(khyber pakhtunkhwa) arshad ali - pakistan research
TRANSCRIPT
PRXDICTTVE VALIDITY OF THE ENTRANCETEST FOR ADMISSION TO THE ENGINEERING
AND MEDICAL INSTITUTIONS OF NWFP(KHYBER PAKHTUNKHWA)
Arshad Ali
INSTITUTE OF EDUCATION & RESEARCHGOMAL UNI\'ERSITY, DERA ISMAIL KHAN
KI{YBER PAKHTUNKHWA, PAKISTAI\December,20l0
PREDICTIVE VALIDITY OF THE ENTRANCETEST FOR ADMISSION TO THE ENGINEERING
AND MEDICAL INSTITUTIONS OF NWFP(KIIYBERPAKHTUNKHWA)
Arshad AliPhD
UDder the supen'ision ofDr. Umar Ali
Submilled i Partialfauillment oJ lhe rcqritementlot Ph.D. i,t Education al lheInstilute ofEducalion & Research (IER)
GOMAL UNIVERSITY, DERA ISMAIL KHAN,KHYBER PAKHTUNKHWA, PAKISTAN
December' 2010

ACKNOWLEDGEMENTS
All glory and praise to Almighty Allah Who has bestoNed His blessings upon
me in my life and now enabled me to accomplish tiis dissetution'
I dcem it my Privilege to thank from the core ofrny heart to:
My supervisor/ Director IE& Professor Dr' Umar AIi Khan' for his cordial
guidancc, congcnial criticism and lhoughtful suggestions through out this
research study.
My disse(ation committee mcmbers, especially' to Dr' Muhammad Shah' for
their valuable guidance and creating genuine academic-cum-research like
environment at IER, Gomal University, Dem Ismail Khan'
All the Controllers of examinations of the respectivc universities' staff in
Officc of Academic Affairs of KMC & UET and Director E:|EA for their
coopemtion ard valuable conribution by providing relevant data for the study'
My parenls for all lhosc nighls thcy spent praying for me'
My wife and sister, for all of their love, support and for shouldering the
responsibilities in the home which gave me the freedom to rvork and study'
My Kids Umair, Suhaima, Zuhair and Manha for allowing me to use tleir time
to work on this study.
My friends, Dr. Asim, Dr. Arbab Khan Afridi, Mr' Rauf' Mr' Alamgir' Dr'
Zulfiqar Ali, Mr. Amir Zaman and Mr' Imran for theit good lvishes' help'
valuable suggestions and constant encoumgement'
My teachers, Mentors, and colteagucs from $'hom I leamt a lot'
lll
ANhad Ali
DECLARATION
I, Arsbad Ali, Son ofHukam Shah, Registration No. 700-Edu-88 as student of PhD
at the IER, Gomal Univcrsity do hereby solemnly declare that the thesis enlitled
"Prcdicfive validity of the Entry Test Prepared by Educatioual Tcstilg aud
Evaluation Agency (ETEA) for admi.ssion io EDgiDeeriDg aDd Medical
Institutious of NWFP (KP).", submitled by me in Partial fulfillment ofPh.D. Degrce
in Education is my original $'orh excePt \rherc othenvise acknowledged in the text
and has not been submitted or published earlier and shall not in future, be submittcd
by me for obtaining any Degree from tlis or any other university or institution.
Deccmeber, 2010W
(Arshad Ali)

FORWARDING SHEET
The thesis entirled ..Predictive yalidit] of the Entry Test prepared by
Educational Testing and Evaluation Agency (ETEA) for admission to
Engineering and Medical Institutions of N.W.F.p. (Khyber pakhtunkhwa)',
submitted by A6had Ali in parlial iulfillmcnt of rhe requirement of phD Degree
in Education has been completed under n1) cuidance and supervision. I am fullysatisfied with the quality ofhis research u,ork.
Dated:31-12-2010
Su EfiTisor
APPROVAL SHEET
We the supervisory committee. ceftiry that the contents and form of dissertation
entitled "Predictive validity of the Entry Test prepared by Educational Testing and
Evaluatiotr Agency @TEA) for admission to Engineering and Medical I[stitutions
of N,W.F.P." submitted by Mr. Arshad have been found satisfactory, and recommend
him for the award ofPhD Degree.
Supervisor -&F-6;;b1.6",* Ali KL-
Extemal Examiner
Dean Faculty of Arts
Director IERProfessor Dr. umar Ali Khan
vi
ABSTRACT
Titlc: "Predictive validity ofthe Entry Test prcparcd by Educational Testing and
Evaluation Agency (ETEA) for admission to Medical and Enginecring Institutions of
NWFP (KP), Pakistan".
Researcher:
Supervisor:
Univcrsity:
Year:
Arshad AIi
Dr. Umar Ali
Comal Universiry, Dera Ismaii Khan, NWFP (KP), Pakistan
2010
Subject Area: Education
Dcgrce: PhD
In Pakistan, a few studies havc been conducted on tie predictive validity of Entry
Tests. The results of the reportcd studies are also no! conforming to tle intemational
studics, which posc a question mark for the applicability of these cntry tests.
Educalional Testing and Evaluation Agency (ETE,{), NWFP (KP), Pakistan sincc
from its inception (1998) has conducted hvelve set of Entrance Tesl for tic NWFP
(KP) Univcrsity of Engineering and Tcchnology (UET) and Medical Colleges of the
province. Horvevcl no research studies have bccn conducted to validate these tests in
term ofpredicting future perlormance oftre studenls. The main Purpose of this study
was focused on examining the predictive validity of the Entry Test prcpared by
Educational Testing and Evaluation Agency (ETEA) for admission to all bnnches of
UET, Peshawar and All thc NWFP (KP) Medical and Dcntal Colleges under the
administlativc control of provincial govcmmsnt.
Mcthod: This study folloved 5478 studcnts Olale = 4195, Female =1283) attending
UET,4 Medical & 2 dental colleges olN$TP (KP) from enrancc (to medical and
engincering institutions) to gradualion, Nho cnrolled in thc 2000, 2001,2002' 2003'
2004, and 2005 academic scssions.
The association behveen the prcdictors (FSc, Entry:est scores and overall merit) and
the critcrion (academic achievementyscores of students from first to final year) lvere
anallzed by utilizing Mean, Standard Dgviation, Co.relations and Regression analysis
as statistical Techniques.
Conclusions and Suggestion: The resuls ofthc study establish the facr that all the
predictors (FSc, Entry test and merit scores) $ere significantly associated rvith the all
fivc MBBS examination scores of all the four medical colleges in almost all the six
cohorts; howcvcr, steprvise regression analysis relealed that among the predictors,
FSc was found the bcst prcdictot follo\ved by merit and entry test. In case ofdental
collegcs, the combination of dental entrance test and college CPA (FSc scores) lvere
more predictive of dental-college performance than are either entry test scores or FSc
scores alonc. So, the study supports the use ofexisting criteria for admission to dental
colleges. With regard 1o enginccring, all thc thrce predictors were significantly
correlated lvith all the four cxamination scorcs of enginccring progranme. Horvevct,
in most of the engineering disciplines, of all the three predictors, FSc was found in
better position to be used as predictor as compared to entry test and merit scores.
Gcnder rvisc results showed that jn all the mcdical colleges, female had higher
correlations bchveen the predictors and the criterion variables, than male. Cender wise
analysis of dental sample illustrated that, unlike the medical sample, the validities
coefficients, for almost all criterion variables rvere higher for male students than for
female. On the average, mal€'s dental scores were under-predicted aad female's dental
scorcs were over-predicted by all lhc three PredictoB i.e. FSc scores, entry test ard
mcrit scores. Due to the very smallsample size (i.c. lcss than 2% ofthe total sample)
of fcmale students in engineering p.ofession, anal)'sis were presented only for overall
enginccring samplc, instead ofgender- wise.
Oycrall, our lindings indicate dat thcre is signillcant relationship benveen the
Predictors and the academic achievement ofdental, n1edical and engineering students.
However, development of additional predictors, such as inleryiew or test of non-
cognitive domains ofthe students may improve the accuracy ofadmission decisions.
Ke)nvords: Predictive validity, Mcdical admission test, Dental entrance lest'
Enginecring Admission tcst, NWFP (KP), Educational Testing and Evaluation
Agcncy (ETEA), Tcsting, Measuremcnt and Evaluation.
YIlI
TABLE OF CONTENTS
Chapter Confent Page
Acknorvlcdgcmcnts iiiDeclaration iv
Fonvarding Shcct
Aoorovel Sheet
Abstract
Tablc of Contents
List ofTables
I. INTRODUCTIONl.l Background ofthe study .-,.,..,......-.....--.--..--..--.. I
1.2 Statement ofthe Problem..-..,.....,,..-..--.......---.-- 3
1.3 Objectives offte Study-....-.....-,..,.....,........---... 4
1.4 Research Questions.... 4
1.5 Significance ofthe Study.........-........, ..,..,........ 4
1.6 Delimitations ofthe sludy.......,............-..-....... 6
l.'l Organizalion ofthe Study . ..-......,...........-...-..--. 6
1.8 Definition ofTerms and Abbreviations........... 'l
2. REVIEW OF RELATED LITERATURE ...-.....,..,,...............-......, &r55
2.1 Educational Measurement and TcstinS: Historical Perspectives........ 8
2.2 Chamctcristics ofa good measuring lnstrument (fen) .......---..-,..,,,.. l4
2.3 Entry tes! the intemational perspective..--...,.. 27
2,3.1 Entrance tests used throughout the \Vorld...... 27
2.3.2 Mcdical Education in Diffc.ent Counties..--..-,,.-,,.-,.......---..-,.,-.,....-.... 3l
A, Americas (United States, Canada, Brarl) . 32
B. Australia 37
C. Europe (U.K., Sweden, Spain, Turkcy) -...-...-,...,.......---..--,.-..-,.....- 38
D. Africa (Egypt, Kenya, Nigeria, South Africa) ...,..-,,.....-.---..-..-,,.... 42
E. Asia (Kore4 , Bangladesh, Indi4 Chin4 kan, etc),.........-----,....--. M
2,4 Admission Requirements in thc liSht ofEducational Policies ofPakistan,.,...--.._...,..,..... 52
2.5 Overvierv ofadmission procedure in Pakisr-an.. 57
2.5.1 Thc Medical Education Syslem of Pakistan.......--...,..,,...,....--..-..-,,..... 5'1
2.5.1.1 Pakistan Medical And Dental Council (PM&DC) ..........--...-,.-.......... 58
2.5.1.2 The Mcdical and Dental Admission crileria in the four provinces ofPakistan: ,...,..--.....,...,.. 66
i. Admission procedure in Sindh....-...............---. 67
ii. Admission procedure in Punjab..-.....,......--. 69
iii. Admission proccdure in Baluchisran..., ..,.. 72
I
iv, Admission procedurc in NWFP (KP).... .... 74
2.5.1.3 Admission Policy of NWFP (KP) Public Scctorledicay DentalCollegcs . 74
2.5.2 EnginccrinE Education System ofPakistan..,....,................................ 84
2.5.2.1 Bricf Hislory of Pakistan Engineering Council(PEC) 84
2.5.2.2 Pakisian Enginecring Council (PEC) -Acr-1975Entry Tcst For Admission in Covcmmcnt scctor EngincerinS.
86
90
93
96
r02
ll0lt2t23
t27
r30
132
132
133
134
134
135
145
152
154
156-170
156
r56
158
158
159
160
l6l
Institutions olThe Punjab.......-..-.-.. .-.-...
Engineering admission at NED, University of Engineering and
Technolory, Karachi.
University of EnginccrinS and Technolos/ (UET), Pcshawar,
2.6.
2.7.
2.8.
2.8.2
2.8.3
2.8.4
2.8.5
2.8.6
2.8.'7
2.8.8
2.8.9
2.8. r0
2.8.1I
2.9.
2.t0.
3.1
3.2
3.3
3.4
3.5
3.6
3.7
An introduction of Educational TestinB and Evaluation Ag€ncy(ETEA) NWFP (KP)..
lssues rclated to prediclive validity studies....-
Related Predictive Validity studies, abroad. ..
Research in USA
Research in Canada
Research in UK ....
Research in Auslralia..
Rescarch in Thailand.
Rcsearch in Ncpal......
Rescarch in Czech Republic .-... . ... .. ..
Rcscarch in India. ...
Research in Sri Lanka.
Dental Predictive validity Studies..... .. .
Engineering Prediclive Validity Studies......-...-
Predictive Validity studies in Pakistan. .........
Why our Prcdictive Validiry (PV) sludy?
METHOD AND PROCEDIJRX.....
Nature of the Study.....
Inslrumentation-..-..-.. ..
Research Design..-.--.--
Data Sourcc
Sample ofthe study -...Data Analysis.-,....--..-..
Statistical methods for determining Predictive validity of admission
critcria.
)(
5.1
5.3
5.4
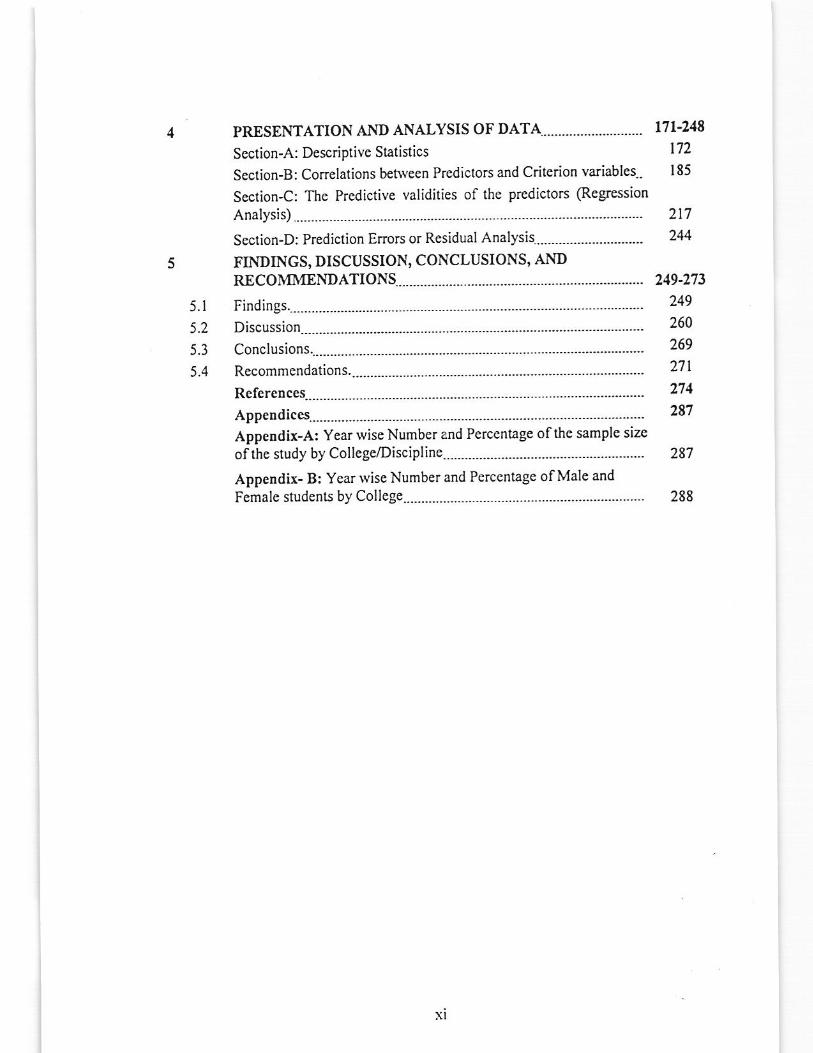
PRESEMATION AND ANALYSIS OF DATA,........-,...........,...,.
Section-A: Descriptive Statistics
Section-B: Correlalions behveen Predictors and Criterion variables.,
Section{: The Predictive validities of the predictors (Regression
Analysis) .......-.....-......
Section-D: Prediciion Errors or Residual Analysit..-..-,..-.........-.--,...,.
FINIDINGS, DISCUSSION, CONCLUSIONS, ANDRXCOMMENDATIONS
Findings..-......,.....-..--..-
Discussion..-,........-...,..
Conclusions.-...,,.,......-.
Recommendations.....-
RcfcreDces............ ......
Appcndices ....... ..Appendix-A: Year wise Number and Perccntage ofthe sample size
of the study by College/Discipline..-.....,..,......
AppeDdir- B: Year lvise Number and Percentage of Male and
Female students by College...-......,............-...,..
t7r-248t'l2185
217
244
249-273
249
260
269
271
274
281
287
288
xl
I
5
Tablc No.
4.t
4.3
4.4
4.5
4.6
4.8
4.94.10
4.1I
4.12
4. t3
4.14
4.15
4,16
4. t7
4.r8
4.t9
4.20
4.21
4.23
4.24
4.25
4.26
4.27
4.28
4.29
4.30
4.31
4.12
4.33
4.34
4.35
4.36
4.37
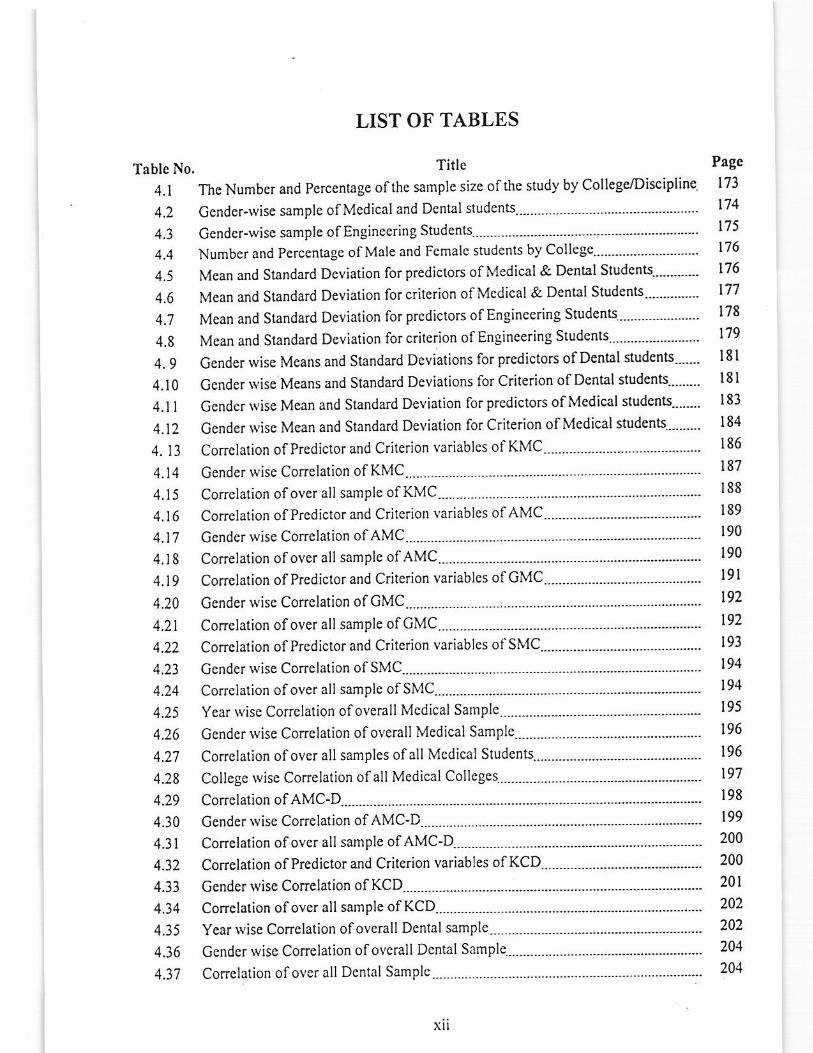
LIST OF TABLES
Title P8gc
The Number and Percentage ofthe sample size ofthe study by College/Discipline 173
Gendcr-wise sample ofMcdicaland Dental studcnts---.........---.. '.......- ......-...-...-..-..... 174
Gender-wise sample ofEngineering Studenls ..-......--.--......-"" 175
Number and Percentage of Male and Femals studenls by College......
Mean and Standard D€viation for predictors olMedical & Dental Studcns-.......---" I76
Mean and Standard Deviation for criterion ofMedical & Dental Students......- " 1?7
Mean and Standard Deviation for predic(ors ofEnginecring Stud€nq.. '-..-... .... - -'- 178
Mean and Standard Deviation iorcriterion ofEngineering Students.. ..-..---.........-..-.. 179
Gender rvise Means and Standard Deviations for predictors of Dental nudents'.....- l8l
C ender rvise Means and Standard Devialions for Criterion of Dental students.....-'.. I 8 I
Gcndcr rvise Mean and Standard Deviation for predictors of Mcdical students.....--' 183
Gender wise Mean and Standard Deviation for Criterion of Medical students.-..'.... 184
Correlalion ofPredictor and Critcrion variables ofKMC... .........--......,,......-...''........ 186
Cender wise Conelation of KMC. ..,.........,.... - 187
Correlarion ofover all sample ofKMC..-. ....,... .'..... ....-.. ..... lSg
Correlation ofPredictor and Criterion variablcs ofAMC-.-....,.......--..--..,.......-'.-'......- 189
cender wise Correlation ofAMC 190
Correlation ofovcr alt sample of AMC......-....., ....-.-..-.......-.... 190
Correlarion ofPredictor and Criterion variables of GMC........... -...-,.,,,.......----.-........ l9l
Cenderrvise Conelation of GMC........-.. ...,. ,.. ....................... 192
Conelation ofover allsample of GMC..-..-...,... ..........--...-.-..-- 192
Corrclation ofPredictor and Crilcrion variablcs ofSMC............-...-...,...........-...'....... 193
Cender wise Corrclation of SMC...,........--.--..... .....-..-..-..-...-.. . 194
Corrclation ofover all sample ofSMC--.-.. ,...... .....--............--' 194
Year wisg Correlation ofoverall Mcdical Sample..,..---......,....-...--..-...,.......-..--.-,,.....-. 195
Cendcr rvise Conelation ofoverall Medical Samp1e...,...,...-........-...............-............-- 196
Conelation ofover all samplcs ofall Medicat Siudents......-....,............-..--..,.........--.-- 196
College wise Conelation ofall Medical Colleges....-...-,,.....-.-..--...-,,............--...-......... 197
Correlation of AMC-D ......---.-..,.......-.. 198
Gender wise Conelation of AMC-D....,..........-. -...................-,, 199
Correlation ofover all sample ofAMC-D..-.. ... -.-,,.......-.--.-,,.. 200
Conelation ofPredictor and Criterion variables ofKCD...--...-...-...-......----..-,...........-- 200
Gender wise Correlation ofKCD.-..-,.,........--.... 201
Corrclation ofover allsample ofKCD..-..-.....,.. ............--....--.- 202
Year wise Correlation ofoverall Dcnlal sample ..-.....-..-.--.-...- 202
Gendcr vise Correlation ofo\,erall Dcntal Sample...--.....-,,.......-....,,.-,.. .....-..-..-..-...... 204
Conelation ofover all Dcntal Sample.,......-..-. -. ....--..........--.. 204
xll
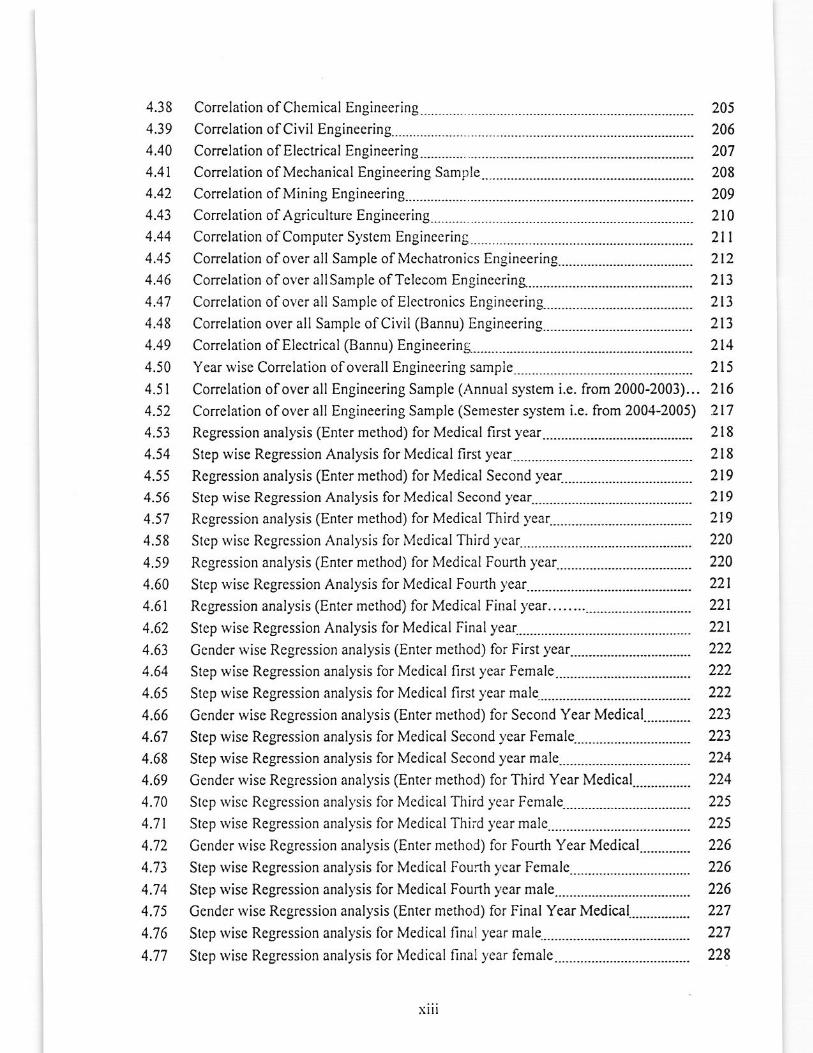
4.38
4.39
4.40
4.41
4.42
4.43
4.44
4.45
4.46
4.47
4.48
4.49
4.50
4.5 t
4.52
4.53
4.54
4.55
4.56
4.51
4.5 8
4.59
4.60
4.61
4.62
4.63
4.64
4.65
4.66
4.67
4.68
4.69
4.70
4.7 |
4.'72
4.73
4.74
4.75
4.',|6
4.',77
Correlation ofchemical Enginee.ing.... . 205
Correlation ofCivilEngineering.........-......... ..._....-..-..-...... 206
Correlation ofElectrical Engineering.-..-... .__.._..__......_.._.._ 207
ConelationofMechanicalEngineeringSample.._..._....-...-..,.........,-....-.--.._.._--...-._-._...208
Conelation of Mining Engineering..........,. 209
Correlalion ofAgriculture Engincering..... .... ...._.......-...-....-.. 210
Corrclaaion ofcompulcr Systcm Enginecring .........._........... 2llCorrclationofoverallSampleofMechatronicsEngineering..........._...-.-.-.....--..--.-._-- 212
Cor.clationofovcrallSamplcofTclccomEnginccring.............................................2l3
Conelation ofover all Sample ofElectronics 8ngineerin9,..,,..,.,...,,..,. ._..._..-_........... 213
Conelation ovci all Samplc ofCivil (Bannu) Engineering..._.........-..__.. ....-...-..--..-..-.. 213
Correlalion ofElectrical (Bannu) Engineerins ..--.---..--..--.-..-.. 214
Year wise Correlation ofoverall Engineering sampie-_..._.._..-__..___.--_..--.._..-_..--...-..-.-.. 215
Conclation ofovcrall Enginccring Sample (Annualsystcm i.e. from 2000-2003)... 216
Corrclation ofover all Engineering Sample (Semester system i.e. from 20M-2005) 217
Reglession analysis (Enler method) for Medical first year..-....-...---..-..-...-,.---,.--..-..-,- 218
Step wisc Regression Analysis for Medical first year--------.-...--...---.--..-. ....................- 218
Regression analysis (Enter method) for Medical Second year--...-...--.. ...............-......- 219
Srcp wisc Rcgression Anelysis for Mcdical Second year ..--.---...--..--... -.--... ..--...-..-.--- 219
Rcgressionanalysis(Entermethod)forMedica1Thirdyear,,...,,,.,,..................--..-..-..219
Srcp wisc Rcgrcssion Analysis for i\4cdical Tltird year ...--.-....-...-....-... ...--..-......-..--... 220
Rcgression analysis (Enrcr mclhod) for Medical Founh ycar...................-..-...-..--..---- 220
Stcp wise Regression Analysis for Medical Fourth )'eai..,...,,,....,.,...... ....................... 221
Rcgression analysis (Enter melhod) for Medical Final)'ear.....................................221
Slep wisc Regrcssion Analysis for Mcdical Final year..--.. ...--... ........-. -.......--........... 221
Cender wise Regrcssion analysis (Enter method) lor First year,...,,..-,, --...-..-......-...... 222
Slcp wise Regression analysis for Medical first year Female 222
222111
223
224
224
225
225
226
226
226
227
228
Stcp rvise Regrcssion analysis for Mcdical first ycar malc
Gcnder wise Regression anal)sis (Entcr method) for Second Year Medical.......-....-
Stcp wisc Regression analysis for Mcdical Sccond ycar FemalE
Stcp wise Regression analysis for Mcdical Sccond ycar male
Cender \{ise Regression anal),sis (Entcr mcthod) for Third Ycar Medical
Stcp rvisc Rcgrcssion anal),sis lor Medical Third year Fcmale
Ccndcr rvisc Regrcssion analysis (En1er melhod) lor Fourth Year Medical.---..-...-.--
Step wise Rcgression anal)sis for Mcdical Thiid )'car malc
Stcp wisc Rcgrcssion analysis for Medical Foulh )'car Fcmale
Stcp rvise Regression anal)'sis for Medical Fourth )'car male
Cender Nise Rcgression analysis (Enter method) for Final Year Medical........-.......
Stcp rvisc Rcgression analysis lor Medical final )'ea. male
Stcp rvise Regrcssion analysis for Mcdical final year fcmale
\ll I
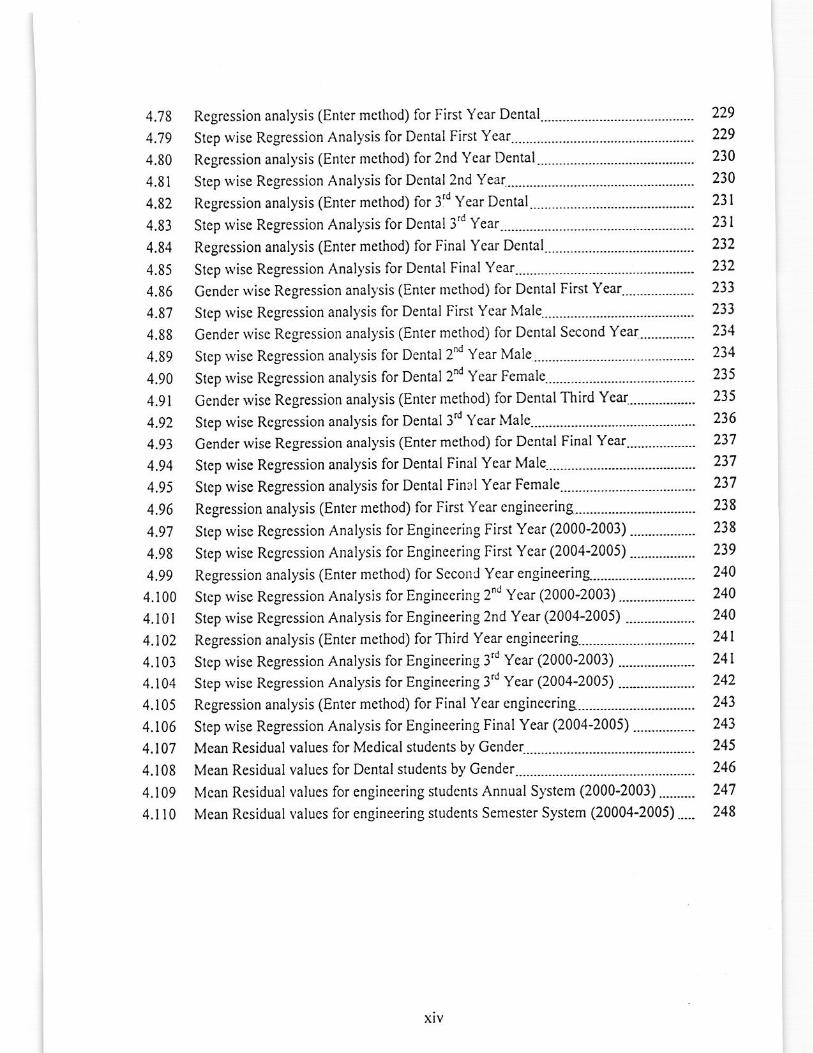
4.'18
4.'19
4.80
4.81
4.83
4.84
4.85
4.86
4.8'1
4.88
4.89
4.90
4.91
4.92
4.93
4.94
4.95
4.96
4.97
4.98
4.99
4.100
4.t01
4.t024.103
4.104
4.105
4.106
4.107
4.108
4.109
4.1 l0
Rcgrcssion analysis (Enlcr mcthod) for First Ycar Dental.,..,,-..-....-...-. .....-...-.........--. 229
Step wise Regression Analysis for Denlal First Year.-...--.....--...--.....-.... .............-.....-. 229
Rcgrcssion anatysis (Entcr mcthod) for2nd Ycar Denta1,...........-...--..,...,,.............-..- 230
Step wise Regression Anal)'sis for Dental 2nd Yeal..--..--........-...........-... .-..-...-..-....... 230
Rcgrcssion analysis (Enter mcthod) for i'd Ycar Dental 23t23111)
213
233,11
734
235
235
236
237
23',1
Step rvisc Regression Anall'sis for Dcntal 3'd Year
Regrcssion analysis (Enter metiod) for Final Ycar Dcntal
Step wise Regrcssion Anal)'sis for Dental Final Ycar..--...-.----.--.......--.,
Gcnder wise Regression anal)sis (Enter mcthod) lor Dcntal First Year
Slep wise Regrcssion anal)'sis for Dental First Year Malc....---..-..
Cender wisc Regression analysis (Enler method) lor Dental Second Year
stcp wise Regression analysis for Denlal 2 Year Male-...-.,.
Stcp wise Regression analysis for Dental2d Year Femaie.-...,,.-.,.......-
Gender rvise Rcgression anal)'sis (Entcr meliod) for Denlal Third Yeat.-.--...,.........
Step rvisc Rcgression analysis for Dental 3d Year Ma1e........-.---..--,..,..
Gendcr wise ReSression analysis (Enter mcthod) for Dcntal Final Ycar
Step wisc Regression analysis for Dcntal Final Ycar Male
Step wisc Regression analysis for Denlal Fin3l Year Femalc ............. ............-.......... 231
Rcgrcssion analysis (Enier meliod) lor Firsi Year engineering......--..- .......-.......-.-..-- 238
Step rvisc Regression Analysis for Enginecring First Year (2000-2003) ..........--...-.. 238
Stcp wisc Rcgression Analysis for Engineering First Ycar (2004-2005) .................. 239
Regrcssion analysis (Enter mcthod) for SeconJ Ycar engineering-.... ........-........-.--.. 240
S!ep wise Regression Analysis for Enginccrirg 2"d Ycar (2000-2003) . .-.................. 240
Step wise Regression Analysis for Engineering 2nd Year (2004-200J) .....-..-..-..-..-. 240
Regression analysis (Enter melhod) for Third Year engineering....--... .......-............... 241
Step wise Regression Analysis for Engincering 3'd Year (2000-2003) ..................... 241
Slcp wise Regression Analysis for Engineering 3'd Year (2004-2005) . ...............-.-.. 242
Regression analysis (Enter mclhod) for Final Ycar cnginccring....-,..-............-.....-..-. 243
Step wise Regression Analysis for Engineering Final Year (2004-2005) -...-............ 243
Mean Residual values for Mcdicalstudents by Gender,....-..---..--...-......... ..........-..-...- 245
Mean Residual values for Dental students by Cender...-..---..--...,....-,,.,.. ......-......-..-.--- 246
Mcan Residual valucs for engineering studcnls Annual Systcm (2000-2003) ..--.-..-- 247
Mean Rcsidual valucs for engineering sludcnrs Semester System (20004-2005) ..... 248
xlv
CHAPTER-1
INTRODUCTION
1.1 Background ofthe StudY:
Test is usually evaluated by h{o technical qualitieJcharacteristics i.e. validity and
Reliability. Tcst expe6 Scncrally agrcc that the most important quality ofa test is its
validity (Rizvi, 1973).Amsrican Psychological Association (APA) classified validiry
into thrce catoSorics stated as under:
(l) Contenr Validity (2) Criterion-relatcd Validity and (3) Construct validity.
The Criterion-related Validity falls into tNo categories (l) Concurrent Validity
(2) Predictive Validiry.
"Prcdictive validity is the degree to which a lest can predict how rvell an individual
will do in a future situation. Predictive validity is extremely important for test tlat one
uscd ro classiry or select individuals. The prediclive validity ofa test is delermined by
cstablishing the relationship betveen scores on the test and some measure ofsuccess
in thc situation of interest. The test use to predict success is refencd to as the
Predictor, and the behaviour predicted is referred to as the Criterion" (Gay' 2000'
p.143).
Roding, K. (2005) highlightcd the importance of admission process in tiese words
"admission to higher education has far reaching implications and an impact not only
on individual, but also on society. The main objective is to seek oul, from the pool of
applicants with academic stardard, highly motivaled students with potential to
becorne good dentists. Thc admission system dctermincs rvho will have access to
highcr education" (p.2).
Scholastic Aptitude Test (SAT) Nas thc llrst testing Program on a large scalc used for
tho purpose ofcollege admission (Angoff, l97l).Anolher example with which we all
too familiar are the (CRE) Craduate Record Examination scores to select studcnts for
admission to graduate school Many graduatc schools rcquire a certain minimum
score for admission, in the belief that students \Yho achieve that scorc have a hiSh€r
probability ofsucceeding in graduate school.
In U.S., at least one major standardizcd test uscd as admission critcria in almost all
colleges and universities. The mo$ widely uscd standardized tests are the SAT and
the Craduate Record Examination (GRE) uscd for admission to undergraduates and
graduate programmes respectively.
Medical schoots in United States, Canada and United Kingdom considered the
undergraduate Gradc Point Average (GPA) and the Medical Collegc Admission Tesr
OICAT) scores as the mosi imPortant criteria for the sclection of aspiring medical
students (Mitchell, Haynes, and Koenig, 1994). Scores on these tests arc mosl often
used to pr€dict students' future achievement in a department's curriculum (Lydia, S'
2005).
The existing literatxre coosistcntly idcntifies CPA and standardized test scores,
individually and in combination, as good prcdictors of nudcnts' subsequent
pcrformance (Wightman, 2003). According to willingham (1985) the nrongcst
predictor ofcollege grades rvas the high school GPA ofthe student arld Willingham ct
al. (1990) also lound that standardizcd lest scores rvere the second best p'edictor of
college grades.
At higher level of education, in Pakistan, traditionally the intermediate exam; scores
were uscd as criteria for selecting of studenB. Till the mid-nineties, intermcdiate
exams were used for ihe sclection of public sector medical collegcs' students' Aga
Khan University (AKl, took the lead and introduced written admission tests and
intcrview for selcction of students. The performance of AKU students in lhe FCPS
and foreign ccrtificalion examinations rvas linked with this selection procedurc Other
insritutions in the private sector like Baqai and Ziauddin universities also adopted the
samc pattem ofadmission like Aga Khan University (Baig, L A' et al' 2001)'
NWFP (KP) Educational Tesling and Evaluation Agency (ETEA) is an indePendent
and autonomous body. Covemmcnt ofNWFP (KP) established ETEA for the purpose
to conduct cducalionat testing and evaluation tbr lhe cducational institutions in a
transparcnt, uninfluenced and academicaily sound manner' Thc gcneral aim of the
Agency is the evaluation ofeducational institutions. Conduction oftest for admission
2
to the professional insiilutions providing Mcdical and Enginccring education is thc
responsibility of ETEA. The agency has been conducting Entrancc Tests for
admission to the NWFP (KP) Universi$' of Engineering and Technology and to the
Medical and Dental Collcgcs ofNWFP (KP) sincc ils inception, l998 ETEA has also
bccn conducting Entrance Tests for admission 10 the programmes of IMS (both
Undcrgraduate and Craduate). The agency also conduct tests for sclection of IT
Teachers, and Lecturers (ETEA, 2005, p.2).
1.2. StatemeDt ofthe ProbleE
A largc number ofresearches have been conducted the predictive validiry of Enu-ance
Test which are used for admission to undergraduate, graduate and prof€ssional
programms throughout the world, for examPle SAT, GRE, MCAT, PCAT and CMAT
etc. AImost all the studies consistently suggest that these tcsls contribute significantly
to the prediction in the respective fields.
In Pakistan, research on predictive validiry is a nerv field for rcsearcher and studies
conduclcd so far, on the prcdictive validiry of Entry Tests can bc counled on finger
tips. The findings ofthe these studies are also not conforming to thc rese.arch Iinding
of the studics conducted at inlemational level, lvhich pose a question mark for the
applicability ofthese entry tests. For example onc ofthe study conducted by BaiE; A.
et al (2001) to determinc the predictive validity of admission Test lor Ka.rachi
Mcdical and Dental College (KM & DC) conducted by lnstitutior of Busincss
Administration (lBA) entitled "ls the admission test at Institution of Business
Administration a good predictor of final profcssional test grades?" concludcd that the
conelalion co-efficicnt r. was - 0.172 for Karachi Medical and Dental College BDS
Students. The findings of this study revealed liat lhcre rvas a ncgative correlation
behvecn lie entry tcst (lBA) scores and the academic achievement of students. As a
rcsult thc researchers suggested re-structuring / improvement of the enlry test on the
basis oftheir study.
Since ils inccption (1998), thc agcncy has conducled tNelvc (12) sets of Entrance
Tes! for the NWFP (KP) university of Engineering and Technolos/ and Medical
Collegcs of the province. Howevet no rescarch study has been conduc(ed to validate
thesc tcsts in term of predicling fulure performence of thc students. The question
arises how effectively the ETEA contribulcs loNards lhe seleciion of compelent and
potential applicants for thc Medical and Enginccring profcssions? And in what
respccts, the ETEA test predicls the future perlormance of these students? Keeping
these questions in mind,lhe investigator intends lo undertake a dekiled investigation
on thc problem.
The study was focuscd on examining the predictive validiry ol the Entry Test
prepared by Educational Tcsting and Evaluation Agcncy (ETEA) for admission to
Medical colleges and Univcrsity of Engineering and Technology' Peshawar' NWFP
(KP).
1.3. Objectives ofthe Study
Thc study was directed by the following objectiYes:
a. To examine thc Predictive validity of thc ETEA entry test for medical and
dental students.
b. To dctermine the predictive validity of the EIEA cntry tcst for cngineering
students.
c. To cxplorc the predictive validity ofF.Sc marks (10 years schooling followed
by 2 years in a college ofintermediate education)'
d. To test the prcdiction ofETEA test acioss the gender (for male & Fcmale)'
1.4. ResearchQuestions
The study was focused on the following questions:
a. Do the F.Sc marks predict well for future performancc, in term of academic
achievcments in both the medicaland enginecring professions?
b. Do fie ETEA Entry Test marks predict academic achievements in botl the
medical and engineering professions?
c. How rvell do F.Sc marks and Entry Test scores collcctively predict medical
and enginccring scores?
d. Are the predictive strengths ofEntry Test consistent across the gender?
4
1.5. SigoificaDce of thc Study
The selection of potcntial candidalcs, who havc inncr potcntiality to succccd in a
pafiicular course/curriculum, is a focal point in cvery admissions p.ocess o. admission
criteria. Accurate and reliable information may be used to ensurc the valid decision
about the sclcction ofstudcnts.
ln almost all thc developcd countrics, sbndardized test is used as a criterion for
admissions. The scorcs on such tests demonstmle applicants' intcllectual ability and
knorvledge in their desired fields of study. Thcy also aid in the prediction of
applicants' succcss or failure in a progmm ofstudy.
Asscssing tost validity is one way lo cnsurc that thc inlormation gathered from such
tcst scores is accurate. Test validity is thcrcforc considered to be the most
fundamenlal and imponant in psychometrics (Angoff, 1998) and an understanding of
fiis conc4pt is in itself the foundation for fair and proper use of lest and
measuremcnls ofall kinds (Ebel & Frisbic, l99l). Predictive validity is viervcd as
very imponant in situations whcre lesls are uscd in making admissions decisions
(I.lunnally, I978).
Thc study can bejustified on lhe following grounds:
l. In Pakistan thc conduct of entry test for admission to the professional
inslitutions is a new experimcnt rvhich may need furtier improvement and
standardization in fulure. So the study is expccted lo validate the entry test for
future use.
2. It is the ever first predictive validity studl'for the ETEA administered entrance
test to all branches of Engineering University, Peshawar and all Medical
Colleges of the N\VFP (KP) province, one of the four federating unit of
Pakistan.
3. The primary and basic bcneficiaries of lhis research may be the curent and
potential users ofETEA enlmnce lcst (i.c. students, parents and institutions).
4. The study may provide information regarding the achievement levcl, the
strenglhs and weaknesses ofstudents in theit professional programmes.
)
5. Such infonnation may help the administration of medical collegcs and
cngineering univcrsity to select appropriatc potcntial students for these
professional pro$ammes.
6. It may provide necessary feedback lo ETEA about its existing design of the
entry test and the possible improvcment for future.
7. This study nray have national significance if the study eslablished the
prcdictive validity of the ETEA Entry Test, olher higher institutions;
especially the professional programs may also adopt Entry Test as a criterion
for admissions to their academic programmes.
8. State policymakers may use tle results ofthis nudy to support public funding
ofprograms at sla{e institulions.
9, The study may provide a usefirl document for the future researcheE in tlis
arca.
1.6. Delimitations ofthe Study
a. The data was collccled for the students ofsix cohons, \vho admitted in 2000 to
2005 academic scssion only.
b. The study was delimited to the information of Medical Colleges under the
administrative control of Provincial Govemment of NWFP (KP) a,ld
University of Engineering and Technology, Peshawat. Private sector Medical
and Enginecring institulions arc noi included in the study.
c. Thc study was Iimited in tho sensc lhat it focuscd on prcdictive validity, which
is only one aspect oftest validity.
1.1. OrgaDiz^tio oflhe Study
The study is documented in five chaplers. Chapter one int oduces the study and its
purpose, tho expected significance of the study, the research questions, and selected
dcfinitions. Chapt€r hvo consists of thc rclatcd literature of the study. Chapter three
deals rvith the methods used in the study, including research design, subjecs,
proccdurc of data collcction, and data aDalysis tcchniques. Chapter four dcscribcs the
results of thc study in dctail. The fifth and final chapter reports the findings,
conclusion and rccommendations ofthe study.
1.8. Definitions ofTerms / Abbreviations
a. Validity. 'rlt is the degrec to which a tcsl measurcs tvhat it is supposcd to and,
consequently, permits appropriate interprclation ofscores" (Cay, L.R.2000).
b. Predictori "The test use to p.cdict success in future is referred to as the
predictol'.
c. CriterioDi "The behaviour/ performance predicted is refcned to as criterion".
d, Predictive validit): "Predictive validity is the degrce to which a test can
predict how an individual will do in a future situation" (Cronlund, 1990).
c. Psychometrics: "The design, administration, and interpretation ofquantitative
tests for the measurement ofpsychological variables such as intelligence, and
aptitude".
ETEA Educational Testing and Evaluation Agency
GPA Grade Point Avcrage
CRE Craduale Record Exarninalion
SAT Scholastic Aptilude Test
MCAT Mcdical College Admission Tcst
PCAT Pharmacy College Admission Test
LSAT l,aw Scholastic Aptitude Test
GMAT Graduaie Managemcnt Admission Test
F.Sc. l0 years schooling follo\ed by 2 years in a college of
intermediate education
KCD Khyber collegc ofdcntistry
BDs Bachelor in Denlal Surgery
UET University ofEngineering & Technologi
KMU Khyber Medical University
CHAPTER.2
REYIEW OF RXLATED LITERATURE
For thc bcttcr understanding of the problem, it is nccessary to review the rclevant
litemturc. Keeping in vicrv the imponance of the reviery and ils advantages, an
atlempt has bcen made in this chapter to $ud),the relared documents on various
aspccts ofthe problem and record observations. For convenience sake the materials so
thrashed out, are prcsented in various sections. The description of rvhich is given
bclorv.
2.1. Educational Measurement and Testing: Hislorical Pe.spectives.
2.2. Characteristics ofa Good Measuring Instrumenr (fen).
3.2. Entry test, the intemational perspectives.
2,4, Admission Requirements in thc light ofEducational Policies ofPakistan.
2.5. Overview ofadmissions procedure in Pakistan.
2.6. Infoduction of NWFP (KP) Educational Testing and Evaluation Agency
(ErEA).
2.7. Issues to consider in assessing predictive validily.
2.8. Related predictive validity studies abroad.
2.9. Rclatcd prcdictive validity studies in Pakistan.
2.10. Why our predictive validity study?
2.1. Educational MeasuremeDt and Tesling: Historical Perspectives
One ofthe best ways to begin a study of a subjecl like educational measurement is to
review the hislory of its development. Obviously the means we use today rvere
dcvclopcd in thc past. Wc rvill understand theii functions and limitalions betlcr iflve
know something of how thcy came into existence (Ebcl, 1972, p.3).
History ofmeasurement and testing can be divided into the follorving four (4) era:
2.1.1 Ancient and Medieval
2.I.2 NineteenthCentuo,
2.1.3 Firsr 60 years ofT$,enrielh Century (t900-1960)
2.1.4 From l96i-Tilt Darc
2.1.1. Ancient and Medieval
Oral Examirationsi It may bc assumcd that reachcrs havc alrvays mcasured orevalualed thc work oftheir pupils, but evidencc ofeariy records indicaie rhat this was
gencrally don tlrough oral questioning or personal obs€rvation e.g. Des_e-Nizami in
religious Dar-ul-Ulooms. In each community there was a ,.School Committee,, ofcitizens responsiblc for ftc local schools to visit the school at least once in a year forinspection to examinc the pupil by asking them questions.
Curtis (1967) statcs that "examinations rvere largcly ordl, cven, when universities
rverc cstablished in Europe in the Renaissance and frequently took the form ofpublic
disputations on controversial qucstions" (p.64).
Chioese Civil Service Exam: China rvas lhe only country in the ancient time where
an extensive system ofwritten examinations of cducational achievements formed the
basis for admission and promotion in the civil scrvice ofancient China. This system
of Compclitive civil scrvicc cxaminations was iniroduccd by Empcror Shun in 2357
B.C.
2.1,2. Ni[cteeDthCeDlury
Inl832 English East India Co. used exam, (copied idca from Chinese exam) to select
employees in Sub-Continent.
In I836, thc University ol London rvas established for extemal examination for
degrees. It had no faculty, no students and offered no courses. This service of
examining body was extended to students in all pans of British Empire, including
Sub-Continent i.e. India and Pakistan.
In 1845, written vs. oral examinations controversy aroused. But due to the efforts of
Horace Mann, who \vas the secretary of the Massachusetts Board of Education, onl
cxamination rcplaced by $ritlen examination.
Competitive Civil Service Examinations, for the first timc rvere intloduccd in ahe
Unitcd States and England in 1850 and 1855 respectively. In 1864, the Rev. George
Fishcr devcloped and published Scale Book that gave examples or spccifications ofa
9
l0
wide range of levcls ofqualiry in Hand \\'riting, spelling, mathematics' knowledge of
scripture and other subjects ofstudy.
In 1865 Stale Testing Programm€ was initialing, staning Nith high school admission
test. Tlesc uniform, impartial cxaminations rvcre s'ell rcceived, and in 1878 a similar
programme of high school g.aduation and collegc admission examinations rverc
instituted.
Tcst of Mental Faculties (1890): In 1890, James Mckeen Cattell undertook to
measure mcnlal ability by measuring precis:ly certain sensory, motor and basic
menlal facultics. Ho thought lhat therc should bc a dircct rclation bctvccn a pcrson'
ability in thesc elemental processes and his abilily to use higher mental process such
as rcasoning, critical thinkinS, and crealive imagination'
AAMC (1890): Thc Association of American Medical Collcges (AAMC) was
establishcd by 66 medical school deans in l89O \Yith a purPose to elevate thc
standards of medical cducation ln the 1960s, the Association opened it door lor
teaching hospital executives, medical school faculq', aad medical sludents to havc a
voice in the govemance oflhc AAMC. According to Hackett J' L (November 1996)
AAMC is a private sector association \\'ith iB membership comprised of the 125
accredited U.S. medical schools; the l6 accredked Canadian medical schools; more
than 400 ma.jor teaching hosPitals; 86 academic and professional societies
reprcsenting 87,000 faculry mcmbers; and the nation's 67,000 medical studcnts and
102, 000 medical residens. fie Medical College Admissions Test (MCAT)'
developed by th€ Association of American Medical Colleges (AAMC), used for the
purpose ofthe entry scrcening assessment for medical schools in U'S'
Survey testing for school Reforms-1894: In 1894, Dr' Joseph, M' Rice, a rctired
Physician who had become an educational reformer, uscd scveral qpcs of spclling
tests administered to thousand of school children. Dr' Rice rvas a skillful pioneer in
tcst construction.
Collcge Etrtrance Examination Board-1899: In United Slates, before 1900 higher
education admission crilcria rvas not uniform. Diverse entranc€ requirements of th€
collcges and varying quality of instruction in lho secondary schools had complicated
the process oftmnsfer from schools to colleges Charles w' Eliot' president of Harvard
II
suggested a proposal that to supplement o. replaced some of the course comPletion
requiremenls with measures of course achielements. So the College Board Tvas
cstablished for thc puryosc of reconciliation among the diverse cntmnce procedures
among collcgcs and framing unilorm policy for college admission procedures in the
United States. The Formation of fie Collcge Eotraoce Examination Board (CEEB)
was formally announced On Nov. 17, 1900. Collcge Entrance Examination Board has
been a major factor in shifting the basis for college admission from scrcioeconomic
status to academic aptitude over the years.
2.1.3. First 60 years ofTnertieth Century (1900-1960)
Thomdike, R.L. & Hagen, E. (1969) divided the history of first 60 years of 20h
century ofPsychological and Educational Mcasurement into four equal patts.
i. The Pioneering Phase (Frorn 1900-1915) :
This was the period of exploration and initial development of mcthod, The
first text book of Educational measurement, written by Thomdike, "father of
modem educalional measuremenf', was published in I903. First Binet-Simon
scale (1905) ofmental development used to classify mentally retarded children
in France. Standard Achievement Tes! Buckingham's spclling Test, Trabue's
Ianguage Tcs! Group tcst of lntelligence, standardized test of arithmetic
(1908) and Hand rvriting Scalc ofThomdikc (1910) rvere developed during
liis period. World War I (1914) produces need in U.S. to quickly classify
incoming recruits, so as consequently, Army Alpha test and Army Beta test
developcd.
ii. Boom Period (1915-1930) r
Standardized lests were devcloped for all th€ content area of the school
programmc. This era sarv cmcrgcncc and dcvelopment of achievement
barleries, starting with Army AIPha of World War-I. Woodrvorth Pcrsonal
Data Sheei and pcrsonality Inventories, for personality measutement came into
being. In 1916, Tcrman developed Stanford - Binct test and the idea of
Intelligencc Quotient (lQ). Thc Schotastic Aptitude Tcst (SAT; renamed sincc
1994 the Scholastic Assessment Tesl) \\as developed in 1926 by Carl
BriBham, a young psychologist teaching at Princcton" (Porvell,2003, p.6). ln
l lt,
t2
Junc 23, 1926, First SAT, made up primaril), of muhiple-choice quesiions, was
adminisrcred. To providc coopcration among the schools in lhe test selection,
use, purchase, distribution, scoring and interprctation, the Educational Record
Bureau was eslablished in 1927. In 1929, Louis L. Tumstone developed a
number of attitude scales. In 1930 AAMC first sponsored an objective test for
applicanls to medical school (called the Scholastic Apritude Tesr for Medicat
School unlil 1946). In 1946, this test was renamed the.,profcssional Aptitude
Test" and then finally it was renamed the MCAT in 194g. This test measurcs
a student's knorvledge of llle sciences, analltical skills and the English
language (Mitchcll, I987).
Period of Critical Appraisal (1930-19.{5) i
In this pcriod tle experts conccntmte their efforts to broaden their approach lo"Evalualing" achievement ofthc wholc range ofeducational objectives instcad
of"Measuring" a Iimited mnge ofacadenric skills. Testing service established
in l930.Attention was focused on measurcment of such outcomcs ofinstructions as attitude, inlerest, and the ability to use the scientific mc6od. In
1935, a Michigan school tcacher, Rcynoid B Johnson, wirh rhe hclp of IBM,
deveiopcd an Eleclric scoring machine. On Ocrober I, 1937, Tte Iirst GREs,
known at that time as thc Cooperativc Graduale Testing progmm, were
administered to first year graduate students at Columbi4 Harvard, princcton,
and Yale Universities. The use of objcctive tes! the whole underlying
philosophy of quantification and the use of number to cxpress psychological
qualitics were critically atlacked in this pcriod.
Pcriod ofTcat Batteriqs and Testing Programme (194S1960) i
During the II World War, there was no progress in this field. A large amount
ofresearch on thc nature olhuman abilitics was conducted by armed services.
Guidance programme came as result of World War. Integrated Aptitude
Batleries for educational and personal usi multiplied during this period. The
test, administered by College Entrance Examination Board, expanded in size
and multiplied in number in this era. In this pcriod standardized testing were
rvidciy administered, used and accepled by the society. Educational Testing
l3
Services (ETS) rvas cstablished in 1947. Jan. l, 1948 ETS sEncd operations in
Princeton, NJ. The LSAT $'as adnrinistered for the first lime in Feb 1948. Since
1951, the Dcntal Admission Tcsl(DAT), administcred by thc American Dcntal
Association (AD,4.) is lhe basic requircmcnt for admission to all U.S. dcntal
schools (Kramcr, G.A., I990).
The GI1AT (callcd thc Admission Tcst for GradLlatc Study in Busincss
untill976) \'as administercd for lhe firsi timc in l954.ThcTaronomy of
Educational Objectivcs $ere emergcd in l956.Benjamin S. Bloom playcd a
major role in initiating, developing and completing this project. Three types of
objectivcs \\'crc idenlificd-cognitivc, affectiyc and ps)chomotor. The cognitivc
taxonomy has bccomc esPecially wcllkno\\'n and has had considcrable impact
in stimulating thc dcyclopment oftesls tnal"m"35gtg 111619 thnn kiqrvledge"
2.1,4 From l96l-TillDate
The concept of Crilcrion-Referenced Tcsting (CRf rvas introduced in 1965.
Amcrican Psychological Association (APA) publishcd "Standards for Educational &
Psychological Tesling" in 1965. In 1967, the Canadian Dcnlal Association introduccd
the Dcntal Aptitude Test (DAT) lor the selection ofdcnial students into dental schools
in Canada. This lest $as dcveloped kccping in Yic\\ thc Amcrican Dental Admission
Test (Boyd, Teleruck, & Thompson, 1980).\\/cchsler Intelligence Scalc Nas
developed by David Wechslcr in 1968. ln 1968 SPSS is developed by Nie, Hull &
Bent. Thcy wcrc Stanford Universiry Sraduates students. "Guidclines lor computcr-
bascd tcsts and intcrpretation" \vcrc dcvcloped by r\PA in 1986. the Swedish
Scholastic Assessment Tcst (SNeSAT) \'as introduccd in 1977 fot selcction lo
different typcs of univcrsity programmcs and therefore it is intcndcd to measure the
sludcnts' gcncral aptitude for studics (Christina, S., 199g).The Craduate Australian
Mcdical School Admissions Tcst (morc commonly known as thc GAMSAT) was
originally produced in 1995 by four Auslralian mcdical schools as a lool to sclect for
candidates applying to study mcdicinc. This tcst basically designcd to cvaluatcs
critical thinking, reasoning skill, \'riltcn communication skill, problcm-solving skill
and intcrprctation dala skill in thc subjecls olsocial, ph1'sical and biological sciences
(Grovcs, Gordon, & Ryan, 2007). In l995"Cuidcliircs for comPuterized- adaptivc tcst
(CAT) devclopment and usc in cducation" *erc preparcd by American Council on
l4
Education. Educational Tesling and EYaluation AScncy (ETEA), an independcnt and
aulonomous cducalional bodl', cstablished by thc Sovemment of NWFP (KP) in
Novcmbcr, 1998 rvith an obiectivc ofholding cnlD lcsts for admission lo enginccring
and mcdical and dcntal colleges of NWFP (KP) protince in a transparent, fair and
acadcmically solrnd manncr (ETEA Ordinance, 2001, p.l). Amcrican Psychological
Association (APA) rcviscd thc "Standards lor Educational & Psl'chological Testing"
in 1999. APA published thc 56 cdition of 'publicalion Manual of Amcrican
Psychological Associalion" in 2001.
ln Pakislan, National Tesling Service (r.\TS) establishcd in 2002, on the
recommendation of educalion policies of 1992 and J 998. cAT (Graduate Assessment
Test) is tcst conductcd by NTS. GAT tcst has bccomc prc-rcquisile for M Phil and
PhD studics in Pakistan and is also basis ofmeril for loreign scholarships managed by
IIEC. This is also callcd GRE lype tcsl but it is not equivalcnt lo GRE. It is ]Yorth
noting that rhc lcst which is conduclcd in Pakistan is not GRE in itsclL Actually, it is
GRE type tcsl. GRE is official trademark of Education Testing Scrvice (ETS), which
conducts CRE for US and forei8n sludents.
2.2. Characteristics ofa Good Measuring Instnrment (fest)
Tcst and olhcr evaluation instrumenls serve a vaicty of uses, for example selection,
placcmcn! diagnosis, cenification of masteD', understanding students leaming
problcms and used for prcdicling success in future leaning activitics or occupation'
Rcgardless of the type of instrument used or how lhe result are to be used, ho\vever,
all of the measurcment should possess ccnain chanclcristics.
The most essenlial oflhese are:
2.2.1 Validity
2.2.2 Rcliability and
2.2.3 Usabilily.
2.2.1. Validity of Tcst.
Somc synonyms for the \\'ord Validit) includc truthfulness, value' and
wo(hrvhileness. The first and foremost question to bc asked with respect to any
tcsling proccdurc is: Ho\v lalid is it? \\/hcn $'c ask this question, lYc arc inquiring
l5
rhcther thc tcst measures \\hal\'e \\'ant it to measurc. A tcst is said to be valid if it
measurc, \\'hal it claims to mcasure "Validitl'rcfers to the appropriatcncss ofthe
interprctations made from test scores and othcr cvaluation results, \vith rcgard to a
paflicular use" (Gronlund, 1990, p.47). According to Lien, A.J. (1976) "an instrument
is considered valid only in terms of a spccific group lor a sPecific purposc at a
specific time" (p.?9).According to lhe standard for educational and p$chological
lcsting (Amcrican Educational Rescarch Association, Amcrican Ps)chological
Association. & National Council on Mcasurenlcnt in Education, 1999), "Validity
rcfcrs lo thc dcgree to \\'hich cvidcncc and theory suppon lhc intcrpretation of tcst
scorcs entailed by proposed uses oftcsls" (p.9).
Nalurc/Characterisiics of \/alidity:
When using the tcrm !alidity in relalion 10 tcsting and evaluation, thcrc are a number
ofcrutions to bc bome in mind. Thesc arc:
a. Validity refcrs to the appropriateness of the interpretatioD of the results
of a test not to the tcst itself. Wc sometimcs spcak ofthc "validi0' oftesf' for
thc sake of conveniencc, bul ii is more colrcct 10 speak of the validity of thc
interprelalion to be made from lhe rcsults.
b. Validity is a malter of degreel Validity docs not crist on an all-or-nonc
basis. So we should avoid speaking valid or invalid tcst. Validiry is best
considcred in terms of calegories that speci$' degree, such as high validily'
modcralc vnlidily ind lo\! validily.
c. Validity is altlays specific to some particular use or interpretation. No test
is valid for all purposc. Whcn describing validity, it is necessary to consider
thc specific inlcrpretalion or use to be made oflhc result and it is not valid for
allpurposes.
d. Validity is a uritary concept: Validity is vicwed as unitary concept based on
various kind of cvidcnce and the traditional vielv that lhere arc several
dillercnt "typcs" ofvalidity has becn discarded (Gronlund, I990).
Approachcs to Test Validation: Validation is thc inquiry proccss of gathcring
validity evidence that supports our score intcrprelations or inferenccs. It involvcs
Iooking at our interprelations or inferenccs for their soundness and relevance ln

l6
rcccnt years, our lhinking about validity issues hrs movcd from a discussion of types
ol validity (i.c. contcn! crilcrion-rclaled, and conslruct validily) to a focus on
obtaining cvidence for a unitary validitv (Johanson' & Chrislcnscn, 2008)'
According 1o Gronlund (1990), therc arc thrcc basic approachcs to thc validity of
lcsts. Thcse arc
i. Content validity
ii. Criterion-rolaledvalidity
iii. ConstructvaliditY
i. ConteDt Related Evidence (content validilv)
According to Gronlund (1990) it rclcrs to thc extent to $'hich the test content
represcnts a Specilicd universc of content. It means that the "test contcnt" (Test
Items) should measure thc "course contcnt" (Cuniculum/objcctives). Content validity
rcfcrs to the cx(cnt to which the samplc oflhe tcsl itemVtask/question represents some
dcfincd universe or domain of course conten/curriculum (AERA, APA' &NCME,
r999).
Contcnt validation follows three steps. First, you must understand the construct lhat
the test is supposed to measure; second, you need to examine the con(ent on specific
lest; and third, you make a decision as 10 rvhcther the content on the test adequately
represcnts the content domain.
Johanson, B & Christensen, L. (2008) slaled that when making your dccision' try to
answer thcse trce queslions:
a. Do thc ilcms appcar 1o represcnt thc thing )'ou arc lryin8 10 mcasurc?
b. Does the set ofitems fully representing the imponant content arcas or topics?
c. Have you included all rclevant items?
Thc process of content validalion is basically a rational or deductivc approach for
judging the lest contcnl. Content validation is usually carried out by cxperts.
Individual \vho arc cxpcns in (hc arca covcrcd by Ihc tcst, rcvicw thc tcsl to dctcrminc
whclhcr it adequately represents the content/ curiculum/ text/objcctivcs. Tablc of
specification is used to cnsure thc content validil) ofa test.
t7
ii. Criterioo-RelatedEr.idence(\'alidit]):
Crilerion-Relalcd validity deals whenevc. \\c nred prcdiction of futurc perfonnancc
of studcnts or lo assess/cslimatc prcscnl/curcnl pcrformancc on somc critcrion
(valucd measure othcr the test itscl0. For cxample, cntmnce test score might be used
to prcdict pupils' future achicvcmcnt, or a tcsl of diclionary skill might be used to
cstimalc pupils' cunent skill in the aclual usc of the dictionary (as determined by
obscrvation). ln the first eranlple, wc are intcrested in prediction and thus in the
relationship behlecn the t\vo measures over an cxtended period of time. This
procedure for obtaining cvidcncc ofvaliditl'calls for a prcdictivc validation study. In
the sccond cxample, \\'e are intcrcstcd in estimating prcscnt sla(us and thus in the
relationship betNeen thc nvo measures obtained concurrently. This procedure for
obtaining evidence of validit, calls lor a concurrent-relalcd validation. The major
diffcrence r€sides in the timc pcriod bet\\'een the t\vo obtaincd mcasures.
Dcfinilior of Crilcrion-Related Evidcnce (r'alidit]) : This general form of
Crilerion-Rclalcd Evidence (validity) may be dcfincd as "the process of dclermining
the extent lo which test pcrformance is relatcd to some other valued measure of
perfonnance, called critcrion" (Gronlund, I990, p.56).4. crilerion is thc standard or
benchmark that you \\'anl prcdict accuralcly on lhc basis of thc scores from your tcst
(Johanson, B & Christensen, L., 2008, p.155).Ve gain Criterion-Related Evidencc
(validity) by examining the relalionship (usually through correlation) lhat exist
behveen your focal test and the scorrs from a \vell -stablished criterion variable
Thc correlation coefficient conducled for the stud)' of validiry is called "Validity
Cocfficicnl'.
Types of Critcrion-Relatcd Evidence (\'alidiq)r
According to Rizvi, A. (1973) therc is tlvo lypcs of Criterion-Rclated Evidcnce
(validify) according to time factor. Thesc are
i. Concurrent Evidcnce (Validity)
ii. PrcdiclivcEvidcncc(Validity)
18
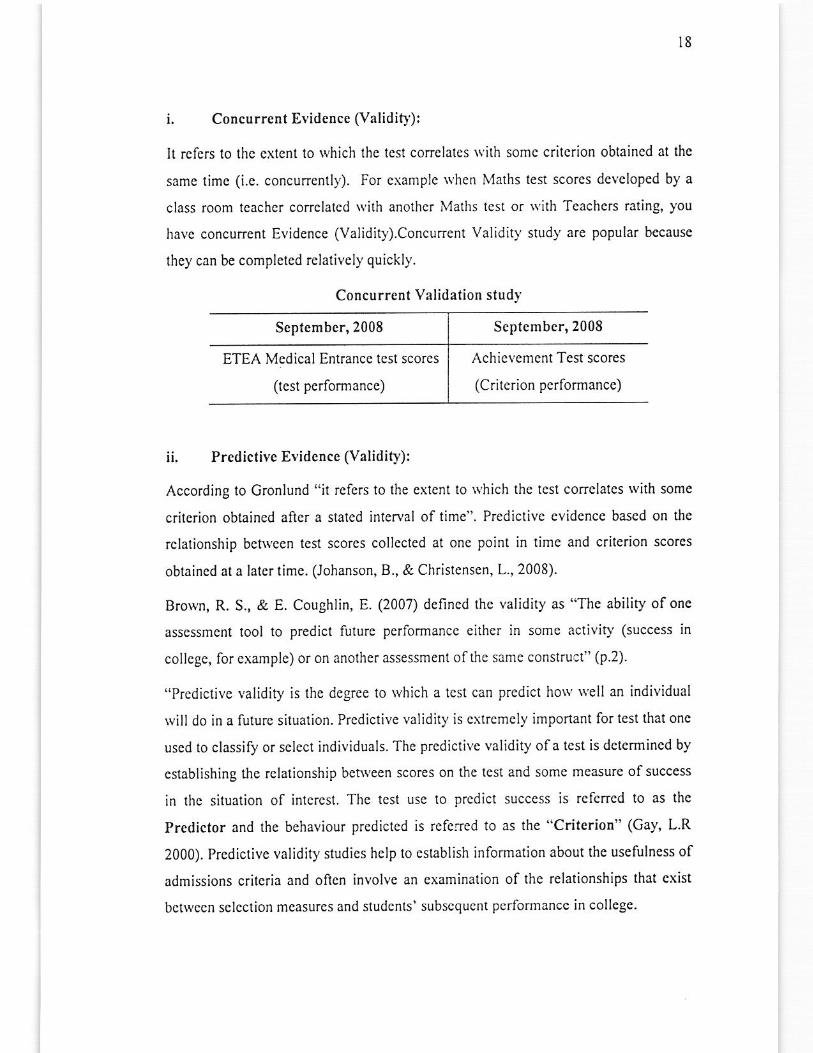
i, ConcurrcntEvidence(Validit,):
Il rcfers to thc cxlent to which lhe test correlatcs *'ith some critcrion obtaincd at thc
same iimc (i.e. concuncnll)'). For example Nhcn Maths lest scorcs dcvcloPed by a
class room lcachcr corrclalcd \vilh anothcr Maths lcst or tYilh Teachcrs rating, you
havc concurrent Evidence (Validity).Concurrent Validit)' study are popular because
they can be complelcd relatively quickly.
September,2008 September,2008
ETEA Medical Entrancc lcsl scores
(test pcrformance)
Achievement Tcst scores
(Criterion performancc)
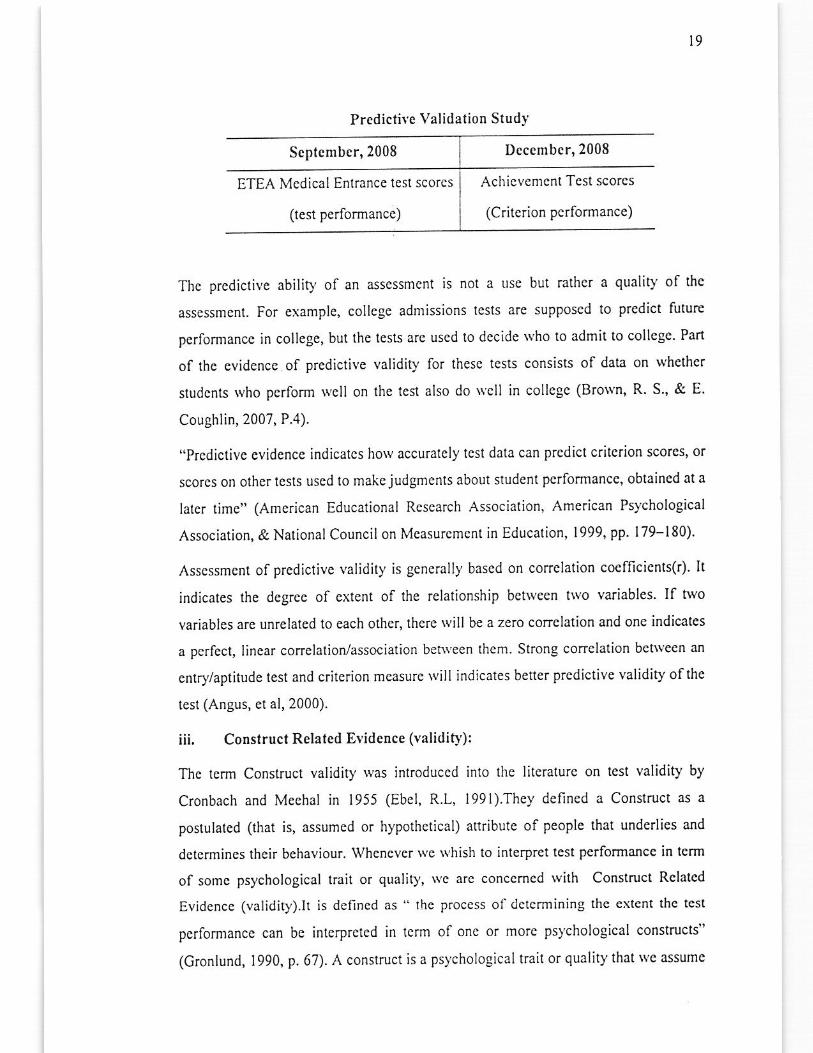
ii. PrediclivcEvidence(Validity):
According to Cronlund "it rcfcrs to the exlent to which the lesl correlates wilh some
critcrion obtaincd afier a staled inlerval of time". Prediclive cvidence based on $e
rclationship bchycen test scorcs collccted al one point in time and crilcrion scorcs
obtained at a later time. (Johanson, B., & Christcnscn, L., 2008)
Brown, R. S., & E. CoughliD, E. (2007) defincd lhe validity as "The ability of onc
assessmcnt tooi 10 predicl fulure perfonnance eithca in some activity (success in
collcge, for cxample) or on anolher assessmenl ofthe same constru.t" (p.2).
"Predictivc validity is thc degree to which a tcst can predict ho$'\\'ell an individual
will do in a future silualion. Prcdictive validiry is cxtrcmely imponanl for test that onc
uscd to classify or sclecl individuals. Thc predic(ive validity ola tcst is detcrmincd by
cstablishing tho rclationship bcBveen scores on thc test and somc measure ofsuccess
in thc siluation of inlercst. Thc tcst usc to prcdict sllccess is rcfcrrcd to as lhe
Predictor and the behaviour prcdicted is refered to as lhe "Criteriotr" (Gay, L.R
2000). Prcdiclive validity studies help to eslablish information about the uselulness of
admissions critcria and oflcn involvc an cxamination of the relationships that cxist
bctwccn sclcction mcasurcs and sludcnls' subscqucnt perfonnancc in college.
Concurrent Yalidation studJ'
l9
Predicti\.e Validation Study
Septcmbcr,2008 Dccembcr,2008
ETEA Mcdical Entrance tesl scores
(test pcrformance)
Achicvemcnt Tcst scorcs
(Critcrion performance)
Thc prcdictive ability of an asscssment is not a usc but radler a quality of the
asscssmcnt. For example, college admissions tcsts are supposed to predict futurc
performance in college, but the lests arc used to decide \\'ho to admit to collcge Pan
of rhe evidencc of predictive validity for thesc lcsts consists of data on lvhethcr
studcnts who pcrform \Ycll on the lefl also do \\'cll in collegc (Bro\vn, R S., & E'
Coughlin,2007, P.4).
"Predictivc cvidcnce indicatcs how accuralcly tcst data can prcdict critcrion scorcs, or
scores on other lesls uscd to makcjudgments about studeni pcriormancc, obtained at a
latcr time" (American Educalional Research Association, American Psychological
Association, & National Council on Measurement in Education, 1999, pp. 179-180)
Asscssment of prcdictivc validity is gcnerally based on conclalion cocfficients(r). lt
indicates the dcgree of extcnt of the relalionship bct\Yeen tlvo variables. If hvo
variables are unrelaled to each other. there rvill be a zero corrclation and one indicates
a perfecl, lincar correlation/association beoYeen thcm. Strong corrclation betwecn an
entry/aplitude test and criterion measure \vill indicates better prcdiclive validity of lie
test (AnBus, et aI,2000).
iii. Construct Related Evidence (validit,):
Thc term Construct validity \vas introduccd into the literalure on test validity by
Cronbach and Mechal in 1955 (Ebel, R.L, l99l).They defined a Construct as a
postulaled (that is, assumed or hypothetical) attribulc of People that underlies and
detcrmines their bchaviour. Whenever rve rvhish to interpret tcst performancc in term
of somc psychological trait or quality, \\'c arc conccmcd \vith Conslruct Related
Evidcnce (validity).lt is defined as " lhe process ol'dciermining thc cxtcot the tcst
pcrformance can be intcrprctcd in lcrm of onc or more ps)'chological constructs"
(Cronlund, 1990, p. 67). A construct is a ps)'chological trait or quality that \ve assume

20
exisls in order to explain some aspect of bchavour' Mathcmatical reasoning'
inrelligcnce, crcaliviq', sociability, honesq and anxici)'are the cxamplcs ofconstruct'
Thcsc arc called construcls bccause the)'arc lheorelical constructions that are used to
explain bchaviour.
Thc proccdure for detcnnining construcl Yciidit] inYolvc thrcc steps (Rizvi' A ' 1973i
Lien, A.J., 1976; & Gronlund. 1990) l.idcnt)'fying and dcscribing, by mcans ofe
thcoretical framcNork, the meaning of thc construct to be measurcd;2 deriving
hypothcsis rcgarding tesl pcrlomance from rhc theory underlying the construct; and
3.verif)ing the h)'pothcsis b1'logical and empirical mcans.
Factor Infl uencing Validiq :
Numcrous factors tcnd to makc lest rcsults invalid fo' thcir intcndcd usc Thcses
faclors can be divided into follo\\ing major calcgories:
i. Factors in the tcst itself
ii. Factors in the tcst administration and scoring
iii. Faclors in pupils'responses.
i. Factors in the test itself:
According to Gronlund (1990), the follotYing factors can Prevcnt thc test items from
lunctioning as intendcd and thereby lo\\'cr the validity ofthe interpretations from the
tesl scores.
a. Unclcar dircctions. Direclion that do not clcarly indicatc to the Pupil hoc to
rcspond to the items, Nhcther it is permissible to guess' and how to record the
ansNcrs Nill tcnd 10 reduce validity'
b. Difficutt vocabulary and sentcnce structure Vocabulary and sentencc
structure that is too comPlicatcd for the pupils laking the test will rcsult in the
test's mcasuring reading comprehension and aspccts of intclligence' rvhich
will dislon thc meaning ofthe test results (validity)'
c. Inappropriate tcvel of difficultJ' of the tesl items' In norm-refcrenccd tesl
ilcms that arc too casy or too dilllcult will not discriminate the abilities of

2l
d.
c.
h.
j
pupil and Nill lo\\'er lhe validily. ln criterion-rcfcrcnccd test' thc failure to
malch the difnculty sPecified b)' lhe Icaming outcomes will lower validiry'
Poorly constructed tesl itcms. Tcsr ilcms that unintentionally provide clues
io thc ansNcr will lcnd to measure lhc pupils'alcrtness in dctccting clues as
\vell as to thosc aspcc6 of pupil pc.lofitance tha! the test is intended to
mcasure.
Ambiguity. Ambiguous stalemcnts in lhe lcst conlributc to misintcPretation
and confusion. lt confuses thc bctter pupil more than it does $e poor pupil'
causing lhe ilcms to discriminatc in a neg3tive dircciion some timc'
Test items inappropriate for the outcomes being measured' Attempting to
measure understanding, thinking skill, and othcr complex typcs of
achievement with test forms that are apPropriaie onl)' for mcasuring factual
knowlcdge will inlalidate thc results'
Inadcquate timc limifs. Time limits that o not proYide puPils Nith cnough
timc 1o considcr the items and provide rhoughtlul responses can reduce th€
validity of interprctat ions of tcst scores.
Test too short, A test is onl)' a samPle of the man)' questions that might bc
asked. If a lest is too shon to provide a reprcsentalive sample of the
pcrformance Nc are interestcd in, it validil)' suffc' accordingly'
Improper arrangement of items. Test itcms are typically arrangcd in order
ofdifficulty, rvith thc casiest item first. Placing difficult items carly in the test
may cause pupil to spend too much time on thesc and prevenl them from
reaching items they could easily ans\\'cr. Improper arangemcnt may also
influcncc validity by having a dclrimenlal effect on pupil motivation This
influcncc is likcly 1o bc stronBcsl \\'ith young puPils'
Idcntifirble pattern of ans\rcrs. Placing correct ans*'cr in some systcmatic
pattern (c.g., T, T, F, F, or A' B, C, D) \'ill enable pupils to Suess the answcr
to somc itcms more easily, and this Nill lorver validity
f.
s.
11
In short, any defecl in the tcst's construction that Prevent (he test itcms from
functioning as intcndcd $'ill helP invalidalc lhc intcrprctation to bc drawn from thc
results-
ii. Factors in lhe test administraliod and scoring
The test administration and scoring of a test also introduce factors that have a
detrimcntal effcct on the validity ofthc inlcrprelations from lhe results. In the casc of
teachcr-madc tests, such factors as insullcienlly lime to complele thc test' unfair aid
to individual pupils, chcating during thc examination, and thc unreliablc scoring of
essay ans\vers lend to loNer validity. In the case of published tests, lailure to follow
the slandard dircctions and time limils, giving pupils unauthorized assistance, and
enors in scoring similarly contribuc to lo*'er validity. For all t)'pcs oftests, adverse
physical and psychological conditions at thc time oftesting may also have a ncgativc
effcct.
iii. Factors in pupils' resPonses
In some instances, invalid test interPrctations arc caused by personal factors
influcncing thc pupil's response to the test situation rather than to any shortcomings in
lhc lcst instrument or its administralion. Some pupil may be bothcred by cmotional
disturbances that inlerfere wilh their tesr perlormance. Others may be frightcncd by
the lest situation (tcst anxiety) and thercby are unablc to respond normally' and still
othcrs may nol be molivaled to put forth their best effon on test. Thcse and other
factors that rcslrict and modify pupil' responses in the tcst situation will obviously
distort the test rcsults.
A lcss obvious factor that influcnces test results is "response set", a consislcnt
tcndcncy to folloN a certain pattcm in rcsponding lo tcst items For example, somc
pcrsons rvill rcspond "true" whcn they do not knoN the answer to a true-falsc item,
and othcrs Nill tend to mark "false". A tcst \vith man)' true statements will
conscquently bc to thc advantagc ofthe first type ofpcrson and to the disadvantagc of
the sccond typc. These responsc scl rcducc fie validity of thc lest results by
inlroducing inlo the lesr score factors that are not periincnt to thc purpose of the
mcaSuremenl.
13
2.2.2. Rcliabilit) ofTcst
Ncxl to validiry, rcliabiliry is thc most important charactcrislics of a mcasuring
instrument (lcs(). Some synonyms for the $'ord Rcliability includc dcpcndability'
stability, and confidence. According lo the joint definition of American Educalional
Rcsearch Association, American Psych<-rlogical Association & National Council on
Mcasurcmcnt in Educalion (1999) reliability is defined as "Thc consistcncy of
mcasuremcnt when thc testing proccdurc is rePcatcd on a Populalion of individual or
group" (p.25). According to Eblc and Frisbie (1991) lhe abiliq'ofa test to mcasurc
the samc quantity $hcn il is administered lo an individual on t\\'o diflercnt occasions
by frlo diffcrent restc.s is callcd reliabiliry. ln short, reliabilit)'means "consistency of
mcasurcmcnt-thal is, ho\' consistent tcsl scorc or other cl'aluation rcsulls arc fiom one
mcasurcmcnt to anothcl' (Cronlund, 1999, p.17)
Naturc/Characteristics of Reliability: Thc mcaning of Reliability can funhcr
clarillcd by noling the following general points:
l. Rcliability rcfers to thc result obtained Nith an evaluation instrument (test) and
not to thc instrumcnt (tesi) itself.
2. Rcliability refers lo some panicular q/pe of consistency. Test scores are not
reliable in gcncral. They are reliable (or gcneraliz-able) ovcr di{Tercnt period of
time, over differcnt samples otqueslions' over diffcrcnt ratcrs, and thc like'
3. Rcliabiliq is a necessary but not a sufficient condition for validity' A valid test
must also be a reliable test, but high reliability docs not ensure that a
satislaclory degrcc of validity will be prescnt. In summary, reliability merely
providcs the consistenc)' that makes validity possible'
4. R€liability is primarily slatistical. The trvo rvidely uscd method ofexpressing
reliability are "standard Error of Measurcment" and Reliability co-efficient'
Rcliability Co-eflicient "is a co clalion Co-efllcient that indicates the degree
ofrelationship benveen two set ofmeasurcs obtaincd from same insfument or
proccdurc" (Cronlund, I9q9. p 79).
21
Mc(hods of estimating Reliabilig
According to Shea & Fortana (2002) lhere are r\yo rypcs of reliabiliry (l)Rcproducibility, and (2) Intcmal consisrcnc)'.
l. Rcproducibility: It rcfers lo lhc cxlent lo Nhich cxaminee,scorcs on t\yo
equivalent forms of a test (equivalcnt forms reliability) and examinee' scores
on the same test administered on diffcrcnt occasions CfcsFRctest reliability)
are similar.
2. Ioternal coDsislenc),: lntemal consistcncl,relcrs to the crtcnt to which a tcst
rsscsscs similar characterislics across e\rminecs.
Licn, A.J. (1976) mentioncd three basic methods ofestimating Rcliabiliry
l. Tcst-Rc-Test Method
2. Altemative Form / Equivalent forms Method
3. Split-HalvesMelhod./lntcmalConsislencyMethod
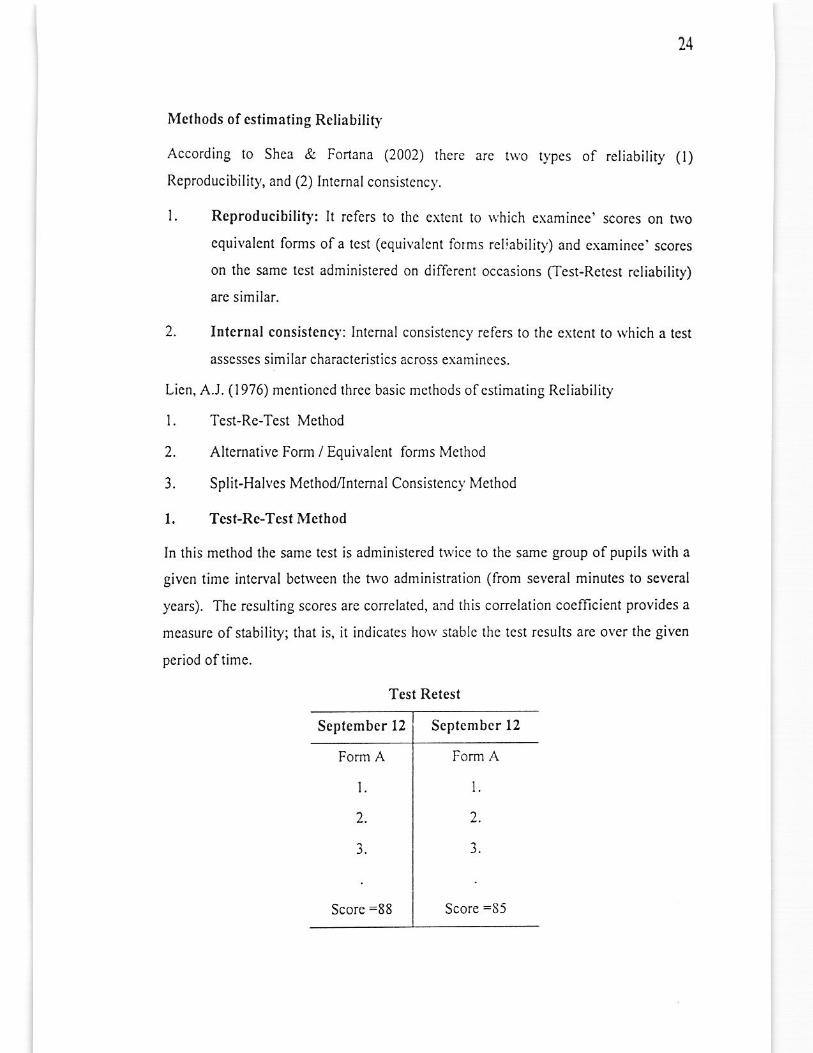
l. Tcst-Re-Test Method
ln this method the same tesl is administcred trvicc 1o lhe same group of pupils with a
given lime intcrval bchYecn the hYo adminislmlion (from several minutes to several
years). Tho resulling scores are corclaled, a:d fiis corelation coefficient provides a
mcasure ofstabilily; thal is, it indicales ho\\'stable the lest rcsults arc ovcr the given
period ofiimc.
Tcst Reiest
Scptember l2 Scptembcr 12
Form A
l.
2.
3.
Form A
l.
2.
3.
Score =88 Score =35
15
Thcrc arc dcfinite Iimitations to this method. Iflhc sccond administrntion is given loo
soon, immcdiale remcmbcring or practicc cflcct \\'ill modiD'thc rcsults ln case ofloo
long intcrval, Ieaming take place, and thc sccond resuhs, ofcoursc, will diffcrcnt from
the first one. In general, largcr the limc inten'al. the smallcr thc r coefficicnl lvill be'
A judgment must bc made to determine thc proper limc lor lhc rctest so $at thc t$'o
factors opcratc at a minimum.
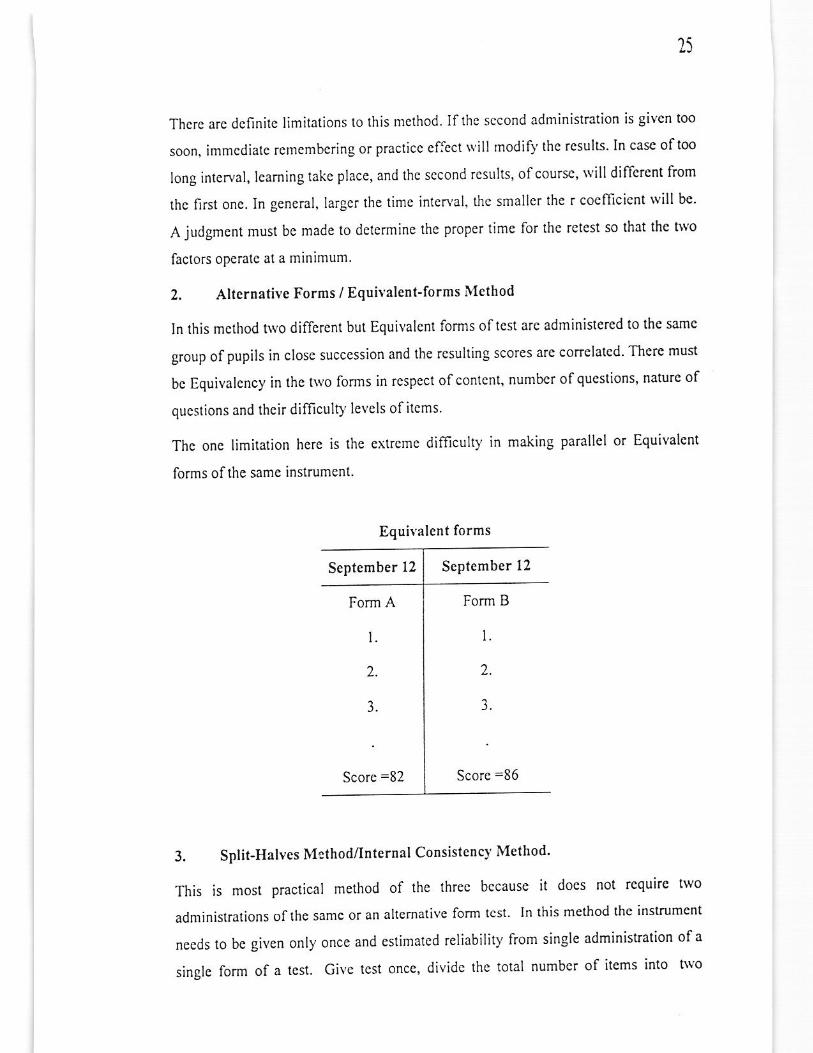
2. Alteroative Forms / Equilalent-forms lucthod
In this mcthod two diffcrenl but Equivalent forms oftest arc administered lo thc samc
group ofpupils in close succcssion and the rcsulting scores are correlatcd There must
bc Equivalcncy in the hvo forms in rcspcct of content, numLlcr ofqucstions, naturc of
qucstions and their difiiculq leYels of itcms.
Thc onc limitation here is the extrcme difficulty in making parallel or Equivalent
forms ofthe same instrumenl.
September l2 Septcmber 12
Form A
l.
2.
3.
Form B
l.
2.
3.
Score =82 Scorc =86
3. Split-HalvesMrthod/InternalConsistencyMethod'
This is most practical method of the thrcc bccausc it does not rcquire two
administrations ofrhe samc or an akemativc form lcst ln this melhod thc instrumcnt
needs to bc given only once and estimated reliabili!y from single administration of a
single form of a tcst. Gilc test once, dividc thc total number of items into t\o
Equilalent forms
26
Equivalent halves (odd items and even ilcms) and score these t\vo Equivalent halves
of tcst. This produccs t\vo scts of scorc for cach pupil, $'hcn conclatcd, provide a
mcasurc of intcmal consislcncy.
It must be rcmembered that \\hen this mcthod is used, the initial cocmcient of
reliability obtaincd is for onc-half of thc test only and must be convcrtcd to thc total
test reliability by a conversion formula. The formula most often used is the Spearman-
BroNn prophecy lormula of conversion:
rr = 2x rt/ l+rh
Where rr is the reliabiliq,coefficient for the \vhole ({otal) test and 16 is the split-half
conclation.
Kudcr-Richardson and Cronbach's alpha melhods are other popular methods ol
cstimating intcmal consislenc)y'reliabilily of a lcst.
Factor Infl ucncing Reliability
A number of factors havc bccn shoNn to affcct lhc conventional measures of
reliability. If sound conclusions are to be dmwn, these factors must bc considcred
whcn interpreling reliability coelficient (Gronlund, I999). Lien, A.J. (1976) idenlified
thc following faclors \vhich can distort thc rcliabiliry ofan inslrum€nl:
l) Lcngth of the instrLrment (Iest) (2) Sprcad of Score (3) Objcctivity
(4) Difficulty of lest (5) Supenision (6) Physical conditions (A Motivation
(8) Directions.
L Lcnglh of the instrument (fest), Gcnerally, the longcr thc instrument, the
grcater is the reliabiliq.
2. Spread of Score. The larger thc sprcad ofscorcs is, the higher ofthc estimate
ofrcliability will be.
3. Objectivify. Objcclivc mcans lrcc from pcrsonal judgment, liking or
disliking. Thc objectivity of a test rcfers to thc dcgree to \vhich equally
competent scorers obtain the same result. Objectivily of scoring process rvill
conlribulc greater reliability of lcsl.
27
4. Difiiculfy of test. In Norm-Rcferenced Test (NRT) that is too easy or too
diflicult lor the group members taking ir will tcnd Io producc scorcs of low
rcliabiliry. This is bccausc both casy and dilliculr test resoh in restricted
Spread of scores.
Supen,isioD. Thc bcltcr thc supcnision, thc more reliable is the instrumcnt.
Ph),sical conditions. The bellcr thc condilioo of thc student ph)sically, thc
morc reliable, generall),, are the resulls.
Motivalion, Thc morc positivc thc motivation, thc greatcr is the rcliability.
DircctioDs of a test, The morc consistent and complcte the directions ofa tesl
thc grcatcr is thc rcliability of a tcsl \ ill bc.
2.2.3. Usability/Practi.aliq
ln addilion to validily and reliability, it is also imponant to consider thc usability/
praclicality oftcsts and othcr instruments. Thc \\'ord practicality means "usabilily "or
'fcasibilily". A lesl \rillbe praclical ifil is
l. Easy to administered,
2. Easy to inlcrprct
3. Economical in operulion and
4. Mcchanically sound
5.
6.
7.
8.

),.3 Entry Test, the lnternationalPerspectile
2.3.1. Entrance tests used throughout the World
Thc following tables sho\v Entrancc lesls used throughoul thc world for admission to
Sccondary Schools, Undergraduatc, Craduate/Profcssional Schools and Languagc
Prollciency Tcsts (Wikipedia cncyclopedia, 2007).
Secondary School Entr!nce test
l. SHSAT Spccialized H igh Schools Admissions Test for Ncw York City
2. ISEE Indcpcndent School Enlmncc Eramination
3. SSAT Secondary School Admission Tcst
4. Elcven plus For entry to grammar schools in thc UK
5. PSLE Entrance test into Secondary Schools for Singapore
6. OKS Entrancc tcst into Secondary Schools forTurkey
7. HSPT High School Placement Test
8. UPSR Entrancc lcst inlo Sccondaq'Schools for Malaysia
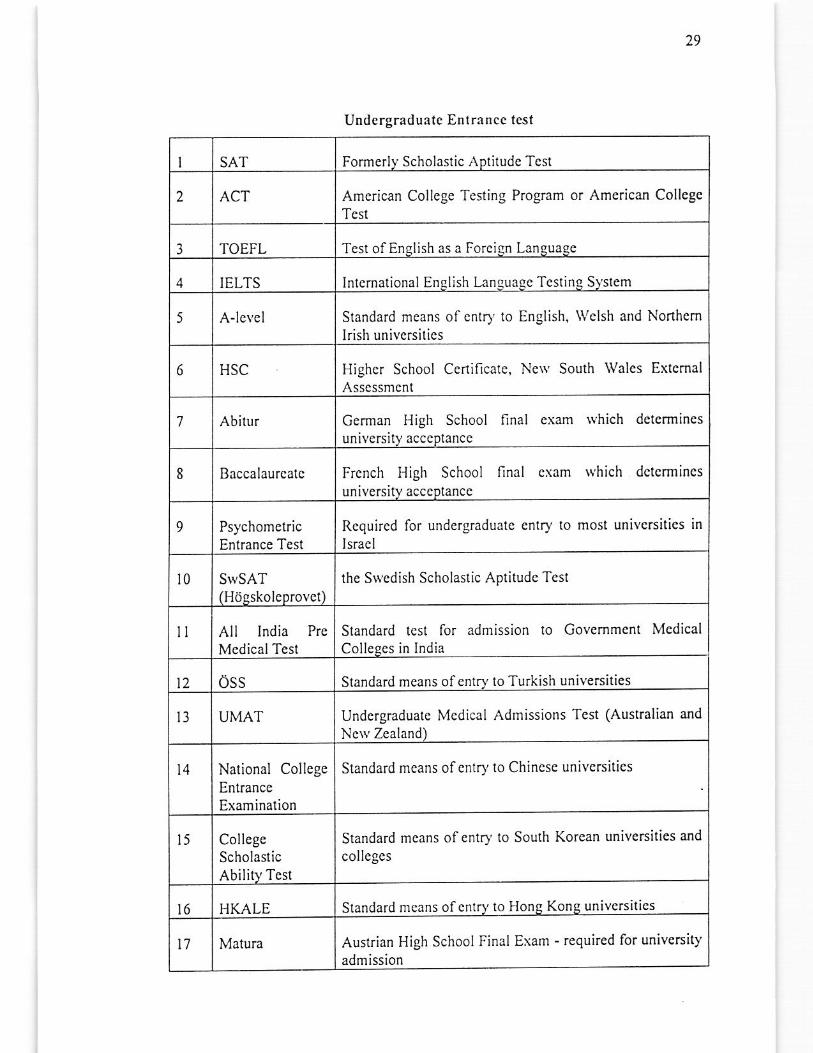
29
Undcrgraduxtc Entrance test
I SAT Fomcrly Scholastic r\ptitudc Test
2 ACT American College Tcsling Program or American CollegcTest
3 TOEFL Tcsl ofEnelish as a Forciqn Languaqc
IELTS Inicmational Enqlish tanquaqc Tcsting S)'stcm
5 A-lcvcl Standard means ofentq'to English, velsh and Nonhemlrish univcrsitics
6 HSC Higher School Certiilcatc, r.\c\v South Walcs ExtemalAsscssmcnt
'7 Abitur German High School final cxam which dctcrminesuniversity acceptancc
I Baccalaurcatc Frcnch I{igh School final csam *'hich dctcrmincs
university acccptance
9 PsychometricEntrance Test
Requircd for undergraduate cnlry to most univcrsities inlsrael
l0 STvSAT(HargskoleproYct)
the S$'cdish Scholaslic Aplitude Test
II All lndia Prc
McdicalTestStandard tcst for admission to Govcmmcnt McdicalColleqes in India
l2 OSS Slandard mclns of enlry to Turkish universities
l3 UlvlAT Undcrgraduatc Mcdical Admissions Tcst (Auslralian and
Ncrv Zcaland)
t4 National CollcgeEntranceExamination
Standard rneans ofcntry to Chincsc univcrsitics
l5 CollegcScholasticAbility Tcst
Standard mcans of entry to South Korcan universities and
collegcs
l6 I]KALE Standard mcans ofcntry to Hong Kong univcrsitics
)7 Malura Austrian High School Final Exam - required lor universityadmission
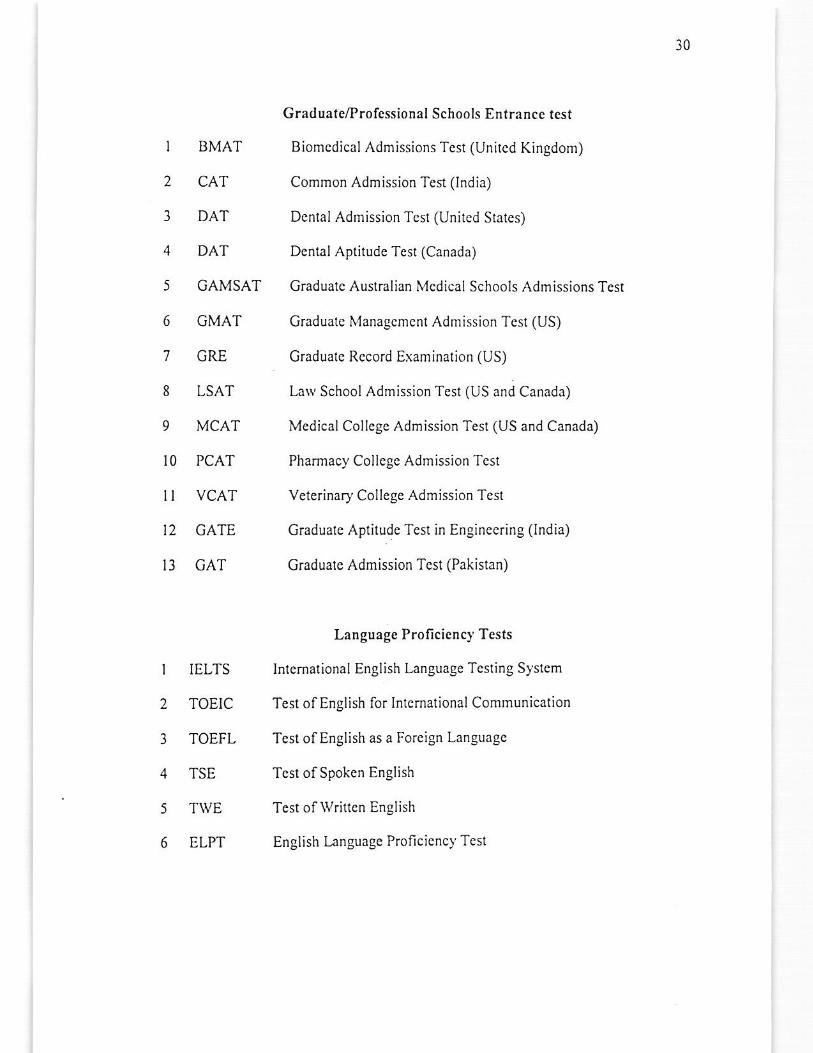
t0
GraduatelProfcssional Schools Entrance test
I BMAT Biomedical Admissions Tcst (Unilcd Kingdom)
2 CAT Common Admission Test (lndia)
3 DAT Dcn{al Adftission Tesr (Unircd Slares)
4 DAT Denral Apliludc Tcsr (Canada)
5 GAMSAT Graduale Australian Mcdical Schools Admissions Tcst
6 GMAT Graduatc Managcmcnt Admission Test (US)
7 CRE Graduatc Rccord Examination (US)
8 LSAT l,aw School Admission Test (US and Canada)
9 MCAT McdicalCollegc Adnission Test (US and Canada)
l0 PCAT Pharmacy Collegc Admission Tcst
ll VCAT Veterinary College Admission Tcst
l2 CATE Craduate Aptitude Test in Engineering (lndia)
13 CAT Graduate Admission Test (Pakistan)
Language Proficienc]' Tests
I IELTS Inlernational English Language Testing S)'stem
2 TOEIC Te ofEnglish for Intcmational Communication
3 TOEFL Test ofEnglish as a Forcign Language
4 TSE Test ofSpoken English
5 TWE Test of Wriltcn EnSlish
6 ELPT English t nguage Proficicnc)'Test
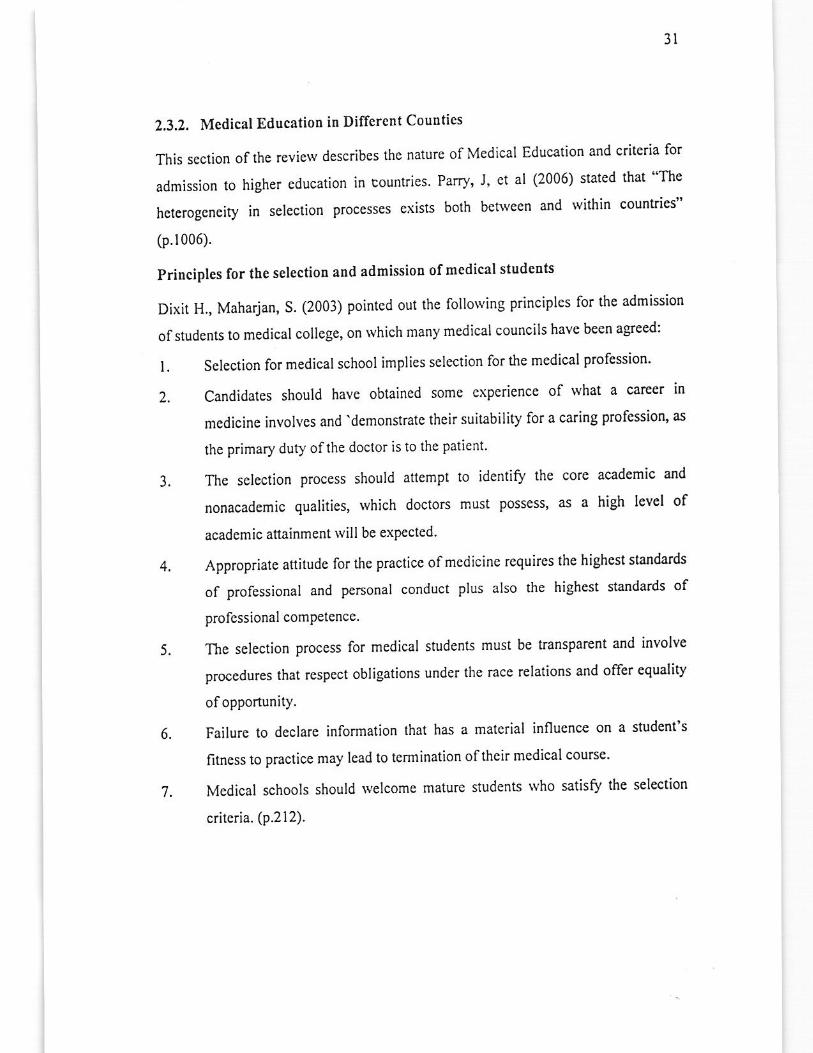
3l
2.3.2. Medical Education iD Differcnt Counties
This section ofthe review describes the nature of Medical Educatiofl and criteria for
admissiontohighereducationincounties.Parry,J,etal(2006)statedtlat..The
heterogeneity in seleclion proccsses exists bolh behveen and wi$in countlies"
(p.1006).
Principles for the selectiotr and admission ofmedicll students
Dixit H., Maharjan, S. (2003) pointed out the follorving principles for the admission
ofstudents to medical college, on rvhich many medical councils have been ageed:
l. Selection for medical school implies selection fo' the medical profession'
2. Candidates should have obtained some experience of rYhat a carc€r in
medicine involves and'demonsratc their suitability for a caring profession' as
the primary duty ofthe doctor is to the palient'
3, The selection process should attemPt to identiry the core academic and
nonacademic qualities, which doctors must possess, as a high level of
academic attainment will be expected.
4, Appropriare attitudo for rhe practicc ofmedicinc requires the hiShest standards
of professional and pcrsonal conduct plus also the highest standards of
prolessional comPetcnce.
5. The selection process for medical
procedures that respect obligations
ofoppoftlnitY.
6. Failure to declare info.mation that has a material influence on a student's
fitness to practice may lead to termination oftheir medical cou'se'
7. Medical schools should welcome mature students who satis& the selection
$itcria. (p.212).
studenE musl be transparent and involve
under the mce relations and offer equality
32
The criteria for admission to higher education
institutions) in a number ofcountries is describcd
A. AMERICAS
(cspecially to medical and dental
in the follorving lines:
l Uniled Slates:
In United Slates. before 1900 higher education admission criteria was not uniform' So
the College Board \vas cstablished for thc purpose ofreconciliation among thc diverse
entrance procedures arnong colleges and fnming uniform policy ior college
admission procedures in the United Stales. In l90l the College Board offered an open-
cnded and subject bascd tests rather than gcneral aptitude' English, math' Grcel(
Latin, history and chemistry \Yere the main subjects in the tcst The test tha! is
rccognized as the SAT, the most rvidely knorvn and inlensively researched aptitude
lest was first offered in 1926, for selection into higher education in the US''SAT'
originally stood for Scholaslic Aptitudc Test, but in 1994 at lhe time of revision' it
rvas renamed li€ Scholastic Assessment Test. Educational Testing Scrvices (ETS)
was established in 1947 by the College Board, and since its inception the development
ofSAT have bcen the responsibl€ ofETS.
In the Unitcd Stal€s. Medical education is provided by both private and state
govemments supported or oPerated medical schools or colleges There is only one
medical school supported by Federal Govemmen! lvhich train physicians for the
Armed Forces ofUSA.
The Association of American Medical Colleges (AAMC) rvas established by 66
medical school deans in 1890 for elevation the medical education standards' In the
l96os, ths Association opencd it door for medical students, medical school faculty,
and teaching hospital cxecutives to play role in the Sovemance of the AAMC'
According to Hackett J. L (November 1996) it is a privale sector organization to
which 125 and 16 medical schools have accredited in United Stat€s and Canada
respectively. More than 400 major teaching hospitals; 86 academic and professional
socicties reprcsenting 87,000 faculty mcmbersi and the nation's 67,000 medical
studcnts and I02, 000 mcdical residents havc bcen associated wift AAMC' Thc
Association of American Medical Colleges (AAMC) has developed the Medical
33
Collegc Admissions Test (MCAT) used as the entry screening assessment for medical
schools in U.S.
In United States, it takes 4 years to get a degrce of Doctor of Medicine (M'D') or
Doctor of Osteopalhic Medicine (D.O ). In the first nvo years are reserved for
classroom education, whilc clinical skills and clinical settings are emphasized in the
last two yea$.
Requirements for medical school admission in US, vary lrom school to school'
Hackeft J. L. (996) stared the following admission criteria ofUS medical schools:
Undergaduate ard postgraduate courses' gradc point averages (GPA),
The Medical College Admission Tcst (MCAT) score
Interview ratinS,
lrtters ofcvaluation from faculty members advisors, and others, and
v. Volunteering activities, along Nith research and leadership roles in an
applicant's history.
vi. Admissions essay,
vii. Involvcment in extracurricular activities, such as student govemment and
community scrvice,
viii. Involvement in and quality ofhcalth relatcd work and research experience,
The Medical College Admission Test (MCAT), originally known as the Scholastic
Aptitude Test for mcdical schools, was developed in 1928. Thc Association of
Amcrican Medical Colleges (AAMC) has developed the ivedical College Admissions
Test (MCAT) used as the entry screening assessment for medical schools in U.S' and
administered annually. Over 55,000 studenls annually appeared for the test' in rvhich
52.3% Ne fernale (Source: American Association of Medical Collegeq Summary
Data on the Combincd ApriyAugust 2000 MCAT).
The duration ofthe test is 6-hour exam and consists of22l multiple-choice items and
two essays. Biological Sciences, Physical Sciences, Vcrbal Reasoning and Writing
Sample ate the four sections of the test, Biological Sciences' Physical Scienc€s, and
Verbal reasoning are scored on a scale from I (lowest) to 15 (highest)' The Writing
II.
34
Sample receivcs a score of I to 6, converted to an a,phabetical scnle ranging from J
(lowest) to T (highest).
MCAT is a shndardizcd tcst that consists of bolh multiple choicc and cssay items.
The Association of American Medical Colleges (AAMC) administets this test
biannually. This test is designed to asscss a student's knowledge of the sciences,
analylical skills and the competency in the English language (Mitchell, 1987).
R€sidency and Fellorvship are the specialized progmmmes offered to those medical
graduates want to work independently to care for paticnts after graduation. These arc
supervised training programmes. The period of suPen'ised uaining ofresidency is of
three to seven years, whilc fellowship(for Physicians who rvant more supervised
experience) programme takes additional two 10 three years training in their area of
specialization.
Dental Admissioo Testing Program in USA
Since 1951, the Dental Admission Test(DAT), administered by the American Dental
Association (ADA) is the basic requirement for admission to all U.S. dental schools
(Kramer, G.A, 1990).
The DAT is a computer based test conducted through Prometric Testing Centers
around thc year. The DAT assesses perceptual ability, general academic ability, and
comprehension ofscientific information. Participatc in the Dental Admission Testing
Program is the basic requirement on the part of applicans for admission to all dental
schools. The tcst scores is only the one factor considered in assessing the applicants
admission potentials. The findings of tle rescarch predictive validity studies
envistigated by the testing program have cstablished the fact that the entrance test
scores in combination vith college GPA are better prcdictors oistudents performance'
For the completion ofallthe four sub-t€sts ofthe DAT, the total duration ofDAT is 4
hours and l5 minutes.
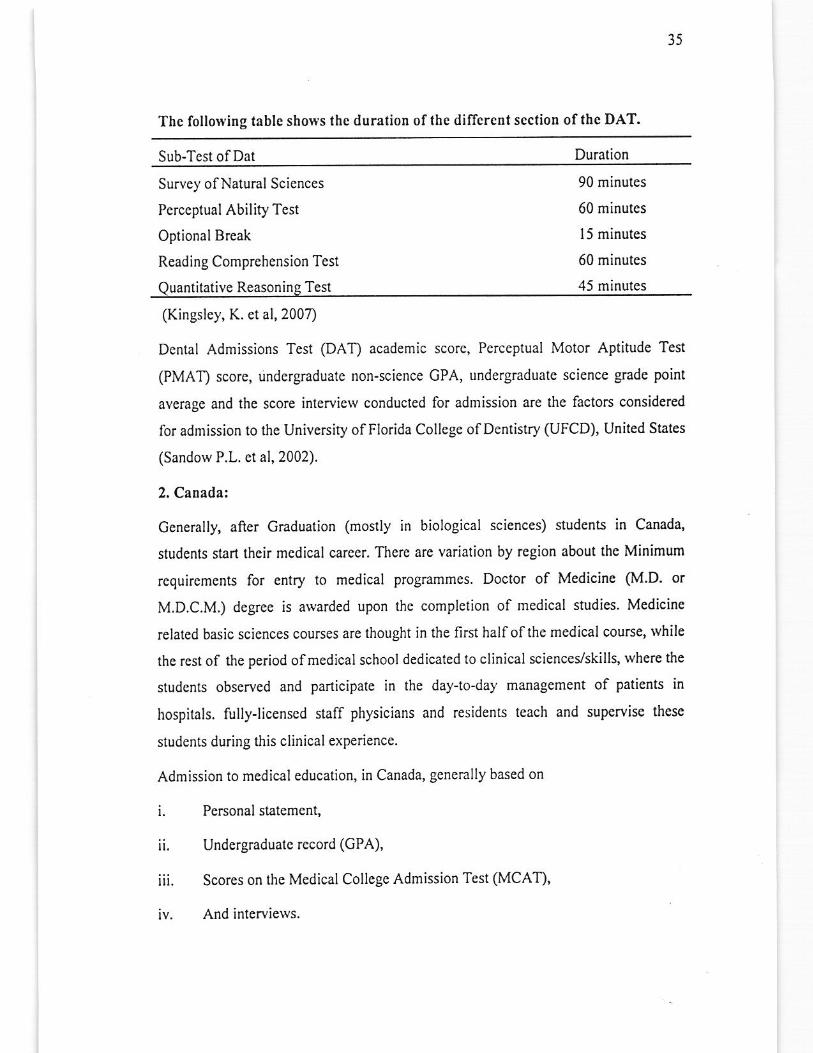
35
Thc following tablc shoI\s the duration ofthe diflcrent section ofthc DAT.
Sub-Test olDat Duration
Survey of Nalural Sciences
Perceptual Ability Test
OptionalBreak
Reading Comprehension Test
Quantitative Reasoning Test
(Kingsley, K. et a1,2007)
Dcntal Admissions Tcst (DAT) academic score, Perceptual Motor Aptitude Test
(PMAT) score, undergraduale non-science GPA, undergraduate science grade point
average and the score interview conducted for admission are the factors considered
for admission to the University ofFlorida College ofDentistry (UFCD), United States
(Sandow P.L. et al, 2002).
2. Canada:
Cenerally, after Graduation (mostly in biological sciences) students in Canad4
siudcnts start their medical carccr. There arc variation by region about the Minimum
requirements for entry to medical programmes. Doctor of Medicine (M.D. or
M.D.C.M.) degree is awarded upon thc complelion of medical studies. Mcdicine
related basic sciences courses are thought in the first halfofthe medical course, rvhile
the rcst of the period ofmedical school dedicated to clinical scienceVskills, rvhere the
studcnts observed and participate in the day.to'day management of patients in
hospitals. fullyJicenscd staff physicians and residents teach and supervisc these
students during this clinical experience.
Admission to medical education, in Canada, generally based on
i. Personal statement,
ii. Undergraduatc record (GPA),
iii. Scores on the Medical College Admission Test (MCAT),
iv. And interviews.
90 minutes
60 minutes
l5 minutes
60 minutes
45 minutes
36
"Volunteer work" is oflen an important crilerion considered for admission. Some
medical institutions (such as mcdical school in euebec and three Ontario schools) do
not rcquire thc MCAT for their admission.
Thc Canadian DentalAptitude Test (DAT)
The selection ofthe best students from highly competitive dentalapplicants pool is a
big challenge for the dental admission committee. Traditionally, in Canada students
are selected on the bases ofmeasures ofacademic achievement, psychomotor skills,
perceptual abilities, interview and reference lctters. The assessment of a Non-
cognitive variablc (such as personality) are very rarcly considered by the selection
committees as admission criteria.
In 1967, the Canadian Dental Associarion introduced the Dcntal Apritude Test (DAT)
for the selection of dcntal students into dental schools in Canada. This test was
developed keeping in view the American Dental Admission Test (Boyd, Teteruclq &
Thompson, 1980). The major differenccs benycen the Canadian and U.S. Dental
Admission Test (DAT) that in Canadian DAT carving test is included for measuring
manual dcxterity while quantitativc rcasoning or organic chemislry portion not
included in the Canadian DAT (Bennen, I.C, & Boyd, M.A, 1990).
Prosently the DAT consists ofthe following four componcnts:
A. The Survey of Natural Science Examination (biology- and inorgaaic or
Gcneral chemistry-based material)
B. Thc Reading Comprehension Examination in the Dcntal Sciences,
C. Tho Pcrceptual MolorAbility Component, and
D. The Carving Dexterity lest.
3. Brazil:
In Brazil, the dumtion ofMedical educalion is 6 years. In the flrst 4 years ofmedical
education prc-clinical and clinical subjecls arc covercd and the last two years
dedicated to intcmship pmctices at University Hospital. fullyJicensed suffphysicians
and residents teach and supervise these students during this clinical experience. At tie
end ofthis six years programme the titled of"Doctors" is conferred to the successful
studcnts.
3?
Admission to medical schools is competitive in Brazil. Entrance exam is conductedafter the completion ofhigh school.
B. AUSTRALIA
1, Australia:
ln Australia, the following hvo options are adopted by students who want to studymedicine:
i. They can either attcmpt to gain entry through the Undergraduate Mcdicine and
Health Sciences Admission Test (UMAT) exam and interyiew to a five_yea.
or six-year undergraduale MBBS or BMed program;
ii. Or complete ao undergEduate degree and thcn attempt to gain cntry to agraduate entry program which requires a srudent to sit in The Graduate
Australian Medical School Admissions Test (GAMSAT) exam and inlcrview
to a four-year graduate entry BMBS or MBBS.
In South Australia, Flinders University adopted the first four-year graduate entry
medicalprogram and now this option (Graduate enlry medicire) is presents in almost
all medical schools in Australian.
For selection of medical, dental and veterinary science students at Australian
Ufiiversities The Graduate Australian Medical School Admissions Test, commonly
known as GAMSAT is used. For the firsr time The GAIUSAT was developed and
uscd by four Australian medical schools as their admission criteria in 1995. This test
basically designed to evaluates critical thirking, reasoning skill, written
communication skill, problem-solving skill and interprcralion data skill in rhe subjects
ofsocial, physicai and biological sciences (Groves, Gordon, & Ryan, 2007).
GAMSAT was used for the selection ofabout 50 % medical studcnts in Australi4 in
2005. The Graduate Auslralian Medical School Admissions Tesr (GAMSAT)
modcled on the NonI American Mcdical College Admissions Test (MCAT) seek to
evaluatc mcdical student abilities and skills dcveloped through prior cxperiencc and
lcrrning.
38
Following are the three secrions ofGAMSAT:
a, Reasoning in Humanities and Social Sciences
b. Written Communication skilland
c. Reasoning in Biologicaland phl,sical Scienccs.
CAMSAT has been designed 10 evaluate rhe porenrialities of studenrs to selecr highIcvel intellectual studies, especially in very demanding subjects. It assesses theabilities and skills acquired through pasr expcrience and lcaming. GAMSAT mainlyfocus on assessment of more general skills in problem solving, rvrinen
communication skills, critical rhinking and maslcry in basic science (ACE& 2006).
GAMSAT evaluates the student,s understanding of basic science, gcneral problem
solving skills, critical thinking skilts and lvriring abiliry (ACER, I998, p.33).
C. EUROPE
5. Uniaed Kingdom.
In UK, the duration of Graduate Medical education is vary lrom school to school.
Usually it takes 4 to 5 years to eam a bachelor degrec in medicine e.g. in Keele
Univcrsity, St Georgc's, University of London and Thc Univcrsity of Nottingham
School ofGraduate Entry Medicine & Heahh the graduate entry Mcdicine prognmme
is of 4-years while in Peninsula Collcge of Medicine and Dentistry, the duration ofBachelor of Medicine, Bachelor of Surgery GM, BS) is five years. Horvever, the
duration ofBachelor of Dental Surgery @DS) programme is 4-years in almost in all
the medical school in UK. Name ofthe degree arvarded by these universitieymedical
schools are also diffcrcnt e.g. degree a\varded by Kcclc University is MBChB, BM,
BS by Peninsula College of Medicine and Dentistry, and The University ofNottingham School of Graduate Entry Mcdicine & Health, MBB54 by St George's,
Univcrsity ofLondon, and MB BCh by Srvansea Univcrsiry.
Admission Procedurer In UK, unlikc Pakistan, thc cntry to Medical Education
programmes are not confined to biologicsl Sraduates only, but open to the students of
any I'ield rvho are able to meet the selection crit€ria, to attract studens with a diverse
39
range of talents, interests and skills. Admissions are open to graduates of thehumanities and social sciences as well as the physical and biological sciences.
In UK, major components of seleclion for entry of school-leavers into medicalschools and universities a.e intellectual aptitudetesls and A- levels. Oxlord MedicineAdmissions Test (James W, Harvkins C., 2004) and the Australian Graduate MedicalSchool Admissions Test (GAMST) are the main cntrance test used for rhe selection ofmedical sludenG (Brown P.,2004).
Th€ following three criteria are used lor selection of the applicants for admission ro
the graduate entry programmcs:
l. Undergraduate Honors degree
2. Graduate Medical School Admissions Tcsr (GAMSAT)
3. Interview (for Assessment ofNon-Academic Attribures) (ACER, 2008, p.2)
The Graduatc Medical School Admissions Test (GAMSAI) :
GAMSAT is a entrance test for admission to medical or dental courses in UK,
developed by the Australian Council Ior Educational Research (ACER).lt is
administercd once a ycar to aspirant medical studcnls.
"CAMSAT evaluates the nature and exrent ofabiliries and skills gained through prior
experience and Ieaming, including the mastery and use of concepts in basic science,
as wcll as the acquisition ofmore general skills in problcm solving, critical rhinking
and writing" ( ACER, 2008, P.3).
CompositioD of GAMSAT:
GAMSAT is designed to measures the probiem solving skills in diverse and wide
range ofcourses. It consist oftle following three sections:
l. Reasoning in Humanities and Social Scienccs
2. WrittenCommunicalion
3. Reasoning in Biological and Physical Sciences
Part 3 is consisting of questions related to Chemislry (40%o), Biology (40%) and
Physics (20%) subjec15.
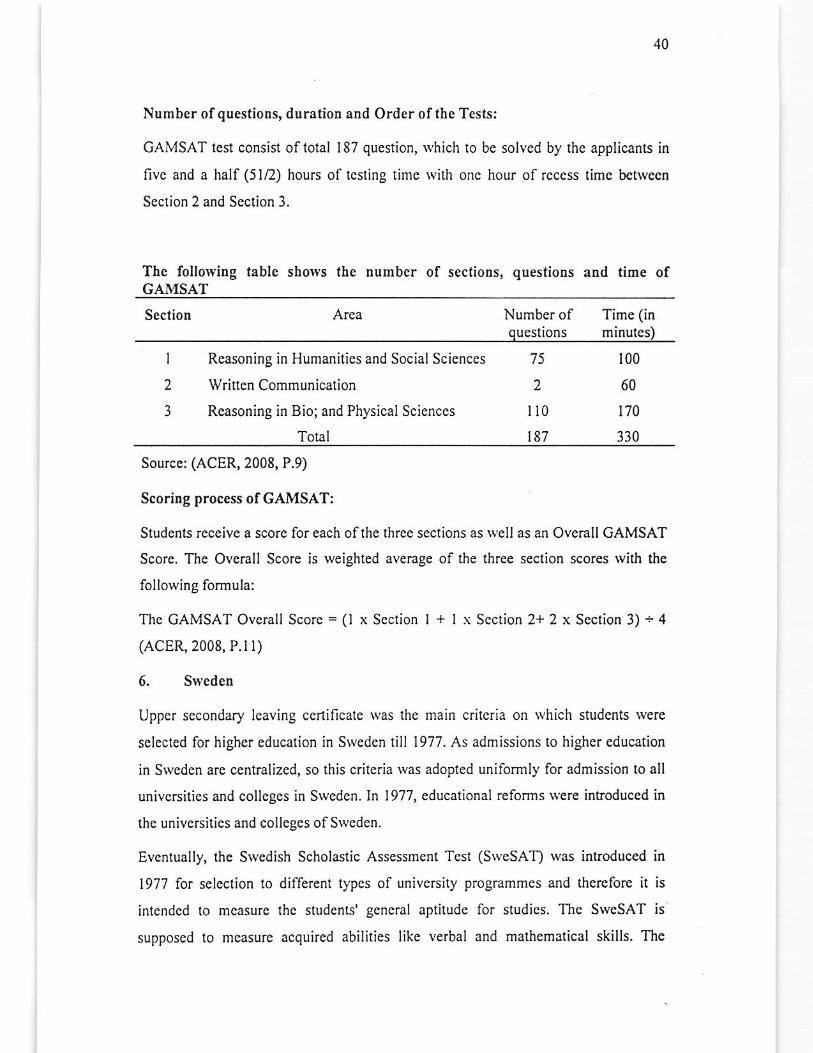
40
Numbcr ofquestions, duratioD and Order ofthe Testsl
CAMSAT test consist oftotal 187 question, which to bc solved by the applicants in
livc and a half(51/2) hours of testing lime \yith onc hour of recess timc between
Seclion 2 and Section 3.
The follorving tablc shorvs the numbcr of sectiods, questions and time ofGAMSAT
Scction Numberof Time (inqucstions minutes)
I
2
3
Reasoning in Humanities and Social Sciences
Written Communication
Reasoning in Bio; and Physical Scienccs
Total
'75
2
ll0187
100
60
170
330
Source: (ACER, 2008, P.9)
Scoring process of GAMSAT:
Students receive a score for each ofthe three sections as rvell as an Overall GAMSAT
Score. The Overall Score is weighted average ofthe three section scores wiih tle
following formula:
Thc GAMSAT Overall Scorc=(l x Scction l+ I x Scction 2+ 2 x Scction 3) - 4
(ACER, 2008, P.1l)
6. S11eden
Uppcr sccondary leaving certificate rvas the main crileria on lvhich students werc
selected for highcr education in Sweden till 1977. As admissions to higler education
in Sweden are centralized, so this criteria rvas adopted uniformly lbr admission to all
univcrsitios and colleges in Swedcn. In 1977, educational reforms $'ere introduced in
the universities and colleges ofSweden.
Evcntually, the Swedish Scholastic Assessment Tcst (S\\'eSAT) was introduced in
1977 for sclcction lo different typcs of university programmes and thercfore it is
intcndcd to mcasure thc students'gcncral aptitude for studics. Thc SrveSAT is
supposed to measure acquired abilities likc verbal and malhematical skills. The
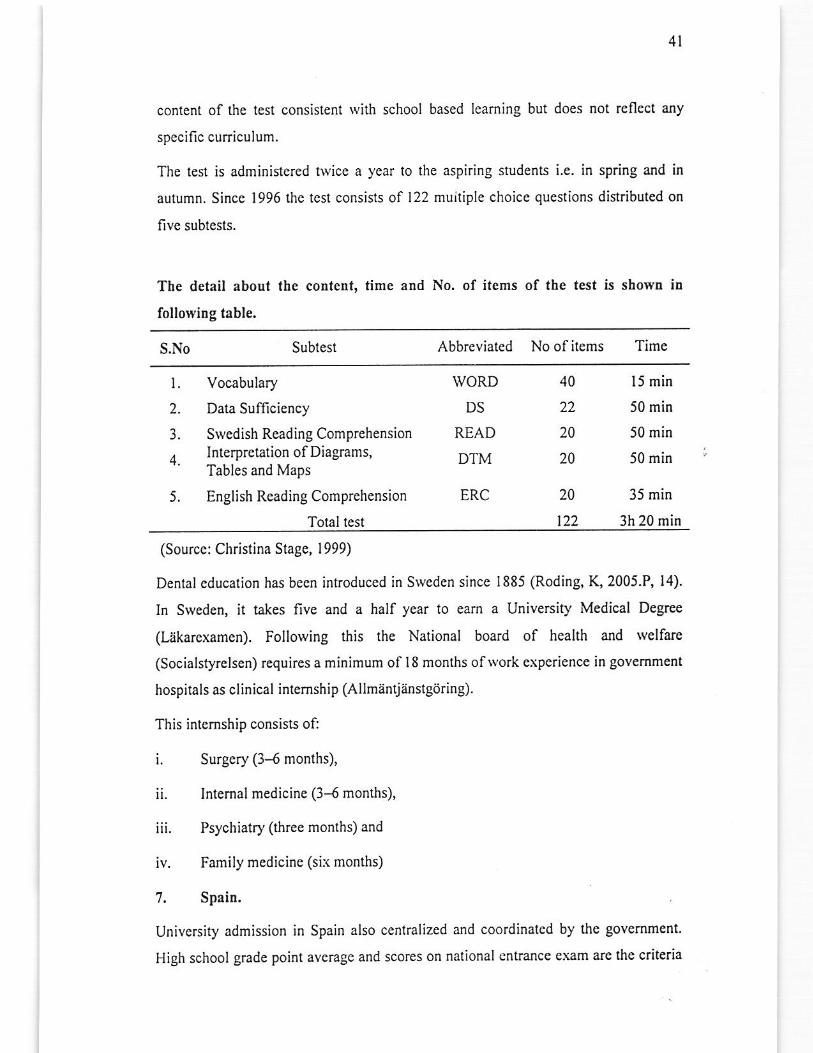
4l
content of the test consistent Nilh school based lcaming but does not rcflect any
spccific cuniculum.
The tesl is administered hvice a year lo the aspiring students i.e. in spring and in
autumn. Since 1996 the test consists of I22 muiliple choice questions distributed on
five subtests.
The detail about the coDtent, lime and No. of items of the test is showD in
following table,
S.No Sublesi Abbreviated No of items Time
l.
2.
3.
4.
5.
40
22
20
20
Vocabulary
Data SufTiciency
Swedish Reading ComprehensionInterprctation of Diagrams,Tables and Maps
English Reading Comprehension
Total test
WORD
DS
READ
DTM
ERC
l5 min
50 min
50 min
50 min
35 min
3h 20 min
20
t22
(Sourcc: Christina Stage, 1999)
Dental education has been introduced in Swcden sincc I885 (Roding, K,2005.P, l4).
In Sweden, it takes five and a half year to eam a University Medical Degree
(Lakarexamen). Following this the National board of health and welfarc
(Socialstyrelsen) requires a minimum of l8 months ofwork experience in govemment
hospitals as clinical intemship (Allmantjanstgijring).
This intemship consists of:
i. Surgery (3-6 months),
ii. Intemalmedicine (3-6 months),
iii. Psychiatry (three months) and
iv. Farnily medicine (si:( months)
7. Spain.
Univcrsity admission in Spain also cent.alized and coordinated by the govemment.
High school grade point avemge and scores on national entmnce ev€m are the criteria

12
for admission. The national entrance exam (Selectividad), administered by the
govcmmcnt for entrance to both public and privat€ institutions. High school grade
point avcrage (weighted at 40 percent) and scores on national cnfance cxaln
(wcighted at 60 percent) are combined to produce a composite score on a scale ofO to
10. A score of5 is required to qualify for university admission.
8. Turkey.
As in China, the number of spaces in each institution and progarn in Turkey is
determined by the Council of Higher Education (CHE), which is a constitutional
body, responsible for the planning, coordination, and govemancc of all higher
education institutions (in both the public and private scctors).
In Turkey, the national university entrance examination, the Student Selection Exam
(Agrenci Segne &ravr, or 0SS), is administcred by the Student Selcction and
Placement Center (,grenci Segme yerlestirmc Merkezi, ot OSYM). 'I,-his Student
Selcction and Placement Center (Ogrenci Segne Yerlestirne Merkezi, ot OSYM) is
affiliated with the Council ofHigher Education (CHE).
Candidates are admittcd to an institution and program based on their program
prefcrences and composite score (OSS scorc is combincd rvitl his or her high school
grade point avemge to creale a composite admission score).
D. AFRICA
9. Eg/pt:
In Egypt" Medical education lasts for 6 years, In the first 3 years ahc basic medical
sciences courses are covered, rvhile clinical sciencis courses aae offered in the last 3
years of medical school. At the complction of this 6 year medical education, the
students have to work as a house omcer at Teaching hospitals for an additional one
year. Admission to these programmes depends on the sco.e ofthe applicants in their
final year ofSecondary School (baccalaureate) because there are no specific ent-ance
examinations. The degrce ofBachelor of Medicine and Surgery (MBBCh) is awarded
to medical sludents alier graduarion.
43
10. Kenya:
In Kenya, Mcdical education lasts for 5 years, the first 2 years the basic medical
sciences courses are covcred. whilc clinical scienccs courses are offered in the last 3
years ofmcdical schoo,, at thc cnd ofwhich, thcrc is an additional one yea! period of
intemship. There are hvo medical schools, established in University ofNairobi (1967)
and Moi University (1980). On complction, a bachelor degree in Medicine and
Surgery is arvarded, MBChB to medical Srdduates.
Thcse universities also offer 3 years post graduate medical training programs. Mastet
of Mcdicine, MMed degrec is awarded on complction with major support from the
Aga Khan University, Karachi, Pakistan and the Aga Khan University Hospital in
Nairobi, a Health Scicnc.€s Univcrsity, in Kenya has been established.
The completion of a high school education is thc basic eligibility fot admission to
these medical colleges in Kenya.
ll. Nigeria:
In Nigcria, it takes 6 years to eam a Bachelor of Mcdicine and Bachelor of Surgery
(MBBS) degree. This is a e five years undergraduate progmm and 12 monlis of
practical expericnce in govemment hospitals. After gmduation one year ofcommuniry
service is mandatory in Nigeria.
Admission 1o medical colleges is highly competitive in Nigeria. Candidatcs
graduating from high school must have:
i. High grades from the Wcst African Examinalion Council's (WAEC)
ii. Senior School Certificate Exam (SSCE/CCE) and
iii. High scores in four subjects (Physics, English, Chemistry, and Biology) in the
University Matriculation Examination (UME).
12. South Africa:
ln Sou(h Africa, there are cight \\'orld class standard medical schools. From all over
the world, Medical students come to South Africa to gct high value pmctical medical
experience in the teaching hospitals and rural clinics ofthe country. On completion of
six years mcdical cducation MBChB dcgrec is a\varded to mcdical students For
44
registration with the Heahh Professions Council all medical graduates in South
Africar are required to complete a hvo-year intemship plus year of community
service. These medical schools admit studcns directly from high school.
E. ASIA
13. Korea
In Korea, before 2005, Medical and Dental Education consisted ofsix-year progams.
liberal arts and basic sciences are studied by the sludcnts in the first tlvo years, and
prcclinical courses in thei. third year rvhilc clinical training programs shned in thc
fiflh year of mcdical courses. High school grades and the Scholastic Aptitude Test
(SAT) were the main criteria for admission. This lBditional six-year undergmduate
medical and dental programme was changed to a four-year graduate-entry program in
2005, for which bachelor's dcgrees rvas fixed as qualirying degree. A n$v admissions
entrance test, , the MedicayDental Education Eli8ibility Tcst (MEET/DEEI) was
dcvclopcd to cvaluato applicants' abililies and skills rcquircd for the McdicayDental
Education programm€.
The composition (subtests and contents) of l}te MEET,DEET lyere the replica ofthe
Mcdical College Admission Test (MCAT) and Dental Admission Test (DAT) in the
Uniled States.
Like the Dental Admission Test (DAT) in the Unilcd States, the DEET has the
following four subsets (Kim, KS.2002) :
L Readingcomprehension,
2. Scientific reasoning part- l (mcasurcs kno*'lcdge and skill in biologr)
3. Scientific reasoning part- ll (evaluates abilitics in chemistry and physics)
4. And pcrceptual abiliry. (assesses ability required for dental programs)
Undergraduate grade point average (UCPA), o.al cxams, rvriften essays and
intcrviervs are also used to assess aspiring mcdical students, in addition to MEET or
DEET scorcs (Kim, M. & I*e, J.L,2007).
45
14. Nepal:
The guidelines for the selection ofmedical students in Nepal may be categorized into
the following thrce groups:
l. Thc guidelines issued by fie NePal Mcdical Council
2. The guidelines issued by thc university
3, The guidelines issued by the concemed medical college/school.
1. The guidelines issued by the Medical Council oflhe couutry
Nepal Medical Council (NMC) issucd it recommendaiions for MBBS education in the
country in 1993 and rcvised it in 1995. The recommendations state the following
prerequisites for MBBS admission as mentioned b)' Dixit & Maharjan (2003) :
. The minimum age ofadmission to be l7 ycars,
. That the candidate should havc passed I.Sc. or cquivalent rvith a minimum of
50% in Physios, Biology, and Chemistry €BC) subjects togcther with over
50Yo in ag9regate.
2. The guidelines issued by thc university
Kathmaodu UDiversity requirements:
. Minimum of completion of l0+2 years of education or I'Sc' (Science
stream rvith Physics, Chemistry, Biology (PCB) and English)'
. Proofofat least 50% marks in PCEB and in aggregate,
. Thore is no uppcr age limit.
3. The guidelines issued by ihe concerned medical collegey'school'
Therc is variation in the Selection process of nledical education at different
institutions ofNepal. Kathmandu Medical Collegc (KMC) considered both academic
and nonacademic profiles ofthe applicants.
Kathmandu Medical College (KMC) AdmissioD Procedure:
The admission crileria for the Ncpali students at Kathmandu Medical College (KMC)
as undcr:
1. Hc/she must bc NePali citizcn.
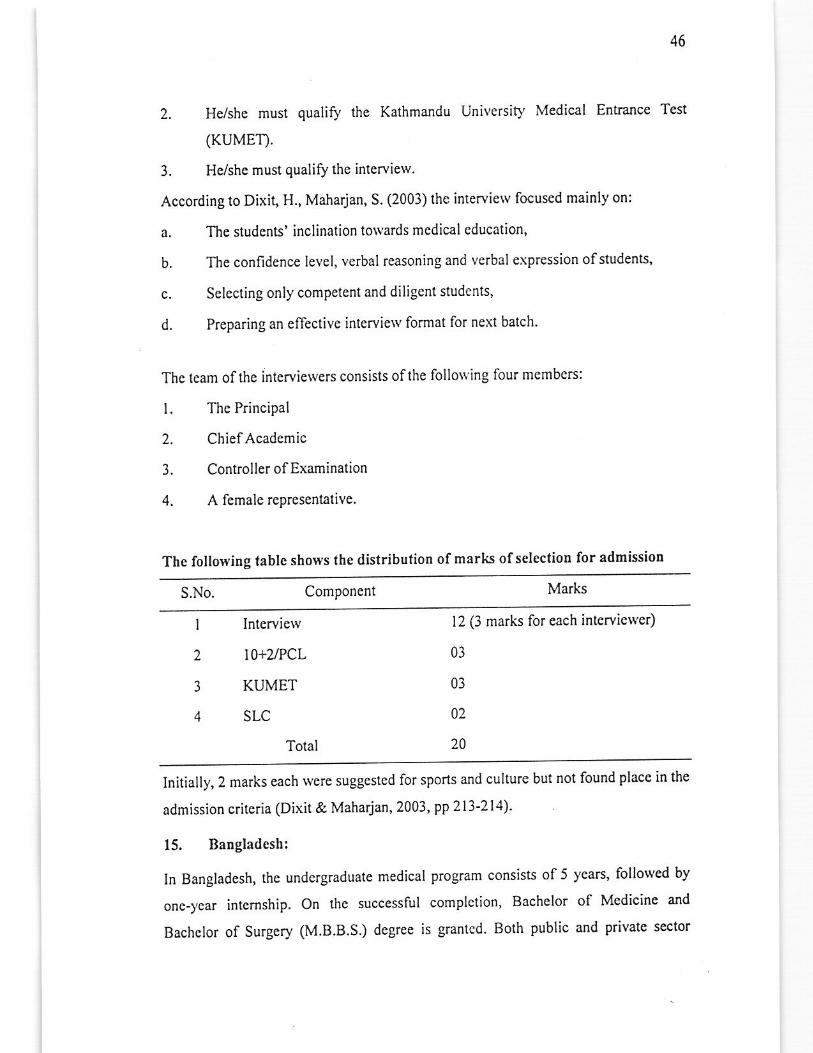
,.lo
2. He/she must qualify the Kathmandu University Medical Entrance Test
(KUMET).
3. He/she must qualify the interview.
According to Dixit, H., Maharjan, S. (2003) thc intervierv focus€d mainly on:
a. The students' inclination towards medical cducation,
b. The confidence level, verbal reasoning and verbal expression ofstudents'
c. Selecting only competent and diligent students,
d. Preparing a, effective interview fo.mat for next batch.
The team offie interviervers consists ofthe follo$ing four members:
l. Thc Principal
2. ChiefAcademic
3. ConfollerofExamination
4. A female representative.
Tbc following table shotts the dislribution ofmarks ofselectiou for admission
MarksS.No. ComPonent
Total
12 (3 marks for each interviewer)
03
03
02
20
Initially, 2 marks each wete suggested for sports and culture but not found place in the
admission criteria (Dixit & Maharjan, 2003, pp213-214).
15, Bangladesh:
In Banglad€sh, the undcrgraduate medical program consists of 5 years, followed by
one-year intemship. On the successful completion, Bachelor of Medicine and
Bachclor of Surgery (M.B.B S.) dcgree is grantcd. Both public and private sector
I Interview
2 t0+yPcL
3 KUMET
4 SLC
47
offer medical programme in Bangladesh. Postgraduate medical programme, like
Diploma or Degree (MS or MD), M. Phil and FCPS, are also offered.
Admissions to medical colleges are highly competitive. Admission to medical
profession is based mainly on the enfiance examination and academic records have
Iess weight age in the admission critcria.
16. India:
After 12 years schooling (10 years secondary -2 years higher secondary xhool
education) students are admitted to medical programme. the undergraduate medical
program consists of 9 semesters, followed by one-year intemship. On the succcssful
completion, Bachelor of Medicine and Bachelor of Surgery (M.B.B.S.) degee is
arvardcd. The Postgraduate Medical Diploma cr Dcgrcc (MS or MD) also offered,
under the auspices ol fte Medical Council of lodia. This diploma may also be
obtained through the National Board of Examinalions.
Medical colleges admissions in India are h;ghly compctilive and the number of
studcnts applied for are usually around 15 times more than the number of seats
available in Indian medical colleges. Admission to medical colleges is organized bolh
by the central govemment as lvell as the stalc govemments. The enlance cxamination
is the based criteria for admission is the based critcria and the previous academic
performances have Iess weighl age in the admission process
AII India (CBSE) Medicay Dental EDtraDce Examiratiotr
All India Entrance Examination for admission to MedicayDental colleges in India is
conducted the Central Board ofSccondary Education (CBSE), Nelv Dclhi.
Eligibility Critcria:
Eligibility Criteria for appearing in the test is as under:
l. All lndian nationals of 17 years Age.
2. The applicant must pass senior secondary cxam with 50% aggregate marks in
English, Physics, Chemistry, and Biology taken together.
48
Composilion of Entrance Eram:
The tcst consists of objective typc questions based on physics, Chemislry, and
Biology subjecs of senior secondary level. This 2.5 hours duration test carries g00
marks total with negative marls for incorrect response. Medium of examination is
Hindi or English (AII India CBSE).
Dental EducatioD in India:
Thc "Calcutta Dental College and Hospitai ' esrablished in 1924. was not only rhc lirst
Dcntal College of India but also of tho first Dcnlal College of Asia. The credit ofestablishment of $is college goes to a single pemon, Dr. Rafiuddin Ahmed, rvho
constructed this college without any financial aid from thc govemmenl.
Norv a days in Indian the Bachelor of Dental Surgery degree (B.D.S.) degiee is
awarded to dental students afier the successful contpletion of four years ofstudy and
one year of intemship programme. The degrec is recognized by the Dental Council of
India. Directorate of Medicll Education conducted enlrancc tcst in most slates ofIndia while in some cascs some autonomous universities arc allorvcd to conduct their
own entrarcc tests for admission in lheir respectivc univcrsities. In India, Post
graduatc courses such as Master ofDental Surgery(MDS) are also offercd in various
specializations. After BDS degree, additional 3 yea.s are required for tiisspecialization (wikipedia" 2008).
17, China:
In China, admission system is centralized and coordinated by the centrdl govemment
ofChina. Under this system, the number ofavailablc spaceJseats in cach educational
institution and courscs, arc determined by the national govemment. Applicaflts
specify the institutions and departments, in order ofpreference, they wish to enter but
are assigned by the govemment to an institution and program based on their
performance on national entrance exam and prel'erences specificd by the Candidates.
Applicants are rcquired to appear in the national entmnce cxam in onc of hvo
categories i.e. humanities or sciences and engineering for university admission.
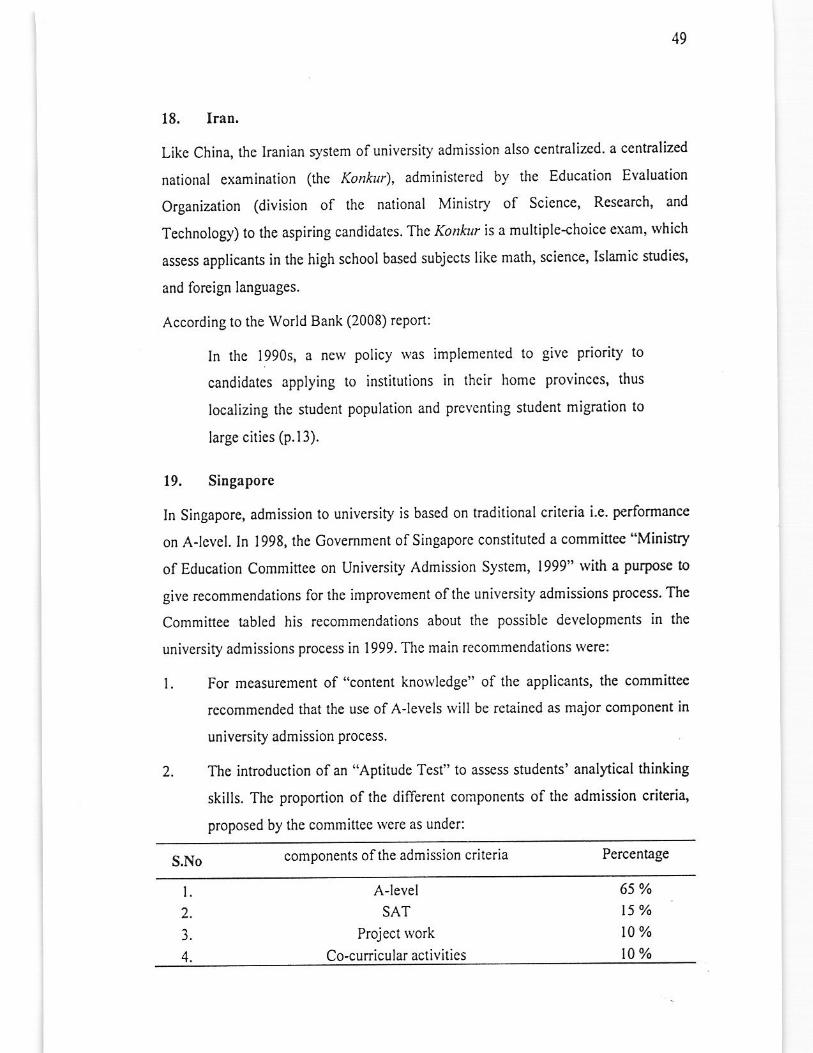
49
18. Iran.
Likc China, the lranian system ofuniversity admission also centralized. a centralized
national examination (the Konkur), administered by t1e Education Evaluation
Organization (division of thc national Minislry of Science, Research, and
Technology) to the aspiring candidatcs. The 1(or&rr is a multiple-choice exam, rvhich
assess applicants in the high schoolbased subjects like math, science, Islamic studies,
and foreign languages.
According to the World Bank (2008) report:
In the 1990s, a nerv policy s'as implemented lo givc p.iority to
candidatcs applying to inslitutions in thcir homc provinccs, thus
Iocalizing the student population and Prevcnting student migration to
large cities (p.13).
19. Singapore
In Singapore, admission to university js based on traditional criteria i.e. performance
on A-level. In 1998, the Govemment ofSingaporc constituted a committee "Ministry
ofEducation Committee on University Admission System, 1999" with a purpose lo
give recommendations for the improvement ofthc universiry admissions process. The
Committee tabled his recommendations about the possible developments in tie
university admissions process in 1999. Thc main recommendations were:
l. For measurement of "content knorvledge" of the applicans, tie committee
recommended that the use ofAJevels will be retained as major component in
university admission process.
2. The introduction ofan "Aptitude Test" to asscss students' analltical lhinking
skills. The proportion of thc different cocrponents of the admission criteriE
proposed by the committee rvere as under:
S.No components of the admission criteria Percentage
t.2.
3.
4.
AJevel
SAT
Project work
Co-curricular actiYities
65%15 Yo
10%t0%
50
In the light of the recommendations of the Commifee, the Ministry of Education
dccided to implement this neN criteria for admission to universities from 2003
scssion. The Ministry ofEducaiion also dccidcd that, for lhe timc being, the SAT, as
uscd in the Unitcd Stales, rvill bc used as Aptitude Test ofthe admissions process.
20. Israel
For university enlmnce, in Israel, Matriculation cenificate (Bagrut) is needed. Beller
(1994) stated that keeping in view the incrcasing dcmand for higher education in tie
country, most of the universities starled their o\\'n testing progmmmes for asses.sing
the aptilude of applicants from diverse nature of courscs and curriculum. They
attachcd lass importance to their applicants having studied a specific curriculum in
thcir previous education. National Institute ofTesling and Evaluation was established
ln 1981, with a purpose to designed and conduct a single test lor univcrsity admission.
Thc tcst developed by National Institute of Testing and Evaluation is named the
Psychometric Entrance Test (PET). The compositc s.orc from Bagrut and the
Psychometric EntBnce Tesl is used for the selcction of students in Israelian
univcrsities. The PET "measures various cognitive and scholastic abilities to estimate
future success in academic studies" (Beller, 1994,p. 13).
The PET' since I 990, has cons ists of the follorving three sections:
i. Verbal reasoning,
ii. Quantitative reasoning and
iii. English
For a limited number of disciplincs (e g. mcdicine), other additional selection
procedurcs (like interviews) are also uscd for sele.tion ofstlidents.
In Israel, the cntrancc requiremenb ofthe various schools ofmedicine are very strict'
The applicans of medical education requirc a high school Baccalaureatc avemge
abovc 100 and psychometric examination grade over 740. Most ofthe univeEities are
also offering MDi?hD prog€mmes.
21, Pakistan,
At higher level of cducation, in Pakistan, traditionally the intcrmcdiatc exami scorcs
were used as criteria for selecling of students. Till the mid-nineties, intermediate
5l
exams were us€d for the selcction of pubiic scctor mcdical colleges' students. Aga
Khan University (AKU) took the lead and introduccd wrincn admission tests ard
interview for selection of studcnts. Thc pcrformancc of AKU sludents in the FCPS
and foreign certification examinations was linked with this selection procedure. Other
institutions in the privale sector likc Baqaiand Ziauddin univcrsities also adopted the
same pattern oladmission Iike Aga Khan University (Baig, L A. et al,2001).
Since mid-ninetees the sclcction criteria for admissions to medical schoolVcolleges
and engineering inslitutions has been changed lrom traditional procedurc, based on
prcvious academic marks. Now entry lcsts play a major role in the admissions process
in the sclection ofstuden1s.joining tlese professional colleges.
Natiotral Testiug Service (NIS) :
National Testing Service (NTS) established on the recommendation of education
policies of 1992 and I998 in Pakisun. Higher Education commission (HEC), Pakistan
is responsible for promotion of higher education in Pakistan. GAT (Graduate
Assessment Tcst) tcst has become prcrcquisitc foi M.Phil and PhD sludies in Pakistan
and is also basis of merit for loreign scholarships managed by HEC. Il is a
prercquisite to take NTs cAT before applying for any ofHEC scholarships and mosl
of HEC scholarships are offered on the basis of marks obtained in NTS GAT
examination-
GAT (Graduate AssessmeDt Test) :
GAT (Cmduate Assessment Test) is test conducted by NTS. This is also called GRE
typc test but it is not equivalent to GRE. lt is worth noting that the test which is
conducted in Pakistan is not CRE in itself. Actually, It is CRE g?e test. GRE is
officialtrademark ofETS which conducts CRE for US studenls and foreign siudents.
Composition ofGAT (Graduatc Assessment Test) :
Thgre are tlree scctions ofGraduate Asscssment Test (GAT) test:
l. Vcrbal sectioni verbal scction again consists offour q?es ofquestions.
i. Antonyms
ii. Analogies
iii. Passage Reading

52
iv. Sentencecompletion
2. Quanlitstivc Scclion; quantitalive scclion consists of differcnt t)?cs ofquestions.
i. Ratios and Proportions
ii. Fractions
iii. Percentages
iv. Algebm
v. Geometry
vi. Probabiliry
3. Atralytical Sectiotr: This section consists oftypcs ofquestions.
i. Logical Reasonirg
ii. Anal)licalreasoning
2,4. Admission Requirements in the light ofEducatiotral policies ofpakistaE
Pakistan has inherited the prcsent education system from the British rule in India.
Since independencr various Govemmenfs have made efforts to develop fte system ofcducation in consonance lvith thc national, social, ideological and economic necds.
Some ofthe significance policy land marks in the history ofeducation development in
Pakistan are:
l. AllPakistan Education Conference, 1947
2. The first Five Year Plan, 1955-60
3, The Commission on National Education. I959
4. The Education Policy, 1972-80
5, National Educalion Policy ard Implementation Programme, 1979
6. National Education Policy, 1992 (1992-2002)
7. National Education Policy, I998-2010
As Ebcl, R L. (1972) statcd that "obviously the means rvc use today \yere dcvclopcd
in the past. We will understand their functions and limitations better if .rve knorv
something ofhow they cam€ inlo existence (p.3). So in follotving lines rve a.rc going
to anallze some of the significance Education Policies to study the
53
recommendationysuggestions and implementalions about the Admission Criteria./requirements, speciallythe introduction of Entrance Test.
2.{.1. The first Five Year Plan 1955.60:
The Plan first (1955-60) anallzed the draw backs of the examination system
prevailing in Pakistan in t-hese words,,the examination has come to serve olher than
education purposes-chiefly as measure ofqualification entitling students to admission
to a higher level ofeducation or for govemment or other emplo).ment. It has becomc
an end in itself rather than the means to an end". Then rhe plan (1955-60) givcs
emphasis on uniform policy for admission into the universitics and profcssional
collegeYinstitutions.
The document says:
There is a general feeling among educationist that some process ofselcction should be introduced for regulating admission into the
universities and their afliliated collcgcs. The Plan further
recommended that "the govemment should invite a commince
consisting of vice-chancellors and a few selccted principals ofcolleges
to consider this maner and makc recommendations on which the
central Govemment in consultation rvith Provincial Govemment could
announce their considered views for the guidance of universities and
colleg€s (p.436).
2,4,2. Tbe Commission oll Natiotral Educatio!, 1959:
About the admission requiremenls for engineering collegevinstitutes the Commission
on National Education (1959) suggested the Aptitude test along with academic mark.
The report ofThe Commission says:
As the future devclopmcnt of the counrry will depend largely on the
quality ofour enginecrs, it is neccssary to ensurc that the limiled places
in engineering colleges are utilized by studens Nho have the nec€ssary
aptitude and ability to profit from such a course.....Qualification for
admission should continue lo be intermediate science. Aptitude test
51
adapted to local conditions should be experimentally dcvcloped to
supplement examination results at the time ofadmission (p.65).
Abor-rt thc admission requiremcnts for medical collcgevinstitutes the Commission
declared "admission io medical colleges shouid be aRcr l2 ycars ofsucccssful study
and by me.it on the results of the (lntermediate sciencc) I.Sc-/F.Sc. examination
medical group and suitably evolved aptilude and oral rests (p.109)-
2.4.3. The National Education Polic, and lmplementatiotr programme, 1979:
For the improvement of system in the policy statement under $e heading of"Evaluation aad Examinations" the National Educarion Policy, 1979 suggestcd that:
The admission policies to higher cducation institutions and
professional colleges rvill be substantially imp.oved. Besides the marks
ofthe public cxaminations, thc marks ofobtaincd in intemai cvaluation
along with the results ofthe aptitude and admission test rvill be givcn
adcquale rreight- age at the lime of admission. The improvement ofexamination system will entail a substantial change in the role of the
Board of Intermediate and Secondary Education from merely
examining bodies to research-oriented professional organizations
primarily concemed with the development and standardization ofachievcment, aptitude and admission tesis (p.66).
2.4.4. The NatioDal Education Policy, 1992 (1992-2002) ,
Thc policy declared the undue importance atlached to the prescnt examination results
for the purposcs of admission in collegcs including professional colleges and
universities for the malpractices in examinations in Pakistan. The policy says:
The cxamination systcm is cxcossivcly fla\ved on account ofa variety
ofmalpractices. Neither the semesler system nor the annual system has
been able to stand up to the widespread coruption in examinalions.
Under a varicty ofcircumstances, the exarliners, the paper setters, the
invigilators, and the examinalion dcpartments appear to be equal
partners in maintaining the vicious circle of corruption around public
examinations. Even the boards of Inte.mediate and Secondary
55
Education (BISE) have vied with one another in the award of
unjustifiably inflated grades to thcir studcnts. AIso, in thcir anxiety to
bring thcir wards to professional colleges, the parcnts havc joincd the
rat race ofnefarious practices (p.29).
So thc Policy has procccded to solve the problem in tlvo rvays:
a. by recommending that a National Tcsting Service (NTS) be cstablished, and
b. by highlighting the reforms which must be introduced for streamlining the
arnual examination system.
NatioDal TestiDg Service (NTS) :
The National Education Policy, 1992 suggesled that a National Tcsting Scrvice (MIS)
rvill be established at the Federal level as a high level autonomous organization in
closc collaboration with Univcrsity Gmnts Commission (UCC) [HEC] and Inter
Board Committee of Chairmen (IBCC). The NTS will provide test as well as testing
serviccs to schools, colleges including professional collcgcs, universities and other
institutions. The tests will be developed by NTS in collaboration rvith national and
intemational agencies.
The education policy declared mandatory the NTS test for admission for colleges and
universities. The policy recommended:
Each person on tie merit list rvill be required to pass the national test
beforc the admission is finalized. Failure in national test will make the
studeni in eligible for admission, inespectivc of his position on the
merh list. The instilutions will introduce rcgulations to accommodate
this provision (p.30).
2.4.5. The National Education Policy, 1998-2010:
In Education Policy 1992, Education Testing Service (NTS) was conccived for entry
examinations in professional colleges and faculties of universities. Accordingly, lhe
Minislry of Education developed the idea of National Education Testing Se.vicc
(NETS) with the objeclive 10 maintain uniformity of scores among various
Examination Boards through scicntifically validated tcsts and raisc tle standard of
education.

56
The basic work on NETS started in 1993. The NETS has developed resr irems in the
subjects ofPhysics, Chemistry, Math, Biology and English at Higher Secondary level.
Thcsc have becn prepared by expcrts and are cuniculum-based \yhich is being taught
at present and encompass knorvledge, comprehension and application of the subjects.
These tests have been tried out at post F.Sc. Ievcl in Karachi and Islamabad.
Till I998, the adoption ofNETS tcsts \(as volunnry, ralhcr than mandatory. Noiv tieNational Education Policy, 1998 dcclared ir mandatory for admission and
recommended Iegislation in thc National Assembly for adoption.
The salient fcatures of NETS described by Nationa! Education Policy, I998 lvere:
l. It will come into operation from lhe Acadcmic ycar 1998.
2. lt rvill be supervised by an independent Board of Govemors, and shall have
advisory, technical and cxpcrt Commitlees.
3. Failure to qualiry NETS test Nill render a srudenr ineligible for admission to a
professionalcollcge.
4. Any pcrson leaking information in respect oftests, items bank or examination
shall bc punishablc with imprisonmcnt and finc (p.143).
National Tcsting Service (NTS) established on lhc rccommcndation of cducation
policies of 1992 and I998 in Pakistan. CAT (Graduate Assessment Test), also called
GRE type test) is conducted by NTS (not CRE in itself, becausc GRE is official
trademark of Educational Testing Service (ETS), \lhich conducts GRE for US
students and foreign students).
Composition ofGraduate Asscssment Test (GAT) test:
Therc are three sections ofGmduate Assessment Test (CAT) test:
I. Verba I section : verbal section again corsisls of four q?es o f questions.
i. Antonyms
ii. Analogies
iii. Passage Rcading
iv. Sentencecompletion
5'l
uI.
II. Quantirative Seclior: Quantitative section consisls of different t,!es ofquestions.
i. Ratios and Proportions
ii. Fractions
iii. Percentages
iv. Algebra
v. Geometry
vi. Probability
Analytical SectioD: This section consists oft),pes ofquestions.
i. Logical Reasoning
ii. Anal),ticalreasoning
2.5| Ovcrview ofAdmission Procedure io Pakistan
"Pakistan has an estimatcd population of 145 million, tNo per cent of the ,lvorld's
population. The areas of88 million hectares comprise four provinces (Punjab, Sindh,
North West Frontier and Balochistan) and four territories { (lslamabad Capital
Terilory, Azad Jammu and Kashmir, Federally Administcrcd Noniem Areas
(FANA) and Fedenl Administered Tribal A;eas (FATA) ) of the total land of 88
million heclares" (Govemment ofPakistan, 2032, p.l).
As thcre arc hvo major arcas of our study i.c. N'ledicalDental Education and
Enginccring Education, so in thc follorving lincs *c rvill discuss thc Education
Systcm ofPakistan \vith respect to these hyo areas.
I. The Medical Education System ofPakistan
2. fie Engineering Education System ofPakistan
5.5.1 The Medical aDd DeDtal Education System ofPakistan
"ln Pakistar, Ne produce one nurse for eight doctors and only one doctor is available
to trcat 2,300 people" (Dawn, l9 January 2004).
In Pakistan, the responsibiiity of mainlenance of educational standards of Medical,
Nursing, Dcntal, Pharmac€uticals, Pre-Medicaland allied subjects rests on the Federal
58
Govemment. The Fcderal Govemment through Medical and Dcntal Ordinance XXXII
of 1962 has constituted an Authorily Know! as Mcdical and Dental Council (PMDC)
in Pakistan, rvhich has been entrusted rvith the responsibiliry ofestablishing a uniform
standard ofbasic and higher qualificalions in medicinc and dentistry.
2.5.1.1. Pakistan Medical aDd DcntalCouncil (PM & DC) |
In 1962, The govemment ofPakistan, undcr lhe Pakistan Mcdical and Dental Council
Ordinance, 1962, constituted, Pakistan Medical & Denral Council (pM & DC) as
a statutory autonomous organization. h is tolally an autonomous body/organization,
and not dependenl on any institution/Ministry of thc govemment of Pakistan, even in
the financial mafter. Fund for the Council comes from inspection (of private medical
collcgcs) fees, and rcgislration and icncwal of rcgisrrarion fces. Initially, the Council
was cnablishcdjust aflcr thc independence, in 1947 by adopring thc lndian Medical
Council Act 1933 by the govemment ofPakistan. At that time, on .ecommendations
from universities and provincial govemments, the federal govemment of Pakistafl
used 10 nominate the mcmbers ofthe Council. In 1951, on the recommendations ofthe Council an Act callcd the Pakinan Medical Council Act was enacted. Through
that act proper due representation were given to all concemed Mcdical institutions and
Profession such as Ministry of Health of the Federal Govemment, Health
Departments of the Provincial Govemments, Medical Faculties of the Universities,
and Registered Medical Practitioncrs. Thrcc provincial mcdical councils(i.e. Punjab,
Sindh and East Bengal) were also established ar that time.
Up io i962, the abovc sct up ofthe rcmained in force. In 1962, the Provincial Medical
Councils were dissolved on the recommendations of the Medical Reforms
Commission and through the Pakistan Medical Council Ordinance, 1962, the Pakistan
Medical Council was constituted. After that through an Act ofthe National Assembly,
it was subsequently amended in 1972, after the ''fall of Dacca" and breakup Vy'est
Pakistan. Through this a[endment the \rord of"cast Pakistan" was deleted and due
rcpresentation wcre givcn to tle four provinces of Pakistan. Under this amendment,
the name of the Council rvas also changed into the "Pakistan Medical and Dental
Council", commenly known as PM&DC norv.
59
I. The functions of the PM&DC:
Follorving arc thc main functions oflhc PM&DC:
a. To set minimum standards for the Bachelor olMedicine, Bachelor ofSurgery.
(MBBS), Master ofScience (MS) and Doctor of Medicine (MD) dcgrees.
b. To set rcquirements for qualifications ofleachers in medical colleges.
c. To inspect medical collcges for provisional and lull recognition.
d. To set the Code ofMedical Eihics lor Registcred Medical Practitioners.
e. To set regulations for formation ofncw public and private medical colleges.
Section 33 of the Ordinance, deals u'ith the poNers of PMDC to fmme regulations,
with the previous sanction ofthe centEl Governmen! to carry out thc purposes ofthe
Ordinance. Sub-Section (2) ofsection 33 provides as follorvs:
a. Prcscribing a uniform minimum standard of courses oftraining for obtaining
$aduate and post- graduate Medical and Dental Qualifications to be included
or excluded respectively in thc firsl third anJ fifth schedules;
b. Prcscribing minimum requirements for the contgnt and dumtion ofcourscs of
study as aforesaid:
c. Prescribing thc conditions for admission to courscs oftraining as aforcsaid:
d. Prescribing minimum Qualifications and experience required to teachem for
appointment in Medical and Dental Institutions:
e. Prescribing the standard of examinations, method of conducting the
examinations and other requirements to be satisfied for securing recognition
ofMedjcal and Dental Qualifications under this Ordinance;
f. Prcscribing the Qualifications and expcriencc rcquired for p,ofessional
examinations in Medicine and Dentistry antecedent to the granting of
recognized medical Qualifi cations.
g. Registration of Medical or Dental students at any Medical and Dental college
or school or any university and lho fce payable in respecl ofsuch registration.
Section 33 (2) (a) ofthe ordinance authorizes PMDC to lay dorvn a minimum uniform
standard ofcourses oftraining for obtaining gradualc and posF graduate Medical and
60
Dcntal Qualifications. Undcr the sub-clause (c) ofthe section 33 (2), the PMDC is
authorized to prescribe the conditions for admission to courses oftraining for graduatc
and posF graduatc Qualifications. PMDC in exercisc of iB power undcr Section 33
(2) of the Ordinance, effective from first year admission of the academic session of
l98l in the medical colleges all over Pakisran, laid do\yn the conditions for admission
and courses oftraining fo. obtaining MBBS degree of not less than 5 ycars duration.
Undcr the heading Admission to Medical college, thc rcgulations provided as under:
No candidate should be allowed to begin the medical curriculum proper unlcss:
(a) Hc/She has passed Intermediate Science c\amination (Pre-Medical goup)
sccuring at Ieast 45% marks in aggregate of a Pakistani university, or an equivalent
examination ofa Board ofSecondary Education in Pakistan.
OR
A higher examination of a Pakistani University lvith any group of subjccts provided
he/she has parsed the Intermedisle Science (F.Sc. Examination, Mcdical Croup)
securing at ieast in the 2nd division.
OR
Any other examination ofa foreign university or examining body, rvhich in scope and
standard is found equivalent to the Intermediatc Science (F.Sc.) Examinalion
(Medical Group), ofa Pakistani university or Board ofSecondary Education.
(b) He/She has qualified a completely computerized entEnce examination.
The final sclcction of the candidale will bc claboratcd by adding his perlormance in
the intermediate science (Medical Group) examination and computerized entrance
examination.
As of September 2008, there are 72 Medical and Dental colleges in Pakistan
recognized by the Pakistan Mcdical & Dental Council (PM&DC).
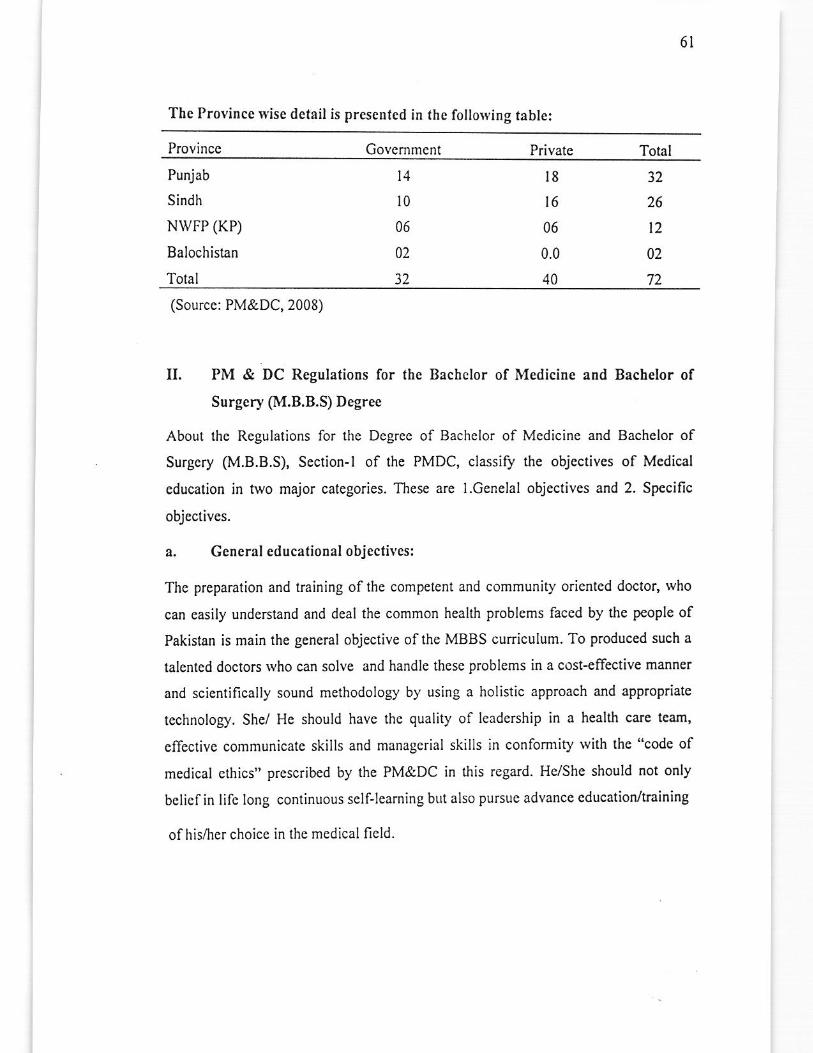
6l
Thc Province $'ise dctail is presented in the follolying table:
Provincc Govcmmcnt Private Total
Punjab
Sindh
NWFP (KP)
Balochistan
Total
t4
t0
06
02
32
l8
I6
06
0.0
40
32
26
t2
02
72
(Sourcc: PM&DC,2008)
II. PM & DC Regulalions for thc Bachclor of Medicine atrd Bachelor of
Surgery (M.B.B.S) Degree
About the Regulations for the Degrec of Bachclor of Mcdicine and Bachelor of
Surgcry (M.B.B.S), Scction-l of the PMDC, classily tle objectives of Mcdical
education in two major categories. These are l.Genelal objectives and 2. Spccific
objcctives.
a. Generaleducationalobjectives:
The preparation and training of the competent and community oriented doctor, who
can easily understand and deal the common health problems faced by tle people of
Pakistan is main the geneml objective ofthe MBBS curriculum. To produced such a
talented doctors who can solve and handle these problems in a cDst-effective manner
and scientifically sound methodology by using a holistic approach and appropriate
technology. She/ He should have thc quality of leadership in a health care tearn,
effectivc communicatc skills and managerial skills in conformity with lhe "code of
medical cthics" prescribed by the PM&DC in this regard. He/She should not only
belicfin Iilc long continuous sclf-leaming b(rt also pursuc advance educatior/training
ofhis/her choice in th€ medical field.

62
b. Speciriceducatiotralobjectives:
For the anaioment of the gcneral objective, the medical collegevinstitution should
focus on the following specillc objectives in the cognitive, affective and psychomolor
domains:
i. Cognitivc Domaiu/Objectivesr At the complction of undergraduate medical
training, a medical graduate is able to know of:
a. The principles of sciences that are essential for understanding tie
structurcs, functions and behavior ofman in health and disease
including:
i. Structure aad function of cells and organ systems and their
adaptations to injury and drugs.
ii. Behavior of man as an individual, as a family, and as a
communily.
b. Macroscopic and microscopic structure of tie human body liom
conception to completion of 8.owth.
c. Functions ofnormal human body at all levels ofdevelopment.
d. Abnormalitios of structure and function of the human body and their
causative agents.
e. Clinical presentations ofhealth and disease in terms olprocesses, both
physical and mental,
f. Diagnoslic procedures and thcir interpretations.
g. Preventivc and therapeutic mcasurcs for management of hcalti and
disease.
h. l-egal aspects ofmedical practice and legal implications ofdiseas€.
i. Normal human behavior and disorders of human behavior resulting
from nonorganic causes.
j. Prcscnt and future health problcms ofthc community and solutions of
such problcms through planning, implementation, critical evaluation
and research in prevenlive progams.

63
k. Diagnosis and lreatment of all common emergcncies in clinical
practice.
l. Tho role of socio-cuhural background, socio_economic factors,
population dynamics and changing cnvironment in hcallh and illncss.
The environmental and social dcterminants of disease, fie principles
ofdiscase surveillance, $e means by which discases spread, and the
analysis ofthe burden ofdisease within the community.
m. The concept of reproductive health and understanding of all related
aspects.
n. Basic principles ofMedical Ethics
ii. Psychomotor Domain/Objectives (Skills) :
In order to achieve the general objcctives of medical education at the end of the
MBBS course ofstudy, a graduatc should be able to:
a. Conducts intcrvicws, takes history and does physical examination of patients
correctly and acquires abilil, to communicate and make accu.ate observation.
b. Collects fluids, effusions, blood, secretions, discharges and excretions from
the human body correclly for diagnostic and ficmPeutics purposcs.
c. Performs simple laboratory investigations, takes an ECC, requests and
interprets tests.
d. Applies dressings, bandages, splints.
e. Performs minor surgical procedures, and givcs injections, and vaccines.
i Gives localalcsthesia and analgesia.
g. Conducts normal dcliveries and rcsuscilates teonates.
h. Performs administrative duties as a member ofthc health care team.
i. Performscardio-pulmonaryresuscilation.
j. Prescribes drugs mtionally.
k. Refers patienG appropriately rvhen requircd.

64
iii. Affective domain (beliefs and attitudqs) /Objectives:
Following specific objectivcs wcre recommcnded by the council, rclated with beliefs,
attitudes, values and interests development MBBS graduate:
a. Displays virtucs personal chamcter such as a sense of responsibility towards
patients, community and colleagues.
b. Respects patient's righls of confident ia lit), and obtains informed consent.
c. Recognizeshis/herprofessionallimitalions.
d. Develops and mainlains good r€lations with patients and all persons concemed
in tho dclivcry ofheal$ carc.
e. Educates, guides and helps in adoption of preventive and cumtive measures
against disease.
f. Improves his"ftcr professional knowledge, skills and attitudes continuously
with a critical and enquiring approach.
g. Shows willingness to tale part in educalion and training of studcnts, Paia.
medical personnel and colleagues in hcalth education.
h. Assumes leadership in the health care delivery team as well as accepts the
Ieadership ofhis seniors, demonslrating a spiri! ofteamwork.
i. Identifieshimself/herselfrviththecommunitv.
lII. Gcneral PriDciples ofPM&DC:
Section- III of PM&DC deals Nith duration, nature of training and hose job etc as
under:
PM&DC suggested five ycars duration lor MBBS course/degree. On successful
completion of the MBBS course and passing all pans of the Professional
Examinations, the Bachelor of Medicine, Bachelor of Surgery (MBBS) degree is
awarded by the affiliated univcrsity to medical graduates. One-year house job is
mandatory for medical Graduales to qualify for the Certificate of full Rcgisx-ation to
practice medicine in Pakistan. The duration of housejob is l2 months, which consists
of six months training in medicine (and allied disciplines) and six mon$s tr-aining in
surgcry(and allicd disciplincs)in onc of the teaching hospitals of Paliistan. For
Registration with Pakistan Medical and Dental Council, this housejob is compulsory,
65
which must bc carried out in a hospital rccognized by the Pakislan Medical& Dental
Council for such purpose. This progranrmm/ lraining of a house job should have a
proper structurcd and supervised by licensed and clipcricnccd faculties. A house job
should have a training program with opportunilies for self-lcaming lor the medical
sludents and should be assessed properly before issuing thc cenificate.
To eslablish the relevance ofbasic scienccs subjccts to clinical subjects is considered
important in thc fir$ n\'o years of the MBBS curriculum for medical students.
Exposurc of resuscitation of patients and fi.st aid should also bc taught in the early
two ycars of medical cducalion. Sludents should develop skills lor history taking,
skills of physical examination of patienll and communication skills in tie third yeat
of the MBBS coursc. Thc skills of paticnt managcmcnt should also be developed in
thc medical studcnls during this ycar.
ln lhe next year of the MBBS programme emphasis is given on thc dcvelopment of
skills that how to manage health problems (both in out-patients and in-patients) by the
medical sludcnts? Mcdical studcnts must also arvarc about the cognitive mcntal
abilities and medical research process such as collection of dat4 interpretation,
analysis ofdata , rynthesis and application ofdata in solving problems situation.
More importance should be attached to clinical worMraining in the final year of
medical training/course. Pre-defined responsibililics in the managemcnt of paticnts
should be allotted to final medical students. For all final year students Day duties
must be declared mandatory while in case of availal;bility of residential facilities
night duties must also be given. Clinico-pathotogical conferences, on rveekly bases
should bc ananged for the final year MBBS students. The main themes of these
conferences should be comprehensive manaScmcnt of health problems, and to
correlate clinical presentations with palholoSy, for rvhich a multidisciplinary,
integratcd approach should be adopted. Equal opporrunity should be extended to all
studenb to take active part in the preparation and presenlation ofthcse conferences.
Eligibility for MBBS and BDS Admission:
Thc PM & DC has determined thc follorving cligibility criteria for MBBS and BDS
programmes:
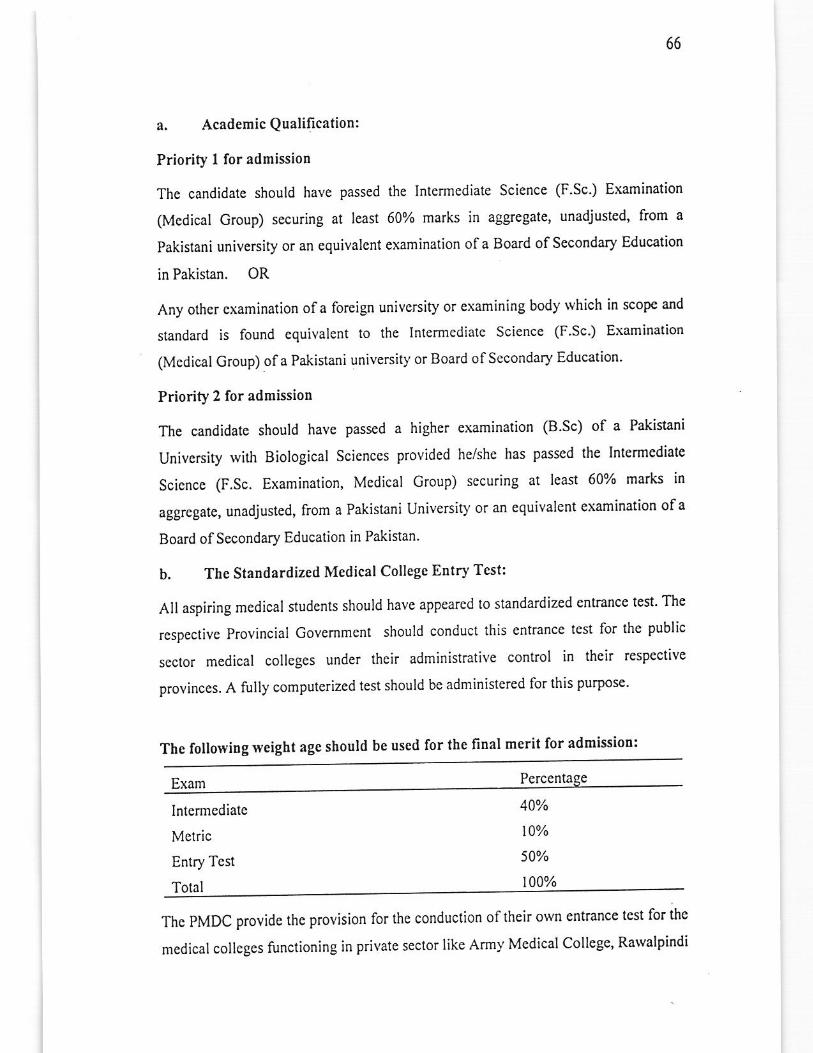
66
Academic Qualification:
Priority t for admissiod
The candidate should have passed the Intermediate Science (F Sc ) Examination
(Mcdical Grcup) sccuring at least 60% marks in aggegat€, unadjusted, from a
Pakistani university or an equivalcnt examination ola Board ofSecondary Education
in Pakistan. OR
Any othcr examination of a foreign university or examining body rvhich in scope and
standard is found equivalent to the Inlermedialc Science (F Sc') Examination
(MedicalCroup) ofa Pakistani universily or Board ofSecondary Education'
Priority 2 for admissioD
The candidate should have passed a higher examination (B Sc) of a Pakistani
Univcrsity with Biological Sciences provided hc/she has passcd the Intcrmediate
Scicnce (F.Sc. Examination, Medicat Group) sccuring at least 600% marks in
aggregate, unadjusted, from a Pakistani University or an equivalent examination ofa
Board ofSecondary Education in Pakistan.
b. The Standardized Medical Collegc Entry Tcst:
All aspiring medical students should have appeared to standardized cntmnce test' The
rcspectivc Provincial Govemment should conduct this entrance 'est
for the public
sector medical colleges under their adminisL'ative control in thcir respective
provinces. A fully computerized test should be adminislered for this purpose'
Thc followiDg weight age should be used for the linal merit for admissioD:
Intermediate
Motric
Entry Tost
Tolal
40%
t0%
50%
100%
The PMDC provide the provision for the conduction oftheir orvn
medical coilcBes functioning in private sector like Army Mcdical
entrance tcst for the
College, Rawalpindi
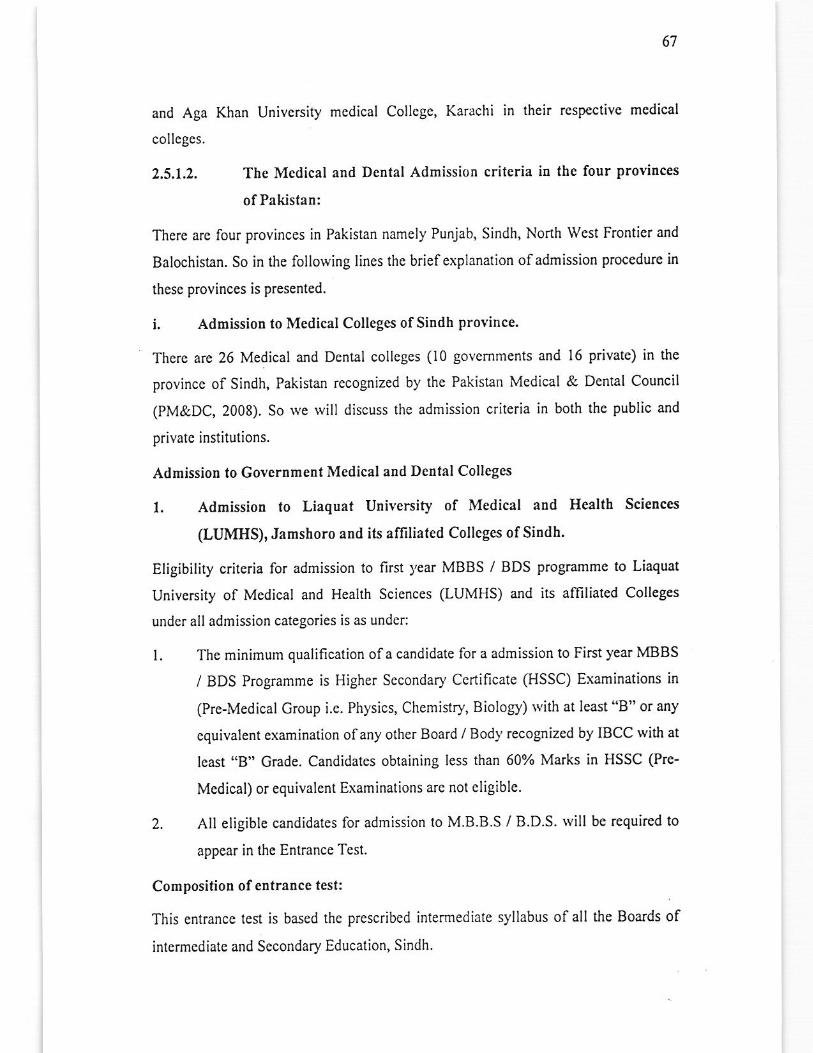
67
and Aga Khan Univcrsity medical Collcge, Karachi in their rcspective medical
collcgcs.
2.5.1,2. The Medical and Dental Admission criteria iD the four providces
ofPakisfaD:
There arc four provinces in Pakistan namely Punjab, Sindh, r.\orth West Frontier and
Balochistan. So in the following lines thc briefexplanation ofadmission p.ocedure in
these provinces is presented.
i. Admission to Medical Collcget ofSindh province'
Therc ate 26 Medical aad Dental colleges (10 govem,nents and 16 private) in fte
provincc of Sindh, Pakistan recoglized by thc Pakistan Medical & Dental Council
(PM&DC,2008). So rve rvill discuss thc admission crileria in both the public and
private institutions.
Adnission 1o Governmeot Mcdical aDd Detrtal Colleges
l. Admission to Liaquat UniYersity of Medical and Health Scietrccs
(LUMHS), Jamshoro and ih alliliafed Colleges ofSindb.
Eligibility criteria for admission to first year MBBS / BDS programme lo Liaquat
University of Medical and Health Sciences (LUMHS) and iB amliated Colleges
under all admission categories is as under:
l. The minimum qualification ofa candidate for a admission to Fi.st year MBBS
/ BDS Programme is Higher Secondary Ccnificate (HSSC) Examinations in
(Pre-Medical Group i.e. Physics, Chemistry, Biology) with at Ieast "B" or any
cquivalent examination ofany other Board / Bod)'recognized by IBCC lvitl at
Ieast "B" Grade. Candidates obtaining less than 600Z Marks in HSSC (Pre-
Medical) or equivalcnt Examinations are not eligible.
2. AII eligible candidates for admission to M.B.B.S / B.D.S. rvill be required to
appear in thc Entrance Test.
Compositiotr of eDtrancc tcsl:
This entrance test is bascd the prescribed intermediale syllabus ofall the Boards of
intermcdiate and Secondary Education, Sindh.
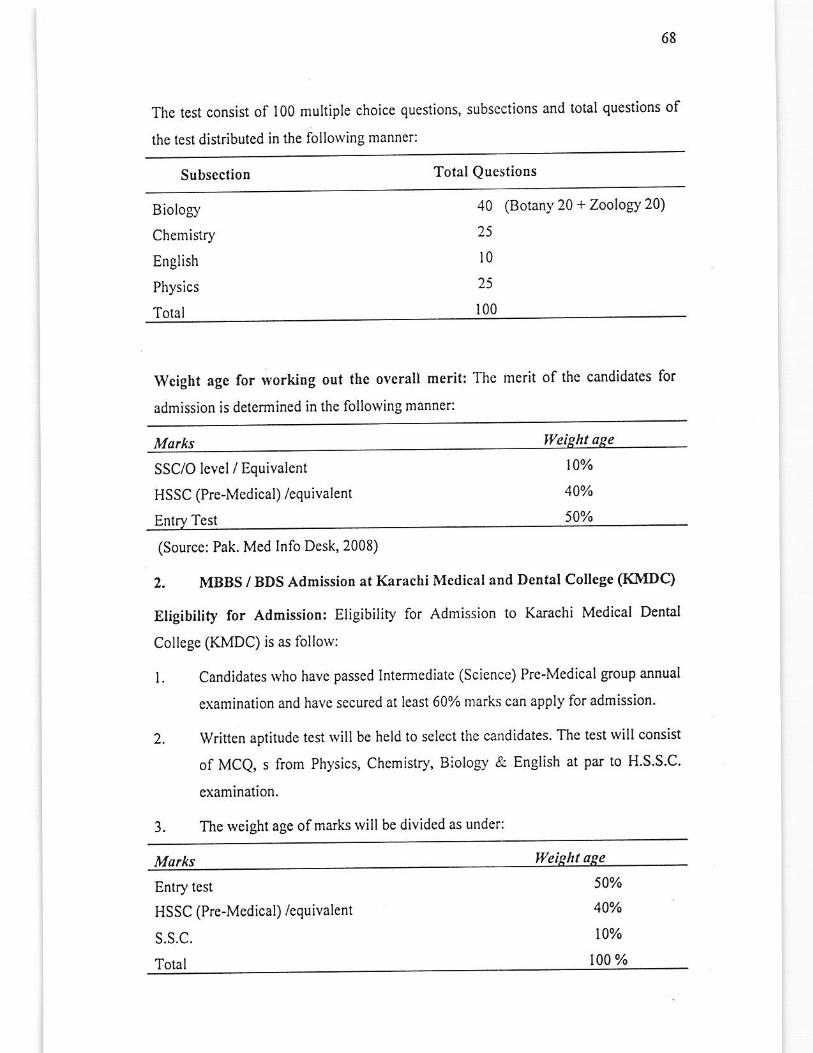
68
Thc test consist of 100 multiple choice questions,
the tcst distributed in the fotlowing manner:
subscctions and total questions of
Subscction Total Qucstions
Biology
Chemistry
English
Physics
Total
40 (Botany 20 + ZoologY 20)
25
l0
25
100
HSSC (Pre-Medical) /equivalent
Entrv Test
Wci8ht age for workin8 out the overall merit: The mcrit ofthc candidatcs for
admission is determined in the following manner:
Marks tveiEht
SSC/O lcvel / Equivalent t0%
40%
50%
2.
3.
t.
2. MBBS / BDS Admissior at Karachi Medical ard Dental College (KMDC)
Eligibilify for AdmissioD: Eligibility for Admission to Karachi Medical Dental
College (KMDC) is as follow:
Candidates rvho have passed Intermediate (Science) Pre-Medical group aruual
examination and have secured at least 60olo nlarks can apply fo. admission.
Written aptitude test will bc held to select the candidates. Thc test ivill consist
of MCQ, s from Physics, Chemistry, Biology & English at pal to H.S.S.C.
examination.
The weight age ofmarks will be divided as under:
(Sourco: Pak. Med Info Desk, 2008)
Marks
Entry test 50%
40%
t0%
100 %
HSSC (Pre-Medical) /equivalent
Tolal
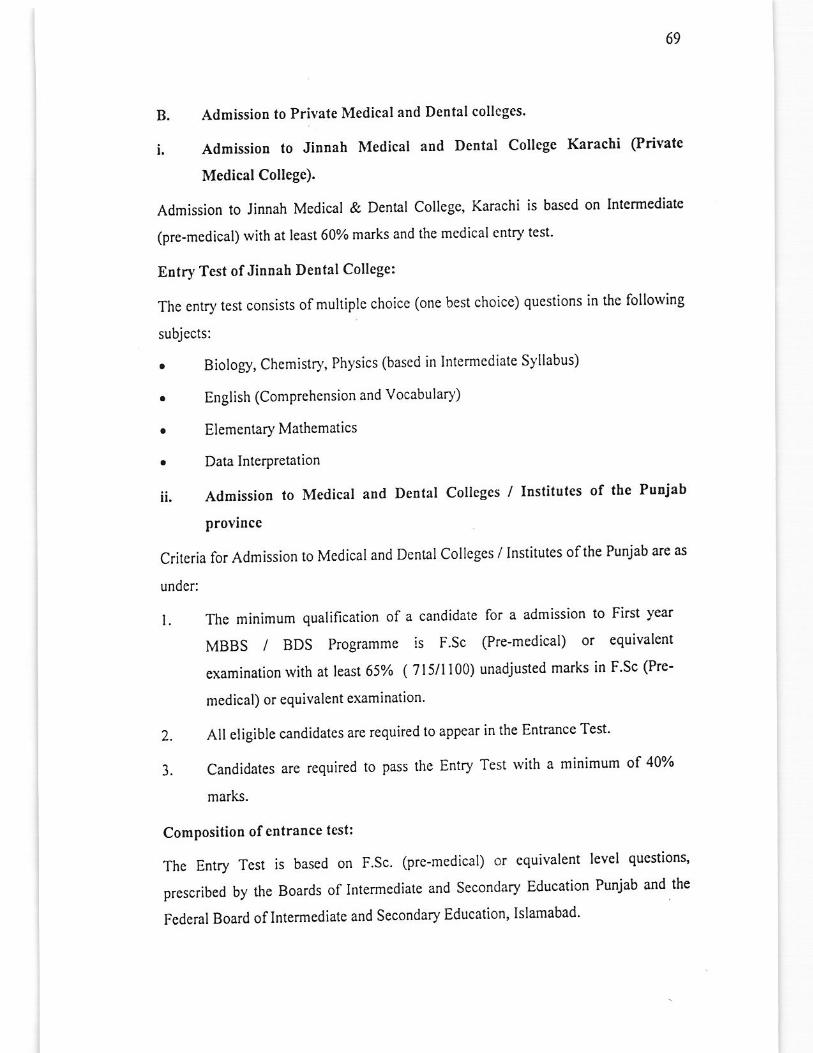
69
B. Admission to Private Medical and Dental collcges'
i. Admission to JiDDah Medical atrd Dental College Karacti (Private
Medical College).
Admission to Jinnah Medical & Dental Collegc, Karachi is ba-s€d on Intermediate
(pre-medical) lvith at least 60olo marks and the medical entry tcst'
Entry Tcst ofJinDah Dental Collegc:
The entry test consists ofmultiple choice (one best choice) questions in thc follorving
subjccts:
. Biology, Chemistry, Physics (bascd in Intermcdiate S)'llabus)
. English (Comprchension and Vocabulary)
. ElementaryMathematics
. Data Interpretalion
ii, Admissio! to Medical aDd Deutal Colleges / Inslitutes of the PuEi'b
province
Critcria for Admission to Mcdical and Dcntal Collcges / Institutes ofthe Punjab arc as
undcr:
l. The minimum qualification ofa candidate for a admission to First year
MBBS i BDS Programme is F Sc (Pre-medical) or equivalenl
examination with at least 65% ( 715/l100) unadjusted marks in F'Sc (Pre-
medical) or equivalent examination'
2. All eligible candidates are required to appear in the Entrance Test'
3. Candidates are required to pass the Entry Test with a minimum of 407'
marks.
Composition of entrance tcsl:
The Entry Test is based on F.Sc. (pre-medical) or equivalent level questions'
prescribed by tie Boards of Intermcdiate and Secondary Education Punjab and tie
Federal Board oflntermediate and Secondary Education, Islamabad'
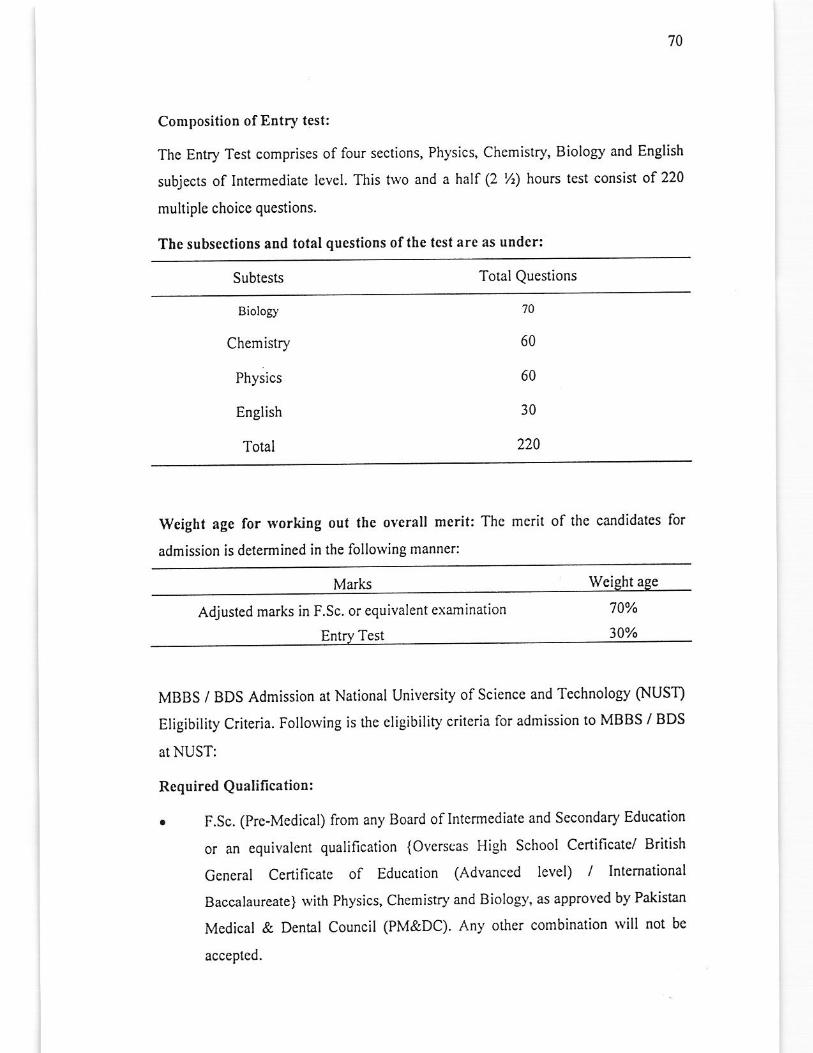
'10
Composition of Entry test:
Thc Enlry Test comprises of four sections, Physics, Chemistry, Biology and English
subjects of Intermediatc level. This hvo and a half(2 %) hours test consist of 220
multiplc choice questions.
Thc subscctions aDd total qucstioDs ofthe tcst are as under:
Subtests Total Questions
Biology
Chemistry
Physics
English
Total
Wcight age for working out the ovcrall merit: Thc merit of the candidaies lor
admission is determined in the following manner:
Marks wgiCht aCe
60
'ta
60
30
220
Adjusted marks in F.Sc. or equivalent examination 70%
30%
MBBS / BDS Admission at National University ofScicnce and Technology (NUST)
Eligibility Criteria. Following is fie eligibility crileria fo. admission to MBBS / BDS
At NUST:
Required Qualilicationi
. F.Sc. (Pre-Mcdical) from any Board oflntcrmediate and Secondary Education
or an equivalent qualification {Ovcrsoas High School Ccrtificatc/ British
Gcneral Certificate of Education (Advanced level) / Intemational
Baccalaureate) with Physics, Chemistry and Biology, as approved by Pakistan
Medical & Dental Council (PM&DC). Any other combination will not be
accepted.
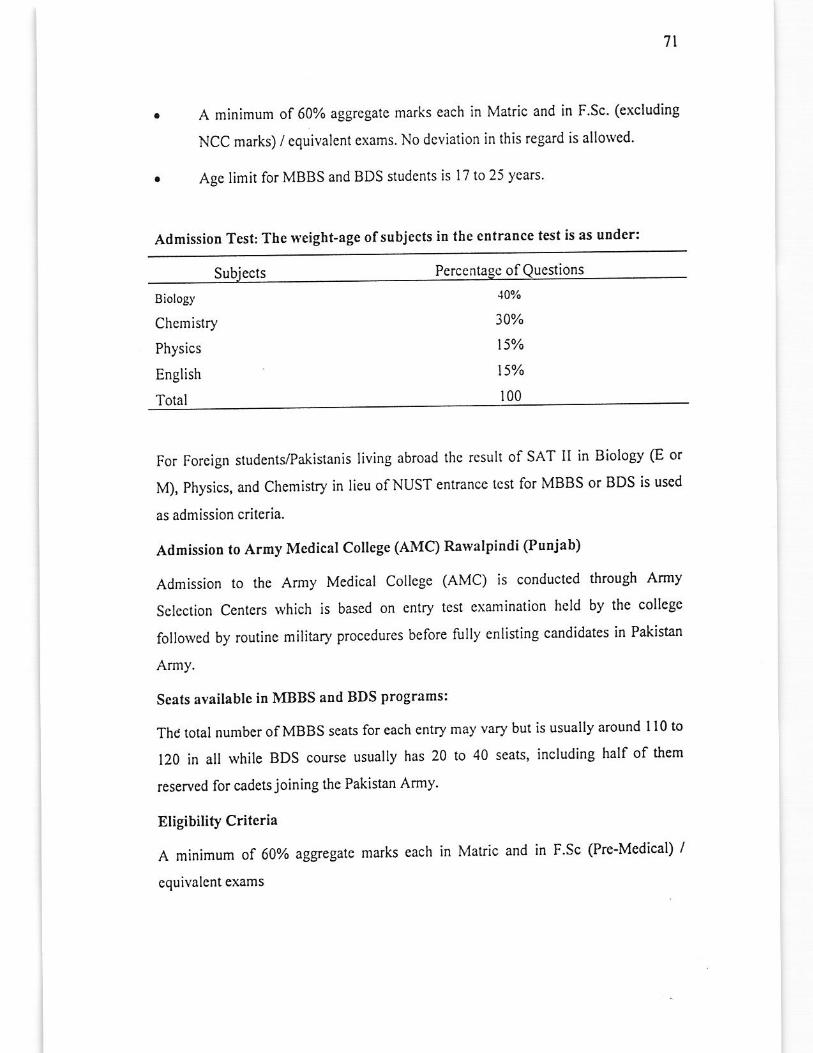
'tl
A minimum of 60% aggregate marks each in Matric and in F'Sc' (excluding
NCC marks) / equivalent cxams. No dcviation in this regard is allowed.
Age limit for MBBS and BDS studcnts is l7 to 25 years
Admission Test: Tbe rveight-age ofsubjects in the eDtraDce test is as uoder:
Subiects Perce of
Biology
Chcmistry
Physics
English
Total
10%
30%
15%
15yo
100
For Forcign srudcntyPakistanis living abroad thc result of SAT II in Biology (E or
M), Physics, and Chemistry in lieu ofNUST entrance tcst for MBBS or BDS is used
as admission criteria.
Admission to Army Medical College (AMC) Ralvalpindi (Pudjab)
Admission to the Army Medical College (AMC) is conducted through Army
Sclcction Cen(crs which is based on entry test cxamination held by thc college
followed by rcutine military procedures bclore fully enlisting candidates in Pakistan
Army.
Seats available in MBBS and BDS programs:
Thd tolal number ofMBBS seats for cach entry may vary but is usually around I l0 to
120 in all while BDS course usuatly has 20 to 40 seats, including half of them
reserved for cad€tsjoining ths Pakistan Army.
Eligibility Criteria
A minimum of 60Yo aggregate marks each in Matric and in F'Sc (Pre-Medical) /
cquivalcnt exams
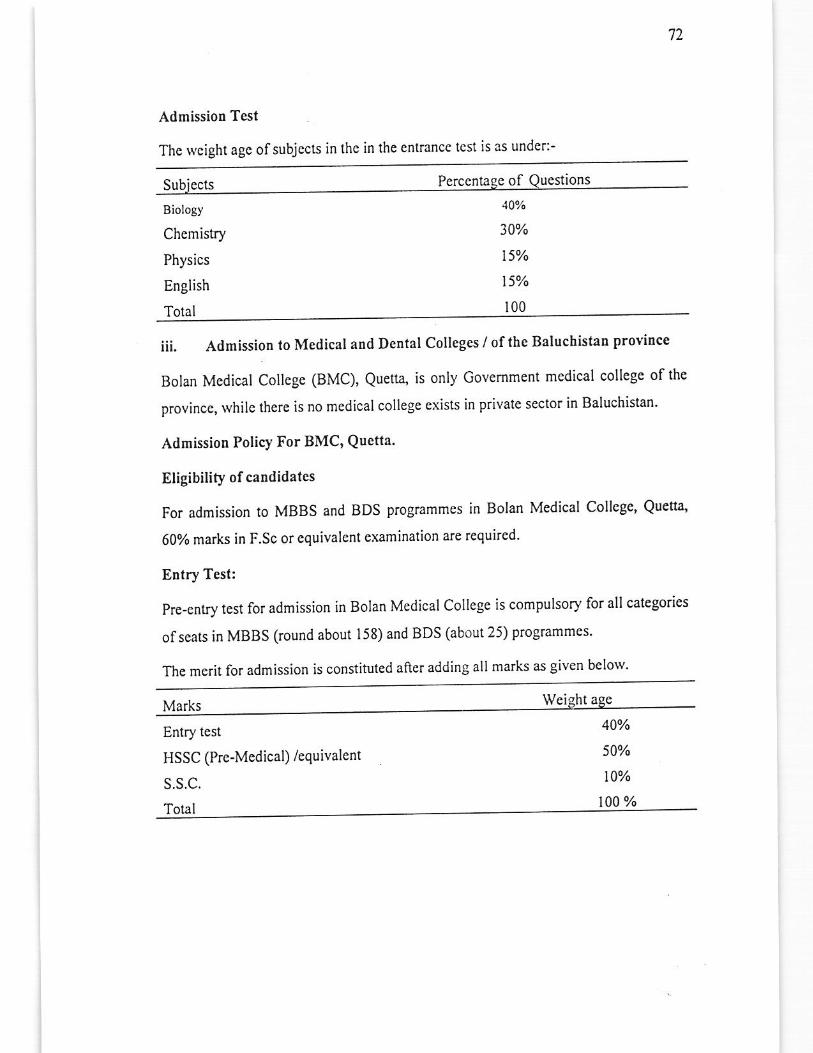
72
Admission Test
The wcight agc ofsubjccts in thc in the entrance tcst is as under:-
Eiology
Chemistry
Physics
English
Total
10%
30%
15%
tSvo
r00
iii. Admission to Medical and DeDlal Colleges/ oftbe Baluchistau province
Bolan Medical College (BMC), Quena, is only Govemment medical collegc of the
province, rvhilc there is no mcdical college cxists in private secior in Baluchistan'
Admission Policy For BMC' Quetta'
Eligibility of cardidales
For admission to MBBS and BDS programmes in Bolan Medical Collcge, Quena'
60% marks in F.Sc or equivalent examinalion are required'
Entry Test:
Pre-entry test for admission in Bolan Medical College is compulsory for all categories
ofseals in MBBS (round about 158) and BDS (about 25) programmcs'
The merit for admission is constituted after adding allmarks as given below'
'.--'.- Wcieht aqe
Entry test
HSSC (Pre-Medical) /equivalent
S.S.C.
Total
40%
50%
t0%
t00 %
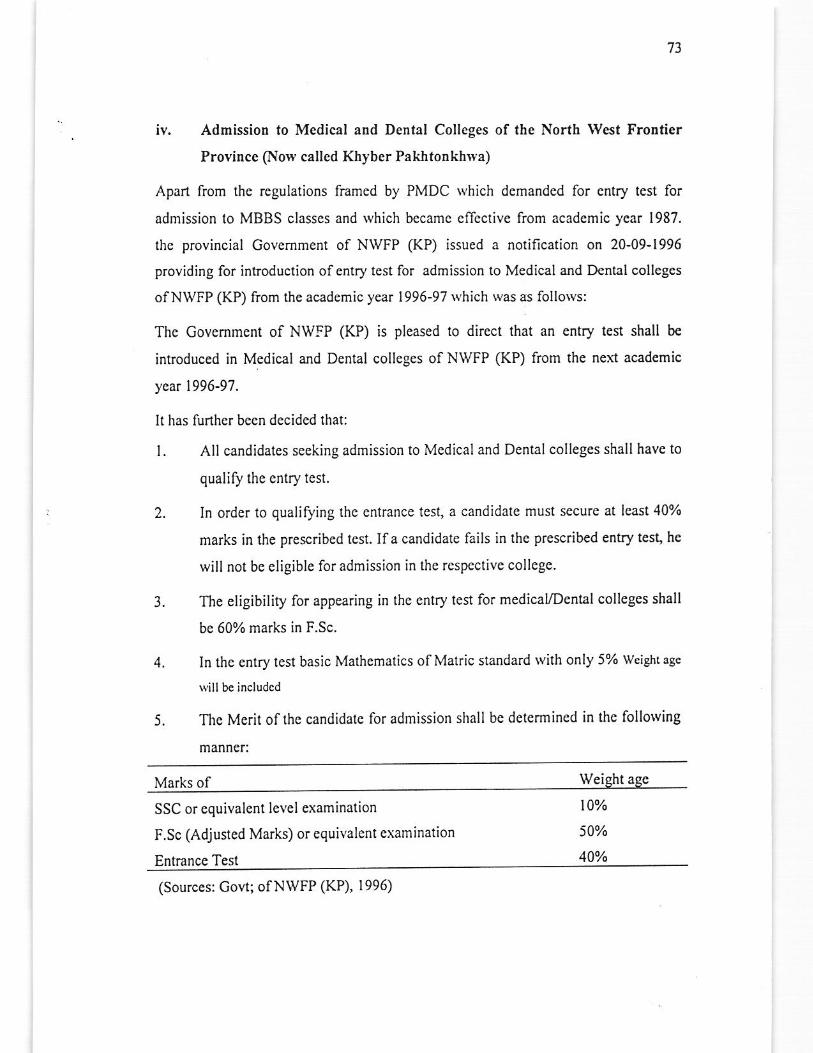
73
iv. Admission to Medical and Dental Colleges of lhe North West Frontier
Provi[ce (Now called Khyber Pak]tonkhrva)
Apart from the rcgulations framed by PMDC which demanded for entry test for
admission to MBBS classes and rvhich becamc cffcctive from acadcmic ycar 1987.
th€ provincial Govemment of NWFP (KP) issued a notification on 20-09-1996
providing for inlroduction of entry test for admission 10 Medical and Dental collegcs
ofNWFP (KP) lrom the academic year 1996-971vhich was as follows:
The Govemment of NWFP (KP) is pleased to direct that an entry test shall be
introduced in Medical and Dental colleges of NWFP (KP) from the nexl academic
yeat 1996-91 .
It has funhe. been decided that:
l. All candjdates seeking admission to Mcdical and Dental colleges shall have to
qualify the entry test.
2. In order to qualifling thc entrance test, a candidate must secure at lcast 40olo
marks in tle prescribed test. Ifa candidate fails in the prescribed entry test, he
will not be eligible for admission in lhc rcspectivc college.
3. The eligibility for appearing in the entry test for medicalDental colleges shall
be 60% mark in F.Sc.
4. In the entry test basic Mathemalics ofMalric standard lvith only 5% weiShlagc
uill bc included
5. Thc Merit ofthc candidatc for admission shall bc dctermincd in the following
manner:
Marks of Wei
examination
or equivalent examination
SSC or equivalent level
F.Sc (Adjusted Marks)
Entrancc Test
\0%
50%
40%
(Sources: Covt; ofNwFP (KP), 1996)
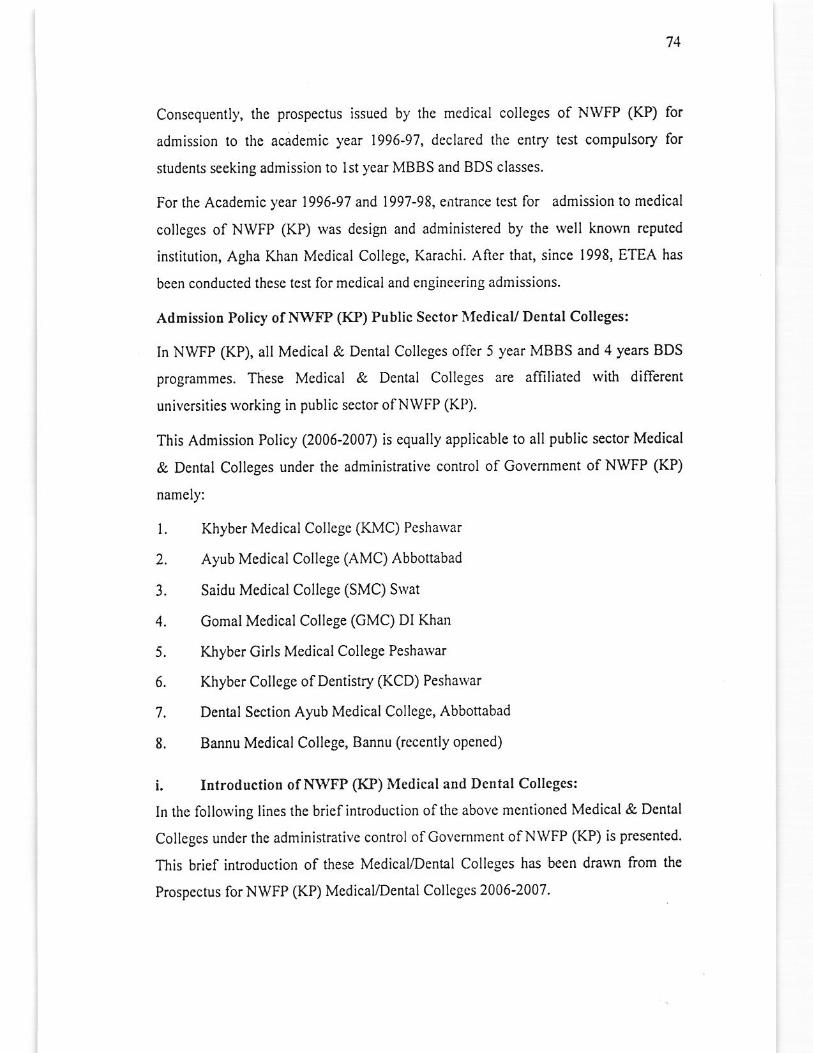
14
Consequently, the prospectus issued by thc medical colleges of NWFP (KP) for
admission to the academic yeat 1996-97, declared the entry test compllsory for
studenls sceking adrnission io lst year MBBS and BDS classes.
For the Academic year 1996-97 and 1997-98, enirance test for admission to medical
colleges of NWFP (KP) rvas design and administcred by the rvell knorvn reputed
institution, Agha Khan Medical Collcgc, Karachi. After that, since 1998, ETEA has
been conducted thesc test for medicaland cngincering admissions.
Admission Policy of NWFP (KP) Public Sector luedicay Detrtal Colleges:
In NWFP (KP), all Medical & Dental Colleges offer 5 year MBBS and 4 years BDS
programmes. These Mcdical & Dental Colleges are alliliatcd rvith different
universitics working in public sector ofNWFP (KP).
This Admission Policy Q006a00n is equally applicable to all public sector Medical
& Dental Colleges under the administrativc control of Govemment of NWFP (KP)
namely:
l. Khyber Medical College (KMC) Pcshalvar
2. Ayub Medical College (AMC) Abbottabad
3. Saidu Medical College (SMC) Swat
4. Gomal Medical College (GMC) DI Khan
5. Khyber Girls Medical Collegc Pcshawar
6. Khyber College ofDentislry (KCD) Peshs\!ar
7. Dental Section Ayub Medical College, Abbottabad
8. Bannu Medical College, Bannu (Iecently opened)
i. ItrtroductioD oftlWFP (KP) Medical and Dental Colleges:
ln the following lines the brief introduction ofthe above meniioned Medical & Dental
Colleges under the administrative control ofGovemment ofNWFP (KP) is presented.
This brief introduction of these MedicayDental Colleges has been drawn from tle
Prospcctus for NWFP (KP) MedicalDental Collcgcs 2006-2007.
75
l. Khyber Medical Collegc (KlvIC), Peshawar:
Khyber Medical College (KMC) siartcd functioning as faculty of Medicinc, of
Peshawar University, with enrolmcnt of filly students, in 1955 The foundation stone
of KMC was laid by thc then Govcmor Gcneral ofPakislan, Mr. Ghulam Muhammad.
The Mcdical Collegc is situated at the doorstep of University of Pesha,var. Since its
inccption (1955), one can sec tremendous devclopment in the college. In 1975, il
parted way from Universiry of Pesharvar and remained under the administrative
control of health department, Govemmenl of N\VFP (KP). In medical education,
KMC is a pioneer instilution in NWFP (KP). lt is the mother institution for rest ofthe
mcdical and dental colleges and other medical inslitution cstablished over thc pasl
hventy five years in the province. The college, ihrough the dedicatcd *ork of its staff
and students, has cnmed namc for itselfat national and intemational lcvel. Over 8000
doctors have graduated from Kiyber Medical College. The gmduates of Khyber
Medical College are not only holding key positions at home but abroad as well. Tle
college, beside undergraduate medical educalion, also offers teaching and research
facilitics to the postgraduate studenls, i.e., M. Phil, in all basic Medical Sciences,
FCPS in Clinical as well as basic medical sciences, and minor diplomas in many
specialties. The college is afnliated with Peshawar Unive.sity and is recognized by
PMDC, General Medical Council of UK, Ireland and liccnsing authoriry of USA
(Prospectus, 2006-07, p.l). For teaching/ lraining purPoses, the college has a lull
fledged hospital (Khyber Teaching Hospital), established in 1976. It is a 1200-bedded
hospital, which maintains high standards with competent medical staff and
sophislicated equipments (Prospectus, 2006-07, p.2).
2, Ayub Mcdical College (AMq, Abbottabad:
Ayub Medical Collcge (AMC) was establishmcnt by the Govcmment ofNWFP (KP)
at Abbottabad, 120 Kfi from Ralvalpjndi/lslamabad, in 1978, rvhich is named after
lnte Fiold Marshal (and President of Pakistan) A1r:b Kian The first academic year
staded with enrolment of 100 students on t5th May, 1979. More than 3, 000 students
have graduated from Ayub Medical College so far, holding key positions at national
and intemational level. It is claimcd that about 70% ofPakistani doctors in Ircland are
A)rubians! The collcge is afllliarcd to Univcrsity olPesharvar aad Hazara University,
'16
Mansehra. The College is not only.ccognized by the PMDC but also many reputcd
Mcdical Councils ofthe rvorld such as Geneml Medical Council ofUK, WHO.
The Collcge of Physicians & Surgeons of Pakistan has recognized many of isDepartments for postgraduate lraining. Thc Royal College of Obstericians &
Cynecologists of UK has granted recognition to thc Depanmeni of Obstetrics and
Gynecology for the clinical training ofthc MRCOC candidates (Prospectus, 200G07,
p.3).
Sincc January 1988, thc College has been publishing a peer revierved joumal rvith a
namc of 'Joumal of Ay,ub Medical College (JAMC), recognized by the PMDC and
rcgistercd witl lntemational Serial Data System ofFrance, Indexed Medicos ofWHO
(EMRO). JAMC is the only medicaljoumal from Pakistan, available full text with
illustrations free online, and is one of the 3 indexed medical joumals from Pakistan
(P.ospcctus, 2006-07, p.4).
3. Saidu Mcdical College (SMC) Swatl
Swat, the SwiDerland olEast, rvas thc former state of Sub-Continent and Saidu Sharif
was the capital ofthat stale. The present Swat o$'es its grandeur and developmenG lo
the inputs by BADSHAH SAHIB AND WALI OF SWAT. In 1998, the cstablishment
oI Saidu Medical College rvas announced by Provincial Assembly but it staned
functioning, rvith enrolment of50 studenls, on 28lh ofDccember I998. At that Saidu
Mcdical College was affiliated with Peshawar University, but presently it is afl'iliated
with Malakand University. Saidu Medical Collegc, S\vat is functioning under the
administrative control of health departmeni, Govemment of NWFP (KP). It has its
orvn 500 bcds tcaching hospital, with a namc of Saidu Group ofTeaching Hospitals
(p.6).
4. Gomal Medical College (GMC) D.I. Khan:
Comal Medical Collcge (GMC), Dera Ismail Khan rvas established in1998 aftcr fie
announcement by lhc Chief Minister of NWFP (KP) in a session of Provincial
Assembly on 26th August I998. Temporarily, thc Collcge started its functioning in a
portion ofCcntral Library ofGomal Univcrsily. Thc first session Tvas started on I lth
January 1999, rvith enrollment of 50 studenls. Future building for the college rvill be
constructcd ncar Mufli Mahmood Memorial Hospital for which Go\4. ofNWFP (K?)
77
has provided 300-canal land. Gofi. of N\\|FP (KP) has declared DHQ
Hospital/zanana Hospital DI Khan as teaching hospitals of 6MC and sulficiena
number of faculty has bcen appointed for lhis purpose. Apart from thal, Mufti
Mahmood Memorial Hospilal has also been declared as the teaching hospital of the
college. PM & DC has granted recognition to the Gomal Medical College in 2004.
D.l.Khan, seven centuries old city is situated at the south of North west Frontier
Province about 300 Km from Pcshawar (the capilal ofrhe province). It is situated on
the main lndus High Way, lead to Karachi. This historical city is rich in socio cultural
heritage, the archaeological antiques and the remnants of the giorious past, like
Rehman Dani, l4 Km north ofthe city, is 3500 BC old and has been the resort ofthe
archaeologists all ovcr the world. The well known Indus River flows in the east ofthe
city.
Gomal Medical CollgSe has been playing a major role in the improvement of hcaltr
services not only for D.l.Khan division but also for closely related areas like Baanu
Division, South Waziristan, Sorthem Punjab and the province of Balochistan. A
student's magazine "Haryan" and research joumal "Gomal Joumal of Medical
Scienccs" has been regularly published by the college since April 2003 ( P.osp€ctus,
2006-07,p.7).
5. K[yber Girls Medical College Peshawar:
NWFP (KP) was in dire need of a separate medical college for girls. Fatima Jinnah
Medical College Lahor€, Punjab and People's Medical College Nalvabshah, Sindh are
exanrples of such facilities, already cxistcd in those provinces. In August 2003 the
Provincial Cabinet approved the establishment of a separate Girls Campus ofKhyber
McdicalCollcgc therc in at Hayatabad, to b€ upgraded
as an independent Girls Medical College. From academic session 2004-05, the Girls
Campus of K.M.C started functioning, \vilh Batch of 50 students, in PDA Blocklv,
Phase-V Hayatabad, Pesharvar. On l3th May 2006, dr-tring the inaugu.ation ceremony
of Girls Campus, KMC, NWFP (KP) Chief Minislcr announced the up gradation of
Girls Campus KMC inlo an independent "Khyber Cirls Medical Collegc". Two wcll
known hospitals of Peshawar i.e. Hayatabad Mcdical Complex and co\4. lndy
Reading (LRH) Hospitals were declarcd its teaching hospitals (Prospectus, 2006-07,
p.8).
78
6. Khyber College OfDentistry (KCD), Pesharvar
Khybcr Collcgc of Dentistry (KCD) is siluatcd \vithin the Univcrsity of Peshalvar
Campus, adjacent to Kiyber Medical College (KMC), Khyber Teaching Hospital
(KTH). It is located on Jamrud road, which leads to World famous "Khyber Pass". On
I2th Octobcr 1964, fte Dcpanmcnt ofDcntistry was established at Klryber Medical
Collegc by the then Ministcr for Health, Begum Mahmuda Salim. Its first batch
graduated in 1968, whcn Pakistan Mcdical and Dental Council accorded pcrmanent
rccognition to BDS degree in November, 1968. The Departmcnt of Dcntistry was
upgraded to tle status of the College by fte then Chief Minister, Mr. Afiab Ahmad
Khan Sherpao On I 16 January 1990. In 1964, the inlake of the college rvas just 14
students, rvhich has gone up gradually and presently KCD admit 50 students per ycar
for its 4 year BDS programme. More lhan 600 dental graduates have qualified from
this institule so far. KCD provides various naturcs ofdental treatment to 300 patients
daily (Prospectus, 2006-07, p.5).
7. Dental Section ofAyub Medical Collcge, Abbottabad:
ln 1998, a Dental Section was established in Ayub Medical College (AMc),
Abbottabad, in order to provide denial cducation and vadous natures of denlal
treatrnent/facilities to the people ofthe area. It started its functioning, with 24 students
in November 1998. The college is amliated with Univcrsity ofPeshawar and Hazara
Univcrsify Mansehra for Degree of Bachelor of Dental Surgery (BDS) programme.
For FCPS training, tie Departrnent of Oral & Maxillofacial Surgery of the dental
scction ofAMC is recognized by the CPSP.
ii. Admission Policy ofthe Nri/FP (KP) Medical aDd Dcntal Colleges:
Admissions to the Medical,Dental Colleges for all Provincial seats are finalized by the
Joint Admission Committce (JAC), consisting ofthe lollorving:
Principal/Dean, Khyber Medical College, Pesharvar Chairman
Principal/Dean, A),ub Medical College, Abbottabad Co-Chairman
Principal, Khyber College ofDentistry, Peshawar Co{hairman (For BDS)
Principal, Gomal/Medical College, D.l. Khan Member
Principal, Saidu MedicalCollcgc Swat Member
l.
2.
3.
4.
5.
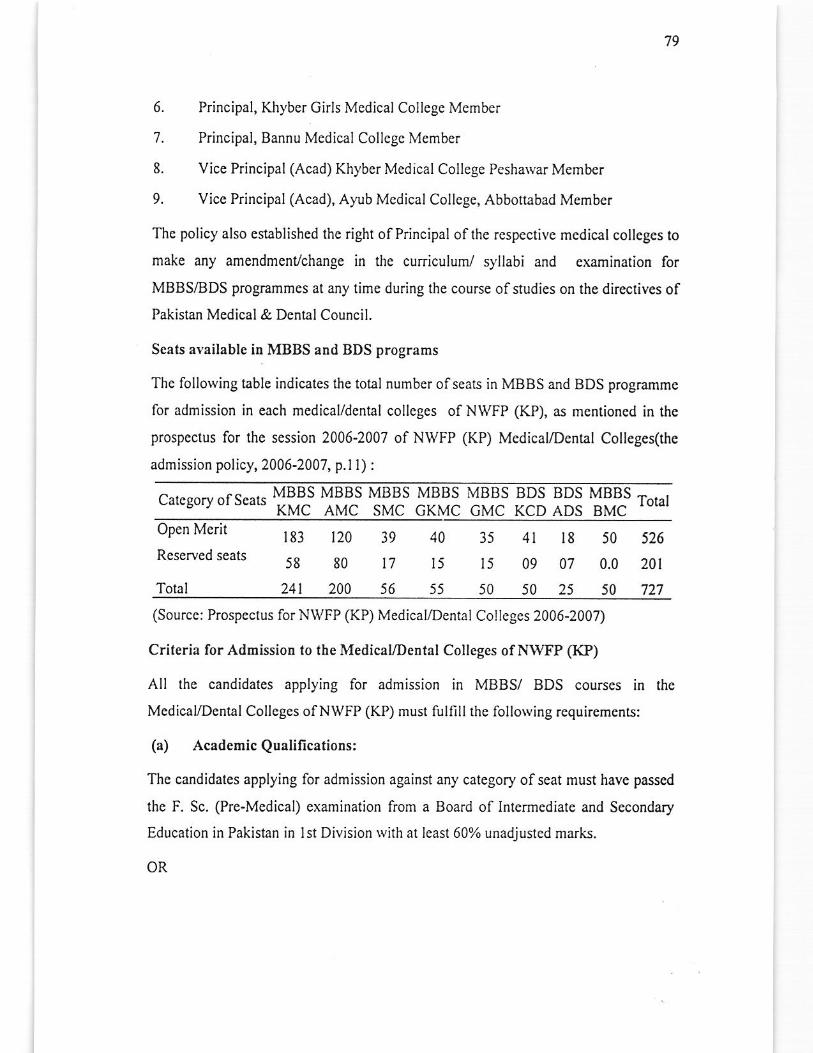
79
6. Principal, Khyber Girls Medical College Member
7. Principal, Bannu Medical Collcgc Member
8. Vice Principal (Acad) Khyber Medical College Peshawar Member
9. Vice Principal (Acad), A),l]b Mcdical College, Abbottabad Membcr
Thc policy also established the right ofPrincipal ofthe rcspcctive medical colleges to
make aly amendmcnt/change in the cuniculurn/ syllabi and examination for
MBBS/BDS programmes at any lime during the course ofstudics on the dircctives ofPakislan Medical & Dental Council.
Seats available iD MBBS and BDS programs
The follorving table indicates the tolal number ofseats in MBBS and BDS programme
for admission in each medical/dcntal collcges of NWFP (KP), as mcntioned in the
prospectus for the session 2006-2007 of NWFP (KP) Medical/Dental Colleges(the
admission policy, 2006-2007, p.1 l) :
c.r.s",)"rs*t' YB,,4Bj YBMBi Xf,Bi:lT: XBMBj fl8;:3: TilBcs
r",.rOpen Mcrit
Reserved seats
Total
r83 t20 39
58 80 t7
24t 200 56
40
I5
55
35 4l l8 50 526
15 09 07 0.0 201
50 50 25 50 72'7
(Sourcc: Prospectus for NWFP (KP) MedicalDenlal Colleges 2006-2004
Criteria for Admission to the Medical/Dcntal Collegss of NWIP (KP)
All the candidates applying for admission in MBBS/ BDS courses in th€
MedicayDental Colleges ofNWFP (KP) must fulfill the following requirements:
(a) AcademicQualificatiors:
The candidates applying for admission against any category ofseat must have passed
the F. Sc. (Pre-Medical) exaaination from a Board of Intermediate and Secondary
Education in Pakistan in Ist Division with at least 60% unadjusted marks.
OR
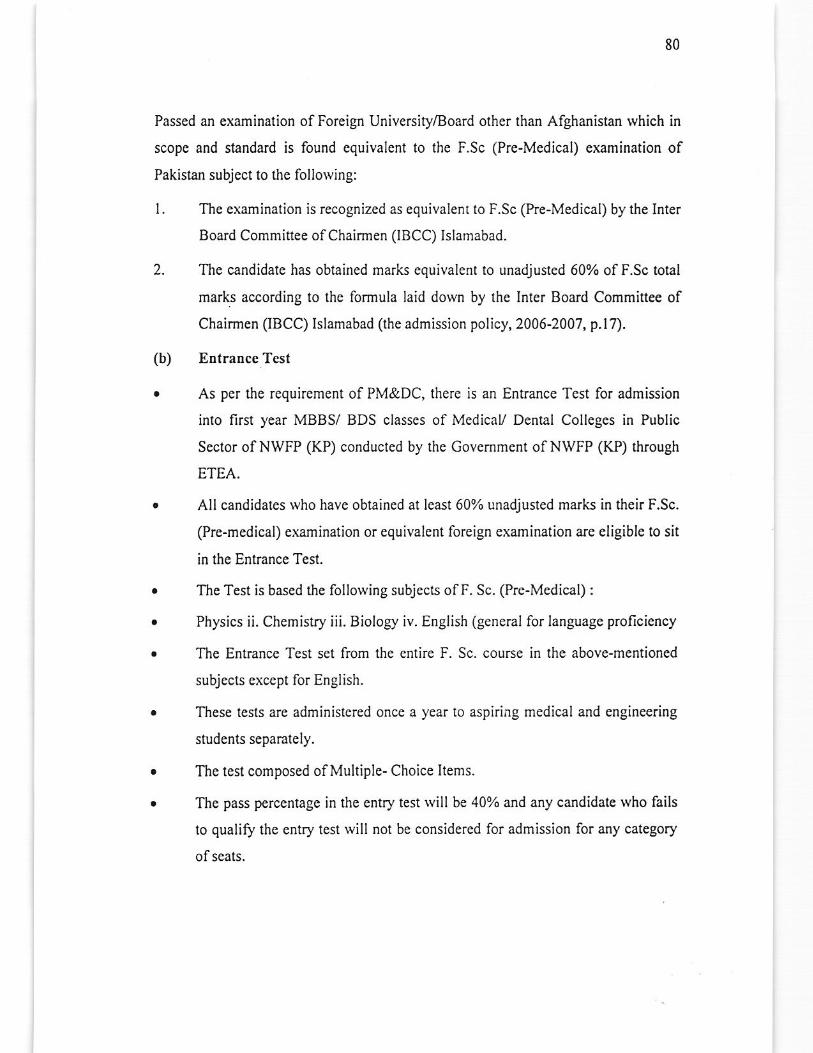
80
Passed an examination ofForeign UniversityBoard other than Afghanistan rvhich rn
scopc and standard is found cquivalent to the F.Sc (Pre-Medical) examination of
Pakislan subject to the following:
l. The examination is recognizcd as equivalenr to F.Sc (Pre-Medical) by the Inter
Board Committee ofChairmen (IBCC) Islamabad.
2. The candidate has obtained marks equivalent to onadjusted 60% of F-Sc total
marks ac{ording to the formula laid dorm by the Inter Board Committee of
Chairmen (IBCC) Islamabad (the admission policy, 2006-2007, p.ln.
(b) EntraDce Test
As pcr the requirement of PM&DC, there is an Entrance Test for admission
into first year MBBS/ BDS classcs of Medicay Dental Colleges in Public
Sector ofNWFP (KP) conducted by the Govemment ofNWFP (KP) through
ETEA.
All candidates who have obtained at least 60% unadjusted marks in their F.Sc.
(Pre-medical) examination or equivalent foreign examination are eligible to sit
in the Entrance Test.
The Test is based the following subjeclr ofF. Sc. (Prc-Medical) :
Physics ii. Chemistry iii. Biology iv. English (Eeneral for language proficiency
The Entrance Test set from the entire F. Sc. course in the above-mentioned
subjccts except for English.
These tests are administered onct a year to aspiri;rg medical and engineering
students separately.
The test composed ofMultiple- Choice Items.
The pass percentage in fie entry test will be 40% and any candidate who fails
to qualify the entry test \vill not be considercd for admission for any category
ofseats.
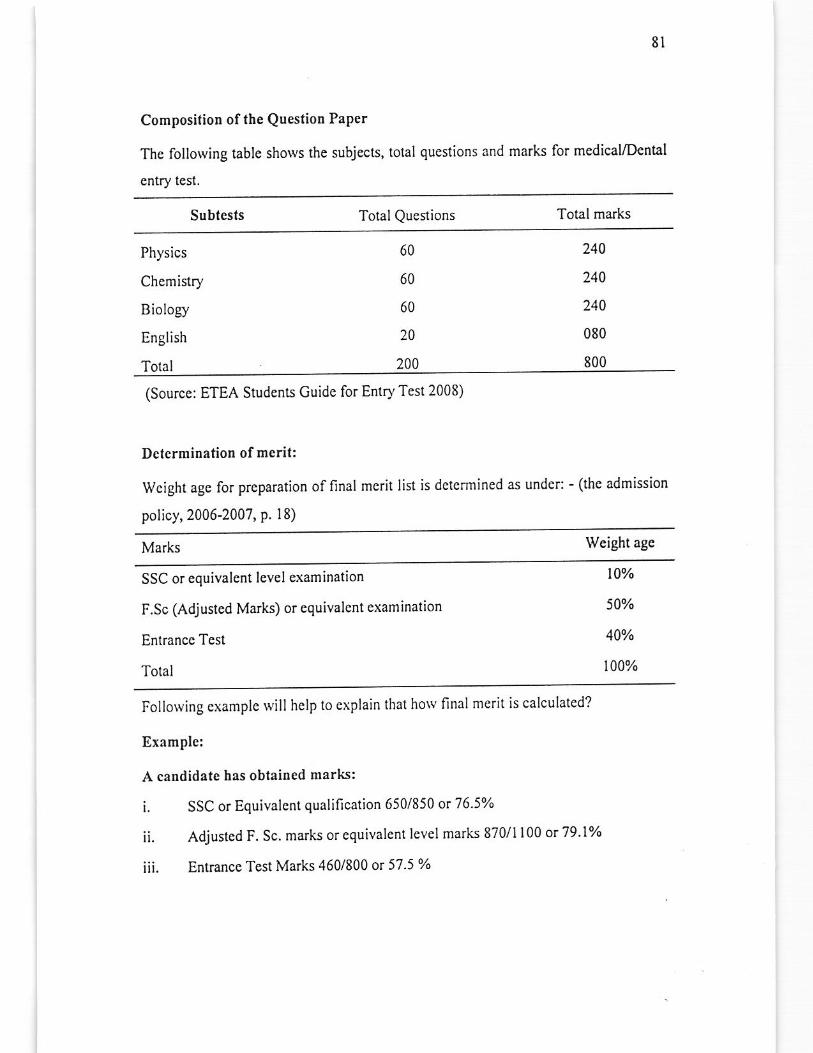
8I
CompositioD of the Questiotr PaPer
Thc following table shows the subjects, total questions and mark for medical/Dental
entry test.
Subtests TotalQueslions Totalmarks
Physics
Chcmistry
Biology
English
Total
(Source: ETEA Studenls Guide for Entry Test 2008)
Detcrmination of merit:
Wcight age for preparation of final merit list is determined as under: - (the admission
policy, 2006-2007, p. l8)
Marks Wcight age
SSC or equivalent level examination loy"
F.Sc (Adjusted Marks) or equivalent examination 50%
Entrancc Test 40%
Total 100%
Follorving example rvill hclp to cxplain that how final merit is calculated?
f,xample:
A candidate has obtained mark:
i. SSC or Equivalent qualification 650/850 or'76,5o/o
ii. Adjusted F. Sc. mark or equivalent tevel marks 870/I 100 or 79 1%
iii. Ent.ance Test Marks 4 601800 ot 57.5 yo
60
60
60
20
200
240
240
240
080
800
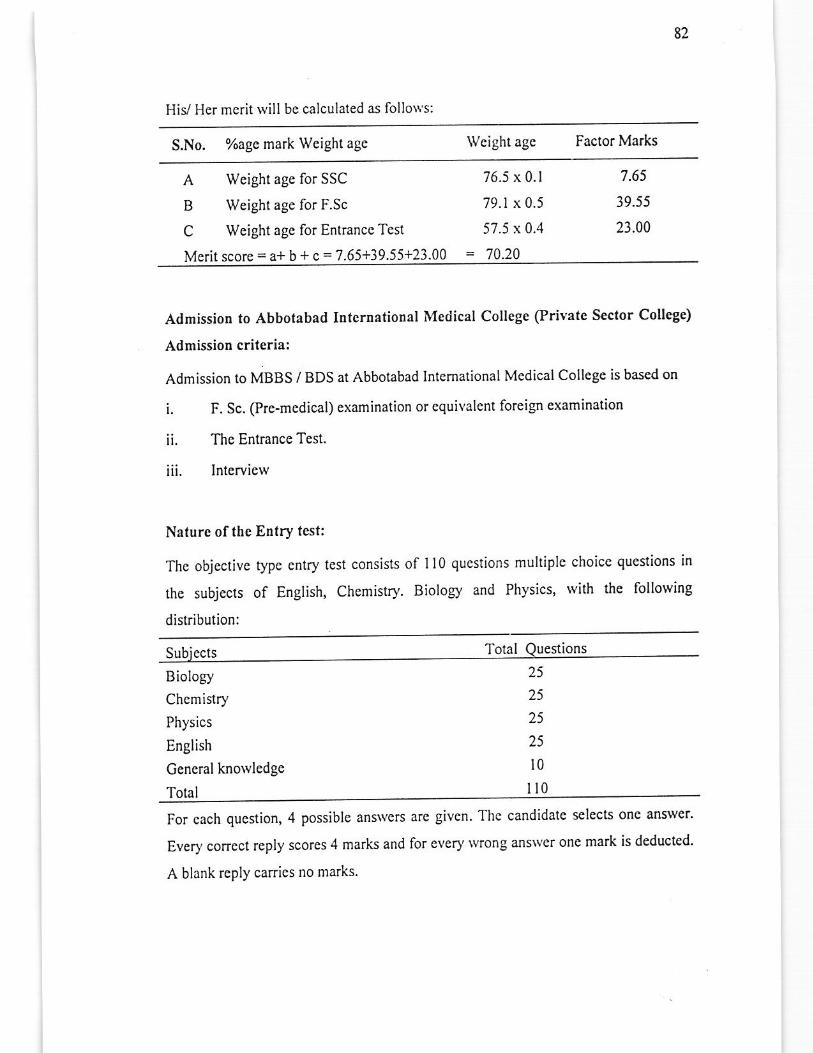
82
HiV Her mcrit rvill be calculated as follorvs:
S.No, %agc mark Weight a8c vcight agc Faclor Marks
A Weight age for SSC
Weight age for F.Sc
Weight age for Entrance Test
D
c
76.5 x 0.1
79.1 x 0.5
57.5 \ 0.4
70.20
7.65
39.55
23.00
Morit scorc = a+ b + c ='7.65+39.55+23.00 =
AdmissioD to Abbotabad Iuternational Medical College (PriYate Sector Collcge)
AdmissioD criteriai
Admission to MBBS / BDS at Abbotabad lntemational Mcdical College is based on
i. F. Sc. (Pre-medical) examination or cquiYalent foreign examination
ii, Tho Entrance Test.
iii. Interview
Naturc of the Eutry test:
The objcctive typc entry test consists of I l0 quesiions multiple choice qucstions in
the subjecls of English, Chemistry. Biology and Physics, with the following
distribution:
Subiects lbtal
Biology
Chemistry
Physics
English
Gencral knorvledge
Total
25
25
25
25
l0r l0
For cach qucstion,4 possible ansrvcrs arc given. Thc candidatc selects one answer'
Every correct reply scores 4 marlis and for every \vrong answer one mark is dcducted'
A blank reply canies no marks.
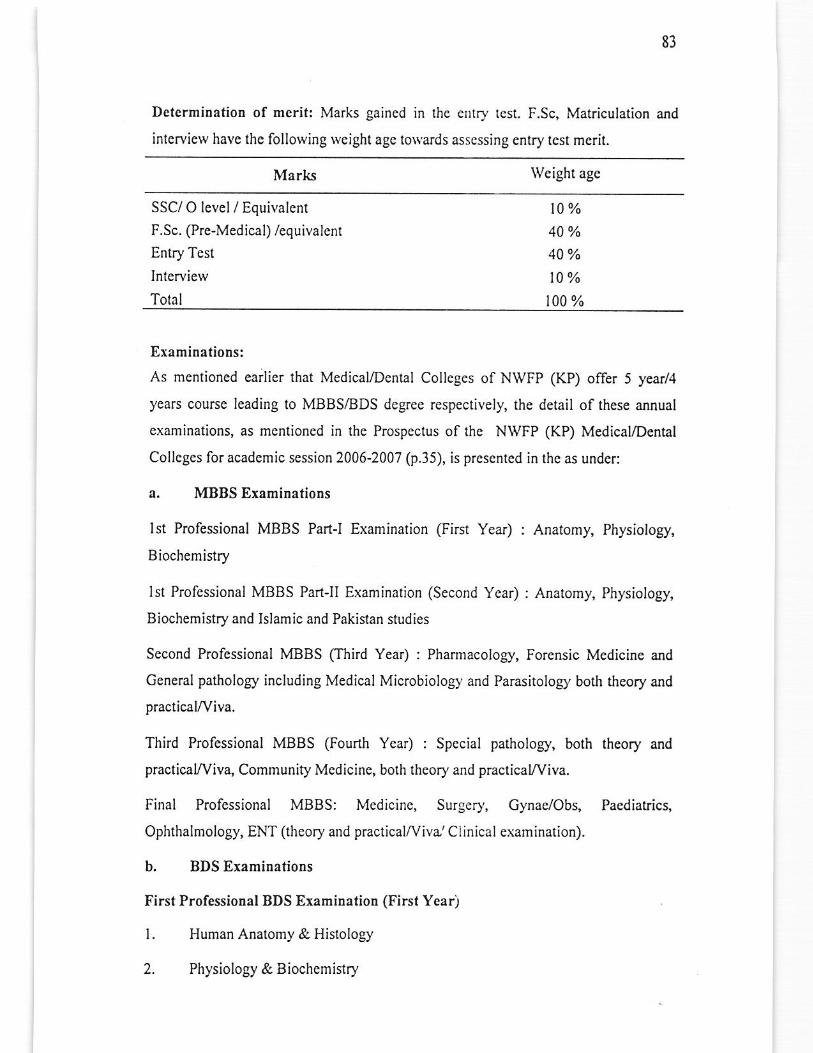
83
Detcrminatiotr of merit: Marks gained in the enlry rcst. F.Sc, Matriculation and
intcrvicw have thc folloNing \veight agc towards asscssing entry tcst mcrit.
Marks Weight agc
SSC/ O level/ Equivalent l0%F.Sc. (Pre-Medical) /equivalent 40 %
Entry Test 40 yo
Interview l0%Total t00%
Eraminationsi
As mcntioned earlier that MedicayDental Colleges of NWFP (KP) offer 5 year/4
ycars course leading 10 MBBSDDS dcgree respectively, the detail of these annual
examinations, as mentioned in the Prospectus of thc NWFP (KP) Medical/Dental
Colleges for acadcmic session 2006-2007 (p.35), is prcscnted in the as under:
a. MBBS ExamiDations
lst Professional MBBS PartJ Examination (First Year) : Anatomy, Physiology,
Biochemistry
lst Professional MBBS PartJI Examination (Second Year) : Anatomy, Physiology,
Biochemistry and Islamic and Pakistan studies
Second Professional MBBS Ghhd Year) : Pharmacology, Forensic Medicine and
General pathology including Medical Microbiology and Parasitology boti theory aad
practicaYViva.
Third Professional MBBS (Fourth Year) : Special pathology, bolh theory and
practica[/Viv4 Communify Medicine, both theory and practicayviva.
Final Professional MBBS: Medicine, Surgery, Gynae/Obs, Pacdiatrics,
Ophthalmology, ENT (theory and practical/Viva,'Clinical examination).
b. BDS Examiuations
First Profelsional BDS EramiDation (First Year)
l. Human Anatomy & Histology
2. Physiology & Biochemistry
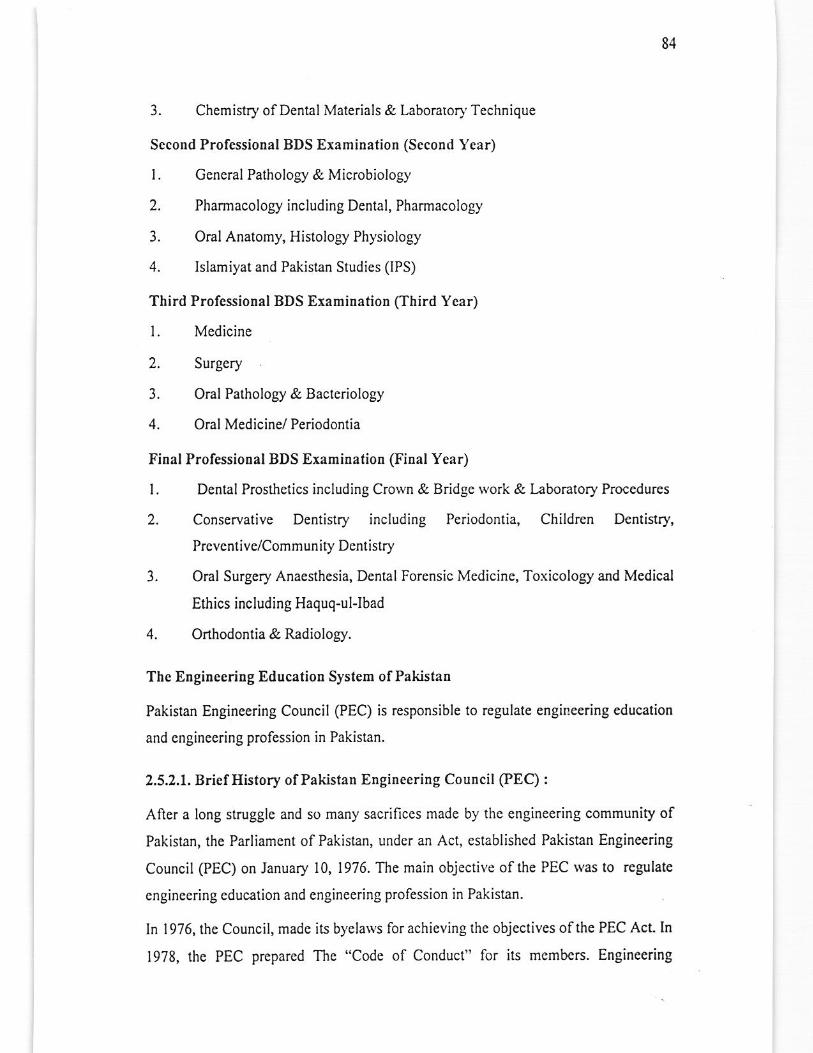
84
3. Chemistry ofDental Materials & l-aborator]' Technique
Second Professiolal BDS Examinalion (Second Year)
l.
2.
3.
4.
t.
General Patholory & Microbiology
Pharmacology including Dental, Pharmacology
Oral Anatomy, Histology Physiology
Islamiyat and Pakislan Studics (lPS)
Third ProfessioDal BDS Examination (Ihird Year)
2.
3.
4.
Medicine
Surgery
Oral Patholo$i & Bacteriology
Oral Medicine/ Periodontia
Final Professional BDS Examination (Final Year)
Dental Prostietics including Crown & Bridge work & l-aboratory Procedures
Conservative Dentistry including Periodontia, Children Dentinry,
Prcvcntive/Community Dentistry
Oral Surgery Anaesthesia, Dental Forensic Medicine, Toxicology and Medical
Ethics including Haquq-ul-lbad
Orthodontia & Radiolos/.
t.
2.
3.
4.
Tbe EtrgiDeedDg Educalion System ofPakistaD
Pakistan Engineering Council (PEC) is responsible to regulate engineering education
and cngineering profession in Pakistan.
2.5.2.1. Brief History ofPakistaD Engineering Council(PEC) :
After a long struggle and so many sacrifices madc by thc engineering community of
Pakistan, the Parliament of Pakistan, under an Act, established Pakistan Engineering
Council (PEC) on January 10, 1976. The main objective ofthe PEC $"s to regulate
cngineering education and engineering prolession in Pakistan.
ln 1976, the Council, made its byclarvs lor achieving the objcctives ofthe PEC Act- In
1978, the PEC prepared The "Code of Conduct" for its members. Engineering

85
Education Re8ulations were fi'amed by PEC in l985.The Council also prepared tle
Consulting Byc-Larvs in I986 and Engineering \\'orks Bye-l3lvs in 1987
rcspectivelY.
Tho foundation stone ofPEC Hcadquarter building in Islamabad was laid by thc then
President of Pakistan Gen Muhammad Zia-ul-Haq on 28 July 1987, but and the HQ
sta(ed its operations form this building on 14 Oct 1992 after its inauguration by Mr-
Nawaz Sharii the lien Prime Minister ofPakistan.
To providc scrvices, at thc door step to thc public, PEC op€n€d the following branch
omccs in provincial capilals.
l. Karachi Branch Ofllce is oPerating sincc 23 June 1987,
2. Lahore Branch Oflice since 30 Jan 1988,
3. Quetla Branch Officc since I7 Feb 1988 and
4. Pesharvar Branch Office since 27 Mar 1988.
Since from its inception, th€ PEC has been serving the engineering profession
untiringly. For the serviccs of the engineering community, PEC has followed and
succeeded in establishing a forum rvithin the country. PEC has always panicipated
actively in Consultative and Advisory Committees,Boa.ds established by thc
Govemment. Il has played a coopemtive role and provided necessaly inputs in the
decision making process at diflerent forums.
PEC has also pcrformed is role as bridge betwecn engineering
univcrsitieyinstitutions, the Govemment and industry. PEC has been p€rforming its
functions in totally professional manner, a feature that needs to bejealously protected
and safeguarded in the national interest. The intemational recognition of our
engineering dcgrees and the strict monitoring ofunde. and sub-qualified engineers are
the main achievements ofPEC.
The formulation ofservice stnicturc for Pakistani Engineers has beerl a main problem
The Council has been emphasizing adoption of ihe .ccommendations of the Civil
Scrviccs Commission hcaded by Justice (Rctd) S. Anwarul Haq made in 1979'
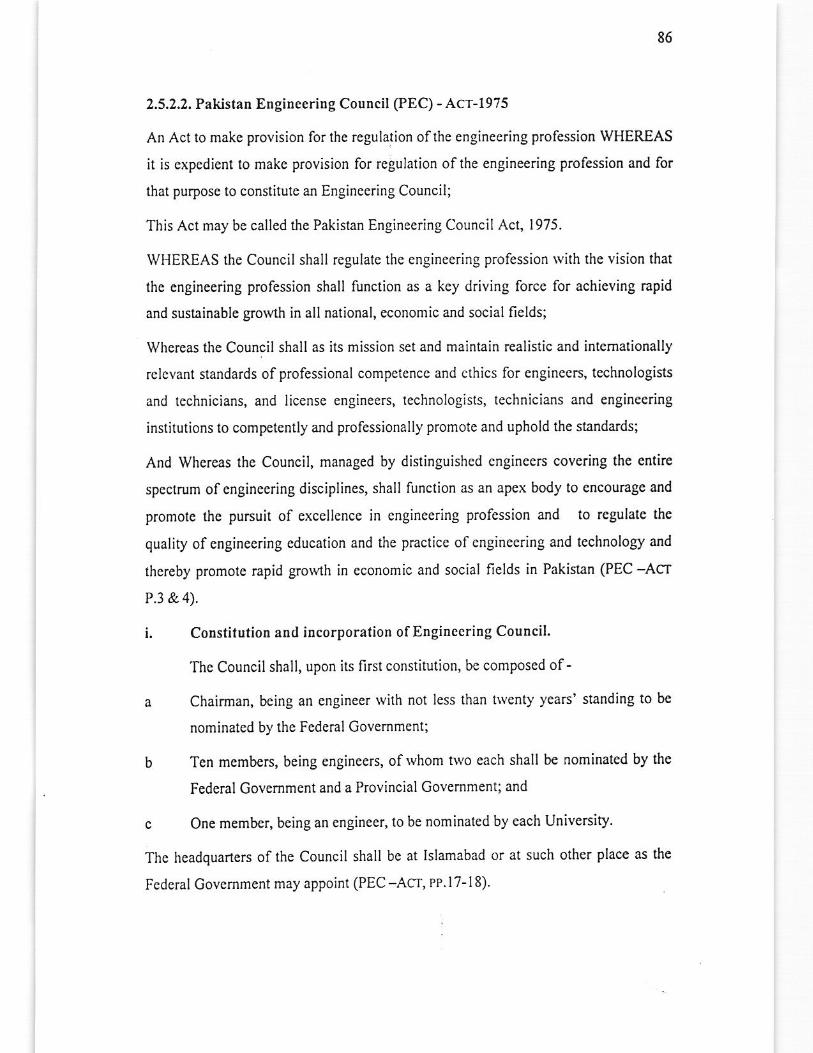
86
2.5,2.2. Pakistan EngineeriDg Council (PEC) - Acr-1975
An Act to make provision for the regulation ofthe enginecring profession WHEREAS
it is cxpcdient to make provision for regulation oflhe engineering profession and for
that purpose to constitule an Engineering Council;
This Act may be called the Pakistan Enginecring Council Act, 1975.
WHEREAS tle Council shall regulatc the engineering profession with lhe vision that
thc engineering profession shall function as a key driving force lor achieving rapid
and sustainable $o*.th in all national, economic and social fields;
Whereas the Council shall as its mission set and maintain realistic and intemationally
relevant standards of professional compctcncc and cthics lor engineers, technologists
and technicians, and license engineers, lechnologists, technicians and engineering
institutions to competently and professionally promote and uphold the standards;
And whcrens the Council, managed by distinguished engineers covering the entire
spcctrum ofengineering disciplines, shall function as an apex My to encourage and
promote the pursuit of exccllencc in engineering profcssion and to regulate the
qualiry of engineering education and the practice of cngineering ald technology and
thereby promotc rapid growth in economic and social fields in Pakinan (PEC -AcrP.3 & 4).
i. CoDstiiutioaandiDcorporationofEnginccringCoulcil.
The Council shall, upon ils first constitution, be composed of-
a Chairman, being an cngineer with not less than tlvcnty years' standing to be
nominatcd by the Federal Govemment;
b Ten members, being engineers, ofwhom two cach shall be iominalcd by the
Federal Govcmment and a Provincial Govemment; and
c One member, being an engineer, 1o be nominated by each Universiry.
Thc headquarters of the Council shall be at Islamabad or at such other Place as the
Fcderal Govemment may appoint (PEC -Act, PP.l7- l8).

87
ii. Functions ofthe Council: -
The folloNing shall be the funclions ofthe Council, namelyt
(a) Maintenance of a Register of persons qualified to work as registered
engineers, proGssional engineers, consLrlting engineers, lechnologists,
technicians, constructors and operators;
(b) Accrcditation ofengineering and tcchnology qualificalions for the purpose of
registration of rcgistered cngineers, profcssional cngineers, consulting
cnginecrs. rechnologisls and tcchnicisns:
(c) Removal olnames from the Registcr and restoration to thc Register of names
rvhich have been removed;
(d) taying down ofstandards ofconduct for the members;
(e) Safeguarding the interests ofthe members;
(f) Promotion ofrelorms in the enginecring profcssion;
(S) Management ofthe funds and propenies ofthe Council;
(h) Promotion of engineering education and review of courses of studies in
consultation with the Universities;
(i) f-€vy and colleclion of fecs from applicants lor registration or temporary
licenses aad members;
(j) Exercise of such disciplinary powers over the mcmbers and servants of the
Council as may be prescribed;
(k) Formation ofsuch committces as may be prescribed;
(l) Promotion ofengineering profession in tolality;
(m) Encouragement, facilitation and re8ulation of rvorking of professional
engineering bodies as leamed socicties for creativity and as custodian of
technology under lhe umbrella of the Council;
(n) Ensuring and managing of conlinued professional development through
engineering academies aad professional bodics:
(o) Establishing standards for engineering products and services;
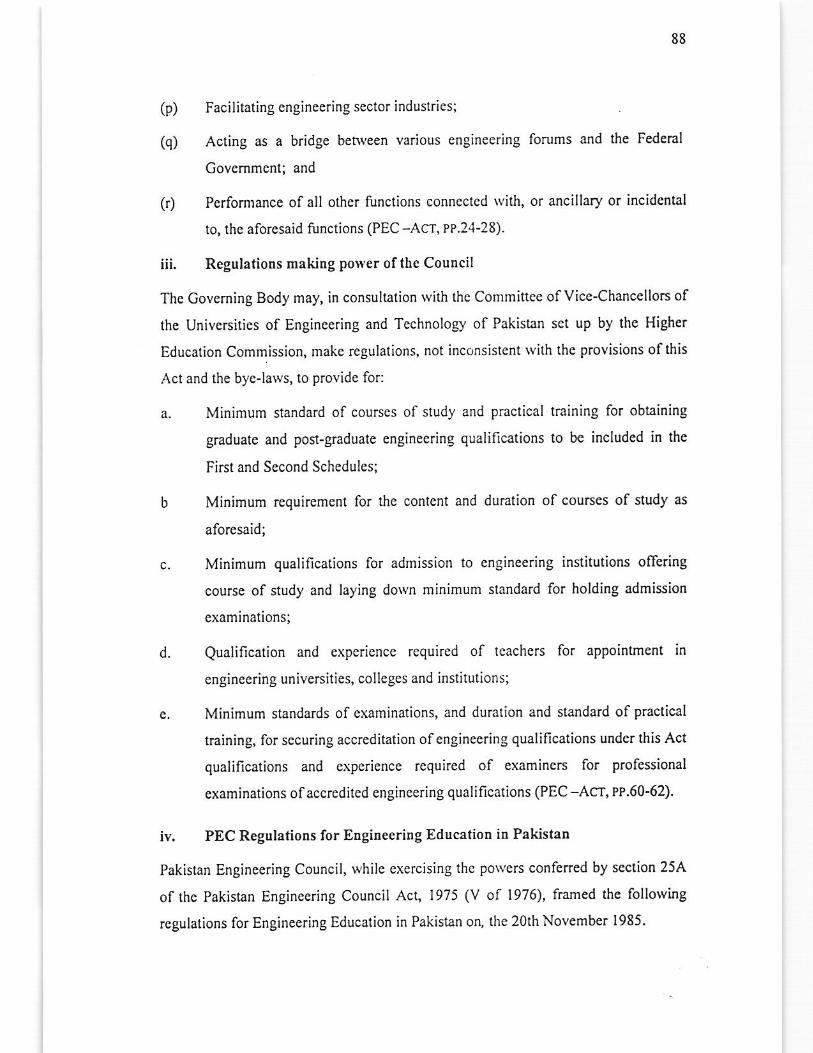
88
(P)
(q)
Facilitaling cngineering sector induslries;
Acting as a bridge between various engineering forums ard the Federal
Govemment; and
(r) Performance of all other functions conncctcd tvilh, or ancillary or incidcntal
to, the aforesaid functions (PEC -Acr, PP.2{-28).
iii. RegulatioDs makiDg po\ver ofthe Coulcil
The Goveming Body may, in consultation \yith the Committcc of vice{hanccllors of
the Universities of Engincering and Technologry of Pakistan set up by thc Higher
Education Commission, make regulations, not inconsistcnt \Yilh the provisions olthis
Act and the byc-laws, to provide for:
a. Minimum standard of cou.scs of study
graduate and post-gmduale enginecring
First and Sccond Schedules;
b Minimum requirement for the content
aforesaid;
and practical training for obtaining
qualifications to be included in $e
and duration of couBes of study as
c. Minimum qualifications for admission to cngineering institutions offering
course of study and laying down minimum standard for holding admission
examinations;
d. Qualification and experience required of icachers for appointment in
engineering universities, collcges and institutions;
e. Minimum standards of examinalions, and duration and standard of practical
training, for securing accreditation ofengincering qualifications under this Act
qualifications and experience rcquired of examincrc for professional
cxaminations of accredited engincering qualifications (PEC-Acr,PP.60-62).
iv. PEC Regulations for Enginecring Education iE PakistaD
Pakistan Engineering Council, while exercising the po\Yers conferred by section 25A
of thc Pakistan EngineerinS Council Act, 1975 (v ol 1976), framed the follorving
regulations for Engineering Education in Pakistan on, the 20th November 1985.
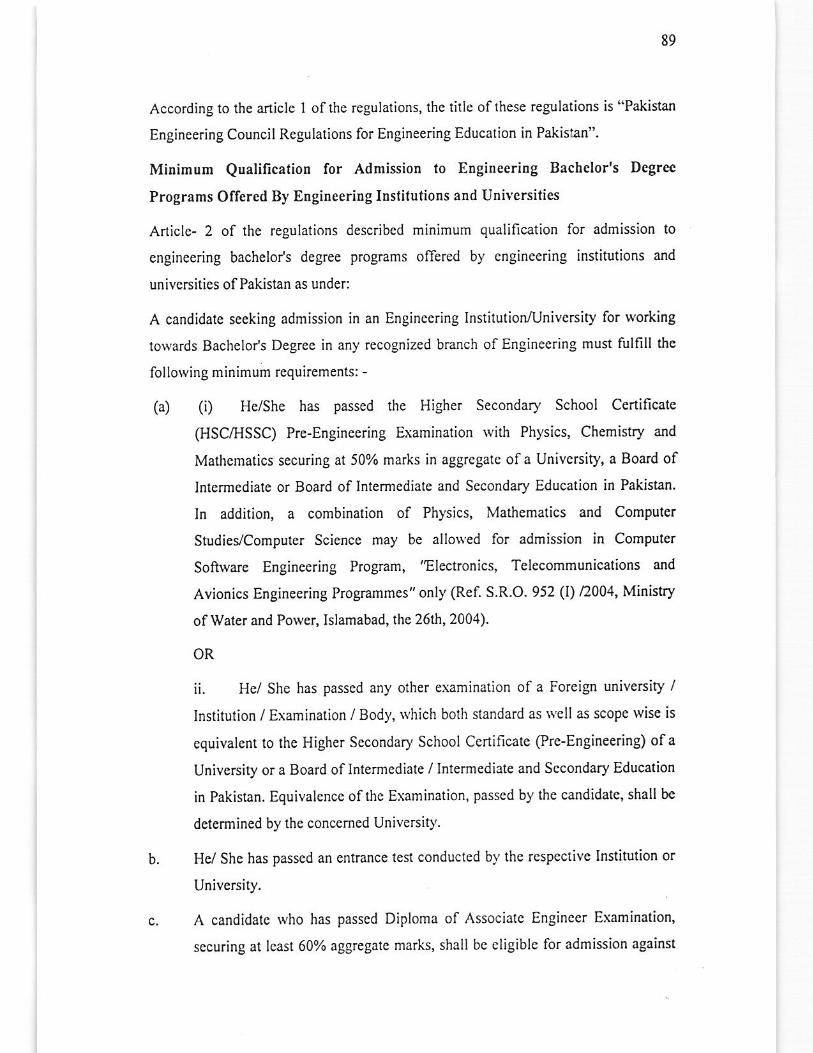
89
According 1o the article I oflhe regulations, the title oflhese regulations is "Pakistan
Engineering Council Regulations for Engineering Education in Pakistan".
Minimum QualificatioD for Admission to Engineeriog Bachelor's Degree
Programs Oflered By Engineeritrg Institutions and Universities
Article- 2 of thc regulations describcd
engineering bachelor's degree programs
univcrsities ofPakislan as under:
minimum qualilicaiion for admission to
offered b), cngineering institutions and
A candidate seeking admission in an Engineering Institutionrunivcrsity for working
towards Bachelo,'s Degree in any recognized branch of Engineering must fulfill tle
lollorving minimum requirements: -
(a) (i) He/She has passed tic Higher Secondary School Certificate
(HSC,HSSC) Pre-Engineering Examination with Physics, Chemistry and
Mathcmatics securing at 50% marks in aggregatc ofa University, a Boad of
Intermediate or Board of Intermediate and Secondary Education in Pakista!.
ln addition, a combination of Physics, Mafiematics and Computer
Studies/Computer Science may be allo$'ed for admission in Computer
Software Engineering Program,'Electronics, Telecommunications and
Avionics Engineering Programmes" only (Rei S.R.O. 952 (l) /2004, Ministry
of Wal€r and Powe., Islamabad,lhe 26th,2004)
OR
b.
ii. Hel She has passcd any other examination of a Foreign university /
lnstitution / Examination / Body, \\'hich bolh standard as wcll as scope wise is
cquivalent lo the Higher Sccondary School Certificate (Pre-Engineering) ofa
University or a Board oflntermcdiate / Intermediate and Sccondary Education
in Pakistan. Equivalence ofthe Examination, passed by the candidate, shall be
determined by the concemed University.
Hd Shc has passed an cntrance test conducted by the rcspective Institution or
Univcrsiry.
A candidalc who has passcd Diploma of Associatc Enginccr EMmination,
sccuring at least 60% aSgregale marks, shall be cligible for admission against
c,
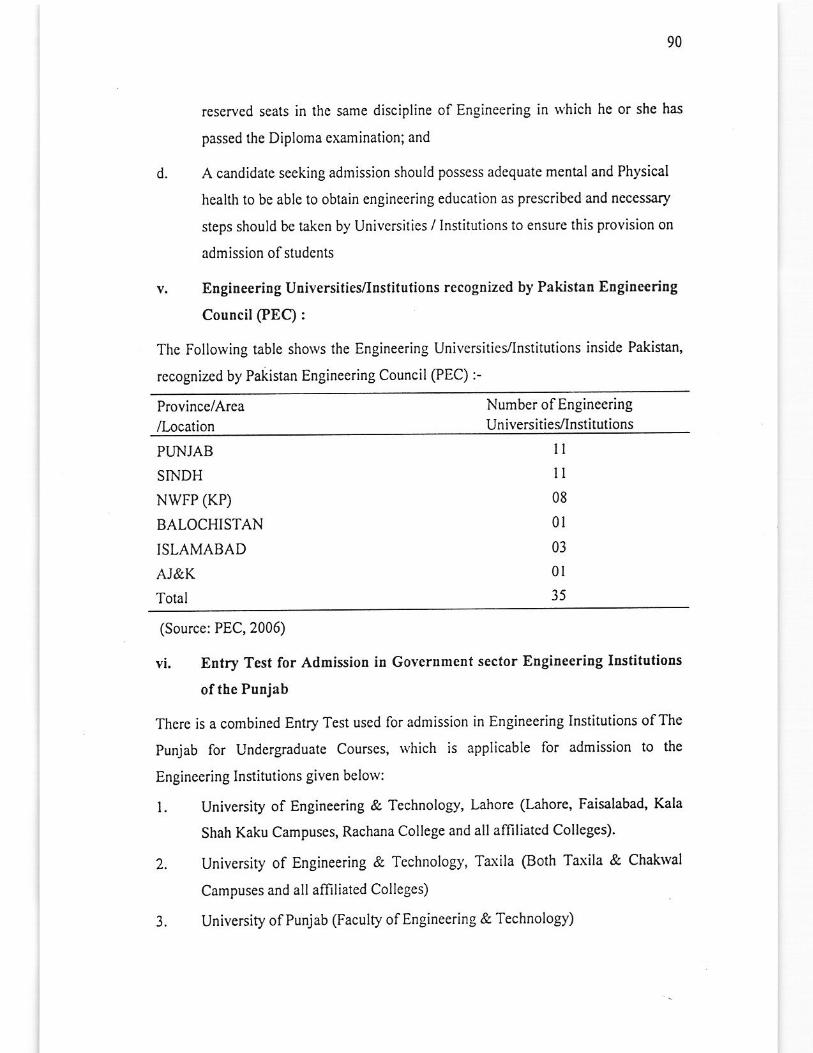
90
reserved seats in the same discipline of Engineering in $'hich he or she has
passed the Diploma examination; and
d. A candidate seeking admission should posscss adcquate mental and Physical
health to be able to oblain enginccring education as prescribed aad necessary
steps should bc taken by Univcrsitics / Institutions to ensure this provision on
admission ofstudcnts
v. EngiueeriDg Universities.{nstitutions recognizcd by Pakistao EDSiueeriEg
Council @EC) :
The Following table shows the Engineering Universiliel4nstitutions inside Pakistan,
rccognized by Pakistaa Engineering Council (PEC) !Province/Area
/lrcationNumber of Enginecring
Universities/Institutions
PTNJAB
SNDH
NWFP (KP)
BALOCHISTAN
ISLAMABAD
AT&K
Total
08
0l
03
0l
35
(Source: PEC,2006)
vi. Entry Test for Admissiotr in GoverumeDt sector EugiDeeriug Institutiods
of the PuDjab
There is a combined Entry Test uscd for admission in Engineering Institutions ofThe
Punjab for Undergraduate Courses, rvhich is applicable for admission to the
Engineering Institutions given belorv:
l. University of Engineering & Technology, Lahore (t ahore, Faisalabad, Kala
Shah Kaku Campuses, Rachana College and allaffiliated Colleges).
2. University of Engineedng & Technology, Toiila (Both Taxila & Chakwal
Campuses and all alliliatcd Colleges)
3. University ofPunjab (Faculty ofEnginecring & Technology)
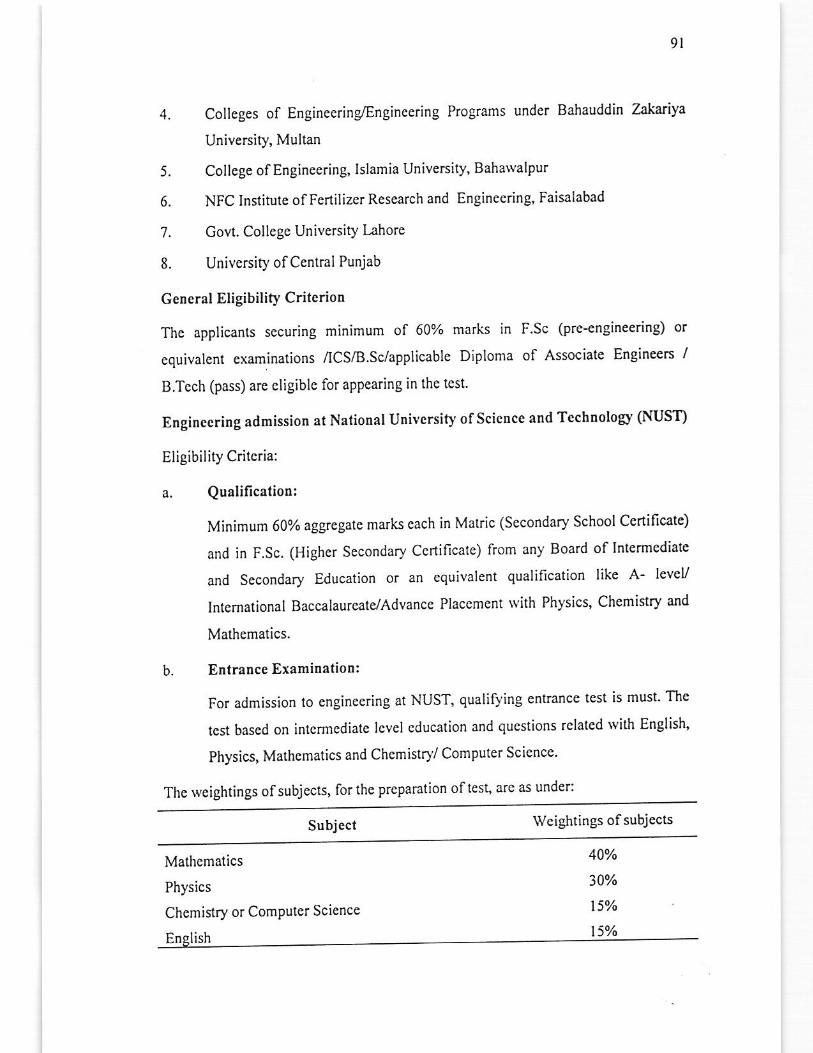
9l
5.
6.
7.
8.
4. Colleges of Engineerins,Enginccring Programs under Bahauddin Zakariya
University, Multan
College of Engineering, Islamia University, Bahawalpur
NFC Institute ofFertilizcr Research and Engineering, Faisalabad
Govt. College University tahore
University of Central Punjab
GeDeral Eligibility Criterion
The applicants securing minimum of 60% marks in F Sc (pre-engineering) or
equivalent examinations /lcs,ts.Sdapplicable Diploma of Associate Engineers /
B.Tcch (pass) are cligible for appearing in the test.
Enginccring adrnissioD at Nation.l UDiversity ofScicnce and Techuologt (NUST)
Eligibility critcria:
a. Qualification:
Minimum 60% aggregate marks each in Matric (Sccondary School Certificate)
and in F.Sc. (HiSher Secondary Ccrtificalc) from any Board of lntermediate
and Secondary Education or an equivalent qualification like A- levey
Intcmational Baccalaurcate/Advancc Placcment \Yith Physics, Chemistry and
Mathematics.
b. EntranceExamiDation:
For admission to enginceriag at NUST, qualifying entrance test is must' The
tcst bascd on intermcdiate level cducation and questions relatcd wi& English'
Physics, Mathematics and Chcmistr)y' Computer Sciencc'
The rveightings ofsubjects, for the prepamtion oftes! are as under:
Subject wcightings ofsubjects
Mathcmatics
Physics
Chemistry or ComPuter Science
40%
30%
t5%
t5%Enelish
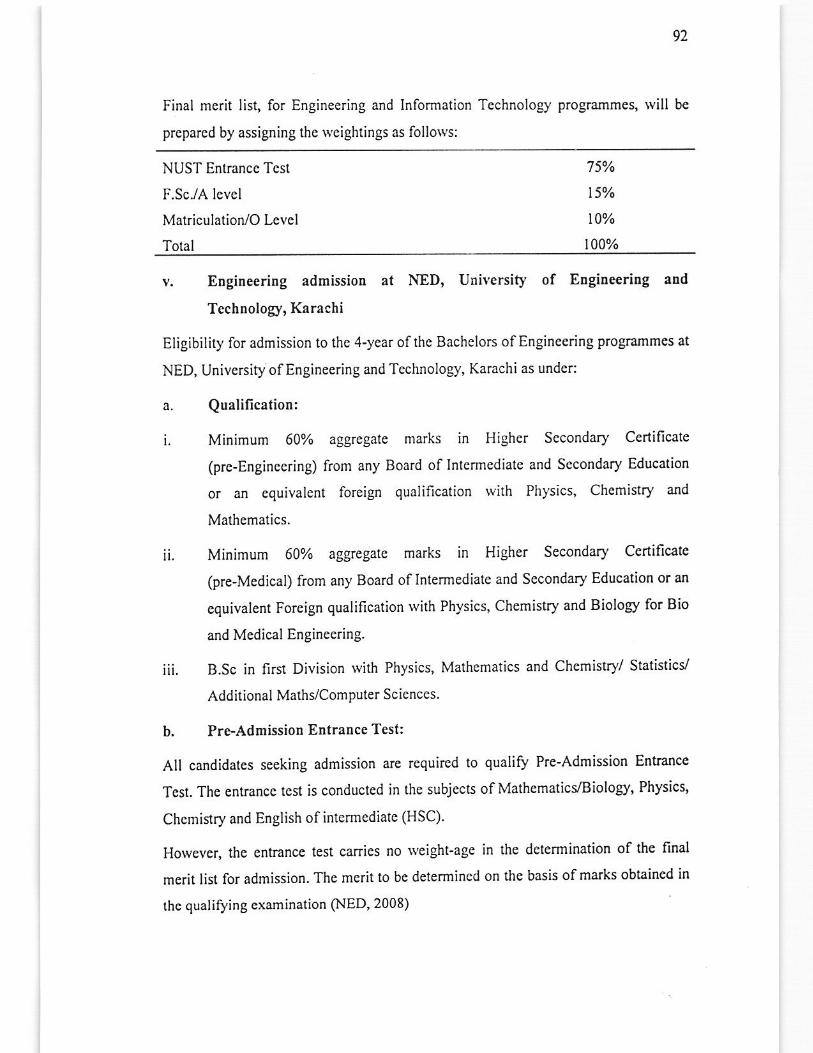
92
Final merit list, for Engineering and Information Tcchnology programmes, rvill be
prepared by assigning the weightings as follows:
NUST Entrancc Tcst
F.Sc./A level
Matriculation/O Lcvcl
Total
7 50/o
t5%
t0%
t00%
v. Engineeritrg admissiotr at NED, University of EngiBeeriog and
Techrolos/, Karachi
Eligibility for admission to the 4-year ofthc Bachelors ofEngineering progranmes at
NED, University ofEngineering and Technology, Kamchias undcr:
a. Quali,ication:
i. Minimum 6oyo aggegatc marks in Higher Secondary Certificate
(prc-Engincering) from any Board of Intcrmediatc and Secondary Education
or an cquivalent foreign qualification with Physics, Chemistry and
Mathematics.
ii. Minimum 6|yo algregale mark in Higher Secondary Certificale
(pre-Medical) from any Board of Intermediate and Secondary Education or an
equivalent Foreign qualification rvith Physics, Chemistry and Biolory for Bio
and Medical Engineering.
iii. B.Sc in first Division rvith Physics, Mathematics and Chemisry/ Statistics/
Additional Maths/Computer Sciences.
b. Pre-Admission EntraDce Test:
All candidates seeking admission are required to qualiry Pre-Admission Entrance
Test. The enbance test is conducted in the subjects of Mathematics'tsiolo$/, Physics'
Chemistry and English of intermediatc (HSC).
Howcver, the entmnce test carries no weight-age in the determination of tie final
merit list for admission. The merit to be determincd on the basis ofmarks obtained in
the qualirying cxaminalion (NED, 2008)
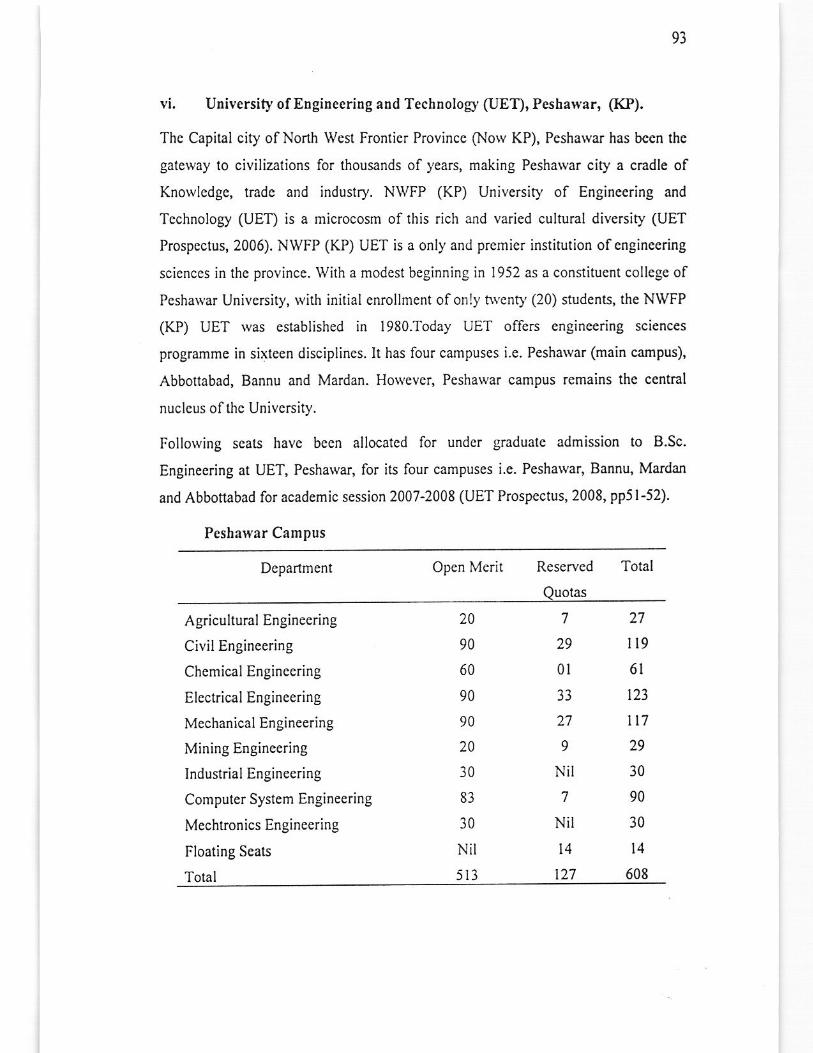
93
vi. Univcrsity ofEbgincering aud Technolos (UET), Peshawar, (KP).
The Capital city ofNo(h West Frontier Provinc€ (Now KP), Peshawar has bccn the
gateway to civilizations for thousands of years, making Peshawar city a cradle of
Knowlcdge, tradc and industry. N\\rFP (KP) University of Enginecring and
Technology (UET) is a microcosm of this rich and varied cultural diversity (UET
Prospectus, 2006). NWFP (KP) UET is a only and premier institution ofenginecring
sciences in the province. With a modcst beginning in 1952 as a constitucnt college of
Pcshawar University, with inilial enrollmcnt of only bvcnq G0) students, the NWFP
(KP) UET was established in l980.Today UET ofTers engineering scienccs
programme in sixteen disciplines. It has lour campuscs i.e. Peshawar (main campus),
Abbotabad, Bannu and Mardan. Horvever, Peshawar campus remains the central
nuclcus of thc University.
Following scats have becn allocatcd lor undcr graduatc admission to B.Sc.
Engineering at UET, Pesharvar, for its four campuses i.e. Peshalvar, Bannu, Mardan
and Abbottabad for academic session 2007-2008 (UET Prospectus, 2008, pp5l-52).
Pcshawar Campus
Opcn MeritDepartment Reservcd Total
Quotas
Agricultural Engineering
Civil Engineering
Chemical Engineering
Electrical Engineering
Mechanical Engineering
Mining Engineering
lndustrial Engineering
Computer System Engineering
Mechtronics Engineering
Floating Seats
Total
20
90
60
90
90
20
30
83
30
Nit
513
27
I t9
6l
t23
tt7
30
90
30
l4
608
7
29
0t
33
27
9
Nit
7
Nil
l4
127
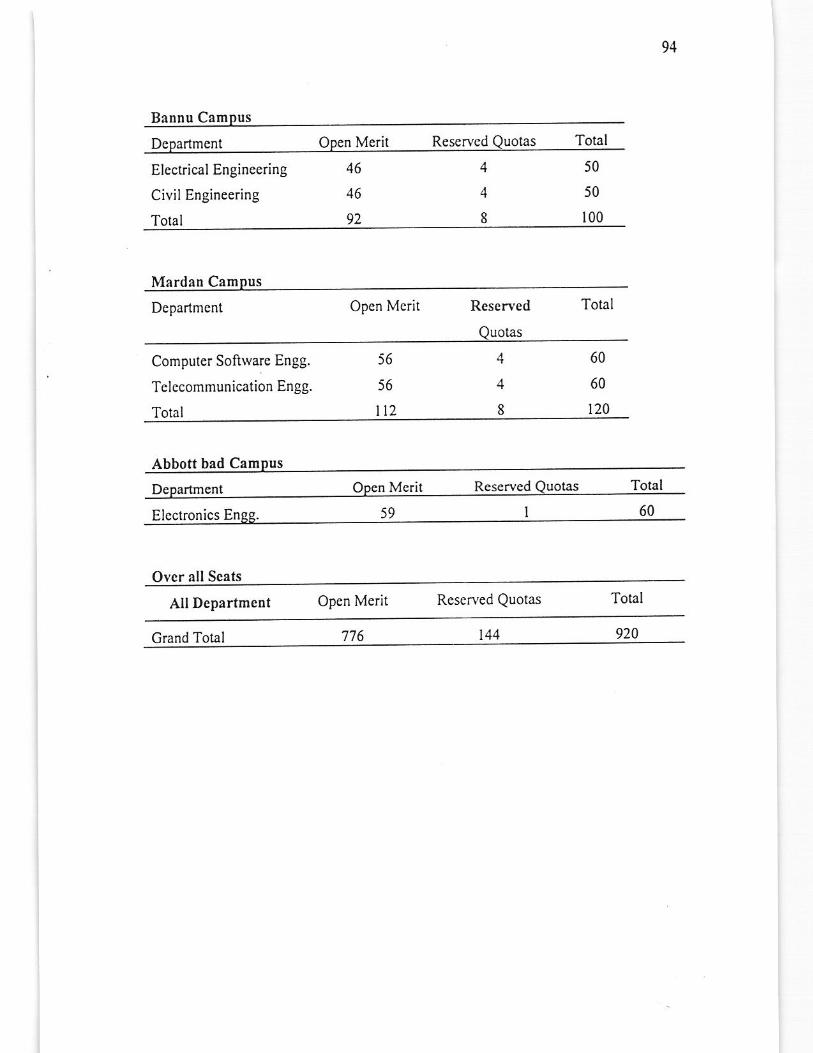
9,1
Bannu Campus
Electrical Engineering
Civil EnBineering
Total
Mardan Cam
Department Open Mcrit
56
56
|2
Computer Software Engg.
Tclccommunication Engg.
Total
Total
60
60
t20
Abbott bad Cam
Elcclronics En
Ovcr all Seals
All DcpartmeDt Open Merit Rescn'ed Quotas Total
Grand Total 't76 920144
4
4
8
50
50
100
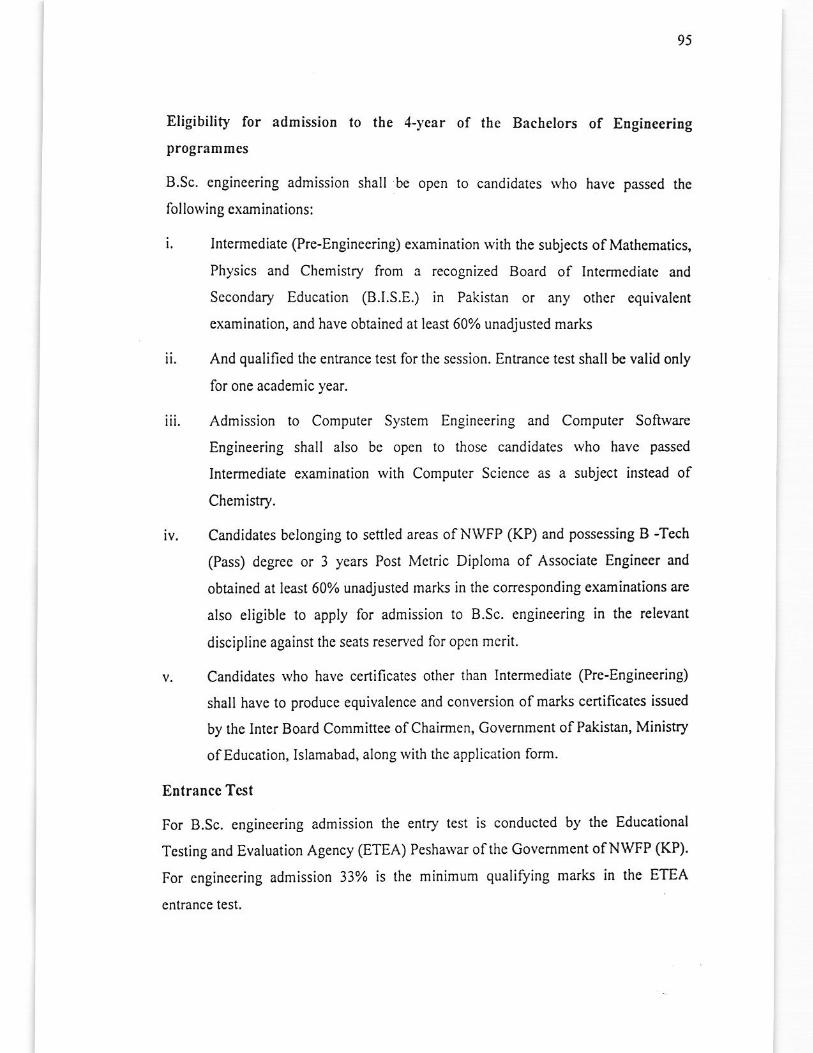
95
Eligibility for admission to the 4-ycar of thc Bachelors of EdgiDeeribg
programmes
B.Sc. engincering admission shall be open to candidates rvho have passed thc
follorving cxaminations:
i. Intermediate (Pre-Engineering) examination with fte subjects ofMath€matics,
Physics and Chemistry from a recognized Board of lntermediate and
Secondary Education (B.I.S.E.) in Pakistan or any othcr equivalent
examination, and have obtained at least 60% unadjusted marks
ii. And qualified the enimnce test for the session. Enkance test shall be valid only
for one academic year.
iii. Admission to Computer System Engineering and Computcr Software
Engineering shall also be open to those candidates rvho have passed
Intermediate examination with Computer Science as a subject instead of
Chemistry.
iv. Candidates belonging to settled areas ofNWFP (KP) and possessing B -Tech
(Pass) degree or 3 years Post Mctric Diploma of Associate Engincer and
obtained at ieast 60% unadjusled marks in the corresponding examinations are
also eligible to apply for admission to B.Sc. engineering in the relevant
discipline against thc seats reservcd for opcn mcrit.
v. Candidates who have cenificatcs other than Intermediate (Pre-Engineering)
shall have to producc equivalence and conversion of marks certificates issued
by the lnter Board Commiftee ofChairmen, Govemmcnt of Pakistan, Minisfy
ofEducation, Islamabad, aiong rvith rhe application lorm.
Etrtrance Test
For B.Sc. engincering admission the entry test is conducted by the Educational
Testing and Evaluation Agency (ETEA) Peshawar ofthe Govemment ofNWFP (KP).
For cnginccring admission 33% is the minimum qualirying marks in lhe ETEA
cnlrance test,
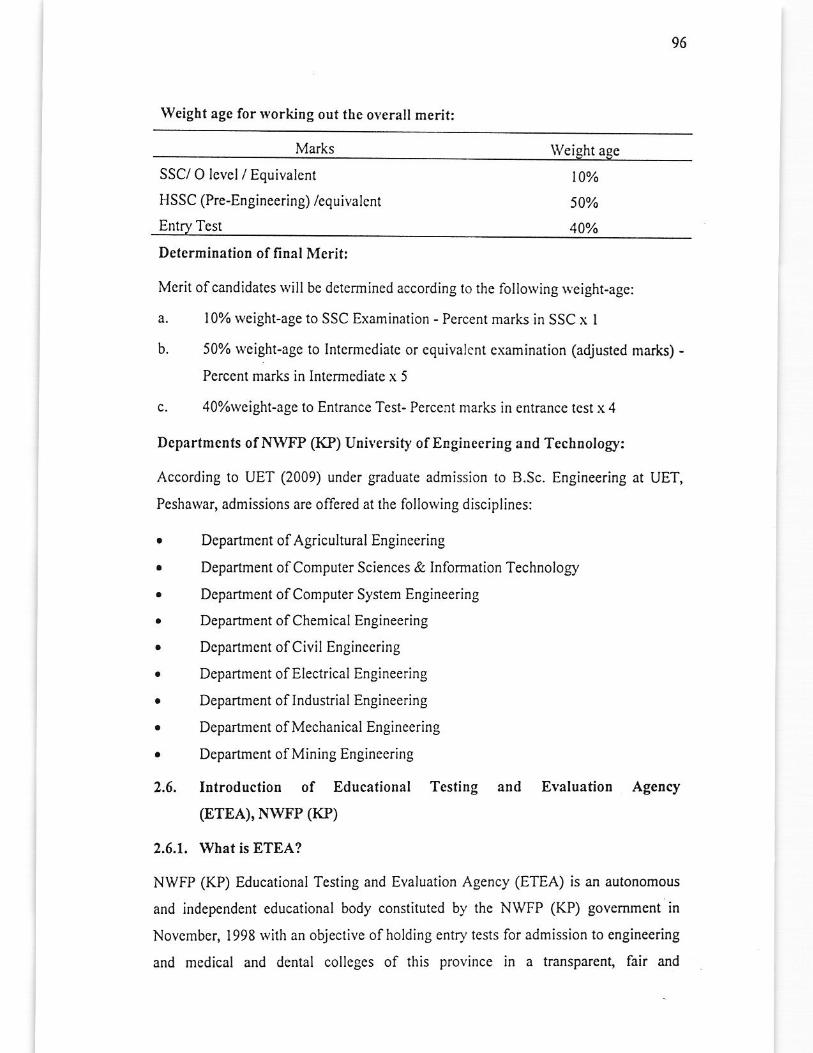
96
Weight age for $orking out the oierall merit:
HSSC (Pre-Engineering) /equivalcnt
Entry Test
Marks Veieht a
SSC/O lcvcl / Equivalcnt t0%
50%
40%
Dctermination of fi tral Merit:
Mcrit ofcandidates will be determined according to rhe following weight-age:
a. I0% weight-age to SSC Examination - Percent marks in SSC x I
b. 50% wcight-age to Intcrmcdiatc or cquivalcnt cxamination (adjusted ma!k) -
Percent marks in lntermediate x 5
c. 40%rveight-age 10 Entrance Test- Pcrce:tt mark in enlmnce test x 4
Depar(mcnts of NWFP (KP) Utriversity ofEngineeriug and Technolog/:
According to UET (2009) under graduale admission to B.Sc. Engineering at UET,
Peshawar, admissions are offered at the following disciplines:
. DepartmentofAgriculturalEngincering
Department ofComputer Sciences & lnformation Technology
Departmenl of Computer Syslem Engineering
Department of Chemical Engineering
Dcpartmcnt of Civil Enginccring
Department of Electrical Engineering
Department of Industrial Engineering
D€partment of Mechanical Engineering
Department of Mining Engineering
Itrtroduction of Educational Testing
(ETEA), ri'WrP (KP)
aud EYaluatiotr Ageucy
2.6.1. What is ETEA?
NWFP (KP) Educational Testing and Evaluation Agency (ETEA) is an autonomous
and independent educational body constitutcd by the NWFP (KP) gov€mment in
November, 1998 rvith an objective ofholding entry tests for admission to engineering
and medical and dental colleges of this province in a transparent, fair and
2.6,
91
academically sound manner (ETEA Ordinance, 2001, p.l). The general aim of the
Agcncy is the evaluation ofeducalional inslitutions. Conduction oftest for admission
to tho profcssional institutions providing Mcdical and Engineering education is the
responsibility of ETEA. The agency has been conducting Entrance Tests for
admission to tho NWFP (KP) University of Enginccring and Technology and to the
M€dical and Dental Colleges ofNWFP (KP) since its inceptior, 1998. ETEA has also
been conducling Enlmnce Tests for admission 10 the programmes of IMS (both
Undcrgraduate aad Graduate). The agcncy also conduct tests for seleclion of IT
Teachers, and Lecturers. On 29d June, 20OI ETEA was made autonomous rlrough an
ordinancc and its scope of activities and objectives rvere broadened beyond tle
enkance tests (ETEA, Students' Guide lor entD,tesr p.2).
2.6.2. RcspoDsibilities of ETEA:
Evaluation of educational institutions functioning in the province is the main
rcsponsibility ETEA, in general and conduction of entrance test for admission to tle
profcssional institutions providing medical and engineering education in particulat.
Inculcation the spirit ofinquiry, application and research among studcnts during stldy
at collcges and schools instcad of creaming and panot Iike mcmorizing are the prime
objcctivos the ETEA wants to achieve through testing and cvaluation process.
2,6,3. FunctioDsofETEA:
Main functions ofthe ETEA are mentioned belcrv:
. To catallze reforms in examination and testing systcm.
. To impart training to the personnel involved in the evaluation programme.
. To inculcate spirit of inquiry, application and research among students during
study at college and schools.
r To develop resources and system lor the conduct of educational evaluation
and testing to bring in Objectivity, Transparency and E(ficiency in the system
(ETEA Ordinancc, 200 l, p.2).
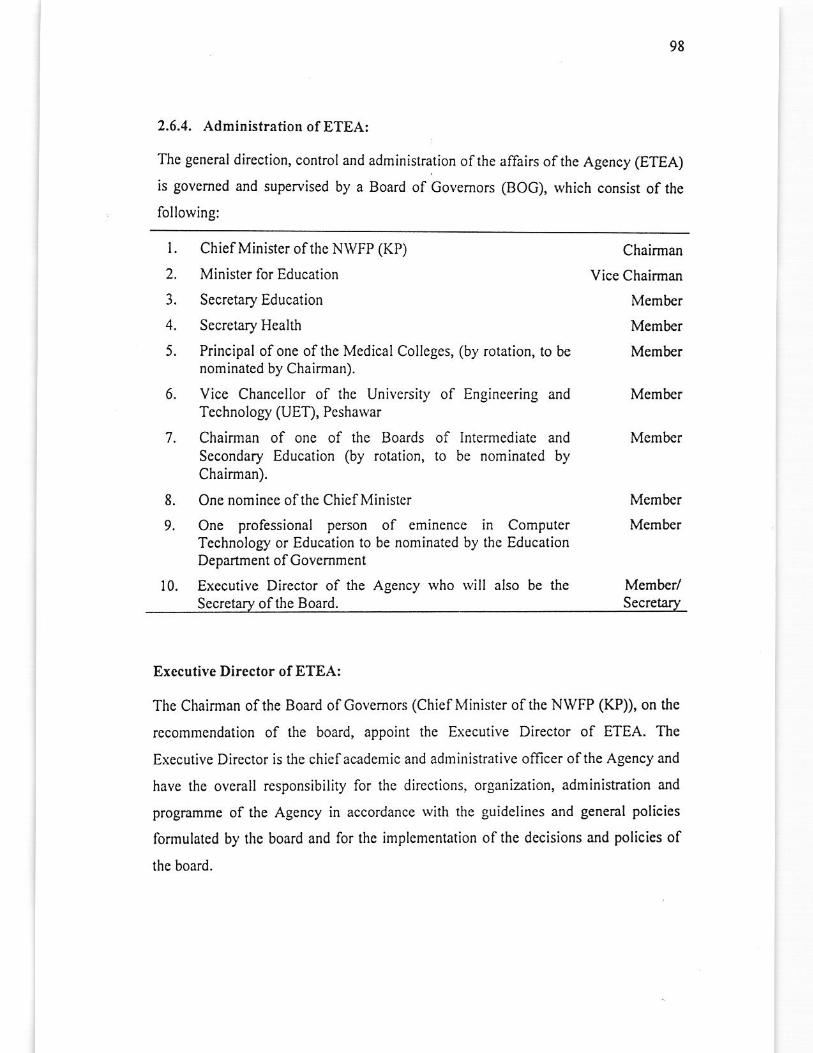
98
2.6.4. Administration of ETEA:
The general dircction, control and administration ofthe aflairs ofthc Agency (ETEA)
is govemcd aad supervised by a Board of Govemors (BOC), rvhich consist of the
following:
I. Chief Minister of thc NWFP (KP)
2. Minister for Education
3. Secrctary Education
4. Secretary Health
5. Principal ofone ofthe Medical Colleges, (by rotation, to benominated by Chairman).
6. Vice Chancellor of the Universily of Engineering andTechnology (UET), Peshawar
7. Chairman of one of frc Boards of Intemrcdiate and
Secondary Education (by rolation, to be nominated byChairmaa).
One nominee ofthe Chief Minister
One professional person of eminence in ComputerTechnology or Education to be nominated by the EducationDepartment of Covcmment
10. Executive Director of the Agency who rvill also be theSccretary ofthe Board.
Chairman
Vice Chairman
Mcmbe.
Memb€r
Member
Membcr
Member
8.
9.
Membcr
Member
Membcr/Secretary
Erecutive Director of ETEA:
The Chairman ofthe Board olCovemors (Chief Minisler ofthe NwFP (KP)), on the
recommcndation of the board, appoint the E\ecutive Director of ETEA. The
Executive Dircctor is the chiefacademic and administrative oflicer ofthe Agency and
have the ovcrall responsibiliry for the directions. organization, administration and
programme of ihe Agency in accordance lvith the guidclincs and general policies
formulated by thc board and for lhe implcmcntation of the dccisions and policies o[
thc board.
99
2.6.5. AchievemeurCharacteristics of ETEA:
ETEA has a uoique status in the field ofrestinS and evaluation in pakistan. Following
are lhc main achievements/chamcteristics of ETEA:
i. It has conducted l0 sets of entrancc tcsrs, lor the NWFP (KP) University ofEnginccring and Technology and mcdical collegcs ofthc provincc.
ii. ETEA delivered the rcsult of thcse entry tests within 24 hours, which is a
record achievement at the national lcvel.
iii. It conducted training tests at 17 centers throughout thc provincc lrom Chitral
throu8h D.l. Khan.
iv. ETEA dcsigned and conduct€d lcsts for the
v. Institute ofManagement Sciences (lMS), Pesha\\'ar
vi. Working Folks Grammar School, NWFP (KP)
vii. Schoois and Literacy Dcvclopmcnt, NWFP (KP).
viii. DirectoratcofHigherEducational.
ix. FATA, ESRU and Edrvards Collcgc, Pesharvar.
x. Conducted Workshops / Teacher Training Programs to train the college
teacher ofNWFP (KP) on "How to consfuct test items, especially MCQS and
enable them to guide their o$n students at college level"?
xi. Prctest and ETEA book ofmodel MCQS containing about 7000 MCQS based
on F.Sc. syllabus rverc madc availablc (o serye as a rcsource and guidance
material for the cardidates.
xii. Facility of marking rvith pen provided to climinatc possible suspicion of
tampering.
xiii. Facility ofvcrificalion ofthe results by the candidates soon after the test.
2.6.6. Tcst CoDstruction proces! ofETEA:
Thc multiple-choice questions uscd in lhc ETEA tesl (related to Physics, Biology,
Chemistry, Mathematics and English subjects) are designed and iwitten by subject
specialisb of integrity from the leeding schoolycollcges and university professors
from throughout the province of NWFP (KP). Thcse arc expcriences leachers in their
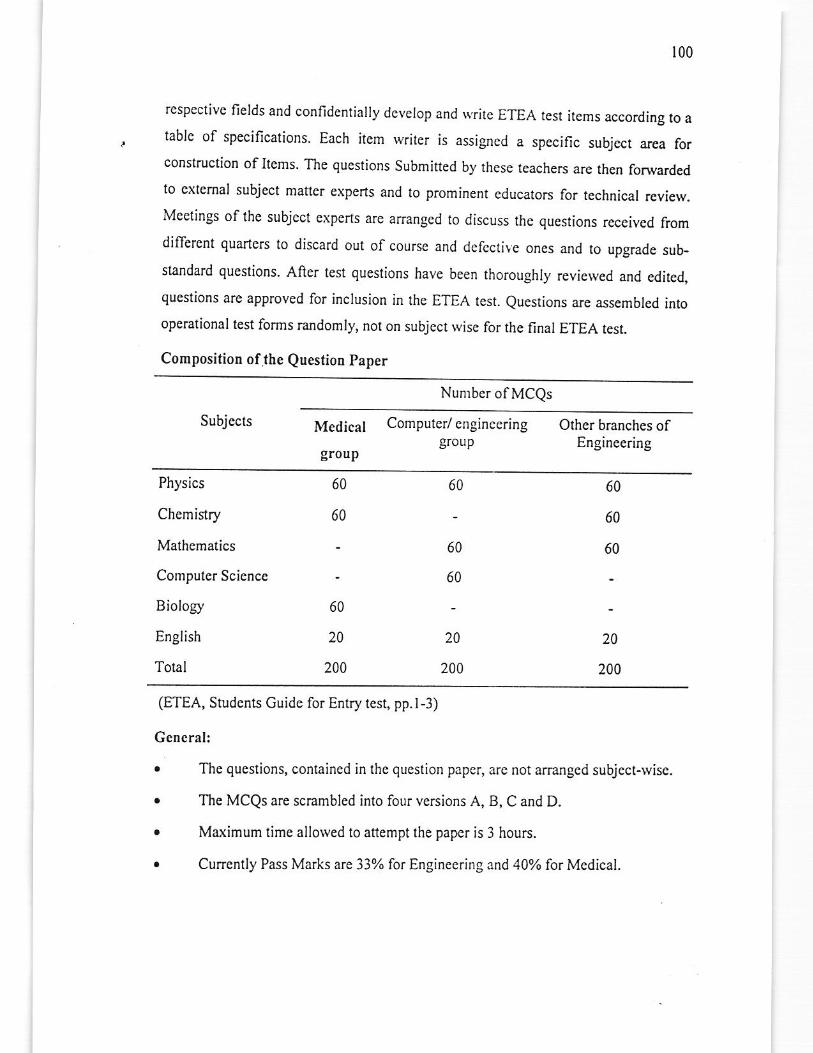
100
respcctive fields and corfidcntially devclop and rYrilc ETEA rest items according to atablc of specifications. Each item wriler is assigned a specific subject area forconstruction of ltems. The questions Submitted by these teachers are then fonvardedto extemal subject matter expeds and to prominent educators for technical review.Mcetings of tho subjcct experts are afianged to discuss the questions received fromdifferent quarters to discard out of cource and defccti\e ones and to upgrade sub.
standard questions. After test questions have been thoroughly reviewed and edited,
questions are approved for inclusion in the ETEA test. euestions are assembled intooperational test forms randomly, not on subject wise for the final ETEA test.
Composition ofthe QuestioD Paper
Number olMCQS
Subjccls 14"6i""1 Computcr/ enginccring Other branches ofgroup Engineering
gr0up
Physics
Chemistry
Malhematics
Biology
English
Tolal
60
60
60 60
60
60
Computer Sciencc
60
60
60
20
200
20
200
20
200
(ETEA, Students Guide for Entry test, pp.l-3)
Gencral:
. The questions, conlaincd in thc question papcr, arc not arranged subject-wise.
r The MCQs are scrambled into four versions A, B, C and D.
. Maximum time allowed io anempt the papcr is 3 hours.
. Currcntly Pass Marks are 33oZ lor Enginecring and 40% for Medical.
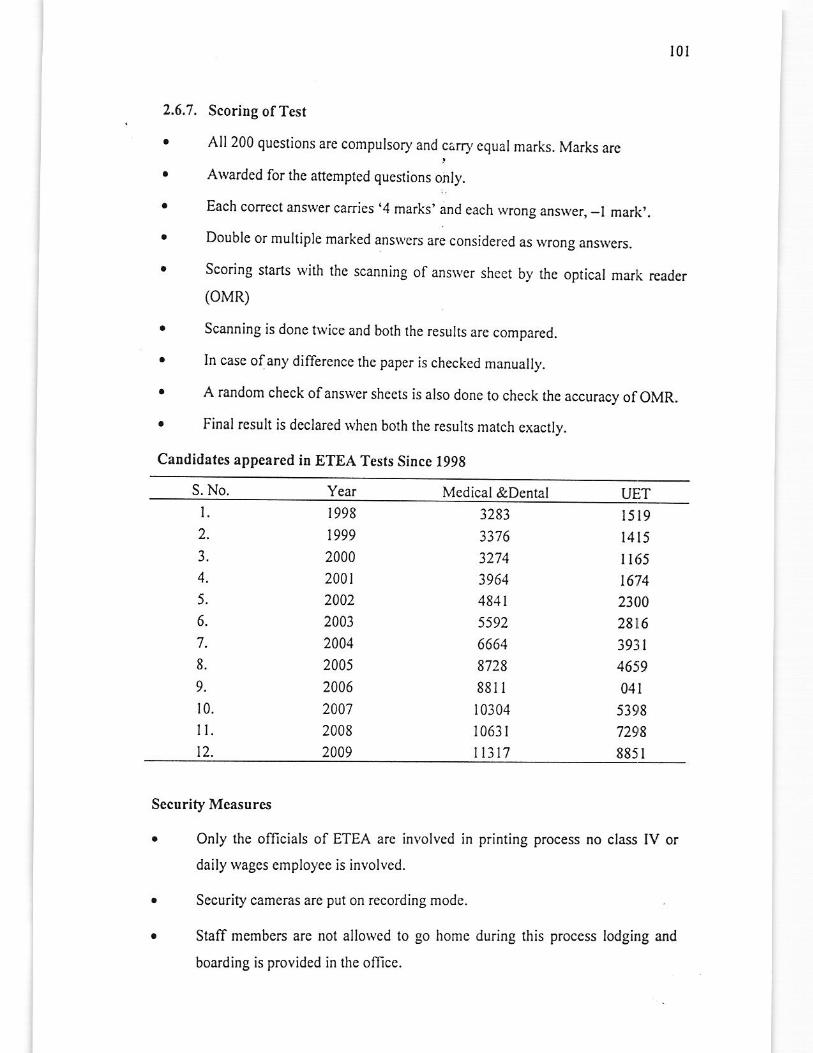
I0l
2.6.7. ScoriDg ofTcst
. All 200 questions a.e compulsory and c.iro,cqual marks. Marks a.e
. Atvarded for the attempted questions only.
. Each correct ansiver carries .4 marks, and each wrong ansNet _l maak,.
. Double or muhiple marked ansrlers are considered as wrong answers.
. Scoring starts with thc scanning of ansrvcr shect by tle opticzl mark reader
(oMR)
. Scanning is donc twice and both the results are compared.
. In casc ofany differcnce the paper is checked manually.
. A random check ofansrver sheets is also done to check &e accuracy ofOMR.
o Final result is declared when both thc resuhs match exactly.
CaDdidates appeared iD ETEA Tests Sitrce 1998
S. No. Year Mcdical&Dentalr998
1999
2000
2001
2002
2003
2004
2005
2006
2001
2008
2409
3283
3376
32?4
3964
484r
5592
6664
8728
881I
r0304
10631
IL3t't
I5t9l4l5r 165
1674
2300
2816
3931
4659
041
5398't298
8851
Sccurity Measures
. Only the officials of ETEA are involved in printing process no class IV or
daily wages employee is involved.
. Security camems are put on recording mode.
. Staff members are not allowed to go home during lhis process lodging and
boarding is provided in the olljcc.
l.2.
3.
4.
5.
6.
7.
8.
9.
t0.
102
. AII the papeN are sealcd in boxes and storcd in strong room.
. NAB and intelligence agencies also monitor lhe process.
Secrel ofSucc€ss
The sccret of succcss largcly depcnds on propcr design of thc qucstion paper and
morc so on the specd of its administration from thc moment ofgetting question papcr
out of the computer to the moment of getling the r€sult finalized, under the strict
supervision ofresponsible staff(ETEA, Srudentr cuide for Entry res! pp.l_3).
2.7, Issues related to predictive validity studics
2.7.1. Methodolos/ related Difficulties in prcdictive Validity (p\) Researches
Hambleton, R. (1999) identified the follorving mctfiodoiogy relared difl'icuhies in
Predictivc Validity (PV) Researchcs:
a. PV Studies are Rarely Conducred on rhe population (or Samplc) of inleres!
Range Restriction Results.
Rangc Restriction on the Criterion
Unreliability of Criterion Scores
Inadequacy of th€ Criterion Variable
Use ofa Sccond Predictor Variable or More (Use ofa Compcosatory
Selection Modcl)
Generally Small Sampl€s.
Iramaneeral C. (2006) exp)ained some of thcsc problemydifficulties of P.cdictive
Validity studies as undcr:
1. Raoge RestrictioD Results:
It is a common pmctice that students with high rarrge entrance examination scores are
admifted into the medical school./professional institution while students with low
entrance examination scor€s are not admitted. Consequently, the pre-admission
variablcs aad crileion measures available for the predictive validity study were
timitcd only in the high range. So due to this restriction ofmnge not only limited the
predictiye power ofadmission criteria, but also limited the population generalizability
ofthc findings.
b,
c.
d.
e.
f.
I.
103
Maturatiotr effect:
The second Problem, rvhich limited predictivc porver of admission criteria is the
maluration effcct. Maturation is a significant conlounding variable in tle relationship
ofprcdictors and criterion variables because oflhe long interval behyeen dre measurcs
of these two variables, Criterion scores are measurcd about one to 2/3 years after the
entrance into the MedicaL€nginecring education. Similarly, Preclinical and clinical
grades are not available until five/six years aller admission. So additional leaming,
haturity and charges in skill levels of students during instrucrion affect the
correlation and rcgression cocfllcicnts in the criterion prediction.
Inadequacy of the Criterion Variablc:
Criterion Variable (outcome variabies) may be included both academic achievement
non-academic skills. Acndemic achievement is only one of the many indicators of
successlul medical study. Prolessionalism, communication skills, Ieadership skills,
and rcsearch skills etc are the non-academic skills, which are also required in medical
study along with personal qualities and cha.actcr anributes like empathy, hooesty,
rcliability, and cultural competence. Most of the predictive validity research is
dominatcd by thc acadcmically dcpendent outcome and other qTes of oulcomes,
rvhich provide an incomplete piclure ofmedical lraining
Burton, N.W. and Ramist, L. (2001) also pointed out the following factors which can
aflect the size of correlation coefficients in interpretation of conelational studies
(Prcdictive validity studies are usually correlational studies) ;
l. Reshiction in the range oftalents ofthe students,
2. Different grading standards assigned by different professors,
3. Othcr problems rvith measurcs ofsucccss in collcge (p.2).
Thcy further explained these three important sourccs ofenor in unadjusted predictiv€
validity studies as under:
Reslriction in the raDgc oftalent
About renriction in the range oflalent factor effecting predictive validity studies, they
argued" lt has been known for years that restriclion of range mathematically lowers
corelation cocfficients" (p.3).As evidence they quoted the study conducted by Ramist

101
(1984).His research \vas based on anal),sis of rhe data for 6gj institurions in theCollcge Board Validity Study Service. Hc searched ou! 2l institr.ltions rvith a fullrangc ofSAT scores and high school records (the rcsr of inslirulions were facing thisproblcm of"rcstriction in thc rangc oflalcnf').On rnil),sis, ofthcsc inslitutions withan unrestrictcd mngc of students, he found lhe average correlation of SAT and highschool record \vilh the first year GpA was.65, as compared to a median of.55 for all685 institutions included in thc study. Il means lhal rhis..rcsrriction in rhe range oftalent" factor lower.l0 thc conclatio, coefncicnls.
Grading stardards:
Assigning ofgradcs to students is not only depends on students pcrforrnance but also
on thc nature and difnculty ofcouases. The researchers stated:
"Regression equations predicting thc CPA in essence predict an avemge grade forindividuals wilh particular valucs on the prcdiclors. The prcdiction will not be correct
for a student who takcs mostly lenicntly gradcd or stringcntly graded courses-the
predicted gradc will be too low or too high" (p.3).
To suppon this phenomena thoy quotcd thc study of Ellioll and Srrcnta (1988) abolt
the prcdiction of college gades, where he found that the correlation be$ccn
prcadmission measurcs and lhc college GPA increaied lrom.57 to.62 in thc firjt year
and from.4l to.51 in the senior year, aftcr controlling for grading standards.
They also mentioned diflerent "statistical methods" for adjustment of variations in
grading, suggested by number of researchcrs c.g. "matching students in pairs ofcourses mcthod" used by Elliott and colleagues at Dartntouth to estimate and adjust
coursc differcnces in grading stringency and "statistical cquating theory" to equate
grading scales acrcss general discipline areas used by Young. In short, 'lhe
unadjusted studies will underestimate the true validity ofadmission predictors" (p.4).
Other problems with mcasurcs ofsucccss in collegc:
Inconsistency and subjectivity of teachers' grading practices and systematic
diffcrcnccs in the skills rcquircd for diffcrcnt courscydisciplines (diflercnt talents arc
uscful/required for the performances in different subjccts c.g. skill rcquired in English
is diffcrcnt from skill in maths) arc thc other problems, \vhich effect the predictive
validity.
105
Refe[ing 1o the sludy of Ramis! and colleagues rvhich rvas based on ,,broadly
rcprcsenlativc sample of7, 800 courses in 45 undergraduate innitutions,', whcre thcy
also identificd the abovc mentioned factors i.e. restriction of range, variations in
grading standards and criterion unreliability. Ramisl and colleagues detcrmined the
relationship of prcdictors to grades within individual college courses by such
methods, in which thcsc three factors \vere controlled. The corrclation bctween
preadmission variables (SAT and high school record) and rhe first-year GpA in these
45 institutions was increased from.4S 10.76, after ad.justing for restriction of range,
grading slandards, and criterion unreliability.
This gap behveen unadjusted and adjusted conelation further increased rvhen used for
the relationship behveen standardized achievement tcst scores and high school gradcs.
Burlon, N.W. and Ramist, L. (2001) quored thc study of Willingham, pollack, and
Le\yis (2000), wherc they found that the corrected correlation.8l as compared to aa
unadjusted correlalion of.62 for fte standardizcd achievement test scores to predict
high school grades.
2.7.2. Thc CriterioD Problem:
According to Gronuld (1990), "in Criterion-related v3lidation srudy, a major problem
is obtaining a satisfactory criterion of success" (p.65). Selecting a satisfactory
criterion is one ofthe most dilTicult problems in making a Criterion validation study,
and for most educational purposes, there is no cntirely satisfactory criterion ofsuccess. Those uscd tend to be lacking in comprehensiveness and in most cases
produce rosults that are less stable than thosc ofthe test bcing validated.
According to Thomdike, R.L. &Hagen, E. (i969) one ofrhe most difficult problcms
that the personnel psychologist or educator faces is that of locating or creating a
satisfactory measure ofjob success to scrve as a criterion measure for test validation
(p.166).Finding or developing acceptablc crilerioo measur€s usually involves the
research worker in the field oftest and measurcmcnt in a number of troublesome
problcm.
Therc are ahvays many criterion mcasures that m;ght be obtained and used for
validating a selection test. In addition to quantitative performance records and
subjective rating, rve might use latcr test ol proficiency. Another common t,,pe of
106
criterion is grades in some type of educational or training programme. Thus, test for
the selection of engineers may be validated against course grades in engineering
school.
Qualities Desircd iD a CritcrioD Measurc
Thomdike, R.L. & Hagen, E. (1969) mentioned four qualilies desired in a criterion
measurc. In order of their importance thcy are (l) relevance, (2) freedom from bias,
(3) reliability, and (4) availability.
l. Relevance. In appraising the relevance of a criterion, we ofren rely upon
professional judgment to provide the appraisal of the degree to which any
availablc partial criterion measure is relevant to thc ultimate criterion ofsucccss in an educational progmmme or injob- Therc is no empirical evidence
tiat rvjll tell us how relevant freshman grade-point averagc (FGPA) is, fo.
example as indicalor ofhaving achieved the objectives ofthe University.
2. Freedom from bias. A second faclor important in a criterion measure is that
of freedom from bias. It means thal the measure should provide each person
witi the same opponunity to makc a good sorc.
3. Reliabilify. A measurc ofsuccess must be stable or reproducible if it is to be
predicted by any type of test device. If the criterion performance is one that
jump around frofit day to day so that the person shows high performance onc
iveek may show lorv performance the ncxt, then there is no possibility offinding a test that will predict it. A rncasure that is fundamcntally unstable
itselfca not be predicted by anyhing else.
4. Availabilify. Finally, in the choice ofcritcrion measure one always encounte.s
practical problems of convenience and availability. How long is it going to
takc to get a criterion score for each individual? Horv much is it going to cost?
Though a personnel research progmmme can oflen afford to sp€nd a
substantial part of its effod in getting good criterion data, thcre is always a
practical limit. Any choice ofa criterion nreasure must take this practical limit
into rccount.
r07
2,7.3. A,rc validity coefficicnts ulderslatcd duc to correctable defects in ihe
GPA?
Various researchers havc pointed out un-reliabiliD' of criterion measures. This
Measurement error in the criterion artificially dcpresscs the size ofobserved validity
coefficicnts. Different melhods havc bcen suggesled by different rcseatchers to handle
this problem. A study was conducted by Young, J.w. (1990) using item rcsponse tieory
(lRT) for the measurement of students' performance instead oftraditional grade point
average rvith purpose to devclop a more reliablo measure of performancc, called an
IRT-bascd GPA. Then this lRT-based GPA was used criterion measure and tesled in a
prcdictive validity sudy using data from Shnford Ullivcrsily studcnts. The result of
the study revealed that thc lRT-based GPA shorved increascd ptedictability is
compared wift the usual GPA.
Adjus(iog grades in thc loDg-lerm crilcria:
Burton, N.W. and Ramist, L. (2001) \\'ere oflhe opinion that:
"mcthods of adjusting gradcs" developed by Lewis, Ramisl and
Willingham and their colleagues have applied to short-term criieria i.e.
first year and have not yet been applied to Iong-term criteria ofsuccess
in college. They a.gued that "The rcsearch available on gmdes over
four years suggesis that t}e problems of range rcstriction, differing
grading standards, and criterion unreliability are likely to be at least as
severe as they have proved to be for firsl-year gmdes (P.4).
2,7.4. Gender differcIces:
In studies of predictive validity, rvhen gmdes are predicted for male and female
separately, it is commonly observed that femalo's actual grades are slightly higler
than predictcd rvhile male's grades are slightly lower than predicted. In the research
literature lhis phenomenon is referred to as "undcr-prediction" for women and "over-
prcdiction" for men" (!.13) as mcntioned by Bunon, N.W. and Ramist, L' (2001).This
"under-prediction" for rvomen is the main theme in lhe recent predictive validity
studies.
108
The researchers (Burton, N.W. and Ramist) explained lhis "over prediction" and
"under prediction" phenomenon by relerring to the sludy of Ramist et al. (1994).They
quoted:
The average over prcdiction and under prediction using SAT scores
and high school CPAs to prcdict unconcctod first-),ear gmdes was -.06
for rvomen and +.06 for men, meaning that \\romen's prcdicted gmdes
\rere.06 grade points lower than their actual grades and men's
predicted grades rvere,o6 points higher than their aclual grades, based
on a 4-point grading scalc. For example, a Sroup of \\omen predicted
1o get a 3.0 firsFyear grade averagc would aclualiy avcrage 3.06, while
men predicted to receivc a 3.0 \\'ould actually average 2.94 (p.13).
Ancis & Sedlacek (1997) inferred from existence of gender differences that affect
malc and female academic performance suggests that the prcdictors of academic
success may also be susceptible to gender influences. There is cvidcnce to suggest
that th€ composilion of SAT may favour rvhit males and may not be as valid a
predictor for females. American Associalion ofUniversity Women (1992) also wer€
of thc views that thcre arc cvidence which shorvs gendcr bias in tle SAT and other
standardizcd tests may give males the advantagc of scoring higher on the exam over
females. Burton & Ramist (2001) explained the reason for better performance of male
on standardized tests that males complete more advanced courses in scienc€ and math
than females and these diflercnccs affect performance on slandardized tesG. EtlolviE
et al. (2000) identified some more factors about gender influences which affect
acadcmic pcrformance for both men and rvomen in engineering programme. Thosc
factors were socialization ofgender role, family background, malhematics and science
ability, and eiucational climate in the schools.
A rcview of the literaturc indicates divergent opinions on gender diffcrences in
acadcmic achievement. The study of Ramsbottom-Lucier M, Johnson M, Elam C.
(1995) about the Medical College Admission Tcst (MCAT), revealed that the
perlormance of male students were bctter than female studens. While the study of
Coy K, McDougall H, Sneed M. (2003) about the DAT, found that female sludents
produce higher scores in verbal reasoning and biological science than male students,
109
whilc the study of Ranney, R.R et al (200i) explored the Perceptual Ability Test
(PAT) ofDAT favoring male students as compared to fcmalc.
On the National Board Dental Examination (NBDE) I and II., the performance of
male students were better tian femal€ (Fields et aI.,2003).With regard to graduating
GPA, Slewart, C.M. (2006) concluded that the overall grades of females were b€ne.
compared to male students.
The results ofthe Lydia S.K (2005) study revealed that " men perfomed bener on the
science subtests while women performed better on the writing test" of tic MCAT
(p.122).The study also idcntified that mcn performed better on the Iirst -yca! medical
school measure tlan rvomen.
Stewa4 C.M. et al (2006) and Kim, M. & Lee, J.L. (2007) studics also found that
female students performed betler than male students in the dental state licensure
cxamination and first semesters ofdental programme.
2.7.5. Factors Affecting tbe Estimation ofvalidity CoefficieDts
Powers, E,D. (May 2001), identified following limitations ofthe previous validity
studies and tie factors which affect the Predictive validity:
L The use ofsmallsamples
2. Range restriction in the criteria and in the predicto.s
3. Employed unreliable criteria
4. Overgeneraliz.tion from a single, atypical departrnent
5. Discounted the effects ofcompcnsalory selection
He further stated that the use of small samples for study can provide inconsistent
rcsults while thc range restriction, criterion unreliability, and compensatory selection
fac{ors can underestimates the predictive power ofadmissions measures.
Small samplc is one ofthe factors, which effect validity cocflicient, specifically when
we study depMment having small number ofstudonts or by age, ethnic group elc. The
solution to this problem suggested b)'Swinton, S.S. (1987) to use Baycsian Mcthods
for Combining Validity Data.
I l0
He argued and explained:
Braun and Jones (1985) demonstrated a po\verful nelv method for
combining validity data from departments as disparatc as physics and
humanities, by modeling the systematic variation of regression
coefficients with differences in departmcntal meaa scores. Their
empirical Bayes approach makes it possible to overcome in one stroke
thc problems of small samples in any one department and of lack of
compambility across departments in different fields. These problems
had seriously constrained previous attempls to study predictive bias by
age, ethnic group, or any other sub-categorization, all ofwhich rcduced
already small sample sizes still further (p.3).
It should also be noted tlat the number of predictors variables is also related to the
needcd sample sizc; thc grcatcr the number of variables, the larger the sample sizc
needs to be (Gay, L.R., 2000, p.483).
2,8. Related Predictive Validity studics, abroad.
Prcvious researches conceming the predictivc validity of differenl selection
instruments are presented in this section ofthe rcvi$v.
What are lhe Best predictors ofcollege grades?
Willingharn (1985) evaluated more than 30 factors, as predictors ofcollege grades to
in order determine rvhich would best predict college gmdes/outcomes. He found th.t
only six ofthe factors were significant conelated wilh student academic achievemcnt
in college. He concluded that the high school GPA of the student was The strongest
predictor of college grades.
The studies also identified lhat standa.dized test scores rverc the sccond best prcdictor
of future performance/college grades (Willingham, 1985; willingham et al., 1990).
Ramist et al. (1994) after examining studenls in ll different colleges, found that the
combination of SAT score and high school GPA was significantly correlated (r =
0.420) with freshmen grades.
lll
The predictability ofA lc1'els (equivalellt to IDaermediate leyel itr pakistatr).
McManus, I.C., Porvis, D.A., Wakeford, R., Fcrguson, E, James, D, Richards, p,
(2005) explaincd the following three broad reasons in favou. ofA levets (equivalent
to lntcrmediale icvel in Pakishn) as predictor for medical oulcomes:
l. Coguitive ability:
By quoting Ferguson E, James D, Nradele),, L. (2002), ftey explained riatexaminations of A-levels measures intclligence indirectly, and there is
established evidence of posilive corelation bcnveen intelligence and
outcomcs ofbiologicrl and social scicnccs.
2. Substa[tivecontent;
They further argued that therc are content rvise commonalitics benveen A
levels and in the subjects ofmedicine- At A levels students study broad based
facts, ideas, and theories in the subjects like biology and chemistry, rvhich
providc basic foundation for further lcaming in medicine.
3. PcrsoDality:
Achieving high grades at Alevel dcpends on personal characteristics like
motivation, comrnitmen! personalily, and attitudes of individual and equally
applicable forthe achievements in lhe fleld ofmedicine.
They supported the A levels in predicting the outcome of universiry and medical
school against li€ intellectual aptitude test. According to thcm the published studies
havc not been shown that intellectual aptitude adds value to the selection process.
The Best predictors ofcollege grades
Willingham (1985) evaluated more than 30 factors, as predictors ofcollege gmdes to
in order determine which would best predict collegc grddeyoutcomes. He found that
only six ofthe factors were significant correlated with student academic achievement
in college. He concluded that the high school CPA of the student was the strongest
predictor of college g.ades.
The studies also identified that standardized test sccres were the second best predictor
of futurc pcrformancdcollege grades (\yillinghant, 1985; Willingham et al., 1990).
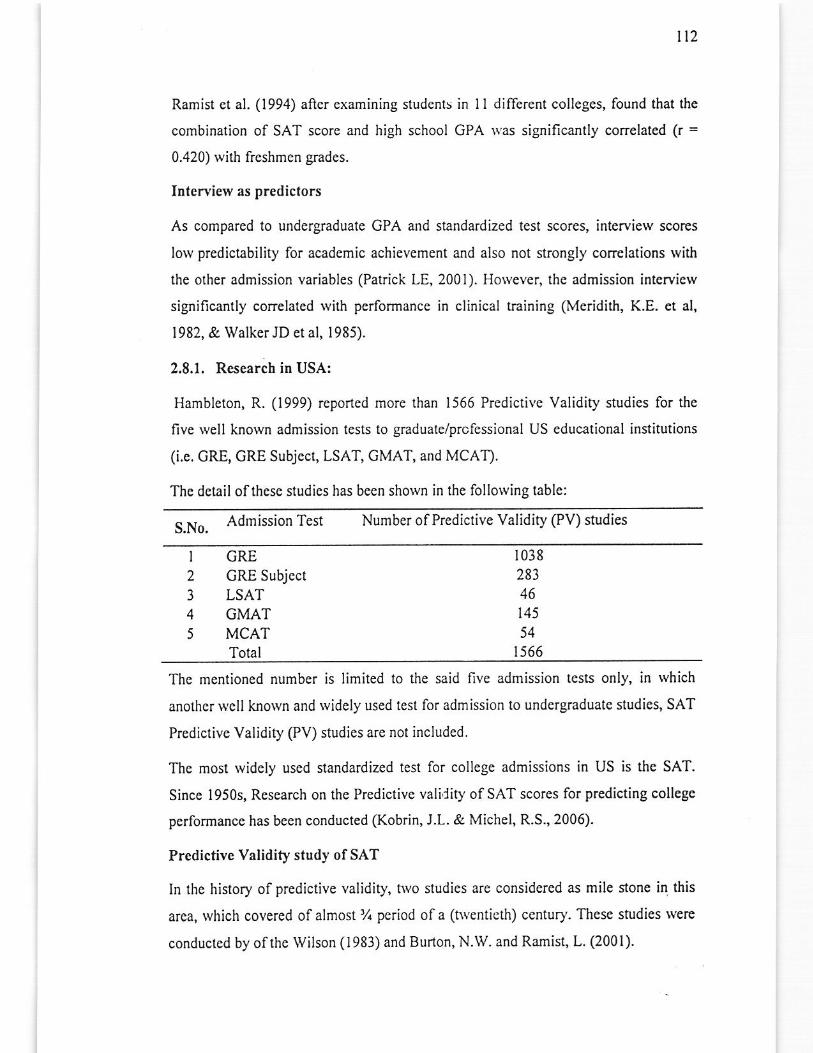
Ramist ct al. (1994) after examining students in I I different colleges, found that the
combination of SAT score and high school GPA $as significantly correlated (r =
0.420) rvith freshmen grades.
Itrierview as predictors
As compared to undergaduate GPA and standardized test scores, interview scorcs
low predictability for academic achievement and also not strongly conelations with
the other admission variables (Patrick LE, 2001). However, the admission int.rview
significantly correlated with performance in clinical training (Meridith, K.E. et al,
1982, & Walker JD et al, 1985).
2.8.1. Research in UsA:
Hambleton, R. (1999) rcported more than 1566 Predictive Validity studies for tie
five well known admission tests to graduate/prcfessional US educational institulions
(i.e. GRE, GRE Subjcct, LSAT, GMAT, and MCAT).
Thc dctailofthese studies has been shown in the Iollowing tablc:
S.No. Admission Test Number ofPredicrive validity (PV) studies
I
2
3
4
5
GREGRE SubjcctLSATGMATMCATTotal
r 038
46145
54
r566
The m€ntioned numbcr is limited to the said fivc admission tess only, in which
another well known and widely used test for admission to undergraduatc studies, SAT
Prcdictive Validity @V) studies are not included.
Thc most widely used standardized test for collcge admissions in US is thc SAT.
Since 1950s, Research on the Predictive valility ofSAT scorcs for predicting college
pcrformance has been conducted (Kobrin, J.L. & Michel, R.S.,2006).
Prcdictive Validity study of SAT
ln the history of predictive validity, hvo studies are considered as mile stone in this
area, which covered of almost % period of a (nventicth) century. These studies werc
conducted by ofthe Wilson (i983) and Bunon, N.W. and Ramist, L. (2001).
ll3
The study of Wilson (1983) covers classes gradualing berlveenl93o and l980.His
study was based ofabout 12, 000 studenls tyho graduated from 40 institutions. The
main purpose of his study was to determine prcdicting cumulative college GpAs
admission variable like SAT. The srudy found rlat rhc combination ofSAT scores and
high school records provided better predictions than either grndcs or test scores alone
and SAT scores made a subsiantial contribution to predicting cumulative CpAs.
For cumularive college GpAs, Burton, N.W. and Ramin, L. (2001) ,evielved
predictive validity Studies about classes graduaring between 1980 and rhe mid 1990s.
In this study, the researchers revielved 14 studies, $,hich is not a big number, ,,but a
number ofthem are based on large, multi-institurion, rcpresentativc samples,'(p.l). In
this rcview thcy summarizcs studies ofabout 80, 000 students who graduated from 80
institutions sinca 1980 plus one study ofstudenb lvith disabilities covering graduated
from 124 different institutions.
Studies considering "students graduation" as criterion, rvere based on almost I00, 000
students from nearly l, 000 colleges and universities, which is broad representative
samplc.
Along with other variables, SAT@ scores and high school records were the most
common predictors in this review. The study anal,zcd several validity criteria Ooth
cognitive and non-cognitive) such as cumulalivc 6PAs, graduation, nonacademic
accomplishments, Ieadership in college, and postrollege income. But the cumulative
GPAs and graduation *ere most frequently studied as criteria in lhese studies.
The results ofthis roview rcvcaled that lhe predictive porvcr ofSAT scores and high
school increased when used logether as compare to use either predictor alone.
They explained:
The revierv establishcs that SAT scores and high school records predict
academic pcrformancc, nonacadcmic accomplishments, Icadcrship in
college, and post college income. The combination of high school
records and SAT scores is consislently the best predictor. Academic
prcadmission mcasurcs contribute substantially to predicting academic
success (gmdes, honors, acceptance and gradualion from graduate oa
professional school); contribule moderately to predicting outcomes
ll4
with both acadcmic and nonacademic components (persistence and
graduation) ; and make a small but significant contribution to
predicting coliege leadership, college accomplishments (artistic,
athletic, business), and post college incomc. A small number ofsrudies
of nonacademic predictors (high school accomplishments, attitudes,
intcrests) establish thcir imponance, panicularly for predicting
nonacademic success (p.1).
They also inferred that "the information available from studies of first-year grades is
gcnerally comparable to the information from studies ofcumulative grades, providing
somc support for Wilson's observation to that effecf'(p.25).
The study also provided evidencc Lha1 SAT scorcs and high school records modeiately
predict graduation, but not to tlat cxtent to which ia predict academic variables (like
gBdes). In sho( "this review tends to confirm the rcsults of Wilson's (1983) earlier
review ofstudies predicting cumulative college cPAs" (p.25), they concluded.
The Medical College AdmissioD Test (MCAT) Predictive Validity:
The Mcdical College Admission Test (MCAT) has received regular updates sincc ils
inccption i.e. 1928. Presently the fiflh revision of MCAT is in use which rvas
introduced in 1991.
Composition of MCATr
Thc MCAT is composed ofthc follorving four subtests:
l. Biology MCAT: This sub-set of MCAT consists of questions rclated to
Biology and Chcmistry.
2. Physical MCAT: This section covers topics on Physics and general Chemistry
3. Verbal MCAT: The vcrbal reasoning test includcs qucstions from natural
sciences, social sciences and humanities disciplines. verbal test consist of
comprchension, evaluation, incorporation of new informalion and evaluation
4. Written MCAT: The rvriting samplc of MCAT consist of hvo cssay writing,
which evaluate the ability of synthesizing ideas and concepts, ccntr:tl lheme,
powcr of organization, clarity and loSical presentation along rvith syntax,
punctuation and grammar (Evans, P. & Wen, F.K.,2007, p.157).
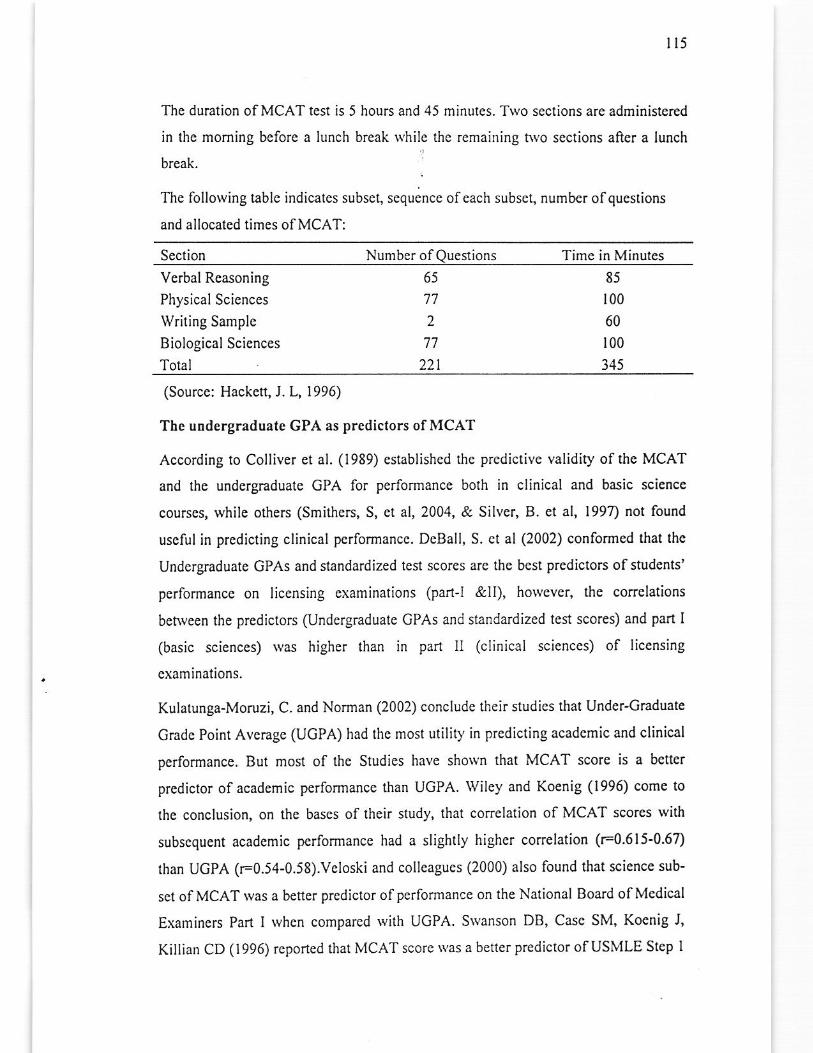
I l5
The duration ofMCAT test is 5 hours and 45 minutes. Two sections are administered
in the moming before a lunch break \\'hile the remaining hyo sections aner a lunch
break.
I ne IolloN rng !aDlc rnOlcales suoset. sequence of each subsel, number ofquestions
and allocated times ofMCAT:
Scction Number ofQuestions Timc in Minutes
VerbalReasoning
Physical Scicnces
Writing Sample
Biological Sciences
Total
65
17
2
77
221
85
I00
60
100
345
(Source: Hacken, J. L, 1996)
The utrdergraduatc GPA as prcdictors ofMCAT
According to Colliver et al. (1989) cstablished $€ predictive validity of tle MCAT
and the undergraduale GPA for perlormance both in clinical and basic science
courscs, while others (Smithers, S, et al, 2004, & Silver, B. et al, l99A not found
useful in prcdicting ciinical performancc. DeBall, s. ct al (2002) conformed fiat thc
Undcrgraduate GPAs and slandardized lest scores are the best predictors ofsrudents'
performancc on licensing examinalions (partJ &U), horvever, the correlations
between the predictors (Undergraduate CPAs and standardized test scores) and part I
(basic sciences) was higher than in part ll (clinical scienccs) of licensing
cxaminations.
Kulatunga-Moruzi, C. and Norman (2002) concllrde their studies tiat Under-Graduate
Gradc Point Average (UGPA) had thc most utilit)'in predicting academic and clinical
pcrfomance. But most of the Studies have shown that MCAT score is a better
predictor of academic perlomance than UCPA. Wilcy and Koenig (1996) come to
the conclusion, on the bases of their study, thal conclation of MCAT scores with
subsequent academic pcrformance had a slightly higher conelation (10.615-0.67)
than UGPA (r=0.54-0.58).Veloski and collcagues (2000) also found that science suE
sct ofMCAT was a better predictor ofperformance on the r.National Board ofMcdical
Examiners Part I when comparcd with UGPA. Swanson DB, Case SM, Koenig J,
Killian CD (1996) rcported that MCAT score was a better predictor ofUSMLE Step I
ll6
performancc than UGPA. Basco VT Jr, Way DP, Cilbert GE, Hudson A (2002)
found strong evidcnce ofcorrelation behvccn the MCAT score and USMLE Srep I
pcrformance than science UGPA,
These evidences were flrther supportcd by Julian, E.R. (2005) study, rvhere tle
researcher reported that MCAT score is subslanlially better than UGPA in predicting
performancc not only on USMLE Stcp l, but also on USMLE Steps 2, and 3.
The Predictive Validity of I}{CAT
Thc MCAT Prcdictivc Validity Research Stud),, reported by the AAMC C2002),
evalualed thc relationships between subsequcnt pcrlormance of medical students, as
rcflcctcd by medical-school gradcs and liccnsing cxamination (USMLE Stcp) scores
for 14 participating schools and scores oflhc mcdical-school applicants on the four
MCAT scores and undergraduate sciencc and non-science gmde-point avcmgcs
(UCPAS). Data from the 1992 and 1993 entering classes were collected from 126
students for the 1992 cohort and 107 for 1993.
The MCAT scores' unique contribution to the prediction of that perlormance lvas of
parlicular interest. This incremental predictive-validit-v approach asks, "How much
prcdictive value does lhe MCAT add above thc use of UGPA alone?" Thc study
concluded that the MCAT and UGPA5 cach contributc something uniquo to thc
prediction of medical school g.ades, and so the combination is more porverful tharl
either predictor alone (e.9., .71 combined vs. 0.54 fot UGPAS and.59 for MCATS in
Cumulative GPA).
Kulatunga-Moruzi, C. and Non-nan (2002) concludcd their studies that Under-
Graduate Gradc Point Average (UGPA) had the most utility in predicting academic
and clinical performance. Howcvcr, olher studies suggest that MCAT score is a better
predictor of academic perlomance than UGPA. Wiley and Koenig found that MCAT
scores had a slightly highcr correlation (r=0.615-0.67) with academic performance
when compared with UGPA (r=0.54-0.58). Veloski and colleagues reported that
science MCAT \vas a bettcr predictor of perlormance on the National Board of
Medical Examiners Part I (a predecessor ofthe present USMLE Step l) than UGPA-
Swanson and colleagugs lound fiat MCAT scorc \\'as a bctlcr predictor of USMLE
Step i performance than UGPA. Basco and colleagues sho*ed that MCAT score was
I l7
morc strongly relatcd to USMLE Step I peformance than sciencc UCPA.ln addition,
Julian recently reported that MCAT score is substantially betler than UGPA in
predicting performancc on USMLE Stcps l, 2, and 3, mcaning there is vinually no
need to usc UGPA to predict these scores in the futurc.
Mcgan Rae, P (2008) conductcd rcscarch on prcdictivc validity of pre-admission
critcria of medical schools i.e. Grade Point Avcrage (GPA) and Medical Collegc
Admissions Test (MCAT) for criterion variablcs i.c. Medical school GPA and
Comprehcnsive Osteopathic Medical Licensing Eram (COMLEx).
Thc rcsearch found that both incoming GPA and MCAT score are good variables to
use to prcdict academic performance in medical school and scorc on the licensing
board exam. Thc research funhcr concludc that rural populations presented similar
scores on prcadmission variables but the perfonnance of rural populations on lhe
COMLEX Level I exarn rvas under predictcd.
Sludy on MCAT and first year GPA
Lydia S.K (2005) evaluatcd the rclationship bct\Yccn thc prcdictors (Mcdical Collcgc
Admission Test sublest scorcs and undergraduatc GPA) and the criterion (first-year
medical school GPA).Total 3, 187 studcnts drawn from 1992 and 1993 cohorts of 14
medical schools of United States rvas used as sample in the study. Using Statinical
procedures likc regression analysis, Fisher's z tmnsfomtations, F-ratio test ofequality
of standard errors of estimale, and ANCOVA, the researcher found the combination
of MCAT subtest scorcs and undergraduate GP;\ as porverfirl indicator of
performancc in the first-year of medical school. About thc Diflerential validity the
study also showed that in most cases Nomcn had higher validity coeflicicnts
compared to men.
In the United States, the updatcd Medical College Admission Test (MCAT) battery,
introduced in 1991 for the seleclion of medical students. Mitchell K; Haynes R;
Koenig J (1994) assessed thc prediclive validity ofthe MCAT, undergraduatc grddes,
and of undergraduate sclectivity data fo. first-year gradcs at 12 institutions. The
rcsearchers found the MCAT scores, undergiaduate grades, and selectivity data not
only for identirying suitable individuals for admission but also for subsequent
acadcmic perlomance in medical schools.
ll8
The MCAT assesses the performance of students in the areas of BCp (biology,
chemistry, and physics) subjects, along ,wilh scienrific problem solving, crirical
thinking and writing skills. According to several independent researchcrs, the MCAT
score has strong predictability for medical school performances, especially for the
first two years of medical school classroom work. Horvever, its predictive power
droppcd sharply for success in clinical training or actual practice as a physician.
Mccaghie, W (1990) argucd rhat
No physician answcrs pages of multiple-choice qucstions when he or
she practices clinical medicine...Gndes predict gmdes, tcst scores
predict test score, mtings predict ratings, but anempts to demonstmte
scientilic convergcnce among such indicalors of professional
competence have not been successful (Abstraci).
Elam, C.L,; Johnson, M.M.S. (1992) research srudy lurther supporred this concept
and staled that ".s a student progresses through medical school the power of the pre-
admission interview ratings to predicl medical school grade point avemge (CpA)
generally increases over time rvhile the porvcr ofMCAT scores decrcases".
Basco, W.T., lr., Way, D.P., Gilberf G.E., & Hudson, A. (2002) conducted a study ro
explore the use ofinstitutional MCAT scores as a measure ofselectivity in predicting
medical school perfo.mance. Their research was based on two public sector medical
schools of the United States. Matriculants' undergraduate sciencc grade-point
averagcs (SciGPAs), and three MCAT scores (Ph)'sical Sciences, Biological Sciences,
and Verbal Rcasoning) rvcre sclectcd as Indepcndent variablcs. The matriculants'
scores from their first sittings for the United Statcs lvledical Licensing Examination
Step I (USMLE Step l) was lhe dependent variable in rhis study. This study
confirmed the findings of the previous studies and concluded that undergBduate
science GPAS and MCAT scores arc strong predictors of standardized test
performances during medical school.
About the interview as selcclion criteria, Elam, C.L.; Johnson, M.M.S. (1992)
concluded their study in thcse words:
If thc interview is expected to be a mcasure of non-cognitive qualities and abilities,
structured interview formats should be cr*ted to assess specific personal dimensions
I t9
so as to increase inlervieu'er consistcncy and to act as ktter outcome measures to
chan the prediclive power oithe interview (Abstract).
Shcn H; Comrey AL (1997) studicd the predictabilit). of mcdical studcns' academ ic
performances by their cognitive abilities and personali$'characteristics at fie
Univcrsity of Los Angeles, Califomia, UCLA School of Medicinc. Students' pre-
medical GPAS, MCAT scores, and personality traits rvere used to predict their
medical school performances. The researchcr stated on the basis oftiere findings that
The MCAT score was a strong prcdictor of medical school performances, as
moasurcd by medical school GPAS and the National Board of Mcdical Examincrs
cxamination scores. Horvever, its predictive porver dropped sharply Nhcn clinical
performance and personal suitability $cre Part ofthe perlormance evaluation. About
tho predictability of penonaliry chamctoristics $e study concluded tlat specific
personality traits not only slrenglhened the predictive porver of cognitive ard
personaliry variables .join(ly, but also becamc the primary prcdictors of clinical
performance
Julian, E. R. (Octobcr, 2005) conductcd study on the relationships between MCAT
scorcs and (l) medical school Srades, (2) Unitcd States Medical Licensing
Examination (USMLE) Stcp scores, and (3) academic distinction or difliculty' Two
cohods of l4 medical schools, \!ho admitled in 1992 and 1993 classes was the sample
oflhis study. Geographic, racial and ethnic reprcsentation has lrcen ensured in the
sample. The sample also consisted of both public and private schools' The range of
medical students in a school was 65 to 148 $'iih a median of 126 for the 1992
acadcmic session and 107 for the 1993 session. Data about cours€ grades was
collected from 4, 076 medical studenls from both cohorts of these medical schools
whilc the scorcs ofUSMLE Slcpsl,2, and 3 were collected from more than 31,000
studcnts who enrered the I25 US medical schools in 1992 and 1993 session' The
following preadmission variables (predictor sets) were used in the analysis of this
study:
l. UGPA (undergraduate Grade Point Average)
2. All four MCAT scores (Verbal Rcasoning, Biological Sciences, Physical
Sciences and $e Writin8 Sample)
3. Combined MCAT and UGPA scores
r20
4. UGPA and undergraduate-institution selectivib,, and
5. MCAT scores, UGPA and undergraduate-institution selectivity
The outcomes variables (Criterion variables), thar were used in this study tvere:
l. Medical school year I and ycar 2 GPAS (separate and combined)
2. United Staies Medical Licensing Examinarion (USMLE) Step l, Srep 2, Stcp 3
scores, and
3. incidence ofacademic difficulty and distinction
Using five preadmission variables (predictor sets) to predict outcomes variablcs
(Criterion variables) i.e. Medical school GPAS and USMLE Step l, Srep 2, Step 3
scores, Regression analyses rvere used.
After anal)zed the data the researcher found that Combination ofMCAT and uGPA
scores were the best predictor of Medical school grades rvhile USMLE Step scorcs
werc predicled better by MCAT scorcs than were uGPAs. At tle end the researcher
conclude that "MCAT scores wcre strong predictors of scores for all three Step
examinations, particularly Step 1".
PreadmissioD Variablqs, Medical School Performance, and COMLEX-USA
Levels I add 2 Performa[ce
Dixon, D (2004) investigated the relation behvccn preadmission academic variables,
osteopathic medical school performance in the first 2 years, and pcrformance on the
Comprehensive Osteopathic Medical Licensing Examination (COMLEX-USA)
Levels 1 and 2 of the studcnts ofthe Nerv York College of Osteopathic Medicine of
the Nerv York Institute ofTechnology.
The preadmission academic variables used in thc study were Medical College
Admission Test (MCAT) sub scores (verbal MCAT, physical MCAT and biological
MCAT) and undcrgraduate gmde point averages (UGPAs).The data werc obtained
from thc American Association of Colleges of Osteopathic Medicinc Application
Service,
ThcsampleofthestudyconsistedoflT4students(93maleand8lfemale)inthsclass
of 2001 study group, rvho had completed their nro years medical education and took
the COMLEX-USA Levcl I cxamination in 1999 and the Level 2 exarnination in
2000.
Using the Pearson's correlation coeflicicnls and multiple linear regression
preadmission academic variablcs, mcdical school course grades in years I and 2, and
COMLEX-USA Level I and 2 scores rverc anal)zed. SPSS, version l0 \vas used for
analysis ofthe data.
The following main findings were drawn from the analysis ofdata:
l. The physical MCAT sub score, biological MCAT sub score, and scicnce
UGPA were significanlly corelated !\ith the year I CPA (,€ = 0.284) and the
biologicai MCAT sub score, science and non-science UGPATvere correlated
withthe year 2 CPA (.d = 0.157).
2. Physical and biological MCAT sub scores \\,ere correlatcd with COMLEX
Level- I performance (P = 0.232) and biological MCAT and thc verbal
MCAT sub scores were con'elated COMLEX l*vel 2 performaace (d :0.r68).
3. The year I and year 2 GPAs rverc corelated rvith COMLEX-USA Level I
scores (ts = 0.702).
4. COMLEX-USA Level 2 scores rvere also prcdicted by ycar I and year 2
GPAS, however, the conelations behveen year I and 2 GPAS and COMLEX-
USA Level2 scores were lower than for Level I scores.
At the end the researcher concluded the study lhat 'lherc was a significant
correlalions behvccn academic preadmission variablcs, osteopathic medical school
performance in the first 2 years, and COMLEX-USA Lcvcl I and 2 scores" (p.336 ).
Donnon, T.Paolucci, E. o.violato, C. (2007) conducled a meta-analysis of published
sludics 1o dctcrmine the predictivc validilv of thc MCAT on mcdical school
performance and mcdical board Iicensing examinalions. Thy selccted all peer-
rcvierved published studics reporting empirical data on $e relationship betlveen
MCAT scores and mcdical school performance or medical board licensing exam
measures. A Total 23 studies (l I studies of Medical school performance measures
and l8 sludics of modical board licensing cxaminations) were selccled for analysis.
122
They found the r = 0.39 as average predictive valiciity coeilicient for rhe MCAT in the
preclinical years (rvith range of0.2l-0.54) and r = 0.60 (with range of 0.50_0.6A on
the USMLE Stcp l. Thcy concludcd their study in thcse words:
The predictive validiry ofthe MCAT ranges from small to medium forboth medical school performance and ntcdical board licensing exam
measures. The medical profession is challenged lo develop screening
and selection criteria \\,ith improved validity that can supplement tleMCAT as an important crilcrion for admission to medicll schools
(p.106).
Preadmissiou Variabler and USMLE Step I and Step 2 performauce
In a more recent srudy, Kleshinski, J., Khudet S.A., Shapiro, J.1., and Gold, J.p.
(2009) examined the predictive ability of preadmission variablcs (undergmduate
Grade Point Average and MCAT scores) on Unired States Medical Licensing
Examinations (USMLE) step I and step 2 performancc. The study was based on the
data collected on matriculates from 1998 to 2004.Linear regession analysis; a
gcncralized regression neural neh\ork (GRNN) and a feed fonvard neural nenvork
(FFNN) were used for analysis ofthe dam. The rcsearchers found that undergraduate
Scicnce Grade Point Average (SGPA), the biologic scienc€ (BS) section of thc
Medical College Admissions Test (MCAT), wcre the srrong predictors of United
Stales Medical Licensing Examinations (USMLE) stcp I and step 2 performance.
Predictive Validity of Veterinary [Iedicine Admission Tcst
Thc Graduate Record Examinalions (CRE) Gcneral Tcst is a standardized test, used
as componcnt of admission criteria for admission to U.S. graduate schools, since its
inception in 1949. lt is consist ofthree sections i.e, verbal, quantitative, and analytical
reasoning.
Powers, E.D. (May, 2001) explored the validity ofthe Graduate Record Examinations
(GRE@) General Test for admissions to colleges oiveterinary medicine. He selected a
comprchensive sample ofveterinary medical colicges. The sample of tiis study was
consistcd of l, 400 students (out of 2, 300 students) of 16 participating veterinary
medicine schools (out oftotal 27 schools) \vho entered U.S. veterinary schools in the
123
fall of l998,Female students were dominated as compared to male in each schooi and,overall, they comprised about 70% offie select sar:lple.
Overall undergraduate grade point average (UGPAT) undergraduate GpA in the last
45 hours of courses (UGPA45) and GRE vcrbal. quantitative, and analltical scores
were tcated as Predictors oflhe study While Cpr\s in each semcster ofthe l99g-99academic year (the first ycar) of veterinary school, gradcs in key individual couBes
for some schools and sludent perc€ptions of their own first-year success and
expcriences were considered as outcomes in the study. Thcsc preadmission variables
were examined individually and in combination to asscss their ability to predict
success in velerinary school. ARer using statistical mcthods for both range ,estriction
and unrcliability of the criterion, the researcher found the rcsulting validity
cocfficients 0.53 for GRE composite scores (verbal, quantitativc, and anallical
rcasoning when used togethe0, 0.56 for overall undergraduate CpA; and adding GRE
scores to undergEduate GPA it increased to 0.72. So it is cleared from the findings
that GRE General Test scores and undergraduatc grades, as admission criteri4 were
lhe best predictors as admission critcria for veterinary school out com measures.
2.8.2. Rescarch in Canada
Predictivc ValidiS ofMedical School Admissions Criteria
Peskun, C. Detsky, A. Shandling, M (2007), conducrcd study on Effecliveness of
medical school admissions criteria in predicting medical school performancc and
residency mnking by postgraduate Inlemal Medicinc and Family Medicine residency
pro8rammes in Canada. Thcir study sample consisted of 5 classes of University of
Toronto medical school students who had admitted between 1994 and 1998. They
applied for postgraduate training from 1999 to 2003 (in thoir rcspectivc graduatinB
year) through the Canadian rcsident matching programme to positions in Family or
Intemal Medicine at the University of Toronto. Total 760 students had applied to
posrgraduate training in Internal Medicine and Family Medicine (315 subjects applied
to the Intemal Mcdicine and 345 subjccts to thc Family Medicine residency
programme) between the years 1999 and 2003.
121
As the relationship was developcd among Admission variables, Medical school
variables (out comes) and Residency ranking in fiis sludy, so in the follorving lines
thesc variables are briefly discussed.
l. AdmissionYariablesi
The sample studenls wcre evaluated by both academic measures and non-
academic measures. The academic measures undergraduate Gp and, MCAT
score while in the personal essay, autobiographical sketch (a listing of extra-
curricular activities), letters ofreference by 3 evaluators (a faculty member, a
medical student and a member of the community) and semi-structured
interview wcre the non-academic measures ofthe admission criteria.
The academic and non-academic mcasures were then combined, tvith a 60 :40
weighting (whh weightings of 60% acadcmic measures, 20% interview and
20% non-cognitive assessment) for final score/ranking of applicans for
admission to Medical school.
2. Mcdical school variable! (out co6es):
The following medical school outcomes (criterion measures) were used as
predictors ofresidency ranking in this study:
a. Objective Strudured Clinical Examination (OSCE) score (conducred at the
end ofthe 2nd academic year)
b. Intemal Medicine and Family lledicine clerkship grades and ward
evaluations (standardized forms trsed to evaluate cognitive and non-
cognitive domains of students)
c. Final medical school grades: these were the combination ol ward and
examination scores, as rvell as the overall final grade (average of all
academic performance throughout the 4 year, in medical school.
3. Residency ratrking:
After 4 ycars medical education, the Famiiy Medicinc programme offe.ed interviews
to studehts rvith high achievcmcnts, by eliminating srudents rvith poor academic
records, afler assessing applicant's prcvious record files. Ranks rvere assigned on the
basis ofall componcnls ofthe assessment process.
125
Using corrclation and iogistic rcgression tcchniques the rcsearchers found that, likethe rcsults of many previous studies, GpA and MCAT provide the best correlations
rvith final gradc in mcdical school. The stud),also establishcd relationship between
non-academic measures (interview and non-cognitive asscssment) and mcdical school
out comes, especially non-cognitivc competencies (which \\cre measured by OSCE
score). In addition, this study provides evidence thar residency ralking in borh
Intcmal Medicine and Family Medicinc Nas also predicted by 2nd-year OSCE score.
After discussing the pnrnes and crones ofthe study, they concluded their discussion in
thcsc words:
The results ofthis study suggest that cognitive as rvcll as non-cognitive
factors evaluated during medical school admission are important in
predicting fulure succcss in Medicine. The non-cognitive assessment
provides additional value io standard academic criteria in prcdicting
ranking by 2 rcsidency programmes, andjustifies its use as part ofthc
admissions process (p.5D.
Thc prcdictability ofHigh-School Grades for louger-term college performauce
Ceiser, S. and Santelices, M.V. (2007) challenged conventional view that
standardized tests are more reiiable and valid yardstick for assessing student ability
and achievcment for college admissions, ard prcdicting longer-term college
performancc than High-school grades. Their sludy was bascd on tie analysis of
Approximately 80, 000 firsFtime freshmcn who entcrcd University of Califomia (UC)
ovcr the four-year period from 1996 through 1999.
High-School Grade-Point Average (HSGPA) and sta dardizcd test scores on each of
tho five tests required for UC admission (i.e. SAT I verbal and math (or ACT
equivalcnt), SAT ll writing and Mathematics, and a SAT II third subject test) were
considered the main predictor variables in the study.
Graduating within dle normative time-toJegree of four years and Cumulative four-
year college CPA (as main indicators ofIong-te.m "success" in college) were sclected
as outcome Mcasurevcriterion in this research.
126
Descriptive statistics, correlation and regression cnal)'sis rvcre used to determine the
extent lo Nhich the predictors (high-school grades and test scores) predict tIe
outcome measures i.e. Iong-term college outcomcs (such as four-year graduation or
cumulative CPA).
Using the above slatisticalaralysis the rcsearchcrs found thc lollowing main findings
from their study:
l. High-School Grade-Point Average (HSGPA) was strong€r predictor than
standardized admission test scores of four-]'car college outcomes for all
acadcmic disciplines, campuses and cohons in the study sample.
2. The predictive porver of HSGPA increases from the freshman ycar to fourth-
yea. for college grades.
l. HSGPA has less open 10 cthnicity and social biasness than standardized tests.
On thc basis oftheir results, thcy recommendcd that Srcater weightcd may be given to
High-School Grades than the stardardized tests, in college adrnissions criteria.
NoIl-cogsitivc attributes aDd Medical studeIts' performance
A rcccntly publishcd study (Donnon, T. Oddonc-Paolucci, E, violato, C., April,
2009) investigated th€ predictive validity of a semi-structured interview for
admissions to medical school based on medical judgment vignettes: (l) ethical
dccision-making (moral), (2) relationships rvith patients and their farnilies (altruistic)'
and (3) roles and responsibilities in professional relationships (dutiful).
The sample ofthe study comprised of26 meoical students admitted to undergraduate
mcdical education program in the medical school at the Univcaity of Calgary,
Canada in the class of2007 in rvhich 16 rverc fcmales (61%) and l0 were males
(39%) with a mean age of26.4 years (range l9-16).
lnterview, as a part ofadmission criteria, was taken as predictor and thei. subsequent
pcrformance results{taken from their In-Training Evaluation RepoG (lTERs) } from
clerkship 3 years latcr (the undergraduale mcdical educalion program at this medical
school is 3 ycars) were considered as out come mtasures in thc study.
t21
The study established evidence that semistrucrured interview, used for the
assessment of medical students' non-cognitivc attributes, has predictive validity for
clinical performance ovcr a 3-year period, indicatcd by scvcn mandatory clerkhipRotalion In-Training Evaluation (lTERs) repo(s. They conclude that interviet% as
component of selection criteria, significantly conclated with medical studenG
outcomes from flrst to fnal y ear (r = 0,39, p < 0.05; to r = 0.55, p < 0.0 I ).
2.8.3. Rescarch in UK:
ParD,, l, (2006) stated that "The helerogenciq'in selection processes exists both
behveen and within countries" (p.l006).
Medical schools SelectioD criteria in UK:
Almost all the English mcdical schools admit applicants lo a live year "traditional"
medicalcourse on academic criteria as wellas non-academic criteria.
Acadcmic criteria:
High grades in the A level exams (exams laken at age l7-18); with science subjects is
a common requirement for admission to medic-al schools.
According to Parry, J, Mathers, J., Stcvens, A., Parsons, A., Lilford, R., Spurgeon, P.,
Thomas, H. (April,2006) "Previous academic performance has been shotvn both in
the UK and the US to predict future academic pcrformance, tltough correlation witi
clinical skills and postgraduate pedormance are lcss clcai'.
Non-academic criteria;
Most of the medical schools in UK considered some aspcct of non-academic criteria
when assessing the sfudent's personal statement and the referee's rePort presented in
the UCAS (the Univcrsitics and Collegcs Admissions Service) application form.
Although the non-academic criteria vary from school to school both in tems of
numbcr and nature but even then the follorving commonality can be found:
l. Evid€nce ofmotivation for, and a commitment lo, medicine;
Experience of team rvorking and leadcrship skills and thc acceptance of
rcsponsibiliry;
A range ofextmcunicular interests; and
2.
3.
t2&
4, Experiencc ofrvorking in health or social care settings.
Thc inferview:
They also found that most schools used a combination of the candidatc's personal
statemcnt, their referee's report, and an intcrview. Students are short listing for
intervicw on the basis ofacademic performance and the information prcsentcd in the
UCAS form and on a wider range ofnon-academic criteria use various techniques and
tools. Intcrviews vary from school to school in terms of structure, content, lenglh,
pancl composition, and scoring methods.
The literalure revicw about the rescarch studies oD predictive validities by
Ferguson & Madeley
A sludy conducted by Fcrguson, E., James, D. & Madeley, L. (2002) in UK to review
the litemture about the research studies on predictive validities and to explore the
Factors associated with succcss in medical school.
Medline OvlD citations, Web of Science, and PsycLlT, databases and threejoumals
i.€. M€dical Education, Joumal of Medical Education, and Academic Medicine rverc
anallzed to identiry papers on the predictive validity ofas many aspects as possible of
the process ofsclecting med ica I students.
The result ofthe.eview ofthe reseaich papcrs publishcd is given in the table below:
S.No. PrcdicloryPreadmissionVariablss No. ofstudics
I Previous academic performance
2 Personality
3 Sex (Gender Issue)
4 Ethnicity
5 Motivation or study habits
6 Interviews
7 Personal statements
8 References
Total
62
3ll6t41l
I602
0l153
Thc mcla-analyscs for undergraduate pcrformance, \Yith a total sample sizc of2l 905
panicipants (mean 248.9, SD 265.06) thc average correlation coelljcients effect siz4
was 0,30 (with range of 0.22 to 0.74).After correction for restriction of range and
unreliability incrsased thc coefficient to 0.48 (\\'ith range of 0.40to 0.51), which
129
indicatcs that 23yo of variancc in medical school pcrformance can be explained by
prcvious acadcmic performancc.
Iutcrviews as predictor of medical performance:
Weiss ct al (1988) referred the ag.eement among lhe dcans ofmedical schools in all
of thc Gulf Shtes that entmncc examination in scicnce subjects and a structured
intcNicw may be introduccd in the systcm ofadmissions to medical colleges.
Fcrguson, E., Jamcs, D, & Madeley, L (2002) reponed 3 q?es of studies, which
cxplored the predictive po\\er of interviclvs. Thc first typc comparcd lhe performancc
of mcdical students \vho ,vere selectcd on thc basis of interview along with other
mcasures with that of students Nho Nere accepted \yithout interview. The studies
concluded that there was no sigaificant diffcrencc in the performancc of the two
groups and the inclusion of interview added litlle to thc sclection process.
Thc sccond type of sludy, conelated interviewers' ratings to the prc-clinical success,
wilhdrawal, and drop out rates and overall rating ofthe graduate physicians' potential
compctency as doctors. Thcse studies reported that intervielv scores conelated with
future success of medical students.
The third type study compared lhe intcwiew with other pre-admission criteria. The
result of thc study showed lhat Intervielv ratings rverc indcpendently associated with
succcss in early training after controlling for g.ade point average.
Utriversity of NottiughaDr study
Admission to medical schools no longcr bascd solely on high academic qualifications
but include varied non-acadcmic criteria as well no!v. ( Yatcs, J., Jamcs, D., 2006)
The UK General MedicalCouncil (GMC) has supponed such a curriculum objective
that should cover not only knolvledge but also skills, attitudes, and behaviour (GMC'
2003.)
Admissions process at University ofNottingham cunently comprises four stages:
i. Revierv ofacademic ability.
ii. Scoring of a validated questionnairc that focuscs on personal attributes and
attitudes,
130
iii. Review ofthestatements on the application fonn from UCAS (the Unive.sities
and Colleges Admissions Service), and
iv. A semi structured intcrviev by two trained interviewers (Yales, J., James, D.,
2006).
2.8.4. Rcsearch iu Australia:
Btackman, I. (2004) study was focused on the factors that influenced academic and
clinical achievement for gmduate-€ntry mcdical srudents complcting their third yea!
of university studies in Australian. Nine latent variables (including the students'
background, previous succssses with their undcrgraduate and postgraduate studies,
Graduate Australian Medical School Admissions Test and their interview selection
scores. werc considered to Predict Academic and Clinical Achievement.
The total sample of99 Australian graduate studenls (consisting of two g.oups of 5l
and 48 studcnls), who commenced thcir four.year graduate medical program in 1998
and 1999 academic session and who had completed their third ycar ofmedical studies
was solected for study. The sample consisted of 51yo rnales and 43yo female medical
studcnts, Aftcr analysis the rcsearchcr concludcd that GAMSAT scores and intcnierv
were not good predictors ofstudent achievement
In thc words ofthe researchcr:
lnterview and GAMSAT scores on liere o\r'n do not add to the
explarBtion of student achievcment in lhis srudy, they are tiemselves
strongly influenced by other student variables particularly those relatcd
to the student's prcvious study (Abstract).
Graduate AustraliaD Medical School Admissions Tcst (GAMSAI) and
strucf urcd interviews as Predictors
Crovcs. M.A.. Gordon, J. & Ryan, G. (2007) concludcd their study that there is no
rolationship behveen the Craduate Auslralian Medical School Admissions Test
(GAMSAT) and structured interviervs and their subsequenl pcrformancr (both clinical
rcasoning skill and acadcmic performancc) in mcdical school. Thc results of their
study challenged the predictive validity of GAMSAT and the reliability ofadmission
intervicws. In thcir study they invited Years 2-'{ Students of the giaduate-entry
l3l
programs at thc Univcrsities of Queensland and Sydney to complete two previously
validated tests of clinical reasoning i.e. Clinical Reasoning Problems (CRP5) and a
Diagnostic Thinking lnventory (DTI) test. Total I89 sludents over the 2003 academic
year, voluntarily (13.60% response ratc) participatcd in these clinical reasoning tests.
Admissions crileria in tiese universilies consisted of Intervierv and GAMSAT
(consists of th.cc sections: Reasoning in Humanitics and Social Scicnc€s, Wrinen
Communication, and Reasoning in Biologicaland Physical Scicnces). The GAMSAT
dcsigned to measures mastery and use of concepls in basic science and skills in
problem solving, critical thinking and writing \Yhile'1he intervicw is designed to
cvaluate communication skills, cognitive style and dccision-making ability'
coopemtiveness and participation, motivation, and personal attributes, including
empathy and self-awarencss" they cxPlained the purpose.
Subsequcnt performance in mcdical school such as Sludents'test results on a set of
Clinical Reasoning Problems (CRPS) and a Diagnostic Thinking Inventory (DTI) and
thoir Year 2 examination results werc considered as outcome measures in the study.
Using descriptive statistics, contingency tables and / tests, One-lvay analysis of
variance and general Iinear modeling, they detcmlined the predictive power ofentry
chamcteristics for clinical reasoning skill and academic performance-
The rcsearcher found no association behleen perlormance in GAMSAT and
performance in the CRPS while conclation bet\'€en performance in CAMSAT a]ld
fie DTI was weak negative (-0.05 > r> -0.31, P = 0.03). They lunher found that the
correlation between GAMSAT and Year 2 cxamination rcsults was weak (r<0.24' P =
0.02). Wcakly negative (/ = -0.34, P < 0.0i) and Tveakly positive (r = 0.ll)
conelation was found bcttYeen GAMSAT and interview scores for University of
Quccnsland and Univcrsity of Sydney rcspcctiYely. The invcsiigators concluded their
study "we did not find evidence that GAMSAT and structured interviervs are good
prediclors of performancc in medical school". They funher statcd" our study
highlights a need for more rigorolls evaluation of Australian medical school
admissions lests".
Coatcs, H. (Sep 2008) examined the crilerion validity oftle Graduate Medical School
Admissions Tcst (GAMSAT), an entrance test has been used Australia, UK and
132
lreland, , in combinalion with grade point average (GPA) and interview scores for
medical outcomes. The study was bascd on datl from six medical school and 351
medicat students. The results of the study revealsd that GAMSAT and CPA scores
provides together are the best prcdictors Year I performance. Howeve., the study
shoNs divcrgent predictability of GAMSAT, interview and GPA scores for
subscquent medical performance.
2.8.5. Research in Thailand
Iramancemt, C. (2006) invesligated thc prcdictive validily of high school grades for
medical school gradcs in Thailand. Total 223 medical studcnts[admitlcd from nvo
admission systems: thc national entrancc (lll students) and the institutional enlrance
(l12 students) l, who admilted in the 1997 academic session in the Faculry of
Medicine, Sirimj Hospilal, Mahidol University, Thailand.
By using Hierarchical multiple regrcssion the rescarcher found that high school
grades were the significant prediclor ofpremedical gtades (d = 0.07, -F Q'214) =
8.83, p < 0.05), afler conlrolling for *le cffect of demographic and enttarce
examination variablcs.
The invcstigator concludes that:
Measures of cognitivc abililies in academic contcnt were good in
predicting short-lerm academic achievement. Long-term academic
achievement in the medical school could bc better predicted from
academic orientalion, commitmcnt to thc medical study, and
demographic traits (p. 505).
2.8.6. Research iD Nepal:
A study conductcd by Niraula, S.R. & Khanal, S.S. ( March 2006) in Nepal has very
close resemblance witl medical education in Pakistan and my study, where they
analyzcd the performance of the first three classes of MBBS (Bachelor's Degtee in
Medicine and Surgery) studenls, who g.aduated betrveen 1999 and 2001 at B. P'
Koirala Institute ofHeal$ Sciences (BPKIHS), a hcalth sciences university in N9pal,
to d€tcrminc the extent to which the premedical performanc€ (preadmission variables)
prcdict achievemcnt in thc mcdical program.
133
The sample oflhe study consisted oftotal 86 studcnts ofthe first three classes (1994,
I995, and 1996 academic session) includes 29,29 aod 28 studcnts ofthe first, second
and third acadcmic session respectively.
High school or school Ieaving certificate score (SLCS), Ten plus hvo or intermediate
lcvel in science scorc (lSS), Entrance cxamination score (EES) along with Gender and
Medium of schooling were taken as predictors in the study rehile the annual MBBS
scores (including 30% intemal assessmcnts and 70% annual cxam) from First to Fiflh
year MBBS and Average MBBS score ( the avemge ofpercentage scorcs of5 years)
vere considered as criterion measures. Analysis ofvariance (ANOVA) and Pearson's
coftelation coeflicicnts \vere calculated to detennine the predictive validity of
premedical performanca for lh€ medical achicvcments ofmedical students.
Thc rescarchcrs concluded that there was no relationship of medical outcomes with
High school or school leaving certificate score (SLCS) and cntance examination
scorcs. Howcver, performance at MBBS course was significantly corrclated with
intermediate level in scicnce score (r=0.2417, p<0.03). Moreover, annual medical
pcrformancc scores were found to be significantly conelated with each other.
Thcy also concluded that "Gender and mcdium of schooling did not have ary
significant role in the performance ofany level ofMBBS" (p.8).
At the end they extended their recommendations for standardization of the entrance
selection procedure of MBBS at BPKIHS. Thcy suggcslcd $at in the Selection
procedures the assessmcnt ofnon.cognitive knolvledge may be included. Along rvith
cognitive abilities, intervicrv may be included as component of sclcction process to
asscss thc studcns' personal characteristics
2.8,7. Research iD Czech Republic
Study conducted in the Charles Univcrsity, Prague, Czech Republic by Hoschl, C. and
Kozcny, K (1997) also provide evidence in the support of predictive validity of
enkance test for the first 3 years ofmedical study. Their study was based on the data
collccted from a study of 92 students admitted in 1992-1993 academic year and rvho
rvere still in the medical school at lhe end of the sixth semester (third year).The
follorving four Variable Ncre selected as Predictol
i. High school gade point averagcs (GPA) in physics, mathematics, and lhe
Czech language over 4 years ofstudy
ii. Results ofadmission testsin biology, chemistry, and physics,
iii. Admission commitlee's assessmcnt ofthc applicanfs ability to reproduce a
text, motivation to study medicine, and social maturity
iv, Scorcs on the sentimenlality and attachment scales of the Triiimensional
Personality Questionnaire.
Thc first-, second-, and third-year Cradc Poinl Avcrages (GPA) ofmedical school was
used as the dependent variables in this study.
Tho study concluded that Predictor variables (i.e. high school grade point averages,
written enttance examination, admission intervie,v, and personality traits) found
significant predictors ofacadcmic success duringthe first 3 years oFmedical study'
2.8.8, Research iD India
A retrospective study of4 consecutivc batches ofstudents at l-ady Hardinge Medical
College, New Delhi in the MBBS examination was conducted by Choudhry & Garg
K, Gaur U, Anand C. (1994. Thc students were cividcd into 3 calegories bascd on the
criteria of entrance into the medical college. The calegory I included studenE who
entered through a tough pre-medical test, category Il comprised those nominated by
govemment and defense personnel and category Ill included the Schedule Castg and
Schedule Tribe students. The results ofthe category I lvas remarkably better than that
ofll while that to category III was dismal. The last hvo categories had a large number
of students lcaving thc collegc without completing their course, resulting in 54%
wastage ofmedical seats and psychoiogical distress to the studcnt concemed'
2.8.9. Research in Sri Izrka
Do Silva NR, Pathmeswaran A, De Silva, H J. (2004) anal)zed the data ofall students
in hvo consecutivc entry cohoru in a Sri lrnkan medical school. The sample size of
the study was 331, in which 46.8% were fcmale studcnts. The main purpose of this
study was to assess the extent to which the sclection criteria predict€d success in
medical school. The follorving selccted Prcadmission variables were included in the
study:
135
l. Marks obtained at the National University Entrance Examination (NUEE) in
physics, chemistry, botany and zoology
2. T7\e aggregale mark of thcsc four subjccts (physics, chcmisrry, botany and
zoology)
3. The dist.ict of eniry ('underprivilcged' dislricts ctc; the other, non-academic
criterion) and gender Success in all examinations in the medical school lvas
considered as criterion in the study.
Using multiplc logistic regressions for analysis, they found only 2-5olo of variaace
between the aggrcgale score alone and medical school pcrformance. So the
researchers coniluded that only mcasurc ofacadcmic perlormancc uscd for selection
ofmcdical students is a very rveal prcdictor ofsuccess in a medical school.
ln Sri Lanka, another predictive validity study conducted by de Silva N&
Palhmeswaran A, de Siiva N, Edirisinghe JS, Kumarasiri PV, Parameswamn SV et al
(2006) by taking 1740 students (ranged from 212 to 356, rvith a median of 285),
admilted to all six medical schools in two consccutive entry cohons. Along with
othq variables, the General Certificate of Education (GCE) Advanced l-evel
examination was used as predictors and Success in medical school examinations as
criterion were considered in the study. To prcdict lhe outcome measures fiom
admission criteria, logistic regression rvas for analysis in the study. The researchers
concluded "Marks obtained at the A Lev€l examination (the only academic criterion
currently used for selection of medical students in Sri lanka) is a poor pr€dicto. of
succcss in mcdical school".
2.8.10. Dental Predictive Validity Studies
Previous researches (such as Heller, D.B, Carson, R.L, & Douglas, B.L., 1965, Chen,
M.K, Podshadlcy, D.W, & Schrock, J.G., I967, and Kreit, L.H, & McDonald, R.E.,
1968) identified undergraduate GPA to be thc stron8est predictor ofdental success.
Coll€ge GPA signillcantly conelated with dental school performance rvith the wide
rangc ofr=0.19 to 0.61 and explained from lcss than 5 percent to nearly 40 percent of
the variation.
The study ofSandow et al (2002) found undergraduate science GPA to be a rclatively
sfong predictor of dental school GPA as compared to Nonsciencc College GPA-
136
They found the corrclation coeflicient r-0.29-0.41 and F0.43 for yearly aad final
dental school GPA.
In addition to college CPA, the DAT and collcgc GPA combined has becn found to be
one of the most consistent predictors of dental performance, specifically in thc fi.st
year or first hvo years, Correlation in thc range of0.l9-{.55 has been found between
its academic average (AA) and academic pcrfonnance in the first year or first nvo
ycars and explained 4 to 30 percent of the varianccs in students' perlormance
(Ranncy, R.R., Wilson, M.B. and Benncfl, R.8.,2005).
A study conducted in the United States by Kramer, G.A. (1999) concluded that 40
perccnt (range 25-{0 percent) of the variance can be accounled benveen predental
GPA plus allDAT scores (predictors) and firsF and second-year dental school grades
(critcrion).
The dental admission test aDd performancc on the National Board DeDtal
ExaminatioDs (NBDE) Part I
De Ball S, Sullivan K, Horine J, Doncan w.K Replogle w. (2002) examined tie
rclationship between performance on the subtest scores of the Dental Admission Test
(biology, gcncral chcmislry, organic chcmistry, rcading comprchension, quantitalivc
reasoning, and perceptual ability) and performance on Pan I the subtest scores ofthe
National Board Dental Examination (anatomical sciences, biochemistry and
physiology, microbiology and patholog), and dental analomy and occlusion) at the
University of Mississippi school of DentistD,. The results of the study results
indicatcd that pcrformancc on all four subtcsts of the NBDE Part I wcrc significant
prcdictcd by the reading comprehension subtest of the DAT lvhile organic chemistry
and biology subtest of the DAT were statistically significant predictors of
performancc on the biochemistry and physiology subtest of the NBDE Pan I. The
rcsult also revealed tlat the quantilative rcasoning of the DAT lvas a predictor of
pcrformancc on the dental anatomy and occlusion subtest of the NBDE Part I. The
rosca.chcrs concludcd thgir study by providing evidcnce lhal thcrc was a rclationship
bchveen Dental Admission Test (DAT) scores and pcrformancc on the NBDE Part l.
137
Thcsc findings of De Ball et al (2002) rvere consistent with tie previously reported
study ofthe Kramer G.A., (1986), rcgarding the rclationship betrveen the DAT scorcs
and NBDE Part I scores in aggregate.
Rcccntly, a similar study was conducted by Bcrgman, A.V., Susarla, S-M., Horvell, T.
H., Karimbux, N.Y. (2005) to examine the relalionship benvcen the DAT subtest and
NBDE Part I subtest scores for studcnts at the Harvard School of Dental Medicinc
(HSDt\O.The subtest scores of the Dcntal Admission Test: biology (DAT-BIO),
general chemistry (DAT-GC), organic chemislry (DAT-OC), rcading cornprehension
(DAT-RC), quantitative rcasoning (DAT-QR), and pcrceptual ability (PAT) were
selectcd as prcdictors, whilc thc scores from differcnt subtcsts of the NBDE Pan I:
anatomical scicnccs (AS), biochemistry and physiology (BCP), microbiology and
pathology (MP), and dcntal anatomy and occlusion (DA) rvcre considcred as the
outcome variables in this study. The sample of this study rvas consistcd of 244
studenls of the Harvard School of Denlal Medicine $ho matriculated into the four-
ycar D.M.D. progmm over an eighFycar (from September l995-Seplember 2002)
period.
Descriptive statistics and four different multiple Iinear regression analyscs rvere
computed to examine the relationship betwecn DAT subtest scorcs and performance
on NBDE Part I subtest ofthe selected sample. The results ofthc study revealed tiat
DAT reading comprehension scores (DAT-RC) \\cre statistically significnntly
associated with pcrformance on all four subsections of the fi{BDE Part I. at 0.05
significance level and scores on thc chemistry DAT subtests (both gcnerdl chemistry
and organic chemistry) rvere statistically significantly associated with performance on
the microbiology and pathology (MP) subt€st of NBDE Part I. Performance on the
dental anatomy and occlusion (DA) subtest of NBDE Part I vas statislically
significantly atsociatcd rvith perfonnance on the pcrceptual ability (PAT) ofthe DAT.
Ovcrall, it was found by the researchers that DAT readinS comprehension subtest
was the strongest and most rcliable predictor ofperformance on the NBDE Pan I.
r38
The Yalidity of both cogDitive and non-cogDitive factors used for sclectioD to
Canadiatr d€Dtal schools.
Smithers, S., Catano, V.M. and Cunningham (2004) examined lie validiry of boticognitiveand non-cognitive factors uscd for seleclion to Canadian denralschools. This
study was based on 145 dental studenls (from first through thirdyear) at tlvo Canadian
dcntal schools, in rvhich 46% ofthe students Nerc male, and 54 oZ.rverc female. Thcy
examined frc validity of the Dental Aprirude Tesr @AT), the Canadian Dental
Association (CDA) intervieN and rhe Five Factor Model of personality in selecting
candidales for Canadian dental schools with respect to both academic and clinical
performance of dcntal studenls.
The study also evaluated incremental predictive validity of personality measurc for
those outcome measures which beyond the scope of an interview and tlc Dental
Aptitude.
Thcrc arc four components in fie DAT:
a. The Surv€y of Natural Scicnce Examination (biology- and inorgalic or
gcncral chcmistry-based matcrial)
b, Thc Reading Comprehension Examination in the Dental Sciences,
c. The Perceptual Motor Ability Component, and
d. The Carving Dexterity test.
According to Canadian Denml Association (1999), the pcrformance of Dental
studenls who are admitted into dental school based on DAT scorcs are significantly
bellgr than thosc admitted into thc programme lhrough other factors.
The intervicw, used by Canadian dental schools for dental students' s€lection was
developed by the "Denl.al Aptitude Test commiftee of lhe Council on Education" of
tho Canadian Dental Association (CDA) in 1980. The inlerview asscsses eight
charactcristics that the commiltee believed, were important to success in dentalschool:
molivation, ability to relate, adaptability, sclf-appraisal, maturity, attitudes, problem
cxploration, and sense of responsibility.
139
The third predictor of this study was Five Factor Model of personality, which
measurcs Extrovcrsion, Conscientiousncss, Ncuroticism, Openncss, and
Agrecableness.
The following four criterion measures we.c used in the study:
l. Thc first year wcighted GPA of dental training, which measu.es the dental
students' performance in the pre-clinical subjects such as human biochemistry,
anatomy, histology, physiology, basic mechanisms of disease, infectious
diseases, cardiology, and periodonrology.
2. The second year Neighted GPAS of dental rraining, which measurcs the
advance concept ofthe firsl year courses.
3. The 3 rd year rveighted GPA, measuring clinical competence of dental
cducation clinical courses.
4. The fourth crilcrion uscd in this study is a ycar rhrce weighted CPA and
assessed academic coursework such as tmditional classrcom evaluation,
didactic performance with minimal orno clinicalactivity involved.
Using Pearson Product moments corelation ard Hierarchical Regression Analyses,
the study indicated that the Dental Aptitude Test is a good prcdictor of preclinical
acadcmic success and positive correlation was found befween The DAT Academic
Average (cognitive ability) and the firsFyear academic performance (r =.24, p<.01).
Howevcr, this association become weakert!ith introduction ofclinical componcnts of
thc program in tle later years.
The study of Dworkin, S.F. (1970) had already pro\ed that Dental Aplitude Test
(DAT) predicis the cognitivc outcomes (academic perlormance) of dental students,
spccifically, in the first hvo years ofdenlal programme.
No predictive validity of the CDA Intervicw rvas found for lhe first-year academic
performarce, because it was negatively rclated to the Year I GPA (r = -.17, p<.01).
However, thc rcsult revealed that "the interview r,'as sensitivc lo bchavioral
characteristics in third-year clinical lraining that the DAT did not asscss" (p.610).
140
Thc researcher also found that the oniy broad persona lity measure that correlated rvilh
thc critcrion me.rsures (success in boih Year 2 and Year 3, including the clinical
aspects) was openness to Experience.
Tho study of Gough, H.G and Hall, W.B. (1964) had statcd that Non-cognitivc
factors, such as personality measures arc valid sclcction lool (s) and good predictors
ofacadcmic success in various progBms ofstud),.
The most significant contribution of this study was thc differentiation between
acadcmic and clinical pcrformance and the identification of thcir different ses olpredictors. The traditional admission measures, based on cognitive abilili€s and
acadcmic performance (such as Under-Craduate GPA, and aptitude tests), will only
predict academic success (in the firs1 hvo years courscs, which are usually preclinical
subjects) in dental school, but will predict long-term academic success or performance
(such as performance in th€ later clinical years).For the prcdiction of successful
clinical performance (clinical skill and bchaviors), a highly nructured intervicw, as a
essential component ofadmission process, may serve as a valid predictor. Moreover,
"the study also supports the use of personality measures in the selection process arld
the impoflancc ofassessing behaviora I ch aracterist ics" (p.61 I).
Evaluation ofApplicaDts to Pr..doctoral Detrtal Education Prograds: Revier of
the Literature
Ranney, R.R., Wilson, M.B. and Benncn, R.B. (2005), after revieNing the literature,
lound that Coll€ge GPA is the best predictor of academic perfotmance in dental
school in the United States and Canada. They also lound the academic avemge
(consisting of the arilhmetic mean of the quantitative reasoning, reading
comprehension, biolog/, and general and organic chemistry scores) of the DAT is a
better predictor than the perccptual ability test (PAT) of the DAT and the PAT
enhanced predictability when added to college GPA and the academic avemge (AA).
They further, concluded that 40 percent of the variance can bc accounted for
convcntionaladmissions criteria and denlal school Pcrfonnance, in the early years of
the curriculum. The researchers highlighted the need ofsuch Studies, which prcdicts
performance beyond the denial school Performance like inter-professional health care,
l4l
cthics and professionalism, filling faculty posilions mcasures, and ensuring access tocare for all.
Validation ofthe DetrtalAdmissioD Test (DAT) : 2003-200j
American Dental Association, Dentai Report (2007) provides a comprehensive
summary ofinformation regarding the 2003-2004 validation ofthe Dental Admission
Test (DAT).fifty-six schools were invited but fifty schools provided complete data to
panicipate in this study. The report investigated the,elationship between admission
selection criteria and outcomes in dental education. The follotving ten (lO) prediclors
used in study:
l. Undergraduate prcdental GPA.
2. Under$aduate science GPA
3. DAT science composite scores
4. DAT academic avemge composite scores
5. DAT quantilalive reasoning scores
6. DAT rcading comprehension scores
7. DAT biology scores
DAT gcncral chcmistry scores
DAT organic chemistry scores and
8.
9.
10. DAT perceptual ability scores
The first- and second-year grades in biomedical sciences, pre-clinical dental technique
and first- and second-year grade point averages (CPA5) were considered as criterion
measures in this report.
Thc conelation (r) and squared muhiple conelation coemcients E2) techniques were
used to detcrmined 1e rclationships bctwccn tlc prcdictors (undergraduate GPAS and
DAT scores) and dental school performance.
Using pre-dental CPA and scicnce GPA as \\'ell as al, DAT scores, the results pointed
out the amount ofcxplainod variance was 34oZ irr achievements ofbiomedical grades,
25% in pre-clinical dental technique grades and 350% in first-year grade point averagc
t42
(CPA). Overall, about 30o% ofthe variance can b. cxplained in first- and second-year
biomedical grades, pre-clinical dental techniqucs gradcs, and grade point averagcs
from thc all the ten prcdictors ofall DAT scores and both undcrgraduate CpAs (pre-
dcntal GPA and science GPA).
Thc study also found that thc perceptual ability score of DAT (of all the ten
predictors) as the best single predictor of prc-clinical dental technique gradcs in tlefirst- and sccond-ycar ofdental school. In addition, thc rcport furthcr cxplored that the
corrclations for first-ycar rvas larger than second-1,ear dental school grades. The report
concluded that:
Whcn all DAT scores, prc-dental GPA, and science GPA arc all used
as predictors, they are more predictive of dental-school pcrformance
than are either DAT scores or pre-dental GPA or science GPA alone
(p.25).
Assessment ofUniyersity admission based oD tests aDd iDtervietvs
Roding, K., (2005) comparcd thc outcomes (in tenns oi student drop-out iates,
academic perlormancc in the preclinical years and professional compctence in final
undcrgradualc ycar) of Sludents dcnlal admitted on thc basis of an individualizcd
admissions system (through testl and interview) for d€ntal underg.aduates and
Students admifted through traditional modes (maliiculation gades and aptitude tests)
in Sweden. Admission to universily studies in Sveden has been centralized but in
1990s permission has been give to univenities to select specified number of students
by thcir own. This centralized admission procedure is called traditional modes and
individual universily own selection (on rcscrve seats) procedure is called
individualized admissions system. This individualizcd admissions system rvas
introduced at the Denlal School, Karolinska Institute (the setting ofthe present study),
in 1993 with a purpose to select highly motivated students rvith good academic
standards from a large a pool ofapplicants. The study also includes the perception of
students and mcmbcrs of the seleclion commillcc about thc ovemll impression of the
selsction procedures. The study based on the data from rhe firsr three intales, using the
individualized admissions system.
143
After analysis of the results of three major integratcd examinations, during thc first
years of the undergraduate course, the study found b€tter results for tle individually
sclected students lian lhose admittcd through traditional modes. Thcre have been few
or no drop-outs afiong the individually selected students found by the researcher, afler
thrcc rounds of admissions. Professional competcnce of the final-ycar students were
asscsscd by "a specially designed prolocol compriscd seven differcnt criteria and one
ovemll - global mting" by the faculty membeB,/clinical supervisors. The assessors
found Oe individually selected studenb more profcssionally compctent than students
admitted by traditional modes.
With respect to the perception of students and members of the selection committee
about tle oveBll imprcssion of the sclcction proccdures, botl studcnts and faculty
members werc ofthe same views: 'that the individualized admissions procedure has a
positive influence on students' academic achievement and prolessional competence',.
The results also revealed that both students and tle admissions comnittee expressed
that thc "individualized admissions proccdure" has a positive influence on students,
academic achicvement and professional compelence. The researcher declared that
"motivation and commitrncnt" arc the important dstcrminants ofstudcnt achievcmcnt
and concluded that these qualities of applicants c.an bc idenrified through tests and
interview (of the individualized admissions procedure) than through matriculation
gradcs and aptitudc tesli (oftraditional modes ofsclection).
The predictive Validity study of Dentat Educrtion Eligibilit, Test (DEET) id
Korca
The rccently conducted study by Kim, M. & b.e, t.L. (April, 200A in Kore4 also
confirmcd that undergraduate grade point averages (UCPAS) and standardized
aptitude tcst (Dental Education Eligibility Tcsr, DEET) scores are the most significarr
predictors ofdental students achievement in the early cunicula ofdeotal school (First
Semesler Achievcment in this nudy).This study tvas based on the Data collected from
all ninety (male = 43, female = 47) students who had admittcd to $e four-year dcntal
program in the spring semesterof2005, at SeoulNational University, Korea.
144
The following Nine predictor variables lvere considered in the study:
l. Age
2. Gender
3. Undergraduate grade point avcrages (UGPAS)
4. Dental Education Eligibility Test (DEET) reading comprehension scores
5. DEET scientific reasoning parts- l scores
6. DEET scientific reasoning paftsJl scores
7- DEET perceptual ability scores
8. Interview and
9. Oralexam
The int€rview used for selection ofdental students was semi structured and consisted
ofthe following three parts;
L Aptitude (interest, career knowledge, motivation)
2. Professional attitude (service experiences, ethics) and
3. Interpcrsonalskills(communication,personality)
Through the oral exam the applicants' understanding of b iological sc iences (concepts,
methodology) and their critical reasoning skills (logical thinking, problem solving)
were assessed.
Thgse four main preadmission variables (undergraduat€ GPAs, DEET scores, scorcs
from interviews and oral exams) were hypothesized to have direct causal influences on
students' achievement (First Semester GPA scores).
Descriptive analysis such as the means and standard deviations, cor.elation and path
analysis was performed to establish the relationship behveen the predictors and
outcomes, and test the model of variables hypothcsizcd to determine their influences
upon academic achievement.
The results illust.ated that female students performed bener than male students in the
first semeslca's courses.
t45
The UGPA scores were posirively conelated (B:.342, p<.01) rvith subsequent
achievement in their first semester of dental stud ies. With regard to DEET, The studyidcntificd not all, but thc two scicnce subtests ofDEET (scicntific rcasoning part I andpartll) havc a high conelation (r=.586, p<.00t) wilh dcnral students achievement.
The researcher found negative correlation (B= -.272, p<.01 lor interview score withthe achievement in the first semester ofdental school, rYhile the oral exam scorc does
not have any significant relationship. The finding that interview scores show a
negative conclation with academic performance in the first semester, was similaa to
the results from a previous sludy of Smithcrs S, Cakno V.M, & Cunningham, D.p.
(2004) based on 145 dental srudents (from first through third year ) ar hvo Canadian
dental schools. However, they lound that the interyielv score positively conelated
with students'clinical performance in the third ycar.
Although thc findings of this study are consistent wilh previous studies, that
undergraduate GPAS and standardized admission tcsts scores a.e promising predictors
studenls achievemonts but the single institution study and vcry limited sample (N=90)
were tie majors limitations ofthe study.
2,8.11. EDgineerirgPredictiveValidityStudies
In lhe U.S., only 5% studcnts complete an engineering program of all bachelors
degrecs awarded (National Science Foundation, NSF, 2002).
The Swedish Scholastic Aptitud. and etrgineering studetrts' performance
Hcnrysson & Wedman (1979) sludied 584 students of enginecring at nvo
technologicai institutcs and students at teacher training colleges to determine the
predictiv€ validity ofadmission tcst in Swcden. They collected Information about the
Predictors like Test scorc, admission points (CPA) and a relatively refined criterion
scale, bascd on a summary of a number of cxams and year I and year 2 points
acquircd on each sub course for the lechnical collcges rvhilc three year information
about the teachcr training collcges as critcrion. Aflcr analysis of data thcy found a
fairly high co.relation (about 0.4-0.5) benleen thc test and the criterion, which was
onc can concludc lhat admission tcst (SwcSAT) could compcte rvith grades in
predicting academic performance.
116
Unlike USA, research in Srveden conceming the prcdictive validity of different
seleclion instruments for success in higher education is not very rich. Only few
studies havc bcen conductcd on the topic in hand. Henrysson et al. (1985) have
conducted research on 200 students in the Mechaaical engineering programme aad
400 in thg Electrical engineering programme. The studcnts'performances scrcobscrved for fivc years. Gmdc Point Avc.age (GpA) from uppcr secondary school,
the mcan of the grades in mathematics, physics and chemistry and additional scores
for work experience were used as prediclors. Scores on all courses given during ftefirst threc years at the technical institutes \\ere uscd as measr.rres ofacademic success
(critcrion).
They found the correlation behveen GPA and the number of scores alvarded on
courses in the technical programmes was about 0.40, but the correlation with the
mean of the grades in mathematics, physics and chemistry f.om upper secondary
schoolwas somewhat st onger than 0.40.
This study was conducted on prcdictive validity oftraditional criteria ofselection not
on SrveSAT for highcr technical studies.
However, in 1998 another study was conducted about the pr€dictive validity of
admission measures from rvhich we can get somc information about both th€
traditionai measures as well as the standardized admission tesr. Henriksson &
Wolming, (1998) in lieir study divided 120 students in the engineering physics
programme into three groups, according lo the grounds on which they had been
admilied to the programme.
i. The first group of students had becn admittcd on the basis of their earlier
academic achievement (GPA)
2. The second group on the basis ollheir SrveSAT scores and
3. The third group on the basis ollhcir SweSAT scores with additional scores lor
work experience.
On the basis oftheir findings, they concluded that thc students admitted on the basis
of their CPA werc somewhat more successful than lhe other hvo grouPs. But tle
diffcrcnccs were rather small. From this study wc can derived that the SweSAT as a
selection instrument is almost as good as the grades from upper secondary school.
t41
Ho\\,ever, a coraelation beflveen the scores on the S\\'eSAT and the criterions was not
calculated in the study.
Predictive Validity Study ofFemale Enginecring Studeots
Lovcgrccn, T.A, (2003) study rvas locused on predicting thc academic success of
fcmalc cngincering studcnts during the first year of collcge using the SAT and non-
cognitive variables (measured through Non Cogritivc Questionnaire, NCQ) as
prcadmission variables. The NCQ, dcvclopcd by Tracey & Sedlacek (1984), used to
identify and provide a quantilative measure of nontognitive yariables relaaed to tic
acadcmic achievcmcnt. The sample ofthis study rvas compriscd 100 femalc (sclcctcd
out of 200 female) Ilrst-year engincering students at public Doctoral Res€arch -Extcnsive institution located in the mid-Atlantic region of lhe United States. After
using step-wise regression anal)'sis, the rcsearcher found that the NCQ did not add to
lhe predictive value of SAT scores in determining the first semester GPA of female
cngine€ring students. Only the SAT Math score and the SAT Verbal score
significantly predicted the academic achicvemcnt of first year fcmale enginecring
students. This result of Love8reen, T.A. (2003) was contrddictory to the previous
research, which stated that using non-cognilive variables, and specifically the NCQ,
predict the academic succcss.
The study ofAncis & Sedlacek (1997) specifically examined the ability of the NCQ
to prcdict academic achievement offemale students. In their study they used th€ NCQ
and the SAT as predictors and collcgc GPA of the participants as the dependent
variabl€ to determine the predictive validiry ofadmission measures. Ancis & Sedlacek
concluded "both cognitive and non-cognitive variables si$ificantly predict the GPA
of female students in the first year and throughout their collgge years". In the
cognitive measures, both verbal and math SAT scorcs were found as predictors of
female student success in college whilc in the non-coSnitive variables, community
service activities, realistic self-appraisal, nontraditional knowledge, successlul
leadership experience, and having a strong support person were correlated with
college outcomes of female studcnts.
t48
Study ofthe AdmissioDs Criteria in a B.Sc. EnginecriDg Programme
Kuo, R. & Ghosh, S. (1998) mentioned elaborate and comprehensive admission
package, to be submifted by the applicants for adrnission to engineering programs at
univcrsities and collcges including ID, League schools, Brown, University. This
comprehensive p!ckage may include their:
l. Transcripts from grades 9 through 12;
2. Recommendations from three or four teachers, one or nvo prefenbly from the
areas ofmathematics, physics, and chemistry;
3. SAT verbal and math sutFscores;
4, ACH scorcs in math-ll, physics, chcmisrry, history, English, ctc.;
5. AP test scores in chemislry, computer science, clc.;
6. Evaluation from the school's guidance counselor \yith a statement relative to
class ranking;
7. A school profile listing thc percentage ofthe graduates going into four-ycar
degree programs;
8. A hand-written essay describing an impo(ant experiencc in the applicant,s
iife;
9. An essay describing the applicant's special aplitude and reasons for pursuing
engineering;
10. A duly filled standard application;
11. Rank-ordered list ofprogram/degree choiccs ofthe applicant;
12. Parental educational and employment background and marital status;
13. Backgroundonsiblings'education;
14. Inlerview with an appropriate person relatcd to fie university (p.96).
The study rvas based on the analysis of I0,000 B.Sc. synlhetic engineering program
applicants at Brown University behvcen 1989 and i992. This correlation-based,
scientific study evaluates the proposed model of admission and the decision oladmissions omcers \yho represent the educational philosophy of $e universiry or
149
college. After analysis they the following main findings wcre drawn by the
researchers:
1. Admission decision effected by the admission officer biases.
2. Admissions ofTiccrs favored applicants with high achievement tesl score in
math and physics, strong parental educntional background, high GPA, and
outstanding teacher recommendalions.
3. 'SAT scorcs play a surprisingly minor role in the admission decision" they
concluded.
Prcdiclion ofGRE in an Engioeering Msnag(jment Program:
Holl, D. T, Blcckmann, C. A, Zio^ann, C. Cl., (2006) investigated thc predictive
validity of thc Graduate Rccord Examination (GRE) for performance in a graduate
enginccring management program in the Craduate School of Engineering and
Managcmenl at the Air Force Institute of Tcchnolog"v. While controlling for agc,
gender, undergraduate GPA, and time betlveen undergmduate and graduate prognms,
CRE scores predictive validify was determincd. Three pcrformance variables i.e. lirst-
year GPA, cumulative GPA, and thesis g"dc (faculty committees' ratings ofstudents'
thescs) wcre considered as outcomes in this study. Sample ofthis study was consisted
of22l students graduating rvith a masle/s of science degree from the engineering
managcmcnt program at the Air Force institutc of Technology during the pcriod of
1995 to 2004, in which 204 studcnrs (92%) \yere Air Force officeK of United States
and l5 students (8%) were U.S, Marine Corps oflccrs or DePartment of Dcfense
civilian employees. At the lime of admission, the mean age ofthe studenB lvas 27.7
ycars, with range of22 to 48.
On analysis the researchers found that lhe GRE verbal and quantilative test scores
werc uscful in prcdictinB lirst-year and cumulatile Srade poiot avemges (GPAS),
GRE-V score was, specifically, found the most predictive among the three CRE
scorcs of first-year and cumulative GPAs (r.34.
150
CoEnitivc Entry Characlcristics and Continuous Assessmelt as Predictors of
Acadcmic Pcrformance among Polytechnic EngiDeeritrg Technolos/ Studeuts
The sludy ofAjobeje, O.J. (2005) was about the predictive validity ofcognitive entry
characleristics (WASC, PCEE results) and continuous assessment measured (semester
results) for studenfs acadcmic performance (in lerm of ycar CPA and second year
GGPA) among Polytcchnic Engineering Sludenls. The researcher hr?othesized that
there is a significant conlibution from cognitivc entry characteristics (WASC' PCEE)
and semcst€r resulls to the first year CPA and sccond year CGPA oflhe Engineering
Technology students.
The study rvas based on thc data of95 students enrollcd in the 1995-1996 acadcmic
scssion for the hvo-ycar ND programme in the Engineering Technology and
Environment studics, Ondo Stale Pol)'lechnic, Os'o. Thcre were 35 students lrom
Electrical and Electronics Engineering, li lrom Mechanical Engineering and 29
srudcnts from Building and Quantity Surveying Engineering Disciplinc'
Conclation, Multiple regression analysis and analysis of variance werc used to find
out the prcdictive streDgth of each of the independent variables (cognitive entry
characrcristics and continuous :lssessmenl measured) and lhe dependent variables (l
ycar CPA and second ycar CCPA).
It was found by the rescarchcr that acadcmic achicvcment ofenginecring technology
students werc predicted by lhe combination ofcognitiYe cntry characteristics (WASC,
PCEE rcsulls) and semcslcr results. Thc study also cxplored that thcrc is a significant
relationship benveen continuous asscssment (i.e. semester rcsults) and academic
perfonnance ofthc subject. HoNever, lhcre was no significant relationship rvas found
between cognitivc cntry chamctcristics (WASC, PCEE) and CPA or CCPA.
Moderating the Prediction ofGrades in Freshman Enginee trg
wood, D.A. & l-angevin, M.J. (1972) cxamined l1lc possible modcrating effect in the
Prcdiction of Grades in Freshman Engineering. "Thc intent of this study rvas to
cxamine an ability and achicvement lest battery used in college engineering Freshman
prcdiclion for possiblc modcraling eilcct in an atlempt to cnhancc the ovcr all
prcdiction" (p.3I l) they statcd.
l5t
They defined the moderalor by quoting Banas, (1964, p lA "h refers to all variablc'
quanrirative or qualilative, which improYe rhe usefulness ofa prcdictor (or predictors)
by isolating subgroups of individuals for Nhom a prcdicior or sct of regrcssion
rveights are especially appropriale". Motivation is an cxamplc of moderato'' Their
study was bascd on thc data of 522 collcgc ficshmcn cnginccring students On
aoalysis, it was found that "the SAT-M overall validity of'39 $as increased to 53 and
an over!ll R or.47 Nas raised 10.6l Nhen only lhose hiShest in HSR were considered"'
Conscqucnlly, they concluded thar "high school rank (HSR) as th' best moderator of
SAT-M and the best p.edictor, in both a validation and hold-out group"'
Prcdictivc ability ofselected cognitive aDd ps]chG social variables on First-Year
Engincering Studeuts performance
Ting, S.R. (2001) examined thc predictive abilib of selected cognitive and psycho-
social variables on cnginecring studenas acadcmic perlormance. TtYo main admission
variables i.e. The Scholastic Aptitudc Test (SAT; verbal, mathematics, and total
scorcs) and eiSht psycho_ social variables \\'crc emPloyed in lhe Non_ Cognitive
Queslionnaire (NCQ) were considered as Prediclors in the study, lYhile rhe students'
firsl year of college Grade-Point-Average (GPA) for the Fall and Spring semeste's
rvcrc the criterion variables. The NCQ was consisted of23 ilems, in which 18 were
Likcrt type, 2 multiple choice, and 3 open-ended qucstions.
Thc sample ofthis study \yas comprised of 690 engineering new freshmen in North
Carolina State University, a public rcsearch university in Soltheastem United Srates
ofAmcric4 in which 544 were men and 146 \{ere Nomen.
Using Mulliple step-wise regrcssion, first the responscs were anallzed (through the
SPSS for window 8.0) by the whole sample and then by gender.
The result of the study (R =0.12; F (4, 685) = 22.94i p <.0001) indicated tllat SAT
total scorcs and NCQ variables (specifically positive self{oncept' leader ship
cxperiences, and preference of long term goals) tvere signific.antly prediclive of the
srudcnts' firsr ycar of college Grade-Point-Avcrage (GPA). About the Sendcr
differcnces, ths study found, a higher percent of variance accountcd for CPA for
women than men.
152
Following were the three main limitations ofthc study:
l. The sludy was based on the data ofonly single institution (i.e. Carolina State
University).
2. Academic success \ras considered in term of students' first year of colleSc
Crade-Point-Averagc (GPA) only (long-rcrm college success not studies)'
3. Predictability about ethnic Sroups or racial differcnces rvere not studied
The Predictive Validit, of the Unirenity Student Selectiou EuEiDatiou id
Turkey
Karakay4 L, & TavFncil, E. (2008) investigatcd the predictivc validity ofthe 2003
Univcrsily Student Selcction Examination (OSS) in Turkcy. Rarv scores, standard
scorcs, and placcment scorcs (YEP) wcre prcadmission variables rvhilc freshman
grade point average (FGPA) in highcr education \as considered as criteriol in this
study. The study tvas based lhc analysis 2103 students from six programmes ic'
agricullural engineering, civil cngineering, law, business administration, socialnudies
cducation, Turkish Language and Literature. Using Steprvise regression analysis' thc
study found that the signillcant prcdictors of sludents' lrcshman grade point averdge
(FGPA) was placement scores (YEP) which is used for the placement ofagiculrural
engineering, civilengineering, and social studies education Program students'
2.9. Predictive Validify studies Rerearch io Pakislan
Thc ever first study conducted in Pakislan on predictivc Yalidity ofadmission critcria
rvas ofKlitgaard, R.E. el al (1978). Thc main focus oflheir study was to determine
whethcr measures of intellcctual merit (intermediate examination score) that are us€d
as criteria for admission to the University of Karachi in Paliistan have predictive
vatidity. The merit of Intermediate examination scores (12 yeat schooling) \vas
considcred as admission criler;a,/predictors for the students final marks ofgraduation
ofthe pharmacy, medicine, and engineering schools. Using Regression analyses, the
rcsearchcrs found that the cunent criterion ofadmission (based on intermediate score
only) has weak predictive powea for thc studenl's subsequent university performance'
Even the researchers included matriculate test scorcs and several independent
153
variablcs in the analysis, but even then they found little predictive porver of the
admission criterirvariables.
ln Pakistan a fcw studies have bccn conducled on the prcdictivc validity of Enry
Tcsts. The resulll ofthc rcponed studies are also not confonning to the intemational
studics, which pose a question mark for the uscfulness of these cntry tests. For
example one of the study conducled by Baig, L. A. Chouri, G.H, Fehmid4 T and
Nargis, A. (2001) to dclermine tle predictivc validity of Entry Test for Karachi
Medical ahd Dcntal College conductcd by IBA entirled "ls the admission test a!
lnstitution of Busincss Administration a Sood predictor of final professional test
grades?" Concluded that the conelation co€fficient r. was 0.057 for MBBS Students,
which was not significant (P=0.511) and - 0.172 fcr BDS Students of Karachi Medic.l
and Denlal College (KM & DC), tlat \\'as also not significant (P=0.364). The findings
of this study show t}at liere was no significant positive relationship benveen IBA
Entry Test Scores and acadcm,c achievenrcnt of MBBS stud€nts. For the BDS
studenls, thcre was a negativc rclationship belNccn the IBA scores and the academic
achievcmcnt. So thc researchcrs suggestcd rc-slructuring /improvement of the entry
test on the basis oftheir sludy.
Baig, L. A. (2001 Sep) conduclcd a similar study ovcr the studens ofthe first four
batchcs of Karachi Medical & Dental College (KMDC), graduated in 1997, 1998,
1999 and 2000. Thc main purpose of the study was to asscss the predictive validity of
the medical colleg€ admission criteria i.e. Secondary School Cenificate (SSC), Higher
Secondary Cenificate (HSC) and Institutio! of Business Administation (lBA)
admission test, for academic pcrformance of MBBS students at KMDC. After using
codclalion and slep-wisc linear regression analysis for the rcsults of total of 166
students, the researcher concluded that the IBA admission scoaes, combined with
Highcr Secondary Certificate (HSC) marks could predict academic achievement of
mcdical studcnts for the first three to four ycars, while thc academic pcrformance of
students at Higher Sccondary Cenificate (HSC) had no effcct on the academic
pcrformancc of mcdical students. The study, however docs not predict thc
performance for the final year, ivhich necd pmctical and clinical competcncics on the
pan of medical graduates.
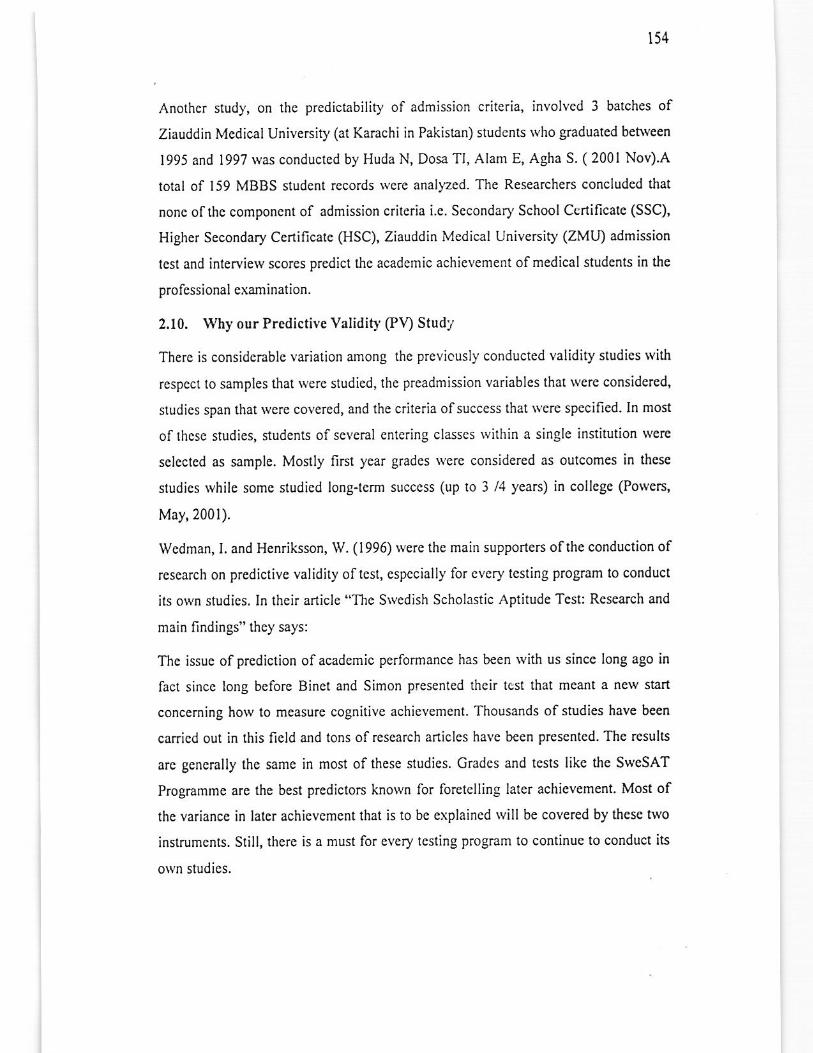
154
Another study, on thc predictability of admission criteria, involved 3 batches ot
Ziauddin Medical Universily (at Katachi in Pakistan) students \Yho gradualed behveen
1995 and 1997 was conducted by Huda N, Dosa TI, Alam E, Agha S ( 2001 Nov).A
total of 159 MBBS student rccords \vcre anallzcd. The Researche6 concluded that
none ofthe componcn! of admission crilcria i.e. Secondary School Ccrtificate (SSC),
Higher Secondary Ceflificate (HSC), Ziauddin Medical University (ZMLI) admission
lcst and interview scorcs predict the academic achicv€ment ofmedical students in the
professional examination.
2.10, why our Prcdictive validit] (PD Study
Thcrc is considerable variation among the preYicusly conducted Yalidity studies \Yilh
respccl to samples that \\'ere studied, the preadmission variables that \Yere considered,
studies span that were covered, and the criieria ofsuccess lhat Nere sPecificd. In most
of thesc srudies, students of scveml entering classes within a singlc institution wcre
selcctcd as sample. Mostly first year grades were considered as oulcomes in ihese
studics rvhile some studied long-term succcss (up to 3 /4 ycars) in collegc (Powers,
May, 2001).
Wedman, L and Henriksson, W. (1996) \vere the mairl supporters ofthe conduction of
rcscarch on predictive validity oftesl, espccially for cvery tcsting pro$am lo conduct
ils own studies. In thcir article "The Swcdish Scholastic Aptitude Tcst: Research and
main findings" they says:
Thc issue of prediction ofacademic performance has been with us since long ago in
fact sincc long beforc Binct and simon presenled lhcir test that meant a new starl
concerning how to measure cognitivc achievement. Thousands of studies have been
canicd out in this field and lons of rcsearch aniclcs havc been prescntcd. The resulls
arc gencmlly the same in most of these studies. Gradcs and tests likc the SrveSAT
Progmmme are the best predictors knoNn lor forelelling later achievement. Most of
lhc variance in later achievemenl that is to be explaincd will b€ covered by thes€ hvo
instruments. Still, thcrc is a must for evcry testing progmm to continue to conduct its
olvn studies.
155
Thc Educational Testing Service (Graduate Records Examination Board, 2003) also
encoumged the departmentvinstitutions to conduct validity studies oftheir o$tl.
To ou. knowlcdgc, there has been no large-scale, multi-institution study of the
validity ofEntrance test scores for medical, dental and engineering school admissions.
This study differs from the earlier research by revierying evidenc€ of rhe predictive
validity ofentry lest in use across a \vide rcgion and disciplincs.
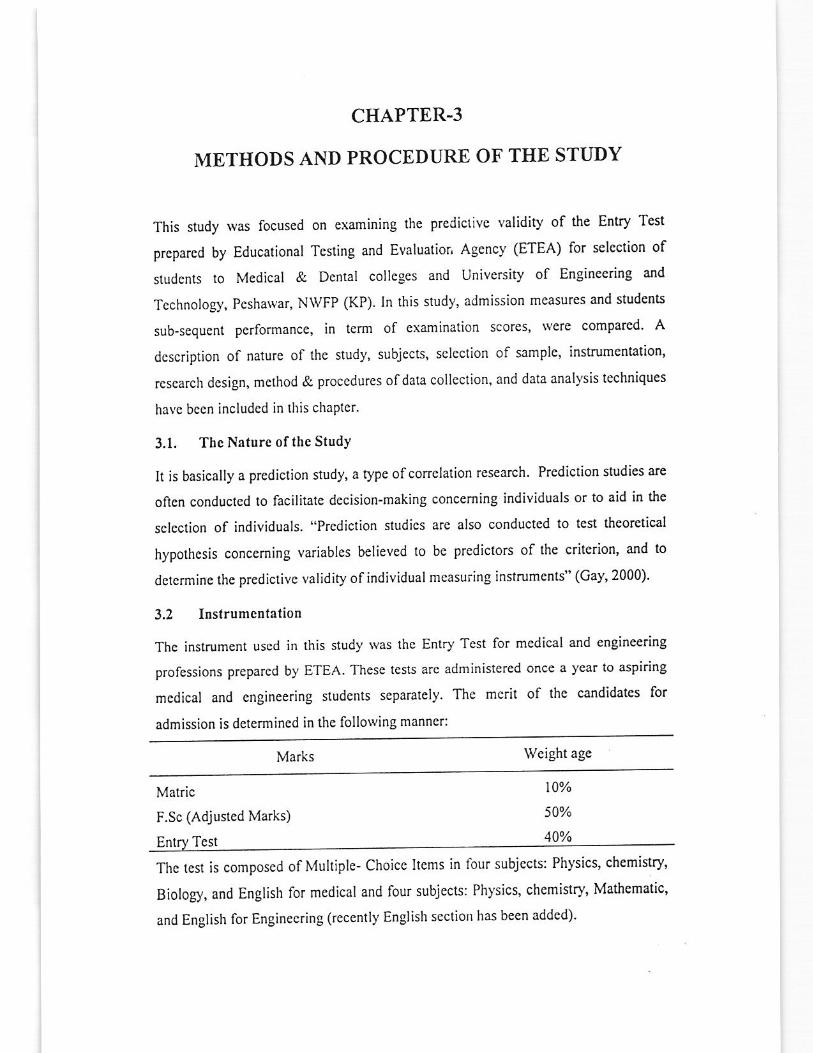
CHAPTER.3
METHODS AND PROCEDURE OF THE STUDY
This study was locused on eramining fie predictive validity of the Entry T€st
prcpared by Educational Testing and Evaluatior, Agency (ETEA) lor selection of
students 10 Medical & Dental colleges and Univcrsity of Engineering and
Technology, Peshawar, NwFP (KP). In liis sludy, admission measures and students
sub-sequcnt performance, in tcrm of cxamination scores, lYere compared' A
dcscription of nature of the study, subjects, sclection of samplc, inslnmentation,
rcscarch dcsiSn, mcthod & procedures ofdata collection, and data anal)'sis techniques
hav€ becn includcd in this chapter.
3.1. The Nature oflhe Study
It is basically a prodiction study, a type ofcorr€lation rcsearch Prediction studies are
oflcn conducled to facilitate decision-making conceming individuals or to aid in the
sclection of individuals. "Prediction studics are also conductcd to test theorctical
hypothesis concerning variables believed 10 be prediclors of the criterion, and to
dctcrmine the predictive validity of individual measuring instruments" (Cay, 2000)'
3.2 Itrstrumenlalion
Thc instrument used in this study was thc Enlry Tcst for mcdical and engineering
professions prcpared by ETEA. These lests are adminislercd once a ycar to asPiring
mcdical and engin€ering students separalely. The merit ol the candidates for
admission is determincd in the following manncr:
Marks Weight age
Matric
F.Sc (Adjusted Marks)
Entry Tcst
Thc test is composcd of Multiple- Choicc Itcms in four subjects: Physics, cheminry,
Biology, and English for medica: and four subjects: Ph)'sics, chemistry, Mathematic,
and English for Enginecring (rccentl)' English section has been added)'
t0%
50%
40%
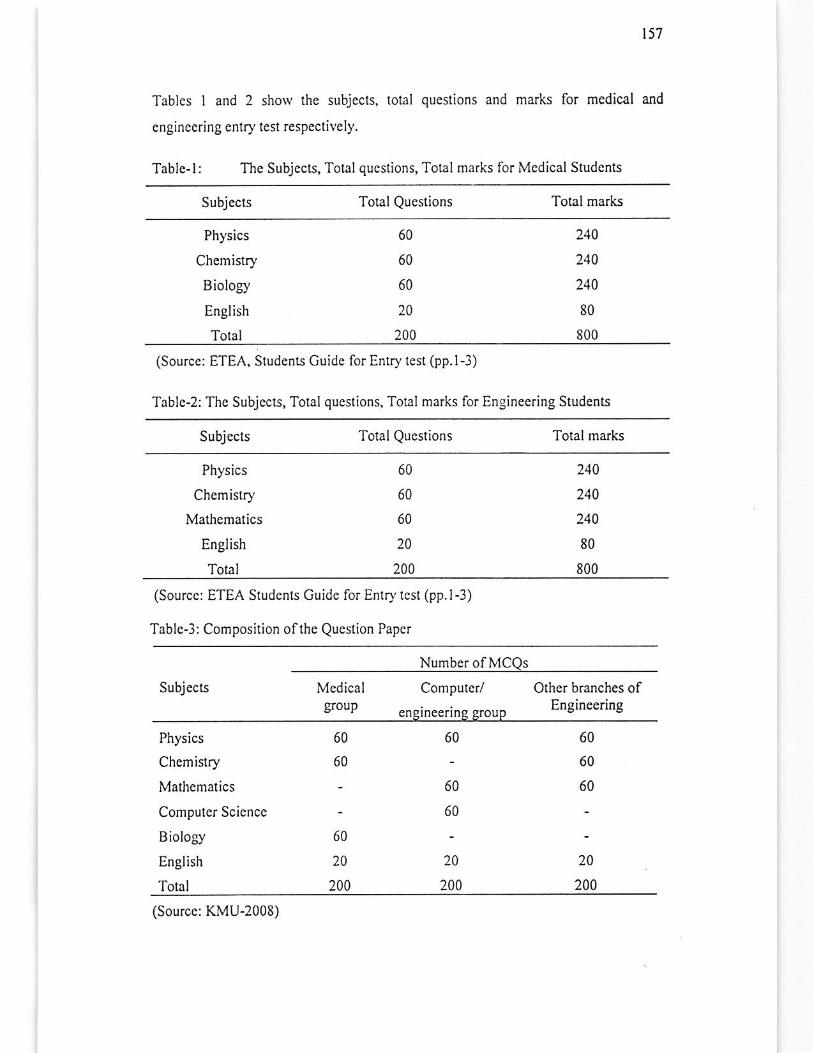
t57
Tables I and 2 show the subjecls, total qucstions a d marks for medical and
engineering entry test respectively.
Tab Ic- I : The Subj ects, Tolal questions, Total marks for Mcd ical Students
Subjecrs Tolal Questions Totalmarks
Physics
Ch€mistry
Biology
English
Total
60
60
60
20
200
240
240
240
80
800
(Source: ETEA, Studenls 6uide for Entry lcst (pp.l-3)
Table-2: The Subjccts, Total questions, Tolalmarks for Engineering Students
Subjccts TotalQucslions Totalmark
Physics
Chemistry
Mathcmatics
English
Total
60
60
60
20
200
240
240
240
80
800
(Sourcc: ETEA Srudenls Guide for Entry tcst (pp.l-3)
Trblc-3: Composition ofthe Question Papcr
Number ofMCQs
SubjcclJ Medicalgroup
Computer/
engineering group
Olher branches ofEngineering
Physics
Chemistry
Malhcmatics
Computcr Scicncc
Biology
English
Total
60
60
60
;,200
60
60
60
20
200
60
60
60
20
200
(Sourccr KMU-2008)
158
3.3. Researcb Design
l Preadmission/Predictorvariables;
In order to exanine the predictive power, the following Preadmission/ predictor
variablcs werc used in the analysis:
a. F.Sc scores ofstudenls.
b. Entry Test scores ofstudcnts.
c. The Mcrit score (lhe combination ofEntry Tcsl and F.Sc scores).
2. The Critcrion measure:
Thc crilcrion measurcs incll-rded in this study rvere:
Medical colleges year I 1o year 5 (final),ear) academic marks (CPA)
Dcnlal colleges year I to year 4 (final year) academic marks (GPA).
Academic mark (GPA) from First to lourth (Final) year of Engineering
Sludenls.
L
2
3.
Using thcse predictors and thc c.itcrion mcasures of thc sludy, firs! the prcdictivc
validitics of Enry Test and F.Sc scores, individually and in combination (merit
scores) wcre evaluated ard then rverc examined across gender.
3.4. Data Source
i. Data about Preadmission/ Predictor variables;
The Prcadmission/ prcdictor variables, Nerc F.Sc scores, Entry Test scores and Merit
scorc (thc combination of Entry Test and F.Sc scores). Students Affairs Section of
medical colleges and academic section ofUniversity of Engineering and Technology
(UET), Peshawar NWFP (KP) \yere contacled for collection of rhe required data.
Studcnts in these inslitutions Nere also sought on the ETEA olficial record for
vcrificalion. When institulions did not providc these measur€s (i.c. F.Sc, Entry Test
and Merit score) aboul their students, the relevant information was then taken from
ETEA office.
ii. Data about Criteriou variables:
Thc critcrion measures for this study $'ere studcnts' grades in dek respeclivc
institutions. Thc Engineering student's exam; scores \!ere collected from lhe office of
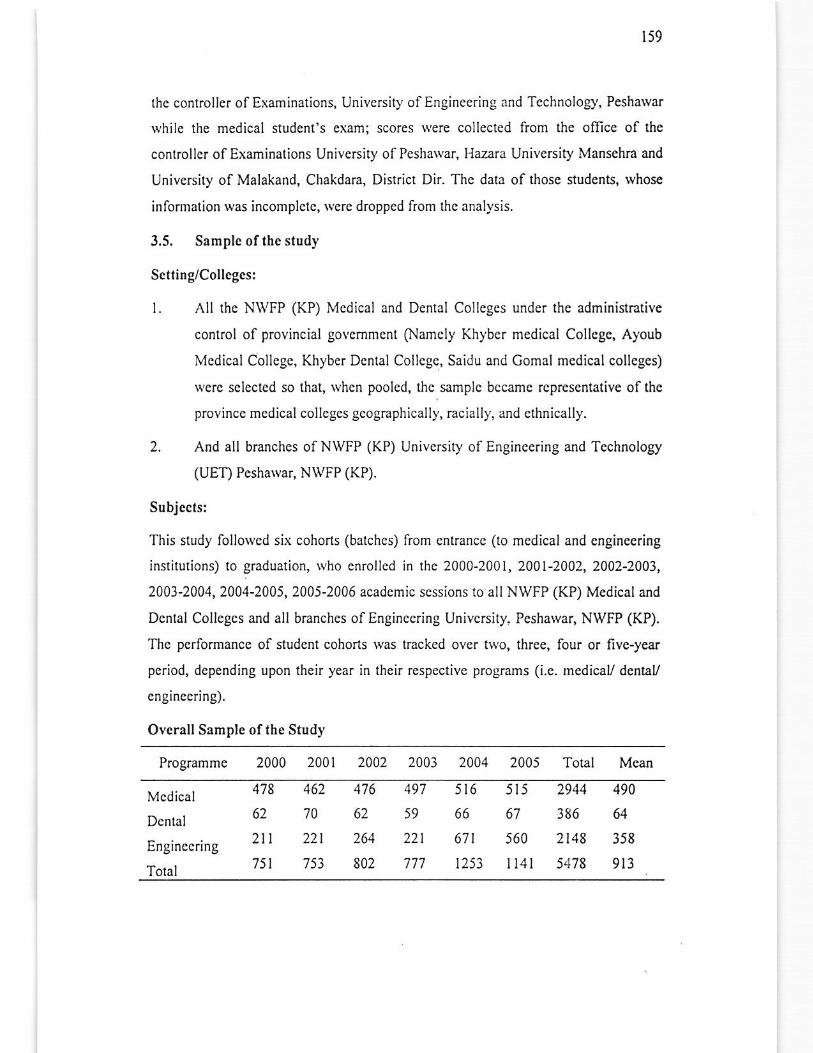
r59
the controller of Examinations, University of Engineering and Technology, Pesharvar
while the medical student's eMm; scores \\'ere collected from the oflice of lhe
controllc. of Examinations University ofPcshaNa., Hazara UniveNity Mansehra and
University of Malakand, Chakdara, Dislrict Dir. Thc dala of $ose students, whose
information rvas incomplctc, Nere dropped lrom the analysis.
3.5. Ssmplc ofthe s(udy
Setting/Collcgcs:
l. All thc NWFP (KP) Mcdical and Denlal Colleges under the administratirc
control of provincial govcmmcnt (Namcly Khybcr medical Collcge, Ayoub
Mcdical Collcgc, Klyber Dcntal Collcgc, Saidu and Gomal mcdical colleges)
Ncrc selcctcd so (hat, whcn poolcd, thc samplc bccame rcprcscntative of thc
province medical colleges geographically, racially, and ethnically.
2. And all branches of NWFP (KP) Univcrsity of Engineering and Technology
(UET) Peshawar, NWFP (KP).
Subjecls:
This study follorved six cohons (batches) from cntrancc (to mcdical and cngineering
institulions) 10 Braduation, \vho cnrollcd in thc 2000-200i, 2001-2002, 2002-2003,
2003-2004,2004-2005,2005-2006 academic scssions 10 all NWFP (KP) Medical and
Dental Colleges and all branches of Engincering Univcrsity. Peshawar, NWFP (KP).
The performance of student cohorts rvas tmcked over two, three, four or five-year
period, depending upon their year in their respective programs (i.e. mcdicay dental/
cnBinccring).
Overall Sample ofthe Study
Programme 2000 2001 2002 2003 2004 2005 Total Mean
Mcdical 478
Dcntal 62
. 211EnErnccflng
751I OlaI
462 476 497 516 515 2944 490
70 62 59 66 67 386 64
221 264 221 671 560 2t48 358
753 802 117 t253 l14i 5478 9t3
160
DcscriptioD of Subjects:
5478 students attending UET, 4 Medical & 2 dental colleges ofNWFP (KP) served as
subjects for this study. The different disciplincs of Engineering wcre Electrical,
Electronics, Mechanical, Civil, and Agriculturc Chemical, Mining, Computer System,
Mechatronics and Telccommunication Engineering. The students in the sample werc
from both genders and from variety ofbackground i.e. urban, runl, co€ducalional and
single scx environment and from diflcrent boards across NWFP (KP) as rvell as from
other provinces of Pakislan.
3.6. Data Analysis:
The data collected lhrough various means Nerc organizcd, tabulated and werc entercd
on SPSS-16 for utilizalion ofthe following statistical procedures for analysis:
a. Descriptive statisrics likc Mcan, Srandard Dcviation, and mnge (minima-
maxima) of lhe medical and engineering students (admitted in 2000-2005
acad€mic session) for each ofme predictors and Criterion (students scores) for
lie combincd gender and separately for malcs and females wcre uscd for
analysis.
b. To hclp answer the questions related lo the predictive validity ofthe Enfy
Test Cor.elations bel1leen Predictors- F.Sc scores, Entry Test scores, Merit
score ( thc combination of Entry Tcst and F.Sc scorcs) -and outcomcs/critcdon
of graduate studies" were uscd. Thcsc corclations evaluate how strongly the
Entry test scores and F.Sc scorcs prcdict subscqucnt mcasurcs of success in
these graduatc schoolVinstitutes.
c. Rcgression analysis rvas used for assessinS thc cffectiveness of the prediclors
(F.Sc, Entry Test, and Mcrit score), specially to find the combination of
admission measures that best predict an outcome (criterion) measures.
Multiple regressions used as the rnain anal)4ic procedure in most predictive
validity studies (Kobrin, J.L. & Michel, R.S., 2006).
In regression analyscs, lie predictors were used lo predict the criterion (grades or
exams scores). In order to compare the predictive power of F.Sc scores, Entry Test
scores, Merit score, (hree predictor sets were uscd in the analyses:
t6i
l. F.Sc scores along,
2. Entry Test scores alone,
3. Merit scores (the combination of F.Sc and Entry Test scores)
For the prediction of gmdes, analyses were completed separately for each
institution/college.
3.1. Statistical mcthods for dctermiriDg Predictive validity of admissiotr
criteria
Mitchell (1990) stated the following four statistical mcthods commonly used in local
and national -level Predictive validity studies:
l. Discriminant function analysis
2. Structural cquations modeling
3. Corelationalanalysis
4. Regression analysis
l. Discriminantfutrctiotranalysis.
Thc purpose of Discriminant analysis (DA) is lo classiry subjects into groups
or from a set ofpredictoN predict group mcmbership.
2. StructuralequatioDsmodeling
A structulal equation modeling is used to study pattem of causation among
variables. According to Tabachinck & Fidell (2001) "tle techniques evaluates
whether the model provides a reasonable fit to the data and the contribution of
each independent variablcs" (p.26).
3. CorrelatioDalaDalysis.
To study the relationship (s) betlveen the predictors and the criterion, the basic
approach is conelation. According to Mitchell (1990) "tle vast majority of
lPredictivc Validity] investigations arc Correlational; somc lstudies] report
simple coficlations for pair ofpredictor and critcrion" (p.I50).
Lien, A.J. (1976) explained the definition, purpose, uscs, kinds and interpretation ol
corelation in very explicitly. He dcfined conelation as' it is the degree ofrelationship
which exist betwecn hvo sets ofscores" (p.68).According to Moore, D. S. (2000) "the
t62
corrclalion measures the direction and strenglh ofthe linear relationshiP betrveen hvo
quantitative variables" (p.98).
Purposc:
Thc purpose is to rcduce 10 a single numbct or indcx the rclationship betwcen two sets
of scores, Whcn this number or index is found, it is knorvn as the coeflicient of
correlation and its symbol is r. A correlalion coemcient providcs a concise'
quantitative summary ofthe relationship benveen hvo sct ofscores'
Uses ofCorrclation:
The basic uses of simplc corretation are to chcck for the validity and for the reliability
ofan instrument. lt may be uscd as a mcans ofpredicting student progrcss or ability'
Kinds ofCorrelatiod:
Therc are basically fwo kinds olcorrelation.
l Posilivecorrclation:
When values or scores of onc instrument go togethcr directly with the valuc
scores oftie other instrument, the correlation is positive. That is, the high go
with the highs, the middle go with the middles, and the lows lvith the lows'
The range of positive correlalion is from +1.00 (perfect positive correlation)
down through any fractional parts ofPositivc I to zero.
2. Negativccorrelation:
When values or scores ofone instrument go inverscly rvith the value scores of
the other instrumen! the correlation is negativc. That is, the high of one go
with thc low ofother, and the lows ofone go \Yith thc high ofother' The range
of negative correlation is from -1.00 (perfecl ncgative correlation) down
through any fractional parts of-i to zero.
Range of conelation = -l-----0-----+l
Inlcrprelalion of corrclation coeffi cicnl:
The correlation can very from perfect positive +1.00 lo -l'00, perfect negative
correlation. As thc coefllcicnt incrcascs from 0.00 1o =i.00, thc rclationshiP bccomes
greater, as it approaches -1.00, it also becomes $caler, but in the negative direction'
t63
A common guide given by Licn, A.J. (1976), \yhich lvill help the beginner in
interpreting a coefficient ofcorelalion, is as follo\v:
+ 0.70 to + iI.00 Highloveryhigh
+ 0.40 to + + 0.70 Average to fairly high
r 0.20 to + + 0.40 Presenr, bur low
* 0.00 to + +0.20 Negligible or low
Another interpretive approach is a test of statistical significance of thc correlation,
bascd upon tlo concept ol sampling enor. Th€ tcst of significance, simply put, is a
test ofthe null hypothcsis: that is, tle coffelation found is not diflerent from zero. In
other words, if the correlation is statistically significant, it is evidence that the
variables are actually relatcd, aithough the magnitude ofthe relationship may or may
nol bc largc.
How high should a correlation be in order to be regarded as "significant"? Garret
(1962) answers the question in the following way.
It is diflicult to answer this queslion categorically as the level ofrelationship indicated
by r depends upon seveml factors (l) lhe absolute size of the coefficient; (2) tle
purpose for which r is calculaled; (3) how our r compares with r's generally found for
the variables studied (p.100).
According to Gronlund (1990) there is no simple ansrver to this question. The
interpr€tation ofcorrelation coefficient is dependcnt on information from a variery of
sources. Thsre arc a number of factors that influence the sizc of all correlation
coefiicicnt, including validity coefficient. ln general, Iarger conclation coefficients
are obtaincd when the chamcteristics measured are more alike, the spread ofscores is
largc, tho stability ofthe scorcs is high, and the time span bchvcen measures is short.
As wc move along the continuum toward the other end of the scalc on any ofthesc
faclors, thc corr€lation cocflicients lends lo bccomc smaller. Thus, a small predictive
validity coefllcient might be explained, in part, by any one of tie factors shown
below, or, more commonly, by some combination of them.
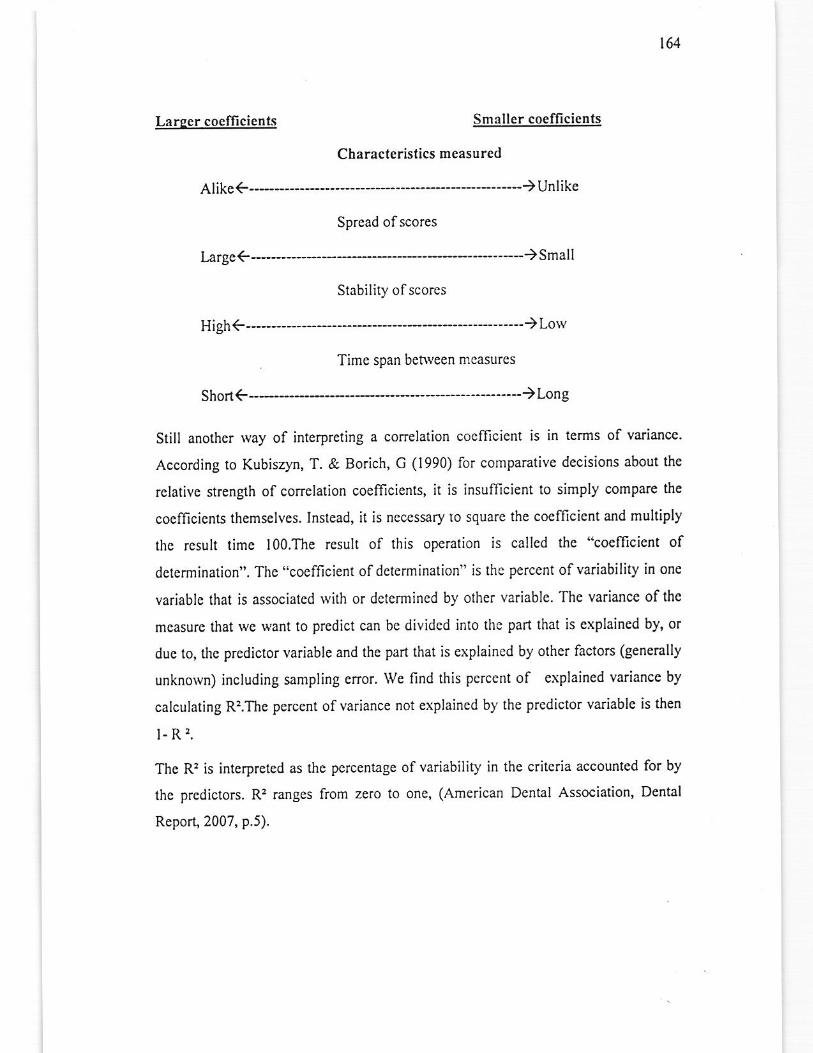
164
L.rser coefficienls Smrller coelficienis
Charactedslics measured
Spread ofscores
Stabili0, ofscores
----------)LorvHigh€
Time span behleen mcasurcs
Short€ -----)Long
Still another way of interprcting a correlation coelficicnt is in terms of variance.
According to Kubisqo, T. & Borich, C (1990) for comparative decisions about tie
rclative strenglh of correlalion coefficiens, it is insufficient to simply compare the
coellicicnts themselves, Inslead, it is necrssary Io square the coeflicicnt and multiply
thc result time loo.The rcsult of this oPeration is callcd thc "coeflicient of
dctcrmination". The "cocfficient ofdetcrmination" is thc percent ofvariability in one
variablc tha( is associated with or dctermincd by other variablc The variaace ofthc
measure that we Nant to prcdict can bc divided into thc part that is cxplained by, or
due to, the predictor variable and the part that is explained by other factors (generally
unknorvn) including sampling cnor. we find this percent of cxplained variance by
calculating R:.The percent of variance not explained by the prcdictor variablc is then
l-R,.
The R'z is interpretcd as the perccntage of variability in the critcria accounted for by
lhc prcdictors. R: ranges from zero to one, (American Dental Association, Dental
Report, 2007, p.5).
165
Moore, D. S. (2000) identified the following points, rvhich one should keep in mind
whilc inlerpreting correlation coeffi cient:
L Cofielation makes no distinction bet\veen explanatory and response variables
It makes no differencc which variablc you call x and rvhich you call y in
calculating the correlation.
2. Correlation requires that both variables be quantitative, so that it makes sense
to do the arithmetic indicated by the formula for r. we can not calculate a
correlation between incomes ofa group and rvhat city tley live in, becausc
city is a categorical variable.
3. Conelati6n (r) does not change lvhen 1\'e change the units of measurement of
x, y, or both, because r uses the siandard values of thc observations'
Measuring height in inches rather than centimete6 and weight in pounds
ralher than Kilograms does nol change the conelation benvecn height and
weight. The conelation r itsetfhas no unit ofmeasurement; it isjust a number.
4. Positiv€ r indicates positive correlation b€nYeen the variables and negative r
indicatcs negative correlation.
5. The correlation r is al,vays a number between -l and +l.Values ofr near 0
indicate a very weak rclationship. The strength oflinear relationship increases
as r moves away fiom 0 toward cithcr -l or +1.
6. Like the mean and standard deviation, tllc cor.elation is not resistant: r is
skongly affcctcd by a fcw oullying obscrvations. So use r with caution, when
outliers appear in the scatter plot.
7. A final principle to remember in interp.cting con'elation is that it docs not
show causation. lf one rvould obtain a correlalion of +.90 behveen height of
boys and baskelball performance, the relationship is high, but it does not
follow that cithcr is lhc causc ofothcr. Proof ofsuch causation would have to
be detcrmined by means other than correlalion
Thc relationship ofthe size ofsample and the significaDce ofcorrclatioD:
There is a relationship benvccn size of samplc and whelher the corelation is
significant. Sincc very high values fo. r are much morc likely to occur by chance lvith
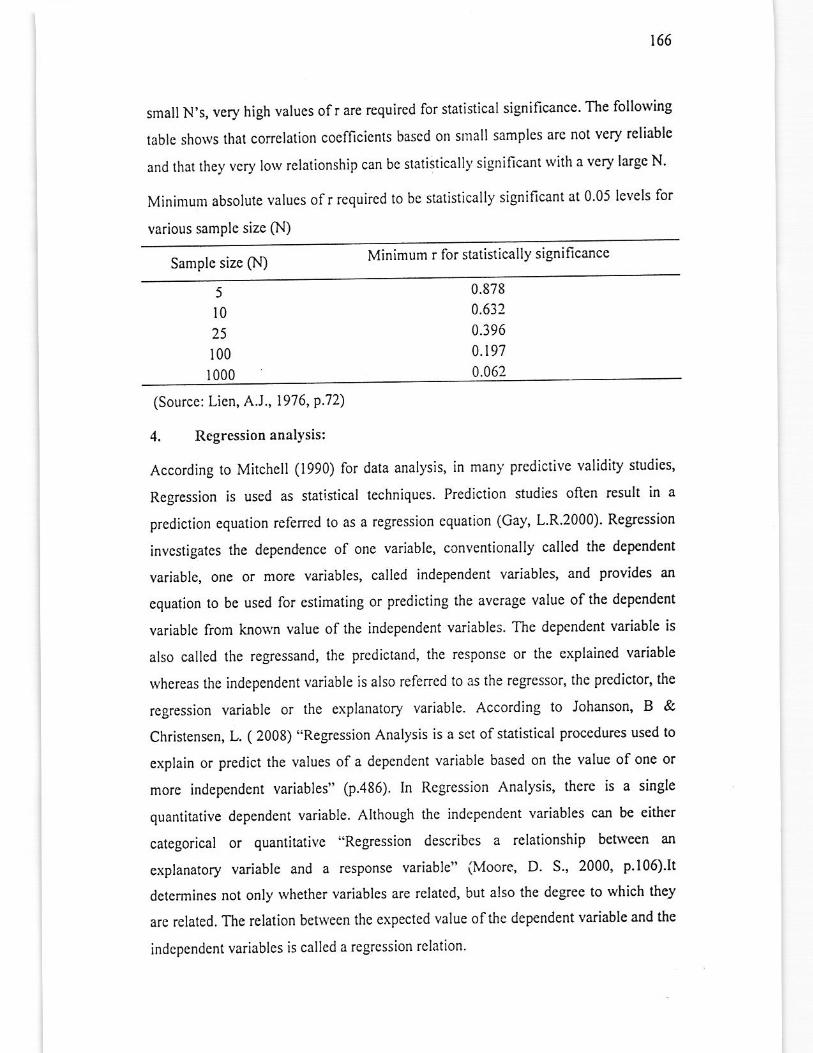
166
smallN's, very high values ofr are requircd for staristical significance' The follolving
tablc shows that corrclation coemcicnts bascd on small samples arc not vcry reliable
and that they vcry lorv rclationship can be statistically significant with a very large N'
Minimum absolute values ofr requircd to bc statistically significant at 0 05 lcvels for
various sample size Q'l)
Samplc size (N) Minimum r lor statistically significance
5
t025
100
1000
0.878
0.632
0.396
0.197
0.062
(Source; Licn, A.J., 1976, P.72)
4, Regressionanalysis:
According to Mitchell (1990) for data analysis' in many prcdictive validity studies'
Regression is used as statistical techniques. Prediction nudies often result in a
prediction equation referred to as a regression equation (Cay, L.R.2000) Regression
invcstiga(cs the dependenco of one variable, conventionally callcd the dependenl
variable, one or more variables, called independent variables, and provides an
equation to be used for estimating or predicting the avcrage value of the dcp€ndent
variable from knorvn value of the indePendent variables. The depcndent variable is
also called the regressand, the predictand, the response or the explained variable
\vhereas the independont variable is also refered to as the regrcssor, thc predictor, the
reBression variable or the cxplanatory variable. According to Johanson, B &
Christensen, L. ( 2008) "Regrcssion Analysis is a sct ofstatistical Procedues used to
explain or predict the values of a dcpcndent va.iable based on the value of one or
more independent variables" (p.486). In Regression Analysis, tlere is a single
quantitative dependent variable Allhough the independcnt variables can be either
categorical or quantitative "Regression describes a relationship behveen an
explanafory vaiiable and a response variable" (Moore, D. S.,2000, p'106)lt
delcrmines not only whether variables are rclated, but also the degree to which tley
are related. The rclation behreen the expected value oftie dependent variable and the
indcpcndent variables is called a regrcssion relation.
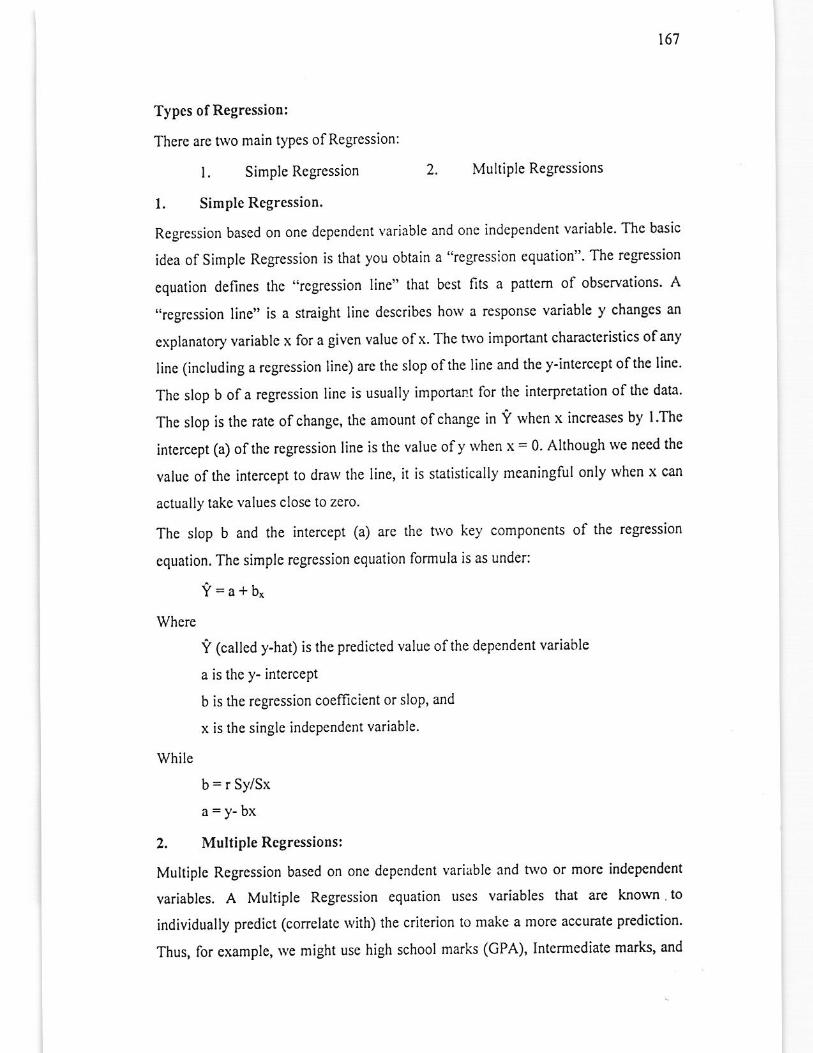
t6'1
Typcs ofRegression:
Therc are two main types ofRegression:
l, Simple Regression 2. Multiple Regrcssions
l. Simple Regression.
Regrcssion bascd on one dePendcnt variablc and one indcpendent variable The basic
idea of Simple Regression is liat you obtain a "rcgression equation" The regression
equation defines the "rcgrcssion line" lhat bcst fits a pattem of observations' A
"regrcssion line" is a straight line describes how a response variable y changcs an
explanatory variable x for a given value ofx. The two important characteristics ofany
line (including a rcgression line) arc (he slop ofthe line and the y-intercept ofthe line'
Thc slop b of a rcgression line is usually important for thc interprctation of lhe data'
The slop is thc rate ofchange, the amount ofcharge in !'rvhen x increases by l 'The
intcrc.ept (a) ofthe rcgression line is thc value ofy rvhen x = 0. Although rve need the
valuc of the intercept to draw the line, it is statistically mcaningful only rvhen x can
actually take values close to zero
The slop b and the intercept (a) arc thc t\Yo key components of the regression
cquation, The simple rcgression equation formula is as under:
g=a+bx
where
i' (called y-hat) is the predicled value ofthe depcndent variable
a is the y- intercept
b is tie regression coefficicnt or slop, and
x is the single indcpendent variable
while
b = r Sy/Sx
a=y-bx
2. MultipleRcgressions:
Multiple Regrcssion bascd on one dependent variable and two or more independent
variables. A Multiple Regression equation uscs variables lhat are known.to
individually predict (conclate Nith) the criterion to make a more accu!-ate Prediction'
Thus, lor example, rve might use high school marks (GPA), lntermediate mark, and
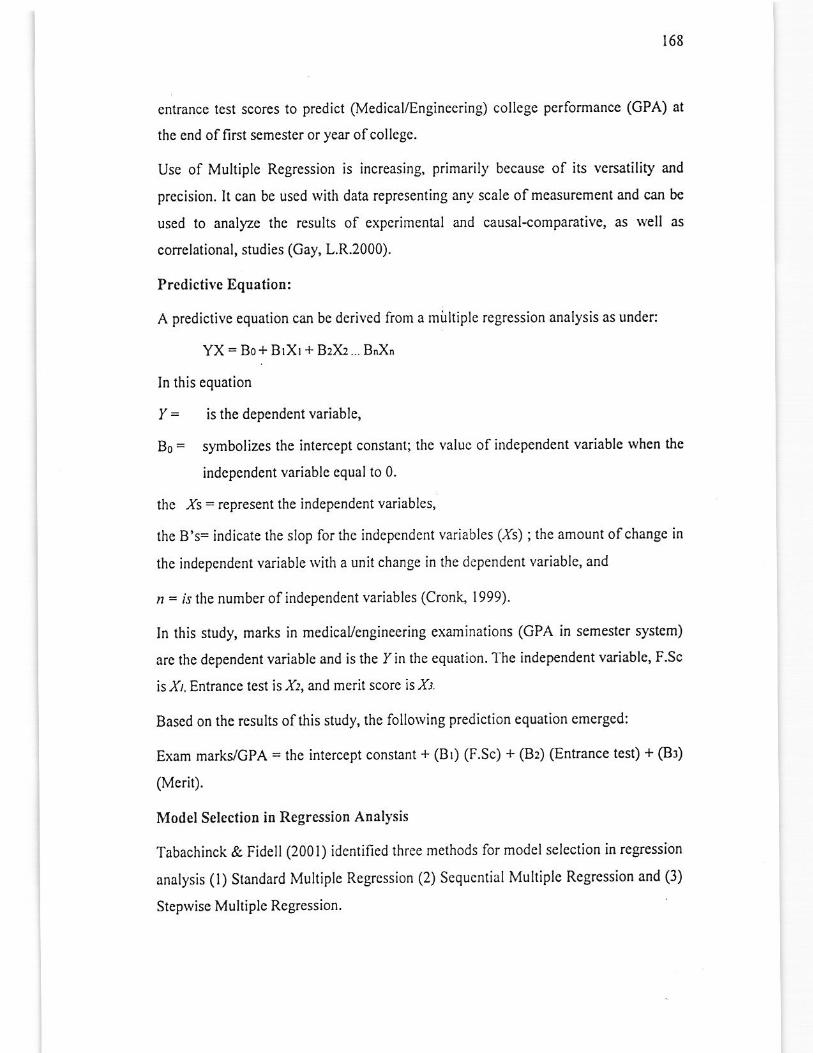
168
entrance test scores to predict (Medical,Engineering) .ollege pcrformance (GPA) at
rhe cnd offirst semester or year ofcollege.
Use of Muhiple Regression is increasing, primarily because of its versatility and
prccision. It can be uscd with data representing any scale ofmeasurement and can be
used to anallzc the results of experimcntal and causal-comparative, as well zts
correlational, studies (Gay, L.R.2000).
Prcdictivc EquatioD:
A predictive equation can be derived from a miltiple rcgression analysis as under
YX = Bo+ BrXr + Bz)0... BnX"
In this equation
Y = is the dependent varjable,
Bo = symbolizes the inlercept constanl; the valuc of indcpcndent variable when lhc
indcpcndcnt variablc cqual lo 0.
thc xs = represent Lhe independent variablcs,
lhe B's= indicale the slop for tic independent variables (xs) ; the amount ofchange in
lhe independont variable wilh a unit change in the dcPendent variable, and
n = rs the number ofindependent variables (CronL, I999).
In this study, marks in medicayengineering examinations (GPA in semest€r system)
are the dependent variable and is the Iin the equation.'l'he independent vatiable, F.sc
isr, Entrancc test isx2, and merit score is xt
Based on the results ofthis study, the following prediction equation emergcd:
Exam markVGPA = the intercept constant + (Br) (F.Sc) + (8, (Entrance test) + (Br)
(Merit).
Model SclcctioD i! Rcgrcssio[ Analysis
Tabachinck & Fidcll (2001) identified thrce methods for model selection in regression
analysis (l) Slandard Multiplc Regrcssion (2) Scqucntial Multiplc Rcgrcssion and (l)
Stcpwise Muhiple Regtession.
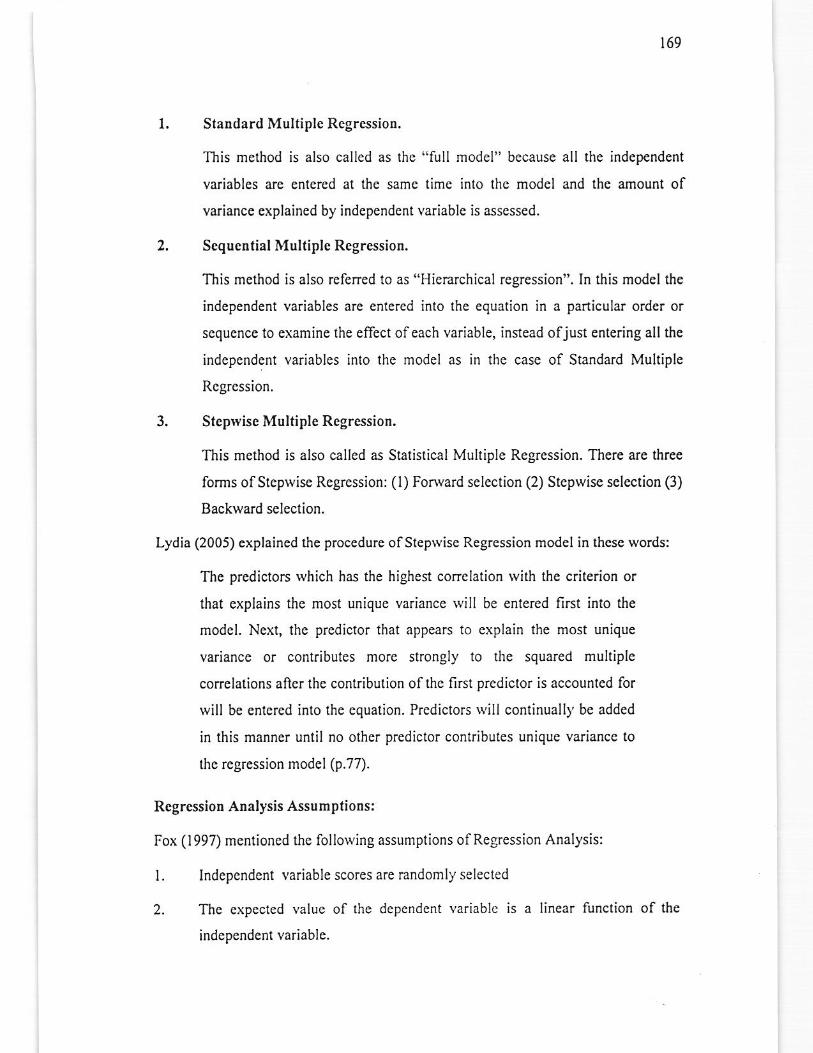
r69
2.
1. Slandard Multiple Regrcssion.
This method is also called as the "firll model" because all the indep€ndent
variables arc entcrcd at fie samc lime inlo lhe model and the amount of
variance €xplained by independcflt variable is assessed.
Scqucntial Multiple Rcgrcssion,
This method is also refencd to as "Hicmrchical regrcssion". In this model the
independent variables are entercd into the equation in a particular order or
scqucnce to examine the effect ofeach variable, instead ofjust entering allthe
indepcndcnt va ablcs into the model as in the casc of Saandard Multiple
Rcgrcssion.
Stepvise Multiple Regression.
This method is also called as Statistical Multiple Regression. There are three
forms ofStcpwise Regression: (l) Fonvard selection (2) Stepwise selection (3)
Backward selection.
Lydia (2005) explained the procedure ofStepwise Regrcssion model in thcse words:
The predictors which has the highest corrclation with the criterion or
that explains tle most unique variance will be entered first into the
model. Next, the prcdictor that appears to explain the most unique
variance or contributes more strongly to fie squared rnultiple
correlations aftcr the contribution ofthe first predictor is accounted for
will be entcrcd into the equation. Predictors \\'ill continualll be added
in this manner until no other predictor contributes unique variance to
the regression model (p.77).
RegressioD Analysis AssumptioDs:
Fox (1997) mentioned the following assumptions ofRegression Analysis:
l. Indepgndent variable scores are mndomly selected
2. The expccted value of the depcndcnt variablc is a linear function of the
independent variable.
3.
170
3. Both the scorcs on indepcndcnt va.iable and depcndent variable follow ajoint
normaldistribution.
The enor values follorv a normal distribution.
5. The crror values and independent variable values are assumcd io be
independent in the population from rvhich the sample is dra$n.
In prcdictivc validity studics, variation of thcse modcls has been used by various
researchers. Like other prcdictive validity studies (such as Klitgaard, ct al, 1978;
Ting,200l; Lovegreen, 2003; Julian, 2005; Violato & Donnon,2005; Lydia,2005;
Ajobeje, 2005; Geiser, & Santeliccs, 2007; Karakaya, & Tavsancil, 2008), stepwisc
rcgrcssion rvas used in this study.
4.
CHAPTER- 4
PRNSENTATION AND ANALYSIS OF DATA
Thc aims of liis study was to dcicrmine the predictive validity of the Entry Test
prcparcd by Educational Testing and Evaluation Agcncy (ETEA), NWFP (KP), for
adnission to University of Engineering and Tochnology (UET), Peshawar and
Mcdical & Dcntal colleges oINWFP (KP). The study also evaluates the prediction of
ETEA test across the gendcr (for malc & Fcmale).
This chapter deais with thc prcscntation and analysis of data obtained from relevant
statistical analysis performed in ordcr to ansNe. the research questions ofthe study.
Thc data mainly rclatcd rvith thc follorving main rrcas:
l. Four mcdical colleges under the administralile control ofNFWP govemment.
2. Two dcntal colleges under the administrative con[ol ofNFWP gov€mment.
3. Onc Engineering Universiry i.c. UET, Pesharvar, NWFP (KP).
The dctail analysis ofthe collcctcd data is prcscntcd in various sections given below:
Sectio!-A:
Thc first scction prosents dgscriptivc statistics for tho Preadmissior/ predictor
variables i.e. F.Sc scoros, Entry Test scores, the Merit score (lhe combination ofEntry
Tcst and F.Sc scorcs) and the criterion measures i.e. lrom first to final-year medical
and dental colleges academic marks and academic marks (GPA) from First to fourth
(Final) ycar of Engincering Sludents. This seclion also prescnts data year wisc,
college Nise and Genderwise.
Scction-B:
Correlations benveen Prediclors and Criterion variabies have been anallzed for
medical, denlal and engineering sample in dctail- This section also displays
corrclation arlalysis year wise, collegc wise and Gender-1visc (for medical and dental
colleges).
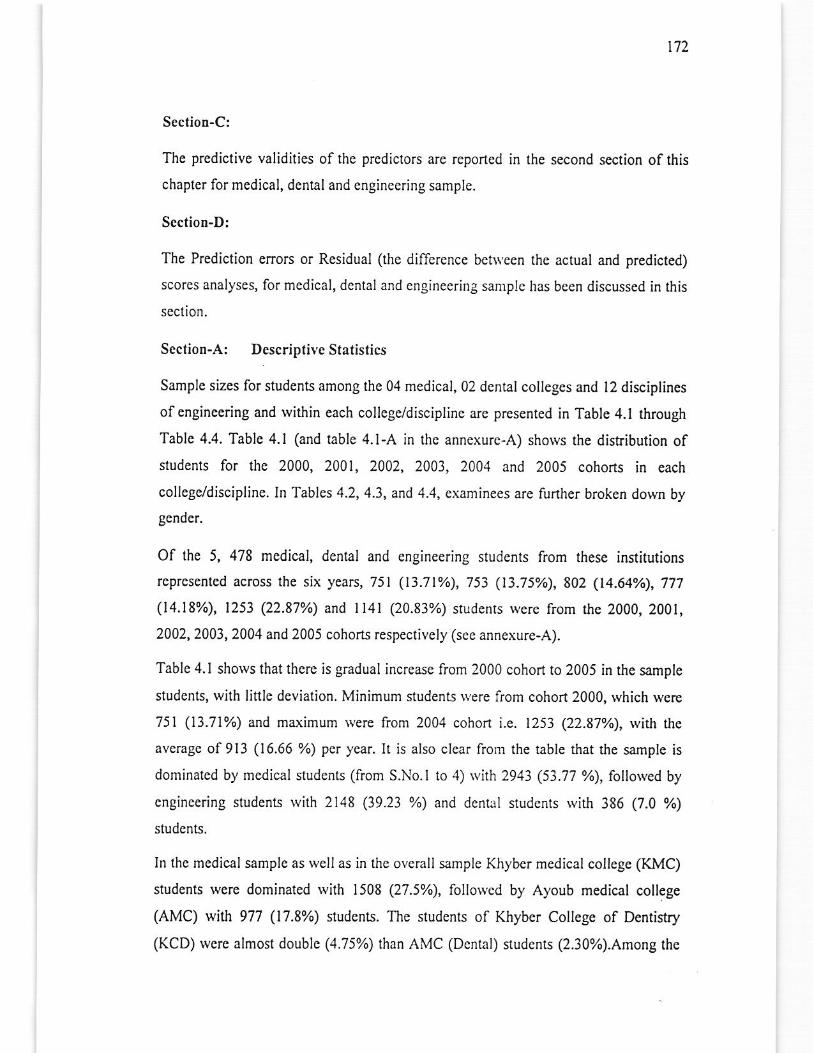
\'t2
Section-C:
The predictivg validities ofthc predictors are reported in the second section of this
chapler for medical, denlaland engineering sample.
Scction-Di
The Prediction errors or Residual (the diffcrence betlr,een the actual and predicted)
scorcs analyses, for mcdical, dental and engineering sanrple has been discussed in flissection.
Section-A: DescriptiveStatistics
Sample sizes for students among the 04 medical, 02 dental colleges and l2 disciplines
ofengineering and within each college/discipline arc presented in Table 4.1 through
Table 4,4. Tablc 4.1 (and table 4.1-A in thc annexurc-A) shorvs the distribution ofstudents for tie 2000, 2001, 2002, 2003, 2004 and 2005 cohorrs in cach
college/discipline. In Tables 4.2,4.3, and 4.4, cxaminees arc funler broken do\yn by
Of the 5, 478 medical, dental and engineering students from rhese institutions
represented across the six yea$,751 (13.71%),753 (13.75%),802 (t4.64%\,777
(14.18y0, 1253 (22.87%) and l14l (20-83%) srudenrs were from rhe 2000, 2001,
2002, 2003, 2004 and 2005 cohorls respectively (sce annexure-A).
Table 4.1 shows that thcre is gradual increasc from 2000 cohort to 2005 in the sample
studcnls, wilh little deviation. Minimum students were fiom cohort 2000, rvhich rvere
751 (13.71%) and maximum were from 2004 cohor i.e. 1253 (22.87%), wirh the
averagc of 913 (16.66 %) per year.lt is also clear from the tabie that rhe sample is
dominated by medical students (from S.rio.l to 4) with 2943 (53.77 %), follorved by
engincering studenls with 2148 (39.23 %) and denhl students witl 386 (7.0 %)
sludcnts.
In the medical sample as well as in thc ovcrall sample Kiyber medical college (KMC)
students were dominated with 1508 (2'1.5yo), follorvcd by Ayoub medical coll€gc
(AMC) with 977 (17.8%) students. The sludenls of Khybcr College of Denristry
(KCD) rvcrc almost doublc (4.?5%) than AMC (Dental) sludents (2.3o%).Among the
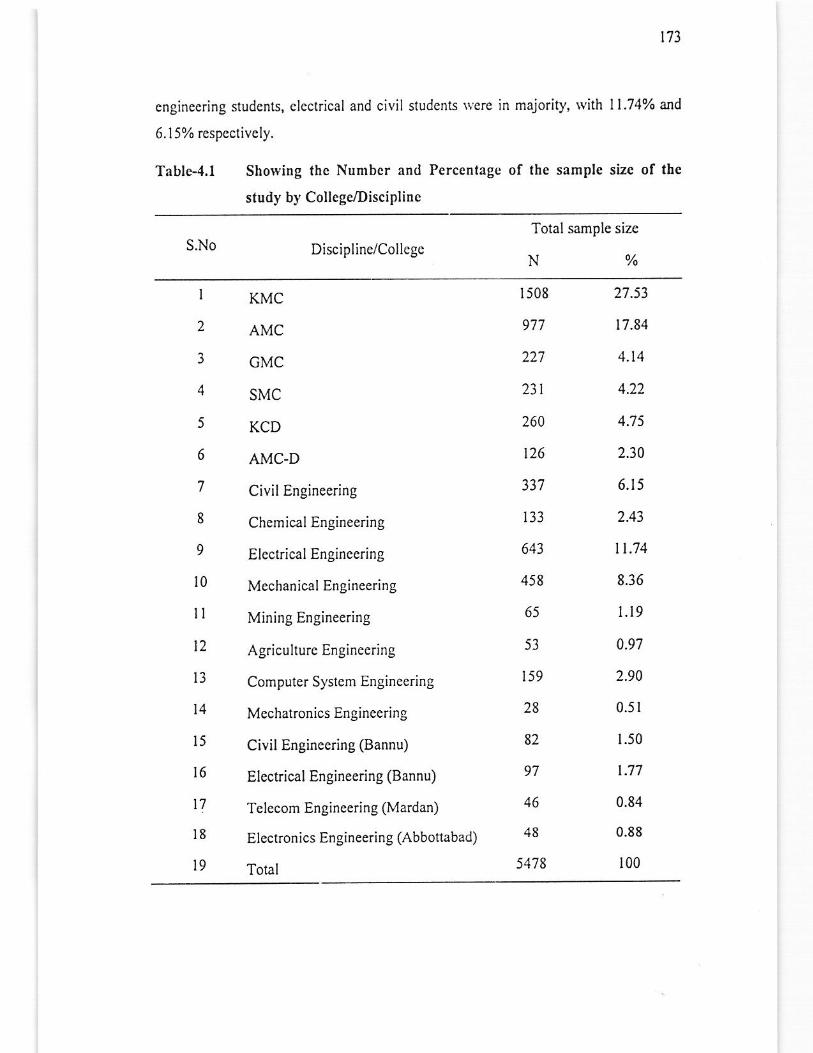
t73
cnginc€ring students, electrical and civil studcnts \t'ere in majority, with 11.74% and
6.15% respcctively.
TablM.l Shorvilg the Numbcr and Percentage of ihe sample size of the
study by Collegc/Discipliuc
S.No Disciplinc/College
Total sample size
N%I
2
3
4
5
6
7
8
9
l0
II
t2
l3
l4
l5
I6
17
l8
19
KMC
AMC
GMC
sMc
KCD
AMC.D
Civil Engineering
Chemical Engineering
Electric.al Enginccring
Mechanical Engineering
Mining Engineering
Agriculturc Engineering
Computer Sysicm Engineering
Mcchatronics Engineering
Civil Engineering (Bannu)
Electrical Engineering (Bannu)
T€lecom Engineering (Mardan)
Electronics Engineering (Abbottabad)
Total
1508
977
227
23t
260
126
337
r33
643
458
65
53
159
82
97
46
48
5178
2'1.53
t7.84
4.t4
4.22
4.7 5
2.30
6.15
2.43
I t.74
8.36
l.t9
0.91
2.90
0.5r
r.50
t.77
0.84
0.88
100
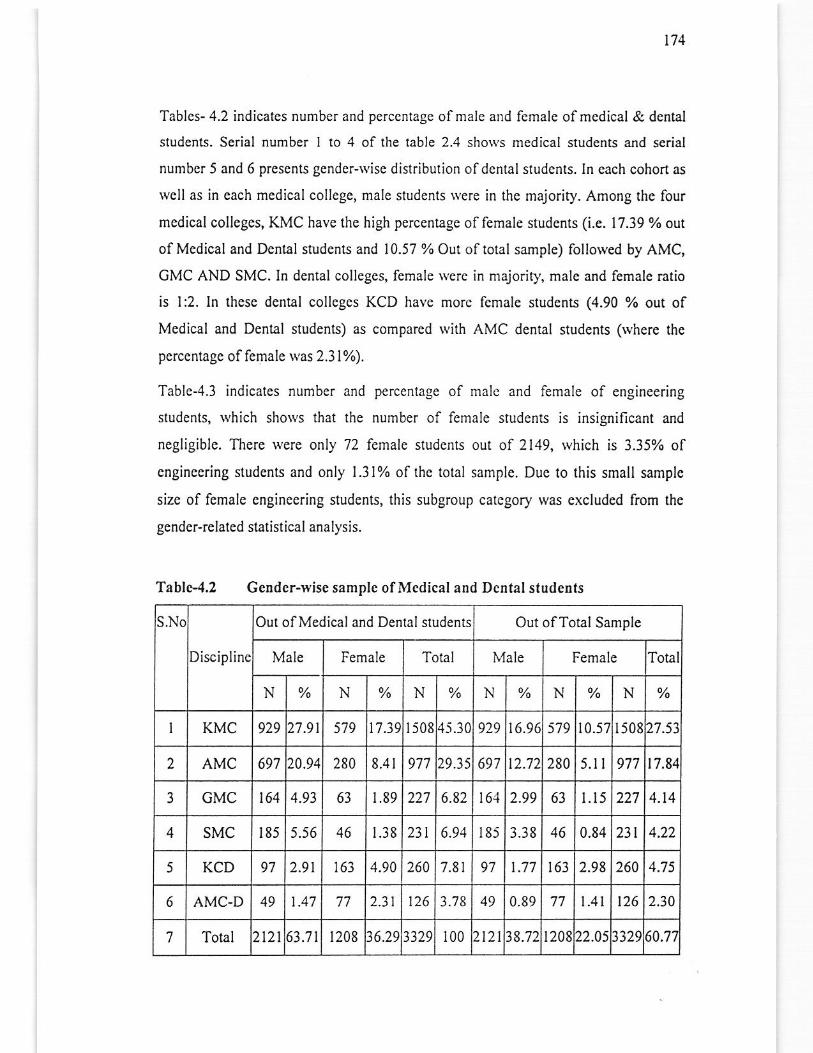
t'l4
Tables- 4.2 indicates number and pcrccntage of male and fcmale ofmedical & dental
students. Serial number I to 4 of the table 2.4 shorYs medical students and serial
numbcr 5 and 6 prcscnls gendcr-wiso distribution ofdcn(al students. In each cohort as
wcll as in cach mcdical college, male sludents Nere in thc majority. Among the four
medical colleges, KMC have the high percentage offemale students (i.e. 17.39 oZ out
of Medical and Denlal students and 10.57 % Out of total sample) follolved by AMC,
OMC AND SMC. In dental colleges, female rvere in nrajoriry, malc and female mtio
is l:2. In these dental colleges KCD have morc fcmale students (4.90 % out of
Medical and Dental students) as compared rvith AMC dental students (rvhere tie
perccntagc of female was 2.31olo).
Tablc-4.3 indicates number and pcrcentage of male and lemale of engineering
sludenls, Nhich shows that the number of fcmale studens is insignificant and
negligible. There were only 72 female students out of 2149, rvhich is 3.35% of
cngincering studcnls and only l.3l/o of thc total sample. Due to this small samplc
sizc of female cnginccring studcnts, this subgroup category was excluded lrom the
gendor-reiated statistical analysis.
Tablc4.2 Gender-wise sample ofMedical and Dental students
s.No
Dixipline
Out of Medical and Dental students Out ofTotal Sample
Male Female Total IUale Female Tota
N % N % N % N % N % N
I KMC 929 2'.t.9\ 5',19 t?.39 1508 4-S.30 929 16.9C 579 10.57 15 08 27.53
2 AMC 697 20.94 280 8.41 977 29.35 697 t2.72 280 5.lt 977 t7.84
GMC 164 4.93 63 1.89 221 6.82 l6l 2.99 63 t.l5 227 4.14
4 185 5.56 46 1.38 231 6.94 185 46 0.84 23t
5 KCD 97 2.9t 163 4.90 260 7.81 97 t.'77 t63 2.98 260 4.75
6 AMC-D 49 1.47 77 2.31 126 3.78 49 0.89 77 I.4l 126 2.30
1 Total 2121 53.11 1208 16.29 3329 100 zt21 )8.72 1208 22.05 )329 50.71
I
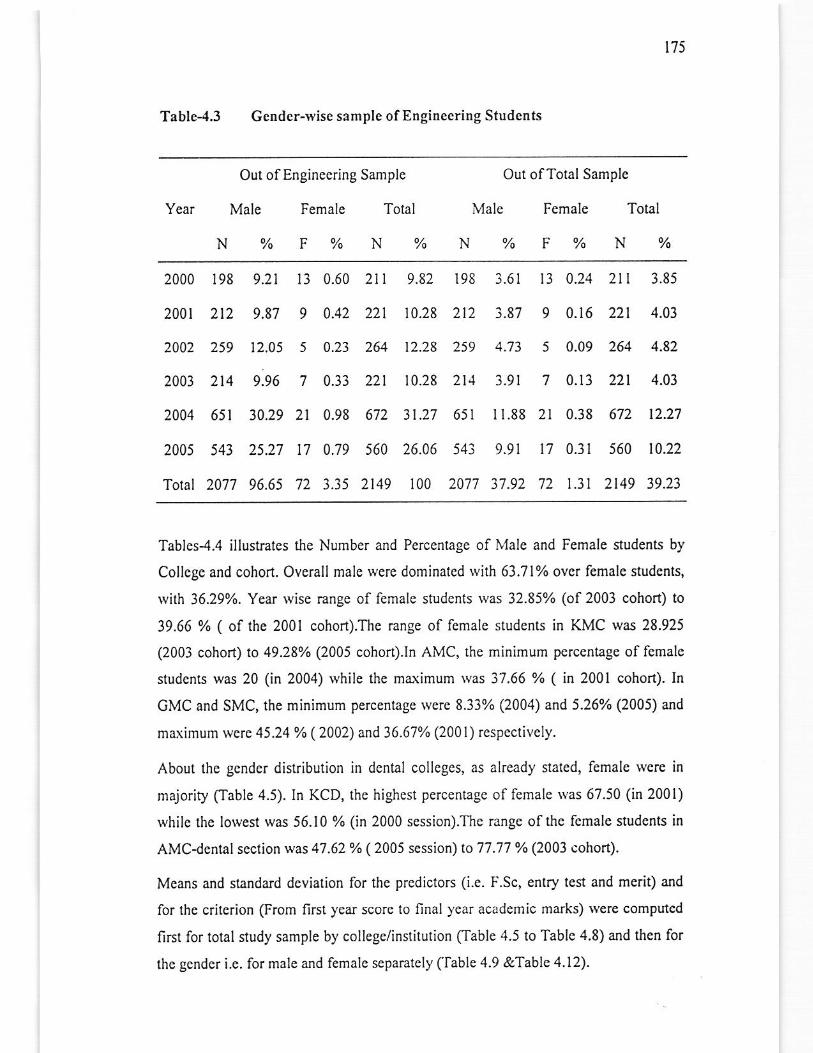
I75
Table-4.3 Gcnder-fl isc sample of Engineering Students
Ycar
Out of Enginccring Samplo
Male Female Total
N%F%N%
Out ofTotal Sample
Male Female
N%F%
Total
N %
2000 198
2001 212
2003 214
2004 651
2005 543
Total 2017
9.2t t3
9.8't 9
12.05 5
9.96 7
30.29 21
25.2't 17
96.65 72
0.60 2l r
0.23 2&
0.33 221
0.98 672
0.79 560
3.35 2149
9.82 198
10.28 212
12.28 259
10.28 211
3t.27 651
26.06 s43
t00 2077
3.61 l3
3.87 9
4.73 5
3.9r 7
I1.88 2l
9.91 t7
37.92 72
0.24 2 3.85
0.16 221 4.03
0.09 264 4.82
0.t3 22t 4.03
0.38 612 12.27
0.31 560 r0.22
t.3t 2149 39.23
Tables-4.4 illustmtes tie Number and Percentage of Male and Female students by
College and cohort. Overall male rvere dominated with 63.71% ovcr female sludents,
vilh 36.29yo. Year rvise mnge of female students vas 32.85%o (of 2001 cohort) to
39,66 % ( of the 2001 cohort).The range of female sludents in KMC was 28.925
(2003 cohort) to 49.28% (2005 cohort).ln AMC, the minimum percentage ol female
students was 20 (in 2004) while the ma.\imum .was 3'7.66 Yo ( in 2001 cohort). In
CMC and SMC, the minimum percentage were 8.33% (2004) and 5.26% (2005) and
ma\imum wcre 45.24 o/o (2002) and36.67% (2001) respectivcly.
About the gcndgr distribution in dcntal collcges, as alrcady statcd, fcmale were in
majority Clable 4.5). ln KCD, the highest percentage of female Nas 67.50 (in 2001)
whilc the lowest was 56.10 % (in 2000 session).Thc range ofthe female students in
AMciental section was 47.62 yo (2005 session) to 77.77 % (2003 cohon).
Means and standard deviation for the predictors (i.e. F.Sc, enlry ten arld merit) and
for lhe criterion (From filst year score to final ycar academic marks) w€re comPutcd
first for total study sample by college/institution Ctable 4.5 to Table 4.8) and then for
the gender i.e. fo. male and female scparatcly ('fable 4.9 &Table 4.12)-
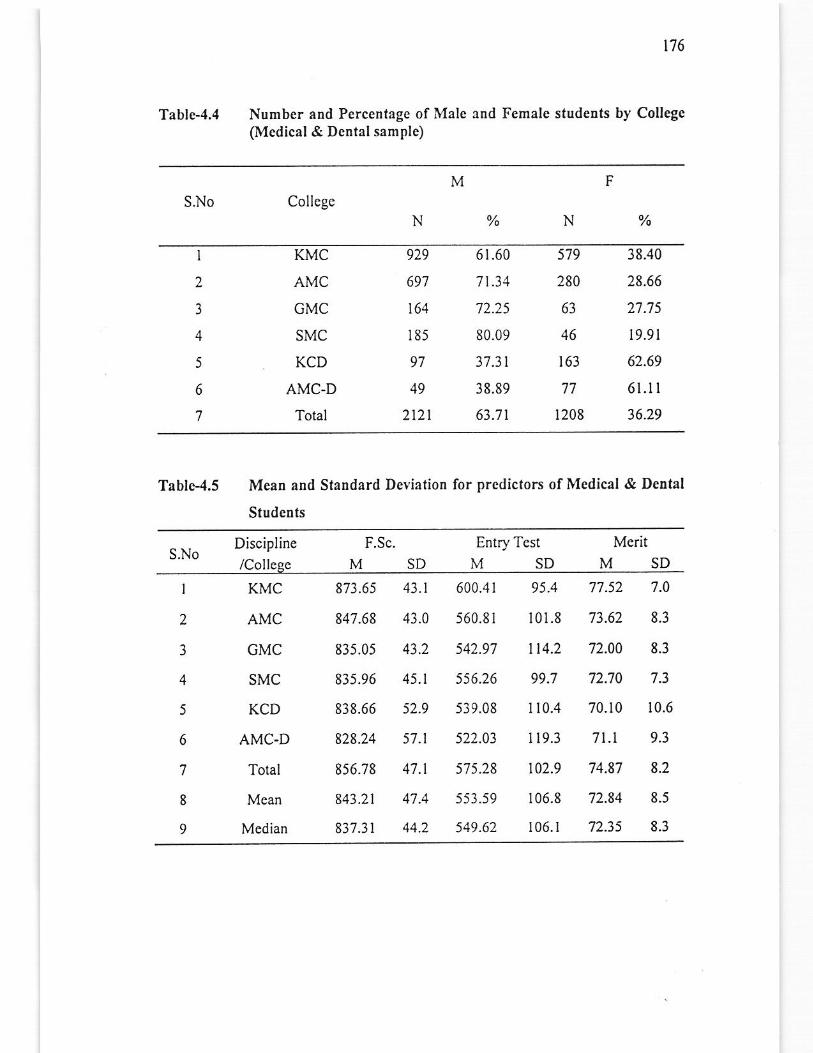
176
Table-4,4 Number and PerceDtagc of Malc rnd Female students by College(Mcdical & Dental sample)
F
s.No College%% N
I
2
3
4
5
6
7
KMC
CMC
SMC
KCD
AMC-D
Total
929
697
164
185
97
49
61.60
'1t.31
72.25
80.09
31.31
38.89
63.'11
579
280
63
46
163
77
r208
38.40
28.66
27.75
19.91
62.69
6I.I1
36.29
Table-4,s Meao and Standard Deviation for prcdictors of Medical & DeDtal
StudeDts
F.Sc.S.No
Discipline
/Collegc
Merit
MSDSD
Entry Tcst
MSDI
2
3
4
5
6
7
8
9
KMC
AMC
GMC
SMC
KCD
AMC.D
Total
Mean
Median
873.65
841.68
835.05
835.96
838.66
828.24
856.78
843.21
837.31
43.1
43.0
43.2
45.t
52.9
57.1
41.1
44.2
600.41 95.4
560.8t t01.8
542.9',1 tt4.2
556.26 99.7
539.08 I10.4
522.03 l19.3
515.28 102.9
553.59 106.8
549.62 106. t
77.52 1.0
73.62 8.3
72.00 8.3
72.70 7.3
70.10 10.6
1t.t 9.3
74.8'7 8.2
72.84 8.5
72.35 8.3
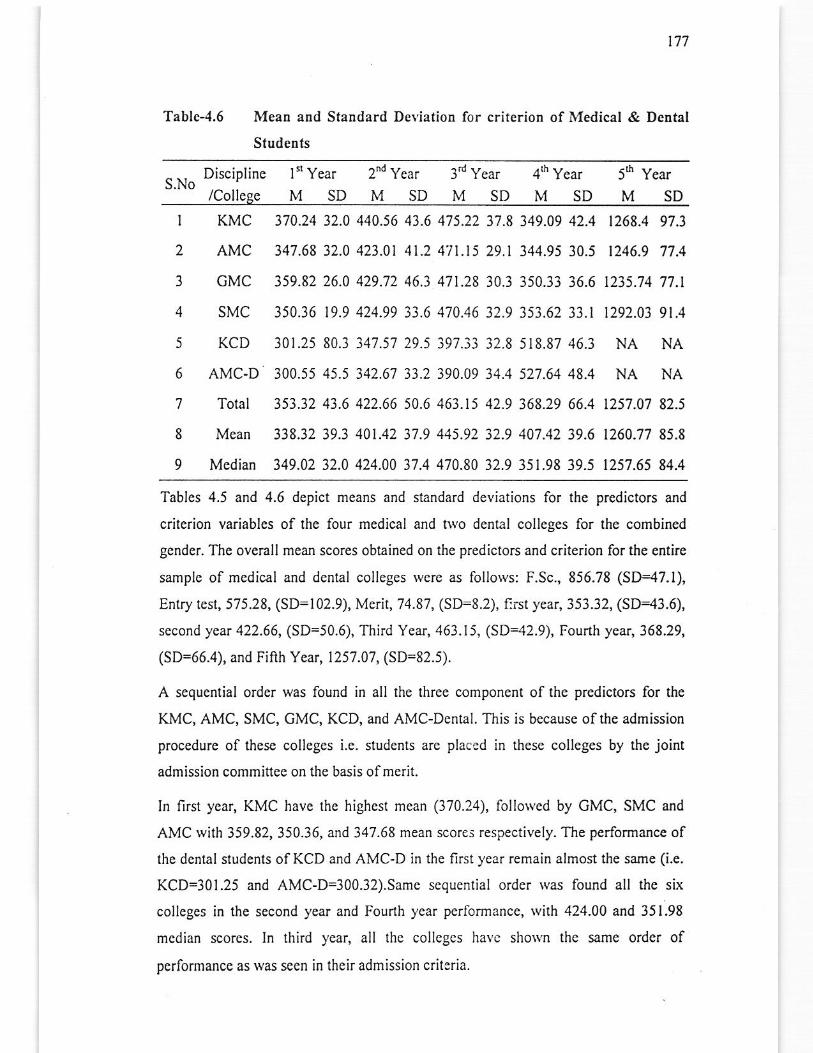
t77
Tablc-4,6 Mean ard Standard DeYiation for criterion of Medical & Dcntal
Studenls
S.No Discipline
/College
ln Year Zfr Ycar
MSDMSD3d Year 4'h Year
MSDMSD5'n
MYear
SD
I
2
3
5
6
7
8
9
KMC
AMC
GMC
SMC
KCD
AMC.D
Total
Mean
Median
370.24 32.0
347 .68 32.0
359.82 26.0
350.36 19.9
30 t.25 80.3
300.55 45.5
353.32 43.6
338.32 39.3
349.02 32.0
440.56 4).6
423.01 41.2
429.72 46.3
424.99 33.6
347.57 29.5
342.67 33.2
422.66 50.6
40t.42 37 .9
424.00 37 .4
475.22 3'1 .8
4't t.t 5 29.1
4't t.28 30.3
470.46 32.9
397.33 32.8
390.09 34.4
463.t5 42.9
445.92 32.9
470.80 32.9
349.09 42.4
344.95 30.5
350.33 36.6
353.62 33.1
518.87 46.3
527.64 48.4
368.29 66.4
407.42 39.6
35t.98 39.5
t268.4 97.3
1246.9 17.4
t235.74 71.1
t292.03 9t.4
NA NA
NA NA
t25',1.07 82.5
t260.77 85.8
125',1.65 84.4
Tables 4.5 and 4.6 depict means and standard deviations for the predictors and
criterion variables of the four medical and nvo dental colleges for the combined
gehder. The overall mean scores obtained on the prediclo.s and criterion for the entire
sample of medical and dental colleges rvere as follorvs: F.Sc., 856.78 (SH7.l),Entry test, 575.28, (SD-l02.9), Merit,74.8'7, (SD:8.2), frst year 353.32, (SD=43.6),
second yeat 422.66, (SD=50.6), Third Year, 463.15, (SD=42.9), Fourth year, 368.29,
(SD=66.4), and Fifth Yea\ 125'1.07, (SD=82.5).
A sequential order was found in all the three component ofthe predictors for the
KMC, AMC, SMC, CMC, KCD, and AMC-Dental. This is because of the admission
procedure of $cse colleges i.e. students are placed in these colleges by the joint
admission comminee on lhe basis ofmerit.
In first year, KMC havc the highest mcan (370.?4), follorvcd by GMC, SMC and
AMC with 359.82,350.36, and 347.68 mean scores respectively. The performance of
the dcntal students ofKCD and AMC-D in the first year remain almost the sarne (i.e.
KCD=301.25 and AMC-D=300.32).Same sequential order was found all the six
colleges in tle second year and Fourth year performance, with 424.00 and 351.98
mcdian scores. ln third year, all thc collcgcs halc shown the same order of
performance as rvas seen in their adrnission criteria.
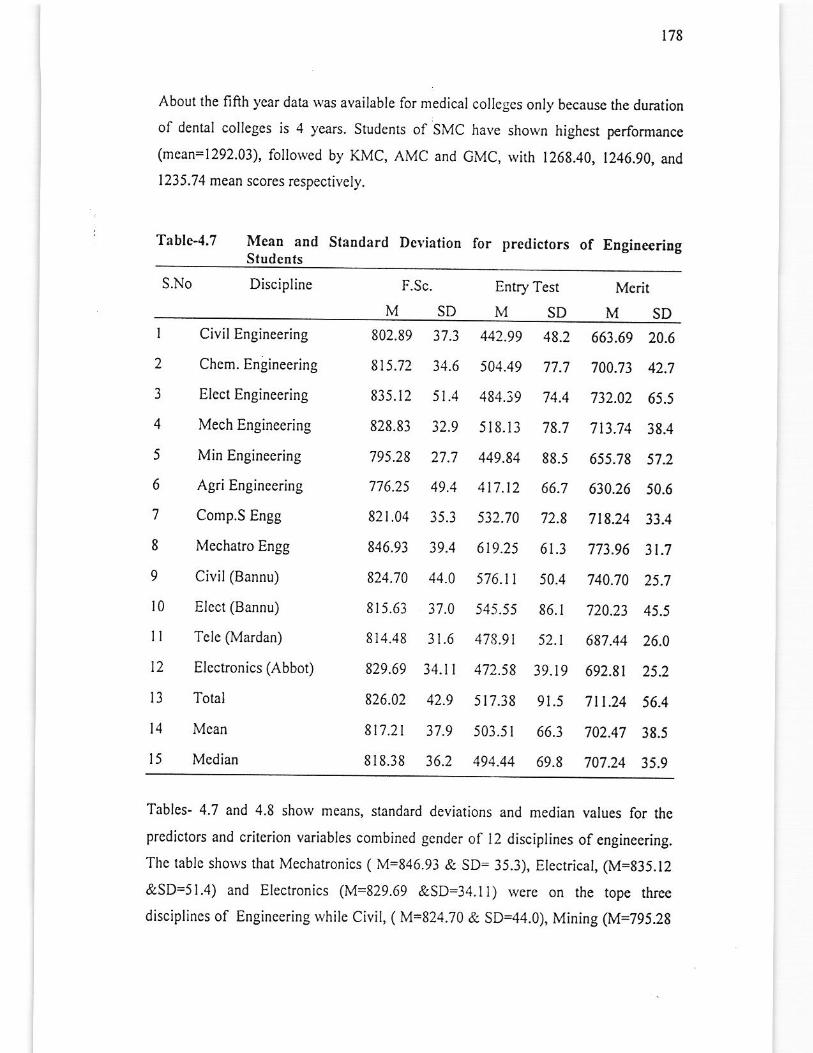
178
About the fifth year data Nas available for medical collegcs only because the duration
of dental colleges is 4 ycars. Students of SMC have shown highest performance
(mcan=1292.03), follorved by KMC, AMC and cMC, wirh 1268.40, 1246.90, and
I235.74 mean scores respectively.
Tablc-{.7 IUeaD and Standard DeYiatiotr for predictors of EiginecriDgStudcnts
S.r '\o
Discipline F.Sc.
MSDEntry Test Me.ia
MSDSD
I
2
3
4
5
6
7
8
9
t0
llt2
l3
t4
l5
Civil Engineering
Lncm. Engrneeflng
Elcct Enginecring
Mech Engineering
Min Engineering
AgriEngineering
Comp.S Engg
Mechatro Engg
Civil(Bannu)
Elect (Bannu)
Tele (Mardan)
Elcctronics (Abbot)
Total
Mean
Mcdian
802.89 37.3
815.72 34.6
835.12 51.4
828.83 32.9
795.28 27.7
776.25 49.4
821.04 35.3
846.93 39.4
824.70 44.0
815.63 37.0
814.48 31.6
829.69 34.|
826.02 42.9
811.2t 37.9
818.38 36.2
442.99 48.2
501.49 77.7
484.39 74.4
5 t8.13 78.7
449.84 88.5
417.12 66.7
532.70 72.8
619.2.5 61.3
576.1t 50.4
545.55 86.1
478.9t 52.t
472.58 39.t9
517.38 9 t.5
503.51 66.3
494.44 69.8
663.69 20.6
100.73 42.7
'132.02 65.5
7t3.74 38.4
655.78 57 -2
630.26 50.6
718.24 33-4
773.96 3t.7
740.10 25.7
'720.23 45.5
68'7.44 26.0
692.81 25.2
7 t t.24 56.4
702.47 38.5
707.24 35.9
Tablcs- 4.7 and 4.8 show fteans, standard deviations and median values for thc
prcdictors and critcrion variables combined gcndcr of l2 disciplines of cngineering.
Thc lable shows that Mechatronics ( M=846.93 & SD= 35.3), Electrical, (M=835.12
&SD=51.4) and Electronics (M=829.69 &SD=34.11) were on th€ tope thrce
disciplines of Engincering rvhile Civil, ( M=824.70 & SD=44.0), Mining (M=795.28
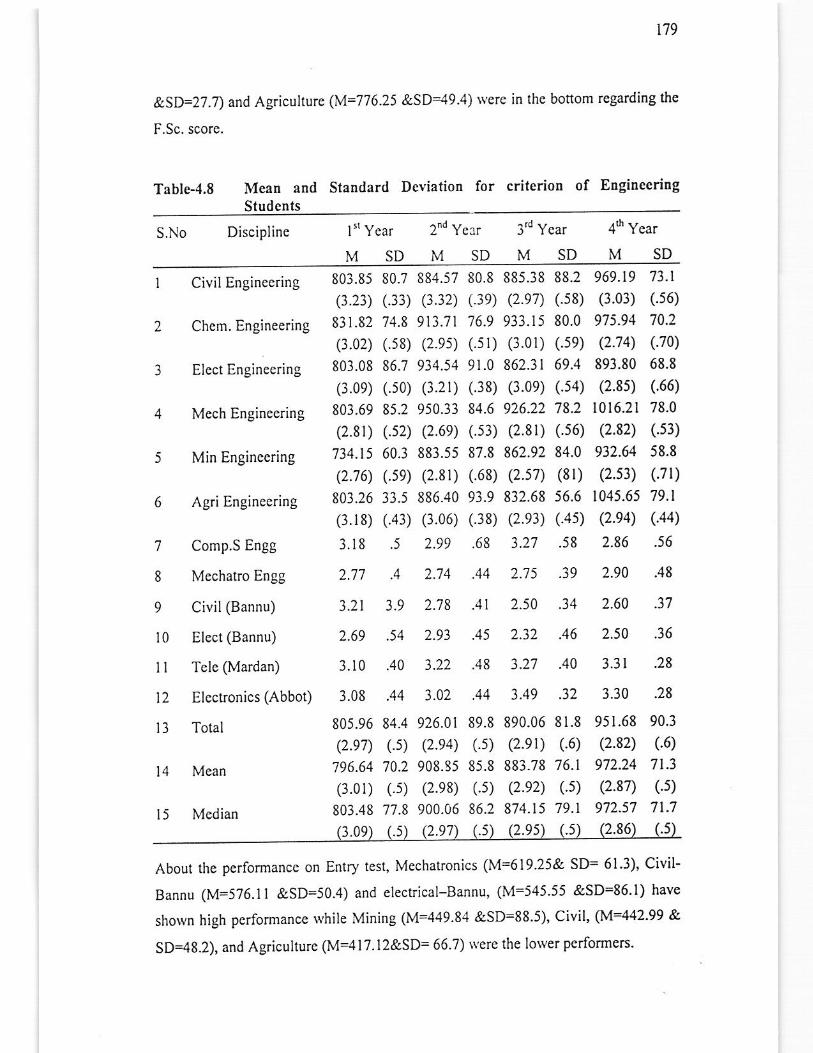
t't9
&SD=27.7) and Agricrhure (M='176.25 &SD=49.4) \\'ere in the bottom rega'ding the
F.Sc. score.
Tablc-4.8 tr{eab and Standard Deviation for criterion of EDgineeritrg
Students
S.No Discipline l" Ycar 2"d Ycar 3'd Ycar 4s Ycar
SDN{SDSDi\,1SD11
I Civil Engineering
2 Chem. Engineering
J Llect tngrnecnng
4 Mech Engineering
5 Min Engineering
6 AgriEnginccring
7 Comp.S Engg
8 Mcchatro Engg
9 Civil(Bannu)
l0 Dlect (Bannu)
1l Tele (Mardan)
l2 Elcctronics (Abbot)
l3 Total
14 Mean
l5 Median
2.77 .4 2.74 .44 2.75 .39
803.85 80.7 884.i7 80.8 885.38 88.2 969.19 73.1
(3.23) (.33) (3.32) (.39) (2.e7) (.58) (3.03) (.56)
83r.82 74.8 913.71 't6.9 933.15 80.0 975.91 ',10.2
(3.02) (.58) (2.95) (.51) (3.01) (.5e) (2.74) (.70\
803.08 86.7 934.54 91.0 862.31 69.4 893.80 68.8
(3.09) (.50) (i.21) (.38) (3.09) (.54) (2.85) (.66)
803.69 85.2 950.33 84.6 916.22 78-2 l0l6.2l 78.0
(2.8r) (.s2) (2.6e) (.53) (2,81) (.56) (2.82) (.53)
734.15 60.3 883.55 87.8 862.92 84.0 932.64 58.8
(2.16) (.se\ (2.81) (.68) (2.57) (81) (2.s3) (.7 t)
803.26 33.5 886.40 93.9 832.68 56.6 1045.65 79.1
(r.r8) (.43) (3.06) (.38) (2.e3) (-4s) (2.94\ (.44)
3.18 .5 2.99 .68 3.27 .58 2.86 .56
2.50 .34
2.90 .48
2.60 .373.21 3.9 2.78 .41
2.69 .54 2.93 .45
3.t0 .40 3.22
3.08 .44 3.02
232 .46 2.50 .36
.48 3 .27 .40 3 .3 I .28
.44 3.49 .32 3.30 .28
805.96 84.4 926.01 89.8 890.06 81.8 951.68 90.3
(2.e1) (.s\ (2.e4) (.5) (2.e1) (.6) (2.82) (.6)
796.64 70.2 908.35 85.8 883.78 76.1 972.24 '71.3
(3.0r) (.5) (2.e8) (.5) (2.92) (.5) (2.87) (.5)
803.48 77.8 900.06 86.2 874.15 79.t 972.s7 11.7
(1.0e) t.5) (2 97) (.5) (2.95) (.5) (2 86) ( 5)
About the performancc on Entry test, Mechatrcnics (M=619.25& SD= 6l'3), Civil-
Bannu (M=576.11 &SD=50-4) and elect cal-Bannu, (M=545.55 &SD=86.1) have
shown high performance while Mining (M=449.84 &SD=88.5), Civil, M442'99 &
SD<8.2), and Agriculture (M=417.12&SD= 66.7) $'ere the lower performers'
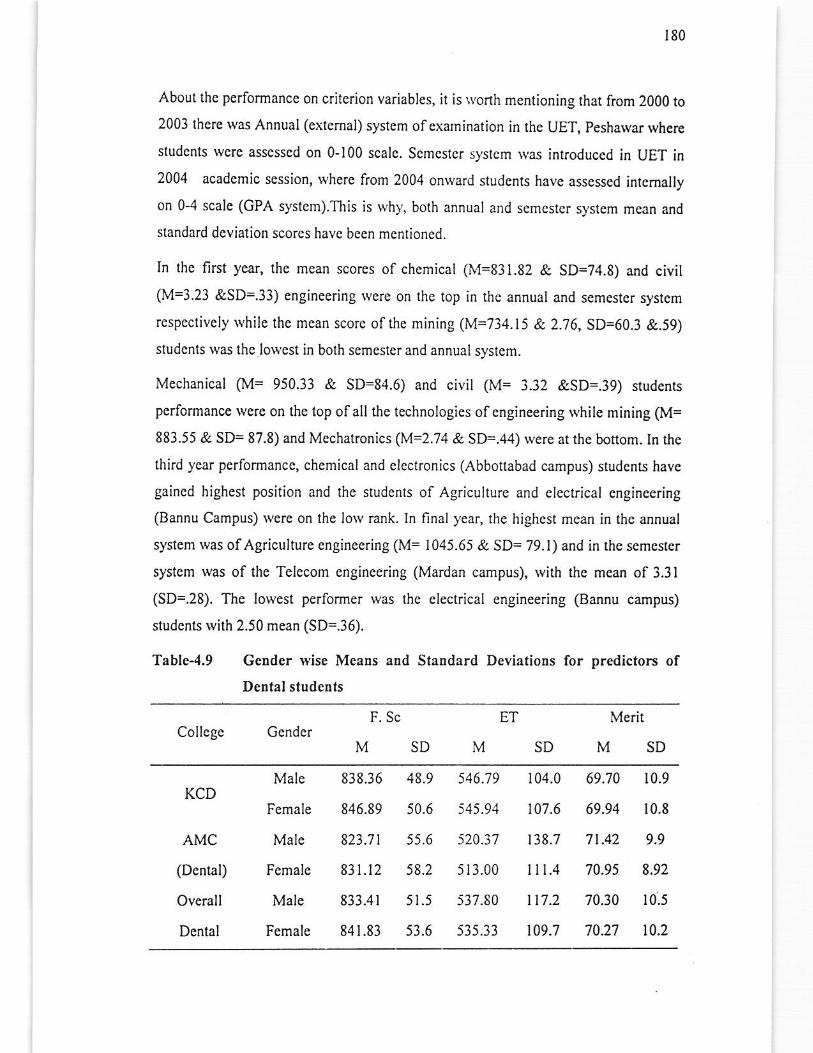
180
About thc performance on critcrion variables, it is.,\,orth mentioning that from 2000 to
2003 there was Annual (extemal) system ofexarnination in the UET, peshawar wherc
sludcnts rvcre asscsscd on 0-100 scalc. Scmcstcr riJ,stcm was int.oduced in UET in
2004 acadcmic session, wherc from 2004 onrvard studcnts have assessed intemally
on 0-4 scaie (GPA system).This is rvhy, both annual and semestcr system mean and
standard deviation scores havc becn mcntioned.
In lhe first year, the mean scores of chemical (M=831.82 & SD=74.8) and civil
(M=3.23 &SD=.33) engineering Nere on the top in the annual and semestcr system
rcspcclively \vhile the mean scorc ofthe mining (M=734.15 & 2.76, SD=60.3 &.59)
sludents \vas thc Iowest in both semcstcr and annualsystcm.
Mechanical O,,I= 950.33 & SD=84.6) and civil (M= 3.32 &SD:.39) studenrs
pcrformance were on the top ofall tle technologies ofcngineering rvhile mining (M=
883.55 & SD= 87.8) and Mcchatronics (M=2.74 & SD=.44) were at the bottom. In rhe
third ycar performancc, chemical and elcctronics (Abbottabad campus) students havc
gaincd highest position and the students of Agriculture and electrical engineering
(Bannu Campus) rvcre on the iow mnk. In final year, the highest mean in the annual
systcm vas ofAgriculture engineering (M= I045.65 & SD= 79.1) and in the semcster
systcm was of the Tclecom engineering (Mardan campus), with the mean of 3.31
(SD=.28). The lowest performer was the clectrical engineering (Bannu campus)
studenls wilh 2.50 mean (SD=.36).
Table-4,9 GeDder wise Meaus and Staldard Deviations for predictors of
DeDtalstudeots
F. Sc MeritCollcgc Gcnder
SD
KCD
AMC
(Dcntal)
Overall
Dental
Male
Female
Male
Female
Male
Female
846.89
823.71
831.12
84r.83
48.9
50.6
55.6
58.2
5r.5
53.6
546.79
545.94
520.37
513.00
537.80
i35.33
104.0
107.6
138.7
t.4
| 17.2
109.7
69.70 r0.9
69.94 10.8
'1t.42 9.9
'10.95 8.92
70.30 10.5
70.27 10.2
ET
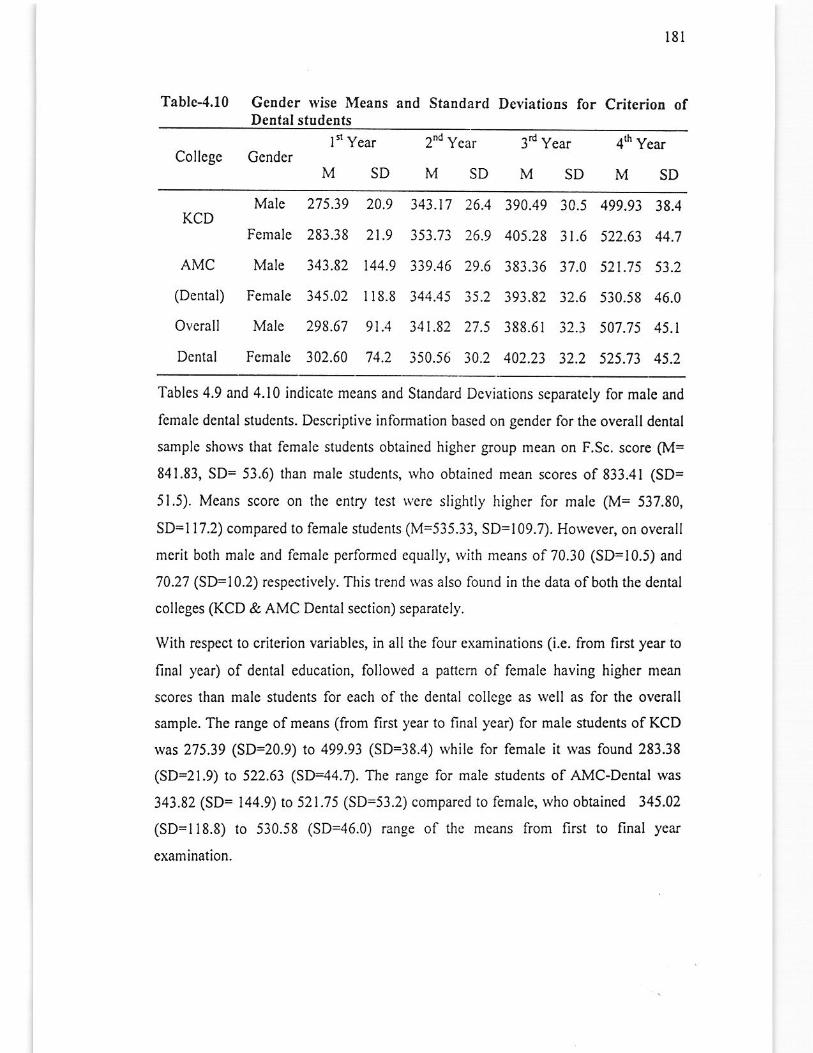
r81
Tablc-4.10 GeDder wise Means and Standard Deviations for CriterioD ofDental students
Collcgc CenderI n Yea.
MSD2nd Year
MSD3d Year 4d Year
MSDMSD
KCD
AMC
(Dental)
Ovcrall
Dcntal
Malc
Femalc
Male
Female
Male
Female
283.38 21.9
343.82 144.9
345.02 1r8.8
298.67 91.4
302.60 74.2
343.17 26.4
353.13 26.9
339.46 29.6
344.45 35.2
341.82 27.5
350.56 30.2
390.49 34.5
405.28 31.6
393.82 32.6
388.6r 32.3
402.23 32.2
499.93 38.4
522.63 44.1
52t.75 51.2
530.58 46.0
507.75 45.1
s25.73 45.2
Tables 4,9 ard 4.10 indicatc means and Standard Dcviations separately for male and
female dental studcnts. Descriptive information bascd on gender for the overall dental
sample shows that lemale students obtaincd highcr group mean on F.Sc. score (M=
841.83, SD= 53.6) than male students, who obtained mean scores of833.41 (SD=
51.5). Mcans scorc on thc cntry test rlcre slightly highc. for male (M= 537.80,
SD=l17.2) compared to female students (M=535.33, SD=109.4. However, on ove.all
merit both malc and fcmalc performcd equally, \vilh means of70.30 (SD=10.5) and
70.27 (SD=10.2) rcspcctively. This trend lvas also lound in the data ofboth the dental
colleges (KCD & AMC Dentalsection) separately.
Wilh rsspect to criterion variables, in all the four cxaminations (i.e. from first year to
final year) of dental education, followed a pattem of fcmale having higher mean
scores than male students lor each of the dental college as rvell as for thc ovemll
sample. The range of means (from first year to final year) for male students of KCD
rvas 275.39 (SD=20.9) to 499.93 (SD=38.4) rvhile for female it was found 283.38
(SD=21.9) to 522.63 (SD44.-f). The range lor male studcnts of AMC-Dental was
343.82 (SD= 144.9) ro 521;15 (SD=53.2) compared to female, \vho obtained 345.02
(SD=I18.8) to 530.58 (SD=46.0) range of the mcans from first to final year
examinalion.
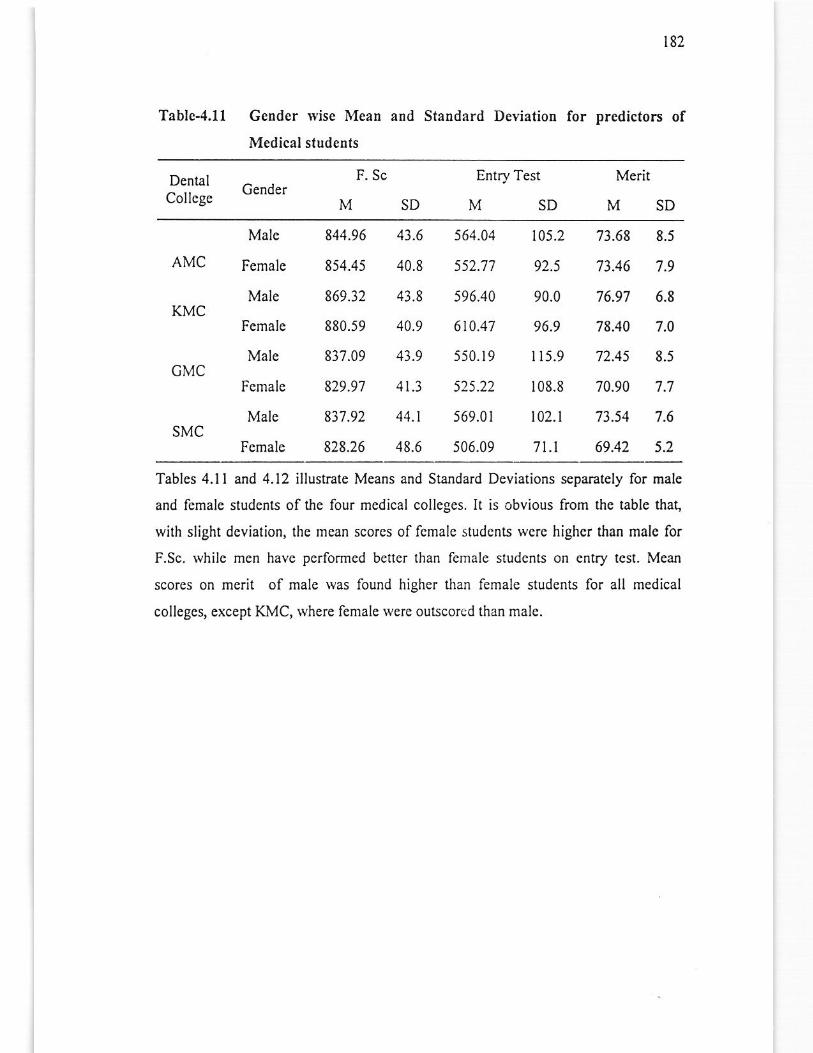
182
Table-,l.ll GeDder $'ise I{ean and StaDdard Deviation for predictoN of
Medicalstudents
DcnlalCollcSc
GenderEntry Test
MSDMerit
MSD
AMC
KMC
Male
Female
Male
Fcmale
Male
Fcmale
Male
Fcmalo
844.96 43.6 564.04
854.45 40.8 552.77
869.32 43.8 s96.40
880.59 40.9 610.4'7
82.9.97 4t.3 525.22
837.92 44.1 569.0i
828.26 48.6 506.09
105.2 73.68 8.5
92.5 73.46 '1.9
90.0 76.97 6.8
96.9 78.40 1.0
108.8 70.90 7.7
102.1 73.54 7.6
7 t.t 69.42 5.2
837.09 43.9 550.19 r 15.9 '12.45 8.5OMC
SMC
Tables 4.ll and 4.12 illustrale Means and Standard Deviations separately for male
and femal€ students of the four medical colleges. It is obvious from the table tha!
with slight deviation, lhc mean sco.cs of fcmalc studcnts wcrc higher than male for
F.Sc. while men have performed betler than female students on entry test. Mean
scores on merit of male was found higher than female studcns for all mcdical
collegcs, except KMC, where female were outscored than malc.
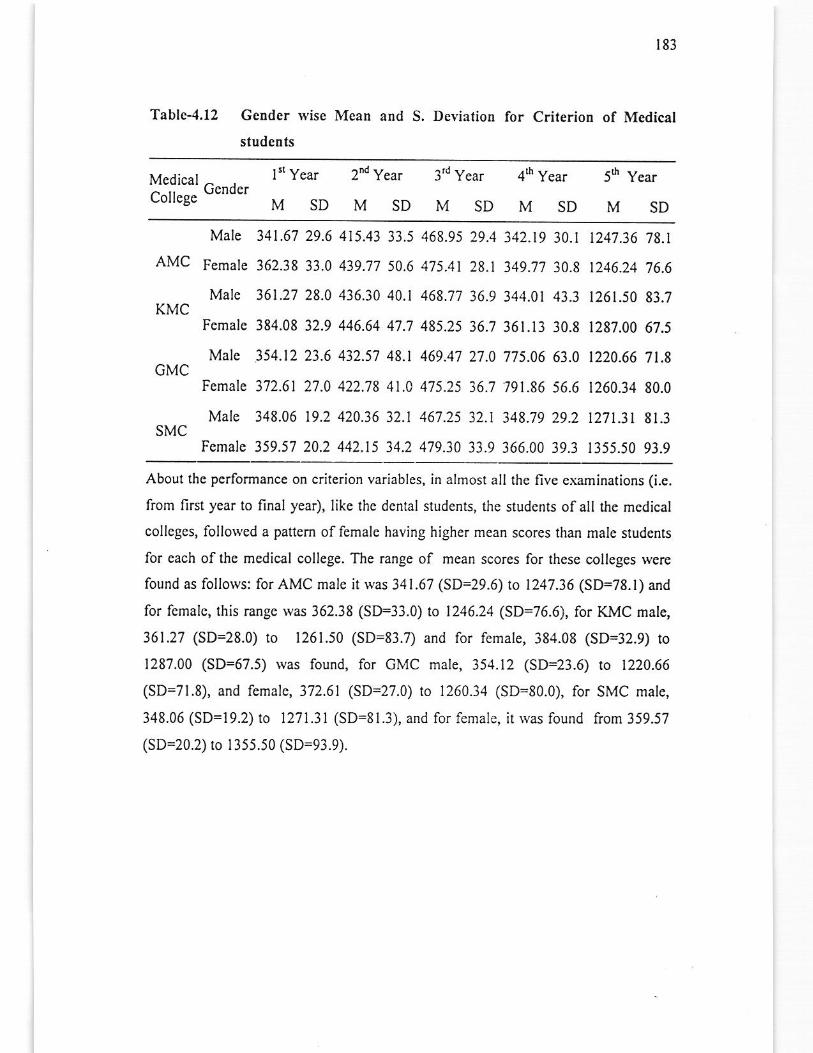
183
Tablc-4.12 Gendcr rrise Mean and S, Deyiation for Criteriotr of Medical
students
Medical uen0el
LOIlCge
I't Year 2tu Year
MSDMSD3'd Year 4s Year 5d year
MSDMSDMSDMale
AMC pgm61s
MaleKMC
Female
MaleGMC
Female
MaleSMC
Female
34t.67 29.6
362.38 33.0
36t .27 28.0
384.08 32.9
354.t2 23.6
312.61 27.0
348.06 t9.2
359.57 20.2
415.43 33.5
439.77 50.6
436.30 40.1
446.64 41 .7
432.5't 48.1
422.78 4t.A
420.36 32.t
442.15 34.2
468.95 29.4
475.4t 28.1
468.77 36.9
485.25 36.1
469.47 27 .0
415)5 36.7
46'1 .25 32.1
479.30 33.9
342.19 30.1
349.17 30.8
344.0r 43.3
36t.13 30.8
775.06 63.0
79 r.86 56.6
348.79 29.2
366.00 39.3
1241.36 78.1
t246.24 76.6
t261.50 83.7
1287.00 67.5
t220.66 7t.8
1260.34 80.0
I27l.3i 81.3
r355.50 93.9
About the performance on criterion variables, in almost all th€ five examinations (i.e.
from fi.st year to final year), like thc dcntal students, the students ofall the medical
colleges, follorved a pattem of female having higher mean scores than male students
for each ofthe medical college. The range of mcan scores for these colleges were
found as follows: for AMC male it was 341.67 (SD=29.6) to 1247.36 (SD=78.1) and
for femalc, this range was 362.38 (SD=33.0) to 1246.24 (SD=76.6), for KMC male,
361.27 (SD=28.0) to 1261.50 (SD=83.7) and for female, 384.08 (SD=32.9) to
1287.00 (SD=67.5) was found, for GMC male, 354.12 (SD:23.6) to 1220.66
(SD=71.8), and female,3'72.61 (SD=27.0) to 1260.14 (SD=80.0), for SMC male,
348.06 (SD=l9.2) to 1271.31 (SD=81.3), and for female, it rvas found from 359.57
(SD=20.2) to 1355.50 (SD=93.9).
t84
SectioD-B: CorrelatioDs behteen Predictors and CriicrioD Yariables
Thc predictive validities of the prcdictors' individually and in combination' ar€
repo(ed in thc second section ofthis chapter. In this study, the predictive validities of
3 diffcrcnt predictors, namely, F.Sc. scorcs, cntry test scorc, merit score (tle
combinalion of F.Sc. and Entry test score) rverc cxamined. Inler-correlation bttrveen
thc predictors and crilerion variables arc rcported first by college/lnstitution for six
cohods (from 2000 to 2005), classified under three professional areas (i e Medical,
Dcntat and Engineering), and then by gender lor each college medical and dental
collegc.
Validir, coefficients for the medical colleges are shown in Table 4.13 through Table
4.28 and for 1ie denral colleges in Table 4-29 firough Table 4.37. For engineering
studcnts, these validities havc been shorvn in Table 4.38 through Table 4.52. As
mentioncd in the Iimilations, due to unavailability ofinformation about the unselected
applicans, validities coefficient werc not corrected for range restriction and criterion
unreliability (Lady, 2005). The results indicated variations in the Validity coeflicients
obtainod for each predictor across the 4 medical colleges,2 dental colleges and 12
disciplines of engineering University.
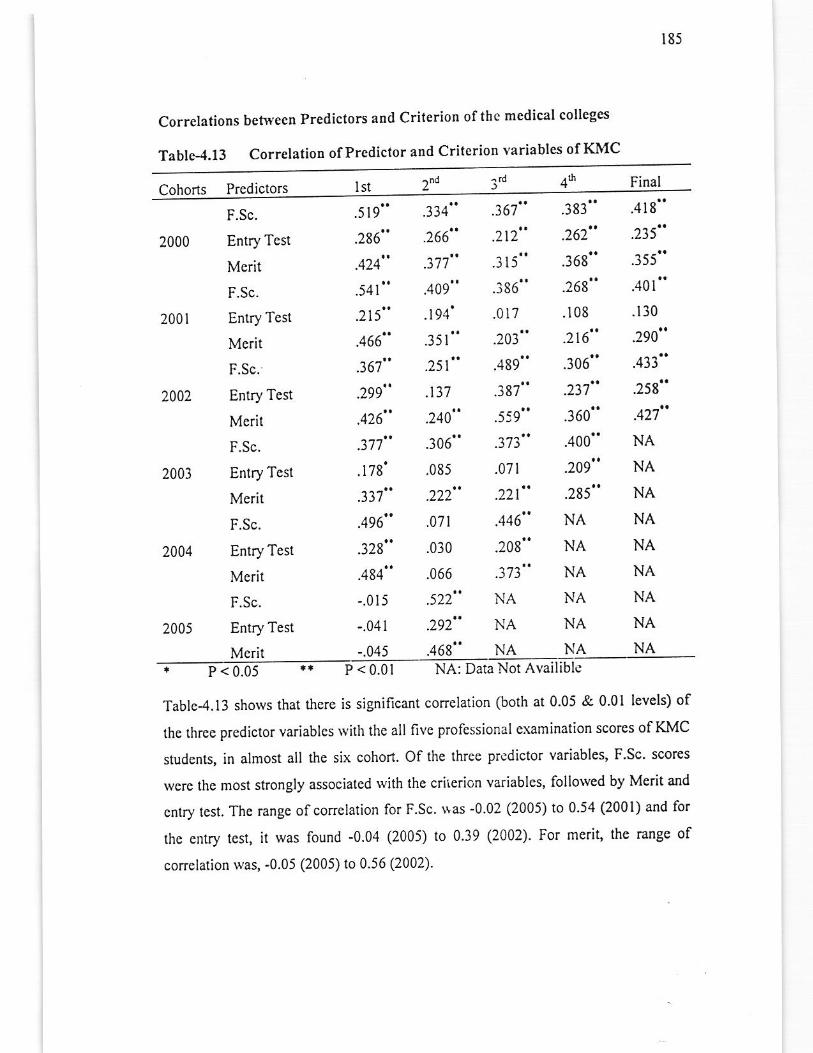
185
Correlations beft\'ecn Predictors and Criterion ofthc medical colleges
Table-4.13 Correlation ofPrcdictor and Criterion variables ofKMC
2"d1stCohons Predictors
2000
2001
24c,.
2003
2004
2005
F.Sc.
Entry Test
Merit
F.Sc.
Enry Test
Merit
F.Sc.
Entry Test
Merit
F.Sc.
Entry Test
Merit
F.Sc.
Entry Test
Mcrit
F.Sc.
EntryTest
Merit
.5 t9
186
.541
.2t5"
.466"
.367
.299
.426"
.171
.178'
.i31
.496"
.328"
.484
-.015
-.04i
-.045
.418"
.235
.J))
.401
.130
.290
.413
.258"
.421
NA
NA
NA
NA
NA
NA
NA
NA
NA
.334" .36'1" .383"
.266" .712" .262"
.37'1" .315" .368"
.409" .386" .268"
.194' .01? .108
.351" .203" .216"
.251" .489" .306"
.137 .387" .231"
.240" .559" .360"
.306" .373" .400"
.085 .071 .209"
.222" .221" .285"
.o?t .446" NA
.030 .208" NA
.066 .373" NA
.522" r.{A NA
.292" r.\A NA
.468" r.\A ^'A* P<0.05
Table-4.13 shows that dere is significant conelation (both at 0 05 & 0 01 levels) of
th€ three predictor variablcs Nith the all {ivc professional examination scores ofKMC
students, in almost all the six cohort. Of the three pr.dictor variables, F Sc' scores
were thc most strongly associated with the crilerion variables, followed by Merit and
entry tcst. Thc range of conelarion for F.Sc. *as -0.02 (2005) to 0 54 (2001) and for
the entry tesl, it was found -0.04 (2005) to 0.39 (2002). For merit, tlc range of
corrolation was, -0.05 (2005) to 0.56 (2002).
P < 0.01 NA: Data Not Availiblc
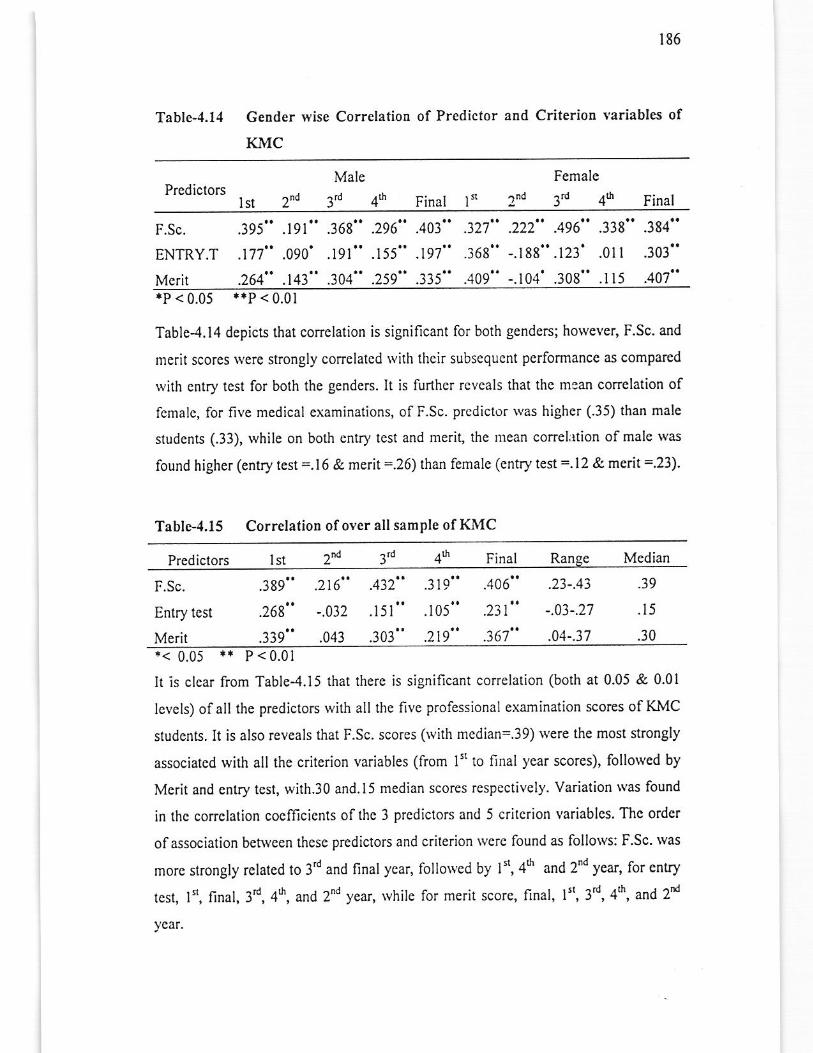
r86
Table-4.1.1 Gender
KMC
Correlation of Predictor aDd Criteriotr Yariables of
Predictorslst 2ro
Male
Final 1n
Female
3'd 4'n Final
F.Sc.
ENTRY.T
Merit
.395 .191
.17't .090
.264 .t43
.368".296".403"
. r9l .155 .197
.304 .259 .135
.12'1" -222"
.368 -. r 88
.409" -.r04'
.496".338".384"
.123' .0i l .303"
.308" .l l5 .407"r'P < 0.05 .+P <0.01
Table-4.14 depicts liat corelation is significant for both genders; horvcver, F.Sc. and
mcrit scorcs were strongly conclatcd with thcir subsequent perlormancc as compared
with cntry tcst for both the genders. It is further reveals that thc mean conelation of
fcmalc, fo. five medical examinations, of F.Sc. prcdictor was higher (.35) than malc
studcnts (.33), while on bolh entry test and meri! the mean correl,ttion of male was
found higher (eniry test =.16 & merit =.26) than female (ontry test =.12 & merit =.23).
Tablc-4,15 CorrelatioD of overallsampleof KIUC
Predictors lst 2"d 3'n 4'l' Final Range M.liqlF.Sc.
Entry tcst
Merit
.389 .216
.268" -.032
.339" .043
.432 .3t9
.r 5l .105
.303 .2t9
--03-.2',7
.04-.37
.406
.231
.361
.39
.15
.30+< 0.05 ** P < 0.01
It is clcar from Table-4.l5 that lhere is significant correlalion (both at 0.05 & 0.01
levels) ofall the predictors with all the fivc professional exarnination scores of KMC
studcnts. lt is also rcveals 0lat F.Sc. scores (with mcdian=.39) were the most strongly
associated with all the criterion variables (from l" to final year scores), followed by
Mcrit and entry tcsl, with.30 and.l5 median scores respectively. variation lvas found
in thc conclation cocflicients of thc 3 prcdictors and 5 critcrion variablcs. Thc ordcr
ofassociation betwcen thesg predictors and crilerion rvcrc found as follows: F.Sc. was
morc strongly related to 3'd and final ycar, follorved by ln, 4s and 2"4 year, for entry
tcst. I'r. final, 3d, 46, and 2nd year, rvhilc for merit score, final, I'r, 3d, 4d, and 2d
ycar.
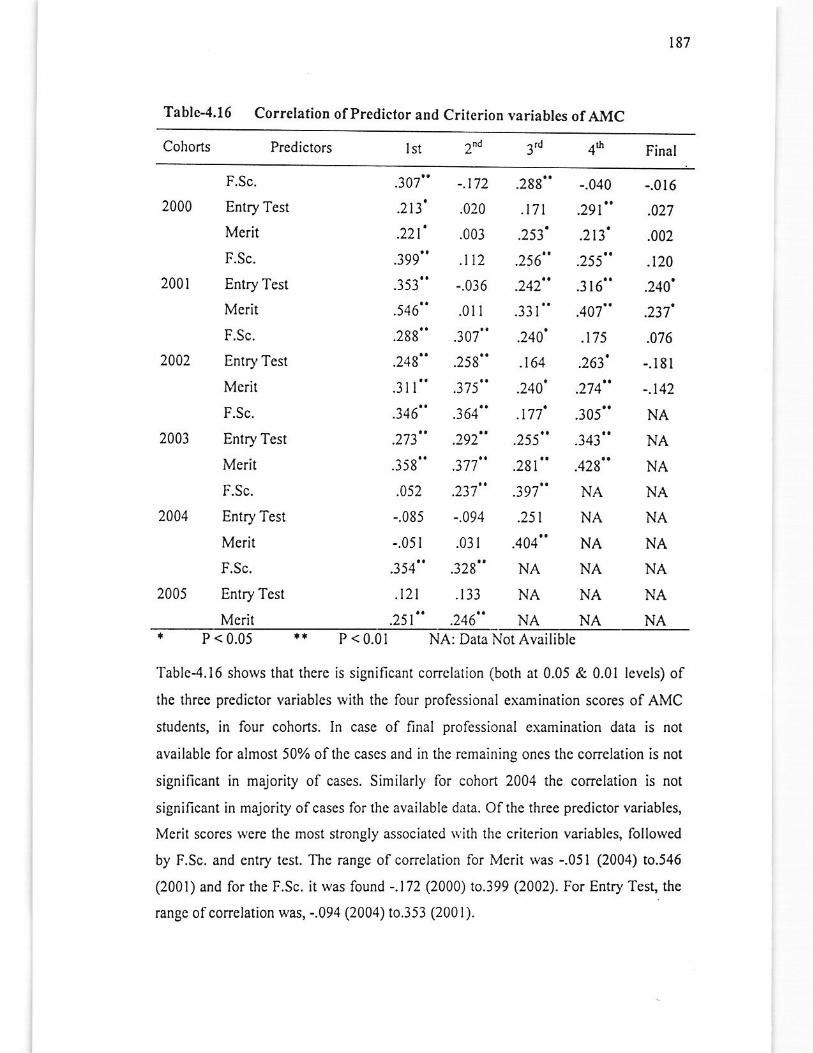
187
Tablc-4.16 Correlation ofPredictor and CriterioD yariables ofAMC
Cohorts Predictors Ist 2,d Final
2000
2001
2002
2003
2405
F.Sc.
Entry Test
Merit
F.Sc.
Entry Test
Merit
F.Sc.
EntryTest
Merit
F.Sc.
Entry Test
Merit
F.Sc.
Entry Test
Mcrit
Entry Tcst
Merit
.307" -.t72 .288"
.213' .020 .t7t
.221' .003 .253'
.399" .lt2 .256"
.353" -.036 .242"
.546" .01 I .31l"
.288" .307" .240'
.248" .258" .164
.3 " .37 5" .240'
.346" .364" .t77'
.2'73" .292" .255"
.358" .3'77" .28t".052 .231" .397"
-.085 -.094 .251
-.05 t .031 .404"
.354" .328" NA
.tzt .t33 NA
.251" .246" NA
-.040 -.016
.29t" -027
.2t3' .OO2
.255" .120
.3 16" .240'
.407" .237'
.115 .076
.263' -.181
274" --142
.305" NA
.343" NA
.428" NA
NA NA
NA NA
NA NA
NA NA
NA NA
NA NA* P<0.05 t* P<0.01 NA: Data Not Availible
Tablc-4.16 sholvs that there is significant correlation (both at 0.05 & 0.01 lcvcls) of
the threo predictor variablcs \vilh thc four profcssional examination scores of AMC
studcnts, in fou. cohorts. In case of final prolessional examination data is not
available for almost 50% ofthe cases and in the remaining ones the conelation is not
significant in majority of cases. Similarly for cohort 2004 the correlation is not
significant in majority ofcases for the available dala. Of the three predictor valiables,
Meril scor€s wcre thc most strongly associated wilh the criterion variables, follorved
by F.Sc. and enlry test, The range ofcorrelation for Merit rvas -.051 (2004) to.546
(2001) and for the F.Sc. it was found -.172 (2000) to.399 (2002). For Entry Test the
range ofconelation was, -.094 (2004) t0.353 (2001).
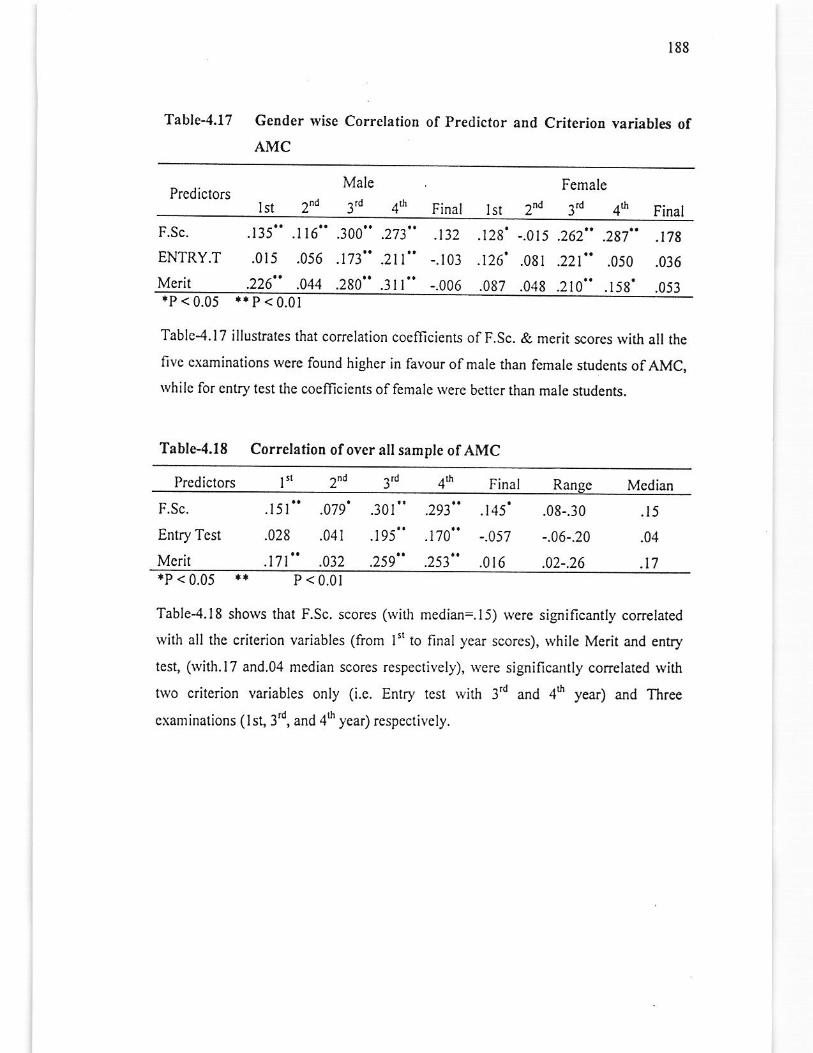
188
Tablc-4.17 Getrder wise Correlation of predictor and CriterioD variabl.s ofAMC
Prcdictorslst 2^o
Male Female
Final lst Final
F.Sc.
ENTRY.T
Merit
.135" .l16".015 .056
.226" .044
.300" .2'73" .t32
.173".21t" -.103
.280" .31l" -.006
.128'
.126'
.087
-.015
.081
.048
.262"
.221"
.210
.281"
.050
.158'
.t78
.036
.053lP<0.05 ,|*P<0.01
Tablc4.l7 illustrates that co.relation coemcients ofF.Sc. & merit scores witl all the
five cxaminations rvere found higher in favour ofmale than female students ofAMC,whilc for entry test the coefficienIs offemale were bettcr than male students.
Table-4.18 Corrclatiotr ofovcr all sample ofAMC
Prediclors
F.Sc.
Entry Test
Merh
tn 2nd 3,! Final Mcdian
.151" .079' .301"
.028 .O4t .195"
.171" .032 .259"
.293
.110
.253
.145'
-.057
.016
.08-.30
-.06-.20
.02-.26
.t5
.04
.17*P < 0.05 ** P < 0.01
Table-4.18 shows that F.Sc. scores (witI median=.I5) were significantly correlated
with all tle criterion variables (from lrtto final year scorcs), lvhile Merit and entry
test, (lvith.l7 and.04 median scores respeciively), \\'cre significantly conelated witltvr'o criterion variables only (i.e. Entry test rvith 3'd and 46 year) and Three
cxaminations (lst, 3d, and 4s year) respectively.
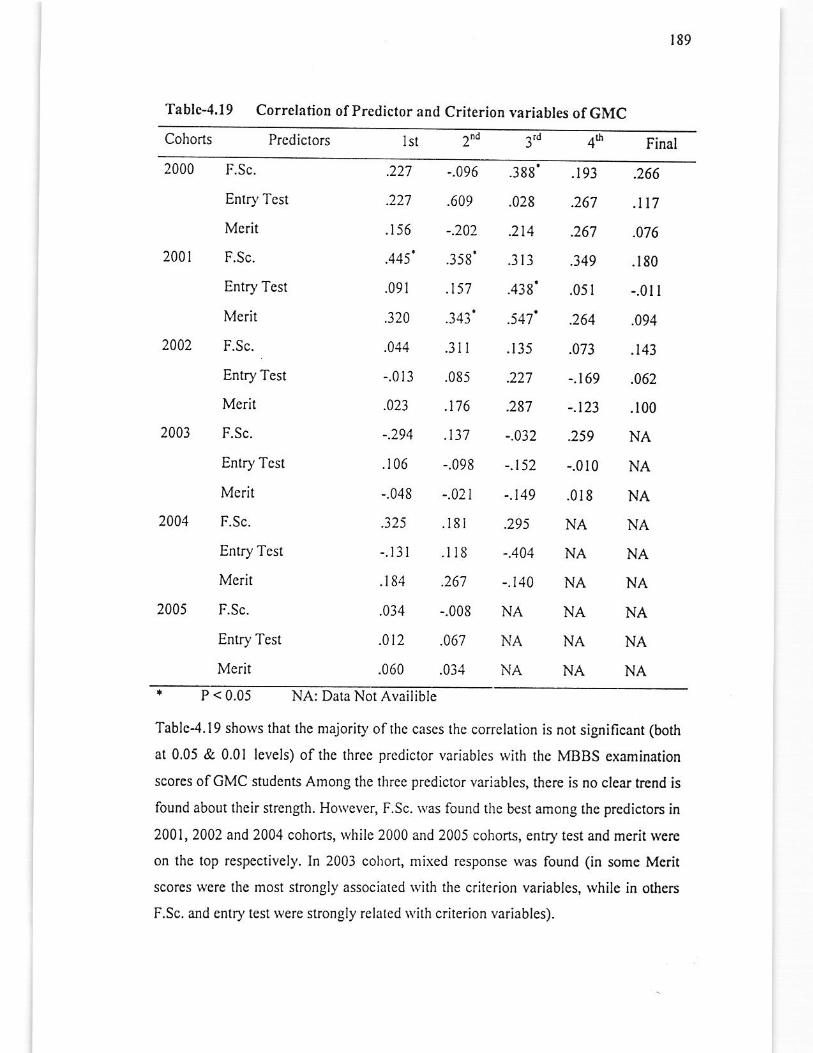
189
Tablc-4.19 Corrclation ofPrediclor and Criterion variables ofGMC
Prcdictors
2000 F.Sc.
Entry Tcst
Merit
2001 F.Sc.
Enrry Test
Merit
2002 F.Sc.
Entry Test
Merit
2003 F.Sc.
Enlry Tcst
Merit
2004 F.Sc.
Entry Test
Mcrit
2005 F.Sc.
Entry Test
Merit
.227 -.096
.227 .609
.156 -.202
.445' .358'
.09t .15'1
.320 .343'
.044 .3 r r
-.013 .085
.023 .176
-.294 .137
.t06 -.098
-.048 -.021
.325 .18l
-.13r .t18
.184 .267
.034 -.008
.0t2 .067
.060 .031
.388' .193
.028 .267
.2t4 .267
.313 .349
.438' .051
.547' .264
.r35 .073
.227 -.r 69
.287 -.123
-.032 .259
-.152 -.010
-.149 .0t 8
.295 NA
-.404 NA
-.140 NA
NA NA
NA NA
NA NA
.266
.|7
.076
.180
-.01I
.094
.143
.062
.100
NA
NA
NA
NA
NA
NA
NA
NA
NAr' P < 0.05 NA: Dala Not Availible
Tablc4.l9 shows that tho majority olthe cascs the corrclation is not significant (both
at 0.05 & 0.01 lcvcls) ofthc thrcc prcdictor variablcs lvith thc MBBS cxamination
scorcs ofGMC students Among thc thrce predictor variables, there is no clear tend is
found about thcir strcngth. Ho\vever, f.Sc. was found the best among the prcdictors in
2001,2002 and 2004 cohoas, while 2000 and 2005 cohorrs, entry tesr and merit werc
on the top rcspectively. In 2003 cohort, mixed response was found (in some Mcrit
scorcs wcre the most slrongly associaled \vith the critc.ion variables, rvhile in others
F.Sc. and enlry tcst werc strongly relalcd \\,ilh criterion variables).
^ra .li ------ .z t I rlnal
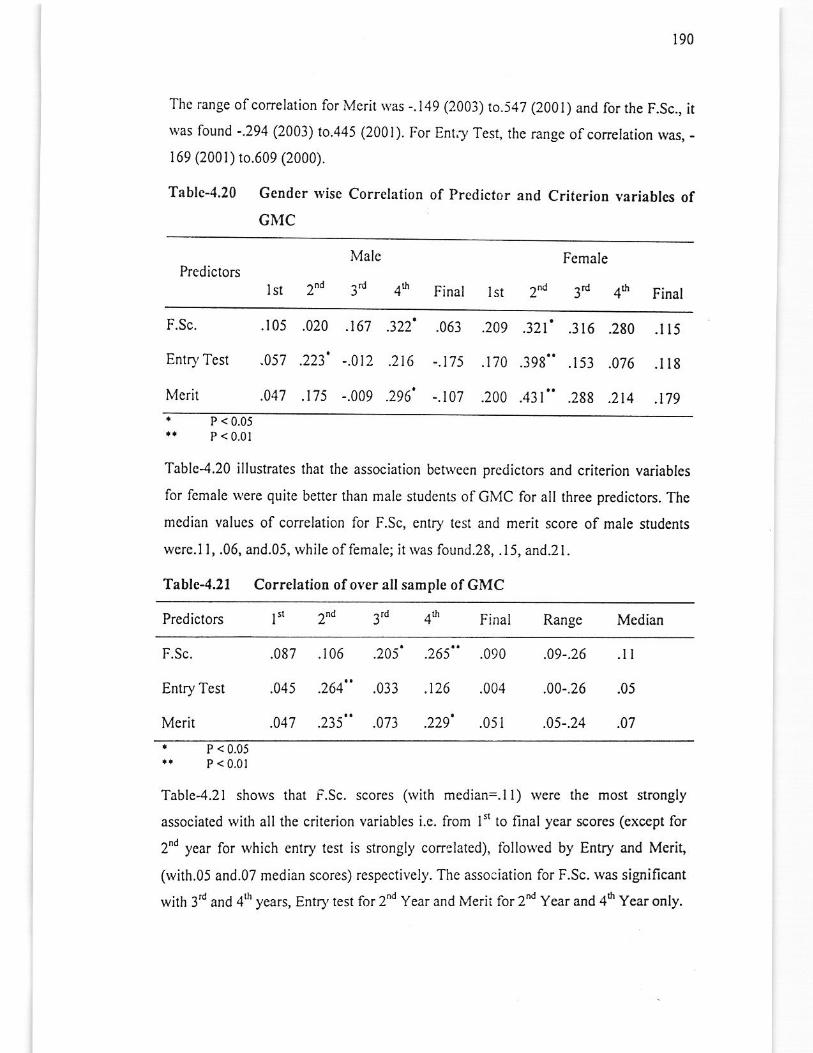
t90
Thc range ofconelation for Merit was -.149 (2003) ro.j47 (2001) and for the F.Sc., itrvas found -.294 (2003) to.445 (2001). For Enr.f Tesl, thc range ofcorrelation was, _
169 (2001) 10.609 (2000).
Table-4,20 Gendcr ryise Co.rclation ol Predictcr and Criterion variables ofGt\{c
PrcdictorsMale
fst 2"d 3'n 4'r'
Fcmale
2nd 3'd 4'r' FinalFinal lst
F.Sc.
Enlry Test
Merit
.105 .020
.057 .223'
.047 .175
.167 .322'
-.012.2t6
-.009.296'
.209 .321'
.t70.398"
.200.431"
.316 .280 .1t 5
.153 .076 .l l8
.288 .214 .t79
.063
-.)75
-.107
P < 0.0JP<O,OI
Tablc4.20 illustratcs thai the association between prediclors and criterion variables
for fcmale *ere quite better than male sludcnts ofGMC for all three predictors. The
mcdian values of correlation for F.Sc, entry test and merit score of malc stud€nts
werc.l l, .06, and.05, while offemale; it rvas found.28, .15, and.2l.
Tablc-4,21 Corrclatior ofovcr allsample of GMC
Prediclors fi 2rd Final Range Median
F.Sc.
Entry Test
Merit
.09-.26
.00-.26
.05-.24
. P<0.05.. P <0.01
Tablc-4.21 shows that F.Sc. scores (with median=-ll) were the most strongly
associatcd with all the crilerion variablcs i.e. from l" to final year scores (cxccpt for
2nd ycar for which cntry tcst is strongly correlated), lollowed by Entry and Merit,
(with.05 and.07 median scores) respectively. The association for F.Sc. was significant
with 3'd and 46 years, Entry rest for 2 Year and Merii ior 2d Year and 46 Year only.
.08? .106 .205' .265" .O9o
.045 .264" .033 .126 .004
.047 .235" .073 .229' .051
.ll
.05
.07
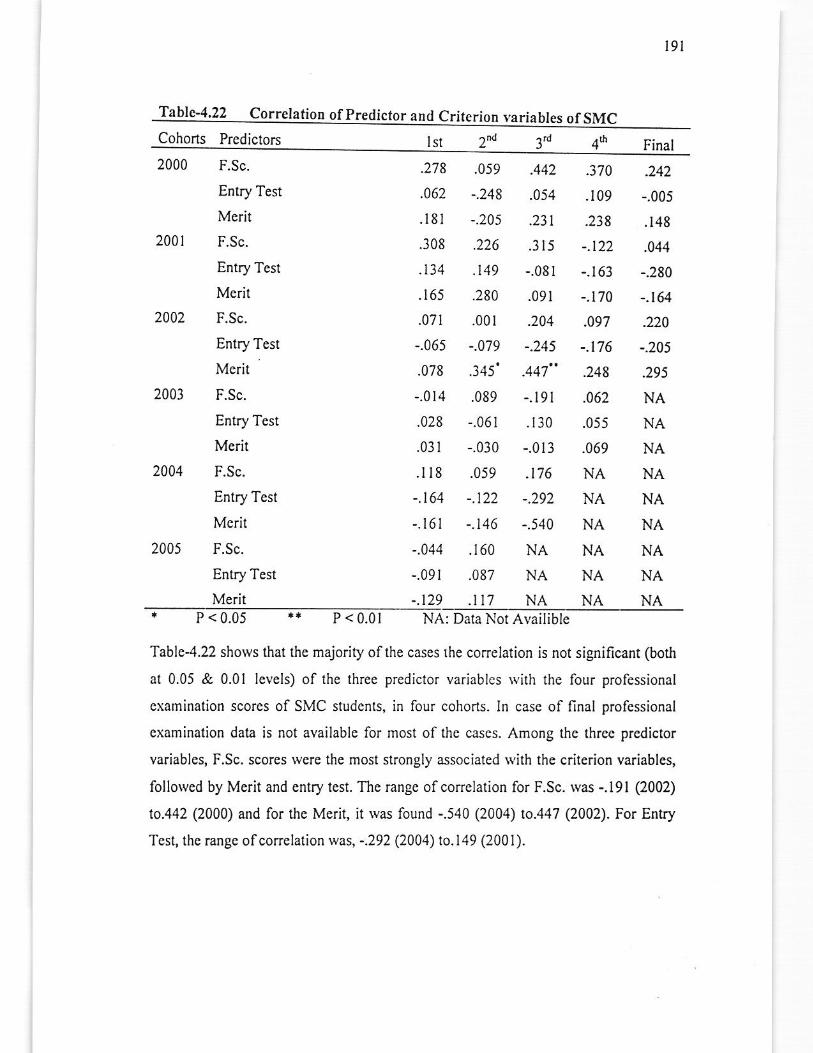
l9l
Table{,22 Correlatiop ofpredictor and Criterion variables ofSMCCohorts Predictors lsi 2 46 Final2000 F.Sc.
Entry Test
Merit
2001 F.Sc.
Entry Test
Merit
2002 F.Sc.
Entry Test
Merit
2003 F.Sc.
Entry Test
Merit
2004 F.Sc.
Entry Test
Merit
2005 F.Sc.
Entry Test
Merit
.278 .059 .442 .370 .242
.062 -.248 .054 .r09 _.005
.r8l -.20s .2-]I .238 .148
.308 .226 .315 -.122 .044
.134 .149 -.081 -.163 -.280
.165 .280 .091 -.1?0 -.t64
.07t .001 .204 -097 .220
-.065 -.079 -.245 -.t76 -.205
.078 .345' -447" .248 .295
-.014 .089 -.191 .062 NA
.028 -.061 .130 .055 NA
.031 -.030 -.013 .069 NA
.l 18 .059 .t76 NA NA
-.164 -.122 -.292 NA NA
-.t6t -.146 -.540 NA NA
-.044 .160 NA NA NA..09I .087 NA NA NA
-.129 .II7 NA NA NA* P < 0.05 *' P < 0.01 NA: Data ^"ot
Availible
Table4.22 shows that tIe majority ofthe cases rhe conelation is not significant (borh
at 0.05 & 0.01 levels) of the three predicior variablcs rvith the four professional
cxamination scores of SMC sludents, in lour cohorts. In casc of final professional
examination data is not available for most of the cases. Among the th.cc prcdictor
variables, F.Sc. scores rvere the most strongly associatedTvith the criterion variables,
followed by Merit and entry tcst. The range ofconelalion for F.Sc. was -.191 (2002)
to.442 (2000) aad for the Merit, it rvas found -.540 (2004) to.447 (2002). For Entry
Tcst, the range ofconelation was, -.292 (2004) to.l49 (2001).
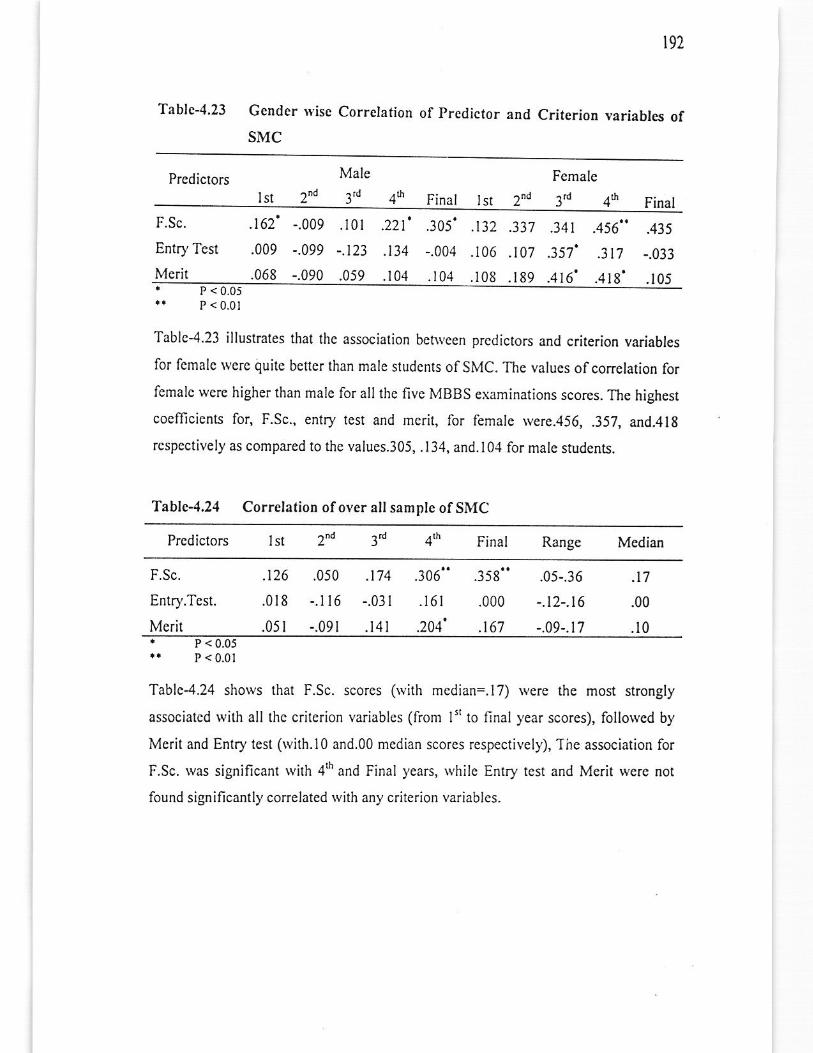
r92
Tablc-4.23 Gendcr
SMC
\vise Correlation of Prcdictor aDd Criterion variablcs of
Prcdiclors Male
3,! 4rL
Female
2ndlst Final 2n,llst FinalF.Sc.
Entry Tcst
Merit
.lot .221'
-.123 .134
.059 .101
.162'
.009
.068
.305'
-.004
.t 04
.t32
.t06
.108
.337
.t07
.189
.34t
.4t6'
.456"
.3t7
.418'
.435
-.033
.105
-.009
-.099
-.090P < 0.0iP<0.01
Tablc4.23 illust.ates tlat the association behvcen prcdictors and criterion variabies
for fcmalc lvore quitc beller than male studcnts ofSMC. The valucs ofcorrelation for
femalc wcre higher than malc lor all thc five MBBS examinations scores. The highest
cocfficients for, F.Sc., entry test and merit, for lemale rvere.456,.357, and.4l8
rcspectively as compared to tie values.305, .134, and.l04 for male students.
Tablc-4,24 Corrclation of oycr all sample of SMC
Predictors lst 2"d 3'n q tlnal Range
F.Sc.
Enlry.Test.
Merit
.t26 .050 .174
.018 -.t l6 -.031
.05 t -.091 .l4l
.306 .158
.t 6l .000
.204' .167
.05-.36
-.t2-.16
-.09-.t7
.t7
.00
.10r P <0.05.. P <0.01
Tablc4.24 shows that F.Sc. scores (rvith mcdian=.17) were the most strongly
associated rvift all tho critcrion variables (from Isr to final year scores), follorvcd by
Merit and Entry test (wilh.l0 and.00 median scores respectively),'[he association for
F.Sc. rvas significant rvirh 4s and Final years, lvhile Entry test and Merit tvere not
found significantly correlated with any crilerion variablcs.
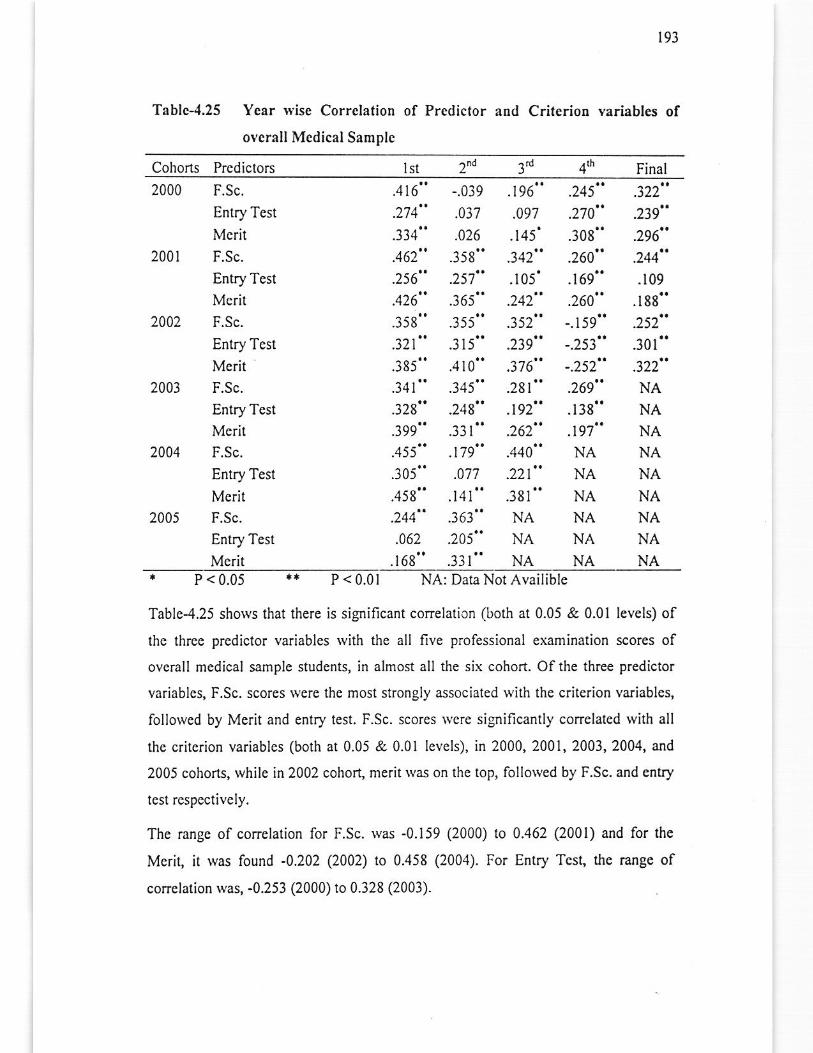
193
Tablc-4.25 Year rvise Correlation of Predictor aod Criterion yariables of
ovcrall Medical Samplc
Cohons Prcdiclors lst lnd Final3'i2000
2001
2007
2003
2004
F.Sc.
Entry Test
Mcrit
F.Sc.
Entry Test
McritF.Sc.
Entry Test
Merit
F.Sc.
Entry Test
MeritF.Sc.
Entry Test
McritF.Sc.
Entry Test
Morit
.4t6" -.039 .196"
.27 4" .037 .Og'l
.334" .026 .145'
.462" .358" .342"
.256" .257" .105'
.426 .365 .242
.358 _t55 .352
.32t .315 .239
.385" .410" .376"
.341" .345" .28r"-328 .2.18 .192
.399 .331 .261
.455 .t79 .440
.305" .071 .221"
.458 .l4l -381
.244" -363" NA.062 .205" NA168 .3ri I NA
.245" .322"
.270" .239"
.308 .296
.260" .244"
.169" .l09
.260" .188"-.r59" .252"-.253" .301"-.252 322.269" NA.138" NA.t97" NANA NANA NANA NANA NANA NANA NA
'r P < 0.05 ** P < 0.01 NA: Data Not Availible
Table-4.25 shows that there is significant correlat;on (both at 0.05 & 0.01 levels) of
the lhree predictor variables rvith the all five prolessional exaftination scores of
overall medical sample studcnts, in almost all the six cohort. Of the three predictor
variablcs, F.Sc. scores were the most strongly associated with the criterion variables,
follorvcd by Merit and entry test. F.sc. scorcs wcre signilicantly correlated rvith all
the criterion variables (both at 0.05 & 0.01 levels), in 2000, 2001, 2003, 2004, and
2005 cohorts, while in 2002 coho4 merit vas on the top, followed by F.Sc. and cnt y
tesi respcctivcly.
The range of conelation for F.Sc. rvas -0.159 (2000) to 0.462 (2001) and for fte
Merit, it was found -0.202 (2002) to 0.458 (2004). For Entry Tes! lhe range of
conclation was, -0.253 (2000) 10 0.328 (2003)
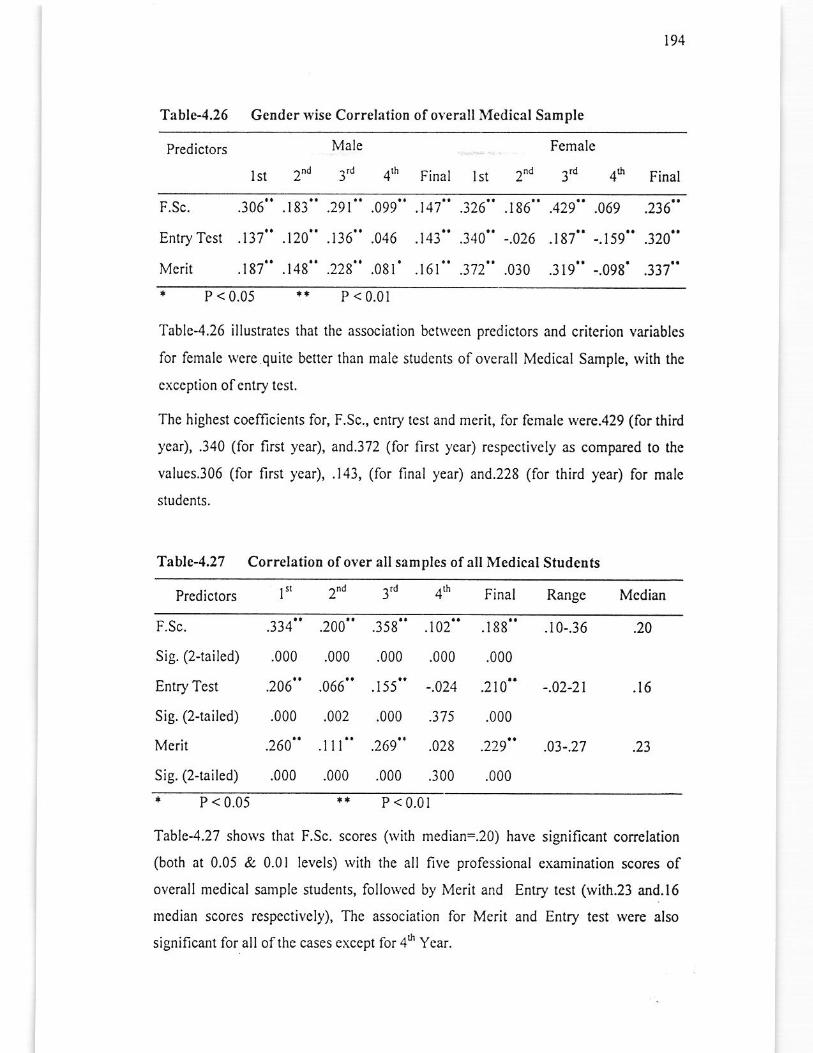
194
Tablc-4.26 GenderwiseCorrelationofoYeralll\{edicalSample
Prediclors Male
2nd 3'd 4'h Final lst
Female
^nd ^rd ,tIlst Final
F.Sc.
Enlry Test
Merit
.306 .r83
.137 . r20
.t87 .148
.29t .099
.136".046
.228 .08r
.141 .326
. t4l .340
.t6t .372
.t86 .429
-.026.i87"
.030 .319"
.069 .236"
--t59 -320
-.098' .337"I P<0.05 .. P < 0.01
Tablc4.26 illustrates that thc association bcts,ccn predictors and critcrion variables
for fcmale rvere quite befler than malc students of overall Medical Sample, with the
excoplion ofentry tcst.
Thc highest coemcienG for, I;.Sc., cntry tesl and merit, for fcmale rvere.429 (for third
year), .340 (for first ycar), and.372 (for Iirst year) respectively as compared to the
values.306 (for first ycar), .143, (for final year) and.228 (for third year) for male
5ludcn15.
Table4,27 CorrelatioD ofover all samples ofall Medical Studetrts
i n ^.d ,rdl,reclrclors I / J 4'n Final Range Median
F.Sc.
Sig. (2-lailed)
Entry Test
Sig. (2-lailed)
Mcrit
Sig. (2-tailed)
334" .200" .358" .i02" .188" .10-.36
.000 .000 .000 .000 .000
.206" .066" .155" -.024 .210" -.02-21
.000 .002 .000 .375 .000
.260" .111" .269" .028 .229" .03-.27
.000 .000 .000 .300 .000
.20
.16
.23
* P<0.05 ** P < 0.01
Tablc4.27 shorvs that F.Sc. scores (with median=.2o) have significant correlation
(both at 0.05 & 0.01 levels) with the all five professional examination scores of
overall medical sample students, follorvcd by Merit and Entry test (with.23 and.l6
mcdian scorcs rgspectively), The associalion for Merit and Entry test rvere also
significant for all ofthc cases cxcepl for 4d Year.
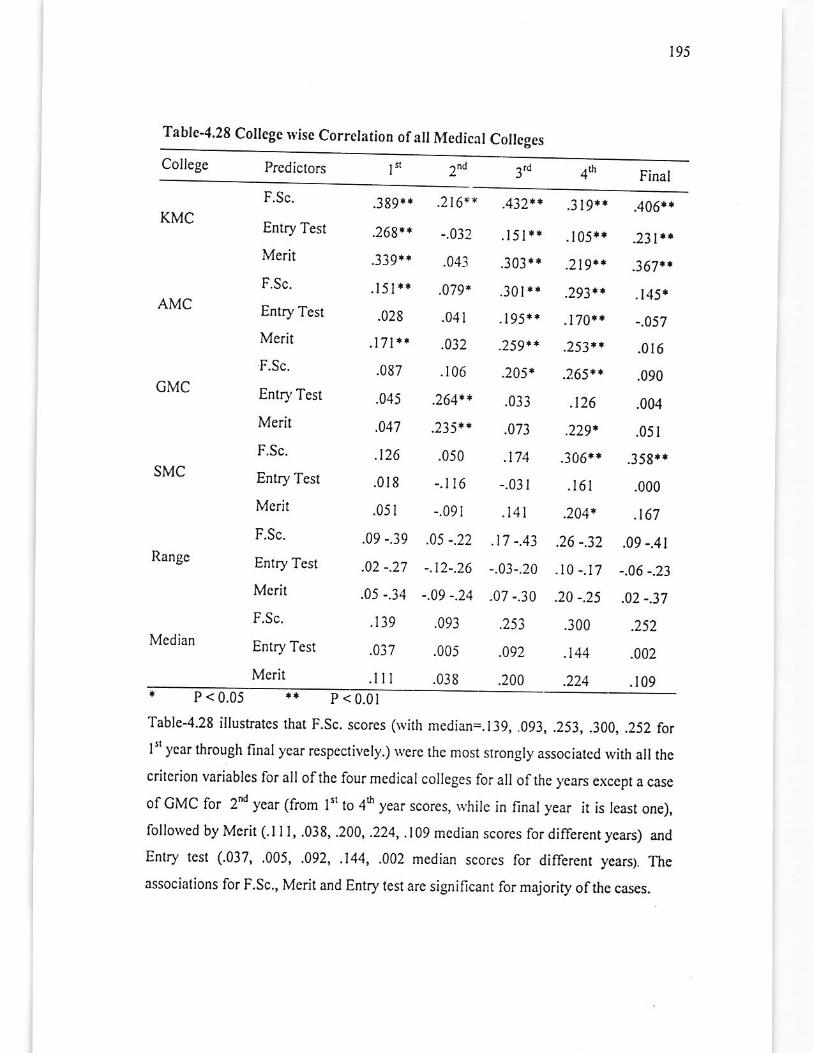
195
Table-4.28 Collegc nise Correlation ofall Mcdical Collcges
College Prcdictors i51 3'd2"d 4,n Final
KMC
AMC
sMc
Rangc
Median
F.Sc.
Entry Test
Me.it
F.Sc.
Entry Test
Merit
F.Sc.
Entry Tcst
Merit
F.Sc.
Entry Test
Merit
F.Sc.
Entry Test
Mcril
F.Sc.
Entry Tesr
Merit
.389**
.26811
339*a
.151.*
.028
.171.t
.087
.045
.01'l
.126
.0t8
.051
.09 -.39
.02 -.27
.05 -.34
.t39
.037
.t 1l
.2164 *
.04i
.079*
.041
.032
.106
.2641*
.235.x
.050
-.t I6
-.091
.05 -.2?
-.12-.26
-.09 -.24
.093
.005
.038
.432**
.t5l*,
.303r*
.30 t'r. t95,r *
.259**
.205*
.033
.073
.174
-.031
.t4 t
.17 -.43
-.03-.20
.07 -.30
.092
.200
.3 t 9r*
. t 05r'
.219*.
.293.'
.170.*
.2531.
.265'.
.126
.229.
.306..
.161
.26 -.32
-10 -.17
.300
.144
.224
.406**
.231rl
.367.i
.145*
-.057
.016
.090
.004
.051
.358*r
.000
.t67
.09 -.41
-.06 -.23
.02 -.37
.002
.109
'r, P <0.01
Table-4.28 iflusuates rhat F.Sc. scorcs (\virh median=.I39, .093, .253, .300, ,252 fotl" ycar through Iinal ycar respcctively.) \vere the most slrongly associated witl all thc
critcrion variables for all ofthe four medical collcges for all ofthe ycars excepl a case
of CMC for 2d ycar (from l" to 46 year scores, rvhilc in final yea. it is least one),
followed by Mcrit (.111, .038, ,200, .224, ,lO9 median scorcs for different years) and
Entry test (.037, .005, .092, .144, .002 mcdian scorcs for differcnr years). The
associations for F.Sc., Merit and Entry test are significant for majority ofthe cases.
P < 0.05
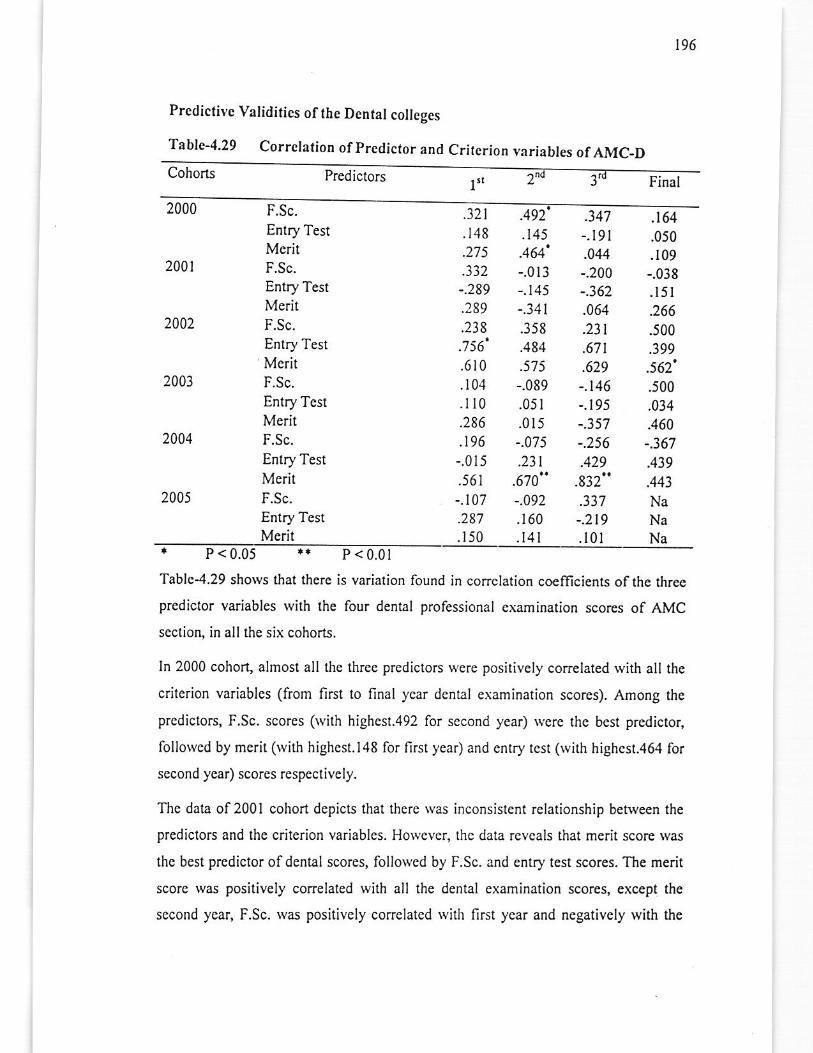
196
Predictive Validitics ofthc Dental collcges
'fablc-4.29 Correlation of predictor and Criterion variables of AMC_D
Predictors Finaltn2000 F.Sc.
Entry TestMeritF.Sc.
Entry TestMeritF.Sc.
Entry Test
McritF.Sc.
Entry TestMeritF.Sc.
Entry Test
MeritF.Sc.
En1ry TestMerit
2001
2002
2001
2005
.464'-.013-.145-.341.358
.484
.57 5
-.089
.051
.015
-.015.231
.6]0
.r 60
.t4t
2004
.32)
.148
.332-.289
.238.756'.6 t0.104
.l t0
.286
.196-.0t5.561
-.\07.287
.150
.492.145
.347 .t64-.19t .050.044 .109-.200 -.038-.362 .r5l.064 .266.23t .500.671 .399.629 .562'-.t46 .500-.195 .034-.357 -460-.256 -.367.429 .439.832" .443.337 Na-.219 Na.l0l Na
P < 0.05 P < 0.01
Table-4.29 shorvs that there is variation found in corrclation coefficients ofthe three
predictor variables with the four dental professional examination scorcs of AMC
section, in allthe six cohorts.
ln 2000 cohor! almost all the three prcdictors were positivcly cofielated rvith all the
criterion variables (from first to final year dental examination scorcs). Among the
prcdictors, F.Sc. scores (with highcst.492 for second year) $.erc the bcst predictor,
follorved by merit (rvith highest.l48 for firsr ycar) and cnrry tcst (tvith highcst.464 for
sccond ycar) scores respectively.
The data of200l cohort depicts that there was inconsistcnt relationship betrveen the
predictors and the criterion variables. However, thc data revcals that merit scorc was
thc best predictor ofdental scores, followed by F.Sc. and entry test scores. The merit
score was positively conelated wilh all the dental examination sco.es, except the
second year, F.Sc. rvas positivcly correlatcd rvith first year and negatively with th€
Cohons
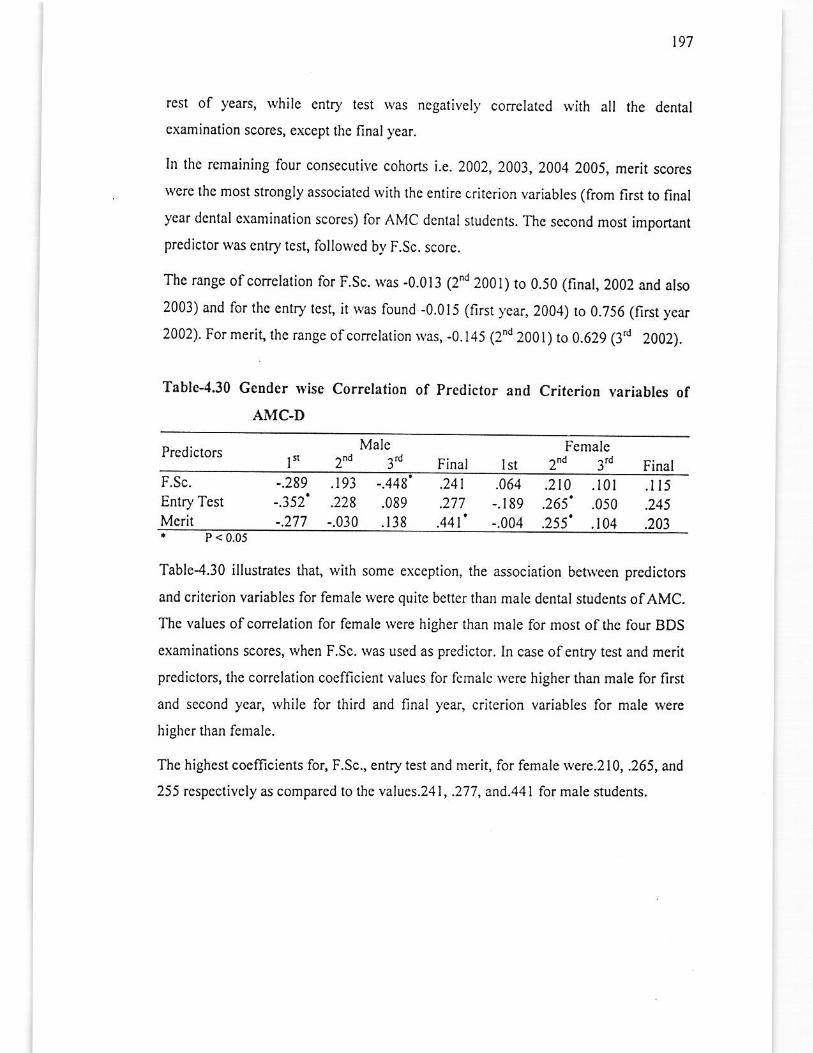
191
rest of years, while entry test Nas ncgatiYel), correlated with all the dental
cxamination scores, except the final year.
In lhe remaining four consecutive cohorrs i.e. 2002, 2003, 2OO4 2OOS, merit scores
were thc mosi strongly associaled with the entire critcrion variables (from first to final
ycar dcntal cxamination scorcs) lor AMC dental studcnts. Thc sccond most important
prcdictor was cntry tcst, followcd by F.Sc. score.
The range ofconelation for F.Sc. was -0.013 (2^d 20OI) to 0.50 (fina|,2002 and also
2003) and for thc entry tes! it was found -0.015 (first year, 200,1) ro 0,756 (first ycar
2002). For merit, thc rang€ ofcorrelalion \vas, -0.145 (2d 2001) ro 0.629 (3,n 2OO2).
Tablc-4,30 GcDdcr Nise Correlation of prcdictor and CritcrioD variables ofAMC-D
Prcdictors ln
Male2"d 3,n
Fcmale2'd 3dFinal lsl Final
F,Sc.
Entry Test
Morit
-.289-.352'-.277
.064-.r89-.004
.193 -.448
.228 .089
-.030 .138
.241
.277.44t'
.210 .l0l.265' .O5o
.255' .tO4
.l l5
.245
.203P < 0.05
Table4.30 illustrates that, with some exccption, the association betr{een predictors
and criterion variables for femalc werc quitc better than male dcntal students ofAMC.
Thc values ofcorelation for female rvere higher than male for most ofthe four BDS
examinations scores, when F.Sc. was used as predictor. In case ofentry test and merit
prcdictors, the co.relation cocfficient values for fcmale rvcrc higher than male for first
and second year, rvhile for third and final year, criterion variab,es for male were
highcr than female.
The highest coefficients for, F.Sc., entry test and merit, for female rverc.2l0, .265, and
255 respectively as compared to the values.24l ,.277,and.441 for male studenrs.
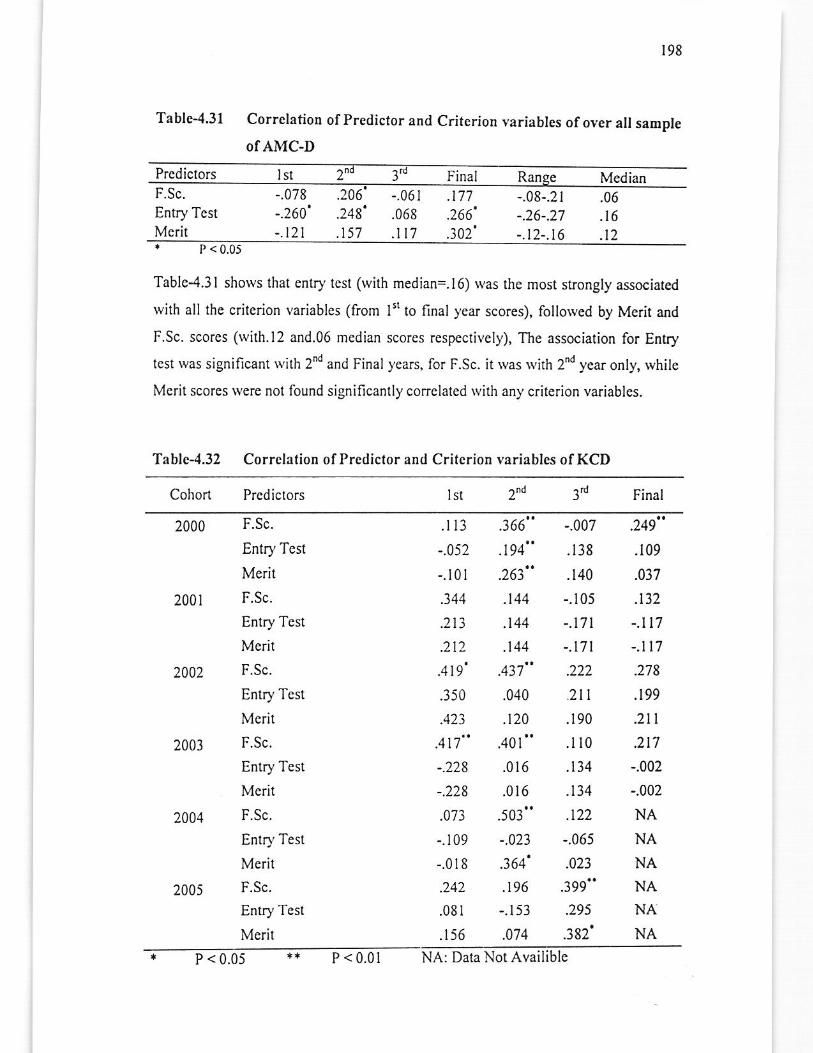
r98
Table4.3l Corrclatiotr ofPredictor and Criterion yariables ofoyer all saDple
Of AMC-D
Prcdictors lst 2 3 Final MedianF.Sc. -.078
-.260'-.t21
.206'
.248'
.t57
-.06t.068
.i7
.177
.266'
.302'
-.08-.21-.26-.27-.t2-.t6
Entry TcstMerit
.06
.16
.12P < 0.05
Table-4.31 shows that entry tcst (with median=.i6) was the most srrongly associared
with all tlre criterion variables (from I't to final ),ear scores), follorved by Merit and
F.Sc. scorcs (with.12 and.06 median scores respectivcl)r, The association for Entry
tcst was significant with 2nd and Final 1,ears, for F.Sc. it was \\,ith 2d yeai only, lvhile
Mcrit scores were not found significantly conclaicd lvith any criterion variablcs.
Table-4.32 Correlalion ofPredictor and Critcrion variables ofKCD
Cohort Prcdiclors 2na 3'd Finallst
2000
2001
2402
2003
2005
2004
F.Sc.
Entry Test
Merit
F.Sc.
Entry Test
Merit
F.Sc.
Entry Test
Merit
F.Sc.
Entry Test
Merit
F.Sc.
Enlry Test
Meril
F.Sc.
Entry Test
Mcrit
.l 13 .366" -.007
-.052 .t94" .138
-.rol .263" .r4o
.344 .144 -.105
.213 .144 -.t11
.212 .144 -.t1t
.419' .437" .222
.350 -040 2t1
A23 .120 .190
.4t'7" .40t " .l l0
-.228 .016 .134
-.228 .016 .134
.o'73 .503" .122
-.109 -.023 -.065
-.018 .364' .023
.242 .196 .399"
.081 -.r 53 .295
.156 .074 .382'
.249"
.109
.03't
.132
-.n7-. 7
.278
.t99
.2t I
.217
-.002
-.002
NA
NA
NANANA
NA
P <0.05 P < 0.01 NA: Data Not Availible
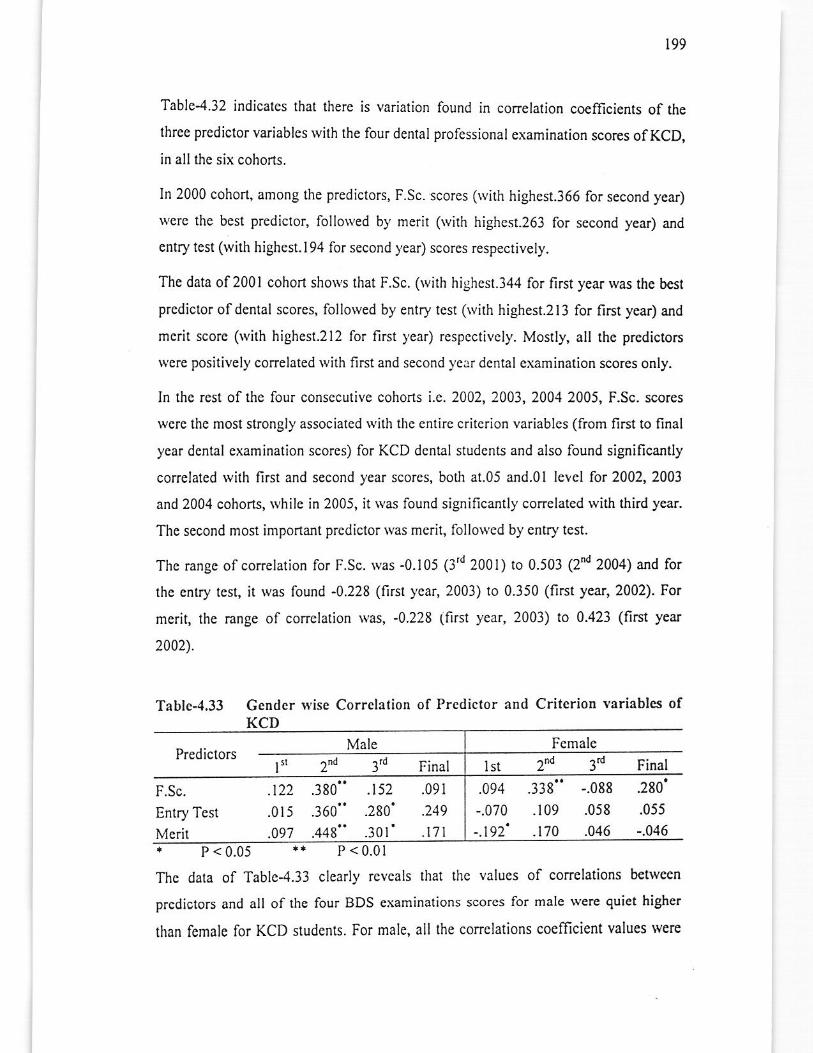
r99
Table-4.32 indicates that there is variation found in correlation coellicients of the
three predictor variables with the four denlal professional examination scorcs ofKCD,
in all the six cohorts.
In 2000 cohort, among the predictors, F.Sc. scorcs (lvith highest.366 for second yeai)
werc the best predicror, folloNed by merit (with highest.263 for second year) and
entry test (with highesl.l94 for secohd year) scores respectively.
The data ol200l cohort shows that F.Sc. (lvith highesr.344 for first year was the b€sr
predictor ofdental scores, followed by entry tcst (lvith highest.2l3 for first year) and
mcrit score (with highest.2l2 for first ),ear) rcspcctively. Mostly, all the p.edictors
were positively conelated with first and second vear dental examination scores only.
In the rest of the four consecutive cohorts i.e. 2002, 2003,2004 2005, F.Sc. scores
were the most strongly associalcd with thc entire critcrion variables (from first to final
year dental examination scores) for KCD dcntal students and also found significantly
corelated wilh first and second year scorcs, bofi at.05 and.0l lelel for 2002, 2003
and 2004 coho(s, while in 2005, it was lound significantly correlaled with third ycar.
The second mosl important prcdictor was meril, followed by entry test.
Thc mngc of correlation for F.Sc. was -0.105 (3'd 2001) to 0.503 (2id 2004) and for
the entry test, it rvas found -0.228 (first ycar, 2003) to 0.350 (first year,2002). For
merit, the range ol conelation rvas, -0.228 (first year, 2003) to 0.423 (first year
2002),
Tablc-4,33 Gendcr ryise Corrclation of Pr€dictor and CritcrioD variablcs ofKCD
Male FcmalePrcdictors
ln 2nd 3'd lst 2nn 3'd FinalFinal
F.Sc.
Entry Tesl
Meril
.122 .380" .152
.0r 5 .360" .280'
.094 .338" -.088 .280'
-.0't0 .109 .058 .055
-.192' .l7o .046 -.046.097 .448" .301'
.091
.249
.111. P<0.05 ** P <0.01
Tho dala of Table-4.33 clcady rcvcals that lhc values of correlalions &tlveen
prediotors and all of the four BDS examinalions scores for male werc quiet higher
than lemale for KCD students. For male, all the corrclations co€mcient values werc
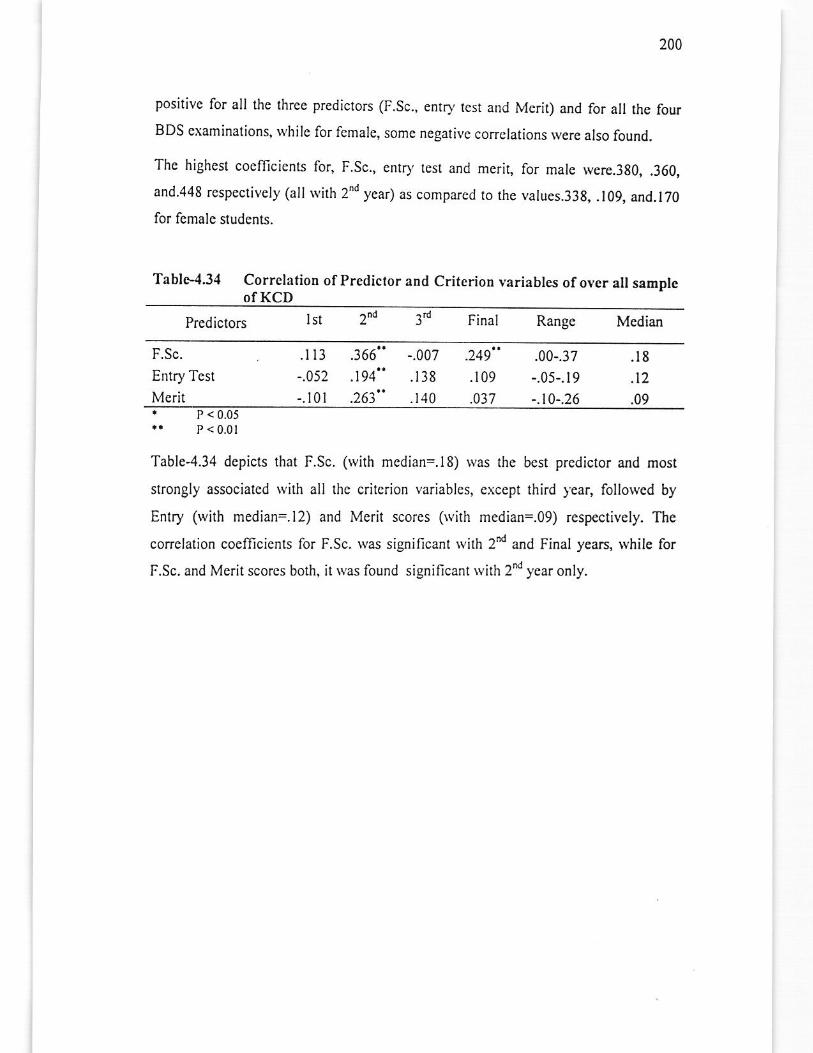
200
positive for all $e three predictors (F.Sc., entry tcst and Merit) and for all the four
BDS examinations, rvhilc for female, somc negativc corrclations were also found.
Thc highcst coefllcicnts for, F.Sc., entD,rest and mcril, lor male were.3go,.360,
and.448 respcclively (all rvith 2nd year) as compar€d to the values.33g, .109, and.l70for fcmale sluden6.
Tabla-4,34 Correlation ofPredictor and CriterioD variables ofover all saEpleofKCD
lst 2"r 3'! Final RangcPrcdictors Median
F.Sc.
Entry Tesl
Merit
.249
.109
.037
.00-.37
-.05-.19
-.10-.26
.t l3 .366" -.007
-.052 .194" .t38-.10t .263" .r40
.18
.t2
.09. P<0.05r. P < 0.0r
Table-4.34 depicts that F.Sc. (rvith mcdian=.I8) was the bcst prcdictor and most
strongly associated with all the critcrion variables, except third 1ear, followcd by
Entry (with mediaa=.I2) and Mcrit scores (wiah median=.09) respectively. The
correlation coefficienls lor F.Sc. \!as significant wilh 2d aad Final years, rvhile for
F.Sc. and Merit scores bolh, it rvas found significant lvilh 2 year only.
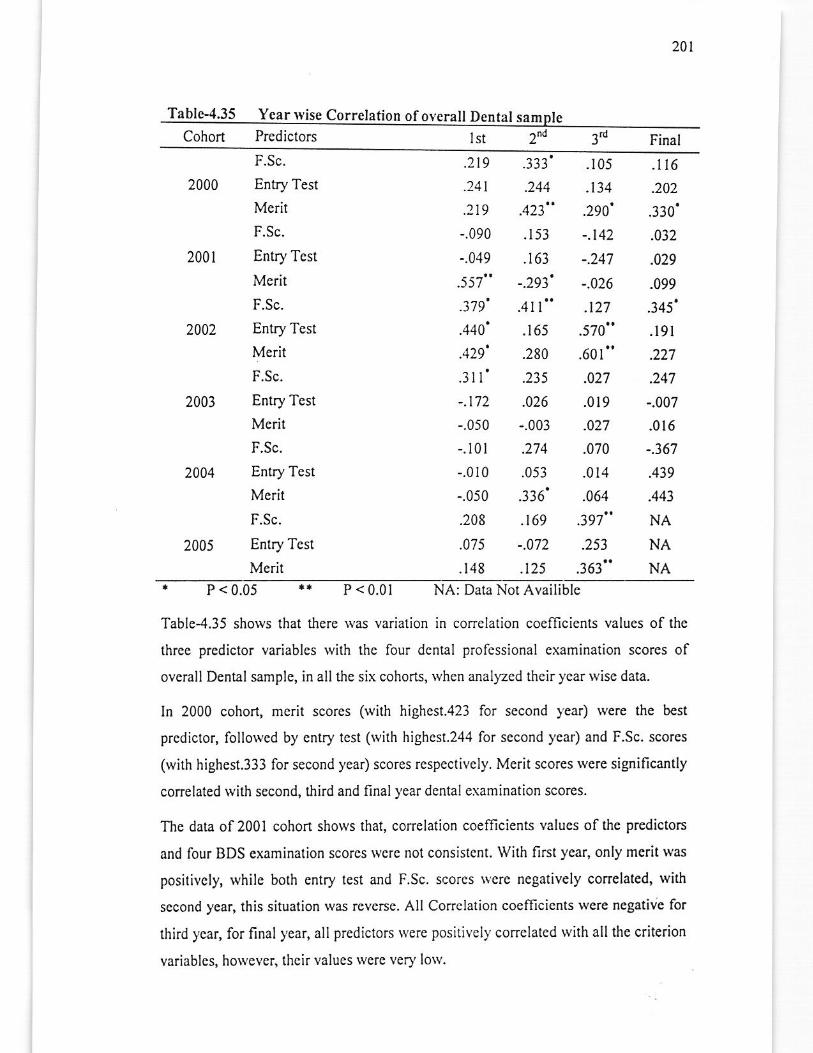
20t
Table..4,35 Year ryise Correlation ofoverall DeDtal saEl
Cohort Predictors Ist 2na Final
2000
2001
2002
2003
2004
Entry Test
Merit
F.Sc.
Entry Test
Merit
F.Sc.
Entry Test
Merit
F.Sc.
Entry Tcst
Me.it
F.Sc.
Entry Test
Merit
F.Sc.
Entry Tcst
Merit
.219 .333' .105 .l 16
.241 .244 .134 .202
.219 .423" .2gO' .330'
-.090 .153 -.142 .032
-.049 .t63 -.24',t .029
.5i7" -.293' -.026 .099
.379' .4r l" .t27 .345'
.440' .165 .570" .191
.429' .280 .601" .221
.3l l' .235 .027 .241
-.172 .026 .019 -.007
-.050 --003 .027 .016
-.10t .274 .070 -.367
-.0r 0 .053 .0t4 .439
-.050 .336' .064 -443
.208 .t69 .397" NA
.075 -.072 .2s3 NA
.148 .t25 .363" NA* P < 0.05 rr P < 0.01 NA: Data Not Availible
Table-4.35 shorvs that there \ras variation in correlation co€lficients values of the
three predictor variables with th€ four dcntal prolessional examination scores of
overall Dental sample, in all the six cohorts, when anal)zed their year wise data.
In 2000 cohort, merit scores (wkh highcst.423 for second )'ear) ivere the best
prcdictor, follorvcd by cntry lcst (with highcst.244 for second ycar) and F.Sc. scores
(with highest.333 for second year) scores respectivcly. Merit scores were significantly
conelated with second, tiird and finalyear dcntal examination scores.
The data of200l cohort shows that, correlation coellicients values of tle predictors
and four BDS examination scorcs wcre not consis(cnt. With lirst yeat only mcrit rvas
posilivcly, whilc both entry test and F.Sc. scorcs wcre negatively conelatcd, with
second ycar, this situation was reverse. All Corrclalion coelTicicnts were negativc for
third year, for final year, all prcdictors were posilivcly conelated with all the criterion
variables, horvevcr, thcir values wcrc very low.
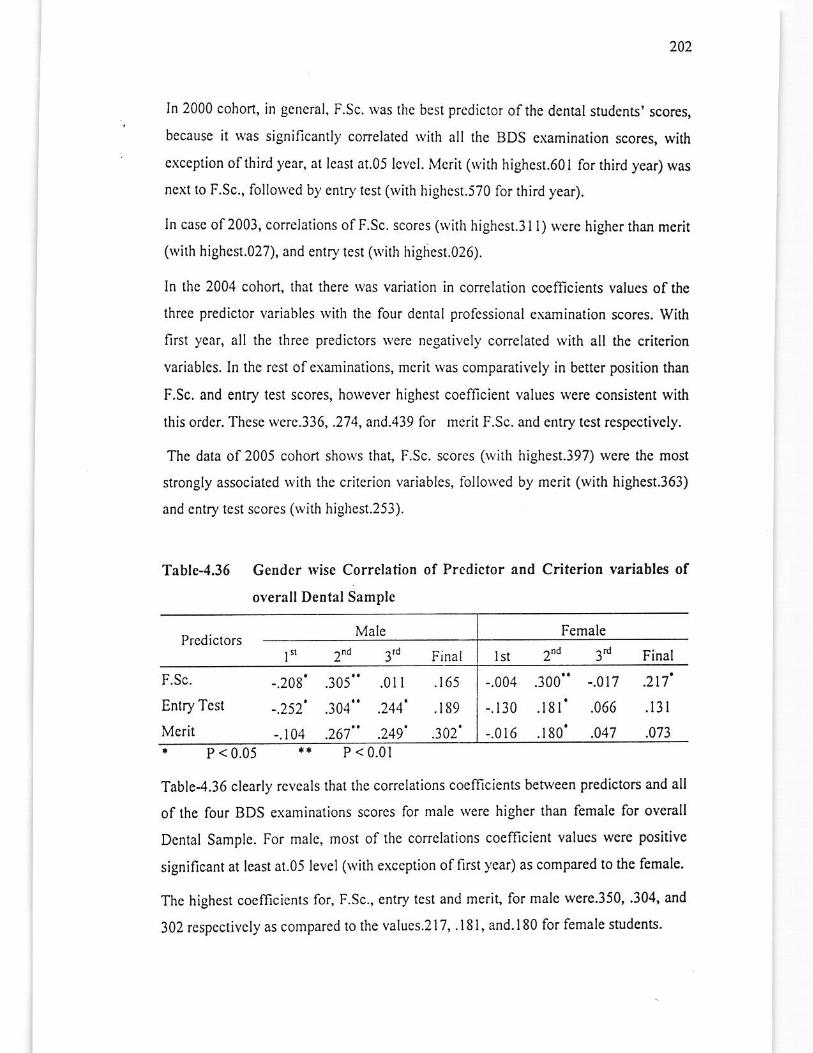
202
In 2000 cohort, in gcneral, F.Sc. rvas the best prcdiclor ofthe dcntal students'scores,
because it was significantly correlated with all the BDS examination scores, lvith
cxception ofthird ycar, at lcasl a1.05 lclcl. Merit ovirh highcsr.60l for rhird year) was
next 10 F.Sc., followcd by enlry lest (wirh highesr.570 for rhird year).
ln casc of2003, corrclations of F.Sc. scores (\\,ith highest.3l l) \yerc higher than merit
(wirh highcsl.027). and enrry lcsl (\r ilh highcsl.o26).
In the 2004 cohort, that there rvas variation in correlation coefficients values ofthe
thrcc prcdictor variables with the four denlal prolessional e\aminalion scores. With
first year, all the three predictors Nere ncgatively conelated with all the criterion
variables. In the resl ofexaminations, mcrit was comparatively in better position than
F.Sc. and entry test scores, horvever highcst coefficient values were consistent with
this order. These \rerc.336, .274, and.439 fot mcrit F.Sc. and entry test respcctively.
The data 0f2005 cohort shoNs tha! F.Sc. scores (rvith highcst.397) were the most
strongly associatcd with the criterion variables, lollorved by merit (wili highest.363)
and cntry test scores (with highest.253).
Table-4,36 Gender wise Correlation of Predicior and Criterion variables of
overall DcDtal SamPlc
Male Female
2"d 3d Final 2ndlst
Entry Test
Merit
.305" .0ll
.304 .244
.261 .249
-.004 .300"
-.130 .l8l'-.0r6 .180'
-.208
-.252'
-.104
.165
.r89
-.0t7
.066
.047
.217'
.l3l
.073. P<0.05 ** P < 0.01
Table4.36 clearly rcvcals that the co.relations coeliicicnts behveen prediclors and all
of the four BDS examinations scorcs for male rvere higher than female for overall
Dcntal Samplc. For malg, most of the correlations coefficient values w€re positive
significant ar te-ast al.05 level (Nith exccption offirst ycar) as compared to the female.
Thc highest cocfficients for, F.Sc., entry lcst and meri! for male were.350, .304' and
302 rcspcctively as compared to the values.2l7, .181, and.l80 for lemale students.
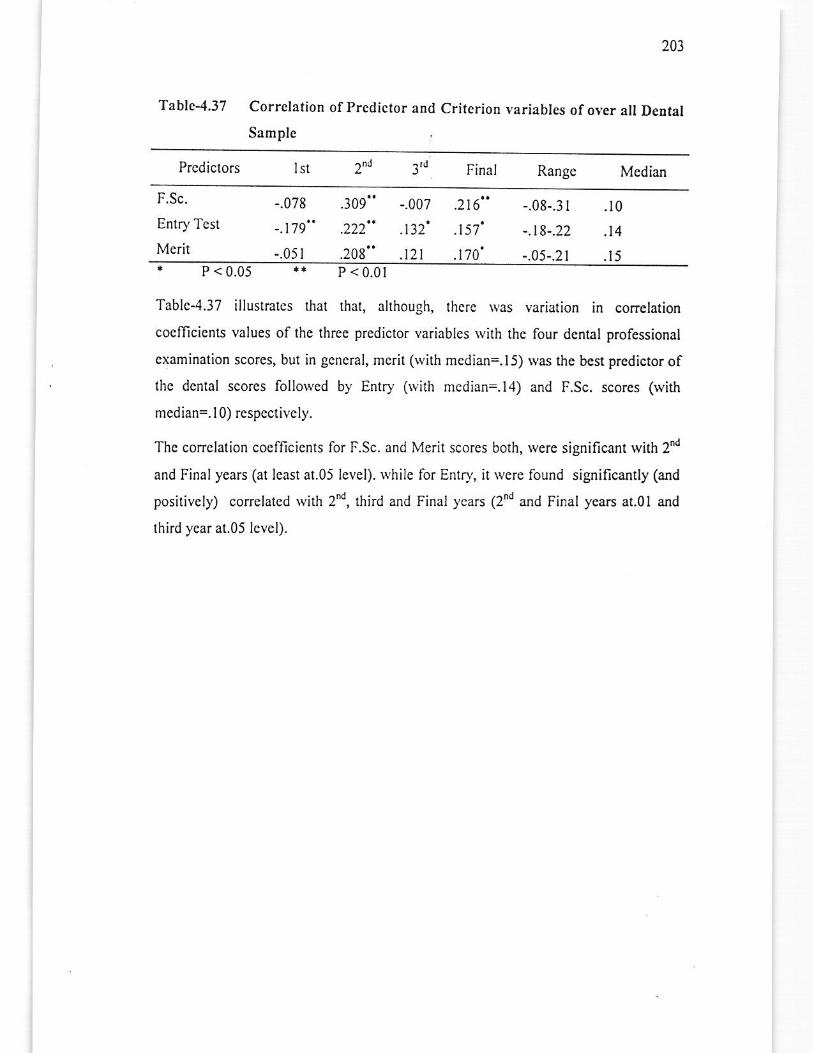
203
Table-4.37 Corrclation ofPredictor and Criterion yarirbtes ofover all DeDhl
Samplc
Prcdictors lsl Final Rangc2n'J
F.Sc.
Entry Test
Mcrit
.309" -.007
.222" .t32'
.208" .t2l
-.08-.31
-.18-.22
-.05-.2r
-.078
-.179
-.051
.2t6"
.r57'
.1',|0'
.10
.14
.15P <0.05 ** P < 0.01
Table4.l7 illustrales fiat that, although, thcrc was variation in corrclation
cocfficients values of the thrce predictor variablcs rvith the four dcntal professional
cxamination scorcs, but in gcneral, merit (Nith mcdiao=.15) was rhe best predictor ofthc dcntal scores foilowed by Entry (with mcdian=.l4) and F.Sc. scores (with
mcdian=.10) respectively.
Thc conclation cocfficicnts for F.Sc. and Merit scorcs bolh, were significant with 2
and Final years (at lcast at.05 lcvel). while for Entry, it l\'ere lound si$ificantly (and
posilively) conelatcd with 2d, third and Final years (2'd and Final years at.0l and
third year at,05 level).
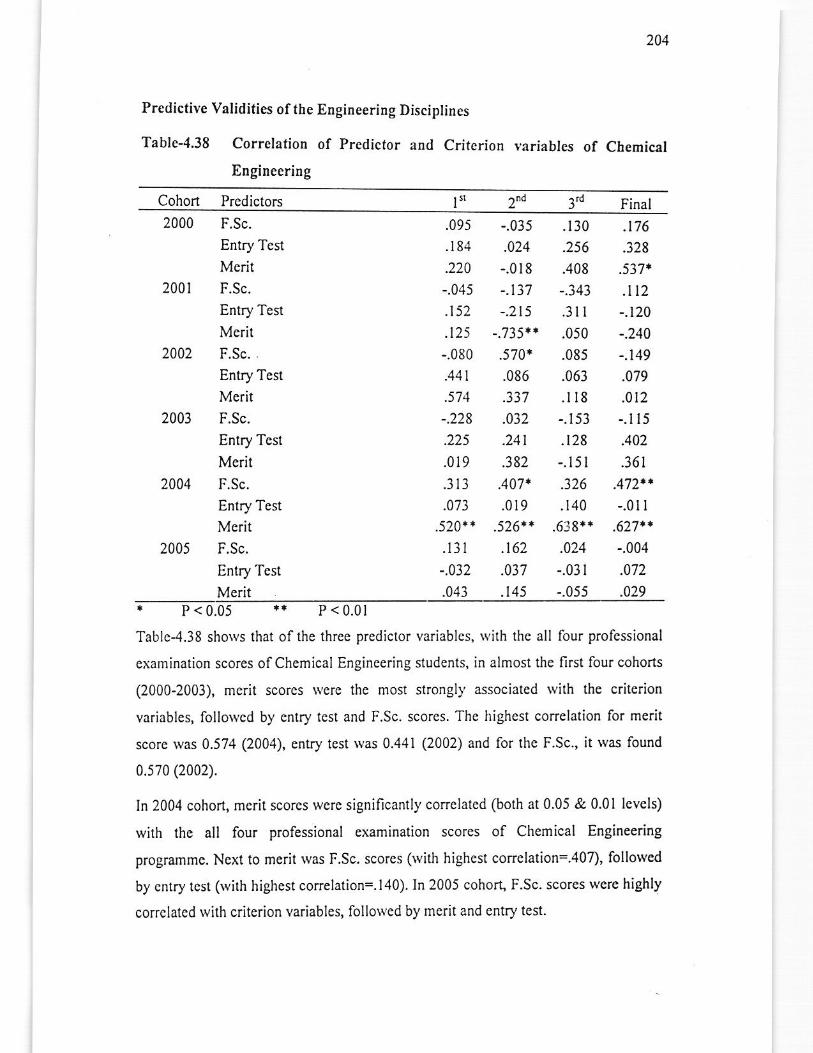
204
Predictive Validities of the Engineering Disciplines
Tablc-4.38 Correlation of Predictor and Criterion variables of Chemical
Engineering
Cohon Predictors Final2nd
200t
2003
2005
2004
F.Sc.
Entry Test
MeritF.Sc.
Enlry Test
Merit
F.Sc. .
Entry Test
Merit
F.Sc.
Entry Tesl
Merit
F.Sc.
Entry Test
McritF.Sc.
Entry Test
Merit
.t76
.328
.537*
.n2-.120
-.240
-.149
.079
.0t2-.1 l5.402
.361
.472'.-.01I
.627..-.004
.072
.029
.095 -.035 .r30
. l 84 .024 .256
.220 -.0r8 .408
-.045 -.137 -.343
.152 -.215 .31 I
.125 -.735* .050
-.080 .570r .085
.441 .086 .063
.s71 .337 .rI8-.228 .032 -.153
.225 .24t .r28
.019 .382 -.151
.3 i3 .407. .326
.013 .0r9 . r40
.520rl .526r* .6r8**.l3l .t62 .024
-.032 .037 -.03 r
.043 .145 -.055,' P < 0.05 ** P < 0.01
Tablc4.38 shows that of the three predictor variablcs, with the all lour professional
examinarion scores ofChemical Engineering studenls, in almost lhc first four cohorts
(2000-2003), merit scorcs Ncre the most strongl)' associated with the criterion
variables, follorvcd by entry test and F.Sc. scorcs. The highest correlalion for merit
score was 0.574 (2004), entry test was 0.441 QA\, and lor the F.Sc., it was found
0.570 (2002).
ln 2004 cohort, mcrit scores were significantly correlated (both at 0.05 & 0.01 lcvels)
with the all four professional examination scores of Chemical Engineering
programmc. Ncxt to merit was F.Sc, scorcs (with highest correlation= 407), followed
by cntry test (with highest correlation=. I 40). ln 2005 cohort, F.Sc. scores lvere highly
corrclated with criterion variables, followed by merit and entry lest.
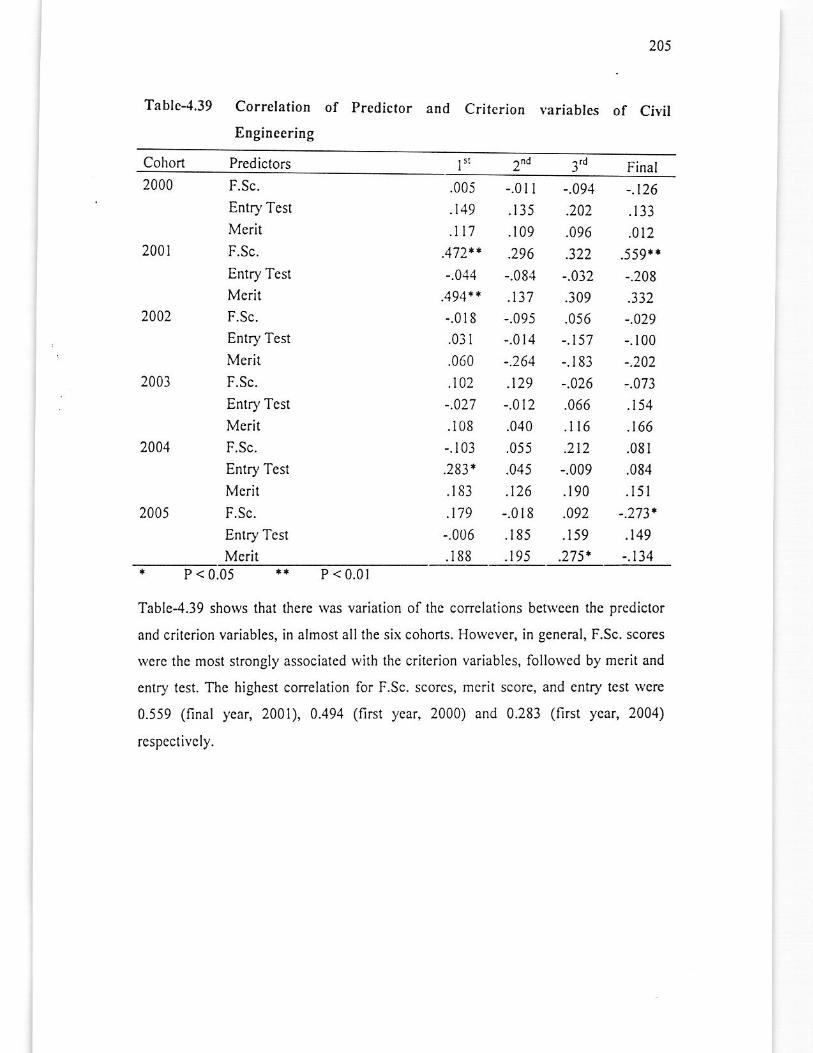
20i
Table-{,39 Correlation of Predicior and
Engineering
Criterion Yariablcs of Ciyil
Cohort Predictors 3''i2"d Final2000
2001
2002
2001
2004
2005
F.Sc.
Enlry Tcst
Merit
F.Sc.
Entry Test
McritF.Sc.
Entry Test
Merit
F.Sc.
Entry Test
Merit
F.Sc.
Entry Test
Merit
F.Sc.
Enlry Test
Merit
.005 -_0ll
.149 .135
.|'7 .109
.472.+ .296
-.011 -.08,+
.494** .t37-.018 -.095
.031 -.014
.060 -.264
.102 .129
-.027 -.012
.108 .040
-.103 .055
.283r .045
. t83 .t26
.179 -.0 r8
-.006 .r85
.t88 .t95
-.091 -.t26.202 .133
.096 .012
.3?2 .559..-.032 -.208
.309 .332
.056 -.029
-.157 -.100
-.183 -.202
-.026 -.073
.066 .154
.l 16 .166
.212 .081
-.009 .084
.190 .l5l
.092 -.773.
. r 59 .149
.275. -.t34,r P < 0.05 *r P < 0.01
Table-1.39 shows that therc was variation of the conclations bctr\'ccn thc predictor
and critcrion variables, in almost all the six cohorts. Howcycr, in geneml, F.Sc. scorcs
wcrc the most strongly associaled wilh the crilerion variables, follorved by merit and
cnlry lest. Thc highest correlation for F.Sc. scores, merit score, and entry test \vcre
0.559 (final year, 2001), 0.494 (first ycar, 2000) and 0.283 (llrst ycar, 2004)
rcspectively.
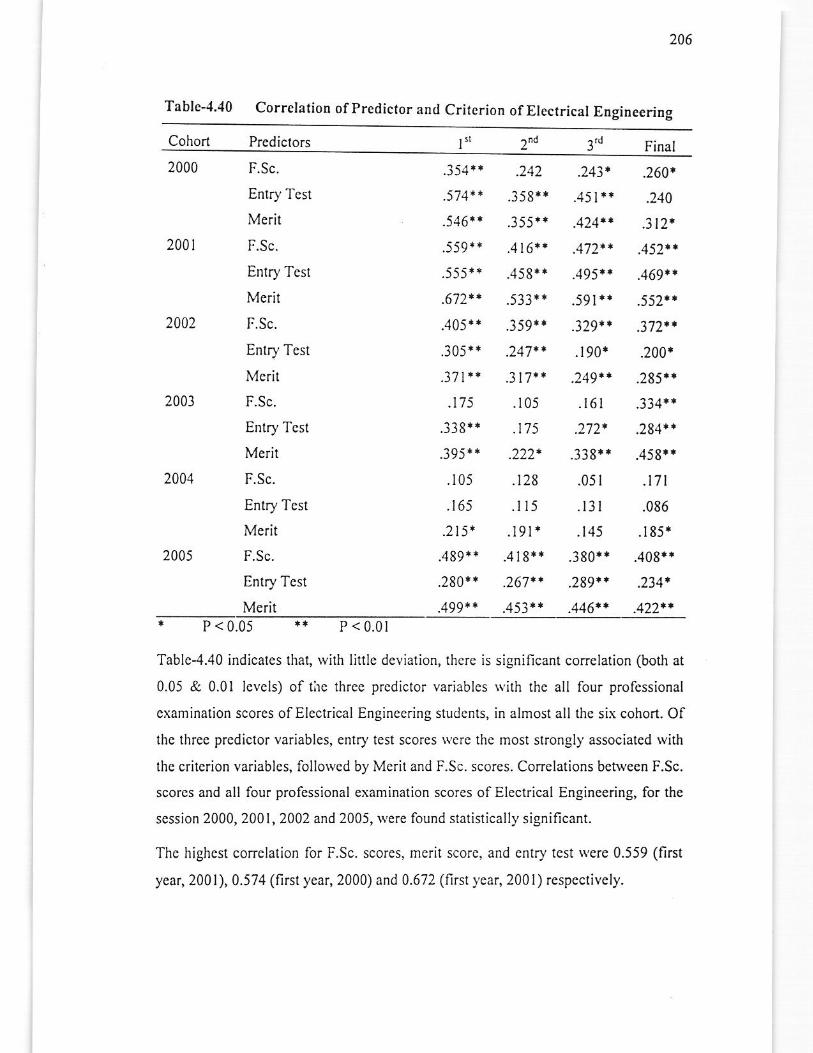
206
Table-.{.40 Correlation ofpredi.tor and Criterion ofElectrical EngiDeeriDg
Cohort Prcdiclors t" 3,.j2nd Final
2000
200t
2002
2003
2004
2005
F.Sc.
Enlry Test
Merit
F.Sc.
Enrry Tesl
Merit
F.Sc.
Entry Tcst
Mcrit
F.Sc.
Entry Tcst
Merit
F.Sc.
Entry Test
Merit
F.Sc.
Entry Tcst
Merit
.354 * *
.571*.
.546* *
.559r.
.555* r
.672.1
.405*.
.305 * *
.3'71"
.175
.i3 8. +
.395.*
.105
.165
.215.
.489 | 1
.280*r
.4994t
.212
.i58**
.355**
.4r6"_45 8r *
.5 33. '
.359* *
.3t7...105
.175
.222*
.12.8
.l I5
. i9l..418**
.267,+
.453.*
.243* .260t
.451r. .210
4141. 1l l.
.472t*.452**
.495'..469.*
.59I*i.552.*
.329...372...190* .200.
,,to.r ,a<.,
.l6l .334".272' .284.*
.338*. .458.+
.051 .t1t
. r3l .086
.r45 . t85.
.380''.408.t'
.289...234.
.446*'_422*'i P<0.05 ** P < 0.01
Tablc4.40 indicates thal, wilh little deviation, there is significant conclation (both at
0.05 & 0.01 lcvcls) of thc thrcc prcdicior variables with the all four professional
examination scores ofEleclrical Engineering students, in almost all lhc six cohon. Of
thc thrce prcdictor variables, cntry tcst scores lvcre thc most strongly associated with
thc critcrion variablcs, follorvcd by Mcrit and F.Sc. scores. Conelations bctwccn F.Sc.
scorcs and all four professional examination scores of Electrical Engincering, for the
scssion 2000, 2001,2002 and 2005, \'ere found statislically significant.
Thc highest corelation for F.Sc. scores, merit score, and entry test \vere 0.J59 (first
year, 200l), 0.574 (first year, 2000) and 0.672 (first ycar, 2001) respcctively.
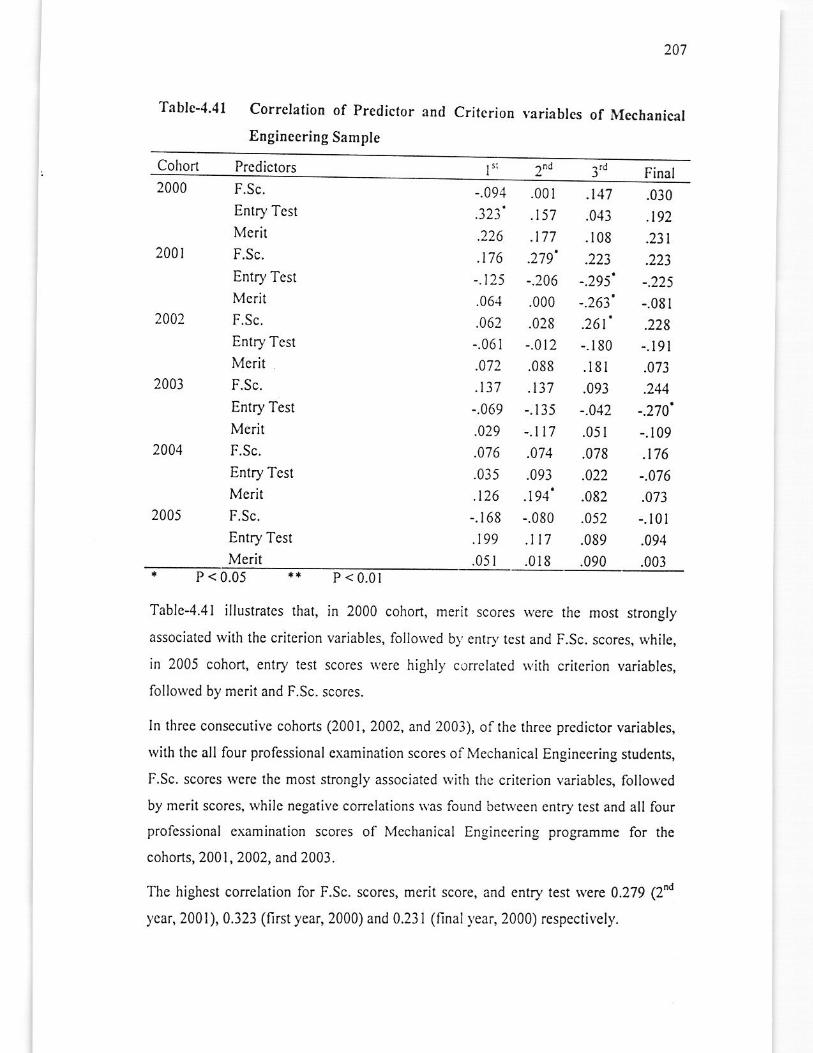
207
Tablc-4.41 Correlalion of predictor and
Enginccring Sample
Critcrion variablcs of l\IcchaDical
Cohorl P.cdiclors l" 2'4 Final2000 F.Sc.
En1ry Tcsi
Merit
F.Sc.
Entry Test
Me.itF.Sc.
Entry Tcst
McritF.Sc.
Entry Test
Merit
F.Sc.
Entry Tcst
Merit
F.Sc.
Entry Tcst
Merit
.030
.192
.231)11
-.08r
.228
-.191
.073
-.270'
-.109
.t76-.0'16
.073
-.101
.094
.003
-.094 .001 .t47.323' .t51 .043
.226 .177 .t08
.116 .2'19' .223-.125 -.206 -.295'.064 .000 -.263'.062 .028 .261'-.061 -.012 -.180
.012 .088 .l8l
.t37 .t37 .093
-.069 -.r35 -.042
.029 -.|7 .051
.076 -074 .078
.035 .093 .022
.t26 .194' .082
-. r 68 -.080 .052
.t99 .n7 .089
.05 r .0r 8 .090
200l
2002
2003
2004
2005
P < 0.05 .* P < 0.01
Table-4.41 illustrates that, in 2000 cohon, merit scores were thc most strongly
associated with the criterion variables, followed b).entD,test and F.Sc. scores, while,
in 2005 cohort, enlry test scorcs $'ere highly corrclated \\'ith critcrion variables,
lollorvcd by merit and F.Sc. scorcs.
In lhrce consecutive cohons (2001, 2002, and 2003), of the three predictor variables,
with thc all four professional cxamination scores ofi!,lcchanical Engineering studcnts,
F.Sc. scorcs rvcrc the most strongly associatcd \yith thc criterion variablcs, follolved
by rnerit scores, whilc negativc conclalions \\.as lound bcnveen cntry test and all four
professional cxamination scores of Mcchanical Engineering programmc for the
cohorls, 2001, 2002, and 2003.
Thc highest correlalion for F.Sc. scores, mcrit score, and entry test rvere 0.279 (2
year, 2001), 0.323 (firstyear, 2000) and 0.231 (final ),eaG 2000) respcctivcly.
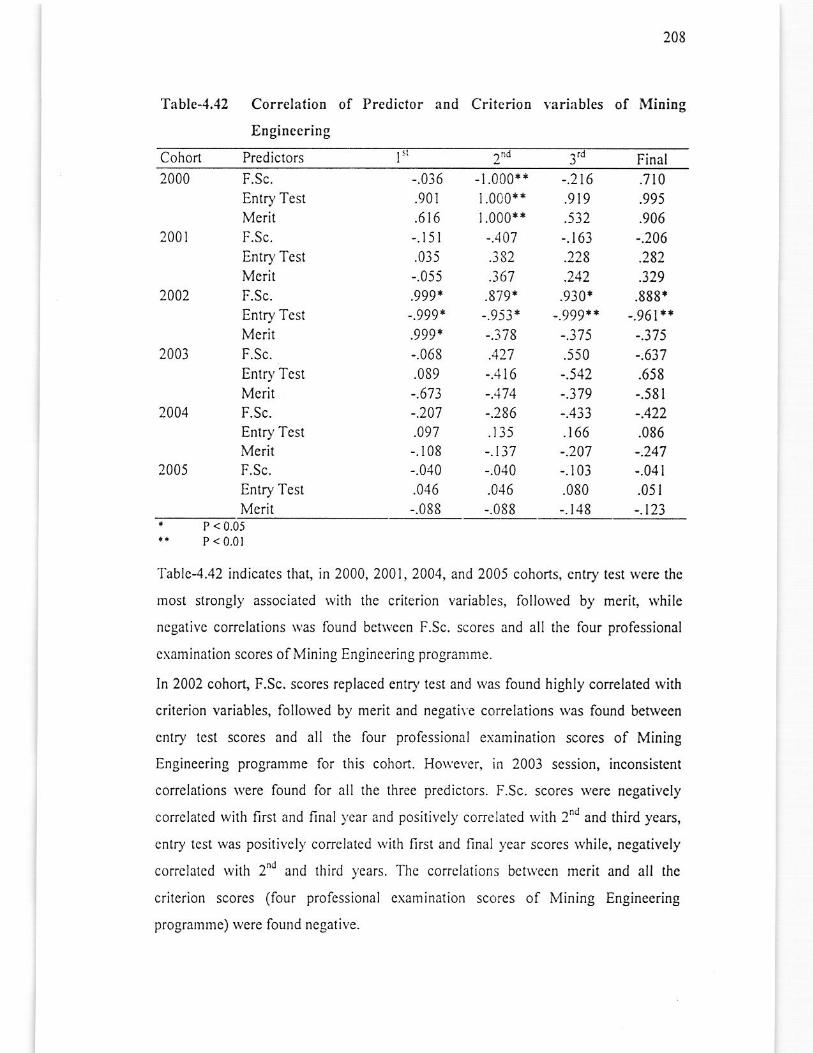
208
Tablc-4.42 Correlation of Predictor and Critcrion variitbles of MioiDg
Engineering
Cohon Prediclors l" Final2000
2001
2002
2003
-.036
.901
.6r6-.r5r.035
-.055
.999.-.999..999'-.068
.089
-.673-.207
.497-.r08-.040.0,16
-.088
-1.000*1r.0c0r11.000**-.407
.367.879|-.9i3*-.378
-..1l6
-.286
.r35-.137-.040
.046
-.088
2004
2005
F.Sc.
Entry TestMeritF.Sc.
Entry TcstMcritF.Sc.
Entry TcstMcritF.Sc.
Enlry TcstMcritF.Sc.
Entry TestMcritF.Sc.
En1ry TeslMcrit
-.216 .7t0.9t9 .995.532 .906
-.163 -.206
.228 .282
.242 .329,9i0i .888.
-.999** -.961*.-.3't5 -.3',15
.550 -.637-.542 .658
-.379 -.581
-.133 -.422
.i66 .086-.207 -.247-.103 -.041
.080 .051
-.r48 -.t23. P<0.0J* P<00r
lhblc4.42 indicatcs that, in 2000,2001,2004, and 2005 cohons, cntry tcst wcrc thc
most strongly associalcd rvith thc critcrion variables, follo$ed by mcrit, rvhile
negalivc correlations rvas lound betNecn F.Sc. scorcs and all the four profcssional
cxamination scores of Mining Engincering programme.
In 2002 cohoG F.Sc. scores replaced entD,lcst and was found highly correlated ryith
criterion variables, follo\r,ed by merit and negative correlations rvas found berween
cnlry tcst scores and all the four profcssional examination scores of Mining
Engincering programme for this cohort. Howevcr, in 2003 session, inconsistent
coffelalions $ere lound lor all the three predictors. F.Sc. scores were negativcly
coffelated wilh first and final ),ear and posilively correlated rvilh 2nd and third years,
enlry lest was positivell,correlated wilh first and final ),car scorcs while, negatively
correlalcd wilh 2"d and thirtl )'ears. 'fhc corrclations bet\\'ecn mcri! and all thc
critcrion scorcs (four profcssional cxamination scores of Mining Engineering
prograrnme) wcre lound negalive.
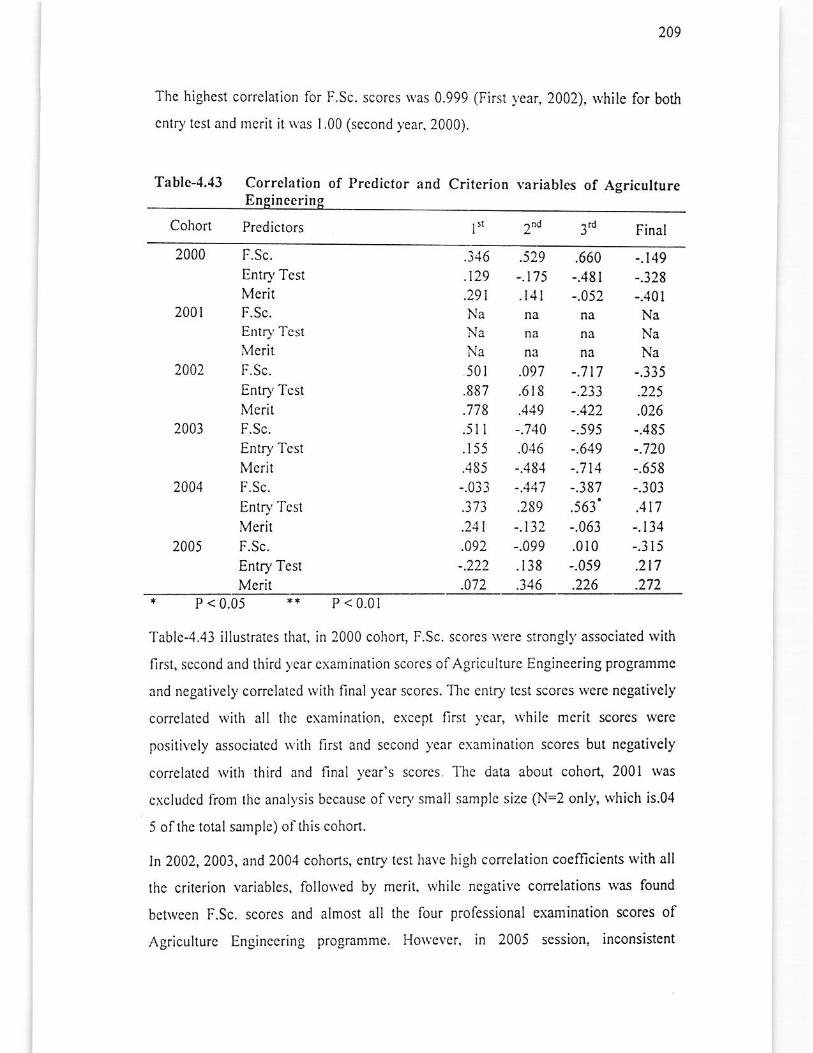
209
Thc highest corclalion for F.Sc. scorcs \ras 0.999 (Firsr year, 2002), rvhile for both
entry lesl and mcrit it $,as 1.00 (sccond )ear.2000).
Tablc-4.43 Correl:rtion of Predictor and Criterion r.eriables of AgricultureEnqinccrin
Cohorl Prcdictors ln 3'd Final2na
2000 F.Sc.
Entry TcstMcrit
2001 F.Sc.
EnlD, TcstMcrit
2002 F.Sc.
Entry Test
Meril2003 F.Sc.
Entry Tcst
Merit2004 F.Sc.
Entry Tcsl
Merit2005 F.Sc.
Entry TcslMerit
.346 .529 .660
.t29 -.t75 -.48t
.29t .l4l -.0521\_a na naNa na na
Na na na
501 .097 -.7t7.887 .618 -.233.778 .449 -.422.5ll -.740 -.595
.155 .0,16 -.649
.485 -.48{ -.714-.0i3 -.44'1 -.381
.373 .289 .563'
.241 -.l]2 -.063
.092 -.099 .010-.222 .138 -.059.072 .346 -226
-.149-.328-.401
NaNaNa
-.335
.225
.026-.485-.720-.658
-.103
.4t7-.134
-.1I5.211
.272* P<0.05 ** P < 0.0t
Tablc-4.43 illustrales lhat, in 2000 cohon, F.Sc. scorcs $'ere slrongly associated with
first, sccond and third lear examination scorcs ofAgriculture Engincering progmmmc
and negatively corrclalcd \virh finalycar scorcs. Thc cnlry tcst scores rvcre negatively
corrclated \rill1 all thc cxamination, cxcept firsl ]'car, !\'hilc mcri! scorcs were
posililely associalcd \\'ith firsl and sccond ycar cramination scorcs but ncgativcly
corrclated with third and final )'ear's scorcs The data about coho4 2001 lvas
clcludcd from lhc analysis bccausc of vcry small sample sizc (N=2 only, rvhich is.04
5 oflhe total sanrplc) ofthis cohorl.
In 2002,2003, and 2004 cohorts, cntry lesl haYe high co.rclation coeflicients wilh all
thc crilcrion variablcs. follorved by mcril, l'hilc negative correlations was found
behvcen F.Sc. scores and almost all thc lour professional cxamination scores of
Agricullurc Enginecring programme. Ho$'e!er, in 2005 s€ssion. inconsistent
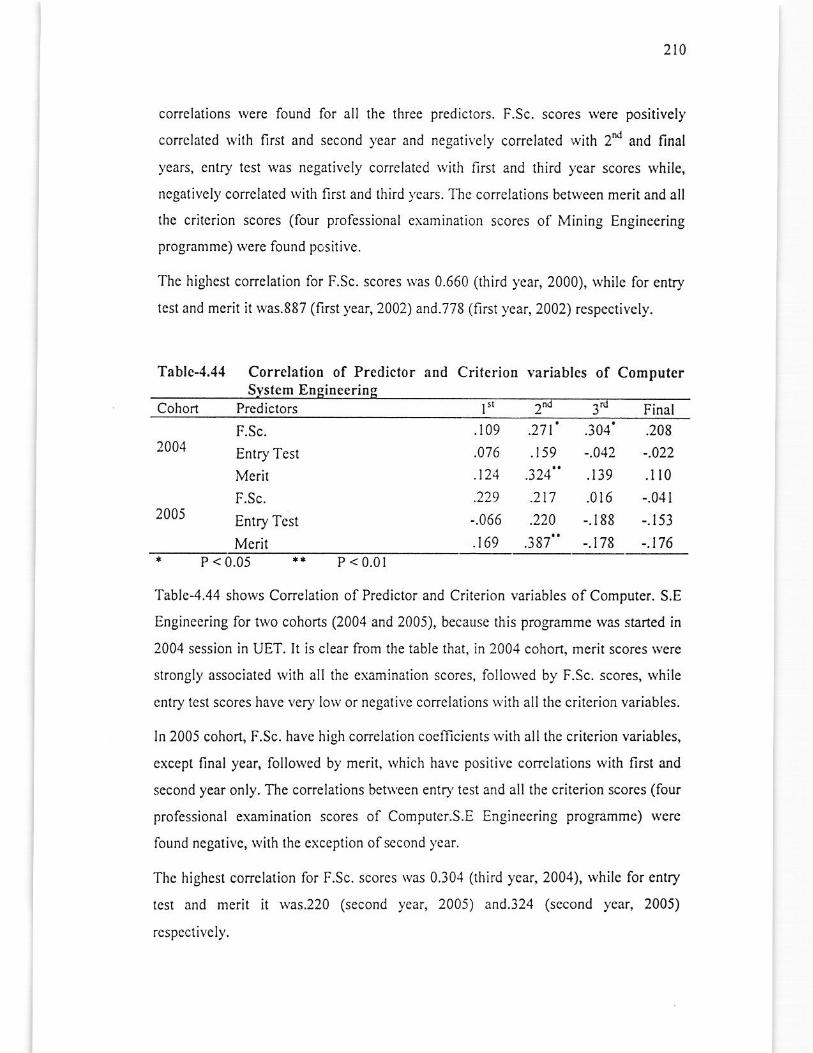
2t0
correlations Nere found for all the three predictors. F.Sc. scores rverc positively
corrclatcd with frrst and sccond ),ear and ncgalilely conclalcd lvith 2d and final
years, enlry test was negatively con'clatcd with first and third year scorcs rvhile,
ncSativcly conelated with first and third ),ears- Thc conciations betrveen merit and all
thc critcrion scores (four prolessional e\amination scores of Mining Engineering
programme) rvere found pcsitivc.
The highest conclalion for F.Sc. scores rvas 0.660 (third )'ear,2000), while for entry
tcst and merit it was.887 (first year, 2002) and.778 (first year, 2002) respectively.
Tablc-4,44 Correlation of Prcdictor aDd Criterioo variables of CornputerSystcm Engircering
Cohort Predictors ffi
2005
2004
* P<0.05 '* P<0.01
Tablc4.44 shows Correlalion of Predicior and Criterion variables of Computer. S.E
Engineering for two cohons (2004 and 2005), because this programme rvas started in
2004 scssion in UET. It is clear lrom the table that, in 2004 cohort, mcrit scores lvere
strongly associated wilh all thc examination scores, follolyed by F.Sc. scores, \ehile
cntry lcst scores have very lo\v or negative correlations \!,ith all the criterion variables.
ln 2005 cohort, F.Sc. havc high conelation coefficients rvith all thc critcrion variablcs,
cxcept final ycar, follorved by merit, rvhich have positive correlations with firsl and
second year only. The correlations behyeen entry test and all the crilerion scorcs (four
professional examination scores of Computcr.S.E Enginccring paogmmme) \vere
lound negativc, with the cxccplion ofsecond )'ear.
Thc highcst corrclation lor F.Sc. scorcs \ras 0.301 (lhird ycar,2004), \vhilc for entry
lcst and merit it \\'as.220 (second year, 2005) and.324 (second year, 2005)
rcsPeciively.
F.Sc.
Enlry Tcst
Mcrit
F.Sc.
Entry Tcst
Mcrit
.109 .27 t' .304' .208
.076 .r59 -.012 -.022
.t24 .324" .t39 .l I0
.229 .217 .016 -.0.11
-.066 .220 -.188 -.153
.169 .387" -.r78 -.t76
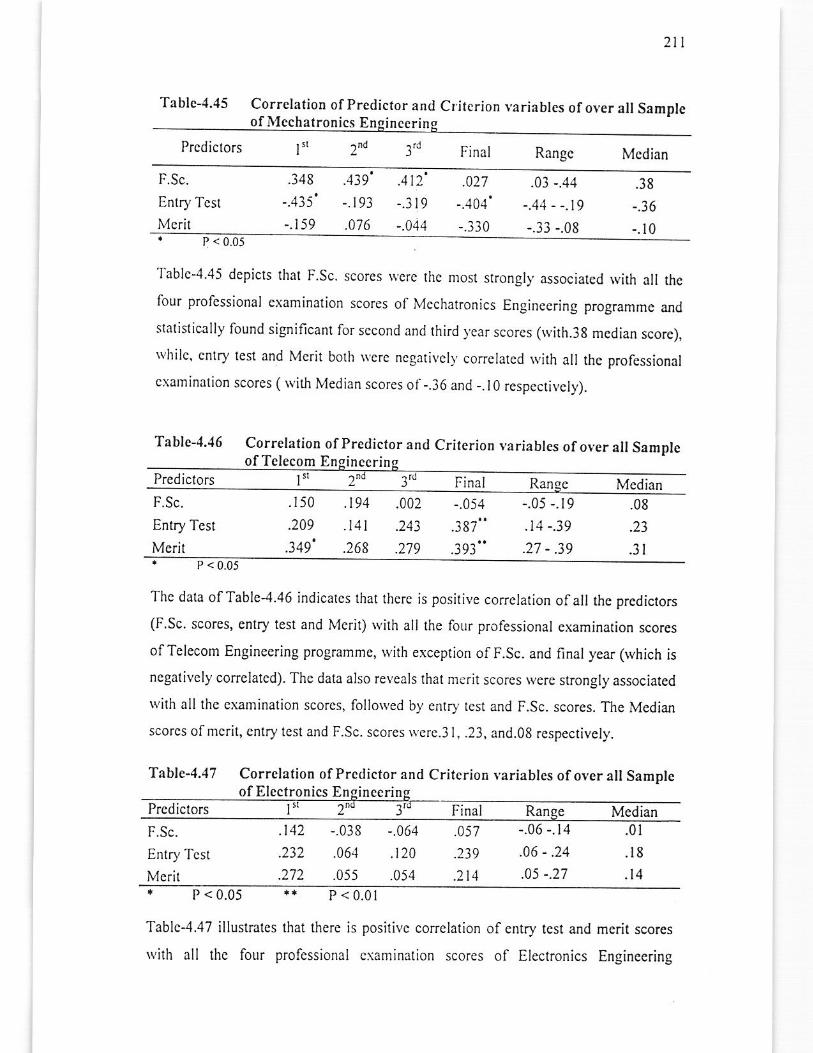
2]l
Table-1,45 Corrclation of Predictor and Criterion yariables of overall Sampleof Mechatronics Enginceri
Prcdiclors I" 2nd 3'i Final Rangc Mcdian
F.Sc.
Enlry Tcst
Mcril
.027
-.404'
-.3t0.44 - -.t9-.13 -.08
.348 .{i9' .412'
-.435' -. t93 -.319
-.159 .076 -.044
.38
-.36
-.10| < 0.05
Tablc-1.45 depicts that F.Sc. scores \\.erc the most srrongly associated wifh all $efour profcssional examinalion scores of Mcchalronics Engineering programme ard
stalislically found significanl for sccond and third 1.car scorcs (rvirh.3g median score),
\\,hilc. cntD, Iesr and Merit both Ncrc ncgativeh,correlatcd wilh all the professional
c\aminalion scorcs ( \vifi Median scores of-.36 and -.10 respectively).
Table-4.16 CorrelationofTclecom
of Prcdictor and Critcrion variables ofover all SrmpleEnsinccrin
Predictors ln 3
.002
.243
.219
Final Ran McdianF.Sc. .150
.209
.349'
.19,{
.14l
.268
-.054
.387"
.l9'j
.08
.23
.31
Enlry Test
Mcrit
-.05 -.r9
.11-.39
.27 - .39P < 0.05
Thc data ofTablc-4.46 indicales that thcre is positive corrclation ofall the prcdiclors
(F.Sc. scorcs, cntry test and Mcrit) with all Ihe lour professional examination scores
ofTglccom Engineering programme, with exception of F.Sc. and final year (which is
ncgalively corrclated). The daia also reveals that merit scores \vere strongly associated
lvith all the cxamination scorcs, follorved b1,cnlry tesr and F.Sc. scorcs. The Median
scorcs ofmcril, entry tcst and F.Sc. scores Ncrc.3l, .2J, and.08 respectivcly.
Tablc-4.17 Corrclalion ofPredictor and Criterion variables ofover all Sampleof Elactronics Engineerin
Prcdictors l,. Final Ranei MedianF.Sc.
EntD,Tcst
Mcrit
-.06 -.14
.06 - .24
.05 -.27
.142 -.038 -.064 .057
.232 .061 .120 .239
.272 .055 .054 .2t4
.01
.18
.14
P < 0.05 *+ P < 0.01
Tablc4.47 illustrates that therc is posilivc correlation
\\ith Jll thc four professionrl cun,nrtion scorcs
of cntry test and
of Electronics
mcrit scores
Engineering
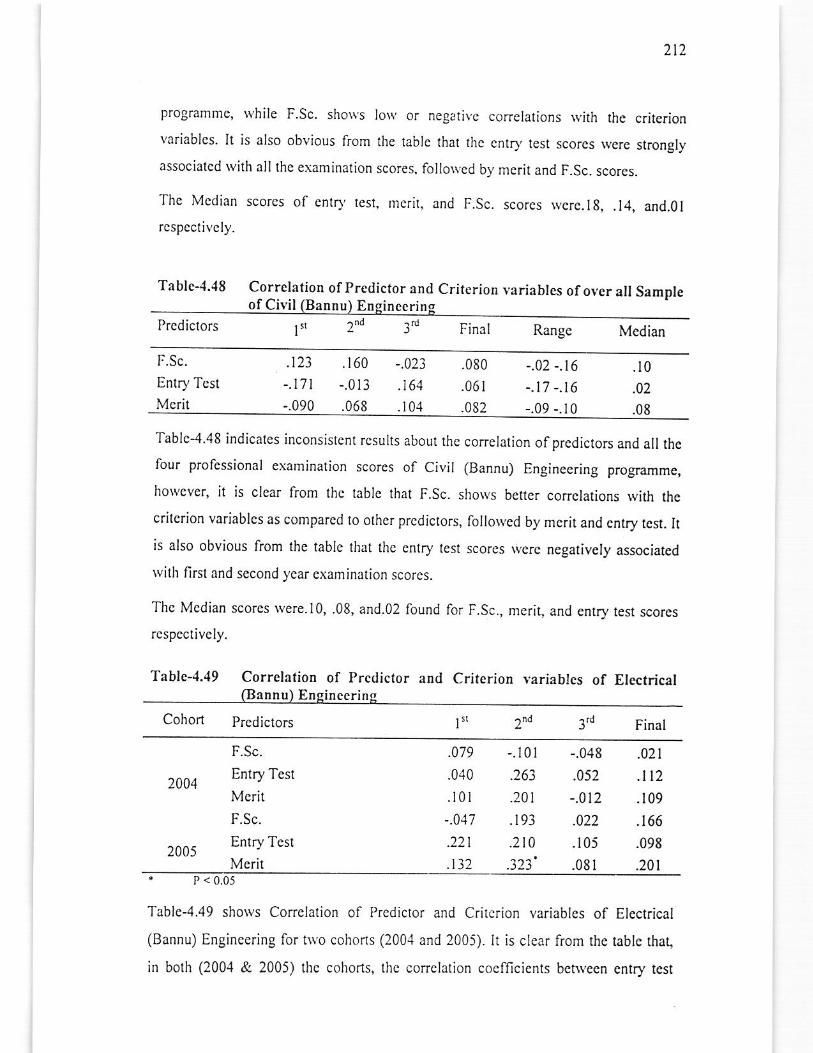
2t2
programme, \yhile F.Sc. sho\\'s low or negrtiye correlalions with tle criteaion
variablcs. It is also obvious from the lablc lhat lhc entry test scorcs lverc strongly
associatcd wilh all the examinalion scores, follo\.ed b),merit and F.Sc. scores.
Thc Mcdian scorcs of cnto, test, merit, and F.Sc. scorcs wcrc.lg, .14. and.ol
rcspcctivcly.
Table-4.48 CorrelationofpredictorandCriterioDYariables ofover all SampleofCi!il nu) Encincerin
Prcdictors 2nd Final Rangc
F.Sc.
Entry Tcst
Merit
.t23 .t60 -.02i-.171 -.01t .164
-.090 .068 .t 04
.080
.061
.082
-.02 -
-.17 --.09 -
.t6
.16
.10
.10
.02
.08
Table-4.48 indicates inconsisrent rcsuhs about fie correlatjon ofpredictors and all thc
four professional examination scores of Civil (Bannu) Engineering progEmme,
howcvcr, it is clear from thc hblc that F.Sc. shotvs bctter correlations wilh thc
critcrion variablcs as comparcd to olhcr prcdictors, followcd by mcrit and cntry tcst. ltis also obvious from the table that thc entry test scorcs \r.erc negatively associated
\vilh firsl and sccond ycar examination scorcs.
Thc Mcdian scorcs rvere.i0,.08, and.02 lound for Ir.Sc., merit, and cntry test scorcs
rcspectivcly.
Tablc-4.19 Correlttion of Prcdictor and Criterion iariables of Electricalnnu) EnEinecrin
Cohorl prcdictors tn 2.d Final
2401
2005
.079
.040
. t0l-.017
.21t
.132.
-.r01
.263
.20t
.191
.2t0.323'
-.048
.052
-.012
.022
.105
.081
.021
.n2
.109
.t66
.098
.20t
F.Sc.
Entry Tcst
Merit
F.Sc.
Entry Test
McritI < 0.05
Tablc-1.49 shows Corrclation of Prediclor and Critcrion variables of Elcctrical
(Bannu) Enginccring for t*o cohons (2004 and 2005). It is clcar from rhe table rhar,
in both (200,1 & 2005) thc cohons, rhc corclarion cocfficienrs berNccn cntry tcst
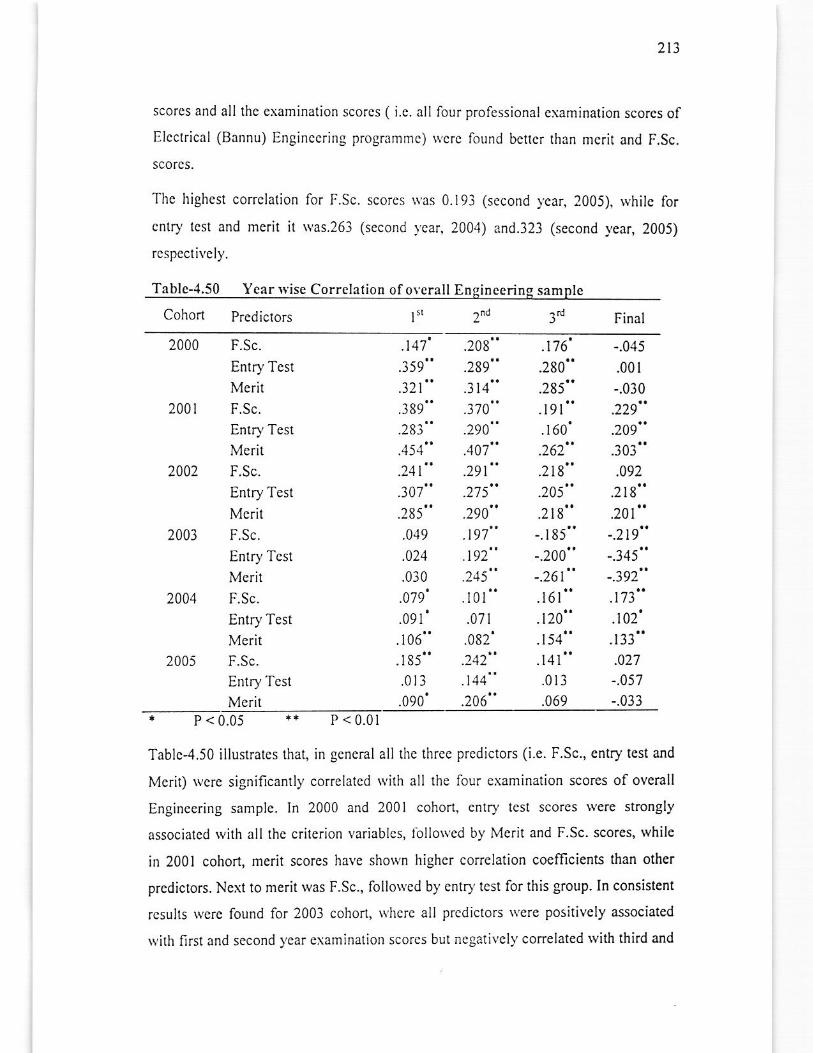
213
scorcs and all the examinalion scorcs ( i.e. all four pro[essional cxamination scorcs ofElcctrical (Bannu) Engincering programmc) \\,crc found bcner than mcrit and F.Sc.
scores.
Thc highcst conclalion for F.Sc. scorcs
cnlry lcst and mcrit it was.263 (second
rcspeclively.
\\'as 0.19i (sccond ),ear, 2005). whilc for
)car, 2004) and.323 (second year, 2005)
Tablc-4.50 Ycar\r'iseCorreleiionoforcrallEngineeringsamDle
Cohon Prcdictors l! Final
2000
2001
2002
2003
2001
2005
F.Sc.
Entry Tcst
McritF.Sc.
Enlry Tesl
McritF.Sc.
Entry Test
MeritF.Sc.
Entry Tcsl
McritF.Sc.
Entry Test
MeritF.Sc.
Enlry Test
Merit
.t4'1' .208".159" .289".321" .314".189 .370
.24 | .29 |
.307 .275
.285 .290
.049 .197"
.021 .192"
.0i0 .245".079 .I0l.091' .071
.106"
.t85
.t?6' -.045
.280" .0ol
.285" -.030
_ l9l .229
.218" .092
.205 .218
.2 t8 .201
-. t 85 -.2t9-200 --145
-.261" -.392".16l .t73.t20" .ro2'.t54" .133".141" .027
.0r I -.05'1
.069 -.033
.28i .290 -160 .209
.15{ ..107 .262 .:toi
.082'1-12
.013 .1,+4"
.090 .206* P<0.05 ** P < 0.01
Tablc-4.50 illustratcs ihat, in general all the lhrec prcdictors (i.e. F.Sc., entry test and
Merit) wcrc significantly corrclatcd \\'ith all the four cxamination scores of ovemll
Enginccring sample. In 2000 and 2001 cohon, entD' test scorcs lvere strongly
associatcd with all the crilerion yariablcs, Ibllo!\'ed by Mcrit and F.Sc. scores, while
in 2001 cohort, merit scores have shoNn higher conelation coeflicienb than otfier
predictors. Ncxt to merit rvas F.Sc., lolloNed by entD test for this group. In consistent
rcsulls werc found for 2003 cohon, \'lrcrc all prcdiclors were positivcly associated
with first and second )'car examinalion scores but negativel)'correlated with third and
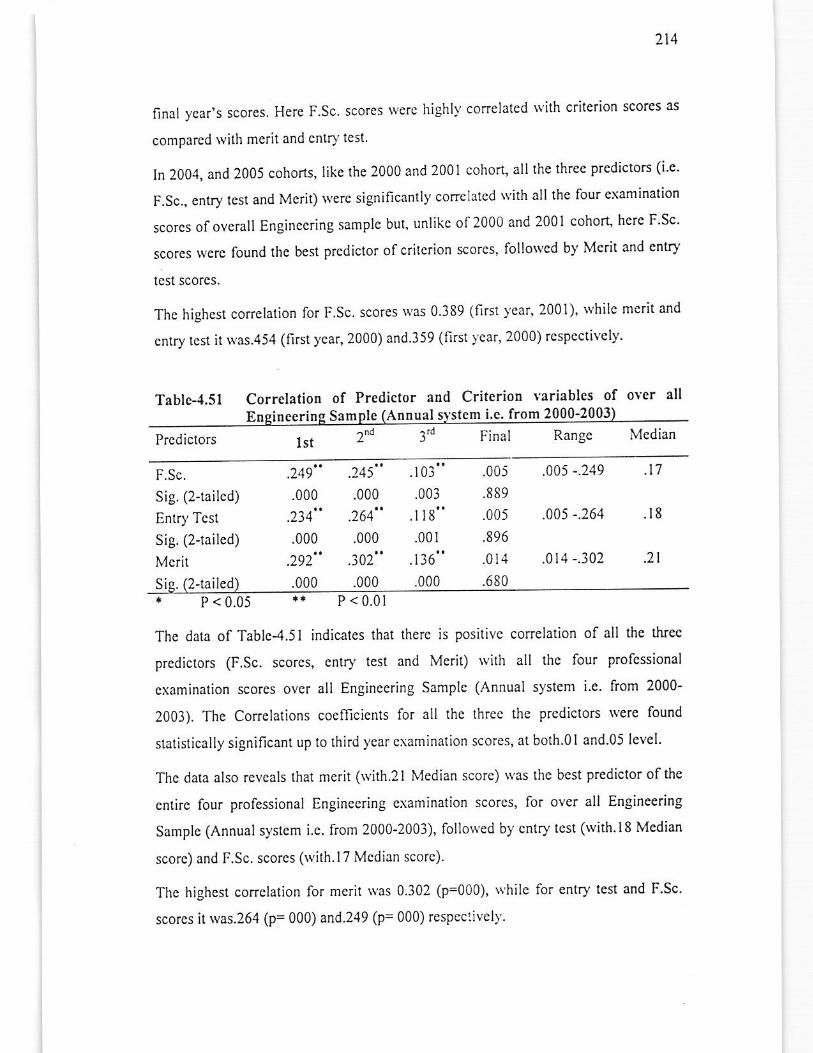
214
Iinal ycar's scores. Here F.Sc. scores rverc highly conclated \\'ith criterion scotes as
comparcd with mcrit and cntry lcst.
In 2004, and 2005 cohons, like the 2000 and 2001 cohor! all the three Prediclors (ie'
F.Sc., enlry lest and Merit) \\'ere significantl)'conelated \\'ith all the four examination
scorcs olovcrall Enginecring sample but' unlikc of2000 and 2001 cohoc herc F sc
scorcs wcre found rhe besr prcdictor ofcrilcrion scorcs, follolved by Mcrit and entry
tcst scorcs.
The highcst correlalion for F.Sc. scores \\'as 0.389 (firsl )'ear' 2001), uhile mcrit and
entry tcst it u'as.454 (first year, 2000) and.359 (first )ear, 2000) rcspectively'
Tablc-{.51 Correlation of Pr.dictor and CriierioD variables of o\.er all
EoEineeri Sample (Annual stem i.c. from 2000-2003
Prediclors 2'd Range McdianFinallst
F.Sc.
Sig. (2-tailed)
Entry Tcst
Sig. (2-lailed)
Mcrit
.005 -.249 .17
.005 -.264 .18
.014 -.302 .21
.249
.000
234
.000
.292
.000
.245
.000
.264
.000
.307
.000
.103"
.003
. 8
.001
.136"
.000
.005
.8 89
.005
.896
.014
.680Sic. -tailedP < 0.0tP < 0.05
Tho data of Table-4.51 indicates that therc is positivc conelation of all the ttllec
predictors (F.Sc. scores, enlry test and Merit) wilh all the four professional
cxamination scores over all Enginccring Samplc (Annual system i.e. from 2000-
2001). The Conelations coefficients for all thc three the predictors were found
s{atistically significant up to third year examination scores, at both.0l and.05 level.
The data also revcals that merit (with 2l Median score) was the bcst Predictor of the
entirc four professional Engineering examination scorcs, for ovcr all Engineering
Samplc (Annualsystcm i.e. from 2000-2003), follo\ied by cnlry test (wilh.l8 Median
scorc) and F.Sc. scorcs (wilh.l7 Mcdian scorc).
Thc highest correlation for merit Nas 0.302 (p=000), \\'hilc for entry lest and F Sc'
scorcs it was.264 (p= 000) and.249 (p= 000) respcclivel)'.
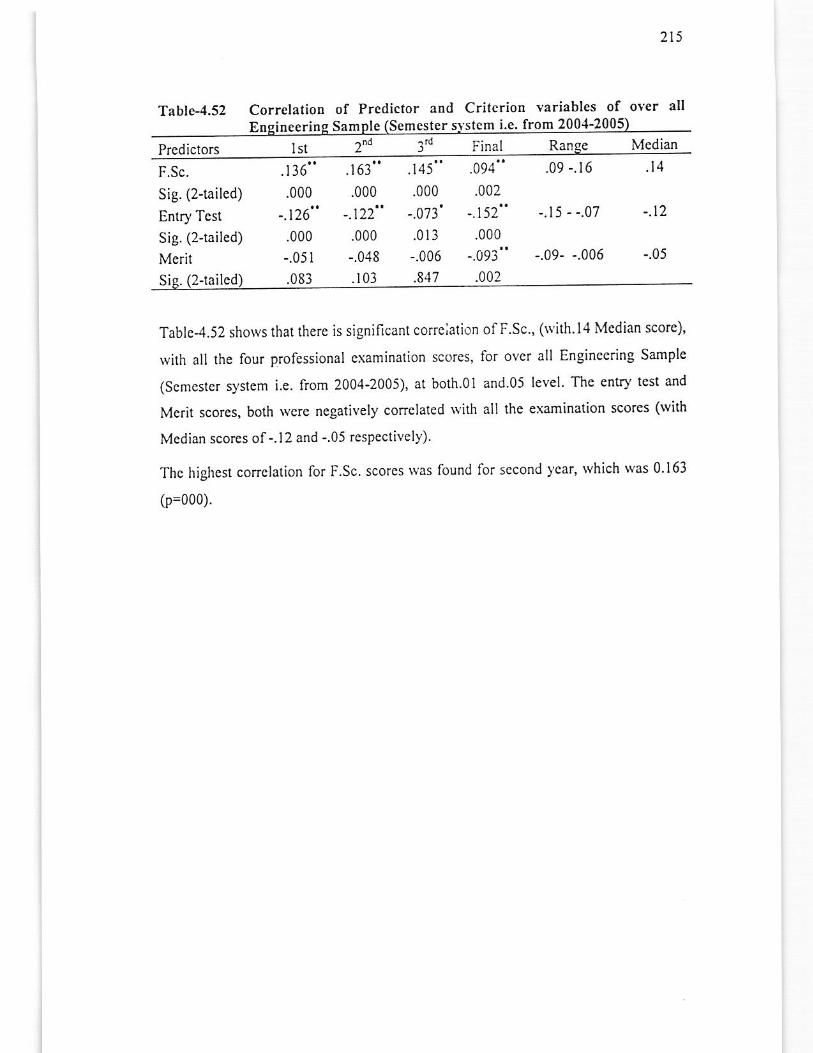
2t5
Tablc-4.52 Correlation of Predictor and Critcrion variables ofEnsineerin Sam olc stem i.e. from 200-{-2r
Prcdictors
Sig. (2-tailed)
Entry Tcst
Sig. (2-lailed)
lst 2nd Mcdian
.t4.l16
.000
-.126"
.000
-.051
.083
.r6l.000
-.t22.000
-.048
.r03
.t45".000
-.073'
.013
-.006
.8,17
.002
- 152
.000
-.09i".002
-.15 - -.07
-.09- -.006
- t)
-.05
Tablc4.52 shoNs that there is significant conciation ofF.Sc., (lYith l4 Median score),
with all the four professional examination scorcs, for ovcr all Engincering Sample
(Scmcster syslem i.e. from 2004-2005), at both.Ol and.Os level Th€ entry test and
Merit scores, both rvcre negatively correlated Niih all the examination scores (rvith
Median scores of-.12 and -.05 rcspectively).
Thc highcst conclation for F.Sc. scorcs was found for sccond ycar, rvhich rvas 0 163
(p=000).
Final
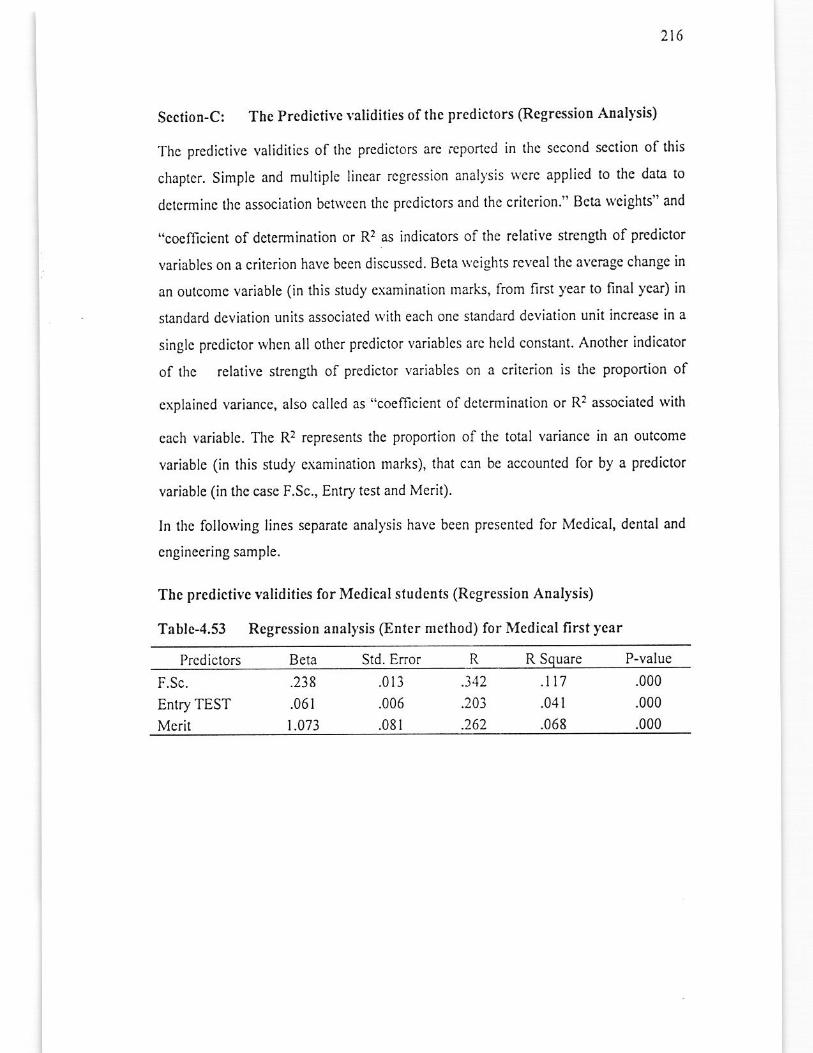
2t6
Section-Ci The Predicti\'c Yalidities ofthe predictors EeSressioD Aralysis)
Thc prcdictivc validitics of thc predictors are ieponcd in the sccond scction of this
chaptcr. Simple and mulliple lincar rcgrcssion anal)sis \\'erc applied to thc data to
dctcnnine rhc associalion bctl\'ecn rhc Prcdiclors and thc critcrion." Bcta weights" and
"coefficicnt of detormination or R2 as indicatoB of the rclative strcn$h of prediclor
variables on a critcrion hayc bcen discusscd. Bela Ncights rcveal thc aYcnge changc in
an ourcome variablc (in this study examination marks, lrom first )'ear to final year) in
standard deviation unils associatcd \yith each one strndard deviation unit increase in a
singlc prcdictor whcn all othcr prcdictor variablcs arc hcld constant. Anothcr indicator
of thc rclativc strcn8fi of prediclor variables on a critcrion is the proPortion of
cxplained variance, also called as "coefficient of dctcrmination or R: associalcd with
cach variable. The R2 represenls thc propofiion of fie total variance in an outcome
variable (in this study examination marks), that can be accountcd for by a prcdictor
variable (in thc case F.Sc., Entry tcst and Merit).
ln the following lines separatc analysis have bcen prescntcd for Medical, dental and
cnginccring sample.
The prcdictivc validities for Medical sludents (Rcgression Analysis)
Table-4,53 ReSrcssion anal)'sis (Enter ethod) for Mcdical first year
R Square l-fqlePrediclors Bcla Srd. Error
F.Sc.
Entry TEST
Merit
.061
1.073
.013
.006
.081
.)42
.203
.262
.|7
.04r
.068
.000
.000
.000
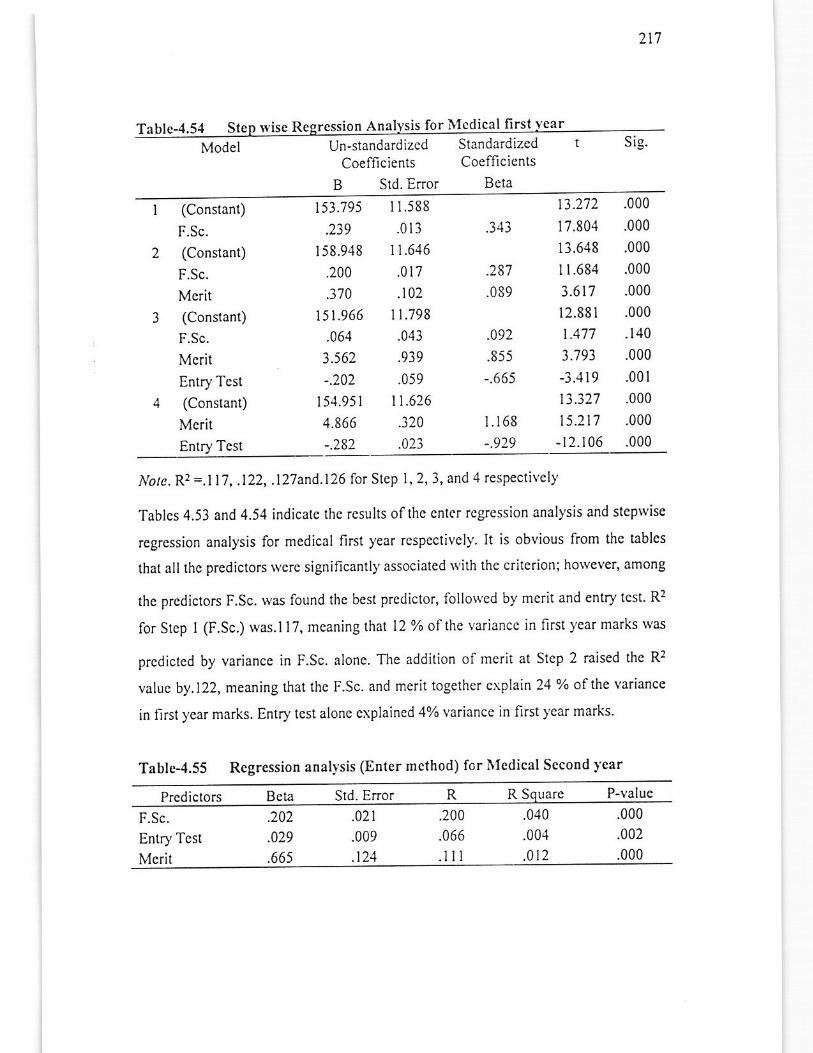
21'l
Tablc-4.54 \r'ise Reeression Anahsis for l\{cdic.l first r"ear
Un-standardized Standardized
Coellicients Coefficients
B Std. Error Bcla
(Constanl)
F.Sc.
(Constan0
F.Sc.
Mcrit(Conslant)
F.Sc.
McritEntry Test
(Constant)
McritEnlry Tcst
t53.795
.239
158.948
.200
.370
15t.966
.064
3.562
-.?02
151.951
4.866
I l.i88.013
l r.646
.017
.102
I t.798
.0,+3
.939
.059
11.626
.320
.023
.343
.287
.0s9
.092
.855
-.665
t.t68
t3.272
17.804
13.648
I1.684
3.6t7
12.881
1.477
3.793
-3.4 t913.327
t5.217
-12.t06
.000
.000
.000
.000
.000
.000
.140
.000
.001
.000
.000
.000
Note, R2 =.1)7, ,122, .l27and.l26 for Step l, 2, l, and 4 r€sP€ctively
Tablcs 4.53 and 4.54 indicalc lltc rcsults ofthc cntcr rcgression analysis and step\visc
regression analysis for medical ,lrst year rcspectivcly. lt is obvious from thc tables
that all thc predictors were significantl)'associated \\'ilh the criterion; however, among
the predictors F.Sc. was found the besl prcdictor, followed by merit and entry tcst. R2
for Step I (F.Sc.) was.ll7, meaning that 12 o% ofthe variance in firsl year marks rvas
prcdictcd by variance in F.Sc. alonc. The addition of merit at Step 2 raised the R2
valuc by.l22, meaning liat the F.Sc. and merit togethcr cxplain 24 % ofthe variance
in first year marks. Enlry tcst alone explained 4% variance in first )'ear marks.
Tablc-4.55 Regression aDalysis (Enter method) for IUcdical Second ytar
Prcdictors Std. Error R Square P-\'alue
F.Sc.
Entry Test
Mcrit
.202
.029
.665
.02t
.009
.)21
.200
.066
.]]l
.010
.001
.012
.000
.002
.000
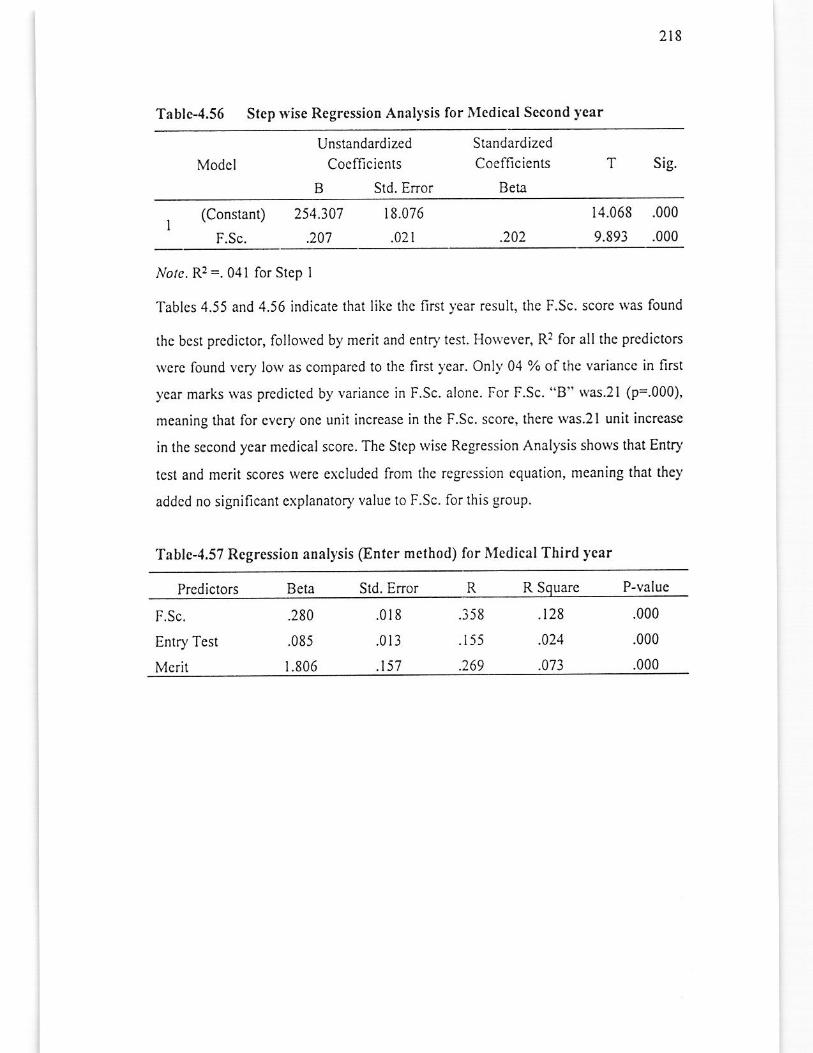
218
Tablc-4.56 Stcp nise Regrcssion Anal)'sis for lledical Sccond ycar
Modcl
Unstandardized
Coefficicnts
B Std. Enor
Standardized
Coefficicnts
Beta
sis.
(Conslant)
F.Sc.
254.301
.207
18.076 14.068 .000
9.89t .000
No/c. R2 =. 041 for Stcp I
Tables 4.55 and 4.56 indicate that like thc first year result, thc F.Sc. score *as found
thc best prediclor, followed by merit and entry test. Ho\Yever, R2 lor all the prcdiclors
wcrc found vcry low as comparcd 1o the first )-car. Only 04 o% of lhe variancc in first
ycar marks Nas predicted by variance in F.Sc. alone. For F.Sc. "8" was.2l (p= 000),
meaning thal foa cvery one unit increase in the F.Sc. score, there lvas 2l unit increase
in thc sccond ycar medical score. The Step rvisc ReSression Analysis shows that Entry
test and mcrit scores wcrc excluded from thc rcgression equation, meaning that thcy
addcd no significant explanatory value to F.Sc. lor !his group.
Tablc-4.57 Rcgression analysis (Enter method) for IUedical Third year
Prcdiclors Beta Sld. Enor R R Souarc P-valuc
F.Sc.
Entry Test
Mcrit
.280
.085
1.806
.0t8
.013
.157
.15 8
.155
.269
.128
.024
_073
.000
.000
.000
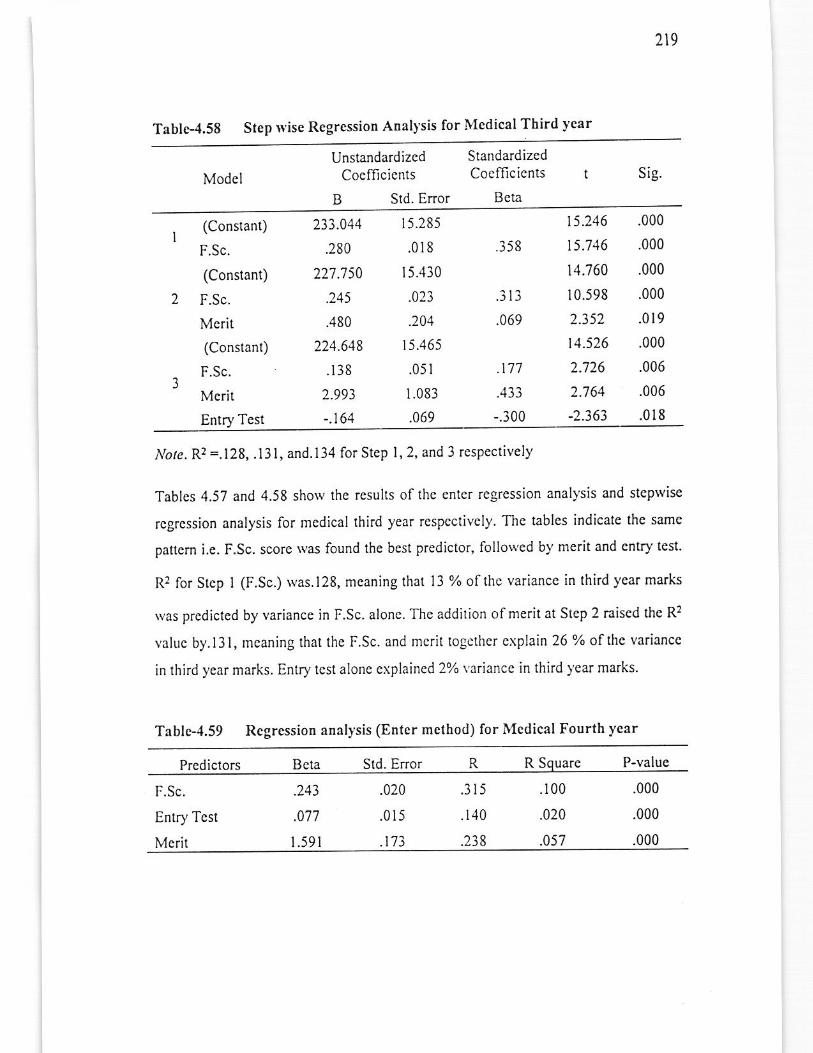
2r9
Tablc-4,58 Step Nise Regression Analysis for l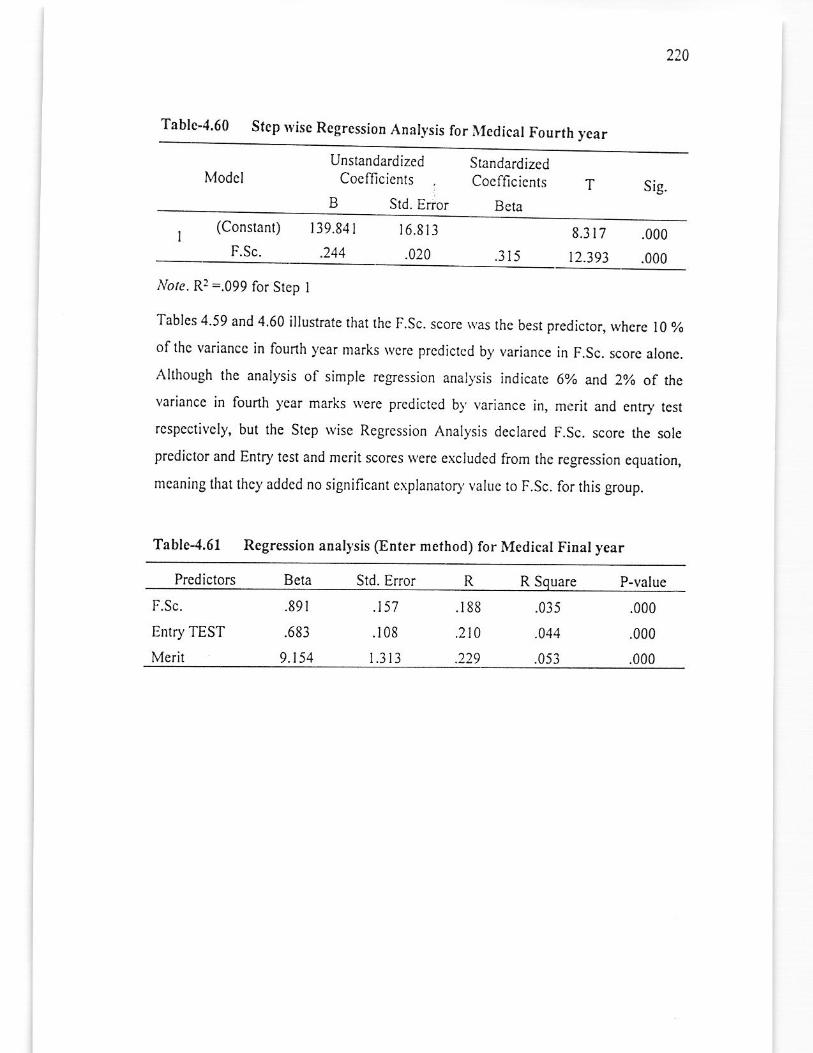
220
Tablc-4.60 Stcp ryisc Regrcssion Anal],sis for i\Iedical Fourth ).ear
ModclUnshndardized ShndardizedCocfllcicnts Cocfficients Sig.
SId. Error
(Conslant)
F.Sc.
139.84 t
.144
r6.813
.020 12.393.3i5.000
.000
ibtc. R: -.099 for Step I
Tables 4.59 and 4.60 illustratc that the F.Sc. score \\,as the best predicror, lvhere I0 %of thc variancc in founh year marks rvcre prcdicted by variance in F.Sc. score alonc.
Allhough the analysis of simple rcgression analysis indicate 6./0 and 2yo of th.variancc in founh 1,car marks Nere predictcd bl,variance in, merit and entry test
rcspcctivcly, but thc Stcp rvise Regrcssion Anall,sis dcclared F.Sc. scorc the sole
predictor and EntD,test and mcrit scores wcre excludcd from thc regression cquation,
mcaning that thcy addcd no significanr cxplanatory value to F.Sc. for this group.
Table-4,61 Regression analysis (Eoter mcthod) for Medical Final year
Predictors Beta Std. Error R R Square p-value
F.Sc.
Enrry TEST
Merit
.89r
.683
9.154
.t57
.r08
1.313
.188
.2t0
.229
.035
.014
.053
.000
.000
.000
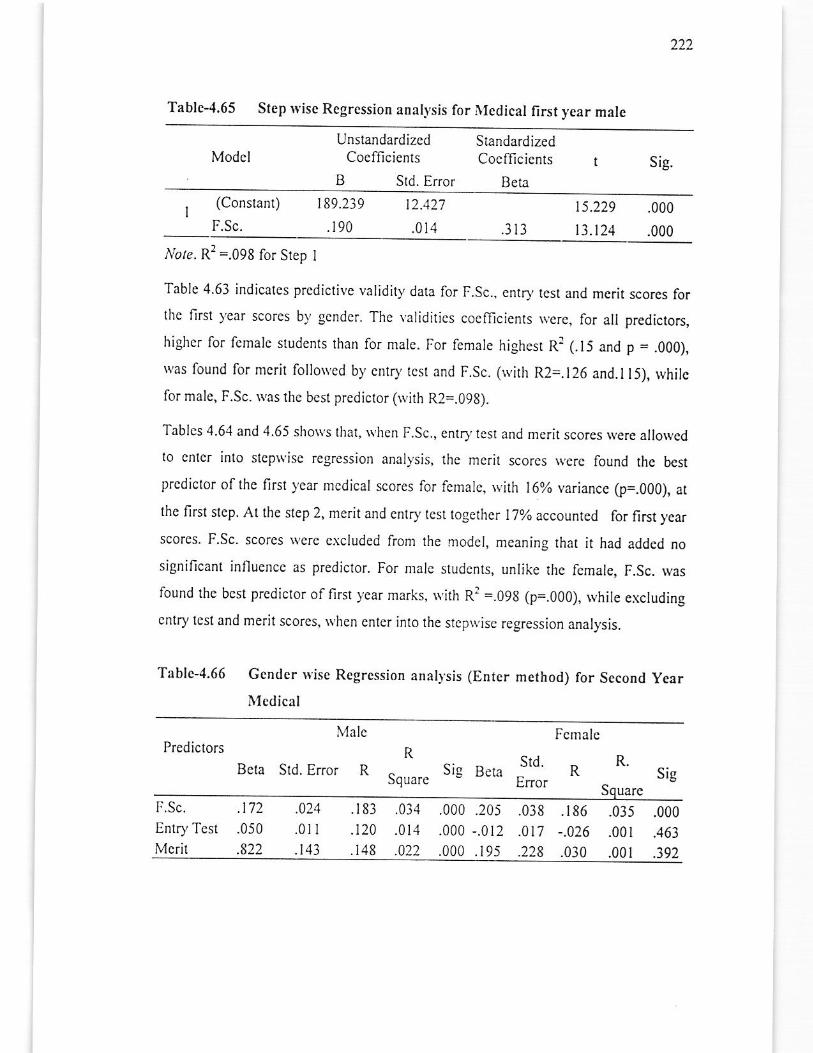
222
Tablc-4.65 Stcp trise Rcgression analr,sis for luedical first ycar male
ModclUnslandardizcd Slandardized
Coefficients Coelficicnts sis.B Std. Error Beta
(Constan0
F.Sc.
189.239
.190
12.427
.014 .lt3ts.229 .000
13.t24 .000
Note. R']=.098 for Srep I
Tablc 4.63 indicates prcdictiYc validity dala lor F.Sc., eniry tesr and mcrit scores [o,thc first ),ear scores by gcnder. The yaliditics cocfficients were, for all predictors,
higher for fcmalc srudents than for malc. For fcmale highesr Rr (.t5 and p = .6661,
was found for ntcril folloNed by cntr), rcsl and F.Sc. (\virh R2=.126 and.l l5), whilc
lor male, F.Sc. rvas the bcsl predictor (\yilh R2=.098).
Tablcs 4.64 and 4.65 shows that, \\'hen F.Sc., entry rcsl and mcrh scorcs \!€re allotved
to cntcr inlo slcp\\'isc rcgression analysis, the mcrit scores rverc found thc best
prcdictor oflhc firsl year mcdical scorcs for lcmale, Nith l6% variancc (p=.000), ar
tho first slep. At thc stcp 2, merit and entry tcst togethcr IToZ accounted for first year
scores. F.Sc. scorcs \\'ere cxcluded from lhe !-nodel, mcaning that it had added no
significant influence as predictor. For male sludcnls, unlike the female, F.Sc. rvas
found the bcst prediclor of firsr year marks, $'ith R2 =.098 (p=.000), while cxcluding
cnlry lest and merit scores, \\'hen enter inlo lhe stepu,ise regression analysis.
Tablc-4.66 Gender rvisc Rcgrcssion anal],sis (Enter mcthod) for Sccond year
llcdical
Prcdictors R
Squarc
!cmalc
RR.
Malc
Beta Srd. Error R Sig BeraSrd.
Eror sigrc
F.Sc. .1'12
Entry Tcsl .050
Mcril .822
.000.205
.000 -.0r2
.000.19i
.024
.0r I
.183
.120
.148
.0ll
.022
.038
.01'7
.186
-.026
.030
.035
.001
.00r
.000
.463
.392
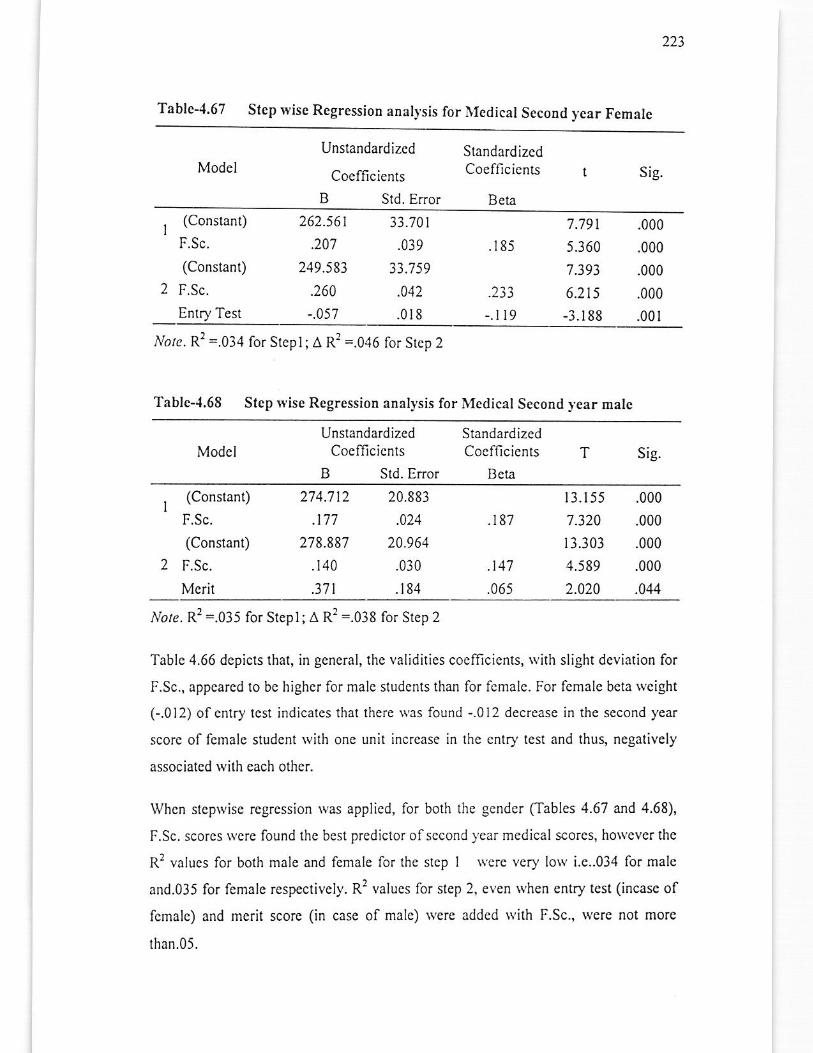
223
Tablc-,1.67 St.p wisc RegressioD anal).sis for iucdical SccoDd ycar Female
ModclUnstandardized
Coefficienls
B Std. Enor
StandardizedCoefficicnts
B eta
Sig.
(Constant)
F.Sc.
(Constant)
F.Sc.
Enlry Test
262.561
.201
249.583
.260
-.057
33.701
.039
33.'',l59
.042
.0r8
7.79 t
5.360
7.393
6.2t5
-3. r 88
.185
.233
-.t t9
.000
.000
.000
.000
.001
,\ro/c. R: =.0J4 for Stepl; A R'? =.046 for Step 2
Table-{.68 Stcp $ise Rcgression anal}.sis for l\ledic:tlSecond }.ear mrlc
ModclUnslandardizcd
Coelficicnls
B Sld. Error
StandardizedCocfficicnls T
Beta
sis.
(Constan0
F.Sc.
(Constant)
F.Sc.
Mcrit
274.'t t2
.t77
27 8.887
.r40
.371
20.883
.024
20.964
.030
.t84
.187
.147
.065
13.155 .000'7.320 .000
r 3.303 .000
4.589 .000
2.020 .044
,Vore. R': =.035 for Stepl; A R'z =.038 for Step 2
Tablc 4.66 depicts thai, in general, the validities coefllcients, tyith slight deviation for
F.Sc., appcarcd to be highcr for malc sludcnls than for fcmalc. For fcmalc bcta wcight
C.012) ofentry tcst indicales that therc \\'as found -.0i2 decrcase in thc second year
scorc of fcmalc studcnt with onc unit incrcase in lhe cntry test and thus, negatively
associatcd rvith each othcr.
Whcn steprvisc rcgrcssion was applied, for both the gcndcr Cfables 4.67 and 4.68),
F.Sc. scorcs $'crc found thc best prediclor ofsccond year m€dical scores, hotvever thc
R2 valucs for both male and female for the step I \\'ere yery lorv i.e..034 for male
and.035 for female respectivcly. R2 valucs for slep 2, even when entry tcst (incase of
Iemale) and merit score (in casc of male) rvcrc addcd with F.Sc., were not morc
lhan.05.
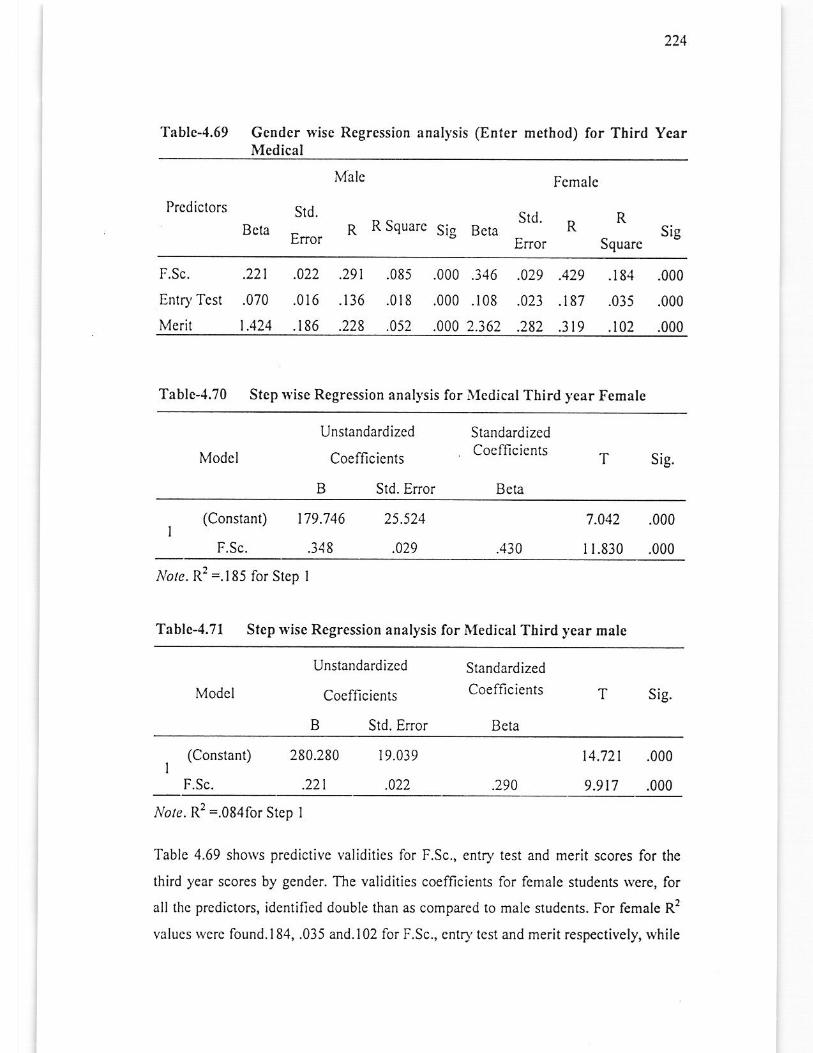
224
Tablerl.69 Gender\r'iseMcdical
Regression anal),sis (Enter method) for Third Yerr
Prcdictors
Bcta
Malc
Srd._ R R SquarcElror
Fcmalc
Srd- - RBeta K si!Enor SquareSig
F.Sc. .221
EnrD,Tcst .070
Merir 1.424
.022 .291
.0r6 .136
.186 .228
.085 .000 .316
.018 .000.i08
.052 .000 2.362
.023 .181
.282 .3 t9
.18.1 .000
.035 .000
.102 .000
Tablc-4,70 Step \lise Regrcssion anal]'sis for lledical Third ),err Female
Modcl
Unstandardizcd
Coefficicnts
B Std. Error
StandardizedCocfficicnts
Bela
'f sis.
(Conslant)
F.Sc.
179.746
.348
25.524
.029 .430
7.042 .000
I r.830 .000
Ablc. R'?=.J85 for Step I
Table-4.71 Stcp ryise Rcgression analysis for iUedical Third year male
Modcl
Unslandardizcd
Coefficients
B Std. Enor
Slandardized
Coelficients T
Beta
sig.
I (conslant)
F.Sc. .290
Note. R2 =.084for Step I
Table 4.69 shows predictivc validitics for F.Sc., entry test and merit scorcs for the
third year scores by gender. The validities coefficients for fcmale students rvere, for
all thc predictors, identified double than as comparcd to male studcnts. For female R2
valucs rverc found.184, .035 and.102 for F.Sc., cntD,lest and merit respectively, while
280.280
.221
19.039
.022
t4.72t .000
9.917 .000
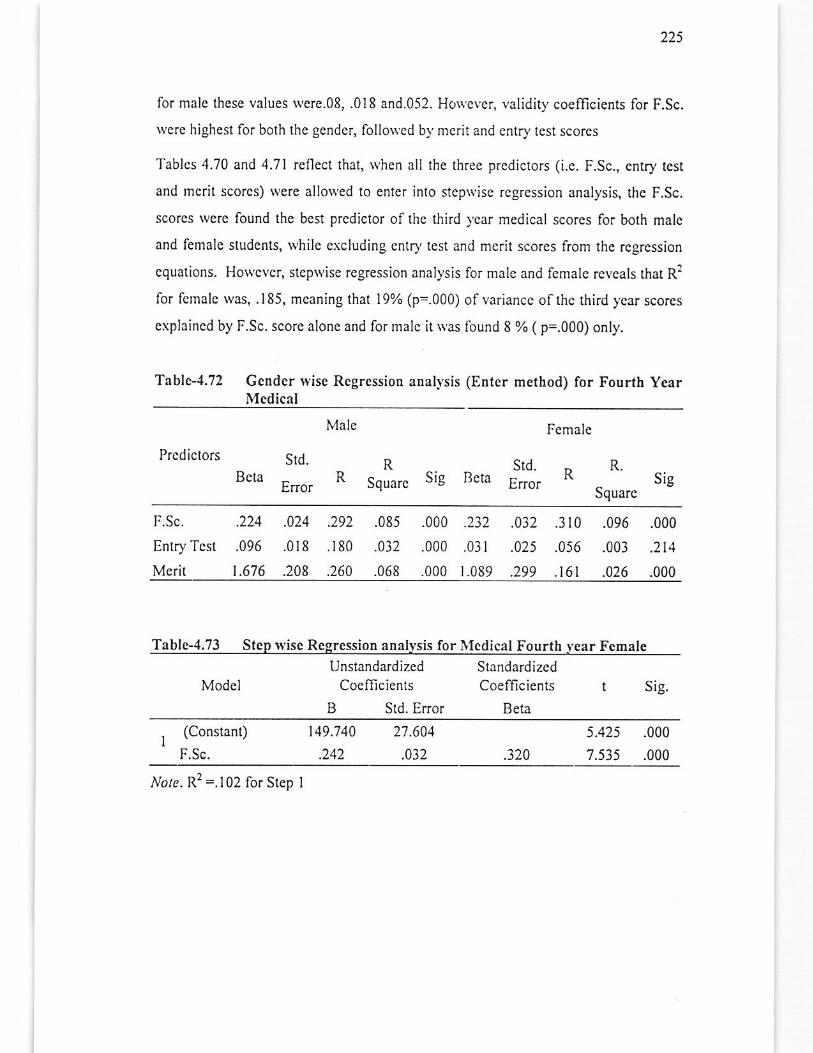
225
for mclc these values \vere.08, .018 and.052. Horvever, validiq coefficients for F.Sc.
lvcre highest for bolh the gender, lollowcd b),merit and entry test scores
Tablcs 4.70 and 4.71 reflect that, \\'hen all the three predictors (i.e. F.Sc., entry lest
and merit scorcs) rvere allo$,ed to enler into stcp$ ise regression analysis, the F.Sc.
scorcs rvere found the bcst prcdictor of the third ycar medical scorcs for both malc
and femalc students, \\'hile e)icluding cntr),test and mcrit scores lrom the regression
cquations. Howcvcr, stcpwise regression ana)1'sis for male and fcmalc rcveals that R?
for fcmale rvas, .185, mcaning that l9% (p=.000) of variance of thc third ycar scores
explaincd by F.Sc. score alone and for malc it was lound 8 % ( p=.000) only.
Tablc-4.72 Gcndcr \risc Rcgression anal!sis (EDter method) for Fourth YearMedical
Male
RR squur" Si8 B"tu
Prcdictors Std.Bcta -Error
Female
R R. Sie
Squarc
Srd.Efior
F.Sc. .224 .024 .292
Enlry Tcst .096 .018 .180
Mcrit 1.676 .205 .260
.085 .000 .232
.032 .000 .031
.068 .000 r.089
.032 .310
.025 .056
.299 .16t
.096
.00i
.026
.000
.211
.000
Table-4.73 Step \visc RegressioD analysis for llcdical Fourtb year Female
ModclUnstandardizcd
CocmcientsStandardizedCoefficients sis.
B Sld. Error Beta
, (Conslan0 t49.740
.242
5.425 .000
1.535 .000
27.604
.032 .320
Nole. R2 =. )02 for Step I
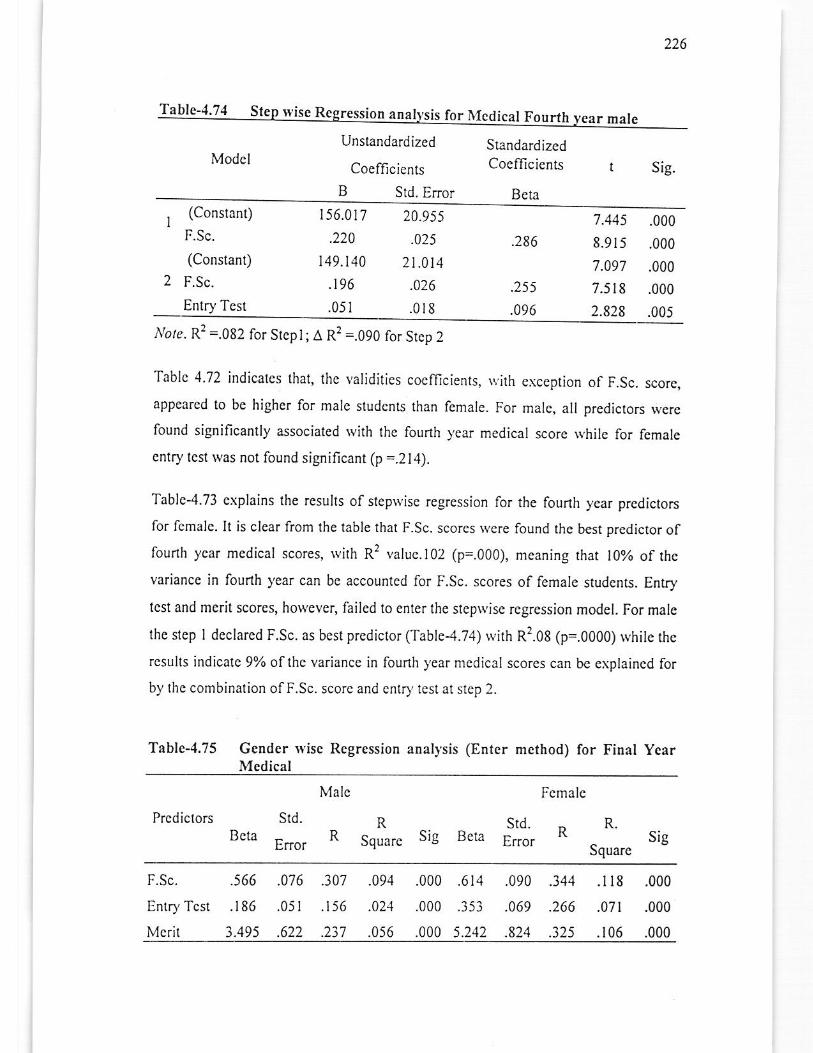
2.26
Table-4.74 SteD ryise Regressiop anal],sis for Medical Fourth y€ar malc
ItlodclUnstandardizcd
Coelficients
StandardizedCocflicicnrs t Sig.
BeIaStd. Error(Constant)
F.Sc.
(Consrant)
F.Sc.
Enlry Test
156.017 20.955
.220 .025
)49.t40 21.014
.t96
.051
.026
.018
.286
.2s5
.096
7.445
8.9r5
7.097
7.5t8
2.878
.000
.000
.000
.000
.005
Ib/e. R2 =.082 for Stcpl; A R2 =.090 for Stcp 2
Tablc 4.72 indicales that, thc validities cocflicienrs, $.irh exceprion of F.Sc. scorc,
appeared to be higher for malc studenB than fcmale. For male, all predictors rvcrc
found significantly associated Nith the fourrh year medical score.$,hile for female
cntry tcst was not found significant (p =.214).
Tablc-4.73 cxplains the rcsulls of slep\\'isc regression for lhe fourth year predictors
Ior femalc. It is clear from the table that F.Sc. scores wcre found thc best prcdictor offourth ycar mcdical scores, rvith R2 valuc.l02 (p=.000), meaning that l0% of the
variance in fouih ),ear can bc accounted lor F.Sc. scores of female studcnts. Entry
tcst and merit scores, however, failed to enter the sicp\yise regression model. For male
the step I dcclarcd F.Sc. as best predictor (Table4.74) \virh R2.08 (p=.0000) \vhile the
rcsults indicatc 90% ofthe variance in lounh year mcdical scores can be explaincd for
by lhc combination ofF.Sc. scorc and cntry testat slep 2.
Tablc-4.75 Gcnder I\isc Regression aDalysis (Entcr method) for Final YearMedical
Malc
Prcdictors Std.Bcta - R
LftOT
RSquarc Si8 Beta
Fcmalc
-RK sicSquare
Srd.
Error
F.Sc.
Entry'ltst
Merit
.566 .076 .307
.r 86 .05 r .r56
3.495 .622 .237
.094 .000 .614
.024 .000 .35 3
.056 .000 5.242
.090 .344 .l l8 .000
.069 .266 .071 .000
.824 .325 .106 .000
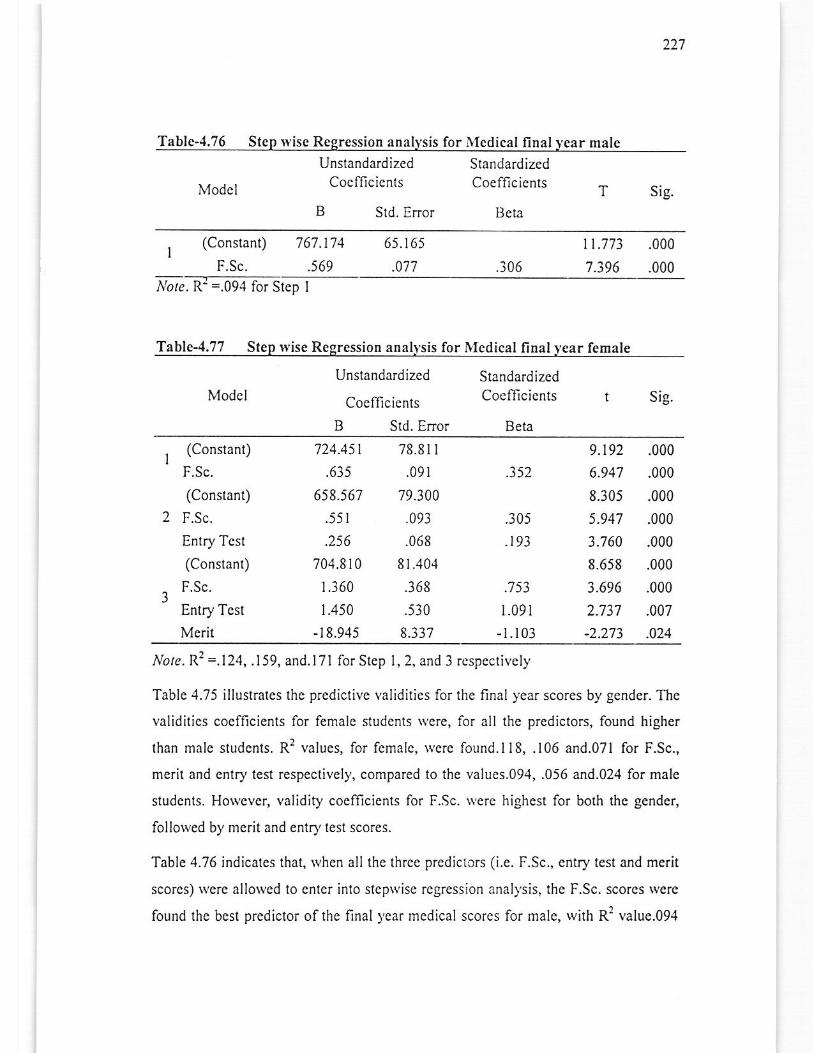
22'7
Table-.r.76 Step rvise Regression analtsis for }ledical final year male
Modcl
UnstandardizedCocmcicnts
B Std. Enor
StandardizedCoelficicnts
Beta
sis.
(Consrant)
F.Sc.
767.171
.569
65. t 65
.011 . i06|.173 .000
7.396 .000iro/c. R =.09.1 for Stcp I
Table-4.77 Step wise Regression anallsis for 1\Iedical finrl],ear lcmale
Modcl
Unstandardized
Coclficients
StandardizcdCocfficicnts t Sig.
B Sld. Error Beta
(Constant)
F.Sc.
(Constant)
F.Sc.
Enrry Tcst
(Conslan0
F.Sc.
Entry Tcst
Mcrit
124.451
.635
658.567
.55r
.256
704.810
1.360
1.450
-t8.945
78.8r l
.09r
79.340
.093
.068
8r.101
.368
.5 30
8.337
.352
.305
,r93
.153
1.09t
-1.103
9.t92 .000
6.947 .000
8.305 .000
5.947 .000
3.760 .000
8.658 .000
3.696 .000
2.737 .007
-2.2-73 .024
Note. R2 =.124, .1 59, and. I 7l lor Siep l, 2, and 3 rcspcclivcly
Tablc 4.75 illustratcs thc prediclive l,alidities lor the final year scores by gender. The
validitics cocfficients lor femalc studcnts sere, lor all thc predictors, found higher
than malc studcnts. R2 valucs, for fcmalc, rlcre found.llS, .106 and.o7l lor F.Sc.,
meri! and entry lest respectively, compared to the values.094, .056 and.024 for male
studcnls. Ho\vcvcr, validity coefficients lor F.Sc. s'crc highest for both $c gender,
followed by merit and entry lest scores.
Table 4.76 indicates that, \vhen all thc thrcc prcdiclcrs (i.e. F.Sc., entry test and meri!
scorcs) wcre allowcd to enlcr into stcpr!isc rcgrcssion anal),sis, lhe F.Sc. scorcs werc
found the besr prcdictor oflhc final 1'car mcdical scorcs for malc, *,ith R2 value.094
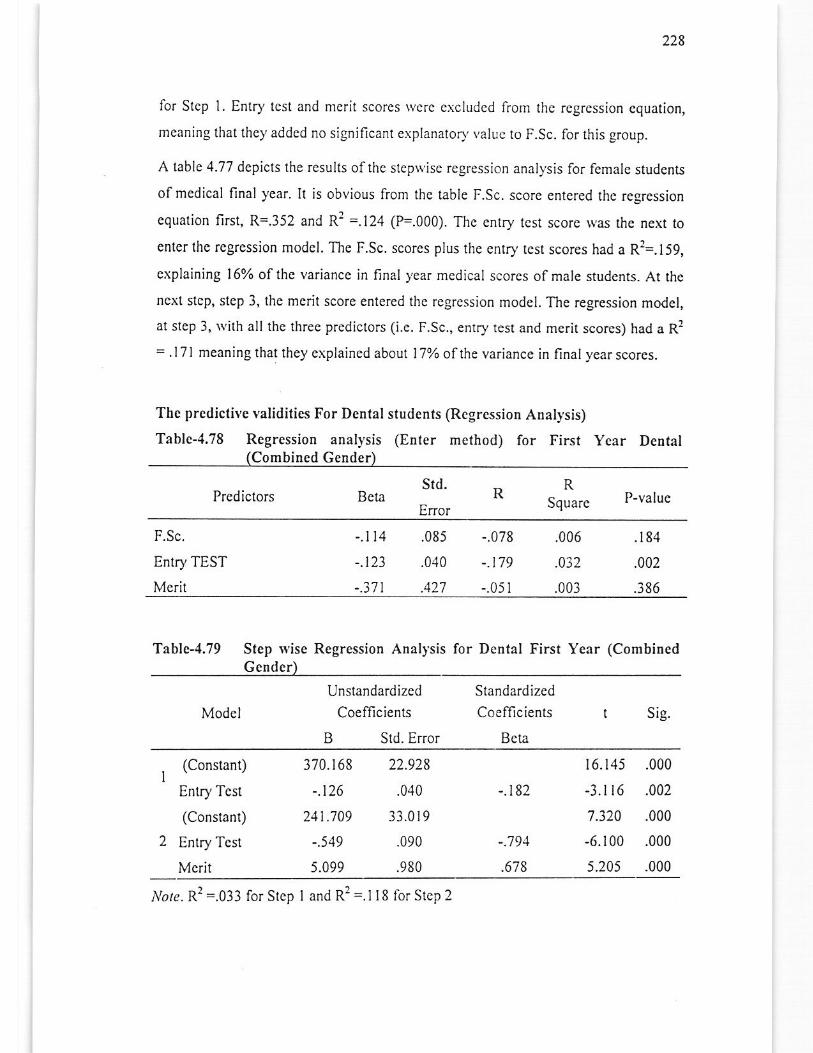
228
for Stcp l. Entry lcst and merit scorcs \\,crc excludcd from the rcgression cquation,
meaning lhat thcy added no significant explanatoD,valuc ro F.Sc. lor this group.
A lable 4.77 depicts the rcsults ofthe step\!.ise rcgression analysis for lemal€ students
of mcdical final year. It is obvious from thc table F.Sc. score entered thc regression
cqualion first, R=.352 and R'?=.124 (P=.000). The cntry tcst score was thc next lo
cntcr thc rcgression model. The F.Sc. scores plus thc cntry lest scores had a R2=.159,
explaining l6% ofthc variance in final year mcdical scorcs of male students. At the
ncxt stcp, stcp 3, the mcrit score entered thc rcgression model. The regression model,
at stcp 3, wilh all lhe three predictors (i.e. F.Sc., entry iest and merit scores) had a Rr: . I 7 I meaninS that they explained about I 7% of the variance in fi nal year scores.
Thc predictive validities For Denlal students (Rcgrcssion Anallsis)
Tablc-4.78 Regressioo analJ,sis (EDter method) for First Year Dcntal(Combined Gcnder)
Prcdiclors Be,, std' R
Error
RSquare P-value
F.Sc.
Entry TEST
Meril
-.123
-.371
.085
.040
.427
-.078
-.t79
-.0i r
.006
.0t2
.003
.184
.002
.3 86
Tablc-4,79 Step *'ise Regression Anallsis for DentalGcnder)
First Year (Combined
Model
Unstandardizcd
Coefficients
B S1d. Error
Standardized
Coelficients
Beta
sig.
(Constant)
Entry Test
(Constan0
Entry Tcst
Mcrit
370.168
-.126
211.109
-.519
5.099
22.928
.040
3t.0 r9
.090
.980
-.182
-.794
.678
16. t45 .000
-3.i16 .002
7.320 .000
-6.100 .000
5.205 .000
,Vorc. Rr =.033 for Stcp I and R: =.1 I8 for Slep 2
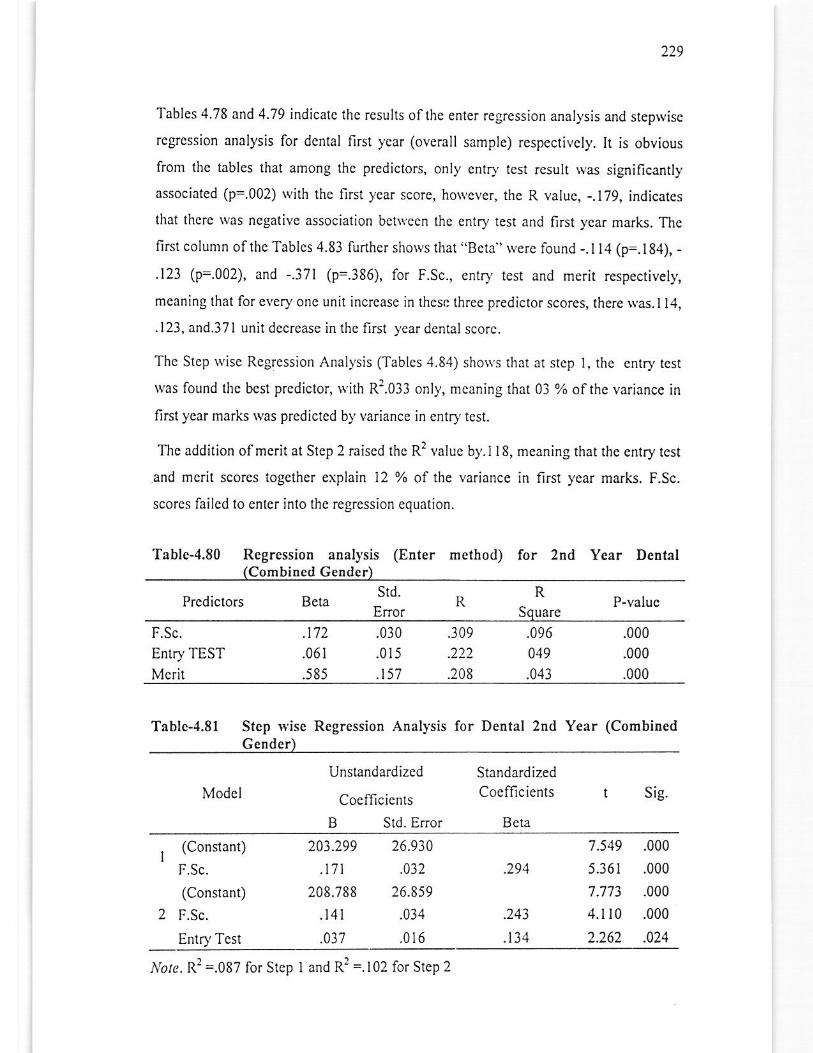
229
Tables 4.78 and 4.79 indicatc the results oflhe enter regression analysis and steprvisc
rcgrcssion analysis for denlal first ycar (overall sample) respcctively. It is obvious
from thc tablcs that among thc predictors, only entry test rcsult rvas significantly
associatcd (p=.002) with the first year score, horvelcr, the R value, -.179, indicates
that thcrc was ncgativc association befiveen thc entry test and first ycar marks. The
first column of thc Tablcs 4,83 funhcr shor(s that "Bcta ' werc lound -.1 l4 (p=.18a), -
.123 (p=.002), and -.371 (p=.386), for F.Sc., entry test and merit respectively,
meaning that for every onc unit increase in these three predictor scores, there 1\"s.1 I4,
.123, and.37l unit decrease in the firsl ),ear dental scorc.
Thc Slep wisc Rcgression Analysis ffablcs,1.84) sho\\.s rhar al srcp l, the entry rest
was found thc bcst predictor, \\'ith R2.033 only, mcaning that 03 % ofthc variancc in
first ycar marks was prcdicted by variance in entry test.
The addition ofmerit at Step 2 raiscd thc R2 value by.l 18, m€aning that fic entry test
and mcrit scorcs together explain 12 yo of the variance in first year mark. F.Sc.
scorcs feilcd to cntcr into lhc rcgrcssion cqualion.
Tablc-4.80 Regression analysis (Enter mcthod) for 2nd Year Deutal(Combincd Cender)
PrcdictorsSrd.
tsetal]ffor
R
SquareP-value
F.Sc.
Entry TEST
Mcrit
.112
.061
.585
.030
.015
.t57
.309
.222
.208
.096
049
.043
.000
.000
.000
Table-4.81 Stcp 'ri ise Rcgression Anall'sis for Dental 2nd Year (Combinedr;.nd.r)
Modcl
Unslandardized
CoefficienE
B Std. Enor
StandardizedCocmcicnts
Bcla
Sig.
(Conslant)
F.Sc.
(Conslant)
F.Sc.
Entry Tcst
203.299
.17t
208.788
.l4l
.037
26.930
.032
26.859
.034
.016
7.549 .000
5.361 .000
7.7't3 .000
4.1t0 .000
2.262 .024
.294
.243
Ablc. Rr =.087 for Step I and Rr =.102 for Step 2
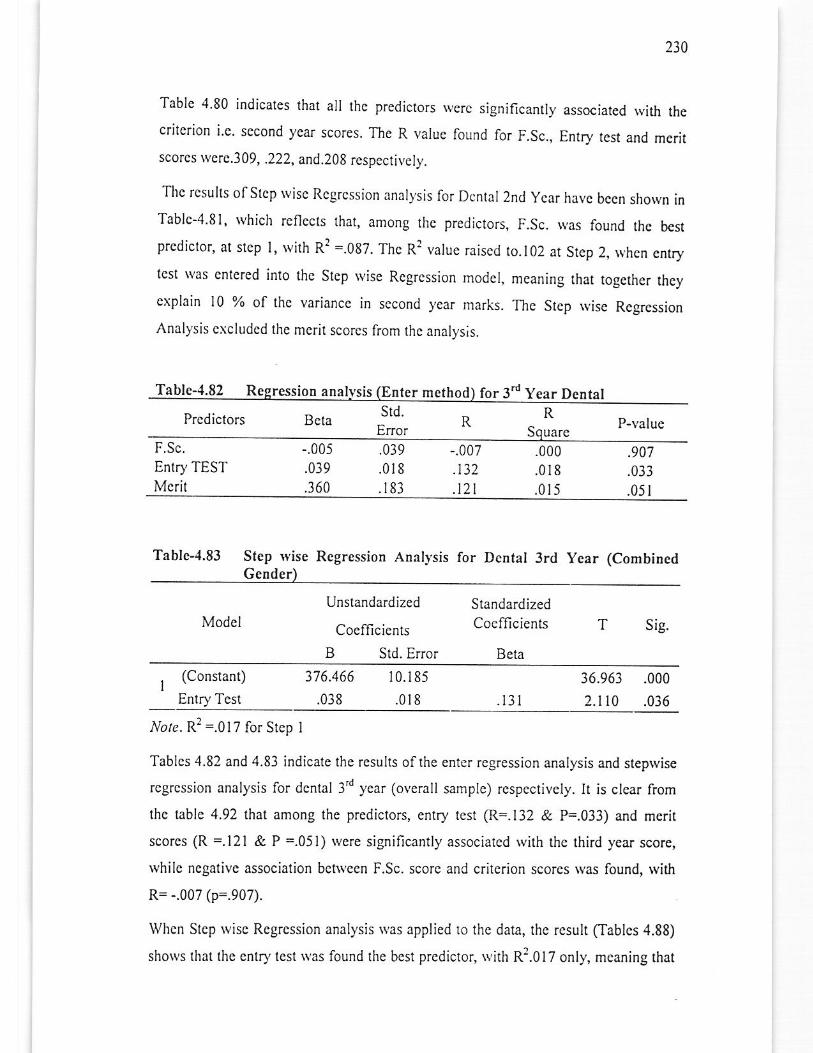
230
Tablc 4.80 indicates that all rhc predictors $.ere significantly associated with thecritcrion i.e. second yc.lr scores. The R valuc found for F.Sc., Entry lcst and meritscorcs rvcrc.309, .222, and.208 rcspectively.
Thc rcsults ofStcp rvisc Rcgrcssion anall,sis for Dcntal 2nd ycar havc bccn shorvn inTablc-4.81, which rcflccb that, among thc prediclors, F.Sc. was found thc bes(
prcdiclor, al slep l, \vith R2 =.087. Thc R2 value raised to.l02 ar Step 2, \yhcn enlry
tcsl wls cntcred inlo thc Step rvise Rcgrcssion modcl, meaning that togcther thcy
cxplain l0 % of the variance in second l,ea narks. Thc Step lvisc Rcgcssion
Analysis cxcludcd the mcril scorcs from thc analysis.
Tablc-{.82 R n ana
Predictors Bcta
is (Enler method) for 3d Year DentalStd.
ErrorR
R P-valueSqLrare
Entry TESTMcrit
-.005
.039
.3 60
.039
.018
.183
-.007
.132
.t2t
.000
.018
.0r5
.907
.033
.05t
Table-1.83 Stcp ryise Regression Analysis for Dental 3rd year (CombiEcdGender'l
Model
Unstandardizcd
Coefficients
B Std. Error
Standardized
Cocfficients
Bela
T sig.
I (Constant)
Enlry Tcst
376.466
.038
36.963 .000
2.t0 .036
10.185
.0r 8 .r3I
rYote. R2 =.017 for Stcp I
Tablcs 4.82 and 4.83 indicate thc results ofthe enter rcgression analysis and stepwise
rcgrcssion analysis for dcntal 3d ycar (overall samplc) respcctively. It is clcar from
tho tablc 4.92 that among the prediclors, entry tcst (R=.132 & P=.033) and merit
scorcs (R =.121 & P =.051) \rere significantly associated with thc third year score,
rvhilc ncgative associalion bctr\,cen F.Sc. scorc and crilerion scorcs rvas found, rvith
R= -.007 (p=.907).
Whcn Stcp \vise Regrcssion analysis was applied 10 thc data, rhc result (Iablcs 4.88)
shows that thc entry lest t\,as found the best predictor, \\'ith R:.017 only, mcaning that
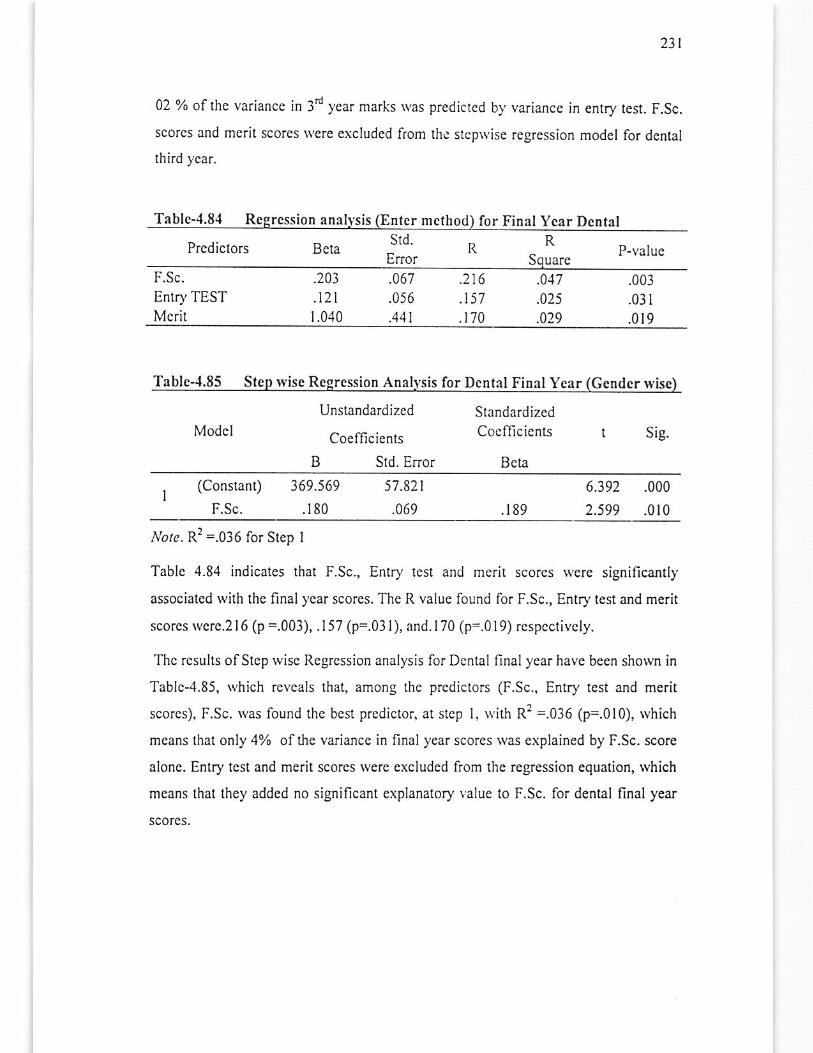
02 % of thc variance in 3d year marks *'as predicled by variance in entry test. F.Sc.
scorcs and meril scorcs \\'ere excludcd from the stcpwise regression model for dental
third ycar.
Tablc-{.84 'sis (Enlcr mcthod) for Final Year Dental
Prcdiclors Bela -std R ^ R
EftOr 5quareP-valuc
F.Sc.
Enlry TESTMcrit
.203
.t21t.040
.067
.0i6
.441
.216
.151
. t70
.047
.025
.029
.003
.031
.0r9
Table-{.85 Step $ isc Rcgrcssion Analr.sis for Dcntal Finil Yca r (Gender $ isc)
ModelStandardizedCocmcicnts t Sig.
Bcta
Unstandardized
Coefficients
B Std. Enor
(Constan0
F.Sc.
369.569
.180
57.821
.069 .189
6.392 .000
2.599 .0r0
Nore. R2 =.036 for Step I
Table 4.84 indicates that F.Sc., Entry lest and merit scores \ve.c signiflcantly
associatcd rvith the final)'ear scores. The R value found for F.Sc., Entry test and merit
scorcs rvcrc.2l6 (p =.003),.157 (p=.031), and.l70 (p=.019) rcspcctivcly.
Tho rcsults ofStcp wisc Regrcssion analysis for Dcntal final year have been shor\.n in
Tablc-4.85, rvhich reveals that, among the prcdiclors (F.Sc., Entry test and merit
scorcs), F.Sc. \vas found thc best predictor, at stcp t, rvith R'z=.036 (p=.010), rvhich
mcans that only 4% oftie variance in final year scores rvas explained by F.Sc. score
alone. Entry tcst and merit scores rvere excluded from the rcgrcssion equation, which
mcans that they added no significant explanatory \'alue to F.Sc. for dental final year
scores,
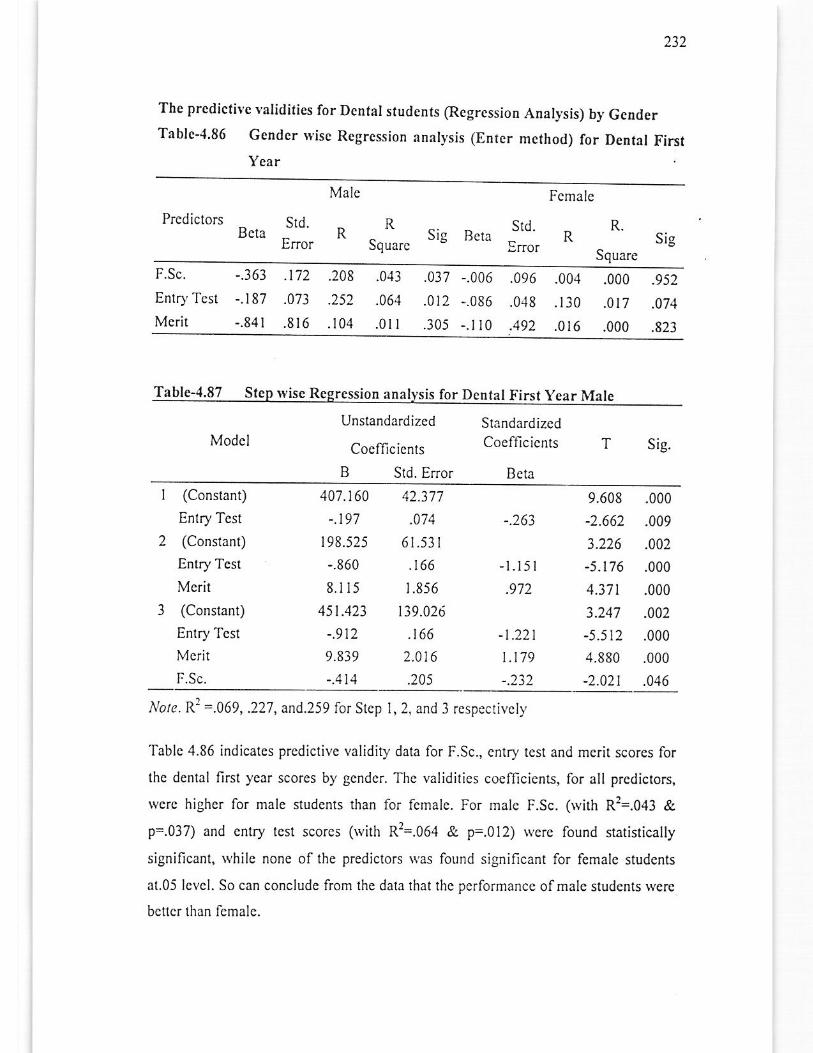
232
Thc predictile yaliditics for Dental students (Rcgression Analysis) by GcnderTablc-4.86 Gcnder \yisc Regrcssion anal),sis (Entcr method) for Dcntal First
Year
Prcdictors
Male
B"r" -Std R R Sishrror Squarc
Femalc
B"r" -std R R
:rTor5quare
sis
F.Sc. -.363 .172 .208
Enrry Tcst -.187 .073 .252
Mcrit -.841 .816 .lO4
.004 .000 .952
. r 30 .0t7 .074
.0t6 .000 .823
.0J3
.061
.01 I
.096
.048
.492
.037 -.006
.012 -.086
.305 -.1r0
Table-,1.87 SleD rvisc ion anah,sis for Dental First Ycar i\I;tlc
ModclUns!andardized
Coefficicnts
SlandardizcdCoefficicnts
Beta
Sig.T
Sid. Error
(Constant)
En1ry Tesl
(Constant)
Enlry Tcst
Mcrit
(Conslant)
Enlry Tcsl
Mcrit
F.Sc.
407.160
-.197
r98.525
-.860
8.115
45 t.423
-.912
9.839
-.414
42.377
6r.53r
.t66
1.856
139.026
.t66
2.016
.205
9.608 .000
-2.662 .009
3.2?6 .002
-5.176 .000
4.37 t .000
3.247 .002
-5.512 .000
4.880 .000
-2.02.1 .046
-.263
-1.151
.972
-t.22]t.t79
Note.ll2 =.069,.227,and.25910r Stcp I,2, and 3 respccrivcly
Tablc 4.86 indicatos prcdictive validity data for F.Sc., cntry test and merit scores for
thc denlal first ycar scorcs by gcnder. Thc validities cocflicients, for all prcdictors,
wcrc higher for male students dlan for fcmale. For male F.Sc. (rvith R'?=.043 &
p=.037) and entry test scorcs (rvith R']=.064 & p=.012) $.cre found srarisrically
significant, rvhile none of the predictors rvas found significant for lemalc studcns
at.05 lcvcl. So can concludc from the dala that thc pcrformance of male studcnts wcrc
bcttcr than lcmale.
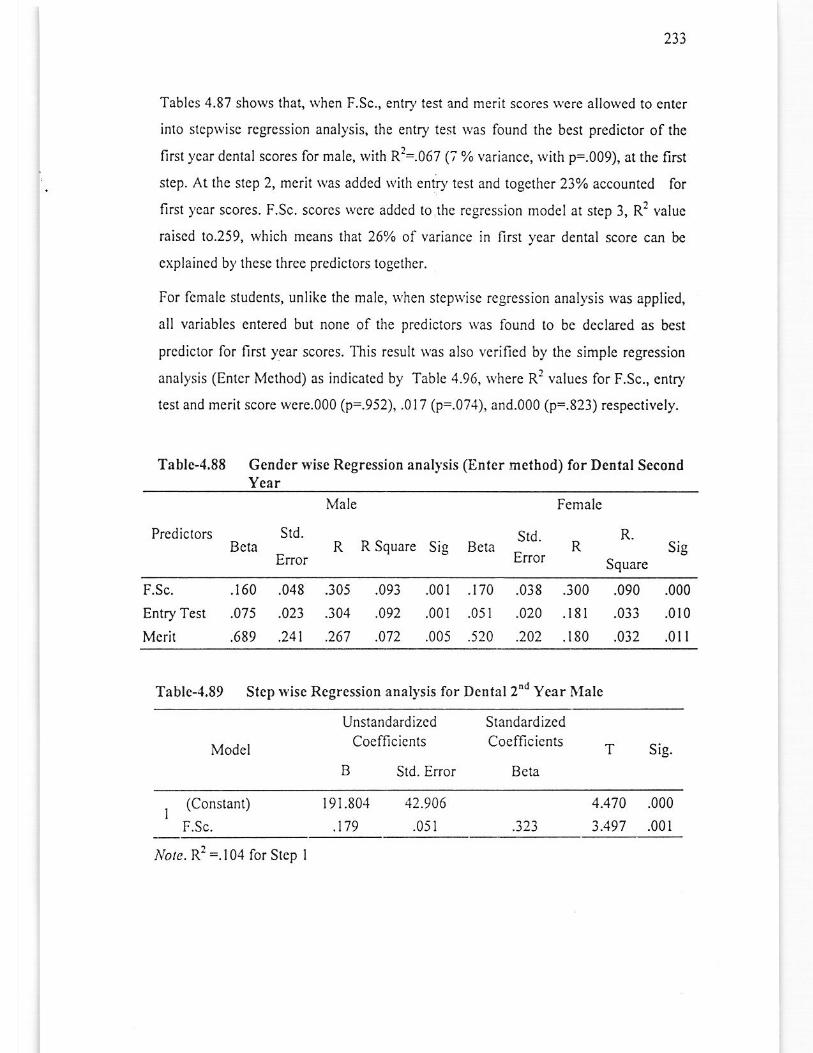
213
Tablcs 4.87 shows that, when F.Sc., entry lest and merit scorcs wcre allolved to enter
inlo step\\'ise regrcssion analysis, the entry test \\'as found thc bcst predictor ofthe
llrst ycar dcnlal scores for male, with R2:.067 (7 % variance, with p=.009), ar the first
slep. At thc slcp 2, mcrit was added lvith cntry rest rnd together 2lo% accounred for
first ycar scorcs. F.Sc. scores were addcd to thc rcgrcssion model at stcp 3, R? value
raiscd to.259, which mcans that 260% of variance in first year dental score can be
cxplained by these three prcdictors togcthcr.
For fcmalc sludcnts, unliko the male, Nhen stcp\visc rcgression analysis rvas applied,
all variables cnlered but none of the prediclors rvas found to be declared as bcst
prcdictor for I'irst ycar scores. This result $'as also vcrificd by the simple regression
analysis (Enlcr Melhod) as indicated by Table 4.96, rvhcre R? valucs for F.Sc., entry
test and merit score wcre.000 (p=.952), .017 (p=.07.1), and.000 (p=.823) respectively.
Table-4.88 Gendcr $isc Regrcssion anal]'sis (Eoter method) for Dental SccondYear
Male
Prcdictors Std.Bcla R Rsquare Sig
Error- Srd.lJela
Error
Femalc
R.R SigSquare
F.Sc.
Entry Test
Mcril
.160 .048 .305
.07 5 .023 .304
.689 .241 .267
.001 .170 .038
.00r .05r .020
.005 .520 .?02
.090 .000
.033 .0r0
.032 .0 t I
.093
.492
.072
,300
.181
.180
Tablc-4.89 Stcp \yise Regression anallsis for Dental2'd Year i\lale
Model
{lnstanda.dized SrandardiTed
Cocfficicnts Cocfficicnts
B Std. Enor
Sis.
BcLa
I (Conslan0
F.Sc.
19t.801
.179
42.9A6
.051
4.470 .000
3.497 .00r.323
Iblc. R2 =.104 fo. Stcp I
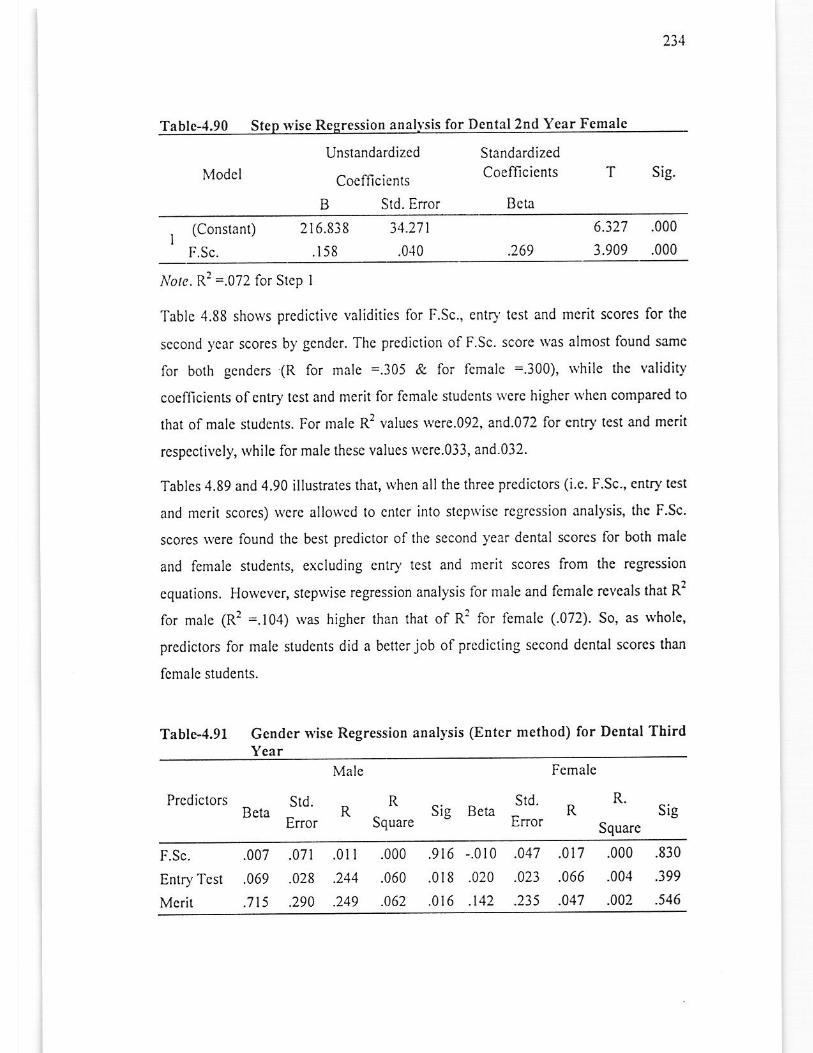
23{
Tablc-d.90 SteD $ ise Regression anal for Dcnial 2nd Year Female
IlodcIUnsrandardized
Cocfllcicnts
Standardized
Coefllcicnts
Bcta
T Sig.
Std. Enor
I (Constano
F.Sc.
216.8t 8
.15 8
6.327 .000
3.909 .000
34.211
.010 .269
AbIc. Rr =.072 for Step I
Tablc 4.88 shorvs prcdictive validitics lor F.Sc., entl-1'test and merit scorcs for the
sccond ycar scores by gcndcr. The prcdiction of F.Sc. score \as almost found samc
for both gcndcrs (R lor malc =.305 & for fcmale =.300), whilc the validity
coeilcicnts ofcntry lest and mcrit lor fcmalc studcnts Nere higher \\hen comparcd to
that of malc students. For male R2 values werc.092, and.072 for entry test and mcrit
rcspcctively, while for male thcse values s'crc.033, and.032.
Tables 4.89 and 4.90 illustrales that, when all the three predictors (i.e. F Sc., entry test
and mcrit scorcs) rvcrc allorlcd lo cnlcr into stcpsisc rcgrcssion analysis, thc F.Sc.
scorcs \\'ere found the best prediclor of the second year dental scores for both male
and fcmale nudents, excluding entry test and merit scores from the regession
equations. However, steprvise regression analysis for malc and female rcvcals lhat R2
for malc (R: =.104) was hiSher than lhat ofR2 for femalc (.072). So, as whole,
prcdictors for malc students did a bcttcr job of prcdicling sccond dcntal scores than
fcmalc students.
Table-4.91 Gcnder $ise Regression analJ'sis (Enter mclhod) for Dcntal ThirdYear
Male
Prcdiclors Std.Dcla - R
t rror
Female
sig B.ru -Std R- lrrorR
Square
R.sis
Square
F.Sc. .007 .071 .0llEnlry Tcst .069 .028 .244
Mcrh .1 | 5 .290 .249
.000 .916 -.010 .047
.060 .018 .020 .023
.062 .016 .142 .235
-017 .000 .830
.066 .004 .399
.047 .002 .546
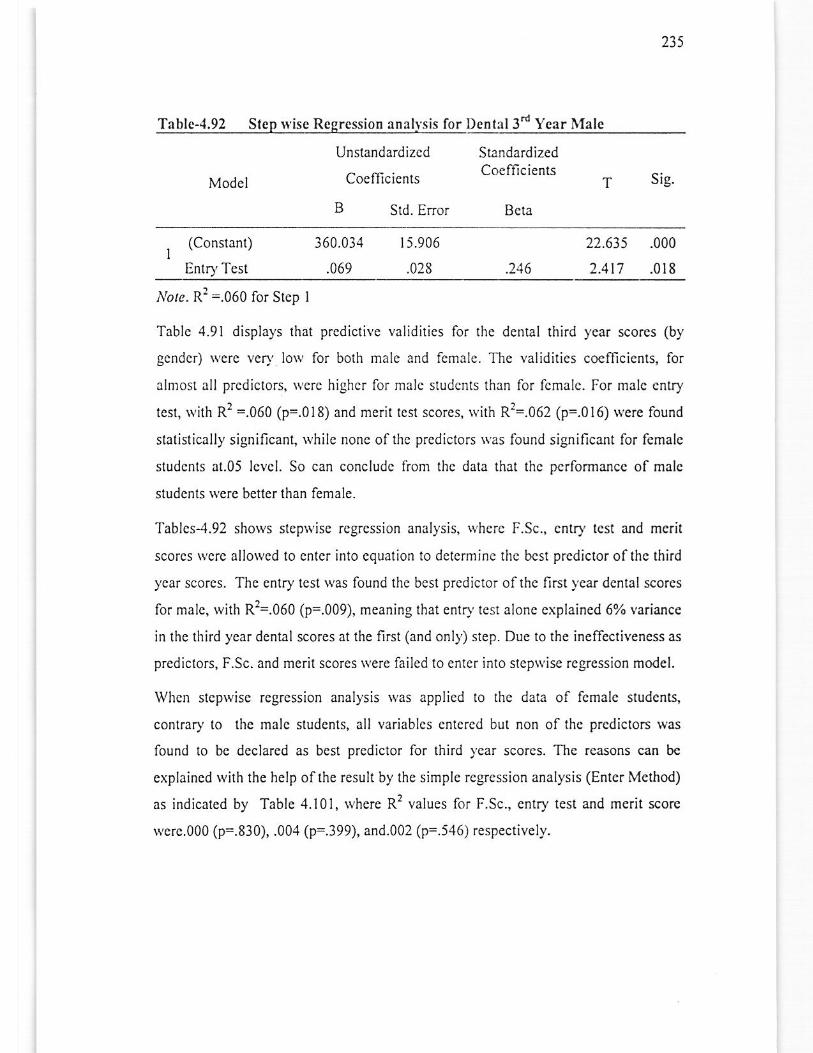
235
Table-,{,92 Step $ isc Regression anahsis for Dcnt:rl 3d Year luatc
Model
Unstandardizcd
Coefllcients
B srd. Error
StandardizedCoefIjcients
Bcta
T Sig.
I (Constant)
EntD,Tcsl
i60.031
.069
22.615 .000
2.4t7 .018
15.906
.028
Ilore. R'? =.060 for Step I
Table 4.91 displays that prcdictive validitics for thc dcntal third ycar scorcs (by
gcnder) \\,erc vcry lo1\, for both male and fcmale. The validities coefficients, for
almost all prcdictors, *crc higher for malc sludcnts lhan for fcmalc. For malc cntry
test, rvith R2 =.060 (p=.018) and merit tcst scores, *,ith R2=.062 (p=.016) were found
slatistically significanl \\'hilc nonc ofthc prcdictors \\'as found significant for female
studcnts at.05 lcvcl. So can concludc from thc dam that thc pcrformancc of malc
studcnts were better than lemale-
Tablcs-4.92 shows slcpwisc rcgrcssion analysis, rvhcre F.Sc., cntry tcst and mcrit
scorcs rvcre allorvcd to entcr into equation to dctcrminc thc bcst predictor ofthc third
ycar scores. The entry test was found the besi predictor ofthe first )ear dental saorcs
for malc, rvith R'?=.060 (p=.009), meaning that enlo'tcsr alonc cxplained 6oZ variancc
in the third ycar dcntal scores at the first (and only) step. Due to the ineffectivencss as
predictors, F.Sc. and merit scores were failed to entcr inlo stepwise rcgression modcl.
Whcn stcprvisc rcgression analysis rvas applied to thc data of fcmale students,
contrary to the malc students, all variablcs cntcrcd but non of thc prcdictors rvas
found to be declared as bcst prcdictor for third ycar scorcs. The reasons can be
cxplaincd wilh the help ofthe result by the simplc rcgrcssion analysis (Enter Method)
as indicated by Tablc 4.101, rvhcre R2 values lor F.Sc., entry test and merit scorc
wcrc.000 (p=.830), .004 (p:.399), and.002 (p=.546) respectively.
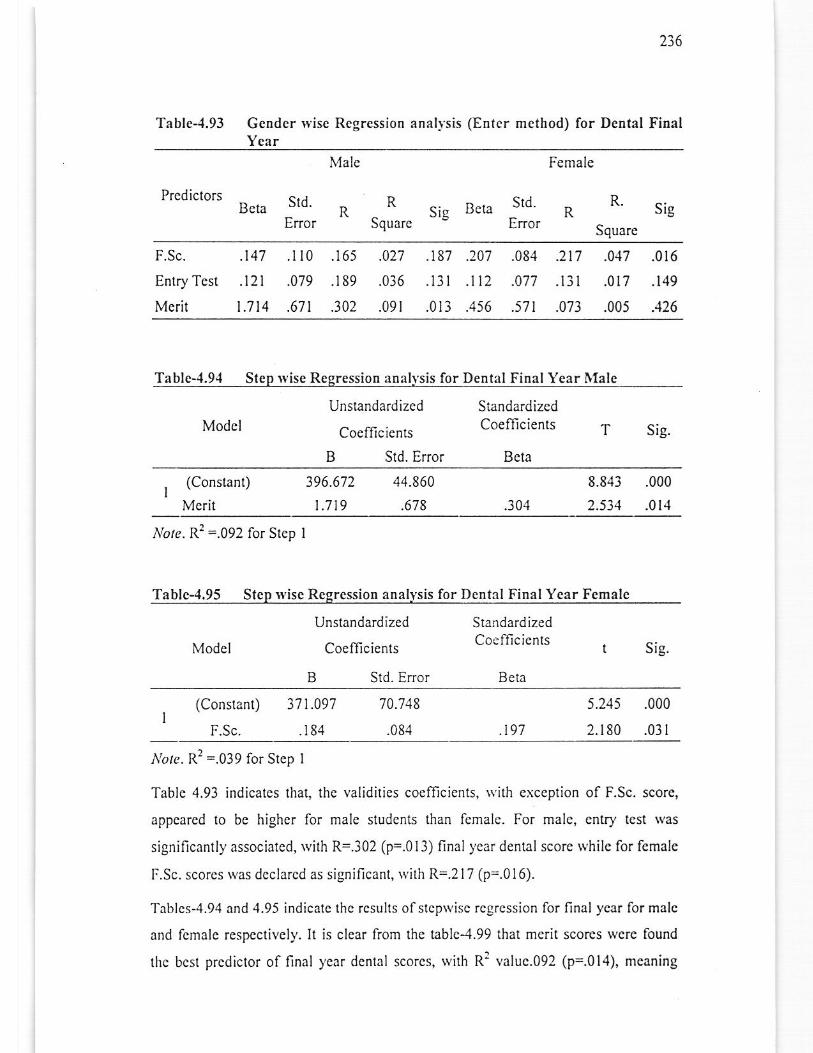
236
Table-'1.93 Gender rvise Rcgression anal)sis (Enlcr method) for Dental FinalYear
Malc
PrediclorsBcri
Error
Female
Sig Bcu -Std R R Sie
Lrror square
R
Squarc
F.Sc. .147 .l l0 .165
Entry Tcst .121 .079 .189
Mcrit l;114 .671 .302
.027 .187 .207 .084
.036 .l3l .n2 .011
.09t .0t3 .456 .511
.217 .017
.l3l .0t7
.073 .005
.016
.149
.126
Table-1.9.{ SlcD rvisc Regression anallsis for Denlal Final Year luale
Model
Unstandardized
Coefficients
B Std. Error
StandardizcdCoefficienls
Bcla
T sig.
I (Constant)
Mcrit
396.672
) .719
8.8,13 .000
2.534 .014
44.860
.678 .30-1
irolc. R: =.092 for Step I
Tablc-4.95 SteD \visc Regression analysis for DeDtal Final Year Female
Nlodcl
Unstandardized
Coefllcicnts
B Std. Error
StandardizedCoclficicnts t
Beta
Sig.
(Constant) 371.091 5.245 .000
2.180 .031F.Sc. .184
10.118
.t97
,Notc. R2 =.039 for Stcp I
Table 4.93 indicates that, lhc validilics cocfTicients, rvith exception of F.Sc. score,
appcared to be higher for male studcnls than fcmalc. For malc, cntry lcst \vas
significanlly associatcd, with R=.302 (p=.013) final 1'car dental score rvhilc for fcmale
F.Sc. scores uas dcclarcd as significanl, \vilh R=.217 (p=.016).
Tablcs-4.94 and 4.95 i0dicalc thc rcsuhs ofsteprvisc rcgression for final ycar for male
and fcmalc respcctivcly. It is clear from the uble-4.99 that merit scores ivere found
lhc bcsl prcdicror of final I'car dcnlal scorcs, rvith Rr valuc.092 (p=.014), mcaning
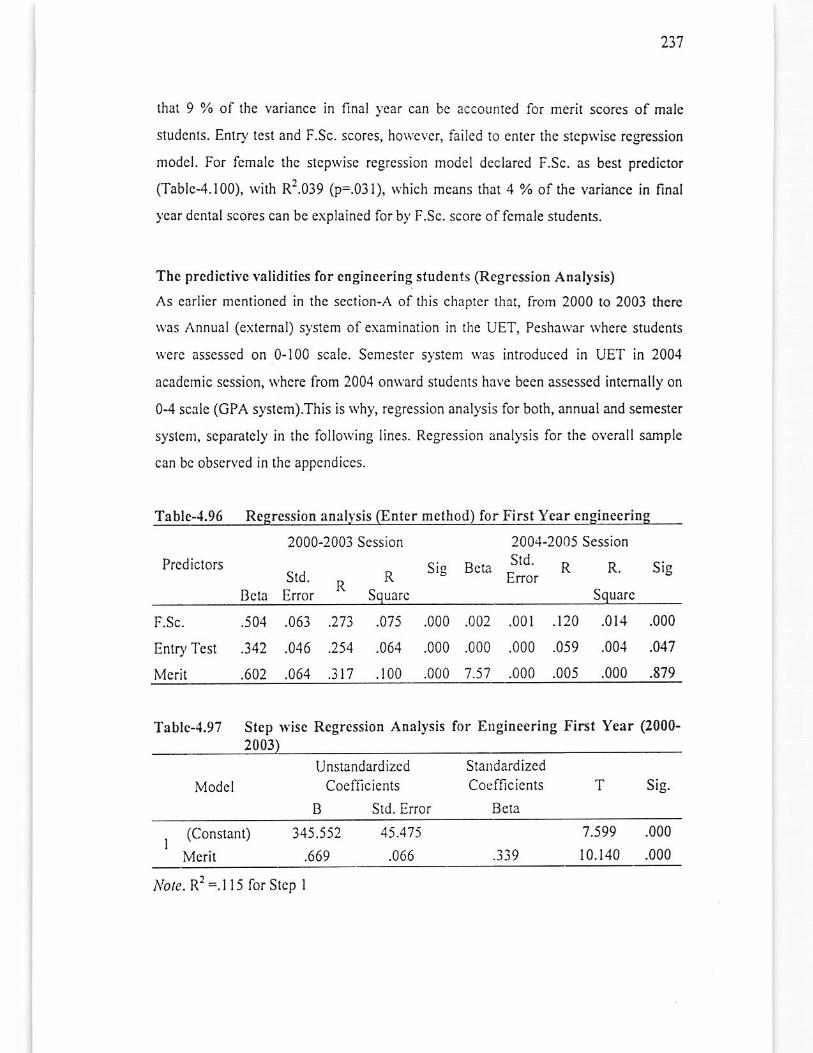
23'1
that 9 % of thc variance in final )car can bc accounted for merit scores of malc
studcnts. Entry test and F.Sc. scores, ho\r'cvcr, failed to cnter the stcp\\'ise rcgression
model. For fcmalc thc step\\'isc regrcssion model declarcd F-Sc. as bcst predictor
(Table-4.100), with R2.039 (p-.031), $'hich means that 4 o/o ofthe variancc in final
year dental scores can be explained for b),F.Sc. scorc of fcmale students.
Thc prcdictive validities for cngineering sludents G.cgrcssiou Analysis)
As earlier mcntioncd in the scction-A of this chaptcr that, lrom 2000 to 2003 therc
\vas Annual (exlernal) syslem ofexamination in the UET, Pcshawar \vhcrc studcnts
\\'erc assesscd on 0-100 scale. Scmester system \yas introduccd in UET in 2004
acadcrnic session, rYhcre from 2004 onNard sludenE have becn asscssed intcmally on
0-4 scale (GPA system).This is why, regression analysis for both, annual and semester
systenr, scpamtcly in thc follorving lines. Rcgression anal)'sis for the overall sample
can bc observcd in thc appendiccs.
Tablc-.1.96 Rcgrcssioll analtsis (Enter method) for First Ycar cngineering
Prcdictors
Squarc
Srd.
Bcla Enor K
2000-2003 Session 2004-2005 Scssion
B.u -sld R R. sistrrorSquq!"
F.Sc.
Entry Tcsr
Merit
.504 .063 .213
.342 .046 .254
.602 .064 .3)7
.075 .000
.064 .000
.100 .000
.002 .001 .r20 .014 .000
.000 .000 .059 .00.1 .04'l
7.57 .000 .005 .000 .819
Tablc-4.97 Step r'isc Regression Analysis for Engineering First Year (2000-,nnl t
ModclUnstandardizcd
Coefficicnts
B Std. Enor
StandardizcdCoefficiens
Bcta
T Sig.
I (Constant)
Merit
345.552
.669
1.599 .000
10.140 .000
45 .47 5
.066
,[rolc. R2 =.1 l5 for Stcp I
.319
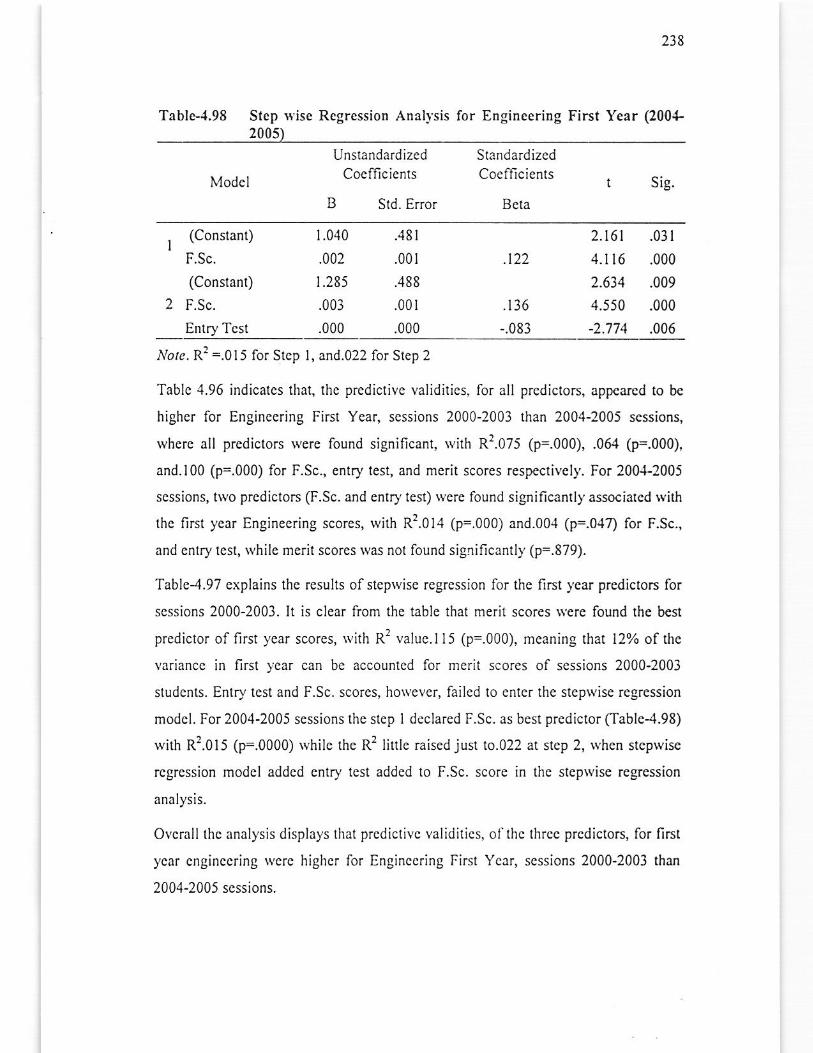
218
Table-4.98 Step \r'ise Rcgression Anall'sis for Engineering First Year (200+2005)
Modcl
UnstandardizedCocmcicnts
B Std. Error
StandardizedCoefficients
Beta
t Sig.
.122
.136
-.083
i{otc. Rr =.015 ior Stcp I, and.022 for Slep 2
Tablc 4.96 indicales thal, the predictivc ralidities. for all prediclors, appcarcd to bc
higher for Enginccring Firsl Ycar, scssions 2000-2003 than 2004-2005 scssions,
whcrc all predictors Nere found significant, Nith R'.075 (p=.000), .06a 0=.000),
and.l00 (p=.000) ficr F.Sc., entry tesl, and merit scores respeclivcly. For 200{-2005
scssions, hvo prcdictors (F.Sc. and entry tesl) wcre lound significantly associated lvitl
thc first ycar Enginecring scorcs, lvith R'].Ot,t 1O=.666; and.00.1 (p=.044 for F.Sc.,
and entry lest, while merit scores rvas nol found sigrificantly (p=.879).
Tablc4.97 explains thc results ofslep*'isc rcgression for the first year predictors lor
scssions 2000-2003. lt is clear lrom the lable that meril scores rvcre lound the bcst
predicior of llrst ycar scores, rvith R1 value.I I 5 (p=.000), meaning that 12% of the
variancc in fi.st year can be accounled for merit scores of sessions 2000-2003
sludcnts. Entry lest and F.Sc. scores, however, failed to enter the stepwise regression
model. For 200,{-2005 sessions the step I declared F.Sc. as best predictor (Table-:l.98)
wift R2.015 (p=.0000) while the R2 lirle raised just ro.022 at step 2, when stepivise
rcgrcssion model added entry test added 10 F.Sc. score in the sleprvise regrcssion
analysis.
Ovcrall thc analysis displa),s lhat prcdictivc validitics, ol'thc thrcc prcdictors, for first
ycar cnginccring rvcrc highcr lor Engincering First Yecr, scssions 2000-2003 than
2004-2005 sessions.
(Constan0
F.Sc.
(Constant)
F.Sc.
Enrry Tcst
2.t6t .031
4.116 .000
2.614 .009
4.550 .000
-2..774 .006
1.040
.002
t.285
.003
.000
..18l
.00i
.488
.001
.000
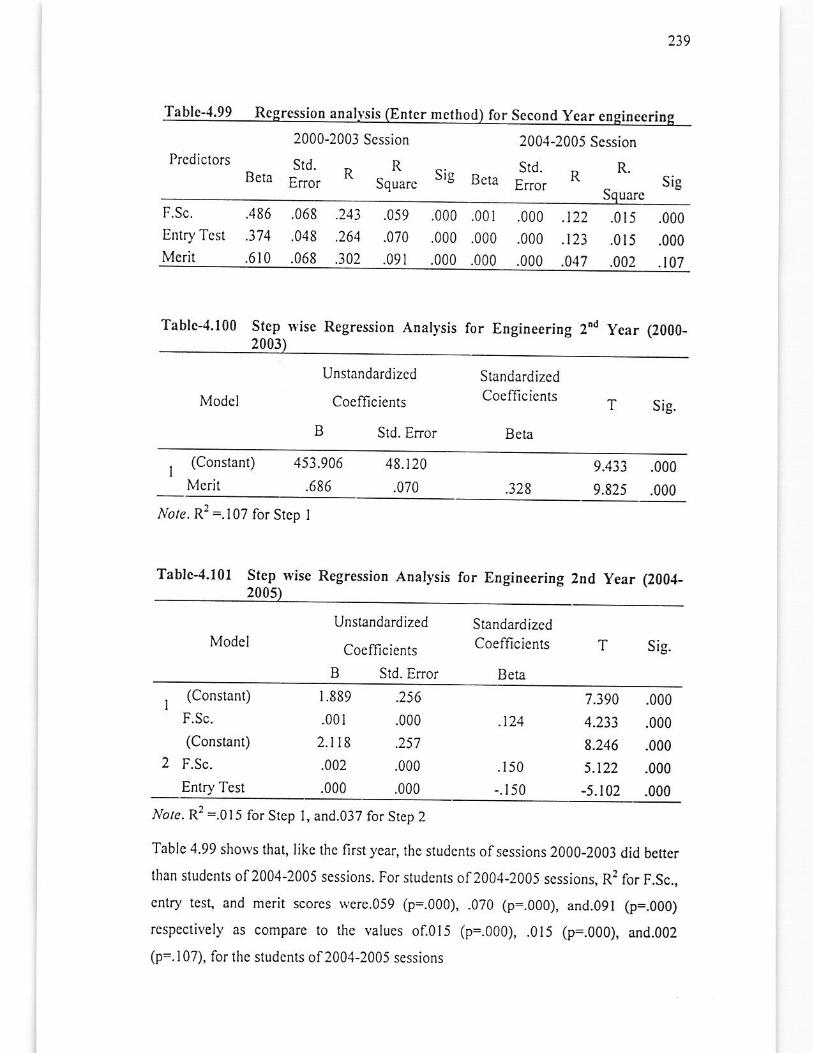
239
Tablc-.1.99 Regrcssion anah.sis (Enlcr mcthod for Second Ycar eDgincc
2000-2003 Scssion 2001-2005 ScssionPrcdiclors
Beta
Ir.Sc. .486
Enlry Tcst .374
Merit .610
R ^. Srd.Squarc sl8 Bcta Eror
Srd.
EnorR.
UAICsis
.001
.000
.000
.068
.048
.068
.743
.302
.059
.070
.09i
.000
.000
.000
.000
.000
.000
.122
.t23
.047
.015
.015
.002
.000
.000
.107
Table-.|.100 Step $ ise Regression Anall'sis lor Engineering 2'd Year (2000-2003
Modcl
Unslandardizcd
Cocflicients
B Std. Enor
StandardizcdCoefficicnts
Beta
sig.
I (Conslanl)
Merit
453.906 48.120
.686 .070
9.433 .000
9.82s .000.328
Ible. R2 =.107 for Step I
Tablc-4.101 Stcp ryisc Rcgression Anal)'sis for EngineeriDg 2nd Year (200.{-20
ModclUnstandardized
Coefficients
B Std. Enor
StandardizedCoefllcients
Beta
T Sie.
(Constant)
(Constan0
F.Sc.
Entry Tcst
1.889 .2s6
.001 .000
2.rr8 .257
.002 .000
.000 .000
'1.390 .000
4.233 .000
8.246 .000
5.122 .000
-5.102 .000
.150
-.t50
,Mote. R2 =.015 for Step l, and.O37 for Slep 2
Tablc 4.99 shows thar, Iike thc llrsr ycar, rhc studcnts ofsessions 2OO0-2001 did betcr
than studcnts 012004-2005 scssions. For studenb 0f2004-2005 scssions, R2 for F.Sc.,
cntry test, and merit scorcs \yere.059 (p=.000), _070 (p:.OOO), and.Ogl (p=.000)
respcclivcly as compare to the values of.ol5 (p=.000), .015 (p=.000), and.002
(p=.107). for lhc studenrs ofl004-2005 scssions
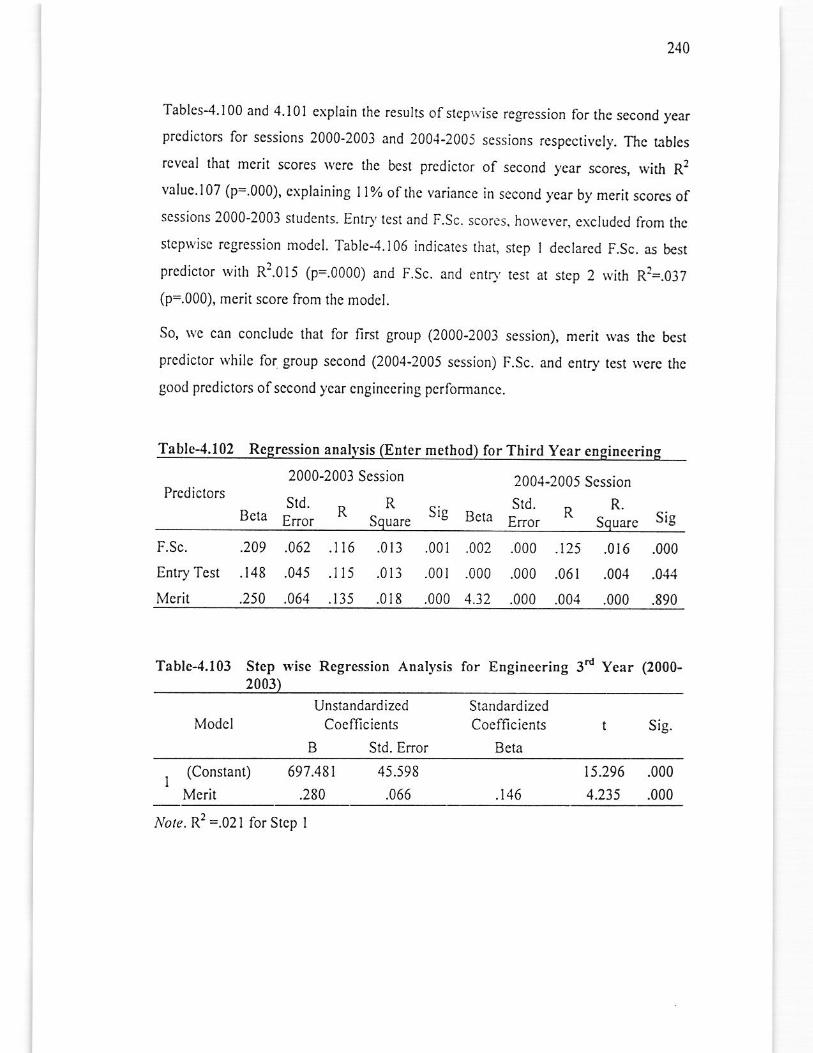
240
Tables-4.100 and 4.101 explain lhe results ofslep\.ise regrcssion for the second ycar
prcdiclors for sessions 2000-2003 and 200.1-200j sessions rcspcctivcly. Thc tablcs
rcveal lhat merit scorcs \vcre thc bcst prcdicto. of second ycar scores, with Rlvaluc.l07 (p=.000), cxplaining Il% offie variance in second year by meri( scorcs ofscssions 2000-2003 sludenls. EntD,lcst and F.Sc. scorcs. ho\r.cver, c\cludcd from lhc
stcpNiso rcgression model. Tablc-4.106 indicates thal, stcp I declarcd F.Sc. as best
prcdictor Nilh R1.015 (p=.0000) and F.Sc. and cnrn, rest at sr€p 2 \vi$ R?=.037
(p=.000), merit score from the model.
So, rvc can conclude that for first group (2000-2003 session), merit was the bcst
prcdictor whilc for group second (2004-2005 session) F.Sc. and entry test rvcre the
good prcdictors ofsccond ycar cnginccring pcrformancc.
Table-4.102 RcgrcssioD aDal]sis (Enter method) for Third Year eDeitreerios
2000-2003 Session 2004-2005 SessionPrcdictors srd. ^ R ^. srd. ^ R.Bcta Error ^ sqru," JIg Bcla Error K Sqr"r" Sig
F.Sc. .209 .062 .)16 .013 .001 .002 .000 .125 .016 .000
Entry Test .148 .045 .l15 .013 .001 .000 .000 .061 .004 .014
Mcrit .250 .064 .135 .018 .000 4.32 .000 .004 .000 .890
Tablc-4.103 Stcp ryisc Regression2003)
ADalysis for EngiDeeriDg 3d Year (2000-
ModclUnslandardizcd
Cocfllcients
B Std. Enor
StandardizedCocfficicnts
Bcta
Sig.
I (Constant)
Mcrit
697.481
.280
t5.296 .000
4.235 .000
45.598
.066 .116
Abte. R2 =.021 for Stcp I
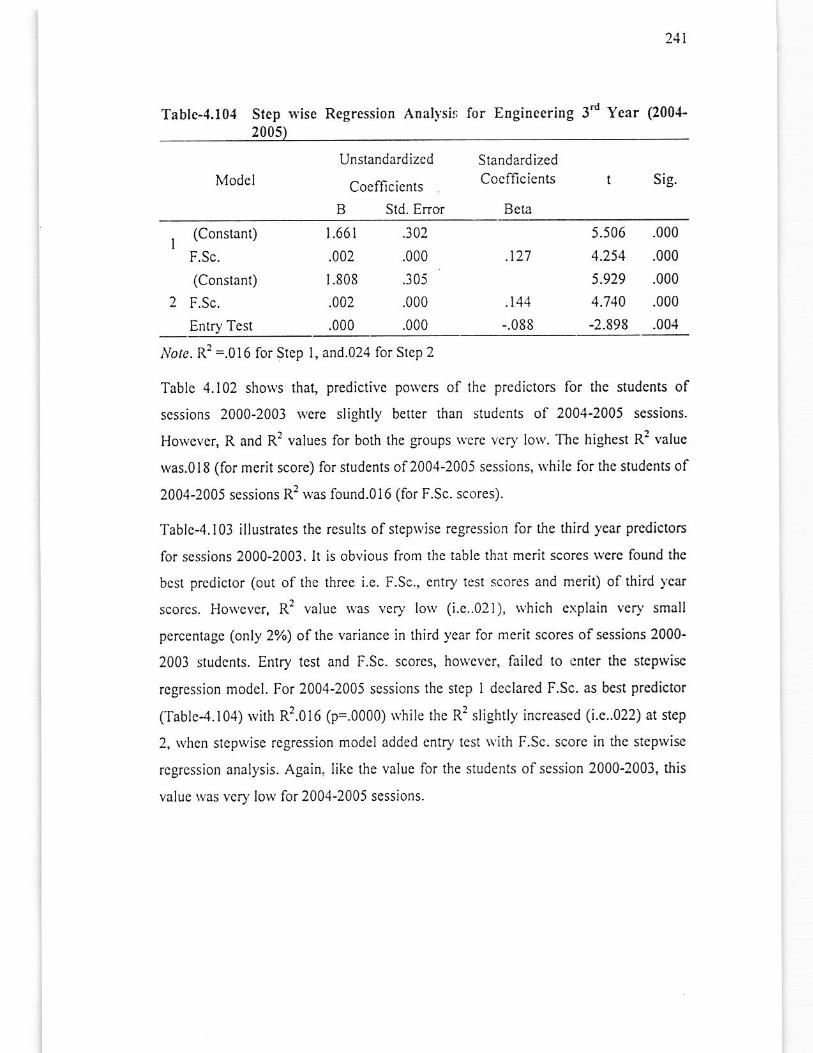
Tablc-4.10.1 Stcp $ise Regression Anal!'si. for Engidecring 3d Year (200{'.nnSr
Modcl
Unslandardizcd StandardizedCocfilcienrs( ocl lrcrcnls
B Std. Error Bcta
211
sis.
(Constan0
F.Sc.
(Constan0
F.Sc.
Entry Tcsl
5.506 .000
4.254 .000
5.929 .000
4.740 .000
-2.898 .004
t.661
.002
1.808
.002
.000
.302
.000
.305
.000
.000
.127
-.088
Nore. Rr =.016 lor stcp l, and.024 for stcp 2
Table 4.102 shoNs tha! predictive poNcrs of lhe predictors for the students of
sessions 2000-2003 wcrc slightly beller than studcnts of 200,{-2005 sessions.
However, R and R2 values for botlt the groups wcre very lo\Y. Thc highest R1 value
was.0l8 (for merit score) for students of2004-2005 sessions, rvhile for the studcnG of
2004-2005 sessions R2 \\as found.Ol6 (for F.Sc. scores).
Tablc-4.103 illustratcs lhe results ofsteptYise regression for ftc third year predictors
for scssions 2000-2003. It is obvious from thc lablc th:rt mcrit scores wcrc found the
bc$ predictor (out of the firee i.e. F.Sc., cntry tcst scores and merit) of $ird l'car
scorcs. Howcvcr, R2 value *'as vcry lorv (i.c..02.)), \\'hich cxplain vcry small
percentage (only 2%) ofthe variance in third ycar for mcrit scores ofsessions 2000-
2003 students. Entry tcst and F,Sc. scorcs, horvcvcr, failed to cnter lhe stcpwisc
rcgrcssion model. For 2004-2005 sessions the step I declared F.Sc. as bcst predictor
(Tablc-4.104) with R'?.Ot6 1p=.6666; "'5,,e the R2 slightly increased (i.e..022) at stcp
2, whcn slepwisc rcgrcssion model addcd cntry test \\'i!h F.Sc. score in the steprvise
rcgrcssion analysis. Again. likc the value for the students of scssion 2000-2003, this
!aluc \\is vcry low for 2004-2005 scssions.
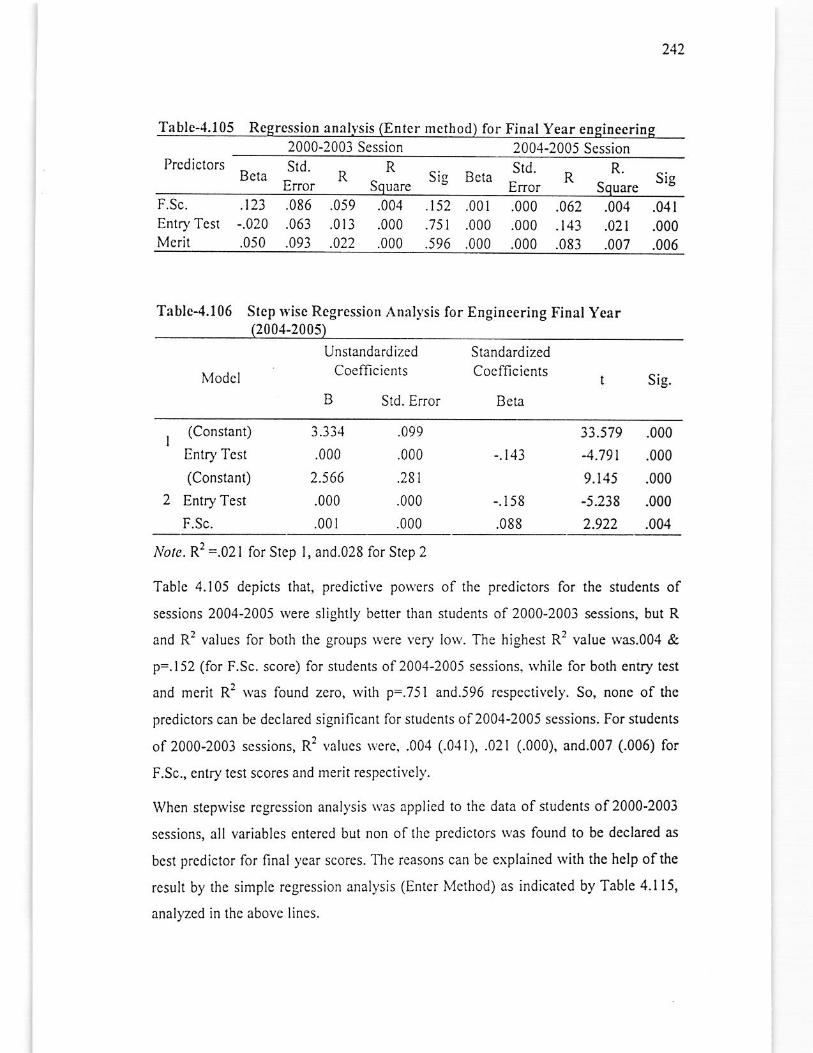
Table-{.105 Regression anallsis (Enter mcthod) for Final Year engineering2000-2003 Scssion 200,1-2005 Session
Prcdictors _ Sld. Rljcta - R ,hrror Squaresis Bcra -s!d R ^R siscrlor Square
F.Sc. .123 .086 .059 .004Entry Tcst -.020 .063 .013 .000Mcril .050 .093 .022 .000
.152 .001 .000 .062 .004 .041
.751 .000 .000 .143 .021 .000
.596 .000 .000 .083 .007 .006
Table-4.106 Slcp \r'ise Regrcssion Anallsis for Enginccring Fihal Year(2004-200s)
N4odcl
UnslandardizedCoemcicnls
B Std. Error
SlandardizedCoemcicnts
Bcta
Sig.
(Conslant)
Entry Tcst
(Constant)
Entry Tesl
F,Sc.
.000
2.566
.000
.00r
.099
.000
.281
.000
.000
-.t43
-.158
.088
33.579 .000
4.79t .000
9.145 .000
-5.238 .000
2.922 .004
Note.R2 =.021for Stcp l, and.028 for Step 2
Tablc 4.105 dcpicls that, predictive po$ers of lhe predictors for thc studenE of
sessions 2004-2005 rvere slightly bctler than students of 2000-2003 sessions, but R
and R2 values for bolh the groups \\,ere very loN. The highest R2 value rvas.004 &
p=.152 (for F.Sc. score) for srudents of 2004-2005 sessions, \\'hile fo. both entry test
and merit Rr \vas lound zcro, Nitlr p=.751 and.596 respeclively. So, none of the
prcdictors can be declared significant for sludents of2004-2005 sessions. For students
of 2000-2003 scssions, R2 valucs $'crc, .004 (.011), .021 (.000), and.007 (.006) for
F.Sc., enlry tesl scores and merit respectivcly.
when step\vise rcgression anal),sis $'as applicd 10 the data ofstudents of2000-2003
scssions, all variables entercd but non of the prcdictors rvas found to be declared as
bcsl prcdictor for final ycar scores. The reasons can be explained rvith tle help ofthe
rcsult by the simplc regression anall'sis (Enler N'lethod) as indicatcd by Table 4.115,
analyzed in thc abovc Iines.
24)
Tablc-4.106 iltustrates thc rcsults ofsteprvise regrcssion for the final year for sessions
2004-2005. The tablc displays that enlrJ'lcst scorcs \\'crc found thc best predicto. of
the final year scorcs at slep l. HoNever, R2 valuc r|as ycq' lorv i.e..021' mcaning that
only 2% ofthe variance in final )ear scorcs accounled for by cntD'tcsl scorcs. At step
2, F.Sc. scorcs cntcrcd the rcgrcssion modcl. Entry tesl and F.Sc. scorcs, togcther at
slep 2 ofthc model explain 3% ofthe variance in final )'car scores for scssions 2000-
2001. Although, lhe slcpwise regression declared EnlD'tcsl at step I and F.Sc. and
Entry lcst at slep 2 signillcant but lhe values of Standardizcd Coefficients (-.143 for
stcp I and -.158 for step 2) indicatcs tirat there Nas negativc conclation bctwccn the
prcdictors and llnalyear enginecrinS score ofthe studcnE of200'l-2005 scssions
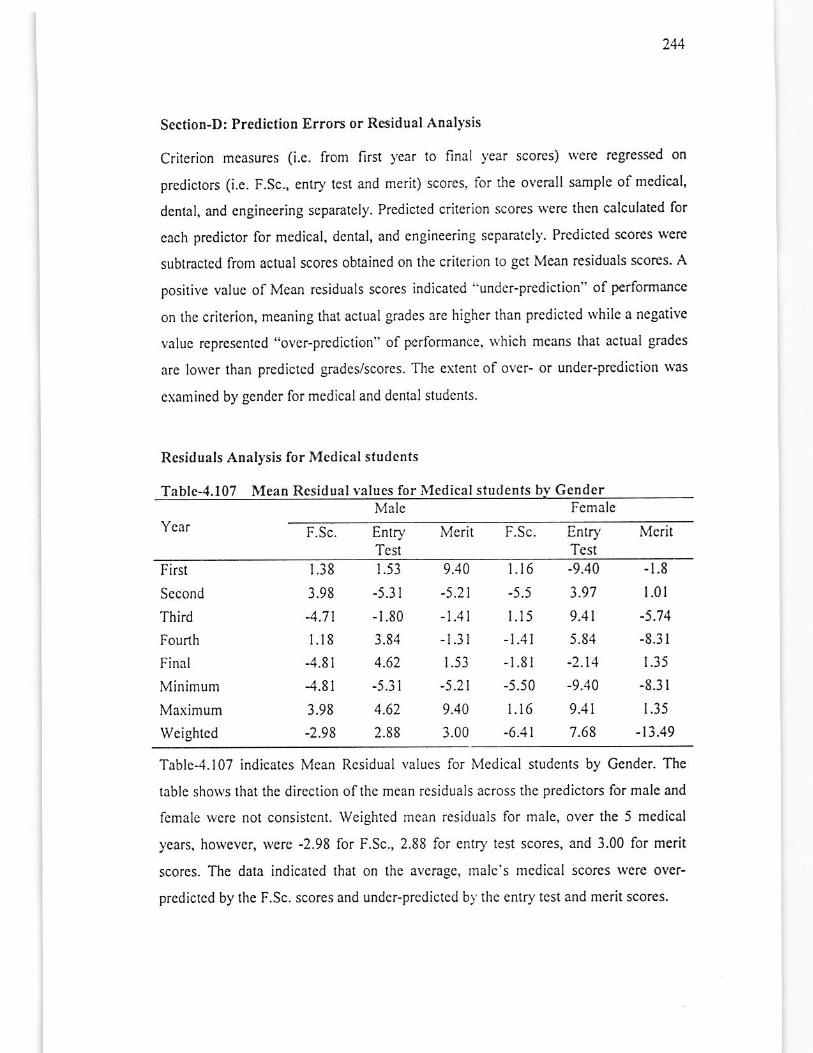
Section-D: Predictioo Errors or Residual ADalysis
Crilcrion mcasures (i.c. from first )'car to final )'ear scores) Nere rcgressed on
predictors (i.c. F.Sc., entry test and merit) scorcs. for lhe olcrall sample ofmcdical,
denlal, and cngineering sepamtely. Prcdicted crilerion scores \\'crc then calculated for
cach predictor for medical, denlal, and cn8ineering scparatel)'. Predictcd scores wcre
sublractcd from actual scorcs oblaincd on the crilerion to get Mcan residuals scorcs. A
posilive value of Mean residuals scorcs indicatcd ''under-prediction' of performance
on the critcrion, meaning that actual grades are highcr than Predictcd rvhile a negative
valuc rcprcscntcd "over-prcdiclion" of pcrlormancc, \Yhich mcans lhat actual grades
are lower than prcdiclcd grades/scorcs. The extent ofovcr- or under_prcdiclion rlas
cxamincd by gcndcr for mcdicaland dcntal sludenls.
Residuals Analysis for Mcdical studenls
Table-,l.107 Mean Rcsidual lalues for l\{edical studcnts bv GenderMale Femalc
F.Sc. McrirEn1ry
TcstF.Sc. Enrry
TcstMcrit
firstSccond
Third
Fourth
Final
Minimum
Maximum
Weighlcd
t.53
-5.3 t
-1.80
4.62
-5.31
4.62
l.l6-5.5
I. t5
-1.41
-r.81
-5.50
t.l6-6.41
-9.40
3.97
9.41
5.84
-2.11
-9.40
9.41
7.68
-t.8
I.0l-5.74
-8.31
r.35
-8.31
i.35
-t3.49
r.38
3.98
4.71
t.l84.81
-4.81
3.98
-2.98
9.40
-5.21
-1.4l
-t.3 r
I.53
-5.2 r
9.40
3.00
Tablc-4.107 indicates Mean Rcsidual values for Medical students by Gcndcr. The
table sho\vs that the dircction ofthe mean residuals across thc predictors for male and
fcmalc wcre not consistcnt. Weighted mcan rcsiduals for mal€, over the 5 mcdical
years, howevcr, rvere -2.98 lor F.Sc., 2.88 for enlry test scores, and 3.00 for merit
scorcs. The data indicatcd lhat on the average, rnalc's mcdical Scores were ovcr-
predictcd by lhe F.Sc. scores and undcr-predicted b,1'the entry tcst and merit scores.
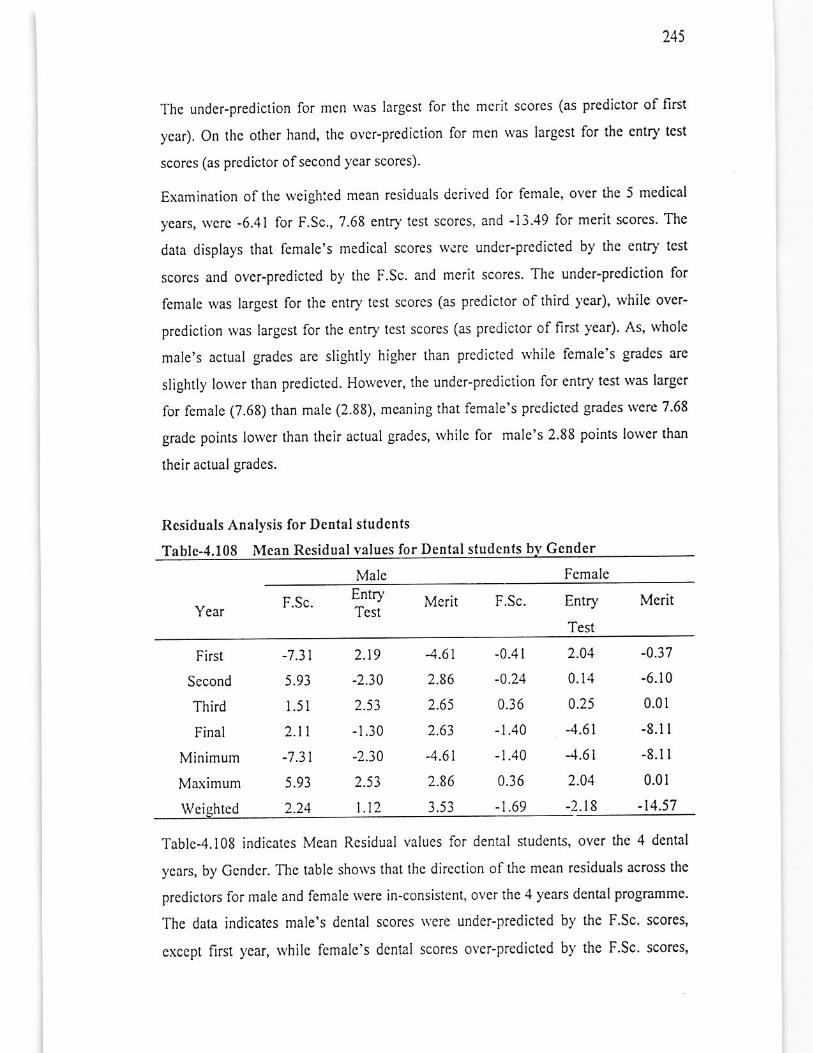
245
Thc undcr-prediclion for mcn lvas largcsl lor the merit scorcs (as paedictor of first
ycar). On thc othcr hand, thc over-prcdiction for men rvas largest for thc cntry tcst
scorcs (as prcdictor ofsecond )'car scores).
Examinalion of the \!eighled mean residuals derived lor fcmale, ovc' the 5 mcdical
ycars, wcrc -6.41 for F.Sc., 7.68 enlry tcst scorcs, and -13.49 for merit sco.cs Thc
data displays that female's medical scores \\erc under-predicted by tlc entry test
scorcs and ovcr-predictcd by lhc F.Sc and mcrit scores. The under-prcdiction for
femalc rvas targest lor thc entry tost scorcs (as predictor of third )'car), while ovcr-
prediction Nas largcsl lor thc entry tcst scores (as prediclor of first )ear). As, whole
male's actual gradcs are slightly higher than Predictcd \hile female's grades are
slightly lowcr than predicted. Ho\\'cvcr,lhe undcr-prediction for eniry tcst was larger
for fcmale (7.68) than male (2.88), meaning that female's predicted grades rvcre 7'68
gradc poinls lower than their ac(ual gradcs, while for male's 2.88 points lower than
thcir actual Srades.
Residuals rtnalysis for Dental sludcnts
Tablc-4.108 Mean Residual Yalues for Dental students
MalcEntryTest
Mcrit
Gender
Fcmale
F.Sc. F.Sc. Entry Merit
TestYear
First
Sccond
Third
Final
Minimum
Moiimum
WciEhtcd
-7.31
5.93
1.51
2.t I
-7.31
5.93
2.24
2.t9
-2.30
2.53
-1.30
-2.30
)..53
l.t2
4.61
2.86
2..65
2.63
-4.61
2.86
3.53
-0.41
-4.24
0.36
-1.40
-1.40
0.36
-1.69
2.01
0.14
0.25
-4.61
2.04
-0.37
-6.r0
0.01
-8.11
-8.1I
0.01
-t4.5'1-2.18
Tablc-4.108 indicates Mean Rcsidual values for dental students, over fic 4 dental
ycars, by Gcndcr. The tablc shows thal thc dircction of the mcan rcsiduals across the
prediclors lor male and female rvere in-consistent, ovcr the 4 years dcntal progmmme'
The dala indicales male's dental scores \{ere undcr-predicled by the F.Sc. scores,
cxccpt firsr 1,car, rvhilc female's dcnlal scorcs over-predicted b)'the F.Sc. scores,

246
cxccpt third ),ear. The under-prediction and over-p.cdiclion rcsuli for cnut- tcst and
mcrit were not consislcnt.
Wcightcd mcan residuals for male, oYer the 4 dcnlal )cars, \r'crc 2.24 for F.Sc., l.l2for cnlry tcst scores, and 3.53 for mcrit scorcs. The dala indicatcd that on the avcragc,
malc's dcntal scores \\'erc undcr'predicted by all predictors i.e. F-Sc. scorcs, cntry lest
and nrcrit scorcs. HoNever, it further illustratcs that thc undcr-prediction lor men tvas
largcst for the F.Sc. (as prcdictor of second Jear). On the other hand, thc ovcr-
prcdiction for mcn was largcst for the F.Sc. scorcs (as predicror offirst ycar scores).
For fcmale, Ncightcd mcan rcsiduals dcrived, oycr thc 4 ),ears denral progmmme,
'\\'crc - 1.69 for F.Sc., -2.18 for entD,tcst scores, and -1.1.57 fo. mcrit scorcs. It is clear
from thc data that on the averagc, fcmalc's dental scores \\'ere over-predictcd by all
the thrce prcdictors i.e. F.Sc. scores, enlry tesl and meri! scores.
The under-prediclion lor female *as largest for the enlry test scorcs (as predictor of
firsl year), whiie over-prcdiction was largcst for thc mcrit scorcs (as prcdictor offinal
ycar). So, we can concludc from the data that as wholc, male's actual gmdes werc
highcr than prcdicled while female's grades were lo$,er than predictcd
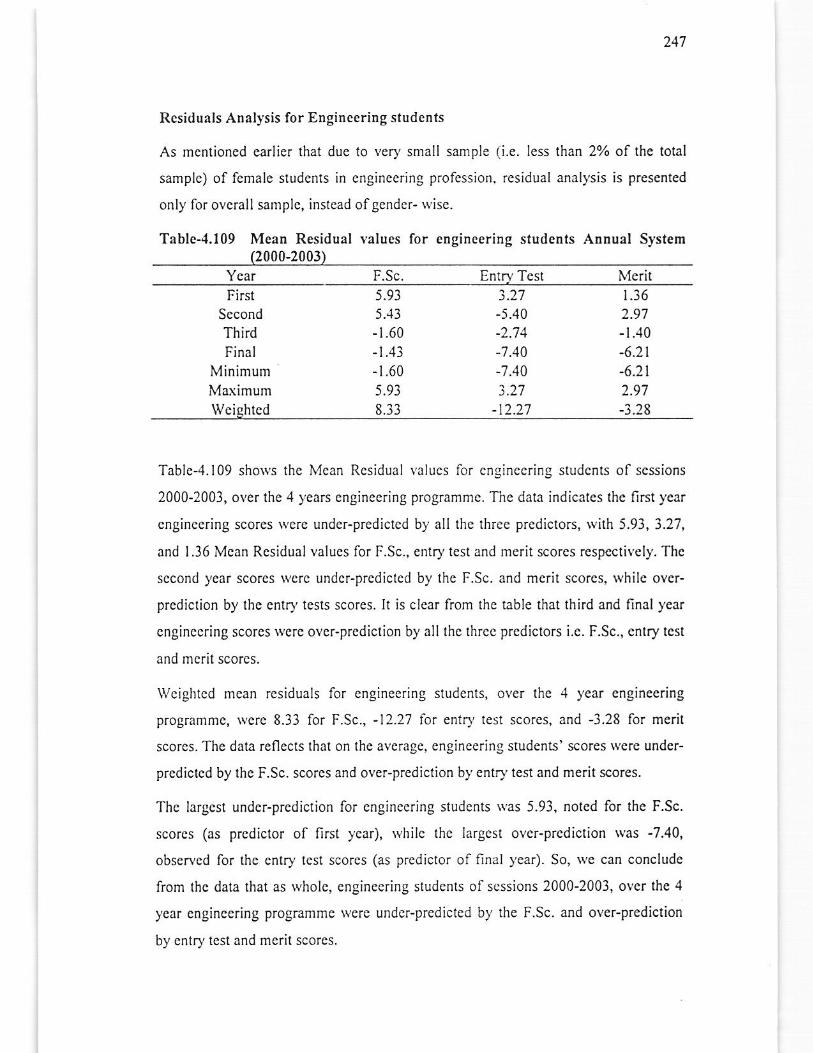
247
Rcsiduals Anallsis for EngineeriDs students
As menlioncd carlier that due to very small sample (i.e. less than 2% of the total
sample) of female students in engineering prolcssion, residual analysis is prescnted
only for ovcrrll samplc, instcad ofgcndcr- *isc-
Table-4.109 Mcan Residual valucs for engineering students Atrnual System(2000-2003)
Year F.Sc. Entry Test ivlerirFirst
Second
Th irdFinal
MinimumMaximumWeighted
-5.40
-7.40-1.104.27
-12.27
r.362.97-1.40-6.2t-6.21
2.97-i.28
5.93
5..13
-1.60
-1.60
5.93
Table4.l09 shoNs thc Mcan Rcsidual valucs for cnginccring studcnts of scssions
2000-2001, over thc 4 years cngineering programmc. n1e data indicatcs the first year
cnginccring scores \vere under-predicted by all the rhree predictors, with 5.93,3.27,
and 1.36 Mcan Rcsidual values for F.Sc., entry test and mcrit scorcs rcspcctit'ely. Thc
sccond ycar scorcs wcrc under-prcdictcd by lhc F.Sc. and mcrit scorcs, rvhilc ovcr-
prcdiclion by thc cntry tcsts scorcs. It is clear from the 6ble that third and final year
cnginccring scores wsrc ovcr-prediclion by all the thrcc predictors i.c. F.Sc., cntry tcst
and mcrit scores.
Wcightcd mcan rcsiduals lor engineering students, over the 4 year engincering
programme, wcre 8.J3 for F.Sc., -l?.27 for enlry test scores, and -3.28 for merit
scores. The data reflccts that on thc avcrage, enginecring students' scores lvere under-
predictcd by the F.Sc. scorcs and over-prediclion by entry test and merit scores.
Thc largcst under-prediction for enginccring studcns rvas 5.93, noted for the F.Sc.
scorcs (as prcdictor of first ycar), whilc the largcst over-prediclion was -7.40,
observcd for the entry test scores (as predictor of final year). So, rve can conclude
from thc data that as whole, enginecring sludenb of sessions 2000-2003, over the 4
year cnginccring programme \\'ere under-predicted by the F.Sc. and over-prediction
by cnlry lest and mcril scores.
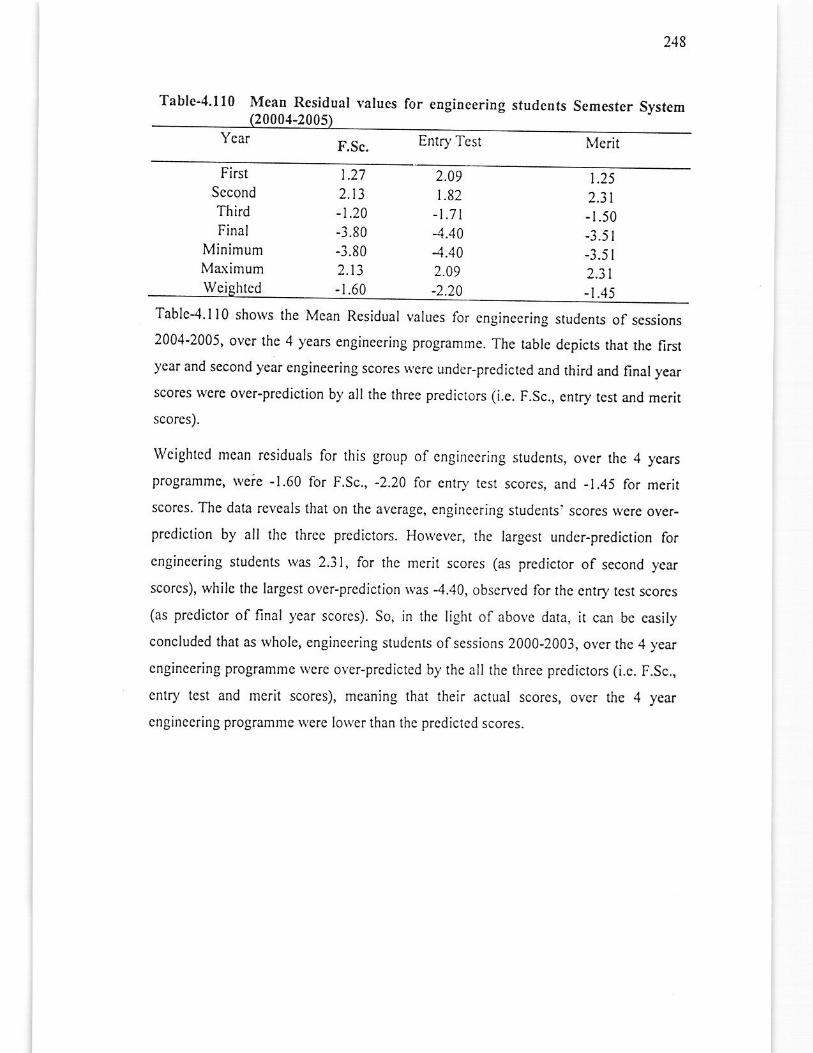
2t8
Tablc-4.110 Mean Residual yalues for engincering students Semester System00
EnlD,Tcst
2.3 t
-1.50-3.51
-3.51
-1.45
Table-4.1 l0 shows lhe Mean Rcsidual values for enginccring studcnts of scssions
2004-2005, over the 4 years engineering progmmrne. The tablc depicts that rhe firstycar and second year engineering scores iyere under-predicted and third and finalycarscores wcrc over-prcdiction by all the three prediclors (i.e. F.Sc., entry tesr and merit
scores).
Wcighlcd mcan rcsiduals for this group ol cngincering sludcnts, ovcr thc 4 ycars
programmcr rvcie -1.60 for F.Sc., -2.20 for entry tesl scores, and -1.45 for merit
scorcs. The dala reveals that on the avcrage, enginccring students: scorcs wcre over-
prediclion by all the three prcdictors. Horvcver, the largest under-prediction for
enginccring students was 2.31, for thc merit scorcs (as prcdictor of second year
scorcs), whilc thc Iargcst ovcr-prcdiction was -4.40, obscrvcd for thc cnry tcst scorcs
(as prcdictor of final ycar scores). So, in lhc light of above dali, it can bc easily
concluded that as whole, enginccring studenls ofsessions 2000-2003, over the 4 year
cngincering programme were ovcr-predicted by lhc all the thr€e prcdictors (i.e. F.Sc.,
cnlry lest and merit scores), meaning that their aclual scores, ovcr tic 4 year
cnginccring programmc \rcre Io\ver than (hc prcdicled scores.
FirsrSccond
ThirdFinal
MinimumMaximum
).272.13
-1.20-3.80
-3.802.13
2.09L82-t./t4ln-4.402.09
-2.20Wcichled
F,Sc.
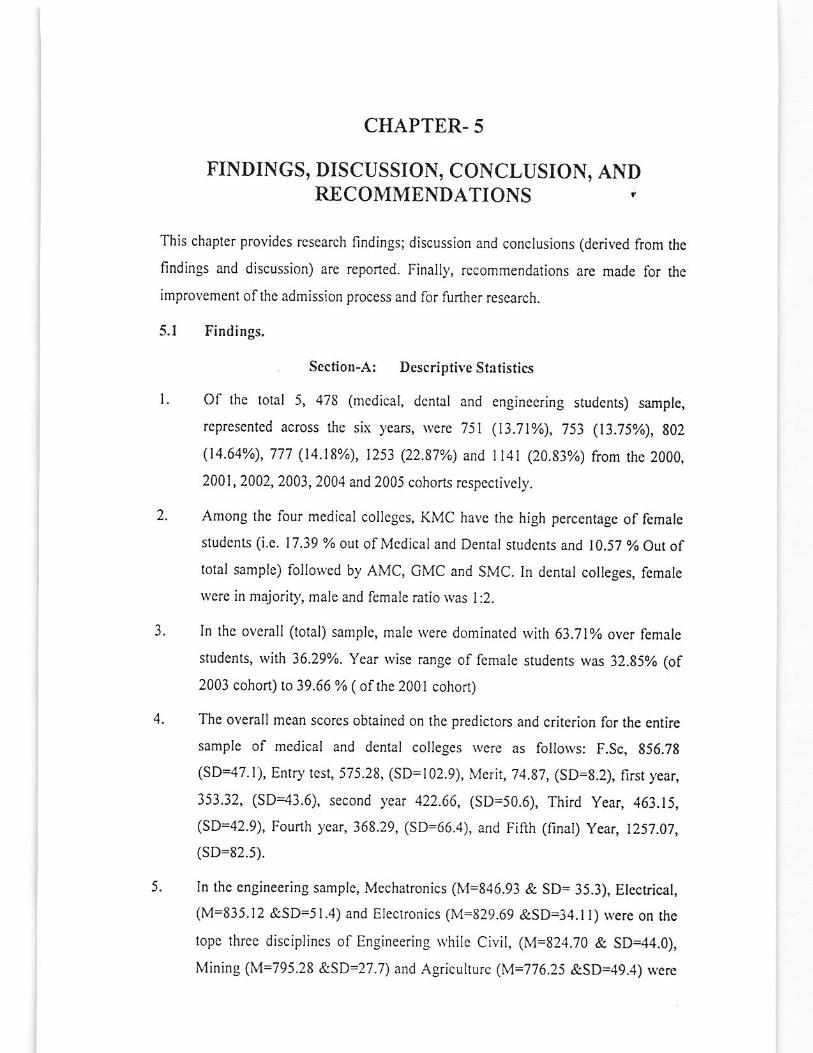
CHAPTER.5
FINDINGS, DISCUSSION, CONCLUSION, ANDRECOMMENDATIONS
This chaptcr providcs rcsearch findings; discussion and conclusions (dcrived from the
findings ard discussion) are reported. Finally, recommendations are made for the
improvemenl of lie admission process and for funher rescarch.
5.1 Findings.
Section-A: DescriptiYe Statistics
L Of the total 5, 478 (mcdical, dcnlal and cngineering students) sample,
rcprescntcd across the six ),ears, \ycre 751 (13.'ll%), 753 (13;75%), BO2
(14.64%),'777 (14.18%), 1253 (22.87%) ar,d |41 (20.83%) from rhe 2000,
200 1, 2002, 2003, 2004 and 2005 cohors rcspccrively.
2. Among the four mcdical colleges, KMC have thc high percentage of female
studcnls (i.c. 17.39 % oul ofMedicat and Denral srudents a ll.sj ./o Otrt oftotal sample) follorvcd by AMC, GMC and SMC. In dental colleges, female
\vcre in majority, male and femalc ratio was I:2.
3. In thc ovcrall (total) samplc, malc wcre dominared with 63.71o/o ovet fell,ale
students, with 36.29ya. Yeej. rvise range of female students was 32.A5% (of
2003 cohort) to 39.66 % ( ofrhe 2001 cohort)
4- Thc overall mean scores obtained on the predictors and criterion for the entire
samplc of medical and dental colleges were as follows: F.Sc. g56.7g
(SD<7.r), Enrry resr, 575.28, (SD=102.9), Merir, 74.87, (SD=8.2), firsr )ear153.32, (SD=43.6), second ycar 422.66, (SD=50.6), Third year, 463.15,
(SD=42.9), Fourth ycar, 368.29, (SD=66.4), and Fifth (final) year, t25?.07,
(sD=82.5).
5. In thc cngineering sample, Mecharronics (M=846.93 & SD- 35.3), Electrical,
(M=835.12 &SD=5i.4) and Elecrronics (M=829.69 &SD=34.1t) werc on rhe
topc thrce disciplines of Engineering x,hile Civil, (M=824.70 & SD=.14.0),
Mining (M=795.28 &SD=27-7) and Agriculturc (M=776.25 &SD=49.4) werc
6.
7.
8.
250
in tho bottom rcgarding the F.Sc. score. About lhe pcrformance on Entry tcst,
Mechatronics (M=619.25& SD= 61.3), Civil-Bannu (M=576.1I &SD=50.4)
and clectrical-Bannu, (M=545.55 &SD=86.1) have sho$'n high perlormancc
while Mining (M=449.84 &SD=88.i), Civil, (M=442.99 & SD-18.2), and
Agriculture (M=417.12&SD= 66.7) rverc the Io1!er performers.
Descriptive information based on gendcr for the olerall dental sample shorvs
that femalc studcnts obtaincd highcr group mcan on F.Sc. scorc (M= 841.83,
SD= 53.6) than male sludcnts, rvho obtained rncan scorcs of 833.'11 (SD=
51.5). Mcans score on thc cnlry tesl \\'ere slightli' higher for malc (M= 537.80,
SD=117.2) cornparcd 10 lcmalc sludcnls (M=535.33, SD=109.7). Ho\vcver, on
ovcrall merit both malc and fcmale performcd cqually, with mcans of 70.30
(SD=10.5) and 70.27 (SD=10.2) rcspectirely. This trend $as also found in thc
data ofboth the denlal collegcs (KCD & AMC Dental scction) scparately.
With respecl lo criterion variablcs, in all the lour examinations (i.e. from first
l,car to final ),car) of dcntal education, follo\\'cd a pancm of female having
higher mean scores than malc sludents lor cach ofthe dental collcgc asTvcll as
for Ihc ovcrall sample. Thc rangc of mcans (from firs! ycar to final ycar) for
male studcnts of KCD rvas 275.39 (SD=20.9) to 499.93 (SD:38.4) while for
fcmale it rvas found 283.38 (SD=21.9) to 522.63 (SD-44.7). The range for
male sludents ofAMC-Dental Nas 343.82 (SD= 144.9) to 521.75 (SD=53.2)
comparcd to female, Nho obtained 345.02 (SD=l 18.8) to 530.58 (SD=46.0)
range ofthe mcans from firsl1o final year examination.
Means and Standard Deviations for malc and female sludents of the four
mcdical collcgcs shorvs that, Nith slight deviation, the mean scorcs of fcmale
students werc highcr rhan male lor F.Sc. while men have perlormcd bctler
than female students on cntry tcst. Mean scores on merit of male was found
higher than lemale studcnts for all medical colleges, except KMC, rvhere
fcmalc werc outscorcd than male.
9. Abou! thc pcrlormance on critcrion variablcs, in almost all lhe fivc
examinations (i.c. from first )'ear lo llnal yea0, like lhc dcnlal studenls, the
25t
studcnts of all the medical colleges, follo\\'ed a pattem of female having
higher mean scores than male students lor each ofthe mcdical collcgc.
Secfion-B: Correlations betl,een Predictors and Critcrion yariables Correlations
of lhe Medical Collcges
10. Thcrc $,ere significant cor.elations (both at 0.05 & 0.01 levcls) ofthe three
predictor variables with the all five prolcssional examinalion scores of I(MC
sludents, in almost all thc six cohort. Of thc three predictor variables, F.Sc.
scores were thc most strongly associated \\'i1h thc criterion variables, lollowed
by Mcrit and entry test. The rangc ofcorclation for F.Sc. \vas -0.02 (2005) to
0.54 (2001) and for the enrry tes! it \\,as found -0.04 (2005) ro 0.39 (2002).
For nrcrit, the range ofcorrclation $,as, -0.05 (2005) to 0.56 (2002).
I l. Co.relation coefficicnts, lor KMC students, \\'crc significant lor borh genders;
horvevcr, F,Sc. and merit scorcs \\'cre strongly corrclated with their subsequcnt
pcrformancc as comparcd with entry test for both thc gendcrs. It is funher
rcveals that thc mean conelation of female, for fivc medical cxaminations, of
F.Sc. predictor \\'as higher (.35) lhan malc studcnts (.33), lvhile on both cntry
tcsl and meril the mean correlation of male rvas lound higher (entry test:.16
& merit =.26) than femalc (entD,tesr =.l2 & mcrit =.23).
12. Over all sample ofAMC shorvs that F.Sc. sco.es (lvith fiedian=.Is) were
significantly correlated with all the criterion variables (lrom I" to final year
scores), r,rhile Merit and entry test, (wirh.l7 and.04 median scores
rcspcctivcly), wcrc signiflcantly correlated \\,i!h hvo criterion variablcs only
(i.e. Entry tcsi rvirh 3'd and 4'h ycar) and Thrcc cxaminations (lst,3'd, and4d
),ear) respectively.
I3. Corrclation coefficicnts ofF.Sc. & merit scores with all the five examinations
wcre lound higher in favour of nrale than lemale studcnts ofAMC, while for
cnlry tcst thc coefllcients of femalc Bere bcncr than male studcnts. Cfhis is
contrary to KMC result, \yhere, entry tesl \\'as in the favour ofmalc students).
The association bct\reco prcdictors and criterion variablcs for fcmalc rvcrc
quitc better than male sludenls of GMC lor all three predictors. The median
valucs of cor.clalion for F.Sc., entry test and merit score of male students
14.
17.
16.
15.
I8.
252
'were.ll, .06, and.05, whilc of fcmale; it \vas lound.28, .15, and.2l. This is
better position in favour of female, evcn from KMC because all three
predictors found in favour ofleftale studcnB.
Over all sample ofCMC shows that F.Sc. scorcs (with median=.ll) were the
most strongly associated wilh all thc criterion variablcs i.e. lrom ln to final
ycar scores (except for 2nd ),car fo, \\,hich cntry tesr is srrongly correlated),
follo\ved by Entry and Meri! (with.05 and.07 m:dian scorcs) rcspectively.
Ovcr all sample of SMC lhat F.Sc. scores (\yilh mcdian=.|7) \\'crc thc most
strongly associatcd $,ith all the crilerion variables folloNcd by Merit and Enrry
lest (wilh.l0 and.00 median scorcs rcspecti\,ely), Thc associalion for F.Sc. was
significant with 46 and Final years, \vhilc Entry test and Mcrit \\ere not found
significantly corrslalcd rvith any critcrion variablcs.
Gcndcr \visc Corelalion of Prcdictor and Crilcrion variablcs of SMC
illustrates that lhe associalion bcnvccn predictors and criterion variables for
fcmale rverc quitc bcncr than male sludents ofSMC. The values ofconclation
for female rvcre higher than malc for all the fivc MBBS examinations scores.
Thc highcst cocfticienb for, F.Sc., cntry test and mcrit, for female rverc.456,
.357, and.4l8 respeclively as compared to ihe values.305, .134, and.l04 for
malc students.
Ycar wise Correlation of Predictor and Crircrion variables of overall Medical
Sample shows that F.Sc. scores (\\,ith median=.20) havc significant correlarion
(both at 0.05 & 0.01 lcvels) \vith thc all fi\,e profcssional e)iamination scorcs
ofoverall medical sample sludents, follorvcd by Merit and Entry test (with.23
and.l6 mcdian scorcs rcspectivcly), Thc association for Mcrit and Entry test
rvcre also significant for all ofrhe cascs cxccpr lor 46 Year. Tle range ofcorrelalion for F.Sc. *as -0.159 (2000) lo 0.462 (2001) and for the Meril itrvas found -0.202 (2002) 10 0.458 (200-l). For Entry Tcsr, the range ofcorrelarion wa.s, -0.253 (2000) ro 0.328 (2003).
Gcndcr rvise Conelation ofoverall Medical Santple illustrates that the female
werc quite bettcr than male students of o\,crall Medical Sample, rvith the
cxccplion of cntry tcst.
19.
253
Thc highest cocliicients for, F.Sc., entD'lcsl and merit, for female were.429
(Ior third year), .340 (for first year), and 372 (for first year) respcclively as
comparcd to thc values.306 (lor first )'cao, .143, (for final ycar) and.228 (for
third year) for male students.
Correlations of the Dental Colleges
20. Over atl sample of AMC-D shoNs that cntry test (with mcdian-.16) was the
most strongly associated \\ilh all thc criterion variables, follolved by Merit and
F.Sc. scorcs (\\'ilh.l2 and.06 mcdian scorcs respcctivcly), The association for
Entry tesl was significant \yith 2d and Final )'cars, for F.Sc. it *'asTvith 2d
year only, lvhile Merit scorcs \\'cr€ nol found signillcantly conelatcd wiih an]'
crilerion variables. Over all sample of KCD depicts that F.Sc. (rvith
mcdian=.18) was the best predictor and most strongly associated with all the
criterion variabies, cxcept third )'ear, follo\\'ed by Entry (rvith median=.I2)
and Mcrit scorcs (rvith rl cdian=.09) rcspcctivcly.
21. Gcndcr rvisc Corrclalion of Prcdictor and Crilcrion variablcs of KCD rcvcals
that the values of corrclations between predictors and all of the four BDS
cxaminalions scorcs for malc rvcrc quiet higher than fcmalc lor KCD studcnts.
For malc, all thc corrclations coelTicienl values lverc positivc for all thc threc
prcdictors (F.Sc., cntD'tcst and Merit) and lor all the four BDS cxaminations,
rvhilc for fcmalc, some neSative conclations \r'cre also found. Thc highest
coelficients for, F.Sc., entry tcst and merit. for male \vere.iS0, .360, and.448
rcspcclivcly (all s'ith 2"d yeao as comparcd ro the values.3]8, .109, and.l70
Ior fcmalc studcnts.
Ovcr all Dcnhl Samplc illustrales that thal, although, lhcrc was variation in
con'clation cocflicicnts values of the three prcdiclor variables with the four
dcntal profcssional examination scorcs, but in general, merit (with
mcdian-.l5) r"-as thc bcst prcdictor ofthe dental scorcs follorved by Entry
(with median=.14) and F.Sc. scorcs (with mcdian:.10) respeclively.
Gcnder wisc Corrclation of Prediclor ar,d Criterion variables ofovcrall Dcntal
Samplc clearly reveals that the coftcli,tions cocfficicnts bcttyeen predictors
and all ofthc four BDS cxatuinations scorcs for malc \ycrc higher than female
22.
23.
for overall Dcntal Sample. For male, most of thc correlations coeff.icient
values lverc positivc significant at leai at.05 level (with exception of firstycar) as compared to thc fcmalc. Thc highcsl coelficients for, F.Sc., entry test
and mcrit, for male wcrc.350, .304, and.302 rcspcctively as comparcd to the
values.2l7, .181, and.l80 for ltmalc studcns.
Correlations of the f, DgiDeering Disciplines
24. Ycar $,ise Correlation ofoverall Engineering samplc illustrates that, in gcneral
all thc thrce predicrors (i.e_ F.Sc., cntry lest and Mcrit) rvcre significantly
corrclatcd with all the four eramination scores ofovcrall Enginccring sample.
In 2000 and 2001 cohort, ent0,lest scores Ncrc stronglv associated \vith all thc
criterion variables, folloNed by Merit and F.Sc. scores, while in 2O0l cohort,
mcrit scores have shown higher corrclation cocmcients than other prcdictors.
ln 2004, and 2005 cohons F.Sc. scorcs t\.ere found the best prcdictor olcritcrion scorcs, follo$,ed b), Mcrit and entry tcst scorcs. Thc highcst
coffelation for F.Sc. scores was 0.jg9 (first ),car, 200i), whilc mcrit and cntry
lcst it was.454 (first ),ear, 2000) and.359 (first ycar, 2000) rcspecrively.
25. Thcrc was positive corglalion ofall the three prcdictors (F.Sc. scores, cnrry
tcst and Merit) with all ths lour profcssional cxamination scorcs ovc. allEngineering Sample (Annual systcm i.e. from 2000-2003).The Correlations
coefl]cients for all the three the predictors were found slat,sticall),signil.icant
uptothirdyearexaminalionscores,al both.0l and.05 level.
Thc data also reveals that merit ovith.2l l\lcdian score) rvas the best predictor
of thc entirc four profcssional Enginccring cxamination scorcs, lbr ovcr allEngincering Sample (Annual s),slcm i.e. from 2000_2003), lollowcd by enrry
lest (wilh.l8 Median score) and F.Sc. scores ($ilh.l7 Median score).The
highcst correlation lor mcrir .was 0.302 (p:000), rvhile lor enrry lest and F.Sc.
scores it was.264 (p= 000) and.249 (p= 000) respecrively.
26. Thcre was significant correlalion of F.Sc., 0vith. i4 Median score), wirh all the
four professiooal examination scores, lor over all Engincering Sample
(Scmcslcr sysrem i.c, from 2004-2005), ar borh.0l and.05 levcl. Thc cnlry test
25i
and Mcrit scores, both \\'ere negalively corrclated \\'ith all the examination
scores (with Mcdian scores of-.12 and -.05 rcspcclivcly).
The highest con'elation for F.Sc. scores was found for sccond year,Tvhich rvas
0.163 (p=000).
27. The highcst correlalion cocmcicnls (covcring all Disciplines ofengineering)
for F.Sc. scorcs with first, sccond, lhird, and final )'ear scores lyerc 0.35 (as
compared 10.23 ol cntry and.35 of merit), .44 (as compalcd to.27 of enlry
and.29 of meril),.41 (as compared 10.24 ofentry and.28 of merit), and.09 (as
compared 1o.39 ofentry and.39 ofmerit), respeclively.
Section-C: The Predictivc validilics olthe predictors (Rcgressiotr A[alysis)
Thc predictivc validities for Medical studeDts (Regrcssion ADal)'sis)
28. Thc rcsults of the entcr regression analysis and stcpwise regression analysis
for medical fi.st year sows thal all lhe prediclors \!ere significantly associarcd
wilh the critcrion; horvever, among thc prcdiciors F.Sc. \\'as found the bcst
prcdiclor, followcd by mcrit and cntry lcst. Rr for Stcp I (F.Sc.) r'as.l17,
mcaning that 12 yo of lhe variancc in first )'ear marks rvas prediclcd by
variance in F.Sc. alonc. Enlry test alone explained 4% variance in first year
marks. Regression Analysis for Medical Sccond )'ear indicatc that likc (he first
year result, the F.Sc. score was lound the bcst prcdiclo., followed by merit and
cniry test. l-lo\\,cver, R2 for all lhc prcdictors $'ere lound very low as compared
to the first year. Only 04 % oflhe varianco in first ycar marks was Predicted
by variancc in F.Sc. alone.
29. Rcgression Analysis for Mcdical Third and Fou(h )'ear sholv thc same panem
i.e. F.Sc. score \\'as found the bcst prcdictor, followed by mcrit and entry test.
For Mcdical Third R2 for Step I (F.Sc.) \\as.128, meaning that l3 % of thc
variance in third year marks \\'as prcdicled by lariance in F.Sc. alone. Entry
test alone cxplained 2yo larian.e in third ycar marks, tYhilclo o/o of thc
variance in fourlh year marks \\'erc prcdicted b)'\'ariance in F.Sc scorc alone.
For Mcdical Final year, unlikc thc resulrc of olher medical ycars, thc merit
scorc was found the best prcdictor of final year narks, accounting lor 6% of30.
256
3t.
33.
32.
thc variance. The F.Sc. and cntry tcst scorcs \,..crc cxcludcd in the Slcplvise
rcgrcssion !nalysis.
The validitics coelTicicnli, fo. all predictors, with first year scores, were
higher for fcmale students than for male. For femalc highest R2 (.15 and
p=.000), was found for merit followed by cnrD,rcsr and F.Sc. (with R:-.126
and.ll5), while for male, F.Sc. \yas the bcst prcdictor (with Rr=.09g).
Regrcssion analysis for Medical Second year dcpicts rha! in gencral, thc
validities coefficicnts, Nith slight dcviation for F.Sc., appeared to be higher for
malc studcns lhan for fcmale. Whcn slcpwisc rcgression \\,as applied, fo. both
thc gendcr Cfables 4.72 and 4.73\, F.Sc. scores $.ere lound the best prcdictor
ofsecond ycar mcdical scorcs.
The validilies coefficients for lemale students,,r,ere, for all thc predictors ofthe third year mcdical scores, identified doublc than as compared to male
studcnls. For femalc R? valucs *,crc found.l84, .035 and.l02 lor F.Sc., cntry
tcst and merit respcctiycly, rlhile for male thcse valucs $,cre.0g, .0lg and.052.
Slepwisc regression analysis indicatcs thal the F.Sc. scores wcrc found the
best prcdictor of lhc third year mcdical scorcs for both male and female
studenls.
Validities coeflicicns, for Medical Follrth ycar, lvith exccption of F.Sc. score,
appcarcd to bc higher for male studcnts than female. For male, all predictors
wcre found significantly associated with thc fourth year medical score while
for female cntry lest was not lound significant (p:.214). F.Sc. scores were
found the best predictor of fourth year medical scorcs, lor both the gender,
rvith R2 value.08 (p-.0000) and.l02 (p=.000) for matc and lemalc
respectivcly. For Mcdical final ),ear, rhe validities coemcicnts for female
sludcnts \verc, for all thc prcdictors, found higher rhan male students. R2
valucs, for female, wcrc found.l18, .106 and.07l lor F-Sc., merit and entry
lest respcctivcly, compared 10 the yalucs.09l, .056 and.024 for male studcnts.
Thc F.Sc. scores rvcrc found lhc besl prediclo. ofthe final ycar mcdical scores
for male and fcmale, rvith R2 valuc.09,1 for malc and R=.352 and R1 =.124
(P=.000) for female studcns.
257
Thc prcdictive validities For Dental students (Rcgression Anal),sis)
34. Thc Step rvisc ReSrcssion Analysis shoNs that at step l, the cntry test was
lound thc best prediclor, with R,.033 onl),, meaning that 03 % ofthe variancc
in dcntal first 1,car marks \\,as prcdictcd by variancc in cntry tes! whilc fo.Dcntal 2nd Year F.Sc. rvas found thc bcst prcdictor, ar stcp I, rvith f =.0g7.
The Rl valuc raised to.102 at Step 2, when cntD.lest rvas €ntered into the Step
\vise Rcgression model. Entry rcst (R=.1j2 & p=.Ojl) and mcrit scores
(R=.121 & P=.051) rverc significantll,associated with the third ycar score,
rvhilc negative association bcnrcen F.Sc. scorc and critcrion scores was found,
\\ irh R= -.007 (p=.907).
35. F.Sc., Entry lest and merit scorcs \r,ere significantly associated with the final
year scores. The R value for_rnd for.F.Sc., EntO,test and merit scorcs werc.2l6
(p=.003),.157 (p=.031), and.l70 (p=.019) rcspecrively.
Step wisc Rcgression analysis for Dcnlal llnal year rcveals rha! among the
predictors, F.Sc. \vas found the bcsr predicror, at step I, \yith R2 =.036
(p=.010), which means that onl),4% ofthe variance in final year scores rvas
cxplained by F.Sc. score alonc_ Entry test and merit scores were e)icludcd
from the regrcssion equation.
The predictiyc validities for Dcntal students (RegressioD An!l)sis) by Geoder
36. Thc validities coemcients, for all predictors, \r'erc higher for male students
than for female. For male F.Sc. (Nith R':-043 & p=.037) and entry tcst scores
(with R2=.064 & p=.012) were lound statistically significanr, rvhilc none ofthe predictors was found significant for female studcnts at.O5 levcl.
On Slepwisc rcgression analysis, the en.ry test \\.as found the best predictor ofthe first year dental scorcs lor male, rvith R'?:.067 (7 o% variance, rvith
p=.009), at the first step. For lemale stuoents, unlikc the male, whcn stepwise
regression analysis rvas applied, all variablcs entered but none of tiepredictors was lound to be dcclared as be$ predictor for first year scores.
37. For the dental 2d ycar scores, the prediction ofF.Sc. score lvas almost found
samc for bolh genders (R for male=.305 & for female =.300), while the
validily coelficicnls of cntry lesr and merit lor femalc studcnts rvere higher
258
whcn comparcd to thal of malo sludcnts For malc Rl valucs werc'092'
and.072 for cntry tcst and meril rcspcctively, \\'hilc lor male thcse values
wcre.033, and.032.
38. Prediclivc validitics for thg dcnhl third and final )'ear scores, lor almost all
prcdictors, were higher for male students than lor fcmale For male entry tcst,
rvith R:=.060 (p=.018) and mcrit test scores, rvith R?='062 (p:'Ol6) werc
found statistically significant, $hile none of the predictors was found
significant for fcmale studcnts for thc dental third at.05 Ievel So can conclude
lrom the data that the Perfoamance of mele siudents Bere bc'ter than iemale
Thc prcdictive validitics for eDgineering studenls (Rcgression Analysis)
39. Thc rcsults of stcp\visc rcgrcssion for thc firsl )'car prcdictors for scssions
2000-2003 indicates that merit scorcs rverc lound thc best predictor offirst
ycar scorcs, with Rr value.l l5 (p=.OOO), meaning that l2% of the variance in
first ycar can be accounted for mcrit scores. For 2004-2005 sessions thc s(ep I
dcclarcd F.Sc. as best prediclor Nith R2.015 (p=.0000). Like the first year, For
first group (2000-2003 session), mcrit \\'as lhc bcst prcdictor, rvith Rl
value.)07 (p=.000), rvhile lor group sccond (2004-2005 scssion) F.Sc. scorcs,
with Rr.0l5 (p=.0000), Nere the good prcdiclors of sccond year engineering
pcrformance. Almosl same paftcr \\'as found for lhird )'ear engincering.
40. When slcpwise rcgression analysis \!as applied 1o the data ofstudents of2000-
2003 scssions, all variables entcred but non ofthe predictors was found to be
dcclarcd as best p.cdictor for final )'car scorcs- Stcp!\'isc regrcssion for thc
fioal ycar for sessions 2004-2005 displays that entry lest scorcs rvcrc found the
bcst prcdiclor oflhe final )'car scorcs al slep 1. liowever, Rl value rvas very
low i.e..021, mcaning that o y 2Yo ol lhc variance in final year scores
accounted for bY cntry test scores.
Scction-D: Prediction Errors or Residual Anallsis
Mean Residual values for Mcdical students by Gender indicatcs that the
direction ofthe mean residuals across lhc prcdictors for male and lcmale wer€
not consistcnt. Weighlcd mean rcsiduals for male, ovcr the 5 medical years,
41.
259
horvever, u,erc -2.98 for F.Sc., 2.gg for entry lcst scores, and 3.00 for meritscorcs. The dala indicated that on the a\,erage, malc,s mcdical scores \vere
ovcr-predicled b1, the F.Sc. scores and undcr-predicr€d by the entry ten and
mcril scores.
42. Examination ofthe wcighted mean residuals deriYed for female, over rhe 5mcdicalyears, \ycrc -6.41 for F.Sc., 7.6g entry icst scorcs, and -13.49 for merit
scorcs. The data displays that fcmale's medical scorcs \\€re under-prcdicted
by the cntry test scores and over-prcdicted by the F.Sc. and merit scores.
43, As, whole male's actual gradcs arc slightly higher rhan predicted rvhilc
fcmale's grades ar€ slightly lo\\,er than predicred. Ho\yever, the under-
prcdiction for cnlry tesl was larger for fcmalc (7.68) rhan male (2.gg),
meaning that female's predicted gmdes Ncre 7.68 g.adc points lower rhan
thcir actual gradcs, [hile for male's 2.88 points lowcr than their actual
grades.
Rcsiduals Analysis for Dental students
44, Wcightcd mean residuals for malc, over thc ,+ dcntal ycars, vcrc 2.24 for
F.Sc., l.l2 lor entry tcst scorcs, and 3.53 lor mcrir scores. The data indicatcd
that on the avemge, male's dental scores were undcr-predicted by all
prcdictors i.e. F.Sc. scorcs, entry lest and merit scores.
45. For female, Neighted mean residuals derived, over the 4 years dental
programmc, were -1.69 for F.Sc., -2.18 for cntry lcst scores, and -14.57 for
merit scores. lt is clear from the dala fiat on thc avcrage, fcmale's dental
scores \\,ere over-predicled by all the three prcdictors i.e. F.Sc. scores, entry
test and merit scores. So, we can conclude from the data tha! as \yhole, male's
actual gradcs rvcrc highcr than predicicd whilc female's gmdes were lolver
than predicled.
46. Wcightcd mean residuals for cnginccring students, of scssions 2000.2003,
ovcr thc 4 year enginccring programme, s'crc 8.33 for F.Sc., -12.27 for cnlry
lcst scores, and -3.28 for merit scorcs. The data reflecb that on the avemge,
cnginccring studcnls'scorcs $'erc undcr-prcdictcd by thc F.Sc. scorcs and
ovcr-prcdiction by enrry lest and mcril scorcs.
760
4',7. Wcightcd mean residuais for engineering siudcnts ofsessions 200,1-2005, over
thc 4 year programmc, \\'erc -1.60 lor F.Sc., -2.20 lor enlrl,tcst scores, and -
1.45 lor merit scorcs. The data rcvcals that on lhc averagc, cngincering
studenls'scores were over-prcdiclion by all thc three predictors.
5,2 Discussion:
Initially, descriptivc data on the predictors and crircrion variables ofthe four medical
and nvo dental collcges for the combincd gender s.erc provided. A scquential ordcr
rvas found in all the three componenr of rhe predictors for rhc KMC, AMC, SMC,
GMC, KCD, and AMc-Dental. This is becausc of thc admission procedure of rhcsc
collegcs i.c. sludents are placcd in these collegcs b), the joint admission committce on
the basis of mcrit.
The direction ofthe avemge scorcs by gender indicated that the mean scores offemale
sludcnls wcre higher than male for F.Sc., rvhilc mcn have pcrformcd bettcr that
fcmalc sludenls on cntry lcst and merit for all mcdical collegcs, cxccpt KMC, where
fcmalc rverc outscored on merit than malc. These findings are consistent with thc
findings drarvn in previous studies related to diffcrences in gender performance on
entrancc test for the admission to medical colleges (L).di& S. 2005; Halpcm, Haviland,
& Killian, 1998; Joncs & Milchcll, 1986).
With rcgards to the performance on criterion variables, in almost all the fivc
cxaminations (i.e. from firsl year to final ycar), thc studcnts of all tlre medical
collcgcs, followed a pattem of femalc having higher mcan scorcs than male students
for cach of the medical college. These findings are supported by the conclusions
drawn by Willingharn and Colc (1997). However, this \vas contmry to conclusions
drarvn by Lydia, S. (2005) that, men had highcr mein scores on first-ycar medical
school GPA than women.
Cofielation coefficienl rcsulls for the predictors (F.Sc., entry tcst and merit score),
showed consideBble variation, across the pafticipalcd mcdical colleges. These
variations may havc bccn due to differences in thc rangc oftalent tYilhin each medical
collcgc (Lydia, S. 2005 & Willingham, Lcwis, Mor;an, & Ramisr, 1990).
On thc wholc, therc appearcd ro be significanl corrclation (bolh at 0.05 & 0.01 Ievels)
ofthc thrcc prcdictor Yariables with thc all five profcssional examination scores ofall
26t
the four medical colleges i.e. KMC, AMC, CMC, and SMC sample, in almosr all thesix cohort. Of the three predictor variables, F.Sc_ scores were the most stronglyassociatcd with the criterion variables, follorved by Merir and entry test. F.Sc. scoreswcre significantly corelatod Nith all the crircrion variables (both ar 0.05 & O.0l
lcvcls). in 2000, 2001, 2003, 2004, and 2005 cohoas, rYhilc in 2002 cohort, mcrit Nas
on thc lop, follo\\ed b),F.Sc. and cntry tesl rcspecrivcly. The rcsults arc consisrent
wili pasl validiry studies (L)dia, S.2005; Kocnig, Hufi & Julian,2002i Julian &Lock\vood, 2000; Veloski, Callahan, Xu, Hoja! & n-ash, 2000; Wilcy & Koenig,r996).
Gendcr rvisc results showed that in all the rnedical colleges, female had highcrcorrclalions betwccn the prcdictors and (hc crirerion variables, than male. The highcstcoclficients of ovcrall Mcdical Sample for F_Sc.. entry lest and merit. for femalc
werc,429, .340, and.372 respcctively as compared 10 the values.306, .143, and.228 formale studenls. This finding is consistent wirh rhe findings by Lydia, S.2005 and Jones
and Vanyur (1985).
Thcrc rvas variation lbund in conclation coefficienls of the thrce predictor variablcs
with thc four dcnhl profcssional cxaminalion scores of AMC seclion, in all thc six
cohorts. In the four consecutivc cohorts i.e. 2002, 200i, 2004 2005, mcrit scor€s \vcrc
thc mosl strongly associated \\,ilh thc entirc criterion variablcs (from first lo llnalyca,denlal cxamination scores) for AMC denral students. The sccond most important
prcdictor was entry lcst, follolved by F.Sc. scorc. Bul lvhcn data $,as poolcd for all six
coho( of AMC dental scction, then cniry test (rvith median=.16) was the most
strongly associated Nith all the critcrion variablcs (from li to final ycar scores),
lolio\red by Merit and F.Sc. Contrary lo AMC denlal scction result, for KCD, F.Sc-.
scores, wilh any doubL were the most slrongl),associated with the cntirc criterion
variablcs, followcd by Merit and entry test. But Nhen data \\?s pooled for both the
dcnlal collcgcs, in gencral, mcrit (rvith mcdian=.]5) \\,as thc best predictor of ahe
dcntal scorcs follo$,ed by Entry orith mcdian=.14) and F.Sc. scores (tvith
mcdian=.10) rcspcctively. This rcsull support the usc ofcxisting crilcria for admission
10 dcntal collcgcs, unlikc thc studies of Baig, 2001; Baig, L. A. el al, 2001; &
Klitgaard, R.E. ct al, 1978.
With some c\ception, the associalion behYeen prcdiclors and criterion variables lor
2.62
femalc $crc quile bcner than malc dcnhl studenrs ofAMC. Again' contrary to AMC
dcntal scction rcsull, valucs ofcorrclations betNccn predictorc and all ofthe four BDS
cxaminalions scorcs lor malc rvcre quict higher than fcmalc for KCD students as rvell
as for oYcrall dental sample. Thcse variations may have been due to differences in the
ranBc oftalcnt wilhin cach collcgc (Lydia, S.2005 & \\/illingham, Lcwis, Morgan' &
Ramist, 1990) or/and to differcnccs in the samplc size (tle sample sizc for fcmale in
AMC-Dcntal scclion \\'as very low as comparcd to that ofKCD).
Wilh regard to cngincering, In general all thc three predictors (i.e- F.Sc., entry test and
Merit) were significantly conelated wilh all the four e\amination scores of
cngincering samplc. Ho$'evcr, in most ofthe engineering disciplines, ofall the threc
prcdic(ors (i.c. F.Sc., cntry tcst and Mcrit) I F.Sc. rvas found in bettcr position lo bc
uscd as prcdictor as compared 10 enlry lesl and medt scores. Nert to F.Sc. rvas merit,
followed by entry test.
In somc cnginccring disciplines, like mining and agricr-tlturc enginecring, the result
was in favour olcntry test scores, bul thc maximum and unrcliable correlations werc
duc io fic small sample sizc (rvhich wcrc l.l9 % for mining and 0.97 yo for
agriculture cnginccring oflhe total samplc) lor these disciplines.
As carlier menlioned in this report that, from 2000 to 2003 there lvas Annual
(cxtemal) systcm ofexamination in the UET, Pesha\var whcre students rvere assessed
on 0-100 scalc. Semester systcm rvas inlroduced in UEf in 2004 academic session,
rvhcre from 2004 onward studenls have been assessed intemally on 0-4 scale (GPA
systenr).This is Nhy, correlations analysis lor both, annual and semester system wetc
calculatcd and discusscd scpamtely.
The data about Annual system i.e. lrom 2000-2003also revealed that merit (with.2l
Median scorc) was the best prcdicror of the entire four professional Engineering
examination scores, followcd by entry test (!vith.l8 Mcdian score) and F.Sc. scores
(wilh.l7 Median score), \vhile correlalions for thc dala of Semestcr system i.e. from
2004-2005, Enginccring Samplc rvas in favour of F.Sc. scores only. Thesc findings
also supported by lhe study of Henriksson & Wolming ( 1998) & Kuo, R & Chosh, S.
(1998), where thcy concluded that lhe sludents admilted on the basis oftheir eailier
acadcmic achievemcnt (GPA) \'cre some\\'hat more successful than the basis of
26i
standardizcd lest scorcs and cntrancc lcsl scorcs play a surprisingly minor rolc in the
aCmission decision. But thcsc findings \\'ere contradictory to lhc rccent researches by
Hol1, ct al (2006) & Ting (2001).
Simplc and multiplc linear regression analysis we.e applied to the data lo determine
the association bct\\'een the predictors and the critcrion. The Rl represcns thc
proportion ofthe total variance in an oulcomc rariablc (in this study examination
marks), that can be accounted for by a prcdiclor variablc (in thc case F.Sc., EnEy test
and lVcrit).
Thc results of thc enter regression analpis and stcprvise rcgrcssion analysis for
mcdical samplc indicatcd that all the predictors ( F.Sc., Entry test and merit scores)
$erc significantly associated with lhe crilerion Yariables (from first to final ycar
medical examination scorcs) ; hoNcver, step\\'isc regression analysis revealed that
among thc prcdiclors, froft first to fourth ycar, F.Sc. rvas found the bcsl prcdiclor,
folloNed by mcrit and entry tcst whilc for flnal )car, mcrit rvas the best predictor,
follorvcd by cntry test and F.Sc, scores.
R'] for Step I (F.Sc.) Nas.l17, meaning that 12 % ofthe yariance in first ycar marks
lvas predicted by variance in F.Sc. alonc. The addition ofmcril at Stcp 2 raiscd thc R2
value by.)22, meaning that thc F.Sc. and mcrit togethcr explain 24 oZ ofthe variance
in first ycar marks. Enlry lcsr alone cxplaincd 4% variancc in {irst ycar marks. R: for
all thc prcdictors were found very low as comparcd to the firsl year. Only 04 % ofthe
variance in first year marks lvas predicled by variance in F.Sc. alone. R2 for Slep I
(F.Sc.) !vas.l28, mcaning that l3 % ofthe variance in third year marks lvas predictcd
by variancc in F.Sc. alone. The addition of merit at step 2 raiscd the R2 value by.l3l,
mcaning that th€ F.Sc. and merit togcthcr explain 26 o% ofthe variance in third year
marks. Entry test alone explained 2yo vatiance in third ycar mark.lo % of the
variance in fou(h year malks \vas predicted by variance in F.Sc. score alonc.
Allhough the analysis of simple reSression anaiysis indicate 6yo and zyo of lhe
variance in founh year marks were predicted by variance in, merit and entry test
rcspcclively., but thc Stcp Nisc Regression Analysis declared F.Sc. score the sole
predictor and Dntry icst and merit scorcs \vcre excluded from lhc rcgression equalion,
meaning that they added no significant explanatory value to F.Sc. lor this grouP.
Unlike thc rcsults olother mcdical )'cars, thc nlcril score \ras found thc bcst prcdiclor
264
of final ycar marks, accounting for 6% ofrhc variance The F Sc and entry test scores
werc oxcluded in thc Stcpwisc regression anal)'sis'
Thcsc findin8s were consislent Nilh the findings of Kleshinski et al' 2009; Megan'
2008i McManus et aI,2005; Willingham, 1985; Ferguson' Jamcs' & Madclcy' 2002:
Kulatunga-Moruzi & Norman, 2002 Willingham (1985) cvaluatcd more than 30
factors, as prcdiclors ofcollegc gradcs to in order dctermine lvhich would bcst prcdict
collcgc gradcvoulcomcs. Hc found that onl)' six of thc factors were significant
corrclatcd with studenr acadcmic achievcment in collcge Hc concluded that thc high
school GPA ofthc student vas the strongest prcdictor ofcollege gradcs HoNcvcr' thc
rcsuk of the present study for thc medical sample \!as coT trary lo the sudies of
Donnon. Paolucci, O.Violato,2007; Julian,2005; Dixon, 2004; Basco et al' 2002; &
Milchcll, Haynes, & KoeniS, 1994, whcrc they concluded that the MCAT and UGPAs
cach contribute something uniquc lo thc prediclion of medical school gadcs' and so
the combination is more porverlul than eithcr Predictor alone.
Validity coefllcienb derived from full regression modcls and stepwisc regressions for
gcndcr comparisons yicldcd that among (he predictors, F Sc. rvas lound the best
predictor, follo$'cd by mcrit and cntry tcst, from sccond to finalycar lor both gendcr
(malc and fcmalc) and of lhc first )'car for male only, wilh R2 = 098 (p= 000), rvhilc
mcrit Nas the best prediclor, follorved by entry test and F.Sc. scores for first ycar
lemalc (with l6vo')adance, p=.000). R' values lor both malc and female Ncre 034
and.035 for second, 8 o/o ( p=.000) and.l85, (p=.000) for third )'car, 08 (p= 0000)
and.l02 (p=.000) for fourth ycar and.094 &.124 (P=.000) for final ycar'
Thc validitics coefficients for femalc students \\'ere, for all the predictors, lound
highcr than malc sludcnls for first, third, and final )'car, \\'hilc for sccond and founh
ycar male oulscorcd than female. The rcsulls of this str-rdy indicatcd that therc is a
stronger rclationship bchleen the F.Sc. scores and mcdicalcollege examination scores
(GPA) for femalc than for male, \Yhich is consisteni (as already stated) with thc
findings by StcNan, 2006 & Jones and van)'ur (l985.But study ofLydia S K (2005)
slatcd lhal rhat m€n pcrformcd better on the medical school mcasurc than womcn'
For dental sample, the Slep wise Rcgrcssion Anallsis indicared that among the
prcdiclors (F.Sc., Enlq' tcst and merit scorcs), thc cntry test rvas found the best
265
prcdiclor for first and third )'car Nith R2033 Jr'017 respcctivcly Thc study of
Dlvorkin (1970) had already Proved that Dental -'\plilude Test (DAT) predicts the
cognitive oulcomcs (academic performance) of denhl srudcnts, specifically' in the
first tvo ycars ofdental programme.
From 4 to 30 pcrcent oflhe variances in students' pcrlonnance in thc fi'styear or first
two ycars has been rcporled by Ranncl'ct al, 2005 & Kramer, 1999 Other studics
(Smithcrs et al, 2004 & Canadian Dcntal Associalion, 1999) also stated that the
pcrformance of Dental students $ho are admifted into dcntal school based on DAT
scores are significantly belter than those admifted into the progBmme through other
factors-
For sccond and final ycar, F.Sc. rvas lound thc besl Prcdictor with R'?=.087 &.036
(p=.010). Previous researches (such as Heller, ct al, 1965; Chcn, et al, 1967; Kreitet
al., 1968; Sandow et a|,2002) identified uniergraduate CPA to be the strongcst
predictor of dcntal success. College GPA significantl)' correlated with dental school
pcrlormancc with the widc range of r=0.)9 10 0.61 and explained from less than 5
porcent to nearly 40 percent of thc variation. Ranliey, R.R., Wilson, M.B. and
Bcnnctt, R.B. (2005), afler rcvicwing the literaturc, found lhat College GPA is lhe
bcst prcdiclor of acadcmic pcrformancc in dental school in the United Statcs and
Canada.
Kccping in view our resuhs, it can bc concluded tha( thc combination oi dental
cntrancc tcst and collcge GPA (F.Sc. scores) arc more predictivc of dcntal_college
pcrfoflnancc lhan are eilher cnlry tcsl scorcs or F.Sc. scorcs alonc. This conclusion
was also supported by fte studies of Kim & Lee, 2A07 & Amc.ican Dental
Associalion, Dcntal Report, 2007.
Ccndcr rvisc rcgrcssion anal)'sis of dcnlal sanlple illuslratcd lhat, in general, thc
validilies cocfllcicnts, for almost all criterion variables (from first to finalyear dental
cxaminations scorcs), were highcr for male stildents than for female. Stcpwisc
regrcssion analysis funher indicated that, for male, cntry tcst was iound the best
prcdictor oflhe first ycar wilh R2=.067 (7 % \'ariance, \vith p=.009) and third ycar
scorcs, with R'=.060 (p=.009), \\'hile for femalc sludenls, unlike the male, rYhen
step\\'isc rcgrcssion analysis Nas applied, all variablcs entered but none of the
266
prcdiclors was found to be declared as bcsr prcdictor for the first year and third year
scores. Fo. second year, F.Sc. scorcs \\'c'e found thc best predictor for both malc
(wilh R'?=.101) and female (R']=.072), rvhile merit scorcs were found the besl
prcdictor for male, with R2 value.092 (p:014) and FSc- scores for female' with
R2.039 (p= 031)' for linal year dental scorcs
Thc llndings of this study about dcnlal samolc, espccialll' regarding thc gcnder
diffcrcnccs, scrc consislcnt wilh other srudics Iike the studics ofRanncy et al' 2005 &
Coy ct al, (2003), Nhere thcy explored rhat enlD' tcst faloring male studenls as
conrparcd 10 femalc. Ho$'cvcr, Stc\Yad' C l\'1. cl al (2006) and Kim & Lcc (2007)
studics found that that femalc studenl pcrlormcd betlcr than malc students in thc
dcntal programme.
For cngineering sample, as alreadl' mcntioned, \'cre classified on the basis of thcir
cxamination system into hvo Sroups i.c. from 2000 to 2003 thcrc Tvas Annual
(cxtcrnal) syslem of cxamination and Semestcr s)stem from 2004 to 2005 Thc
rcsults of stcprvisc rcgression for sessions 2000-200i declared that m€rit scores were
found thc bcst predictor (out ofthe threc i.c. F Sc , cnlry test scorcs and mcri0 offirst,
sccond and third ycar cngineering scorcs, with R1 valuc.ll5 (p=.000), 107 (P='000),
and 021 (p=.000) respcctively vhen stcpwise regrcssion analysis was applicd to thc
data ofsrudcnrs 0f2000-200J sessions, all lariablcs enlcrcd but non ofthe predictors
was lound (o be declared as best prediclor for finalyear scores.
P.ovious rescarches (likc Karakaya & Tavsancil,2008; Hott et aI,2006; Lovegrecn,
2003; Ting,2OOl; & Kuo & Chosh, 1998) also idcntified that entrancc test and
collcgc GPA, combined are morc predictivc of enginecring perlormance than cither
component alonc,
For 2004-2005 (Semestcr system) scssions, the rcsuhs ofstcprvise regression revealed
that among the prediclors, F.Sc. scores rvcre found the best Predictor of thc first,
sccond and third year cngineering scores, \\'ith R2 value.0l5 (p=.000),015 (p= 000),
and.0l6 (p=.000) respcctively. Entry tesl scores were lound the best predictor ofihe
final ycar scores. Horvcver, Rr value was very lolv i.e..021. Same findings rvere
drawn by Ajobcjc, 2005; Henriksson & \\'olming, I998; & Hcnrysson & Wedman
(1979).
267
These variations may have been due to differenccs in the grading criteria arnong these
t\vo groups of engineering sludents (Julian & tnck\rood, 2000). For Students of
2OOO.2OOl.2002, & 2003 sessions thcre was Annual (e\temal) syslcm ofcxamination
in thc UET, Peshawar Nhcrc studcnls \vcrc asscssed on 0_100 scale. Semester systcm
rvas introduccd in UET in 2004 academic session. rvhcre from 2004 onward students
have bccn assessed intcmally on 0-4 scalc (GPA system). Moreover, both Annual
(oxtemal) and Semester systcm of examination nced their o\,n style of study and
study habils on the part of students. So, \\,e can conclude thal lor first Sroup (2000-
2003 scssion), mcrit \vas thc bcst prcdictor Nhile for group second (2004-2005
scssion) F.Sc. scores \\'erc the good predictors of sccond )eaa cngineering
pcrformancc.
As mcntioncd carlicr that duc to \'ery small sample (i.c. less than 2% of the tolal
samplc) of femate studcnts in enginecring profcssion, regression analysis is presentcd
only for ovcrall cnginccring samplc, inslcad ofgcnder- rrisc.
Resulrs from residual analyses (Wci8hled mea,t residuals) revcaled that, ovcr thc 5
medical yea.s, on the avcmge, malc's medical scorcs $cre over-prcdicted by thc F.Sc.
scorcs and under-prcdictcd by the cntry tcst and meril scorcs. Altcmatively, the data
displays thal fcmale's mcdical scorcs \\'ere undcr-prcdictcd by the cntry tcst scorcs and
ovcr-prcdictcd by thc F.Sc. and merit scores. As, \'holc malc's actual gradcs are
slightly higher than predicted \\'hile fcmale's grades arc slighrl)'lo\\er than predicted.
Ho\vcvcr, lhc undcr-prcdiction for entry tcst Nas largcr lor fcmalc (7.68) than male
(2.88), mcaning thal female's predicted grades rvere 7.68 gradc points lolver than ticir
actual grades, while for malc's 2.88 points lo\\cr than fieir actual gmdes.
Mean Residual values for dcntal students, by Cender, showed that the on the avcnge,
malc's dcntal scores $,erc undcr-predictcd by all predictors i.e. F.Sc. scores, cnlry test
and merit scorcs. Ho\\'evcr, it funher illusiraled that thc under_prediction for men was
largest for thc F.Sc. (as prcdiclor of second ycar). Altemativcly, on the average,
fcmalc's dcnlal scores \vere over-predicted by allthe three predictors i.e. F.Sc. scorcs,
enlry lcst and merit scores. So, \\'e can conclude from thc data that, unlike the medical
sample, as whole, malc's actual gmdcs Ncre higher than p.cdicted while fcmale's
gradcs were lorvcr than predicled.
268
These genderrelaled findings \\'ere in confornil)'\\ith thc past MCAT research
findings of Lydia, S. (2005), which idcntified significant gcnder-relatcd bias in the
MCAT but contrary to that Jones & Vanyur, 198 5 rcscarch rvhich failed io identiry thc
prcscncc ofsignificant gendcr-relalcd bias in the MCAT'
As mcniionod earlier thlt due to vcry small samplc (ic' less than 2% olthe total
sample) ol fomale students in en8ineering profcssion' residual analysis Nas prescnted
only for ovcrall samplc. insleid of gcnder- \ ise'
Weighted mean residuals for engineering studcnts of scssions 2000-200i, over the 4
ycar cnginecring programmc, rcflccted that on ihe avcrdgc, cnginccring studcnts'
scores were under-prcdicted by the F Sc. scorcs and oYcr-prediction by entry tcst and
merit scores. While studcnls of sessions 2004-2005, over the 4 1'car engincering
programme wcre over-prediclcd by the alllhe threc predictors (i e F Sc', entry test and
mcrit scorcs), meaning that tlleir actual scores, oYer lhe'l ycar engineering programme
werc loNcr than thc Predictcd scores
This study addrcssed scveral typical shoncomings/limitations of test validation
sludics likc singlc collcge/school/institution, but at thc same limc, il is not frcc from
all limitarions. l1 is acknowledge that Technical problents caused by small depanment
sizes, highly correlated admission measures, a rcstricted mnge of talent among
admifled sludenls, and vcry limited variation in g.aduate gradcs ofthe studcn6 oflhc
pariicipating inslitutions, placed tcstriction on thc Seneralization ofour rcsults.
Thc study was delimited 1o the informalion of Mcdical & Dental Colleges under the
administralive control of Provincial Goveromenl of ^-wFP
(KP) and University of
Enginccring and Tcchnology, Peshas'ar. Private sector Medical and Engineering
institutions are not included in lhe sludy. Thus the findings of this study may not be
gcncralized over all medical/dcntal and Engineering institutions in the province of
NwFP (KP).
Another Iimitation of the study is the unavailabilily of data for entirc applicants (i.c.
data for both the selccted and unselccted applicanls). This informalion could be used
Ior corrccling observed validity coe{iicicnts for restriction ofrange. So, no co.rections
u'crc madc for rcslriclion of rangc in this stud)'. although such rcstriction almost
cenainly occuncd (i.c. stLldenls are seleclcd on the basis of ETEA cntry test scores as
269
Ncll as F.Sc. score, \\'hich correlatc strongly rvith cntry lesl scorcs).This rcstriction of
range malhcmatically lou'crs correlation cocfllcici]ts and not only underestimatc thc
prcdictive po\\'cr oflhe predictors (admission crilcria), but also limited the population
generalizability ofthe findings (Nalhan, .2005 & Bunon and Ramist,200l). In this
study validily coelTicienls \vcre also not adjustcd lor the cffcct of criterion
unreliability.
5.3 Conclusions:
In spite ofthc limitations, discuss in thc prcvious section (Discussion), dre researchcr
is of thc opinion liat this study is significant becausc it is thc cvcr first predictivc
validily study for the ETEA administcrcd cntmnce tcst to all branches of Enginccring
Univcrsity, Pcsharvar and all Medical Colleges of lhe hNWFP (KP) province, one of
thc four fcderating unit of Pakistan. The study conrribut€s 10 the cxisting body of
kno\vlcdge conccrning the predictive validity of Mcdical, Dcntal and Engineering
cntmnce lest and undcrgmduate examination scorcs (GPA) and providcs a baseline of
informalion for future reseJrch in the arca
Dcscriplivc dala on the predictors and crilerion variables indicated that thc mcan
scorcs of lcmalc studcnts \\'crc highcr than malc for f.Sc., rvhilc rncn havc pcrformcd
bcttcr fian fcmalc students on entry test and meri! lor ali medical colieges. Wilh
rcgards to the performance on crilerion variables, in almost all the five examinations
(i.c. lrom first year to final year), thc studcnts ofall thc medical colleges, folloN'ed a
pallcrn of female having higher mean scores than male studcnts for each of the
ftedicalcollege.
Thc results of the study eslablish the lact that all rhe prediclors (F.Sc., Entry test and
mcrit scorcs) werc significantly associated with the all five MBBS exalnination scores
of all lhc four mcdical collcges i.c. KMC, AMC, GMC, and SMC sample, in almost
all thc six cohon; howevea, slepwise rcgression analysis reveal€d that among the
prediclors, from firsl to fou(h year, F.Sc. was found the bes! predictor, followed by
mcrit and cntry tcst whilc for final ycar, rncrit was thc best prcdiclor, followed by
cntry lcst and F.Sc. scores.
Cender \visc resulb sho\vcd thal in all the medical colleges, female had highe.
corrcla(ions bchvccn the prcdictors and thc criterion variables, lhan malc. validity
210
cocmcicnls dcrivcd from Iuli regression models and stcp\vise rcgressions for gender
cornparisons yielded that among thc prcdictors, F.Sc. rvas found the best predictor,
follo\vcd by merit and cntry tcst, from sccond to final )'ear for bolh gcnder (male and
female). For first ycar, F.Sc. and merit scores \\'crc lhe best predictors for malc and
femalc rcspcctively. Results lrom rcsidual aaall,ses (Wcightcd mcan rcsiduals)
rcvcalcd that, ovcr lhc 5 medical ),ears, on thc avcmge, male's medical scoacs \ycre
ovcr-prcdicted by the F.Sc. scores and undcr-predicted by thc cntry tcst and merit
scorcs. Allcmativcly, thc dala displays that fcmalc's medical scores ryere undcr-
p.cdictcd by thc entry test scores and over-predicted b),rhe F.Sc. and merit scores. As,
'wholc malc's aclual grades are slightl),highcr than predicted while femalc's gndes
arc slightly loNcr than predictcd. flo\vcvcr, the under-prediction for cntry test rvas
largcr for fcmalc than male.
For dental samplc, whcn data was pooled lor both the dental colleges, in general,
mcrit \vas lhc best prcdictor of thc dcntal scorcs follo\\.ed by Entry and F.Sc. scores
rcspcclively. Thc Step rvisc Rcgrcssion Analysis indicalcd that among the prcdictors
(F.Sc., Enlry test and merit scorcs), thc cntry test \\,as found thc bcst predictor for first
and third ycar, rvhilc for second and final year, F.Sc. rvas found the bcst prcdictor.
Kccping in vielv ou. results, it can bc concludcd that thc combination of dental
cnlrancc tcst and collcge GPA (F.Sc. scorcs) arc more prcdictive of denml-collegc
perlormance than arc eithcr cntry tcst scorcs or F.Sc. scorcs alonc. So, the study
supporls the usc ofcxisling crilcria lor admission 10 dental collcgcs.
Gcndcr wisc analysis of dcntal samplc illustrated that, in gcncral, tlc validitics
coefllcienb, for almost all crilerion variables (lrom first to final year dental
cxaminations scorcs), wcrc highcr for malc sludents than for fcmale. On thc averagc,
male's dcntal scores wcre undcr-prcdicted ard female's dental scores were over-
prcdic{ed by all the three predictors i.e. F.Sc. scores, cnirJ, test and merit scorcs. So, lve
can concludc from the data that, unlike the medical samplc, as whole, male's actual
grades were highcr than predicted while female's grades rvcre lolvcr than predicted.
With reSard to engineering, in general (for overall cngineering sample), all the three
predictors werc significantly conelated \\'ith all thc four cxamination scores of
enginecring programme. Holever, in most of the engineering disciplines, of all the
threc prcdictors (i.c. F-Sc., cntD test and l\4crit) ; F.Sc. \'as found in bcner position to
211
be used as predictor as compared 1o en!ry icst and mcrit scores. Next to F.Sc. scorcs
was the merit scorc, followed by entry test. Thc rcsults of stepwise regression for
sessions 2000-2003 declared that merit scores \vere lound the best prcdictor while, for
2004-2005 (Scmcster system) sessions, F.Sc. scorcs rvcrc found the best predictor of
the enginccring scorcs. So, \,c can conclude lhat lor first group (2000-2003 scssion),
mcrit was the best predictor \vhile for group sccond (2004-2005 session) F.Sc. scores
wcrc thc good predictors of second year engineering perlormance. Weighted mean
rcsiduals for engineering sludents ofscssions 2000-2003, over the,1 )'ear enginccring
programmc, rcflected that on the avemgc, engincering students' scores rvere undcr-
predictcd by the F.Sc. scorcs and ovcr-prcdiction b)'antry test and merit scorcs. while
studcnts ofscssions 2004-2005, \\'crc ovcr-prcdiclcd by lhe all the three predictors (i.e.
F.Sc., cntry tcst and meril scores), mcaning that lheir actual scores, ovcr thc 4 year
cnginccring programme $'erc loNer ftan tre predicted scores.
As mcntioned earlier that due to vcry small sample (i.e. less than 2% of thc total
samplc) of fcmalc studcnts in cngineering profcssion, analysis is presentcd only for
ovcrall cnginccring sample, instead ofgcndcr- rvisc.
5.3 Sug8cslions&Rccommcndations:
On lhc basis of findings and discussion, the suggestions and recommendations ofthe
study can be classificd into lhc follor\ ing thrcc catcgorics:
a. Rccommendations for Admission Committecs
b. Rccommcndations for ETEA
c. Recommendations for Future Research
Rccommeodations for Admission Committees:
Presently, the admission criterion for medical, dental and engineering
prolcssions bascd on cognitivc lactors only and docs not include an intcrview
or tcst ofnon-cognitivc domains ofthc studenls, such as personality mcasurcs.
Thcrelore, it is recommended that, along rvith cognitive abilities, tic
asscssment of non-cognitive knowledge may be included in the Selection
procedures. The students' pcrsonal characteristics assessmcnt (through
intcrvicN) as componcnt of sclcction proccss may belter predict studcnts'
a.
)1.
l .
iv.
b.
271
subsequent pcrformancc. Ho\Yevcr, lhese measures \Yould be best used to
compliment cxisting prcdictors ralher than replace them.
For personnel selection and lor thc selection ofapplicants to ali types ofhiSher
cducation, inlervie\vs arc the mosl \Yidcly uscd method A structured intervic'w
format may be introduced in the system of admissions to asscss specific
pcrsonal dimensions (indepcndcnl thinking, maturity, social and cultunl
arvareness and motivation) so as to incrcase intervielrer consistency and
objectivity.
Many collcges havc acknowledged thc impoflance of non-cognitive variablcs
in their admission practices by including essays, interviervs, and
recommcndations among the factors that dcterminc admissibility.
In the individual collegeVdiscipline, admission committees may conduct their
own intemal research./analyscs 10 confirm Nhether prediction of slldents'
pcrlormancc differ significantly lor thc differcnt gcndcr.
Recommendations for ETEA:
Prcscntly, qucstions on cntry test arc arranged randomly, inslead of subject
rvise. So, consequently, it is impossible to conduct validily study on subtcst of
ETEA lo dctcrmine which ol the subtests of ETEA best predict
mcdical/dcntal/enginecring school performance lor thcir studcnts. Thcrcforc, it
is rccommended that, like MCAT of USA, therc may bc subtcst of ETEA test
such as Biological, Physical, Chemislry, Mathematics and English tests.
The ETEA authorily may also ensurc acccss ofrcsearchers to the test data for
research on "ltem Anal),sis" 1o cvalualc the qualiry of itcms used in rhc ETEA
tcst.
The existing tesl can not bc labcled as "Standardized Test" because propcr
standardization proccdure is no1 adoplcd for dcsigning the test. Therefore,
through "ltem Analysis" and oficr procedurc, ETEA tesl may be standardized.
273
c. Rccommcndations for Future Rescarchl
viii. No corrcctions \vcrc madc for rcstriction of rangc in this studyj thcrcforc, it is
rccommendcd that future research Nould cxamine the effect of multivariate
rcslriction ofrnnge on cntry lest validilics.
ir. ln thc prcscnt slud)', sludenls' examination scorcs, as wholc, havc becn
considered as crilerion measures. In a future study, studcnts'achievcment
scores necd to be divided inlo several arcas (e.g., basic scienccs, pnctical field
rvork, prcclinical skills, and clinical pcrformance) and lo compare the
prcdictive validitics for cach area.
x. To generalize thcse results across the nation, the lulure rescarchers may
rcplicale this study in medical, dental and cngineering insiilutions of othcr
provinccs ofPakislan.
xi. Other important aspects ofsuccess, such as Craduation rale, college leadershiP
and posl-cotlege employmcnt, incomc, and communify contributions may al5o
he mcasured.
xii. Thc validity of other prcdictors, such as studcnts' socio-economic status, ruml
urban background and F.Sc. from difllrent boards need to bc examined in
future study.
xiii. Research study on "ltem Analysis" to evalualc the quality of itcms used in the
ETEA test may also be conducted.
xiv. ln future validily study may be conducted on subtcst of ETEA (such as
Biological, Physical, Chcmislry, Mathematics and English tests) to determinc
Nhich ofthc subtesls of ETEA besl predict mcdical/dentayengineering school
pcrformance for their studcnts.
274
REFERENCES
Ajobeje, O. J. (2005). Cognitive entD'charactcristics and continuous assessment as' "
iredictois oi acid".ic pertormance among polfechnic engineering
icchnolos/ srudents. The African Synposiu : On Line Journal of Alrican
Edu c at i o nal Re se arc h, 39 4 5.
Aldous, C., Leeder, S., Price, J., Sefton, A., & Teubncr, J (1997) A selection test for
Australian graduatc-cntry medical schools. l'lcdical Jountal oJAwtralio, 166,
247-250.
Aldrich, C. K. (1987). Ps)'chiairic inlerviervs and Psychological lests as prediclors of
mcdical students success.Journal ofllfcdical Educalion, 62, 658'
Al-Nasir, F., & Robcdson, A. S. (2001). Can seleclion assessmcnts prcdict studenls'
achicvemcnls in the Premcdical ycar? A sludy at Arabian Gulf Universily'
Ed cationJor Heallh, (14),271 -286.
Amcrican Dcntal Association (1999). Denlal aptitude tesling manual Ottawa: Author'
Amcrican Dcnlal Association (2007) Dental Admission Test validity Study 2003-
2004. Dcntal RcPort I . Chicago: Dental AJmission Tcsting Program '
Amcrican Educalional Rcsearch Association, Anlcrican Psychological Association, &
Naiional Council on Measuremenl in Education (Joint Committee), (1999)'
Slan.lards lot educotional and psychological rcrll'S Washington, DC:
Authors.
AD Intcrnitional Mcdical Educalion (2001) r'vc\\'slcllcr volumc 2, No l wintcr'
Rctrievcd from htto://$n"t' fsmb.ordpub utr!!9d-v l on l7-9-
08.
Ancis, J. R., & Sedlacek, \V. E. (1997). Predicting the academic achievement of'femaic
students using the SAT and non cognitive .,atiable' College o dUni'crsity. 72 (3), 2-8.
Association ofAmcrican Medical Collegcs (2002). Prcdictive Validity ofthc Medical
Collegc Admission Tesl conteDtPora4' issues in medical edtcation Vol 3 No'
2.lyashington, DC: Di|ision of l{edical Edncotion'
Australian Council for Educational Research (2008)' Graduate Medical School
Admissions Test (CAMSAT) UK informalion booklet,2008 Retrievcd from
w\\lv.eamsatuk.ore/documents/CAN4SATUKlB08.odf on l- l2-2008'
215
Baig, L. A. (2001). Predictivc validily of the medical .ollcge admission criteria foracademic pcrfonnancc: results from the four MBBS batches of Karachi
Mcdical and Dental C ollege. Journal of Pakiston Medical Association,5l (9),
312-3t6.
Baig, L. A. Chouri, C.H., Fchmida, T., & Nargis, A. (2001). 1s l,c adntission test at
instifi!k ofb siness rldntinislration o Sood predictot offnal prolcssional tesl
gradcs. P akist on Joltrnal of l,ledical Sc ienccs, 17, No.3,160.
Basco, W. T., Jr., Way, D.P., Gilbefl, G.E., & Hudson, A. (2002). Undergradualeinstitutional MCAT scorcs as predictors of USMLE Step I pcrformance.
Academic ltledicine,77 (I0 suppIy), 513-Sl6.
Bcllcr, M. (1994). Psychomelric and social issucs in admissions to IsracliuniversitiesEducatioral lleasurenrcnl: I.tslle!; and Proclice- 13 (2), pp. 12 '20.
Bennctt, I. C., & Boyd, M.A. (1990). Origin of first-time write6 of the Canadian
Dcntal Apliludc Test. J Can Dcnl Assoc. P/olincial 56 C) :129-31.
Bcrgoran, A. V., Susarla, S.M., Ho$cll, T.H., Karimbux, N.Y (2005). Dental
Admission Test scorcs aad performance on NBDE Pan I. Rcvisited Journal ofDcntal Educat ion, 7 0, No. 3, 258-262.
Blackman, I. (2004). Gradualc-Dntry medical studcnt variablcs that predict acadcmic
and clinical achievoment. lnlemalional E catiott Joirnal, vol. J, No 1' 30-
4t.
Boyd, M. A., Tctcruck, W.R., & Thompson, G.\\'. (1980). Interprctation and use ofthc dental admission and aplilude tests. J. Dent Edrc ll (5), 275-8.
Brown, R. S., & Coughlin, E. (2007). Thc prcdictive validiD' of selected benchma*
assessmcnts used in the Mid-Atlantic Rcgion: Issucs & Ans\Ycrs'
Pq,chological Btlletin, 121 (7), 162-181.
Burton. N. W., & Ramist, L. (2001). Prcdicting success in college: SAT@ studies ofclasscs graduating sincel980. Col/cge Board rcscarch rcport No- 2001'2.)
Ncv York : College Board.
Chcn, M. K., Podshadlcy, D.W, & Schrock, J. G. (1967). A factorial study of somc
psychological, vocalional intercst and mental abiliq variablcs as prcdictions ofpcrformance in dcntal s chool. J Appl Ps\chol 51 (3),236-241.
Choudhry, R., Garg, K., Gaur, U., & Anand, C. ( (1997). Acadcmic perlormancc ofvarious catcgories of students admitted io Lady Hardinge Medical College,
Ne\v Dclhi. J-Irdior,Ued Assoc.,95 (2),15.47.
276
Coates, H. (2008). Eslablishing the crircrion validir),olrhc Craduarc Mcdical SchoolAdmissions Test (CAMSAT). Mcdical Jaurno! of Ausrralia, 42 (10), 999 _1006.
Colliver, J. A., Vcrhulsr, S. J., Williams, R. c. (1989). Using a standardized-parientexamination lo cstablish the prcdicti\'. vslidiq, of the MCAi andundcrgraduatc GPA as admissions critcria. Acad Mcd 6J, ,1g2-1g4.
Coy, K,, Mc Dougall, H., Sneed, M. (2003). Issucs regarding pracric.al validity, andgcnder bias ofrhe Pcrccprual Abililies Test (pAT). J Dcnt Educ; 67, 3l -37.
Cronk, B. C. (1999). Horv to use SPSS: A srcp-b;.51sp guidc ro analysis andinierprelation, Los Angclcs, CA: P)'rczac.
Cu(is, S. J. (1967). Hisrory of Educarion in Crear Brirain. London: UniversiryTutorial Prcss, Lrd, 64.
De Ball S., Sullivan, K., Horine, J., Duncan, \\r.K., & Replogle, W. (2002). Therclarionship of performancc on the dcntal admission lcst and performance onPan I oflhc National Board Dcntal Examinarions. J Dent Educ, 66 (1),478-484.
De Silva, N.R. ct al (March,2006) Admission ro m.dical students in Sri Lanka:predictivc validity of selcction criterion. Ceylon Med J. 5l (l) :17-2l.Relreived from http://r\1!1v.ncbi.nlm.n ih. qov/pubmed./16898032 on 27-6-2009.
Ds Silva N.R., Pathmeswaran, A., & De Silt,a, H.J. (2001, Sep) Selccrion oistudenrsfor admission to a medicai school in Sri Lanka. Ceylon Med J.,49 (3) :81-5.From http://*$.rv.ncbi.nlm.nih.rov/oubmed/l 5524225? on 27 -6-2009.
Dixit. H., & Maharjan, S. (2003). Rcvicrv ofadmission ofMBBS studenrs ar KMC.Kolhnandu Uniwrsity Medicol Journal, Yol. 1,
^-o. 3, 212-221.
Dixon, D. A. (2004). Relation between variablcs of preadmission mcdical s.hoolpcrlormaocc and COMLEX-USA Levcls I and 2 performancc. Journal ofAnerican Oslcopallic Association,I04 ( 8), 332-336.
Donnon, T., Oddonc-Paolucci, E., & Violato, C. (2009). A predictivc validity study ofmcdical judgmcnt vignettes to assess studcnts'noncognitive attributes. A 3-ycar prospcclivc longiludinal sludy. Medical Tcachcr, 3l ( 4), pp.el48 -155e.Retrievcd from hlto://\\.\\\v.inlormaworld.com on 4-'7 -2009.
277
Donnon, T., Paolucci, E. O. & Violato, C. (2007). The predictive validity of theMCAT for medical school pcrlormance and medical board licensingexaminations: A meta-analysis of the published rcscarch. Acod Med, 82 (l),t 00-t06.
Drvorkin, S. f. (1970). Dcntal aptitudc tcst as prcdictors of pcrformance ovcr fourycars ofdental school: anal),sis and interprctation. J Den! Edu;, 31,58-62.
Ebel, R. L. (1972). Esscntials of Educational Mcasurement. n-ew Jersq,: prenticc-Ilall, hc.
Elam, C. L. & Johnson, M.S. (1992). P.cdiclion of mcdical studcnrs, acadcmicpcrfornrances: Docs thc admission inlcn,ic*, help? lcolc nic lledicinc, 67, S28-S30.
Encyclopcdia Wikipedia (2007). Standardizcd tcsls. USA: Wikimedia Foundation,Inc.
Etzkolvilz, H., Kemclgor, C., & Uzzi, B. (2000). Alhena unbound. Cambridge (UK):Cambridgc University Prcss.
Evans, P., & Wen, F.K. (2007). Does lhc Mcdical Collcge Admission Tesr prcdictglobal acadcmic performancc in oslcopathic mcdical school? Journal of/ltDcrican Osteopath ./lssociation, yol.I07, No l, 157)62.
Fensler, A., Markus, K. A., Wiedemann, C. F., Bracken, M. A., & Femandez, J.(2001). Selccting tomorow's lorensic ps).chologisrs: A fresh look at somefamiliar prodiclors. ,ed,rcational ond Psychological Measurenenr, 6l (2),336-348.
Fcrguson, E., Jamcs, D., & Madclcy, Lmcdical school and in a mcdical8n, ,321,952-957.
(2002). Factors associalcd with success incareer: systeDtatic revier\, of thc Iiterature.
Field, M., & Gordon, J. (2022). NeN Parhways into Medical School ..Do\vn Under,,.http:/ \'\r'w.studenrmi.com,6ack isues/o900/editorialVi05.htmlon l2-6-2009.
Gciscr, S. and Santelices, M.V., (2007). Validiry ol high-school gradcs in predictingsludcnt success beyond the lreshman year: High-school record vs.standardized tests as indicalors of four-)ear collegc outcomcs. Research &occasional poper series CSHE.6.07- Bc.keley: Univcrsity of Califomia.Rctrieved from htp://N1\.w.eric.ed.gov on 25-l l-2008.
Gcncral Medical Council, (2003). To orrow's doctots.London_ GMC. Author.
2't8
Cough, H. G. & Hall, W.B. (1964). Predicrion of pcrformance in medical schoolfrom thc California Psychological Inventory. J Appl psychot, tg (l),218-226.
Covernmcnt of NWFP (KP) (1996). Notification No. SO-II (Hcalrh) /2-9196_96.Peshawar: Heahh Dcparhent.
Govemmcnt of NWFP (KP) (2000). prospecrus for NWFP (Kp) Medical/DenralCollcges (2006-2007), Pcshawar: I{calrh Dcparrment.
Govcrnmcnt of NWFP (KP) (2001). Educational Testing and Evaluation AgencyOrdinancc, 2001. Peshatvar: [.arv Dcpartment.
Govcmment of NWFP (KP) (200i). Education Sector Rcfonns: Acrion plan 2OOl-2004. Pcsharvar: Ministry of Education.
Covemmcnt of NWFP (KP) (2003). Prospectus of NWFP (KP) medical and denralcolleges (2003- 2004). Pesha\\'ar: Dcparrrnenr ofHealth. pp. 26-27.
Covcmmcnt of Pakistan, Planning Board (1956). The firsr Five Ycar Plan 1955-60.Chapler 26: Education and Training. Karachi: Covcmment ofPakistan P.ess.
Covernment of Pakistan (1959). Report of The Commission on National Educarion.Karachi, Govcmment of Pakistan Prcss.
Govcmmcnt of Pakistan. (1976). Pakistan Engineering Council (PEC) AC'f, t976.Act No.V of 1976. Published in the Gu:ettc of Pakistan, Antendcd t'ideOrditance No. XLN of2a07, Islonabad (Scptember I7,2007).
Govcmment of Pakistan (1979). National Educaiion Policy and ImplementaaionProgramme. Islamabad: Ministry of Education.
Govcrnmenl of Pakislan (1992). National Education Policy. Islamabad: Ministry ofEducation.
Coveroment of Pakistan (1998). National Educarion Policy. Islamabad: Ministry olEducalion.
Govcrnment of thc Punjab (2008). Admission schedule MBBS / BDS (2008-09).medical and dcntal collogcs / institutcs of Punjab (Pakistan). Rctrievcd fromhtlp://pakmed.net/colleee/pros06/admission schcdule on 24-01-2009.
Grovcs, M. A., Cordon, J., & R),an, G. (2007). Enlry tests for graduate medicalprograms: is il lime to rc-think? Medical Jorrnal ofAusrralia, 186 (3), 120-123. http://*.\vw.mia.com.au/public/issucvl86 03 050207/srol063 | fm.pdfRetrievcd on 26-03-2008.
279
Hackctt, J. L. (1996). The Medical College Admission Test (MCAT): is use in U.S.and Canada and somc rcsuks of validation studics. Beficht iibet daslnlemaliokal S)'ntpositol r), Berr. Retrievcd on l7-06-2009 fromhnp://u,*,rv.unifr.ch/ztdlcms/bcrichtc,/b3/lhc mcd ical.htm.
Hambleton, R. (1999). Establishing thc validi!) ofadmission rcsts, Graduate schoolprcdiclile validity results: Ablcr jrlorr the Ser.enth lnrernationol SrI.e-SATConfercrce, hrc3 -5, S*eden: Umci Universiry.
Hcllcr, D. B., Carson, R.L., & Douglas, B. L. (1965). Selection ofstudents for dentalschool. J Dent Educ, 29 (2),20?-207 .
Hclms, R. M. (2008). Univcrsity admission \yorld \\'idc. \\'orld Bank, Educationrvorking paper series r'{o.15.
Henriksson, W., & Wolming, S. (1998). Acadcmic pcrfomancc in four studyprogrammcs. A comparison of studcnts admittcd on thc basis of GPA and
SwcSAT scores, \vith and wilhout crcdits for rvork c\petieoce. Scandi ovianJotntal of Educational Rescarch, 12, 135-150.
Hcnrysson, S., & Wcdman, I (1979). Research in S\\'cden with rcgards to prcdictivctcsts and interviews for admission 1o higher cdocation. Spdnorfrda SPINT, Nr13, Deparlnent ofEdtcation, Uniwrsity oj Uned.
Hezlcll, S. A., Kuncel, N., Vcy, M. A., Ahart, A. t!1., Oncs, D.S., Campbell, J.P., &Camara, W.J. (2001, April). The cffcctiveness of the SAT in prcdictingsuccess early and late in college: A comprchensive mcla-analysis. Paperpresenled at thc annual meeting of the National Council on Measurcment inEducalion, Scattle, WA.
IIojat, M., Robcrson, M., Damjonov, 1., vcloski, J.J., Glaser, K., & Gonnella, J. S.
(1993). Studcnls' psychosocial chamcteristics as predictors of academic
pcrformancc in mcdical school. lcalenic A'lcdicinc, 68,635 -637.
Holt, D. T., Bleckmann, C. A, & Zitzmann, C. C. (006). Gmduate Record
Examination and Success in an Engineering Management Program: Care
Sn$'. Engilccrihg A'lanogencnt JaunMI. Rctrieved fromwww.hiehbcam.com/doc/ lP3- 10i2921 I I I . lml on I0-07-2009.
Hoschl, C., & Kozcny, K. (1994. Prcdicting academic pcrformance of medical
sludents) : the first threc years- The .'lmcrican Jotrnal of Psychiatry. 151: 87-
92.
Iramaneerat, C. (2006). Predicting academic achicvcment in the medical school with
hiBh school g.ades. J Med lssoc Tho| 89 (9), 1497-1505. Retrieved from
hltp://w\r.v.medassocthai.orqliournal on I l -05-2007.
Jamcs, W., & Hawkins, C. (2004). Assessing potential: the development of selectionprocedurcs for the Oxford medical course. Ox/ord Rev Educ: 30: 2l)_55.
Jinnah medical college (2008). Admission in JMC: admission critcria. Retrievedlrom http:// r$rrv.imc.edu.pVcontact.hrm on 25-09-2008.
Joncs, R. F., & Mitchell, K. (1986, April). -Racrol/ethhic difercnces in the predicti|eralidiD, of MCAT scores. paper presenlcd at rhc annual meeting of theAmcrican Educational Research Association, San Francisco.
Jones, R. F., & Vanyur, S. (1985, April). Gender-relared test bias fot the i.ledicalCollegc ldnission Tesl Papcr presented ar the annual mccting oflhc NationalCouncil on Measurement in Education, Chicago.
Julian, E. R., & lrck\\,ood, J. (2000). Prediclive validily of thc mcdi€l colleg€adnrission lest. Corlcrryorary Issues in Medical Education, 3,2.
Julian, E.R. (2005). Validity of the Medical Collcge Admission Tcsr for predicringmcdical school pcrform ance. Acadcnic i,Ielicine, 80 ( l0), 910-911.
280
Karakaya, 1., & Tavtancil, E. (2008). Thc prediclivc validity ofthe universiry s(udenrsclection examination. Educational Sciences: Theory and Practice, yol I No.3l0l l-1019. Retrievcd from htlp:/ !\!,w.eric.ed.eov/ERIC|)ocs/pdf on l7-7-2009.
Kim, K,S. (2002). Basic schcmc for dcvcloping Dental(DEET). Joumal of Mcd Educalion; 4:55-S.
Kim, M., & Lce, J. L. (2007). Variablcs predictingachievcment in a graduatc-cntry dcntal school inEdicatio,l, 7l (1), 550-556. Rctricvedhtlp://wN,w.idcntaled.ore/cei/contcnt/abstract.
Education Eligibility Test
studenls' first semesterKorea. Journal of Dentalon 05-09-2008 from
Kingslcy, K., Scrvcll, J., Ditmycr, M., O'Malley, S., & Calbrailh, G.M. (2007).
Crealing an cvidcncc-bascd admissions formula for a new dental school.Journal of Dcntal Education, 7) (1) : 492-500. Retrievcd Fromhttp://\I.\vv.ncbi.nlm.nih.eov/sites/entrez on 03-09-2008.
Kleshinski, J., Khudcr, S. A., Shapiro, J. I., & Cold, J. P. (2009). Impact ofprcadmission variables on USMLE Step I and Slcp 2 petfonnance. /ld'atlcesin Hcahh Scienccs Education, yol. ll n'o.1, 69-78. Relrieved Fromhtlo://\\.*,w.cric.ed.eor/ERICWebPortal an 17 -7 -2009.
281
Klilgaard, R. E. er al. (1978) ). llerit ond adnissians polic1,l sar" srudies fromPakistan. Discussion paper serjcs r\o. 59 D. ERIC Jocumcnt No.t7260j.Rctricvcd lrom \11\1v.eric.cd.pov/ERIC on 4-7-2009.
Kobrin, J.L. & Michcl, R.S. (2006) The SAT@ as a predictor of differentcollcgc pcrformance. Rcsearch report No.2006-3. New york: TheBoard.
Icvels olCollcge
Kramer, G. A. (1986). Prcdicti\'e validiry ofthe Denral Admission Test. J Dcnt Edtrc,50 (9),526-s31.
Kramcr, G.A., (1990). Valuc in dcnral aprirudc resling for minoriry applicants. J DentEdrc,63 (10), 759-65.
Krcit, L. H., & McDonald, R.E.Apliludc Ten a5 predictorsEdtG, 32 (4). 452457.
(1968). Prc-professional grades and rhe Dcntalof studcnt pcrformance in dcntal school. -I Derr
Kubiszyn, T.. & Borich. G. (1990).Educational testing and measurement: classroomapplication and priclicc (.3'o ed;.Unitcd Srares: Hrrpcr Collins publishen.
Kulatunga-Moruzi, C., & Norman, O. R. (2002). Validiry ofadmissions mcasurcs inprcdicling pcrformance outcomes: the conlribution of cognitive and non-cognilive dimcnsions. Ieach Lcarn Med. Ilinter 14,3442.
Kuncel, N. R., Hczlett, S.A., & Oncs, D.S. (2001). A comprehensive meta-analysis ofthe prcdictivc validiry ofthe Gradualc Record Examination: implications fotgraduatc str-rdent sclcction and pcrlomancc. Psychological Bulletin, 127 (7),162-r8t.
Kuo, R., & Ghosh, S. (1998). A correlation-bascd srudy oithe admissions critcria in aB.Sc- cnginccring progtum. It1t. J- Engng Ed., Vol. l.l, No- 2,95-101.
Licn, A.J. ( I976).Measurement and Evaluation of lcaming (3d ed). Iowa (JSA) :\vm.C. Brown Company Publishers.
Lovcgrccn, T. A. (2003). Predicting the academic success of femalc enginceringstudcnts during thc first ),car of collcgc using the SAT and non-cognitivcvariablcs. Unpublished Mastcr ofAns io Educalion Thcsis, thc Faculty oftheVirginia Pol),lcchnic Insti{utc and Statc Unircrsity Blacksburg, Virginia.
Lydia, S.K. (2005). Predictive validity, diflerential validity, and differential prediclionofthc sublcsts ofthe Medical College Admission Test. Unpublished Doctorialdissertation. Ohio University: Educational Research and EvaluationEducalion.
Mccaghie, W.C. (1990). Pcrspcctives on mcdical school admissions. lcoderrctledi c ittc, 65 No. 3, 136-1 39.
McGaghic, W.C. (2002). Asscssing rcadiness for mcdical cducation: evolution oftheMcdical Collegc Admission Tcst. Jl,lzr, 288:1085- I090.
McManus, I. C., Porvis, D.A., Wakeford, R., Fcrguson, E., Jamcs, D., Richards, p.(2005). Intcllcctual aptit!de tcsrs and A lcvels for sclecting UK school leavcrcntranls for medical school. BMJ ; 331:555-559.
Mcgan Rac, P. (2008). Diffcrenrial prediction ofmedical school selecrion: facrors fo,rural and non-rural popularions. Mastcr,s Thesis, department of psl,chology(Abstracl) Virginia Tech. Retrieled on 13-3-2009. fromhtlp://scholar.lib.vr.cdu/thcscs/available/crd-05022008- I I 2,126.
Mcridith, K.E., Dunlap, M.R., & Bakcr, ILH. (1982). Subjccrivc an<i objccrivcadmissions factors as prcdictors ofclinical clc rkship pe.fomance. J Med Educ5 7, 7 43-'1 51 .
Milchcll, K.J. (1987).Use of MCAT dala in selccring sludents for admission tomedicalschool. Academic Medicinc. 62: 87 t -879-
Milchell, K.J., Haynes, R., & Koenig, J. (1994). Assessing the validiry ofrhc updatcdMcdical Collcgc Admission Tcst. Acadcmic M cdicinc, 69 (5),394401.
Moorc, D. S. (2000).The basic practice of statistics (2nd ed).r.\crv York: W.H. Frcemanand Co.
National University of Science and Technology. (2009 ). Enginccring admission,2008-9. Retrievcd from http://$1v!v.nust.edu.pk on 29-07 -2009.
Nalional University of Science and Technology. (2009 ). MBBS / BDS admission atNational Univcrsity of Scicncc and Tcchnology (NUST) 2008-9. Rcrrievcdfrom hflp://www.interlace.edu.oUleslVmedicakest/nust.aso on 3l-01-2009.
NED, University of Engineering and Technology (2008). Admission Notice:Academic Session, 2008-2009. Ref No-Acad./Admission/2008-09/9323. dated:2 I -08-2008. Karachi: Registrar.
Niraula, S. R., & Khanal, S. S. (2006). Crilical anal),sis of pcrformance of medicalstlJdcnts. Education lor Healrh, Vol. 19, rr-o.1, 5 -13. Retricved fromhtt p://\'\\,rv.ed ucalionforh ealth.nel,/74 3 763 290. pd f otr I -7 -2009 .
NWFP (KP) Universily of Engineering and Technology (2006).Undergraduateprospsctus, 2006-2007. Pesha\var: Author
Pak; l\,{cd lnfo Dcsk (2008). Admission ro CoYemmen! mcdical colleges of Sindh,
NWFP (KP) Univ-ersiry of Engineering and Tcchnology (2008).Undergmduareprospcclus, 2008-2009. peshawar: Aulhor
from httn: kmcd.net/coll urnhs admission roc tml
Pakislan Engincering Cor.rncil (2004-2005). History ofpakistan Engineering Council.
Parry, J., Mathers, J., Stevcns, A., parsons, A., Lilford, R., Spurgeon, p., & Thomas,H. (2006). Admissions processes lor five year medicai courses at Englishschools: rcvicrv. -B,ly'J; JJ2, I005-1009.
Patrick, L. E., Altmaier, E. M., Kupcrman, S., & Ugolini, K. (2001). A srrucruredintervicw for mcdical school admission-phasc l: initial procedurcs and rcsults.Acod l4ed 76,66-71.
on l7-09-2008.
Peskun, C. Dctsky, A., & Shandling, M. (2007). Eflccrivencss of medical schooladmissions crileria in prediclins rcsidcnc) ranking fovt r-cats latet. lt{edicalEducotion, 4l (1), 57-64.
Powcll, K. M. (2003) Access and opportunity: racc and gender variations in theprcdictivc validity ofrhc admissions indcr. Unpublishcd docrorial thcsis at rhcDcpanmcnt ofEducalional Rcscarch and Lcadcrsltip and Counselor EducationNorth Carolina Statc University.
Powcrs, E. D. ( 2001, May). Validity of GR-EO gencml lesl scores for admission rocollegcs of vcterinary nedicinc. GRE Board Rcport irto.98-09R., princeton,NJ 08541 : Educational Testins Scrvice.
Ramsbottom-Lucicr M., Johnson, M., EIam, C. (i995). Agc and gendcr diffcrcnccs instudcnts' preadmission qualifi cation and mcdical school pcrformances. AcadMcd.70,236-239.
Ranney, R. R., Wilson, M. B., & Benneli, R. B. (2005). Evaluarion of applicanrs loprc-doctoral denlal education p,ograms: re?iew oflhe litcratwc. J Denr Ed c,69 (t 0), 1095- 06.
Roding, K. (2005). Univcrsity admission based on tests and inrerviewsimplcmcntation and asscssment. Un-published Doctorial Thesis; Departmentof Leaming, Informatics, Managcment and Ethics, M€dical ManagcmcntCenter, Karolinska Institute, Stockholm, S\\,eden.
281
Sandow. P. L., Jones, A C, PeeL, C W'Courts'F J'' & Warson' R E (2002)'
"""""'i*iir"ir"" "i"a^ission
crii.ria r.,lrtt acnlal school Per[ormance and attrilion'
Journal of Dentat Educatiotl, 66 (3)' 385-392'
Shcn. Il. & Comrey. A' L (1997) Prcdicring mcdicai students' acadcmic
'"'" ritrJ.""*;;i; rh"i' *gniti',. rbilities and-personaliq characterinics /c'dMed;72 (9):181-6'
Silvcr. B., & Hodgson, C S. (1997) Evsluaring CPAs and N1CAT.scorcs' as"" -'*"a;.io"
oiNave t ani clerklhip performsnccs brsed on studcn(s' dal'l
i.oni on" rnd.rg."arutc inslitution "l'ad'll'd' 7 2' 391-396'
Smirhcrs, S., Cttano. V. M. & Cunningham (2001) \\'hrt prcdics pcrformance.in" "" H;;;; Jenul schools? Jou'nil of De'tot Edtrcotion 6s' A':9:^118^^613
ilir]Jvea i.om t,toyl'**".ia"nt"t"a otg/"e;/tto'inyeslelsqs on 26108'2008'
Stage, C. (1999). Notcs From Thc Sevcnlh Intemalional S\\'e-SAT Confcrence' Umel
Univcrsity, Sweden. Junc 3 -5.
Srcwan, C. M., Batcs, R. E., Smith, G.E., & Young, L (2006) Impact of-gender on--- - l;al slatc lic;nsure examinalion Perfonance J Dent Ed c 70' 525-530'
Stihvell, L. A., Dalessandro, S. P., & Reesc, L l\1 (2005) Predictivc validity of the"' iiair'z national summary of lhc 2001-2002 corrclation studics' Al"{rii"i,rira n"p*t No.03-0f. Novtorvn, Pr1: t,a$' School Admission Council'
SNanson, D.8., Casc, S.M., Koenig, J., & Kiuian, C D (1996) Prcliminary-study of- - - thc uccumciei of thc old ind ne*' Mcdical College Admissions Tests for
prcdicting pcrformancc on USMLE Step \.AcadMcd,7l (l suppll)'25-27'
Swinton, S. S. (1987). Thc Predictile validity ofthc reslructurcd C RE, with- penicular- -;i;";"; to ;dcr students. GM Boord profcssional report No 83-25P EN
rcsearch report 87'22 Educotional Testing Sen'ice, Princeton N'J 08511'
Tabachinck, 8.G., & Fidell, L.S. (2001).Using multivariatc sutistics (4s cd)' Bonon:
Allyn and Bacon.
Thomdikc. R. L & Hagcn, E (1969). Mcasurcmcnt and Evalualion in Psychology
and Education (3'd cd) NcN York: John \\/ilcy & Sons, lnc'
Ting, S. R. (2001). Predicting academic sttcccss of firsFyear engineering students
from standardizcd test scorcs and psychosocial latiables lnlernalional
Jounnlof Enginecring Ed catioll, | 7 (i), 75-80'
285
Universiry of Engineering and Technologl', Pcsha$ar. (2009)- Admission to B.Sc
cngineering.From.hllp://\\'eb.N\\rFP{ KPluel.edu.ok/addmissions /addmission-
b!l[ on 30-01-2009.
Veloski, J. J., Callahan, C. A., Xu, C., Hojat, M., & Nash, D. B. (2000). Prediction olstudcnG'performanccs on liccnsing examinations using agc, race' scx,
undcrgraduate GPAs, and MCAT scores. 75 (10 supply),28-30.
violato, C, & Donnon, T. (2005). Does the Nrcdical College Admission Test prcdict
clinical reasoning skills? a longitudinal studl' emplof ing the medical council
of Canlda clinical rcasoning examination. Acadcmic Medicinc, Vol.80,
No.l0, l35-165.
Walkcr, J. D, Killip, D. E., Puller, J. L. (i985). Significance of the admission
interrierv in predicting studcnls' perlormance in dental school. Jotmal ofMedical Educat ion, 60, 569 -57 ).
Wedman, I., & Hcnrikson, W. (1996). The Swedish Scholastic Aptitude Test:
Research and main findings. Paper presenlcd al hiefiational Synposiun itBem. Rctrieved from htlp://www.unifr.ch/ztdlcmsbcrichtefu3/lhemedical.htmon l7-06-2009.
wciss, M., Lotan, I., & Kedar, H. (1988). Sclccling candidates for a medical school:
an evaluation of a sclection modcl based on cognitivc and Personalityptcdiclots. Medical Educat ion, 2 2, 492' 497.
Wikipcdia Encyclopedia (2007). Standardizcd tcsts. USA: Wikimedia Foundation,
Inc. Retrievcd from y54y;{!iqg!j1Qg!g1i91q1g on I 8-12-2007
Wikipcdia Eencyclopedia (2008). Dentistry throughou! thc world: Rctricved from
http://en.wikioedia.ordwikiDentistrv throuqhout the \\orld, on I l-09-2008.
Wiley, A., & Kocnig, J. A. (1996). The validily of the Medical College Admission
Test for prcdicting performance in the first two yea.s of medical school.
Vol.7 I (l 0 sfipply), 83-85.
Willingham, w. W. (1985). Success in college: The role of personal qualities and
academic ability. New York: The Collegc Enlmnce Exanlination Board.
Willinsham, W. W., LeB,is, C., Morgan, R., & Ramisl, L. (1990). Predicting college
grades: An analysis of institLltional lrends oYer t\Yo decades Nclv York:
Educational Tcsling Scrvice.
286
Wilson, K. M. (1983). Jl reliae of rescarch onperfornwnce oJier the freshntan year (Collegcl'ork: College Entronce Lta ination Board.
Wood, D.A. & Langcvin, M. l. (19'12). Moderatingfrcshman cnginecring. Jotrnal of Educationall1l-320.
the prcdic;ion of acade icBoard Rcport No. 83-2. Nas
thc prediction of grades inMeasurenent, Yol. 9, No. I
Yalcs, J. & Jamcs, D. (2006). Prcdicting the "srrugglers": a cdic-conlrol study ofsatdents at \totthtghant Uniwrsity Medical School. B,\,lJ; 332,I009- 1013.
Young, J. W. (1990). Are validity cocfllcicnts underslated due to correctablc dcfccBin thc GPA? Rcsearch in high cducation. Vol. J l, lto.1,319-325.
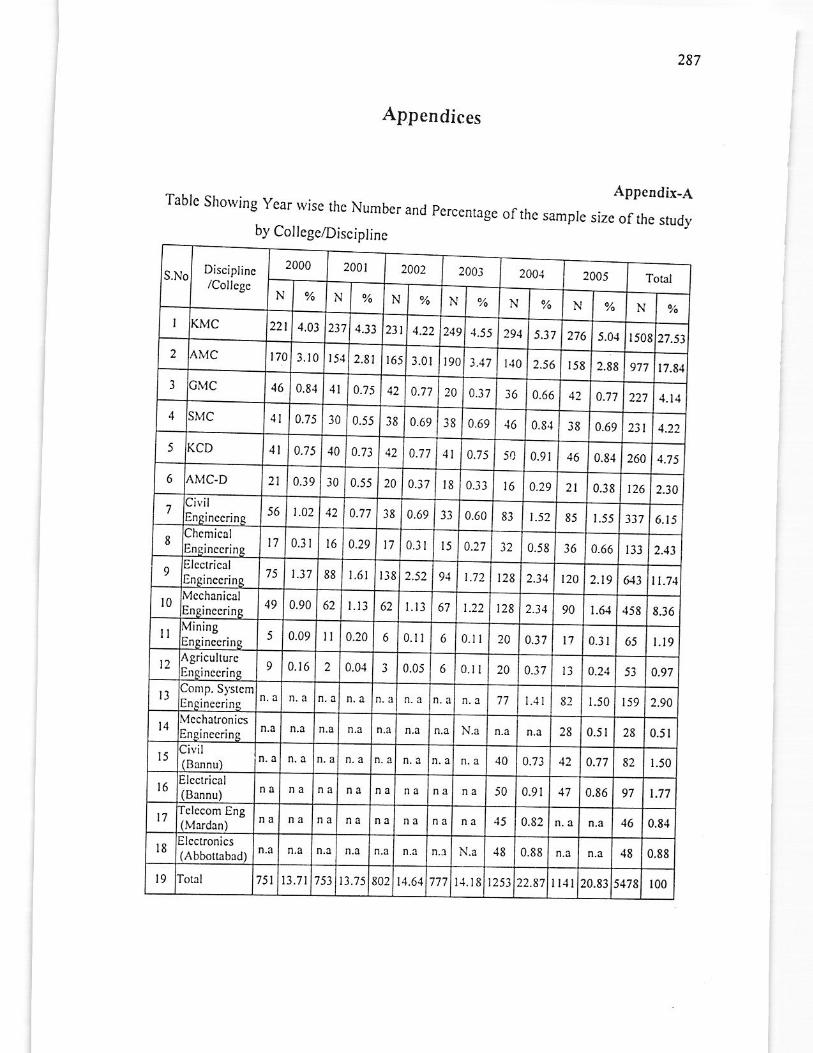
Tablc Showing year s,ise fte Numbcr and percenrage ofthe sampleby CollcgelDisciplinc
Appendices
Appendix_A
sizc ofrhe study
S.^"oDisciplinc/CollcSc
2000 2001 2002 200i 2001 2005
N % N N
2UI
% % %
I KMC 1.03 1:7 4..13 1_?2. 219 1.55
3 -17
l9{ 5.37 276 5.0r 1508 27.532 AlvlC 170 3.t0 t5{ 2.81 I65 3.01
0_7'1
19A l{0 7_56 r58 2.88 977 l7.E{3 cIlC .t6 0.8{ 4l 4.75 12 20 0.37 l6 0_66 1? 0.7-l 227 .t.l.t
J ;]\,C .11 4.7 5 30 0.55 38 0_69 l6 0.69 16 0.s{ i8 0.69 131
5 KCD .11 0.'t5 l0 4.13 42 a_77 .11 aTs l 5ri 0.9r .16 0.8.1 264 4.75
6 AMC.D 2t 0_39 i0 0.55 2A 0.37 8 0.13 16 4.29 2t 0.36 r26l2.io- lcivil
56 1.42 42 4.77 38 4.69 0.60 6i .52 85 I.55 337 6.15
8:hcmic,
17 0.ll 16 0 29 | 17 I 0..1r I5 0_27 i2 | 0.58 36 0.06 | Bl 2-13
o iElccrricJl' Enlinccri 75 r.t7I 88 t.6r E8 ?.52 9l 1.72 t28 2.)1 120 2.19 643 1.11
t0 McchanicaltnEinccrinR 49 0.90 62 I,I] 62 l.li 67 1.22 I28 2.i{ 90 I.6l ,rJ8 8.36
Il VininS5 0.09 II 0.20 6 l),II 6 0.tl 20 4.37 l1 0.il 65 l. t9
12ASriarlturcEnBinccrinc 9 0. t6 2 0.01 l 0.05 6 0.11 20 a-37 IJ 0.2., 5l 0-97
I] Conrp. Slstcm11 L.lI 3: r.50 159 1..90
1.1Enrinccrine 0.51 28 0.51
l5 3iril(Bannu) ,10 0.?l ,12 0.77 32 1.50
t6 Elcctrical(Bannu) i0 a_91 17 0.86 97 t.17
17Iclccom En8(Mardnn) .15 0.82 .16 0.E.1
l8Elccrronics
{8 0.E8 .18 0.88
l9 Iolal 75) t3.71 753 13.75 802 I1.6r 777 11. t8 1253 II{I 20.8i 5.178 r00
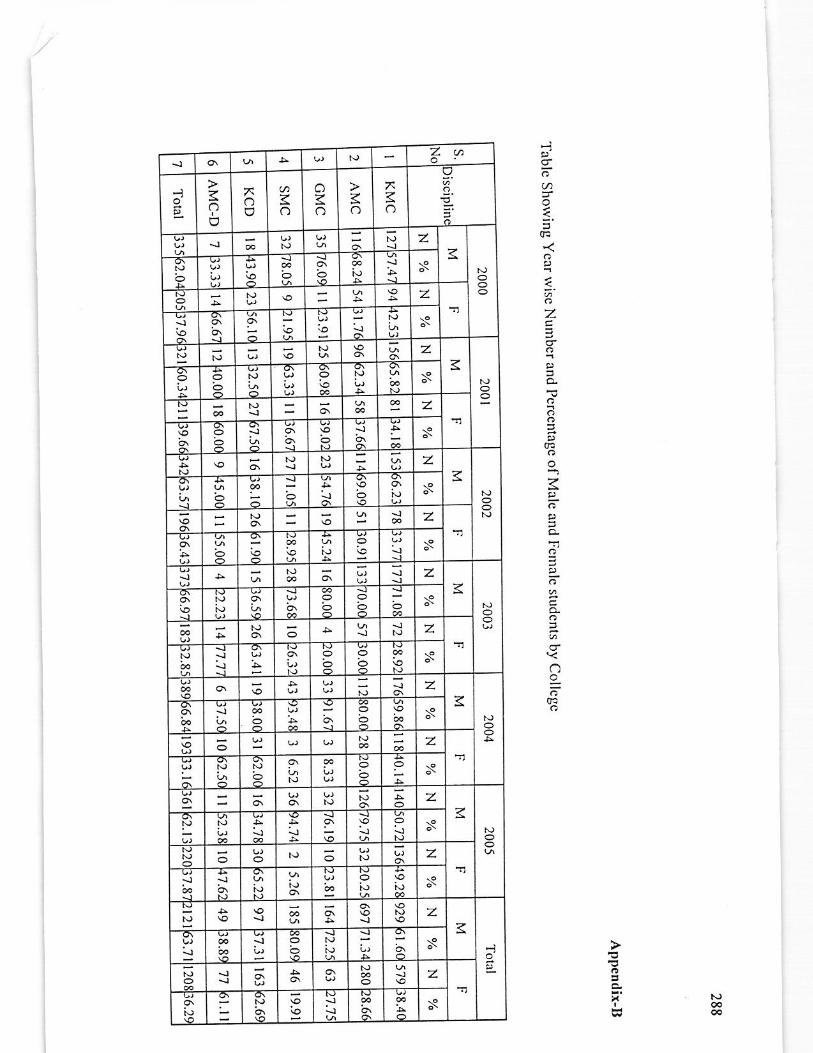
7
z3
o
Za
-loU
o ooo o o
z7
sz
z
z
z
u
z
z
I'r
z
z
z
z
z
-l'iz
s