study of the properties and spectral energy distributions of the herbig aebe stars hd 34282 and hd...
TRANSCRIPT

arX
iv:a
stro
-ph/
0402
599v
1 2
5 Fe
b 20
04Astronomy & Astrophysics manuscript no. aa˙2003˙0561 February 2, 2008(DOI: will be inserted by hand later)
Study of the properties and spectral energy distributions of the
Herbig AeBe stars HD 34282 and HD 141569 ⋆
B. Merın1, B. Montesinos1,2, C. Eiroa3, E. Solano1, A. Mora3, P. D’Alessio4, N. Calvet5, R.D. Oudmaijer6,D. de Winter7, J.K. Davies8, A.W. Harris9, A. Cameron10, H.J. Deeg11, R. Ferlet12, F. Garzon11, C.A.
Grady13, K. Horne10, L.F. Miranda2, J. Palacios3, A. Penny14, A. Quirrenbach15, H. Rauer9, J.Schneider16, P.R. Wesselius17
1 Laboratorio de Astrofısica Espacial y Fısica Fundamental (LAEFF), Apartado 50727, 28080 Madrid, Spain2 Instituto de Astrofısica de Andalucıa-CSIC, Apartado 3004, 18080 Granada, Spain3 Departamento de Fısica Teorica, Modulo C-XI, Facultad de Ciencias, Universidad Autonoma de Madrid, 28049
Cantoblanco, Madrid, Spain4 Centro de Radioastronomıa y Astrofısica (UNAM), Apartado Postal 3-72 (Xangari) 58089, Morelia, Mexico.5 Harvard-Smithsonian Center for Astrophysics, 60 Garden Street, Cambridge, MA 02138, USA6 Department of Physics and Astronomy, University of Leeds, Leeds LS2 9JT, UK7 TNO/TPD-Space Instrumentation, Stieltjesweg 1, PO Box 155, 2600 AD Delft, The Netherlands8 Astronomy Technology Centre, Royal Observatory, Blackford Hill, Edinburgh, EH9 3HJ, UK9 DLR Department of Planetary Exploration, Rutherfordstrasse 2, 12489 Berlin, Germany
10 Department of Physics and Astronomy, University of St. Andrews, North Haugh, St. Andrews KY16 9SS,Scotland, UK
11 Instituto de Astrofısica de Canarias, c/Via Lactea s/n, 38200 La Laguna, Tenerife, Spain12 CNRS, Institute d’Astrophysique de Paris, 98bis Bd. Arago, 75014 Paris, France13 NOAO/STIS, Goddard Space Flight Center, Code 681, NASA/GSFC, Greenbelt, MD 20771, USA14 Rutherford Appleton Laboratory, Chilton, Didcot, Oxfordshire OX11 0QX, UK15 Sterrewacht Leiden, PO Box 9513, 2300 RA Leiden, The Netherlands16 Observatoire de Paris, place Jules Janssen, 92195 Meudon, France17 SRON, Universiteitscomplex “Zernike”, Landleven 12, P.O. Box 800, 9700 AV Groningen, The Netherlands
Received –, accepted –
Abstract. We present a study of the stellar parameters, distances and spectral energy distributions (SEDs) ofHD 34282 and HD 141569, two pre-main sequence Herbig AeBe stars. Both objects have been reported to show‘anomalous positions’ in the HR diagram in the sense that they appear below the main sequence. A significantresult of this work is that both stars are metal-deficient. The Hipparcos distance of HD 34282 is very uncertainand the current study places the star at the expected evolutionary position in the HR diagram, i.e. as a PMS star.The distance for HD 141569 found in this work matches the Hipparcos distance, and the problem of its anomalousposition is solved as a result of the low metallicity of the object: using the right metallicity tracks, the star is inthe PMS region. The SEDs are constructed using data covering ultraviolet to millimetre wavelengths. Physical,non-parametric models, have been applied in order to extract some properties of the disks surrounding the stars.The disk around HD 34282 is accreting actively, it is massive and presents large grains in the mid-plane and smallgrains in the surface. HD 141569 has a very low mass disk, which is in an intermediate stage towards a debris-typedisk.
Key words. Stars: pre-main sequence – Stars: fundamental parameters – Stars: protoplanetary disks
Send offprint requests to: Bruno Merın, e-mail address:[email protected]
⋆ Based on observations made with the CST, NOT, INTand WHT telescopes of the Canary Islands observatories underthe auspices of its International Time Programme. Also basedon observations made with the 2.2m telescope at Calar AltoObservatory (Almerıa).
1. Introduction
The study of protoplanetary disks is currently undergo-ing an exciting stage partly propelled by the discovery ofextrasolar planetary systems following the detection of 51Peg B by Mayor & Queloz (1995). The possible discoveryof telluric planets in the near future, in addition to the

2 Merın et al.: A study of the properties and SEDs of HD 34282 and HD 141569
jovian-like planets already detected, will pose interestingquestions on the formation of extrasolar planetary sys-tems. Knowledge of the properties of protoplanetary disksand how they evolve to debris disks around main-sequence(MS) stars is one of the tools required for modelling sucha process.
Observed spectral energy distributions (SEDs) of pre-main sequence (PMS) stars are widely used to study theproperties of protoplanetary disks and to classify T Tauriand Herbig AeBe stars (HAeBe hereafter) into an evo-lutionary scheme (Adams et al. 1987; Hillenbrand et al.1992). Although the interpretation of a given SED is, tosome extent, model dependent, the theoretical modellingof SEDs constitutes an invaluable tool for understandingthe structure and properties of protoplanetary disks, e.g.Chiang & Goldreich (1997, 1999), D’Alessio et al. (1998,1999, 2001), Dullemond et al. (2001). The EXPORT con-sortium (Eiroa et al. 2000) observed a large sample of PMSand Vega-type stars during the 1998 International TimeProgramme of the Canary Islands’ Observatories. One ofthe driving goals of this effort was the study of the evolu-tion and properties of protoplanetary disks by analysingthe SEDs of the young stars, taking advantage of the factthat the EXPORT optical and near-IR photometry wereobtained simultaneously. This observational approach isappropriate since T Tauri and HAeBe stars vary markedlyin these spectral regimes and a significant part of the to-tal luminosity of the object is radiated by the PMS stellarphotosphere at these wavelengths. Among the stars in theEXPORT sample with measured Hipparcos parallaxes, theHAeBe stars HD 34282 and HD 141569 are the only oneswhose positions fall below the zero-age main sequence ina log L − log Teff HR diagram or equivalent (e.g. van denAncker et al. 1998, Weinberger et al. 2000). This result isdifficult to reconcile with some observational results andwith theoretical PMS evolutionary models (e.g. Yi et al.2001).
In this paper we present an analysis of the stellar prop-erties of HD 34282 and HD 141569 and their circumstellardisks, based on EXPORT data complemented with newspectroscopic observations and data from the literature.The structure of the paper is as follows. In Section 2 webriefly review what is currently known about the stars.Sections 3 and 4 present the observations used in thiswork and their results. In Section 5 we do a comprehen-sive study of the stellar parameters and distances to thestars. In Section 6 the disk models used to reproduce theobserved SEDs are presented. In Section 7 we summarizethe results of the work.
2. The stars
HD 34282: It is a HAeBe star with spectral type estimatesin the range A0 V - A3 V and a rotational velocity ofv sin i=129±8 km/s (Mora et al. 2001). It is variable withpublished mV values between 9.8 and 10.11 mag (Sylvesteret al. 1996; de Winter et al. 2001). Malfait et al. (1998) re-port a visual variability amplitude of ∼ 2.5 mag, while an
Algol-type minimum of ∆m ∼0.8 mag is observed in theHipparcos light curve, indicating that HD 34282 is mostlikely an UXOR-type object. Its SED shows a strong IRexcess which is already noticeable at near-IR wavelengths(Sylvester et al. 1996; Malfait et al. 1998). The Hipparcos
parallax is π = 6.10 ± 1.63 mas, equivalent to a distanceof 164+60
−30 pc. Based on this distance, van den Ancker etal. (1998) estimate a luminosity of 4.8 L⊙, a value whichlocates HD 34282 in an anomalous position in the HR di-agram, well below the expected luminosity of a star of itsspectral type. Note that the error in the parallax, namelyσ = 1.63 mas, is slighly larger than usual for Hipparcos
objects, most probably due to the faintness of the star, af-fecting the estimate of the distance. A large keplerian diskaround HD 34282 has been inferred from interferometric12CO J =2→1 line observations (Pietu at al. 2003). Thoseauthors estimate a distance d = 400+170
−100 pc based on dy-
namical considerations, which yields L∗/L⊙ = 29+30−13 and
M∗/M⊙=2.1+0.4−0.2 for the star, much more consistent with
the expected stellar properties of HD 34282.
HD 141569: This star is considered to be a transi-tional object between the PMS HAeBe stars and the moreevolved Vega-type systems. Optical and near-IR imagesreveal a circumstellar disk with a complex annular struc-ture extending up to a radial distance of about 600 AU(Weinberger et al. 1999; Augereau et al. 1999; Mouillet etal. 2001; Clampin et al. 2003). Mid-IR images trace theinner portion of the disk, up to about 100 AU (Fisheret al. 2000; Marsh et al. 2002). The disk in HD 141569shares many of the properties of dusty debris disks associ-ated with young MS stars, such as β Pic or HR 4796. Onthe other hand, the gas content of the disk is significantlyhigher than that of MS debris disks, as evidenced by theCO measurements at millimetre and near-IR wavelengths(Zuckerman et al. 1995; Brittain & Rettig 2002; Boccalettiet al. 2003).
Concerning the star itself, HD 141569 has spectral typeestimates between B9 and A0V and a very high rotationalvelocity, v sin i=258±17 km/s (Andrillat et al. 1990; Moraet al. 2001 and references therein). The star has no photo-metric variability (Alvarez & Schuster 1981). Its spectrumexhibits double-peaked Hα emission superimposed on abroad and strong absorption line (Andrillat et al. 1990;Dunkin et al. 1997) as well as double-peaked emission ofO i at 7772 and 8446 A (Andrillat et al. 1990); an outflowof material is suggested by the Na i D lines (Dunkin etal. 1997). Van den Ancker et al. (1998) estimate an age> 107 years, while Weinberger et al. (2000) give an ageof 5 Myr, on the basis of the stellar properties and ageestimates of two nearby stars, which are most likely itscompanions and have T Tauri characteristics. Consideringthe Hipparcos distance, 99 pc, and the observed opticalbrightness and colours (e.g. de Winter et al. 2001), we de-duce an absolute magnitude of MV = 1.8 mag, assumingan A0V spectral type and a typical interstellar extinctionlaw (Rieke & Lebofsky 1985). This makes the star under-luminous, a property seemingly shared by the debris disk

Merın et al.: A study of the properties and SEDs of HD 34282 and HD 141569 3
Table 1. Telescopes, instruments, setups and observing modes.
Telescope Instrument Range/Bands λ/∆λ Observing mode
WHT (4.2m) UES 3800–5900 A ∼49000 Echelle spectroscopyINT (2.5m) IDS 5800–6800 A ∼5000 Mid resolution spectroscopyNOT (2.5m) Turpol (photopol.) UBVRI PhotopolarimetryCST (1.5m) Photometer+near-IR camera JHK PhotometryCAHA 2.2m CAFOS (spectros.) 3700–6440 A ∼2400 Mid resolution spectroscopy
Observing dates for the spectroscopic observations†
HD 34282 HD 141569
WHT/UES 28, 29 January 99 16, 17 May 98 (2+2)28, 29, 30 July 9828, 29, 30, 31 January 99
INT/IDS 24, 25, 26, 27, 28 October 98 14, 15, 16, 17 May 9829, 30, 31 January 99 29, 30, 31 July 98
29, 30, 31 January 99
CAHA 2.2/CAFOS 3 February 03 6 March 03† The observing logs for the photometric observations are given by Eiroa et al.(2001) and Oudmaijer et al. (2001).
systems β Pic, HR 4796 and some other A-type youngMS stars (Jura et al. 1998, Lowrance et al. 2000). Wenote, however, that HD 141569 has the largest IR excessamong all these objects, it is the only object with emissionlines in its optical spectrum, there is evidence of outflow-ing gas, its disk has a remarkable gas content, and it likelyhas the smaller evolutionary age. In addition, from a PMSevolution theory point of view, a 5 Myr old A0 star (Teff
= 10000 K, see below) with solar metallicity would havean absolute magnitude MV = 1.0–1.1 mag (e.g. Yi et al.2001), which is significantly brighter than the magnitudededuced from the Hipparcos parallax.
3. Observations
High resolution echelle (wavelength range 3800–5900 A)and intermediate resolution (wavelength range 5800–6700A) spectroscopy, optical photo-polarimetry and near-infrared photometry of HD 34282 and HD 141569 wereobtained during the four EXPORT observational cam-paigns in May, July and October 1998 and January 1999carried out at the Canary Islands observatories (Eiroaet al. 2000). Details of the observations, instrumental se-tups and reduction procedures for each particular observ-ing mode are given in Eiroa et al. (2001), Mora et al.(2001) and Oudmaijer et al. (2001), so we do not repeatthem here, though Table 1 provides an overview of thetelescopes, instruments, setups and observing modes usedduring the EXPORT campaigns, plus the additional ob-servations carried out in 2003 (see below). The dates forthe spectroscopic observations are also specified.
The spectra of HD 34282 and HD 141569 are presentedand analysed here for the first time, while the photometricdata, though already published as such in the previousreferences, are collected here together and also discussedfor the first time. We note that the data are simultaneousor almost simultaneous, allowing a coherent study to bemade of the photometric and spectroscopic variations, and
the construction of the corresponding SEDs in the intervalUBVRIJHK with contemporaneous data.
In addition to the EXPORT observations, intermedi-ate resolution spectra in the range 3700–6200 A, with veryhigh signal-to-noise ratio, have been taken for both starswith CAFOS (Calar Alto Faint Object Spectrograph) onthe 2.2m telescope at Calar Alto observatory (Almerıa,Spain). The motivation was to obtain high quality Balmerline profiles, in particular Hβ, Hγ and Hδ, in order to es-timate the stellar gravities (see Section 5). The echellespectra were inadequate for analysis of the Balmer lineprofiles: these are so wide that their wings extend up tothree echelle spectral orders – the correction of the re-sponse function of the spectrograph and the splicing ofadjacent orders are not accurate enough to consider thereconstructed profiles as reliable. CAFOS was equippedwith a CCD SITe detector of 2048×2048 pixels (pixel size24 µm) and the grism Blue-100, centered at 4238 A, giv-ing a reciprocal linear dispersion of 88 A/mm (2 A/pixel).Three spectra, with exposure times 120, 1200 and 1200 s,were taken for HD 34282 on 5 February 2003, and two withexposure times 10 and 100 s were obtained for HD 141569on 6 March 2003. The usual bias, dark and dome flat-field frames were taken in each case. Standard procedureswere used to process the data. The nominal wavelengthsof the Balmer lines were used to self-calibrate the spectrain wavelength.
4. Results
4.1. Spectroscopy
The high and intermediate resolution spectra of both starsshow non-variable early-type photospheric spectra, inter-stellar (IS) narrow absorption lines and diffuse IS bands.In both cases, however, the most prominent features comefrom the circumstellar (CS) environment. Fig. 1 shows theaverage INT spectra of HD 34282 (January 99) and HD

4 Merın et al.: A study of the properties and SEDs of HD 34282 and HD 141569
Fig. 1. The normalized average IDS/INT spectra of HD34282 and HD 141569. Some prominent lines are identi-fied. DIB stands for “diffuse interstellar band”. The spec-trum of HD 34282 is the average of the January 1999 runwhile the spectrum of HD 141569 is the average of theMay 1998 run.
141569 (May 98) where some lines are identified. In thefollowing, we describe the CS spectrum of both objects.
HD 34282: The UES echelle spectra show a CS contri-bution in the Ca ii K line and in the Balmer lines Hβ andHγ. The line He i at 5876 A is seen in absorption; it isunlikely to be of photospheric origin since HD 34282 hasan ∼A3 spectral type. Its strength and profile might showsmall variations (after a comparison of all the INT spec-tra), but this should be confirmed with higher resolutionspectra. He i 5876 A has been observed with large vari-ations in HAeBe and T Tauri stars (e.g. Bohm & Catala1995, Johns & Basri 1995) and it has been explained interms of magnetospheric accretion in the low-mass PMSstars (e.g. Oliveira et al. 2000), but in the case of HAeBestars its origin is controversial (e.g. Bouret & Catala 2000).
Hα always presents a variable double-peaked emissionwith a central absorption. Fig. 2 shows the observed Hαprofiles after the subtraction of a spectrum of a standard ofthe same spectral type broadened to the rotational veloc-ity of HD 34282. The depth of the central absorption variesand its radial velocity, measured with respect to the stel-lar photosphere, shifts from an average value of 27.5±5.5km s−1 in October 98 to –63.3±14.6 km s−1 in January99. The radial velocities of the violet and red emissionpeaks and their separation also change from October 98to January 99 (the maximum peak separation is 319 kms−1 on 28 Oct 98 and the minimum is 117 km s−1 on 30 Jan99). The relative intensity of the emission peaks changesfrom day to day and a flip is observed from October 98,when the violet peak is stronger, to January 99, when theread peak is the stronger one. Furthermore, the blue wingshows a shoulder on 28 October 98 which could be due toa third velocity component. Finally, the total equivalent
Fig. 2. Hα profiles for HD 34282 and HD 141569. Spectraof standard stars with spectral types A3 V and A0 V,respectively, have been subtracted from the original spec-tra, therefore only the pure emission is shown in thesepanels. The lines have been shifted vertically by an ar-bitrary amount for clarity, so their wings should be putat the same level in order to compare the profiles. Eachprofile has been shifted horizontally 30 A with respect tothe previous one as indicated in the abscissae. The verticaldotted lines mark the rest wavelength for Hα. The spectrahave been ordered chronologically from left to right (seethe dates of the observations in Table 1).
width varies from –3.0 to –5.7 A. Using the R band fluxfrom simultaneous optical photometry on 27 October 98and 30 January 99 we estimate a Hα line emission flux of7.4×10−13 and 1.6×10⁻¹² erg cm−2 s−1, respectively. Thevariability in the emission flux and shape of Hα proves thechanging conditions in the CS region where this line orig-inates. Grinin & Rostopchina (1996) studied a sample ofHAeBe stars and found that double-peaked Hα emissionlikely arises in irregular gaseous circumstellar disks rotat-ing close to the stars and seen nearly edge on. We noticethat Pietu et al. (2003) find an inclination of the CO ke-plerian disk of i = 56◦ with respect to the plane of thesky. The change of the strength ratio between the violetand red peaks could reflect the relative contribution of theapproaching and receding parts of the disk in the differentspectra. More sophisticated accretion disk models have re-cently been developed by Tambovtseva & Grinin (2000)to explain the hydrogen lines of HAeBe stars in a contextsimilar to the widely accepted magnetospheric accretionmodels for the low-mass T Tauri stars.

Merın et al.: A study of the properties and SEDs of HD 34282 and HD 141569 5
Table 2. Compilation of optical (UBVRI) and near-IR (JHK) photometry for HD 34282 and HD 141569.
Object U B V R I J H K Refs.
HD 34282 10.47 10.23 10.03 9.91 9.76 9.11 8.40 7.62 1, October 9810.19 10.03 9.87 9.77 9.63 9.15 8.53 7.84 1, January 99
10.11 9.17 8.32 7.42 210.16 10.05 9.88 9.79 9.68 9.02 8.20 7.44 310.15 10.05 9.89 9.81 9.71 410.11 9.97 9.81 9.73 9.62 410.51 10.07 9.94 9.95 9.79 4
8.99 8.54 8.08 6
HD 141569 7.23 7.20 7.11 7.01 7.03 6.70 6.59 6.53 17.09 6.88 6.86 6.82 27.13 6.87 6.84 6.80 3
7.24 7.21 7.10 7.03 6.96 47.28 7.26 7.18 5
(1) EXPORT, (2) Malfait et al. (1998), (3) Sylvester et al. (1996), (4) de Winter et al. (2001),(5) Penprase (1992), (6) Coulson et al. (1998)
Fig. 3. Details of the Hα profiles for HD 34282 and HD141569. The most extreme cases have been taken for eachstar to illustrate the complex behaviour of this line. Thevariations in the absorption profiles appear in both wingsbut are more pronounced in the blue one.
HD 141569: Double-peaked Hα emission is observed inthe spectrum of this star. Such double-peaked emission,though much less pronounced, is also observed superim-posed to the Hβ photospheric line in all UES spectra. Theheliocentric radial velocity of the star obtained from theUES spectra is –13.1 km s−1, which is in good agreementwith previous estimates (Dunkin et al. 1997, Brittain etal. 2003), given the velocity resolution of the UES spec-tra, 6 km s−1. The violet and red Hα emission peaks have−113.2±3.9 km/s and 128.3±5.0 km/s, respectively, whilethe central absorption lies at a velocity of 11.9±4.2 (aver-
age values and rms error of the 10 INT spectra, velocitiesmeasured with respect to the stellar photosphere). Dunkinet al. (1997) find agreement between the stellar and theHα central absorption velocities; the discrepancy in ourvalues must be treated with caution given the spectralresolution of the individual INT spectra, ∼ 50 km s−1.The observed velocity separation between both emissionpeaks is in good agreement with the results of Dunkin etal. (1997). The emission profiles are quite similar in allspectra, although they vary noticeably. The violet peakis always stronger than the red one, but their relative in-tensity changes (Fig. 2); there is also a variation in theHα blue wing (Fig. 3). In addition, the equivalent widthvaries, ranging from –6.14±0.03 A in July 1998, when theviolet peak was larger, to –5.63±0.25 A in January 1999,when the violet peak was smaller. The average Hα lineflux is 2.1 × 10⁻¹¹ erg cm−2 s−1.
All INT spectra show [O i] in emission, relativelystrong at 6300 A and very weak at 6364 A. The emissionis constant and has an equivalent width W([O i] 6300 A)= 0.13 A; its flux is 4.6×10⁻¹³ erg cm−2 s−1. The peak ofthe emission occurs at the same radial velocity as the Hαabsorption peak. [O i] emission is usually interpreted asan indicator of low density winds in HAeBe stars (Bohm& Catala 1994; Corcoran & Ray 1997).
4.2. Photometry and the spectral energy distribution
EXPORT optical UBVRI and near-IR JHK magnitudesof HD 32482 and HD 141569 are given in Oudmaijer et al.(2001) and Eiroa et al. (2001). HD 34282 varies in bothwavelength regimes from October 98 to January 99, but novariability is detected on time scales of days. HD 141569remains constant on all time scales within the photometricuncertainties (typically a few percents in any photometryband). Table 2 shows the mean magnitudes of HD 34282as observed in October 98 and January 99, as well as themean magnitudes of HD 141569. For the sake of com-parison, photometric results taken from the literature are

6 Merın et al.: A study of the properties and SEDs of HD 34282 and HD 141569
Table 3. Absolute dereddened fluxes for the SEDs
HD 34282 HD 141569
Band log λ log Fλ log Fλ
(µm) (W m−2µm−1) (W m−2µm−1)
IUE –0.86 – –9.90±0.02 (4)IUE –0.75 – –9.79±0.02 (4)IUE –0.66 – –9.94±0.02 (4)IUE –0.59 – –10.01±0.02 (4)IUE –0.53 – –10.08±0.02 (4)Wal W –0.49 –11.45±0.02 (5) –Wal U –0.44 –11.44±0.02 (5) –Wal L –0.42 –11.23±0.02 (5) –Wal B –0.37 –11.11±0.02 (5) –Wal V –0.26 –11.32±0.02 (5) –U –0.44 –11.35±0.01 (1) –10.02±0.02 (1)B –0.36 –11.12±0.01 (1) –9.88±0.02 (1)V –0.26 –11.31±0.01 (1) –10.12±0.02 (1)R –0.15 –11.62±0.01 (1) –10.45±0.02 (1)I –0.01 –11.90±0.01 (1) –10.82±0.04 (1)J 0.10 –12.15±0.02 (1) –11.22±0.02 (2)H 0.21 –12.32±0.02 (1) –11.64±0.02 (2)K 0.35 –12.54±0.02 (1) –12.12±0.02 (2)ISO 0.39 – –12.27±0.02 (6)ISO 0.51 – –12.66±0.02 (6)L 0.58 –12.75±0.02 (3) –12.92±0.02 (3)ISO 0.63 – –13.14±0.02 (6)M 0.68 –13.12±0.02 (3) –13.25±0.02 (3)ISO 0.77 – –13.46±0.02 (6)ISO 0.83 – –13.54±0.02 (6)ISO 0.89 – –13.39±0.02 (6)ISO 0.94 – –13.61±0.02 (6)ISO 0.99 – –13.78±0.02 (6)ISO 1.03 – –13.82±0.02 (6)ISO 1.06 – –13.84±0.02 (6)IRAS 1.08 –13.82±0.10 (7) –13.92±0.05 (7)IRAS 1.40 –14.09±0.10 (7) –14.03±0.07 (7)IRAS 1.78 –14.03±0.10 (7) –14.32±0.09 (7)IRAS 2.00 –14.50±0.10 (7) –15.00±0.10 (7)0.45 mm 2.65 –16.72±0.23 (3) –0.8 mm 2.90 –17.72±0.07 (3) –1.1 mm 3.04 –18.34±0.09 (3) <−19.05 (3)1.3 mm 3.12 –18.71±0.09 (8) –1.35 mm 3.13 – –20.05±0.02 (9)2.6 mm 3.41 –19.99±0.13 (10) –3.4 mm 3.53 –20.89±0.06 (8) –
(1) EXPORT, (2) Malfait et al. (1998), (3) Sylvester et al.(1996), (4) INES Database, (5) de Geus et al. (1990), (6)ISO PHOT-S, TDT No. 62701662, (7) IRAS PSC (colour cor-rected), (8) Pietu et al. (2003), (9) Sylvester et al. (2001), (10)Mannings & Sargent (2000)
also shown. In general, typical intrinsic error bars in theEXPORT UBVRI magnitudes are of the order of ±0.04mag and always less than 0.10 mag; for JHK they are lessthan 0.05 mag (see Eiroa et al. 2001 and Oudmaijer et al.2001 for specific values).
HD 34282 was brighter in the optical in January 99than in October 98 (the values of V are 10.02, 10.03and 9.87 for 24, 28 October 98 and 30 January 99, re-spectively). The January 99 magnitudes likely correspond
to the maximum optical brightness level of this star, ascomparison with other results (Table 2) and with theHipparcos light curve suggests. The near-IR brightness be-haves in the opposite way: the star was brighter in October98. The optical variability amplitude decreases with wave-length, as expected from the usual mechanisms invokedto explain the photometric variability in PMS stars (e.g.Herbst & Shevchenko 1999), but in the near-IR the max-imum variability amplitude occurs in K. The cause ofthis different behaviour might be due to the fact that theoptical variability is due to changes affecting the stellarphotosphere while the near-IR fluxes reflect the contribu-tion of the star and the circumstellar disk. A simultane-ous anticorrelation of the variability in both wavelengthregimes has also been found in other pre-main sequencestars, though on a much shorter time scale (Eiroa et al.2002; Grinin et al. 2002).
Concerning HD 141569, our optical photometry andprevious results are in excellent agreement. The apparentdiscrepancy between our near-IR magnitudes and thoseobtained by Sylvester et al. (1996) and Malfait et al.(1998) is likely due to the fact that the companion starHD 141569B was at least partly in our beam (Weinbergeret al. 2000). Once our measurements are corrected for this,the agreement is satisfactory.
For both stars EXPORT photometry together withdata from near ultraviolet to millimetre wavelengths havebeen used to delineate the spectral energy distributions,which are, to our knowledge, the most complete onesto date. Figs. 9 and 10 show the observed spectral en-ergy distributions of both stars. Table 3 gives dereddenedfluxes for each star and corresponding references (theyare also plotted in Figs. 9 and 10). E(B−V ) values of0.05 for HD 34282 and 0.12 for HD 141569 (see sub-section 5.1 for the origin of these values) were used forthe reddening corrections. The extintion curve of Rieke& Lebofsky (1985), from 4400 A to longer wavelengths,and that of Steenman & The (1991) for shorter wave-lengths were used. We have used the UBVRI (one setof values) and the mean JHK (three sets) photometryfrom January 99 for HD 34282 because they likely repre-sent better the stellar photosphere, i.e. when the star wasbrighter in the optical. For HD 141569, we used the meanEXPORT UBVRI photometry and JHK magnitudes fromMalfait et al. (1998). UBVRIJHK magnitudes have beenconverted into fluxes using the absolute calibration givenby Schmidt-Kaler (1982). IUE spectra in the range 1250–3000 A of HD 141569 are taken from the INES database1
(Solano et al. 2001). No IUE observations are availablefor HD 34282. Walraven photometry for HD 34282 wasnot contemporaneous with EXPORT observations and hasonly been used in subsection 6.2.1 for a determination ofthe disk mass accretion rate. In the infrared, we have usedcolour-corrected IRAS fluxes and ISO scientifically vali-dated ‘Off-Line Processing’ products (OLP) taken fromthe Data Archive at the ISO Data Centre. Submillimetre
1 http://ines.laeff.esa.es/

Merın et al.: A study of the properties and SEDs of HD 34282 and HD 141569 7
and millimetre continuum fluxes have been taken from thereferences listed in Table 3; the inclusion of the continuumfluxes at these long wavelengths alleviates, to some extent,the uncertainties in the flux calibration of the infrared ISO
pipeline-reduced fluxes.
5. Stellar parameters of the stars and their
distances
As we mentioned above, both stars have been reported tohave anomalous positions in the HR diagram, falling be-low the main sequence. However, the observational datashow that HD 34282 is a highly variable HAeBe star withan active CS environment. Concerning HD 141569, thoughits disk shares similarities with some debris disk systems,which are found to be located below the main sequence,the star does show observational properties which suggestan earlier evolutionary stage. In particular, our data showthat the object retains a non-negligible CS activity, asevidenced by the [O i] emission and the variable Hα emis-sion. Taking into account these considerations, both starsshould be located above or on the main sequence, in bet-ter agreement with normal expectations from their photo-metric and spectroscopic properties, and stellar evolutiontheory. In this section we carry out a detailed study of thephysical parameters of the stars leading us to re-considertheir location in the HR diagram. The determination ofthe effective temperature, gravity and stellar metallicitywill allow us, by using the appropriate set of evolutionarytracks and isochrones, to estimate the luminosity, massand age of the stars, as well as their distances by meansof the measured stellar fluxes.
5.1. Stellar parameters: effective temperature, gravity,
metallicity and rotational velocity
Kurucz (1993) model atmospheres are used to estimatethe physical parameters describing the photospheres ofHD 34282 and HD 141569. We use the following iterativeprocedure. First, an initial value of the stellar gravity isobtained from the comparison of synthetic profiles, com-puted with solar metallicity, with the observed Hβ, Hγ andHδ profiles extracted from the CAFOS observations. Forthis purpose, a tentative value of Teff , based on the spec-tral type of each star, is taken. The gravity is obtainedby measuring the width of the observed Balmer profilesat one intensity level below the normalized continuum,namely I = 0.80; this has been chosen to avoid potentialartifacts in the wings near the continuum arising from thenormalization of the original spectra. The widths of theBalmer lines are then compared with those measured on agrid of synthetic profiles computed for different gravities2.
2 The convolution of the theoretical profiles with the instru-mental response changes the results by a minute quantity. ForHD 141569, which is the star with less intrinsic uncertaintiesin the determination of the gravity, the relative difference withthe value in Table 4 is about 0.5%.
Fig. 4. The Balmer lines Hβ, Hγ and Hδ for HD 34282 andHD 141569 (solid lines) extracted from the spectra takenwith CAFOS on the 2.2m telescope at CAHA. The dottedlines are the Kurucz synthetic profiles corresponding tothe Teff , log g∗ and metallicity listed in Table 4 for eachstar. The discrepancies in the higher parts of the wingsarise from contamination with weak metalic lines and alsofrom the difficulties in normalizing the original spectra.
A linear interpolation is done taking the widths of eachBalmer line as independent variables and the gravity asthe unknown. The result for log g∗ is the mean value ofall the interpolations with an uncertainty correspondingto the standard deviation.
With this value of log g∗ fixed, we re-estimate the efec-tive temperatures of the stars and their metallicities. Thisis done by means of a systematic comparison of syntheticline profiles, obtained using Kurucz’s models of differenttemperatures and metallicities, with the high resolutionWHT/UES spectra. The regions of effective temperaturesfrom 8500 to 9750 K for HD 34282, and from 9750 to 10500K for HD 141569 were explored, which approximately en-compass the values corresponding to the spectral typesreported for both stars. For each temperature, differentmetallicities were used to synthesize spectral lines in sev-eral selected spectral intervals. The synthetic spectra wererotationally broadened with the corresponding v sin i val-ues for each star (Mora et al. 2001). A microturbulencevelocity of 2 km/s was used throughout.
For HD 34282 the lines chosen are: 4404.75, 4957.60A (Fe i), 4508.29, 4515.34, 4583.84, 4629.34 A (Fe ii) and4501.27 A (Ti ii). For HD 141569 the projected rotationalvelocity is so high that it is difficult to find individualmetallic lines; instead the regions 4260–4280 A, 4375–4400A and 4540–4560 A, which contain a large number of lines,have been selected. For both stars the lines 3933.66 A (Caii), 4481.13 A(Mg ii), and the Si ii doublet at 6347.11,6371.37 A have also been used (the Si ii doublet is clearlyobserved in the INT spectra). It is found, particularly inthe case of HD 34282, that different (Teff , [Fe/H]) pairs

8 Merın et al.: A study of the properties and SEDs of HD 34282 and HD 141569
fit the observed spectra reasonably well. The comparisonshows that higher effective temperatures require highermetallicities to fit a given spectral line. This (Teff , [Fe/H])degeneracy can be solved by using the observed SEDs, inparticular the UBVRI photometry.
For each (Teff , [Fe/H]) pair, which provides an ap-parent satisfactory fit to the observed spectra, we havecomputed the corresponding synthetic Kurucz SED in thespectral interval from 3000 to 10000 A, i.e., the range fromU to I. The observed UBVRI fluxes from each star havebeen dereddened at small steps of E(B−V ) and comparedto the Kurucz synthetic models (we have covered the in-terval 0.0 < E(B−V ) < 0.30 with a stepsize of 0.01).The observed and synthetic photometry were normalizedto R. It turns out that the overall SED shape is signifi-cantly more sensitive to the effective temperature than tothe metallicity; thus, this method is particularly useful topinpoint the best Teff , and consequently the (Teff , [Fe/H])solution. The best Teff value fitting the data is chosen bymeans of a minimum χ2 criteria. Once the best values forTeff and [Fe/H] have been found, the value of the gravityis re-calculated using the procedure described above withsynthetic Balmer profiles corresponding to this metallicity.The process is iterated until convergence is achieved.
The optimum solutions found are (see also Table 4):HD 34282, Teff = 8625 K, [Fe/H] =−0.8, log g∗ = 4.20; HD141569, Teff = 10000 K, [Fe/H] =−0.5, log g∗ = 4.28. Thecorresponding spectral types for these temperatures andgravities are A3 V and B9.5 V respectively. The relevantresult is that both stars have low metal abundances. Inaddition, projected rotational velocities, v sin i, of 110 kms−1 for HD 34282 and 236 km s−1 for HD 141569 providea better agreement with the observed profiles than thev sin i values reported by Mora et al. (2001). Finally, thebest χ2 fit gives E(B − V ) = 0.05 mag for HD 34282 and0.12 mag for HD 141569. We note that Mora et al. (2001)deduced E(B−V ) = 0.15 ± 0.10 mag for the latter starfrom the graphite interstellar absorption band at 2200 Aobserved with the IUE, also Oudmaijer et al. (2001) foundAV = 0.34 ± 0.20, which implies E(B−V ) = 0.11 ± 0.06;both values of the extinction are in very good agreementwith our present estimate. Figs. 5 and 6 show the compar-ison between the observed and best synthetic spectra forseveral spectral lines and ranges; synthetic spectra usingsolar abundances are also plotted for comparison. Both fig-ures clearly show that the observed spectra of HD 34282and HD 141569 are much better reproduced with our lowmetallicity estimates and, therefore, a low metal contentin the photospheres of both stars is strongly suggested. Wenote that HD 34282 has some similarities with HD 37411,another low metallicity PMS star (Gray & Corbally 1998).With respect to HD 141569, Gray & Corbally (1998) in-dicate that it is a ‘mildy metal-weak’ star, in agreementwith our results, though Dunkin et al. (1997) give a solarabundance.
Table 4. Stellar parameters determined.
HD 34282
Effective temperature 8625±200 KSpectral type A3 Vv sin i 110 ± 10 km/sMetallicity [Fe/H]=−0.8 ± 0.1Log g∗ 4.20±0.20E(B − V ) 0.05
Stellar flux (F∗) (3.61 ± 0.44) × 10−12 W m−2
IR Excess (FIR) (2.28 ± 0.40) × 10−12 W m−2
λIR 1.25 µm
[±∆ log g∗] [±∆Teff ]
L/L⊙ 13.64−5.36+12.02 13.64+1.78
−1.53
Mass (M⊙) 1.59−0.07+0.30 1.59+0.04
−0.05
Age (Myr) 6.41+1.92−2.58 6.41−0.41
+0.46
Distance (pc) 348−77+129 348+22
−20
HD 141569
Effective temperature 10000±200 KSpectral type B9.5 Vv sin i 236 ± 15 km/sMetallicity [Fe/H]=−0.5 ± 0.1Log g∗ 4.28±0.04E(B − V ) 0.12
Stellar flux (F∗) (7.16 ± 0.24) × 10−11 W m−2
IR Excess (FIR) (1.27 ± 0.27) × 10−12 W m−2
λIR 3.25 µm
[±∆ log g∗] [±∆Teff ]
L/L⊙ 25.77−2.20+1.63 25.77+3.01
−2.54
Mass (M⊙) 2.00+0.01−0.01 2.00+0.06
−0.05
Age (Myr) 4.71+0.09−0.15 4.71−0.31
+0.33
Distance (pc) 108−5+3 108+6
−6
5.2. Stellar fluxes and infrared excesses. Luminosities,
masses, ages and distances.
Once the stellar parameters defining the photospheres ofHD 34282 and HD 141569 have been determined, we cancalculate the stellar fluxes and infrared excesses. In addi-tion, we can locate the stars in a HR diagram using appro-priate evolutionary tracks and estimate their distances.
The stellar flux, F∗, is computed by integrating thebest-fit Kurucz model normalized to the dereddened ob-served R-band flux, as given in Table 3. The infrared ex-cess, FIR, is calculated by subtracting the flux under thetail of the best-fit Kurucz model from the observed fluxes,and integrating the result from λIR, the wavelength wherethe SED separates from the tail of the Kurucz model (seeFigs. 9 and 10). Extrapolations to long wavelengths fol-lowing the formula by Chavarria et al. (1981) have beenincluded in the integration. Table 4 shows the integratedfluxes for the stars and their IR excesses. HD 34282 has aFIR/F∗ ratio of 0.63 ± 0.19, which suggests that some in-trinsic luminosity might be arising from the disk; FIR/F∗
values of ∼0.25 and ∼0.5 are expected from flat and flaredoptically thick reprocessing disks, respectively (Kenyon &Hartmann 1987). In the case of HD 141569, we find FIR/F∗
= 0.018 ± 0.004 and a passive disk with relatively low op-tical depth is suggested. This figure is one order of magni-

Merın et al.: A study of the properties and SEDs of HD 34282 and HD 141569 9
Fig. 5. Comparison of observed and synthetic spectral features of HD 34282. From top to bottom and left to right thefollowing lines have been plotted: Ca ii K (3933.66 A), Mg ii (4481.13 A), Si ii (6347.11, 6371.37 A), Fe ii (4583.84A), Fe i (4957.60 A) and Fe ii (4629.34 A). Observed spectra are plotted as solid lines. Synthetic spectra computedwith Teff =8625 K, [Fe/H]=–0.8 and log g∗ = 4.20 and broadened with v sin i=110 km/s are plotted as dashed lines.Dotted lines represent synthetic spectra computed with the same Teff , log g∗ and v sin i but using solar abundances.In the lower panels, the synthetic unbroadened spectra are shown to illustrate the lines giving rise to the observedprofiles.
tude higher than typical values in Vega-type stars, (10−5
to 10−3, Sylvester et al. 1996). We note that the ratioFIR/F∗ = 8 × 10⁻³ given by Zuckerman et al. (1995) andusually quoted in the literature does not include the 1.35mm flux measured by Sylvester et al. (2001). If we removethat flux from our estimates, we recover the figure givenby Zuckerman et al.
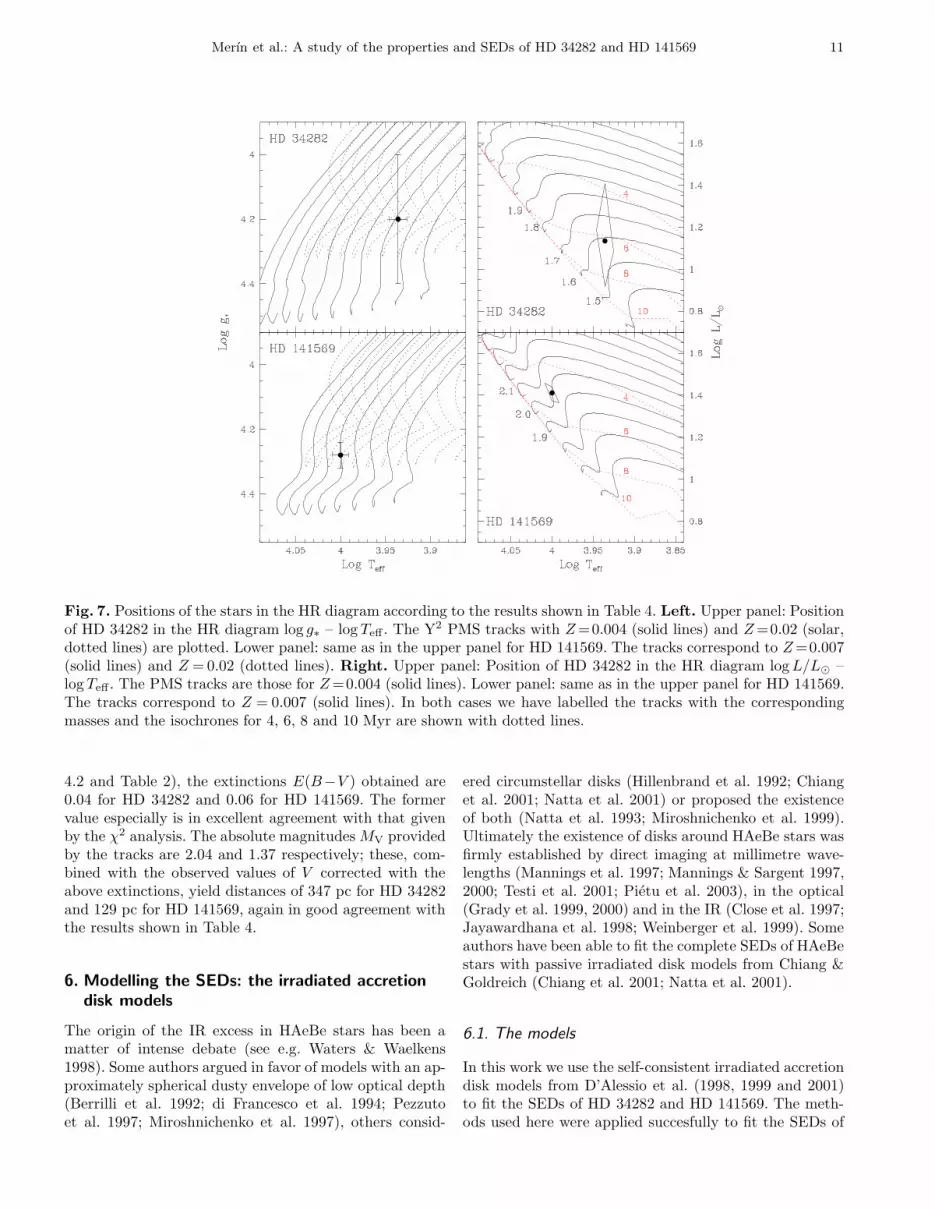
Knowledge of the stellar metallicities is relevantsince changes in the metal abundance, Z, produce non-negligible changes in the relative positions of the evolu-tionary tracks. In particular, a decrease in the metallicitymoves one given track with a fixed value of the stellarmass, to lower luminosities, higher gravities and highertemperatures, apart from changing its overall shape. Thiseffect is illustrated in Fig. 7 for the log g∗ – log Teff HRdiagram. The left two panels of Fig. 7 show the positionsof the stars in the HR diagram according to the resultsfound for Teff and log g∗. The evolutionary tracks for ascaled solar mixture from the Yonsei-Yale group (Yi etal. 2001) – Y2 in their notation – have been used in thiswork. The Y2 tracks with Z =0.004 and Z =0.007 are ap-propriate for HD 34282 and HD 141569, respectively. For
comparison, the tracks with solar metallicity (Z = 0.02)are also included in the plot3.
The corresponding values of the effective temperatureand gravity are compared with the set of tracks and valuesfor the luminosity, mass and age are derived. The positionof HD 34282 and HD 141569 in the HR diagram log L/L⊙
– log Teff are plotted in the two panels at the right handside of Fig. 7. The luminosities, combined with the to-tal stellar fluxes F∗ obtained, imply distances of 348 pcfor HD 34282, and 108 pc for HD 141569. All the resultsare summarized in Table 4. The results for the luminos-ity, mass, age and distance are given in two columns foreach star: in the first one the error bars derive from the
3 In the original Y2 set, there are no tracks for Z =0.003 and0.006, the appropriate values for each star considering thatthe relationship Fe/Fe⊙=X/X⊙ holds (in number if particles),where X means any element with atomic number larger than3. The closest sets of tracks are those with Z =0.004 and 0.007respectively. We have preferred to use original tracks kindlyprovided by the authors than interpolating between adjacentgrids to build new sets of tracks and isochrones. In any casethe differences are expected to be very small.

10 Merın et al.: A study of the properties and SEDs of HD 34282 and HD 141569
Fig. 6. Comparison of observed and synthetic spectral features of HD 141569. In the top panels, the spectral lines arethe same as in Fig. 5. In the bottom panels, three spectral regions, instead of individual lines, are displayed. Observedspectra are plotted as solid lines. Synthetic spectra computed with Teff =10000 K, [Fe/H]=–0.5 and log g∗= 4.28 andbroadened with v sin i=236 km/s are plotted as dashed lines. Dotted lines represent synthetic spectra computed withthe same Teff , log g∗ and v sin i but using solar abundances. In the lower panels, the synthetic unbroadened spectraare shown to illustrate the lines giving rise to the observed profiles.
uncertainties in log g∗, keeping Teff fixed; in the second,the error bars derive from the uncertainties in Teff , keep-ing log g∗ fixed. The uncertainties for HD 34282 are largerthan those for HD 141569 because of the larger uncertain-ties in the determination of the gravity. The vertices ofthe ‘diamond-like’ boxes appearing in the two right-handpanels of Fig. 7 correspond to the tips of the error bars inthe panels on the left.
Fig. 7 shows that both stars lie above the main se-quence in positions in agreement with their observationalproperties and current PMS evolution theory. The anoma-
lous positions in the HR diagram previously reported forthese stars referred to standard sets of tracks or photo-metric parameters computed with solar metallicity and avery doubtful distance in the case of HD 34282. For thisstar the anomalous position in the HR diagram is resolvedboth by the low metallicity and an appropriate distanceestimate. In the case of HD 141569, its anomalous posi-tion originated only from the use of the wrong metallicityin the definition of the main sequence4.
4 Note that in the two left-hand-side diagrams of Fig. 7 bothstars also occupy correct positions in the HR diagram whencompared with tracks with solar metallicity. If these tracks
The distance we obtain for HD 34282 (348+129−77 pc) is
comparable to that given by Pietu et al. (2003) (400+170−100
pc). Both values are remarkably similar, and are morethan 2σ larger than the Hipparcos value. This leads usto consider that the Hipparcos parallax for this objecthas been overestimated. The stellar parameters quoted byPietu et al. (2003) are compatible with ours, although wenote their larger errors and their use of indirect methodsto estimate the temperature and spectral type of the star;in addition, they use solar metallicity tracks which are notappropriate for this star. In the case of HD 141569 our dis-tance is comparable to the Hipparcos one (99+9
−8 pc). Wenote that the age estimate by Weinberger et al. (2000) forthe two nearby low mass stars is similar to that deducedby us for HD 141569 directly. This result reinforces theidea that the three stars are real companions.
Finally, estimates of the extinctions and distances canalso be made using the absolute magnitudes and coloursprovided by the Y2 isochrones. Taking the values of mass,age and metallicity given in Table 4 and the observed val-ues of B and V used to construct the SEDs (see subsection
were used to obtain values of masses, luminosities and ages,these quantities would be incorrect.
Merın et al.: A study of the properties and SEDs of HD 34282 and HD 141569 11
Fig. 7. Positions of the stars in the HR diagram according to the results shown in Table 4. Left. Upper panel: Positionof HD 34282 in the HR diagram log g∗ – log Teff . The Y2 PMS tracks with Z =0.004 (solid lines) and Z =0.02 (solar,dotted lines) are plotted. Lower panel: same as in the upper panel for HD 141569. The tracks correspond to Z =0.007(solid lines) and Z = 0.02 (dotted lines). Right. Upper panel: Position of HD 34282 in the HR diagram log L/L⊙ –log Teff . The PMS tracks are those for Z =0.004 (solid lines). Lower panel: same as in the upper panel for HD 141569.The tracks correspond to Z = 0.007 (solid lines). In both cases we have labelled the tracks with the correspondingmasses and the isochrones for 4, 6, 8 and 10 Myr are shown with dotted lines.
4.2 and Table 2), the extinctions E(B−V ) obtained are0.04 for HD 34282 and 0.06 for HD 141569. The formervalue especially is in excellent agreement with that givenby the χ2 analysis. The absolute magnitudes MV providedby the tracks are 2.04 and 1.37 respectively; these, com-bined with the observed values of V corrected with theabove extinctions, yield distances of 347 pc for HD 34282and 129 pc for HD 141569, again in good agreement withthe results shown in Table 4.
6. Modelling the SEDs: the irradiated accretion
disk models
The origin of the IR excess in HAeBe stars has been amatter of intense debate (see e.g. Waters & Waelkens1998). Some authors argued in favor of models with an ap-proximately spherical dusty envelope of low optical depth(Berrilli et al. 1992; di Francesco et al. 1994; Pezzutoet al. 1997; Miroshnichenko et al. 1997), others consid-
ered circumstellar disks (Hillenbrand et al. 1992; Chianget al. 2001; Natta et al. 2001) or proposed the existenceof both (Natta et al. 1993; Miroshnichenko et al. 1999).Ultimately the existence of disks around HAeBe stars wasfirmly established by direct imaging at millimetre wave-lengths (Mannings et al. 1997; Mannings & Sargent 1997,2000; Testi et al. 2001; Pietu et al. 2003), in the optical(Grady et al. 1999, 2000) and in the IR (Close et al. 1997;Jayawardhana et al. 1998; Weinberger et al. 1999). Someauthors have been able to fit the complete SEDs of HAeBestars with passive irradiated disk models from Chiang &Goldreich (Chiang et al. 2001; Natta et al. 2001).
6.1. The models
In this work we use the self-consistent irradiated accretiondisk models from D’Alessio et al. (1998, 1999 and 2001)to fit the SEDs of HD 34282 and HD 141569. The meth-ods used here were applied succesfully to fit the SEDs of

12 Merın et al.: A study of the properties and SEDs of HD 34282 and HD 141569
young T Tauri stars with an approximate age of 1 Myr.This approach is valid for these two stars since they areyoung (see Section 5) and at least one of them seems tobe still actively accreting. Since the calculations yield thevertical structure and emission properties of the disk self-consistently with the stellar parameters, and we have char-acterized the stellar photospheres with precision, a goodfit to the SED would provide a physically based pictureof the system without the use of ad-hoc parametrizationsfor the disk temperature or surface density profiles.
The models involve the following assumptions: the diskis in a steady state (M = dM/dt is constant), it is geomet-rically thin (H/R<<1, where H is the scale height of thedisk and R is the radial distance), the accretion viscosityis computed with ν =αH cs, following the α-prescriptionfrom Shakura & Sunyaev (1973), in which cs is the soundspeed. The dust and gas are well mixed in the whole diskwith the usual dust to gas mass ratio of 1/100. For thedust we use a grain size distribution n(a) = n0 a−p withp values of 2.5 or 3.5 and a minimum grain size of 0.005µm. Possible values for the maximum grain size are 1 µmto 10 cm. The abundances are those given by Pollack et al.(1994). The radiation field is considered in two separateregimes (one characteristic of the disk local temperatureand one characteristic of the stellar effective temperature)as in Calvet et al. (1991, 1992) and finally the radiativetransfer is done by solving the first two moments of the ra-diative transfer equation with the Eddington approxima-tion (see D’Alessio et al. 1998, 1999 and 2001 for furtherdetails).
The disk is the solution of the detailed vertical struc-ture equations for each annulus, and the synthetic SEDsare obtained by solving the radiative transport equationin rays parallel to the line of sight and integrating (in solidangle) the disk’s emission.
Note that, although the models we have applied areamongst the most sophisticated available, they have lim-itations inherent in the complexity of the physics andthe computational techniques. For example, they assumea unique dust size distribution with a maximum grainsize amax and the same viscosity parameter α throughout,which in some real cases precludes fitting the observedSED with a single component. For HD 34282 a combina-tion of two disk models is needed: one for the long wave-length part of the SED, with high viscosity and a maxi-mum grain size of 1 cm (subsection 6.2.2) and a secondone for the mid-infrared region of the SED, with lowerviscosity and a maximum grain size of 1 µm (subsection6.2.3); the first one will be referred to as the mid-plane
disk and the latter as the surface disk according to theirvertical scale heights, of which the first has a lower value.We found that these two models were the only combina-tion able to reproduce the whole SED of this star, implyingthat some vertical grain segregation may be present in thedisk around HD 34282. In addition, to explain the bumpat 3 µm we propose the presence of a wall-like structureat the inner edge of the disk (subsection 6.2.4). For HD
141569 a single disk model accounts for the whole SED(subsection 6.3).
6.2. The disk model for HD 34282
The disk around HD 34282 shows signs of activity: opti-cal and near-IR variability, Hα variable emission and highfractional IR excess. Hence, to fit the SED of HD 34282,we assume that the disk is heated by irradiation from thecentral star and viscous dissipation from the mass accre-tion onto the star.
For the central star the following stellar parameters areassumed (Table 4): Teff =8625 K, R∗=1.66 R⊙, M∗=1.59M⊙, L∗ = 13.64 L⊙ and d = 348 pc, where the stellar ra-dius was calculated from the stellar mass and the surfacegravity. For the disk we take an inclination angle of i=56◦
(Pietu et al. 2003) and an outer radius of 705 AU, whichis the disk radius given by these authors scaled from theirdistance of 400 pc to our value of 348 pc. The inner diskradius is calculated self-consistently using the position ofthe near-IR bump, the result being 0.31 AU (see subsec-tion 6.2.4).
To find the remaining input disk parameters we needto know the mass accretion rate towards the star (whichwill be derived from ultraviolet Walraven photometry),the disk viscosity α (which will be fitted to raise the ap-propriate flux at millimetre wavelengths once we know themass accretion rate) and the dust properties (related tothe slope in the millimetre range and the IR excess shapeat shorter wavelengths).
6.2.1. The mass accretion rate in the disk of HD 34282
The fractional IR excess, FIR/F∗, of HD 34282, namely0.63 ± 0.19 (Table 4), is a little bit larger than the val-ues measured in the SEDs of the HAeBe stars studied byNatta et al. (2001), all of them being smaller than 0.45.These authors reproduce the SEDs assuming that no ac-cretion is present, the reprocessing of radiation being themechanism invoked to explain the IR excess. We proposethat, given the more prominent IR excess of this star com-pared to those of the HAeBe stars in Natta et al. (2001)and the higher fractional IR excess (slightly larger than0.5), accretion may be present in this object. For this rea-son, we first try to estimate the mass accretion rate to-wards HD 34282.
This parameter has been studied using Walraven ul-traviolet photometry of HD 34282 (de Geus et al. 1990)and shock emission models by Muzerolle et al. (2003a),who apply to HAeBe stars the magnetospheric accretionscenario from Calvet & Gullbring (1998) and Gullbring etal. (2000). This theory explains the UV excess emissionseen in many T Tauri stars as arising from an accretionshock. In HAeBe stars, the emission from the shocked at-mosphere modifies the underlying photospheric emissionreducing the Balmer jump with respect to the normal
Merın et al.: A study of the properties and SEDs of HD 34282 and HD 141569 13
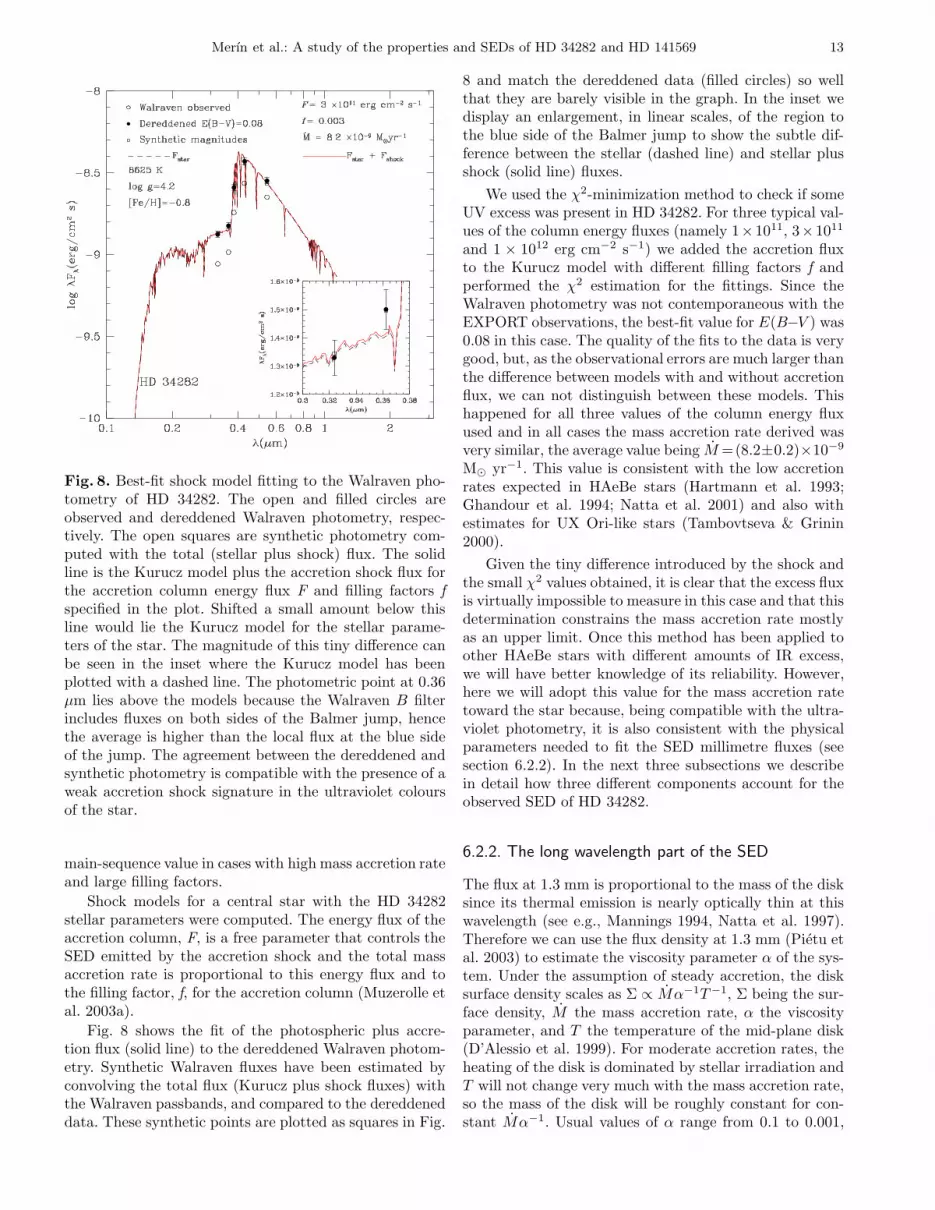
Fig. 8. Best-fit shock model fitting to the Walraven pho-tometry of HD 34282. The open and filled circles areobserved and dereddened Walraven photometry, respec-tively. The open squares are synthetic photometry com-puted with the total (stellar plus shock) flux. The solidline is the Kurucz model plus the accretion shock flux forthe accretion column energy flux F and filling factors f
specified in the plot. Shifted a small amount below thisline would lie the Kurucz model for the stellar parame-ters of the star. The magnitude of this tiny difference canbe seen in the inset where the Kurucz model has beenplotted with a dashed line. The photometric point at 0.36µm lies above the models because the Walraven B filterincludes fluxes on both sides of the Balmer jump, hencethe average is higher than the local flux at the blue sideof the jump. The agreement between the dereddened andsynthetic photometry is compatible with the presence of aweak accretion shock signature in the ultraviolet coloursof the star.
main-sequence value in cases with high mass accretion rateand large filling factors.
Shock models for a central star with the HD 34282stellar parameters were computed. The energy flux of theaccretion column, F, is a free parameter that controls theSED emitted by the accretion shock and the total massaccretion rate is proportional to this energy flux and tothe filling factor, f, for the accretion column (Muzerolle etal. 2003a).
Fig. 8 shows the fit of the photospheric plus accre-tion flux (solid line) to the dereddened Walraven photom-etry. Synthetic Walraven fluxes have been estimated byconvolving the total flux (Kurucz plus shock fluxes) withthe Walraven passbands, and compared to the dereddeneddata. These synthetic points are plotted as squares in Fig.
8 and match the dereddened data (filled circles) so wellthat they are barely visible in the graph. In the inset wedisplay an enlargement, in linear scales, of the region tothe blue side of the Balmer jump to show the subtle dif-ference between the stellar (dashed line) and stellar plusshock (solid line) fluxes.
We used the χ2-minimization method to check if someUV excess was present in HD 34282. For three typical val-ues of the column energy fluxes (namely 1×10¹¹, 3×10¹¹
and 1 × 10¹² erg cm−2 s−1) we added the accretion fluxto the Kurucz model with different filling factors f andperformed the χ2 estimation for the fittings. Since theWalraven photometry was not contemporaneous with theEXPORT observations, the best-fit value for E(B−V ) was0.08 in this case. The quality of the fits to the data is verygood, but, as the observational errors are much larger thanthe difference between models with and without accretionflux, we can not distinguish between these models. Thishappened for all three values of the column energy fluxused and in all cases the mass accretion rate derived wasvery similar, the average value being M =(8.2±0.2)×10−9
M⊙ yr−1. This value is consistent with the low accretionrates expected in HAeBe stars (Hartmann et al. 1993;Ghandour et al. 1994; Natta et al. 2001) and also withestimates for UX Ori-like stars (Tambovtseva & Grinin2000).
Given the tiny difference introduced by the shock andthe small χ2 values obtained, it is clear that the excess fluxis virtually impossible to measure in this case and that thisdetermination constrains the mass accretion rate mostlyas an upper limit. Once this method has been applied toother HAeBe stars with different amounts of IR excess,we will have better knowledge of its reliability. However,here we will adopt this value for the mass accretion ratetoward the star because, being compatible with the ultra-violet photometry, it is also consistent with the physicalparameters needed to fit the SED millimetre fluxes (seesection 6.2.2). In the next three subsections we describein detail how three different components account for theobserved SED of HD 34282.
6.2.2. The long wavelength part of the SED
The flux at 1.3 mm is proportional to the mass of the disksince its thermal emission is nearly optically thin at thiswavelength (see e.g., Mannings 1994, Natta et al. 1997).Therefore we can use the flux density at 1.3 mm (Pietu etal. 2003) to estimate the viscosity parameter α of the sys-tem. Under the assumption of steady accretion, the disksurface density scales as Σ ∝ Mα−1T−1, Σ being the sur-face density, M the mass accretion rate, α the viscosityparameter, and T the temperature of the mid-plane disk(D’Alessio et al. 1999). For moderate accretion rates, theheating of the disk is dominated by stellar irradiation andT will not change very much with the mass accretion rate,so the mass of the disk will be roughly constant for con-stant Mα−1. Usual values of α range from 0.1 to 0.001,

14 Merın et al.: A study of the properties and SEDs of HD 34282 and HD 141569
0.01 being the one that reproduces best the millimetrefluxes in T Tauri stars (D’Alessio et al. 2001). We findthat α=0.0008 yields the appropriate millimetre flux forHD 34282, given the stellar and disk parameters consid-ered.
The slope of the SED at millimetre wavelengths αmm
is normally modelled with the β dependence of the opac-ity κλ = κ0(λ/λ0)
−β (Beckwith et al. 1990; Beckwith &Sargent 1991) where αmm = β + 2 to account for thegrowth of the dust grains. In our case, the millimetreslope is controlled by the dust distribution and the op-tical depth of the disk. To obtain the observed millimetreslope αmm =2.2 (Fν ∝ ν2.2), a combination of p=2.5 anda maximum grain size amax=1 cm was needed. This valueof p can be interpreted as the resulting size distribution ofa coagulation process in which most of the disk dust massresides in large grains (Miyake & Nakagawa 1993).
The contribution of the mid-plane disk to the SED isshown in Fig. 9 as a long-dashed line. There is an excessflux with respect to the observed flux at 3.4 mm measuredby Pietu et al. (2003). We consider the sub-millimetre andmillimetre slope well fitted with Fν ∝ ν2.2 since five fluxdensities, between 0.45 and 2.6 mm, are consistent withit, and no significant change in the slope is expected (see,D’Alessio et al. 1990, but also Qi et al. 2003 for a counter-example). Missing flux, a sudden change in the dust opac-ity at large wavelengths or the contribution of opticallythick regions at small radii may explain the discrepancy(e.g. D’Alessio et al. 2003). A way to check the validityof this result would be to simulate the observation of thismodel for the mid-plane disk in the same line observedby Pietu et al. (2003), namely the 12CO J =2 → 1 tran-sition, and compare the resulting map with the observa-tions. This work is being done and it will be presentedelsewhere.
6.2.3. The mid-infrared region of the SED
As can be seen in Fig. 9 the IR emission coming from asingle irradiated accretion disk model does not reproducethe observed mid-IR fluxes. According to the CIRR val-ues in the IRAS PSC, the cirrus infrared emission aroundthis star is not an important contribution to the measuredfluxes at 60 and 100 µm, so we consider that the flux inthis part of the SED is also coming from the disk, implyingthat a second component is required.
The IR excess produced by an irradiated accretiondisk model with dust and gas well mixed decreases asthe size of the dust particles increases (D’Alessio et al.2001). For a fixed dust mass, a decrease in the amount oflarge dust particles obviously implies the presence of moresmall grains in the disk; the effect is that the opacity ofthe dust to the stellar radiation increases and the heightwhere most of the stellar radiation is deposited is greater.In that case, the disk intercepts more radiation from thestar and hence it will emit more IR flux. In order to fitthe mid-IR excess in HD 34282, we need the contribution
of a disk component that we will call the surface disk withamax = 1 µm, p = 3.5, the same mass accretion rate asthe mid-plane disk (in this way we assure that the masstransfer is conserved through the disk) and α = 0.008.The contribution of the surface disk to the SED is shownin Fig. 9 as a dotted line.
Considering both components, the disk would containlarge grains in the mid-plane, which are responsible forthe almost optically thin emission at sub-millimetre andmillimetre wavelengths and a population of small grains –the surface disk – on top of the previous model, which isresponsible for the emission in the mid-IR. The total massof the disk around HD 34282 can now be estimated fromthe masses of both disk components (Table 5) assumingthat the mid-plane disk extends out to some intermediateheight and the surface disk occupies the higher layer tothe end of the disk. Given that the disks are in hydro-static equilibrium, the density distribution with height isa gaussian function centered at the mid-plane. The totalmass is then dominated by the mid-plane disk and liesbetween 0.6 and 0.7 M⊙. The disk mass is less than halfthe stellar mass, supporting the hypothesis that the maingravitational field is due to the central star.
Natta et al. (2000) used the flux at 2.6 millimetres toestimate a mass of 0.05 M⊙ for the disk of HD 34282,an order of magnitude smaller than our value. Differencesin the gas temperature and the opacity parametrizationused in their calculation may account for the difference.Nevertheless, the upper limit of the disk masses computedby Natta and collaborators for a large sample of HAeBestars matches our estimate for the mass of the disk aroundHD 34282, showing that it is quite massive compared totypical HAeBe disks.
6.2.4. The near-IR wavelength region of the disk
Some HAeBe stars show conspicuous near-IR bumps.Hillenbrand et al. (1992) used high mass accretion ratemodels to fit their SEDs but Hartmann et al. (1993) ar-gued that such large values for M were incompatible withthe bolometric luminosity of the objects. Finally Nattaet al. (2001) proposed the presence of a frontally illumi-nated wall at the dust destruction radius where this near-IR bump would be emitted making compatible the shapeof the SED and the luminosity of the object.
We assume that the excess emission at 3 µm in theSED of HD 34282 originates in a wall-like structure at theinner part of the disk and model it as a black body at1400 K. Following Natta et al. (2001) and Dullemond etal. (2001), if this wall of irradiated material were opticallythick then it would radiate as a black body at the localtemperature, namely that of dust destruction (accordingto Pollack et al. 1994, Tevap∼1200 − 1400 K).
The position, Rrim, and height, Hrim, of this irradiatedwall can be computed following the methods described inDullemond et al. (2001). Also, Muzerolle et al. (2003b)have recently fitted the near-IR bump in the SEDs of

Merın et al.: A study of the properties and SEDs of HD 34282 and HD 141569 15
Fig. 9. Disk models fitting the full SED of HD 34282.Filled triangles are dereddened Walraven photometryfrom de Geus et al. (1990). Filled circles are dereddenedEXPORT optical and near-IR photometry. Filled squaresare LM magnitudes from Sylvester et al. (1996). Opensymbols are the observed fluxes. The crosses are the IRAScolour-corrected fluxes and the open pentagons are sub-millimetre fluxes from Sylvester et al. (1996), Pietu et al.(2003) and Mannings & Sargent (2000). The dashed lineis the Kurucz model for the stellar parameters computedin Section 5. The thin solid line is the 1400 K black bodyfit to the near-IR excess. The dotted line is the contribu-tion of the surface model with inclination angle i = 56◦,M = 8.2 × 10⁻⁹ M⊙yr−1, α = 0.008, Rin=0.31 AU,Rout=705 AU, p = 3.5 and amax = 1 µm. The long-dashedline is the contribution of the mid-plane disk model withthe same parameters as the surface one except p = 2.5,amax = 1 cm and α = 0.0008. The thick solid line on thetop of the others is the addition of all components. Seethe text for explanation.
Classical T Tauri stars with a black body arising froma similar model for a dust destruction wall. These authorsfind best-fit temperatures for the wall to be around 1400K. The main difference with respect to the first modelis that the dust is not treated as optically thick but theposition of the rim is computed with the same dust sizedistributions as in D’Alessio et al. (2001) and the methodsused in Calvet et al. (1991, 1992).
The projected area, A, of the rim is computed as inappendix B in Dullemond et al. (2001). The solid anglesubtended by this area is A/d2, where d is the distanceto the source. The normalization constant needed to fit ablack body to the near-IR photometry is proportional tothe solid angle subtended by the rim, so after computing
the position of the wall, Rrim, we can estimate the cor-responding height so that the emitting area is consistentwith the photometry.
Then, using equation (14) in Dullemond et al. (2001)in a simple iterative procedure, we get Rrim = 0.31 AUand Hrim = 0.06 AU. Also, using the equation for Rrim
in Muzerolle et al. (2003b) similar results were obtained(namely Rrim =0.31 AU and Hrim =0.04 AU). This agree-ment is due to the fact that the different optical depthassumed for the dust in Muzerolle et al. (2003) is com-pensated by the autoirradiation correction introduced byDullemond et al. (2001).
It is remarkable that the height obtained in this wayis similar to the height of the surface disk component atRrim (Hmodel = 0.06 AU). However, we must take intoaccount that the height of a single disk where the largegrains are in the mid-plane and the small grains in upperlayers may be different to this5. Firmer conclusions aboutthese heights require a self-consistent determination of thevertical structure with settled dust, which is left for futurework.
As quoted in Natta et al. (2001), the hypothesis ofthe irradiated wall assumes a negligible opacity of the gasdisk inside Rrim so that the stellar radiation is able toreach the inner wall. The calculation of the actual gasopacity inside the wall is difficult because of the multipleatomic and molecular absorption lines present. Muzerolleet al. (2003b) studied the opacity of a gaseous disk insidethe dust destruction radius using an extended set of gasopacities and a detailed treatment of the heating of thegas due to accretion and stellar irradiation. They foundthat for typical parameters of HAeBe stars, the opticaldepth of the inner hole would be low enough to allow asubstantial fraction of the stellar radiation to reach thedust sublimation wall.
The thin solid line in Fig. 9 is the contribution of theirradiated wall to the SED. The thick solid line is theaddition of the Kurucz model and the contributions tothe IR excess of the wall and the mid-plane and surfacedisks. In Table 5 a summary of the input parameters forthe models is given. Also the values found for the heightat 10 AU and the disks’ masses for each component aregiven.
6.3. The disk model for HD 141569
The SED of this star has already been fitted with opti-cally thin dust models (e.g. Sylvester et al. 1996, Malfaitet al. 1998). Recently Li & Lunine (2003) have publisheda highly detailed, thorough model in which the star istaken to be a Vega-type object with a debris disk filled
5 This is a consequence of the fact that the model with largeamax has a smaller vertical scale height – is less flared – thanthe model with small amax (see Table 5), so the dust in thecomposite model would look like a slighly flared distribution oflarge particles surrounded by a more flared structure of smallerparticles.

16 Merın et al.: A study of the properties and SEDs of HD 34282 and HD 141569
Table 5. Disk model parameters and results.
HD 34282 HD 141569
Mid-plane Surface
M (M⊙ yr−1) 8 × 10⁻⁹ 8 × 10⁻⁹ 1 × 10⁻¹¹
α 8 × 10⁻⁴ 8 × 10⁻³ 1 × 10⁻³
Rin (AU) 0.31 0.31 0.24Rout (AU) 705 705 428p 2.5 3.5 2.5amax 1 cm 1 µm 1 mmInclination 56◦ 56◦ 51◦
H10 AU (AU) 3.06 4.13 2.33Mdisk (M⊙) 0.70 0.06 6.3 × 10⁻⁴
with optically thin porous dust. We have shown in previ-ous sections, however, that HD 141569 is a PMS HAeBestar and not a Vega-type MS star, surrounded by a CSdisk. This disk is clearly more evolved than usual CS disksdetected around other HAeBe stars, but it cannot be con-sidered as a ‘typical’ debris disk, as indicated by the ra-tio between the IR excess and the bolometric luminosityand the non-negligible gas content and activity. Thus, theHD 141569 disk appears to be in an intermediate stagebetween ‘first generation’ PMS disks and ‘second genera-tion’ debris disks. We take this as a justification to carryout an exploratory study in which we fit the SED of HD141569 with PMS disk models and then compare the re-sults with those from the debris disks models, looking forconvergent aspects. Note also that A-type Vega-like starswith debris disks are older systems than HD 141569 (Songet al. 2001).
The observational results strongly indicate that thereis no significant mass accretion. Thus, we assume that thedisk is heated only by irradiation from the central starand that no viscous dissipation from the mass accretiononto the star is present, which translates in the modelswe are using into an extremely low mass accretion rate.The central star has the following parameters (Section 5):Teff = 10000 K, R∗ =1.70 R⊙, M∗ =2.00 M⊙, L∗ =25.77L⊙ and d=108 pc, where the stellar radius was calculatedfrom the stellar mass and the surface gravity. For the disk,we will use an inclination angle i=51◦ (Weinberger et al.1999) and an outer radius Rout = 428 AU, i.e. the valueof 400 AU given by Weinberger et al. (1999) scaled to ourestimated distance of 108 pc. A change in the outer radiusof no more than 50 - 60 AU will not affect substantiallythe final results. The inner radius is fitted to be Rin=0.24AU to account for the lack of near-IR excess in the SED.
Fig. 10 shows the results of our irradiated disk modelcompared to the SED of HD 141569. The peak at 7.7 µmis a PAH feature (see Li & Lunine 2003) that has not beenmodelled because it is not included in the dust model used(D’Alessio et al. 2001, Pollack et al. 1994). We find thata disk with a negligible mass accretion rate, M ∼ 10−11
M⊙ yr−1, and α = 0.001 (which translates into a dustand gas distribution of Σ ∝ R−1.0 with Σ(10 AU) = 3 gcm−2), and a dust distribution with amax = 1 mm andp = 2.5 fits reasonably well the multiwavelength SED of
Fig. 10. Disk model fitting the SED of HD 141569. Filledtriangles are dereddened IUE data. Filled circles aredereddened EXPORT optical magnitudes. Filled hexagonsare dereddened JHK magnitudes from Malfait et al. (1998)and filled squares are LM magnitudes from Sylvester etal. (1996). The corresponding open symbols are the ob-served fluxes. The small open circles are the ISO-PHOTmeasurements. The crosses are the IRAS colour-correctedfluxes, the open pentagon is the submillimetre flux fromSylvester et al. (2001) and the arrow is the upper limit fluxfrom Sylvester et al. (1996). The dashed line is the Kuruczmodel for the stellar parameters computed in Section 5.The thick solid line is the disk model with inclination an-gle i=51◦, M =10−11 M⊙yr−1, α=0.001, Rin=0.24 AU,Rout=428 AU, p = 2.5 and amax = 1 mm. See text fordetails.
HD 141569. The fractional IR luminosity from our modelis 0.011, consistent with the measured value (Section 5).The total mass (gas and dust) of our disk is 6.4 ×10⁻⁴
M⊙ which is equivalent to 213 M⊕. The mass of the diskderived with this model is higher than the typical massesencountered in Vega-like disks (Thi et al. 2001) but clearlysmaller than those found in HAeBe stars (Natta et al.1997), as expected given the evolutionary status of HD141569. Table 5 gives a summary of the input parametersfor the model as well as the mass of the disk and the heightat 10 AU6.
6 Note that, whereas the disk of HD 141569 seems to be moreevolved than that of HD 34282, the estimated age of HD 141569is less than that of HD 34282 (see Table 4). However, one hasto be careful when comparing this parameter for both stars,given the fact that HD 141569 is more massive and has largermetal abundance than HD 34282. Therefore, the evolutionarytime scales are different for both objects. The initial conditions

Merın et al.: A study of the properties and SEDs of HD 34282 and HD 141569 17
In the model by Li & Lunine (2003) the surface den-sity of dust particles is introduced with three analyticalapproximations that reproduce the surface brightness pro-files observed in thermal and scattered light images byAugereau et al. (1999), Weinberger et al. (1999), Mouilletet al. (2001) and Marsh et al. (2002). However, the verti-cal height of the dust is computed assuming vertical hy-drostatic equilibrium with a gas temperature taken to bea power law of the distance from the central star. In ourdisk models, both the density profile and the vertical scaleheight are computed taking into account the stellar irradi-ation heating (assuming that dust and gas are in thermalequilibrium). Concerning the continuum emission in theinfrared to millimetre wavelengths, the presence of gaps ofmoderate width with smaller dust density does not changedramatically the shape of the SED (see e.g. Fig. 3 in Li &Lunine (2003) where the three dust components are addedto yield the smooth observed SED). Therefore we can as-sume that our continuous dust distribution is a good firstapproximation to the actual dust density with the advan-tage that it is self-consistently computed, along with itsvertical hydrostatic structure, with the set of stellar pa-rameters previously determined. This is in agreement withthe results obtained by Clampin et al. (2003).
Concerning the dust, Li & Lunine (2003) found thata ‘cold-coagulation’ dust composed of porous dust grainswith a porosity P = 0.9 (90 % of the volume is vacuumand 10 % material), and a power law distribution of sizesn(a) ∝ a−3.3 with 1 µm < a < 1 cm, fitted very accu-rately the whole continuum SED of HD 141569. This dustmodel is not very far from our assumed n(a) ∝ a−2.5 with0.005 µm < a < 1 mm mostly at large sizes. The differ-ence in the optical properties of the compact dust grainscompared to the porous dust grains may be accounted forby using a different power law exponent for the size distri-bution. The contribution of the PAH molecules to the IRemission is more important around the peaks at 3.3, 6.6,7.7, 11.3 µm (see Li & Draine 2001 for details) and thecontinuum is well reproduced by the porous or compactdust populations.
The main effect of having a disk with gas and dust, in-stead of a pure dusty disk, is that the heating due to stel-lar irradiation produces an increase in the vertical scaleheight of the disk, yielding a more dilute dust population.Summarizing, we find that our approach fits the observedSED of HD 141569 reasonably well, although the modelwe have used does not include as many details as thatdeveloped by Li & Lunine, particulary in the treatmentof the dust properties. In this sense, our result is inter-esting since it shows the possibility of studying CS disksin transition objects from both perspectives, namely thePMS and MS sides.
of the clouds where the stars and disks formed must also playa role in the evolutionary scenario.
7. Conclusions
We have presented a study of the properties and spectralenergy distributions of the HAeBe stars HD 34282 andHD 141569 and their disks, based mainly on observationsmade by the EXPORT consortium (Eiroa et al. 2000). Themain conclusions can be summarized as follows:
– The spectroscopic and photometric observations ofboth stars have been described and analysed in detailwith the aim of throwing light on their evolutionarystatus and the dynamics and variability of their pho-tospheres and disks.
– Both stars are metal-deficient. Our estimates are[Fe/H]=−0.8 for HD 34282 and −0.5 for HD 141569.
– The analysis has provided values for the stellar dis-tances. The distance to HD 34282, namely 348 pc, isconsistent with the value given by Pietu et al. (2003)and corrects the Hipparcos distance that is uncertaindue to the large error in the parallax. The new dis-tance for HD 34282, together with its low metallic-ity, resolves the anomalous position of this star in theHR diagram previously reported under the assump-tion that the star has solar abundances. The distanceto HD 141569, namely 108 pc, is consistent with theHipparcos data and in this case, the question of theanomalous position of this star in the HR diagram isresolved by using the correct set of tracks with theappropriate metallicity.
– In addition to the above two parameters, our analy-sis has provided for both stars values for the effectivetemperatures, spectral types, masses, gravities, lumi-nosities, ages, projected rotational velocities and ex-tinctions. These results are given in Table 4.
– Complete SEDs from the ultraviolet to the millimetrerange have been constructed for both stars and theirdisks using the EXPORT data plus additional resultsgathered from the literature and on-line databases.Table 3 gives a full account of this compilation andthe data sources.
– The self-consistent irradiated accretion disk models ofD’Alessio et al. (1998, 1999 and 2001) have been usedto fit the SEDs of both systems. A summary of thedisk parameters obtained is given in Table 5.
– The SED of the disk of HD 34282 has been repro-duced using a three-component model. The mid-plane
disk is modelled with a maximum dust grain size of 1cm and emits mainly at submillimetre and millimetrewavelengths, the surface disk model has a maximumgrain size of 1 µm and is responsible for the mid-IRexcess emission. A near-IR bump similar to those seenin other HAeBe stars (see Natta et al. 2001) is fit-ted with the emission of a frontally illuminated wall
placed at the dust destruction radius (Dullemond etal. 2001; Muzerolle et al. 2003b, D’Alessio et al. 2003).The geometry of the wall is constrained by the near-IRphotometry.
– In the process of fitting the SED of HD 34282, we havetried for the first time a new method to estimate the

18 Merın et al.: A study of the properties and SEDs of HD 34282 and HD 141569
mass accretion rate towards a HAeBe star using ultra-violet Walraven photometry and the magnetosphericaccretion shock models of Muzerolle et al. (2003a). Weobtained un upper limit for the mass accretion ratein HD 34282 compatible with the parameters neededto fit the millimetre SED. The low value found doesnot support the idea by Herbst & Shevchenko (1999)about the FU Ori-like mechanism causing the photo-metric activity of UX Ori stars.
– The SED of HD 141569 has been fitted with a diskmodel irradiated by the central star with negligibleaccretion and with large grains (amax = 1 mm). Aslightly flared dust and gas distribution was obtained,which is consistent with a substantial amount of resid-ual gas in the disk.
Acknowledgements. We would like to acknowledge Prof.Vladimir Grinin for his careful reading of the manuscript andhis constructive suggestions. The authors are also grateful toSukyoung Yi for kindly providing unpublished smoothed evo-lutionary tracks and for advice on their use, and to DavidBarrado y Navascues, Pedro Garcıa-Lario, Jose FranciscoGomez and Pedro Rodrıguez for discussions. The work ofC. Eiroa, B. Merın, B. Montesinos, A. Mora and E. Solanohas been supported in part by the Spanish grant AYA2001-1124-C02. P. D’Alessio acknowledges grants from DGAPA-UNAM and CONACyT, Mexico. B. Merın wishes to acknowl-edge the hospitality of the Young Stars’ group at the Harvard-Smithsonian Center for Astrophysics and its support with theSTScI grant GO-9524 during his stay as a visiting student, andto the INTA for its financial support of a graduate fellowship.
References
Alvarez, M., & Schuster, W.J. 1981, RMxA&A,6, 163Andrillat, Y., Jaschek, M., & Jaschek, C. 1990, A&A, 233, 474
Augereau, J.C., Lagrange, A.M., Mouillet, D., & Menard, F.1999, A&A, 350, L51
Beckwith, S.V.W., & Sargent, A.I. 1991, ApJ, 381, 250Beckwith, S.V.W., Sargent, A.I., Chini, R.S., & Guesten, R.
1990, AJ, 99, 924
Berrilli, F., Corciulo, G., Ingrosso, G., et al. 1992, ApJ, 398,254
Boccaletti, A., Augereau, J.C., Marchis, F., & Hahn, J. 2003,ApJ, 585, 494
Bohm, T., & Catala, C. 1994, A&A, 290, 167Bohm, T., & Catala, C. 1995, A&A, 301, 155
Bouret, J.-C., & Catala, C. 2000, A&A, 359, 1011Brittain, S.D., & Rettig, T.W. 2002, Nat, 418, 57
Brittain, S.D., Rettig, T.W., Simon, Th., et al. 2003, ApJ, 588,535
Calvet, N., & Gullbring, E. 1998, ApJ, 509, 802Calvet, N., Patino, A., Magris, G.C., & D’Alessio, P. 1991,
ApJ, 380, 617Calvet, N., Magris, G.C., Patino, A., & D’Alessio, P. 1992,
RMxA&A, 24, 27
Chavarrıa, C. 1981, A&A, 101, 105Chiang, E.I., & Goldreich, P. 1997, ApJ, 490, 368
Chiang, E.I., & Goldreich, P. 1999, ApJ, 519, 279
Chiang, E.I., Joung, M.K., Creech-Eakman, M.J., et al. 2001,ApJ, 547, 1077
Clampin, M., Krist, J.E., Ardila, D.R., et al. 2003, AJ, 126,385
Close, L.M., et al. 1997, ApJ, 489, 210Corcoran, M., & Ray, T.P. 1997, A&A, 321, 189Coulson, I.M., Walther, D.M., & Dent, W.R.F. 1998, MNRAS,
296, 934D’Alessio, P., Canto, J., Calvet, N., & Lizano, S. 1998, ApJ,
500, 411D’Alessio, P., Calvet, N., Hartmann, L., Lizano, S., & Canto,
J. 1999, ApJ, 527,893D’Alessio, P., Calvet, N., & Hartmann, L. 2001, ApJ, 553, 321D’Alessio, P., Calvet, N., Hartmann, L., et al. 2003. ASP Conf.
Series, vol. 221, submitted.de Geus, E.J., Lub, J., & van de Grift, E. 1990, A&AS, 85, 915de Winter, D., van den Ancker, M.E., Maira, A., et al. 2001,
A&A, 380, 609di Francesco, J., Evans, N.J., II, Harvey, P.M., Mundy, L.G.,
& Butner, H.M. 1994, ApJ, 432, 710Dullemond, C.P., Dominik, C., & Natta, A. 2001, ApJ, 560,
957Dunkin, S.K., Barlow, M.J., & Ryan, S.G. 1997, MNRAS, 286,
604Eiroa, C., Mora, A., Palacios, J., et al. (EXPORT) 2000, in:
Disks, Planetesimals and Planets, eds. F. Garzon, C. Eiroa,D. de Winter, T. Mahoney, ASP Conf. Series, vol. 219, p.3
Eiroa, C., Garzon, F., Alberdi, A., et al. (EXPORT) 2001,A&A, 365, 110
Eiroa, C., Oudmaijer, R.D., Davies, J.K., et al. (EXPORT)2002, A&A, 384, 1038
Fisher, R.S., Telesco, C.M., Pina, R.K., Knacke, R.F., &Wyatt, M.C. 2000, ApJ, 532, L141
Ghandour, L., Strom, S., Edwards, S., & Hillenbrand, L. 1994in: The nature and evolutionary status of Herbig Ae/Bestars, eds. P.S. The, M.R. Perez, E.P.J. Van den Heuvel,ASP Conf. Series, vol. 62, p.223
Grady, C.A., Woodgate, B., Bruhweiler, F.C., et al. 1999, ApJ,523, L151
Grady, C.A., Devine, D., Woodgate, B., et al. 2000, ApJ, 544,895
Gray, R.O., & Corbally, C.J. 1998, AJ, 116, 2530Grinin, V.P., & Rostopchina, A.N. 1996, ARep, 40, 171Grinin, V.P., Shakhovskoi, D.N., Shenavrin, V.I., Rostopchina,
A.N., & Tambovtseva, L.V. 2002, ARep, 46, 646Gullbring, E., Calvet, N., Muzerolle, J., & Hartmann, L. 2000,
ApJ, 544, 927Hartmann, L., Kenyon, S.J., & Calvet, N. 1993, ApJ, 407, 219Herbst, W., & Shevchenko, V.S. 1999, AJ, 118, 1043Hillenbrand, L.A., Strom, S.E., Vrba, F.J., & Keene, J. 1992,
ApJ, 397, 613Jayawardhana, R., Fisher, S., Hartmann, L., et al. 1998, ApJ,
503, L79Johns, C.M., & Basri, G. 1995, ApJ, 449, 341Jura, M., Malkan, M., White, R., et al. 1998, ApJ, 505, 897Kenyon, S.J., & Hartmann, L. 1987, ApJ 323, 714Kurucz, R.L. 1993, ATLAS9 Stellar Atmosphere Programs and
2 km/s grid. CD-ROM No. 13. Cambridge, Massachusetts,Smithsonian Astrophysical Observatory
Li, A., & Draine, B.T. 2001, ApJ, 554, 778Li, A., & Lunine, J.I. 2003, ApJ, 594, 987Lorenzetti, D., Giannini, T., Nisini, B., et al. 2002, A&A, 395,
637Lowrance, P.J., Schneider, G., Kirkpatrick, J.D., et al. 2000,
ApJ, 541, 390

Merın et al.: A study of the properties and SEDs of HD 34282 and HD 141569 19
Lub, J., & Pel, J.W. 1977, A&A, 54, 137Malfait, K., Bogaert, E., & Waelkens, C. 1998, A&A, 331, 211Mannings, V. 1994, MNRAS, 271, 587Mannings, V., & Sargent, A.I. 1997, ApJ, 490, 792Mannings, V., & Sargent, A.I. 2000, ApJ, 529, 391Mannings, V., Koerner, D.W., & Sargent, A.I. 1997, Nat, 388,
555Marsh, K.A., Silverstone, M.D., Becklin, E.E., et al. 2002, ApJ,
573, 425Mayor, M., & Queloz, D. 1995, Nat, 378, 355Miroshnichenko, A., Ivezic, Z., & Elitzur, M. 1997, ApJ, 475,
41 (erratum in ApJ, 479, 153)Miroshnichenko, A., Ivezic, Z., Vinkovic, D., & Elitzur, M.
1999, ApJ, 520, 115Miyake, K., & Nakagawa, Y. 1993, Icarus, 106, 20Mora, A., Merın, B., Solano, E., et al. (EXPORT) 2001, A&A,
378, 116Mouillet, D., Lagrange, A.M., Augereau, J.C., & Menard, F.
2001, A&A, 372, L61Muzerolle, J., D’Alessio, P., Calvet, N., & Hartmann, L. 2003a,
ApJ, in preparationMuzerolle, J., Calvet, N., Hartmann, L., & D’Alessio, P. 2003b,
ApJ, in preparationNatta, A. 1993, ApJ, 412, 761Natta, A., Palla, F., Butner, H.M., Evans, N.J., II, & Harvey,
P.M. 1993, ApJ, 406, 674Natta, A., Grinin, V.P., Mannings, V., & Ungerechts, H. 1997,
ApJ, 491, 885Natta, A., Grinin, V.P. & Mannings, V. 2000, in Protostars
and Planets IV, eds. V. Mannings, A.P. Boss, S.S. Russell,The University of Arizona Press, p. 559
Natta, A., Prusti, T., Neri, R., et al. 2001, A&A, 371, 186Oliveira, J.-M., Foing, B.H., van Loon, J.Th., & Unruh, Y.C.
2000, A&A, 362, 615Oudmaijer, R.D., Palacios, J., Eiroa, C., et al. (EXPORT)
2001, A&A, 379, 564Penprase, B.E. 1992, ApJS, 83, 273Pezzuto, S., Strafella, F., & Lorenzetti, D. 1997, ApJ, 485, 290Pietu, V., Dutrey, A., & Kahane, C. 2003, A&A, 398, 565Pollack, J.B., Hollenbach, D., Beckwith, S., et al. 1994, ApJ,
421, 615Qi, C., Kessler, J., Koerner, D., et al. 2003, ApJ, submittedRieke, G.H., & Lebofsky, M.J. 1985, ApJ, 288, 618Schmidt-Kaler, T., 1982, Landolt-Bornstein New Series, Vol.
2B, Chapt. Physical parameters of the stars, Springer-Verlag, New York
Shakura, N.I., & Sunyaev, R.A. 1973, A&A, 24, 337Solano, E., Gonzalez-Riestra, R., Talavera, A., et al. 2001, in:
Astronomical Data Analysis Software and Systems X, eds.F.R. Harnden, Jr., F.A. Primini, H.E. Payne, ASP Conf.Series, vol. 238, p. 152
Song, I., Caillaut, J-P., Barrado y Navascues, D., & Stauffer,J.R. 2001, ApJ, 546, 352
Steenman, H.,& The, P.S. 1991, Ap&SS, 184, 9Sylvester, R.J., Skinner, C.J., Barlow, M.J., & Mannings, V.
1996, MNRAS, 279, 915Sylvester, R.J., Dunkin, S.K., & Barlow, M.J. 2001, MNRAS,
327, 133Tambovtseva, L.V., & Grinin, V.P. 2000, in: Disks,
Planetesimals and Planets, eds. F. Garzon, C. Eiroa, D.de Winter, T. Mahoney, ASP Conf. Series, vol. 219, p. 428
Testi, L., Natta, A., Shepherd, D.S., & Wilner, D.J. 2001, ApJ,554, 1087
Thi, W.F., Blake, G.A., van Dishoeck, E.F., et al. 2001 Nat,409, 60
van den Ancker, M.E., de Winter, D., & Tjin A Djie, H.R.E.1998, A&A, 330, 145
Waters, L.B.F.M., & Waelkens, C. 1998 ARA&A, 36, 233Weinberger, A.J., Becklin, E.E., Schneider, G., et al. 1999,
ApJ, 525, L53Weinberger, A.J., Rich, R.M., Becklin, E.E., Zuckerman, B., &
Matthews, K. 2000, ApJ,544, 937Yi, S., Demarque, P., Kim, Y.-Ch., et al. 2001, ApJS, 136, 417Zuckerman, B., Forveille, T., & Kastner, J.H. 1995, Nat, 373,
494