study of selective marketing mix contributing to success of
TRANSCRIPT
Study of Selective Marketing Mix Contributing to Success of Restaurant
Operations in Pune Municipal Corporation Area
(Period: April 2014 to March 2017)
A Thesis Submitted to
Tilak Maharashtra Vidyapeeth, Pune
For the Degree of Doctor of Philosophy in Management
Under the Board of Management Studies
Submitted By
Mr. Mahesh Rangnath Randhave
PRN: 15813007843
Under the Guidance of Dr. Suvarna Sathe
Department of Management
November 2020
i
Annexure III
Tilak Maharashtra Vidyapeeth, Pune
Undertaking
I Mahesh Rangnath Randhave is the Ph. D Scholar of the Tilak Maharashtra Vidyapeeth in
Management subject. Thesis entitled Study of selective marketing mix contributing to success of
restaurant operations in Pune Municipal Corporation area (Period: April 2014 to march 2017)
under the supervision of Dr. Suvarna Sathe, Solemnly affirm that the thesis submitted by me is
my own work. I have not copied it from any source. I have gone through extensive review of
literature of the related published / unpublished research works and the use of such references
made has been acknowledged in my thesis. The title and the content of research is original. I
understand that, in case of any complaint especially plagiarism, regarding my Ph.D. research
from any party, I have to go through the enquiry procedure as decided by the Vidyapeeth at any
point of time. I understand that, if my Ph.D. thesis (or part of it) is found duplicate at any point of
time, my research degree will be withdrawn and in such circumstances, I will be solely
responsible and liable for any consequences arises thereby. I will not hold the TMV, Pune
responsible and liable in any case.
I have signed the above undertaking after reading carefully and knowing all the aspects therein.
Signature :
Address : L3/48, Konark Housing Society,
Laxmi Nagar, Parvati,
Pune – 411009
Ph.No.: 9823524764 E-mail : [email protected]
Date: Place: Pune
ii
Annexure IV
Certificate of the Supervisor
It is certified that work entitled, “Study of selective marketing mix contributing to success of
restaurant operations in Pune Municipal Corporation area (Period: April 2014 to march 2017)” is
an original research work done by Mr. Mahesh Rangnath Randhave under my supervision for the
degree of Doctor of Philosophy in Management to be awarded by Tilak Maharashtra Vidyapeeth,
Pune. To best of my knowledge this thesis
Embodies the work of candidate himself
Has duly been completed
Fulfils the requirement of the ordinance related to Ph. D. degree of the TMV
Up to the standard in respect of both content and language for being referred to the examiner.
Signature of the Supervisor
iii
ACKNOWLEDGEMENT
I would like to thank all the individuals and organizations that assisted me in carrying out the
research work presented through this thesis. I must acknowledge with gratitude prominent
persons who have spent their time, resources and shared experiences with me. All of them have
helped me to complete this work with pleasure and satisfaction.
At the beginning, I express my gratitude to my guide Dr. Suvarna Sathe, Principal, Department
of Hotel Management, Tilak Maharashtra Vidyapeeth, Pune for her constant research-oriented
efforts in guiding and supervising my work. At every step of this research she carefully helped
me to complete this work irrespective of all odds.
I am grateful to my father Mr. Rangnath P. Randhave and mother Ms. Alka R. Randhave. Their
encouragement, has led me to complete this research successfully. My wife, Vaishali Randhave
and my brother Ganesh Randhave have encouraged me from time to time helping me to
complete this work. A special mention would be reserved for my dear son, Pratham.
I would like to dedicate this work to my late Mother in Law Mrs. Sunita Rajaram Sant.
I would like to thank my all friends, family and colleagues at the Department of Hotel
Management, Tilak Maharashtra Vidyapeeth, Pune.
I would like to thank Tilak Maharashtra Vidyapeeth (TMV), Department of Management and
Lokmanya Tilak Centre for Research and Development. Dr. Hemant Abhyankar, Dr. Pranati
R. Tilak and Dr. C. Sunanda Yadav need a special mention for their inputs and constant
encouragement throughout my research journey. The course work, workshops and guidance
offered has been very helpful. I would like to thank the Hotel and Restaurant industry in Pune
for their valuable time during survey conducted for research.
Mr. Mahesh Rangnath Randhave
CONTENT
Chapter Particulars Page number
Undertaking i
Certificate of Supervisor ii
Acknowledgement iii
List of Tables iv-vi
List of Figures vii-viii
Abstract ix-xviii
1
Introduction
1-41
2 Literature Review 42-74
3 Research Methodology 75-82
4 Data analysis and Interpretation 83-157
5 Conclusions and Recommendations 158-174
6 Bibliography 175-186
Appendix
Questionnaire 1 187-189
Questionnaire 2 190-195
iv
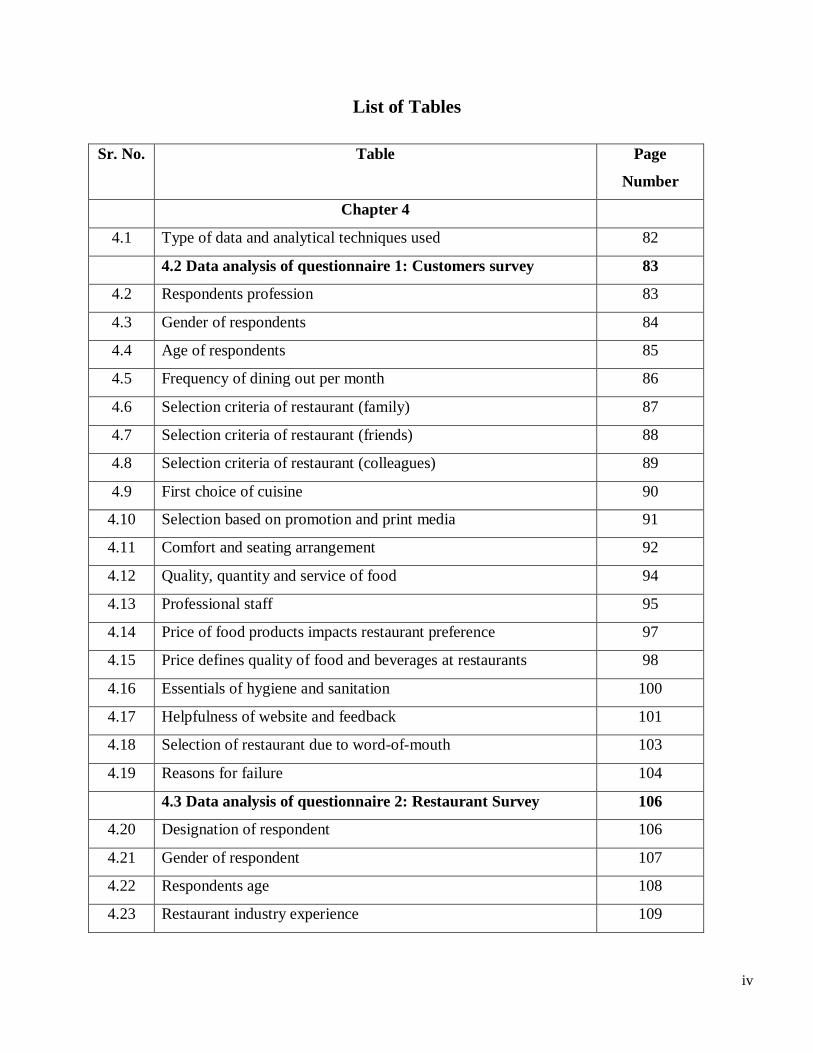
List of Tables
Sr. No. Table Page
Number
Chapter 4
4.1 Type of data and analytical techniques used 82
4.2 Data analysis of questionnaire 1: Customers survey 83
4.2 Respondents profession 83
4.3 Gender of respondents 84
4.4 Age of respondents 85
4.5 Frequency of dining out per month 86
4.6 Selection criteria of restaurant (family) 87
4.7 Selection criteria of restaurant (friends) 88
4.8 Selection criteria of restaurant (colleagues) 89
4.9 First choice of cuisine 90
4.10 Selection based on promotion and print media 91
4.11 Comfort and seating arrangement 92
4.12 Quality, quantity and service of food 94
4.13 Professional staff 95
4.14 Price of food products impacts restaurant preference 97
4.15 Price defines quality of food and beverages at restaurants 98
4.16 Essentials of hygiene and sanitation 100
4.17 Helpfulness of website and feedback 101
4.18 Selection of restaurant due to word-of-mouth 103
4.19 Reasons for failure 104
4.3 Data analysis of questionnaire 2: Restaurant Survey 106
4.20 Designation of respondent 106
4.21 Gender of respondent 107
4.22 Respondents age 108
4.23 Restaurant industry experience 109
v
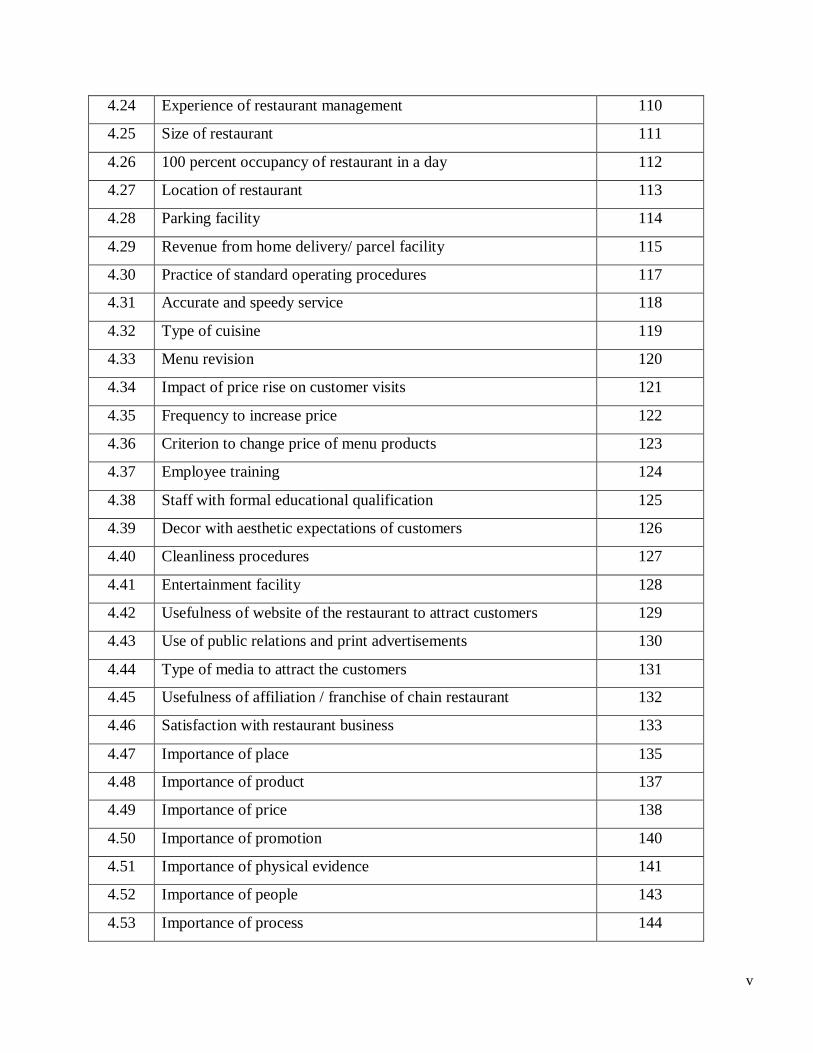
4.24 Experience of restaurant management 110
4.25 Size of restaurant 111
4.26 100 percent occupancy of restaurant in a day 112
4.27 Location of restaurant 113
4.28 Parking facility 114
4.29 Revenue from home delivery/ parcel facility 115
4.30 Practice of standard operating procedures 117
4.31 Accurate and speedy service 118
4.32 Type of cuisine 119
4.33 Menu revision 120
4.34 Impact of price rise on customer visits 121
4.35 Frequency to increase price 122
4.36 Criterion to change price of menu products 123
4.37 Employee training 124
4.38 Staff with formal educational qualification 125
4.39 Decor with aesthetic expectations of customers 126
4.40 Cleanliness procedures 127
4.41 Entertainment facility 128
4.42 Usefulness of website of the restaurant to attract customers 129
4.43 Use of public relations and print advertisements 130
4.44 Type of media to attract the customers 131
4.45 Usefulness of affiliation / franchise of chain restaurant 132
4.46 Satisfaction with restaurant business 133
4.47 Importance of place 135
4.48 Importance of product 137
4.49 Importance of price 138
4.50 Importance of promotion 140
4.51 Importance of physical evidence 141
4.52 Importance of people 143
4.53 Importance of process 144
vi
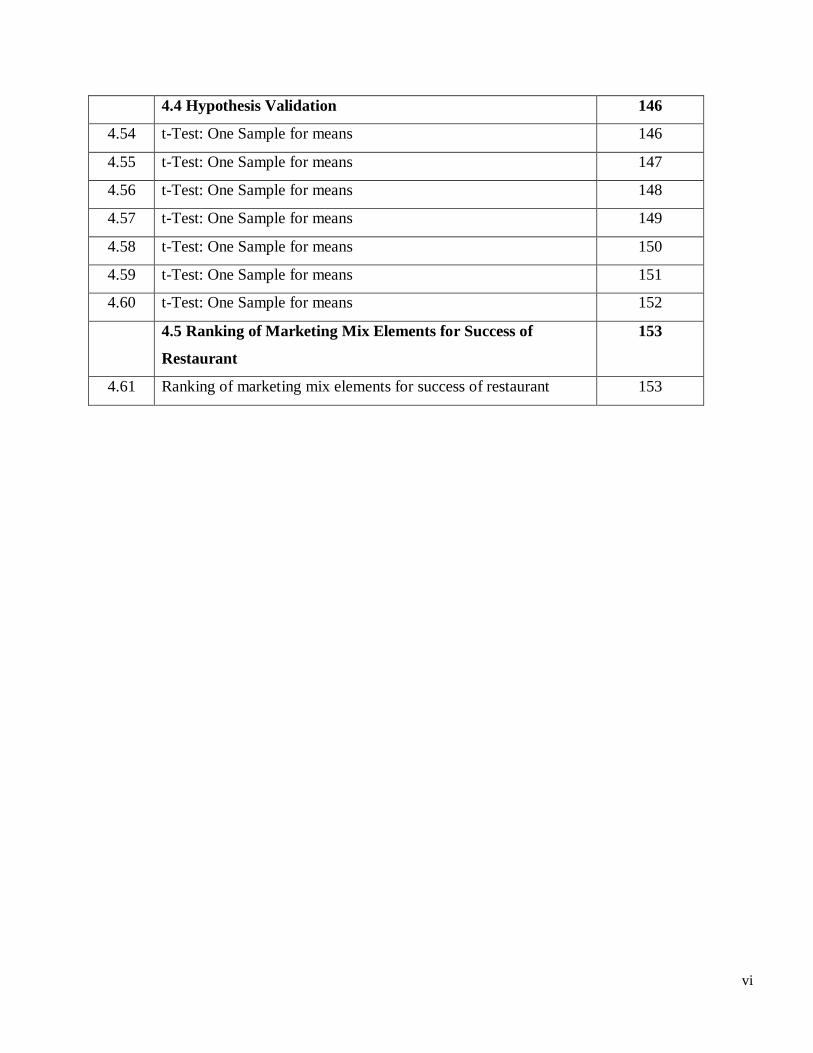
4.4 Hypothesis Validation 146
4.54 t-Test: One Sample for means 146
4.55 t-Test: One Sample for means 147
4.56 t-Test: One Sample for means 148
4.57 t-Test: One Sample for means 149
4.58 t-Test: One Sample for means 150
4.59 t-Test: One Sample for means 151
4.60 t-Test: One Sample for means 152
4.5 Ranking of Marketing Mix Elements for Success of
Restaurant
153
4.61 Ranking of marketing mix elements for success of restaurant 153
vii
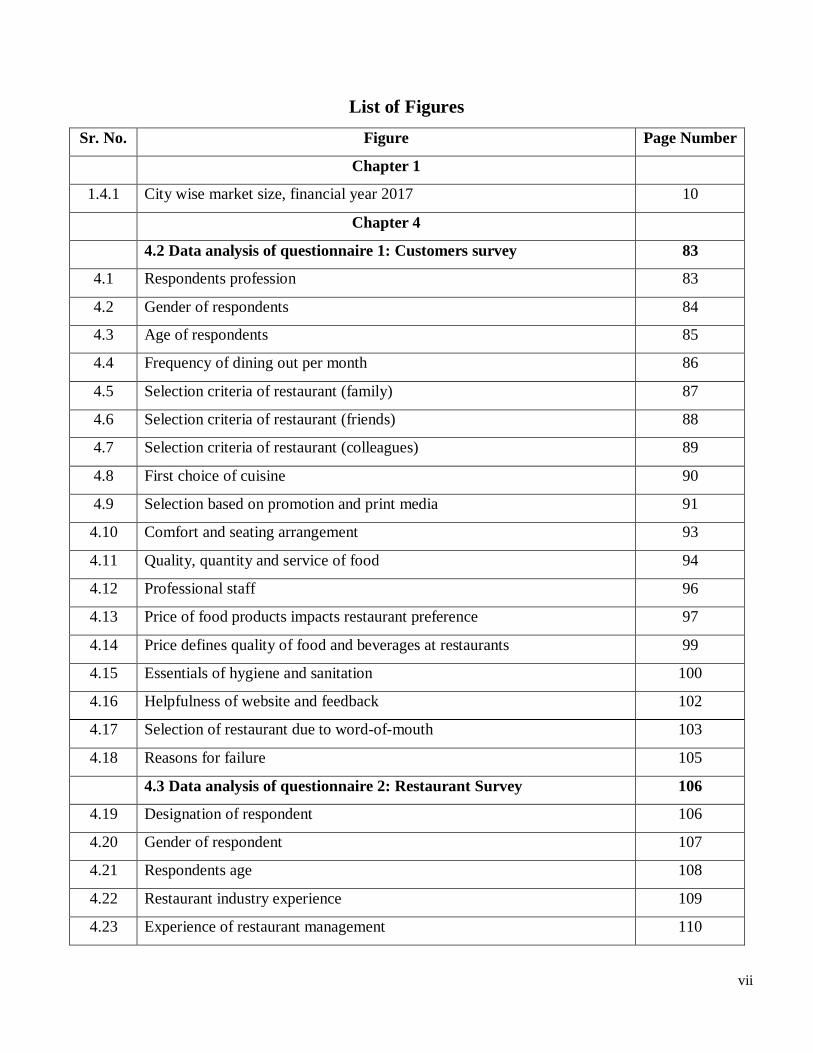
List of Figures
Sr. No. Figure Page Number
Chapter 1
1.4.1 City wise market size, financial year 2017 10
Chapter 4
4.2 Data analysis of questionnaire 1: Customers survey 83
4.1 Respondents profession 83
4.2 Gender of respondents 84
4.3 Age of respondents 85
4.4 Frequency of dining out per month 86
4.5 Selection criteria of restaurant (family) 87
4.6 Selection criteria of restaurant (friends) 88
4.7 Selection criteria of restaurant (colleagues) 89
4.8 First choice of cuisine 90
4.9 Selection based on promotion and print media 91
4.10 Comfort and seating arrangement 93
4.11 Quality, quantity and service of food 94
4.12 Professional staff 96
4.13 Price of food products impacts restaurant preference 97
4.14 Price defines quality of food and beverages at restaurants 99
4.15 Essentials of hygiene and sanitation 100
4.16 Helpfulness of website and feedback 102
4.17 Selection of restaurant due to word-of-mouth 103
4.18 Reasons for failure 105
4.3 Data analysis of questionnaire 2: Restaurant Survey 106
4.19 Designation of respondent 106
4.20 Gender of respondent 107
4.21 Respondents age 108
4.22 Restaurant industry experience 109
4.23 Experience of restaurant management 110

viii
4.24 Size of restaurant 111
4.25 100 percent occupancy of restaurant in a day 112
4.26 Location of restaurant 113
4.27 Parking facility 114
4.28 Revenue from home delivery/ parcel facility 116
4.29 Practice of standard operating procedures 117
4.30 Accurate and speedy service 118
4.31 Type of cuisine 119
4.32 Menu revision 120
4.33 Impact of price rise on customer visits 121
4.34 Frequency to increase price 122
4.35 Criterion to change price of menu products 123
4.36 Employee training 124
4.37 Staff with formal educational qualification 125
4.38 Decor with aesthetic expectations of customers 126
4.39 Cleanliness procedures 127
4.40 Entertainment facility 128
4.41 Usefulness of website of the restaurant to attract customers 129
4.42 Use of public relations and print advertisements 130
4.43 Type of media to attract the customers 131
4.44 Usefulness of affiliation / franchise of chain restaurant 133
4.45 Satisfaction with restaurant business 134
4.46 Importance of place 135
4.47 Importance of product 137
4.48 Importance of price 139
4.49 Importance of promotion 140
4.50 Importance of physical evidence 142
4.51 Importance of people 143
4.52 Importance of process 145
ix
Abstract
Purpose of the Study
The purpose of this study is to understand, why there is restaurant failure in
Pune city in spite of having a huge potential market. Is there any relation between
Marketing Mix elements, use of these elements for restaurant business and its impact
on restaurant success? It is also necessary to know whether all marketing mix
elements are used by Restaurants in Pune city and to what extent? The researcher
would also like to know how the mixture of 7P’s is calculated and used by these
restaurants and what is the best way of mixing these elements for restaurant success?
Many Expert’s in this field believes that, if one is able to use the Marketing Mix in
right manner for restaurant business, chances of success are more and it can be saved
from failure. Moreover, this study and its outcome will be very helpful for all
stakeholders of the restaurant industry.
Background
The food & beverage provision is a major part of the various activities of the
hotel industry. Food & beverage service has developed into a vast industry at present.
Food and beverage industry, we witness today has an ancient history related to trade
and travel of human being for various reasons. The industry has seen many changes in
the past and transformed today as one of the leading industry in the world generating
remarkable amount of revenue and employment for the host country. Food and
Beverage Services can be broadly defined as the process of preparing, presenting and
serving food and beverages to the customers. Food and Beverage Services can be of
the following two types –
1. On-Premise and
2. Off-Premise or Outdoor Catering
A restaurant or an eatery is a business that prepares and serves food and
beverages to customers in exchange for money. A restaurant as we see today is no
more a place which is only focused on offering food and beverages but have various
aspects like valet parking facility, reception area with a hostess to receive customers
with a smile on a face and taking reservations, customer oriented and comfortable
seating arrangements, décor, ambience, lighting arrangements, music and
entertainment facilities available (on some special occasions including Live
x
streaming), well-dressed staff, food served on sparkling clean crockery which is
nicely garnished and so on. Meals are usually served and consumed on the premises
in a restaurant set up, however many restaurants also started to offer take-away and
food delivery services. Restaurants differ greatly in look and offerings, including an
extensive variety of cuisines (Region wise or Nation wise categorised Menu) and
service models ranging from reasonably priced fast food restaurants and cafeterias to
mid-priced family restaurants, to expensive luxury establishments. Eating in
restaurants has also become more popular with the growth of higher household
earnings. At the same time, less expensive establishments such as fast food
establishments can be quite reasonably priced, making restaurant eating available to
many.
As per the study, it shows that there is tremendous growth in restaurant sales
all over the world. The restaurant sales are growing at an annual rate of 5.6% (without
the adjustment of inflation). Trends in foodservice industry differ from country to
country, but certain trends that are important and have an impact on the foodservice
industry at a global level. Following are the significant trends observed in foodservice
industry,
1. Advancement in Technology
2. Conscious Dining
3. Food and beverage service at places which are not primarily meant for the same
for e.g. multiplex
Massive growth is expected in the restaurant industry in all parts of the world.
Restaurant industry showing steady growth globally which makes it necessary to
adapt to emerging trends in the industry. Restaurants with better updated knowledge
on current trends in market and customers requirements have better scope for survival
in the long run.
Eating out pattern in Indians is increasing and many factors are responsible for
the same. Indian diners are conservative about their food choices, preferring north
Indian food. Customer can get information of restaurant through restaurant guides that
include reviews of restaurants and often ranking of the restaurant based on facilities
available. More recently Internet sites have started up which publish both food critic
reviews and popular reviews by the public. The study shows that a good review about
food and beverages prepared and served in a restaurant leads to a significant increase
in revenue of restaurants.
xi
There are more than 7200 food and beverage service outlets in Pune city
which includes quick bites (fast food), casual dining, dessert parlour, bakeries, cafes,
bars, beverage shops, sweet shops as per the data available on Zomato.
Approximately 250 New Restaurants enters in the Food and Beverage Service Sector
of Pune city every year in PMC area – Organized sector (Source: Food and Drug
Administration Office, Aundh, Pune). The research in the field suggests that failure
rate is almost 59% in the period of the first 3 years of starting a New Restaurant. To
compete in a market and maximize profit, it is necessary for one to understand the
Marketing Mix in a Restaurant business.
Marketing mix concept is usually known as the balanced combination of 4P’s
of Marketing: Product, Price, Place and Promotion. McCarty’s 4P’s of Marketing Mix
stayed the standard model for developing the marketing strategy until today.
According to Philip Kotler, - “Marketing mix is the mixture of controllable
marketing variable that the firm uses to pursue the sought level of sales in the
target market”. To summarise the marketing mix one can say it is an appropriate
combination of four P’s i.e. Product, Price, Place and Promotion for achieving
marketing objectives. For restaurants, 4P’s means a simple and effective marketing
plan to execute for achieving various goals of the restaurant business. Beyond this
Restaurants should use 7P’s (with added 3P’s namely People, Process and Physical
Evidence) of Marketing Mix as it is a part of service sector.
A restaurant should develop marketing mix plan based on budget allocated, its
objectives and marketing channels selected for the same. It can be online or offline
improving the chances of its success. It is very essential for restaurant business in
today’s competitive market to develop and implement a long-term marketing mix plan
even it is a well-established brand or a new entry in the market. Experts and
experienced people in the Food and Beverage Service Industry reveal the trick of
using Marketing Mix. Based on the real experience it is proven fact that, using of
marketing mix needs to be well balanced for restaurant success.
If one knows the most common reasons why restaurants fail, one can identify
the problems in time to correct. It can prevent the failure in the restaurant business.
Common reasons for Restaurant failure are low start-up capital, poor knowledge
about competition, wrong location, poor restaurant promotion, bad partnership
relations, poor inventory and staff management, lack of original ideas.

xii
Research conducted till date in the field of Restaurant’s success or failure has
covered specific areas related to management plan, human resource management,
location, affiliation, food quality (characteristics of food that is acceptable to
consumers and should be same every time), service quality (difference between
customer expectations for service performance prior to the service and their
perceptions of the service received, Asubonteng et al. 1996), and facilities (Reception,
reservation, parking, audio visual system, toilets) in relation to specific region and
focusing only on one or two factors listed.
Restaurant Industry in Pune city is expanding at a rapid pace. All categories of
Food and Beverage Service outlets in Pune city at present, which includes Fine Dine,
Family Restaurant, Fast Food, Casual Dining Restaurant, Bistro, Coffee Shop, Pubs,
Ethnic/ Specialty Restaurant, Multi Cuisine Restaurant, Themed Restaurants, Drive-
thru Restaurant, Cafe, Buffet-style Restaurant, Cafeteria, Bars, Banquets, A la carte
Restaurants, Food Truck, Cafeteria, Pizza Outlets, Home Delivery/ Take Away,
Bakery, Quick Service Restaurants (QSR) and so on.
Increasing disposable income among citizens has led to a boom in the food
and beverage industry in the Pune city with a new Food and Beverage Service outlets
opening nearly every day. As per the information provided by president of Pune
Restaurants and Hoteliers Association (PRAHA) Ganesh Shetty, on an average 20
new food outlets are entering in the market in Pune city every month while 5 to 10 are
shutting down. This shows that the failure rate in restaurant business in Pune is almost
25% to 50 %. Considering the high failure rate in restaurant business, it becomes
necessary to study the local market in Pune city before entering in to the business. As
per the information received from experts in the field, one can understand it is a
considerable amount of investment to start a restaurant in Pune city that is up to Rs.
25 lakhs. Despite of uncertainties in the sector people are ready to get into restaurant
business and invest huge amount of money in Pune city assuming it as an opportunity
to make quick money out of this business. Investors or Entrepreneurs doesn’t study
the market place to understand the requirement of customers. Without considering
various types of costs incurred in business like material cost, labour cost and overhead
costs entrepreneurs do the pricing for dishes to be offered on menu which is further
not helpful to achieve the desired profit margin. Some of these costs are fixed or semi
fixed in nature, while remaining are variable in nature. Beyond this entrepreneur have
not calculated the minimum period required to achieve the “Breakeven Point” in
xiii
restaurant business. It is very important to know the concept of “Breakeven Point”
(Point at which total cost in a business and total revenue are equal, i.e. "even" and
there is no net loss or profit). For restaurant business the concept of “Breakeven
Point” is must to determine what sales volume is necessary to cover costs. It's
particularly important for start-ups that need to know their initial sales goals for
sustenance in the market.
Although the study is the limited to specific geographical region, the
researcher aims to study all 7P’s of Marketing Mix elements in relation to restaurant
success. Marketing mix concept of 7 P’s is universally accepted and study of the same
with the help of data science is helpful to understand consumer behaviour, so the
research can be generalised and there is a broader scope for future study. Findings of
this research study can be generalised and useful as guidelines for starting up a new
restaurant irrespective whether it is used in city like Pune in Indian context or any
other place in the world as the study is based on the theoretical framework of
marketing mix (7P’s) which is accepted worldwide.
Considering all above facts about restaurant industry in Pune city it is very
essential to study on marketing mix which explains 7P’s elements namely Product,
Price, Place, Promotion, People, Process and Physical Evidence for service sector (as
restaurant industry is the part of service sector). If one knows the theory of 7P’s of
marketing mix and practical application of the same in restaurant business, it will
definitely help to have a successful restaurant business in Pune city by using the
perfect mixture of these 7P’s.
Research in the field of restaurant operations has covered specifically about its
success or failure in relation to a particular area (the region in the world) and focusing
only on specific factors (internal or external) responsible for the same. Researches
published in the field till now have not covered all 7P’s marketing mix elements and
its co-relation with the restaurant success (as basic fundamentals of marketing mix).
Researcher wants to put all 7P’s of marketing mix together and study its co-relation
with the success of restaurants through this study in detail.
Thus, the current research topic selected as follows,
“Study of selective marketing mix contributing to success of restaurant
operations in Pune Municipal Corporation area (Period: April 2014 to march
2017).”
xiv
Objectives of the Study
1. To study the role of selective Marketing Mix in the success of restaurant
operations in PMC Area.
2. To identify the chronology of selective Marketing Mix factors in success of
Restaurant operations in Pune Municipal Corporation Area.
Hypotheses
1. H1: Place is an important marketing mix factor in success of restaurant operations
2. H2: Product is an important marketing mix factor in success of restaurant operations.
3. H3: Price is an important marketing mix factor in success of restaurant operations.
4. H4: Promotion is an important marketing mix factor in success of restaurant
operations.
5. H5: Physical evidence is an important marketing mix factor in success of restaurant
operations.
6. H6: People are an important marketing mix factor in success of restaurant operations.
7. H7: Process is an important marketing mix factor in success of restaurant operations.
Data Collection
Together primary and secondary data as information source were used to
collect data required. Structured questionnaires were developed to collect primary
data for the research. Various types of questions like multiple choice, dichotomous
and likert - type scale is included in these questionnaires. In addition, questionnaires
comprised scale like ordinal, nominal, ratio and interval to formulate the
questionnaires effective and to make sure quality of replies received. The researcher
paid attention to the sequence of questions while preparing the questionnaires.
Researcher has used books, magazines, research articles, industry literatures and
online reports of various research and government organizations to collect secondary
data.
The study is descriptive in nature and comprises of 258 responses from
restaurants and 502 responses from customers visiting restaurants in Pune city. Simple
random sampling technique adopted for the population of restaurants in Pune city for
each item in the entire population to have chance of being included in the sample.
xv
However, to collect the data from customers, convenience sampling technique is used
as the population is infinite.
Data Analysis and Hypotheses Testing
The data was checked carefully to remove incorrect entries and missed values.
Statistical Package for the Social Sciences Program (SPSS) 17.0 used for all the
statistical assessments. Descriptive statistics is used along with inferential statistics
plus “One Sample t – Test” to test the hypotheses.
All alternative hypotheses framed in chapter 4 were accepted and all null
hypotheses rejected after testing.
Conclusions and Recommendations
Following are the conclusions of research study and also recommends few
suggestions for successful restaurant operations.
Conclusions based on the data collected from Customers visiting restaurants in
PMC area,
1. Eating out is very common these days for the residents in Pune city.
Recommendation: Pune city has the great potential market for restaurant
industry. Entrepreneurs should study the potential market well and utilise the
opportunity to start a new restaurant in PMC.
2. Selection criteria of restaurant vary as per accompanying people of host.
Place/Location and Product are most important element while selecting restaurant
irrespective of accompanying people.
Recommendation: Restaurant should be located in prime location and offer tasty
and qualitative products.
3. Indian food is most preferred by customers in Pune city as compared to any other
cuisine.
Recommendation: Offer Indian food as a part of menu irrespective of type of
restaurant (except specialty restaurants).
4. Promotion has significant impact on customers’ selection criteria of restaurant.
Recommendation: Dedicated efforts and budget for promotion is necessary for
every restaurant.

xvi
5. Comfortable and spacious seating arrangement in restaurant is important from
customer point of view.
Recommendation: Depending on the type of restaurant décor and seating layout
should be planned.
6. Today’s customers are tech savvy and using the technology for getting
information of restaurant before visiting.
Recommendation: Restaurants should have up to date website and use various
mobile applications as it suits the operation.
7. Customers expect good quality and standardised food and service every time
visiting a same restaurant.
Recommendation: Develop and follow SOP’s for all types of operations in
restaurant.
8. Price is an important element while selecting a restaurant for customers in Pune
city.
Recommendation: Study the market place and potential customer to set the
prices of product on offer.
9. Customers always have set expectations for the money they spend – value for
money.
Recommendation: Depending on type of restaurant it is necessary to offer
facilities in addition of offering standard food and beverages.
10. Cleanliness, hygiene and sanitation are important for the customers visiting
restaurant.
Recommendation: Follow the standards set by FDA and FSSAI for cleanliness
and hygiene.
11. Inappropriate location is the most important element in case of failure of
restaurant as per the customers view point.
Recommendation: To start a new restaurant, location (Place) should be
strategically selected to avoid failure in business.
Conclusions based on the data collected from Restaurant Owners / Managers/
Supervisors,
1. Considerable failure rate in restaurant business in Pune Municipal Corporation
area.
xvii
Recommendation: Study the market well before entering. Restaurant should have
sustainability till the time achieving Breakeven Point.
2. Place is the most important element of marketing mix for success of restaurant.
Recommendation: Select the place either at prime location or near to the target
market in the city.
3. Home delivery / parcel facility adds as an average 30% and above to the revenue
of restaurant.
Recommendation: Highly recommended to offer home delivery/ parcel facility in
restaurant business.
4. Process is an important element of marketing mix for success of restaurant.
Recommendation: Develop and follow Standard Operating Procedures for all
types of operations in restaurant.
5. Competitive pricing has low significance. Restaurants in Pune city are pricing
their products by calculating cost incurred and desired amount of profit to be
achieved.
Recommendation: Pricing strategy should be planned in such a way that
Breakeven Point is achieved at the earliest.
6. None of the restaurant has 100% employees who have completed formal
education. Every restaurant has combination of some skilled employees (without
any formal education) and remaining that have formal education in the field.
Recommendation: Have set Standard Operating Procedures and offer formal
training on SOP’s to all employees of restaurant.
7. Depending on type of restaurant décor is adopted (either partially or entirely) by
restaurants in Pune city.
Recommendation: Décor is necessary as per the type of restaurant. Beyond that
hygiene and sanitation is mandatory to follow.
8. Entertainment facility is helpful to attract customers in restaurant.
Recommendation: Offer entertainment facility that blends well with theme of
restaurant.
9. Very few restaurants in Pune city have official website but almost all are
registered on delivery apps.
Recommendation: Restaurants should focus on promotion and have certain
budget allocated for the same on monthly basis.
xviii
10. Having franchise of well known brand always helps for sustainable and successful
restaurant.
Recommendation: Entrepreneurs with no previous experience should do market
survey, study the marketing mix concept carefully and practically apply the
concept to enter in restaurant business.
11. “Place” is the most important element followed by “Product” and “Price”
respectively in marketing mix for restaurant. Least important element is “Physical
Evidence”.
Recommendation: Select Place strategically, offer standard and quality menu
Products every time and Pricing in relation to quality and quantity of products on
offer for success in restaurant business.
1
Chapter – 1
Introduction
Title of the Research Study
Operational Definitions
Introduction
History of Food and Beverage Service Industry
Restaurants - Brief History
Restaurant Operations - The Global View
Global Trends in Foodservice Industry
Future growth for the Restaurant Industry
Indian Food and Beverage service industry
City wise Market Size
Categorisation of Restaurant Sector in India
Classification of Restaurants
Ranking of Restaurants
About Pune
Restaurant Industry in Pune City
Meaning of Marketing Mix
Definition
Element of the marketing mix
Nature of Marketing Mix
How to Develop Marketing Mix for a Restaurant business?
Marketing Objectives
Allocation of Funds for Marketing
Components of Promotion Mix for Restaurant
Developing Marketing Mix for Restaurant
Research Problem (Purpose for selecting the topic under study)
Data Collection through designed questionnaire
Pilot Study
Preparation of Questionnaire
Chapter Scheme
Keys
Summary
2
Title of the Research Study
“Study of selective Marketing Mix contributing to success of restaurant
operations in Pune Municipal Corporation Area (Period: April 2014 to March
2017)”
Operational Definitions
1. Selective Marketing Mix: This research includes study of 7 P’s of Marketing Mix
namely Product, Place, Price, Promotion (basic 4 P’s of marketing mix) along with
added 3 P’s namely People, Process and Physical Evidence. These 7 P’s are
universally accepted for marketing services.
2. Restaurant (Definition): A restaurant is an establishment that serves the customers
with prepared food and beverages to order, to be consumed on the premises. This
includes a multiple venue and a diverse cuisine. Restaurants are also projected as an
important feature of a large hotel or other residential facility that provides dining for
the convenience of the residents and for the hotel to non-resident guest.1
3. Restaurants (Considered for Research): Only those Restaurants within the limits of
Pune Municipal Corporation (PMC) area are covered in this research which are listed
and licensed from Food and Drug Administration (FDA) Authority of Government of
Maharashtra, Pune office.
4. Successful Restaurant: Restaurants which exist and functioning for minimum 2 or
more years are considered as Successful Restaurants for the purpose of this research
study.
3
Introduction
History of Food and Beverage Service Industry
The food & beverage provision is a foremost important part of the numerous
activities of the hotel industry nowadays. Provision of food and beverages is
important for people if they are away from their residence along with the lodging
facility whether it is for short or long duration of stay. Food & beverage service has
developed into a vast industry at present. Eating out establishments are increasing day
by day in numbers and even different forms (types) are entering in the market to cater
changing demands and sense of taste of customers. The hotel industry originated in
the sixth century B. C. and doubtless one of the oldest Industries2. Ancient travellers
were usually traders, pilgrims and military men. In case of military movement, they
used to carry food and accommodation with them on their own. It had been traders
and pilgrims who required food and accommodation provision while travelling. The
earlier inns were nothing but just large halls (A hotel in a small city/village with
rooms for out of town guests to sleep in) where travellers used to sleep on ground
along with animals (on they travelled during journey). Here sanitation and privacy
were non-existent and travellers have to share their room with livestock.
In third century3, Roman Empire facilitated traders by developing roads in
Europe. Almost immediately a series of roadside Inns were constructed from Spain to
Turkey. This scenario continued to be the same till the end of the 17th century for
common people. By the end of 17th century, hotel concept came into existence for
common people which has guest rooms consisting living room and attached bath.
American innkeepers enhanced the class of facility by providing comfort and
hygiene at reasonable rates. A huge jump in this course was the launch of “City
Hotel” in the year of 1794 - the largest hotel in New York. It was entirely used for
accommodation purposes and stimulated the construction of other pioneer hotels in
the industry. Added landmark was the establishment of another property “Tremont
House” in the year 1829. Tremont House was offering a private room to its guests.
The room used to be with a locking facility, water pitcher, wash basin, soap in the
toilet along with full-time upkeep staff. “Palace Hotel “which was established in the
year 1874 furnished with Air Conditioner, plumbing system, fire sprinklers, other
4
comfortable and luxurious facilities. The trend was followed by the alteration to
completely different types of hotels and concepts like motels, budget hotels, resorts,
etc. came in to existence. Alongside the accommodation as a basic facility offered in
any hotel which generates the maximum share of revenue in the hotel business, food,
and beverage service facility is the next most important facility offered now a day
which ranks second when it comes to revenue generation4.
A definition of Food and Beverage Services is as follows,
“The process of preparing, presenting and serving food and beverages to the
customers”5
There are two types of Food and Beverage Services -
On-Premise − Food is prepared and served where it is prepared or cooked. In this
type of operations customer have to visit the premise for availing food service.
Premises are ideally kept well-equipped and well-furnished to appeal customers to
have Food and Beverage service. For example, restaurants, pubs, etc.
Off-Premise or Outdoor Catering –In this type of operations, service comprises of
two parts. In first part partial cooking and preparation is done. Final finishing of food
and beverages as well as service is done at the customer’s premises. It is provided
away from the Food and Beverage Service provider’s base on major events that call
for many customers.
Restaurants - Brief History
A restaurant or an eatery can be defined as a business that deals in preparation
and service food and beverages (alcoholic and non alcoholic) to customers by means
of exchange for money. “Restaurant” is a term that defined as “restorative beverage”
in 1507 and in association to mean “that which restores the strength, a fortifying
food” in 1521. As per the available literature, France played a significant role in the
development of restaurant culture in the world. In either 1782 or 1786, ‘Beauvilliers’
started a restaurant named ‘Grand Tavern de Londres’ and first time in the world this
restaurant provide table service and guest could select dishes from menu card. The
father of the modern restaurant considered as Mr. M. Boulanger, he served soup on
5
‘Rue Bailleul’ that soup was called restorantes (restoratives) by Mr. Boulanger which
is believed to be known as the source of the word ‘restaurant’. In 1794, due to the fall
of aristocracy power the chefs who worked in royal kitchens all of a sudden had no
work. Many of these chefs migrated to America, Europe and opened restaurants to
display their culinary skills. During this period restaurants spread rapidly across the
world.6
As per Brillat-Savarin, restaurant was the first place to combine four
fundamentals i.e. an elegant room, smart servers, a choice of cellar (underground store
of Alcoholic and Non-alcoholic Beverages, and good cooking.7In the year 1802 the
term was used to business that served restorative foods, such as bouillon (soup/ stock
made by stewing meat, fish or vegetables in water). In French called as,
"établissement de restaurateur" At the beginning of 19th century, the restaurants was
most popular kind of eating houses. By the year 1820, many good and well-designed
restaurants were well-established in London. However, such restaurants were not
available in smaller towns and cities. In 1870, taking women in restaurant to dine
become acceptable in the society. Meals in the train were first introduced in 1879 in
England. During the World War 2, concept of industrial canteen system started. Till
the second half of the 20th century, food and beverage services were considered as
minor importance by most of the hotels. The concept was changed really after 1950;
food and beverage services were transformed in new system.8
Arora (2011) said that “the term restaurant came to the United States of
America (USA) in 1794, via a French refugee, Jean Baptiste Gilbert Paypalt, who set
up the ‘French’ restaurant in USA, known as ‘Julien’s Restaurator’ in Boston. Gupta
(2007) the restaurant word originates from the French word ‘restaurer’ which means
to restore and it was appeared in the 16th century, meaning “a food which restores”.
A restaurant as we see today is no more a place which is only focused on
offering food and beverages. Restaurants have been through a major development in
various aspects like valet parking facility, reception area with a hostess to receive
customers with a smile on a face and taking reservations, customer oriented and
comfortable seating arrangements, décor, ambience, lighting arrangements, music and
entertainment facilities available (on some special occasions including Live
6
streaming), well-dressed staff, food served on sparkling clean crockery which is
nicely garnished and so on. Meals are usually served and consumed on the premises
in a restaurant set up, however many restaurants also started to offer take-away and
food delivery services, and a number of restaurants even offer only take-out and
delivery of food and beverages. Restaurants differ greatly in look and offerings,
including an extensive variety of cuisines (Region wise or Nation wise categorised
Menu) and service models ranging that starts from reasonably priced fast food
restaurants to cafeterias to mid-priced family restaurants, to high-priced luxury
establishments. Eating in restaurants has also become more popular with the growth
of higher household earnings. At the same time, less expensive establishments such as
fast food establishments can be quite reasonably priced, making restaurant eating
available to many.
Restaurant Operations - The Global View
As per the study, it shows that there is tremendous growth in restaurant sales
all over the world. The restaurant sales are growing at an annual rate of 5.6% (without
the adjustment of inflation).9 By the end of 2017, United States have approximate
revenue generated through the restaurant industry was calculated near around 799
billion dollars. In United States, more than 10% of the overall workforce got
employment in restaurant industry and represents 4 % of share in total GDP of the
nation. Spending by Americans is nearly 48 % on eating out instead of cooking at
home. A study released by Deloitte (Deloitte is an Accounting organization and
largest multinational professional services network provides audit, tax, consulting,
enterprise risk and financial advisory) is highlighting the fact that there are over
6,20,000 food and beverage establishments in America (this shows that restaurants
rate of growing is two times the rate of population growth). In Europe and the United
Kingdom market value for the consumer, foodservice was 508 billion dollars and 73.6
billion Euros’ respectively in 2017. The hospitality sector is one of the key drivers for
job creation and a leading industry in Europe. In the UK there were 83,635 businesses
operational in mobile food service and restaurant industry as per the record of the year
2016. In Asia, there is a good prospect for operators as it is predicted to have nearly
10% growth rate per annum in foodservice market.
7
Global Trends in Foodservice Industry
Trends in foodservice industry differ from country to country, but certain
trends that are important and have an impact on the foodservice industry at a global
level. Following are the significant trends observed in foodservice industry,
1. Advancement in Technology: Food ordering services and apps are playing a
very important role at present and will remain important for revenue generation in
restaurant business in future as well. Online restaurant review sites and social
media have created intense competition in the Foodservice Industry. Globally,
with few exceptions' delivery and takeaway options are becoming more popular
and used by customers frequently as compared to dine – in visits.
2. Conscious Dining: One of the growing trends with the intention of focusing on
seasonal and local foodstuff that is farmed in natural way. It is observed in recent
past that there is a shift in the direction of vegans and vegetarian dining. Records
of vegan diners particularly in developed countries have shown a remarkable
growth. All over the world, 69% of customers pay attention for availability of
healthy options on menu as a major factor in deciding the place from which they
buy a food.10
3. Food and beverage service at multiplex: Food and beverage service at multiplex
is an essential part today. It add to the profits of multiplexes and hence it is
integrated part of multiplexes. Though customers have choice of home food to
carry along, preference is given to order food at multiplexes. Customers even
prefer pre-ordering food even before leaving their home. This underlines the
importance of food and beverage service at multiplexes. Service quality plays
major role to attract customers and menu variation adds to value in food and
beverage service offered at multiplexes. 11“Soon one won’t be surprised, to find
the guest to check the food and beverage menu offered at the multiplex before
buying a movie ticket. The customer today demands not only a good movie
experience with ambience and aesthetics, but a complete meal experience along
with entertainment. Ultimately a customer spends more money on food and
beverage than the entertainment which is a movie.”
8
1.3.6 Future growth for the Restaurant Industry
Massive growth is expected in the restaurant industry in all parts of the world.
Foodservice market in the US is expecting that by 2027, there will be 16.3 million
jobs in the restaurant industry. In Europe, the industry is likely to demonstrate a stable
growth rate of 2.1% until the year 2021 and will further continue the trend of steady
growth. In Asia region sales predicted to go up by 38.7% between the span of 2015
and 2019. Asia offers an exciting opportunity for growth and expansion. Asia is
witnessing a number of international chains entering the market and capitalising on
projected growth. Restaurant industry showing steady growth globally which makes it
necessary to adapt to emerging trends in the industry. 12 Restaurants with better
updated knowledge on current trends in market and customers’ requirements have
better scope for survival in the long run.
Indian Food and Beverage Service Industry
Indian people are well known for their natural hospitality quality. “Atithi Devo
Bhava” (the guest is like a god) is the belief of Indians for which they are known all
over the world. Traditional community feasts can be considered as root of restaurant
industry in India. Thousands of years ago movement of people on pilgrimage and for
education used to took shelter under trees. During journey, they were relying on
natural sources to get fulfil their need of food. But there was a risk to their lives of
getting attacked by wild animals and robbers. Considering these facts, they started
searching for a place that can assure them protection, lodging and food. In ancient
time travellers in India usually relied on road side homes and temples for their meal
and accommodation. Then the concept of ‘Dharamshala’ and ‘Sarai’ was started by
great Indian king Chandrgupt Maurya where traveller could stay free of cost. During
British era ‘Circuit House’ and ‘Dak Bunglow’ came in to picture in India.
‘Dharamshala’ and ‘Sarai’ were converted into inns and western style hotels during
British rule in India. Britisher’s inculcated their food and beverages, table etiquettes
and manners, eating habits in India. British era played an important role in
development of food and beverage service industry in India. Britisher’s introduced
hotels and restaurants culture in India and first hotel in Asia established in ‘Culcutta’
during 17th century under their patronage. Metropolitan cities like Bombay and
Madras adopted the concept of modern hotels in 1840.
9
19th century witnessed major growth in transportation facilities and
introduction of railways enabled large number of people to travel effectively and
efficiently. It further resulted in demand of lodges and restaurants around railway
stations. Even after independence British style operations retained and the sector
witnessed a significant growth. Many changes and developments are continuously
happened in food and beverage service industry and will continue in future as well.
As an effect of globalisation, liberalization and public private partnership policies of
government many foreign brands dealing in food and beverage service industry
entered in Indian hospitality market. Even though Indian origin restaurants able to
retain their place in the market strongly.13
Food and Beverage service industry in India has seen unparalleled growth in
the recent past and will expand rapidly in the future. An increase in disposable
income, urbanisation, double incomes in a family, and nature of tasting something
new or different are contributing factors in this growing phenomenon. The
foodservice sector generated direct employment for 5.5 to 6 million people in the
financial year 2016, which is expected to increase (rise) to 8.5 to 9 million by the
financial year 2021. The food and beverage service market in India is estimated at
INR 3, 37,500 crores in 2017 (organised and unorganised) and is anticipated to grow
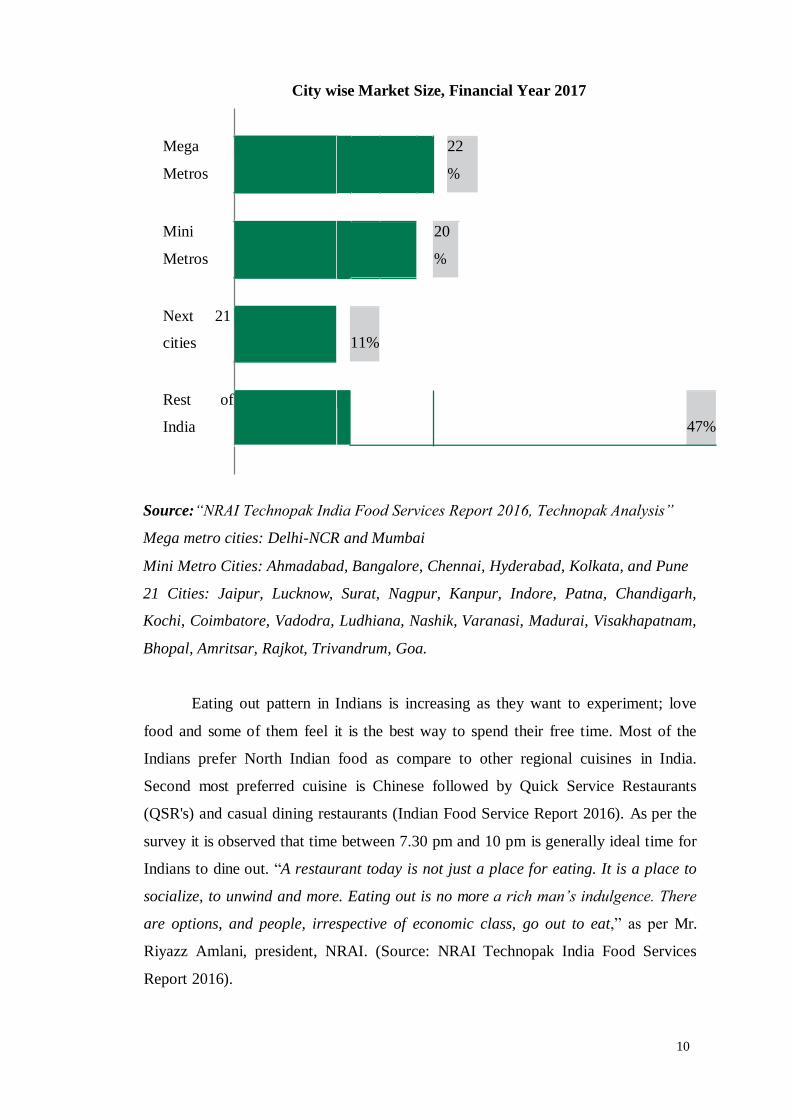
over to achieve INR 5, 52,000 crores by the year 2022. Mega metros namely, Delhi
and Mumbai contribute to 11% each in overall Food Service market (22% together)
followed by 6 mini metros which include Pune along with Ahmadabad, Bangalore,
Chennai, Hyderabad and Kolkata comprised of 20% share in the foodservice
market.14
10
City wise Market Size, Financial Year 2017
Mega
Metros
22
%
Mini
Metros
20
%
Next 21
cities
11%
Rest of
India
47%
Source:“NRAI Technopak India Food Services Report 2016, Technopak Analysis”
Mega metro cities: Delhi-NCR and Mumbai
Mini Metro Cities: Ahmadabad, Bangalore, Chennai, Hyderabad, Kolkata, and Pune
21 Cities: Jaipur, Lucknow, Surat, Nagpur, Kanpur, Indore, Patna, Chandigarh,
Kochi, Coimbatore, Vadodra, Ludhiana, Nashik, Varanasi, Madurai, Visakhapatnam,
Bhopal, Amritsar, Rajkot, Trivandrum, Goa.
Eating out pattern in Indians is increasing as they want to experiment; love
food and some of them feel it is the best way to spend their free time. Most of the
Indians prefer North Indian food as compare to other regional cuisines in India.
Second most preferred cuisine is Chinese followed by Quick Service Restaurants
(QSR's) and casual dining restaurants (Indian Food Service Report 2016). As per the
survey it is observed that time between 7.30 pm and 10 pm is generally ideal time for
Indians to dine out. “A restaurant today is not just a place for eating. It is a place to
socialize, to unwind and more. Eating out is no more a rich man’s indulgence. There
are options, and people, irrespective of economic class, go out to eat,” as per Mr.
Riyazz Amlani, president, NRAI. (Source: NRAI Technopak India Food Services
Report 2016).
11
Wide varieties of international cuisines are available in most of the top Indian
cities. Still, Indian diners are conservative in their food selection and mostly prefer
north Indian food.15 An Indian customer usually chooses north Indian food most of
the time and it accounts for about 28%, followed by Chinese food which calculates
about 19% and south Indian food is about 9% of the time as per the report. However,
at the same time, Indian customers are also trying out the Western cuisine like
American food which accounts for 7% and Pizza 6.2%of total eating out occasions.
Categorisation of Restaurant Sector in India
1. Organised Sector: According to CRISIL, this sector in food and beverage
service industry follows norms set by government, quality control,
structured supply chain, multiple outlets, standardised design and
transparency in operation.
2. Unorganised Sector: This sector does not have any standardised system
of supply, accounting, quality and design.
Types of Restaurant
1. Coffee Shop: Coffee shop is generally a part of large hotel. It offers reasonably
priced snacks, quick meals and beverages in pleasant surrounding with informal
service.
2. Cafe: It mainly serves coffee and snacks. The French people introduced this
concept.
3. Specialty Restaurant: In this type of restaurants atmosphere, decor, fixture,
menu card, music and so on is in accordance with a particular type of food
(Cuisine) or theme. The service and uniform of the staff will be according to the
style and tradition of the region or country from which the cuisine is offered. Food
is served in traditional authentic style of that country, giving authentic experience
of food, ambience, design, and service of a particular region.
4. Grill Room (Rotisserie): Known for grilled or roast meat, poultry and fish which
are prepared in front of the guest. Moderate decor may be used for this type of
restaurants.
5. Snack Bar: It is informal, moderately decorated, moderately priced and offers
fast service (Self service operations).
12
6. Bistro: The idea of ‘Bistro’ is to offer basic robust food, medium priced menu,
simple dishes, and informal service.
7. Fine Dining Restaurant: Mends for luxury and rich class, those who really want
to enjoy fine dining experience. High level of ambience, interior decoration,
dining table and chair with arm rest, fine linen and cloth napkins match with the
decor and theme of restaurant, fine glassware and cutlery and personalized
service. Uniformed and trained service staff that have a sound knowledge of how
to serve food and beverages.
8. Quick Service Restaurant (QSR): The concept of quick service restaurant
(QSR) is minimum table service, fixed menu and ready to prepare meal at
reasonable price. Generally, main features of this segment is to follow the norms
set by the government, quality control, multiple outlets, structured supply chain
with standardized design and transparency.
9. Dhaba: A road side food stall found on national and state highways. It specializes
in ‘Punjabi cuisine and tandoor cooking’ serving very limited dishes. The service
is very informal. Coir cots are used for the customers to sit on and a narrow table
is used for placing the dish and eating.
10. Barbeque Restaurant: Specialized in barbeque dishes. The way dishes are
barbequed and serve acts as an excellent tool of merchandising.
11. Cafeteria: Comprises of a straight line of food and beverage counters holding a
variety of hot and cold food and beverages. In most cafeteria style operations,
guest make payment at the cash counter beforehand for items they want to eat and
then collect them against bill from the appropriate counters. Water service and the
clearance of table are done by service staff.
12. Food Court: Refers to cluster of a number of independent food stalls, serving
different food items. Customers order the food items they want to have and
consume them at a common dining area.
13. Casual Dine Restaurant: Restaurants with casual ambience, good quality of food
and moderate pricing planned to attract middle income group.
14. Ethnic Restaurant: Restaurants which offer a regional cuisine of country or
another country prepared and served in authentic way.
15. Family Restaurant: Restaurants which offers menu that suits the taste of all
family members, pocket friendly price of dishes. Basic decoration and service is
concerned about comfort of guest.
13
Classification of Restaurants
Restaurants are classified or distinguished in many ways. The primary factors
are usually the food itself (e.g., vegetarian, seafood, steak); the cuisine (e.g., Italian,
Chinese, Japanese, Indian, French, Mexican, Thai). Beyond this, restaurants may
differentiate themselves on factors including speed (fast food restaurant), location,
cost, service, or themes. Restaurants vary from reasonably priced and informal
lunching or dining places catering to people working nearby, with modest food served
in simple settings at low prices, to expensive establishments serving stylish food and
fine wines in a formal set up.
In general, at mid- to high-priced restaurants, customers take a seat at table.
Their orders for food and beverages are taken by a member of staff serving at table
(waiter), who brings the food or beverages as soon as it is ready and subsequent to
eating, the customers pay the bill. In some of the restaurants, similar to workplace
cafeteria, there is n one like waiter; the customers make use of trays, on these trays
they set cold items that they select from a refrigerated storage and hot food and
beverage items they normally request from cooks. Subsequently, they pay to the
cashier prior to seating and consuming the meal. An additional restaurant approaches
that make use of few waiters and offers food and beverages in buffet set up.
Customers dish up food on own plates, consumes the meal at table and after that pay
at the end. Usually in buffet restaurants few waiters are employed to serve alcoholic
and non-alcoholic beverages. As per the classification, Fast food outlets are as well
considered as a restaurant.
Ranking of Restaurants:
Customer can get information of restaurant through restaurant guides that
include reviews of restaurants and often ranking of the restaurant based on facilities
available. Michelin series of guides is one of the most famous guides based on
culinary merit and rating restaurants from 1 to 3 stars. Restaurants with stars in the
Michelin guide are luxurious, formal, high-priced establishments. Generally, the price
increases with the increase in number of stars awarded. Gault Millau is the guidebook
series in Europe is the most competition to the Michelin guide. In contrast to the
Michelin guide which takes the restaurant décor and service into consideration with
14
its rating, Gault Millau solely judges the quality of the food. Gault Millau’s ratings are
based on the scale of 1 to 20, with 20 being the best. In United States, Forbes Travel
Guide (previously the Mobil travel guide’s) and the AAA rate restaurants on a similar
1 to 5 stars (Forbes) or diamond (AAA) scale and considers three, four, and five
stars/diamonds. The ratings are roughly equivalent to the Michelin one, two, and
three-star ratings, while one and two-star ratings typically specify more casual places
to have food and beverages.16
Fairefox newspaper in Australia, publishing "The Good Food Guide", 17 is
listing the best places to eat including bars and cafes. It has system of awarding chef’s
hat for outstanding food and beverage service outlets ranging from one hat through
three hats. "The Good Restaurant Guide" is another restaurant guide in Australia that
has public reviews based on their experience. Anyone from general public can submit
a review and information on location and contact details. Nearly all leading
newspapers in America have food critic and publishing online dining guides.
Similarly, in India, all leading newspapers have a separate section for reviews
or critic for restaurants in relation to the respective cities of publication. FDA (Food
and Drug Administration) 18 and FSSAI (Food Safety and Standards Authority of
India) recently started system of hygiene based rating for restaurants in Pune which is
based on the various parameter’s which takes in to account raw material used,
cleanliness in kitchen, expiry date of raw food material used, health condition of
workers, cleanliness in store room, drinking water used, fire safety audit, complaint
management system in place, preservatives used and disposal of surplus food. A
certification with star-based ‘hygiene rating’ system is awarded to restaurant by
evaluating all these parameters. One who willing to achieve certificate, can fill the
form on FDA website and go for assessment. Certificate will be displayed on the door
of restaurant with a score in 'Excellent', 'Very Good', 'Good' or 'Bad' generated by
FSSAI Office, Delhi based on the audit report. Such hygiene rating systems are
influencing the decision-making process of customers.19However Indian system of
ranking or rating restaurants is not based on quality, standardization or creativity used
in food preparation. Food blogs, reviews by customers are recently started
phenomenon’s in India. It doesn’t have any traces in history of India about food critic
or blog writing.
15
More recently Internet sites have started up which publish popular reviews as
well as food critic reviews by the general public. Online consumer review websites
help to share the information available about the place, product, price, facilities,
service quality and process followed at a certain organisation. This information is
available on a large scale and relatively conveying the same for an unknown or new
organisation. The study shows that a good review about food and beverages prepared
and served in a restaurant leads to a significant increase in revenue of restaurants.20
About Pune
In terms of population of the city, Pune stands as a second largest metropolitan
city in Maharashtra and ranked Hundred and first in the world. Pune was the centre of
the Maratha Empire made by Shivaji Maharaj in the past. Population of Pune city was
recorded as 31, 24,458 in 2011(as per provisional reports of Census India).21 The
population of Pune city in 2019 as per estimate is 71, 26,400. City is considered
Maharashtra's culture capital. Pune city emerged as a manufacturing, and IT centre
with the 6th highest per capita income in India.22
Pune city is considered to be the cultural capital of Maharashtra. The City is
also known for both the forms of theatre i.e. experimental and professional. Both of
these theatre forms are specially meant for Marathi community. The Tilak Smarak
Ranga Mandir, Yashwantrao Chavan Natya Gruha, Bal Gandharva Ranga Mandir,
Bharat Natya Mandir, and Sudarshan Rangmanch are famous theatres in the city.
Thelargest indoor theatre in the city is Ganesh Kala Krida Rangamanch which has
seating capacity of about 45,000. The concept of “Diwali Pahat” literally meaning
“Diwali Dawn” originated in Pune as a music festival on the morning of the festival
of Diwali (Festival of Lights celebrated all over India).23
It is additionally referred as the “Oxford of the East". Number of reputed
education institutes and universities has either their base or branches in Pune.24The
city is now known all over the world as a major educational centre and nearly 50%
international students in India are studying in Pune. Apart from the Savitribai Phule
Pune University (SPPU; formerly University of Pune), which is the second largest
University in the country based on the total number of affiliated colleges. Pune has
16
more than hundred educational institutes and number of deemed universities like
Tilak Maharashtra Vidyapeeth, Bharati Vidyapeeth and Symbiosis International, Dr.
D. Y. Patil Vidyapeeth to name a few. Educational institutes like Fergusson College
started in 1885 and one of oldest educational institute in Pune. International students
from Middle Eastern countries such as Iran, and the United Arab Emirates, and
African countries such as Kenya and Ethiopia are getting attracted and taking
admissions in Higher education institutes in Pune. Pune is the main centre for
Japanese language learning in India. Apart from that many other languages taught in
the city which includes German and French. Various research works are taken by
different government and non-government institutes in Pune to study a variety of
subjects including humanities, sciences and so on.25
There are near about 300 primary schools operated by Pune Municipal
Corporation and in addition to it, 30 secondary and higher secondary schools. Pune
city has developed in to a modern Metropolis today. Education sector in Pune city
played an important role in its growth. University of Poona (now Savitribai Phule
Pune University) established in 1949, the National Chemical Laboratory in 1950 and
the National Defence Academy in 1955 in Pune city.26,27,28
In the year 1954, industrial development started in the various parts of Pune
city like Hadapsar, Bhosari and Pimpri to name a few. Hindustan Antibiotics open up
the way for the same.29 Government of Maharashtra’s initiative commonly known as
Maharashtra Industrial Development Corporation (MIDC) worked on basic and
essential infrastructure for new businesses. This helped a lot to set operations for new
businesses and industrial development in Pune. 30 Information Technology and
Engineering Industry began to attract foreign capital in 1990. At various places like
Wagholi, Aundh and Hinjewadi large IT parks were established and city saw a huge
number of people arrivals in city due to opportunities on offer.
Pune city ranked at quite a good position in terms of quality of living ranking
in Mercer Quality of Living survey in 2017.In total 440 cities surveyed Pune ranked at
145. While in India it stands second highest in terms of living ranking.31 Additionally
Pune city is developing as commerce centre and known as IT hub all over the globe as
well as major automotive companies have set up here.
17
Pune has the eighth largest metropolitan economy and also the sixth highest
per capita financial gain with in the country. Economy of the city is based on the
production, information technology (IT) and education sectors primarily. There are
many globally renowned automotive companies have set up in Pune city for
manufacturing their products. The list of companies includes Mercedes Benz, General
Motors, Tata Motors, Bajaj Auto, Mahindra, Force Motors, Kinetic Motors, Fiat,
Volkswagen, Land Rover, Jaguar and Renault. Kirloskar group, dealing in various
sectors like oil engines, diesel engines and pumps existing in Pune since 1945. It have
largest infrastructure in Asia in pumping projects.
Serum Institute of India, the world's fifth largest vaccine producer by volume,
has a manufacturing plant located in Pune. The Rajiv Gandhi InfoTech Park in
Hinjewadi is a project by the Maharashtra Industrial Development Corporation
(MIDC). The IT Park encompasses an area of about 2,800 acres and is home to over
800 IT companies of all sizes32,33 Besides Hinjewadi, IT companies are also located at
Kharadi, Magarpatta and a number of other parts of the city and the sector have
employed more than 300,000 people by the Year 2017.34
Pune city has a glorious history and so historical attractions too. The rock-cut
Pataleshwar cave temple, Aga Khan Palace, Shaniwarwada, Lal Mahal, Sinhagad fort,
Shinde Chhatri are few to name.35 Number of museums in Pune helps in exploring the
history which includes, Raja Dinkar Kelkar Museum, Mahatma Phule Industrial
Museum, Dr Babasaheb Ambedkar Museum, Joshi’s Museum of Miniature Railway
and so on.
Pune city is also well known for parks and gardens. To name a few famous
parks and gardens in Pune we can consider Kamala Nehru Park, Sambhaji Park,
Peshwe Urja Park, Saras Baug, Empress Garden, Bund garden and Pu La Deshpande
Udyan (which is a replica of Korakuen Garden in Okayama, Japan).36 There are few
hills protected as a nature reserves within the city. The Rajiv Gandhi Zoological Park
in Katraj is a zoological park with wild animals, birds and reptiles.37
18
Sports and games that are popular in Pune include Athletics, Kabaddi, Kho-
Kho, Chess, Cricket, Basketball, Badminton, Football, Hockey, and Tennis. City have
basketball courts at two places, out of those two, one is located at Deccan Gymkhana
and second is at Fergusson College. There are many distinguished sporting
establishments in Pune city including the PYC Hindu Gymkhana, the Nehru Stadium,
the Poona Cricket Club and the Poona Golf Club. An annual international event of
marathon organised in Pune known as “The Pune International Marathon”. Both the
levels i.e. National games and International games were hosted successfully by the
city utilizing it potential. Balewadi is famous for Shree Shiv Chhatrapti Sports
Complex which hosted National Games in 1994 Commonwealth Youth Games in
2008 and second edition of Khelo India Youth Games in 2019. City also have Cricket
stadium with 37,000 seating capacity managed by Maharashtra Cricket Association
and hosted international cricket matched in all three formats i.e. One Day
Internationals (ODI), Test Matches and T20’s,.38
Healthcare Services within the Pune city are provided by both private and
public facilities with the use of western as well as ancient alternative medicine
commonly known as Ayurveda. Healthcare facilities in the city have government
hospitals and number of private hospitals to deal with all types of illnesses. The main
medical services in India as compared to the developed countries are very much low
in cost. Pune, above all, encompasses a very high potentiality of attracting the medical
tourists in India together with this Ayurveda and other different age-old medical
practices and treatments offered in Pune.39
Restaurant Industry in Pune City
There are more than 7200 food and beverage service outlets in Pune city
which includes quick bites (fast food), casual dining, dessert parlour, bakeries, cafes,
bars, beverage shops, sweet shops as per the data available on
Zomato 40 Approximately 250 New Restaurants enters in the Food and Beverage
Service Sector of Pune city every year in PMC area – Organized sector (Source: Food
and Drug Administration Office, Aundh, Pune).
The failure rate is almost 59% in the period of the first 3 years of starting a
New Restaurant.41 Many restaurants get head start but may lead to failure soon in the
19
business due to some of the internal factors such as no or less market research before
starting a restaurant, wrong calculations of finance (wrong pricing strategies, cost and
profit calculations), less sustenance capacity till business achieves breakeven, nothing
different or superior to offer in terms of its products (no product differentiation in
Menu), lacunas in standard operating procedures, type of management/ownership,
work culture, and less or no efforts on promotion and so on. While external factors
responsible are competition, type of customers, a supply of raw material, regulating
agencies, legal and political factors, economy and demography.
To compete in a market and maximize profit, it is necessary for one to
understand the Marketing Mix in a Restaurant business. Further, it is essential to
review and ensure that the restaurant is operating at the maximum level. Marketing
mix can be used as perfect instrument while making decisions like in which specific
area to pay attention in restaurant operations regardless of whether the restaurant is
operating smooth and achieving preset targets along with the desired profit margin or
even facing rough patch42. Marketing mix is a designed plan of marketing for any
business in association with the goals. In case of Restaurant business, it is related to
the menu offered i.e. product, menu item pricing i.e. price, location of the restaurant
in market i.e. place, and various promotional efforts taken like special offers,
discounts in relation to promoting the sale of restaurant i.e. promotion – 4Ps.
So the one must know, what is a Marketing Mix?
Meaning of Marketing Mix
Marketing is a process designed by the management of a production
Firm/Company/Enterprise for the distribution of its goods and services. Production
has no relevance unless the products are sold in the market and services offered to the
customer’s for their needs and want satisfaction.43
The success of marketing depends on various factors which include,
1. What the production firm/ company/ enterprise will produce i.e. Product.
2. How much the product is going to be charged? I.e. Price
3. Where the product is going to be delivered to the customer or services are offered
to the customer? I.e. Place
4. How to tell the customers about products and services i.e. Promotion.

20
Traditionally these factors are known as 4P’s of Marketing Mix.44Marketing
mix concept is usually known as the balanced combination of 4P’s of Marketing:
Product, Price, Place and Promotion. The concept has dominated marketing since the
1940s and further in 1960 by marketing professor E. Jerome McCarthy the concept
was refined and developed to 4P’s of Marketing Mix. McCarty’s 4P’s of Marketing
Mix stayed the standard model for developing the marketing strategy until today.
Definition
According to Philip Kotler,45 - “Marketing mix is the mixture of controllable
marketing variable that the firm uses to pursue the sought level of sales in the
target market”
To summarise the marketing mix one can say it is an appropriate combination
of four P’s namely, Product, Price, Place and Promotion for achieving marketing
objectives. For restaurants, 4P’s means a simple and effective marketing plan to
execute for achieving various goals of the restaurant business.
Marketing mix used by a particular firm will vary according to its resources,
market conditions and changing needs of customer’s. The significance of some
elements within the marketing mix can differ at any one point in time. Decisions
cannot be made on one element of the marketing mix with no considering its impact
on other elements.46
In 1981, Bernard H. Booms and Mary J. Bitner further developed traditional
marketing mix concept by the American Professor of Marketing E. Jerome
McCarthy into the extended marketing mix or services marketing mix. As Marketing
becomes a more disciplined and integrated part of the business approach in today’s
world, 3 more P’s were added to the Marketing Mix concept i.e. People, Process and
Physical Evidence. All factors together are known as 7P’s of Marketing Mix. Being a
part of the service industry Restaurants should have 7P’s of Marketing Mix. The
unique characteristics of the services like Intangibility, Inseparability, Perishability
and Variability - making marketing process as the most important factor in a Service
Industry to lead any business to success47.
21
Element of the marketing mix
1. Product:
Product can be finalised after a long thought process starting from idea
generation consisting varieties of product, material to be used for product packaging,
labelling and so on. Many businesses decide what to offer first and then find a market
afterwards. The successful businesses first find out what the customers’ needs or
wants and then develop the right product with the right features to meet those needs.
48
2. Price:
Price is the amount of money charged for a product or service. Broadly, price
is the total amount that being exchange by the customer to obtain a benefit of the
product or service. Price needs to be competitive but it doesn’t mean cheapest. Pricing
must provide profit in the business. Price is the only element in Marketing Mix which
generates revenue and rest all other elements are cost elements. Price positions the
business in any marketplace, if any business charges more for its product or service -
the more quality and value customers will expect for their money spend on such
product or service.49 Pricing in case of the service industry is more difficult than in the
case of products. Pricing can be done only for the food that served to the customers
and then question arises how to earn sufficient by charging the customer in a way that
that restaurant owner/ operator can able to pay the staff preparing and serving food.
Beyond that it should be priced in a way that it will cover up the expenses on decor,
entertainment and so on which ultimately planned for customers.50
3. Place:
The place is also an important element of the marketing mix which refers to
the decision regarding the market location where products and services will be offered
for sale. It is also a means of distributing a product. The place must be appropriate and
convenient for customers. The product must be available in the right place, at the right
time and in right quantity while keeping distribution cost at an acceptable level.51 For
e.g. the one should able to understand the right place to start a petrol pump and should
able to select between highway and a place within city. Whatever is the selected
option, it must have more traffic as compared to the rejected option.52

22
4. Promotion:
Promotion is the way a company communicates what it does offer to its
customers. Promotion involves decisions focusing on the ways of increasing sales.
Different methods are used for promotion considering its relative importance.
Multiple factors need to be considered like government policy, consumer
expectations, and competition in market and so on while taking any decisions
regarding promotion. Promotion includes activities such as branding, sales
management, advertising, special offers, public relations (PR), and exhibitions.
Promotion must be appealing, gaining attention, conveying a consistent message and
should give a reason to the customers to choose the particular product. Promotion
should communicate the benefits of that the customer obtains from a product and how
it is better than other similar products available in the market.53 A very important
factor in service marketing mix is promotion. Brand is the only factor which sets a
service apart from its competitors in case of restaurant business. Competition in the
service industry is generally high and promotions are necessary to survive. 54
These are the 4P’s of Marketing Mix, the next 3P’s have mentioned below are
generally considered as additional Marketing Mix factors beyond the traditional 4 Ps
of Marketing Mix but necessary to consider for Restaurant Business as a part of
service industry.
5. People:
People considered here is anyone who comes in contact with the customer.
They can make an impression on customer regarding a business which can be positive
or negative. In a restaurant business, people working as your employees like chef and
service staff defines your business. In a restaurant business as a service industry,
people (staff) working can make or break customer’s experience. Interaction between
staff delivering food service and customer is very important and has a direct effect on
the customer’s perception of quality. Products of a restaurant can be better established
with the help of service offered by well motivated staff (people) with the right attitude
in a restaurant. Thus staff (people) training in interpersonal skills and customer
service with special attention towards customer satisfaction is very important.55
23
6. Process:
Process means a series of actions taken in an order to achieve a particular
result. Production and service process in case of a restaurant is the way in which food
and beverages are produced and served to the customer. Consider the e.g. of
McDonalds and FedEx, both the companies are well known for their quick service
and confidence in their processes is the reason that they can do so. The process is a
critical component in the planning phase itself, even before the actual operations
start.56 Home Delivery or Parcel Counter is also a very important part of physical
evidence of restaurant which generates a considerable amount of revenue for any
restaurant business in today’s world.
7. Physical Evidence:
Physical Evidence means the Environmental factors which influence the
perception regarding the quality of product and services offered by any organisation.
(Booms and Bitner, 1981) Physical evidence can be defined as the experiences at a
restaurant which are based on tangible or intangible products and services. Menu card
that explain products to the customer, enables him /her to recognize what he /she is
buying. If a restaurant is furnished in a neat way, it will lead to individuals
comfortable dining. It is advisable to have the flexible arrangement of the restaurant,
which can be adjusted to suit for various types of seating as per the requirement of
customers of different categories.57
A restaurant should consider their physical evidence such as decoration,
dining room, table design, menu cards, plates, uniforms, parking, washrooms and
overall services offered. Physical evidence helps in representing the product and
service quality and attracts the customers.58
Even though the customer cannot experience the service previous to
purchase, he or she can talk to other individuals with experiences of the service.
Their testimonials are reliable because their views do not come from the company.
Some companies connect these customers and request for their feedback with the
intention to develop reference materials. New customers in that case can see these
testimonials and are further likely to purchase with assurance.
24
Each of the ‘ingredients’ of the marketing mix is the key to success. No one
element can be considered in isolation — you cannot, for example, develop a
product without considering a price, or how it will reach the customer i.e. place.59
Nature of Marketing Mix
1. Each element of the marketing mix should have proper weightage (as a part of
Mixture in Marketing) to achieve the best result in any business.
2. Marketing mix has to be reviewed constantly to make necessary changes
according to changes in market conditions.
3. Considering changes in the internal and external environment for business and
changing marketing mix accordingly.
4. Various goals in business like achieving profit or share in market can be achieved
with the help of proper marketing mix.
5. Marketing mix concentrates on customers focusing on maximum customer
satisfaction.60
How to Develop Marketing Mix for a Restaurant business?
To develop the particular marketing mix for the restaurant, the following
factors must be clearly defined,61
Market Segment – It is very important to know the target customers to whom the
restaurant is offering food and beverage services and needs or wants of those target
customers. What all the products and services offered by the restaurant is a base to
develop a marketing plan for the restaurant business. Knowing the target customer,
their age, gender, their income etc. is very helpful information to develop a marketing
plan for a restaurant.
Clear understanding of the segment of the market for a restaurant business is a
crucial factor. The market segment for which the restaurant is going to cater must be
clearly defined by target customer. Whether restaurant is planning to serve food and
beverages on premises only, or off premises only, or both the way has to be well
defined. Many restaurants offer to carry out and delivery facility in addition to their
daily on premises operations nowadays as delivery apps and services are present
today in the market.
25
Competition – Identifying competitors in a specific market segment in which the
restaurant is operating or going to operate in future is also necessary for a restaurant
business to sustain in the market. Analyzing competitors menu, pricing, promotions
and online presence will guide to understand how to position a restaurant in a specific
and competitive market.
Marketing Objectives
Marketing objectives for the restaurant can be as follows,
Brand Awareness – To become well known locally and make the restaurant as a
brand recognized by the public. This can be achieved with the help of a well-planned
promotion strategy as a part of the marketing mix.62
Increase repeat visits of customers – There is a number of restaurants present in the
market which may offer the same menu as a product and similar services which
creates a great competition in a market. It becomes necessary to get some repeat
customers in the restaurant business to sustain in the competitive environment. To
acquire a new customer is more costly. It can cost five times more than retaining an
existing customer. Increasing customer retention by 5% can increase profits from 25
to 95%.63
Increase the average spending power of customer – There are various ways to
increase the average spending power of customers visiting the restaurant. Techniques
like up selling (even up selling of a small portion of dessert will work), rewarding
customers for the money they spend (the more customers spend, the more they earn in
terms of rewards), and pairing of food with alcoholic and non alcoholic beverages will
help a lot to increase the average spending power of customer at restaurant. 64
Competitive differentiation – It is essential to make restaurant differentiation
identifiable for customers in terms of its products, services or as a brand in a
competitive marketplace. It also helps in positioning the business and defining the
specific advantages for customers. 65
26
Brand Building – Due to the strong competition in the market, it is essential to
differentiate the restaurant for the consumer. This differentiation can be built on the
principles of brand management. 66
Develop value perceptions of Customers– Customers perceive the quality of food,
food and beverage service quality and physical environment as determinants of
overall customer satisfaction. Restaurant managers have to pay attention to enhance
the restaurant experience for customers which result in customer satisfaction. Food
quality is the most important factor of customer satisfaction followed by food and
beverage service quality and physical environment at a restaurant.
One should be having a clear marketing plan and goals to achieve, which makes it
easier to determine the right path for a restaurant business and gives the right message
to customers.67
Allocation of Funds for Marketing
The budget should be planned carefully for a restaurant business like
allocation of budget for operations which includes material cost, labour cost and
overhead cost. Some guidelines for marketing budget are as follows,
New Business: 20-30% of forecasted revenues
When undergoing a business transformation: 10-20% of the revenue
Established Restaurant business: should spend 2-10% of revenue.
All these figures are just rough guideline. The actual percentage may be
different depending upon the nature of the restaurant business and the real situation.
Marketing is a key to bring in new customers in a restaurant and grow the business.68
27
Components of Promotion Mix for Restaurant
Following are the components of Promotion Mix used broadly for restaurant,69
1. Marketing through Direct Mail:
Marketing through direct mail include sending a brochure, letter or mail to
find out new clientele in the local region. Restaurants generally use this technique
when it’s new in the market or when a drop in sales realises and wish to increase the
same. It is effective with special offers and coupons to attract new customers.
Restaurant website link, images and a mobile app can be of great help in this case.
2. Calling campaigns:
This is a very successful technique for the marketing of the restaurant
business. It can be a part of restaurants marketing mix even at its introduction phase
and will be continued throughout. Generally, phone calls are answered and its
inexpensive way to build new relationships and maintain with the existing customers
(with the regular messaging). It can be time-consuming but very useful for local
marketing building trust due to personal interaction with customers. An effective
strategy is to use a coupon code for calling campaigns.
3. Billboard Advertising:
Restaurants can use billboard advertising to capture attention for a long time.
This form of advertising is expensive and charges can be paid per month basis. It is
difficult to track responses from such advertising but with the certain form of
feedbacks it can be done which is necessary to find out the return on investment.
4. Search Engine Optimization:
With a website of restaurant search engine optimization can be done. This
service can be hired and can be designed as customer friendly. Social media
marketing and content marketing is also helpful to convert occasional or first time
visitors into regular customers. Particularly, restaurants should incorporate search
engine optimization (SEO) as a part of their marketing mix. Restaurants can register
themselves and get paid services from search engines like Google, Bing, Just Dial,
Yahoo, Ask.com are to name a few.
28
5. Local Search Optimization:
Registering a restaurant website and contact details in local directories and
updating in the local listing can help the people looking for restaurant outlets in that
specific area. Claiming restaurant business in directories and updating information
about the menu, cuisine, location, website address and phone number can help to do
local search optimization.
6. Email Marketing:
It is a cost-effective and fast way to communicate with customers and acquire
more potential customers. Email marketing is very effective marketing mix for
restaurants which can offer huge returns on investment. This return on investment can
be enjoyed by restaurants actually for long time period with constant and closely
monitored efforts.
7. Social Media Marketing:
People are spending almost 2 hours of their day as an average on social media.
It is a necessity to be on social media if the restaurant wants people to know about its
presence in the market. Someone from the restaurant team or dedicated agency (paid
by a restaurant) should manage social media posting and daily engagement of
customers.
Use of social media today, becoming prominent for promotions in restaurant
industry. Social media started replacing traditional marketing such as newspaper
advertisement, television advertisement and brochures. People want instant access to
information these days. Social media will constantly evolve, bringing inventive ways
to reach potential customers. Administered correctly this can not only bring higher
revenues but also enhance the marketing strategy in the restaurant industry.
8. Mobile Marketing:
Percentage of people respond to a text message is more than they do to emails.
Having a mobile app for a Restaurant which offers information, special offers and
deals can help a lot for business.
29
9. Deals Marketing:
It is the best way for a restaurant to become popular. Deals marketing need to
be planned well to achieve business objectives.
10. Community Marketing:
Community marketing is another marketing opportunity for restaurants. It may
be in the form of sponsoring local events. Offering free samples to the people at local
events can be effective in gaining local recognition and it doesn’t cost much.
11. Advertising in Local Publication:
Many people are referring local publications and advertising in it can catch
their attention to get them to the restaurant.
12. Television and Radio Advertisements:
Television and Radio advertising are the other options for advertising of a
restaurant. It has a wide reach and positive impact in relation to publicity of the
restaurant.
Developing Marketing Mix for Restaurant
A restaurant should develop marketing mix plan based on budget allocated, its
objectives and marketing channels selected for the same. It can be online or offline
improving the chances of its success.70 It is very essential for restaurant business in
today’s competitive market to develop and implement a long term marketing mix plan
even it is a well established brand or a new entry in the market.
Experts and experienced people in the Food and Beverage Service Industry
reveal the trick of using 4P’s of Marketing Mix. Based on the real experience it is
proven fact that, using 4P’s of marketing mix needs to be well balanced for restaurant
success. Good food can cover up for bad location or high price. Reasonably priced
menu and good service can make up for location and less efforts taken on promotion
and so on. Though, the core product in restaurant is most important. Reasonable
pricing, good site or good advertising cannot save bad foodstuff and unreceptive
service.71
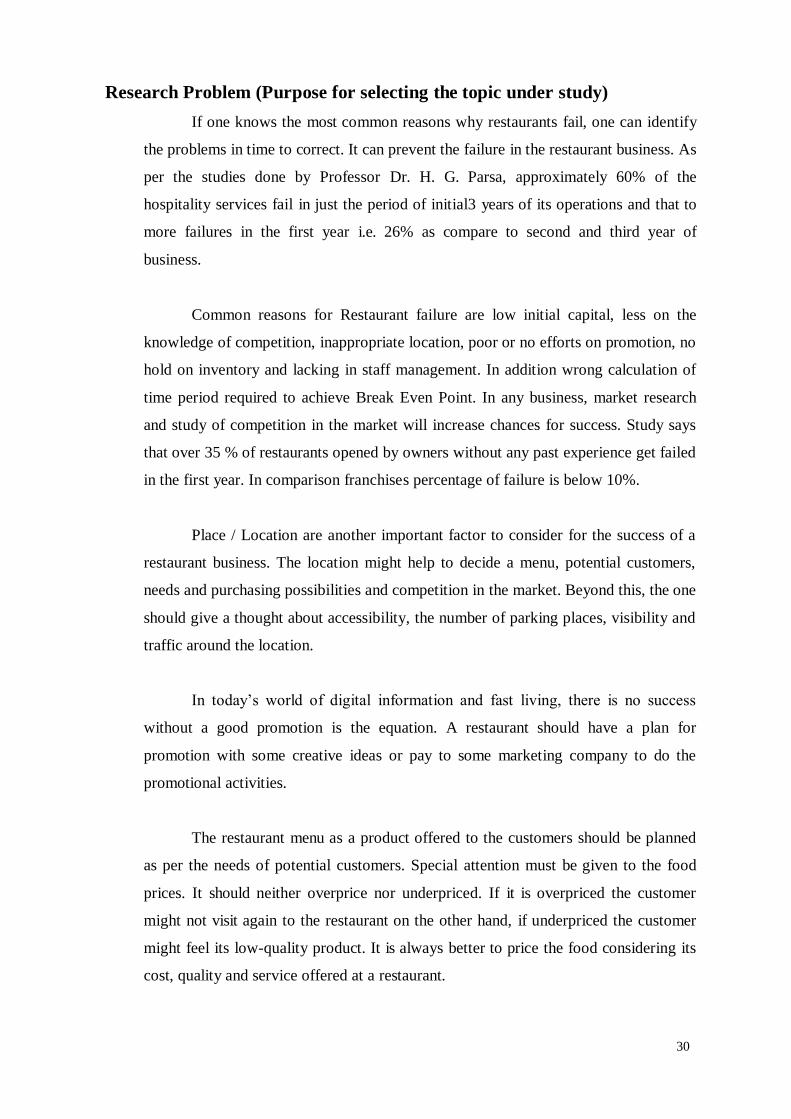
30
Research Problem (Purpose for selecting the topic under study)
If one knows the most common reasons why restaurants fail, one can identify
the problems in time to correct. It can prevent the failure in the restaurant business. As
per the studies done by Professor Dr. H. G. Parsa, approximately 60% of the
hospitality services fail in just the period of initial3 years of its operations and that to
more failures in the first year i.e. 26% as compare to second and third year of
business.
Common reasons for Restaurant failure are low initial capital, less on the
knowledge of competition, inappropriate location, poor or no efforts on promotion, no
hold on inventory and lacking in staff management. In addition wrong calculation of
time period required to achieve Break Even Point. In any business, market research
and study of competition in the market will increase chances for success. Study says
that over 35 % of restaurants opened by owners without any past experience get failed
in the first year. In comparison franchises percentage of failure is below 10%.
Place / Location are another important factor to consider for the success of a
restaurant business. The location might help to decide a menu, potential customers,
needs and purchasing possibilities and competition in the market. Beyond this, the one
should give a thought about accessibility, the number of parking places, visibility and
traffic around the location.
In today’s world of digital information and fast living, there is no success
without a good promotion is the equation. A restaurant should have a plan for
promotion with some creative ideas or pay to some marketing company to do the
promotional activities.
The restaurant menu as a product offered to the customers should be planned
as per the needs of potential customers. Special attention must be given to the food
prices. It should neither overprice nor underpriced. If it is overpriced the customer
might not visit again to the restaurant on the other hand, if underpriced the customer
might feel its low-quality product. It is always better to price the food considering its
cost, quality and service offered at a restaurant.

31
Many restaurants fail due to the inability of partners in resolving the dispute in
partnership relations. They need to analyze the situation and value the relationship.
The best solution to maintain good partnership leading to the success in business is to
formalize roles, responsibilities and duties which are clearly defined.
Most of the restaurant owners pay more attention and do their best to make
nice decor for a restaurant and offering a good service. However these restaurants do
not conduct any survey to find out useful information of their possible customers
which can guide them to fulfil all requirements of potential customers. To understand
the needs of the customers and exceed their expectations should be the priority in a
restaurant business. Further improvements can be made by listening to customers’
feedback. Give an opportunity to a customer for rating variables in a restaurant. It is
the best way to find out present weaknesses in the restaurant which may lead to a
problematic situation in future. Always get back to the customer with what has been
done based on this feedback and ratings.
Inventory control and profitability need to be analysed timely in the restaurant
business to prevent theft and reduce unnecessary costs. Study shows that there is
about 20 % loss in a restaurant and bar business due to theft, complimentary,
overproduction, spillages and other expenses per month without its knowledge to the
owner or manager.
Another important and neglected reason for failure in the restaurant business is
inconsistent quality of food and service offered. If the quality of food and service is
good and quality standards are set, well defined and maintained constantly, it will lead
to the customers returning to the restaurant again and again. If the quality of products
on offer is not maintained, the probabilities of retaining customers are almost zero.
There is too strong competition in restaurant business nowadays so it becomes a
necessity to make sure that the quality of food and service offered at a restaurant
should be of high standards and most important is to keep constant. Standard
Operating Procedures (SOP’s) namely standard yield, standard recipe, standard
portion size, standard service procedures are key success factors to any restaurant
business. One should understand it doesn’t mean that there should be the same menu
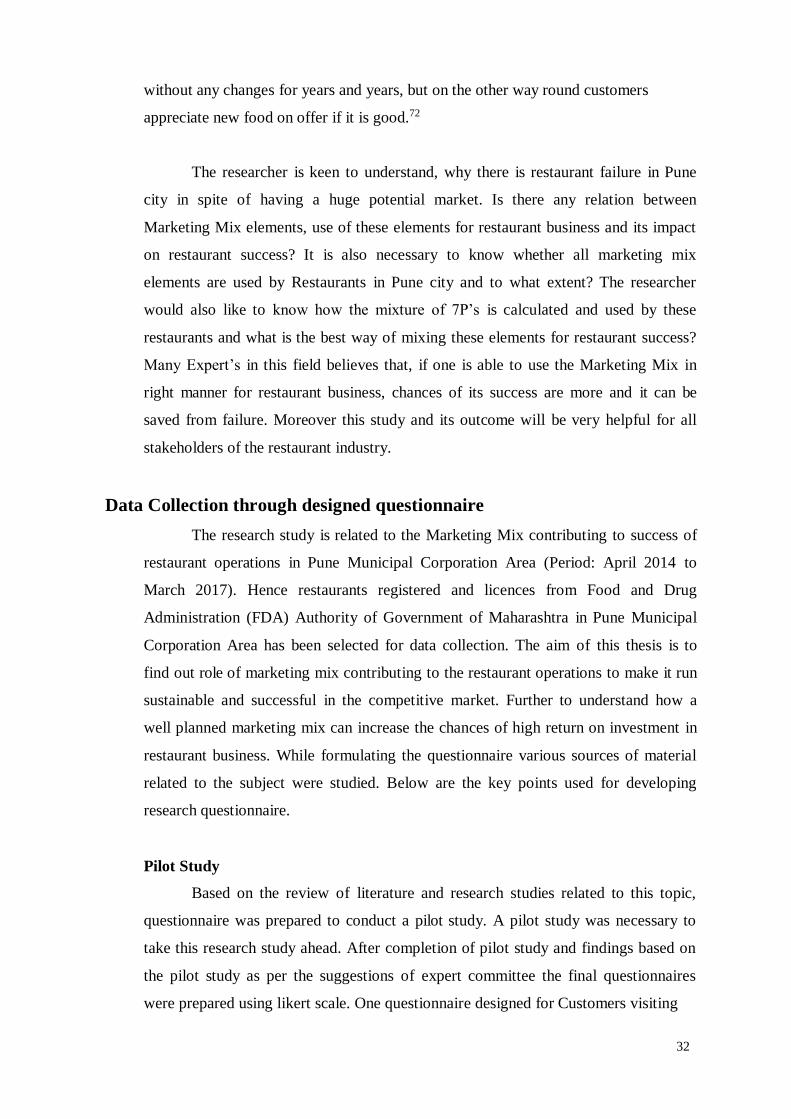
32
without any changes for years and years, but on the other way round customers
appreciate new food on offer if it is good.72
The researcher is keen to understand, why there is restaurant failure in Pune
city in spite of having a huge potential market. Is there any relation between
Marketing Mix elements, use of these elements for restaurant business and its impact
on restaurant success? It is also necessary to know whether all marketing mix
elements are used by Restaurants in Pune city and to what extent? The researcher
would also like to know how the mixture of 7P’s is calculated and used by these
restaurants and what is the best way of mixing these elements for restaurant success?
Many Expert’s in this field believes that, if one is able to use the Marketing Mix in
right manner for restaurant business, chances of its success are more and it can be
saved from failure. Moreover this study and its outcome will be very helpful for all
stakeholders of the restaurant industry.
Data Collection through designed questionnaire
The research study is related to the Marketing Mix contributing to success of
restaurant operations in Pune Municipal Corporation Area (Period: April 2014 to
March 2017). Hence restaurants registered and licences from Food and Drug
Administration (FDA) Authority of Government of Maharashtra in Pune Municipal
Corporation Area has been selected for data collection. The aim of this thesis is to
find out role of marketing mix contributing to the restaurant operations to make it run
sustainable and successful in the competitive market. Further to understand how a
well planned marketing mix can increase the chances of high return on investment in
restaurant business. While formulating the questionnaire various sources of material
related to the subject were studied. Below are the key points used for developing
research questionnaire.
Pilot Study
Based on the review of literature and research studies related to this topic,
questionnaire was prepared to conduct a pilot study. A pilot study was necessary to
take this research study ahead. After completion of pilot study and findings based on
the pilot study as per the suggestions of expert committee the final questionnaires
were prepared using likert scale. One questionnaire designed for Customers visiting
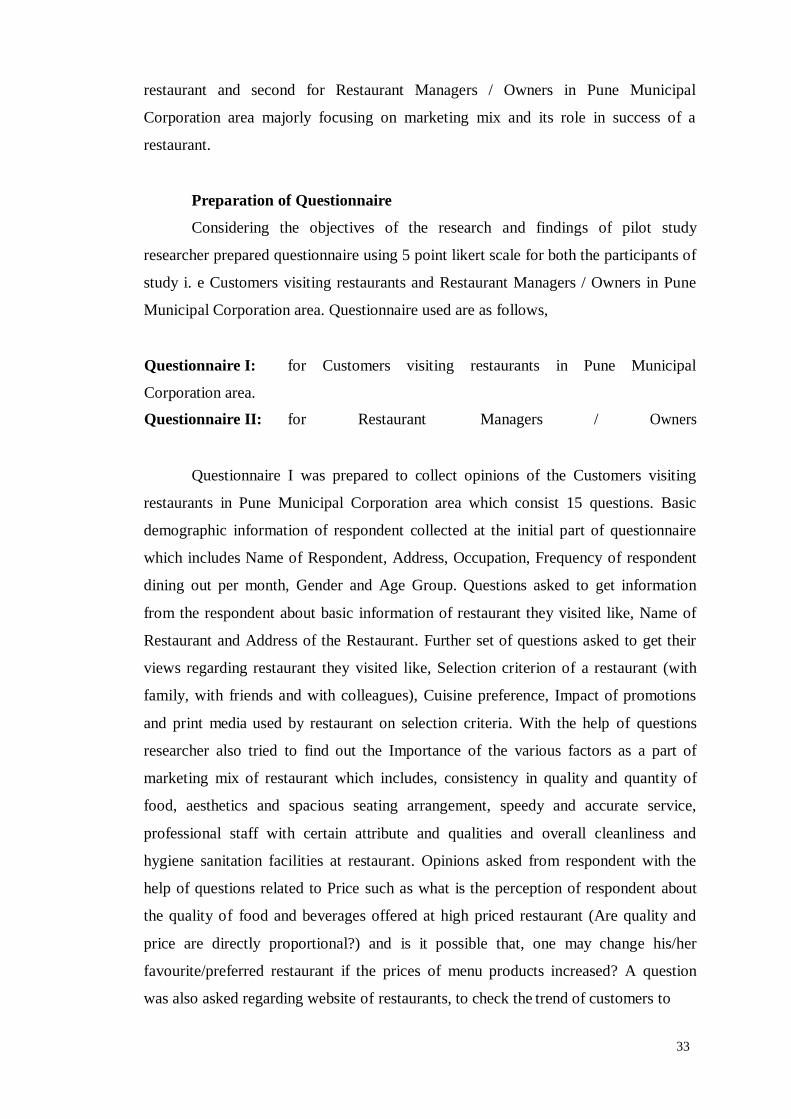
33
restaurant and second for Restaurant Managers / Owners in Pune Municipal
Corporation area majorly focusing on marketing mix and its role in success of a
restaurant.
Preparation of Questionnaire
Considering the objectives of the research and findings of pilot study
researcher prepared questionnaire using 5 point likert scale for both the participants of
study i. e Customers visiting restaurants and Restaurant Managers / Owners in Pune
Municipal Corporation area. Questionnaire used are as follows,
Questionnaire I: for Customers visiting restaurants in Pune Municipal
Corporation area.
Questionnaire II: for Restaurant Managers / Owners
Questionnaire I was prepared to collect opinions of the Customers visiting
restaurants in Pune Municipal Corporation area which consist 15 questions. Basic
demographic information of respondent collected at the initial part of questionnaire
which includes Name of Respondent, Address, Occupation, Frequency of respondent
dining out per month, Gender and Age Group. Questions asked to get information
from the respondent about basic information of restaurant they visited like, Name of
Restaurant and Address of the Restaurant. Further set of questions asked to get their
views regarding restaurant they visited like, Selection criterion of a restaurant (with
family, with friends and with colleagues), Cuisine preference, Impact of promotions
and print media used by restaurant on selection criteria. With the help of questions
researcher also tried to find out the Importance of the various factors as a part of
marketing mix of restaurant which includes, consistency in quality and quantity of
food, aesthetics and spacious seating arrangement, speedy and accurate service,
professional staff with certain attribute and qualities and overall cleanliness and
hygiene sanitation facilities at restaurant. Opinions asked from respondent with the
help of questions related to Price such as what is the perception of respondent about
the quality of food and beverages offered at high priced restaurant (Are quality and
price are directly proportional?) and is it possible that, one may change his/her
favourite/preferred restaurant if the prices of menu products increased? A question
was also asked regarding website of restaurants, to check the trend of customers to
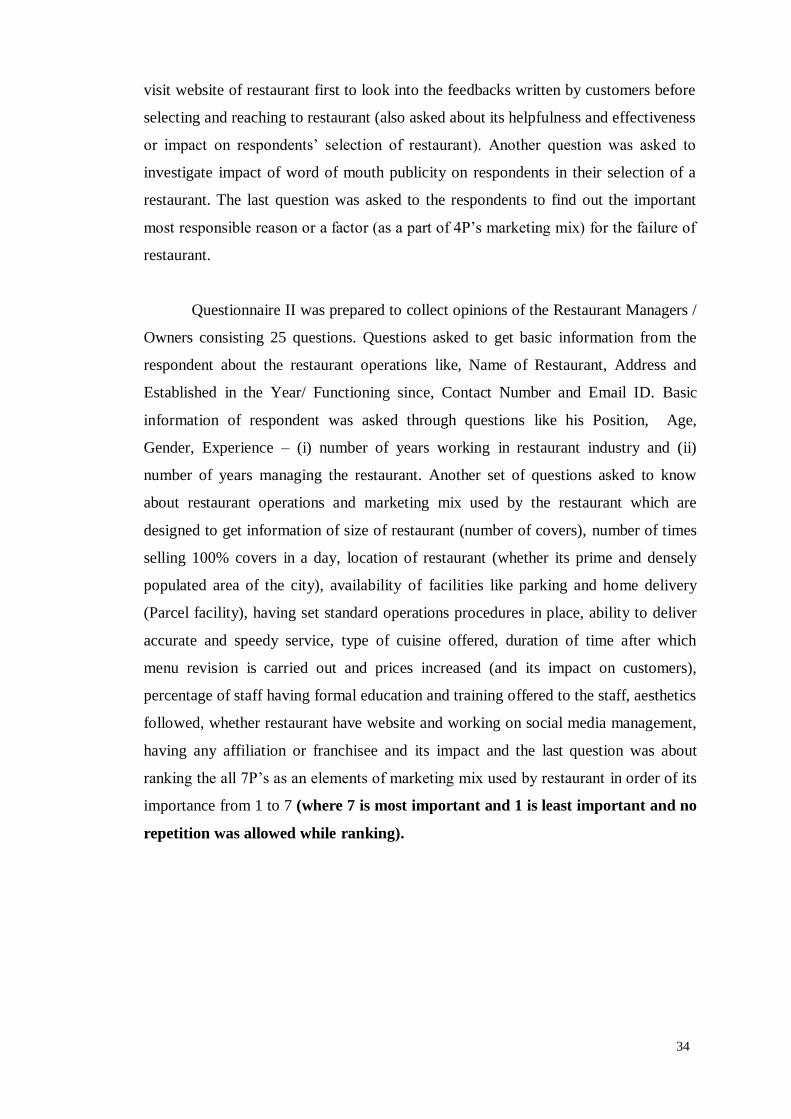
34
visit website of restaurant first to look into the feedbacks written by customers before
selecting and reaching to restaurant (also asked about its helpfulness and effectiveness
or impact on respondents’ selection of restaurant). Another question was asked to
investigate impact of word of mouth publicity on respondents in their selection of a
restaurant. The last question was asked to the respondents to find out the important
most responsible reason or a factor (as a part of 4P’s marketing mix) for the failure of
restaurant.
Questionnaire II was prepared to collect opinions of the Restaurant Managers /
Owners consisting 25 questions. Questions asked to get basic information from the
respondent about the restaurant operations like, Name of Restaurant, Address and
Established in the Year/ Functioning since, Contact Number and Email ID. Basic
information of respondent was asked through questions like his Position, Age,
Gender, Experience – (i) number of years working in restaurant industry and (ii)
number of years managing the restaurant. Another set of questions asked to know
about restaurant operations and marketing mix used by the restaurant which are
designed to get information of size of restaurant (number of covers), number of times
selling 100% covers in a day, location of restaurant (whether its prime and densely
populated area of the city), availability of facilities like parking and home delivery
(Parcel facility), having set standard operations procedures in place, ability to deliver
accurate and speedy service, type of cuisine offered, duration of time after which
menu revision is carried out and prices increased (and its impact on customers),
percentage of staff having formal education and training offered to the staff, aesthetics
followed, whether restaurant have website and working on social media management,
having any affiliation or franchisee and its impact and the last question was about
ranking the all 7P’s as an elements of marketing mix used by restaurant in order of its
importance from 1 to 7 (where 7 is most important and 1 is least important and no
repetition was allowed while ranking).
35
Chapter Scheme
Chapter I : Introduction
Chapter II : Literature Review
Chapter III : Research Methodology
Chapter IV : Analysis of Data and Interpretation
Chapter V : Findings, Conclusion and Recommendations
Chapter VI : Bibliography
Keys
1. PMC – Pune Municipal Corporation
2. NRAI - National Restaurants Association of India
3. QSR – Quick Service Restaurants
36
Summary
The food & beverage provision is a major part of the various activities of the
hotel industry. Food & beverage service has developed into a vast industry at present.
Food and beverage industry, we witness today has an ancient history related to trade
and travel of human being for various reasons. The industry have seen many changes
in the past and transformed today as one of the leading industry in the world
generating remarkable amount of revenue and employment for the host country. Food
and Beverage Services can be broadly defined as the process of preparing, presenting
and serving food and beverages to the customers. Food and Beverage Services can be
of the following two types –
1. On-Premise and
2. Off-Premise or Outdoor Catering
A restaurant or an eatery is a business that prepares and serves food and
beverages to customers in exchange for money. A restaurant as we see today is no
more a place which is only focused on offering food and beverages but have various
aspects like valet parking facility, reception area with a hostess to receive customers
with a smile on a face and taking reservations, customer oriented and comfortable
seating arrangements, décor, ambience, lighting arrangements, music and
entertainment facilities available (on some special occasions including Live
streaming), well-dressed staff, food served on sparkling clean crockery which is
nicely garnished and so on. Meals are usually served and consumed on the premises
in a restaurant set up, however many restaurants also started to offer take-away and
food delivery services. Restaurants differ greatly in look and offerings, including an
extensive variety of cuisines (Region wise or Nation wise categorised Menu) and
service models ranging from reasonably priced fast food restaurants and cafeterias to
mid-priced family restaurants, to expensive luxury establishments. Eating in
restaurants has also become more popular with the growth of higher household
earnings. At the same time, less expensive establishments such as fast food
establishments can be quite reasonably priced, making restaurant eating available to
many.
As per the study, it shows that there is tremendous growth in restaurant sales
all over the world. The restaurant sales are growing at an annual rate of 5.6% (without
the adjustment of inflation). Trends in foodservice industry differ from country to

37
country, but certain trends that are important and have an impact on the foodservice
industry at a global level. Following are the significant trends observed in foodservice
industry,
1. Advancement in Technology
2. Conscious Dining
3. Food and beverage service at places which are not primarily meant for the same
for e.g. multiplex
Massive growth is expected in the restaurant industry in all parts of the world.
Restaurant industry showing steady growth globally which makes it necessary to
adapt to emerging trends in the industry. Restaurants with better updated knowledge
on current trends in market and customers requirements have better scope for survival
in the long run.
Indian people are well known for their natural hospitality quality. “Atithi Devo
Bhava” (the guest is like a god) is the belief of Indians for which they are known all
over the world. 19th century witnessed major growth in transportation facilities and
introduction of railways enabled large number of people to travel effectively and
efficiently. It further resulted in demand of lodges and restaurants around railway
stations. Even after independence, British style operations retained and the sector
witnessed a significant growth. Food and Beverage service industry in India has seen
unparalleled growth in the recent past and will expand rapidly in the future. An
increase in disposable income, urbanisation, double incomes in a family, and nature of
tasting something new or different are contributing factors in this growing
phenomenon. The foodservice sector generated direct employment for 5.5 to 6 million
people in the financial year 2016, which is expected to increase (rise) to 8.5 to 9
million by the financial year 2021. The food and beverage service market in India is
estimated at INR 3, 37,500 crores in 2017 (organised and unorganised) and is
projected to grow over to reach INR 5, 52,000 crores by 2022. Two mega metros,
Delhi and Mumbai contribute to 22% of the overall Food Service market (11% each)
followed by six mini metros which include Pune along with Ahmadabad, Bangalore,
Chennai, Hyderabad and Kolkata comprised of 20% share in the foodservice market.
(Source: NRAI Technopak India Food Services Report 2016, Technopak Analysis)
38
Eating out pattern in Indians is increasing and many factors are responsible for
the same as discussed early in the chapter. Indian diners are conservative about their
food choices, preferring north Indian food. Restaurant sector in India broadly
categorised in to two categories i.e. organised and unorganised sector. Restaurants are
classified primarily based on type of food offered. Restaurants vary from reasonably
priced and informal lunching or dining places catering to people working nearby, with
modest food served in simple settings at low prices, to expensive establishments
serving stylish food and fine wines in a formal set up.
Customer can get information of restaurant through restaurant guides that
include reviews of restaurants and often ranking of the restaurant based on facilities
available. More recently Internet sites have started up which publish both food critic
reviews and popular reviews by the public. The study shows that a good reviews
about food and beverages prepared and served in a restaurant leads to a significant
increase in revenue of restaurants.
Pune is the second largest city in Maharashtra after Mumbai and 101st largest
in cities in the world as per population. Pune city emerged as a manufacturing, and IT
centre with the 6th highest per capita income in India. Pune city is considered to be
the cultural capital of Maharashtra. It is additionally referred as the “Oxford of the
East" because of the presence of many well-known educational institutions. The city
is also having a very well setup of numerous industries. MIDC provided necessary
infrastructure for new businesses to set their operations and industrial development in
Pune. Information Technology and Engineering Industry began to attract foreign
capital in 1990. At various places like Wagholi, Aundh and Hinjewadi, large IT parks
were established and city saw a huge number of people arrivals in city due to
opportunities on offer. Pune has the eighth largest metropolitan economy and also the
sixth highest per capita financial gain with in the country. The key sectors of the local
economy are education, production and information technology (IT). The city is also
well known for its Historical attractions, Museums, Parks and green spaces and
zoological park. Sports and games that are popular in Pune include Athletics,
Kabaddi, Kho-Kho, Chess, Cricket, Basketball, Badminton, Football, Hockey, and
Tennis. Healthcare Services within the Pune city are provided by private and public

39
facilities. For each minor and chronic illness, the healthcare facilities are available
within the city.
There are more than 7200 food and beverage service outlets in Pune city
which includes quick bites (fast food), casual dining, dessert parlour, bakeries, cafes,
bars, beverage shops, sweet shops as per the data available on Zomato.
Approximately 250 New Restaurants enters in the Food and Beverage Service Sector
of Pune city every year in PMC area – Organized sector (Source: Food and Drug
Administration Office, Aundh, Pune). The research in the field suggests that failure
rate is almost 59% in the period of the first 3 years of starting a New Restaurant. To
compete in a market and maximize profit, it is necessary for one to understand the
Marketing Mix in a Restaurant business.
Marketing mix concept is usually known as the balanced combination of 4P’s
of Marketing: Product, Price, Place and Promotion. McCarty’s 4P’s of Marketing Mix
stayed the standard model for developing the marketing strategy until today.
According to Philip Kotler, - “Marketing mix is the mixture of controllable
marketing variable that the firm uses to pursue the sought level of sales in the
target market”. To summarise the marketing mix one can say it is an appropriate
combination of four P’s i.e. Product, Price, Place and Promotion for achieving
marketing objectives. For restaurants, 4P’s means a simple and effective marketing
plan to execute for achieving various goals of the restaurant business. Promotion Mix
used broadly for restaurant includes, Marketing through Direct Mail, Calling
campaigns, Billboard Advertising, Search Engine Optimization (SEO), Local Search
Optimization, Email Marketing, Social Media Marketing, Mobile Marketing, Deals
Marketing, Community Marketing, Local Publication, Television and Radio
Advertisements and so on.
A restaurant should develop marketing mix plan based on budget allocated, its
objectives and marketing channels selected for the same. It can be online or offline
improving the chances of its success. It is very essential for restaurant business in
today’s competitive market to develop and implement a long term marketing mix plan
even it is a well established brand or a new entry in the market. Experts and
experienced people in the Food and Beverage Service Industry reveal the trick of
40
using 4P’s of Marketing Mix. Based on the real experience it is proven fact that, using
4P’s of marketing mix needs to be well balanced for restaurant success. Good food
can cover up for bad location or high price. Reasonably priced menu and good service
can make up for location and less efforts taken on promotion and so on. However, the
core product is most important. Inexpensive price, good location or good marketing
cannot save bad food and inhospitable service.
If one knows the most common reasons why restaurants fail, one can identify
the problems in time to correct. It can prevent the failure in the restaurant business.
Common reasons for Restaurant failure are low start-up capital, poor knowledge
about competition, wrong location, poor restaurant promotion, bad partnership
relations, poor inventory and staff management, lack of original ideas. Place /
Location are another important factor to consider for the success of a restaurant
business. In today’s world of digital information and fast living, there is no success
without a good promotion is the equation. The restaurant menu as a product offered to
the customers should be planned as per the needs of potential customers. Special
attention must be given to the food prices. It should neither overprice nor underpriced.
Many restaurants fail due to the inability of partners in resolving the dispute in
partnership relations. They need to analyze the situation and value the relationship.
The best solution to maintain good partnership leading to the success in business is to
formalize roles, responsibilities and duties which are clearly defined. It is very
essential to understand the needs of the customers and exceed their expectations
should be the priority in a restaurant business. Further improvements can be made by
listening to customers’ feedback.
Inventory control and profitability need to be analysed timely in the restaurant
business to prevent theft and reduce unnecessary costs. Study shows that there is
about 20 % loss in a restaurant and bar business due to theft, complimentary,
overproduction, spillages and other expenses per month without its knowledge to the
owner or manager.
Another important and neglected reason for failure in the restaurant business is
inconsistent quality of food and service offered. If the quality is not constant chances
41
of retaining customers are almost zero. There is too strong competition in restaurant
business nowadays so it becomes a necessity to make sure that the quality of food and
service offered at a restaurant should be of high standards and most important is to
keep constant. It can be achieved with the set of Standard Operating Procedures
(SOP’s) in restaurant business.
The researcher is keen to understand, why there is restaurant failure in Pune
city in spite of having a huge potential market. Is there any relation between
Marketing Mix elements, use of these elements for restaurant business and its impact
on restaurant success? It is also necessary to know whether all marketing mix
elements are used by Restaurants in Pune city and to what extent? The researcher
would also like to know how the mixture of 7P’s is calculated and used by these
restaurants and what is the best way of mixing these elements for restaurant success?
Many Expert’s in this field believes that, if one is able to use the Marketing Mix in
right manner for restaurant business, chances of its success are more and it can be
saved from failure. Moreover this study and its outcome will be very helpful for all
stakeholders of the restaurant industry.
Based on the review of literature and research studies related to this topic,
questionnaire was prepared to conduct a pilot study. A pilot study was necessary to
take this research study ahead. After completion of pilot study and findings based on
the pilot study as per the suggestions of expert committee the final questionnaires
were prepared using likert scale. One questionnaire designed for Customers visiting
restaurant and second for Restaurant Managers / Owners in Pune Municipal
Corporation area majorly focusing on marketing mix and its role in success of a
restaurant.
42
Chapter – 2
Literature Review
Introduction
Restaurant: Concept and Operations
Opening and Operating a Successful Restaurant
Marketing Mix Strategies and Promotion of Restaurant
Marketing Mix for Restaurant Business
State of Restaurant Business in India
Restaurant Business Failure
Research Gap
Summary
43
Introduction:
Literature review is an attempt to study and organise the literature available
related to the research topic to find out the gap (missing areas that need to study).
Various studies made related to research topic by different researchers at different
time. Studies undertaken by various researchers have been reviewed in detail and
brief information is presented as a review of earlier literature available in the related
subject.
Literature review uses as database reports of primary or original study and
does not report new primary study itself.73 The primary reports used in the literature
may be verbal, but in the vast majority of cases reports are written documents. The
types of research may be theoretical, investigative, experimental, or methodological in
nature. Second, a literature review seeks to evaluate, describe, summarize, clarify and
integrate the content of primary reports.
According to Cooper74 literature review is a body of text that determines the
aims to review the critical points of existing information including substantive
findings as well as theoretical and methodological contributions to a particular topic.
Review of literature is a standard chapter of a thesis or dissertation. Literature review
forms an important chapter in a thesis where its purpose is to provide the background
and validation for the research undertaken.
This chapter has covered literature from the time frame of past 31 years (Year
1988 to Year 2019). The researcher has referred various types of literature which
includes research articles published in journals (national as well as international),
news paper articles, master’s thesis, doctoral thesis, blogs, text books and reports.
Major shift noticed in the research work done in the mentioned period in
relation to the marketing mix used for the success of restaurant business. Recent 15
years literature is focused more on promotion mix and customer meal experience. It
has covered the topics related to information and communication technology (ICT),
electronic word of mouth communication, search engine optimization (SEO), use of
social media and networking sites (like facebook), website design, brand building –
using marketing mix, marketing strategies (local and global) used by restaurants,

44
coupon promotion, consumer behaviour, customer retention, customer loyalty,
customer satisfaction and so on. While the preceding 15 years literature focused more
on study of core 4 P’s of marketing mix (product, place, price and promotion).
Literature covered the topics by considering the 4 P’s of marketing mix as a base and
discussed specifically more on understanding restaurant success, advertising and
promotion strategies used by restaurants, restaurant failure and how to work for
restaurant success.
This chapter has incorporated literature associated to the research topic from
various nations all over the globe. Flow of the chapter is maintained by the researcher
as per the sections or sub headings which may be including the literature from various
nations and random year selection to achieve the same. Almost all types of restaurants
have considered in the literature available till date including fast food restaurants,
independent restaurants and chain restaurants, restaurants in luxury hotels, quick
service restaurants (QSR), coffee shops, fine dining restaurants, casual restaurants,
small size restaurants, family restaurants and ethnic restaurants.
Restaurant: Concept and Operations
This section in the chapter is typically trying to understand the concepts and
operations of restaurant with the help of literature available. It is essential to
understand the restaurant concepts and operations before understanding the concept of
marketing mix and co-relation between both of these for sustainable and successful
restaurant business.
A text book titled “The Restaurant: From Concept to Operation” by author
Walker, J. R. published in United States is helpful for one, who wish to start a new
restaurant. According to Walker J. R., restaurant concept has to be developed
cautiously before starting a business. It is very important to understand the business
before getting in to it. Location is the most important factor and needs to be selected
wisely for restaurant business. The best thing one should get a good lawyer and
accountant who will be able to take care of legal and financing part of restaurant
business effectively and efficiently. The next part to focus while starting restaurant
business is menu, kitchen and purchasing. Menu planning is the most crucial element
and has many considerations like market demand, pricing strategy used, menu mix to
45
offer, standardization, menu design and layout. Kitchen layout should be planned
carefully considering the flow of material. It is advisable to have a kitchen design
which is flexible. One should take the help from professional planners for which
he/she have to pay consulting fees. Planners may also help to choose equipments that
fit the menu and make sure that the chef and kitchen crew have the knowledge and
skills to operate the kitchen. Subsequently it is necessary to establish standard
purchasing, receiving, storing, issuing and preparation of food and beverages to
achieve the quality standards that please the clientele served every time. After all this
is set it is important to maintain the standards and serving hygienic and wholesome
food to customers by following the approach of food safety. Service staff serving food
and beverages at restaurant must be professional with a sense of humour, good health
and lively intelligence. Service staff should have desire to please and to serve which is
more valuable aspect of restaurant from the customers point of view. Restaurant
should also take opportunity for creating cocktails and serving full range beverages
and combination of wines with food. Technology and its application for front and
back of the house restaurant operations can be implemented for better control on day
to day operations. All the food and beverage service operations must be controlled
strictly to minimize any wastages, pilferages and losses results from. Once all this set
the next most important part for restaurant business is organizing, recruiting and
staffing. Staff training and development can help at a great extent to the restaurant to
have sustainable and successful business throughout. Organization plan and Human
Resource Management together are important for restaurant operations. Restaurant
should modify and improve all plans and concept frequently which are adopted at its
initial phase as per market requirement.75
Opening and Operating a Successful Restaurant
Under this subheading of the chapter researcher have put together all literature
discussing on various considerations of opening and operating successful restaurant.
The literature includes the study of considerations of restaurant while opening first
franchise in foreign nation, important attribute areas for operating successful
restaurant, talks on the impact of earnings and borrowings by restaurant, and gap
analysis between management perception and customer expectations.
46
A research paper published by Shrabanee Shah et al. 76 labelled
“Contemplations for Opening the First McDonald’s Restaurant Franchise in the IT
Capital of India’s Bangalore” reported that the use to open any new business in a
foreign country, especially a restaurant, it must be realistic and suited for the culture,
traditions, and customs, it must cater to all age groups and generations with an
faultless customer service. Continuing with the authenticity of McDonald’s history of
customer service, and team effort in building a McDonald’s to the satisfaction of the
clientele of the host country. The paper offers strategies for effectively expanding into
new territories across borders.
The research paper titled, “Operating a Successful Restaurant” published in
SNU-Tulsa Research Journal by John P. Harrison with aim to learn the most
important attributes needed to operate a restaurant successfully. The Hypothesis were
stated for correlation existence between the successes of the restaurant, practice of
these attribute areas, restaurant managers and its importance to the success of
restaurant. Through the literature review researcher could identify five important
attribute areas essential for operating a successful Restaurant namely management
understanding, customer service, employee retention, expenditure control and food
quality.77
The research paper published by Budhwar K. titled, “Understanding the
Success Factors for Independent Restaurants in the Delhi / Gurgaon Region: An
Analysis of the Gap between Management Perceptions and Customer Expectations”
in Journal of Services Research. the study undertaken by researcher to identify
perceptual GAPs between what restaurant operators perceive their customers to desire
as part of the given service and product and what customers actually look for. The
study covers a sample base of 60 restaurants in Delhi and surrounding areas and,
covers major geographical and economic segments that comprise the capital’s
independent dining market. The data analysis as detailed in the paper has turned up
some predictable as well as surprising results. Significant GAPs were observed in the
study, suggesting that the average operator have a good idea what his/ her customer
wants. This highlights the importance of the human element and experience in
running an establishment. There are however some important factors where operators
do seem to be not in harmony with their client base. The average operators have a

47
tendency to underestimate competition, do not engage the customer enough doesn’t
understand the importance of setting and enforcing written standards and does not
stress enough on courtesy. There are other variables that operators need to be better
aware of. The paper also suggests key recommendations for operators to follow to
enhance competitiveness and maintain a loyal customer base. Recommendations in
the paper for standalone restaurant operators in Delhi area to get success are
understanding competition, document and follow standard operating procedure (SOP),
good press relations are important, talk to customers to understand their needs,
facilities offered to costumer, hygiene and upkeep, access and parking, stress more on
courtesy, use of websites.78
According to news article by Dr. Zheng G D. published in “Nation’s
Restaurant News”, restaurant firms with high operation-generated earnings and low
borrowings are less likely to go penniless or bankrupt, whereas restaurant firms with
low operating earnings but high amounts outstanding are more likely to meet business
failure. The restaurant industry had the most business failures of all segments in the
retail trade sector during the six-year period from 1992 through 1997. Therefore
predicting potential restaurant firm failure and taking necessary corrective actions to
turn the business around can help reduce such losses. Bankruptcy is considered as the
major reason for the failure of restaurant business.79
Marketing Mix Strategies and Promotion of Restaurant
Under this particular section researcher have put together all literature related
to marketing mix strategies and its use by restaurants for their promotion.
Nora Mork, a business journalist and editor shares her experience through
various articles written for blog and online magazines, such as Australian
Reviewer and Boom essays. Her Blog titled “How to Use Local SEO to Grow Your
Restaurant’s Business”80 reveals the importance and effectiveness of Local SEO in
growing restaurant business. SEO literally means Search Engine Optimization for
restaurant website to perform the best it can be the search engines. By optimizing
restaurant website, it can help restaurant to appear higher and higher on the search
engine results page (SERPs). The higher the restaurant seen in search engines, the
more likely people will be to find the restaurant, and the more successful the
48
restaurant will be. For effective SEO, website pages should be nice and clean, easy to
use and have the most up to date information available. Over 50% of all internet
traffic these days comes through mobile devices, which increases the chances more
number of people going to explore the website of restaurant. If restaurant website is
not optimized, the people tend to leave quickly, and it will harm ranking of restaurant.
What works on desktop doesn’t always translate well to mobile. The good part is
many templates are now available with a mobile version that does most of the work
for restaurant, but the same should be checked by restaurant operator via mobile to
see how potential guests will experience it. Most of the time visitors will be accessing
restaurant website to get contact information, check out the menu, or book a table.
The restaurant operator need to make sure that this information is as easy as possible
to find. Even the facilities like live chat feature which can be answered from phone
can be opted by restaurants. Blogs and articles shared on social media are useful
because you can bring value and learning to your guests and visitors. Guests and
visitors stay on website for longer, thus boosting your SEO ranking and being seen by
more people. Blog posts talking about the different types of food served at restaurant,
how it’s made, how to make it at home, the history behind it, the culture, recipes,
what drinks work well with what food, the styles, the flavours, the training and so on.
Marketing strategy is a main element of success for organization. To execute
an effective marketing strategy is as important as conceptualizing and creating it.
Through marketing strategy implementation firms achieve the set goals and targets.
To demonstrate the value of marketing strategy and the process of implementation a
detailed literature review was performed by Nashwan Mohammed Abdullah Saif et
al.81. A total of 45 studies on the topic of marketing strategy have been examined by
the author. The literature suggests that there is a relationship of marketing strategy,
and marketing mix elements on organizational performance, and emphasizes a further
need to perform conceptual and empirical studies.
A thesis titled “Marketing Strategies Restaurant Leaders Use to Develop Their
Customer Base” by Carrie Weinreich 82 reveals that surviving in the competitive
market for any restaurant is the major concern especially past first year of its
operation. Some of the restaurant lacks the marketing strategy to develop a loyal
customer base to survive in the market. Researcher have used case study method to
49
explore the marketing strategies that independent, family-oriented, full-service
restaurant leaders located in the Pittsburgh, PA, metro area in business for at least 5
years have used to develop their customer base during the first year of operation. The
study was based on 7Ps of marketing mix theory emphasizing how people, including
customers and employees, influence the marketing process. Data collected through
interviews with restaurant leaders and secondary documentation that included
marketing and business strategies, customer base data, and profitability records during
the first year of operation. Analysis of data suggest three main strategies for
restaurants for survival in the market, 1) Influence of word of mouth, 2) Power of
consumer-driven marketing and social media, 3) The need for an integrated marketing
mix. Findings indicate that the family oriented, full-service restaurants were able to
develop a customer base during their first year of business by integrating marketing
strategies including word of mouth, social media, and limited print advertising. The
study also assist restaurant leaders in creating best practices for developing a customer
base and surviving past the first year of operation.
Research paper by Umeze, G. E.et al. 83assessed the utilization of marketing
mix strategies and entrepreneurial competencies of micro restaurant owners in
Calabar metropolis. Proportionate random sampling was used to select 132 restaurants
which formed the sample of the study. Results showed that preparing tasty meal was
the most utilized marketing mix factor. Result also indicated that there was an
association between the use of marketing mix strategies and entrepreneurial
competencies of the business owners. Study proved that there is a reasonable degree
of agreement among the respondents regarding the ranking of the constraints facing
their enterprises. The study recommended consistent application of 7Ps marketing
mix strategies to eliminate most of the constraints identified by the operators and
continuous capacity building on entrepreneurial skills.
It can be concluded for this particular section that marketing mix strategies
and use of social media along with word of mouth (Promotion) are essential for
success of restaurant. The major focus highlighted here is on 2P’s of marketing mix
strategies i.e. Product and Promotion to achieve success in a restaurant business.
50
Marketing Mix for Restaurant Business
In this section of the chapter researcher have considered literature available
discussing on 7P’s of Marketing Mix for the services marketing as the restaurant
business is a part of service industry. Available literature shows that restaurant chains
have already adopted the 4 P’s of marketing mix and beyond this they have taken
cognizance of extended 3 P’s for sustainable and successful operations worldwide.
Balanced mix of 7 P’s for services marketing demonstrated very helpful for restaurant
industry. It also shows relation between place and price is very important inn
competitive market. It again highlights significance of promotion by means of
advertising, E-marketing, social media and messaging.
Branding emerged as most important marketing strategy in late 20th century
and is reason for the success of many companies now days. Beyond this a strong
brand is an asset, resulting high sale, more profit and additionally loyal customer. But
it takes lot of efforts to build a brand and even more to keep it strong.84 Concepts like
brand personality and more recent brand authenticity are now introduced. Most
marketing plans rely greatly on the marketing mix for their accomplishment. The 4 Ps
framework used commonly for many years but this is extended to 7Ps when
considering services marketing. Brand’s marketing mix should have each element of
mix working together to present united front and support organizations marketing
objectives.
Research paper titled “Global marketing strategies of McDonalds’
Corporation (with Reference to India and Russia)” by Devanshi Dixit 85 reveals that
McDonald's Corporation's business model is slightly different from that of most other
fast-food chains. The researcher has studied on marketing strategies of McDonalds
concerning 2 countries that are India and Russia where all the taste & preferences are
different. The Research paper included global operation, marketing strategies with
product, pricing, promotion, menu food variation in both the countries and further
future plans that company have in both the countries. The Technique is used that is
SWOT analysis with field survey. Conclusions and suggestion are drawn from the
analysis. In India and Russia company want to use attractive and affordability
proposition for their customer along with taste and preference. Company has
51
implemented the strategy of “Think Global Act Local” during its expansion all over
the world and serving more than 100 countries.
A thesis submitted by Long Thanh Nguyen, 86 titled “Restaurant Start up
Marketing Mix Case study Mad Wok and Helmi restaurant - success and failure in
marketing” highlights that just making good quality food is not enough to stand out
from the huge competition in food and beverage industry. Restaurant start-up is most
popular business that can gain profit quickly as it solves the human’s most basic need:
Food. Pricing, location and promotions are the other elements of marketing mix (4Ps
marketing) for business owner or the restaurant’s marketing team to consider. The
thesis provides a fundamental background for food and beverage start-up focusing on
4Ps marketing. The study also discussed practical tips and tricks for young
entrepreneurs. The most important topic of this thesis is marketing mix strategy (4Ps
marketing). Each of the “P” has explained with the basic features. Practical real-life
experience tips and tricks of each “P” in 4Ps of marketing mix. Mad Wok and Helmi
restaurant are used as case study to analyze the marketing mix effectiveness of each.
Discussion and face-to-face interview with marketing directors of restaurant are
conducted for data collection. The case study contains a SWOT analysis to process
the data for Helmi. Conclusion of the research suggest that running a new business is
not easy for start up as they are groups of people being lack of experience and budget
to create a perfect environment for each “P”. Balanced marketing mix for each “P” is
one of the strong points to design a marketing mix for new business. Researcher also
suggested to Business owner to spend time and take effort to understand their product
and target customers.
A Doctoral study “Marketing Strategies: How Small Restaurant Businesses
use Social Media” by Tasheenia Bennett87 was conducted with a purpose to explore
the strategies that small restaurant business owners use to support social media
marketing. The target population was five small restaurant business owners in WNC,
who successfully used social media marketing for 1 year or more. Data collection
included semi structured interviews, documents pertaining to social media marketing
strategies, and social media pages and websites from the participating restaurants.
Facebook, Yelp, and Instagram were the most used social media platforms. The
participants implied that word-of-mouth has the potential to increase sales and to
52
grow business. Challenges implementing social media included the ability to be
consistent and actively engaged on the social media sites to allow business owners to
respond quickly to negative posts made by customers. Small restaurant businesses can
be successful if they develop and implement a social media presence, encourage
customer feedback, and formulate a plan to overcome obstacles and challenges that
may arise with implementing social media marketing strategies. These findings
contribute to positive social change by increasing the sustainability of small
businesses in the community, which may drive economic development and improve
community relations.
Social media is important and inseparable part in marketing communication of
restaurant today. There might be distrust in marketer-generated communication.
Effective use of social media with a clear type and style of communication can serve
better for generating positive electronic word of mouth (e-WOM). The study was
conducted in Dublin, Ireland to explore types and styles of communication for
effective e-WOM. Data collected for the research used interviews with restaurant
marketers who handle social media marketing for restaurants. Conclusion of the study
suggested that, social media communication should be casual and flexible. Content
used for the same should be giving some value to its reader which may include story
behind the restaurant or recipes using seasonal ingredients. Specific messages for
media should be created and posted.88
According to the research paper of Jalal Hanaysha 89 titled “Restaurant
Location and Price Fairness as Key Determinants of Brand Equity: A Study on Fast
Food Restaurant Industry” restaurant location has significant positive effect on brand
image, brand loyalty, brand preference, and brand leadership. The study also able to
find that price fairness has significant positive effect on overall brand equity and its
dimensions. Results of the study suggest that if a restaurant location is visible and
accessible to customers, it helps to achieve a success in business. The research also
reveals that the consumers tend to evaluate a restaurant brand based on price fairness
that is harmonized with the quality of food and beverages on offering. The study
urges strategy makers in fast food restaurant industry to consider restaurant location
and price fairness when designing their branding strategies. The purpose of study was
to examine the direct effects of restaurant location and price fairness on brand equity
53
in Malaysian market. The data collected from several customers of international fast
food restaurants in East Coast Malaysia. Convenience sampling methodology was
utilized to obtain the responses from 384 customers during different times of data
collection period. The collected data were coded into SPSS and analysed using
structural equation modelling through AMOS 18.
The study was conducted by Ofosu Amofah et al.90 focusing on the influence
of service marketing mix on customers’ choice of registered restaurants in the Kumasi
Metropolis-Ghana. The study focused on 7Ps, including product, price, place, process,
promotion, people and physical evidence. The study used quantitative research
approach and primary data were collected through questionnaire to 293 customers of
five registered restaurants in the Kumasi Metropolis. The restaurants were stratified
into grade 1, grade 2 and grade 3 restaurants and 1 restaurant was selected from grade
1, 2 restaurants were from grade 2 and 3 each. The data collected were analyzed with
the use of Statistical Package for Social Sciences (SPSS) and Chi-square and
Pearson’s Correlation Coefficient were used to test independency and relationship of
service marketing mix and customer choice of repeat purchase. Process had the
greatest influence on customer’s decision to repeat purchase. All other attributes,
except place significantly influence decision to repeat purchase. The study
recommended that restaurant operators should limit investment on opening of many
branches but they should think of making the existing ones more reachable using
signage to direct customers. Restaurants operators should increase their investment on
the extended 3p’s (process, people and physical evidence), especially process by
ensuring quick delivery of service, home delivery and having opening and closing
time consistent with customers’ life style.
Blog titled “How the 4P’s of Restaurant Marketing Can Help Your Menu” by
Donald Burns91 reveals the usefulness of exercising 4P’s of Marketing for restaurant
menu for success. 4P’s of Marketing is the concept created by McCarthy and has been
used worldwide by all marketing companies. As a first principle of marketing mix the
menu i.e. Product is marketing tool for a restaurant. One can use to maximize profit
potential through menu. In the opinion of Mr. Donald, menu of the restaurant should
not be offering too many food items on choice; rather it should offer limited menu
items which are in symphony with the brand identity. Price is the second principle of
54
marketing mix that needs to be working out correctly for the menu. Cost based pricing
is the best strategy as per the writer as compare to competitive piecing. Next principle
of marketing is Place. In accordance with menu, how do we get guests to buy more of
what you want? should be the prime concern. Menu Engineering is the answer for this
question. Better headlines, Boxing and Price justification (with the help of description
of the menu item) are few suggestions in menu engineering. Last principle in
marketing mix is promotion and that can be achieved best way by training the
restaurant staff members on how to make recommendations and inform guests what
can make their dining experience incredible. These promotion efforts taken by staff
can help to increase profitability for restaurant.
According to Taguinod, 92 Ethnic restaurants are flourishing in the United
States. Ethnic restaurants highlight promotional strategies to acclimatize effectively in
the competitive market. The study was conducted to find out the effect of using
coupons on customer retention in independent ethnic restaurants. It also tried to find
out whether coupon promotions help independent ethnic restaurants attract new and
old customers? Literature review, referred for this study suggests that there is no
effect of coupon promotion with return intention of customer to a particular
restaurant. The results of this study will help restaurateurs in their marketing strategy
and to improve the overall quality of the business. Using coupons as an advertising
and promotion in restaurants enhances the ability to increase sales, attract new
customers, willingness to revisit and re-consume, aids in strong market competition,
and force new customers to switch brands.
The study was conducted by Eva Cheserem to find out the marketing mix
strategies adopted by fast food restaurants in Nairobi Kenya and establish the
relationship between marketing mix strategies and customer loyalty. The study used
the descriptive survey design. The use of this design facilitated an in depth analysis of
the role of marketing strategies on customer loyalty in fast food industry in Nairobi.
The population of study was fast food restaurants in Nairobi County. The findings
based on data collected confirmed that, branding, product marketing, price
considerations and location all form part of the customer intention. The study
concluded that customer loyalty is one of the indicators of business performance
metrics.93
55
According to the newspaper article published in “Eastern Eye” Chef
Mahamud Zaman shared his innovative way to launch a new menu which was
designed as per the feedback received from the loyal customers of Zaman Restaurant.
As he described customer inspired, a la carte menu at an affordable prices in London.
Up gradation and changes in Menu is essential for Restaurant success. 94 This
newspaper article is suggesting up gradation of Menu can aid to attract customers to
the Restaurant.
Managers have capability to make use of menu in enhancing the meal
experience perceptions of customers and attaining the cost and profit objectives of
restaurant firms. Menu Management which comprises of menu planning, menu
pricing, menu designing, menu operating and menu development is defined as an
ongoing process to achieve short term and long term goals of a restaurant.95 Opinions
expressed in this research paper are focusing only on Menu as a Product in Marketing
Mix and suggesting it as an important factor which can guide Restaurant to its
success.
Restaurant owners should focus more on four factors, service quality, physical
design, product quality and price as part of their marketing strategy yet among all
these four variables they should take service quality as the most important tool to
achieve customer satisfaction and success in a business. It is assumed by customers
that all restaurants of almost equal levels are giving same food quality. So, the point
of differentiation is not food quality now.96 Research Paper is focusing on the Service
Quality of a Restaurant and the study was conducted for specific Area/ Location. The
research also clarify that customers have reference prices in their minds and memories
when they go to buy something in restaurant. When price is not in accordance with
the expectations of customers their satisfaction level declines. It also found in the
research that physical design or atmosphere has second largest contribution effect
towards customer satisfaction.
Research paper titled “The Impacts of Marketing Mix on the Consumer
Experience in Fast Food Industries” published by R. Uma Maheswari et al. 97 in
International Journal of Research and Development – A Management Review

56
(IJRDMR). The aim of research was analyzing marketing mix of chosen fast food
company. For the study data was collected from 120 respondents in Coimbatore City.
Percentage analysis, weighter average rank analysis and Chi-square test used for
analyzing primary data to find the relation between various marketing mix elements.
Co-relation coefficient was used to find the relationship between various elements.
Based on the analysis, some suggestions and recommendations were given by the
authors. Findings of the study suggest that the menu of fast food industry gives
emphasis on customer requirements. Respondent of the study agrees that Fast food
industry in Coimbatore city able to offer good quality and packaging of food. Almost
40% of the respondent of the study agreed that the price suggest best value for money.
Out of the total respondent, 60% of the respondent agreed that the location aids easy
accessibility and most of the fast food outlets are located at prime locations in the city.
Promotional strategies are inducing the target customers to purchase the products.
Fast food industry is using different Medias for the promotional strategy and it is very
helpful for both the customer and the fast food industry. About 50% of the
respondents agreed that the staffs employed at fast food industry provide fast and
friendly service. Nearly 80% of the respondent agreed the speed of food preparation is
well maintained in fast food industry and respondents are satisfied with the marketing
mix of McDonalds.
The research was conducted by Dr. Mohammad Haghighi et al.98 titled “The
Evaluation of the Effect of the Marketing Mix Elements on the Performance of Pakat
Restaurants Group” with the purpose of examining the effect of the marketing mix
elements on the performance of Pakat Restaurants Complex based on the surveys of
the consumers and experts. The data obtained from 171 questionnaires gathered from
the consumers and the experts of the restaurant. All variables (including quality, price,
information, packing, distribution and branding) were important according to the
consumers and experts of this industry. The results showed that all variables were
significant according to the consumers of this complex except the distribution.
According to the strategies predicted in Pakat Complex, it became clear that the
performance of the complex was successful to derive customer's satisfaction and
increase the number of loyal customers and is proved to promote a brand of healthy
and high quality food for the consumers.
57
The research article titled “Spreading Social Media Messages on Facebook:
An Analysis of Restaurant Business-to-Consumer Communications” written by
Kwok, L. et al. 99 reveals what types of social media messages work best for
hospitality firms. The study conducted on what types of messages gained the most
clicks of “Like” and comments on Facebook. The study was based on an analysis of
the number of likes and comments regarding nine hundred and eighty-two Facebook
messages from ten restaurant chains and two independent operators revealed clear
patterns. The more popular keywords involved information about the restaurant (e.g.,
menu descriptions) and the less popular messages were those that contained
marketing-related words (including “winner” and “check”). Dividing the messages
into four media types, namely, status (text only), link (containing a URL), video
(embedding a video), and photo (showing photos), revealed that photo and status
receive more likes and comments than the other two categories. Social media
messages can also be categorized into two message types: sales and marketing (about
two-thirds of the messages in this study) and conversational messages. Based on
number of likes and comments, conversational messages are endorsed by more
Facebook users. The results do not expressly assess Facebook users’ reactions, the
guidelines developed here should help managers improve their use of Facebook, as
well as provide groundwork for developing a defined typology of Facebook messages
and an automatic text classifier with the machine learning techniques.
The article published in Procedia – Social and Behavioral Sciences Journal
titled, “A comparative study on international marketing mix in China and India: The
case of McDonald's” by Yeu, C. S. et al. investigated different kind of 4Ps adopted by
McDonald’s in their international marketing mix.100The objective of the study is to
analyze and understand the similarities and differences of the international marketing
mix strategy implementation by McDonald’s. Using comparative analysis, this study
focused on 4P approach of marketing mix which is based on product, price,
promotion and place analysis. Marketing strategy of the company in China and India
were used for this study. The study found that the McDonald has adopted different
kind of its 4P in their international marketing mix based on both, localization and
globalization approaches. This study revealed that approaches by McDonald’s are
greatly depending on their localization strategy and globalization strategy. The
general menu of McDonald’s tends to be typical in all its products and services, for
example burger or sandwich, fries, and a drink i.e. Coca-Cola for its main course. But

58
when it comes to specific countries like China and India, where religious laws and
customs are quite sensitive it requires localization approach. In China and India,
McDonald’s is successful in identifying and making proper changes to suit with the
local customer needs and requirement. McDonald’s China uses beef, pork, fish, and
chicken for burger with less spicy but in India, it has to avoid using beef and pork in
its burger products. Only in India, McDonald’s serves vegetable McNuggets and
mutton based Maharaja Mac. In terms of pricing strategy, McDonald China does not
apply market segmentation as compared to McDonald’s India. Marketing mix
Strategy by McDonald’s implementation is closely related to its customers’
preference fulfilment.
According to Robin B. DiPietro et al. 101 social media and use of social
networking sites help consumers share opinions, insights, experiences, and
perspectives. The study relevant to the use of social media sites with the largest chain
restaurants in the U.S. and the managers' perceptions of the usefulness of such sites
for their organization. The research shows there are no consistent social networking
sites restaurant chains use, there are no consistent uses for these sites, and managers
have differing opinions about their overall usefulness in restaurant operations and
marketing. One consistent theme is that social networking sites are useful for
advertising and marketing a restaurant brand at an inexpensive cost to the restaurant.
Managerial implications are discussed in the article along with best practices and
future research recommendations are made to further explore social networking in the
restaurant industry.
A thesis submitted to University of Jammu by Sandeep Singh Chib102 titled,
“Consumer Behaviour In Food And Beverage (F&B) Industry: A Case Study Of Fast
Food Industry” to understand the consumer behaviour in fast food and beverage
industry which can aid the organisations in achieving their short term and long term
objectives. Consumer behaviour has gained tremendous consideration of academia
and the industry at the same time as it affects the operational efficiency and
performance of organisation. In addition, by precisely interpreting consumer
behaviour, the business organisations can elevate the customer satisfaction level by
adjusting their operations in accordance to the variable needs and requirements of the
customers. The researcher studied with the purpose to find and bridge the gap
59
between the theory and the practice which has been identified in number of studies.
The study revealed that brand loyalty positively influences customer satisfaction,
therefore the companies need to adapt strategies to increase brand loyalty. The pricing
of the fast food products need to be appropriate as it affects the customer satisfaction.
The study highlights that business organisations need to take efforts to improve the
behaviour of staff towards customers by providing individualised training
programmes and connected appraisal policy for the employee for better customer
satisfaction. The study also highlights relation between service quality and customer
satisfaction. It suggests that the companies need to take efforts to increase and
maintain high level of service quality to achieve better customer satisfaction.
According to Raab, C. et al. 103 setting correct price for hospitality products is
a key management task that has a major influence on a firm's productivity. In general,
there has been a lack of academic interest in the area of pricing in services. The
restaurant industry typically establishes prices by marking up a variable cost
percentage and by intuition, or by trial-and-error methods. This study illustrates how
restaurant managers can use price-sensitivity measurement to assess their guests' price
sensitivity. By means of a relatively simple survey, restaurant managers can get
insight about their menu pricing directly from customers. The study uses data
collected from a Hong Kong buffet restaurant. The results reveal price ranges that
symbolize real value for dinner buffet patrons.
According to the research article titled “The website design and Internet site
marketing practices of upscale and luxury hotels in Turkey” published by Baloglu, S.
et al. 104 in “Tourism Management”, internet provides ample opportunities for
marketing with current and emerging multimedia features. It is particularly useful for
dealing with intangible nature of the service, and transforming marketing mix
variables to capitalize on the informational and transactional potential of the Internet,
and to increase a competitive advantage. The study utilized content analysis to
analyze the websites of a select group of hotels in Turkey (4- and 5-star) in terms of
site design characteristics (interactivity, navigation, and functionality) and site
marketing practices on the Internet. The study also investigated variations in design
and use of marketing mix elements on the Internet based on hotel type (4- and 5-star
resort and transient hotels). The findings showed that the hotels in Turkey are not
60
utilizing the Internet to its full potential and effectively e-marketing their hotels
regardless of the hotel type.
According to article “Food Advertising and Marketing Directed at Children
and Adolescents in the US” by Mary Story et al.105published in International Journal
of Behavioural Nutrition and Physical Activity, children and adolescents are a major
market force in food and beverage industry in US. Specialised and intense food
marketing efforts are now taken by the organisations to target children and
adolescents. Marketers are more interested in youth as a consumer because of their
spending power and as future adult consumers. Various techniques are used for brand
building and influencing these customers including television advertising, in-school
marketing, kids clubs, products with brand logos and youth targeted promotions. The
article examines the food advertising and marketing channels used to target children
and adolescents in the US and impact of food advertising on eating behaviour,
regulation and policies.
The research titled, “Frequency of Restaurant Advertising and Promotion
Strategies” conducted by Jackson, F. H. et al.106 to investigate the benefit and use of
ten advertising and promotion strategies used by urban restaurants. A phone survey
was conducted of randomly selected restaurant members of an urban restaurant
association. Respondents were asked to evaluate each of the strategies based on
frequency of use and derived benefit. The survey achieved a 39.7 percent response
rate. Overall, respondents reported limited use and benefit from advertising and
promotion activities. However, radio advertising, coupons, electronic/Internet media,
and food samples appeared to be more frequently used and produce greater benefit
when differences did exist. Franchisees, larger restaurants, and higher guest check
establishments indicated greater use of and more benefit from these selected
advertising and promotion strategies.
Defining market segment and differentiation of product from rival products is
the main objective of marketing for Fast Food Restaurants. 107 The study was
conducted to discover the consumers’ preferences and perceptions for Fast Food
Restaurants in the USA and Canada. The study reveals that more number of meals is
taken outside by the people as compare to the meals taken at home. It is a prediction
61
that this tendency of having meals outside will accelerate in future. Fast food markets
are having greater growth opportunity as a result. Findings of the study show that
need-oriented marketing will be helpful in a competitive fast food market in the USA
and Canada for franchisers as well as franchisees.
State of Restaurant Business in India
Under this heading researcher gathered information through literature
available to get the exact state of restaurant business in India. The researcher could
find out restaurant business in India is one of the largest sector in India and have
opportunities for good earnings and employment generation. Considering the ever
increasing demands for more and more restaurants in metropolitan cities like Pune
and opportunity of making quick money, many entrepreneurs are entering into the
restaurant business without its prior knowledge or any plans. Many of them face
failure in restaurant business and the failure percentage of such restaurants is very
high i.e. 25 to 50 percent.
Niharika Maggo108 writes about the present state of restaurant business in
India in her blog titled “The State of Restaurant Business in India”. According to
NRAI India food service report, “Restaurant business in India is the largest service
sector in India after retail and insurance and is 20 times of the film industry, 4.7 times
of hotels and 1.5 times of the pharmaceutical sector”. While in an analysis, Forbes
found out, “Restaurant business in India will continue to grow which range anywhere
from 15 to 30%”. Although these are very good facts and figures but there are many
Challenges of Running a Restaurant Business in India such as, constantly increasing
food cost, unaffordable rent, increasing competition, hiring and retaining employees,
slim profit margins and so on. Furthermore author says that Dark Kitchens and Meal
Delivery services are the concepts taking up in the Indian market. Towards the
conclusion author says, it is always the customer experience is the key for success of
restaurant business in India. New trends in Indian Restaurant business are Healthy
food, automation in restaurants, off-premises business by restaurants, kiosk and fast
casual will be more important players in restaurant industry, reusable packaging,
cocktail culture, eating at shopping mall/ complex/ multiplexes, more use of
technology in restaurants and so on. Restaurant customers are now technologically
savvy, connected, and have high expectations now days. Restaurants in India that

62
understand their customers started capitalizing on digital/technology investments and
analytics, taking opportunity to engage customers in a personalized way. These
restaurants can drive increased dining frequency, customer retention, customer
conversion, and loyalty.
According to the president of Pune Restaurants and Hoteliers Association
(PRAHA) Ganesh Shetty, people get attracted to the concept of owning a restaurant
and so they take quick decisions. They think that restaurants are opportunities to make
quick money. Further, they dissect the prices of a particular dish and feel that the
margin involved is huge, without considering the operational costs incurred. In the
opinion of Food processing entrepreneur Mr. Kedar Gadgil, people are entering into
the industry without any knowledge of the business or any plans. It is more important
to conceive a business plan that incorporates the aspects like inputs, front end and
service, compliance, staff trouble and issues with sourcing. Pilferages by staff and
customers are also the responsible factors leading business to huge losses which are
difficult to cover up later on. Increasing disposable income among citizens has led to
a boom in the food and beverage industry in the Pune city with a new Food and
Beverage Service outlets opening nearly every day. However, the failure rate of such
outlets is also high as many entrepreneurs fail to understand the nature of business and
requirements of customers. With investments upwards of Rs. 25 lakh, people are
ready to get into the sector despite uncertainties involved. According to research, on
an average 20 food outlets are opening in the city each month while 5 to 10 are
shutting down. Experts point out that while the profit margin in the industry may
seem huge, one must also carefully consider the operational costs that may be
incurred. Even some brand owners fail to realize that the local market is different
from the cities like Mumbai and Delhi in terms of marketing and promoting their
restaurant.109
Restaurant Business Failure
The researcher is interested to find out the insights of use of marketing mix
and its role in restaurant success and sustainability. For the same reason researcher
has put together literature published till the date and have information on failure of
restaurant business due to various known and unknown reasons. Certainly both
internal as well as external factors are equally responsible for the failure of
63
restaurants. Existing literature is also exploring the information regarding the impact
of affiliation, size of outlet, place or location in relation to restaurant failure.
Association / Affiliation, place, and size of outlet each have significant
impacts on restaurant failure. The study shows that independent restaurants have
greater closing rates than multiple location group units which are affiliated or
associated with someone as a brand in a market. It also states that the place influences
the failure rate. The research demonstrates that large size restaurants have better
survival probability as compare to small size restaurants. Customers need keeps on
changing as their tastes and preferences change. It is the manager’s responsibility to
keep an eye on the changes and provide for the same and allow employees to do any
alterations if required to provide quality services. The location and facilities in hotels /
restaurants determines the group and category of customers which eventually affects
their success and market share in the industry. 110The research has more stress on
employee empowerment and location along with the facilities on offer as factors
affecting everyday performance of hotels and restaurants.
Restaurant failure rate is affected more by inner factors than by outside
factors, although both are applicable. 111 Inner factors covered in the research are
products on offer, management and type of ownership, work culture, strategy, finance
and marketing along with the personal factors such as leadership, personal/family
goals. Whereas outside factors includes competition in a market, supply of raw
material, type of customers, regulating agencies, legal and political factors,
technology, social and cultural factors, financial system and demography.
Research Gap
Research conducted till date in the field of Restaurant’s success or failure has
covered specific areas related to management plan, human resource management,
location, affiliation, food quality (characteristics of food that is acceptable to
consumers and should be same every time), service quality (difference between
customer expectations for service performance prior to the service and their
perceptions of the service received, Asubonteng et al. 1996), and facilities (Reception,
reservation, parking, audio visual system, toilets) in relation to specific region and
focusing only on one or two factors listed.
64
As discussed earlier in Chapter 1, Pune city is one of the 6 Mini Metro cities
in India and these cities together comprise 20% of the Market share of Food and
Beverage Service Industry in India which is a considerable share of this industry.
Restaurant Industry in Pune city is expanding at a rapid pace. All categories of Food
and Beverage Service outlets in Pune city at present, which includes Fine Dine,
Family Restaurant, Fast Food, Casual Dining Restaurant, Bistro, Coffee Shop, Pubs,
Ethnic/ Speciality Restaurant, Multi Cuisine Restaurant, Themed Restaurants, Drive-
thru Restaurant, Cafe, Buffet-style Restaurant, Cafeteria, Bars, Banquets, A la carte
Restaurants, Food Truck, Cafeteria, Pizza Outlets, Home Delivery/ Take Away,
Bakery, Quick Service Restaurants (QSR) and so on.
Increasing disposable income among citizens has led to a boom in the food
and beverage industry in the Pune city with a new Food and Beverage Service outlets
opening nearly every day. As per the information provided by president of Pune
Restaurants and Hoteliers Association (PRAHA) Ganesh Shetty, on an average 20
new food outlets are entering in the market in Pune city every month while 5 to 10 are
shutting down. This shows that the failure rate in restaurant business in Pune is almost
25% to 50 %. Considering the high failure rate in restaurant business, it becomes
necessary to study the local market in Pune city before entering in to the business. As
per the information received from experts in the field, one can understand it is a
considerable amount of investment to start a restaurant in Pune city that is up to Rs.
25 lakhs. Despite of uncertainties in the sector people are ready to get into restaurant
business and invest huge amount of money in Pune city assuming it as an opportunity
to make quick money out of this business. Investors or Entrepreneurs doesn’t study
the market place to understand the requirement of customers. Without considering
various types of costs incurred in business like material cost, labour cost and overhead
costs entrepreneurs do the pricing for dishes to be offered on menu which is further
not helpful to achieve the desired profit margin. Some of these costs are fixed or semi
fixed in nature, while remaining are variable in nature. Beyond this entrepreneurs
have not calculated the minimum period required to achieve the “Breakeven Point” in
restaurant business. It is very important to know the concept of “Breakeven Point”
(Point at which total cost in a business and total revenue are equal, i.e. "even" and
there is no net loss or profit).For restaurant business the concept of “Breakeven Point”
65
is must to determine what sales volume is necessary to cover costs. It's particularly
important for start-ups that need to know their initial sales goals for sustenance in the
market.
Although the study is the limited to specific geographical region, the
researcher aims to study all 7P’s of Marketing Mix elements in relation to restaurant
success. Marketing mix concept of 7 P’s is universally accepted and study of the same
with the help of data science is helpful to understand consumer behaviour, so the
research can be generalised and there is a broader scope for future study. Findings of
this research study can be generalised and useful as guidelines for starting up a new
restaurant irrespective whether it is used in city like Pune in Indian context or any
other place in the world as the study is based on the theoretical framework of
marketing mix (7P’s) which is accepted worldwide.
Entrepreneurs are entering into the industry without any knowledge of the
business or any plans. It is more important to conceive a business plan that
incorporates the aspects like inputs, front end and service, compliance, staff trouble
and issues with sourcing. Pilferages by staff and customers are also the responsible
factors leading business to huge losses which are difficult to cover up later on. The
failure rate of such outlets is high in Pune city. In the opinion of experts, profit margin
in the industry may seem huge; one must also carefully consider the operational costs
that may be incurred. Even some brand owners fail to realize that the local market is
different from the cities like Mumbai and Delhi in terms of marketing and promoting
their restaurant
Considering all above facts about restaurant industry in Pune city it is very
essential to study on marketing mix which explains 7P’s elements namely Product,
Price, Place, Promotion, People, Process and Physical Evidence for service sector (as
restaurant industry is the part of service sector). If one knows the theory of 7P’s of
marketing mix and practical application of the same in restaurant business, it will
definitely help to have a successful restaurant business in Pune city by using the
perfect mixture of these 7P’s. “Place” is the location (market or segment of market)
where the restaurant business planned need to be well studied in terms of its
demography and requirements of customers (Their Preferences – likes and dislikes
66
when they eat out). “Product” as an element of marketing mix is “Menu” in terms of
restaurant business that needs to be planned as per the market demand (simply based
on study of “Place”).
The next element of marketing mix is “Price” of the product offered to the
customer. There are various approaches of Pricing the product like cost plus pricing,
competitive pricing, penetration pricing and so on, but the one should adopt the right
pricing strategy which will help to attract the customers (may be competitive or
penetration pricing) and at the same time able to cover up various cost incurred in
business to achieve the desired amount of net profit. Another important element of
marketing mix which needs to be planned carefully and maintained throughout the
journey of restaurant is “Promotion”. One should plan restaurant budget with higher
share allotted for promotional activities when the restaurant is new in the market and
even if the restaurant business set, doing well in terms of sale as well as profitability,
certain percentage of budget must be allotted every month for continuous efforts on
promotion. 112
“People” is one of the most important elements in marketing mix for service
sector as all these services are offered by the people (staff) to people (customer).
Human touch in this industry is the key factor for its success or failure. A well
groomed, neatly dressed in uniform, professionally trained and humble staff can make
very pleasant dining experience for the customer. On the other hand the same staff
can prepare poor quality food or offer wrong food; delayed service can spoil
customers’ dining experience at restaurant. It is very important to have professional
and well trained staff at restaurant in all its sections from reception staff, production
department till service staff.
One more essential element in marketing mix that plays an important role to
make restaurant operations sustainable and successful is “Process”. It is more over
known as SOP (Standard Operating Procedures) in Hospitality industry. These SOP’s
enable to offer same quality and quantity of products prepared to the customers in
exactly the same and standard way every time.
67
Last but not the least and equally important element of 7P’s of marketing mix
is “Physical Evidence” which is environment created at restaurant by due
consideration of various tangible factors like decoration, furnishing, staff uniforms,
menu card, cutlery and crockery used and so on. Essentially all these tangible factors
should be in harmony with the restaurant theme or the food on offer. As the restaurant
industry is a part of service industry, it is necessary to portray the picture by means of
physical evidence for potential customers about what can be expected and how it will
be delivered by the restaurant to make it a memorable experience.
This research will try to cover all 7P’s of Marketing Mix contributing to
success of restaurant operations pertaining to Pune Municipal Corporation area. As
the preliminary study and survey shows there is high failure rate in restaurant
business, it is essential to understand the importance of market survey at the time of
opening a new restaurant. Beyond this a well-planned marketing mix will help
restaurant business to sustain in the market for long run and increased chances of
getting good return on investment. The successful operation of a restaurant is
important for future or potential operators, current operators and employees of the
restaurant industry.
Research in the field of restaurant operations has covered specifically about its
success or failure in relation to a particular area (the region in the world) and focusing
only on specific factors (internal or external) responsible for the same. Researches
published in the field till now have not covered all 7P’s marketing mix elements and
its co-relation with the restaurant success (as basic fundamentals of marketing mix).
Researcher wants to put all 7P’s of marketing mix together and study its co-relation
with the success of restaurants through this study in detail.
The researcher has considered a limited time frame to complete the research
work abiding financials and other factors in consideration. Even if some new elements
of marketing mix will discover in future, the same needs to study for taking this
research study ahead. Considering the dynamic nature of the restaurant industry and
due consideration to the development in theoretical framework of marketing mix in
future, there is always a scope of similar researches in future at various region in the
world exploring the new perspectives.
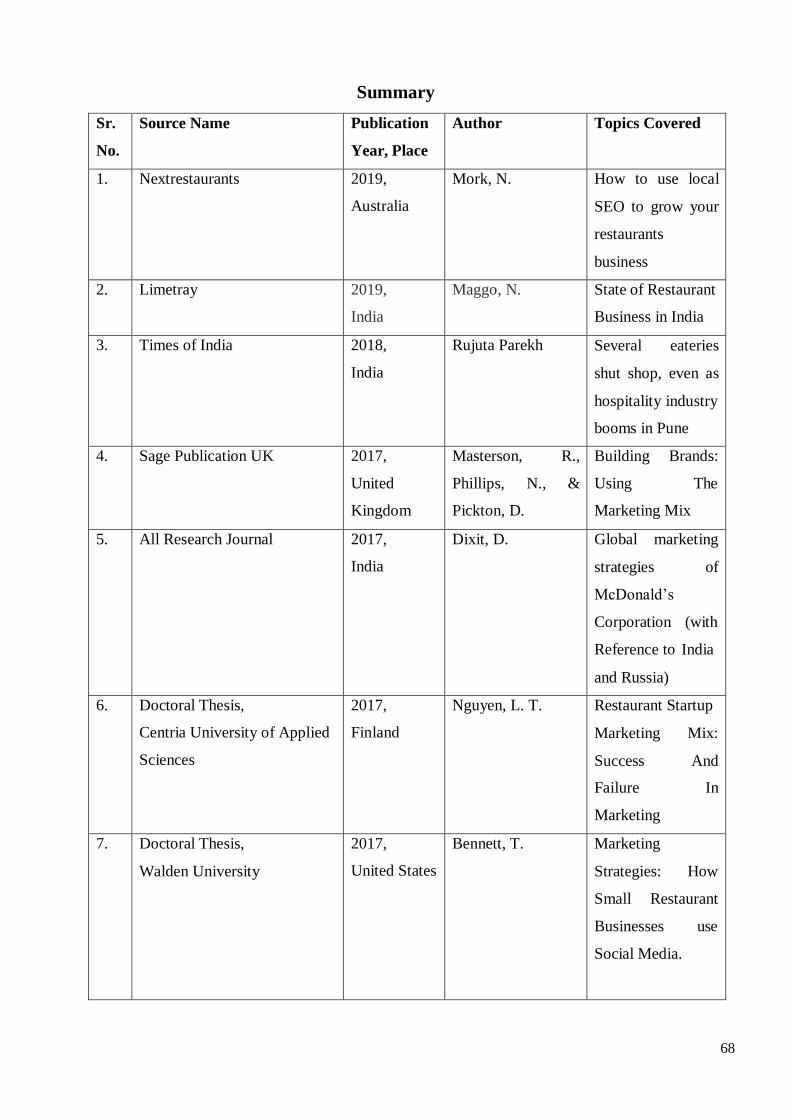
68
Summary
Sr.
No.
Source Name Publication
Year, Place
Author Topics Covered
1. Nextrestaurants 2019,
Australia
Mork, N. How to use local
SEO to grow your
restaurants
business
2. Limetray 2019,
India
Maggo, N. State of Restaurant
Business in India
3. Times of India 2018,
India
Rujuta Parekh Several eateries
shut shop, even as
hospitality industry
booms in Pune
4. Sage Publication UK 2017,
United
Kingdom
Masterson, R.,
Phillips, N., &
Pickton, D.
Building Brands:
Using The
Marketing Mix
5. All Research Journal 2017,
India
Dixit, D. Global marketing
strategies of
McDonald’s
Corporation (with
Reference to India
and Russia)
6. Doctoral Thesis,
Centria University of Applied
Sciences
2017,
Finland
Nguyen, L. T. Restaurant Startup
Marketing Mix:
Success And
Failure In
Marketing
7. Doctoral Thesis,
Walden University
2017,
United States
Bennett, T. Marketing
Strategies: How
Small Restaurant
Businesses use
Social Media.
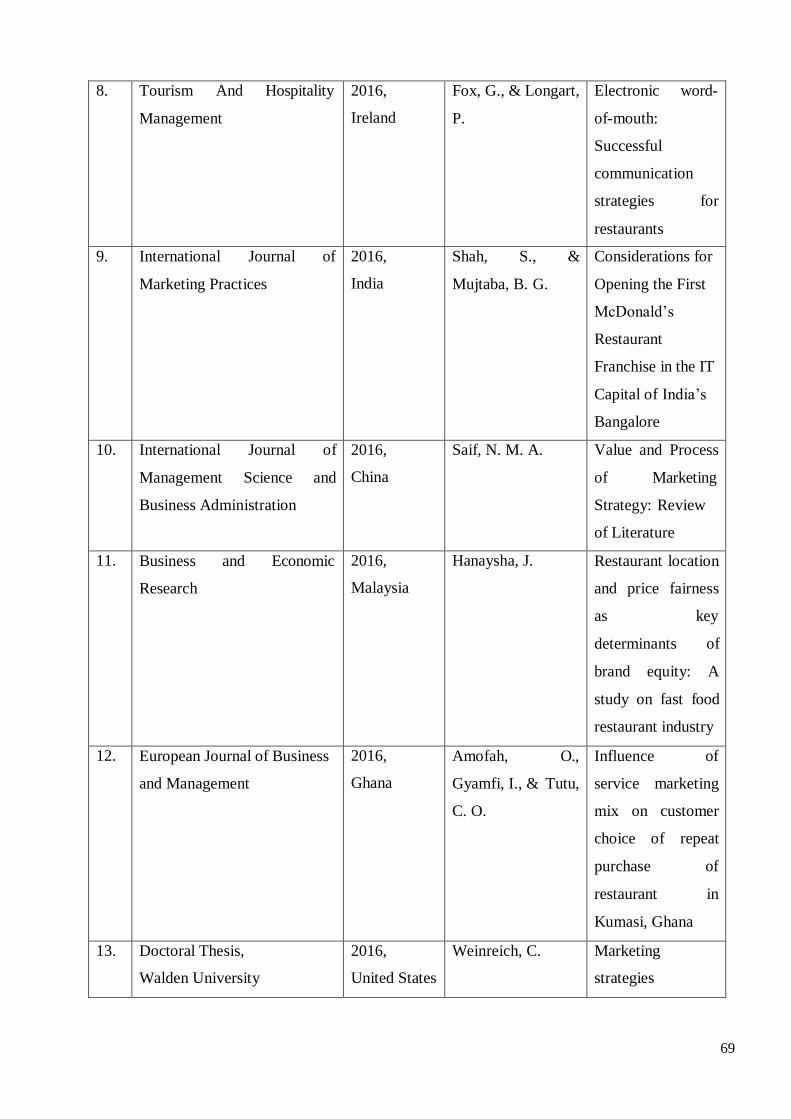
69
8. Tourism And Hospitality
Management
2016,
Ireland
Fox, G., & Longart,
P.
Electronic word-
of-mouth:
Successful
communication
strategies for
restaurants
9. International Journal of
Marketing Practices
2016,
India
Shah, S., &
Mujtaba, B. G.
Considerations for
Opening the First
McDonald’s
Restaurant
Franchise in the IT
Capital of India’s
Bangalore
10. International Journal of
Management Science and
Business Administration
2016,
China
Saif, N. M. A. Value and Process
of Marketing
Strategy: Review
of Literature
11. Business and Economic
Research
2016,
Malaysia
Hanaysha, J. Restaurant location
and price fairness
as key
determinants of
brand equity: A
study on fast food
restaurant industry
12. European Journal of Business
and Management
2016,
Ghana
Amofah, O.,
Gyamfi, I., & Tutu,
C. O.
Influence of
service marketing
mix on customer
choice of repeat
purchase of
restaurant in
Kumasi, Ghana
13. Doctoral Thesis,
Walden University
2016,
United States
Weinreich, C. Marketing
strategies
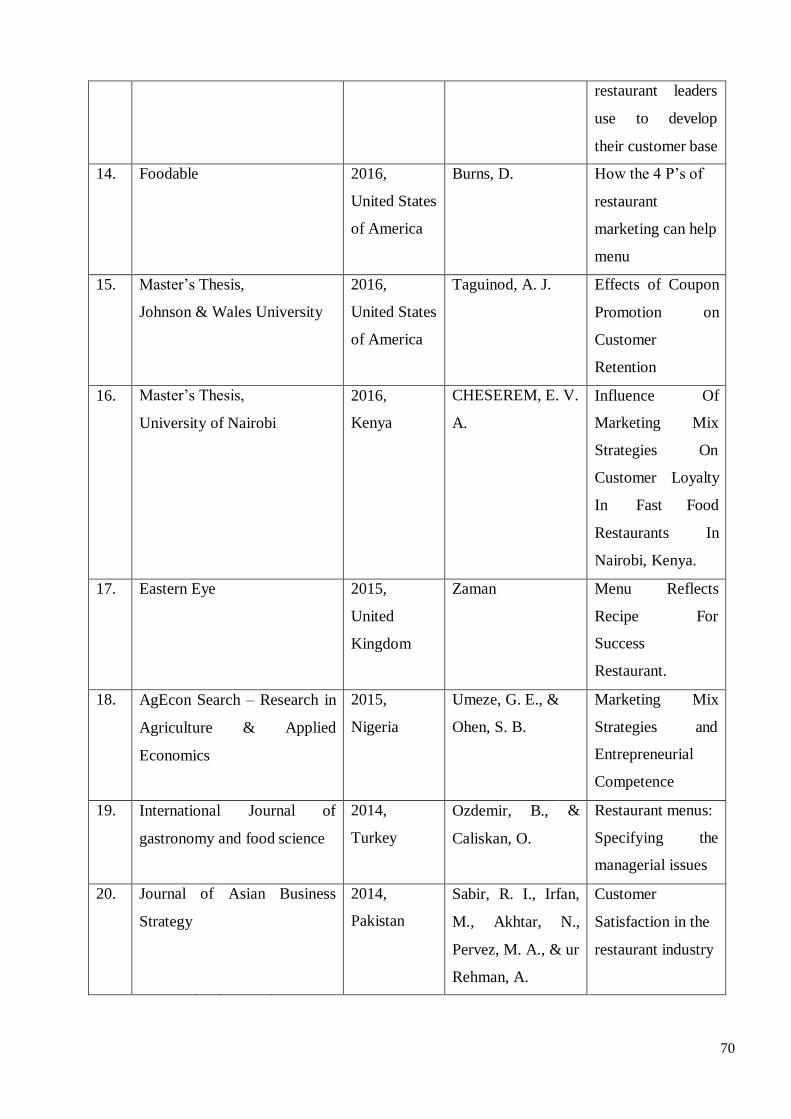
70
restaurant leaders
use to develop
their customer base
14. Foodable 2016,
United States
of America
Burns, D. How the 4 P’s of
restaurant
marketing can help
menu
15. Master’s Thesis,
Johnson & Wales University
2016,
United States
of America
Taguinod, A. J. Effects of Coupon
Promotion on
Customer
Retention
16. Master’s Thesis,
University of Nairobi
2016,
Kenya
CHESEREM, E. V.
A.
Influence Of
Marketing Mix
Strategies On
Customer Loyalty
In Fast Food
Restaurants In
Nairobi, Kenya.
17. Eastern Eye 2015,
United
Kingdom
Zaman Menu Reflects
Recipe For
Success
Restaurant.
18. AgEcon Search – Research in
Agriculture & Applied
Economics
2015,
Nigeria
Umeze, G. E., &
Ohen, S. B.
Marketing Mix
Strategies and
Entrepreneurial
Competence
19. International Journal of
gastronomy and food science
2014,
Turkey
Ozdemir, B.,
Caliskan, O.
& Restaurant menus:
Specifying the
managerial issues
20. Journal
Strategy
of Asian Business 2014,
Pakistan
Sabir, R. I., Irfan,
M., Akhtar, N.,
Pervez, M. A., & ur
Rehman, A.
Customer
Satisfaction in the
restaurant industry
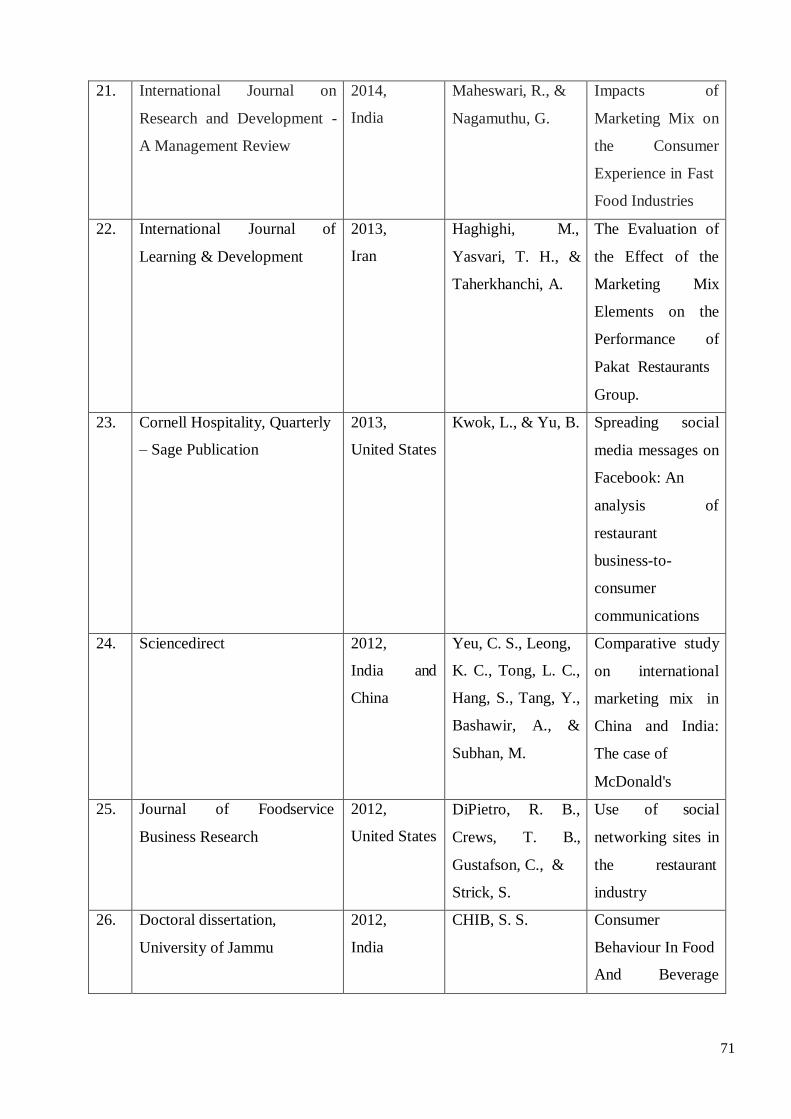
71
21. International Journal on
Research and Development -
A Management Review
2014,
India
Maheswari, R., &
Nagamuthu, G.
Impacts of
Marketing Mix on
the Consumer
Experience in Fast
Food Industries
22. International Journal of
Learning & Development
2013,
Iran
Haghighi, M.,
Yasvari, T. H., &
Taherkhanchi, A.
The Evaluation of
the Effect of the
Marketing Mix
Elements on the
Performance of
Pakat Restaurants
Group.
23. Cornell Hospitality, Quarterly
– Sage Publication
2013,
United States
Kwok, L., & Yu, B. Spreading social
media messages on
Facebook: An
analysis of
restaurant
business-to-
consumer
communications
24. Sciencedirect 2012,
India and
China
Yeu, C. S., Leong,
K. C., Tong, L. C.,
Hang, S., Tang, Y.,
Bashawir, A., &
Subhan, M.
Comparative study
on international
marketing mix in
China and India:
The case of
McDonald's
25. Journal of Foodservice
Business Research
2012,
United States
DiPietro, R. B.,
Crews, T. B.,
Gustafson, C., &
Strick, S.
Use of social
networking sites in
the restaurant
industry
26. Doctoral dissertation,
University of Jammu
2012,
India
CHIB, S. S. Consumer
Behaviour In Food
And Beverage
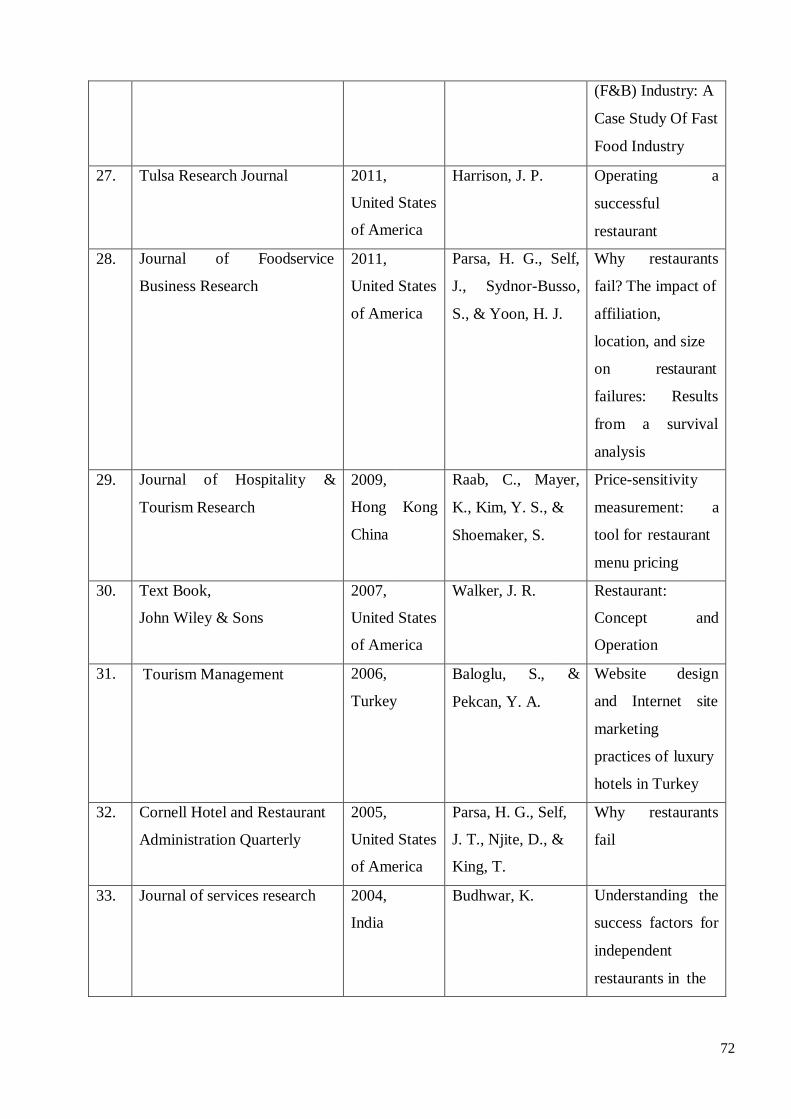
72
(F&B) Industry: A
Case Study Of Fast
Food Industry
27. Tulsa Research Journal 2011,
United States
of America
Harrison, J. P. Operating
successful
restaurant
a
28. Journal of Foodservice
Business Research
2011,
United States
of America
Parsa, H. G., Self,
J., Sydnor-Busso,
S., & Yoon, H. J.
Why restaurants
fail? The impact of
affiliation,
location, and size
on restaurant
failures: Results
from a survival
analysis
29. Journal of Hospitality &
Tourism Research
2009,
Hong
China
Kong
Raab, C., Mayer,
K., Kim, Y. S., &
Shoemaker, S.
Price-sensitivity
measurement: a
tool for restaurant
menu pricing
30. Text Book,
John Wiley & Sons
2007,
United States
of America
Walker, J. R. Restaurant:
Concept
Operation
and
31. Tourism Management 2006,
Turkey
Baloglu, S.,
Pekcan, Y. A.
& Website design
and Internet site
marketing
practices of luxury
hotels in Turkey
32. Cornell Hotel and Restaurant
Administration Quarterly
2005,
United States
of America
Parsa, H. G., Self,
J. T., Njite, D., &
King, T.
Why restaurants
fail
33. Journal of services research 2004,
India
Budhwar, K. Understanding the
success factors for
independent
restaurants in the

73
Delhi/ Gurgaon
region: An analysis
of the gap between
management
perceptions and
customer
expectations
34. International Journal of
Behavioral Nutrition and
Physical Activity
2004,
United States
Story, M., &
French, S.
Food advertising
and marketing
directed at children
and adolescents in
the US
35. Journal of Food Products
Marketing
2004,
United States
Jackson, F. H.,
Titz, K., &
Defranco, A. L.
Restaurant
advertising and
promotion
strategies for
exploring an urban
market
36. Nation's Restaurant News 1999,
United States
of America
Zheng, G. D. Predicting
potential failure,
taking corrective
action are keys to
success
37. Thousand Oaks Sage
Publication
1998,
United States
Cooper, Harris. Synthesizing
research: a guide
for literature
reviews
38. International Journal of
Contemporary Hospitality
Management
1995,
United States
of America
and Canada
Kara, A., Kaynak,
E., &
Kucukemiroglu, O.
Marketing
strategies for fast-
food restaurants: a
customer view
39. Centre for Research in Social 1988, Cooper, Harris. Structure of

74
Behaviour, University of
Missouri - Columbia, USA
United States
of America
knowledge
synthesis,
Knowledge in
Society
75
Chapter – 3
Research Methodology
Objectives of the Study
Hypotheses
Research Design
Type of Data Sources
Sampling Design
Reliability and Validity of the Measures Used
Statistical Tools to Test the Hypothesis
Scope and Limitations of the Study
Summary

76
Title of the Research Study
“Study of selective marketing mix contributing to success of restaurant operations in
Pune Municipal Corporation area (Period: April 2014 to march 2017)”
Objectives of the Study
1. To study the role of selective Marketing Mix in the success of restaurant
operations in PMC Area.
2. To identify the chronology of selective Marketing Mix factors in success of
Restaurant operations in Pune Municipal Corporation Area.
Hypotheses
H1: Place is not an important marketing mix factor in success of restaurant
operations
H2: Product is an important marketing mix factor in success of restaurant
operations.
H3: Price is not an important marketing mix factor in success of restaurant
operations.
H4: Promotion is an important marketing mix factor in success of restaurant
operations.
H5: Physical evidence is not an important marketing mix factor in success of
restaurant operations.
H6: People are an important marketing mix factor in success of restaurant
operations.
H7: Process is an important marketing mix factor in success of restaurant
operations.
Research Design
Methods and procedures used to conduct a research can be called as “Research
Design”. These methods and procedures are helpful for the collecting, measuring and
analyzing data collected for the research purpose. For the present research, researcher
has adopted descriptive research design which describes attitudes of people, collection
of quantitative information, description of categories of qualitative information,
gathering of data that describe events and then organization, tabulation, depiction, and
77
description of data. In the present study, data is organized in such a way that it
appears in analysis and with visual aids it is presented. For the same purpose graphs
and charts are used to help readers.113
Type of data sources
Researcher has used together primary and secondary data as information
source to collect data required. Structured questionnaires were developed to collect
primary data for the research. Various types of questions like multiple choice,
dichotomous and likert - type scale are included in these questionnaires. In addition,
questionnaires comprised scale like ordinal, nominal, ratio and interval to formulate
the questionnaires effective and to make sure quality of replies received. The
researcher paid attention to the sequence of questions while preparing the
questionnaires. Researcher has used books, magazines, research articles, industry
literatures and online reports of various research and government organizations to
collect secondary data.
Sampling Design
I. Population:
A specific plan to obtain a sample from a given population is known as
‘Sampling Design’. Researcher has chosen diversified techniques while selecting the
items for the samples. Since the present study is based on selective marketing mix
strategies contributing to success of restaurant operations in Pune Municipal
Corporation area, each hotel kitchen / restaurant under various categories are potential
units of getting responses for research questionnaire and can be a part of the Research
population. Thus population consisting of hotels and restaurants with various
categories like Speciality Restaurants, Multi-cuisine Restaurants, Ethnic Restaurants,
Fast Food Restaurants and Fast Casual Restaurants, etc. in the region. After referring
the list of licensed food and beverage service outlets received from (FDA) Food and
Drug Administration office, Pune, researcher has able to establish a list of population
consisting 768 units of hotel kitchens and restaurants. Thus, population for this study
is considered as 768 units.
Out of all potential units i.e. from population, the researcher has chosen the
restaurants with Multi Cuisine International, Multi Cuisine Indian, Fast Food, Quick
78
Service Restaurant and Specialty Cuisine. The responses were obtained from
restaurant owners, managers and supervisors. One organization (kitchen / restaurant)
is considered as one unit for response of questionnaire. To get more insight into the
subject, researcher has also conducted survey with the help of designed questionnaire
for customers who frequently visit those restaurants.
II. Sample Size:
Sample size is the number of items needs to be chosen from population to
make up ‘Sample’ for Research. Formula to derive the right sample size ‘By
Proportion’ is,
n=z2*p*q/e2,
The sample size is 256 with 95% level of confidence along with 50% of
precision for the population of 768. For better output in terms of more detailed and
qualitative information the researcher has circulated 500 questionnaires. As a
response, researcher received total 258 appropriate responses. This makes a 51.2%
rate of response in this case. Likewise, for infinite population of customers, researcher
has distributed 900 questionnaires and received 502 appropriate responses, which is
55.7% rate of response.
III. Sampling Method:
Simple random sampling technique is used by researcher based on the list of
hotels, kitchens and restaurants in Pune region which refers to sample selection
method. This method creates an equal chance for each potential sample combination
for being picked up and every item in the whole population has equal possibility of
being incorporated in sample. On the other hand, to collect the data from customers,
researcher has used convenience sampling technique.
Validity and Reliability of Measures Used for Research
After collecting 30 responses and tested for validity in terms of content
validity, face validity and pre-test with regards to check the dependability and
soundness of research measures.
79
Statistical Tools used to Test Hypothesis
To test the hypotheses descriptive statistics is used along with inferential
statistics plus One Sample t –Test. SPSS of version 17.0 (Statistical Package for
Social Sciences Program) is used for this research study for the assessments of all
statistical data. All the data was checked carefully to remove incorrect entries and
missed values. It is necessary to check all the data collected before its assessment to
get reliable analysis at the end.
Scope and Limitations of the Study
Primary and secondary methods are used by researcher for various data
collection. There is a possibility of data collected is affected directly or indirectly due
to various reasons. The researcher has complete awareness of these possibilities.
Beyond this the researcher tried to take care to get the results which are representative
for the universe. In addition, researcher is also aware following limitations of research
work. There is a scope for further research regards to this topic. Limitations of this
study are as follows,
a. The researcher had chosen Pune Municipal Corporation region as a geographical
region for the research study. With the available and limited resources researcher has
opted for limited geographical area for research study. Similar research can be
conducted in future with more and sufficient resources availability.
b. Considering the time frame constraint the research study was conducted. Restaurant
industry is very dynamic in nature and there are chances of references become
obsolete. For the same reason, research need to be completed in a certain time frame.
Taking into account the limitations of time, only Pune Municipal Corporation region
is selected for the study by researcher.
c. Undoubtedly, restaurant industry is very dynamic in nature. Though the researcher
had made every effort to account for these ‘happenings’ in the industry, but it was
beyond the scope of the study to cover all the happenings.
d. At the outset of the need of secondary data, reliability of the presumption and
observations naturally depend on the authenticity of the secondary source of
information and also the information itself. Of course, while doing so and being aware
of these limitations, the researcher herein has taken due care and precautions at very
possible stage not allowing any prejudice or bias in the work.

80
While considering the limitations of the existing study, the researcher
proposes that the similar kind of study can be conducted in other parts of the country
to get more insight into the subject.
81
Summary
The researcher has used both primary and secondary data sources to collect
information. Structured and un-disguised questionnaires were developed as a research
instrument to collect primary data. However, researcher has collected the secondary
data through books, magazines, research articles, industry literatures and online
reports of various research and government organizations.
The present study is based on selective marketing mix strategies contributing
to success of restaurant operations in Pune Municipal Corporation area. Population
consisting of hotels and restaurants with various categories likes Speciality
Restaurants, Multi-cuisine Restaurants, Ethnic Restaurants, Fast Food Restaurants and
Fast Casual Restaurants, etc. in the region. After referring the list of licensed food and
beverage service outlets received from (FDA) Food and Drug Administration office,
Pune, researcher has able to establish a list of population consisting 768 units of hotel
kitchens and restaurants. Thus, population for this study is considered as 768 units.
Out of all potential units i.e. from population the responses were obtained
from restaurant owners, managers and supervisors. One organization (kitchen /
restaurant) is considered as one unit for response of questionnaire. To get more insight
into the subject, researcher has also conducted survey with the help of designed
questionnaire for customers who frequently visit those restaurants.
As per the sample size formula ‘By Proportion’ (n=z2*p*q/e2), when
population is 768 and at 95% confidence level and 50% precision; the sample size is
256. To get more detailed and qualitative output the researcher has distributed 500
questionnaires. In response to that, researcher has received 258 appropriate responses,
which is 51.2% rate of response. Likewise, for infinite population of customers,
researcher has distributed 900 questionnaires and received 502 appropriate responses,
which is 55.7% rate of response.
The researcher has adopted simple random sampling technique based on the
list of hotels kitchens and restaurants in Pune region which refers to that method of
sample selection which gives each possible sample combination an equal probability
of being picked up and each item in the entire population to have equal chance of
82
being included in the sample. However, to collect the data from customers, researcher
has used convenience sampling technique.
In this study, descriptive statistics is used followed by inferential statistics
including One Sample t-Test to test the hypotheses. The Statistical Package for the
Social Sciences Program (SPSS) version 17.0 was used in this study for all the
statistical assessments.
The researcher had chosen Pune Municipal Corporation region as a
geographical spread for the study. By the limited resources available with the
researcher, the geographical area was limited. However, the study could have been
conducted on a larger geographical area with availability of sufficient resources. On
account of the highly dynamic nature of the restaurant industry, it is always possible
that the data, references and periodicals may become obsolete. Also, because of
having limitations of time, the researcher has to limit his study to the selected samples
in Pune Municipal Corporation region. It is beyond the scope of the study to cover all
the happenings in restaurant industry.
While considering the limitations of the existing study, the researcher
proposes that the similar kind of study can be conducted in other parts of the country
to get more insight into the subject.
83
Chapter 4
Data Analysis and Interpretation
Introduction
Data Analysis of Questionnaire 1: Customers Survey
Data Analysis of Questionnaire 2: Restaurant Survey
Hypotheses Validation
Summary
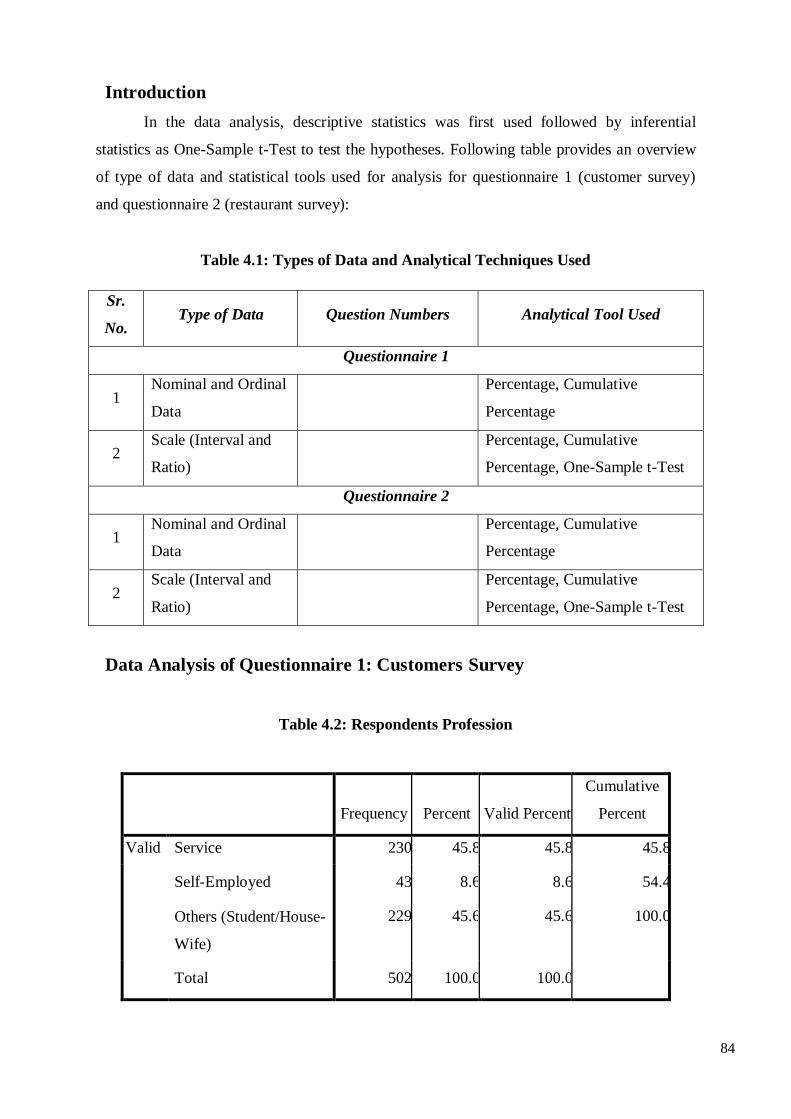
84
Introduction
In the data analysis, descriptive statistics was first used followed by inferential
statistics as One-Sample t-Test to test the hypotheses. Following table provides an overview
of type of data and statistical tools used for analysis for questionnaire 1 (customer survey)
and questionnaire 2 (restaurant survey):
Table 4.1: Types of Data and Analytical Techniques Used
Sr.
No. Type of Data Question Numbers Analytical Tool Used
Questionnaire 1
1 Nominal and Ordinal
Data
Percentage, Cumulative
Percentage
2 Scale (Interval and
Ratio)
Percentage, Cumulative
Percentage, One-Sample t-Test
Questionnaire 2
1 Nominal and Ordinal
Data
Percentage, Cumulative
Percentage
2 Scale (Interval and
Ratio)
Percentage, Cumulative
Percentage, One-Sample t-Test
Data Analysis of Questionnaire 1: Customers Survey
Table 4.2: Respondents Profession
Frequency
Percent
Valid Percent
Cumulative
Percent
Valid Service 230 45.8 45.8 45.8
Self-Employed 43 8.6 8.6 54.4
Others (Student/House-
Wife)
229 45.6 45.6 100.0
Total 502 100.0 100.0
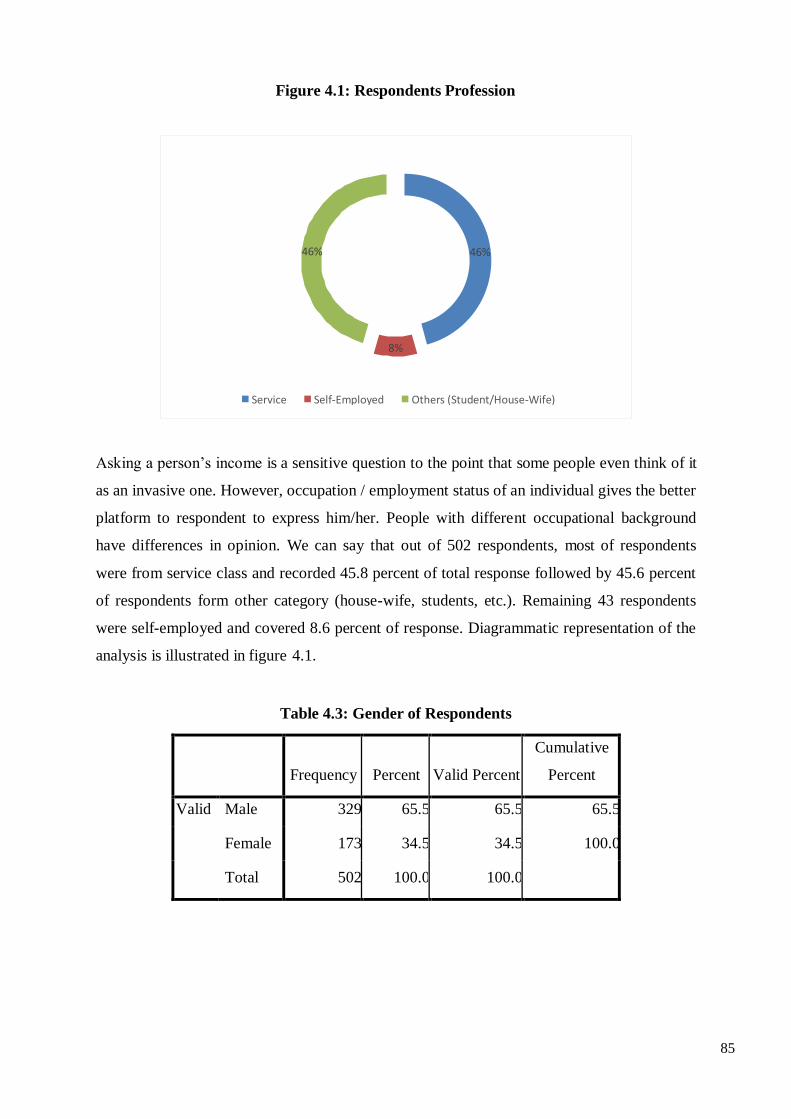
85
Figure 4.1: Respondents Profession
Asking a person’s income is a sensitive question to the point that some people even think of it
as an invasive one. However, occupation / employment status of an individual gives the better
platform to respondent to express him/her. People with different occupational background
have differences in opinion. We can say that out of 502 respondents, most of respondents
were from service class and recorded 45.8 percent of total response followed by 45.6 percent
of respondents form other category (house-wife, students, etc.). Remaining 43 respondents
were self-employed and covered 8.6 percent of response. Diagrammatic representation of the
analysis is illustrated in figure 4.1.
Table 4.3: Gender of Respondents
Frequency
Percent
Valid Percent
Cumulative
Percent
Valid Male 329 65.5 65.5 65.5
Female 173 34.5 34.5 100.0
Total 502 100.0 100.0
Others (Student/House-Wife) Self-Employed Service
8%
46% 46%
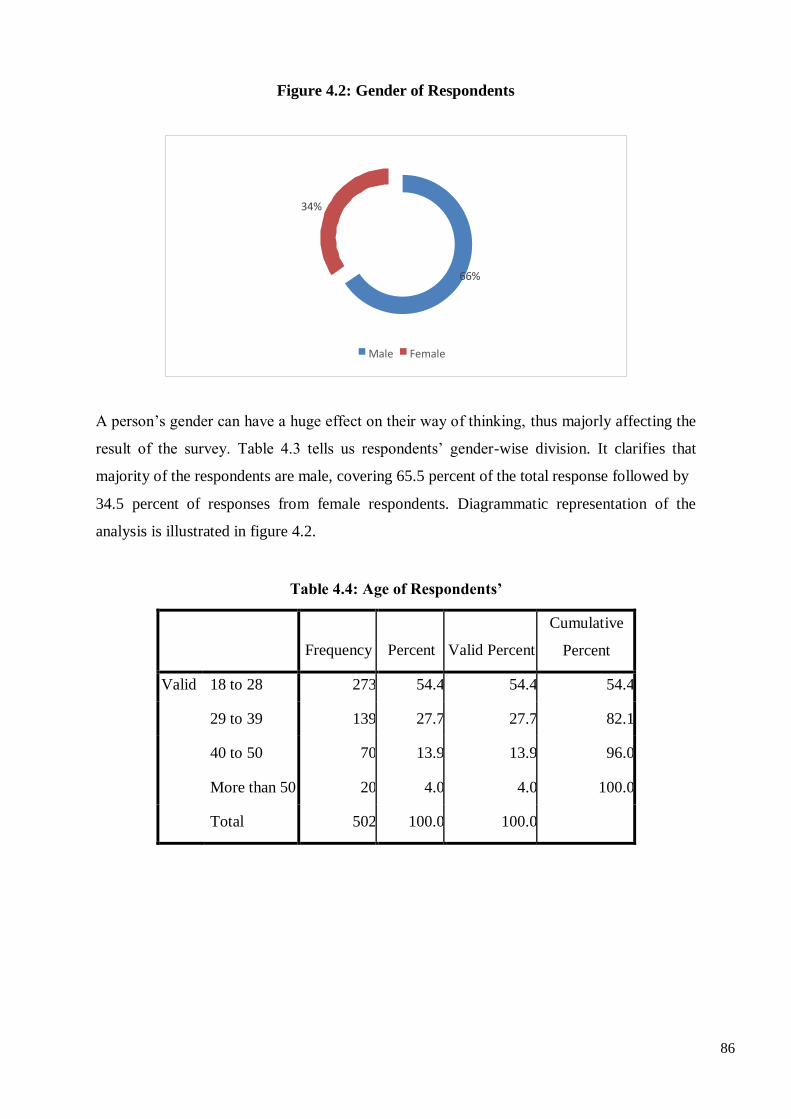
86
Figure 4.2: Gender of Respondents
A person’s gender can have a huge effect on their way of thinking, thus majorly affecting the
result of the survey. Table 4.3 tells us respondents’ gender-wise division. It clarifies that
majority of the respondents are male, covering 65.5 percent of the total response followed by
34.5 percent of responses from female respondents. Diagrammatic representation of the
analysis is illustrated in figure 4.2.
Table 4.4: Age of Respondents’
Frequency
Percent
Valid Percent
Cumulative
Percent
Valid 18 to 28 273 54.4 54.4 54.4
29 to 39 139 27.7 27.7 82.1
40 to 50 70 13.9 13.9 96.0
More than 50 20 4.0 4.0 100.0
Total 502 100.0 100.0
34%
66%
Male Female
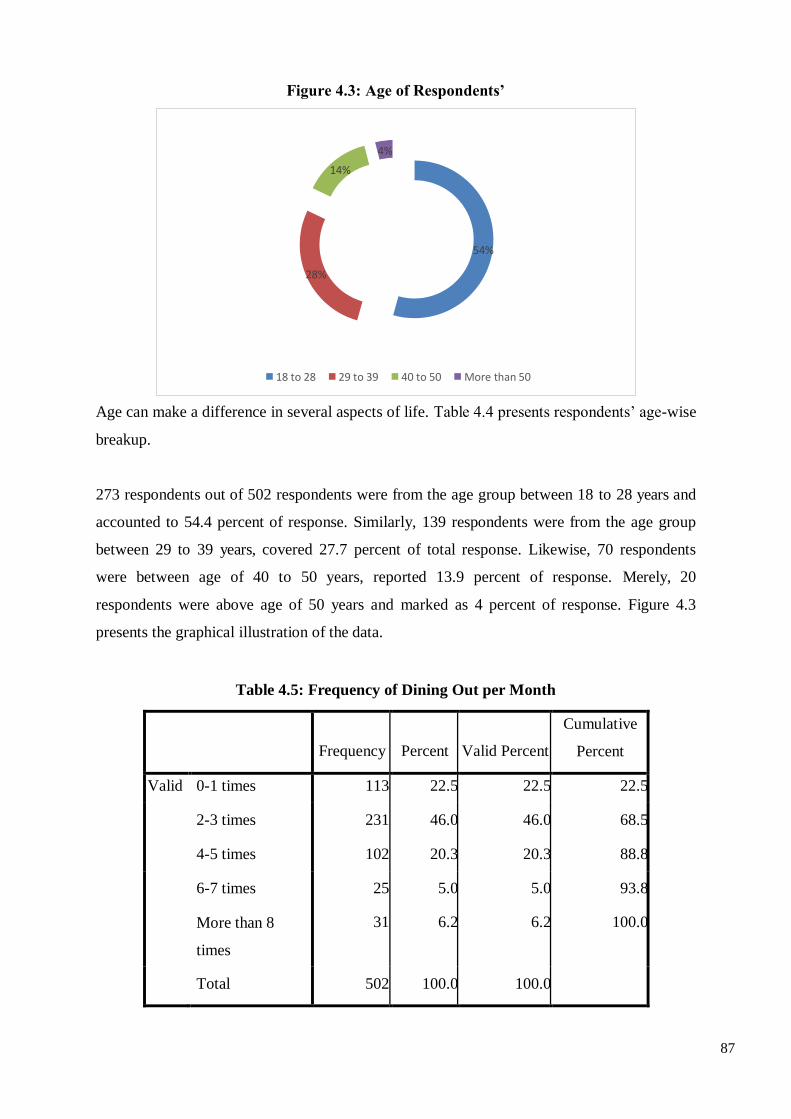
87
Figure 4.3: Age of Respondents’
Age can make a difference in several aspects of life. Table 4.4 presents respondents’ age-wise
breakup.
273 respondents out of 502 respondents were from the age group between 18 to 28 years and
accounted to 54.4 percent of response. Similarly, 139 respondents were from the age group
between 29 to 39 years, covered 27.7 percent of total response. Likewise, 70 respondents
were between age of 40 to 50 years, reported 13.9 percent of response. Merely, 20
respondents were above age of 50 years and marked as 4 percent of response. Figure 4.3
presents the graphical illustration of the data.
Table 4.5: Frequency of Dining Out per Month
Frequency
Percent
Valid Percent
Cumulative
Percent
Valid 0-1 times 113 22.5 22.5 22.5
2-3 times 231 46.0 46.0 68.5
4-5 times 102 20.3 20.3 88.8
6-7 times 25 5.0 5.0 93.8
More than 8
times
31 6.2 6.2 100.0
Total 502 100.0 100.0
4%
14%
54%
28%
18 to 28 29 to 39 40 to 50 More than 50
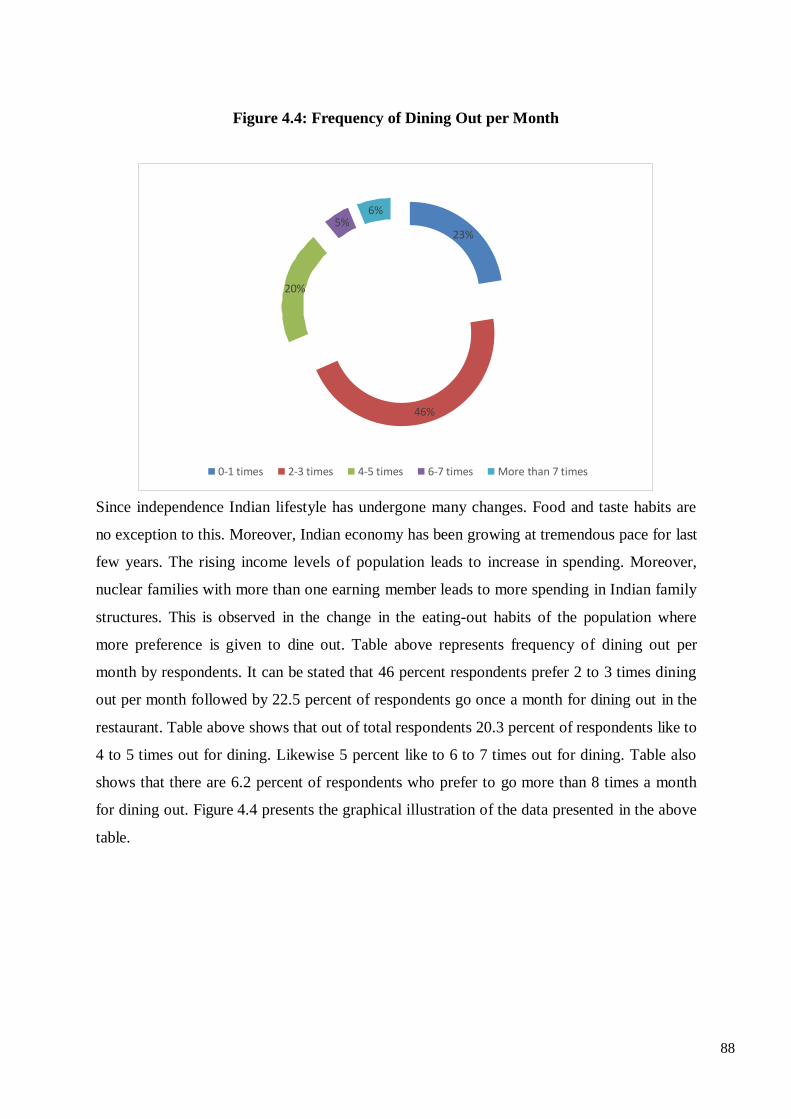
88
Figure 4.4: Frequency of Dining Out per Month
Since independence Indian lifestyle has undergone many changes. Food and taste habits are
no exception to this. Moreover, Indian economy has been growing at tremendous pace for last
few years. The rising income levels of population leads to increase in spending. Moreover,
nuclear families with more than one earning member leads to more spending in Indian family
structures. This is observed in the change in the eating-out habits of the population where
more preference is given to dine out. Table above represents frequency of dining out per
month by respondents. It can be stated that 46 percent respondents prefer 2 to 3 times dining
out per month followed by 22.5 percent of respondents go once a month for dining out in the
restaurant. Table above shows that out of total respondents 20.3 percent of respondents like to
4 to 5 times out for dining. Likewise 5 percent like to 6 to 7 times out for dining. Table also
shows that there are 6.2 percent of respondents who prefer to go more than 8 times a month
for dining out. Figure 4.4 presents the graphical illustration of the data presented in the above
table.
6% 5%
23%
20%
46%
0-1 times 2-3 times 4-5 times 6-7 times More than 7 times
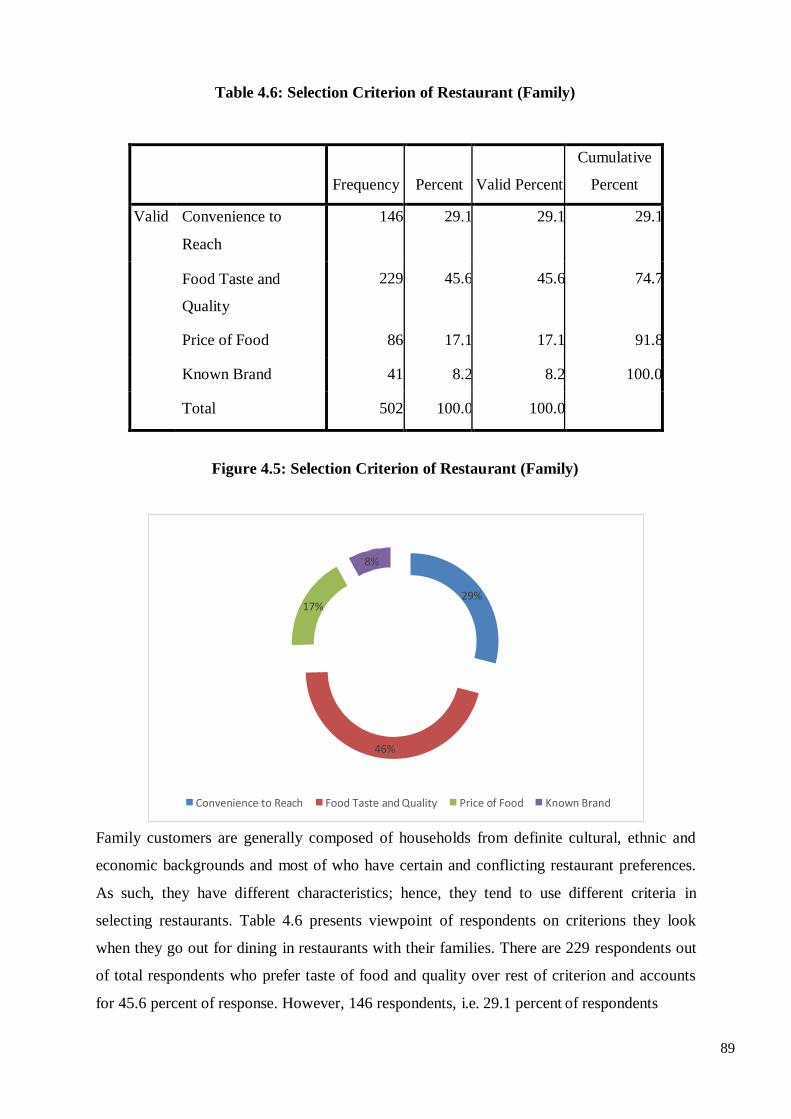
89
Table 4.6: Selection Criterion of Restaurant (Family)
Frequency
Percent
Valid Percent
Cumulative
Percent
Valid Convenience to
Reach
146 29.1 29.1 29.1
Food Taste and
Quality
229 45.6 45.6 74.7
Price of Food 86 17.1 17.1 91.8
Known Brand 41 8.2 8.2 100.0
Total 502 100.0 100.0
Figure 4.5: Selection Criterion of Restaurant (Family)
Family customers are generally composed of households from definite cultural, ethnic and
economic backgrounds and most of who have certain and conflicting restaurant preferences.
As such, they have different characteristics; hence, they tend to use different criteria in
selecting restaurants. Table 4.6 presents viewpoint of respondents on criterions they look
when they go out for dining in restaurants with their families. There are 229 respondents out
of total respondents who prefer taste of food and quality over rest of criterion and accounts
for 45.6 percent of response. However, 146 respondents, i.e. 29.1 percent of respondents
8%
29% 17%
46%
Convenience to Reach Food Taste and Quality Price of Food Known Brand

90
prefer convenience of restaurant as an important criterion while selecting restaurant for
dining out with family. It can be observed that from17.1 percent of respondents price of food
product is an important criterion of selection of restaurant. Merely 8.2 percent of respondents
prefer brand as a section criterion over other elements while dining out with family.
Diagrammatic representation of the analysis is illustrated in figure 4.5.
Table 4.7: Selection Criterion of Restaurant (Friends)
Frequency
Percent
Valid Percent
Cumulative
Percent
Valid Convenience to
Reach
241 48.0 48.0 48.0
Food Taste and
Quality
171 34.1 34.1 82.1
Price of Food 66 13.1 13.1 95.2
Known Brand 24 4.8 4.8 100.0
Total 502 100.0 100.0
Figure 4.6: Selection Criterion of Restaurant (Friends)
Table 4.7 presents the selection criterion that respondents look for while going out for dining
with their friends. “Reach of restaurant” is the most important criterion affects section of
restaurant for respondents while dining out with friends and this count to 241 responses, i.e.
48 percent of total response. Food taste and quality is the rated as the important criterion for
34.1 percent of respondents while dining out with friends. Likewise from the perspective of
13.1 respondents price of food affects their selection of restaurant while dining out with
5% 13%
48%
34%
Convenience to Reach Food Taste and Quality
Price of Food Known Brand
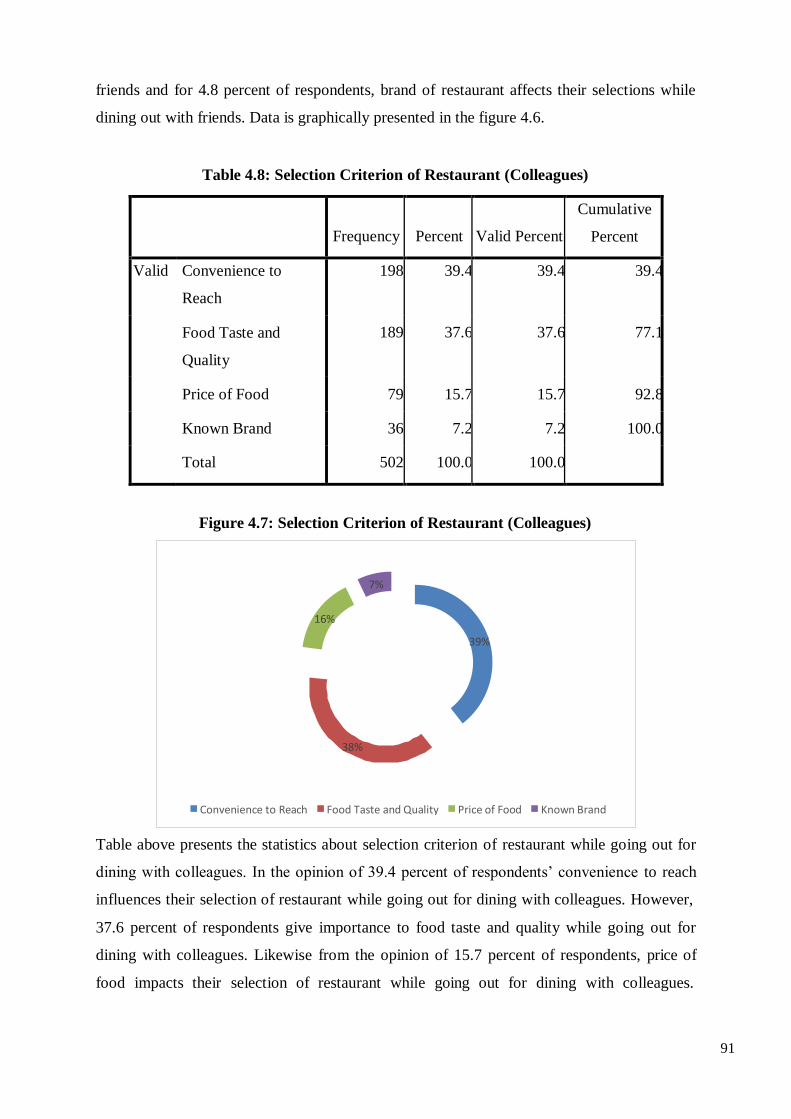
91
friends and for 4.8 percent of respondents, brand of restaurant affects their selections while
dining out with friends. Data is graphically presented in the figure 4.6.
Table 4.8: Selection Criterion of Restaurant (Colleagues)
Frequency
Percent
Valid Percent
Cumulative
Percent
Valid Convenience to
Reach
198 39.4 39.4 39.4
Food Taste and
Quality
189 37.6 37.6 77.1
Price of Food 79 15.7 15.7 92.8
Known Brand 36 7.2 7.2 100.0
Total 502 100.0 100.0
Figure 4.7: Selection Criterion of Restaurant (Colleagues)
Table above presents the statistics about selection criterion of restaurant while going out for
dining with colleagues. In the opinion of 39.4 percent of respondents’ convenience to reach
influences their selection of restaurant while going out for dining with colleagues. However,
37.6 percent of respondents give importance to food taste and quality while going out for
dining with colleagues. Likewise from the opinion of 15.7 percent of respondents, price of
food impacts their selection of restaurant while going out for dining with colleagues.
7%
16%
39%
38%
Convenience to Reach Food Taste and Quality Price of Food Known Brand
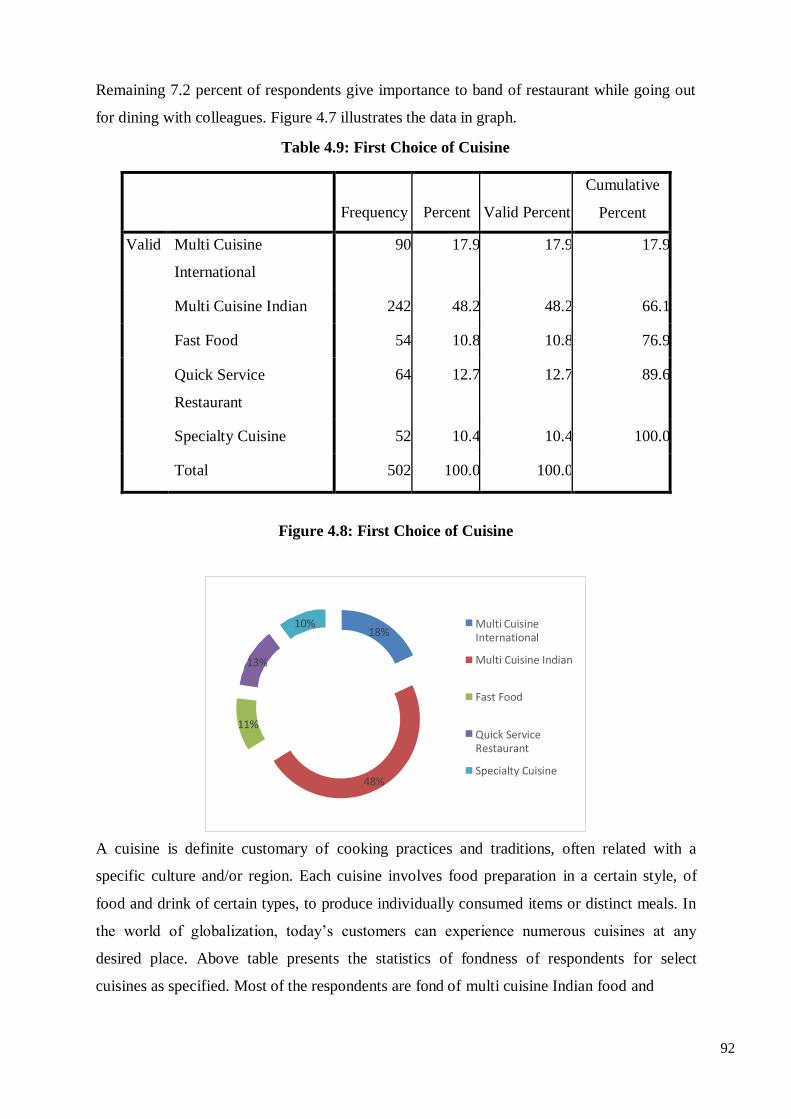
92
Remaining 7.2 percent of respondents give importance to band of restaurant while going out
for dining with colleagues. Figure 4.7 illustrates the data in graph.
Table 4.9: First Choice of Cuisine
Frequency
Percent
Valid Percent
Cumulative
Percent
Valid Multi Cuisine
International
90 17.9 17.9 17.9
Multi Cuisine Indian 242 48.2 48.2 66.1
Fast Food 54 10.8 10.8 76.9
Quick Service
Restaurant
64 12.7 12.7 89.6
Specialty Cuisine 52 10.4 10.4 100.0
Total 502 100.0 100.0
Figure 4.8: First Choice of Cuisine
A cuisine is definite customary of cooking practices and traditions, often related with a
specific culture and/or region. Each cuisine involves food preparation in a certain style, of
food and drink of certain types, to produce individually consumed items or distinct meals. In
the world of globalization, today’s customers can experience numerous cuisines at any
desired place. Above table presents the statistics of fondness of respondents for select
cuisines as specified. Most of the respondents are fond of multi cuisine Indian food and
48%
Quick Service Restaurant
Specialty Cuisine
11%
Multi Cuisine International
Multi Cuisine Indian
Fast Food
13%
18% 10%
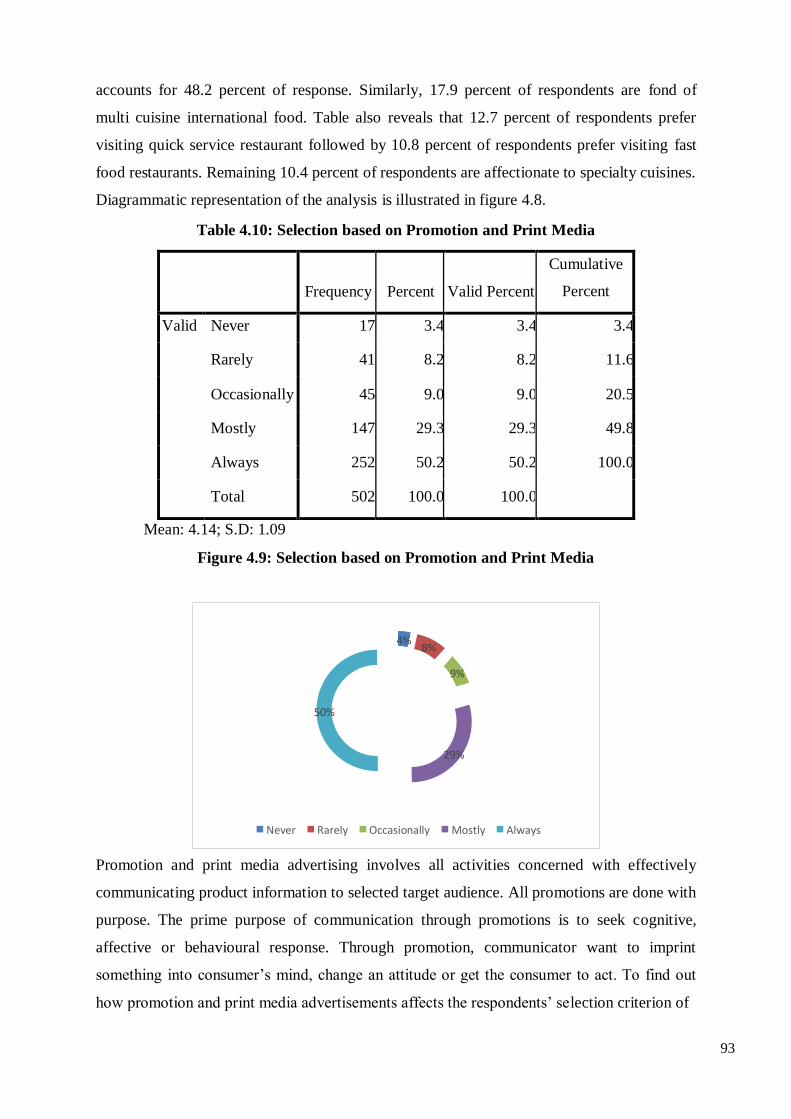
93
accounts for 48.2 percent of response. Similarly, 17.9 percent of respondents are fond of
multi cuisine international food. Table also reveals that 12.7 percent of respondents prefer
visiting quick service restaurant followed by 10.8 percent of respondents prefer visiting fast
food restaurants. Remaining 10.4 percent of respondents are affectionate to specialty cuisines.
Diagrammatic representation of the analysis is illustrated in figure 4.8.
Table 4.10: Selection based on Promotion and Print Media
Frequency
Percent
Valid Percent
Cumulative
Percent
Valid Never 17 3.4 3.4 3.4
Rarely 41 8.2 8.2 11.6
Occasionally 45 9.0 9.0 20.5
Mostly 147 29.3 29.3 49.8
Always 252 50.2 50.2 100.0
Total 502 100.0 100.0
Mean: 4.14; S.D: 1.09
Figure 4.9: Selection based on Promotion and Print Media
Promotion and print media advertising involves all activities concerned with effectively
communicating product information to selected target audience. All promotions are done with
purpose. The prime purpose of communication through promotions is to seek cognitive,
affective or behavioural response. Through promotion, communicator want to imprint
something into consumer’s mind, change an attitude or get the consumer to act. To find out
how promotion and print media advertisements affects the respondents’ selection criterion of
Never Rarely Occasionally Mostly Always
29%
50%
9%
8% 4%
94
restaurants, researcher has developed and used five point likert scale where responses were
recorded on ‘always’ to ‘never’ approach; where (5) being the highest and (1) being the
lowest score on response bench.
252 respondents have acknowledged that their selection of restaurant is always influenced by
promotion and print advertisements and recorded for 50.2 percent of total response.
Similarly, 29.3 percent of respondents have affirmed that their selection of restaurant is
mostly influenced by promotion and print advertisements. Merely, 3.2 percent of respondents
acknowledged that they never select the restaurant based on promotion and print
advertisements. The mean value of an element is observed as 4.14 with 1.09 values of
standard deviations. As standard deviation is lesser than one third of mean, mean is the
representative value. Thus it can be concluded that respondents select restaurants based on
promotion and print advertisements. Diagrammatic representation of the analysis is illustrated
in figure 4.9.
Table 4.11: Comfort and Seating Arrangement
Frequency
Percent
Valid Percent
Cumulative
Percent
Valid Not at all Important 13 2.6 2.6 2.6
Less Important 31 6.2 6.2 8.8
Moderately
Important
60 12.0 12.0 20.7
Important 144 28.7 28.7 49.4
Very Important 254 50.6 50.6 100.0
Total 502 100.0 100.0
Mean: 4.18; S.D.: 1.03
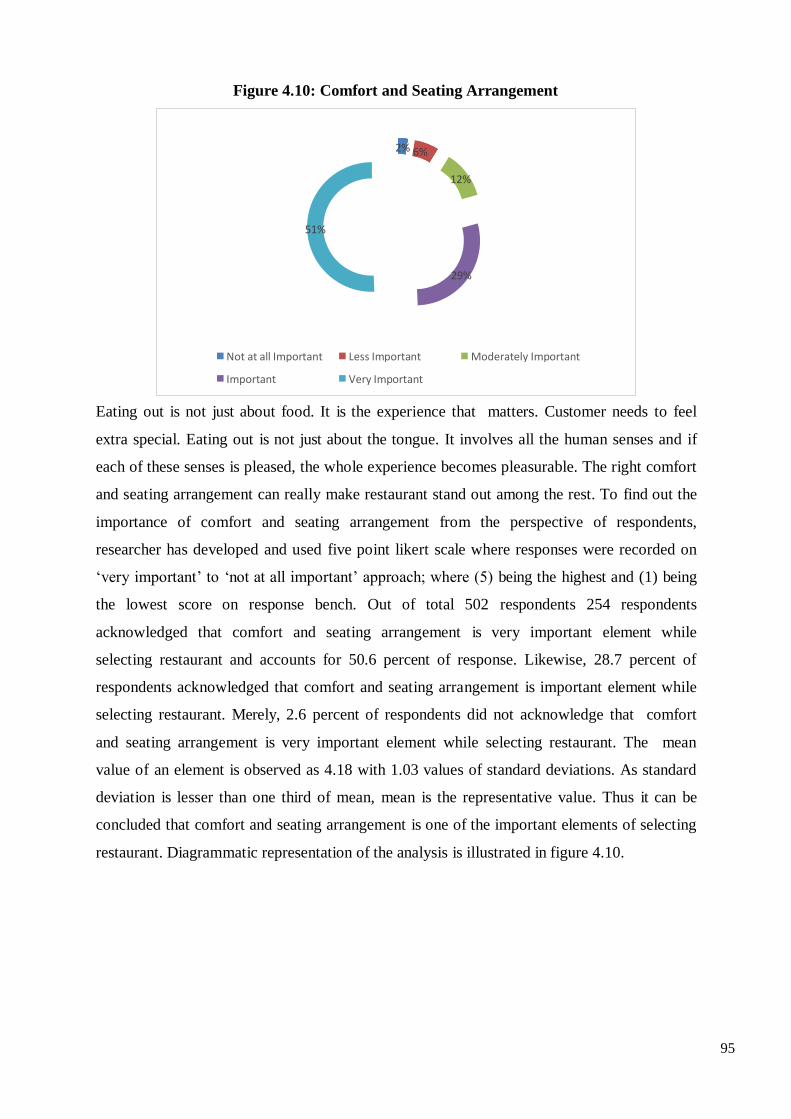
95
Figure 4.10: Comfort and Seating Arrangement
Eating out is not just about food. It is the experience that matters. Customer needs to feel
extra special. Eating out is not just about the tongue. It involves all the human senses and if
each of these senses is pleased, the whole experience becomes pleasurable. The right comfort
and seating arrangement can really make restaurant stand out among the rest. To find out the
importance of comfort and seating arrangement from the perspective of respondents,
researcher has developed and used five point likert scale where responses were recorded on
‘very important’ to ‘not at all important’ approach; where (5) being the highest and (1) being
the lowest score on response bench. Out of total 502 respondents 254 respondents
acknowledged that comfort and seating arrangement is very important element while
selecting restaurant and accounts for 50.6 percent of response. Likewise, 28.7 percent of
respondents acknowledged that comfort and seating arrangement is important element while
selecting restaurant. Merely, 2.6 percent of respondents did not acknowledge that comfort
and seating arrangement is very important element while selecting restaurant. The mean
value of an element is observed as 4.18 with 1.03 values of standard deviations. As standard
deviation is lesser than one third of mean, mean is the representative value. Thus it can be
concluded that comfort and seating arrangement is one of the important elements of selecting
restaurant. Diagrammatic representation of the analysis is illustrated in figure 4.10.
2% 6%
12%
51%
29%
Not at all Important Less Important Moderately Important
Important Very Important
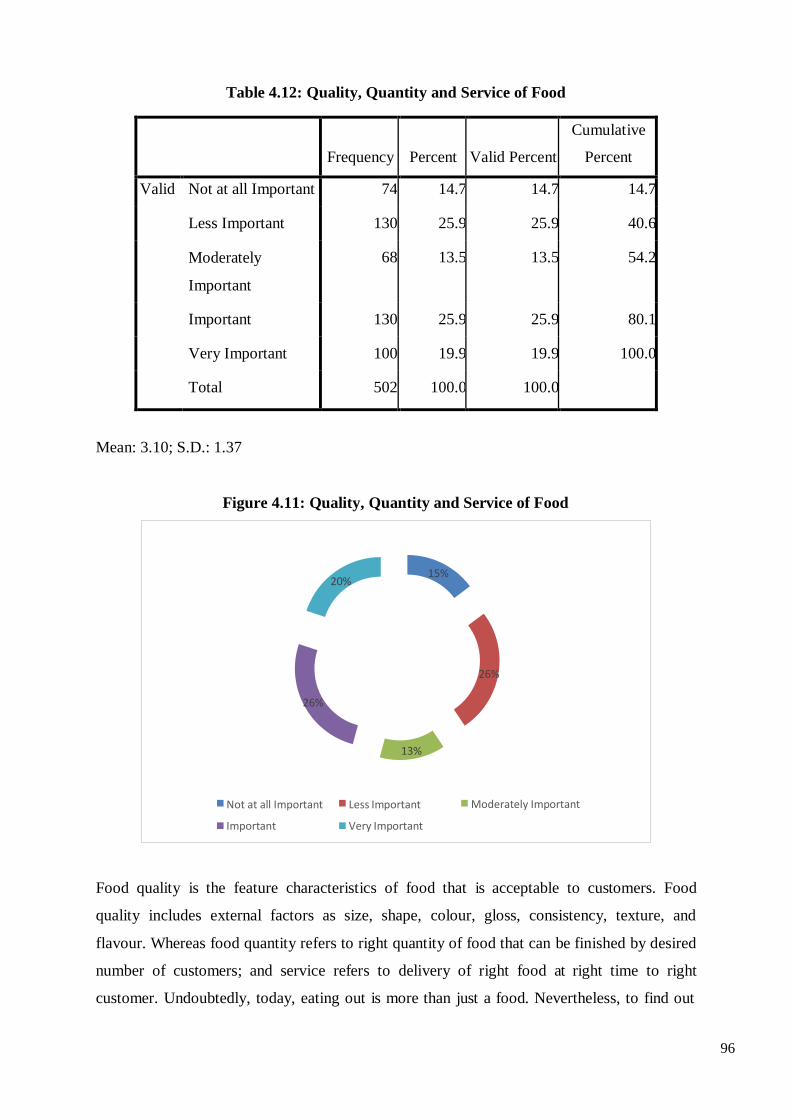
96
Table 4.12: Quality, Quantity and Service of Food
Frequency
Percent
Valid Percent
Cumulative
Percent
Valid Not at all Important 74 14.7 14.7 14.7
Less Important 130 25.9 25.9 40.6
Moderately
Important
68 13.5 13.5 54.2
Important 130 25.9 25.9 80.1
Very Important 100 19.9 19.9 100.0
Total 502 100.0 100.0
Mean: 3.10; S.D.: 1.37
Figure 4.11: Quality, Quantity and Service of Food
Food quality is the feature characteristics of food that is acceptable to customers. Food
quality includes external factors as size, shape, colour, gloss, consistency, texture, and
flavour. Whereas food quantity refers to right quantity of food that can be finished by desired
number of customers; and service refers to delivery of right food at right time to right
customer. Undoubtedly, today, eating out is more than just a food. Nevertheless, to find out
20% 15%
26%
26%
13%
Not at all Important
Important
Less Important
Very Important
Moderately Important

97
the importance of quality, quantity and service of food from the perspective of respondents,
researcher has developed and used five point likert scale where responses were recorded on
‘very important’ to ‘not at all important’ approach; where (5) being the highest and (1) being
the lowest score on response bench.
130 respondents acknowledged the importance of quality, quantity and service of food while
selecting restaurant. However, same amount of respondents acknowledged that quality,
quantity and service of food are not important while selection of restaurant. The mean value
of an element is observed as 3.10 with 1.37 values of standard deviations. Though mean
value is more than the mid of measurement scale, standard deviation is greater than one third
of mean. Thus it can be concluded that mean is not the representative value. Thus it can be
concluded that the quality, quantity and service of food are not important elements of
selecting restaurant. Diagrammatic representation of the analysis is illustrated in figure 4.11.
Table 4.13: Professional Staff
Frequency
Percent
Valid Percent
Cumulative
Percent
Valid Not at all Important 16 3.2 3.2 3.2
Less Important 69 13.7 13.7 16.9
Moderately
Important
72 14.3 14.3 31.3
Important 210 41.8 41.8 73.1
Very Important 135 26.9 26.9 100.0
Total 502 100.0 100.0
Mean: 3.75; S.D.: 1.09
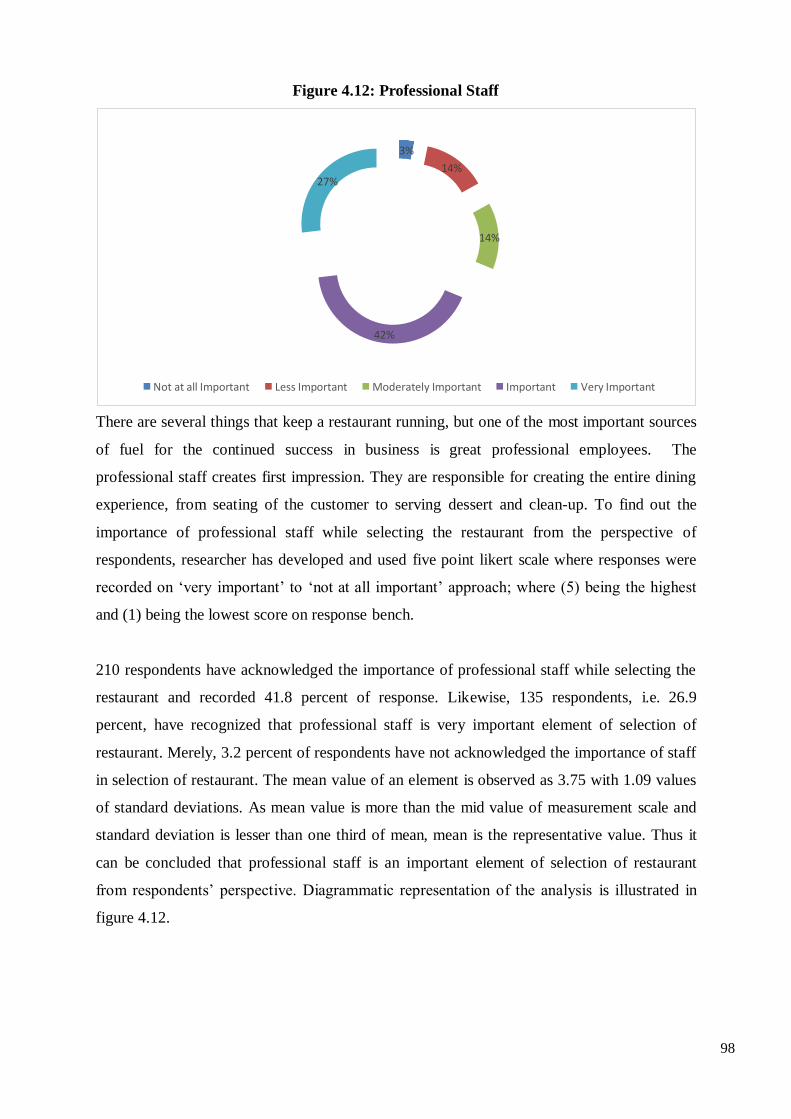
98
Figure 4.12: Professional Staff
There are several things that keep a restaurant running, but one of the most important sources
of fuel for the continued success in business is great professional employees. The
professional staff creates first impression. They are responsible for creating the entire dining
experience, from seating of the customer to serving dessert and clean-up. To find out the
importance of professional staff while selecting the restaurant from the perspective of
respondents, researcher has developed and used five point likert scale where responses were
recorded on ‘very important’ to ‘not at all important’ approach; where (5) being the highest
and (1) being the lowest score on response bench.
210 respondents have acknowledged the importance of professional staff while selecting the
restaurant and recorded 41.8 percent of response. Likewise, 135 respondents, i.e. 26.9
percent, have recognized that professional staff is very important element of selection of
restaurant. Merely, 3.2 percent of respondents have not acknowledged the importance of staff
in selection of restaurant. The mean value of an element is observed as 3.75 with 1.09 values
of standard deviations. As mean value is more than the mid value of measurement scale and
standard deviation is lesser than one third of mean, mean is the representative value. Thus it
can be concluded that professional staff is an important element of selection of restaurant
from respondents’ perspective. Diagrammatic representation of the analysis is illustrated in
figure 4.12.
3%
14% 27%
14%
42%
Not at all Important Less Important Moderately Important Important Very Important
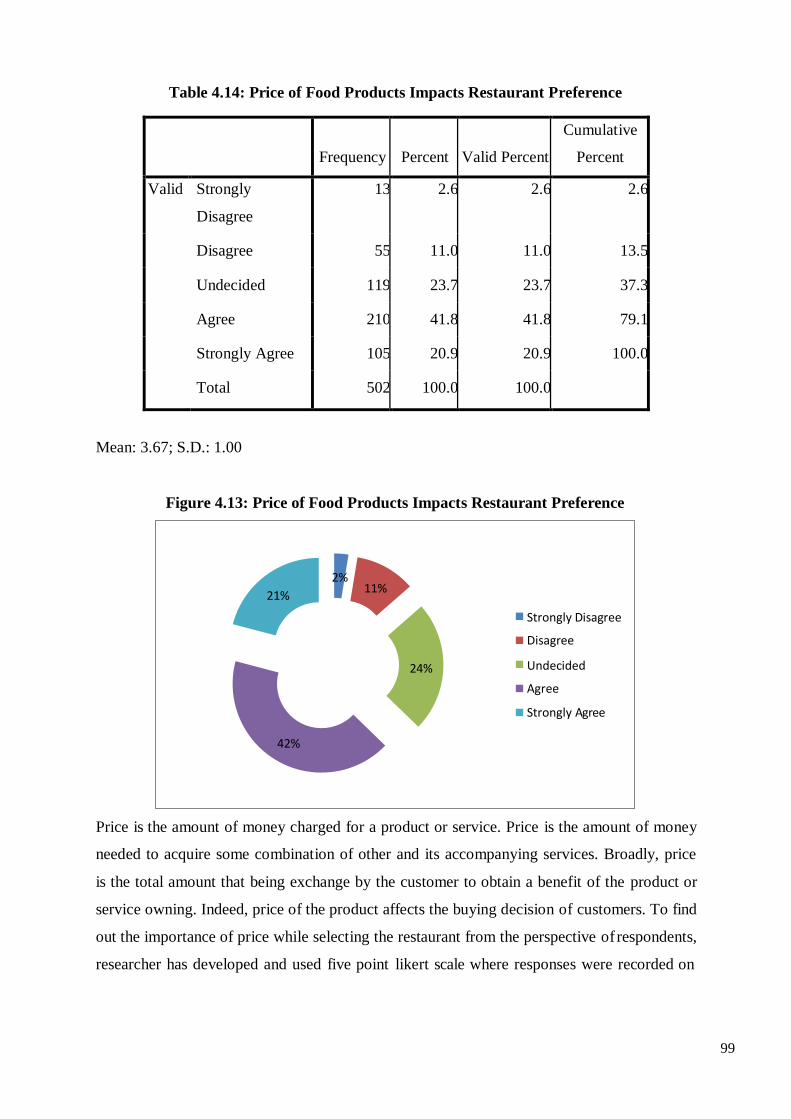
99
Table 4.14: Price of Food Products Impacts Restaurant Preference
Frequency
Percent
Valid Percent
Cumulative
Percent
Valid Strongly
Disagree
13 2.6 2.6 2.6
Disagree 55 11.0 11.0 13.5
Undecided 119 23.7 23.7 37.3
Agree 210 41.8 41.8 79.1
Strongly Agree 105 20.9 20.9 100.0
Total 502 100.0 100.0
Mean: 3.67; S.D.: 1.00
Figure 4.13: Price of Food Products Impacts Restaurant Preference
Price is the amount of money charged for a product or service. Price is the amount of money
needed to acquire some combination of other and its accompanying services. Broadly, price
is the total amount that being exchange by the customer to obtain a benefit of the product or
service owning. Indeed, price of the product affects the buying decision of customers. To find
out the importance of price while selecting the restaurant from the perspective of respondents,
researcher has developed and used five point likert scale where responses were recorded on
2%
21% 11%
Strongly Disagree
Disagree
24% Undecided
Agree
Strongly Agree
42%
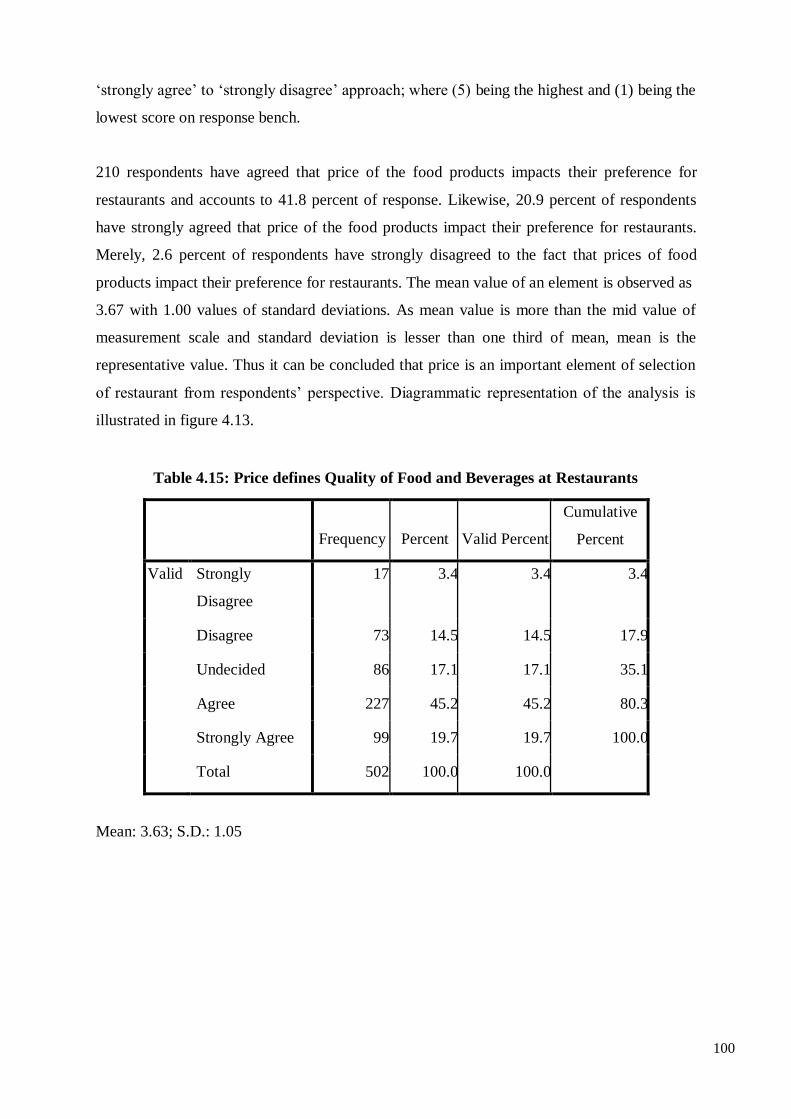
100
‘strongly agree’ to ‘strongly disagree’ approach; where (5) being the highest and (1) being the
lowest score on response bench.
210 respondents have agreed that price of the food products impacts their preference for
restaurants and accounts to 41.8 percent of response. Likewise, 20.9 percent of respondents
have strongly agreed that price of the food products impact their preference for restaurants.
Merely, 2.6 percent of respondents have strongly disagreed to the fact that prices of food
products impact their preference for restaurants. The mean value of an element is observed as
3.67 with 1.00 values of standard deviations. As mean value is more than the mid value of
measurement scale and standard deviation is lesser than one third of mean, mean is the
representative value. Thus it can be concluded that price is an important element of selection
of restaurant from respondents’ perspective. Diagrammatic representation of the analysis is
illustrated in figure 4.13.
Table 4.15: Price defines Quality of Food and Beverages at Restaurants
Frequency
Percent
Valid Percent
Cumulative
Percent
Valid Strongly
Disagree
17 3.4 3.4 3.4
Disagree 73 14.5 14.5 17.9
Undecided 86 17.1 17.1 35.1
Agree 227 45.2 45.2 80.3
Strongly Agree 99 19.7 19.7 100.0
Total 502 100.0 100.0
Mean: 3.63; S.D.: 1.05
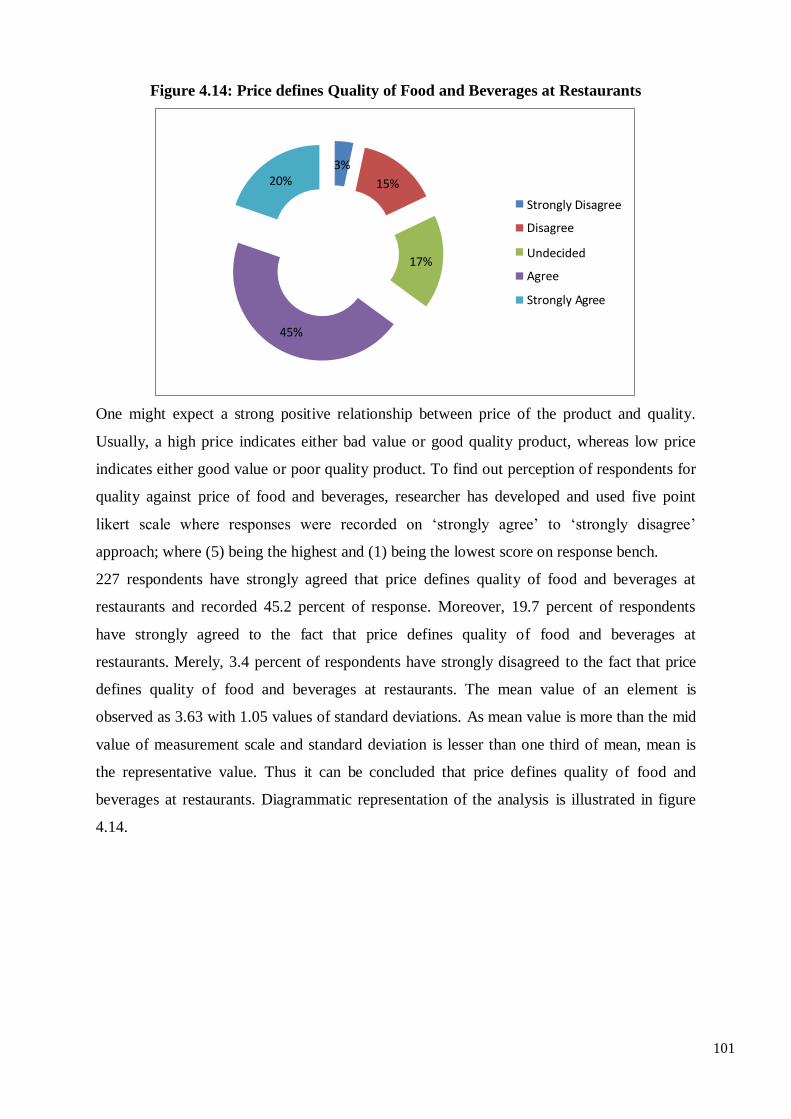
101
Figure 4.14: Price defines Quality of Food and Beverages at Restaurants
One might expect a strong positive relationship between price of the product and quality.
Usually, a high price indicates either bad value or good quality product, whereas low price
indicates either good value or poor quality product. To find out perception of respondents for
quality against price of food and beverages, researcher has developed and used five point
likert scale where responses were recorded on ‘strongly agree’ to ‘strongly disagree’
approach; where (5) being the highest and (1) being the lowest score on response bench.
227 respondents have strongly agreed that price defines quality of food and beverages at
restaurants and recorded 45.2 percent of response. Moreover, 19.7 percent of respondents
have strongly agreed to the fact that price defines quality of food and beverages at
restaurants. Merely, 3.4 percent of respondents have strongly disagreed to the fact that price
defines quality of food and beverages at restaurants. The mean value of an element is
observed as 3.63 with 1.05 values of standard deviations. As mean value is more than the mid
value of measurement scale and standard deviation is lesser than one third of mean, mean is
the representative value. Thus it can be concluded that price defines quality of food and
beverages at restaurants. Diagrammatic representation of the analysis is illustrated in figure
4.14.
3% 20% 15%
Strongly Disagree
Disagree
17% Undecided
Agree
Strongly Agree
45%
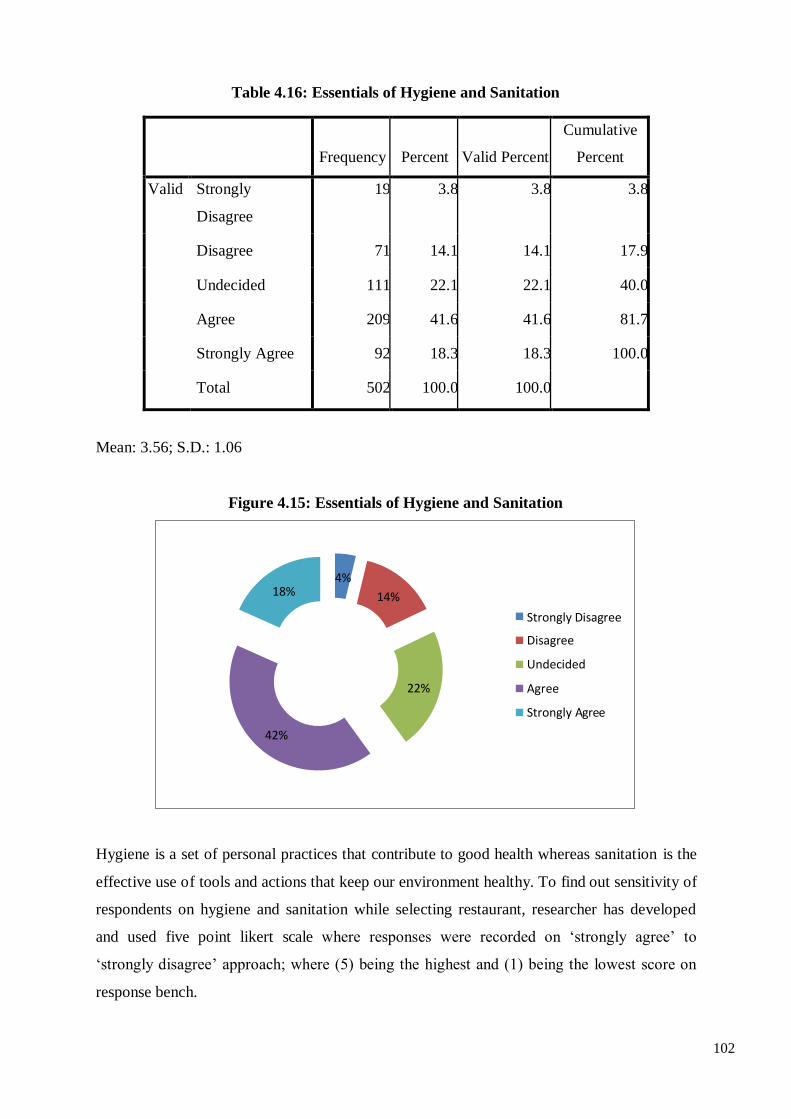
102
Table 4.16: Essentials of Hygiene and Sanitation
Frequency
Percent
Valid Percent
Cumulative
Percent
Valid Strongly
Disagree
19 3.8 3.8 3.8
Disagree 71 14.1 14.1 17.9
Undecided 111 22.1 22.1 40.0
Agree 209 41.6 41.6 81.7
Strongly Agree 92 18.3 18.3 100.0
Total 502 100.0 100.0
Mean: 3.56; S.D.: 1.06
Figure 4.15: Essentials of Hygiene and Sanitation
Hygiene is a set of personal practices that contribute to good health whereas sanitation is the
effective use of tools and actions that keep our environment healthy. To find out sensitivity of
respondents on hygiene and sanitation while selecting restaurant, researcher has developed
and used five point likert scale where responses were recorded on ‘strongly agree’ to
‘strongly disagree’ approach; where (5) being the highest and (1) being the lowest score on
response bench.
4% 18% 14%
22%
Strongly Disagree
Disagree
Undecided
Agree
Strongly Agree
42%
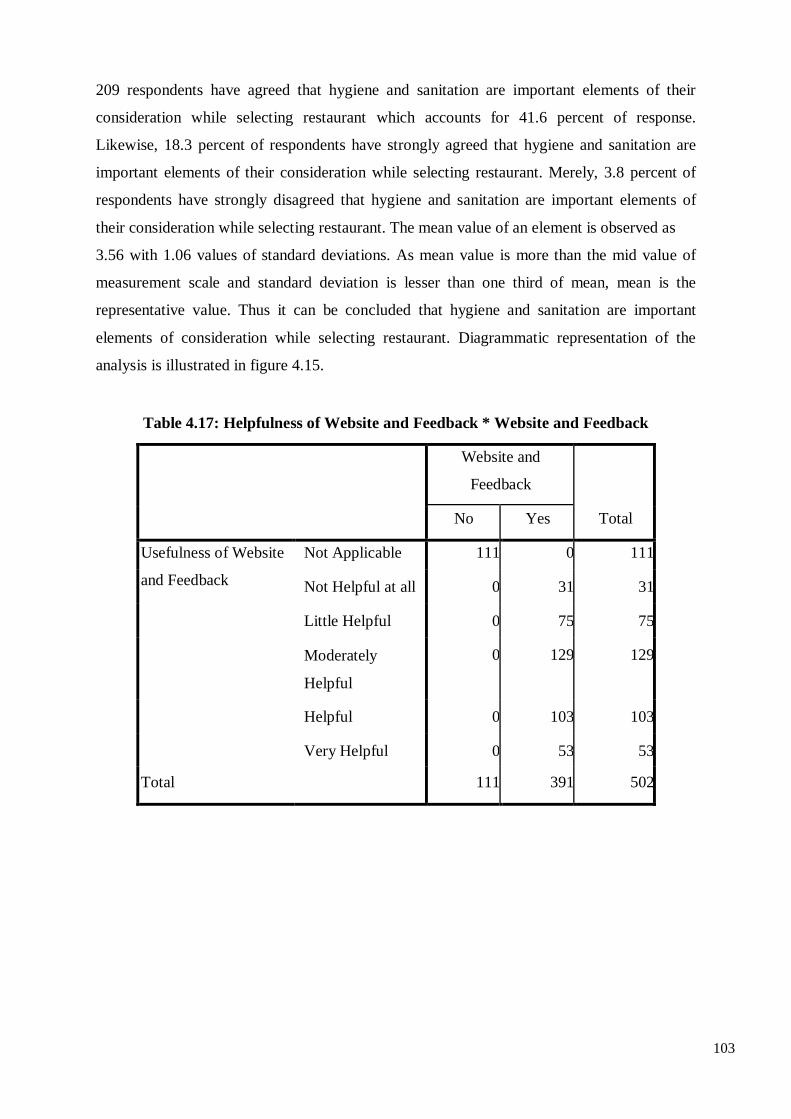
103
209 respondents have agreed that hygiene and sanitation are important elements of their
consideration while selecting restaurant which accounts for 41.6 percent of response.
Likewise, 18.3 percent of respondents have strongly agreed that hygiene and sanitation are
important elements of their consideration while selecting restaurant. Merely, 3.8 percent of
respondents have strongly disagreed that hygiene and sanitation are important elements of
their consideration while selecting restaurant. The mean value of an element is observed as
3.56 with 1.06 values of standard deviations. As mean value is more than the mid value of
measurement scale and standard deviation is lesser than one third of mean, mean is the
representative value. Thus it can be concluded that hygiene and sanitation are important
elements of consideration while selecting restaurant. Diagrammatic representation of the
analysis is illustrated in figure 4.15.
Table 4.17: Helpfulness of Website and Feedback * Website and Feedback
Website and
Feedback
Total No Yes
Usefulness of Website
and Feedback
Not Applicable 111 0 111
Not Helpful at all 0 31 31
Little Helpful 0 75 75
Moderately
Helpful
0 129 129
Helpful 0 103 103
Very Helpful 0 53 53
Total
111 391 502
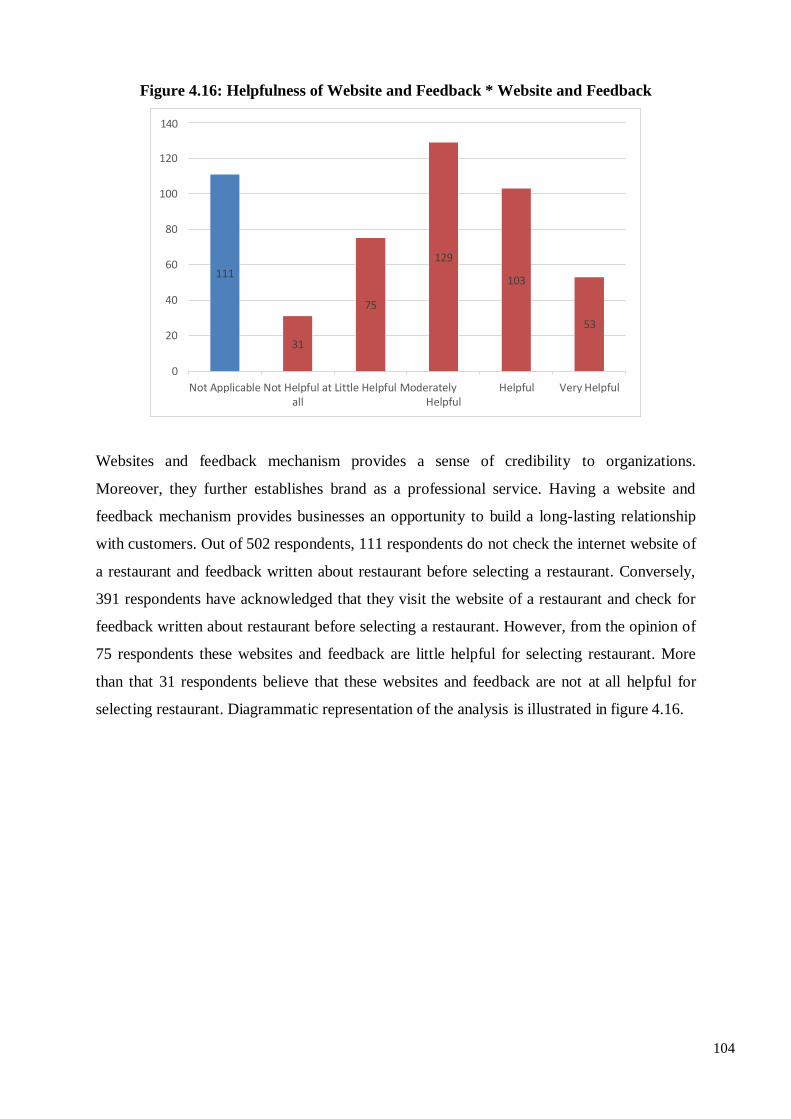
104
Figure 4.16: Helpfulness of Website and Feedback * Website and Feedback
Websites and feedback mechanism provides a sense of credibility to organizations.
Moreover, they further establishes brand as a professional service. Having a website and
feedback mechanism provides businesses an opportunity to build a long-lasting relationship
with customers. Out of 502 respondents, 111 respondents do not check the internet website of
a restaurant and feedback written about restaurant before selecting a restaurant. Conversely,
391 respondents have acknowledged that they visit the website of a restaurant and check for
feedback written about restaurant before selecting a restaurant. However, from the opinion of
75 respondents these websites and feedback are little helpful for selecting restaurant. More
than that 31 respondents believe that these websites and feedback are not at all helpful for
selecting restaurant. Diagrammatic representation of the analysis is illustrated in figure 4.16.
140
120
100
80
60
40
20
0
Not Applicable Not Helpful at Little Helpful Moderately Helpful Very Helpful all Helpful
31
53
75
103
111
129
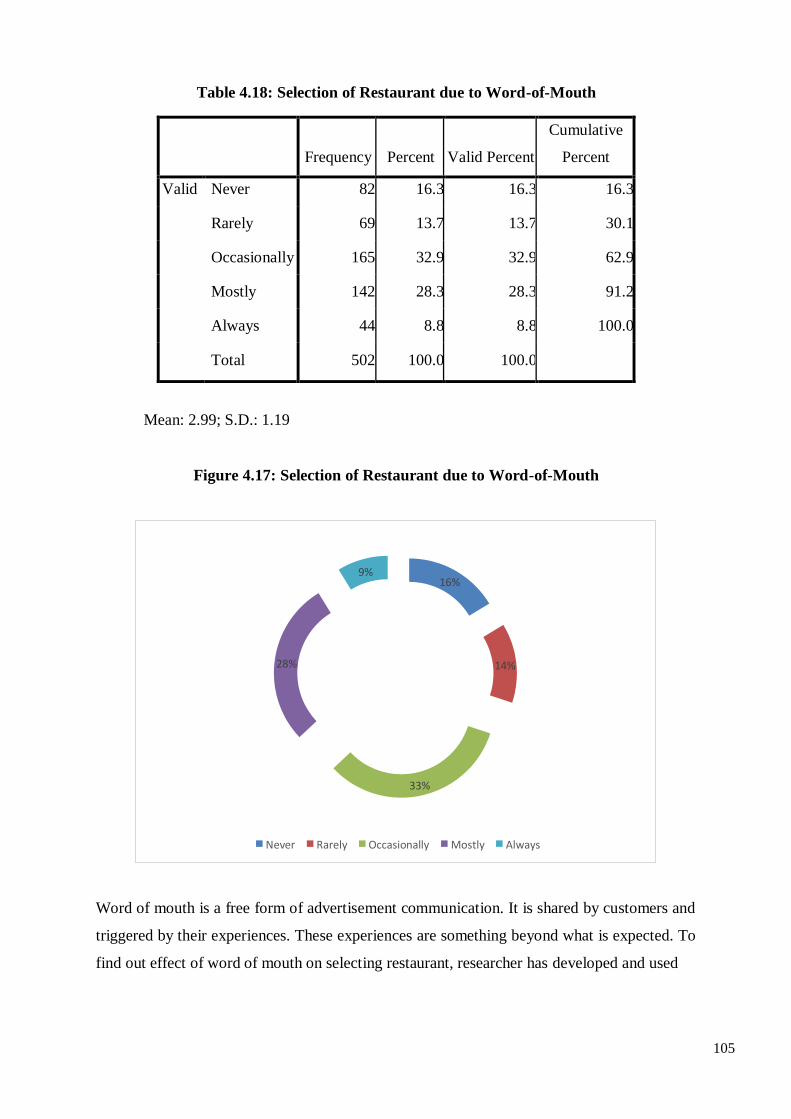
105
Table 4.18: Selection of Restaurant due to Word-of-Mouth
Frequency
Percent
Valid Percent
Cumulative
Percent
Valid Never 82 16.3 16.3 16.3
Rarely 69 13.7 13.7 30.1
Occasionally 165 32.9 32.9 62.9
Mostly 142 28.3 28.3 91.2
Always 44 8.8 8.8 100.0
Total 502 100.0 100.0
Mean: 2.99; S.D.: 1.19
Figure 4.17: Selection of Restaurant due to Word-of-Mouth
Word of mouth is a free form of advertisement communication. It is shared by customers and
triggered by their experiences. These experiences are something beyond what is expected. To
find out effect of word of mouth on selecting restaurant, researcher has developed and used
9% 16%
28% 14%
33%
Never Rarely Occasionally Mostly Always
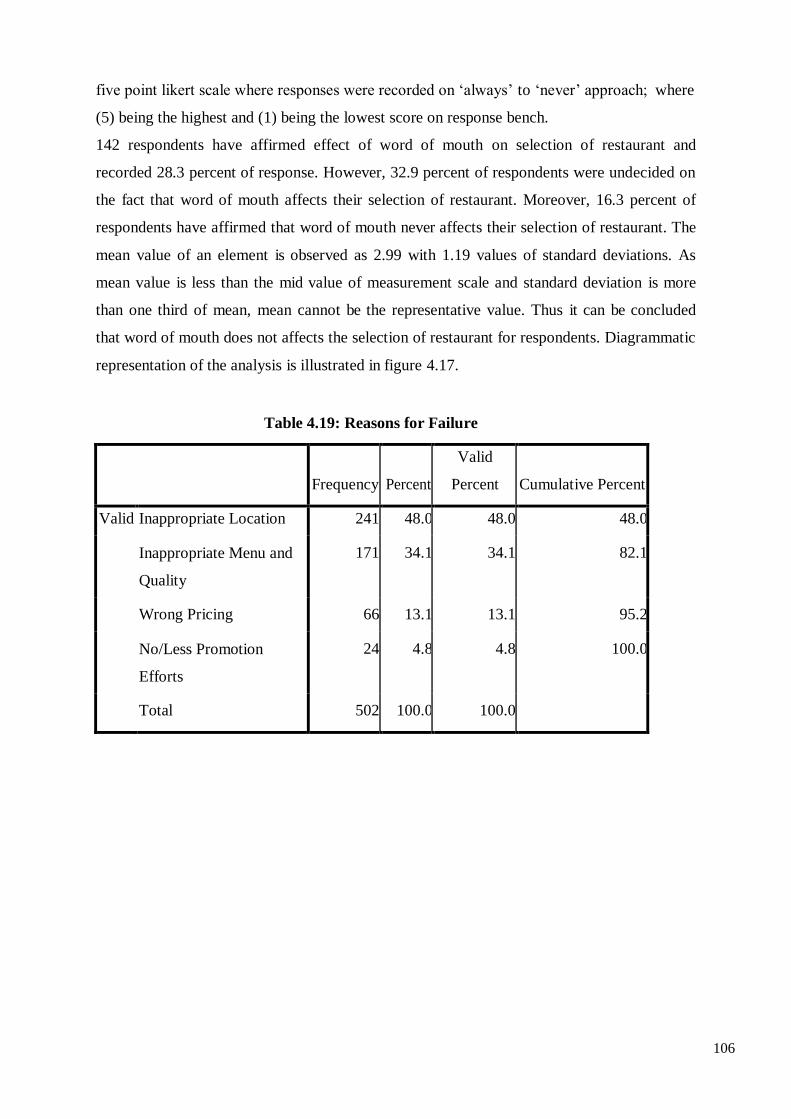
106
five point likert scale where responses were recorded on ‘always’ to ‘never’ approach; where
(5) being the highest and (1) being the lowest score on response bench.
142 respondents have affirmed effect of word of mouth on selection of restaurant and
recorded 28.3 percent of response. However, 32.9 percent of respondents were undecided on
the fact that word of mouth affects their selection of restaurant. Moreover, 16.3 percent of
respondents have affirmed that word of mouth never affects their selection of restaurant. The
mean value of an element is observed as 2.99 with 1.19 values of standard deviations. As
mean value is less than the mid value of measurement scale and standard deviation is more
than one third of mean, mean cannot be the representative value. Thus it can be concluded
that word of mouth does not affects the selection of restaurant for respondents. Diagrammatic
representation of the analysis is illustrated in figure 4.17.
Table 4.19: Reasons for Failure
Frequency
Percent
Valid
Percent
Cumulative Percent
Valid Inappropriate Location 241 48.0 48.0 48.0
Inappropriate Menu and
Quality
171 34.1 34.1 82.1
Wrong Pricing 66 13.1 13.1 95.2
No/Less Promotion
Efforts
24 4.8 4.8 100.0
Total 502 100.0 100.0
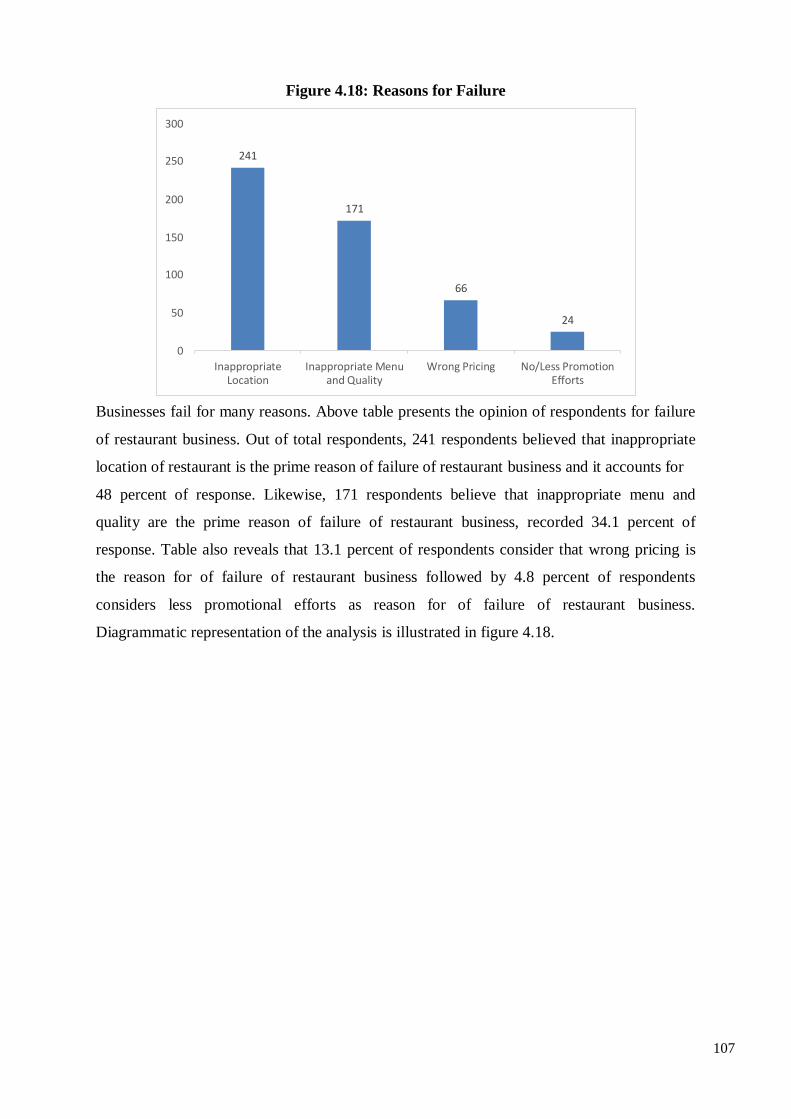
107
Figure 4.18: Reasons for Failure
Businesses fail for many reasons. Above table presents the opinion of respondents for failure
of restaurant business. Out of total respondents, 241 respondents believed that inappropriate
location of restaurant is the prime reason of failure of restaurant business and it accounts for
48 percent of response. Likewise, 171 respondents believe that inappropriate menu and
quality are the prime reason of failure of restaurant business, recorded 34.1 percent of
response. Table also reveals that 13.1 percent of respondents consider that wrong pricing is
the reason for of failure of restaurant business followed by 4.8 percent of respondents
considers less promotional efforts as reason for of failure of restaurant business.
Diagrammatic representation of the analysis is illustrated in figure 4.18.
300
250 241
200 171
150
100 66
50 24
0
Inappropriate Inappropriate Menu Wrong Pricing No/Less Promotion Location and Quality Efforts
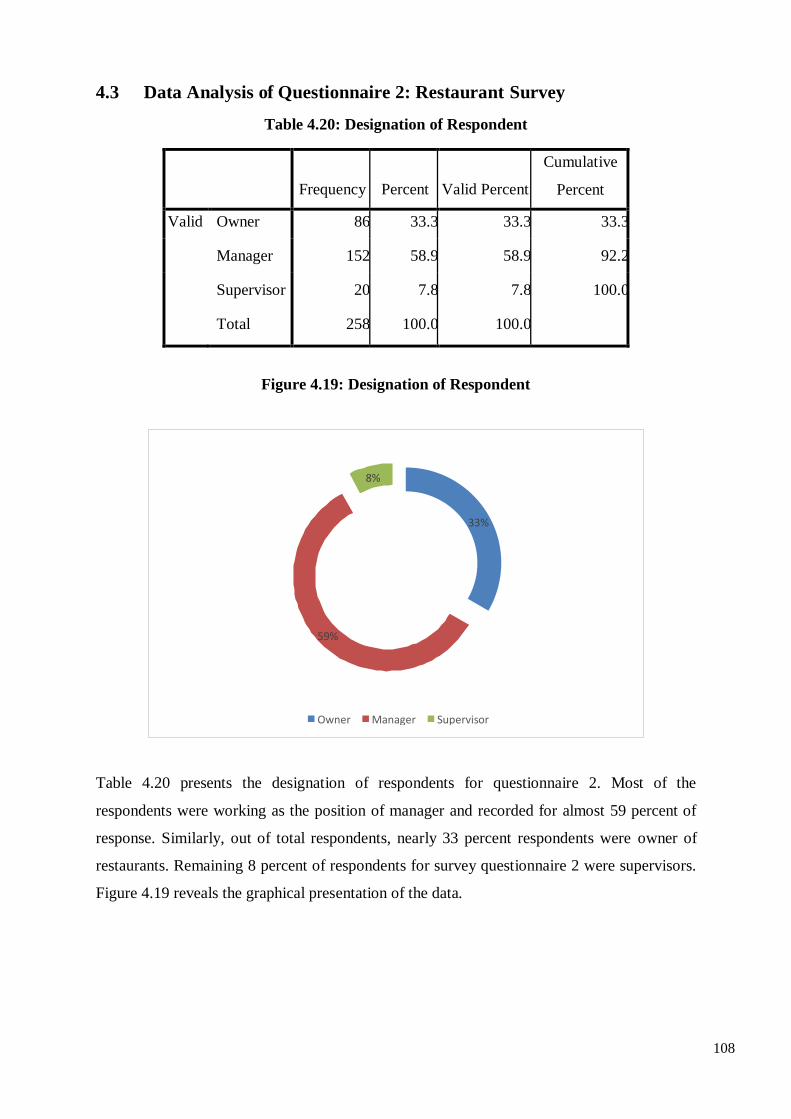
108
4.3 Data Analysis of Questionnaire 2: Restaurant Survey
Table 4.20: Designation of Respondent
Frequency
Percent
Valid Percent
Cumulative
Percent
Valid Owner 86 33.3 33.3 33.3
Manager 152 58.9 58.9 92.2
Supervisor 20 7.8 7.8 100.0
Total 258 100.0 100.0
Figure 4.19: Designation of Respondent
Table 4.20 presents the designation of respondents for questionnaire 2. Most of the
respondents were working as the position of manager and recorded for almost 59 percent of
response. Similarly, out of total respondents, nearly 33 percent respondents were owner of
restaurants. Remaining 8 percent of respondents for survey questionnaire 2 were supervisors.
Figure 4.19 reveals the graphical presentation of the data.
8%
33%
59%
Owner Manager Supervisor
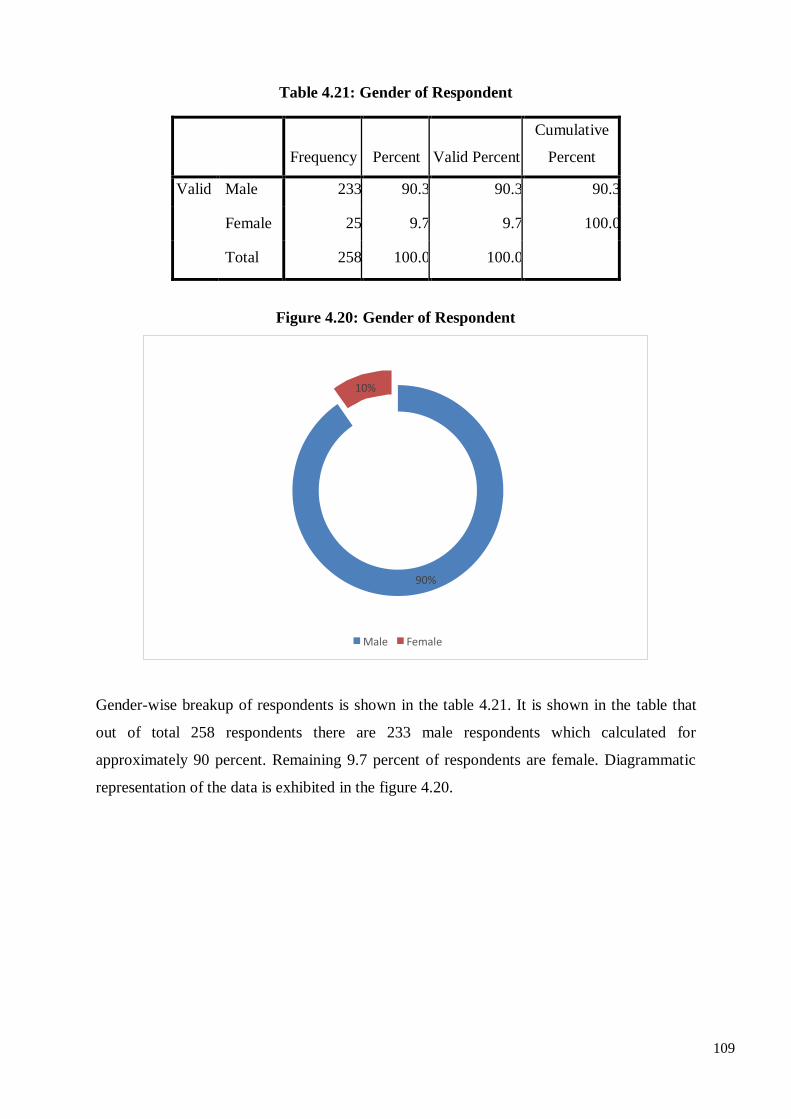
109
Table 4.21: Gender of Respondent
Frequency
Percent
Valid Percent
Cumulative
Percent
Valid Male 233 90.3 90.3 90.3
Female 25 9.7 9.7 100.0
Total 258 100.0 100.0
Figure 4.20: Gender of Respondent
Gender-wise breakup of respondents is shown in the table 4.21. It is shown in the table that
out of total 258 respondents there are 233 male respondents which calculated for
approximately 90 percent. Remaining 9.7 percent of respondents are female. Diagrammatic
representation of the data is exhibited in the figure 4.20.
10%
90%
Male Female
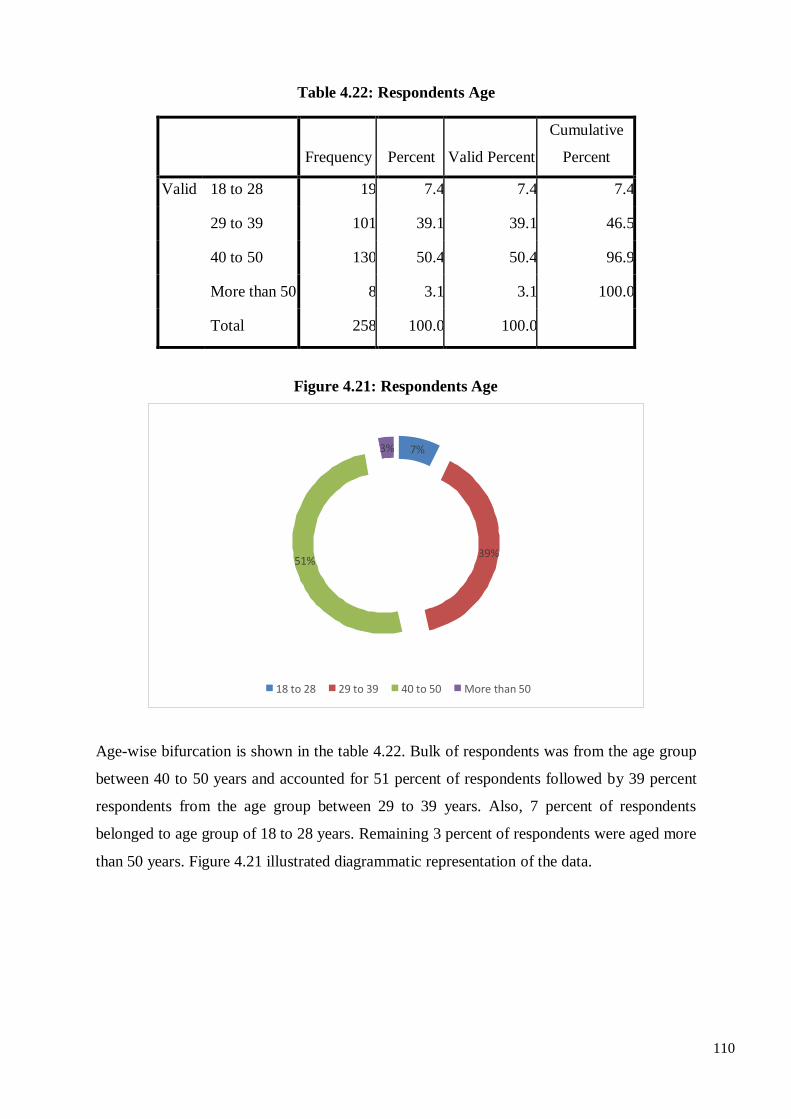
110
Table 4.22: Respondents Age
Frequency
Percent
Valid Percent
Cumulative
Percent
Valid 18 to 28 19 7.4 7.4 7.4
29 to 39 101 39.1 39.1 46.5
40 to 50 130 50.4 50.4 96.9
More than 50 8 3.1 3.1 100.0
Total 258 100.0 100.0
Figure 4.21: Respondents Age
Age-wise bifurcation is shown in the table 4.22. Bulk of respondents was from the age group
between 40 to 50 years and accounted for 51 percent of respondents followed by 39 percent
respondents from the age group between 29 to 39 years. Also, 7 percent of respondents
belonged to age group of 18 to 28 years. Remaining 3 percent of respondents were aged more
than 50 years. Figure 4.21 illustrated diagrammatic representation of the data.
3% 7%
51% 39%
18 to 28 29 to 39 40 to 50 More than 50
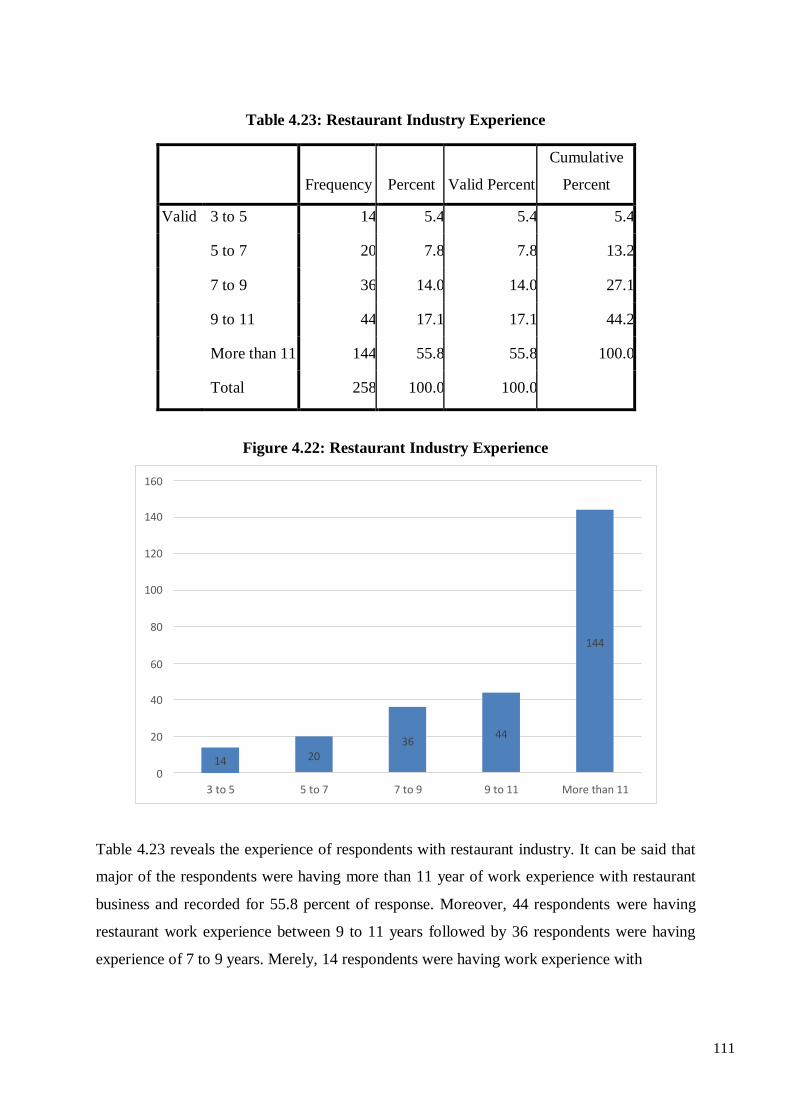
111
Table 4.23: Restaurant Industry Experience
Frequency
Percent
Valid Percent
Cumulative
Percent
Valid 3 to 5 14 5.4 5.4 5.4
5 to 7 20 7.8 7.8 13.2
7 to 9 36 14.0 14.0 27.1
9 to 11 44 17.1 17.1 44.2
More than 11 144 55.8 55.8 100.0
Total 258 100.0 100.0
Figure 4.22: Restaurant Industry Experience
Table 4.23 reveals the experience of respondents with restaurant industry. It can be said that
major of the respondents were having more than 11 year of work experience with restaurant
business and recorded for 55.8 percent of response. Moreover, 44 respondents were having
restaurant work experience between 9 to 11 years followed by 36 respondents were having
experience of 7 to 9 years. Merely, 14 respondents were having work experience with
More than 11 9 to 11 7 to 9 5 to 7 3 to 5
0
20
44 36
60
40
20
144
160
140
120
100
80
14
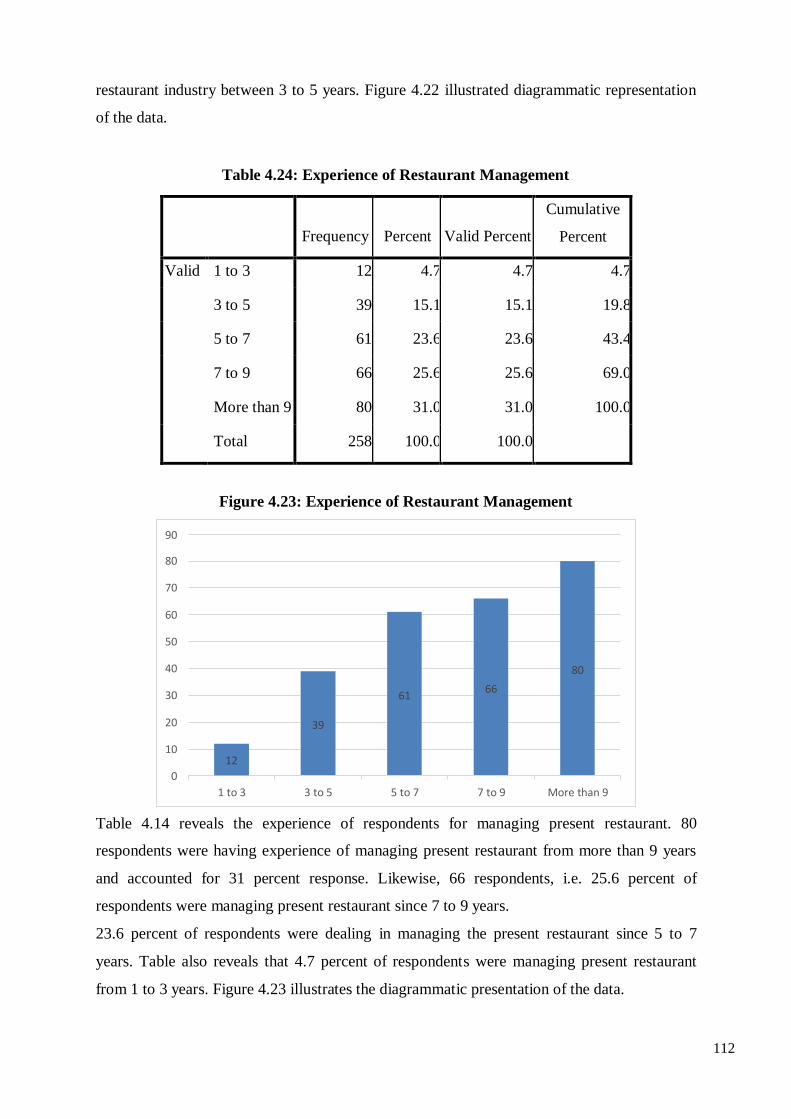
112
restaurant industry between 3 to 5 years. Figure 4.22 illustrated diagrammatic representation
of the data.
Table 4.24: Experience of Restaurant Management
Frequency
Percent
Valid Percent
Cumulative
Percent
Valid 1 to 3 12 4.7 4.7 4.7
3 to 5 39 15.1 15.1 19.8
5 to 7 61 23.6 23.6 43.4
7 to 9 66 25.6 25.6 69.0
More than 9 80 31.0 31.0 100.0
Total 258 100.0 100.0
Figure 4.23: Experience of Restaurant Management
Table 4.14 reveals the experience of respondents for managing present restaurant. 80
respondents were having experience of managing present restaurant from more than 9 years
and accounted for 31 percent response. Likewise, 66 respondents, i.e. 25.6 percent of
respondents were managing present restaurant since 7 to 9 years.
23.6 percent of respondents were dealing in managing the present restaurant since 5 to 7
years. Table also reveals that 4.7 percent of respondents were managing present restaurant
from 1 to 3 years. Figure 4.23 illustrates the diagrammatic presentation of the data.
90
80
70
60
50
40
30
20
10
0
1 to 3 3 to 5 5 to 7 7 to 9 More than 9
12
39
61 66
80
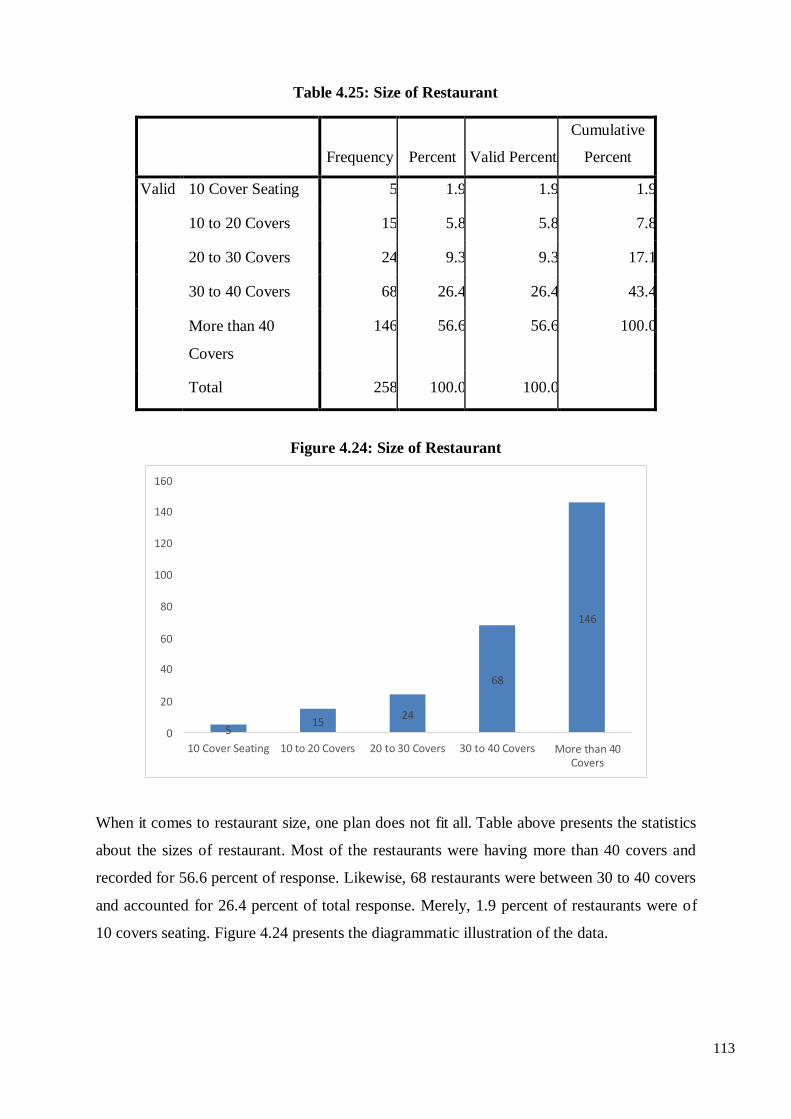
113
Table 4.25: Size of Restaurant
Frequency
Percent
Valid Percent
Cumulative
Percent
Valid 10 Cover Seating 5 1.9 1.9 1.9
10 to 20 Covers 15 5.8 5.8 7.8
20 to 30 Covers 24 9.3 9.3 17.1
30 to 40 Covers 68 26.4 26.4 43.4
More than 40
Covers
146 56.6 56.6 100.0
Total 258 100.0 100.0
Figure 4.24: Size of Restaurant
When it comes to restaurant size, one plan does not fit all. Table above presents the statistics
about the sizes of restaurant. Most of the restaurants were having more than 40 covers and
recorded for 56.6 percent of response. Likewise, 68 restaurants were between 30 to 40 covers
and accounted for 26.4 percent of total response. Merely, 1.9 percent of restaurants were of
10 covers seating. Figure 4.24 presents the diagrammatic illustration of the data.
More than 40 Covers
5
10 Cover Seating 10 to 20 Covers 20 to 30 Covers 30 to 40 Covers 0
24 15
20
68
60
40
146
160
140
120
100
80
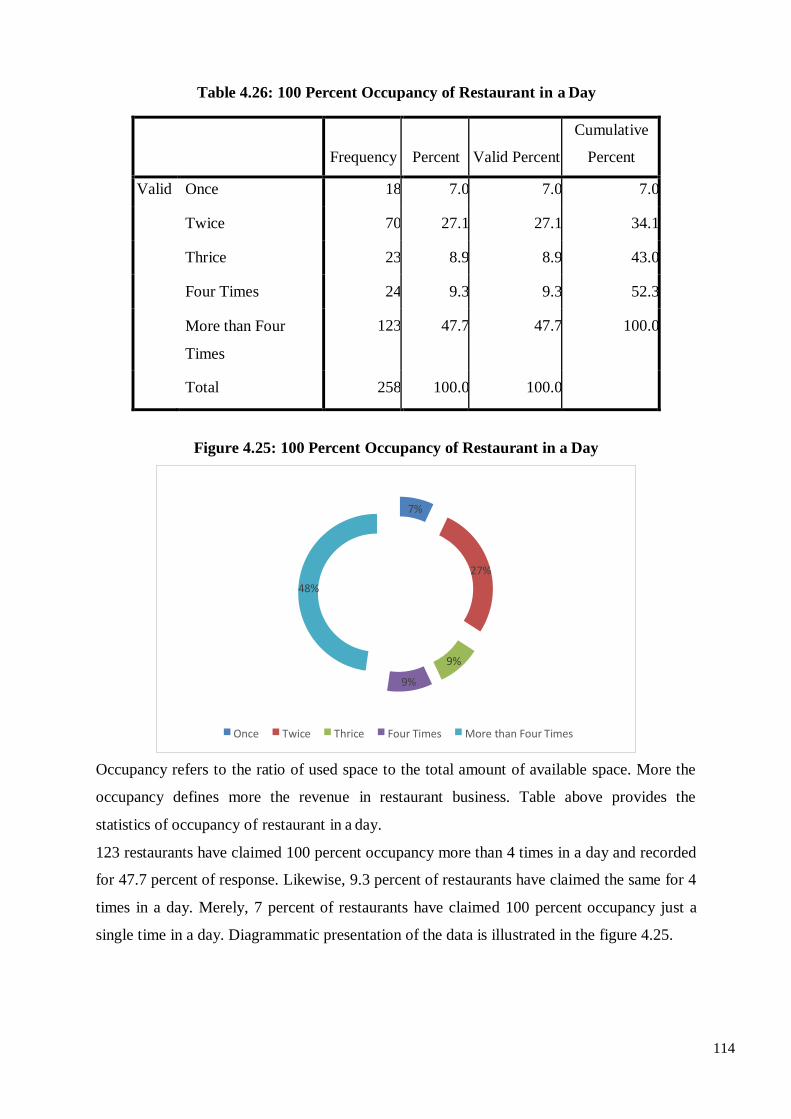
114
Table 4.26: 100 Percent Occupancy of Restaurant in a Day
Frequency
Percent
Valid Percent
Cumulative
Percent
Valid Once 18 7.0 7.0 7.0
Twice 70 27.1 27.1 34.1
Thrice 23 8.9 8.9 43.0
Four Times 24 9.3 9.3 52.3
More than Four
Times
123 47.7 47.7 100.0
Total 258 100.0 100.0
Figure 4.25: 100 Percent Occupancy of Restaurant in a Day
Occupancy refers to the ratio of used space to the total amount of available space. More the
occupancy defines more the revenue in restaurant business. Table above provides the
statistics of occupancy of restaurant in a day.
123 restaurants have claimed 100 percent occupancy more than 4 times in a day and recorded
for 47.7 percent of response. Likewise, 9.3 percent of restaurants have claimed the same for 4
times in a day. Merely, 7 percent of restaurants have claimed 100 percent occupancy just a
single time in a day. Diagrammatic presentation of the data is illustrated in the figure 4.25.
7%
27%
48%
9%
9%
Once Twice Thrice Four Times More than Four Times
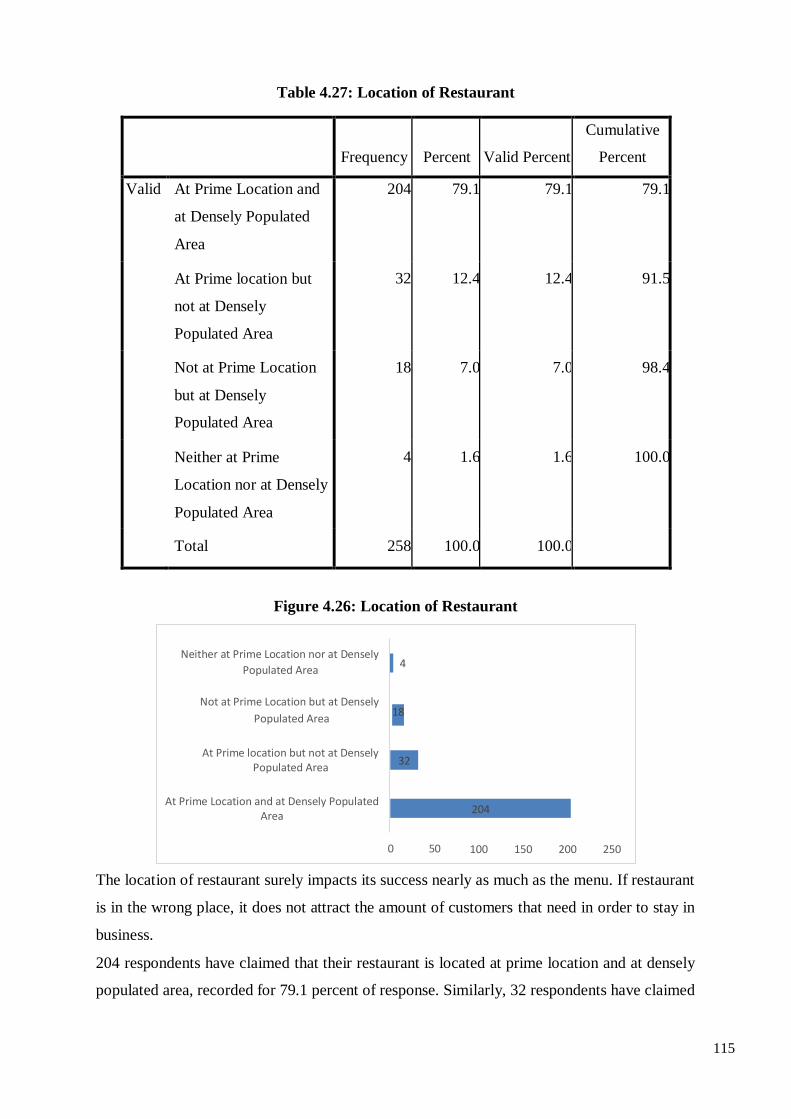
115
Table 4.27: Location of Restaurant
Frequency
Percent
Valid Percent
Cumulative
Percent
Valid At Prime Location and
at Densely Populated
Area
204 79.1 79.1 79.1
At Prime location but
not at Densely
Populated Area
32 12.4 12.4 91.5
Not at Prime Location
but at Densely
Populated Area
18 7.0 7.0 98.4
Neither at Prime
Location nor at Densely
Populated Area
4 1.6 1.6 100.0
Total 258 100.0 100.0
Figure 4.26: Location of Restaurant
The location of restaurant surely impacts its success nearly as much as the menu. If restaurant
is in the wrong place, it does not attract the amount of customers that need in order to stay in
business.
204 respondents have claimed that their restaurant is located at prime location and at densely
populated area, recorded for 79.1 percent of response. Similarly, 32 respondents have claimed
Neither at Prime Location nor at Densely
Populated Area 4
Not at Prime Location but at Densely
Populated Area 18
At Prime location but not at Densely
Populated Area
At Prime Location and at Densely Populated
Area
0 50 100 150 200 250
204
32
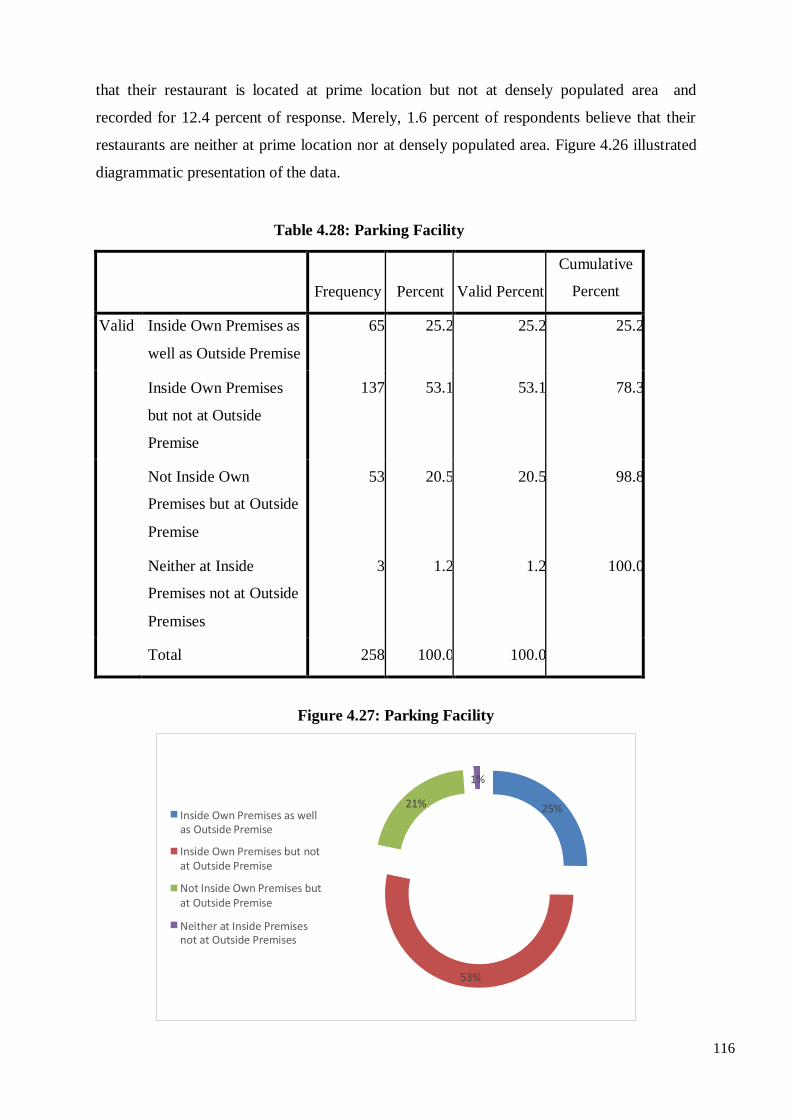
116
that their restaurant is located at prime location but not at densely populated area and
recorded for 12.4 percent of response. Merely, 1.6 percent of respondents believe that their
restaurants are neither at prime location nor at densely populated area. Figure 4.26 illustrated
diagrammatic presentation of the data.
Table 4.28: Parking Facility
Frequency
Percent
Valid Percent
Cumulative
Percent
Valid Inside Own Premises as
well as Outside Premise
65 25.2 25.2 25.2
Inside Own Premises
but not at Outside
Premise
137 53.1 53.1 78.3
Not Inside Own
Premises but at Outside
Premise
53 20.5 20.5 98.8
Neither at Inside
Premises not at Outside
Premises
3 1.2 1.2 100.0
Total 258 100.0 100.0
Figure 4.27: Parking Facility
1%
21% Inside Own Premises as well as Outside Premise
Inside Own Premises but not at Outside Premise
Not Inside Own Premises but at Outside Premise
25%
Neither at Inside Premises not at Outside Premises
53%
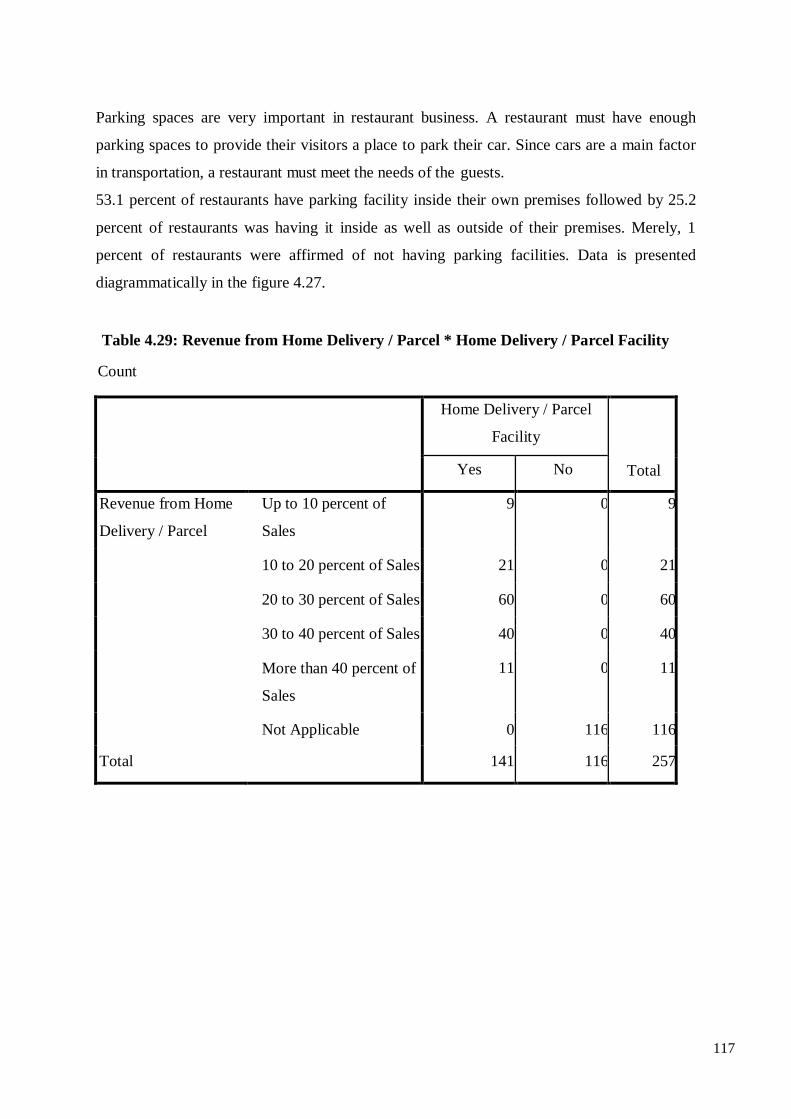
117
Parking spaces are very important in restaurant business. A restaurant must have enough
parking spaces to provide their visitors a place to park their car. Since cars are a main factor
in transportation, a restaurant must meet the needs of the guests.
53.1 percent of restaurants have parking facility inside their own premises followed by 25.2
percent of restaurants was having it inside as well as outside of their premises. Merely, 1
percent of restaurants were affirmed of not having parking facilities. Data is presented
diagrammatically in the figure 4.27.
Table 4.29: Revenue from Home Delivery / Parcel * Home Delivery / Parcel Facility
Count
Home Delivery / Parcel
Facility
Total Yes No
Revenue from Home
Delivery / Parcel
Up to 10 percent of
Sales
9 0 9
10 to 20 percent of Sales 21 0 21
20 to 30 percent of Sales 60 0 60
30 to 40 percent of Sales 40 0 40
More than 40 percent of
Sales
11 0 11
Not Applicable 0 116 116
Total
141 116 257
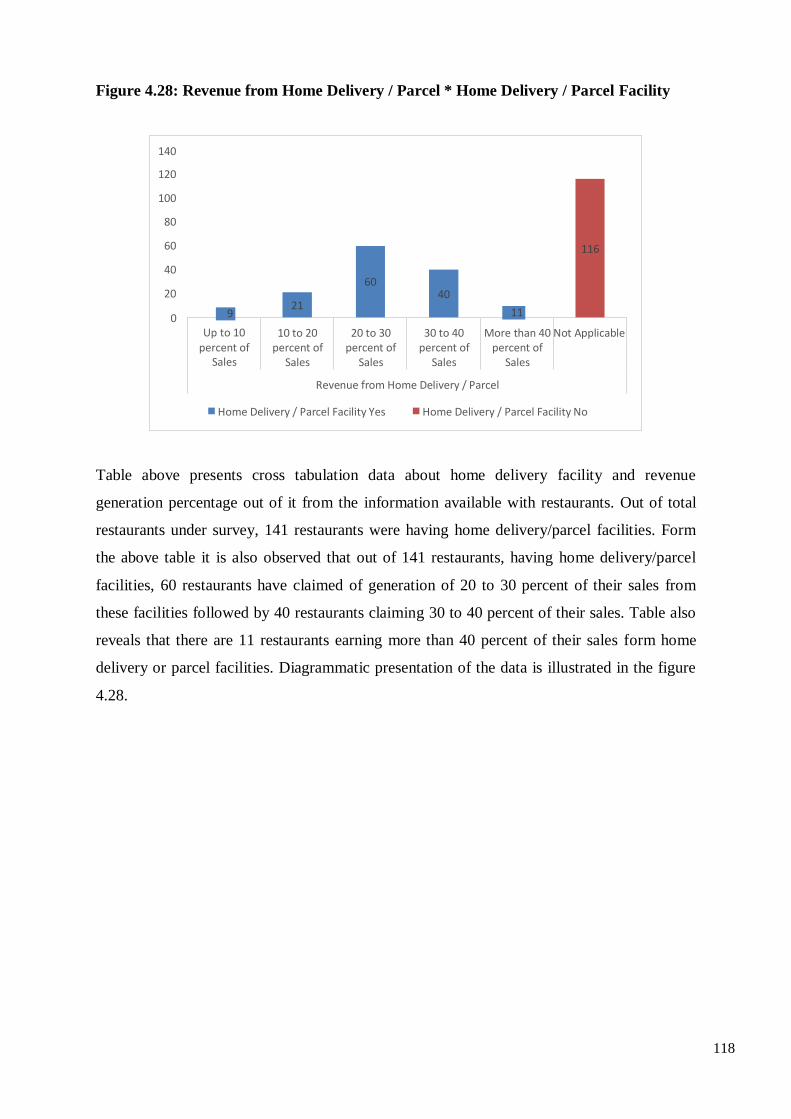
118
Figure 4.28: Revenue from Home Delivery / Parcel * Home Delivery / Parcel Facility
Table above presents cross tabulation data about home delivery facility and revenue
generation percentage out of it from the information available with restaurants. Out of total
restaurants under survey, 141 restaurants were having home delivery/parcel facilities. Form
the above table it is also observed that out of 141 restaurants, having home delivery/parcel
facilities, 60 restaurants have claimed of generation of 20 to 30 percent of their sales from
these facilities followed by 40 restaurants claiming 30 to 40 percent of their sales. Table also
reveals that there are 11 restaurants earning more than 40 percent of their sales form home
delivery or parcel facilities. Diagrammatic presentation of the data is illustrated in the figure
4.28.
Home Delivery / Parcel Facility No Home Delivery / Parcel Facility Yes
11
10 to 20 20 to 30 30 to 40 More than 40 Not Applicable percent of percent of percent of percent of
Sales Sales Sales Sales
Revenue from Home Delivery / Parcel
9
Up to 10 percent of
Sales
0
140
120
100
80
60
40
20 21
40
60
116

119
Table 4.30: Practice of Standard Operating Procedures
Frequency
Percent
Valid Percent
Cumulative
Percent
Valid For all Procedures 155 60.1 60.1 60.1
For Selected Procedures 80 31.0 31.0 91.1
Only for Kitchen
Procedures
9 3.5 3.5 94.6
Only for Service
Procedures
9 3.5 3.5 98.1
Not at all 5 1.9 1.9 100.0
Total 258 100.0 100.0
Figure 4.29: Practice of Standard Operating Procedures
Standard operating procedures are set of step-by-step instructions compiled by an
organization to help workers carry out complex routine operations.
60.1 percent of restaurants follow standard operating procedures for all practices at their
restaurants followed by 31 percent of restaurants following standard operating procedures for
selected practices at restaurants. Merely, there are 3.5 percent of restaurants following
standard operating procedures for only kitchen practices and only for service practices. Data
also observes that 1.9 percent of restaurants do not have standard operating procedures.
Diagrammatic presentation of the data is illustrated in the figure 4.29.
Not at all 60%
Only for Service Procedures
31%
For all Procedures
For Selected Procedures
Only for Kitchen Procedures
4% 3% 2%
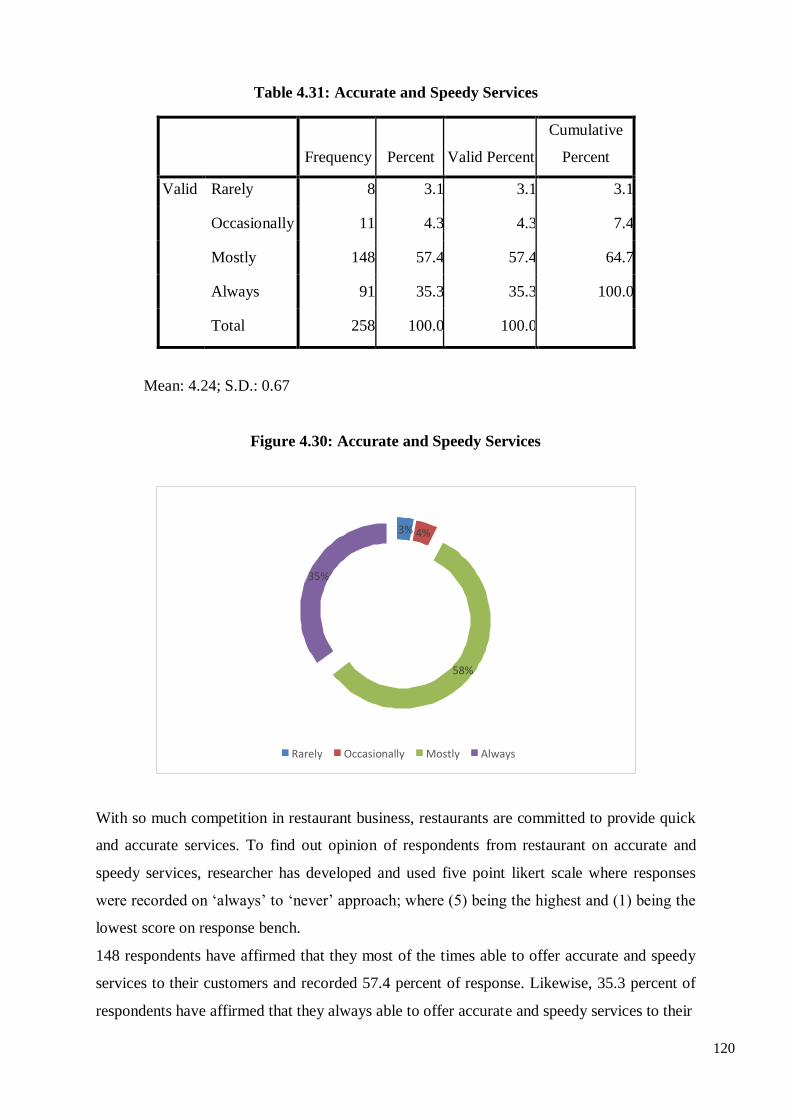
120
Table 4.31: Accurate and Speedy Services
Frequency
Percent
Valid Percent
Cumulative
Percent
Valid Rarely 8 3.1 3.1 3.1
Occasionally 11 4.3 4.3 7.4
Mostly 148 57.4 57.4 64.7
Always 91 35.3 35.3 100.0
Total 258 100.0 100.0
Mean: 4.24; S.D.: 0.67
Figure 4.30: Accurate and Speedy Services
With so much competition in restaurant business, restaurants are committed to provide quick
and accurate services. To find out opinion of respondents from restaurant on accurate and
speedy services, researcher has developed and used five point likert scale where responses
were recorded on ‘always’ to ‘never’ approach; where (5) being the highest and (1) being the
lowest score on response bench.
148 respondents have affirmed that they most of the times able to offer accurate and speedy
services to their customers and recorded 57.4 percent of response. Likewise, 35.3 percent of
respondents have affirmed that they always able to offer accurate and speedy services to their
3% 4%
35%
58%
Rarely Occasionally Mostly Always

121
customers. Merely, 3.1 percent of respondents have affirmed that they rarely able to offer
accurate and speedy services to their customers. The mean value of an element is observed as
4.24 with 0.67 values of standard deviations. As mean value is less than the mid value of
measurement scale and standard deviation is more than one third of mean, mean cannot be
the representative value. Thus it can be concluded that restaurants are able to offer accurate
and speedy services. Diagrammatic representation of the analysis is illustrated in figure 4.30.
Table 4.32: Type of Cuisine
Frequency
Percent
Valid Percent
Cumulative
Percent
Valid Multi Cuisine
International
61 23.6 23.6 23.6
Multi Cuisine Indian 123 47.7 47.7 71.3
Fast Food 42 16.3 16.3 87.6
Quick Service
Restaurant
9 3.5 3.5 91.1
Specialty Cuisine 23 8.9 8.9 100.0
Total 258 100.0 100.0
Figure 4.31: Type of Cuisine
48%
16%
Multi Cuisine International
Multi Cuisine Indian
Fast Food
Quick Service Restaurant
Specialty Cuisine
24% 3%
9%
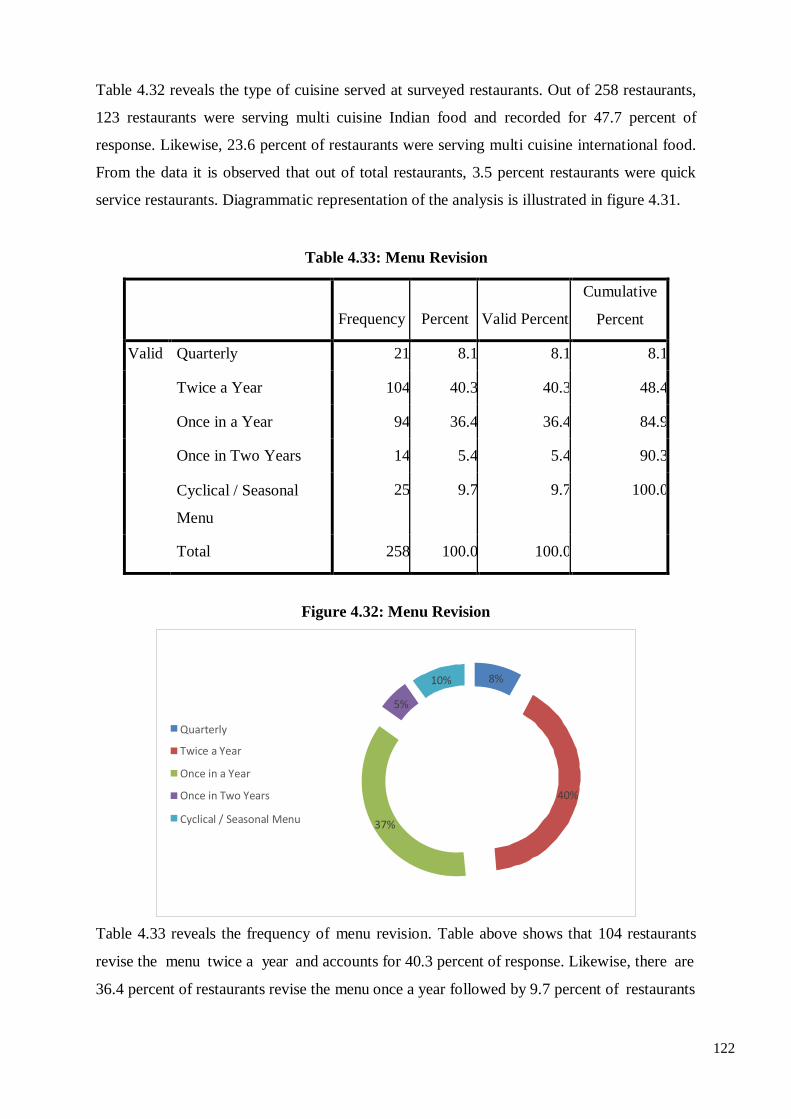
122
Table 4.32 reveals the type of cuisine served at surveyed restaurants. Out of 258 restaurants,
123 restaurants were serving multi cuisine Indian food and recorded for 47.7 percent of
response. Likewise, 23.6 percent of restaurants were serving multi cuisine international food.
From the data it is observed that out of total restaurants, 3.5 percent restaurants were quick
service restaurants. Diagrammatic representation of the analysis is illustrated in figure 4.31.
Table 4.33: Menu Revision
Frequency
Percent
Valid Percent
Cumulative
Percent
Valid Quarterly 21 8.1 8.1 8.1
Twice a Year 104 40.3 40.3 48.4
Once in a Year 94 36.4 36.4 84.9
Once in Two Years 14 5.4 5.4 90.3
Cyclical / Seasonal
Menu
25 9.7 9.7 100.0
Total 258 100.0 100.0
Figure 4.32: Menu Revision
Table 4.33 reveals the frequency of menu revision. Table above shows that 104 restaurants
revise the menu twice a year and accounts for 40.3 percent of response. Likewise, there are
36.4 percent of restaurants revise the menu once a year followed by 9.7 percent of restaurants
10% 8%
5%
Quarterly
Twice a Year
Once in a Year
Once in Two Years 40%
Cyclical / Seasonal Menu 37%

123
revising the menu seasonally. Merely, there are 5.4 percent of restaurants revising the menu
once in two years. Diagrammatic representation of the analysis is illustrated in figure 4.32.
Table 4.34: Impact of Price Rise on Customer Visits
Frequency
Percent
Valid Percent
Cumulative
Percent
Valid Huge Decrease 14 5.4 5.4 5.4
Small Decrease 148 57.4 57.4 62.8
No Impact 89 34.5 34.5 97.3
Small Increase 7 2.7 2.7 100.0
Total 258 100.0 100.0
Figure 4.33: Impact of Price Rise on Customer Visits
Table 4.34 reveals data of impact of price on restaurant customer visits.
148 respondents have acknowledged that they observed small decrease in sales with rise in
price and recorded for 57.4 percent of response. However, 34.5 percent of respondents
claimed that they have not observed any impact of increase in price on customer visit.
Surprisingly, 2.7 percent of respondents have claimed to observed increase in customer visits
instead of increase in price. Diagrammatic representation of the analysis is illustrated in
figure 4.33.
7
Small Increase No Impact Small Decrease Huge Decrease
0 14
20
89
60 40
148
160 140
120
100
80
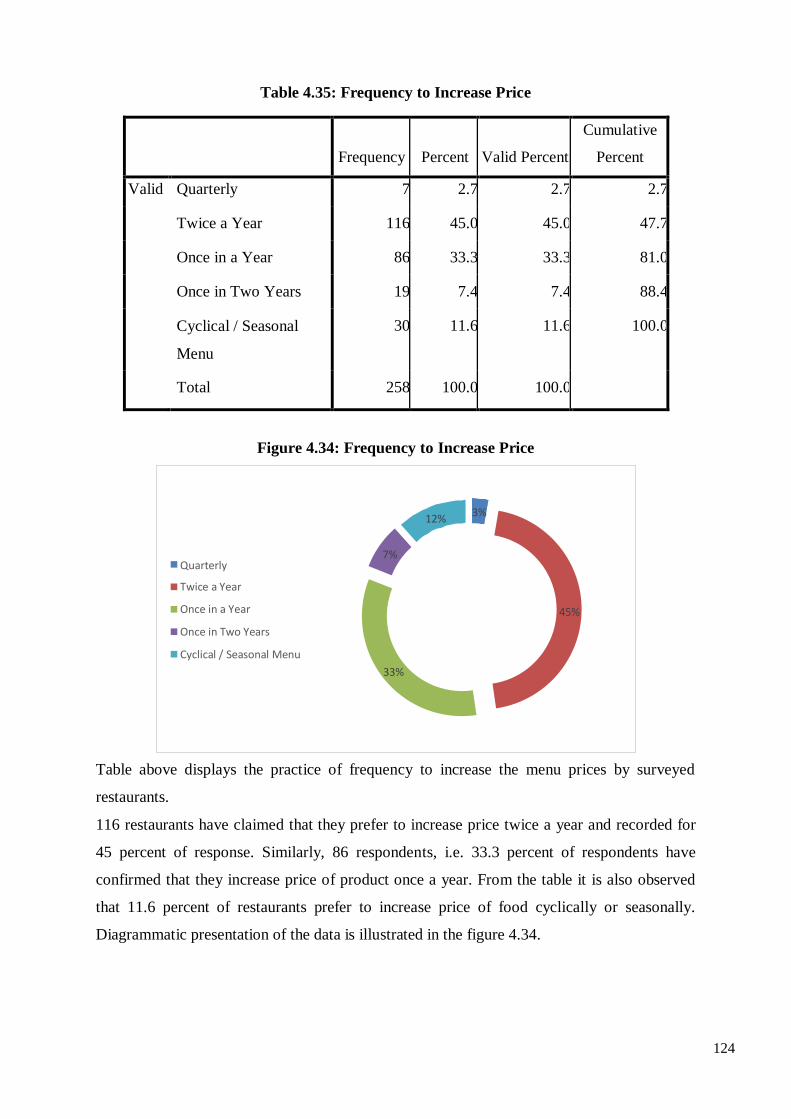
124
Table 4.35: Frequency to Increase Price
Frequency
Percent
Valid Percent
Cumulative
Percent
Valid Quarterly 7 2.7 2.7 2.7
Twice a Year 116 45.0 45.0 47.7
Once in a Year 86 33.3 33.3 81.0
Once in Two Years 19 7.4 7.4 88.4
Cyclical / Seasonal
Menu
30 11.6 11.6 100.0
Total 258 100.0 100.0
Figure 4.34: Frequency to Increase Price
Table above displays the practice of frequency to increase the menu prices by surveyed
restaurants.
116 restaurants have claimed that they prefer to increase price twice a year and recorded for
45 percent of response. Similarly, 86 respondents, i.e. 33.3 percent of respondents have
confirmed that they increase price of product once a year. From the table it is also observed
that 11.6 percent of restaurants prefer to increase price of food cyclically or seasonally.
Diagrammatic presentation of the data is illustrated in the figure 4.34.
33%
45%
Quarterly
Twice a Year
Once in a Year
Once in Two Years
Cyclical / Seasonal Menu
7%
3% 12%
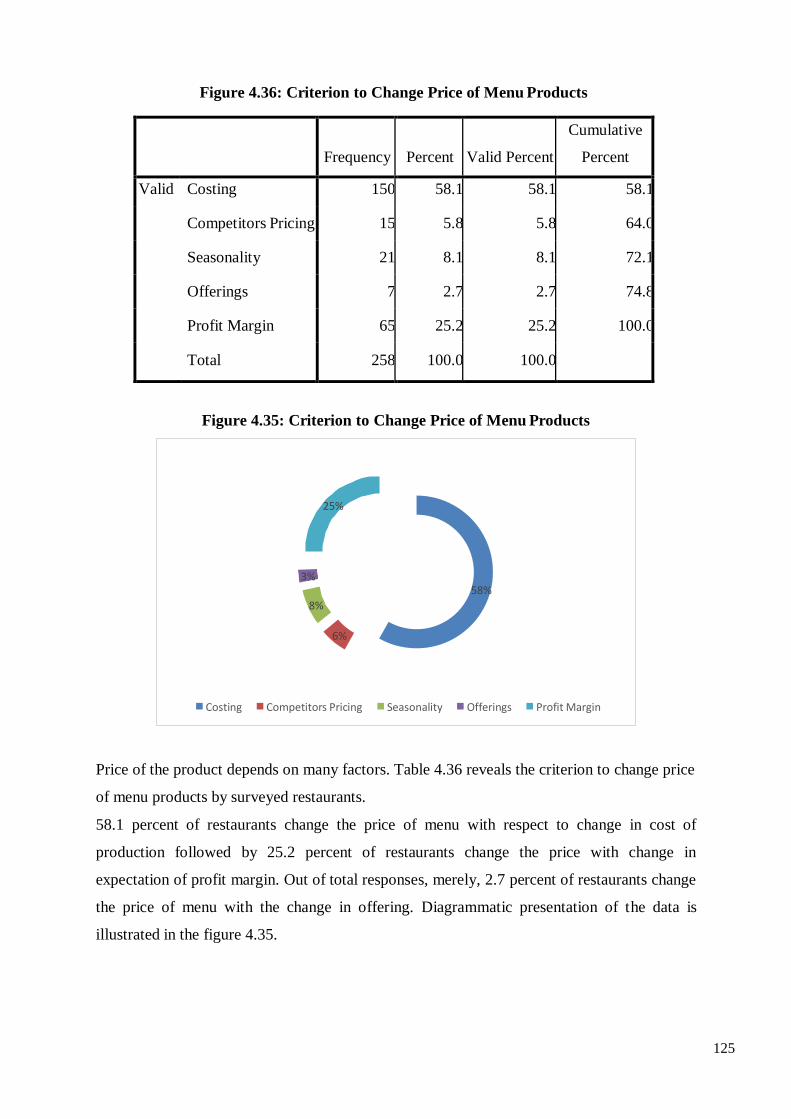
125
Figure 4.36: Criterion to Change Price of Menu Products
Frequency
Percent
Valid Percent
Cumulative
Percent
Valid Costing 150 58.1 58.1 58.1
Competitors Pricing 15 5.8 5.8 64.0
Seasonality 21 8.1 8.1 72.1
Offerings 7 2.7 2.7 74.8
Profit Margin 65 25.2 25.2 100.0
Total 258 100.0 100.0
Figure 4.35: Criterion to Change Price of Menu Products
Price of the product depends on many factors. Table 4.36 reveals the criterion to change price
of menu products by surveyed restaurants.
58.1 percent of restaurants change the price of menu with respect to change in cost of
production followed by 25.2 percent of restaurants change the price with change in
expectation of profit margin. Out of total responses, merely, 2.7 percent of restaurants change
the price of menu with the change in offering. Diagrammatic presentation of the data is
illustrated in the figure 4.35.
25%
3% 58%
8%
6%
Costing Competitors Pricing Seasonality Offerings Profit Margin
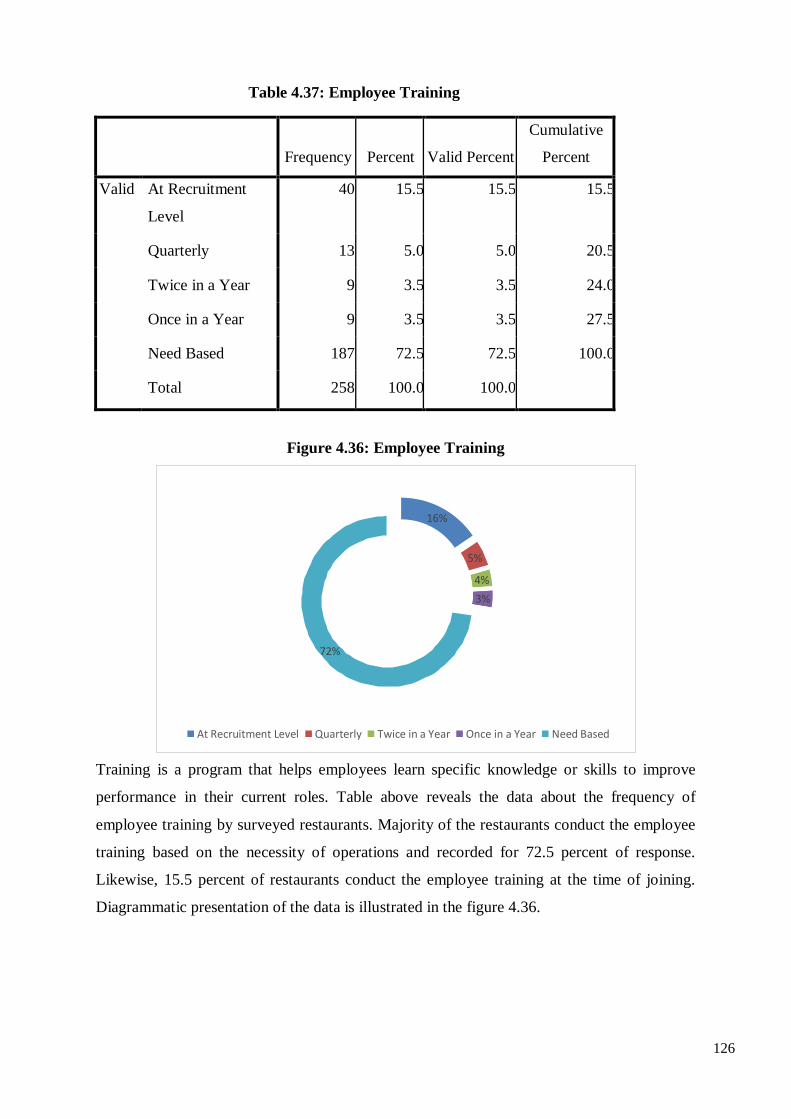
126
Table 4.37: Employee Training
Frequency
Percent
Valid Percent
Cumulative
Percent
Valid At Recruitment
Level
40 15.5 15.5 15.5
Quarterly 13 5.0 5.0 20.5
Twice in a Year 9 3.5 3.5 24.0
Once in a Year 9 3.5 3.5 27.5
Need Based 187 72.5 72.5 100.0
Total 258 100.0 100.0
Figure 4.36: Employee Training
Training is a program that helps employees learn specific knowledge or skills to improve
performance in their current roles. Table above reveals the data about the frequency of
employee training by surveyed restaurants. Majority of the restaurants conduct the employee
training based on the necessity of operations and recorded for 72.5 percent of response.
Likewise, 15.5 percent of restaurants conduct the employee training at the time of joining.
Diagrammatic presentation of the data is illustrated in the figure 4.36.
16%
5%
4%
3%
72%
At Recruitment Level Quarterly Twice in a Year Once in a Year Need Based
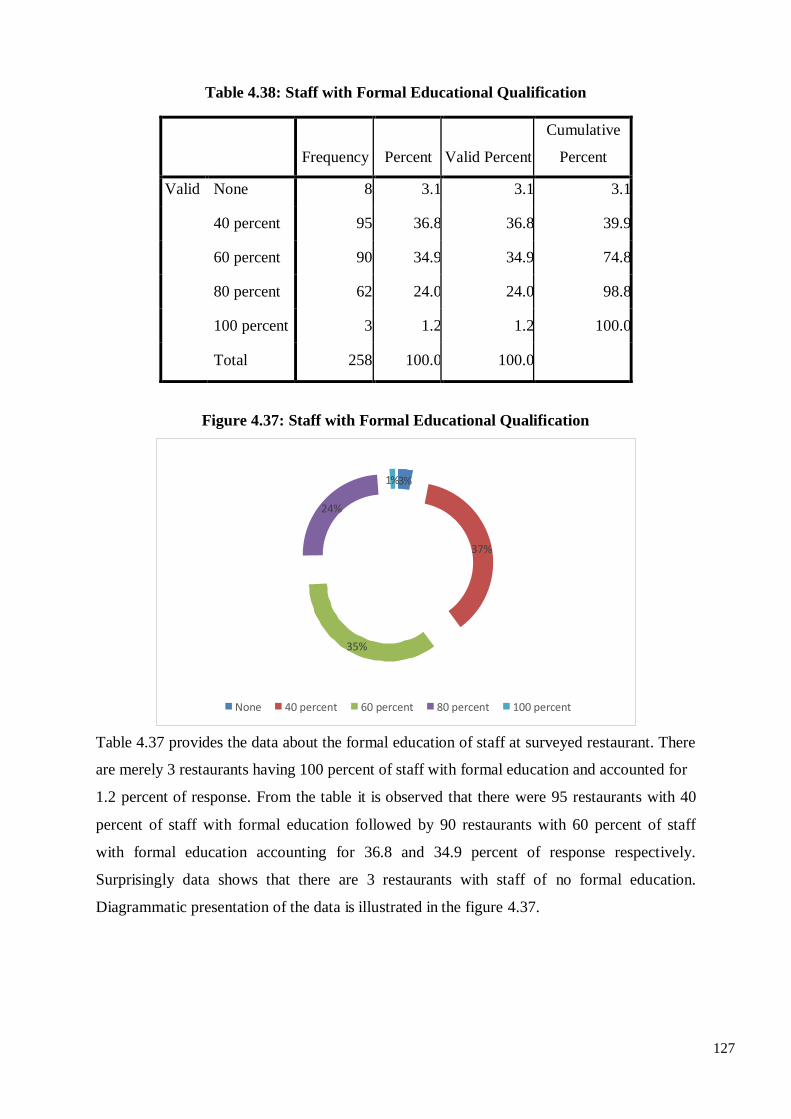
127
Table 4.38: Staff with Formal Educational Qualification
Frequency
Percent
Valid Percent
Cumulative
Percent
Valid None 8 3.1 3.1 3.1
40 percent 95 36.8 36.8 39.9
60 percent 90 34.9 34.9 74.8
80 percent 62 24.0 24.0 98.8
100 percent 3 1.2 1.2 100.0
Total 258 100.0 100.0
Figure 4.37: Staff with Formal Educational Qualification
Table 4.37 provides the data about the formal education of staff at surveyed restaurant. There
are merely 3 restaurants having 100 percent of staff with formal education and accounted for
1.2 percent of response. From the table it is observed that there were 95 restaurants with 40
percent of staff with formal education followed by 90 restaurants with 60 percent of staff
with formal education accounting for 36.8 and 34.9 percent of response respectively.
Surprisingly data shows that there are 3 restaurants with staff of no formal education.
Diagrammatic presentation of the data is illustrated in the figure 4.37.
1%3%
24%
37%
35%
None 40 percent 60 percent 80 percent 100 percent
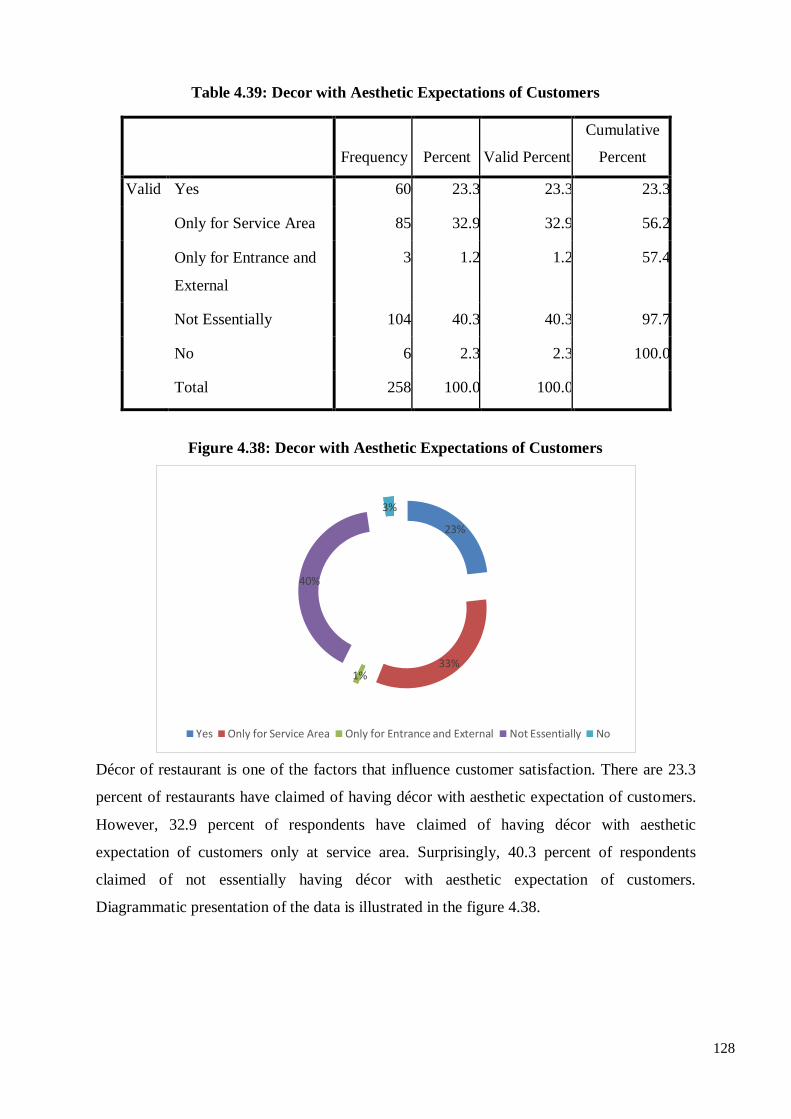
128
Table 4.39: Decor with Aesthetic Expectations of Customers
Frequency
Percent
Valid Percent
Cumulative
Percent
Valid Yes 60 23.3 23.3 23.3
Only for Service Area 85 32.9 32.9 56.2
Only for Entrance and
External
3 1.2 1.2 57.4
Not Essentially 104 40.3 40.3 97.7
No 6 2.3 2.3 100.0
Total 258 100.0 100.0
Figure 4.38: Decor with Aesthetic Expectations of Customers
Décor of restaurant is one of the factors that influence customer satisfaction. There are 23.3
percent of restaurants have claimed of having décor with aesthetic expectation of customers.
However, 32.9 percent of respondents have claimed of having décor with aesthetic
expectation of customers only at service area. Surprisingly, 40.3 percent of respondents
claimed of not essentially having décor with aesthetic expectation of customers.
Diagrammatic presentation of the data is illustrated in the figure 4.38.
3%
23%
40%
33%
1%
Yes Only for Service Area Only for Entrance and External Not Essentially No
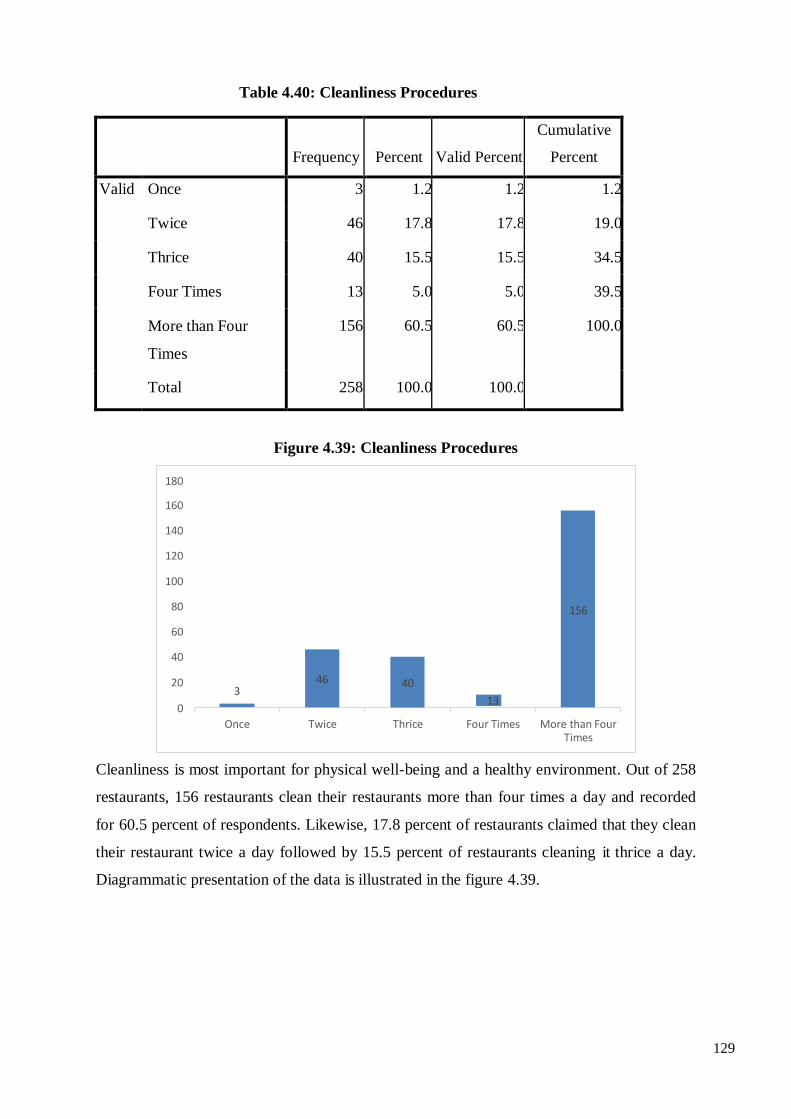
129
Table 4.40: Cleanliness Procedures
Frequency
Percent
Valid Percent
Cumulative
Percent
Valid Once 3 1.2 1.2 1.2
Twice 46 17.8 17.8 19.0
Thrice 40 15.5 15.5 34.5
Four Times 13 5.0 5.0 39.5
More than Four
Times
156 60.5 60.5 100.0
Total 258 100.0 100.0
Figure 4.39: Cleanliness Procedures
Cleanliness is most important for physical well-being and a healthy environment. Out of 258
restaurants, 156 restaurants clean their restaurants more than four times a day and recorded
for 60.5 percent of respondents. Likewise, 17.8 percent of restaurants claimed that they clean
their restaurant twice a day followed by 15.5 percent of restaurants cleaning it thrice a day.
Diagrammatic presentation of the data is illustrated in the figure 4.39.
Four Times More than Four Times
Thrice Twice Once
13 0
3
180
160
140
120
100
80
60
40
20
40
46
156
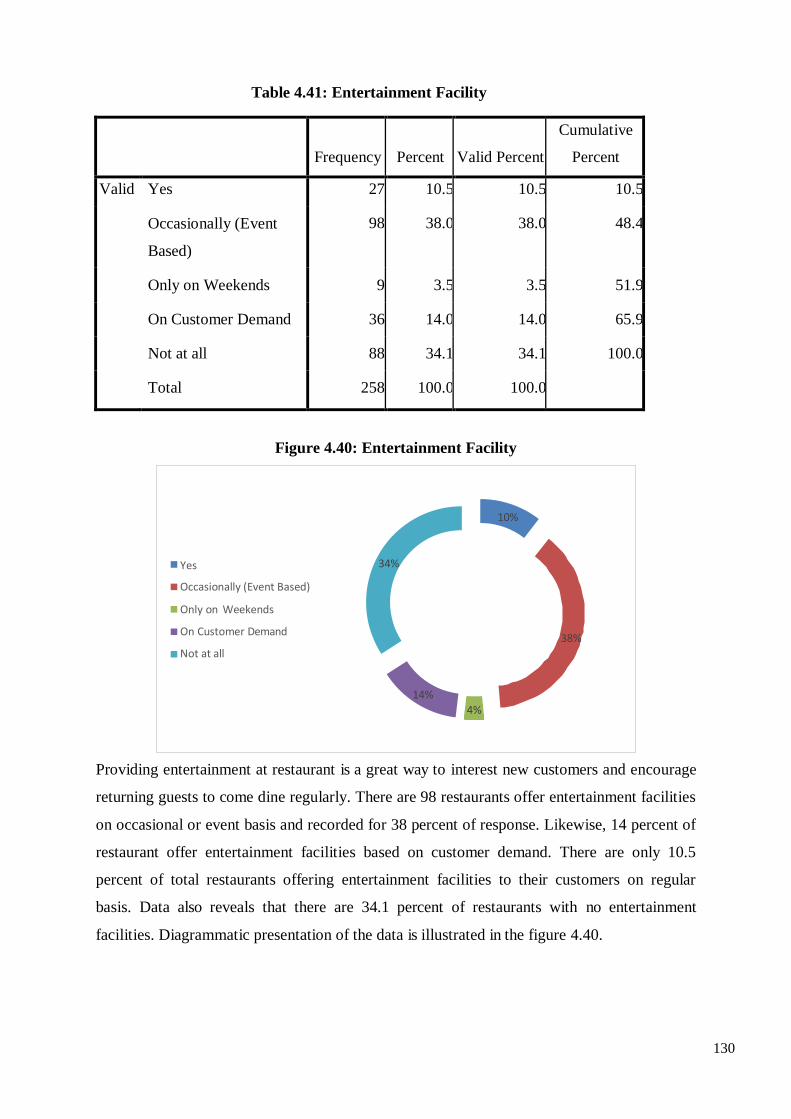
130
Table 4.41: Entertainment Facility
Frequency
Percent
Valid Percent
Cumulative
Percent
Valid Yes 27 10.5 10.5 10.5
Occasionally (Event
Based)
98 38.0 38.0 48.4
Only on Weekends 9 3.5 3.5 51.9
On Customer Demand 36 14.0 14.0 65.9
Not at all 88 34.1 34.1 100.0
Total 258 100.0 100.0
Figure 4.40: Entertainment Facility
Providing entertainment at restaurant is a great way to interest new customers and encourage
returning guests to come dine regularly. There are 98 restaurants offer entertainment facilities
on occasional or event basis and recorded for 38 percent of response. Likewise, 14 percent of
restaurant offer entertainment facilities based on customer demand. There are only 10.5
percent of total restaurants offering entertainment facilities to their customers on regular
basis. Data also reveals that there are 34.1 percent of restaurants with no entertainment
facilities. Diagrammatic presentation of the data is illustrated in the figure 4.40.
4%
14%
38%
34% Yes
Occasionally (Event Based)
Only on Weekends
On Customer Demand
Not at all
10%
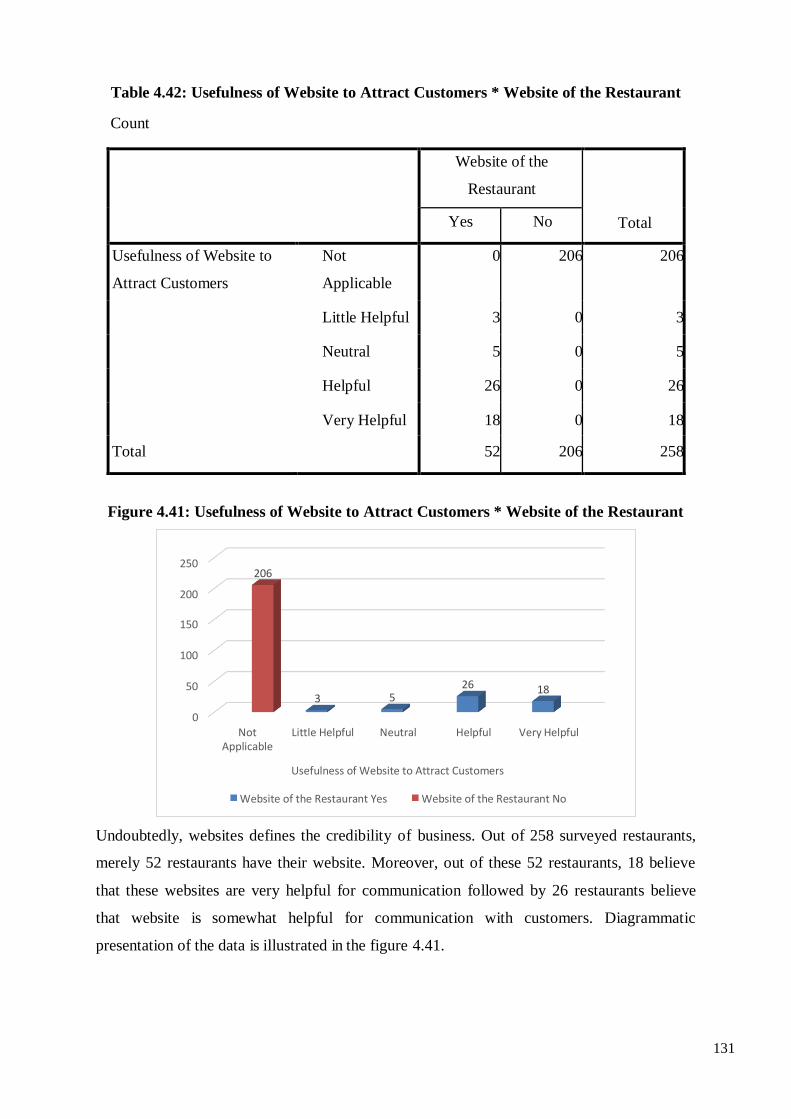
131
250 206
200 150
100
50 26
5 18
Usefulness of Website to Attract Customers
Website of the Restaurant Yes Website of the Restaurant No
Table 4.42: Usefulness of Website to Attract Customers * Website of the Restaurant
Count
Website of the
Restaurant
Total Yes No
Usefulness of Website to
Attract Customers
Not
Applicable
0 206 206
Little Helpful 3 0 3
Neutral 5 0 5
Helpful 26 0 26
Very Helpful 18 0 18
Total
52 206 258
Figure 4.41: Usefulness of Website to Attract Customers * Website of the Restaurant
3
0 Not
Little Helpful
Neutral Helpful Very Helpful
Applicable
Undoubtedly, websites defines the credibility of business. Out of 258 surveyed restaurants,
merely 52 restaurants have their website. Moreover, out of these 52 restaurants, 18 believe
that these websites are very helpful for communication followed by 26 restaurants believe
that website is somewhat helpful for communication with customers. Diagrammatic
presentation of the data is illustrated in the figure 4.41.
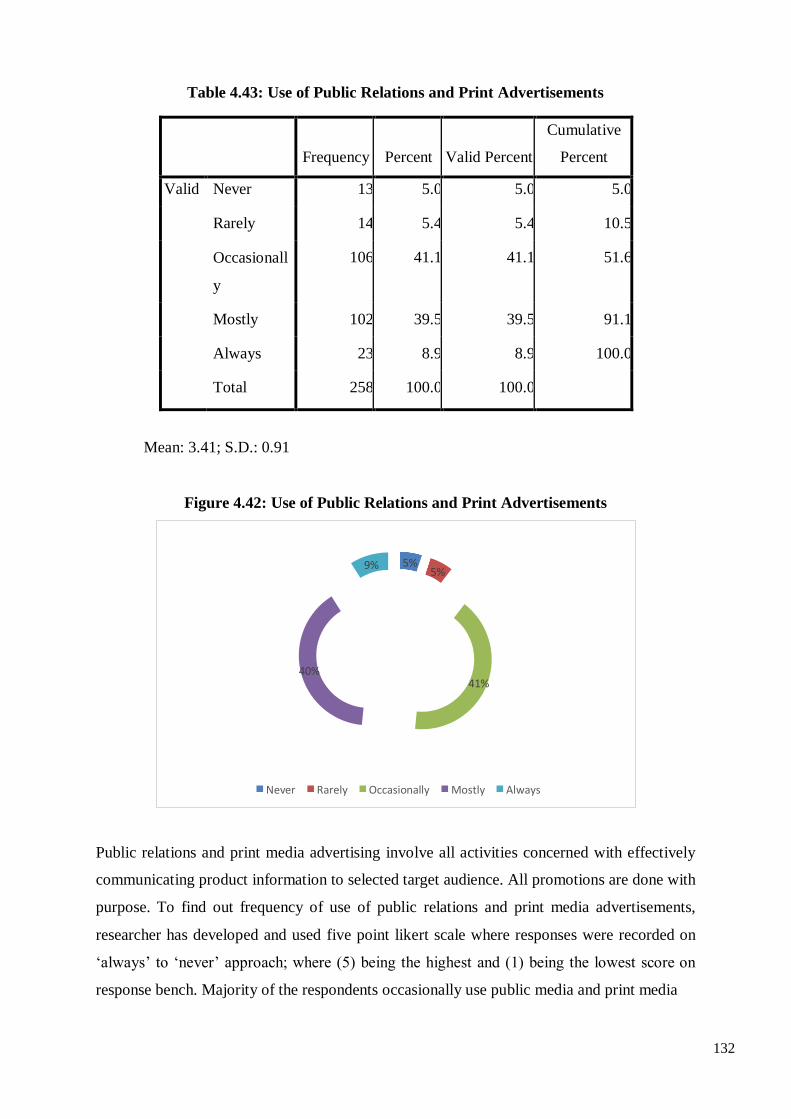
132
Table 4.43: Use of Public Relations and Print Advertisements
Frequency
Percent
Valid Percent
Cumulative
Percent
Valid Never 13 5.0 5.0 5.0
Rarely 14 5.4 5.4 10.5
Occasionall
y
106 41.1 41.1 51.6
Mostly 102 39.5 39.5 91.1
Always 23 8.9 8.9 100.0
Total 258 100.0 100.0
Mean: 3.41; S.D.: 0.91
Figure 4.42: Use of Public Relations and Print Advertisements
Public relations and print media advertising involve all activities concerned with effectively
communicating product information to selected target audience. All promotions are done with
purpose. To find out frequency of use of public relations and print media advertisements,
researcher has developed and used five point likert scale where responses were recorded on
‘always’ to ‘never’ approach; where (5) being the highest and (1) being the lowest score on
response bench. Majority of the respondents occasionally use public media and print media
9% 5% 5%
40% 41%
Never Rarely Occasionally Mostly Always

133
advertisements to communicate with their target customers and recorded for 41.1 percent of
response. There are only 8.9 percent of restaurants who frequently uses print media
advertisements to communicate with their target customers. The mean value of an element is
observed as 3.41 with 0.91 values of standard deviations. As standard deviation is lesser than
one third of mean on five point likert scale, mean is the representative value. Thus it can be
concluded that restaurants frequently uses public relations and print media advertisements to
communicate with their target customers. Diagrammatic representation of the analysis is
illustrated in figure 4.42.
Table 4.44: Type of Media to Attract the Customers
Frequency
Percent
Valid Percent
Cumulative
Percent
Valid Television 31 12.0 12.0 12.0
Radio 8 3.1 3.1 15.1
Newspaper 38 14.7 14.7 29.8
On Screens of
Multiplex
5 1.9 1.9 31.8
Messages on Mobile 176 68.2 68.2 100.0
Total 258 100.0 100.0
Figure 4.43: Type of Media to Attract the Customers
Newspaper On Screens of Messages on Multiplex Mobile
Radio Television
0
5 38 8 31 20
176
200
180
160
140
120
100
80
60
40
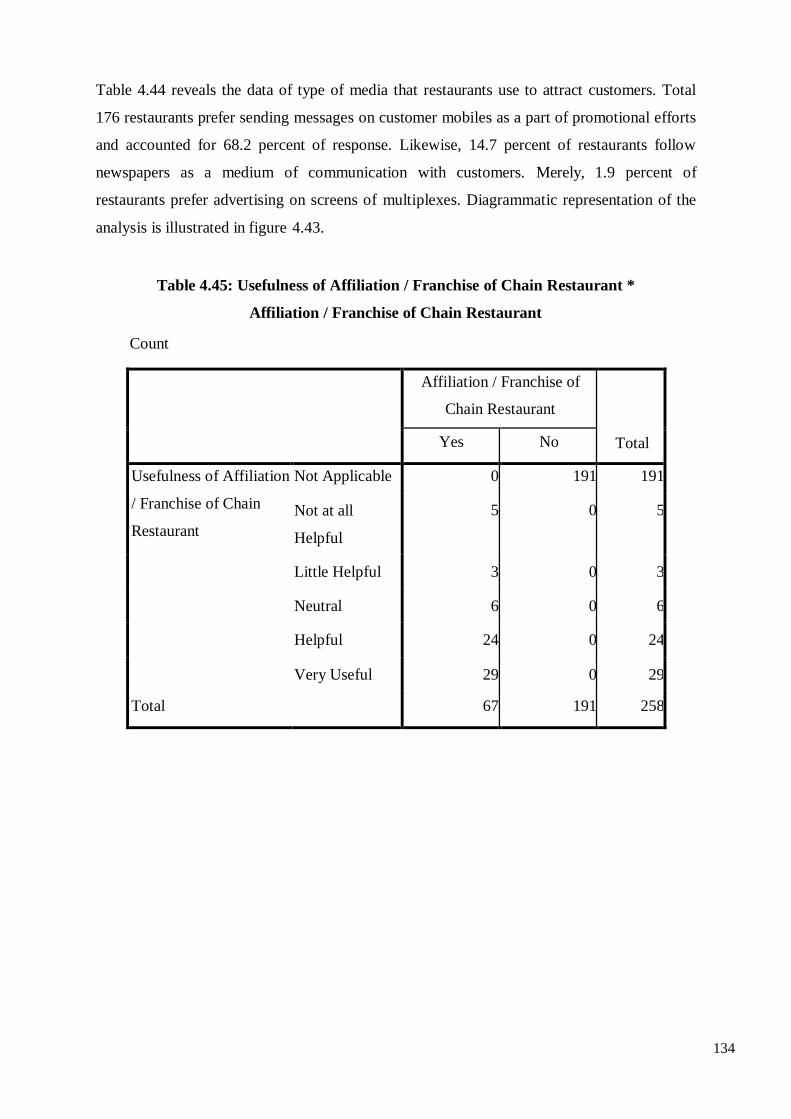
134
Table 4.44 reveals the data of type of media that restaurants use to attract customers. Total
176 restaurants prefer sending messages on customer mobiles as a part of promotional efforts
and accounted for 68.2 percent of response. Likewise, 14.7 percent of restaurants follow
newspapers as a medium of communication with customers. Merely, 1.9 percent of
restaurants prefer advertising on screens of multiplexes. Diagrammatic representation of the
analysis is illustrated in figure 4.43.
Table 4.45: Usefulness of Affiliation / Franchise of Chain Restaurant *
Affiliation / Franchise of Chain Restaurant
Count
Affiliation / Franchise of
Chain Restaurant
Total Yes No
Usefulness of Affiliation
/ Franchise of Chain
Restaurant
Not Applicable 0 191 191
Not at all
Helpful
5 0 5
Little Helpful 3 0 3
Neutral 6 0 6
Helpful 24 0 24
Very Useful 29 0 29
Total
67 191 258
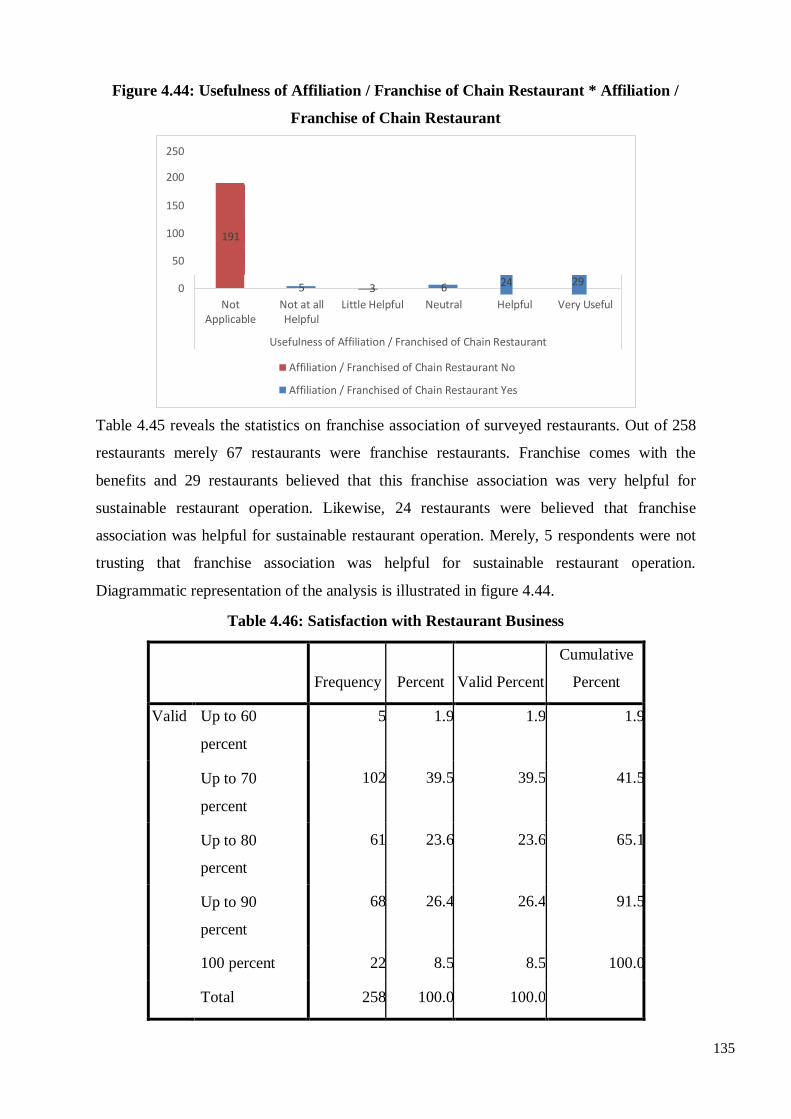
135
Affiliation / Franchised of Chain Restaurant No
Affiliation / Franchised of Chain Restaurant Yes
Figure 4.44: Usefulness of Affiliation / Franchise of Chain Restaurant * Affiliation /
Franchise of Chain Restaurant
250
200
150
100 191
50
0 5 3 6 24 29
Not Not at all Little Helpful Neutral Helpful Very Useful Applicable Helpful
Usefulness of Affiliation / Franchised of Chain Restaurant
Table 4.45 reveals the statistics on franchise association of surveyed restaurants. Out of 258
restaurants merely 67 restaurants were franchise restaurants. Franchise comes with the
benefits and 29 restaurants believed that this franchise association was very helpful for
sustainable restaurant operation. Likewise, 24 restaurants were believed that franchise
association was helpful for sustainable restaurant operation. Merely, 5 respondents were not
trusting that franchise association was helpful for sustainable restaurant operation.
Diagrammatic representation of the analysis is illustrated in figure 4.44.
Table 4.46: Satisfaction with Restaurant Business
Frequency
Percent
Valid Percent
Cumulative
Percent
Valid Up to 60
percent
5 1.9 1.9 1.9
Up to 70
percent
102 39.5 39.5 41.5
Up to 80
percent
61 23.6 23.6 65.1
Up to 90
percent
68 26.4 26.4 91.5
100 percent 22 8.5 8.5 100.0
Total 258 100.0 100.0

136
Figure 4.45: Satisfaction with Restaurant Business
Table 4.46 reveals the opinion of respondents regarding their satisfaction with their restaurant
business. Table above shows that 102 respondents were 70 percent satisfied, with their
restaurant business and accounted for 39.5 percent of response. Similarly, 26.4 percent were
90 percent satisfied with their restaurant business followed by 23.6 percent were 80 percent
satisfied with their restaurant business. Diagrammatic representation of the analysis is
illustrated in figure 4.45.
100 percent
5
Up to 60 percent Up to 70 percent Up to 80 percent Up to 90 percent 0
22
20
68 61
40
102
60
80
100
120

137
Table 4.47: Importance of Place
Frequency
Percent
Valid Percent
Cumulative
Percent
Valid Not at all Important 18 7.0 7.0 7.0
Not Important 17 6.6 6.6 13.6
Somewhat
Important
9 3.5 3.5 17.1
Moderately
Important
18 7.0 7.0 24.0
Important 25 9.7 9.7 33.7
Very Important 45 17.4 17.4 51.2
Extremely
Important
126 48.8 48.8 100.0
Total 258 100.0 100.0
Figure 4.46: Importance of Place
To find out importance of place from restaurant perspective, researcher has developed and
used seven point rating scale where responses were recorded on ‘extremely important’ to ‘not
7%
7% Not at all Important
Not Important
Somewhat Important
Moderately Important
Important
3%
7%
49%
10%
Very Important
Extremely Important
17%
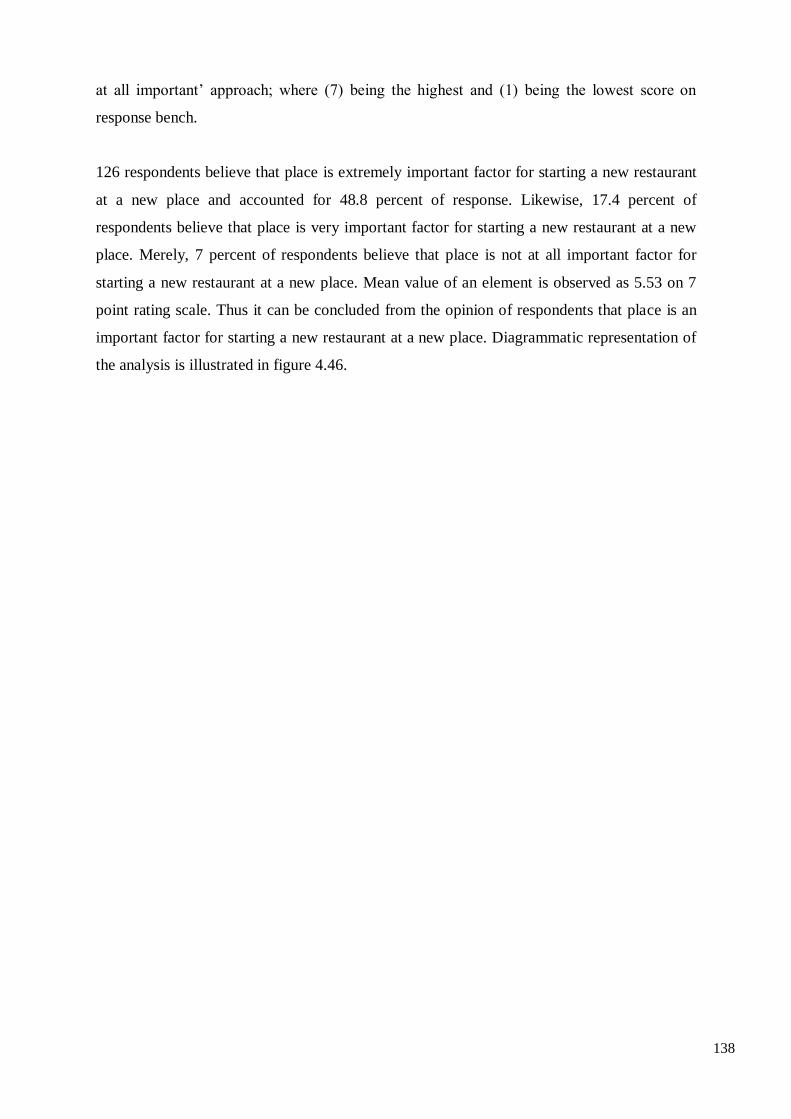
138
at all important’ approach; where (7) being the highest and (1) being the lowest score on
response bench.
126 respondents believe that place is extremely important factor for starting a new restaurant
at a new place and accounted for 48.8 percent of response. Likewise, 17.4 percent of
respondents believe that place is very important factor for starting a new restaurant at a new
place. Merely, 7 percent of respondents believe that place is not at all important factor for
starting a new restaurant at a new place. Mean value of an element is observed as 5.53 on 7
point rating scale. Thus it can be concluded from the opinion of respondents that place is an
important factor for starting a new restaurant at a new place. Diagrammatic representation of
the analysis is illustrated in figure 4.46.
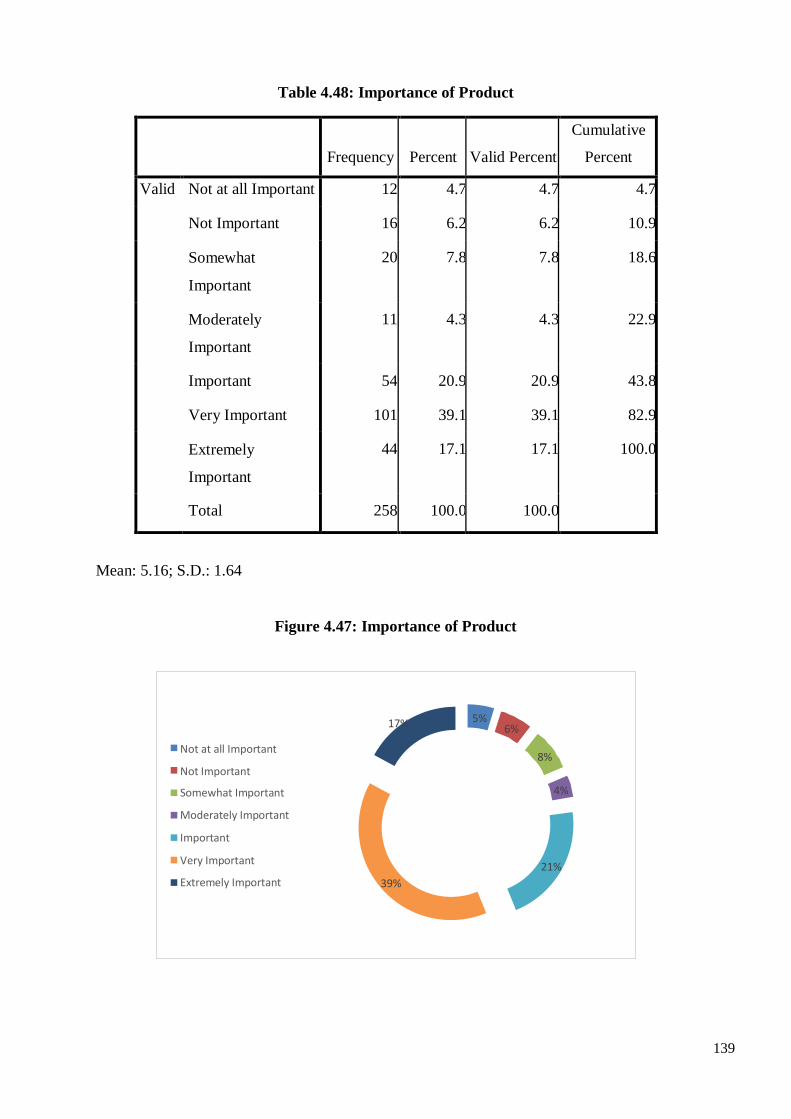
139
Table 4.48: Importance of Product
Frequency
Percent
Valid Percent
Cumulative
Percent
Valid Not at all Important 12 4.7 4.7 4.7
Not Important 16 6.2 6.2 10.9
Somewhat
Important
20 7.8 7.8 18.6
Moderately
Important
11 4.3 4.3 22.9
Important 54 20.9 20.9 43.8
Very Important 101 39.1 39.1 82.9
Extremely
Important
44 17.1 17.1 100.0
Total 258 100.0 100.0
Mean: 5.16; S.D.: 1.64
Figure 4.47: Importance of Product
39%
21%
4%
Not Important
Somewhat Important
Moderately Important
Important
Very Important
Extremely Important
8% Not at all Important
6% 5% 17%
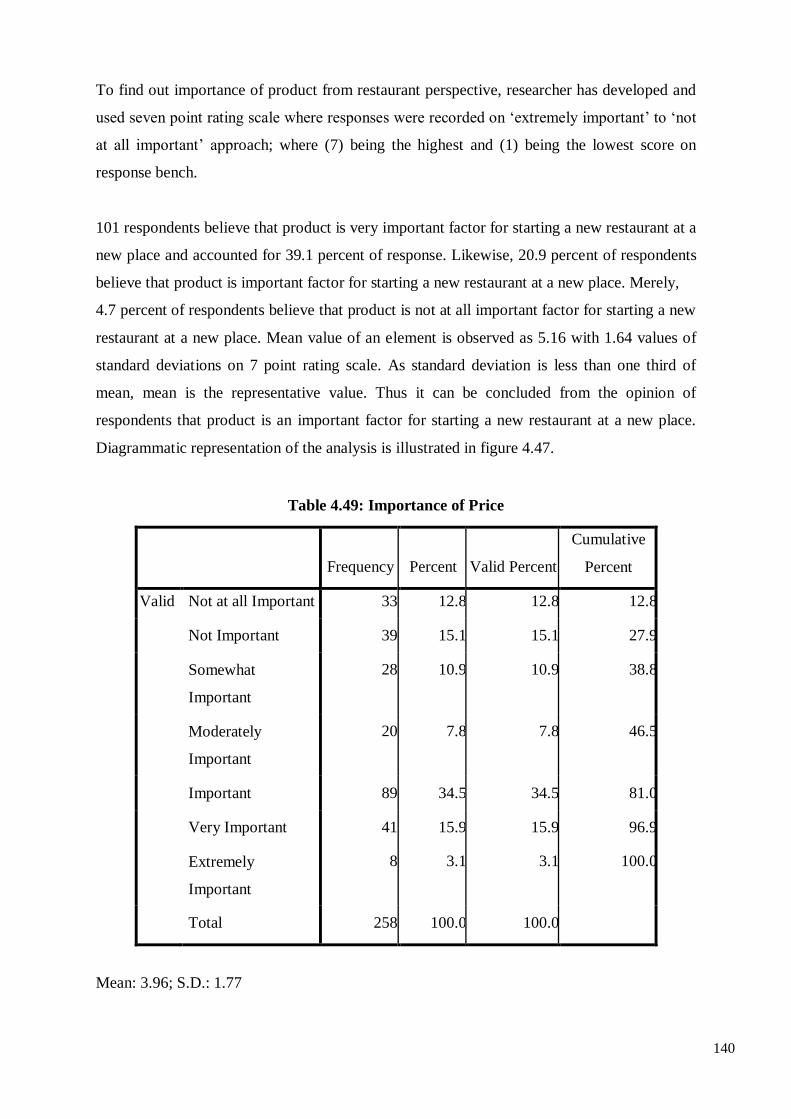
140
To find out importance of product from restaurant perspective, researcher has developed and
used seven point rating scale where responses were recorded on ‘extremely important’ to ‘not
at all important’ approach; where (7) being the highest and (1) being the lowest score on
response bench.
101 respondents believe that product is very important factor for starting a new restaurant at a
new place and accounted for 39.1 percent of response. Likewise, 20.9 percent of respondents
believe that product is important factor for starting a new restaurant at a new place. Merely,
4.7 percent of respondents believe that product is not at all important factor for starting a new
restaurant at a new place. Mean value of an element is observed as 5.16 with 1.64 values of
standard deviations on 7 point rating scale. As standard deviation is less than one third of
mean, mean is the representative value. Thus it can be concluded from the opinion of
respondents that product is an important factor for starting a new restaurant at a new place.
Diagrammatic representation of the analysis is illustrated in figure 4.47.
Table 4.49: Importance of Price
Frequency
Percent
Valid Percent
Cumulative
Percent
Valid Not at all Important 33 12.8 12.8 12.8
Not Important 39 15.1 15.1 27.9
Somewhat
Important
28 10.9 10.9 38.8
Moderately
Important
20 7.8 7.8 46.5
Important 89 34.5 34.5 81.0
Very Important 41 15.9 15.9 96.9
Extremely
Important
8 3.1 3.1 100.0
Total 258 100.0 100.0
Mean: 3.96; S.D.: 1.77
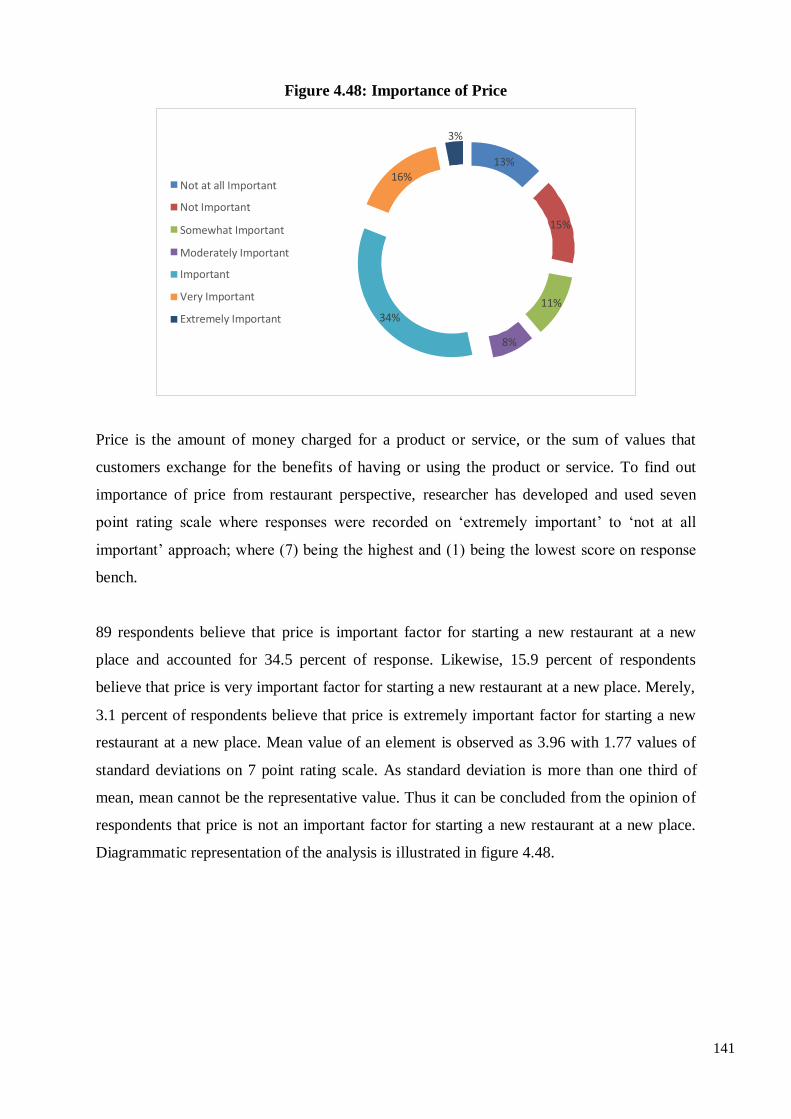
141
Figure 4.48: Importance of Price
Price is the amount of money charged for a product or service, or the sum of values that
customers exchange for the benefits of having or using the product or service. To find out
importance of price from restaurant perspective, researcher has developed and used seven
point rating scale where responses were recorded on ‘extremely important’ to ‘not at all
important’ approach; where (7) being the highest and (1) being the lowest score on response
bench.
89 respondents believe that price is important factor for starting a new restaurant at a new
place and accounted for 34.5 percent of response. Likewise, 15.9 percent of respondents
believe that price is very important factor for starting a new restaurant at a new place. Merely,
3.1 percent of respondents believe that price is extremely important factor for starting a new
restaurant at a new place. Mean value of an element is observed as 3.96 with 1.77 values of
standard deviations on 7 point rating scale. As standard deviation is more than one third of
mean, mean cannot be the representative value. Thus it can be concluded from the opinion of
respondents that price is not an important factor for starting a new restaurant at a new place.
Diagrammatic representation of the analysis is illustrated in figure 4.48.
3%
13%
Not at all Important
Not Important
16%
Somewhat Important 15%
Moderately Important
Important
Very Important
Extremely Important
11% 34%
8%
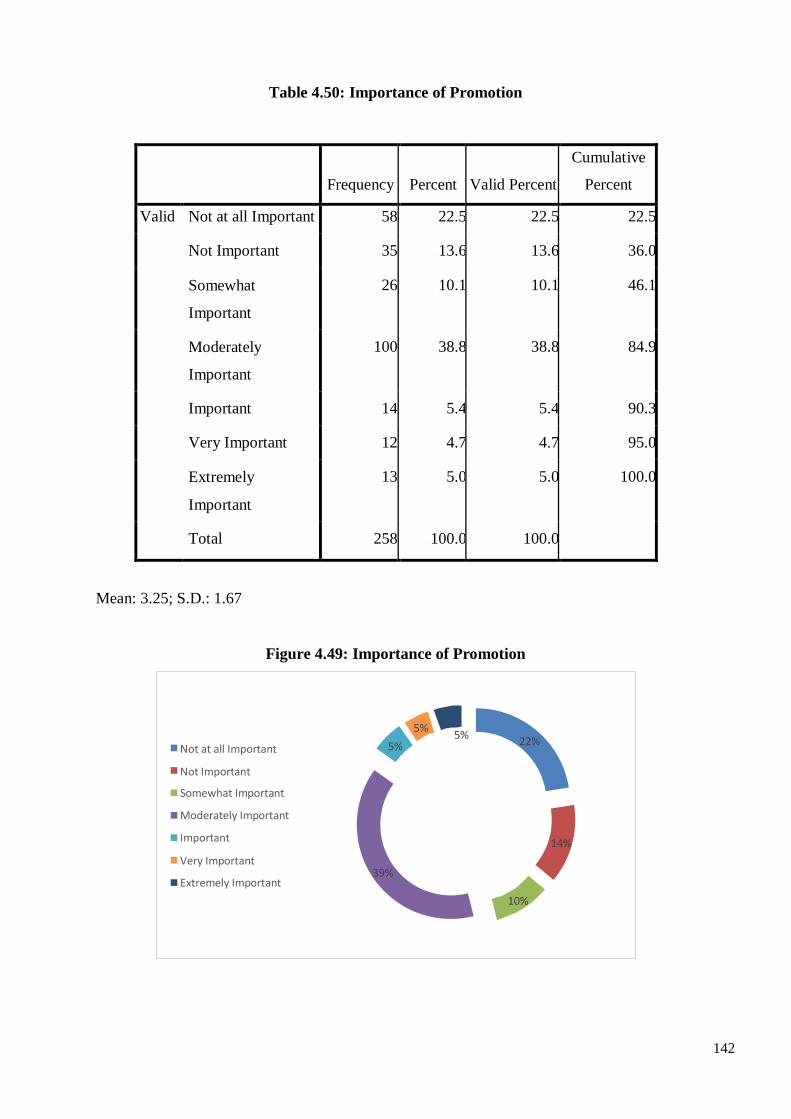
142
Table 4.50: Importance of Promotion
Frequency
Percent
Valid Percent
Cumulative
Percent
Valid Not at all Important 58 22.5 22.5 22.5
Not Important 35 13.6 13.6 36.0
Somewhat
Important
26 10.1 10.1 46.1
Moderately
Important
100 38.8 38.8 84.9
Important 14 5.4 5.4 90.3
Very Important 12 4.7 4.7 95.0
Extremely
Important
13 5.0 5.0 100.0
Total 258 100.0 100.0
Mean: 3.25; S.D.: 1.67
Figure 4.49: Importance of Promotion
10%
39%
14%
Not Important
Somewhat Important
Moderately Important
Important
Very Important
Extremely Important
22% 5% Not at all Important 5%
5%
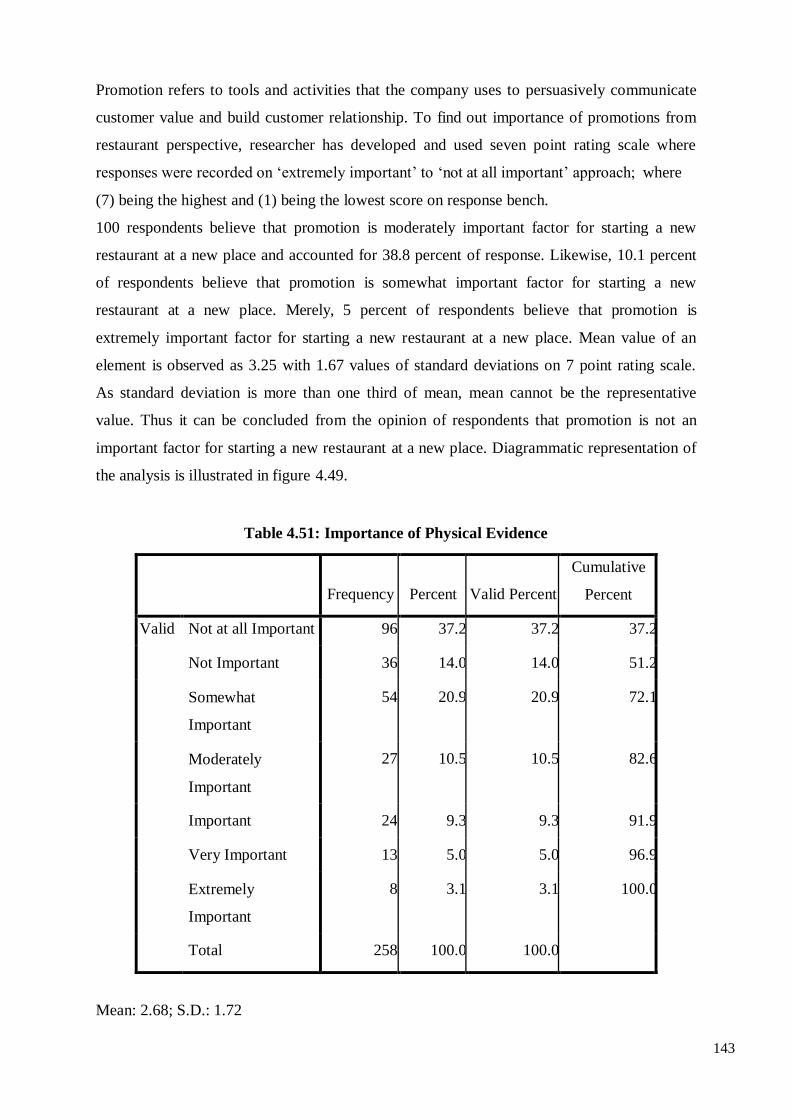
143
Promotion refers to tools and activities that the company uses to persuasively communicate
customer value and build customer relationship. To find out importance of promotions from
restaurant perspective, researcher has developed and used seven point rating scale where
responses were recorded on ‘extremely important’ to ‘not at all important’ approach; where
(7) being the highest and (1) being the lowest score on response bench.
100 respondents believe that promotion is moderately important factor for starting a new
restaurant at a new place and accounted for 38.8 percent of response. Likewise, 10.1 percent
of respondents believe that promotion is somewhat important factor for starting a new
restaurant at a new place. Merely, 5 percent of respondents believe that promotion is
extremely important factor for starting a new restaurant at a new place. Mean value of an
element is observed as 3.25 with 1.67 values of standard deviations on 7 point rating scale.
As standard deviation is more than one third of mean, mean cannot be the representative
value. Thus it can be concluded from the opinion of respondents that promotion is not an
important factor for starting a new restaurant at a new place. Diagrammatic representation of
the analysis is illustrated in figure 4.49.
Table 4.51: Importance of Physical Evidence
Frequency
Percent
Valid Percent
Cumulative
Percent
Valid Not at all Important 96 37.2 37.2 37.2
Not Important 36 14.0 14.0 51.2
Somewhat
Important
54 20.9 20.9 72.1
Moderately
Important
27 10.5 10.5 82.6
Important 24 9.3 9.3 91.9
Very Important 13 5.0 5.0 96.9
Extremely
Important
8 3.1 3.1 100.0
Total 258 100.0 100.0
Mean: 2.68; S.D.: 1.72
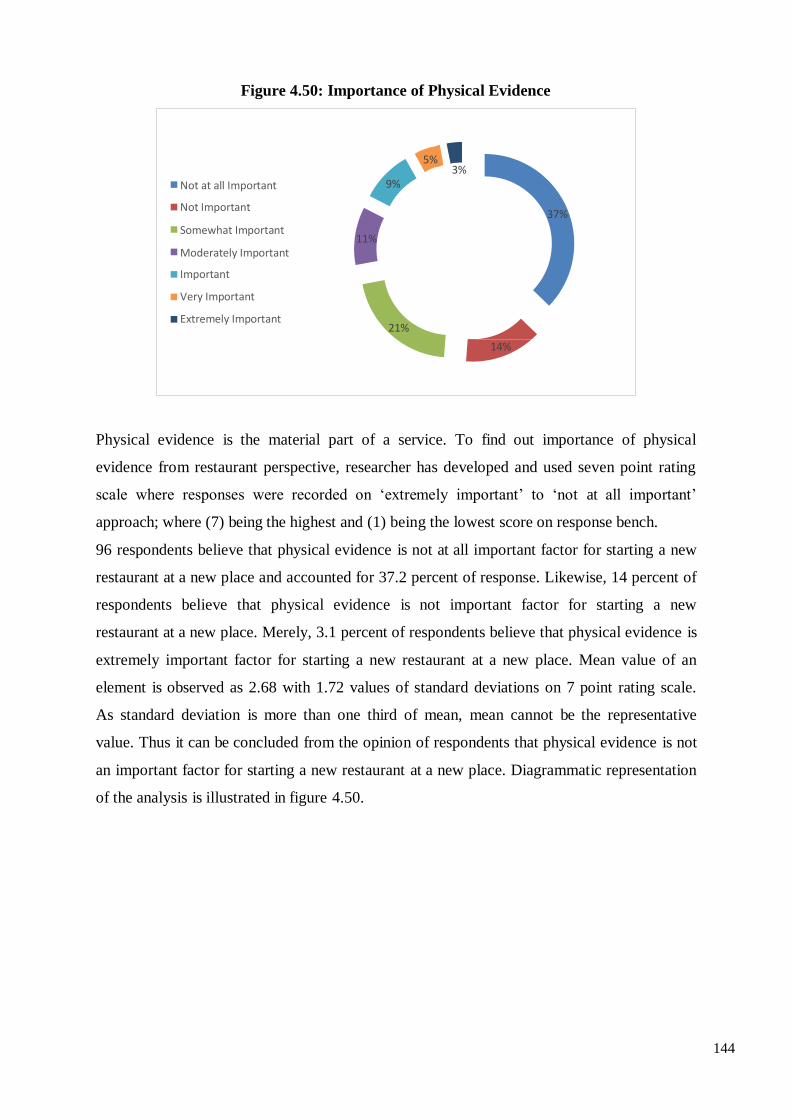
144
Figure 4.50: Importance of Physical Evidence
Physical evidence is the material part of a service. To find out importance of physical
evidence from restaurant perspective, researcher has developed and used seven point rating
scale where responses were recorded on ‘extremely important’ to ‘not at all important’
approach; where (7) being the highest and (1) being the lowest score on response bench.
96 respondents believe that physical evidence is not at all important factor for starting a new
restaurant at a new place and accounted for 37.2 percent of response. Likewise, 14 percent of
respondents believe that physical evidence is not important factor for starting a new
restaurant at a new place. Merely, 3.1 percent of respondents believe that physical evidence is
extremely important factor for starting a new restaurant at a new place. Mean value of an
element is observed as 2.68 with 1.72 values of standard deviations on 7 point rating scale.
As standard deviation is more than one third of mean, mean cannot be the representative
value. Thus it can be concluded from the opinion of respondents that physical evidence is not
an important factor for starting a new restaurant at a new place. Diagrammatic representation
of the analysis is illustrated in figure 4.50.
5% 3%
Not at all Important
Not Important
9%
37%
Somewhat Important 11%
Moderately Important
Important
Very Important
Extremely Important 21%
14%
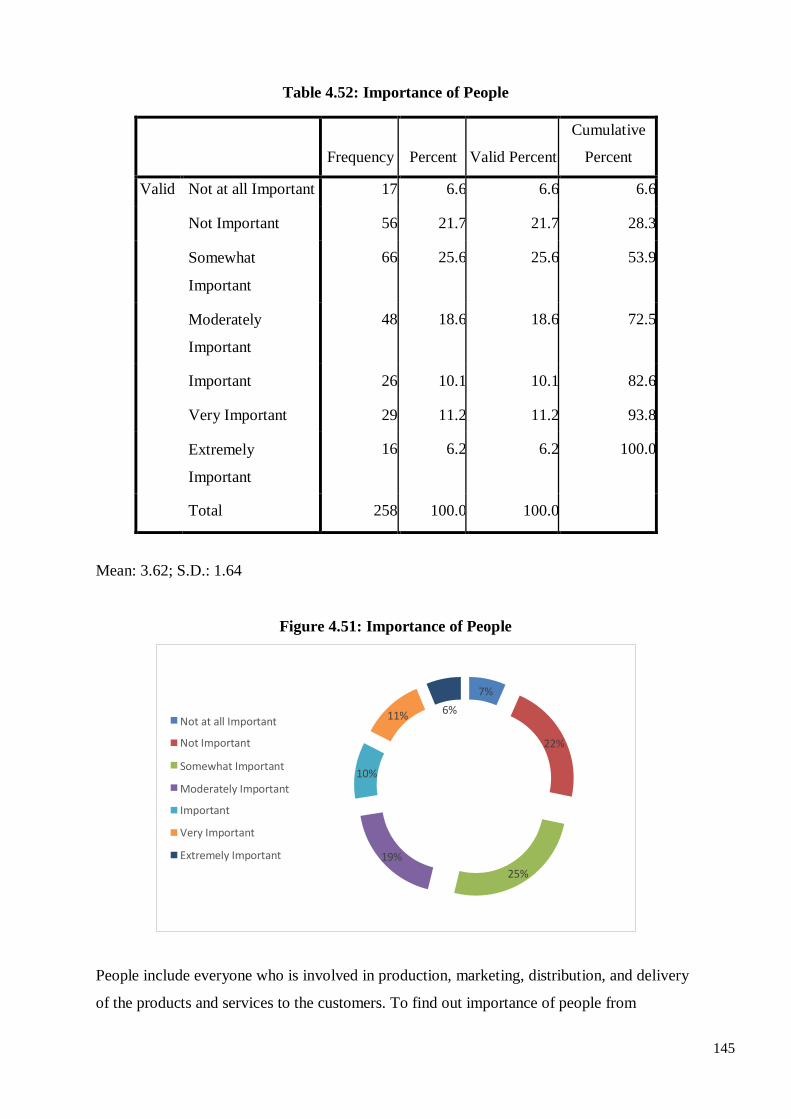
145
Table 4.52: Importance of People
Frequency
Percent
Valid Percent
Cumulative
Percent
Valid Not at all Important 17 6.6 6.6 6.6
Not Important 56 21.7 21.7 28.3
Somewhat
Important
66 25.6 25.6 53.9
Moderately
Important
48 18.6 18.6 72.5
Important 26 10.1 10.1 82.6
Very Important 29 11.2 11.2 93.8
Extremely
Important
16 6.2 6.2 100.0
Total 258 100.0 100.0
Mean: 3.62; S.D.: 1.64
Figure 4.51: Importance of People
People include everyone who is involved in production, marketing, distribution, and delivery
of the products and services to the customers. To find out importance of people from
25%
19%
Moderately Important
Important
Very Important
Extremely Important
10% Somewhat Important
22%
11% Not at all Important
Not Important
6%
7%
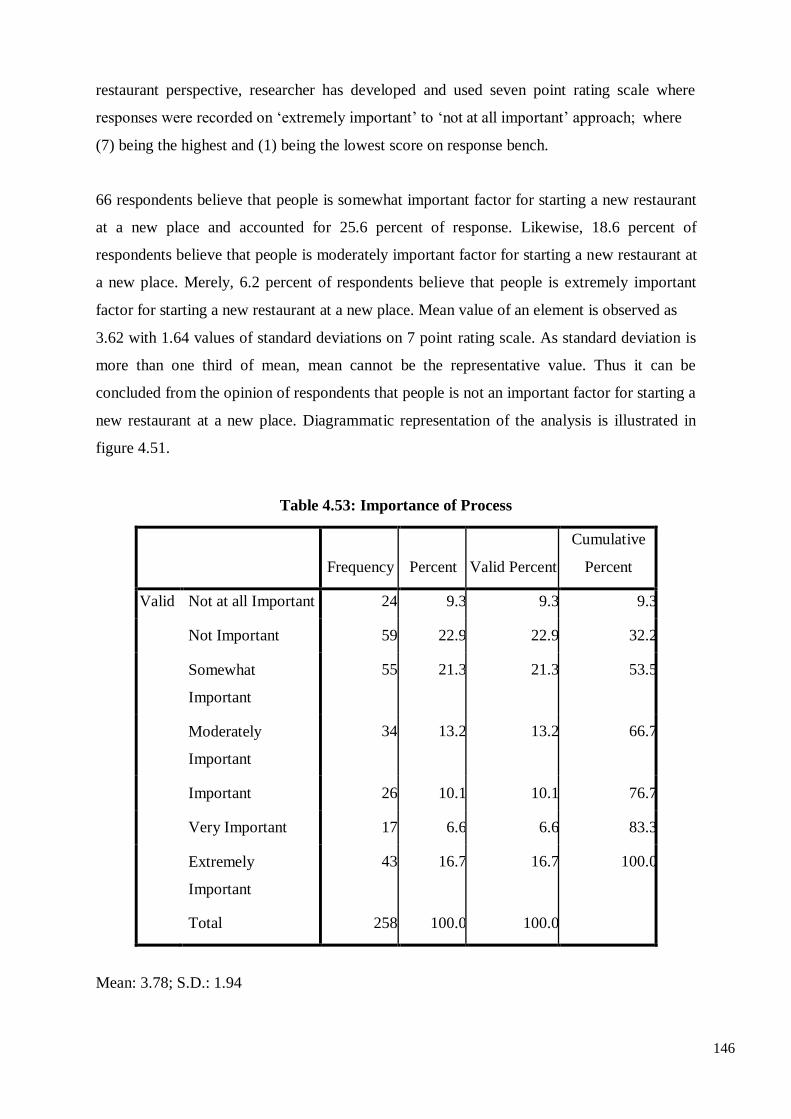
146
restaurant perspective, researcher has developed and used seven point rating scale where
responses were recorded on ‘extremely important’ to ‘not at all important’ approach; where
(7) being the highest and (1) being the lowest score on response bench.
66 respondents believe that people is somewhat important factor for starting a new restaurant
at a new place and accounted for 25.6 percent of response. Likewise, 18.6 percent of
respondents believe that people is moderately important factor for starting a new restaurant at
a new place. Merely, 6.2 percent of respondents believe that people is extremely important
factor for starting a new restaurant at a new place. Mean value of an element is observed as
3.62 with 1.64 values of standard deviations on 7 point rating scale. As standard deviation is
more than one third of mean, mean cannot be the representative value. Thus it can be
concluded from the opinion of respondents that people is not an important factor for starting a
new restaurant at a new place. Diagrammatic representation of the analysis is illustrated in
figure 4.51.
Table 4.53: Importance of Process
Frequency
Percent
Valid Percent
Cumulative
Percent
Valid Not at all Important 24 9.3 9.3 9.3
Not Important 59 22.9 22.9 32.2
Somewhat
Important
55 21.3 21.3 53.5
Moderately
Important
34 13.2 13.2 66.7
Important 26 10.1 10.1 76.7
Very Important 17 6.6 6.6 83.3
Extremely
Important
43 16.7 16.7 100.0
Total 258 100.0 100.0
Mean: 3.78; S.D.: 1.94
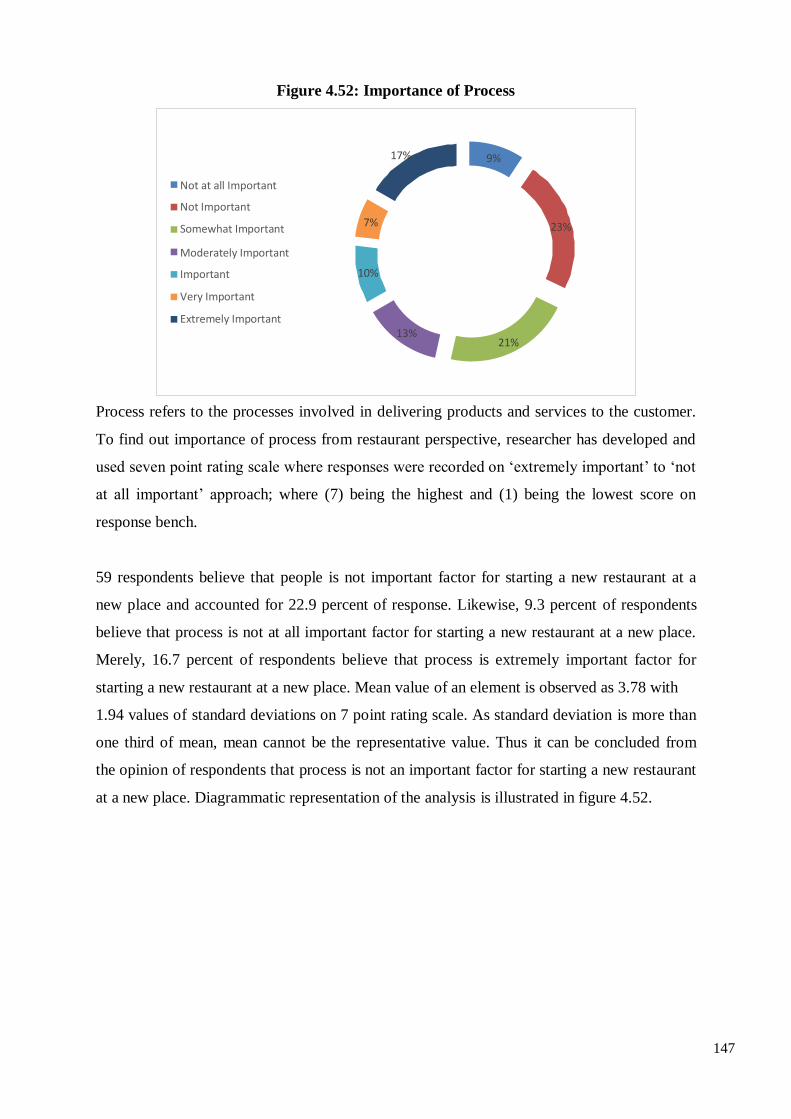
147
Figure 4.52: Importance of Process
Process refers to the processes involved in delivering products and services to the customer.
To find out importance of process from restaurant perspective, researcher has developed and
used seven point rating scale where responses were recorded on ‘extremely important’ to ‘not
at all important’ approach; where (7) being the highest and (1) being the lowest score on
response bench.
59 respondents believe that people is not important factor for starting a new restaurant at a
new place and accounted for 22.9 percent of response. Likewise, 9.3 percent of respondents
believe that process is not at all important factor for starting a new restaurant at a new place.
Merely, 16.7 percent of respondents believe that process is extremely important factor for
starting a new restaurant at a new place. Mean value of an element is observed as 3.78 with
1.94 values of standard deviations on 7 point rating scale. As standard deviation is more than
one third of mean, mean cannot be the representative value. Thus it can be concluded from
the opinion of respondents that process is not an important factor for starting a new restaurant
at a new place. Diagrammatic representation of the analysis is illustrated in figure 4.52.
17% 9%
Not at all Important
Not Important
Somewhat Important 7% 23%
Moderately Important
Important 10%
Very Important
Extremely Important 13%
21%
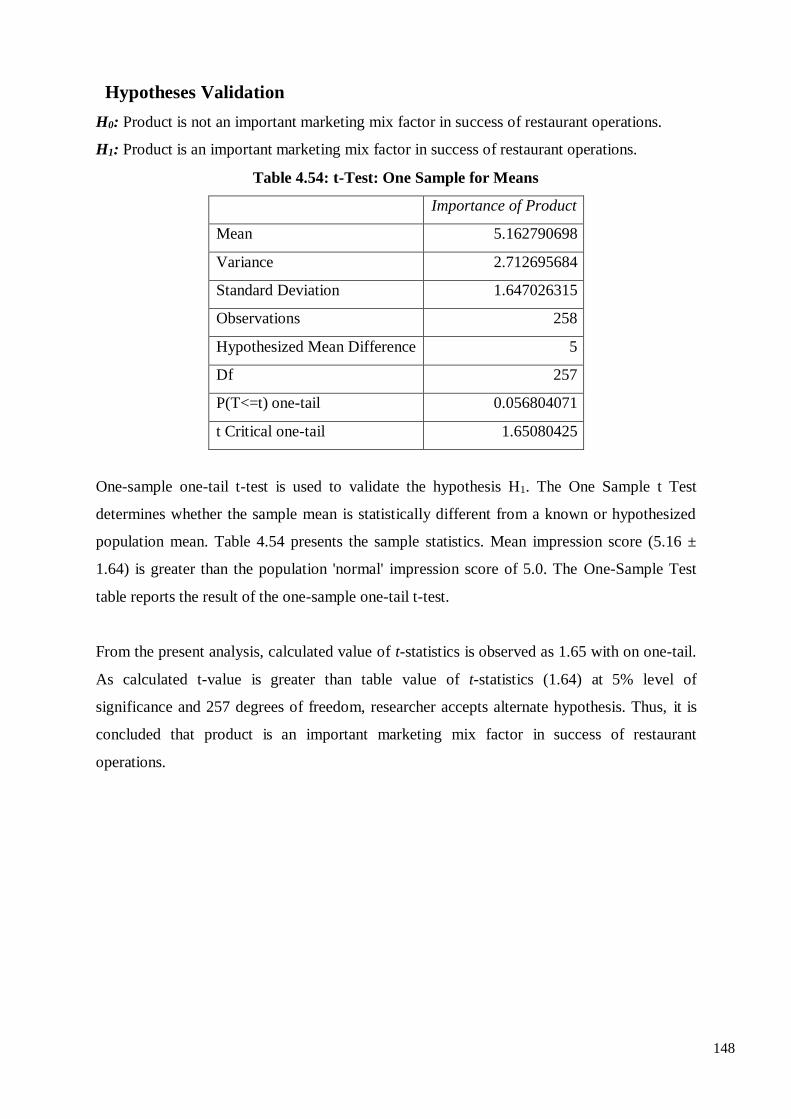
148
Hypotheses Validation
H0: Product is not an important marketing mix factor in success of restaurant operations.
H1: Product is an important marketing mix factor in success of restaurant operations.
Table 4.54: t-Test: One Sample for Means
Importance of Product
Mean 5.162790698
Variance 2.712695684
Standard Deviation 1.647026315
Observations 258
Hypothesized Mean Difference 5
Df 257
P(T<=t) one-tail 0.056804071
t Critical one-tail 1.65080425
One-sample one-tail t-test is used to validate the hypothesis H1. The One Sample t Test
determines whether the sample mean is statistically different from a known or hypothesized
population mean. Table 4.54 presents the sample statistics. Mean impression score (5.16 ±
1.64) is greater than the population 'normal' impression score of 5.0. The One-Sample Test
table reports the result of the one-sample one-tail t-test.
From the present analysis, calculated value of t-statistics is observed as 1.65 with on one-tail.
As calculated t-value is greater than table value of t-statistics (1.64) at 5% level of
significance and 257 degrees of freedom, researcher accepts alternate hypothesis. Thus, it is
concluded that product is an important marketing mix factor in success of restaurant
operations.
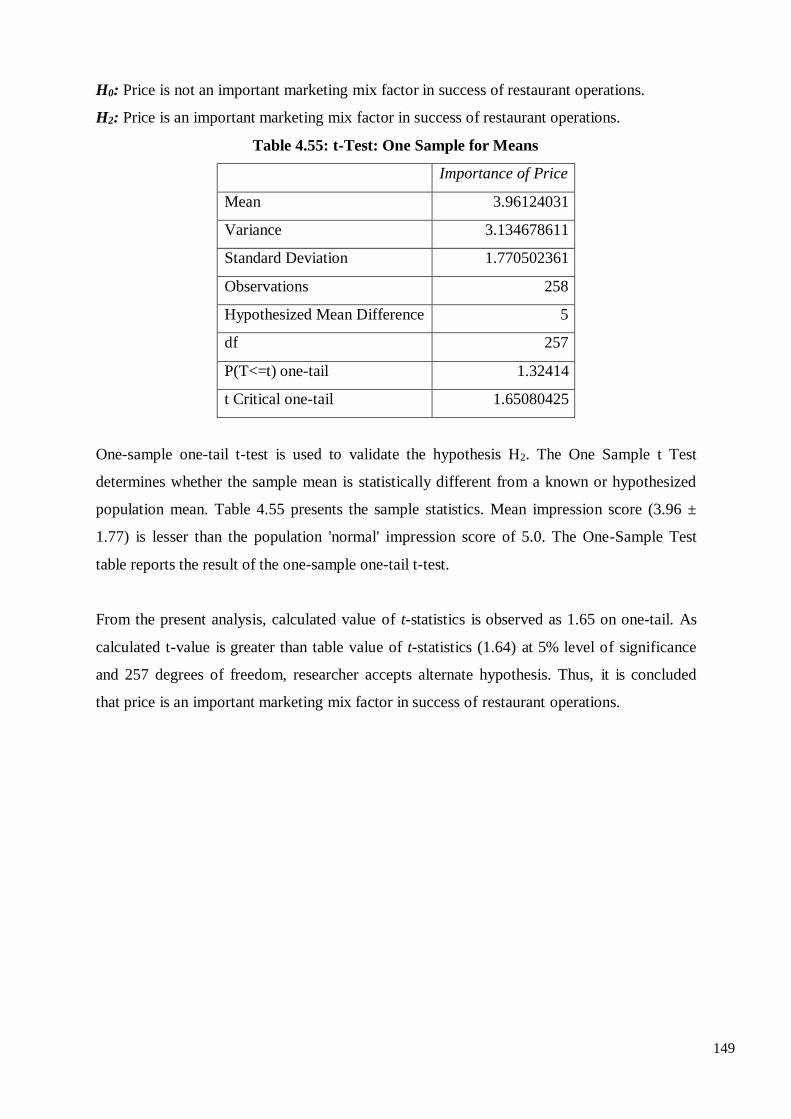
149
H0: Price is not an important marketing mix factor in success of restaurant operations.
H2: Price is an important marketing mix factor in success of restaurant operations.
Table 4.55: t-Test: One Sample for Means
Importance of Price
Mean 3.96124031
Variance 3.134678611
Standard Deviation 1.770502361
Observations 258
Hypothesized Mean Difference 5
df 257
P(T<=t) one-tail 1.32414
t Critical one-tail 1.65080425
One-sample one-tail t-test is used to validate the hypothesis H2. The One Sample t Test
determines whether the sample mean is statistically different from a known or hypothesized
population mean. Table 4.55 presents the sample statistics. Mean impression score (3.96 ±
1.77) is lesser than the population 'normal' impression score of 5.0. The One-Sample Test
table reports the result of the one-sample one-tail t-test.
From the present analysis, calculated value of t-statistics is observed as 1.65 on one-tail. As
calculated t-value is greater than table value of t-statistics (1.64) at 5% level of significance
and 257 degrees of freedom, researcher accepts alternate hypothesis. Thus, it is concluded
that price is an important marketing mix factor in success of restaurant operations.
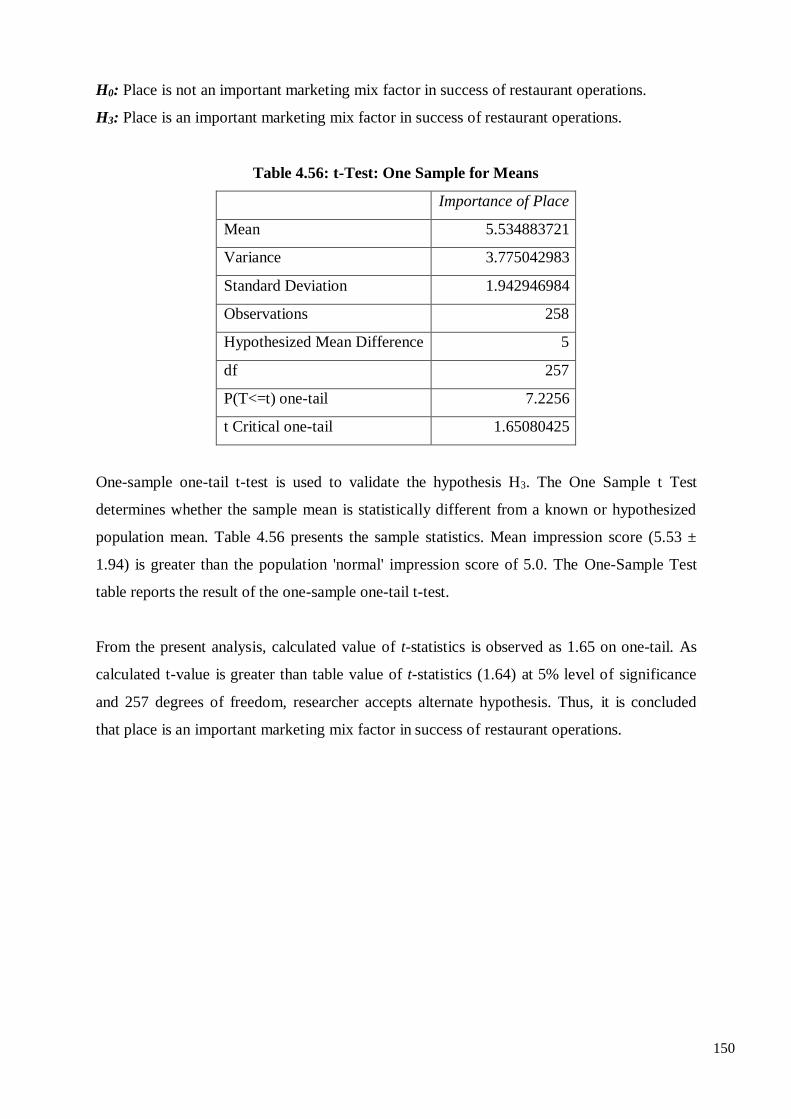
150
H0: Place is not an important marketing mix factor in success of restaurant operations.
H3: Place is an important marketing mix factor in success of restaurant operations.
Table 4.56: t-Test: One Sample for Means
Importance of Place
Mean 5.534883721
Variance 3.775042983
Standard Deviation 1.942946984
Observations 258
Hypothesized Mean Difference 5
df 257
P(T<=t) one-tail 7.2256
t Critical one-tail 1.65080425
One-sample one-tail t-test is used to validate the hypothesis H3. The One Sample t Test
determines whether the sample mean is statistically different from a known or hypothesized
population mean. Table 4.56 presents the sample statistics. Mean impression score (5.53 ±
1.94) is greater than the population 'normal' impression score of 5.0. The One-Sample Test
table reports the result of the one-sample one-tail t-test.
From the present analysis, calculated value of t-statistics is observed as 1.65 on one-tail. As
calculated t-value is greater than table value of t-statistics (1.64) at 5% level of significance
and 257 degrees of freedom, researcher accepts alternate hypothesis. Thus, it is concluded
that place is an important marketing mix factor in success of restaurant operations.
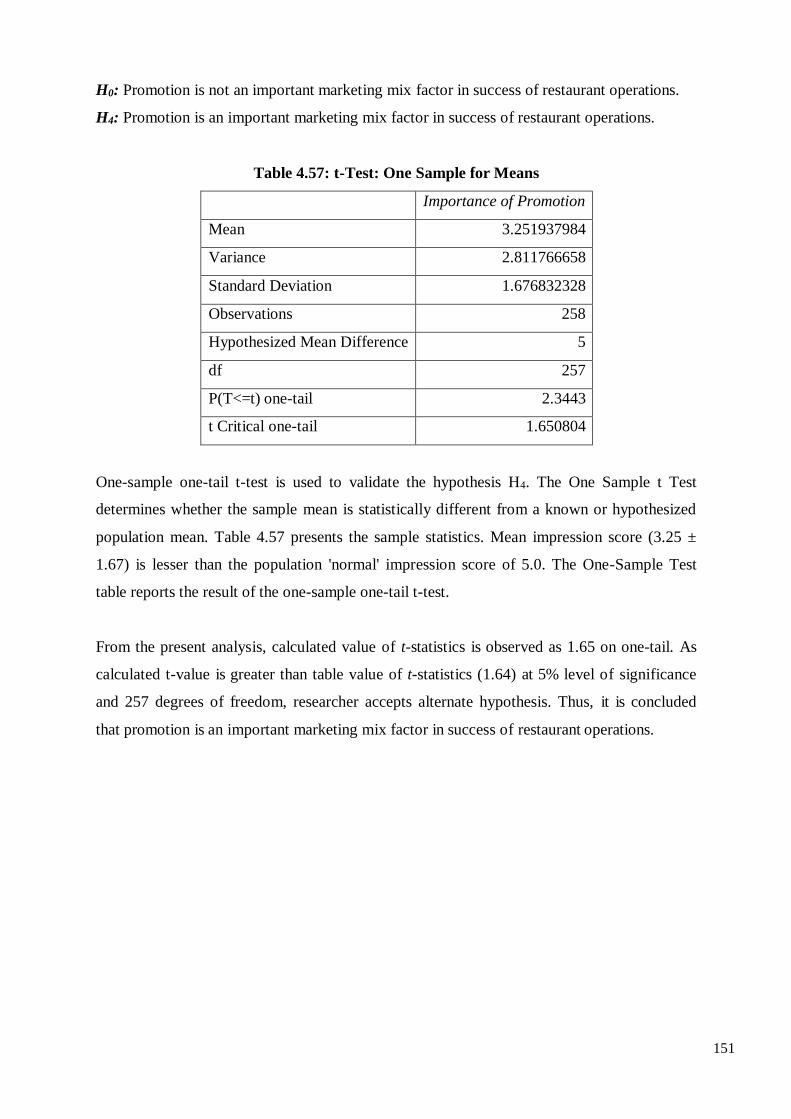
151
H0: Promotion is not an important marketing mix factor in success of restaurant operations.
H4: Promotion is an important marketing mix factor in success of restaurant operations.
Table 4.57: t-Test: One Sample for Means
Importance of Promotion
Mean 3.251937984
Variance 2.811766658
Standard Deviation 1.676832328
Observations 258
Hypothesized Mean Difference 5
df 257
P(T<=t) one-tail 2.3443
t Critical one-tail 1.650804
One-sample one-tail t-test is used to validate the hypothesis H4. The One Sample t Test
determines whether the sample mean is statistically different from a known or hypothesized
population mean. Table 4.57 presents the sample statistics. Mean impression score (3.25 ±
1.67) is lesser than the population 'normal' impression score of 5.0. The One-Sample Test
table reports the result of the one-sample one-tail t-test.
From the present analysis, calculated value of t-statistics is observed as 1.65 on one-tail. As
calculated t-value is greater than table value of t-statistics (1.64) at 5% level of significance
and 257 degrees of freedom, researcher accepts alternate hypothesis. Thus, it is concluded
that promotion is an important marketing mix factor in success of restaurant operations.
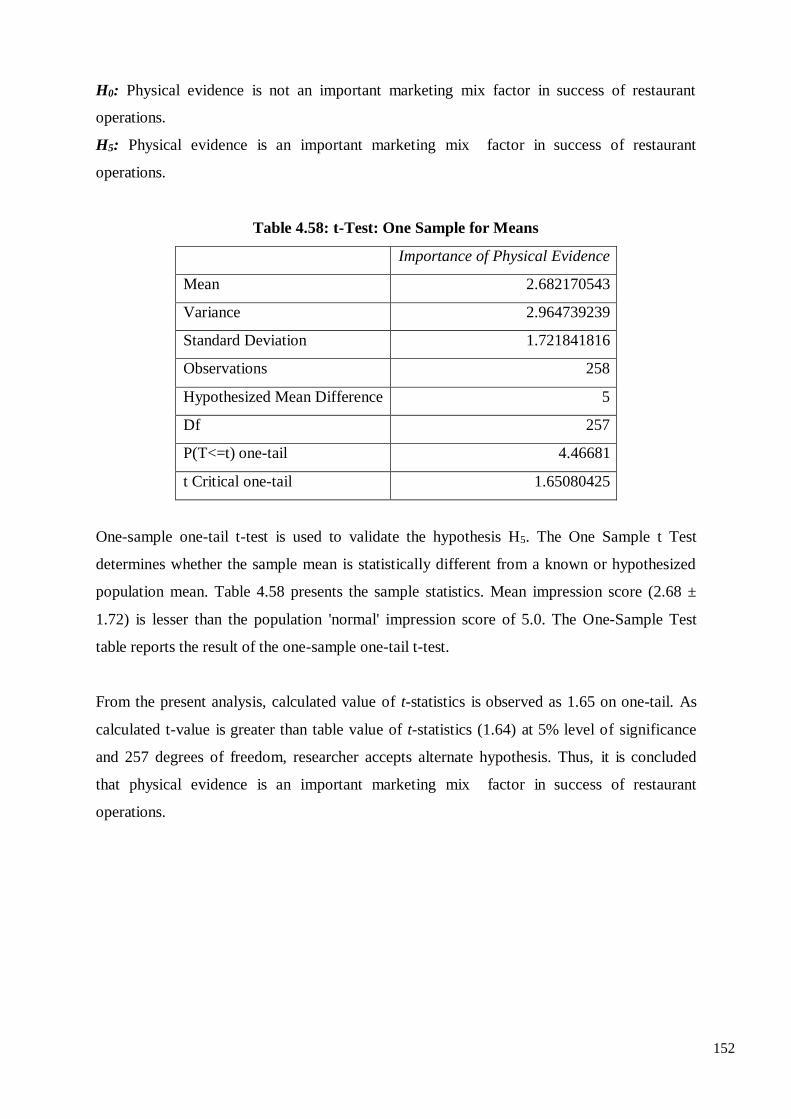
152
H0: Physical evidence is not an important marketing mix factor in success of restaurant
operations.
H5: Physical evidence is an important marketing mix factor in success of restaurant
operations.
Table 4.58: t-Test: One Sample for Means
Importance of Physical Evidence
Mean 2.682170543
Variance 2.964739239
Standard Deviation 1.721841816
Observations 258
Hypothesized Mean Difference 5
Df 257
P(T<=t) one-tail 4.46681
t Critical one-tail 1.65080425
One-sample one-tail t-test is used to validate the hypothesis H5. The One Sample t Test
determines whether the sample mean is statistically different from a known or hypothesized
population mean. Table 4.58 presents the sample statistics. Mean impression score (2.68 ±
1.72) is lesser than the population 'normal' impression score of 5.0. The One-Sample Test
table reports the result of the one-sample one-tail t-test.
From the present analysis, calculated value of t-statistics is observed as 1.65 on one-tail. As
calculated t-value is greater than table value of t-statistics (1.64) at 5% level of significance
and 257 degrees of freedom, researcher accepts alternate hypothesis. Thus, it is concluded
that physical evidence is an important marketing mix factor in success of restaurant
operations.
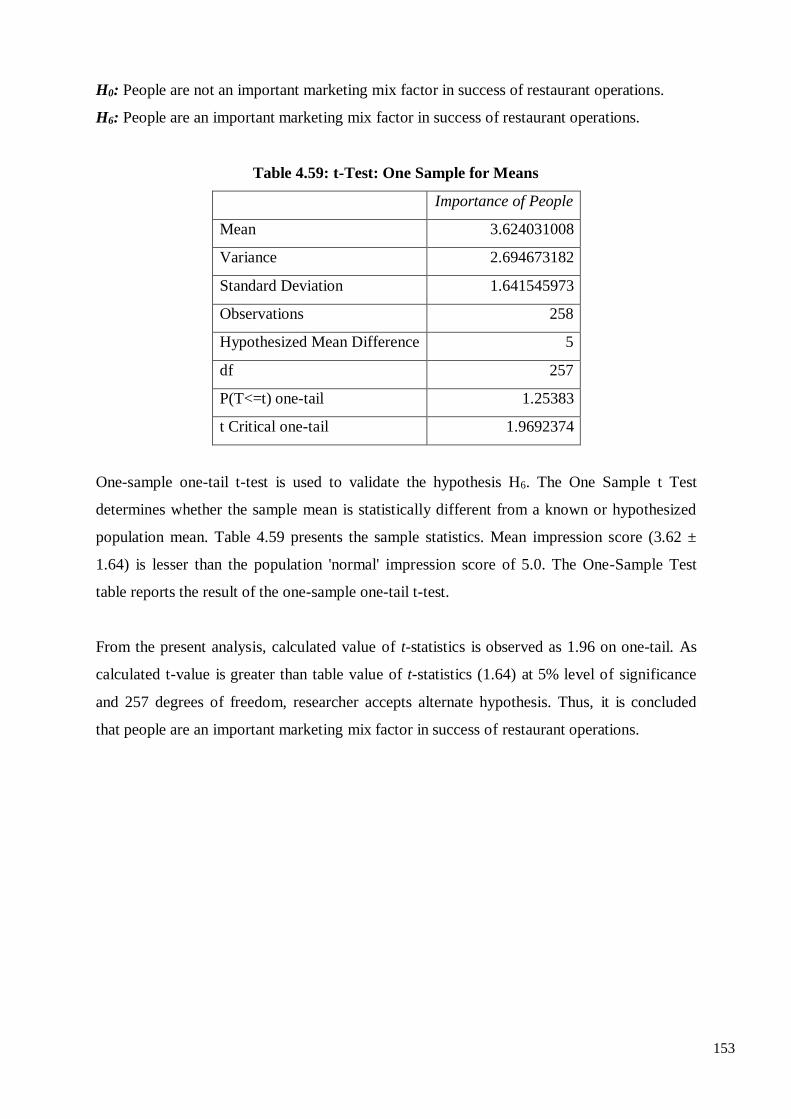
153
H0: People are not an important marketing mix factor in success of restaurant operations.
H6: People are an important marketing mix factor in success of restaurant operations.
Table 4.59: t-Test: One Sample for Means
Importance of People
Mean 3.624031008
Variance 2.694673182
Standard Deviation 1.641545973
Observations 258
Hypothesized Mean Difference 5
df 257
P(T<=t) one-tail 1.25383
t Critical one-tail 1.9692374
One-sample one-tail t-test is used to validate the hypothesis H6. The One Sample t Test
determines whether the sample mean is statistically different from a known or hypothesized
population mean. Table 4.59 presents the sample statistics. Mean impression score (3.62 ±
1.64) is lesser than the population 'normal' impression score of 5.0. The One-Sample Test
table reports the result of the one-sample one-tail t-test.
From the present analysis, calculated value of t-statistics is observed as 1.96 on one-tail. As
calculated t-value is greater than table value of t-statistics (1.64) at 5% level of significance
and 257 degrees of freedom, researcher accepts alternate hypothesis. Thus, it is concluded
that people are an important marketing mix factor in success of restaurant operations.
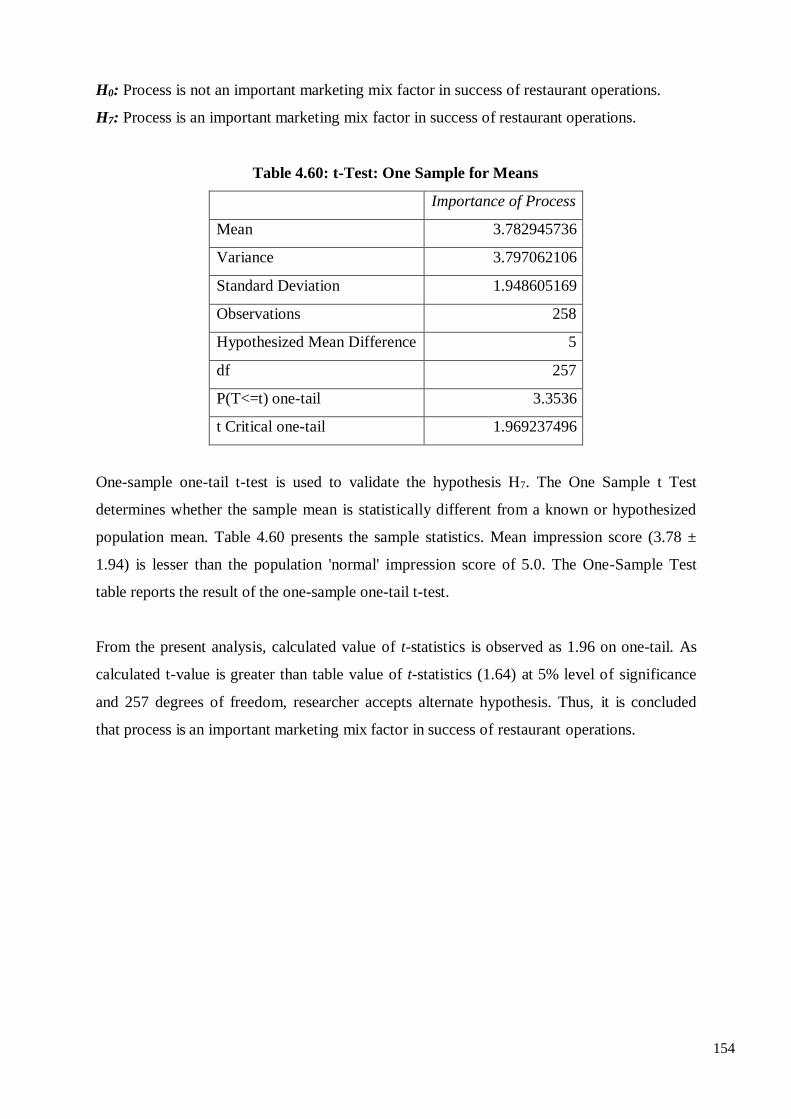
154
H0: Process is not an important marketing mix factor in success of restaurant operations.
H7: Process is an important marketing mix factor in success of restaurant operations.
Table 4.60: t-Test: One Sample for Means
Importance of Process
Mean 3.782945736
Variance 3.797062106
Standard Deviation 1.948605169
Observations 258
Hypothesized Mean Difference 5
df 257
P(T<=t) one-tail 3.3536
t Critical one-tail 1.969237496
One-sample one-tail t-test is used to validate the hypothesis H7. The One Sample t Test
determines whether the sample mean is statistically different from a known or hypothesized
population mean. Table 4.60 presents the sample statistics. Mean impression score (3.78 ±
1.94) is lesser than the population 'normal' impression score of 5.0. The One-Sample Test
table reports the result of the one-sample one-tail t-test.
From the present analysis, calculated value of t-statistics is observed as 1.96 on one-tail. As
calculated t-value is greater than table value of t-statistics (1.64) at 5% level of significance
and 257 degrees of freedom, researcher accepts alternate hypothesis. Thus, it is concluded
that process is an important marketing mix factor in success of restaurant operations.
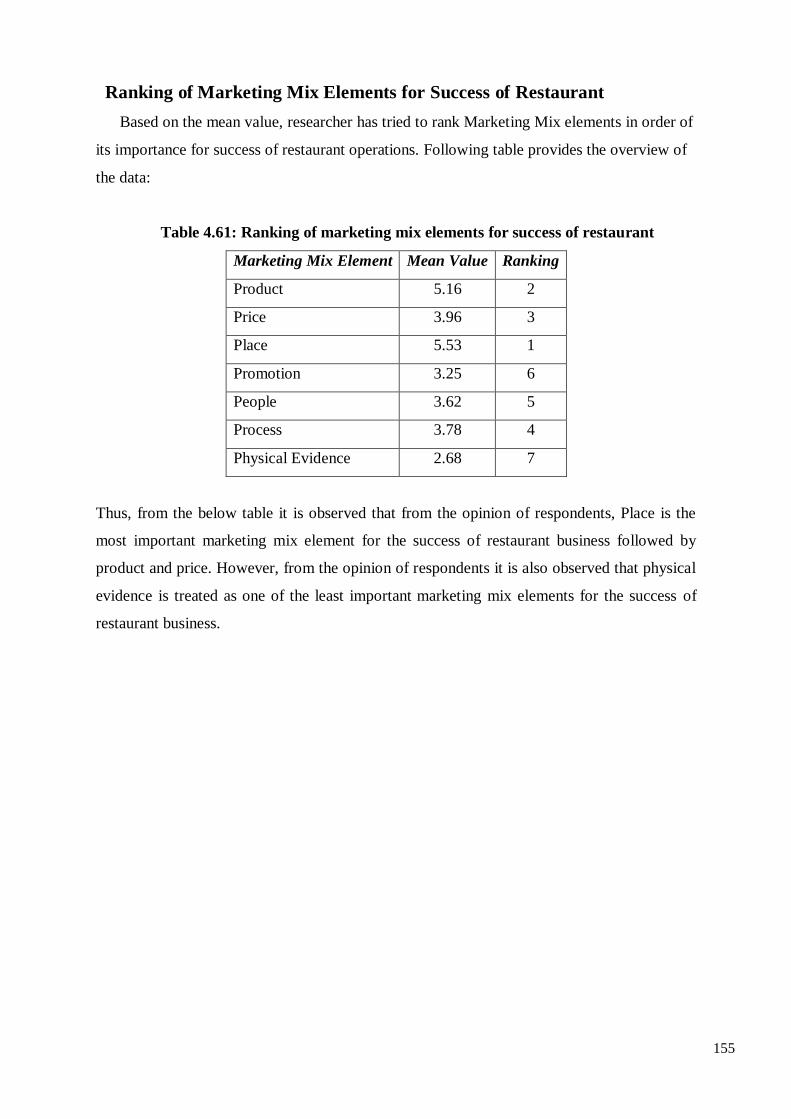
155
Ranking of Marketing Mix Elements for Success of Restaurant
Based on the mean value, researcher has tried to rank Marketing Mix elements in order of
its importance for success of restaurant operations. Following table provides the overview of
the data:
Table 4.61: Ranking of marketing mix elements for success of restaurant
Marketing Mix Element Mean Value Ranking
Product 5.16 2
Price 3.96 3
Place 5.53 1
Promotion 3.25 6
People 3.62 5
Process 3.78 4
Physical Evidence 2.68 7
Thus, from the below table it is observed that from the opinion of respondents, Place is the
most important marketing mix element for the success of restaurant business followed by
product and price. However, from the opinion of respondents it is also observed that physical
evidence is treated as one of the least important marketing mix elements for the success of
restaurant business.
156
Summary
Eating out is increasing ever in last decade in India due to number of reasons as
discussed in chapter 1. Food and Beverage service sector in India has shown a tremendous
growth and Pune city is not an exception for the same. Pune is well known as an Education
Hub, City with the set up of MIDC clusters boosting manufacturing industry and Clusters of
IT Centres, Ultra modern hospitals with latest technologies in the world, Sports facilities,
Historical places and Museums, Gardens and Zoological park and so on. The Pune city is a
very balanced and best suited place considering the living standards, climate and
affordability. Almost all migrated people for various reasons from all over the world love to
be permanent resident of Pune city. All these factors resulted into growth and expansion of
the city beyond imagination in terms of its size and population.
Ever increasing population of Pune city has increasing demand for food and beverage
service facilities. To fulfil this increasing demand for food and beverages, restaurant industry
in the city is also expanding with a rapid speed. As per the information given by the president
of Pune Restaurants and Hoteliers Association (PRAHA) Ganesh Shetty, on an average every
month 20 new food and beverage service outlets are entering in the PMC limits. Failure rate
of these outlets is also too high. Almost 5 to 10 restaurants are shutting down every month in
PMC.
The researchers has particularly focused on the study of use of 7P’s of marketing mix
by the restaurant operators (knowingly or unknowingly the theoretical concept of marketing
mix) and its role in the success of restaurant business with interest to the restaurants in Pune
Municipal Corporation area for the period considered for research. Considering all facts and
figures of increasing demand for food and beverage service outlets in Pune and failures of
such outlets, the researcher found it very important to study the relevance of use of marketing
mix concept in a restaurant business. The researcher attempted to study all 7P’s of marketing
mix in restaurant business in PMC and usefulness of the same in sustenance as well as
success of restaurant business.
Researcher has collected the data with help of two separate designed questionnaires to
find out the role of marketing mix in restaurant business from customers point of view as well
as restaurant operators view point. The study able to find the relevance of all 7P’s of
marketing mix in restaurant business with the data collected and analysed. The study also has
157
certain recommendations from customer’s point of view to restaurant business operators for
betterment in their business operations by considering most effective use of marketing mix.
These vital factors studied in this research made this study relevant for restaurant operators as
well as customers visiting restaurants.
However, on the other hand study has some limitations as well. The study relates and
limited to Restaurant business operations in Pune Municipal Corporation area only. The study
concluded that the proper mixture of marketing elements (Marketing Mix) is helpful for
restaurant business to be sustainable as well as successful in the competitive market. It is
necessary to review the marketing mix planned for restaurant business time to time and do
the adjustment or changes in this mixture for the betterment of restaurant business for a long
run.
158
Chapter – V
Conclusions and Recommendations
159
Researcher aimed to collect the data with the help of 2 separate questionnaires,
one designed for general public who visit restaurants to dine out and the other
designed for Restaurant Managers/ Supervisors/ Owners. The motive was, to find out
the role of marketing mix in restaurant success with special reference to PMC area.
On the basis of data collected and analysed, the researcher has come to following
conclusions and also recommends few suggestions for successful restaurant
operations.
For infinite population of customers, researcher has distributed 900
questionnaires and received 502 appropriate responses, which is 55.7% rate of
response.
Conclusions based on the data collected from Customers visiting restaurants in
PMC area,
1. Eating out is very common these days for the residents in Pune city. There are
many responsible factors for the same like double income in a family, no time for
cooking, number of events every month to celebrate or even just to relax and try
out something new as a food lover and so on. All respondents of this research are
eating out at least once in a month. Almost 50% of the respondents are eating out
for minimum 2 to 3 times in a month, 20% of them are for 4 to 5 times and 6.2%
of them are eating out more than 8 times in a month. To support the ever-
increasing demand of eating out, as an average 20 new restaurants are entering
into the competitive market of PMC every month.
Recommendation: Pune city has the great potential market for restaurant
industry. Entrepreneurs should study the potential market well and utilise the
opportunity to start a new restaurant in PMC. During and post COVID-19 the
entrepreneurs willing to enter in to the restaurant industry and start their own
restaurant in PMC area should start with limited menu following new norms of
hygiene and sanitation offering Parcel/ Take Away/ Home Delivery services only.
They can save on investments on actual space required for dining or seating area
and just having basic kitchen set-up.
160
2. A selection criterion of restaurant varies as per the accompanying people of the
host. The researcher tried to find the selection criteria of a restaurant when one is
dining out with family members, with friends and even with office colleagues.
The most preferred option in selection criteria irrespective of the members
accompanying is taste and quality of food and beverages offered at restaurant. It
proves the importance of product as a part of marketing mix of restaurant. Next
considerable factor which affects selection criteria is convenience to reach (Place/
Location).As Pune is a Metro city and always being crowded with heavy traffics
on the roads, respondents like to select restaurant which is easy to reach.
Recommendation: It is recommended to offer tasty food prepared hygienically
using quality ingredients. Taste and quality of food offered matters a lot for
customers visiting restaurants in PMC.
Further it is essential to select the place for restaurant which is easy to locate and
reach (probably in prime location of the city). This helps to get a steady flow of
customers at restaurant which is necessary for its sustenance in the competitive
market.
During and post COVID-19 the reach of restaurants in terms of offering home
deliveries should be broader. The same can be achieved by restaurants having own
website and app or hire a delivery vendor or register with the online food ordering
and delivery platforms like Swiggy, Zomato, Faasos, Uber eats to name a few.
3. Although variety of options are available namely multi-cuisine international
restaurants, fast food restaurants, quick service restaurants, speciality or ethnic
restaurants most of the respondents prefer to have Indian food while dining out.
Multi cuisine international restaurants are the second most preferred option by the
respondents followed by quick service restaurants (QSR), fast food and speciality
cuisine restaurants respectively.
Recommendation: Considering menu as a “Product” to be offered by restaurant,
it is recommended to offer Indian food as a part of menu irrespective of the type
of restaurant even in case of quick service restaurant (QSR), fast food restaurants
or multi cuisine restaurant. There are plenty options available in Indian cuisine
which can suite perfectly for various types of restaurants. International restaurant
161
chains like McDonalds has implemented the strategy of “Think Global Act Local”
during its expansion all over the world and serving more than 100 countries to
modify the menu preparations that suites local palate.
4. Researcher tried to find out the impact of various promotion efforts taken by
restaurants and its impact on selection criteria of restaurant. It is found that most
of respondents always check the print media or promotional advertisements before
selecting the restaurant. There is significant impact of print media and
promotional advertisement on customers and they select restaurant based on the
same. Few of the respondents have never check print media or promotional
advertisements for selecting a restaurant.
Recommendation: “Promotion” as an element of marketing mix used for
restaurant operations should have dedicated monthly budget for promotional
activities to be carried out to attract customers. At the initial phase of Restaurant,
the budget allocated should be more for the promotional activities. Even when the
restaurant is well established in the market and have a stable business certain
percentage of the budget should be always allocated and spent on promotional
activities.
During and post COVID-19, promotion efforts need to be increased to show the
restaurants presence in the market and convey the message that the restaurant is
operating with all new hygiene and safety norms.
5. Half of the respondents feel that comfortable and spacious seating arrangement is
important at restaurant. Beyond this decor of restaurant in harmony with the food
and standard service offered by well-groomed staff helps to create the good
environment that customer prefers. Restaurant authorities must plan a layout of
restaurant carefully which should have ambience in harmony with the type of
restaurant and offering comfortable seating arrangement for customers even if it is
not possible to offer spacious seating arrangement due to space constraints.
There are many mid-priced restaurants, fast food outlets and quick service
restaurants in Pune city serving since many decades. They are simply serving tasty
food prepared hygienically and offering comfortable seating with good quality
lighting arrangements without any specific decor.
162
Recommendation: “Physical Evidence” as an environment created at restaurant
is very important aspect from customer’s point of view. It is recommended and
necessary for speciality restaurants, fine dining restaurants and ethnic restaurants
to have well planned decor, comfortable and specious seating arrangements.
Customers visiting to such types of restaurants are ready to pay more for fine dine
experience and personalised service.
Whereas in case of quick service restaurants (QSR), fast food and casual dine
restaurants decor is not important. Customers visiting here are more bothered
about quality of food offered that prepared in hygienic way and should be
available at an affordable price. Restaurant operators should consider these
recommendations.
During and post COVID-19 rather than pleasant environment and comfortable
seating arrangement or a decor, hygiene and safety norms followed at restaurant
are more important from customers point of view. The same needs to be followed
strictly and guaranteed to the customers.
6. In today’s tech-savvy world most of the respondents check either website of
restaurant or mobile applications to get the information of restaurant they are
planning to visit. This enables them to check the feedbacks and reviews about
menu products, variety of products available, speed and accuracy of service,
ambience, price and so on. This information is used by them to compare the other
similar type of restaurants in the same area they are planning to dine out.
The respondents agreed that checking website and selecting restaurant based on
the information provided on website and reviews is worth for selection of
restaurant from the choices available. Beyond this they can avail the facilities
available on website such as reserving the table or even ordering food for home
delivery.
Some of the respondents are still relying on the word of mouth publicity. They
discuss amongst their family and friends or with colleagues before finalising any
restaurant to dine out from the available options with them.
Recommendation: As a part of “Promotion” used by restaurants to enhance their
market share, it is always better to have own website for the restaurant. The
website of restaurant needs to keep up to date and always handled properly to
163
enjoy marketing benefits for the business. In COVID-19 scenario a well designed
website with online ordering facility will help a lot for restaurant to sustain and
manage home deliveries more efficiently.
7. All respondents expect to get same quality of food with standard quantity along
with accurate and speedy service at restaurant every time of their visit. It
highlights the importance of standardisation in restaurant industry which is
possible with the help of development and implementation of standard operating
procedures (SOP’s) for all the departments in restaurant namely purchasing,
receiving, storing, food preparation and service of food and beverages. Maintained
standards helps to increase business with satisfied customers who are going to be
repeat customers of the restaurant and getting new customers through word of
mouth publicity. It further helps the restaurant management in reducing wastage
due to wrong practices or procedures and pilferages by employee.
Recommendation: “Processes” followed for all the activities carried out at
restaurants are very important and should be standard. It is advisable to develop
Standard Operating Procedures (SOP’s) for all types of operations in restaurant. It
is much easy to develop SOP’s for any business operations but more important is
to maintain these SOP’s by all staff members throughout the operations to enjoy
the benefits of the same. The same can be achieved by close supervision by senior
staff, training for staff whenever required, feedback system (from both staff as
well as customers for SOP’s followed) and strict control measures
implementation.
8. There are mixed opinions obtained in this research while finding out the relation
between prices of the menu products offered and preference of restaurant by
customers. Majority of the respondents were agreed to the statement that, “one
may change his/her preferred/ favourite restaurant due to increase in prices of
menu product”. The other group of respondents were undecided and few of them
were disagree with this statement. It clarifies that customers visiting to the
restaurants in PMC are price sensitive and price is one of the important elements
which impacts on selection of restaurant by them.
164
Recommendation: Based on the data collected, it is recommended to the
restaurants to study the market place and potential customers’ average spending
power (ASP) to set “Price” for the menu products on offer. The pricing should be
clearly stating whether it is inclusive or exclusive of any taxes applicable by
government. If it is exclusive of taxes then the percentage of taxes applicable also
need to be mentioned clearly on the menu itself. There should not be any hidden
costs charged to customer’s visiting restaurant. Increasing in menu prices should
not be done frequently (there should be a sufficient time gap), as it may result in
losing the regular customers in today’s competitive market.
9. Majority of respondents are disagreed with the statement, “Higher the price, better
is the quality of food and beverages offered at restaurant”. Few of the respondents
were undecided and few were agreed to the statement. There is certainly a
different clientele that is even ready to pay on higher price with the expectations
of better or beyond that best quality of products on offer, spacious seating
arrangement, comfort and more sophisticated service along with the nice
ambience at the restaurant. Here it becomes necessary to study the market place
where the restaurant is located or going to start its operations along with type of
customers to be served and accordingly set the prices for the menu product and
offer other facilities to the customers. Customers always have set of expectations
for money they are spending irrespective of market segment and that needs to be
satisfied by restaurants every time.
Recommendation: Customers visiting to any restaurant are looking for good
experience which may be created by the combination of tangible things like
furniture, fixtures, crockery, cutlery to name a few and intangible things like food
and beverage taste, consistency, appearance and service of the same offered by
staff of restaurant. Further it is necessary in case of Speciality or Fine Dine
Restaurant to understand that customers visiting to restaurant expect better and
standard quality food products along with other facilities and standard service of
food and beverages for which they are ready to pay more. As per the type of
restaurant, price of the food products on offer may vary but the expectation by
customers’ remains same for the quality of food products (in relation to price
charged).
165
10. All respondents have given importance to the cleanliness hygiene and sanitation
facilities at restaurant. It highlights the value of cleanliness, hygiene and sanitation
in restaurant. Further the respondents added that they are more concerned about
hygiene and sanitation followed at restaurant while food and beverages are
prepared and served. They surely not visit the restaurant again if they do not find
it appropriate in terms of its cleanliness or hygiene and sanitation in overall
operations. Beyond this stop others in their relations from visiting such restaurant.
Recommendation: Restaurant operators should follow the standards set by FDA
and FSSAI for cleanliness and hygiene. Restaurant should get assessment done
from FDA to earn the certificate of star-based ‘Hygiene rating’. They should
display this certificate on the door of restaurant which assures to the customers
visiting restaurant for its cleanliness, hygiene and sanitation.
At present scenario, during and post COVID-19 pandemic it’s mandatory and
recommended for every restaurant to follow the guidelines set by government to
assure their customers about safety and hygiene practices are followed while
preparing and serving food. It is “Do or Die” scenario for restaurant industry and
only those can survive who will follow new safety and hygiene practices.
11. Nearly half of the respondents believed that inappropriate location or place of
restaurant is responsible for its failure. Next major responsible reason for failure
of any restaurant is inappropriate menu and bad quality of products (food and
beverage) offered. Wrong pricing strategy ranked third responsible reason for
restaurant failure. Merely 4.8% of the respondent feels less or no promotional
efforts are the responsible for failure of any restaurant. Many respondents feel it is
a common impact of negligence and poor use of all core 4P’s of marketing mix
together in restaurant business.
Recommendation: Based on the research conducted, researcher have done
ranking for all 7 P’s of marketing mix. Market survey is recommended before
starting a new restaurant in PMC to find out best combination of core 4P’s of
marketing mix. Place for the restaurant should be strategically selected as it is one
of the most important selection criteria from the customers point of view while
166
selecting a restaurant to dine out. Based on the market survey and demand ‘Menu’
should be offered in the restaurant as a ‘Product’. Initially competitive pricing
strategy should be used by restaurants to sustain in the market and achieve target
market share. Although no or less promotional efforts are considered responsible
for the failure of any restaurant as per the customers’ opinion, initially dedicated
efforts by restaurants are necessary for restaurant promotion.
Conclusions based on the data collected from Restaurant Owners / Managers/
Supervisors,
1. The sample size required was 256 restaurants for the data to be collected from (for
the period considered for research), so the researcher aimed to collect the data
from 500 restaurants. Researcher could collect the information from 258
appropriate responses, which is 51.2% rate of response. Beyond this while
collecting the data 15 restaurant owners denied to answer the questions asked for
data collection and 52 restaurants were found closed (Shut down) due to various
unknown reasons. On an average 20 food outlets are opening in the city each
month while 5 to 10 are shutting down per month. It can be concluded that there
are considerable failures of restaurant business in PMC area.
Recommendation: It is highly recommended for entrepreneurs who wish to start
their own restaurant should study the market well before entering in. Must know
the market demand, formalise the financial policy, marketing policy and catering
policy thoroughly. He/ she must know the all types of costs incurred in the
restaurant business. Must have strong supervisory skills as many research’s done
in the field; prove that pilferages by staff and loss due to over production or
negligent storage leads to heavy costing, that further results in less profitability
which ultimately lead to unsustainable restaurant business. The entrepreneur
should know the concept of breakeven point analysis (No Profit and No Loss
situation in Business) and must have sustainability till the time business achieves
the breakeven point to enjoy further returns and profitability in business.
2. Majority of the restaurants are operating in the prime location of the city which
are densely populated areas of Pune Municipal Corporation (PMC). It notifies that
167
from the owners/ operators’ point of view, it is very important to have a restaurant
located in a prime location even if they have to pay huge amount to purchase the
land and built a restaurant or paying high amount of rent every month and hefty
deposits for the same. It proves that the “Place” is most important part of
marketing mix for success of restaurant operations in the opinion of restaurant
owners/ operators. All of these restaurants are providing the facility of parking for
the guests either inside the own premises or outside premises. Data collected
supports the restaurant operator’s point of view highlighting the importance of
prime and densely populated location to have sustainable restaurant operations in
the long run. Most of the restaurant operators also mentioned offering secured
parking facility is also essential for restaurant operation in present time.
Recommendation: It is advisable to select the “Place” to start a new restaurant at
prime and densely populated location in the city to get more footfalls. This further
helps to achieve sales target, makes restaurant business sustainable and profitable.
If the one has his owned place, its better but most of the time due to huge capital
investment owning a place is not possible for all entrepreneurs. It doesn’t matter
whether the place selected for restaurant is owned or rented as long as it is located
at prime and densely populated area in the city.
3. A restaurant offering home delivery and parcel facility for their guests is a
common scenario in today’s world. All restaurants are enjoying the benefit of
offering this facility in terms of earning additional revenue from it with basic
investment cost. Most of these restaurants are earning as an average 30% and
above of their total revenue earned just because of this facility.
Recommendation: It is highly recommended to offer the facilities like home
delivery or parcel service at restaurant as a part of “Process”. As the data shows
restaurants can earn additional revenue by offering such facilities which will be
very helpful for sustainability in case of new entrant in the market. It will add
more profitability to the well-established restaurants where space constraint does
not allow expansion. The same is applicable in case the restaurant operators do not
wish to offer any franchisee and want to operate from one outlet only.
168
At present due to the COVID-19 pandemic, parcel or take away services are the
only mean for restaurants to sustain in the market. In other words, Dark Kitchen or
cloud kitchens are the best options to work with (whether it is a restaurant in
existence since many years or to start a new one). Beyond this restaurant need to
assure their customers about hygiene and sanitation measures are strictly
observed.
4. Data collected for the research suggest that almost all restaurants are following the
Standard Operating Procedures (SOP’s) in their day to day operations (either for
all operations or at least for production and food and beverage services offered in
restaurant). Most of these restaurants are operating from past 2 or more years in
PMC area and admitted the fact that, following SOP’s helped them to have
sustainable restaurant business. Restaurant owners also agreed that SOP’s are very
useful to achieve customer satisfaction by offering standard products in a standard
way every time. It is very essential to offer standard quality products every single
time to retain the customers in competitive market. Retained customers and repeat
business from them is the key for success in restaurant business. It proves that the
“Process” is an important element of marketing mix for success of restaurant
operations.
Recommendation:“Process” as an element of marketing mix is a key factor for
success of restaurant operations. Every restaurant operators should have set SOP’s
at restaurant for all the operations. All these SOP’s should be readily available for
the staff working in restaurant in printed formats (whether the staff is newly
joined or working for the restaurant since its inception). If the staff follow all the
SOP’s in all types of operations in restaurant, it will be easy to have maintained
standards in restaurant. The most important part here is to enforce and maintain
the standards throughout the operations of restaurant to enjoy the benefits of the
same.
In the scenario of COVID-19 to follow the new norms of hygiene and sanitation is
a mandatory part of all SOP’s followed at every operational phase of restaurant
from receiving of raw material till delivering the final food and beverage products
to customers.
169
5. Few questions were asked by researcher to find out the role of “Price” as a
marketing mix element for restaurant business. Information given by the
restaurant operators suggests that their pricing for food and beverages is mostly
cost based and profit oriented. Surprisingly competitive pricing has low
significance in restaurants product pricing in PMC.
The customers visiting to the restaurant are sensitive to the price of menu products
and whenever there is a price increase in the menu products, small decrease in
number of customers visiting is experienced by restaurants in PMC.
Recommendation: Pricing strategy should be planned in such a way that BEP is
achieved at the earliest. Frequent increase in prices affect the number of guests
visiting restaurant so it is suggested to keep a sufficient time gap between the
increases in price of menu products offered at restaurant. Beyond this the prices
charged for menu products should be offering value for money to the guest in
terms of quality and quantity offered. There are various pricing strategies but
depending on the type of market and average spending power of potential
customers, restaurant owner should adopt pricing for menu in PMC area.
6. None of the restaurant has all employees who have completed formal
education/degree. Most of the restaurants have employees with formal education
specifically working for front of the house operations or working at supervisory
level. All restaurants have their own pattern of training employees. Few of the
restaurants provide training to the employees at the recruitment level itself but
most of them provide need-based training to their employees. Restaurants are
using preset SOP’s (Standard Operating Procedures) to train the staff. Study
reveals that hiring all employees who have formal education or degree in the field
is neither possible nor affordable as well. From the restaurants point of view there
is no relevance to have all employees with a formal education/degree in the field.
Recommendation: Employees working at any restaurant are the “People” as in
marketing mix elements. Even if the employee is not having any formal education,
skills on hand are more important to work in back area of restaurant for e.g.
Kitchen. Front of house staff need to have formal education and soft skills to
create better image of restaurant. Cost cutting is better achieved if restaurant hires
170
combination of employees. Skilled employees with hands on experience for back
areas in the restaurant are best suited, rather than employees having any formal
education. Employees with soft skills along with managerial abilities acquired
through formal education are better for front of house areas in restaurant.
Irrespective of having employees with or without any formal education or a
degree, it is highly essential to set SOP’s for restaurant operation as concluded
earlier. Having set SOP’s and implementing these SOP’s in day to day practice
by all employees is very important. This can be achieved by offering formal
training on SOP’s to all employees. Proper training to the employees help
restaurants to maintain SOP’s and achieves guest satisfaction. It is highly
recommended to offer training to the employees working in restaurant to achieve
the various management goals like cost effectiveness, increasing profit
percentage, reduce wastages, achieve guest satisfaction, getting repeat business
and so on. Training can help a lot to adopt the required basic knowledge and
additional skills to do the work assigned efficiently by restaurant staff.
As an impact of COVID-19 restaurants have already cut down on their employee
strength and will continue with limited or less number of employees until the
normal table service of food and beverages will begin in future. As at present
restaurants are operating for limited menu and offering only parcel delivery and
take away facility. Restaurant industry will regain its momentum again provided
with the vaccine or medication found for the COVID-19.
7. To check the importance of “Physical Evidence” as a marketing mix element in
restaurant operation few questions were asked by researcher. “Physical Evidence”
is nothing but an environment created at restaurant. Data collected reveals that,
most of the restaurants have done decor only for service area. Few of them done it
for only external part and entrance of the restaurant. Although the restaurants have
not paid attention towards decor, all of the restaurants have given a prime most
importance to cleanliness in the restaurant premises. Irrespective of type and size
of restaurant minimum cleanliness procedures are followed 2 times in a day at all
restaurants. Few restaurants are even implementing 4 times a day cleanliness
procedure as a part of their standard operating procedure, to maintain clean and
hygienic environment at restaurant which is very important. Depending on the
category or type of restaurant decor might be done more intensely or just at the
171
seating area in restaurant (as per the owners or operators decision whether it is
required or not).
Recommendation: Restaurants should have decor and beautify the service area
which should be complimenting to food and beverages on offer. It helps to create
pleasing Environment at restaurant. Fine dine restaurants / speciality restaurants
must have a well-groomed staff in clean and tidy uniform in harmony with the
theme or cuisine offered at restaurant to create the suitable environment at
restaurant.
Restaurants should observe cleanliness as a part of standard operating procedure.
Maintaining cleanliness in restaurant is very important as it reflects the hygiene
and sanitation followed in restaurant which further has impact on selection of
restaurant by customers. It also helps the restaurant management to serve
wholesome food to customers and get rid of the incidents like food poisoning.
Even the restaurant can easily face any inspection committee that is critically
examining the restaurant and have rights to cancel the licences on the basis of
unhygienic conditions at restaurant. FSSAI (Food Safety and Standards Authority
of India) recently started system of hygiene-based rating for restaurants which is
mainly based on the cleanliness parameters. Restaurants receive a certification
under the star-based ‘hygiene rating’ system which can be displayed on the door
of restaurant. Restaurants should apply and have certificate with maximum stars.
During and post COVID-19 it is abiding on restaurants of all types and at all
places in the world to follow new norms of hygiene and sanitation.
Implementation of new norms of hygiene and sanitation is more important than
decor or furnishing creating pleasant environment at restaurant.
8. Most of the restaurants in PMC have entertainment facility on offer as a part of
“Physical Evidence” to create better environment for their customers (chiefly on
the special occasions like mega sports event and cultural event with live telecast,
some of them offers it on customers demand or on weekends and few of them
offer this facility throughout the year). It can be concluded that offering
entertainment facility is always helpful for the restaurants to attract the desired
number of customers in a competitive market and at the same time it is an
essential requirement of customers while selecting a restaurant. Depending on the

172
type of restaurant and profile of customers visiting, it is decided by restaurant
operator whether entertainment facility is required or not. For every restaurant it is
not possible to offer entertainment facility.
Recommendation: It is advisable to offer certain type of entertainment facility
which blends well with the theme and clientele of the restaurant for example a
sports bar can have live streaming of various sports events; an ethnic restaurant
may have live or recorded entertainment suitable for the theme.
9. Surprisingly very few restaurants in Pune city have their own official website for
marketing purpose. However, all of those restaurants having own official website
are agreed on the fact that it helps to attract more customers due to the information
posted on it. Irrespective of either having an official website or not having an
official website, all restaurants spend on promotion. Public relations and print
media are the techniques mostly used by restaurants to attract customers. Most of
them are sending messages on mobile and newspaper for the same. Few of the
restaurants are even advertising on television (through local cable network); on
screens of multiplexes and even on regional FM radio station. Almost every
restaurant in PMC is attached to delivery service apps like Swiggy, Zomato,
Faasos, Uber eat and so on.
Recommendation: “Promotion “always helps to bring the new customer to
restaurant, so it is always wise decision to have certain budget allocated for
advertising on monthly basis. Today’s world is techno savvy with the use of smart
phones and as people like to have information on tip of fingers, it is better to have
an official website of a restaurant that can keep posting the updated information of
restaurant to customers along with the basic information like menu, prices,
operational timings and so on to help users in decision for selection of restaurant.
During COVID-19 promoting home delivery service by restaurant is essential and
the only mean to survive in the market. Beyond this DIY (Do-it-yourself) meal
boxes were introduced by many reputed hotels. These meal kits were launched
during lockdown and going to be new normal, even after post lockdown as people
are not going to immediately dine out.
173
10. Out of the total responses, 12% of the respondents are franchise or have affiliation
or part of chain restaurant. Out of these 12% Franchise Restaurants, most of the
respondents agreed that it is beneficial to have affiliation and accepted that the
same helped to have a sustainable restaurant operation. Although having
affiliation or being a part of chain restaurant is beneficial all categories restaurants
are not offering their affiliation. There are certain restaurants in PMC area like
Malaka Spice that rather offering affiliation, operating at various places with the
own set of staff and management (Chain Restaurant).
Recommendation: Entrepreneurs with no previous experience should do market
survey, study the marketing mix concept carefully and practically apply the same
to enter in restaurant business. Another option is to avail franchise with already
established brands in market especially for one, who is not having any experience
of restaurant operations. This helps to have sustainable restaurant operations.
11. Restaurant authorities asked to rank 7 P’s of Marketing Mix in order of its
importance while starting a restaurant at new place through the questionnaire
asked by researcher. The ranking proved that “Place” is the most important
element followed by “Product” and “Price” as the second and third most important
elements respectively in marketing mix of restaurant.
Strategically selected “Place” helps to get better footfall of customers at restaurant
which further helps restaurant to sustain at its initial phase of operation (while
starting a restaurant at new place).
Further the second most important marketing mix element for restaurant success is
“Product” on offer i.e. Menu.
“Price” of the products offered at restaurant should be decided and charged
carefully as most of the restaurant authorities agreed that the clientele is price
sensitive.
Least important element in marketing mix of restaurant is “Physical Evidence” in
the opinion of restaurant authorities.
Recommendation: “Place” plays an important role in restaurants success in
PMC; it should be strategically located either in the prime and densely populated
area of the city.
174
It is essential to offer standard and good quality menu products (food and
beverages) every time to the customers by implementing SOP’s like “Standard
Recipe” in kitchen. For sustainable restaurant operation and retaining the
customer as a repeat customer it helps a lot. It further leads to word of mouth
publicity by these satisfied customers and increase revenue of restaurant.
Prices charged for menu product should be in relation to quality and quantity of
products offered. Pricing should be based on the local market research and
potential customers’ profile, as study reveals it is best suited pricing strategy in
PMC rather than any other strategies like competitive or cost-based pricing or
even profit oriented pricing strategy.
175
Bibliography
About CSIR- NCL. (2018, May 31). Retrieved March 23, 2019, from
http://www.ncl- india.org/
Amofah, O., Gyamfi, I., & Tutu, C. O. (2016). The influence of service
marketing mix on customer choice of repeat purchase of restaurant in Kumasi,
Ghana. European Journal of Business and Management, 8(11), 102-112.
Baloglu, S., &Pekcan, Y. A. (2006). The website design and Internet site
marketing practices of upscale and luxury hotels in Turkey. Tourism
management, 27(1), 171-176.
Banerjee, S. (2017, May 27). Pune, where panic reigns an IT campus. Retrieved
from https://www.thehindu.com/business/Industry/pune-where-panic-reins-an-
it- campus/article18591285.ece
Behera, M. (2017, October 25). A Guide To Restaurant Marketing Mix.
Retrieved December 29, 2018, from https://thedigitalrestaurant.com/restaurant-
marketing-mix/
Bennett, T. (2017). Marketing Strategies: How Small Restaurant Businesses use
Social Media.
Biswas, P. S. (2017, July 10). Journey from auto hub to Industry 4.0 in Pune.
Retrieved from https://indianexpress.com/article/cities/pune/journey-from-auto-
hub-to-industry-4-0-in-pune- 4743553/
Biswas, P. S. (2017, July 10). Journey from auto hub to Industry 4.0 in Pune.
Retrieved March 23, 2019, from
https://indianexpress.com/article/cities/pune/journey-from-auto-hub- to-
industry-4-0-in-pune-4743553/

176
Bohle, H. G., & Warner, K. (2008). Megacities: Resilience and social
vulnerability. Unu- Ehs.
Bolder, M. (2018, August 10). Population of Pune 2019. Retrieved April 14,
2019, from https://indiapopulation2019.com/population-of-pune-2019.html
Booms, B. (1981). Marketing strategies and organizational structures for
service firms. Marketing of services.
Budhwar, K. (2004). Understanding the success factors for independent
restaurants in the Delhi/Gurgaon region: An analysis of the gap between
management perceptions and customer expectations. Journal of services
research, 4(2), 7.
Burns, D. (2016, February 17). Retrieved
from https://www.foodabletv.com/blog/2016/2/17/how-the-4-ps-
of-restaurant-marketing-can-help- your-menu
Byatnal, A. (2016, July 05). Why Pune is an international favourite. Retrieved
March 23, 2019, from https://www.thehindu.com/news/national/why-pune-is-
an-international- favourite/article3640297.ece
CHESEREM, E. V. A. (2016). The Influence of Marketing Mix Strategies On
Customer Loyalty In Fast Food Restaurants In Nairobi, Kenya. THE
INFLUENCE OF MARKETING MIX STRATEGIES ON CUSTOMER
LOYALTY IN FAST FOOD RESTAURANTS IN NAIROBI, KENYA(pp. 01–58).
NAIROBI, Kenya: RESEARCH PROJECT SUBMITTED IN PARTIAL
FULFILMENT OF THE REQUIREMENTS OF THE DEGREE OF MASTER
OF BUSINESS ADMINISTRATION, SCHOOL OF BUSINESS,
UNIVERSITY OF NAIROBI.
177
CHIB, S. S. (2012). CONSUMER BEHAVIOUR IN FOOD AND BEVERAGE
(F&B)
INDUSTRY: A CASE STUDY OF FAST FOOD INDUSTRY (Doctoral
dissertation, UNIVERSITY OF JAMMU, JAMMU).
Cooper, Harris. Synthesizing research: a guide for literature reviews. 3rd
ed.Thousand Oaks, Ca: Sage, 1998.
Cooper, Harris. The structure of knowledge synthesis, Knowledge in Society,
Vol. 1, 1988. Cousins, J., Lillicrap, D., & Weekes, S. (2014). Food and
beverage service. Hachette UK.
Cravy, &Cravy. (2018, October 02). The Restaurant Industry - A Global
Perspective. Retrieved June 6, 2019, from https://medium.com/@CravyHQ/the-
restaurant-industry-a- global-perspective-26cea1b91701
Cravy, & Cravy. (2018, October 02). The Restaurant Industry - A Global
Perspective. Retrieved June 6, 2019, from https://medium.com/@CravyHQ/the-
restaurant-industry-a- global-perspective-26cea1b91701
Dabas, S., &Lunawat, H. (2017, November 14). Indian Food Services Industry:
Engine for Economic Growth & Employment A Roadmap for Unlocking
Growth Opportunities. Retrieved January 11, 2019, from
http://ficci.in/spdocument/20969/foodzania-2017- report.pdf
DiPietro, R. B., Crews, T. B., Gustafson, C., & Strick, S. (2012). The use of
social networking sites in the restaurant industry: Best practices. Journal of
Foodservice Business Research, 15(3), 265-284.
Dixit, D. (2017, December 18). Global marketing strategies of Mcdonald’s
Corporation (with Reference to India and
Russia). Retrieved from
http://www.allresearchjournal.com/archives/2017/vol3issue1/PartL/3-1-133-
625.pdf
178
Essays, UK. (November 2018). Marketing Mix Analysis Of Le Bistrot Pierre
Restaurant Marketing Essay. Retrieved from
https://www.ukessays.com/essays/marketing/marketing- mix-analysis-of-le-
bistrot-pierre-restaurant-marketing-essay.php?vref=1
Food and Beverage Service Foundation -I. (n.d.). In Food and Beverage Service
Foundation -I (p. 01 to 142). Retrieved from
http://www.uou.ac.in/sites/default/files/slm/BHM-102T.pdf
Food and beverage services basics. (n.d.). Retrieved March 23, 2019, from
https://www.tutorialspoint.com/food_and_beverage_services/food_and_beverag
e_services_b asics.htm, www.tutorialspoint.com
Foodzania - A Knowledge report on Indian Food Services Industry by
Technopak Advisors Pvt. Ltd. as partner with FICCI
Fox, G., &Longart, P. (2016). Electronic word-of-mouth: Successful
communication strategies for restaurants. Tourism and hospitality management,
22(2), 211-223.
Goi, C. L. (2009). A review of marketing mix: 4Ps or More?. International
journal of marketing studies, 1(1), 2.
Gupta, A. (2006). Early childhood education, postcolonial theory, and teaching
practices in India: Balancing Vygotsky and the Veda. Springer.
Haghighi, M., Yasvari, T. H., &Taherkhanchi, A. (2013). The Evaluation of the
Effect of the Marketing Mix Elements on the Performance of Pakat Restaurants
Group.
Hanaysha, J. (2016). Restaurant location and price fairness as key determinants
179
of brand equity: A study on fast food restaurant industry. Business and
Economic Research, 6(1), 310- 323.
Harrison, J. P. (2011). Operating a successful restaurant. Innovation and
Empowerment: SNUTulsa Research Journal, 3(1).
History of NDA. (2018, May 31). Retrieved March 23, 2019, from
https://nda.nic.in/
History of University - Official Website. (2018, May 31). Retrieved March 23,
2019, from http://www.unipune.ac.in/
India to host England in five match Test series. (2016, July 15). Retrieved
January 04, 2019, from https://indianexpress.com/article/sports/cricket/india-vs-
england-test-series-odi-t20- fixtures-schedule-2915628/
Jackson, F. H., Titz, K., &Defranco, A. L. (2004). Frequency of restaurant
advertising and promotion strategies: Exploring an urban market. Journal of
Food Products Marketing, 10(2), 17-31.
Kara, A., Kaynak, E., &Kucukemiroglu, O. (1995). Marketing strategies for
fast-food restaurants: a customer view. International Journal of Contemporary
Hospitality Management, 7(4), 16-22.
Kelkar, S. (2008, October 20). The ‘Oxford of the East’ goes West - Indian
Express. Retrieved March 23, 2019, from
http://archive.indianexpress.com/news/the--oxford-of-the- east--goes-
west/375464/1
Kolekar, B. D. (1993). Human Resources Development. Northern Book Centre.
Kothari, C. R. (2004). Research methodology: Methods and techniques. New
180
Age International
Kotler, P., & Franke, G. (1990). Marketing: an introduction. Prentice-Hall.
Kotler, P., Armstrong, G., Harker, M., & Brennan, R. (1990). Marketing:
an introduction (Vol. 1). Englewood Cliffs, NJ: Prentice-Hall.
Kwok, L., & Yu, B. (2013). Spreading social media messages on Facebook: An
analysis of restaurant business-to-consumer communications. Cornell
Hospitality Quarterly, 54(1), 84- 94.
Landis, T. (2019, February 27). Customer Retention Marketing vs. Customer
Acquisition Marketing. Retrieved May 15, 2019, from
https://www.outboundengine.com/blog/customer- retention-marketing-vs-
customer-acquisition-marketing/
Luca, M. (2016). Reviews, reputation, and revenue: The case of Yelp. com.
Com (March 15, 2016). Harvard Business School NOM Unit Working Paper,
(12-016).
Lust, J. (2014). The herb book: the most complete catalog of herbs ever
published. Courier Corporation.
Maggo, N. (2019, August 6). Retrieved from
https://limetray.com/blog/restaurant-business- in-india/
Maheswari, R., & Nagamuthu, G. (2014). The Impacts of Marketing Mix on the
Consumer Experience in Fast Food Industries. International Journal on
Research and Development-A Management Review, 3(2).
Marketing library resources. (2009). Retrieved April 20, 2019, from
http://www.cim.co.uk/marketingresources
Marketing Mix: Meaning, Definition and Characteristics of Marketing Mix
(with diagram). (2014, April 02). Retrieved
181
December 21, 2018, from
http://www.yourarticlelibrary.com/marketing/marketing-mix-meaning-
definition-and- characteristics-of-marketing-mix-with-diagram/32321
Marketing Mix: Meaning, Definition and Characteristics of Marketing Mix
(with diagram). (2014, April 02). Retrieved
December 21, 2018, from
http://www.yourarticlelibrary.com/marketing/marketing-mix-meaning-
definition-and- characteristics-of-marketing-mix-with-diagram/32321
Masterson, R., Phillips, N., &Pickton, D. (2017). BUILDING BRANDS:
USING THE MARKETING MIX.SAGE,4, 423–461. Retrieved from
https://uk.sagepub.com/en- gb/eur/marketing/book251883
Menon, S. (2002, March 30). Pimpri-Chinchwad industrial belt: Placing Pune at
the front. Retrieved March 23, 2019,
from
https://www.thehindubusinessline.com/2002/03/30/stories/2002033000801300.
htm
Mercer, W. M. (2017). Mercer Quality of Living Survey. Available at the
website of Marsh Mercer Kroll.
Mitra, S. (2016, July 20). How India eats out. Retrieved January 21, 2017, from
https://www.livemint.com/Consumer/DeU2aNxRI3U0unsxnjhy5L/Study-
Quickservice- restaurants-top-dining-destination-for.html
Montagné, P., & Turgeon, C. S. (1977). New laroussegastronomique. Crown
Publishers. Mork, N. (2019, March 21). Retrieved from
http://nextrestaurants.com/seo/how-to-use-local- seo-to-grow-your-restaurants-
business/
Muller, C. C. (1999). The business of restaurants: 2001 and beyond.
182
International Journal of Hospitality Management, 18(4), 401-413.
Nguyen, L. T. (2017). RESTAURANT STARTUP MARKETING MIX: Case
study Mad
Wok and Helmi restaurant-success and failure in marketing.
Now, your favourite Pune restaurant can flaunt its 'stars', as 350 eateries opt for
FDA's hygiene rating system. (2018, August 28). Retrieved
April 09, 2019, from https://www.hindustantimes.com/pune-
news/now-your-favourite-pune-restaurant-can-flaunt- its-stars-as-350-eateries-
opt-for-fda-s-hygiene-rating-system/story- 9fEpFoz17s9LSiXA9pDo9N.html
Ozdemir, B., &Caliskan, O. (2014). A review of literature on restaurant menus:
Specifying the managerial issues. International Journal of gastronomy and food
science, 2(1), 3-13.
Parsa, H. G., Self, J. T., Njite, D., & King, T. (2005). Why restaurants fail.
Cornell Hotel and Restaurant Administration Quarterly, 46(3), 304-322.
Parsa, H. G., Self, J., Sydnor-Busso, S., & Yoon, H. J. (2011). Why restaurants
fail? Part II- The impact of affiliation, location, and size on restaurant failures:
Results from a survival analysis. Journal of Foodservice Business Research,
14(4), 360-379.
Pune (2019, May 28). Retrieved June 1, 2019, from
https://en.wikipedia.org/wiki/Pune
Pune City Census 2011 data. (n.d.). Retrieved April 14, 2019,
from https://www.census2011.co.in/census/city/375-pune.html
Raab, C., Mayer, K., Kim, Y. S., & Shoemaker, S. (2009). Price-sensitivity
measurement: a tool for restaurant menu pricing. Journal of Hospitality &
Tourism Research, 33(1), 93-105.
183
Rathod, N. G. (1994). The Great Maratha MahadajiScindia. Sarup& Sons.
Rawson, K., & Shore, E. (2019). Dining Out: A Global History of
Restaurants. Reaktion Books.
Restaurant. (2019, May 23). Retrieved May 24, 2019,
from https://en.wikipedia.org/wiki/Restaurant
Rujuta Parekh | TNN | Updated: Sep 17, 2. (2018). Food: Several eateries shut
shop, even as hospitality industry booms in Pune: Pune News - Times of India.
Retrieved from https://timesofindia.indiatimes.com/city/pune/several-eateries-
shut-shop-even-as-hospitality- industry-booms-in-
city/articleshow/65834504.cms
Sabir, R. I., Irfan, M., Akhtar, N., Pervez, M. A., & ur Rehman, A. (2014).
Customer Satisfaction in the restaurant industry; examining the model in
local industry perspective. Journal of Asian Business Strategy, 4(1), 18.
Saif, N. M. A. (2016). Exploring the Value and Process of Marketing Strategy:
Review of Literature. International Journal of Management Science and
Business Administration, 2(2), 7-18.
Sathe, S., & Randhave , M. (2017). Advances in food and beverage business in
multiplexes - A case study of PVR cinemas in Pune. KIMI Hospitality
Research Journal , 2(1).
Service Marketing Mix - 7Ps of marketing mix - Marketing mix of Services.
(2017, December 15). Retrieved March 16, 2019, from
https://www.marketing91.com/service- marketing-mix/
Shah, S., & Mujtaba, B. G. (2016). Contemplations for Opening the First
McDonald’s Restaurant Franchise in the IT Capital of India’s Bangalore.
International Journal of Marketing Practices, 3(2), 33-46.
184
Sharma, P. (1970, January 01). Origin of Food & Beverage Service Industry.
Retrieved from http://parikshitsharma.blogspot.com/2012/10/origin-of-food-
beverage-service-industry.html
Story, M., & French, S. (2004). Food advertising and marketing directed at
children and adolescents in the US. International Journal of Behavioral
Nutrition and Physical Activity, 1(1), 3.
Taguinod, A. J. (2016), The Effects of Coupon Promotion on Customer
Retention.
The 7 P`s of Marketing Mix - Practising in Asian Restaurant. (2015, June 29).
Retrieved April 22, 2019, from
http://mbabusinessmodels.blogspot.com/2015/06/the-7-ps-of- marketing-mix-
practising-in.html
Tutorialspoint.com. (n.d.). Food and Beverage Services
Basics. Retrieved from
https://www.tutorialspoint.com/food_and_beverage_services/food_and_beverag
e_services_b asics.htm
Umeze, G. E., & Ohen, S. B. (2015). Marketing Mix Strategies and
Entrepreneurial Competence: Evidence from Micro Restaurants in Calabar
Metropolis, Cross River State, Nigeria(No. 1008-2016-80313).
Van der Walt, R., Greyling, M., & Kotzé, T. (2014). Customers’ perceptions of
restaurant experience in Gauteng.
Venkatraman, D. P., &Korane, S. (2019). Food and Beverage Service:
Principles and Practices (First). Mumbai, Maharashtra: Himalaya Publishing
House.
Walker, J. R. (2007). Study Guide to Accompany The Restaurant: From
Concept to Operation, 5e. John Wiley & Sons.
185
Weinreich, C. (2016). Marketing strategies restaurant leaders use to develop
their customer base.
Wiki Actuen. (2008, October 12). Retrieved March 23, 2019,
from http://en.wikiactu.com/?page_id=25095
World food Safety Day: FSSAI to start rating eateries on quality, hygiene.
(2018, June 07). Retrieved April 09, 2019, from
https://indianexpress.com/article/cities/pune/world-food- safety-day-fssai-to-
start-rating-eateries-on-quality-hygiene-5207423/
Yeu, C. S., Leong, K. C., Tong, L. C., Hang, S., Tang, Y., Bashawir, A., &
Subhan, M. (2012). A comparative study on international marketing mix in
China and India: The case of McDonald's. Procedia-Social and Behavioral
Sciences, 65, 1054-1059.
Zheng, G. D. (1999). Predicting potential failure, taking corrective action are
keys to success. Nation's Restaurant News, 33(25), 31-32.
zomato. (2017). Retrieved from https://www.zomato.com/pune
(2015, September 4). NEW MENU REFLECTS RECIPE FOR SUCCESS AT
ZAMAN
RESTAURANT. Eastern Eye. Retrieved from www.easterneye.eu
“10 Ways How Restaurants Failure Can Be Avoid.” POS Sector, 20 Mar. 2015,
possector.com/management/restaurant-failure.
10 Best Modern Australian Restaurants in Melbourne, CBD. (2016, September
21). Retrieved March 23, 2019, from https://www.10keythings.com/10-best-
modern-australian- restaurants-melbourne-cbd/

186
10 Ways How Restaurants Failure Can Be Avoid. (2015, March 20). Retrieved
March 04, 2017, from https://possector.com/management/restaurant-failure
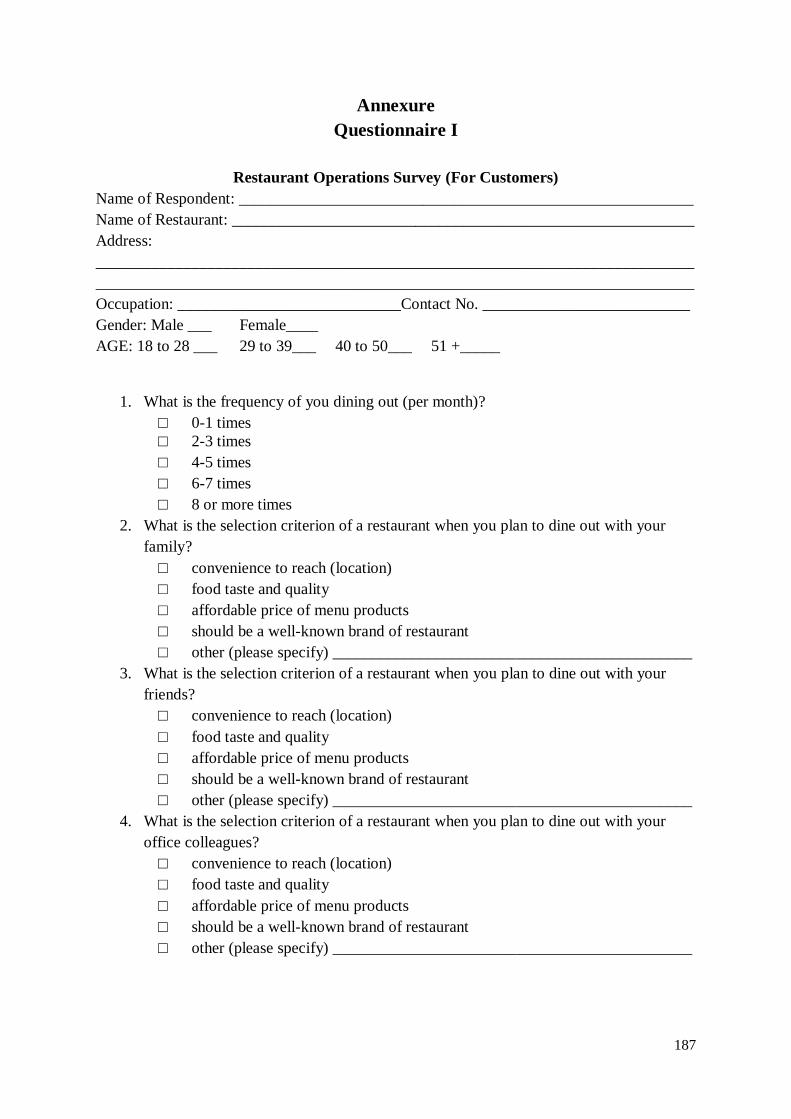
187
Annexure
Questionnaire I
Restaurant Operations Survey (For Customers)
Name of Respondent: _________________________________________________________
Name of Restaurant: __________________________________________________________
Address:
___________________________________________________________________________
___________________________________________________________________________
Occupation: ____________________________Contact No. __________________________
Gender: Male ___ Female____
AGE: 18 to 28 ___ 29 to 39___ 40 to 50___ 51 +_____
1. What is the frequency of you dining out (per month)?
□ 0-1 times
□ 2-3 times
□ 4-5 times
□ 6-7 times
□ 8 or more times
2. What is the selection criterion of a restaurant when you plan to dine out with your
family?
□ convenience to reach (location)
□ food taste and quality
□ affordable price of menu products
□ should be a well-known brand of restaurant
□ other (please specify) _____________________________________________
3. What is the selection criterion of a restaurant when you plan to dine out with your
friends?
□ convenience to reach (location)
□ food taste and quality
□ affordable price of menu products
□ should be a well-known brand of restaurant
□ other (please specify) _____________________________________________
4. What is the selection criterion of a restaurant when you plan to dine out with your
office colleagues?
□ convenience to reach (location)
□ food taste and quality
□ affordable price of menu products
□ should be a well-known brand of restaurant
□ other (please specify) _____________________________________________
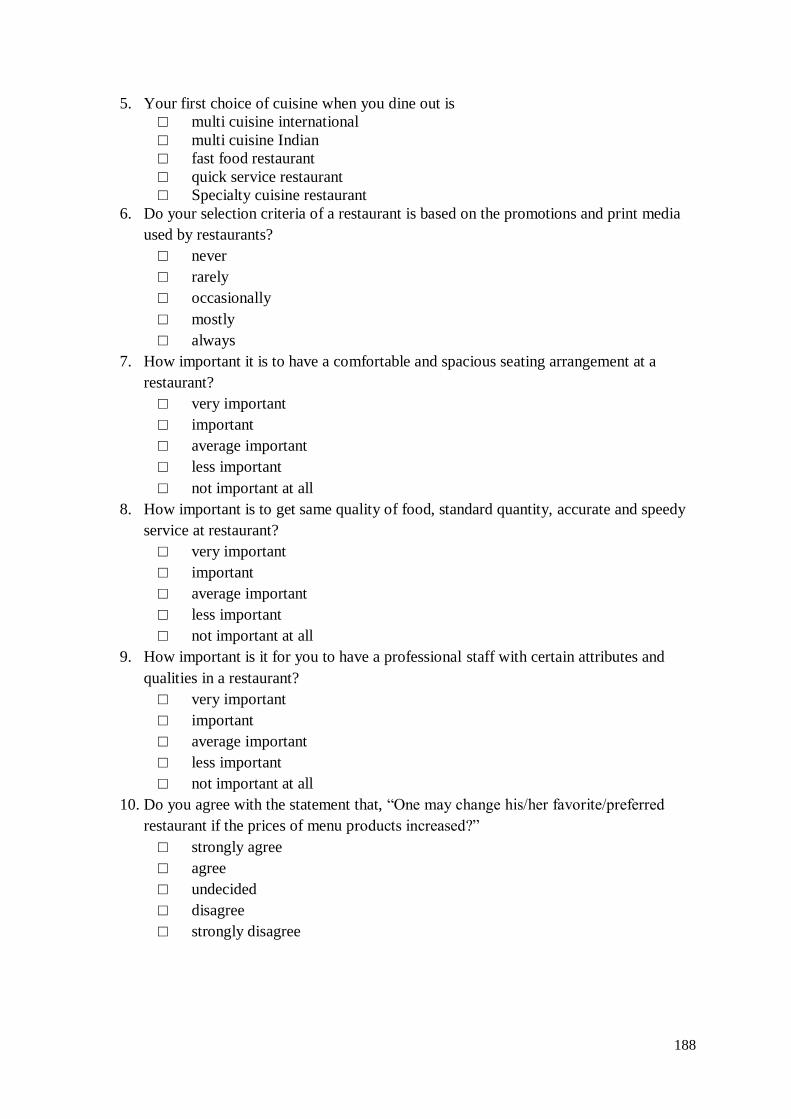
188
5. Your first choice of cuisine when you dine out is
□ multi cuisine international
□ multi cuisine Indian
□ fast food restaurant
□ quick service restaurant
□ Specialty cuisine restaurant
6. Do your selection criteria of a restaurant is based on the promotions and print media
used by restaurants?
□ never
□ rarely
□ occasionally
□ mostly
□ always
7. How important it is to have a comfortable and spacious seating arrangement at a
restaurant?
□ very important
□ important
□ average important
□ less important
□ not important at all
8. How important is to get same quality of food, standard quantity, accurate and speedy
service at restaurant?
□ very important
□ important
□ average important
□ less important
□ not important at all
9. How important is it for you to have a professional staff with certain attributes and
qualities in a restaurant?
□ very important
□ important
□ average important
□ less important
□ not important at all
10. Do you agree with the statement that, “One may change his/her favorite/preferred
restaurant if the prices of menu products increased?”
□ strongly agree
□ agree
□ undecided
□ disagree
□ strongly disagree
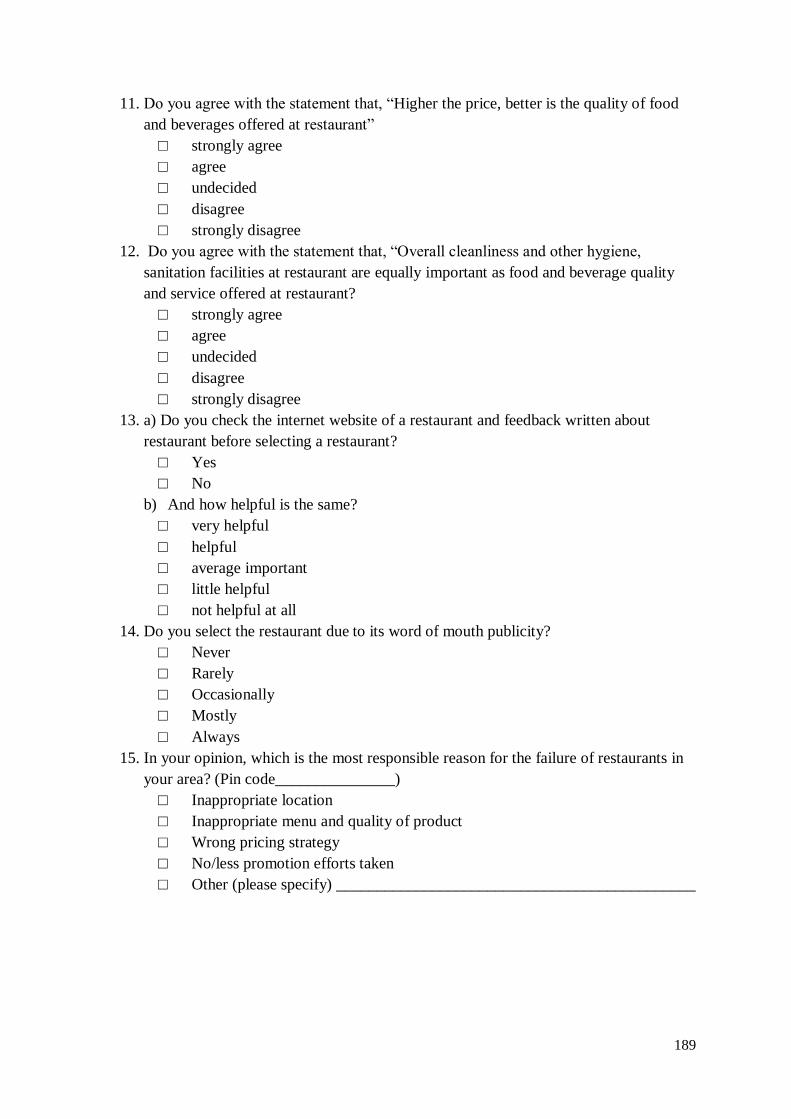
189
11. Do you agree with the statement that, “Higher the price, better is the quality of food
and beverages offered at restaurant”
□ strongly agree
□ agree
□ undecided
□ disagree
□ strongly disagree
12. Do you agree with the statement that, “Overall cleanliness and other hygiene,
sanitation facilities at restaurant are equally important as food and beverage quality
and service offered at restaurant?
□ strongly agree
□ agree
□ undecided
□ disagree
□ strongly disagree
13. a) Do you check the internet website of a restaurant and feedback written about
restaurant before selecting a restaurant?
□ Yes
□ No
b) And how helpful is the same?
□ very helpful
□ helpful
□ average important
□ little helpful
□ not helpful at all
14. Do you select the restaurant due to its word of mouth publicity?
□ Never
□ Rarely
□ Occasionally
□ Mostly
□ Always
15. In your opinion, which is the most responsible reason for the failure of restaurants in
your area? (Pin code_______________)
□ Inappropriate location
□ Inappropriate menu and quality of product
□ Wrong pricing strategy
□ No/less promotion efforts taken
□ Other (please specify) _____________________________________________
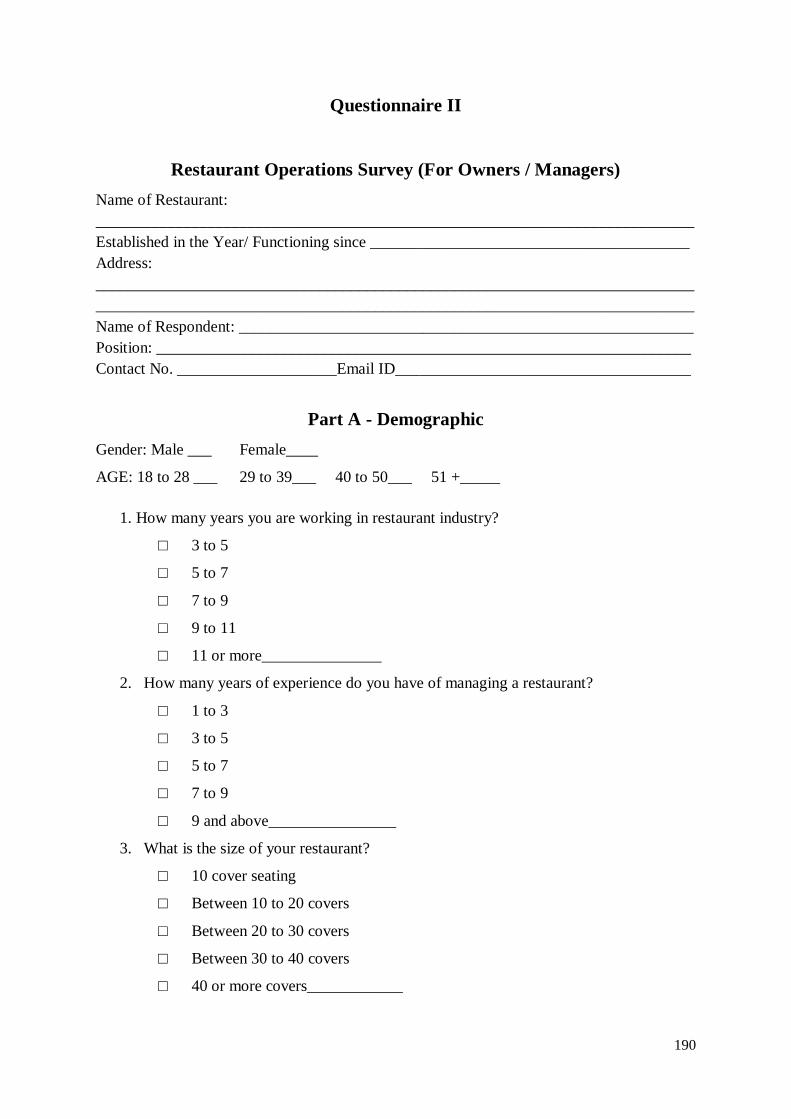
190
Questionnaire II
Restaurant Operations Survey (For Owners / Managers)
Name of Restaurant:
___________________________________________________________________________
Established in the Year/ Functioning since ________________________________________
Address:
___________________________________________________________________________
___________________________________________________________________________
Name of Respondent: _________________________________________________________
Position: ___________________________________________________________________
Contact No. ____________________Email ID_____________________________________
Part A - Demographic
Gender: Male ___ Female____
AGE: 18 to 28 ___ 29 to 39___ 40 to 50___ 51 +_____
1. How many years you are working in restaurant industry?
□ 3 to 5
□ 5 to 7
□ 7 to 9
□ 9 to 11
□ 11 or more_______________
2. How many years of experience do you have of managing a restaurant?
□ 1 to 3
□ 3 to 5
□ 5 to 7
□ 7 to 9
□ 9 and above________________
3. What is the size of your restaurant?
□ 10 cover seating
□ Between 10 to 20 covers
□ Between 20 to 30 covers
□ Between 30 to 40 covers
□ 40 or more covers____________
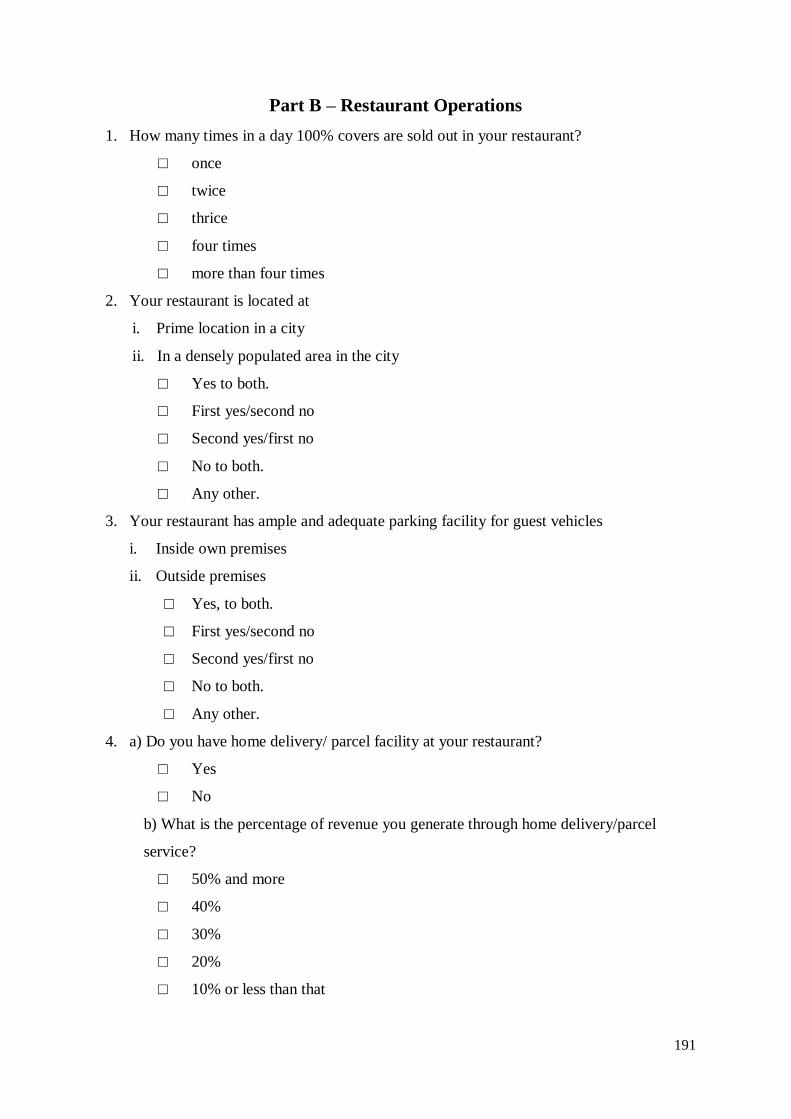
191
Part B – Restaurant Operations
1. How many times in a day 100% covers are sold out in your restaurant?
□ once
□ twice
□ thrice
□ four times
□ more than four times
2. Your restaurant is located at
i. Prime location in a city
ii. In a densely populated area in the city
□ Yes to both.
□ First yes/second no
□ Second yes/first no
□ No to both.
□ Any other.
3. Your restaurant has ample and adequate parking facility for guest vehicles
i. Inside own premises
ii. Outside premises
□ Yes, to both.
□ First yes/second no
□ Second yes/first no
□ No to both.
□ Any other.
4. a) Do you have home delivery/ parcel facility at your restaurant?
□ Yes
□ No
b) What is the percentage of revenue you generate through home delivery/parcel
service?
□ 50% and more
□ 40%
□ 30%
□ 20%
□ 10% or less than that
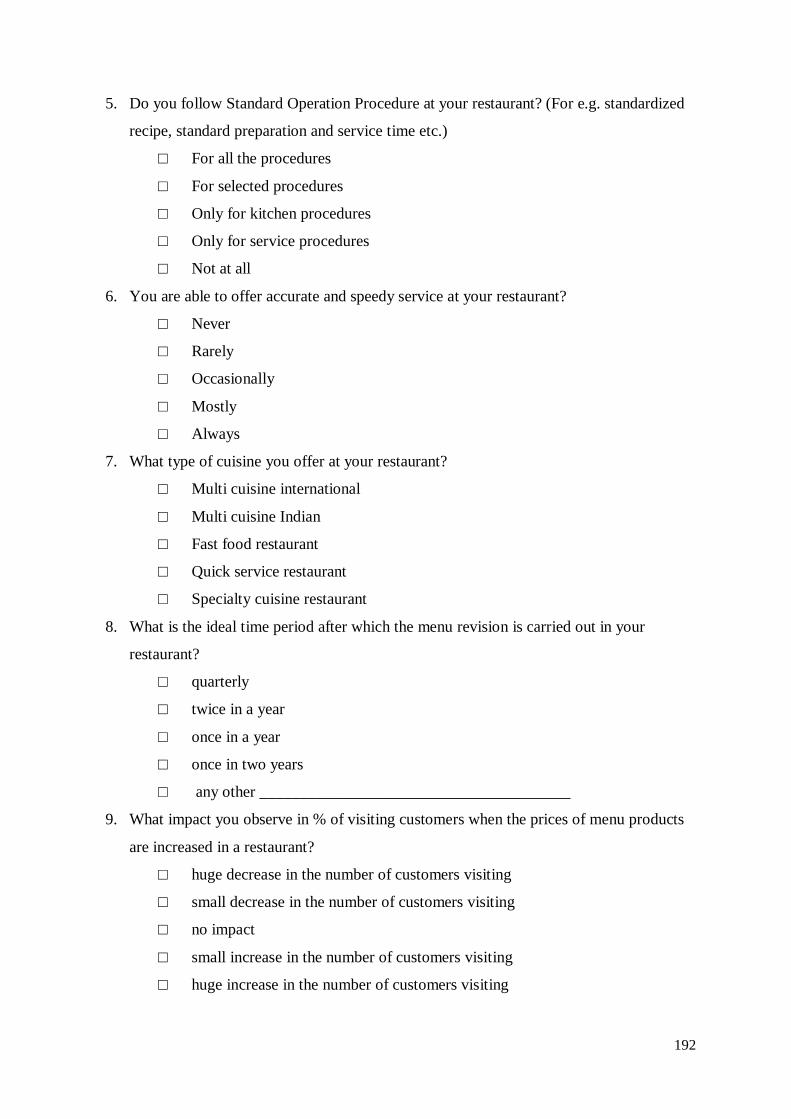
192
5. Do you follow Standard Operation Procedure at your restaurant? (For e.g. standardized
recipe, standard preparation and service time etc.)
□ For all the procedures
□ For selected procedures
□ Only for kitchen procedures
□ Only for service procedures
□ Not at all
6. You are able to offer accurate and speedy service at your restaurant?
□ Never
□ Rarely
□ Occasionally
□ Mostly
□ Always
7. What type of cuisine you offer at your restaurant?
□ Multi cuisine international
□ Multi cuisine Indian
□ Fast food restaurant
□ Quick service restaurant
□ Specialty cuisine restaurant
8. What is the ideal time period after which the menu revision is carried out in your
restaurant?
□ quarterly
□ twice in a year
□ once in a year
□ once in two years
□ any other _______________________________________
9. What impact you observe in % of visiting customers when the prices of menu products
are increased in a restaurant?
□ huge decrease in the number of customers visiting
□ small decrease in the number of customers visiting
□ no impact
□ small increase in the number of customers visiting
□ huge increase in the number of customers visiting
193
10. How frequently you increase price of menu products offered at restaurant?
□ quarterly
□ twice in a year
□ once in a year
□ once in two years
□ any other _______________________________________
11. What is the most important criterion to change the price of menu products?
□ Cost based pricing
□ According to competitors
□ As per seasonality
□ Offer based pricing
□ Profit margin based
12. How often you offer training to your employees?
□ At the recruitment level
□ Quarterly
□ Twice in a year
□ Once a year
□ Need based
13. How many of the staff has completed formal education/degree working at restaurant?
□ 100%
□ 80%
□ 60%
□ 40%
□ None
14. Is your décor been planned as per the aesthetic expectations of your target customers?
□ Yes
□ Only for Service area
□ Only for entrance and external
□ Not essentially
□ No
194
15. How many often in a day you follow cleanliness procedures at your restaurant?
□ Once
□ Twice
□ Thrice
□ Four times
□ More than four times
16. Do you have entertainment facility at your restaurant?
□ Yes, all year round
□ Offering occasionally (during mega sport and social, cultural event – live
telecast etc.)
□ Only on weekends
□ On customer demand.
□ Not at all
17. a) Do you have your own website of a restaurant?
□ Yes
□ No
b) How helpful is the same for attracting customers to your restaurant?
□ very helpful
□ helpful
□ so-so
□ little helpful
□ not helpful at all
18. Whether public relations and print media are used by your restaurant to attract
customers?
□ Never
□ Rarely
□ Occasionally
□ Mostly
□ Always
19. Which type of media you are using to attract customers?
□ Television
□ Radio
□ Newspaper
□ On screens of multiplex
□ Messages on mobile
195
20. Whether your restaurant has any Affiliation/ Franchised or is a part of Chain of
Restaurants? If yes, has it helped to have a sustainable restaurant operation?
□ very helpful
□ helpful
□ so-so
□ little helpful
□ not helpful at all
21. To what extent you are happy with the business of your restaurant?
□ 100%
□ 90%
□ 80%
□ 70%
□ 60%
22. If you are starting a new restaurant at a new place please rank the following marketing
mix (7P’s) in order of its importance from 1 to 7 (7 is most important and 1 is least
important) (no repetition is allowed).
Place (Location/ Distribution)
Product (Menu)
Price
Promotion (Advertisement and Marketing)
Physical Evidence (Facilities)
People (Management/ Staff)
Process (Production and Service)