structure of genetic diversity among common bean (phaseolus vulgaris l.) varieties of mesoamerican...
TRANSCRIPT
RESEARCH ARTICLE
Structure of genetic diversity among common bean(Phaseolus vulgaris L.) varieties of Mesoamerican andAndean origins using new developed microsatellite markers
Luciana Lasry Benchimol Æ Tatiana de Campos ÆSergio Augusto Morais Carbonell Æ Carlos Augusto Colombo ÆAlisson Fernando Chioratto Æ Eduardo Fernandes Formighieri ÆLıgia Regina Lima Gouvea Æ Anete Pereira de Souza
Received: 5 June 2006 / Accepted: 4 December 2006 / Published online: 20 April 2007� Springer Science+Business Media B.V. 2007
Abstract A common bean genomic library was
constructed using the ‘IAC-UNA’ variety en-
riched for (CT) and (GT) for microsatellite
motifs. From 1,209 sequenced clones, 714 showed
microsatellites distributed over 471 simple and
243 compound motifs. GA/CT and GT/CA were
the most frequent motifs found among these
sequences. A total of 123 microsatellites has been
characterized. Out of these, 87 were polymorphic
(73.7%), 33 monomorphic (26.8%), and 3 (2.4%)
did not amplify at all. In a sample of 20 common
bean materials selected from the Agronomic
Institute Germplasm Bank, the number of alleles
per locus varied 2–9, with an average of 2.82. The
polymorphic information content (PIC) of each
marker varied from 0.05 to 0.83, with a 0.45
average value. Cluster and principal coordinate
analysis of the microsatellite data were consistent
with the original assignment of the germplasm
accessions into the Andean and Mesoamerican
gene pools of common bean. Low polymorphism
levels detected could be associated with the
domestication process. These microsatellites
could be a valuable resource for the bean com-
munity because of their use as new markers for
genetic studies.
Keywords Common bean � Molecular markers �Phaseolus vulgaris L. � Simple sequence repeats
(SSRs) � SSR Enriched libraries
Introduction
Common bean (Phaseolus vulgaris L.) is the
primary source of protein in the human diet in
some countries, such as Brazil. It consists of two
major gene pools, a Mesoamerican and an An-
dean one, as determined by morphological and
phaseolin seed protein attributes (Gepts 1988).
From a genomic perspective, common bean has a
small genome comparable to rice, estimated to be
Electronic supplementary material The online version ofthis article (doi: 10.1007/s10722-006-9184-3) containssupplementary material, which is available to authorizedusers.
L. L. Benchimol (&) � S. A. M. Carbonell �C. A. Colombo � A. F. Chioratto � L. R. L. GouveaCentro de Pesquisa e Desenvolvimento de RecursosGeneticos Vegetais, Fazenda Santa Elisa, IAC,CP. 28, Campinas 13012-970 SP, Brazile-mail: [email protected]
T. de Campos � A. P. de SouzaCentro de Biologia Molecular e Engenharia Genetica(CBMEG), Departamento de Genetica e Evolucao,Instituto de Biologia, UNICAMP, Campinas13083-970 SP, Brazil
E. F. FormighieriLaboratorio de Genomica e Expressao, DGE,Instituto de Biologia, UNICAMP, Campinas 13083-970 SP, Brazil
123
Genet Resour Crop Evol (2007) 54:1747–1762
DOI 10.1007/s10722-006-9184-3
about 450–650 million base pairs (Mb)/haploid
(McClean et al. 2004).
Common bean breeders have traditionally
developed new cultivars by selection and adapta-
tion of superior lines. Breeding programs based
on previous knowledge of the genetic distances
among potential progenitors to be crossed are
of great importance. Molecular markers have
been an important tool to characterize and
determine genetic diversity among common
beans (Vasconcelos et al. 1996; Metais et al.
2002). RFLPs were principally used as framework
markers to develop molecular linkage maps in
common beans (Nodari et al. 1993; Adam-
Blondom et al. 1994). RAPDs have been exten-
sively used, not only to develop linkage maps, but
also to characterize genetic diversity (Beebe et al.
2000; Kelly et al. 2003). AFLPs have also proven
useful to characterize germplasm (Pallottini et al.
2004) and develop low-density linkage maps
(Ta’ran et al. 2002).
Microsatellites or Simple Sequence Repeats
(SSRs) have been widely recognized as powerful
and informative genetic markers in both animals
and plants. SSRs consist of tandem repeated units
of short nucleotide motifs that are 1–6 bp long.
Di-, tri- and tetranucleotide repeats are the most
common and widely distributed throughout
genomes (Jarne and Lagoda 1996). Their great
utility as genetic markers comes from their
inherent variability that is derived from unusually
high mutation rates for nucleotide sequences
within SSR loci (Peakall et al. 1998).
In recent years, microsatellites for common
beans have been developed from published
sequences (Yu et al. 1999; Blair et al. 2003; Masi
et al. 2003; Guerra-Sanz 2004) and from microsat-
ellite-enriched libraries (Metais et al. 2002; Blair
et al. 2003; Gaitan-Solis et al. 2002; Yaish et al.
2003). Recently, two major publications have added
new data information to the Phaseolus database
(Ramırez et al. 2005; Melotto et al. 2005). These
publications reported EST sequencing in common
bean, information which was deposited in a data-
base at TIGR (Common Bean Gene Index—http://
www.tigr.org). The number of microsatellites for
common beans remains small, especially when
compared to grasses, making it difficult to conduct
whole-genome or fine mapping. Additional
microsatellite markers are needed to increase
density on the linkage map (McClean et al. 2004)
especially for QTL mapping. They can also help in
establishing marker-assisted selection programs and
characterizing exotic germplasm. The present paper
reports the use of newly developed microsatellite
markers to evaluate the genetic divergence of
common bean cultivars and assign them to common
bean domestication centers.
Materials and methods
Plant material and DNA preparation
The variety IAC-UNA, developed by the Agro-
nomic Institute (IAC, Campinas, Sao Paulo), was
used for the enriched microsatellite library
construction. It is a black-seeded variety that
belongs to the Mesoamerican gene pool. It is
resistant to anthracnose but susceptible to bean
rust, Fusarium oxysporum Schlecht. f. sp. phaseoli
[Kendrick and Snyder (Fop)] and angular leaf
spot.
A total of 20 genotypes were selected in the
IAC Core Germplasm Bank and used for the
evaluation of the newly developed microsatellites
(Table 1). The twenty P. vulgaris entries repre-
sented the Andean and Mesoamerican gene
pools. Total genomic DNA from powdered lyo-
philised young leaf tissue was extracted using the
CTAB method (Hoisington et al. 1994).
Construction of an enriched microsatellite
library
An enriched library was constructed according to
Billotte et al. (1999) for IAC-UNA. Six hundred
nanograms of genomic DNA were digested with
RsaI and adaptors (consisting of 21- and 25-mer
primers) were ligated to the digested fragments.
Selection was carried out using (CT)8 and (GT)8
biotinylated microsatellite primers and Streptavidine
MagneSphere Paramagnetic Particles (Promega,
Sao Paulo). The selected fragments were ampli-
fied by PCR using Rsa21 primers and then cloned
into the pGEM-T vector (Promega, Sao Paulo).
1748 Genet Resour Crop Evol (2007) 54:1747–1762
123
Plasmids were introduced into XL-1 Blue cells;
transformed cells were then plated onto agar
plates containing 100 lg ml–1 ampicilin and
50 lg ml–1 X-galactosidase. Following incubation
overnight at 37 �C, single colonies were trans-
ferred onto microplates for long-term storage
at –70�C.
Detection and sequencing of microsatellite-
containing clones
The genomic libraries were screened by picking
2 ll of frozen white colonies and amplifying them
directly in a PCR reaction. Each amplification
reaction contained 25 ll consisting of 1x reaction
buffer, 2 mM MgCl2, 0.5 lM of RsaI primer,
200 lM of total dNTP mixture, and 0.5U Taq
DNA polymerase (Invitrogen, Sao Paulo). Ampli-
fications were performed in a PTC-100 MJ Re-
search thermocycler, programmed with a hot start
of 4 min at 95�C; followed by 30 cycles of 30 s at
94�C, 45 s at 52�C, 1 min 30 s at 72�C, followed by
8 min at 72�C. PCR products were separated onto
3% agarose gels. Plasmid DNA was isolated
according to Maniatis et al. (1982). Sequencing
was done with T7 or SP6 primer sites (all clones
were sequenced in both directions) and the Bigdye
Terminator Cycle Sequencing Kit (Applied Bio-
systems, ABI 377 sequencer).
Analysis and edition of the generated
sequences and primer design
Microsat Software (CIRAD, Risterucci et al.
2005) was used to excise adaptors and find
possible RsaI sites inside the sequences. Reads
were processed by the Phred version 0.000925.c
base calling program (www.phrap.org; Ewing
et al. 1998); and vector sequences, poly-A tail,
and adapters were trimmed after cross-match
analysis. Clustering was performed using CAP3
software with default parameters (Huang and
Madan 1999). BLASTN and BLASTX program
search utilities were used to identify similarities
within known genes represented in the GenBank
non-redundant database (Altschul et al. 1990,
1997). GO (Gene Ontology Consortium, http://
www.geneontology.org) analysis was performed
with the total amount of sequences with a
stringency of 1 e–05. Each sequence was blasted
against the go.fasta sequences (downloaded from
http://www.geneontology.org/) and the first hit
was considered.
Only perfect and/or imperfect sequences con-
taining to five or more repeated units were
considered. To identify, count, and localize the
SSR motif inside the sequences, a free software
was used (SSRIT—Simple Sequence Repeat
Identification Tool; Temnykh et al. 2001), avail-
able at http://www.gramene.org/db/searches/ssr-
tool. Complementary primers to the single
sequences, flanking the microsatellites, were
designed with Primer Select software from the
Lasergene program (DNASTar, Inc.). The strin-
gency criteria adopted was based on GC content
between 40 and 60%, melting temperature
between 46 and 60�C, a salt concentration of
50 mM, and a product length between 150 and
300 pb. The primers were designed without
extensive palindromes within a primer, and no
dimmers. Microsatellites were synthesized by
Imprint LTDA (Sao Paulo, Brazil).
Table 1 Common bean (P. vulgaris L.) accessions used inthe determination of the allelic variation of the microsat-ellites
No. IAC accession Gene pool
1 Sanilac Mesoamerican2 Bagajo Andean3 Baetao Mesoamerican4 Red Kidney Andean5 Cornell-49242 Mesoamerican6 Porrillo Sintetico Mesoamerican7 Jamapa Mesoamerican8 Arc-1 Mesoamerican9 G-4000 Mesoamerican10 Flor de Mayo Mesoamerican11 Tu Andean12 Kaboon Andean13 Durango-222 Mesoamerican14 Bayo Andean15 Goiano Precoce Andean16 Carioca Comum Mesoamerican17 Carioca ETE Mesoamerican18 Jabola (CB) Andean19 IAC-UNA Mesoamerican20 CAL-143 Andean
Genet Resour Crop Evol (2007) 54:1747–1762 1749
123
Microsatellite primer characterization
The annealing temperature (Ta) of each micro-
satellite was identified using a temperature gradi-
ent in a PTC-200 thermocycler (MJ Research).
PCRs were performed in a 25 ll final volume
containing 50 ng of template DNA, 0.2lM of each
forward and reverse primer, 100 lM of each
dNTP, 2.0 mM MgCl2, 10 mM Tris-HCl, 50 mM
KCl, and 0.5 U Taq DNA Polymerase (Invitrogen,
Sao Paulo). Reactions were performed using the
following conditions: 1 min. at 94�C; then, 30
cycles of 1 min at 94�C, 1 min at Ta, 1 min at 72�C,
followed by 5 min at 72�C. Amplification products
were loaded on 6% w/v denatured polyacrylamide
gels using a 10 bp ladder as a size standard and
silver stained according to Creste et al. (2001).
Polymorphism analysis
SSR data scored for presence (1) or absence (0)
of bands were transformed to genotypic data to
identify locus and alleles. The polymorphism
information content (PIC) value was calculated
by the following formula PIC ¼ 1�Px
i¼1
fi2 ,where
fi is the frequency of the ith allele (marker) for
the ith SSR locus (Lynch and Walsh 1998).
Genetic distances (GD) were calculated from
SSR data for all possible pairs of varieties using
modified Rogers’ genetic distance (Goodman and
Stuber 1983). A genetic distance matrix was
estimated using TFPGA vs. 1.3 (Mark Miller
1997). Cluster analysis was performed using
UPGMA (Unweighted Pair-Group Method with
Arithmetical Averages) with the NTSYS-pc com-
puter package version 2.02E (Rohlf 1997). The
stability of the clusters was also tested by a re-
sampling procedure with 10,000 bootstraps using
the BooD program (Coelho 2002). Principal
coordinate analysis (PCO, Gower 1966) was
performed the common bean MRD distance
matrix and the first three principal coordinates
were used to describe the dispersion of the 20
accessions according to their allele data.
Results
After screening of a total of 2,479 clones in the
IAC-UNA library, 1,453 (58.6%) putative
positive colonies were isolated and 1,209
(48.8%) clones were sequenced. A total of 714
sequences contained microsatellites. The screen-
ing of the library showed that 471 SSRs were
simple motifs (perfect and imperfect) and 243
were compound motifs. A total of 451 dinucleo-
tides were observed and the maximum number of
repeats among them was 37 (perfect GA). From
Phred/Cap3 analysis, sequences were aligned in
478 contigs and 648 singlets. A total of 451
dinucleotides were observed and the maximum
number of repeats among them was 37 (perfect
GA). Trinucleotides were less frequent (2.1%)
and showed a lesser number of repeat units (2–5
units). Other categories (tetra, penta, hexa-nucle-
otides) also appeared as simple repeats. Around
540 sequences were suitable for designing primers
due to their sequence flanking repeats or com-
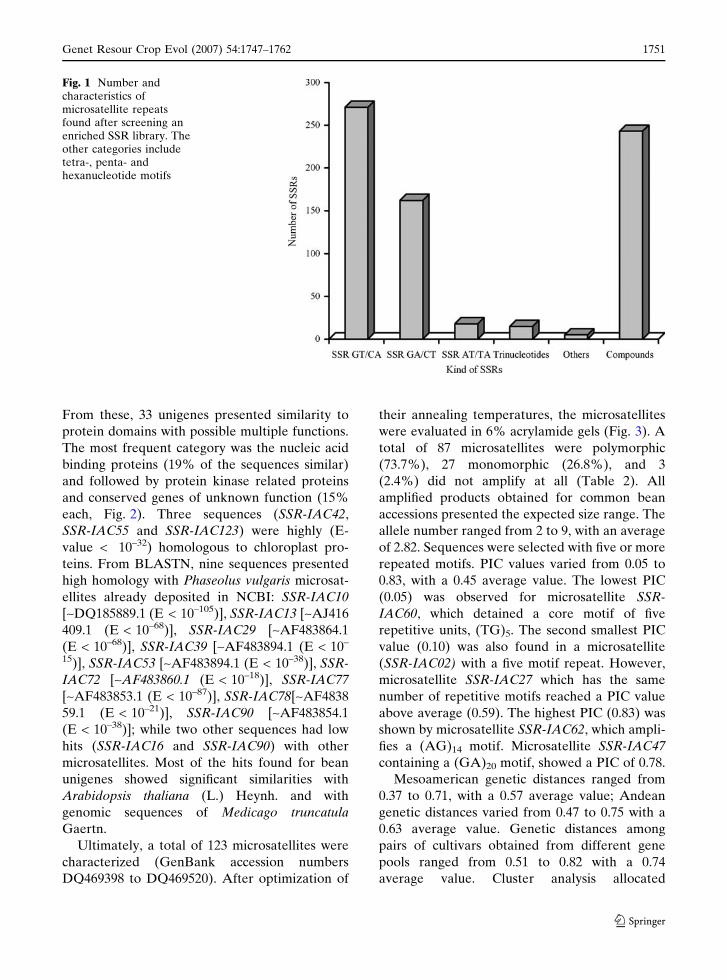
plexity. SSRs containing GT/CA motif (38%) and
GA/CT motif (22.7%) were most frequent among
simple repeats (Fig. 1). The GA/CT motifs also
appeared in the more extensive motifs in terms of
the average number of nucleotide per motif
(14 nucleotides in average) followed by com-
pound motifs (12 nucleotides in average), which
were represented by perfect and imperfect
repeats. Many small microsatellites (fewer than
five repeat units) were frequently found in all the
analysed sequences, but they were all discarded.
Gene ontology (GO) analysis was performed
with all aligned sequences (478 contigs and 648
singlets). At the biological processes level, the
‘‘cellular’’ category was the most expressed
(35.57%). Following the cellular component level,
most of the sequences presented products whose
functions were supposed to be inside the ‘‘cell’’
(42.28%) and targeted to ‘‘organelles’’ (30.20%).
At a molecular function level, the strongest
category was ‘‘binding’’ (35.58%). Inside the
binding category, most of the sequences seemed
to be related to the ‘‘nucleic acid binding’’
function (38.71%), followed by ‘‘nucleotide bind-
ing’’ (7.53%).
BLASTN and BLASTX were used to align the
123 microsatellite sequences to the GeneBank
database. The ‘‘no hits’’ category comprehended
73% of the data but 27% of the sequences
showed some level of similarity with the align-
ment of non-redundant nucleotide database.
1750 Genet Resour Crop Evol (2007) 54:1747–1762
123
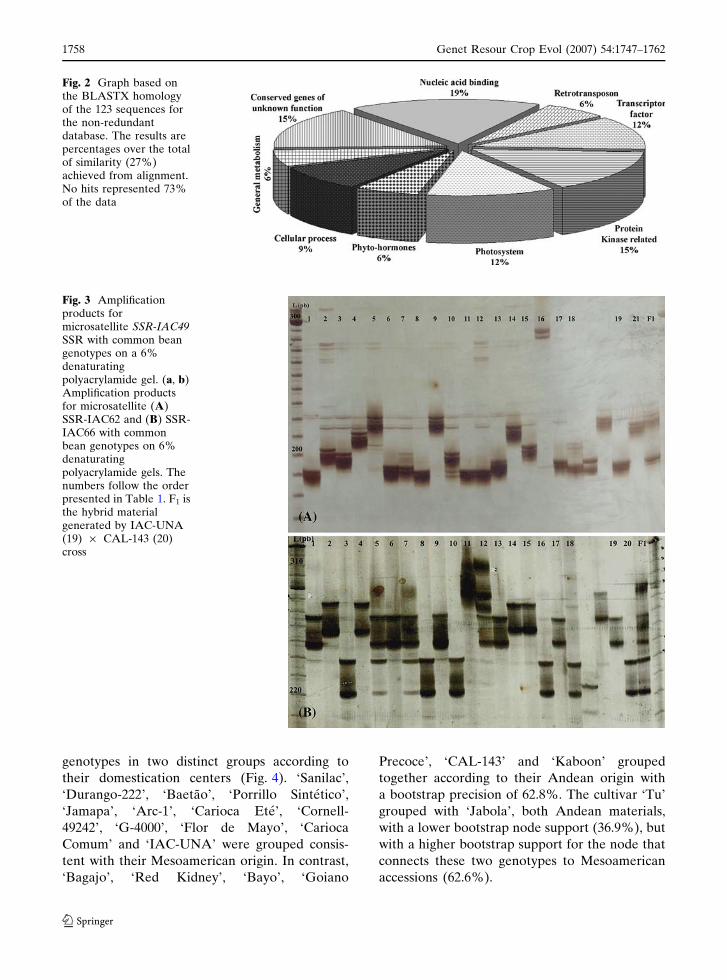
From these, 33 unigenes presented similarity to
protein domains with possible multiple functions.
The most frequent category was the nucleic acid
binding proteins (19% of the sequences similar)
and followed by protein kinase related proteins
and conserved genes of unknown function (15%
each, Fig. 2). Three sequences (SSR-IAC42,
SSR-IAC55 and SSR-IAC123) were highly (E-
value < 10–32) homologous to chloroplast pro-
teins. From BLASTN, nine sequences presented
high homology with Phaseolus vulgaris microsat-
ellites already deposited in NCBI: SSR-IAC10
[~DQ185889.1 (E < 10–105)], SSR-IAC13 [~AJ416
409.1 (E < 10–68)], SSR-IAC29 [~AF483864.1
(E < 10–68)], SSR-IAC39 [~AF483894.1 (E < 10–
15)], SSR-IAC53 [~AF483894.1 (E < 10–38)], SSR-
IAC72 [~AF483860.1 (E < 10–18)], SSR-IAC77
[~AF483853.1 (E < 10–87)], SSR-IAC78[~AF4838
59.1 (E < 10–21)], SSR-IAC90 [~AF483854.1
(E < 10–38)]; while two other sequences had low
hits (SSR-IAC16 and SSR-IAC90) with other
microsatellites. Most of the hits found for bean
unigenes showed significant similarities with
Arabidopsis thaliana (L.) Heynh. and with
genomic sequences of Medicago truncatula
Gaertn.
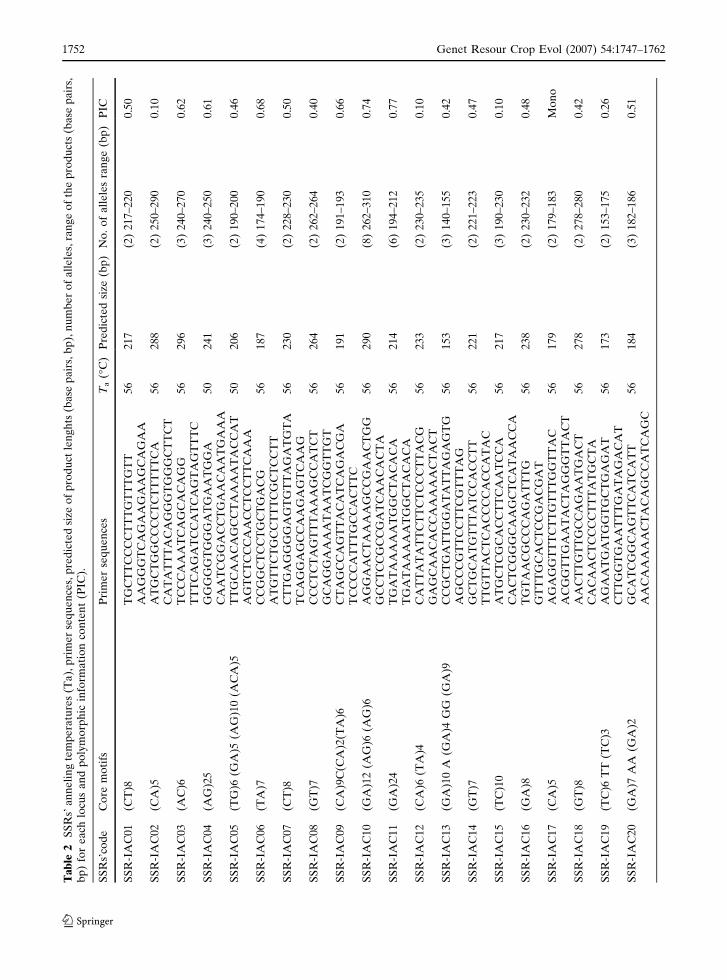
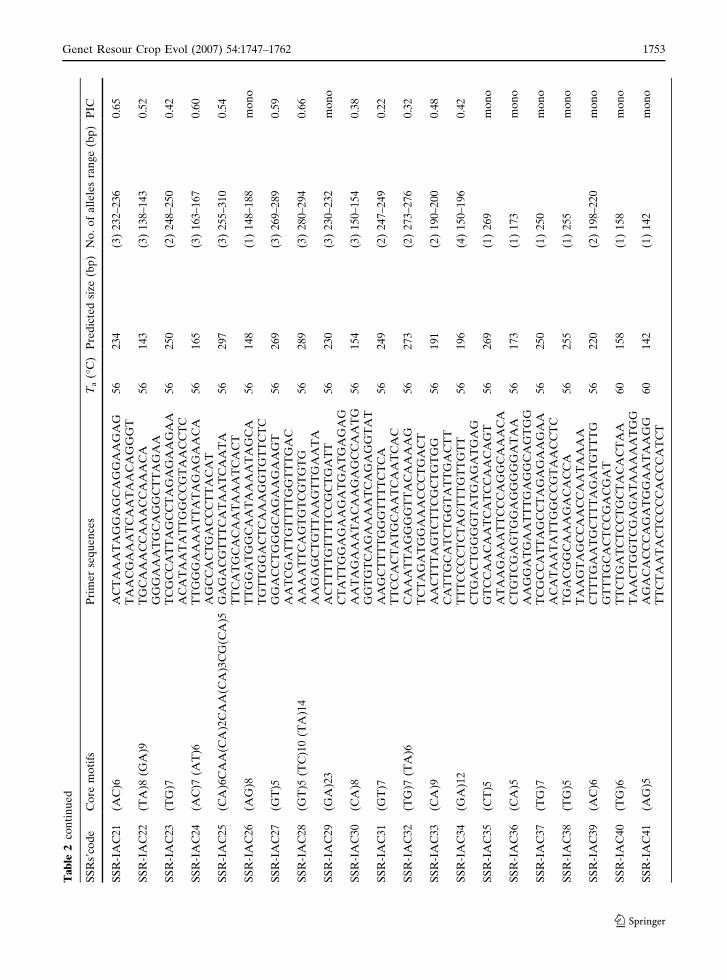
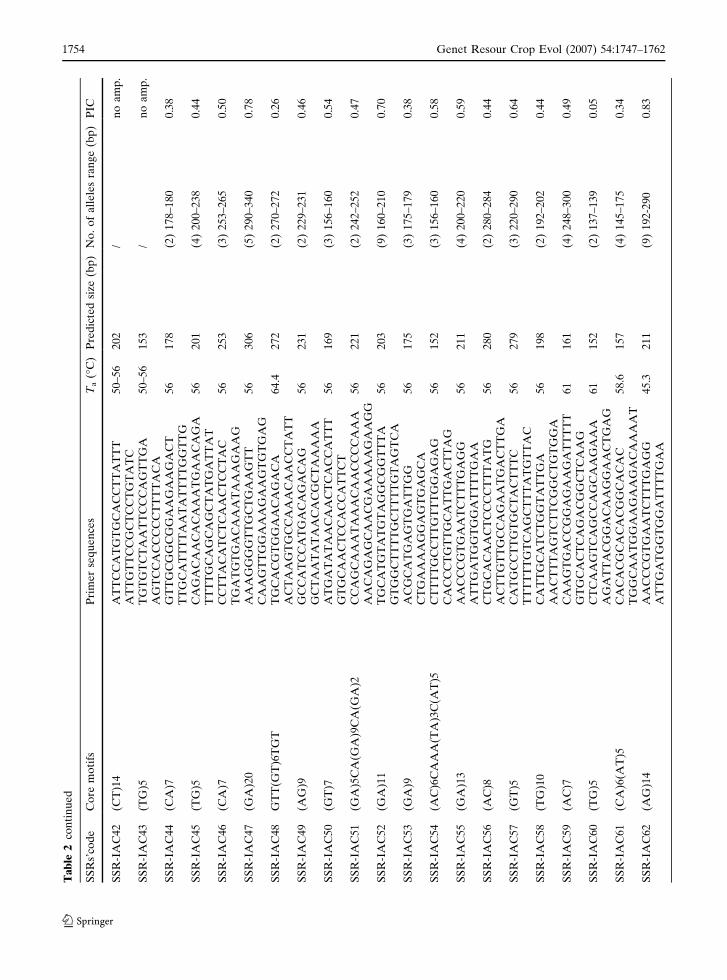
Ultimately, a total of 123 microsatellites were
characterized (GenBank accession numbers
DQ469398 to DQ469520). After optimization of
their annealing temperatures, the microsatellites
were evaluated in 6% acrylamide gels (Fig. 3). A
total of 87 microsatellites were polymorphic
(73.7%), 27 monomorphic (26.8%), and 3
(2.4%) did not amplify at all (Table 2). All
amplified products obtained for common bean
accessions presented the expected size range. The
allele number ranged from 2 to 9, with an average
of 2.82. Sequences were selected with five or more
repeated motifs. PIC values varied from 0.05 to
0.83, with a 0.45 average value. The lowest PIC
(0.05) was observed for microsatellite SSR-
IAC60, which detained a core motif of five
repetitive units, (TG)5. The second smallest PIC
value (0.10) was also found in a microsatellite
(SSR-IAC02) with a five motif repeat. However,
microsatellite SSR-IAC27 which has the same
number of repetitive motifs reached a PIC value
above average (0.59). The highest PIC (0.83) was
shown by microsatellite SSR-IAC62, which ampli-
fies a (AG)14 motif. Microsatellite SSR-IAC47
containing a (GA)20 motif, showed a PIC of 0.78.
Mesoamerican genetic distances ranged from
0.37 to 0.71, with a 0.57 average value; Andean
genetic distances varied from 0.47 to 0.75 with a
0.63 average value. Genetic distances among
pairs of cultivars obtained from different gene
pools ranged from 0.51 to 0.82 with a 0.74
average value. Cluster analysis allocated
Fig. 1 Number andcharacteristics ofmicrosatellite repeatsfound after screening anenriched SSR library. Theother categories includetetra-, penta- andhexanucleotide motifs
Genet Resour Crop Evol (2007) 54:1747–1762 1751
123
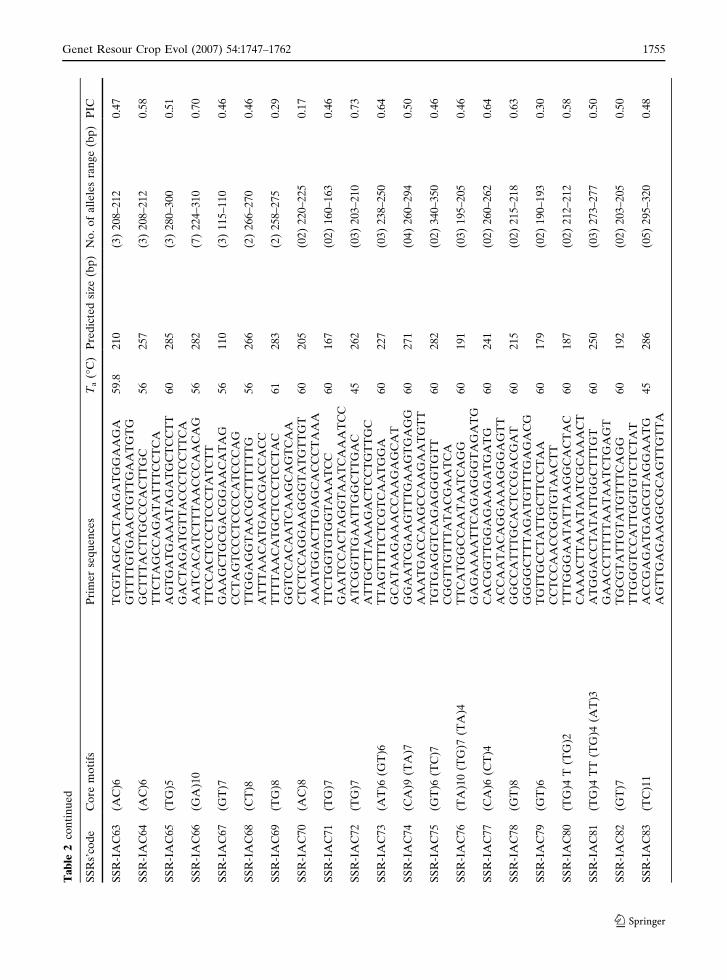
Ta
ble
2S
SR
s’a
nn
eli
ng
tem
pe
ratu
res
(Ta
),p
rim
er
seq
ue
nce
s,p
red
icte
dsi
zeo
fp
rod
uct
len
gh
ts(b
ase
pa
irs,
bp
),n
um
be
ro
fa
lle
les,
ran
ge
of
the
pro
du
cts
(base
pa
irs,
bp
)fo
re
ach
locu
sa
nd
po
lym
orp
hic
info
rma
tio
nco
nte
nt
(PIC
).
SS
Rs’
cod
eC
ore
mo
tifs
Pri
me
rse
qu
en
ces
Ta
(�C
)P
red
icte
dsi
ze(b
p)
No
.o
fa
lle
les
ran
ge
(bp
)P
IC
SS
R-I
AC
01
(CT
)8T
GC
TT
CC
CC
TT
TG
TT
TG
TT
56
21
7(2
)2
17
–2
20
0.5
0A
AG
GG
TC
AG
AA
GA
AG
CA
GA
AS
SR
-IA
C0
2(C
A)5
AT
GC
TG
GC
CC
CT
CT
TT
TT
CA
56
28
8(2
)2
50
–2
90
0.1
0C
AT
AT
TT
AC
AG
GG
TG
GG
CT
TC
TS
SR
-IA
C0
3(A
C)6
TC
CC
AA
AT
CA
GC
AC
AG
G5
62
96
(3)
24
0–
27
00
.62
TT
TC
AG
AT
CC
AT
CA
GT
AG
TT
TC
SS
R-I
AC
04
(AG
)25
GG
GG
GT
GG
GA
TG
AA
TG
GA
50
24
1(3
)2
40
–2
50
0.6
1C
AA
TC
GG
AC
CT
GA
AC
AA
TG
AA
AS
SR
-IA
C0
5(T
G)6
(GA
)5(A
G)1
0(A
CA
)5T
TG
CA
AC
AG
CC
TA
AA
AT
AC
CA
T5
02
06
(2)
19
0–
20
00
.46
AG
TC
TC
CC
AA
CC
TC
CT
TC
AA
AS
SR
-IA
C0
6(T
A)7
CC
GG
CT
CC
TG
CT
GA
CG
56
18
7(4
)1
74
–1
90
0.6
8A
TG
TT
CT
GC
CT
TT
CG
CT
CC
TT
SS
R-I
AC
07
(CT
)8C
TT
GA
GG
GG
AG
TG
TT
AG
AT
GT
A5
62
30
(2)
22
8–
23
00
.50
TC
AG
GA
GC
CA
AG
AG
TC
AA
GS
SR
-IA
C0
8(G
T)7
CC
CT
CT
AG
TT
TA
AA
GC
CA
TC
T5
62
64
(2)
26
2–
26
40
.40
GC
AG
GA
AA
AT
AA
TC
GG
TT
GT
SS
R-I
AC
09
(CA
)9C
(CA
)2(T
A)6
CT
AG
CC
AG
TT
AC
AT
CA
GA
CG
A5
61
91
(2)
19
1–
19
30
.66
TC
CC
CA
TT
TG
CC
AC
TT
CS
SR
-IA
C1
0(G
A)1
2(A
G)6
(AG
)6A
GG
AA
CT
AA
AA
GC
CG
AA
CT
GG
56
29
0(8
)2
62
–3
10
0.7
4G
CC
TC
CG
CC
GA
TC
AA
CA
CT
AS
SR
-IA
C1
1(G
A)2
4T
GA
TA
AA
AA
TG
GC
TA
CA
CA
56
21
4(6
)1
94
–2
12
0.7
7T
GA
TA
AA
AA
TG
GC
TA
CA
CA
SS
R-I
AC
12
(CA
)6(T
A)4
CA
TT
AT
AT
TC
TT
CT
CC
CT
TA
CG
56
23
3(2
)2
30
–2
35
0.1
0G
AG
CA
AC
AC
CA
AA
AA
CT
AC
TS
SR
-IA
C1
3(G
A)1
0A
(GA
)4G
G(G
A)9
CC
GC
TG
AT
TG
GA
TA
TT
AG
AG
TG
56
15
3(3
)1
40
–1
55
0.4
2A
GC
CC
GT
TC
CT
TC
GT
TT
AG
SS
R-I
AC
14
(GT
)7G
CT
GC
AT
GT
TT
AT
CC
AC
CT
T5
62
21
(2)
22
1–
22
30
.47
TT
GT
TA
CT
CA
CC
CC
AC
CA
TA
CS
SR
-IA
C1
5(T
C)1
0A
TG
CT
CG
CA
CC
TT
CA
AT
CC
A5
62
17
(3)
19
0–
23
00
.10
CA
CT
CG
GG
CA
AG
CT
CA
TA
AC
CA
SS
R-I
AC
16
(GA
)8T
GT
AA
CG
CC
CA
GA
TT
TG
56
23
8(2
)2
30
–2
32
0.4
8G
TT
TG
CA
CT
CC
GA
CG
AT
SS
R-I
AC
17
(CA
)5A
GA
GG
TT
TC
TT
GT
TT
GG
TT
AC
56
17
9(2
)1
79
–1
83
Mo
no
AC
GG
TT
GA
AT
AC
TA
GG
GT
TA
CT
SS
R-I
AC
18
(GT
)8A
AC
TT
GT
TG
CC
AG
AA
TG
AC
T5
62
78
(2)
27
8–
28
00
.42
CA
CA
AC
TC
CC
CT
TT
AT
GC
TA
SS
R-I
AC
19
(TC
)6T
T(T
C)3
AG
AA
TG
AT
GG
TG
CT
GA
GA
T5
61
73
(2)
15
3–
17
50
.26
CT
TG
GT
GA
AT
TT
GA
TA
GA
CA
TS
SR
-IA
C2
0(G
A)7
AA
(GA
)2G
CA
TC
GG
CA
GT
TC
AT
CA
TT
56
18
4(3
)1
82
–1
86
0.5
1A
AC
AA
AA
AC
TA
CA
GC
CA
TC
AG
C
1752 Genet Resour Crop Evol (2007) 54:1747–1762
123
Ta
ble
2co
nti
nu
ed
SS
Rs’
cod
eC
ore
mo
tifs
Pri
me
rse
qu
en
ces
Ta
(�C
)P
red
icte
dsi
ze(b
p)
No
.o
fa
lle
les
ran
ge
(bp
)P
IC
SS
R-I
AC
21
(AC
)6A
CT
AA
AT
AG
GA
GC
AG
GA
AG
AG
56
23
4(3
)2
32
–2
36
0.6
5T
AA
CG
AA
AT
CA
AT
AA
CA
GG
GT
SS
R-I
AC
22
(TA
)8(G
A)9
TG
CA
AA
CC
AA
AC
CA
AA
CA
56
14
3(3
)1
38
–1
43
0.5
2G
GG
AA
AT
GC
AG
GC
TT
AG
AA
SS
R-I
AC
23
(TG
)7T
CG
CC
AT
TA
GC
CT
AG
AG
AA
GA
A5
62
50
(2)
24
8–
25
00
.42
AC
AT
AA
TA
TT
GG
CC
GT
AA
CC
TC
SS
R-I
AC
24
(AC
)7(A
T)6
TT
GG
GA
AA
AT
TA
TA
GA
GA
AC
A5
61
65
(3)
16
3–
16
70
.60
AG
CC
AC
TG
AC
CC
TT
AC
AT
SS
R-I
AC
25
(CA
)6C
AA
(CA
)2C
AA
(CA
)3C
G(C
A)5
GA
GA
CG
TT
TC
AT
AA
TC
AA
TA
56
29
7(3
)2
55
–3
10
0.5
4T
TC
AT
GC
AC
AA
TA
AA
TC
AC
TS
SR
-IA
C2
6(A
G)8
TT
GG
AT
GG
CA
AT
AA
AA
TA
GC
A5
61
48
(1)
14
8–
18
8m
on
oT
GT
TG
GA
CT
CA
AA
GG
TG
TT
CT
CS
SR
-IA
C2
7(G
T)5
GG
AC
CT
GG
GC
AG
AA
GA
AG
T5
62
69
(3)
26
9–
28
90
.59
AA
TC
GA
TT
GT
TT
TG
GT
TT
GA
CS
SR
-IA
C2
8(G
T)5
(TC
)10
(TA
)14
AA
AA
TT
CA
GT
GT
CG
TG
TG
56
28
9(3
)2
80
–2
94
0.6
6A
AG
AG
CT
GT
TA
AG
TT
GA
AT
AS
SR
-IA
C2
9(G
A)2
3A
CT
TT
TG
TT
TT
CC
GC
TG
AT
T5
62
30
(3)
23
0–
23
2m
on
oC
TA
TT
GG
AG
AA
GA
TG
AT
GA
GA
GS
SR
-IA
C3
0(C
A)8
AA
TA
GA
AA
TA
CA
AG
AG
CC
AA
TG
56
15
4(3
)1
50
–1
54
0.3
8G
GT
GT
CA
GA
AA
AT
CA
GA
GG
TA
TS
SR
-IA
C3
1(G
T)7
AA
GC
TT
TT
GG
GT
TT
TC
TC
A5
62
49
(2)
24
7–
24
90
.22
TT
CC
AC
TA
TG
CA
AT
CA
AT
CA
CS
SR
-IA
C3
2(T
G)7
(TA
)6C
AA
AT
TA
GG
GG
TT
AC
AA
AA
G5
62
73
(2)
27
3–
27
60
.32
TC
TA
GA
TG
GA
AA
CC
CT
GA
CT
SS
R-I
AC
33
(CA
)9A
AC
TT
TA
GT
CT
TC
GC
TG
TG
G5
61
91
(2)
19
0–
20
00
.48
CA
TT
GC
AT
CT
GG
TA
TT
GA
CT
TS
SR
-IA
C3
4(G
A)1
2T
TT
CC
CC
TC
TA
GT
TT
GT
TG
TT
56
19
6(4
)1
50
–1
96
0.4
2C
TG
AC
TG
GG
GT
AT
GA
GA
TG
AG
SS
R-I
AC
35
(CT
)5G
TC
CA
AC
AA
TC
AT
CC
AA
CA
GT
56
26
9(1
)2
69
mo
no
AT
AA
GA
AA
TT
CC
CA
GG
CA
AA
CA
SS
R-I
AC
36
(CA
)5C
TG
TC
GA
GT
GG
AG
GG
GG
AT
AA
56
17
3(1
)1
73
mo
no
AA
GG
AT
GA
AT
TT
GA
GG
CA
GT
GG
SS
R-I
AC
37
(TG
)7T
CG
CC
AT
TA
GC
CT
AG
AG
AA
GA
A5
62
50
(1)
25
0m
on
oA
CA
TA
AT
AT
TG
GC
CG
TA
AC
CT
CS
SR
-IA
C3
8(T
G)5
TG
AC
GG
CA
AA
GA
CA
CC
A5
62
55
(1)
25
5m
on
oT
AA
GT
AG
CC
AA
CC
AA
TA
AA
AS
SR
-IA
C3
9(A
C)6
CT
TT
GA
AT
GC
TT
TA
GA
TG
TT
TG
56
22
0(2
)1
98
–2
20
mo
no
GT
TT
GC
AC
TC
CG
AC
GA
TS
SR
-IA
C4
0(T
G)6
TT
CT
GA
TC
TC
CT
GC
TA
CA
CT
AA
60
15
8(1
)1
58
mo
no
TA
AC
TG
GT
CG
AG
AT
AA
AA
AT
GG
SS
R-I
AC
41
(AG
)5A
GA
CA
CC
CA
GA
TG
GA
AT
AA
GG
60
14
2(1
)1
42
mo
no
TT
CT
AA
TA
CT
CC
CC
AC
CC
AT
CT
Genet Resour Crop Evol (2007) 54:1747–1762 1753
123
Ta
ble
2co
nti
nu
ed
SS
Rs’
cod
eC
ore
mo
tifs
Pri
me
rse
qu
en
ces
Ta
(�C
)P
red
icte
dsi
ze(b
p)
No
.o
fa
lle
les
ran
ge
(bp
)P
IC
SS
R-I
AC
42
(CT
)14
AT
TC
CA
TG
TG
CA
CC
TT
AT
TT
50
–5
62
02
/n
oa
mp
.A
TT
GT
TC
CG
CT
CC
TG
TA
TC
SS
R-I
AC
43
(TG
)5T
GT
GT
CT
AA
TT
CC
CA
GT
TG
A5
0–
56
15
3/
no
am
p.
AG
TC
CA
CC
CC
CT
TT
TA
CA
SS
R-I
AC
44
(CA
)7G
TT
GC
GG
CG
GA
AG
AA
GA
CT
56
17
8(2
)1
78
–1
80
0.3
8T
TG
CA
TT
TT
AA
TA
TT
TT
GG
TT
GS
SR
-IA
C4
5(T
G)5
CA
GA
CA
AC
AC
AA
AT
GA
AC
AG
A5
62
01
(4)
20
0–
23
80
.44
TT
TT
GC
AG
CA
GC
TA
TG
AT
TA
TS
SR
-IA
C4
6(C
A)7
CC
TT
AC
AT
CT
CA
AC
TC
CT
AC
56
25
3(3
)2
53
–2
65
0.5
0T
GA
TG
TG
AC
AA
AT
AA
AG
AA
GS
SR
-IA
C4
7(G
A)2
0A
AA
GG
GG
TT
GC
TG
AA
GT
T5
63
06
(5)
29
0–
34
00
.78
CA
AG
TT
GG
AA
AG
AA
GT
GT
GA
GS
SR
-IA
C4
8G
TT
(GT
)6T
GT
TG
CA
CG
TG
GA
AC
AG
AC
A6
4.4
27
2(2
)2
70
–2
72
0.2
6A
CT
AA
GT
GC
CA
AA
CA
AC
CT
AT
TS
SR
-IA
C4
9(A
G)9
GC
CA
TC
CA
TG
AC
AG
AC
AG
56
23
1(2
)2
29
–2
31
0.4
6G
CT
AA
TA
TA
AC
AC
GC
TA
AA
AA
SS
R-I
AC
50
(GT
)7A
TG
AT
AT
AA
CA
AC
TC
AC
CA
TT
T5
61
69
(3)
15
6–
16
00
.54
GT
GC
AA
CT
CC
AC
CA
TT
CT
SS
R-I
AC
51
(GA
)5C
A(G
A)9
CA
(GA
)2C
CA
GC
AA
AT
AA
AC
AA
CC
CC
AA
A5
62
21
(2)
24
2–
25
20
.47
AA
CA
GA
GC
AA
CG
AA
AA
AG
AA
GG
SS
R-I
AC
52
(GA
)11
TG
CA
TG
TA
TG
TA
GG
CG
GT
TT
A5
62
03
(9)
16
0–
21
00
.70
GT
GG
CT
TT
TG
CT
TT
TG
TA
GT
CA
SS
R-I
AC
53
(GA
)9A
CG
CA
TG
AG
TG
AT
TG
G5
61
75
(3)
17
5–
17
90
.38
CT
GA
AA
AG
GA
GT
GA
GC
AS
SR
-IA
C5
4(A
C)6
CA
AA
(TA
)3C
(AT
)5C
TT
TT
GC
CT
TG
TT
TG
GA
GA
G5
61
52
(3)
15
6–
16
00
.58
CA
CC
CT
GT
TG
CA
TT
GA
CT
TA
GS
SR
-IA
C5
5(G
A)1
3A
AC
CC
GT
GA
AT
CT
TT
GA
GG
56
21
1(4
)2
00
–2
20
0.5
9A
TT
GA
TG
GT
GG
AT
TT
TG
AA
SS
R-I
AC
56
(AC
)8C
TG
CA
CA
AC
TC
CC
CT
TT
AT
G5
62
80
(2)
28
0–
28
40
.44
AC
TT
GT
TG
CC
AG
AA
TG
AC
TT
GA
SS
R-I
AC
57
(GT
)5C
AT
GC
CT
TG
TG
CT
AC
TT
TC
56
27
9(3
)2
20
–2
90
0.6
4T
TT
TT
TG
TC
AG
CT
TT
AT
GT
TA
CS
SR
-IA
C5
8(T
G)1
0C
AT
TG
CA
TC
TG
GT
AT
TG
A5
61
98
(2)
19
2–
20
20
.44
AA
CT
TT
AG
TC
TT
CG
GC
TG
TG
GA
SS
R-I
AC
59
(AC
)7C
AA
GT
GA
CC
GG
AG
AA
GA
TT
TT
T6
11
61
(4)
24
8–
30
00
.49
GT
GC
AC
TC
AG
AC
GG
CT
CA
AG
SS
R-I
AC
60
(TG
)5C
TC
AA
GT
CA
GC
CA
GC
AA
GA
AA
61
15
2(2
)1
37
–1
39
0.0
5A
GA
TT
AC
GG
AC
AA
GG
AA
CT
GA
GS
SR
-IA
C6
1(C
A)6
(AT
)5C
AC
AC
GC
AC
AC
GG
CA
CA
C5
8.6
15
7(4
)1
45
–1
75
0.3
4T
GG
CA
AT
GG
AA
GA
AG
AC
AA
AA
TS
SR
-IA
C6
2(A
G)1
4A
AC
CC
GT
GA
AT
CT
TT
GA
GG
45
.32
11
(9)
19
2-2
90
0.8
3A
TT
GA
TG
GT
GG
AT
TT
TG
AA
1754 Genet Resour Crop Evol (2007) 54:1747–1762
123
Ta
ble
2co
nti
nu
ed
SS
Rs’
cod
eC
ore
mo
tifs
Pri
me
rse
qu
en
ces
Ta
(�C
)P
red
icte
dsi
ze(b
p)
No
.o
fa
lle
les
ran
ge
(bp
)P
IC
SS
R-I
AC
63
(AC
)6T
CG
TA
GC
AC
TA
AG
AT
GG
AA
GA
59
.82
10
(3)
20
8–
21
20
.47
GT
TT
TG
TG
AA
CT
GT
TG
AA
TG
TG
SS
R-I
AC
64
(AC
)6G
CT
TT
AC
TT
GC
CC
AC
TT
GC
56
25
7(3
)2
08
–2
12
0.5
8T
TC
TA
GC
CA
GA
TA
TT
TC
CT
CA
SS
R-I
AC
65
(TG
)5A
GT
GA
TG
AA
AT
AG
AT
GC
TC
CT
T6
02
85
(3)
28
0–
30
00
.51
GA
CT
AG
AT
GT
TA
CC
CT
CC
TT
CA
SS
R-I
AC
66
(GA
)10
AA
TC
AC
AT
CT
TT
AA
CC
CA
AC
AG
56
28
2(7
)2
24
–3
10
0.7
0T
TC
CA
CT
CC
CT
CC
CT
AT
CT
TS
SR
-IA
C6
7(G
T)7
GA
AG
CT
GC
GA
CG
GA
AC
AT
AG
56
11
0(3
)1
15
–1
10
0.4
6C
CT
AG
TC
CC
TC
CC
CA
TC
CC
AG
SS
R-I
AC
68
(CT
)8T
TG
GA
GG
TA
AC
GC
TT
TT
TT
G5
62
66
(2)
26
6–
27
00
.46
AT
TT
AA
CA
TG
AA
CG
AC
CA
CC
SS
R-I
AC
69
(TG
)8T
TT
TA
AC
AT
GC
TC
CC
TC
CT
AC
61
28
3(2
)2
58
–2
75
0.2
9G
GT
CC
AC
AA
TC
AA
GC
AG
TC
AA
SS
R-I
AC
70
(AC
)8C
TC
TC
CA
GG
AA
GG
GT
AT
GT
TG
T6
02
05
(02
)2
20
–2
25
0.1
7A
AA
TG
GA
CT
TG
AG
CA
CC
CT
AA
AS
SR
-IA
C7
1(T
G)7
TT
CT
GG
TG
TG
GT
AA
AT
CC
60
16
7(0
2)
16
0–
16
30
.46
GA
AT
CC
AC
TA
GG
TA
AT
CA
AA
TC
CS
SR
-IA
C7
2(T
G)7
AT
CG
GT
TG
AA
TT
GG
CT
TG
AC
45
26
2(0
3)
20
3–
21
00
.73
AT
TG
CT
TA
AA
GA
CT
CC
TG
TT
GC
SS
R-I
AC
73
(AT
)6(G
T)6
TT
AG
TT
TT
CT
CG
TC
AA
TG
GA
60
22
7(0
3)
23
8–
25
00
.64
GC
AT
AA
GA
AA
CC
AA
GA
GC
AT
SS
R-I
AC
74
(CA
)9(T
A)7
GG
AA
TC
GA
AG
TT
TG
AA
GT
GA
GG
60
27
1(0
4)
26
0–
29
40
.50
AA
AT
GA
CC
AA
GC
CA
AG
AA
TG
TT
SS
R-I
AC
75
(GT
)6(T
C)7
TG
TG
AG
GT
CA
GA
GG
GT
GT
T6
02
82
(02
)3
40
–3
50
0.4
6C
GG
TT
GT
TT
AT
AC
GA
AT
CA
SS
R-I
AC
76
(TA
)10
(TG
)7(T
A)4
TT
CA
TG
GC
CA
AT
AA
TC
AG
G6
01
91
(03
)1
95
–2
05
0.4
6G
AG
AA
AA
TT
CA
GA
GG
GT
AG
AT
GS
SR
-IA
C7
7(C
A)6
(CT
)4C
AC
GG
TT
GG
AG
AA
GA
TG
AT
G6
02
41
(02
)2
60
–2
62
0.6
4A
CC
AA
TA
CA
GG
AA
AG
GG
AG
TT
SS
R-I
AC
78
(GT
)8G
GC
CA
TT
TG
CA
CT
CC
GA
CG
AT
60
21
5(0
2)
21
5–
21
80
.63
GG
GG
CT
TT
AG
AT
GT
TT
GA
GA
CG
SS
R-I
AC
79
(GT
)6T
GT
TG
CC
TA
TT
GC
TT
CC
TA
A6
01
79
(02
)1
90
–1
93
0.3
0C
CT
CC
AA
CC
GG
TG
TA
AC
TT
SS
R-I
AC
80
(TG
)4T
(TG
)2T
TT
GG
GA
AT
AT
TA
AG
GC
AC
TA
C6
01
87
(02
)2
12
–2
12
0.5
8C
AA
AC
TT
AA
AT
AA
TC
GC
AA
AC
TS
SR
-IA
C8
1(T
G)4
TT
(TG
)4(A
T)3
AT
GG
AC
CT
AT
AT
TG
GC
TT
TG
T6
02
50
(03
)2
73
–2
77
0.5
0G
AA
CC
TT
TT
TA
AT
AA
TC
TG
AG
TS
SR
-IA
C8
2(G
T)7
TG
CG
TA
TT
GT
AT
GT
TT
CA
GG
60
19
2(0
2)
20
3–
20
50
.50
TT
GG
GT
CC
AT
TG
GT
GT
CT
CT
AT
SS
R-I
AC
83
(TC
)11
AC
CG
AG
AT
GA
GC
GT
AG
GA
AT
G4
52
86
(05
)2
95
–3
20
0.4
8A
GT
TG
AG
AA
GG
CG
CA
GT
TG
TT
A
Genet Resour Crop Evol (2007) 54:1747–1762 1755
123
Ta
ble
2co
nti
nu
ed
SS
Rs’
cod
eC
ore
mo
tifs
Pri
me
rse
qu
en
ces
Ta
(�C
)P
red
icte
dsi
ze(b
p)
No
.o
fa
lle
les
ran
ge
(bp
)P
IC
SS
R-I
AC
84
(TG
)6T
TG
CA
CT
CT
TG
TT
GT
TT
AT
GG
A6
01
54
(02
)1
62
–1
64
0.3
0C
AC
AA
TG
AC
GA
CA
GA
TG
AC
AG
AS
SR
-IA
C8
5(T
G)4
T(T
G)
TT
CT
TC
CC
CT
TC
AC
AC
TC
AA
A6
01
73
(02
)1
85
–1
86
0.1
7A
GG
AA
TC
TC
AG
AA
TG
CT
CA
AT
CS
SR
-IA
C8
6(A
C)5
(AT
)2A
AT
GC
GC
TA
CG
TT
TT
CT
AA
T6
4.8
14
1(0
2)
15
5–
15
6m
on
oA
GC
AC
CG
CG
TA
TG
GC
AC
TC
SS
R-I
AC
87
(AC
)9A
AC
TT
TA
AT
TT
TG
CT
GC
TG
TC
A6
3.5
24
2(0
2)
25
0–
25
70
.55
CT
TC
TC
CC
CC
TA
TT
TG
TC
TT
SS
R-I
AC
88
(CA
)7(A
T)7
TT
CT
TG
GG
TG
CT
CG
CT
AC
TT
A6
02
74
(04
)2
75
–2
90
mo
no
GT
TT
GG
GA
TC
TC
GG
GA
CC
TT
SS
R-I
AC
89
(CA
)2C
(CA
)3G
CC
TC
CA
GC
GG
TT
CT
TT
AC
TT
G6
02
22
(02
)1
64
–1
65
mo
no
TC
GG
GC
AT
GC
AG
GA
GG
AC
SS
R-I
AC
90
(CT
)5(T
C)6
e(C
A)4
(TA
)6G
CA
CA
TT
CT
TC
TT
CC
CT
CC
TA
A6
02
57
(05
)2
50
–2
70
0.1
7G
CG
TG
GC
CC
TA
TT
TT
CA
TT
SS
R-I
AC
91
(AC
)3(T
C)2
AA
CC
GC
AA
AG
AG
AC
AC
CA
60
19
6(0
5)
19
0–
20
00
.46
TG
CA
GG
CT
AC
AC
AA
AC
AC
AS
SR
-IA
C9
2(A
C)6
GA
TA
AT
CA
GG
GT
CA
AA
GG
TT
60
21
1(0
3)
11
5–
22
20
.76
GT
GG
AC
AG
GG
AC
AT
AA
TC
TA
AT
SS
R-I
AC
93
(AC
)5A
GT
TC
GC
CT
TG
GA
TT
CT
A6
02
51
(04
)2
60
–2
68
0.1
8G
GA
TT
TT
GT
TC
TG
CC
TT
AC
CS
SR
-IA
C9
4(A
C)5
CG
AG
AT
GT
CC
CT
GC
TT
CA
60
18
2(0
2)
19
0–
23
50
.68
CT
CC
AT
TT
CA
TT
AT
AG
TT
TT
CA
SS
R-I
AC
95
(CA
)7(A
T)7
AA
AC
AA
CA
GG
GA
AA
TA
AC
AC
AA
60
16
5(0
3)
16
2–
17
50
.64
TA
AA
GC
AC
AA
CA
AA
CG
AA
CA
TA
SS
R-I
AC
96
(CA
)5(T
A)2
AA
GC
GA
TA
AT
CA
TT
CC
AA
CA
T6
02
85
(03
)2
83
–2
95
0.6
2C
TT
AC
CC
AT
CA
CT
CA
TT
TC
AT
TS
SR
-IA
C9
7(A
C)3
(TC
)2A
AC
TT
CA
TG
CA
TC
TT
CT
TT
AT
T6
02
44
(04
)2
42
–2
60
0.5
4G
TG
TT
GT
GG
CT
GC
TG
TC
AS
SR
-IA
C9
8(C
T)8
(TA
)3(T
G)8
AC
AT
GG
GC
TA
CA
GG
GA
CA
AT
60
24
3(0
2)
24
1–
24
40
.32
AG
GG
AG
TT
AA
CG
GT
AT
GG
TA
TG
SS
R-I
AC
99
(AA
G)7
GA
TA
GC
TG
AA
TG
AT
TT
GG
TT
TA
60
17
6(0
3)
17
4–
18
00
.42
TC
CC
TA
TT
TA
CT
GC
GA
CA
TT
SS
R-I
AC
10
0(A
T)4
(GT
)8G
TA
AA
CC
GC
AA
AG
AG
AC
AC
C6
02
74
(04
)2
74
–2
82
0.7
2T
GC
AG
GC
TA
CA
CA
AA
CA
CA
SS
R-I
AC
10
1(A
C)7
CG
TT
TT
AA
AT
GC
GT
TG
AA
60
17
2(0
2)
17
0–
17
20
.50
TT
CG
AG
AG
CA
AG
CA
AC
CA
SS
R-I
AC
10
2(C
T)7
(GT
CA
)(C
T)8
GG
TT
GT
TT
CT
GC
CT
CC
AC
TG
60
20
1(0
4)
22
5–
23
30
.49
GC
TA
AT
GC
TG
CA
CA
CC
AA
AC
TS
SR
-IA
C1
03
(AG
)3A
(AG
)G
(AG
)3C
CG
TG
AA
GT
GA
AA
CA
AG
GT
G6
01
27
(1)
13
0m
on
oG
GC
CA
TC
AT
CC
CC
AA
CA
GS
SR
-IA
C1
04
(GT
)4(G
TT
G)2
GT
TA
CT
TA
GC
AG
AG
GC
AG
AG
AA
60
23
5(1
)2
46
mo
no
GC
AG
GG
GA
CA
CT
TA
CT
AC
AG
AG
1756 Genet Resour Crop Evol (2007) 54:1747–1762
123
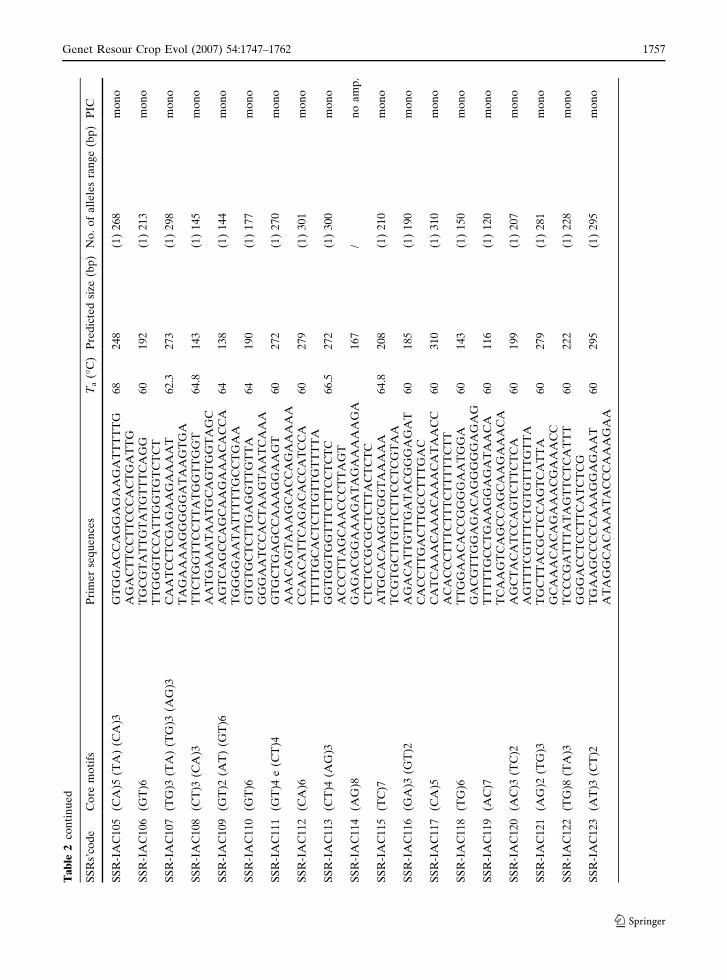
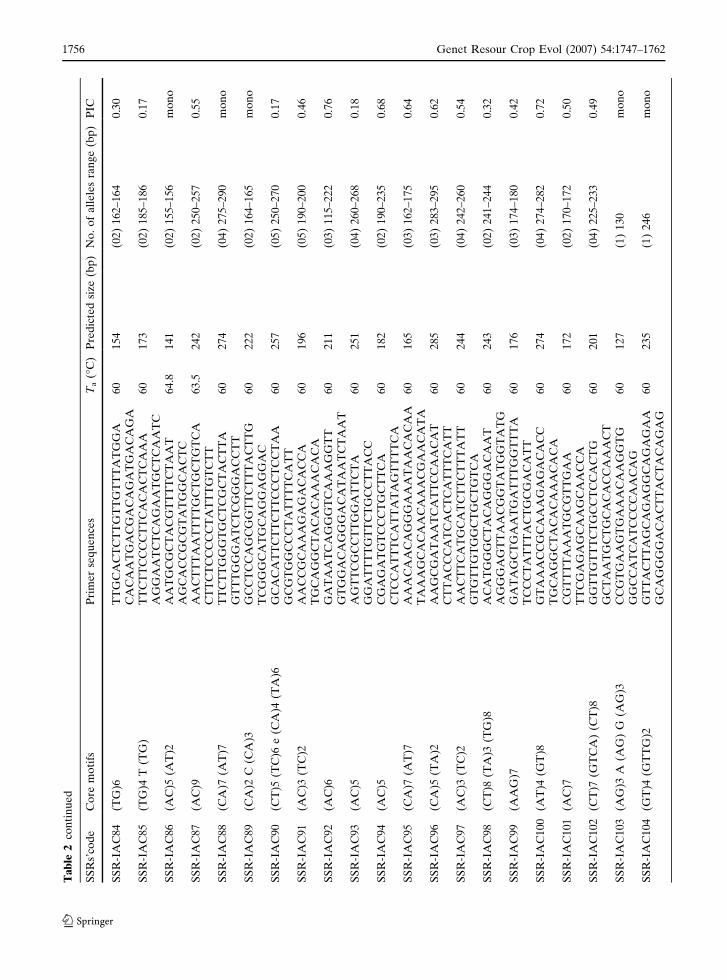
Ta
ble
2co
nti
nu
ed
SS
Rs’
cod
eC
ore
mo
tifs
Pri
me
rse
qu
en
ces
Ta
(�C
)P
red
icte
dsi
ze(b
p)
No
.o
fa
lle
les
ran
ge
(bp
)P
IC
SS
R-I
AC
10
5(C
A)5
(TA
)(C
A)3
GT
GG
AC
CA
GG
AG
AA
GA
TT
TT
TG
68
24
8(1
)2
68
mo
no
AG
AC
TT
CC
TT
CC
CA
CT
GA
TT
GS
SR
-IA
C1
06
(GT
)6T
GC
GT
AT
TG
TA
TG
TT
TC
AG
G6
01
92
(1)
21
3m
on
oT
TG
GG
TC
CA
TT
GG
TG
TC
TC
TS
SR
-IA
C1
07
(TG
)3(T
A)
(TG
)3(A
G)3
CA
AT
CC
TC
GA
GA
AG
AA
AA
T6
2.3
27
3(1
)2
98
mo
no
TA
GA
AA
AG
GG
GG
AT
AA
GT
GA
SS
R-I
AC
10
8(C
T)3
(CA
)3T
TC
TG
GT
TC
CT
TA
TG
GT
TG
GT
64
.81
43
(1)
14
5m
on
oA
AT
GA
AA
TA
AT
GC
AG
TG
GT
AG
CS
SR
-IA
C1
09
(GT
)2(A
T)
(GT
)6A
GT
CA
GC
CA
GC
AA
GA
AA
CA
CC
A6
41
38
(1)
14
4m
on
oT
GG
GG
AA
TA
TT
TT
TG
CC
TG
AA
SS
R-I
AC
11
0(G
T)6
GT
GT
GC
TC
TT
GA
GG
TT
GT
TA
64
19
0(1
)1
77
mo
no
GG
GA
AT
CC
AC
TA
AG
TA
AT
CA
AA
SS
R-I
AC
11
1(G
T)4
e(C
T)4
GT
GC
TG
AG
CC
AA
AG
GA
AG
T6
02
72
(1)
27
0m
on
oA
AA
CA
GT
AA
AG
CA
CC
AG
AA
AA
AS
SR
-IA
C1
12
(CA
)6C
CA
AC
AT
TC
AG
AC
AC
CA
TC
CA
60
27
9(1
)3
01
mo
no
TT
TT
TG
CA
CT
CT
TG
TT
GT
TT
TA
SS
R-I
AC
11
3(C
T)4
(AG
)3G
GT
GG
TG
GT
TT
CT
TC
CT
CT
C6
6.5
27
2(1
)3
00
mo
no
AC
CC
TT
AG
CA
AC
CC
TT
AG
TS
SR
-IA
C1
14
(AG
)8G
AG
AC
GG
AA
AG
AT
AG
AA
AA
AG
A1
67
/n
oa
mp
.C
TC
TC
CG
CG
CT
CT
TA
CT
CT
CS
SR
-IA
C1
15
(TC
)7A
TG
CA
CA
AG
GC
GG
TA
AA
AA
64
.82
08
(1)
21
0m
on
oT
CG
TG
CT
TG
TT
CT
TC
CT
CG
TA
AS
SR
-IA
C1
16
(GA
)3(G
T)2
AG
AC
AT
TG
TT
GA
TA
CG
GG
AG
AT
60
18
5(1
)1
90
mo
no
CA
CC
TT
GA
CT
TG
CC
TT
TG
AC
SS
R-I
AC
11
7(C
A)5
CA
TC
AA
AC
AA
AC
AA
AC
AT
AA
CC
60
31
0(1
)3
10
mo
no
AC
AC
CC
TT
TC
TT
TC
TT
TT
TC
TT
SS
R-I
AC
11
8(T
G)6
TT
GG
AA
CA
CC
GG
GG
AA
TG
GA
60
14
3(1
)1
50
mo
no
GA
CG
TT
GG
AG
AC
AG
GG
GG
AG
AG
SS
R-I
AC
11
9(A
C)7
TT
TT
TG
CC
TG
AA
GG
AG
AT
AA
CA
60
11
6(1
)1
20
mo
no
TC
AA
GT
CA
GC
CA
GC
AA
GA
AA
CA
SS
R-I
AC
12
0(A
C)3
(TC
)2A
GC
TA
CA
TC
CA
GT
CT
TC
TC
A6
01
99
(1)
20
7m
on
oA
GT
TT
CG
TT
TC
TG
TG
TT
TG
TT
AS
SR
-IA
C1
21
(AG
)2(T
G)3
TG
CT
TA
CG
CT
CC
AG
TC
AT
TA
60
27
9(1
)2
81
mo
no
GC
AA
AC
AC
AG
AA
AC
GA
AA
CC
SS
R-I
AC
12
2(T
G)8
(TA
)3T
CC
CG
AT
TT
AT
AG
TT
CT
CA
TT
T6
02
22
(1)
22
8m
on
oG
GG
AC
CT
CC
TT
CA
TC
TC
GS
SR
-IA
C1
23
(AT
)3(C
T)2
TG
AA
GC
CC
CC
AA
AG
GA
GA
AT
60
29
5(1
)2
95
mo
no
AT
AG
GC
AC
AA
AT
AC
CC
AA
AG
AA
Genet Resour Crop Evol (2007) 54:1747–1762 1757
123
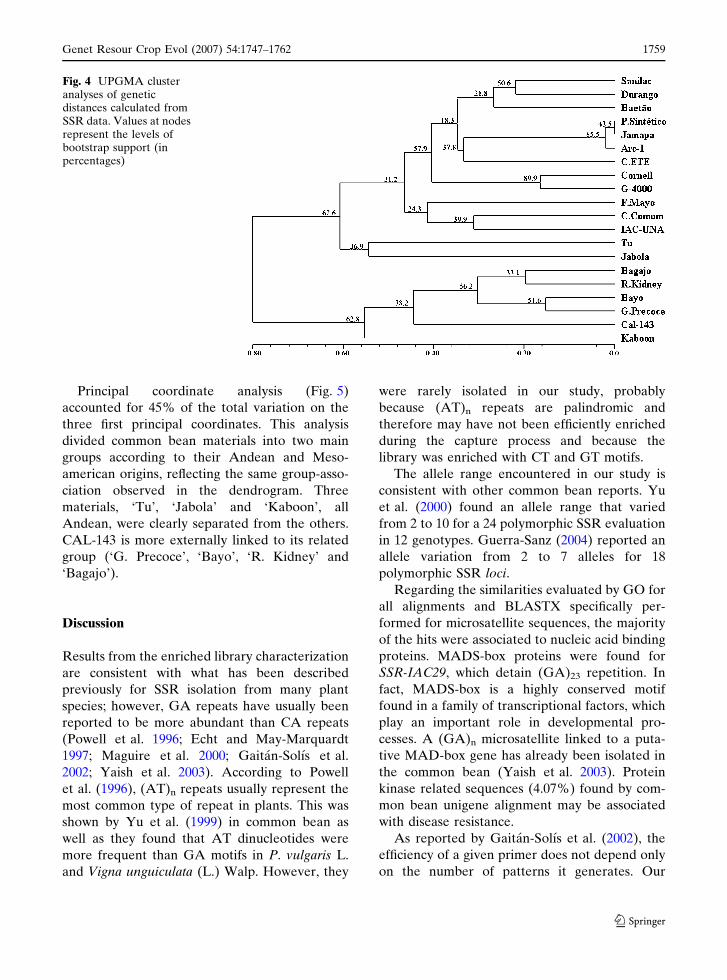
genotypes in two distinct groups according to
their domestication centers (Fig. 4). ‘Sanilac’,
‘Durango-222’, ‘Baetao’, ‘Porrillo Sintetico’,
‘Jamapa’, ‘Arc-1’, ‘Carioca Ete’, ‘Cornell-
49242’, ‘G-4000’, ‘Flor de Mayo’, ‘Carioca
Comum’ and ‘IAC-UNA’ were grouped consis-
tent with their Mesoamerican origin. In contrast,
‘Bagajo’, ‘Red Kidney’, ‘Bayo’, ‘Goiano
Precoce’, ‘CAL-143’ and ‘Kaboon’ grouped
together according to their Andean origin with
a bootstrap precision of 62.8%. The cultivar ‘Tu’
grouped with ‘Jabola’, both Andean materials,
with a lower bootstrap node support (36.9%), but
with a higher bootstrap support for the node that
connects these two genotypes to Mesoamerican
accessions (62.6%).
Fig. 2 Graph based onthe BLASTX homologyof the 123 sequences forthe non-redundantdatabase. The results arepercentages over the totalof similarity (27%)achieved from alignment.No hits represented 73%of the data
Fig. 3 Amplificationproducts formicrosatellite SSR-IAC49SSR with common beangenotypes on a 6%denaturatingpolyacrylamide gel. (a, b)Amplification productsfor microsatellite (A)SSR-IAC62 and (B) SSR-IAC66 with commonbean genotypes on 6%denaturatingpolyacrylamide gels. Thenumbers follow the orderpresented in Table 1. F1 isthe hybrid materialgenerated by IAC-UNA(19) · CAL-143 (20)cross
1758 Genet Resour Crop Evol (2007) 54:1747–1762
123
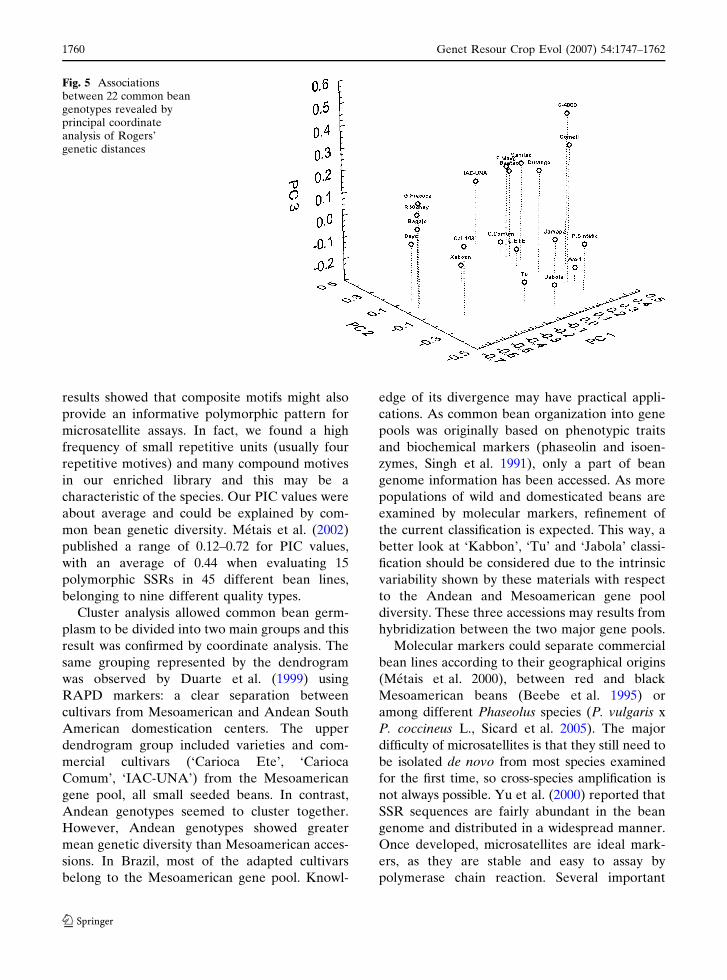
Principal coordinate analysis (Fig. 5)
accounted for 45% of the total variation on the
three first principal coordinates. This analysis
divided common bean materials into two main
groups according to their Andean and Meso-
american origins, reflecting the same group-asso-
ciation observed in the dendrogram. Three
materials, ‘Tu’, ‘Jabola’ and ‘Kaboon’, all
Andean, were clearly separated from the others.
CAL-143 is more externally linked to its related
group (‘G. Precoce’, ‘Bayo’, ‘R. Kidney’ and
‘Bagajo’).
Discussion
Results from the enriched library characterization
are consistent with what has been described
previously for SSR isolation from many plant
species; however, GA repeats have usually been
reported to be more abundant than CA repeats
(Powell et al. 1996; Echt and May-Marquardt
1997; Maguire et al. 2000; Gaitan-Solıs et al.
2002; Yaish et al. 2003). According to Powell
et al. (1996), (AT)n repeats usually represent the
most common type of repeat in plants. This was
shown by Yu et al. (1999) in common bean as
well as they found that AT dinucleotides were
more frequent than GA motifs in P. vulgaris L.
and Vigna unguiculata (L.) Walp. However, they
were rarely isolated in our study, probably
because (AT)n repeats are palindromic and
therefore may have not been efficiently enriched
during the capture process and because the
library was enriched with CT and GT motifs.
The allele range encountered in our study is
consistent with other common bean reports. Yu
et al. (2000) found an allele range that varied
from 2 to 10 for a 24 polymorphic SSR evaluation
in 12 genotypes. Guerra-Sanz (2004) reported an
allele variation from 2 to 7 alleles for 18
polymorphic SSR loci.
Regarding the similarities evaluated by GO for
all alignments and BLASTX specifically per-
formed for microsatellite sequences, the majority
of the hits were associated to nucleic acid binding
proteins. MADS-box proteins were found for
SSR-IAC29, which detain (GA)23 repetition. In
fact, MADS-box is a highly conserved motif
found in a family of transcriptional factors, which
play an important role in developmental pro-
cesses. A (GA)n microsatellite linked to a puta-
tive MAD-box gene has already been isolated in
the common bean (Yaish et al. 2003). Protein
kinase related sequences (4.07%) found by com-
mon bean unigene alignment may be associated
with disease resistance.
As reported by Gaitan-Solıs et al. (2002), the
efficiency of a given primer does not depend only
on the number of patterns it generates. Our
Fig. 4 UPGMA clusteranalyses of geneticdistances calculated fromSSR data. Values at nodesrepresent the levels ofbootstrap support (inpercentages)
Genet Resour Crop Evol (2007) 54:1747–1762 1759
123
results showed that composite motifs might also
provide an informative polymorphic pattern for
microsatellite assays. In fact, we found a high
frequency of small repetitive units (usually four
repetitive motives) and many compound motives
in our enriched library and this may be a
characteristic of the species. Our PIC values were
about average and could be explained by com-
mon bean genetic diversity. Metais et al. (2002)
published a range of 0.12–0.72 for PIC values,
with an average of 0.44 when evaluating 15
polymorphic SSRs in 45 different bean lines,
belonging to nine different quality types.
Cluster analysis allowed common bean germ-
plasm to be divided into two main groups and this
result was confirmed by coordinate analysis. The
same grouping represented by the dendrogram
was observed by Duarte et al. (1999) using
RAPD markers: a clear separation between
cultivars from Mesoamerican and Andean South
American domestication centers. The upper
dendrogram group included varieties and com-
mercial cultivars (‘Carioca Ete’, ‘Carioca
Comum’, ‘IAC-UNA’) from the Mesoamerican
gene pool, all small seeded beans. In contrast,
Andean genotypes seemed to cluster together.
However, Andean genotypes showed greater
mean genetic diversity than Mesoamerican acces-
sions. In Brazil, most of the adapted cultivars
belong to the Mesoamerican gene pool. Knowl-
edge of its divergence may have practical appli-
cations. As common bean organization into gene
pools was originally based on phenotypic traits
and biochemical markers (phaseolin and isoen-
zymes, Singh et al. 1991), only a part of bean
genome information has been accessed. As more
populations of wild and domesticated beans are
examined by molecular markers, refinement of
the current classification is expected. This way, a
better look at ‘Kabbon’, ‘Tu’ and ‘Jabola’ classi-
fication should be considered due to the intrinsic
variability shown by these materials with respect
to the Andean and Mesoamerican gene pool
diversity. These three accessions may results from
hybridization between the two major gene pools.
Molecular markers could separate commercial
bean lines according to their geographical origins
(Metais et al. 2000), between red and black
Mesoamerican beans (Beebe et al. 1995) or
among different Phaseolus species (P. vulgaris x
P. coccineus L., Sicard et al. 2005). The major
difficulty of microsatellites is that they still need to
be isolated de novo from most species examined
for the first time, so cross-species amplification is
not always possible. Yu et al. (2000) reported that
SSR sequences are fairly abundant in the bean
genome and distributed in a widespread manner.
Once developed, microsatellites are ideal mark-
ers, as they are stable and easy to assay by
polymerase chain reaction. Several important
Fig. 5 Associationsbetween 22 common beangenotypes revealed byprincipal coordinateanalysis of Rogers’genetic distances
1760 Genet Resour Crop Evol (2007) 54:1747–1762
123
genes such as the resistance genes may be linked
to microsatellite motifs, which make them rele-
vant for studies of germplasm characterization,
mapping and marker assisted-selection.
Acknowledgements This work was supported by theFoundation for Research for the State of Sao Paulo(FAPESP), contract 02/03225-9. Dr. A. P. Souza receiveda fellowship from the National Council of Research andDevelopment (CNPq). Dr. L.L. Benchimol received apost-graduate fellowship (02/00752) and T. Camposreceived under-graduate (03/13282-2) and post-graduate(140310/2005-3) fellowships from FAPESP and CNPq. Wewould like to thank Dr. Ange-Marie Risterrucci forhelping with the construction of the enriched library andDr. JP Jacquemoud-Collet for providing Microsat software(CIRAD, France); Dr. Dario A. Palmieri and Dr. MarcoA. Takita for helping with the PHRED/CAP3 analysis(IAC, Cordeiropolis, S.P., Brazil) and Dr. Maria I. Zucchifor the bootstrap analysis (IAC, Campinas, S.P., Brazil).
References
Adam-Blondom A, Sevignac M, Dron M (1994) A geneticmap of common bean to localize specific resistancegenes against anthracnose. Genome 37:915–924
Altschul SF, Gish W, Miller W, Myers EW, Lipman DJ(1990) Basic local alignment search tool. J Mol Biol215:403–410
Altschul SF, Madden TL, Schaffer A, Zhang J, Zhang Z,Miller W, Lipman DJ, (1997) Gapped BLAST andPSI-BLAST: a new generation of protein databasesearch programs. Nucleic Acids Res 25:3389–3402
Beebe S, Skroch PW, Nienhuis J, Tivang J (1995) Geneticdiversity among common bean breeding line devel-oped for Central America. Crop Sci 35:1178–1183
Beebe SE, Skroch P, Tohme J, Duque M, Pedraza F,Nienhuis J (2000) Structure of genetic diversityamong common bean landraces of Middle-Americanorigin based on correspondence analysis of RAPD.Crop Sci 40:264–273
Billotte N, Lagoda PJL, Risterucci AM, Baurens C (1999)Microsatellite-enriched libraries: applied methodologyfor the development of SSR markers in tropical crops.Fruits 54:277–288
Blair MW, Pedraza F, Buendia HF, Gaitan-Solıs E, BeebeSE, Gepts P, Tohme J (2003) Development of agenome-wide anchored microsatellite map for com-mon bean (Phaseolus vulgaris L.). Theor Appl Genet107:1362–1374
Coelho ASG (2002) BooD: avaliacao dos erros associadosa estimativas de distancias/similaridades geneticasatraves do procedimento de bootstrap com numerovariavel de marcadores (software). Goiania: UFG,Instituto de Ciencias Biologicas, Laboratorio deGenetica Vegetal.
Creste S, Tulmann A, Figueira A (2001) Detection of SingleSequence Repeat Polymorphism in denaturating
Polyacrylamide Sequencing Gels by Silver Staining.Plant Mol Biol Rep 19:299–306
Duarte JM, Dos Santos JB, Melo LC (1999) Geneticdivergence among common bean cultivars fromdifferent races on RAPD markers. Genet Mol Biol22(3):419–426
Echt CS, May-Marquardt P (1997) Survey of microsatelliteDNA in pine. Genome 40:9–17
Ewing B, Hillier L, Wendl MC, Green P (1998) Base-calling of automated sequencer traces using Phred.I. Accurancy assessment. Genome Res 8:175–185
Gaitan-Solıs E, Duque MC, Edwards KJ, Tohme J (2002)Microsatellite Repeats in Bean (Phaseolus vulgaris):Isolation, Characterization and Cross-SpeciesAmplication in Phaseolus spp. Crop Sci 42:2128–2136
Gepts P (1988) A Middle American and Andean genepool. In: Gepts P (eds) Genetic resources of Phaseolusbeans. Kluwer, Dordrecht, the Netherlands, pp 375–390
Guerra-Sanz JM (2004) New SSR markers of Phaseolusvulgaris from sequence databases. Plant Breeding123:87–89
Hoisington D, Khairallah M, Gonzalez-de-Leon D (1994)Laboratory Protocols: CIMMYT Applied MolecularGenetics Laboratory. 2nd Edition. Mexico, DF,CIMMYT
Huang X, Madan A (1999) CAP3: A DNA SequenceAssembly Program. Genome Res 9:868–877
Jarne P, Lagoda PJL (1996) Microsatellites from mole-cules to populations and back. Trends Ecol Evol11:424–429
Kelly JD, Gepts P, Miklas PN, Coyne DP (2003) Taggingand mapping of genes and QTL and molecularmarker-assisted selection for traits of economicimportance in bean and cowpea. Field Crops Res82:135–154
Lynch M, Walsh JB (1998) Genetics and analysis ofquantitative traits. Sinauer Associates, Sunderland,MA. p 980
Maguire TL, Edwards KJ, Saeger P, Henry R (2000)Characterization and analysis of microsatellite lociin mangrove species, Avicennia marina (Forsk.)Vierh. (Avicenniaceae). Theor Appl Genet 101:279–285
Maniatis T, Frisch EF, Sambrook J (1982) MolecularCloning: A Laboratory Manual. Cold Spring HarborLab., Cold Spring Harbor, New York
Masi P, Spagnoletti Zeulli PL, Donini P (2003) Develop-ment and analysis of multiplex microsatellite markerssets in common bean (Phaseolus vulgaris L.). MolBreeding 11:303–313
McClean P, Gepts P, Kami J (2004) Genomics and geneticdiversity in common bean. In: Wilson RF, Stalker HT,Brummer EC (eds) Legume Crops Genomics. AOCSPress, Champaign, Illinois, pp 60–82
Melotto M, Monteiro-Vitorello CB, Bruschi AG, CamargoLEA (2005) Comparative bioinformatic analysis ofgenes expressed in common bean seedlings. Genome48(3):562–570
Metais I, Hamon B, Jalouzot R, Peltier D (2002) Structureand level of genetic diversity in various bean types
Genet Resour Crop Evol (2007) 54:1747–1762 1761
123
evidenced with microsatellite markers isolated from agenomic enriched library. Ther Appl Genet 104:1346–1352
Nodari RO, Tsai SM, Gilbertson RL, Gepts P (1993)Towards an integrated linkage map of common bean.II. Development of an RFLP-based linkage map.Theor Appl Genet 85:513–520
Pallottini L, Garcia E, Kami J, Barcaccia G, Gepts P(2004) The genetic anatomy of a patented yellowbean. Crop Sci 44:968–977
Peakall R, Gilmore S, Keys W, Morgante M, Rafalski A(1998) Cross-species amplification of soybean(Glycine max) Simple Sequence Repeats (SSRs)within the genus and other legume genera: implica-tions for the transferability of SSRs plants. Mol BiolEvol 15(10):1275–1287
Powell W, Morgante M, Andre C, Hanafey M, Vogel J,Tingey S, Rafalski A, (1996) The comparison ofRFLP, RAPD, AFLP and SSR (microsatellite) mark-ers for gemplasm analysis. Mol Breeding 2:225:238
Ramırez M, Graham MA, Blanco-Lopez L, Silvente S,Medrano-Soto A, Blair M, Risterucci AM, Duval MF,Rohde W, Billotte N (2005) Isolation and character-ization of microsatellite loci from Psidium guajava L.Mol Ecol Notes 5(4):745–748
Singh SP, Gepts P, Debouck DG (1991) Races of commonbean (Phaseolus vulgaris, Fabaceae). Econ Bot45:379–396
Sicard D, Nanni L, Porfiri O, Bulfon D, Papa R (2005)Genetic diversity of Phaseolus vulgaris L. and
P. coccineus L. landraces in central Italy. PlantBreeding 124:464–472
Ta’ran B, Michaels Thomas E, Pauls KP (2002) Geneticmapping of agronomic traits in common bean. CropSci 42:544–556
Temnykh S, De Clerk G, Lukashova A, Lipovich L,Cartinhour S, Mc Couch, S (2001) Computational andexperimental analysis of microsatellites in rice (Oryzasativa L.): frequency, length variation, transposonassociation and genetic marker potential. GenomeRes 11:1441–1452
Vasconcelos MJV, Barros EG, Moreira MA and Vieira C(1996) Genetic diversity of common bean Phaseolusvulgaris L. determined by DNA-based molecularmarkers. Brazilian J Genet 19(3):447–451
Yaish MWF, Perez de la Vega M (2003) Isolation of(GA)n microsatellite sequences and description of apredicted MADS-box sequence isolated from com-mon bean (Phaseolus vulgaris L.). Genet Mol Biol26(3):337–342
Yu K, Park SJ, Poysa, V (1999) Abundance and variationof microssatellite DNA sequences in beans (Phaseolusand Vigna). Genome 42:27–34
Yu K, Park J, Poysa V, Gepts P (2000) Integration ofSimple Sequence Repeats (SSR) markers into amolecular linkage map of common bean (Phaseolusvulgaris). J Hered 91:429–434
1762 Genet Resour Crop Evol (2007) 54:1747–1762
123