structural changes and specialization in brazilian industry: the evolution of leading companies and...
TRANSCRIPT
The Developing Economies, XL-4 (December 2002): 497–521
STRUCTURAL CHANGES AND SPECIALIZATION INBRAZILIAN INDUSTRY: THE EVOLUTION OF LEAD-
ING COMPANIES AND THE M&A PROCESS
FREDERICO ROCHADAVID KUPFER
This paper analyzes changes in the Brazilian productive structure and in ownership struc-tures of leading companies during the 1990s. It uses information from balance sheetspublished in Gazeta Mercantil and from the Thomson Financial Securities Data data-base on M&A. The main findings are: (i) the sectoral distribution of leading companieshas remained stable; (ii) there has been a strong change in the ownership structure inBrazil, with an increase in the participation of multinational enterprises (MNEs) in thesample of leading companies; (iii) this increase in participation may be partially, thoughnot integrally, explained by M&A transactions; (iv) though the M&A process has beenquite intensive in the period, productive concentration has decreased among the groupof leading companies; and (v) acquiring firms have adopted specializing strategies dur-ing the period. This trend is even clearer when private national enterprises (PNEs) areexamined separately.
INTRODUCTION
DURING the 1990s, the Brazilian economy went through significant changes.The country liberalized its financial markets and trade, successfully imple-mented a price stabilization program, and undertook a privatization of state-
owned enterprises in infrastructure and commodity industries. These changes had amajor impact on the country’s institutional framework and changed the behavior ofeconomic agents. Firms changed their conduct in order to take into account newpatterns of performance. They had to face a new competitive environment, withgreater exposure to international competition, and took new positions in the inter-national division of labor. Economists have recognized these factors as the maincauses of the industrial restructuring process in the period.
Nonetheless, economists do not seem to have reached a consensus on the extent––––––––––––––––––––––––––The authors are grateful for the support offered by CEPAL, PIBIC/CNPq, FAPERJ, and ThomsonFinancial Securities Data. This work could not be accomplished without the assistance of Ana PaulaMeireles, Alan Oliveira, and Mariana Lemos Alves. The authors are grateful for comments receivedfrom João Carlos Ferraz and José Carlos Miranda.

THE DEVELOPING ECONOMIES498
of industrial change in the period. On the one hand, some economists argue that theincrease in competition has eliminated firms and whole sectors that showed lowlevels of competitiveness. They hold therefore that the new environment has strength-ened the country’s production sector and that surviving firms and sectors are morecapable of facing international competition (Mendonça de Barros and Goldenstein1997; Franco 1998; Moreira 1999). On the other hand, some economists maintainthat the adoption of defensive behavior, mainly based on cost reduction strategies,has made possible the survival of less capable firms. In these cases, in order tosurvive, firms have reduced their investment, endangering their long-term expan-sion perspectives (Ferraz, Kupfer, and Haguenauer 1996; Haguenauer, Markwald,and Pourchet 1998; Coutinho 1997; Laplane et al. 2000). Furthermore, the greaterlevel of trade openness and financial liberalization may have deepened asymme-tries between national and multinational enterprises (MNEs). Private national en-terprises (PNEs) became more vulnerable to takeovers by MNEs. Therefore, notonly have domestic enterprises weakened their investment perspectives; they havealso become easy targets for acquisition, which may have a negative effect ongreenfield investment.
This paper aims to shed some light on this debate, covering three topics:(i) the evolution of leading Brazilian companies in regard to their sectoral com-
position and the origin of their capital (national, state, or foreign);(ii) the effects of ownership and production transformations of leading compa-
nies on their competitiveness and on market structure; and(iii) the direction of the growth of leading companies, focusing on the merger
and acquisition (M&A) process.The paper is divided in three parts. The first focuses on the main methodological
features of the paper. The second is dedicated to the analysis of the structural trans-formations that occurred in the Brazilian production sector during the 1990s, basedon a sample covering leading companies. It focuses on a description of the evolu-tion of the industrial structure in respect to sectoral and national composition. Thedescription of these features aims to capture the impacts of institutional changes onbusiness performance. The third part of the paper analyzes the M&A process in Brazil,emphasizing its role in the shaping of the growth directions of leading companies.
I. METHODOLOGICAL NOTES
The empirical analysis of this paper is based on two data sets. The first uses infor-mation published by Balanço Anual da Gazeta Mercantil on the biggest Braziliancompanies for the years 1991, 1996, and 1999.1 The choice of these years wasmade to separate the M&A process into two distinct phases. From 1991 to 1996,
1 Therefore, “leading companies” here refers to the group of largest companies, that is, the group ofcompanies that hold the largest market shares in the economy.
499STRUCTURAL CHANGES AND SPECIALIZATION
transactions were concentrated in the manufacturing sector, whereas from 1997 to1999 transactions in the service sector prevailed. This division also coincides withdifferent moments in the privatization process. In the first period, the governmentprivatized companies in the commodity sector, and the second period is character-ized by the privatization of companies in the infrastructure sector.
Company size was measured using sales. This choice was made due to the betterquality of the information on sales than on net worth. However, the use of sales asan indicator for size has some shortcomings. Though sales volume seems to be anadequate measure in the manufacturing sectors, it is not adequate for evaluations inthe financial sector. This is especially important in the Brazilian case due to thevery high levels of inflation in the 1991–93 period. Therefore, the financial sectorhas been analyzed separately.
Firms were aggregated according to the sectoral classification presented in TableI. The classification was structured into three classes—construction, manufacturingindustry, and services. The last two classes were divided into three different sec-tors. As stated above, most of this paper will analyze the financial sector separately.
The classification of the leading companies into each category was based on themain sector of production. In the case of diversified companies, the ideal procedurewould require the allocation of sales to the different sectors of production theybelonged to. Available data, however, does not allow such a procedure.
The origin of capital was defined based on the nationality of the headquarters.Companies were classified into three different categories: state-owned enterprises(SOEs), private national enterprises (PNEs), and multinational enterprises (MNEs).In most cases, the information available in the Balanço Anual was sufficient for anadequate classification.
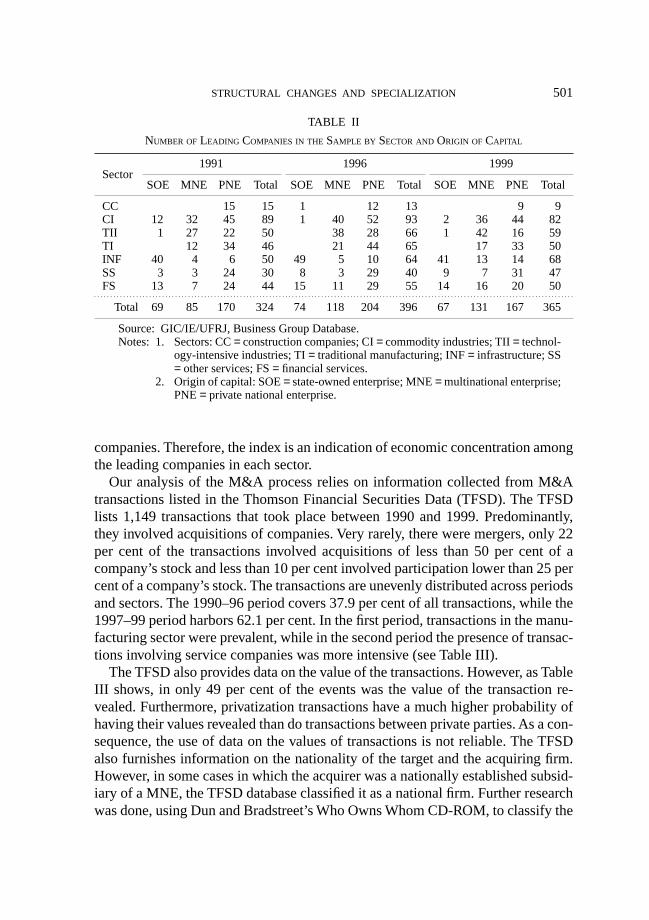
In order to build the sample of firms, all companies or business groups2 withsales above U.S.$35 million in each of the three periods covered by the database—1991, 1996, and 1999—were selected and included in the database. The sample ofleading companies is described in Table II, which shows that there were fluctua-tions in the number of companies. In 1991, the sample covers 324 companies, in1996, it covers 396 and, in 1999, 365. Only 190 companies appear in all threeyears, 140 appear in two of the three years and 160 appear in only one year, leadingto a total of 490 companies.3
2 From now on, we will use the term company to describe independent companies and businessgroups.
3 Many reasons may explain the fluctuation in the number of firms. Companies may have been extin-guished or sold out; they may have shrunk and left the list of leading firms; new entrants may haveappeared in the markets; and firms may have grown and entered the list of leading companies.Furthermore, there may be registration failures. The Balanço Anual mainly collects informationfrom published balance sheets or from balance sheets that are sent out spontaneously. Only opencapital companies are obliged to publicly release their balance sheets. Therefore, in some years,some companies may not send out information, and be left out of the Balanço Anual.

THE DEVELOPING ECONOMIES500
Special emphasis is placed on the distribution of the market share of each cat-egory in the whole sample. Absolute values and variations of market share shouldbe understood in this paper as indicators of competitiveness in a previously definedmarket. In this framework, the market share expresses the revealed competitivenessat a certain moment, and its evolution in time.
The Herfindahl-Hirschman index (HHI) for each of the seven sectors is used asan indicator of economic concentration, that is, the HHI is the sum of the squares ofthe market share of each business group or company in a sector of activity. Thisindex is commonly used in the literature as a measure of concentration. It may havesome shortcomings, as many different market structures may be compatible withthe same HHI value. Furthermore, the database only has information on leading
TABLE I
SECTORAL CLASSIFICATION
Class Sector TFSDa Sector
Excluding Construction CC: Construction companies ConstructionFS
Industry CI: Commodity industries Stone, clay, glass, and concrete productsMetal and metal productsMiningPaper and allied productsOil, gas, and petroleum refiningChemicals and allied productsRubber and misc. plastic productsAgriculture, forestry, and fishing
TII: Technology-intensive Electronic and electrical equipmentindustries Transportation equipment
DrugsMachinery
TI: Traditional Food and kindred productsmanufacturing Printing, publishing, and allied services
Textile and apparel products
Services INF: Infrastructure Electricity, gas, and water distributionTransportation and shipping (except air)Telecommunications
SS: Other services Wholesale tradeRetail trade–food storesRadio and television broadcastingBusiness servicesAdvertising services
FS FS FS: Financial services Commercial banksInsuranceInvestment firms
a Thomson Financial Securities Data.
. . . . . . . . . . . . . . . . . . . . . . . . . . . . . . . . . . . . . . . . . . . . . . . . . . . . . . . . . . . . . . . . . . . . . . . . . . . . . . . . . . . . . . . . . . . . . . . . . . . . . . . . . . . . . . . . . . . . . . . . . . . . . . . . . . .
. . . . . . . . . . . . . . . . . . . . . . . . . . . . . . . . . . . . . . . . . . . . . . . . . . . . . . . . . . . . . . . . . . . . . . . . . . . . . . . . . . . . . . . . . . . . . . . . . . . . . . . . . . .
. . . . . . . . . . . . . . . . . . . . . . . . . . . . . . . . . . . . . . . . . . . . . . . . . . . . . . . . . . . . . . . . . . . . . . . . . . . . . . . . . . . . . . . . . . . . . . . . . . . . . . . . . . .
. . . . . . . . . . . . . . . . . . . . . . . . . . . . . . . . . . . . . . . . . . . . . . . . . . . . . . . . . . . . . . . . . . . . . . . . . . . . . . . . . . . . . . . . . . . . . . . . . . . . . . . . . . .
. . . . . . . . . . . . . . . . . . . . . . . . . . . . . . . . . . . . . . . . . . . . . . . . . . . . . . . . . . . . . . . . . . . . . . . . . . . . . . . . . . . . . . . . . . . . . . . . . . . . . . . . . . . . . . . . . . . . . . . . . . . . . . . . . . .
. . . . . . . . . . . . . . . . . . . . . . . . . . . . . . . . . . . . . . . . . . . . . . . . . . . . . . . . . . . . . . . . . . . . . . . . . . . . . . . . . . . . . . . . . . . . . . . . . . . . . . . . . . . . . . . . . . . . . . . . . . . . . . . . . . . . . . . . . . . . . . . . . . . .
501STRUCTURAL CHANGES AND SPECIALIZATION
companies. Therefore, the index is an indication of economic concentration amongthe leading companies in each sector.
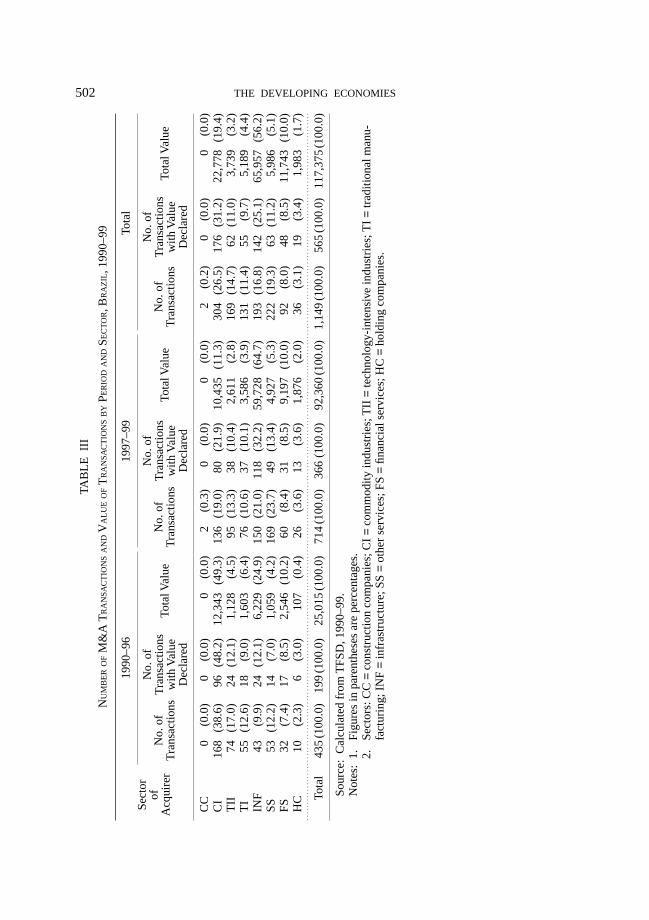
Our analysis of the M&A process relies on information collected from M&Atransactions listed in the Thomson Financial Securities Data (TFSD). The TFSDlists 1,149 transactions that took place between 1990 and 1999. Predominantly,they involved acquisitions of companies. Very rarely, there were mergers, only 22per cent of the transactions involved acquisitions of less than 50 per cent of acompany’s stock and less than 10 per cent involved participation lower than 25 percent of a company’s stock. The transactions are unevenly distributed across periodsand sectors. The 1990–96 period covers 37.9 per cent of all transactions, while the1997–99 period harbors 62.1 per cent. In the first period, transactions in the manu-facturing sector were prevalent, while in the second period the presence of transac-tions involving service companies was more intensive (see Table III).
The TFSD also provides data on the value of the transactions. However, as TableIII shows, in only 49 per cent of the events was the value of the transaction re-vealed. Furthermore, privatization transactions have a much higher probability ofhaving their values revealed than do transactions between private parties. As a con-sequence, the use of data on the values of transactions is not reliable. The TFSDalso furnishes information on the nationality of the target and the acquiring firm.However, in some cases in which the acquirer was a nationally established subsid-iary of a MNE, the TFSD database classified it as a national firm. Further researchwas done, using Dun and Bradstreet’s Who Owns Whom CD-ROM, to classify the
TABLE II
NUMBER OF LEADING COMPANIES IN THE SAMPLE BY SECTOR AND ORIGIN OF CAPITAL
Sector1991 1996 1999
SOE MNE PNE Total SOE MNE PNE Total SOE MNE PNE Total
CC 15 15 1 12 13 9 9CI 12 32 45 89 1 40 52 93 2 36 44 82TII 1 27 22 50 38 28 66 1 42 16 59TI 12 34 46 21 44 65 17 33 50INF 40 4 6 50 49 5 10 64 41 13 14 68SS 3 3 24 30 8 3 29 40 9 7 31 47FS 13 7 24 44 15 11 29 55 14 16 20 50
Total 69 85 170 324 74 118 204 396 67 131 167 365
Source: GIC/IE/UFRJ, Business Group Database.Notes: 1. Sectors: CC = construction companies; CI = commodity industries; TII = technol-
ogy-intensive industries; TI = traditional manufacturing; INF = infrastructure; SS= other services; FS = financial services.
2. Origin of capital: SOE = state-owned enterprise; MNE = multinational enterprise;PNE = private national enterprise.
. . . . . . . . . . . . . . . . . . . . . . . . . . . . . . . . . . . . . . . . . . . . . . . . . . . . . . . . . . . . . . . . . . . . . . . . . . . . . . . . . . . . . . . . . . . . . . . . . . . . . . . . . . . . . . . . . . . . . . . . . . . . . . . . . . . . . . . . . . . . . . . . . . . .
THE DEVELOPING ECONOMIES502TA
BL
E I
II
NU
MB
ER O
F M
&A
TR
AN
SAC
TIO
NS A
ND
VA
LU
E O
F T
RA
NSA
CT
ION
S B
Y P
ER
IOD
AN
D S
EC
TO
R, B
RA
ZIL
, 199
0–99
1990
–96
1997
–99
Tota
l
CC
0(0
.0)
0(0
.0)
0(0
.0)
2(0
.3)
0(0
.0)
0(0
.0)
2(0
.2)
0(0
.0)
0(0
.0)
CI
168
(38.
6)96
(48.
2)12
,343
(49.
3)13
6(1
9.0)
80(2
1.9)
10,4
35(1
1.3)
304
(26.
5)17
6(3
1.2)
22,7
78(1
9.4)
TII
74(1
7.0)
24(1
2.1)
1,12
8(4
.5)
95(1
3.3)
38(1
0.4)
2,61
1(2
.8)
169
(14.
7)62
(11.
0)3,
739
(3.2
)T
I55
(12.
6)18
(9.0
)1,
603
(6.4
)76
(10.
6)37
(10.
1)3,
586
(3.9
)13
1(1
1.4)
55(9
.7)
5,18
9(4
.4)
INF
43(9
.9)
24(1
2.1)
6,22
9(2
4.9)
150
(21.
0)11
8(3
2.2)
59,7
28(6
4.7)
193
(16.
8)14
2(2
5.1)
65,9
57(5
6.2)
SS53
(12.
2)14
(7.0
)1,
059
(4.2
)16
9(2
3.7)
49(1
3.4)
4,92
7(5
.3)
222
(19.
3)63
(11.
2)5,
986
(5.1
)FS
32(7
.4)
17(8
.5)
2,54
6(1
0.2)
60(8
.4)
31(8
.5)
9,19
7(1
0.0)
92(8
.0)
48(8
.5)
11,7
43(1
0.0)
HC
10(2
.3)
6(3
.0)
107
(0.4
)26
(3.6
)13
(3.6
)1,
876
(2.0
)36
(3.1
)19
(3.4
)1,
983
(1.7
)
Tota
l43
5(1
00.0
)19
9(1
00.0
)25
,015
(100
.0)
714
(100
.0)
366
(100
.0)
92,3
60(1
00.0
)1,
149
(100
.0)
565
(100
.0)
117,
375
(100
.0)
Sour
ce:
Cal
cula
ted
from
TFS
D, 1
990–
99.
Not
es:
1.Fi
gure
s in
par
enth
eses
are
per
cent
ages
.2.
Sect
ors:
CC
= c
onst
ruct
ion
com
pani
es; C
I =
com
mod
ity in
dust
ries
; TII
= te
chno
logy
-int
ensi
ve in
dust
ries
; TI
= tr
aditi
onal
man
u-fa
ctur
ing;
IN
F =
infr
astr
uctu
re; S
S =
othe
r se
rvic
es; F
S =
finan
cial
ser
vice
s; H
C =
hol
ding
com
pani
es.
Sect
orof
Acq
uire
rN
o. o
fT
rans
actio
ns
No.
of
Tra
nsac
tions
with
Val
ueD
ecla
red
Tota
l Val
ueN
o. o
fT
rans
actio
ns
No.
of
Tra
nsac
tions
with
Val
ueD
ecla
red
Tota
l Val
ueN
o. o
fT
rans
actio
ns
No.
of
Tra
nsac
tions
with
Val
ueD
ecla
red
Tota
l Val
ue
....
....
....
....
....
....
....
....
....
....
....
....
....
....
....
....
....
....
....
....
....
....
....
....
....
....
....
....
....
....
....
....
....
....
....
....
....
....
....
....
....
....
....
....
....
....
....
....
....
....
....
....
....
....
...

503STRUCTURAL CHANGES AND SPECIALIZATION
nationality of these subsidiaries according to the country of the parent company.Therefore, as stated above, nationality refers to the firm’s headquarters.
Data was organized to cover two different perspectives. The first uses the acquir-ing firm as the basic unit of analysis. The aim is to address the product diversifica-tion or specialization characteristics of the strategy undertaken by the firm. Twoindicators were built to cover this first topic:
(i) the sum of acquisitions of firms in the sector r of the acquiring firm, dividedby total acquisitions by acquiring firms in sector r. This indicator is 1 whenall acquisitions are concentrated in the main sector of production of theacquiring firm, and has value 0 when no acquisitions are made in the sectorof the acquiring firm; and
(ii) the numbers-equivalent index of acquisitions by firms that belong to sectorr, defined as NEA = 1/[
n
Σi=1
(pir)2], where pir is the share of target firms in sec-tor i among the total acquisitions of firms that belong to sector r. This indi-cator assumes value 1 when firms that belong to sector r acquire firms fromonly one sector. The greater the level of diversification of the purchases, thegreater NEA will be.
The second perspective takes target firms as the unit of analysis, allowing theevaluation of the sectoral origin of acquirers of firms in a certain sector. In order tocover this topic, two indicators were formulated:
(i) the share of acquiring firms of sector r in total transactions involving targetfirms in sector r (srr); and
(ii) the numbers-equivalent index of the acquirers’ level of diversification, ex-pressed by NES = 1/[
n
Σi=1
s2ri], where sri is the share of sales transactions of
firms of sector r that have acquiring firms from sector i.4
The classification of sectors into broad categories seemed inadequate for theanalysis of diversification patterns. Thus, a special sectoral classification providedby TFSD was used. In order to ensure that indicators significantly represented the out-comes of the M&A process, only those sectors that had over ten purchasing and sellingtransactions were examined. Therefore, from the fifty-six sectors listed in the database,only twenty-seven remained (see Table I for an analysis of the sectoral classification).
II. STRUCTURAL TRANSFORMATIONS IN THE BRAZILIANPRODUCTION SECTOR
This section analyzes the structural transformations that took place in the Brazilian
4 There is an important shortcoming in this analysis. In order to calculate these diversification indi-cators, a sectoral classification has been used. As emphasized by Teece et al. (1994), the chosenlevel of aggregation may be too broadly or too narrowly defined. The classification here used wasobtained from TFSD. It more or less corresponds to a two-digit ISIC classification. The use of sucha classification will normally classify sectors too broadly.
THE DEVELOPING ECONOMIES504
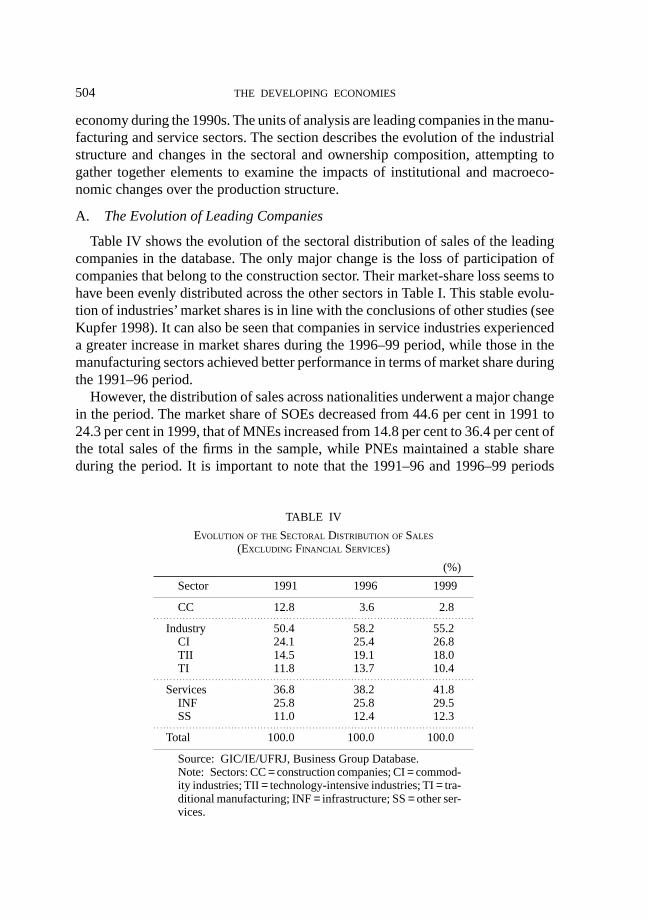
economy during the 1990s. The units of analysis are leading companies in the manu-facturing and service sectors. The section describes the evolution of the industrialstructure and changes in the sectoral and ownership composition, attempting togather together elements to examine the impacts of institutional and macroeco-nomic changes over the production structure.
A. The Evolution of Leading Companies
Table IV shows the evolution of the sectoral distribution of sales of the leadingcompanies in the database. The only major change is the loss of participation ofcompanies that belong to the construction sector. Their market-share loss seems tohave been evenly distributed across the other sectors in Table I. This stable evolu-tion of industries’ market shares is in line with the conclusions of other studies (seeKupfer 1998). It can also be seen that companies in service industries experienceda greater increase in market shares during the 1996–99 period, while those in themanufacturing sectors achieved better performance in terms of market share duringthe 1991–96 period.
However, the distribution of sales across nationalities underwent a major changein the period. The market share of SOEs decreased from 44.6 per cent in 1991 to24.3 per cent in 1999, that of MNEs increased from 14.8 per cent to 36.4 per cent ofthe total sales of the firms in the sample, while PNEs maintained a stable shareduring the period. It is important to note that the 1991–96 and 1996–99 periods
TABLE IV
EVOLUTION OF THE SECTORAL DISTRIBUTION OF SALES
(EXCLUDING FINANCIAL SERVICES)
(%)
Sector 1991 1996 1999
CC 12.8 3.6 2.8
Industry 50.4 58.2 55.2CI 24.1 25.4 26.8TII 14.5 19.1 18.0TI 11.8 13.7 10.4
Services 36.8 38.2 41.8INF 25.8 25.8 29.5SS 11.0 12.4 12.3
Total 100.0 100.0 100.0
Source: GIC/IE/UFRJ, Business Group Database.Note: Sectors: CC = construction companies; CI = commod-ity industries; TII = technology-intensive industries; TI = tra-ditional manufacturing; INF = infrastructure; SS = other ser-vices.
. . . . . . . . . . . . . . . . . . . . . . . . . . . . . . . . . . . . . . . . . . . . . . . . . . . . . . . . . . . . . . . . . . . . . . . . . . . . . . . . . . . . . . . . . . . . . . . . . . .
. . . . . . . . . . . . . . . . . . . . . . . . . . . . . . . . . . . . . . . . . . . . . . . . . . . . . . . . . . . . . . . . . . . . . . . . . . . . . . . . . . . . . . . . . . . . . . . . . . .
. . . . . . . . . . . . . . . . . . . . . . . . . . . . . . . . . . . . . . . . . . . . . . . . . . . . . . . . . . . . . . . . . . . . . . . . . . . . . . . . . . . . . . . . . . . . . . . . . . .

505STRUCTURAL CHANGES AND SPECIALIZATION
show different trends. State-owned enterprises lost most of their market share in the1991–96 period. In the same period, PNEs increased their market share by 3.5percentage points. Therefore, the increase of the market share of MNEs in the firstperiod was due almost exclusively to the decrease (privatization) of SOEs. In thesecond period, the market share of SOEs continued to decrease, though not at thesame rate, and that of PNEs shifted from 44.1 per cent to 39.3 per cent. Therefore,the increase in the MNEs’ market share was due both to the privatization of SOEsand the decrease of PNEs’ sales shares (see Figure 1).
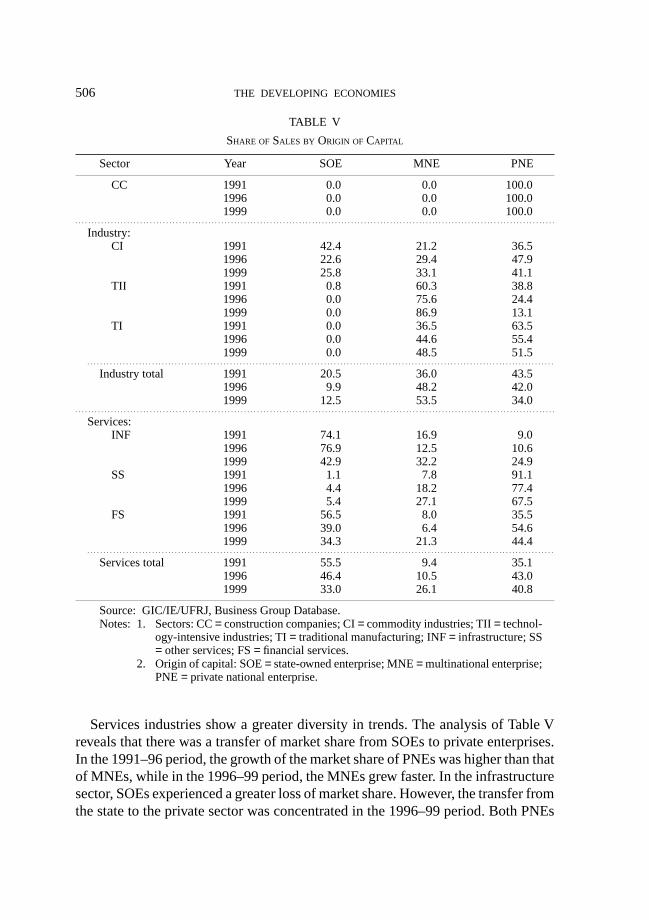
Multinational enterprises seem to have increased their market shares in all sec-tors analyzed with the sole exception of companies in the construction sector. Thecauses of this shift seem to differ across sectors and periods of analysis. In thecommodity industries, the gains in market share of MNEs were accompanied by aloss in those of SOEs and an increase in those of PNEs. During the 1991–96 period,the main force behind the market share gains of MNEs in the commodity sectorseems to have been the privatization of SOEs, for, as can be seen in Table V, themarket share of PNEs increased in the period. However, in the 1996–99 period, theincrease in the market share of MNEs was due to the transfer of assets from PNEsto MNEs. In technology-intensive industries, the increase in the market share ofMNEs confirmed their leading position in Brazil. Their participation in the totalsales of the sample rose from 60.3 per cent in 1991 to 86.9 per cent in 1999. Thisgrowth implied a decrease in the share of PNEs from 38.8 to 13.1 per cent. Intraditional manufacturing industries, where the PNEs were historically dominant,MNEs showed an increase in market share as well.
0
20
40
60
80
100
(%)
SOE MNE PNE
1991
40.6
14.8
44.6
1996
44.1
26.4
29.6
1999
39.3
36.4
24.3
Source: GIC/IE/UFRJ, Business Group Database.Note: Origin of capital: SOE = state-owned enter-prise; MNE = multinational enterprise; PNE = private national enterprise.
Fig. 1. Evolution of the Share of Sales of Leading Companies by Origin of Capital (Excluding Financial Services)
THE DEVELOPING ECONOMIES506
TABLE V
SHARE OF SALES BY ORIGIN OF CAPITAL
Sector Year SOE MNE PNE
CC 1991 0.0 0.0 100.01996 0.0 0.0 100.01999 0.0 0.0 100.0
Industry:CI 1991 42.4 21.2 36.5
1996 22.6 29.4 47.91999 25.8 33.1 41.1
TII 1991 0.8 60.3 38.81996 0.0 75.6 24.41999 0.0 86.9 13.1
TI 1991 0.0 36.5 63.51996 0.0 44.6 55.41999 0.0 48.5 51.5
Industry total 1991 20.5 36.0 43.51996 9.9 48.2 42.01999 12.5 53.5 34.0
Services:INF 1991 74.1 16.9 9.0
1996 76.9 12.5 10.61999 42.9 32.2 24.9
SS 1991 1.1 7.8 91.11996 4.4 18.2 77.41999 5.4 27.1 67.5
FS 1991 56.5 8.0 35.51996 39.0 6.4 54.61999 34.3 21.3 44.4
Services total 1991 55.5 9.4 35.11996 46.4 10.5 43.01999 33.0 26.1 40.8
Source: GIC/IE/UFRJ, Business Group Database.Notes: 1. Sectors: CC = construction companies; CI = commodity industries; TII = technol-
ogy-intensive industries; TI = traditional manufacturing; INF = infrastructure; SS= other services; FS = financial services.
2. Origin of capital: SOE = state-owned enterprise; MNE = multinational enterprise;PNE = private national enterprise.
. . . . . . . . . . . . . . . . . . . . . . . . . . . . . . . . . . . . . . . . . . . . . . . . . . . . . . . . . . . . . . . . . . . . . . . . . . . . . . . . . . . . . . . . . . . . . . . . . . . . . . . . . . . . . . . . . . . . . . . . . . . . . . . . . . . . . . . . . . . . . . . . . . . .
. . . . . . . . . . . . . . . . . . . . . . . . . . . . . . . . . . . . . . . . . . . . . . . . . . . . . . . . . . . . . . . . . . . . . . . . . . . . . . . . . . . . . . . . . . . . . . . . . . . . . . . . . . . . . . . . . . . . . . . . . . . . . . . . . . . . . . . . . . . . . . . .
Services industries show a greater diversity in trends. The analysis of Table Vreveals that there was a transfer of market share from SOEs to private enterprises.In the 1991–96 period, the growth of the market share of PNEs was higher than thatof MNEs, while in the 1996–99 period, the MNEs grew faster. In the infrastructuresector, SOEs experienced a greater loss of market share. However, the transfer fromthe state to the private sector was concentrated in the 1996–99 period. Both PNEs
507STRUCTURAL CHANGES AND SPECIALIZATION
and MNEs saw an increase in their market shares. In the other services sector,PNEs lost market share to MNEs. It is important however to note that other servicesis the only sector of our analysis where PNEs remain in a clear leading position.
B. Changes in Concentration
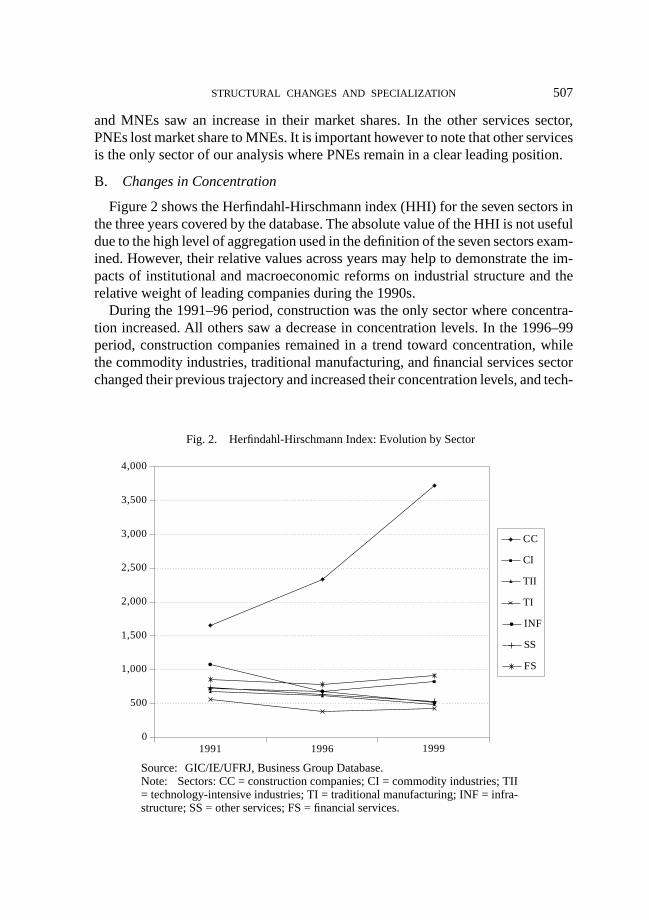
Figure 2 shows the Herfindahl-Hirschmann index (HHI) for the seven sectors inthe three years covered by the database. The absolute value of the HHI is not usefuldue to the high level of aggregation used in the definition of the seven sectors exam-ined. However, their relative values across years may help to demonstrate the im-pacts of institutional and macroeconomic reforms on industrial structure and therelative weight of leading companies during the 1990s.
During the 1991–96 period, construction was the only sector where concentra-tion increased. All others saw a decrease in concentration levels. In the 1996–99period, construction companies remained in a trend toward concentration, whilethe commodity industries, traditional manufacturing, and financial services sectorchanged their previous trajectory and increased their concentration levels, and tech-
Fig. 2. Herfindahl-Hirschmann Index: Evolution by Sector
0
500
1,000
1,500
2,000
2,500
3,000
3,500
4,000
CC
CI
TII
TI
FS
INF
SS
1991 1996 1999
Source: GIC/IE/UFRJ, Business Group Database.Note: Sectors: CC = construction companies; CI = commodity industries; TII = technology-intensive industries; TI = traditional manufacturing; INF = infra-structure; SS = other services; FS = financial services.
THE DEVELOPING ECONOMIES508
nology-intensive industries, infrastructure, and other services maintained a trajec-tory towards lower levels of concentration.
Two main factors may explain the changes in concentration levels of these sectors:(i) differences in the growth rates of firms in a single sector; and(ii) changes in the number of firms producing in the same sector.
In the first case, concentration places whenever larger firms show greater rates ofgrowth than small firms; inversely, a lower HHI will appear when small firms ex-hibit higher growth rates than larger ones. In both cases, changes in HHI showdifferences in the composition of relative firm size. As firm size become more ho-mogeneous, concentration levels decrease while concentration levels increase asthe market shows greater heterogeneity in firm sizes.
Changes in the number of firms may occur due to the entry of new firms, to theexit of existing firms, to M&As, and to the fragmentation of enterprises into differ-ent firms. Entries and firm fragmentations result in lower levels of concentration,while exits, M&As of firms lead to higher levels of concentration.
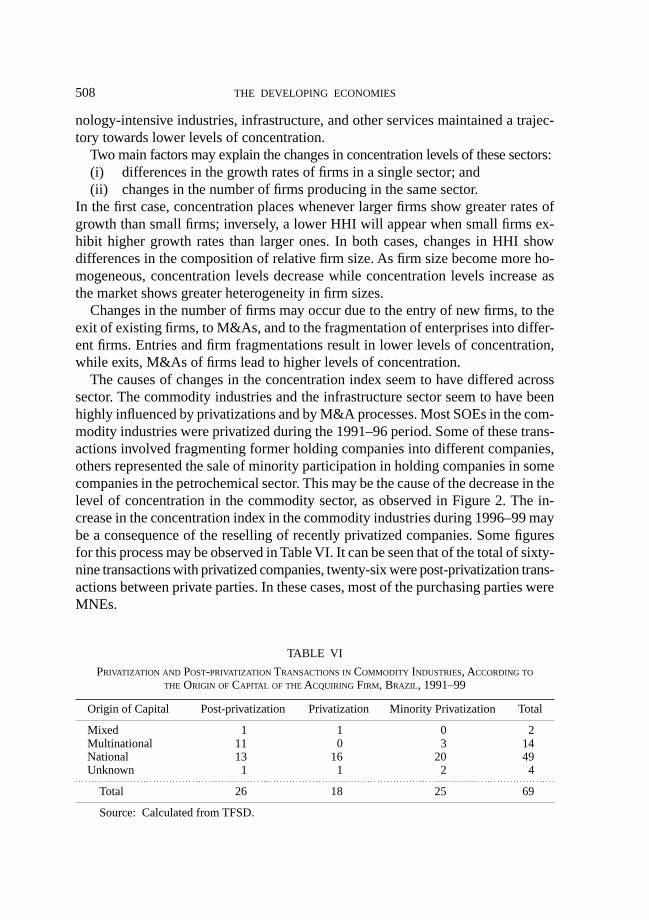
The causes of changes in the concentration index seem to have differed acrosssector. The commodity industries and the infrastructure sector seem to have beenhighly influenced by privatizations and by M&A processes. Most SOEs in the com-modity industries were privatized during the 1991–96 period. Some of these trans-actions involved fragmenting former holding companies into different companies,others represented the sale of minority participation in holding companies in somecompanies in the petrochemical sector. This may be the cause of the decrease in thelevel of concentration in the commodity sector, as observed in Figure 2. The in-crease in the concentration index in the commodity industries during 1996–99 maybe a consequence of the reselling of recently privatized companies. Some figuresfor this process may be observed in Table VI. It can be seen that of the total of sixty-nine transactions with privatized companies, twenty-six were post-privatization trans-actions between private parties. In these cases, most of the purchasing parties wereMNEs.
TABLE VI
PRIVATIZATION AND POST-PRIVATIZATION TRANSACTIONS IN COMMODITY INDUSTRIES, ACCORDING TO
THE ORIGIN OF CAPITAL OF THE ACQUIRING FIRM, BRAZIL, 1991–99
Origin of Capital Post-privatization Privatization Minority Privatization Total
Mixed 1 1 0 2Multinational 11 0 3 14National 13 16 20 49Unknown 1 1 2 4
Total 26 18 25 69
Source: Calculated from TFSD.
. . . . . . . . . . . . . . . . . . . . . . . . . . . . . . . . . . . . . . . . . . . . . . . . . . . . . . . . . . . . . . . . . . . . . . . . . . . . . . . . . . . . . . . . . . . . . . . . . . . . . . . . . . . . . . . . . . . . . . . . . . . . . . . . . . . . . . . . . . . . . . . . . . . .

509STRUCTURAL CHANGES AND SPECIALIZATION
The decrease in the concentration level of the infrastructure sector was also causedby privatization transactions, mostly in the 1996–99 period. Some of these transac-tions involved fragmentations of SOEs. However, there was another factor that playeda major role in this case. In the telecommunications sector, there were many newentries in mobile phones, fixed phones, and long-distance call services.
It is likely that changes in the concentration in traditional manufacturing can beexplained by differences in the rate of growth, mainly in the food industry, and byM&A transactions. During the 1991–96 period, there was a rapid expansion ofdemand in those industries, providing room for recently established MNEs. Someof the growth of these enterprises took place through the acquisition of smallerenterprises. In this situation, the type of concentration index that we used actuallyshows a decentralization effect. As explained above, the database deals solely withleading companies. Therefore, though the acquisition of small companies by lead-ing enterprises may have a positive influence on concentration indexes, in the sampleused this may result in a decrease in the levels of concentration, for it may result ina more even distribution of sales across leading companies. The slight increase inthe concentration index during the 1996–99 period may be due to a slowdown ofdemand and the consolidation of the market shares of recently established MNEs.
In the technology-intensive industries, the fall in the concentration levels overthe whole period seems to be due to the entry of MNEs. This may be especially truein the motor vehicles sector, where there was a large expansion in the number ofcompanies producing in Brazil.
Finally the decrease in the concentration levels of other services may be ex-plained by the emergence of large companies in new dynamic sectors such as infor-mation technology.
III. THE M&A PROCESS
The evidence analyzed above is helpful for assessing the growth perspectives offirms in Brazil. However, it does not say much about the direction of the growth.Nonetheless, the direction of growth is also economically relevant because:
(i) it may establish the production trajectories followed by firms; and(ii) it may open up possible specialization and diversification strategies according
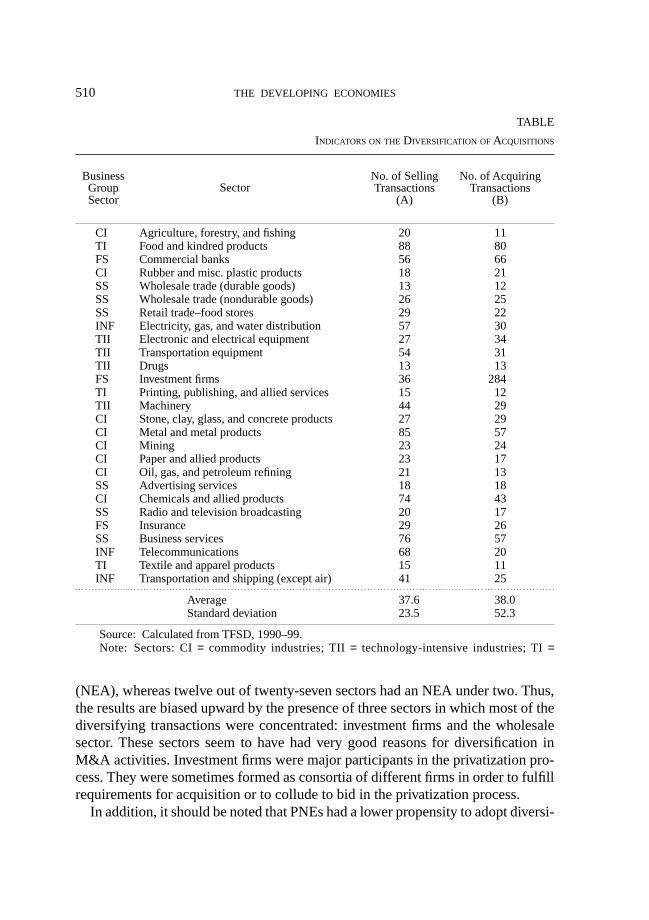
to nationality.The data shows that the M&A process in Brazil was not driven by high levels of
diversification among acquiring firms. Only 37 per cent of acquisitions involvedtargets that did not belong to the acquirer’s main sector of production (see columnF of Table VII). The number equivalent index for diversification activities (NEA),in Table VII, column D, also indicates a low level of diversification of productionactivities. Furthermore, it seems that a few sectors are biasing the results upwards.Only seven out of twenty-seven sectors had above average diversification rates
THE DEVELOPING ECONOMIES510
TABLE
INDICATORS ON THE DIVERSIFICATION OF ACQUISITIONS
CI Agriculture, forestry, and fishing 20 11TI Food and kindred products 88 80FS Commercial banks 56 66CI Rubber and misc. plastic products 18 21SS Wholesale trade (durable goods) 13 12SS Wholesale trade (nondurable goods) 26 25SS Retail trade–food stores 29 22INF Electricity, gas, and water distribution 57 30TII Electronic and electrical equipment 27 34TII Transportation equipment 54 31TII Drugs 13 13FS Investment firms 36 284TI Printing, publishing, and allied services 15 12TII Machinery 44 29CI Stone, clay, glass, and concrete products 27 29CI Metal and metal products 85 57CI Mining 23 24CI Paper and allied products 23 17CI Oil, gas, and petroleum refining 21 13SS Advertising services 18 18CI Chemicals and allied products 74 43SS Radio and television broadcasting 20 17FS Insurance 29 26SS Business services 76 57INF Telecommunications 68 20TI Textile and apparel products 15 11INF Transportation and shipping (except air) 41 25
Average 37.6 38.0Standard deviation 23.5 52.3
Source: Calculated from TFSD, 1990–99.Note: Sectors: CI = commodity industries; TII = technology-intensive industries; TI =
No. of AcquiringTransactions
(B)
No. of SellingTransactions
(A)
BusinessGroupSector
Sector
. . . . . . . . . . . . . . . . . . . . . . . . . . . . . . . . . . . . . . . . . . . . . . . . . . . . . . . . . . . . . . . . . . . . . . . . . . . . . . . . . . . . . . . . . . . . . . . . . . . . . . . . . . . . . . . . . . . . . . . . . . . . . . . . . . . . . . . . . . . . . . . . . . . .
(NEA), whereas twelve out of twenty-seven sectors had an NEA under two. Thus,the results are biased upward by the presence of three sectors in which most of thediversifying transactions were concentrated: investment firms and the wholesalesector. These sectors seem to have had very good reasons for diversification inM&A activities. Investment firms were major participants in the privatization pro-cess. They were sometimes formed as consortia of different firms in order to fulfillrequirements for acquisition or to collude to bid in the privatization process.
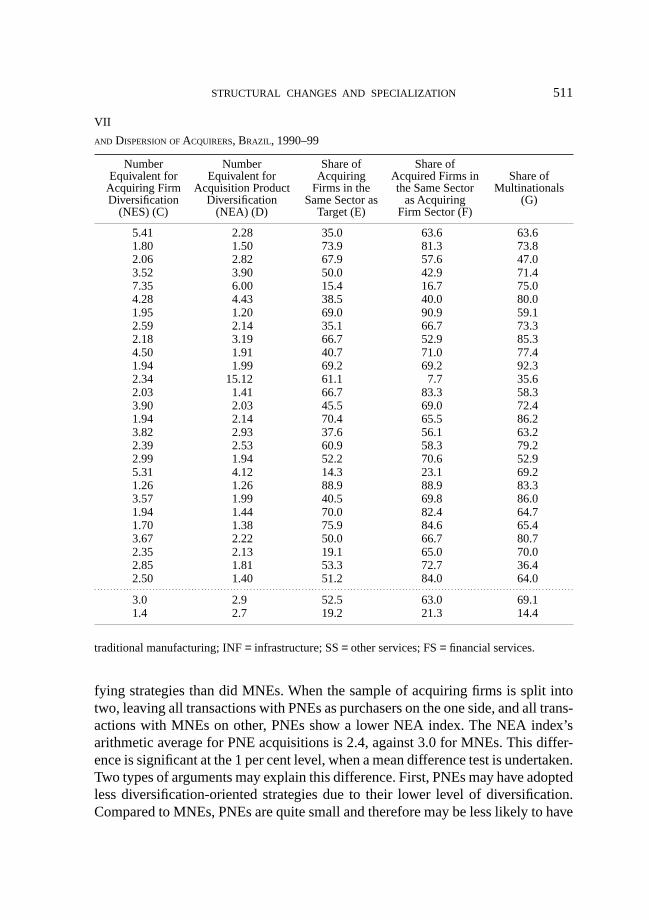
In addition, it should be noted that PNEs had a lower propensity to adopt diversi-
511STRUCTURAL CHANGES AND SPECIALIZATION
VII
AND DISPERSION OF ACQUIRERS, BRAZIL, 1990–99
5.41 2.28 35.0 63.6 63.61.80 1.50 73.9 81.3 73.82.06 2.82 67.9 57.6 47.03.52 3.90 50.0 42.9 71.47.35 6.00 15.4 16.7 75.04.28 4.43 38.5 40.0 80.01.95 1.20 69.0 90.9 59.12.59 2.14 35.1 66.7 73.32.18 3.19 66.7 52.9 85.34.50 1.91 40.7 71.0 77.41.94 1.99 69.2 69.2 92.32.34 15.12 61.1 7.7 35.62.03 1.41 66.7 83.3 58.33.90 2.03 45.5 69.0 72.41.94 2.14 70.4 65.5 86.23.82 2.93 37.6 56.1 63.22.39 2.53 60.9 58.3 79.22.99 1.94 52.2 70.6 52.95.31 4.12 14.3 23.1 69.21.26 1.26 88.9 88.9 83.33.57 1.99 40.5 69.8 86.01.94 1.44 70.0 82.4 64.71.70 1.38 75.9 84.6 65.43.67 2.22 50.0 66.7 80.72.35 2.13 19.1 65.0 70.02.85 1.81 53.3 72.7 36.42.50 1.40 51.2 84.0 64.0
3.0 2.9 52.5 63.0 69.11.4 2.7 19.2 21.3 14.4
traditional manufacturing; INF = infrastructure; SS = other services; FS = financial services.
Share ofMultinationals
(G)
Share ofAcquired Firms inthe Same Sector
as AcquiringFirm Sector (F)
Share ofAcquiring
Firms in theSame Sector as
Target (E)
NumberEquivalent for
Acquisition ProductDiversification
(NEA) (D)
NumberEquivalent for
Acquiring FirmDiversification
(NES) (C)
. . . . . . . . . . . . . . . . . . . . . . . . . . . . . . . . . . . . . . . . . . . . . . . . . . . . . . . . . . . . . . . . . . . . . . . . . . . . . . . . . . . . . . . . . . . . . . . . . . . . . . . . . . . . . . . . . . . . . . . . . . . . . . . . . . . . . . . . . . . . . . . . . . . .
fying strategies than did MNEs. When the sample of acquiring firms is split intotwo, leaving all transactions with PNEs as purchasers on the one side, and all trans-actions with MNEs on other, PNEs show a lower NEA index. The NEA index’sarithmetic average for PNE acquisitions is 2.4, against 3.0 for MNEs. This differ-ence is significant at the 1 per cent level, when a mean difference test is undertaken.Two types of arguments may explain this difference. First, PNEs may have adoptedless diversification-oriented strategies due to their lower level of diversification.Compared to MNEs, PNEs are quite small and therefore may be less likely to have
THE DEVELOPING ECONOMIES512
high levels of diversification. Second, these figures may be revealing defensive strat-egies adopted by PNEs. In the face of external competition, PNEs may have soldtheir assets in sectors of production where they had little competitive advantage,specializing instead in those sectors where they had competitive advantage or atleast where they still found themselves protected.5
A second important piece of information in Table VII is related to the sector oforigin of acquiring firms in each sector. Whether acquiring firms were from thesame sector of production or from a different one may give valuable information onthe effect of M&As on market structure. If most acquiring firms came from thesame sector as target firms, M&As should have had a concentrating effect on mar-ket structure, unless acquirers were new entrants in the markets;6 if targets andacquirers were in different sectors, then M&As should have had little direct impacton market structure. Column E in Table VII shows the percentage of acquiringfirms for each sector that belonged to the same sector as the target firm. The arith-metic average shows that only 52.5 per cent of total acquirers belonged to the samesector. The equivalent number for the diversification for acquiring firms is 3.0 onaverage. However, it should be stressed that the dispersion is much lower than thatfor the NEA variable. On average, there were acquiring firms from three differentsectors in each sector. Only seven sectors had equivalent numbers for the diversifi-cation of acquiring firms under 2.0. No sector had figures over 8.0.
A third feature shown by Table VII is the very high participation by MNEs asacquirers. This may explain the increase in the participation of MNEs in the Brazil-ian production sector. It should be stressed however that the figures presented inTable VII account for both new entrants into the Brazilian markets and firms thatwere already producing in the country. The effects on the industrial structure wouldbe quite different. In the former case, acquisitions should have had a neutral effecton concentration rates. In the latter, acquisitions may have had a concentrating ef-fect on market structure.
The three features established above may be considered to be important conse-quences of the M&A process on market structure. The growth strategies under-taken by firms may be classified as either specializing or diversifying. Specializing
5 It should be stressed that these figures are based on TFSD’s sectoral classification. This classificationpresents two important shortcomings for our purposes. (i) It is more or less compatible with thetwo-digit SIC classification. Most international studies are based on less aggregated sectoralclassifications (see Ravenscraft and Scherer 1987). This feature may induce a bias towards lowerlevels of diversification compared to other studies. (ii) It takes into account only the main sector ofactivity of each firm. Therefore, in some cases, a firm may already be diversified towards somesector, but the TFSD does not give specific knowledge about it. For instance, this was the case withThyssen. Thyssen was classified by TFSD as a metal products firm. It is, however, also a player inthe machinery sector. Whenever Thyssen bought a machinery firm, the transaction was classified asa diversifying transaction.
6 For instance, MNEs with no previous participation in Brazil.

513STRUCTURAL CHANGES AND SPECIALIZATION
strategies are achieved when firms buy assets in their main sector of activity, whereasdiversifying strategies are achieved when firms buy assets outside their main sectorof activity. If strategies are mainly specializing, there should be a tendency towardsconcentration. There may be one important exception to this concentration effect,however. As stated above, the concentration effect is not present if the acquiringfirm is a newcomer to that geographic market, meaning in our case, that the firm isa multinational. Diversifying strategies may be an indication of either great poten-tial of growth of existing firms or of slow growth in a market where firms are estab-lished.
New entry through M&As may occur in two modes. Firms may come from dif-ferent sectors of activity, or they may come from different geographic markets. Thedirect effect of new entries should not be a concentrating one. In fact, entry maydiminish concentration, depending on the characteristic of the acquired firm. If theacquired firm is a one-unit firm, the change of ownership should have no effect onmarket structure. However, if the target firm was a unit of a greater enterprise thathad adopted a strategy of fragmentation of its parts, then, the effect should be adecrease in concentration. This could be quite important in the Brazilian case dueto the privatization process that broke up SOEs in the telecommunications, petro-chemical, and energy sectors.
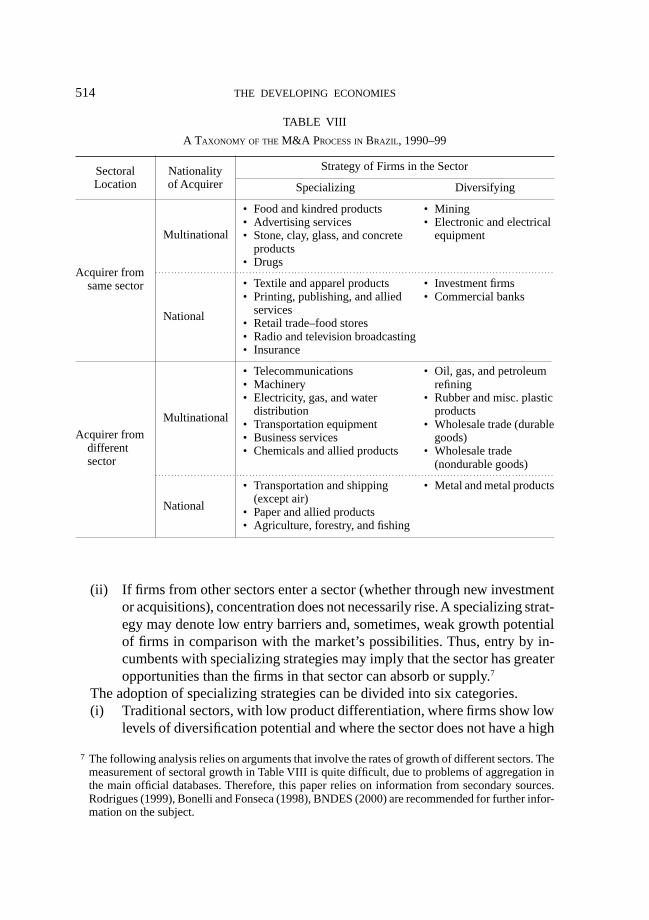
The effects of the M&A process on market structure should then vary acrosssectors, in accordance with their main characteristics such as level of technology,previous state participation, rate of growth, importance of brand names, etc. TableVIII provides us with a taxonomy of sectors, arranged according to the strategy ofacquiring firms that belonged to the sector (specializing or diversifying strategies),and the sectoral and national origin of acquiring firms. The classification of sectorsinto categories was established by comparing the arithmetic averages of each char-acteristic. If the sector had a specialization index (column F of Table VII) above 63per cent, it was considered to have implemented a specializing strategy; if the indexwas under 63 per cent, it was classified as a diversifying strategy sector. Table VIIIshows that two-thirds (eighteen out of twenty-seven) of the sectors appear to havefirms that pursued a specializing strategy, while in one-third of the sectors, M&Aactivities seem to reflect the adoption of diversifying strategies by firms.
A. Specializing Strategies
In those sectors where specializing strategies were prevalent, nine sectors showan intensive entry of acquiring firms from other sectors, and nine a low entry ofacquiring firms from other sectors. As stated above, sectors with M&A specializingstrategies are more likely to have higher rates of concentration. However, this de-pends on two important features.
(i) If firms come from different geographic markets, specialization strategiesdo not lead to higher concentration indices.
THE DEVELOPING ECONOMIES514
(ii) If firms from other sectors enter a sector (whether through new investmentor acquisitions), concentration does not necessarily rise. A specializing strat-egy may denote low entry barriers and, sometimes, weak growth potentialof firms in comparison with the market’s possibilities. Thus, entry by in-cumbents with specializing strategies may imply that the sector has greateropportunities than the firms in that sector can absorb or supply.7
The adoption of specializing strategies can be divided into six categories.(i) Traditional sectors, with low product differentiation, where firms show low
levels of diversification potential and where the sector does not have a high
TABLE VIII
A TAXONOMY OF THE M&A PROCESS IN BRAZIL, 1990–99
Strategy of Firms in the Sector
Specializing Diversifying
• Food and kindred products • Mining• Advertising services • Electronic and electrical• Stone, clay, glass, and concrete equipment
products• Drugs
• Textile and apparel products • Investment firms• Printing, publishing, and allied • Commercial banks
services• Retail trade–food stores• Radio and television broadcasting• Insurance
• Telecommunications • Oil, gas, and petroleum• Machinery refining• Electricity, gas, and water • Rubber and misc. plastic
distribution products• Transportation equipment • Wholesale trade (durable• Business services goods)• Chemicals and allied products • Wholesale trade
(nondurable goods)
• Transportation and shipping • Metal and metal products(except air)
• Paper and allied products• Agriculture, forestry, and fishing
SectoralLocation
. . . . . . . . . . . . . . . . . . . . . . . . . . . . . . . . . . . . . . . . . . . . . . . . . . . . . . . . . . . . . . . . . . . . . . . . . . . . . . . . . . . . . . . . . . . . . . . . . . . . . . . . . . . . . . . . . . . . . . . . . . .
. . . . . . . . . . . . . . . . . . . . . . . . . . . . . . . . . . . . . . . . . . . . . . . . . . . . . . . . . . . . . . . . . . . . . . . . . . . . . . . . . . . . . . . . . . . . . . . . . . . . . . . . . . . . . . . . . . . . . . . . . . .
Acquirer fromdifferentsector
Acquirer fromsame sector
Multinational
National
Nationalityof Acquirer
National
Multinational
7 The following analysis relies on arguments that involve the rates of growth of different sectors. Themeasurement of sectoral growth in Table VIII is quite difficult, due to problems of aggregation inthe main official databases. Therefore, this paper relies on information from secondary sources.Rodrigues (1999), Bonelli and Fonseca (1998), BNDES (2000) are recommended for further infor-mation on the subject.
515STRUCTURAL CHANGES AND SPECIALIZATION
rate of growth. This is the case with: textile and apparel products; printing,publishing, and allied services; and stone, clay, glass, and concrete prod-ucts.
(ii) High growth rate sectors, where the entry of MNEs has dominated the M&Aprocess. This is the case with food and kindred goods, advertising services,transportation equipment, and business services.
(iii) Recently privatized sectors that presented good opportunities for short-termprofits. In this case, firms from other sectors and countries entered the mar-ket through acquisitions. In a second phase, there was a restructuring of thesectors, with recently privatized firms being resold to firms that belonged tothe same sector as the privatized companies. This is the case with: telecom-munications; chemicals and allied products; electricity, gas, and water dis-tribution; and transportation and shipping.
(iv) High technology sectors that attracted foreign acquiring firms due to theopening of the economy.8 This is the case with transportation equipmentand machinery.
(v) Exporting sectors with very high rates of growth, and which were domi-nated by PNEs, such as: paper and allied products; and agriculture, for-estry, and fishing.
(vi) Service sectors still protected by legislation, such as radio and televisionbroadcasting; and insurance.
1. Low entry from other sectorsNine out of the eighteen sectors that had firms that predominantly adopted spe-
cializing strategies showed low entry from other sectors, and the adoption of spe-cializing strategies. These nine sectors included three traditional manufacturing(printing, food, and textile) in our sample, one commodity industries sector (stone,clay, glass, and concrete products), three other services sector (radio and television;advertising; and retail trade–food stores), one technology-intensive sector (drugs),and one financial services sector. With the exception of drugs, all the manufactur-ing sectors involved have very low levels of technology.
When sectors are divided according to the intensity of participation of MNEs asacquiring firms, a clearer scenario unfolds. Four sectors showed high rates of inter-nationalization: food; stone, clay, glass, and concrete products; advertising; anddrugs. With the exception of stone, clay, glass, and concrete products, the otherthree sectors are either high technology—and therefore the presence of nationalenterprises came about due to greater international exposure to competition afterthe institutional reforms—or have a very high growth potential. This should also betrue for food (see Rodrigues 1999), due to its very high income elasticity in Brazil,
8 This process will be explained later.
THE DEVELOPING ECONOMIES516
and also for advertising. The case of the food industry is quite interesting becausethe entry through acquisition was part of the global competition strategy of some ofthe MNEs in Brazil.
The five sectors with low rates of internationalization may be divided into twogroups. The traditional manufacturing sectors showed very low prospects for growthand shrunk sharply in size during the period. In the case of textiles, the liberaliza-tion of imports has had a very strong impact on the sector. The services sector,however, seems quite different. In radio and television broadcasting, there is stillsevere legislation regulating foreign ownership. The food retail sector had a verystrong concentration structure in the period, and had quite high barriers to entry(BNDES 2000). It should nonetheless be stressed that though these sectors havelower internationalization rates, the level of internationalization has increased dur-ing the period and the share of MNEs in total acquisitions is quite high (see Table VII).
2. High entry from other sectorsThere were nine sectors with high shares of acquiring firms from other sectors:
telecommunications; machinery; electricity, gas, and water distribution; transpor-tation equipment; business services; chemicals and allied products; transportationand shipping; paper and allied products; and agriculture, forestry, and fishing.
Three of these nine sectors are commodity industries (chemicals and allied prod-ucts; paper and allied products; and agriculture, forestry, and fishing), three areclassified as infrastructure sectors (transportation and shipping; electricity, gas, andwater distribution; and telecommunications), two belong to technology-intensiveindustries (machinery and transportation equipment), and one is a service sector.
Four out of these nine sectors (chemicals and allied products, and the three infra-structure sectors) were part of the government privatization process. Some acquisi-tions in infrastructure were made through firm consortia that are here classified inthe investment firms sector; others in transportation had former construction firmsas acquirers. The opportunities for short-term profits provided by the purchase ofSOEs seem to have been an important driving force to explain the diversity of theacquirers in these cases.9
The presence of machinery and transportation equipment in this category cannotbe separated from the fact that most of the entries have been multinationals. Theliberalization of the Brazilian market created a major threat for national high techfirms. These firms, which were accustomed to protected markets, would be facingnew competition and were in danger of losing market share. Nonetheless, they hada solid position in the market and owned valuable assets. The entry of MNEs wasunavoidable. However, MNE could follow two different paths. They could engage
9 Graça (2001) finds that acquirers of SOEs earned very high profits immediately after the privatizationprocess.
517STRUCTURAL CHANGES AND SPECIALIZATION
in greenfield investment and then attempt to displace well-established national firms,or they could acquire some of these firms. The choice would depend on a compari-son between two extremes: the present value of national enterprises and the cost ofnew investment, versus the cost of displacing competition. Any asset price betweenthese two extremes would be advantageous for both parties. Most firms followedthe latter option.10
The three cases where national acquirers seem to have had a greater presence(transportation and shipping; agriculture, forestry, and fishing; and paper and alliedproducts) seem to have one important thing in common—a great advantage fornational enterprises. Some of the transactions in transportation and shipping in-volved the acquisition of road administration by construction companies. Agricul-ture, forestry, and fishing; and paper and allied products are amongst Brazil’s majorexporting sectors, and are dominated by PNEs.
B. Diversifying Strategies
Diversifying strategies could be identified in only nine sectors: mining; elec-tronic and electrical equipment; investment firms; commercial banks; oil, gas, andpetroleum refining; rubber and miscellaneous plastic products; wholesale trade (du-rable goods); wholesale trade (nondurable goods); and metal and metal products.These sectors may be divided into three different groups.
(i) Financial investment—a category that includes investment firms and com-mercial banks. Investment in these cases is not directed at increasing theacquiring firm’s capacity to affect and decide production in these indus-tries. It rather involves portfolio diversification investments (and are com-posed of acquisitions of minority shares) or short-term gains, mainly throughinvestment firms buying privatized enterprises.
(ii) Verticalization of activities—oil, gas, and petroleum refining, rubber andplastics, mining, and the two wholesale sectors fall in this category. Theacquisition of firms from other sectors is carried out with aim of verticalizingactivities in the same productive chains.
(iii) Product pervasiveness—this is the case for electrical and electronics andmetal and metallurgy. In these cases, acquiring firms are usually morediversified and have their main sector of production located elsewhere.
1. Low entry from other sectorsFour sectors (mining, electronic and electrical equipment, investment firms, and
10 One example of the stylized fact described above may be found in the acquisition of Metal Leve byMahle of Germany. However, though Metal Leve is classified as a transportation equipment firm,Mahle, due to its diversified multinational structure, is classified as an electronic and electricalfirm. The acquisition of Elevadores Sur, a machinery manufacturer, by Thyssen a diversified mul-tinational classified as metal, is another example of this process.
THE DEVELOPING ECONOMIES518
commercial banks) had low entry from firms from other sectors. Two sectors had anintensive presence of MNEs: mining and electronic and electrical equipment. Theelectronic and electrical equipment sector is a classical case of the acquisition ofhigh tech firms by multinational enterprises, as described above.11 In this sector,though foreign acquirers were already present in the market in some cases, oneshould not expect that the M&A process had a great influence on the market struc-ture. Furthermore, as entry is usually achieved through the acquisition of existingassets, it should have little influence in the lowering of concentration.
The commodity and investment firms and commercial bank sector has low entryfrom other sectors and low participation rates by MNEs. Acquired and acquiringfirms in this sector are quite different and should be analyzed separately. Acquirersin this sector are mostly consortia, which play an important role in the privatizationprocess, mainly in the acquisition of infrastructure companies. However, acquiredfirms from this sector are usually small brokers in the stock market or firms thatgather consumers into consortia for the acquisition of durable goods, such as motorvehicles, and which thus may act as tools for long-term financing for the purchaseof such goods. Usually there is little interest among major MNEs in the purchase ofthis type of firm. Therefore, if the M&A process is viewed from the point of view ofinvestment firms as acquirers it should not play an important role in the investmentfirm sector, but rather in infrastructure. However, if it is viewed from the point ofview of acquired firms in the sector, the influence over the concentration rates pre-sented above should not be very important due to the small size of the acquiredfirms and the small role played by large firms in such acquisitions.
Though the participation of foreign acquirers in transactions involving commer-cial banks is not as intensive as it is in other sectors, when the value of transactionsis analyzed MNEs may play an even more important role. However, it is likely thatthis sector has a slight concentration in its market structure.
2. High entry from other sectorsFive sectors show high entry from other sectors: oil, gas, and petroleum refining;
rubber and miscellaneous plastic products; wholesale trade (durable goods); whole-sale trade (nondurable goods); and metal and metal products. There are four sectorsthat present a high level of entry, with intensive participation by MNEs: oil, gas,and petroleum refining; rubber and miscellaneous plastic products; wholesale trade(durable goods); and wholesale trade (nondurable goods). The situations in the oil,gas, and petroleum-refining sector may be explained by three important govern-
11 It seems that in this case, the cost of the acquisition of a national company was lower than the costof entry through greenfield investment and winning market share. In the case of national compa-nies, the threat of entry by MNEs and the new competition caused by the liberalization of thedomestic market created expectations of a devaluation of the firms assets, creating an incentive forowners to sell the firms.
519STRUCTURAL CHANGES AND SPECIALIZATION
ment policy measures. First, there has been increasing interest in gas, not only afuel for thermoelectric generation, but also as an input for the petrochemical sector.Second, it should be stressed that the petroleum and gas sector has underwent aderegulation process in recent years, which has attracted the entry of MNEs. Third,the privatization program involved the selling off of some gas transportation anddistribution companies that belonged to different federative units (estados) in Bra-zil. The effect on the sector of the deregulation should be a decrease in concentra-tion.
The acquisition of firms belonging to the rubber and miscellaneous plastic prod-ucts sector by firms from other sectors has a high level of dispersion, as can bedemonstrated by the NES indicator in Table VII. Two transactions involved acquirersfrom the food sector. In this case, the targets were packaging firms, and the transac-tions seem to reflect the verticalization strategies of the food firms. Other acquirerscome from textiles, metals, drugs, oil, and paper sectors. Most transactions (eightout of ten) involving acquirers from the rubber and plastic sector had MNEs aspurchasers. Thus, it does not seem that this type of transaction will lead to marketconcentration.
In the case of the wholesale sectors, no clear strategies can be established fromthe available data. An analysis of the transactions reveals that there seems to be aprevalence of verticalization strategies. In this case, wholesale firms in the durablegoods sector appear to have specialized in the direction of durable goods firms.Therefore, M&A transactions could not be expected to have a strong impact onconcentration rates.
The metal and metal products sector has been influenced by two types of events.First, privatization has encouraged purchases by companies from other sectors, dueto the already mentioned expectations of short-term gains. Twenty-eight out of theeighty-five transactions involving the sale of metal and metal products firms hadinvestment firms as acquirers. Second, after privatization, the former SOEs hadtheir ownerships restructured, and were taken over by owners interested in long-term profitability. Due to the fact that mostly transactions involved former SOEs,M&As should not have a concentrating effect as well.
CONCLUSION
Since the beginning of the 1980s the Brazilian industry has been under pressure tochange. This pressure may be rooted in the fading power of the import substitutionparadigm, which guided national development throughout the postwar period.
The analysis undertaken in this paper suggests that the 1990s cannot be charac-terized as years of strong transformation in industry structure. Instead, it suggeststhat the most salient characteristic of the period was the change in the ownershipstructure of productive assets. In sectoral terms, the only important characteristic
THE DEVELOPING ECONOMIES520
was the loss of importance of the construction sector. Nonetheless, many changesin ownership structure may be identified. Multinational enterprises have come todominate the whole industrial structure. This strongly contrasts with previous peri-ods, when they were concentrated in parts of the manufacturing sector. Today, theirparticipation has increased in every sector. SOEs have reduced their market shareto about half what it once was, while PNEs have roughly maintained their marketshares. However, PNEs have been displaced from the manufacturing sector andhave concentrated their activities in the service sector.
The decade may also be characterized by a reduction in economic concentration.This finding contradicts a previous work (Willmore 1989) that suggests that anincrease in the share of MNEs raised the level of concentration of industrial activ-ity. Some important characteristics of the evolution of the industry may explain thereduction in economic concentration. First, as shown above, the increase in themarket share of MNEs was accompanied by a decrease of that of SOEs. As shownby Willmore (1989), SOEs have a positive effect on concentration levels. Further-more, in the 1990s, the privatization process has been carried out in some casesthrough the dismemberment of SOEs into parts which were then sold to differentprivate players. Second, in some cases, MNEs have entered the Brazilian marketthrough the acquisition of existing companies. In this case, the entry of an MNEdoes not necessarily lead to greater levels of concentration. In addition, the shortlength of time from the date of acquisition to the date of observation of the marketstructure does not allow for great changes in market structure through efficiencygains. Finally, the results here reported refer to economic concentration and not toconcentration in specific markets. The level of aggregation of the analysis is muchhigher than in Willmore (1989). Further research is still needed in this respect.
The results from our analysis of the M&A process may contribute to the attain-ment of sharper conclusions. On the one hand, acquiring firms seem to have adoptedspecializing strategies, mainly acquiring firms in their main sector of productionactivity. This type of behavior seems to support conclusions favoring the concen-tration of markets. On the other hand, it is shown that the M&A process has beenmarked by the entry of MNEs. They have been the main purchasers of assets, andsome have used acquisitions as means to enter the market. Therefore, the processdoes not seem to have led to concentration, due to the presence of new actors in themarketplace.
In addition, PNEs seem to have adopted even less diversified strategies than MNEs.This result seems to support the idea that PNEs have adopted defensive strategies asa reaction to changes in macroeconomic and institutional conditions that took placein the 1990s. Thus, this finding does not seem to support the ideas of those thatargue that the institutional changes of the 1990s eliminated weaker companies andsectors and strengthened the Brazilian industrial structure. On the contrary, it sug-gests that firms were able to survive through the adoption of defensive strategies.
521STRUCTURAL CHANGES AND SPECIALIZATION
REFERENCES
Banco Nacional de Desenvolvimento Economico e Social (BNDES). 2000. “Super ehipermercados no Brasil: Desempenho recente.” Informe setorial no. 21. Available fromhttp://www.bndes.gov.br/.
Bonelli, Regis, and Renato Fonseca. 1998. “Ganhos de produtividade e de eficiência: Novosresultados para economia Brasileira.” Rio de Janeiro: Instituto de Pesquisa EconómicaAplicada. Mimeographed.
Coutinho, Luciano. 1997. “A especialização regressiva: Um balanço do desempenho indus-trial pós-estabilização.” In Brasil: Desafios de um país em transformação, ed. R. Velloso.Rio de Janeiro: José Olympio.
Ferraz, João Carlos; David Kupfer; and Lia Haguenauer. 1996. Made in Brasil: Desafioscompetitivos para a indústria Brasileira. Rio de Janeiro: Ed. Campus.
Franco, Gustavo H. B. 1998. “A inserção externa e o desenvolvimento.” Revista de economiapolítica 18, no. 3: 121–47.
Graça, Tales. 2001. “Ganhadores dos leilões da privatização Brasileira realmente ganham:Evidência empírica de um estudo de evento.” Paper presented to XXIX Encontro Nacionalde Economia, December 2001, Salvador. Available from http://www.anpec.org.br/.
Haguenauer, Lia; Rubens Markwald; and H. Pourchet. 1998. Estimativas do valor daprodução industrial e elaboração de coeficientes de exportação e importação da indústriaBrasileira. IPEA Texto para discussão no. 563. Brasilia: Instituto de Pesquisa EconómicaAplicada.
Kupfer, David. 1998. “Trajetórias de reestruturação da indústria Brasileira após a abertura ea estabilização.” Ph.D. diss., Instituto de Economia, Universidade Federal do Rio deJaneiro.
Laplane, Mariano, et al. 2000. “Empresas transnacionais no Brasil nos anos 90: Fatores deatração, estratégias e impactos. Relatório de pesquisa.” Campinas: NEIT/IE/UNICAMP.Mimeographed.
Mendonça de Barros, José Roberto, and Lygia Goldenstein. 1997. “Reestruturação indus-trial: Três anos de debate.” In Brasil: Desafios de um país em transformação, ed. R.Velloso. Rio de Janeiro: José Olympio.
Moreira, Maurício Mesquita. 1999. Estrangeiros em uma economia aberta: Impactos recentessobre a produtividade, a concentração e o mercado exterior. BNDES Texto para discussãono. 67. Rio de Janeiro: Banco Nacional de Desenvolvimento Economico e Social.
Ravenscraft, David J., and F. M. Scherer. 1987. Mergers, Sell-Offs, and Economic Efficiency.Washington, D.C.: Brookings Institution.
Rodrigues, Rute Imanishi. 1999. Empresas estrangeiras e fusões e aquisições: O caso daindústria de autopeças e de alimentação/bebidas em meados da década de 90. IPEATexto para discussão no. 622. Brasilia: Instituto de Pesquisa Económica Aplicada.
Teece, David; Richard Rumelt; Giovanni Dosi; and S. Winter. 1994. “Understanding Cor-porate Coherence: Theory and Evidence.” Journal of Economic Behavior and Organi-zation 23, no. 1: 1–30.
Willmore, Larry. 1989. “Determinants of Industrial Structure: A Brazilian Case Study.”World Development 17, no. 10: 1601–17.