structural and magnetic properties of nanocrystalline yttrium substituted cobalt ferrite synthesized...
TRANSCRIPT
Advanced Powder Technology xxx (2014) xxx–xxx
Contents lists available at ScienceDirect
Advanced Powder Technology
journal homepage: www.elsevier .com/locate /apt
Original Research Paper
Structural and magnetic properties of nanocrystalline yttriumsubstituted cobalt ferrite synthesized by the citrate precursor technique
http://dx.doi.org/10.1016/j.apt.2014.10.0020921-8831/� 2014 Published by Elsevier B.V. on behalf of The Society of Powder Technology Japan. All rights reserved.
⇑ Corresponding author.E-mail address: [email protected] (L. Kumar).
Please cite this article in press as: S. Kumari et al., Structural and magnetic properties of nanocrystalline yttrium substituted cobalt ferrite synthesthe citrate precursor technique, Advanced Powder Technology (2014), http://dx.doi.org/10.1016/j.apt.2014.10.002
Swati Kumari a, Vikash Kumar a, Pawan Kumar b, Manoranjan Kar b, Lawrence Kumar a,⇑a Center for Nanotechnology, Central University of Jharkhand Ranchi, Ranchi 835205, Indiab Department of Physics, Indian Institute of Technology Patna, Patna 800013, India
a r t i c l e i n f o a b s t r a c t
Article history:Received 30 July 2014Received in revised form 23 September2014Accepted 1 October 2014Available online xxxx
Keywords:X-ray diffractionRaman spectroscopyMagnetocrystallineCoercivityMagnetization
CoFe2�xYxO4 (x = 0.0 and 0.05) compound has been synthesized by citrate precursor method and, theirstructural and magnetic properties have been investigated. X-ray diffraction and Raman spectroscopyhave been used to confirm the formation of single phase cubic spinel structure. The X-ray diffraction pat-terns have been analyzed employing Rietveld refinement technique. The surface morphology and particlesize of the samples have been examined using FE-SEM and TEM. Substituting small amount of Y3+ cationcauses significant reduction of the particle size. The magnetic hysteresis curve recorded at room temper-ature using VSM over a field range of ±2 T shows enhancement in coercivity and reduction in highestmagnetization with the Y3+ substitution. The enhancement of coercivity is attributed to the transitionfrom multidomain to single domain state. The cubic magnetocrystalline anisotropy constants for presentsamples has been determined by ‘‘law of approach’’ to saturation which suggests the smaller value forsubstituted sample (x = 0.05) than that of unsubstituted sample (x = 0.0). ZFC and FC magnetization mea-surement over the temperature range 300–900 K shows blocking temperature is far above than roomtemperature. The decrease of highest magnetization and magnetocrystalline anisotropy constant isascribed to weakening of superexchange interaction and surface effect.
� 2014 Published by Elsevier B.V. on behalf of The Society of Powder Technology Japan. All rightsreserved.
1. Introduction
Cobalt ferrite (CoFe2O4) is a centrosymmetric hard magneticmaterial which crystallizes to Fd�3m space group with cubic mixedspinel structure. This compound is represented as
Co2þd Fe3þ
1�d
� �Co2þ
1�dFe3þ1þd
h iO4, where cations inside the round and
square brackets occupy A-sites and B-sites respectively, and d(degree of inversion) depends on thermal history and preparationcondition [1,2]. Its magnetic ordering temperature is around520 �C, which is far above than room temperature. It exhibits highcoercivity, large magnetocrystalline anisotropy, moderate satura-tion magnetization, and, excellent chemical, thermal and structuralstability at room temperature [3,4]. Hence, this material is a prom-ising candidate for a wide variety of technological applications atroom temperature such as drug delivery, magnetic sensors, actua-tors, memory and high frequency devices [5,6]. The magneticbehavior in this material is governed by the spin coupling of theunpaired 3d electrons of Co2+ and Fe3+ cations present at the
A and B-sites. Hence, various superexchange interactions exitsinside the structure such as Fe3+(B)–O–Fe3+(B), Fe3+(B)–O–Co2+(B),Fe3+(B)–O–Fe3+(A), Co2+(B)–O–Fe3+(A) and Co2+(A)–O–Fe3+(B)which is responsible for magnetic behavior in this compound.Among these superexchange interactions, the interaction betweenA and B site is the strongest one which mainly controls the mag-netic behavior of the cobalt ferrite [7–9]. The physical propertiesof cobalt ferrite nanoparticles depend upon its size and composi-tion. One could tune the size of the cobalt ferrite nanoparticle bytailoring its chemical composition in order to get the modifiedproperties. However, it is difficult to tune the size of the particlein control way as the size is affected by the rate of the nucleationand its subsequent growth. The size of the particle can be con-trolled by restricting particle’s rate of the nucleation and its subse-quent growth with introducing a large strain at the lattice site byincorporating suitable substituent element [10–12]. Rare earth ele-ments (La3+, Gd3+, Sm3+, Y3+ etc.) have larger ionic size than that ofFe and Co ions. Substituting very small amount of rare earth cat-ions at the Co and/or Fe site will create a large strain at the latticesite which may restrict the rate of the nucleation of the particleand its subsequent growth. Several authors have reported the syn-thesis of rare earth cations substituted cobalt ferrite by solid state
ized by
2 S. Kumari et al. / Advanced Powder Technology xxx (2014) xxx–xxx
route and chemical method. However, it suffers from drawbackslike phase segregation of metal monoxides, hematite and orthofer-rites even for very low concentration of rare earth cations substitu-tion [13–15]. A few reports are available which have mentionedthe synthesis of rare earth substituted nanocrystalline spinel fer-rites in single phase form using chemical route despite havingbig difference in ionic radius of rare earth cations and Co/Fe cations[16–22]. The magnetic behavior in RE3+ (RE: rare earth) element isdue to 4f electrons. Hence substituting small amount of Y3+ cationsin Place of Fe ions, one can expect an appearance of spin couplingof 3d-4f electrons, which will modify the physical properties.Hence the present report is aimed to synthesis the single phaseyttrium (Y3+) cations substituted cobalt ferrite using chemicalroute and investigates its structural and magnetic properties.
0 200 400 600 800 1000
92
94
96
98
100
Wei
ght (
%)
Temperature (ΟC)
Fig. 1. TGA curve of as prepared CoFe1.95Y0.05O4.
2. Experimental
Yttrium (Y3+) substituted cobalt ferrite compound with empiri-cal formula (CoFe2�xYxO4, x = 0.0 and 0.05) have been synthesizedby the citrate-precursor method. Cobalt nitrate (Co (NO3)2�6H2O),Iron nitrate (Fe (NO3)3�9H2O), Yttrium oxide (Y2O3) and citric acid(C6H8O7�H2O) supplied with 99.9% purity were used as startingmaterials. The clear solution of yttrium nitrate was obtained bydissolving Yttrium oxide in nitric acid. The aqueous solution ofcobalt nitrate, iron nitrate and citric acid were obtained by dissolv-ing it in deionized water. An aqueous solution of citric acid wasmixed with the above metal nitrates solutions. The mixed solutionwas kept on a hot plate with a continuous stirring at 90 �C. The cit-ric acid plays two important roles: on one hand, it provides fuel forthe reaction, as decomposition of citric acid in the solution liber-ates heat (exothermic process) which implies that the heatrequired for chemical reaction is provided by the reaction itself.On the other hand, it has an ability to form complexes with metalions. Thus, citric acid acts as a ligand to stabilize metal ions. Gen-erally the molar ratio of citric acid to metal nitrates is maintainedhigh to form a cage like linkage so that metal ions are no longerfree to undergo many of its chemical reaction to produce precipi-tates. In the present work, the molar ratio of metal nitrates to citricacid was taken as 1:3. The mixture solution became viscous duringevaporation. This viscous gel was dried in a heating oven at 100 �Cfor 10 h in order to remove excess water. After that it was heattreated in air atmosphere at 200 �C for 1 h to produce deep browncolored ashes. The ashes were grinded and annealed at 800 �C for2 h. The annealing temperature 800 �C was selected after the TGAanalysis.
Thermogravimetric analysis (TGA) of the samples were carriedout using PerkinElmer STA 6000 instrument in the nitrogen atmo-sphere under the heating rate of 10 �C/min. Powder X-ray diffrac-tion pattern at room temperature were recorded by rotatinganode based Rigaku (TTRX-III) X-ray diffractometer operating at50 kV and 100 mA in order to examine the crystalline phase ofthe annealed samples. The measurements were performed usingthe Cu Ka radiation (k = 0.154 nm). The structural analysis by theRietveld method has been carried out using FullProf suite. Thecomposition of the sample was studied by EDS (Energy-dispersivespectroscopy) using the Hitachi S4800 Field Emission ScanningElectron Microscopy (FE-SEM). The particle size measurementwere carried out by transmission electron microscopy (TEM,) usingthe JEM-2100 JEOL device. Raman spectra were measured in thebackscattering geometry using confocal micro-Raman spectrome-ter (Seki Technotron Corp Japan) with the 514.5 nm laser line asexcitation source by STR 750 RAMAN spectrograph. A 100�micro-scope was used to focus the laser beam and collects the scatteredlight. Magnetic hysteresis loops were measured at room tempera-ture by using a Lake Shore (Model No. 7410) Vibrating Sample
Please cite this article in press as: S. Kumari et al., Structural and magnetic prothe citrate precursor technique, Advanced Powder Technology (2014), http://d
Magnetometer (VSM) over a field range of ±2 T. ZFC and FCmagnetization measurement were carried out at 100 Oe magneticfield over the temperature range 300–900 K using VSM insert ofPhysical Properties Measurement System (PPMS) of quantum design.
3. Results and discussion
3.1. Thermogravimetric analysis (TGA)
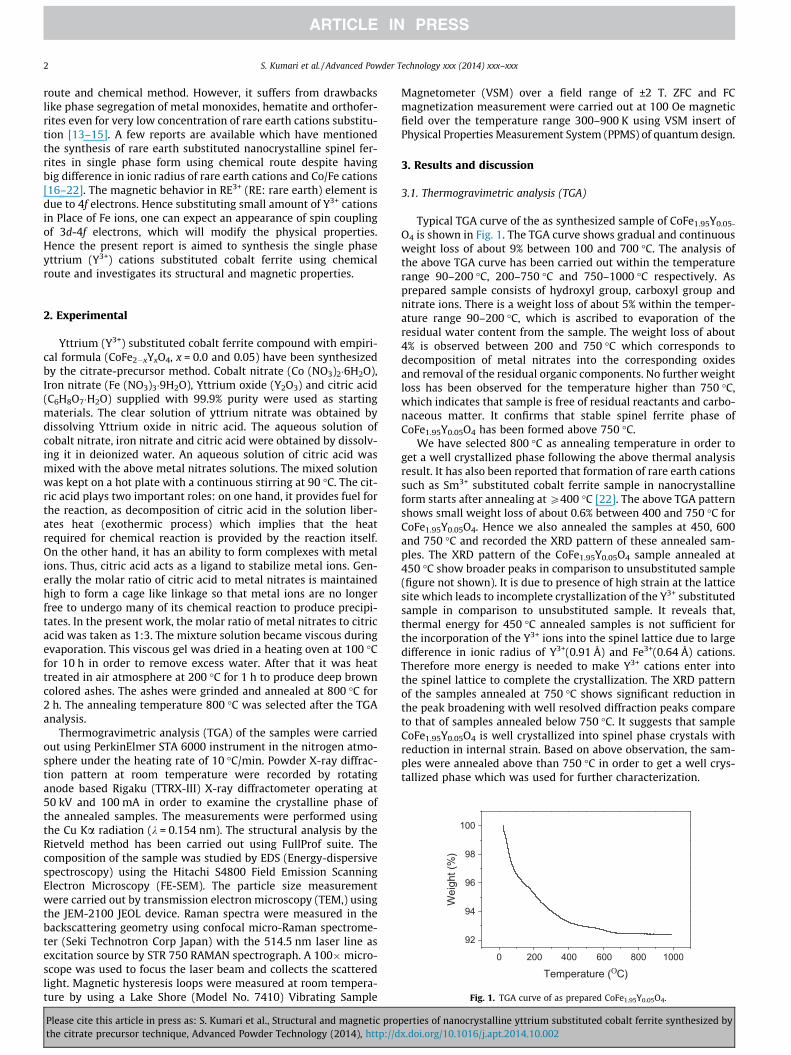
Typical TGA curve of the as synthesized sample of CoFe1.95Y0.05-
O4 is shown in Fig. 1. The TGA curve shows gradual and continuousweight loss of about 9% between 100 and 700 �C. The analysis ofthe above TGA curve has been carried out within the temperaturerange 90–200 �C, 200–750 �C and 750–1000 �C respectively. Asprepared sample consists of hydroxyl group, carboxyl group andnitrate ions. There is a weight loss of about 5% within the temper-ature range 90–200 �C, which is ascribed to evaporation of theresidual water content from the sample. The weight loss of about4% is observed between 200 and 750 �C which corresponds todecomposition of metal nitrates into the corresponding oxidesand removal of the residual organic components. No further weightloss has been observed for the temperature higher than 750 �C,which indicates that sample is free of residual reactants and carbo-naceous matter. It confirms that stable spinel ferrite phase ofCoFe1.95Y0.05O4 has been formed above 750 �C.
We have selected 800 �C as annealing temperature in order toget a well crystallized phase following the above thermal analysisresult. It has also been reported that formation of rare earth cationssuch as Sm3+ substituted cobalt ferrite sample in nanocrystallineform starts after annealing at P400 �C [22]. The above TGA patternshows small weight loss of about 0.6% between 400 and 750 �C forCoFe1.95Y0.05O4. Hence we also annealed the samples at 450, 600and 750 �C and recorded the XRD pattern of these annealed sam-ples. The XRD pattern of the CoFe1.95Y0.05O4 sample annealed at450 �C show broader peaks in comparison to unsubstituted sample(figure not shown). It is due to presence of high strain at the latticesite which leads to incomplete crystallization of the Y3+ substitutedsample in comparison to unsubstituted sample. It reveals that,thermal energy for 450 �C annealed samples is not sufficient forthe incorporation of the Y3+ ions into the spinel lattice due to largedifference in ionic radius of Y3+(0.91 Å) and Fe3+(0.64 Å) cations.Therefore more energy is needed to make Y3+ cations enter intothe spinel lattice to complete the crystallization. The XRD patternof the samples annealed at 750 �C shows significant reduction inthe peak broadening with well resolved diffraction peaks compareto that of samples annealed below 750 �C. It suggests that sampleCoFe1.95Y0.05O4 is well crystallized into spinel phase crystals withreduction in internal strain. Based on above observation, the sam-ples were annealed above than 750 �C in order to get a well crys-tallized phase which was used for further characterization.
perties of nanocrystalline yttrium substituted cobalt ferrite synthesized byx.doi.org/10.1016/j.apt.2014.10.002
34.0 34.5 35.0 35.5 36.0 36.5 37.0
CoFe1.95Y0.05O4
CoFe2O4
Inte
nsity
(A.U
)
2θ (Degree)
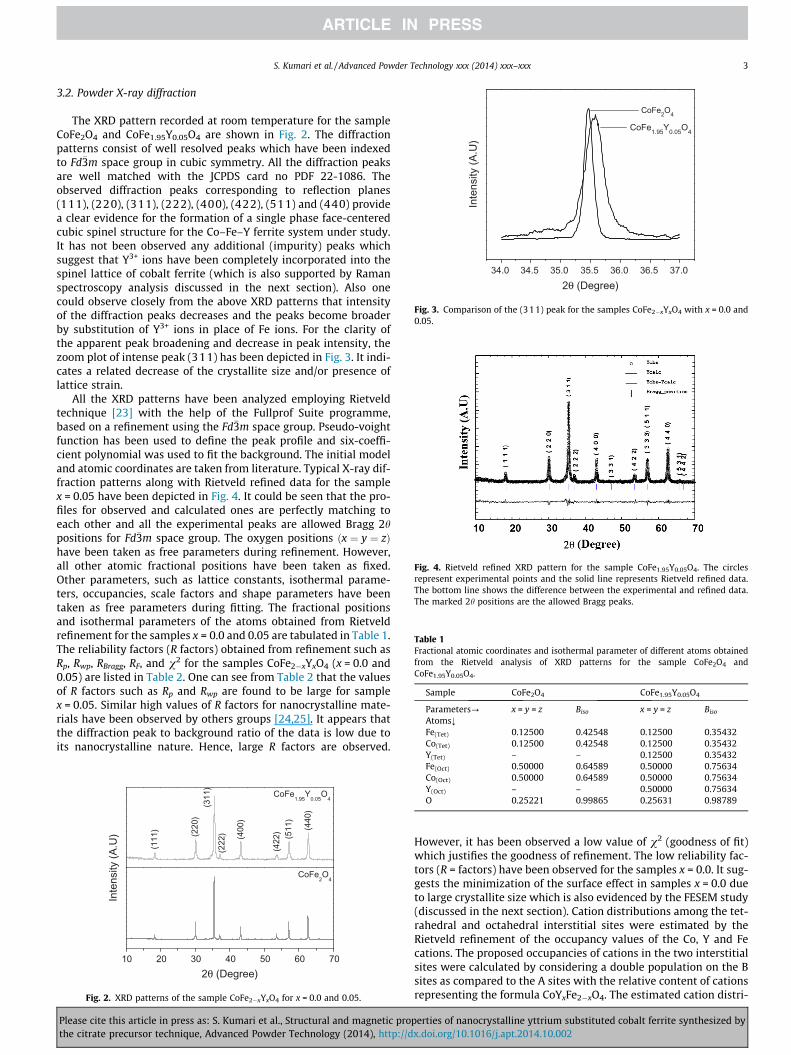
Fig. 3. Comparison of the (311) peak for the samples CoFe2�xYxO4 with x = 0.0 and0.05.
Fig. 4. Rietveld refined XRD pattern for the sample CoFe1.95Y0.05O4. The circlesrepresent experimental points and the solid line represents Rietveld refined data.The bottom line shows the difference between the experimental and refined data.The marked 2h positions are the allowed Bragg peaks.
Table 1Fractional atomic coordinates and isothermal parameter of different atoms obtainedfrom the Rietveld analysis of XRD patterns for the sample CoFe2O4 andCoFe1.95Y0.05O4.
Sample CoFe2O4 CoFe1.95Y0.05O4
Parameters? x = y = z Biso x = y = z Biso
Atoms;Fe(Tet) 0.12500 0.42548 0.12500 0.35432Co(Tet) 0.12500 0.42548 0.12500 0.35432
S. Kumari et al. / Advanced Powder Technology xxx (2014) xxx–xxx 3
3.2. Powder X-ray diffraction
The XRD pattern recorded at room temperature for the sampleCoFe2O4 and CoFe1.95Y0.05O4 are shown in Fig. 2. The diffractionpatterns consist of well resolved peaks which have been indexedto Fd�3m space group in cubic symmetry. All the diffraction peaksare well matched with the JCPDS card no PDF 22-1086. Theobserved diffraction peaks corresponding to reflection planes(111), (220), (311), (222), (400), (422), (511) and (440) providea clear evidence for the formation of a single phase face-centeredcubic spinel structure for the Co–Fe–Y ferrite system under study.It has not been observed any additional (impurity) peaks whichsuggest that Y3+ ions have been completely incorporated into thespinel lattice of cobalt ferrite (which is also supported by Ramanspectroscopy analysis discussed in the next section). Also onecould observe closely from the above XRD patterns that intensityof the diffraction peaks decreases and the peaks become broaderby substitution of Y3+ ions in place of Fe ions. For the clarity ofthe apparent peak broadening and decrease in peak intensity, thezoom plot of intense peak (311) has been depicted in Fig. 3. It indi-cates a related decrease of the crystallite size and/or presence oflattice strain.
All the XRD patterns have been analyzed employing Rietveldtechnique [23] with the help of the Fullprof Suite programme,based on a refinement using the Fd�3m space group. Pseudo-voightfunction has been used to define the peak profile and six-coeffi-cient polynomial was used to fit the background. The initial modeland atomic coordinates are taken from literature. Typical X-ray dif-fraction patterns along with Rietveld refined data for the samplex = 0.05 have been depicted in Fig. 4. It could be seen that the pro-files for observed and calculated ones are perfectly matching toeach other and all the experimental peaks are allowed Bragg 2hpositions for Fd�3m space group. The oxygen positions ðx ¼ y ¼ zÞhave been taken as free parameters during refinement. However,all other atomic fractional positions have been taken as fixed.Other parameters, such as lattice constants, isothermal parame-ters, occupancies, scale factors and shape parameters have beentaken as free parameters during fitting. The fractional positionsand isothermal parameters of the atoms obtained from Rietveldrefinement for the samples x = 0.0 and 0.05 are tabulated in Table 1.The reliability factors (R factors) obtained from refinement such asRp, Rwp, RBragg, RF, and v2 for the samples CoFe2�xYxO4 (x = 0.0 and0.05) are listed in Table 2. One can see from Table 2 that the valuesof R factors such as Rp and Rwp are found to be large for samplex = 0.05. Similar high values of R factors for nanocrystalline mate-rials have been observed by others groups [24,25]. It appears thatthe diffraction peak to background ratio of the data is low due toits nanocrystalline nature. Hence, large R factors are observed.
10 20 30 40 50 60 70
CoFe2O
4
2θ (Degree)
Inte
nsity
(A.U
)
CoFe1.95
Y0.05
O4
(440
)
(511
)(4
22)(400
)
(222
)
(311
)(2
20)
(111
)
Fig. 2. XRD patterns of the sample CoFe2�xYxO4 for x = 0.0 and 0.05.
Y(Tet) – – 0.12500 0.35432Fe(Oct) 0.50000 0.64589 0.50000 0.75634Co(Oct) 0.50000 0.64589 0.50000 0.75634Y(Oct) – – 0.50000 0.75634O 0.25221 0.99865 0.25631 0.98789
Please cite this article in press as: S. Kumari et al., Structural and magnetic prothe citrate precursor technique, Advanced Powder Technology (2014), http://d
However, it has been observed a low value of v2 (goodness of fit)which justifies the goodness of refinement. The low reliability fac-tors (R = factors) have been observed for the samples x = 0.0. It sug-gests the minimization of the surface effect in samples x = 0.0 dueto large crystallite size which is also evidenced by the FESEM study(discussed in the next section). Cation distributions among the tet-rahedral and octahedral interstitial sites were estimated by theRietveld refinement of the occupancy values of the Co, Y and Fecations. The proposed occupancies of cations in the two interstitialsites were calculated by considering a double population on the Bsites as compared to the A sites with the relative content of cationsrepresenting the formula CoYxFe2�xO4. The estimated cation distri-
perties of nanocrystalline yttrium substituted cobalt ferrite synthesized byx.doi.org/10.1016/j.apt.2014.10.002
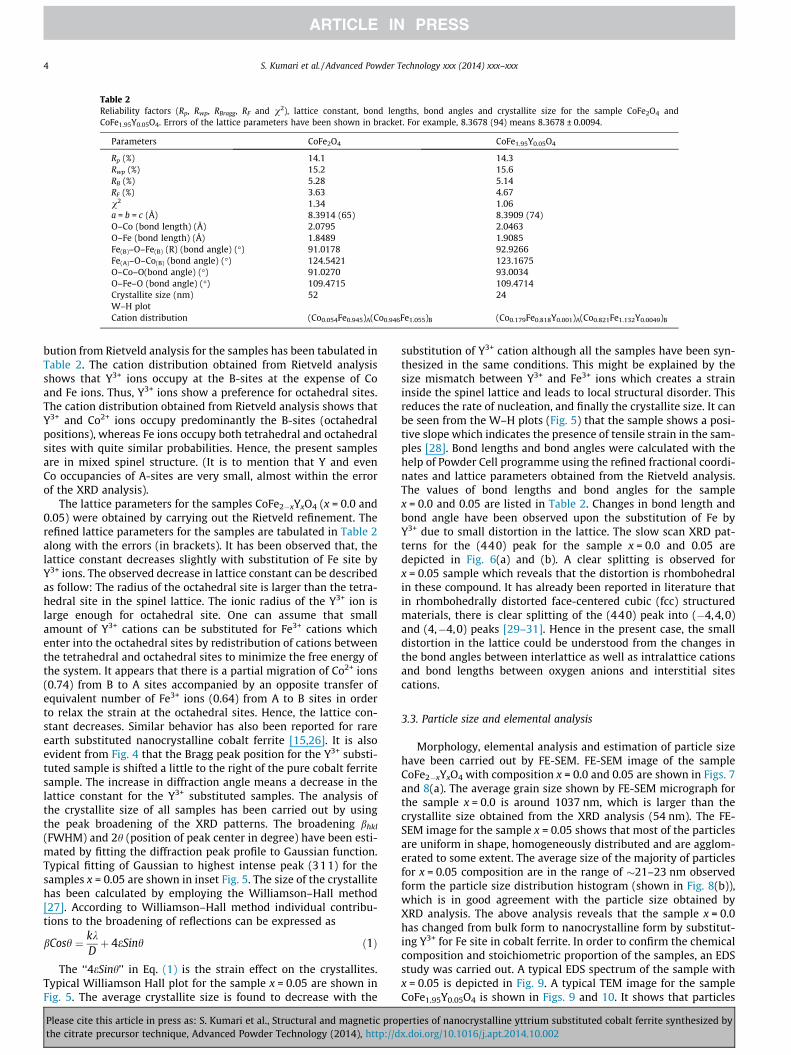
Table 2Reliability factors (Rp, Rwp, RBragg, RF and v2), lattice constant, bond lengths, bond angles and crystallite size for the sample CoFe2O4 andCoFe1.95Y0.05O4. Errors of the lattice parameters have been shown in bracket. For example, 8.3678 (94) means 8.3678 ± 0.0094.
Parameters CoFe2O4 CoFe1.95Y0.05O4
Rp (%) 14.1 14.3Rwp (%) 15.2 15.6RB (%) 5.28 5.14RF (%) 3.63 4.67v2 1.34 1.06a = b = c (Å) 8.3914 (65) 8.3909 (74)O–Co (bond length) (Å) 2.0795 2.0463O–Fe (bond length) (Å) 1.8489 1.9085Fe(B)–O–Fe(B) (R) (bond angle) (�) 91.0178 92.9266Fe(A)–O–Co(B) (bond angle) (�) 124.5421 123.1675O–Co–O(bond angle) (�) 91.0270 93.0034O–Fe–O (bond angle) (�) 109.4715 109.4714Crystallite size (nm) 52 24W–H plotCation distribution (Co0.054Fe0.945)A(Co0.946Fe1.055)B (Co0.179Fe0.818Y0.001)A(Co0.821Fe1.132Y0.0049)B
4 S. Kumari et al. / Advanced Powder Technology xxx (2014) xxx–xxx
bution from Rietveld analysis for the samples has been tabulated inTable 2. The cation distribution obtained from Rietveld analysisshows that Y3+ ions occupy at the B-sites at the expense of Coand Fe ions. Thus, Y3+ ions show a preference for octahedral sites.The cation distribution obtained from Rietveld analysis shows thatY3+ and Co2+ ions occupy predominantly the B-sites (octahedralpositions), whereas Fe ions occupy both tetrahedral and octahedralsites with quite similar probabilities. Hence, the present samplesare in mixed spinel structure. (It is to mention that Y and evenCo occupancies of A-sites are very small, almost within the errorof the XRD analysis).
The lattice parameters for the samples CoFe2�xYxO4 (x = 0.0 and0.05) were obtained by carrying out the Rietveld refinement. Therefined lattice parameters for the samples are tabulated in Table 2along with the errors (in brackets). It has been observed that, thelattice constant decreases slightly with substitution of Fe site byY3+ ions. The observed decrease in lattice constant can be describedas follow: The radius of the octahedral site is larger than the tetra-hedral site in the spinel lattice. The ionic radius of the Y3+ ion islarge enough for octahedral site. One can assume that smallamount of Y3+ cations can be substituted for Fe3+ cations whichenter into the octahedral sites by redistribution of cations betweenthe tetrahedral and octahedral sites to minimize the free energy ofthe system. It appears that there is a partial migration of Co2+ ions(0.74) from B to A sites accompanied by an opposite transfer ofequivalent number of Fe3+ ions (0.64) from A to B sites in orderto relax the strain at the octahedral sites. Hence, the lattice con-stant decreases. Similar behavior has also been reported for rareearth substituted nanocrystalline cobalt ferrite [15,26]. It is alsoevident from Fig. 4 that the Bragg peak position for the Y3+ substi-tuted sample is shifted a little to the right of the pure cobalt ferritesample. The increase in diffraction angle means a decrease in thelattice constant for the Y3+ substituted samples. The analysis ofthe crystallite size of all samples has been carried out by usingthe peak broadening of the XRD patterns. The broadening bhkl
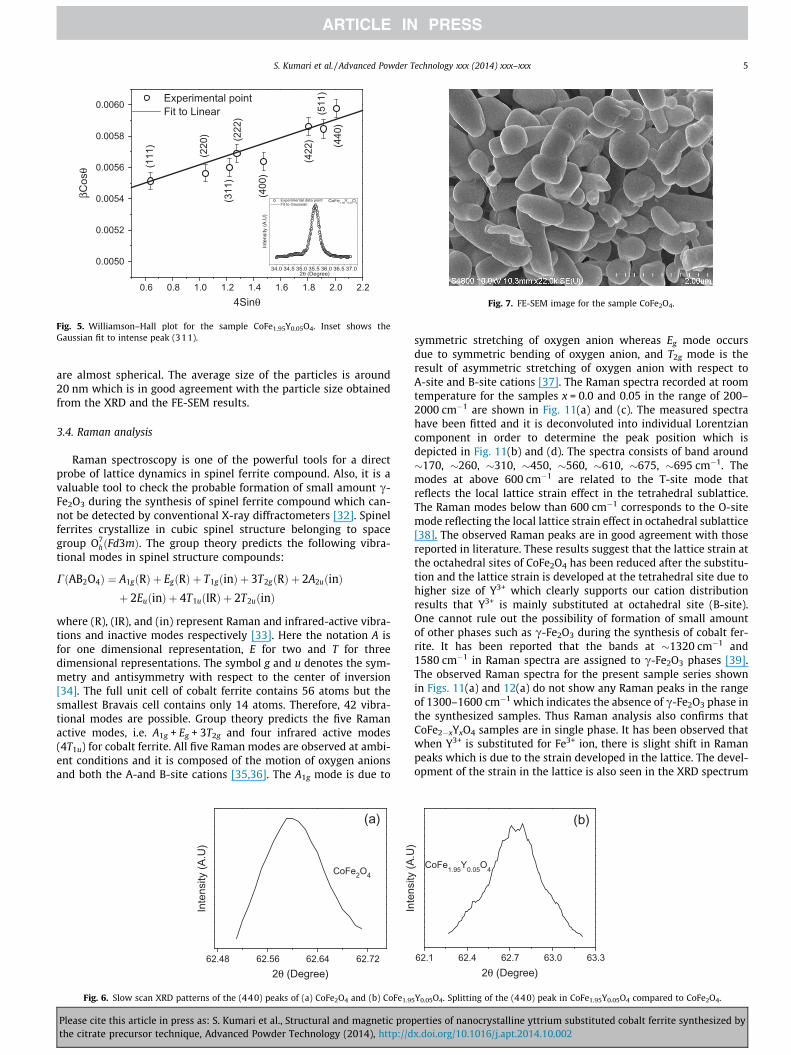
(FWHM) and 2h (position of peak center in degree) have been esti-mated by fitting the diffraction peak profile to Gaussian function.Typical fitting of Gaussian to highest intense peak (311) for thesamples x = 0.05 are shown in inset Fig. 5. The size of the crystallitehas been calculated by employing the Williamson–Hall method[27]. According to Williamson–Hall method individual contribu-tions to the broadening of reflections can be expressed as
bCosh ¼ kkDþ 4eSinh ð1Þ
The ‘‘4eSinh’’ in Eq. (1) is the strain effect on the crystallites.Typical Williamson Hall plot for the sample x = 0.05 are shown inFig. 5. The average crystallite size is found to decrease with the
Please cite this article in press as: S. Kumari et al., Structural and magnetic prothe citrate precursor technique, Advanced Powder Technology (2014), http://d
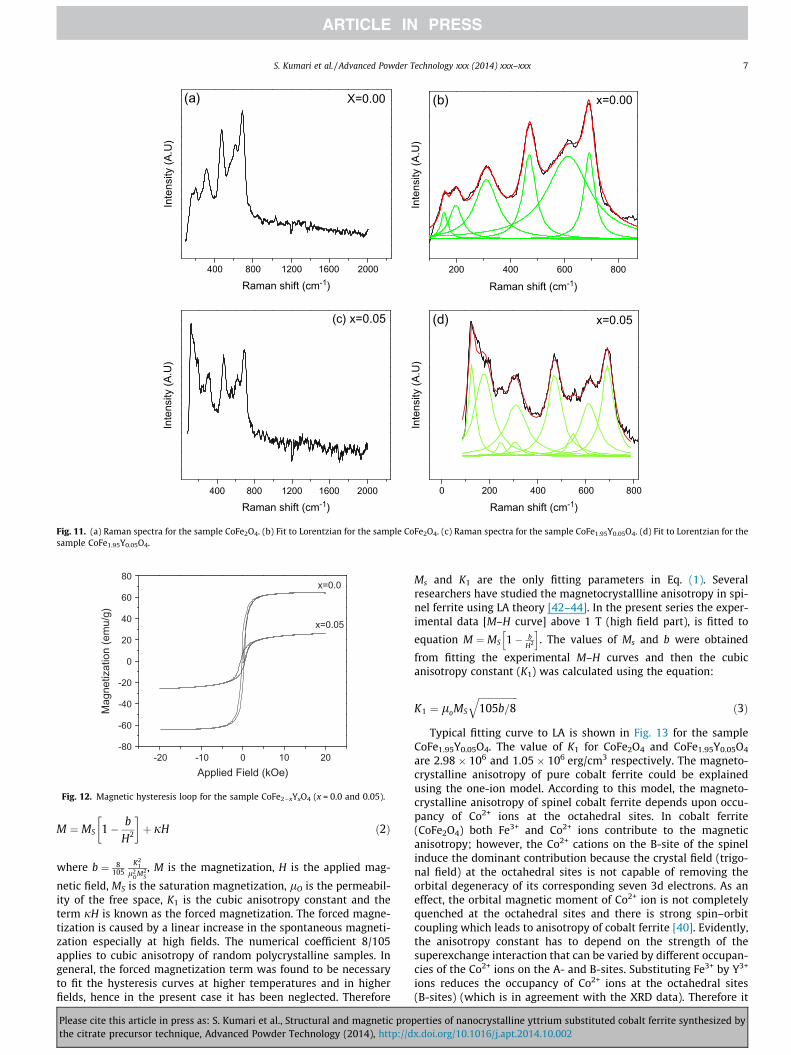
substitution of Y3+ cation although all the samples have been syn-thesized in the same conditions. This might be explained by thesize mismatch between Y3+ and Fe3+ ions which creates a straininside the spinel lattice and leads to local structural disorder. Thisreduces the rate of nucleation, and finally the crystallite size. It canbe seen from the W–H plots (Fig. 5) that the sample shows a posi-tive slope which indicates the presence of tensile strain in the sam-ples [28]. Bond lengths and bond angles were calculated with thehelp of Powder Cell programme using the refined fractional coordi-nates and lattice parameters obtained from the Rietveld analysis.The values of bond lengths and bond angles for the samplex = 0.0 and 0.05 are listed in Table 2. Changes in bond length andbond angle have been observed upon the substitution of Fe byY3+ due to small distortion in the lattice. The slow scan XRD pat-terns for the (440) peak for the sample x = 0.0 and 0.05 aredepicted in Fig. 6(a) and (b). A clear splitting is observed forx = 0.05 sample which reveals that the distortion is rhombohedralin these compound. It has already been reported in literature thatin rhombohedrally distorted face-centered cubic (fcc) structuredmaterials, there is clear splitting of the (440) peak into (�4,4,0)and (4,�4,0) peaks [29–31]. Hence in the present case, the smalldistortion in the lattice could be understood from the changes inthe bond angles between interlattice as well as intralattice cationsand bond lengths between oxygen anions and interstitial sitescations.
3.3. Particle size and elemental analysis
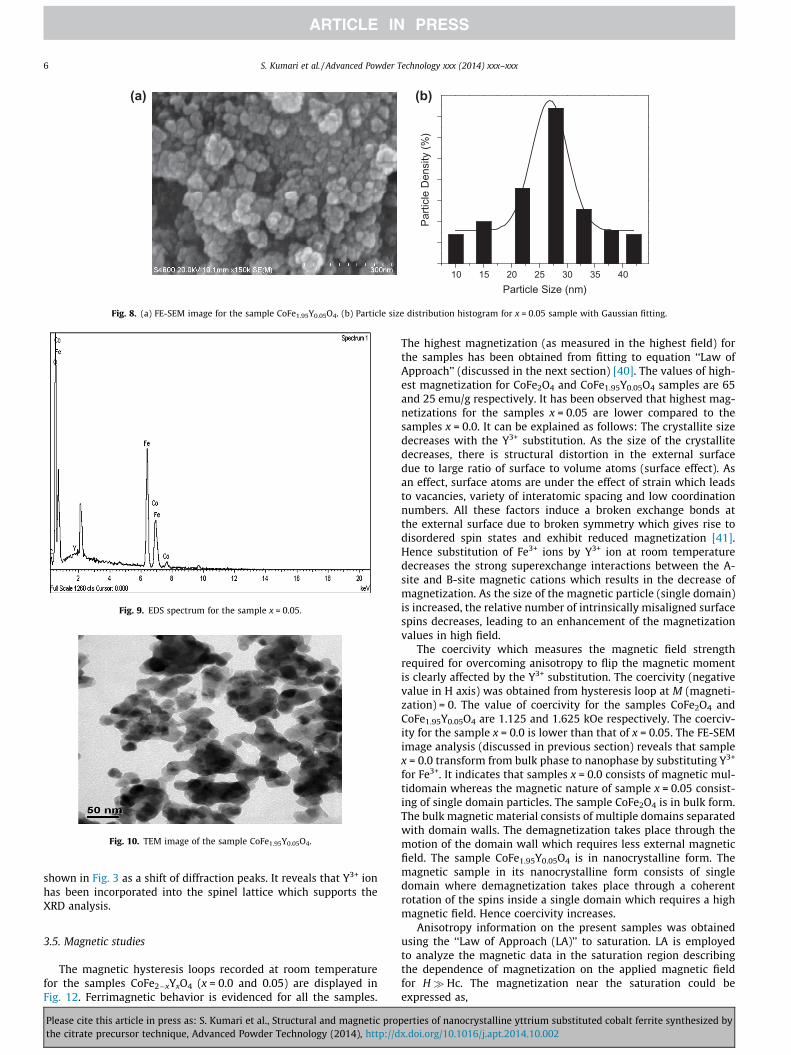
Morphology, elemental analysis and estimation of particle sizehave been carried out by FE-SEM. FE-SEM image of the sampleCoFe2�xYxO4 with composition x = 0.0 and 0.05 are shown in Figs. 7and 8(a). The average grain size shown by FE-SEM micrograph forthe sample x = 0.0 is around 1037 nm, which is larger than thecrystallite size obtained from the XRD analysis (54 nm). The FE-SEM image for the sample x = 0.05 shows that most of the particlesare uniform in shape, homogeneously distributed and are agglom-erated to some extent. The average size of the majority of particlesfor x = 0.05 composition are in the range of �21–23 nm observedform the particle size distribution histogram (shown in Fig. 8(b)),which is in good agreement with the particle size obtained byXRD analysis. The above analysis reveals that the sample x = 0.0has changed from bulk form to nanocrystalline form by substitut-ing Y3+ for Fe site in cobalt ferrite. In order to confirm the chemicalcomposition and stoichiometric proportion of the samples, an EDSstudy was carried out. A typical EDS spectrum of the sample withx = 0.05 is depicted in Fig. 9. A typical TEM image for the sampleCoFe1.95Y0.05O4 is shown in Figs. 9 and 10. It shows that particles
perties of nanocrystalline yttrium substituted cobalt ferrite synthesized byx.doi.org/10.1016/j.apt.2014.10.002
0.6 0.8 1.0 1.2 1.4 1.6 1.8 2.0 2.2
0.0050
0.0052
0.0054
0.0056
0.0058
0.0060
34.0 34.5 35.0 35.5 36.0 36.5 37.0
Experimental data point Fit to Gaussian
CoFe1.95Y0.05O4
Inte
nsity
(A.U
)
2θ (Degree)
(440
)(5
11)
(422
)
(400
)
(222
)
Experimental point Fit to Linear
(311
)
(220
)
(111
)
βCos
θ
4Sinθ
Fig. 5. Williamson–Hall plot for the sample CoFe1.95Y0.05O4. Inset shows theGaussian fit to intense peak (311).
Fig. 7. FE-SEM image for the sample CoFe2O4.
S. Kumari et al. / Advanced Powder Technology xxx (2014) xxx–xxx 5
are almost spherical. The average size of the particles is around20 nm which is in good agreement with the particle size obtainedfrom the XRD and the FE-SEM results.
3.4. Raman analysis
Raman spectroscopy is one of the powerful tools for a directprobe of lattice dynamics in spinel ferrite compound. Also, it is avaluable tool to check the probable formation of small amount c-Fe2O3 during the synthesis of spinel ferrite compound which can-not be detected by conventional X-ray diffractometers [32]. Spinelferrites crystallize in cubic spinel structure belonging to spacegroup O7
hðFd3mÞ. The group theory predicts the following vibra-tional modes in spinel structure compounds:
CðAB2O4Þ ¼ A1gðRÞ þ EgðRÞ þ T1gðinÞ þ 3T2gðRÞ þ 2A2uðinÞþ 2EuðinÞ þ 4T1uðIRÞ þ 2T2uðinÞ
where (R), (IR), and (in) represent Raman and infrared-active vibra-tions and inactive modes respectively [33]. Here the notation A isfor one dimensional representation, E for two and T for threedimensional representations. The symbol g and u denotes the sym-metry and antisymmetry with respect to the center of inversion[34]. The full unit cell of cobalt ferrite contains 56 atoms but thesmallest Bravais cell contains only 14 atoms. Therefore, 42 vibra-tional modes are possible. Group theory predicts the five Ramanactive modes, i.e. A1g + Eg + 3T2g and four infrared active modes(4T1u) for cobalt ferrite. All five Raman modes are observed at ambi-ent conditions and it is composed of the motion of oxygen anionsand both the A-and B-site cations [35,36]. The A1g mode is due to
62.48 62.56 62.64 62.72
(a)
CoFe2O4
Inte
nsity
(A.U
)
2θ (Degree)
Fig. 6. Slow scan XRD patterns of the (440) peaks of (a) CoFe2O4 and (b) CoFe1.9
Please cite this article in press as: S. Kumari et al., Structural and magnetic prothe citrate precursor technique, Advanced Powder Technology (2014), http://d
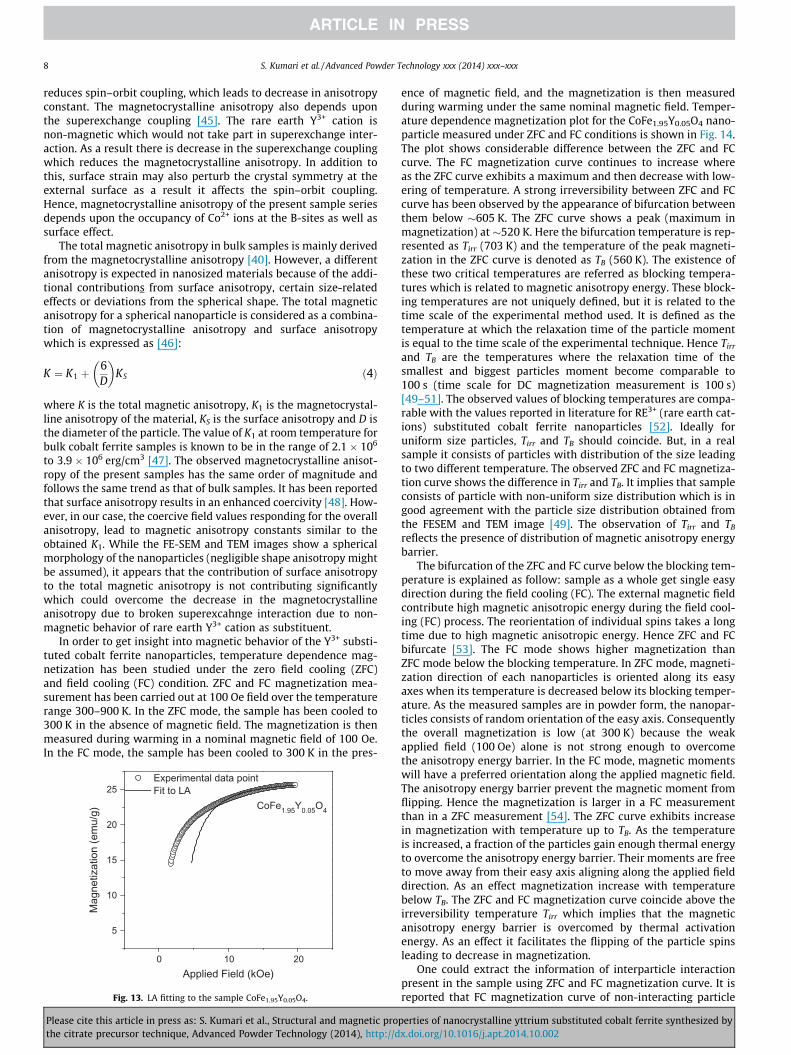
symmetric stretching of oxygen anion whereas Eg mode occursdue to symmetric bending of oxygen anion, and T2g mode is theresult of asymmetric stretching of oxygen anion with respect toA-site and B-site cations [37]. The Raman spectra recorded at roomtemperature for the samples x = 0.0 and 0.05 in the range of 200–2000 cm�1 are shown in Fig. 11(a) and (c). The measured spectrahave been fitted and it is deconvoluted into individual Lorentziancomponent in order to determine the peak position which isdepicted in Fig. 11(b) and (d). The spectra consists of band around�170, �260, �310, �450, �560, �610, �675, �695 cm�1. Themodes at above 600 cm�1 are related to the T-site mode thatreflects the local lattice strain effect in the tetrahedral sublattice.The Raman modes below than 600 cm�1 corresponds to the O-sitemode reflecting the local lattice strain effect in octahedral sublattice[38]. The observed Raman peaks are in good agreement with thosereported in literature. These results suggest that the lattice strain atthe octahedral sites of CoFe2O4 has been reduced after the substitu-tion and the lattice strain is developed at the tetrahedral site due tohigher size of Y3+ which clearly supports our cation distributionresults that Y3+ is mainly substituted at octahedral site (B-site).One cannot rule out the possibility of formation of small amountof other phases such as c-Fe2O3 during the synthesis of cobalt fer-rite. It has been reported that the bands at �1320 cm�1 and1580 cm�1 in Raman spectra are assigned to c-Fe2O3 phases [39].The observed Raman spectra for the present sample series shownin Figs. 11(a) and 12(a) do not show any Raman peaks in the rangeof 1300–1600 cm�1 which indicates the absence of c-Fe2O3 phase inthe synthesized samples. Thus Raman analysis also confirms thatCoFe2�xYxO4 samples are in single phase. It has been observed thatwhen Y3+ is substituted for Fe3+ ion, there is slight shift in Ramanpeaks which is due to the strain developed in the lattice. The devel-opment of the strain in the lattice is also seen in the XRD spectrum
62.1 62.4 62.7 63.0 63.3
(b)
CoFe1.95Y0.05O4
Inte
nsity
(A.U
)
2θ (Degree)
5Y0.05O4. Splitting of the (440) peak in CoFe1.95Y0.05O4 compared to CoFe2O4.
perties of nanocrystalline yttrium substituted cobalt ferrite synthesized byx.doi.org/10.1016/j.apt.2014.10.002
10 15 20 25 30 35 40
Parti
cle
Den
sity
(%)
Particle Size (nm)
(a) (b)
Fig. 8. (a) FE-SEM image for the sample CoFe1.95Y0.05O4. (b) Particle size distribution histogram for x = 0.05 sample with Gaussian fitting.
Fig. 9. EDS spectrum for the sample x = 0.05.
Fig. 10. TEM image of the sample CoFe1.95Y0.05O4.
6 S. Kumari et al. / Advanced Powder Technology xxx (2014) xxx–xxx
shown in Fig. 3 as a shift of diffraction peaks. It reveals that Y3+ ionhas been incorporated into the spinel lattice which supports theXRD analysis.
3.5. Magnetic studies
The magnetic hysteresis loops recorded at room temperaturefor the samples CoFe2�xYxO4 (x = 0.0 and 0.05) are displayed inFig. 12. Ferrimagnetic behavior is evidenced for all the samples.
Please cite this article in press as: S. Kumari et al., Structural and magnetic prothe citrate precursor technique, Advanced Powder Technology (2014), http://d
The highest magnetization (as measured in the highest field) forthe samples has been obtained from fitting to equation ‘‘Law ofApproach’’ (discussed in the next section) [40]. The values of high-est magnetization for CoFe2O4 and CoFe1.95Y0.05O4 samples are 65and 25 emu/g respectively. It has been observed that highest mag-netizations for the samples x = 0.05 are lower compared to thesamples x = 0.0. It can be explained as follows: The crystallite sizedecreases with the Y3+ substitution. As the size of the crystallitedecreases, there is structural distortion in the external surfacedue to large ratio of surface to volume atoms (surface effect). Asan effect, surface atoms are under the effect of strain which leadsto vacancies, variety of interatomic spacing and low coordinationnumbers. All these factors induce a broken exchange bonds atthe external surface due to broken symmetry which gives rise todisordered spin states and exhibit reduced magnetization [41].Hence substitution of Fe3+ ions by Y3+ ion at room temperaturedecreases the strong superexchange interactions between the A-site and B-site magnetic cations which results in the decrease ofmagnetization. As the size of the magnetic particle (single domain)is increased, the relative number of intrinsically misaligned surfacespins decreases, leading to an enhancement of the magnetizationvalues in high field.
The coercivity which measures the magnetic field strengthrequired for overcoming anisotropy to flip the magnetic momentis clearly affected by the Y3+ substitution. The coercivity (negativevalue in H axis) was obtained from hysteresis loop at M (magneti-zation) = 0. The value of coercivity for the samples CoFe2O4 andCoFe1.95Y0.05O4 are 1.125 and 1.625 kOe respectively. The coerciv-ity for the sample x = 0.0 is lower than that of x = 0.05. The FE-SEMimage analysis (discussed in previous section) reveals that samplex = 0.0 transform from bulk phase to nanophase by substituting Y3+
for Fe3+. It indicates that samples x = 0.0 consists of magnetic mul-tidomain whereas the magnetic nature of sample x = 0.05 consist-ing of single domain particles. The sample CoFe2O4 is in bulk form.The bulk magnetic material consists of multiple domains separatedwith domain walls. The demagnetization takes place through themotion of the domain wall which requires less external magneticfield. The sample CoFe1.95Y0.05O4 is in nanocrystalline form. Themagnetic sample in its nanocrystalline form consists of singledomain where demagnetization takes place through a coherentrotation of the spins inside a single domain which requires a highmagnetic field. Hence coercivity increases.
Anisotropy information on the present samples was obtainedusing the ‘‘Law of Approach (LA)’’ to saturation. LA is employedto analyze the magnetic data in the saturation region describingthe dependence of magnetization on the applied magnetic fieldfor H� Hc. The magnetization near the saturation could beexpressed as,
perties of nanocrystalline yttrium substituted cobalt ferrite synthesized byx.doi.org/10.1016/j.apt.2014.10.002
400 800 1200 1600 2000
(a) X=0.00
Inte
nsity
(A.U
)
Raman shift (cm-1)200 400 600 800
x=0.00(b)
Inte
nsity
(A.U
)
Raman shift (cm-1)
400 800 1200 1600 2000
(c) x=0.05
Inte
nsity
(A.U
)
Raman shift (cm-1)0 200 400 600 800
x=0.05(d)
Inte
nsity
(A.U
)
Raman shift (cm-1)
Fig. 11. (a) Raman spectra for the sample CoFe2O4. (b) Fit to Lorentzian for the sample CoFe2O4. (c) Raman spectra for the sample CoFe1.95Y0.05O4. (d) Fit to Lorentzian for thesample CoFe1.95Y0.05O4.
-20 -10 0 10 20-80
-60
-40
-20
0
20
40
60
80
x=0.05
x=0.0
Mag
netiz
atio
n (e
mu/
g)
Applied Field (kOe)
Fig. 12. Magnetic hysteresis loop for the sample CoFe2�xYxO4 (x = 0.0 and 0.05).
S. Kumari et al. / Advanced Powder Technology xxx (2014) xxx–xxx 7
M ¼ MS 1� b
H2
� �þ jH ð2Þ
where b ¼ 8105
K21
l2OM2
S, M is the magnetization, H is the applied mag-
netic field, MS is the saturation magnetization, lO is the permeabil-ity of the free space, K1 is the cubic anisotropy constant and theterm jH is known as the forced magnetization. The forced magne-tization is caused by a linear increase in the spontaneous magneti-zation especially at high fields. The numerical coefficient 8/105applies to cubic anisotropy of random polycrystalline samples. Ingeneral, the forced magnetization term was found to be necessaryto fit the hysteresis curves at higher temperatures and in higherfields, hence in the present case it has been neglected. Therefore
Please cite this article in press as: S. Kumari et al., Structural and magnetic prothe citrate precursor technique, Advanced Powder Technology (2014), http://d
Ms and K1 are the only fitting parameters in Eq. (1). Severalresearchers have studied the magnetocrystallline anisotropy in spi-nel ferrite using LA theory [42–44]. In the present series the exper-imental data [M–H curve] above 1 T (high field part), is fitted to
equation M ¼ MS 1� bH2
h i. The values of Ms and b were obtained
from fitting the experimental M–H curves and then the cubicanisotropy constant (K1) was calculated using the equation:
K1 ¼ loMS
ffiffiffiffiffiffiffiffiffiffiffiffiffiffiffiffiffi105b=8
qð3Þ
Typical fitting curve to LA is shown in Fig. 13 for the sampleCoFe1.95Y0.05O4. The value of K1 for CoFe2O4 and CoFe1.95Y0.05O4
are 2.98 � 106 and 1.05 � 106 erg/cm3 respectively. The magneto-crystalline anisotropy of pure cobalt ferrite could be explainedusing the one-ion model. According to this model, the magneto-crystalline anisotropy of spinel cobalt ferrite depends upon occu-pancy of Co2+ ions at the octahedral sites. In cobalt ferrite(CoFe2O4) both Fe3+ and Co2+ ions contribute to the magneticanisotropy; however, the Co2+ cations on the B-site of the spinelinduce the dominant contribution because the crystal field (trigo-nal field) at the octahedral sites is not capable of removing theorbital degeneracy of its corresponding seven 3d electrons. As aneffect, the orbital magnetic moment of Co2+ ion is not completelyquenched at the octahedral sites and there is strong spin–orbitcoupling which leads to anisotropy of cobalt ferrite [40]. Evidently,the anisotropy constant has to depend on the strength of thesuperexchange interaction that can be varied by different occupan-cies of the Co2+ ions on the A- and B-sites. Substituting Fe3+ by Y3+
ions reduces the occupancy of Co2+ ions at the octahedral sites(B-sites) (which is in agreement with the XRD data). Therefore it
perties of nanocrystalline yttrium substituted cobalt ferrite synthesized byx.doi.org/10.1016/j.apt.2014.10.002
8 S. Kumari et al. / Advanced Powder Technology xxx (2014) xxx–xxx
reduces spin–orbit coupling, which leads to decrease in anisotropyconstant. The magnetocrystalline anisotropy also depends uponthe superexchange coupling [45]. The rare earth Y3+ cation isnon-magnetic which would not take part in superexchange inter-action. As a result there is decrease in the superexchange couplingwhich reduces the magnetocrystalline anisotropy. In addition tothis, surface strain may also perturb the crystal symmetry at theexternal surface as a result it affects the spin–orbit coupling.Hence, magnetocrystalline anisotropy of the present sample seriesdepends upon the occupancy of Co2+ ions at the B-sites as well assurface effect.
The total magnetic anisotropy in bulk samples is mainly derivedfrom the magnetocrystalline anisotropy [40]. However, a differentanisotropy is expected in nanosized materials because of the addi-tional contributions from surface anisotropy, certain size-relatedeffects or deviations from the spherical shape. The total magneticanisotropy for a spherical nanoparticle is considered as a combina-tion of magnetocrystalline anisotropy and surface anisotropywhich is expressed as [46]:
K ¼ K1 þ6D
� �KS ð4Þ
where K is the total magnetic anisotropy, K1 is the magnetocrystal-line anisotropy of the material, KS is the surface anisotropy and D isthe diameter of the particle. The value of K1 at room temperature forbulk cobalt ferrite samples is known to be in the range of 2.1 � 106
to 3.9 � 106 erg/cm3 [47]. The observed magnetocrystalline anisot-ropy of the present samples has the same order of magnitude andfollows the same trend as that of bulk samples. It has been reportedthat surface anisotropy results in an enhanced coercivity [48]. How-ever, in our case, the coercive field values responding for the overallanisotropy, lead to magnetic anisotropy constants similar to theobtained K1. While the FE-SEM and TEM images show a sphericalmorphology of the nanoparticles (negligible shape anisotropy mightbe assumed), it appears that the contribution of surface anisotropyto the total magnetic anisotropy is not contributing significantlywhich could overcome the decrease in the magnetocrystallineanisotropy due to broken superexcahnge interaction due to non-magnetic behavior of rare earth Y3+ cation as substituent.
In order to get insight into magnetic behavior of the Y3+ substi-tuted cobalt ferrite nanoparticles, temperature dependence mag-netization has been studied under the zero field cooling (ZFC)and field cooling (FC) condition. ZFC and FC magnetization mea-surement has been carried out at 100 Oe field over the temperaturerange 300–900 K. In the ZFC mode, the sample has been cooled to300 K in the absence of magnetic field. The magnetization is thenmeasured during warming in a nominal magnetic field of 100 Oe.In the FC mode, the sample has been cooled to 300 K in the pres-
0 10 20
5
10
15
20
25
CoFe1.95Y0.05O4
Experimental data point Fit to LA
Mag
netiz
atio
n (e
mu/
g)
Applied Field (kOe)
Fig. 13. LA fitting to the sample CoFe1.95Y0.05O4.
Please cite this article in press as: S. Kumari et al., Structural and magnetic prothe citrate precursor technique, Advanced Powder Technology (2014), http://d
ence of magnetic field, and the magnetization is then measuredduring warming under the same nominal magnetic field. Temper-ature dependence magnetization plot for the CoFe1.95Y0.05O4 nano-particle measured under ZFC and FC conditions is shown in Fig. 14.The plot shows considerable difference between the ZFC and FCcurve. The FC magnetization curve continues to increase whereas the ZFC curve exhibits a maximum and then decrease with low-ering of temperature. A strong irreversibility between ZFC and FCcurve has been observed by the appearance of bifurcation betweenthem below �605 K. The ZFC curve shows a peak (maximum inmagnetization) at �520 K. Here the bifurcation temperature is rep-resented as Tirr (703 K) and the temperature of the peak magneti-zation in the ZFC curve is denoted as TB (560 K). The existence ofthese two critical temperatures are referred as blocking tempera-tures which is related to magnetic anisotropy energy. These block-ing temperatures are not uniquely defined, but it is related to thetime scale of the experimental method used. It is defined as thetemperature at which the relaxation time of the particle momentis equal to the time scale of the experimental technique. Hence Tirr
and TB are the temperatures where the relaxation time of thesmallest and biggest particles moment become comparable to100 s (time scale for DC magnetization measurement is 100 s)[49–51]. The observed values of blocking temperatures are compa-rable with the values reported in literature for RE3+ (rare earth cat-ions) substituted cobalt ferrite nanoparticles [52]. Ideally foruniform size particles, Tirr and TB should coincide. But, in a realsample it consists of particles with distribution of the size leadingto two different temperature. The observed ZFC and FC magnetiza-tion curve shows the difference in Tirr and TB. It implies that sampleconsists of particle with non-uniform size distribution which is ingood agreement with the particle size distribution obtained fromthe FESEM and TEM image [49]. The observation of Tirr and TB
reflects the presence of distribution of magnetic anisotropy energybarrier.
The bifurcation of the ZFC and FC curve below the blocking tem-perature is explained as follow: sample as a whole get single easydirection during the field cooling (FC). The external magnetic fieldcontribute high magnetic anisotropic energy during the field cool-ing (FC) process. The reorientation of individual spins takes a longtime due to high magnetic anisotropic energy. Hence ZFC and FCbifurcate [53]. The FC mode shows higher magnetization thanZFC mode below the blocking temperature. In ZFC mode, magneti-zation direction of each nanoparticles is oriented along its easyaxes when its temperature is decreased below its blocking temper-ature. As the measured samples are in powder form, the nanopar-ticles consists of random orientation of the easy axis. Consequentlythe overall magnetization is low (at 300 K) because the weakapplied field (100 Oe) alone is not strong enough to overcomethe anisotropy energy barrier. In the FC mode, magnetic momentswill have a preferred orientation along the applied magnetic field.The anisotropy energy barrier prevent the magnetic moment fromflipping. Hence the magnetization is larger in a FC measurementthan in a ZFC measurement [54]. The ZFC curve exhibits increasein magnetization with temperature up to TB. As the temperatureis increased, a fraction of the particles gain enough thermal energyto overcome the anisotropy energy barrier. Their moments are freeto move away from their easy axis aligning along the applied fielddirection. As an effect magnetization increase with temperaturebelow TB. The ZFC and FC magnetization curve coincide above theirreversibility temperature Tirr which implies that the magneticanisotropy energy barrier is overcomed by thermal activationenergy. As an effect it facilitates the flipping of the particle spinsleading to decrease in magnetization.
One could extract the information of interparticle interactionpresent in the sample using ZFC and FC magnetization curve. It isreported that FC magnetization curve of non-interacting particle
perties of nanocrystalline yttrium substituted cobalt ferrite synthesized byx.doi.org/10.1016/j.apt.2014.10.002
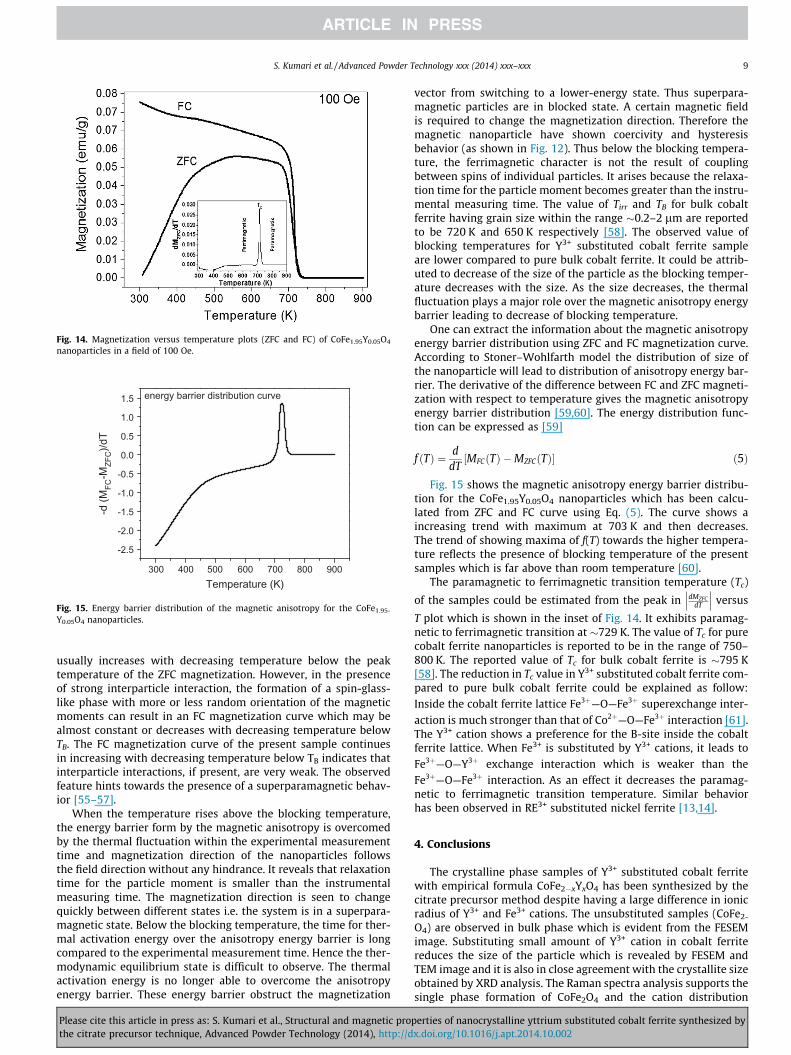
Fig. 14. Magnetization versus temperature plots (ZFC and FC) of CoFe1.95Y0.05O4
nanoparticles in a field of 100 Oe.
300 400 500 600 700 800 900
-2.5
-2.0
-1.5
-1.0
-0.5
0.0
0.5
1.0
1.5 energy barrier distribution curve
-d (M
FC-M
ZFC)/d
T
Temperature (K)
Fig. 15. Energy barrier distribution of the magnetic anisotropy for the CoFe1.95-
Y0.05O4 nanoparticles.
S. Kumari et al. / Advanced Powder Technology xxx (2014) xxx–xxx 9
usually increases with decreasing temperature below the peaktemperature of the ZFC magnetization. However, in the presenceof strong interparticle interaction, the formation of a spin-glass-like phase with more or less random orientation of the magneticmoments can result in an FC magnetization curve which may bealmost constant or decreases with decreasing temperature belowTB. The FC magnetization curve of the present sample continuesin increasing with decreasing temperature below TB indicates thatinterparticle interactions, if present, are very weak. The observedfeature hints towards the presence of a superparamagnetic behav-ior [55–57].
When the temperature rises above the blocking temperature,the energy barrier form by the magnetic anisotropy is overcomedby the thermal fluctuation within the experimental measurementtime and magnetization direction of the nanoparticles followsthe field direction without any hindrance. It reveals that relaxationtime for the particle moment is smaller than the instrumentalmeasuring time. The magnetization direction is seen to changequickly between different states i.e. the system is in a superpara-magnetic state. Below the blocking temperature, the time for ther-mal activation energy over the anisotropy energy barrier is longcompared to the experimental measurement time. Hence the ther-modynamic equilibrium state is difficult to observe. The thermalactivation energy is no longer able to overcome the anisotropyenergy barrier. These energy barrier obstruct the magnetization
Please cite this article in press as: S. Kumari et al., Structural and magnetic prothe citrate precursor technique, Advanced Powder Technology (2014), http://d
vector from switching to a lower-energy state. Thus superpara-magnetic particles are in blocked state. A certain magnetic fieldis required to change the magnetization direction. Therefore themagnetic nanoparticle have shown coercivity and hysteresisbehavior (as shown in Fig. 12). Thus below the blocking tempera-ture, the ferrimagnetic character is not the result of couplingbetween spins of individual particles. It arises because the relaxa-tion time for the particle moment becomes greater than the instru-mental measuring time. The value of Tirr and TB for bulk cobaltferrite having grain size within the range �0.2–2 lm are reportedto be 720 K and 650 K respectively [58]. The observed value ofblocking temperatures for Y3+ substituted cobalt ferrite sampleare lower compared to pure bulk cobalt ferrite. It could be attrib-uted to decrease of the size of the particle as the blocking temper-ature decreases with the size. As the size decreases, the thermalfluctuation plays a major role over the magnetic anisotropy energybarrier leading to decrease of blocking temperature.
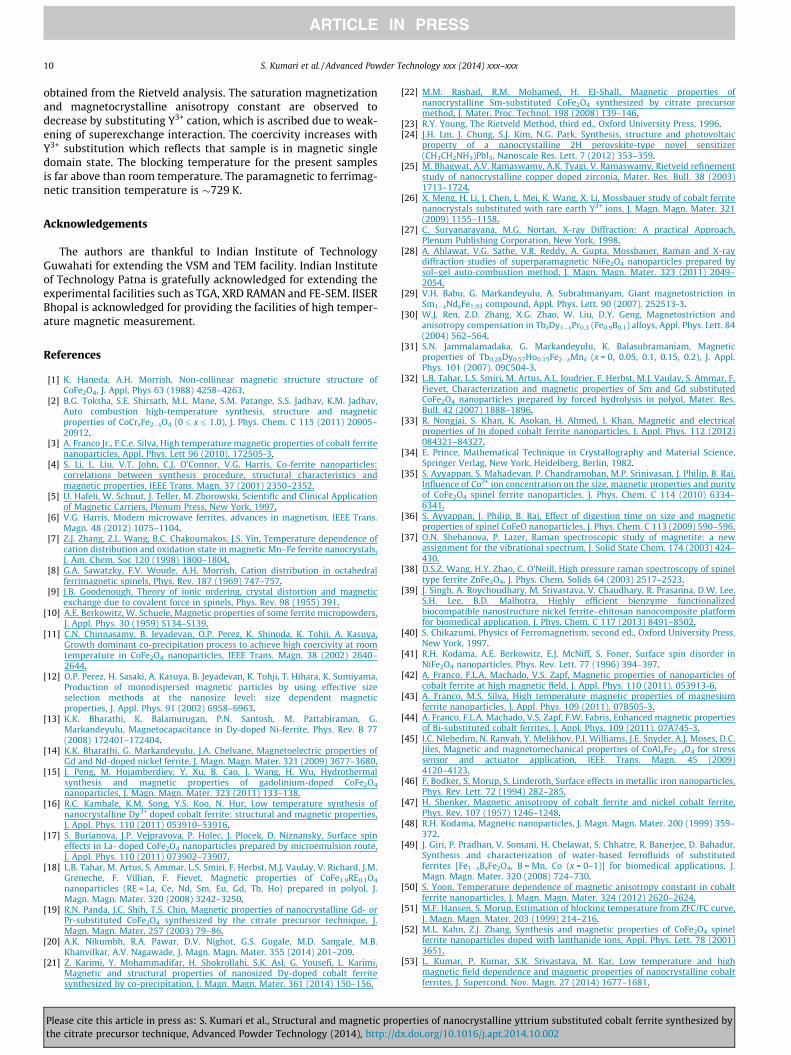
One can extract the information about the magnetic anisotropyenergy barrier distribution using ZFC and FC magnetization curve.According to Stoner–Wohlfarth model the distribution of size ofthe nanoparticle will lead to distribution of anisotropy energy bar-rier. The derivative of the difference between FC and ZFC magneti-zation with respect to temperature gives the magnetic anisotropyenergy barrier distribution [59,60]. The energy distribution func-tion can be expressed as [59]
f ðTÞ ¼ ddT½MFCðTÞ �MZFCðTÞ� ð5Þ
Fig. 15 shows the magnetic anisotropy energy barrier distribu-tion for the CoFe1.95Y0.05O4 nanoparticles which has been calcu-lated from ZFC and FC curve using Eq. (5). The curve shows aincreasing trend with maximum at 703 K and then decreases.The trend of showing maxima of f(T) towards the higher tempera-ture reflects the presence of blocking temperature of the presentsamples which is far above than room temperature [60].
The paramagnetic to ferrimagnetic transition temperature (Tc)
of the samples could be estimated from the peak in dMZFCdT
versus
T plot which is shown in the inset of Fig. 14. It exhibits paramag-netic to ferrimagnetic transition at �729 K. The value of Tc for purecobalt ferrite nanoparticles is reported to be in the range of 750–800 K. The reported value of Tc for bulk cobalt ferrite is �795 K[58]. The reduction in Tc value in Y3+ substituted cobalt ferrite com-pared to pure bulk cobalt ferrite could be explained as follow:Inside the cobalt ferrite lattice Fe3þ—O—Fe3þ superexchange inter-action is much stronger than that of Co2þ—O—Fe3þ interaction [61].The Y3+ cation shows a preference for the B-site inside the cobaltferrite lattice. When Fe3+ is substituted by Y3+ cations, it leads toFe3þ—O—Y3þ exchange interaction which is weaker than theFe3þ—O—Fe3þ interaction. As an effect it decreases the paramag-netic to ferrimagnetic transition temperature. Similar behaviorhas been observed in RE3+ substituted nickel ferrite [13,14].
4. Conclusions
The crystalline phase samples of Y3+ substituted cobalt ferritewith empirical formula CoFe2�xYxO4 has been synthesized by thecitrate precursor method despite having a large difference in ionicradius of Y3+ and Fe3+ cations. The unsubstituted samples (CoFe2-
O4) are observed in bulk phase which is evident from the FESEMimage. Substituting small amount of Y3+ cation in cobalt ferritereduces the size of the particle which is revealed by FESEM andTEM image and it is also in close agreement with the crystallite sizeobtained by XRD analysis. The Raman spectra analysis supports thesingle phase formation of CoFe2O4 and the cation distribution
perties of nanocrystalline yttrium substituted cobalt ferrite synthesized byx.doi.org/10.1016/j.apt.2014.10.002
10 S. Kumari et al. / Advanced Powder Technology xxx (2014) xxx–xxx
obtained from the Rietveld analysis. The saturation magnetizationand magnetocrystalline anisotropy constant are observed todecrease by substituting Y3+ cation, which is ascribed due to weak-ening of superexchange interaction. The coercivity increases withY3+ substitution which reflects that sample is in magnetic singledomain state. The blocking temperature for the present samplesis far above than room temperature. The paramagnetic to ferrimag-netic transition temperature is �729 K.
Acknowledgements
The authors are thankful to Indian Institute of TechnologyGuwahati for extending the VSM and TEM facility. Indian Instituteof Technology Patna is gratefully acknowledged for extending theexperimental facilities such as TGA, XRD RAMAN and FE-SEM. IISERBhopal is acknowledged for providing the facilities of high temper-ature magnetic measurement.
References
[1] K. Haneda, A.H. Morrish, Non-collinear magnetic structure structure ofCoFe2O4, J. Appl. Phys 63 (1988) 4258–4263.
[2] B.G. Toksha, S.E. Shirsath, M.L. Mane, S.M. Patange, S.S. Jadhav, K.M. Jadhav,Auto combustion high-temperature synthesis, structure and magneticproperties of CoCrxFe2�xO4 (0 6 x 6 1.0), J. Phys. Chem. C 115 (2011) 20905–20912.
[3] A. Franco Jr., F.C.e. Silva, High temperature magnetic properties of cobalt ferritenanoparticles, Appl. Phys. Lett 96 (2010). 172505-3.
[4] S. Li, L. Liu, V.T. John, C.J. O’Connor, V.G. Harris, Co-ferrite nanoparticles:correlations between synthesis procedure, structural characteristics andmagnetic properties, IEEE Trans. Magn. 37 (2001) 2350–2352.
[5] U. Hafeli, W. Schuut, J. Teller, M. Zborowski, Scientific and Clinical Applicationof Magnetic Carriers, Plenum Press, New York, 1997.
[6] V.G. Harris, Modern microwave ferrites, advances in magnetism, IEEE Trans.Magn. 48 (2012) 1075–1104.
[7] Z.J. Zhang, Z.L. Wang, B.C. Chakoumakos, J.S. Yin, Temperature dependence ofcation distribution and oxidation state in magnetic Mn–Fe ferrite nanocrystals,J. Am. Chem. Soc 120 (1998) 1800–1804.
[8] G.A. Sawatzky, F.V. Woude, A.H. Morrish, Cation distribution in octahedralferrimagnetic spinels, Phys. Rev. 187 (1969) 747–757.
[9] J.B. Goodenough, Theory of ionic ordering, crystal distortion and magneticexchange due to covalent force in spinels, Phys. Rev. 98 (1955) 391.
[10] A.E. Berkowitz, W. Schuele, Magnetic properties of some ferrite micropowders,J. Appl. Phys. 30 (1959) S134–S139.
[11] C.N. Chinnasamy, B. Jeyadevan, O.P. Perez, K. Shinoda, K. Tohji, A. Kasuya,Growth dominant co-precipitation process to achieve high coercivity at roomtemperature in CoFe2O4 nanoparticles, IEEE Trans. Magn. 38 (2002) 2640–2644.
[12] O.P. Perez, H. Sasaki, A. Kasuya, B. Jeyadevan, K. Tohji, T. Hihara, K. Sumiyama,Production of monodispersed magnetic particles by using effective sizeselection methods at the nanosize level: size dependent magneticproperties, J. Appl. Phys. 91 (2002) 6958–6963.
[13] K.K. Bharathi, K. Balamurugan, P.N. Santosh, M. Pattabiraman, G.Markandeyulu, Magnetocapacitance in Dy-doped Ni-ferrite, Phys. Rev. B 77(2008) 172401–172404.
[14] K.K. Bharathi, G. Markandeyulu, J.A. Chelvane, Magnetoelectric properties ofGd and Nd-doped nickel ferrite, J. Magn. Magn. Mater. 321 (2009) 3677–3680.
[15] J. Peng, M. Hojamberdiev, Y. Xu, B. Cao, J. Wang, H. Wu, Hydrothermalsynthesis and magnetic properties of gadolinium-doped CoFe2O4
nanoparticles, J. Magn. Magn. Mater. 323 (2011) 133–138.[16] R.C. Kambale, K.M. Song, Y.S. Koo, N. Hur, Low temperature synthesis of
nanocrystalline Dy3+ doped cobalt ferrite: structural and magnetic properties,J. Appl. Phys. 110 (2011) 053910–53916.
[17] S. Burianova, J.P. Vejpravova, P. Holec, J. Plocek, D. Niznansky, Surface spineffects in La- doped CoFe2O4 nanoparticles prepared by microemulsion route,J. Appl. Phys. 110 (2011) 073902–73907.
[18] L.B. Tahar, M. Artus, S. Ammar, L.S. Smiri, F. Herbst, M.J. Vaulay, V. Richard, J.M.Greneche, F. Villian, F. Fievet, Magnetic properties of CoFe1.9RE0.1O4
nanoparticles (RE = La, Ce, Nd, Sm, Eu, Gd, Tb, Ho) prepared in polyol, J.Magn. Magn. Mater. 320 (2008) 3242–3250.
[19] R.N. Panda, J.C. Shih, T.S. Chin, Magnetic properties of nanocrystalline Gd- orPr-substituted CoFe2O4 synthesized by the citrate precursor technique, J.Magn. Magn. Mater. 257 (2003) 79–86.
[20] A.K. Nikumbh, R.A. Pawar, D.V. Nighot, G.S. Gugale, M.D. Sangale, M.B.Khanvilkar, A.V. Nagawade, J. Magn. Magn. Mater. 355 (2014) 201–209.
[21] Z. Karimi, Y. Mohammadifar, H. Shokrollahi, S.K. Asl, G. Yousefi, L. Karimi,Magnetic and structural properties of nanosized Dy-doped cobalt ferritesynthesized by co-precipitation, J. Magn. Magn. Mater. 361 (2014) 150–156.
Please cite this article in press as: S. Kumari et al., Structural and magnetic prothe citrate precursor technique, Advanced Powder Technology (2014), http://d
[22] M.M. Rashad, R.M. Mohamed, H. EI-Shall, Magnetic properties ofnanocrystalline Sm-substituted CoFe2O4 synthesized by citrate precursormethod, J. Mater. Proc. Technol. 198 (2008) 139–146.
[23] R.Y. Young, The Rietveld Method, third ed., Oxford University Press, 1996.[24] J.H. Lm, J. Chung, S.J. Kim, N.G. Park, Synthesis, structure and photovoltaic
property of a nanocrystalline 2H perovskite-type novel sensitizer(CH3CH2NH3)Pbl3, Nanoscale Res. Lett. 7 (2012) 353–359.
[25] M. Bhagwat, A.V. Ramaswamy, A.K. Tyagi, V. Ramaswamy, Rietveld refinementstudy of nanocrystalline copper doped zirconia, Mater. Res. Bull. 38 (2003)1713–1724.
[26] X. Meng, H. Li, J. Chen, L. Mei, K. Wang, X. Li, Mossbauer study of cobalt ferritenanocrystals substituted with rare earth Y3+ ions, J. Magn. Magn. Mater. 321(2009) 1155–1158.
[27] C. Suryanarayana, M.G. Nortan, X-ray Diffraction: A practical Approach,Plenum Publishing Corporation, New York, 1998.
[28] A. Ahlawat, V.G. Sathe, V.R. Reddy, A. Gupta, Mossbauer, Raman and X-raydiffraction studies of superparamagnetic NiFe2O4 nanoparticles prepared bysol–gel auto-combustion method, J. Magn. Magn. Mater. 323 (2011) 2049–2054.
[29] V.H. Babu, G. Markandeyulu, A. Subrahmanyam, Giant magnetostriction inSm1�xNdxFe1.93 compound, Appl. Phys. Lett. 90 (2007). 252513-3.
[30] W.J. Ren, Z.D. Zhang, X.G. Zhao, W. Liu, D.Y. Geng, Magnetostriction andanisotropy compensation in TbxDy1�xPr0.3 (Fe0.9B0.1) alloys, Appl. Phys. Lett. 84(2004) 562–564.
[31] S.N. Jammalamadaka, G. Markandeyulu, K. Balasubramaniam, Magneticproperties of Tb0.28Dy0.57Ho0.15Fe2�xMnx (x = 0, 0.05, 0.1, 0.15, 0.2), J. Appl.Phys. 101 (2007). 09C504-3.
[32] L.B. Tahar, L.S. Smiri, M. Artus, A.L. Joudrier, F. Herbst, M.J. Vaulay, S. Ammar, F.Fievet, Characterization and magnetic properties of Sm and Gd substitutedCoFe2O4 nanoparticles prepared by forced hydrolysis in polyol, Mater. Res.Bull. 42 (2007) 1888–1896.
[33] R. Nongjai, S. Khan, K. Asokan, H. Ahmed, I. Khan, Magnetic and electricalproperties of In doped cobalt ferrite nanoparticles, J. Appl. Phys. 112 (2012)084321–84327.
[34] E. Prince, Mathematical Technique in Crystallography and Material Science,Springer Verlag, New York, Heidelberg, Berlin, 1982.
[35] S. Ayyappan, S. Mahadevan, P. Chandramohan, M.P. Srinivasan, J. Philip, B. Raj,Influence of Co2+ ion concentration on the size, magnetic properties and purityof CoFe2O4 spinel ferrite nanoparticles, J. Phys. Chem. C 114 (2010) 6334–6341.
[36] S. Ayyappan, J. Philip, B. Raj, Effect of digestion time on size and magneticproperties of spinel CoFeO nanoparticles, J. Phys. Chem. C 113 (2009) 590–596.
[37] O.N. Shebanova, P. Lazer, Raman spectroscopic study of magnetite: a newassignment for the vibrational spectrum, J. Solid State Chem. 174 (2003) 424–430.
[38] D.S.Z. Wang, H.Y. Zhao, C. O’Neill, High pressure raman spectroscopy of spineltype ferrite ZnFe2O4, J. Phys. Chem. Solids 64 (2003) 2517–2523.
[39] J. Singh, A. Roychoudhary, M. Srivastava, V. Chaudhary, R. Prasanna, D.W. Lee,S.H. Lee, B.D. Malhotra, Highly efficient bienzyme functionalizedbiocompatible nanostructure nickel ferrite–ehitosan nanocomposite platformfor biomedical application, J. Phys. Chem. C 117 (2013) 8491–8502.
[40] S. Chikazumi, Physics of Ferromagnetism, second ed., Oxford University Press,New York, 1997.
[41] R.H. Kodama, A.E. Berkowitz, E.J. McNiff, S. Foner, Surface spin disorder inNiFe2O4 nanoparticles, Phys. Rev. Lett. 77 (1996) 394–397.
[42] A. Franco, F.L.A. Machado, V.S. Zapf, Magnetic properties of nanoparticles ofcobalt ferrite at high magnetic field, J. Appl. Phys. 110 (2011). 053913-6.
[43] A. Franco, M.S. Silva, High temperature magnetic properties of magnesiumferrite nanoparticles, J. Appl. Phys. 109 (2011). 07B505-3.
[44] A. Franco, F.L.A. Machado, V.S. Zapf, F.W. Fabris, Enhanced magnetic propertiesof Bi-substituted cobalt ferrites, J. Appl. Phys. 109 (2011). 07A745-3.
[45] I.C. Nlebedim, N. Ranvah, Y. Melikhov, P.I. Williams, J.E. Snyder, A.J. Moses, D.C.Jiles, Magnetic and magnetomechanical properties of CoAlxFe2�xO4 for stresssensor and actuator application, IEEE Trans. Magn. 45 (2009)4120–4123.
[46] F. Bodker, S. Morup, S. Linderoth, Surface effects in metallic iron nanoparticles,Phys. Rev. Lett. 72 (1994) 282–285.
[47] H. Shenker, Magnetic anisotropy of cobalt ferrite and nickel cobalt ferrite,Phys. Rev. 107 (1957) 1246–1248.
[48] R.H. Kodama, Magnetic nanoparticles, J. Magn. Magn. Mater. 200 (1999) 359–372.
[49] J. Giri, P. Pradhan, V. Somani, H. Chelawat, S. Chhatre, R. Banerjee, D. Bahadur,Synthesis and characterization of water-based ferrofluids of substitutedferrites [Fe1�xBxFe2O4, B = Mn, Co (x = 0–1)] for biomedical applications, J.Magn. Magn. Mater. 320 (2008) 724–730.
[50] S. Yoon, Temperature dependence of magnetic anisotropy constant in cobaltferrite nanoparticles, J. Magn. Magn. Mater. 324 (2012) 2620–2624.
[51] M.F. Hansen, S. Morup, Estimation of blocking temperature from ZFC/FC curve,J. Magn. Magn. Mater. 203 (1999) 214–216.
[52] M.L. Kahn, Z.J. Zhang, Synthesis and magnetic properties of CoFe2O4 spinelferrite nanoparticles doped with lanthanide ions, Appl. Phys. Lett. 78 (2001)3651.
[53] L. Kumar, P. Kumar, S.K. Srivastava, M. Kar, Low temperature and highmagnetic field dependence and magnetic properties of nanocrystalline cobaltferrites, J. Supercond. Nov. Magn. 27 (2014) 1677–1681.
perties of nanocrystalline yttrium substituted cobalt ferrite synthesized byx.doi.org/10.1016/j.apt.2014.10.002

S. Kumari et al. / Advanced Powder Technology xxx (2014) xxx–xxx 11
[54] S. Thakur, S.C. Katyal, M. Singh, Structural and magnetic properties of nanonickel–zinc ferrite synthesized by reverse micelle technique, J. Magn. Magn.Mater. 321 (2009) 1–7.
[55] M.D. Mukadam, S.M. Yusuf, P. Sharma, S.K. Kulshreshtha, G.K. Dey, Dynamicsof spin clusters in amorphous Fe2O3, Phys. Rev. B 72 (2005) 174408.
[56] S. Singh, S.B. Krupanidhi, Surface spin glass behavior in sol–gel derivedLa0.7Ca0.3MnO3 nanotubes, Dalton. Trans. (2008) 4708–4710.
[57] D. Peddis, C. Cannas, G. Piccaluga, E. Agostinelli, D. Fiorani, Spin-glass-likefreezing and enhanced magnetization in ultra-small CoFe2O4 nanoparticles,Nanotechnology 21 (2010) 125705–125710.
[58] S. Imine, F. Schoenstein, S. Mercone, M. Zaghrioui, N. Bettahar, N. Jouini,Bottom-up and new compaction processes: a way to tunable properties of
Please cite this article in press as: S. Kumari et al., Structural and magnetic prothe citrate precursor technique, Advanced Powder Technology (2014), http://d
nanostructured cobalt ferrite ceramics, J. Eur. Ceram. Soc. 31 (2011) 2943–2955.
[59] N. Guskos, S. Glenis, V. Likodimos, J. Typek, M. Maryniak, Z. Roslaniec, M.Kwiatkowska, M. Baran, R. Szymczak, D. Petridis, Matrix effects on themagnetic properties of c-Fe2O3 nanoparticles dispersed in a multiblockcopolymer, J. Appl. Phys. 99 (2006) 084307.
[60] R. Topkaya, O. Akman, S. Kazan, B. Aktas, Z. Durmus, A. Baykar, Surface spindisorder and spin glass like behavior in manganese-substituted cobalt ferritenanoparticles, J. Nanopart. Res. 14 (2012) 1156.
[61] G.A. Sawatzky, F.V. Woude, A.H. Morrish, Mossbauer study of severalferrimagnetic spinels, Phys. Rev. 187 (1969) 747–757.
perties of nanocrystalline yttrium substituted cobalt ferrite synthesized byx.doi.org/10.1016/j.apt.2014.10.002