structural and dielectric properties of na1−x ba x nb1−x (sn0.5ti0.5) x o3 ceramics
TRANSCRIPT
1 23
Journal of Materials ScienceFull Set - Includes `Journal of MaterialsScience Letters' ISSN 0022-2461Volume 47Number 4 J Mater Sci (2012) 47:1943-1949DOI 10.1007/s10853-011-5987-5
Structural and dielectric properties ofNa1−x Ba x Nb1−x (Sn0.5Ti0.5) x O3 ceramics
H. Khelifi, A. Aydi, N. Abdelmoula,A. Simon, A. Maalej, H. Khemakhem &M. Maglione

1 23
Your article is protected by copyright and
all rights are held exclusively by Springer
Science+Business Media, LLC. This e-offprint
is for personal use only and shall not be self-
archived in electronic repositories. If you
wish to self-archive your work, please use the
accepted author’s version for posting to your
own website or your institution’s repository.
You may further deposit the accepted author’s
version on a funder’s repository at a funder’s
request, provided it is not made publicly
available until 12 months after publication.
Structural and dielectric propertiesof Na12xBaxNb12x(Sn0.5Ti0.5)xO3 ceramics
H. Khelifi • A. Aydi • N. Abdelmoula •
A. Simon • A. Maalej • H. Khemakhem •
M. Maglione
Received: 3 June 2011 / Accepted: 21 September 2011 / Published online: 5 October 2011
� Springer Science+Business Media, LLC 2011
Abstract Lead-free (1 - x)NaNbO3/xBa(Ti0.5Sn0.5)O3 (x =
0.1, 0.125, 0.15, 0.175, 0.2, and 0.3) ceramics were elaborated by
the conventional ceramic technique. Sintering has been
made at 1523 K for 2 h. The crystal structure was investi-
gated by X-ray diffraction with CuKa radiation at room
temperature. As a function of composition, these compounds
crystallize with tetragonal or cubic symmetry. Dielectric
measurements show that the materials have a classical fer-
roelectric behavior for compositions in the range 0.10
B x B 0.15 and relaxor one for compositions in the range
0.15 \ x B 0.30. Temperatures TC or Tm decrease as x con-
tent increases. The ferroelectric behavior has been confirmed
by hysteresis characterization. For x = 0.1, a piezoelectric
coefficient d31 of 42.146 pC N-1 was obtained at room
temperature. The evolution of the Raman spectra was studied
as a function of temperature for x = 0.1.
Introduction
Relaxor ferroelectrics are considered promising materials
for use in modern devices such as capacitors, sensors,
information storage devices, and optical modulators [1].
However, most typical relaxors are lead-based perovskite
compounds, which are environmentally unfriendly because
of the toxicity of lead [2, 3]. Recently, many studies have
been carried out on the lead-free relaxors [4–6].
Sodium niobate is a dielectric material of the perovskite
group. This material undergoes several phase transitions as
the following [7]:
Cubic��!914 Ktetragonal��!842 K
orthorhombic��!173 Krhombohedral:
At room temperature, NaNbO3 (NN) is antiferroelectric
[7, 8] and becomes ferroelectric by mixing with even a
small amount of KNbO3 [9, 10], LiNbO3 [11, 12], BaSnO3
[13], and SrSnO3 [14].
BaTi1-xSnxO3 are basically suitable as environmentally
friendly materials used for capacitor ceramic, dielectric
amplifier, switching circuit snubbers, sensor [15–17], and
in functionally graded materials [18].
In addition, several studies have shown that the partial
replacement of titanium by tin in BaTi1-xSnxO3 (BTSx) sys-
tem improves the dielectric behavior [19, 20]. As, increasing
Sn-content, the temperature TC of the paraelectric–ferroelec-
tric phase transition decreases considerably. Besides, the
analysis of temperature dependent permittivity data taken at
various frequencies revealed characteristic features of relaxor
ferroelectrics for x C 0.2 [21]. However, Boudaya et al. [22]
have shown that the replacement of titanium by tin in ceramics
Ba0.1Na0.9(Ti1-ySny)0.1Nb0.9O3 with 0 B y B 1 induces a
decrease in Curie temperature without relaxor behavior.
Therefore, in this study we report on the structural and
the relaxor behavior of Na1-xBaxNb1-x(Sn0.5Ti0.5)xO3 system
(0.1 B x B 0.3) obtained by mixing NN with Ba(Ti0.5
Sn0.5)O3. The ferroelectric and piezoelectric properties of the
sample with x = 0.1, characterized by the best density (of
about 93% of the theoretical one), are reported. Raman
spectroscopy characterization for x = 0.1 is also carried out.
H. Khelifi � A. Aydi � N. Abdelmoula (&) � A. Maalej �H. Khemakhem
Laboratoire des Materiaux Ferroelectriques, Unite de recherche
Physique-Mathematiques, 05/UR/15-04, Faculte des Sciences de
Sfax, Universite de Sfax, B.P. 1171, 3000 Sfax, Tunisie
e-mail: [email protected]
A. Simon � M. Maglione
CNRS, Universite de Bordeaux, ICMCB,
87 avenue Dr. A. Schweitzer, Pessac 33608, France
123
J Mater Sci (2012) 47:1943–1949
DOI 10.1007/s10853-011-5987-5
Author's personal copy
Experimental
Na12xBaxNb12x(Sn0.5Ti0.5)xO3 ceramics with various
compositions (x = 0.10, 0.125, 0.15, 0.175, 0.2, and 0.3)
were prepared by solid-state synthesis using the following
chemical reaction:
ð1�xÞ2
Na2CO3 þ xBaCO3 þð1�xÞ
2Nb2O5 þ
x
2TiO2
þ x
2SnO2 ! Na1�xBaxNb1�xðSn0:5Ti0:5ÞxO3
þ ð1�xÞ2
CO2 " :
The starting materials are BaCO3, Na2CO3, Nb2O5, TiO2,
and SnO2 (99% purity). They have been thoroughly mixed in
agate mortar for 1 h and calcined at 1300 K for 12 h. After
calcination, powders have been mixed for 1 h and pressed
under 100 MPa into disks of 8 mm in diameter and about
1 mm in thickness. These pellets have been sintered at
1523 K for 2 h in air atmosphere. The densities of the
sintered samples were 90–93% of the theoretical values. The
diameter shrinkages of ceramics disks were systematically as
(/init - /fin)//init (/init and /fin represent initial and final
diameter, respectively). Their values are between 0.15 and
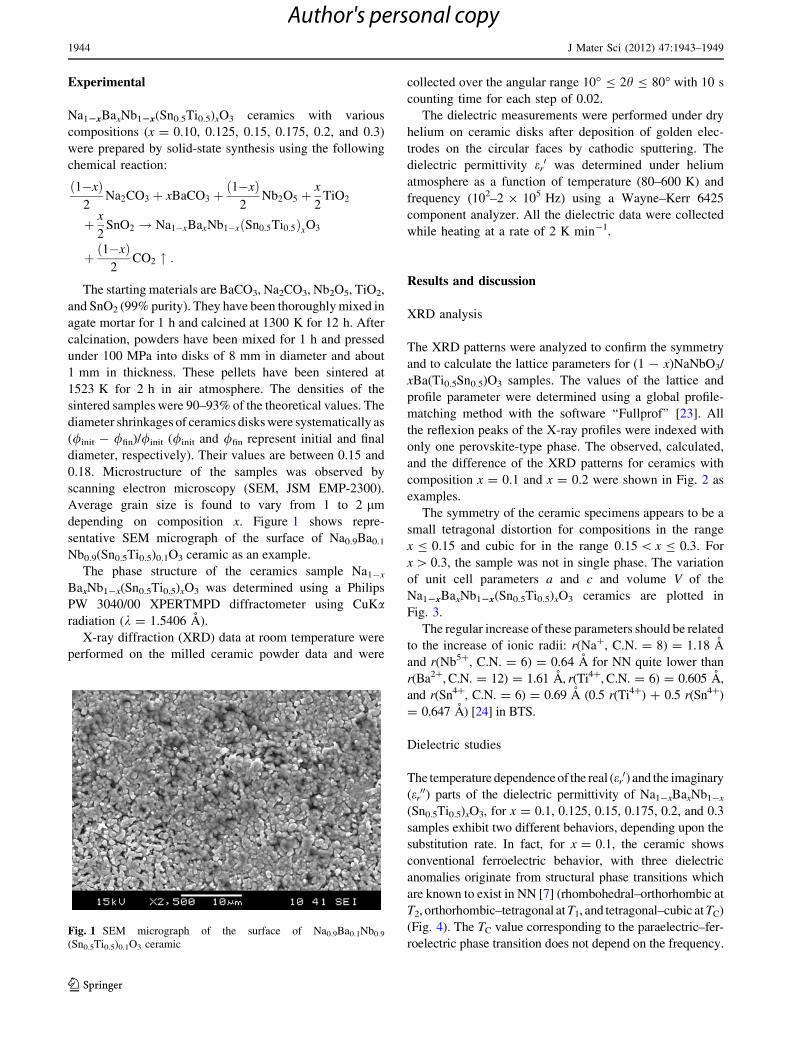
0.18. Microstructure of the samples was observed by
scanning electron microscopy (SEM, JSM EMP-2300).
Average grain size is found to vary from 1 to 2 lm
depending on composition x. Figure 1 shows repre-
sentative SEM micrograph of the surface of Na0.9Ba0.1
Nb0.9(Sn0.5Ti0.5)0.1O3 ceramic as an example.
The phase structure of the ceramics sample Na1-x
BaxNb1-x(Sn0.5Ti0.5)xO3 was determined using a Philips
PW 3040/00 XPERTMPD diffractometer using CuKaradiation (k = 1.5406 A).
X-ray diffraction (XRD) data at room temperature were
performed on the milled ceramic powder data and were
collected over the angular range 10� B 2h B 80� with 10 s
counting time for each step of 0.02.
The dielectric measurements were performed under dry
helium on ceramic disks after deposition of golden elec-
trodes on the circular faces by cathodic sputtering. The
dielectric permittivity er0 was determined under helium
atmosphere as a function of temperature (80–600 K) and
frequency (102–2 9 105 Hz) using a Wayne–Kerr 6425
component analyzer. All the dielectric data were collected
while heating at a rate of 2 K min-1.
Results and discussion
XRD analysis
The XRD patterns were analyzed to confirm the symmetry
and to calculate the lattice parameters for (1 - x)NaNbO3/
xBa(Ti0.5Sn0.5)O3 samples. The values of the lattice and
profile parameter were determined using a global profile-
matching method with the software ‘‘Fullprof’’ [23]. All
the reflexion peaks of the X-ray profiles were indexed with
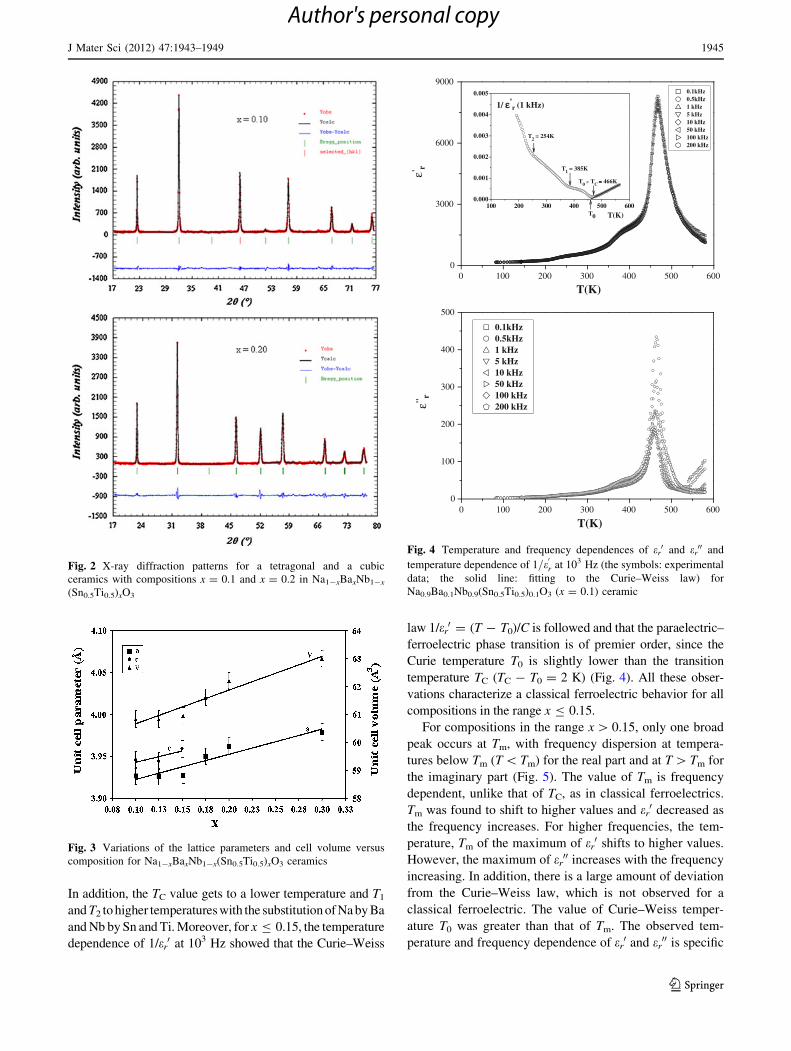
only one perovskite-type phase. The observed, calculated,
and the difference of the XRD patterns for ceramics with
composition x = 0.1 and x = 0.2 were shown in Fig. 2 as
examples.
The symmetry of the ceramic specimens appears to be a
small tetragonal distortion for compositions in the range
x B 0.15 and cubic for in the range 0.15 \ x B 0.3. For
x [ 0.3, the sample was not in single phase. The variation
of unit cell parameters a and c and volume V of the
Na12xBaxNb12x(Sn0.5Ti0.5)xO3 ceramics are plotted in
Fig. 3.
The regular increase of these parameters should be related
to the increase of ionic radii: r(Na?, C.N. = 8) = 1.18 A
and r(Nb5?, C.N. = 6) = 0.64 A for NN quite lower than
r(Ba2?, C.N. = 12) = 1.61 A, r(Ti4?, C.N. = 6) = 0.605 A,
and r(Sn4?, C.N. = 6) = 0.69 A (0.5 r(Ti4?) ? 0.5 r(Sn4?)
= 0.647 A) [24] in BTS.
Dielectric studies
The temperature dependence of the real (er0) and the imaginary
(er00) parts of the dielectric permittivity of Na1-xBaxNb1-x
(Sn0.5Ti0.5)xO3, for x = 0.1, 0.125, 0.15, 0.175, 0.2, and 0.3
samples exhibit two different behaviors, depending upon the
substitution rate. In fact, for x = 0.1, the ceramic shows
conventional ferroelectric behavior, with three dielectric
anomalies originate from structural phase transitions which
are known to exist in NN [7] (rhombohedral–orthorhombic at
T2, orthorhombic–tetragonal at T1, and tetragonal–cubic at TC)
(Fig. 4). The TC value corresponding to the paraelectric–fer-
roelectric phase transition does not depend on the frequency.Fig. 1 SEM micrograph of the surface of Na0.9Ba0.1Nb0.9
(Sn0.5Ti0.5)0.1O3 ceramic
1944 J Mater Sci (2012) 47:1943–1949
123
Author's personal copy
In addition, the TC value gets to a lower temperature and T1
and T2 to higher temperatures with the substitution of Na by Ba
and Nb by Sn and Ti. Moreover, for x B 0.15, the temperature
dependence of 1/er0 at 103 Hz showed that the Curie–Weiss
law 1/er0 = (T - T0)/C is followed and that the paraelectric–
ferroelectric phase transition is of premier order, since the
Curie temperature T0 is slightly lower than the transition
temperature TC (TC - T0 = 2 K) (Fig. 4). All these obser-
vations characterize a classical ferroelectric behavior for all
compositions in the range x B 0.15.
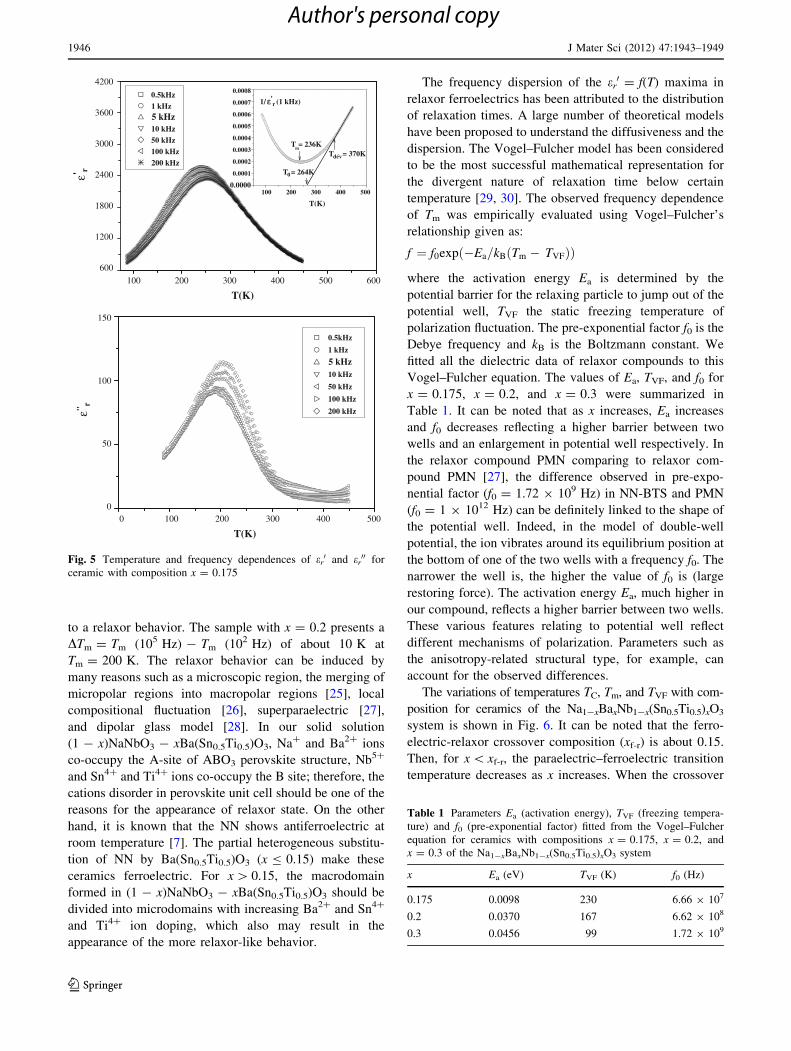
For compositions in the range x [ 0.15, only one broad
peak occurs at Tm, with frequency dispersion at tempera-
tures below Tm (T \ Tm) for the real part and at T [ Tm for
the imaginary part (Fig. 5). The value of Tm is frequency
dependent, unlike that of TC, as in classical ferroelectrics.
Tm was found to shift to higher values and er0 decreased as
the frequency increases. For higher frequencies, the tem-
perature, Tm of the maximum of er0 shifts to higher values.
However, the maximum of er00 increases with the frequency
increasing. In addition, there is a large amount of deviation
from the Curie–Weiss law, which is not observed for a
classical ferroelectric. The value of Curie–Weiss temper-
ature T0 was greater than that of Tm. The observed tem-
perature and frequency dependence of er0 and er
00 is specific
Fig. 2 X-ray diffraction patterns for a tetragonal and a cubic
ceramics with compositions x = 0.1 and x = 0.2 in Na1-xBaxNb1-x
(Sn0.5Ti0.5)xO3
Fig. 3 Variations of the lattice parameters and cell volume versus
composition for Na1-xBaxNb1-x(Sn0.5Ti0.5)xO3 ceramics
0
3000
6000
9000
100 200 300 400 500 6000.000
0.001
0.002
0.003
0.004
0.005
1/ ε'r (1 kHz)
T0 TC = 466K
T2 = 254K
T1 = 385K
T(K)T0
ε' r
0.1kHz 0.5kHz 1 kHz 5 kHz 10 kHz 50 kHz 100 kHz 200 kHz
T(K)0 100 200 300 400 500 600
0 100 200 300 400 500 6000
100
200
300
400
500
ε'' r
0.1kHz 0.5kHz 1 kHz 5 kHz 10 kHz 50 kHz 100 kHz 200 kHz
T(K)
Fig. 4 Temperature and frequency dependences of er0 and er
00 and
temperature dependence of 1=e0r at 103 Hz (the symbols: experimental
data; the solid line: fitting to the Curie–Weiss law) for
Na0.9Ba0.1Nb0.9(Sn0.5Ti0.5)0.1O3 (x = 0.1) ceramic
J Mater Sci (2012) 47:1943–1949 1945
123
Author's personal copy
to a relaxor behavior. The sample with x = 0.2 presents a
DTm = Tm (105 Hz) - Tm (102 Hz) of about 10 K at
Tm = 200 K. The relaxor behavior can be induced by
many reasons such as a microscopic region, the merging of
micropolar regions into macropolar regions [25], local
compositional fluctuation [26], superparaelectric [27],
and dipolar glass model [28]. In our solid solution
(1 - x)NaNbO3 - xBa(Sn0.5Ti0.5)O3, Na? and Ba2? ions
co-occupy the A-site of ABO3 perovskite structure, Nb5?
and Sn4? and Ti4? ions co-occupy the B site; therefore, the
cations disorder in perovskite unit cell should be one of the
reasons for the appearance of relaxor state. On the other
hand, it is known that the NN shows antiferroelectric at
room temperature [7]. The partial heterogeneous substitu-
tion of NN by Ba(Sn0.5Ti0.5)O3 (x B 0.15) make these
ceramics ferroelectric. For x [ 0.15, the macrodomain
formed in (1 - x)NaNbO3 - xBa(Sn0.5Ti0.5)O3 should be
divided into microdomains with increasing Ba2? and Sn4?
and Ti4? ion doping, which also may result in the
appearance of the more relaxor-like behavior.
The frequency dispersion of the er0 = f(T) maxima in
relaxor ferroelectrics has been attributed to the distribution
of relaxation times. A large number of theoretical models
have been proposed to understand the diffusiveness and the
dispersion. The Vogel–Fulcher model has been considered
to be the most successful mathematical representation for
the divergent nature of relaxation time below certain
temperature [29, 30]. The observed frequency dependence
of Tm was empirically evaluated using Vogel–Fulcher’s
relationship given as:
f ¼ f0exp �Ea=kB Tm � TVFð Þð Þ
where the activation energy Ea is determined by the
potential barrier for the relaxing particle to jump out of the
potential well, TVF the static freezing temperature of
polarization fluctuation. The pre-exponential factor f0 is the
Debye frequency and kB is the Boltzmann constant. We
fitted all the dielectric data of relaxor compounds to this
Vogel–Fulcher equation. The values of Ea, TVF, and f0 for
x = 0.175, x = 0.2, and x = 0.3 were summarized in
Table 1. It can be noted that as x increases, Ea increases
and f0 decreases reflecting a higher barrier between two
wells and an enlargement in potential well respectively. In
the relaxor compound PMN comparing to relaxor com-
pound PMN [27], the difference observed in pre-expo-
nential factor (f0 = 1.72 9 109 Hz) in NN-BTS and PMN
(f0 = 1 9 1012 Hz) can be definitely linked to the shape of
the potential well. Indeed, in the model of double-well
potential, the ion vibrates around its equilibrium position at
the bottom of one of the two wells with a frequency f0. The
narrower the well is, the higher the value of f0 is (large
restoring force). The activation energy Ea, much higher in
our compound, reflects a higher barrier between two wells.
These various features relating to potential well reflect
different mechanisms of polarization. Parameters such as
the anisotropy-related structural type, for example, can
account for the observed differences.
The variations of temperatures TC, Tm, and TVF with com-
position for ceramics of the Na1-xBaxNb1-x(Sn0.5Ti0.5)xO3
system is shown in Fig. 6. It can be noted that the ferro-
electric-relaxor crossover composition (xf-r) is about 0.15.
Then, for x \ xf-r, the paraelectric–ferroelectric transition
temperature decreases as x increases. When the crossover
0
50
100
150
ε'' r
0.5kHz
1 kHz
5 kHz 10 kHz
50 kHz
100 kHz
200 kHz
T(K)
0 100 200 300 400 500
100 200 300 400 500 600
600
1200
1800
2400
3000
3600
4200
100 200 300 400 5000.0000
0.0001
0.0002
0.0003
0.0004
0.0005
0.0006
0.0007
0.0008
1/ ε'r (1 kHz)
Tm= 236K
T0 = 264K
T(K)
Tdév = 370K
T(K)
ε' r 0.5kHz 1 kHz 5 kHz 10 kHz 50 kHz 100 kHz 200 kHz
Fig. 5 Temperature and frequency dependences of er0 and er
00 for
ceramic with composition x = 0.175
Table 1 Parameters Ea (activation energy), TVF (freezing tempera-
ture) and f0 (pre-exponential factor) fitted from the Vogel–Fulcher
equation for ceramics with compositions x = 0.175, x = 0.2, and
x = 0.3 of the Na1-xBaxNb1-x(Sn0.5Ti0.5)xO3 system
x Ea (eV) TVF (K) f0 (Hz)
0.175 0.0098 230 6.66 9 107
0.2 0.0370 167 6.62 9 108
0.3 0.0456 99 1.72 9 109
1946 J Mater Sci (2012) 47:1943–1949
123
Author's personal copy
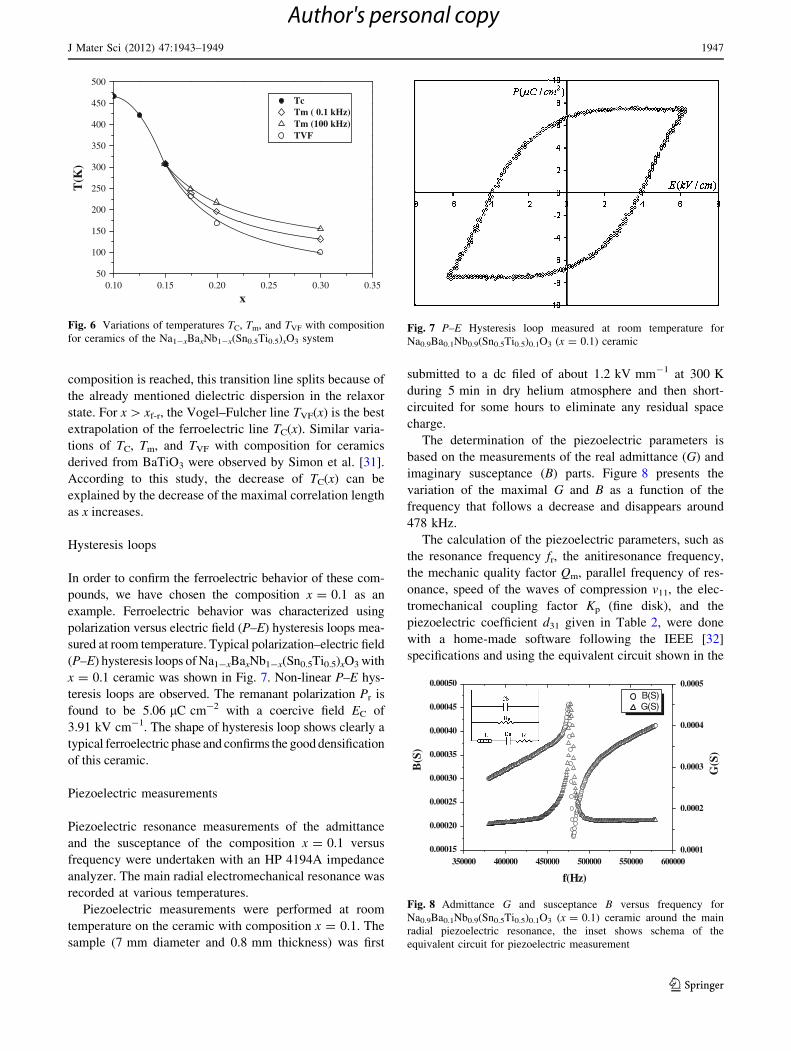
composition is reached, this transition line splits because of
the already mentioned dielectric dispersion in the relaxor
state. For x [ xf-r, the Vogel–Fulcher line TVF(x) is the best
extrapolation of the ferroelectric line TC(x). Similar varia-
tions of TC, Tm, and TVF with composition for ceramics
derived from BaTiO3 were observed by Simon et al. [31].
According to this study, the decrease of TC(x) can be
explained by the decrease of the maximal correlation length
as x increases.
Hysteresis loops
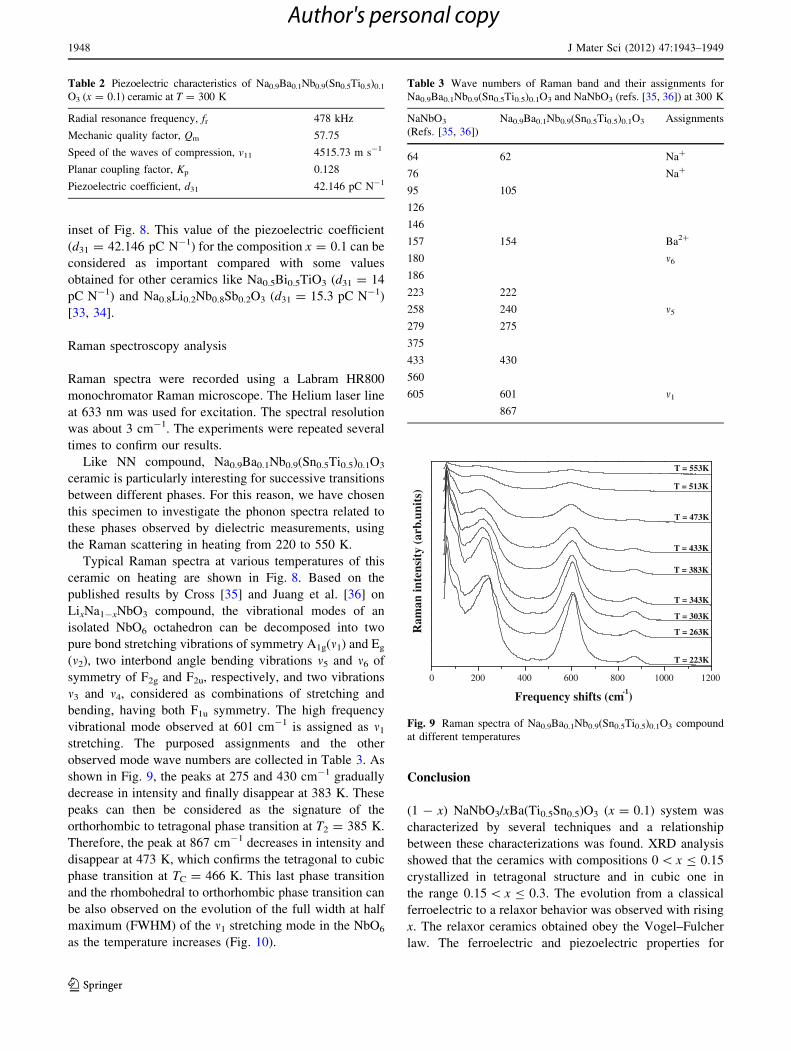
In order to confirm the ferroelectric behavior of these com-
pounds, we have chosen the composition x = 0.1 as an
example. Ferroelectric behavior was characterized using
polarization versus electric field (P–E) hysteresis loops mea-
sured at room temperature. Typical polarization–electric field
(P–E) hysteresis loops of Na1-xBaxNb1-x(Sn0.5Ti0.5)xO3 with
x = 0.1 ceramic was shown in Fig. 7. Non-linear P–E hys-
teresis loops are observed. The remanant polarization Pr is
found to be 5.06 lC cm-2 with a coercive field EC of
3.91 kV cm-1. The shape of hysteresis loop shows clearly a
typical ferroelectric phase and confirms the good densification
of this ceramic.
Piezoelectric measurements
Piezoelectric resonance measurements of the admittance
and the susceptance of the composition x = 0.1 versus
frequency were undertaken with an HP 4194A impedance
analyzer. The main radial electromechanical resonance was
recorded at various temperatures.
Piezoelectric measurements were performed at room
temperature on the ceramic with composition x = 0.1. The
sample (7 mm diameter and 0.8 mm thickness) was first
submitted to a dc filed of about 1.2 kV mm-1 at 300 K
during 5 min in dry helium atmosphere and then short-
circuited for some hours to eliminate any residual space
charge.
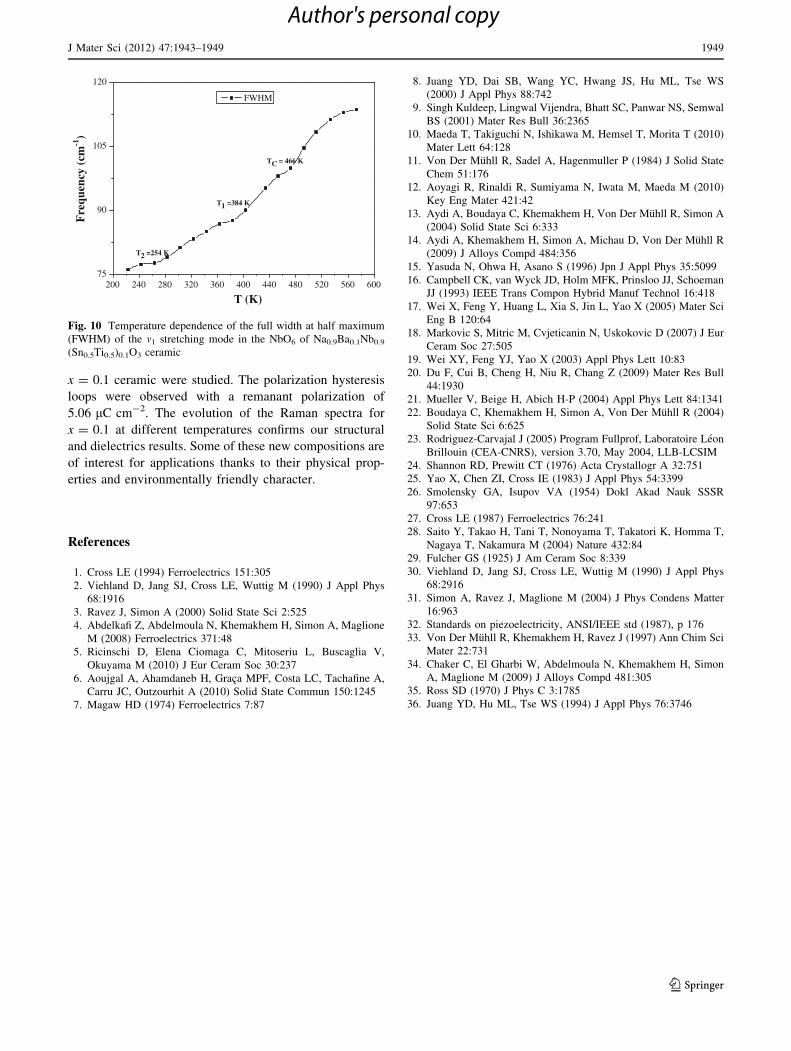
The determination of the piezoelectric parameters is
based on the measurements of the real admittance (G) and
imaginary susceptance (B) parts. Figure 8 presents the
variation of the maximal G and B as a function of the
frequency that follows a decrease and disappears around
478 kHz.
The calculation of the piezoelectric parameters, such as
the resonance frequency fr, the anitiresonance frequency,
the mechanic quality factor Qm, parallel frequency of res-
onance, speed of the waves of compression v11, the elec-
tromechanical coupling factor Kp (fine disk), and the
piezoelectric coefficient d31 given in Table 2, were done
with a home-made software following the IEEE [32]
specifications and using the equivalent circuit shown in the
0.10 0.15 0.20 0.25 0.30 0.3550
100
150
200
250
300
350
400
450
500
Tm ( 0.1 kHz) Tm (100 kHz) TVF
Tc
x
T(K
)
Fig. 6 Variations of temperatures TC, Tm, and TVF with composition
for ceramics of the Na1-xBaxNb1-x(Sn0.5Ti0.5)xO3 systemFig. 7 P–E Hysteresis loop measured at room temperature for
Na0.9Ba0.1Nb0.9(Sn0.5Ti0.5)0.1O3 (x = 0.1) ceramic
350000 400000 450000 500000 550000 6000000.00015
0.00020
0.00025
0.00030
0.00035
0.00040
0.00045
0.00050 B(S) G(S)
f(Hz)
B(S
)
0.0001
0.0002
0.0003
0.0004
0.0005
G(S
)
Fig. 8 Admittance G and susceptance B versus frequency for
Na0.9Ba0.1Nb0.9(Sn0.5Ti0.5)0.1O3 (x = 0.1) ceramic around the main
radial piezoelectric resonance, the inset shows schema of the
equivalent circuit for piezoelectric measurement
J Mater Sci (2012) 47:1943–1949 1947
123
Author's personal copy
inset of Fig. 8. This value of the piezoelectric coefficient
(d31 = 42.146 pC N-1) for the composition x = 0.1 can be
considered as important compared with some values
obtained for other ceramics like Na0.5Bi0.5TiO3 (d31 = 14
pC N-1) and Na0.8Li0.2Nb0.8Sb0.2O3 (d31 = 15.3 pC N-1)
[33, 34].
Raman spectroscopy analysis
Raman spectra were recorded using a Labram HR800
monochromator Raman microscope. The Helium laser line
at 633 nm was used for excitation. The spectral resolution
was about 3 cm-1. The experiments were repeated several
times to confirm our results.
Like NN compound, Na0.9Ba0.1Nb0.9(Sn0.5Ti0.5)0.1O3
ceramic is particularly interesting for successive transitions
between different phases. For this reason, we have chosen
this specimen to investigate the phonon spectra related to
these phases observed by dielectric measurements, using
the Raman scattering in heating from 220 to 550 K.
Typical Raman spectra at various temperatures of this
ceramic on heating are shown in Fig. 8. Based on the
published results by Cross [35] and Juang et al. [36] on
LixNa1-xNbO3 compound, the vibrational modes of an
isolated NbO6 octahedron can be decomposed into two
pure bond stretching vibrations of symmetry A1g(m1) and Eg
(m2), two interbond angle bending vibrations m5 and m6 of
symmetry of F2g and F2u, respectively, and two vibrations
m3 and m4, considered as combinations of stretching and
bending, having both F1u symmetry. The high frequency
vibrational mode observed at 601 cm-1 is assigned as m1
stretching. The purposed assignments and the other
observed mode wave numbers are collected in Table 3. As
shown in Fig. 9, the peaks at 275 and 430 cm-1 gradually
decrease in intensity and finally disappear at 383 K. These
peaks can then be considered as the signature of the
orthorhombic to tetragonal phase transition at T2 = 385 K.
Therefore, the peak at 867 cm-1 decreases in intensity and
disappear at 473 K, which confirms the tetragonal to cubic
phase transition at TC = 466 K. This last phase transition
and the rhombohedral to orthorhombic phase transition can
be also observed on the evolution of the full width at half
maximum (FWHM) of the m1 stretching mode in the NbO6
as the temperature increases (Fig. 10).
Conclusion
(1 - x) NaNbO3/xBa(Ti0.5Sn0.5)O3 (x = 0.1) system was
characterized by several techniques and a relationship
between these characterizations was found. XRD analysis
showed that the ceramics with compositions 0 \ x B 0.15
crystallized in tetragonal structure and in cubic one in
the range 0.15 \ x B 0.3. The evolution from a classical
ferroelectric to a relaxor behavior was observed with rising
x. The relaxor ceramics obtained obey the Vogel–Fulcher
law. The ferroelectric and piezoelectric properties for
Table 2 Piezoelectric characteristics of Na0.9Ba0.1Nb0.9(Sn0.5Ti0.5)0.1
O3 (x = 0.1) ceramic at T = 300 K
Radial resonance frequency, fr 478 kHz
Mechanic quality factor, Qm 57.75
Speed of the waves of compression, v11 4515.73 m s-1
Planar coupling factor, Kp 0.128
Piezoelectric coefficient, d31 42.146 pC N-1
Table 3 Wave numbers of Raman band and their assignments for
Na0.9Ba0.1Nb0.9(Sn0.5Ti0.5)0.1O3 and NaNbO3 (refs. [35, 36]) at 300 K
NaNbO3
(Refs. [35, 36])
Na0.9Ba0.1Nb0.9(Sn0.5Ti0.5)0.1O3 Assignments
64 62 Na?
76 Na?
95 105
126
146
157 154 Ba2?
180 m6
186
223 222
258 240 m5
279 275
375
433 430
560
605 601 m1
867
0 200 400 600 800 1000 1200
T = 553K
T = 343K
T = 303K
T = 263KRam
an in
tens
ity
(arb
.uni
ts)
Frequency shifts (cm-1)
T = 223K
T = 513K
T = 473K
T = 433K
T = 383K
Fig. 9 Raman spectra of Na0.9Ba0.1Nb0.9(Sn0.5Ti0.5)0.1O3 compound
at different temperatures
1948 J Mater Sci (2012) 47:1943–1949
123
Author's personal copy
x = 0.1 ceramic were studied. The polarization hysteresis
loops were observed with a remanant polarization of
5.06 lC cm-2. The evolution of the Raman spectra for
x = 0.1 at different temperatures confirms our structural
and dielectrics results. Some of these new compositions are
of interest for applications thanks to their physical prop-
erties and environmentally friendly character.
References
1. Cross LE (1994) Ferroelectrics 151:305
2. Viehland D, Jang SJ, Cross LE, Wuttig M (1990) J Appl Phys
68:1916
3. Ravez J, Simon A (2000) Solid State Sci 2:525
4. Abdelkafi Z, Abdelmoula N, Khemakhem H, Simon A, Maglione
M (2008) Ferroelectrics 371:48
5. Ricinschi D, Elena Ciomaga C, Mitoseriu L, Buscaglia V,
Okuyama M (2010) J Eur Ceram Soc 30:237
6. Aoujgal A, Ahamdaneb H, Graca MPF, Costa LC, Tachafine A,
Carru JC, Outzourhit A (2010) Solid State Commun 150:1245
7. Magaw HD (1974) Ferroelectrics 7:87
8. Juang YD, Dai SB, Wang YC, Hwang JS, Hu ML, Tse WS
(2000) J Appl Phys 88:742
9. Singh Kuldeep, Lingwal Vijendra, Bhatt SC, Panwar NS, Semwal
BS (2001) Mater Res Bull 36:2365
10. Maeda T, Takiguchi N, Ishikawa M, Hemsel T, Morita T (2010)
Mater Lett 64:128
11. Von Der Muhll R, Sadel A, Hagenmuller P (1984) J Solid State
Chem 51:176
12. Aoyagi R, Rinaldi R, Sumiyama N, Iwata M, Maeda M (2010)
Key Eng Mater 421:42
13. Aydi A, Boudaya C, Khemakhem H, Von Der Muhll R, Simon A
(2004) Solid State Sci 6:333
14. Aydi A, Khemakhem H, Simon A, Michau D, Von Der Muhll R
(2009) J Alloys Compd 484:356
15. Yasuda N, Ohwa H, Asano S (1996) Jpn J Appl Phys 35:5099
16. Campbell CK, van Wyck JD, Holm MFK, Prinsloo JJ, Schoeman
JJ (1993) IEEE Trans Compon Hybrid Manuf Technol 16:418
17. Wei X, Feng Y, Huang L, Xia S, Jin L, Yao X (2005) Mater Sci
Eng B 120:64
18. Markovic S, Mitric M, Cvjeticanin N, Uskokovic D (2007) J Eur
Ceram Soc 27:505
19. Wei XY, Feng YJ, Yao X (2003) Appl Phys Lett 10:83
20. Du F, Cui B, Cheng H, Niu R, Chang Z (2009) Mater Res Bull
44:1930
21. Mueller V, Beige H, Abich H-P (2004) Appl Phys Lett 84:1341
22. Boudaya C, Khemakhem H, Simon A, Von Der Muhll R (2004)
Solid State Sci 6:625
23. Rodriguez-Carvajal J (2005) Program Fullprof, Laboratoire Leon
Brillouin (CEA-CNRS), version 3.70, May 2004, LLB-LCSIM
24. Shannon RD, Prewitt CT (1976) Acta Crystallogr A 32:751
25. Yao X, Chen ZI, Cross IE (1983) J Appl Phys 54:3399
26. Smolensky GA, Isupov VA (1954) Dokl Akad Nauk SSSR
97:653
27. Cross LE (1987) Ferroelectrics 76:241
28. Saito Y, Takao H, Tani T, Nonoyama T, Takatori K, Homma T,
Nagaya T, Nakamura M (2004) Nature 432:84
29. Fulcher GS (1925) J Am Ceram Soc 8:339
30. Viehland D, Jang SJ, Cross LE, Wuttig M (1990) J Appl Phys
68:2916
31. Simon A, Ravez J, Maglione M (2004) J Phys Condens Matter
16:963
32. Standards on piezoelectricity, ANSI/IEEE std (1987), p 176
33. Von Der Muhll R, Khemakhem H, Ravez J (1997) Ann Chim Sci
Mater 22:731
34. Chaker C, El Gharbi W, Abdelmoula N, Khemakhem H, Simon
A, Maglione M (2009) J Alloys Compd 481:305
35. Ross SD (1970) J Phys C 3:1785
36. Juang YD, Hu ML, Tse WS (1994) J Appl Phys 76:3746
200 240 280 320 360 400 440 480 520 560 60075
90
105
120
TC = 466 K
T1 =384 K
Fre
quen
cy (
cm-1
)
T (K)
FWHM
T2 =254 K
Fig. 10 Temperature dependence of the full width at half maximum
(FWHM) of the m1 stretching mode in the NbO6 of Na0.9Ba0.1Nb0.9
(Sn0.5Ti0.5)0.1O3 ceramic
J Mater Sci (2012) 47:1943–1949 1949
123
Author's personal copy