strategic groups based on marginal rates: an application to the spanish banking industry
TRANSCRIPT
Strategic groups based on marginal rates: An applicationto the Spanish banking industry
Diego Prior a,*, Jordi Surroca b
a Department of Business Economics, Universitat Autonoma de Barcelona, Bellaterra (Barcelona) 08193, Spainb Department of Business Administration, Universidad Carlos III de Madrid, Getafe (Madrid) 28903, Spain
Abstract
This paper uses Data Envelopment Analysis (DEA) to identify strategic groups (SGs) in the Spanish banking indus-try. The concept of SG relies on the fact that firms grouped together value inputs and outputs in the same way. As such,they take identical direction when, due to external influences, changes are required. Weights obtained from DEA areextremely useful in the valuation of inputs and outputs. Specifically, by comparing DEA weights pair-wise, i.e. quan-tifying the variables� marginal rates (MR), we can obtain a very good representation of the existent trade-off and therelative importance of the two variables.The paper uses MRs obtained through DEA models and, simultaneously, proposes feasible ways to overcome two
usual problems with DEA virtual weights, namely: (1) the multiplicity of weights for efficient DMUs; and (2) the inex-istence of dual variables for inefficient DMUs.From the empirical point of view, once the MRs are determined, the second stage is to perform Cluster Analysis. We
apply Cluster Analysis in two ways: (1) on the basis of the MRs; and (2) following the traditional application by run-ning Cluster Analysis with the original variables. The results obtained show the advantages of using MRs instead of thestandard application of Cluster Analysis.Summing up, the concept of SG is reinforced if we use refined methods to determine the existence of SGs. The results
of the application of DEA models to observe the presence of SG in the Spanish banking industry offer interesting viewson it.
Keywords: Data Envelopment Analysis (DEA); DEA weights; Banking; Strategic groups; Marginal rates
* Corresponding author. Tel.: +34 9358 11539; fax: +34 9358 12555.E-mail addresses: [email protected] (D. Prior), [email protected] (J. Surroca).
imtotocrtrggtaDedDotppStS
D(okoDahooTcglwfi
gateo
1. Introduction
To manage organizations, knowledge of the implicit trade offs among the activities is necessary.For example, to increase the production of a specific output, organisations must know how muchadditional quantity of a necessary input is required, or how much one input (output) should increase when another input (output) decreases. Thisreasoning, taken from production theory, can alsobe applied when examining the choice of competitive strategy made by a firm. For example, Porter(1980), when defining generic strategies of differentiation and costs leadership, states that a firm�scurrent trade offs indicate its capacity to adapt tonew competitive market conditions.In fact, according to Porter (1979, p. 215), the
concept of trade off is already implicit in the verydefinition of a strategic group (henceforth anSG). Thus, it is assumed that all firms that are inthe same SG will respond to a disturbance is similar ways, given that their costs of change in strategy are very similar. Similarly, Hatten and Hatten(1987) make it very clear that the cost of a changein strategy within a SG is different from the rest ofthe SGs in the industry.Pursuing this viewpoint, this study introduces
an alternative approach of assigning firms toSGs: firms are classified according to their capacityto respond to disturbances, where capacity to respond to disturbances is defined as the trade offsamong key decision variables. In fact, the mainmotivation of this paper is to demonstrate thatthe traditional focus of the SG literature, whichgroups firms according to their similarities in keystrategic dimensions, can be surpassed.In our application, we have found the taxon
omy proposed by Cool and Schendel (1987) tobe very useful in the key variables selection process. Cool and Schendel classify the strategic variables into scope and resource commitmentsvariables. Later, this classification turns out to beof great help in the use of the non parametric,Data Envelopment Analysis (DEA) models todetermine the response capacity of each strategicgroup.The initial DEA model was proposed by Char
nes et al. (1978). A DEA model performs compar
sons among organisations (referred to as decisionaking units, DMUs), which use similar composiions of inputs to obtain similar compositions ofutputs. In our case, the DMUs are banking firms,he inputs are resource commitments and theutputs are dimensions of scope. The result is theonstruction of an empirical frontier, the configuation of which is defined by different firms sharinghe same commitment of resources in order toeach the maximum scope; i.e. to participate in areater number of market segments, to offer areater number of products in these markets, oro extend the geographic reach of its strategy. Iffirm lies on the frontier (say, there is no otherMU producing more outputs by consumingqual or lower inputs), it is labelled a strategic leaer (SL). If not, it is a strategic follower (SF).EA provides efficiency scores, and for SFs a setf peers that are obtained by projecting them ono the frontier. The efficiency score indicates theercentage by which a SF should increase its oututs in order to become efficient, i.e. become anL. Reference units are hypothetical DMUs onhe efficient frontier regarded as target units forFs.There exists a broad research stream usingEA models to evaluate efficiency in bankingsee, for instance, Grifell Tatje and Lovell, 1997,r Pastor et al., 1997). However, as far as wenow, previous literature using the DEA methodlogy to determine strategic groups is truly scarce.ay et al. (1994, 1995) reveal the indubitabledvantages of this technique. In particular, theyighlight the capacity to consider multiple outputsr the establishment of a nexus between inputs andutput when firms pursue multiple objectives.heir proposal is valuable because it introduces alear and objective criterion for identifying strateic groups. It does, however, suffer from severeimitations: depending on the line segment tohich they are projected, two practically identicalrms can end up being classified in different SGs.This paper applies DEA to identify strategicroups, but in another direction. To us, a SG isset of firms that are similar because of the wayhey value inputs and outputs. This shifts themphasis to the determination of weights. Thus,ur proposal consists of grouping together firms
according to similarities in their relative valuationof key decision variables (the trade offs betweenthe relative weights). However, there are two technical problems that must be addressed first. First,for each efficient firm there is not just one but amultiple number of weights that could be used.Second, for DMUs that do not form part of thefrontier, the weights are undefined. The latterproblem arises from microeconomic theory.This paper is organised as follows. Besides this
introduction, there are five remaining sections.Section 2 gives an analysis of the theoretical foundations of the SGs and closes with a proposal thathelps to resolve the problems that arise when Cluster Analysis is used directly to establish SGs. InSection 3, a variant of the non parametric DEAmodels is developed to determine the existingtrade offs between each pair of strategic variables.Section 4 is methodological: it comprises a description of the sample, the strategic decision variablesand the selection of marginal rates required todetermine the presence of SGs in the bankingindustry. The results of the empirical applicationare reported in Section 5. The article ends with asynthesis of the principal conclusions.
2. The strategic group concept: Multi-
dimensionality and causality of the strategy
The concept of SG was introduced by Hunt in1972, although it was later contributions (namelyCaves and Porter, 1977; Porter, 1979) defined theprincipal elements of the theory. According to Porter (1979), the concept of the SG serves to distinguish a group of firms with similar strategiesthat, in turn, are different from those followed byother firms in the same industry. Thus, the strategic decisions made by a firm within an SG cannotbe imitated by firms outside the group withoutsubstantial costs (monetary, time or uncertaintyabout the outcome of such decisions). Accordingly, the existence of SGs requires the existenceof barriers to imitation (Caves and Porter, 1977;Porter, 1979). These group specific entry barriers,the so called ‘‘barriers to mobility’’, give protection to group members, and explain why somefirms obtain positive economic benefits from
adopting intra group strategies while others donot. Without such barriers, successful strategiescould be imitated quickly, resulting in loss of performance differentials (Porter, 1979). From thisviewpoint, mobility barriers could be interpretedas the penalty costs of moving from one SG to another: high mobility barriers mean the expectedcosts of any attempt to change group membershipare high, which leads to lower expected profitability. This eliminates the incentives to change amongSGs and deters entry into groups (Hatten and Hatten, 1987).Obviously, there is a price to pay for changing
strategies; and the more dissimilar a strategy is,the more it will cost to imitate it. Hence, firmsin the same group will find it less costly to behavelike the rest of the group members. In contrast,barriers to mobility between groups imply thatnon members suffer a high cost for copying thestrategies of the group to which they do not belong. Consequently, each SG comprises firms following similar strategies about key variables.This also concurs with the definition by McGeeand Thomas (1986) of an SG as a group of firmsresponding in the same way to environmental disturbances. The result of this homogeneity is that aspecific strategic dimension acquires increasingimportance while other dimensions have decreasing importance. In contrast, when we comparefirms forming part of different SGs, the barriers(the costs of imitation) depend upon the relativecircumstances of each firm, as costs functionsmay be asymmetric (Hatten and Hatten, 1987).It follows from the previous discussion that a
strategic group can be defined as a set of firms thatorganize themselves in the same way and react in aunified way to the same external influences. This is,precisely, the definition of SG we are interested inutilizing throughout the paper.Basically, the SG framework relies on barriers
to mobility to account for persistent intra industryperformance variation (Porter, 1979). Althoughthe existing literature has had relative success inthe identification of groups of firms with differentstrategies (i.e., dissimilarities in the collectivebehavior between groups), no conclusive empiricalevidence exists for the hypothesized group performance linkage (McGee and Thomas, 1986;
st(tftad
eachieve the three objectives just mentioned.
3
repADeootS‘‘inStpetne
m(pscdt(pefip
Thomas and Venkatraman, 1988; Barney andHoskisson, 1990). There are two possible explanations for the weak empirical evidence on the performance implications associated with groupmembership. One possibility is that the relationship has not been captured adequately (due topoor specification of the model). The other possibility is simply that no such linkage exists (see,for instance, the work of Hatten and Hatten,1987, who assume the concept of SG exists as ananalytical convenience). Being more optimisticthan Hatten and Hatten, and assuming that SGis something more than a methodological artifact,the literature identifies to two essential problems.First, there has been limited progress towards anacceptable definition of the concept of SG (Cooland Schendel, 1987). Recently, this lack of progress has led to the suggestion of new theoreticalapproaches to define SG such as, for example,the cognitive perspective (see Fombrun and Zajac,1987) or the resource determinants of performancedifferences (see Dierickx and Cool, 1989; Mehra,1996). The second problem identified is that themethodology for treating the data is inadequate(Ketchen and Shook, 1996); and the habitual useof Cluster Analysis is criticised (Thomas and Venkatraman, 1988; Barney and Hoskisson, 1990).Day et al. (1994, 1995) illustrate the crucial weakness of this technique by showing that when firmsare designing strategies; in fact, managers cognisea causal model (i.e. a transformation function)relating, in a more or less conscious manner, operational decisions with the attainment of an objective function. Furthermore, Day et al. (1994,1995) report that firms are typically driven by multiple goals: not just profit maximization. Therefore, Cluster Analysis is an inadequate techniquebecause (i) it does not capture the multidimensionality of strategy; (ii) it does not take into accountthe relative importance of the key decision variables (Hatten and Hatten, 1987); and (iii) becauseit does not allow the incorporation the inherentcausality of the definition of strategy (Thomasand Venkatraman, 1988).From the discussion of the literature below, it is
our belief that (a) it is necessary to identify thecausal model which helps to identify the characteristics of the transformation function between the
trategic variables; (b) it is important to knowhe relative weights of the key decision variablesi.e., the trade offs between the variables) in ordero test the existence of mobility barriers among diferent SGs; and finally (c) it is beneficial to identifyhe strategic leaders (DMUs forming the frontier)nd strategic followers (DMUs that are inefficient,espite forming part of the same SG).Given this conception of SG, the next sectionxplains how to use DEA models in order to
. Using DEA to assess response ability
Here, we attempt to eliminate the limitationsaised in the previous section by using DEA modls. Our final goal is the proposition of a three stagerocess, which tries to avoid the direct Clusternalysis of the original variables. In the first stage,EA is used to assess the degree of efficiency ofach firm, allowing each firm to convert inputs intoutputs autonomously. DEA efficiency scores arebtained by radially projecting all DMUs on tohe frontier. A firm lying on the frontier is efficient.uch a firm is, as mentioned earlier, so called astrategic leader’’, or SL. Otherwise, the DMU isefficient and is thus a ‘‘strategic follower’’, orF. In the latter case, the efficiency score quantifyhe percentage by which the SF should increaseroportionally all its outputs in order to becomefficient. In the second stage, the relative imporance of the variables (trade offs) is computed. Fially, Cluster Analysis of the trade offs is thenmployed to identify the strategic groups.Let us begin with the most standard DEAodel (Charnes et al., 1978). Consider a set of Sr = 1, . . . , S) firms, each of which individuallyroduces M (i = 1, . . . ,M) different outputs foreveral markets or segments in which it partiipates (in Section 4 the output variables areesignated as variables of scope) having commited N (j = 1, . . . , N) different resources. Let X/
= xj/)j 1,. . .,N and Y/ (= yi/)i 1,. . .,M denote the inut and output vectors for DMU /. From this, thefficiency (in our case, competitive advantage) ofrm /, h/, can be evaluated through the followingrogram (the so called CCR model):
Maxui;vj
h/ ¼XMi 1
uiyi/XNj 1
vjxj/
, !
s:t:XMi 1
uiyirXNj 1
vjxjr
, !6 1; r ¼ 1; . . . ; S;
uiXMi 1
uiyif
, !P e; i ¼ 1; . . . ;M ;
vjXNj 1
vjxjf
, !P e; j ¼ 1; . . . ;N ;
ð1Þ
where vj and ui are the input and output weights ormultipliers (taken as relative or shadow prices).For the DMU under evaluation (/), program (1)chooses the weights combination that maximizesits efficiency, which is the weighted ratio of outputsto inputs. The constraints guarantee that the efficiency score h/ will not be greater than unity (maximum efficiency level), and that the virtual pricesare, necessarily, non negative.The CCR model constructs a piecewise linear
envelopment surface (i.e., an empirical frontier)in RMþN
þ , which can be described in terms of itsdefining facets. The optimal weights that solveprogram (1) are the coefficients of the linear equations that describe these facets. In this sense, v�jand u�i yield a facet of the frontier to DMU /:
XMi 1
u�i yi/XNj 1
v�j xj/ ¼ 0:
From this, the production possibility set can bedescribed in terms of (1) the marginal rate of substitution between inputs (MRS), (2) the marginalrate of transformation between outputs (MRT),(3) the marginal productivity of outputs relativeto inputs, (4) the marginal cost of inputs relativeto outputs and (5) the elasticity of substitution(see Rosen et al., 1998; Cooper et al., 2000).However, when DMU / is efficient (h/ = 1), the
virtual weights may not be unique. Thus, we cannot directly use the weights obtained from (1) asinput or output shadow prices (Rosen et al.,1998). Nevertheless, program (1) distinguishes between efficient and inefficient DMUs. It is mostinteresting to provide an alternative approach to
weights computation: The next section is devotedto the identification of a harmonized set of weightsfor efficient DMUs.For h/ = 1 we can say that DMU / is a strate
gic leader (SL) that lies on the frontier. Whenh/ < 1, DMU / is not on the frontier and we saythat / is a strategic follower (SF). A strategic follower can proportionally contract its inputs by h/,while still producing at least the same level ofoutputs.
3.1. Response capacity of strategic leaders
As has been pointed out, SG is defined here as aset of firms that convert inputs into outputs whileplacing an identical valuation on the variables.This is why firms in the same SG will present identical reactions to the same external stimuli; or, inother words, why they present similarities in theirresponse capacity.Since DEA weights reveal a firm�s order of pref
erences for decision variables, the importance ofweights indicates a firm�s relative valuation of inputs and outputs. From this, we define responsecapacity as the trade offs among weights. Thesetrade offs are very informative because marginalrelations between variables equal the negative inverse of weights ratios.Let DMU / be a SL whose decisions on the M
dimensions of scope and the virtual prices associated with each one of them are labeled as, respectively, y1/, . . . , yM/ and u1/, . . . , uM/. Theresponse capacity of /, with respect to the pairof variables yk/, yl/ (k,l 2 i), is defined byMRT/
yk ;yl¼ oyk/=oyl/, whose value is equal to the
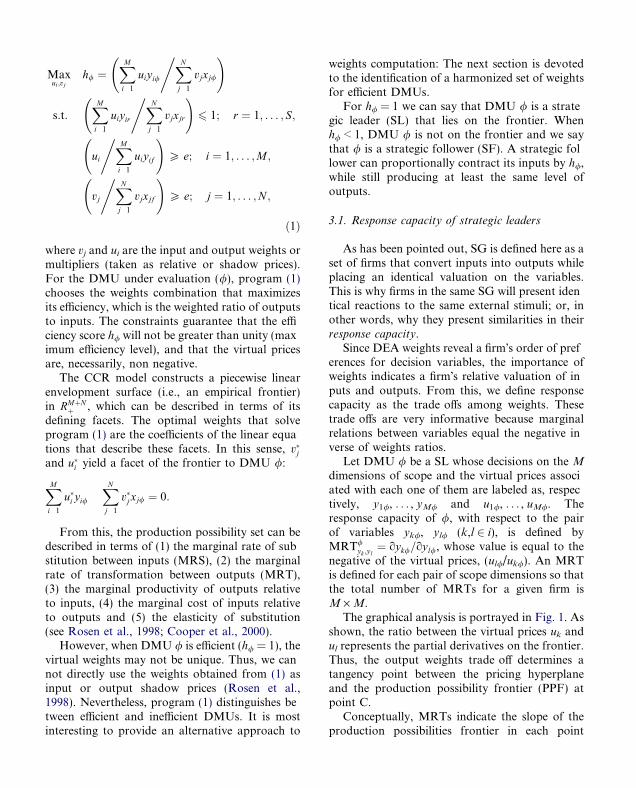
negative of the virtual prices, (ul//uk/). An MRTis defined for each pair of scope dimensions so thatthe total number of MRTs for a given firm isM ·M.The graphical analysis is portrayed in Fig. 1. As
shown, the ratio between the virtual prices uk andul represents the partial derivatives on the frontier.Thus, the output weights trade off determines atangency point between the pricing hyperplaneand the production possibility frontier (PPF) atpoint C.Conceptually, MRTs indicate the slope of the
production possibilities frontier in each point
M
s
wspptrfMtrtoo
gc(rr
Mdm
t
lk
uu−
Yk
Yl
A B
C
D
E
Fig. 1. Graphical representation of the production possibilityset and the marginal rate of transformation between twooutputs.
Yk
Yl
C
α β
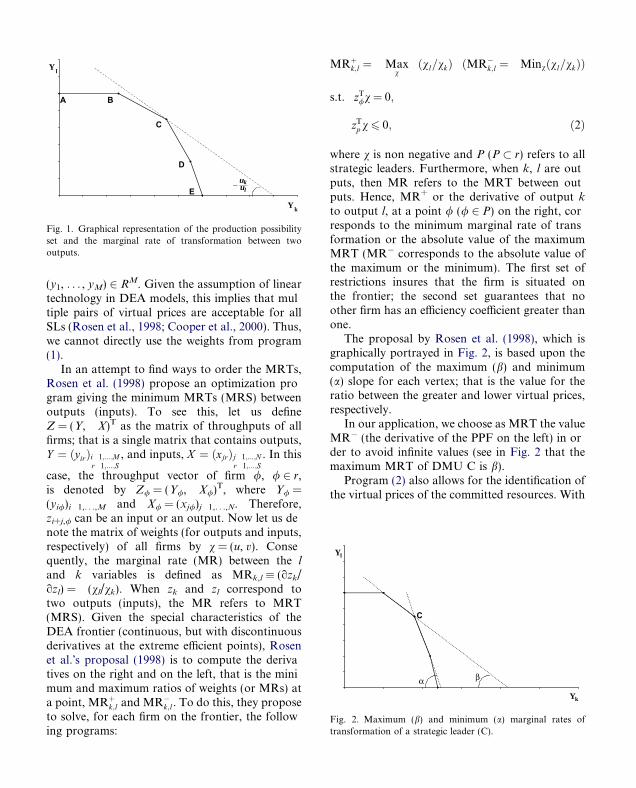
Fig. 2. Maximum (b) and minimum (a) marginal rates oftransformation of a strategic leader (C).
(y1, . . . , yM) 2 RM. Given the assumption of lineartechnology in DEA models, this implies that multiple pairs of virtual prices are acceptable for allSLs (Rosen et al., 1998; Cooper et al., 2000). Thus,we cannot directly use the weights from program(1).In an attempt to find ways to order the MRTs,
Rosen et al. (1998) propose an optimization program giving the minimum MRTs (MRS) betweenoutputs (inputs). To see this, let us defineZ = (Y, X)T as the matrix of throughputs of allfirms; that is a single matrix that contains outputs,Y ¼ ðyirÞi 1;...;M
r 1;...;S, and inputs, X ¼ ðxjrÞj 1;...;N
r 1;...;S. In this
case, the throughput vector of firm /, / 2 r,is denoted by Z/ = (Y/, X/)
T, where Y/ =(yi/)i 1,. . .,M and X/ = (xj/)j 1,. . .,N. Therefore,zi+j,/ can be an input or an output. Now let us denote the matrix of weights (for outputs and inputs,respectively) of all firms by v = (u, v). Consequently, the marginal rate (MR) between the land k variables is defined as MRk,l � (ozk/ozl) = (vl/vk). When zk and zl correspond totwo outputs (inputs), the MR refers to MRT(MRS). Given the special characteristics of theDEA frontier (continuous, but with discontinuousderivatives at the extreme efficient points), Rosenet al.�s proposal (1998) is to compute the derivatives on the right and on the left, that is the minimum and maximum ratios of weights (or MRs) ata point, MRþ
k;l and MR�k;l. To do this, they propose
to solve, for each firm on the frontier, the following programs:
Rþk;l ¼ Max
vðvl=vkÞ ðMR�
k;l ¼ Minvðvl=vkÞÞ
.t. zT/v ¼ 0;
zTp v 6 0; ð2Þ
here v is non negative and P (P r) refers to alltrategic leaders. Furthermore, when k, l are oututs, then MR refers to the MRT between oututs. Hence, MR+ or the derivative of output ko output l, at a point / (/ 2 P) on the right, coresponds to the minimum marginal rate of transormation or the absolute value of the maximumRT (MR� corresponds to the absolute value ofhe maximum or the minimum). The first set ofestrictions insures that the firm is situated onhe frontier; the second set guarantees that nother firm has an efficiency coefficient greater thanne.The proposal by Rosen et al. (1998), which israphically portrayed in Fig. 2, is based upon theomputation of the maximum (b) and minimuma) slope for each vertex; that is the value for theatio between the greater and lower virtual prices,espectively.In our application, we choose as MRT the valueR� (the derivative of the PPF on the left) in orer to avoid infinite values (see in Fig. 2 that theaximum MRT of DMU C is b).Program (2) also allows for the identification of
he virtual prices of the committed resources. With
this, we can also determine the inputs marginalrates of substitution, MRSs. This time, to avoidinfinite values, we choose the minimum MRSs(derivative on the left). Nevertheless, as Rosenet al. (1998) indicate, unbounded solutions canexist in an indeterminate number of cases. In asimilar vein, Cooper et al. (2000) point out thatsome problems arise with this previous approach,because these weights are often very small, so thatadditional treatment, such as scaling, is needed.This problem, given the multiplicity of inputoutput variables, assumes greater importance inour application, especially. For this reason, weintroduce a new set of constraints on program(2), which ensures bounded weights. See inAppendix A how we propose to sort this problemout.
Yk
C
D
α β µ
H
H*
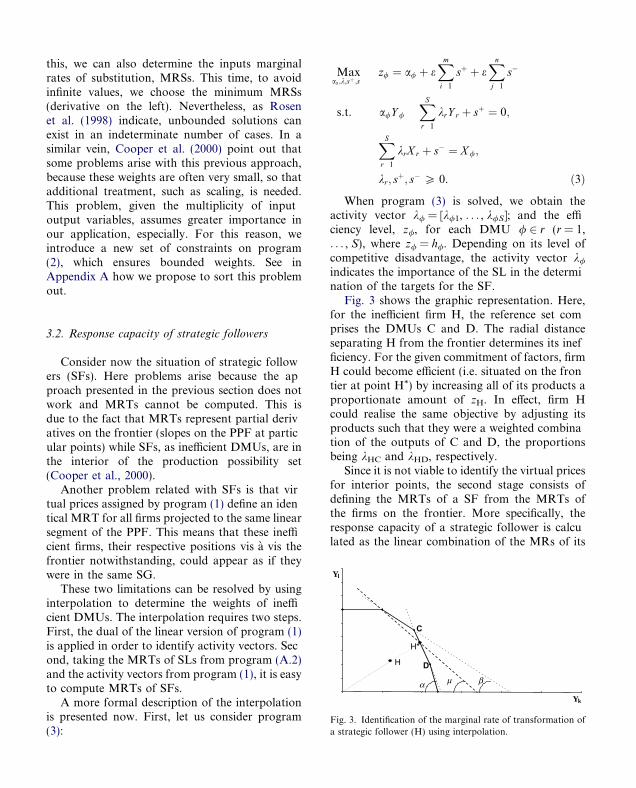
Fig. 3. Identification of the marginal rate of transformation ofa strategic follower (H) using interpolation.
3.2. Response capacity of strategic followers
Consider now the situation of strategic followers (SFs). Here problems arise because the approach presented in the previous section does notwork and MRTs cannot be computed. This isdue to the fact that MRTs represent partial derivatives on the frontier (slopes on the PPF at particular points) while SFs, as inefficient DMUs, are inthe interior of the production possibility set(Cooper et al., 2000).Another problem related with SFs is that vir
tual prices assigned by program (1) define an identical MRT for all firms projected to the same linearsegment of the PPF. This means that these inefficient firms, their respective positions vis a vis thefrontier notwithstanding, could appear as if theywere in the same SG.These two limitations can be resolved by using
interpolation to determine the weights of inefficient DMUs. The interpolation requires two steps.First, the dual of the linear version of program (1)is applied in order to identify activity vectors. Second, taking the MRTs of SLs from program (A.2)and the activity vectors from program (1), it is easyto compute MRTs of SFs.A more formal description of the interpolation
is presented now. First, let us consider program(3):
Maxas;k;sþ ;s
z/ ¼ a/ þ eXmi 1
sþ þ eXnj 1
s�
s.t. a/Y /
XSr 1
krY r þ sþ ¼ 0;
XSr 1
krX r þ s� ¼ X /;
kr; sþ; s� P 0. ð3Þ
When program (3) is solved, we obtain theactivity vector k/ = [k/1, . . . , k/S]; and the efficiency level, z/, for each DMU / 2 r (r = 1,. . . , S), where z/ = h/. Depending on its level ofcompetitive disadvantage, the activity vector k/
indicates the importance of the SL in the determination of the targets for the SF.Fig. 3 shows the graphic representation. Here,
for the inefficient firm H, the reference set comprises the DMUs C and D. The radial distanceseparating H from the frontier determines its inefficiency. For the given commitment of factors, firmH could become efficient (i.e. situated on the frontier at point H*) by increasing all of its products aproportionate amount of zH. In effect, firm Hcould realise the same objective by adjusting itsproducts such that they were a weighted combination of the outputs of C and D, the proportionsbeing kHC and kHD, respectively.Since it is not viable to identify the virtual prices
for interior points, the second stage consists ofdefining the MRTs of a SF from the MRTs ofthe firms on the frontier. More specifically, theresponse capacity of a strategic follower is calculated as the linear combination of the MRs of its
Yl
ibased on the composition of its respective activityvector.
4
4
tDpAafppitSfd6iTasbitl
atmitcDaaAeulio
technological reference set. For each pair of outputs yk and yl (k, l 2 i), the MRT of a SF / is defined thus:
MRT/yk ;yl
¼XSr 1
k/rulrukr
� �
¼ k/1ul1uk1
� �þ k/2
ul2uk2
� �þ
þ k/SulSukS
� �; ð4Þ
where ulr and ukr indicate the virtual prices of outputs yk and yl that satisfy program (A.2) for eachfirm r, r = 1, . . . , S.Let r* r be the reference group of /; and
r 0 r be the rest of the firms in the sample(r* + r 0 = r). For /, the weights that satisfy program (3) are non zero only for the firms that arein its technological reference group, k/r* 5 0(k/r 0 = 0). Thus, expression (4) reduces to theweighted sum of the MRTs only of those DMUsthat form part of the reference group:
MRT/yk ;yl
¼X8r�
k/r�ulr�
ukr�
� �: ð5Þ
It can be seen in Fig. 3 that DMU H, situatedunder the frontier, has two technological references, C and D. The position on the frontier ofthese DMUs determine the inefficiency of H because point H* is nothing more than a convexcombination of points C and D. For firm H, theMRT between outputs yk and yl, MRT
Hyk ;yl
¼ðulH=ukHÞ ¼ l, is equivalent to the weighted
sum of the marginal rates of transformation of Cand D: l¼ kHC MRTCyk ;yl þ kHD MRTDyk ;yl ¼ kHCb þ kHD a. Since the weight of C is greater thanthe weight of D (kHC > kHD), the MRT of DMUH is closer to C than to D.The interpolation we propose helps to resolve
the common microeconomic problem of lack ofmarginal rates for interior points. Usually, DEAcannot distinguish between MRTs for firms sharing the same technological references (they areprojected on the same linear segment of thefrontier). Consequently, our approach is a newcontribution to DEA research because it allowsus to differentiate between them since each
nefficient firm is assigned to a specific MRT
. Spanish banking data
.1. The sample of banks
Annual data were collected about a sample ofwo types of banks: Savings and Commercial.ata for savings banks were collected from theublication ‘‘Anuario Estadıstico de las Cajas dehorros Confederadas’’ published by ‘‘Confedercion Espanola de Cajas de Ahorros’’. The dataor commercial banks were obtained from the reort ‘‘Anuario Estadıstico de la Banca Privada’’ublished by ‘‘Consejo Superior Bancario’’. Ournitial observation was that the quality levels beween the two sources were diverse: the data foravings banks were considerably better. We, thereore, proceeded to analyse the reliability of theata. As a result, the final sample was reduced to2 Commercial banks and 47 Savings banks. Thiss much smaller than the original population.here were four main reasons for exclusion: thebsence of data (21 commercial banks and twoaving banks); the elimination of foreign bankingranches (51 commercial banks); the presence ofnconsistent data (seven commercial banks); andhe elimination of outliers. The elimination of outiers was executed as follows:Outlier detection is a basic requirement prior tony DEA application. It is common knowledgehat the analysis of efficiency with deterministicodels is very sensitive to the presence of outliersn the sample. This is due to the fact that the exreme points determine the efficiency frontier andould affect the marginal rates of the rest of theMUs. To control for extreme observations, wepplied an iterative process, based on Andersennd Petersen�s (1993) super efficiency coefficient.s Wilson (1995) points out, in the output orinted DEA program, excluding units with low vales of the super efficiency coefficient produces theargest shift in the position of the frontier. Followng this reasoning, we ranked units in increasingrder of their super efficiency coefficients. This
enabled us to identify, and then remove, the DMUwith the lowest value. We then re calculated theefficiencies and compared the two samples, i.e.the before and the after the DMU exclusion: ifwe found the difference of the efficiency coefficientbetween the two samples to be statistically significant, we proceeded to remove such a unit. We thenrepeated the whole process anew, and so on: theiteration ended when the null hypothesis of equality of the efficiency coefficients could not be rejected. Evidently, our procedure is an extensionof Wilson�s (1995) proposal. The final outcomeof the application of this iterative process wasthe elimination of 12 banking firms (11 commercial banks and 1 Savings bank).
4.2. Strategic variables and marginal rates
As indicated in Section 2, we have followed theconcept of the SG defined, first, by Hofer andSchendel (1978) and, later, applied by Cool andSchendel (1987). Hofer and Schendel (1978, p.25) define the strategy of a firm as ‘‘the presentand future pattern of deploying of resources andinteractions with the environment (scope of thestrategy) which indicate how the organization willachieve its objectives’’, where ‘‘the decisions uponscope of the strategy and deploying of resourcesdetermine competitive advantage and synergy’’. 1
Under this definition of strategy, a SG feeds from‘‘a set of firms competing within an industry on thebasis of similar combinations of scope and resource commitments’’ (Cool and Schendel, 1987,p. 1106). The decisions about scope include thechoice of the segments of the firm�s target market,the product mix offered in these markets and thegeographic reach of the strategy. With regard tothe committed resources, human, material andfinancial resources support the business strategyof the firm. A firm�s competitive advantage is theresult of its positioning in the product market segments in which it participates and of how it applies
1 The relevance of each one of the four components of the
strategy depends upon the level-corporate, business or func-tional area of the strategy considered (Hofer and Schendel,1978).its resources and capacities in each one of them;and is defined as ‘‘the advantageous position of afirm vis a vis its competitors by means of its decisions over resources and/or scope’’ (Hofer andSchendel, 1978).Following the proposal of Hofer and Schendel
(1978), we summarize the most common variables generally used in previous studies devotedto the identification of SGs in the banking industry (see Walter, 1988; Mehra, 1996). With regardto the scope of the strategy, the multi productnature of the banking firm can be measured inthree global aspects, namely: (1) product scope,(2) geographical reach and (3) customer proximity:
(1) Product scopeThis dimension of the strategy is captured by six
variables:
(S1): (commercial loans)/(financial investments).This ratio captures a bank�s orientationtowards commercial banking, specialisationin domestic economies and in small andmedium firms.
(S2): (portfolio of securities)/(financial invest
ments). This ratio determines the extent ofbanking firm�s orientation towards activeinvestments in stock markets.
(S3): (liquid assets)/(financial investments). Thisratio indicates the degree of conservatismin the banking activity (maintaining liquidassets avoids risky investments).
(S4): (commissions due to financial services)/
(products of financial activity). Ratioreflecting the diversification away from thetraditional banking business towards innovative banking focused in different servicesand financial intermediation.
(S5): (Savings and deposit accounts of the private
sector)/(total liabilities). This ratio distinguishes between the traditional and conservative banking business, based on thetraditional accumulation of family Savings.
(S6): (net position in financial markets)/(total lia
bilities). Reflects a novel and aggressiveway of capturing funds by means of sophisticated formulas, such as, for instance, theuse of the interbank market.
(fic
(
(
(
dtfias
T
sdbSta
1
2
3
(b) Geographical reachThis dimension investigates the extent of the
inter regional presence of each bank. To measuregeographical reach; we compute the Herfindahl index by calculating the ratio of the number ofbranches of each bank in every Spanish provinceto the total number of bank branches. Formally,the index is defined as
H ¼X32j 1
ðNij=NiÞ2; 0 6 H 6 1; ð6Þ
where Nij is the number of branches of the bankingfirm evaluated in province j and Ni is the totalnumber of branches of this bank.The specific variable used in the DEA evalua
tion is
ðS7Þ: 1 H . ð7Þ
(c) Proximity to customersThe aim of this variable is to capture differences
between commercial and saving banks. As reportedby Canals (1994), and also by Prior (2003), as aconsequence of specific regulation, Spanish savingsbanks have had to constrain their ambitions of territorial expansion, until recent times. This is whymost Savings banks remain situated within theiroriginal geographical area, in close proximity totheir customers. Obviously, this fact explains whythe dimension measuring geographical reach (S7)generally penalizes saving banks. Nevertheless,Savings banks have the advantage of being closerto their domestic customers. To measure customerproximity, a dimension is introduced by means of avariable defined by the Herfindahl index corresponding to the market quota of each firm i withineach province j (j = 1, . . . , 32). More specifically,the variable is defined as
ðS8Þ:X32j 1
ðNij=NjÞ2; ð8Þ
where Nij is the number of branches in province jfor the DMU under evaluation and Nj is the totalnumber of branches in this province.To determine the characteristics of the inputs,
we again follow the lead of Cool and Schendel
1987): We define three variables measuring arm�s commitment of physical, human and finanial resources:
R1) Physical capital: (depreciation and amortization expenses)/(operating income). This variable captures the importance of the directcosts of fixed assets (buildings and information technology) as a percentage of the operating income.
R2) Human capital: (personnel expenses)/(oper
ating income). This variable captures theimportance of human re sources as a percentage of the operating income.
R3) Credit quality: (loan loss provisions and
write offs)/(operating income). This ratioreflects the risk inherent in a bank�s strategyand the quality of its loans.
Contrarily to Mehra (1996), we do not introuce any specific variable to represent the strucure of liabilities because the deposits andnancing coming from the inter banking marketlready figure among the scope variables, and, asuch, they would be redundant.The descriptive statistics are shown inable 1.Once the variables measuring the scope of the
trategy and the resources committed have beenefined, the next step is to select the trade offs toe used in the Cluster Analysis to determine theGs. According to the theory, the following arehe most significant trade offs that take placemong the scope variables:
. (S1/S2) Commercial loans versus portfolio ofsecurities. This trade off points out the dichotomy between commercial banking and investment banking.. (S1/S3) Commercial loans in respect to treasury.This MRT serves to distinguish between banksspecialising in domestic economies and SMFsfrom those whose investment is focused infinancial markets.. (S3/S2) Treasury and portfolio of securities.This is a relationship that identifies, by exploring the strategy of investing assets, risk takingbehaviour.
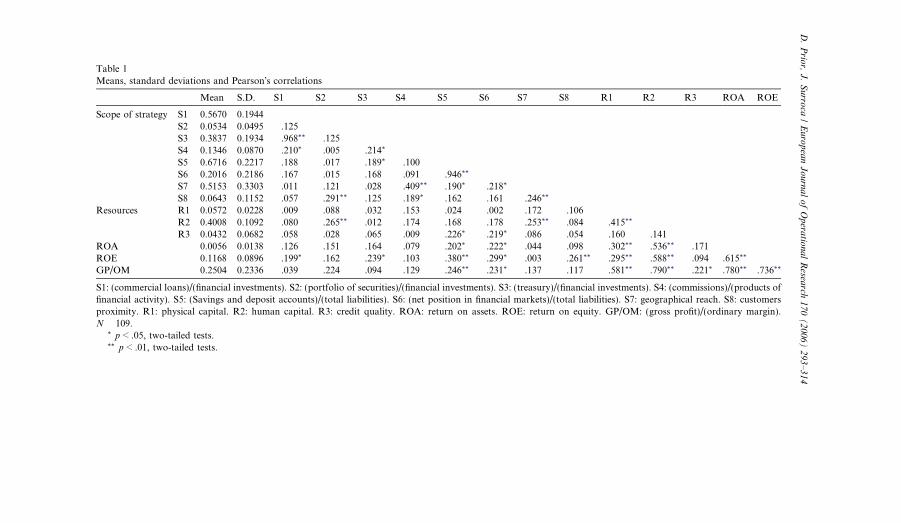
Table 1Means, standard deviations and Pearson�s correlations
Mean S.D. S1 S2 S3 S4 S5 S6 S7 S8 R1 R2 R3 ROA ROE
Scope of strategy S1 0.5670 0.1944S2 0.0534 0.0495 .125S3 0.3837 0.1934 .968** .125S4 0.1346 0.0870 .210* .005 .214*
S5 0.6716 0.2217 .188 .017 .189* .100S6 0.2016 0.2186 .167 .015 .168 .091 .946**
S7 0.5153 0.3303 .011 .121 .028 .409** .190* .218*
S8 0.0643 0.1152 .057 .291** .125 .189* .162 .161 .246**
Resources R1 0.0572 0.0228 .009 .088 .032 .153 .024 .002 .172 .106R2 0.4008 0.1092 .080 .265** .012 .174 .168 .178 .253** .084 .415**
R3 0.0432 0.0682 .058 .028 .065 .009 .226* .219* .086 .054 .160 .141ROA 0.0056 0.0138 .126 .151 .164 .079 .202* .222* .044 .098 .302** .536** .171ROE 0.1168 0.0896 .199* .162 .239* .103 .380** .299* .003 .261** .295** .588** .094 .615**
GP/OM 0.2504 0.2336 .039 .224 .094 .129 .246** .231* .137 .117 .581** .790** .221* .780** .736**
S1: (commercial loans)/(financial investments). S2: (portfolio of securities)/(financial investments). S3: (treasury)/(financial investments). S4: (commissions)/(products offinancial activity). S5: (Savings and deposit accounts)/(total liabilities). S6: (net position in financial markets)/(total liabilities). S7: geographical reach. S8: customersproximity. R1: physical capital. R2: human capital. R3: credit quality. ROA: return on assets. ROE: return on equity. GP/OM: (gross profit)/(ordinary margin).N 109.
* p < .05, two-tailed tests.** p < .01, two-tailed tests.
D.Prior,J.Surroca/EuropeanJournalofOperationalResea
rch170(2006)293–314
(omstcawhop
iCafitetpvgtoiR
FTomeu
4. (S5/S6) Savings and deposit accounts with
respect to financial intermediaries. This ratioclarifies the different strategies that can be usedto raise funds.
5. (S2/S4) Investment banking vis a vis innovativebanking. This ratio accounts for the disparitybetween a specialized bank with a narrow rangeof services and a diversified bank that offers acomprehensive level of financial services.
6. (S7/S8) Geographical reach versus level of service. This captures the conflict between a strategyof disseminating throughout the whole countryas opposed to one of focusing on a single province to achieve a greater level of proximity tothe client.
With regard to the trade offs among resources variables, two MRs have been chosen:
7. (R1/R2) Physical capital in relation to humanresources. This MR captures the potentialdichotomy between a capital intensive technology and a more labor intensive one.
8. (R2/R3) Human resources with respect to creditquality. Relates the expenses due to insolvencieswith personnel expense. The rationale behindthis is that a greater investment in human capital reinforces supervision, and this should bereflected in improvements in the quality of theoperations.
4.3. Analysis
cnlsitarcinartB
The first part of the analysis was to quantifymarginal rates. This was executed by identifyingthe response capacity of each firm using the methodology described in Section 3. Next, an arraymatrix of MRT and MRS was obtained for eachinstitution by, initially, applying the standardDEA program to obtain the weights followed bythe application of program (A.2) to get the marginal rates of the strategic leaders. Finally, takinginto account the MRs of SLs and the activity vectors obtained from program (3), the MRs of SFs(expression (5)) were computed.Once the MRs corresponding to each DMU
were known, Cluster Analysis was performed onthe basis of the weights. As Ketchen and Shook
1996) note, previous research has generally reliedn Ward�s method to cluster firms. However, thisethod tends to produce clusters with roughly theame number of observations, with solutions thatend to be heavily distorted by outliers. To overome this problem, a solution, advocated in manycademic papers (see, for instance, Punj and Steart, 1983), is to use a two stage process where aierarchical algorithm is used to define the numberf clusters. The initial results serve as the startingoints for iterative partitioning in the second stage.A correct identification of the number of clusters
s indispensable. Thus, multiple methods (Ward,entroid, Median, Single Linkage, Complete Linkge and Average Linkage) were employed in therst stage in order to propose different possible paritions of the sample. From these results, two differnt tests were carried out. The first was a rule ofhumb for selecting the number of clusters proosed by Harrigan (1985). Harrigan�s proposal inolves the examination of the tightness of theroups. For example, using the R2, the contribuion that an additional group would make to theverall fit of the clusters is examined. The processs iterative, the stopping rule being an increase in2 lower than 5%. The second method we used isiegenbaum and Thomas�s (1990) stopping rule:he clusters obtained must explain at least 65%f the overall variance, while any additional clusterust add less than 5% to the incremental variancexplained. Finally, we reversed the procedure. Wesed Discriminant Analysis to calculate the perentage of firms correctly classified in the identifiedumber of groups. Together, these processes alowed us to identify the appropriate number oftrategic groups in existence.In the second stage, starting from the number of
dentified strategic groups, each firm was assignedo a group using the non hierarchical K meanslgorithm. The non hierarchical K means algoithm has some interesting advantages over hierarhical methods: it is less impacted by outliers andts final solution optimizes within clusters homogeeity and between clusters heterogeneity (Ketchennd Shook, 1996). However, the K means algoithm has an important shortcoming: It requireshat the number of clusters be specified a priori.ut, in our case, this has already been solved.
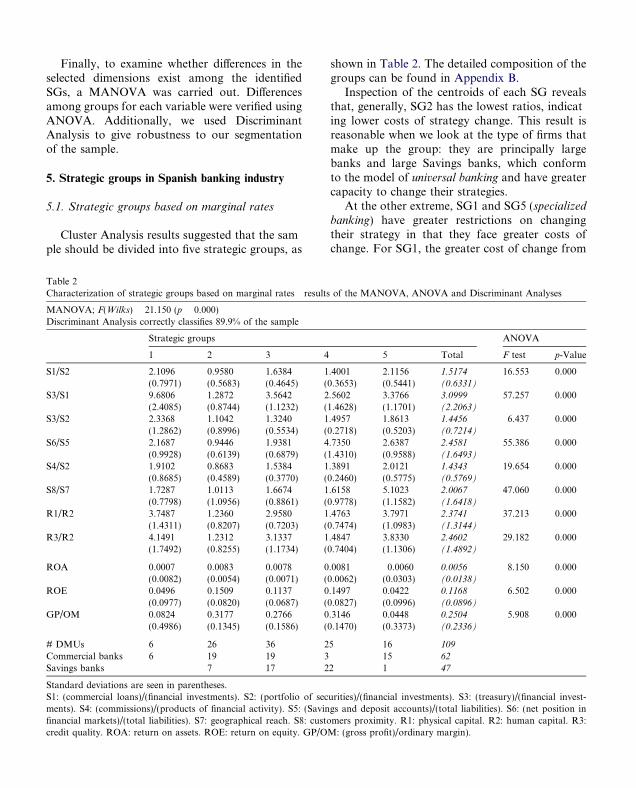
Finally, to examine whether differences in theselected dimensions exist among the identifiedSGs, a MANOVA was carried out. Differencesamong groups for each variable were verified usingANOVA. Additionally, we used DiscriminantAnalysis to give robustness to our segmentationof the sample.
5. Strategic groups in Spanish banking industry
5.1. Strategic groups based on marginal rates
Cluster Analysis results suggested that the sample should be divided into five strategic groups, as
Table 2Characterization of strategic groups based on marginal rates result
MANOVA; F(Wilks) 21.150 (p 0.000)Discriminant Analysis correctly classifies 89.9% of the sample
Strategic groups
1 2 3 4
S1/S2 2.1096 0.9580 1.6384 1(0.7971) (0.5683) (0.4645) (
S3/S1 9.6806 1.2872 3.5642 2(2.4085) (0.8744) (1.1232) (
S3/S2 2.3368 1.1042 1.3240 1(1.2862) (0.8996) (0.5534) (
S6/S5 2.1687 0.9446 1.9381 4(0.9928) (0.6139) (0.6879) (
S4/S2 1.9102 0.8683 1.5384 1(0.8685) (0.4589) (0.3770) (
S8/S7 1.7287 1.0113 1.6674 1(0.7798) (1.0956) (0.8861) (
R1/R2 3.7487 1.2360 2.9580 1(1.4311) (0.8207) (0.7203) (
R3/R2 4.1491 1.2312 3.1337 1(1.7492) (0.8255) (1.1734) (
ROA 0.0007 0.0083 0.0078 0(0.0082) (0.0054) (0.0071) (
ROE 0.0496 0.1509 0.1137 0(0.0977) (0.0820) (0.0687) (
GP/OM 0.0824 0.3177 0.2766 0(0.4986) (0.1345) (0.1586) (
# DMUs 6 26 36 2Commercial banks 6 19 19 3Savings banks 7 17 2
Standard deviations are seen in parentheses.S1: (commercial loans)/(financial investments). S2: (portfolio of secments). S4: (commissions)/(products of financial activity). S5: (Savinfinancial markets)/(total liabilities). S7: geographical reach. S8: custcredit quality. ROA: return on assets. ROE: return on equity. GP/O
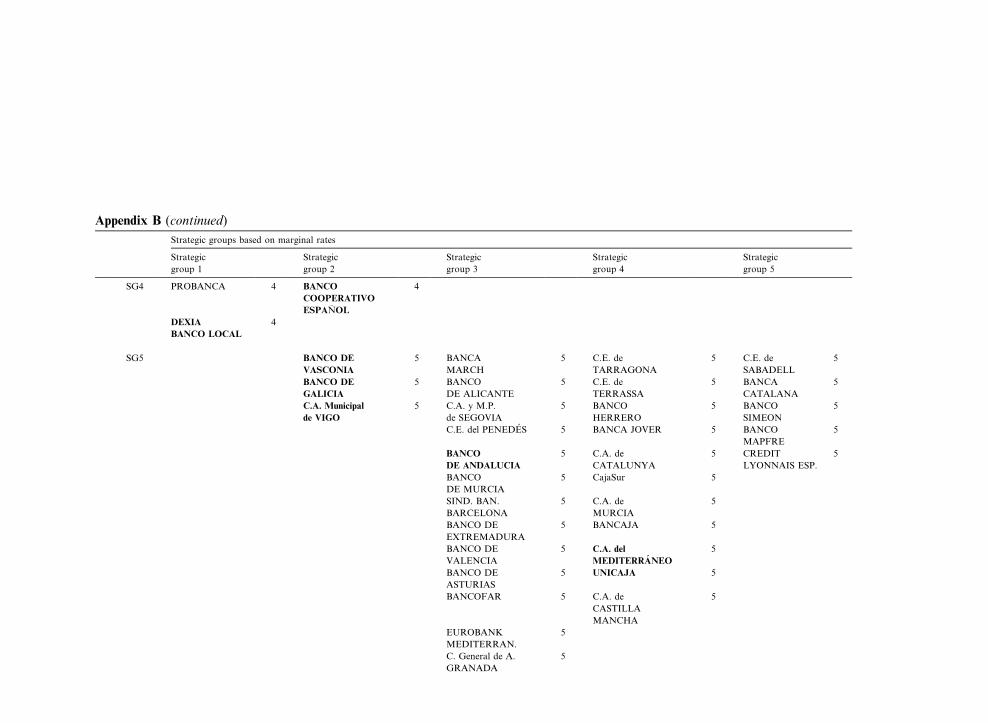
shown in Table 2. The detailed composition of thegroups can be found in Appendix B.Inspection of the centroids of each SG reveals
that, generally, SG2 has the lowest ratios, indicating lower costs of strategy change. This result isreasonable when we look at the type of firms thatmake up the group: they are principally largebanks and large Savings banks, which conformto the model of universal banking and have greatercapacity to change their strategies.At the other extreme, SG1 and SG5 (specialized
banking) have greater restrictions on changingtheir strategy in that they face greater costs ofchange. For SG1, the greater cost of change from
s of the MANOVA, ANOVA and Discriminant Analyses
ANOVA
5 Total F test p-Value
.4001 2.1156 1.5174 16.553 0.0000.3653) (0.5441) (0.6331)
.5602 3.3766 3.0999 57.257 0.0001.4628) (1.1701) (2.2063)
.4957 1.8613 1.4456 6.437 0.0000.2718) (0.5203) (0.7214)
.7350 2.6387 2.4581 55.386 0.0001.4310) (0.9588) (1.6493)
.3891 2.0121 1.4343 19.654 0.0000.2460) (0.5775) (0.5769)
.6158 5.1023 2.0067 47.060 0.0000.9778) (1.1582) (1.6418)
.4763 3.7971 2.3741 37.213 0.0000.7474) (1.0983) (1.3144)
.4847 3.8330 2.4602 29.182 0.0000.7404) (1.1306) (1.4892)
.0081 0.0060 0.0056 8.150 0.0000.0062) (0.0303) (0.0138)
.1497 0.0422 0.1168 6.502 0.0000.0827) (0.0996) (0.0896)
.3146 0.0448 0.2504 5.908 0.0000.1470) (0.3373) (0.2336)
5 16 109
15 62
2 1 47
urities)/(financial investments). S3: (treasury)/(financial invest-gs and deposit accounts)/(total liabilities). S6: (net position inomers proximity. R1: physical capital. R2: human capital. R3:M: (gross profit)/ordinary margin).
t
S
ctaetfljm
5o
tfsud
dsTiAaAotw
oihfua(ai
t
hr
b
commercial loans to treasury (high S3/S1 tradeoff) indicates that this group places higher valueon strategies oriented towards domestic economiesand SMEs than on avoiding risk and saving onoperating costs. SG1 places the greatest value onthe trade off between treasury and portfolio ofsecurities (S3/S2) than the other groups, reaffirming a risk taking approach. Further still, it is unlikely that SG1 can change its strategy frominvestment banking (S2) to commercial banking(S1) because for every reduction of one monetaryunit in their stocks portfolio, there are importantcompensations in terms of loans. In other words,for SG1, investments in securities are more valuable than money lending. This group also has thegreatest costs of strategy change from commercialloans (S1) to treasury (S3), from portfolio of securities (S2) to treasury (S3), from human resources(R2) to production technology (R1) and from human resources (R2) to credit quality (R3). Due tothe last trade off, this cluster could be labeled asrisky banking. Its high valuation of human capitalreinforces this business orientation, as we can seefrom the trade offs from physical capital (R1) tohuman capital (R2), and also, from credit quality(R3) to human capital (R2).SG5 can be labeled as wholesale banking. It is
characterized by a focus on geographical reachrather than concentration in a single province(high S7/S8 ratio). It also has the greatest costsof strategy change between the following pairs ofthe variables: commercial loans (S1) to portfolioof securities (S2), commissions (S4) to portfolioof securities (S2) and productive technology (R1)to human resources (R2). These ratios suggest thatSG5 values a strategy of security investment (S1)more than one of specializing in domestic economies and in SMEs (S2); and also more than theusual diversification of traditional banking (S4).SG3 and SG4 are in an intermediate situation
with regard to the costs of strategy change. Nevertheless, it is worth noting the difficulties that SG4faces to switch between traditional liabilities (S5)and financial intermediaries (S6) an understandable situation because this group is basically composed of Savings banks where Savings and depositaccounts play a dominant role in the compositionof liabilities. Thus, SG4 can be labeled as tradi
ional Savings banks. Finally, we can refer to theG3 as generalist banking.When we relate the capacity or costs of strategyhange to the indicators of results, we observe thathe SGs experiencing the greatest difficulties inttempting to change the orientation of their stratgies have, simultaneously, the worse results. Athe opposite extreme SG2, which had the greatestexibility in the orientation of its strategy, also enoys the best results. This observation holds noatter which indicator we use.
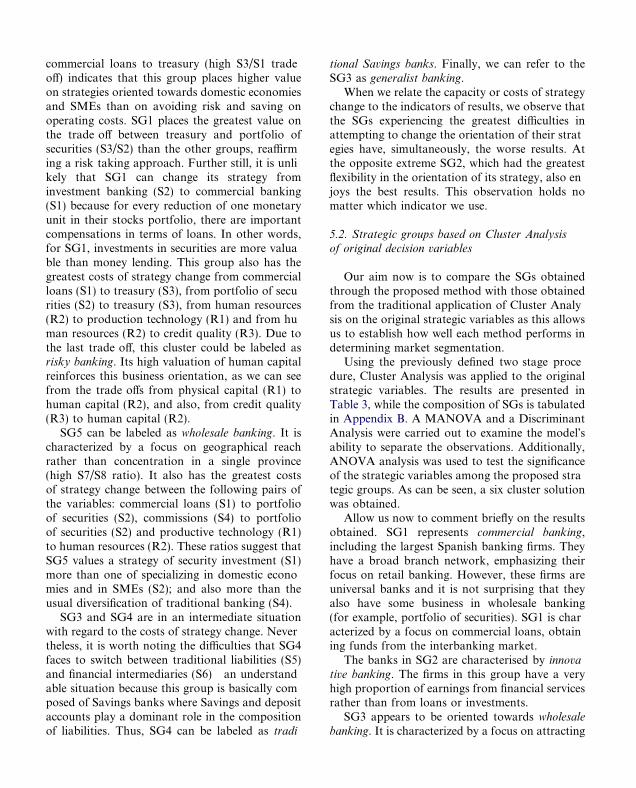
.2. Strategic groups based on Cluster Analysisf original decision variables
Our aim now is to compare the SGs obtainedhrough the proposed method with those obtainedrom the traditional application of Cluster Analyis on the original strategic variables as this allowss to establish how well each method performs inetermining market segmentation.Using the previously defined two stage proceure, Cluster Analysis was applied to the originaltrategic variables. The results are presented inable 3, while the composition of SGs is tabulatedn Appendix B. A MANOVA and a Discriminantnalysis were carried out to examine the model�sbility to separate the observations. Additionally,NOVA analysis was used to test the significancef the strategic variables among the proposed straegic groups. As can be seen, a six cluster solutionas obtained.Allow us now to comment briefly on the resultsbtained. SG1 represents commercial banking,ncluding the largest Spanish banking firms. Theyave a broad branch network, emphasizing theirocus on retail banking. However, these firms areniversal banks and it is not surprising that theylso have some business in wholesale bankingfor example, portfolio of securities). SG1 is charcterized by a focus on commercial loans, obtainng funds from the interbanking market.The banks in SG2 are characterised by innova
ive banking. The firms in this group have a veryigh proportion of earnings from financial servicesather than from loans or investments.SG3 appears to be oriented towards wholesaleanking. It is characterized by a focus on attracting
funds by means of sophisticated formulas and functioning as a resource to the interbankingmarket.Wealso find foreign banks, in SG3, that have a poor
on securities investments and on treasury. Wherethe strategy about liabilities is concerned, SG4banks capture funds using aggressive sophisticated
Table 3Characterization of strategic groups based on cluster analysis of original decision variables results of the MANOVA, ANOVA andDiscriminant Analyses
MANOVA; F(Wilks) 2.942 (p 0.000)Discriminant Analysis correctly classifies 95.6% of the sample
Strategic groups ANOVA
1 2 3 4 5 6 Total F test p-Value
S1 0.482 0.320 0.817 0.428 0.708 0.528 0.567 15.179 0.000(0.151) (0.106) (0.132) (0.357) (0.090) (0.188) (0.194)
S2 0.060 0.037 0.027 0.113 0.041 0.064 0.053 2.237 0.056(0.065) (0.038) (0.029) (0.091) (0.033) (0.045) (0.049)
S3 0.464 0.648 0.166 0.459 0.255 0.410 0.384 12.663 0.000(0.156) (0.117) (0.133) (0.447) (0.084) (0.186) (0.193)
S4 0.198 0.179 0.079 0.026 0.131 0.091 0.135 8.221 0.000(0.114) (0.106) (0.082) (0.017) (0.054) (0.038) (0.087)
S5 0.686 0.302 0.139 0.069 0.769 0.769 0.672 60.250 0.000(0.104) (0.141) (0.139) (0.077) (0.089) (0.138) (0.222)
S6 0.196 0.584 0.661 0.858 0.111 0.091 0.202 69.811 0.000(0.107) (0.145) (0.268) (0.073) (0.087) (0.089) (0.219)
S7 0.836 0.830 0.790 0.000 0.570 0.119 0.515 101.943 0.000(0.105) (0.108) (0.115) (0.000) (0.180) (0.124) (0.330)
S8 0.120 0.024 8.7E 5 9.8E 8 0.064 0.042 0.064 2.239 0.056(0.178) (0.067) (1.6E 4) (8.5E 8) (0.104) (0.047) (0.115)
R1 0.061 0.072 0.072 0.023 0.056 0.053 0.057 3.139 0.011(0.016) (0.021) (0.073) (0.016) (0.018) (0.019) (0.023)
R2 0.406 0.507 0.439 0.349 0.415 0.355 0.401 3.345 0.008(0.086) (0.106) (0.182) (0.172) (0.093) (0.112) (0.109)
R3 0.040 0.098 0.047 0.053 0.044 0.030 0.043 1.299 0.270(0.032) (0.180) (0.114) (0.019) (0.046) (0.059) (0.068)
ROA 0.0063 0.0003 0.0024 0.0040 0.0067 0.0063 0.0056 0.642 0.668(0.0050) (0.0049) (0.0078) (0.0089) (0.0081) (0.0230) (0.0138)
ROE 0.1348 0.0368 0.0448 0.0445 0.1221 0.1316 0.1168 2.816 0.020(0.0863) (0.0769) (0.1480) (0.0552) (0.0817) (0.0860) (0.0896)
GP/OM 0.2617 0.0781 0.0393 0.2782 0.2496 0.3184 0.2504 2.900 0.017(0.1206) (0.1543) (0.5511) (0.3694) (0.1518) (0.2925) (0.2336)
# DMUs 27 8 4 3 35 32 109
Commercial banks 19 8 4 3 18 8 62Savings banks 6 17 24 47
Standard deviations are seen in parentheses.S1: (commercial loans)/(financial investments). S2: (portfolio of securities)/(financial investments). S3: (treasury)/(financial invest-ments). S4: (commissions)/(products of financial activity). S5: (Savings and deposit accounts)/(total liabilities). S6: (net position infinancial markets)/(total liabilities). S7: geographical reach. S8: customers proximity. R1: physical capital. R2: human capital. R3:credit quality. ROA: return on assets. ROE: return on equity. GP/OM: (gross profit)/ordinary margin).
market quota despite a broad geographical reach,a patternpossibly following the lead of foreign firms.The key feature of SG4 is investment banking.
Rather than commercial loans, this SG is focused
formulas. They are also sparsely spread acrossgeographical markets.The orientation in SG5 is intermediation bank
ing: SG5members generally capture funds through
tcRi
tSvcvfmts4fit
mtp1tgStottpHgftgo
traditional and conservative formulas (Savingsand deposit accounts of the private sector), whichthey then convert into commercial loans. This is,clearly, a low risk strategy.Finally, SG6 clusters small Savings banks,
where Savings and deposits accounts occupy adominant place. Furthermore, other key characteristics of their strategy are high security investments most likely in SMEs, some commercialactivity and treasury endowments and no risk.The firms in this group are small, both in physicaland human capital terms.From the point of view of the performance
group membership linkage, a look at the resultsin Table 3 suggests that there are no substantialperformance differentials across groups. More specifically, the ANOVA test shows that groupsformed by clustering on the original variables donot exhibit significant differences for the ROA (return on assets). In contrast, for the ROE (returnon equity) and the GP/OM (gross profit/ordinarymargin), the group differences are significant atthe 5% level.
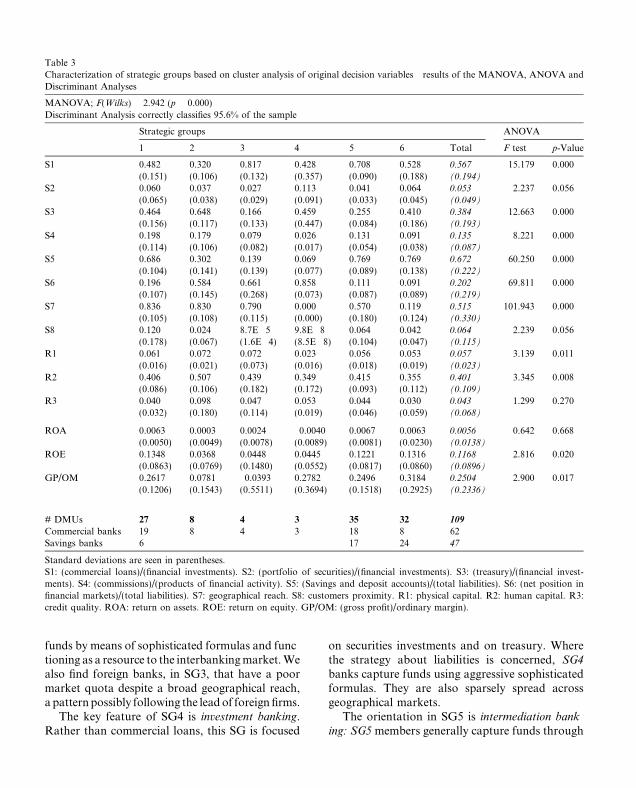
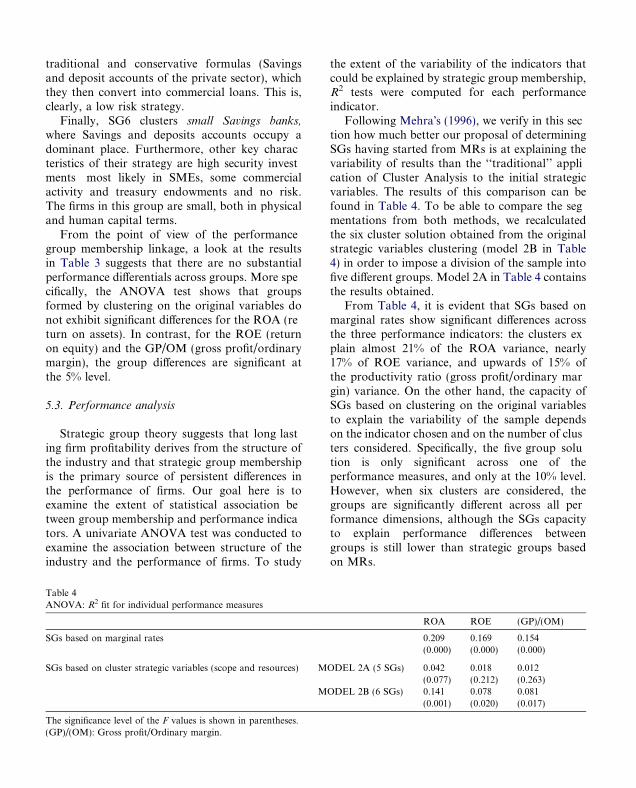
5.3. Performance analysis
Strategic group theory suggests that long lasting firm profitability derives from the structure ofthe industry and that strategic group membershipis the primary source of persistent differences inthe performance of firms. Our goal here is toexamine the extent of statistical association between group membership and performance indicators. A univariate ANOVA test was conducted toexamine the association between structure of theindustry and the performance of firms. To study
Table 42
ANOVA: R fit for individual performance measuresSGs based on marginal rates
SGs based on cluster strategic variables (scope and resources) MO
MO
The significance level of the F values is shown in parentheses.(GP)/(OM): Gross profit/Ordinary margin.
he extent of the variability of the indicators thatould be explained by strategic group membership,2 tests were computed for each performancendicator.Following Mehra�s (1996), we verify in this sec
ion how much better our proposal of determiningGs having started from MRs is at explaining theariability of results than the ‘‘traditional’’ appliation of Cluster Analysis to the initial strategicariables. The results of this comparison can beound in Table 4. To be able to compare the segentations from both methods, we recalculatedhe six cluster solution obtained from the originaltrategic variables clustering (model 2B in Table) in order to impose a division of the sample intove different groups. Model 2A in Table 4 containshe results obtained.From Table 4, it is evident that SGs based onarginal rates show significant differences acrosshe three performance indicators: the clusters exlain almost 21% of the ROA variance, nearly7% of ROE variance, and upwards of 15% ofhe productivity ratio (gross profit/ordinary marin) variance. On the other hand, the capacity ofGs based on clustering on the original variableso explain the variability of the sample dependsn the indicator chosen and on the number of clusers considered. Specifically, the five group soluion is only significant across one of theerformance measures, and only at the 10% level.owever, when six clusters are considered, theroups are significantly different across all perormance dimensions, although the SGs capacityo explain performance differences betweenroups is still lower than strategic groups basedn MRs.
ROA ROE (GP)/(OM)
0.209 0.169 0.154(0.000) (0.000) (0.000)
DEL 2A (5 SGs) 0.042 0.018 0.012(0.077) (0.212) (0.263)
DEL 2B (6 SGs) 0.141 0.078 0.081(0.001) (0.020) (0.017)
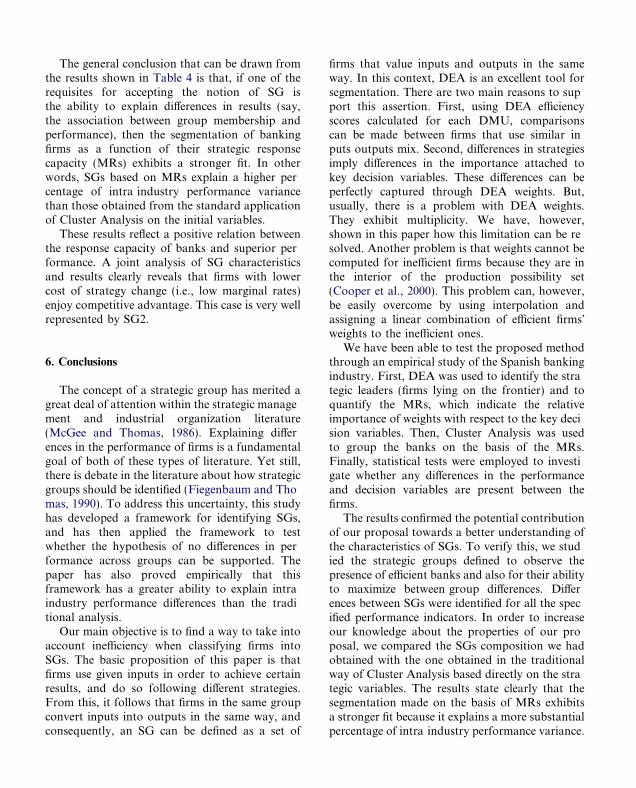
The general conclusion that can be drawn fromthe results shown in Table 4 is that, if one of therequisites for accepting the notion of SG isthe ability to explain differences in results (say,the association between group membership andperformance), then the segmentation of bankingfirms as a function of their strategic responsecapacity (MRs) exhibits a stronger fit. In otherwords, SGs based on MRs explain a higher percentage of intra industry performance variancethan those obtained from the standard applicationof Cluster Analysis on the initial variables.These results reflect a positive relation between
the response capacity of banks and superior performance. A joint analysis of SG characteristicsand results clearly reveals that firms with lowercost of strategy change (i.e., low marginal rates)enjoy competitive advantage. This case is very wellrepresented by SG2.
6. Conclusions
The concept of a strategic group has merited agreat deal of attention within the strategic management and industrial organization literature(McGee and Thomas, 1986). Explaining differences in the performance of firms is a fundamentalgoal of both of these types of literature. Yet still,there is debate in the literature about how strategicgroups should be identified (Fiegenbaum and Thomas, 1990). To address this uncertainty, this studyhas developed a framework for identifying SGs,and has then applied the framework to testwhether the hypothesis of no differences in performance across groups can be supported. Thepaper has also proved empirically that thisframework has a greater ability to explain intraindustry performance differences than the traditional analysis.Our main objective is to find a way to take into
account inefficiency when classifying firms intoSGs. The basic proposition of this paper is thatfirms use given inputs in order to achieve certainresults, and do so following different strategies.From this, it follows that firms in the same groupconvert inputs into outputs in the same way, andconsequently, an SG can be defined as a set of
firms that value inputs and outputs in the sameway. In this context, DEA is an excellent tool forsegmentation. There are two main reasons to support this assertion. First, using DEA efficiencyscores calculated for each DMU, comparisonscan be made between firms that use similar inputs outputs mix. Second, differences in strategiesimply differences in the importance attached tokey decision variables. These differences can beperfectly captured through DEA weights. But,usually, there is a problem with DEA weights.They exhibit multiplicity. We have, however,shown in this paper how this limitation can be resolved. Another problem is that weights cannot becomputed for inefficient firms because they are inthe interior of the production possibility set(Cooper et al., 2000). This problem can, however,be easily overcome by using interpolation andassigning a linear combination of efficient firms�weights to the inefficient ones.We have been able to test the proposed method
through an empirical study of the Spanish bankingindustry. First, DEA was used to identify the strategic leaders (firms lying on the frontier) and toquantify the MRs, which indicate the relativeimportance of weights with respect to the key decision variables. Then, Cluster Analysis was usedto group the banks on the basis of the MRs.Finally, statistical tests were employed to investigate whether any differences in the performanceand decision variables are present between thefirms.The results confirmed the potential contribution
of our proposal towards a better understanding ofthe characteristics of SGs. To verify this, we studied the strategic groups defined to observe thepresence of efficient banks and also for their abilityto maximize between group differences. Differences between SGs were identified for all the specified performance indicators. In order to increaseour knowledge about the properties of our proposal, we compared the SGs composition we hadobtained with the one obtained in the traditionalway of Cluster Analysis based directly on the strategic variables. The results state clearly that thesegmentation made on the basis of MRs exhibitsa stronger fit because it explains a more substantialpercentage of intra industry performance variance.
pidtfuture.
A
liv
M
s
bwttspsttpa
M
s
ebmow
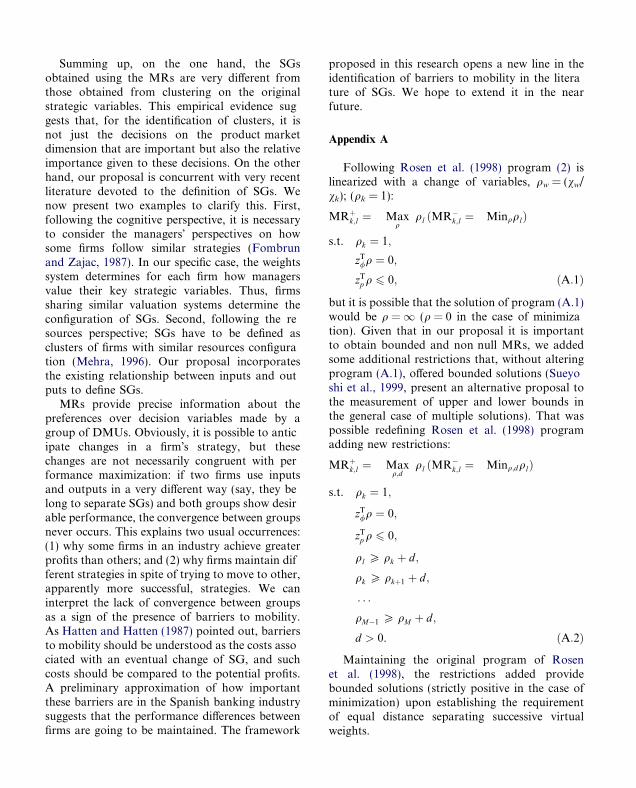
Summing up, on the one hand, the SGsobtained using the MRs are very different fromthose obtained from clustering on the originalstrategic variables. This empirical evidence suggests that, for the identification of clusters, it isnot just the decisions on the product marketdimension that are important but also the relativeimportance given to these decisions. On the otherhand, our proposal is concurrent with very recentliterature devoted to the definition of SGs. Wenow present two examples to clarify this. First,following the cognitive perspective, it is necessaryto consider the managers� perspectives on howsome firms follow similar strategies (Fombrunand Zajac, 1987). In our specific case, the weightssystem determines for each firm how managersvalue their key strategic variables. Thus, firmssharing similar valuation systems determine theconfiguration of SGs. Second, following the resources perspective; SGs have to be defined asclusters of firms with similar resources configuration (Mehra, 1996). Our proposal incorporatesthe existing relationship between inputs and outputs to define SGs.MRs provide precise information about the
preferences over decision variables made by agroup of DMUs. Obviously, it is possible to anticipate changes in a firm�s strategy, but thesechanges are not necessarily congruent with performance maximization: if two firms use inputsand outputs in a very different way (say, they belong to separate SGs) and both groups show desirable performance, the convergence between groupsnever occurs. This explains two usual occurrences:(1) why some firms in an industry achieve greaterprofits than others; and (2) why firms maintain different strategies in spite of trying to move to other,apparently more successful, strategies. We caninterpret the lack of convergence between groupsas a sign of the presence of barriers to mobility.As Hatten and Hatten (1987) pointed out, barriersto mobility should be understood as the costs associated with an eventual change of SG, and suchcosts should be compared to the potential profits.A preliminary approximation of how importantthese barriers are in the Spanish banking industrysuggests that the performance differences betweenfirms are going to be maintained. The framework
roposed in this research opens a new line in theentification of barriers to mobility in the literaure of SGs. We hope to extend it in the near
ppendix A
Following Rosen et al. (1998) program (2) isnearized with a change of variables, qw = (vw/k); (qk = 1):
Rþk;l ¼ Max
qql ðMR�
k;l ¼ MinqqlÞ
.t. qk ¼ 1;zT/q ¼ 0;zTp q 6 0; ðA:1Þ
ut it is possible that the solution of program (A.1)ould be q =1 (q = 0 in the case of minimizaion). Given that in our proposal it is importanto obtain bounded and non null MRs, we addedome additional restrictions that, without alteringrogram (A.1), offered bounded solutions (Sueyohi et al., 1999, present an alternative proposal tohe measurement of upper and lower bounds inhe general case of multiple solutions). That wasossible redefining Rosen et al. (1998) programdding new restrictions:
Rþk;l ¼ Max
q;dql ðMR�
k;l ¼ Minq;dqlÞ
.t. qk ¼ 1;
zT/q ¼ 0;
zTp q 6 0;
ql P qk þ d;
qk P qkþ1 þ d;
. . .
qM�1 P qM þ d;
d > 0. ðA:2Þ
Maintaining the original program of Rosent al. (1998), the restrictions added provideounded solutions (strictly positive in the case ofinimization) upon establishing the requirementf equal distance separating successive virtualeights.
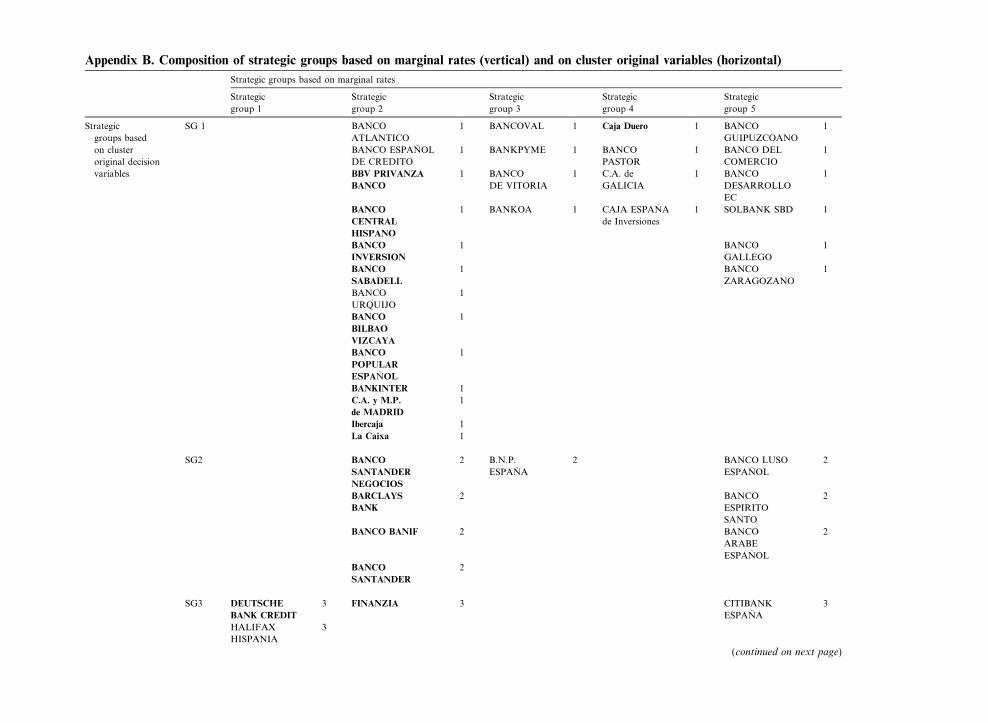
Appendix B. Composition of strategic groups based on marginal rates (vertical) and on cluster original variables (horizontal)
Strategic groups based on marginal rates
Strategic
group 1
Strategic
group 2
Strategic
group 3
Strategic
group 4
Strategic
group 5
Strategic
groups based
on cluster
original decision
variables
SG 1 BANCO
ATLANTICO
1 BANCOVAL 1 Caja Duero 1 BANCO
GUIPUZCOANO
1
BANCO ESPANOL
DE CREDITO
1 BANKPYME 1 BANCO
PASTOR
1 BANCO DEL
COMERCIO
1
BBV PRIVANZA
BANCO
1 BANCO
DE VITORIA
1 C.A. de
GALICIA
1 BANCO
DESARROLLO
EC
1
BANCO
CENTRAL
HISPANO
1 BANKOA 1 CAJA ESPANA
de Inversiones
1 SOLBANK SBD 1
BANCO
INVERSION
1 BANCO
GALLEGO
1
BANCO
SABADELL
1 BANCO
ZARAGOZANO
1
BANCO
URQUIJO
1
BANCO
BILBAO
VIZCAYA
1
BANCO
POPULAR
ESPANOL
1
BANKINTER 1
C.A. y M.P.
de MADRID
1
Ibercaja 1
La Caixa 1
SG2 BANCO
SANTANDER
NEGOCIOS
2 B.N.P.
ESPANA
2 BANCO LUSO
ESPANOL
2
BARCLAYS
BANK
2 BANCO
ESPIRITO
SANTO
2
BANCO BANIF 2 BANCO
ARABE
ESPANOL
2
BANCO
SANTANDER
2
SG3 DEUTSCHE
BANK CREDIT
3 FINANZIA 3 CITIBANK
ESPANA
3
HALIFAX
HISPANIA
3
(continued on next page)
Appendix B (continued)
Strategic groups based on marginal rates
Strategic
group 1
Strategic
group 2
Strategic
group 3
Strategic
group 4
Strategic
group 5
SG4 PROBANCA 4 BANCO
COOPERATIVO
ESPANOL
4
DEXIA
BANCO LOCAL
4
SG5 BANCO DE
VASCONIA
5 BANCA
MARCH
5 C.E. de
TARRAGONA
5 C.E. de
SABADELL
5
BANCO DE
GALICIA
5 BANCO
DE ALICANTE
5 C.E. de
TERRASSA
5 BANCA
CATALANA
5
C.A. Municipal
de VIGO
5 C.A. y M.P.
de SEGOVIA
5 BANCO
HERRERO
5 BANCO
SIMEON
5
C.E. del PENEDES 5 BANCA JOVER 5 BANCO
MAPFRE
5
BANCO
DE ANDALUCIA
5 C.A. de
CATALUNYA
5 CREDIT
LYONNAIS ESP.
5
BANCO
DE MURCIA
5 CajaSur 5
SIND. BAN.
BARCELONA
5 C.A. de
MURCIA
5
BANCO DE
EXTREMADURA
5 BANCAJA 5
BANCO DE
VALENCIA
5 C.A. del
MEDITERRANEO
5
BANCO DE
ASTURIAS
5 UNICAJA 5
BANCOFAR 5 C.A. de
CASTILLA
MANCHA
5
EUROBANK
MEDITERRAN.
5
C. General de A.
GRANADA
5

C.A. Provincial
PONTEVEDRA
5
CAJA SAN
FERNANDO
5
M.P. y C.A. HUEL.
SEVILLA
5
SG6 BANCO
UNIVERSAL
6 BANCO DIRECTO 6 BANCO
CONDAL
6 M.P. y C. General
de BADAJOZ
6 OPEN BANK 6
SDAD.ESP.BAN.
NEGOCIOS
6 C.A. y M.P. del
C.C.O. de BURGOS
6 BANCO
ETCHEVERRIA
6 C.E. de GIRONA 6
C.A. Municipal
de BURGOS
6 BANCA
PUEYO
6 C.A. de ASTURIAS 6
Caja Vital 6 BANCO
ALCALA
6 C.A. y M.P.
de las BALEARES
6
C.A. y Prestamos
de CARLET
6 C.A. de NAVARRA 6
C.A. Prov.
GUADALAJARA
6 C. General de A.
de CANARIAS
6
C.A. de LA RIOJA 6 C.A. de
SANTANDER-
CANT
6
C.E. de MANRESA 6 BILBAO BIZKAIA
KUTXA
6
C.E. LAIETANA 6 C.A. y M.P.
de EXTREMADURA
6
C.A. y M.P
de ONTINYENT
6 C.A. GIPUZ.
SAN SEBAS
6
C.A. Provincial
de ORENSE
6
C.A. y M.P. Mun.
PAMPLONA
6
C.A. de POLLENCA 6
C.A. de la INMA.
ARAGON
6
C. Provincial
de A. de JAEN
6
In bold are shown the strategic leaders.
R
A
B
C
C
C
C
C
C
D
D
D
F
F
G
H
H
H
H
K
M
M
P
P
P
P
P
R
S
T
W
eferences
ndersen, P., Petersen, N.C., 1993. A procedure for rankingefficient units in data envelopment analysis. ManagementScience 39 (10), 1261 1264.
arney, J.B., Hoskisson, R.E., 1990. Strategic groups: Untestedassertions and research proposals. Managerial and DecisionEconomics 11 (3), 187 198.
anals, J., 1994. Competitive Strategies in European Banking.Claredon Press, Oxford.
aves, R.E., Porter, M.E., 1977. From entry barriers tomobility barriers: Conjectural decisions and contriveddeterrence to new competition. Quarterly Journal of Economics 91 (2), 421 441.
harnes, A., Cooper, W.W., Rhodes, E., 1978. Measuring theefficiency of decisions making units. European Journal ofOperational Research 6 (2), 429 444.
ooper, W.W., Park, K.S., Pastor, J.T., 2000. Marginal ratesand elasticities of substitution with additive models in DEA.Journal of Productivity Analysis 13 (2), 105 123.
ooper, W.W., Seiford, L.M., Tone, K., 2000. Data Envelopment Analysis: A Comprehensive Text with Models,Applications, References and Dea solver Software. KluwerAcademic Publishers, Boston/Dordrecht/London.
ool, K.O., Schendel, D., 1987. Strategic group formation andperformance: The case of the US Pharmaceutical Industry,1963 1982. Management Science 33 (9), 1102 1124.ay, D.L., Lewin, A.Y., Li, H., Salazar, R., 1994. Strategicleaders or strategic groups: A longitudinal analysis ofoutliers. In: Charnes, A., Cooper, W.W., Lewin, A.Y.,Seiford, L.M. (Eds.), Data Envelopment Analysis Theory,Methodology and Applications. Kluwer Academic Publishers, Boston/Dordrecht/London, pp. 211 234.ay, D.L., Lewin, A.Y., Li, H., 1995. Strategic leaders orstrategic groups: A longitudinal data envelopment analysisof the US brewing industry. European Journal of Operational Research 80 (3), 619 638.ierickx, I., Cool, K.O., 1989. Asset stock accumulation andsustainability of competitive advantage. Management Science 35 (12), 1504 1513.
iegenbaum, A., Thomas, H., 1990. Strategic groups andperformance: The US Insurance Industry, 1970 1984.Strategic Management Journal 11 (3), 197 215.
ombrun, C.J., Zajac, E.J., 1987. Structural and perceptual
influences on intraindustry stratification. Academy ofManagement Journal 30 (1), 33 50.rifell Tatje, E., Lovell, C.A.K., 1997. The sources of productivity change in Spanish banking. European Journal ofOperational Research 98 (2), 364 380.W
arrigan, K.R., 1985. An application of clustering for strategicgroup analysis. Strategic Management Journal 6 (1), 55 73.atten, K.J., Hatten, M.L., 1987. Strategic groups, asymmetrical mobility barriers and contestability. Strategic Management Journal 8 (4), 329 342.ofer, C., Schendel, D., 1978. Strategy Formulation: AnalyticalConcepts. West Publishing, St. Paul.unt, M.S., 1972. Competition in the Major House ApplianceIndustry 1960 1970, unpublished doctoral dissertation,Harvard University.etchen, D.J., Shook, C., 1996. The application of clusteranalysis in strategic management research: An analysis andcritique. Strategic Management Journal 17 (6), 441 458.cGee, J., Thomas, H., 1986. Strategic groups: Theory,research and taxonomy. Strategic Management Journal 7(2), 141 160.ehra, A., 1996. Resource and market based determinants ofperformance in the US banking industry. Strategic Management Journal 17 (4), 307 322.
astor, J.M., Perez, F., Quesada, J., 1997. Efficiency analysis inbanking firms: An international comparison. EuropeanJournal of Operational Research 98 (2), 395 407.
orter, M.E., 1979. The structure within industries and companies performance. Review of Economics and Statistics 61(2), 224 227.
orter, M.E., 1980. Competitive Strategy. Free Press, NewYork.
rior, D., 2003. Long and short run nonparametric costfrontier efficiency: An application to Spanish savings banks.Journal of Banking and Finance 27 (4), 107 123.
unj, G., Stewart, D.W., 1983. Cluster analysis in marketingresearch: Review and suggestions for application. Journal ofMarketing Research 20 (2), 134 148.osen, D., Schaffnit, C., Paradi, J.C., 1998. Marginal rates andtwo dimensional level curves in DEA. Journal of Productivity Analysis 9 (3), 205 232.
ueyoshi, T., Ohnishi, K., Kinase, Y., 1999. A benchmarkapproach for baseball evaluation. European Journal ofOperational Research 115 (3), 429 448.
homas, H., Venkatraman, N., 1988. Research on strategicgroups: Progress and prognosis. Journal of ManagementStudies 25 (6), 537 555.ilson, P.W., 1995. Detecting influential observations in dataenvelopment analysis. The Journal of Productivity Analysis6 (1), 27 45.
alter, I., 1988. Competitive performance and strategic positioning in international financial services. In: Lamb, R.,Shrivastava, P. (Eds.), Advances in Strategic Management,vol. 5. JAI Press, Greenwich and London, pp. 69 87.