strain-driven noncollinear magnetic ordering in orthorhombic epitaxial ymno3 thin films
TRANSCRIPT
1
Published in J. Appl. Phys. 108, 123917 (2010)
Strain-driven non-collinear magnetic ordering in orthorhombic epitaxial YMnO3
thin films
X. Marti1, V. Skumryev2,3, V. Laukhin1,2, R. Bachelet1, C. Ferrater4, M.V. García-
Cuenca4, M. Varela4, F. Sánchez1, J. Fontcuberta1
1 Institut de Ciència de Materials de Barcelona (ICMAB-CSIC), Campus UAB, 08193
Bellaterra, Spain 2 Institució Català de Recerca i Estudis Avançats, Lluís Companys 23, 08010 Barcelona,
Spain 3 Universitat Autònoma de Barcelona, Dept. Física, Campus UAB, 08193 Bellaterra,
Spain 4 Universitat de Barcelona, Dept. Física Aplicada i Òptica, Martí i Franquès 1, 08028,
Barcelona, Spain
We show that using epitaxial strain and chemical pressure in orthorhombic
YMnO3 and Co-substituted (YMn0.95Co0.05O3) thin films, a ferromagnetic
response can be gradually introduced and tuned. These results, together with
the measured anisotropy of the magnetic response, indicate that the
unexpected observation of ferromagnetism in orthorhombic o-RMnO3 (R=
Y, Ho, Tb, etc) films originates from strain-driven breaking of the fully
compensated magnetic ordering by pushing magnetic moments away from
the antiferromagnetic [010] axis. We show that the resulting canting angle
and the subsequent ferromagnetic response, gradually increase (up to ~ 1.2º)
by compression of the unit cell. We will discuss the relevance of these
findings, in connection to the magnetoelectric response of orthorhombic
manganites.
PACS: 75.70.Ak, 75.25.+z, 75.50.Ee, 75.80.+q
2
I. INTRODUCTION
Multiferroic materials are being intensively investigated due to their potential
application in spintronics. Particularly relevant is the recent discovery that pronounced
dielectric anomalies or even ferroelectricity can be obtained, in the so-called improper
ferroelectrics, subsequent to magnetic ordering (see for instance [1]). In this case, either
particular non-collinear magnetic structures (such as spiral order) or even collinear
ordering can lead to ferroelectricity. The best known examples for this class of materials
are probably the antiferromagnetic orthorhombic manganites (o-RMnO3) where,
depending on the Mn-O-Mn bond angle, different magnetic structures can be obtained
ranging from collinear (E-type AFM) such as observed in TmMnO3 [2] or HoMnO3 [3]
to sinusoidal or spiral as in YMnO3 [4] or TbMnO3 [5] respectively. Ferroelectricity has
been observed in all of them. Apart from these, let’s call them intrinsic ferroelectrics,
some particular type of domain walls, as recently emphasized by D. Komskii [1], can
also be the source of electric polarization and, in antiferromagnets, lead to magnetic
frustration and, eventually, to some ferromagnetic response. This novel approach may
have profound implications as it may constitute a new way to obtain improper
ferroelectric and, if domain walls in antiferromagnets were a source of incomplete
magnetic compensation, ferromagnetism and ferroelectricity would be intimately linked.
From these considerations it follows that epitaxial thin films of
antiferromagnetic o-RMnO3 oxides offer unique opportunities to tailor the magnetic
structure eventually breaking antiferromagnetic ordering and lowering its symmetry or
even engineering crystal domains and/or magnetic domain walls. Indeed, recent results
in o-RMnO3 thin films [6-13] brought the unexpected observation of spontaneous
magnetization, in the following labelled as weak-ferromagnetism (w-FM), in what it
was supposed to be antiferromagnetic compounds. However, the understanding and
control of this w-FM has remained elusive: whereas earlier reports suggested strain-
driven effects [6-9], it has also been claimed that it could be originated from symmetry
breaking at domain walls [13]. The observation of w-FM in these materials may point to
the occurrence or modification of an eventual of magnetoelectric coupling. However,
the lack of a detailed understanding of the observed w-FM may have hampered its
exploitation to induce magnetoelectric response.
3
Here we will show that by an appropriate use of epitaxial strain, the magnetic
properties of o-YMnO3 can be gradually tuned into a spin-canted away from the b-axis
magnetic structure. In this manuscript we follow different strategies to allow fine tuning
of structural parameters and structural strain: (i) film-thickness variation, (ii, iii) growth
and annealing conditions and (iv) chemical composition (Co substitution). As 3d6-Co3+
ions have the same magnetic moment as 3d4-Mn3+ cations but smaller ionic radius,
partial substitution of Mn by Co is an additional fine-tuning tool for the shrinking of
unit cell and of the magnetic interactions. It will be shown that the (ferro)magnetic
response, that is the occurrence of a finite net magnetic moment, does not correlate with
the film roughness thus denying spin incomplete magnetic compensation at grain
boundaries as a source of w-FM. Detailed data analysis, particularly the observed
magnetic anisotropy, indicates that ferromagnetic response arises from strain-
unbalanced antiferromagnetic structure. Therefore, it follows that epitaxial strain can be
used to induce and tailor the ferromagnetic response in otherwise antiferromagnetic
materials, thus opening a way to obtain magnetic structures susceptible of tunable
magnetoelectric coupling. In fact, in a subset of the samples presented here, indications
of magnetoelectric coupling have been already reported [14]. Our findings, which
specifically refer to o-YMnO3, are not, however, restricted to this oxide as other oxide
thin films of the same o-RMnO3 family are expected to display a similar response.
II. EXPERIMENTAL
Thin films were deposited on [001] and [110]-oriented SrTiO3 (STO)
substrates by pulsed laser deposition. A KrF excimer laser beam (repetition rate of 5
Hz) was focused on stoichiometric YMnO3 (YMO) and YMn0.95Co0.05O3 (YMCO)
targets placed at a distance of 5 cm of the substrate. Samples were grown at 785 ºC and
PO2 in the 0.1 – 0.3 mbar range. By changing the number of laser pulses, samples with
different thickness (30 – 140 nm) were obtained. Details on YMO samples can be found
elsewhere [8,15]. Film thickness (t) was determined by X-ray reflectivity. X-ray
diffraction (XRD) measurements were carried out with a Philips’ Material Research
Diffractometer. Magnetic data were obtained using a Superconducting Quantum
Interference Device by Quantum Design. Atomic force microscopy images were
obtained with PicoSPM from Molecular Imaging.
III. RESULTS
4
A. Tuning the lattice parameters
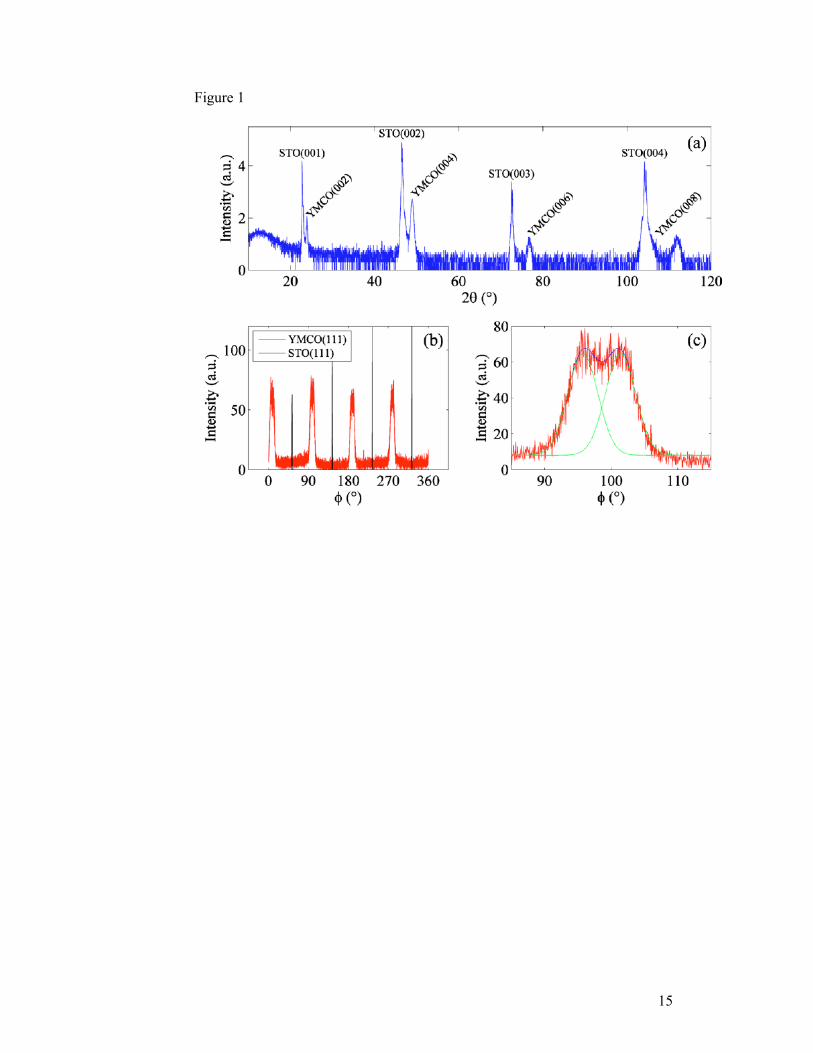
Fig. 1(a) shows the θ/2θ XRD scan for one illustrative YMCO sample,
showing only (00l) peaks (Pbnm setting of YMO) with no traces of other phases and/or
orientations. -scan (Fig. 1(b)) reveals that the film is epitaxial. The splitting observed
in the zoom of -scan (Fig. 1(c)) indicates the presence of two in-plane crystal domains,
90 degrees in-plane rotated, with the epitaxial relationships [100]YMCO//[110]STO and
[010]YMCO//[110]STO. The same crystal domain structure was observed in all YMCO
and YMO films [15].
We previously reported [8] that lattice parameters and cell volume of YMO
films change progressively with oxygen pressure during growth or increasing thickness.
Here we will show that lattice parameters of YMO can be changed also by Co-doping.
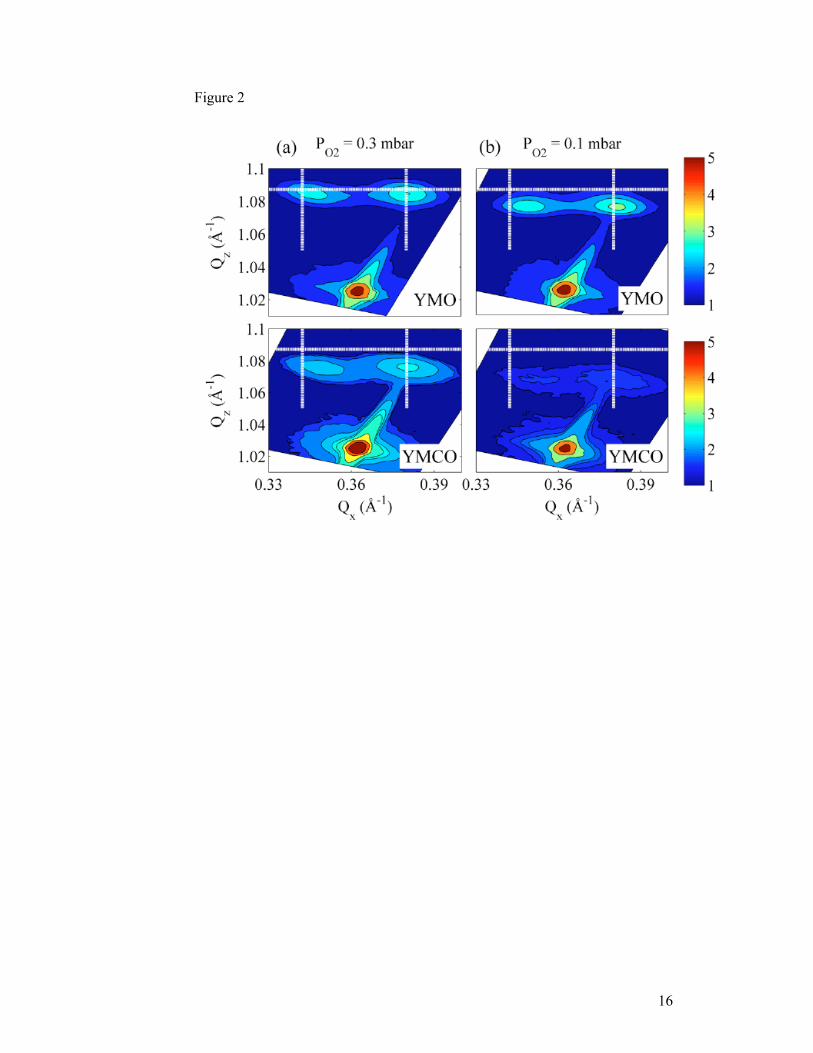
The reciprocal space maps around the (208) and (028) reflection for two pairs of YMO
and YMCO samples having the roughly same thicknesses (~ 140 nm) but grown under
distinct PO2 (0.3 and 0.1 mbar) are shown in Fig. 2 (panels a and b, respectively). Lines
in Fig. 2 indicate the corresponding position of bulk (208) and (028) reflection of YMO
[16]. We discuss first data corresponding to films prepared at the highest PO2 (Fig. 2(a)).
Regarding the in-plane H directions, it turns out that, in both compounds, the (208)
reflections appear at the bulk position, thus indicating that the cell along a is fully
relaxed. In contrast, when scanning along the in-plane K direction, it appears that the
(028) reflections are shifted towards higher K values. It indicates that both YMO and
YMCO films have smaller b parameters than bulk YMO; therefore their unit cells are
compressively strained along b. Regarding the out-of-plane direction L, data in Fig. 2(a)
indicate that the (208) and (028) reflections of both YMO and YMCO appear at smaller
L-values than bulk, thus indicating an expansion of the c parameter. In summary, the
epitaxial strain is anisotropic being tensile along [001], compressive along [010] and
negligible along [100]. By comparing data in Fig. 2 for YMCO and YMO films, it is
observed that shorter b and larger c and are obtained by partial Co-substitution. As a
result of the changes in the lattice parameters, the unit cell volume Vc(YMCO) is
smaller than that of Vc(YMO). For instance, for samples in Fig. 2(a), Vc(YMCO) =
223.19 Å3 and Vc(YMO) = 224.37 Å3, both visibly smaller (compressed) than the YMO
bulk value (226.47 Å3 [16]). Inspection of data of YMO and YMCO films prepared at
0.1 mbar (Fig 2(b)) indicate the very same trend although obviously the cell parameters
5
are different. Therefore, varying film thickness [8], growth conditions (PO2) and Co-
substitution, the cell parameters and unit cell volume can be varied at whish.
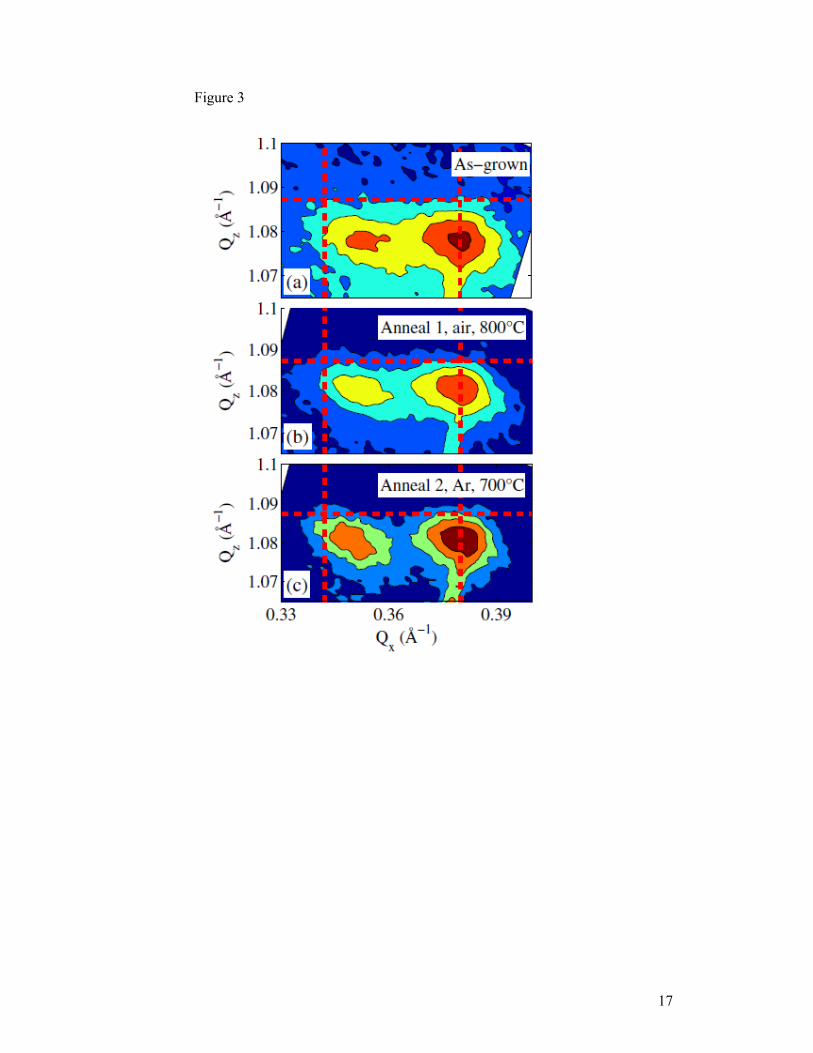
Post-growth annealing of the thin films is an alternative method to modify the
unit cell parameters. Annealings effects under air or Ar atmosphere were tested on a
YMO film relatively thin (30 nm) grown at 0.1 mbar PO2. A first annealing step (Anneal
1) was performed on air during 12 h at 800 ºC; in a second annealing step (Anneal 2)
the very same sample was annealed again for 2 h but in Ar atmosphere (0.1 mbar) at
700 ºC. The reciprocal space maps around the (208) and (028) YMO reflections were
recorded after each annealing step and are shown in the left and right columns of Fig. 3,
respectively. The bulk positions for the displayed diffraction spots are signalled by
vertical and horizontal lines. The vertical dashed line is a guide for the eye. Data show
that the a- and b-cell-parameter (H and K-directions) do not change appreciably by air
annealing (Anneal 1) and remain closely coincident with those of the as-grown YMO
film (top panels in Fig. 3) and bulk YMO. In contrast, the c cell parameter slightly
shortens and approaches the bulk value; in overall the unit cell is somewhat compressed
(0.05 %). Both oxygen uptake and plastic relaxation may contribute to the observed
behaviour. A later reducing (Ar atmosphere) annealing process (Anneal 2) of the same
sample promotes an expansion of the b-axis whereas the others (a and c) remain
virtually constant and thus some expansion of the unit cell (0.72 %) occurred suggesting
that desorption of oxygen may have occurred leading to an expansion of the unit cell
volume. In short, film annealing under distinct atmospheres provides an additional
tuning tool to modulate the cell parameters of YMO perovskite.
B. Magnetic properties versus lattice parameters
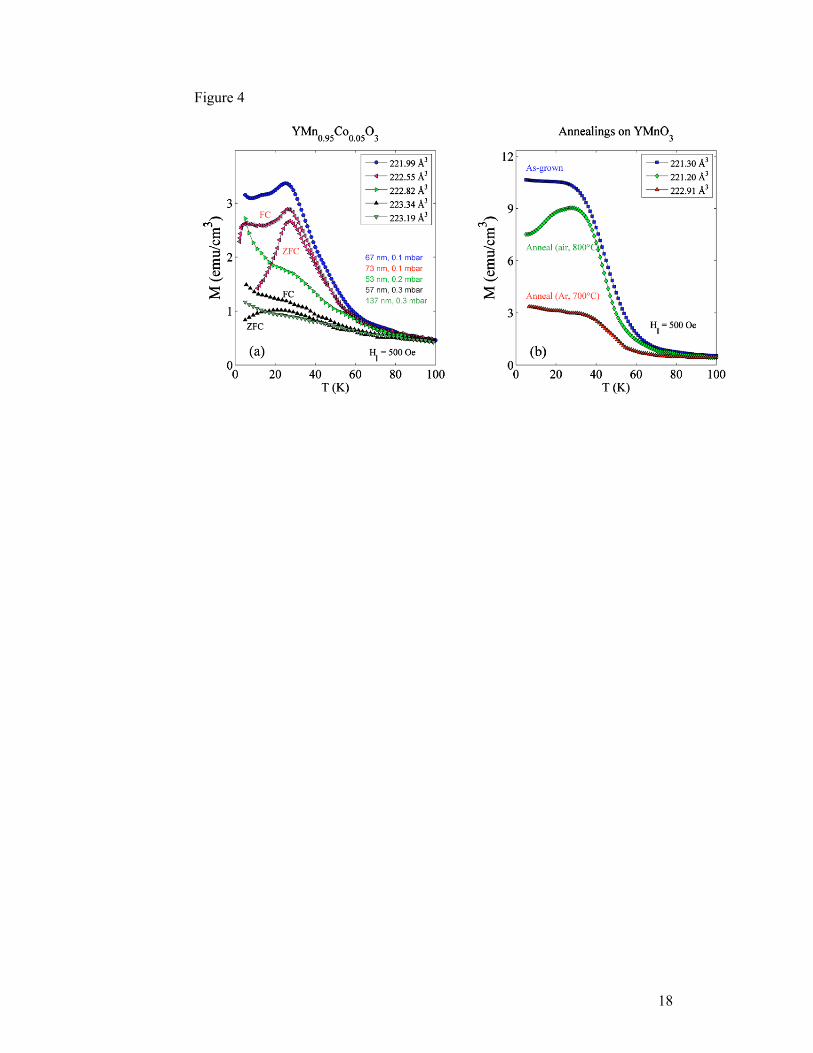
We now focus on the magnetic properties of the YMCO films. Detailed results
on strained YMO films can be found elsewhere [8]. Field-cooled (FC) and zero-field
cooled (ZFC) magnetization measurements have been performed in the 150 K to 5 K
temperature range with 500 Oe magnetic field applied in-plane of the sample. In Fig.
4(a) we include the FC data for selected samples (samples are labelled by the
corresponding Vc; the corresponding thickness (t) and used PO2 values, indicated in the
caption). The ZFC branches are shown, for sake of clarity, only for two samples.
Thermal ZFC-FC hysteresis is well evident at low temperature revealing the occurrence
of net magnetization below the antiferromagnetic ordering temperature signalled by a
kink well visible at TN ≈ 40 K. Data in Fig. 4(a) clearly shows that the low-temperature
6
FC magnetization, is much enhanced as Vc shrinks. This behaviour resembles the trend
we reported for the pure YMO films [8] where a correlation of net ferromagnetic
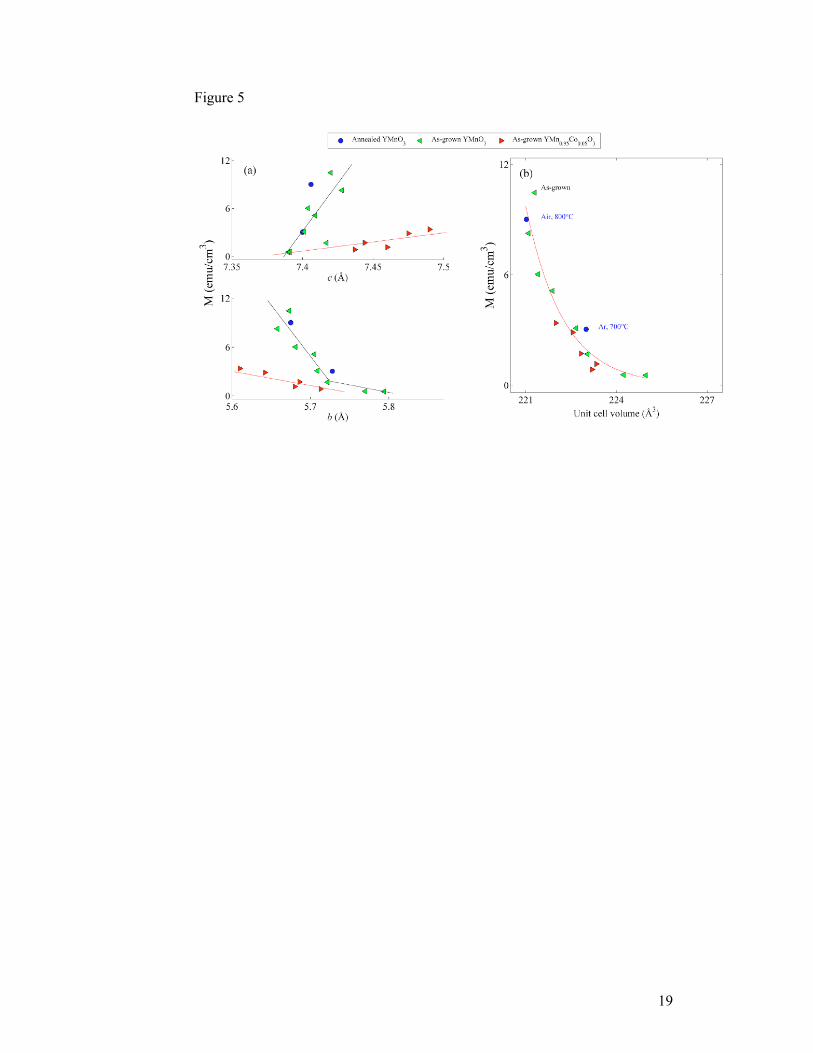
moment with the strain of the b parameter was found. To further determine if the
distortion along the modulation direction of the antiferromagnetic structure (b-axis) is
the only relevant parameter accounting for the observed response, we compare in Fig.
5(a) the FC magnetization at 25 K (measured at 500 Oe) versus b- and c- lattice
parameters; a is not discussed because, as shown above, for YMCO films, and in
agreement with previous results for YMO [8], it remains constant. Data in Fig. 5(a)
shows that for both c- and b- parameters (top and bottom panels respectively), a
monotonic increase of the magnetization is observed as b shrinks or c increases,
indicating that the more distorted the unit cell is, the stronger is the (ferro)magnetic
response. However, comparison of data for YMO and YMCO in Fig. 5(a) (bottom)
display distinct slopes in (M(25K, 500Oe) vs b) thus indicating that the observed w-FM
is not solely determined by the length of the b-axis. Most naturally, the contribution of
the modification of c (expansion) and a (constant) axis upon epitaxial and chemical
strain should be also included to get a measure of the overall distortion of the unit cell.
Note that the ground magnetic structures in bulk o-RMnO3 are essentially determined
by the Mn-O-Mn bonding angle and subsequent modification of the strength of the
competing magnetic interactions which should be modified through changes in both b
and c lattice parameters. Therefore, we chose the unit cell volume as the simplest
parameter to include all structural distortions and we plot in Fig. 5(b) M(25 K, 500Oe)
(accounting for net magnetic moment) versus Vc (accounting for unit cell distortion).
Collapsing of all data (corresponding to YMO, YMCO films of different thicknesses
and growth conditions) onto a single curve strongly indicates that the overall distortion
of the unit cell is determining the induced ferromagnetism rather than the simple
shrinking of the b-axis. Therefore we conclude that the observed w-FM results from
unbalanced magnetic Mn-O-Mn(Co) interactions by modification of bond length
topology along b and c due to epitaxial strain or chemical pressure.
It is worth mentioning that since unit cell volume for all films is slightly
smaller than the bulk, the eventual presence of oxygen vacancies are not expected to
play a major role. The annealing experiments discard absolutely oxygen vacancies as
cause of the observed w-FM. FC magnetization curves (H// = 500 Oe) measured for an
YMO sample before and after the annealing described in the previous section are given
in Fig. 4(b). Data show that, upon the Anneal 1 process (air, 800 ºC), the magnetization
7
slightly reduces as a result of the tiny changes in the lattice parameters. More noticeable
is the drastic reduction of susceptibility and thus of w-FM after Anneal 2 process (Ar,
700 ºC, favouring the creation of oxygen vacancies). In correspondence to the visible
expansion of the unit cell (Fig. 3), there is drop of over 60 % of the magnetization.
Importantly, the magnetic and structural data of these annealed films fall just on top of
the data shown in Fig. 5(b) for all films. We must therefore conclude that irrespective of
the method used to tune the lattice parameters (thickness and PO2 [8], chemical pressure
or annealing) the ferromagnetic response is ruled by the unit cell distortion.
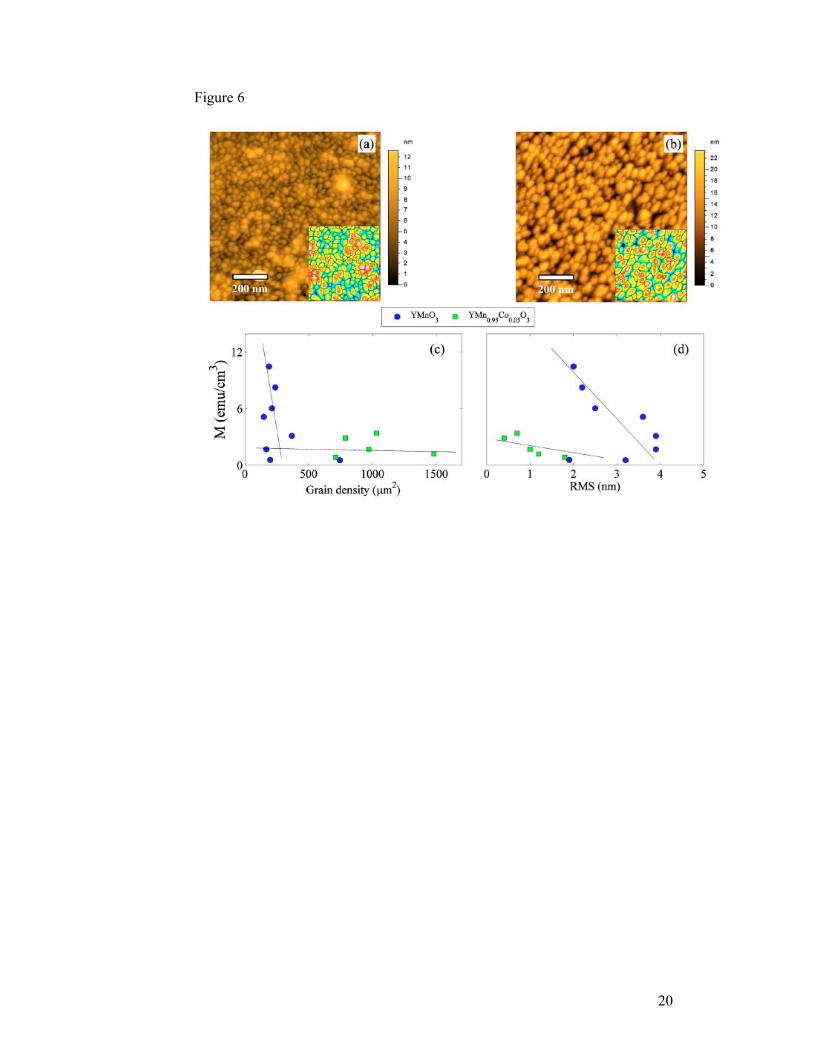
C. Magnetic properties versus surface morphology
Next, aiming to discriminate among strain and surface or domain boundaries as
a source of w-FM by spin disorder, as suggested in Ref. 16, we compare the magnetic
properties of films having distinct morphologies. Topographic images of representative
YMCO and YMO films are shown in Figs. 6(a) and 6(b) respectively. Magnetometry
revealed that the magnetization of the YMCO sample (0.84 emu/cm3) is significantly
smaller than in the YMO sample (3.11 emu/cm3). Both images display morphology of a
dense granular system with a significant quantitative difference: YMCO films are
formed by smaller grains and thus the grain density and the density of grain boundaries
are definitely larger than in YMO. If disorder at grain boundaries or surfaces were
relevant sources of net magnetization, one would expect M to increase with grain
density and roughness. The dependencies of the measured magnetization M(a25 K) on
grain density and roughness (root mean square, RMS) for all samples shown in Fig. 6(c)
and 6(d) clearly indicate the opposite trend, thus denying any important role of surface
or interface disorder as sources of w-FM.
D. Magnetic anisotropy
Finally, we focus on the anisotropy of the magnetic response. In the simplest
antiferromagnetic picture, a drop of magnetization below TN should occur if the
measurement is performed with H applied along the antiferromagnetic axis whereas
magnetization should remain constant if H is applied perpendicular to this axis. In
YMO, according to neutron diffraction experiments [4], the spins are confined along the
[010] direction with a sinusoidal modulation of their amplitude. We recall here that our
films contain two-type of in-plane domains with (a, b) axis rotated in-plane by 90º. In
this situation, when measuring in the plane of the sample along the two edges of the
8
substrate ([100]STO), H will be applied along the [110] direction of YMO, that is 45º
away from the spin modulation axis (b). On the other hand, in the out-of-plane
measurements, H is applied along the [001]YMO direction which is perpendicular to the
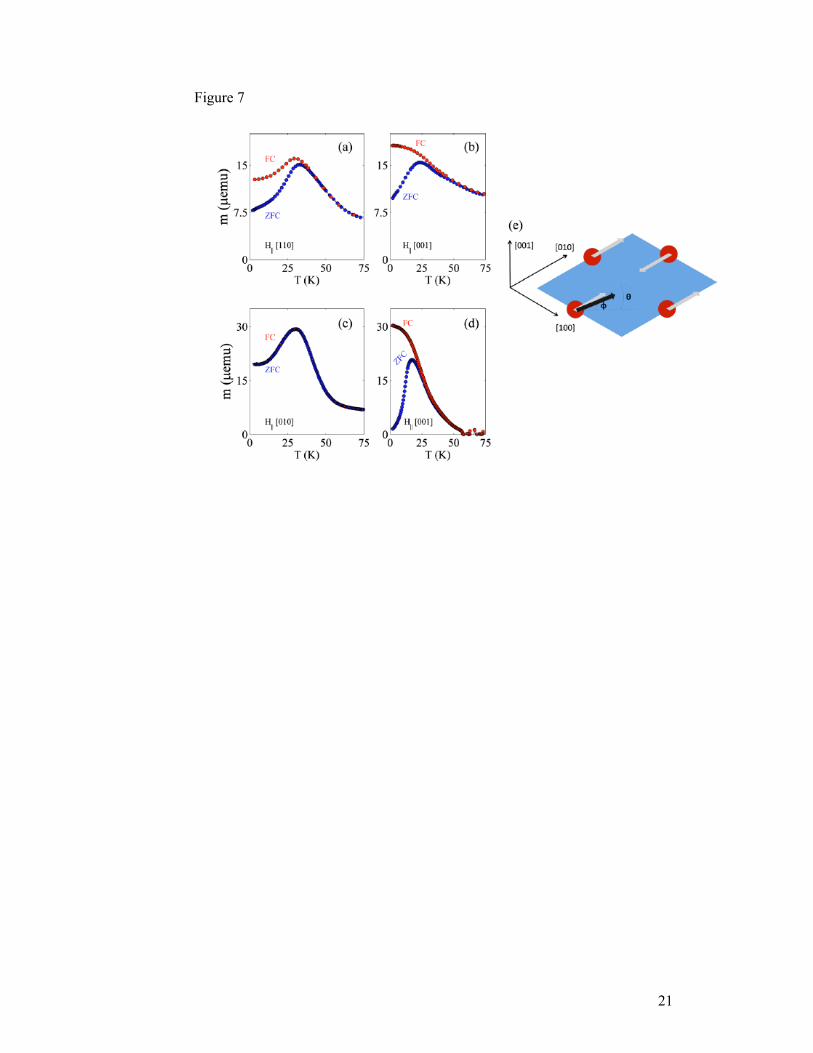
b direction. Figs. 7(a) and 7(b) display the ZFC-FC curves for the most strained YMO
sample we produced [8]. Notice that here magnetic moment rather than magnetization is
displayed to emphasize that the features described below are a genuine experimental
observation, not affected mass or volume normalization. Panels (a) and (b) correspond
to the in-plane and out-of-plane measurements, respectively, and are sketched in Fig.
7(e). Data show that in both measurements the ZFC-FC curves split at around TN ~ 40 K
indicating that the magnetic ordered state is not purely antiferromagnetic but a net
magnetic moment is present along the two measured directions. However, data shows a
clear FC drop in the measurement with H applied partially containing the [010]
direction (Fig. 7(a)) that resemble a measurement of a pure antiferromagnet when H is
along the antiferromagnetic axis. Although data supports the canted scenario sketched in
Fig. 6(e), in the set of films discussed so far is not possible a conclusive measurement
with H applied solely along the [010] direction due to the mixed contribution of two in-
plane crystal domains. To circumvent this problem we prepared strained single domain
films on STO(110) substrates. Details on the growth and structural characterization of
similar films are described elsewhere [15]. In these films, (100)-textured, the [010] and
[001] directions are contained in the plane of the sample. Measurements along [010] and
[001] directions with H applied in the plane of the sample are plotted in Figs. 7(c) and
7(d), respectively. There is a perfect match between the ZFC and FC magnetic moment
curves when H is applied along the [010] direction (Fig. 7(c)) indicating the absence of
remanent net magnetic moment along the mentioned direction. In all, data in Fig. 7
clearly show that the net magnetic moment is only observed when the magnetic field is
applied perpendicular to the spin-modulation, [010], direction.
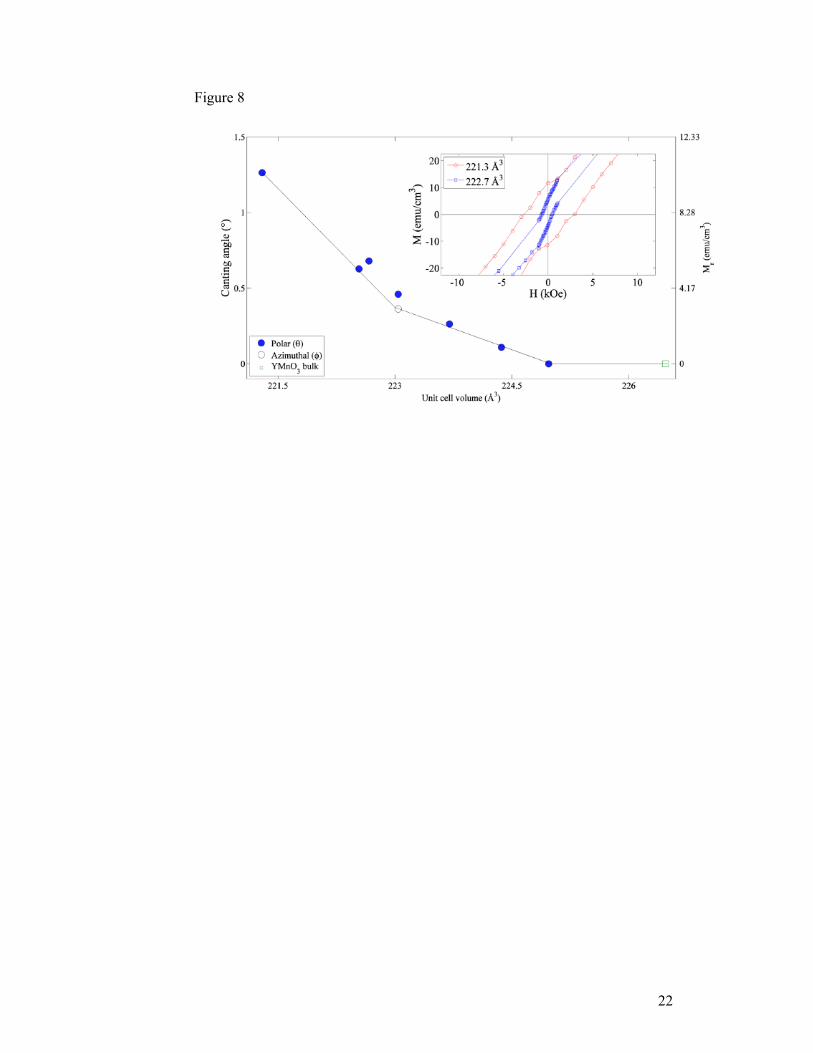
The average departure of the magnetic moment away from the b-axis (canting
angles) can be estimated from the measured remnant magnetization in the in-plane and
out-of-plane configurations. Two magnetic loops corresponding to two (001)-oriented
samples with different unit cell volumes are shown in the inset of Fig. 8. In this plot, the
magnetic field is applied along the [110] direction. A larger remnant magnetic moment
is found for the smaller unit cell supporting that the ferromagnetic response is increased
by the unit cell contraction, also in agreement with our previous hypothesis based on the
temperature dependence of the magnetization. From the values of the remnant
9
magnetization and assuming that the total moment in the Mn3+ atoms is 4 B, the
component of magnetization along the [100] and [001] directions, perpendicular to the b
axis, can be found by trigonometry. Notice the choice of polar () and azimuthal ()
angles definitions according to the sketch in Fig. 7e. Using the measurements with the
magnetic field applied along the [110] direction, we estimate that the polar canting
angle is higher than 1.2º in the most ferromagnetic sample. Data for the complete set of
samples is shown in Fig. 8 where both the canting angle and the remnant magnetization
are shown as a function of the unit cell volume. As shown in Fig. 8, naturally, this value
gets reduced when films are progressively relaxed. For one sample we also show the
calculated azimuthal canting angle by using the remnant magnetization of loops
collected with magnetic field applied along the [001] direction. Data leads to a very
similar value (empty symbol in Fig. 8) for the azimuthal canting angle. To conclude,
magnetic anisotropy observed in the YMO films can be explained by a canting of the
spins away from the [010] direction.
Before concluding we would like to stress that the observed anisotropic
magnetic response, or more precisely, the observation of a net magnetization for a
particular direction of the in-plane applied magnetic field, would not be expected if the
finite remanent magnetization were produced by randomly distributed grain or domain
boundaries.
IV. SUMMARY and CONCLUSIONS
Using epitaxial strain and chemical pressure a substantially wide range of unit
cell distortions in o-YMnO3 has been achieved. We have shown that the observed net
magnetic moment depends on the unit cell distortion involving both b and c distances
which promote the occurrence of an uncompensated spin arrangement. Single domain
fully textured YMO films have provided a unique opportunity to explore the magnetic
anisotropy of the films, to demonstrate the intrinsic nature of the net magnetic moment
and to show that it is related to spin canting out of the b-axis. More distortion implies
larger ferromagnetic response; antiferromagnetism is recovered as lattice parameters
tend to bulk. Therefore new, non-collinear magnetic structures have been stabilized by
strain-driven distortions of the unit cell. Our findings provide a rationale to describe the
observation of ferromagnetic response in o-YMnO3 films, reported also in other
orthorhombic manganites thin films. On these grounds, the strain-induced changes in
10
the films would certainly resound on the dielectric properties as we have reported in an
earlier work [14].
Acknowledgements
Financial support by the Ministerio de Ciencia e Innovación of the Spanish
Government [Projects MAT2008-06761-C03 and NANOSELECT CSD2007-00041]
and Generalitat de Catalunya (2009 SGR 00376 ) are acknowledged.
11
References
1. D. Khomskii, Phys. 2, 20 (2009)
2. V.Y. Pomjakushin, M. Kenzelmann, A. Dönni, A.B. Harris, T. Nakajima, S.
Mitsuda, M. Tachibana, L. Keller, J. Mesot, H. Kitazawa, and E. Takayama-
Muromachi, New J. of Phys. 11, 043019 (2009)
3. A. Muñoz, M.T. Casais, J.A. Alonso, M.J. Martínez-Lope, J.L. Martínez, M.T.
Fernández-Díaz, Inorg. Chem. 40, 1020 (2001)
4. A. Muñoz, J.A. Alonso, M.T. Casais, M.J. Martínez-Lope, J.L. Martínez, M.T.
Fernández-Díaz, J. Phys. Condens. Matter 14, 3285 (2002)
5. R. Kajimoto, H. Yoshizawa, H. Shintani, T. Kimura, Y. Tokura, Phys. Rev. B 70,
012401 (2004)
6. X. Marti, V. Skumryev, V. Laukhin, F. Sánchez, C. Ferrater, M.V. García-
Cuenca, M. Varela, and J. Fontcuberta, J. Mater. Res. 22, 2096 (2007)
7. T.H. Lin, H.C. Shih, C.C. Hsieh, C.W. Luo, J.-Y. Lin, J.L. Her, H.D. Yang, C.-H.
Hsu, K.H. Wu, T.M. Uen, and J.Y. Juang, J. Phys. Condens. Matter 21, 026013
(2009)
8. X. Marti, V. Skumryev, A. Cattoni, R. Bertacco, V. Laukhin, C. Ferrater, M.V.
García-Cuenca, M. Varela, F. Sánchez, and J. Fontcuberta, J. Magn. Magn. Mat.
321, 1719 (2009)
9. C.C. Hsieh, T.H. Lin, H.C. Shih, C.-H. Shu, C.W. Luo, L.-Y. Lin, K.H. Wu, T.M.
Uen, J.Y. Juang, J. Appl. Phys 104, 103902 (2008)
10. B.J. Kirby, D. Kan, A. Luykx, M. Murakami, D. Kundaliya, and I. Takeuchi, J.
Appl. Phys. 105, 07D917 (2009)
11. D. Rubi, S. Venkatesan, B.J. Kooi, J.Th.M. De Hosson, T.T.M. Palstra, and B.
Noheda, Phys. Rev. B 78, 020408 (2008)
12. D. Rubi, C. de Graaf, C.J.M. Daumont, D. Mannix, R. Broer, and B. Noheda,
Phys. Rev. B 79, 014416 (2009)
13. C.J.M. Daumont, D. Mannix, S. Venkatessan, G. Catalan, D. Rubi, B.J. Kooi,
J.Th.M. De Hosson, and B. Noheda, J. Phys. Cond. Matter. 21, 182001 (2009)
14. X. Marti, I. Fina, V. Skumryev, C. Ferrater, M. Varela, L. Fabrega, F. Sanchez. J.
Fontcuberta , Appl. Phys. Lett. 95, 142903 (2009)
15. X. Marti, F. Sánchez, V. Skumryev, C. Ferrater, M.V. García-Cuenca, M. Varela
and J. Fontcuberta, Thin Solid Films 516, 4899 (2008)
12
16. M.N Iliev, M.V. Abrashev, H.-G. Lee, V.N. Popov, Y.Y. Sun, C. Thomsen, R.L.
Meng, and C.W. Chu, Phys. Rev. B 57, 2872 (1998)
17. M. Mostovoy, Phys. Rev. Lett. 96, 067601 (2006); H. Katsura, N. Nagaosa and
A. V. Balatsky, Phys. Rev. Lett. 95, 057205 (2005)
18. K. Yamauchi, F. Freimuth, S. Blügel and S. Picozzi, Phys Rev. B 78, 014403
(2008)
13
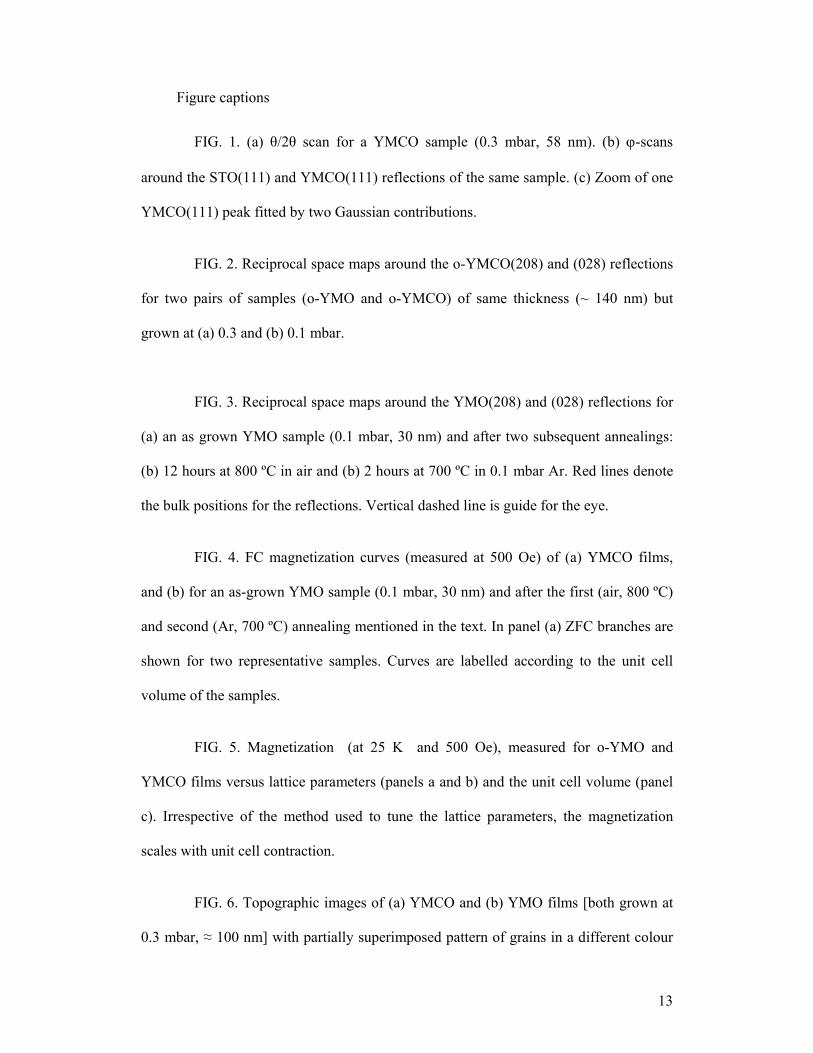
Figure captions
FIG. 1. (a) θ/2θ scan for a YMCO sample (0.3 mbar, 58 nm). (b) -scans
around the STO(111) and YMCO(111) reflections of the same sample. (c) Zoom of one
YMCO(111) peak fitted by two Gaussian contributions.
FIG. 2. Reciprocal space maps around the o-YMCO(208) and (028) reflections
for two pairs of samples (o-YMO and o-YMCO) of same thickness (~ 140 nm) but
grown at (a) 0.3 and (b) 0.1 mbar.
FIG. 3. Reciprocal space maps around the YMO(208) and (028) reflections for
(a) an as grown YMO sample (0.1 mbar, 30 nm) and after two subsequent annealings:
(b) 12 hours at 800 ºC in air and (b) 2 hours at 700 ºC in 0.1 mbar Ar. Red lines denote
the bulk positions for the reflections. Vertical dashed line is guide for the eye.
FIG. 4. FC magnetization curves (measured at 500 Oe) of (a) YMCO films,
and (b) for an as-grown YMO sample (0.1 mbar, 30 nm) and after the first (air, 800 ºC)
and second (Ar, 700 ºC) annealing mentioned in the text. In panel (a) ZFC branches are
shown for two representative samples. Curves are labelled according to the unit cell
volume of the samples.
FIG. 5. Magnetization (at 25 K and 500 Oe), measured for o-YMO and
YMCO films versus lattice parameters (panels a and b) and the unit cell volume (panel
c). Irrespective of the method used to tune the lattice parameters, the magnetization
scales with unit cell contraction.
FIG. 6. Topographic images of (a) YMCO and (b) YMO films [both grown at
0.3 mbar, ≈ 100 nm] with partially superimposed pattern of grains in a different colour
14
scale. Panels (c) and (d) show the magnetization (25 K, 500 Oe) versus the grain density
and surface roughness, respectively.
FIG. 7. ZFC-FC magnetic moment of YMO(001)/STO(001) films measured
with H (500 Oe) applied (a) in-plane YMO[110] and (b) out-of-plane YMO[001]
direction. ZFC-FC curves for single domain YMO(100)/STO(110) films along the (c)
YMO[010] and (d) YMO[001] in-plane directions. Data show that net magnetization
only occurs perpendicularly to [010] direction. Panel (e) shows a sketch of the spin-
canted structure according to the experimental data. Notice the polar () and azimuthal
() angles description in the sketch.
FIG. 8. Dependence of the remnant magnetization (right vertical axis) and
calculated canting angles (left vertical axis) as a function of the unit cell volume. Data
points represent the polar (solid circles) and azimuthal angles (empty circle) as defined
in the text and sketch in Fig. 7. The data show that canting vanishes as the unit cell
volume approaches the bulk value. Inset: a zoom of the magnetization loops of the two
YMO samples with different unit cell volume (see legend), revealing the clear presence
of a remanent magnetization.
15
Figure 1
16
Figure 2
17
Figure 3
18
Figure 4
19
Figure 5
20
Figure 6
21
Figure 7
22
Figure 8