strain bursts in plastically deforming molybdenum micro- and nanopillars
TRANSCRIPT
arX
iv:0
802.
1843
v1 [
cond
-mat
.mtr
l-sc
i] 1
3 Fe
b 20
08
Strain bursts in plastically deforming
Molybdenum micro- and nanopillars
February 14, 2008
M. Zaiser1, J. Schwerdtfeger1, A.S. Schneider2,
C.P. Frick 2, B.G. Clark2 and P.A. Gruber2,3, and E. Arzt2,4
1 The University of Edinburgh, Institute for Materials and Processes,The King’s Buildings, Sanderson Building, Edinburgh EH9 3JL, UK
2 Max-Planck-Institut fur Metallforschung, Heisenbergstrasse 3,70569 Stuttgart, Germany
3 Universitat Karlsruhe, Institut fur Zuverlassigkeitvon Bauteilen und Systemen, Kaiserstr. 12, 76131 Karlsruhe, Germany
4 Leibniz Institute for New Materials, Campus Building D2 2, 66123Saarbrucken, Germany
Abstract
Plastic deformation of micron and sub-micron scale specimens is char-acterized by intermittent sequences of large strain bursts (dislocationavalanches) which are separated by regions of near-elastic loading. Inthe present investigation we perform a statistical characterization of strainbursts observed in stress-controlled compressive deformation of monocrys-talline Molybdenum micropillars. We characterize the bursts in terms ofthe associated elongation increments and peak deformation rates, anddemonstrate that these quantities follow power-law distributions that donot depend on specimen orientation or stress rate. We also investigate thestatistics of stress increments in between the bursts, which are found to beWeibull distributed and exhibit a characteristic size effect. We discuss ourfindings in view of observations of deformation bursts in other materials,such as face-centered cubic and hexagonal metals.
1 Introduction
On microscopic and mesoscopic scales, plastic deformation of crystalline solidsproceeds as an intermittent series of strain bursts (’slip avalanches’). Indirectevidence of such bursts has been provided by systematic acoustic emission (AE)studies of Weiss and co-workers on ice [1, 2], hcp metals [3], and fcc metals[4]. These studies indicate that the AE signals of plastically deforming crystalsconsist of discrete bursts separated by quiescent intervals of low AE activity.The energies E (amplitude square integrated over the duration of a burst) and
1
peak amplitudes A of the AE bursts exhibit a huge scatter; their statistics ischaracterized by scale-free (power law) distributions, with probability densityfunctions p(E) ∝ E−κE and p(A) ∝ A−κA that are well described as power lawswith material-independent exponents κE ≈ 1.5 and κA ≈ 2, extending over upto 8 decades with no apparent cut-off.
Dimiduk and co-workers confirmed temporal intermittency of plastic flow bydirect observation of strain bursts during compressive deformation of micropil-lars machined out of Ni single crystals [5]. In these experiments, the elongationvs. time curves observed under stress-controlled loading were characterized byan intermittent sequence of deformation jumps, with elongation increments ∆lthat exhibited a scale-free distribution p(∆l) ∝ ∆l−κl where κl ≈ 1.5. Recently,Ngan observed bursts with similar statistical characteristics in creep deformationof aluminum micropillars under constant stress conditions [6]. These findingscan be directly related to the acoustic emission results if one assumes that afixed fraction of the work done by the external forces during an elongation jumpis released in the form of acoustic energy.
Theoretically, the formation of intermittent deformation bursts has beenmodelled using two-dimensional [7] and three-dimensional [8] discrete dislo-cation dynamics simulations, as well as various types of continuum models[9, 10, 11, 12]. In the discrete simulations, the stochastic nature of the de-formation process is directly ’inherited’ from the statistical choice of the initialdislocation configuration, which in turn reflects the variability of the initialmicrostructure of real specimens. In the continuum models, statistical hetero-geneity needs to be explicitly incorporated into the constitutive equations, e.g.in terms of fluctuations in the local flow stresses or energy dissipation rates.While less ’realistic’ than discrete dislocation simulations, such models providea conceptual framework for understanding the origin of the scale-free avalanchedynamics which can be related to a depinning-like transition between an elas-tic and a plastically deforming phase (‘yielding transition’). A comprehensiveoverview of experimental and theoretical results has been given by Zaiser [13].
In spite of all these investigations, open questions remain. The relationsbetween different characteristics of strain bursts, such as the associated strainor elongation increments, the burst durations and the peak strain rates, haveremained largely unexplored. Other open issues concern the statistics of stressincrements between bursts and the correlation between stress increments andburst sizes. Furthermore, practically all the experimental evidence has beengathered on materials (fcc and hcp metals, ice close to its melting point) wherethe motion of dislocations is governed by their mutual interactions. Molybde-num (Mo), on the other hand, is a bcc metal where dislocation interactions withthe crystal lattice (Peierls stresses) may have a crucial influence on the defor-mation behavior: Below the so-called knee temperature (∼ 500-550 K for Mo[14]), the plastic deformation of bulk bcc metals is controlled by the nucleationand motion of kinks on screw dislocations. These materials exhibit therefore astrong temperature and strain-rate dependence of the flow stress (for a detailedoverview of the deformation behavior of bcc metals, see [14, 15]). Since the mo-tion of dislocations is at low temperatures governed by their interactions withthe crystal lattice, it has been argued that collective behavior, and hence strainbursts, may be suppressed in this temperature regime [4].
In the present paper, we adress these open questions by investigating strainbursts observed in Molybdenum (Mo) micropillars that are deformed at room
2
temperature in compression under load control. In the following sections we firstdescribe the experimental procedure and the methods used for characterizingthe strain bursts. We then discuss the results of our analysis in view of thestatistics of burst sizes and stress increments, and the relations between burststrain and peak strain rate. We conclude with a comparison of our findings withtheoretical and experimental results on strain bursts in other materials.
2 Experimental
2.1 Specimen preparation and mechanical testing
Zone refined Mo single crystals were oriented using Laue diffraction, and disk-shaped samples of approximately 3 mm height and 10 mm diameter with disknormals pointing along [100] and [235] lattice directions were cut by spark ero-sion. The disk surfaces were then mechanically polished using 6, 3 and 1 µmdiamond suspensions and subsequently electro-polished for 60 seconds using amixture of 610 ml Methanol and 85 ml H2SO4 at a current of 1-2 Amperes. Thesamples were mounted on a custom machined aluminum holder for testing, andtheir orientation was confirmed by electron backscatter diffraction.
The specific process used in fabricating micropillars from the oriented sam-ples is very similar to the method of Frick et al. [16]. Free-standing pillarsof tapered shape were fabricated using a dual focused ion beam (FIB) andscanning electron microscope (SEM) (FEI Nova 600 NanoLab DualBeamTM).The as-machined pillars were deformed in compression at ambient pressure andtemperature by using a MTS XP nanoindenter system equipped with a sapphireconical indenter with a flat 10 µm diameter tip. The loading rates varied be-tween 4 and 60 µN/sec, depending on pillar diameter. Geometrical parameters(top diameter dt, bottom diameter db, and length l of the analysed pillars) andloading rates are compiled in Table 1.
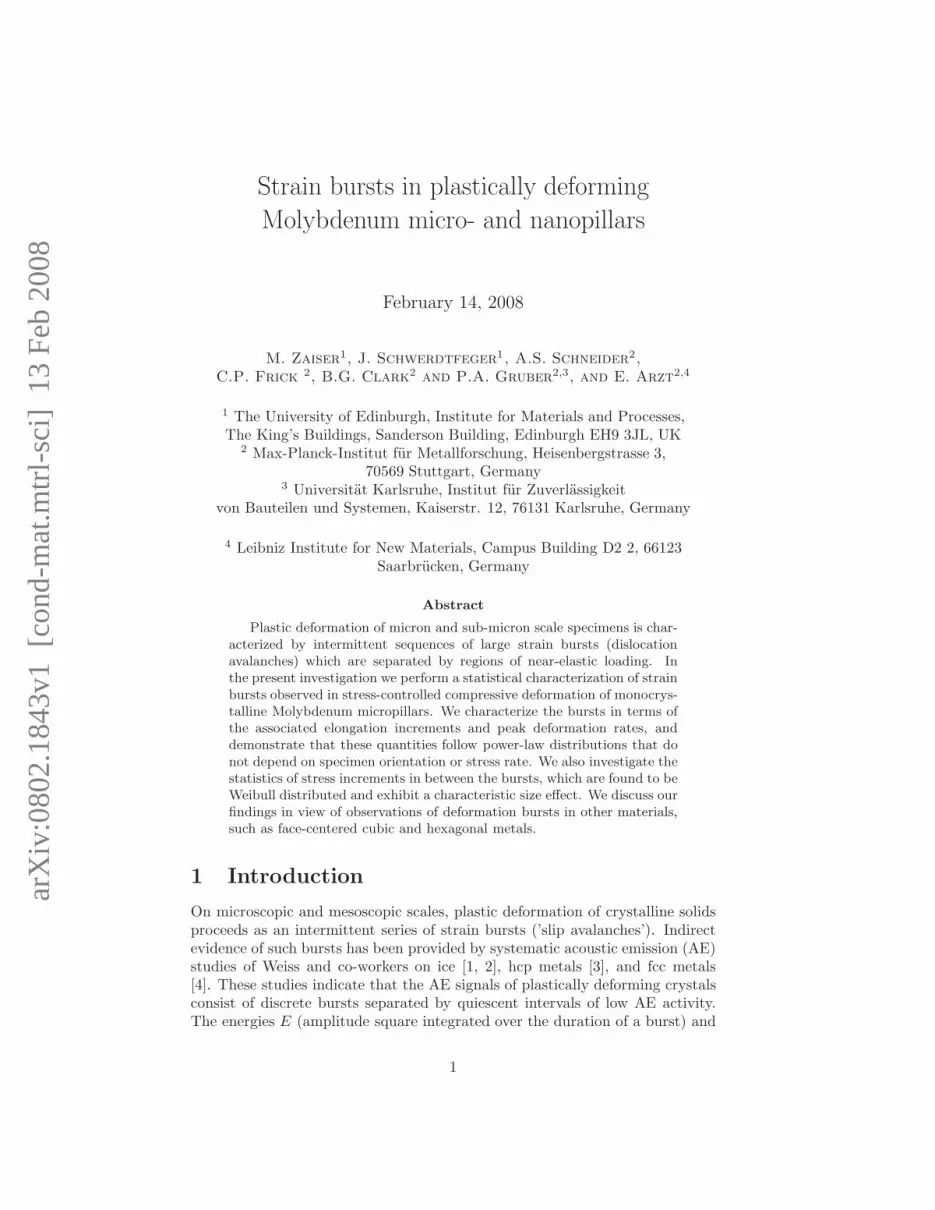
Deformation experiments were performed at a control rate of 500 Hz witha data storage rate of 25 Hz, i.e., data were recorded at intervals ∆t = 0.04 s.Tests were typically performed with two intermediate unloading and reloadingcycles at about 2.5% and 5% strain in order to observe the linear elastic responseand transient loading/unloading behavior of the pillars. The intermediate un-loading may influence the strain burst statistics: Most of the deformation occursduring the largest bursts (see Figure 1) and it is thus very likely that these aretruncated by unloading (in fact, sometimes the burst continued during unload-ing or burstlike deformation resumed at a reduced stress level upon reloading).Therefore, a set of [100] oriented pillars (labelled with the subscript ’nr’ in Table1) were deformed without intermediate unloading. Analysing these separatelyallows us to assess the influence of unloading on the burst statistics.
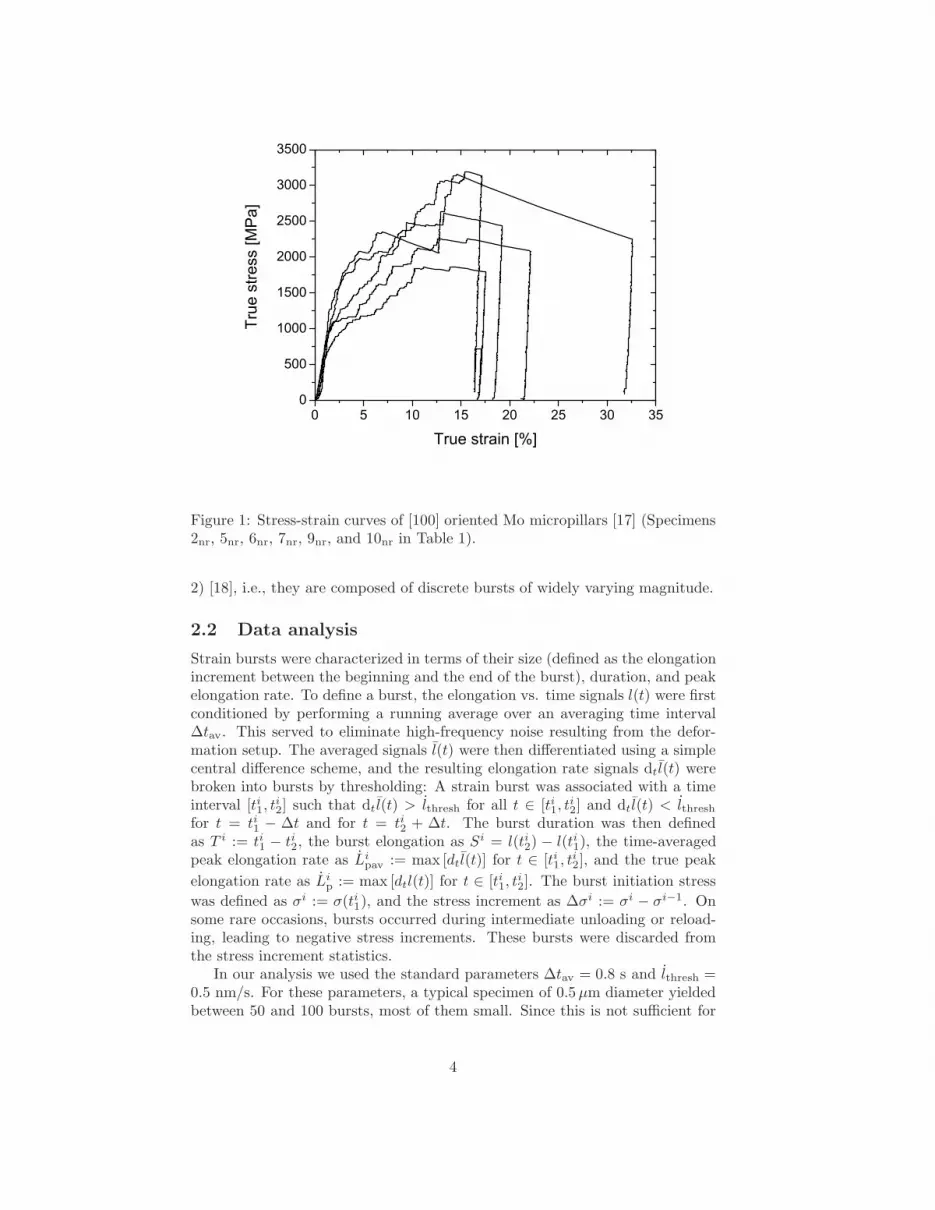
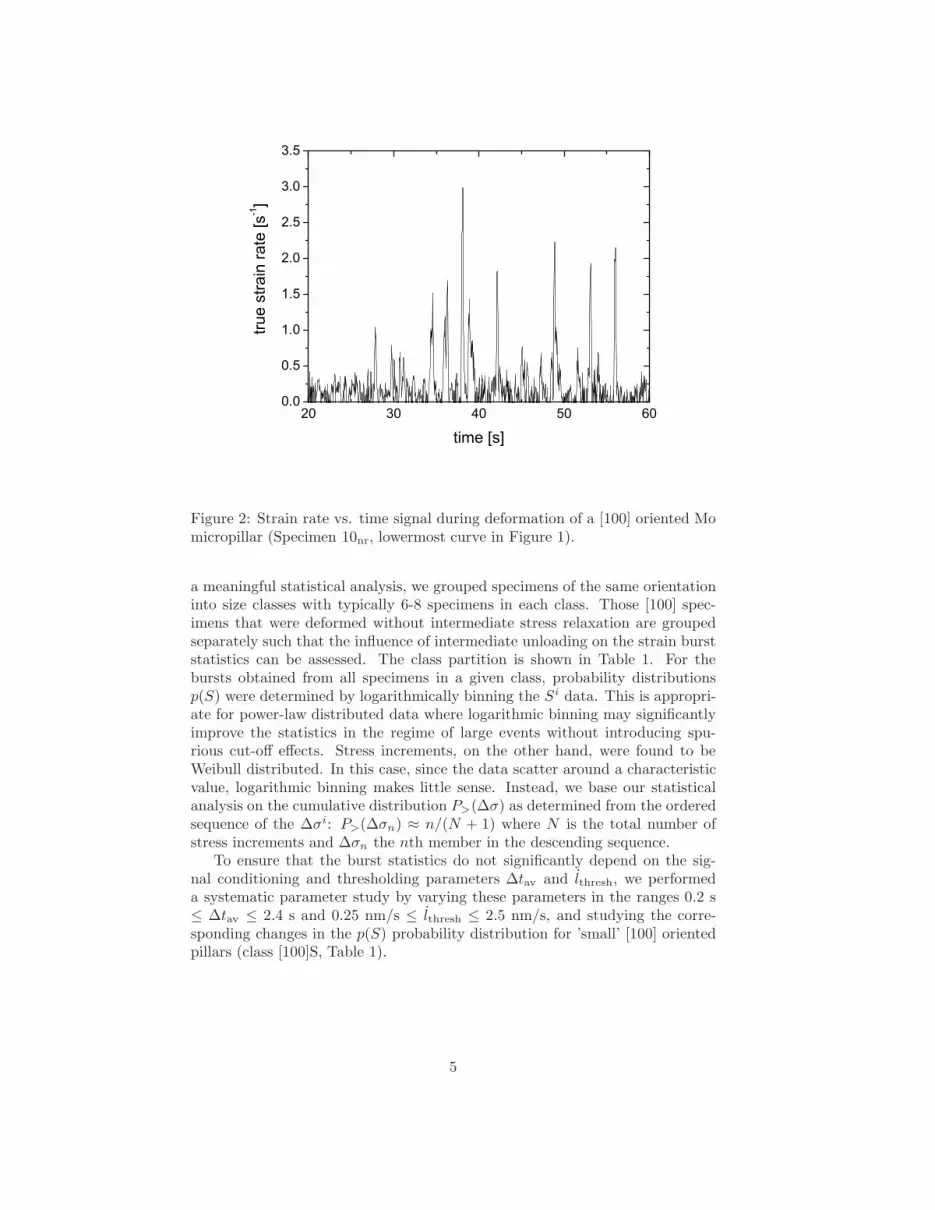
The flow stresses of the investigated samples increase with decreasing samplesize. A study of this size effect has been published elsewhere [17]. Here, wefocus exclusively on the intermittent nature of the deformation process. Ascan be seen from Figure 1, the deformation curves are characterized by anirregular sequence of large strain bursts visible as steps on the stress vs. strainor elongation vs. time curves. During the bursts, which typically lasted lessthan a second, deformation rates were high (peak strain rates > 1 s−1). Theelongation rate signals have the typical signature of a ’crackling noise’ (Figure
3
0 5 10 15 20 25 30 350
500
1000
1500
2000
2500
3000
3500
True
stre
ss [M
Pa]
True strain [%]
Figure 1: Stress-strain curves of [100] oriented Mo micropillars [17] (Specimens2nr, 5nr, 6nr, 7nr, 9nr, and 10nr in Table 1).
2) [18], i.e., they are composed of discrete bursts of widely varying magnitude.
2.2 Data analysis
Strain bursts were characterized in terms of their size (defined as the elongationincrement between the beginning and the end of the burst), duration, and peakelongation rate. To define a burst, the elongation vs. time signals l(t) were firstconditioned by performing a running average over an averaging time interval∆tav. This served to eliminate high-frequency noise resulting from the defor-mation setup. The averaged signals l(t) were then differentiated using a simplecentral difference scheme, and the resulting elongation rate signals dt l(t) werebroken into bursts by thresholding: A strain burst was associated with a timeinterval [ti1, t
i2] such that dt l(t) > lthresh for all t ∈ [ti1, t
i2] and dt l(t) < lthresh
for t = ti1 − ∆t and for t = ti2 + ∆t. The burst duration was then definedas T i := ti1 − ti2, the burst elongation as Si = l(ti2) − l(ti1), the time-averagedpeak elongation rate as Li
pav := max [dt l(t)] for t ∈ [ti1, ti2], and the true peak
elongation rate as Lip := max [dtl(t)] for t ∈ [ti1, t
i2]. The burst initiation stress
was defined as σi := σ(ti1), and the stress increment as ∆σi := σi − σi−1. Onsome rare occasions, bursts occurred during intermediate unloading or reload-ing, leading to negative stress increments. These bursts were discarded fromthe stress increment statistics.
In our analysis we used the standard parameters ∆tav = 0.8 s and lthresh =0.5 nm/s. For these parameters, a typical specimen of 0.5 µm diameter yieldedbetween 50 and 100 bursts, most of them small. Since this is not sufficient for
4
20 30 40 50 600.0
0.5
1.0
1.5
2.0
2.5
3.0
3.5
true
stra
in ra
te [s
-1]
time [s]
Figure 2: Strain rate vs. time signal during deformation of a [100] oriented Momicropillar (Specimen 10nr, lowermost curve in Figure 1).
a meaningful statistical analysis, we grouped specimens of the same orientationinto size classes with typically 6-8 specimens in each class. Those [100] spec-imens that were deformed without intermediate stress relaxation are groupedseparately such that the influence of intermediate unloading on the strain burststatistics can be assessed. The class partition is shown in Table 1. For thebursts obtained from all specimens in a given class, probability distributionsp(S) were determined by logarithmically binning the Si data. This is appropri-ate for power-law distributed data where logarithmic binning may significantlyimprove the statistics in the regime of large events without introducing spu-rious cut-off effects. Stress increments, on the other hand, were found to beWeibull distributed. In this case, since the data scatter around a characteristicvalue, logarithmic binning makes little sense. Instead, we base our statisticalanalysis on the cumulative distribution P>(∆σ) as determined from the orderedsequence of the ∆σi: P>(∆σn) ≈ n/(N + 1) where N is the total number ofstress increments and ∆σn the nth member in the descending sequence.
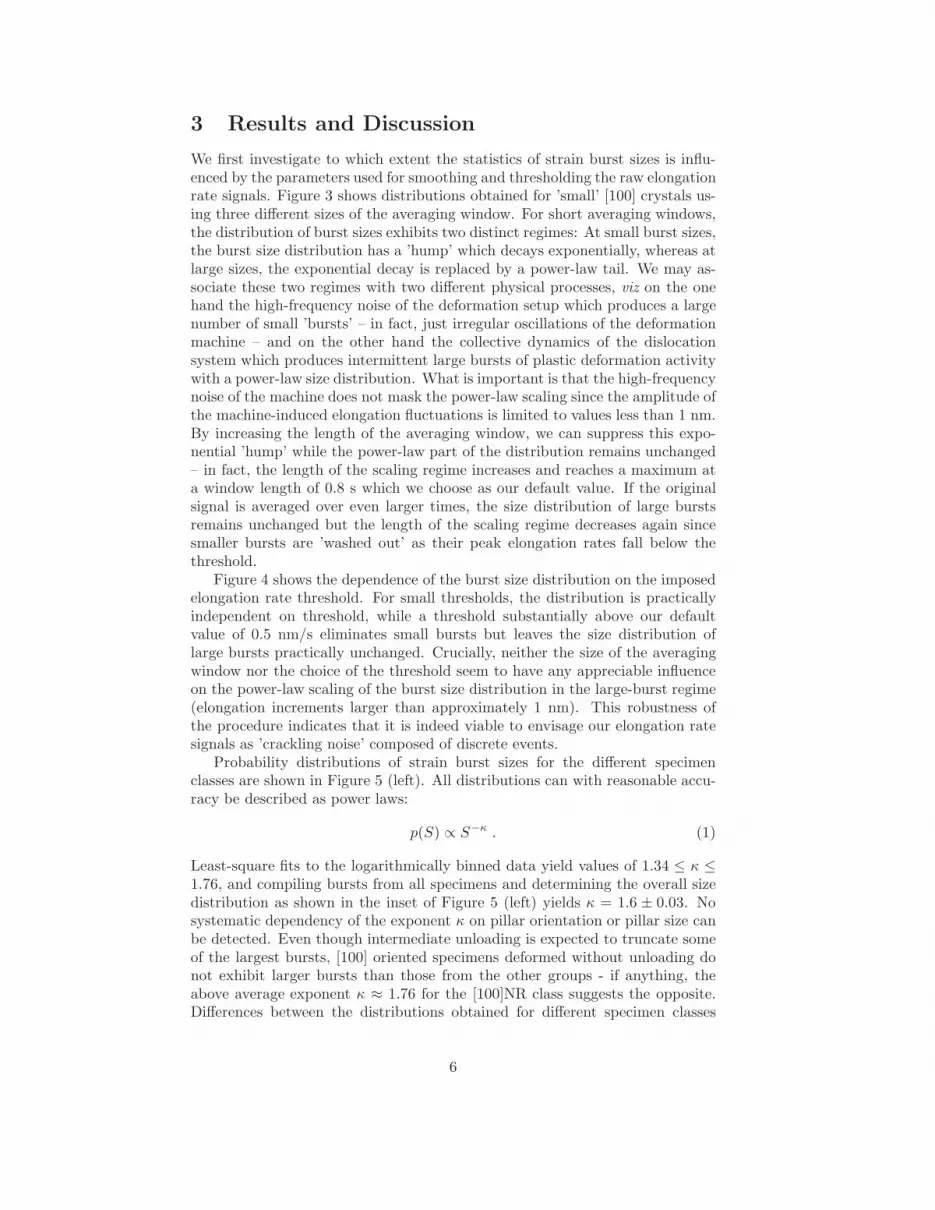
To ensure that the burst statistics do not significantly depend on the sig-nal conditioning and thresholding parameters ∆tav and lthresh, we performeda systematic parameter study by varying these parameters in the ranges 0.2 s≤ ∆tav ≤ 2.4 s and 0.25 nm/s ≤ lthresh ≤ 2.5 nm/s, and studying the corre-sponding changes in the p(S) probability distribution for ’small’ [100] orientedpillars (class [100]S, Table 1).
5
3 Results and Discussion
We first investigate to which extent the statistics of strain burst sizes is influ-enced by the parameters used for smoothing and thresholding the raw elongationrate signals. Figure 3 shows distributions obtained for ’small’ [100] crystals us-ing three different sizes of the averaging window. For short averaging windows,the distribution of burst sizes exhibits two distinct regimes: At small burst sizes,the burst size distribution has a ’hump’ which decays exponentially, whereas atlarge sizes, the exponential decay is replaced by a power-law tail. We may as-sociate these two regimes with two different physical processes, viz on the onehand the high-frequency noise of the deformation setup which produces a largenumber of small ’bursts’ – in fact, just irregular oscillations of the deformationmachine – and on the other hand the collective dynamics of the dislocationsystem which produces intermittent large bursts of plastic deformation activitywith a power-law size distribution. What is important is that the high-frequencynoise of the machine does not mask the power-law scaling since the amplitude ofthe machine-induced elongation fluctuations is limited to values less than 1 nm.By increasing the length of the averaging window, we can suppress this expo-nential ’hump’ while the power-law part of the distribution remains unchanged– in fact, the length of the scaling regime increases and reaches a maximum ata window length of 0.8 s which we choose as our default value. If the originalsignal is averaged over even larger times, the size distribution of large burstsremains unchanged but the length of the scaling regime decreases again sincesmaller bursts are ’washed out’ as their peak elongation rates fall below thethreshold.
Figure 4 shows the dependence of the burst size distribution on the imposedelongation rate threshold. For small thresholds, the distribution is practicallyindependent on threshold, while a threshold substantially above our defaultvalue of 0.5 nm/s eliminates small bursts but leaves the size distribution oflarge bursts practically unchanged. Crucially, neither the size of the averagingwindow nor the choice of the threshold seem to have any appreciable influenceon the power-law scaling of the burst size distribution in the large-burst regime(elongation increments larger than approximately 1 nm). This robustness ofthe procedure indicates that it is indeed viable to envisage our elongation ratesignals as ’crackling noise’ composed of discrete events.
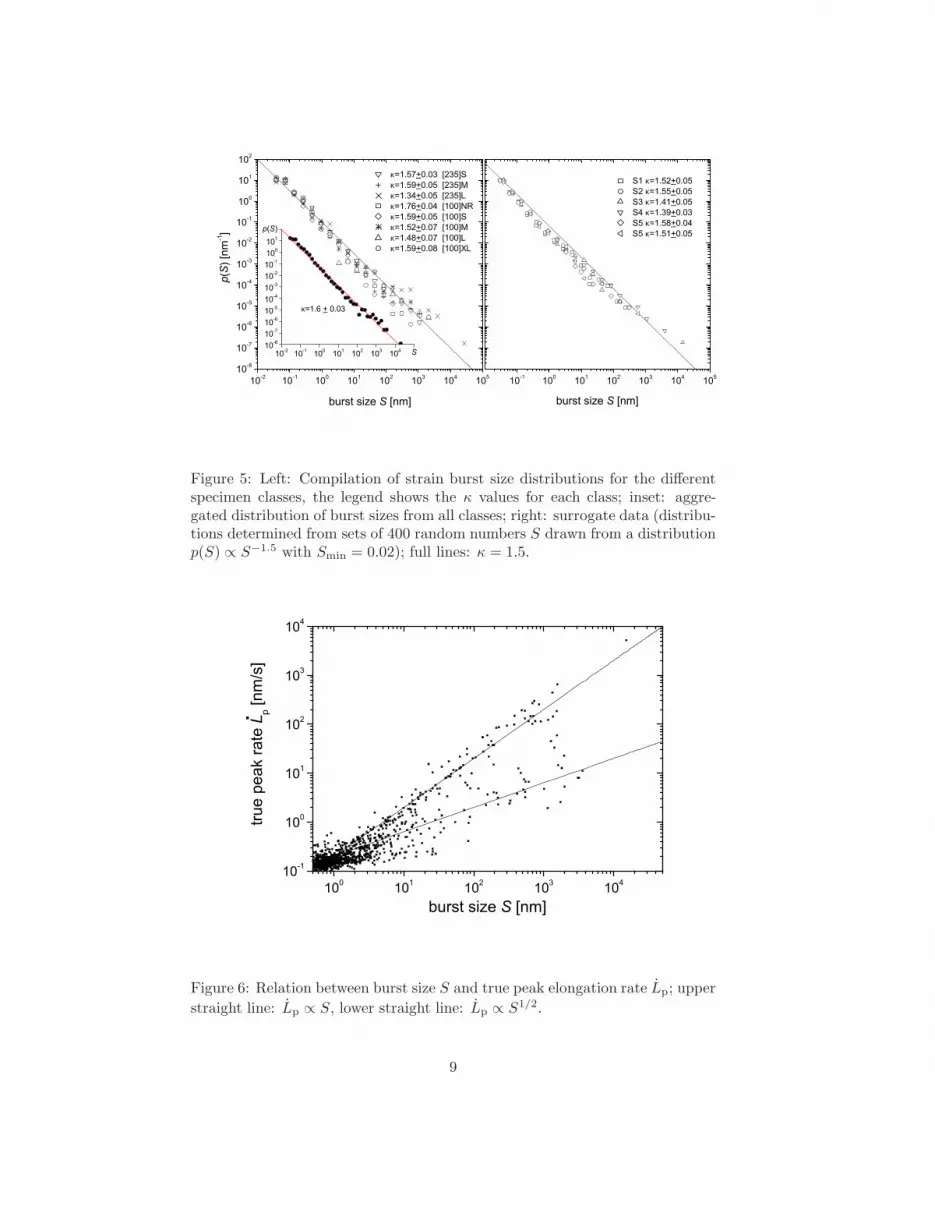
Probability distributions of strain burst sizes for the different specimenclasses are shown in Figure 5 (left). All distributions can with reasonable accu-racy be described as power laws:
p(S) ∝ S−κ . (1)
Least-square fits to the logarithmically binned data yield values of 1.34 ≤ κ ≤1.76, and compiling bursts from all specimens and determining the overall sizedistribution as shown in the inset of Figure 5 (left) yields κ = 1.6 ± 0.03. Nosystematic dependency of the exponent κ on pillar orientation or pillar size canbe detected. Even though intermediate unloading is expected to truncate someof the largest bursts, [100] oriented specimens deformed without unloading donot exhibit larger bursts than those from the other groups - if anything, theabove average exponent κ ≈ 1.76 for the [100]NR class suggests the opposite.Differences between the distributions obtained for different specimen classes
6

0.01 0.1 1 10 100 100010-6
10-5
10-4
10-3
10-2
10-1
100
101
102
κ=1.5
window 0.2 s window 0.8 s window 2.4 s
p(S)
[nm
-1]
burst size S [nm]
Figure 3: Strain burst size distributions for ’small’ [100] oriented Mo micropillars(class [100]S in Table 1), determined with an elongation rate threshold of 0.02nm/s and different sizes of the averaging window; full line: fit function p(x) =100 exp[−x/0.12] + 0.05x−1.5
should not be over-interpreted – they may simply reflect statistical scatter in-herent in the not very large size of the datasets which comprise typically some400 bursts for each specimen class. To illustrate this point, we show on theright-hand side of Figure 5 simulated p(S) distributions determined from 6 setsof surrogate data, each consisting of 400 random numbers drawn independentlyfrom a distribution p(S) ∝ S−1.5. As can be seen, the scatter of the exponentsdetermined from these sets, the scatter in the data ranges, and the error of thelinear least-square fits are all comparable with the corresponding values for theexperimental datasets. This illustrates the intrinsic problems encountered indetermining distribution parameters from limited sets of data.
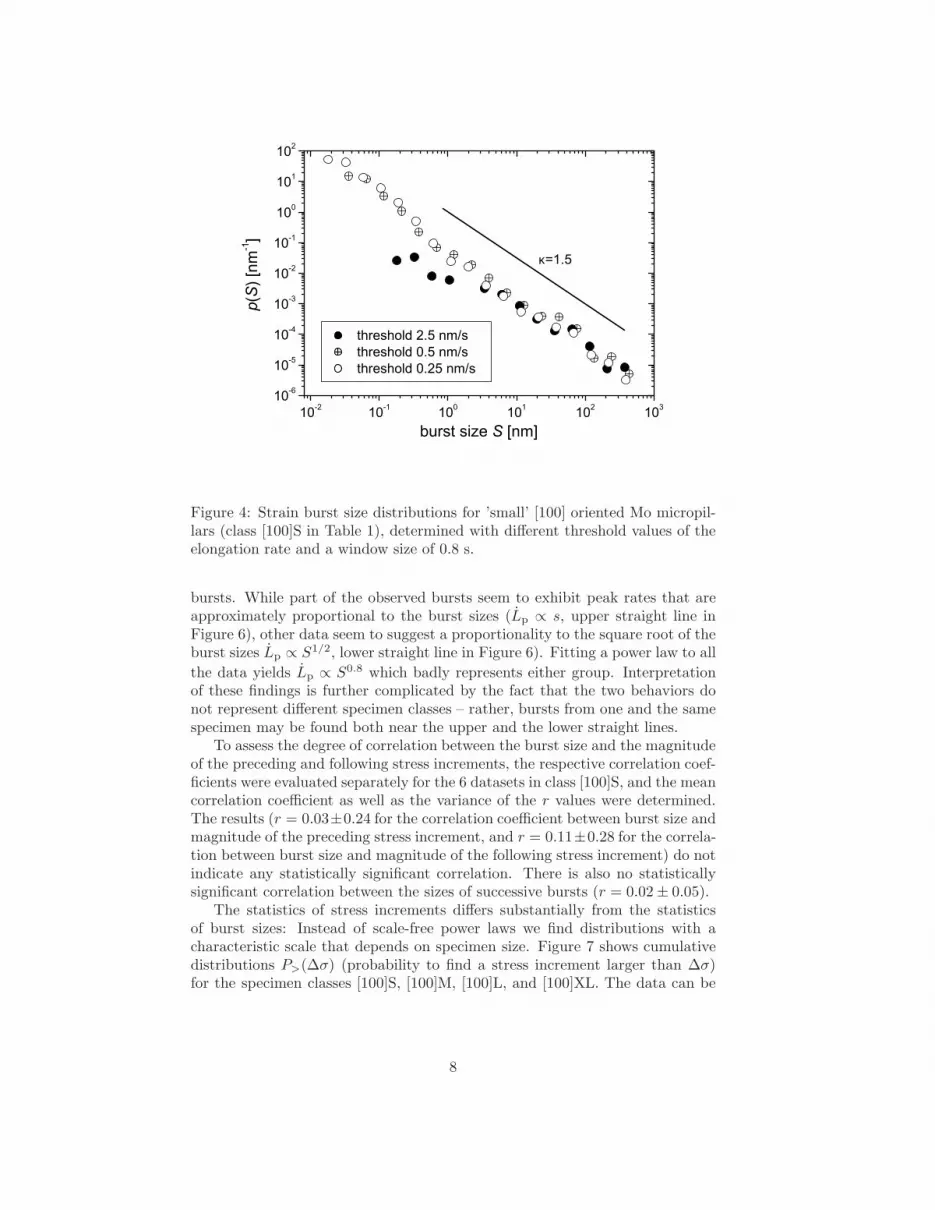
We now proceed to investigate other burst characteristics, viz the burst du-rations and peak elongation rates. Unfortunately, the intrinsic burst durationsmay be well below the size ∆tav of our averaging window. As a consequence,all large bursts determined from the averaged elongation rate signal have ap-proximately the same duration which is roughly proportional to ∆tav. Hence,the burst durations as determined from the averaged signals are no longer goodcharacterizers of the bursts and, for evident reasons, the same is true for the peakrates of the time-averaged signals which decrease with increasing ∆tav. The truepeak elongation rate Lp, on the other hand, represents an intrinsic property ofthe bursts that is not affected by time averaging. There is a strong statisticalcorrelation between Lp and burst size S (correlation coefficient r > 0.9) but itit is not easy to establish a clear-cut mathematical relation between the twoquantities. This is seen from Figure 6 which shows Lp vs. S values for all large
7
10-2 10-1 100 101 102 10310-6
10-5
10-4
10-3
10-2
10-1
100
101
102
κ=1.5
threshold 2.5 nm/s threshold 0.5 nm/s threshold 0.25 nm/s
p(S)
[nm
-1]
burst size S [nm]
Figure 4: Strain burst size distributions for ’small’ [100] oriented Mo micropil-lars (class [100]S in Table 1), determined with different threshold values of theelongation rate and a window size of 0.8 s.
bursts. While part of the observed bursts seem to exhibit peak rates that areapproximately proportional to the burst sizes (Lp ∝ s, upper straight line inFigure 6), other data seem to suggest a proportionality to the square root of theburst sizes Lp ∝ S1/2, lower straight line in Figure 6). Fitting a power law to all
the data yields Lp ∝ S0.8 which badly represents either group. Interpretationof these findings is further complicated by the fact that the two behaviors donot represent different specimen classes – rather, bursts from one and the samespecimen may be found both near the upper and the lower straight lines.
To assess the degree of correlation between the burst size and the magnitudeof the preceding and following stress increments, the respective correlation coef-ficients were evaluated separately for the 6 datasets in class [100]S, and the meancorrelation coefficient as well as the variance of the r values were determined.The results (r = 0.03±0.24 for the correlation coefficient between burst size andmagnitude of the preceding stress increment, and r = 0.11±0.28 for the correla-tion between burst size and magnitude of the following stress increment) do notindicate any statistically significant correlation. There is also no statisticallysignificant correlation between the sizes of successive bursts (r = 0.02 ± 0.05).
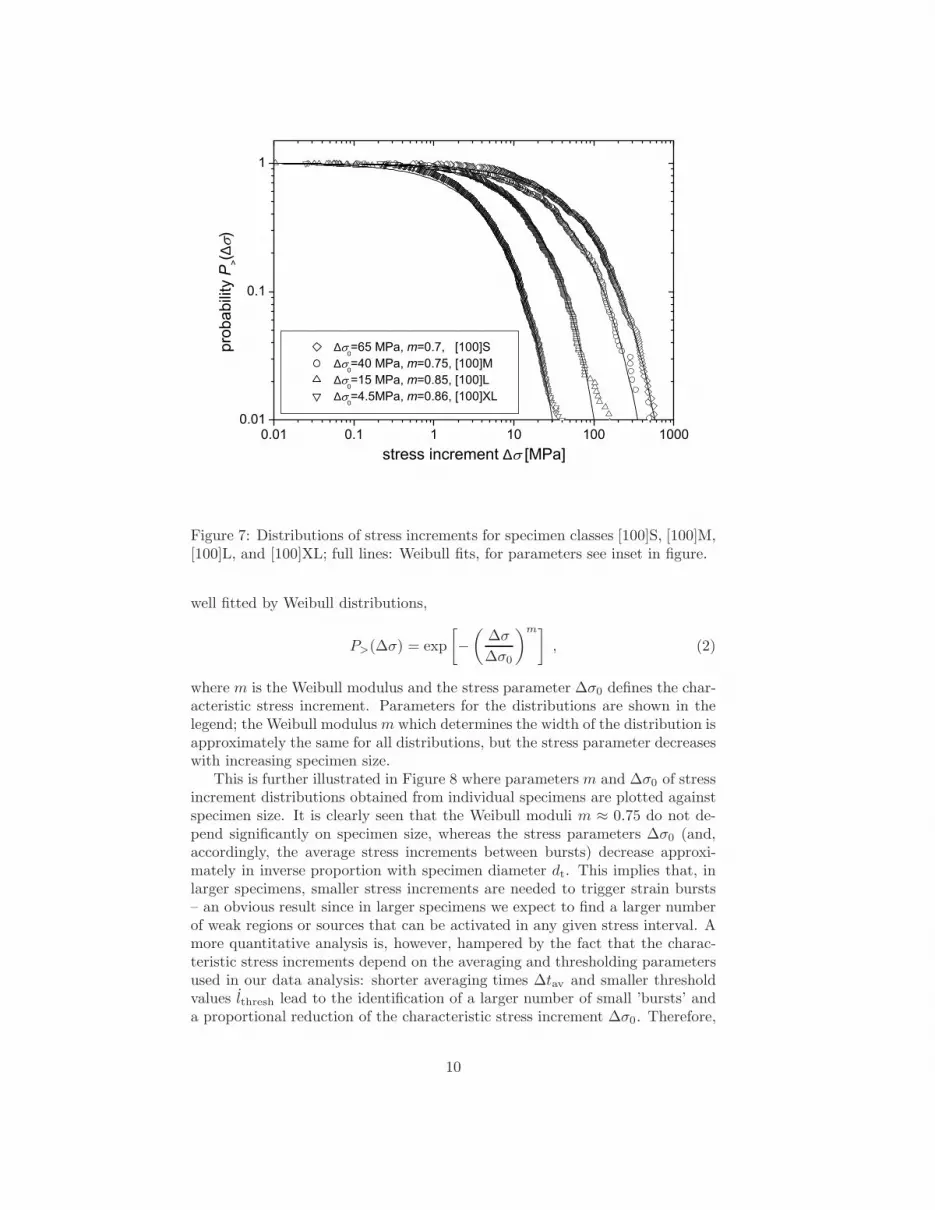
The statistics of stress increments differs substantially from the statisticsof burst sizes: Instead of scale-free power laws we find distributions with acharacteristic scale that depends on specimen size. Figure 7 shows cumulativedistributions P>(∆σ) (probability to find a stress increment larger than ∆σ)for the specimen classes [100]S, [100]M, [100]L, and [100]XL. The data can be
8
10-2 10-1 100 101 102 103 104 10510-8
10-7
10-6
10-5
10-4
10-3
10-2
10-1
100
101
102
10-2 10-1 100 101 102 103 104 S10-810-710-610-510-410-310-210-1100101
p(S)
10-1 100 101 102 103 104 105
κ=1.57+0.03 [235]S κ=1.59+0.05 [235]M κ=1.34+0.05 [235]L κ=1.76+0.04 [100]NR κ=1.59+0.05 [100]S κ=1.52+0.07 [100]M κ=1.48+0.07 [100]L κ=1.59+0.08 [100]XL
p(S)
[nm
-1]
burst size S [nm]
κ=1.6 + 0.03
S1 κ=1.52+0.05 S2 κ=1.55+0.05 S3 κ=1.41+0.05 S4 κ=1.39+0.03 S5 κ=1.58+0.04 S5 κ=1.51+0.05
burst size S [nm]
Figure 5: Left: Compilation of strain burst size distributions for the differentspecimen classes, the legend shows the κ values for each class; inset: aggre-gated distribution of burst sizes from all classes; right: surrogate data (distribu-tions determined from sets of 400 random numbers S drawn from a distributionp(S) ∝ S−1.5 with Smin = 0.02); full lines: κ = 1.5.
100 101 102 103 10410-1
100
101
102
103
104
.
true
peak
rate
Lp [
nm/s
]
burst size S [nm]
Figure 6: Relation between burst size S and true peak elongation rate Lp; upper
straight line: Lp ∝ S, lower straight line: Lp ∝ S1/2.
9
0.01 0.1 1 10 100 10000.01
0.1
1
∆0=65 MPa, m=0.7, [100]S
∆0=40 MPa, m=0.75, [100]M
∆0=15 MPa, m=0.85, [100]L
∆0=4.5MPa, m=0.86, [100]XL
prob
abili
ty P
>(∆)
stress increment ∆ [MPa]
Figure 7: Distributions of stress increments for specimen classes [100]S, [100]M,[100]L, and [100]XL; full lines: Weibull fits, for parameters see inset in figure.
well fitted by Weibull distributions,
P>(∆σ) = exp
[
−
(
∆σ
∆σ0
)m]
, (2)
where m is the Weibull modulus and the stress parameter ∆σ0 defines the char-acteristic stress increment. Parameters for the distributions are shown in thelegend; the Weibull modulus m which determines the width of the distribution isapproximately the same for all distributions, but the stress parameter decreaseswith increasing specimen size.
This is further illustrated in Figure 8 where parameters m and ∆σ0 of stressincrement distributions obtained from individual specimens are plotted againstspecimen size. It is clearly seen that the Weibull moduli m ≈ 0.75 do not de-pend significantly on specimen size, whereas the stress parameters ∆σ0 (and,accordingly, the average stress increments between bursts) decrease approxi-mately in inverse proportion with specimen diameter dt. This implies that, inlarger specimens, smaller stress increments are needed to trigger strain bursts– an obvious result since in larger specimens we expect to find a larger numberof weak regions or sources that can be activated in any given stress interval. Amore quantitative analysis is, however, hampered by the fact that the charac-teristic stress increments depend on the averaging and thresholding parametersused in our data analysis: shorter averaging times ∆tav and smaller thresholdvalues lthresh lead to the identification of a larger number of small ’bursts’ anda proportional reduction of the characteristic stress increment ∆σ0. Therefore,
10

100 1000 100001
10
100
1
10st
ress
par
amet
er ∆
0 [M
Pa]
specimen size dt [nm]
Wei
bull
mod
ulus
m
Figure 8: Parameters of Weibull fits to stress increment distributions determinedfor individual specimens; different symbol shapes distinguish different specimenclasses (⋄ [100]S, © [100]M, △ [100]L, ▽ [100]XL); open symbols: Weibullmoduli; cross-center symbols: stress parameters.
without a method to clearly distinguish between machine-induced noise and thesmaller bursts that result from collective dislocation motion, it is difficult todraw quantitative conclusions from the observed size dependence of the P (∆σ)distributions.
4 Conclusions
Our investigation provides an example of plasticity behaving as a ’cracklingnoise’ [18], with intermittent bursts of activity characterized by scale-free sizedistributions. For the burst sizes (elongation increments) we find a distributionp(S) ∝ S−1.5 which is in line with experimental findings on Ni micropillars [5]as well as theoretical predictions based on continuum and discrete dislocationmodels [12]. The same theoretical models predict power-law relationships Lp ∝T ∝ S1/2 to hold between the peak rate, duration, and size of strain bursts.Unfortunately, owing to the need for conditioning the signal by time averaging,no useful information about the burst durations could be obtained in the presentinvestigation, while the information regarding the relationship between burstsize and peak elongation rate turned was found to be ambiguous.
In line with previous investigations, the power-law characteristics of strainbursts seem to be little affected by specimen orientation, size, or imposed defor-mation rate. While theoretical investigations [8, 19] suggest an intrinsic cut-offto the power-law scaling regime, no such cut-off could be identified in our inves-
11
tigation. This may be due to the fact that establishing a cut-off requires goodstatistics in the region of very large strain bursts, which could not be achievedin the present investigation as the total number of bursts obtained from eachindividual specimen was small (< 100).
The distributions of stress increments between subsequent strain bursts differsubstantially from the burst size distributions. Instead of scale-free power laws,we find Weibull distributions with a characteristic stress scale (the stress pa-rameter ∆σ0) that decreases approximately in inverse proportion with specimensize. However, the very presence of a characteristic scale makes the distributionparameters depend on the number of identified bursts. This dependency raisesthe problem of distinguishing between the effects of collective dislocation motionand the effects of machine noise, which may increase the apparent burst numberby adding spurious ’bursts’ of small size into the statistics. For the same rea-son, any conclusions based upon the observed lack of correlation between burstsizes and strain increments, or between the sizes of subsequent bursts, must beregarded with caution.
Our investigation demonstrates for the first time the occurrence of scale-freestrain bursts in a bcc metal deforming below the transition temperature, andwe find that the burst characteristics are similar to those in fcc metals. Thisimplies that even a significant Peierls stress, which is of crucial importance forthe deformation properties of bulk Mo at ambient tempeature, is not sufficient toinhibit burst-like deformation. In this sense, we may conclude that the Peierlspotential is irrelevant as far as the dynamics and statistics of strain burstsare concerned, and that the observed behaviour constitutes a truly universalfeature of dislocation plasticity that can be observed in all kinds of crystallattice structures. It may be mentioned that the same is not true for the sizedependence of the flow stress: The size effects observed in fcc micropillars (forreference, see, e.g. [20]) differ substantially from those observed in the presentsamples [17]. The universality of strain burst behavior is a key result of thepresent study, and it would be desirable to obtain further corroboration of thisresult from acoustic emission measurements on bulk bcc metals.
Acknowledgements: We acknowledge support of the Commission of theEuropean Communities under contract NEST-2005-PATH-COM-043386 and ofEPSRC under Grant No. EP/E029825.
References
[1] J. Weiss, J.-R. Grasso, M.-C. Miguel, A. Vesipignani and S. Zapperi, Mater.Sci. Engng. A 309-310, 360 (2001).
[2] T. Richeton, J. Weiss and F. Louchet, Acta Mater. 53, 4463 (2005).
[3] T. Richeton, P. Dobron, F. Chmelik, J. Weiss and F. Louchet, Mater. Sci.Engng. A 424, 190 (2006).
[4] J. Weiss, T. Richeton, F. Louchet, F. Chmelik, et al., Phys. Rev. B, inpress.
[5] D.M. Dimiduk, C. Woodward, R. LeSar and M.D. Uchic, Science 26, 1188(2006).
12
[6] A.H.W. Ngan, Phil. Mag. Letters 87, 967 (2007).
[7] M.-C. Miguel, A. Vespignani, S. Zapperi, J. Weiss and J.-R. Grasso, Nature410, 667 (2001).
[8] F. F. Csikor, C. Motz, D. Weygand, M. Zaiser and S. Zapperi, Science 318,251 (2007).
[9] M. Zaiser and E.C. Aifantis, J. Mech. Behavior Mater. 14, 255 (2003).
[10] M. Koslowski, R. LeSar, and R. Thomson, Phys. Rev. Lett. 93 125502(2004).
[11] M. Zaiser and P. Moretti, J. Stat. Mech., P08004 (2005).
[12] M. Zaiser and E.C. Aifantis, Int. J. Plasticity 22, 1432 (2006).
[13] M. Zaiser, Adv. Physics 55, 185 (2006).
[14] B. Sestak and A. Seeger, Z. Metallkde. 69, 195, 355 (1978).
[15] A. Seeger, Z. Metallkde. 93, 760 (2002).
[16] C.P. Frick, B.G. Clark, S. Orso, A.S. Schneider, and E. Arzt, Mater. Sci.Engng. A, in press.
[17] A.S. Schneider, C.P. Frick, B.G. Clark, P.A. Gruber and E. Arzt, Appl.Phys. Letters, submitted.
[18] J.P. Sethna, K.A. Dahmen and C.R. Myers, Nature 410, 242 (2001).
[19] M. Zaiser and N. Nikitas, J. Stat. Mech., P04013, (2007).
[20] D.M. Dimiduk, M.D. Uchic and T.A. Parthasarathy, Acta Mater. 53, 4065(2005).
13
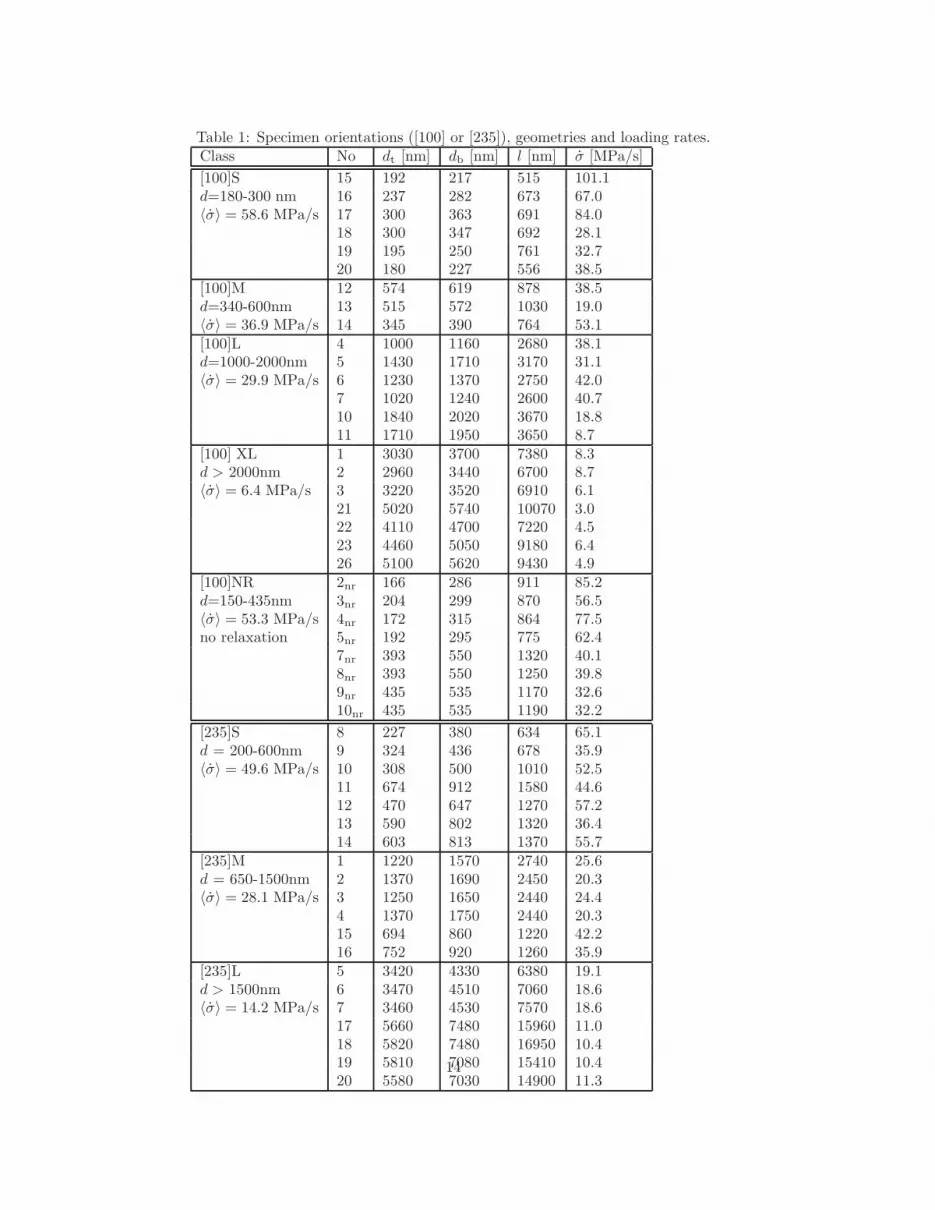
Table 1: Specimen orientations ([100] or [235]), geometries and loading rates.Class No dt [nm] db [nm] l [nm] σ [MPa/s]
[100]S 15 192 217 515 101.1d=180-300 nm 16 237 282 673 67.0〈σ〉 = 58.6 MPa/s 17 300 363 691 84.0
18 300 347 692 28.119 195 250 761 32.720 180 227 556 38.5
[100]M 12 574 619 878 38.5d=340-600nm 13 515 572 1030 19.0〈σ〉 = 36.9 MPa/s 14 345 390 764 53.1[100]L 4 1000 1160 2680 38.1d=1000-2000nm 5 1430 1710 3170 31.1〈σ〉 = 29.9 MPa/s 6 1230 1370 2750 42.0
7 1020 1240 2600 40.710 1840 2020 3670 18.811 1710 1950 3650 8.7
[100] XL 1 3030 3700 7380 8.3d > 2000nm 2 2960 3440 6700 8.7〈σ〉 = 6.4 MPa/s 3 3220 3520 6910 6.1
21 5020 5740 10070 3.022 4110 4700 7220 4.523 4460 5050 9180 6.426 5100 5620 9430 4.9
[100]NR 2nr 166 286 911 85.2d=150-435nm 3nr 204 299 870 56.5〈σ〉 = 53.3 MPa/s 4nr 172 315 864 77.5no relaxation 5nr 192 295 775 62.4
7nr 393 550 1320 40.18nr 393 550 1250 39.89nr 435 535 1170 32.610nr 435 535 1190 32.2
[235]S 8 227 380 634 65.1d = 200-600nm 9 324 436 678 35.9〈σ〉 = 49.6 MPa/s 10 308 500 1010 52.5
11 674 912 1580 44.612 470 647 1270 57.213 590 802 1320 36.414 603 813 1370 55.7
[235]M 1 1220 1570 2740 25.6d = 650-1500nm 2 1370 1690 2450 20.3〈σ〉 = 28.1 MPa/s 3 1250 1650 2440 24.4
4 1370 1750 2440 20.315 694 860 1220 42.216 752 920 1260 35.9
[235]L 5 3420 4330 6380 19.1d > 1500nm 6 3470 4510 7060 18.6〈σ〉 = 14.2 MPa/s 7 3460 4530 7570 18.6
17 5660 7480 15960 11.018 5820 7480 16950 10.419 5810 7080 15410 10.420 5580 7030 14900 11.3
14