steps towards sustainable manufacturing through modelling material, energy and waste flows
TRANSCRIPT
Int. J. Production Economics 140 (2012) 227–238
Contents lists available at SciVerse ScienceDirect
Int. J. Production Economics
0925-52
doi:10.1
n Corr
Univers
E-m
journal homepage: www.elsevier.com/locate/ijpe
Steps towards sustainable manufacturing through modelling material,energy and waste flows
Leigh Smith, Peter Ball n
Manufacturing and Materials Department, Cranfield University, UK
a r t i c l e i n f o
Article history:
Received 20 October 2010
Accepted 27 January 2012Available online 3 February 2012
Keywords:
Process mapping
Sustainable manufacture
Zero carbon
Material energy and waste modelling
73/$ - see front matter & 2012 Elsevier B.V. A
016/j.ijpe.2012.01.036
espondence to: Manufacturing and Materials
ity, Cranfield, Bedfordshire MK43 0AL, UK. Te
ail address: [email protected] (P. Ball).
a b s t r a c t
A sustainable society cannot be realised without more efficient approaches and technologies, which
must in part be provided by manufacturing. Available literature covers the principles for making
manufacturing more sustainable, but there is little, if any, practical guidance to show how to apply
these principles. Lower level guidelines are required to provide guidance on systematically analysing
manufacturing facilities and to assist with the identification and selection of improvement opportu-
nities. This paper reports on work to develop guidelines for Material, Energy and Waste (MEW) process
flow modelling to support the pursuit of sustainable manufacturing. Using qualitative MEW process
flow maps of a case facility, data was collected to build a spreadsheet model aligned to each of the MEW
process flows. The quantitative analysis provided detailed insight into the MEW process flows within
the system and assisted with the identification and selection of environmental efficiency improve-
ments. The key learning points from conducting the analysis generated a set of guidelines to aid the
analysis of manufacturing systems, using MEW process flow modelling. This paper documents the
approach developed and the environmental performance improvement opportunities identified in
the case facility.
& 2012 Elsevier B.V. All rights reserved.
1. Introduction
A sustainable society must live within its means and useenergy and materials in a way that will not compromise thestandards and health of future generations (Brundtland, 1987).Substantial improvements in the efficiency in which finite naturalresources are used, and reduction of the wastes and emissionsgenerated through their use, are required.
A sustainable society cannot be realised without more efficientapproaches and technologies, which must in part be provided bymanufacturing. Whilst the existing industrial system has helpedto create the high standard of living, which is enjoyed today indeveloped countries, merely using its existing configuration toproduce these technologies is no longer appropriate (Evans et al.,2008). As global living standards continue to rise; the challengefor manufacturing is to meet a constantly increasing demand forproducts whilst using less material, less energy and generatingless waste (European Commission, 2010).
Organisations that pursue more environmentally friendly pro-ducts and operations will recover costs quickly (O’Brien, 1999) and
ll rights reserved.
Department (B50), Cranfield
l.: þ44 1234 750111.
contribute to competitive advantage (Yang et al., 2010) rather thansuffering a burden (Menzel et al., 2010). Indeed, as material, energyand waste costs rise, environmental efficiency improvements willhave greater benefit than ever before. Those that do not improvewill suffer higher costs from waste disposal and non-compliancewith punitive legislation (Ball et al., 2008). Significant benefits froman environmental focus have been shown (Schonsleben et al., 2010)and forward thinking companies that prepare for this future willthrive, while the rest will be left behind (Industry Today, 2010).
For manufacturing companies that have recognised the needfor change, their challenge becomes understanding how it can beachieved. Research has been carried out to address this challenge(Rahimifard and Clegg, 2007; Abdul Rashid et al., 2008; Seligeret al., 2008), however, in general most research is generic andhigh level. The literature covers the principles for making man-ufacturing operations more sustainable, but there is little, if any,practical guidance available showing how to apply these princi-ples. Lower level guidelines are required to aid manufacturers inmaking changes in their factories in order to improve environ-mental efficiency. The methodology must provide detailed gui-dance on systematically analysing individual manufacturingprocesses and assistance with the identification and selection ofimprovement opportunities.
Process flow modelling could be the basis for the creation of asuitable approach by mapping the lifecycle of Material, Energy
L. Smith, P. Ball / Int. J. Production Economics 140 (2012) 227–238228
and Waste (MEW) process flows. This has been achieved at a genericlevel (Ball et al., 2008) and has potential for use at a company level.MEW process flows are the physical resource inputs and outputs tothe facility, and their efficiency within a manufacturing systemcould be measured financially and in terms of carbon emissions.This paper introduces an implementation approach developed andillustrates its application in a case company.
2. Aim and method
The aim of this work is to develop guidelines for Material,Energy and Waste (MEW) process flow modelling to support thepursuit of more sustainable manufacture.
The method used was to review available literature to establishthe principles of sustainable manufacturing and the approaches totheir deployment. Based on earlier literature review, it was knownthat available detailed approaches for manufacturing operationswere sparse and therefore this work was necessarily inductive todraw from practice and generalise. From the literature review aninitial approach for modelling MEW flows was developed anddeployed in a case company to capture the qualitative and quanti-tative process flow data. This data was then analysed to assist in theidentification of improvement opportunities. The result was bothpotential savings for manufacturing operations by taking a sustain-ability perspective as well as key learning points that were used togenerate practical guidelines for others to use.
In scope are the production operations and supporting facilities ofmanufacturer. Efforts to reduce the environmental impact throughsupply chain configuration, product design, material selection, pro-duct use and product end of life are out of scope. Wider issuesrelating to consumerism and business models are also out of scope.
3. Literature review
3.1. Sustainability and business
Brundtland (1987) defines sustainability as ‘‘meeting the needsof the present generation without compromising the ability offuture generations to meet their own needs’’ (p. 8). Sustainabilityis the goal of sustainable development and this is described as‘‘types of economic and social development that protect andenhance the natural environment and social equity’’ (Diesendorf,2000, p. 3). To be physically sustainable, Daly (1990) identifies threerules, which must be met: harvest or extraction rates should notexceed regeneration rates; waste emission rates should not exceedthe natural absorption capacities of the ecosystems into which theyare emitted; regenerative and absorption capacities are consideredto be natural capital, and failure to maintain these capacities isnatural capital consumption, which is not sustainable. Today, noneof these rules are being met. The consequences of this have been thekey environmental issues identified by Esty and Winston (2009) ofclimate change, energy, water, biodiversity, toxics, air pollution,waste management, ozone, oceans and deforestation. In addition,materials sourcing and cost are also causes for concern, particularlyfor manufacturing businesses.
Environmental sustainability is of significant relevance to allsectors and presents both risks and opportunities for businesses(Gaughran et al., 2007). Elkington (1998) depicts the sustainabilitychallenge as ‘‘an unprecedented source of commercial opportunityfor competitive companies, through technological innovation andimproved eco-efficiency’’. A sustainable business model is one,which recognises the triple bottom line (3BL) of social justice(People), environmental quality (Planet) and economic prosperity(Profit) (Elkington, 1998). This means that whether the justification
for improved environmental performance is concern for the envir-onment itself, management of the risks associated with sustain-ability, or to capitalise on the associated opportunities, it is essentialto recognise the importance of sustainability and to adapt businessmodels accordingly.
3.2. Linking environmental and financial performance
Traditional thinking in manufacturing companies suggests thatthe minimum amount of work should be done in order to meetenvironmental regulatory compliance, as going beyond this willincrease costs (Sharma, 2010). Manufacturers accept environ-mental excellence can lead to extensive benefits, but have foundthe cost of complying with environmental regulation, or bestpractice targets, can be high (Machin, 2010). Notably, the surveyby the Economist Intelligence Unit found that ‘‘y 69% believe thelink [between financial performance and commitment to sustain-ability] is strong in the long term (5–10 years), and companiesworldwide are moving sustainability principles into their corepolicies and practices’’ (The Manufacturer.com, 2010). Addition-ally, Yang et al. (2011) found that environmental performancepositively impacts on financial and market performance.
Forward thinking manufacturing companies have recognisedthat whilst in the short term, improved environmental efficiencymay lead to increased costs in some areas, in the long term it willlead to significantly improved financial performance and is now aprerequisite to make a business sustainable. As material and energycosts (as well as their subsequent waste disposal) costs rise, the costof inaction towards environmental efficiency improvements maycost more than making the improvements themselves.
There are an increasing number of examples of savings thatcompanies have made, for example:
�
Brandix reduced water usage by 58% and reduced energyusage by 46% resulting in 30–40% reduction in operating costs(Evans et al., 2008). � Ford (Global Operations) reduced their energy usage by 30%and water usage by 43% (Ford Motor Company, 2007).
� Sony reduced their CO2 emissions from electricity use andfacility heating (European operations) by 93% over 10 years(Sony, 2010).
� Rolls-Royce reduced solvents by 51%, reduced greenhouse gasemissions by 24% and increased the proportion of solid wastesent for recycling by 63% over a period of 10 years whilstdoubling turnover (Rolls-Royce, 2010).
Analysis of the improvements found showed that each of themfits into one or more of the three Material, Energy and Waste(MEW) process flow categories, which can be directly linked tothe economic dimension. Clearly, drawing less inputs and gen-erating less waste outputs which must be paid for, or paid todispose of, is of financial and environmental benefit. Theseexamples collectively suggest that a focus on the MEW processflows within a facility provides a basis upon which environmentaland financial performance improvements can be pursued.
3.3. Approaches for achieving environmental efficiency
improvements
Having recognised the importance of the environment tobusinesses and seen examples of real benefits being achieved, itis necessary to understand the approaches available for pursuingimprovements. As awareness of environmental concerns hasgrown, so has the literature and research activity in this area.
The Natural-Step (TNS) defined by Broman et al. (2000) is abroad strategic framework for organisations, which provides
L. Smith, P. Ball / Int. J. Production Economics 140 (2012) 227–238 229
high-level guidance for sustainability investments and initiatives.According to this framework, there are systems conditions whichmust be met for society to become sustainable (the ecospheremust not be subjected to increasing concentrations of waste,over-harvested or used inefficiently), and a strategy is required tochange the organisation in order to fulfil these conditions (under-standing the conditions, understand a company’s relative posi-tion, creating a vision and specifying an action plan). TNSintentionally does not prescribe specific actions hence companiesmust define the tactical and operational level changes required,possibly combining with other approaches to realise environ-mental improvements.
For the concept of Industrial Ecology (IE), Graedel and Allenby(2002) describes three model types that capture resource flows fromthe ecosphere to the technosphere and back. In the first model(linear, type I) the resources flow (material and energy) from theecosphere into the technosphere and then waste is returned to theecosphere with the assumption there is unlimited capacity to absorbthe industrial waste. In the second model (quasi-cyclic, type II) thereis a certain degree of cycling of resource in the technosphere andthereby reducing the burden on the ecosphere to provide resourceand absorb waste. Hence material and energy flows are reduced, aswell as waste flows. In the third model (cyclic, type III) the highestdegree of cycling through closed loop occurs to enable self-suffi-ciency and reliance only on renewable energy inputs. IE concept hasnot been applied at factory level (Andrews, 2001) and thereforewhilst conceptually it is of relevance there is no guidance for itsdeployment in companies.
Sustainable Manufacturing (SM) (Rahimifard and Clegg, 2007;Seliger, 2007; Kumazawa and Kobayashi, 2003) (based on environ-mental conscious manufacturing) is broad in scope, taking a highlevel view of manufacturing and including all three elements of thetriple bottom line. SM and its predecessors looks beyond theboundaries of a single facility and considers the entire materialcycle from material extraction through processing and use tosubsequent disposal (O’Brien, 1999; Allwood, 2005). A lot of SMresearch has focused on product development and end-of-lifemanagement in order to keep products within the technosphereafter the ‘‘Use’’ phase. There has been less SM research activityfocusing on improving specific manufacturing systems, especiallythe component production and assembly stages. This has meant thatSM does not provide a methodology for manufacturers to generateimprovements within their own facilities (Despeisse, 2010).
Zero Carbon Manufacturing (ZCM) (Ball et al., 2008) can beviewed as a constituent element of sustainable manufacturing,which is focused on the tactical and operational levels of anorganisation. ZCM takes the perspective of the manufacturer andseeks to improve the environmental performance of their system byunderstanding the process flows within it. This is achieved byexamining the manufacturing processes, the surrounding buildingand the associated facilities at a systems level through Material,Energy and Waste (MEW) process mapping. A black-box view of thesystem and its components is adopted and the focus is on examiningthe process inputs and outputs. Opportunities are sought for reusingoutputs elsewhere in the system as inputs to other processes, toreduce net environmental impact. When viewed in isolation, man-ufacturing processes cannot be zero carbon, but when consideringsuch processes as part of a wider system; it is possible to achieve netcarbon reduction (Despeisse et al., 2009).
4. Development of an approach to address sustainability atfactory level
It is apparent from the literature that most approaches forprogressing towards sustainable development are generic and high
level. There is a lack of guidance and tools for manufacturers toidentify improvement opportunities within their own factories. Theuse of Material, Energy and Waste (MEW) as a basis for improve-ment has potential for analysis given that manufacturers expresstheir improvements in those forms and there are high level conceptsin which to frame the work. Any analysis must address both thequalitative MEW flows as well as the quantitative flows.
In order to develop the MEW process flow modelling techni-que, it is first necessary to determine the most appropriateprocess flow mapping tool to be used. To pursue environmentalefficiency improvements, the systems within a manufacturingorganisation must be represented so that the complexities andinteractions are reduced to a manageable level for analysis.Process maps can be jointly analysed by Facilities Maintenanceand Manufacturing Engineering Specialists, to highlight where theinput of one activity can be provided by the output of anotheractivity, in order to reduce overall consumption. Traditionallythese departments would be focused on reducing waste withintheir own areas rather than adopting an integrated view of thefacility and reducing waste at the system level.
IDEF0 is a suitable format for representing MEW process flows,providing a structured representation of activities (boxes) within asystem with their corresponding Input, Control, Output andMechanism (ICOM) (arrows). Inputs enter on the left of the activitybox, outputs leave on the right, mechanisms (activity enablers) enterfrom below and controls (legislations and policies) feed from above.Conveniently, each activity can be hierarchically decomposed to alower level to provide a more detailed representation of thatactivity. The approach is standardised but users must possess basicknowledge of the technique in order to understand it.
The use of a structured process mapping tool followed bydetailed quantitative analysis is useful in understanding interactionswithin a system (Hall and Martin, 2002). Quantitative analysis ofMEW flows can be done using a top down, or bottom up approach.The top down approach involves examining the total MEW flowsand costs in a given time period and attempting to trace the usageand generation to particular assets. The bottom up approach, whichis used in this work, involves mapping MEW process flows from asystems level perspective to understand the inputs and outputs ofthe system and the individual processes within it.
Lean production (Womack et al., 1990) is an approach withsupporting tools to reduce waste and improve flow by focusing ondelivering value to the customer. Lean approaches for lean have thepotential as a base for looking at wider production resources, namely:look see, process mapping, data collection, data analysis, improve-ment opportunities, implementation and review. However, whilstsustainable manufacturing practices are compatible with lean, pri-marily through waste reduction, it is not a given that lean practiceswill improve environmental performance (Yang et al., 2011) throughreducing waste and reusing resources across the spectrum of amanufacturing system necessary. Lean in practice and as a result ofthe typical toolset is focused on the primary flows to customer, notthe support infrastructure to achieve them. This is supported byempirical evidence. For example, as a proponent of lean, Toyota isseen as the benchmark for lean adoption, however has made massivereductions in resource consumption since it adopted its eco-factoryfocus in its sustainable plants over the last decade (Toyota, 2011).
The literature review failed to uncover techniques for gatheringMEW process flow data and quantitative modelling. The closestexamples are Life Cycle Analysis (LCA) (see ISO14040) and adaptedversions of Value Stream Mapping (VSM) (Erlach, 2010), both ofwhich are product stream rather than production function focused.Another example is that of de Ron (1998), which lacks theproduction system depth and case evidence presented here.
These areas currently represent gaps in the literature whichthis research is intended to fill. The following steps were judged
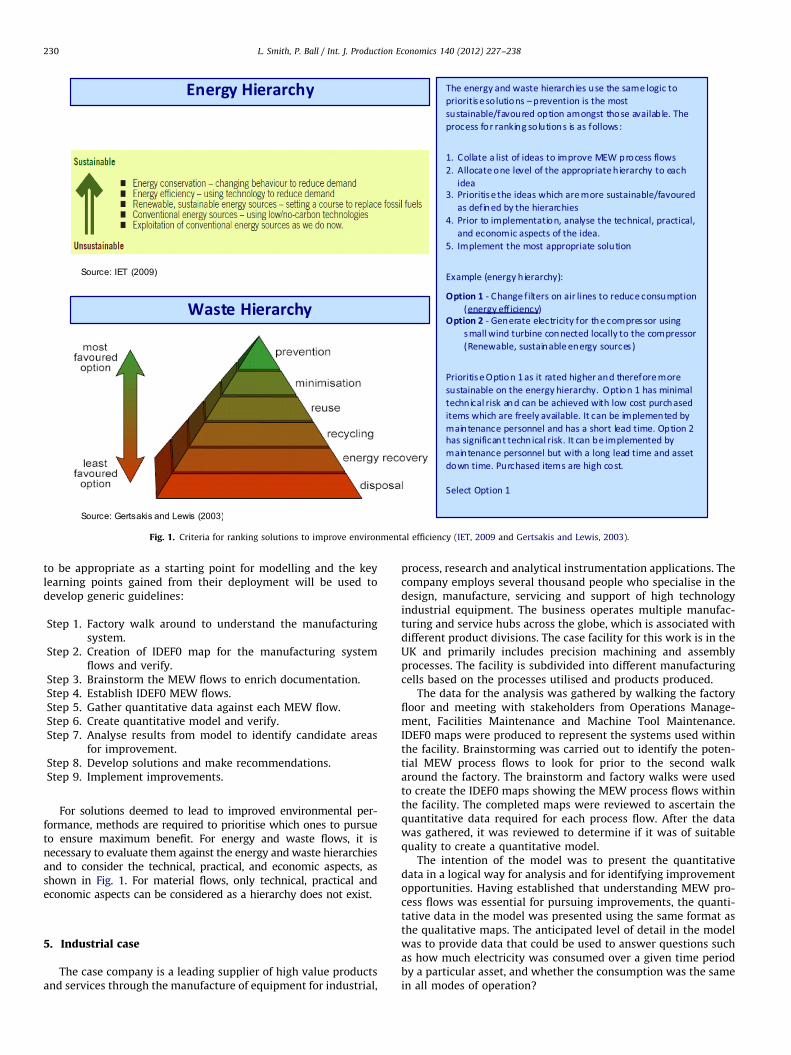
Fig. 1. Criteria for ranking solutions to improve environmental efficiency (IET, 2009 and Gertsakis and Lewis, 2003).
L. Smith, P. Ball / Int. J. Production Economics 140 (2012) 227–238230
to be appropriate as a starting point for modelling and the keylearning points gained from their deployment will be used todevelop generic guidelines:
Step 1.
Factory walk around to understand the manufacturingsystem.Step 2.
Creation of IDEF0 map for the manufacturing systemflows and verify.Step 3.
Brainstorm the MEW flows to enrich documentation. Step 4. Establish IDEF0 MEW flows. Step 5. Gather quantitative data against each MEW flow. Step 6. Create quantitative model and verify. Step 7. Analyse results from model to identify candidate areasfor improvement.
Step 8. Develop solutions and make recommendations. Step 9. Implement improvements.For solutions deemed to lead to improved environmental per-formance, methods are required to prioritise which ones to pursueto ensure maximum benefit. For energy and waste flows, it isnecessary to evaluate them against the energy and waste hierarchiesand to consider the technical, practical, and economic aspects, asshown in Fig. 1. For material flows, only technical, practical andeconomic aspects can be considered as a hierarchy does not exist.
5. Industrial case
The case company is a leading supplier of high value productsand services through the manufacture of equipment for industrial,
process, research and analytical instrumentation applications. Thecompany employs several thousand people who specialise in thedesign, manufacture, servicing and support of high technologyindustrial equipment. The business operates multiple manufac-turing and service hubs across the globe, which is associated withdifferent product divisions. The case facility for this work is in theUK and primarily includes precision machining and assemblyprocesses. The facility is subdivided into different manufacturingcells based on the processes utilised and products produced.
The data for the analysis was gathered by walking the factoryfloor and meeting with stakeholders from Operations Manage-ment, Facilities Maintenance and Machine Tool Maintenance.IDEF0 maps were produced to represent the systems used withinthe facility. Brainstorming was carried out to identify the poten-tial MEW process flows to look for prior to the second walkaround the factory. The brainstorm and factory walks were usedto create the IDEF0 maps showing the MEW process flows withinthe facility. The completed maps were reviewed to ascertain thequantitative data required for each process flow. After the datawas gathered, it was reviewed to determine if it was of suitablequality to create a quantitative model.
The intention of the model was to present the quantitativedata in a logical way for analysis and for identifying improvementopportunities. Having established that understanding MEW pro-cess flows was essential for pursuing improvements, the quanti-tative data in the model was presented using the same format asthe qualitative maps. The anticipated level of detail in the modelwas to provide data that could be used to answer questions suchas how much electricity was consumed over a given time periodby a particular asset, and whether the consumption was the samein all modes of operation?
L. Smith, P. Ball / Int. J. Production Economics 140 (2012) 227–238 231
Examination of the quantitative analysis of the process flows ledto the application of Pareto analysis to rank the process flows byvalue to establish, which area was best to focus improvement efforts,noting that it is not only necessary to look at the quantities of theMEW process flows but also the ability to influence them. Followingthe ranking the approach described for Fig. 1 was adopted.
6. Results
Using the provisional approach presented earlier the applica-tion of MEW process flow modelling was applied in the casecompany. Step 9 (implementation) is omitted.
�
Step 1. Understanding the manufacturing systemOne author was already familiar with the manufacturingsystem. A walk around the production area was necessaryhowever to look at the system not from the eyes of a leanspecialist improving flow by focusing on value add but fromthe view of MEW flows. The walk draws from the benefits ofGemba practised by adopters of lean management wheregoing to see the problem an essential early step.
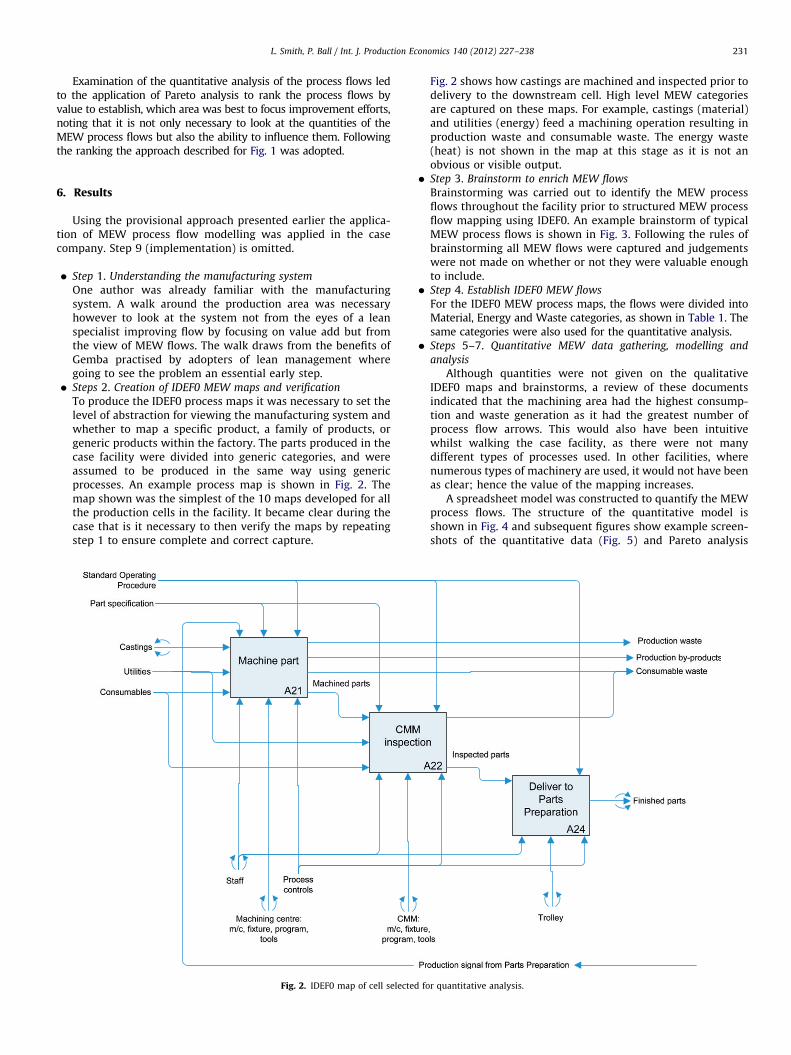
� Steps 2. Creation of IDEF0 MEW maps and verificationTo produce the IDEF0 process maps it was necessary to set thelevel of abstraction for viewing the manufacturing system andwhether to map a specific product, a family of products, orgeneric products within the factory. The parts produced in thecase facility were divided into generic categories, and wereassumed to be produced in the same way using genericprocesses. An example process map is shown in Fig. 2. Themap shown was the simplest of the 10 maps developed for allthe production cells in the facility. It became clear during thecase that is it necessary to then verify the maps by repeatingstep 1 to ensure complete and correct capture.
Fig. 2. IDEF0 map of cell selected fo
Fig. 2 shows how castings are machined and inspected prior todelivery to the downstream cell. High level MEW categoriesare captured on these maps. For example, castings (material)and utilities (energy) feed a machining operation resulting inproduction waste and consumable waste. The energy waste(heat) is not shown in the map at this stage as it is not anobvious or visible output.
� Step 3. Brainstorm to enrich MEW flowsBrainstorming was carried out to identify the MEW processflows throughout the facility prior to structured MEW processflow mapping using IDEF0. An example brainstorm of typicalMEW process flows is shown in Fig. 3. Following the rules ofbrainstorming all MEW flows were captured and judgementswere not made on whether or not they were valuable enoughto include.
� Step 4. Establish IDEF0 MEW flowsFor the IDEF0 MEW process maps, the flows were divided intoMaterial, Energy and Waste categories, as shown in Table 1. Thesame categories were also used for the quantitative analysis.
� Steps 5–7. Quantitative MEW data gathering, modelling andanalysis
Although quantities were not given on the qualitativeIDEF0 maps and brainstorms, a review of these documentsindicated that the machining area had the highest consump-tion and waste generation as it had the greatest number ofprocess flow arrows. This would also have been intuitivewhilst walking the case facility, as there were not manydifferent types of processes used. In other facilities, wherenumerous types of machinery are used, it would not have beenas clear; hence the value of the mapping increases.
A spreadsheet model was constructed to quantify the MEWprocess flows. The structure of the quantitative model isshown in Fig. 4 and subsequent figures show example screen-shots of the quantitative data (Fig. 5) and Pareto analysis
r quantitative analysis.
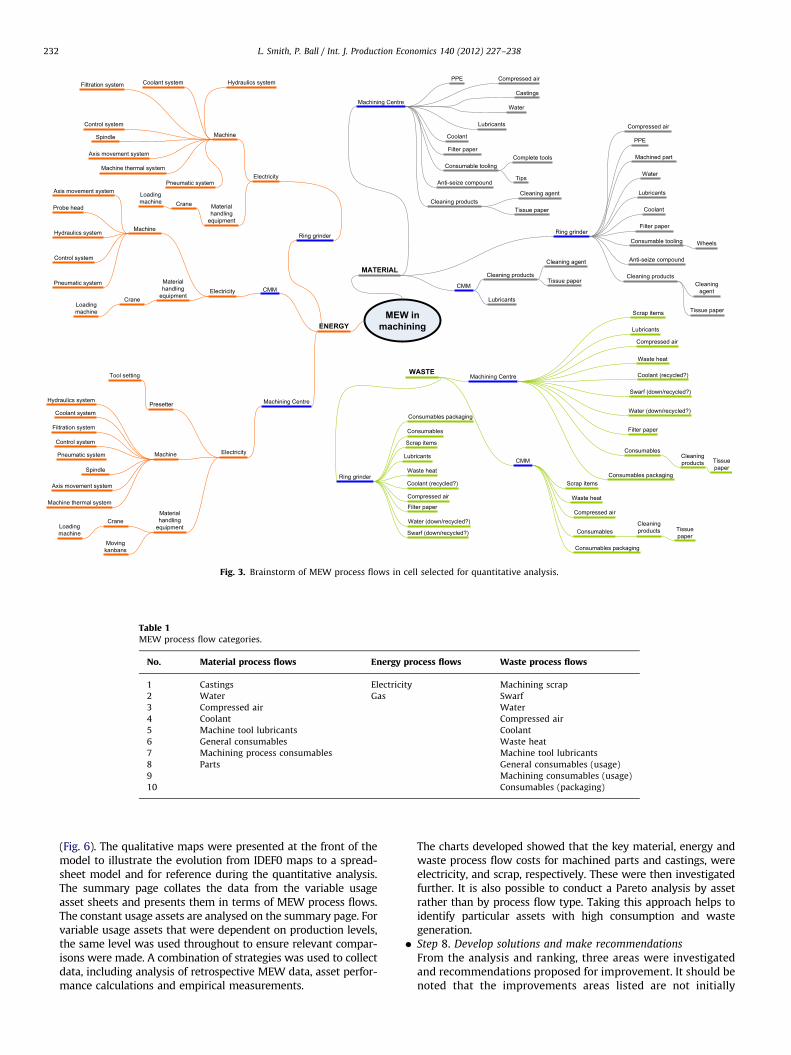
Fig. 3. Brainstorm of MEW process flows in cell selected for quantitative analysis.
Table 1MEW process flow categories.
No. Material process flows Energy process flows Waste process flows
1 Castings Electricity Machining scrap
2 Water Gas Swarf
3 Compressed air Water
4 Coolant Compressed air
5 Machine tool lubricants Coolant
6 General consumables Waste heat
7 Machining process consumables Machine tool lubricants
8 Parts General consumables (usage)
9 Machining consumables (usage)
10 Consumables (packaging)
L. Smith, P. Ball / Int. J. Production Economics 140 (2012) 227–238232
(Fig. 6). The qualitative maps were presented at the front of themodel to illustrate the evolution from IDEF0 maps to a spread-sheet model and for reference during the quantitative analysis.The summary page collates the data from the variable usageasset sheets and presents them in terms of MEW process flows.The constant usage assets are analysed on the summary page. Forvariable usage assets that were dependent on production levels,the same level was used throughout to ensure relevant compar-isons were made. A combination of strategies was used to collectdata, including analysis of retrospective MEW data, asset perfor-mance calculations and empirical measurements.
The charts developed showed that the key material, energy andwaste process flow costs for machined parts and castings, wereelectricity, and scrap, respectively. These were then investigatedfurther. It is also possible to conduct a Pareto analysis by assetrather than by process flow type. Taking this approach helps toidentify particular assets with high consumption and wastegeneration.
� Step 8. Develop solutions and make recommendationsFrom the analysis and ranking, three areas were investigatedand recommendations proposed for improvement. It should benoted that the improvements areas listed are not initially
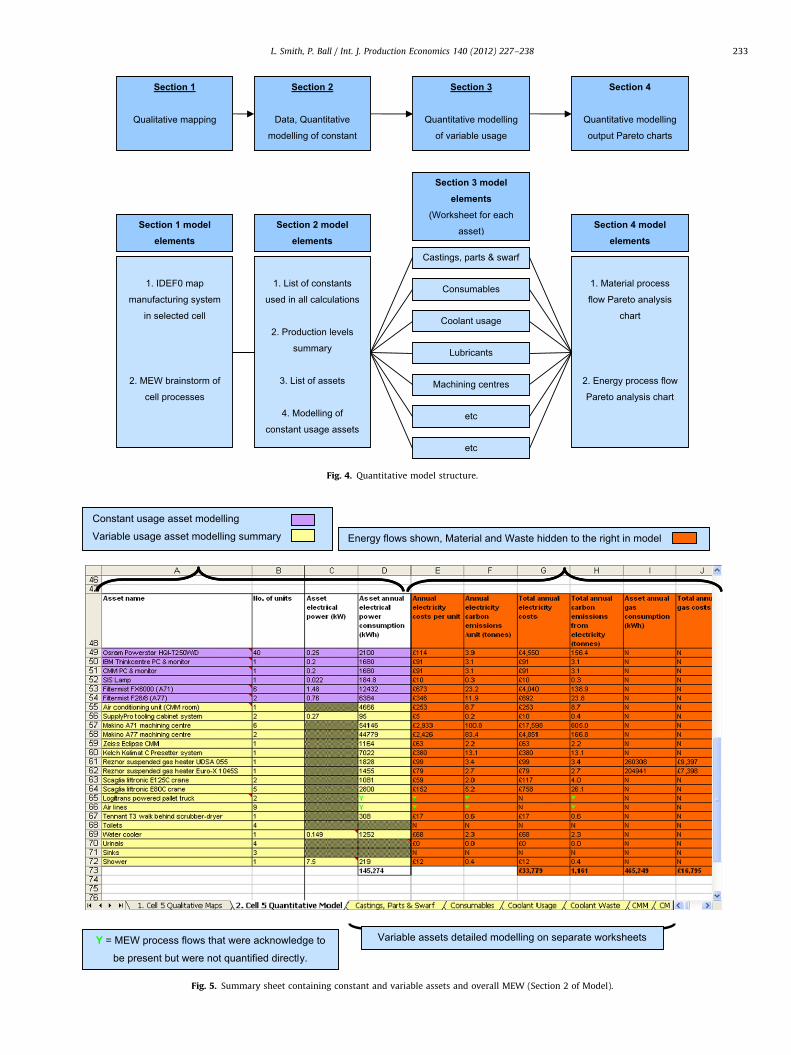
Fig. 4. Quantitative model structure.
Fig. 5. Summary sheet containing constant and variable assets and overall MEW (Section 2 of Model).
L. Smith, P. Ball / Int. J. Production Economics 140 (2012) 227–238 233
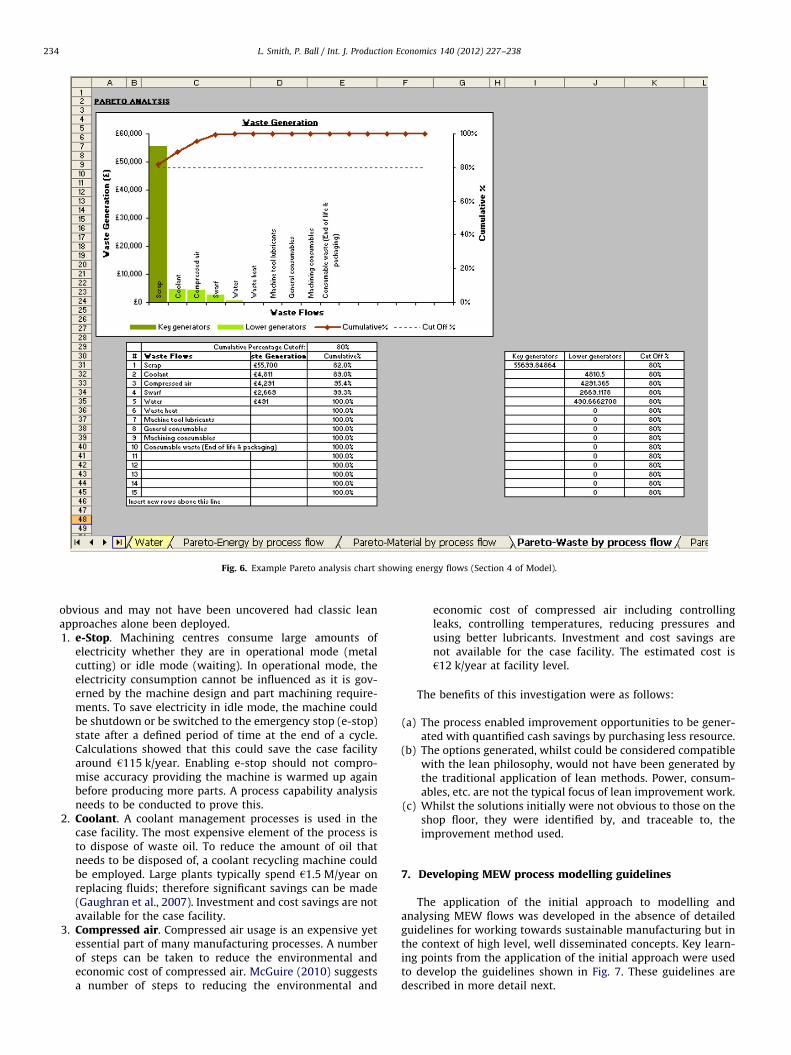
Fig. 6. Example Pareto analysis chart showing energy flows (Section 4 of Model).
L. Smith, P. Ball / Int. J. Production Economics 140 (2012) 227–238234
obvious and may not have been uncovered had classic leanapproaches alone been deployed.1. e-Stop. Machining centres consume large amounts of
electricity whether they are in operational mode (metalcutting) or idle mode (waiting). In operational mode, theelectricity consumption cannot be influenced as it is gov-erned by the machine design and part machining require-ments. To save electricity in idle mode, the machine couldbe shutdown or be switched to the emergency stop (e-stop)state after a defined period of time at the end of a cycle.Calculations showed that this could save the case facilityaround h115 k/year. Enabling e-stop should not compro-mise accuracy providing the machine is warmed up againbefore producing more parts. A process capability analysisneeds to be conducted to prove this.
2. Coolant. A coolant management processes is used in thecase facility. The most expensive element of the process isto dispose of waste oil. To reduce the amount of oil thatneeds to be disposed of, a coolant recycling machine couldbe employed. Large plants typically spend h1.5 M/year onreplacing fluids; therefore significant savings can be made(Gaughran et al., 2007). Investment and cost savings are notavailable for the case facility.
3. Compressed air. Compressed air usage is an expensive yetessential part of many manufacturing processes. A numberof steps can be taken to reduce the environmental andeconomic cost of compressed air. McGuire (2010) suggestsa number of steps to reducing the environmental and
economic cost of compressed air including controllingleaks, controlling temperatures, reducing pressures andusing better lubricants. Investment and cost savings arenot available for the case facility. The estimated cost ish12 k/year at facility level.
The benefits of this investigation were as follows:
(a)
The process enabled improvement opportunities to be gener-ated with quantified cash savings by purchasing less resource.(b)
The options generated, whilst could be considered compatiblewith the lean philosophy, would not have been generated bythe traditional application of lean methods. Power, consum-ables, etc. are not the typical focus of lean improvement work.(c)
Whilst the solutions initially were not obvious to those on theshop floor, they were identified by, and traceable to, theimprovement method used.7. Developing MEW process modelling guidelines
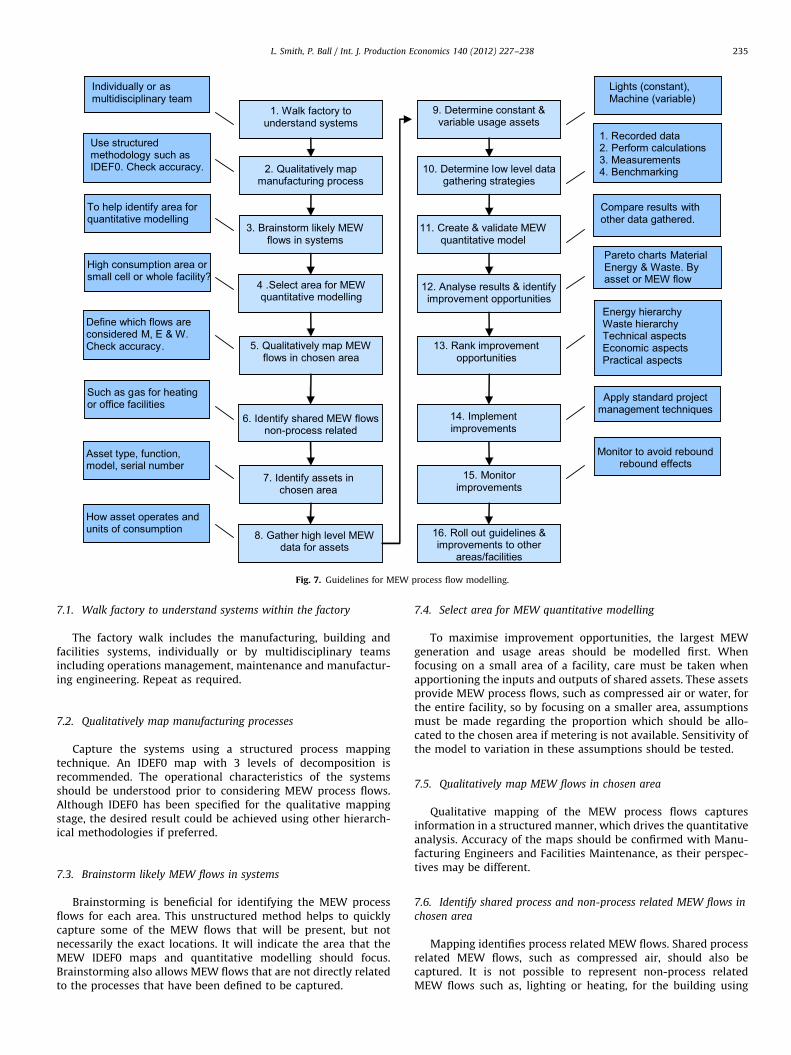
The application of the initial approach to modelling andanalysing MEW flows was developed in the absence of detailedguidelines for working towards sustainable manufacturing but inthe context of high level, well disseminated concepts. Key learn-ing points from the application of the initial approach were usedto develop the guidelines shown in Fig. 7. These guidelines aredescribed in more detail next.
High consumption area or small cell or whole facility?
Such as gas for heatingor office facilities
Lights (constant),Machine (variable)
Individually or as multidisciplinary team
Use structured methodology such asIDEF0. Check accuracy.
To help identify area for quantitative modelling
1. Walk factory to understand systems
2. Qualitatively map manufacturing process
3. Brainstorm likely MEW flows in systems
4 .Select area for MEW quantitative modelling
5. Qualitatively map MEW flows in chosen area
7. Identify assets in chosen area
8. Gather high level MEW data for assets
6. Identify shared MEW flows non-process related
Energy hierarchyWaste hierarchyTechnical aspectsEconomic aspectsPractical aspects
Pareto charts MaterialEnergy & Waste. By asset or MEW flow
Define which flows are considered M, E & W. Check accuracy.
Asset type, function, model, serial number
How asset operates and units of consumption
Compare results with other data gathered.
16. Roll out guidelines & improvements to other
areas/facilities
15. Monitor improvements
14. Implement improvements
13. Rank improvement opportunities
12. Analyse results & identify improvement opportunities
11. Create & validate MEW quantitative model
10. Determine low level data gathering strategies
9. Determine constant & variable usage assets
1. Recorded data2. Perform calculations3. Measurements4. Benchmarking
Monitor to avoid reboundrebound effects
Apply standard project management techniques
Fig. 7. Guidelines for MEW process flow modelling.
L. Smith, P. Ball / Int. J. Production Economics 140 (2012) 227–238 235
7.1. Walk factory to understand systems within the factory
The factory walk includes the manufacturing, building andfacilities systems, individually or by multidisciplinary teamsincluding operations management, maintenance and manufactur-ing engineering. Repeat as required.
7.2. Qualitatively map manufacturing processes
Capture the systems using a structured process mappingtechnique. An IDEF0 map with 3 levels of decomposition isrecommended. The operational characteristics of the systemsshould be understood prior to considering MEW process flows.Although IDEF0 has been specified for the qualitative mappingstage, the desired result could be achieved using other hierarch-ical methodologies if preferred.
7.3. Brainstorm likely MEW flows in systems
Brainstorming is beneficial for identifying the MEW processflows for each area. This unstructured method helps to quicklycapture some of the MEW flows that will be present, but notnecessarily the exact locations. It will indicate the area that theMEW IDEF0 maps and quantitative modelling should focus.Brainstorming also allows MEW flows that are not directly relatedto the processes that have been defined to be captured.
7.4. Select area for MEW quantitative modelling
To maximise improvement opportunities, the largest MEWgeneration and usage areas should be modelled first. Whenfocusing on a small area of a facility, care must be taken whenapportioning the inputs and outputs of shared assets. These assetsprovide MEW process flows, such as compressed air or water, forthe entire facility, so by focusing on a smaller area, assumptionsmust be made regarding the proportion which should be allo-cated to the chosen area if metering is not available. Sensitivity ofthe model to variation in these assumptions should be tested.
7.5. Qualitatively map MEW flows in chosen area
Qualitative mapping of the MEW process flows capturesinformation in a structured manner, which drives the quantitativeanalysis. Accuracy of the maps should be confirmed with Manu-facturing Engineers and Facilities Maintenance, as their perspec-tives may be different.
7.6. Identify shared process and non-process related MEW flows in
chosen area
Mapping identifies process related MEW flows. Shared processrelated MEW flows, such as compressed air, should also becaptured. It is not possible to represent non-process relatedMEW flows such as, lighting or heating, for the building using
L. Smith, P. Ball / Int. J. Production Economics 140 (2012) 227–238236
IDEF0. Brainstorming is recommended for capturing this informa-tion qualitatively.
7.7. Identify assets in chosen area
The processes and MEW flows on the qualitative maps must belinked to the assets in the selected area.
7.8. Gather high level MEW data for assets
It is essential to develop a basic understanding of how eachasset works, particularly for shared assets that were not investi-gated in the process mapping stage.
7.9. Determine constant and variable usage assets
All assets have variable consumption and waste generationlevels. For modelling purposes, some assets can be simplified bytreating them as constant usage whilst maintaining a suitablelevel of accuracy. Data will be required from the asset manufac-turer in order to accurately model variable usage assets. Less datais required for constant usage assets.
7.10. Determine low level data gathering strategies
In preparation for detailed quantitative analysis it is necessaryto determine suitable low level data gathering strategies of (inorder of increasing effort):
(a)
Analysis of retrospective MEW data, (b) Asset calculations, (c) Empirical measurements, (d) Benchmark against similar companies or available casestudies.
7.11. Create and validate MEW quantitative model
At the earliest opportunity set the scope of the MEW quanti-tative model to drive its creation and to validate it appropriately.The qualitative analysis will suggest areas of the facility to focusthe quantitative analysis, as high consumption or waste andgeneration will be reflected in the process maps. Data availabilitywill also influence what can be achieved; if there is more dataabout one area then greater insights can be made.
7.12. Analyse results and identify improvement opportunities
Pareto analysis identifies, which of the MEW process flowshave the greatest impact. The costs can be represented per assetor per MEW flow.
7.13. Rank improvement opportunities
To rank improvement opportunities, it is necessary to look atthe quantities of the MEW process flows and the ability toinfluence them. The energy and waste hierarchies are also usefulfor this purpose followed by consideration of the technical,practical and economic aspects of each improvement.
7.14. Implement improvements
Standard project management techniques apply here.
7.15. Monitor improvements
Improvements must be monitored to ensure benefits arerealised after the initial implementation and rebound effects donot occur.
7.16. Roll out guidelines and improvements to other areas/facilities
The methodology and improvements should be applied toother cells within the facility and to other manufacturing facilitiesin order to minimise environmental impact.
8. Discussion
The processes and flows that were observed by walkingaround the case facility were mapped first. This is in contrast tothe recommended IDEF0 practice of producing the more abstract,top level diagram first and then decomposing down to lowerlevels with increasing detail. It was easier to map what had beenseen during the walk rather than attempting to think abstractlyabout processes that were unfamiliar. The convention for IDEF0 isto show less than 6 processes per level of decomposition. Themaps produced showed additional processes, which added totheir complexity but avoided any reduction in clarity from thecross-over of many arrows that could have otherwise occurred.The process walk and the use of process maps are complemen-tary; the process walk captures the visible processes and genericprocess maps prompt for omissions such as waste (particularlyheat waste) and checks for mass flow balance.
Retrospective data can be of value as a comparison to establishthe accuracy of a quantitative model if the quality of the data ishigh. An issue found in the case study data was that available dataoften had missing data points or extreme outliers meaningmanual correction was necessary by knowledgeable individuals.If there is a high degree of uncertainty in the data it is possible toattempt to cleanse it by removing anomalies, and confirming thatthe data collection frequency and resolution is appropriate. Tofacilitate meaningful comparisons, a disciplined approach to datagathering is required. Personnel tasked with gathering data do notnecessarily have formal training in this area, or the awareness ofthe value of the data and its use in downstream activities. It is notnecessary to conduct such detailed analysis on assets with lowconsumption levels and costs, however, identifying them doeshelp educate staff. The work here provide guidance on the typesof data to collect but does not completely address the gap in theliterature of guiding the quality of data to collect, i.e. frequency,duration, detail and accuracy.
This work does not attempt to reduce scrap levels, but it doeshighlight both the cost of wasted material and also the cost ofwasted production overheads, which are not traditionally con-sidered. It will help to raise awareness, such that operators areencouraged to be more careful when using expensive assets andparts. The same is true of swarf; the amount of swarf produced isnot influenced directly, but by highlighting the associated costs, itencourages better product and process design to reduce swarfgeneration, and better management of what swarf is produced.
An alternative modelling strategy to adopt is to produce amodel without any form of qualitative process mapping first.Whilst this could have been pursued, the maps made thequantitative model easier and quicker to construct. They offer awider appreciation of the opportunities for system level improve-ments and provide confidence that all the MEW process flowshave been considered. They are also easier to communicate than acomplex quantitative model and in turn help build confidence
L. Smith, P. Ball / Int. J. Production Economics 140 (2012) 227–238 237
with those affected by potential changes or those needed to giveapproval for change.
Process maps can only represent improvement opportunitiesrelated to the process itself. They do not directly identify non-process related opportunities for integrating MEW process flowssuch as rainwater harvesting or using waste water. The mapsassist indirectly because as opportunities are sought for processrelated improvements, the scope of the search naturally evolvesto include non-process related opportunities. One issue with theapproach is that it guides improvements in areas that typicalmanufacturing engineers lack experience. This is in contrast toimprovements in value-adding processes through the applicationof lean and other tools where engineers will have more experi-ence and access to more examples. There is potential therefore tofind ways of linking the guidelines presented to repositories ofpractices (Despeisse et al., in press) that engineers can search forspecific ideas. This particular case study was based on activitiesby manufacturing engineering, wider membership could haveprompted how inputs and outputs identified in the process mapsare provided and or can utilised, respectively.
The number of opportunities for integrating MEW processflows by recovering wastes, such as heat or water, for use asinputs elsewhere in the system is dependent on the type ofmanufacturer. There will be more opportunities in process indus-tries or other plants where the building is designed around theprocess. In such companies, assets have a long lifespan and arelarge in size, or have high throughputs, meaning their locationstend to be fixed for the duration of their life. In smaller companiesmaking lower volume parts, or smaller discrete products, moreflexibility is required in their factory setup meaning the locationsof their assets do not tend to be permanent. In larger companiesthe level of investment available will be higher meaning moresophisticated systems can be built around assets to maximise therecovery and recycling of wastes. This starts to move the focus ofMEW modelling from Industrial Ecology Type I to Type II with acertain degree of recycling internally such as heat waste.
Applying the guidelines and improvement opportunities tofacilities has the potential to reduce their environmental impactand improve economic performance. The improvements identi-fied in the case directly impact on economic and environmentalmetrics through more efficient use of resources and lower wasteoutput. The analysis results should be used to influence thedesign of new facilities, or the expansion of existing facilities,by integrating manufacturing, building and facility systems toreduce environmental impact.
It should be noted that the improvements offered by model-ling MEW flows does not replace the use of lean techniques butcomplements them by broadening the scope beyond the valuestream to less obvious, less visible improvement opportunities.Future opportunities, apart from the application of the approachin a wider range of companies, could come from understandinghow to ‘‘mainstream’’ the approach to integrate the developmentshere with improvement approaches that focus on the value addprocesses to customer. The method developed here demonstratesthe applicability of the approach to the particular case but thestrength of this method over others is difficult to assess given theabsence of published alternatives.
9. Conclusion
Manufacturers have a key role in aiding the transition towardssustainable development. Sustainability must be a key considera-tion for manufacturing organisations today, and its importancewill only increase in the future. Some companies are alreadybenefiting by managing the risks associated with sustainability
and capitalising on the opportunities. Improved environmentalperformance leads to larger profits, as operational costs arereduced.
Detailed methodologies are required to aid manufacturers inanalysing their operations to identify and implement improve-ments within their factories to reduce environmental impact. Theliterature review revealed that these are not available andrepresent a gap in knowledge. The aim of this work was todevelop guidelines for Material, Energy and Waste (MEW) processflow modelling, to support the pursuit of Zero Carbon Manufac-turing (ZCM) and sustainable manufacturing to address the gaps.
The aim was achieved through qualitative mapping of theMEW process flows within a machining cell in a case facility. Thiswas followed by the creation of a quantitative spreadsheet modeland the definition of methods for selecting and implementingenvironmental improvement opportunities. Guidelines were pro-duced by capturing what was learnt through the analysis of thecase facility.
This work contributes to the state of the art by introducingguidelines to identify improvements not explicitly or typicallyidentified by lean or other improvement approaches. Whilst thesolutions derived are not novel, structured procedures to identifythem, such as the one presented here, are new.
Through this work, potential future research directions havebeen identified. Firstly, improvement metrics are important butthere is an absence of work on what effective metrics are and howthey can be combined with existing key performance indicators todrive appropriate shop floor actions. Secondly, the work usedbespoke spreadsheet models as there was an absence of availabletools to support modelling and evaluation. Future tools developedneed to be able to span the primary materials processing throughto the support environment and be able to evaluate the inevitabletrade-offs transpire. Thirdly, sustainable manufacturing solutionsdeveloped are typically derived locally from structured analysis ofproblems and there is potential for databases of sustainablepractices to inform the solution generation to improve thesolutions selected or reduce the time to establishing solutions.Finally, it is important that research is conducted on under-standing and recognising that compromises have to be made inimplementing more sustainable manufacturing practices and theimpact that reducing resources use has on production activities.
Acknowledgements
The authors would like to acknowledge L Beaufort-Jones,D Gayen, M Gonzalez Ortega, T Mangwiro, O O Oguntuyi, J Orizuand F Soumare for their work on generic IDEF0 material, energyand waste flow maps that informed this investigation.
References
Abdul Rashid, S.H., Evans, S., Longhurst, P., 2008. A comparison of four sustainablemanufacturing strategies. International Journal of Sustainable Engineering 1(3), 214–229.
Andrews, C.J., 2001. Building a micro foundation for industrial ecology. Journal ofIndustrial Ecology 4 (3), 35–51.
Allwood J., 2005. What is sustainable manufacturing? In: Proceedings of theSustainable Manufacturing Seminar Series, 16th February 2005. Institute forManufacturing, Cambridge, UK.
Brundtland, G., 1987. World Commission on Environment and Development, OurCommon Future. Oxford University Press, Oxford, UK.
Ball, P.D., Evans, S., Levers, A., Ellison, D., 2008. Zero carbon manufacturingfacility—towards integrating material, energy and waste process flows.Proceedings of the Institution of Mechanical Engineers, Part B: Journal ofEngineering Manufacture 223 (9), 1085–1096.
Broman, G., Holmberg, J., Rob�ert., K.H., 2000. Simplicity without reduction—thinkingupstream towards the sustainable society. Interfaces: International Journal of theInstitute for Operations Research and the Management Sciences 30 (3), 13–25.
L. Smith, P. Ball / Int. J. Production Economics 140 (2012) 227–238238
Diesendorf, M., 2000. Sustainability and sustainable development. In: Dunphy, D.,Benveniste, J., Griffiths, A., Sutton, P. (Eds.), Sustainability: The CorporateChallenge of the 21st Century. Allen & Unwin, Sydney, pp. 19–37.
Daly, H.E., 1990. Toward some operational principles of sustainable development.Ecological Economics 2 (1), 1–6.
Despeisse, M., 2010. Zero Carbon Manufacturing through Material Energy and WasteProcess Flow Modeling, MSc Thesis, Cranfield University, Cranfield, UK.
Despeisse, M., Ball, P.D., Evans, S., Levers, A., 2009. Zero carbon manufacturingthrough process flow modelling. In: Proceedings of 11th International Con-ference on Modern Information Technology in the Innovation Processes of theIndustrial Enterprises (MITIP), 15–16 October 2009, Bergamo, Italy.
Despeisse, M., Mbaye, F., Ball, P.D., Levers, A., Emergence of sustainable manu-facturing practices, Production Planning and Control. doi:10.1080/09537287.2011.555425, in press, doi:10.1080/09537287.2011.555425.
Evans, S., Bergendahl, M.N., Gregory, M., Ryan, C., 2008. Towards a SustainableIndustrial System with Recommendations for Education, Research, Industryand Policy. The Institute for Manufacturing, Cambridge, UK.
European Commission, 2010. Factories of the Future, /http://ec.europa.eu/research/industrial_technologies/factories-of-the-future_en.htmlS, (accessed24th November 2011).
Esty, D.C., Winston, A.S., 2009. Green to Gold: How Smart Companies UseEnvironmental Strategy to Innovate, Create Value, and Build CompetitiveAdvantage. Wiley, Chichester, UK.
Elkington, J., 1998. Cannibals with Forks: The Triple Bottom Line of 21st CenturyBusiness. New Society Publishers, Connecticut, USA.
Erlach, K., 2010. Energy efficiency in manufacturing using the energy value streammethod for building an energy-efficient factory. In: Proceedings of the APMS2010 International Conference, IFIP Working Group 5.7.
Ford Motor Company, 2007. Sustainability Report 2007/08—Dagenham EnginePlant Case Study, /www.ford.com/microsites/sustainability-report-2007-08/environment-case-dagenhamS, (accessed 31st July 2010).
Gaughran, W.F., Burke, S., Phelan, P., 2007. Intelligent manufacturing and environ-mental sustainability. Robotics and Computer-Integrated Manufacturing 23 (6),704–711.
Graedel, T.E., Allenby, B.R., 2002. Industrial Ecology. Prentice Hall, EnglewoodCliffs, NJ, USA.
Gertsakis, J., Lewis, H., 2003. Sustainability and the Waste ManagementHierarchy—A Discussion Paper on the Waste Management Hierarchy and itsRelationship to Sustainability, /www.cfd.rmit.edu.au/programs/sustainable_products_and_packaging/sustainability_and_the_waste_management_hierarchyS, (accessed 2nd April 2010).
Hall, A., Martin, S., 2002. Sustainable development—professional practice andsystems thinking. In: Proceedings of the International Conference on Designand Manufacture for Sustainable Development, Liverpool, UK, pp. 47–52.
Industry Today, 2010. A Climate of Change—Manufacturing must Rise to the Risksand Opportunities of Global Warming, /www.usitoday.com/article_view.asp?ArticleID=F272S, (accessed 24th November 2011).
IET, 2009. The IET Energy Principles: The Institution of Engineering and Technol-ogy Primer on Electrical Energy Policy. The IET, London, UK.
Kumazawa, T., Kobayashi, H., 2003. Feasibility study on sustainable manufacturingsystem. In: Proceedings of the 3rd International Symposium on Environmen-tally Conscious Design and Inverse Manufacturing (EcoDesign 03), Tokyo,Japan, p. 517.
Menzel, V., Smagin, J., David, F., 2010. Can companies profit from greenermanufacturing? Measuring Business Excellence 14 (2), 22–31.
Machin, E., 2010. Emissionary Times, /http://www.themanufacturer.com/uk/detail.html?contents_id=9923S, (accessed 24 November 2011).
McGuire, T., 2010. Top 7 Compressed Air Energy Saving Tips, /http://ezinearticles.com/?Top-7-Compressed-Air-Energy-Saving-Tips&id=3940109S, (accessed 31stAugust 2010).
O’Brien, C., 1999. Sustainable production—a new paradigm for the millennium.International Journal of Production Economics 60–61, 1–7.
Rahimifard, S., Clegg, A.J., 2007. Aspects of sustainable design and manufacture.International Journal of Production Research 45 (18–19), 4013–4019.
Rolls-Royce, 2010. Operational Excellence, /www.rolls-royce.com/cr/environment/operational_excellence.jspS, (accessed 5th September 2010).
Schonsleben, P., Vodicka, M., Bunse, K., Ernst, F.O., 2010. The changing concept ofsustainability and economic opportunities for energy-intensive industries.CIRP Annals—Manufacturing Technology 59 (1), 477–480.
Seliger, G., Kim, H.-J., Kernbaum, S., Zettl, M., 2008. Approaches to sustainablemanufacturing. International Journal of Sustainable Manufacture 1 (1–2),58–77.
Sharma, A., 2010. Business as Unusual: Trash to Cash, /www.themanufacturer.com/uk/content/10784/Business_as_Unusual%3A_Trash_to_CashS, (accessed24th November 2011).
Sony, 2010. Sony launches Road to Zero Environmental Plan and Sets 2015 Mid-termTargets, /www.sony.com/SCA/press/100407.shtmlS, (accessed 24th November2011).
Seliger, G., 2007. Sustainability in Manufacturing: Recovery of Resources inProduct and Material Cycles. Springer, Berlin.
The Manufacturer.com, 2010. Of Sustainability and Profit, /www.themanufacturer.com/uk/content/10158/Of_sustainability_and_profitS, (accessed 24November 2011).
Toyota, 2011. Toyota European Sustainability Report, /www.toyota.eu/sustainability/Pages/default.aspxS, (accessed 23 November 2011).
Womack, J.P., Jones, D.T., Roos, D., 1990. The Machine that Change the World.Simon & Schuster Ltd.
Yang, C-.L., Lin, S-.P., Chan, Y-.H., Sheu, C., 2010. Mediated effect of environmentalmanagement on manufacturing competitiveness: an empirical study. Interna-tional Journal of Production Economics 123, 210–220.
Yang, M.G., Hong, P., Modi, S.B., 2011. Impact of lean manufacturing and environ-mental management on business performance: an empirical study of manufac-turing firms. International Journal of Production Economics 129, 251–261.
de Ron, A.J., 1998. Sustainable production: the ultimate result of a continuousimprovement. International Journal of Production Economics 56–57, 99–110.