statistical practices of likert scales in human-robot ... - arxiv
TRANSCRIPT
Four Years in Review: Statistical Practices of Likert Scales inHuman-Robot Interaction Studies
Mariah L. Schrum∗
[email protected] Institute of Technology
Atlanta, Georgia
Michael Johnson∗[email protected] Institute of Technology
Atlanta, Georgia
Muyleng Ghuy∗[email protected]
Georgia Institute of TechnologyAtlanta, Georgia
Matthew C. [email protected] Institute of Technology
Atlanta, Georgia
ABSTRACTAs robots become more prevalent, the importance of the field ofhuman-robot interaction (HRI) grows accordingly. As such, weshould endeavor to employ the best statistical practices. Likertscales are commonly used metrics in HRI to measure perceptionsand attitudes. Due to misinformation or honest mistakes, most HRIresearchers do not adopt best practices when analyzing Likert data.We conduct a review of psychometric literature to determine thecurrent standard for Likert scale design and analysis. Next, weconduct a survey of four years of the International Conferenceon Human-Robot Interaction (2016 through 2019) and report onincorrect statistical practices and design of Likert scales. Duringthese years, only 3 of the 110 papers applied proper statistical testingto correctly-designed Likert scales. Our analysis suggests there areareas for meaningful improvement in the design and testing ofLikert scales. Lastly, we provide recommendations to improve theaccuracy of conclusions drawn from Likert data.
CCS CONCEPTS•General and reference→ Surveys and overviews; Evaluation;Metrics.
KEYWORDSMetrics for HRI; Likert Scales; Statistical Practices
ACM Reference Format:Mariah L. Schrum, Michael Johnson, Muyleng Ghuy, and Matthew C. Gom-bolay. 2020. Four Years in Review: Statistical Practices of Likert Scales inHuman-Robot Interaction Studies. In Proceedings of the 2020 ACM/IEEEInternational Conference on Human-Robot Interaction (HRI ’20), March 23–26,2020, Cambridge, United Kingdom. ACM, New York, NY, USA, 10 pages.https://doi.org/10.1145/3319502.3378178
∗All three authors contributed equally to this research.
Permission to make digital or hard copies of all or part of this work for personal orclassroom use is granted without fee provided that copies are not made or distributedfor profit or commercial advantage and that copies bear this notice and the full citationon the first page. Copyrights for components of this work owned by others than theauthor(s) must be honored. Abstracting with credit is permitted. To copy otherwise, orrepublish, to post on servers or to redistribute to lists, requires prior specific permissionand/or a fee. Request permissions from [email protected] ’20, March 23–26, 2020, Cambridge, United Kingdom© 2020 Copyright held by the owner/author(s). Publication rights licensed to ACM.ACM ISBN 978-1-4503-6746-2/20/03. . . $15.00https://doi.org/10.1145/3319502.3378178
1 INTRODUCTIONThe study of human-robot interaction is the interdisciplinary ex-amination of the relationship between humans and robots throughthe lenses of psychology, sociology, anthropology, engineering andcomputer science. This all-important intersection of fields allows usto better understand the benefits and limitations of incorporatingrobots into a human’s environment. As robots become more preva-lent in our daily lives, HRI research will become more impactfulon robot design and the integration of robots into our societies.Therefore, it is critical that best scientific practices are employedwhen conducting HRI research.
Likert scales, a commonly employed technique in psychologyand more recently in HRI, are used to determine a person’s attitudesor opinions on a topic [37]. Statistical tests can then be applied tothe responses to determine how an attitude changes between dif-ferent treatments. Such studies provide important information forhow best to design robots for optimal interaction with humans. Be-cause of the nearly universal confusion surrounding Likert scales,improper design of Likert scales is not uncommon [25]. Further-more, care must be taken when employing statistical techniques toanalyze Likert scales and items. Because of the ordinal nature of thedata, statistical techniques are often applied incorrectly, potentiallyresulting in an increased likelihood of false positives. Unfortunately,we find the misuse of Likert questionnaires to occur frequentlyenough to be worth investigating.
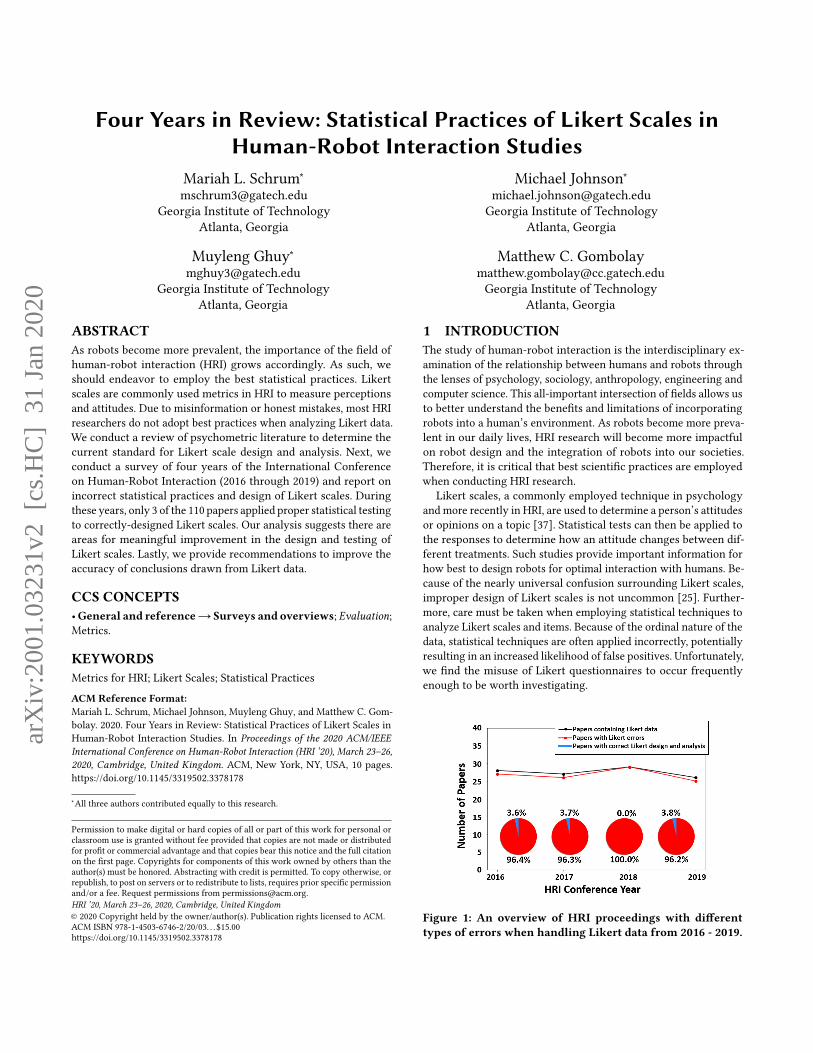
Figure 1: An overview of HRI proceedings with differenttypes of errors when handling Likert data from 2016 - 2019.
arX
iv:2
001.
0323
1v2
[cs
.HC
] 3
1 Ja
n 20
20
In this paper, we 1) review the psychometric literature of Likertscales, 2) analyze the past four years of HRI papers, and 3) positrecommendations for best practices in HRI. Based upon our reviewof psychometric literature, we find that only 3 of 110 papers in thelast four years of proceedings of HRI research properly designedand tested Likert scales. A summary of our analysis is depicted inFig. 1. Unfortunately, this potential malpractice may suggest thatthe findings in 97.3% of HRI papers that based their conclusions offof Likert scales may warrant a second look.
Our first contribution is comprised of a survey of the latest psy-chometric literature regarding the current best practices for designand analysis of Likert scales. In cases where there is dissent ordisagreement, we present both perspectives. Nonetheless, we findareas of consensus in the literature to establish recommendationsfor how to best design Likert scales and to analyze their data. Inareas of agreement, we provide recommendations to the HRI com-munity for how we can best construct and analyze Likert data.
Our second contribution is a survey of the proceedings of HRI2016 through 2019 based upon the established best practices. Ourreview revealed that a majority of papers incorrectly design Likertscales or improperly analyze Likert data. Common mistakes arenot including enough items, analyzing individual Likert items, notverifying the assumptions of the statistical test being applied, andnot performing appropriate post-hoc corrections.
Our third and final contribution is a discussion of how we, asa field, can correct these practices and hold ourselves to a higherstandard. Our purpose is not to dictate legalistic rules to be followedat penalty of a paper rejection. Instead, we seek to open up the floorfor a constructive debate regarding how we can best establish andabide by our agreed upon best practices in our field. We hope thatin doing so, HRI will continue to have a strong, positive influenceon how we understand, design, and evaluate robotic systems.
Nota Bene: We confess we have not employed best practices inour own prior work. Our goal for this paper is not to disparage thefield, but instead to call out the ubiquitous misuse of a vital metric:Likert scales. We hope to improve the rigor of our own and others’statistical testing and questionnaire design so that we can standmore confidently in the inferences drawn from these data.
2 LITERATURE REVIEW & BEST PRACTICESLikert scales play a key role in the study of human-robot interaction.Between 2016 and 2019, Likert-type questionnaires appeared inmore than 50% of all HRI papers. As such, it is imperative thatwe make proper use of Likert scales and are careful in our designand analysis so as not to de-legitimize our findings. We begin witha literature review to investigate the current best practices forLikert scale design and statistical testing. We acknowledge thatreviews concerning the design and analysis of Likert scales havebeen previously conducted [11, 29, 53]. However, our analysis is thefirst targeted at the HRI community, and we believe it is importantto ground our discussion in the current understanding of the bestmethods related to the construction and testing of Likert data asfound in the psychometric literature.
Many of the debates surrounding Likert scale design and analysisare unsettled. As such, we present both sides of these arguments
and reason through the areas of agreement and disagreement toarrive at our own recommendations for how HRI researchers canbest navigate these often murky waters.
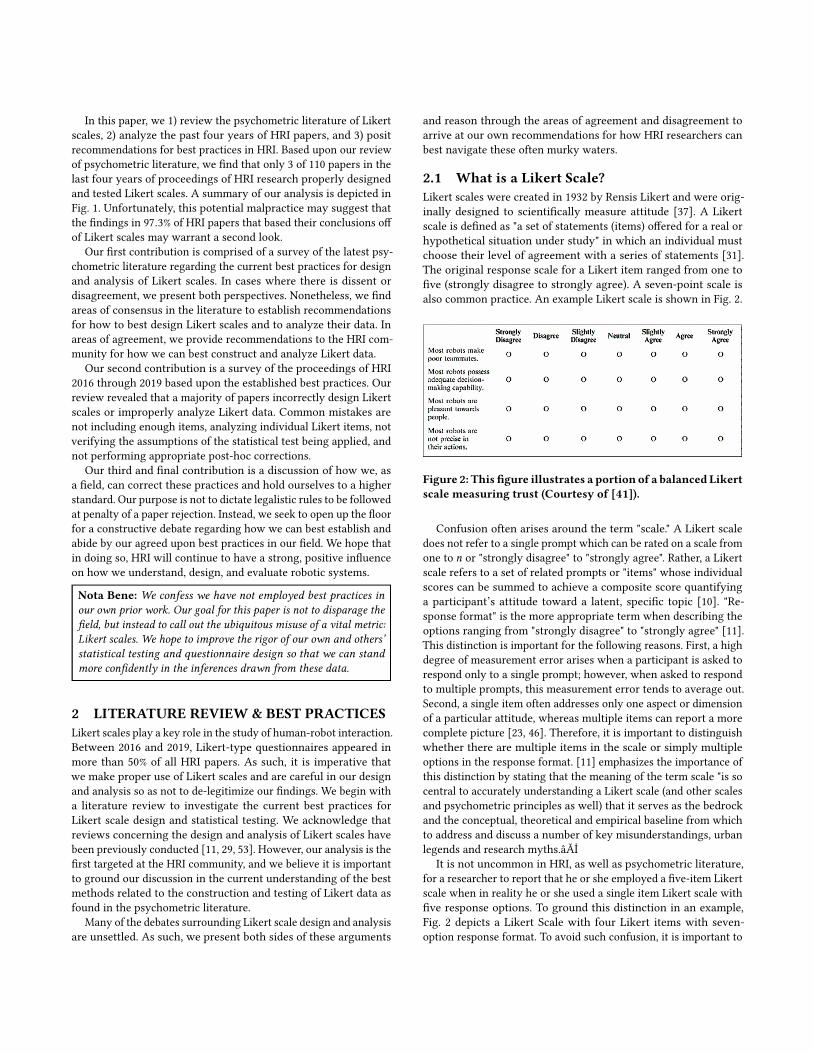
2.1 What is a Likert Scale?Likert scales were created in 1932 by Rensis Likert and were orig-inally designed to scientifically measure attitude [37]. A Likertscale is defined as "a set of statements (items) offered for a real orhypothetical situation under study" in which an individual mustchoose their level of agreement with a series of statements [31].The original response scale for a Likert item ranged from one tofive (strongly disagree to strongly agree). A seven-point scale isalso common practice. An example Likert scale is shown in Fig. 2.
Figure 2: This figure illustrates a portion of a balanced Likertscale measuring trust (Courtesy of [41]).
Confusion often arises around the term "scale." A Likert scaledoes not refer to a single prompt which can be rated on a scale fromone to n or "strongly disagree" to "strongly agree". Rather, a Likertscale refers to a set of related prompts or "items" whose individualscores can be summed to achieve a composite score quantifyinga participant’s attitude toward a latent, specific topic [10]. "Re-sponse format" is the more appropriate term when describing theoptions ranging from "strongly disagree" to "strongly agree" [11].This distinction is important for the following reasons. First, a highdegree of measurement error arises when a participant is asked torespond only to a single prompt; however, when asked to respondto multiple prompts, this measurement error tends to average out.Second, a single item often addresses only one aspect or dimensionof a particular attitude, whereas multiple items can report a morecomplete picture [23, 46]. Therefore, it is important to distinguishwhether there are multiple items in the scale or simply multipleoptions in the response format. [11] emphasizes the importance ofthis distinction by stating that the meaning of the term scale "is socentral to accurately understanding a Likert scale (and other scalesand psychometric principles as well) that it serves as the bedrockand the conceptual, theoretical and empirical baseline from whichto address and discuss a number of key misunderstandings, urbanlegends and research myths.âĂİ
It is not uncommon in HRI, as well as psychometric literature,for a researcher to report that he or she employed a five-item Likertscale when in reality he or she used a single item Likert scale withfive response options. To ground this distinction in an example,Fig. 2 depicts a Likert Scale with four Likert items with seven-option response format. To avoid such confusion, it is important to
be precise when describing a Likert scale as a five-option responseformat has a very different meaning from a five-item Likert scale.Furthermore, a set of items that prompts the user to select a ratingon a bipolar scale of antonyms, i.e., human-like to machine-like,is not a true Likert scale. This is a semantic differential scale andshould be referred to as such [57].
Recommendation - We recommend that HRI researchers be delib-erate when describing Likert response formats and scales to avoidconfusion and misinterpretation.
2.2 DesignBecause HRI is a relatively new field, HRI researchers often ex-plore novel problems for which they appropriately need to craftproblem-specific scales. However, care must be taken to correctlydesign and assess the validity of these scales before utilizing themfor research. The design of the scale is one of the least agreed upontopics pertaining to Likert questionnaires in the psychometric liter-ature. Disagreement arises around the optimal number or responsechoices in an item, the ideal number of items that should comprisea scale, whether a scale should be balanced, and whether or not toinclude a neutral midpoint. Below, we address each topic.
Number of Response Options - Rensis Likert himself suggesteda five point response format in his seminal work, A Technique forthe Measurement of Attitudes [37]. However, Likert did not basethis decision in theory and rather suggested that variations on thisfive-point format may be appropriate [37]. Further investigationhas yet to provide a consensus on the optimal number of responseoptions comprising a Likert item [39]. [47] found that scales withfour or fewer points performed the worst in terms of reliability andthat seven to nine points were the most reliable. This finding isbacked up by [16] in their investigation of categorization error. [61]demonstrated via simulation that the more points a response con-tains, the more closely it approximates interval data and thereforerecommended an 11-point response format.
This line of reasoning may lead one to believe that one shoulddramatically increase the number of response points to more ac-curately measure a construct. However, just because the data maymore closely approximate interval data does not mean increasingthe number of response points monotonically increases the abilityto measure a subject’s attitude. A larger number of response optionsmay require a higher mental effort by the participant, thus reducingthe quality of the response [5, 35]. For example, [5] conducted astudy that suggested that response quality decreased above elevenresponse options. [52] also investigated the optimal number of re-sponse options and found that no further psychometric advantageswere obtained once the number of response options rose above sixand [35] suggested based on study results that the optimal numberis between four and six.
Recommendation - As a general rule-of-thumb, we recommendthe number of response options be between five and nine due to thedeclining gains with more than ten and lack of precision with lessthan five. However, if the study involves a large cognitive load orlengthy surveys, the researcher may want to err on the side of fewerresponse items to mitigate participant fatigue [47].
Neutral Midpoint - Another point of contention which influencesthe response number of a scale is whether or not to include a
neutral midpoint. Likert, with his five-point scale, included a neutral,âĂIJundecidedâĂİ option for participants who did not wish to take apositive or negative stance [37]. Some argue that a neutral midpointprovides more accurate data because it is entirely possible that aparticipant may not have a positive or negative opinion about theconstruct in question. Studies have shown that including a neutraloption can improve reliability in other, similar scales [15, 26, 31, 38].Furthermore, the lack of a neutral option precludes the participantfrom voicing an indifferent opinion, thus forcing him or her to picka side which he or she does not agree with.
On the other hand, a neutral midpoint may result in users “satis-ficing" (i.e., choosing the option that may not be the most accurateto avoid extra cognitive strain resulting in an over-representationat the midpoint) [33]. [30] argue that “. . . the midpoint should beoffered on obscure topics, where many respondents will have nobasis for choice, but omitted on controversial topics, where socialdesirability is uppermost in respondents’ minds."
Recommendation - We adopt the recommendation of [30], whichsuggests that HRI researchers utilize their best judgement based on thecontext of use when deciding the merits of including a neutral optionin their response format. For example, if the authors are conducting apre-trust survey to gauge a baseline level of trust before the participanthas interacted with the robot, they may want to include a neutraloption since some participants, especially those unfamiliar with robots,may not truly have a good sense of their own trust in robots. A neutraloption would allow participants to present this sentiment. However,if a survey is being utilized to assess trust after a participant hasinteracted with a robot, the researchers may want to remove theneutral option, arguing that participants should have developed asense of either trust or distrust after the interaction. Nonetheless, theremay be cases when “neutral" truly is appropriate, which is why weargue in favor of researcher discretion [30].
Number of Items - The next point of contention we address is theideal number of Likert items in a scale. In his original formulation,Likert stated that multiple questions were imperative to capture thevarious dimensions of a multi-faceted attitude. Based on Likert’sformulation, the individual scores are to be summed to achieve acomposite score that provides a more reliable and complete repre-sentation of a subject’s attitude [23, 46].
Yet, in practice it is not uncommon for a single item to be used inHRI research due to the efficiency that such a short scale provides.Research into the appropriateness of single item scales has beenextensively studied in marketing and psychometric literature [36].For example, [36] investigated the use of a single-item scale formeasuring a construct concluding that a single-item scale is onlysufficient for simple, uni-dimensional, unambiguous objects.
Multi-item scales on the other hand are “suitable for measuringlatent characteristics with many facets.” [49] proposed a procedurefor developing scales for evaluating marketing constructs and sug-gested that if the object of interest is concrete and singular, such ashow much an individual likes a specific product, then a single itemis sufficient. However, if the construct is more abstract and complex,such as measuring the trust an individual has for robots, then amulti-item scale is warranted. This line of reasoning is supportedby [6, 17, 19]. As to the exact number of items, [19] demonstratedvia simulation that at least four items are necessary for evaluation
of internal consistency of the scale. However, as suggested by [60],one should be cautious of including too many items as a large scalemay result in higher refusal rates.
Recommendation - Due to the complexity of attributes most oftenmeasured in HRI (e.g., trust, sociability, usability, etc.), we recommendthat researchers in the HRI community utilize multi-item scales withat least four items. The total number of items again is left to thediscretion of the researcher and may depend on the time constraintsand the workload that the participant is already facing. Because anaverage person takes two to three seconds to answer a Likert item andindividuals are more likely to make mistakes or “satisfy" after severalminutes, we recommend surveys not be longer than 40 items [63].Recall that this recommendation for the number of “Likert Items" isdistinct from our recommendation regarding the number of “responseoptions," which we recommend generally be between five and nineoptions, as noted previously.
Scale Balance - The last aspect of scale design which we will dis-cuss is that of balance. The question of whether the items within ascale should be balanced, i.e. there should be a parity of positive andnegative statements, is one less often addressed in literature. It isbelieved that balancing the questionnaire can help to negate acqui-escence bias, which is the phenomenon in which participants havea stronger tendency to agree with a statement presented to them bya researcher. Likert [37] advocated that scales should consist of bothpositive and negative statements. Many textbooks, such as [42], alsostate that scales should be balanced. Perhaps the most compellingevidence that balance is an important factor when developing Lik-ert scales is provided by [51]. The authors in [51] conducted a studyin which they asked participants to respond to a positively wordedquestion to which 60% of participants agreed. They asked the samequestion but rephrased in a negative way and again, 60% of partici-pants agreed. This study reveals the extent to which acquiescencebias can sway participants to answer in a particular way that is notalways representative of their true feelings.
One would find this evidence to be sufficiently compelling torecommend scale balance; however, this debate is not so easily set-tled. Recent work suggests that although including both positivelyand negatively worded items reduces the effects of acquiescencebias, it may have a negative impact on the construct validity (i.e., ifthe scale adequately measures the construct of interest) of the scale[48, 62]. This result may be due to the fact that a negatively wordeditem is not a true opposite of a positively worded item. Therefore,reversing the scores of the negatively worded items and summingmay have an impact on the dimensionality of the scale due to theconfusion that reversed items cause [28, 56].
Recommendation - Because of a lack of consensus and the problemsarising from both approaches, we do not provide a concrete recom-mendation to researchers about scale balance.
Validity and Reliability of Likert Prompts - Likert’s originalwork states that the prompts of a Likert scale should all be relatedto a specific attitude (e.g., sociability) and should be designed tomeasure each aspect of the construct. Each item should be writtenin clear, concise language and should measure only one idea [37, 45].This formulation helps to ensure the reliability (i.e., the scale givesrepeatable results for the same participant) and the validity (i.e.,the scale measures what is intended) of the scale.
A poorly formed scale may result in data that does not assessthe intended hypothesis. Thus, before a statistical test is appliedto a Likert scale, it is best practice to test the quality of the scale.Cronbach’s alpha is one method by which to measure the internalconsistency of a scale (i.e., how closely related a set of items are). ACronbach’s alpha of 0.7 is typically considered an acceptable levelfor inter-item reliability [54]. If the items contains few responseoptions or the data is skewed, another method such as ordinal alphashould be employed [21].
While Cronbach’s alpha is an important metric, a full item factoranalysis (IFA) can be conducted to better understand the dimen-sionality of a scale. A scale consisting of unrelated prompts mayachieve a high Cronbach’s alpha for other underlying reasons orsimply because Cronbach’s alpha can increase as the number ofitems in the scale increases [24, 55]. Furthermore, a scale can showinternal consistency, but this does not mean it is uni-dimensional.On the other hand, a factor analysis is a statistical method to testwhether a set of items measure the same attribute and whether ornot the scale is uni-dimensional. Factor analysis thus provides amore robust metric to assess the scale quality [2].
Recommendation - Due to the complex nature of scale design, werecommend that researchers utilize well-established and verified scalesprovided in literature when possible. Many common constructs mea-sured in HRI can be measured with already validated scales such as the"Trust Perception Scale" for human-robot trust or the RoSAS scale forperceived sociability [12, 50]. This practice will reduce the prevalenceof employing poorly designed scales. Otherwise, a thorough analysisof the internal consistency and dimensionality of new scales shouldbe conducted when being employed to answer research questions. Forin-depth instructions on how best to construct Likert scales from theground up, please see [4, 27].
2.3 Statistical TestsOnce a scale is designed and its validity statistically verified, it isimportant that correct statistical tests are applied to the responsedata obtained from the scale. Another fiercely debated topic iswhether data derived from single Likert items can be analyzed withparametric tests. We want to be clear that this controversy is notover the data type produced by Likert items but whether parametrictests can be applied to ordinal data.
Ordinal versus Interval - Previous work has demonstrated thata single Likert item is an example of ordinal data and that the re-sponse numbers are generally not perceived as being equidistant byrespondents [34]. Because the numbers of a scale for Likert itemsrepresent ordered categories but are not necessarily spaced at equiv-alent intervals, there is not a notion of distance between descriptorson a Likert response format [14]. For example, the difference be-tween "agree" and "strongly agree" is not necessarily equivalent tothe difference between "disagree" and "strongly disagree." Thus, aLikert item does not produce interval data [7]. While it has beenspeculated that a large-enough response scale can approximateinterval data, Likert response scales rarely contain more than 11response points [1, 61].
Recommendation - Because a Likert item represents ordinal data,parametric descriptive statistics, such as mean and standard deviation,
are not the most appropriate metric when applied to individual Likertitems. Mode, median, range, and skewness are better to report.
Parametric versus Non-Parametric - The question now be-comes, given the ordinal nature of individual Likert items, is itappropriate to apply parametric tests to such data? A famous studyby [22] showed that the F test is very robust to violation of datatype assumptions and that single items can be analyzed with aparametric test if there is a sufficient number of response points.[34] demonstrates through simulation that ANOVA is appropriatewhen the single-item Likert data is symmetric but that Kruskall-Wallis should be used for skewed Likert item data. [16] also foundthat skew in the data results in unacceptably high errors when thedata is assumed to be interval. [40] compared the use of the t-testversus the Wilcoxon signed rank test on Likert items and foundthat the t-test resulted in a higher Type I error rate for small samplesizes between 5 and 15. [44] made a similar comparison and alsofound that Wilcoxon rank-sum outperformed the t-test in termsof Type I error rates. As demonstrated by these studies, the fieldhas yet to reach a clear consensus on whether parametric tests areappropriate, and if so when, for single Likert item data.
Likert scale data (i.e., data derived from summing Likert items)can be analyzed via parametric tests with more confidence. [22]showed that the F test can be used to analyze full Likert scale datawithout any significant, negative impact to Type I or Type II errorrates as long as the assumption of equivalence of variance holds.Furthermore, [58] showed that Likert scale data is both intervaland linear. Therefore, parametric tests, such as analysis of variance(ANOVA) or t-test, can be used in this situation as long as theappropriate assumptions hold.
Recommendation - Because studies are inconclusive as to whetherparametric tests are appropriate for ordinal data, we recommend thatresearchers err on the conservative side and utilize non-parametrictests when analyzing Likert data. However, we also recommend thatHRI researchers avoid performing statistical analysis on single Likertitems altogether. As [11] so eloquently states, "one item a scale doth notmake." A single item is unlikely to be the best measure for the complexconstructs that are of interest in HRI research as discussed in Section 2.2.Therefore is best to avoid the ordinal vs. interval controversy altogetherand instead perform analysis on a multi-item scale since Likert scalescan be safely analyzed with parametric tests. If a researcher doeschoose to analyze an individual item, he or she should clearly statethey are doing so and acknowledge possible implications. At the veryleast, it is recommended to test for skewness.
Post-hoc Corrections - The importance of performing properpost-hoc corrections and testing for assumptions are broadly appli-cable concerns, not specific to Likert data. Nevertheless, they areimportant considerations when analyzing Likert data and are oftenincorrectly applied in HRI papers.
As the number of statistical tests conducted on a set of dataincreases, the chances of randomly finding statistical significanceincreases accordingly even if there is no true significance in the data.Therefore, when a statistical test is applied to multiple dependentvariables that test for the same hypothesis, a post-hoc correctionshould be applied. Such a scenario arises frequently when a statis-tical analysis is applied to individual items in a Likert scale [11]. In2006, [3] conducted a study investigating whether individuals born
under a certain astrological sign were more likely to be hospitalizedfor a certain diagnosis. The authors tested for over 200 diseasesand found that Leos had a statistically higher probability of beinghospitalized for gastrointestinal hemorrhage and Sagittarians hada statistically higher probability of a fractured humerus. This studydemonstrated the heightened risk of Type I error that occurs whenno post-hoc correction is applied.
There is controversy as to which post-hoc correction is best. [32]suggests applying the Bonferonni correction when only severalcomparisons are performed, i.e., ten or less. The authors recom-mend employing a different correction such as Tukey or Schefféwith more than ten comparisons to avoid the increased risk of TypeII errors that stems from the conservative nature of the Bonfer-onni correction. [43] suggests that researchers should, instead ofperforming post-hoc correction, focus on reporting effect size andconfidence intervals, such as Pearson’s r.
Recommendation - Because of the danger that comes with per-forming many statistical tests without predefined comparisons werecommend that researchers always perform the proper post-hoc cor-rections. Due to the increased risk of Type II error that some post-hoctests pose, we encourage researchers to also report the effect size andconfidence interval to provide a more informative and holistic view ofthe results. In general, we recommend against pair-wise comparisonsperformed on individual Likert items for reasons already discussed.
Test Assumptions - Most statistical tests require certain assump-tions to be met. For example, an ANOVA assumes that the residu-als are normally distributed (normality) and the variances of theresiduals are equal (homoscedasticity) [59]. Tests to ensure theseconditions are met include the Shapiro-Wilk test for normality andLevene’s test for homoscedasticity [13]. [22] argues that even whenassumptions of parametric tests are violated, in certain situations,the test can still be safely applied. However, [8] counters [22] andcontends that [22] failed to take into account the power of para-metric tests under various population shapes and that these resultsshould not be trusted.
Recommendation - To navigate this controversy, we suggest thatresearchers err on the conservative side and always test for the as-sumptions of the test to reduce the risk of Type I errors. If the dataviolates the assumptions, and the researchers decide to utilize the testdespite this, they should report the assumptions of the test that havenot been met and the level to which the assumptions are violated.
3 REVIEW OF HRI PAPERS3.1 Procedures and LimitationsWe reviewed HRI full papers from years 2016 to 2019, excludingalt.HRI and Late Breaking Reports, and investigated the correctusage of Likert data over these years. We considered all papersthat include the word "Likert" as well as papers that employ Likerttechniques but refer to the scale by a different name. We utilized thefollowing keywords when conducting our review: "Likert", "Likert-like," "questionnaire," "rating," "scale," and "survey." After filteringbased on these keywords, we reviewed a total of 110 papers. Belowwe report on the following categories: 1) misnomers and misleadingterminology 2) improper design of Likert scales and 3) improperapplication of statistical tests to Likert data.
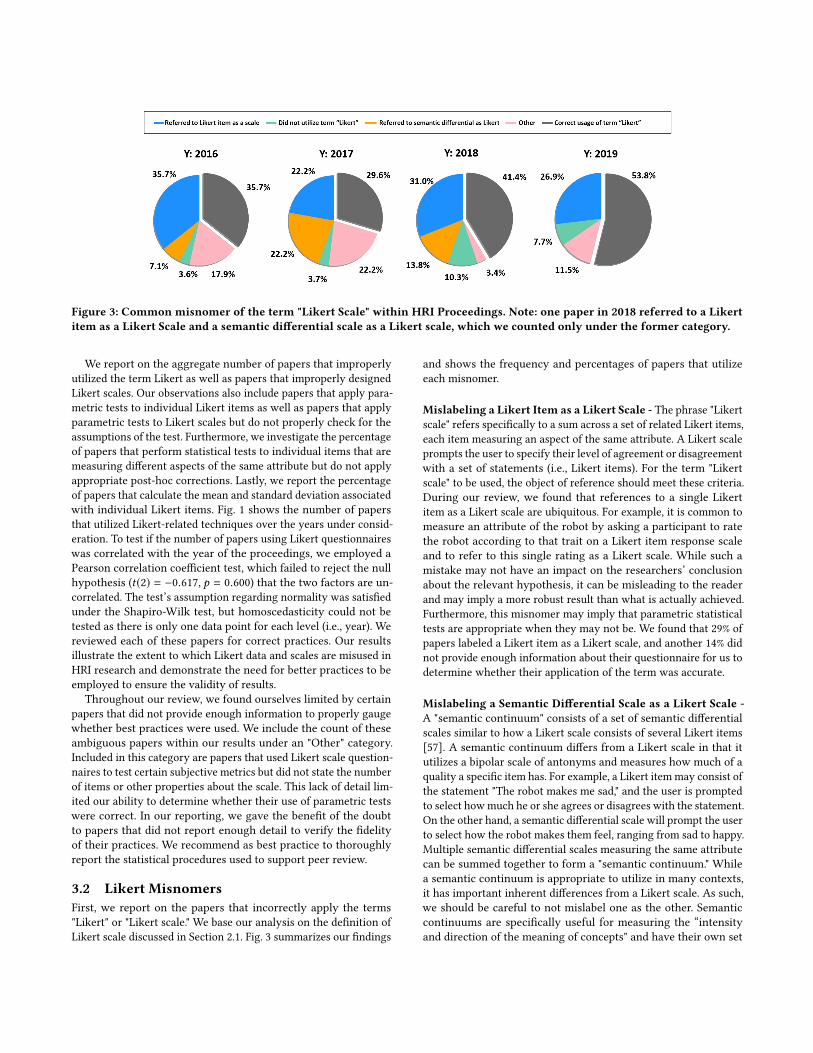
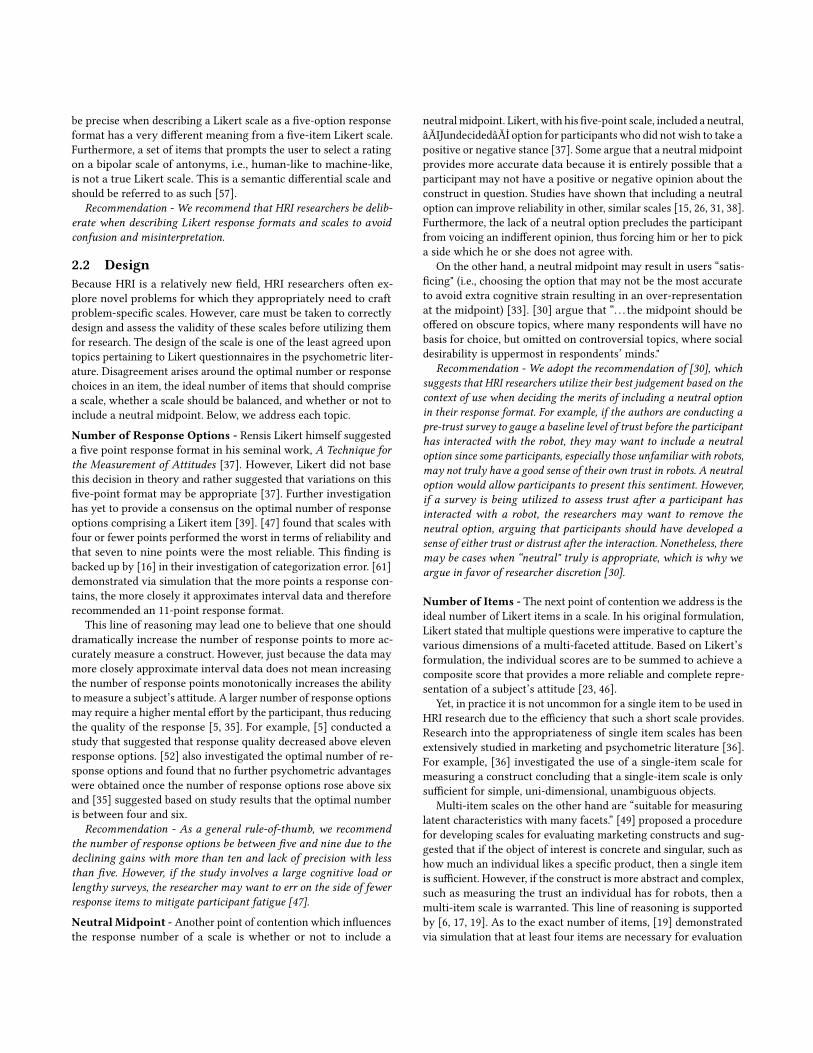
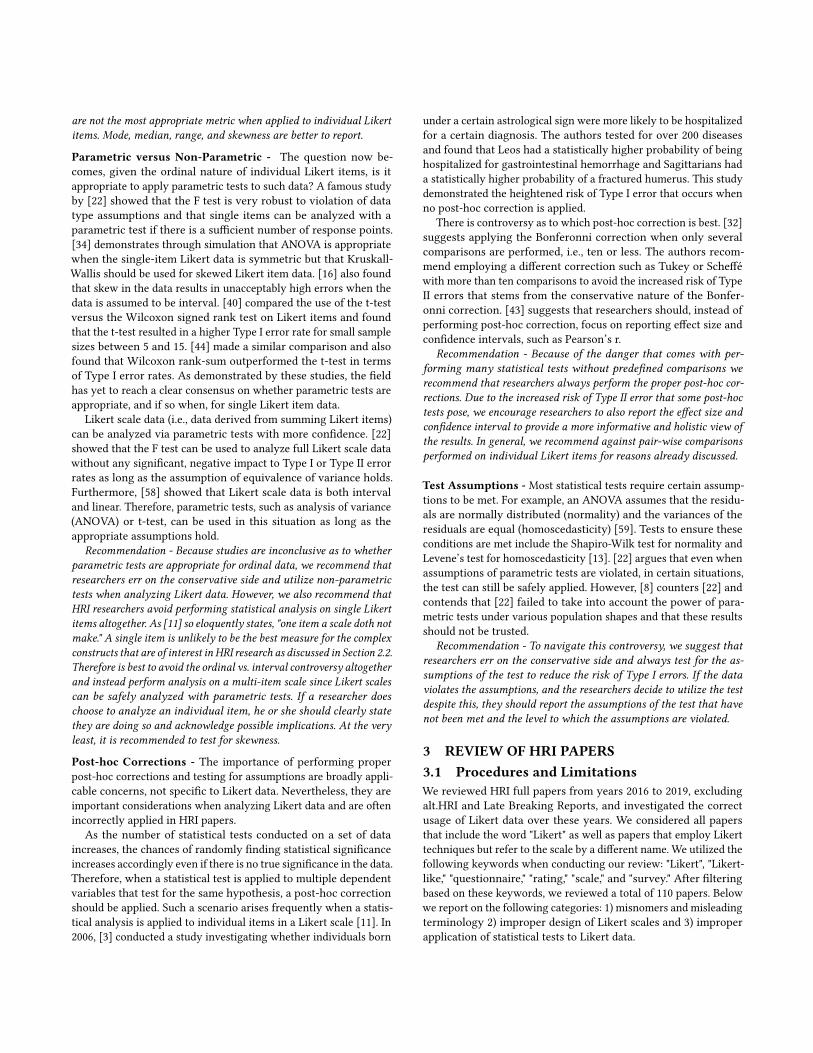
Figure 3: Common misnomer of the term "Likert Scale" within HRI Proceedings. Note: one paper in 2018 referred to a Likertitem as a Likert Scale and a semantic differential scale as a Likert scale, which we counted only under the former category.
We report on the aggregate number of papers that improperlyutilized the term Likert as well as papers that improperly designedLikert scales. Our observations also include papers that apply para-metric tests to individual Likert items as well as papers that applyparametric tests to Likert scales but do not properly check for theassumptions of the test. Furthermore, we investigate the percentageof papers that perform statistical tests to individual items that aremeasuring different aspects of the same attribute but do not applyappropriate post-hoc corrections. Lastly, we report the percentageof papers that calculate the mean and standard deviation associatedwith individual Likert items. Fig. 1 shows the number of papersthat utilized Likert-related techniques over the years under consid-eration. To test if the number of papers using Likert questionnaireswas correlated with the year of the proceedings, we employed aPearson correlation coefficient test, which failed to reject the nullhypothesis (t(2) = −0.617, p = 0.600) that the two factors are un-correlated. The test’s assumption regarding normality was satisfiedunder the Shapiro-Wilk test, but homoscedasticity could not betested as there is only one data point for each level (i.e., year). Wereviewed each of these papers for correct practices. Our resultsillustrate the extent to which Likert data and scales are misused inHRI research and demonstrate the need for better practices to beemployed to ensure the validity of results.
Throughout our review, we found ourselves limited by certainpapers that did not provide enough information to properly gaugewhether best practices were used. We include the count of theseambiguous papers within our results under an "Other" category.Included in this category are papers that used Likert scale question-naires to test certain subjective metrics but did not state the numberof items or other properties about the scale. This lack of detail lim-ited our ability to determine whether their use of parametric testswere correct. In our reporting, we gave the benefit of the doubtto papers that did not report enough detail to verify the fidelityof their practices. We recommend as best practice to thoroughlyreport the statistical procedures used to support peer review.
3.2 Likert MisnomersFirst, we report on the papers that incorrectly apply the terms"Likert" or "Likert scale." We base our analysis on the definition ofLikert scale discussed in Section 2.1. Fig. 3 summarizes our findings
and shows the frequency and percentages of papers that utilizeeach misnomer.
Mislabeling a Likert Item as a Likert Scale - The phrase "Likertscale" refers specifically to a sum across a set of related Likert items,each item measuring an aspect of the same attribute. A Likert scaleprompts the user to specify their level of agreement or disagreementwith a set of statements (i.e., Likert items). For the term "Likertscale" to be used, the object of reference should meet these criteria.During our review, we found that references to a single Likertitem as a Likert scale are ubiquitous. For example, it is common tomeasure an attribute of the robot by asking a participant to ratethe robot according to that trait on a Likert item response scaleand to refer to this single rating as a Likert scale. While such amistake may not have an impact on the researchers’ conclusionabout the relevant hypothesis, it can be misleading to the readerand may imply a more robust result than what is actually achieved.Furthermore, this misnomer may imply that parametric statisticaltests are appropriate when they may not be. We found that 29% ofpapers labeled a Likert item as a Likert scale, and another 14% didnot provide enough information about their questionnaire for us todetermine whether their application of the term was accurate.
Mislabeling a Semantic Differential Scale as a Likert Scale -A "semantic continuum" consists of a set of semantic differentialscales similar to how a Likert scale consists of several Likert items[57]. A semantic continuum differs from a Likert scale in that itutilizes a bipolar scale of antonyms and measures how much of aquality a specific item has. For example, a Likert itemmay consist ofthe statement "The robot makes me sad," and the user is promptedto select howmuch he or she agrees or disagrees with the statement.On the other hand, a semantic differential scale will prompt the userto select how the robot makes them feel, ranging from sad to happy.Multiple semantic differential scales measuring the same attributecan be summed together to form a "semantic continuum." Whilea semantic continuum is appropriate to utilize in many contexts,it has important inherent differences from a Likert scale. As such,we should be careful to not mislabel one as the other. Semanticcontinuums are specifically useful for measuring the “intensityand direction of the meaning of concepts" and have their own set
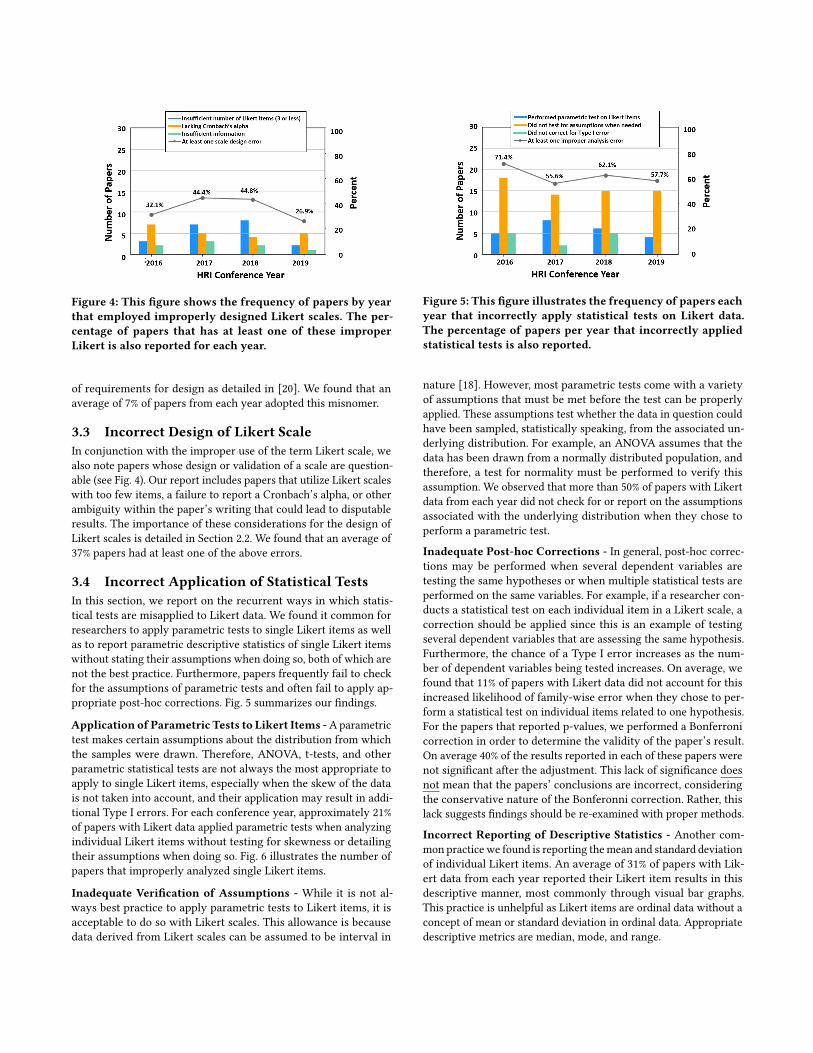
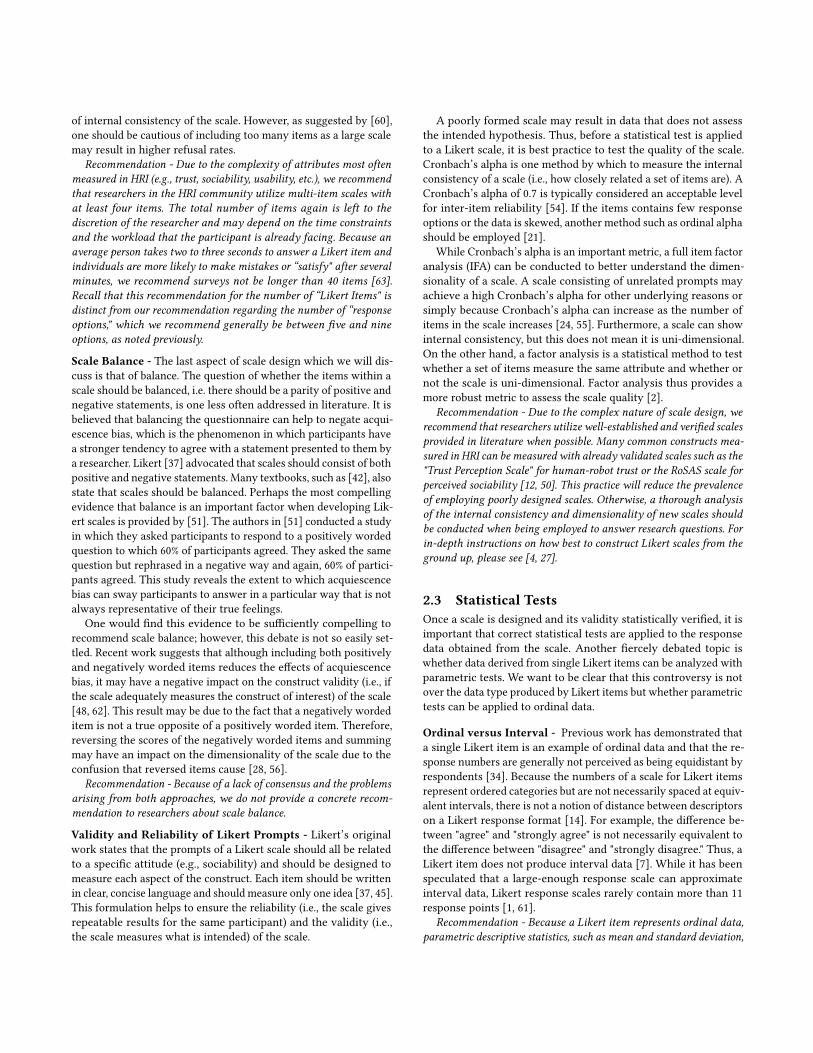
Figure 4: This figure shows the frequency of papers by yearthat employed improperly designed Likert scales. The per-centage of papers that has at least one of these improperLikert is also reported for each year.
of requirements for design as detailed in [20]. We found that anaverage of 7% of papers from each year adopted this misnomer.
3.3 Incorrect Design of Likert ScaleIn conjunction with the improper use of the term Likert scale, wealso note papers whose design or validation of a scale are question-able (see Fig. 4). Our report includes papers that utilize Likert scaleswith too few items, a failure to report a Cronbach’s alpha, or otherambiguity within the paper’s writing that could lead to disputableresults. The importance of these considerations for the design ofLikert scales is detailed in Section 2.2. We found that an average of37% papers had at least one of the above errors.
3.4 Incorrect Application of Statistical TestsIn this section, we report on the recurrent ways in which statis-tical tests are misapplied to Likert data. We found it common forresearchers to apply parametric tests to single Likert items as wellas to report parametric descriptive statistics of single Likert itemswithout stating their assumptions when doing so, both of which arenot the best practice. Furthermore, papers frequently fail to checkfor the assumptions of parametric tests and often fail to apply ap-propriate post-hoc corrections. Fig. 5 summarizes our findings.
Application of Parametric Tests to Likert Items -Aparametrictest makes certain assumptions about the distribution from whichthe samples were drawn. Therefore, ANOVA, t-tests, and otherparametric statistical tests are not always the most appropriate toapply to single Likert items, especially when the skew of the datais not taken into account, and their application may result in addi-tional Type I errors. For each conference year, approximately 21%of papers with Likert data applied parametric tests when analyzingindividual Likert items without testing for skewness or detailingtheir assumptions when doing so. Fig. 6 illustrates the number ofpapers that improperly analyzed single Likert items.
Inadequate Verification of Assumptions - While it is not al-ways best practice to apply parametric tests to Likert items, it isacceptable to do so with Likert scales. This allowance is becausedata derived from Likert scales can be assumed to be interval in
Figure 5: This figure illustrates the frequency of papers eachyear that incorrectly apply statistical tests on Likert data.The percentage of papers per year that incorrectly appliedstatistical tests is also reported.
nature [18]. However, most parametric tests come with a varietyof assumptions that must be met before the test can be properlyapplied. These assumptions test whether the data in question couldhave been sampled, statistically speaking, from the associated un-derlying distribution. For example, an ANOVA assumes that thedata has been drawn from a normally distributed population, andtherefore, a test for normality must be performed to verify thisassumption. We observed that more than 50% of papers with Likertdata from each year did not check for or report on the assumptionsassociated with the underlying distribution when they chose toperform a parametric test.
Inadequate Post-hoc Corrections - In general, post-hoc correc-tions may be performed when several dependent variables aretesting the same hypotheses or when multiple statistical tests areperformed on the same variables. For example, if a researcher con-ducts a statistical test on each individual item in a Likert scale, acorrection should be applied since this is an example of testingseveral dependent variables that are assessing the same hypothesis.Furthermore, the chance of a Type I error increases as the num-ber of dependent variables being tested increases. On average, wefound that 11% of papers with Likert data did not account for thisincreased likelihood of family-wise error when they chose to per-form a statistical test on individual items related to one hypothesis.For the papers that reported p-values, we performed a Bonferronicorrection in order to determine the validity of the paper’s result.On average 40% of the results reported in each of these papers werenot significant after the adjustment. This lack of significance doesnot mean that the papers’ conclusions are incorrect, consideringthe conservative nature of the Bonferonni correction. Rather, thislack suggests findings should be re-examined with proper methods.
Incorrect Reporting of Descriptive Statistics - Another com-mon practice we found is reporting themean and standard deviationof individual Likert items. An average of 31% of papers with Lik-ert data from each year reported their Likert item results in thisdescriptive manner, most commonly through visual bar graphs.This practice is unhelpful as Likert items are ordinal data without aconcept of mean or standard deviation in ordinal data. Appropriatedescriptive metrics are median, mode, and range.
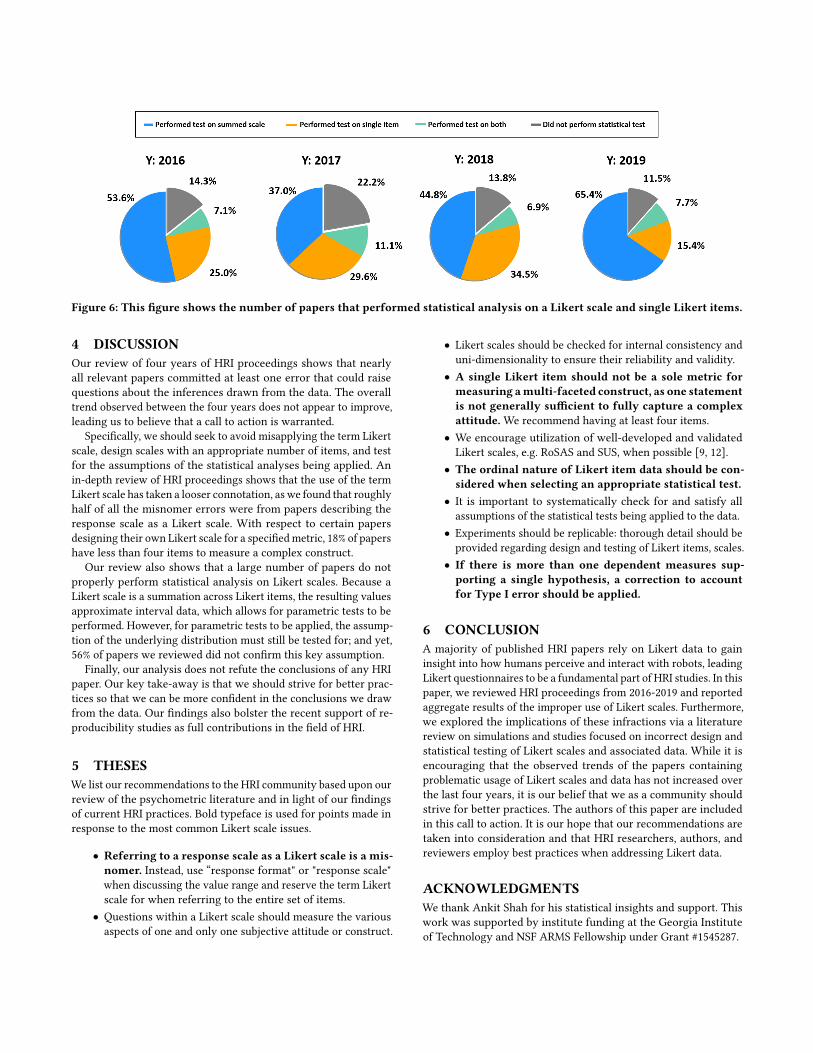
Figure 6: This figure shows the number of papers that performed statistical analysis on a Likert scale and single Likert items.
4 DISCUSSIONOur review of four years of HRI proceedings shows that nearlyall relevant papers committed at least one error that could raisequestions about the inferences drawn from the data. The overalltrend observed between the four years does not appear to improve,leading us to believe that a call to action is warranted.
Specifically, we should seek to avoid misapplying the term Likertscale, design scales with an appropriate number of items, and testfor the assumptions of the statistical analyses being applied. Anin-depth review of HRI proceedings shows that the use of the termLikert scale has taken a looser connotation, as we found that roughlyhalf of all the misnomer errors were from papers describing theresponse scale as a Likert scale. With respect to certain papersdesigning their own Likert scale for a specifiedmetric, 18% of papershave less than four items to measure a complex construct.
Our review also shows that a large number of papers do notproperly perform statistical analysis on Likert scales. Because aLikert scale is a summation across Likert items, the resulting valuesapproximate interval data, which allows for parametric tests to beperformed. However, for parametric tests to be applied, the assump-tion of the underlying distribution must still be tested for; and yet,56% of papers we reviewed did not confirm this key assumption.
Finally, our analysis does not refute the conclusions of any HRIpaper. Our key take-away is that we should strive for better prac-tices so that we can be more confident in the conclusions we drawfrom the data. Our findings also bolster the recent support of re-producibility studies as full contributions in the field of HRI.
5 THESESWe list our recommendations to the HRI community based upon ourreview of the psychometric literature and in light of our findingsof current HRI practices. Bold typeface is used for points made inresponse to the most common Likert scale issues.
• Referring to a response scale as a Likert scale is a mis-nomer. Instead, use “response format" or "response scale"when discussing the value range and reserve the term Likertscale for when referring to the entire set of items.
• Questions within a Likert scale should measure the variousaspects of one and only one subjective attitude or construct.
• Likert scales should be checked for internal consistency anduni-dimensionality to ensure their reliability and validity.
• A single Likert item should not be a sole metric formeasuring amulti-faceted construct, as one statementis not generally sufficient to fully capture a complexattitude.We recommend having at least four items.
• We encourage utilization of well-developed and validatedLikert scales, e.g. RoSAS and SUS, when possible [9, 12].
• The ordinal nature of Likert item data should be con-sidered when selecting an appropriate statistical test.
• It is important to systematically check for and satisfy allassumptions of the statistical tests being applied to the data.
• Experiments should be replicable: thorough detail should beprovided regarding design and testing of Likert items, scales.
• If there is more than one dependent measures sup-porting a single hypothesis, a correction to accountfor Type I error should be applied.
6 CONCLUSIONA majority of published HRI papers rely on Likert data to gaininsight into how humans perceive and interact with robots, leadingLikert questionnaires to be a fundamental part of HRI studies. In thispaper, we reviewed HRI proceedings from 2016-2019 and reportedaggregate results of the improper use of Likert scales. Furthermore,we explored the implications of these infractions via a literaturereview on simulations and studies focused on incorrect design andstatistical testing of Likert scales and associated data. While it isencouraging that the observed trends of the papers containingproblematic usage of Likert scales and data has not increased overthe last four years, it is our belief that we as a community shouldstrive for better practices. The authors of this paper are includedin this call to action. It is our hope that our recommendations aretaken into consideration and that HRI researchers, authors, andreviewers employ best practices when addressing Likert data.
ACKNOWLEDGMENTSWe thank Ankit Shah for his statistical insights and support. Thiswork was supported by institute funding at the Georgia Instituteof Technology and NSF ARMS Fellowship under Grant #1545287.
REFERENCES[1] I. Elaine Allen and Christopher A. Seaman. 2007. Likert Scales and Data Analyses.[2] Rodrigo A. Asún, Karina Rdz-Navarro, and Jesús M. Alvarado. 2016. Developing
Multidimensional Likert Scales Using Item Factor Analysis: The Case of Four-point Items. Sociological Methods and Research 45, 1 (2016), 109–133. https://doi.org/10.1177/0049124114566716
[3] Peter C. Austin, Muhammad M. Mamdani, David N. Juurlink, and Janet E. Hux.2006. Testing multiple statistical hypotheses resulted in spurious associations:a study of astrological signs and health. Journal of Clinical Epidemiology 59, 9(2006), 964–969. https://doi.org/10.1016/j.jclinepi.2006.01.012
[4] N Balasubramanian. 2012. Likert Technique of Attitude Scale Construction inNursing Research. Cultural Anthropology Methods 2 (2012).
[5] A W Bendig. 1953. The Reliability of Self-Ratings as a Function of the Amountof Verbal Anchoring and of the Number of Categories on the Scale. 37, 1 (1953),38–41.
[6] Lars Bergkvist and John R Rossiter. 2007. The Predictive Validity of Multiple-ItemVersus Single-Item Measures of the Same Constructs. 2437 (2007).
[7] Phillip A Bishop and Robert L Herron. 2015. Use and Misuse of the Likert ItemResponses and Other Ordinal Measures. International journal of exercise science8, 3 (2015), 297–302. http://www.ncbi.nlm.nih.gov/pubmed/27182418%0Ahttp://www.pubmedcentral.nih.gov/articlerender.fcgi?artid=PMC4833473
[8] Clifford R Blair. 1981. A Reaction to âĂIJConsequences of Failure to Meet As-sumptions Underlying the Fixed Effects Analysis of Variance and CovarianceâĂİ.Review of Educational Research 51, 4 (1981), 499–507.
[9] John Brooke. 1996. SUS: a quick and dirty usability scale. In Usability EvaluationIn Industry. CRC Press, 189–200.
[10] James Carifio and Rocco Perla. 2008. Resolving the 50-year debate around usingand misusing Likert scales. (2008), 1150–1152. https://doi.org/10.1111/j.1365-2923.2008.03172.x
[11] James Carifio and Rocco J. Perla. 2007. Ten Common Misunderstandings, Mis-conceptions, Persistent Myths and Urban Legends about Likert Scales and LikertResponse Formats and their Antidotes. Journal of Social Sciences 3, 3 (2007),106–116. https://doi.org/10.3844/jssp.2007.106.116
[12] ColleenM. Carpinella, Alisa B.Wyman, Michael A. Perez, and Steven J. Stroessner.2017. The Robotic Social Attributes Scale (RoSAS): Development and Validation.ACM/IEEE International Conference on Human-Robot Interaction Part F1271 (2017),254–262. https://doi.org/10.1145/2909824.3020208
[13] Flavia Chiarotti. 2004. Detecting assumption violations in mixed-model analysisof variance. Ann Ist Super Sanità 40, 2 (2004), 165–171.
[14] Dennis L. Clason and Thomas J. Dormody. 1994. Analyzing Data Measured ByIndividual Likert-Type Items. Journal of Agricultural Education 35, 4 (1994), 31–35.https://doi.org/10.5032/jae.1994.04031
[15] Bradley Courtenay and Craig Weidemann. 1985. The Effects of a âĂIJDon’tKnowâĂİ Response on Palmore’s Facts on Aging Quizzes. The Gerontologist 2, 2(1985), 117–181.
[16] James C. Creech and David Richard Johnson. 2019. Ordinal Measures in MultipleIndicator Models : A Simulation Study of Categorization Error Author ( s ): DavidRichard Johnson and James C . Creech Source : American Sociological Review, Vol . 48 , No . 3 ( Jun ., 1983 ), pp . 398-407 Published by : Amer. 48, 3 (2019),398–407.
[17] A. de Boer and P. van Lanschot, J., Stalmeier. 2004. Is a single-item visual analoguescale as valid, reliable and responsive as multi-item scales in measuring qualityof life? Quality of Life Research 13, 2 (2004), 311–320.
[18] Ben Derrick and Paul White. 2017. Comparing two samples from an individualLikert question. International Journal of Mathematics and Statistics (2017).
[19] Adamantios Diamantopoulos, Marko Sarstedt, Christoph Fuchs, PetraWilczynski,and Sebastian Kaiser. 2012. Guidelines for choosing between multi-item andsingle-item scales for construct measurement : a predictive validity perspective.(2012), 434–449. https://doi.org/10.1007/s11747-011-0300-3
[20] Oddgeir Friborg, Monica Martinussen, and Jan H. Rosenvinge. 2006. Likert-basedvs. semantic differential-based scorings of positive psychological constructs:A psychometric comparison of two versions of a scale measuring resilience.Personality and Individual Differences 40, 5 (2006), 873–884. https://doi.org/10.1016/j.paid.2005.08.015
[21] Anne M Gadermann, Martin Guhn, Bruno D Zumbo, and British Columbia. 2012.Estimating ordinal reliability for Likert-type and ordinal item response data : Aconceptual , empirical , and practical guide. 17, 3 (2012).
[22] Gene V Glass, Percy D Peckham, and James R Sanders. 1972. Consequences ofFailure to Meet Assumptions Underlying the Fixed Effects Analyses of Varianceand Covariance. (1972).
[23] Joseph A. Gliem and Rosemary R. Gliem. 2003. Calculating, Interpreting, and Re-porting Cronbach’s Alpha Reliability Coefficient for Likert-Type Scales. MidwestResearch to Practice Conference in Adult, Continuing, and Community EducationCalculating, (2003). https://doi.org/10.1016/B978-0-444-88933-1.50023-4
[24] Chelsea Goforth. 2016. Using and Interpreting Cronbach’s Alpha. https://data.library.virginia.edu/using-and-interpreting-cronbachs-alpha/
[25] Matthew Gombolay and Ankit Shah. 2016. Appraisal of Statistical Practices inHRI vis-á-vis the T-Test for Likert Items/Scales. In 2016 AAAI Fall SymposiumSeries.
[26] Rebecca F. Guy and Melissa Norvell. 1997. The Neutral Point on a Likert Scale.The Journal of Psychology 95, 2 (1997).
[27] W. Penn Handwerker. 1996. Constructing Likert Scales: Testing the Validity andReliability of Single Measures of Multidimensional Variables. Cultural Anthropol-ogy Methods 8 (1996).
[28] Patrick M Horan, Christine Distefano, and Robert W Motl. 2009. Wording Effectsin Self-Esteem Scales : Methodological Artifact or Response Style ? 5511 (2009).https://doi.org/10.1207/S15328007SEM1003
[29] Susan Jamieson. 2004. Likert scales: How to (ab)use them. Medical Education 38,12 (2004), 1217–1218. https://doi.org/10.1111/j.1365-2929.2004.02012.x
[30] Robert Johns. 2006. One Size Doesn ’ t Fit All : Selecting Response Scales ForAttitude Items. 7289 (2006). https://doi.org/10.1080/13689880500178849
[31] Ankur Joshi, Saket Kale, Satish Chandel, and D. Pal. 2015. Likert Scale: Exploredand Explained. British Journal of Applied Science & Technology 7, 4 (2015), 396–403.https://doi.org/10.9734/bjast/2015/14975
[32] Hae-Young Kim. 2015. Statistical notes for clinical researchers: post-hoc multiplecomparisons . Restorative Dentistry & Endodontics 40, 2 (2015), 172. https://doi.org/10.5395/rde.2015.40.2.172
[33] W. R. Krosnick, J. A., Narayan, S. S., & Smith. 1996. Satisficing in surveys: Initialevidence. San Francisco:.
[34] Bjorn Lantz. 2013. Equidistance of Likert-Type Scales and Validation of InferentialMethods Using Experiments and Simulations. 11, 1 (2013), 16–28.
[35] Jihyun Lee and Insu Paek. 2014. In Search of the Optimal Number of ResponseCategories in a Rating Scale. 1 (2014). https://doi.org/10.1177/0734282914522200
[36] Shing On Leung and Meng Lin Xu. 2013. Single-Item Measures for SubjectiveAcademic Performance , Self-Esteem , and Socioeconomic Status. 8376 (2013).https://doi.org/10.1080/01488376.2013.794757
[37] Rensis Likert. 1932. A TECHNIQUE FOR THE MEASUREMENT OF ATTITUDES.Archives of Psychology (1932).
[38] Theodore M. Madden and Frederick J. Klopfer. 1978. The "Cannot Decide" Optionin Thurstone-Type Attitude Scales. Educational and Psychological Measurement(1978), 259–264.
[39] Michael S. Matell and Jacob Jacoby. 1971. Is there an optimal number of al-ternatives for likert scale items? study 1: Reliability and validity. Educationaland Psychological Measurement 31, 3 (1971), 657–674. https://doi.org/10.1177/001316447103100307
[40] Gary E. Meek, Ceyhun Ozgur, and Kenneth Dunning. 2007. Comparison of the tvs. Wilcoxon Signed-Rank test for likert scale data and small samples. Journal ofModern Applied Statistical Methods 6, 1 (2007), 91–106. https://doi.org/10.22237/jmasm/1177992540
[41] Ranjeev Mittu, Donald Sofge, Alan Wagner, and W. F. Lawless. 2016. Robustintelligence and trust in autonomous systems. 1–270 pages. https://doi.org/10.1007/978-1-4899-7668-0
[42] Pam Moule. 2015. Making Sense of Research in Nursing, Health and Social Care.SAGE Publications Ltd.
[43] Shinichi Nakagawa. 2004. A farewell to Bonferroni: The problems of low statisticalpower and publication bias. Behavioral Ecology 15, 6 (2004), 1044–1045. https://doi.org/10.1093/beheco/arh107
[44] Michael J Nanna. 1998. Analysis of Likert Scale Data in Disability and MedicalRehabilitation Research. 3, 1 (1998), 55–67.
[45] Tomoko Nemoto and David Beglar. 2013. Developing Likert-Scale Questionnaires.JALT2013 Conference Proceedings (2013).
[46] J. C. Nunnally and I. H Bernstein. 1994. Psychometric Theory (3rd ed.). McGraw-Hil, New York, New York, USA.
[47] Carolyn C Preston and Andrew M Colman. 2000. Optimal number of responsecategories in rating scales : reliability , validity , discriminating power , andrespondent preferences. 104 (2000), 1–15.
[48] Lena C Quilty, Jonathan M Oakman, Evan Risko, Lena C Quilty, Jonathan MOakman, and Evan Risko. 2009. Correlates of the Rosenberg Self-Esteem ScaleMethod Effects. 5511 (2009). https://doi.org/10.1207/s15328007sem1301
[49] John R Rossiter. 2002. The C-OAR-SE procedure for scale development in mar-keting. 19 (2002), 305–335.
[50] Kristin E. Schaefer. 2016. Measuring Trust in Human Robot Interactions: Devel-opment of the “Trust Perception Scale-HRI”. Springer US, Boston, MA, 191–218.https://doi.org/10.1007/978-1-4899-7668-0_10
[51] Howard Schuman and Stanley Presser. 1981. Questions and Answers in AttitudeSurveys. Academic Press, New York, New York, USA.
[52] Leonard J Simms, Kerry Zelazny, Trevor F Williams, and Lee Bernstein. 2019.Does the Number of Response Options Matter ? Psychometric Perspectives UsingPersonality Questionnaire Data. 31, 4 (2019), 557–566.
[53] Basu Prasad Subedi. 2016. Using Likert Type Data in Social Science Research:Confusion, Issues and Challenges. International Journal of Contemporary AppliedSciences 3, 2 (2016), 2308–1365. www.ijcas.net
[54] Keith S. Taber. 2018. The Use of Cronbach’s Alpha When Developing and Report-ing Research Instruments in Science Education. Research in Science Education 48,
6 (2018), 1273–1296. https://doi.org/10.1007/s11165-016-9602-2[55] Mohsen Tavakol and Reg Dennick. 2011. Making sense of Cronbach’s alpha.
International journal of medical education 2 (2011), 53–55. https://doi.org/10.5116/ijme.4dfb.8dfd
[56] Eric van Sonderen, Robbert Sanderman, and James C. Coyne. 2013. Ineffectivenessof Reverse Wording of Questionnaire Items: Let’s Learn from Cows in the Rain.PLoS ONE 8, 7 (2013), 1–7. https://doi.org/10.1371/journal.pone.0068967
[57] Tibert Verhagen, Bart van den Hooff, and Selmar Meents. 2015. Toward a betteruse of the semantic differential in IS research: An integrative framework ofsuggested action. Journal of the Association of Information Systems 16, 2 (2015),108–143.
[58] Andrew J Vickers. 2019. Comparison of an Ordinal and a Continuous OutcomeMeasure of Muscle Soreness. 4, 1999 (2019), 709–716.
[59] Rebecca Warner. 2012. Applied Statistics From Bivariate Through MultivariateTechniquese. Sage Publications. 1–40 pages.
[60] Fern Willits, Gene Theodori, and A.E. Luloff. 2016. Another look at likert scales *fern k. willits. 31, August 2015 (2016), 126–139.
[61] Huiping Wu and Shing-on Leung. 2017. Can Likert Scales be Treated as IntervalScales?âĂŤ A Simulation Study. Journal of Social Service Research 43, 4 (2017),527–532. https://doi.org/10.1080/01488376.2017.1329775
[62] J Yamaguchi. 1997. Positive versus Negative Wording. Rasch MeasurementTransactions 11 (1997).
[63] Ting Yan and Roger Tourangeau. 2008. Fast Times and Easy Questions : TheEffects of Age , Experience and Question Complexity on Web Survey ResponseTimes. 68, February 2007 (2008), 51–68. https://doi.org/10.1002/acp