statistical modelling of extreme rainfall, return periods and associated hazards in the bamenda...
TRANSCRIPT
GOT, n.º 9 – Revista de Geografia e Ordenamento do Território (junho de 2016)
GOT, nr. 9 – Geography and Spatial Planning Journal (June 2016)
5
Geografia e Ordenamento do Território, Revista Electrónica
Centro de Estudos de Geografia e Ordenamento do Território
http://cegot.org
ISSN: 2182-1267
AFUNGANG, ROLAND University of Yaounde 1, Faculty of Arts and Social Sciences, Department of Geography P O Box 755, Yaounde, Cameroon [email protected]
BATEIRA, CARLOS University of Porto, Faculty of Letters, Department of Geography Via Panorâmica, s/n, 4150-564 Porto, Portugal [email protected]
Statistical modelling of extreme rainfall, return periods and
associated hazards in the Bamenda Mountain, NW Cameroon
Modelação estatística e tempos de retorno de precipitações extremas
associadas a desastres naturais na serra de Bamenda, NW dos Camarões.
Referência: Afungang, Roland; Bateira, Carlos (2016). Statistical modelling of extreme rainfall, return periods
and associated hazards in the Bamenda Mountain, NW Cameroon. Revista de Geografia e Ordenamento do
Território (GOT), n.º 9 (junho). Centro de Estudos de Geografia e Ordenamento do Território, p. 5-19,
dx.doi.org/10.17127/got/2016.9.001
ABSTRACT
The Bamenda mountain region has one of the highest frequencies of landslides in Cameroon and the lowlands are prone to floods. The occurrence of these hazards is attributed to the estimated 2500 mm of rainfall that the area receives annually. The aim of this paper was to estimate the maximum rainfall the area is likely to receive in future and to examine some past extreme rainfall episodes that triggered landslides and floods and their return periods. The type I extreme value (Gumble) distribution was used to make these estimates through an Excel worksheet. From the model, it was predicted that the area could receive a maximum rainfall of about 87.7mm/day in 3 years, 116.97mm/day in 25 years, 126.13mm/day in 50 years and 135.23/day in 100 year. Seven extreme rainfall episodes were identified within the 43 year study period with rainfall amounts ranging from 99.5mm/day to 129.3mm/day. The extreme rainfall episodes initiated both landslide and floods and with return periods ranging between 7.3 years to 68.9 years. Predicting these extreme cases can be useful in the construction of dams and bridges and further research on rainfall thresholds for rainfall-induced hazards affecting the region.
Keywords: Extreme rainfall, return periods, landslides, floods, NW Cameroon
GOT, n.º 9 – Revista de Geografia e Ordenamento do Território (junho de 2016)
GOT, nr. 9 – Geography and Spatial Planning Journal (June 2016)
6
RESUMO
A região montanhosa de Bamenda tem uma elevada frequência de ocorrência de deslizamentos de terra e nas terras baixas ocorrem inundações com elevada frequência. A frequência de ocorrência destes processos é atribuída à elevada precipitação, estimada em 2500 mm/ano. O objetivo deste trabalho consiste em estimar valores extremos de precipitação relativos a diferentes períodos de retorno que provocaram deslizamentos de terra e inundações, com recurso à função de distribuição de Gumble (tipo I). Com base neste modelo, estima-se que a precipitação máxima de cerca de 87,7 milímetros / dia em 3 anos, 116,97 milímetros / dia em 25 anos, 126,13 milímetros / dia em 50 anos e 135,23 / dia em 100 anos constitui valores de referência. Sete episódios extremos de chuva foram identificados dentro do período de estudo de 43 anos com quantidades de precipitação variando de 99,5 milímetros / dia a 129,3 milímetros / dia. Os episódios de precipitação extrema que originam em simultâneo deslizamentos de terra e inundações têm períodos de retorno que variam entre 7,3 anos e 68,9 anos. Embora a área tem oito meses de chuva, estes processos estão diretamente relacionados com as chuvas diárias extremas, sendo difícil estabelecer uma boa correlação com as precipitações acumuladas. A definição de limiares críticos de precipitação é importante para a resolução dos problemas relativos aos riscos naturais que afetam a região.
Palavras-chave: Precipitação extrema, Período de retorno, Deslizamentos de terra, inundações, NW Camarões
1. Introduction
Rainfall is the main cause of flash floods and landslides in many parts of the world. Most of
these hazards are caused by extreme rainfall conditions during short periods of time
(Modricka and Georgakakos, 2015; Staley et al., 2015; Reichenbach et al., 1998). Changes in
hydrological conditions such as soil moisture and the variation in fluvial discharge depend
on rainfall (Sharma and Nakagawa, 2005). The South West winds (monsoon winds) which
blows across Bamenda mountain between March and October accompanied by heavy
rainfall (about 2500mm per year) is seen as the main cause of landslides and floods in the
area. About 82% of the rain is received within four months (June – September) causing
extreme wet conditions that results on floods in the river valleys and lowlands and
landslides along steep slopes. There are about 189 rainfall-induced landslides within the last
ten years (Afungang, 2015) that is believed to have caused 12 deaths and lots of material
damage. Similarly, annual occurrences of floods in Bamenda town are on the rise (Nyambod,
GOT, n.º 9 – Revista de Geografia e Ordenamento do Território (junho de 2016)
GOT, nr. 9 – Geography and Spatial Planning Journal (June 2016)
7
2010) resulting to material and environment damage including human casualties. Some
recent examples and statistics on damages attributed to flood hazard in the area include:
the Mulang 2006 floods which drown two people; the Mougheb 2009 floods that swept
houses and resulted to one death and most recently, the Sunday, 2 August 2015 flash floods
that drowned 10 goats, sheep and fowls in Mulang and Ntasin neighbourhoods in Bamenda
II and III municipalities (CRTV News bulletin, 05/08/2015). These examples are just a few
reminders of the effects of extreme rainfall in the area. The population boom in the area
(Bamenda city) especially around the city centre has only made the job of the civil
protection department more challenging and complicated. The city is fast grow with an
estimated population of 58.400 in 1980 (Shende and Ndi, 2012) to about 269.530 today with
a growing rate of 4.67 (MINDHU, 2005). The susceptibility of the area to landslides is largely
due to the natural terrain characterised by steep slopes, abundant weathered material, high
stream density and pore water pressure, although some landslide events have been
attributed to anthropogenic activities. Human activities such as unplanned housing, poor
infrastructure, construction on marshy land and the encroachment of the urban poor into
marshy lands have increased the exposure of area to flood hazard. From this background,
we considered that the prediction of extreme rainfall episodes can constitute part of the
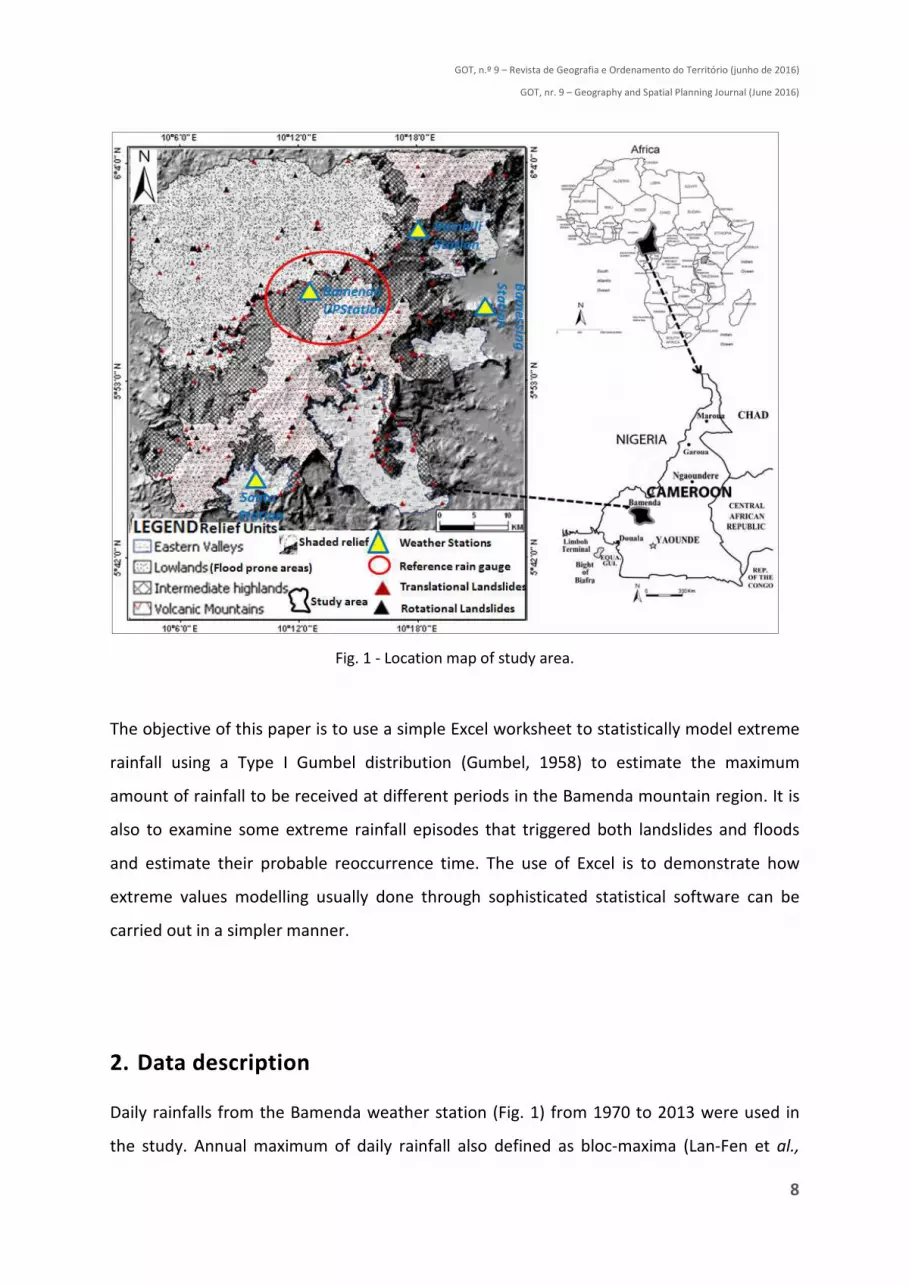
solution to this problem. The intermediate highlands are prone to landslides (translational
and rotational landslides), while the volcanic mountains are affected by rock fall. The
lowlands and parts of the eastern valleys are prone to floods (Fig. 1).
Most often, the modelling of extreme random variables (e.g., Rainfall, wind speed) have
been done using sophisticated distribution modelling methods such as Generalized Pareto
Distribution (LI et al., 2005; Davison and Smith 1990; Joe 1987), Generalized Extreme Value
distribution also known as extreme Frechet or value type II (Lan-Fen et al., 2012; Coles et al.,
2003; Nguyen et al., 2002), Weibull distribution (Weilbull, 1951), or a combination of the
above (Coles et al., 2003). The application of different formulas to evaluate a single situation
rather gives very different and contradictory results making the situation more confused.
Although the Generalized Pareto distribution and the Generalized extreme value
distribution had proven useful in modelling the occurrence of extreme daily precipitation
and their return period (Elian et al., 2015), the practical and theoretical explanations are
somehow difficult to master.
GOT, n.º 9 – Revista de Geografia e Ordenamento do Território (junho de 2016)
GOT, nr. 9 – Geography and Spatial Planning Journal (June 2016)
8
Fig. 1 - Location map of study area.
The objective of this paper is to use a simple Excel worksheet to statistically model extreme
rainfall using a Type I Gumbel distribution (Gumbel, 1958) to estimate the maximum
amount of rainfall to be received at different periods in the Bamenda mountain region. It is
also to examine some extreme rainfall episodes that triggered both landslides and floods
and estimate their probable reoccurrence time. The use of Excel is to demonstrate how
extreme values modelling usually done through sophisticated statistical software can be
carried out in a simpler manner.
2. Data description
Daily rainfalls from the Bamenda weather station (Fig. 1) from 1970 to 2013 were used in
the study. Annual maximum of daily rainfall also defined as bloc-maxima (Lan-Fen et al.,

GOT, n.º 9 – Revista de Geografia e Ordenamento do Território (junho de 2016)
GOT, nr. 9 – Geography and Spatial Planning Journal (June 2016)
9
2012; Gumbel, 1958) is calculated from the rainfall time series dataset with the assumption
that these represent extreme episodes which are most likely to cause floods and landslide
hazards. The annual rainfall and annual maximum daily rainfall for the hydrological year
1970-71 to 2012-13 (March – February) are presented in a bi-logarithm graph (fig. 2). The
annual maximum rainfall ranged from 129.3mm (1998-99) to 60.3mm (2005-06)
hydrological year. Natural hazards caused by extreme rainfall are mostly related with the
daily extremes while monthly extremes reflect most favourable periods for the event. From
fig. 2, the former (left) is the total rainfall amounts and the later (right) is annual maximums
of daily precipitation.
Figure 2 - Annual precipitation (left) and Annual maximum daily rainfall (right) from 1970-2013 hydrological year. MAP is the mean annual precipitation.
The 2009/2010 hydrological year had the highest number of rainy days (268 days) with
2377.5mm of rainfall and 1988/1989 was the lowest (154 days with precipitation) with
1934.4mm of rain (fig. 2 left). But the highest annual rainfall was in 1999/2000 (2811.8mm)
and the least was in year 1973/1974 (1930.8mm). These statistics shows years with extreme
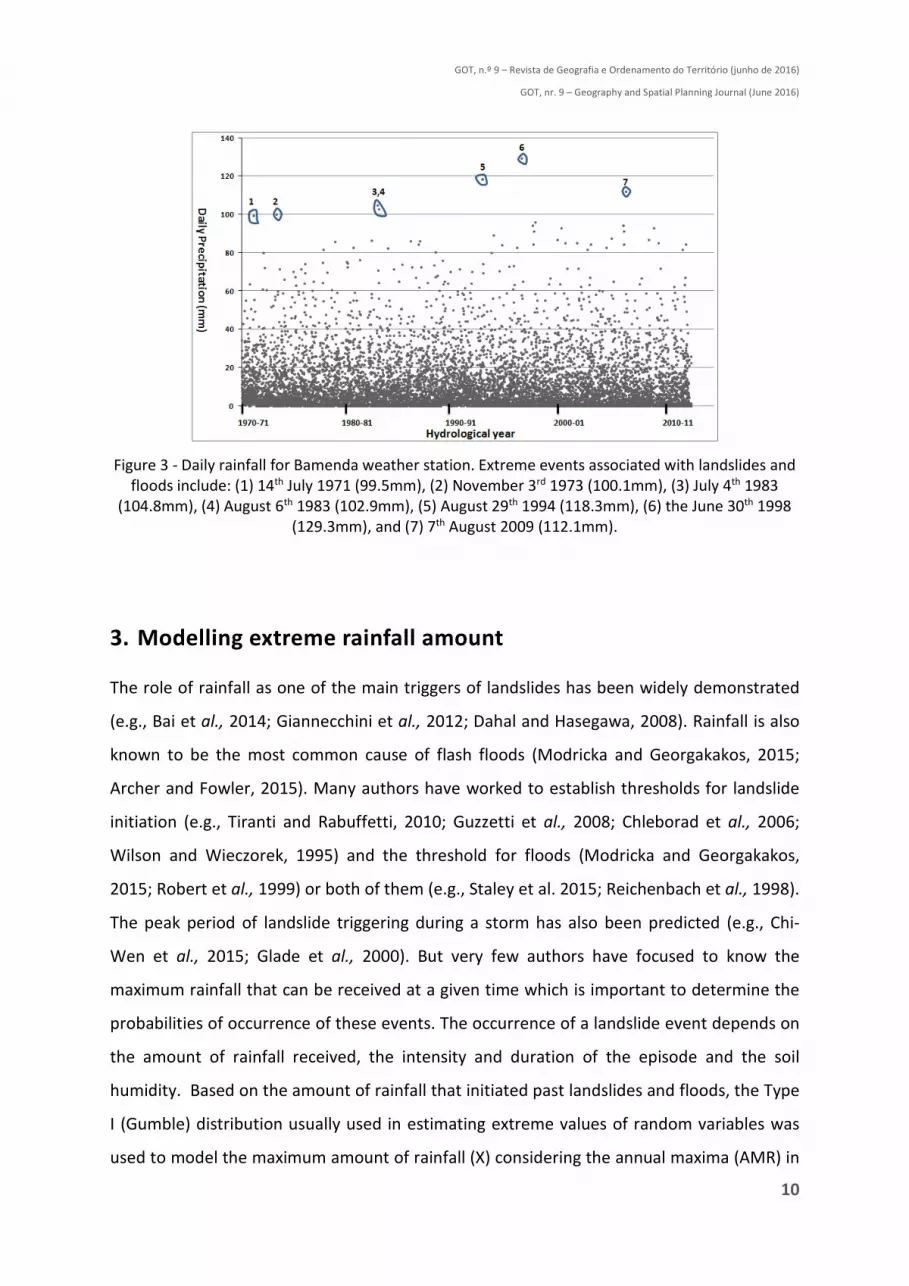
rainfall variations. Daily rainfall distribution shows some extreme episodes which can
probably cause hazardous events. The extreme rainfall episodes identified on figure 3 are
those extremes that caused both landslides and floods in the area.
GOT, n.º 9 – Revista de Geografia e Ordenamento do Território (junho de 2016)
GOT, nr. 9 – Geography and Spatial Planning Journal (June 2016)
10
Figure 3 - Daily rainfall for Bamenda weather station. Extreme events associated with landslides and floods include: (1) 14th July 1971 (99.5mm), (2) November 3rd 1973 (100.1mm), (3) July 4th 1983
(104.8mm), (4) August 6th 1983 (102.9mm), (5) August 29th 1994 (118.3mm), (6) the June 30th 1998 (129.3mm), and (7) 7th August 2009 (112.1mm).
3. Modelling extreme rainfall amount
The role of rainfall as one of the main triggers of landslides has been widely demonstrated
(e.g., Bai et al., 2014; Giannecchini et al., 2012; Dahal and Hasegawa, 2008). Rainfall is also
known to be the most common cause of flash floods (Modricka and Georgakakos, 2015;
Archer and Fowler, 2015). Many authors have worked to establish thresholds for landslide
initiation (e.g., Tiranti and Rabuffetti, 2010; Guzzetti et al., 2008; Chleborad et al., 2006;
Wilson and Wieczorek, 1995) and the threshold for floods (Modricka and Georgakakos,
2015; Robert et al., 1999) or both of them (e.g., Staley et al. 2015; Reichenbach et al., 1998).
The peak period of landslide triggering during a storm has also been predicted (e.g., Chi-
Wen et al., 2015; Glade et al., 2000). But very few authors have focused to know the
maximum rainfall that can be received at a given time which is important to determine the
probabilities of occurrence of these events. The occurrence of a landslide event depends on
the amount of rainfall received, the intensity and duration of the episode and the soil
humidity. Based on the amount of rainfall that initiated past landslides and floods, the Type
I (Gumble) distribution usually used in estimating extreme values of random variables was
used to model the maximum amount of rainfall (X) considering the annual maxima (AMR) in
GOT, n.º 9 – Revista de Geografia e Ordenamento do Território (junho de 2016)
GOT, nr. 9 – Geography and Spatial Planning Journal (June 2016)
11
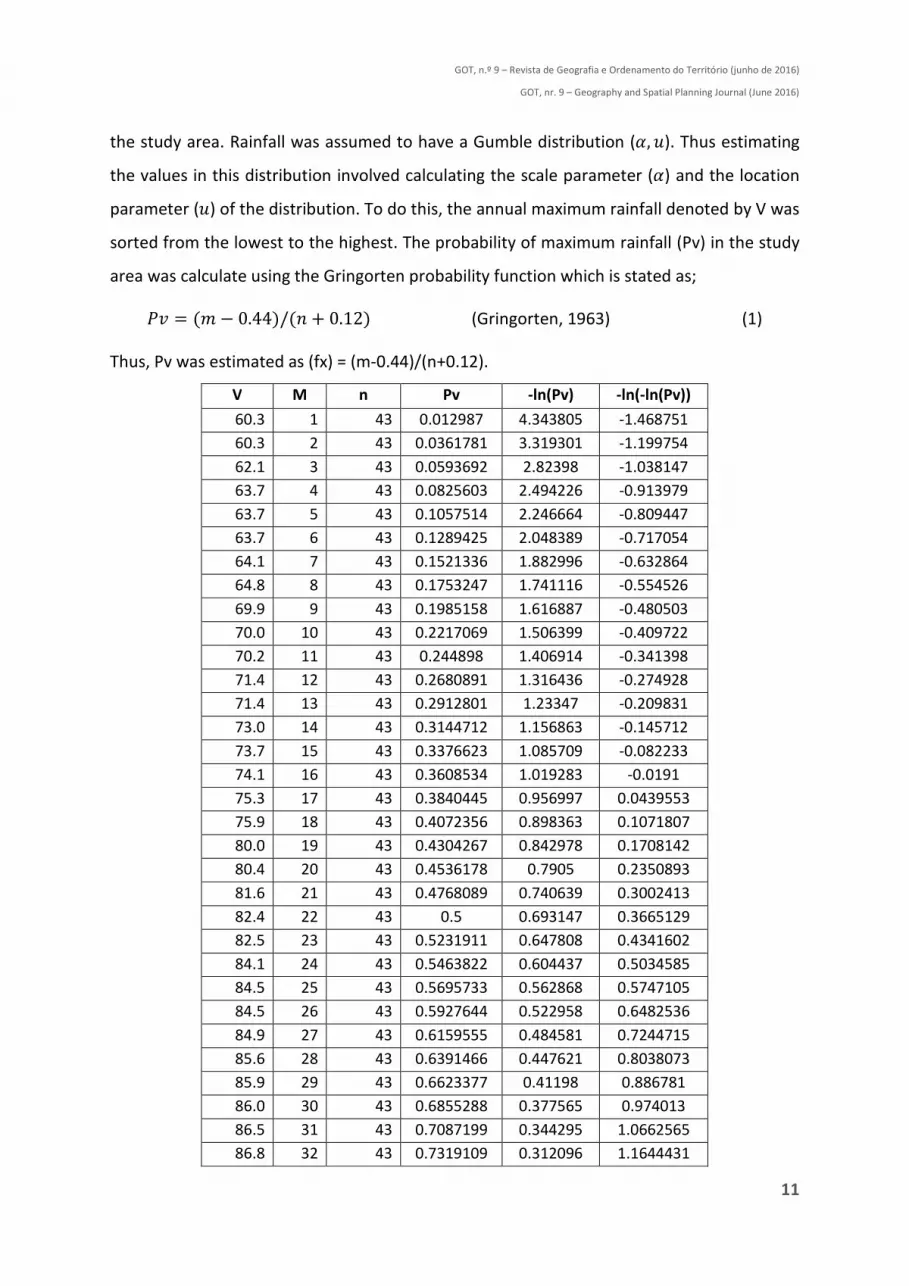
the study area. Rainfall was assumed to have a Gumble distribution (�, �). Thus estimating
the values in this distribution involved calculating the scale parameter (�) and the location
parameter (�) of the distribution. To do this, the annual maximum rainfall denoted by V was
sorted from the lowest to the highest. The probability of maximum rainfall (Pv) in the study
area was calculate using the Gringorten probability function which is stated as;
�� = (� − 0.44)/(� + 0.12) (Gringorten, 1963) (1)
Thus, Pv was estimated as (fx) = (m-0.44)/(n+0.12).
V M n Pv -ln(Pv) -ln(-ln(Pv))
60.3 1 43 0.012987 4.343805 -1.468751
60.3 2 43 0.0361781 3.319301 -1.199754
62.1 3 43 0.0593692 2.82398 -1.038147
63.7 4 43 0.0825603 2.494226 -0.913979
63.7 5 43 0.1057514 2.246664 -0.809447
63.7 6 43 0.1289425 2.048389 -0.717054
64.1 7 43 0.1521336 1.882996 -0.632864
64.8 8 43 0.1753247 1.741116 -0.554526
69.9 9 43 0.1985158 1.616887 -0.480503
70.0 10 43 0.2217069 1.506399 -0.409722
70.2 11 43 0.244898 1.406914 -0.341398
71.4 12 43 0.2680891 1.316436 -0.274928
71.4 13 43 0.2912801 1.23347 -0.209831
73.0 14 43 0.3144712 1.156863 -0.145712
73.7 15 43 0.3376623 1.085709 -0.082233
74.1 16 43 0.3608534 1.019283 -0.0191
75.3 17 43 0.3840445 0.956997 0.0439553
75.9 18 43 0.4072356 0.898363 0.1071807
80.0 19 43 0.4304267 0.842978 0.1708142
80.4 20 43 0.4536178 0.7905 0.2350893
81.6 21 43 0.4768089 0.740639 0.3002413
82.4 22 43 0.5 0.693147 0.3665129
82.5 23 43 0.5231911 0.647808 0.4341602
84.1 24 43 0.5463822 0.604437 0.5034585
84.5 25 43 0.5695733 0.562868 0.5747105
84.5 26 43 0.5927644 0.522958 0.6482536
84.9 27 43 0.6159555 0.484581 0.7244715
85.6 28 43 0.6391466 0.447621 0.8038073
85.9 29 43 0.6623377 0.41198 0.886781
86.0 30 43 0.6855288 0.377565 0.974013
86.5 31 43 0.7087199 0.344295 1.0662565
86.8 32 43 0.7319109 0.312096 1.1644431
GOT, n.º 9 – Revista de Geografia e Ordenamento do Território (junho de 2016)
GOT, nr. 9 – Geography and Spatial Planning Journal (June 2016)
12
86.8 33 43 0.755102 0.280902 1.2697481
89.0 34 43 0.7782931 0.250652 1.3836896
93.0 35 43 0.8014842 0.22129 1.5082813
93.0 36 43 0.8246753 0.192766 1.6462808
96.1 37 43 0.8478664 0.165032 1.8016148
96.1 38 43 0.8710575 0.138047 1.9801591
99.5 39 43 0.8942486 0.111771 2.1912991
100.1 40 43 0.9174397 0.086168 2.4514515
104.8 41 43 0.9406308 0.061205 2.7935335
118.3 42 43 0.9638219 0.036849 3.3009333
129.3 43 43 0.987013 0.013072 4.3372765
Table 1 - Excel worksheet computation of annual extreme rainfall for Bamenda mountain region, for the years 1970-2013 using Gumbel distribution
Where: Pv = Probability of maximum annual rainfall in mm/day, -ln(Pv) = negative of the natural logarithm of Pv (Gringorten Estimation), -ln(-ln(Pv)) = negative of the natural logarithm of Pv, taken
twice.
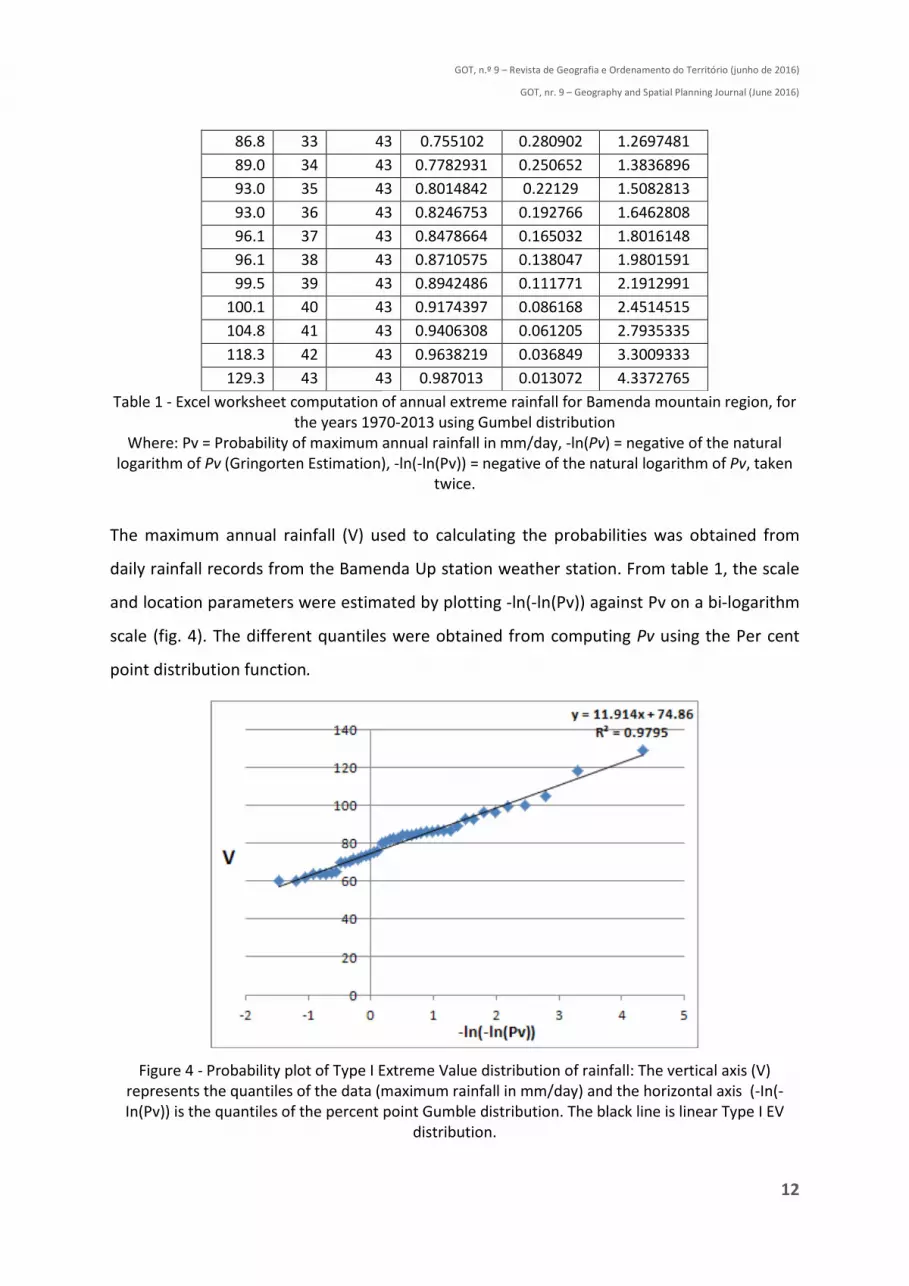
The maximum annual rainfall (V) used to calculating the probabilities was obtained from
daily rainfall records from the Bamenda Up station weather station. From table 1, the scale
and location parameters were estimated by plotting -ln(-ln(Pv)) against Pv on a bi-logarithm
scale (fig. 4). The different quantiles were obtained from computing Pv using the Per cent
point distribution function.
Figure 4 - Probability plot of Type I Extreme Value distribution of rainfall: The vertical axis (V) represents the quantiles of the data (maximum rainfall in mm/day) and the horizontal axis (-In(-In(Pv)) is the quantiles of the percent point Gumble distribution. The black line is linear Type I EV
distribution.
GOT, n.º 9 – Revista de Geografia e Ordenamento do Território (junho de 2016)
GOT, nr. 9 – Geography and Spatial Planning Journal (June 2016)
13
It can be seen that the annual maximum rainfall (points on the graph) form an
approximately straight line depicting a good distribution to the model used (Chambers et al.
1983). The scale parameter is depicted by the slope of the linear curve (� =11.914) and the
location parameter by the intercept (μ = 74.86). The fitted function R2 = 0.9795 shows a very
good adjustment of the distributed points.
After determining the location and scale parameters of the Gumble distribution, it
was now possible to estimate the extreme rainfall that the Bamenda mountain region can
possibly receive over time. The inverse of the cumulative function also known as Percent
Point Distribution (PPD) was used and denoted as (G);
G(1/(1-1/R)) (4)
The percent point is a probability that x is less than or equal to a given value. It was then
expressed as;
�� − ��{−�� ����} (5)
P is the probability of the desired quantile and from R above. The probability of each
quantile was computed as;
�� = 1 − (1 / Rp), (6)
Where: Rp is the return period for the desired period.
The extreme rainfall expected at any period in future was calculated using the Gumbel
Percent Point. Different return periods ranging from 3, 5, 10, 15, 25, 50 and 100 years was
computed by applying the percent point function (PPF) to the quantiles above. The
probabilities of extreme rainfall estimated by the PPF were defined as;
PPF = � ∗ (− ln(− ln(��))) + μ
The result of the modelling within different future time intervals is shown in table 2.
GOT, n.º 9 – Revista de Geografia e Ordenamento do Território (junho de 2016)
GOT, nr. 9 – Geography and Spatial Planning Journal (June 2016)
14
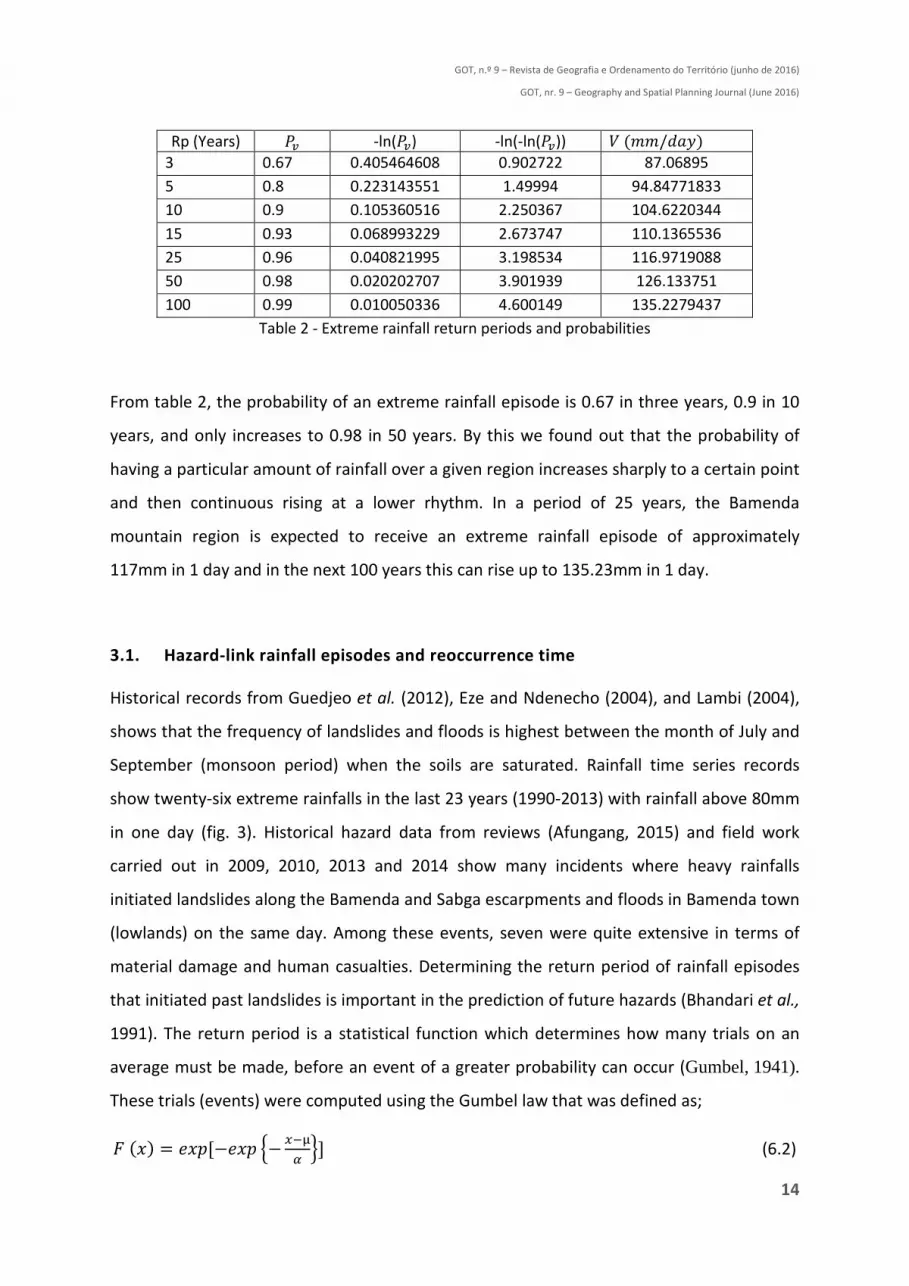
Rp (Years) �� -ln(��) -ln(-ln(��)) (��/"#$ 3 0.67 0.405464608 0.902722 87.06895
5 0.8 0.223143551 1.49994 94.84771833
10 0.9 0.105360516 2.250367 104.6220344
15 0.93 0.068993229 2.673747 110.1365536
25 0.96 0.040821995 3.198534 116.9719088
50 0.98 0.020202707 3.901939 126.133751
100 0.99 0.010050336 4.600149 135.2279437
Table 2 - Extreme rainfall return periods and probabilities
From table 2, the probability of an extreme rainfall episode is 0.67 in three years, 0.9 in 10
years, and only increases to 0.98 in 50 years. By this we found out that the probability of
having a particular amount of rainfall over a given region increases sharply to a certain point
and then continuous rising at a lower rhythm. In a period of 25 years, the Bamenda
mountain region is expected to receive an extreme rainfall episode of approximately
117mm in 1 day and in the next 100 years this can rise up to 135.23mm in 1 day.
3.1. Hazard-link rainfall episodes and reoccurrence time
Historical records from Guedjeo et al. (2012), Eze and Ndenecho (2004), and Lambi (2004),
shows that the frequency of landslides and floods is highest between the month of July and
September (monsoon period) when the soils are saturated. Rainfall time series records
show twenty-six extreme rainfalls in the last 23 years (1990-2013) with rainfall above 80mm
in one day (fig. 3). Historical hazard data from reviews (Afungang, 2015) and field work
carried out in 2009, 2010, 2013 and 2014 show many incidents where heavy rainfalls
initiated landslides along the Bamenda and Sabga escarpments and floods in Bamenda town
(lowlands) on the same day. Among these events, seven were quite extensive in terms of
material damage and human casualties. Determining the return period of rainfall episodes
that initiated past landslides is important in the prediction of future hazards (Bhandari et al.,
1991). The return period is a statistical function which determines how many trials on an
average must be made, before an event of a greater probability can occur (Gumbel, 1941).
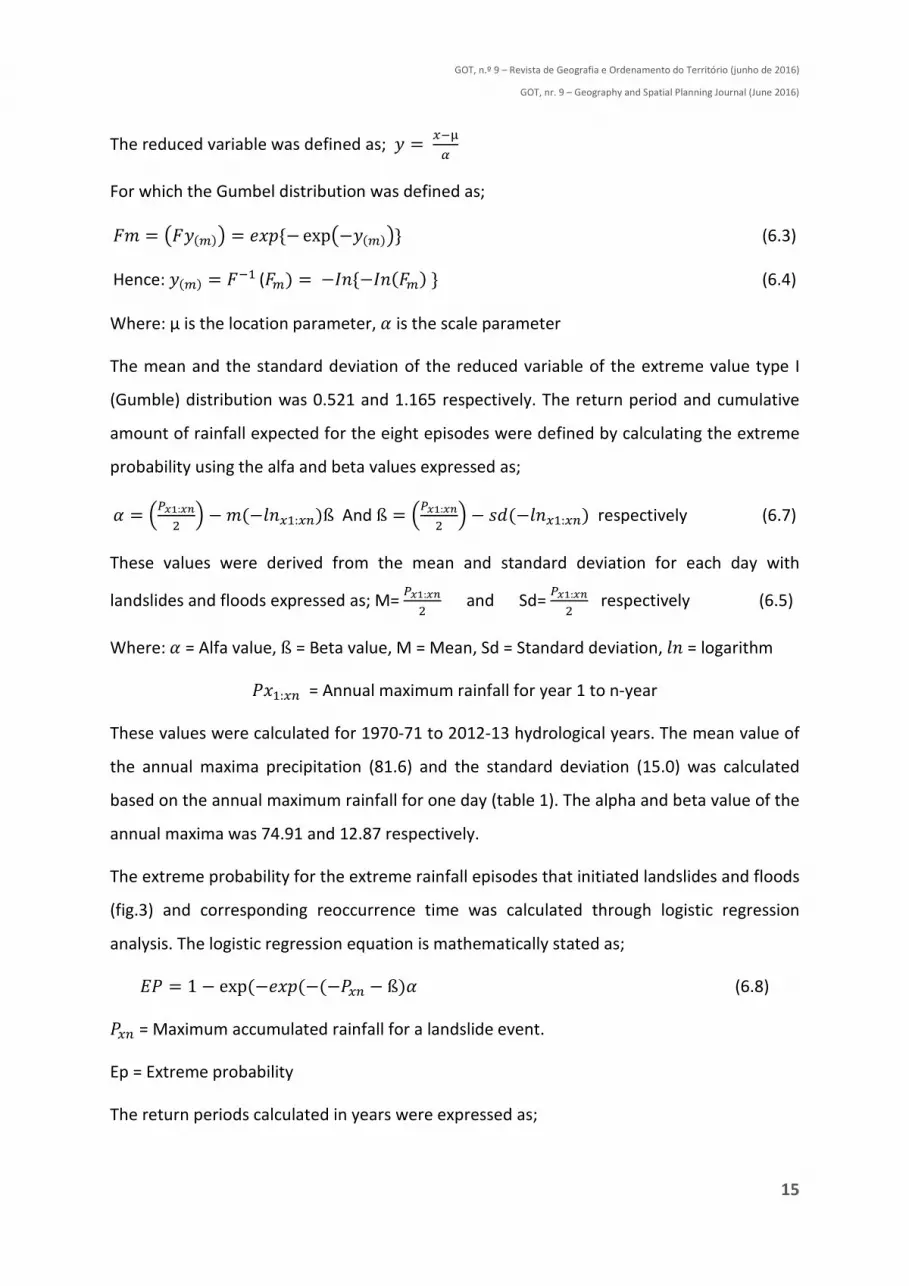
These trials (events) were computed using the Gumbel law that was defined as;
%�& � '&()'&( * +,-. /0 (6.2)
GOT, n.º 9 – Revista de Geografia e Ordenamento do Território (junho de 2016)
GOT, nr. 9 – Geography and Spatial Planning Journal (June 2016)
15
The reduced variable was defined as; $ � +,-.
For which the Gumbel distribution was defined as;
%� = 1%$�2 3 = '&({− exp1−$�2 3} (6.3)
Hence: $�2 = %,� (%2 = −7�{−7��%2 } (6.4)
Where: μ is the location parameter, � is the scale parameter
The mean and the standard deviation of the reduced variable of the extreme value type I
(Gumble) distribution was 0.521 and 1.165 respectively. The return period and cumulative
amount of rainfall expected for the eight episodes were defined by calculating the extreme
probability using the alfa and beta values expressed as;
� = �89::9<= � − ��−>�+�:+? ß And ß = �89::9<
= � − A"�−>�+�:+? respectively (6.7)
These values were derived from the mean and standard deviation for each day with
landslides and floods expressed as; M= 89::9<
= and Sd= 89::9<
= respectively (6.5)
Where: � = Alfa value, ß = Beta value, M = Mean, Sd = Standard deviation, >� = logarithm
�&�:+? = Annual maximum rainfall for year 1 to n-year
These values were calculated for 1970-71 to 2012-13 hydrological years. The mean value of
the annual maxima precipitation (81.6) and the standard deviation (15.0) was calculated
based on the annual maximum rainfall for one day (table 1). The alpha and beta value of the
annual maxima was 74.91 and 12.87 respectively.
The extreme probability for the extreme rainfall episodes that initiated landslides and floods
(fig.3) and corresponding reoccurrence time was calculated through logistic regression
analysis. The logistic regression equation is mathematically stated as;
B� = 1 − exp �−'&(�−�−�+? − ß � (6.8)
�+? = Maximum accumulated rainfall for a landslide event.
Ep = Extreme probability
The return periods calculated in years were expressed as;
GOT, n.º 9 – Revista de Geografia e Ordenamento do Território (junho de 2016)
GOT, nr. 9 – Geography and Spatial Planning Journal (June 2016)
16
C( � �D8 (6.9)
Thus C( for each day over the 43 year period calculated for days with landslides was
expressed as;
C(�….? � �D8:…..<
(6.10)
The return period (Rp) for each landslide was the maximum value obtained by dividing one
over the extreme probability and was expressed as;
C( � �D8:: �
D8< (6.11)
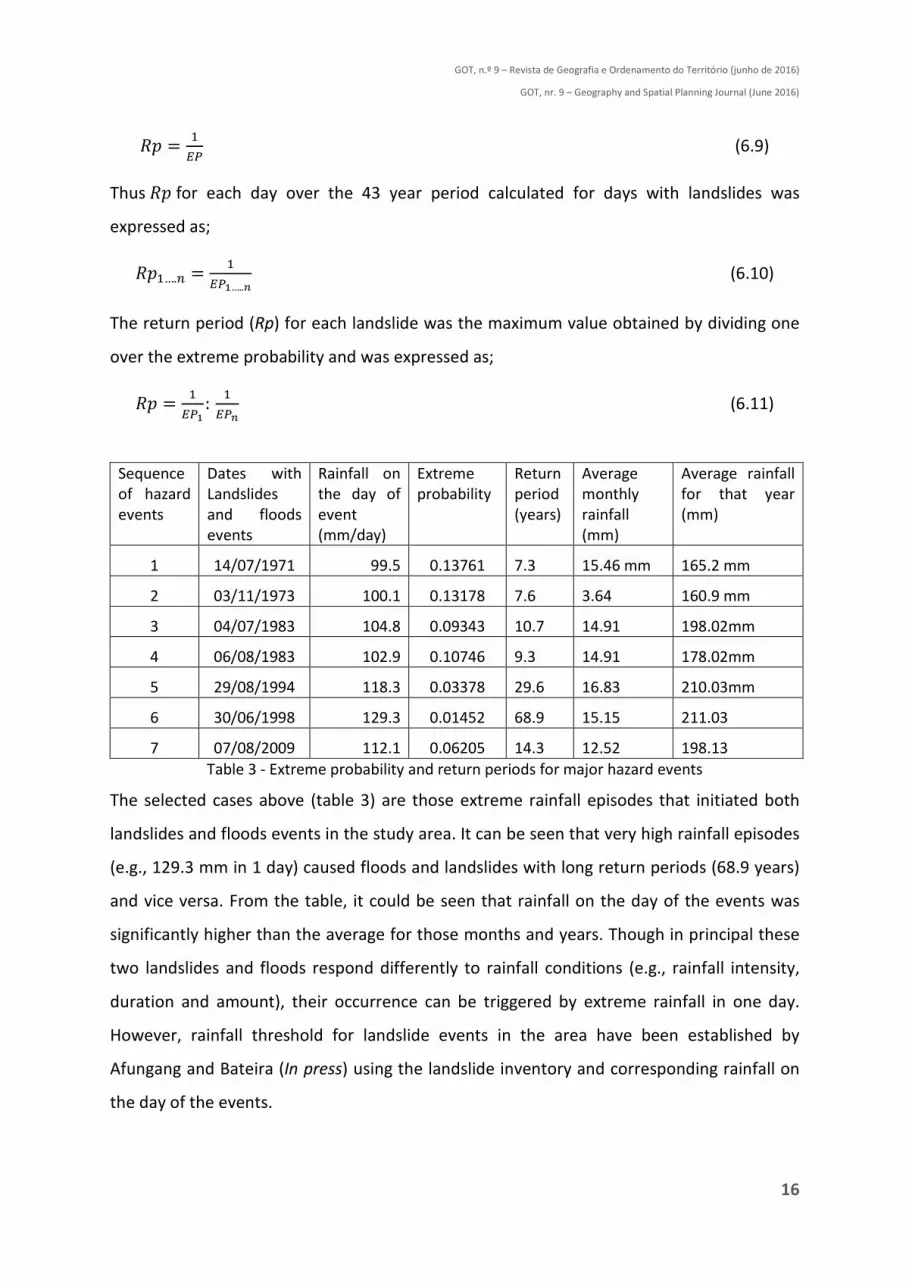
Sequence of hazard
events
Dates with Landslides and floods events
Rainfall on the day of event (mm/day)
Extreme probability
Return period (years)
Average monthly rainfall (mm)
Average rainfall for that year (mm)
1 14/07/1971 99.5 0.13761 7.3 15.46 mm 165.2 mm
2 03/11/1973 100.1 0.13178 7.6 3.64 160.9 mm
3 04/07/1983 104.8 0.09343 10.7 14.91 198.02mm
4 06/08/1983 102.9 0.10746 9.3 14.91 178.02mm
5 29/08/1994 118.3 0.03378 29.6 16.83 210.03mm
6 30/06/1998 129.3 0.01452 68.9 15.15 211.03
7 07/08/2009 112.1 0.06205 14.3 12.52 198.13
Table 3 - Extreme probability and return periods for major hazard events
The selected cases above (table 3) are those extreme rainfall episodes that initiated both
landslides and floods events in the study area. It can be seen that very high rainfall episodes
(e.g., 129.3 mm in 1 day) caused floods and landslides with long return periods (68.9 years)
and vice versa. From the table, it could be seen that rainfall on the day of the events was
significantly higher than the average for those months and years. Though in principal these
two landslides and floods respond differently to rainfall conditions (e.g., rainfall intensity,
duration and amount), their occurrence can be triggered by extreme rainfall in one day.
However, rainfall threshold for landslide events in the area have been established by
Afungang and Bateira (In press) using the landslide inventory and corresponding rainfall on
the day of the events.
GOT, n.º 9 – Revista de Geografia e Ordenamento do Território (junho de 2016)
GOT, nr. 9 – Geography and Spatial Planning Journal (June 2016)
17
4. Conclusion
Following our first objective, we have demonstrated that extreme rainfall conditions can be
computed using simple procedures (Excel worksheet) enabling everyone to arrive at a given
result. The amount of extreme rainfall increases continuously with time while the
probability of having extreme rainfall increases at a decreasing rate after a period of 10
years. The model predicted 126.13mm in 1 day in 50 years which was almost the same
rainfall amount (129.3mm in 1 day) received on June 30th 1998. Secondly, rainfall episodes
from 90mm in 1 day are capable of triggering multiply hazards irrespective of the
environmental fix factors that influence landslides and floods. The threshold value for
landslides is in the area is estimated at CFG � 94.063 K,L.M�N (Afungang and Bateira, in
press) which is somewhat below the minimum extreme value identified in this text. The
Extreme rainfall shows only rainfall episodes where landslides and floods were initiated.
Knowledge of expected rainfall in 100 years can be used by land use managers to improve
on the management of existing Dams and the construction of new ones thereby turning the
hazard situation into a resource. Construction plans for critical infrastructural such as
bridges and houses especially on marshy lands can be improved upon.
5. References
AFUNGANG, Roland. Spatiotemporal Probabilistic assessment of landslide hazard along the Bamenda
Mountain region of the Cameroon Volcanic Line. PhD thesis, University of Porto, 2015.
ARCHER, D.R and FOWLER H.J. Characterising flash flood response to intense rainfall and impacts using historical information and gauged data in Britain. Journal of Flood Risk Management, 2015, DOI: 10.1111/jfr3.12187.
BAI, S., JIAN W, THIEBES, B., CHEN, C and YANG Y. Analysis of the relationship of landslide occurrence with rainfall: a case study of Wudu County, China. Arab Journal of Geoscience, 2014, 7: 1277–1285
CHAMBERS, J. M., CLEVELAND, W. S., KLEINER, B and TUKEY, P. A. Graphical Methods for Data Analysis, Belmont Califonia: Wadsworth International Group, 1983.
CHLEBORAD, A.F., BAUM, R.L and GODT, J.W. Rainfall thresholds for forecasting landslides in the Seattle,
Washington, area-exceedance and probability. [access 25-01-2016], USGS open-file report, 10-64
CHI-WEN C., HITOSHI S and TAKASHI O. Rainfall intensity–duration conditions for mass movements in Taiwan. Progress in Earth and Planetary Science, 2015, 2:14. DOI 10.1186/s40645-015-0049-2
GOT, n.º 9 – Revista de Geografia e Ordenamento do Território (junho de 2016)
GOT, nr. 9 – Geography and Spatial Planning Journal (June 2016)
18
COLES, S., PERICCHIB, L and SISSON, S. A fully probabilistic approach to extreme rainfall modelling. Journal of
Hydrology, 2003, 273:35–50.
CRTV News bulletin [accessed on 05-08- 2015). Bamenda floods, enormous material damage. http://crtv.cm/fr/latestnews/societe-10/bamenda-floods-enormous-damage-caused-on-property-15243.htm.
DAHAL, R.K and HASEGAWA, S. Representative rainfall thresholds for landslides in the Nepal Himalaya, Geomorphology, 2008, 100(3-4): 429-443. DOI:10.1016/j.geomorph.2008.01.014
DAVISON, A and SMITH, R. Models for exceedances over high thresholds (with discussion). Jornal of the Royal
Statistical Society B, 1990, 52: 393–442.
ELIANE, B., PAULO, S., CLÁUDIO., M and SILVA, S. Estimating return periods for daily precipitation extreme events over the Brazilian Amazon. Theoretical and Applied Climatology, 2015, DOI: 10.1007/s00704-015-1605-9
GIANNECCHINI, R. Galanti, R and Amato, AG. Critical rainfall thresholds for triggering shallow landslides in the Serchio River Valley (Tuscany, Italy). Natural Hazards Earth System Science, 2012, 12: 829–842.
GLADE T, CROZIER M and Smith, P. Applying probability determination to refine landslide triggering rainfall thresholds using empirical “Antecedent daily rainfall model”, Pure and Applied Geophysics, 2000, 157: 1059–1079.
GUMBEL, E. Statistics of Extremes. Columbia University Press, 1985, New York, ISBN 0231021909 9780231021906
GUMBEL, E. The return period of flood flows. Annals of Mathematical Statistics, 1941, 12(2): 163-190
GUZZETTI, F., PERUCCACCI, S., Rossi, M., Stark, C.P. The rainfall intensity–duration control of shallow landslides and debris flows: an update. Landslides, 2008, 5(1): 3-17.
GRINGORTEN, I. A plotting role for extreme probability paper. Journal of Geophysics Resources, 1963, 68 (3): 813-814
JOE, H. Estimation of quantile of the maximum of N observations. Biometrika, 1987, 74: 347–354
LAN-FEN C, MCALEEr, M and SZU-HUA, W. Statistical Modelling of Recent Changes in Extreme Rainfall in Taiwan. International Journal of Environmental Science and Development, 2013, 4(1): 52-55
LI, Y., CAI, W and Campbell EP. Statistical Modeling of Extreme Rainfall in Southwest Western Australia. Journal
of climate, 2005, 18: 852-863.
MINISTRY OF HOUSING AND URBAN DEVELOPMENT (MINDHU- Bamenda) 2005 annual report.
MODRICKA, TM and GEORGAKAKOS KP. The character and causes of flash flood occurrence changes in mountainous small basins of Southern California under projected climatic change. Journal of Hydrology:
Regional Studies, 2015, 3: 312–336.
NGUYEN, D., FEDKIW, R and JENSEN, H. Physically based modelling and animation of fire. ACM Transactions on Graphics- Proceedings of ACM SIGGRAPH, 2002, 21(3): 721–728.
NYAMBOD, Emmanuel. Environmental Consequences of Rapid Urbanisation: Bamenda City, Cameroon. Journal
of Environmental Protection, 2010, DOI: 10.4236/jep.2010.11003
REICHENBACH, P., CARDINALI, M., DE VITA, P and GUZZETTI, F. Regional hydrological thresholds for landslides and floods in the Tiber River Basin (central Italy). Environmental Geology, 1998, 35(2):146 -159.
ROBERT, R., MASON, J., JEFFREY, N., WILBERT, O and THOMAS J. The National Flood-Frequency Program-
Methods For Estimating Flood Magnitude And Frequency In Rural And Urban Areas In Alabama. U.S. Geological Survey, 1999, Fact Sheet 088-97
SHARMA, RH and NAKAGAWA, H. Shallow landslide modelling for heavy rainfall events. Annals of Disaster
Prevention Research, 2005, Institute of Kyoto University, No 48B.
SHENDE, S and NDI, R. The Hydro-geomorphological Implications of Urbanisation in Bamenda, Cameroon. Journal of Sustainable Development, 2012, 5: 64-73.
GOT, n.º 9 – Revista de Geografia e Ordenamento do Território (junho de 2016)
GOT, nr. 9 – Geography and Spatial Planning Journal (June 2016)
19
STALEY MD., GARTNER EJ., KEAN JW. Objective Definition of Rainfall Intensity-Duration Thresholds for Post-fire Flash Floods and Debris Flows in the Area Burned by the Waldo Canyon Fire, Colorado, USA. Engineering Geology for Society and Territory, 2015, 2: 621-624. 10.1007/978-3-319-09057-3_103
TIRANTI, D and RABUFFETTI, D. Estimation of rainfall thresholds triggering shallow landslides for an operational warning system implementation. Landslides, 2010, 4(7): 471–481.
WEIBULL, W. A. statistical distribution function of wide applicability. Journal of Applied Mechanics, 1951, 18(3): 293-297.
Wilson, R.C. and WIECZOREK, G.F. Rainfall thresholds for the initiation of debris flow at La Honda, California, Environmental Engineering Geoscience, 1995, 1: 11-27.