state water portfolio risk analysis
TRANSCRIPT
WCEAM 2006 Paper 123 Page 1
STATE WATER PORTFOLIO RISK ANALYSIS
Brian Coopera and Robecca Gilhamb
a Dams & Civil, Department of Commerce, Rawson Place, Sydney New South Wales 2000, Australia
b Strategic Asset Services, State Water Corporation, Wentworth Street, Parramatta New South Wales 2150, Australia
Abstract: State Water Corporation (SWC) is a bulk water supply business which manages a portfolio of large dam structures prescribed under the Dams Safety Act (1978). The Act sets out deterministic criteria to ensure that dam owners apply adequate consideration to dam safety for structures under their control. With limited funding and what may seem to be endless upgrading programs to keep pace with revised hydrology, in recent years dam safety management has moved away from application of traditional deterministic criteria, toward a risk based approach. Risk assessment provides the means to trade off the varying needs of structures in a portfolio, enabling owners to prioritise limited funding resources to areas likely to have the greatest impact and benefit. The process engaged to analyse risk in SWC’s portfolio, and further to develop its capital works upgrading program will be the focus of the following discussion.
Keywords: Bulk water, dam safety, hydrology, risk analysis.
1 ABOUT STATE WATER CORPORATION & ITS REGULATORY ENVIRONMENT
State Water Corporation is wholly owned by the Government of New South Wales. The Corporation’s principal objectives are ‘to capture, store and release water in an efficient, effective, safe and financially responsible manner’ – for use by customers and the community – and for preservation of riverine ecosystem health. Water allocation to meet competing demands is governed by a Statutory Water Sharing Plan. State Water operates within the plan and its revenue is effectively capped by the plan limit.
As an owner/manager of large dams SWC is regulated by the Dams Safety Committee (DSC), a NSW government statutory authority created under the Dams Safety Act. Its role (among other things) is to “formulate measures to ensure the safety of dams” and to “maintain a surveillance of prescribed dams” (Dams Safety Act 1978). A “prescribed dam” is one listed in Schedule 1 of the Act.
In addition to the DSC, SWC is guided by the Australian National Committee on Large Dams (ANCOLD). ANCOLD’s goal is to encourage improvement in the planning, design, construction and operation of large dams in Australia, and to ensure that dam owners have access to world best practice through the skills of Australian professionals.
ANCOLD has published the Guidelines on Risk Assessment (October, 2003), which has shown a significant move away from the deterministic approach to dam safety management. This Guideline has seen ANCOLD embrace the concept of risk, and has been a major source of guidance for SWC Portfolio Risk Analysis.
2 INTRODUCTION
The portfolio of dams owned by SWC presents it with a certain exposure to risk. The risk presented by some dams will be greater than by others. Some dams will satisfy deterministic standards for dam design while others will not, and will require remedial works to bring them up to standard. Of this latter group of dams, some will cause greater loss of life (LOL) and economic damage if they were to fail than others. It is apparent then, that there needs to be some means to rank the dams regarding their likelihood of failure and the associated consequences of failure. The Portfolio Risk Analysis (PRA) provides these means. The PRA is currently in the third stage of an extended risk management exercise that is briefly outlined below.
The first stage of risk assessment in its current form was the Screening Level Risk Analysis (SLRA). The SLRA was completed in 1999, and was a first pass at assessing the risk for 16 major dams (Hume Dam, Menindee Lakes and Fish River structures were not included) and 14 minor (ex-CaLM) dams that were under the control of SWC at this time. The SLRA developed probabilities of failure using event trees, however only made a rough estimate of LOL.
Following on from the SLRA, was the PRA (2002). This study developed the probabilities of failure (via event trees) from those estimated in the SLRA, and assessed the consequences of dam failure including LOL, economic damages, and environmental/cultural damages. A separate consequence assessment report was prepared, by consultants Sinclair Knight Merz, for each major and minor dam in the portfolio.
WCEAM 2006 Paper 123 Page 2
The current revision of the PRA is focussed on updating information that has become out of date, extending the study to include all prescribed dams managed by SWC, as well as developing the usefulness of PRA (2002) as a tool to guide SWC’s program of capital works. The structures included in this revision of the PRA are listed in Table 2-1 below.
Table 2-1 Prescribed Dams in the Current PRA Revision
Dam Name Blowering Dam Brogo Dam Burrinjuck Dam Burrendong Dam Chaffey Dam Carcoar Dam Copeton Dam Glenbawn Dam Glennies Creek Dam Hume Dam Keepit Dam Lostock Dam Menindee Lakes Storage’s Oberon Dam Pindari Dam Rydal Dam Split Rock Dam Toonumbar Dam Windamere Dam Wyangala Dam
3 ASSET MANAGEMENT FRAMEWORK FOR DAM SAFETY
The Role of the DSC
The DSC has statutory functions under the Dams Safety Act 1978 and the Mining Act 1992. Its main objective is to ensure that all prescribed dams in NSW are in such a condition as to not pose an unacceptable danger to downstream residents and property, or to adversely affect the public welfare and environment. This is achieved by requiring all dam owners to arrange for:
• Regular monitoring and surveillance of their dams;
• Ongoing assessment of their behaviour on the basis of monitoring and surveillance information;
• Regular review of the compliance of their dams with current standards;
• Review of all such information and assessments by experienced personnel;
The DSC has an ongoing watchdog role to oversight the safety of the State’s prescribed dams and to prevent significant inadvertent or uncontrolled loss of their stored waters. In this context safety means that the dam complies with the Committee’s current requirements and conforms to current accepted national and international practices.
The Committee requires owners of prescribed dams with known, or assessed potential, deficiencies to formulate appropriate remedial action programs and to implement appropriate surveillance and emergency plans. These actions are to be undertaken with a degree of urgency that is dependent on the extent of the deficiency and the scale of the consequences in the event of dam failure.
3.1 The Role of ANCOLD
ANCOLD is the Australian national committee of the International Commission on Large Dams (ICOLD), a non-government organisation established in 1928. As part of ICOLD, ANCOLD guidelines are generally representative of current accepted national and international practices. ANCOLD is an incorporated voluntary association of organisations and individual professionals with an interest in dams in Australia. Members include local, state and federal agencies, dam owners and operators, contractors, consultants and academics. Many disciplines are represented including planners, environmental scientists, engineers, hydrologists, geologists, social scientists, economists and legal practitioners.
WCEAM 2006 Paper 123 Page 3
ANCOLD's goal is to encourage improvement in the planning, design, construction and operation of large dams in Australia, and to ensure that dam owners have access to world best practice through the skills of Australian professionals. ANCOLD pursues this goal through a number of activities, however the publication of Guidelines setting national standards in many aspects of dams and their environs, are summaries of asset management activities which together constitute best practice asset management of dam structures. ANCOLD guidelines cover topics including, but not limited to the following:
• Risk Assessment
• Dam Safety Management
• The Environmental Management of Dams
• Assessment of the Consequences of Dam Failure
• Selection of Acceptable Flood Capacity for Dams
• Design of Dams for Earthquake
• Strengthening and Raising Concrete Gravity Dams
• Design Criteria for Concrete Gravity Dams
• Concrete Faced Rockfill Dams
3.2 Asset Management within the Regulatory Environment
In terms of dam safety, SWC has a statutory obligation to comply with the requirements of the DSC, and a professional responsibility to comply with ANCOLD guidelines and hence demonstrate best practice and due diligence.
Traditionally asset management in dam safety is composed of a number of areas, including design, operations and maintenance, surveillance and risk management and these are discussed in the topics of the ANCOLD guidelines listed above. Risk assessment is the most recent addition to the asset management tools, and it is important to remember that this provides one input into an asset management process.
ANCOLD is currently leading change in Australia, away from deterministic standards. The DSC is undertaking a review of the regulatory policy framework for dam safety. This revised policy, if implemented, will represent a large shift away from purely deterministic statutory dam safety standards, and move to focus on an integrated dam risk management process which includes risk analysis, risk evaluation, risk communication and risk control.
4 WHAT IS RISK?
4.1 Risk Analysis, Evaluation, Assessment and Management
There is often confusion between the terms Risk Analysis, Risk Evaluation and Risk Assessment. To clarify this difference, ANCOLD definitions for each follow:
4.1.1 Risk Analysis: The use of available information to estimate the risk to individuals or populations, property or the environment from
hazards. Risk analyses generally contain the following steps: scope definition, hazard identification, and risk estimation.
4.1.2 Risk Evaluation: The process of examining and judging the significance of risk. The risk evaluation stage is the point at which values
(societal, regulatory, legal and owner’s) and judgements enter the decision process, explicitly or implicitly, by including consideration of the importance of the estimated risks and the associated social, environmental, economic, and other consequences, in order to evaluate a range of alternatives for managing the risks.
4.1.3 Risk Assessment: The process of reaching a decision recommendation on whether existing risks are tolerable and present risk control
measures are adequate, and if not, whether alternative risk control measures are justified or will be implemented. Risk assessment incorporates, as inputs, the outputs from the risk analysis and risk evaluation phases.
Together risk analysis and risk evaluation, represent risk assessment. Risks are first analysed and then compared to tolerability criteria, and hence the risk is evaluated. The ANCOLD (2003) guidelines are directed to the practical application of
WCEAM 2006 Paper 123 Page 4
risk assessment, with a primary focus on risk to life. The guidelines therefore provide guidance on tolerability criteria within the dam safety framework.
The SWC PRA is generally only concerned with risk analysis in terms of dam safety, with risk evaluation and assessment only really being introduced with respect to risk to life. ANCOLD provides guidance in the tolerability of societal risk, through the ANCOLD Societal Risk Curve and individual risk limits. However economic, environmental and cultural risks remain a matter for a business to decide upon a tolerable level. SWC has not considered the tolerability of economic, environmental and cultural risk at the present time. The outputs from the present process to revise and develop the PRA (2002) will remain a risk analysis with risk evaluation in terms of life safety risks.
Risk management is the end objective – risk assessment is a means to that end. In SWC, we have developed a risk analysis process, and assessed risk to life with respect to the ANCOLD guidelines. This process is the subject of this paper. The tolerability of risk in terms of economic, environmental and cultural risk remains yet to be addressed.
4.2 General
To quantify risk, the basic equation of Risk = Probability x Consequences was applied. The total risk is then the sum of all risks for the number of events considered, as is represented as:
})((*)({1
ii
n
ifailcsqfailP∑
=
Where:
P(fail)i is the probability of failure path i on the event trees csq(fail)i is the consequence of failure for failure path i (loss of life) n is the number of failure paths considered
4.3 Probabilities of Failure
4.3.1 General Risk has been treated on a dam by dam basis, therefore to determine the probability of failure for a single dam, the structure
is first broken down into its components (these may include the main embankment, spillway, reservoir and any subsidiary dams). Failure of these individual components is then considered separately.
The process of assessing the probability of failure of each dam component under various hazards follows a similar path. Hazards that have been included in the PRA assessment include earthquake, flooding, and sunny day (normal) events. In PRA (2002) piping was considered as a separate failure mode, however current practice is to assess piping following from one of the above hazards, using an event tree approach. The overall failure of the dam may result from a combination of the above hazards and the dam components not performing in a satisfactory manner.
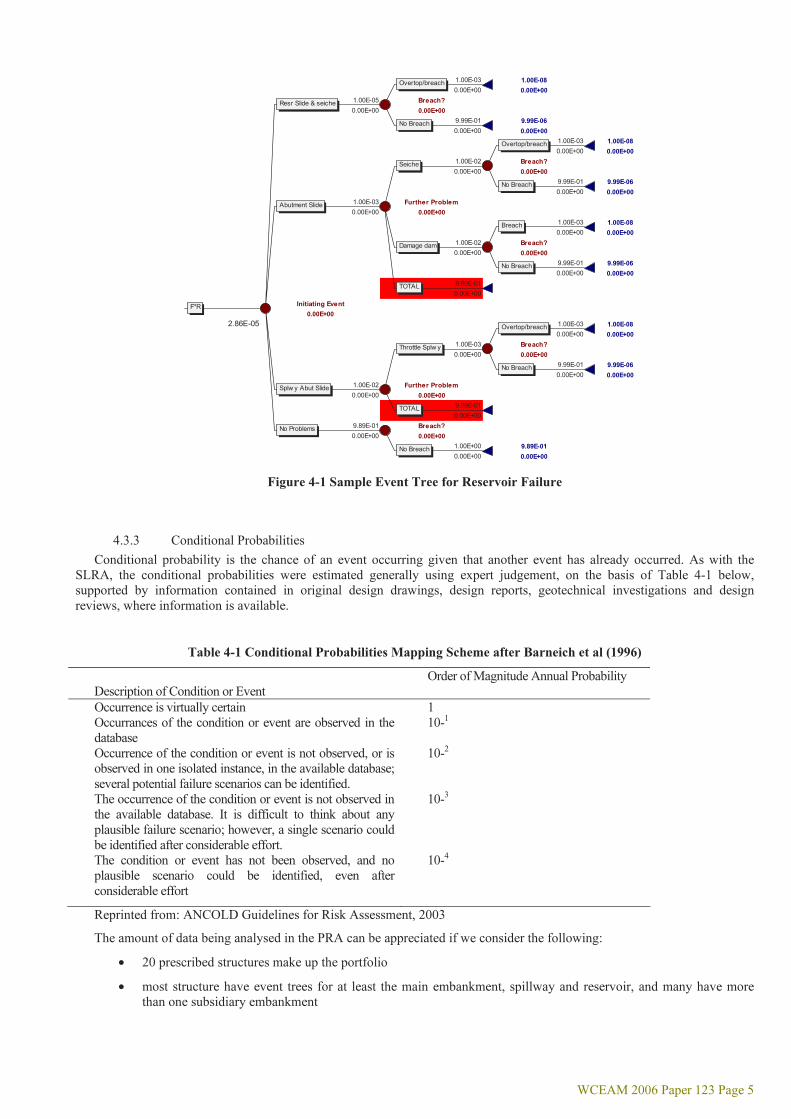
4.3.2 Event Trees Event trees have been developed to separate the dam components into events that are mutually exclusive, and therefore
may be summed to calculate an overall probability of failure for the component, or the dam system. This overall probability of failure would therefore consist of earthquake, flooding, and sunny day events, relating to the various dam components. A sample even tree is shown in Figure 4-1 below.
Looking at Figure 4-1 we can see that the tree starts with a single node ‘F*R’, that is known as the initiating event. ‘F’ tells us that the type of initiating event is flood, and the characters following describe the particular flood partition. The probability of a particular flood partition occurring is the probability of the particular initiating event. Partitioning of annual exceedence curves within event types facilitates a more refined calculation, as it allows consequences relevant to the magnitude of each event being considered to be applied. Without partitioning, only one set of consequences would be applied to a probability of failure, which may, for example, overstate the risk. The initiating event is then followed by a number of branches (four in the example below), each with probabilities attached. The probabilities following the initiating event are known as conditional probabilities.
WCEAM 2006 Paper 123 Page 5
1.00E-03 1.00E-080.00E+00 0.00E+00
1.00E-05 Breach?0.00E+00 0.00E+00
9.99E-01 9.99E-060.00E+00 0.00E+00
1.00E-03 1.00E-080.00E+00 0.00E+00
1.00E-02 Breach?0.00E+00 0.00E+00
9.99E-01 9.99E-060.00E+00 0.00E+00
1.00E-03 Further Problem0.00E+00 0.00E+00
1.00E-03 1.00E-080.00E+00 0.00E+00
1.00E-02 Breach?0.00E+00 0.00E+00
9.99E-01 9.99E-060.00E+00 0.00E+00
9.80E-010.00E+00
Initiating Event0.00E+00
2.86E-05 1.00E-03 1.00E-080.00E+00 0.00E+00
1.00E-03 Breach?0.00E+00 0.00E+00
9.99E-01 9.99E-060.00E+00 0.00E+00
1.00E-02 Further Problem0.00E+00 0.00E+00
9.99E-010.00E+00
9.89E-01 Breach?0.00E+00 0.00E+00
1.00E+00 9.89E-010.00E+00 0.00E+00
F*R
Resr Slide & seiche
Abutment Slide
Splw y Abut Slide
No Problems
Overtop/breach
No Breach
Seiche
Damage dam
TOTAL
Overtop/breach
No Breach
Breach
No Breach
Throttle Splw y
TOTAL
Overtop/breach
No Breach
No Breach
Figure 4-1 Sample Event Tree for Reservoir Failure
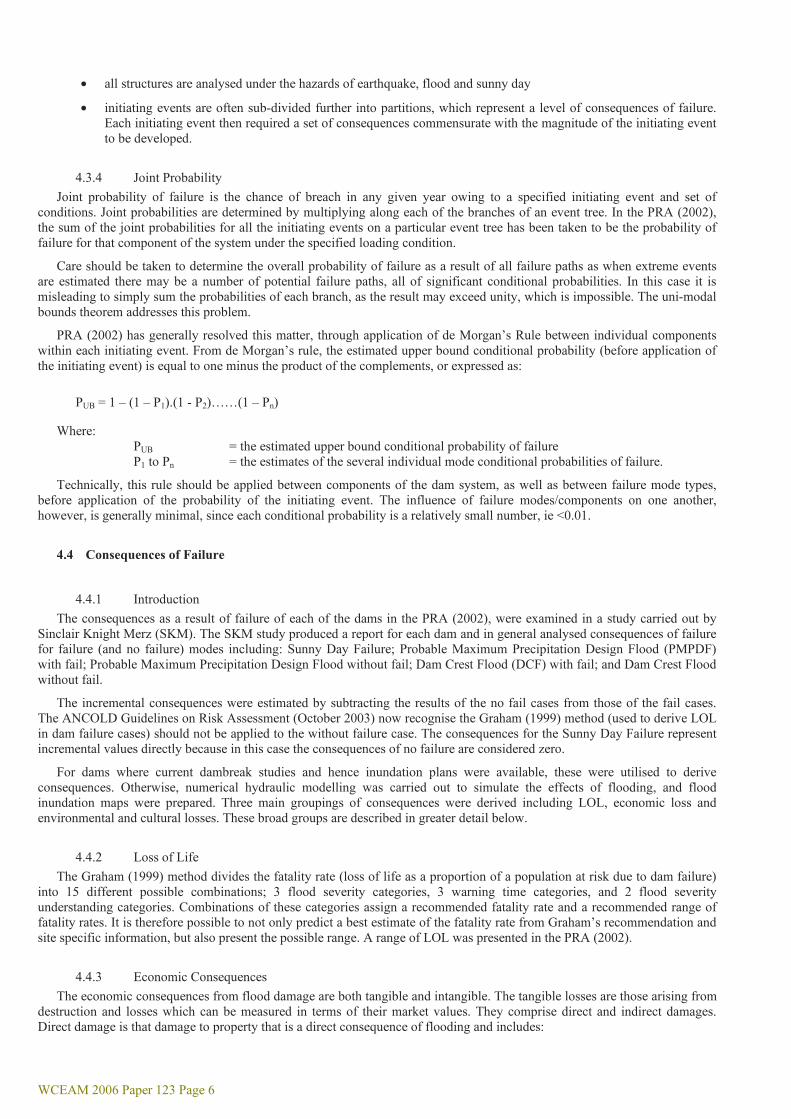
4.3.3 Conditional Probabilities Conditional probability is the chance of an event occurring given that another event has already occurred. As with the
SLRA, the conditional probabilities were estimated generally using expert judgement, on the basis of Table 4-1 below, supported by information contained in original design drawings, design reports, geotechnical investigations and design reviews, where information is available.
Table 4-1 Conditional Probabilities Mapping Scheme after Barneich et al (1996)
Description of Condition or Event
Order of Magnitude Annual Probability
Occurrence is virtually certain 1 Occurrances of the condition or event are observed in the database
10-1
Occurrence of the condition or event is not observed, or is observed in one isolated instance, in the available database; several potential failure scenarios can be identified.
10-2
The occurrence of the condition or event is not observed in the available database. It is difficult to think about any plausible failure scenario; however, a single scenario could be identified after considerable effort.
10-3
The condition or event has not been observed, and no plausible scenario could be identified, even after considerable effort
10-4
Reprinted from: ANCOLD Guidelines for Risk Assessment, 2003
The amount of data being analysed in the PRA can be appreciated if we consider the following:
• 20 prescribed structures make up the portfolio
• most structure have event trees for at least the main embankment, spillway and reservoir, and many have more than one subsidiary embankment
WCEAM 2006 Paper 123 Page 6
• all structures are analysed under the hazards of earthquake, flood and sunny day
• initiating events are often sub-divided further into partitions, which represent a level of consequences of failure. Each initiating event then required a set of consequences commensurate with the magnitude of the initiating event to be developed.
4.3.4 Joint Probability Joint probability of failure is the chance of breach in any given year owing to a specified initiating event and set of
conditions. Joint probabilities are determined by multiplying along each of the branches of an event tree. In the PRA (2002), the sum of the joint probabilities for all the initiating events on a particular event tree has been taken to be the probability of failure for that component of the system under the specified loading condition.
Care should be taken to determine the overall probability of failure as a result of all failure paths as when extreme events are estimated there may be a number of potential failure paths, all of significant conditional probabilities. In this case it is misleading to simply sum the probabilities of each branch, as the result may exceed unity, which is impossible. The uni-modal bounds theorem addresses this problem.
PRA (2002) has generally resolved this matter, through application of de Morgan’s Rule between individual components within each initiating event. From de Morgan’s rule, the estimated upper bound conditional probability (before application of the initiating event) is equal to one minus the product of the complements, or expressed as:
PUB = 1 – (1 – P1).(1 - P2)……(1 – Pn)
Where: PUB = the estimated upper bound conditional probability of failure P1 to Pn = the estimates of the several individual mode conditional probabilities of failure.
Technically, this rule should be applied between components of the dam system, as well as between failure mode types, before application of the probability of the initiating event. The influence of failure modes/components on one another, however, is generally minimal, since each conditional probability is a relatively small number, ie <0.01.
4.4 Consequences of Failure
4.4.1 Introduction The consequences as a result of failure of each of the dams in the PRA (2002), were examined in a study carried out by
Sinclair Knight Merz (SKM). The SKM study produced a report for each dam and in general analysed consequences of failure for failure (and no failure) modes including: Sunny Day Failure; Probable Maximum Precipitation Design Flood (PMPDF) with fail; Probable Maximum Precipitation Design Flood without fail; Dam Crest Flood (DCF) with fail; and Dam Crest Flood without fail.
The incremental consequences were estimated by subtracting the results of the no fail cases from those of the fail cases. The ANCOLD Guidelines on Risk Assessment (October 2003) now recognise the Graham (1999) method (used to derive LOL in dam failure cases) should not be applied to the without failure case. The consequences for the Sunny Day Failure represent incremental values directly because in this case the consequences of no failure are considered zero.
For dams where current dambreak studies and hence inundation plans were available, these were utilised to derive consequences. Otherwise, numerical hydraulic modelling was carried out to simulate the effects of flooding, and flood inundation maps were prepared. Three main groupings of consequences were derived including LOL, economic loss and environmental and cultural losses. These broad groups are described in greater detail below.
4.4.2 Loss of Life The Graham (1999) method divides the fatality rate (loss of life as a proportion of a population at risk due to dam failure)
into 15 different possible combinations; 3 flood severity categories, 3 warning time categories, and 2 flood severity understanding categories. Combinations of these categories assign a recommended fatality rate and a recommended range of fatality rates. It is therefore possible to not only predict a best estimate of the fatality rate from Graham’s recommendation and site specific information, but also present the possible range. A range of LOL was presented in the PRA (2002).
4.4.3 Economic Consequences The economic consequences from flood damage are both tangible and intangible. The tangible losses are those arising from
destruction and losses which can be measured in terms of their market values. They comprise direct and indirect damages. Direct damage is that damage to property that is a direct consequence of flooding and includes:

WCEAM 2006 Paper 123 Page 7
• destruction and damage to homes, commercial/industrial structures, building contents, goods and equipment
• public building including schools, hospitals, libraries
• destruction and damage to infrastructure including roads, bridges, power lines, water supply pipelines, sewage treatment plants and other utilities
• vehicles
• mines and power stations
• farm assets
• agricultural, pastoral and stock losses
• agricultural losses due to loss of irrigation water.
• Indirect damages are those which flow on from the direct damages and include:
• cost of temporary accommodation
• cost of emergency services
• cost of traffic disruption
• loss of retail trade
• loss of industrial production
• temporary costs for provision of water and sewerage services
• lost agricultural and pastoral production in periods after flooding
• subsequent health costs that can be costed and attributed to the flooding.
Intangible damages are those damages that do not have a market value that can be easily measured. Factors such as anxiety and ill health cost the community but the costs are not readily measured. The consequences assessed in this study only quantify the tangible losses.
The damage costs presented are generally economic costs rather than financial costs. Economic costs are those costs measured in terms of consumption of resources from a community aspect. In this case, the community is the whole of Australia. Financial losses focus on the losses suffered by a single individual or group of individuals, businesses or government agency.
4.4.4 Environmental and Cultural Consequences Dam failure is likely to cause significant environmental damage and cultural loss. A qualitative assessment involved
classifying the ecological and cultural value of the following sensitive areas:
Environmental Consequences:
• Riverine Systems
• Wetlands
• Terrestrial Species
• Threatened Species
• Effect of Major Point Pollution
Cultural Consequences:
• European Heritage Sites
• Aboriginal and Heritage Sites
• Parks and Reserves
Impacts were ranked from 1 to 5 with negligible effect at the low end of the scale and total destruction at the high end of the scale. Intermediate impacts were minor, moderate and major.
WCEAM 2006 Paper 123 Page 8
4.5 Calculating Risk
4.5.1 Risk to Life Risk to life is comprised of both societal and individual risk. The ANCOLD definition of life safety risks is outlined below:
Individual risk:
The increment of risk imposed on a particular individual by the existence of a hazardous facility. This increment of risk is in addition to the background risk to life, which the person would live with on a daily basis if the facility did not exist.
Societal Risk:
Also referred to as societal concerns. The risk of widespread or large scale detriment from the realisation of a defined hazard, the implication being that the consequence would be on such a scale as to provoke a socio/political political response, and/or that the risk (that is, the chance combined with the consequences) provokes public discussion and is effectively regulated by society as a whole through its political processes and regulatory mechanisms. Such large risks are typically unevenly distributed, as there are attendant benefits. Thus the construction of a dam may represent a risk to those close by and a benefit to those further off, similarly a process may harm some future generation more than the present one.
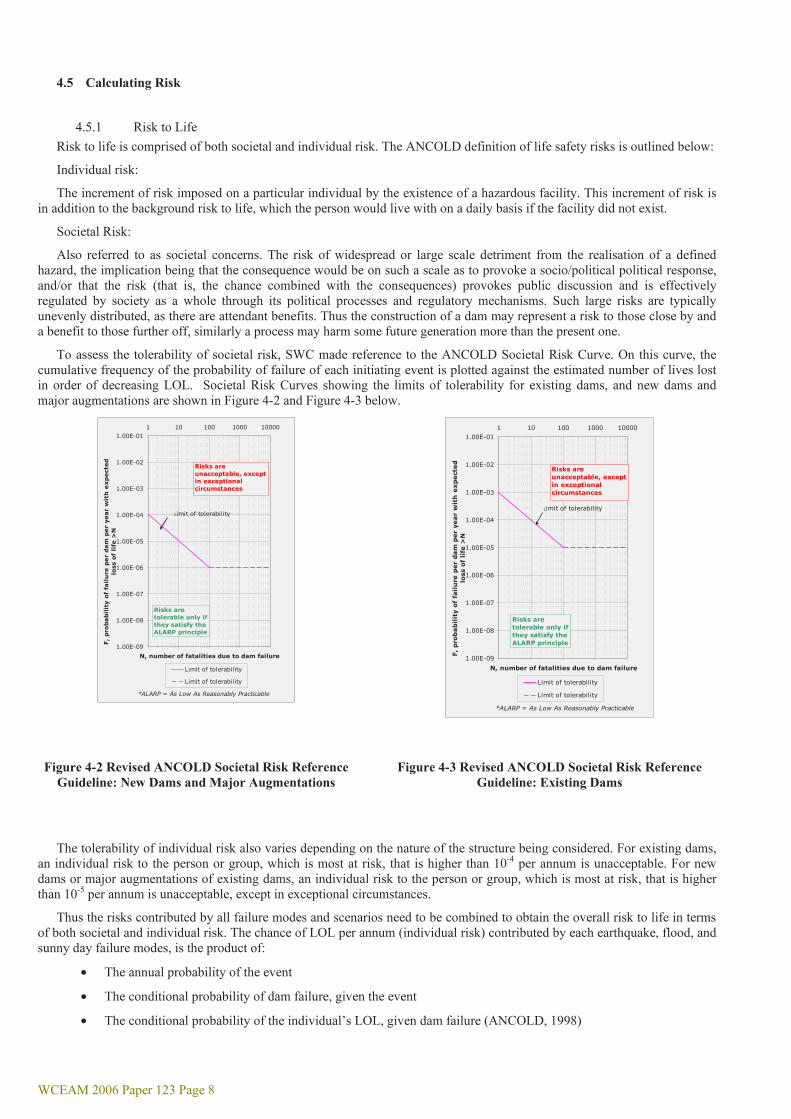
To assess the tolerability of societal risk, SWC made reference to the ANCOLD Societal Risk Curve. On this curve, the cumulative frequency of the probability of failure of each initiating event is plotted against the estimated number of lives lost in order of decreasing LOL. Societal Risk Curves showing the limits of tolerability for existing dams, and new dams and major augmentations are shown in Figure 4-2 and Figure 4-3 below.
1.00E-09
1.00E-08
1.00E-07
1.00E-06
1.00E-05
1.00E-04
1.00E-03
1.00E-02
1.00E-011 10 100 1000 10000
N, number of fatalities due to dam failure
F,
pro
ba
bil
ity o
f fa
ilu
re p
er
da
m p
er
ye
ar
wit
h e
xp
ect
ed
lo
ss o
f li
fe >
N
Limit of tolerability
Limit of tolerability
Limit of tolerability
Risks are unacceptable, except in exceptional circumstances
Risks are tolerable only if they satisfy the ALARP principle
*ALARP = As Low As Reasonably Practicable
1.00E-09
1.00E-08
1.00E-07
1.00E-06
1.00E-05
1.00E-04
1.00E-03
1.00E-02
1.00E-011 10 100 1000 10000
N, number of fatalities due to dam failure
F,
pro
babil
ity o
f fa
ilu
re p
er
dam
per
year
wit
h e
xpect
ed
loss
of
life
>N
Limit of tolerability
Limit of tolerability
Limit of tolerability
Risks are unacceptable, except in exceptional circumstances
Risks are tolerable only if they satisfy the ALARP principle
*ALARP = As Low As Reasonably Practicable
Figure 4-2 Revised ANCOLD Societal Risk Reference Guideline: New Dams and Major Augmentations
Figure 4-3 Revised ANCOLD Societal Risk Reference Guideline: Existing Dams
The tolerability of individual risk also varies depending on the nature of the structure being considered. For existing dams, an individual risk to the person or group, which is most at risk, that is higher than 10-4 per annum is unacceptable. For new dams or major augmentations of existing dams, an individual risk to the person or group, which is most at risk, that is higher than 10-5 per annum is unacceptable, except in exceptional circumstances.
Thus the risks contributed by all failure modes and scenarios need to be combined to obtain the overall risk to life in terms of both societal and individual risk. The chance of LOL per annum (individual risk) contributed by each earthquake, flood, and sunny day failure modes, is the product of:
• The annual probability of the event
• The conditional probability of dam failure, given the event
• The conditional probability of the individual’s LOL, given dam failure (ANCOLD, 1998)
WCEAM 2006 Paper 123 Page 9
Using the ANCOLD Societal Risk Reference Guidelines, the 16 major and 14 minor dams included in PRA (2002) were ranked into risk categories for societal risk; being:
• Unacceptable risks which fall above the ANCOLD limit of tolerability and require high priority remedial works or investigations.
• Intermediate risks which fall under the ANCOLD limit of tolerability but above what was known as the ANCOLD Objective Line (in older revisions of the ANCOLD Societal Risk Reference Curve). These risks are subject to the principle of “As Low As Reasonably Practicable” (ALARP).
• Risks which are below both the ANCOLD limit of tolerability, and the ANCOLD objective line, and are tolerable only if they satisfy the ALARP principle.
The major dams, included in PRA (2002) were then separated into the above three categories and a group of SWC’s 7 most critical dams, were formed. These dams are currently the subject of upgrading programs to satisfy the ANCOLD principle of ALARP. The dams included in the group of SWC’s 7 most critical dams are Blowering, Burrendong, Chaffey, Copeton, Keepit, Split Rock, and Wyangala.
4.5.2 Economic Risk In PRA (2002) economic risk was calculated as the sum of the products of the likelihood of dam failure in any one year,
and the annualised economic damages for the full range of initiating events. In PRA (2002) the reporting of economic and financial risks followed the same principles as the reporting of risks to life, with “$” replacing “N”, except that there is no parallel concept to that of the Maximum Individual Risk to Life. The tolerability of economic risks in SWC was not addressed in PRA (2002).
4.5.3 Environmental/Cultural Risk In PRA (2002) environmental and cultural risk was represented by plotting the likelihood of failure in any one year, and the
qualitative consequence ranking of pairs on environmental and cultural risk charts. Because the different categories of risks are incommensurable, risks cannot be aggregated across categories. However within a category, it may be appropriate to combine the raw “f” values, provided there is little variation in impact over the various failure scenarios. The tolerability of environmental or cultural risks in SWC was not addressed in PRA (2002).
4.5.4 Application of Consequences Assessments using Risk Database As discussed above, consequence assessments including LOL, economic, environmental and cultural losses were assessed
in PRA (2002) for the various cases of flood loading (Sunny Day, PMPDF with and without fail, DCF with and without fail) by consultants, SKM.
As estimates of the probabilities of failure for system components were derived for partitioned floods these ranges did not match those described in the consequences assessments. Interpolation of consequence assessments was required so that the results were appropriate for the level of flooding being considered, hence, results from the consequences assessments were not applied directly to the probability of failure numbers, but required considerable work to be interpolated.
Once each initiating event for every dam component had an associated appropriate set of consequences, this data was entered into a database, created internally within SWC, which could then be interrogated to derive risk data.
5 THE WAY FORWARD
5.1.1 General As outlined above, PRA (2002) analysed 16 Major and 14 Minor dams within its portfolio and did not include Hume Dam
or the Menindee Lakes Storage’s. Since completion of this study, the minor dams have been transferred to the Department of Lands, and Fish River Water Supply has been merged with SWC hence Rydal and Oberon Dams need to be incorporated into the PRA. The PRA is now being progressed to include SWC’s complete portfolio of dams prescribed under the Dam Safety Act which are listed in Table 2-1 above.
There have also been significant changes to the inflow hydrology of structures located in the area of the Generalised Tropical Storm Method Revised (GTSMR) application. Hydrology changes to inflow floods affect the areas of inundation determined by dambreak studies which in turn may alter the consequences, that may be associated with any failure event. Consequence assessments were previously undertaken in 2000 by consultants SKM. It is also possible that since this time developments have occurred within the inundated areas downstream of dams which may further impact 2000 consequences assessments. Overall, these changes may have a significant impact on the current risk level posed by dams in the region of the GTSMR. The changes required to review the current risk position of SWC are outlined below in terms of changes to both the probabilities and consequences of failure.
WCEAM 2006 Paper 123 Page 10
To move forward, SWC have also commenced a program of reviewing the revised risk position for each of the 7 most critical dams, post implementation of current proposed upgrading programs. This process will change the usefulness of the PRA for management and the Board in planning, particularly to prioritise proposed capital upgrading works. This phase of the PRA is outlined below and is known generally as developing the PRA.
5.2 Updating PRA (2002)
5.2.1 Revised Probabilities of Failure Since completion of PRA (2002) the probabilities of failure have become outdated. To provide a current reflection of SWC
current risk position, the following will be considered:
• Annual Exceedance Probabilities (AEP) of the inflow floods for dams in the GTSMR area, and the transition zone between the Generalised Southern Australia Method (GSAM) and the GTSMR areas have been revised, hence initiating events for dams in these areas should reflect these changes.
• Interim works have been completed at Keepit and Chaffey Dams. Changes to the structures relevant event trees and paths to failure should be revised accordingly.
• AEP’s used to develop flood initiating events in PRA (2002) applied joint probability to the storage being at a level less than FSL, rather than the more conservative assumption accepted by the DSC that AEP’s are derived from the storage initially at FSL. All dams to be included in the PRA should be reviewed to include initiating events commencing at FSL.
• In 2005 the probability of piping failure was revised using an event tree approach in lieu of the outdated UNSW Database method that was applied in 2002, this should be incorporated into the probabilities of failure for all dams in the prescribed portfolio.
• ANCOLD Guidelines on Risk Assessment, were revised in October 2003, hence these should be applied in revisions to the PRA.
5.2.2 Revised Consequences of Failure Changes to hydrology in the GTSMR and the transition zone have a flow on effect to the consequences of failure associated
with flooding events. Increased inflow floods increase the inundated areas downstream, hence possibly increase the population at risk and the LOL that may be expected.
PRA (2002) did not consider the effects of cascade failure at storage’s with large dams upstream. Dambreak Studies and associated consequence assessments should consider these effects.
In PRA (2002), consequences for each of the partitioned initiating events were interpolated from the consequence assessments. This process was labour intensive, and included many assumptions. In moving forward with the PRA, a more practical approach is to run appropriate dambreak cases, and therefore evaluate consequences for individual flood partitions. This will provide a much greater level of accuracy, and be considerably more efficient.
Consequence assessments were undertaken for PRA (2002) by SKM and were largely completed in 2000. These are now upwards of 5 years old. Developments may have occurred downstream of dams, which may have an impact on the consequences associated with dam failure, even where there has been no substantial change to hydrology in the catchment area. Existing consequence assessments should be subjected to peer review particularly for currency.
The process to revise the consequences of failure has several stages, including the following:
• Update hydrology. Note that this task is discussed under probabilities above
• Revise the Dambreak Studies (including investigation of cascade effects where applicable)
• Review and compare existing consequence assessments. First, consideration should be given to ensure that previously developed consequences are still current (ie there have not been significant developments in the inundated area that were previously not identified). Secondly, a comparison should be made to determine if the existing consequence assessment data adequately covers the revised areas of inundation.
Changes in hydrology, as a result of changes to the GTSMR, therefore have a considerable impact on assessed consequences as a result of dam failure, and for this reason, SWC should reassess the consequences for dams in the GTSMR region as well as the transition zone. Dams in the GTSMR requiring consequence reassessment include Keepit, Chaffey, Pindari, Toonumbar Dam, Split Rock and Copeton Dams. Dams in the transition zone requiring consequence reassessment include Lostock, Glennies Creek and Glenbawn Dams.
WCEAM 2006 Paper 123 Page 11
The bulk of this work is required to comply with the statutory obligations of the DSC. To keep the PRA live and enable it to become a useful management tool, PRA (2002) should be revised and developed so that it is representative of SWC’s current dam safety risk position, and hence useful as a management tool.
5.3 Developing the PRA (2002)
Together, the extended portfolio including revised probabilities and consequences will provide considerable data that SWC will be able to utilise to justify projects and programs to improve the dam safety risks associated with its large dam assets. This is one step to an improved risk understanding. Building upon this, SWC is currently developing PRA (2002) to analyse the risk position as a result of implementing upgrading works (staged where possible). This process will develop event trees for a staged program of work at each of SWC’s 7 most critical dams. For dams where significant risk reduction may be achieved through undertaking upgrading works in stages, each stage of work, through to full deterministic compliance with DSC criteria, has been reviewed in terms of probabilities and consequences of failure.
The results of this analysis will provide the revised risk position (in terms of the ANCOLD Societal Risk curve) for the preferred option for each of the 7 most critical dams. This process is currently underway. It should be noted that each of these dams is currently at differing stages of progress toward upgrading, hence selection of a preferred option has been based on the available information at the time and may not reflect the final option selection. This process will allow SWC to compare the improvement to risk achieved at each dam with the implementation of staged/interim works, and ascertain the likely best value for money.
6 CONCLUSION
The goals of the current PRA exercise are two fold. SWC are currently reviewing the probabilities and consequences of failure, and in a parallel process, have also commenced a program to review the revised risk position as a result of implementation of upgrading works. Considerable resources will be required to deliver this extent of work, as well as work with management and the Board to ensure that the project is on track to deliver results that are useful, relevant and timely.
Many tasks to update the PRA, are justified to comply with the DSC, and hence require updating regardless of the existence of the PRA project. The challenge will be to ensure that studies required for statutory compliance, produce results with sufficient detail/information/data that may be used in the PRA.
SWC requires outputs of the PRA to enable it to understand and progress its business, and enable it to maintain and operate safe assets. As well as creating data that is useful to management, the PRA can be a useful tool to project managers of the 7 most critical dams to enable an understanding of issues of concern, and justify proposed works. It is important that adequate exposure and understanding is portrayed at all levels through SWC to enable further development of this tool in areas that will benefit the business as a whole.
7 REFERENCES
[1] ANG, A.S. and TANG, W. 1975, Probability Concepts in Engineering Planning and Design, John Wiley and Sons Inc. NY, 1975.
[2] Australian National Committee on Large Dams (ANCOLD) website
[3] Australian National Committee on Large Dams (ANCOLD) (1994) Guidelines on Risk Assessment, 1994.
[4] Australian National Committee on Large Dams (ANCOLD) (1998) Guidelines on Risk Assessment, Position Paper on Revised Criteria for Acceptable Risk to Life, August 1998.
[5] Australian National Committee on Large Dams (ANCOLD) (2003) Guidelines on Risk Assessment, October 2003.
[6] Dam Safety Committee (DSC) website
[7] Dam Safety Committee (DSC) Information Sheet DSC2: Role, Policies and Procedures (1999)
[8] FOSTER M.A., FELL R, DAVIDSON R, and WAN C.F. (2001), Estimation of the Probability of Failure of Embankment Dams by Internal Erosion and Piping using Event Tree Methods, ANCOLD Conference 2001.
[9] GRAHAM, W.J., (1999) A procedure for Estimating Loss of Life Caused by Dam Failure DSO-99-06, Bureau of Reclamation, September 1999.
[10] Seismicity Research Centre (SRC) (1999), Review of Seismicity Southern/Northern NSW, March 1999.

WCEAM 2006 Paper 123 Page 12
[13] SWC (1999) Status of Risk Assessment of State Water Dams: Screening Level Risk Assessment DLWC, State Water, August 1999
Acknowledgments
The authors gratefully acknowledge the assistance of colleagues in the Department of Commerce, and the support and cooperation of State Water Corporation in allowing us to present this paper.
[11] SKM (2001), 24 Dams Portfolio Risk Assessment (Consequences Only) 2000/2001.
[12] STANDARDS AUSTRALIA (1999), AS/NZS 4360:1999 Risk Management.