state reg hurdles to utility environmental compliance hanser celebi zhou 4 12
TRANSCRIPT

This article appeared in a journal published by Elsevier. The attachedcopy is furnished to the author for internal non-commercial researchand education use, including for instruction at the authors institution
and sharing with colleagues.
Other uses, including reproduction and distribution, or selling orlicensing copies, or posting to personal, institutional or third party
websites are prohibited.
In most cases authors are permitted to post their version of thearticle (e.g. in Word or Tex form) to their personal website orinstitutional repository. Authors requiring further information
regarding Elsevier’s archiving and manuscript policies areencouraged to visit:
http://www.elsevier.com/copyright
Author's personal copy
State Regulatory Hurdles toUtility EnvironmentalCompliance
The EPA’s current and forthcoming coal generationregulations present enormous challenges for both utilitiesand state regulators because of their scope, the uncertaintyregarding their final form, and the substantial costs theyentail. Utilities need to develop a strategy that iscompliant with environmental regulations, acceptable tostate regulators, and leaves the utility financially sound.
Philip Q Hanser, Metin Celebi and Bin Zhou
I. Introduction
Utility coal plants, i.e.,
non-merchant plants, are facing an
enormous uncertainty about their
future. Low gas prices and the
dispatching of wind generation
have resulted in record low
operating rates for coal plants in
the United States. In addition, the
Environmental Protection
Agency’s pending and future
environmental regulations may
force coal plant owners to choose
between investing hundreds of
millions, if not billions, of dollars
in additional equipment to comply
with these rules or face shutting
down operations completely.
T his new reality has both plant
owners and regulators very
concerned, although for different
reasons. If coal-plant-owning
utilities choose the option of
retaining their coal generation
assets, they need to optimize their
investment decisions and
maintain their asset’s value. If
there is no investment decision for
the utility to retain the asset’s
value, the non-merchant plant
owners will want to recover the
Philip Q Hanser is a Principal with TheBrattle Group with more than 30 years ofexperience in the energy industry. He has
appeared as an expert witness on such matterssuch as transmission pricing, mergers and
acquisitions, market power, retail tariffs,environmental compliance, forecasting, and
demand-side management before the FederalEnergy Regulatory Commission, numerousstate public utility and siting commissions,and Canadian energy boards. He was at the
Electric Power Research Institute beforejoining Brattle and has had several academic
appointments. He served six years on theAmerican Statistical Association’s Advisory
Committee to the Energy InformationAdministration.
Dr. Metin Celebi is a Principal with TheBrattle Group who provides expertise in
electricity markets and analysis ofenvironmental and climate policy. He has
consulted primarily in the areas of electricityspot pricing and market design, and hasexperience in developing and analyzing
climate policies, assessing generation marketpower, LMP modeling, and merger analysis.He has also consulted and published on the
interaction of resource planning andenvironmental/climate policies within the
electric sector, likely impacts of climatepolicies on natural gas demand, and impacts
of environmental policies on coal plantretirements. Dr. Celebi has significant
experience in the estimation of marginal costsand analysis of ratemaking for electric
utilities from the perspective of alternativemethods to allocate costs among functions,
classifications, and customer groups in bothrestructured markets and for vertically
integrated utilities.
Dr. Bin Zhou is a Senior Consultant at TheBrattle Group, and has more than 13 years’
consulting experience in financialinstitutions (banking and insurance), utility
(gas, electric, and pipelines), and energyindustries. He specializes in financial
statement analysis, valuation, and economicanalysis of tax issues. He also has extensive
experience in cost of capital and riskassessment, ratemaking mechanisms, dispute
resolutions, and bankruptcies in the utilityindustry. Dr. Zhou holds a Ph.D. inInternational Finance from Brandeis
University.
April 2012, Vol. 25, Issue 3 1040-6190/$–see front matter # 2012 Elsevier Inc. All rights reserved., http://dx.doi.org/10.1016/j.tej.2012.03.009 7
Author's personal copy
undepreciated value of the asset(s)
and have assured recovery for the
costs of any substitute resources
through rates. For rate-regulated
utilities, either path requires
achieving approval for their
compliance strategy investments.
And that approval by regulators
will be focused on the financing
and rate impacts of utilities’
compliance strategies.
A n integrated utility facing
such decisions must take a
comprehensive look at its
compliance strategy and the state
regulatory hurdles it faces in
achieving that strategy. The
strategy must look beyond merely
what looks attractive for
maintaining financial value, and
take into account the commission’s
reception. The differences in
market outlook, risk tolerances, or
regional economic priorities
between the utility and the
commission must be accounted
for. If the utility is to pursue a path
that it believes may be at odds with
the commission’s philosophy in
such matters, it will need to
develop facts and arguments to
make its case. Even discerning the
commission’s viewpoint may be
difficult. There is no simple
solution, but there are some
observations that may be useful to
in acquiring regulatory approval
and maintaining the financial
health of the utility.
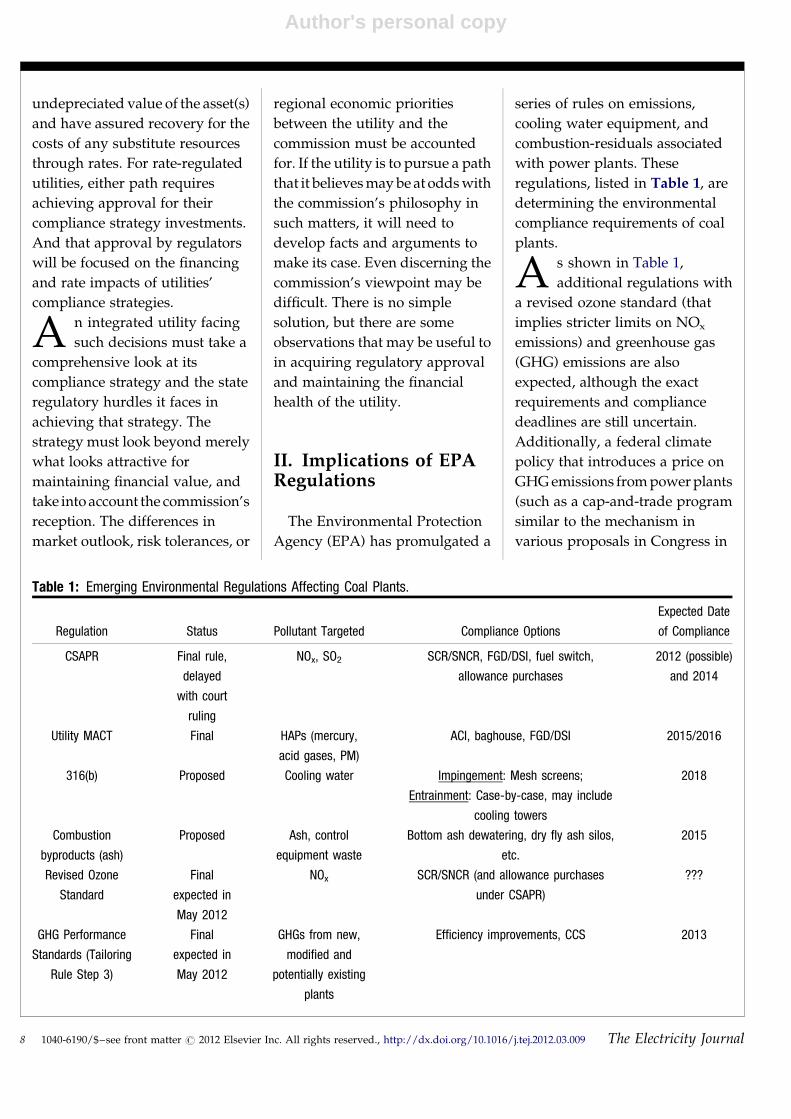
II. Implications of EPARegulations
The Environmental Protection
Agency (EPA) has promulgated a
series of rules on emissions,
cooling water equipment, and
combustion-residuals associated
with power plants. These
regulations, listed in Table 1, are
determining the environmental
compliance requirements of coal
plants.
A s shown in Table 1,
additional regulations with
a revised ozone standard (that
implies stricter limits on NOx
emissions) and greenhouse gas
(GHG) emissions are also
expected, although the exact
requirements and compliance
deadlines are still uncertain.
Additionally, a federal climate
policy that introduces a price on
GHG emissions from power plants
(such as a cap-and-trade program
similar to the mechanism in
various proposals in Congress in
Table 1: Emerging Environmental Regulations Affecting Coal Plants.
Regulation Status Pollutant Targeted Compliance Options
Expected Date
of Compliance
CSAPR Final rule,
delayed
with court
ruling
NOx, SO2 SCR/SNCR, FGD/DSI, fuel switch,
allowance purchases
2012 (possible)
and 2014
Utility MACT Final HAPs (mercury,
acid gases, PM)
ACI, baghouse, FGD/DSI 2015/2016
316(b) Proposed Cooling water Impingement: Mesh screens;
Entrainment: Case-by-case, may include
cooling towers
2018
Combustion
byproducts (ash)
Proposed Ash, control
equipment waste
Bottom ash dewatering, dry fly ash silos,
etc.
2015
Revised Ozone
Standard
Final
expected in
May 2012
NOx SCR/SNCR (and allowance purchases
under CSAPR)
???
GHG Performance
Standards (Tailoring
Rule Step 3)
Final
expected in
May 2012
GHGs from new,
modified and
potentially existing
plants
Efficiency improvements, CCS 2013
8 1040-6190/$–see front matter # 2012 Elsevier Inc. All rights reserved., http://dx.doi.org/10.1016/j.tej.2012.03.009 The Electricity Journal
Author's personal copy
2008 and 2009) may be enacted in
the future. Although pricing GHG
emissions is not likely in the next
few years, it could plausibly occur
well within the lifespan of the
investment decisions utilities must
make soon. Implementation of a
GHG price in the future would
reduce the profit margins and
capacity factors for most of the
coal units, and is a significant
risk factor to consider in the
upcoming decisions for coal units
to retire or retrofit with control
equipment.
T here are a number of
difficulties that utilities face
in regard to these regulations.
First is the sheer uncertainty
about the regulations and their
final implementation. The
Economist1 reports that Ralph
Izzo, president of Public Service
Electric and Gas’s (PSE&G)
Electric, Gas and Energy Services
division, said that PSE&G had lost
millions of dollars on past natural
gas power plant investments
because the final version of a set of
prior EPA regulations were more
lenient than anticipated.
Second, the timing of the
implementation of these
regulations is separated by years.
Some of these rules are nearly
immediate while others are six or
eight years away, not taking into
account any potential appeals
through the judicial system. The
recent experience with the Cross-
State Air Pollution Rule (CSAPR)
is an example of a regulation that
was delayed due to an appeal and
whose final version departed, for
some states, significantly from its
initial version. A court injunction
halted its implementation mere
days before it was to start.2 In
addition, the rules were amended
and some states that were
included in the initial version of
the rule became exempt.
Third, the compliance
technologies vary significantly in
terms of the relative balance
between capital costs and
operating expenses. For example,
in dealing with SO2, a wet flue gas
desulfurization (wet FGD) is more
than an order of magnitude more
expensive than dry sorbent
injection (DSI) equipment in terms
of capital costs, but a wet FGD’s
variable operations and
maintenance (O&M) expenses are
approximately one-fourth those of
DSI.3
Fourth, the value of sustaining
the operation of these coal plants
and, thus, the value of investments
to comply with the regulations,
varies enormously depending on
the state of power markets.
Anyone making investments in
coal plants will simultaneously
note the recent trend of almost
shockingly low natural gas prices.
Those prices have been low
enough in some regions of the
country that efficient combined-
cycle natural gas plants have been
dispatched ahead of coal-fired
generation. In addition, in parts of
the Midwest,4 wind resources
(which primarily operate during
the night) are forcing changes in
coal plant strategies to guarantee
that their plants will be committed
for dispatch because they cannot
compete successfully against wind
in off-peak time periods.
III. Three StrategicConsiderations
Given these legislative,
regulatory, technological, and
financial complexities related to
the compliance with EPA
regulations, we outline below a
three-step process for utilities and
regulators to evaluate their
options and strategies.
Step One: The Utility’s Assessmentof Its Compliance Options
The utility must first assess
compliance strategies without
consideration of its regulatory
strategy. An initial step is to decide
on the scope of its compliance
strategy. For example, regardless
of the compliance strategy, was the
utility considering the possibility
of retiring the plant affected by the
EPA regulations in a time frame
that is shorter than that of the
longer-term rules promulgation?
If it was not, then it will need to
take a longer-term outlook across
the range of rules. Any assessment
must begin with: (1) a forecast of
Some of theserules are nearlyimmediatewhile othersare six oreight yearsaway.
April 2012, Vol. 25, Issue 3 1040-6190/$–see front matter # 2012 Elsevier Inc. All rights reserved., http://dx.doi.org/10.1016/j.tej.2012.03.009 9
Author's personal copy
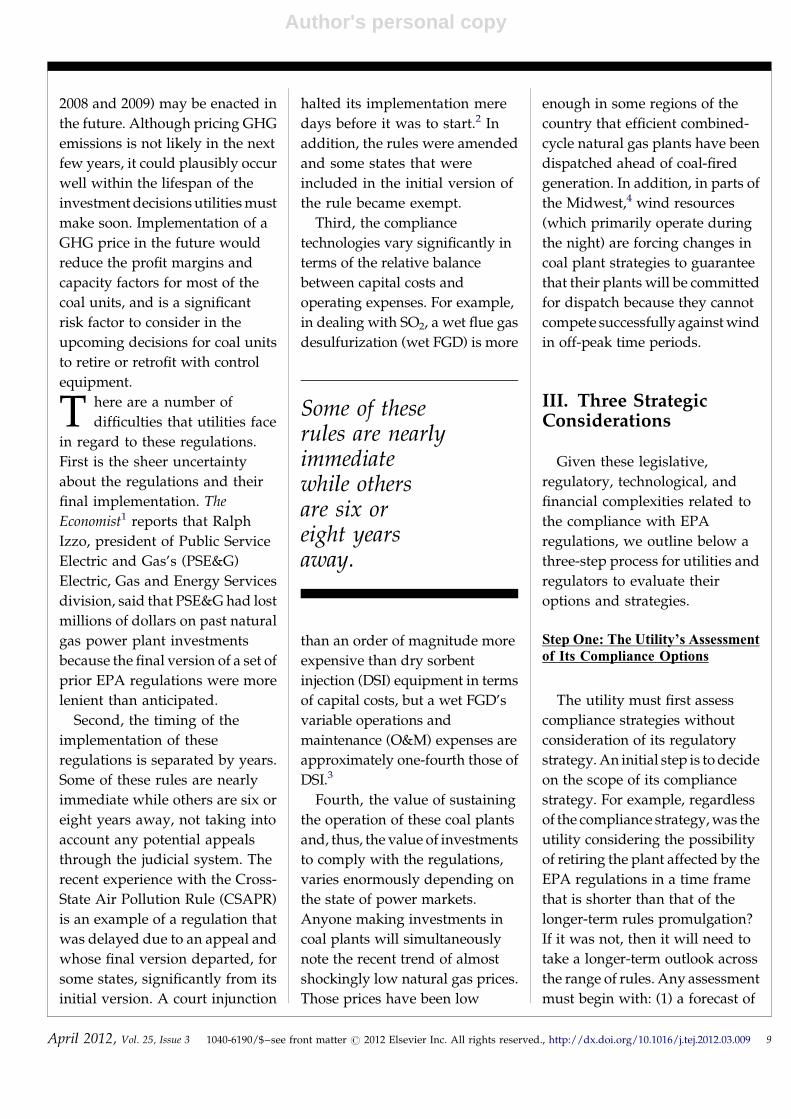
fuel prices; (2) an evaluation of the
variety of technologies at the
disposal of the utility and their
associated costs; and (3) the
financial and market modeling
capability to assess the position of
the generation asset vis a vis the
market. Figure 1 shows the
complexity of modeling these
factors and how they may interact
with a utility’s decision-making
process for retire-versus-retrofit
strategies.
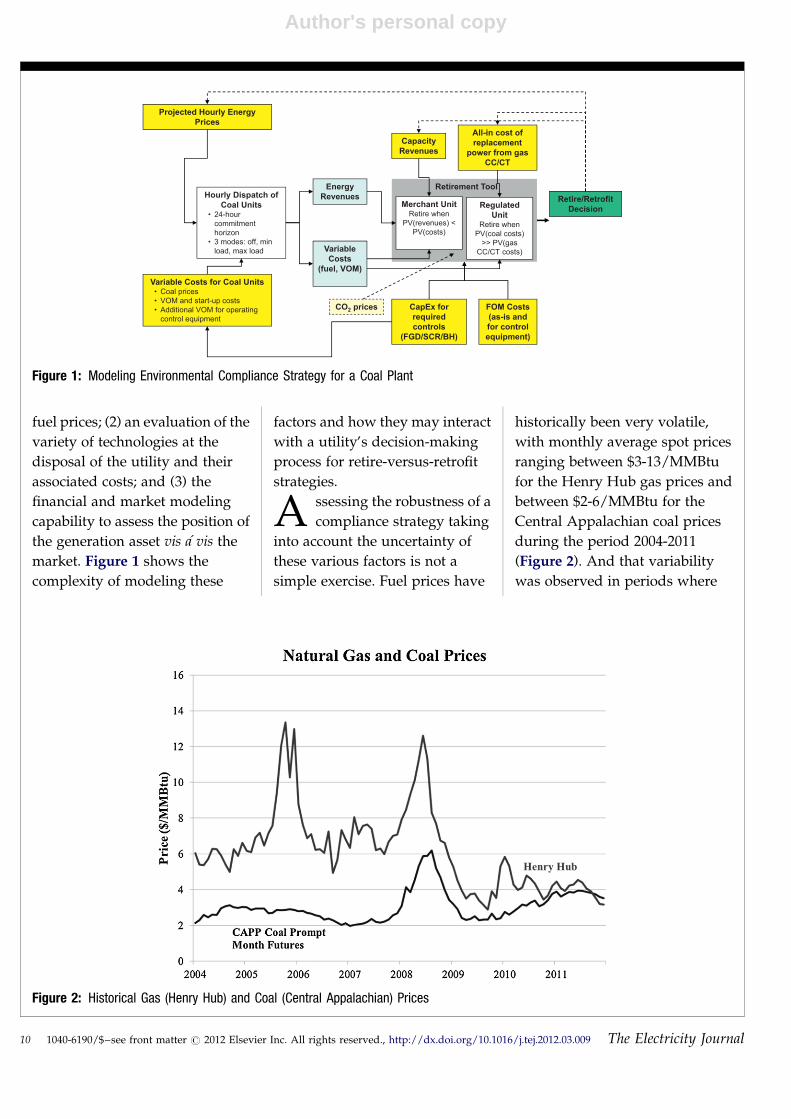
A ssessing the robustness of a
compliance strategy taking
into account the uncertainty of
these various factors is not a
simple exercise. Fuel prices have
historically been very volatile,
with monthly average spot prices
ranging between $3-13/MMBtu
for the Henry Hub gas prices and
between $2-6/MMBtu for the
Central Appalachian coal prices
during the period 2004-2011
(Figure 2). And that variability
was observed in periods where
[(Figure_2)TD$FIG]
Figure 2: Historical Gas (Henry Hub) and Coal (Central Appalachian) Prices
[(Figure_1)TD$FIG]
Merchant UnitRetire when
PV(revenues) <
PV(costs)
Hourly Dispatch of
Coal Units• 24-hour
commitment
horizon
• 3 modes: off, min
load, max load
Projected Hourly Energy
Prices
Variable Costs for Coal Units• Coal prices
• VOM and start-up costs
• Additional VOM for operating
control equipment
Capacity
Revenues
FOM Costs
(as-is and
for control
equipment)
CapEx for
required
controls
(FGD/SCR/BH)
All-in cost of
replacement
power from gas
CC/CT
Regulated
UnitRetire when
PV(coal costs)
>> PV(gas
CC/CT costs)
Retirement Tool
Variable
Costs
(fuel, VOM)
Energy
Revenues Retire/Retrofit
Decision
CO2 prices
Figure 1: Modeling Environmental Compliance Strategy for a Coal Plant
10 1040-6190/$–see front matter # 2012 Elsevier Inc. All rights reserved., http://dx.doi.org/10.1016/j.tej.2012.03.009 The Electricity Journal
Author's personal copy
there was not nearly so much
capacity at risk in the overall
market.
T he difficulties of such an
analysis are greatly
compounded by the significant
uncertainty associated with the
scope of the regulations and their
timing. Prognosticating
incorrectly, and making
investments too narrowly
optimized to satisfy a specific set of
prognostications, can be costly. On
the other hand, some degree of
such expert disappointments are
inevitable. Good decisions arising
out of a well-reasoned process can
still yield uncomfortable
outcomes. As a result, the utility
will need to review its technology
options and decide if it wishes to
take a staged approach to the
investments, postponing the
technology choices until the
regulations are clearly delineated,
or whether it is worth the risk to
give up that approach and its
option value because of the
potential for reduced overall costs.
A forthcoming article by Brattle
experts provides a more detailed
discussion and examples of key
factors and optionalities to
consider in environmental
compliance planning.
Step Two: Strategy Development:Regulatory Evaluation of Alterna-tives
Commissions are increasingly
moving towards the use of pre-
approval processes rather than
after-the-fact approval of
expenditures. That does not
change the standard criteria of
‘‘prudently incurred’’ and ‘‘used
and useful,’’ but the pre-approval
process attempts to reduce the
likelihood that issues will arise
based on these criteria at final
approval. The venues for the
utility’s request for pre-approval
of its environmental compliance
expenditures are varied. Such pre-
approval could arise during the
proceedings of the utility’s
integrated resource plan (IRP), an
acquisition of a certificate of
convenience and necessity, or a
rate case. Depending on the
regulatory circumstances, that
process may begin with informal
discussions with commission staff
regarding the issues that they
foresee arising in the proceedings.
It is important to note that staff’s
concerns or their perceptions of
the commissioners’ concerns may
not perfectly reflect the
commissioner’s views. It is also
important to note that even with
commission pre-approval, there is
still the chance that the
commission will change its view.
The closure of the Mohave
generating station by Southern
California Edison (SCE) was
preceded by a California Public
Utilities Commission (CPUC)-
mandated study, the Mohave
Generating Station Alternatives/
Complements Study,5 which
included assessment of renewable
energy options. The plant was
closed by SCE. However, in a
recent case before CPUC, SCE’s
request for a return on the recovery
of the decommissioning costs, on
unavoidable cost in the closure of a
plant, was challenged.6
T he utility’s case for its
compliance strategy needs to
have two main focuses. The first is
providing justification for the
compliance strategy, the second
providing the mechanism for
financing and the impact on rates. The
justification will hinge on the
utility’s capability to demonstrate
that making the investment it has
chosen is the best of all
alternatives. In the past, that case
might have been made solely as an
evaluation of the alternative
technologies available to achieve
compliance with the relevant
regulations. Now the evaluation
may include alternatives such as
other conventional generation,
renewables,7 energy efficiency
(energy optimization in
Michigan), distributed generation,
grid efficiency improvements, and
demand response of various
forms. Some or all of these may
have been part of the utility’s
compliance planning, but if not,
they will likely need to be
incorporated when the
commission considers their
request. The utility will likely be
required to defend the plant’s past
operating record and provide a
The utility needs, first,to provide justificationfor the compliancestrategy, and second, toprovide the mechanismfor financing and theimpact on rates.
April 2012, Vol. 25, Issue 3 1040-6190/$–see front matter # 2012 Elsevier Inc. All rights reserved., http://dx.doi.org/10.1016/j.tej.2012.03.009 11
Author's personal copy
justification for why it believes the
plant will operate as well or better
than it has in the past. The utility
will need to clearly delineate all
environmental and health
regulations – local, state, and
federal – that it currently meets
and that its compliance plan will
meet going forward. It can expect
that it must provide information
on short-term and long-term
alternatives for compliance and
provide a comparison of those
costs.
O ne particularly thorny issue
will arise if the utility
pursues a staged path for
compliance that attempts to
postpone its compliance decisions
until the EPA’s issuance of final
order, clarifying amendments, and
any subsequent litigation
decisions that affect the
regulations. The commission may
be seeking an optimized
investment path with a very
specific set of assumptions about
the final form of regulations, a
position not consistent with an
approach that postpones
investments until there is
regulatory clarity. There is no best
approach to dealing with this, but
there are some considerations that
the utility can bring before the
commission. First, the utility can
use historical experience, perhaps
its own, to demonstrate that
forecasting what a regulation will
be can lead to costly mistakes.
Those costs may have taken the
form of over-compliance,
inappropriate technology choice,
or failing to employ a non-capital-
intensive alternative, such as
emissions credits. Second, the
utility will need to demonstrate the
risks that it faces by making its
choices in advance of final
determination of the regulations.
This will require assessing the
potential rules’ variations and the
alternatives to address them and
the range of compliance costs, an
exercise the utility will likely have
already gone through internally,
and showing how these costs,
when translated into revenue
requirements, will adversely affect
ratepayers. Third, the utility may
need to put forward a clear plan
that demonstrates how it will
implement the appropriate
strategy as quickly as possible
once the regulations are in place.
This may require creating
optionality at the plant to accept
the various compliance
alternatives. This optionality may
take the form of implementing less
capital-intensive technologies
with higher operating costs, or
delaying the decision to commit to
large cost commitments and
instead rely on market purchases
in the interim. However, the
additional cost of allowing for
these flexibilities should be
weighed against the expected
option value associated with these
strategies.
Potentially, the optimal
compliance strategy is none at all,
i.e., that the plant’s economics
cannot justify the level of
additional investments that would
be required to be fully compliant.
The utility will likely need to
simultaneously develop a short-
run plan for compliance prior to
retiring the plant and a longer-
term plan for the replacement of
the resources, if it so chooses. If
those resources are conventional
(for example, a combined-cycle
gas turbine), then the commission
will likely need an analysis of
all of the non-conventional
generation alternatives partially
listed above.
Step Three: Assessing Financingand Rate Mechanisms
Once the utility has justified its
compliance strategy, it must
address with the commission the
financing of the investments and
the mechanisms for the recovery of
costs. Financing the costs of
environmental compliance may
turn out to be a much larger issue
than it has been in the past. For
some utilities, the size of the
investments that are required may
impinge on other potential
investments that the utility would,
in the absence of the compliance
requirements, undertake.
Depending on the level of
previous compliance by the utility
and the size of the incremental
investment that must be made, the
utility may find itself bumping up
12 1040-6190/$–see front matter # 2012 Elsevier Inc. All rights reserved., http://dx.doi.org/10.1016/j.tej.2012.03.009 The Electricity Journal
Author's personal copy
against a capital constraint in
order to accommodate all of the
required investments.8 This can
arise whether the utility’s
compliance program aims to
modify its current generation fleet
or retire units and find substitute
resources. These capital
constraints are important and
urgent because they can put the
utility in the unenviable, and
possibly untenable, position of
choosing between generation
investments and investments in its
transmission and distribution
systems. This is also not a position
that regulators would like to find
themselves in when presented
with the reality of the financing
constraints that utilities face. Even
in the absence of a capital
constraint, any additional
financing of these investments
through utility-issued debt will
have the effect of increasing the
financial leverage of the company
and may result in a lowered credit
rating and/or higher costs of
financing, also not a desirable
situation for the utility or
regulator. This rating or financing
cost impact can be particularly
acute in situations of prolonged
regulatory approval processes
before the investment is put into
the rate base.
F ortunately, regulators have a
number of tools at their
disposal to address the utilities’
financing issues. Effective
communication and coordination
between the commission and the
regulated utilities on these
mechanisms will be critical in
allaying the financial constraints,
lowering cost of environmental
compliance, and reducing rate
impacts on consumers.
First, some states have allowed
utilities to access state-sponsored
tax-exempt bonds to fund
environmental compliance
investments. Wisconsin Electric
Power Company availed itself of
Wisconsin’s ‘‘Environmental
Trust Funding’’ mechanism to
secure approximately $430 million
in environmental financing for one
of its past projects. A bill surcharge
collected the required revenues.
Similar mechanisms have been
used in West Virginia and North
Carolina. Whether other states
adopt similar mechanisms, or use
the existing mechanisms for the
wave of potential compliance
investment, remains to be seen.
S econd, for many jurisdictions,
an environmental rate rider
may be the rate mechanism of
choice.9 The environmental rider is
attractive to the utility because it
permits timely recovery of its costs
without the requirement that the
time when compliance costs are
incurred must coincide with its
rate case cycle. Although a rider is
attractive to the utility it will not
necessarily go unopposed by the
commission, which may require a
demonstration of its necessity
and/or merits. The utility may be
required to demonstrate its
inability to raise funds without the
rider or, if it can raise funds, how
the costs of those funds will be
higher absent the rider. A
demonstration of the
reasonableness of the costs and the
efficiency of the approach is also
likely when the rider is applied for.
The major difference between an
environmental rider and other
forms of cost riders, such as fuel
and purchased power, is that the
costs included in the rider are
capital, not operating, costs. Even
in the presence of an
environmental rider, the operating
costs of an environmental
compliance technology are often
included in fuel adjustment riders,
likely so as to maintain some
clarity to the cost accounting. In
the past, most states have included
all costs required to comply with
environmental regulations in their
environmental adders. In the face
of uncertainty about the costs of
compliance, the commission may
set a limit on the amount of costs
that can be covered under the
environmental rider, with
additional costs requiring a
separate approval mechanism.
That limit may be based on the size
of the costs themselves or the rate
impact of the environmental rider.
Thus, the utility seeking a rider
will need to assess beforehand the
rate impacts of the rider. As noted
above, pre-approval may
increasingly be an attractive
option. Some states have instituted
April 2012, Vol. 25, Issue 3 1040-6190/$–see front matter # 2012 Elsevier Inc. All rights reserved., http://dx.doi.org/10.1016/j.tej.2012.03.009 13
Author's personal copy
penalties in the form of reduced
rates of return on equity if the final
costs of the compliance project
exceed its initially projected costs.
In that situation, the rate approach
is likely to be accompanied by an
audit process which informs the
commission of progress of the
compliance strategy and the
permissible level of revenue
collection.
T hird, a variety of rate designs
can be utilized to alleviate the
financing constraints and
minimize consumer impact.
Although utilities and
commissions may prefer historical
precedents, innovative
mechanisms used by other utilities
can be beneficial to consider. We
offer two examples. The first one is
the CWIP (construction work in
progress) mechanism, through
which utilities are allowed to place
large capital expenditures during
the construction phase into the rate
base and to recover the investment
before the asset becomes ‘‘used
and useful.’’ A CWIP mechanism
will alleviate the rate shocks by
accelerating the capital recovery to
the construction phase. Kentucky,
West Virginia, and Minnesota
have allowed for the recovery of
environmental compliance
expenditures through CWIP. If the
expenditures are modest, then
even a one-time rate increase may
suffice. For many compliance
requirements envisioned in Table
1, however, the investments may
be substantial, and the CWIP
treatment will be beneficial to the
utilities and ratepayers. Another
example to mitigate the initial rate
shock is the use of trended original
cost (TOC) or other levelization
mechanisms in ratemaking during
the operation phase10 in contrast
with depreciated original cost
ratemaking (DOC), which is
routinely applied in cost-based
ratemaking (see sidebar on TOC
and levelization mechanisms). The
TOC method has been applied to
oil pipelines since the 1980s11 and
some forms of levelization
mechanisms have been adopted
for gas pipelines12 more recently
by FERC, but these alternative rate
designs have been used little, if at
all, in the electric power industry.
Compared to DOC, whose main
feature is front loading of the
capital recovery, the alternative
mechanisms defer the cost
recovery to later periods of the
asset life. Consequently, they tend
to bring the regulated rates closer
to those prevailing in a
competitive market, thereby
enhancing economic efficiency,
and mitigate rate shocks to the
ratepayers in the initial years of a
new asset. The impact on rates can
be quite substantial. For example,
for a small utility to retrofit its coal
plants, the new capital cost can
easily amount to one-third of the
utility’s existing rate base. Were
DOC adopted to recover both the
existing and new investment over
a 20-year period, the rate increase
in the first year of the new retrofit
equipment could be as high as 33
percent. Under similar
assumptions, TOC and
levelization methods can
significantly lower the initial rate
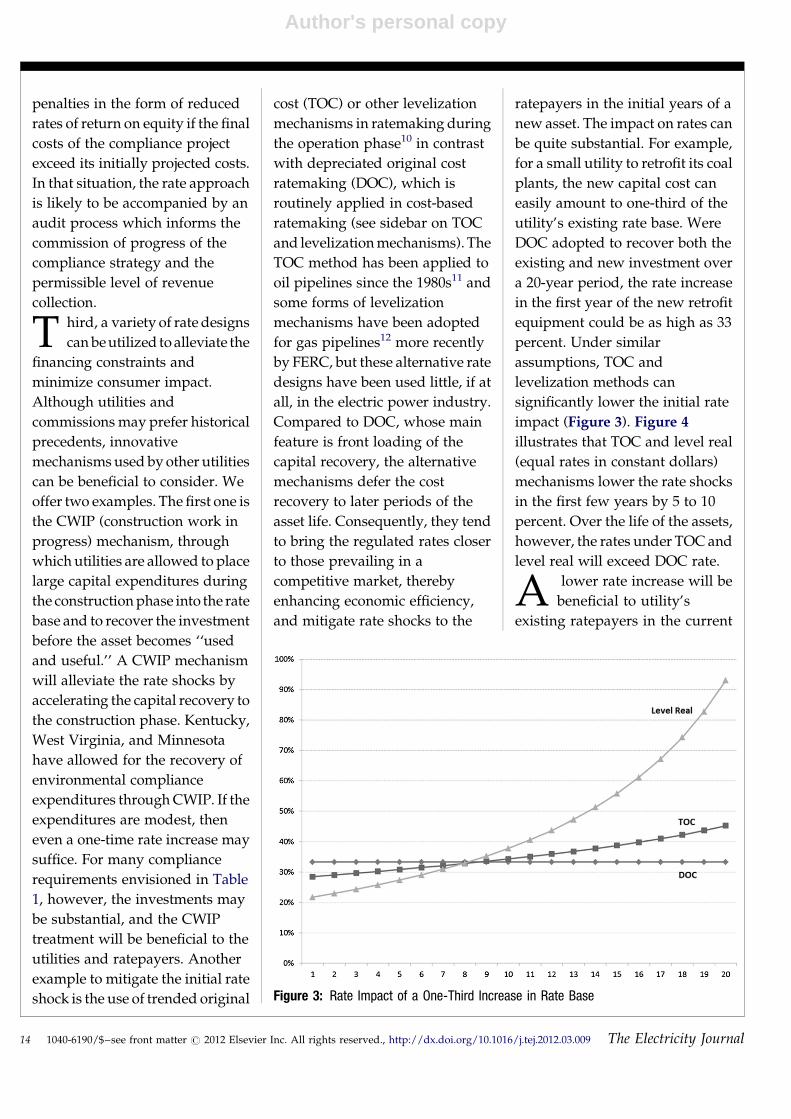
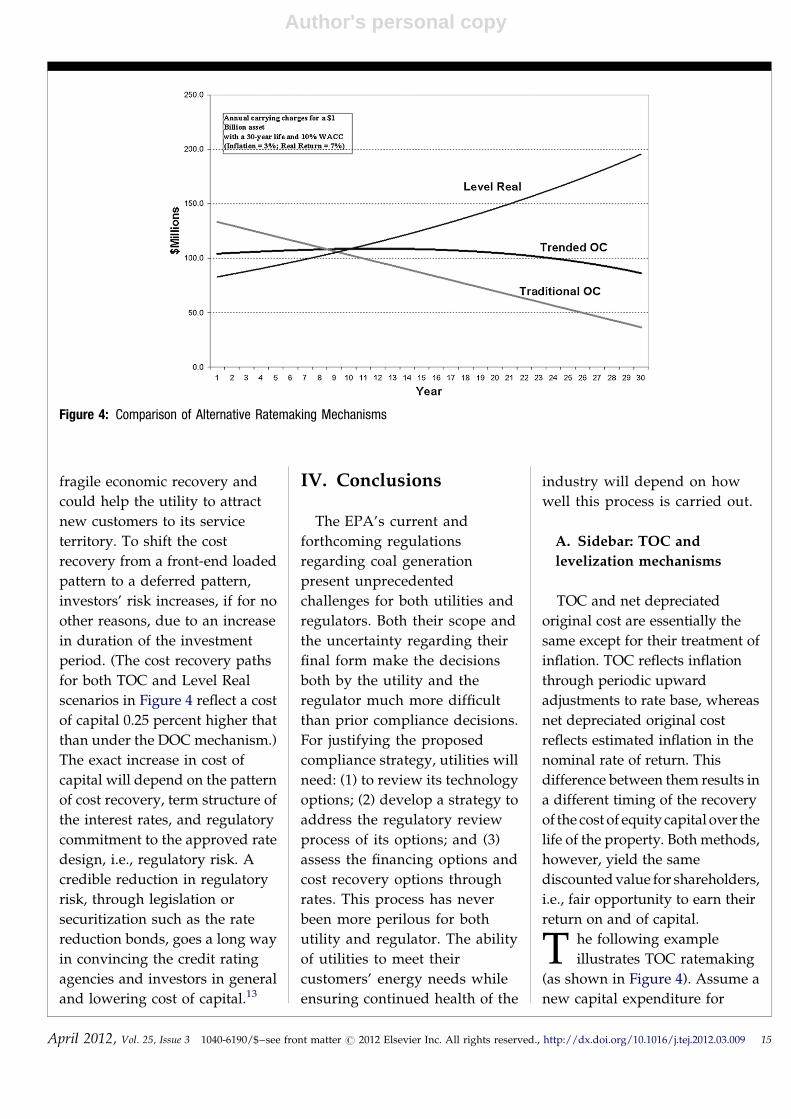
impact (Figure 3). Figure 4
illustrates that TOC and level real
(equal rates in constant dollars)
mechanisms lower the rate shocks
in the first few years by 5 to 10
percent. Over the life of the assets,
however, the rates under TOC and
level real will exceed DOC rate.
A lower rate increase will be
beneficial to utility’s
existing ratepayers in the current[(Figure_3)TD$FIG]
Figure 3: Rate Impact of a One-Third Increase in Rate Base
14 1040-6190/$–see front matter # 2012 Elsevier Inc. All rights reserved., http://dx.doi.org/10.1016/j.tej.2012.03.009 The Electricity Journal
Author's personal copy
fragile economic recovery and
could help the utility to attract
new customers to its service
territory. To shift the cost
recovery from a front-end loaded
pattern to a deferred pattern,
investors’ risk increases, if for no
other reasons, due to an increase
in duration of the investment
period. (The cost recovery paths
for both TOC and Level Real
scenarios in Figure 4 reflect a cost
of capital 0.25 percent higher that
than under the DOC mechanism.)
The exact increase in cost of
capital will depend on the pattern
of cost recovery, term structure of
the interest rates, and regulatory
commitment to the approved rate
design, i.e., regulatory risk. A
credible reduction in regulatory
risk, through legislation or
securitization such as the rate
reduction bonds, goes a long way
in convincing the credit rating
agencies and investors in general
and lowering cost of capital.13
IV. Conclusions
The EPA’s current and
forthcoming regulations
regarding coal generation
present unprecedented
challenges for both utilities and
regulators. Both their scope and
the uncertainty regarding their
final form make the decisions
both by the utility and the
regulator much more difficult
than prior compliance decisions.
For justifying the proposed
compliance strategy, utilities will
need: (1) to review its technology
options; (2) develop a strategy to
address the regulatory review
process of its options; and (3)
assess the financing options and
cost recovery options through
rates. This process has never
been more perilous for both
utility and regulator. The ability
of utilities to meet their
customers’ energy needs while
ensuring continued health of the
industry will depend on how
well this process is carried out.
A. Sidebar: TOC and
levelization mechanisms
TOC and net depreciated
original cost are essentially the
same except for their treatment of
inflation. TOC reflects inflation
through periodic upward
adjustments to rate base, whereas
net depreciated original cost
reflects estimated inflation in the
nominal rate of return. This
difference between them results in
a different timing of the recovery
of the cost of equity capital over the
life of the property. Both methods,
however, yield the same
discounted value for shareholders,
i.e., fair opportunity to earn their
return on and of capital.
T he following example
illustrates TOC ratemaking
(as shown in Figure 4). Assume a
new capital expenditure for
[(Figure_4)TD$FIG]
Figure 4: Comparison of Alternative Ratemaking Mechanisms
April 2012, Vol. 25, Issue 3 1040-6190/$–see front matter # 2012 Elsevier Inc. All rights reserved., http://dx.doi.org/10.1016/j.tej.2012.03.009 15
Author's personal copy
environmental compliance with
an original equity investment of
$1 billion.14 Also assume that a
just and reasonable return on
equity would be 11 percent and
that 4 percent of that represents
inflation. This leaves 7 percent as
the ‘‘real’’ rate of return. In its
first year of service, the power
plant would be entitled to earn
$70 million (7 percent times $1
billion) and $40 million (4 percent
times $1 billion) would be
capitalized into the firm’s equity
rate base to be amortized over the
life of the property starting in the
first year, along with the
depreciation on the $1 billion. If
the depreciation life were 20
years, in addition to the return of
$70 million, the plant would be
entitled to recover, in the first
year, $2 million as amortization
($40 million divided by 20), $50
million as depreciation ($1 billion
divided by 20), its embedded
debt cost, and depreciation
associated with debt investment.
The equity rate base at the start of
year two would be $988 million
($1 billion � $50 million + $38
million). This process would
continue over the life of the
property until the rate base
(assuming no salvage value) hit
zero. Unless changed in a
subsequent rate case, the real rate
of return, which should be
relatively stable, would be 7
percent each year. The inflation
rate would vary as the chosen
inflation index varies. Potential
inflation indices include a
construction price index (such as
the Handy-Whitman index) or
the U.S. Treasury bill rate.&
Endnotes:
1. See http://www.economist.com/node/21547804.
2. http://www.reuters.com/article/2011/12/30/us-utilities-epa-idUSTRE7BT17420111230.
3. Capital cost estimates for a 100 MWcoal unit are $783/kW for a wet FGDand $41/kW for a DSI. Variable O&Mexpenses for the same size unit are$1.8/MWh for a wet FGD and $7/MWh for a DSI. See Edison ElectricInstitute, Potential Impacts ofEnvironmental Regulation on the USGeneration Fleet, Jan. 2011, at 36, andEPA IPM Basecase V4.10 (Aug. 2010).
4. This is also occurring in Texas,albeit for merchant generation.
5. The study was conducted bySynapse and Sargent & Lundy in Feb.2006, and is posted at http://www.synapse-energy.com/Downloads/SynapseReport.2006-02.SCE.Mohave-Alternative-Generation-Resources.05-020.pdf.
6. Southern California Edison 2012General Rate Case Rebuttal TestimonyVolume 2: Plant, Taxes DepreciationExpense and Reserve, Rate Base, and Non-Tariffed Products & Service, July 5, 2011.
7. See Paul Joskow’s paper Comparingthe Costs of Intermittent and DispatchableElectricity Generating Technologies(posted at http://hdl.handle.net/1721.1/59468) for some pitfalls toavoid in the renewable resourcecomparisons.
8. There appears to be recognition ofthese potential constraints by thefinancial community. See http://guidance.fidelity.com/viewpoints/utilities-sector-2012.
9. See F.C. Graves, P.Q Hanser and G.Basheda, Electricity Utility AutomaticAdjustment Clauses: Why They AreNeeded More Than Ever, ELEC. J., June,2007.
10. See S.C. Myers, A.L. Kolbe andW.B. Tye, Regulation and CapitalFormation in the Oil Pipeline Industry,TRANSPORTATION J., Summer 1984, at25-49; S.C. Myers, A.L. Kolbe and W.B.Tye, Inflation and Rate of ReturnRegulation, RES. IN TRANSPORTATION REG.,
Vol. 2 (1985), at 83-119; and W.B. Tyeand A.L. Kolbe, Optimal TimeStructures for Regulated Industries,TRANSPORTATION PRACTITIONERS J.,Winter 1992, at 176-196. The firstarticle also contains references to theWilliams Pipeline case before theFederal Energy RegulatoryCommission in which Mr. Myersprovided testimony on oil pipelineratemaking. See also the endnotebelow.
11. See Federal Energy RegulatoryCommission, Williams Pipe LineCompany, Docket Nos. OR79-1-000and 022 (Phase I) Opinion No. 154-B;Opinion and Order on Remand(issued June 28, 1985) and FederalEnergy Regulatory CommissionWilliams Pipe Line Company, DocketNos. OR79-1-026, -027, -028, -029, -030and -031 Opinion No. 154-C; OrderDenying Rehearing in Part, ModifyingOpinion No .154-B in Part, ClarifyingThat Opinion, and Denying Stay for oilpipeline cases.
12. See, e.g., Kern River GasTransmission Co., Opinion No. 486,117 FERC � 61,077 (2006), order onreh’g, Opinion 486-A, 123 FERC �61,056 (2008), order on reh’g,Opinion 486-B, 126 FERC � 61,034,order on reh’g, Opinion No. 486-C, 129FERC � 61,240 (2009), order on reh’g,Opinion No. 486-D, 133 FERC �61,162, at P 156 (2010) (Kern River);and Portland Natural GasTransmission System, OPINION NO.510, 134 FERC � 61,129, OPINIONAND ORDER ON INITIALDECISION, (2011).
13. See also F.C. Graves, P.Q Hanserand G. Basheda, Means of MitigatingRate Shock, ELEC. J., Oct. 2007. Also, afuller exposition of the use of trendedoriginal cost will be found in aforthcoming paper by the currentauthors.
14. This amount of capitalexpenditure would be equivalent to a1,000 MW coal plant installingmultiple environmental controls at acost of $1,000/kW. The capitalexpenditure of $1 billion representsabout 20 percent of AEP’s projectedtotal capital expenditures of $5-6billion on environmental controlequipment by 2020.
16 1040-6190/$–see front matter # 2012 Elsevier Inc. All rights reserved., http://dx.doi.org/10.1016/j.tej.2012.03.009 The Electricity Journal