stakeholders' perception on critical success factors
TRANSCRIPT
61
American Scientific Research Journal for Engineering, Technology, and Sciences (ASRJETS)
ISSN (Print) 2313-4410, ISSN (Online) 2313-4402
© Global Society of Scientific Research and Researchers
http://asrjetsjournal.org/
Stakeholders’ Perception on Critical Success Factors
Influencing Electronic Procurement Adoption in
Developing Counties: Experience from Tanzania
Deus N. Shattaa*
, France A. Shayob, John N. Layaa
c, Alban D. Mchopa
d
aPh.D candidate at Open University of Tanzania. P. O BOX 705. Dar Es Salaam-Tanzania
bLecturer at Open University of Tanzania. P. O BOX 23409 Dar Es Salaam-Tanzania
cLecturer at National Institute of Transport. P. O BOX 705. Dar Es Salaam-Tanzania
dLecturer at Moshi Co-operative University. P. O BOX 474. Moshi-Tanzania
aEmail: [email protected],
bEmail: [email protected]
cEmail: [email protected],
dEmail: [email protected]
Abstract
The general objective of this study was to examine the stakeholders’ perception on critical success factors
influencing Tanzania National electronic Procurement System adoption in public sector. The specific research
objectives of the study were to: evaluate the perceived influences of legal framework, performance expectancy,
relative advantage and attitude towards Tanzania National Electronic Procurement System implementation.
The study adopted positivism philosophy and cross-sectional survey research design. The study also used
stratified sampling technique. Sample size was 157 respondents. A questionnaire with closed ended questions
and documentary review were used for data collection. The collected data were analyzed using Partial Least
Squares Structural Equation Modelling with the help of SmartPLS 3 software. Findings reveal that all critical
success factors were perceived the same by stakeholders (procurement experts and suppliers) towards Tanzania
National Electronic Procurement System adoption. The study concludes that there is no significant difference
with regard to stakeholders’ perception on critical success factors influencing Tanzania National electronic
Procurement System adoption. The study recommends paying attention to relative advantage, performance
expectancy and legal framework to significantly change the mindset of all stakeholders in the country in
supporting of Tanzania National Electronic Procurement System implementation.
Keywords: Stakeholder; Success Factors; Electronic Procurement; Adoption.
------------------------------------------------------------------------
* Corresponding author.
American Scientific Research Journal for Engineering, Technology, and Sciences (ASRJETS) (2020) Volume 71, No 1, pp 61-86
62
1. Introduction
1.1 Overview and Problem Setting
Globally, countries are increasingly becoming focused on improving their public procurement systems both in
terms of their legal frameworks and their practical procedures [19]. In developing countries including Uganda,
Ghana, Malaysia, Kenya and Tanzania, there has been a tremendous paradigm shift towards e-procurement
adoption in public sector [1,2,7,15,17]. This is due to the fact that e-procurement system has gained a reputation
of being one of the most effective way in attaining sustainable procurement, efficiency and transparency in
terms of its performance and benefits it brings to the public procurement processes [6,27]. Reference [12] claim
that e-procurement practice leads to better payment processes, eliminate administrative errors, increase buyers’
productivity, makes information management easy for a given business and serves to reduce procurement cycle
time and costs. [9] also revealed that e-procurement relatively removes chances of corruption in the public
sector because of being an online based approach with minimal face to face contact between the Government
officials and the suppliers. However, [8] revealed that some stakeholders (for example procuring entities’ staff
and suppliers) do hesitate to use e-procurement system due to their diverse perceptions, hence inspiring further
studies on e-procurement adoption in public sector context to understand the reasons for this diversity
perceptions. In addition, the diversity views of different authors on studies regarding the relationship between
critical success factors and e-procurement adoption have attracted many researchers particularly in developing
countries whereby low level of e-procurement adoption is experienced [1,5,7,9,11,13,16, 20, 22,30]. However,
there has been a debate in the literature with regard to which critical success factors influencing e-procurement
adoption in public sector [6,7,20,21,22,30]. With regard to the paradigm shift towards the adoption of e-
procurement in the Tanzanian public sector, it is important to have a framework of analysis with regard to
stakeholders’ perception on critical success factors influencing Tanzania National e-Procurement System
(TANePS) adoption. This argument is supported by [19] who proposed that in experimenting with new
procurement system (for example TANePS adoption), Government leaders and policy makers need a framework
of analysis for decision making pertaining to critical success factors which influence the adoption of the new
procurement system. The framework of analysis should play role in decision making in terms of new public
procurement system design, development and reform [19].
1.2 Model Construct and Hypotheses
The study involved four endogenous constructs and one exogenous construct. Endogenous constructs included
performance expectancy from UTAUT by [29], relative advantage (perceived benefits), attitude from TOE
model by [24] as well as TANePS adoption. UTAUT has been employed in this study because the theory has
been criticized that it does not consider the public organizational’ perspective. On the other hand, it has been
criticized to be used in e-Government adoption while it does not show the interaction of its determinants with
legal framework which is the most important determinant for e-Government adoption. Whether these arguments
are valid or not valid, this study was excited for testing the validity of both criticisms. Likewise, TOE has been
criticized that it does not consider the individuals’ perspective and does not show the concrete model in adopting
new technology which call upon new integrated theoretical model to accommodate the organizational’
American Scientific Research Journal for Engineering, Technology, and Sciences (ASRJETS) (2020) Volume 71, No 1, pp 61-86
63
perspective and individuals’ perspective and show the direct and indirect interactions of its elements in the
actual model in adopting new technology. The existing theories and theoretical models are clarifying
inadequately the integrated theoretical model for the combined perspectives hence inspires this study to be
conducted and developed an integrative model comprehensively explains the determinants which the existing
literature is explaining unclearly. The exogenous construct was legal framework from TOE because this study
supports the argument that countries are increasingly improving their public procurement systems first
(amending legal frameworks first) and then their practical procedures towards e-procurement adoption in public
sector [19]. That means, legal framework is regarded as dominant critical success factor which influences other
critical success factors towards e-procurement adoption in public sector. In addition, performance expectancy of
the system determines the benefits (relative advantage) of the system because this study supports the argument
that e-procurement system has gained a reputation of being one of the most effective way in attaining
sustainable procurement, efficiency and transparency in terms of its performance and benefits it brings to the
public procurement processes [6,27]. Lastly, change of attitude of buyers and suppliers depends on
understanding of the performance and relative advantage of the system because this study supports the argument
that despite the performance and benefits of e-procurement, some buyers and suppliers do hesitate to use the
system due to diverse perceptions [8,26]. In addition, performance expectancy is defined as a degree to which
using technology will provide benefits to consumers in performing certain activities hence benefits (relative
advantages) depend on performance expectancy [28]. Whether these assertions are valid or not valid in relation
to paradigm shift to e-procurement adoption in public sector, it was something valuable and worth testing their
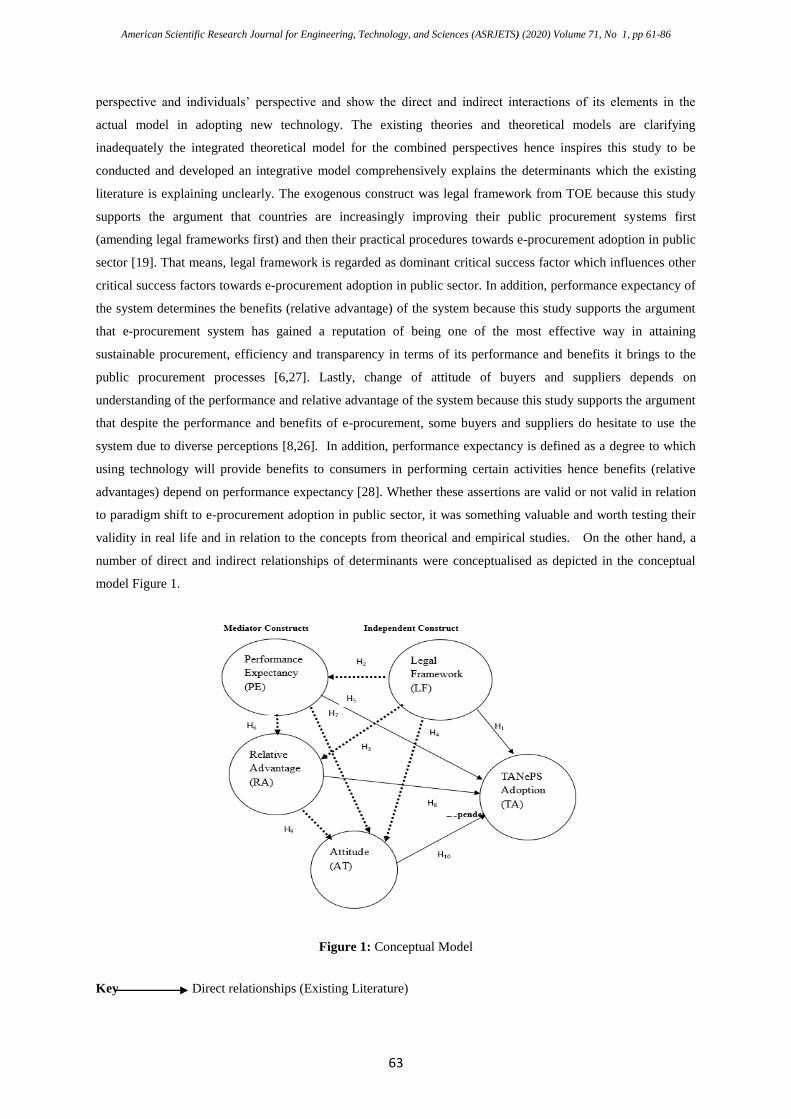
validity in real life and in relation to the concepts from theorical and empirical studies. On the other hand, a
number of direct and indirect relationships of determinants were conceptualised as depicted in the conceptual
model Figure 1.
Figure 1: Conceptual Model
Key Direct relationships (Existing Literature)

American Scientific Research Journal for Engineering, Technology, and Sciences (ASRJETS) (2020) Volume 71, No 1, pp 61-86
64
Indirect relationships (Theoretical Gaps)
Source: Conceptualized from Literature, 2020. In order to operationalise the concepts in the model, the
following hypotheses were tested:
H 1a: Legal framework (LFs) positively and directly influences TANePS adoption in the public sector
H 1b: In the presence of Performance Expectancy (PE), Legal framework (LFs) positively and indirectly
influences TANePS adoption in the public sector.
H 1c: In the presence of Relative Advantages (RA), Legal framework (LFs) positively and indirectly influences
TANePS adoption in the public sector.
H 1d: In the presence of Attitude (AT), Legal framework (LFs) positively and indirectly influences TANePS
adoption in the public sector.
H 2a: Performance expectancy (PE) positively and directly influences TANePS adoption in the public sector
H 2b: In the presence of Relative Advantage (RA), Performance Expectancy (PE) positively and indirectly
influences TANePS adoption in the public sector.
H 2c: In the presence of Attitude (AT), Performance Expectancy (PE) positively and indirectly influences
TANePS adoption in the public sector.
H 3a: Relative advantage (RA) positively and directly influences TANePS adoption in the public sector
H 3b: In the presence of Attitude (AT) Relative advantage (RA) positively and indirectly influences TANePS
adoption in the public sector
H 4: Attitude (AT) positively and directly influences TANePS adoption in the public sector.
Table 1: Summary of Hypotheses Generated from the Theoretical Model
Hypothesis Path Influence
H1a LF -> TA -> H1 Direct
H1b LF->PE -> TA -> H2.H5 Indirect
H1c LF-> RA -> TA -> H3.H8 Indirect
H1d LF ->AT-> TA -> H4.H10 Indirect
H2a PE->TA -> H5 Direct
H2b PE ->RA -> TA -> H6.H8 Indirect
H2c PE -->AT -> TA ->H7.H10 Indirect
H3a RA -> TA -> H8 Direct
H3b RA ->AT-> TA -> H9.H10 Indirect
H4 AT-> TA ->H10 Direct
American Scientific Research Journal for Engineering, Technology, and Sciences (ASRJETS) (2020) Volume 71, No 1, pp 61-86
65
Key:
LF=Legal Framework; PE= Performance Expectancy; RA=Relative Advantage
AT= Attitude and TA= TANePS Adoption
2. Methods
2.1 Philosophy, Research Design, Data Collection Methods, Target Population and Sample Size
This study adopted positivism philosophy and cross-sectional survey research design. The study also used
stratified sampling technique. Sample size was 157 respondents of whom 100 were trained procurement experts
from the selected procuring entities for piloting TANePS adoption and 57 were trained and registered suppliers
in TANePS. A questionnaire with closed ended questions and documentary review were used for data
collection. The collected data were analysed using descriptive statistics with the help of Statistical Package for
Social Sciences software Version 21 and Partial Least Squares Structural Equation Modelling with the help of
SmartPLS 3 software. The study was conducted in Tanzania because of the initiatives shown of improving the
public procurement systems which led to piloting TANePS adoption in procuring entities based in Arusha, Dar
es Salaam, Dodoma, Mbeya and Mwanza [26]. Therefore, the study was conducted in those five cities of
Tanzania because suppliers and procurement experts working with selected procuring entities were trained on
how to use and interact with TANePS. The unit of analysis were registered suppliers in TANePS and
procurement experts from each selected procuring entity who attended training for piloting TANePS adoption
[26]. The registered suppliers in TANePS and procurement experts were used because they were the ones who
were trained on how to interact with the system in the course of acquiring goods and were regarded to have the
required knowledge and skills pertaining operationalization of TANePS in the country. Therefore, the targeted
population was 987 of whom 730 were suppliers who were trained and registered in TANePS and 257 were
procurement experts who were trained with regard to TANePS application [25,26]. The sample size was
obtained using Yamane formula given by: n = N / (1 + N (e) 2) Where n=the required sample, N= Target
Population, e=Level of Precision assuming a 95% confidence level and precision of ±5%, Given N=987 [26],
then expected sample size was 285 (approximated). However, the total actual sample size obtained in data
collection for this study was 157 (55.09% of expected sample size) from which 35.09 per cent of the
respondents were from procuring entities and 20 per cent of the respondents were suppliers. Generally, this
response rate was good and representable and conforms to [14] who stipulated that a response rate of 50% is
adequate for analysis, a response rate of 60% is good and a response rate of 70% and over is excellent. In
addition, this study was able to achieve higher statistical powers with unexpected sample size because the actual
sample size collected was more than the minimum number of sample size required for this study under the rule
of thumb suggested by [3] which requires number of indicators of the exogenous latent construct (with
maximum indicators) times ten equals to be the minimum number of the sample size for the research model to
be tested its hypotheses. Taking into consideration the number of indicators of legal framework as exogenous
latent construct of the research model times ten equals to forty (40).
American Scientific Research Journal for Engineering, Technology, and Sciences (ASRJETS) (2020) Volume 71, No 1, pp 61-86
66
2.2 Data Processing and Analysis
Questionnaire with closed ended questions were assigned numbers to enable the process of quantitative data
analysis be more accurate and simpler. All missing values were assigned 99 as special number before running
the PLS algorithm and bootstrapping. In data analysis for this study, the PLS-SEM evaluation procedures were
used for reflective models suggested by [18]. Basing on PLS-SEM evaluation procedures for reflective model
suggested by [18], the analysis was performed by assessing reflective measurement models and structural
models. This study adopted PLS-SEM evaluation procedures for reflective models due to the nature of the
constructs and their indicators in the theoritical model. All indicators depended on their constructs hence,
reflective model was an appropriate for this study.
3. Results
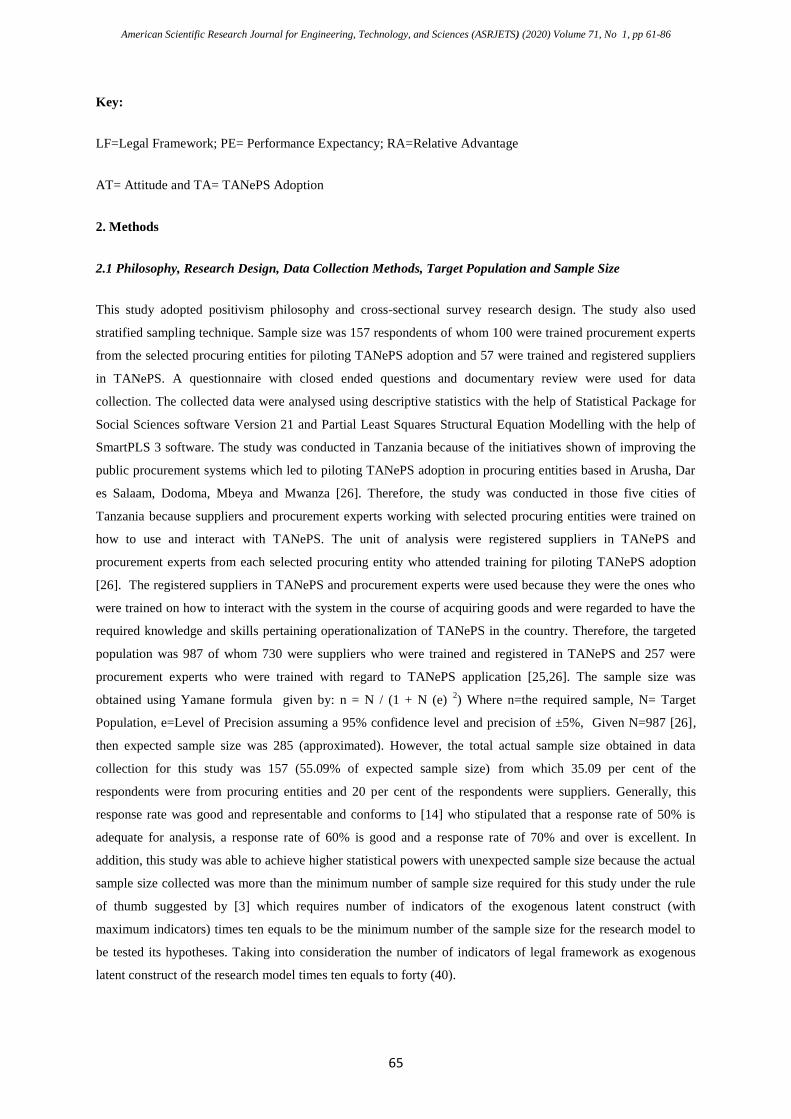
3.1 Education Level of Respondents against Type of Respondent
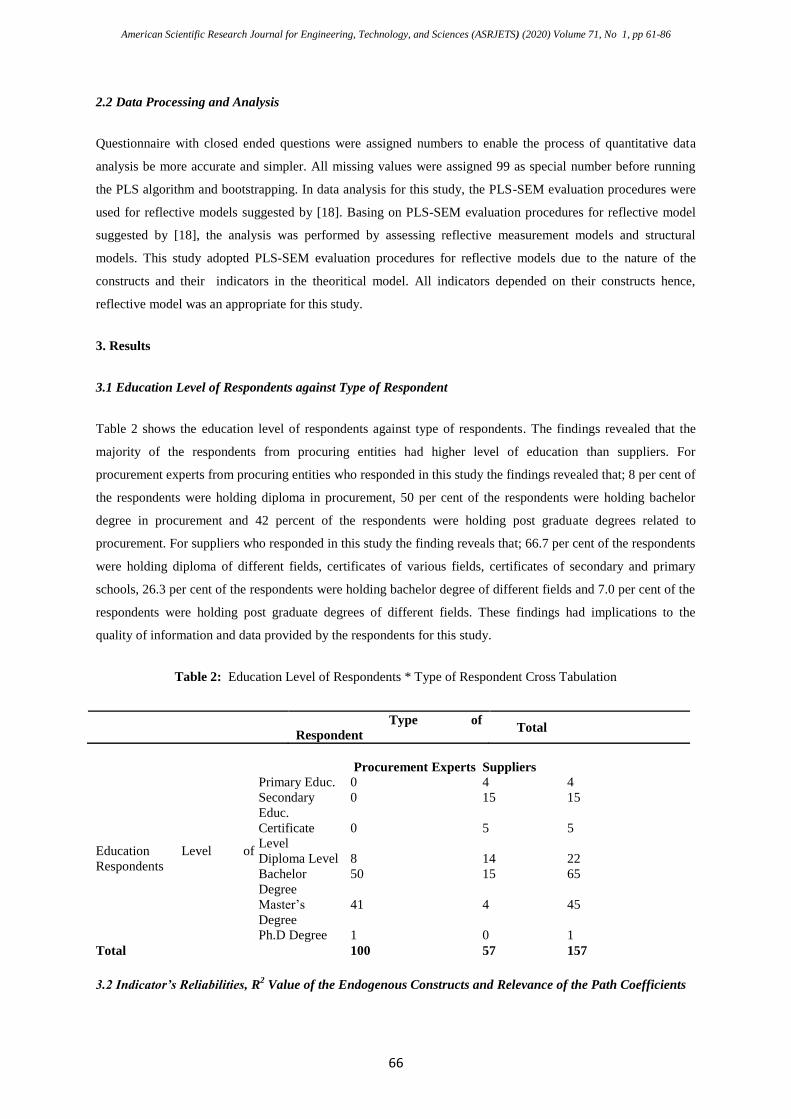
Table 2 shows the education level of respondents against type of respondents. The findings revealed that the
majority of the respondents from procuring entities had higher level of education than suppliers. For
procurement experts from procuring entities who responded in this study the findings revealed that; 8 per cent of
the respondents were holding diploma in procurement, 50 per cent of the respondents were holding bachelor
degree in procurement and 42 percent of the respondents were holding post graduate degrees related to
procurement. For suppliers who responded in this study the finding reveals that; 66.7 per cent of the respondents
were holding diploma of different fields, certificates of various fields, certificates of secondary and primary
schools, 26.3 per cent of the respondents were holding bachelor degree of different fields and 7.0 per cent of the
respondents were holding post graduate degrees of different fields. These findings had implications to the
quality of information and data provided by the respondents for this study.
Table 2: Education Level of Respondents * Type of Respondent Cross Tabulation
Type of
Respondent Total
Procurement Experts Suppliers
Education Level of
Respondents
Primary Educ. 0 4 4
Secondary
Educ.
0 15 15
Certificate
Level
0 5 5
Diploma Level 8 14 22
Bachelor
Degree
50 15 65
Master’s
Degree
41 4 45
Ph.D Degree 1 0 1
Total 100 57 157
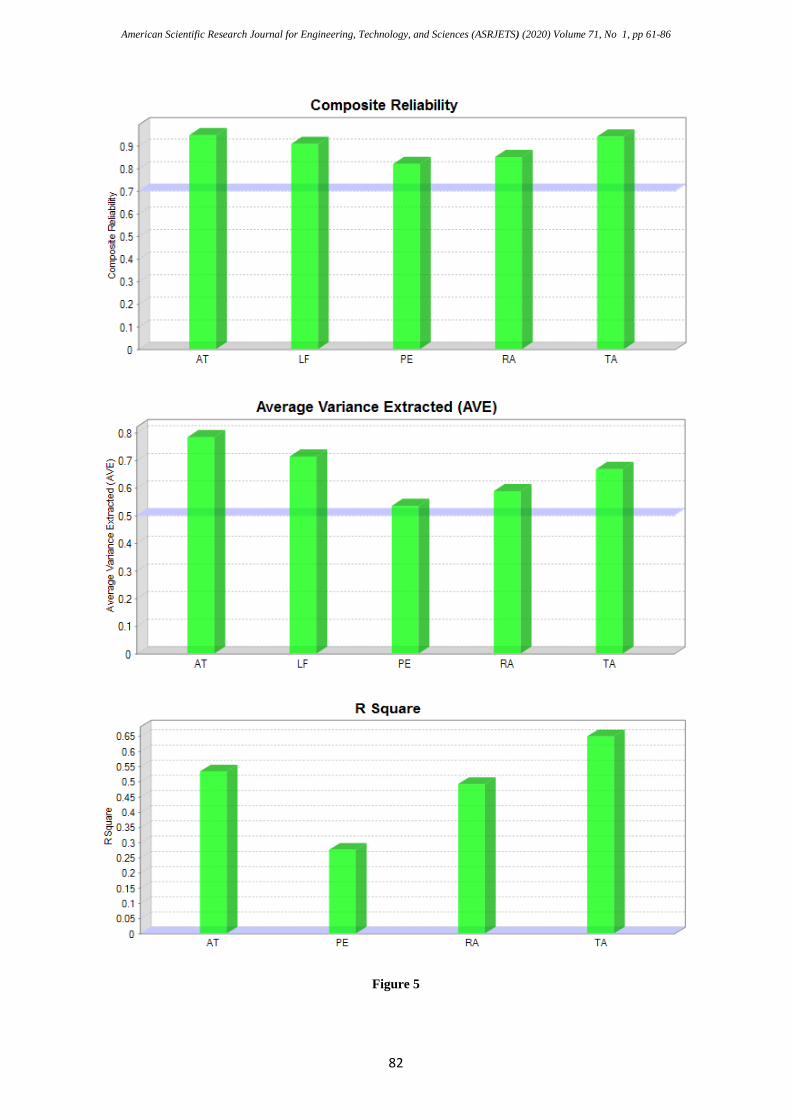
3.2 Indicator’s Reliabilities, R2 Value of the Endogenous Constructs and Relevance of the Path Coefficients
American Scientific Research Journal for Engineering, Technology, and Sciences (ASRJETS) (2020) Volume 71, No 1, pp 61-86
67
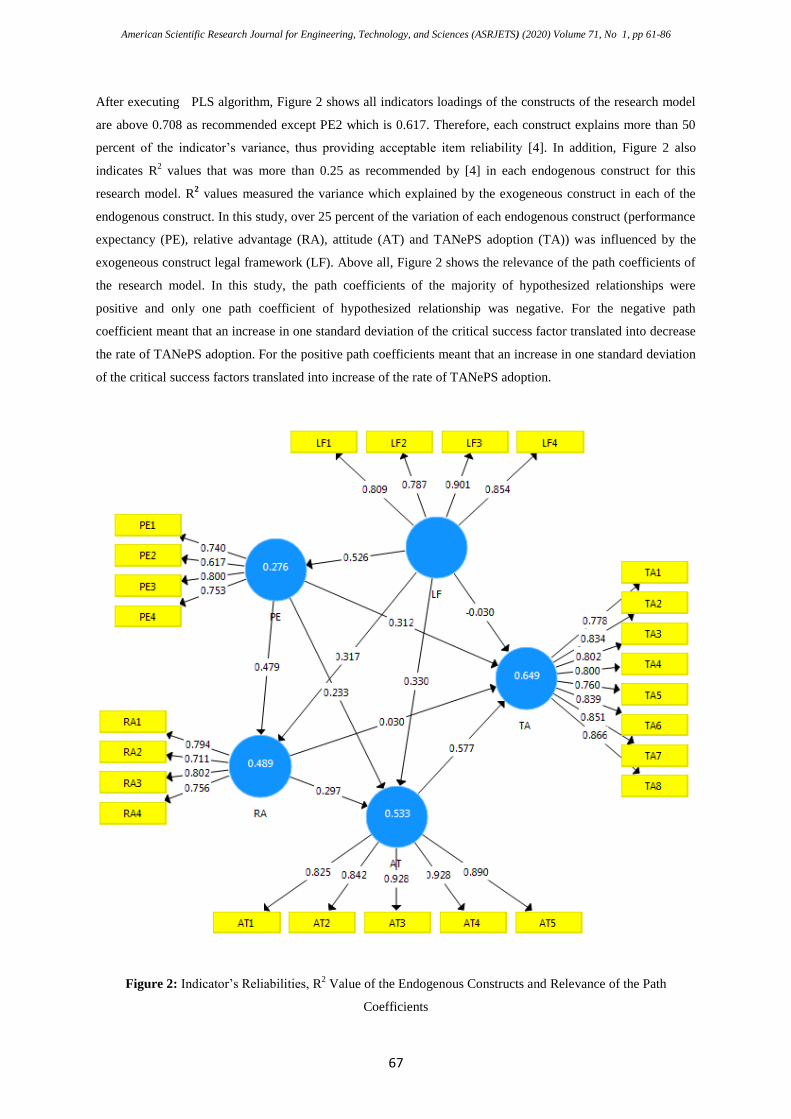
After executing PLS algorithm, Figure 2 shows all indicators loadings of the constructs of the research model
are above 0.708 as recommended except PE2 which is 0.617. Therefore, each construct explains more than 50
percent of the indicator’s variance, thus providing acceptable item reliability [4]. In addition, Figure 2 also
indicates R2 values that was more than 0.25 as recommended by [4] in each endogenous construct for this
research model. R2 values measured the variance which explained by the exogeneous construct in each of the
endogenous construct. In this study, over 25 percent of the variation of each endogenous construct (performance
expectancy (PE), relative advantage (RA), attitude (AT) and TANePS adoption (TA)) was influenced by the
exogeneous construct legal framework (LF). Above all, Figure 2 shows the relevance of the path coefficients of
the research model. In this study, the path coefficients of the majority of hypothesized relationships were
positive and only one path coefficient of hypothesized relationship was negative. For the negative path
coefficient meant that an increase in one standard deviation of the critical success factor translated into decrease
the rate of TANePS adoption. For the positive path coefficients meant that an increase in one standard deviation
of the critical success factors translated into increase of the rate of TANePS adoption.
Figure 2: Indicator’s Reliabilities, R2 Value of the Endogenous Constructs and Relevance of the Path
Coefficients
American Scientific Research Journal for Engineering, Technology, and Sciences (ASRJETS) (2020) Volume 71, No 1, pp 61-86
68
Key:
LF=Legal Framework; PE= Performance Expectancy; RA=Relative Advantage
AT= Attitude and TA= TANePS Adoption
3.3 Internal Consistency Reliability and Convergent Validity Results
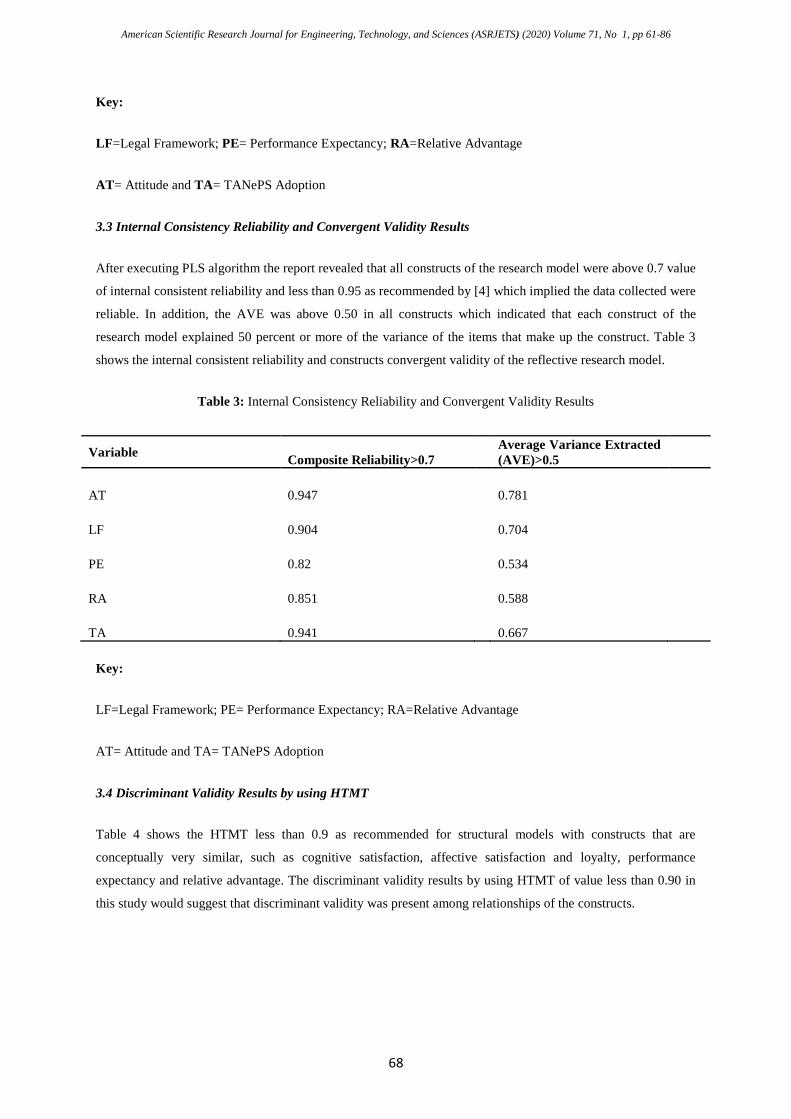
After executing PLS algorithm the report revealed that all constructs of the research model were above 0.7 value
of internal consistent reliability and less than 0.95 as recommended by [4] which implied the data collected were
reliable. In addition, the AVE was above 0.50 in all constructs which indicated that each construct of the
research model explained 50 percent or more of the variance of the items that make up the construct. Table 3
shows the internal consistent reliability and constructs convergent validity of the reflective research model.
Table 3: Internal Consistency Reliability and Convergent Validity Results
Variable Composite Reliability>0.7
Average Variance Extracted
(AVE)>0.5
AT 0.947
0.781
LF 0.904
0.704
PE 0.82
0.534
RA 0.851
0.588
TA 0.941
0.667
Key:
LF=Legal Framework; PE= Performance Expectancy; RA=Relative Advantage
AT= Attitude and TA= TANePS Adoption
3.4 Discriminant Validity Results by using HTMT
Table 4 shows the HTMT less than 0.9 as recommended for structural models with constructs that are
conceptually very similar, such as cognitive satisfaction, affective satisfaction and loyalty, performance
expectancy and relative advantage. The discriminant validity results by using HTMT of value less than 0.90 in
this study would suggest that discriminant validity was present among relationships of the constructs.
American Scientific Research Journal for Engineering, Technology, and Sciences (ASRJETS) (2020) Volume 71, No 1, pp 61-86
69
Table 4: Discriminant Validity Results by using HTMT
AT LF PE RA
LF 0.692
PE 0.727 0.658
RA 0.745 0.69 0.854
TA 0.82 0.565 0.79 0.675
Key:
LF=Legal Framework; PE= Performance Expectancy; RA=Relative
Advantage AT= Attitude and TA= TANePS Adoption
3.5 Statistical Significance Testing of the Hypothesized Relationships
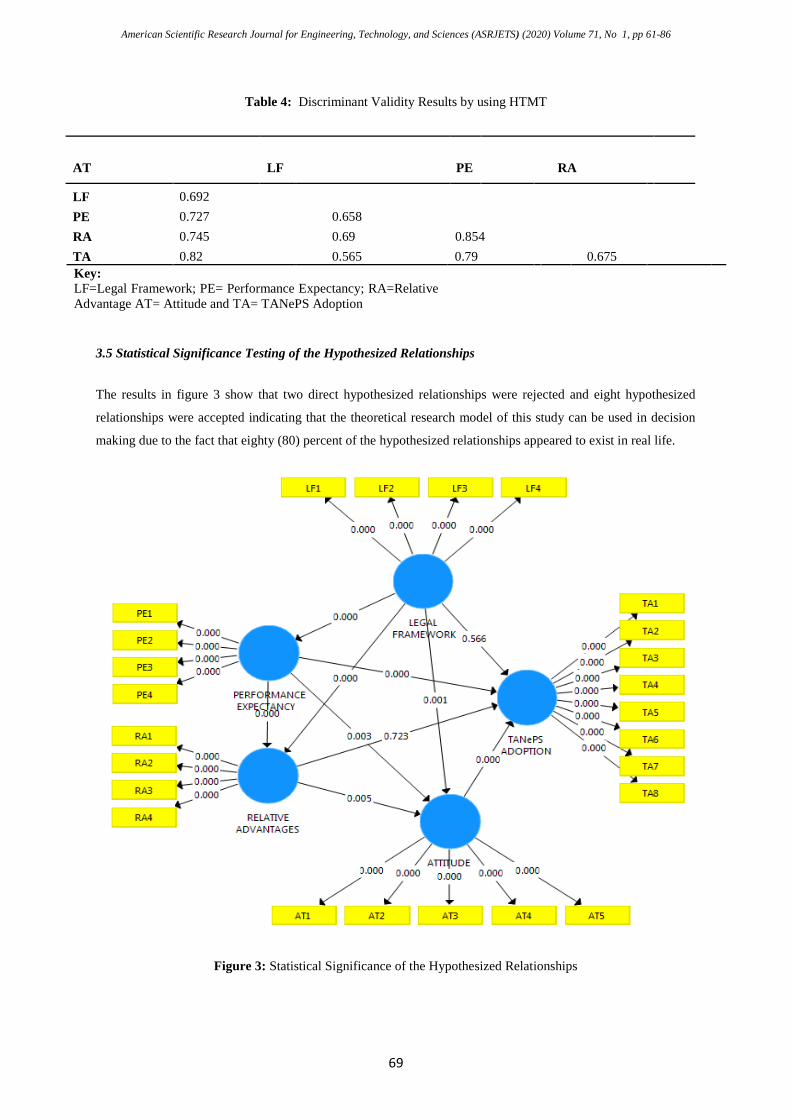
The results in figure 3 show that two direct hypothesized relationships were rejected and eight hypothesized
relationships were accepted indicating that the theoretical research model of this study can be used in decision
making due to the fact that eighty (80) percent of the hypothesized relationships appeared to exist in real life.
Figure 3: Statistical Significance of the Hypothesized Relationships
American Scientific Research Journal for Engineering, Technology, and Sciences (ASRJETS) (2020) Volume 71, No 1, pp 61-86
70
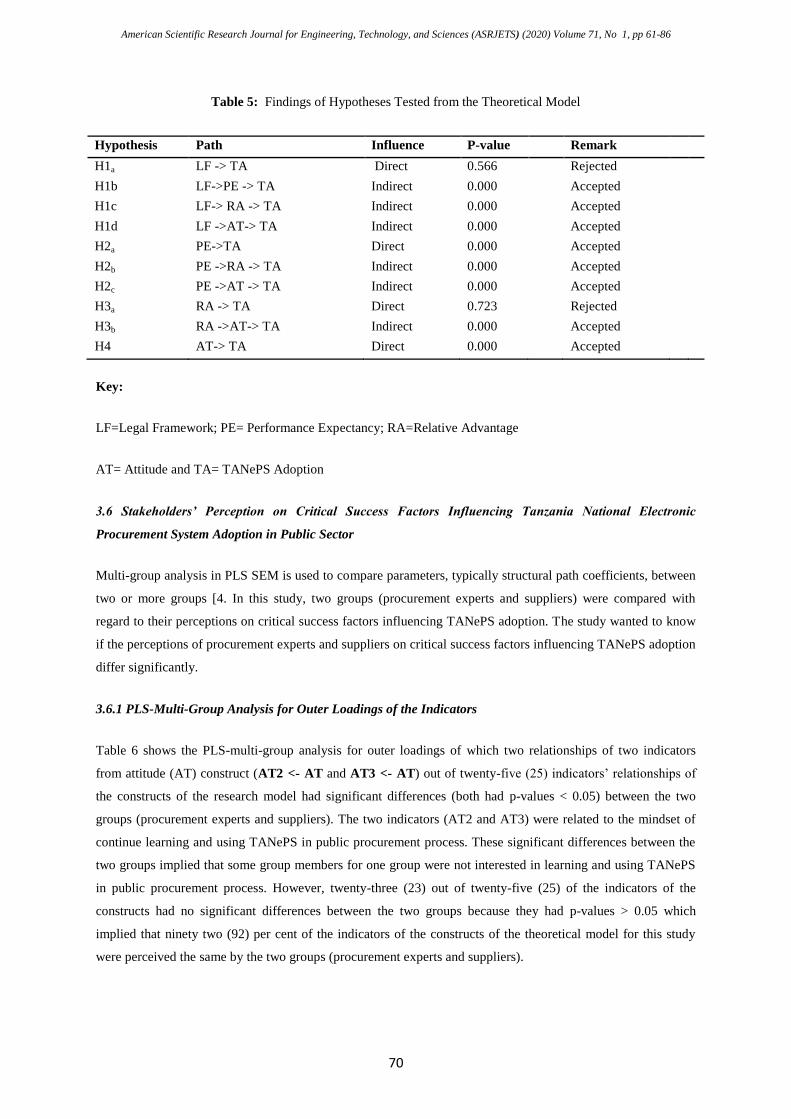
Table 5: Findings of Hypotheses Tested from the Theoretical Model
Hypothesis Path Influence P-value Remark
H1a LF -> TA Direct 0.566 Rejected
H1b LF->PE -> TA Indirect 0.000 Accepted
H1c LF-> RA -> TA Indirect 0.000 Accepted
H1d LF ->AT-> TA Indirect 0.000 Accepted
H2a PE->TA Direct 0.000 Accepted
H2b PE ->RA -> TA Indirect 0.000 Accepted
H2c PE ->AT -> TA Indirect 0.000 Accepted
H3a RA -> TA Direct 0.723 Rejected
H3b RA ->AT-> TA Indirect 0.000 Accepted
H4 AT-> TA Direct 0.000 Accepted
Key:
LF=Legal Framework; PE= Performance Expectancy; RA=Relative Advantage
AT= Attitude and TA= TANePS Adoption
3.6 Stakeholders’ Perception on Critical Success Factors Influencing Tanzania National Electronic
Procurement System Adoption in Public Sector
Multi-group analysis in PLS SEM is used to compare parameters, typically structural path coefficients, between
two or more groups [4. In this study, two groups (procurement experts and suppliers) were compared with
regard to their perceptions on critical success factors influencing TANePS adoption. The study wanted to know
if the perceptions of procurement experts and suppliers on critical success factors influencing TANePS adoption
differ significantly.
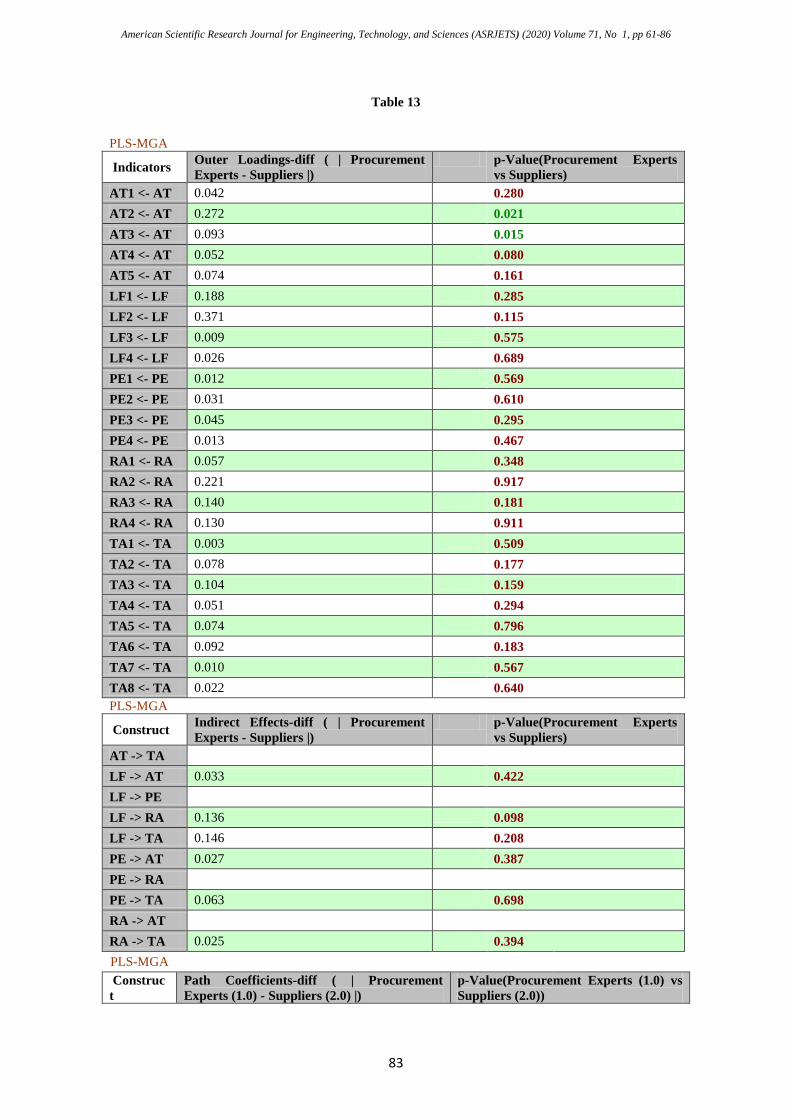
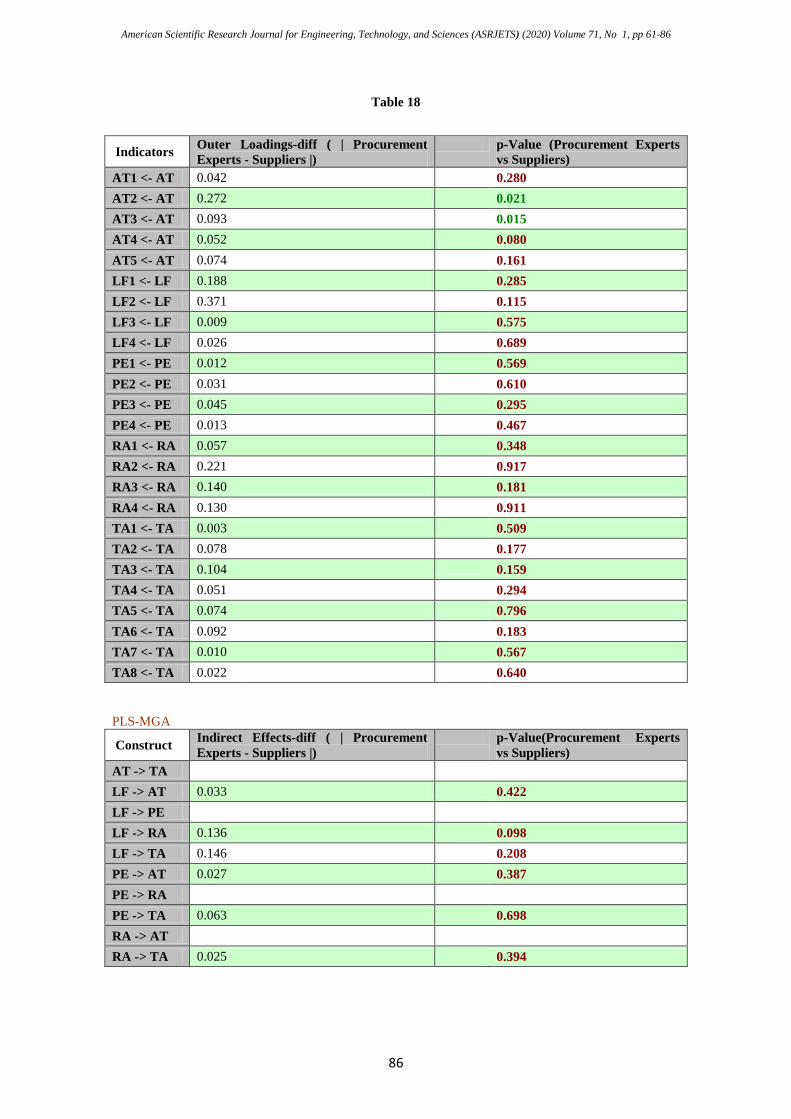
3.6.1 PLS-Multi-Group Analysis for Outer Loadings of the Indicators
Table 6 shows the PLS-multi-group analysis for outer loadings of which two relationships of two indicators
from attitude (AT) construct (AT2 <- AT and AT3 <- AT) out of twenty-five (25) indicators’ relationships of
the constructs of the research model had significant differences (both had p-values < 0.05) between the two
groups (procurement experts and suppliers). The two indicators (AT2 and AT3) were related to the mindset of
continue learning and using TANePS in public procurement process. These significant differences between the
two groups implied that some group members for one group were not interested in learning and using TANePS
in public procurement process. However, twenty-three (23) out of twenty-five (25) of the indicators of the
constructs had no significant differences between the two groups because they had p-values > 0.05 which
implied that ninety two (92) per cent of the indicators of the constructs of the theoretical model for this study
were perceived the same by the two groups (procurement experts and suppliers).

American Scientific Research Journal for Engineering, Technology, and Sciences (ASRJETS) (2020) Volume 71, No 1, pp 61-86
71
Table 6: PLS-Multi-Group Analysis for Outer Loadings of the Indicators
Indicators Outer Loadings-diff ( | Procurement
Experts - Suppliers |)
p-Value (Procurement Experts vs
Suppliers)
AT1 <- AT 0.042 0.280
AT2 <- AT 0.272 0.021
AT3 <- AT 0.093 0.015
AT4 <- AT 0.052 0.080
AT5 <- AT 0.074 0.161
LF1 <- LF 0.188 0.285
LF2 <- LF 0.371 0.115
LF3 <- LF 0.009 0.575
LF4 <- LF 0.026 0.689
PE1 <- PE 0.012 0.569
PE2 <- PE 0.031 0.610
PE3 <- PE 0.045 0.295
PE4 <- PE 0.013 0.467
RA1 <- RA 0.057 0.348
RA2 <- RA 0.221 0.917
RA3 <- RA 0.140 0.181
RA4 <- RA 0.130 0.911
TA1 <- TA 0.003 0.509
TA2 <- TA 0.078 0.177
TA3 <- TA 0.104 0.159
TA4 <- TA 0.051 0.294
TA5 <- TA 0.074 0.796
TA6 <- TA 0.092 0.183
TA7 <- TA 0.010 0.567
TA8 <- TA 0.022 0.640
Key:
LF=Legal Framework; PE= Performance Expectancy; RA=Relative Advantage
AT= Attitude and TA= TANePS Adoption
3.6.2 PLS-Multi-Group Analysis for Indirect Effects Constructs
Table 7 shows the PLS-multi-group analysis for indirect effects of which no significant differences between the
two groups were observed for the indirect relationships between legal framework (LF) and attitude (AT) had p-
value > 0.05, legal framework (LF) and relative advantage (RA) had p-value > 0.05, legal framework (LF) and
TANePS adoption (TA) had p-value > 0.05, performance expectancy (PE) and attitude (AT) had p-value > 0.05,
performance expectancy (PE) and TANePS adoption (TA) had p-value > 0.05, relative advantage (RA) and
TANePS adoption (TA) had p-value > 0.05 which implied that all indirect relationships of the theoretical model
of this study were perceived the same by the two groups (procurement experts and suppliers).
American Scientific Research Journal for Engineering, Technology, and Sciences (ASRJETS) (2020) Volume 71, No 1, pp 61-86
72
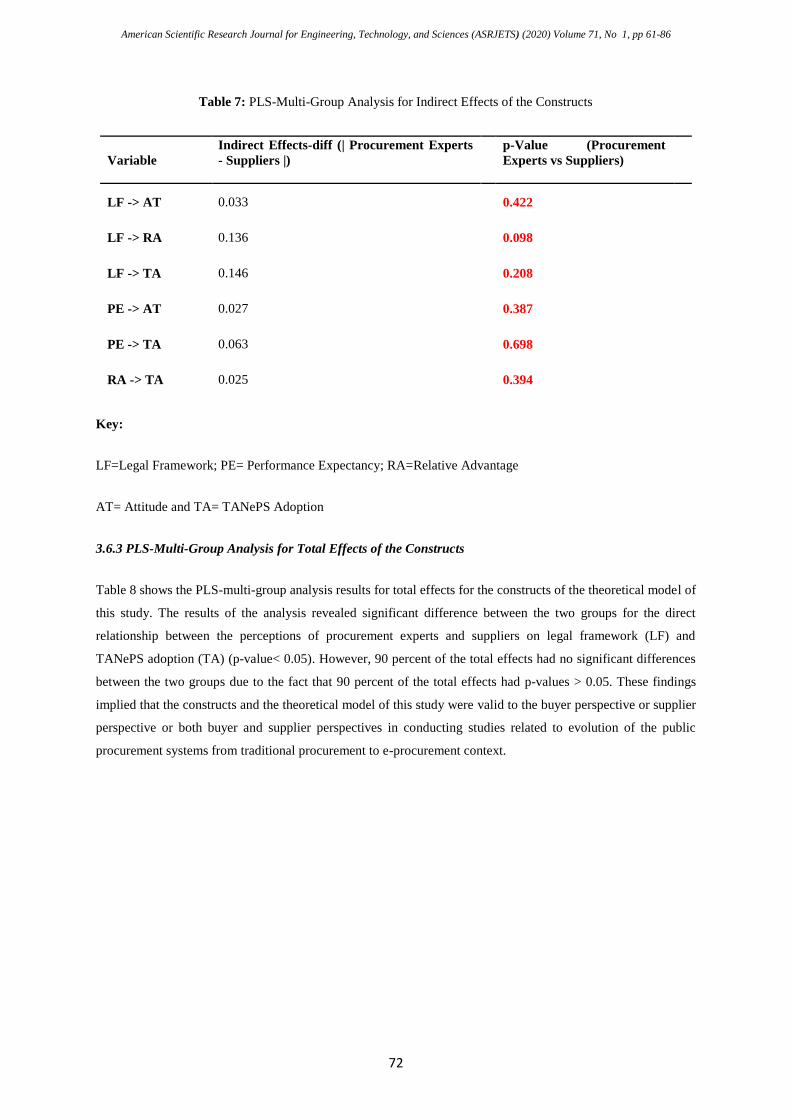
Table 7: PLS-Multi-Group Analysis for Indirect Effects of the Constructs
Variable
Indirect Effects-diff (| Procurement Experts
- Suppliers |)
p-Value (Procurement
Experts vs Suppliers)
LF -> AT 0.033 0.422
LF -> RA 0.136 0.098
LF -> TA 0.146 0.208
PE -> AT 0.027 0.387
PE -> TA 0.063 0.698
RA -> TA 0.025 0.394
Key:
LF=Legal Framework; PE= Performance Expectancy; RA=Relative Advantage
AT= Attitude and TA= TANePS Adoption
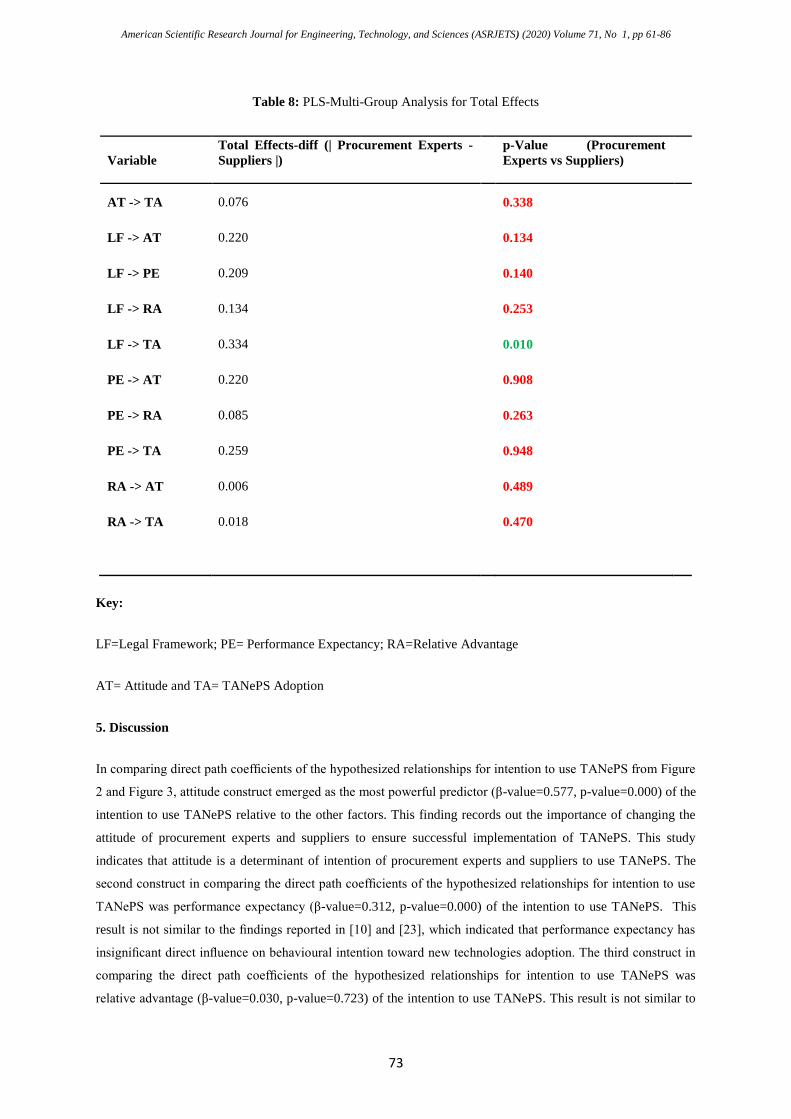
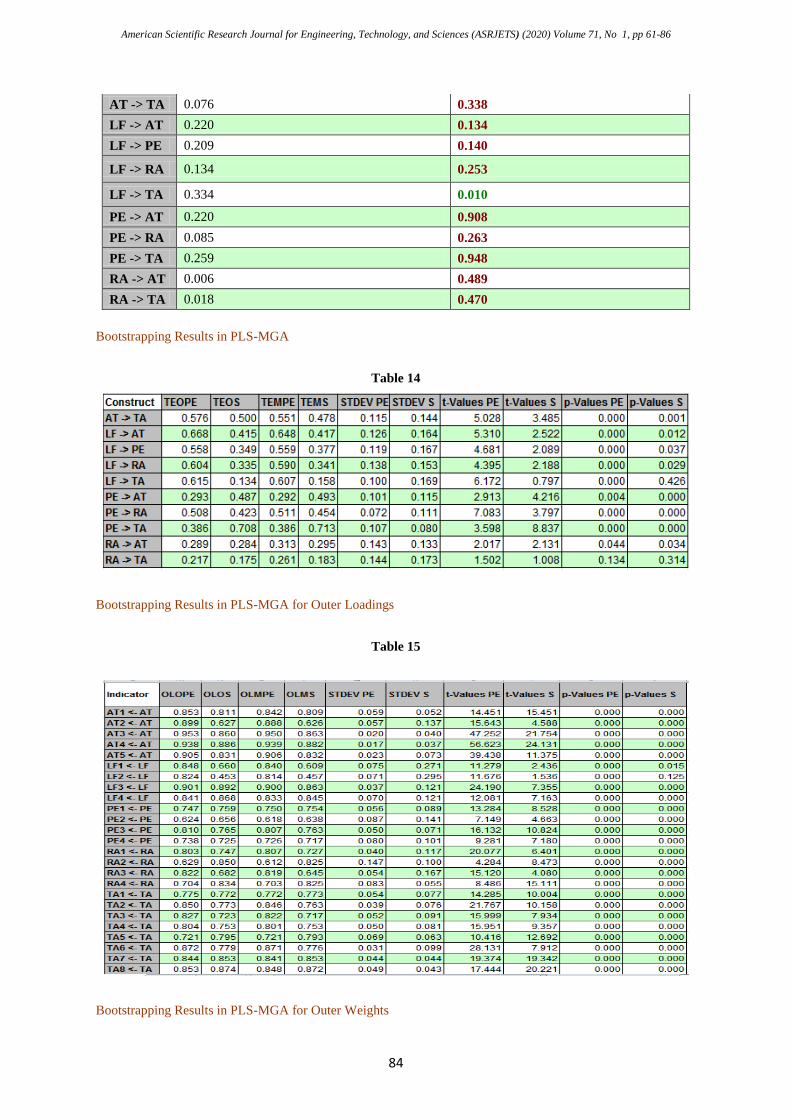
3.6.3 PLS-Multi-Group Analysis for Total Effects of the Constructs
Table 8 shows the PLS-multi-group analysis results for total effects for the constructs of the theoretical model of
this study. The results of the analysis revealed significant difference between the two groups for the direct
relationship between the perceptions of procurement experts and suppliers on legal framework (LF) and
TANePS adoption (TA) (p-value< 0.05). However, 90 percent of the total effects had no significant differences
between the two groups due to the fact that 90 percent of the total effects had p-values > 0.05. These findings
implied that the constructs and the theoretical model of this study were valid to the buyer perspective or supplier
perspective or both buyer and supplier perspectives in conducting studies related to evolution of the public
procurement systems from traditional procurement to e-procurement context.
American Scientific Research Journal for Engineering, Technology, and Sciences (ASRJETS) (2020) Volume 71, No 1, pp 61-86
73
Table 8: PLS-Multi-Group Analysis for Total Effects
Variable
Total Effects-diff (| Procurement Experts -
Suppliers |)
p-Value (Procurement
Experts vs Suppliers)
AT -> TA 0.076 0.338
LF -> AT 0.220 0.134
LF -> PE 0.209 0.140
LF -> RA 0.134 0.253
LF -> TA 0.334 0.010
PE -> AT 0.220 0.908
PE -> RA 0.085 0.263
PE -> TA 0.259 0.948
RA -> AT 0.006 0.489
RA -> TA 0.018 0.470
Key:
LF=Legal Framework; PE= Performance Expectancy; RA=Relative Advantage
AT= Attitude and TA= TANePS Adoption
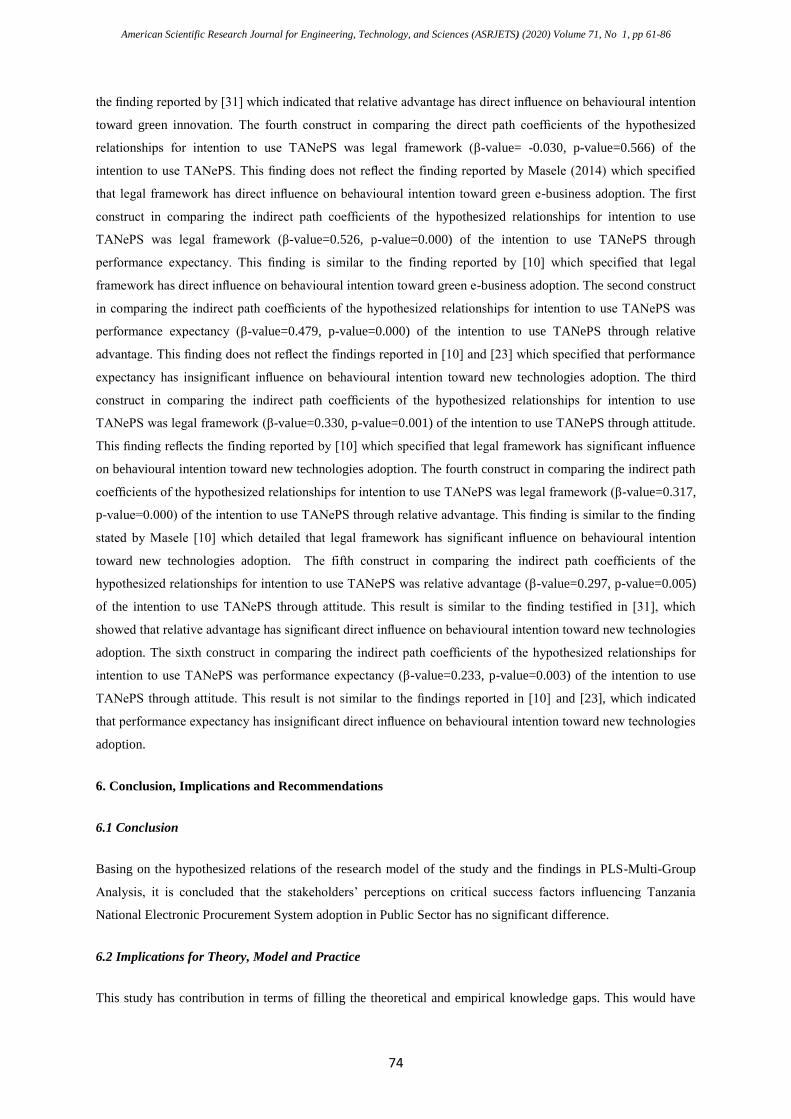
5. Discussion
In comparing direct path coefficients of the hypothesized relationships for intention to use TANePS from Figure
2 and Figure 3, attitude construct emerged as the most powerful predictor (β-value=0.577, p-value=0.000) of the
intention to use TANePS relative to the other factors. This finding records out the importance of changing the
attitude of procurement experts and suppliers to ensure successful implementation of TANePS. This study
indicates that attitude is a determinant of intention of procurement experts and suppliers to use TANePS. The
second construct in comparing the direct path coefficients of the hypothesized relationships for intention to use
TANePS was performance expectancy (β-value=0.312, p-value=0.000) of the intention to use TANePS. This
result is not similar to the findings reported in [10] and [23], which indicated that performance expectancy has
insignificant direct influence on behavioural intention toward new technologies adoption. The third construct in
comparing the direct path coefficients of the hypothesized relationships for intention to use TANePS was
relative advantage (β-value=0.030, p-value=0.723) of the intention to use TANePS. This result is not similar to
American Scientific Research Journal for Engineering, Technology, and Sciences (ASRJETS) (2020) Volume 71, No 1, pp 61-86
74
the finding reported by [31] which indicated that relative advantage has direct influence on behavioural intention
toward green innovation. The fourth construct in comparing the direct path coefficients of the hypothesized
relationships for intention to use TANePS was legal framework (β-value= -0.030, p-value=0.566) of the
intention to use TANePS. This finding does not reflect the finding reported by Masele (2014) which specified
that legal framework has direct influence on behavioural intention toward green e-business adoption. The first
construct in comparing the indirect path coefficients of the hypothesized relationships for intention to use
TANePS was legal framework (β-value=0.526, p-value=0.000) of the intention to use TANePS through
performance expectancy. This finding is similar to the finding reported by [10] which specified that legal
framework has direct influence on behavioural intention toward green e-business adoption. The second construct
in comparing the indirect path coefficients of the hypothesized relationships for intention to use TANePS was
performance expectancy (β-value=0.479, p-value=0.000) of the intention to use TANePS through relative
advantage. This finding does not reflect the findings reported in [10] and [23] which specified that performance
expectancy has insignificant influence on behavioural intention toward new technologies adoption. The third
construct in comparing the indirect path coefficients of the hypothesized relationships for intention to use
TANePS was legal framework (β-value=0.330, p-value=0.001) of the intention to use TANePS through attitude.
This finding reflects the finding reported by [10] which specified that legal framework has significant influence
on behavioural intention toward new technologies adoption. The fourth construct in comparing the indirect path
coefficients of the hypothesized relationships for intention to use TANePS was legal framework (β-value=0.317,
p-value=0.000) of the intention to use TANePS through relative advantage. This finding is similar to the finding
stated by Masele [10] which detailed that legal framework has significant influence on behavioural intention
toward new technologies adoption. The fifth construct in comparing the indirect path coefficients of the
hypothesized relationships for intention to use TANePS was relative advantage (β-value=0.297, p-value=0.005)
of the intention to use TANePS through attitude. This result is similar to the finding testified in [31], which
showed that relative advantage has significant direct influence on behavioural intention toward new technologies
adoption. The sixth construct in comparing the indirect path coefficients of the hypothesized relationships for
intention to use TANePS was performance expectancy (β-value=0.233, p-value=0.003) of the intention to use
TANePS through attitude. This result is not similar to the findings reported in [10] and [23], which indicated
that performance expectancy has insignificant direct influence on behavioural intention toward new technologies
adoption.
6. Conclusion, Implications and Recommendations
6.1 Conclusion
Basing on the hypothesized relations of the research model of the study and the findings in PLS-Multi-Group
Analysis, it is concluded that the stakeholders’ perceptions on critical success factors influencing Tanzania
National Electronic Procurement System adoption in Public Sector has no significant difference.
6.2 Implications for Theory, Model and Practice
This study has contribution in terms of filling the theoretical and empirical knowledge gaps. This would have
American Scientific Research Journal for Engineering, Technology, and Sciences (ASRJETS) (2020) Volume 71, No 1, pp 61-86
75
practical implications in terms of public procurement policy implementation and applicability of TANePS in the
public sector. Therefore, this model can be used by the Government leaders and policy makers as a framework
of analysis for decision making with regard to stakeholders’ (procurement experts from procuring entities and
suppliers’) interests on TANePS adoption in the public sector. However, this study would help other future
researchers to use the final integrated model in the process of adding new knowledge to the existing literature
when conducting researches related to buyer-supplier perspectives. In addition, the final integrated model has
practical implications in terms of applicability of TANePS in the public sector. Basing on the relationships of
the legal framework with other critical success factors influencing TANePS adoption, the final integrated model
of this study suggests that, legal framework should not be used directly in the process of adopting new
technology (TANePS) particularly when suppliers (private sector) are involved in Government business. Instead
the legal framework should be used indirectly after significant change of the mindset of the traditional
suppliers and the procurement experts working with procuring entities. The significant change of the mindset
can be done through training with regard to the performance expectancy and the benefits of TANePS it brings to
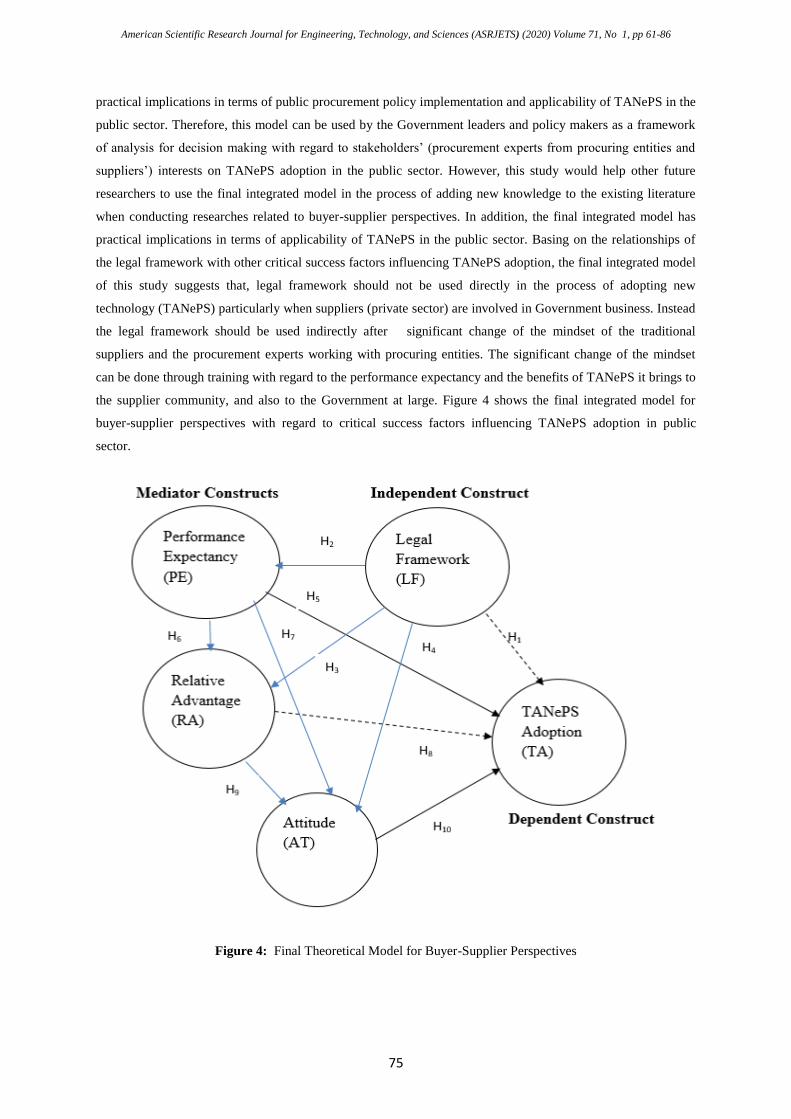
the supplier community, and also to the Government at large. Figure 4 shows the final integrated model for
buyer-supplier perspectives with regard to critical success factors influencing TANePS adoption in public
sector.
Figure 4: Final Theoretical Model for Buyer-Supplier Perspectives
American Scientific Research Journal for Engineering, Technology, and Sciences (ASRJETS) (2020) Volume 71, No 1, pp 61-86
76
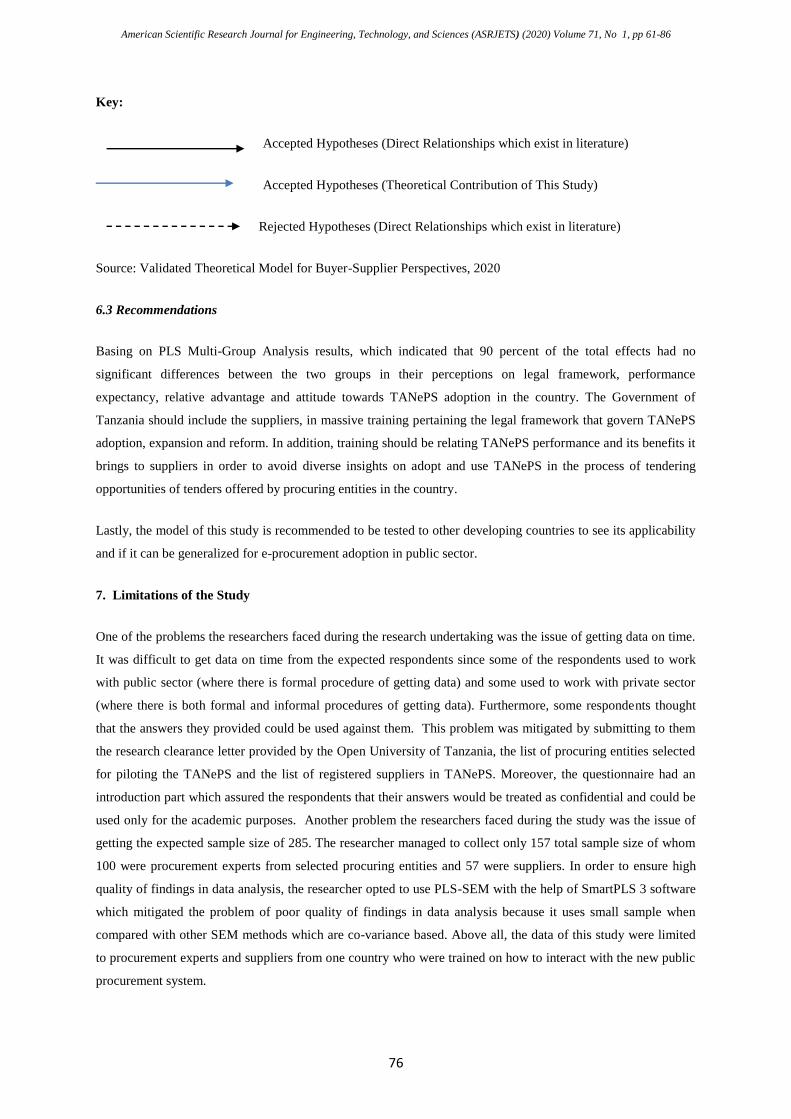
Key:
Accepted Hypotheses (Direct Relationships which exist in literature)
Accepted Hypotheses (Theoretical Contribution of This Study)
Rejected Hypotheses (Direct Relationships which exist in literature)
Source: Validated Theoretical Model for Buyer-Supplier Perspectives, 2020
6.3 Recommendations
Basing on PLS Multi-Group Analysis results, which indicated that 90 percent of the total effects had no
significant differences between the two groups in their perceptions on legal framework, performance
expectancy, relative advantage and attitude towards TANePS adoption in the country. The Government of
Tanzania should include the suppliers, in massive training pertaining the legal framework that govern TANePS
adoption, expansion and reform. In addition, training should be relating TANePS performance and its benefits it
brings to suppliers in order to avoid diverse insights on adopt and use TANePS in the process of tendering
opportunities of tenders offered by procuring entities in the country.
Lastly, the model of this study is recommended to be tested to other developing countries to see its applicability
and if it can be generalized for e-procurement adoption in public sector.
7. Limitations of the Study
One of the problems the researchers faced during the research undertaking was the issue of getting data on time.
It was difficult to get data on time from the expected respondents since some of the respondents used to work
with public sector (where there is formal procedure of getting data) and some used to work with private sector
(where there is both formal and informal procedures of getting data). Furthermore, some respondents thought
that the answers they provided could be used against them. This problem was mitigated by submitting to them
the research clearance letter provided by the Open University of Tanzania, the list of procuring entities selected
for piloting the TANePS and the list of registered suppliers in TANePS. Moreover, the questionnaire had an
introduction part which assured the respondents that their answers would be treated as confidential and could be
used only for the academic purposes. Another problem the researchers faced during the study was the issue of
getting the expected sample size of 285. The researcher managed to collect only 157 total sample size of whom
100 were procurement experts from selected procuring entities and 57 were suppliers. In order to ensure high
quality of findings in data analysis, the researcher opted to use PLS-SEM with the help of SmartPLS 3 software
which mitigated the problem of poor quality of findings in data analysis because it uses small sample when
compared with other SEM methods which are co-variance based. Above all, the data of this study were limited
to procurement experts and suppliers from one country who were trained on how to interact with the new public
procurement system.

American Scientific Research Journal for Engineering, Technology, and Sciences (ASRJETS) (2020) Volume 71, No 1, pp 61-86
77
Acknowledgments
The researchers wish to acknowledge Prof. Joseph Hair and Prof. Christian Ringle for their facilitations on
quantitative data analysis workshop conducted at University of Dar es Salaam Business School in Tanzania. All
facilitators enabled the researchers to acquire knowledge and skills of which they have used to analyze the data
and write this paper.
References
[1]. J.A. Azanlerigu, & E. Akay. “Prospects and challenges of e-procurement in some selected public
institutions in Ghana” European Journal of Business and Management, vol. 7, 29, 2015
[2]. C. B., Basheka, N. P. Oluka, & G. Mugurusi. “Adopting new approaches for public procurement
efficiency: critical success factors (CSFS) for the implementation of e-procurement in Uganda’s public
sector” International Journal of Procurement Management, vol.5, 6, 2012
[3]. J. F., Hair, C. M. Ringle, & M. Sarstedt. “PLS-SEM: Indeed, a silver bullet” The Journal of Marketing
Theory and Practice, vol.19, 2, pp. 139–152, 2014
[4]. J.F., Hair, J.J., Risher, M. Sarstedt, & C.M. Ringle, (2018). “When to use and how to report the results
of PLS-SEM” European Business Review, Permanent link to this document: available at:
https://doi.org/10.1108/EBR-11-2018-0203 (May, 20,2020)
[5]. E.O. Ibem, E.B. Aduwo, P., Tunji-Olayeni, E.K. Ayo-Vaughan, & O.U. Uwakonye. “Factors
influencing e-procurement adoption in the Nigerian building industry” Journal of Construction
Economics and Building, vol.16, 4, pp.54-67, 2016
[6]. J. Iles. “How is e-procurement related to the success of U.S. cities’ sustainable purchasing policies?”
Arizona State University, ASU School of Sustainability, 2017,
[7]. E. S. Kassim, & H. Hussin. “A success model for the Malaysian Government e-procurement system:
the buyer perspective” International Journal of Electronic Government Research (IJEGR), vol.9,1,
2013
[8]. F. B Latif. “The Adoption of Electronic Procurement in Turkey” Advances in Economics and Business,
vol. 2,2, 85-91, 2014
[9]. D. Malekia. “E-Procurement as anti-corruption tool in public procurement in Tanzania” European
Journal of Business and Management, vol.7, 14, 2018
[10]. J. J. Masele. “Adoption of green e-business applications for sustainable tourism development in
developing countries the case of Tanzania” (PhD Thesis), Department of Business Informatics I,
VLBA-University of Oldenburg, 2014
[11]. L.M. Mgidlana. “Factors affecting the adoption of e-procurement technologies from the supplier
perspective” (Master’s Research Project) Gordon Institute of Business Science, University of Pretoria,
2013
[12]. R. M. Monczka., & Carter, P. L. Strategic Performance Measurement for Purchasing and Supply,
Tempe AZ, CAPS: Center for Strategic Supply Research, 2015
[13]. J. M. Mose, J. M. Njihia, & P. O. Magutu. “The critical success factors and challenges in e-
procurement adoption among large scale manufacturing firms in Nairobi, Kenya” European Scientific
American Scientific Research Journal for Engineering, Technology, and Sciences (ASRJETS) (2020) Volume 71, No 1, pp 61-86
78
Journal, vol. 9, 13, pp.1857- 7431, 2013
[14]. O. M. Mugenda. Research methods: Quantitative and Qualitative approaches: African Center for
Technology Studies Press, Nairobi: 2003
[15]. G.P., Mwangi, D. Kiarie, & R. Kiai, “Integrated financial management information system,
procurement performance and customer satisfaction in the county Government of Nyeri”, International
Journal of Supply Chain Management, vol. 3, 1, pp.127-45, 2018.
[16]. K. O. Ombat. “Relationship between e-procurement systems and performance of procurement function
in commercial banks in Kenya” International Journal of Economics, Commerce and Management,
United Kingdom, vol. 3, 12, 2015
[17]. G.K. Rotich, & B. Okello. “Analysis of Use of E-Procurement on Performance of the Procurement
Functions of County Governments in Kenya” International Journal of Economics, Commerce and
Management United Kingdom, vol. 3, 6, 2015.
[18]. M. Sarstedt, C. M. Ringle, & J. F. Hair, (2017). “Partial Least Squares Structural Equation Modeling”
[On-line]. available at: DOI: 10.1007/978-3-319-05542-8_15-1 (May,21, 2020)
[19]. L. S., Schooner, I. D. Gordon, & L. J. Clark, “Public Procurement Systems”: Unpacking Stakeholder
Aspirations and Expectations”. GW Law Faculty Publications and Other Works, 111, 2008
[20]. N. I. Shale. “Role of e-procurement strategy on the performance of state corporations in Kenya” (PhD
Thesis) School of Entrepreneurship and Procurement Management in the College of Human Resource
Development, Jomo Kenyatta University of Agriculture and Technology, 2014
[21]. D. N., Shatta, F. A. Shayo, & J. N. Layaa (2020a). “Determinants of e-procurement adoption model for
green procurement in developing countries: Experience from Tanzania”. International Academic
Journal of Procurement and Supply Chain Management, Vol.3, 2, pp.1-18, [On-line]. Available at:
http://www.iajournals.org/articles/iajpscm_v3_i2_1_18.pdf
[22]. M. Suleiman. “Adoption of e-procurement and value addition: Tanzanian context” European Journal of
Business and Management, vol. 7, 14, 2015
[23]. E.A. Taluka. “Understanding factors influencing consumer behavioral intention to use mobile payment
services in rural Tanzania: A Case of Pwani Region” (Master’s Dissertation) University of Dar es
Salaam, 2016
[24]. L. Tornatzky, & M. Fleischer, The Process of Technology Innovation, Lexington, MA, Lexington
Books, 1990
[25]. United Republic of Tanzania (2019). Public Procurement Regulatory Authority Annual performance
evaluation report for 2018/2019 financial year
[26]. United Republic of Tanzania (2018). Public Procurement Regulatory Authority Annual performance
evaluation report for 2017/2018 financial year
[27]. United Republic of Tanzania (2016). National Information and Communications Technology Policy,
Government Printers, Dar es Salaam.
[28]. V., Venkatesh, J. Y. L., & Xu, X. Thong. “Consumer Acceptance and Use of Information Technology:
Extending the Unified Theory” MIS Quarterly, vol. 36, 1, pp. 157–178, 2012
[29]. V. Venkatesh, M. G., Morris, G. B. Davis, & F. D. Davis. “User acceptance of information technology:
Toward a Unified View", MIS Quarterly, vol. 27, 3, pp. 425-478, 2003

American Scientific Research Journal for Engineering, Technology, and Sciences (ASRJETS) (2020) Volume 71, No 1, pp 61-86
79
[30]. J. Watuleke, “E-procurement: evolution and adoption. a review of literature” IJRDO-Journal of
Educational Research: pp. 2456-2947, 2017
[31]. Y., Zhang, J.,Sun, Z. Yang, & Y. Wang, (2020). “Critical success factors of green innovation:
Technology, organization and environment readiness” [On-line]. Available at:
https://doi.org/10.1016/j.jclepro.2020.121701
APPENDIX
Education Level of Respondents against Type of Respondent Cross Tabulation
Table 9
Type of respondent Total
Procuring Entity’
Staff (Procurement
Experts)
Supplier
Education Level of
Respondents
Standard Seven 0 4 4
Secondary level 0 15 15
Certificate
Level
0 5 5
Diploma Level 8 14 22
Degree Level 50 15 65
Master’s
Degree
41 4 45
Ph.D Level 1 0 1
Total 100 57 157
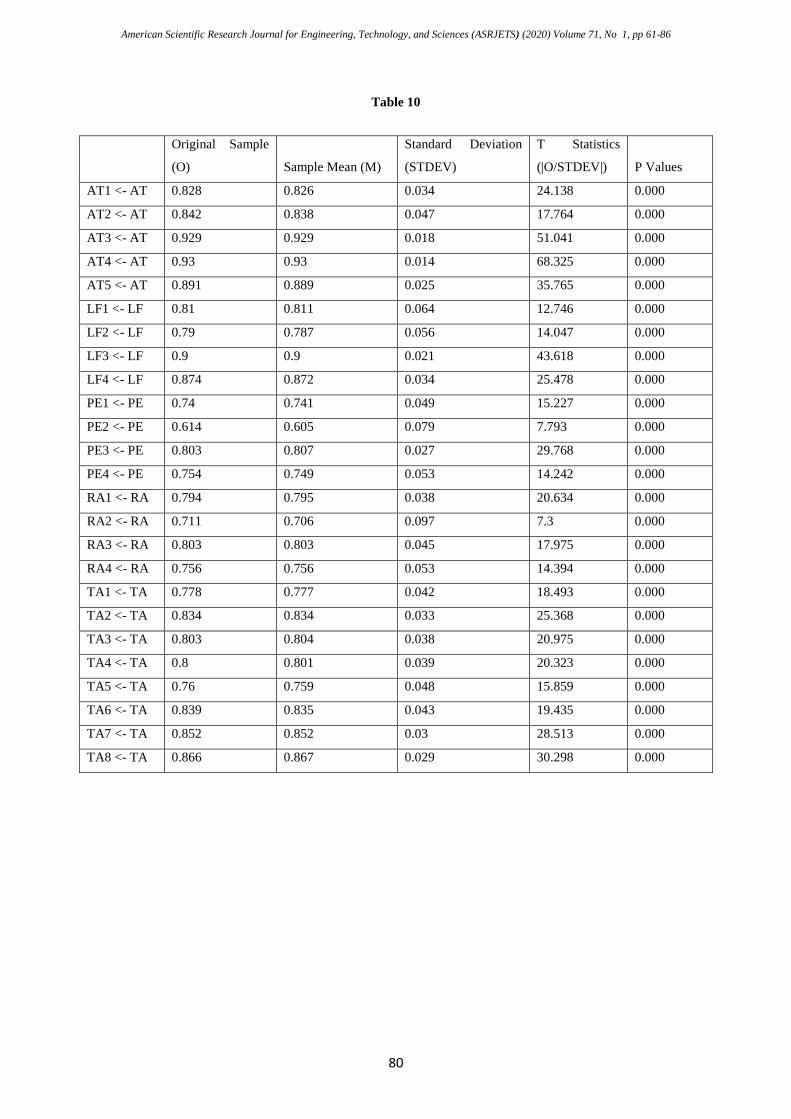
Outer Loadings
American Scientific Research Journal for Engineering, Technology, and Sciences (ASRJETS) (2020) Volume 71, No 1, pp 61-86
80
Table 10
Original Sample
(O) Sample Mean (M)
Standard Deviation
(STDEV)
T Statistics
(|O/STDEV|) P Values
AT1 <- AT 0.828 0.826 0.034 24.138 0.000
AT2 <- AT 0.842 0.838 0.047 17.764 0.000
AT3 <- AT 0.929 0.929 0.018 51.041 0.000
AT4 <- AT 0.93 0.93 0.014 68.325 0.000
AT5 <- AT 0.891 0.889 0.025 35.765 0.000
LF1 <- LF 0.81 0.811 0.064 12.746 0.000
LF2 <- LF 0.79 0.787 0.056 14.047 0.000
LF3 <- LF 0.9 0.9 0.021 43.618 0.000
LF4 <- LF 0.874 0.872 0.034 25.478 0.000
PE1 <- PE 0.74 0.741 0.049 15.227 0.000
PE2 <- PE 0.614 0.605 0.079 7.793 0.000
PE3 <- PE 0.803 0.807 0.027 29.768 0.000
PE4 <- PE 0.754 0.749 0.053 14.242 0.000
RA1 <- RA 0.794 0.795 0.038 20.634 0.000
RA2 <- RA 0.711 0.706 0.097 7.3 0.000
RA3 <- RA 0.803 0.803 0.045 17.975 0.000
RA4 <- RA 0.756 0.756 0.053 14.394 0.000
TA1 <- TA 0.778 0.777 0.042 18.493 0.000
TA2 <- TA 0.834 0.834 0.033 25.368 0.000
TA3 <- TA 0.803 0.804 0.038 20.975 0.000
TA4 <- TA 0.8 0.801 0.039 20.323 0.000
TA5 <- TA 0.76 0.759 0.048 15.859 0.000
TA6 <- TA 0.839 0.835 0.043 19.435 0.000
TA7 <- TA 0.852 0.852 0.03 28.513 0.000
TA8 <- TA 0.866 0.867 0.029 30.298 0.000
American Scientific Research Journal for Engineering, Technology, and Sciences (ASRJETS) (2020) Volume 71, No 1, pp 61-86
81
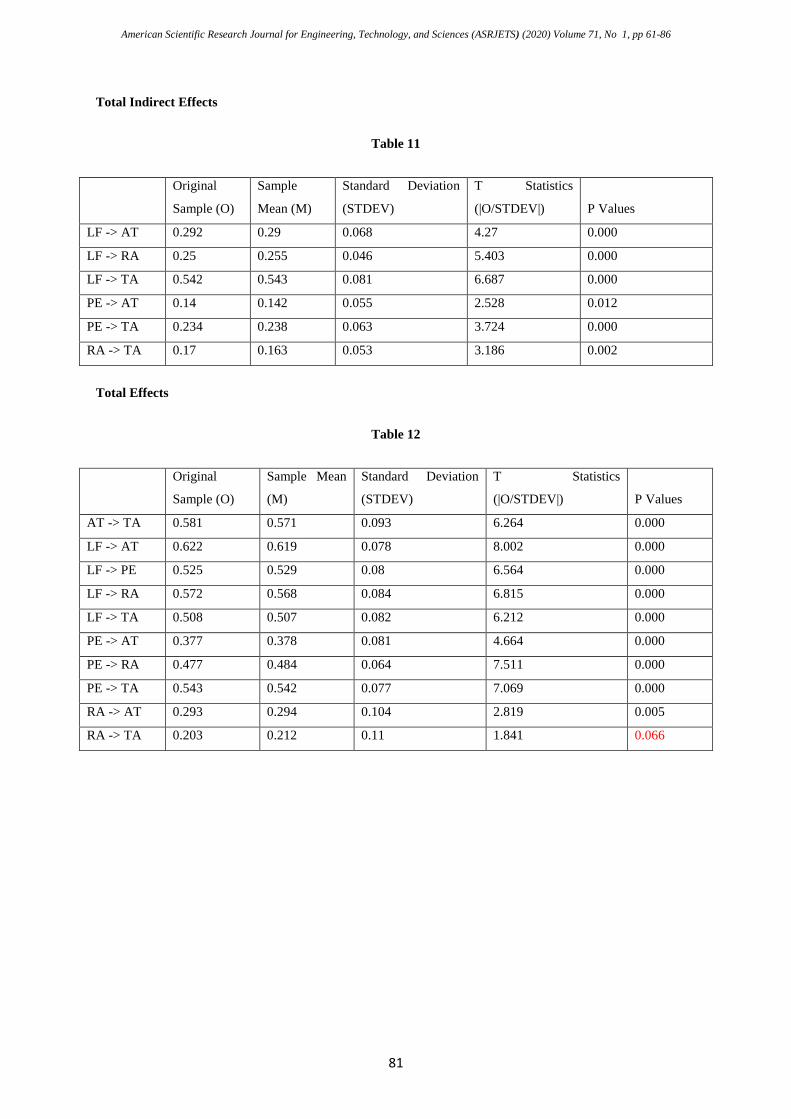
Total Indirect Effects
Table 11
Original
Sample (O)
Sample
Mean (M)
Standard Deviation
(STDEV)
T Statistics
(|O/STDEV|) P Values
LF -> AT 0.292 0.29 0.068 4.27 0.000
LF -> RA 0.25 0.255 0.046 5.403 0.000
LF -> TA 0.542 0.543 0.081 6.687 0.000
PE -> AT 0.14 0.142 0.055 2.528 0.012
PE -> TA 0.234 0.238 0.063 3.724 0.000
RA -> TA 0.17 0.163 0.053 3.186 0.002
Total Effects
Table 12
Original
Sample (O)
Sample Mean
(M)
Standard Deviation
(STDEV)
T Statistics
(|O/STDEV|) P Values
AT -> TA 0.581 0.571 0.093 6.264 0.000
LF -> AT 0.622 0.619 0.078 8.002 0.000
LF -> PE 0.525 0.529 0.08 6.564 0.000
LF -> RA 0.572 0.568 0.084 6.815 0.000
LF -> TA 0.508 0.507 0.082 6.212 0.000
PE -> AT 0.377 0.378 0.081 4.664 0.000
PE -> RA 0.477 0.484 0.064 7.511 0.000
PE -> TA 0.543 0.542 0.077 7.069 0.000
RA -> AT 0.293 0.294 0.104 2.819 0.005
RA -> TA 0.203 0.212 0.11 1.841 0.066
American Scientific Research Journal for Engineering, Technology, and Sciences (ASRJETS) (2020) Volume 71, No 1, pp 61-86
82
Figure 5
American Scientific Research Journal for Engineering, Technology, and Sciences (ASRJETS) (2020) Volume 71, No 1, pp 61-86
83
Table 13
PLS-MGA
Indicators
Outer Loadings-diff ( | Procurement
Experts - Suppliers |)
p-Value(Procurement Experts
vs Suppliers)
AT1 <- AT 0.042 0.280
AT2 <- AT 0.272 0.021
AT3 <- AT 0.093 0.015
AT4 <- AT 0.052 0.080
AT5 <- AT 0.074 0.161
LF1 <- LF 0.188 0.285
LF2 <- LF 0.371 0.115
LF3 <- LF 0.009 0.575
LF4 <- LF 0.026 0.689
PE1 <- PE 0.012 0.569
PE2 <- PE 0.031 0.610
PE3 <- PE 0.045 0.295
PE4 <- PE 0.013 0.467
RA1 <- RA 0.057 0.348
RA2 <- RA 0.221 0.917
RA3 <- RA 0.140 0.181
RA4 <- RA 0.130 0.911
TA1 <- TA 0.003 0.509
TA2 <- TA 0.078 0.177
TA3 <- TA 0.104 0.159
TA4 <- TA 0.051 0.294
TA5 <- TA 0.074 0.796
TA6 <- TA 0.092 0.183
TA7 <- TA 0.010 0.567
TA8 <- TA 0.022 0.640
PLS-MGA
Construct
Indirect Effects-diff ( | Procurement
Experts - Suppliers |)
p-Value(Procurement Experts
vs Suppliers)
AT -> TA
LF -> AT 0.033 0.422
LF -> PE
LF -> RA 0.136 0.098
LF -> TA 0.146 0.208
PE -> AT 0.027 0.387
PE -> RA
PE -> TA 0.063 0.698
RA -> AT
RA -> TA 0.025 0.394
PLS-MGA
Construc
t
Path Coefficients-diff ( | Procurement
Experts (1.0) - Suppliers (2.0) |)
p-Value(Procurement Experts (1.0) vs
Suppliers (2.0))
American Scientific Research Journal for Engineering, Technology, and Sciences (ASRJETS) (2020) Volume 71, No 1, pp 61-86
84
AT -> TA 0.076 0.338
LF -> AT 0.220 0.134
LF -> PE 0.209 0.140
LF -> RA 0.134 0.253
LF -> TA 0.334 0.010
PE -> AT 0.220 0.908
PE -> RA 0.085 0.263
PE -> TA 0.259 0.948
RA -> AT 0.006 0.489
RA -> TA 0.018 0.470
Bootstrapping Results in PLS-MGA
Table 14
Bootstrapping Results in PLS-MGA for Outer Loadings
Table 15
Bootstrapping Results in PLS-MGA for Outer Weights
American Scientific Research Journal for Engineering, Technology, and Sciences (ASRJETS) (2020) Volume 71, No 1, pp 61-86
85
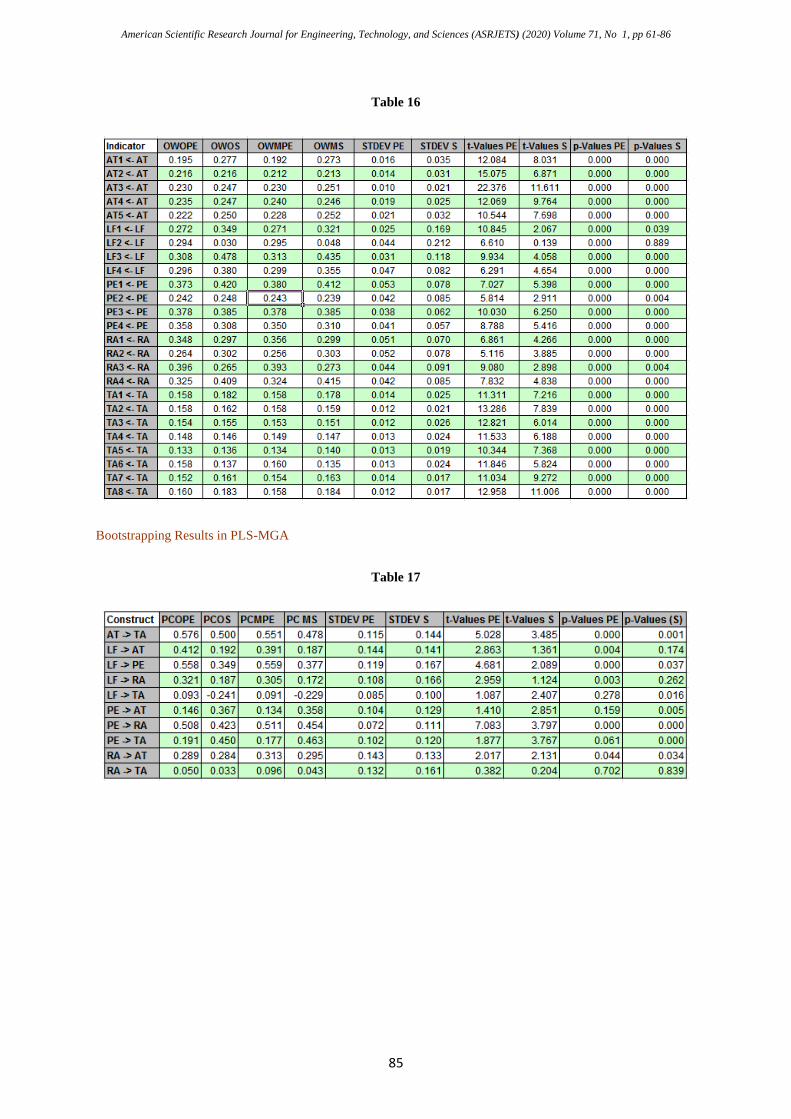
Table 16
Bootstrapping Results in PLS-MGA
Table 17
American Scientific Research Journal for Engineering, Technology, and Sciences (ASRJETS) (2020) Volume 71, No 1, pp 61-86
86
Table 18
Indicators Outer Loadings-diff ( | Procurement
Experts - Suppliers |)
p-Value (Procurement Experts
vs Suppliers)
AT1 <- AT 0.042 0.280
AT2 <- AT 0.272 0.021
AT3 <- AT 0.093 0.015
AT4 <- AT 0.052 0.080
AT5 <- AT 0.074 0.161
LF1 <- LF 0.188 0.285
LF2 <- LF 0.371 0.115
LF3 <- LF 0.009 0.575
LF4 <- LF 0.026 0.689
PE1 <- PE 0.012 0.569
PE2 <- PE 0.031 0.610
PE3 <- PE 0.045 0.295
PE4 <- PE 0.013 0.467
RA1 <- RA 0.057 0.348
RA2 <- RA 0.221 0.917
RA3 <- RA 0.140 0.181
RA4 <- RA 0.130 0.911
TA1 <- TA 0.003 0.509
TA2 <- TA 0.078 0.177
TA3 <- TA 0.104 0.159
TA4 <- TA 0.051 0.294
TA5 <- TA 0.074 0.796
TA6 <- TA 0.092 0.183
TA7 <- TA 0.010 0.567
TA8 <- TA 0.022 0.640
PLS-MGA
Construct
Indirect Effects-diff ( | Procurement
Experts - Suppliers |)
p-Value(Procurement Experts
vs Suppliers)
AT -> TA
LF -> AT 0.033 0.422
LF -> PE
LF -> RA 0.136 0.098
LF -> TA 0.146 0.208
PE -> AT 0.027 0.387
PE -> RA
PE -> TA 0.063 0.698
RA -> AT
RA -> TA 0.025 0.394