stability analysis of photogrammetry models - case studies
TRANSCRIPT

Stability analysis of photogrammetry
models - Case studiesJessica Ka Yi Chiu
2020-03-05 NBG Vårsleppet

E39 Rock Cliff above Eastern Portal for Søgne Tunnel

LiDAR X Photogrammetry

Leica P40
Control and scanning points are surveyed by CPOS cm accuracy

DJI Phantom 4 Pro drone

DJI Phantom 4 Pro drone

Photogrammetrymodel
LiDAR model
Georeferencing:Agisoft Metashape
(<5 cm accuracy)
Meshing, joint mapping, volume estimation:Maptek Point Studio
ST1 ST2 ST4 ST5LiDAR X PhotogrammetryCloud to Cloud registration(error: 2-4 mm)DGNSS (error 3-9 mm)
Joint orientation Joint spacing Volume

Georeferencing of photogrammetry model
Picking 28 fixed points + 8 controlled pointsusing CloudCompareError ~ 3-3.3 cm

9

‘Smart query’

‘Extract’
Red+Black: mapped bothmanually and automatically
Black: overlooked by manual mapping

‘Query’ – manual trace mapping

S1
S2S3
S4
S3
S2
S5?
13
651 joints are mapped
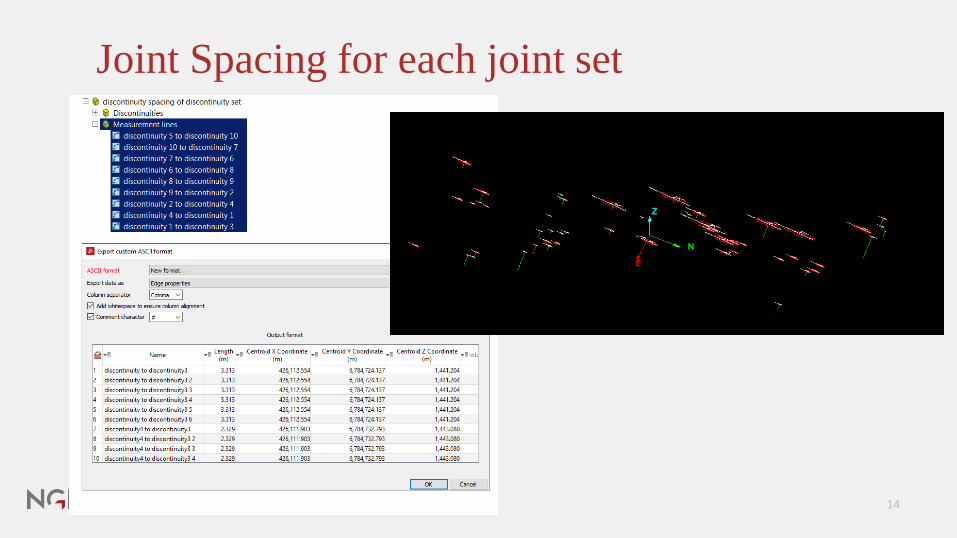
Joint Spacing for each joint set
14

Volume estimation
15

Volume estimation – agreed with client
Aog BC
D
E1
F og GE2
A
B
CD
E2FG
E1
A
B
C DE2 F G
E1

E18 Larvik Rock cut failure investigation

Before failture

https://cloud.google.com/maps-platform/terms/#3.-license-.

Before failure: Google Street View screenshotsGenerated by Agisoft Metashape

After failure: Drone + camera picturesGenerated by Agisoft Metashape

Before and after failure

Georeferencing of models by using Ground Control Points surveyed by DGNSS.Accuracy better than 5 cm

NORWEGIAN GEOTECHNICAL INSTITUTENGI.NO
#onsafeground
Joint mapping usingMaptek PointStudio

Joint roughness estimation usingMaptek PointStudio

Volume and distance measurement using PolyWorks

Underground?
(Source: Bever Control)
Hoverings Solutions drone
Autonomous flight beyond line-of-sight (source: Emesent)

Maptek Laser skanner 2018 NGI Photogrammetry 2017 Bever Control Profiler 2019
S1
S4?
S3
S3b
N
S
EW
Symbol SOURCE Quantity
Bever 19
Color Density Concentrations
0.00 - 2.50
2.50 - 5.00
5.00 - 7.50
7.50 - 10.00
10.00 - 12.50
12.50 - 15.00
15.00 - 17.50
17.50 - 20.00
20.00 - 22.50
22.50 - 25.00
Contour Data Pole Vectors
Maximum Density 24.43%
Contour Distribution Fisher
Counting Circle Size 1.0%
Plot Mode Pole Vectors
Vector Count 19 (19 Entries)
Hemisphere Lower
Projection Equal Angle
Rock joint mapping in tunnel (Båndkall)
S1
S3
S3b
S1
S3
N
S
EW
Symbol SOURCE Quantity
Bever 19
Color Density Concentrations
0.00 - 2.00
2.00 - 4.00
4.00 - 6.00
6.00 - 8.00
8.00 - 10.00
10.00 - 12.00
12.00 - 14.00
14.00 - 16.00
16.00 - 18.00
18.00 - 20.00
Contour Data Pole Vectors
Maximum Density 19.08%
Contour Distribution Fisher
Counting Circle Size 1.0%
Plot Mode Pole Vectors
Vector Count 48 (48 Entries)
Hemisphere Lower
Projection Equal Angle
N
S
EW
Symbol SOURCE Quantity
Bever 19
Color Density Concentrations
0.00 - 2.50
2.50 - 5.00
5.00 - 7.50
7.50 - 10.00
10.00 - 12.50
12.50 - 15.00
15.00 - 17.50
17.50 - 20.00
20.00 - 22.50
22.50 - 25.00
Contour Data Pole Vectors
Maximum Density 24.76%
Contour Distribution Fisher
Counting Circle Size 1.0%
Plot Mode Pole Vectors
Vector Count 37 (37 Entries)
Hemisphere Lower
Projection Equal Angle
S4? S3
S1
S3b S3
S1
S3b
S1
S3

Further applications of 3D models:
Example from E18 Rugtvedt-Dørdahl

>> Parametric Designs of rock support
Example from E18 Rugtvedt-Dørdahl

The what?
A combination of CAD software and programming interface to create 3D geometries.
Grasshopper is a visual programming tool used to create the geometry, and much more…
Rhino is used to visualize results (CAD)

The what?
Geometries are parametric – we can change the parameters to modify the model seamlessly
Geometries are computational – we apply math to create the design
Geometries can be generative– we can iterate the process based on goals to obtain the best solution

The how?It’s like scripting – but simply more intuitive
We can create complex geometries in 3D with little effort – fast and efficient
On this geometry we can perform evaluations and analysis
We can then communicate our design and results using BIM and VR, or export to drawings.
Suitable for development of diciplinemodels in rock support, rock grouting and geotechnical constructions.

Parametric model of rock support in rock slope

NORWEGIAN GEOTECHNICAL INSTITUTENGI.NO
#onsafeground