squat lobster assemblages on seamounts differ from some, but not all, deep-sea habitats of...
TRANSCRIPT

ORIGINAL ARTICLE
Squat lobster assemblages on seamounts differ from some,but not all, deep-sea habitats of comparable depthAshley A. Rowden1, Kareen E. Schnabel1, Thomas A. Schlacher2, Enrique Macpherson3, ShaneT. Ahyong1 & Bertrand Richer de Forges4
1 National Institute of Water & Atmospheric Research, Wellington, New Zealand
2 Faculty of Science, Health & Education, The University of the Sunshine Coast, Maroochydore DC, Queensland, Australia
3 Centro de Estudios Avanzados de Blanes (CSIC), C. acc. Cala Sant Francesc, Blanes, Girona, Spain
4 Systematique, Adaptation et Evolution, UMR7138UPMC-IRD-MNHN-CNRS (URIRD148), Institut de Recherche pourle Developement, Noumea
Cedex, Nouvelle-Caledonie
Introduction
Not long after the first detailed geological descriptions of
seamounts (Hess 1946), biologists began to speculate that
the composition of biotic communities in such environ-
ments might differ from other deep-sea habitats (Hubbs
1959). Early investigations of benthic assemblages on sea-
mounts suggested that levels of endemism were relatively
high (Wilson & Kaufman 1987), thereby establishing a
generalization that benthic communities on seamounts
are distinct. This assertion was strongly supported by
Richer de Forges et al. (2000), who showed that fish and
invertebrate communities of seamounts on adjacent ridges
in the Southwestern Pacific differed markedly at scales of
1000 km. Since then, researchers have sought to deter-
mine whether benthic communities on seamounts are
Keywords
Beta-diversity; community composition; deep-
sea; seamounts; squat lobsters.
Correspondence
Ashley A. Rowden, National Institute of Water
& Atmospheric Research, Private Bag 14-901,
Wellington, New Zealand.
E-mail: [email protected]
Accepted: 2 April 2010
doi:10.1111/j.1439-0485.2010.00374.x
Abstract
This study was carried out to test the hypothesis that benthic communities on
seamounts are distinct from those of other deep-sea habitats at comparable
depths. Analysis of the squat lobster fauna of deep-sea habitats in the South-
western Pacific revealed that the species composition of assemblages on sea-
mounts was not statistically dissimilar from assemblages on slope and plateau
habitat at comparable depths. However, compositional differences were
observed between seamount and rise and ridge habitat. Differences in assem-
blage composition between seamount and ridge habitat were statistically signifi-
cant for two of the four ridge systems examined. Assemblages on seamounts
that were distinct from non-seamount ridge habitat were typically dominated
by small-bodied species with an abbreviated larval stage. Various environmental
variables were correlated with the observed assemblage patterns observed;
depth-related variables may account for differences between seamount and rise
assemblages, whilst differences in POC flux likely play a role in determining
the assemblage compositional patterns between seamount and non-seamount
ridge habitat. Extensive pre-analysis data treatment was required to ensure that
multivariate analyses of assemblage data from seamount and non-seamount
habitats were robust. Our results confirm the findings of recent studies that
found no compositional differences in assemblages from seamount and slope
habitats, and support the idea that dissimilarity between seamount assemblages
on different ridge systems increases with geographic distance. Further research
will be required before the generality of these findings can be confirmed.
Marine Ecology. ISSN 0173-9565
Marine Ecology 31 (Suppl. 1) (2010) 63–83 ª 2010 Blackwell Verlag GmbH 63

also dissimilar from other habitats. More recent studies
have examined the species richness, endemism and or
genetic population structure components of communities,
rather than overall compositional characteristics, and how
they might differ (i.e. beta-diversity or species turnover)
among seamounts and other habitats (e.g. Samadi et al.
2006; O’Hara 2007). A few notable exceptions exist. First,
Hall-Spencer et al. (2007) found that, on average, the
composition of coral assemblages on North Atlantic sea-
mounts were dissimilar to assemblages on island and
slope habitats, but that only the taxonomic distinctness of
coral assemblages on isolated oceanic seamounts and
islands was consistently different from the expected taxo-
nomic distinctness of the regional species pool. Secondly,
O’Hara et al. (2008) found that only ophiuroid assem-
blages associated with coral matrix on seamounts were
dissimilar in composition from assemblages not associ-
ated with biogenic habitat on slope and other seamounts
(which were similar to one another) in the Southwestern
Pacific. Finally, McClain et al. (2009) noted that although
the epifaunal community on an eastern Pacific seamount
and a nearby canyon were generally similar in composi-
tion, there was a difference in the frequency of occurrence
of the component species.
Although worthy contributions to our understanding
of seamount ecology, these recent compositional studies
are somewhat equivocal regarding the question of
whether benthic communities on seamounts are distinct.
What they do demonstrate is that great care is needed
when making comparisons among seamounts, and
between seamounts and other habitats. That is, compara-
tive analyses need to take account of the confounding fac-
tors that can plague examinations of data collected from
sites with different depth ranges, and the combination of
data from multiple sources where the taxonomic consis-
tency among datasets may be in doubt. Unfortunately,
the conclusions of the early study of Richer de Forges
et al. (2000) are somewhat confounded by depth (McC-
lain 2007), and thus the question of whether seamounts
on adjacent ridges have distinct benthic communities
remains unresolved. Likewise, the difference in assemblage
composition between seamount and surrounding ridge
habitats remains completely unassessed.
Squat lobsters (decapod families Galatheidae and Chi-
rostylidae) are particularly well-suited for examining eco-
logical patterns in the deep-sea. They are (i) relatively
large (carapace lengths of 2–70 mm), (ii) easily sampled
by gears such as dredges, sleds and trawls, (iii) ubiquitous
and common from the continental shelf to the deep-sea
(including seamounts), (iv) they display a variety of
opportunistic feeding strategies (e.g. suspension- and
deposit-feeding, scavenging and predation) (Aurioles-
Gamboa & Perez-Flores 1997; Hudson & Wigham 2003;
Romero et al. 2004), (v) some species associate closely
with habitat-forming benthic species such as corals (Rice
& Miller 1991; Kilgour & Shirley 2008), a biogenic habitat
that is found on seamounts (Rogers et al. 2007), and (vi)
are well-resolved taxonomically. In fact, the Census of
Marine Life project COMARGE (Continental Margin
Ecosystems) recently produced a world catalogue of spe-
cies (Baba et al. 2008). Finally, in terms of dispersal,
whereas galatheids generally have extended planktotrophic
larval stages, most chirostylids have an abbreviated larval
stage, thereby offering a useful contrast in terms of larval
dispersal (Guerao et al. 2006; Clark & Ng 2008).
Squat lobster data have recently been compiled for the
Southwestern Pacific (Schnabel 2009a), covering and
extending the region studied by Richer de Forges et al.
(2000) and including data from their analyses (although
species identifications have been updated). These records
were used to examine the following questions: (i) Are
squat lobster assemblages on seamounts different from
other habitats at comparable depths? (ii) Do assemblages
on different ridges systems (seamounts and ridge habitat)
differ? (iii) Do dispersal strategy, body size and environ-
mental factors modify spatial patterns in assemblage com-
position?
Material and Methods
Study area
The study area is located in the Southwestern Pacific
between 5–60� S and 145� E–170� W, and includes the
Solomon Islands, Vanuatu, Fiji and Tonga in the north,
Southeastern Australia in the west, and New Zealand in
the south (Fig. 1). This area covers a diverse range of
undersea geomorphological features, including extensive
shallow shelf, continental slope, oceanic ridges, rises,
abyssal basins, troughs, plateaux and seamounts (isolated,
in complexes, chains, volcanic arcs, or as elevated features
on ridges), which provide habitat for benthic assemblages.
Data
Data for galatheid and chirostylid squat lobsters were
compiled from multiple sources: (i) Historical records for
global expeditions undertaken by the Challenger, Albatross
and Galathea, and reports on local collections between
1873 and 1952 (Haswell 1882; Henderson 1888; Faxon
1895; Thompson 1899; Baba 1988, 1994, 2005) (67
records). (ii) Collections from the tropical Southwest
Pacific Ocean carried out by the Institute de Recherche
pour le Developpement (IRD) and Museum national
d’Histoire naturelle, Paris (MnHn), since 1976 (e.g. Saint
Laurent de & Macpherson 1990; Macpherson 1994, 1996,
Squat lobster assemblages of deep-sea habits Rowden, Schnabel, Schlacher, Macpherson, Ahyong & Richer de Forges
64 Marine Ecology 31 (Suppl. 1) (2010) 63–83 ª 2010 Blackwell Verlag GmbH

1999, 2004; Saint Laurent de & Poupin 1996) (4253
records). (iii) Collections made by Australian scientific
programs since 1948 by the Commonwealth Scientific
and Industrial Research Organisation (CSIRO), South
Australia Research and Development Institute (SARDI),
New South Wales Fisheries, and the CIDARIS I, II and
III expeditions between 1986 and 1992 (Baba 1994;
Ahyong & Poore 2004a,b) (436 records). (iv) Collections
from the New Zealand region made primarily by the
National Institute of Water and Atmospheric Research
(NIWA) and its predecessor the New Zealand Oceano-
graphic Institute, plus miscellaneous collections in the
Dominion Museum, now the National Museum Te Papa
Tongarewa, made by Victoria University of Wellington,
and the Portobello Marine Laboratory (University of
Otago) since 1956 (e.g. Vereshchaka 2005; Schnabel &
Bruce 2006; Schnabel 2009b) (1701 records). (v) Records
from the 2003 NORFANZ voyage to the mid-Tasman
Sea, a collaborative sea-floor survey between Australian
and New Zealand institutions (National Oceans Office,
Fig. 1. Map showing the main geomorphic features in Southwestern Pacific Ocean from which squat lobster data were obtained for the study.
Dotted lines indicates break between geomorphic features. Bathymetric contours for 200 and 1600 m are shown. Inset: galatheid Munida obesa
(left) and chirostylid Uroptychus nitidus occidentalis (right) [after Faxon 1895 and Henderson 1888, respectively].
Rowden, Schnabel, Schlacher, Macpherson, Ahyong & Richer de Forges Squat lobster assemblages of deep-sea habits
Marine Ecology 31 (Suppl. 1) (2010) 63–83 ª 2010 Blackwell Verlag GmbH 65

CSIRO Marine Research, Australia, New Zealand Ministry
of Fisheries and NIWA (Ahyong 2007) (33 records). The
complete dataset comprised 6490 specimen records
throughout the region and between 0 and 4520 m water
depth.
The dataset contained 502 species of Galatheidae (24
genera, 302 species) and Chirostylidae (six genera, 200
species). Recent monographic treatments provide stable
classifications within both families (e.g. Baba 2005; Mac-
pherson 2007; Baba et al. 2008), allowing for taxonomic
consistency across datasets and regions. Taxon names
generally follow Baba et al. (2008); however, where spe-
cies remained incompletely defined, the following conven-
tions were followed: (i) Agononida incerta is represented
by two unresolved species, type A and B, that co-occur
along the eastern Australian margin. Not all, particularly
historical, records can be referred to either of these types
and all records were combined to a single species
A. incerta. (ii) Approximately 100 undescribed taxa,
primarily within the chirostylid genus Uroptychus, are
currently being described. These undescribed species
occur in the source records, and these have been recon-
ciled by Keiji Baba (Kumamoto University, Japan) and
K.S., based on drawings and unpublished descriptions.
Data treatment
To compare squat lobster assemblage composition among
and within regions and major geomorphic habitat types
(hereafter referred to simply as ‘habitats’), the following
series of treatments was applied to the compiled dataset:
Gear type
Only trawled gear (trawls, sleds, dredges, etc.) were
included. Towed gear is efficient at sampling squat lob-
sters, and the different towed gears are likely to produce
comparable data.
Habitat and region affiliation
The affiliation of each station was determined via a gen-
eral geomorphic habitat classification (rise, ridge, plateau,
continental slope) for the study area using arcgis 9.3.1
software. Stations were considered to be on a seamount
when the sampling record made specific note of a se-
amount name, or when the station position was within
10 km of a seamount included in seamount databases for
the Western Pacific and the New Zealand regions (Allain
et al. 2008; Rowden et al. 2008). A 10-km radius approxi-
mates the average area of seamounts in the region (Row-
den et al. 2005). Although this criterion will deem some
station records to be associated with smaller features, the
bias introduced is acceptably small. The regional affilia-
tion (e.g. Tonga, Lord Howe, Southeastern Australia) of
stations within habitats was made with reference to a
map of the study area that named each geomorphic habi-
tat (Fig. 1).
Overall depth range
Graphical examination of the depth distribution of all
seamount and non-seamount stations indicated that the
majority of records for these two habitat groups spanned
a depth range of 200–1600 m. Records outside this range
were excluded.
Number of stations per ‘feature’
This was used in the initial analysis to examine bias
related to variable sample effort (see section below).
Spatial sampling scale
To account for a potential sampling area effect (see
O’Hara 2007) it was necessary to standardize the area
over which samples were taken on seamounts and non-se-
amount habitats. We used gis software and tools (argis
9.3.1) for our approach (some standard gis terms are
included in the following description). The geometric
mean distance between sample stations was computed
using the ‘distance between points tool’ in Hawth’s Tools
(Beyer 2004). The mean distance between seamount sta-
tions ranged from <100 m to approximately 100 km with
an average distance of �10 km. To attain a similar spatial
scale of sampling density for seamount and non-se-
amount habitats, ‘pseudo-features’ were generated for
non-seamount habitats that were of such a size that they
contained sample stations at similar densities as occurred
on individual seamounts (= features). This treatment was
achieved by buffering sample stations on non-seamount
pseudo-features by a radius which resulted in the mean
distance between sample stations within the polygons
being similar to that within seamounts. The individual
buffers were dissolved based on the feature-type attribute
for each station. Only pseudo-features that contained
three or more sample stations were used in the mean dis-
tance calculations. A buffer radius of 7 km was found to
produce similar densities between seamount features and
non-seamount pseudo-features (hereafter both are
referred to as simply ‘features’), with average mean
distances ranging from 9.2 (ridge) to 11.4 km (rise).
The net result of these five treatments was a dataset
comprising 389 species from 1871 stations that were
distributed among 201 features. There were one to 18
features within one region and habitat (Table 1). This
dataset was further treated as follows:
Depth range per habitat ⁄ region
A graphical examination of the bathymetric distribution
of stations for each habitat ⁄ region was used to select only
Squat lobster assemblages of deep-sea habits Rowden, Schnabel, Schlacher, Macpherson, Ahyong & Richer de Forges
66 Marine Ecology 31 (Suppl. 1) (2010) 63–83 ª 2010 Blackwell Verlag GmbH

data from a depth range that overlapped between the
seamount and non-seamount group of stations. The
resulting depth ranges varied from 300–700 m for the
Chatham Rise to 200–1200 m for the Norfolk Ridge.
Number of species per feature
Features with fewer than three species were excluded, as
exploratory analysis revealed that such features appeared
as outliers in terms of their assemblage dissimilarity to
other features.
Number of features per habitat ⁄ region
To ensure at least three features per seamount and non-
seamount habitat in a region, data were excluded from
habitats with fewer than three features and from regions
with only one habitat type.
These final treatment steps resulted in a dataset of 290
species distributed among 1202 stations on 109 features
within four habitat types (plateau, rise, continental slope,
ridge) over seven regions (Chatham, Kermadec, Loyalty,
Norfolk, Northland, Southeastern Australia and Tonga)
(Fig. 2). This dataset allowed for four regional seamount-
ridge comparisons and single comparisons between
seamount and rise, plateau and continental slope habitats
(Table 1).
Environmental data
To identify important factors that may influence
the composition of squat lobster assemblages, a dataset
of environmental variables for each station was compiled
from a number of sources: (i) Mean depth per station
was calculated from start- and end-depth for each
tow from published and unpublished station records. In
the absence of an end-depth, the start-depth alone was
used. (ii) Sea-floor temperature (�C), salinity (ppm) and
oxygen (mlÆl)1) data were derived from the CARS2006
dataset, which contains mean values and seasonal coeffi-
cients (annual ⁄ semi-annual sine ⁄ cosine values) created
by averaging ⁄ interpolating available oceanographic cast
data across the southern hemisphere and equatorial
regions for 79 depth layers at a resolution of 0.5�latitude ⁄ longitude (Dunn & Ridgway 2002; Ridgway
et al. 2002; http://www.marine.csiro.au/~dunn/cars2006/).
(iii) Estimates of particulate organic carbon (POC) were
derived from a global NPZD (nutrient-phytoplankton-
zooplankton-detritus) model (R. Matear, CSIRO unpub-
lished data), of resolution 1.875� longitude, 0.9375�latitude, and 31 depth layers, by converting the detritus
data (mmol NÆm)3) to carbon (lg CÆm)3) using the 106:
16 N:C ratio of seawater multiplied by the molar weight
of carbon (12.01 gÆmol)1). All data were horizontally
interpolated (and extrapolated across coastlines) for each
depth layer to 0.02� by using the inverse distance
weighted algorithm in the Spatial Analyst module of
arcmap v. 9.0 (ESRI 2004). Values for each station
(on the sea floor) were then calculated by trilinear
interpolation between these fine-scale depth layers,
scaled by the actual latitude ⁄ longitude ⁄ depth recorded
for each station. (iv) Additionally, POC flux (molÆm)2Æ-day)1) values were obtained from the sea-floor model
of these variables by Yool et al. (2009). (v) Data for
scleractinian or stony coral habitat suitability (%), as a
proxy for the availability of such coral as a habitat
for squat lobsters, was obtained from Tittensor et al.
(2009).
Table 1. Number of features (sample unit), and their depth range,
per region and habitat (see text for full definition of these terms) for
squat lobster data compiled for the study.
Region Habitat
A – all features B – selected
features
No. of
features
Depth
range (m)
No. of
features
Depth
range (m)
Cascade Plateau 1 843
Challenger Plateau 3 212–484
Northland Plateau 6 361–781 5 361–781
Seamount 10 296–1373 7 296–998
Queensland Plateau 3 606–1424
Chatham Rise 12 173–422 7 253–483
Seamount 11 382–1081 3 382–699
Chesterfield Rise 1 970
Seamount 2 401–622
Hikurangi Slope 5 478–806
Seamount 1 921
SE Australia Slope 11 397–1015 6 531–1015
Seamount 6 828–1253 5 828–1253
Kermadec Ridge 3 441–621 3 441–621
Seamount 7 369–1387 4 369–659
Lau Ridge 15 269–589
Seamount 1 492
Loyalty Ridge 4 409–700 4 425–700
Seamount 5 323–722 5 323–722
Norfolk Ridge 18 202–754 18 202–754
Seamount 18 279–1207 17 279–778
Solomon Ridge 12 327–1164
Tonga Ridge 10 323–585 10 323–585
Seamount 10 401–1285 9 401–734
Vanuatu Ridge 12 343–1392
Seamount 1 450
Lord Howe Seamount 7 309–763
Macquarie Seamount 1 1297
Reinga Seamount 1 653
West Norfolk Seamount 3 428–811
Regions in bold indicate sufficiently large sample size for comparisons
of assemblages between seamount and non-seamount habitats. A: all
possible features between 200 and 1600 m. B: features selected for
comparable depth, habitat and with ‡3 features per habitat.
Rowden, Schnabel, Schlacher, Macpherson, Ahyong & Richer de Forges Squat lobster assemblages of deep-sea habits
Marine Ecology 31 (Suppl. 1) (2010) 63–83 ª 2010 Blackwell Verlag GmbH 67

(A)
(B)
(D)
(C)
Fig. 2. Maps showing the location of ‘features’ (see text for definition) from which squat lobster data were analysed from different regions and
habitats: (A) Norfolk, Loyalty, Kermadec and Tonga Ridges, (B) Southeastern Australia continental slope, (C) Northland Plateau and (D) Chatham
Rise. Symbols indicate sampled features, with red triangles representing seamount habitat, diamonds inverted triangles (plateau), squares (slope)
and circles (rise) representing non-seamount habitat. Bathymetric contours for 200 and 1600 m are shown.
Squat lobster assemblages of deep-sea habits Rowden, Schnabel, Schlacher, Macpherson, Ahyong & Richer de Forges
68 Marine Ecology 31 (Suppl. 1) (2010) 63–83 ª 2010 Blackwell Verlag GmbH

Ancillary biological data
Factors implying either an abbreviated (short) or
complete (long) larval duration were assigned to each
species using information from the literature to examine
possible effects for the assemblage patterns observed. For
example, most chirostylid larvae (observed in genera Chi-
rostylus, Uroptychus and Gastroptychus, but not Eumun-
ida) appear to hatch at an advanced zoeal stage
equivalent to the fourth or fifth stage zoea of galatheids
(with the exception of the galatheid genus Munidopsis)
(Pike & Wear 1969; Samuelsen 1972; Guerao et al. 2006;
Clark & Ng 2008). Secondly, maximum body size (mea-
sured as the postorbital carapace length in mm) was
established for each species, based on examinations of
specimens and literature.
Data analysis
Data were analysed using the primer v. 6 software pack-
age (Clarke & Gorley 2006; and references in Clarke &
Warwick 2001). Species data were first averaged for the
selected features (so that feature rather than station
became the ‘sample unit’ of comparison), then presence–
absence transformed. The Bray–Curtis coefficient was
used to measure assemblage similarity between all fea-
tures.
Assessment of sampling effort bias
To address the possibility of a bias imposed by the
difference in sampling effort per feature (i.e. number of
stations per feature ranged from three to 97, with a
mean of 9.1 ± 12.7 SD), a series of Spearman’s rank
correlation coefficients (q) were computed using the
RELATE routine in primer to test for significant devia-
tions between the similarity matrices for features con-
taining all and a maximum of 20, 10 and five stations.
Stations were chosen at random for features with sta-
tions exceeding the chosen number of stations and a
similarity matrix was constructed for the averaged sta-
tion data by feature. In all cases the Spearman rank
correlations indicated that there were no significant
differences between fully (all stations) and partially (20,
10, 5 randomly sampled stations) sampled features
(q > 0.96 in all cases). Thus, all subsequent analyses
included data from all stations for each seamount and
non-seamount feature.
Assemblage composition
Non-metric multi-dimensional scaling (NMDS) ordina-
tion plots were used to visualize the similarity among
squat lobster assemblages of different features among
habitats ⁄ regions. Differences in assemblage composition
between seamount and non-seamount habitats were
tested with analysis of similarities (ANOSIM). For fea-
tures from the habitat rise, plateau and slope, only
one-way comparisons with seamount habitat were pos-
sible for the Chatham, Northland and Southeastern
Australia regions, respectively. For features of the
ridge habitat, a two-way crossed test was examined
using the habitat (seamount or non-seamount) and
region (Norfolk, Kermadec, Loyalty and Tonga) as the
factors.
Species contributing the most to the average similar-
ity within a habitat ⁄ region and the average dissimilarity
between habitat ⁄ region were identified using the simi-
larities percentage (SIMPER) routine. SIMPER was con-
ducted using the same design as used for the ANOSIM
test. Characterizing and discriminating species were
ranked by their average contribution (%) to the within-
and between-group similarity and dissimilarity and the
ratio of similarity ⁄ dissimilarity and standard deviation
(SD), respectively. Species are considered a good char-
acterizing ⁄ discriminating species if the ratio of the
mean to the standard deviation of the contribution of
each species to the overall similarity ⁄ dissimilarity
between groups is ‡1.3 (page 7–3, Clarke & Warwick
2001).
The body size of characterizing ⁄ discriminating species,
whether the species belonged to the families Galatheidae
or Chirostylidae, or had a complete (long) or abbreviated
(short) larval stage was recorded to assess qualitatively
whether there were any notable differences in these
biological attributes for squat lobster assemblages from
seamount and non-seamount habitats.
Relationship with environmental variables
Relationships between environmental data and overall
squat lobster assemblage composition pattern were
assessed using the BIOENV Spearman rank correlation
routine for each of the subsets of seamount and non-se-
amount habitat assemblage data. BIOENV searches for
the smallest possible subset of variables which, in combi-
nation, describe most of the pattern in the full dataset.
Before running the analyses, draftsman’s plots of pair-
wise combination of variables were examined visually for
collinearity. A variable would be excluded if its correla-
tion with another variable(s) exceeded 0.90. Environmen-
tal variables in the final analysis were normalized,
and included mean station depth, mean temperature,
temperature range, mean salinity, mean oxygen, POC
concentration, POC flux, and stony coral habitat suitabil-
ity. ‘Bubble plots’, where the values for the BIOENV
identified environmental variable(s) are overlaid as
proportional circles on the NMDS plots for assemblage
data, were used to visually explore how environmental
Rowden, Schnabel, Schlacher, Macpherson, Ahyong & Richer de Forges Squat lobster assemblages of deep-sea habits
Marine Ecology 31 (Suppl. 1) (2010) 63–83 ª 2010 Blackwell Verlag GmbH 69

variability is related to differences in assemblage composi-
tion by habitat ⁄ region.
Results
Differences in assemblage composition
The overall NMDS ordination (Fig. 3) revealed a regional
separation of squat lobster assemblages on features that is
apparently unrelated to habitat type; with a generally
south–north gradient from the southern assemblages of
the Chatham Rise and the Southeastern Australian conti-
nental margin (bottom right and bottom of plot), to
those of the northern ridges of Norfolk, Loyalty and
Tonga (top left of plot), with assemblages of the North-
land Plateau and the Kermadec Ridge in between
(roughly in the centre of plot). Within regions, differences
in assemblage composition between habitat types were
less obvious. However, for ridge habitat, which is not pre-
dominantly restricted to a single region, assemblages of
features from this habitat mostly cluster separately from
those of seamount habitat (Fig. 3). Examination of sepa-
rate NMDS plots for each habitat ⁄ region (Fig. 4) within
which an assemblage composition comparison can be
made between seamount habitat and another habitat,
allowed for a better appreciation of differences that were
indicated by the formal ANOSIM tests.
One-way ANOSIM tests (Table 2) revealed that the
composition of squat lobster assemblages on seamount
habitat was significantly different from that on rise habi-
tat (Chatham Rise region), but not plateau (Northland
region) or slope (southeastern Australia region) habitat.
The two-way ANOSIM test (Table 2) indicated a rela-
tively small yet significant difference in assemblage com-
position across regions, and between seamount and non-
seamount habitats for the four ridge regions examined.
Pair-wise tests revealed that differences in assemblage
composition between seamount and non-seamount ridge
habitat were significant for the Norfolk and Tonga ridge
regions, but not the Kermadec and Loyalty ridge
regions.
Assemblage composition
SIMPER analyses provided a list of the species that con-
tribute to 90% of the similarity ⁄ dissimilarity observed
for ⁄ between squat lobster assemblages of seamount and
non-seamount habitats for the Southeastern Australia
slope, Chatham Rise and Northland Plateau (Table 3),
and for the Kermadec, Loyalty, Norfolk and Tonga Ridges
(Table 4). The taxonomic group, body size and larval
duration of these contributing species is also noted in
these tables.
As indicated by the proportional contribution to the
total similarity, most of the assemblages were dominated
by galatheid taxa, primarily of the genera Munida, Phyll-
adiorhynchus and Agononida. In particular, two species,
Munida gracilis and Munida isos, not only were dominant
in the slope, rise and plateau habitats but were also
consistently identified as characterizing species. However,
Fig. 3. NMDS ordination plot of presence ⁄ absence squat lobster data for all features coded by habitat (see key) and labelled by region. Norfolk
(Nf), Loyalty (L), Tonga (T) and Kermadec (K) ridges, Northland Plateau (Nl), southeastern Australia continental slope (A), Chatham Rise (C).
Squat lobster assemblages of deep-sea habits Rowden, Schnabel, Schlacher, Macpherson, Ahyong & Richer de Forges
70 Marine Ecology 31 (Suppl. 1) (2010) 63–83 ª 2010 Blackwell Verlag GmbH

with the exception of M. isos on the Chatham Rise, these
species tend to occur in both seamount and non-se-
amount habitats. The latter species, along with Munidop-
sis ceres, are the galatheids that discriminate between
assemblages of seamount habitat (where they occur more
frequently) and the non-seamount habitat on the rise
(which were identified by the ANOSIM as being signifi-
cantly different in composition).
Chirostylids were represented primarily by the genus
Uroptychus in both seamount and non-seamount habitats
(with the exception of the plateau habitat). Uroptychus
gracilimanus and Gastroptychus novaezelandiae were the
characterizing species for non-seamount habitats of the
slope and rise, whilst two undescribed species of Uropty-
chus characterized the assemblage of the seamount habitat
on the Chatham Rise. An undescribed species (U. sp. P)
and G. novaezelandiae were the most important discrimi-
nating species for assemblages from the seamount and
non-seamount habitats on the rise, with the former
occurring more often on seamount habitat and the
latter more often sampled on the non-seamount habitat
on the rise.
For assemblages associated with different ridge struc-
tures, only one species (Munida leagora) was deemed a
2D Stress: 0 2D Stress: 0.08
2D Stress: 0.15
2D Stress: 0.07
2D Stress: 0
2D Stress: 0.08
2D Stress: 0.12
2D Stress: 0.13
(A) Rise Plateau
Slope Ridges
Norfolk ridge Loyalty ridge
Tonga ridge Kermadec ridge
(B)
(C) (D)
(E) (F)
(G) (H)
Fig. 4. NMDS ordination plots of presence ⁄ absence of squat lobster assemblage composition data for seamount and non-seamount habitats: (A)
rise, (B) plateau, (C) continental slope, (D) ridges (all regions); and for seamount and ridge habitat within a region: (E) Norfolk Ridge, (F) Loyalty
Ridge, (G) Tonga Ridge, (H) Kermadec Ridge. Seamounts are shown by red triangles in all cases.
Rowden, Schnabel, Schlacher, Macpherson, Ahyong & Richer de Forges Squat lobster assemblages of deep-sea habits
Marine Ecology 31 (Suppl. 1) (2010) 63–83 ª 2010 Blackwell Verlag GmbH 71

characterizing species (for non-seamount habitat on
Loyalty Ridge). Three different Munida species were
identified as discriminating species from seamounts and
non-seamount ridge habitats for Kermadec, Loyalty and
Tonga Ridges. Munida runcinata, which occurred more
often on non-seamount ridge habitat, was the discrimi-
nating species for one (Tonga) of two pair-wise, inter-
ridge comparisons of assemblage composition identified
by ANOSIM as being statistically significant (the other
being the Norfolk Ridge).
No chirostylid species were identified as discriminating
species for the dissimilarity observed between seamount
and non-seamount habitat on the Tonga and Norfolk
Ridges. However, this taxonomic group dominated the
list of species that contributed to the similarity for the
assemblage of the seamount habitat on Norfolk Ridge,
and representative species were also found among those
that defined the similarity of the seamount assemblage on
the Tonga Ridge.
Species characteristics
The average body size of species that contributed to 90%
of the similarity observed for squat lobster assemblages of
seamount and non-seamount habitats was larger for non-
seamount rise and plateau habitat (19 mm) than for se-
amount habitat (13 ⁄ 14.5 mm) (Table 4). The size of the
individual discriminating species for the Chatham Rise
comparison of seamount and non-seamount assemblages
reflected the aforementioned differences in average size
between habitats. No obvious difference in average size
was observed for assemblages of slope habitats. For
assemblages of the different ridge structures, average body
size was somewhat larger for non-seamount ridge habitat
(18.6 ⁄ 16 mm) than for seamount habitat on Norfolk and
Tonga Ridges (13.8 ⁄ 14.9 mm). The size of the single dis-
criminating species for the Tonga Ridge comparison of
seamount and non-seamount assemblages did not reflect
the aforementioned differences in average size between
habitats. No obvious difference in average size was
observed for assemblages of habitats on the Loyalty and
Kermadec Ridges.
Examination of the list of species that contributed
most to the dissimilarity observed in assemblage compo-
sition between habitats on the rise and plateau indicated
that species that occur more frequently on seamount
habitat have a short larval duration. A similar pattern
was observed for the ridge structure, where an examina-
tion of the list of species that contributed most to the
dissimilarity observed in assemblage composition
between habitats on the Tonga and Norfolk Ridges
(those assemblages that indicated significant differences
between seamount and non-seamount assemblages)
indicated that typically, species that occur more
frequently on non-seamount ridge habitat have a long
larval duration.
Environmental drivers
Results of the BIOENV analysis reveal that different envi-
ronmental drivers, or combinations of variables, appear
to provide the highest explanatory power for different
assemblage groupings (Table 5). The overall assemblage
pattern (which, as already noted, appeared to at least
partly reflect a geographic pattern) was most highly corre-
lated with the predicted average flux of POC to the sea
floor. Examination of the bubble plot (not shown) for the
overall assemblage data indicates that POC flux to be rel-
atively high on the Chatham Rise (where it was particu-
larly high), Northland Plateau, and Southeastern
Australian continental slope for both seamount and non-
seamount habitats.
For assemblage data that ANOSIM revealed to be dif-
ferent between seamounts and other habitats, i.e. rise and
some ridges, median depth was indicated as being corre-
lated with the assemblage pattern observed. Bubble plots
indicated that seamounts on the Chatham Rise were gen-
erally deeper than non-seamount features on this rise. No
obvious depth–habitat pattern was suggested by the bub-
ble plots for the overall ridge assemblage data. However,
in addition to depth, the predicted average flux of POC
was also included as an explanatory environmental vari-
able for the seamount-ridge assemblage pattern. Examina-
tion of the bubble plot suggests that the overall ridge
assemblage pattern is partly driven by a decreasing south–
north gradient in POC flux.
Table 2. Results of the ANOSIM analysis (R values) for tests of squat
lobster assemblage composition dissimilarity between habitat and
region.
Rise Plateau Slope
One-way
Seamount versus
non-seamount
habitat
0.956 0.105 0.179
Two-way crossed
Across regions 0.292
Seamount versus
Ridge habitat
0.264
Pair-wise for each
region (ridge
system)
Norfolk Kermadec Loyalty Tonga
Seamount versus
Ridge habitat
0.310 0.148 0.047 0.263
Bold indicates results with significance levels of P < 0.05.
Squat lobster assemblages of deep-sea habits Rowden, Schnabel, Schlacher, Macpherson, Ahyong & Richer de Forges
72 Marine Ecology 31 (Suppl. 1) (2010) 63–83 ª 2010 Blackwell Verlag GmbH

Tab
le3.
Res
ults
of
the
SIM
PER
anal
ysis
for
one-
way
com
par
isons
bet
wee
nse
amount
and
non-s
eam
ount
hab
itat
s(s
lope,
rise
,pla
teau
)w
ithin
are
gio
n,
listing
squat
lobst
ersp
ecie
sth
at
contr
ibute
dth
em
ost
toas
sem
bla
ge
sim
ilarity
⁄dis
sim
ilarity
obse
rved
.
Seam
ount
Non-s
eam
ount
Seam
ount
vers
us
non-s
eam
ount
Fam
ilyTa
xon
Contr
ib
%
Sim ⁄SD
Body
size
Larv
al
dev
Fam
ilyTa
xon
Contr
ib
%
Sim ⁄SD
Body
size
Larv
al
dev
Fam
ilyTa
xon
Abund
SMT
Abund
nSM
T
Contr
ib
%
Dis
s
⁄SD
Body
size
Larv
al
dev
Slope
GM
un
ida
iso
s57.6
77.7
514
lC
Uro
pty
chu
s
gra
cili
man
us
32.1
41.2
98
sC
Uro
pty
chu
s
gra
cili
man
us
00.8
311.5
41.9
38
s
GM
unid
a
endea
voura
e
16.3
70.6
218
lC
Uro
pty
chus
aust
ralis
21.3
60.7
711
sG
Munid
ais
os
10.5
7.9
50.9
614
l
CU
ropty
chus
aust
ralis
16.3
70.6
211
sC
Uro
pty
chus
bab
ai10.5
40.4
713
sC
Uro
pty
chus
bab
ai
00.5
7.3
70.9
413
s
CG
astr
opty
chus
roger
i
9.5
20.4
730
sG
Munid
a
endea
voura
e
0.6
0.5
7.1
70.9
418
l
GM
unid
a
endea
voura
e
9.5
20.4
718
lC
Gas
tropty
chus
roger
i
0.2
0.5
6.9
80.9
430
s
GM
unid
ais
os
8.2
50.4
814
lC
Uro
pty
chus
aust
ralis
0.6
0.6
76.6
60.8
811
s
CU
ropty
chus
empher
es
0.4
0.3
36.4
30.8
912
s
CU
ropty
chus
litosu
s
0.4
0.3
36.4
30.8
915
s
Ave
rage
body
size
14.3
Ave
rage
body
size
15.7
GM
unid
opsi
s
kensl
eyi
00.3
34.3
00.6
819
s
Proport
ion
of
s⁄l
1⁄2
Proport
ion
of
s⁄l
4⁄ 2
GM
unid
opsi
s
cf.
serr
icorn
is
0.2
0.1
74.2
60.6
312
s
Ris
eG
Mu
nid
ag
raci
lis
20.7
14.6
425
lG
Mu
nid
ag
raci
lis
35.9
5.3
625
lC
Uro
pty
chu
s
sp.
P
10
17.4
64.2
09
s
GPh
yll
ad
iorh
yn
-
chu
ssp
.1
20.7
14.6
412
lG
Ph
yll
ad
iorh
yn
-
chu
ssp
.1
35.9
5.3
612
lC
Gast
rop
tych
us
no
vaeze
lan
-
dia
e
00.8
214.2
41.8
220
s
CU
rop
tych
us
sp.
A20.7
14.6
47
sC
Gast
rop
tych
us
no
vaeze
lan
dia
e
23.3
1.2
920
sC
Uro
pty
chus
sp.
A
10.3
611.8
21.2
27
s
CU
rop
tych
us
sp.
P20.7
14.6
49
sG
Mu
nid
ais
os
0.6
70
10.1
81.3
314
l
GM
unid
ais
os
5.7
10
0.5
814
lG
Mu
nid
op
sis
cere
s
0.6
70
10.1
81.3
311
s
GM
unid
opsi
sce
res
5.7
10
0.5
811
sC
Uro
pty
chus
sp.
T
0.6
70.1
89.6
61.1
810
s
GPh
ylla
dio
rhyn
-
chus
pusi
llus
0.3
30.2
78.0
70.8
14
l
Ave
rage
body
size
13
Ave
rage
body
size
19
GM
unid
opsi
s
pap
anui
0.3
30
4.2
80.6
97
s
Proport
ion
of
s⁄l
3⁄3
Proport
ion
of
s⁄l
1⁄2
GM
unid
opsi
s
cf.
serr
icorn
is
0.3
30
4.2
80.6
912
s
Rowden, Schnabel, Schlacher, Macpherson, Ahyong & Richer de Forges Squat lobster assemblages of deep-sea habits
Marine Ecology 31 (Suppl. 1) (2010) 63–83 ª 2010 Blackwell Verlag GmbH 73

Tab
le3.
(Continued
)
Seam
ount
Non-s
eam
ount
Seam
ount
vers
us
non-s
eam
ount
Fam
ilyTa
xon
Contr
ib
%
Sim ⁄SD
Body
size
Larv
al
dev
Fam
ilyTa
xon
Contr
ib
%
Sim ⁄SD
Body
size
Larv
al
dev
Fam
ilyTa
xon
Abund
SMT
Abund
nSM
T
Contr
ib
%
Dis
s
⁄SD
Body
size
Larv
al
dev
Plat
eau
GLe
iogal
athea
laev
irost
ris
45.9
21.0
58
lG
Munid
agra
cilis
54.3
61.1
425
lG
Leio
gala
thea
laevir
ost
ris
0.7
50.2
6.7
91.3
18
l
GM
unid
agra
cilis
24.6
40.5
025
lC
Gas
tropty
chus
nova
ezel
andia
e
24.1
60.6
220
sC
Gas
tropty
chus
nova
ezel
andia
e
00.6
6.1
31.1
720
s
GM
unid
a
endea
voura
e
9.4
00.3
418
lG
Phyl
ladio
rhyn
chus
sp.
1
13.4
20.3
212
lG
Munid
agra
cilis
0.5
0.8
5.1
30.9
425
l
CU
ropty
chus
spin
irost
ris
4.1
50.1
911
sG
Phyl
ladio
rhyn
-
chus
sp.
1
00.4
5.0
00.7
812
l
CU
ropty
chus
sp.
A3.8
00.1
97
sC
Uro
pty
chus
sp.
S
0.1
30.4
4.6
00.8
111
s
GA
gononid
a
nie
lbru
cei
3.5
10.1
918
lG
Munid
aen
de-
avoura
e
0.3
80
3.8
50.7
518
l
GPh
ylla
dio
rhyn
-
chus
pusi
llus
0.1
30.2
3.2
20.5
94
l
GM
unid
aer
ato
0.1
30.2
3.1
70.5
914
l
Ave
rage
body
size
14.5
Ave
rage
body
size
19
CU
ropty
chus
aust
ralis
0.1
30.2
3.1
70.5
911
s
Proport
ion
of
s⁄l
2⁄4
Proport
ion
of
s⁄l
1⁄2
CU
ropty
chus
spin
irost
ris
0.2
50
3.1
00.5
611
s
Gal
athei
dae
(G)
and
Chirost
ylid
ae(C
);A
vera
ge
per
centa
ge
contr
ibution
(Contr
ib%
)to
sim
ilarity
(Sim
)or
dis
sim
ilarity
(Dis
s)w
ithin
or
bet
wee
nhab
itat
asse
mbla
ges
;ch
arac
terizi
ng
and
dis
crim
inat
ing
spec
ies
are
those
with
ara
tio
of
Sim
⁄SD
and
Dis
s⁄S
Dof
‡1.3
(inbold
);av
erag
eab
undan
ce(A
bund)
for
seam
ount
(SM
T)an
dnon-s
eam
ount
(nSM
T)sp
ecie
s(a
vera
ge
abundan
cew
ith
pre
sence
⁄abse
nce
dat
aeq
uat
esto
freq
uen
cyof
occ
urr
ence
);body
size
isin
dic
ated
inm
m;
larv
aldev
elopm
ent
(larv
aldev
)is
eith
ersh
ort
(s)
or
long
(l).
Squat lobster assemblages of deep-sea habits Rowden, Schnabel, Schlacher, Macpherson, Ahyong & Richer de Forges
74 Marine Ecology 31 (Suppl. 1) (2010) 63–83 ª 2010 Blackwell Verlag GmbH
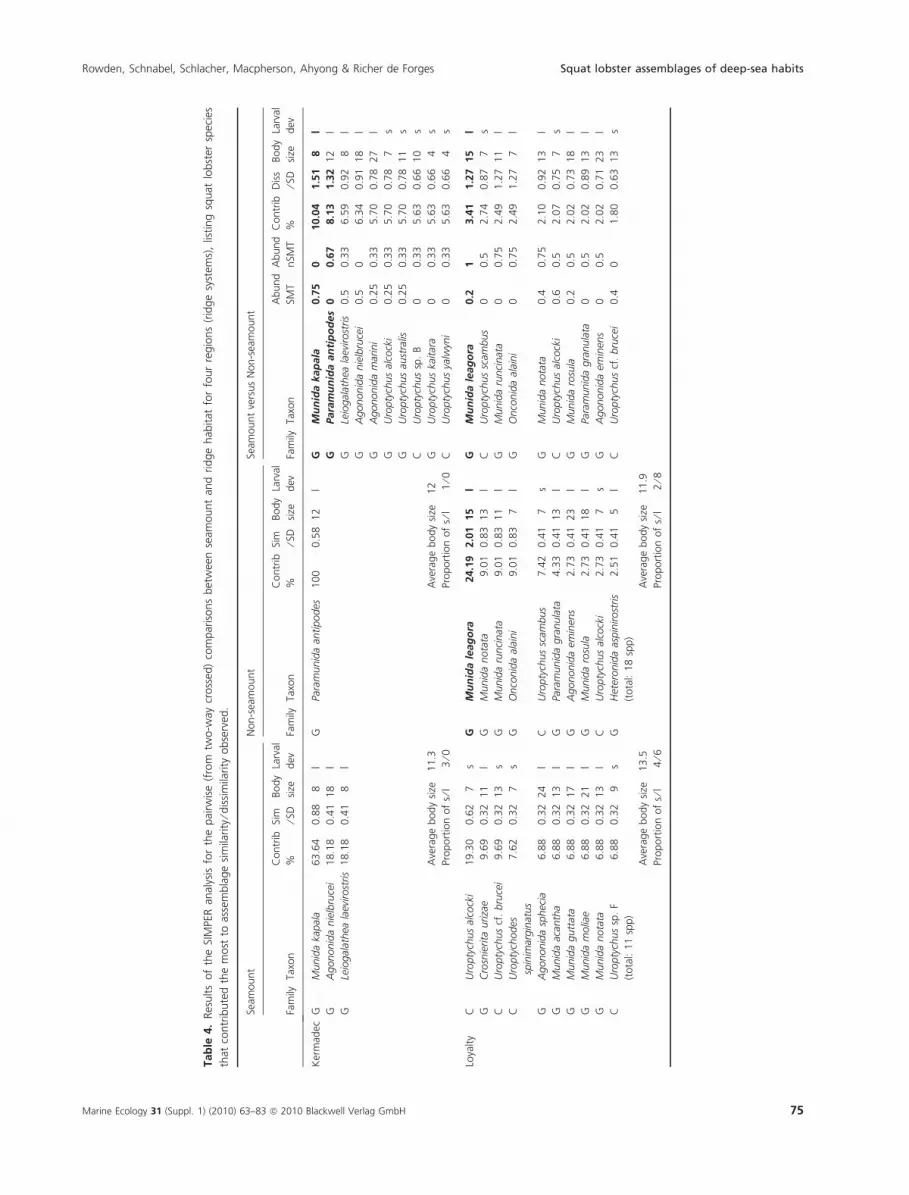
Tab
le4.
Res
ults
of
the
SIM
PER
anal
ysis
for
the
pai
rwis
e(f
rom
two-w
aycr
oss
ed)
com
par
isons
bet
wee
nse
amount
and
ridge
hab
itat
for
four
regio
ns
(rid
ge
syst
ems)
,lis
ting
squat
lobst
ersp
ecie
s
that
contr
ibute
dth
em
ost
toas
sem
bla
ge
sim
ilarity
⁄dis
sim
ilarity
obse
rved
.
Seam
ount
Non-s
eam
ount
Seam
ount
vers
us
Non-s
eam
ount
Fam
ilyTa
xon
Contr
ib
%
Sim ⁄SD
Body
size
Larv
al
dev
Fam
ilyTa
xon
Contr
ib
%
Sim ⁄SD
Body
size
Larv
al
dev
Fam
ilyTa
xon
Abund
SMT
Abund
nSM
T
Contr
ib
%
Dis
s
⁄SD
Body
size
Larv
al
dev
Ker
mad
ecG
Munid
aka
pal
a63.6
40.8
88
lG
Para
munid
aan
tipodes
100
0.5
812
lG
Mu
nid
akap
ala
0.7
50
10.0
41.5
18
l
GA
gononid
anie
lbru
cei
18.1
80.4
118
lG
Para
mu
nid
aan
tip
od
es
00.6
78.1
31.3
212
l
GLe
iogal
athea
laev
irost
ris
18.1
80.4
18
lG
Leio
gal
athea
laev
irost
ris
0.5
0.3
36.5
90.9
28
l
GA
gononid
anie
lbru
cei
0.5
06.3
40.9
118
l
GA
gononid
am
arin
i0.2
50.3
35.7
00.7
827
l
GU
ropty
chus
alco
cki
0.2
50.3
35.7
00.7
87
s
GU
ropty
chus
aust
ralis
0.2
50.3
35.7
00.7
811
s
CU
ropty
chus
sp.
B0
0.3
35.6
30.6
610
s
Ave
rage
body
size
11.3
Ave
rage
body
size
12
GU
ropty
chus
kaitar
a0
0.3
35.6
30.6
64
s
Proport
ion
of
s⁄l
3⁄0
Proport
ion
of
s⁄l
1⁄0
CU
ropty
chus
yalw
yni
00.3
35.6
30.6
64
s
Loya
lty
CU
ropty
chus
alco
cki
19.3
00.6
27
sG
Mu
nid
ale
ag
ora
24.1
92.0
115
lG
Mu
nid
ale
ag
ora
0.2
13.4
11.2
715
l
GC
rosn
ierita
uriza
e9.6
90.3
211
lG
Munid
anota
ta9.0
10.8
313
lC
Uro
pty
chus
scam
bus
00.5
2.7
40.8
77
s
CU
ropty
chus
cf.
bru
cei
9.6
90.3
213
sG
Munid
aru
nci
nat
a9.0
10.8
311
lG
Munid
aru
nci
nat
a0
0.7
52.4
91.2
711
l
CU
ropty
chodes
spin
imar
gin
atus
7.6
20.3
27
sG
Onco
nid
aal
aini
9.0
10.8
37
lG
Onco
nid
aal
aini
00.7
52.4
91.2
77
l
GA
gononid
asp
hec
ia6.8
80.3
224
lC
Uro
pty
chus
scam
bus
7.4
20.4
17
sG
Munid
anota
ta0.4
0.7
52.1
00.9
213
l
GM
unid
aac
anth
a6.8
80.3
213
lG
Para
munid
agra
nula
ta4.3
30.4
113
lC
Uro
pty
chus
alco
cki
0.6
0.5
2.0
70.7
57
s
GM
unid
agutt
ata
6.8
80.3
217
lG
Agononid
aem
inen
s2.7
30.4
123
lG
Munid
aro
sula
0.2
0.5
2.0
20.7
318
l
GM
unid
am
olia
e6.8
80.3
221
lG
Munid
aro
sula
2.7
30.4
118
lG
Para
munid
agra
nula
ta0
0.5
2.0
20.8
913
l
GM
unid
anota
ta6.8
80.3
213
lC
Uro
pty
chus
alco
cki
2.7
30.4
17
sG
Agononid
aem
inen
s0
0.5
2.0
20.7
123
l
CU
ropty
chus
sp.
F6.8
80.3
29
sG
Het
eronid
aas
pin
irost
ris
2.5
10.4
15
lC
Uro
pty
chus
cf.
bru
cei
0.4
01.8
00.6
313
s
(tota
l:11
spp)
(tota
l:18
spp)
Ave
rage
body
size
13.5
Ave
rage
body
size
11.9
Proport
ion
of
s⁄l
4⁄6
Proport
ion
of
s⁄l
2⁄8
Rowden, Schnabel, Schlacher, Macpherson, Ahyong & Richer de Forges Squat lobster assemblages of deep-sea habits
Marine Ecology 31 (Suppl. 1) (2010) 63–83 ª 2010 Blackwell Verlag GmbH 75

Tab
le4.
(Continued
)
Seam
ount
Non-s
eam
ount
Seam
ount
vers
us
Non-s
eam
ount
Fam
ilyTa
xon
Contr
ib
%
Sim
⁄SD
Body
size
Larv
al
dev
Fam
ilyTa
xon
Contr
ib
%
Sim ⁄SD
Body
size
Larv
al
dev
Fam
ilyTa
xon
Abund
SMT
Abund
nSM
T
Contr
ib
%
Dis
s
⁄SD
Body
size
Larv
al
dev
Norf
olk
CU
ropty
chus
longio
r10.9
30.4
06
sG
Agononid
ain
cert
a12.6
31.1
436
lG
Agononid
ain
cert
a0.1
70.8
32.5
71.0
236
l
CU
ropty
chus
sp.
D7.4
20.4
28
sG
Agononid
asq
uam
osa
9.8
01.0
424
lG
Agononid
asq
uam
osa
00.7
82.3
81.2
424
l
CU
ropty
chus
sp.
F7.2
90.4
29
sG
Munid
arh
odonia
8.9
50.9
114
lG
Munid
arh
odonia
0.2
20.7
22.1
10.9
914
l
CU
ropty
chus
alco
cki
6.9
20.3
57
sG
Enriquea
levi
ante
nnat
a7.3
60.7
917
lG
Enriquea
levi
ante
nnat
a0
0.6
72.0
81.0
517
l
GA
gononid
ala
ure
nta
e4.1
80.3
932
lG
Agononid
aca
llirr
hoe
6.4
40.7
918
lG
Munid
anota
ta0.1
10.6
11.9
80.7
313
l
GM
unid
aze
bra
3.9
50.3
919
lG
Munid
anota
ta5.9
20.6
313
lG
Agononid
aca
llirr
hoe
00.6
71.8
91.0
818
l
CU
ropty
chus
levi
crust
us
3.2
70.2
35
sG
Para
munid
alo
ngio
r5.2
70.6
011
lG
Para
munid
alo
ngio
r0
0.5
61.7
90.8
811
l
CU
ropty
chus
nan
ophye
s2.9
50.3
212
sG
Para
munid
ase
tiger
a5.0
50.6
112
lG
Para
munid
ase
tiger
a0
0.5
61.7
20.9
312
l
GA
gononid
asp
hec
ia2.9
10.3
224
lG
Munid
aro
sula
3.4
30.5
218
lC
Uro
pty
chus
alco
cki
0.3
90.3
91.6
30.6
87
s
GM
unid
aar
mill
a2.8
20.3
216
lG
Agononid
aem
inen
s2.5
40.3
623
lC
Uro
pty
chus
longio
r0.5
0.1
11.5
50.6
86
s
(tota
l:44
spp)
(tota
l:29
spp)
Ave
rage
body
size
13.8
Ave
rage
body
size
18.6
Proport
ion
of
s⁄l
6⁄4
Proport
ion
of
s⁄l
0⁄1
0
Tonga
GM
unid
atu
ber
cula
ta20.5
00.6
5l
GM
unid
aru
nci
nat
a16.4
1.0
711
lG
Mu
nid
aru
nci
nata
00.8
4.0
31.4
111
l
GA
gononid
anorm
ani
12.5
10.4
315
lG
Munid
anota
ta13.0
0.8
513
lG
Munid
anota
ta0.3
30.7
2.9
40.9
813
l
GA
gononid
ain
cert
a11.3
30.4
436
lG
Para
munid
ala
bis
5.3
60.5
18
lG
Munid
atu
ber
cula
ta0.5
60.3
2.7
90.9
25
l
GM
unid
anota
ta6.5
50.2
913
lG
Munid
ale
ptitis
4.9
10.5
17
lG
Agononid
ain
cert
a0.4
40.4
2.5
00.8
736
l
GPa
ram
unid
ast
ichas
5.4
10.2
911
lG
Agononid
asq
uam
osa
4.8
00.5
224
lG
Para
munid
ala
bis
0.2
20.5
2.4
60.8
98
l
GM
unid
apsa
mat
he
4.9
20.2
97
lG
Para
munid
ast
ichas
4.8
00.5
211
lG
Para
munid
ast
ichas
0.3
30.5
2.4
50.9
011
l
GM
unid
am
ilita
ris
4.7
40.3
021
lG
Para
munid
agra
nula
ta4.6
90.5
213
lG
Agononid
anorm
ani
0.4
40.1
2.4
40.8
115
l
GA
gononid
aem
inen
s4.5
80.3
023
lG
Munid
am
ilita
ris
3.6
30.3
721
lG
Munid
am
ilita
ris
0.3
30.4
2.3
90.8
421
l
CU
ropty
chus
aust
ralis
4.4
30.3
011
sG
Para
munid
alo
ngio
r3.1
60.3
711
lG
Munid
ale
ptitis
0.2
20.5
2.3
40.9
17
l
CU
ropty
chus
scam
bus
4.4
30.3
07
sG
Onco
nid
atr
opis
3.1
40.3
87
lG
Para
munid
agra
nula
ta0.1
10.5
2.1
90.9
313
l
(tota
l:15
spp)
(tota
l:24
spp)
Ave
rage
body
size
14.9
Ave
rage
body
size
16
Proport
ion
of
s⁄l
2⁄8
Proport
ion
of
s⁄l
0⁄1
0
Gal
athei
dae
(G)
and
Chirost
ylid
ae(C
);av
erag
eper
centa
ge
contr
ibution
(Contr
ib%
)to
sim
ilarity
(Sim
)or
dis
sim
ilarity
(Dis
s)w
ithin
or
bet
wee
nhab
itat
asse
mbla
ges
;ch
arac
terizi
ng
and
dis
crim
inat
ing
spec
ies
are
those
with
ara
tio
of
Sim
⁄SD
and
Dis
s⁄S
Dof
‡1.3
(inbold
);av
erag
eab
undan
ce(A
bund)
for
seam
ount
(SM
T)an
dnon-s
eam
ount
(nSM
T)sp
ecie
s(a
vera
ge
abundan
cew
ith
pre
sence
⁄abse
nce
dat
aeq
uat
esto
freq
uen
cyof
occ
urr
ence
);body
size
isin
dic
ated
inm
m;
larv
aldev
elopm
ent
(larv
aldev
)s
eith
ersh
ort
(s)
or
long
(l).
Squat lobster assemblages of deep-sea habits Rowden, Schnabel, Schlacher, Macpherson, Ahyong & Richer de Forges
76 Marine Ecology 31 (Suppl. 1) (2010) 63–83 ª 2010 Blackwell Verlag GmbH

For ridge systems with different assemblage composi-
tions for seamount and non-seamount ridge habitats, i.e.
Norfolk and Tonga Ridges, a combination of the predicted
average POC flux to the sea floor and the average amount
of POC at the sea floor, together with average oxygen con-
centration (Norfolk) and average salinity of bottom water
(Tonga), were the environmental variables with the highest
correlation. Examination of the bubble plots (not shown)
for the Norfolk Ridge indicates that POC flux and oxygen
concentration are higher for seamount habitat than for
non-seamount ridge habitat, whilst the relationship
between the amount of POC reaching the sea floor and
assemblage composition reflects to some extent a geo-
graphic gradient (particularly high values for some of the
more southern features). Bubble plots (not shown) for the
Tonga Ridge are less revealing of obvious habitat or geo-
graphic pattern, although POC flux was generally higher on
seamounts than on non-seamount ridge habitat.
Discussion
The results help to further our understanding of how
benthic communities on seamounts differ from those
found on other habitats at comparable depths. Our analy-
ses confirmed the findings of some previous seamount
studies, while also providing new insights. The findings
are discussed below with reference to the three questions
posed at the outset of the study.
Do squat lobster assemblages on seamounts differ from
those on other habitats at comparable depths?
The overall pattern of squat lobster assemblage composi-
tion has a geographic component across the study area.
This reflects recent biogeographic patterns for squat lob-
sters in the region (Macpherson et al. 2010) and empha-
sizes the need to account for regional differences in
analyses of differences in assemblage composition by hab-
itat type (e.g. O’Hara 2007). Where data were unavailable
for seamount and particular non-seamount habitats
across regions, our within-region analyses revealed that
assemblage composition was not different between
seamount and slope, and plateau habitats. These results
are similar to those of O’Hara et al. (2008), who found
no difference between ophiuroid assemblages of seamount
and slope habitats. McClain et al. (2009) also found that
assemblages on a seamount and a canyon (incised in a
nearby slope) were similar in terms of species composi-
tion.
In contrast, squat lobster assemblage composition was
dissimilar between seamount and rise habitats. The galat-
heid species that discriminated the seamount assemblage
from the assemblage of non-seamount habitat were Mun-
ida isos and Munidopsis ceres, which occurred more fre-
quently on seamounts. These species have a relatively
small body size, a characteristic that could explain their
being typical of the assemblages of seamount habitat (see
‘Do dispersal strategy, body size and environmental fac-
tors modify spatial patterns in assemblage composition?’
below for more discussion). For the less dominant chiro-
stylid component of the squat lobster assemblage, Uropty-
chus sp. P and Gastroptychus novaezelandiae discriminated
between assemblages of the different habitats on the rise
(the former occurring more often on seamounts, the lat-
ter on the rise). Gastroptychus novaezelandiae Baba 1974
was originally described from muddy and sandy substrate
on the Chatham Rise and has been found in association
with the pennatulacean Balticina willemoesii (Kollicker),
which resides in soft substrata. The new species of
Uroptychus was collected with coral matrix sampled on
seamounts (K.E. Schnabel personal observation). This dif-
ference in assemblage composition is therefore perhaps
not surprising, considering the stark difference in substra-
tum type between these two habitats on the Chatham
Rise (the rise is predominantly composed of soft sedi-
ments such as mud, sand and gravels; Norris 1964). How-
ever, our environmental analysis results (see ‘Do dispersal
strategy, body size and environmental factors modify spa-
tial patterns in assemblage composition?’ below) suggest
that the observed difference in assemblage composition
between seamount and rise may be depth-confounded,
despite our best efforts to account for sampling effects,
and should thus be treated with caution.
Differences in assemblage composition between
seamount and non-seamount habitat have been observed
previously for coral assemblages, where corals of slope
and island habitats were dissimilar to those on seamounts
Table 5. Results of the BIOENV analysis for squat lobster assemblages
from seamount and non-seamount habitats. Highest Spearman rank
correlation (q) for best combination of factors indicates the highest
correlation with observed patterns of species assemblage composition.
q
No. of
variables
Environmental
variables
selected
Environmental
variables
All features 0.399 1 3
Plateau 0.528 6 1, 2, 3, 5,
7, 8
1. Coral habitat
suitability
Rise 0.687 1 8 2. POC flux
Slope 0.664 1 5 3. POC concentration
Ridge (averaged
across regions)
0.440 2 2,8 4. O2 concentration
Norfolk Ridge 0.518 3 2, 3, 4 5. Salinity
Kermadec Ridge 0.266 2 7, 8 6. Temperature
Loyalty Ridge 0.509 1 4 7. Temperature
range
Tonga Ridge 0.520 3 2, 3, 5 8. Depth
Rowden, Schnabel, Schlacher, Macpherson, Ahyong & Richer de Forges Squat lobster assemblages of deep-sea habits
Marine Ecology 31 (Suppl. 1) (2010) 63–83 ª 2010 Blackwell Verlag GmbH 77

(Hall-Spencer et al. 2007). However, it is not possible to
determine whether this comparison was confounded by
environmental factors such as water depth.
Do assemblages on different ridges systems (seamounts and
ridge habitat) differ?
Our across-region analysis shows an overall dissimilarity
in the squat lobster assemblages of seamount and ridge
habitat, but that this difference also had a regional (dif-
ferent ridge system) component. Before considering the
within-ridge and between-ridge differences in more detail,
it is worth noting that the overall dissimilarities observed,
though statistically significant, were not particularly large.
Results of pair-wise tests to determine dissimilarity in
assemblage composition between seamount and non-
seamount habitats on different ridge systems indicated
that differences between these habitats were only signi-
ficant for the Tonga and Norfolk Ridges. In general, chiro-
stylids were more typical of the squat lobster assemblages
on seamount habitat for these two ridges. However, it was
differences in the frequency of occurrence of galatheid
Munida species that best discriminated between the assem-
blages of the different habitat types on the ridges. Munida
runcinata, which occurred more often on non-seamount
habitat, was the discriminating species for Tonga Ridge
assemblages. The reason why chirostylid rather than galat-
heid species such as Munida spp. were more often found
on seamount habitat probably relates to their presumed
association with live corals, which are often found on sea-
mounts in the region (see Do dispersal strategy, body size
and environmental factors modify spatial patterns in
assemblage composition? below for more discussion).
Pair-wise tests failed to reveal a difference in the assem-
blage composition between seamount and ridge habitats
for the Kermadec and Loyalty Ridges. This finding may
relate to the particular geomorphological ⁄ environmental
conditions of these ridges. That is, conditions could be
homogeneous enough to prevent significant dissimilarities
from emerging between assemblages at seamount and
(A)
(B)
Fig. 5. (A) Relationship between average Bray–Curtis similarity of squat lobster assemblage composition for seamount ⁄ non-seamount habitat and
geographic distance between ridges. Seamount habitats are represented by triangles and non-seamount ridge habitats by diamonds, and the iden-
tity of the ridges is indicated by a letter: Kermadec (K), Loyalty (L), Norfolk (Nf) and Tonga (T). (B) Same data as for (A) (green and red symbols)
overlaid onto macrofauna assemblage data presented in Fig. 3 of Richer de Forges et al. (2000), where axes labels of original figure are retained.
The coefficient of community (C) (equivalent to average Bray–Curtis similarity) is shown in relation to geographic distance between sites of differ-
ent habitat. Seamount habitat (inverted solid diamonds), hydrothermal vent sites from the East Pacific Rise in the North and South Pacific and
Galapagos Rift (open circles), and vent sites from disjunct ridges in the northeast Pacific at 41–49 ºN (crossed circles).
Squat lobster assemblages of deep-sea habits Rowden, Schnabel, Schlacher, Macpherson, Ahyong & Richer de Forges
78 Marine Ecology 31 (Suppl. 1) (2010) 63–83 ª 2010 Blackwell Verlag GmbH

non-seamount habitats on these ridges. However, the
prospect remains that some unaccounted for sampling
artifact could prevent the detection of the sort of differ-
ences in assemblage composition that were observed for
the Tonga and Norfolk Ridges.
Richer de Forges et al. (2000) previously observed dif-
ferences between seamount macrofauna assemblages
across different ridges in the Southwestern Pacific and
found that assemblages on ridges systems separated by
�1000 km were dissimilar in composition, and that dis-
similarity increased with geographic distance. Our results,
when plotted as average levels of assemblage similarity for
habitats versus geographic distance, suggest a similar
decreasing trend in similarity with distance between ridge
systems (Fig. 5A). Interestingly, this plot indicates that
assemblages of non-seamount ridge habitat are more sim-
ilar than are assemblages of seamount habitat between
ridges, and that this pattern is consistent across different
ridge systems [i.e. red triangles (seamount habitat) are
always below green diamonds (non-seamount ridge habi-
tat) on the plot]. This lends support to the suggestion
that benthic communities on seamounts are likely to be
more dissimilar to one another because of their ‘island’-
like nature than are communities at different locations in
the surrounding habitat. However, it is worth noting that
differences in the average assemblage similarity between
the seamount and non-seamount habitat were greater for
some between-ridge comparisons than for others. The
small difference between levels of average similarity for
the Kermadec–Tonga Ridges comparison is probably
related to the semi-continuous nature of these two ridges,
and arguably represents an along- rather than a between-
ridge pattern.
Overlaying our data on the original Fig. 3 of Richer
de Forges et al. (2000) reveals a reasonable congruence
(Fig. 5B), despite the original data covering all macrofa-
una and sharing only a very limited amount of data
(from Norfolk Ridge) with the present dataset. Thus,
the present study supports the original finding of
seamount assemblage dissimilarity between ridges, which
increases with increasing geographic distance. Richer de
Forges et al. (2000) argued that relatively closed circula-
tion patterns at seamounts (e.g. Taylor columns and
eddies) and rectification of currents along ridges were
responsible for the differences in assemblage composi-
tion they observed, particularly between ridge systems.
Larger scale oceanographic features such as fronts
(Sokolov & Rintoul 2000; Schiller et al. 2008) could
also affect dispersal of benthic fauna between ridge
systems. A key finding of our study is that of consistent
differences in levels of assemblage similarity for
seamount and non-seamount habitats, nested within
inter-ridge system patterns.
Do dispersal strategy, body size and environmental factors
modify spatial patterns in assemblage composition?
For differences in assemblage composition between ridges
that were significantly different, squat lobster species of
seamount assemblages were relatively small and had short
larval duration, compared to the larger species with long
larval duration that dominated the assemblages of non-se-
amount ridge habitat. This observation supports a previ-
ous study that indicated seamount fauna are characterized
by species with short larval durations and limited dis-
persal ability (Parker & Tunnicliffe 1994). It has been
suggested that tidally rectified circulation of currents
around seamounts serves to preferentially retain larvae
with limited planktonic duration (Mullineaux & Mills
1997). Species with a smaller body size are generally more
likely to brood or have abbreviated development than are
those with a larger body size, which tend to have long-
lived larvae that disperse more widely in the plankton
(Stratham and Strathman 1982). Although this has not
been demonstrated specifically for squat lobsters, our
observations on body size and larval duration of squat
lobsters on seamounts (on ridges) support the generaliza-
tions concerning the life history characteristics of species
that are thought typical of island-like habitats (Whittaker
& Fernandez-Palacios 2007).
In terms of environmental drivers, the overall pattern
in assemblage composition across the study area (irre-
spective of habitat type) was related to the gradient in
amount of POC reaching the sea floor. Whilst the
amount of potential food arriving at the sea floor could
influence overall compositional pattern, it is more likely
that this general south–north gradient reflects the differ-
ence in the overall water mass characteristics (oligo-
trophic waters in the north moving towards more
productive waters in the south of the area), as well as the
related water circulation patterns (Sokolov & Rintoul
2000; Schiller et al. 2008). That is, as already mentioned
(in ‘Do squat lobster assemblages on seamounts differ
from those on other habitats at comparable depths?’
above) the overall assemblage pattern reflects the biogeo-
graphic pattern observed for squat lobsters in the South-
western Pacific Ocean (Macpherson et al. 2010).
The environmental factor that was most strongly
related to the assemblage composition for seamount and
non-seamount habitats on Chatham Rise was water
depth. However, seamount habitat was generally deeper
than non-seamount habitat, which, despite our efforts to
minimize the known influence of water depth, suggests
that the assemblage dissimilarity observed between
seamount and rise habitat is potentially depth-
confounded. Future research will be required to deter-
mine whether a difference in assemblage composition
Rowden, Schnabel, Schlacher, Macpherson, Ahyong & Richer de Forges Squat lobster assemblages of deep-sea habits
Marine Ecology 31 (Suppl. 1) (2010) 63–83 ª 2010 Blackwell Verlag GmbH 79

actually exists or whether (as for the plateau and slope)
no difference is apparent between seamount and rise hab-
itat at comparable water depths.
For assemblages on seamount and non-seamount habi-
tats across all ridges there was a relationship with the
indications of a geographic cline in POC flux. Like the
amount of POC at this large spatial scale, this cline is
thought to be related to differences in water mass ⁄ current
circulation patterns and to influence biogeographic pat-
terns (see above for overall assemblage pattern). Ideally,
our environmental correlation analysis would have
included variables that describe, or act as proxies for, the
types of current flow proposed to explain between-ridge
differences in the composition of assemblages on sea-
mounts (e.g. Richer de Forges et al. 2000). Unfortunately,
data (speed and direction) from regional circulation mod-
els are not yet available at the appropriate vertical (depth)
spatial resolution.
Within regions (ridge system) where differences in
assemblage composition were found between seamount
and non-seamount ridge habitats (Tonga and Norfolk
Ridges) the observed assemblage patterns were related to
the POC flux, which was higher on seamounts. A differ-
ence in POC fluxes on and off seamounts (higher on sea-
mounts) has been predicted to occur as a result of tidally
forced circulation, accelerated current flow and turbulent
mixing (White et al. 2007), and to have an influence on
the faunal composition of seamounts; that is, seamount
communities dominated by suspension feeding groups
that could exploit the elevations in the delivery of a
particulate food resource (e.g. corals, sponges, crinoids
Samadi et al. 2007). It is possible that differences in POC
flux are responsible for between-habitat compositional
patterns within a group such as squat lobsters that exhibit
a range of feeding strategies. Feeding strategies for chiro-
stylids are unknown but they are assumed to be suspen-
sion feeders (e.g. Kilgour & Shirley 2008) and are
associated with suspension feeding taxa such as corals,
which could explain their dominance in seamount assem-
blages. Feeding studies and in situ observation have so far
only been carried out for galatheids of genus Munida,
and indicate that they are opportunistic feeders with a
strong seasonal variation between predatory and deposit
feeding (e.g. Romero et al. 2004). The flexible use of
these feeding strategies by galatheids may explain their
dominance in non-seamount habitat that receives a lower
POC flux.
Dissolved oxygen concentration, which was higher on
seamounts, was also related to differences in the assem-
blage composition between habitats on the Norfolk Ridge.
The overall difference in oxygen concentration between
the habitats was not large, nor was it across the oxygen
minimum threshold. Thus, it is difficult to envisage how
this variable may be influencing assemblage composition
in a way that has been observed previously for a single
seamount in an oxygen minimum zone in the Northern
Pacific Ocean (Wishner et al. 1990).
Stony coral habitat suitability was not identified as
being correlated with any of the observed patterns. This
finding was somewhat surprising because some squat lob-
sters, particularly chirostylids, use corals as a habitat from
which to feed and gain shelter from predation (Kilgour &
Shirley 2008). It was therefore expected that, as in a pre-
vious study on ophiuroids (O’Hara et al. 2008), there
should be some form of pattern that reflected the rela-
tionship between assemblage composition and the pres-
ence of coral habitat. However, whereas the
aforementioned study included data from samples known
to have been taken from coral habitat, our study used
output from a coral habitat suitability model. The uncer-
tainty associated with this model and its spatial resolution
may account for the lack of a relationship between
squat lobster assemblage composition (particularly on
seamounts) and presence of the biogenic habitat.
The present study lends further support to conclusions
derived from recent studies that suggest benthic commu-
nities of seamounts are not distinct, in terms of species
composition (rather than abundance or biomass), from
those found at other habitats at comparable depth such
as slope and canyons. However, our study provided
evidence to suggest that the benthic communities of
seamounts on ridges can be distinct from those found
elsewhere on ridges. Our results also extend a previous
finding that differences in seamount communities
between ridges increase with geographic distance, by find-
ing the same pattern for assemblages of non-seamount
ridge habitat. Clearly, further study will be required to
determine the generality of these findings (including a
re-assessment of the case for rise habitat) can be fully
realized. In addition, future analyses (with similarly
robust datasets as used in the present study) should
include a greater array of environmental data at appropri-
ate spatial resolution, in order to gain a better under-
standing about the natural forces that drive any
peculiarity in the composition of seamount communities.
Acknowledgements
The authors wish to acknowledge the squat lobster taxon-
omy and biogeography initiative of the Census of Marine
Life (CoML) project COMARGE, which made possible
the compilation of a dataset with consistent species iden-
tifications. Particular thanks are owed to the participants
of a workshop run by the Data Analysis Working Group
(DAWG) of the CoML project CenSeam, whose advice
and support served to advance the analysis reported upon
Squat lobster assemblages of deep-sea habits Rowden, Schnabel, Schlacher, Macpherson, Ahyong & Richer de Forges
80 Marine Ecology 31 (Suppl. 1) (2010) 63–83 ª 2010 Blackwell Verlag GmbH
here. In addition to their support at the DAWG work-
shop, Tim O’Hara (Victoria Museum, Australia) and
Derek Tittensor (Dalhousie University, Canada) are
thanked for their provision of environmental data. Kevin
McKay (NIWA) provided a great deal of valuable gis
assistance during the data treatment phase of the study.
Funding (for A.R. and K.S.) was provided by the New
Zealand Foundation for Research, Science and Technol-
ogy (FRST) for NIWA’s research programme ‘Seamounts:
their importance to fisheries and marine ecosystems’
(CO1X0508) and its ‘Marine Biodiversity and Biosecurity
Outcome Based Investment’ (project CO1X0502).
References
Ahyong S. (2007) Decapod Crustacea collected by the NOR-
FANZ expedition: Galatheidae and Polychelidae. Zootaxa,
1593, 1–54.
Ahyong S.T., Poore G.C.B. (2004a) The Chirostylidae of south-
ern Australia (Crustacean: Decapoda: Anomura). Zootaxa,
436, 1–88.
Ahyong S.T., Poore G.C.B. (2004b) Deep-water Galatheidae
(Crustacea: Decapoda: Anomura) from southern and eastern
Australia. Zootaxa, 472, 1–76.
Allain V., Kerandel J.-A., Andrefouet S., Magron F., Clark M.,
Kirby D.S., Muller-Karger F.E. (2008) Enhanced seamount
location database for the western and central Pacific Ocean:
screening and cross-checking of 20 existing datasets. Deep-
Sea Research Part I Oceanographic Research Papers, 55,
1035–1047.
Aurioles-Gamboa D., Perez-Flores R. (1997) Seasonal and
bathymetric changes in feeding habits of the benthic red
crab Pleuroncodes planipes (Decapoda, Anomura, Galathei-
dae) off the Pacific coast of Baja California sur, Mexico.
Crustaceana, 70, 272–287.
Baba K. (1974) Four new species of galatheidean Crustacea
from New Zealand waters. Journal of the Royal Society of
New Zealand, 4, 381–393, figures 381–389.
Baba K. (1988) Chirostylid and galatheid crustaceans
(Decapoda: Anomura) of the ‘‘Albatross’’ Philippine Expedi-
tion, 1907–1910. Researches on Crustacea, Special Number, 2,
1–203.
Baba K. (1994) Deep-sea galatheid crustaceans (Anomura:
Galatheidae) collected by the ‘Cidaris I’ Expedition off
central Queensland, Australia. Memoirs of the Queensland
Museum, 35, 1–21.
Baba K. (2005) Deep-sea chirostylid and galatheid crustaceans
(Decapoda: Anomura) from the Indo-West Pacific, with a
list of species. Galathea Reports, 20, 1–317.
Baba K., Macpherson E., Poore G.C.B., Ahyong S.T., Bermudez
A., Cabezas P., Lin C.-W., Nizinski M., Rodrigues C., Schna-
bel K.E. (2008) Catalogue of squat lobsters of the world
(Crustacea: Decapoda: Anomura-families Chirostylidae,
Galatheidae and Kiwaidae). Zootaxa, 1905, 1–220.
Beyer H.L. (2004) Hawth’s Analysis Tools for ArcGIS. Avail-
able at http://www.spatialecology.com/htools
Clark P.F., Ng P.K.L. (2008) The lecitotrophic zoea of Chiro-
stylus ortmanni Miyake & Baba, 1968 (Crustacea: Anomura:
Galatheoidea: Chirostylidae) described from laboratory
hatched material. Raffles Bulletin of Zoology, 56, 85–94.
Clarke K.R., Gorley R.N. (2006) PRIMER v6: User Man-
ual ⁄ Tutorial. PRIMER-E Ltd, Plymouth.
Clarke K.R., Warwick R.M. (2001) Change in Marine Commu-
nities: An Approach to Statistical Analysis and Interpretation,
2nd edn. PRIMER-E Ltd, Plymouth.
Dunn J.R., Ridgway R. (2002) Mapping ocean properties in
regions of complex topography. Deep-Sea Research Part I,
49, 591–604.
ESRI (2004) ArcGIS 9.0. ESRI Software, Redlands, CA.
Faxon W. (1895) The stalk-eyed Crustacea XV. In: Reports on
an exploration off the west coasts of Mexico, Central and
South america, and off the Galapagos Islands, in charge of
Alexander Agassiz, by the U.S. Fish Commission Steamer
‘Albatros’ during 1891, Lieut.-Commander Z.L. Tanner,
U.S.N., commanding. Memoirs of the Museum of Compara-
tive Zoology at Harvard College XVIII.
Guerao G., Macpherson E., Samadi S., Richer de Forges B.,
Boisselier M.-C. (2006) First stage zoeal descriptions of five
Galatheoidea species from Western Pacific (Crustacea: Deca-
poda: Anomura). Zootaxa, 1227, 1–29.
Hall-Spencer J.M., Rogers A., Davies J., Foggo A. (2007)
Historical deep-sea coral distribution on seamount, oceanic
island and continental shelf-slope habitats in the NE Atlan-
tic. In: George R.Y., Cairns S.D. (Eds). Rosenstiel School of
Marine and Atmospheric Science, Miami, 324 p.
Haswell W.A. (1882) Catalogue of the Australian Stalk- and
Sessile-Eyed Crustacea. Australian Museum, Sydney.
Henderson J.R. (1888) Report on the Anomura collected by
H.M.S. Challenger during the years 1873–76. Report on the
Scientific Results of the Voyage of H.M.S. Challenger during
the years 1873–76. Zoology 27: 1–221, 221 pls.
Hess H.H. (1946) Drowned ancient islands of the Pacific basin.
American Journal of Science, 244, 772–791.
Hubbs C.L. (1959) Initial discoveries of fish faunas on sea-
mounts and offshore banks in the eastern Pacific. Pacific Sci-
ence, 13, 311–316.
Hudson I.R., Wigham B.D. (2003) In situ observations of
predatory feeding behaviour of the galatheid squat lobster
Munida sarsi using a remotely operated vehicle. Journal of
the Marine Biological Association of the United Kingdom, 83,
463–464.
Kilgour M.J., Shirley T.C. (2008) Eumunida picta S. I. Smith,
1883, and Lophelia pertusa (Linnaeus, 1758): a relationship
or just good friends?. Crustaceana (Leiden), 81, 587–593.
Macpherson E. (1994) Crustacea Decapoda: studies on the
genus Munida Leach, 1820 (Galatheidae) in New Caledonia
and adjacent waters with descriptions of 56 new species. In:
Crosnier A. (Ed.), Resultats des Campagnes MUSORSTOM.
Rowden, Schnabel, Schlacher, Macpherson, Ahyong & Richer de Forges Squat lobster assemblages of deep-sea habits
Marine Ecology 31 (Suppl. 1) (2010) 63–83 ª 2010 Blackwell Verlag GmbH 81

Memoires du Museum National d’Histoire Naturelle, Paris
12: 421–569.
Macpherson E. (1996) Crustacea Decapoda: species of the gen-
era Munida Leach, 1820 and Paramunida Baba, 1988 (Galat-
heidae) from the seas around the Wallis and Futuna Islands.
In: Crosnier A. (Ed.), Resultats des Campagnes MUSOR-
STOM, vol. 15. Memoires du Museum National d’Histoire
Naturelle, Paris 168: 387–421.
Macpherson E. (1999) Crustacea Decapoda: species of the gen-
era Agononida Baba & de Saint Laurent, 1996 and Munida
Leach, 1820 (Galatheidae) collected during the MUSOR-
STOM 8 cruise in Vanuatu. In: Crosnier A. (Ed.), Resultats
des Campagnes MUSORSTOM Volume 20. Memoires du
Museum National d’Histoire Naturelle, Paris: 407–426.
Macpherson E. (2004) Species of the genus Munida Leach,
1820 and related genera from Fiji and Tonga (Crustacea:
Decapoda: Galatheidae). In: Marshall B.A., Richer de Forges
B. (Eds), Tropical Deep-Sea Benthos, Vol. 23. Memoires du
Museum National d’Histoire Naturelle, Paris 191: 231–292.
Macpherson E. (2007) Species of the genus Munidopsis Whit-
eaves, 1784 from the Indian and Pacific Oceans and reestab-
lishment of the genus Galacantha A. Milne-Edwards, 1880
(Crustacea, Decapoda, Galatheidae). Zootaxa, 1417, 1–135.
Macpherson E., Richer de Forges B., Schnabel K.E., Samadi S.,
Boiselier M.-C., Garcia-Rubies A. (2010) Biogeography of
the deep-sea galatheid squat lobsters of the Pacific. Deep-Sea
Research Part I, 57, 228–238.
McClain C.R. (2007) Seamounts: identity crisis or split person-
ality. Journal of Biogeography, 34, 2001–2008.
McClain C.R., Lundsten L., Ream M., Barry J., De Vogelaere
A. (2009) Endemicity, biogeography, composition and com-
munity structure on a northeast Pacific seamount. PLoS
ONE, 4,e4141, 8: pp.
Mullineaux L.S., Mills S.W. (1997) A test of the larval reten-
tion hypothesis in seamount-generated flows. Deep-Sea
Research Part I, 4, 745–770.
Norris R.M. (1964) Sediments of the Chatham Rise. New Zea-
land Department of Scientific and Industrial Research Bulle-
tin 159. Wellington. 40 p.
O’Hara T.D. (2007) Seamounts: centres of endemism or spe-
cies-richness for ophiuroids? Global Ecology and Biogeogra-
phy, 16, 720–732.
O’Hara T.D., Rowden A.A., Williams A. (2008) Cold-water
coral habitats on seamounts: do they have a specialist fauna?
Diversity and Distributions, 14, 925–934.
Parker T., Tunnicliffe V. (1994) Dispersal strategies of the
biota on an oceanic seamount: implications for ecology and
biogeography. Biological Bulletin, 187, 336–345.
Pike R.B., Wear R.G. (1969) Newly hatched larvae of the genus
Gastroptychus and Uroptychus (Crustacea, Decapoda, Galat-
heidae) from New Zeaand waters. Transactions of the Royal
Society of New Zealand, Biological Sciences, 11, 189–195.
Rice A.L., Miller J.E. (1991) Chirostylid and galatheid crusta-
cean associates of coelenterates and echinoderms collected
from the Johnson-Sea-Link submersible, including a new
species of Gastroptychus. Proceedings of the Biological Society
of Washington, 104, 299–308.
Richer de Forges B., Koslow J.A., Poore G.C.B. (2000) Diver-
sity and endemism of the benthic seamount fauna in the
south-west Pacific. Nature, 405, 944–947.
Ridgway K.R., Dunn J.R., Wilkin J.L. (2002) Ocean interpola-
tion by four-dimensional least squares – Application to the
waters around Australia. Journal of Atmospheric and Oceano-
graphic Technology, 19, 1357–1375.
Rogers A.D., Baco A., Griffiths H., Hall-Spencer J.M. (2007)
Corals on seamounts. In: Pitcher T.J., Morato T., Hart
P.J.B., Clark M.R., Haggan N., Santos R.S. (Eds)., Sea-
mounts: Ecology, Conservation and Management. Fish and
Aquatic Resources Series, Blackwell, Oxford: 141–169.
Romero M.C., Lovrich G.A., Tapella F., Thatje S. (2004) Feed-
ing ecology of the crab Munida subrugosa (Decapoda:
Anomura: Galatheidae) in the Beagle Channel, Argentina.
Journal of the Marine Biological Association of the United
Kingdom, 84, 359–365.
Rowden A.A., Clark M.R., Wright I.C. (2005) Physical charac-
terisation and a biologically focused classification of ‘sea-
mounts’ in the New Zealand region. New Zealand Journal of
Marine & Freshwater Research, 39, 1039–1059.
Rowden A.A., Oliver M., Clark M.R., Mackay K. (2008) New
Zealand’s SEAMOUNT Database: Recent Updates and its
Potential Use for Ecological Risk Assessment. New Zealand
Environment and Biodiversity Report No. 27. Ministry of
Fisheries, Wellington: 49, p.
Saint Laurent de M., Macpherson E. (1990) Crustacea Deca-
poda: Le genre Eumunida Smith, 1883 (Chirostylidae) dans
les eaux neo-caledoniennes. In: Crosnier A. (Ed.), Resultats
des Campagnes MUSORSTOM, Vol. 6. Memoires du
Museum National d’Histoire Naturelle, Paris, Section A
Zoologie Biologie et Ecologie Animales 145: 227–288
Saint Laurent de M., Poupin J. (1996) Crustacea Decapoda:
Les especes indo-ouest pacifiques du genre Eumunida Smith,
1880 (Chirostylidae). Description de six especes nouvelles.
In: Crosnier A. (Ed.), Resultats des Campagnes MUSOR-
STOM, Vol. 15. Memoires du Museum national d’Histoire
naturelle, Paris, Section A Zoologie Biologie et Ecologie Ani-
males 168, 337–385
Samadi S., Bottan L., Macpherson E., Richer de Forges B., Bois-
selier M.-C. (2006) Seamount endemism questioned by the
geographical distribution and population genetic structure of
marine invertebrates. Marine Biology, 149, 1463–1475.
Samadi S., Schlacher T., Richer de Forges B.R. (2007)
Seamount benthos. In: Pitcher T.J., Morato T., Hart P.J.B.,
Clark M.R., Haggan N., Santos R.S. (Eds). Seamounts:
Ecology, Conservation and Management. Fish and Aquatic
Resources Series, Blackwell, Oxford: 119–140.
Samuelsen T.J. (1972) Larvae of Munidopsis tridentata
(Esmark) (Decapoda, Anomura) reared in the laboratory.
Sarsia, 48, 91–98.
Schiller A., Oke P.R., Brassington G., Entel M., Fiedler R., Griffin
D.A., Mansbridge J.V. (2008) Eddy-resolving ocean
Squat lobster assemblages of deep-sea habits Rowden, Schnabel, Schlacher, Macpherson, Ahyong & Richer de Forges
82 Marine Ecology 31 (Suppl. 1) (2010) 63–83 ª 2010 Blackwell Verlag GmbH

circulation in the Asian-Australian region inferred from an
ocean reanalysis effort. Progress in Oceanography, 76, 334–365.
Schnabel K.E. (2009a) Squat lobsters (Crustacea: Anomura: Gal-
atheidae and Chirostylidae) of New Zealand: Diversity, phy-
logeny and biogeography. Ph.D. thesis, Department of Marine
Science, University of Otago, Dunedin.
Schnabel K.E. (2009b) A review of the New Zealand Chiro-
stylidae (Anomura: Galatheoidea) with description of six
new species from the Kermadec Islands. Zoological Journal of
the Linnean Society, 155, 542–582.
Schnabel K.E., Bruce N.L. (2006) New records of Munidopsis
(Crustacea: Anomura: Galatheidae) from New Zealand with
description of two new species from a seamount and under-
water canyon. Zootaxa, 1172, 49–67.
Sokolov S., Rintoul S. (2000) Circulation and water masses of
the southwest Pacific: WOCE Section P11, Papua New Gui-
nea to Tasmania. Journal of Marine Research, 58, 223–268.
Strathmann R.R. & Strathmann M.F. (1982) The relationship
between adult and brooding in marine invertebrates. Ameri-
can Naturalist, 119 (1): 91–101.
Thompson G.M. (1899) Revision of the Crustacea Anomura of
New Zealand. Transactions and Proceedings of the New Zea-
land Institute 31: 169–197, Pl. 120, 121.
Tittensor D.P., Baco A.R., Brewin P.E., Clark M.R., Consalvey
M., Hall-Spencer J.M., Rowden A.A., Schlacher T., Stocks
K.I., Rogers A.D. (2009) Predicting global habitat suitability
for stony corals on seamounts. Journal of Biogeography, 36,
1111–1128.
Vereshchaka A.L. (2005) New species of Galatheidae (Crusta-
cea: Anomura: Galatheoidea) from volcanic seamounts off
Northern New Zealand. Journal of the Marine Biological
Association of the United Kingdom, 85, 137–142.
White M., Bashmachnikov I., Aristegui J., Martins A. (2007)
Physical processes and seamount productivity. In: Pitcher
T.J., Morato T., Hart P.J.B., Clark M.R., Haggan N., Santos
R.S. (Eds). Seamounts: Ecology, Conservation and Manage-
ment. Fish and Aquatic Resources Series, Blackwell, Oxford:
65–85.
Whittaker R.J., Fernandez-Palacios J.M. (2007) Island Biogeog-
raphy: Ecology, Evolution and Conservation. Oxford Univer-
sity Press, Oxford.
Wilson R.R., Kaufman R.S. (1987) Seamount biota and bioge-
ography. Geophysics Monographs, 43, 355–377.
Wishner K., Levin L., Gowing M., Mullineaux L. (1990)
Involvement of the oxygen minimum in benthic zonation
on a deep seamount. Nature, 346, 57–59.
Yool A., Shepherd J.G., Bryden H.L., Oschlies A. (2009) Low
efficiency of nutrient translocation for enhancing oceanic
uptake of carbon dioxide. Journal of Geophysical Research,
114: doi:10.1029/2008JC004792.
Rowden, Schnabel, Schlacher, Macpherson, Ahyong & Richer de Forges Squat lobster assemblages of deep-sea habits
Marine Ecology 31 (Suppl. 1) (2010) 63–83 ª 2010 Blackwell Verlag GmbH 83