spontaneous improvement of tj-ii plasmas confinement
TRANSCRIPT

INSTITUTE OF PHYSICS PUBLISHING PLASMA PHYSICS AND CONTROLLED FUSION
Plasma Phys. Control. Fusion 44 (2002) 1639–1649 PII: S0741-3335(02)35165-0
Spontaneous improvement of TJ-II plasmasconfinement
I Garcıa-Cortes, D Lopez-Bruna, F L Tabares, T Estrada, F Medina andthe TJ-II Team
Laboratorio Nacional de Fusion por Confinamiento Magnetico. Asociacion Euratom-Ciemat,28040 Madrid, Spain
Received 25 March 2002, in final form 6 June 2002Published 30 July 2002Online at stacks.iop.org/PPCF/44/1639
AbstractSpontaneous improvements in particle and energy confinement have beenobserved in TJ-II plasmas with ≈300 kW of electron cyclotron resonanceheating. Density and temperature profiles broaden giving rise to energy contentenhancement up to a factor of 1.4. The transport analysis on one of thesedischarges describes the evolution of the profiles via a sudden reduction (∼50%)of the thermal and particle diffusivities inside the main plasma. A briefcomparison with transition phenomena in other devices is given.
1. Introduction
An improved particle confinement regime [1] has already been described for TJ-II [2] plasmaswith different heating power densities operating with metallic walls and limiters. With anappropriate wall conditioning, this regime can be accessed and abandoned by controlling theparticle source rate from shot-to-shot. In addition, the magnetic configuration does not seemto be the most important condition for the appearance of spontaneous peaking in the densityprofile, because the regime has been observed in all the configurations for which the puffingrate scan has been performed. It has been suggested that the transport properties in the plasmaconfinement region may be playing the dominant role in controlling the phenomenon. Thereferenced transitions do not affect electron temperature profiles, although the density changesnotably.
More recently, sudden improvements in both particle and energy confinement—to bereferred as transitions—using the fuelling rate as the only external knob have been found.The main purpose of this paper is to inform on the characteristics of these plasmas, whichis of general interest for the stellarator community. For example, W7-AS [3] transitions tohigher confinement are observed for plasmas with much higher particle densities (and differentheating schemes) but lower heating power to density ratio than in TJ-II. In the LHD device [4]different confinement regimes can be accessed from the startup of the discharge [5]. Thehigh confinement mode (H-mode) is characterized by a clear pedestal close to the plasmaboundary externally bound by steep pressure gradients, but no L–H transition as in W7-AS
0741-3335/02/081639+11$30.00 © 2002 IOP Publishing Ltd Printed in the UK 1639

1640 I Garcıa-Cortes et al
is observed during the discharge. Results from the CHS device [6] about the formation ofan internal thermal transport barrier in low-density plasmas more similar to those of TJ-II [7]are also reported. The phenomenon is described as a combination of neoclassical transporttheory and turbulence suppression via sheared radial electric field. It looks like stellaratorconcept devices can be rather unique because, depending upon design and operation regime,several major mechanisms can dominate confinement: ergodic regions in magnetic structure,neoclassical effects, electrostatic turbulence or a combination of these. For this reason, thispaper primarily aims at contributing to the phenomenology of stellarator devices.
In particular, all physics relating MHD and transport are important for the TJ-II programmedue to the capability of this device to scan magnetic configurations. In this respect, thetransitions to be described have appeared, till now, only in plasmas with pre-transition ELM-likeactivity [8]. Although a larger database is necessary to dwell on these issues, it is neverthelessuseful to know whether the phenomenon admits to be interpreted as a sharp transition betweenconfinement regimes or as a gradual readjustment of thermodynamic profiles. Therefore,along with characterizing these plasmas experimentally, we shall include a first estimate onthe evolution of transport coefficients. Even though the latter always requires some theoreticalassumptions, our aim is to make a mostly interpretative transport analysis of the phenomenon.
The paper is organized as follows: in section 2 the main characteristics of the TJ-II deviceand its diagnostic system are presented. The description of the new plasmas with improvedconfinement can be found in section 3. Section 4 is devoted to describing a representativedischarge in terms of transport analysis and, finally, the summary and discussion are addressedin section 5.
2. TJ-II device and diagnostics
The flexible heliac TJ-II [2] (R = 1.5 m, a < 0.2 m, Bo � 1.2 T, PECRH � 600 kW, andPNBI � 2 MW currently being installed) is a four-period helical axis stellarator. TJ-II wasdesigned to have a low magnetic shear and a high magnetic configuration flexibility, as itis inherent of heliac devices. The rotational transform can be varied over a wide range(0.9 � ι/2π � 2.2) by changing the current fed into the two central coils, helical andcircular. The discharges to be described have been operated under metallic wall conditions. Inorder to achieve reproducible and controlled discharges for ECRH power injection, new gascontrol and wall conditioning techniques have been implemented. This requires the sequentialapplication of He (overnight) and Ar (<30 min) glow discharges to the metallic vessel and thedevelopment of a gas injection monitoring system for very low gas flows [9].
A Thomson scattering (TS) system [10] is used to determine the radial profiles of theelectron temperature and density, one per shot, with high spatial resolution. The time evolutionof the electron temperature profile is measured by an absolutely calibrated electron cyclotronemission (ECE) radiometer [11]. There are seven channels available covering from thecentre to the edge of the plasma at the high field side part of the profile, and another oneat the last flux surface. The line-averaged density is measured by a two channel microwaveinterferometer. The ion temperature of the plasma is obtained by a charge exchange neutralparticle analyser [12]. Local emissivities in the range of soft x-rays (SXR) are obtained bytomographic reconstruction of the line-integrated emissions measured with a multi-array diodesystem [13]. An array of bolometers [14] is used to monitor the total plasma radiation. Adescription of the TJ-II Rogowsky coils measuring the net plasma current, the Mirnov pick-upcoils that provide magnetic fluctuations up to 50 kHz and the diamagnetic loop system for themeasurements of the plasma energy content can be found in [15]. Recycling is monitored by aset of Hα detectors at different toroidal locations. Langmuir probes embedded in the poloidal

Spontaneous improvement of TJ-II plasmas confinement 1641
limiters give temperature and density and their fluctuations at the last closed magnetic surface(LCMS). A reflectometry system [16] gives the radial profile of electron density at the edge.A detailed description of the TJ-II diagnostic system used can be found in [12].
3. General description of the experiments
The plasmas reported here show spontaneous enhancement of the confinement. They wereheated with about 300 kW of ECRH (53 GHz, second harmonic, extraordinary mode ofpolarization) coupled to the plasma by quasi-optical transmission line with a power densityof about 15 W cm−3. The averaged electron densities fall into the range (0.6–0.7) × 1019 m−3
before the transition occurs. A post-transition steady state cannot be reached due to the ECRHcut-off density (n(0) ∼ 1.7 × 10¹⁹ m−3). The plasmas have a bean shaped cross-sectionwith average minor radius 〈a〉 ∼ 0.2 m. In what follows, we shall make use of the averagednormalized radius, ρ, deduced from the vacuum magnetic configuration. The phenomena tobe described were observed in plasmas with H2 as working gas, and metal walls and limiters,where the typical energy and particle confinement times are of the order of 1 ms and 10 ms,respectively. The LCMS was defined by the intersection of the field lines with the region ofthe vessel surrounding the central helical coil, which acts as a helical limiter.
The ι’s (ι(0)/2π = 1.68, ι(a)/2π = 1.76) correspond to a vacuum magnetic configurationthat excludes large magnetic islands inside the confinement region. However, the sign of theinduced plasma current in TJ-II is such that it decreases the ι value, especially in the plasmacentre. In magnetic configurations in which vacuum ι profiles lie just above a low-orderrational, the effect of even a small current can introduce the rational surface well inside theconfinement region. In this particular case, the (m, n) = (3, 5) mode can easily enter theplasma and explain the presence of the ELM-like instabilities, as occurs in plasmas analysedin [8].
The spontaneous transition to an improved regime is seen as an increase in the line-averaged density, a rise in the electron and ion temperature, and a jump in the SXR signals.Figure 1 shows a number of time traces from the particular discharge #5196, which features oneof these transitions at about 1147 ms. Figure 1(a) shows the time evolution of the local SXRemission (red line) for normalized effective radius ρ = 0.5 and three ECE channels (blacklines). The 〈ne〉 rapidly rises from t = 1147 ms (figure 1(b), black line) and the net plasmacurrent becomes negative (figure 1(b), red line) after the transition time. The low-frequencyharmonic (∼30 Hz) that can be observed in the plasma current is induced by a spurious andwell-known resonant perturbation that sometimes appears in the current flowing through thecentral conductor. Both central and helical coils are very well coupled to the plasma. Thediamagnetic energy of the plasma increases up to 50% after the transition (figure 1(c), blackline) and the ion temperature increases from 90 to 105 eV (see figure 1(c), red line). Themagnetic fluctuations (figure 1(d), red line), present before the transition and attributed toELM-like phenomena [8], are reduced in the improved confinement plasma. The ELM-freeperiod is accompanied by an enhancement of the particle confinement time as indicated by aconstant Hα signal (figure 1(d), black line) together with the rapid increase of the line-averageddensity (figure 1(b)), so that the rate (Hα/〈ne〉) [1] is reduced after the transition. The Hα signallooking at the puff valve is almost constant during the transition (figure 1(e), red line). Thetotal radiated power is shown in figure 1(e) (black line), its increment being ∼10 kW duringthe whole enhanced confinement regime. No hard x-ray emissions were detected. Finally, theplasma is terminated because of the density cut-off for the ECRH (t = 1200 ms in figure 1).
The profiles of different plasma parameters for the discharge #5196 before (black lines)and after (red lines) the transition, are presented in figure 2. The electron temperature profile

1642 I Garcıa-Cortes et al
0.1
0.3
0.5
0.7 SXR ( = 0.5) (a.u.)ρ
Te (
keV
)
ρ = – 0.16
ρ = – 0.30
ρ = – 0.49
0.4
0.6
0.8
1.0
1.2
–0.4
–0.2
0
0.2
0.4<
n e> (
x1019
m–3
)
Ip (kA)
0 . 2
0 . 4
0 . 6
0 . 8
1
70
90
110
Wdi
a (kJ
)
Ti (eV)
2 . 5
3 . 5
4 . 5
H
li
mit
er (
a.u.
)α
B (a.u.)θ
.~
20
30
40
50
1080 1100 1120 1140 1160 1180 1200
Pra
d (kW
)
time (ms)
Halpha
puff (a.u.)
(a)
(b)
(c)
(d)
(e)
Figure 1. Time evolution of different plasma parameters, across the transition in the discharge#5196. See text for explanation. Vertical line shows the transition time (≈1147 ms).
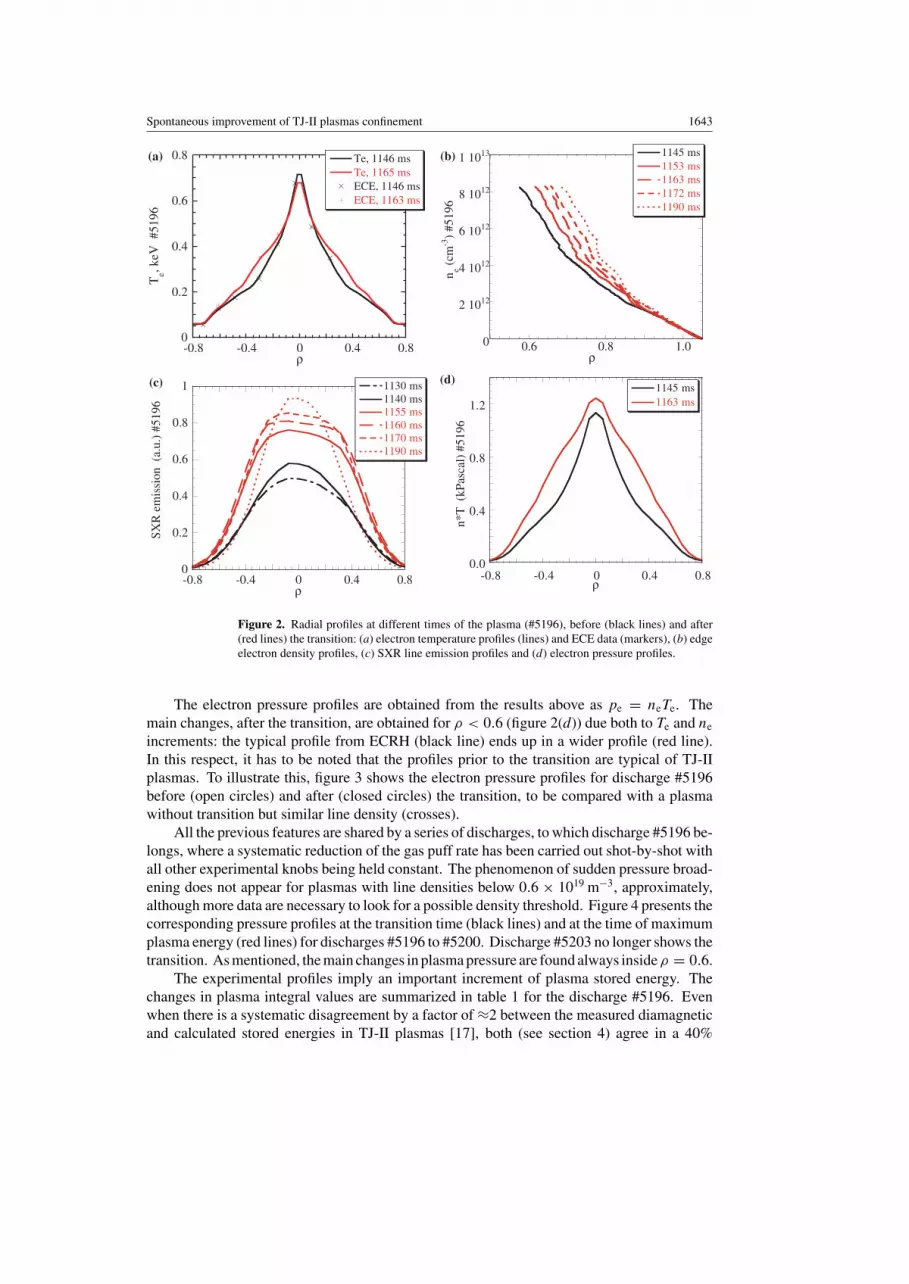
becomes broader in the enhanced regime. Figure 2(a) shows the maximum increase in electrontemperature inside ρ < 0.6, while the temperature measured by Langmuir probes at the limiterradius drops (Te(a) varies from 30 eV, before the transition, to 10 eV after the transition).
The density profile, in the plasma region where the density is below 0.8 × 10¹⁹ m−3
(roughly the outer half radius of the plasma), is measured by the reflectometer and it showsa clear steepening, especially in the region of ρ < 0.85 (see figure 2(b)). The SXR emissionprofile becomes broader after the transition, in the plasma region inside ρ < 0.7 (figure 2(c)).SXR and ECE data have been used to complete ne profiles: Bremsstrahlung and recombinationradiation were taken into account for oxygen, the dominant impurity in TJ-II for metal wallconditions, using coronal equilibrium, which allows to reconstruct the time evolution of thedensity profiles. They were then calibrated after comparison with TS profiles. The resultingprofiles match the reflectometer data reasonably well and allow to conclude that the density risesin almost the whole plasma volume. This agrees with the rapid increase of the line-averageddensity after the transition.
Spontaneous improvement of TJ-II plasmas confinement 1643
0
0.2
0.4
0.6
0.8
-0.8 -0.4 0 0.4 0.8
Te, 1146 msTe, 1165 msECE, 1146 msECE, 1163 ms
Te, k
eV #
5196
ρ0
2 1012
4 1012
6 1012
8 1012
1 1013 1145 ms1153 ms1163 ms1172 ms1190 ms
n e (cm
-3)
#519
6
ρ
(b)
1.00.80.6
0
0.2
0.4
0.6
0.8
1
-0.8 -0.4 0 0.4 0.8
SXR
em
issi
on (
a.u.
) #5
196
1130 ms1140 ms1155 ms1160 ms1170 ms1190 ms
ρ
0.0
0.4
0.8
1.2
-0.8 -0.4 0 0.4 0.8
n*T
(kP
asca
l) #
5196
1145 ms1163 ms
ρ
(d)
(a)
(c)
Figure 2. Radial profiles at different times of the plasma (#5196), before (black lines) and after(red lines) the transition: (a) electron temperature profiles (lines) and ECE data (markers), (b) edgeelectron density profiles, (c) SXR line emission profiles and (d) electron pressure profiles.
The electron pressure profiles are obtained from the results above as pe = neTe. Themain changes, after the transition, are obtained for ρ < 0.6 (figure 2(d)) due both to Te and ne
increments: the typical profile from ECRH (black line) ends up in a wider profile (red line).In this respect, it has to be noted that the profiles prior to the transition are typical of TJ-IIplasmas. To illustrate this, figure 3 shows the electron pressure profiles for discharge #5196before (open circles) and after (closed circles) the transition, to be compared with a plasmawithout transition but similar line density (crosses).
All the previous features are shared by a series of discharges, to which discharge #5196 be-longs, where a systematic reduction of the gas puff rate has been carried out shot-by-shot withall other experimental knobs being held constant. The phenomenon of sudden pressure broad-ening does not appear for plasmas with line densities below 0.6 × 10¹⁹ m−3, approximately,although more data are necessary to look for a possible density threshold. Figure 4 presents thecorresponding pressure profiles at the transition time (black lines) and at the time of maximumplasma energy (red lines) for discharges #5196 to #5200. Discharge #5203 no longer shows thetransition. As mentioned, the main changes in plasma pressure are found always insideρ = 0.6.
The experimental profiles imply an important increment of plasma stored energy. Thechanges in plasma integral values are summarized in table 1 for the discharge #5196. Evenwhen there is a systematic disagreement by a factor of ≈2 between the measured diamagneticand calculated stored energies in TJ-II plasmas [17], both (see section 4) agree in a 40%

1644 I Garcıa-Cortes et al
0
0.5
1
1.5
–0.8 –0.4 0 0.4 0.8ρ
Pressure (kPa)
Figure 3. Pressure profile for #5196 before (◦) and after (•) the transition. Crosses belong to atypical TJ-II plasma pressure profile (shot #5043 with a line-averaged density about 0.7×10¹⁹ m−3)
measured by TS system. A few error bars in the interest region have been added to the TS crosses(vertical lines about ρ = −0.2).
0.0
0.4
0.8
1.2
–0.8 –0.4 0 0.4 0.8
Pressure (kPa) #5196–5200 5196 b.t.5196 a.t.5197 b.t.5197 a.t.5198 b.t.5198 a.t.5200 b.t.5200 a.t.
ρ
Figure 4. Electron pressure profiles for a series of discharges with transition. The gas-puff isreduced shot-by-shot. Black lines: before transition, red lines: after transition.
Table 1. Calculated stored energy, W ; particle confinement time, τp, energy confinement time,τE , at the transition time and when the diamagnetic energy (from diamagnetic loops) is maximum.Shot #5196.
Time W Wdia τp τE
Comment (ms) (J) (J) (ms) (ms)
Pre-transition ≈1145 320 ± 10 630 14 ± 2 2.4 ± 0.5Max. W ≈1163 440 ± 20 880 21 ± 3 3.5 ± 0.7
increment. The calculated particle confinement time increases from 14 to 21 ms and theenergy confinement time also increases considerably.
4. Transport analysis
Interpretative analysis has been done to estimate transport changes between confinementregimes. The aim is to gain information from the perspective of fluid plasma evolution withthe least amount of possible theoretical modelling. Owing to the similarity among discharges,

Spontaneous improvement of TJ-II plasmas confinement 1645
only the results for a representative one (#5196) will be presented. This analysis is basedon the knowledge of the following magnitudes from the experiment: electron density, electrontemperature and total radiation profiles, central ion temperature and the integral of the electronparticle source into the plasma. The heating source is based on ray tracing estimates of thedeposition profile, which can be approached with a Gaussian profile [7]. The total powerdeposited has been reduced by 15% with respect to the nominal 300 kW available [18].
The analysis has been performed with the transport shell ASTRA [19]. The electrondensity transport has been described with a fixed parabolic-shaped transport coefficient anddirect losses attributed to ECRH pump out in the core region and magnetic ripple in theouter region. These profiles, D(ρ) and v(ρ), respectively, remain fixed until the equilibriumis reached before the transition time (see figure 5), to be changed abruptly afterwards asnoted in the labels. The evolution of the electron energy density has been modelled withexperimental radiation losses, P rad, electron–ion heat exchange, P ei, convective heat flux andan interpretative transport coefficient, χe = Qtot
e /V ′ne∇Te, where Qtote stands for the electron-
integrated power coming from the sources and V ′ is a geometrical coefficient (volume radialderivative). This transport coefficient forces Te to follow the experimental profiles wheneverthe diffusive thermal flux is dominant because the convective heat flux is not considered in χe.The corresponding evolution equations are
∂ne
∂t= −∇ · (−Dn∇ne + vpne) + Sn = −∇ · �n + Sn
3
2
∂(neTe)
∂t= −∇ ·
(−χen∇Te +
5
2Te�n
)+ P ECRH − P rad − P ei
If the convective thermal losses are comparatively strong, the chosen transport coefficientmust give smaller calculated than experimental equilibrium Te gradients. This may be the casefor average normalized radii ρ � 0.7. For this reason, the estimation of transport coefficients isconsidered to be meaningful only for smaller radii. Core estimates of χe will not be consideredeither: neither the spatial resolution of ECE (figure 2(a)) nor TS data (figure 3) allow for a fairestimate of ∇Te near the core, thus undetermining Qtot
e /∇Te in the definition of the coefficient.According to the experimental data (see figure 1), there is a change in confining properties
at t = 1147 ms when both ne and Te start increasing. The drop in Te causes Wdia to nolonger increase as of t = 1165 ms. In performing the analysis, both particle and heat sources(figure 6) have been assumed to remain constant within this time interval. In the case of theparticle source, this is supported by the roughly constant Hα signal monitored at the gas-puffing
0.0
0.1
0.2
0
10
20
0 0.2 0.4 0.6 0.8 1
Dn(t < 1.145 s)
Dn(t > 1.145 s)
v(t < 1.145 s)v(t > 1.145 s)
elec
tron
dif
fusi
vity
, m2/s
electron flow radial velocity, m
/s
ρ
Figure 5. Non-evolving particle diffusion coefficient, Dn, and radial velocity, v, before and afterthe transition time (t = 1.147 s). The profile of v is reduced only inside ρ = 0.4.
1646 I Garcıa-Cortes et al
0
1
2
3
4
0 0.2 0.4 0.6 0.8 1
PECH
Sn 1.147 s
Sn 1.165 s
heat
ing
pow
er d
ensi
ty, M
W/m
3
electron source, 1019 m
-3s
-1
ρ
38·1019 s- 1
37·1019 s- 1
0
10
20
30
40
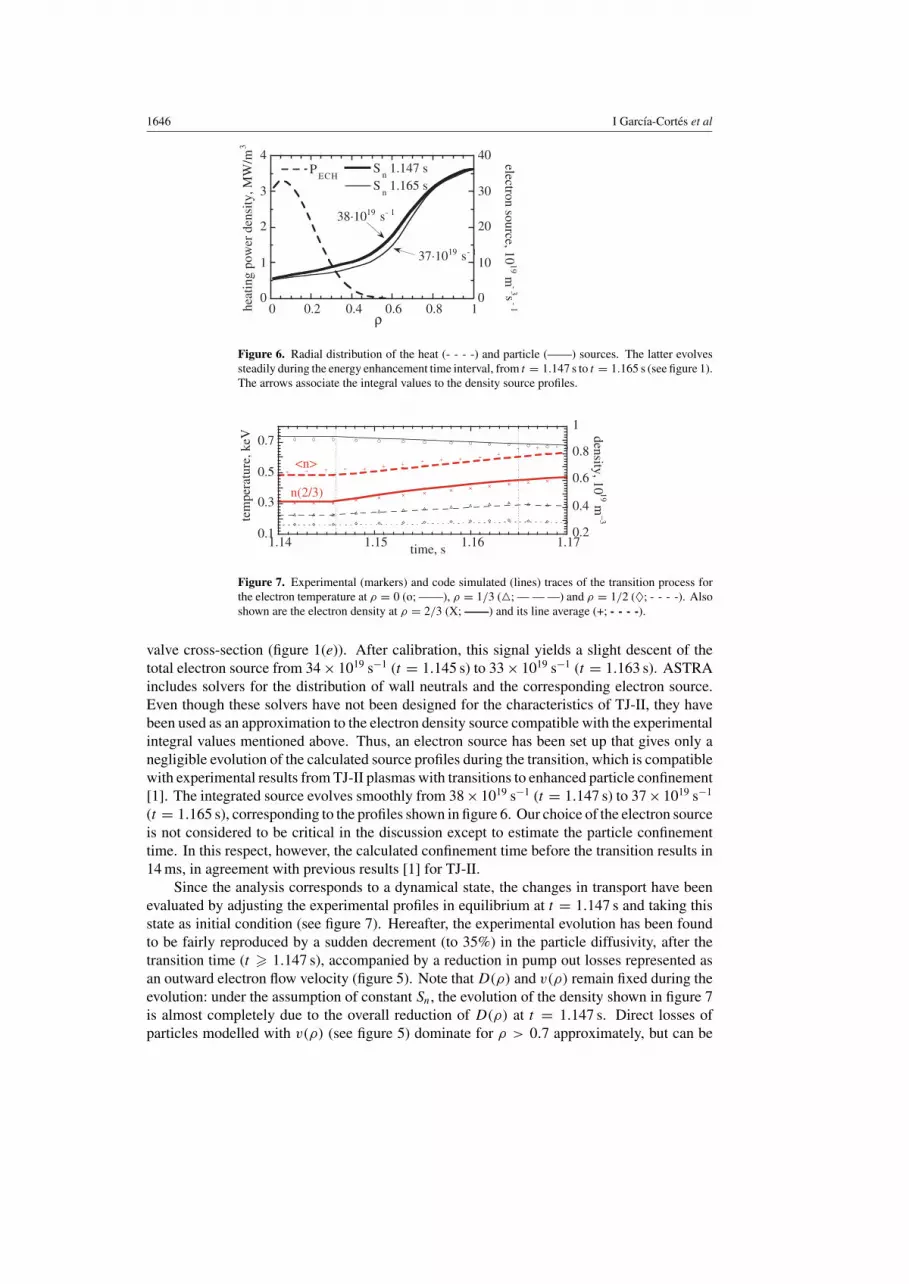
Figure 6. Radial distribution of the heat (- - - -) and particle (——) sources. The latter evolvessteadily during the energy enhancement time interval, from t = 1.147 s to t = 1.165 s (see figure 1).The arrows associate the integral values to the density source profiles.
0.1
0.3
0.5
0.7
0.2
0.4
0.6
0.8
1
1.14 1.15 1.16 1.17
tem
pera
ture
, keV
density, 1019 m
–3
time, s
<n>
n(2/3)
Figure 7. Experimental (markers) and code simulated (lines) traces of the transition process forthe electron temperature at ρ = 0 (o; ——), ρ = 1/3 (�; — — —) and ρ = 1/2 (♦; - - - -). Alsoshown are the electron density at ρ = 2/3 (X; ——) and its line average (+; - - - -).
valve cross-section (figure 1(e)). After calibration, this signal yields a slight descent of thetotal electron source from 34 × 1019 s−1 (t = 1.145 s) to 33 × 1019 s−1 (t = 1.163 s). ASTRAincludes solvers for the distribution of wall neutrals and the corresponding electron source.Even though these solvers have not been designed for the characteristics of TJ-II, they havebeen used as an approximation to the electron density source compatible with the experimentalintegral values mentioned above. Thus, an electron source has been set up that gives only anegligible evolution of the calculated source profiles during the transition, which is compatiblewith experimental results from TJ-II plasmas with transitions to enhanced particle confinement[1]. The integrated source evolves smoothly from 38 × 1019 s−1 (t = 1.147 s) to 37 × 1019 s−1
(t = 1.165 s), corresponding to the profiles shown in figure 6. Our choice of the electron sourceis not considered to be critical in the discussion except to estimate the particle confinementtime. In this respect, however, the calculated confinement time before the transition results in14 ms, in agreement with previous results [1] for TJ-II.
Since the analysis corresponds to a dynamical state, the changes in transport have beenevaluated by adjusting the experimental profiles in equilibrium at t = 1.147 s and taking thisstate as initial condition (see figure 7). Hereafter, the experimental evolution has been foundto be fairly reproduced by a sudden decrement (to 35%) in the particle diffusivity, after thetransition time (t � 1.147 s), accompanied by a reduction in pump out losses represented asan outward electron flow velocity (figure 5). Note that D(ρ) and v(ρ) remain fixed during theevolution: under the assumption of constant Sn, the evolution of the density shown in figure 7is almost completely due to the overall reduction of D(ρ) at t = 1.147 s. Direct losses ofparticles modelled with v(ρ) (see figure 5) dominate for ρ > 0.7 approximately, but can be
Spontaneous improvement of TJ-II plasmas confinement 1647
0
5
10
15
20
0.1 0.3 0.5 0.7
TJ2 #51961147 ms1150 ms1155 ms1160 ms1165 ms
ther
mal
dif
fusi
vity
, m2 /s
ρ
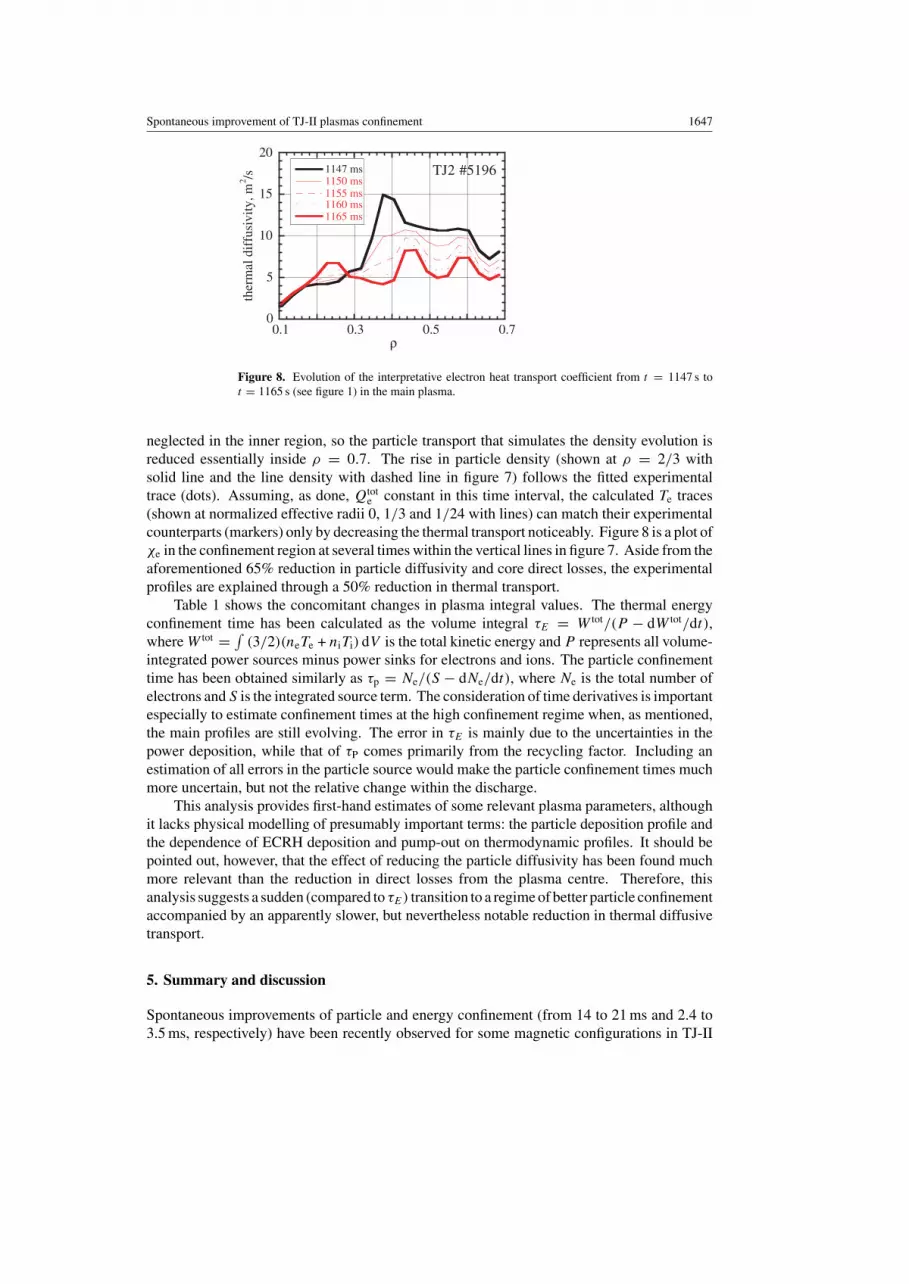
Figure 8. Evolution of the interpretative electron heat transport coefficient from t = 1147 s tot = 1165 s (see figure 1) in the main plasma.
neglected in the inner region, so the particle transport that simulates the density evolution isreduced essentially inside ρ = 0.7. The rise in particle density (shown at ρ = 2/3 withsolid line and the line density with dashed line in figure 7) follows the fitted experimentaltrace (dots). Assuming, as done, Qtot
e constant in this time interval, the calculated Te traces(shown at normalized effective radii 0, 1/3 and 1/24 with lines) can match their experimentalcounterparts (markers) only by decreasing the thermal transport noticeably. Figure 8 is a plot ofχe in the confinement region at several times within the vertical lines in figure 7. Aside from theaforementioned 65% reduction in particle diffusivity and core direct losses, the experimentalprofiles are explained through a 50% reduction in thermal transport.
Table 1 shows the concomitant changes in plasma integral values. The thermal energyconfinement time has been calculated as the volume integral τE = W tot/(P − dW tot/dt),where W tot = ∫
(3/2)(neTe + niTi) dV is the total kinetic energy and P represents all volume-integrated power sources minus power sinks for electrons and ions. The particle confinementtime has been obtained similarly as τp = Ne/(S − dNe/dt), where Ne is the total number ofelectrons and S is the integrated source term. The consideration of time derivatives is importantespecially to estimate confinement times at the high confinement regime when, as mentioned,the main profiles are still evolving. The error in τE is mainly due to the uncertainties in thepower deposition, while that of τP comes primarily from the recycling factor. Including anestimation of all errors in the particle source would make the particle confinement times muchmore uncertain, but not the relative change within the discharge.
This analysis provides first-hand estimates of some relevant plasma parameters, althoughit lacks physical modelling of presumably important terms: the particle deposition profile andthe dependence of ECRH deposition and pump-out on thermodynamic profiles. It should bepointed out, however, that the effect of reducing the particle diffusivity has been found muchmore relevant than the reduction in direct losses from the plasma centre. Therefore, thisanalysis suggests a sudden (compared to τE) transition to a regime of better particle confinementaccompanied by an apparently slower, but nevertheless notable reduction in thermal diffusivetransport.
5. Summary and discussion
Spontaneous improvements of particle and energy confinement (from 14 to 21 ms and 2.4 to3.5 ms, respectively) have been recently observed for some magnetic configurations in TJ-II
1648 I Garcıa-Cortes et al
plasmas, at relatively low plasma densities ((0.6–0.7) × 1019 m−3). The transitions start witha same pressure profile for ρ > 0.6 (figure 4) and lead to major changes inside that radialposition: both density and temperature profiles broaden thus giving rise to higher stored energy.The transport analysis indicates substantial (∼50%) reductions of the thermal and particlediffusivities inside the main plasma. Several transport related signals (SXR, Ti, Te, 〈ne〉, Hα ,etc) change trends significantly marking the transition time. The evolution of Hα and δBpol
(figure 1 around the vertical line) seem to be delayed in their response, i.e. changes in magneticactivity (which is related to ELM-like phenomena, see Hα) are apparently a consequence, not atrigger, of the transition. This is compatible with an increase in the absolute value of the plasmacurrent (figure 1(b)), bootstrap driven, due to the enhancement in plasma pressure gradients.The magnetic geometry of TJ-II allows for wide displacements of the rational surfaces in thisway. If the displacement takes the rational out to small pressure gradient regions, the magneticactivity should consequently be suppressed.
The CHS device has observed internal barriers with a power threshold in low density(∼0.4 × 10¹⁹ m−3) plasmas [6]. An explanation is provided based on neoclassical transportvia the appearance of an electron root in the core plasma. A similar phenomenon for TJ-II low-density plasmas is described in [7], where the transport analysis indicates substantial reductionsof χe inside ρ ≈ 0.3. Moreover, when the peaked temperature profile is established the particleaveraged density decreases notably. The present transitions in TJ-II happen spontaneouslyafter a slow (some five times τp) evolution of the plasma at constant operation parametersand are compatible with particle and energy transport reductions for radii up to ≈0.7. As ofyet, no experimental measurements of electric field profiles are available for TJ-II, but thedependence of neoclassical particle diffusivity on electric field is very weak for medium andhigh collisionalities [20]. This makes unlikely an explanation based on neoclassical changesin electric field. More detailed studies are necessary at this point.
The phenomena reported here have some similarities with L–H transitions in other devices:the time traces of ECE channels, line density and diamagnetic energy change trends, increasingat a fairly well defined time; and magnetic fluctuations are reduced from that same time on. Tomention some differences, the various Hα signals in TJ-II do not show a sustained reductionfrom the transition time (figure 1). There is an apparent transient drop of the signals but theyrecover to (at least) pre-transition values. This is still compatible with a sudden reduction ofparticle diffusive transport because no control on the particle source has been exerted withinthe discharge: the rapidly rising density can easily restore outward particle fluxes. On the otherhand, the density near the boundary (figure 2(b)) does not show a pivot point or a tendencyto develop a pedestal. Its evolution responds to a simple broadening as would correspondto a larger accumulation of particles inside ρ 0.8, where the transport has been assumed tobe diffusive (figure 5). Furthermore, the main changes in transport are estimated to happenin 0.3 < ρ < 0.6 approximately. The broadening of the electron pressure is explained withnotable reductions of diffusive (particles and energy) transport in an extended region that has tobe considered, then, inside the main plasma (see figure 2). Therefore, neither the experimentaldata nor the transport analysis support some of the features from a transition phenomenon withthe rapid formation of an edge transport barrier.
In summary, these experiments add new features to the phenomenology of transitionevents in stellarators. To discriminate among the several possible explanations a largerdatabase is needed. As a first step, further investigation of confinement and stability propertiesof the plasmas in a wide range of operating regimes with ECRH will be performed inTJ-II. Especially, experiments with full boronization of the first wall have been carriedout recently and new results related to improved confinement modes will be presentedelsewhere [21].

Spontaneous improvement of TJ-II plasmas confinement 1649
Acknowledgments
The support of all the TJ-II Team is gratefully acknowledged. In particular, the authors wishto thank I Pastor and J Herranz (TS), M Ochando (bolometry), R Balbın (CX), E de la Luna(ECE), E Ascasıbar (magnetic diagnostics), D Tafalla (Hα), A Lopez-Fraguas and J A Jimenez(magnetic configuration reconstruction) and V Tribaldos and J Romero for useful discussions.
References
[1] Tabares F L et al 2001 Plasma Phys. Control. Fusion 43 1023–37[2] Alejaldre C et al 1999 Plasma Phys. Control. Fusion 41 A539[3] Wagner F et al 1994 Plasma Phys. Control. Fusion 36 A61–74[4] Motojima O et al 1997 Proc. 16th Conf. on Fusion Energy (Montreal, 1996) vol 3 (Vienna: IAEA) p 437[5] Ohyabu N et al 2000 Phys. Plasmas 7 1802–8[6] Fujisawa et al 1999 Phys. Rev. Lett. 82 2669[7] Castejon F et al 2002 Nucl. Fusion 42 271–80[8] Garcıa-Cortes I et al 2000 Nucl. Fusion 40 1867[9] Tabares F L et al 1999 J. Nucl. Mater. 266–269 1273
[10] Barth C J, Pijper F J, v d Meiden H J, Herranz J and Pastor I 1999 Rev. Sci. Instrum. 70 760[11] de la Luna E, Sanchez J, Tribaldos V and Estrada T 2001 Rev. Sci. Instrum. 72 79[12] Sanchez J et al 1998 J. Plasma Fusion Res. 1 338–41[13] Medina F et al 1999 Rev. Sci. Instrum. 70 642[14] Ochando M A et al 1999 Rev. Sci. Instrum. 70 384[15] Ascasıbar E et al 1999 Proc. 12th Int. Stellarator Workshop (Madison, Wisconsin, USA, September 1999)
(in CD-ROM)[16] Estrada T et al 2001 Plasma Phys. Control. Fusion 43 1535–45[17] Ascasıbar E et al 2002 Proc. 13th Int. Stellarator Workshop (Canberra, Australia, February 2002) CD-ROM[18] Fernandez et al 1999 Lineas de transmision Cuasi-Opticas para el Sistema ECRH del Stellorator TJ-II Informes
Tecnicos Ciemat 896[19] Pereverzev G V et al 1991 Rep. IPP 5142, Max-Plank-Institut fur Plasmaphysick, Garching[20] Tribaldos V 2001 Phys. Plasmas 4 1229[21] Tabares F L et al 2002 15th Inter. Conf. on Plasma Surface Interactions in Controlled Fusion Devices
(Nagaragawa Convention Center, Gifu, Japan, 27–31 May 2002)