spectrum control of intense thz-radiation from inas under magnetic field irradiated with stretched...
TRANSCRIPT

vntim Optics Materials, Fundamentals and Applications Topica Meeting
10-14 August 1998 Princeville Hotel Princeville, Kauai, Hawaii
•ÄRpfcwed fOT prfcJic reiaase;~ h. *.. BMxution Unlimited
OSA Optical Society of A me rice
*TEOS1

REPORT DOCUMENTATION PAGE Form Approved OMB No. 0704-0188
Public reporting burden for this collection of information is estimated to average 1 hour per response, including the time for reviewing instructions, searching existing data sources, gathering and maintaining the data needed, and completing and reviewing the collection of information. Send comments regarding this burden estimate or any other aspect of this collection of information, including suggestions for reducing this burden, to Washington Headquarters Services, Directorate for Information Operations and Reports, 1215 Jefferson Davis Highway, Suite 1204, Arlington, VA 22202-4302, and to the Office of Management and Budget, Paperwork Reduction Project (0704-0188), Washington, DC 20503.
1. AGENCY USE ONLY (Leave Blank)
2. REPORT DATE
August 1998
3. REPORT TYPE AND DATES COVERED Final Technical
TITLE AND SUBTITLE Technical Digest of the 1998 Nonlinear Optics:
Topical Meeting NLO'98
Materials Fundamentals and Applications
6. AUTHORS Multiple
FUNDING NUMBERS G N00014-98-1-0547
7. PERFORMING ORGANIZATION NAME(S) AND ADDRESS(ES) Institute of Electrical and Electronics Engineers, Inc. 445 Hoes Lane, P.O. Box 1331 Piscataway, NJ 08855-1331
PERFORMING ORGANIZATION REPORT NUMBER
SPONSORING / MONITORING AGENCY NAME(S) AND ADDRESS(ES)
Office of Naval Research Herschel S. Pilloff, ONR 331 Ballston Center Tower One, 800 North Quincy Street Arlington, VA 22217-5660
10. SPONSORING / MONITORING AGENCY REPORT NUMBER
11. SUPPLEMENTARY NOTES
12a. DISTRIBUTION / AVAILABILITY STATEMENT APPROVED FOR PUBLIC RELEASE
12b. DISTRIBUTION CODE
13. ABSTRACT (Maximum 200 words)
t.c-
losrsff«
': .y&jjpfovsd for public releaftfS Bisiiibutjcm Unlimited
-■tin' 3Ü '■T^ftifo mm i -rtj
14. SUBJECT TERMS Nonlinear Optics, Nonlinearities, Optical
17. SECURITY CLASSIFICATION OF REPORT Unclassified
18. SECURITY CLASSIFICATION OF THIS PAGE Unclassified
19. SECURITY CLASSIFICATION OF ABSTRACT Unclassified
15. NUMBER OF PAGES 478
16. PRICE CODE
20. LIMITATION OF ABSTRACT UL
NSN 7540-01-280-5500 Standard Form 298 (Rev. 2-89) Prescribed by ANSI Std. Z39-1 298-102

Nonlinear Optics'98 Materials, Fundamentals and Applications Topical Meeting
10-14 August 1998
Princeville Hotel Princeville, Kauai, Hawaii
IEEE Catalog #: 98CH36244 Library of Congress # 98-85597
DTIC QUALITY INSPECTED 4

The papers in this book make up the digest of the Nonlinear Optica'98 Materials, Fundamentals and Applications Topical Meeting. They reflect the author's opinions and are published as presented and without change in the interest of timely dissemination. Their inclusion in this publication does not necessarily constitute endorsement by the editors, the Institute of Electrical and Electronics Engineerings, Inc.
Copyright and Reprint Permission: Abstracting is permitted with credit to the source. Libraries are permitted to photocopy beyond the limit of U.S. copyright law for private use of patrons those articles in this volume that carry a code at the bottom of the first page, provided per-copy fee indicated in the code is paid through Copyright Clearance Center, 222 Rosewood Drive, Danvers, MA 01923. For other copying, reprint or republication permission, write to IEEE Copyrights Manager, IEEE Operations Center, 445 Hoes Lane, PO Box 1331, Piscataway, NJ 08855-1331.
© 1998 by the Institute of Electrical and Electronics Engineers, Inc. All rights reserved.
IEEE Catalog Number:
ISBN:
Library of Congress:
98CH36244
0-7803-4950-4 0-7803-4951-2 0-7803-4952-0
98-85597
Softbound Edition Casebound Edition Microfiche Edition
Additional copies can be ordered from: IEEE Service Center
445 Hoes Lane P.O. Box 1331
Piscatawy, NJ 08855-1331 Tel: (732) 981-1393 Fax: (732) 981-9667

Nonlinear Optics'98 Materials, Fundamentals and Applications
General Co-Chairs Robert W. Boyd Ian McMichael University of Rochester Rockwell Science Center Rochester, NY Thousand Oaks, CA
Program Co-Chairs Galina Khitrova Wayne H. Knox University of Arizona Bell Labs Lucent Tech Tucson, AZ Holmdel, NJ
Dana Anderson University of Colorado Boulder CO
Program Committee Daniel S. Chemla Metin Mangir Lawrence Berkeley Lab Hughes Research Labs Berkeley, CA Malibu, CA
Carlo Sirtori Masamichi Yamanishi Thomas-CSF Hiroshima University Orsay, France Hiroshima, Japan
Paul Berman University of Michigan Ann Arbor, Ml
Henry Everitt US Army Research Office Research Triangle Park, NC
Thomas W. Mossberg University of Oregon Eugene, OR
Art Smirl University of Iowa Iowa City, IA
Christoph Bubeck Max-Planck-Institute Mainz, Germany
Daniel Gammon Naval Research Lab Washington, DC
Demetri Psaltis California Insitute of Tech Pasadena, CA
George Stegeman University of Central Florida Orlando, FL
Tallis Chang Rockwell International Co. Thousand Oaks, CA Y
Jeffrey Kash IBM T.J. Watson Rsch Center orktown Heights, NY
Yaron Silberberg Weizmann Institute of Science Rehovot, Israel
Andy Weiner Purdue University W. Lafayette, FL
Christopher Clayton US Air Force Phillips Lab KirtlandAFB.NM
Domestic Advisory Committee Robert Guenther Richard Lind Army Research Office Hughes Research Lab Washington, DC Malibu, CA
Chung L. Tang William R. Woody Cornell University Wright Laboratory/MLP Ithaca, NY Wright Patterson AFB, OH
L. N. Durvasula DAPRA Arlington, VA
1. C. Khoo Pennsylvania State Univ Philadelphia, PA
Howard Schlossberg AFOSR Washington, DC
Pochi Yeh University of California Santa Barbara, CA
Hyatt Gibbs University of Arizona Tucson, AZ
David Pepper Hughes Research Lab Malibu, CA
Y. R. Shen University of California Santa Barbara, CA
Herschel S. Pilloff Office of Naval Research Arlington, VA
H. J. Eichler Technische Univ Berlin Germany
International Advisory Committee Nikolai Korteev C. L. Pan Moscow State University National Chaio Tung Univ Russia China
Daniel Walls University of Auckland New Zealand
W. J. Firth University of Strathclyde UK
B. Luther-Davis National Univ of Australia Australia
A. Persoons University of Leuven Belgium
Herbert Walther Max Planck Institute Germany
Christos Flytzanis CNRS Lab France
Peter Guenter ETH-Hoenggerberg Switzerland
Seizo Miyata Tokyo Univ of Agrigulture & Technology Japan
Hiroyuki Sasabe RIKEN Japan
Francesco Simoni Universita di Ancona Italy
Guo-Zheng Yang Academia Sinica China
Zhi-Ming Zhang Fudan University China

Table of Contents
SUNDAY, August 9,1998
SuA Sunday Night Session SuA1 Laser Cooling and Trapping of Atoms and Particles: So What Have You Done Lately? N/A SuA2 Information Storage & Retrieval From a Single Atom 3 SuA3 Nonlinear Optical Spectroscopy for Studies of Surfaces, Interfaces, and Films 5
MONDAY, August 10,1998
MA Fundamentals MA1 Quantum Optics with Large XP> Nonlinearities 9 MA2 The Cavity QED Circus: Juggling Atoms, Flying Photons, and Fantastic Finesse N/A MA3 Dynamics of Photon-Photon Scattering in Rb Vapor 10 MA4 Photon Number Squeezing of Optical Pulses Using a Simple Asymmetric Fiber Loop 13 MA5 Pattern Formation and Competition in Nonlinear Optics: Multiscaling and Complex Behavior 16
MB Metals MB1 Ultrafast Optical Nonlinearities of Metal Colloids 19 MB2 Nonlinear Optics of Random Metal-Dielectric Films 22 MB3 Effect of Percolation on the Cubic Susceptibility of Metal Nanoparticle Composites 25 MB4 Suface Plasmon & Off Electron Dynamics in Metal Nanocrystals and Films 28
MC Poster Session I MC1 Investigations of GaP for Terahertz Wave Generation Using Quasi-phasematched Difference
Frequency Mixing 30 MC2 Z-Scan Measurements on Au/Si02 Composite Films 33 MC3 Symmetry Breaking in Condensed Phases: The Interaction-Induced Optical Kerr Response
of Liquid CC14 36 MC4 Time Delayed Beam Splitting in Nonlinear Polymeric Waveguides Induced by Low Power
Upconverted Photobleaching 39 MC5 Size-depedent Many-body Effects in the Non-linear Optical Dynamics of Metal Nanoparticles 42 MC7 Low-Threshold Periodic Optical Parametric Oscillator 45 MC8 Singly Resonant Cavity-Enhanced Frequency Tripling 48 MC9 Nonlinear Interactions of Excitons in Conducting Polymers: Femtosecond Transient Absorption
and Holography Studies 51 MC10 High Optical Gain in Iron Doped Lithium Niobate by Contradirectional Two Beam Coupling 54 MC11 Recording of High Harmonic Grating in Photorefractive Media 57 MC12 Stable Generation of Ultrashort Tunable Pulses Using a Soliton Fiber Laser 60 MC13 Effect of Fe Doping on Optical Properties in KTiOAs04 Crystals 63 MC14 Microscopic Spectral Imaging of Defect Centers in KDP 66 MC15 Statistical Analysis of Polymer Grating Distortions in Volume Holographic Digital Storage 69

MC16 Properties of Compositional Volume Grating Recording in Photopolymers 72 MC17 The Optical Properties of Gold Nanocluster Composites in Silica Formed by Ion
Beam Assisted Deposition 75
MC18 Fourier Treatment of Nonlinear Optics 78 MC19 Hyper-Rayleigh Scattering of Polymers with Orientationally Correlated Chromophores 81 MC20 Coherent Coupling and Transient Optical Kerr Effect in Liquids 83 MC21 Ultrafast Electronic Dynamics in Metal Nanoparticles 87 MC22 Electron Trapping in Ultrathin Si02 on Si(001) Probed by Electric-Field-lnduced Second-
Harmonic Generation 89
MC23 A New Photoelectric Reorientation Effect for the Realization of Highly Sensitive Photorefraction in Liquid Crystals 92
MC24 Second-Harmonic Generation in the Bulk of a Chiral Liquid by a Focused Laser Beam 95 MC25 Stimulated Brillouin Scattering (SBS) Dye Laser Amplifiers 98 MC26 Swing Effect of Spatial Soliton in Second Order Material 101 MC27 Finite Difference Time Domain Analysis of Nonlinear Optical Waveguide 104 MC28 Fluorescence-Based Measurement Schemes Using Doped Fiber: Theoretical Analysis and
Experimental Validation 107
MC29 Large Phase Change by Cascaded Second-order Effects in 3-Methyl-4-Methoxy-4'-Nitrostilbene Single Crystals -j -JQ
MC30 Model of a Passively Q-Switched Laser Accounting Nonlinear Absorption Anisotropy in a Passive Switch 113
MC31 Solitary Waves and Two-Photon Absorption 116 MC32 Soliton Cloning in a Dispersive Nonlinear Medium Coherently Driven 119
MD Monday Night Session MD1 From Nanosecond to Femtosecond Science N/A MD2 Nonlinear Optics Using Electromagnetically Induced Transparency 122 MD3 The Physics of Laser Acceleration of Particles 124 MD4 Optical Projection Lithography at Half the Rayleigh Resolution Limit by Two Photon Exposure.... 126 MD5 Mazer Action a New Kind of Induced Emission 129
TUESDAY, August 11,1998
TuA Semiconductors I
TuA1 Quantum Cascade Microlazers with Deformed Chaotic Resonators N/A TuA2 Optical Spectroscopy of Single Nanometer Size Semiconductor Quantum Dots 135 TuA3 Optical Nonlinearities and Ultrafast Carrier Dynamics in Semiconductor Quantum Dots 136 TuA4 Ultrashort Pulse Controlled All-Optical Modulation by Intersubband-coupled-interband
Transitions in Doped Quantum Wells 139
TuA5 Light-Exciton Coupling Effects in Semiconductor Microcavities and Heterostructures 142
TuB Communications
TuB1 The Latest Nonlinearities to Rear Their Ugly Heads in Lightwave N/A TuB2 Dispersion-managed Solitons at Normal Average Dispersion 144 TuB3 Polarization-Locked Vector Solitons in a Fiber Laser 147 TuB4 Self Phase Modulation Limitations in Long Nonrepeatered Standard Fibre Transmission:
Influence From Dispersion Compensation Scheme and Modulation Format 150

TuB5 Strong Time Jitter Reduction Using Solitons in Hyperbolic Dispersion Managed Fiber Links 153 TuB6 Efficient Frequency Conversion in Optical Fibers with Tailored Birefringence 156 TuB7 An Improved Semiconductor Optical Amplifier for Ultrafast all-optical Signal Processing 159
TuC Poster Session II TuC1 Multidimensional Optical Pulses in non-resonant Quadratic Materials .................. ,....-,■■ 162 TuC2 Strong Correlation Effect in the Second Harmonic Generation of a Bose-Einstein Condensate.... 165 TuC3 Novel Measurement of Linear Dispersion Slope Near the Zero Dispersion Wavelength by
Four Wave Mixing 168 TuC4 Second and Third Harmonic Generations of Vandyl-Phthalocyanine Single Crystal Prepared
on KBr Substrate by Molecular Beam Epitaxy 171 TuC5 Limits of Nonlinear Optical Transmission Systems Induced by the Non-Ideal Behaviours of the
Transmitter 174
TuC6 Nondegenerate Four-Wave Mixing in a Double-A System Under the Influence of Coherent
Population Trapping 177
TuC7 Optical Frequency Tripling Using Cascading Quasi-Phasematched Nonlinearities in Periodically
Poled Lithium Niobate 180
TuC8 3D, True Color Photorefractive Hologram 182 TuC9 Nonlinear Optical Properties of A1 GaAs/GaAs Multiple Quantum Well due to Two-Photon
Transitions Between Bound-to-Continuum States 185 TuC10 Structure of Oriented Porphyrin J-Aggregates Determined by Dichroic Electrooptic
Measurement 188 TuC11 Interference Patterns of Scattering Light From an Electric Field Biased Nematic Liquid-
Crystal Film 1Q1 TuC12 Studies of SPM-lnduced Spectral Broadening in PTS-Polydiacetylene 194 TuC13 Single-Pass Thin-Film Electro-Optic Modulator Based On DAST 197 TuC14 Femtosecond Pump-Probe Spectroscopy of Quantum Confined Silicon and Germanium
Nanocrystals 200
TuC15 Novel Electrode Geometries for Periodically Poling of Ferroelectric Materials 203 TuC16 Observation of Nonlinear Spatial and Temporal Phenomena in a Long Er3+: Cr3+: YA103 Rod 206 TuC17 Measurement of Gain-Grating Dynamics in Erbium Doped Fibre 209 TuC18 Plane-Wave Dynamics of Optical Parametric Oscillation with Simultaneous Sum-Frequency
Generation 212 TuC19 Advances in Femtosecond Single-Crystal Sum-Frequency Generating Optical Parametric
Oscillators 215
TuC20 Ultrafast Time-Resolved Spectroscopic Imaging Using Femtosecond Amplifying Optical
KerrGate 2i8
TuC21 Bessel Function Solution for the Gain of a One-Pump Fiber Optical Parametric Amplifier 221 TuC22 Femtosecond Induced Susceptibility Change due to a Two-Photon Population Grating in
Caratenoid Solutions 224 TuC23 Third-Order Optical Nonlinearities in a Regioregular Head-to-Tail Poly(3-(4-dodecylphenyl)
thiophene) 227
TuC24 Sublattice Inversion Epitaxy of Compound Semiconductors for Quadratic Nonlinear
Optical Devices 230 TuC25 Third-Order Optical Nonlinearity at Excitonic Resonance in Poly(3-[2-(S)-2-methylbutoxy)ethyl]
thiophene) 233

TuC26 Soliton-Like Propagation in Biexciton Two-Photon Resonant Region 236 TuC27 Biexcitonic Contribution to the Four-Wave-Mixing Signal From a Self-Organized Quantum-
Well Material (C6Hi3NH3)2 Pbl4 239 TuC28 Demonstration of a Phase Conjugate Resonator Using Degenerate Four-Wave Mixing via
Coherent Population Trapping in Rubidium 242
TuD Tuesday Night Session TuD1 Astoonomicasl Interferometry , N//\
TuD2 Spatial Solitons and Light Guiding Light N/A
TuD3 Nonlinear Optical Propagation Experiments in Photonic Bandgap Materials 245 TuD4 Squeezed Phonon Fields: Controlling Quantum Lattice Fluctuations with Light Pulses N/A
WEDNESDAY, August 12,1998
WA Storage
WA1 Fundamental Issues Related to Digital Holographic Data Storage 251 WA2 Photorefractive Crystals for Holographic Storage: What are the Performance Limits? 254 WA3 Science and Engineering of Two Photon 3D Storage Devices 257 WA4 Recording of Permanent Holographic Gratings in Liquid Crystals 259 WA5 A Novel Method for Non-Volatile Holographic Recording in Lithium Niobate 262
WB Applications I
WB1 Engineered Nonlinear Materials: Progress in QPM Materials and Devices N/A WB2 Robust High-Power and Wavelength-Tunable Femtosecond Fiber System Based on
Engineerable PPLN Devices 265
WB3 High Intensity Direct Third Harmonic Generation in BBO '"".'.'. 268 WB4 Phase-Matched Generation of Short Wavelength, Ultrashort-Pulse Light in Capillary
Waveguides 271
WB5 Toward an Optical Synthesizer: Widely Tunable C.W. Parametric Oscillators N/A
WC Nonlinear Optics
WC1 Chip's: Their Characterization and Understanding 274 WC2 Tunable Parametric Downconverter with Photon-Conversion Efficiencies Greater than 100% 276 WC3 Nonlinear Optical Activity Induced by Linearly and Circularly Polarized Light 279 WC4 Nonlinear Effects due to Optical Pumping of Sodium Vapor by Single-Pass Laser Beams 282 WC5 Measurements of SBS Reflectivity and Phase Conjugation Fidelity in Light Guides 285 WC6 Phase Conjugation of Depolarized Light with a Loop PCM 288 WC7 Visualization of the Frequency-Doubling Space-Charge Region in Thermally Poled
Fused Silica: Measurement Technique and Model 291
WD Terahertz Radiation
WD1 Applications of Terahertz Imaging 294
WD2 Comparisons of Different Methods of Generation of Terehertz Radiation N/A WD3 THz Pulse Measurement with a Chirped Optical Beam 297 WD4 Spectrum Control of Intense THz-Radiation from InAs under Magnetic Field Irradiated
with Stretched Femtosecond Laser Pulses 299

THURSDAY, August 13,1998
ThA New Materials ThA1 Efficient Wavelength Shifting Through Cascaded Second-Order Nonlinear Process
in Organic and Inorganic Crystals ■ 305 ThA2 Third-Order Optical Nonlinearities in Retinal Derivatives and Mesoionic Conpounds 308 ThA3 A Birefringent Polymer for Holographic Recording 311 ThA4 Light-Induced Index Change in a Waveguide of a Novel Organic Quinoid Dye and its
Applications to All-Optical Devices with Localized Nonlinearity 313 ThA5 Two-Photon Organic Photochemistry for 2-D Spatial Multiplexing in Volume
Holographic Storage ■ 316 ThA6 Anomalous Nonlinearity in Hierarchical J-Aggregates of Three-Level Porphyrin 319 ThA7 Hyperpolarizability of Genetically Engineered Bacteriorhodopsin 322
ThC Poster Session III ThC1 A Theoretical Analysis of Optical Clock Extraction Using a Self Pulsating Lasert Diode 325 ThC2 Self-Consistent Analysis of Nonlinear Multimode Dynamics in External Cavity Laser Diodes 328 ThC3 Modelling Pulse Propagation in Optical Communication Systems Using Wavelets 331 ThC4 Spatial Soliton Arrays in a Ring Shaped Complex Nonlinear Medium 334 ThC5 Saturation and Oscillation of SBS Reflectivity in Fiber Phase Conjugators 337 ThC6 Demonstration of All-Optical Switching in a GalnAsP Distributed Feedback Waveguide 340 ThC7 All-Solid-State Tunable Ultraviolet Ce Activated Fluoride Laser Systems Directly
Pumped by the Fourth and Fifth Harmonic of Nd: YAG Lasers 343 ThC8 Limit of Amplitude Squeezing in Quasi-Phase-Matched Device for Harmonic Generation 346 ThC9 Numerical Study of Second Harmonic Generation in Semiconductor Waveguides 349
ThC10 Design of All-Optical Logic Gates in Polydiacetylene PTS-Clad Waveguides 352 ThC11 Photorefractive Grating Recording in Reversible Polymer Films Containing 4-keto
Bacteriorhodopsin Under Absorption Saturation 355 ThC12 All-Fiber Optical Switch Based on Raman Scattering .358 ThC13 Spontaneous Vortice Arrays Formation in Broad Area Vertical Cavity Semiconductor Lasers 361 ThC14 Enhancement of Nonlinear Optical Properties through Supramolecular Chirality 364 ThC15 Computational Modeling of Vertical-Cavity Surface-Emitting Lasers 367 ThC16 Large Second-Order Susceptibility in Poled ZF7 Lead Silica for Sum-Frequency Generation 370 ThC17 Quasi-Phase-Matched Backward Second-Harmonic and Sum-Frequency Generation in
Periodically-Poled Lithium Niobate 373 ThC18 Near-Field Optical Second-Harmonic Gemeration in Semiconductor Quantum Dots 376 ThC19 Dye-Doped Glasses: Nonlinear Optical Material for Spatial Soliton Applications 379 ThC20 Two Wavelength KGd(W04)2 and PbW04 Raman Lasers in the IR and Visible Under
Efficient Picosecond Excitation 381 ThC21 Electrostatic Effects in the Dynamics of Wall Defects in Liquid Crystal Optical Devices 384 ThC22 Scattering Noise Reduction in Phase Conjugators via Photo-Induced Redistribution in
Atomic Vapors 387 ThC23 A New Bifunctional Chromophore Working at Short Wavelength in Photorefractive
Polymer Composite 390 ThC24 Extreme Large Enhancement on Optical Nonlinearity of Fullerene by Forming Charge
Transfer Complex 392 ThC25 Photogeneration Quantum Efficiency of Ceo: poly(A/-vinylcarbazole) Photoconductive
Composite 395

ThC26 Squeezing Enhancement for the Light Interacting with a Polarizable Confined System ThC27 Mid-Infrared THz Pulse 401
ThD Photorefractives
ThD1 Four-Wave Mixing with Partically Coherent Waves in Photorefractive Crystals: (I) Transmission Grating Approximation 403
ThD2 Photorefractive and Charge Transport Properties of the Organic Crystal 4-N, N-Dimethylamino- 4'-N'-MethylstilbazoliumToluene-p-Sulfonate 406
ThD3 Multifunctional Carbazole Oligomers and Polymers for Photorefractive Applications 409 ThD4 Photorefractive Diffusion-Driven Self-Focusing and Self-Trapping in Near-Transition
Paraelectric Crystals 411
THE Nonlinear Dynamics
ThE1 Multiple Birth of Nonlinear Optical Vortices 414
ThE2 The Optical Whistle: A Novel Transverse Oscillation in Nonlinear Optical Cavities 416 ThE3 Self-Focusing and Limiting at Nanowatt Laser Power and Image Conversion with \i Watt/cm2
Optical Intensity Using Nematic Liquid Crystal Films 419 ThE4 Interactions of Coherent or Incoherent Spatial Pairs in the Viscidity of a Non-Linear Interface 422
FRIDAY, August 14,1998
FA Applications II
FA1 Life at 1010W/cm2: Low-Damage Microscopy in Living Specimens Using Multi-Photon Microscopy 427
FA2 Fluorescent Two-Photon 2.5 D Optical Data Storage: A«Real World» Applications of Femtosecond Nonlinear Optics 429
FA3 Enhancing the Detectability of Ballistic Photons Travelling Through Highly Scattering Media by Frequency-Doubling Their Far-Field Pattern 432
FA4 Surface Second Harmonic Generation as a Probe of Anodic Oxidation of Si(001) 435 FA5 Femtosecond Incoherent Second-Order Nonlinear Light Scattering: Opportunities for Molecular
and Device Characterization 433
FA6 Efficient Second-Harmonic Generation for Generating Ultrafast Blue Light in Periodically- Poled Bulk and Waveguide Potassium Titanyl Phosphate 441
FA7 Nonlinear Optical Adaptive Photodetectors for Remote Sensing: Application to Ultrasound Detection 444
FB Semiconductors II
FB1 Femtosecond Optical Parametric Oscillator in the Mid-Infrared and the Dynamics of Holes inGaAs 447
FB2 Coherent Dynamics of Excitons in Radiatively Coupled Multiple Quantum Well Structures and Microcavities 450
FB4 Polarization Dynamics of the Nonlinear Coherent Emission from Uniaxially-Strained Quantum Wells 452
FB5 Electron-Phase Quantum Kinetics in Semiconductors 455 FB6 Coherent Wavepackets and Phonons in Superlattices 458 FB7 Anisotropie Electron-Hole Wavepackets in Quantum Wells for Multiple-Harmonic-Generation
in the Terahertz Regime 45-j

SUNDAY, 9 August
SuA Sunday Night Session

Sunday Papers Not Available
SuA1 Laser Cooling and Trapping of Atoms and Particles: So What Have You Done Lateley? Steve Chu, Stanford University, Stanford, CA

SuA2 (Invited) 7:45pm - 8:15pm
Information Storage and Retrieval from a Single Atom
C. R. Stroud, Jr. Institute of Optics, University of Rochester, Rochester, NY 14627-0186
In atomic physics and nonlinear optics we generally assume that a valence electron travels in an orbit with a radius of a few Angstroms, and that it has a binding energy of a few electron volts. Recently in a number of laboratories atomic states of a very different nature have been excited: Rydberg eigenstates and wave packets with principal quantum numbers in the range n - 50- 1000 These highly excited atoms have electronic orbital radii ranging from a fraction of a ^ micron up to nearly a millimeter. The corresponding atomic volumes then range up to 10 A .
What sort of new physics and even applications might result from these remarkable atomic states'? From the point of view of conventional nonlinear optics the most interesting possibility may be the enormous dipole matrix elements for transitions between Rydberg states. These matrix elements scale as the square of the principal quantum number, so they can be as large as 106 eao Of course, transitions between Rydberg levels have resonance frequencies in the radio frequency range, so they would not appear to be very interesting in nonlinear optics. However, with dipole matrix elements this large even a modest laser intensity will produce Rabi frequencies that are in the optical frequency range. With such large Rabi frequencies transitions detuned by optical frequencies are power broadened into resonance - the optical field can drive the rf transitions. High order nonlinear processes can occur with corresponding high harmonic generation and stabilization of the highly excited states against ionization. We will review these phenomena that were described in a paper recently published,1 and discuss possible applications.
An even more intriguing possible application of the unique nature of these atomic states is the possibility of information storage and perhaps even quantum computing within one atom. As we have seen the volume of the atom becomes extremely large at high Rydberg levels, there is a corresponding increase in the state space of the atom. There are n angular momentum states associated with the level with principal quantum number n, thus with n = 1000 we have 10 states. If we form an angular wave packet which is a superposition of these million states we can
write the wave function as
vP(r) = £i;mai,myi,m(r)
where vu, m(r) are the angular momentum eigenstates, and the a ,,m are arbitrary complex amplitudes which are constrained only by overall normalization. We have then a million complex numbers which can be specified to encode the state. If we could write these amplitudes at will, and read them out without noise, we would have a rather interesting information storage
medium.
Of course shot noise is a problem with reading out information from a single quantum system. In principle one could prepare the atomic electron in any of the million different angular momentum eigenstates, and then by measuring the square of the angular momentum, and the z component ofthat angular momentum, determine in which of the million states the system was
1 J. D. Corless and C. R. Stroud, Jr., Phys. Rev. Letters 79, 637-640 (1997).
0-7803-4950-4/98/$10.00 1998 IEEE

prepared. This corresponds to approximately 20 bits of information stored and read out without introducing quantum noise by collapsing the wave packet. If we make measurements on an entire ensemble of atoms similarly prepared, then the information storage capacity is much arger While the information is stored in the atom unitary transformations can be carried out on
the state of the atom allowing the possibility of quantum computing within this single atom. The potentiality of this scheme and its strengths and weaknesses in comparison with other schemes for quantum computing will be discussed.

SuA3 (Invited) 8:15pm - 8:45pm
Nonlinear Optical Spectroscopy for Surfaces, Interfaces, and Films
Y. R. SHEN Department of Physics, University of California and Materials Sciences Division,
Lawrence Berkeley National Laboratory, Berkeley, CA 94720
Summary
Structural symmetries of the surface and bulk of a condensed medium generally are
different. They can be exploited to develop optical techniques for surface and interfacial
studies. Sum-frequency generation (SFG) spectroscopy, in particular, has been proven to
be an effective and versatile surface analytical tool. It can be used to study any interfaces
accessible by light, including liquid/liquid, liquid/solid, and solid/solid interfaces. Quite
a few unique applications have been found that could open up new areas of research in
various disciplines. A selected few will be described in this talk. The possibility of using
SFG spectroscopy for thin-film studies will also be discussed.
This work was supported by Department of Energy under Contract No. DE-AC03-
76SF00098.
0-7803-4950-4/98/$10.00 1998 IEEE

MONDAY, 10 August
MA Fundamentals MB Metals MC Poster Session I MD Monday Night Session

Monday Papers Not Available
MA2 The Cavity QED Circus: Juggling Atoms, Flying Photons, and Fantastics Fienesse H. J. Kimble, California Institute of Technology, Pasadena, CA
MD1 From Nanosecond to Femtosecond Science Nicolaas Bloembergen, Harvard University, Cambridge, MA

MAI (Invited) 8:00am - 8:30am
Quantum Optics with large x® nonlinearities
D F Walls, S Rebic, A S Parkins, M Dunstan and M J Collett
Department of Physics, University of Auckland,
Private Bag 92019, Auckland, New Zealand
Tel 64 9 3737999
Fax 64 9 3737445
E-mail [email protected]
SUMMARY
Recently Imamoglu and Schmidt [1] have proposed a scheme to generate large %(3) non-
linearities utilising electromagnetically induced transparency [2] in an ensemble of four level
atoms. It relies on quantum interference effects to minimise absorption while retaining a
large x(3)- Tnis is related to lasing without inversion [3] which also relies on quantum
coherence effects to reduce absorption while maintaining laser gain. For applications in
quantum optics it is necessary that the quantum noise resulting from spontaneous emission
by the atoms be small. The reduction of absorption in these systems effectively reduces the
spontaneous emission.
The use of quantum coherence effects to reduce quantum noise in atomic systems was
first proposed by Dalton, Reid and Walls [4]. An analysis of quantum noise in three level
atoms interacting with 2 light fields by Gheri et al [5] demonstrated that a nonlinear phase
shift could be imposed on the probe beam due to the signal. This particular configuration
utilised a "ghost transition" where the population in one transition was nearly zero, thus
the quantum noise due to spontaneous emission was negligible and the conditions for a good
QND measurement were satisfied. This was verified in a recent experiment by Roch et al [6]
who using cold trapped atoms and the "ghost transition" scheme, obtained the best QND
correlation scheme to date.
0-7803-4950-4/98/$10.00 1998 IEEE a

MA3 9:00am - 9:15am
Dynamics of Photon-Photon Scattering in Rb Vapor
Morgan W. Mitchell and Raymond Y. Chiao Department of Physics, University of California, Berkeley, California 94720
Voice: (510) 642-5620 Fax: (510) 642-5620
1 Motivation
Processes such as self-focusing and four-wave mixing, which classically can be described in terms of an intensity-dependent refractive index (the optical Kerr effect), appear at the microscopic level to involve momentum exchange among photons, as if there were a photon- photon interaction potential. A simple example of this is self-focusing of a collimated beam by a medium with a positive Kerr coefficient. Outside of the medium, the photons propagate freely, without interactions. Within the medium, the photons of the beam are drawn together as if there were an attractive potential between the photons. The goal of this research is to determine the domain of validity of a description in terms of a photon-photon interaction potential [1].
2 Criteria
At the most fundamental level, photons do not directly interact, but can interact indirectly via intermediaries. This is analogous to the interaction of electrons in QED, which is me- diated by exchange of virtual photons. In non-relativistic situations, this photon-mediated electron-electron interaction can be reduced to a direct electron-electron interaction, the Coulomb interaction. An example of a mediated interaction which cannot be reduced to a direct interaction is a slow optical nonlinearity such as thermal blooming or the photorefrac- tive effect. In these effects, some photons are absorbed, leaving an imprint on the medium which affects the behavior of photons which arrive later. Neither the delay nor the inherent loss of particles is characteristic of an interaction potential.
Thus our minimal criteria for validity of the description as a direct photon-photon inter- action are: One, that the process not require the consumption of photons, and two, that the interaction be approximately local, i.e., that the photons only interact if they are in nearly the same place at nearly the same time. One way to test for this is to observe time and momentum correlations of photons which have interacted. To observe this, a DFWM setup is constructed, as shown in Figure 2, and photons pairs which suffer spontaneous large-angle
0-7803-4950-4/98/S10.00 1998 IEEE 10

scattering are observed. The signature of a direct photon-photon interaction will be tight time and momentum correlations of the scattered photons.'
3 Microscopic Description
To examine the microscopic physics most clearly, we choose a clean system which shows a strong optical Kerr effect, namely rubidium vapor. We model the vapor as non-interacting atoms in a thermal distribution of hyperfme and momentum states. The total system is described by a hamiltonian which we break into an unperturbed part and a perturbation:
1 h2p2
Ho = Yl hck(al,a^« + ö) + Y,(huJn + ^ir)4,pCn,p (1)
H' = - 7"d3xE(xj-d(x)
= -\/^7^Zl^I]IZ(iek,a-M„m4,p+kcm,pak,a + h.c.) (2) * V k,a n,m p
Here e(x) and d(x) are the electric and dipole field operators (//„im is the transition dipole matrix element), k and p are the photon and atomic momenta, a and n are indices of photon polarization and internal atomic state, and hun is the energy of the internal atomic state. V is the quantization volume and a* and c* are photon and atom creation operators.
The photon-photon scattering is then calculated as a fourth-order process in time-dependent perturbation theory. Two sorts of processes can produce photons propagating in a given di- rection, those which leave a trace on the medium (by changing the momentum of an atom or an atom's internal state) and those which do not. For those processes which leave the medium unchanged, it is impossible to tell which atom participated, and scattering ampli- tudes must be summed coherently over the atoms. This gives rise to a scattering rate which scales as iV£toms, and dominates except for low atomic densities. One such process is shown diagrammatically in Figure 1.
Photons:
Atoms:
Figure 1: A fourth-order process which contributes to photon-photon scattering.
11

From the diagram, we see that the atom acts as an intermediary, absorbing momentum q from one photon and then giving that momentum to the other photon. At the end of the process the atom is returned to its original state. Only processes which conserve photon momentum will leave the medium unchanged, thus the strong, coherent effect will produce tight photon-momentum correlations. What is perhaps less obvious is that the photons must interact with the atom in quick succession or else leave a trace on the medium. Roughly speaking, if the atom carries the momentum q for long enough that it is displaced by more than the atom's thermal coherence length, the state of the medium has been changed, not by a momentum kick, but by a displacement. Thus the coherent process also produces tight time correlations.
Detector
Detector
Figure 2: Experimental setup.
4 Experiment
Experiments are in progress at the time of this writing. A schematic of the experiment is shown in Figure 2. We use a diode laser to produce counterpropagating beams tuned near, but not on, the D2 resonance of rubidium. The scattering products are detected by single-photon counting modules (silicon avalanche photodiodes run in Geiger mode), and their time correlations are registered by a time-interval counter with an accuracy of ~ lOOps. Momentum correlations are determined by scanning an aperture in front of one of the detectors.
References
[1] R. Y. Chiao, I. H. Deutsch, J. C. Garrison, and E. W. Wright, Solitons in quantum non- linear optics, in Frontiers in Nonlinear Optics: the Serge Akhmanov Memorial Volume, edited by H. Walther, N. Koroteev, and M. 0. Scully (Institute of Physics Publishing, Bristol and Philadelphia, 1993), p. 151.
12

MA4 9:15am -9:30am
Photon number squeezing of optical pulses using a simple asymmetric
fiber loop
Dmitriy Krylov and Keren Bergman
Department of Electrical Engineering, Princeton University; J303, E-Quad, Olden Street, Princeton, NJ 08544 tel: (609) 258-5151, fax: (609) 258-0463
Generation of amplitude-squeezed states
using the Kerr nonlinearity in optical fibers has
been recently demonstrated in a novel scheme
employing soliton propagation followed by
spectral filtering [1,2]. The possibility of
significant noise reduction in direct detection of
optical pulses can have important applications
for soliton communication systems. Recently, it
has been proposed that amplitude-squeezed
pulses can be produced by interference between
the counter-propagating fields in an asymmetric
fiber Sagnac loop [3,4]. Though optimal for
soliton pulses, the theory predicted a significant
noise reduction for Gaussian pulses as well. In
the present paper we experimentally
demonstrate this approach The experimental setup is shown in Fig. 1.
A Spectra-Physics OPO is used as a source of
200-fs (FWHM) Gaussian optical pulses at
repetition rate of 82 MHz, and centered at 1550
nm. For the Gaussian pulses, the corresponding dispersion length in a standard polarization
maintaining (PM) fiber (ß" = -19 psVkm) is
about 76 cm, or in soliton terms, to a 1.2m
soliton period. The average power required to
produce a fundamental (N=l) is 26mW. We use
an asymmetric Sagnac loop configuration,
where the light is split by an 82/18 free space
beamsplitter and then coupled into the two ends
of a 3.5m standard PM optical fiber. The
experiment is not critically sensitive to the
splitting ratio, so the coupling was varied until 0-7803-4950-4/98/$ 10.00 1998 IEEE
the optimal squeezing was observed for the
input splitting of 88/12.
I0P0I
' \
Fig. 1. Experimental Setup.
With such highly asymmetric splitting, most
of the energy propagates in the 88% reflection
arm. The optical pulse acquires a significant
nonlinear phase shift propagating through
nearly three soliton periods, and its noise
properties are modified in accordance with the quantum nonlinear Schrödinger equation [3,4].
The field in the 12% transmission arm is a
dispersive wave which propagates linearly in the
fiber loop. Polarization is carefully controlled at
all stages to assure optimal interference. The
photocurrent fluctuations associated with the
pulse, resulting from the interference of the two
counter-propagating fields in the loop, are
measured by a balanced receiver followed by a
power spectrum analyzer. The subtraction mode
of the receiver is utilized for shot noise
calibrations. The summing mode is used for direct detection of the amplitude fluctuations.
Using a balanced receiver is a convenient way of
keeping the maximum power falling on the
photodiodes (Epitaxx ETX-1000T) below
saturation values. In order to avoid the
saturation of electronics, the overall bandwidth
13

of the receiver is limited to 35 MHz. Noise
measurements were performed with an
HP3588A power spectrum analyzer operated in
the 'zero span' regime in a narrow-band interval
centered around 5 MHz with the resolution bandwidth of 17 kHz.
Several calibrations were performed to
accurately establish relevant noise levels.
Subtracting the photocurrents eliminates
classical fluctuations present in the laser signal
with an extinction ratio of about -25dB, and the
measured noise levels following this subtraction
accurately represent the shot noise level. These
values were confirmed to within 0.1 dB by
plotting the noise levels versus incident optical
power for the above experimental setup as well
as in free space. The sum of the photocurrent fluctuations as a function of incident power
measured with free space propagation represents the classical noise inherent in the laser signal
which can be more than 3 dB above the shot noise levels.
The results of the squeezing experiment are
shown in the Fig. 2. Figure 2(a) shows the shot
noise level, the classical noise, and the noise
variations due to squeezing and anti-squeezing
all as a function of the incident optical power.
Figure 2(b) shows only the two latter noise
levels normalized to the shot noise. We observe three squeezing resonances (at 27mW, 46mW,
and 60mW) with the larger amounts of
squeezing corresponding to larger incident
powers. The largest resonance occurs at the
input power into the loop of 60mW, which
corresponds to an approximate N=1.52 in
soliton units. The reduction below shot noise is
measured to be 3.7 dB (57%). Taking into
account 88% overall detection efficiency
including detector quantum efficiencies an the
beam overlap, and 8% reflection losses at the
beamsplitters, this corresponds to 5.3 dB (70%) reduction.
-106.00
N jj -10B.0O
CO -110.00
CD
_| -11200
CD
■§ -1,4M
-116.00
4.0
^^T"»
-•■-Shotnoise —-Squeezing --*•-- ClassNoise
6 8 10 30 50 70
Optical power, mW (a)
DO 3.o T3 -T 2.0
> <D 1.0 ■
T"r
— Squeezing ■■*-- Class. Noise
3) 70
Optical power, mW (b) Fig. 2. Absolute (a) and relative (b) noise levels vs. optical power incident into the 88% reflection port.
This result is in very good agreement with
numerical simulations done by Werner for
N=1.55 Gaussian pulse propagating through 3 soliton periods in a loop with a 90/10 splitting
ratio [5]. We also note that an important
practical advantage of this squeezing scheme is
the removal of classical noise inherent in the
laser signal. For the largest squeezing
resonance at 60 mW incident power, we observe
more than 3 dB of classical noise reduction. Our
experiment demonstrates the removal of
14

classical noise in addition to the reduction in
quantum photon number fluctuations.
The Raman effect in fibers has been
predicted to limit the amount of squeezing
observed for longer propagation lengths [4]. We
performed additional experiments with different
fiber lengths (2.5 and 9 meters). The maximum
amount of squeezing measured with the shorter
2.5m loop was approximately 1.7 dB and with
the longer 9m loop, the squeezing saturated at
2.5 dB. These measurements demonstrate that
the squeezing indeed increases with the
propagation distance but is reduced for longer
fiber lengths as the Raman effect plays a more
dominant role. This phenomenon is currently
under further theoretical and experimental
investigation. The amount of photon number quantum
noise reduction measured is within 0.5 dB
(10%) of the theoretically predicted value for
Gaussian pulses. These results lead us to expect
even greater squeezing with soliton sech-shaped
pulses which is predicted to exceed 10-dB
levels. In conclusion, we have experimentally
demonstrated the new scheme to produce non- classical states of light in a highly asymmetric
Sagnac loop and measured a 3.7-dB (5.3 dB
accounting for losses) reduction in photon- number fluctuations of Gaussian pulses. The
scheme is also useful in removing classical noise
from the signal, and appears to be limited by the
Raman effect for longer propagation distances.
[2] S. Spalter, M. Burk, U. Strossner,
A.Sizmann, and G. Leuchs, Europhys. Lett. 38,
335 (1997). [3] MJ. Werner, "Quantum solitons in optical
fibers: A quantum state engineering approach
(Invited)". Symposium on Quantum Optics for
Communications, OSA Annual Meeting '97,
Long Beach. [4] M.J. Werner, "Quantum soliton generation
using a simple fiber loop", to be published in
Physics Review Letters. [5] Private communication with M.J. Werner
(NTT Research Labs, Japan).
References. [1] S.R. Friberg, S. Machida, M.J. Werner, A.
Levanon, and Takaaki Mukai, Phys. Rev. Let.
77, 3775 (1996).
15

MA5 (Invited) 9:30am - 10:00am
Pattern formation and competition in nonlinear optics: multiscaling and complex behavior
F.T. Arecchi Dept. of Physics, University of Florence
And Istituto Nazionale di Ottica, Largo E. Fermi, 6, Florence
Pattern formation results from the combination of a local nonlinear dynamics with space gradient terms. In biology and chemistry these latter ones are due to diffusion. In optics, a crucial role is played by diffraction. We focus our attention on a passive system consisting of a thin Kerr cell in an optical feedback configuration. As the intensity of an impinging plane wave is increased, the transverse pattern on the cell entrance bifurcates from a uniform front to patterns of different symmetries depending on the type of feedback. We call "phases" the various symmetries* by analogy with liquid mixtures. For standard Kerr media, the threshold intensities are of the order of kW/cm2. Using a LCLV (Liquid Crystal Light Valve), the threshold reduces to some milliwatts/cm2. In the past we have explored the instabilities close to threshold, corresponding to the onset of a single phase covering the whole transverse domain of linear size I - 2.5 cm [1] . Since
the characteristic scale of diffraction ruled patterns is lx = -JÄL , where A = 0,5 jum is the
laser wavelength and Z, = 10-102 cm is the free propagation length within the feedback
loop, the aspect ratio (<?/02 can be of the order of 102 to 104. Notice that (^/^,)2 is the Fresnel number of the optical configuration, and intuitively it is the number of separate bright spots visible in the pattern. This way, we have shown evidence of optical 2D periodic and qUasi-periodic patterns (crystals and quasi-crystals) [2].
When many phases are simultaneously above threshold, three scenarios can occur, namely:
i) space-time chaos, whereby many phases compete [3]; ii) stationary single phase configuration due to mode locking, that is, to locking in phase
of the Fourier components relative to different phases [4]; iii) stationary coexistence, whereby different phases are localized in different regions of
the available space, with stable interfaces [5].
The third scenario is the space equivalent of the heteroclinic connection which rules periodic and chaotic alternation in time [6]. A laboratory implementation of the third scenario is realized by a LCLV system with a lateral shift in the feedback loop. This shift is equivalent to introducing into the dynamical equations a drift term with a velocity V along the direction x. The most elementary phase competition is made of two phases of amplitude a and b, ruled by the following equations [5]
0-7803-4950-4/98/$10.00 1998 IEEE 16

(dt-Vdx)a = (x-a\a\- -ß\b\2)a + DV2a
(dt-Vdx)b = (x-a\b\2-ß\a\2)b + DV2b.
Within the time IIV it takes for the lateral drift to span the whole available space, diffusion
D spreads a point-like excitation to a spot of size lD =<J2D£IV. The figure shows a numerical solution of the equations and the corresponding experimental results. The number of different domains of one phase increases with the length ratio
V~ £D ~\2D
For T|»l we observe many domains of different size s. The number distribution N(s) scales as s~a where a is close to 1. This is a case of space intermittency which suggests analogies with other physical situations going under the general name of self organized criticality (SOC) [7].
References
[1] P.L. Ramazza, E. Pampaloni, S. Residori and F.T. Arecchi, Physica D 96, 259 (1996)
[2] F.T. Arecchi, A.V. Larichev and M.A. Vorontsov, Opt. Comm, 105, 297 (1994), E. Pampaloni, P.L. Ramazza, S. Residori and F.T. Arecchi, Phys. Rev. Lett., 74, 258 (1995)
[3] S. Residori, P.L.Ramazza, E. Pampaloni, S. Boccaletti and F.T. Arecchi, Phys. Rev. Lett, 76, 1063(1996).
[4] E. Pampaloni, S. Residori, S. Soria and F.T. Arecchi, Phys. Rev. Lett., 78, 1042 (1997).
[5] S. Boccaletti, J. Bragard, P.L. Ramazza and F.T. Arecchi, to be published.
[6] F.T. Arecchi, G. Giacomelli, P.L. Ramazza and S. Residori, Phys. Rev. Lett., 65, 2531 (1990); F.T. Arecchi, S. Boccaletti, G.B. Mindlin and C. Perez Garcia, Phys. Rev. Lett., 69, 3723 (1992).
[7] P. Bak, C. Tang and K. Wiesenfeld, Phys. Rev. Lett., 59, 381 (1987).
17

■ : ; i-ä" f * $ i .,' \, •■ \ •<
/ I i / f / , ■ ,,-* , ■■." A. \. \ \ '* ■ y i ' i J ' $ ■' , i \ '; ^
„ '///// i\f/j\\Y / / i f * f * '< " " -s - > 'i- ;
* f i f * J f u* J «
i / * f f i I i J if
Fig. 1. Transient build up of a two phase pattern in a LCLV system with a lateral drift Ax (vertical) in the feedback loop. Upper row: experimental; lower row: numerical solution starting from random initial conditions. From left to right: increasing times toward the stationary states (rightmost pictures) Technically, the stripe tilt corresponds to an angle +c£=arccos (qAx) where q = 2TCIIX is the wavenumber associated with the stripe separation.
18

MB1 (Invited) 10:30am -11:00am
Ultrafast Optical Nonlinearities of Metal Colloids
Jochen Feldmann
Lehrstuhl für Photonik und Optoelektronik, Sektion Physik,
Ludwig-Maximilians-Universität, D-80799 München, Germany.
The optical properties of metal nanoparticles have been the subject of intensive research
due to the electric field enhancement associated with the excitation of surface plasmons
(SP) [1]. These field enhancement effects determine the linear and nonlinear optical pro-
perties of the metal nanoparticles and can be used to manipulate the optical properties
of molecules located in their near-field. The most prominent example is the dramatic en-
hancement of molecular Raman signals (surface enhanced Raman scattering: SERS) [2].
Energy [eV]
Fig.l: a) Absorption spectrum of a thin dielectric film containing gold colloids together
with the maximum DT-signal. b) DT-signal versus probe photon energy for various time
delays. The arrow indicates the central photon energy of the pump pulse.
0-7803-4950-4/98/flO.OO 1998 IEEE 19

I will address various aspects of the nonlinear optical response of metal nanoparticles.
Femtosecond white-light pump and probe experiments performed on gold colloids embed-
ded in a dielectric thin film show that a spectral broadening of the SP resonance is the
dominant optical nonlinearity [3]. The experimentally determined differential transmissi-
on (DT) spectra are shown in Fig.l. This enhanced damping of the plasmon oscillation is
a direct consequence of optically induced heating of the electron distribution. The Fermi
edge smearing associated with this heating process results in an enhanced probability for
electron scattering between states in the vicinity of the Fermi energy. The dots in the
linear absorption spectrum (Fig.la) show the dependence of the DT-signal on the pump
photon energy providing important insights into the heating mechanism [3].
1.90 1.92 1.94 1.96 Peak Energy (eV)
1.98
Fig.2: Linewidth versus peak energy determined from the near-field spectra of individual
nanoparticles (circles). Solid line: theoretical results for gold spheres of different radii.
Dashed line: ensemble linewidth (300 meV) as determined from the far-field extinction
spectrum.
The nonlinear optical transmission spectra of Fig.l show an increased broadening of the
homogeneous linewidth, i.e. an optically induced shortening of the SP dephasing time T2.
In order to draw any conclusions from the change in T2 it is necessary to know the homo-
geneous linewidth of the SP resonance in the linear optical spectrum. This dephasing time
20

is also the limiting factor for the electric field enhancement achievable in the near-field
of a metal nanoparticle. Using a near-field optical antenna effect, we recently managed
to observe SP resonances of single gold colloids [4]. The individually measured homoge-
neous linewidths are plotted as hollow circles in Fig.2 for eleven gold colloids versus the
individually observed photon energy of the SP resonance. The dotted line indicates the
overall ensemble linewidth (300 meV) determined by far-field transmission spectra. The
solid line shows the result of a Mie-theory calculation using the bulk dielectric function
of gold. As indicated the energy dependence of the calculated homogeneous linewidth is
due to varying sizes of the spherical particles. The gradual increase in the linewidth with
growing particle size is caused by an increase in radiation damping. For the majority
of particles, the measured linewidths are relatively close to the results of the calculation.
Larger deviations, like that of particle #3, are interpreted by assuming particle-to-particle
variations in the local nanoenvironment [4].
Finally, I will present recently obtained results on the nonlinear optical interplay between
different plasmons present in silver nano-ellipsoids.
I thank Gero von Plessen, Wolfgang Spirkl, Martin Perner, Stephan Grosse, and Thomas
Klar for various contributions. This work has been supported by the Deutsche Forschungs-
gemeinschaft (Gerhard-Hess Förderpreis) and by the European Union (Ultrafast Quantum
Optoelectronics Network).
Literature 1. U. Kreibig and M. Vollmer, Optical Properties of Metal Clusters, Springer, Berlin (1995).
2. S.R. Emory and S. Nie, Science 275,1102 (1997).
3. M. Perner, P. Bost, U. Lemmer, G. von Plessen, and J. Feldmann, Phys. Rev. Lett. 78, 2192 (1997).
4. T. Klar, M. Perner, S. Grosse, G. von Plessen, W. Spirkl, and J. Feldmann, submitted for publication.
21

MB2 11:00am-11:15am
Nonlinear Optics of Random Metal-Dielectric Films
Vladimir M. Shalaev and A.K. Sarychev
Department of Physics, New Mexico State University, Box30001/3D, Las Cruces, NM 88003 tel: (505) 646-1932, fax (505) 646-1934, email: [email protected]
The optical properties of random metal-dielectric thin films (referred also to as semicontinuous metal films) are of great interest, in large part because of their high potential for various appli- cations [1,2]. Two-dimensional (2c?) semicontinuous metal films are usually produced by thermal evaporation or sputtering of metal onto an insulating (dielectric) substrate. In the growing process small metallic grains are formed on the substrate first. As the film grows, the metal concentration increases and coalescences occur, so that irregularly shaped clusters are formed on the substrate eventually resulting in 2d fractal structures. At the percolation threshold, the sizes of the fractal structures diverge and a continuous conducting path of metal appears between the ends of the sample. At higher surface coverage, the film is mostly metallic, with voids of irregular fractal shapes. As further coverage increases, the film becomes uniform.
For most of metals the real part, e'm, of the complex dielectric constant, em = e' + ie" is negative (and large in modulus) in the visible and infrared spectral ranges, whereas the losses are small, K — e^/k'm! < 1- At the percolation, the effective dielectric constant ee = ^emEd, is purely imaginary, if we neglect the metal losses and possible small losses in the dielectric substrate with the dielectric constant e^. Therefore, a film consisting of a loss-free metal and dielectric grains is absorptive. The effective absorption in a loss-free film means that the electromagnetic energy is stored in the system and thus the local fields could increase unlimitedly; in reality, the local fields in a metal film are, of course, finite because of the small losses. From this simple consideration, one anticipates very strong field fluctuations in random metal film with small losses [3].
We calculated the field distributions on a semicontinuous film at the fundamental and gener- ated (in nonlinear optical processes) frequencies using a very effective numerical method based on the real space renormalization group (RSRG) approach. Our RSRG calculations demonstrate the large fluctuations for the intensity of the local electric fields. For example, for silver semicon- tinuous films the field intensity I(x,y) is up to ~ 105 (the applied field E0 = 1) in the peaks and ~ 102, on average, for the wavelength A = 20/zm, at the percolation threshold, p = pc, where p is the film fraction filled by metal (see Fig. la). The local intensity, I(x,y), at the fundamental frequency is highly inhomogeneous in space and concentrated in sharp well-separated peaks. The local fields are enhanced because of the excitation of the semicontinuous film eigenmodes. With increase of A, both the peak heights and their spatial separations increase.
The spatial distribution of the local second-harmonic-generation (SHG) enhancement is shown in Fig. lb. One can see that in the "hot" spots the enhancement can reach values up to 1015
(whereas the average enhancement is by many orders of magnitude less). This makes possible to perform the local SHG-based nanospectroscopy of single molecules and nanoparticles on a semicontinuous metal film.
To theoretically describe the field distributions over the system at small losses (K = e^/|e'm| < 1), we apply the renormalization procedure based on dividing a system into squares of size I and considering each square as a new renormalized element. At the percolation, the effective dielectric constant of a "conducting" square, e*m{l), decreases with increasing its size, /, as e*m(l) = (l/a)~^Vp£m, whereas the effective dielectric constant of a "dielectric" square, ea(l), increases with increasing I as ed(l) = (l/a)s/uPed, where t, s, and up are the critical exponents for the static conductivity, dielectric constant, and the percolation correlation length, respectively, (t w s m Up = 4/3, for d = 2), and a is the grain size [1]. We set now the square size, I, to be equal to I = I* = aKup^t+s\ Then, in the renormalized system, where each square of the size /* is considered as a single element, the ratio of the dielectric constants of these new elements is equal to £m(l*\/£d(l*) — £m/\e'm\ = -1+in. Thus, for the renormalized elements, we have the "resonance" situation that can be thought of as a resonance of the L - R and C elements (associated with the conducting and dielectric clusters, respectively) in the effective LiJC-contours corresponding 0-7803-4950-4/98/$ 10.00 1998 IEEE 22

to the renormalized I* elements [3]. Accordingly, the local electric fields, #*(/*), are significantly enhanced in comparison with the applied field, E0, in the renormalized system. The local fields E*(l*) for the resonance ratio e*m{l*)/'e*d{l*) w -1 are approximated as E* = EQK'
1^ » E0,
where 7 « 1 [3].
Fig. 1. Distributions of the local enhancements on the semicontinuous silver film a): for the fundamental wave and b): for the SHG signals at the incident wavelength A = 20/xm. One unit
is 10 nm so that the film size is ~ 1/j.m.
In the renormalized system the local fields E*(r) are still strongly inhomogeneous. The spatial scale £* for the field fluctuations in the renormalized (resonance) system has been estimated in [3] as £* oc n~Ue, where the critical exponent ve « 0.5. Therefore, the field distribution in the renormalized system might be thought of as a set of peaks with amplitudes E^ = E*(£*/a)
separated by the distances £ so that E*2 S (|E*(r)|2) S E*m2/'(£/'af'.
Now we can estimate the fields in the original system. The average distance £e between the field maxima in the original system is £e S gl*/a S K-"*l* S afle'J/e^)"' {\e'm\/ed),/^t+s\ which is much larger than the grain size, £e 3> a.
We consider now a resonant square containing two conducting clusters of the size ~ I*. The potential drop across the gap between the clusters is U* ~ E^l*, and the local field concentrates in the points of the closest approach of the clusters where the gap shrinks to a. In these points the local field acquires the largest values Em S* E^{l*/a) ~ E^{\e'm\/e'^/2+"e(\e'm\/ed)^^t+s\ The points of the closest approach determine the gap capacity conductance T,(l*) that depends on the cluster size I*. Therefore, the number nc(l*) of the points of the closest approach scales with size I* in the same way as the conductance of the resonant cluster S(P), namely nc(l*) ~ £(P) ~ e*d(l*) ~ l*s/uK
The following pattern of the local field distribution emerges from these speculations: The largest local fields axe concentrated in resonant clusters of the size I*; because of the interaction between the resonance clusters, the areas with high local fields are separated in distance by the field correlation length £e 3> a, which also exceeds I*. Within each resonant area I* there are nc(l*) of sharp peaks with the amplitude Em(l*). This field pattern can be tracked in Fig. la.
From this pattern of the local field distribution we obtain the following estimate for the high-order moments of the local fields in semicontinuous metal films: (|E(r)|n) ~ El^nc{l*)l^2. Substituting in this equation the above expressions for the field amplitude Em, the field correlation length £e, and the number of maxima in one resonance cluster nc(l*) ~ /*, we obtain
Gn = <|E(r)p) /|E(°)|n ~ (|4| /ed)»^/(«-H^-)/C"-) (141 /e£)»<7/2+*H»* .
The quantity Gn characterizes enhancement of an optical nonlinearity of the n-the order due to the high local fields on a semicontinuous metal film. For a 2d system, t m s « vv = 4/3 [1].
23

Using these critical indices and 7 = 1, ue = 0.5, we find Gn ~ (\e'm\/ed){n~l)/2 {\e'm\/e'ln)n~i.
For the Drude metal and sufficiently small frequencies, w «^ up the above formula simplifies to
Gn ca ed n)l (u)p/T)n~ , where uip is the plasmon frequency and T is the relaxation rate. From
this equation it follows that for frequencies u«wp the local field moments are extremely large and independent of the frequency. For silver semicontinuous films (OJP = 9.1 eV, T = 0.021 eV) on a glass substrate {ed = 2.2), we obtain the following estimate Gn ~ 3 • 102, 8 • 104, 2.5 • 107, 7 • 109
and 2 • 1012 for n = 2,3,4,5 and 6, respectively. Note that the local enhancements in the peaks, \Em/E^\n, are by many orders of magnitude larger than the above average values for the enhancement.
In Fig. 2, results of our numerical calculations of the high-order field moments for silver semicontinuous films are compared with predictions of the above scaling formula. We see that there is excellent agreement between the scaling theory and numerical simulations.
n = 5
n = 4
juuuujuuuuuuowacee 11 — 3
ktk±±±i±i±±±± n = 2
ln(A)
Fig. 2: The average enhancement of the n-th order optical nonlinearity, Gn, in a silver semicontinuous film as a function of the frequency at p = pc (A is given in pm.)
The above estimates for the field moments can be used, for example, for Raman scattering. Al- though Raman scattering is a linear process, its enhancement for small Stokes shifts is proportional to |E| [3] (in this sense RS is similar to nonlinear processes), i.e., GRS — G4 ~ \e'm\9^2/edZ^2e'^n
3. The above scaling formula for the average SERS from random metal dielectric films describes well the recent experimental observation of the French group from Versailles [3].
The above estimations for enhancements were found at the percolation threshold, i.e., at p = pc. Indeed, they are also valid in some interval Ap = p - pc in a vicinity of pc, when the size I* is smaller than the percolation correlation length, £p = a|Ap|~"p. Equating the values of I* and fp, we obtain the estimation for the concentration range where the estimations are valid: Ap < A* = (ed/|£rol)1/(f+s)- Using the optical constants for silver and glass we find that Ap « 0.5 for A = 0.5/zm; the interval Ap where the enhancement occurs shrinks toward the infrared.
To summarize, the strongly fluctuating fields associated with the sharp peaks in various ran- dom parts of a percolating film, result in giant enhancements of nonlinear optical processes since they are proportional to the enhanced local fields raised to some high power higher. Because the "hot" spots are localized in nm-sized areas and provide giant enhancement in their locations, a fascinating possibility of nonlinear nano-spectroscopy of single molecules becomes feasible.
References
[1] D. J. Bergman and D. Stroud, Solid State Phys. 46,14 (1992); Introduction to Percolation Theory 2-nd ed., by D. Stauffer and A. Aharony, Taylor and Francis, Philadelphia, 1991. '2] V. M. Shalaev, Phys. Reports 272, 61 (1996). 3 V. M. Shalaev and A. K. Sarychev, Phys. Rev. B, in press; A. K. Sarychev and V. M. Shalaev, hys. Rev. Lett., submitted; P. Gadenne, et al, J. Opt. Soc. Am. B 15, 68 (1998); F. Brouers,
et al., Phys. Rev. B 55, 13234 (1997).
24

MB3 11:15am-11:30am
Effect of Percolation on the Cubic Susceptibility of Metal Nanoparticle Composites
David D. Smith and Matthew W. Bender
NASA Marshall Space Flight Center, Space Sciences Laboratory, ES-76, Huntsville, AL 35812, (205)544-7778, (205)544-8762(f),
Robert W. Boyd
The Institute of Optics, University of Rochester, Rochester, NY 14627
Summary:
It is well known that one of the most unique and interesting properties of metal colloids arises at the surface plasmon resonance where the dipole moment of the particle becomes large and the local field is enhanced in magnitude in comparison to the applied field. Less discussed is the fact that the local field may also be shifted in phase with respect to the applied field. Previously, we demonstrated that a counterintuitive consequence of these local field effects occurs in metal colloids at the surface plasmon resonance1. Remarkably, although x(3) is positive for each component by itself, x(3) may be negative for the colloid as a whole. There are thus two metal volume fill fractions
where x(3) = 0. This counterintuitive consequence arises because at the surface plasmon
resonance the optical properties of the insulating host and the metal inclusions are linked by the relation
8[(<D.) = -26; (1)
where CDS is the surface plasmon resonance frequency, primed quantities are real, and double primed quantities are imaginary. This resonance condition modifies the local field factor making it mainly imaginary. The sign reversal in x(3) is therefore a result of the fact that at the surface plasmon resonance the local field factor has an imaginary component corresponding to a phase shift between the applied field E and the local field inside the particle e.
This phase shift is partly determined by the selective coupling of /^-polarized photons into plasmons at the surface and partly by refraction at the metal interface, which in turn is determined by absorption in the host and the conductivity of the surface. Thus, to the extent that percolation affects the conductivity of the surface it also determines the phase shift between e and E.
0-7803-4950-4/98/110.00 1998 IEEE 25

Our hypothesis is that the sign reversal in x(3) that occurs at higher fill fractions is associated with the percolation threshold. We apply generalized two- and three- dimensional Maxwell Garnett and Bruggeman geometries2,3'4 to the case of these metal nanoparticle composites and use complex linear and nonlinear constituent susceptibilities to determine the complex composite nonlinear susceptibility. Because the nonlinear response in small metal particles arises primarily from absorptive mechanisms5 the sign reversal is most evident in the imaginary part of x(3)-
The generalized Bruggeman theory predicts a sign reversal in the imaginary part of x(3) at fill fractions of f = 0.25 and f = 0.42 for three- and two-dimensional systems, respectively, as shown in Figure 1. These values increase when the real part of the cubic susceptibility of the metal inclusions is made to be significant in comparison to the imaginary part. Similarly the generalized Maxwell Garnett theory predicts a sign reversal at f = 0.27 and f = 0.51 for three- and two-dimensional systems, respectively, as shown in Figure 2. Bond percolation has been shown to yield percolation threshold volume fractions of pc = 0.25 on a 3D cubic lattice and pc = 0.5 on a 2D square lattice6. The sign reversal in the imaginary part of x(3) as predicted from these theories therefore occurs in the vicinity of the critical volume fraction as determined from percolation theory for both two- and three-dimensional systems.
3
i o i—■i
m
if
Figure 1. Imaginary part of the effective cubic susceptibility determined from the nonlinear Bruggeman model for two- and three-dimensions.
26

Figure 2. Imaginary part of the effective cubic susceptibility determined from the nonlinear Maxwell Garnett model for two- and three-dimensions.
References:
1. D. D. Smith, G. Fischer, R. W. Boyd, and D. A. Gregory, "Cancellation of photoinduced absorption in metal nanoparticle composites through a counterintuitive consequence of local field effects," J. Opt. Soc. Am. B 14, 1625 (1997).
2. J. W. Sipe and R. W. Boyd, "Nonlinear susceptibility of composite optical materials in the Maxwell Garnett model," Phys. Rev. A 46, 1614 (1992).
3. X. C. Zeng, D. J. Bergman, P. M. Hui, D. Stroud, "Effective-medium theory for weakly nonlinear composites," Phys. Rev. B 38, 10970 (1988).
4. D. Stroud and X. Zhang, "Cubic nonlinearities in small-particle composites: local-field induced giant enhancements," Physica A 207, 55 (1994).
5. F. Hache, D. Ricard, C. Flytzanis, and U. Kreibig, "The optical Kerr effect in small metal particles and metal colloids: the case of gold," Appl. Phys. A 47, 347 (1988).
6. V. K. S. Shante and S. Kirkpatrick, "An introduction to percolation theory," Adv. Phys. 20, 325 (1971).
27

MB4 (Invited) 11:30am- 12:00noon
Surface plasmon and off electron Dynamics in metal nanocrystals and films
N. Del Fatti, F. Vallee and C. Flytzanis
Laboratoire d'Optique Quantique du CNRS Ecole Polytechnique, 91128 Palaiseau cedex, France Tel: 01 69 33 41 24 Fax : 01 69 33 30 17
The study of electron dynamics in metals in bulk or confined space has been of central
importance not only regarding the understanding of their conductivity properties and the
applications they engender but also because they constitute a key example for irreversible
dynamics in a system that in many respects can be considered(1'2) as ideal. Recently with the
progress in femtosecond laser techniques one can address(3) their dynamics in time scales
close to the very early off equilibrium stages and single out the processes that lead to their
thermalization. These aspects although of key importance in testing the Fermi liquid theory
were only indirectly addressed(1'2) before the advent of ultrashort laser pulse techniques.
Furthermore with the growing interest for the electron behavior in nanometer size structures
the interplay between temporal and special aspects in the thermalization process has moved
into the forefront of these studies coupled with the study of the optical nonlinearities of the
metallic nanostructures, in particular the metal nanocrystals in glasses.
Here we summarize the most recent studies of the photoinduced nonlinearities in noble
metal nanostructures in glasses which establish the key role played by the surface plasmon
resonance (SPR) through the dielectric confinement and that of the hot electron mechanism(4).
We exploit this sensitivity to these features to address the evolution of the off electron
dynamics as well as that of the surface plasmon, a collective dipolar oscillation of the
electrons in the nanocrystal which incorporates their interaction with the interface.
A two-color femtosecond pump-probe technique with 18-25 fs resolution was used to
study both the on and off surface plasmon resonance regimes and also the relevance of the
interband transitions. In this respect the case of silver was singled out because there the SPR is
well separated from the interband transitions and the transient behavior of both can be studied
in Well defined conditions. A transient shift and broadening of the SPR is observed and related 0-7803-4950-4/98/$10.00 1998 IEEE 28

to the optical Kerr effect and the modification of the electron-electron scattering mechanisms
respectively. Furthermore the electron-phonon coupling through the deformation potential is
clearly evidenced.
This intrinsic modification of the electron electron scattering time and in particular a
transient acceleration of the electron-electron interactions during the electron gas internal
thermalization were also strikingly evidenced(5) in thin metal films using the same pump probe
technique.
This acceleration of the effective electron gas-lattice coupling is a direct consequence of
the non instantaneous intermal thermalization of the electron gas and can also be
quantitatively accounted for by computing the electron gas relaxation dynamics using the
Boltzman equation for electrons in noble metals and including electron-electron and electron-
phonon scattering
1. D. Pines, P. Nozieres, The Theory of Quantum Liquids, W.A. Benjamin Inc N.Y. ,1996
2. M. Kaveh and N. Wiser, Adv. Phys. 33, 257 (1984)
3. C.K. Sun, F. Vallee, L.H. Acioli, E.P. Ippen and J. G. Fujimoto, Phys. Rev. B50, 15337
(1994)
4. F. Hache, D. Ricard, C. Flytzanis and V. Kreibig, Appl. Phys. A47, 347 (1998)
5. N. Del Fatti, R. Bouffanais, F. Vallee and C. Flytzanis, to be published
29

MCI 12:30pm - 2:30pm
Investigations of GaP for Terahertz Wave Generation Using Quasi-phasematched Difference Frequency Mixing
Gregory S. Herman Science Applications International Corporation
1 Enterprise Parkway, Suite 300, Hampton, Virginia, 23666 Tel (757)864-8616 Fax (757)864-8828
Norman P. Barnes, Stephen P. Sandford NASA Langley Research Center
Hampton, Virginia, 23681
1.0 Introduction There is considerable interest in the scientific community in developing compact, solid-state, far-infrared sources. A technique to produce terahertz sources that has been regaining interest is the use of nonlinear crystals12. In our studies, undoped, high-resistivity GaP crystal is being investigated as a nonlinear element in a difference frequency generation (DFG) scheme to generate a tunable, narrow-band, FIR idler wave using near-infrared (NIR) pump and signal sources3.
2.0 Difference Frequency Generation In the following analysis we are considering a first-order quasi-phasematched (QPM) nonlinear interaction involving a pump wave at frequency co t, a signal wave at frequency co2 and an idler wave at frequency o)3, and where o3 = Oi - G>2- The pump and signal waves are incident upon a QPM stack of diffusion-bonded GaP plates. For a first order QPM interaction4, the intensities of the signal and idler waves after traversing the crystal of length L are given by,
•2(ri) (i)
12 = I20 cosh
/3 = /20 sinh' (TL)
where I2o is the incident signal intensity and L=N» lc is the length of the QPM stack, N is the number of layers in the stack and lc = n/Ak is the coherence length, which is given by Ak = ki-k2-k3. T is the gain and is given by,
r2=- 8*2(^)2 (2)
We calculated lc to be -1.5 millimeters for the interaction involving pump and signal wavelengths of 1.064 and 1.072 micrometers, respectively, using Sellmeier equations fit to experimental values for GaP taken in both the NIR and FIR5. The generated FIR power at 1.9 THz was calculated assuming a GaP crystal of 12.5 millimeters length (N=8) and a constant signal intensity of 12kW/cm2.
t* THE Output PlHW
Figure 1. FIR Output Power as a function of Pump Intensity
0-7803-4950-4/98/110.00 1998 IEEE 3Q

3.0 GaP Optical Properties GaP is a cubic, III-V semiconductor crystal with a large nonlinear susceptibility (di4= 37 pm/V) and a high transmission in the NIR High Resistivity GaP is available in cylindrical boules that are 50 mm diameter x 75 mm long. In this paper, we report new measurements of the FIR transmission, damage threshold and optical quality of undoped, high-resistivity GaP single crystal.
3.1 FIR Transmission We measured the FIR absorption coefficient of two samples of GaP cut from opposite ends of the same ultrahigh purity GaP boule. The resistivity of the boule varied from 109 Ohm-cm to greater than 1012 Ohm-cm end-to-end. The absorption coefficient was calculated using low-resolution FTS transmission spectra using the full multiple reflection formula. As was expected, samples of GaP with larger resistivity showed superior FIR transmission, especially at the longer wavelengths.
GaP FIR Absorption Coefficient (T=300K)
i 1
i
; \
!
R a 1 E 9 Ohm •2 |
R> 1 F l?nh
Micrometers
Figure 2. GaP FIR Absorption Coefficient
3.2 Damage Threshold Optical damage experiments were carried out on GaP using three different sources; a continuous-wave C02 laser, a single-frequency Nd:YAG laser with a 3ns-pulse width, and a multi-mode Nd:YAG with a pulse width that could vary from 10 to 50 ns. All lasers had fairly Gaussian beam profiles and the crystal samples were all finely polished with very parallel faces.
The crystal did not damage when subjected to the cw C02 laser, even at maximum power using the shortest focal length lens available. The damage threshold for the pulsed Nd:YAG lasers was defined by whether the crystal withstood 3 hours of operation at a 10 Hz repetition rate. Damage always occurred on the front face. In the tests with the single-frequency 3ns NdrYAG laser, although the incident beam had a TEMoo spatial mode, the damage pattern appeared as an interference (fringe) pattern similar in form to the beam exiting the crystal sample. We believe that the GaP is acting as a cavity with a Finesse of J ~2 in the test with the single-frequency Nd:YAG laser. Therefore, we believe this test underestimates the real damage threshold by a factor of ~2.
Pulse width
Energy Peak Power Beam Diameter (cm)
Damage Threshold (MW/cm2)
"Nd:YAG 3 ns 6mJ 2MW 0.6 14.1 Nd:YAG 10 ns 25 mJ 2.5 MW 0.6 17.7 Nd:YAG 50 ns 50 mJ 1MW 0.6 7.1
2C02 ~ ~ 20 W 0.007 >1 1 Value is suspected low,2 Crystal not damaged
Table 1. Optical damage thresholds for various lasers and laser pulse widths.
31

3.3 Optical Quality To the naked eye, the GaP samples had little visible defects or scattering centers. The GaP was placed between crossed polarizers designed for use with Nd:YAG and the sample was illuminated with a Nd:YAG laser whose beam had been blown up to a 15 mm diameter. In the figures below, light colored areas indicate regions of the GaP crystal with a slight birefringence, thus indicating a region of internal strain. Although the strain is clearly visible, measurements of the extinction ratio of the crossed polarizer system with and without the GaP in place showed that the extinction dropped from 5000:1 to 100:1 so that the crystal is near strain-free.
Figure 3. Strain in GaP
4.0 Conclusions
Standard models predict that GaP can produce terahertz waves using near-IR pump and signal sources. Materials analysis results on samples of undoped, high resistivity GaP support this assertion and show room for improvement. Current work includes creating the quasi-phasematched structure with the GaP crystal, a technique that has already been developed by Stanford University for GaAs6, and performing a proof of concept demonstration using 3ns pulsed laser and OPPO sources. Following that work, a cw source will be developed using a pump- and signal-resonant system3 and the GaP diffusion-bonded stacked structure.
1 Kawase, K., M. Sato, T. Taniuchi and H. Ito, Appl. Phys Lett, 68, 18, 2483, (1996). 2 Apollonov, V., R Bocquet, A Boscheron, A. Gribenyukov, V. Korotkova, C. Rouyer, A Suzdal'tsev, and Y. Shakur, International Journal of Millimeter Waves, 17, 8, 1465, (1996). 3 Herman, G. and N. Barnes, "Proposed System for a 2.5 Terahertz laser", postdeadline paper, Proceedings of the OSA/IEEE Topical Conference on Nonlinear Optics, Wailea, Hawaii. (1996). 4 Fejer, M., G. Magel, D. Jundt and R. Byer, IEEE J. Quantum Electron., 28, 11, 2631, (1992). 5 Parsons, D., and P. Coleman, Appl. Opt., 10, 1683, (1971). 6 Gordon, L., R. Eckhardt, and R. Byer, Proceedings of the SPIE, 2145, (1995).
32

MC2 12:30pm - 2:30pm
Z-Scan Measurements on Au/Si02 Composite Films
Matthew W. Bender and David D. Smith
NASA Marshall Space Flight Center, Space Sciences Laboratory, ES-76, Huntsville, AL 35812, (205)544-7778, (205)544-8762(f)
Rongfu Xiao
Department of Physics, Hong Kong University of Science and Technology, Clear Water Bay, Kowloon, Hong Kong
Sergei Sarkisov
Department of Physics, Alabama A&M University, Normal, AL 35762
Don A. Gregory
Department of Physics, University of Alabama in Huntsville, Huntsville, AL 35899
Robert W. Boyd
The Institute of Optics, University of Rochester, Rochester, NY 14627
Summary:
In order to evaluate the validity of effective medium theories for describing two- phase metal cluster systems at appreciable volume fractions, we performed Z-scan measurements on composite films consisting of small gold particles in Si02. The samples ranged in volume fraction from 4% to 75% Au. We resolve the real and imaginary parts of x(3) to confirm previous results and compare with effective medium theories which consider the full complex nature of x(3)-
These samples were the subject of a previous study conducted by Liao et al.\ Films of 150 nm thickness were fabricated by cosputtering gold and Si02 onto a quartz substrate using a multitarget magnetron sputtering system. With the target surfaces inclined at 45° with respect to the substrate, the concentration of gold varied continuously across the resulting sample. Following thermal annealing at 850 °C, the electrical
0-7803-4950-4/98/$10.00 1998 IEEE 33
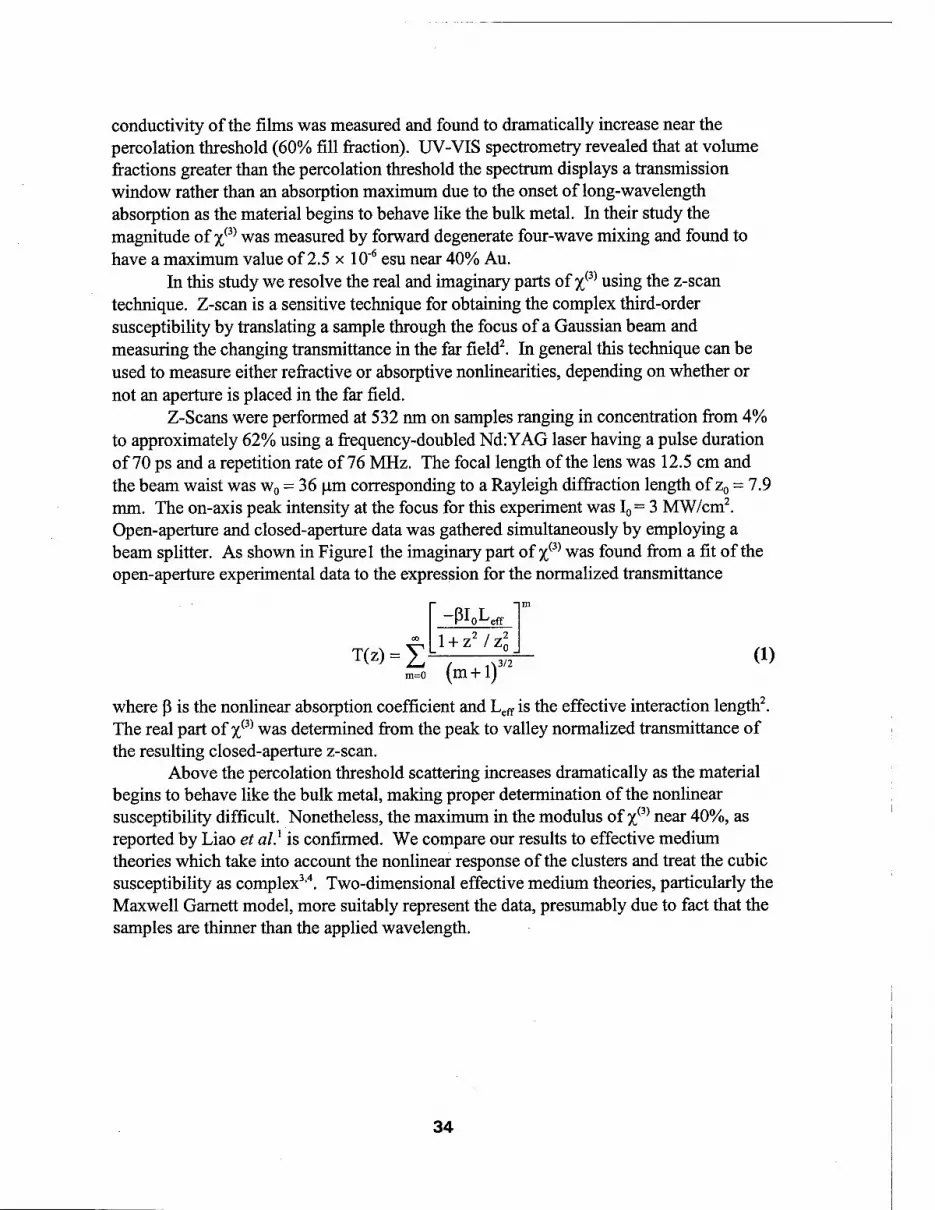
conductivity of the films was measured and found to dramatically increase near the percolation threshold (60% fill fraction). UV-VIS spectrometry revealed that at volume fractions greater than the percolation threshold the spectrum displays a transmission window rather than an absorption maximum due to the onset of long-wavelength absorption as the material begins to behave like the bulk metal. In their study the magnitude of x(3) was measured by forward degenerate four-wave mixing and found to have a maximum value of 2.5 x 10"6 esu near 40% Au.
In this study we resolve the real and imaginary parts of x(3) using the z-scan technique. Z-scan is a sensitive technique for obtaining the complex third-order susceptibility by translating a sample through the focus of a Gaussian beam and measuring the changing transmittance in the far field2. In general this technique can be used to measure either refractive or absorptive nonlinearities, depending on whether or not an aperture is placed in the far field.
Z-Scans were performed at 532 nm on samples ranging in concentration from 4% to approximately 62% using a frequency-doubled Nd:YAG laser having a pulse duration of 70 ps and a repetition rate of 76 MHz. The focal length of the lens was 12.5 cm and the beam waist was w0 = 36 |j.m corresponding to a Rayleigh diffraction length of z0 = 7.9 mm. The on-axis peak intensity at the focus for this experiment was I0 = 3 MW/cm2. Open-aperture and closed-aperture data was gathered simultaneously by employing a beam splitter. As shown in Figure 1 the imaginary part of x(3) was found from a fit of the open-aperture experimental data to the expression for the normalized transmittance
T(z) = I
-ßI0L eff
1 + z2 / z2
. .3/2
m=0
(1) (m + 1)
where ß is the nonlinear absorption coefficient and Leff is the effective interaction length2. The real part of x(3) was determined from the peak to valley normalized transmittance of the resulting closed-aperture z-scan.
Above the percolation threshold scattering increases dramatically as the material begins to behave like the bulk metal, making proper determination of the nonlinear susceptibility difficult. Nonetheless, the maximum in the modulus of x(3) near 40%, as reported by Liao et al} is confirmed. We compare our results to effective medium theories which take into account the nonlinear response of the clusters and treat the cubic susceptibility as complex3,4. Two-dimensional effective medium theories, particularly the Maxwell Garnett model, more suitably represent the data, presumably due to fact that the samples are thinner than the applied wavelength.
34

Figure 1. Open Aperture Z-Scan of 22% Au in Si02
References:
1. H. B. Liao, R. F. Xiao, J.S. Fu, P. Yu, G. K. L. Wong, and Ping Sheng, "Large third-order optical nonlinearity in Au:Si02 composite films near the percolation threshold," Appl. Phys. Lett. 70, 1 (1997).
2. M. Sheik-Bahae, A. A. Said, T. Wei, D. J. Hagan, and E. W. Van Stryland, "Sensitive Measurement of Optical Nonlinearities Using a Single Beam," IEEE Journal of Quantum Electronics 26, 760 (1990).
3. J. W. Sipe and R. W. Boyd, "Nonlinear susceptibility of composite optical materials in the Maxwell Garnett model," Phys. Rev. A 46, 1614 (1992).
4. X. C. Zeng, D. J. Bergman, P. M. Hui, D. Stroud, "Effective-medium theory for weakly nonlinear composites," Phys. Rev. B 38, 10970 (1988).
35

MC3 12:30pm - 2:30pm
Symmetry Breaking in Condensed Phases: The Interaction-Induced Optical Kerr Response of Liquid CC14
Dale McMorrow, Napoleon Thantu* and Joseph S. Melinger Naval Research Laboratory, Code 6613, Washington, DC 20375
Tel: (202) 767-5469 FAX: (202) 404-8076 E-mail: [email protected]
Interpretation of the intermolecular Raman scattering spectrum of carbon tetrachloride, and its corresponding ultrafast nonlinear- optical response, represents a challenging problem in the study of ultrafast dynamics in molecular liquids.1"6 For this spherical top molecular species, single-molecule intermol- ecular Raman activity is symmetry forbidden. The intermolecular spectrum in solution, there- fore, is purely interaction induced. The origin of the intermolecular scattering intensity in CCI4 liquid typically is discussed in terms of collisional models of which, for simplicity, the binary collision model is most commonly invoked.1"4,6
In this paper we investigate in detail the intermolecular spectrum of CCI4. It is demon- strated that, in addition to the 200 fs relaxation that previously had been identified with a collision-induced intensity,3"6 the intermolecu- lar dynamics of this liquid exhibit a 1.9 ps ex- ponential decay, and also evidence for a third, intermediate-timescale relaxation. This tempor- al signature is analogous to that observed for numerous liquids composed of anisotropic molecular species5, and can not be accounted for solely in terms of a collisional model. The data presented below suggest that the inter- molecular Raman activity of CCI4 liquid is a consequence of a solvent-induced molecular symmetry breaking phenomenon7 in which the RIKES dynamics more closely resemble those expected for weakly anisotropic species than for a collision-induced process. These findings are possible because of increased sensitivity afforded by the femtosecond optical hetero- dyne detected Raman-induced Kerr effect (OHD RIKES) technique3"5 when coupled with Fourier-transform data reduction procedures, which are described elsewhere5.
Fig. la shows the OHD RKES response measured for CCI4 liquid at 23C using the 0-7803-4950-4/98/$10.00 1998 IEEE
output of a mode-locked Ti: sapphire laser; fig. lb shows the corresponding frequency re- sponse function, Im xih- Figure lb is obtained from fig. la using standard Fourier transform/ deconvolution relationships,5 and is free from the spectral filter effects of the finite-duration optical pulses. For transform-limited pump and probe pulses, with a properly optimized experi- mental setup, this procedure is effectively exact. The amplitude of the intermolecular contribution to the dynamics, which is clearly separated in the spectral data in fig. lb, is two orders of magnitude smaller than that of the electronic response.
1.0
■e CO
(/> c
0.5
0.0
1.0
CCI4 OHD RIKES (a)-
_J /V\^\/\^-AA*AAI-N/V*^VW*
0 12 3 Probe Delay, ps
■e
0.5
intramolecular.
intermolecular
/
0 100 200 300 400 Frequency, cm"1
Figure 1. Femtosecond OHD RIKES of CCl4 liquid at 23° C: (a) dynamics and (b) imaginary part of the frequency response function.
A powerful feature of the OHD RKES technique is the ability to separate uniquely the nuclear and electronic parts of the measured transients, as is illustrated in fig. 2 for the CCI4 data. Details of the Fourier transform procedures are presented elsewhere5. The
36

complexity of the nuclear response is evident in the data of fig. 2a, and the intermolecular part is given in figs. 2b and 2c. Evident in the logarithmic plot of fig. 2c is the markedly non- exponential relaxation of the subpicosecond dynamics followed by a 1.9 ps exponential decay. This temporal signature is analogous to
2 3 4
Probe Delay, ps
Figure 2. Nuclear part of the fs OHD RIKES response of CCI4 liquid: (a) nuclear response function; (b) intermolecular part of nuclear response function; and (c) log plot of intermolecular response.
that observed for numerous weakly interacting anisotropic liquids, including CS2, CHCI3, and acetonitrile. The 1.9 ps time constant determin- ed from the data of fig. 2 agrees well with the 1.8 ps decay time deduced from Raman line- broadening studies and attributed to diffusive reorientation8.
Additional insight is gained from the data of fig. 3. Fig. 3 reproduces the 23 C intermolec- ular dynamics of fig. 2, together with those measured at 75C. While the changes in the
transients are not large, the observed trends are significant. As the temperature is varied, the femtosecond and picosecond dynamics evolve in opposite directions. In particular, as the temperature is increased, the RIKES transient exhibits: (/') a broadening (slowing down) at short times; and (») a more rapid decay in the picosecond regime. This behavior, which gives rise to the curve crossing that is evident in fig. 3, is typical ofthat for liquids of weakly inter- acting, anisotropic molecular species.
The temperature dependence of the pico- second relaxation is in accordance with that expected for diffusive reorientational relaxa- tion. This behavior is illustrated more clearly in the inset, in which the two curves are normalized at 1.5 ps. The femtosecond behav- ior is consistent with that of intermolecular vib- rational modes as the intermolecular potentials are relaxed.
2 4
Probe Delay, ps
Figure 3. Log plot of the intermolecular OHD RIKES response at two different temperatures. The inset shows the two transients normalized at 1.5 ps.
The data presented suggest that the picosecond relaxation evident in the CCI4 OHD RIKES response is associated with diffusive reorientation of weakly anisotropic molecular species. The most likely origin of this aniso- tropy lies in a solvent-induced symmetry break- ing phenomena, although other possibilities are under investigation. Further, the temporal sig- nature of the subpicosecond dynamics is con-
37

sistent with that observed for anisotropic molecular liquids, suggesting that a significant fraction of the subpicosecond response arises from anisotropic intermolecular degrees of freedom.
t Current address: Sparta, Inc., 1911 N. Fort Meyer Drive, Suite 1100, Arlington, VA 22209
1. F. J. Bartoli and T.A. Litovitz, J. Chem. Phys. 54, 3846 (1971).
2. J.A. Bacaro and T.A. Litovitz, J. Chem. Phys. 55,3585(1971). 3. D. McMorrow, W.T. Lotshaw, and G.A. Kenney-Wallace, IEEE J. Quantum Electron. 24, 443 (1988). 4. E.W. Castner, Jr., Y.J. Chang, J.S. Melinger, and D. McMorrow, J. Luminescence, 61&62, 723 (1994). 5. W.T. Lotshaw, D. McMorrow, N. Thantu, J.S. Melinger, and R. Kitchenham, J. Raman Spect. 26, 571 (1995). 6. T. Hattori, A. Terasaki, T. Kobayashi, T. Wada, A. Yamada, and H. Sasabe, J. Chem. Phys. 95, 937 (1991). 7. A.E. Johnson and A.B. Myers, J. Phys. Chem. 100, 7778 (1996). 8. F. J. Bartoli and T.A. Litovitz, J. Chem. Phys. 56, 404 (1972).
38

MC4 12:30pm - 2:30pm
Time Delayed Beam Splitting in Nonlinear Polymeric Waveguides Induced by Low Power Upconverted Photobleaching
Aaron Wilkosz, Nichols Research Corporation, 4040 S. Memorial Parkway, Huntsville, Alabama 35815, (205) 885-7632
Sergey Sarkisov, Alabama A&M University, Normal, Alabama 35762 (205) 851-5305
INTRODUCTION Optical beam splitting has been first reported for photorefractive waveguides built by titanium diffusion in LiNb03 [1,2]. The effect has been qualitatively explained as an appearance of spatial dark solitons in self-defocusing nonlinear medium [3]. Optical splitting has also been observed in pure self-defocusing Kerr media in a two dimensional configuration [4,5] similar to that of a slab waveguide. The splitting effect in this case is apparently associated with dark spatial solitons. This paper presents theoretical and experimental data and discusses a theoretical model developed to study optical beam splitting induced by photobleaching a dye-doped polymeric waveguide, where instant refractive index reaction to light intensity redistribution is replaced by permanent index decrease associated with dye photobleaching.
MODEL THEORY The index response to an optical field amplitude E is given by the rate equation
iM = _CIM!(n(E)-ns) (1) at 2
for n = 0 at t = 0, where fi(E) is the electric field dependent component of the refractive index h(E) = n(E) - n0, where n0 is the initial unperturbed refractive index; E is the electrical component of a TE mode propagating in a single mode slab waveguide; C is the efficiency of light induced index modification; and hs is the saturation index change. Equation (1) applies to nonstationary and nonuniform optical fields. According to experimental data the absorption coefficient and dependent on it propagation loss rate remain constant. The light propagation in a single mode slab waveguide is given by a two dimensional nonlinear Schrödinger type equation
0.09E 32E .__ ß2n(E) n ,n, -2iß —+ —a—i7ßE + £-L-d = 0 (2)
3x dyd n0
where x and y are coordinates in the plane of the waveguide along and across the propagation direction respectively; ß is the mode wave number; and y is the propagation loss factor. The light beam injected into the waveguide was assumed to have a uniform phase plane wavefront and a Gaussian profile of the optical field given by E = E0 exp(-y2/2o2) at x = 0, where E0 is the beam amplitude, and a is the beam width. Equations 1 and 2 were solved by integrating along the dimensions 0-7803-4950-4/98/$10.00 1998 IEEE gg

x and time t using central difference method for the second order partial derivative in the y direction.
RESULTS Figure 1 shows results obtained from numerical simulations of light propagating in the waveguide at various times after the light was launched. The time scale shown in Figure 1 is based on a normalized time parameter given by x = t/CIE0l2/n0. One can see apparent primary beam splitting into two secondary beams With separation between them growing in time. This process can be understood qualitatively in terms of light escaping out of bleached regions with low refractive index to unbleached regions with high index of refraction.
Figure 1. Numerical simulation of the evolution of the beam intensity profile along the propagation direction at a) x = 1.5, b) T = 2.0, and c) x = 3.0.
The experimental waveguide was fabricated by spin-coating preoxidized silicon wafer with Si02 layer with a thickness of 1.5 urn and a refractive index of 1.46. The coat was made of poly(methyl methacrylate) (PMMA) solution in chlorobenzene doped with the dye 4-(Dicyanomethylene)-2-methyl-6-(p-dimethylaminostyryl)4H-pyran (DCM) and spin coated. This produced a dual mode slab waveguide with thickness of 1.2 urn and a refractive index of 1.496 at 633 nm. The Gaussian beam width of 0.35 mm from a He- Ne cw laser (633 nm) with TE polarization was injected into the waveguide using a
40

prism coupler. Figure 2 shows the transverse intensity profiles of experimental results taken at different times. The features of the branch structures are similar to those predicted by the computer model. The appearance of the central branch at 323 seconds in Figure 2 coincides with simulation results shown in Figure 1. In conclusion, optical branching has been modeled and experimentally observed with very close agreement between theory and experiment.
350
-400 -200 0 200 400
DISTANCE [um]
Figure 2. Experimental measurements showing the evolution of the light beam profile at various times after beam injection.
REFERENCES 1. H. Jerominek, R. Tremblay, and C. Delisle, "Optical branching effect in photorefractive sensitive Ti:LiNb03 slab waveguides", IEEE J. Lightwave Technol. Vol. LT-3, p. 1105, 1985. 2. H. Jerominek, C. Delisle, and R. Tremblay, "Optical branching effect in Ti:LiNb03 waveguides: near-field pattern studies", Appl. Opt. Vol. 25, pp. 732-736, March 1986. 3. P.A. Belander, and P. Mathieu, "Dark solitons in a Kerr defocussing medium", Appl. Opt. Vol. 26, pp. 111-113, January 1987. 4. G.R. Allan, S.R. Skinner, D.R. Andersen, and A.L. Smirl, "Observation of fundamental dark spatial solitons in semiconductors using picosecond pulses", Opt. Lett. Vol. 16, pp. 156-158, Febr. 1991. 5. B. Luther-Davies, and X. Yang, "Waveguides and Y junctions formed in bulk media by using dark spatial solitons", Opt. Lett. Vol. 17., pp. 496-498, April 1992.
41

MC5 12:30pm - 2:30pm
Size-dependent Many-body Effects in the Non-linear Optical Dynamics of Metal Nanoparticles
T. V. Shahbazyan and I. E. Perakis Department of Physics and Astronomy, Vanderbilt University, Box 1807-B, Nashville, TN 37235
Fax: (615) 343-7263, Tel: (615) 343-1706, E-mail: [email protected]
The absorption of light by metal nanoparticles is dominated by the surface plasmon (SP) resonance. Although, the linear absorption has been extensively studied [1], very little is known about the SP non-linear optical dynamics. Recent pump-probe experiments [2-6] have revealed that many-body correlations play an important role in the subpicosecond dynamics.
A very interesting observation was recently made by Bigot and collaborators [3]. By studying the temporal evolution of the differential transmission lineshape in small Cu nanoparticles, they found that the hot electron relaxation to the lattice appears to be signif- icantly slower at the SP frequency. Such a strong frequency dependence is absent in metal films [7,8]. Here we explain this by considering size-dependent dynamical screening effects on the electron relaxation.
In bulk metals, the scattering rate of a quasiparticle with energy E close to the Fermi energy EF is 7e oc [1 - F(E)][(E - EFf + (TTT)
2], where T is the temperature and F{E) is
the Fermi distribution. For sufficiently high energies, the quasiparticle lifetime is largely de- termined by plasmons. The scattering rate in this case is much higher and can be calculated from the dynamically screened interaction, Uw(r - r') = U(r - r')/e6(w), where U(r - r') is the Coulomb potential and eb(u>) = 1 -u^/u>2 + Sed(uj), is the dielectric function, whose zeros determine the (volume) plasmon frequency (LüP is the plasmon frequency of free electrons). We include the d-band polarization, Sed(u) , which plays an important role in the optical properties of noble metals.
In nanoparticles, dynamical screening is strongly modified by the confinement. In ad- dition to the bulk-like plasmons, a positively charged hole inside a nanoparticle will excite surface charge oscillation modes. We find a surface-induced interaction potential of he form
flUr.rO oc *£.-*-y (1)
es(co) is the effective dielectric function whose zero determines the frequency of the SP resonance,
es(uj) = 1 - UI/U(üJ + ils) + 6ed(uj) + 2e0. (2)
Here fs ~ vF/R is the SP width due to surface scattering [1] and e0 is the dielectric constant of the surrounding medium. This new dynamically screened interaction strongly depends on the nanoparticle size and sharply peaks at the SP frequency. This leads to a new channel for quasiparticle decay mediated by the SP.
This mechanism strongly affects the optical properties of noble-metal nanoparticles. Here we focus on Cu nanoparticles, where the interband threshold is close to the SP frequency.
Consider the SP-mediated decay of the d-hole into the conduction band. If Ee and Eh are the conduction electron and d-hole energies, respectively, (assuming dispersionless d-band), we derive the following expression for the d-hole scattering rate 7^ 0-7803-4950-4/98/$ 10.00 1998 IEEE 42

,(*,&) .-^(ftJto-j^L-j. (3)
Here A = 9e2P2/m2(Ee - Eh)2, where P is the interband dipole matrix element. Since
l/es(u}) has a pole at the SP frequency, usp, the scattering rate Eq. (3) peaks at Ee-Eh = LOSP.
Such a sharp energy dependence of *)h results from the fact that transitions caused by the surface potential are dipole transitions and involve no momentum transfer. One can see that
jh depends strongly (as R~3) on the nanoparticle size. Consider now the absorption. For small nanoparticles, the experimentally measurable
extinction cross-section is determined by the SP resonance, cr(u) oc — u;Im[l/es(ü;)], with es(u>) as in Eq. (2). For noninteracting electrons, the interband polarization is
4ne2P2 fdEeg(Ee) 2(Ee - Eh)
where g(Ee) is the density of states of conduction electrons (7 is infinitesimal). Let us include in Std{oj) the corrections due to the above manyObody mechanism. A
photon with frequency u creates a virtual electron-hole pair. The conduction electron decays into the Fermi sea, while the d-hole can decay to conduction band via emitting a SP. Since the energy of a virtual (/-hole is Ee — u, the scattering rate of such a hole,
7, oc F(£?e)Im[l/e.(w)], (5)
is determined by the frequency of the incident light. So, as u> approaches the SP frequency, the lifetime of the optically excited d-ho\e sharply decreases. This affects strongly 8td(uj) and, in turn, the effective dielectric function Eq. (2). Since the latter determines the SP resonance, which mediates the e?-hole decay, es(w) must be calculated self-consistently. In the numerical calculations we also included the real part of the d-hole self-energy.
The calculations of differential transmission spectra for Cu nanoparticles were performed with the parameters of Ref. [3]. During the first picosecond following the pump excitation, the initial nonequilibrium electron distribution relaxes due to the fast e-e scattering processes towards a hot Fermi distribution with electron temperature ~1000 K. At the same time, the lattice temperature remains basically unaffected. To determine the temperature changes due to the energy exchange with the phonon bath, we adopt the two-temperature model [9].
The sharp frequency dependence of 7^ implies that it affects the absorption only in the frequency region close to u>sp. In Fig.l we compare the differential transmission spectra with and without 7^ at time delay 1 ps, using parameters that give the same linear absorption spectrum. The main effect of 7^ is a considerably steeper decrease in the differential trans- mission for frequencies above the SP resonance u>sp ~ 2.2 eV. Although this difference may be hard to observe in the spectra at given time delay, it leads to a rather pronounced effect in the temporal evolution of the differential transmission (Fig.2) that can be detected exper- imentally. With 7/!, the differential transmission exhibits a significantly stronger frequency dependence above u>sp, in a very good agreement with the experiment [3].
43

2.0 2.2 2.4 energy (eV)
2.6
FIG. 1. Differential transmittance spectra for time delay 1.0 ps with (solid line) and without (dashed line) jh-
1000 2000 3000 4000 t|me delay (fs)
FIG. 2. Temporal evolution of differential transmittance with 7^ for u = 2.2 eV (solid line), uj = 2.13 eV (long-dashed line), and u> = 2.26 eV (dashed line).
In conclusion, we have shown that the time evolution of the differential transmission spectra in metal nanoparticles is strongly influenced by dynamic many-body correlations. This indicates a need for more systematic experimental studies of the size-dependence of the nanoparticle nonlinear optical dynamics.
[1] U. Kreibig and M. Vollmer, Optical Properties of Metal Clusters (Springer, Berlin, 1995). [2] T. Tokizaki et.al., Appl. Phys. Lett. 65, 941 (1994). [3] J.-Y. Bigot et.al. Phy. Rev. Lett., 75, 4702 (1995). [4] T. S. Ahmadi, S. L. Logunov, and M. A. Elsayed, J. Phys. Chem. 100, 8053 (1996). [5] M. Perner et.al., Phys. Rev. Lett. 78, 2192 (1997). [6] M. Nisoli et.al., Phys. Rev. Lett. 78, 3575 (1997). [7] C. K. Sun et. al., Phys. Rev. B 50, 15 337 (1994). [8] R. H. M. Groeneveld, R. Sprik, and A. Lagendijk, Phys. Rev. B 51, 11 433 (1994). [9] R. Rosei and D. W. Lynch, Phys. Rev. B 5, 3883 (1972).
44

MC7 12:30pm - 2:30pm
Low-Threshold Periodic Optical Parametric Oscillator
Gerald T. Moore and Karl Koch Solid State Laser and Nonlinear Optics Branch, AFRL/DELO,
USAF Research Laboratory, Kirtland AFB, NM 87117. (505) 846-4753, (505) 846-1191 (FAX)
We describe here numerical simulations in three spatial dimensions of a device which could achieve low-threshold singly resonant optical parametric oscillation at pump powers easily reached by diode lasers. This device, which we call the periodic optical parametric oscillator (POPO), utilizes 2NC interactions in Nc 5-cm periodically poled lithium niobate (PPLN) crystals. Except for the input coupler, all mirrors are highly reflecting for the pump, signal, and idler waves. The crystals are arranged in a fan-fold configuration. Concave mirrors with focal length / refocus the light after each interaction, and retroreflect the light after Nc interactions. Here we present the calculated behavior of a POPO with Nc = 2, f = 1.25 cm, and 1 cm gaps between the mirrors and the ends of the crystals, as shown in Fig. 1.
Except for the first interaction region, where the nonresonant generated field (NGF) grows from zero, the relative phases of the three fields entering each interaction region, together with the phase (f>G of the %(2) grating in the PPLN, determine whether the parametric amplification process proceeds constructively or whether destructive interference occurs. Among other things, the relevant phase (j)p — <f>s — <f>i — <j>G depends on the amounts of lithium niobate at the end of one crystal and the beginning of the next relative to the placement of the domain inversion, as illustrated in Fig. 2. In a periodic device the phase shifts between consecutive gratings should all be made equal to some optimal value. The relation between the phase of a grating on the forward and reverse trips is not a property of that grating per se, but depends on phase shifts between the intermediate gratings. However, an optimal phase shift between gratings on a forward trip is also optimal on the reverse trip. While it should be possible to construct a device with optimally phased gratings if the phase shifts at the mirrors and antireflection coatings, as well as the resonator geometry, are known, an alternative is to use PPLN wafers with a number of gratings in parallel, all with the same grating period, but with different phases, and to select the combination of gratings which minimizes the oscillation threshold. Another alternative is to use wafers with a single wide grating, but with the end surfaces slightly nonparallel to the grating planes. Since air dispersion is small, precise longitudinal positioning of the PPLN wafers in the cavity is unnecessary.
In both the limits of very small iVc and very large Nc, loss in the POPO dominates over small-signal gain at low pump power. However, in the intermediate regime the net small-signal gain per pass G0 can be substantial. We model losses by discrete photon flux attenuations Ts,Th and Tp after each interaction. The most important losses in practice are due to Fresnel reflections at the crystal surfaces. The reflected light is not mode-matched to the resonator, and any effects on the POPO dynamics are not included in the present simu- lations. It is easy to design anti-reflection (AR) coatings to operate well at two wavelengths, but more difficult to obtain coatings which operate well at all three OPO wavelengths. For the simulations presented here we choose T = 0.99 for the resonant generated field (RGF). We choose either T = 0.99 or T = 0.74 (lossy field) for the pump and the NGF.
We have numerically integrated the three-dimensional three-wave mixing equations to simulate a POPO with Nc = 2 in the configuration of Fig. 1. The calculations do not 0-7803-4950-4/98/$10.00 1998 IEEE 45

take longitudinal cavity modes into account, though we anticipate single-mode operation over short times and possible mode hopping caused by thermal or mechanical drifts over longer times. The pump wavelength is Xp = 0.8 /im and the grating period is chosen to generate signal and idler wavelengths Xs = 1.0723 ßm and A^ = 3.15 //m. The fundamental transverse modes are slightly elliptical because of crystal birefringence. The radii (wY, wz) in micrometers are (54.2,55.1) for the signal, (90.8,96.6) for the idler, and (47.1,49.0) for the pump. We present results for the two cases when the signal is the RGF and when the idler is the RGF. We take the incident pump radiation to be mode-matched to the fundamental resonator mode. Aside from the effects of nonlinear interaction and linear attenuation, the slowly varying amplitudes for radiation in the fundamental mode are unchanged after a period, except for a phase eigenvalue exp(—i$) determined by the resonator geometry and crystal refractive indices. Since there is dispersion in $, the optimal phase relation between the fields is maintained in the simulations by multiplying the NGF field by exp[i($s + $; — $p)] after each interaction. This accomplishes the same objective as experimentally optimizing the grating phase. When the gain per period is small, the RGF remains in the fundamental mode with essentially perfect beam quality, so one can predict steady-state operating characteristics of the POPO using single-pass calculations with varying amounts of input pump and RGF. The results of our simulations are summarized in Table 1. The first column identifies which field is the RGF. The second column identifies which field, if any, has T = 0.74. The third column is the net small-signal gain G0 of the RGF after four periods at a pump power of 400 mW. By reducing the pump power until G0 = 1, we calculate the threshold power of the POPO when there is no useful RGF outcoupling, given in the fourth column. The final four columns are calculated for an input pump power of 400 mW and the input RGF power which most completely depletes the pump. Column 5 gives the net strong-signal gain G of the RGF. The output mirror reflectivity for the RGF should be R = 1/G to have a steady state which optimally depletes the 400 mW pump. Column 6 gives the fraction of the incident pump energy which is undepleted. Columns 7 and 8 give the quantum efficiencies r\n and r]r for the NGF and RGF respectively, defined as generated photon flux minus incident photon flux, expressed in units of incident pump photon flux.
Although the beam radii are dramatically different for the signal and idler, we see that the results in Table 1 are rather insensitive to whether the signal or the idler is the RGF. We also see that r\n is large compared to r\r. In applications where only one of the generated fields is desired, it should be the NGF. Resonating the idler would result in less intracavity power, less non-phase-matched generation of short-wavelength radiation, and less thermal and photorefractive distortion. These considerations suggest that it may be possible to operate the POPO at room temperature. When there is a lossy field, rjr is rather small and G is close to unity. An alternative would be to not outcouple the RGF and to deplete the pump at lower input pump power. Our results indicate that remarkably good pump depletion is possible in the POPO, much better than is generally found in either experiments or simulations of ordinary OPO's. We suspect that this is related to the excellent NGF beam quality produced by the POPO. This beam quality is understandable, since the modal eigenvalues for higher-order modes correspond to different phase shifts than that of the fundamental, so that the NGF contributions to higher-order modes from different periods do not add constructively. For the strong-signal simulation on line 2 of the table, the idler
46

beam quality is M2 = 1.28 after the first period, but this improves to M2 — 1.04 by the end of the fourth period. Figure 3 shows the quantum efficiencies and residual pump fraction as a function of period number for this case. We see from the table that having a lossy pump results in higher r)n, but in smaller Gp, smaller r]r, and a higher threshold, than having a lossy NRF.
In conclusion, we have presented simulations of an POPO with two crystals which can down-convert diode or Ti:sapphire radiation at a threshold power as low as 105 mW. Further threshold reductions and efficiency improvements have been seen in simulations with Nc> 2 and high transmission per period for all three fields.
Table 1. Tabulated Simulation Results
RGF lossy field
Go threshold power [mW]
G residual pump
Vn Tjr
signal none 1.1166 105 1.0215 0.00187 0.9588 0.3384 signal pump 1.0627 156 1.0104 0.00059 0.6288 0.1314 signal idler 1.0924 124 1.0097 0.00199 0.4563 0.1891 idler none 1.1157 105 1.0222 0.00055 0.9600 0.3455 idler pump 1.0619 159 1.0105 0.00021 0.6202 0.1306 idler signal 1.0905 128 1.0100 0.00047 0.4640 0.1940
/=1.25 cm
PPLN
-7.00 cm-
/=1.25 cm pump
signal
PPLN /= 1.25 cm" idler
•I
Fig. 1. POPO configuration.
refocusing PPLN . PPLN
+-■++-+■*-+* +++++++
vAAA_-W\A, <t>=<t>p-t-(t)i
Fig. 2. Compensation of shift in rela- tive phases of fields by shift in grating phase.
•Ö 0.6
£ 0.4
residual pump (small signal) residua! pump
1r
0.0 0.5 1.0 1.5 2.0 2.5 3.0 3.5 4.0 period number
Fig. 3. Efficiencies and residual pump with resonant signal, lossy 400 mW incident pump, and maximal pump depletion after four periods.
47

MC8 12:30pm - 2:30pm
Singly Resonant Cavity-Enhanced Frequency Tripling
Karl Koch, Gerald T. Moore, and Nathan A. Brilliant Solid State Laser and Nonlinear Optics Branch,
AFRL/DELO, USAF Research Laboratory, Kirtland AFB, NM 87117 (505) 846-4753, (505) 846-1191 (FAX)
There are a number of applications for short-wavelength radiation. Nonlinear optical frequency conversion represents an effective alternative to producing such radiation. Single- pass configurations of nonlinear conversion elements are simple and relatively efficient when pumped with high-peak-power pulsed lasers. However, single-pass configurations are in- sufficient for producing higher harmonics with low-peak-power lasers. The technique of resonant cavity enhancement has been successfully applied to frequency doubling [1] and quadrupling [2] of cw and low-energy pulsed lasers. In this paper we analyze the design and performance of a singly resonant cavity-enhanced frequency tripler. A schematic of the device is shown in Fig. 1. The device consists of a cavity that resonates the pump laser. The cavity contains a second-harmonic generation (SHG) interaction that generates the second harmonic of the pump laser. This is followed by a sum-frequency generation (SFG) in- teraction that frequency sums the resonating fundamental frequency with second-harmonic frequency to produce the third-harmonic of the pump laser. The second- and third-harmonic of the pump laser are coupled out of the cavity. We model intracavity loss by a single-point attenuation RQ.
From the perspective of energy flow, energy flows into the system at the pump frequency Li and flows out of the system through four possible channels: (1) pump energy rejected by the cavity, (2) pump energy lost through linear intracavity losses, (3) second-harmonic of the pump frequency that is unconverted in the SFG interaction, and (4) third-harmonic of the pump frequency. When the reflectivity of the input coupler is chosen appropriately, the incident pump light reflected from the coupler can be equal in amplitude to, but opposite in phase from the resonating pump light transmitted by the input coupler. This eliminates un- useful energy flow into channel (1). Energy flow into channel (2) can be minimized through improved anti-reflection coatings and low loss materials. Energy flow out the unuseful chan- nel (3) can be eliminated by choosing the ratio of the nonlinear drive between the SHG and SFG stages, so that all the second harmonic of the pump frequency is converted to third harmonic in the SFG stage. This approach maximizes the flow of energy into channel (4). We use a plane-wave analysis similar to our previous work on intracavity frequency con- version [3-4] to examine the system and derive expressions for the optimum input coupler reflectivity and the optimum ratio of nonlinear couplings between the SHG and SFG stages, as well as expressions for the second- and third-harmonic conversion efficiencies.
To illustrate the device performance we consider frequency tripling a 350-mW, 1319-nm, continuous-wave laser in periodically poled lithium niobate (PPLN). Using Sellmeier relations from the literature [5], the quasi-phasematched periods for the SHG and SFG interactions at 170° C are 12.325 /zm and 3.866 /im, respectively. Since 3.866 //m is beyond current state- of-the-art fabrication techniques, we also consider third-order quasi-phasematching (QPM) for the SFG stage; in that case the QPM period is 11.598 //m. We limit the total interaction length to 5 cm. We choose the confocal parameter of the beam equal to 1.76 cm, which corresponds to a 41 //m spot size. In Figs. 2(a) and (b) we plot the third-harmonic power 0-7803-4950-4/98/$! 0.00 1998 IEEE 4g

conversion as a function of the SHG interaction length La for a series of input coupler reflectivities for first- and third-order QPM. We find that the conversion is maximized for a SHG length La = 1.85 cm for first-order SFG QPM and La = 0.53 cm for third-order SFG QPM. In Figs. 3(a) and (b) we plot the second- and third-harmonic power-conversion efficiencies as a function of incident pump power for both the first- and third-order SFG QPM. The third-harmonic conversion efficiency is 95.3% (81.1%) for first(third)-order SFG QPM.
In addition to the plane-wave analysis, we have performed numerical simulations that model the SHG and SFG interactions in three spatial dimensions. This numerical model accounts for the effects of diffraction, birefringent walkoff, and cavity focusing. Using the parameters from the plane-wave example discussed above as a starting point, we reoptimized the design and found for the case of first-order SFG QPM the optimum SHG length La = 1.89 cm and the input coupler intensity reflectivity is R = 0.92. For the case of third-order SFG QPM the three-dimensional simulation found the optimum SHG interaction length La = 0.85 cm and input coupler cavity reflectivity R = 0.97. In both cases, the third- harmonic beam is predicted to be essentially diffraction limited. The higher reflectivity determined from the three-dimensional analysis has been seen in previous examples of multi- stage intracavity frequency conversion devices. In the three-dimensional simulation the input beam is mode matched to the resonant cavity. The cavity beam waist is in the center of the 5- cm nonlinear interaction length. The large difference between plane-wave and the numerical simulation for the optimum interaction length can be accounted for by the increased spot size in the SHG interaction, which effectively reduces the plane-wave interaction length. In Fig. 4 we plot the results of the three-dimensional simulation for the third-harmonic power efficiency as a function of input power for the cases of first- and third-order SFG QPM. The plot indicates a moderate range of pump intensities will still produce good efficiency.
[1] W. J. Kozlovsky, C. D. Nabors, and R. L. Byer, Opt. Lett. 12, 1014-1016 (1987). [2] J. Knittel and A. H. Kung, IEEE J. Quantum Electron. 33, 2021-2028 (1997). [3] G. T. Moore, K. Koch, and E. C. Cheung, Opt. Commun. 113, 463-470 (1995). [4] G. T. Moore and K. Koch, IEEE J. Quantum Electron. 29, 2334-2341 (1993). [5] D. H. Jundt, Opt. Lett. 22, 1553-1555 (1997).
(1) CO\ '1 Zn z
"f
\
R
SHG - SFG i\ «2 (3)
z\ z2 z3
CO,
V
Oh (4)
A Rn
(2)
Fig. 1. Schematic diagram of the singly resonant cavity-enhanced frequency tripler.
49

1 (5 S o D. O 'c o
c o o <D
C o 1 5 o a
1.0 .i ■■'— -i 1 1—
Ä = 0.86 j**^
0.82 llf
, . ., , , , ,.
first-order SFG QPM
0.8 \v (a)
0.6 II \^.
0.4 ' A1 a78 A.
0.2 \
0.0 ■ i i . i-
c .a o Q)
0) $ 0 a
0.0 1.0 2.0 3.0 4.0 SHG interaction length [cm]
1.0 _i' ■ i ■ i ■ i ■ 1 1 r;
third-order SFG QPM
0.8 - ä (b) .
0.6 1 x^. R=on
1 >^.' 094
0.4
1 \^ 096
0.2
0.0 7 ^^__' I . 1 . 'I 1
5.0 0.0 1.0 2.0 3.0 4.0 5.0 SHG interaction length [cm]
Fig. 2. Power conversion efficiency of the singly resonant cavity-enhanced frequency tripler as a function of SHG interaction length for a series of input coupler reflectivities R. The total interaction length is held constant, La + Lb = 5 cm. (a) first-order SFG QPM (b) third-order SFG QPM.
1.0K.. ; •.' 'J.L'1'~-.'. '— '-i i.o
a o E
c o £ % o a.
I ' I r
third-order SFG QPM
0.1 1 incident pump power [W]
10 0.1 1 incident pump power [W]
10
Fig. 3. Power conversion efficiency of the singly resonant cavity-enhanced frequency tripler. The solid (dashed) lines show third-harmonic (second-harmonic) power-conversion efficiency as a function of incident pump power for the example of (a) first-order and (b) third-order sum-frequency generation quasi-phasematching.
r? 100
80
I O D.
60
40
20 -+- third-order SFG QPM -■- first-order SFG QPM
0.0 2.0 0.4 0.8 1.2 1.6 input pump power [W]
Fig. 4. Power dependence of third-harmonic power-conversion efficiency of PPLN resonant tripler for La = 1.89 cm and R = 0.92 (first-order SFG QPM) and La = 0.85 cm and R = 0.97 (third-order SFG QPM). The intracavity attenuation is R0 = 0.99.
50

MC9 12:30pm - 2:30pm
Nonlinear Interactions of Excitons in Conducting Polymers: Femtosecond Transient Absorption and Holography Studies
p.W- McBraijch, B. Kraabel, and V.l. Klimov Chemical Science and Technology Division, CST-6, MS-J567,
Los Alamos National Laboratory, Los Alamos, NM 87544
The nonlinear optical (NLO) properties of luminescent conducting polymers from the poly(para-phenylene vinylene) (PPV) family are studied using femtosecond (fs) transient absorption (TA) and holography to address several issues: what are the primary photoexci- tations; how do they interact at high excitation densities; what are the signatures of biexci- tons; how can these materials be harnessed for ultrafast holographic signal processing? We have measured solutions and films of the PPV oligomer MEH-DSB, and several soluble PPV derivatives, with similar results. MEH-DSB results are representative of the entire family. The fs TA spectra of MEH-DSB show: (1) a positive band due to stimulated emission (SE) around 2.4 eV; (2) a photoinduced absorption (PA) band extending from 1.3-2.0 eV. In so- lutions at low intensities, both features show exponential decay (r ~ 650 ps), indicating that both originate from singlet excitons. In films, the decay is much faster and strongly non- exponential, with a second PA band at ~1.8 eV. The 1.4-eV band (PAi) shows pronounced intensity-dependent dynamics, while PA2 exhibits slower pump-independent decay, indicat- ing the creation of two species. The matching PAX and SE features both arise from singlet excitons. We assign PA2 to interchain excitons (geminate electron-hole pairs on adjacent chains [1].
The intensity-dependent decay of PAi shows a fast component (r ~ 450 fs) which grows quadratically with respect to the slower, nonexponential decay [2]. We infer that A/ origi- nates from intrachain two-exciton states generated within the pump pulsewidth. The decay of the doubly-excited molecules leads to interchain species (PA2), with a complementary 500 fs build-up time. This nonlinear generation process occurs in parallel with for exciton-exciton annihilation, a nonlinear decay process which also leads to generation of interchain states [3].
Biexcitons have been predicted in organic ^-conjugated systems,[4] although not doc- umented experimentally. In thin films, doubly-excited molecules relax rapidly via charge separation to adjacent chains. These "hot" biexcitons should be stabilized in dilute solu- tions. Indeed, we find that at pump levels exceeding 1-2 mJ cm-2, the solution SE decay grows superlinearly, showing a ~ 150 ps component which grows quadratically with flu- ence. The shorter lifetime of doubly-excited excitons is indicative of coherent interactions due to biexciton formation. Another signature is the superlinear increase of the SE at high pump levels, indicating a new species with enhanced oscillator strength. We estimate the enhancement factor for the biexciton oscillator strength by simultaneously modeling the SE pump-dependence and dynamics, obtaining S = 4.5 (Fig. 1). The model predicts a contri- bution to the SE signal SE oc nx + S * n^, where nx and nte are the exciton and biexciton populations, respectively. The PA signal is given by PA oc nx + 0.4 * n^. This simple model reproduces the major experimental features observed in solution: the SE shows su- perlinear growth with intensity, along with the appearance of a fast decay; the PA shows a slightly sublinear intensity-dependence due to saturation of the excited-state population,
0-7803-4950-4/98/110.00 1998 IEEE 51

and a rounding of the initial decay due to regeneration of excitons at later times due to
r 0.1 -
= 0.01 - 0 200 400 600
Delay Time (ps) 200 400 600 Delay Time (ps)
Figure 1. Intensity-dependent dynamics for MEH-DSB oligomer solutions for two spectral features: (a) photo'induced absorption at 1.46 eV; (b) stimulated emission at 2.43 eV. Solid lines are fits using a model for nonlinear generation of biexcitons with enhanced SE oscillator strength. Excitation fluences are 0.05 mJ/cm2 (xxx), 0.15 mJ/cm2 (squares), 0.36 mJ/cm2 (crosses), 0.76 mJ/cm2
(circles), 1.52 mJ/cm2 (diamonds).
radiative relaxation of biexcitons. In thin films, in addition to generation of doubly-excited excitons during the pump pulse
at high intensities, the presence of adjacent chains leads to other nonlinear interactions. The efficient formation of nonemissive interchain excitons is one effect observed in films which is absent in solutions. Another nonlinear interaction present only in films is bimolecular annihilation of excitons due to long-range interactions within the polymer films. It has been demonstrated by fitting to an intensity-dependent decay of the form dN/dt = —N/T - ßN2t~1/2 that above an excitation density of « 1018 cm-3, annihilation effects are responsible for the nonlinear decay observed subsequent to the pump pulse arrival [3]. Unlike the direct excitation of biexcitons, this annihilation process is dispersive, so that polarization memory of the excitations on quasi-one-dimensional chains is lost during the annihilation process. A direct measurement of the annihilation is thus offered by monitoring the photoinduced
52

dichroism, defined as D = AT\\/AT±, where AT|| and ATj_ are the differential transmission signals for pump and probe beams polarized parallel and perpendicular with respect to each other, respectively. The intensity-dependent dichroism is shown in Fig. 2 for the SE signal of a thin film of a soluble PPV derivative.
We also present detailed studies of femtosecond transient holography in conjugated poly- mer blends and superlattices, using tunable non-degenerate four-wave mixing. Combined with spectral transient absorption studies, these experiments allow determination of the com- plex nonlinear index of refraction over the photon energy range from 1-3 eV. In addition to luminescent polymers, we have studied charge transfer blends with soluble methanofullerenes, and donor-acceptor superlattices formed by ionic self-assembly. By controlling the degree of charge transfer, one can achieve diffaction efficiencies of several percent for a single fem- tosecond pulse, with a time constant tunable over the range from 1-100 ps. This represents a potential holographic information processing density up to 12 orders of magnitude higher than other holographic nonlinear optical materials [5].
3.5
3.0
2.5 o '** o ,M CJ 2.0 Q
1.5
1.0
I ' ' ' ' |
■-..II lf,-r T i i I i l i i i i | r
11 i i
I 1
i i i i i _I_I_ j_
10 20
Time (ps)
30
Figure 2. Dichroic ratio for low fluence (squares) and 8x higher fluence (circles) in a thin film of a PPV polymer derivative. The rapidly decaying dichroism indicates loss of polarization memory due to exciton-exciton annihilation.
[1] M. Yan, L. Rothberg, F. Papadimitrakopoulos, M. Galvin, and T. Miller, Phys. Rev. Lett. 72, 1104 (1994). [2] V.l. Klimov, D.W. McBranch, N.N. Barashkov, and J.P. Ferraris, Chem. Phys. Lett. 277 109 (1997). [3] E.S. Maniloff, V.l. Klimov, and D.W. McBranch, Phys. Rev. B56 1876 (1997). [4] F. Guo, M. Chandross, and S. Mazumdar, Phys. Rev. Lett. 74 2086 (1995). [5] E. Maniloff, D. Vacar, D.W. McBranch, H.-L. Wang, B.R Mattes, J. Gao, and A.J. Heeger, Opt. Commun. 141 243 (1997).
53

MC10 12:30pm - 2:30pm
High Optical Gain In Iron Doped Lithium Niobate by Contradirectional Two Beam Coupling.
Craig J Finnan, Gary Cook*, David Jones*, T.P.J. Han, H.G. Gallagher.
Optical Materials Research Centre(OMRC), Department of Physics and Applied Physics, University of Strathclyde, Colville Building, North Portland Street, Glasgow, Gl 1XN,
Scotland.
fDERA Malvern, St Andrews Road, Malvern, Worcester, WR14 3PS, UK.
Phone:0141-548-3165 Fax:0141-553-4162
Two beam coupling is the process whereby 2 beams of light at similar frequencies are
coupled together resulting in energy transfer from one beam to the other. The mechanism
responsible for the coupling is a diffraction grating written within a photorefractive crystal.
Most Two Beam Coupling experiments to date, have been carried out using codirectional
geometry's as indicated in Figure 1. Contradirectional geometries have been used recently to
study samples of Fe:LiNb03 [1] and also Rh:BaTi03 [2]. Use of a contradirectional coupling
geometry allows the formation of much finer diffraction gratings and should make higher gain
coefficients possible due to increased diffusion fields.
Gain measurements of up to 106cm"1 were made on a Brewster prism of .08mol% Fe:LiNb03
(path length 0.7mm) using the experimental set-up shown in Figure 2, at a wavelength of
523.5nm. Figure 3 shows measurements of gain coefficients versus signal Intensity for a
pump beam intensity of lkW/cm2 and an absorption coefficient of 16cm"1. Previously
reported results have shown the maximum gain coefficient to be 26cm"1 for
counterpropagating beams [1].
A practical application of two beam coupling is demonstrated by image amplification. This
was carried out using codirectional beams as shown in Figure 1, but with a resolution chart in
the path of the pump beam. Amplification occurs in a .05mol% Brewster Slice of Fe:LiNb03.
0-7803-4950-4/98/$10.00 1998 IEEE 54

Figure 4(a) shows the transmitted signal image with the pump beam blocked. After the
pump is unblocked the image is amplified as shown in Figure 4(b).
REFERENCES
[1] Photorefractive reflection gratings and coupling gain in LiNb03:Fe, A.Krummins, Z.Chen, T. Shiosaki. Optics Communications 117(1995) 147-150.
[2] Contradirectional two-beam coupling in absorptive photorefractive materials: application to Rh-doped strontium barium niobate (SBN:60) M.D. Ewbank, R.A. Vazquez, R.R. Neurganokar, Frederick Vachss. Journal of the Optical society of America B, Vol 12 (1995), No 1, 87-98.
BEAM SPUTTER RESOLUTION
CHART
Fe:LiNb03
BREWSTER SLICE
DETECTOR
PUMP BEAM
FIGURE 1: Codirectional Two Beam Coupling used to demonstrate image amplification
PHOTO DETECTOR
BEAM SPLITTER
BEAM SPLITTER
Fe:LiNb03 BREWSTER PRISM
PHOTO DETECTOR
y^nn
FIGURE 2: Experimental Set-up used to measure coupling gain of Fe:LiNb03 Brewster prisms.
55

.08 mol% Fe:LiNb03 optical gain at 523.5nm 1kW/cm2 pump intensity,
120 _ 0.7mm path Length
100
0.001 0.01 0.1 1 10
Peak Signal lntensity(W/cm2)
100 1000
FIGURE 3: Fe:LiNb03 optical gain at 523.5nm pump intensity 1.18kW/cm2
FIGURE 4(a): Image transmitted with pump FIGURE 4(b): Amplified Image after beam blocked. unblocking pump beam
56

MC11 12:30pm - 2:30pm
Recording of high harmonic gratings in photorefractive media
Xiaonong Shen, Ruibo Wang, Jianhua Zhao, Xianmin Yi, Pochi Yeh Electrical and Computer Engineering, University of California, Santa Barbara, CA 93106,
Tel # (805)893-7015, Fax: (805)893-3262
Summary
Volume index gratings can be recorded in photorefractive crystals.!^] These gratings can be employed for applications in optical memory and spectral filters. It is known that a minimum grating period can be obtained by using a pair of counterpropagating beams. This leads to a grating period of A = X/2n, where n is the refractive index of the recording medium. It is also known that the photo-induced index gratings in photorefractive media are not exactly sinusoidal, even though the optical intensity is sinusoidal. In other words, higher harmonic index gratings exist.!2'3] In this paper, we propose and demonstrate a novel double exposure scheme which removes the fundamental component and all higher odd-orders of the index grating. As a result, a volume index grating is obtained with a grating period of A/2. The recording scheme can be further extended to produce index gratings with periods of A/4, A/8, etc. We present the experimental results of our investigation in a KNSBN:Mn photorefractive crystal.
Referring to Fig.l, we consider the recording of a volume index grating by using a Mach- Zehnder interferometer. The phase of the recorded index grating is either 0 or n, depending on the input port of the laser beam. This interferometric arrangement has been employed previously for parallel image subtraction and optical implementation of perceptron learning[4,5] jn our investigation, the same interferometric arrangement is employed to remove the fundamental component of a volume index grating. The idea is described briefly as follows.
Let the intensity of the first set of recording beams be written.
I = I0 + Itcos(K-x) (1)
where Io and Ii are constants, K is the grating wavenumber ( K = 2rc/A, with A being the period of the grating). As a result of the photorefractive effect in a pure diffusion-driven case, a photo-induced space-charge field is produced which can be written,
E = Elsm(Kx) + E2sm(2Kx) + Eisin(3Kx) + ... (2)
where Ei5 E2, and E3 are the amplitudes of the space harmonics (Fourier components) of the space charge field. These amplitudes are increasing functions of time before reaching saturation. By controlling the shutters in Fig.l, we are able to control the phase (either 0 or n) of the intensity pattern. In the second exposure, a phase shift of n is introduced. This is equivalent to replacing Kx by Kx + % in equation (2). As a result, all odd space harmonics ( K, 3K, 5K, ...) of the space charge field are reversed in sign. Under the appropriate exposure times, we are able to eliminate the fundamental harmonics and, possibly all the odd harmonics. Consequently, the net space charge field of the volume index grating becomes
0-7803-4950-4/98/$!0.00 1998 IEEE 57
E = E2sm(2K-x) + E4sin(4K-x)+... (3)
We note that the resultant index grating has a grating period of A/2, where A is defined as the period of the fundamental index grating.
In our experimental investigation, we used a (^05Afa05)02(Sr075ßa025)09^2O6(KNSBN) crystal doped with Mn of 0.075wt.%. The crystal(5x5x5mm3) was grown by pulling method with Crystalox MCGS-3 system in the State Key Laboratory of Crystal Materials in Shandong University, China. With a total beam intensity of 135mw(lA=lB=67.5mw) at X, = 514.5«m and a beam angle of 26=12°, we obtained five orders of harmonic gratings. The measured diffraction efficiencies with self-enhancement are shown in Fig.2. Two He- Ne laser beams with beam intensity of Ireadl=6.2mw and Iread2=4.9mw at X = 632.8nm are employed to monitor the diffraction intensity of the fundamental grating and the second harmonic grating, respectively.
The measured results are shown in Fig.3. In our experiment, the first exposure time was ti=36s, and the second exposure process began at t=36s. We note that the first order grating(lK) decreases to zero rapidly during the second exposure, and the second order grating(2K) maintains the same strength. The time evolution of these gratings can be described as:
Ex ={[l-exp(-r1/T)]exp(-r2/x)-[l-exp(-r2/i;)]}£10 (4)
E2 ={[l-exp(-f1/T')]exp(-r2/T') + [l-exp(-f2/f)]}£20 (5)
where x T are the time constants of the first and second order gratings, tvt2 are the exposure time in the double exposure process, and Ei0, E2o are space charge fields for first and second order gratings at steady state. By choosing a suitable first exposure time ti?
depending on the response properties of first and second order grating, the fundamental grating can be eliminated, according to Eq.(4).
In summary, we have proposed and demonstrated a novel scheme for the recording of high harmonic index gratings in photorefractive crystals. By using a double exposure in a Mach- Zehnder interferometer with a dual input port, we demonstrated the recording of a second harmonic index grating with a period of A/2 in a photorefractive KNSBN:Mn crystal. The technique can be employed to record index gratings with a grating period less than A/2n.
References:
[1]. Pochi Yeh, Introduction to photorefractive nonlinear optics, (Wiley, New York, 1993) [2]. Ragini Saxena and T.Y.Chang, J.Opt. Soc. Am. B9, 1467(1991) [3]. E.Serrano, M.Carrascosa and T. Agullo-lopez, J.Opt. Soc. Am. B13, 2587(1996) [4]. Pochi Yeh, Tallis Y. Chang, and Pau H. Beckwith, Opt. Lett. 13, 586(1988) [5]. J.Hong, S.Campbell and P.Yeh, Appl.Opt., 29, 3019(1990)
58

X/2PBS .^l SB M2 L5 L6 ' M 5
Ar+Laserl'
ML, ^
»14^-\ ." '"a
M 4
M 6
Fig.l The experimental setup for the double exposure scheme PBS: polarization beam splitter, BS: Beam splitters, M: mirrors, S; shutters, IR: irises, D: power meters
10° 111111111111 III 1 i 11 |n 11=
,». : IK a .
10* §** ■-* w> ■* lT ■= 5 _i w»
> : f J* : ** ■»-*-.— . _-
c " / j ^-« - J*; ,. * *-•-- * " -» ■• - ™. -. J
r 10* Tfi' 1 •e 5K
c i #«" _o 10* ■ 0 -2
o (0 it a
.■«^ ■ ■ .i... i. i
0.07 ii | i i i 11 111 i i i | 111 | i i i | i i i | ij 0.05 O
8 80 160 240 320 400 480
Time(s)
Fig.2 The measured diffraction efficiencies of five orders of harmonic index gratings
g 0.01
5 o , i... i... 111 ■ i ■ ■ ■ i ■■■ i ■ ■ ■ i
8 16 24 32 40 48 56
Exposure time (s)
Fig. 3 The measured diffraction efficiencies of the fundamentale IK) and the second harmonic(2K) index gratings.
59

MC12 12:30pm - 2:30pm
Stable Generation of Ultrashort Tunable Pulses using a Soliton Fiber Laser
Michiyuki Endo, Gorachand Ghosh1 and Yuichi Tanaka2
Electrotechnical Laboratory, 1-1-4 Umezono, Tsukuba 305-8568, Japan
'Femtosecond Technology Research Association (FESTA), Electrotechnical Laboratory 2Oyokoden Lab. Co., Ltd., NiizominamiToda, Saitama 335
Phone: +81-298-54-5639, Fax: +81-298-54-5640, 1. Introduction
Mode-locked erbium-doped fiber (EDF) lasers in soliton regime are attractive sources of ultrashort optical pulses. The pulse will propagate with constant shape and amplitude over essentially unlimited distance, limited only by linear absorption in the medium. However, the generated pulses over a wide wavelength tuning range are not so stable. Noise mainly results from spontaneous emission of the gain medium and from fluctuations of the optical path length in the cavity. Even small variations in the length of the cavity can lead to large fluctuations in timing. Another problem to operating in the soliton regime is the resonant instability which occurs for solitons periodically perturbed.1* We describe stable generation in a passively mode- locked tunable EDF ring laser, in soliton regime.
2. Experiments A schematic diagram of the experimental setup is shown in Fig. 1. It uses a 1.48 /xm laser
diode as a pump source. The pump power from a laser diode is fed into one end of the EDF using a bulk wavelength division multiplexer (WDM). Bulk WDM couplers are used instead of fused couplers to obtain wide wavelength operation. Since the gain bandwidth can be extended by increasing Er concentration and codoping Al,2) generation is possible over a wide wavelength range. The erbium gain bandwidth allow for substantial wavelength tuning. The EDF was doped with 3200 ppm Er / 8000 ppm Al and had a 2.5 m length. In the negative group velocity dispersion (GVD) region, for normal telecommunication fibers, there exists a condition in which the propagation of a short pulse is stable. The pulse duration of the laser is determined by the total cavity dispersion.3* Anormal single-mode fiber and a dispersion-shifted fiber are included in the cavity to control the total dispersion. These fibers have nonlinear polarization rotation and converts purely reactive Kerr nonlinearities into fast saturable absorber action. The nonlinear polarization rotates the polarization ellipse, and the mechanism to a point where higher intensities experience lower loss.
Before inserting a band-pass filter (BPF) in the cavity, the waveplates were rotated to obtain mode-locking. In general, mode-locked oscillation was most reliable in the centers from spontaneous emission of the gain medium. The output spectrum shown by the solid curve in Fig. 2 has a sidelobe appears in the main component, but no continuous wave light. Such sidelobes are commonly observed in soliton lasers. From the spectral width and the sidelobe positions, we can determine the net GVD of the cavity and the pulse duration. The pulse duration is 270 fs assuming a sech2 shape at center wavelength of 1.558 fim. By inserting the BPF, a typical output spectrum and the peak intensities are shown by the dashed curve and the solid circles, respectively. The ratio of the peak sidelobe to the main peak of the pulse spectrum was less than 2%. Continuous operation at wavelengths from 1.532 to 1.594 fim is obtained by rotating the BPF. The spectral width is 9.2-9.8 nm and the pulse duration is 270-325 fs for all wavelengths. No adjustment of the pump power and the setting point of the waveplates was required for tuning. The total length of the cavity is 4.4 m, which leads to a 45.4 MHz repetition rate.
A problem to operating in the soliton regime is the resonant instability which occurs for
0-7803-4950-4/98/$! 0.00 1998 IEEE 6Q

solitons periodically perturbed at periods 8Zsp, where Zsp oc tf is the soliton period, and t0 is the pulse duration. The instability limits t0 since it requires Zc / Zsp>8, where Zc is the cavity length. In tunable oscillations, one may measure the dispersion by measuring the change in repetition frequency as a function of wavelength (Fig. 3).4) The linear fitting has a slope of 0.049 ps/nm which is a measure of cavity dispersion. This yielded the dispersion parameter ß2
= -0.0143 ps2/m at 1.558 ßm which is in reasonable agreement with the value -0.013 ps2/m determined from the material parameters. These measurements indicate the wavelength dependence of the total cavity round-trip in actual operation. The soliton period Zsp is then 2.58 m, thus Zc/Zsp-2.5.
Noise properties are important with respect to applications of the sources. The fluctuations in pump intensity changes the group velocity, the change in the gain profile of the EDF, also changes its index profile. However, owing to the excited states of the erbium ions having long relaxation times, the output pulses is not sensitive directly to the gain fluctuations except at low frequencies. To reduce the amplitude fluctuations of the pump source, and to maintain a constant cavity length, it is essential to reduce the influence of airflow and temperature fluctuations. Using an external feedback loop, the intensity is stabilized to within a fluctuation limit of less than 0.1%. Simultaneously, the airflow and the temperature fluctuations in the cavity are closely controlled by using a double-sealed box with a temperature controller. By this controller, the temperature fluctuation in the cavity is reduced to less than 0.01 degrees.
Timing jitter (fluctuations in the arrival time of the pulses) is a type of phase noise that can occur in a short time scale. Amplitude noise and timing jitter in the laser, relative to a radio frequency (RF) reference was determined from the power spectrum of the pulse intensity.5,6)
From the fundamental frequency power spectrum, the noise represents amplitude fluctuations less than 0.12%of the output pulse energy. To evaluate the timing jitter, we measured the higher harmonics of the noise spectral density. The noise increases with an increasing harmonic number n because of the contribution from the jitter (n2 dependence). The measurements are made using a fiber coupled, high-speed pin photodiode and a RF spectrum analyzer. Figure 4 plots the normalized noise against wavelength, covering an offset frequency span from 30 Hz to 3 kHz. The resolution bandwidth of the spectrum analyzer is 30 Hz and the measurement time is 35 ms. The rms jitter is estimated to be below 34 parts in 106 of the round-trip time (0.8 ps) at center wavelength, and to be below 86 parts in 106 (1.8 ps) over a wavelength tuning range of 25 nm. The noise components of the laser are majored at lower frequencies, it should be possible to reduce the noise by feedback controlling of path length in the cavity.
3. Conclusions We have stable generation optical pulses with durations of 270 - 325 fs using a soliton fiber
laser. The lasing wavelength is tuned continuously over a wavelength range of 60 nm from 1.532 to 1.594 /^m by rotating a bulk band-pass filter inserted in the resonator with a repetition rate of 45.4 MHz. The rms jitter is estimated to be below 34 parts in 106 of the round-trip time at center wavelength, and to be below 86 parts in 106 over a wavelength tuning range of 25 nm. Since the noise density of the laser is predominated at lower frequencies, the cavity phase locking technique should be possible.
The work of G. Ghosh was performed under the management of FESTA supported by NEDO. References 1) S. M. J. Kelly: Electron. Let., 28, (1992) 806. 2) H. Ohizumi et al.: OFC/IOOC'93, WG8,Yl993) 105. 3) H. A. Haus, E. P. Ippen and K. Tamura: IEEE J. Quantum Electron. 30, (1994) 200. 4) W. H. Knox: Opt. Lett., 17, (1992) 514. 5) D. von der Linde: Appl. Phys. B39, (1986) 201. 6) M. Endo, G. Ghosh and Y. Tanaka: Jpn. J. Appl. Phys. 36, (1997) L860.
61

Pump source ( cw-LD)
Intensity stabi- lizing circuit
Power fluctuation < 0.1 96
SMF
Laser cavity
pin photodiode
O.S.A
RF specrt um analyzer
Temperature fluctuation < 0.01 deg. output coupler.
EDF, erbium-doped fiber (3200 ppm Er/ 8000 ppm Al); SMF, single- mode fiber; DSF, dispersion-shifted fiber; WDM, wavelength division multiplexer; BPF, band-pass filter; PC, polarization controller, OC,
Ei&_L A schematic diagram of the experimental setup.
0.40 -
0.20
—1 1 rr —i— -r -T —r
• • flpM • • • ■*
/ 1 • • •
■■
• • • - • •
I *\ -
- without BPF ||
1 .A_~4**/- zL
/ M
/ \
with BPE/^
\ uJ_ __L
-
0.0 1.52 1.53 1.54 1.55 1.56 1.57 1.58 1.59 1.60
Wavelength (/im)
Eig^ Typical output spectrum and the peak intensities. Solid curve shows a typical output pulse obtained with no filtering. The dashed curve shows an output pulse obtained using the BPF. The solid circles show the peak intensities of tunable lasing wavelength.
•^«tj.oot 1 \ | X s • Ä • _ jj" 45.382 •
• - V •
~ 45.380 •• 4 •
.3 • ■2 £.45.378 S « • OS
AS inf. " ' . *
- 600 10"
| 500 10"6
I 400 10"6
- £ 300 10° -
,-12
1.52 1.54 1.56 1.58 1.6 Wavelength (ß m)
Fig. 3. Change in repetition frequency versus wavelength.
200 10"'
100 10"'
0 10°
14 10 _ 19 Ä
J 12 10"12 s
- 10 10 .12:»
- 8 10
- 6 10
_ 4 10
2 10
12
,-12
,-12
12
0 10u
1.52 1.54 1.56 1.58 1.6 Wavelength (ßm)
Fig. 4. Normalized noise and timing jitter against wavelength, covering an offset frequency span from 30 Hz to 3 kHz.
62

MCI 3 12:30pm - 2:30pm
Effect of Fe Doping on Optical Properties in KTiOAs04 Crystals
Heping Li and Feng Zhou
Photonics Laboratory, Division of Microelectronics School of Electrical and Electronic Engineering, Nanyang Technological University
Nanyang Avenue, Singapore 639789 Tel: +65 799 5635; Fax: +65 792 0415
Potassium titanyl arsenate KTiOAs04 (KTA) is a new nonlinear optical material, like the well-known KTiOP04 (KTP), but with a larger nonlinear coefficient and figure of merit [1]. It has the potential to be a superior material to KTP for second-harmonic-generation (SHG) and optical parameter oscillation. It has also been reported [2] that the addition of a small amount of Fe2C>3 into the melt during the growth promotes the crystallization of single- domain KTA crystals, and an unusually strong optical birefringence increase with Fe203
dopant concentration, which leads to blue shift in the SHG cutoff wavelength of as much as 37 nm. In this study, optical absorption properties of KTA crystals doped with Fe203 are reported compared with undoped KTA crystals in UV-visible and infrared ranges. The effect of Fe-doping on the optical absorption properties is discussed.
The crystals used for this work were tungstate flux-grown undoped KTA and KTA doped with 0.1 wt % Fe203 (Fe:KTA). The optical transmission of undoped and Fe-doped KTA crystals was measured at room temperature in UV-visible range. The forbidden energy gaps Eg of undoped KTA and Fe:KTA are obtained to be 3.60 and 3.32 eV, respectively. The absorption coefficient a was determined from the transmittance using Mclean's formula. Figure 1 shows the absorption coefficient a as a function of photon energy, as determined for undoped KTA and Fe:KTA, which indicates that doping with Fe203 makes the absorption edge of Fe:KTA move towards infrared compared with that of undoped KTA. The (ochv)1 ~ versus photon energy hv curves for undoped KTA and Fe:KTA exhibit good linear relations as shown in Figure 2. Based on the indirect transition process, the theoretical oc1/2-hv curve fit to the experimental data is also given. Analysis reveals that the absorption edges of undoped and Fe-doped KTA are indirect allowed transitions. The indirect energy gaps E'g for
undoped KTA and Fe:KTA were calculated to be 3.24 and 2.88 eV, respectively, and the energy Ep of phonons taking part in the indirection transition were also estimated to be 0.105 and 0.106 eV, respectively. The Raman spectra of the samples confirm the existence of phonons corresponding to the Ep.
The infrared spectra of undoped and Fe-doped KTA crystals were also measured as compared with that of KTP, as shown in Figure 3. The infrared cutoff of undoped KTA is shifted to 1885 cm"1 as compared to 2200 cm"1 for KTP, and Fe-doping seems not to make obvious movement of the infrared cutoff for KTA. The strong absorption in the 2700-3100 cm" region is observed in KTP, which is identified [3] as the second overtone of the tetrahedral phosphate fundamental vibrations. In comparison, the corresponding absorption in undoped KTA and Fe:KTA is shifted to the lower frequency 2300-2600 cm"1 region due to the frequencies for the arsenate fundamental vibrations lower than that for the phosphate ones.
The OFT absorption bands of undoped KTA and Fe:KTA were displayed in the infrared spectra. Three bands at 3444, 3465 and 3601 cm"1 were found in the region of OH-group stretching vibrations in undoped KTA sample, where the 3465 band is the most intensive one. 0-7803-4950-4/98/J10.00 1998 IEEE 63

In Fe:KTA sample, the most intensive band is moved to 3584 cm"1, whose intensity is much larger than that for undoped KTA, and the positions of two other bands are the same as those in undoped KTA. This strong effect on the position and intensity of the OFT absorption band in Fe:KTA is attributed to the doping with Fe203, which can be interpreted as being associated with the formation of Fe-O-H-type complexes. The position difference between the OH" absorption band in Fe:KTA and undoped KTA indicates a different environment for OPT in Fe:KTA from that in undoped KTA. This also implies that interstitual OFT located in the proximity of the Ti-0 bond in Fe:KTA should be responsible for the range of frequency doubling efficiencies of the crystals since the short Ti-0 bond determines the magnitude of the nonlinear polarizability in KTP-type crystals [4]. Other research about the effect of Fe doping on nonlinear optical properties in KTA crystals is in progress.
[1] J. D. Bierlein, H. Vanherzeele and A. A. Ballman, Appl. Phys. Lett. 54, 783 (1989). [2] L. K. Cheng, L. T. Cheng, J. D. Bierlein, F. C. Zumsteg and A. A. Ballman, Appl. Phys.
Lett. 62,346(1993). [3] J. C. Jacco and G. M. Loiacono, Appl. Phys. Lett. 58, 560 (1991). [4] F. C. Zumsteg, J. D. Bierlein and T. E. Gier, J. Appl. Phys. 47,4980 (1976).
20
16
-. 12 uj
c
.£>
CO
Fe:KTA
undoped KTA
Fe:KTA
Undoped KTA
/ /
2.6 2.8 3.0 3.2 3.4 3.6 3.8 4.0
Photon Energy (eV)
2.4 2.6 2.8 3.0 3.2 3.4 3.6 3.8 4.0
Photon Energy (eV)
Fig. 1 Absorption coefficient vs photon energy for undoped and Fe-doped KTA
Fig. 2 (ahv)1/2 vs hv for undoped and Fe- doped KTA. The solid circles are representative experimental points deduced from transmission spectra and the solid lines are the theoretical fits.
64

4000 3500 3000 2500 2000 1500
100
4000 3500 3000 2500 2000 1500
100
80
60
40
20
0
.' ' I ' ' ' ' i * ' ' ' i ' ' ■ ' i ' ,,, i,,,,
: H Fe:KTA ; r "~v
i , , , ,■ i , , . , i .
\ I 4000 3500 3000 2500 2000 1500
Fig.3 Infrared spectra of KTP, undoped KTA and Fe:KTA crystals between 4000 and 1600 cm"1.
65

MC14 12:30pm - 2:30pm
Microscopic Spectral Imaging of Defect Centers in KDP
S. G. Demos, M. Yan, M. Staggs, H. B. Radousky and J. J. De Yoreo
Lawrence Livermore National Laboratory, PO Box 808, Livermore, CA 94580. Tel: (510) 423 3388, Fax: (510) 423 2463
The development of short-pulsewidth, high-power laser sources requires new nonlinear materials or the improvement of existing ones in order to take full advantage of the enhanced nonlinear optical performance these new laser systems can offer. The nonlinear optical properties of KH2PO4 (abbreviated as KDP) have made it one of the most well studied materials. The ability of KDP to grow at a fast rate (10-20 mm/day) and as large crystals (40-55 cm)1 has made it a unique candidate for large-aperture laser systems such as the National Ignition Facility (NIF)2. Important problems that need to be examined are the behavior of the crystal under high power laser irradiation and the mechanism for localized damage at relatively low laser fluence.
The photophysics associated with laser induced damage in dielectric crystals is still not well understood.3-6 It is currently believed by many researchers that bulk damage in wide-gap optical materials is initiated by defect clusters or foreign particles where free carriers are generated which stimulate additional absorption that leads to irreversible cascade processes.
In this work, the presence of defect clusters in the bulk of large KDP crystals is revealed using a spectral imaging technique and a microscopic optical system allowing for 1 micron spatial resolution. The observed particle concentration varies between 104-106 per mm3 depending on the crystal growth method and sector of the crystal. Exposure in high power 355 nm, 3 ns laser irradiation leads to a significant reduction of the number of observed defect centers.
The experimental setup consists of a Q-switched Nd:YAG laser operating at 100 Hz, a CW argon laser, a microscopic optical imaging system and a liquid nitrogen cooled CCD detector to capture the images. The 514 nm CW output of the Argon laser was expanded to a diameter of 10 mm and focused into the sample using a 10 cm focal length cylindrical lens. The 3 ns, 355 nm third harmonic of the YAG laser is overlapped with the argon beam and focused into the sample using the same cylindrical lens. The imaging optics are located at 90 degrees with respect to the illumination beam. The imaging plane of the microscope objective coincides with the focal plane of the illumination beam- In this arrangement, a 30 \im in depth (z axis) volume of the crystal is illuminated and imaged. The field of view of the imaging system is 500 X 500 urn2, its spatial resolution (x,y plane) is 2 CCD detector pixels per ^im of the sample imaged. A 700 nm long pass filter is incorporated into the imaging system so that the image is formed by near IR photons emitted following absorption of the 514 nm laser light. The samples used were fast-grown as well as conventionally grown KH2PO4 crystals. The experiments were performed with the sample held at room temperature.
0-7803-4950-4/98/$10.00 1998 IEEE 66

Fig. la shows the image captured using a conventionally grown KDP crystal. The image shows the presence of light emitting "particles" inside the KDP crystal. The characteristic o-ring around the central point is due to the imaging microscope objective lens which was kept slightly out-of-focus in order to easily discriminate the presence of the "particles" from the noise signal (cosmic ray) of the CCD detector. Fig. la indicates that the concentration of emitting "particles" is approximately 104 per mm3. Fig. lb shows the image captured using a fast grown KDP crystal. This image shows the presence of a larger number of "particles" in the bulk of the crystal. The intensity of the "particles" as recorded by the CCD detector varies widely within the image field. Most of the "particles" have a recorded intensity of about 10 counts/pixel above background level (10 minutes exposure under 2 W cw laser illumination at 514 nm) but a small percentage («5%) have intensities of 50 counts or higher.
Fig. 2a shows the spectral image of a fast grown crystal at the boundary between prismatic and pyramidal sectors. This image shows that the concentration of the "particles" is very different in the two sectors of the crystal. The effect that the 355 nm, 3 ns high power pulsed laser irradiation has on these "particles" is shown in fig. 2b. The same part of the crystal (shown in fig.2a) was illuminated with the third harmonic of the Q-switched laser with average power on the order of 1 J/cm2 for 10 minutes. The result is that the number of particles is reduced significantly with respect to the image shown in fig. 2a and the sector boundary is no longer clearly distinguishable.
67
Figure 1: Emission images originating from a 200X200X30 ^im3 section of KDP crystals grown using a) conventional and b) fast grown method.

It has been reported previously that .355 nm pulsed laser illumination of KDP crystals at sub-damage laser threshold intensities leads to increased laser damage threshold7 (laser annealing). Fig. 2b shows a dramatic change in the particle concentration which could be described as laser conditioning. The reason for this change may be the diffusion of the defect cluster into the lattice following intense heating of the "particles" by the high power laser pulse. We have not yet demonstrated that the emitting "particles" are associated with laser induced damage in KDP. However, their presence may contribute to laser induced heating, enhancement of absorption, lowering of nonlinear optical performance and damage of the crystal. The role of the observed emitting "particles" in laser induced damage and the origin of these particles is the focus of this investigation.
This work was supported under the auspices of the U.S. Department of Energy by the Lawrence Livermore National Laboratory under contract No. W-7405-ENG-48 through the Institute for Laser Science and Applications.
References 1. N. P. Zaitseva, J. J. De Yoreo, M. R.
Dehaven, R. L. Vital, K. E. Montgomery, M. Richardson, and L. J. Atherton, J. Crystal Growth, 180, 255 (1997).
2. E. M. Campbell, Fusion Technology, 26, 755 (1994).
3. N. Bloembergen, IEE J. Quantum Electron. QE-10, 375, (1974).
4. S. C. Jones, P. Braunlich, R. T. Casper, X. A. Shen and P. Kelly, Opt. Engineering, 28, 1039 (1989).
5. L. L. Chase, H. W. H. Lee, and R. S. Hughes, Appl. Phys. Lett. 57, 443 (1990).
6. B. C. Stuart, M. D. Feit, S. Herman, A. M. Rev. B, 53, 1749 (1996).
7.M. Runkel, B. Woods, M. Yan, J.J. DeYoreo
* '*V% '*''',■■*•■
• .
Jft T
Figure 2: Emission images originating from a 500X500X30 |im3 section of fast grown KDP crystal at the boundary between prismatic and pyramidal sectors a) prior and b) after .irradiation with 355 nm, 3 ns laser pulses.
Rubenchic, B. W. Shore and M. D. Perry, Phys.
and M. Kozlowski, SPIE, 2714,185, (1995). 68

MCI 5 12:30pm - 2:30pm
Statistical analysis of polymer grating distortions in volume holographic digital storage.
L. Paraschist, and L. Hesselink Departments of Applied Physics and Electrical Engineering,
Stanford University, Stanford,CA 94305 +Tel. 650 723-4940, FAX 650 725-3377, tEmail: [email protected]
Summary
Holographic digital data storage (HDDS) offers the potential for high capacity, and fast transfer rates. The performance of a HDDS system is practically limited by the effects of noise upon the BER. There are several noise processes introduced in the recording, recon- struction, and detection of volume information gratings. The capacity of a HDDS system is predominantly limited by postrecording fluctuations, because the associated signal-to-noise ratio (SNR) scales as ~ 1/AT2 with the number of multiplexed holograms N (data pages). Fluctuations during reconstruction may arise due to optical scattering, and deviations from the Bragg condition. In the widely investigated HDDS in photorefractive crystals, the sys- tem is typically limited by the scattering of the reconstruction beam. This optical scattering noise has been modeled as a sum of random phasors imposed onto a known phasor corre- sponding to the optical signal Ib [1, 2]. In that case, the fluctuations of the intensity incident on the photodetector (I) are described by Rician statistics [3], and the probability density function (pdf) distribution is:
for / > 0 and zero otherwise, where 2o is the modified Bessel function of the first kind of zero order. The mean of the received intensity is (7) = h + 2a^c, and 2a2
sc essentially corresponds to the mean scattering noise component; where ofc is the variance of the random phasors. The analysis (eq.l) assumes that the optical signal does not fluctuate, and the digital signal intensity levels corresponding to ON and OFF SLM pixels (Ib = Ih and Ib = It respectively) are deterministic.
There are systems, however, in which significant fluctuations of the optical signal (Ib) may arise during grating reconstruction. In the recent prominent development of HDDS utilizing a photopolymer recording medium, system performance is significantly limited by grating distortions, arising mainly due to postexposure anisotropic changes in the dimensions of the material. In the promising cationic-ring opening photopolymerization process, measurements of more than 1% shrinkage in the transverse direction (A2maa;), and slight expansion (< 0.5%) in lateral direction (Armax), have been reported, while in previous materials utilizing free radical photopolymerization, volume contractions may be an order of magnitude more pronounced [4]. The distortion of the compositional volume gratings results to deviations from the Bragg condition during reconstruction, and gives rise to Bragg mismatch \- Bragg mismatch reduces the grating diffraction efficiency (ifc), affecting the strength of diffracted signal during reconstruction,
h ~ r\% ~ sinc2(xi), (2)
where i refers to the ith grating, in the typical transmission phase grating case. |x«l < Xmax = ^(Azmax,Armax,Omax,X), where the maximum mismatch is proportional to the induced distortions, and the angular spectrum (6max, A) of the recorded information gratings. Depending on the degree of anisotropy, and the ability to accommodate the corresponding
0-7803-4950-4/98/110.00 1998 IEEE 69

deviations from the Bragg condition, grating distortions may result in significant grating strength (diffraction efficiency) fluctuations (> 10 - 20%) .
In such a system, the intensity incident on the detector is most accurately described by a double stochastic process, where the Rician distribution is conditional on the optical signal distribution, for the optical signal intensity fluctuates. The pdf of the intensity received on the photodetector becomes
roo
Vi(I) = I Vr(I\Ib)VJs(h)dIb JO (3)
where Vj{I\Ib) accounts for the optical scattering (eq.l), and Vh{h) generally depends on the physical process responsible for the optical signal fluctuations .
In polymer HDDS, Vh{h) describes the intensity fluctuations due to the distortions of the multiplexed volume gratings, for a typical pixel (or bit channel) of the system. As the capacity of the system increases (large TV), signal intensity fluctuations (VIt) approach a gaussian distribution with variance of proportional to the grating distortions/ The variance (of) for a particular grating record is evaluated for the specific material, according to the grating strength fluctuations (eq.2) due to corresponding the Bragg mismatch (xmax)- Figure 1 shows the resulting intensity pdfs (eq.3) for the different grating distortion (signal noise) regimes. For low signal intensity fluctuations (Fig.lb), the system may still quite accurately be described by Rician statistics (Fig.la), and is practically limited by scattering. As grating strength fluctuations increase to the levels of scattering noise (Fig.lc), the intensity distri- butions change from the Rician ones. When signal noise becomes dominant (Fig.Id), the gaussian eventually prevails. In figure 1, we also show the scattering-noise-equivalent'dis- tributions (dashed curves), which are evaluated by incorporating signal noise contributions into the scattering noise. It is important to notice that as signal noise increases (mainly in Fig.l c and d), the intensity distributions resulting from the double stochastic process analysis become significantly different from the scattering-noise-equivalent description. This is particularly important in the calculation of the bit-error rates (BER), which evaluates the overlapping tails of the digital intensity distributions (Ih and I,). Therefore, signal noise analysis becomes essential for the accurate evaluation of system BER performance. Figure 2 shows an example of BER evaluation for threshold encoding in a system with relatively high volume grating distortions (SNRS =13.5 dB) and different levels of scattering noise (10 > SNRSC < 30 dB). As volume grating distortions become dominant in this system, differential encoding provides better (lower) BER performance compared to threshold en- coding at constant capacity levels, contrary to the established threshold encoding superiority for scattering noise. or- J
In summary, we discuss the statistical properties of the polymer grating strength fluc- tuations due to postrecording distortions in HDDS. The present study further provides a formalism for incorporating signal noise in the analysis of a HDDS system, and for evaluat- ing, in a unified framework, the system performance characteristics.
[1] J. F. Heanue, M. C. Bashaw, and L. Hesselink. Science, 265:749-752, 1994.
[2] C. Gu, G. Sornat, and J. Hong. Opt. Lett, 21:1070, 1996.
[3] Joseph W. Goodman. Statistical Optics. John Wiley and Sons, 1985.
[4] D. A. Waldman, et. al. SPIE, 2689:127-141, 1996.
This research work has been supported in part by the ARPA/NSIC.
70

Figure 1: Probability density functions for the received normalized intensities, with constant scattering noise (asc = 0.1), and for as = 0.0 (upper left), as = 0.03 (lower left), as = 0.1 (upper right), and as = 0.3 (lower right).
rr LU CD
Encoding comparison for scattering and signal noise (SNRs-IO dB) - i i i i i i i i >
-2
-4 V s
N. \
-6
-8
-10 Thres.Enc.( -. g), Diff.Enc.( — r). \
\ v
\ -12 \
\ - \
'■iii 1 1 1 1
0.2 0.4 0.6 0.8 1 1.2 1.4 SNR ratio
1.6 1.8 2.2
Figure 2: BER for threshold and differential encoding, at constant capacity, in a system with signal noise at different scattering noise levels.
71

MC16 12:30pm - 2:30pm
Properties of compositional volume grating recording in photopolymers.
L. Paraschist, and L. Hesselink Stanford University, Stanford,CA 94305
tTel. 650 723-4940, FAX 650 725-3377, tEmail: [email protected]
Summary
Photoinitiated formation of compositional volume gratings in polymers provides an at- tractive recording mechanism for holographic storage, allowing for relatively large permanent refractive index modulation (An ~ 10-2) in an inexpensive medium with high recording sen- sitivity [1, 2]. During recording, polymerization initiated by the illumination interference pattern gives rise to diffusion induced compositional variations which eventually modulate the medium refractive index, corresponding to volume phase gratings. Nonlinearities, how- ever, may arise during recording and post-recording, limiting the performance of a holo- graphic data storage system. Previous studies have investigated the diffusion and reaction processes under single exposure recording in the free-radical polymerization [2, 3]. The present study evaluates the diffusion and reaction processes under multi-exposure recording, mainly in the promising cationic ring opening photoinitiated polymerization (CROP) [1], and identifies the important exposure and material characteristics that allow for efficient grating formation.
Efficient information recording calls for minimal nonlinearity in the response of the medium to illumination, and allows for the maximum possible refractive index modulation (or grating strength), for grating strength defines the recording medium dynamic range that determines the capacity of a holographic data storage system. We investigate the physical properties of the grating formation process, by evaluating the the polymer (Cp) and monomer (Cm) concentrations, obtained from the standard equations for polymerization and monomer diffusion
dCj, dt
dCm _ d dt dx
= VCm (1)
D ßCm
dx ^ (2) dt
During cw recording in this process, the evolution of the compositional grating spatial profile (Fig.l), within a grating period A, is determined by the competition between the diffusive transport (D) and the polymerization (with rate V). More specifically, for the CROP pro- cess, V = TZI [1], where H corresponds physically to the polymerization cross section per incident photon. We identify the characteristic time scales for diffusion rd = (A2/D), and polymerization rp = (P)-1, as the principal quantities for comprehensive evaluation of holographic recording. We further define a recording quality parameter,
ß™ = - = ^-/A2, (3) Tp U
that uniquely characterizes the cw grating formation process described by eqs.(l,2), and also incorporates the important material (left term) and illumination (intensity and geometry, right term) characteristics for holographic recording analysis. Linear response in grating recording calls for balance between photoreaction and diffusive transport, which corresponds to R ~ 1 (Fig.l left). For iüOT <C 1, gratings are linear but recording is slow or weak (underexposure), while as Rcw > 1 the resulting gratings become highly nonlinear (Fig.l 0-7803-4950-4/98/$10.00 1998 IEEE 72

right), as diffusion can not follow polymerization. The refractive index modulation during compositional volume grating recording corresponds to the amplitude of the first harmonic of the grating profile (Fig.2 middle). For sinusoidal illumination (Fig.l middle), nonlinearities arise mainly due to the amplitude of the second order harmonic (absolute values in Fig.2 bottom), as higher harmonics are negligible for R < 102.
Under interrupted illumination, as during multiple hologram recording, the exposure times (rj!ec) and the times between exposures (r^) also influence the grating formation pro- cess. During exposure, both the photoinduced polymerization and the monomer diffusion transport are present. On the other hand, in between exposures photoinitiated polymer- ization ceases, ignoring the contributions of dark reactions for the moment, while diffusion may still be present. For a given total exposure (rrec = 5lT*ec), as interexposure time (TW) increases, R decreases, for as long as diffusion continues, thus providing us with the ability to scale R closer to unity, and so allowing for efficient holographic recording. In this sense, in every polymer, there is an optimal recording schedule for hologram multiplexing, that scales with the illumination and material characteristics identified in eq.(3). We calculate (Fig. 2) the grating strength and grating nonlinearity resulting from the grating formation process (eq.1,2) in two different recording situations and for four different schedules (Fig.2 top), with constant total exposure rrec = 5. (The dimensionless time t/r-p has units of exposure, and uniform illumination eventually polymerizes any remaining monomer after diffusion terminates.) Significantly improved grating recording is achieved through appro- priate illumination schedule that allows for balanced polymerization and diffusion processes in the material under consideration. Specifically, in the nonlinear material (right), grating strength is increased relative to cw recording by almost 40% for an illumination schedule with T^ = 2rj!ec = 2, and 30% for an illumination schedule with r^ = rj!ec = 1. At the same time, grating nonlinearity is suppressed by about 35% and 25% respectively. For the linear material (left), the improvements in dynamic range are less pronounced, about 10%, and it is also interesting to notice that they arise for illumination schedules with smaller inter- exposure times than before. Nevertheless, grating nonlinearities are significantly suppressed for the linear material too, between 40% and 30% (although much less in absolute values), when an inter-exposure time is introduced in the recording schedule (r^ > 0).
In conclusion, the use of an appropriate recording schedule enhances recording in pho- topolymers. Eventually, the recording characteristics are also determined by the dependence of D and V (essentially 11), and the corresponding time scales (ra and T-p), on polymer concentration. Moreover, grating recording is affected by the dependence of polymerization on the photo-initiator dye concentration, as well as by the effects of post-exposure continued polymerization (dark reaction). We evaluate the importance of these contributions, and in- corporate these phenomena into the physical model (eq.s 1,2) describing grating formation. In polymer holographic recording media, the concentration dependence is typically closely related also with the pre-exposure illumination schedule. At the same time, reduced dye concentration after initial recording or pre-exposure, may account for the reduced recording sensitivity observed. On the other hand, dark reaction contributes to the final polymer com- position, consuming part of the recording medium dynamic range, and should be accounted for in the optimal recording time and exposure schedules. In summary, the present analysis discusses a more complete, than previously presented, evaluation of efficient photopolymer grating recording in a holographic storage system.
[1] D. A. Waldman, R. T. Ingwall, et. al. SPIE, 2689:127-141, 1996.
[2] V. L. Colvin, R. G. Larson, et. al. J. Appl. Phys., 81:5913, 1997.
[3] G. Zhao and P. Mouroulis. J. Mod. Opt, 41:1929, 1994.
This research work has been supported in part by the ARPA/NSIC.
73

Figure 1: The compositional polymer grating spatial profile (growing with exposure time) under cw illumination (middle), for two different recording situation; R = 1 (left), and R = 102 (right).
ExpMiM Evolution Expoaura Evolution
9 / •
e
! / * '" / / • / '' / / / /
/ „• ' / ? - / •**.""'' ' - i. /-'*-',-- _*
// /
.
QraWng Slranglh Evolution Gratino. Stivngth Evolution
f
'
as ^ „-;'_'-'
f" a m
I *
0.1
.v^***
NonNnwrity Evofcjtion
Tim« {Dmmilori(M) Tim* (Oimansionlwi)
Figure 2: Grating strength (middle) and nonlinearity (bottom) evolution (in exposure time) under different exposure schedules (top), for R = 20 (left) and R = 102 (right).
74

MCI 7 12:30pm - 2:30pm
The Optical Properties of Gold Nanocluster Composites in Silica Formed by Ion Beam Assisted Deposition
R.M. Stroud. S. Schiestel, J.S. Melinger, C.A. Carosella and D.L. Knies U.S. Naval Research Laboratory, Code 6670, Washington, DC 20375
Tel:(202) 404-4143; FAX (202) 767-5301
INTRODUCTION This report will describe the linear and nonlinear optical (NLO) properties
of thin films of gold nanoclusters in silica matrices, produced by a technique called ion beam assisted deposition (IBAD). IBAD has achieved a significant amount of application in the optical thin-film industry due mainly to the fact that IBAD films are denser than evaporated or sputtered films. We have used the technique in recent years to produce metal and semiconductor nanoclusters embedded in dielectric matrices.[1,2] Metal nanocluster thin film consisting of clusters 5-30 nm in size embedded in an active metal oxide matrix were deposited by co-evaporation of two metals, one more highly reactive toward oxygen than the other, with 02+ ion bombardment. We have also produced nanoclusters in dielectrics by co-evaporation of a metal and a dielectric. Here the ion beam (e.g. argon) is used to control the microstucture of the nanoclusters and to densify the films. Values of %(3)/a (where a is the absorption coefficient) for the IBAD films were as good as or even superior to those reported for ion implanted films[3]. The advantages of the IBAD method for fabricating films with NLO properties include the ability to deposit films with greater active region thicknesses, higher nanocluster densities and more uniformly sized nanoclusters.
EXPERIMENTAL PROCEDURE The thin films were deposited by IBAD in a multihearth vacuum chamber
with a base pressure of 5x10⁻⁹ mm Hg. Silica films containing Au nanoclusters were prepared in two different ways: Si and Au were evaporated from separate hearths in the presence of an 02+ ion beam; and, silica and Au were evaporated from hearths with and without the presence of an A+ ion beam. The substrate temperatures ranged from room temperature to 730 °C. Post deposition anneals were conducted in air between 500 and 1000 °C. We experimentally explored the processing parameters, such as atom/ion arrival rates and ion energies to examine the effects on nanocluster size and shape and ultimately on linear and NLO properties. We will report on these results at Nonlinear Optics '98.
Linear optical properties were measured using standard optical spectrometers. The NLO properties were probed experimentally using the degenerative four-wave mixing (DFWM) technique and non-linear transmission. A tuneable Ti-sapphire laser with an optical parametric amplifier was used for these measurements. The system had a pulse width less than 120 fs. 0-7803-4950-4/98/510.00 1998 IEEE 75

Nanocluster sizes and distributions were determined from transmission electron micrographs (TEM) of cross-sectional samples on Si. Cross-sectional samples were thinned to electron transparency by ion milling on a liquid nitrogen-cooled stage.
RESULTS The bright field TEM images from two films, prepared identically except
for the ion beam treatment, show variation in cluster size, cluster density and matrix morphology. These films were annealed at 600 °C in air for 10 minutes. The arrival rate of the Au/silica was 0.2. The film grown without the ion beam (Fig. (la)) shows clusters 6-40 nm in diameter that are irregularly shaped. The ion beam treated film (Fig. (lb)) shows clusters that are ~ 30% smaller, 4-28 nm, and more spherical. The ion beam treated film also shows a lower density of clusters than the untreated film, resulting is less impingement of neighboring clusters. Between the clusters, the Si02 matrix shows a mottled contrast in the case of the untreated film. This may be due to incorporation of amorphous Au in the matrix.
100 nm
(a) (b) Figure 1. TEMs of Au nanoclusters in silica, (a) is the film grown without IB AD; film (b) has an ion assist of 135 uA/cm.2 of A+
Figure 2 shows the dependence of the linear absorption coefficient as a function of wavelength for two films of Au nanoclusters, one prepared by IBAD and one prepared with no beam. These films were annealed in air at 1000 °C for 2 hours. The Au/silica arrival rates were indentical for the two films and the same as those shown in Fig. 1. The IBAD film was prepared with an 02+ ion beam (150 eV, 135 \iA/cm^). Au fill factor for the two films was 0.09. The linear absorption peak is very large and is due to Mie scattering. The effect of the microstructure on the absorption peak is very apparent. The nanoclusters in the IBAD film are more uniform in size and are more spherical, giving a narrower absorption peak.
76

I
7 10"
6 104
5 104
s 4 1(f o
g 3 10* V)
JO < 2 104
1 104 -
0
I I I I I I I I I I I
Au/Si02 film deposited by IBAD
u/Si02 film deposited by PVD
l l l l"
400 500 600 700 Wavelength (nm)
800 900
Fig.2 The absorption spectra for films with Au nanoclusters in silica. The films were post- annealed at 1000°C for 2 hours in air. The film prepared with IBAD has a narrower, higher absorption peak than the one prepared with physical vapor deposition.
We have measured the NLO properties of similarly prepared IBAD films (Au nanoclusters in Nb205)[4]. They were characterized near the peak of the Mie absorption curve for that system (600 nm). The value of lx(3)xxxxl was as high as 7.8x10⁻⁸ esu? an(j the value of the figure of merit for device application l%Ö)xxxx|/oc was 3.3x10⁻¹³ esu-cm. Measurements of Im%(3)xxxx show small values that indicate a significant fraction of the response is refractive despite excitation near the peak of the plasmon resonance. We plan to report on the NLO properties about the peak shown in Fig. 2 for Nonlinear Optics'98. Our main goal is to characterize the dispersion of l%(3)xxxx| from 530-600 nm for the Au/silica system.
REFERENCES [1] S. Schiestel, CM. Cotell, C.A. Carosella, K.S. Grabowski and G.K. Hubler; Nuc. Instr. and Methods, B, 127/128, 566-569 (1997). [2] S. Schiestel, C.A. Carosella, R. M. Stroud, S. Guha, CM. Cotell and K.S. Grabowski; to be published; MRS Meeting, Boston, MA,(Dec. 1997). [3] R.H. Magruder III, R.F. Haglund Jr., Li Yang, C.W. White. Lina Yang, R.Dorsinville and R.R. Alfano; Appl. Phys. Lett, 62, 1730 (1993). [4] CM. Cotell, S. Schiestel, C.A. Carosella,K.S. Grabowski and G.K. Hubler; Nuc. Instr. and Methods, B, 127/128, 557-561 (1997).

MC18 12:30pm - 2:30pm
Fourier treatment of Nonlinear Optics
Robert Mcleod, Kelvin H. Wagner, Robert T. Weverka, and Steve Blair
Optoelectronic Computing Systems Center University of Colorado, Boulder, CO 80309-0525
[email protected] l-303-492-5810(FAX)
As the spatial angular bandwidth and tempo- ral frequency bandwidth of nonlinear optical inter- actions is increased it becomes necessary to fully ac- count for the effects of diffraction, anisotropy, and dispersion upon propagation through the volume of the nonlinear optical media. This increased band- width is required in order to increase the peak inten- sities through focusing or the use of ultrashort pulses and thereby increase the strength and efficiency of nonlinear interactions, or in order to increase the information capacity of the optical fields. The in- creased bandwidth appears to significantly compli- cate the simple plane wave coupled mode analytic formulation, however in this paper we will show that in the Born regime of weak scattering a simple Fourier decomposition mechanism can be employed that fully accounts for the spatial, temporal, and polarization structure of the nonlinearly generated fields. This momentum space approach allows simple visualiza- tions of the process, allows optimizations of the ef- ficiency, resolution, and bandwidth of the nonlin- earity, and enables the design and interpretation of novel interaction geometries.
The momentum space solution begins with a 3-D spatio-temporal Fourier transformation of the vector field applied to the planar boundary of the nonlinear optical medium.
Sp(u, A?xi z=0) = Ftxy {E(t,x, y, 0)} • fff*(w, kT).
NLO medium is then given by
E°(t, r^-J \ £ ep(u, kT) £p(U) kT) e~^>-^ U=i
where the x component of the momentum vector as- sociated with the pth polarization can be found from either the roots of the spherical coordinate charac- teristic equation, or more conveniently for the planar boundary value problem as the roots of the Booker quartic equation^
a4n% + a3n% + a2n2
N + ain^ + a0 = 0
with k = kr+kN = Ao(rax+«jvrcjv). The coefficients of the quartic can be found in a coordinate free rep- resentation for an arbitrarily anisotropic media at each frequency u by specifying f (u>).
Ü4 = e ■ h^fiN
a3 = e '■ (nj^N + njqnx)
a2 = [/ 2= f x=(2)7\ • „ . I , f=. ^ _ (nTe — 1 x e ) • njvn/v + k • UTTIT
ai - (nTl — I xT ' ) • (nrfiN + Ä/vnr) 1
a0 = (nTI - I x V ) : nynx + det(f)
The dyad notations is defined as (ab) '■ (cd) = (a ■ c)(b-d) and (ab) * (cd) = (a X c)(b x d) The roots TIN yield the z component of the momentum vector
where jFtxy represents the 3-D spatio-temporal Fourier kPz(u, kr) = k0riN- The roots must be sorted and transform, kx represents the transverse wavevector and u is the radian frequency. The eigenpolariza- tions associated with k? and w ({ei,^}) are not necessarily orthogonal as in the spherical solution, so are orthogonalized with the Gram Schmidt pro- cess to trivp efE - [gi~(gi-gs)fr] . -£ _ [h-(e2-e*)ei] cess to give ax - ^-../p and a2 - x—|«f-«k|* which are used to uniquely decompose the total in- put field as E = £p ep (ß ■ df} The unperturbed source field at any position within the volume of the 0-7803-4950-4/98/$10.00 1998 IEEE 78
the two selected modes p = 1, 2 must have positive Poynting vector with respect to the planar surface normal, and for each of these modes the eigenpo- larizations ep must be calculated. This formulation is illustrated for one transverse dimension in Fig- ure 1, and it rigorously solves the linear part of the propagation problem for arbitrarily anisotropic, gy- rotropic, dispersive, lossy media including the con- tribution of the evanescent modes (kx > kmax) and

Figure 1: Pulsed spatially apertured field incident on nonlinear anisotropic dispersive media. Representation of the Fourier space boundary condition and anisotropic dispersive momentum surfaces (with group velocity re- moved) onto which it is projected in order to describe dill'raetive and dispersive propagation.
including all vectorial effects. We will find it con- venient, to represent the solution in spatio-temporal Fourier space as
2
^V, *HW-1U°{t, x, y, z)} = Y, «PK M£PV, k) P=i
= Y2 'TO-^ kr, ~ = 0) t'p(u), kr) & [kz - kPz(u, kT)J , v
where the Fourier energy is localized on the dual sheeted hyper cone defined by A,-p„(u;, £?•). This so- lution is then used as the basis for expansion of the nonlinear problem.
The nonlinear polarization that is generated by the diffracting and dispersing incident field (which can consist of a multiplicity of spectrally or angularly distinct, beams) contains the usual expansion terms consisting of the inhomogeneous dielectric perturba- tion (possibly time varying such as that produced by an acoustic wave), the second order nonlinear polar- ization (assumed to be instantaneous), and the third
order nonlinear terms;
PNL(t, r) = c0f(t, 7)E°(t, f) + €0f(2) : E°(t, r)£°(i, f)
f°° f°° f°° =(3) +€0 / drx I dr2 dT3xy(T1,T2,T3,r)
E°(t - rj, f) : -E°(t - r2, f)E°(t - r3, f).
Explicit dependence on position of the nonlinear ten- sors is included to represent periodic poling. The spatio-temporal Fourier representation of the unper- turbed propagating fields £Q is inserted in these equa- tion and then used as the source term of an an- gularly-and spectrally rich SVAA evolution equa- tion. As an example, the second order sum frequency source term can be represented in Fourier space as the convolution of the 4-D spatio-temporal spectra of the diffracting and dispersing fields, additionally convolved with the Fourier transform of any spatial
=(2) variations of \ ■ We will show that out of this spectrally rich distribution of source polarization the phase matching conditions select the tensorially al- lowed contributions that fall on the momentum hy- persurfaces.
P(2){u,kx,ky,z) = fdt fdpe-^-^-^pW^.,?)
= eof (2)(^, z) *E^(W> WPV kT, 0)e-M»^* p,q = l
*e,(w, kT)£°(ut k~T, Q)e~jk"^u'l''T)s + other terms
where * represents 3-D spatiotemporal convolution in u>, kr, and ky, and the other terms refer to the difference frequency contributions.
This polarization vector field is the source term for the radiating waves at all frequencies and an- gles. To account for the polarizations launched by the source vector field we must introduce the vectors
bp =
1
0
2k Pz
0
2k v
kr 2A:P,
ky' '2kr,
0
The vectors b\ and b2 are not necessarily orthogonal, so again a set of Gram-Schmidt projection vectors must be defined for the electric field polarization.
These projection vectors are <rf (a>, kj) 1-16?-6* I2
79

and c^M = %fefiM where bp = bp/\bp i-|6j-62p ' ""— »p — "y/rpi-
Using these vectors, the coupled, vector differential equations can be separated into two scalar, ordi- nary, constant coefficient, inhomogeneous differen- tial equations which in the SVAA limit yield the first-order spectral set of evolution equations
order contributes corrections to the first order scat- tering as well as higher order terms. Successive terms are generated by iteration.
2jkPz dz - Co
Ttxy{PNL(t,x,y,z)} xP'Jb,*
si+1 v
E
(u,k) k0
2k S(kz
Pz
kPz)°p'(uikT) eof2\k)>
J=1L
e„i (w, kT) i2 Q M) * H K M £ eT (w> *) n=0 m=0
where i represents the iteration number; for exam- Since this is a first-order, constant-coefficient equa- pie the momentum-space prediction is given by £l.
■'■"*•'- After each iteration, the scattered field distribution, tion, it can be directly integrated to find the Born approximation to the spectral amplitudes, £p
£p{u, kT, z) = £j(w, kTt z = 0)e-^
k2 jkp.z'
The boundary condition has been used to set the constant of integration as the original, unperturbed propagating field (Oth order solution) and the scat- tered field is the first order perturbation. By multi- plying the function inside the integral by a window function, the limits of integration can be extended to infinity and the right-hand side becomes a for- ward spatial Fourier transform wrt z evaluated at the particular longitudinal spatial-frequency, kPz:
£p{u,k) = £°p{u>,k)
k2
+j*&/**" ipNL{t>m <*-*)}*(** - *P.) zp* ap .
Thus we can interpret the nonlinear propagation prob- lem as the nonlinear generation of vectorial polariza- tion in spatiotemporal Fourier space followed by the selection of the allowed propagating modes by inter- secting with the double sheeted momentum surface weighted by the inner product with the eigenvectors at each position on the momentum surface. >^
The momentum space solution is only valid in the limit that one scattering event accurately de- scribes the problem (the Born or undepleted-pump limit). An obvious extension of this method is to continue the perturbation series by substituting the momentum-space result back into the transcendental equation. The second order accounts for the deple-
tion of the pump as well as cascaded x contribu- tions to third order nonlinearities (including all spa- tiotemporal phase matching effects), and the third
£p(u,k), can be transformed back to the real-space vector electric field via the four-dimensional inverse Fourier transform.
E(t,P) Cp(w.*T)$3£*(w,£) i=0
This perturbative solution approaches the exact so- lution (in the SVAA limit) for the fields in all space and time.
In this paper we have presented the generalized Fourier space approach as a basis for the solution of spectrally rich nonlinear and inhomogeneous prop- agation in arbitrary anisotropic, gyrotropic, disper- sive media. The linear solutions are used as a basis for the expansion of the nonlinear problem. The nonlinearly generated polarization distributions are considered as source terms in spatiotemporal Fourier space. The momentum matching conditions are in- terpreted as slicing through the polarization source terms with the dual sheeted hypersurfaces of allowed propagating modes with the vector projections onto the eigenmodes of propagation. Examples of this technique applied to problems in inhomogeneous and nonlinear optical propagation will be presented.
References [1] R. R. Mcleod, Spectral-domain analysis and de-
sign of three-dimensional optical switching and computing systems. PhD thesis, University of Colorado, 1995. H. C. Chen, Theory of electromagnetic waves. Mcgraw-Hill, 1983. R. T. Weverka, K. Wagner, R. Mcleod, K.-Y. Wu, and C. Garvin, "Low-loss acousto-optic pho- tonic switch," in Acousto-optic signal process- ing, Theory and Implementation, 2nd Edition, pp. 479-573, Marcel Decker, 1995.
[2]
[3]
80

MCI 9 12:30pm - 2:30pm
Hyper-Rayleigh Scattering of Polymers with Orientationally Correlated Chromophores Chia-Chen Hsu, Tzer-Hsiang Huang, Fen-Fen Yeh, and Sean Liu
Department of Physics, National Chung Cheng University Ming-Hsiung, Chia-Yi, Taiwan
Tel: 886-5-272-0411, ext-6072; Fax: 886-5-272-0587 And
Tien-Yau Luh, Jitendra A. Sattigeri, and Chung-Wai Shiau Department of Chemistry, National Taiwan University
Taipei, Taiwan
Conjugated organic chromophores capped with electron donor and acceptor groups are known to have good electro-optical (E-O) properties such as large second order susceptibility. Much research activity has been focused on these molecules to search for possible applications in second harmonic generation, frequency conversion, and E-0 modulation. Organic chromophores used in second order nonlinear devices must be noncentrosymmetric such that their first hyperpolarizabilities (ß) are nonvanishing. Furthermore, in macroscopic scale organic chromophores should be arranged into a noncentrosymmetric distribution with a non- zero second order susceptibility. This is usually achieved by poling organic chromophores with a static electric field. The second order susceptibility of poled nonlinear devices are proportional to |iß, where |! is the permanent dipole moment of the chromophores and ß is
the vectorial part of the first hyperpolarizability. Consequently, the second order nonlinear response of a poled nonlinear device can be enhanced by increasing either (J. and/or ß of the constituent chromophores. Recently, Kauranen et al. have shown that organic chromophores can be organized as orientationally correlated side groups of the polymers with a rigid backbone. In such organization, each chromophore contributes coherently to both |x and ß of the polymers and hence the second order nonlinear responses of the polymers are enhanced.1"
In this paper, the hyperpolarizabilities of the push-pull chromophores and the poly- norbornenes that contain the push-pull chromophores as side groups are measured and compared using the long wavelength hyper-Rayleigh scattering (HRS) technique. Figure 1 shows the chemical structures of the four organic molecules studied in this work. Structures 1 and 3 are the push-pull chromophores, and 2 and 4 are the chromophore-substituted poly- norbornenes. Polymers 2 and 4, respectively, have nc of 13 and 27, where lie represents the degree of polymerization, i.e the number of nonlinear chromophores attached to the rigid polymer backbone.
HRS technique has been shown to be useful for characterizing the chromophore ß
values.3"5 It is more straightforward than the electric field induced second harmonic generation technique. Recently, HRS from some molecules excited by the 1064nm radiation has been found to be accompanied by the two-photon absorption (TPA) induced fluorescence. " Consequently, the ß value, that is determined by the usual HRS technique without making appropriate corrections for contribution from the TPA induced fluorescence, could be too large. To obtain the correct ß value, the TPA induced fluorescence must be discriminated against, and this can be done using, as excitation source, a long wavelength laser. For the latter we use the 1480nm output of the optical parametric oscillating laser (Continuum Mirage 500), which is tunable from 400nm to 2000nm and generates 8ns pluses at a 10 Hz repetition rate.
The set-up for this long wavelength HRS experiment is similar to that for the 1064nm experiment,4"5 except that the 1064nm half-wave plate and the 532nm band-pass interference filter are replaced with an achromatic half-wave plate and a 740nm interference filter, 0-7803-4950-4/98/$ 10.00 1998 IEEE g1

^cr^ ' v
4
respectively. To ensure that no TPA induced fluorescence contributes to the HRS signal, an interference filter centered at 780nm instead of 740nm was placed in front of the photomultiplier tube (PMT), and no signal was registered by the PMT for all the samples studied in this work. This indicates that no TPA induced fluorescence occurred in the downstream vicinity of the HRS A/2 spectral position using the A, = 1480nm fundamental excitation.
In this HRS experiment, the solution of disperse red 1 (DR1) in CHCI3 is used as external reference for the determination of the ß values of
samples included in Table 1 below. The ß value of DR1 in CHC13 at 1480nm is
calculated to be 75xl0~30esu using the un-damped two-state model as well as the dispersion free ß value
(ßo=38xl(T30esu) of DR1 in CHC13
obtained from the literature.7
Summarized in Table 1, for all molecules studied, are the molecular weight (Mw), iic, linear absorption maximum (kmxd, and the first hyperpolarizability (ßc) measured with the 1480nm fundamental wavelength, and its dispersion-free counterpart (ß0). The ß0
values of polymers 2 and 4 are larger than those of chromophores 1 and 3 by factors of 5.7 and 8.8, respectively. Since the nonlinearity of the polymer backbone is negligible, the ß0
enhancement is due to the chromophore arrays attached to the backbone. The enhancement indicates that the chromophores in the arrays are orientationally correlated, and that each chromophore contributes coherently to the hyperpolarizability of the polymer. No enhancement on ß0 value have been reported for chromophores incorporated into other type
of polymer with a flexible backbone.8 Consequently, the rigidity of the poly-norbornene backbone is essential to the observed increase in hyperpolarizability. When the ß0 value of
polymer 2 is compared with that of polymer 4, the effect of increasing n« on the hyperpolarizability is clear. As showed in Table 1, the ß0 value of the polymer is proportional
to the degree of polymerization, even though polymers 2 and 4 contain different chromophores.
CO2ET CO, ET
Figure 1 Chemical structures of the substituted norbornenes (1 and 3) and the substituted poly- norbornenes (2 and 4).
82

Table 1 Linear and nonlinear optical properties of molecules 1, 2, 3, and 4.
Molecules Mw (g/mol)
lie
(nm) ßc
(10"30esu) ßo
(10-30esu)
1 313 475 59 31
2 4228 13 469 329 178
3 432 495 65 32
4 11700 27 487 557 283
References: 1. M. Kauranen, T. Verbiest, C. Boutton, M. N. Teerenstra, K. Clays, A. J. Schouten,
R. J. M. Nolte, and A. Persoons, Science 270 (1995) 965. 2. T. Verbiest, C. Samyn, C. Boutton, S. Houbrechts, M. Kauranen, and A. Persoons,
Adv. Matter, 8 (1996) 756 3. K. Clays and A. Persoons, Phys. Rev. Lett. 66(1991)2980. 4. C. C. Hsu, T. H. Huang, Y. Z. Zang, J. L. Lin, Y. Y. Cheng, J. T. Lin, H. H. Wu,
C. H. Wang, C. T. Kuo, and C. H. Chen, J. Appl. Phys. 80, 5996 (1996). 5. C. C. Hsu, C.F. Shu, T. H. Huang, C. H. Wang, J. L. Lin, Y. K. Wang, and Y. L. Zang,
Chem. Phys. Lett. 274, 446 (1997). 6. M. C. Flipse, R. de Jonge, R. H. Woundenberg, A. A. Marsman, C. van Walree, and
L. W. Jenneskens, Chem. Phys. Lett. 245, 297 (1995). 7. S. Stadler, R. Dietrich, G. Bourhill, C. Brauchte, A. Pawlik, and W. Grahn, Chem. Phys.
Lett. 247, 271 (1995). 8. O. K. Song, J. N. Woodford, and C. H. Wang, J. Phys. Chem. 106, 2819 (1997).
83

(/3-0.00915)deg
MC20 12:30pm - 2:30pm
Coherent Coupling and Transient Optical Kerr Effect in Liquids Tzer-Hsiang Huang, Chia-Chen Hsu, Tai-Huei Wei, and Michael Jiunn Chen
Department of Physics, National Chung-Cheng University Ming-Hsiung, Chia-Yi, Taiwan, Tel: (05)272-041 lext.6076; Fax: (05)242-8127
and Chao-Ming Fu and Ju-Iang Chen
Department of Physics, National Kaoshiung Normal University, Taiwan
Pump-probe optical Kerr effect (OKE) detected in time domain with a resolution a few tens of femtosecond has proved useful for the study of the coherent transients in liquids at room temperature.[l][2] Experimental procedure is more or less standardized. However, results are not always consistent because of experimental complexities that, as shown in this report, mainly arise from coherent coupling. [3] [4] Coherent coupling persists for the full pulse-duration, and can overwhelm the Kerr signal. Fine-tuning the optical alignment is thus needed to discriminate against it. This, along with the ensuing results, will be given in the following.
As expected the strength of coherent coupling relative to that of Kerr effect is found to be very sensitive to a change in the angle (ß) subtended by the pump and probe beams, which is set at ~ 9° to begin with. To fine-tune the ß angle we conveniently change the pump beam from its parallel position with respect to the probe beam at an increment of 0.00305° at a time. The results are shown in Figure 1. As explained below the noisy signals around delay zero arise mostly from coherent coupling. They appear as noises because the resolution of the delay scan used is not high enough. Thus, the top profile has the highest Kerr content.
In order to reduce the strength of coherent coupling we find it also useful to fine-tune the sample Z-position, i.e. its position with respect to the probe laser beam waist. Additionally, we find the iris positioned before the lens, which collimates the probe- beam before it falls on the photo-detector, necessary for obtaining a nice Kerr profile. Although it is easier to discriminate against coherent coupling with the iris, we can not rule out the effect of non-linear refraction as in the case of a Z-scan experiment. [5] Under optimal condition a Kerr profile similar to the top one of Figure 2 is obtained using the highest resolution available, 0.33fs per step. Note the fast oscillation around delay zero and the stronger broad structure underneath. The former overwhelms the latter in the bottom profile when a different combination of Z-position and ß angle is used. Their strength becomes 0-7803-4950-4/98/110.00 1998 IEEE g4
200 400 600 800 Delay time (femtoseconds)
1200
Figure 1 Variation of the Kerr profile of liquid CS2 with the angle subtended by the pump and probe beams.
ß = 9°.

comparable in the middle profile when still another combination is used. The fast oscillation around delay zero is attributed to coherent coupling and the broad structure underneath to the electronic Kerr signal. The broad structure to the right arises from the nuclear Kerr response. As expected they are free of coherent coupling. If the delay scan used were not high enough, the fast oscillations shown in this figure would have appeared as random noises. In the previous transient optical Ken- experiments on liquid CS2, where the laser pulses were not short enough for resolving the electronic response from the delayed nuclear one,[3] coherent coupling (if not suppressed) simply appeared as noises in the leading portion of a Kerr profile. We are now convinced that these noises are indeed coherent coupling.
The most convincing evidence for coherent coupling is the interference fringes (fast oscillations, Figure 2) and their period (2.7fs). The latter agrees with the carrier wavelength (820nm) of the mode-locked titaniumrsapphire laser used. A weaker sequence of interference with half the period of the major one is also observed in the bottom profile of Figure 2. We believe it arises from the second harmonic of the incident laser fundamental frequency. With the CBrCl3 liquid a second harmonic sequence almost as strong as the fundamental one is also observed. The stronger sequence of interference fringes is consistent with the third order formulation for coherent coupling, [3] [6] [7]
Sc (x) = \ Re r dt r dt3 E*r (t - x)Ey (f)^ (t -t3 )E*X (t3 )EX (t3 - x) .
-100 200 100 Delay (femtoseconds)
Figure 2 Variation of the CS2 Kerr profile with the combination of the sample Z-position and the angle between the pump and probe beams. For the profiles from top to bottom three different combinations are used.
(1)
In this equation \ is a constant, ^ is the nuclear response function, and x is the delay of
the probe pulse maximum with respect to the pump pulse maximum (a negative delay means the probe maximum arrives at the sample earlier than the pump maximum). The Ex (t3) of the
pump pulse interferes with the E* (f3 -x) of the probe pulse in the liquid sample, and forms a
transient grating. At the same time, the second pump field Ey (f) scatters off the grating in the
nonzero order and interferes with E*Y(t-%). Figure 3 shows the strength of coherent coupling (o) as a function of the local oscillator
85

field, the E^ (t-x) of equation (2), which is introduced to enhance the feeble OKE signal by the optical heterodyne detection (OHD) method,
SIC(T) = Tl0Re£4>3 E? (t-x)EaB(t-x)<I>?BCD(t-t3)Ea
c* (,3)E°(?3) . (2)
In this equation the pump fields, Eac*(t3) and Ea
D(t3), and the probe field EaB(t-x) lead to
the OKE field EOKE(*-i) that
interferes with E°*(/-x) . The increase of the OHD-OKE intensity with the local oscillator field is also shown in Figure 3. Dots in Figure 3 refer to the maximum values of the prompt (delay 0) response as shown by the upper trace of Figure 2. Crosses represent the electronic response, as they are obtained by subtracting the amplitudes of the fast oscillation from the maximum values. Hollow triangles in Figure 3 refer to the maximum values of the very broad structure to the right of the electronic response in Figure 2, i.e. the delayed nuclear response. These data (electronic and nuclear) confirm the linear dependence of the OHD- OKE signal on the local oscillator field, as per equation (2).[2]
Note particularly that, as shown in Figure 3, the amplitude of the fast
oscUlation hardly changes with the local oscillator field. Thus, the E*Y(t-x) of equation (1),
which interferes with EY(t) to give the coherent coupling signal, is not the delayed local oscillator field, and is likely the delayed OKE field EOKE(t-x). When coherent coupling was
first found to coexist with the transient optical Kerr signal of liquid CS2 we were unable to pinpoint the field that interfered with Ey (?) .[3]
REFERENCES: [1] Yong Joon Chang and Edward W. Castner, Jr., J. Chem Phys. 99, 7289-7299,
Dale McMorrow, William T. Lotshaw, and Geraldine A. Kenney-Wallace, IEEE J. Quantum Electron., QE-24, 443-454, 1988. Tzer-Hsiang Huang, et al., IEEE J. Selected Topics in Quant. Electronics, 2 756- 768, 1996. S. Kinoshita, T. Ariyoshi, and Y. Kai, Chem. Phys. Lett, 257, 303-308, 1996. Tai-Huei Wei and Tzer-Hsiang Huang, Opt. and Quant. Electronics, 28, 1495- 1508, 1996. Z. Vardeny and J. Taue, Opt. Comm., 39, 396-400, 1981. S.L. Palfrey and T.F. Heinz, J. Opt. Soc. Amer. B, 2, 674-679, 1985.
86
Local oscillator field (mV2) Figure 3 The peak electronic (•) and nuclear (A) Ken- responses of liquid CS2 as a function of the local oscillator strength. Crosses refer to the peak prompt-response, (•), minus the amplitude of the fast oscillation (O).
[2]
[3]
[4] [5]
[6] [7]

MC21 12:30pm - 2:30pm
Ultrafast Electronic Dynamics in Metal Nanoparticles
G. Lüpke, D. H. Osborne and C. H. Chen, R. F. Haglund, Jr. Department of Physics and Astronomy, Vanderbilt University, Nashville TN 37235
R. H. Magruder, III Department of Physics and Chemistry, Belmont University, Nashville, TN 37235
R. A. Zuhr Solid-State Division, Oak Ridge National Laboratory, Oak Ridge, TN 37831
The electronic and vibrational relaxation mechanisms of metal quantum-dots embedded in
dielectric matrices following ultrashort-pulse laser excitation is a topic of intense current interest.1
The electronic dephasing process in metal quantum dots occurs on a time scale of 10-20 fs.2 The
electron-phonon (e-p) coupling within the quantum dot, and the phonon-phonon (p-p) coupling
between the dot and the matrix, are typically picoseconds and tens of picoseconds, respectively.
Among the critical issues are variations in these time constants between intraband and interband
transitions, for high vs low pulse-repetition frequency (prf), and for different combinations of
quantum dot and matrix.
We have measured these time constants at high pulse repetition frequencies using both pump-
probe (PP) and transient-grating (TG) schemes for
well-characterized Ag, Au and Cu quantum dots of
varying size distributions in fused silica.
Wavelengths on and off the plasmon resonance and
near as well as away from the interband excitations
were employed.
Figure 1 shows PP measurements made on Au
dots in Si02 (average diameter 12-16 nm) as a
-20 -io o lo 20 so 40 function of prf at 575 nm, to the red of the Au Pump-Probe Delay (ps)
Figure 1. Pump-probe measurements in an plasmon resonance. The PP measurement scheme Au:Si02 nanocrystal composite, at prfs of 3.8 and 0.23 MHz. The sample was made employed phase-sensitive detection to enhance the by ion implantation; the average size of the quantum dots is 15 nm diameter. signal-to-background ratio. The coherence spike on 0-7803-4950-4/98/S10.00 1998 IEEE 87
1.0 H ' " ■ 1' ■ ■ '
Au:Si02 >>
*3) 0.8 s i x, = 730 fs laser
^1asei= 596 nm
ö \ prf= 3.80 MHz prf-0.23 MHz
'o>6
Xi o u ^0.4
>
ed
1 J \
ti
0.0 JwwTi i t i 1 i i i i 1 t i i i 1 i i i i 1 i i i i A

the leading edge of the pulse marks the time zero. 1 0
The e-p relaxation time shows a slight variation 0.8
from about 9 ps at 3.9 MHz prf to 8 ps at 230
kHz, while the p-p coupling time is very much § o.6
longer, and is still measurable as late as 200 ps g> +3 0.4 cd
after the initial excitation. Both time constants g
are substantially longer than those observed in 02
1 kHz PP experiments, indicating that the
steady-state heating of the matrix affects the e-p
■ -
Au:SiOz
- *laser~™0fs,
*laser 575 *"" d~12-15nm
- d~7-8nm
1 -
1
1 ^ 1 t
1 ■ 1—^r.:,---P--iirV-- 4 0 4 8
Pump-probe Delay (ps)
Figure 2. Phase conjugate intensity in a TG coupling by changing temperature of the experiment on Au nanocrystals of differing
. . sizes in SiO,. The samples were made by ion quantum dot prior to the next arriving pump implantation, with multiple energies employed
, to produce a uniform depth profile of Au dots, pulse.
TG measurements, on the other hand, show a size-dependent e-p relaxation time with little
sign of a p-p relaxation tail (Figure 2). When the pump wavelength was tuned further to the red of
the plasmon resonance, the e-p relaxation time was reduced somewhat for a given dot size (not
shown here). The appearance of a clear e-p relaxation signal in these TG measurements contrasts
with previous TG studies of Au nanoparticles in liquids3 in which the e-p coupling was apparently
masked by the longer pulse duration (5 ps). On the other hand, those p-p relaxation times are
similar to our measurements, consistent with the thermal conductivities of the matrix. This
suggests that dramatic reductions in the pp-relaxation time might be achieved embedding quantum
dots in matrix materials with higher thermal conductivities, such as A1203.
REFERENCES
1. T. Tokizaki, A. Nakamura, S. Kaneko, K. Uchida, S. Omi, H. Tanji and Y. Asahara, Appl. Phys. Lett. 69, (1994). J.-Y. Bigot, J.-C. Merle, O. Cregut and A. Daunois, Phys. Rev. Lett. 75, 4702 (1995). M. Perner, P. Bost, U. Lemmer, G. von Plessen, J. Feldmann, U. Becker, M. Mennig, M. Schmitt and H. Schmidt, Phys. Rev. Lett. 78, 2192 (1997). M. Nisoli, S. Stagira, S. De Silvestri, A. Stella, P. Tognini, P. Cheyssac and R. Kofman, Phys. Rev. Lett. 78, 3575 (1997).
2. E. J. Heilweil and R. M. Hochstrasser, J. Phys. Chem. 82, 4762 (1985)
3. K. Puech, W. Blau, A. Grund, C. Bubeck and G. Cardenas, Opt. Lett. 20, 1613 (1995).
88

MC22 12:30pm - 2:30pm
Electron Trapping in Ultrathin Si02 on Si(001) Probed by
Electric-Field-Induced Second-Harmonic Generation
G. Lüpke, W. Wang, N. H. Tolk, and L. C. Feldman Department of Physics and Astronomy
Vanderbilt University, Nashville TN 37235
I. C. Kiziyalli Microelectronics, Lucent Technologies Inc.
Orlando, FL 32819-8698
The important role of the Si/Si02 interface in semiconductor devices has made it an active subject
of research for many years. Processes involving electron and hole tunneling are significant in the
science and technology of this interface. Of particular interest are "band-to-trap" tunneling
processes involving electrons and holes in the silicon bands and defects in the silicon dioxide
which are near the interface. Oxide traps within =3 nm of the interface can discharge by tunneling
to interface traps on time scales from 10"3 s to years, and are known as slow traps. As dimensions
of typical metal-oxide-semiconductor (MOS) transistors continue to shrink, the use of gate oxides
-5 nm thick implies that most oxide traps act as slow traps.
Electric-field-induced second-harmonic generation (EFISHG) allows the direct observation of
charge trapping at near-interface oxide defects, which alters the reflected second-harmonic (SH)
signal due to a change of the band-bending in the silicon space-charge region (SCR) at the interface
(Fig. I).1-2-3-4 The time-dependence of the SH response resulting from charge trapping can be
described by'
mt)=ix(2)+x(XcR(t)i2,
where I(2<0)(t) is the time-dependent SH intensity, 5SCR(t) is the space-charge field change near the
Si/Si02 interface, %(2) and %(3) are the second- and third-order nonlinear susceptibilities. At
A^800nm the EFISHG response is resonantly enhanced by two-photon transitions in the silicon
space-charge region near the Si/SiOz interface. Electron-hole pairs are constantly being generated in 0-7803-4950-4/98/$10.00 1998 IEEE gg

this region by the incident fundamental laser light. Some of the excited electrons reach the Si02
conduction band through multi-photon absorption and diffuse to the oxide surface. This surface
charging leads to a fast rise in the SH response (Fig. I).3'4
1.2 1 Cr ii i i i | i i i i |—r-
1 10° h
Q. Ü . w 8 104 h >•
"(5 O 6 104 h c
a x 4 104 -
2 10"
I i i i ■ I i i i i I i i i i l i i i i I i i i i
Thermal Oxide on Si (001)
on
■ i i i ii J_ * ' ' ' ' fl
-100 0 100 200 300 400 500 600 700
Time (sec)
Fig. 1: SH signal vs time during illumination of a thermally-oxidized Si(001) sample by 1.55 eV
photons. ON-heam on; OFF-beam off.
Some of the excited electrons will be trapped at oxide defects yielding a gradual increase of the SH
intensity. After blocking and unblocking the laser beam (marked as on and off in Fig. 1), the SH
signal recovers fast due to surface charging and apparently exceeds quickly its level before
blocking indicating that more charge traps have been filled while the beam was blocked. Repeating
this procedure when the SH signal has almost gone into saturation reveals first, a steep rise,
followed by a slow decrease and finally a gradual increase of the SH intensity. This behavior
shows that some of the trapped charges can be released from the defect sites either through thermal
activation or due to direct electronic excitation by the laser beam. The variation in the SH intensity
90

from MOS structures under an applied bias voltage allows one to estimate the electric field in the Si
space-charge region and also the areal density of trapped electrons.1,4 The typical lifetime of these
trapped electrons is on the order of several minutes (Fig l).u The measurements presented here
provide important information about the trapping and detrapping mechanism in ultrathin thermally-
grown oxides.
REFERENCES
1 C. Meyer, G. Lüpke, Z.G. Lii, A. Gölz, H. Kurz, and G. Lucovsky, J. Vac. Sei. Technol. B14, 3107 (1996). 2 J. G. Mihaychuk, J. Bloch, Y. Liu, and H. M. van Driel, Opt. Lett. 20, 2063 (1995). 3 J. Bloch, J. G. Mihaychuk, and H. M. van Driel, Phys. Rev. Lett., 77, 920 (1996). 4 N. Shamir, J. G. Mihaychuk, and H. M. van Driel, J. Vac. Sei. Technol. A15, 2081 (1997).
91

MC23 12:30pm - 2:30pm
A New Photoelectric Reorientation Effect for the Realization of Highly Sensitive Photorefraction in Liquid Crystals
R. Macdonald, P. Meindl
Technical University of Berlin, Optical Institute Str. des 17Juni 135, D-10623 Berlin, Germany
Phone: (49)(30) 314-26227, Fax: (49)(30) 314-26888 e-mail: [email protected]
The present investigations concern a new molecular reorientation effect in nematic liquid
crystals consisting of discotic molecules1'2. The effect occurs under the combined application
of DC-electrical fields and low power optical waves and has a very huge photosensitivity. An
illumination with intensities as low as 10"3 W/cm2 is sufficient for a strong photo-induced
reorientation process which indicates a rather large nonlinear optical coefficient. Even a
microscope lamp or a small torch provides enough illumination to induce the reorientation
which has been observed by a change of the birefringence.
The investigations Were carried out with homeotropically aligned films of 5 um thickness.
DC electric fields were applied across the film with the help of transparent ITO (Indium-Tin-
Oxide) electrodes covered by weakly rubbed polymer (PI) orientation layers. The liquid
crystal studied was pentakis [(4-pentylphenyl)ethynyl] phenyl 10-carbethoxydecyl ether3
which has a nematic liquid crystalline phase between 57 °C and 69 °C. The following
investigations were performed in the nematic phase at 7= 60 °C.
Because of the homeotropic alignment, the optical axis is oriented perpendicular to the
glass plates (fig. 1). The optical properties are thereby quasi isotropic for light that propagates
normally through the cell. However, if an optical axis reorientation is induced, the rubbed
orientation layer leads to a preferential ITO Pi-Orientation Layer
5jjm
Fig. 1 Orientation of the discotic molecules without (left) and with an electric field (right)
0-7803-4950-4/98/110.00 1998 IEEE
direction of the reorientated molecules. As a
consequence, the birefringence changes
which can be detected with a polarized weak
HeNe laser by detecting the transmitted
intensity behind a crossed polarizer.
Previous investigations proved that the
92

wavelength of the probe beam is not absorbed and therefore does not excite the liquid crystal.
An Argon laser beam with wavelengths between 458 nm and 514 nm was used to excite the
sample. The effect was found to
458 nm
633 nm (j IF 633 nm
s- LC
Pol -E
U PD
Fig. 2 Experimental Setup
be independent of the Ar laser
polarization. With increasing
reorientation the effective
birefringence increases and
leads to a larger depolarized
signal I±. The effect becomes stronger if the spectral position of the excitation is closer to the
absorption edge of the liquid crystal at about 460 nm.
The large sensitivity of the effect can be seen in the results shown in Fig. 3. The plotted
depolarization is defined as the quotient of the intensity of the crossed polarized part
compared to the intensity of the input probe beam. Laser powers of 100 uW or even less on a
beam diameter of 1.1 mm are 0'3->—■ ■ 1 ■ 1 ' ' n sufficient to induce a large
birefringence at voltages
between 1.5 V and 5 V. A
typical intensity to induce a A/2
phase shift was as low as
J=4-10"3 W/cm2 at l = 458nm
for an applied DC voltage of
3V. The nonlinear coefficient
Ane/I, i.e. the induced
birefringence per optical
intensity is calculated from
1 2 3
Power of AT laser at 458 nm (mW)
Fig. 3 Argon laser illumination of the liquid crystal leads to a large enhancement of the birefringence
these results to 6 cm2/W. For comparison, nonlinear coefficients in anorganic photorefractive
crystals4 are in the range of 10"5 to 10"6 cm2/W and about 10"3 cm2/W for the orientational
photorefractive effect in calamitic nematics5.
Investigations concerning the dynamics of the reorientation process were performed by
gating either the voltage or the laser intensity. The response times observed were running on
the time scale of several seconds which is a clear confirmation of reorientation as the
nonlinear mechanism in the highly viscous liquid crystal. The difference in the phase
93

retardation between the extraordinary and ordinary beam reaches multiples of the wavelength
at higher voltages. Accordingly, the depolarization transiently passes one or more maxima
before reaching a stationary state if the voltage or the Argon laser intensity is switched on.
The reorientation effect observed has been explained1 by assuming photo-induced space
charges which enhance the effective electric field inside the liquid crystal. In contrast to
columnarly ordered liquid crystals, the mobility of holes is mainly given by the mobiltity of
ions in the nematic discotic phase and therefore neglectable compared to the mobility of the
free electrons6. Consequently, the electrons will almost be removed by the electric field
whereas the holes basically remain at their positions. As a result, illumination of the liquid
crystal leads to a space charge field which enhances the electric field in the liquid crystal. The
locally increased internal electric field supports electrical torque induced molecular
reorientation.
In conclusion, we have demonstrated that photoelectric reorientation effects are very
promising for various electro-optical, opto-optical and opto-electronic applications because of
the large nonlinear coefficients and sensitivity. The liquid crystal cell can be interpreted as a
light valve with an intrinsic photo-conductor which works in a similar way to conventional
hybrid liquid crystal light valves consisting of a photo-sensitive semiconductor and a liquid
crystalline electro-optical modulator. Devices such as optically controlled spatial light
modulators or all-optical sensors may be constructed on the basis of this new photoelectric
reorientation effect.
References
1. R. Macdonald, P. Meindl, G. Chilaya, D. Sikharulidze, Opt. Comm. (in press, 1998)
2. D. Sikharulidze, G. Chilaya, K. Praefcke, D. Blunk, Liquid Ciystals 23, 439 (1997)
3. D. Ianefz, K. Praefcke, D. Singer, Liquid Ciystals 13, 247 (1993)
4. P. Günther and J.-P. Huignard, "Photorefractive Materials and their Applications I", in Topics in Applied
Physics 61, Springer-Verlag, Berlin (1988). P. Yeh, "Introduction to Photorefractive Nonlinear Optics",
John Wiley & Sons, Inc., New York (1993)
5. I.C. Khoo, IEEEJ. Quant. Electr. 32, 525 (1996). I.C. Khoo, Opt. Lett. 20, 2137 (1995). I.C. Khoo, Opt.
Lett. 19, 1723(1994)
6. D. Adam, P. Schuhmacher, J. Simmerer, L. Haeussling, K. Siemensmeyer, K.H. Etzbach and D. Haarer,
Nature 371, 141 (1994). D. Adam, W. Roemhildt and D. Haarer, Jpn. J. Appl. Phys. 35, 1826 (1996).
D. Adam, F. Closs, T. Frey, D. Funhoff, D. Haarer, H. Ringsdorf, P. Schuhmacher and K. Siemensmeyer,
Phys. Rev. Lett. 70,457 (1993)
94

MC24 12:30pm - 2:30pm
Second-harmonic generation in the bulk of a chiral liquid by a focused laser beam
N. I. Koroteev, V. A. Makarov, and S. N. Volkov
International Laser Center, Moscow State University, Moscow 119899, Russia. FAX: +7/095/939-3113
Second-harmonic generation (SHG) was recently detected in the bulk of a non-centrosymmetric liq- uid suspension of bacteriorhodopsin-bearing fragments of Halobacterium Halobium purple membranes [1]. This effect long thought to be forbidden was attributed to the partially coherent hyper-Rayleigh scatter- ing [2]. More recently, a purely coherent second-harmonic (SH) signal was observed [3] whose properties could not be interpreted using the theory of Ref. [2]. Unlike the dc-induced near-resonance SHG in atomic gases that is due to the gas ionization by focused laser pulses with consequent diffusion-assisted charge separation [4], the SHG experiments in bacteriorhodopsin-containing liquids were not associated with any kind of medium's damage, and the dependence of the SH intensity on the fundamental-beam intensity was not parabolic, but could be only approximated with a fourth-order polynomial [3]. In this paper we will show that the coherent SH signal can be attributed to usual three-wave (due to the non-local quadratic optical nonlinearity) and five-wave (due to the local-type susceptibility x(4)) mixing in the bulk of a homogeneous isotropic non-centrosymmetric liquid if focusing of the beam of the fundamental frequency w is taken into account.
The local-type electric-dipole optical susceptibility x(2) (2w; w, w) in the isotropic non-centrosymmetric medium under study vanishes [5, 6] and, hence, the following terms in the expression for the SH polar- ization PSH of the bulk of the medium are predominant:
pSH(r) = I7(2)v(E-E)+7f)E(V-E)+7f(E-V)E + x(4)(E-E)[ExE*]. • (1) ■
Here V = d/dr, -y[2^ 3 are three independent components of the fourth-rank tensor describing the
nonlocality of the quadratic optical response of the substance, x(4) is tne only independent tensorial component of the local-type optical susceptibility x(4) (2w; w, w, u, -u>) [6], E is the electric field of the pump wave. The magnetic-dipole, electric-quadrupole, and other non-local mechanisms are described, to the first approximation, by 7^,3 which do not vanish (unlike x(4)) with imposing the inversion symmetry to the medium. The first two terms give no contribution into the bulk-SHG wave because of the vortex nature of the free pump wave (divE = 0) and the potential nature of gradS2. These are the two last terms in Eq. (1) that describe the two mechanisms of the bulk SHG discussed in this paper.
Let us assume that the lowest-order (= zeroth-order) Gaussian transverse mode [8] with the field EQ
is predominant in the pump beam of the fundamental frequency w propagating along the z -axis of the coordinate system xyz:
EG(r) = E0 [e0 + ik^ez (e0 • V)] eG(r), (2)
where the normalized scalar Gaussian beam is given by the expression:
eG{T)^W)e^{~^t + lk{z~k)~^)}' (3)
Here ß(z) = l+i[{z-l0)/ld}, Id = kw2/2 is the diffraction length, w is the half-width of the beam in its waist plane z = l0, k is the wave vector, E0 and e0 are the amplitude and the unit polarization vector of the electric field of the beam, respectively (both are complex-valued, e0 ± ez), ez is a z-directed unit vector, r is the radius-vector with its component rj_ lying in the ay-plane. It should be noted that the longitudinally-polarized component of EG comes into play. Substituting Eq. (2) into the third term on the right of Eq. (1) yields zero, however, a non-vanishing SH wave can be produced in the bulk of the liquid if we assume a small additive of two first-order Gaussian transverse modes occurring in the pump beam. The expressions for the electric fields of these modes are given by Eq. (2) with the amplitudes Eff, EQ instead of E0 and the polarization vectors ejf, e$ instead of e0 as well as with the factors
0-7803-4950-4/98/110.00 1998 IEEE 95
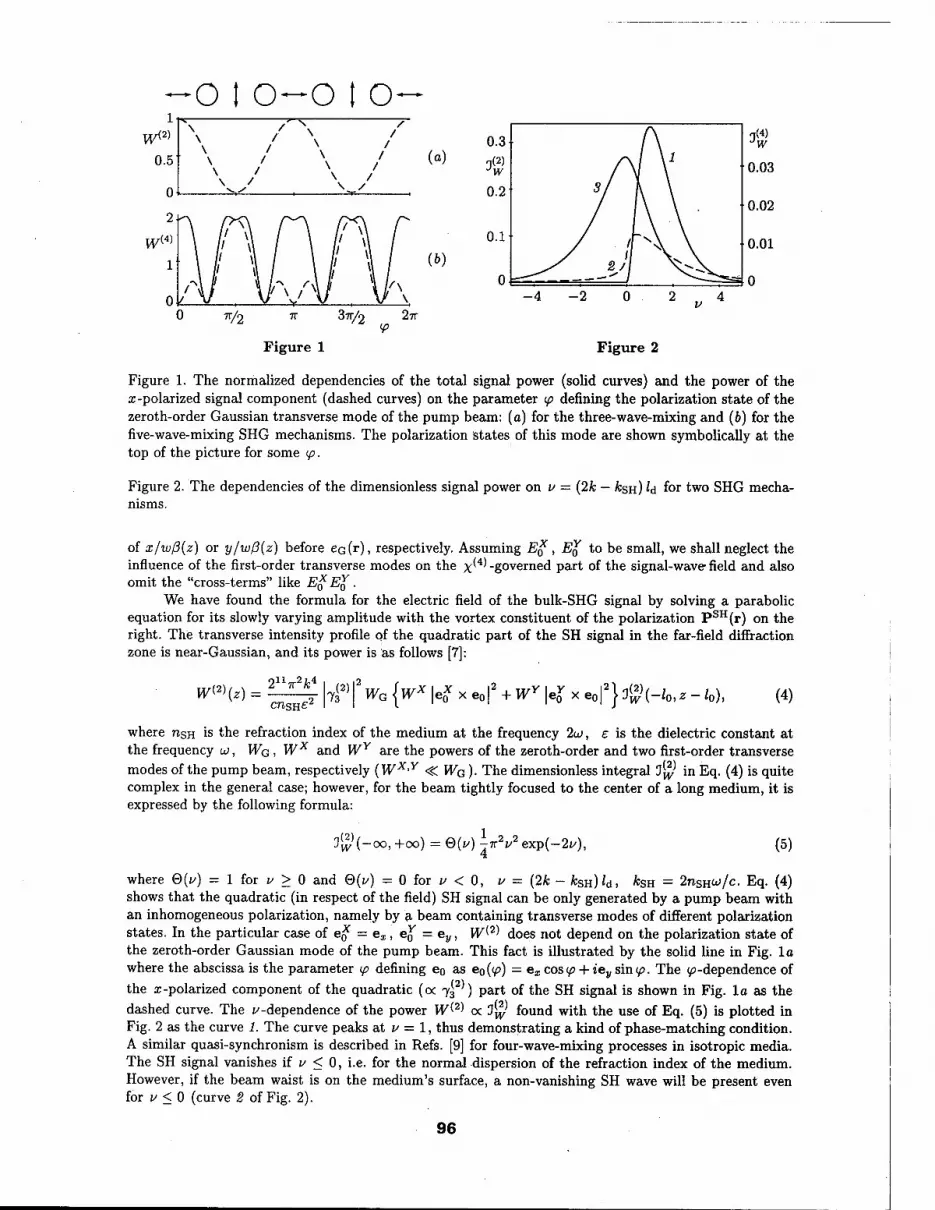
o t o-o t o (a)
(b)
37T/2 2TT
Figure 1 Figure 2
Figure 1. The normalized dependencies of the total signal power (solid curves) and the power of the a;-polarized signal component (dashed curves) on the parameter ip defining the polarization state of the zeroth-order Gaussian transverse mode of the pump beam: (a) for the three-wave-mixing and (b) for the five-wave-mixing SHG mechanisms. The polarization states of this mode are shown symbolically at the top of the picture for some tp.
Figure 2. The dependencies of the dimensionless signal power on v = (2k - fell) 'd f°r two SHG mecha- nisms.
of x/wß(z) or y/wß(z) before ec(r), respectively. Assuming Ex, EY to be small, we shall neglect the influence of the first-order transverse modes on the x'4' -governed part of the signal-wave field and also omit the "cross-terms" like Ex EQ .
We have found the formula for the electric field of the bulk-SHG signal by solving a parabolic equation for its slowly varying amplitude with the vortex constituent of the polarization PSH(r) on the right. The transverse intensity profile of the quadratic part of the SH signal in the far-field diffraction zone is near-Gaussian, and its power is as follows [7]:
cnSHe2 I d I WG{ Wx\ex xe0| + WY\eYxe0\2}3$(-l0,z-l0)> (4)
where nsH is the refraction index of the medium at the frequency 2w, e is the dielectric constant at the frequency u>, WQ , Wx and WY are the powers of the zeroth-order and two first-order transverse modes of the pump beam, respectively (WX'Y -C WQ )• The dimensionless integral T$ in Eq. (4) is quite complex in the general case; however, for the beam tightly focused to the center of a long medium, it is expressed by the following formula:
3[y (-co,+oo) 0H-7r2I/2exp(-2i/), (5)
where Q(i/) = 1 for v > 0 and 0(i/) = 0 for v < 0, u - (2k - fcsH^d, A:SH = 2nSHw/c. Eq. (4) shows that the quadratic (in respect of the field) SH signal can be only generated by a pump beam with an inhomogeneous polarization, namely by a beam containing transverse modes of different polarization states. In the particular case of ex = ex, eY = ey, W(2' does not depend on the polarization state of the zeroth-order Gaussian mode of the pump beam. This fact is illustrated by the solid line in Fig. la where the abscissa is the parameter ip defining eo as e0((p) = ex cosip + iey simp. The «^-dependence of the x-polarized component of the quadratic (a 73 ) part of the SH signal is shown in Fig. la as the dashed curve. The v -dependence of the power W^ oc 3$ found with the use of Eq. (5) is plotted in Fig. 2 as the curve 1. The curve peaks at v = 1, thus demonstrating a kind of phase-matching condition. A similar quasi-synchronism is described in Refs. [9] for four-wave-mixing processes in isotropic media. The SH signal vanishes if v < 0, i.e. for the normal dispersion of the refraction index of the medium. However, if the beam waist is on the medium's surface, a non-vanishing SH wave will be present even for v < 0 (curve 2 of Fig. 2).
96

The x'4' -governed part of the signal beam has the following power:
^(4H^) = 4^%|x(4lV^|eo-eo|2{2 + 3|eoXeS|2}jWHo^-/o), (6)
where 3$ is the dimensionless power of the SH wave. The analytical expression for 3$ for the tight focusing to the center of a long medium can only be found at v > 0:
2
3#(-oo, +oo) = ^(19 + 36i/ + 18i/2)exp(-2i/). (7)
The ^-dependence of 3$ in this case is illustrated by the curve 3 in Fig. 2, with the integral 3$ at v < 0 having been calculated numerically. In contrast to W(2), the power W(4) oc 3J4/ is non-zero for tight beam focusing even for i/ < 0, with the SHG efficiency peaked at v « 0. The polarization dependence of the power of the signal wave generated through the five-wave-mixing SHG mechanism is shown in Fig. 16 as the solid curve, while the dashed curve illustrates the ^-dependence of the power of the a;-polarized signal component.
We have also shown that at v > 0 the transverse structure of the x(4) -governed part of the SH beam in the far-field diffraction zone is a superposition of the first- and third-order transverse Gaussian modes. Modes of higher odd orders are present in the signal beam at v < 0, with the transverse intensity distribution over the beam cross-section at \u\ > 1 being a ring whose radius increases with \v\. From the orthogonality of different transverse modes, one can expect two powers given by Eqs. (4) and (6) to be additive, since the respective parts of the total signal beam are of essentially different mode structure.
Taking into account the two described-above mechanisms of the coherent SHG in the bulk of an isotropic gyrotropic medium, one can explain the arising of contributions to the observed signal [3] from both the three- and five-wave-mixing processes; however, the detected wave interference of these contributions is yet to be understood. The proposed theory accounts for the generation of the SH signal at a circular polarization of the pump wave, but not for the peak of the signal power on this condition. A possible reason for these inconsistencies remaining between our theory and the experiment could be other, not considered in this Letter, SHG mechanisms such as certain cascaded nonlinear-optical effects [3].
The authors are grateful to Dr. A. P. Shkurinov and A. V. Pakulev for helpful discussions and to the Russian Foundation for Basic Research for a partial financial support (project No. 96-02-16596).
References
1. P. K. Schmidt and G. W. Rayfield, Appl. Opt. 33, 4286 (1994); Q. Song, C. Wan, and C. K. Johnson, J. Phys. Chem. 98, 1999 (1994); E. Hendrickx, K. Clays, A. Persoons et al., J. Am. Chem. Soc. 117, 3547 (1995); P. Allcock, D. L. Andrews, S. R. Meech, and A. J. Wigman, Phys. Rev. A 53, 2788 (1996).
2. D. L. Andrews, P. Allcock, and A. A. Demidov, Chem. Phys. 190, 1 (1995). 3. A. V. Balakin, D. Boucher, E. Fertein et al., Opt. Commun. 141, 343 (1997); A. V. Balakin,
D. Boucher, N. I. Koroteev et al., JETP 85, 52 (1997). 4. D. Kim, C. S. Mullin, and Y. R. Shen, J. Opt. Soc. Am. B 14, 2530 (1997). 5. J. A. Giordmaine, Phys. Rev. A 138, 1599 (1965). 6. N. I. Koroteev, JETP 79, 681 (1994). 7. S. N. Volkov, N. I. Koroteev, and V. A. Makarov, JETP 86, no. 5 (1998) (to be published). 8. H. Haus, Waves and Fields in Optoelectronics (Prentice-Hall, Englewood Cliffs, New Jersey, 1984). 9. J. F. Ward and G. H. C. New, Phys. Rev. 185, 57 (1969); R. B. Miles and S. E. Harris, IEEE
J. Quantum Electron. QE-9, 470 (1972); G. Bjorklund, IEEE J. Quantum Electron. QE-11, 287 (1975).
97

MC25 12:30pm - 2:30pm
Stimulated Brillouin Scattering (SBS) Dye Laser Amplifiers
Gary Cook
PB115, Defence and Evaluation Research Agency, St. Andrews Road, Malvern, Worcs. WR14 3PS, England.
Tel. (44) 1684 896096 Fax (44) 1684 896270
email: [email protected]
Introduction In optically pumped dye laser amplifiers, pump energy is necessarily lost to the gain medium. With collimated beams the pumping intensity therefore decreases as it propagates, so that the pumping rate varies throughout the gain volume. Because of this, the pumping rate is generally only optimum at a given point within the amplifier. However, this condition changes if a focusing lens is placed immediately in front of a longitudinally pumped dye cell, so that there is a significant geometrical reduction in beam diameters within the gain volume. Although pump energy will continue to diminish, the pump intensity can be preserved. The pumping rate can therefore be similar throughout the gain volume. An additional benefit is that since the signal also passes through the same lens, the signal intensity is geometrically increased in addition to the gain in intensity experienced through normal laser amplification. This enhancement in signal intensity leads to a more efficient energy extraction and further contributes to a higher overall gain. This paper considers the extreme case where the beams are fully focused within the gain medium. Here, the signal is double-passed through the gain volume by phase conjugation through SBS. An SBS dye amplifier combines high gain with excellent beam quality, high conversion efficiency and extremely low levels of amplified spontaneous emission (ASE), in a simple compact design.
SBS Dye Laser Amplifier The SBS dye laser amplifier concept is shown in figure 1. The SBS dye amplifier contains laser dye dissolved in a mixture of three solvents, N-hexane:methanol:isopropyl alcohol in a 7:2:1 ratio by volume. This tertiary solvent mixture is both a good dye solvent and a good SBS material. A pump beam is made to co-propagate with a narrow bandwidth dye signal beam (preferably transform limited) using a dichroic mirror. Both beams pass through a polariser and a broad-band quarter wave plate (a Fresnel rhombus), and are focused into the SBS dye amplifier.
k, A Pump' input Dye flow
Dye signal input
output
Figure 1 - SBS dye amplifier concept
This arrangement has the following advantages: 1. Maximum geometric gain enhancement and conversion efficiency due to the complete focusing. 2. The gain and energy extraction are further increased by double-passing the gain volume due to phase conjugation
of the amplified signal. 3. Gain can be higher than achievable with conventional amplifiers due to ASE decoupling by the narrow
bandwidth of the SBS process. Broad-band ASE is not reflected by the SBS process, whereas the amplified dye laser signal is. This leads to the dye signal experiencing gain from a double pass through the amplifier, whilst any
0-7803-4950-4/98/$! 0.00 1998 IEEE 98

generated ASE experiences only a single pass gain. The overall gain therefore strongly discriminates in favour of the signal.
4. Brillouin gain adds to the dye laser gain. 5. Phase conjugation helps to maximise beam quality by compensating for any thermally induced distortions within
the gain medium.
The SBS dye laser amplifier concept has been demonstrated using a 300mm long cell filled with a 3.8X10"6 molar solution of Rhodamine 6G. A 250mm focal length lens, placed 60mm in front of the cell was used to focus the beams. A commercial 60mJ 532nm Q-switched frequency doubled Nd:YAG laser was used to pump the SBS dye amplifier. The dye signal was provided by an in-house build dye laser with a diffraction limited beam and a linewidth of 88MHz (1.8 times the transform limit for the 9nsec FWHM Gaussian pulse). The maximum intrinsic conversion efficiency of 532nm pump light into dye light was 53%, and the small signal gain peaked at ~105. No optical breakdown was observed in the SBS dye amplifier. The experimental data is shown in figure 2.
f 0.2
Ä \ ■\ H H m
Y
i Y
i 300rrm long cell +250mm focal length lens Gem lens to cell separation 3.8 x 10>£ molar Rhodamine 6G 7050:10 solvent mix BOmJ pump energy
104
I «f
10*
0.001 0.1 10 0°0
300iTm long cell +250Tm focal length lens 6cm lens to cell separation 3.8 x 10⁶ rrriar Rnodam'ne 6G 7020:10 solvent nix 60ml pmp energy
Input energy (mj)
0.001 0.1
Input energy (mJ)
Figure 2 - SBS conversion efficiency (left) and gain (right) as a function of signal energy
The beam quality from the SBS dye amplifier was extremely good, being smooth and Gaussian-like in the near and far fields. Beam diameter measurements of the far field profile at the focus of a 2.5m focal length lens showed the output to be within 5% of the diffraction limit. The near and far field beam profiles are shown in figure 3.
Figure 3 - SBS dye amplifier output near field (left) and far field (right)
Theory It has been assumed that the pumping pulse duration is much shorter than the inter-system singlet to triplet crossing rate, K st, for the dye, which is typical of most dye solutions pumped by Q-switched laser pulses. The triplet population density will therefore be small and can be neglected. It is also assumed that the stimulated emission cross-section at the pump wavelength is very small, and that the pump beam is not reflected by SBS (it is absorbed). With these assumptions, the coupled equations describing the forward dye beam intensity, IL, the
backward (SBS) dye beam intensity, I*L , and the pump beam intensity, Ip are:
dz
VJKW-^W] h + h IP(SAT) IJSAT).
-<*.,(£) 1 + -^ L- IL{SAT)\\ 2(z-f)lL
1 + - /,+/, /, + /: *:+(*-/)'
-gJX 0)
IP{SAT) IJSAT) IL(SAT)
99

dl,
dz
^ k(i)-«„(i)] /, +1. MSAT) IU(SAT). -O..W 1 + -
1 + - w; /,+/: If(SAT) IJSAT) ItSAT)
IL(SATl -gJX (2)
rf/, F_
dz
-»rlA°m(P) I, + I'
L IL{SAT)_ + °n(P)
I.+I.
MSAT) Iu(SATl
1 + - -+A±JL+.J- + I' If(SAT) IU(SAT) IL(SAT)
2(z-f)lf (3)
where aM(L,P) is the ground state absorption cross-section at the laser and pump wavelengths respectively,
ci10(i) is the stimulated emission cross-section at the laser wavelength,
ai2(L,P) is the excited state singlet absorption cross-section at the laser and pump wavelengths respectively, nT is the number density of dye
molecules, A(SAT) are the
MO6
i-105
SBS Dye Amplifier 1
1°
1 I i I 1 1
1-104 -
wo5 - 0 -
100 -
10
1 1 1 I I I I-— ....
Numerical solution, g;
000 Experiment
1-10 1-10 I-10 Input signal intensity (W/m2)
= 12cm/GW
Figure 4 - Comparison between experiment and theory for a SBS dye amplifier
classical saturation intensities [1] for stimulated emission, pump absorption and laser ground state absorption
respectively, z2R is the Rayleigh range
for the focused beam, gB is the Brillouin gain coefficient (sum of electrostrictive and absorptive contributions), and/is the focal length of the input lens. This system of equations has been solved numerically, and gives excellent agreement with experiment as shown in figure 4. A figure of e"30 was used for the Brillouin noise [2].
Cascaded SBS Dye Amplifiers Because broad-band ASE is not reflected by SBS, several SBS dye amplifiers can be operated in series without the usual problems from ASE associated with high gain systems. Figure 5 shows two SBS dye amplifiers operated in a compact series arrangement. The two amplifiers are polarisation decoupled using a central polariser.
Conclusions The concept of a SBS dye amplifier has been demonstrated, with good agreement between experiment and theory. SBS dye amplifiers offer high gain, good conversion efficiency and excellent beam quality in a simple compact arrangement.
References F. J. Duarte (Ed.), "High Power Dye Lasers", Springer Series in Optical Sciences, vol. 65, chapter 3 (C. Jensen), 1991. W. Kaiser and M. Maier, "Laser Handbook 2, Eds. F. T. Arecchi and E. O. Schulz-Dubois, North Holland pubs., Amsterdam, 1972.
100

MC26 12:30pm - 2:30pm
SWING EFFECT OF SPATIAL SOLITON IN SECOND ORDER MATERIAL
A. Di Vito, F.Garzia, C.Sibilia, M.Bertolotti Dipartimento di Energetica, Universita' degli Studi di Roma "La Sapienza"
also GNEQ of CNR and INFM Via AScarpa 14, 00161 Roma, Italy
Tel. +39-6-49916541, Fax. +39-6-44240183, E-mail [email protected]
INTRODUCTION Spatial solitons are self-trapped optical beams that propagate without changing their spatial shape, since the diffraction and the nonlinear refraction balance each other in a self-focusing medium1. In this paper we study the behavior of a soliton beam in a second order material and in a waveguide which, in the plane between the cladding and the substrate, has a distribution of refractive index that follows a Gaussian curve, where the initial position of the maximum of the intensity of the soliton is shifted with respect to the maximum of the index profile. In this situation the beam is attracted towards the center of the index profile, acquiring a certain velocity that allows it to pass this point and to continue to move forward to the other side of the index profile, decreasing its velocity.
TRANSVERSE EFFECT OF A SOLITON BEAM IN A GAUSSIAN SHAPED REFRACTIVE INDEX PROFILE
Interesting effects have been found in the study of transverse effects of soliton propagation at the interface between two nonlinear materials2"3 or in a material in the presence of a gaussian refractive index profile, that is in low perturbation regime4. It is possible to show that in a plane wave geometry, where the transverse field confinement is given by the refractive index variation, the e.m. propagation of the fundamental and of the second harmonic is described by the following nonlinear coupled equations in the x-z plane:
l -£ + --£? + 2 (r0*oXW/W - "0 )«! + U\U2 = 0 (la)
^+^+(^o)(»52K)-»o2K+w> =° <lb>
being z the longitudinal propagation coordinate, x the transversal coordinate, r0 is the transverse
scale length, z0 =r*k0n0 is the longitudinal scale length, w,,w2 = %Ah2 being Al2\ the intensities i
of the fundamental and of the second harmonic wave and % = a]!/^ e0n){G>)n]{2coy§2 d with d
the effective quadratic susceptibility. Moreover «/s are the refractive indeces of the fundamental
and of the second harmonic and n0 is a reference refractive index. A conserved quantity of the system of eqs.[l] is the normalized total power of the two beams:
M=](^ui\2 +2\u2\
Z}lx, (2) —00
and the center of gravity of the system:
0-7803-4950-4/98/f 10.00 1998 IEEE 101

Jx(|wi| +2|M2| )dx
M (3)
It is possible to demonstrate that, in the absence of gradient of the transverse refractive index, M dx
and v = — are constant quantities. This fact together with the existence of localized, stationary dz
solutions of system[l], which has been solved both analytically and numerically, allows us to introduce the equivalent particle model as a tool to study the beams evolution. Because of the inhomogenities of the medium the velocity v is no longer constant due to the presence of a force f acting on the center of gravity of the system given from:
/
(4) where Aflf(x) and AsH(x) are the refractive index profiles at co0 and 2co0 respectively and
It is possible to show that the potential has the following expression:
U(x) = krA)W 1 (|«.(* - xf)H(x)dx - (r0k0f As](\u2(x - xf)H(x)dx + T }(«;«,(* - x))H{x)dx + r J(«fc(x - x))H{x)dx
(5) If the initial profile of the input beams are:
M, (x-,o) = u° exp -
u2 (x,0) = u° exp
where a andß are constants, the eq.[5] becomes:
r ( 'x-x^ 2~
—
^ 2a )
fx-s) 2~
l 2ß )
Ut (x) = *,. Jexp[- a, (x - x)2 ]ff(x)dx
(6a)
(6b)
(7)
where *, = ^(u°f Af(r0k0)\ k2 = (w20)2 As{r0k0f , k3 = 2T(u°)2 u°2, «,=^7, ai=Jf>
a3 ~ o _ 2 TJO2 2a2 Aß2 '
If H(x) = exp(- bx2), that is a Gaussian refractive index profile, where b is a parameter responsible
for the width of the profile, the potential can be written as:
Ut(x) = k, K
\a,+b exp (-a;x2), (8)
where a. = _al_ a, +b
The acceleration that acts on the beams can thus be rapidly calculated as: n
a{x)~l^--M cSe -MV^ai+baXQXP (-ay). (9)
102

If b « at eq.[9] can be approximated as:
a(x) = —^lki j—bxexp(-bx2) = Kxexp(-bx2) M a,
(10)
2 n where K-—T^/fc —b. If the beams are positioned in the point where the acceleration is
M , 'v- \ai
maximum, that can be calculated to be x0 Ynrr, the resulting oscillation period is: / \2b
\ 32
^(l-exp(-l/2))^ (11)
The above theory as been confirmed through numerical simulations, using a BPM algorithm, whose results are shown in figs.(l).
Fig.lA Upper view of a numerical simulation of fundamental beam for r=0.05, A/ = As = 0.05, u° = 4.2, u°2 = 3.
Fig. IB Upper view of a numerical simulation of a fundamental beam for r=0.05, A/ = As = 0.05, u° = 5.6, u°2 = 4 .
CONCLUSIONS The studied behavior of a soliton beam in a Gaussian shaped waveguide allows the swing effect to take place even in second order material. The oscillation period depend on both the amplitude of the beams and on the parameters of the waveguide.
REFERENCES [1] F.Garzia, C.Sibilia, M.Bertolotti, R.Horak, and J.Bajer, Optics Comm. 108 (1994), 47. [2] A.B.Aceves, J.V.Moloney, and A.C.Newell, Opt.Lett. 13 (1988), 1002. [3] AB.Aceves, P.Varatharajah, AC.Newell, E.M.Wright, G.I.Stegman, D.R.Heatley, J.V.Moloney, and H.Adachihara, J.Opt.Soc.Am.B 7 (1990), 963. [4] F.Garzia, C.Sibilia, and M.Bertolotti, Optics Comm. 139 (1997), 193.
103

MC27 12:30pm - 2:30pm
Finite Difference Time Domain Analysis of Nonlinear Optical Waveguide
Hiroshi MAEDAt Hideyuki HAMADA* Kiyotoshi YASUMOTO* f Fukuoka Institute of Technology, Wajiro-Higashi, Fukuoka 811-0295, Japan
PHONE: +81-92-606-3131 Ext. 2362, FAX: +81-92-606-0758 | Kyushu University, Hakozaki, Fukuoka 812-81, Japan
PHONE: +81-92-642-4045, FAX: +81-92-632-5204
1 INTRODUCTION
Soliton in optical fiber communications is a key technology for Giga-bps data transmission]!]. The trade-off between linear and nonlinear dispersions plays important role in the phenomena. In this paper, we shall demonstrate the propagation of solitons in two-dimensional nonlinear optical waveguide with dispersive characteristics by making use of finite difference time do- main(FDTD) method[2]. In the conventional FDTD analysis, the computational window was fixed and the size was relatively small. In this paper, by shifting the computational window, we confirmed the soliton propagation up to 1000 [/urn].
2 Finite Difference Time Domain Method
According to the FDTD scheme[2], the two dimensional(9/9y = 0), discretized Maxwell's equations for transverse electric (TE) mode, which propagates to z axis, are described as follows;
H2+1/2(i + \,k) = flJ-i/2(i + I,A:) + -^-[^(i + i>fc + i)-^(i + i>fc-i)]) (1)
+At [{flJ+1/2(* + \,k + 1) - f£+1/2(t + \,fc)} /Az
- {H^l\i + 1, k + \) - H?+1'\i, k + \)} /Aa (3)
where E and H are electric and magnetic field and D and H are respective flux densities. The space and time discretization steps are Ax, Az, At and i, k, n are the number of the corresponding grid. Giving a set of suitable initial conditions to above equations, the latest field is calculated successively as the increase of time step.
3 Frequency Dependent FDTD Method
Some authors developed the FDTD technique for dispersive medium [3] [4] [5]. The electric field, the polarizations and the flux density of the nonlinear material holds the following relation;
eoeooEy = Dy-PL-PR- PK, (4)
where eo and e,» are permittivity of free space and the saturated value of the relative constant in the limit that frequency is infinity. The frequency dependent polarizations PL, PR, and PK are linear polarization, Raman scattering, and Kerr effect, respectively. The permeability is assumed to be nondispersive and equal to that of free space \i§ in the whole region. Sullivan formulated these polalizations for FDTD algorhithm utilizing Z-transform technique[5]. In the followings, we use a character z for space coordinate and z = JLJ for Z-transform.
0-7803-4950-4/98/$10.00 1998 IEEE 104

3.1 Linear Dispersion PL
The linear dispersion is given by the following convolution between the electric field and the linear susceptibility x^\t) in time domain:
PL(t)=e0 /*X(1)(*-T)-S(r)dr (5)
Jo
where x(1)(*) = 7Lexp(aj^)sin(/?Li), aL = u)L6L, ßL = u)LyJl-52L, and jL = uL{es -
£00)IJ1 — ?>L,- Taking the Z transform of Eq.(5) for the discrete data train, the following equaiton is obtained [5].
PL(Z) = eoX(1)(z)-E(z)-At
7L ■ At • e~aL5t sin(/3L At) • z~l • E(z) = eo
1 - 2e-a^At cos(ßLAt) ■ z-1 + e-2Q^At • z~2
= ^"^(z), (6)
Here we should note that the z_1 operator indicate the delay of one time step. Prom Eq.(6), we have the relation between latest SL(Z) and the past values;
5L(z) - ciz^SUz) - c2z-2SL(z) + c3E(z) = aSf1 - c2Sl~2 + c3En, (7)
where c\ = 2e_QLA*cos(/?zAt), c2 = e~aLAt, and c3 = 7iAte-aLA*sin(/9LAt). Finally, we can obtain the following form which is suitable for FDTD algorhitm:
P£ = eo52_1 (8)
3.2 Raman Scattering PR
The nonlinear polarization due to Raman scattering is given by
PR(t) = E(t)IR(t) = xä,3)(l - a)E(t) f'eogRit - r)E2(r)dr (9) Jo
where Xo ^ *ne third order nonlinear susceptibility and a is a weight factor between PR and PK- Because the gR{t) is similar to x^\ we have following FDTD form of PR;
P% = EnIl = eQEnSR-1 (10)
SnR = cNL1S
nR-l-cNL2SR-2 + cNLZ{En)2 (11)
where cNLl = 2e-Q*A*cos(/3fiAt), cNL2 = e'2aRAt, and cNL3 = iRAte-a*Atsm{ßRAt), aR =
UNLSNL, ßR = UNL\J1 - 8%L, and -yR = u)NLXb (l ~ «Vy * ~ SNL-
3.3 Kerr Effect PK
Kerr effect is given as Pft;(t) = £0X0 ®E3(t). Taking Taylor expansion to E3(t) around t = tn-i, Pi<{t) is described as:
PK(t) = £oXo3)« {3(En~l)2En - 2(En~1)3} (12)
3.4 Total Expression of Electric Field
Substituting Eqs.(8), (10), and (12) into (4), the latest field En is described by making use of known data as:
En = Dn/eo-Sl'l+2Xf)a(E-if .
£00 + Xo3)(l - «)SS-1 + 3XJ3)a(^-i)2
105

4 Numerical Results and Discussion
The waveguide structure is depicted in Fig.l and the parameters used here are listed in Table I. The material is same with silica based optical fiber. This waveguide is illuminated by linear TEo mode. The envelope funcion along z-axis of the incident wave is hyperbolic-sine which is modulated by the carrier signal with wavelength 1.55 urn. The computational window is surrounded by Mur's absorbing boundary[6] and the perfectly matching layer(PML)[7] as sketched in Fig.l. When the envelope reaches to the output end, the electromagnetic field data arrays near the output end are shifted to the input end as illustrated in Fig.l. Repeat- ing this procedure, the envelope soliton can propagate to longer distance compared with the conventional technique.
In Fig.2, the maximum electric field of the envelope soliton along x axis at z = 100[jum], 300[/im], and 1000[jum] are plotted. The maximum electric field intensity at the input end is Eyi = 0.7[V/m] and the vertical axis of Figs.2 and 3 are normalized by Eyi. The soliton is formed at x = 300[//m] and keeps its shape till z — 1000[/im]. The electric fields of the envelope soliton at z = 300[)um] and 1000[/im] are plotted in Fig.3. Both curves corredpond to each other very well. From these figures, the propagation of envelope soliton in two-dimensional waveguide can be simulated effectively by the FDTD with window shift. Appliying this technique to various waveguide designs such as bend, taper, directional couplers will be future subjects.
NX r - - - - — PML
\ MUR \ x :■:)■ j *
>
/ / / / / / / PML
~MUR
NZ- NZ'
Fig.l : Shift of computational window.
Ax QA/jim
Az 0.05/im At 0.1/s NX 51 NZ 3001
core width 4.8/mi
Xo3) (core) 0.07(F/m)-2
£oo (core) 2.25 £oo (cover,clad) 2.00
Table I : Parameters used here. Ey/Eyl i.sr 1.4
1.2
1
0.8
0.6
0.4
0.2
O
-0.2
z-100[^ m]
z>300[|i m]
ZBlOOO[fim]
z-3oom™ z-1000[|ln
0 »[Jim]
275 975
300 325 1000 1025 zftiml
Fig.2 : Comparison of field Ey along x axis. Fig.3 : Comparison of field Ey along z axis at NX=26.
References
[1] G. P. Agrawal, "Nonlinear Fiber Optics" Academic Press, 1995.
[2] K. S. Yee, IEEE Trans, on AP, Vol.14, No.3, 1996.
[3] P. M. Goorjian, et al., IEEE Jour, of QE, Vol.28, No.10, 1992.
[4] R. Luebbers, F. Hansberber, IEEE Trans, on AP, Vol.40, 1992.
[5] D. M. Sullivan, IEEE Trans, on AP, Vol.44, No.l, 1996.
[6] G. Mur, IEEE Trans, on EMC, Vol.23, No.4, 1981.
[7] J. P. Berenger, Jour, of Comp. Phys., Vol.114, No.l, 1994.
106

MC28 12:30pm - 2:30pm
FLUORESCENCE-BASED MEASUREMENT SCHEMES USING DOPED FIBER: THEORETICAL ANALYSIS AND EXPERIMENTAL VALIDATION
T W2\ w 121
T
T. Sun, K.T.V. Grattan, Z.Y. Zhang and A.W. Palmer Department of Electrical, Electronic & Information Engineering, City University, Northampton Square, London EC IV OHB. Direct Tel&Fax: +44(0)171-4778121, Email: [email protected] S.F. Collins, G.W. Baxter and S.A. Wade Optical Technology Research Laboratory, Department of Applied Physics, Victoria University, P.O. Box 14428, Melbourne City MC, Victoria, Australia 8001.
1. Introduction Fluorescence-based sensing and measurement schemes are widely used, for example, using doped "communications" fiber. The underlying physical principle exploited in these measurement systems is the thermalization which occurs between closely-spaced excited ionic energy levels when the levels are populated using an appropriate excitation source, usually an LED or LD. The two schemes compared in this paper (fluorescence lifetime (FL) and fluorescence intensity ratioing (FIR) exploit very different aspects of the
resultant fluorescence decay from these levels1'2. Both have the major advantage of being independent of possible fluctuations of the excitation source, which is very important for robust measurements and the understanding of the physical processes.
Fluorescence lifetime (FL) based sensing techniques employ an analysis of the exponential decay which enables the fluorescence lifetime to be determined. The
Fig. 1 Schematic energy level diagram of fluorescence intensity ratio (FIR) in rare- the three level model earth-doped optical materials (particularly
fibers) uses fluorescence from two closely-spaced levels to a common final state which is monitored, and the ratio of the two emission intensities is calculated, resulting in a temperature-dependent quantity. These approaches are discussed and compared.
2. Essential background theory The simplified energy level diagram of a typical fluorescent material depicted in Fig. 1 shows two closely-spaced upper states, levels 1 and 2 (energy separation AE2l), which may decay radiatively to level 0. When levels 1 and 2 are excited through some pumping scheme (the details of which are not important here) the relevant populations, N0, Nx and N2 respectively, are given by the following rate equations
__ *
w20<: W02<
WlO^ Wois
0 JL
Ei
dN,
dt ■ ^2! N1(wl2+ww) + N0w0
dN
dt 1 = N2An - Nt(wl2 +Al0) + N0w01
dN2 ,. ... . .. dN2 —- ~ N,wn - N2(wn +ww) + N0w0 —2- dt dt #iwi2 -#2(4l + A20) + ^owo: (1)
dN dN —f- = N,ww + N2w20 - N0 (wm + w02 )—f- = N,Aw+N2A2li-N0 (w01 + w02) dt dt
where Ay and wv are the spontaneous radiative transition rate and the absorption rate, respectively, of the ions from level i to level j (where i, j are integers). It is assumed that
0-7803-4950-4/98/$10.00 1998 IEEE -|()7
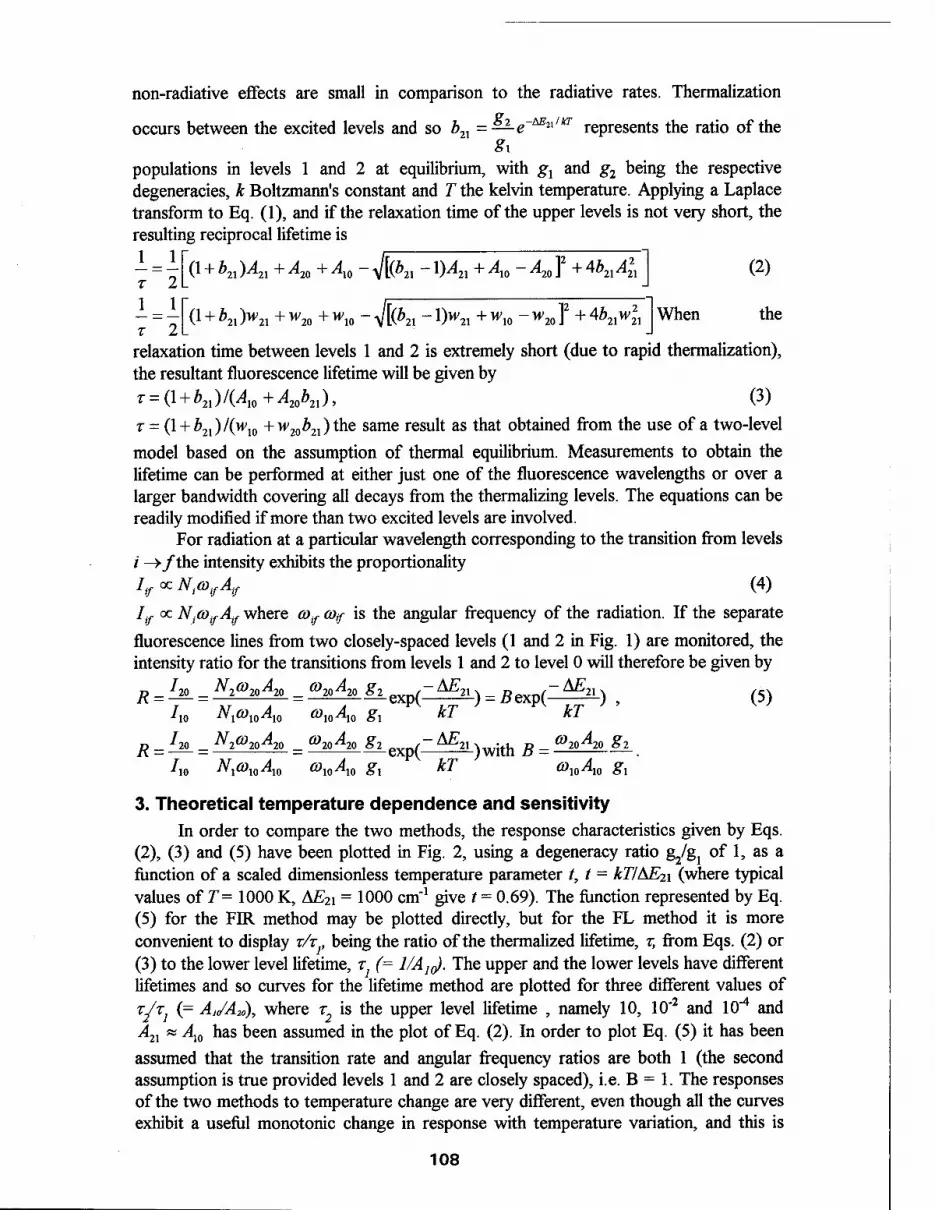
non-radiative effects are small in comparison to the radiative rates. Thermalization
occurs between the excited levels and so b2X =sJ^e~AE21'kT represents the ratio of the Si
populations in levels 1 and 2 at equilibrium, with gx and g2 being the respective degeneracies, k Boltzmann's constant and T the kelvin temperature. Applying a Laplace transform to Eq. (1), and if the relaxation time of the upper levels is not very short, the resulting reciprocal lifetime is
T~ 2 (1 + b2X )A2X + A20 + Axo - V[(*21 -l)4i +Ao -4o]2 +4KA 2\"-l\ (2)
(1 + b2X )w2X + w20 + wxo - <J[(b2X-l)w2X + wio - w2o ]2 + 4Ö21w When the r~ 2
relaxation time between levels 1 and 2 is extremely short (due to rapid thermalization), the resultant fluorescence lifetime will be given by T = (l + b2X)/(Ax0+A20b2X), (3) T = (l + b2X)/(wX0 + w20b2X)the same result as that obtained from the use of a two-level model based on the assumption of thermal equilibrium. Measurements to obtain the lifetime can be performed at either just one of the fluorescence wavelengths or over a larger bandwidth covering all decays from the thermalizing levels. The equations can be readily modified if more than two excited levels are involved.
For radiation at a particular wavelength corresponding to the transition from levels / —»/the intensity exhibits the proportionality Iif oc NtcoifAif (4)
Ijf oc NjCO^Ajf where coif coif is the angular frequency of the radiation. If the separate
fluorescence lines from two closely-spaced levels (1 and 2 in Fig. 1) are monitored, the intensity ratio for the transitions from levels 1 and 2 to level 0 will therefore be given by
R = l*L= ^20^20 = fjjA g2_exp(Z^l) = ffexp(Z^k) t (5) Iw N,(owAw o)wA10 gx kT kT
n _ Ao _ -^26)20y*20 _ ^20^20 Si cxp( ~ 21 'i with B = ^^ ^2
Iw Nx<oX0Aw toxoAxo gx kT et)X0AX0 gx
3. Theoretical temperature dependence and sensitivity In order to compare the two methods, the response characteristics given by Eqs.
(2), (3) and (5) have been plotted in Fig. 2, using a degeneracy ratio g2/gj of 1, as a function of a scaled dimensionless temperature parameter t, t - kT/AE2i (where typical values of T= 1000 K, A£2i = 1000 cm"1 give t = 0.69). The function represented by Eq. (5) for the FIR method may be plotted directly, but for the FL method it is more convenient to display T/T , being the ratio of the thermalized lifetime, T, from Eqs. (2) or (3) to the lower level lifetime, T} (= 1/A10). The upper and the lower levels have different lifetimes and so curves for the lifetime method are plotted for three different values of T/T (= Aj/A20), where T is the upper level lifetime , namely 10, 10"2 and 10"4 and A2X « Al0 has been assumed in the plot of Eq. (2). In order to plot Eq. (5) it has been assumed that the transition rate and angular frequency ratios are both 1 (the second assumption is true provided levels 1 and 2 are closely spaced), i.e. B = 1. The responses of the two methods to temperature change are very different, even though all the curves exhibit a useful monotonic change in response with temperature variation, and this is
108

1e+2
S. 1e-3
K 1e-4
- - f- - j :-- ;■■ -■
Y / ^ / X
r~ r
I i i i i
discussed below.
4. Comparison of theory with experimental data In Fig. 3 normalized FIR experimental data are shown as a function of the scaled temperature
0.6 0.9
Scaled temperature
Intensity ratio method Upper/lower lifetime ratio=0.01 (rts) Upper/lower lifetime ratio=0.0001 (rts) Upper/tower lifetime ratio=10 (rts) Upper/lower lifetime ratio=10 (rtl) Upper/tower lifetime ratio=0.01 (rtl) rts: relaxation time is short rtl: relaxation time is long
for Er -doped fiber, Yb -doped fiber and bulk Pr3+:ZBLAN. Each data set was fitted using Eq. (5) in which the normalizing factor B and AE^were the free parameters. All data were divided by the appropriate value of B, and so the three data sets follow the same curve. The agreement between the experimental results and theory is very good and the simple theory of operation of FIR sensors implied by Eq. (5) is confirmed. The above comparison shows that at very low temperatures the FER method has a higher sensitivity and thus is to be preferred for temperature monitoring as the response for the
1 0.8
0.6
0.4
0.2
0.1 0.08
0.06
0.04
0.02
• R/B (Er3' • R/B (Pr3*) — Theoretical curve A R/B (Yb3*)
Fig.2 Comparison of the performance of the FIR and FL methods
FL method tends to a constant value with its sensitivity approaching zero. However, over a wider range the difference between the responses is less evident, especially for the case when the intrinsic lifetime of the upper level is shorter than the lower and the relaxation time is short. Many other factors need to be taken into account in any practical comparison of these responses, including the spectroscopic details of the dopant ion and the technical issues associated with constructing a sensor based on these results. However, very large intensity ratios may cause problems of accuracy, as do very short lifetime measurements (x < 1 |j.s) in low cost instrumentation. However, the analysis presented here is helpful in the selection, and a process of cross-referencing and cross- calibration of one method to the other may be used to widen and optimize the range of the sensor, in the same way that the use of blackbody radiation has been demonstrated as a cross-referencing approach to measurement of both higher (T> 500K) and lower (T< 500 K) temperatures with the same probe.
References 1. K.T.V. Grattan and Z.Y. Zhang, Fiber Optic Fluorescence Thermometry (Chapman
and Hall, London, 1995). 2. G.W. Baxter, S.A. Wade, S.F. Collins, G. Monnom and E. Maurice, SPIE Proc.
2841, 249 (1996). 3. T. Sun, Z.Y. Zhang, K.T.V. Grattan, A.W. Palmer and S.F. Collins, Rev. Sei.
Instrum., accepted for publication, 1997.
0.01 0.0 0.5 1.5 2.0 1.0
Scaled temperature
Fig. 3 Normalized FIR data as a function of the scaled temperature
109

MC29 12:30pm - 2:30pm
Large Phase Change by Cascaded Second-order Effects in 3-Methyl-4- methoxy-4'-nitrostilbene Single Crystals
Sungwon Kimf, Hyung-Ki Hong*, Choon Sup Yoon* and E. W. Van Stryland*
*CREOL, University of Central Florida, Orlando, Florida 32826, U.S.A. (Tel: +1-407-823-6814, FAX: +1-407-823-6880)
'Department of Physics, KAIST, Taejon 305-701, Korea (Tel:+82-42-869-2532, FAX: +82-42-869-5532)
In recent years second-order cascading effects in non-centrosymmetric crystals have drawn much attention not only in the context of basic understanding of the nonlinear optical processes but also potential applications in all-optical devices such as optical switches and transistors05.
From the coupled amplitude equations, the nonlinear phase change impressed on to the fundamental beam in small depletion limit at the exit surface z = L is given by(2)
Ad^s—{l-[l + (2l7M)2],/2} (1)
cod w | E0 | where T = —. and E0 is the incident fundamental field. For large phase mismatch
and/or low irradiance, | Ak |»| T | , and Eq. (1) can be further approximated as
AcD^*- IllL . (2) ML
The effective nonlinear refractive index can be derived from the analogy to the optical Ken- effect.
wf=_d_A«Dwt. (3) 2nLl
Although %m((o;2a),-a)): %mQcojo,co) cascading process utilizes the second-order susceptibility, the nonlinear phase shift due to the process is exactly equivalent to that caused by the third-order susceptibility %(3). Since the amount of phase change due to the second-order cascading is proportional to the square of the effective d-value, organic crystals with large second-order susceptibilities, such as 3-methyl-4-methoxy-4- nitrostilbene(MMONS) are of great interest in this respect. MMONS crystals show one of the largest second-order susceptibilities and the effective d-value was measured to be deff
= 38 pm/V at 1.064 JJ. m by Maker fringe technique. MMONS crystals were grown by solution growth method. The crystal was cut normal
to the type II phase matching direction, (6, <p) = (73.63 °, 0°). The thickness of the sample was 1.994 mm. Although the effective d-coefficient has the largest value at (6,<p) = (73.63 °, 0°) , the walk-off angle in this direction is fairly large, which is about 10°. To overcome the problem of the large walk-off, a beam of elliptical profile was used to increase the interaction length of fundamental and harmonic beams.
The energy depletion curve of the fundamental beam was measured by using a Nd:YAG laser operating at 1.06 // m with a pulse duration of 26.5 ps. The beam was focused by the cylindrical lens of f = 8 inch and the Gaussian beam size at the waist was measured to be 0-7803-4950-4/98/$10.00 1998 IEEE 11Q

1.91 mm for the major axis and 49 ftm for the minor axis. The peak irradiance of the fundamental wave at the focal point was 21.2 MW/cm2 . The sample was rotated around the phase-matching angle by ± 0.5° with the y-axis as a rotation axis. The depletion curve is shown in Fig.l and the effective d-value is calculated to be 39 pm/V which agrees very well with the Maker fringe value, deff= 38 pm/V.
The Z-scan technique was used to monitor the induced phase change by the cascaded Zm '■ Z(2) process in MMONS. The beam intensity was reduced to 2.16 MW/cm2 at the focal point to satisfy the condition for small depletion limit. The positions of the transmittance maximum (peak) and the transmittance minimum (valley) were determined and the transmittances at the peak and valley were measured as a function of phase mismatch \AkL\. The difference between the transmittances at the peak and valley, AT _v was found to be largest at ML * ±n (Fig. 2). For the case of cylindrical beam
profile, it was derived by numerical method (3) that ATp_v is related to the nonlinear phase
change as follows. ATpv «0.44(l-5)073 | AO^ | for | AO0 |<>r/2 (4)
where S represents the relative ratio of an aperture size. By using the relations (3) and (4), the effective nonlinear refractive index was estimated to be | nf |« 1.7 x 10"12 cm2/W. To the best of our knowledge this value is the largest among the reported values, which is about 80 times larger than that of KTP with much smaller irradiance (Table 1).
The bound electronic Kerr effect, n2(Kerr) was measured for each polarization used in the cascading experiments and these values were subtracted from the value of n2
eff in order to obtain the nonlinear refractive index of purely cascaded effect. For the b-polarization and the polarization perpendicular to the b-axis, these values are 0.56 x 1014cm2/W and 1.16 x 10"14 cm2/W respectively, which are almost negligible compared to the effective nonlinear refractive index value due to the cascaded effect.
Table 1. Comparison of effective nonlinear refractive indices. All of them were measured by
Z-scan method.
Sample deff Phase Irradiance nf
Material thickness(mm) (pm/V) matching type (GW/cm2) (10- 14 cm2/W)
KTP(2) 1 3.1 I 9.4 2
KNb03(4) 5 5.1 I 6.5 x 10'1 7.3
DAN(5) 0.77 27 I 2 25
MMONS 1.99 39 II 2.16 x 10'3 170
111

Transmittance
-67t -4% -'.
*fes 0.10 -
-0.10
-67t -47C -2TC 0 27t 47C 67c AkL
Fig. 1 Depletion curve of die fundamental wave as a function of phase mismatch AkL. The closed circles represent the experimental data and the solid line is a calculated curve for which absorption is taken into consideration.
Fig. 2 AT as a function of AkL. The closea circles represent the experimental data and the solid line represents the calculated one.
References
(1) G. I. Stegeman, D J. Hagan, L. Tomer, Optical and Quantum electronics, 28, 1691(1996).
(2) R. DeSalvo, D. J. Hagan, M.Sheik-Bahae, G. Stegeman, and E. W. Van Stryland, Opt. Lett. 17, 28 (1992).
(3) Sungwon Kim, Ph.D. Dissertation, Univ.of Central Florida, Orlando, Florida (1996).
(4) R. DeSalvo, Ph.D. Dissertation, Univ.of Central Florida, Orlando, Florida (1993).
(5) D. Y. Kim, W. E. Torruellas, J. Kang, C. Bosshard, G. I. Stegeman, P. Vidakovic, J. Zyss,
W. E. Moerner, R. Twieg and G. Bjorklund, Optics Letters, 19, 868(1994).
112

MC30 12:30pm ■ 2:30pm
MODEL OF A PASSIVELY Q-SWITCHED LASER ACCOUNTING NONLINEAR ABSORPTION ANISOTROPY IN A PASSIVE SWITCH
N.N.H'ichev, A.V.Kir'yanov, and P.P.Pashinin General Physics Institute, Vavilov St., 38, Moscow, Russia, Phone: (095)135-0327, Fax: (095)135-2055
1. INTRODUCTION Interest to the passive Q-switching mode in lasers does not fade on decades. Manufacturing in the last time of
new passive Q-switches (PS) of crystalline type allows one to realize this regime for lasers of the broad spectral range. This, in turn, demands to perfect the model [1,2] describing this mode of oscillation. In particular, general formulas for output energy and giant pulse duration are recently generalized [3] for the case of excited state (ES) absorption in PS with phototropic centers (PC).
The aim of the present paper is further developing of the model [1-3], i.e. finding general formulas for output energy and duration of giant pulse, taking into acount: (i) PC orientations in crystalline PS (is done at first) and (ii) the ratio of generation spot sizes in PS and active medium (AM). On the one hand, despite to be considered in a sample of classic works, (ii) is used in incorrect form in others. On the other hand, (ii) is not reflected in general expressions of [2,3]. Our paper is aimed to fill these gaps.
Here, we present the theoretical analysis of the generalized model (part 2); its verification by the experiment with a Nd:YAG laser passively Q-switched with PS based on an LiF:F2" or an Cr^YAG crystal (part 3); and the main conclusions of the work (part 4).
2. THEORETICAL ANALYSIS Let us use the approach [2]. The system of equations describing the passive Q-switching mode in a laser sketched
in Fig. 1 can be written as
£ - ^(2o-alana -2o-Osls|f«(ö)nÖ -2^1s|f^)n® -ln(±) -L
:-£<T,n,F,c
= -o^f«(S)n«F.cK i = l:m
= a^f»(d)n»F,cK
(1.1)
(1.2)
(1.3)
(1.4)
(1.5)
where Fa is the intracavity photon density in AM, m is the inverse population in AM, o-a is the effective luminescence cross- section in AM, la is the AM length, C, is the "inversion decrease" factor in AM (C, = 1 and 2 for four- and three-level system, respectively); n^and n®« are the populations of a PC group of i-th orientation (see Fig.2a,b, the case of cubic PS) in the
dn, dt
dt
*& dt
^+nl?=n0
i = Lm
i = tm
100 % PS
m = 3
[loo] / im] \ a
Fig.1. a) Schematic diagram of laser passively Q-switched with PS. Mi and M2 are the cavity miiTors; ri and r2 are their radia of curvature; P is the polariser, D is the diaphragm.
b) Coordinate system used for PS angular position accounting: The case of the cavity axis coincidence with the crystallographic axis [100] of PS. 0-7803-4950-4/98/J10.00 1998 IEEE 113
Fig.2. Equivalent allowed orientations of PC groups in crystalline PS (cubic crystal): a - m=3, Cr4+: YAG; b - m=6, LiF:F2". c - Scheme of PC levels in PS.

ground and the ES state, respectively, n<, = N0/m is the initial density of PC of each orientation (m is the number of PC groups orientations in PS crystalline lattice), cr0^ and <T°es are the absolute values of PS absorption cross-section from the ground and the ES, fi>(Q) is the "geometrical factor" of PC groups arrangment in PS crystalline lattice (see Tablel), U is the PS length; K=Sa/Ss is the ratio of laser generation spot sizes in AM and PS in the cavity; R is the reflectivity öf output mirror (the another one is consisted to be of 100%); L is the unsaturated (passive) losses of the cavity including those in AM and PS; tr = 217c is the cavity (of the length 1') round-trip time; c is the velocity of light.
orientation m = 3
m = 6
f» (9)
JIM. fl'^cos^; fg^sin^; f3>=0
fTO=(l/2)(sin9 + cosGP; jC2)=p;3)=(j/2)CoS2e; f(4)=p5)=(i/2)sin2e;
fttfeq/zxsine-cosey
fa (9)
JIÜL P')=(2/3)cos^e; fa=(2/3)sin2(30°-9); f3>=(2/3)cos2(60°-9) fl'>=(l/4X(l/V3)cos9 - sin9P; f»=(l/4X(l/V3)cos9 + sin9P;
P»=(l/3)cos2e; fW=sin29; f®=(l/4)[V3cos9 + sin9J2; fK>=(U4)[V3cos9 - sin9]2
Table 1
Let us stop on some key moments. (i) The system (1) is written for the case of four-level scheme of PC in PS (see Fig.2c). It is supposed that PC
transit very fast from the levels 3 and 4 to the lasing level 2, and spontaneous emission from 2 to 1 is negligible during the giant pulse formation.
(ii) On the contrary to a variety of papers, there is no dependence of the terms in (1.1) on the ratio K of generation spot sizes in AM and PS.
(iii) The nonlinear absorption anisotropy in PS (see [4,5]), appearing on the absorption saturation stage due to definite orientations of PC groups in crystalline lattice, manifests itself in a set of equations (i=l:m) for PS (see (1.3) and (1.4)) and sums in (1.1). At the same time, amplification in AM is suggested to be isotropic (see (1.2)).
(iiii) Polarization of a laser is supposed to be selected effectively by a total polariser, so that one can consist intracavity radiation to be polarised linearly during all the stages of giant pulse formation.
Below are the final solutions for the giant pulse energy Eout and pulse duration t:
(2) 2<y,C IRJ UH
In
fN0<ls+h{l) + L . „inh „max , J \K/ . n, n, -n, + —ln|
n,
„fin
(3)
2CT.1,
w. mKl,
.Ü5
/ i
o.(*n
where
F. =-- Q!
„fin „init fNXsls+ln(i) + L
2a,l.
.fin
„mit CN01S
mKl, 1-- 1-
-fin i«i(»n
<*,(»)= ffl>(»). gs K; Zf(i)(»)=f;
1 v
^ + L
2o.l.
with n a and nmaxa to be determined from the conditions: Fa = 0 and dFa/dna = 0, respectively, and hv to be photon energy.
3. EXPERIMENTAL In order to verify formulas of the section 2, we studied the output characteristics of a Nd:YAG laser passively Q-
switched with an LiF:F2"or an Cr4+:YAG crystal (see Fig.l). The characteristics of PS: T"*- 30%, T8"- 74% (LiF:F2"); T1* ~ 30%, T8" ~ 88% (Cr4+:YAG). The parameters of the cavity: ^=100%, R2=R=30%, n ~1 m, r2=oc, 1' was varied in order to study maximally the parameter K=Sa/Ss changes (1' was varied from 60 cm, K ~ 0.5, up to unstable configuration of the cavity, f ~1 m, K ~ 0.01). During the experiments, the laser oscillated in TEM» mode. We measured the angular dependences of output energy and pulse duration, E„u, (6) and t (6) (the angle 6 is the orientation of PS (its [010] axis) in respect to the plane of minimal linear losses assigned by the polariser, whereas the laser beam is supposed to propagate along its [100] axis). We investigated the dependences for various positions of the rear mirror and PS's.
In Fig.3 are shown the experimental dependences Eort (6) for PS LiF:F2- (a,b) and Cr*: YAG (c,d) as well as the
theoretical ones with the geometrical factors to be taken in accordance with the experimental situation (see colomn for the [100] propagation of light in Table 1) and cr0« to be equal to zero. One can see good agreement between the theory and the experimental data. The differences appeared for the values of K, corresponding to the regime of oscillation intermediate between the "clear" passive O-switching and free-running (Fig.3a, LiF:F2", and Fig.3c, Cr4^:YAG), are considered in [6]. In Fig.4 are shown the corresponding experimental and theoretical data (a - LiF:F2\ b - Cr44: YAG) for the giant pulse duration of the laser under investigation. One can also see fine agreement between these dependences.
114

Eout, mJ is
a 0.5
ja BT^B
Eout, mJ 1.5
Eout, mJ 3.14
3.12
3.1
3.08
II p f.
1 1 1 1 I 1 I V k
—!y- U
Eout, mJ 3
V -50 50 6, deg. -50 50 6, deg.
Fig.3. Experimental (dots) and theoretical (solid lines) dependences of output energy (EM) on PS angular position (6) in the cavity. a-l'=101cm(K=0.01),c-r=95cm(K=0.145),and b,d -1'=77 cm (K=0.225); for all pictures 1* = 14cm.
T, ns 200
i 150
A 3
100 »\ If ■V\-j V
°-B a
50 2
0 1 - M»-»***
X, nS 250
200
150
100
50
0
3
u
r \\
E *^Ss=
-50 0 50 e, deg. -50 0 50 e.deg.
Fig 4 Experimental (dots) and theoretical (solid lines) dependences of giant pulse duration (t) on PS angular position (6) in the cavity. K = 0.23 (1), 0.025 (2X 0.01 (3) - PS LiF:F2" (l'-100 cm, 1*=14 cm); K = 0.5 (1), 0.35 (2), 0.23 (3) - PS Cr4+:YAG (l'=75 cm, 1*-14 cm).
4. CONCLUSION 1. The model is generazed for a laser Q-switched with a crystalline PS. 2. The expressions for output energy and pulse duration are found, acounting as the geometrical factor of PC
groups orientation in PS crystalline lattice, as the ratio of generation spot sizes in AM and PS. 3. The model is shown to be in good agreement with experiment dealing with a pulsed Nd:YAG laser passively
Q-switched with PS based on an LiF:F2" or an Cr . YAG crystal. 4. The nonlinear absorption anisotropy in crystalline PS is shown to be a source for the output energy and pulse
duration angular dependences appearance, that should be taken into acount when developing or optimizing a laser passively Q-switched with such a PS.
REFERENCES 1. G.G.Basiev, B.I.Denker, et al., Sov. J. Quant. Electron., 1982, vJ2, p.984. 2. J.J.Degnan. IEEE J. Quant. Electon., 1995, OE-31, p.1890. 3. G.Xiao and M.Bass. IEEE J. Quant. Electron., 1997, OE-33, p.41. 4. N.N.ITichev, A.V.Kir'yanov, et al. Laser Physics, 1993, vj, p.182. 5. N.N.Il'ichev, A.V.Kir'yanov, et al. JETP, 1994, VJ8, p.768. 6. N.N.Fichev, E.S.Guryamova, et al. Quant. Electron., 1997, yJA (in press).
115

MC31 12:30pm - 2:30pm
Solitary waves and two-photon absorption
J. M. de Oliveira, Solange B. Cavalcanti and J. Miguel Hickmann
Departamento de Fisica
Universidade Federal de Alagoas
Maceiö AL 57072-970, Brazil
Investigations on pulse propagation near the half band gap of semiconductors, where a two-photon
resonant enhanced nonlinearity takes place, indicate asymmetric frequency spectra together with self-
steepening of the transmitted pulse. These features are attributed to the frequency dispersion of the
nonlinear refractive index coefficient and also to the coefficient of two-photon absorption[2].
Lately there has been considerable interest on such investigations for all-optical switching applications [3],
so that, in this paper we investigate an extended version of the nonlinear Schrödinger equatioh (NLSE)
including a self-steepening term, which takes into account the frequency dispersion of the nonlinear sus-
ceptibility and also a nonlinear absorptive term. To this end we employ a recently devised variatiönal
approach[l] suitable to deal with nonlinear dissipative propagation and show the existence of a solitary
wave as a result of the interplay among the various effects considered.
Let us begin by writing the extended wave equation as:
.du 1 d2u , ,9 . . .~du . i i9 (0.1)
where u is the normalized envelope amplitude, a oc —f£p~ is the self-steepening parameter and K is the
TPA coefficient.Following along the fines of Reference (3) we identify Lc with the conservative part of
the equation and Q with the work function,
i ( du' Lc = 2 I "*
,0u\ 1 du i . l2 du* 2aH u-dV
(0.2)
Q = — IK\U\ U. (0-3)
To balance the self-steepening effect one must choose a proper ansatz which we take as a sech profile
with a time dependent phase of the particular form,
p{i,r) = A(Z)sech M0
(0.4)
0-7803-4950-4/98/$! 0.00 1998 IEEE 116

■£ = a0 + a2p2 , (0.5)
where where ao and a2 are constants. By means of the Hamilton principle we obtain the Euler-Lagrange
equations,
jj(2uA2) = -IKUA* , (0.8)
with
p = 1 + a0(a - 2a2) , (0.9)
rj = a2(a - a2) . (0.10)
At this point we have not solved the problem yet, but we may already get some insight on pulse
evolution from Equation (8) which clearly expresses the rate at which energy is being dissipated, pro-
portional to A4 due to the process of two-photon absorption. Solving the above set of equations we
obtain a solitary wave solution for the particular situation when the chirp parameter is equal to the
self-steepening parameter a2 = a yielding to a conservation principle that guarantees an exact balance
for the existence of a solitary wave. This means that the amplitude and the width of the pulse vary in
such a way as to keep the product w2A2 constant. Figure (1) is plotted to show these features, that
is, the dissipation of energy together with the conserved product along the distance £ . The dynamical
behaviour of the parameters are denned by,
A(0 = . A(Q) , (0.11) ^1 + 1^(0)^ '
«(0=^(0)^1 + 1^2(0)^, (0-12)
m = m + ^-^^(l+j^2(om •) co-is) Fig. 2 shows the intensity profile for various propagation distances, illustrating the reshaping and
broadening of the solitary wave. In this way we have shown that, by choosing adequately an initial
chirp as the pulse is launched at £ = 0, one is able to balance the self-steepening process by forcing the
slower points situated on the less intense part of the pulse, to follow the faster ones situated near the
peak where the intensity is higher.
117

1.00
\ a 095
.8 1 090 a
5 085
(
^^ 5 ) 5 . 10 1
Figure 1: Evolution of the pulse energy and conserved quantity
Figure 2: Evolution of the pulse along a medium with K=0.01
In conclusion we have shown that by choosing a suitable phase chirp to a sech profile, an exact balance
between self-phase modulation, group velocity dispersion and self-steepening effects is reached yielding
to a solitary wave solution that evolves smoothly through the medium attenuated and broadened by the
nonlinear absorption process.
This work was partially supported by the Brazilian agencies: FINEP, CNPq, CAPES e FAPEAL.
References
1. S. C. Cerda, S. B. Cavalcanti and J. M. Hickmann, European Journal of Physics (1998).
2. A. S. Rodrigues, M. Santagiustina and E. M. Wright, Phys. Rev. A 52, 3231 (1995).
3. G.I. Stegeman et al, Int. J. Nonlinear Opt. Phys. 3 347 (1994).
118

MC32 12:30pm - 2:30pm
Soliton Cloning in a Dispersive Nonlinear Medium
Coherently Driven
D. P. Caetano, Solange B. Cavalcanti, R. F. de Souza and J. Miguel Hickmann
Departamento de Ffsica
Universidade Federal de Alagoas
Maceiö AL 57072-970, Brazil
Many physical phenomena observed in quantum optics (self-induced transparency solitons[3],
photon echo, etc.) may be studied in doped optical fibers whose dispersive and nonlinear prop-
erties may lead to new qualitative features[l, 2]. The light propagation in dispersive nonlinear
waveguides can be described by the nonlinear Schrödinger equation (NLSE). Soliton solutions to
this equation were theoretically predicted and experimentally observed in time and space domain.
The NLSE can be extended in order to include the effects of rare earth ions dopants such as er-
bium. One way to do that is by the inclusion of dispersive terms associated to the susceptibility
of the dopant [4].
Figure 1: Energy levels and fields interacting with the atomic system.
On the other hand we know that the response of a three-level atomic system is governed by
0-7803-4950-4/98/$10.00 1998 IEEE 119

the Bloch equations together With the associated population and dipole (polarization) relaxation
times TU and T2, so that the above mentioned dopant model should only be used by assuming an
instantaneous system's response to the field, which is true if T2 is much shorter than pulse width
T0. In this work we will study the interaction of two fields, described by an extended NLSE, with
three-level atomic systems coherently driven by these fields. This three-level atomic system is
inserted in a host waveguide and the level distribution is shown in figure 1.
Initially let us focus on the interaction of the electrical fields with our collection of dopant
atoms. We suppose one oscillating field El2(t) (pump) with the frequency close to the transition
frequency o>12 between states |1) and |2>, and another field E13(t) (signal) with a frequency
corresponding to the frequency u;13 related to states |1> and |3>. Using the Schrödinger quantum
description for this system one may obtain the following set of coupled differential equations for
the probability amplitude Cj(t) of the atomic levels \j):
dci . i — = -ZUJlCl + -[c2li12El2{t) + c3fx13E13(t)) (01)
dc2 . i — = -lU)2c2 + ~[clt*21E12(t)} (0 2)
dc3 . i. — = -ZUJ3C3 + -[clß21E12(t)] (0 3)
where ßl2 and ^13 are the electrical dipole moments associated with the transitions.
We also need a description of the electric field to compute the time and space dynamics of the
system. Starting from the wave equation and using the slowly varying envelope approximation
we obtain the following equations for the field envelopes, including cross-phase modulation terms:
dA{2 ndA12 i d2A12
~dT + ~c~W = -2ß2~dW~ + ^A^2 + 2 l^3|2]A12 + fgcfciMi, (0.4)
~d7 + Z~W = ~\ß^-1 ^isl2 + 2 |A12|2]^13 + fr^Cl/.13 (o.5)
where 7 is a coefficient proportional to the nonlinearity, na is a dopant density and ß2 is the group
velocity dispersion.
By solving the above set of equations using a combination of Runge-Kutta and split-step
methods one is able to study the soliton cloning properties in the presence of group velocity
120

dispersion, self and cross-phase modulation with sounding consequences for optical fiber commu-
nication systems. The effect of soliton cloning in doped fibers may be used to generate solitons
streams at different wavelengths with potential applications in soliton multiplexing.
In conclusion we have investigated the cloning of soliton pulses in dispersive nonlinear waveg-
uide using the coherent dynamics of three level dopant with resonances at the pump and signal
fields.
This work was partially supported by the Brazilian agencies: FINEP, CNPq, CAPES and
FAPEAL.
References
1. M. Nakazawa, E. Yamada and H. Kubota, Phys. Rev. Lett. 66, 2625 (1991).
2. M. Nakazawa, K. Suzuki, Y. Kimura and H. Kubota, Phys. Rev. Lett. 45, R2682 (1992).
3. S. L. McCall and E. H. Hahn, Phys. Rev. 183, 82 (1969); L. Allen and J. H. Eberly, Optical Resonance and Two Level Atoms, Wiley, New York (1975).
4. J. M. Hickmann, A. S. L. Gomes, C. B. de Araujo and A. S. Gouveia-Neto, Ultrafast Phenom- ena VIII, Springer-Verlag Series of Chemical Physics, volume 55, 323 (1993).
5. G. Vemuri, G. S. Agarwal and K. V. Vasada, Phys. Rev. Lett. 79, 3889 (1997).
121

MD2 (Invited) 7:45pm-8:15pm
NONLINEAR OPTICS USING ELECTROMAGNETICALLY INDUCED TRANSPARENCY
S. E. Harris and G. Y. Yin
Edward L. Ginzton Laboratory Stanford University Stanford, CA 94305
It is now well understood that the characteristics of a nonlinear optical process are the result of the interplay of the linear and nonlinear susceptibilities. In general, as an atomic transition to the ground state is approached, the nonlinear susceptibility is resonantly enhanced, but, at the same time, the media exhibits a rapidly increasing refractive index and becomes opaque.
During the last several years we have shown how electromagnetically induced transparency (EIT) may be used to dramatically solve this problem: By first applying a strong coupling laser field with frequency Q.c [Fig. 1(a)], the atom is modified so as to create a quantum interference for a second probe field with Rabi frequency Qp. In the ideal case, where the linewidth of the |l)-|2) transition is zero and both fields are increased sufficiently slowly, the electromagnetic fields on both the probe and coupling laser transitions propagate as if in vacuum. The quantum interference creates a situation where the probability amplitude of state |3) is very small and where that of state |2) may be large and equal to that of state |l). With these conditions one has created an unusual nonlinear medium where the nonlinear susceptibility has only a single nonresonant denominator and is therefore as large as is the linear susceptibility.
I3>
Coupling Laser
Oc 406 nm
I2>
ll>
Probe Laser
283 nm
(a)
.1. . 1112cm-1
"T"
425 nm
•••
|3> 35287 cm"1
293 nm
I2> 1065°cm"1
i- II •> Ocnr1
(b)
Fig. 1. (a) A large atomic coherence, p12, is prepared by the probe laser (283 nm) and the coupling laser (406 nm). (b) The 425-mm laser mixes with the coherence in (a) to generate a sum frequency at 293 nm. |l), |2), and |3) denote states 6s26p2 3P0 (ground), 6s2 6p2 3P2, and 6s26p7s 3Pt of atomic 20^Pb. 0-7803-4950-4/98/$10.00 1998 IEEE 122

If one adjusts the density length product of this medium so that it is equal to that density length product which would cause a retardation of % radians, then one will obtain nominally 100% photon conversion efficiency or, equivalently, in a related system, a parametric gain of unity. Figure 1(b) shows an energy schematic for an experiment recently done at Stanford. Here, in addition to the applied coupling and probe lasers with wavelengths of 406 nm and 283 nm, one also applies a laser with a wavelength of 425 nm. This causes the generation of light at 293 nm with a conversion efficiency (of the temporally and spatially overlapped portions of the beams) of about 40%.
One example of this type of frequency converter is to tunable picosecond time scale infrared generation. In Pb vapor, an incident frequency is down shifted by 10650 cm-1, and an incident source which is tuned from 7604 Ä to 9389 Ä will generate an infrared output which tunes continuously from 4 \i to dc.
We also expect to begin experiments on optical parametric oscillators which have bandwidths on order of their center frequencies, and on generators of spontaneous polarization correlated photons.
1. M. Jain, H. Xia, G. Y. Yin, A. J. Merriam, and S. E. Harris, "Efficient Nonlinear Frequency Conversion with Maximal Atomic Coherence," Phys. Rev. Lett. 77, 4326-4329 (November 1996).
2. S. E. Harris, G. Y. Yin, M. Jain, H. Xia, and A. J. Merriam, "Nonlinear Optics at Maximum Coherence," Philos. Trans. R. Soc. London A (to be published).
3. S. E. Harris and M. Jain, "Optical Parametric Oscillators Pumped by Population- Trapped Atoms," Opt. Lett. 22, 636-638 (May 1997).
123

MD3 (Invited) 8:15pm-8:45pm
SUMMARY OF NONLINEAR OPTICS '98 INVITED TALK
August 10-14, 1998, Kauai, Hawaii
THE PHYSICS OF LASER ACCELERATION OF PARTICLES
C. Joshi
University of California, Los Angeles, CA 90024
In our quest to build higher energy accelerators that are both cheaper and smaller,
we search for new paradigms that offer potentially high accelerating gradients. The laser
features very prominently in many of these schemes. The proposed use of lasers to
accelerate particles to ultra-high energies has been motivated by the very high electric fields
associated with focused laser beams. A number of conceptually different schemes have
been proposed for this purpose and are under very active investigation. In the last couple
of years significant results have been obtained on four of these schemes: the inverse-
Cherenkov accelerator,1 the inverse-free-electron laser accelerator,2 the laser-plasma beat-
wave accelerator,3 and the self-modulated laser wake-field accelerator.4 Of these, the first
two are an example of what is known as far-field accelerators, that is, the acceleration of
charges takes place far away from any solid surfaces. On the other hand, the latter two are
an example of acceleration by a space charge wave that is induced by a laser beam in an
ionized medium: a plasma.
In order to effectively utilize the electric field of a laser to accelerate particles, one
has to somehow obtain a component of the field in the direction of the particle and slow the
electromagnetic wave down so that this electric field can interact with the particle over a
long distance. In the inverse-Cherenkov scheme, the wave is slowed down by introducing
a gas at the focus of the laser beam. A radially polarized laser beam is focused into this gas
such that the particles to be accelerated interact with the laser field at the Cherenkov angle.
This accelerator employs the Cherenkov mechanism: If a particle moves faster through a
medium than light travels in the same medium, then it will radiate. The inverse-Cherenkov
accelerator (ICA) simply runs this effect backwards. Recently a proof-of-principle
experiment has been carried out at Brookhaven National Laboratory's Advanced
Accelerator test facility,1 which shows acceleration of a relativistic electron beam using a
C02 laser in the ICA mode. 0-7803-4950-4/98/$10.00 1998 IEEE 124

In the inverse free electron laser (IFEL) scheme, the particles are accelerated by the
ponderomotive bucket formed by the beating of the laser light with a static magnetic
wiggler. The synchronism condition is maintained by bending the electron orbits
continuously and periodically by the wiggler field such that the particle traverses one
wiggle period just as one period of the electromagnetic wave passes by the particle. Very
encouraging results on acceleration by the EFEL scheme have recently been obtained.2
Finally, relativistic space charge waves excited in a plasma by intense laser beams
have shown dramatic results. Coherent space charge waves have accelerated electrons to
about 30 MeV in just 1 cm using the laser beat-wave technique.3 Electrons have been
shown to gain up to 100 MeV of energy in about a millimeter using the so-called self-
modulated laser wake-field acceleration4 scheme. These accelerating gradients are thus by
far the largest terrestrial accelerating gradients for charged particles obtained to date.
REFERENCES
1. W. Kimura et al., Phys. Rev. Lett. 74, 546 (1995).
2. A. van Steenbergen et al., Phys. Rev. Lett. 77, 2690 (1996).
3. M. Everett et al., Nature, 368, 527 (1994)
4. A. Modena et al., Nature, 377, 606(1995).
125

MD4 8:45pm - 9:00pm
Optical Projection Lithography at Half the Rayleigh Resolution Limit by Two Photon Exposure
E. Yablonovitch and R. B. Vrijen, Electrical Engineering Department, University of California, Los Angeles, Los Angeles, CA, 90095-1594, Phone: (310) 206 3724, Fax: (310) 206 8495,
E-mail: [email protected], [email protected]
In recent years, with the advent of femtosecond pulse technology, two-photon absorption has commenced to be used for exposing photo-resists. It is natural to ask then, what is the spatial resolution of two-photon lithography? There has already been some discussion of resolution limits in two-photon, scanning confocal fluorescence microscopy. We will find that ordinary two-photon exposure of photo-resist merely enhances the photographic contrast, or gamma. While this improves the spatial resolution somewhat, it does so at the expense of a requirement for tighter control over the incident light intensity. Instead, we introduce a new type of exposure system employing a multiplicity of 2-photon excitation frequencies which interfere with one another to produce a super-resolution stationary image, exhibiting a true doubling of the spatial resolution.
CO CO co0+co0
Lens
ww Fringe Pattern
COj+C02
Fringe Pattern
Figure 1(a): The intensity fringe pattern produced by rays converging from opposite edges of a lens, (b) The fringe pattern produced by two-photon excitation of a photoresist, in which the incident rays on opposite sides of the lens are separated into distinct frequency groupings. The frequency differences cause normal resolution fringes to oscillate rapidly in time, and they get washed out.
We can examine the resolution limits by studying the fringe pattern produced by two rays converging from opposite edges of a lens as illustrated in Figure 1(a). Such a fringe pattern is an indication of the resolution limits. Figure 2(a) shows the intensity fringe pattern in the focal plane, that results from two rays of individual wave vector k, converging at an angle 0. The spatial period of the fringes is determined by wave-vector of magnitude Ar=2fcsin0. The distribution of intensity, I(x), in the focal plane is simply I(x) = (I+COSAJC).
0-7803-4950-4/98/110.00 1998 IEEE 12g

Since two-photon absorption is proportional to the square of intensity, the two-photon exposure will be proportional to:
(1+COSKX)2={- + 2COSKX + -COS2KX\, ..........(1)
a functional dependence which is plotted in Fig. 2(b). We can see that the fringe pattern of two-photon absorption in Eq'n. (1) and Fig. 2(b), is a mixture of a normal resolution image represented by the cos Kx term and a super-resolution image represented by cos 2Kx. The super-resolution image at cos 2Kx consists of spatial harmonics at the wave-vector 2K, and would represent a doubling of the spatial resolution over ordinary one-photon lithography. Unfortunately the image is a mixture of both resolutions. Our goal in this paper is to show how to enhance the super-resolution image, and to suppress the normal resolution image, to the greatest degree possible.
In Intensity = 1 + cos Kx a u_ *w . o i _ I-—K 1
Exposure c 2
2rc .tfd
Exposure a (Intensity)2 = (3/2 + 2 cos Kx +1/2 cos 2Kx)
Exposure a (3/2 + 2 cbs^kx +1/2 cos 2kx)
Exposure 2
1 fcfe.
Figure 2(a): The ordinary intensity fringe pattern produced by converging rays as in Fig. 1(a), where K= 2£sin9. (b) The intensity squared fringe pattern which consists of a normal resolution spatial harmonics at K, a super-resolution spatial harmonic at 2K, as well as a constant term, (c) The effect of canceling the normal resolution spatial harmonic at K. The super resolution component at IK remains, on a constant background, (d) By employing a photoresist with a sharp atomic transition at 2 % cot,, the constant background is also eliminated, leaving a pure super- resolution image.
The method, or trick, for eliminating the normal resolution image is indicated in Fig. 1(b). The idea is to destroy stationary interference patterns corresponding to the linear image, while maintaining a stationary interference pattern for the super-resolution image. Arrange the incident rays to consist of C0o on one edge of the lens, and two other frequencies slightly above and below GX,: i.e. GOi = (ÖO+8, and ©2 = COQ-5, on the other edge of the lens, where 2us0=Qb\+(&1 . Fringes resulting from the interference of C0Q and C0i oscillate rapidly at the difference frequency 8, and they wash away, averaging to a uniform background. Thus the normal resolution image goes away. Since the frequencies 2a>o and CO1+CO2 are coherently related, derived from four-wave mixing ©2=20)0-0)1 for example, the super-resolution fringes are stationary and they don't wash away. This produces the result indicated in Fig. 2(c). If desired, the smeared out background on which the super-resolution image is superimposed, can be entirely eliminated. This can be accomplished by arranging for a relatively sharp atomic transition at 2ft(öo, inside the
127

photoresist. Then the background two-photon transitions at uVKöi, <öb+a)2, 2CöI, and 2Cü2 in Fig. 1(b) do not occur, and the smeared out background becomes absent. This results in the pure super-resolution fringe pattern of Fig. 2(d) at a spatial wave vector of 2 K with no background, and is the ultimate culmination of two-photon lithography.
A possible exposure system is shown in Fig. 3. Very short pulses of high peak power are needed to produce a damage-free two-photon exposure in the photoresist. Fortunately such pulses can be readily frequency converted to provide new optical frequencies, for example by four wave mixing as shown in Fig. 3. The various frequencies can illuminate a mask, even a phase mask, as in conventional photo-lithography, but near the lens the various frequencies become spatially separated by spectral filters. The lens can be divided into zones, some of which pass certain frequency combinations, and some which pass other combinations. For example in Fig. 3 the lens is divided into two zones. The frequency (do passes through one zone and the frequencies coi and G>2 pass through the other zone. Miscellaneous variations on the optical layout in Fig. 3 are possible, including the insertion of optical gain, and various ways of generating C0o, C0i and (»2, etc. Fig. 3 also displays various numerically computed images of a narrow, sharp, spatial line source, as limited by the finite numerical aperture (N. A.) of a lens, treating the problem one-dimensionally. We take in this case, N. A.=0.5, expressing the image size in units of the fundamental wavelength A-s^Ttc/cOo. A description of each curve is given in the figure caption. For 2-photon exposure with 2 zones, the resolution has already almost doubled. More zones give further improvement.
Lasers or other high power optical sources
C00,(0.
Four wave mixing medium
(O,,,«,^
(O2=2co0-(0|
Mask
Filter to separate coofromti^+coj
Photoresist
as n o i_ Q. C o
Ü X
LU
I ! I ! : 1.0 \\
2-photon, monochromatic 2-photon, 2 zones //
• /'/ \'\ : 2-photon, 4 zones
' .7 V*•'* 2-photon, 8 zones
0.5 - I--
/;' / ■' ■>' /
'■ 1 // ' ' ■' • s : / ;'\S
■'" ■' H
/: • a: /: ■' at
ft \ V \ \ \
0.0 ^s?U: y v
—i i
! '• •' a •
—L i
i\ \i \ i ■ V. ;, \ •
i i i i ;
-1.5 -1.0 -0.5 0.0 0.5 1.0 1.5
Position in Image Plane (units of X)
Figure 3: Left: Layout of a two-photon exposure system. Right: Computer-calculated image of a line source at infinity. The dash- dotted line represents the intensity distribution at the focus of a lens by linear diffraction through a numerical aperture=0.5. The dotted line is the intensity squared distribution associated with two photon absorption from a monochromatic beam. The other three curves represent multi-frequency two-photon excitation in a photoresist with a two, four and eight zones respectively. Whether two or eight zones the resolution is essentially twice as good as for the dash-dotted ordinary one-photon exposure.
128

MD5 (Invited) 9:00pm - 9:30pm ^
MAZER ACTION
A NEW KIND OF INDUCED EMISSION
Marian 0. Scully
Department of Physics, and Institute for Quantum Studies,
Texas A&M University, College Station, TX 77843
Max-Planck-Institut fur Quantenoptik,
Hans-Kopfermann-Strasse I, D-85748 München, Germany
Abstract
The abrupt change in the atom-field coupling strength which an atom
experiences upon passing into and out of a micromaser cavity leads to changes
in the atomic center-of-motion. Very slow (laser-cooled) atoms, however, can
be reflected from or tunnel through the cavity, and in the process undergo a
new kind of induced emission.
One of the cleanest experiments in modern quantum optics involves resonant atoms
passing through a high-Q microwave cavity, i.e., the micromaser. The "usual" treatment
of the problem, in the notation of Fig. 1, assigns a time-of-flight r = Ijv to the atom-
field interaction. In such a case, the Rabi oscillation between upper level and lower level,
beginning with n photons in the cavity and an excited atom, i.e., beginning with 1^(0)) =
|<z,n), is described by
\iß(r)) = cos gr\Jn + l\a,n) — ism gry/n + l\b,n + 1) (1)
where we have assumed resonance between the atom and field, and g is the atom-field
coupling constant. The emission process here is stimulated emission.
# M. 0. Scully. G. M. Meyer, and H. Walther, Phys. Rev. Lett. 76. 4144 (1996).
0-7803-4950-4/98/$10.00 1998 IEEE 129

In the present paper we show that operation in the limit of ultracold atoms requiring
a quantum-mechanical treatment of the center-of-mass (CM) motion' taken together with
a high-Q cavity, leads to a completely new type of induced, but not stimulated emission,
Fig. 1. That is, in the ordinary maser, stimulated emission prevails as the mechanism for
amplification of radiation, but in the case of ultracold atoms the physics of the induced
emission process is intimately associated with the quantization of the CM motion (taken to
be in the z-direction).
FIG. 1. Emission probability versus the interaction time gr = K2L/2k (a) for IC/K S 10 and versus the interaction length KL (b) for k/K = 0.1 (dotted) and it//c = 0.01 (solid), when the cavity field is initially in the vacuum state.
For the case of thermal ("fast") atoms passing through the micromaser cavity, we find
the emission probability associated with maser action
'K2L
± maser — Sill 2k V» + l (2)
where K is the CM wave vector for which the kinetic energy (HK)2/2M equals the vacuum
coupling energy hg, and L is the cavity length. Eq. (2) embodies the usual stimulated emis-
sion process and the well-known Rabi oscillations since K2L/2k = gr, where the interaction
time r = L{hnlM)~l. As is shown below, Eq. (2) applies only when k > Kyjn + 1.
For the case of ultracold atoms, such that k <C K\/n + 1, we find the photon emission
probability
1 + («^n+T/2Jb) sin2 (KZ^T + T) (3)
Several aspects of Eq. (3), which is only valid for KL > 1, should be noted. First of all, 130

instead of the usual "Rabi phase" gry/n + 1 = (K2L/2k)\/n + 1, now the phase nL\/n + 1
appears, which is independent of k, i.e., independent of the classical interaction time, we
further note the Eq. (3) resembles the Airy function of classical optics, [l + F sin2 (A/2)J ,
which gives the transmitted intensity in a Fabry-Perot interferometer with finesse F and
phase difference A. In our case, the finesse F = \Ky/n + 1/2&J depends on the number of
photons in the cavity.
For this reason we distinguish between the usual stimulated emission maser physics and
that characterized by the present quantized-z-motion induced emission and call the process
Microwave Amplification via Zmotion-induced Emission of Radiation "mazer action".
New features of the mazer are, for example, its ability to produce number states, and
other novel states of the field. These and other aspects of the mazer will be presented.
131

TuA2 (Invited) 8:30am - 9:00am
Optical Spectroscopy of Single Nanometer Size Semiconductor Quantum Dots.
David Gershoni Physics Department, Technion-Israel Institute of Technology, Haifa, 32000, Israel
Abstract: We spatially resolve, and spectroscopically study single self assembled quantum dots using low temperature confocal optical microscopy. The experimental spectra are in quantitative agreement with a many body theoretical model.
Summary: The study of electronic processes in semiconductor heterostructures of reduced dimensionality has been a subject of recent extensive research efforts. Of particular importance are the efforts to fabricate and study semiconductor quantum dots (QDs) of nanometer size, in which the charge carriers are confined in all three directions to characteristic lengths which are smaller than their De-Broglie wavelengths. These efforts are motivated by both the QDs potential device applications as well as their being an excellent stage for experimental studies of basic quantum mechanical principles. One very promising way of fabricating such QDs is the so named self assembled QDs (SAQDs) method. This method uses the self formation of small islands which reduce the elastic energy associated with the lattice mismatch strain between epitaxially deposited layers of different lattice constant. By capping these islands with an additional layer of higher energy bandgap, high quality QDs are produced. The size distribution of these SAQDs (typically about 10%), and the resultant inhomogeneous broadening of the SAQDs ensemble spectral features, has so far limited the ability to clearly understand and unambiguously interpret the experimental results. We overcome this obstacle, by applying diffraction limited confocal optical microscopy for spectroscopically studying such a single InAs QD embedded within an AlGaAs host. The low temperature photoluminescence spectrum of such a single dot and its excitation intensity dependence are reported. We show, indeed, that multiple sharp spectral lines, as well as broad spectral features, which previously were always interpreted as an optical signature for emission from an ensemble of dots, can actually be a result of carrier recombination within a single dot. We use a many carrier Hamiltonian to describe multi exciton states confined within the QD and to calculate optical transitions between these states. By varying the dimensions of our model dot we can quantitatively fit the observed PL spectrum and its evolution with increasing excitation power, and thus the average number of QD excitons. We demonstrate that sharp spectral lines, in the dot PL spectrum, are due to optical transitions between confined discrete multi-excitonic states. From the spectrum we directly deduce the magnitude of the interaction between the charge carriers within the self assembled quantum dot. The spectral evolution as a function of excitation power, clearly indicates shell fillings of these multi-exciton states. Under high excitation power, once the limited number of discrete exciton levels within the dot are fully occupied, spectrally broad emission bands are formed due to optical transitions between multi exciton states which contain continuum electrons. From the quantitative agreement between the calculated and measured spectra we safely conclude that the confined excitons reach thermalization well within their radiative lifetime. 0-7803-4950-4/98/$10.00 1998 IEEE 135

TuA3 9:00am - 9:15am
Optical Nonlinearities and Ultrafast Carrier Dynamics in Semiconductor Quantum Dots
V. Klimov, D. McBranch, and C. Schwarz Chemical Sciences and Technology Division, CST-6, MS-J585,
Los Alamos National Laboratory, Los Alamos, NM 87545
Low-dimensional semiconductors have attracted great interest due to the potential for tailoring their linear and nonlinear optical properties over a wide-range. Semiconductor nanocrystals (NC's) represent a class of quasi-zero-dimensional objects or quantum dots. Due to quantum confinement and a large surface-to-volume ratio, the linear and nonlinear optical properties, and the carrier dynamics in NC's are significantly different from those in bulk materials [1,2]. Trapping at surface states can lead to a fast depopulation of quantized states, accompanied by charge separation and generation of local fields which significantly modifies the nonlinear optical response in NC's [3]. 3D carrier confinement also has a drastic effect on the energy relaxation dynamics [2]. In strongly confined NC's, the energy-level spacing can greatly exceed typical phonon energies. This has been expected to significantly inhibit phonon-related mechanisms for energy losses, an effect referred to as a phonon bottle- neck [4]. It has been suggested recently that the phonon bottleneck in 3D-confined systems can be removed due to enhanced role of Auger-type interactions [5]. In this paper we report femtosecond (fs) studies of ultrafast optical nonlinearities, and energy relaxation and trap- ping dynamics in three types of quantum-dot systems: semiconductor NC/glass composites made by high temperature precipitation, ion-implanted NC's, and colloidal NC's. Compar- ison of ultrafast data for different samples allows us to separate effects being intrinsic to quantum dots from those related to lattice imperfections and interface properties.
High-sensitivity fs nonlinear transmission experiments in the novel chirp-free configura- tion [6] were applied to measure pump-induced absorption changes for optical transitions involving the lowest (IS) and the first excited (IP) electron states (Bx and B3 features in Fig. 1, respectively) in CdSe NCs of different radii, with 1S-1P energy separation up to 16 longitudinal optical phonon energies. At early times after excitation, the nonlinear optical response of the NC's is dominated by two effects: state-filling induced bleaching of optical transitions [2] (B!-B3, Fig. 1) and the Coulomb two-pair interaction (biexciton effect) [7]. While state-filling affects only transitions coupling occupied states, the Coulomb interac- tion influences all transitions, resulting in transition shifts which are seen as derivative-like features in transient absorption (TA) (see feature at ~1.85 eV in the early time TA spec- tra in Fig. 1). Analysis of the TA allows us to extract the state-filling-induced portion of the nonlinear signal, which provides the information on population/depopulation rates of the adjacent (IS and IP) electronic states. Instead of the drastic reduction of the energy relaxation rate expected due to a phonon bottleneck [4], we observe a fast sub-ps lP-to-lS re- laxation (inset to Fig. 1), indicating the opening of new relaxation channels which dominate any phonon bottleneck effects. We observe the enhancement in the relaxation rate in NCs of smaller radius, which strongly suggests that energy relaxation is mediated by nonlinear Auger-type processes. Similar energy relaxation behavior is observed in different types of NCs, indicating that ultrafast electron relaxation, not limited by a phonon bottleneck, is a general feature of quantum-dot systems. 0-7803-4950-4/98/$10.00 1998 IEEE 136

80xl(T F
60
"8
40
20
-20
1.2
1.0
0.8
BjflS-ISaa) < " 0.2
0.0
I r\\
—i 1 1 1 1 r 1
cross-correlation 1.87eV(Bj) - A «**——*«
- / \ y -
- i/L "^,2.06 eV (B3)_
I ,_j I I J -0.2 0.0 0.2 0.4 0.6 0.8 1.0 1.2
Delay time (ps)
/ •-A.\Bb(1p-1Pa«) B B2(1S-3S1/2) 1/2' _
R = 4.2 nm (CdSe NCs/glass) Iz x
1.8 2.0 2.2 Photon Energy (eV)
2.4
Figure 1. Chirp-free TA spectra recorded at different delay times after excitation for CdSe NC/glass sample with NC mean radius of 4.2 nm. Inset: normalized IS (circles) and IP (squares) dynamics indicating the lP-to-lS relaxation time of ~300 fs.
In contrast to the initial energy relaxation, the subsequent lS-electron decay is strongly sample dependent. In colloidal samples with passivated surfaces, the depopulation of the IS state is dominated by radiative recombination, whereas in glass samples made by both high-temperature precipitation and ion implantation, the IS electrons relax via efficient ps trapping at deep defect states, an effect which is strongly enhanced in NCs of smaller radius (Fig. 2). In the inset to Fig. 2, we show that the size dependence of the IS relaxation time follows an R6 dependence. This can be explained in terms of confinement-induced squeezing of the IS electron wave function, resulting in an increased overlap with the wave function of the deep-trap state. Application of fs up-conversion photoluminescence and TA allowed us to separate electron and hole relaxation paths [8]. We observed very fast PL decay (attributed to sub-ps hole trapping). The slower decay of the TA signal is controlled by depopulation of electron states which occurs on the 1-10 ps time scale.
Studies of pump intensity-dependent TA indicate a change in carrier relaxation channels at high pump levels. This is manifested as a distinct difference in the nonlinear optical response measured at low and high pump intensities in quasiequilibrium at long times after excitation. Analysis of the spectral- and time-dependence of the nonlinear transmission over
137

a wide pump intensity range indicates that this difference is due to carrier trapping at surface states activated by the Auger process. Surface trapping leads to efficient charge separation, with associated local electric fields [3], drastically modifying the nonlinear optical response
I5
Delay Time (ps)
Figure 2. lS-bleaching dynamics in CdSe/glass samples with NC mean radii R = 3.4 (open squares), 4.2 (crosses), and 5.6 nm (open triangles). Inset: size dependence of the IS relaxation time (symbols), fit to an R6 dependence (line).
of NC's at high pump fluences. Using NCs in different types of matrices, we studied the effect of the height of the confinement barrier on the efficiency of Auger-assisted surface trapping.
[1] A. P. Alivasatos, Science 271, 933 (1996). [2] V. Klimov, in Handbook on Nanostructured Materials and Nanotechnology, edited by H. Nalwa (to be published by Academic Press, 1998). [3] V. Klimov and D. McBranch, Phys. Rev. B 55, 13173 (1997). [4] U. Bockelman and G. Bastard, Phys. Rev. B 42, 8947 (1990). [5] A. L. Efros, V. A. Kharchenko, and M. Rosen, Solid State Commun. 93, 281 (1995). [6] V. Klimov and D. McBranch, Opt. Lett. 23, (February, 1998). [7] V. Klimov, S. Hunsche, and H. Kurz, Phys. Rev. B 50, 8110 (1994). [8] V. Klimov, P. Haring Bolivar, and H. Kurz, Phys. Rev. B 53, 1463 (1996).
138

TuA4 9:15am - 9:30am
Ultrashort pulse controlled all-optical modulation by intersubband-coupled- interband transitions in doped quantum wells
A. Neogi1,2, H. Yoshida1, T. Mozume' and O. Wada' FESTA Laboratories, The Femtosecond Technology Research Association
TSTew Energy and Industrial Technology Development Organization FESTA Laboratories, 5-5- Tokodai, Tsukuba, Ibaraki 300-26, Japan
Tel: 81 298 47 5181, Fax: 81 298 47 4417
Ultrafast all-optical modulation of interband (IB) resonant light by intersubband (ISB) resonant light in quantum wells (QW) is attractive for its application to multiplexers and demultiplexers for Tbit/s ultrafast OTDM systems [1-4]. An ultrafast modulation of a cw IB signal light in the picosecond domain has been demonstrated based on resonantly excited free- carrier induced nonlinearity in doped QW's [2]. The drawback of the modulation scheme using a cw IB-light is that the speed is limited to 1 ps due to the ISB energy relaxation rate of the QW [2, 3]. The efficiency is also limited due to carrier accumulation at high repetition rate. The optical nonlinearities inducing the modulation can be enhanced by high ISB excitation intensities which hinder practical device application. To achieve high nonlinearities in the femtosecond regime, we thereby consider the application of ultrashort ISB light pulses maintaining the optical energy sufficiently low for device operations. We propose a novel scheme based on the simultaneous use of ISB-control and IB-signal lights both in the pulse form. The control light pulses width (xc) are assumed to be very short (1 ps - 200 fs) comparable to the ISB relaxation time. The signal pulse width is shorter than the IB carrier recombination lifetime to reduce carrier accumulation at high repetition rate. The modulation speed limit of 1 ps in the conventional scheme (corresponding to ISB energy relaxation time ~T,) can be enhanced by using femtosecond control light pulses. We show that the modulation speed can be improved to about 250 fs which is determined by the ISB phase relaxation rate (T2 ~ 200 fs) of the QW.
We consider a InP based InGaAs/AlAs QW system with the signal light tuned to the IB state |cl>-|hhl>, while the control light tuned to the ISB state |cl>-|c2> as shown in Fig.l. An absorption change of the IB-light resulting in the optical modulation is achieved when the ISB- control light field excites the carrier to the upper subband state |c2>, resulting in vacant sites at the lower subband and consequently enhancing IB transitions. The origin of modulation lies for an n-doped QW lies in the third-order nonlinear interaction between the IB and ISB transitions [1]. We present for the first time the transient analysis of a such a pulse-pulse modulation scheme including the many body effects. We developed a numerical model for simulating the response of the medium for a train of optical pulse excitation using the three-level semiconductor optical- Bloch equations. The analysis of the pulse IB and ISB light interaction provides an estimate of the critical limit of the parameters governing the speed and efficiency of the modulation scheme.
In principle for an InGaAs-AlAs system, this scheme can be employed for the modulation of near infrared (NIR) IB-light pulses (1.2 urn - 2.0 urn) by ISB-light pulses ranging from the NIR to the FIR regime (2.0 - 11.0 urn) depending on the well width and the material parameters.
IB-Signal Light
ISB-Control Light
IB-Signal Light |hh1>
Without control light wi* control light
Fig.l. The All-Optical Pulse Modulation Scheme in doped QWs
0-7803-4950-4/98/$10.00 1998 IEEE ^

The LO-phonon scattering is considered to be the dominant dephasing process in the doped structures and the phase relaxation time in the off-diagonal elements of the interaction Hamiltonian is assumed to be 200 fs. The IB-light pulse absorption is manipulated by the shape of the ISB-control light pulses which governs the rate of optical pumping of the carriers in the intersubband states as compared to the carrier relaxation processes.
The effect of the control pulse width (xc) on the absorption of a 6 ps IB-signal light pulse has been shown in Fig.2. At xc~ 500 fs, the signal light absorption increases to its maximum and the effect of the control light recedes if its pulse width approaches the phase-relaxation time (T2 ~ 200 fs). Although it is not shown here the modulation efficiency was found to be unaffected by the increase in control light intensity above an optimum value determined by the control pulse width. This optimum intensity is proportional to the ISB saturation intensity and is 5 MW/cm2 at TC~ 200 fs as compared to 2 MW/cm2 at xc~ 500 fs.
The change in the signal absorption due to the ISB transitions induced by the control light is estimated by the modulation depth t| defined as [xc(t) - %c=o(t)]/Xc=o(t); Xc(t) and Xc=o(t) are the transient response function with and without the control light field. The effect of the ISB control field intensity on the modulation characteristics of a 6 ps IB-signal pulse at various pulse widths is depicted in Fig.3. Higher modulation efficiencies by the control pulses with their width comparable to the phase relaxation rates can be achieved at ISB light intensities Ic which establishes a population inversion between the intersubband states. The increase in absorption eventually saturates when the rate of intersubband carrier excitation is faster than its relaxation rate leading to the complete occupation of the upper conduction subband state |c2>. The ISB saturation intensity estimated to be 5 MW/cm2 agrees well with the analytical calculations [4]. At higher ISB-control light intensities (> 10 MW/cm2), the optical phonon scattering becomes significant due to the excess carriers at the upper subband state. These cause relaxation oscillations in the absorption when the control pulse width becomes comparable to the carrier energy relaxation time (0.5 - 1.0 ps). However, for shorter pulses (~ 200 fs) the switching of the IB light is smooth.
0.0
Signal Pulse Width (FJ-eps
T =200fe
Fig.2. Signal Light Absorption at various ISB-control-pulse width
Fig.3. Modulation characteristics at various peak ISB-control-light-pulse intensities.
The rise and the decay time of the modulated pulses are faster for xc ~ T2. It should also be noted from Fig.3. that the rise time of the IB-light modulation is a characteristic of the control pulse width and is much faster than the band-to-band relaxation time (~ ns). It indicates that the
140

modulation speed of the device is not limited by the hole accumulation in the valence band as in conventional electrooptic modulators based on IB transitions. Thus the speed and nonlinearity of an interband nonlinear process which are usually limited by the IB relaxation rate is enhanced by several orders by the nonlinear coupling of the IB and ISB transitions.
Fig.4 represents the optimum operating conditions for achieving the fastest modulation speed with a high efficiency using the proposed scheme. It also shows a comparison of the present results with the earlier experimental results involving cw and long pulse ISB-control light at 10.6 urn. The modulation depth is observed to increase for control pulse widths shorter than the ISB carrier lifetime (Ti ~ 1 ps). It is seen that at 1 MW/cm2 the maximum modulation efficiency can be achieved by applying a control pulse of 600 fs which can be increased further at 10 MW/cm2
using a 200 fs pulse. The high modulation depth obtained by Suzuki et al. [3] was achieved in an 18 3
AlGaAs/GaAs system at a higher carrier concentration (3x10 cm ) and should be reduced by 18 3
20% at a lower carrier concentration (1 x 10 cm) as used in our estimations. Moreover the estimated modulation efficiency will increase further at higher carrier concentrations. We obtain a large IB-signal light absorption change of 4600 cm1 using 500 fs control light pulses at 1 MW/cm2 compared to 3000 cm"1 IB-absorption change with 5 ps pulses reported by Suzuki et al. This value of absorption change is large enough for actual device performance. The modulation depth is also considerably higher than in a symmetric undoped QW structure proposed by Lee and Malloy [5].
In conclusion, a new scheme was proposed in which the IB-light pulse absorption can be modulated by the ISB-control light pulses exhibiting an enhanced efficiency compared to a scheme involving cw-IB light. The modulation speed can be enhanced by optimizing the control pulse width (Ti > TC > T2) instead of increasing the light intensity. A femtosecond modulation speed can be obtained by 200 fs at 5 MW/cm2 or 500 fs control light pulses at 2 MW/cm2. It corresponds to excitation energies less than 100 fJ using a waveguide configuration. This is significantly lower than any proposal based on ISB-IB transitions and is useful for all- optical switching applications. As the modulation speed is not restricted by IB- relaxation rates, efficient modulation is achieved even at high bit rates and for strong signal light intensities.
6 16
*SuzukietäL (I =lMVcmfat10.6^ 5ps)
•Nxfaetal (Ic=lMVcm at 10.6|jrqT 100IB)
#Lee&MJky(Iheayat lQ6(jmlOMVcm)
0^ Q0
Fig.4
■ QlMVctn
-1 MVan #
-lOMVan J i I i I i L£u I i_
1.0 20 30 4.0 50 60 7.0
Ctr*dFUseWdh(F6)
60 100 2D0 IB
Variation of Maximum Modulation Depth for a 6 ps signal light with control pulse width
Acknowledgment This work was supported by the New Energy and Industrial Development Organization
(NEDO) within the framework of the Femtosecond Technology Project.
1. A. Neogi, Y. Takahashi and H. Kawaguchi, IEEE J. Quant. Electron., 33,2060 (1997). 2. S. Noda, M.Ohya, T. Sakamoto & A. Sasaki, IEEE J. Quant. Electron., 32 ,448 (1996). 3. T. Suzuki et al., Appl. Phys. Lett. 69, 4136 (1996). 4. T. Asano, S. Noda & A. Sasaki, Proc. 58th Autumn Meet. Japan Soc. Appl. Phys. 3,1303 (1997). 5. D.S. Lee and K.J. Malloy, IEEE J. Quant. Electron., 30, 85 (1994).
141

TuA5 (Invited) 9:30am - 10:00am
Light-Exciton Coupling Effects in Semiconductor Microcavities and Heterostructures
S.W. Koch, M. Kira and. F. Jahnke, Department of Physics, Philipps University Marburg, Renthof 5, 35032 Marburg/Germany
The optical properties of Wannier excitons in direct bandgap semiconductors have been studied in great detail since the middle of this century. The linear absorption spectra of low temperature high quality materials are dominated by exciton resonances. The energetically lowest of these electron-hole pair states has a binding energy of a few meV, i.e. much less than the semiconductor bandgap which is of the order of eV. Hence, these pair states are relatively weakly bound and the Fermionic nature of the constituent particles - electron and hole - govern the excitonic properties at finite levels of excitation.
Due to its finite thickness a semiconductor quantum well constitutes a system without translational invarance. Hence, the analysis of its optical properties requires a careful study of the spatially inhomogeneous environment of the quantum confined electron-hole pairs, leading to a loss of momentum conservation in the optical interaction process. Hence, the microscopic analysis of excitonic properties requires a selfconsistent solution of the light-matter interaction problem.
In this talk we discuss light-exciton coupling effects for semiconductor quantum wells inside and outside a microcavity geometry. A semiclassical theory for the absorption, transmission and reflection properties is presented and applied to analyze experiments in high quality systems [1].
A recently developed, fully quantum mechanical theory for the emission properties of quantum-well excitons is discussed. The resulting semiconductor luminescence equations are solved to study i) the build-up of excitonic luminescence from a nonequilibrium electron-hole plasma and ii) the excitation dependent luminescence of a semiconductor microcavity.
The results show that the appearance of excitonic signatures in the emission cannot simply be taken as an indication of exciton formation. Fermionic effects like excitation induced dephasing and the Pauli exclusion principle lead to characteristic nonlinearities in the emission spectra, which cause interesting nonlinear changes in the normal mode luminescence of microcavity systems [2].
Acknowledgements: We acknowledge fruitful theory/experiment collaborations with H. Gibbs, G. Khitrova and their co-workers in Tucson/AZ. This research is supported by the Deutsche Forschungsgemeinschaft, partially through the Leibniz Prize (SWK) and the Heisenberg programm (FJ). MK is supported through a TMR fellowship of the EC. We acknowledge a grant for CPU time at the Forschungszentrum Juelich/Germany.
.0-7803-4950-4/98/$10.00 1998 IEEE 142

References:
[1] F. Jahnke, M. Kira and S.W. Koch, Z. Physik B104, 559 (1997); F. Jahnke et al., Phys. Rev. Lett. 77, 5257 (1996)
[2] M. Kira et al. Phys. Rev. Lett. 79, 5170 (1997); M. Kira, F. Jahnke, and S.W. Koch, to be published.
143

TuB2 11:00am-11:15am
Dispersion-managed solitons at normal average dispersion
by
V. S. Grigoryan and C. R. Menyuk
Department of Computer Science and Electrical Engineering University of Maryland Baltimore County
Baltimore, MD 21250 phone: 410-455-6503, fax: 410-455-6500
It has recently been shown that in strongly dispersion-managed fibers, consisting of a periodic dispersion map with alternating spans of anomalous and normal dispersion, solitons can exist not only with anomalous average dispersion, but also with zero and normal average dispersion.1 Here we find based on a reduced model that we have described elsewhere,2 that if the dispersion difference AD between the anomalous and normal dispersion spans is higher than some threshold the dependence of the soliton energy S on the average dispersion D is described by a C-shaped curve. Two different solitons of higher and lower energy and the same pulse duration can exist with normal average dispersion below a limiting value. We used a reduced model because it allowed us to rapidly explore a large parameter space, but we checked our results by full numerical simulations in key instances and found good agreement.
Our starting point is the nonlinear Schrödinger equation in the lossless medium, modified to include a spatially varying dispersion D(z),
where we have used a standard normalization of the nonlinear Schrödinger equation. We choose a time scale T0 which is of the order of a pulse duration and a (negative) dispersion scale ß2 which is of the order of typical average dispersion in our system. Then we set z as distance normalized to the length scale LD = -T0
2//?2, t as time normalized to T0) D as dispersion normalized to /32, and q as the normalized field amplitude of a pulse. First, we analyze this system based on a reduced model2 obtained with the help of a variational approach.3 We recall that using the ansatzq = Aexp[(-l/r2 + ia)t2 + ia], where A, r, a and a indicate the pulse amplitude, duration, chirp, and phase respectively, one can derive the following eigenvalue equations which determine the parameters of the dispersion-managed soliton2
A , /giTo + Zi + v^aoTo2^ n n , ,nJ2 In , = Ci-DiLi + a0r0, V7i2 + Ci fC-
x (2) In . = C2D2L2 - a0r0,
\/ft + c2
where /1)2 = f(Dli2) and d,2 = C(Dlj2), C = a2r2 + 1/r2 - 2//r0, / = S/2D, S = A2TV2.
0-7803-4950-4/98/110.00 1998 IEEE ^4

The pulse durations at the midpoints of the spans with dispersion Dx and D2 are then defined respectively as r1>2 = 1/Cli2 (-/i,2 + y/ffa + Ci,2) • Using the last equation, we vary
the average dispersion D = (D1L1 + A^V^i + ^2) with a fixed dispersion difference AD = Di-D2, and we numerically find the normalized pulse energy S. Figure 1 shows the variation of S(D) for different values of AD in the case when Lx = L2 = 0.0777. This length corresponds to 100 km in the case when the dispersion unit ß2 = -0.1 ps2/km and the time unit To is chosen such that the pulse duration TFWHM = 1.763 x T0 = 20 ps. In this case LD = 1287 km and for AeS = 47 /mi2 and n2 = 2.6 x 10"16cm2/W the unnormalized pulse energy is 0.007 x S pj. One can see that at small AD the curve S{D) is almost a straight line, and there is no solution with normal average dispersion. However, when AD exceeds a threshold value of about 190 the curve makes a bend through the normal dispersion regime. Beyond the threshold dispersion difference, a non-trivial solution exists for the dispersion- managed soliton with exactly zero average dispersion.1 One can see in Fig. la that if the normal average dispersion does not lie below the turning point, then there exist two solitons with energies A and B. At the turning point the lower (B) and higher (A) energy solitons merge. We checked these results using complete numerical solutions of Eq. (1). Figure lb shows the actual FWHM pulse duration at the point of maximum compression in the anomalous dispersion span as a function of the normalized pulse energy S along the curve corresponding to AD = 220 in Fig. la. The pulse duration differs by about 9% from what was predicted by the theory, but it remains almost^constant at about 1.97. We conclude that for every value of average normal dispersion D above the turning point there are in fact two solitons with nearly equal pulse durations and different pulse energies. The pulse shapes of the higher and lower energy solitons at the point of maximum compression remain nearly the same, with a flat top and weakly oscillating wings that are apparent only on a logarithmic scale.
A careful study of the evolution during one period of the dispersion map yields an im- portant clue as to why strongly dispersion-managed solitons can exist with average normal dispersion. We find that the soliton undergoes more compression in the anomalous disper- sion span than in the normal dispersion span. Consequently, the length of the anomalous dispersion span measured relative to the dispersion length can be higher than that of the normal dispersion span, so that the rescaled average dispersion would be negative rather than positive giving the dispersion and nonlinearity a chance to balance.
Finally, we consider the stability of the solitons by injecting an initially hyperbolic se- cant pulse and allowing it to propagate over a long distance z = 1000 that for the system parameters indicated above corresponds to over 1.2 million km. We show that lower energy, dispersion-managed solitons are stable even with very small energy in the normal average dispersion near the zero dispersion point when we varied the energy in the range indicated by diamonds in Fig. lb along the curve corresponding to AD = 220 in Fig. la. This point is significant because Carter, et alA have recently shown that the main source of errors in a dispersion-managed soliton system is the growth of spontaneous emission noise. The sta- bility of the lower energy soliton solution may indicate that the noise growth is nonlinearly damped in the normal dispersion regime by being incorporated into the lower energy soliton. However, the question of the soliton stability in the whole parameter space in the normal dispersion regime still remains open.
145

In conclusion, we showed that if the strength of the dispersion management is above some threshold then two different dispersion-managed solitons of higher and lower energy and the same pulse duration can exist with normal average dispersion below a limiting value. If the normal average dispersion exceeds this limit then no dispersion-managed soliton can exist. Both higher and lower energy dispersion-managed' solitons are dynamically stable, periodically stationary pulses in the range of parameter space that we have considered.
This work was supported by DOE, NSF, and AFOSR.
References
[1] .1. H. B. Nijhof, N. .1. Doran, W. Forysiak and F. M. Knox, Electron. Lett. 33, 1726 (1997).
[2] V. S. Grigoryan, T. Yu, E. A. Golovchenko, C. R. Menyuk, and A. N. Pilipetskii, Opt, Lett. 22, l(i()9 (1997).
[3] 1). Anderson, Phys. Rev. A 27, 3135 (1983). I. R. Gabitov, E. G. Shapiro, and S. K. Tu- ritsyn, Opt. Oonnnun. 134, 317 (1997). M. Matsumoto and H. A. Hans, IEEE Photon. Technol. Lett. 9, 785 (1997).
[1] G. M. Carter, J. M. Jacob, C. R. Menyuk, E. A. Golovchenko, and A. N. Pilipetskii. Opt. Lett. 22, 513 (1997).
o ■(-» a u
T3
OH
(a) ^Iji—f*— t rt\
0
T 1 1 r
J i_
0 10 Pulse energy
20
u
(b)
0
—1 1— -1 1 1 \ 1 r
: A„ ^^'^
f ...-••-" :
» i .**" ..-■••
\R ** -..-^""
v^ «iiäiÄSSS^-r^ i i i
0 0.2 Average dispersion
-AD=220
-AD=200
■AD=180
-AD=160
•AD=140
AD=120
Figure 1: (a) Dependence of the pulse energy on the average dispersion for different dispersion dif- ferences AD predicted by reduced model, (b) Comparison of the FWHM pulse durations obtained from the reduced model (solid line) and full simulations (dotted line) corresponding to the curve AD = 220 shown in Figure (a).
146

TuB3 11:15am-11:30am
Polarization-Locked Vector Solitons in a Fiber Laser
S.T. Cundiff Bell Laboratories, Lucent Technologies, Holmdel, NJ07733 andJILA, University of Colorado and National
Institute of Standards and Technology, Boulder Colorado, 80309-0440 (303)492-7858, (303)492-5235 (fax), [email protected]
B.C. Collings, Bell Laboratories, Lucent Technologies, Holmdel, NJ 07733 and Electrical Engineering Department, Princeton
University, Princeton, NJ 08544
J.M. Soto-Crespo Instituto de Optica, C.S.I.C, Serrano 121, 28006Madrid, Spain
N.N. Akhmediev Australian Photonics Cooperative Research Centre, Optical Sciences Centre, The Australian National University,
Canberra ACT 0200, Australia
W.H. Knox Bell Laboratories, Lucent Technologies, Holmdel, NJ 07733
Solitons are pulses that preserve their integrity due to the balance between nonlinearity and dispersion [1,2]. Solitons in a lossless optical fiber have been extensively studied. However, polarization properties are not completely understood. Experimental observations show that solitons transform their polarization as a unit, even in the presence of weak random birefringence [3]. In the case of regular weak birefringence, theoretical studies of the full vector equations have shown that there are vectorial two- soliton [4] and one-soliton [5] solutions that preserve the state of polarization. The former are unstable but the latter can be stable pulses with a fixed state of polarization. In an isotropic fiber, only periodic, elliptically polarized solitons exist [6]. Solitons with a fixed state of polarization in birefringent fibers only exist above an intensity threshold [2, 5]. Here, we show that solitons with a fixed state of polarization may be observed in a laser cavity filled with birefringent fiber. These solitons exist due to a balance between nonlinearity and dispersion as well as between loss and gain.
For the first time, we experimentally observe that, for certain values of average intracavity birefringence, the output polarization from a modelocked fiber laser spontaneously locks into a fixed state. The fiber laser is operating in the soliton regime. The locking only happens when the laser is modelocked. The experimental observations are well reproduced by numerical simulations. These results demonstrate that a vector soliton, which maintains its polarization state, is being formed in the cavity.
a)
Polarizer
Polarization _ . Controller °utP,ut
(Wave Plates) h?up'e.r Linear , . (Coated D„i„,i,
SBR V \ Ferrule)
O 1 Er/Yb ^ ^ W/T X K BB^T US s-
0, 02
Laser Cavity
mp Laser
RF Spectrum Analyzer
m ■D O
I a LL a.
b) T ' 1 ' 1 ■ T
rtiialMWiifriidJbw* c)
LA
eil mm 0 is ' do 7*5 1 bo
Frequency (MHz)
mm 100 125
Fig. 1. a) Schematic of laser cavity and measurement, b) RF spectrum without linear polarizer, c) RF spectrum with linear polarizer.
0-7803-4950-4/98/$10.00 1998 IEEE 147

The fiber laser is shown schematically in Fig. 1 [7]. The cavity consists of three sections of fiber. The two on each end are standard single mode fiber (SMF). The center piece is erbium/ytterbium co-doped; this piece provides gain. The SMF has anomalous dispersion at 1550 nm and the codoped section has normal dispersion. The net cavity dispersion is anomalous. One end of the cavity is a dielectric output coupler, coated directly onto a fiber ferrule. It reflects 99% at 1550 nm and high transmission at 980 nm. The gain fiber is pumped through this output coupler by a 980 nm pump diode. A wavelength division multiplexer external to the cavity separates the output from the incoming pump light. The laser is modelocked by a semiconductor saturable absorber (SBR), which consists of a pair of quantum wells grown on top of the AlAs/GaAs Bragg reflector. One of the two sections of SMF is wrapped around two paddles of a standard fiber polarization controller, each providing about 1.2 radians of retardance.
The evolution of an optical pulse in the laser cavity taking into account polarization effects is described by a pair of coupled modified non-linear Schrödinger equations
(1)
where z is normalized to the cavity length, t is normalized retarded time, D = ß2/\ß2\ and ß2 is the
intracavity group velocity dispersion, ^and ^are the normalized envelopes of the two components of the optical field, y is the half-difference between the propagation constants of </> and y/, A is the cross-phase modulation coefficient, B is the energy-exchange coefficient (four-wave-mixing, FWM), ß represents spectral filtering, g(Q,) is gain (which depends on the pulse energy, Q,) and Ss is the time dependent loss, including background losses and the saturable absorber.
To observe the evolution of the polarization, the output of the laser is detected with a fast photodiode and the RF spectrum monitored (see Fig. 1). The directly detected spectrum consists of a comb of harmonics separated by the cavity repetition rate, Fc. When a linear polarizer is inserted before the photodiode, additional sidebands appear in the RF spectrum. These sidebands are due to evolution of the pulse polarization during one cavity round-trip. The spacing, A, between the sidebands and the cavity harmonics is a measure of how fast the polarization is evolving.
In Fig. 2a & b, A is plotted as a function of the angle, &\, of one of the two paddles of the polarization controller. The angle of the other paddle, 6>j, is held constant. Regions with distinctly different behaviors are observed. One is that A is non-zero and varies as &\ is varied. Another is A fixed at zero. A = 0 means that polarization is not evolving, we call this polarization locking. The transitions between these two are very abrupt and display hysteresis. There are also small regions where A is locked at values of Fcln, n = 2,3. When the SBR is replaced with an ordinary high reflector, so that the laser runs CW, only the first behavior is observed. The CW A(0U&i) can be described by a simple model, which ignores fiber
25 -iLockingat Fc/2
20 - F/: j*\.
~°w o o o o o o
-*—ä ° s.
-"—I—«- 90 135
©2 (deg.)
-0.6
-0.4
-0.2
- 0.0 J"
--0.2
--0.4
--0.6
135 180 62 (deg.)
225
Fig. 2. Experimentally measured polarization evolution for two cavities.
148

0, 02 0<
D + S+g D + SPM + XPM + FWM
li5 ' 1&0
Fig. 3. Theoretical results: a) schematic of model used for numerical calculations, each line segment represents a section of fiber, left most has only gain, loss and dispersion, the others include birefringence (labeled by the angles of the axes) and nonlinearity, b) calculated A for various values of birefringence.
nonlinearity, that describes the cavity as concatenated waveplates [8]. The simple model reveals that the residual birefringence in the portions of cavity fiber that are not wrapped on the polarization controller must also be considered. The difference between Fig. 2a and Fig. 2b is that the residual birefringence was minimized in the latter.
The output polarization was measured in addition to A for the configuration used in Fig. 2b. We plot the third Stokes parameter, S3 in Fig. 2b. 1S3 = 0 for linearly, +1 for right circularly and -1 for left circularly polarized light. Intermediate values indicate elliptically polarized light. These results show that the locked output is elliptically polarized for regions where A ~ 0 "naturally," i.e., it would be close to zero for CW operation. Linear polarization is observed for the regions where A 4- 0 "naturally."
Equations (1) were solved numerically for a slightly simplified model of the laser cavity (see Fig. 3a). All of the behaviors described above are reproduced by the numerical results (Fig. 3b). This includes the overall A{0\,0i), the multiple polarization locking regions, locking at A = Fcln, hysteresis, and the output polarization in the locked states. As it is difficult to ascertain the exact birefringence and nonlinearity in the experiment, we focus on the presence of all of these features. In particular, switching between linear and elliptically polarized output in the locked regions is in remarkable agreement with experiment.
The theoretical results provide insight into how the polarization locking occurs. In fact, polarization locking can be described as phase locking of the two polarization components. The two key ingredients are that the phase of a soliton depends on its amplitude and that the two polarization components can exchange energy via FWM, which is phase sensitive, both in the magnitude and direction of the energy flow. Because of the combined action of these two phenomena, a negative-feedback situation can develop that fixes the relative phases of the two components.
In summary we have experimentally observed solitons in a fiber laser that preserve their polarization state, i.e., they are vector solitons. We believe that this is the first experimental observation of a vector soliton. Numerical calculations provide excellent agreement with the observations.
*current address
[1] G.S. Agarwal, Phys. Rev. A 37, 4741 (1988). [2] N.N. Akhmediev and A. Ankiewicz, Solitons (Chapman & Hall, London, 1997). [3] S.G. Evangelides, et al, J. Lightwave Technol. 10, 28 (1992). [4] D.N. Christodoulides and R.I. Joseph, Opt. Lett. 13, 53 (1988). [5] N.N. Akhmediev, et al, J. Opt. Soc. Am. B. 12, 434 (1995). [6] Y. Barad and Y. Silberberg, Phys. Rev. Lett. 78, 3290 (1997). [7] B.C. Collings, et al, IEEE J. Sei. Top. Quantum Electr. 3, 1065 (1997). [8] S.T. Cundiff, B.C. Collings, and W.H. Knox, OpticsExpress 1, 12 (1997).
149

TuB4 ii:30am - ii:45am Self phase modulation limitations in long
nonrepeatered standard fibre transmission: influence from dispersion compensation
scheme and modulation format
Arne Reyset Norwegian University of Science and Technology, NTNU, N-7034 Trondheim, Norway
Phone: +47 73 59 44 05, Fax: +47 73 59 14 41, email: [email protected] Dag Roar Hjelme
SINTEF Electronics and Cybernetics, N-7034 Trondheim, Norway.
Introduction The use of dispersion compensating elements, such as dispersion compensating fibres (DCF) or fibre Bragg gratings (FBG), has allowed upgrade of bitrates to lOGbit/s and beyond at 1.55u.m on standard single mode fibres (SMF). Long nonrepeatered spans may be a cost effective solution in many cases. Long spans can only be obtained with high input powers in the transmission fibre, causing the interaction between self phase modulation (SPM) and dispersion to be a major source of distortion, [l]-[5]. Obtaining high power budgets by combatting SPM induced distortion by clever system design is therefore of great importance. Among the important design considerations is the choice of dispersion compensation scheme and modulation format. The optimum modulation format may be return-to-zero (RZ) or nonreturn-to-zero (NRZ), binary or duobinary. Dispersion compensating schemes includes, precompensation, postcompensation, a combination thereof, as well as the degree of compensation: overcompensation, 100% compensation, and undercompensation. Most numerical studies on this topic [3]-[5] has limited the analysis to either fixing the bitrate [3]-[5], modulation format [3]-[4], or the dispersion compensation scheme [4]-[5]. In this paper we demonstrates numerically how the systems ability to combat SPM depends on all these three parameters. Hence optimum design rules are found, allowing to maximise transmission length, and system margin.
System configuration A schematic of the system is shown in Figure 1. A chirp-free externally modulated transmitter was used with three different modulation formats: duobinary NRZ, binary NRZ, and binary RZ, while the bitrate was varied from 10 to 40 Gbit/s. The receiver was optically preamplified and the receiver sensitivity was calculated using a gaussian noise model.. The SMF had a loss of 0.2dB/km, a dispersion of D=17ps/nmkm, and a nonlinearity of l^W'km"1 (n2=2.36-10"20m2/W, A=ff=85um2). The DCF's were considered to be lossless and linear in order to isolate the effect of SPM in the transmission fibre. Linearity can be obtained by using low power levels or applying a FBG with the same dispersion. The effect of Brillouin scattering, third order dispersion, and polarisation mode dispersion have also been omitted in our study.
TX j»inO o RX r SMF
nonlinear DCF2 linear
Figure 1: Schematic of the simulated system TX: transmitter, DCF1: precompensating element,
DCF1 ^/ SMF DCF2 | | SMF: 150km standard singlemode fibre, linear nonlinear linear DCF2: postcompensating element, RX: receiver
Numerical results and discussion Extensive simulations were carried out by varying bitrate, modulation format, transmitted power level Pin
(increased in steps of ldB) and fibre lengths. The nonlinear transmission fibre was kept constant at 150km while the dispersion in DCF1 and DCF2 were adjusted. All fibre lengths presented are normalised to the corresponding SMF fibre length (17ps/nmkm). The limit on tolerable distortion caused by dispersion and SPM were set to 0.5dB compared to back-to-back. Figure 2 and 3 show how the maximum power level depends on the amount of dispersion before and after the SMF input for 10 and 40Gbit/s. The optimum DCF1 dispersion were between 0 and -40km, while the optimum SMF+DCF2 dispersion were between 0 and 40km in all the simulated cases. Note that the highest power levels can not be obtained either with 100% postcompensation or 100% precompensation. The importance of DCF1 is small at 10Gbit/s compared to 40Gbit/s. The dispersion length of the signal is longer than the loss length (22km) at 10Gbit/s. SPM adds chirp to the signal along the first part of the SMF, resulting in a chirped signal with moderate distortion after =30km transmission. This chirp is strong at high power levels and leads to distortion if the SMF+DCF2 dispersion is zero. 0-7803-4950-4/98/$10.00 1998 IEEE 15Q

[dBm]
25
20
15
10
5
DCF1=0km ^ *>—-^——
*CY **N.^ y "*^v *~*
■ % **I"***■>
*-, X
\: ^r .
***'' 4*
*
25
20
15
10
5
DCF1= =-12km
i 'Y ' •-- * • • ,
* &"^ —duoNRZ — binNRZ ■"' binRZ
•
p max
[dBm]
normalised length DCF2+SMF fibres [km]
Figure 2: Input power levels Pin causing a 0.5dB SPM/dispersion penalty at 10Gbit/s. The vertical dotted line indicates 100% compensation.
[dBm]
25
20
15
10
5
DCF1=0km •
— duoNRZ
• — binNRZ """" binRZ
■
• ■
■ \ ; i . i
■
25
20
15
10
5
DCF1=-12km
[dBm]
20 40 0 20 normalised length DCF2+SMF fibres [km]
Figure 3: Input power levels Pin causing a 0.5dB SPM/dispersion penalty at 40Gbit/s. 151

The signal dispersion length is shorter than the loss length at 40Gbit, and we can not achieve this moderately chirped signal and the tolerable power levels are much lower. Precompensating 10-20km fibre gives the best results independent of modulation format, while the optimum amount of postcompensation depends on the modulation format. Binary RZ requires zero total net dispersion, binary NRZ performs best with a small undercompensation, while duobinary NRZ performs best with larger undercompensation. The design tolerance on fibre lengths are considerable larger for duobinary NRZ. Note that the optimum precompensation in our non-soliton systems is close to the precompensation required in soliton SMF transmission [6]. This small amount of precompensation, shorter than the loss length, reduces the average distortion of the pulse in the high power portion of the fibre and thereby reduces the SPM induced distortion. Binary RZ tolerates highest Pin at both 10 and 40Gbit/s if 100% postcompensation scheme is employed, while duobinary NRZ allows highest power levels if the compensation is optimized. The differences in input power levels in the optimised case corresponds nearly to the differences in receiver sensitivity for the modulation formats. This is demonstrated in figure 4 which displays how the maximum power budget varies with bitrate and modulation format.
power budget [dB] 50*
optimized Densation
•duoNRZ ■ binNRZ binRZ
100% postcompensation
Figure 4: Maximum power budget versus bitrate for different modulation formats and compensation schemes.
10 20 30 40 bitrate [Gbit/s]
RZ modulation gives a 4-5dB increase in power budget in a system emplying 100% postcompensation, while the power budget is nearly independent of modulation format if the dispersion is optimized.
Conclusions A large increase in power budget can be obtained, particularly at 10Gbit/s, if optimized pre and post- compensation is employed rather than 100% postcompensation. NRZ and RZ have comparable power budget in the case of optimized compensation, while RZ is preferrable with 100% postcompensation. Our results have clearly demonstrated the impact of bitrate, modulation format, and dispersion compensation in the design of SPM/dispersion tolerant systems.
References 1. A. Ludwig, W. Pieper, H. G. Weber, D. Breuer, K. Petermann, F. Küppers, and A. Mattheus: "Unrepeatered
40Gbit/s RZ single channel transmission over 150km of standard singlemode fibre at 1.55um", Electron. Lett., 1997, 33, (1), pp. 76-77.
2. K. Suzuki, N. Ohkawa, M. Murakami, and Kazuo Aida: "Unrepeatered 40 Gbit/s RZ signal transmission over 240km convential single mode fiber", ECOC'97, Edinburgh 1997, pp. 27-30.
3. R. J. Nuyts, Y. K. Park, and P. Gallion: "Dispersion equalization of a 10Gb/s repeatered transmission system using dispersion compensating fibres", IEEE J. Lightwave Technol., 15, (1), pp. 31-42, 1997.
4. B. Schmauß, M. Berger, M. Rastovits-Wiech, A. Schinabeck, and D. Werner: "Modular dispersion compensation schäme for high bitrate single channel and WDM transmission with varying channel power", ECOC'97, Edinburgh, 1997, pp. 239-242
5. D. Breuer and K. Petermann: "Comparison of NRZ- and RZ-modulation format for 40Gb/s TDM standard- fiber systems", IEEE Photon. Technol. Lett., 9, (3), pp. 398-400, 1997
6. F. Favre, D. Le Guen, M. L. Moulinard, M Henry, G. Michaud, F. Devaux, E. Legros, B. Charbonnier, and T. Georges: "Demonstration of soliton transmission at 20Gbit/s over 2200km of standard fibre with dispersion compensation and prechirping", Electron. Lett., 33, (6), pp. 511-512, 1997.
152

TuB5 11:45am - 12:00noon
STRONG TIME JITTER REDUCTION USING SOLITONS IN HYPERBOLIC DISPERSION MANAGED FIBER LINKS
M. Zitelli Universitä di Roma La Sapienza, Dipartimento di Energetica, INFM-GNEQP CNR, via Scarpa 16 Roma, ITALY
B. Malomed Tel Aviv University, Department of Interdisciplinary Studies, Faculty of Engineering,
Tel Aviv 69978, Israel
F. Matera, M. Settembre Fondazione Ugo Bordoni, via B. Castiglione 59, 00142 Roma ITALY
tel. +39-6-54802215, fax +39-6-54804402, e-mail: [email protected]
INTRODUCTION. In the environment of the high capacity optical communications on transoceanic distances, several theoretical works, confirmed by numerical simulations, have shown that the method called dispersion management (DM) [1] permits to achieve the highest performance in transmission of digital signals both in the nonreturn to zero (NRZ) and return to zero (RZ) format [2]. Dispersion management means that the chromatic dispersion or Group Velocity Dispersion (GVD) is periodically varied along z in order to have an average GVD very low. The nonlinear behaviour of a system operating in this regime is really different from that one in a system with constant GVD. In particular, the propagation of soliton pulses is strongly affected when dispersion management is used even if it is still possible to have stable pulses that recover their shape after a period which depends on the dispersion map. The required input energy of these stable solutions is greater respect to that one required by an equivalent soliton with the same average pulsewidth in a uniform fibre with the same average dispersion. As a result, the effect of spontaneous emission noise on system performance are reduced: the Gordon Haus effect can be limited without in-line control devices, the nonlinear interaction due to Four Wave Mixing (FWM) between signal and noise is reduced by the high value of local dispersion and signal to noise ratio can be improved both by the increased value of pulse energy and a stronger receiver filtering. These effects are even stronger if a "sliding" dispersion management is used in which the local average GVD decreases with a 1/z law [3]. This method has two advantages since it tolerates an higher pulse energy, making a comparison with a classical dispersion management, the local average GVD is higher at the input link and lower at the link output and these characteristics permit a reduction of the time jitter and to operate with an higher pulse energy. In this paper we suggest to implement this scheme by simply using two kinds of fibers and changing the length of the compensating fibers that are supposed located at the optical amplifier positions. We analytically and numerically demonstrate that with this dispersion map the jitter can be deeply reduced with respect to a classical sawtooth DM method.
THEORY. In an Hyperbolic DM system, let Lc<mp be the period of dispersion compensation. The n-th period is composed first by a fiber span having normal dispersion ß2. (ps2/km) and length L<">, followed by a span with anomalous dispersion ß2+ and length L+
M (we observed that using first the anomalous dispersion is not a better solution). The span lengths must be
L(n)=L_-l/n,L(+
n)=L++l/n O).
with the conditions: L,„„„,=L++L., ß2+L++ß2.L.=0, and / generally much smaller than L+ and L.; in this way the average
local dispersion ß2(n) - calculated over the n-th compensation period, will decrease with distance as ß2(n) = ß20)/n >
with
P2(1) = ß2+(l++l) + P2.(L.-l) (2) Lcomp
being the average local dispersion at the first compensation period. The overall average dispersion, calculated over all the link length will be given by
i/o a \ ncomp , <ß2(n)>^1(ß2+;ß2-) £ 1 (3),
ncompljcomp n-i n
with ncomi, being the total number of compensation periods. For solitons pulses having arbitrary peak power Pm„ at the output of every amplifier, the Gordon Haus time jitter in a uniform dispersion link can be expressed as
0-7803-4950-4/98/J10.00 1998 IEEE 153

°GH
2,3 Nsphv(G-l)|ß2|/z lX
"TQLampPoin
(4),
where z is the propagation distance. The time jitter in DM links can be roughly evaluated assuming that its increase in the n-th compensation period is given by Aa(n) = (aa/3z)| _ 7__T Lcomp , thus z-IUjcomp
Aa(n) = Nsphv(G-l)|ß2(n)|2nL3
comp
4TQLampPoin
X (5).
In eq. (5) we have substituted ß2 with the average local dispersion. We recall that in a conventional sawtooth [1-2] DM
link it results ß2(n) = ß2 = COS? , while in hyperbolic DM we have the average dispersions given in the above section.
ncomp Assuming the time jitter as 0 ~ ]£ Ao(n) , with ncomp the total number of compensation periods, we have
n=l
'f(n) aDM Nsphv(G-l)l4omp
4TgLampPojn
(6),
ncomp ncomp with f(n) = |ß2| X Vn for conventional DM, and f(n) = |ß~2(l)| X l/Vn for hyperbolic DM. Eq. (6) in the case
n=l n=l of conventional DM approximates to eq. (4). Eq. (6) shows that if we compare two links, one with conventional DM and another with hyperbolic DM having the same global average GVD, the latter can have a smaller value of f(n) with respect to the first and this explain the reduction of the time jitter. Furthermore preliminary simulations have shown that the hyperbolic DM can permit the use of higher power P0in and it is mainly due to the fact that the link input shows a stronger strength of the DM.
NUMERICAL RESULTS. In order to investigate numerically the performances of hyperbolic DM systems, we simulated the generalized nonlinear Schroedinger equation using the split step Fourier method including the behaviour of the optical erbium amplifiers with the generation of the ASE noise [2]. The model accounts for higher order dispersion and Raman effect. The performance is evaluated in terms of Q factor and time jitter and details on the simulations can be found in [2]. We recall that to have an error probability lower than 10"9 an IM-DD system must satisfy the conditions that the Q factor must be higher than 6 and the time jitter must be lower than 6% of the bit time. The parameter values that we chose for our link are: Pulse repetition rate /?=10 Gb/s , link length L=9000 km, amplifier spacing Lflmp=40 km, pulsewidth TFWH/^20 ps , loss coefficient a=0.21 dB/km , higher order dispersion parameter ft=0.066 ps3/km , effective core area Ae^=48 um2 , pulse wavelength A=1.55 u.m , nonlinear index coefficient n2 =3.2xl0"16 cm2/W, amplifier inversion population factor Nsp=2 , amplifier gain G=6.90 . The two fiber spans used in a compensation period have dispersion parameters ß2+ =-20 ps2/km for the anomalous dispersion (a common step index fiber), and ß2. =1.28 ps2/km for the normal dispersion. The other parameters are assumed equal and are given above. In fig. 1 we report a typical behaviour of the GVD in a link with hyperbolic DM having Lcomp=200 km. We considered the following compensation period lengths: Lcomp=600 km , which was the maximum period giving transmission over 9000 km, and Lcomp=360, 200 and 120 km. For a smaller period the performances rapidly fall down. The compensation periods are chosen to be multiples of L^ and submultiples of 9000 km. In Fig.2 we show the Q factor in the above cases, and for an optimal choice of the length I in eqs.(l) and the pulse input peak power P0in. According to eq.(3), it must be noted that except for Lcomp=600 km, having overall average dispersion of -0.09 ps2/km, all other cases correspond to an overall average dispersion, calculated over 9000 km, < ß2(n) >= -0.05 ps2/km. The best transmission is given for Lcomp=200 km, £=4.81 km and a peak power P0in=&30 mW. In Fig.3 the time jitter for the same cases is shown. The surprisingly low jitter values encountered have been justified in the above section and from eq. (6) in particular. Since in the best cases the time jitter and the Q factor show constant values over a large range of pulse power values, eq.(6) can be only used for a qualitative estimate of the jitter behaviour, and to compare different DM methods. A good prediction can be made in any case, if we substitute in eq. (6) the lowest pulse power that we expect to give transmission over a fixed distance.
154

Finally in Fig.4 we show the time jitter in the best cases with Lamp=200 km, 1=4.81 km, P0|n=8.3 mW and Ltom/;=360 km, 1=5.54 km, Poi„=5.2 mW, over the maximum distances that give a good transmission (about 22000 km). To have a comparison we report the case of a uniform DM system with Lram;,=200 km, optimized input power P0i„-4.0 mW and
global (and local) average dispersion ß2 = —0.05 ps2/km. We report also the theoretical Gordon-Haus time jitter for
an equivalent uniform dispersion system having ^=-0.05 ps2/km and input power calculated according to the average soliton formulae. REFERENCES [1] F. M. Knox, W. Forysiak, N. J. Doran, IEEE Journal Lightwave Technology, 13, 1955 (1995)
[2] B. A. Malomed, F. Matera, M. Settembre, Optics Communications, 143, 193 (1997)
[3] P. V. Mamyshev, L. F. Mollenauer, Optics Letters, 21, 396 (1996).
E
•5
g? 0.2
10
a 4.
_-*
a- ••-. X \ X N-^
Q D (a)
v—, (b)
^ >
-■— (c) » B (d)
,
4000 6000 8000 12
Distance (km)
Fig.l: Local average dispersion j32(w) • (w'tn n=^a»,.)'
in an hyperbolic DM link having £„,„,=200 km and overall
average dispersion < ß2(n) >= _0.05 psVkm over 9000
km.
P0in(mW)
Fig.2: Q factor after a distance of 9000 km, versus pulse input peak power Pan , in hyperbolic DM systems having: a) compensation period Lcim=600 km and /=11.72 km; b) Lcilm=360 km and /=5.54 km; c) L,o„=200 km and /=4.81 km; d) L =120 km and /=4.31 km.
E H 2
B o (a) ^--* (b) --. (c) » o (d)
0L-r 12
P0in(mW)
1.5x10
1.0x10''
H 0.5x10-"
0
--.. (a) *■—■> (b)
■ ■ (c) (d)
■
•»■-•''
0 5000 10000 15000 20000
Distance (km)
Fig.3: Time jitter after a distance of 9000 km, versus pulse Fig.4: Time jitter versus propagation distance in the cases:
input peak power Pan, in the same cases of fig.2. a) hyperbolic DM system having L.om/=200 km, /=4.81 km,, b) Hyperbolic DM system with Lcmp=360 km, /=5.54 km, c) uniform DM system equivalent to the case a), with L =200 km and d) theoretical Gordon-Haus time jitter for a uniform dispersion system equivalent to the cases a). b) and c) with ß,=-0.05 psVkm.
155

TuB6
12:00noon - 12:15pm
Efficient frequency conversion in optical fibers with tailored birefringence.
S.G.Murdoch, Z.Rong, R.Leonhardt, and J.D.Harvey
Physics Department
University of Auckland
Private Bag 92019
Auckland
New Zealand
Ph +64-9-373-7599 Ext 8831
Fax +64-9-373-7445
e-mail j .harvey @ auckland.ac.nz
Summary
Four wave mixing in optical fibers has long been recognised as important method of generating new
optical frequencies. The process holds promise as a means of wavelength switching for optical
communications, but the presence of a nonlinear term in the phase-matching condition normally
prevents strong energy exchange between the waves (1). We present here a scheme for optimising
the conversion efficiency. The four wave mixing process considered here is called polarisation
modulation instability (PMI) where a strong pump wave on one axis of a birefringent fiber results in
the growth of two equally detuned sidebands on the other axis. In the absence of any external seed
the sidebands start to grow with a frequency shift f0 where the wavevector mismatch is zero. This
mismatch is a function of the power of the pump and the fibre's birefringence, dispersion, and
nonlinearity. Our analysis of the evolution of the power in the sidebands utilises three coupled mode
equations which describe the interaction of a monochromatic pump, with a pair of sidebands
polarised along the orthogonal fibre axis. In the absence of Raman gain, it is possible to solve these
equations so that by varying the birefringence along the fibre, the sidebands with a frequency shift
of f0 are phase matched for the entire length of the fibre. Figure 1 shows this calculated
birefringence as a function of the normalised fibre length (1).
In the absence of a tailored birefringence, and with no Raman gain, the evolution of the sidebands is
spatially periodic with a maximum of about 20% of the power in each sideband, whereas with the
tailored birefringence, complete conversion is, in principle, possible with 50% of the original pump
power in the Stokes sideband, and 50% in the antistokes sideband. The presence of Raman gain
adds an additional mechanism for the transfer of power between the three waves. Although no
analytic solutions exist for the evolution equations in this case, complete transfer of power from the
pump to the sidebands is still possible for a fiber with a tailored birefringence, but the Raman gain
results in stronger growth of the Stokes sideband, and the eventually decay of the anti-Stokes
0-7803-4950-4/98/$! 0.00 1998 IEEE TSÖ

sideband. This is shown in Figure 2 where the power evolution is compared for fibres with tailored
birefringence without and with Raman gain.
The required variation of the birefringence can be achieved by winding the fibre on a tapered spool,
and we have performed experiments to assess the efficiency with which the pump power can be
converted into sideband power using the arrangement shown in Figure 3. As an intense pump
(700W), pulses from a cavity-dumped mode-locked Krypton laser (A^=647nm) were used. In order
to demonstrate the improved conversion of PMI sidebands in fibers with the correct tailored
birefringence we prepared two fibers each 2.2m long. With parameters used in our experiment, the
actual length of 2.2m corresponds to a normalised length of £=8 (see fig.2). The first was wrapped
around a spool with a constant diameter of 3cm. The second was wrapped around a spool whose
diameter (and therefore its birefringence) changed as a function of fiber length as required by the
theoretical investigation (see Fig.l). With this set-up the frequency shift of the sidebands reletive to
the pump was about ±5THz. To achieve a higher conversion efficiency a very small seed at the
Stokes frequency was used in both cases. With a simple spool, only 8% of the pump power could
be converted into the sidebands (with 3.5% in the antistokes), while we have obtained substantially
increased conversion efficiency (35% with 8% in the antistokes) using the tapered spool. The
results indicate that with further optimisation, greater conversion efficiencies should be possible.
Reference
1. S.G.Murdoch , R. Leonhardt and J.D.Harvey, "Nonlinear dynamics of polarization modulation
instability in optical fibres" J. Opt. Soc. Am. B 14, 3403 (1997).
3.4
3.2 (O
O 3 X
8 2.8 c 8> ?fi c .f- ffi 2.4
CO 2.2
2
1.8 3 4 5 6
Normalised Length p)
10
Figure 1: Calculated birefringence for optimal phasematching over the entire length of the fibre
as a function of the normalised fibre length.
157

3 o
1 — i ^L
u.y 0.8
0.7
0.6 05
- i-^SJ (a)... '-. ; :- -
0 A ..Jump ■. \ '^^ "J...V-.;-
•••■;-Stokes-&;a
0.3
02 - i- \;S...\^... 0.1
0.9 0.8
0.7
0.6
...
;T;;;;;;;^^i;;;;;;j:br; -j/S V|::::::::|=
Stokes
: anti-Stqkes
-j- :
0.5 : Pump"";• ;■ ■ ■ \■ ■ ■ -'^- —
0.4
0.3
0.2
0.1
o ) 1 1 2 3 4 5 6 7 8 ~g TO
Figure
a fibre
Normalised length(£)
2: Calculated power conversion to the stokes and antistokes PMI sidebands considering
with tailored birefringence: (a) without Raman gain, (b) with Raman gain.
Seed In
Pump In
Tailored Birefringence ,__!. Fiber
Rotating X/2
Plate
Mirror^V
E PI
PBS1 M1
.Reflecting Grating
PBS2
H Beam Stop
PBS3 Reflecting Grating
m Constant Birefringence ^
Fiber
Figure 3 Experimental arrangement for observation of enhanced power conversion in four
wave mixing experiments using a tailored birefringence fibre
158

TuB7 12:15pm-12:30pm
An improved semiconductor optical amplifier for ultrafast all-optical signal processing
R.J. Manning, A.E. Kelly, A.J. Poustie, K.J. Blow BT Laboratories,
Martlesham Heath, Ipswich, Suffolk IP5 3RE
U.K. Tel: +44 1473 645362 Fax: +44 1473 646885
email: [email protected]
Introduction The use of semiconductor optical amplifiers (SOAs) as optical nonlinear elements has had a profound effect on the field of all-optical signal processing for telecommunications applications. The invention of the TOAD (terahertz all-optical asymmetric demultiplexer) [1], and the subsequent discovery that switching rates much faster than the natural recovery rate of the SOA are possible, has allowed all-optical demultiplexing at high switching rates (>10GHz) [2,3,4]. In this paper we use a SOA which has been designed to have a larger band-gap than usual, having a gain peak at -1500 nm [5]. This improves the both the contrast ratio and the amplitude modulation associated with TOAD arrangement. All-optical switching of pulse trains using a TOAD is achieved by placing the SOA offset from the centre of an optical fibre loop mirror, and injecting data into the loop via the 50:50 coupler, as in Figure 1. A switching window is created, which is used to demultiplex a high-speed pulse train using switching pulses of a lower repetition rate. However, amplitude modulation of the data pulses in the loop occurs, which is caused by the SOA gain dynamics. The switching pulses at wavelength Xx cause an amplitude and concomitant phase change at 7^, the wavelength of data pulses in the loop. For interferometric switching, where we assume a 50:50 coupler at the loop input and a phase difference of 7t radians, the contrast ratio between reflected and transmitted ports of the loop is given by:
(GX +G2+ 240^) Contrast Ratio = -. , N (2)
(Gx +G2- 2jG^) where Gi andG2 are the gains of the amplifier for data pulses in the loop before and
after switching. For a typical ratio VQ of 3 dB for a 7t radians phase change, a
contrast ratio of 15 dB is attainable, considerably worse than the typical 25-30 dB usually achieved with an all-fibre nonlinear loop mirror (where no amplitude modulation of the loop pulses occurs). The unswitched channels also experience a slowly recovering gain in the SOA and hence are amplitude modulated on output of the loop. The recent development of large band-gap SOAs with gain peaks around 1500nm [5] has allowed us to minimise these problems, since standard pulse sources can now access carrier transitions closer to the band edge where large phase changes correspond to only small amplitude (gain) changes [6]. Experimental The experimental arrangement is shown in Figure 1. A switching window of ~ 40 ps was used in a loop biased for reflection.. The ~5 ps pulses injected into the loop were tuneable from 1540-1590nm, and were switched by ~5 ps, 1539nm pulses.The SOA was a 1mm long device whose active layer was a strained layer MQW ternary, and had a gain peak at ~1500nm for an operating current of ~ 130 mA [5]. Three complimentary
0-7803-4950-4/98/$10.00 1998 IEEE 159

Loop pulses in (1550-1590 im)
Loop and switching puls es out
Switching Pulses in (1539nm)
Offset
Figure 1: Schematic of TOAD switching arrangement.
measurements were undertaken and each was repeated for loop pulse wavelengths between 1550nm and 1590nm.. Firstly, to measure the contrast ratio between transmitted and reflected ports of the loop mirror, both sources were run at ~ 5GHz drive frequency. Switching energies of ~ 200fJ were typical for n radians phase change. The integrated output powers from the transmitted and reflected ports, from which the contrast ratio was calculated, were carefully measured using an optical spectrum analyser. In a second set of experiments, the data pulse source was run at ~ 5GHz, and the switching pulse source at 1.25 GHz, so every forth data pulse was switched out of the loop. The slow recovery of the SOA meant that the unswitched pulses each experienced a different gain and were hence amplitude modulated.The ratio of the first unswitched pulse to the third (i.e. last) pulse in the data pulse sequence was measured as a function of wavelength. The third experiment directly measured the amplitude modulation of a pulse traversing the SOA before and after the switching pulse. The loop was set up for full switching (corresponding to ~ n radians phase difference), and was then broken and the amplitude of data pulse before and immediately after the switching pulse were measured by delaying the arrival time of the switching pulses using a variable optical delay stage.
Results Figure 2 shows the measured variation of the loop mirror contrast ratio with data pulse
25 T
to 2. 20
o"
£ 15
c ü 5
1 1 1 1 1
1540 1550 1560 1570 1580 1590
Wavelength(nm)
Figure 2: Measured contrast ratio of the nonlinear loop mirror as a function of data pulse wavelength.
160
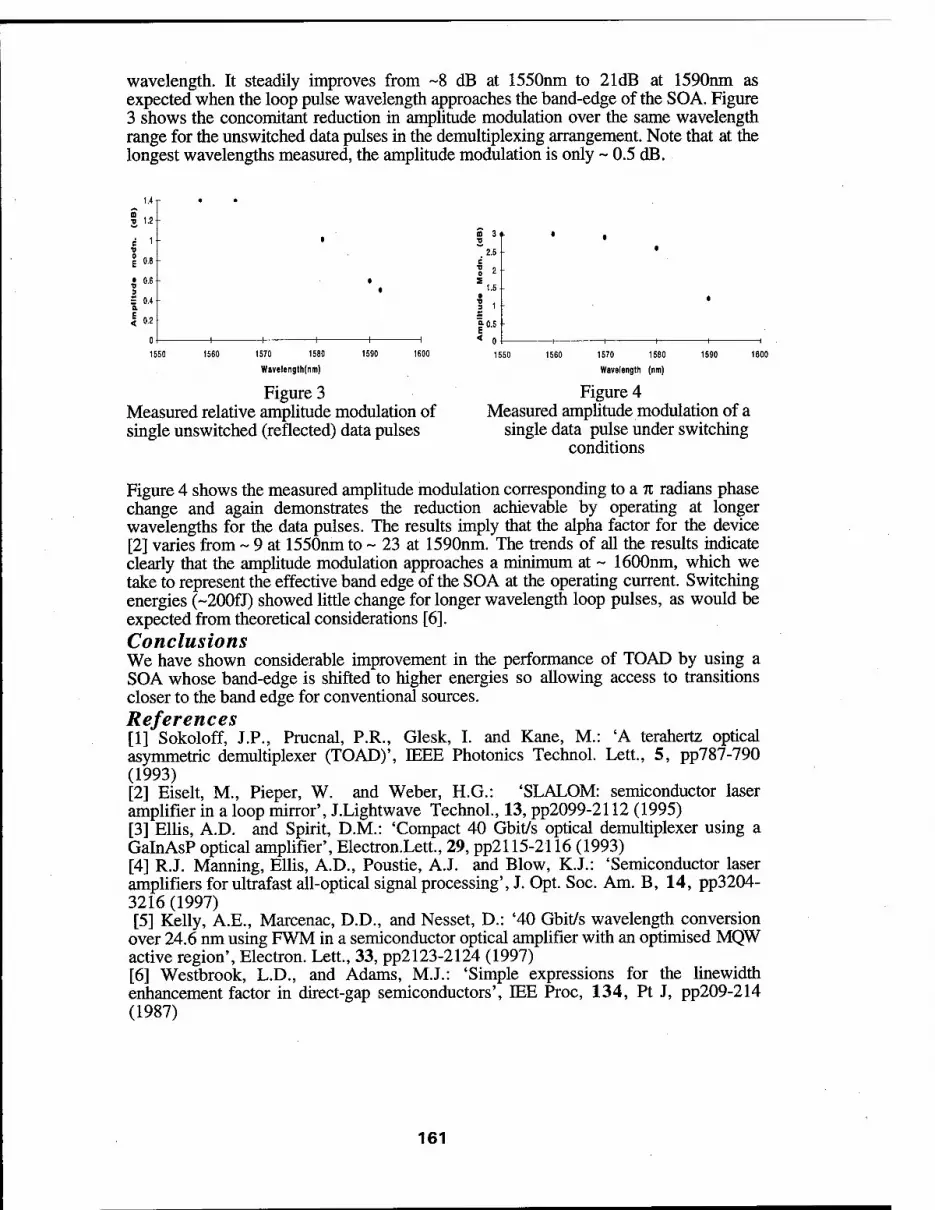
wavelength. It steadily improves from ~8 dB at 1550nm to 21dB at 1590nm as expected when the loop pulse wavelength approaches the band-edge of the SOA. Figure 3 shows the concomitant reduction in amplitude modulation over the same wavelength range for the unswitched data pulses in the demultiplexing arrangement. Note that at the longest wavelengths measured, the amplitude modulation is only ~ 0.5 dB.
1.4
D z '-2
• •
V
I 0.8
•
• 0.6 3 = 0.4 a
| 0.2
• •
0 1 1 1 1 1
1550 1570 1580
Wavelength(nm)
1590 1600
Figure 3 Measured relative amplitude modulation of single unswitched (reflected) data pulses
2.5 -
2
1.5
1
0.5
1550 1570 1580
Wavelength (nm)
1600
Figure 4 Measured amplitude modulation of a
single data pulse under switching conditions
Figure 4 shows the measured amplitude modulation corresponding to a n radians phase change and again demonstrates the reduction achievable by operating at longer wavelengths for the data pulses. The results imply that the alpha factor for the device [2] varies from ~ 9 at 1550nm to ~ 23 at 1590nm. The trends of all the results indicate clearly that the amplitude modulation approaches a minimum at - 1600nm, which we take to represent the effective band edge of the SOA at the operating current. Switching energies (~200fJ) showed little change for longer wavelength loop pulses, as would be expected from theoretical considerations [6]. Conclusions We have shown considerable improvement in the performance of TOAD by using a SOA whose band-edge is shifted to higher energies so allowing access to transitions closer to the band edge for conventional sources. References [1] Sokoloff, J.P., Prucnal, P.R., Glesk, I. and Kane, M.: 'A terahertz optical asymmetric demultiplexer (TOAD)', IEEE Photonics Technol. Lett., 5, pp787-790 (1993) [2] Eiselt, M., Pieper, W. and Weber, H.G.: 'SLALOM: semiconductor laser amplifier in a loop mirror', J.Lightwave Technol., 13, pp2099-2112 (1995) [3] Ellis, A.D. and Spirit, D.M.: 'Compact 40 Gbit/s optical demultiplexer using a GalnAsP optical amplifier', Electron.Lett., 29, pp2115-2116 (1993) [4] RJ. Manning, Ellis, A.D., Poustie, A.J. and Blow, K.J.: 'Semiconductor laser amplifiers for ultrafast all-optical signal processing', J. Opt. Soc. Am. B, 14, pp3204- 3216 (1997) [5] Kelly, A.E., Marcenac, D.D., and Nesset, D.: '40 Gbit/s wavelength conversion
over 24.6 nm using FWM in a semiconductor optical amplifier with an optimised MOW active region', Electron. Lett., 33, pp2123-2124 (1997) [6] Westbrook, L.D., and Adams, M.J.: 'Simple expressions for the linewidth enhancement factor in direct-gap semiconductors', IEE Proc, 134, Pt J, pp209-214 (1987)
161

TuCl 12:30pm - 2:30pm
Multidimensional optical pulses in non-resonant quadratic materials
Mark J. Ablowitz, Gino Biondini and Steve Blair Department of Applied Mathematics, University of Colorado, Campus Box 526, Boulder, CO 80309-0526
Phone: (303)492-6974; Fax: (303)492-4066; E-mail: [email protected]
The propagation of a light pulse in media with quadratic nonlinearity has attracted significant interest in recent years (see e.g. [1] and references therein). In such media the nonlinear response is known to generate d.c. fields which subsequently play a key role in the evolution of the optical pulse. In a one- dimensional nonresonant quadratic material, the evolution of the slowly-varying envelope of the optical pulse was recently found [2] to be governed by the nonlinear Schrödinger equation (hereafter NLS), äs in the more familiar case of Kerr materials. The NLS equation is also a centrally important equation in other areas as well, e.g. fluid dynamics, plasma physics. However, it is well known that (H-l)-dimensional structures propagating in a multidimensional medium may be unstable with respect to transverse modulations (see e.g. Refs. [3]). As a consequence, pulse dynamics in a multidimensional medium cannot be reduced to simple one-dimensional systems. When studying the modulation of a wave packet in a multidimensional dispersive medium, generalized NLS systems with coupling to a mean term (hereafter denoted as NLSM) are known to appear in various physical situations [4]. In special cases these systems are known to be integrable. However, even in the non-integrable case these equations exhibit interesting phenomena such as focusing, singularities and a rich structure of solutions (see e.g. Refs. [3]).
In a recent letter [5] we discussed how novel NLSM systems appear in the context of nonlinear optics when studying three-dimensional materials with quadratic nonlinearity. Consider the propagation of a single optical pulse in a suitable quadratic medium (e.g. an orthorhombic mm2 material or a tetragonal 4mm material): For convenience, we choose the coordinate axes (X,Y,Z) to be a permutation of the crystallographic set (x,y,z); i.e. set (X,Y,Z) = (z,-y,x), with the electric field polarized along X and propagating along Z, and define T to be the retarded time (that is, the time in a frame that moves with the group velocity of the pulse). With these assumptions the evolution of the slowly varying envelope of the optical field A(X, Y, Z, T) and the associated d.c. field <j)(X, Y, Z, T) generated (in the X component) by the nonlinearity is described by the following coupled set of partial differential equations: [5]
2ikxAz + (l-ax,1)Axx+AYY-kxkZATT + (Mx,1\A\2 + Mx,o4>)A = 0, (la)
(1 - axfi)<t>xx + <}>YY - SX(/>TT = NxA(\A\2)TT - Nx>i{\A\2)xx , (lb)
with the phase and group velocity given by c|(w) = c2/(l+Xsx (<*>)) andu^w) = l/k'x(u) (where c is the speed of light in vacuum, x(1)(*) is the linear susceptibility tensor and u> is the central frequency of the pulse), the propagation wavenumber and the linear refraction index given by fc|(w) = (w/c)2n|(w), n\(bS) - l + x£x(u>), with sx = l/vl(u>) - 1/4(0), and where subscripts on A and <j> denote partial derivatives. The coefficients <*x,m, Mx>m and NXim depend on the material considered. In particular, MXti contains the third-order self-phase modulation coefficient plus the effective contribution due to second harmonic cascading, Mxfi
is the second-order coupling coefficient between d.c. and fundamental and the NXytn are the second-order coefficients of the d.c. rectification process, while the ax,m arise from the contribution of the divergence of the electric field. In what follows we will consider the case 1 - ax>m > 0 and sx > 0.
It is important to note that: i) The above equations are derived under the assumption that there are no resonant wave interactions. In this case the second harmonic generated by the nonlinearity can be solved explicitly in terms of the field at the fundamental. Otherwise the governing equations and relevant scales are very different—e.g. two/three wave interactions, which have already been the subject of many research papers (see e.g. Refs. [6] and references therein), ii) We do not introduce d.c. field and/or second harmonic at leading order because we are interested in the evolution of a modulated optical field and not in the interactions amongst different waves. This is a standard assumption in order to obtain NLS—and in this case NLSM—type equations. Of course, other assumptions would lead to different evolution equations (cf.
0-7803-4950-4/98/$10.00 1998 IEEE 162

Ref. [3, 7]). in) The d.c. field needs to be included in the calculation, otherwise inconsistencies arise in the'derivation of the evolution equations. This is true even in the one-dimensional case, where, however, the mean fields can be integrated explicitly, and the equations reduce to the well-known NLS equation (cf. Refs. [2]). iv) If x{2) = 0 there are n0 source terms in eq. (lb) (i.e. the Nj,m vanish) and the mean fields are zero. In this case the standard multidimensional NLS equation is obtained as a special "limiting" case.
If the dependence of A and <f> on Y is neglected, or if it is already taken into account when dealing with the linear modes (e.g. in a waveguide configuration), eqs. (1) become effectively (2+l)-dimensional. Then, upon nondimensionalization, rescalings and rotation to the characteristic reference frame of eq. (lb), the optical NLSM equations in the case of anomalous dispersion can be rewritten as
iq* + (1 - Oo) fa« + qTT) + #o ftr + (*2 M2 + Qh = 0, (2a)
Q€r = (|«|2)« + (|«|2)rr- (2b)
All the properties of the material are absorbed into the values of 0O and 02 (plus of course the normalization units of X, Z, T, A and». The well-known integrable case corresponds to 0O = 02 = 0. Equation (2b) allows us to express the d.c. field as Q = U + V, where
U(t,r,z)= H\q\2)tdT + u(Z,z), V{t,T,z)= J(\q\2)rdZ + v(T,z). (3) — oo —oo
The boundary conditions u and v play a key role in the dynamics of the pulse. More precisely, in the integrable case, stable localized multidimensional pulses are known to exist, which are driven by the d.c. field through a proper choice of u and v (cf. Refs. [8]). One of the main purposes of this work is to show that localized multidimensional pulses exist even in the more general non-integrable case described here.
To investigate the properties of eq. (2a) with U and V given by eqs. (3) we have performed numerical simulations for a number of different values of 0O and 02. We integrated eq. (2a) with a 2-dimensional split-step method and eqs. (3) with a second order numerical quadrature routine. Fig. 1 shows a typical stationary pulse in the integrable case 90=62= 0. The particular shape of the pulse results from the exact solution (cf. Refs. [8]). Fig. 2 shows the output pulse after 25 normalized propagation units for a prototypical value 0o = 02 = °-2> when the same boundary conditions as in Fig. 1 are used for the d.c. fields (see Figs. 5,6); Fig. 3 corresponds to 0O = 02 - 0.4. Even though some radiation is present, a localized pulse is still present. The maximum amplitude of the pulse is the same in all these cases. On the other hand Fig. 4 shows the output produced after only 2 propagation distances by the same input pulse as in Figs. 1-3 if the boundary conditions u, v for the d.c. fields are set to zero. Figs. 5,6 show the d.c. fields U(€,T), V(£,T) corresponding to the case shown in Fig. 1 {similar pictures result for the cases shown in Figs. 2,3). It is clear that, even in the more general situation 0O ^ 0, 02 ? 0, the presence of the d.c. fields can stabilize the optical pulses, which otherwise would disperse away very quickly without the presence of the boundary conditions. Similar results were found for a wide range of values of 0O and 02.
These findings suggest that stable localized multidimensional pulses are not unique to integrable systems; rather, they are a generic feature of forced evolution equations. Also, preliminary studies indicate that the above'described dynamical configuration can be designed experimentally. This possibility is particularly interesting because such experiments would allow the production of stable localized multidimensional optical pulses whose dynamics can be electrically controlled by modification of the relevant d.c. fields. These issues are currently under careful investigation and we will report on them in the near future.
REFERENCES
1. C. Bosshard, R. Spreiter, M. Zgonik and P. Günther, Phys. Rev. Lett. 74, 2816 (1995); A. A. Zozulya and D. Z. Anderson, Phys. Rev. A 51, 1520 (1995)
2. A. G. Kalocsai and J. W. Haus, Opt. Commun. 97, 239 (1993); Phys. Rev. A 49, 574 (1994)
3. M. J. Ablowitz and H. Segur, J. Fluid Mech. 92, 691 (1979); "Solitons and the inverse scattering transform" (SIAM, Philadelphia, 1981)
4. D. J. Benney and G. J. Roskes, Stud. Appl. Math. 48, 377 (1969); V. E. Zakharov, Sov. Phys. JETP35, 908 (1972)
163

Fig. 1 Fig. 2
Fig. 3 Fig. 4
Fig. 5 Fig. 6
5. M. J. Ablowitz, G. Biondini and S. Blair, Phys. Lett. A 236, 520 (1997)
6. A. V. Buryak, Y. S. Kivshar and S. Trillo, Phys. Rev. Lett. 77, 5210 (1996); C. B. Clausen, 0. Bang and Y. S. Kivshar, Phys. Rev. Lett. 78, 4749 (1997)
7. A. G. Kalocsai and J. W. Haus, Phys. Rev. E 52, 3166 (1995); J. Opt. Soc. Am. B 14, 1680 (1997)
8. A. Fokas and P. Santini, Phys. D 44, 99 (1990); M. J. Ablowitz and P. A. Clarkson, "Solitons, nonlinear evolution equations and inverse scattering" (Cambridge University Press, 1991)
164

TuC2 12:30pm - 2:30pm
Strong Correlation Effect in the Second Harmonic Generation of a Bose-Einstein Condensate
A.M. Levine and A. Kuklov
Department of Applied Sciences, College ofStaten Island, CUNY, 2800 Victory Blvd, Staten Island, NY 10314
tel: 718/982-2825 fax: 718/982-2830
The effect of Bose-Einstein condensation, achieved recently for alkaline gases in magnetic traps [1], should lead to a strong enhancement of non-linear harmonic generation. A nearly resonant light imposed on the gas of two-level atoms excites the intra-atomic transitions and causes generation of various harmonics. Normally, in the thermal state of the gas, a contribution of the inter-atomic interaction to the non-linear harmonic generation is negligible. However, if a Bose-Einstein condensate (BEC) is present, the inter-particle interaction cannot be ignored. Considering second harmonic generation, we show that, in the presence of the BEC, the intensity of the second harmonic is proportional to (aNrif, where N and n are the total number and the effective density of the condensed atoms, respectively, and a stands for the scattering length describing the process of scattering of two excited atoms by each other so that, after the collision, one excited atom enters the condensate.
We consider the interaction between light, represented by the electric field E, and the atomic Bose field IPas well as the two body interaction treated within the scattering length approximation. Thus the total interaction Hamiltonian is taken in the form
H* =\dV{-T. ^.(vV.+A.c) + Zs*(vV>» V. +h.c.) + a abc / -1 \
+ Y.SabcdWaW'aWbWd') abed
Here we represent the total atomic field as ¥= y/a + y/. The subscript refers to the excited intra-atomic state which may be characterized by the degeneracy as well as a small splitting of the originally degenerate state. The part $/describes the atoms in their ground internal state; de stands for the matrix elements of the intra-atomic dipole transition; the quartic terms account for the inter-atomic interaction taken in the contact form; the corresponding constants of this interaction are denoted as gab~a and gabcd. Note that we ignore the interaction terms ~ y + y + y ys h , V + W + V V anc* t*ie*r conJugates
because these do not cause non-linear harmonic generation in the lowest order with respect to the scattering length. The interaction terms ~ gabc and gabcd are responsible for the second and the third harmonic generation, respectively. In what follows we will ignore the third harmonic by setting gabCd =0.
At temperatures T below the temperature Tc of the Bose-Einstein condensation, the operator y/ can be treated as a classical field [2] normalized to N. Specifically, in the case
0-7803-4950-4/98/$10.00 1998 IEEE 165

of the uniform condensate y/ = Jn~ -const [2]. Thus, the interaction term acquires the
form
Hmi^]dV{-Ede^n~{¥\^y/e.) + Y,gabc^n~{¥:¥b¥c+h.c.)} . (2) abc
The total polarization of the system is defined as
P=\dvXdeyfc(v: + Ye)- (3) e
The Hamiltonian (2) without the interaction part ~ gabc has been analyzed in [3] with respect to a possibility of the polaritonic effect in the BEC. Here we consider the role of the interaction term in the coherent second harmonic generation by the BEC.
Thus, we look for the second order response on the electric field in Hint. For sake of concreteness, we choose E=E0 [cos (o)ot- ikx) + cos (o)ot+ ikx)], where E0, a)0 and k are fixed. The polarization (3) can be found by perturbations with respect to Eo. The equation of motion for y/a following from (2) is
ib-ftTa = &<»<, -^k)y/a-Eda^ + ^gabc4n(\i/by/c+2\i/b+y/c) (4)
where hcoa stands for the energy of the excited state. In what follows we assume that %coa
is much larger than any typical kinetic energy in the system. Thus, solving (4), we will neglect the kinetic energy term. Accordingly, we find the solution of (4) in the zeroth order with respect to the interaction constants in the rotating wave approximation as
(0) _ E&fi <fi***+***"*) m Wa " 2» co,-coa
PJ
The first order correction to y/a which does not have the spatial factor exp(ikx) has a form
¥, a) e ■^ „ (E0db)(E0dc)
S abc 77,—7777—77^ n ■ (6) 2h3(2co0 - coa) tr' K - «JK " <°c)
The total polarization (3) P0 can be obtained after substituting (6) into (3) and performing the integration. Finally, one finds
166

cos(2a>0t) y da(Eodb)(E0dc) r
fc3 ST* (2^-a^"«OK"».)
As one can see, this polarization is proportional to gjdVn2 « aJV«. As a matter of fact, the form (7) indicates that the condensate behaves as a single non-linear oscillator with the effective oscillator strength ~ aNn. Accordingly, the intensity I (2)of the second harmonic is
l(2)~(aNn)2. (8)
This is a main result of our work. We note that the thermal part of the atomic cloud produces an incoherent contribution to /<2) which is proportional to the first power of the total number of atoms in the thermal state.
The role of the BEC in higher harmonic generation will be considered elsewhere.
References:
[1] M. H. Anderson, J.R. Ensher, et al, Science 269, 198 (1995); C. C. Bradley, C. A. Sackett, et al, Phys. Rev. Lett. 75, 1687 (1995); K. B. Davis, M.-O. Mewes, et al, Phys. Rev. Lett. 75, 3969 (1995). [2] D. R. Tilley and J. Tilley, Superfluidity and Superconductivity (Hilger, Bristol, 1990). [3] B.V. Svistunov and G.V. Shlyapnikov, Sov. Phys. JETP 71, 71 (1990); H. D. Politzer, Phys. Rev. A 43, 6444 (1991).
167

TuC3 12:30pm - 2:30pm
Novel Measurement of Linear Dispersion Slope near the Zero
Dispersion Wavelength by Four Wave Mixing
Dong Hwan Kim, Sang Hyuck Kim, Jae Cheol Jo, Sang Kuk Kim, Sang Sam Choi
KOREA INSTITUTE of SCIENCE and TECHNOLOGY, PHOTONICS RESEARCH CENTER,
P.O.BOX 131, CHEONGRYANG, SEOUL, 130-650, KOREA,
Tel : +82-2-958-5718, Fax : +82-2-958-5709,
E-mail: [email protected]
The FWM is one of the interesting nonlinearities in optical fibers and semiconductor
optical amplifiers [1,2]. A new frequency light is generated from the wave mixing of three
different lights. This phenomenon causes system degradation in WDM transmissions, but it
can be also used for new wavelength converter for other applications such as optical PLL[3].
FWM efficiency in fibers strongly depends on phase-mismatching which is determined by
the chromatic dispersion. The dependence of FWM efficiency on the phase mismatching has
been investigated for the dispersion-shifted fibers. We calculated the dispersion slope from the
modulation behavior of the FWM efficiency. The experimental set-up is shown in Fig.l. A
tunable pump wave and DFB LD probe wave were combined by a fiber coupler after each
amplification through an EDFA and were launched in the dispersion shifted fiber. The
launched input power was about 6 dBm for each. The polarization controller was adjusted for
the maximal FWM efficiency. The dependence of FWM efficiency on the phase mismatching
Aß, is written as[l],
„2 ,)„-«£•„:„ 2 St ri | Ae-aLsinHML/2) , at + (J0)2L> ' a-e-aL)
with Aß= -\ -fa~2(fpump—fpn^Xfpump—fd , where Dc is the fiber chromatic
0-7803-4950-4/98/$10.00 1998 IEEE 168

dispersion, L fiber length, b the propagation constant, k0 zero-dispersion wavelength and a
fiber loss coefficient. FWM efficiency r, takes the maximal value of 1 for 48=0 and shows
damping modulation behavior as 45 increases. In the expression of phase mismatching,
43=0 is always satisfied when A^ coincides with the zero-dispersion wavelength, i.e.
Apump=A0, or with the probe wavelength i.e. ApumP= Apmbe which is totally degenerate.
The FWM efficiency as a function of the tuning pump wavelength is shown in Fig.2. The
FWM power was measured by an optical spectrum analyzer with a 0.05nm resolution. The
probe wave was fixed at 1554.21nm. The used dispersion shifted fiber is commercial product
and 15 km long. The two peak efficiencies are clearly shown at the zero wavelength and
probe wavelength, which are both phased matched. The wider bandwidth at the probe
wavelength is expected from the smaller phase mismatching because of the frequency
dependence of (fpump~fpmbe) \fpump~W •
The modulation behavior of FWM efficiency was investigated by fine tuning pump
wavelength near the zero dispersion wavelength in Fig.3. The efficiency shows damping
modulation as 48L/2 increases. Since the first minimal efficiency is shown in the condition
of (J/5)!lL/2-Ä , the dispersion slope can be calculated from the above condition as
dPc 1
, where Ax is a pump wavelength corresponding to the phase mismatching of (4S)*. From
the experimental results, the pump wavelength at the first minimal efficiency is 1549.42nm
and the zero dispersion wavelength is 1549.77nm. The calculated dispersion slope is
0.068ps/km-nm-nm.
1. Klnoue, IEEE J. Lightwave Technol., 10, ppl553-1561 (1992).
2. T.Ducellier, M.B.Bibey, IEEE Photonics Technol. Lett, 8, pp530-532 (1996).
3. M. Saruwatari, IEICE Trans.Commun., E78-B, pp635-643(1995).
169

EDFA PC
Tunable ID
3dB -TS4t| flnO^Ooipler,
EDFA DSF(15Km) mo.
TUNABLE POLARIZER FILTER
Fig.l. Experimental Setup for FWM. PC; Polarization Controller, DSF; Dispersion-Shifted Fiber, OSA; Optical Spectrum Analyzer.
Fig.2. FWM efficiency as a function of pump wavelength (A{). DSF is 15km long.
10 - —■ r-
MM ■ EiqMrlM«at Tlwwy
OS - >. 1 «\
% 06
0 E Ul 04
1
" V
•■■■•■/ \""
1
00
i . i ceo «as «00 H05
X (nm)
Fig.3. FWM efficiency as a function of pump wavelength (A{) in zero-dispersion wavelength
region. Probe wavelength is set at 1554.21nm
170

TuC4 12:30pm - 2:30pm
Second and Third Harmonic generations of Vandyl- Phthalocyanine Single Crystal Prepared on KBr Substrate by Molecular Beam Epitaxy
A. Maeda*, N. Okumura*, H. Furuhashi*, T. Yoshikawa*, Y. Uchida*, K. Kojima*, A. Ohashi*, S. Ochiai* M. Ieda* and T. Mizutani**
*Dept. of Elect. Eng., Aichi Inst., Tech. **Dept. of Elect. Eng., Nagoya Univ. *470- 0392, Toyota, JAPAN **464- 8603, Nagoya, JAPAN
*Dept. of Elect. Eng., Aichi Inst., Tech., 470-0392, Toyota, JAPAN TEL. 0565- 48- 8121, <Ext.2001 > E- Mail [email protected]
Summary Vandyl-phthalocyanine (VOPc) single crystals were prepared on KBr(100) substrate
by a molecular beam epitaxy (MBE). The second and third harmonic generations of nonlinear optical thin films are proportional to the square of the thickness. Therefore, it's important to prepare a large nonlinear optical single crystal.
The orientation of VOPc single crystals prepared by the MBE method was studied by optical absorption spectra in the visible and infrared regions, scanning electron microscopy (SEM) and reflection high energy electron diffraction (RHEED). VOPc single crystals on KBr were epitaxially or monoclinically grown. Table 1 shows conditions of sample preparetion.
Table 1 : Conditions of sample preparetion
Sample name Tp (°C) Te (°C) Ts(°C) t (min.) ta (min.) d (nm)
Sample 1 150 300 200 120 60 65
Samole 2 150 300 200 180 60 100
Sample 3 150 300 200 240 180 125
Tp : preliminary heating temp., Te : evaporating temp. Ts : substrate temp., t : evaporating temp., ta : annealing temp, and d : film thickness.
Sample 1 and 2 show epitaxially grown single crystal and monoclinically grown one, respectively from the absorption spectra in Fig. 1. Sample 3 shows monoclinically grown single crystal from the absorption spectra in Fig. 1, SEM image of Fig. 2 and RHEED pattern of Fig. 3.
Second harmonic (SH) and third harmonic (TH) generations of VOPc single crystals were measured with Maker fringes. The incident light of Nd:YAG laser was vertically polarized and Maker fringes were measured by rotating the samples along an axis parallel to the incident beam polarization. The SH intensity in Fig. 4 of VOPc 0-7803-4950-4/98/J10.00 1998 IEEE -jy]

Isample-3 (t:240min, ta:i80min)
200 300 400 500 600 700 800 90ol wavelength [nml j
Fig. 1 Absorption spectra of sample 1, 2 and 3
Fig. 2 SEM image of sample 3
Fig. 3 RHEED pattern of sample 3 172

single crystal epitaxially grown on KBr substrate is higher about 5X10⁴ times than that of a Y cut crystal. We estimated the third-order nonlinear optical susceptibilities X (:,) from the third harmonic intensity in Fig. 5 for VOPc single crystal monoclinically grown on KBr. Its x <;i) value 1.14X10° esu, which was about 4
times greater than that reported by S. Fang (' .
3
c CD
X C/5
0.006
0.004
0.002
0
>*#a
* • • • D • ••• •
D • • D • «a • •
a a • i a •
D , UD a tn •-
D aa
' D □
«B
& C?
D [D DG
D a D D
3 [D O D
a ID
-50 0 50
Incident angle (° ) Fig.4 SH intensities of samples 1 and 2
D Sample 1 Sample 2
CO
CO
C tu
0.02
0.01
0
ai ä
4?
A & a $ A
4«
#•• %
* A
A . f » ^AAA
"-1 DDDD_m» 0 DD
D D o of qg,' L1 tP
-50 0 50
D : Sample 1 # : Sample 2 A : Sample 3
Incident angle (° ) Fig.5 TH intensities of samples 1, 2 and 3
Reference (1) S. Fang, H. Tada and S. Mashiko, Appl. Phys. Lett., 69, L767 (1996)
173

TuC5 12:30pm - 2:30pm
Limits of Nonlinear Optical Transmission Systems induced by the Non-ideal Behaviours of the Transmitter
F. Matera, M. Settembre Fondazione Ugo Bordoni, via B. Castliglione 59, 00142 Roma ITALY
tel. +39-6-54802215, fax +39-6-54804402, e-mail [email protected]
M. Midrio Universitä di Padova, via Gradenigo 6, 35131 Padova ITALY
Work carried out in the framework of the European ACTS UPGRADE and ESTHER Projects
INTRODUCTION. For high capacity optical transmission systems very good characteristics of the optical transmitter are required. As a consequence the use of direct modulation of the semiconductor laser is avoided due to the presence of large signal bandwidth, the low extinction ratio (ER) between "1" and "0"and to the fact that the pulse can be much different from the ideal one [1]. On the other hand also in presence of an external modulation some minor defects in the transmission can be present as an example the chirp effect [2] and the nonzero power in correspondence of the bit "0". In previous papers we have investigated on the maximum capacity that can be achieved by optically amplified systems by using an ideal transmitter [3-4]. In this work we investigate on the meaning of good characteristics for the transmitter to evaluate the tolerances that permit to consider the results reported in [3-4] still valid in presence of a real source. The cases reported in this paper refer to the soliton propagation in regime of fluctuating chromatic dispersion or Group Velocity Dispersion (GVD) regime, also known as dispersion management [5] since this is the method that permits to achieve the highest capacity. We also show that the use of the dispersion management is fundamental in the implementation of optical systems adopting a direct modulation of the semiconductor lasers. In this case the propagation is preferable in the normal average dispersion regime since the combination of chirp, GVD and Kerr effect, together the squeezing effect [6] due to the nonlinear interaction between signal and ASE in normal dispersion, permits to increase the signal-to-noise ratio.
THEORY. An optical transmission can be obtained either by externally modulating a CW laser or directly modulating the current of a semiconductor laser. The first method is less chip but the quality of the transmitted signal is very good and it permits to reach the highest capacity. Conversely the latter is simpler and chipper even though the many imperfections in the transmitted signal strongly reduce the system capacity. In the case of a transmitter composed by a CW laser with a negligible linewidth and a Mach- Zehnder modulator the signal can be described in terms of power P and phase § as [2]
P(t) = P0 cos 2-^Ut^K-— (1)
where V(t) is the drive voltage, Vn the switch voltage, K = — is the chirp parameter [2] VA + VB
and VA and Vg are the peak-to-peak voltage applied to the electrode A and B of the modulator.
In the case of direct modulation of the semiconductor laser the density of the carriers and of the photons is studied by means of the following equations 0-7803-4950-4/98/110.00 1998 IEEE 174

dN I / v . N
f = -|--rAg(N-Nlr)(i-es)s+rp^
where N is the carrier number, q the electron charge, I is the current Va is the volume of the active layer, Ag the differential gain, Ntr is the carrier density for zero gain, S the photon density, e the gain compression coefficient, xs the carrier lifetime, T is the optical confinement factor, xp the photon lifetime and ß is the spontaneous emission factor. By a suitable choice of the laser parameters and of the input current I(t) a 10 Gbit/s transmission can be obtained. The MQW laser parameters that we have used are: xs=l ns, tp=2 ps, NQ= 1018 cm"3, the Henry constant aH=4, e=3.610"17 cm3, Va=710"12 cm3, Ag=2 10"6 cm3/s, ß=10"5. The threshold current, Ith, is 29 mW. As shown by the example reported in fig. 1, the transmitted signal, obtained by a semiconductor laser driven by a current oscillating between 1.03 Ith and 1.5 Ith, is quite different from the ideal one. The simulation code used to study the system performance is the same described in previous work [3-4].
RESULTS. In figure 2 we report the Q factor for soliton systems operating at 10 Gbit/s on a 9000 km link versus the input peak power, in the case of a link with dispersion management having an average GVD equal to 0.1 ps/nm/km. The link is constituted by erbium amplifiers with a spacing of 40 km, while the dispersion management is obtained by compensating the GVD of a DS fiber (-1 ps/nm/km) with step index fiber (15 ps/nm/km) with a periodicity of 160 km and locating the DS fibers at the input of the optical amplifiers. The pulses have a TFWHM equal to 40 ps and we remember that for an Intensity Modulation-Direct Detection (IM-DD) system a Q factor higher than 6 is required/The figure shows that for values of |K| lower than 0.5 the difference with respect to the ideal case is negligible. Such a behaviour was confirmed by analysing several other systems reported in ref. [3-4]; as a consequence we conclude that the results obtained in conditions of ideal transmitter are still valid if the external modulator only induces a maximum spectral broadening of 10% with respect to the ideal case. The same conclusions were obtained by studying the system performance in terms of time jitter. The improvement shown by the system for K=l is due to the partial compensation of the average GVD. A similar analysis was made on the presence of a limited ER. This effect can be study in a first approximation as nonlinear interaction between signal and a CW wave and it is particularly degrading in the soliton propagation. For the cases reported in fig. 2 we have seen that the presence of a residual power on the zero can be neglected when ER is higher than 12 dB, conversely analysing the cases of ref. [3], an higher value of ER is required especially in the case of soliton propagation with fixed filters. As a margin we conclude that the required ER must higher than 16 dB. We have consider the possibility of propagating pulses emitted by a semiconductor laser in the same propagation conditions of fig.2. In fig. 3 we report the Q factor versus the input peak power of a 10 Gbit/s IM-DD system operating in links 2000 long with a direct modulated laser. Preliminary simulations had shown that better performance could be achieved if the dispersion management of fig.2 was obtained by locating the normal dispersion at the output of the optical amplifiers. Three values of the average GVD are reported in the figure. The drive peak current varied between 1.2 and 1.7 Ith. The result show that the best performance is obtained in a condition of normal average dispersion while the worst performance is obtained for anomalous dispersion. The latter result is in agreement with reference [1] since in anomalous dispersion the effect of the laser chirp and of the GVD tend to broaden the pulse in the same way and the Kerr effect can weakly compensate this behaviour. Conversely in normal dispersion region, the GVD can be partially compensated by the laser chirp. The higher improvement in normal dispersion region, with respect to the region with
175

zero average GVD, is due to the squeezing effect that induces a less degradation of the ASE noise when a signal nonlinearly interacts with the ASE noise in normal dispersion region [6]. In fig. (4) we report the Q factor for a system operating in a link with dispersion management assuming the same characteristics of fig. (3) with an average GVD equal to -0.1 ps/nm/km. The results shows that a transmission with directly modulated laser on 3000 km is possible thanks to the use of dispersion management and it is much longer than the one predicted by ref. [1] where a constant GVD was assumed. CONCLUSIONS. In this work a numerical analysis on the impact of the degrading effect that can be present in a real transmitter for high capacity optical transmission systems has been carried out. The result show that in the case of external modulator, the transmitted signal can be considered as ideal if the chirp parameter is lower than 0.5 and the extintion ratio is higher than 16 dB. Conversely the presence of a directly modulated laser induces much stronger limitation but transmission at 10 Gbit/s on links 3000 km long can be achieved if the dispersion management method is used. REFERENCES [1] N. Suzuki, T. Ozeki, J. of Lightwave Technology 11, 1486 (1993).
[2] A. Djupsjobacka, IEEE Photonics Technology Letters, 4,41 (1992)
[3] F. Matera, M. Settembre, Journal of Lightwave Technology, 14, 1 (1996).
[4] B. A. Malomed, F. Matera, M. Settembre, Optics Communications, 143, 193 (1997)
[5] F. M. Knox, W. Forysiak, N. J. Doran, IEEE Journal Lightwave Technology, 13,1955 (1995).
[6] M. Midrio, F. Matera, M. Settembre, Electronics Letters, 33, 1066 (1997).
2 4 6 8 10 12 14 16 Normalized time
Fig. 1: time beaviour of a 10 Gbit/s signal emitted by a directly driven MQW semiconductor laser.
-5 0 5 10 Input peak power (dBm)
Fig. 2: Q factor vs input peak power for a 10 Gbit/s soliton system with external modulator with different chirps in a link with dispersion management 9000 km long.
12
10 .-*- -0.1 ps/nm/km .#
08 : ~°- 01 ps/nm/km/\ : "*"0 / \ ■
^6 °4 ^^~ ' B ~° V 1 ""^\^
2 DV - n ■ i > . . t i i i i ! i i . i t . ■ i i. J,,... :
-2 0 2 4 6 8 Input peak power (dBm)
12
10
8
°6 o o
04
2
I ' ' ' I 1 ' I I 1 1 1 1 1 1
: -*~2000 km . • -°- 3000 km \
; ^-3200 km ,B^ \ P- ' A :
- ^^ -O" -*■< A j '< - -a- " - -*■■' \* 1 ■— Z - - -*"" A \
JLSVV
, I i , i I i , i I 1 1 1 ' -202468
Input peak power (dBm)
Fig. 3: Q factor vs input peak power for a 10 Gbit/s soliton Fig 4. Q factor vs input peak power for a 1Q Qbit/s soliton
system with direct modulated laser considering different system with direct modulated laser operating in a link with GVD values m a link with dispersion management 2000 dispersion management for different length, km long.
176

TuC6 12:30pm - 2:30pm
Nondegenerate Four-Wave Mixing in a Double-A System under the Influence of Coherent Population Trapping
Min Xiao, Baolong Lii, and W.H. Burkett Department of Physics, University of Arkansas
Fayetteville, Arkansas 72701
Phone: (501) 575-6568; Fax: (501) 575-4580 e-mail: [email protected]
SUMMARY
The atomic coherence effect can be used in enhancing the efficiencies of nonlinear
optical processes [1-6]. Particularly, nondegenerate four-wave mixing (NDFWM) in multi-
level systems has recently gained attention in connection with the advantage of using coherent
population trapping (CPT) or electromagnetically induced transparency (EIT) to enhance the
efficiency of generated signals [3-6]. Generally speaking, linear absorption competes with the
nonlinear signal generation at the exact one-photon resonance condition. However, the linear
absorption can, in principle, be reduced or even eliminated by preparing the system in the
CPT or EIT state. Continuous NDFWM with high conversion efficiency has been realized in a
double-A system of Na2 [3]. However, the quantum interference effect is not strong in that
system since the residual Doppler-broadening (-100 MHz) is much larger than the natural
linewidths of transitions involved and their pump fields do not propagate colinearly. The
influence of CPT, therefore, could not be clearly established in that experiment. We report experimental demonstrations of NDFWM in several multi-level
configurations in rubidium atomic vapor. In one of the double-A systems (inset B in Fig.l), an
unusual behavior of signal output power as a function of pump power, i.e. a maximum in the generated signal power is reached as the pump power increases, is experimentally observed
(curve B in Fig.2). By comparing with several related A and double-A systems (e.g. insets A
and D in Fig.l, which show the usual saturation behavior in signal generation as the pump
power increases, as shown in curves A and D in Fig.2.), we have concluded that CPT is the
mechanism for this interesting effect. This double-A system, shown in inset B of Fig.l,
involves four magnetic sub-levels of slRb. The two hyperfine levels F=l and F=2 of the
ground state 5Sm , spaced by 6.8 GHz, serve as the two lower states. The two upper levels are
the two excited states in 5PU2 (F'=l and 2), which have a frequency spacing of 812 MHz
and are well separated in comparison with the Doppler-broadened linewidth. The advantage of
this configuration is that the residual Doppler linewidth (-0.01 MHz) is much less than the
natural linewidth (~6 MHz) of the transitions. If the laser beams are co-propagating in the
same direction, the two-photon Doppler-free resonance (as well as the CPT condition) is, 0-7803-4950-4/98/$10.00 1998 IEEE 177

therefore, preserved for all atoms [7], offering an ideal system for the investigation of
influence of CPT in a double-A configuration. We experimentally measured the generated NDFWM signal power as a function of pump power.
For all the systems studied, the pump field co2 is kept strong (25.3 mW) with the
sideband intensity of approximately 1.6% that of the carrier as probe field co3. The atomic
density is approximately N=2.2 x 10" cm'3 (cell temperature -55 °C), at which the absorption
coefficient of the F=l to F'= 1 transition is -22% without the pump field co, and -40% with
the pump field co2 due to optical pumping. The NDFWM process is efficient when the
conditions <J>4 =<|>, -(|>2 +<h and A4=A,-A2+A3 are satisfied, where ((),. are the phase
variations of the fields and A,. =©,. -co jk are the detunings of the field frequency co/ from
the corresponding line centers co jk. Note that the fields co 2 and co 3 have fixed phase and
frequency differences in our experimental arrangement ((J)3 -<J>2 = Const., A3 - A2 =0), so
the conditions for an efficient NDFWM process reduce to A4 = A, and <j)4 =()), + Const.,
which indicate that the generated signal wave should follow the detuning and the phase of the
pump field co,. A reference beam of co, + 80MHz is introduced to beat with the generated
signal wave, offering 732 MHz and 892 MHz beat signals for co4=co,±812 MHz,
respectively. Moreover, the intensity of the reference field is unchanged for the convenience
of comparing the beat signal intensity. Other double-A or A systems can also work for
NDFWM with the generated signals shifting either 812 MHz up or down from the pump field
co,, as shown in Fig.l, where the beat signals appear as four separate peaks when the
frequency of the pump field co, is scanned through the two transitions F=l-> F'= 1 and
F'= 2. Each peak is attributed to a NDFWM process in a A or double-A system as shown in
the insets of Fig.l.
Figure 2 shows the dependence of the generated nonlinear signal power as a function
of the power of the pump field co, for the systems in insets A, B, and D in Fig.l. The signal
power falls beyond the pump level of-1 mW for curve B in Fig.2a. This is a direct indication
of the existence of a power balance requirement between the two strong pump fields co, and
co, for an efficient NDFWM process for the double-A system in inset B of Fig. 1. The
ordinary saturation behavior for the other double-A system (inset D in Fig.l) and A system
(inset A) is also shown in Fig.2b. We believe that the strong coupling between the two lower
levels (through the lower A system formed by the two strong pump fields co, and co,) makes
the double-A system in inset B different from other systems (such as insets A and D). From
our experimental results, one learns that, although CPT can reduce the absorption of pump
fields and the generated signal field, it does not always facilitate the NDFWM process. There
is a requirement on optimal power matching between the pump fields.
178

In summary, NDFWM in several A and double-A systems were experimentally
studied for three collinear pump and probe fields. The atomic coherence effect strongly
modifies the efficiency of this nonlinear process and creates an optimal efficiency for
generating nonlinear signal in the double-A system that has a power balance in the coupling
fields sharing the same upper state (inset B). This effect can be very important in the
application of double-A system in phase conjugation. A comprehensive theory is needed to
understand the effects of CPT in NDFWM process for these double-A systems.
References [1]. M. Jean, G.Y. Yin, J.E. Field, and S.E. Harris, Opt. Lett. 18, 998 (1993). [2]. G.Z. Zhang, K. Hakuta, and B.P. Stoicheff, Phys. Rev. Lett. 71, 3099 (1993). [3]. S. Babin, U. Hinze, E. Tiemann, and B. Wellegehausen, Opt. Lett. 21, 1186 (1996). [4]. P.R. Hemmer, et al., Opt. Lett. 20, 982 (1995). [5], B.S. Ham, M.S. Shahriar, and P.R. Hemmer, Opt. Lett. 22, 1138 (1997). [6]. Y. Li, and Min Xiao, Opt. Lett. 21, 1064 (1996). [7]. J. Gea-Banacholoche, Y. Li, S. Jin, and M. Xiao, Phys. Rev. A, 51, 576 (1995).
3
CO
CO c
0.8
0.4
0.0 -
(0 C 0.8 O)
CO
(0 <D 0.4
CO
0.0
y^. /
VuM*MMf¥* H»M*HM'WP'»'ii'"" '*"»m*1
J . 1 1
°>2
c
k k ■ H'IHIIIWW"""»'
\
i^wi«v*y V*#*
■/jw
q**##fcMMIM#at«*'*^
■ ■ I . 1 ■ <-
-1000 -500 0 500 1000 1500 2000
Detuning of <o1 (MHz)
Fig. 1 Beat signal intensity versus the detuning of the pump field co,. Upper trace, 732 MHz beat signal; lower trace, 892 MHz beat signal. P,=l mW and P2=25.3 mW.
3 TO
1 .u "■■ r ■'— -i i
0.8 a
I ■
0.6 i _!_*••. --I.... ---I.... B
0.4
i "■±-...
0.2 i
"
0.0
0.0 0.5 1.0 1.5 2.0 2.5 3.0
0.0 0.5 1.0 1.5 2.0 2.5 3.0
P1 (mW)
Fig.2 Generated nonlinear signal power P4 as a function of pump power P,. A, B, and D curves correspond to the insets in figure 1.
179

TuC7 12:30pm - 2:30pm
Optical Frequency Tripling Using Cascading Quasi-Phasematched Nonlinearities in Periodically Poled Lithium Niobate
M.D. Levenson Optics Consulting, 19868 Bonnie Ridge Way, Saratoga, CA 95070
O. Poster JILA, National Institute of Standards and Technology and University of Colorado, Boulder, CO 80309-0440
(Present address: Dept. of Physics, Duke University, Durham, NC 27708-0305. Phone: (919) 660 2513. Fax: (919) 660 2525. e-mail: [email protected])
J.S. Wells, L. Hollberg National Institute of Standards and Technology, Boulder, CO 80303
W.R. Bosenberg Lightwave Electronics Corporation, Mountain View, CA 94043
D.A. Van Baak Calvin College, Grand Rapids, MI 49564
In modern Metrology, definitions and realizations of Time/Frequency and Length standards make use of laser oscillators electronically stabilized on ultra-narrow optical resonances provided by atoms, molecules, and trapped ions. Precise and accurate comparison and evaluation of these standards require connecting them by means of a frequency chain. Besides preserving coherence from one oscillator to another, such connections must span the electromagnetic spectrum from the microwave to the UV region. Because of that,. nonlinear mixings of optical frequencies in crystals are excellent building blocks for frequency chains [1].
The recent achievement of reliable quasi-phasematching (QPM) [2] in periodically poled crystals, and in particular periodically poled lithium niobate (PPLN), has empowered even more the use of nonlinear optical mixings in frequency connections. As is well-known, QPM gives access to the largest nonlinear coefficients of the material (which are almost never usable for birefringent phasematching — BPM), suppresses walk-off, and gives great flexibility in the choice of the wavelengths involved in the nonlinear mixing.
Simultaneous QPM of different interactions in the same crystal is now easy to obtain by poling different regions of the crystal with the different corresponding periods [3]. But even a single-period (50% duty cycle) crystal offers many QPM cascading possibilities, which are impossible most of the time with BPM because of constraints on the optical polarizations [4].
We experimentally realized third-harmonic generation (THG) by cascading second-harmonic generation (SHG: w i-> 2u>) and sum frequency generation (SFG: w + 2u/1-> 3u>), which of course realizes a 3:1 frequency connection.
The initial wavelength A = 27rc/o; was 3.54 /mi, emitted by a CO overtone laser [5] (output power 200 mW). The laser beam was focused into our PPLN crystal (period A = 31.5 /mi), which generated, at a given angle for a given temperature, waves at 2u> (A = 1.77 /tin) and 3w (A = 1.18 /mi), with power levels quite enough to use in a heterodyne beat note for phase-locking purposes.
The THG power was 0.5 nW at room temperature and increased to 7.3 nW at 133°C (Fig. 1). This power variation comes from the fact that the respective incidence angles were 15 degrees and 0 degrees. In the former case, noncollinear QPM yields an effective interaction length smaller than the crystal length, which reduces the THG efficiency, compared to collinear QPM in the latter case.
We wrote a simple model for temperature and angle tuning in noncollinear QPM, in the case where the crystal is tilted around its poling direction. In the vicinity of the SHG-SFG overlap and for small angles, the angles (in the crystal) of the (CJ) wave vector with the direction perpendicular to the domain walls are
^SHG) = ±^,h-ni-^ (1) Til "2 1l
W(5fG) = ±^./3"%-^-"T^ (2) * Y r»3 m ni
0-7803-4950-4/98/110.00 1998 IEEE 180

where the index p in <pp and np refers to the pu wave. The angles at 2u and 3a> are <^2 ^ ^Vi and <p3 « ^y?!. The condition ipi(SHG) = tpi(SFG) defines the occurence of THG at given temperature and wavelength, from the dependences np(\,T) and A(T)
10
i x
1 -
0.1 •:
0.01
mmjMwwm 1180 1184 1188 1192 1196
\;o ' 3 (nm)
Fig. 1. Output signal of an optical spectrum analyzer giving the THG power, at 133 °C, for different lines of the CO overtone laser. The width of the signals is the resolution of the input slit of the optical spectrum analyzer.
Fitting our THG results therefore requires a good knowledge of the Sellmeier coefficients of LiNb03 and their temperature dependence, but also of the thermal expansion coefficients [6], since the poling period changes when the crystal length changes with temperature. Previously published Sellmeier coefficients for LiNbOs [7,8] did not allow us to make quantitative predictions about angle/temperature tunings, because of their still imprecise determination in the 3 fim region. Very recent measurements of the indices of refraction of LiNb03 [9], although lacking the temperature dependence, now give, along with Ref. [6], reasonable agreement with our experimental results at room temperature.
[1] O. Pfister, M. Mürtz, J.S. Wells, L. Hollberg, and J.T. Murray, Opt. Lett. 21, 1387 (1996), and references therein. [2] M.M. Fejer, G.A. Magel, D.H. Jundt, and R.L. Byer, IEEE J. Quantum Electron. 28, 2631 (1992); L.E. Myers,
R.C. Eckardt, M.M. Fejer, R.L. Byer, W.R. Bosenberg, and J.W. Pierce, J. Opt. Soc. Am. B 12, 2102 (1995). [3] P.T. Nee and N.C. Wong, Opt. Lett. 23, 46 (1998). [4] O. Pfister, J.S. Wells, L. Hollberg, L. Zink, D.A. Van Baak, M.D. Levenson, and W.R. Bosenberg, Opt. Lett. 22,
1211 (1997). [5] A. Dax, J.S. Wells, L. Hollberg, A.G. Maki, W. Urban, J. Mol. Spectr. 168, 416 (1994). E. Bachern, A. Dax,
T. Fink, A. Weidenfeller, M. Schneider, W. Urban, Appl. Phys. B 57, 185 (1993). [6] PK. Gallagher, H.M. O'Bryan, E.M. Gyorgy, and J.T. Krause, Ferroelectrics 75, 71 (1987). [7] M.V. Hobden and J. Warner, Phys. Lett. 22, 243 (1966). [8] G.J. Edwards and M. Lawrence, Opt. Quantum Electron. 16, 373 (1984). [9] D.E. Zelmon, D.L. Small, and D. Jundt, J. Opt. Soc. Am. B 14, 3319 (1997).
181

TuC8 12:30pm - 2:30pm
3D, true color photorefractive hologram
Christy A. Heid, Brian P. Ketchel, Gary L. Wood, U.S. Army Research Laboratory, AMSRL-SE-EO, 2800 Powder Mill Rd., Adelphi, MD 20783-1197, phone: (301)721-3408, fax: (301)721-3400, [email protected] Richard J. Anderson. National Science Foundation, 4201 Wilson Boulevard, Suite 875, Arlington, Virginia 22230, phone: (703)306-1683, fax: (703)306-0456, [email protected] Gregory J. Salamo. University of Arkansas, Physics Department, Fayetteville, Arkansas 72701, phone: (501)575-5931, fax: (501)575-4580, [email protected]
Holography is a common technique used to generate realistic three-dimensional (3D) images. Photorefractive crystals are an ideal storage medium for recording holographic images because of the following advantages: real-time exposure and display, simpler recording process in which no pre- or post-processing is required, low writing beam powers, and a potentially large multiplexed storage volume. Recent experiments have clearly demonstrated the potential of photorefractive crystals for storage and retrieval of 3D images.1 In this paper, we describe the corresponding storage and retrieval of 3D, true color holograms in a photorefractive crystal. The 3D image reproduces the actual colors of the object. The 3D hologram is visible over a wide perspective as demonstrated by moving one's head back and forth while viewing the hologram. The wide field-of-view of the hologram is also demonstrated using an imaging lens with a color CCD camera mounted on a goniometer to record various perspectives.
The holographic storage material is a strontium barium niobate crystal (SBN:60) doped 0.03% by weight with Ce. The color hologram was recorded using a geometry typical of degenerate four wave mixing, shown in Figure l.2 The hologram was recorded in the storage medium by interfering two coherent writing beams: the reference beam, Eref, and a beam scattered off the object, the object beam, E0. In this experiment, the writing beams consisted of two primary colors: red (647.1 nm), from a continuous wave Krypton ion laser operating single-line; and blue (488 nm), from a continuous wave Argon ion laser also operating single-line. Both writing beams consisted of co- propagating dual color beams that have been expanded to both fill the storage crystal, which has dimensions of 20 x 20 x 1.3 mm, and fill the object. The length of the crystal was minimized to reduce beam-fanning3 effects which degrade the hologram. The crystal was oriented such that the axis with the largest electro-optic coefficient (r33 for SBN), referred to as the c axis, was parallel to the plane of polarization, which for this study was/>-polarization. The c axis is shown in Fig. 1 for SBN:60.
The object used was a pair of dice measuring 2 mm on a side. The top die was blue, while the bottom die was red, as shown in Fig. 2. The dice were painted with blue and dark red enamel paint. Both lasers were used simultaneously to illuminate the object. The scattered light was then collected by the photorefractive crystal. The object was placed approximately 25 mm from the storage crystal in this experimental setup to avoid blocking the reference beam, collect the maximum amount of scattered light and maximize the field-of-view. The object and reference beams intersected in the photorefractive storage crystal, SBN:60, thus writing an index of refraction grating via the photorefractive effect.4 The strongest modulation of the grating occurred when the 0-7803-4950-4/98/$10.00 1998 IEEE ^

3D, true color hologram (Heid, et al.)
two interfering beams had equal intensities. The intensities of the red and blue beams were chosen by determining the sensitivity of the photorefractive crystal to each wavelength. It was determined experimentally that a 15:1 ratio between the red and the blue beams, respectively, resulted in an equivalent holographic response within the photorefractive crystal. The powers of the red and blue writing beams used in this experiment were 200 uW and 13 uW, respectively.
The holograms were retrieved using a dual color read beam, Eread, which is counter-propagating to the reference beam, as shown in Fig. 1. The generated beam, E^, was diffracted off the index grating stored in the crystal. The dual color read beam consisted of co-propagating beams originating from the same lasers used to record the hologram. The respective powers of the red and blue read beams were determined experimentally to produce an equivalent holographic response. The read beam was expanded to read the entire grating recorded in the storage crystal.
The read beam was counter-propagating to the reference beam and the crystal is considered a thick medium, therefore, the real image formed in the same position as the object. The writing beams, E0 and Eref, were blocked and the object was removed and since the hologram persisted for some time it was possible to view and record it on film. The hologram was viewed with an imaging lens either directly with the eye or with a camera. The hologram was documented using an imaging lens with a color CCD camera mounted on a goniometer system. Various perspectives of the 3D hologram are shown in Fig. 3. The parallax between the red and blue dice is evident in Fig. 3 by comparing the relative position of the lower right corner of the blue die with the upper left corner of the red die. The field-of-view through which the hologram was clearly visible was measured to be 20 degrees. The clarity of the hologram in Fig. 3 can be compared to the white light image of the object, shown in Fig. 2. While we have only demonstrated true 3-D color holography for two colors, the data is a clear proof-of-principle of the potential for the storage and recall of true 3-D color images in a photorefractive crystal.
1 B. P. Ketchel, G. L. Wood, R. J. Anderson, G. J. Salamo, Appl. Phys. Lett. 71, 7 (1997). 2 D. M. Pepper, J. au Yeung, D. Fekete, and A. Yariv, Opt. Lett. 3, 7 (1978). 3 G. L. Wood, et al., Photorefractive Materials in Spatial Light Modulators: Materials Devices and Applications, U. Efiron, ed., Marcel Dekker, N.Y. 161-215 (1994). 4 R. W. Boyd, Nonlinear Optics, Academic Press, Inc., N.Y. (1992).
183

3D true color hologram (Heid, et al.)
-read
Photorefractive Storage Crystal
A i -dif
Figure 1: Four wave mixing geometry used to record a hologram in a photorefractive crystal.
Figure 2: White light picture of 3D object used to record holograms shown in figure 3. The top die is painted with blue enamel paint and the bottom die is painted with dark red enamel paint.
(a) (b) (c)
Figure 3: 3D true color hologram where the top die is blue and the bottom die is red. The hologram is viewed at various perspectives by changing the angle of the lens-CCD acquisition system.
184

TuC9 12:30pm - 2:30pm
Nonlinear optical properties of AlGaAs/GaAs multiple quantum well due to two-photon transitions between bound-to-continuum states
Jacob Khurgin Electrical and Computer Engineering Dept. Johns Hopkins University, Baltimore, MD
Jin U. Kang Code 5672, Naval Research Laboratory, Washington, DC 20375
Tel: (202) 404-4201 Fax: (202) 404-8645; Email: [email protected]
C. C. Yang and H. H. Lin College of Electrical Engineering, National Taiwan Univ. Taipei, Taiwan
George I. Stegeman Center for Research and Education in Optics and Lasers (CREOL), Univ. of Central Florida, Orlando, Florida
Multiple quantum wells (MQW) have been studied extensively for their enhencement in linear and nonlinear optical properties and their possible applications in optical switching devices[ 1]. Although there have been extensive studies on the linear optical properties and excitons resulting from single photon excitation, there are only limited studies on the nonlinear optical properties MQWs. Earlier studies have measured positions of two-photon induced excitions using two-photon induced photoluminescence [2] and magnitude of two-photon absorption coefficients using inverse transmission methods [3]. Both involving two-photon transitions between the bound states. In this work, we show, for the first time in our knowledge, a nonlinear optical properties of AlGaAs/GaAs MQW near half the bandgap due to the two-photon transitions between the bound and continuum states. m,™,, . i
For the two-photon absorption (TPA) measurements, we used a 1 cm long MQW channel waveguide with 7 nm thick GaAs wells, separated by 12 nm thick Al^Ga^gAs barriers. Because of strong TPA in the sample, the nonlinear refractive indices could not be measured. Thus, the nonlinear refraction was measured using a sample with 3 nm thick GaAs wells, separated by 20 nm thick barriers such that TPA peaks occur above the tuning range of our laser. A color center laser producing 4-7 ps pulses from 1490-1660 nm was used for the experiments.
Using the inverse transmission method, the TPA coefficients for both the TE and TM modes were measured. The two-photon spectrum for TM polarization is shown in Fig. 1. In order to inteipret this spectrum one has to note a rather interesting feature of the MQWs used in the experiments That is the second light hole (L2) and conduction (C2) subbands involved in the TM two-photon transition are so close to the edge of the continuum that they should be analyzed as minibands rather than as confined states as was considered in [4,5]. Due to the extended character of the L2 and especially C2 states the excitons associated with TM-polarized TPA are weaker and broader than the excitons belonging to the confined states. In order to explain the features observed in our experiments, we performed calculations using the model in [4,5], modified by the Kronic-Penney method for evaluation of the extended states L2 and C2 as in [6]. These theoretical results'are included in Fig. 1. It is evident that the location of the L2-C1 and L1-C2 exciton resonances are predicted correctly and their magnitude is predicted to within a factor of two. The binding energies of the excitons resulting from L2-C1 and L1-C2 are calculated to be 4.5 eV and 6 eV, respectively. The TPA spectrum for TE polarized guided waves is
0-7803-4950-4/98/$ 10.00 1998 IEEE 185

15
10
5
0
—1—'—<- i ' • TM exp.
TM theory x 2
I II iM
>
C2 LI
C1L2 :
V ■■■ -.. 1 1 1 . i i J—i—i—i i i J, i i
1500 1550 1600 1650
wavelength (nm)
Figure 1 Two-photon absorption spectrum of an MQW waveguide for TM polarization
shown in Fig. 2. As predicted by the theory, the TPA edge lies below twice the photon energy of the TM polarized waves and no distinct features are observed since the oscillator strength of the 2P excitons is too weak. The spectrum does show, however, some weak features in the vicinity of the TM-polarized TPA peaks. These weak features can be attributed to band-mixing and/or selection rule violations, possibly due to asymmetry of the MQWs or the interface roughness [6]. As in the case of TE-polarized TPA, the theoretical estimate is roughly within a factor of two of the experimental result.
%
25
20
15
10
5
0 P
• TE exp. —— TE theory x 2
1 ■ ■ ■ ' ' ■ ■ ' ■ '
1500 1550 1600 1650
wavelength (nm)
Figure 2 Two-photon absorption spectrum of an MQW waveguide for TE polarization
186

o
Ö
1480 1520 1560 1600
wavelength (nm)
1640
Figure 3 Dispersion of n2 for the TE and TM modes for MQW channel waveguides
The nonlinear refractive indices were measured using the self-phase modulation techniques for both TE and TM polarization and is shown in figure 3. As can be seen from the graph, the n2's for the TE polarizaion were approximately 50% larger than that for TM polarization, consistent with the theory.
In conclusion, we have measured the anisotropic TPA of AlGaAs/GaAs MQW that exhibits two-photon transition from confmed-to-continuum states. We also have measured the anisotropic nonlinear refractive indices of AlGaAs/GaAs MQW. From the inspection of the TPA spectra and fitting the data, we found that the excitons resulting from two-photon transitions from confined-to- continuum states exhibit reduced binding energies and this is in good agreement with the theory.
The work at NRL was supported by the Office of Naval Research, and JHK and GIS were supported by the Air Force Office of Scientific Research.
[1] D. S. Chemla, D. A. B. Miller, and P. W. Smith, Opt. Eng. 24, 5 [2] K. Tai, A. Mysyrowicz, R. J. Fischer, R. E. Slusher, and A. Y. Cho, Phys. Rev. Lett., 62, 1784(1989) [3] C. C. Yang, A. Villeneuve, G. I. Stegeman, C.-H. Lin, and H.-H. Lin, Electron. Lett., 29, 37 (1993) [4] J. Khurgin J. Opt. Soc. Am, 11, 624 (1994) [5] A. Obeidat and J. Khurgin J. Opt. Soc. Am, 12, 1222 (1995) [6] S. Li and J. B. Khurgin, J. Appl. Phys. , 1 73, 4367 (1993)
187

TuCIO 12:30pm - 2:30pm
Structure of oriented porphyrin J-aggregates determined by dichroic electrooptic measurement
Kazuhiko Misawa and Takayoshi Kobayashi
Department of Physics, University of Tokyo,
7-3-1 Hongo, Bunkyo-ku, Tokyo 113, Japan
phone 81-3-3812-2111 ex.4227, fax 81-3-3818-7812
e-mail: [email protected]. u-tokyo.ac.jp
Summary The excitonic transition in J-aggregates has a sharp absorption band
characteristic to a one-dimensional system, which results in an enhanced optical nonlinearity. A structure of molecular J-aggregates is a key subject to understand mechanisms of large optical nonlinearity in one-dimensional systems [1]. A few years ago, we developed a vertical sphiTCoating method to prepare oriented J- aggregates dispersed in polyvinylalcohol (PVA) films [2]. The new method enabled us to investigate the detailed structure of J-aggregates [3].
In the present paper, the molecular stacking and the number of molecules in a one dimensional J-aggregate were determined by means of electrooptic (EO) effects studied by dichroic electromodulation spectroscopy. The sample was the oriented films dispersed with J-aggregates of tetraphenyl porphine tetrasulfonic acid(TPPS).
To prepare highly oriented J-aggregates, a glass substrate was attached to the horizontally settled shaft of a small motor along its shorter edge. The aquaous solution containing TPPS and PVA was poured on the substrate, which is spun vertically. The viscous solution was spread and coated on the substrate uniaxially like a jet stream along the radial direction of the rotational motion by centrifugal force.
Figure 1 shows the concentration dependence of dichloic spectra of oriented TPPS aggregates prepared by the vertical spin-coating. At a weight ratio of 0.4/80 mg (TPPS/PVA), monomer spectrum was observed with peaks of Qx,Qy,Bx, and By
bands at 1.92, 2.25, 2.95, and 3.06 eV, respectively. At 8/80 mg (TPPS/PVA), distinct dichroism was observed due to the highly oriented aggregates of TPPS. The peaks at 1.74 and 2.51 eV are parallel-polarized corresponding to the red- shifted Qx and Bx bands, and those at 1.82 and 2.93 eV are perpendicular-polarized corresponding to the red-shifted Qy and By bands. All the bands are red-shifted, which means the head-to-tail alignment in both x andy coordinates. 0-7803-4950-4/98/$10.00 1998 IEEE 188

According to the above assignment, the red-shift enegies are calculated to be
0.18:0.43 eV (Qx:Qy), 0.41:0.08 eV (Bx:By). The ratio between stabilized
energies AE is rewritten as a function of the ratio of oscillator strengths of these bands and the tilt angle 9 of the transition moment as,
AEy ^;(l-3sin26>)
AEx~rf(l-3cos2ey
The tilt angle 0 is calculated to be 44 ± 1° consistently for both Q and B bands.
Therefore, it can be concluded that TPPS molecules form a J-aggregate with a
stacking axis of the constituent molecules in the direction of about 45 degrees with
respect to the molecular x and y coordinates. A schematic diagram of molecular
stacking is depicted in Fig. 2. This configuration is very reasonable if the steric
hindrance of the substituted phenyl rings are considered.
The aggregate size, i. e. the number of the constituent molecules, in a single
mesoaggregate was determined by the electromodulation spectroscopy. The Kerr
signal, which is proportional to the squared electric field, is given by the sum of the
contributions from the static polarizability difference Aa and static dipole moment
difference Ap upon electronic excitation. The two contributions of Aa and A/i can
generally be decomposed from the electroabsorption spectra as a first and second
derivatives of stationary absorption spectra, respectively.
The electroabsoption spectra were similar to the first derivative of the linear
aborption spectrum. This is mainly due to a contribution of change in static
polarizability upon electronic excitation [4]. The static polarizability differences of
TPPS J-aggregates were obtained to be 230 and 190 A3, while those of TPPS
monomer were obtained to be 63 and 31 A3 for B and Q bands, respectively. The
oriented sample is mainly composed of the macroaggregates. However, the static
polarizability is associated with the mesoaggregates, which is defined by the
coherent extension of the exciton. Hence, the mesoaggregate size was determined
to be 4 and 6 for B and Q bands, respectively, from the enhancement factor of the static polarizability.
In conclusion, we could for the first time determine the structural configuration
and the aggregate size in a single dimensional porphyrin J-aggregate by means of dichroic electromodulation spectroscopy.
References
[1] J-aggregates, ed. T. Kobayashi (World Scientific, Singapore (1996)).
[2] K. Misawa, H. Ono, K. Minoshima, and T. Kobayashi, Appl. Phys. Lett. 63, 577 (1993).
[3] T. Kobayashi and K. Misawa, J. Lumin. 72, 38 (1997).
[4] K. Misawa and T. Kobayashi, Nonlin. Opt. 14,103 (1995).
189

2.Or
0 u c CO a o » <
1.5
1.0-
0.5
0.0 1.0
0.8 o o § 0.6f a »■ o 2 0.4- <
8mg/80mg
A- 6mg/80mg
0.2-
.iA. 0.0 1 2.0 2.4 2.8
Photon energy (eV) 3.2 2.0 2.4 2.8
Photon energy (eV) 3.2
Fig. 1: Dichroic spectra of TPPS samples with several molecular concentrations. The amount of TPPS/PVA is indicated in each panel.
y 1
S03 so3
—£ Strait
its.
»
rfS°3
^IP\ —1 1»-
so3
soä V
{S(h/
soä
o .X,
%
< <
0,
0.
0,
0.
-0.
-0.
-0.
"8: 0.
0.
0.
-0.
-0.
-0.
-0.
fV-
1 ■ 1 ■'' 1' ■ ■ 1 < ■ ■ 11
FIP, e||d
1/1 rrvTi 11 I I>l I I I I I I I I I Ipl I I I I I
L FlfrJ, e±d
Fig. 2: Illustration of molecular stacking of TPPS in a J-aggregate. The stacking axis is in the direction of 44+1 degrees with respect to the x andy coordinates of TPPS molecule.
1.6 1.8 2.0 2.2 2.4 2.6 2.8 3.0' Photon Energy (eV)
190
Fig. 3: Dichroic electroabsorption spectra of TPPS J-aggregates for parallel (upper panel) and perpendicular (lower panel) polarization of light with respect to the orientation axis. The absorption spectrum is also depicted (thin line).

TuCll 12:30pm - 2:30pm
Interference patterns of scattering light from an electric field biased nematic liquid-crystal film
Yuhren Shen, Shu-Hsia Chen, Ching-Hsiang Hsu and Yinchieh Lai
Institute of Electro-Optical Engineering , National Chiao Tung University Hsinchu, Taiwan, R.O.C.
Tel: 886-3-5712121 ext. 56307 Fax: 886-3-5716631
Nonlinear light scattering phenomena of liquid-crystal films have attracted a lot of
research interest since they are useful tools for diagnosing properties of liquid-crystal materials and may have some applications.1"5 As an example, diffraction ring patterns caused by the spatial self-phase modulation induced by the optical gaussian intensity profile in a planar aligned nematic liquid crystal film have been reported and studied extensively.6"10 It has also been proposed that optical intensity limiting devices can be made based on such a phenomenon.6-7 In the present paper we would like to report and study a new nonlinear light scattering phenomenon from the same planar aligned nematic liquid crystal film structure. This new phenomenon exhibits ring patterns in the orthogornal polarization and is caused by the interference of the scattering lights. The aim of this paper is thus to investigate the influences of the applied electric and optical fields upon these interference patterns both experimentally and
theoretically. Our experimental setup is shown in Fig. 1(a). The liquid-crystal film we use is
composed of nematic liquid-crystal E7 sandwiched between two indium tin oxide coated glass windows that have been treated with polyvinyl alcohol (PVA) for planar alignment. The sample thickness d is about 150 |im. An 1 kHz electric field is applied normally to the
sample's glass windows. The light beam from an Ar+ laser is normally incident onto the sample with a spot diameter about 1.9 mm and its polarization is parallel to the direction of the molecular director (the e-wave). The sample is fixed on the sample holder which has a cooling system for eliminating laser heating effect and keeping the cell temperature in nematic phase range. The scattering light in the orthogornal polarization (the o-wave) is observed with an analyzer. The photographs in Fig. 1(b) show the patterns of o-wave scattering light under different bias voltages with an input light intensity about 4.55 W/cm2. From (b-1) to (b-5), the bias voltage is monotonously increased and the maximum is less than 1.8 volt. In the patterns, dark ring fringes are observed and they move outwards as the bias voltage is increased. As a comparison, no dark ring fringe is observed for the e-wave and this rules out the possibility that these patterns are diffraction rings caused by the self-phase modulation. We believe that the observed ring patterns are induced by the interference of o-wave scattering lights and have developed the following simple model to explain our experimental results.
The schematic diagram of the incident and scattered laser lights is shown in Fig. 2. The molecular orientation distribution in the liquid-crystal film under different bias voltage can be
approximated by : "-12
Q(Z) =Qmsm(Tiz/d) 0) 0-7803-4950-4/98/3(10.00 1998 IEEE 191

and the effective refractive-index seen by the e-wave can be written as :
ne((nJn0)2-l)K .,,...
Weff(6)^We- 2 Sm (%Zld)- (2)
Here 6m is a function of the bias voltage. The maximum phase difference between beam 1 and
beam 2 can be expressed as :
2% \d
A5 =— fnJQ)dz-ndcos§ , (3) max «Jeffv/oT' v/
A, LO
where the angle (j) is the scattering angle and X, is the wavelength of light in vacuum From the
viewpoint of optical interference, the condition of the occurrence of destructive interference at
the scattering angle (j) is AS =N 2n, where N is an integer. Using typical parameter values max
for our nematics E7 sample,13 the numerical results of the angle § at which dark fringes occur
are shown in Fig. 3(a) and 3(b) as a function of the applied bias voltage. The curve in Fig. 3 correctly predict the moving of dark fringes along with the increase of the bias voltage. When the optical intensity is increased, the patterns are also changed due to the optically induced molecular re-orientation effect. The details of experimental results and their explanation will be presented during the conference.
In conclusion, we have observed and studied a new nonlinear light scattering phenomenon from a planar aligned nematic liquid-crystal film. A model based on optical interference has been developed and its predictions agree very well with our experimental observations.
References : 1. I.V. Gusev, B.Ya Zel'dovich, V.A. Krivoshchekov and V.N. Sadovskii, JEPT Lett. 55,
178 (1992). 2. S. Stallinga, M.M. Wittebrood, D.H. Luijendijk and The. Rasing, Phys. Rev. E 53, 6085
(1996). 3. Holger Stark and Tom C. Lubensky, Phys. Rev. Lett. 77, 2229 (1996). 4. P.G. De Gennes and J. Prost, The Physics of Liquid Crystals (Clarend Press, Oxford,
1993), pp. 139-150, 227-230. 5. I.C. Khoo, Liquid Crystals (John Wiley & Sons, Inc., New York, 1995), Chapter 5. 6. Hiroshi Ono and Noburhiro Kawatsuki, Optics Communications 139, 60 (1997).
7. I.C. Khoo, R.R. Michael and G.M. Finn, Appl. Phys. Lett. 52, 2108 (1988). 8. S.-H. Chen and J. J. Wu, Appl. Phys. Lett. 52, 1998 (1988). 9. I.C. Khoo, S.L. Zhuang and S. Shepard, Appl. Phys. Lett. 39, 937 (1981). 10. S.D. Durbin, S.M. Arakelian nd Y.R. Shen, Optics Letters 6, 411 (1981). 11. S.-H. Chen and Y. Shen, J. Opt. Soc. Am. B 14, 1750 (1997).
12. S.-H. Chen, T.-J. Chen, Y. Shen and C.-L. Kuo, Liq. Cryst., 14, 185 (1993). 13. H. Hakemi, E.F. Jagodzinski and D.B. DuPre, Mol. Cryst. Liq. Cryst. 91, 129 (1983).
192

LC film
Screen
o-wave
0H§H£*- e-wave
I <$r
vjy- Screen tm vrr Camera
1 KHz electric field /////w
(a)
Bias voltage Low ■^ High
'4>r<> <&! ^Mäki
(b-l) (b-2) (b-3) (b)
(b-4) (b-5)
Fig. I (a) The experimental apparatus of scattering light : PBS, polarized beam splitter; LC, liquid crystal; d , sample thickness; o-wave, ordinary wave; e wave, extra-ordinary wave, (b) Photographs of o-wave scattering light for various bias voltages.
Fig. 2 The schematic diagra of the incident and scattered light : k; and kf are the wave vectors of the incident and scattered light, respectively; $, scattering angle; , molecular director; 8, molecular orientation angle.
t»0
1
<!>M
o
3.82" /
I54 1 1 153
/N=57 /
/56
/55
r I
0.900 0.910 0.920 Bias voltage (volt)
0.930
0.7
0.6 ■
0.5
0.4 N=55 54 ^-s
t>0
3 0.3 •o-
0.2 0.134
<l>lvl (b-4) ■
0.1 * (b-3) * (b-2)
0.0 (b-l) (b-5)
0.910 0.915 0.920 0.925 Bias voltage (volt)
(b) Fig. 3 (a) The numerical results of the angle (|) versus bias voltage for various integer N. (b) The resized Fig. 3(a) for large-scale present. The dot points present the photographs for various bias voltage in Fig. 1(b) from (b-l) to (b-5). §M : the maximum observable scattering angle is about 0.134°.
193

TuC12 12:30pm - 2:30pm
Studies of SPM-Induced Spectral Broadening in PTS-Polydiacetylene
Achintya K. Bhowmik and Mrinal Thakur Auburn University, AL 36849
Phone: (334) 844-3326
PTS (poly-[2,4 hexadiyne-1,6 diol-bis-(/?-toluene sulfonate)]) has significant potential for future applications in ultrafast all-optical switches and logic gates due to its large off-resonant third-order susceptibility and subpicosecond response time.1,2 In this work, we have made detailed measurement of spectral broadening in PTS induced by self-phase modulation at 720- 1064 nm. The nonlinear refractive index has been determined as a function of wavelength from the spectral broadening data. Similar spectral broadening measurements were made in silica fibers and other materials.3,4 The effect of group-velocity dispersion has been analyzed.
The intensity dependence of the refractive index in nonlinear media causes a time-varying phase shift within the same optical pulse, which is termed as the self-phase modulation (SPM). New frequency components are continuously generated due to SPM as the pulse propagates through the media, resulting in spectral broadening. The instantaneous optical frequency difference Sa(t) across the pulse is related to the temporally varying phase (/>NL by the following equation:
asA S<o(t) = —f. (1)
The phase shift S6{i) is proportional to the effective sample length Leff and the intensity- dependent refractive index change ön at time t:
lit S6 = — LeffSn, (2)
where the effective length Leff and Sn are given by:
ön = n2[A{t)f, (4)
where a is the linear absorption coefficient, n2 is the intensity-dependent refractive index, and A(i) is the slowly varying amplitude of the optical electric field.
A Ti:Sapphire laser producing 2 ps pulses at 82 MHz repetition rate was used for measurements at 720-840 nm, and a Nd:YAG laser producing 60 ps pulses at 10 Hz repetition 0-7803-4950-4/98/$! 0.00 1998 IEEE 194

rate was used for 1064 nm. The incident beam of 100 W peak power was focused into a 300 um thick PTS single crystal. The incident beam was linearly polarized parallel to the polymer chain axis. The spectra of the input and output pulses were recorded using a high resolution spectrometer, and the maximum broadening of the spectrum was measured. Figure 1 shows a typical set of input and output spectra. The nonlinear refractive index «•, of PTS has been
3
CO
tf> c CD
719 719.1 719.2 719.3
A,(nm)
719.4 719.5 719.6
Figure 1. Spectra of a typical set of input (A) and output (O) pulses at 719.25 nm.
determined as a function of wavelength from the spectral broadening data. Figure 2 shows the measured values of n2, and a fit through the points.
700 800 900 1000 1100
^(nm)
Figure 2. Measured magnitude of n2 of PTS. Solid line is a hyperbolic fit.
It is necessary to estimate the effects of group- velocity dispersion (GVD) on the pulse propagation in the nonlinear media. Different frequency components of an optical pulse travel at slightly different speeds, causing a dispersion-induced broadening of the pulse. To determine the significance of GVD effects, it is customary to define the dispersion length LD as follows:
U = T0
2
'D"lA|' (5)
where To is the initial pulse width, and the group-velocity dispersion parameter /% is defined as follows:
A = dßx r d2n dco ITZC dX
(6)
195

If the sample length L is such that L « LD, then GVD does not play a significant role. Figure 3 shows the dispersion length of PTS as a function of wavelength, determined from Equation 5. The dispersion length was found to decrease with the increase in wavelength, and was found to be -190 mm at 1064 nm. Since the length of the PTS single- crystal was 300 |im, which is much smaller than the dispersion lengths at 720-1064 nm wavelengths, group- velocity dispersion effects were negligible.
E E
300
260
220
1100
X(nm)
Figure 3. Dispersion length of PTS at 2 ps pulse width.
In summary, spectral broadening of picosecond optical pulses in PTS-polydiacetylene single-crystal induced by self-phase modulation was measured. The nonlinear refractive index of PTS as a function of wavelength was determined from the spectral broadening information. The effects of group-velocity dispersion were analyzed. This is the first measurement of the nonlinear refractive index of PTS from spectral broadening data.
References
1. R. Quintero-Torres and M. Thakur, Appl. Phys. Lett. 66, 1310 (1995). 2. G. M. Carter, M. K. Thakur, Y. J. Chen, and J. V. Hryniewicz, Appl. Phys. Lett. 47, 457
(1985). 3. E. P. Ippen, C. V. Shank, and T. K. Gustafson, Appl. Phys. Lett. 24, 190 (1974). 4. R. H. Stolen and C. Lin, Physical Review A 17,1448 (1978).
196

TuC13 12:30pm - 2:30pm
Single-pass Thin-film Electro-optic Modulator based on DAST
Jianjun Xu , A. Mahadervan, Ligui Zhou and M. Thakur
Auburn University, AL 36849
Organic molecular salts such as 4-N,N-dimethylamino-4-methylstilbazolium tosylate,
abbreviated as DAST, are important electro-optic materials. The major challenge at present lies
in the preparation of single crystal films of such molecular salts. Polycrystalline films are not
useful because they lead to substantial scattering loss of laser light and electrical and optical fields
can not be applied along specific molecular axes resulting in a substantial reduction in nonlinear
optical coefficients. Therefore, we have invested a significant effort in growing single crystal
films of this material.
Recently, we have successfully prepared single crystal films of DAST using a modification
of the shear method.1 This is the first time that DAST single crystal films have been prepared and
the films we obtained are about 15mm2 in area. Polarized optical microscopic studies have shown
that these films have excellent optical quality. Availability of such a single crystal film was
essential for the successful demonstration of single-pass electro-optic modulation using thin films.
Optical absorption spectrum of the DAST film on fused quartz, shown in Fig.l, shows
an onset of absorption at 600nm. Therefore absorption loss is minimal through the thin film for
wavelengths longer than about 600nm. X-ray diffraction of the thin film indicated that two
possible assignments, [101] and [001], could be made for the surface orientation. The observed
d-spacings were consistent with either of these assignments. However, inspection of the surface
morphology of the crystal-film suggested a [001] orientation, with a and b-axes along the film
plane.
Electro-optic measurement on the films was made using Mach-Zehnder interferometry.
Gold electrodes were deposited on the film to apply electric field in the transverse configuration
along the a-axis which lies on the film plane. The film with the electrodes was placed in one arm
of the Mach-Zehnder interferometer to introduce phase changes using electric field while in the
other arm the light traveled through air. A TirSapphire laser was used to produce the wavelength 0-7803-4950-4/98/$10.00 1998 IEEE 197

of 720nm and the light polarized parallel to the dipole axis (a-axis) of DAST was transmitted
through the film. The film thickness was 3um. One of the corner mirrors of the Mach-Zehnder
interferometer was attached to a piezo-electric drive to control the bias point in the Mach-Zehnder
fringes. Light modulation at an optimum bias point was measured for different magnitudes of
applied electric field using a photodiode and lock-in detection and also using an oscilloscope.
The oscilloscope trace of the signal modulation for applied ac field of magnitude 1 V/um
at the frequency of 2kHz is shown in Fig.2. Clearly, the observed modulation is substantial (-20%)
for a 3\xm thick film. As these results show, this is a clear demonstration of a thin-film single-
pass electro-optic modulator. Speeds many orders of magnitude higher than 4kHz, of-course, is
expected and have been demonstrated for organic molecular electro-optic materials. Therefore the
potential for applications is significant. The fabrication of device structures on thin films should
be straightforward provided large-area (>lcm2) single crystal films are available. Therefore, as
stated earlier, the major challenge, at present, lies in the successful preparation of large-area high
quality single crystal films of this material.
In summary, single crystal films of DAST have been prepared. Single-pass electro-
optic modulation has been demonstrated by Mach-Zehnder interferometry using such a thin film.
Modulation as large as 20% was observed for a low ac field (lV/pm) using a 3(j,m thick film.
These films are highly promising for applications in photonics.
1. M. Thakur and S. Meyler, Macromolecules, 18 2341 (1985); M. Thakur, Y.Shani, G.C. Chi,
and K. O' Brien, Synth Met. 28 D595 (1989).
198

Optical Absorption Spectrum of DAST
To 2 o.t:
200
Fig.l
Fig.2 Oscilloscope trace of electro-optic modulation of the transmitted beam (A=720nm) through
a 3(im thick sample. The modulation is about 20% for a field of lV/pm at 2kHz.
199

TuC14 12:30pm - 2:30pm
Femtosecond Pump-Probe Spectroscopy of Quantum Confined Silicon and
Germanium Nanocrystals
Howard W. H. Lee, Peter A. Thielen, Gildardo R. Delgado
University of California
Lawrence Livermore National Laboratory
P. O. Box 808, M/S L-174, Livermore, CA 94551
(510)423-5877
(510) 422-1066 (FAX)
Susan M. Kauzlarich, Boyd R. Taylor, Daniel Mayeri, and Chung-Sung Yang
Department of Chemistry
University of California
Davis, CA 95616
The electronic structure and relevant dynamical processes of indirect bandgap
semiconductor nanocrystals such as Si and Ge are topics of considerable interest due to the
complexity of the physics, the difficulty in obtaining useful experimental results, and the increasing
interest in technological applications of Si and Ge nanocrystals. Unlike direct bandgap
semiconductor nanocrystals, steady-state linear optical spectroscopy reveals little information due
in part to the indirect nature of the lowest optical transition of the bulk material from which the
nanocrystals are derived. However, experimental results in this area would clarify many
controversial issues regarding the physics of these nanocrystals and, in particular, the mechanism
of visible light emission.
The nanocrystals in this study were fabricated via a chemical synthetic route !'3 that
provides excellent surface passivation by various organic functional groups. These nanocrystals 0-7803-4950-4/98/$! 0.00 1998 IEEE 200

have been well-characterized by electron microscopies such as High Resolution Transmission
Electron Microscopy and Electron Diffraction, and by steady-state linear optical spectroscopies
such as absorption, and size-selective phtoluminescence and photoluminescence excitation. The Si
quantum dots ranged in size from -2-3 nm, while the Ge quantum dots in various samples were
2.5-10 nm. These electronic and optical characterizations reveal moderately broad size
distributions and compelling evidence of quantum confinement 4>5
We present the results of various femtosecond pump-probe spectroscopies on quantum
confined Si and Ge nanocrystals. The spectroscopies include femtosecond hole burning,
differential transmission, and pump-probe decays. The experiments were performed with a
Thsapphire regenerative amplifier with output of 800 nm, -100 fs pulsewidth, -1 mJ energy per
pulse, and 1 kHz repetition rate. The output was divided into two beams, one of which was
frequency doubled to generate 400 nm excitation. The other beam was focused into a 1 mm
sapphire plate to generate a stable, single filament white light continuum.
The results of the femtosecond hole burning and differential transmission experiments
revealed information on the homogeneous lineshape and linewidth of various electronic transitions
in these nanocrystals. Our studies show that the electron-phonon coupling in these quantum dots,
as given by the temperature dependent linewidth and Stokes shift at short times (femtoseconds after
excitation), is actually small (meV's). In contrast, steady-state optical spectroscopy erroneously
gives values of 100's meV due to complications in part with the particle size distribution. Our
time-resolved results agree well with tight binding models by Delerue et al. 6 that indicate that the
Stokes shift should be a few me Vs. In addition, we resolved for the first time various excited
states through size-selective femtosecond hole-burning. The confinement-induced shift of then-
energies with particle size is also reported for the first time. This is an important result since the
indirect nature of these semiconductors obscures the observation of excited electron-hole states in
their quantum confined nanocrystalline form. These results provide the first data of this kind for
the theoretical modeling of the electronic excited states of these indirect quantum dots.
201

Our results also address the important but controversial issue of the origin of the blue and
red light emission that has been reported in nanocrystalline Si and Ge. We observed the ultrafast
relaxation of the initial electronic excitations. Vibrational relaxation occurs in <100 fs, followed by
rapid localization of the initial excitation into several trap states. We find that these traps are
responsible for the red emission that has been previously and erroneously assigned in some reports
to the quantum confined bandedge emission from Si and Ge nanocrystals. We also observed the
ultrafast relaxation into traps responsible for blue and green emission. Our results support and
enhance our earlier model that a very specific ultraviolet-blue emission corresponds to the quantum
confined bandedge transition 4-5 in nanocrystals of this size, while other red, green, and blue
emissions originate from trap states.
References
1 • B. R. Taylor, S. M. Kauzlarich, H. W. H. Lee, and G. R. Delgado, Chem. Mat. accepted
(1997).
2- R. A. Bley and S. M. Kauzlarich, J. Am. Chem. Soc, 118, 12461 (1996).
3- R. A. Bley and S. M. Kauzlarich, in Nanoparticles in Solids and Solutions, edited by J. H.
Fendler and I. Dekäny (Kluwer Academic Publishers, Netherlands, 1996), p. 467-475.
4- G. R. Delgado, H. W. H. Lee, S. M. Kauzlarich, and B. R. Taylor, "Comparative Optical
Studies of Chemically Synthesized Silicon Nanocrystals," Materials Research Society
Symposium Proceedings, 457, (1997).
5- H. W. H. Lee, G. R. Delgado, R. A. Bley, et al., Phys. Rev. B, in preparation; G. R.
Delgado and H. W. H. Lee, Phys. Rev. B, submitted.
6- C. Delerue, G. Allan, E. Martin, and M. Lannoo, in Porous Silicon Science and Technology,
edited by J. C. Vial and J. Derrien (Springer-Verlag, New York, 1995), p. 91-110.
202

TuC15 12:30pm - 2:30pm
Novel electrode geometries for periodically poling of ferroelectric materials
M. Reich, F. Korte, A. Tünnermann Laser Zentrum Hannover e. V., Hollerithallee 8, D-30419 Hannover, Germany
phone:+49 511 2788 0 fax:+49 511 2788 100
Recent developments in electric field poling have enabled the production of high quality QPM-structures for efficient frequency conversion in the mid-IR and visible spectral region. However, the poling results are difficult to reproduce, especially for small structure dimensions. The main reason is the patterning process of the electrodes, which are today exclusively realized by lithographic methods. The patterning results depend strongly on the parameters of each lithographic step, which are difficult to reproduce with the required accuracy. In this paper we present a simple patterning method based on laser induced material ablation using a novel electrode configuration for periodic poling of ferroelectric materials. In order to indentify optimized configurations for domain formation by electric field poling, several electrode geometries have been analysed theoretically. The investigations are based on the published results of the domain formation in lithium niobate [1], the most commonly used medium for QPM. With an electrostatic model, the distribution of the electric field inside lithium niobate crystals was analysed using commercially available software based on the method of finite elements. For domain inversion, the field component along the z-axis of the crystal is the crucial value. The calculations were carried out with an externally applied voltage difference between the two polar faces that corresponds to the coercive field of about 20kV/mm. The result for a commonly used electrode configuration, consisting of metal stripes on the +z-surface with a surrounding isolator is shown on figure 1. A significant spatial modulation of the field strength occurs only in a small layer at the structured surface with a thickness in the order of the structure period. Therefore, only a small part of the crystal is shown in cross- section. At the edges of the structures a significant increase of the field strength occur which reaches beyond the metal electrodes. This is believed to be the reason for the observed broadening of the poled structures.
Ez [kV/mm]
30 10
6
9
Figure 1. Field strength distribution Ez with metal electrodes
An analysis of a novel geometry with gaussian shaped grooves is shown in figure 2. In this geometry the surfaces were completely contacted, which could be realized for example by using liquid electrodes. The maximum field strength occurs at the peak of the grooves. 0-7803-4950-4/98/$10.00 1998 IEEE 203

Therefore, with this eonfiguration the poling is expected to start at the peaks following by a broadening of the inverted domains into the wings of the grooves. This should enable a precise controlling of the width and therefore of the duty cycle of the inverted stripes.
E, fkV/mml 50
liquid electrode
25
20
15
10
5
0
Figure 2. Field strength distribution Hz with gauss-like shaped grooves
The above described electrode configuration was realized with laser induced material ablation. As laser source, a titan sapphire laser system with repetition rates up to 5 kHz and a pulse duration of 150 Is was used. With such ultra-short pulse laser systems heat induced effects during material processing are minimized [2]. The laser beam was focussed and scanned over the +/.-face of the crystal. The gaussian beam of the laser led to an corresponding cross-section of the ablated groove. With this simple preparation method lithium niobate crystals with a thickness of 500 urn were periodically poled successfully with periods down to less than 20 urn. A side view along the y-direction of a poled and etched crystal is shown in figure 3. The domain inverted regions corresponding to the light areas are smaller than the grooves. This is in coincidence with the theoretical investigations.
Figure 3: Domain structure after electric field poling with gauss-like shaped grooves
204

The periods realized so far are sufficient for difference frequency mixing to generate radiation in the mid-IR spectral region. First experiments to realize continuous tunable single-frequency radiation with a wavelength around 3 urn will be presented. In conclusion we have demonstrated a novel electrode configuration for periodic field poling, which could be easily fabricated in one step. Furthermore, the manufacturing process avoids the need of a clean-room environment. The direct writing process requires no mask and enables a rapid realization and iteration of new QPM-designs.
This work was supported by the German Ministry of Science, Education, Research, and Technology (Bundesministerium für Bildung, Forschung und Technologie, 13N7022).
References:
[1] G. D. Miller, R. G. Batchko, M. M. Fejer, R. L. Byer, Proc. SPIE 2700, 34-45 (1996) [2] S. Nolte, C. Momma, H. Jacobs, A. Tünnermann, B. N. Chichkov, B. Wellegehausen,
H. Welling, J. Opt. Soc. Am. B 14,2716 (1997)
205

TuC16 12:30pm - 2:30pm
Observation of nonlinear spatial and temporal phenomena in a long Er3+:Cr3+:YA103 rod
S. A. Boothroyd, T. Okamoto, J. Chrostowski, A. Skirtach
National Research Council, Institute for National Measurement Standards
Ottawa, Ontario, Canada K1A 0R6, Tel.(613) 991 6839, Fax.(613) 998 5732
We report observations from a simple experiment in which a single laser beam is incident on a highly non-linear Er +:Cr +:YA1C>3 crystal. At low intensity the transmitted beam is attenuated by transmission through the crystal but retains the Gaussian intensity profile of the incident beam. As the intensity is increased a pattern of concentric rings is evident in the transmitted far-field and at still higher intensities the transmitted beam and the beam reflected within the medium show time-dependent behaviour. Above an intensity threshold a self-pumped phase conjugate beam can be generated. Optical media with a large nonlinear index are of interest for many applications, for example optical switching and image processing. It is important to characterize instabilities which may limit these applications and which are potentially useful phenomena by themselves. Here we investigate effects produced with a Er :Cr3+:YA103
rod whose length is greater than the coherence length of the laser and for which the light induced phase shift can be much greater than n.
The 56 mm long Er3+:Cr3+:YA103 rod with number density ratio Cr:Er:Al (or Y) - 1:20:750 [1,2] is shown in figure 1. Light at wavelengths from a cw argon ion laser and a cw mode-locked frequency-doubled YAG laser at 532 nm was used in these experiments. Absorption takes place into both Cr3+ and Er3+ ions for all the wavelengths used. Absorption by the erbium ion leads to strong fluorescence in the green from decay of the 2Hi m and 4S3/2 levels to the ground state as shown in figure 1. Absorption by the chromium ion leads to population of the long lived 2E level. This Cr3+ excited state population, and not excitation of the erbium ion, gives rise to a large light induced refractive index change [1-4]. The dynamics for this refractive index change depend on decay of the E level to the 4A2 ground state or via energy transfer to the erbium levels. Although the index dynamics appear complicated [1,2] the dual nature of the decay path for the "E level is not responsible for the temporal phenomena described here which are due to feedback and interference effects within the rod.
Ü i il ii II i lii iii III r M
Figure 1. Erbium and chromium doped YAIO3 rod showing fluorescence track due to decay of excited erbium ions. The strongest fluorescence occurs at the left where laser light at 514 nm (a - 0.6 cm ) enters the rod. Absorption of the incident beam along the rod is indicated by the decreasing fluorescence signal. We note that the doping along the rod was non-uniform as the fluorescence signal was brighter at one end of the rod than the other when both of the ends were placed in the incident laser beam.
YAIO3 is a biaxial crystal and our sample could be rotated about the rod axis with four positions, 90° apart, where the linear polarization of the incident light was unchanged on transmission through the rod. In the experiments below the incident light was linearly polarized and the electric vector aligned along one of these crystal axes. However, rotating the rod about the rod axis appeared to make no change to the ring patterns shown below or influence generation of a self-pumped phase conjugate beam.
0-7803-4950-4/98/$10.00 1998 IEEE 206

SBBBraBBBF / 8 ^ m/ 6 J"
v J •* / /
2 <?
Figure 2. Cross-section scans of the experimental far-field pattern at 532 nm obtained using a CCD camera with the video signal going to an oscilloscope and TV line triggering. The intensity values were calculated for the focused beam waist at the input face of the rod. Modeled results are shown on the right taking account of diffraction and an intensity dependent refractive index n-n0 + n2I which can saturate over the input Gaussian beam profile.
I E l^^^^B B IB
B*!L^B ^B
^^^B^^B. B
EJ^ •■•''3
B ET ■.. .fjal
9r ^^^^H
3+ ^ j+ Fi'gKre 3. Far-field patterns produced on transmission through a long Er":Cr+:YAl03 rod at X = 476nm. A-K show patterns for successively increasing input power, K and L at same beam power. Distance to screen is same in all cases. Note decrease in beam divergence between E and F, a result of self-focussing in the crystal. For F the power in the beam before the crystal was 130 mW and the beam was focused to a spot with 1/e amplitude radius -37' yon at the input
face of the rod. ■ 207

Figure 2 shows experimental far-field cross-sections for the transmitted beam together with simulation results. Here laser light at 532 nm was focused on the input face of the rod with a 300 mm focal length lens. At the highest intensities shown in figure 2 the ring pattern was stable and the phenomena of diffraction and the nonlinear refractive index are sufficient to account for the observed behaviour. For higher incident beam power the ring pattern started to 'wobble' and became further unstable as the power was increased. At 532 nm the small signal absorption coefficient is high (a = 1.0 cm ) and mainly due to absorption by the Er"1+ ions which do not contribute to the refractive index change. The same experiment was performed with lines from the argon ion laser and the ring pattern could be pushed to its furthest development at 476 nm (a = 0.18 cm" ), a combination of the available beam power and low absorption by the Er3+ ions. The ring development in this case is shown in figure 3 where A - K are the far field patterns for successively increasing incident beam power and K and L are two snap shots of the quickly changing pattern at the same incident power. Patterns A - F were stable, in G the pattern had a low frequency wobble and in I we can see interference fringes where the fringe period could be changed by tilting the rod slightly. J - L the pattern was changing rapidly.
Figure 4. Illustration of the experimental arrangement together with images of the transmitted beam and beams reflected within the rod, X = 476 nm.
Our experimental arrangement is shown in figure 4 and includes a beam splitter to redirect the back-reflected beam to a screen. Light from the laser, shown at left in figure 4, was focused through the beam splitter, oriented at 45°, onto the input face of the YAlO.i rod. The end faces of the rod were not parallel and the beam traveled through the crystal with a slight angle to the
rod axis so that light reflected from the input face (beam spot not shown in figure 4) was not directed back into the laser. Similarly, light reflected back through the crystal from the far end of the rod, shown to the right of the 'good quality' spot in the split-off back-reflected beam (figure 4), was also not directed back into the laser. This beam did, however, overlap the incident beam for most of its path in the crystal. The 'good quality' beam spot picked-off by the beam splitter (figure 4) resulted from a transient beam reflected back from the crystal. This is a self-pumped phase conjugate signal which, using a scries of apertures along the incident beam path, traveled exactly back along the incident beam direction. Feedback into the nonlinear medium is necessary for instability. The reflection coefficient for the YAlO.i/air interface is - 0.07 and light reflected from the back surface overlaps with the incident light to form an interference pattern and an index grating. The light forming the interference pattern and index grating is also reflected by the grating so that establishing the grating is a dynamic process. Also, the forward traveling beam creates a transverse index structure which influences itself and the back reflected beam. However, provided the input power remains constant a steady state index variation is established in the rod. We observe that the spatial instabilities are faster at higher intensities and show variations on the ms time scale of the :E Cr3+ population lifetime. One possible mechanism takes account of the laser coherence length. Lc - 30 mm, in the YAIO., rod. Once a grating has established at the far end of the rod the light reflected from this grating can develop the grating further along the rod. This changes the light pattern in the region of the initial grating giving a continuing dynamic process. Further results showing stable self-pumped phase conjugation and temporal periodic oscillations will be presented. Video clips showing development of the ring pattern and the self-pumped phase conjugate signal are available on our web site www.nrc.ea/inms/photonics (August 981 References. 1. S.A.Boothroyd. .I.Chrostowski. D.J.Simkin, "Dual time-constant phase conjugate dynamics in CV^Er^YAlO/, CLFO 1994. Anaheim. California, May 8-13. Technical digest pp 37-38. 2. A.G.Skirtach. D.J.Simkin. S.A.Boothroyd, "Nondegenerate two-wave mixing in Cr,+:Er'+:YA10.i", J. Opt. Soc. Am. B13. 546-552. 19%. 3. I. McMichael. R. Saxena. T. Y. Chang. Q. Shu, S. Rand. J. Chen, H. Tuller. "High-gain nondegenerate two-wave mixing in Cr:YA10.r, Opts. Lett. 19, 1511-1513, 1994. 4. 1. McMichael. T. Y. Chang. "Self-oscillation and self-pumped phase conjugation in CrYAlO.,", CLEO 1996, Anaheim. California, June 2-7. Technical disiest pp 509-510.
208

TuC17 12:30pm - 2:30pm
Measurement of gain-grating dynamics in erbium doped fibre
S. A. Boothroyd, A. Skirtach, L. Chan, A. Akmaloni
National Research Council, Institute for National Measurement Standards
Ottawa, Ontario, Canada K1A 0R6, Tel.:(613) 991 6839, Fax.:(613) 998 5732
We present analysis and experimental results tor two counter-propagating beams coupled through real-time »ratings in a pumped erbium-doped fibre while a fast phase transient is applied to one of the beams. The initial phase of the beam coupling is measured and the ratio of the imaginary to the real part of the complex nonlinear refractive index determined. The signal measured during the fast phase transient is influenced by the gain-grating response time. We show experimentally and theoretically that the response time depends on the pump intensity at 980 nm and the amplified signal at -1550 nm. Investigation of real time gratings in erbium doped fibre 111 is useful because of potential applications such as real-time filters and switches |2.3|. In strongly pumped erbium-doped fibre the measured grating response time is -100 u,s. This is much shorter than the 4I|:1/2 Er,+ level fluorescence decay lifetime - 5 ms in highly doped fibre.
The experimental arrangement is shown in figure I. Two counter-propagating mutually coherent beams interact in a highly doped and strongly pumped erbium fibre. A fibre optic coupler was used after the dfb laser to divide the beam along two separate paths to the 80 cm length of ~ 2000 ppm Er3* doped fibre. The two path lengths are equal to the center of the erbium fiber and a real-time index grating is created. Both signal beams at 1532 nm were - -l4dBm measured before the erbium fibre. One of the interacting beams could he phase modulated and some of the non phase-modulated beam split off by a fibre coupler and detected by a photodiode. A series of 10 periods of a triangular voltage signal was applied to the phase modulator. When the phase modulation is applied in a time which is short compared to the grating response time then the interference pattern in the erbium fibre moves relative to the stationary refractive index grating and the transmitted beams are amplitude modulated. Large beam coupling is made apparent during the phase transient as can be seen in figure 2.
Figure 1. Experimental arrangement. DFB is distributed feedback laser; OI, optical isolator; PC, polarisation controller; WDM. wavelength division multiplexer; EDF, erbium doped fiber; PM, phase modulator; PD. photodiode.
Figure 2 shows the intensity variation of the signal beam recorded throughout 10 periods of triangular phase modulation. The signal before the phase modulation has been normalised to unity in the figure, it can be seen that as the interference pattern moves over a grating period the signal increases by - 20%. As the phase modulation continues the stationary grating is no longer being reinforced and so decays. This is evident in the measured
signal where the amplitude of the signal modulation decays. We also introduced a 40 m length of additional fibre into the fibre loop in figure 1 so that the mutual coherence of the counter-propagating beams in the erbium-doped fibre was destroyed. In this case applying the phase modulation signal as in figure 2(b1 did not produce any amplitude modulation in the signal measured by the photodiode. The inset
0-7803-4950-4/98/$10.00 1998 IEEE 209
_WDM
980 nm pump WDM

in figure 2 shows the initial development of the signal in figure 2(a) from which we can determine the phase of the beam coupling [4]. The nonlinear refractive index in erbium doped fibre nnl = n + n2I, where I is the signal intensity and n2 the nonlinear Kerr coefficient, is driven by the difference in population between the ground state and the %in excited state of the erbium ion. In a strongly pumped fibre where the excited state is highly populated then the signal gain is high and the imaginary part of the nonlinear index n2 = n2' + in2'' is large. The linear relationship between the signal intensity and the nonlinear refractive index will hold as long as the amplified signals do not saturate the gain so that the population of the ground state remains small.
1.2- ja)
llllMWrtAM 1 -
-(b)
—\
IIIIIIIIIIIIIHHWL 2 0 25 30
vVVVvVVVVv —I—I—I—I—1_ H 1 1
0 40 80 120
time, |o,sec 160 200
Figure 2. (a) Signal development of one of the two- wave mixing beams in pumped erbium doped fiber while a triangular phase shift was applied to the other beam, (b) voltage signal applied to phase modulator, 10 bipolar triangular periods at 100 kHz. The phase modulation goes from 0 to approx. + 1.4K and -1.4m Inset shows first few microseconds of the signal development in (a).
We assume a Debye relaxation time x for the nonlinear index change and take the case where the interacting signal beams are stationary for a long time before a phase transient is applied to one of the beams at time t = 0. The amplitudes A] and A2 of the two counter-propagating beams can be expressed through the following coupled wave equations.
dA]2(t) _2m"2
dz X {AXA, +A2A2 )A2± 2,TMn
A(l - idem) [l-e /v** + (1 -iSm)e A\AXA2A2,
Here Sco is the frequency shift on one of the beams throughout a period of linear phase modulation. For times much shorter than the response time for the nonlinear index change, t « x, we have the following simple expressions for the temporal development of the two beams throughout the phase transient.
I\ 2 (0 x [n2" cos(5cot) ±n2 sm(8cot)~\L I Vl
Using this equation we can model the signal development (inset to figure 2) during the initial phase shift and find that the ratio r = n2"/n2' = -8 showing that gain gratings are the main contribution to the beam coupling. The index grating is seen in figure 2 to decay significantly over the 100 |J.s during which the phase modulation is applied. Figure 3 shows the measured beam intensity for 10 triangular periods of phase modulation as in figure 2. However, for the result in figure 3 the phase modulation signal was applied at lower frequency i.e. over a longer time period so that the grating decay is more evident. We can see that the initial grating response decays to almost nothing after - 200 u.s because the signal modulation has become very small as the interference pattern is swept over a grating period. Following this small signal modulation the signal again becomes large as a result of the development of a time-averaged or 'blurred' grating. This behaviour can been modelled analytically based on the coupled wave equations above and a result is shown in figure 3.
210

1.25-
1.15 -
1.05
0.95
jVvwvWWWVl
+ 4- 200 400 600
time, |isec 800 1000
Figure 3. Measured signal for 10 periods of triangular phase modulation applied at 20 kHz. Inset shows a theoretical result, abscissa same as main figure.
From these results we can determine the grating response time x. We found that this value depends on both the pump and signal intensities. For example, with 39 mW pump power, measured in the single mode fibre just before the erbium doped fibre x = 60 u,s and with 25 mW pump power x = 120 u.s. We can understand the dependence of the index response time on the pump and signal beams from
the basic three-level system rate equations for the erbium ion [5] where N0 is the total ion population and (N„-N) is the population of the 4I|3/2 level population. If we introduce the signal beam at time t - 0 to the strongly pumped and excited system then the dynamic population N(t) of the ground state can be written as
I550I1W + (A„„7 A,m/ }/
9S0nm '* I550nm
* sat "*" * 980mn
exp(-^/)}
Here Is:11 = h(Ü98()nm/a980nm' ' T(). A - O"|550nm X(/ hCOi: A""" = C|550nm I*/ hO»i550nm, tfl IS the 1,3/2
fluorescence lifetime, a and aem are absorption and emission cross-sections and
■T0{l + A""Iim,w,+A'""I '980nro 1-1 1550m»
From these equations it can be seen that the population dynamics are governed by time scales which are shorter than x0. The populations N and (N0-N) follow a simple exponential time response where the time constant is dependent on both the pump and signal intensities.
We have shown that strong beam coupling can occur in erbium doped fibre and that the contribution from the gain grating, or the imaginary component of the nonlinear refractive index, is much larger than the phase grating contribution. From the measured signal when a fast phase modulation is applied we can conveniently measure the response time of the real-time index grating under conditions of strong pump and amplified signal beams.
References 1. B. Fischer, J. L. Zyskind, J. W. Sulhoff, D. J. DiGiovanni, "Nonlinear wave mixing and induced gratings in erbium-doped fibre amplifiers," Opt. Lett., vol. 18, pp. 2108 - 2110, 1993. 2. S. J. Frisken, "Transient Bragg reflection gratings in erbium-doped fiber amplifiers," Opt. Lett., vol. 17, pp. 1776-1778, 1992. 3. P. L. Chu, B. Wu, "Optical switching in twin-core erbium-doped fibres," Opts! Lett., vol. 17, pp. 255 - 257, 1992. 4. S. A. Boothroyd, J. Chrostowski, M. S. O'Sullivan, "Determination of the phase of the complex refractive index by transient two-wave mixing in saturable absorbers," Opt. Lett. vol. 14, pp. 946-948, 1989. 5. E. Desurvire, "Study of the complex atomic susceptibility of erbium-doped fibre amplifiers," J. Lightwave Tech., vol. 8, pp. 1517 - 1527, 1990.
211

TuC18 12:30pm - 2:30pm
Plane-wave dynamics of optical parametric oscillation with simultaneous sum-frequency generation
Gülbin Akgün, Yamag Dikmelik, and Orhan Aytür
Department, of Electrical and Electronics Engineering, liilkent. University,
TR-06533 Bilkent, Ankara, Turkey
I'hone:00-312-266-4307; Fax:90-312-266-4126; e-mail: ayt.iirWee.bilkent.cdu.t.r
Single-crystal u peon version optical parametric oscillators (OPO's) where either second-
harmonic1 or sum-frequency2 generation is simultaneously phase-matched with parametric
generation have recently been demonstrated. Here, we present the plane-wave dynamics of
simultaneous parametric oscillation and sum-frequency generation (SFC), where the resonant
OPO signal Held is summed with the pump field. Our analysis presumes that simultaneous
phase-matching of the SFG and OPO processes has been achieved utilizing biref'ringent phase
matching (HPM). However, quasi phase-matching either or both processes is another promising
possibility, and our results can readily be extended to those cases.
Potential polarization geometries for collinear 13PM shown in Fig. 1 lead to four different
sets of coupled mode equations dependiug on which field components are common to the two
processes inside the crystal. We designate these sets as classes A through 1). Some of these
geometries require the polarization of certain fields to be rotated in order to have components
along both fast and slow axes of the nonlinear crystal. The absence of idler and sum frequency fields at the input of the crystal makes it possible
to reduce the coupled mode equations for the complex field amplitudes to a set of equations
for real variables «.,„, in all classes. We normalize the fields so that. </>„,. = af„ represent the
photon llux densities. Polarization geometries where no polarization rotation is required and the signal and pump
fields have contributions from both OPO and SFG processes belong to class A. The equations
describing this interaction are
dn,j
Iz da,,
17 dav
dz dasf
Kaaxav {1)
K.„rt/«p - H.bapnsf (2)
-K„.«,,«.s. - Ki,asasf (3)
Ki,axap, (4)
OPO
dz
JP Jp Jp
SFG 1 V V IT ^
—Tf —Tr T
SFG II 1<
sf Tr Tr
SFG III
Si ©
—Tr
Si ®
—Tr
rsi (,f>
Figure 1: Polarization geometries leading to simultaneous phase-matching.
0-7803-4950-4/98/J10.00 1998 IEEE 212

where
(5)
is the coupling constant of the OPO process. Here, de denotes the effective nonlinear coefficient, the frequencies are related by uv = w,- + yjs, and nm are the corresponding refractive indices. The coupling constant Kb is defined similarly for SFG. The ratio ß = K,,/K.„ is an important quantity determining the relative strengths of the two processes. The nonlinear drive, D = </>.,({)) i<:?J'2, for a crystal of length / is a measure of how strongly the device is pumped.
Using the proportionality of Equations (1) and (4), class A equations can be reduced to those of an ordinary OPO, and the solutions can be expressed in terms of Jacobi elliptic
functions. We investigate the temporal evolution of the OPO by simulating the growth of the intra-
cavity signal from noise similar to the analysis of OPO's with intracavity SFG crystal.3 As a. measure of performance, we evaluate the photon conversion efficiency (twice the ratio of sum
frequency photon flux at the crystal output to input pump photon flux). For nonlinear drive values below threshold, there is no conversion. Above threshold, a well-
defined steady state, multistability, periodicity or chaotic behaviour can be observed depending
on the values of various parameters. l'br class A devices, if ß is larger than unity, the signal is not amplified for any value
of the nonlinear drive and there is no oscillation. As ß increases towards unity, maximum conversion efficiency increases. Depending on the value of the nonlinear drive, single or multiple steady states are observed (see Fig.2). /Ms closely related to natural properties of the crystal, therefore, it is not adjustable. Nevertheless, crystals with ß larger than unity can be found.
Class H has no field components common between the OPO and SFG processes and there- fore requires polarization rotations before the cavity for the pump and inside the cavity for the resonant signal fields. The fields evolve according to well known OPO and SFG solutions.
('lass C requires a polarization rotation of the pump field. The rotation angle a is another important parameter. The signal field which couples the two processes is amplified by OPO and attenuated by SFG. The equations governing the behaviour of class G signal, pump and
rotated pump fields are
das
~d7 dnp
dz da.
- Kaai(lp - Kbdrpdnf (6)
-K,,«,:«, (")
-i- = -K.fcflÄrt.,/. \*> dz
Analytical solutions for these classes are not available, hence, we used Ruuge-Kut ta integration to calculate single pass solutions. Small signal gain of a class G device is given by
«7 = cosh2 [cos aty/l - ß2 tan'2 a K„«,,(0) IJ (9)
with the requirement that ß tan n < 1 for the oscillation to start, for a and ß values satisfying this condition a threshold value for the nonlinear drive can be determined.
for class C. above the threshold nonlinear drive value, first steady oscillation is observed. For some n and ß values, as the nonlinear drive increases further, transition to chaos through period doublings occurs (see Fig.3). Increasing or brings an increase in conversion efficiency,
but causes chaos to start at smaller nonlinear drive values. In class 1), the signal field requires an intracavity polarization rotation and the pump field
provides the coupling. The rotation angle a can be optimized for particular values of the nonlinear drive and ß to maximize the conversion efficiency (See Fig.l).
213

1.0
:0.8
cO.6 o
g0.4
:0.2
0.0 0.01
.... ;.! i.:.!;!; JLl. I' ; .;ii;\o.s
I jr::| :| M : ^^-?^
i--i i-|rnl rH h"l
0.1 1 10 Nonlinear drive
100 10 15 Nonlinear drive
Figure 2: Photon conversion efficiency as a Figure 3: Photon conversion efficiency as a function of the nonlinear drive in class A function of the nonlinear drive in class C OPO's for various values of ß. Multistabil- OPO's with a = 45.9° for ß = 0.5, a = 30° ity is displayed for the ß = 0.8 case only. for ß = 1.5, and a = 16.2° for ß = 3.
1 10 Nonlinear drive
100
Figure 4: Photon conversion efficiency as a function of the nonlinear drive in class D OPO's for various values of ß. In each case, a is adjusted to maximize the conversion efficiency at a nonlinear drive of 1, yielding a = 39.7° for ß = 0.5, a - 38.1° for ß = 1, a = 35.9° for ß = 1.5, and a = 27.8° for ß = 3. The chaotic regime is displayed for the ß = 1.5 case only.
In conclusion, we classified the single-crystal upconversion OPO's with simultaneous SFG and investigated their plane-wave dynamics. Our results show that classes A and D are efficient frequency upconverters. The performance of class A OPO's is limited by crystal properties whereas classes C and D can be optimized by adjusting the polarization rotation angle.
1. T. Kartaloglu, K. G. Köprülü, and 0. Aytiir, Opt. Lett. 22, 280 (1997).
2. K. G. Köprülü, T. Kartaloglu, and O. Aytür, in Conference on Lasers and Electro-Optics, Vol. 11 of OSA Technical Digest Series (Optical Society of America, Washington, D.C., 1997) p. 457.
3. G. T. Moore and K. Koch, IEEE J. Quantum Electron. 29, 961 (1993).
4. O. Aytür and Y. Dikmelik, to be published in IEEE J. Quantum Electron. 34, March 1998.
214

TuC19 12:30pm - 2:30pm
Advances in Femtosecond Single-Crystal Sum-Frequency Generating Optical Parametric Oscillators
Kahraman G. Köprülü, Tolga Kartaloglu, Yamac. Dikmelik, and Orhan Aytür
Department of Electrical and Electronics Engineering, Bilkent University, TR-06533 Bilkent, Ankara, Turkey
Phone: 90-312-266-4307; Fax:90-312-266-4126; e-mail: [email protected]
Upconversion of lasers to shorter wavelengths is commonly achieved by using second- harmonic generation (SHG)1 or sum-frequency generation (SFG)2 in conjunction with optical parametric oscillators (OPO's). The SHG or SFG crystal is usually internal to the OPO cavity to take advantage of the high intracavity field intensities. Recently, upconversion OPO's that use a single crystal for both parametric generation and SHG/SFG have been demonstrated.3'4
These devices have achieved conversion efficiencies in excess of those utilizing a second crystal
for SHG/SFG. Here we report recent advances on the femtosecond single-crystal sum-frequency gener-
ating OPO.4 Our OPO is based on a KTP (KTiOP04) crystal that is cut for noncritical phase matching (NCPM), and synchronously-pumped by a Ti:sapphire laser operating at a wavelength of 828 nm. At this wavelength, the KTP crystal is phase matched for a signal wavelength of 1175 nm in a type-II geometry; the corresponding idler wavelength is 2.8 /mi. The KTP crystal is also phase matched for SFG of the pump and the signal beams to yield a blue output beam at 487 nm. However, a polarization rotation of the pump beam at the OPO input is necessary for this interaction to occur.
The pump laser has 180fs long pulses at a repetition rate of 76 MHz. A ring cavity is constructed with four mirrors that are highly reflecting at the signal wavelength for the OPO. The 5-mm long KTP crystal is positioned at the intracavity focus. A half-wave retarder is placed at the input of the OPO to rotate the polarization of the laser beam. This configuration allows the input beam to be distributed between the OPO pump and the SFG input by an arbitrary ratio. This polarization rotation is necessary for both processes to be phase matched. The horizontally polarized component of the pump beam provides parametric gain whereas the vertically polarized component provides one SFG input, the other being the resonant signal field. The resulting sum-frequency beam exits the cavity through a dichroic cavity mirror, together with the residual pump beam. At the output of the OPO, the blue sum-frequency beam is separated from the residual pump beam with a dichroic mirror.
To achieve synchronization between the resonating signal pulse and the pump pulse, the length of the OPO cavity is adjusted using a cavity mirror mounted on a piezo-controlled translation stage. However, the vertically and horizontally polarized components of the pump pulse have different group velocities due to birefringence in the KTP crystal. As they propagate in the crystal, these components get separated from each other in the direction of propagation and arrive at the intracavity focus at different times. Since the signal pulse is synchronized with the horizontal component, it is out of synchronization with the vertical component. This results in a reduced efficiency for the SFG process. We calculate the group velocity mismatch between the horizontal and the vertical components of the pump as 330fs/mm. Assuming the intracavity focus to be at the middle of the 5-mm long OPO crystal, the horizontal component needs to be delayed with respect to the vertical by 825 fs. To achieve this delay, we placed a 1.5-mm long KTP crystal at the input of the OPO. This crystal is also cut for NCPM but rotated 90° with respect to the OPO crystal; hence, there are no phase matched interactions. The time delay due to birefringence in the second KTP crystal is 600 fs (measured). With this compensation, parametric generation and SFG become nearly synchronous, leading to higher
conversion efficiency to the blue.
0-7803-4950-4/98/$10.00 1998 IEEE 215

0.25r
0.2h 8- c g>
l0.15|- CD c o
0.1
o Ü
0.05-
r
(a) [ »..«..*..
: • • • :
1
• •
•
• •
•
: • •
• ■ •
5 10 15 20 Retarder rotation angle (degrees)
0.8
c .2 <
... J50.6 Q. CD
TJ Q. E0.4 =J
Q-
0.2
(b) I • • Horizontal A A Vertical
.AAA ! !AA A AAA
Ä
•
>
■•
»
; A
; i ■ i A
5 10 15 20 Retarder rotation angle (degrees)
Figure 1: Conversion efficiency (a) and pump depletion (b) as functions of the retarder rotation
angle.
Figure 1 shows the conversion efficiency and the depletion of the horizontal and vertical components of the pump beam as functions of retarder rotation angle when the input pump power is held constant at 485 mW. We obtain a maximum of 99 mW blue power at a retarder rotation angle of 18°, corresponding to 20% power conversion efficiency.
Figure 2 shows the conversion efficiency and the depletion of the horizontal and vertical components of the pump beam as functions of input pump power where at each power level the retarder angle is optimized to give the highest conversion. Figure 2(a) also shows conversion efficiency data for the case where group-velocity compensation is not done. We observe a 24% increase in the output power with compensation.
The coupled OPO and SFG interactions in our experiment can no longer be described with the usual three coupled-mode equations of second-order nonlinear interactions. In our case, the coupling between the two processes leads to a set of five coupled-mode equations. For monochromatic plane-waves under singly resonant operation, these equations can be expressed
0.25
0.2 >. o c SB go.15 a> c o
CD 0.1 > c o Ü
0.05
(a)
• . D
• • compensation D D no compensation
0.8
c o t»0.6 Q. CD 13 Q. E0.4 a.
0.2
100 200 300 400 500 Pump power(mW)
(b) • • Horizontal A A Vertical
A.A..
A A
A A . • "A ••■;•■■•
100 200 300 400 500 Pump power(mW)
Figure 2: Conversion efficiency (a) and pump depletion (b) as functions of the input pump power.
216

in terms of real field amplitudes as
dai
dz das
dz dap
dz
dz dasf
dz
— /cactpös (1)
— Ka.Q'pG'i K'bQ'sfG'rp (2)
= -Kaaias (3)
= -Kl,asfas (4)
—- Kbdsdrp. ^5}
In these equations, Ka and KJ, are the coupling coefficients of the 0P0 and SFG processes, respectively. These coefficients depend on the frequencies of the interacting waves and the effective nonlinear coefficients of the respective processes. The field amplitudes are normalized such that their squares correspond to photon flux densities for each field.
Analytical solutions to these equations are available only in the small-signal regime, where depletion of both the pump and the rotated pump fields are negligible. The small-signal gain in this case is
H^ = cosh2 (cos a^Jl - ß2 tan2 a Kadt(0)lj (6)
where aj(0) is the total pump field amplitude before polarization rotation, a is the polarization rotation angle (twice the retarder rotation angle), ß is the ratio of the coupling coefficients Kb/Ka, and I is the interaction length. For the small-signal gain to be larger than unity, the condition ß tan a < 1 should be satisfied.
The expression for the small-signal gain is valid only near the threshold. To determine the intracavity signal in steady-state, we solved the coupled-mode equations numerically using the Runge-Kutta-Fehlberg method. Based on the intracavity signal, the photon conversion efficiency to the sum-frequency, and the depletion of both pump components are calculated. We found that the results can be characterized in terms of three parameters, the nonlinear drive (Kaat(0)l)2, the polarization rotation angle a, and the ratio of coupling constants ß. Our plane wave model is in qualitative agreement with the experiments, especially when we extend our model to include the Gaussian intensity profile of the pump beam.
In conclusion, we demonstrated that compensating for the group velocity mismatch be- tween the orthogonal pump components increases the conversion efficiency of femtosecond single-crystal sum-frequency OPO's. Further improvement may be achieved with a setup where the amount of compensation is adjustable. Numerical modeling of the sum-frequency 0P0 yields a better understanding of the processes involved in the conversion.
1. R. J. Ellingson and C. L.Tang, Opt. Lett. 18, 438 (1993).
2. E. C. Cheung, K. Koch, and G. T. Moore, Opt. Lett. 19, 1967 (1994).
3. T. Kartaloglu, K. G. Köprülü, and 0. Aytiir, Opt. Lett. 22, 280 (1997).
4. K. G. Köprülü, T. Kartaloglu, and 0. Aytür, in Conference on Lasers and Electro-Optics, Vol. 11 of OSA Technical Digest Series (Optical Society of America, Washington, D.C., 1997) p. 457.
217

TuC20 12:30pm - 2:30pm
Ultrafast Time-resolved Spectroscopic Imaging using Femtosecond Amplifying Optical Kerr Gate
T. Yasui1, E. Abraham1, K. Minoshima1, H. Matsumoto1, G. Jonusauskas2
and C. Rulliere2
1 National Research Laboratory of Metrology Centre de Physique Moleculaire Optique et Hertzienne, Bordeaux I University, 2
Return Address: 1-1-4 Umezono, Tsukuba, Ibaraki 305-8563, Japan Tel: +81-298-54-4030 Fax: +81-298-50-1456 E-mail: [email protected]
Ultrafast time-gated imaging has gained wide interests due to potential application such as visualization of ultrafast phenomena or objects in scattering media. Optical Kerr gate (OKG) has been providing useful tools for such applications in picosecond region: (1) high sensitivity, (2) real time 2D imaging and (3) wide spectral bandwidth. To meet recent demand to realize higher spatial and temporal resolution, especially shortening of opening time is necessary. However, there is an inherent trade-off between high sensitivity and fast response in conventional OKG, which limits its performance for time- resolved imaging. Jonusauskas et al have developed new setup (fast setup) to overcome this problem, which uses optical Kerr effect in gain medium and two perpendicularly polarized pump pulses. They realized an amplifying OKG in picosecond region using dye solution. [1, 2] Minoshima et al have applied femtosecond pulse to fast setup and make possible a femtosecond amplifying OKG (fast OKG). [3] In this paper, we demonstrate ultrafast time-resolved spectroscopic imaging using modification of fast OKG setup and evaluation of its imaging performances.
Figure 1 shows the setup for fast OKG imaging system. To realize opening time on femtosecond time scale, two perpendicularly polarized pulses with some time delay are used as pump, which are splitted in a BBO briefringent crystal from one pulse. The first pump is used for opening of the shutter and excitation of the Kerr gain medium, while the second one is for forced closing. The most efficient signal was obtained with a pyridine dye in acetonitrile solution (absorption peak = 475 nm, emission peak = 720 nm) as a Kerr material. The excitation wavelength by the first pump is 395 nm, the upper edge of the main absorption band. The probe pulse is a white-continuum ranging from 350 to 900 nm. Here, we introduced imaging optics in probe beam pathway to apply fast OKG to time-resolved imaging. A US Air Force test pattern is placed before the polarizer for evaluation of imaging performances. To prevent loss of high spatial frequency information of the test pattern due to the limit size of the pump beam at the Kerr shutter plane, the Kerr cell is set in the imaging plane of the probe beam. Amplified and time-sliced image signal after passing an analyzer is detected with a CCD camera through a imaging lens with long focal length.
Figure 2 shows the time-dependence of fast OKG signal, without the test 0-7803-4950-4/98/$10.00 1998 IEEE 21R

pattern, at probe wavelength of 670 nm which is in the upper edge of the gain band. The peak transmission of 160 % with fast OKG is more than 20 times larger than that (= 7 %) of CS2 with the same experimental conditions. In addition, opening time is 400 fs and the tail is lower than 6 % relative to the peak intensity. The transient spectra with regard to each delay time is given in Fig. 3, showing that their widths are 60 nm at all delay times.
Next, we evaluate imaging performance of fast OKG imaging system using the test pattern (11.3 lp/mm). Contrast (I^-I^J/CI^+InJ of the amplified probe image obtained with fast OKG is 0.76, whereas that of the reference probe image without fast OKG is 0.85. Due to the amplification process around 670 nm induced by the excited Kerr medium, there is no loss in the OKG (105 % transmission efficiency), demonstrating the efficiency of this technique to detect image signal with weak intensity. The opening time of this imaging system is also 400 fs due to use of the two perpendicularly polarized pump pulses.
We demonstrate ultrafast time-gated spectroscopic imaging by applying Ms fast OKG imaging system to colored object. Figure 4(a) shows colored object consisting of the test pattern and two color filters. The left pattern (8.0 lp/mm) is covered with an IR pass filter (kc = 695 nm, t = 3 mm), while the right pattern (10.1 lp/mm) with an IR cut filter (kc = 700 nm, t = 1.1 mm). Time-resolved image by fast OKG is detected with CCD camera through bandpass filters with center wavelength of either a 670 nm (FWHM = 10 nm) or 725 nm (FWHM = 13 nm) for spectroscopy. Figure 4(b) shows the reference probe image obtained without the OKG at each wavelength. Kinetics of fast OKG signal is also measured at two wavelengths as shown in Fig. 5(a). The fast OKG signal indicates defective closing at 725 nm, whereas closing of fast OKG signal is almost complete at 670 nm. Time delay between two signals is caused by thickness of filters and chirping in continuum probe. Figure 5(b) shows temporal evolution of the two images obtained with the fast OKG at 670 and 725 nm. Image signal at 725 nm reaches the maximum at delay time of 0 ps, while that of 3.2 ps corresponds to the maximum at 670 nm. One can find that ultrafast time-gated spectroscopic imaging is realized.
We have demonstrated that the fast OKG imaging system makes possible ultrafast time-gated spectroscopic imaging with a good spatial resolution as well as amplification.
This work is supported by the designated research project on the Femtosecond Technology (FST), Industrial Science and Technology Frontier Program (ISTF), AIST, MITI, Japan.
[1] G. Jonusauskas, J. Oberle, E. Abraham and C. Rulliere, Optics Commun., 137 (1997) 199. [2] G. Jonusauskas, J. Oberle, E. Abraham and C. Rulliere, Optics Commun., 112(1994)80. [3] K. Minoshima, G. Jonusauskas, C. Rulliere and H. Matsumoto, OSA Annual Meet. (1997) California.
219

pump, 395 nm »T variable delay
probe, continuum
test pattern p optical Kerr and gain material
Fig. 1. Experimental setup for fast OKG imaging system.
2.0
0.0 -2.0 0.0 2.0 T 4.0 6.0 8.0 10.0
Time delay (ps)
Fig. 2. Time dependence of fast OKG signal.
JR pass filter
JR cut filter
test pattern
620 640 660 680 700 720 740 Wavelength (nm)
Fig. 3. spectra of fast OKG signal for different time delays.
X = 725 nm X = 670 nm ioq—r
(a) S S 20 3 0
I ̂wSS •202468
Delay time (ps)
&60
1 *° |»
0 ■202468
Delay time (ps)
k = 725nm
X = 670 nm
(b)
Fig. 4. (a) colored object and (b) reference image without OKG
Fig. 5 (a) time dependence of image signal and (b) temporal evolution.
220

TuC21 12:30pm - 2:30pm
Bessel Function Solution for the .Gain of a One-Pump Fiber Optical Parametric Amplifier
M. E. Marhic ^T Department of Electrical and Computer Engineering, Northwestern University,
2145 N. Sheridan Rd, Evanston, IL 60208
V. Curri, and L. G. Kazovsky Department of Electrical Engineering, Stanford University,
202 Durand Bldg., Stanford, CA 94305
The 1-pump fiber optical parametric amplifier (OPA) with dispersion and loss, but no pump depletion, has recently been characterized by a 2X2 transfer matrix, with each term expressed in terms of four Hankel functions, Hiu, of imaginary order iu [1]. Unfortunately, these functions are not commonly available in mathematical packages such as Mathematica, and their use in practical applications thus requires the development of special software. The evolution of the related modulation instability (MI) has also been studied in terms of modified Bessel functions Iiv, of imaginary order iv [2]. However, these results do not directly provide expressions for the complex output fields of an OPA; furthermore, they assume a simplified form for fiber dispersion. In this paper we present an alternate approach, which yields the complex OPA idler gain in terms of just four Bessel functions Ju, which have the advantage of being commonly available in mathematical packages. In addition, fiber dispersion is handled in a most general manner.
Consider an optical fiber with nonlinearity coefficient 7, and power loss coefficient a. A strong pump, of initial power Po, angular frequency UQ, co-propagates with a signal (a>i) and an idler (o;2); the frequencies satisfy u)\ + W2 = 2u>o- Assuming that the pump is not depleted by the nonlinear interaction, its electric field envelope AQ is governed by
^^ = {~+*7fte-»Mo(*), (1) az 1
which yields A0(z) = y/Pb exp(-%z + iiP0£), where P0 is the initial pump power, and £ = (1 - e~az)/a. The four-wave mixing equations for the envelopes A\ and A2 of the signal and idler are [3]
dAk(z) = {-^ + 2ijPQe-az}Ak(z)+i7P0e-aze2i^e-iAt3zA?(z),k = l,2, l = 3-k, (2) dz l 2
where Aß = ß\ + ßi - 2/?o, and ßk is the propagation constant at ujk. Letting
Bk(z) = Ak{z)e%z-2^, fc = l,2, (3)
leads to dBk{z) = ijP0e~(a+iAß)z-2iip°tBt(z), Jfc = 1,2, l = 3-k. (4)
dz
Eliminating B\ (z) from these two equations yields
^M + (a + iAß + 2i7P0e-«z)d^- - (7P0)2e-2azBk(z) = 0, * = 1,2. (5)
dzz äz
0-7803-4950-4/98/110.00 1998 IEEE 221 .

Letting
Bk(z) = Ck{z)exp{--[(a + iAß)z + 2iiPo£]}, k = l,2, (6)
yields
where
^l-g*(z)Ck(z)=0, * = 1,2, (7)
;2(z)=(«±iA^_A/37Poe_„
Making now the change of variable Z = ^(AßjPo^^e-^, Eq.(8) becomes
r (*) = 4 - AjfryJfrT". (8)
^2%^ + ^^ + (^2-^^) = 0) it = 1,2 (9)
where Dk{Z) = Cjt(2), and v = 1+ iAß/a. Eq.(9) is Bessel's equation [4], hence £>i(Z) and D2(Z) must have the forms
Di(Z) = AJU(Z) + BJ-v(Z), (10)
Z>2(2) = CJV{Z) + DJ-„(Z), (11)
where A, B, C, and .D are constants to be determined from the initial conditions at z = 0.
As is customary for OPA's, we assume that no idler is present at the input, i.e. that M(0) = 0, while the signal has a finite amplitude Ai(0) = Aio. The idler gain is thus simpler to calculate, and we study it first. Eq.(ll) implies that
D2(Z0) = CJV{Z0) + DJ-U(Z0) = 0, (12)
D'2(Z0) = CJ'V{Z0) + DJ'_U(Z0), (13)
where ZQ = Z(0), and prime means differentiation with respect to Z. It can be shown that D2{ZQ) = —2i^PoA\0/aZo. The system of linear equations (12) and (13) can then be solved by making use of the Wronskian for JU(Z) and J-V(Z), namely W = -2sin(7r^)/7rZ [4]. This leads to
C = -lPo . * JU(Z0)A*10, D = ilPo . * MZQ)A\Q. (14) a sm(7T^) 1U a sin(7ri/) ' 1U v '
We may then define the idler field gain as gi(z) = A2(z)/Al0. It is given by
27r7*p* ^ 9i(z) = -r-7-r- [MZo)J-v(Z) ~ J-u{Zo)Jv{Z)], (15) sm(7ri/)
222

where r = ^Po/a, and $ = 7P0C _ Aßz/2. Similarly, it can be shown that the signal gain gs(z) = A!(z)/Aio is given by
g8{z) = ^—T {[ZMZo) + ZoJl(Z0)}J-u(Z) - [ZiMZo) + ZoJl(Zo)]Jv(Z)}, (16) sin(7rz/J *•
where Z\ = v + 2ir.
Alternatively, if one is interested in the power gains Gs(z) = \gs(z)\2 and Gi(z) = \gi(z)\2, Gs(z) can be conveniently obtained from Eq.(16) and the following relation
Gs(z) = Gi(z) + e-az, (17)
which can be derived from Eq.(2).
In summary, we have derived a compact form for the output idler field of a 1-pump fiber OPA, for a ^ 0 and Aß ^ 0; it is expressed in terms of four Bessel functions J„, which are commonly available in numerical packages. Another advantage of this approach is that Aß can correspond to dispersion to arbitrary order, which is important in tailoring OPA gain profile [5]; the same feature is not incorporated in the models based on the nonlinear Schrodinger equation [1,2].
References
[1] A. Carena, et al., IEEE Photon. Technol. Lett., 9, p. 535, 1997.
[2] M. Karlsson, J. Opt. Soc. Amer. B, 12, p. 2071, 1995.
[3] G. Cappellini and S. Trillo, J. Opt. Soc. Amer. B, 8, p. 824, 1991.
[4] M. Abramowitz and I. A. Stegun, Handbook of Mathematical Functions (Dover, New York, 1972).
[5] M. E. Marhic et al., Optics Lett., 21, p. 573, 1996.
223

TuC22 12:30pm - 2:30pm
Femtosecond Induced Susceptibility Change due to a Two-Photon Population Grating in Carotenoid Solutions Ryuji MORITA,
1,3 Hirotaka YANAGISAWA,
1 Mikio YAMASHITA
1'3
and Hidemi SHIGEKAWA2'3
1 Department of Applied Physics, Hokkaido University, Kita-13, Nishi-8, Kita-ku, Sapporo 060-8628, JAPAN Phone/Fax: +81-11-706-6706 E-mail: [email protected] institute of Material Science, Center for TARA, University of Tsukuba 1-1-1, Tennodai, Tsukuba 305-8573, JAPAN Phone: +81-298-53-5276 Fax: +81-298-55-7440 3CREST, Japan Science and Technology Corporation (JST)
Organic materials with 7r-conjugated electron systems attract much attention be- cause of their large optical nonlinearities. One of the organic molecules with an extended 7r-electron structure is carotene.1'2 Moreover, excited states of carotenoids play crucial roles in the primary processes of photosynthesis. Information on electronic energy levels of carotenoids is essential to understand the mechanism of their-harvesting function in photosynthetic systems. In the present study, we have investigated femtosecond dy- namics of optical nonlinearily in /3,/?-carotene (/?-carotene) solutions by means of an optical heterodyne-detected optical Kerr effect (OHD-OKE) technique.
The OHD-OKE measurement was done in two types of pump-probe configuration (with linearly or circularly polarized pump beam) using a femtosecond mode-locked Ti:sapphire laser (center wavelength ~780 nm, pulse repetition rate 100 MHz). Setup of the OHD-OKE measurement used was similar to that of McMorrow et a/.3 Samples were /9-carotene solutions in tetrahydrofuran (THF). Sample cells of 1.0 mm pathlength were made of quartz. A high refractive index glass (HRG) with a thickness of 1.3 mm (x — 1-03 x 10-12 esu) was used as a reference.
Figure 1 (a) and (b) shows the results of the femtosecond time-resolved OHD- OKE measurement performed on HRG and a /3-carotene solution in THF (3.1 x 10~2
M), respectively, with the linealy polarized pump beam. Since HRG has only positive instantaneous electronic nonlinearity, the signal is positive and has the form of auto- correlation G^
2>{T). From this, the pulse duration at the sample position is evaluated
to be 94 fs. On the other hand, it is found that, for the /3-carotene/THF solution, a negative instantaneous signal is observed around the probe delay time origin.
To clarify mechanism of this negative signal around the time origin, we investigated an input-power dependence of the OHD-OKE signal, which is shown in Fig. 2. Whereas, in the heterodyne detection scheme, the signal of HRG depends on the second power of the input power, the signal of the /?-carotene/THF solution depends on the third power. This fact reveals that the former is due to a one-photon process, while the latter is due to a two-photon process. This is also confirmed from the fact that the FWHM of the /9-carotene solution signal is narrower than that of the HRG signal. Since the absorption peak wavelength Amax of the /^-carotene solution is ~450 nm (S2 C'B^) <— So (1^4~)), excitation can occur through a two-photon process (S„ <— So CA~)) with ~780 nm pump pulses. Thus, it is suggested that the negative signal around the time 0-7803-4950-4/98/$ 10.00 1998 IEEE

origin for the /?-carotene/THF solution originates from the creation of an excited state by a two-photon process. Prom the fact that the negative signal of the /?-carotene/THF solution is only around the time origin, there are two possibilities as follows:
(1) a two-photon pump-excited population relaxation time shorter than the pulse
duration is probed. (2) a scattering of the pump into the probe direction by the two-photon population
grating, which is produced only if the pump and probe fields are coherently overlapping in time, is observed.
Since the population lifetime of a higher S„ singlet is considered to be much longer than the pulse duration,4 the possibility (1) can be ruled out. Thus, it is concluded that the observed negative signal around the time origin results from the coherent coupling effect through two-photon excitation, that is, the induced linear susceptibility change Z\%g due to a two-photon grating induced by both the pump and probe beams.
The results for the circularly polarized pump is shown in Fig. 3. The imaginary
part of Ax% through a two-photon process is observed in this case, while the real part is observed for the linearly polarized pump case. It is found that the imaginary part of
Axg, is smaller than the real part and the sign of the imaginary part is changed from positive to negative at the time origin.
3
c
CO
30
25
20
15
10
5
0
i
i i i i ..(a). i i i i
i i
i
i
i
i
0 i
i
i (b) -c.
-4
-6
-8
1
i
i
-200 0 200 400
Probe Delay time [fs]
600
Fig. 1 Optical heterodyne-detected optical Kerr signals for (a) the high re-
fractive index glass and (b) /?-carotene/THF solution (3.1 x 10⁻² M) with the
linearly polarized pump.
225

3
if) c
ro c
■ ■
High Refractive Index Glass s* Slope=1.93 4«
3-
2i i
^^» ■ ■
6« • 5«
4'
3«
2« ß -carotene/THF i i i
Slope=3.03 ./•
1U- ^ ■
6- • Si
■ 100 150 200 250 300 350
Input Power [mW]
Fig. 2 The absolute values of the optical heterodyne-detected optical Kerr
signals for the high refractive index glass and /?-carotene/THF solution are
plotted as a function of the input power.
600
Probe Delay time [fs]
Fig. 3 Optical heterodyne-detected optical Kerr signals for /?-carotene/THF
solution (3.1 x 10~2 M) with the circularly polarized pump.
References 1. Carotenoids, ed. G. Britton, S. Liaaen-Jensen and H. Pfander (Birkhäuser Verlag,
Basel, 1995). 2. J. R. Heflin, Y. M. Cai, and A. F. Garito, J. Opt. Soc. Am. B 8, 2132 (1991). 3. D. McMorrow, W. T. Lotshaw, and G. A. Kenney-Wallace, IEEE J. Quantum
Electron. 24, 443 (1988). 4. M. E. Orczyk, M. Samoc, J. Swiatkiewicz, and P. N. Prasad, J. Chem. Phys. 98,
2524 (1993).
226
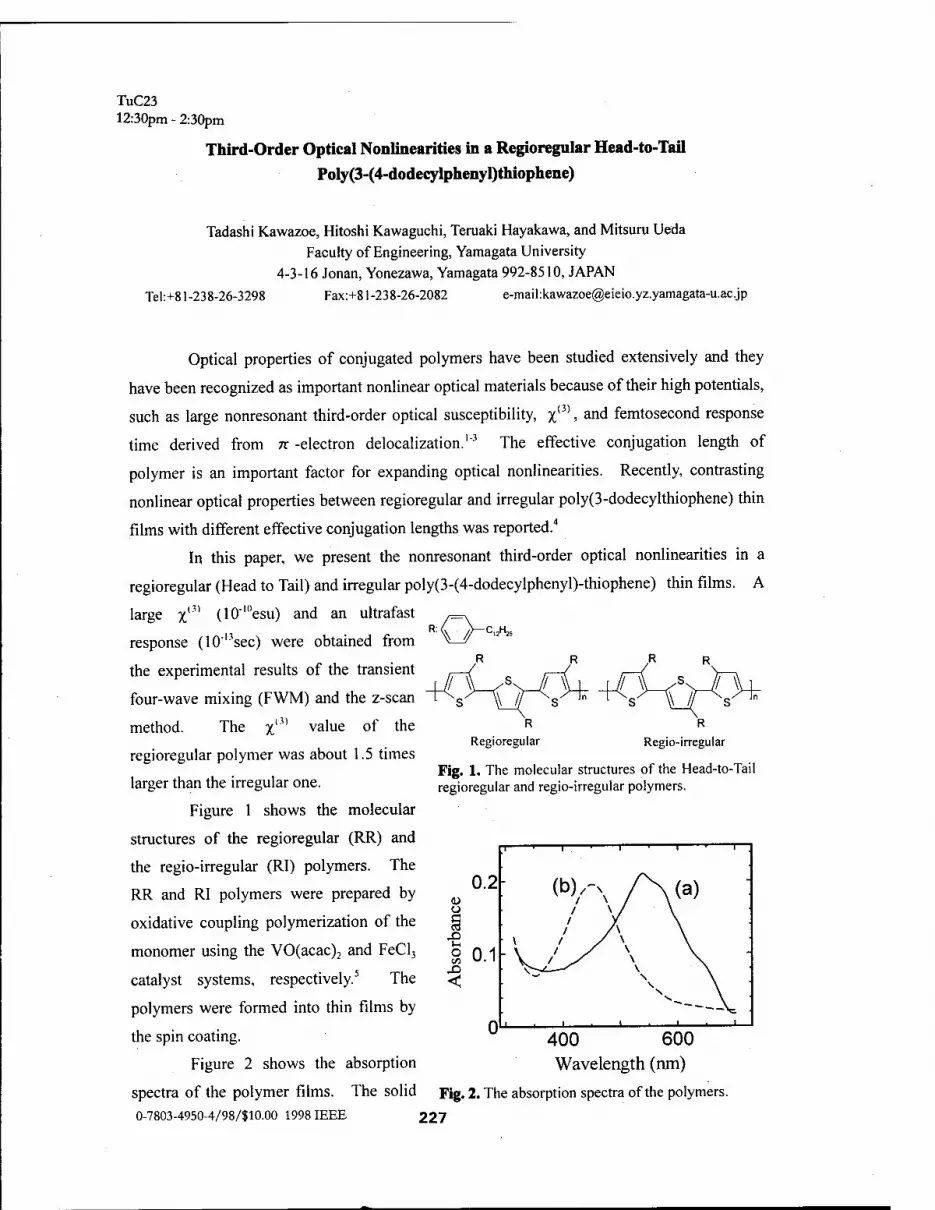
TuC23 12:30pm - 2:30pm
Third-Order Optical Nonlinearities in a Regioregular Head-to-Tail
Poly(3-(4-dodecylphenyl)thiophene)
Tadashi Kawazoe, Hitoshi Kawaguchi, Teruaki Hayakawa, and Mitsuru Ueda Faculty of Engineering, Yamagata University
4-3-16 Jonan, Yonezawa, Yamagata 992-8510, JAPAN Tel:+81-238-26-3298 Fax:+81-238-26-2082 e-mail:[email protected]
Optical properties of conjugated polymers have been studied extensively and they
have been recognized as important nonlinear optical materials because of their high potentials,
such as large nonresonant third-order optical susceptibility, %0), and femtosecond response
time derived from n -electron delocalization.1"1 The effective conjugation length of
polymer is an important factor for expanding optical nonlinearities. Recently, contrasting
nonlinear optical properties between regioregular and irregular poly(3-dodecy!thiophene) thin
films with different effective conjugation lengths was reported.4
In this paper, we present the nonresonant third-order optical nonlinearities in a
regioregular (Head to Tail) and irregular poly(3-(4-dodecylphenyl)-thiophene) thin films. A
large %lM (10"'"esu) and an ultrafast ,=
response (10"nsec) were obtained from V_J/
the experimental results of the transient
four-wave mixing (FWM) and the z-scan
method. The x0) value of the
regioregular polymer was about 1.5 times
larger than the irregular one.
Figure 1 shows the molecular
structures of the regioregular (RR) and
the regio-irregular (RI) polymers. The
RR and RI polymers were prepared by
oxidative coupling polymerization of the
monomer using the VO(acac)2 and FeCl,
catalyst systems, respectively.5 The
polymers were formed into thin films by
the spin coating.
Figure 2 shows the absorption
Fig. 1. The molecular structures of the Head-to-Tail regioregular and regio-irregular polymers.
T ■ r-—■ 1 ■ 1 i .
0.2 (bV~\ /X\(a) o / \ / \ Ö / y \ <a / /\ \
■£ v ' / \ \ ä 0.1 x> \~u—/ \ \ < \ \
n 1 . 1 —. 1 , 1 , 1—
400 600
Wavelength (ran)
spectra of the polymer films. The solid Fig. 2. The absorption spectra of the polymers. 0-7803-4950-4/98/$10.00 1998 IEEE 227

line (a) and the broken line (b) show the
absorption spectra of RR and IR polymer films
with lOOnm thick, respectively. The
absorption peak of RR polymer shows a red
shift of 90nm from the absorption peak of IR
polymer. The red shift agrees with the
experimental result reported by T. Bjornholm,
et al.,4 and may be caused by the extending of
the effective conjugation length.
The third-order nonlinear optical
susceptibility x0) of the polymers were
measured by using a transient, degenerate
four-wave mixing (DFWM) experiment and z-
scan method. A mode-locked Ti: sapphire
laser was used as a pump source. The pulse
duration and the repetition rate of the laser
system were 100 — 150 fs and 80 MHz,
respectively, and the central wavelength was
tuned to nonresonant region of 775nm.
In Fig. 3, the time-resolved DFWM
signals on the polymers are shown, and the
inset shows the experimental configuration of
the sample and the excitation pulses. A solid
line and a dashed line correspond to the
experimental results of RR and RI polymers,
respectively. Open circles show the third-
order auto-correlation function of the laser
pulse. The signal decay time was very fast
and close to the pump pulse duration. In a
nonresonant excitation, the real carrier
transition is absent and the nonlinear optical
effect takes place only while the excitation
pulse pumps a sample. The third-order
nonlinear optical susceptibility k(3)| of the
polymers were calculated from the reflection 228
Regioregular Regio-irregular
-400 0 400 Time Delay (fs)
Fig. 3. The time-resolved DFWM signal.
. 9, i
' <D
£ 1°5 ■ 0 &\
A4> „=-0.32 " ■*-» ■+-» ' s GO % w
■
C cd u. H 1 - P~ •o • (U
E f~
O 0.95 Jr z
-10 0 10
Z (mm) 20
Fig. 4. The experimental result of z-scan method for RR polymer.
1) - &
i ■
. n 1.05 • A 0O=-O.27 • <a . •^ "tJ *j S ■ V - C ■ •*7 - CO
1 :% Hz® i >
N •"'
c« E • 1« o 1«T - z 0.95
-
-10 10
Z (mm) Fig. 5. The experimental result of z-scan method for IR polymer.

intensity.
Figures 4 and 5 show the experimental results of z-scan method for RR and RI
polymers, respectively.7 In the z-scan experiment, the central wavelength was 775nm. In
the Figs. 4 and 5, dots are the experimental results and solid curves are the calculated results
with the nonlinearly induced phase change A 4>0 = -0.32 and A 0O = -0.27. The
experimental results are good agreement with the calculated results. The experimental
results indicate the decrease in the refractive index, that is self-defocusing, of the polymers.
Nonlinear indexes of refraction n2 could be obtained from the fitting curves in the Figs. 4 and
5. Here, it has to be careful that the experimental results may include the thermal effect.
Four Wave Mixing Z-scan
l%(3)l Relaxation Time n2 -,(3) A 1111
Head to Tail 5.3X10¹⁰esu <100fs 3.3X10⁸esu 1.3X10'9esu
Random 3.5X10¹⁰esu <100fs 0.95X10⁸esu 3.8X10¹⁰esu
Table 1. Nonlinear optical indexes and susceptibilities obtained by DFWM and z-scan method.
Obtained nonlinear optical indexes and susceptibilities of RR and IR polymers are
summarized in Table 1. The third-order nonlinear optical susceptibilities x(3)mi f°r me z-
scan experiment were given by x(3)"" = ^2nn2/nQ, where n0 = 1.5 was the linear refraction
index of the polymer obtained experimentally. Both experiments, DFWM and z-scan
methods almost give the same results. |^(3)| of RR polymer was larger than that of RI
polymer. This increase in the optical nonlinearities should come from the regioregularity of
RR polymer.
In conclusion, we succeeded in the preparation of the head-to-tail regioregular
poly[3-(4-dodecylphenyl)-thiophene] by oxidative coupling polymerization using the
VO(acac)2 catalyst system. The increase in the third-order nonlinear optical susceptibility
\z{3)\, caused by the regioregularity, was observed.
1 P. N. Prasad and D. J. Williams, Introduction to Nonlinear Optical Effects in Molecules and Polymers, (Wiley, New York, 1991). 2 G. M. Carter, M. K. Thakur, Y. J. Chen, and J. V. Hryniewicz, Appl. Phys. Lett. 47, 457, (1985). 3 G. M. Carter, J. V. Hryniewicz, M. K. Thakur, Y. J. Chen, and S. E. Meyler, Appl. Phys. Lett. 49, 998, (1985). 4 T. Bjernholm, D. R. Greve, T. Geislar, J. C. Petersen, M. Jayaraman, and R. D. McCullough, Synthetic Metals 84, 531,(1997). 5 O. Haba, T. Hayakawa, M. Ueda, H. Kawaguchi, and T. Kawazoe, Reactive Polymers, to be published. 6 P. G. Huggard, W. Blau, and D. Schweitzer, Appl. Phys. Lett. 51, 2183, (1987). 7 M. Sheik-bahae, A.A. Said, and E. W. Van Stryland, Opt. Lett. 14, 955, (1989).
229

TuC24 12:30pm - 2:30pm
Sublattice Inversion Epitaxy of Compound Semiconductors for Quadratic Nonlinear Optical Devices
Shinji Koh, Minoru Ebihara, Ryuji Katayama, Takashi Kondo, and Ryoichi Ito
Department of Applied Physics, Faculty of Engineering, The University of Tokyo
7-3-1 Hongo, Bunkyo-ku, Tokyo 113-8656, Japan
Tel: +81-3-3812-2111 ext. 6842 Fax: +81-3-5802-2972 E-mail: kohSphotonics .rcast .u-tokyo .ac.jp
Compound semiconductors have not attracted much attention as materials for quadratic nonlinear optics such as frequency doubling and parametric amplification because most semi- conductors are optically isotropic and hence do not allow phase matching required for efficient nonlinear optical processes. This is, however, unfortunate in view of the large optical nonlin- earities exhibited by a number of semiconductors; for example, d36(GaAs) = 170 pm/V and d36(GaP) = 71 pm/V, both at 1.064 /xm.[l] Furthermore, the sophisticated crystal growth and fabrication technologies available for semiconductors might make it possible monolithically to integrate semiconductor-based nonlinear optical devices with laser diodes, thus opening up a new possibility of compact laser sources. To exploit this potential requires spatial modulation of the optical nonlinearity, which should enable quasi phase matching. [2] The ideal method to exploit the optical nonlinearity of semiconductors will be to achieve crystal domain inversion, resulting in sign reversal of the nonlinear optical coefficient. Yoo et al. reported periodic do- main inversion of AlGaAs by use of wafer bonding followed by overgrowth. [3] In this paper, we present an alternative, and potentially more versatile, technique to achieve domain inversion in compound semiconductors.
Let us consider III-V semiconductors of the zinc-blende structure. Spatial inversion oper- ation in zinc-blende type crystals is equivalent to a 90° rotation around the [100] direction and its equivalents owing to the existence of four-fold inversion axes parallel to the [100] axes. Alternatively, an exchange of the sublattices would also result in spatial inversion since the zinc-blende structure consists of two mutually penetrating face-centered-cubic sublattices, one occupied by group-Ill atoms and the other by group-V atoms. Usual epitaxy, however, does not allow sublattice inversion because of the considerable difference in the valence characteristics of the group-Ill and group-V atoms. In order to achieve sublattice inversion, we trick the atoms into forgetting which sublattice they should occupy. Figure 1 illustrates the basic scheme of our sublattice inversion epitaxy for the simplest case, GaAs grown on a (100) GaAs substrate. By inserting a thin intermediate layer of group-IV atoms, Si in Fig. 1, we would be able to invert the sublattice occupation: sublattice A is occupied by As and sublattice B by Ga in the grown layer, while sublattice A is occupied by Ga and sublattice B by As in the substrate. For this to happen, we must terminate the substrate surface by As atoms and initiate the GaAs growth by As deposition after inserting two monolayers of Si. More generally, the intermediate Si layer should be even-numbered-monolayers thick, allowing even-numbered atomic steps on the interface.
0-7803-4950-4/98/$10.00 1998 IEEE 230

OGa«As© Si
Y sublattice A
A sublattice B
[100]
(i)—-[011] [011]
Figure 1 Basic scheme of the sublattice inver- sion epitaxy for GaAs/Si/GaAs (100).
In order to demonstrate sublattice in- version epitaxy, we have grown GaAs on GaAs substrates with an Si or Ge intermediate layer (GaAs/Si/GaAs, or GaAs/Ge/GaAs) using a molecular beam epitaxy (MBE) system. The typical growth rate was 14 Ä/h, 600 Ä/h, and 8000 Ä/h for Si, Ge, and GaAs, respec- tively. The substrates used were (100) GaAs wafers tilted by 4° toward [011] or [011]. Sublattice inverted GaAs has been successfully grown in certain growth conditions. [4] Spatial inversion achieved in the epilayers was confirmed by the reflected high energy electron diffraction (RHEED) observation and the anisotropic chemical etching.
The quadratic nonlinear optical properties of sublattice-inverted GaAs epilayers have been characterized by the method of reflected second harmonics. In order to obtain the thickness dependence of the second-harmonic powers from the epilayers, we grew wedge-shaped GaAs epilayers using the local-growth-rate nonuniformity in our MBE system. The dependence of the second-harmonic power on the film thickness was measured in a reflection geometry using a Q- switched Nd:YAG laser as the fundamental light source. Figure 2 shows an observed thickness dependence of the second harmonic power emanating from a sublattice-inverted GaAs layer grown with a Si intermediate layer. The reflected second harmonic power displays an oscillatory structure with a half period of 350 Ä; this occurs as a result of the interference of second harmonic wave generated in the sublattice-inverted GaAs epilayer with that from the substrate. The observed half period exactly agrees with the coherence length, lc = IX/{K
2W+2K
U>), where K2W
and KU are the wavenumbers in the GaAs film along the [100] direction at 2u and w, respectively.
Similar experiments on non-inverted GaAs epilayers gave essentially flat dependence of the second harmonic power on the film thickness. The clear difference of the behavior of the reflected second harmonics between the inverted and non-inverted GaAs epilayers arises because the sign of the nonlinear optical coefficient of the sublattice-inverted GaAs epilayers is reversed with respect to that of the GaAs substrate.
1000 1500 Film Thickness (A)
2000
Figure 2 Reflected second-harmonic intensities of the sublattice-inverted GaAs film as a function of the film thickness.
231
In-situ RHEED observations and cross- sectional transmission electron microscopy (XTEM) observations revealed that ini- tial GaAs crystals grown on group-]V in- termediate layers were dominated by an- tiphase domains (APDs).[5] The APDs in the GaAs layers, however, grown on the intermediate layers were annihilated in the initial growth process. This behavior may be explained as follows. Antiphase bound- aries (APBs) are known to be created on the terrace edges of odd-numbered- monolayer step heights on the Si surface

1. Ge thin film growth
onGaAs(100)
2. Selective etching of
Ge films by H2O2
3. GaAs growth by
sublattice inversion
epitaxy
GaAs (100) _ misorientedto[011]
and propagate on {111} planes.[6] As the GaAs growth proceeds, the APBs are annihilated at intersecting lines, eventually resulting in the dominance of a single domain. [7] The sublattice allocation in the single-domain overgrown GaAs epicrystal is supposed to be determined by growth conditions such as the growth temperature, substrate misorientation, etc. Although the mechanism involved in the observed sublattice inversion epitaxy seems to be different from the one we had initially in mind, APD-free sublattice inversion epitaxy should be possible on Si (Ge) (100) surfaces with biatomic steps.[8] Surface treatment to enhance the creation of bi- atomic steps on Si (Ge) intermediate layers is a key technique to realize APD-free sublattice inversion.
Another method to fabricate APD-free devices using the current sublattice inversion epitaxy is to make use of "template" substrates with APD- free surfaces for overgrowth. Figure 3 shows the process to prepare the APD-free "template" for the overgrowth of periodically domain-inverted AlGaAs epilayers. Fablication of AlGaAs quasi- phase-matching wavelength conversion devices using this technique is now under way.
In summary, a novel epitaxial growth tech- nique, sublattice inversion epitaxy, has been proposed for fabricating nonlinear optical de- vices with domain-inverted semiconductor struc- tures. Sublattice inversion epitaxy has been demonstrated in the GaAs/Si/GaAs (100) GaAs/Ge/GaAs (100) systems using MBE. Al- though the present sublattice inversion epitaxy is assisted by the APD self-annihilation mech- anism, APD-free sublattice inversion should be possible by use of appropriate surface treat-
ments, more favorable crystal orientations. Fablication process for APD-free domain-inverted devices has also been proposed based on the current sublattice inversion epitaxy technique.
References
[1] I. Shoji, T. Kondo, A. Kitamoto, M. Shirane, and R. Ito, J. Opt. Soc. Am. B 14, 2268 (1997).
[2] J. A. Armstrong, N. Bloembergen, J. Ducuing, and P. S. Pershan, Phys. Rev. 127, 1918 (1962).
[3] S. J. B. Yoo, R. Bhat, C. Caneau, and M. A. Koza, Appl. Phys. Lett. 66, 3410 (1995).
[4] S. Koh, T. Kondo, H. Yaguchi, R. Ito, T. Usami, and Y. Shiraki, submitted to J. Appl. Phys.
[5] H. Kroemer, J. Cryst. Growth 81, 193 (1987).
[6] J. Varrio, H. Asonen, J. Lammasniemi, K. Rakennus, and M. Pessa, Appl. Phys. Lett. 55, 1987 (1989).
[7] K. Adomi, S. Strite, H. Morkog, Y. Nakayama, and N. Otsuka, J. Appl. Phys. 69, 220 (1991).
[8] T. Ueda, S. Nishi, Y. Kawarada, M. Akiyama, and K. Kaminishi, Jpn. J. Appl. Phys. 25, L789 (1986).
Figure 3 Preparation of the APD-free tem- plate for the overgrowth of periodically domain-inverted AlGaAs epilayers.
232

TuC25 12:30pm - 2:30pm
Third-order Optical Nonlinearity at Excitonic Resonance inPoly(3-[2-((S)-2-methylbutoxy)ethyl]thiophene)
S.Kishino, Y.Ueno, H.Kunugita, and K.Ema
Department of Physics, Sophia University 7-1 Kioi-cho, Chiyoda-ku, Tokyo 102-8554, Japan
Phone: 81-3-3238-3432, Fax: 81-3-3238-3341 E-mail: [email protected]
M.Rikukawa, K.Ochiai, Y.Tabuchi, H.Sato, K.Sanui, and N.Ogata Department of Chemistry, Sophia University
7-1 Kioi-cho, Chiyoda-ku, Tokyo 102-8554, Japan
The optical properties of polythiophene have generated widespread interest. Because this
material shows high electronic conductivity by doping [1] and demonstrate large third-order optical nonlinearity | x0)\ [2], it may be applicable as an active material in electro-optical
devices. Recently, we reported the enhancement of third-order optical nonlinearity in Poly(3- hexylthiophene)(P3HT) by the control of regularity in the polymetric structure [3]. The enhancement is due to increasing the conjugation length. In the present study, we use the thin films of Poly(3-[2-((S)-2-methylbutoxy)ethyl]thiophene)(P(S)MBET) which is expected to have large conjugation length. We measured | xß)\ at excitonic resonance using degenerate
four-wave mixing (DFWM), and estimate the conjugation length of samples .
Fig.l shows the structure of P(S)MBET. This
substance has a optically active group with the H2 | 3
coupling of ether, which is more flexible than alkyl ^ C^°^C^*^c^^3
group. We used the thin films of P(S)MBET which fff V\ H2 H2 H2
were prepared by Spin-coating method and \~^§ J~ Langumuir-Blodgett (LB) method. Fig.2 and Fig. 3
show the absorption spectra of P(S)MBET spin- Fig j The structure of P(S)MBET coated film and LB film. The absorption spectrum of LB film represents the lowest peak at 1.95eV, which is due to exciton absorption, and phonon side-bands of it around 2.13eV and 2.30eV. The interval of side-bands corresponds to C=C vibration energy (0.18eV). In spin-coated film, the exciton peak is found at 2.02eV, and
there are phonon side-bands around 2.20eV and 2.38eV. Comparing their spectrum, it is found
that LB film has larger conjugation length and smaller dispersion of conjugation length than
spin-coated one. In DFWM experiment, We used 200fs pulses from optical parametric amplifier (OPA)
seeded by mode-locked Ti:Al203 laser. The pulse repetition rate was 100kHz and the maximum
0-7803-4950-4/98/$! 0.00 1998 IEEE 233
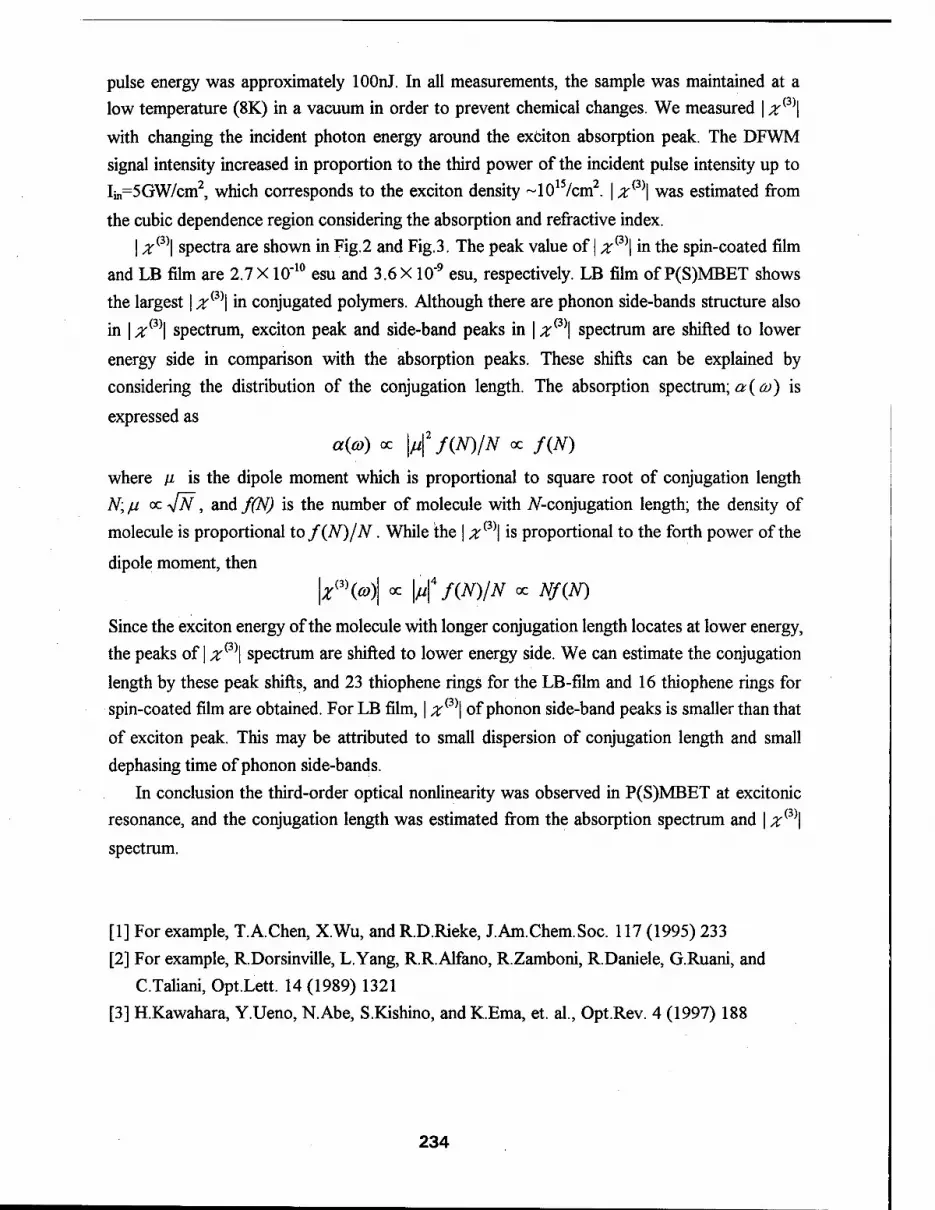
pulse energy was approximately lOOnJ. In all measurements, the sample was maintained at a low temperature (8K) in a vacuum in order to prevent chemical changes. We measured | zQ)\
with changing the incident photon energy around the exciton absorption peak. The DFWM
signal intensity increased in proportion to the third power of the incident pulse intensity up to Iin=5GW/cm2, which corresponds to the exciton density ~1015/cm2. | z^\ was estimated from
the cubic dependence region considering the absorption and refractive index. | ^r(3)| spectra are shown in Fig.2 and Fig.3. The peak value of | zQ)\ in the spin-coated film
and LB film are 2.7X10"10 esu and 3.6 X10"9 esu, respectively. LB film of P(S)MBET shows the largest | z(3)\ in conjugated polymers. Although there are phonon side-bands structure also
in | z{y)\ spectrum, exciton peak and side-band peaks in | z{i)\ spectrum are shifted to lower
energy side in comparison with the absorption peaks. These shifts can be explained by considering the distribution of the conjugation length. The absorption spectrum; a(co) is
expressed as
a{a>) oc \ju\2f(N)/N oc f(N)
where ß is the dipole moment which is proportional to square root of conjugation length N; ju oc *JN , and f(N) is the number of molecule with TV-conjugation length; the density of molecule is proportional to f(N)jN. While the | z{3)\ is proportional to the forth power of the
dipole moment, then Z*\co)\ x \$f(N)lN oc Nf(N)
Since the exciton energy of the molecule with longer conjugation length locates at lower energy, the peaks of | z{3)\ spectrum are shifted to lower energy side. We can estimate the conjugation
length by these peak shifts, and 23 thiophene rings for the LB-film and 16 thiophene rings for spin-coated film are obtained. For LB film, | zi3)\ of phonon side-band peaks is smaller than that
of exciton peak. This may be attributed to small dispersion of conjugation length and small
dephasing time of phonon side-bands. In conclusion the third-order optical nonlinearity was observed in P(S)MBET at excitonic
resonance, and the conjugation length was estimated from the absorption spectrum and | z{3)\
spectrum.
[1] For example, T.A.Chen, X.Wu, and R.D.Rieke, J.Am.Chem.Soc. 117 (1995) 233 [2] For example, R.Dorsinville, L.Yang, R.R.Alfano, R.Zamboni, RDaniele, G.Ruani, and
C.Taliani, Opt.Lett. 14 (1989) 1321 [3] H.Kawahara, Y.Ueno, N.Abe, S.Kishino, and K.Ema, et. al., Opt.Rev. 4 (1997) 188
234

,(j.8 2.0 2.2 2.4 Photon Energy (eV)
Fig.2 Absorption spectrum and | z{3)\ spectrum of P(S)MBET (spin-coated film)
2.0 2.2 2.4 Photon Energy (eV)
Fig. 3 Absorption spectrum and | z \ spectrum of P(S)MBET (LB film)
235

TuC26 12:30pm - 2:30pm
Soliton-like Propagation in Biexciton Two-Photon Resonant Region
M. Sakai, H. Kunugita and K. Ema
Department of Physics, Sophia University
7-1 Kioi-cho, Chiyoda-ku, Tokyo 102-8554, Japan
Phone: +81-3-3238-3432, Fax: +81-3-3238-3341
E-mail: [email protected]
M. Nagai and M. Gonokami
Department of Applied Physics, The University of Tokyo
7-3-1 Hongo, Bunkyo-ku, Tokyo 113, Japan
Phone: +81-3-3812-2111 ex.6836, Fax: +81-3-5689-8262
E-mail: [email protected]
1. Introduction Soliton-like pulse propagation in the exciton resonant region is the issue of current interest
because of their importance in the ultrafast optical switching devices. Although several
types of polariton solitons at exciton resonance have been theoretically proposed [1],
experimental studies for soliton-like propagation in such region have not been fully explored.
Recently, we proposed a new scheme of soliton-like propagation supported by biexciton two-
photon dispersion, and demonstrated a preliminary indication of our scheme using biexciton
two-photon resonance (TPR) in CuCl [2]. In the present study, we perform sub-ps pulse
propagation experiments under several conditions using biexciton TPR in CuCl. We
compare the results with the calculated results using the frequency domain wave equation.
We obtain good agreement between them, and confirm soliton-like propagation supported by
biexciton two-photon dispersion.
2. Principle of soliton-like propagation in biexciton two-photon resonant region The Fourier components of the electric field of the pulse in the form of running wave are
E{<»,z) = EMeik^, *2(co) = ^[l + x(1)(<ö)] , (1)
where k{<a) is complex wave number. Within a slowly varying envelope approximation
(SVEA), we obtain the following derivative of complex envelope function E((a,z) [3]:
x E{(üx,z)E(co2iz)E*((n1 +co2 -co,z)e'Mz,
where we take account of only the lowest nonlinearity x(3)> a110" Afc represents phase
0-7803-4950-4/98/fl0.00 1998 IEEE 236

mismatch.
If we neglect the phase-mismatched terms in Eq. (2), we can define the nonlinear dispersion
**(«)=4(7lKN2- (3)
In the numerical calculation, we use material parameters of the bulk CuCl, and set the
input pulse width to 300 fs and center frequency to biexciton TPR, 3.186 eV. In Fig.l, the
dotted curve shows the linear polariton dispersion curve [k(co)] and the solid one shows the
total dispersion curve [k(to)+kNL(to)]. As we can see in Fig. 1, the nonlinear dispersion
compensates polariton dispersion in the frequency region of the input pulse at a certain
intensity. We calculate changes of the pulse shape along z using Eq. (2), including phase-
mismatched terms. Results of calculation are shown in Fig. 2. By increasing pulse
intensity, soliton-like propagation occurs at a certain intensity.
3. Experimental results
We used a high purity single crystal of CuCl, thickness of 10 um and kept them at 10 K.
In order to obtain the transmitted pulse shape, we use different frequency generation (DFG)
intensity correlation technique. Fig. 3(a) shows the transmitted pulse shapes with a linearly
polarized beam tuned to the biexciton TPR. With increasing the intensity, we clearly see
the narrowing of the pulse duration and the increase in the velocity. To clarify the biexciton
TPR effect, we performed the experiments with a circularly polarized beam (the biexciton
two-photon transition is forbidden for a single circularly polarized beam), and with beams
whose energy are detuned to ±3 meV from the biexciton TPR energy. The results are shown
in Fig. 3(b-d). In these cases, no pulse narrowing is observed. We conclude that the
soliton-like propagation shown in Fig. 3(a) is attributed to the biexciton TPR nonlinearity.
3.195-
> 3.190-
iS 3.185- c o j2 3.180-
3.175- lnput pulse frequency region
1 1 1— 400 450 500 550x10'
Wavenumbei^cm'1)
FIG. 1. The real part of the linear polariton dispersion k(a>) (dotted curve) and the total dispersion with the nonlinear dispersion k(co)+kNL(co) (solid curve). The nonlinear dispersion compensates for polariton dispersion in the region of the input pulse frequency.
237

I 'S J 20 S 16 | 12 d 8
4
A I=Io
w 5 i A7 ^ A'* /y\ v. i i ■ r ■■ i -1
0 (a)
-1 -2 -3 -4 Time(ps)
FIG. 2. The calculated pulse shapes with (a) low intensity, and (b) high intensity. By increasing pulse intensity, the pulse duration becomes shorter and the group velocity increases.
1.3GWW
860MW/cm'
430MW/cm'
76Mw7cm"
-2 -4 Time(ps)
860MW/cm'
1.3GW7cm2
430MW/cm'
220MW/cm'
^^*im 76MW/cmz
Reference -T 1
-4 -6 Time(ps)
T-
-10 -2 -4 Time(ps)
1.3GW/cm"
650MW/cm'
430MW/cm'
TÖMW/cm"
FIG. 3. The experimental results, (a) with a linearly polarized beam, (b) with a circularly polarized beam, (c) with a beam detuned +3meV from biexciton TPR, (d) with a beam detuned -3meV from biexciton TPR.
References
[1] for example, I. B. Talanina and M. A. Collins, Solid State Commun. 88, 541 (1993)
[2] K. Ema and M. Kuwata, Phys. Rev. Lett. 75, 224 (1995)
[3] P. N. Butcher and D. Cutter, The Elements of Nonlinear Optics (Cambridge University
Press, Cambridge, 1990)
238

TuC27 12:30pm - 2:30pm
Biexcitonic contribution to the four-wave-mixing signal from a self-organized quantum-well material (CeHisNHa^Pb^
H. Kunugita, J. Ishi, K. Sano and K. Ema
Department of Physics, Sophia University,
7-1 Kioi-cho, Chiyoda-ku, Tokyo 102, Japan
tel: +81-3-3238-3339 fax: +81-3-3238-3341
K. Tanaka, T. Kondo and R. Ito
Department of Applied Physics, Faculty of Engineering,
The University of Tokyo, Bunkyo-ku, Tokyo 113, Japan
tel: +81-3-3812-2111 ext 6842 fax: +81-3-5802-2972
Numerous studies have shown that the nonlinear optical responses in quantum-well sys- tems arise primarily from interactions between excitons, and recent investigations have demonstrated that biexcitons play an important role in the nonlinear optical processes. In order to observe biexcitonic effects in quantum-well systems, it is necessary to reduce the inhomogeneous broadening linewidth that originates from the well-width fluctuations. For this reason, observation of biexcitonic effects is limited in high quality crystals.
(C„H2n+iNH3)2PbI4 are self-organized quantum-well systems with intrinsically flat well- barrier interfaces as well as a large band-gap energy difference between the well and the barrier layers. The lowest excitons are tightly confined within the very thin (6.36 A) inorganic well layers. Moreover, the dielectric-confinement effect significantly enhances the effective Coulomb interaction, the excitons have an extremely large binding energy (~ 400 meV) and oscillator strength (~ 0.7 per formula unit).[l, 2] Recently, we demonstrated that the x(3)(w;a;, -a;, a;) of (C6H13NH3)2Pbl4 at the exciton resonance was as large as ~ 10~6 esu[3] and that the biexcitons had a large binding energy (~ 40 meV).[4]
In the present study, we have observed the biexciton contribution to nonlinear opti- cal process in (C6Hi3NHs)2PbI4 using four wave mixing (FWM). FWM experiment was performed using a two-incident-beam configuration (wave vectors were ki and k2). The TI- FWM signals were obtained by monitoring the signal beam in the direction k, = 2kx — k2
as a function of the time delay between the two pulses r = *i - i2 (positive when pulse 2 precedes pulse 1). .
Figure 1(a) shows the TI-FWM signals for the exciton resonance (fix = 2.345 eV) with co-linearly polarized pulses. In this case, the polarization created by pulse 2 interferes with the field of pulse 1 and creates a grating which diffracts the pulse 1 along 2kx — k2. Therefore, the TI-FWM signals are expected only at positive time-delays.[5] The observed signal intensity actually reaches a maximum at positive time-delays because of a finite relaxation time.[6] The phase relaxation time T2 was approximately 0.2 ps. The absolute value of x^(a,ia;i _wiw) — 10~6 ^^ was estimated from the cubic dependence region considering the absorption and reflection losses. [3] In the cross-linearly polarized 0-780.V4950-4/98/$10.00 1998 IEEE 239

configuration, the intensity of the TI-FWM signals shows a large reduction because exciton one photon coherence (OPC) does not contribute to the coherent FWM process. Figure l(b- d) shows the TI-FWM signals for excitation at 2.330 eV, which is slightly below the exciton resonance energy. The spectrum of the incident pulses are broadened with a 35-meV full width at half maximum, which includes the exciton resonance energy and the biexciton- exciton transition energy (QM = 2.300 eV). In the co-linearly polarized configuration, another peak appears at negative time-delays. This signal can be explained by biexciton two-photon coherence (TPC). The two-photon absorption process induced by pulse 1 leads to TPC between the ground state and the biexciton state. The subsequent pulse 2 is diffracted from this TPC. This process (shown schematically in Fig. 2) introduces the TI- FWM signals at negative time-delays. In the circularly polarized configuration (kx and k2
pulses are circularly and linearly polarized, respectively), this negative time-delay signal is largely reduced. According to the selection rules of biexciton transition, biexcitons cannot be excited in this configuration. The intensity of the positive time-delay signal is largely reduced in the cross-linearly polarized configuration. Thus, the coherent process related to exciton OPC is dominant in the positive time-delay signal. From the diagram shown in Fig. 2, we can see the photon energy of FWM signals which arise from the biexciton TPC processes. In the case of Fig. 2 (a), the FWM signal with broadband pulse excitation is generated at both positive and negative time-delays with a photon energy of ilu- In the case of Fig. 2 (b), the FWM signal is generated at only negative time-delays with a photon energy of fix- In order to confirm this, we spectrally resolved the FWM signal in the cross-linearly polarized configuration as a function of delay time r.(Figure 3) Although the exciton OPC cannot contribute to the FWM signal in the cross-linearly polarized configuration, we observes the fix peak at negative time delay in this configuration. Consequently, the negative time-delay fix peak is attributed to the biexciton TPC. At positive time delay, we can see the broad signal between f&M and fix position, which decays to f&M peak. Since the M peak observed at positive time delay can be attributed to the process of Fig. 2 (a), this result suggest the existence of two exciton band above the biexciton level. No signal is observed at negative time-delays around the position of Clu in the present experiment. Thus, biexciton dephasing energy may be so large that the FWM signals rapidly decay at negative time-delays. According to the third order perturbation calculation, the signal intensity ratio of the M peak to the X peak at negative time-delays is 7/7M, where 7, 7M
are the dephasing energy of exciton-to-ground and biexciton-to-exciton, respectively. In summary, polarization-dependent TI- and SR-FWM for excitation below the exciton
resonance are measured to investigate the nonlinear optical response of excitons and biex- citons in a self-organized quantum-well material (CeHiaNHa^Pbl^ Biexciton contribution to FWM signals is clearly observed.
References
[1] T. Ishihara, J. Takahashi, and T. Goto, Phys. Rev. B42, 11099 (1990).
[2] T. Kataoka, T. Kondo, R. Ito, S. Sasaki, K. Uchida, and N. Miura, Phys. Rev. B47, 2010 (1993).
[3] T. Kondo, S. Iwamoto, S. Hayase, K. Tanaka, J. Ishi, M. Mizuno, K. Ema and R. Ito, submitted to Solid State Commun.
240

[4] T. Kondo, T. Azuma, T. Yuasa, and R. Ito, submitted to Solid State Commun.
[5] T. Yajima, and Y. Taira, J. Phys. Soc. Jpn. 47, 1620 (1979)
[6] C. Dörnfeld, and J.M. Hvam, IEEE J. Quantum Electron. 25, 904 (1987).
-0.4 0.0 0.4 Time Delay (ps)
8K
OM
Ox
bx-
2k,-k2 k,
ex-
k2 k,
— t -
2krkj
(•) (b)
Figure 2: Energy diagrams showing hiexciton two photon coherence, where g, ex, and bx represent ground, exciton, and biexciton states, respectively, (a) Signals at ftM are
A g generated at negative and positive time-delays, (b) Signals at ftx are generated at negative time-delays.
Figure 1: (a): TI-FWM signals for the exciton resonance (fix = 2.345 eV) with co-linearly polarised pulses. (b,c,d): TI-FWM signal intensity for excitation with various polarised pulses . Photon energy of excitation pulses is slightly below exciton resonance, 2.330 e V. (b): Excitation pulses are co-linearly polarised and excitation intensify is lO.OMW/cm1. (c): Excitation pulses are cross-linearly polarised and excitation intensity is 14.2 MW/cm*, (d): ki and ki pulses are circularly and linearly polarised, respectively, and excitation intensity is 11.3 MW/cm*.
W/W*I>WI'
540
Wavelength (nm)
530 520
2.30 2.35
Photon Energy (eV)
2.40
Figure 3: Spectra of FWM signal at different time-delays. Excitation pulses are cross- linearly polarized.
241

TuC28 12:30pm - 2:30pm
Demonstration of a Phase Conjugate Resonator using Degenerate Four- Wave Mixing via Coherent Population Trapping in Rubidium
X. Xia, D. Hsiung, T.T. Grove and M.S. Shahriar Research Laboratory of Electronics, Massachusetts Institute of Technology,
Cambridge, MA 02139 Tel: 617-253-8147
Optical phase conjugation (OPC) is of interest for many applications such as optical resonators, high speed turbulence correction, and the production of the squeezed vacuum state. In the interest of practical implementation of OPC, the simplest method is to produce a phase conjugate mirror (PCM). In this work we have used the PCM as well as the gain associated with the OPC to form a ring laser.
Previous work demonstrated a double-A system in sodium vapor to be an efficient optical phase conjugator1'2. This OPC used a CPT-based grating that produced a conjugate at low pump intensity (1 W/cm2) with high efficiency (reflectivity greater than 50), and fast response time (less than 1 [is). The sodium double-A system corrected high speed turbulence which demonstrates the potential for using an atomic vapor as a non- linear material3. In order to use a CPT based grating on almost any resonant media, we reproduced the double-A system using Zeeman sublevels of a single hyperfine ground state and polarized light4. This particular experiment used rubidium and found similar performance as the sodium system. The transition frequencies and required power levels are also within the range of diode lasers for this rubidium system, potentially allowing inexpensive and practical systems in the future. This conjugation process can work with degenerate laser frequencies which further simplifies the experimental requirements5.
The OPC process is based on coherent population trapping. For four-wave mixing, the forward beam and the signal beam are Raman resonant which puts vapor atoms in a dark state. A grating is formed in the coherence between to two ground states of the Raman transition. In this work, the two ground state levels are Zeeman sublevels of the same hyperfine ground state. Thus, we have oppositely polarized forward (CT+) and signal beams (CT.). The backward beam diffracts off this grating and forms the conjugate beam. In a similar manner, the backward beam and the conjugate beam form a grating since they are also Raman resonant. The forward beam diffracts off this grating creating an amplified signal beam. By feeding the output conjugate beam back into the system as a signal beam (using a XIA waveplate to correct the polarization), we create an optical resonator cavity.
The experimental set up is shown in figure 2. A single Ti:Saphire laser produces both pump beams via beam splitters. Each of the pump beams has a FWHM of 1.0 mm, and the angle between any of the beams is less than 5 mrad. We use a heat pipe rubidium oven as our rubidium source with Helmholtz coils to provide a magnetic field. The heat pipe oven and Helmholtz coils are then boxed in with mu metal to eliminate stray magnetic fields. A ring cavity is produced when one considers the PCM created by the four-wave mixing as part of the resonator cavity. We use a 98% reflector in the cavity as an output coupler. However, we also have an effective output coupler in the amplified signal beam. In practice, we found that the signal shapes produced by these different methods yield virtually identical results.
Figure 2 shows the lasing dependence on the pump beam frequency. The maximum occurs to the blue of the 87Rb 52Si/2, F=2 to 5 Pi/2, F=l transition. There is 0-7803-4950-4/98/$10.00 1998 IEEE 242

162 mW in the forward beam and 91 mW in the backward beam. As we showed before the
Figure 1. General experimental set up. The pump beams (F and B) are derived from a Titantium:Saphire laser and beam splitters. The resonator cavity cycles the conjugate back into the
system as the signal beam.
\
1500
Frequency (MHz)
Figure 2. Pump frequency dependence of the ring laser. The largest maxima occurs blue shifted to the 87Rb 52Sj/2, F=2 to 52Pi/2, F=l transition (the left dotted line). The right dotted line is the 52S1/2, F=2 to 52Pm, F=2 transition.
1.25
!
0.00
Zeeman Shift (MHz)
Figure 3. Losing Dependance on magnetic field. The narrow sharp peak is attributable to a Raman resonance.
open-loop gain shows a single Lorentzian shape, with three dips, two corresponding to the two resonances (vertical dotted lines), and one corresponding to a detuning exactly halfway between the resonances. The four peaks corresponding to the three dips would imply that we should get four peaks in the laser. The line shape observed in figure 2 indicates that only the first two of these peaks (located around the first resonance) had a gain large enough for lasing to occur.
243

The output power after the 98% reflector is 0.02 mW while the amplified signal output is around 1 mW. Taking account of loss in the system due to other factors, we can estimate the internal intensities to be approximately 0.85 mW for the incident beam, and 1 mW for the reflected. This indicates a saturated gain in the PCM of around 1.2. The linear gain during the lasing build-up is of course much higher (about 40, as reported in reference 6). Note that in a PCM laser of this form, the output power (observed as the amplified signal) is greater than the power circulating in the cavity.
Figure 3 demonstrates the lasing dependence on the magnetic field produced by the Helmholtz coils. By using the Zeeman shift, we are able to change the effective detunings the atom sees from both the forward and signal beams. As the Zeeman shift is opposite for these two beams (see figure 1), increasing the magnetic field takes the atom away from Raman resonance. As can be seen from figure 4, the lasing width is quite narrow (< 0.5 MHz FWHM). Under the open-loop conditions5,6, we have observed this linewidth to be of the order of 2 MHz. The smaller linewidth observed here is again due to the fact that the gain has to be larger than a threshold value in order for lasing to occur.
References:
P. R. Hemmer, D. P. Katz, J. Donoghue, M. Cronin-Golomb, M. S. Shahriar, and P. Kumar, Opt. Lett. 20, 982 (1995). 2 T. T. Grove, M. S. Shahriar, P. R. Hemmer, Prem Kumar, V. K. Sudarshanam, and M. Cronin-Golomb, Opt. Lett. 22, 769 (1997). 3 V. K. Sudarshanam, M. Cronin-Golomb, P. R. Hemmer, and M. S. Shahriar, Opt.Lett. 22, 1141 (1997). 4 T.T. Grove, E. Rousseau, X. -W. Xia, M.S. Shahriar, and P.R. Hemmer, Opt. Letts. 22, 1677(1997)). 5 "Polarization Selective Motional Holeburning for High Efficiency, Degenerate Optical Phase Conjugation in Rubidium," X. Xia, D. Hsiung, T. Grove, P.R. Hemmer, and M.S. Shahriar, submitted to Opt. Letts." 6 High Gain Optical Phase Conjugation Using Degenerate Four Wave Mixing via Coherent Population Trapping in Moving Atoms," X. Xia, D. Hsiung, M.S. Shahriar, T.T. Grove, and P.R. Hemmer, to be presented at the Quantum Electronics and Laser Science Conference, 1998.
244

TuD3 (Invited) 8:15pm-8:45pm
Nonlinear Optical Pulse Propagation Experiments in Photonic Bandgap Materials
Richart Slushier and Benjamin Eggleton Bell Laboratories
Lucent Technologies 600 Mountain Avenue Murray Hill, NJ 07974
SUMMARY
Periodic dielectric structures, often called photonic bandgap materials, have now expanded from simple gratings to engineered structures in one, two and three dimensions that can be tailored with a wide variety of amplitude, phase, and defect structures. Photonic bandgap systems include one-dimensional fiber gratings, two dimensional planar waveguides with dielectric arrays, and three dimensional arrays. Photonic bandgap materials include glasses, organic materials and semiconductors. Optical dispersion is very strong and varies rapidly near the photonic bandgap where forward and backward traveling waves are strongly coupled by the periodic structure. The effective linear velocity of an optical pulse goes to zero at the edge of the gap. These linear characteristics can be engineered over distances of from a few wavelengths to meters depending on the magnitude of the index variation in the periodic dielectric.
Nonlinear phase shifts near n can be achieved in many photonic bandgap materials over distances of a few centimeters. The combination of nonlinear phase shifts near K and the tailored dispersive characteristics of photonic bandgap materials leads to a rich new set of nonlinear phenomena including solitons, modulational instabilities, and pulse compression. "Bragg" solitons were observed for the first time in 1995 in uniform fiber gratings12. These experiments revealed that at high intensities and wavelengths near the short wavelength edge of the photonic bandgap, the combination of the strong dispersion provided by the Bragg grating, along with the third order nonlinear response give rise to pulse compression and pulse retardation. Indeed it was confirmed by numerical simulation that solitons propagating at velocities substantially less than the speed of light had been observed. In this talk we discuss our recent experiments studying soliton propagation and soliton dynamics in novel fiber grating structures and highly nonlinear materials.
An important property of fiber gratings that can be effectively engineered is called apodization, i.e. the gradual increase in the index modulation at the beginning of the grating and gradual decrease at the end. The coupling of light into apodized gratings is more efficient than in uniform gratings. This increased
0-7803-4950-4/98/110.00 1998 IEEE 245
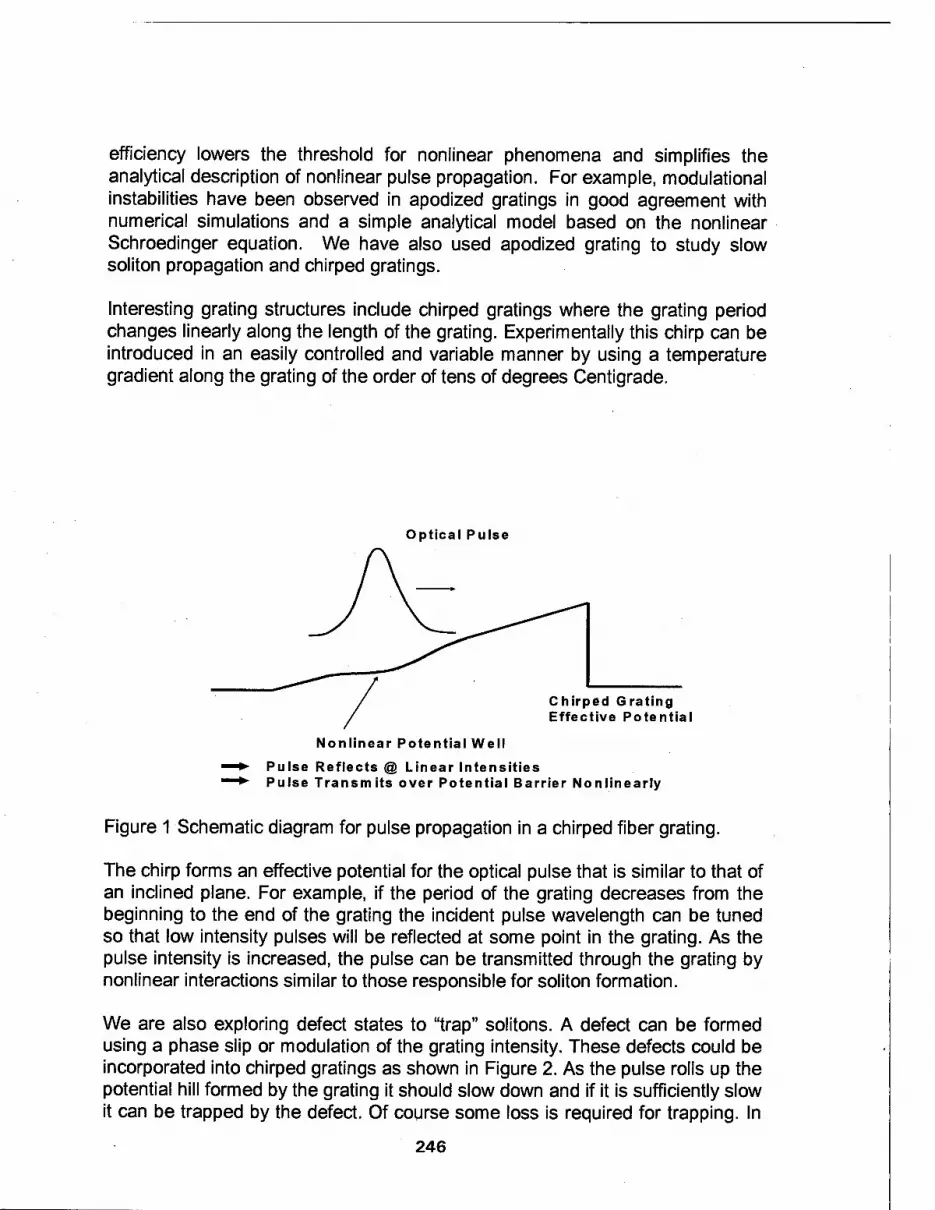
efficiency lowers the threshold for nonlinear phenomena and simplifies the analytical description of nonlinear pulse propagation. For example, modulational instabilities have been observed in apodized gratings in good agreement with numerical simulations and a simple analytical model based on the nonlinear Schroedinger equation. We have also used apodized grating to study slow soliton propagation and chirped gratings.
Interesting grating structures include chirped gratings where the grating period changes linearly along the length of the grating. Experimentally this chirp can be introduced in an easily controlled and variable manner by using a temperature gradient along the grating of the order of tens of degrees Centigrade.
Optical Pulse
Chirped Grating Effective Potential
Nonlinear Potential Well
Pulse Reflects @ Linear Intensities Pulse Transmits over Potential Barrier Nonlinearly
Figure 1 Schematic diagram for pulse propagation in a chirped fiber grating.
The chirp forms an effective potential for the optical pulse that is similar to that of an inclined plane. For example, if the period of the grating decreases from the beginning to the end of the grating the incident pulse wavelength can be tuned so that low intensity pulses will be reflected at some point in the grating. As the pulse intensity is increased, the pulse can be transmitted through the grating by nonlinear interactions similar to those responsible for soliton formation.
We are also exploring defect states to "trap" solitons. A defect can be formed using a phase slip or modulation of the grating intensity. These defects could be incorporated into chirped gratings as shown in Figure 2. As the pulse rolls up the potential hill formed by the grating it should slow down and if it is sufficiently slow it can be trapped by the defect. Of course some loss is required for trapping. In
246

principle the pulse will decay slowly enough in the trap that it could be released by the nonlinear action of a second pulse at a later time.
Optical Pulse
Defect Potential
Chirped Grating Effective Potential
Nonlinear Potential Well
Pulse can be trapped in defect potential and released by second pulse
Figure 2 Schematic diagram of trapping an optical pulse in chirped fiber grating with a defect.
Initial experiments on soliton-soliton interactions will be described along with simulations that show behavior for the symmetric and anti-symmetric cases that are remarkably similar to solitons in normal fiber.
Exploratory work on pulse propagation in highly nonlinear chalcogenide fiber gratings is in progress. As2S3 fibers have optical nonlinearities nearly 100 times that of silica fiber. Gratings can be written in these nonlinear fibers using visible light.
Finally, we are planning planar waveguide experiments using thin organic films. A dielectric array is formed lithographically as pillars or holes in an Si02 layer grown on a Si substrate. An organic film is deposited over this array to form a patterned planar waveguide. The dielectric array can be further patterned to form defect states, linear waveguides and gratings, and efficient coupling structures. Organic materials with large nonlinear indices will be used that have electronic bandgap energies greater than twice the incident optical pulse photon energies.
1. B. J. Eggleton, R. E. Slusher, C. M. de Sterke, P. A. Krug, and J. E. Sipe, Phys. Rev. Lett. 76,1627(1996).
2. B. J. Eggleton, C. M. de Sterke, and R. E. Slusher, J. Opt. Soc. Am. B 14, 2980(1997).
247

TUESDAY, 11 August
TuA Semiconductors I TuB Communications TuC Poster Session II TuD Tuesday Night Session

WEDNESDAY, 12 August
WA Storage WB Applications I WC Nonlinear Optics WD Terahertz Radiation

Wednesday Not Available
WB1
WB5
WD2
Engineered Nonlinear Materials: Progress in QPM Materials and Devices Robert L. Byer, Stanford University, Stanford, CA
Toward an Optical Synthesizer: Widely Tunable c.w. Parametric Oscillators J. Mlynek, Universität Konstanz, Konstanz, Germany
Comparisons of Different Methods of Generation of Terahertz Radiation Jacob Khurgin, Johns Hopkins University, Laurel, MD
WA1 (Invited) 8:00am - 8:30am
Fundamental Issues Related to Digital Holographic Data Storage
Lambertus Hesselink Stanford University
Stanford, CA 94305-4035 e-mail: bert(5),kaos.stanford.edu
Phone: 650-723-4850
Digital holographic data storage fundamentally differs from bit-wise surface recording techniques by storing the transform of a two-dimensional array of bits throughout the volume of a recording medium. Upon readout the data are transformed and detected by a 2-D detector array, providing massively parallel data streams. The third dimension of the recording medium provides an additional degree of freedom to increase capacity per unit surface area. Data storage densities exceeding those of conventional optical and magnetic recording devices by up to ten times (200 bits/cm2 )have been achieved. These densities allow 200 GB of information to be stored on a single sided 5.25" disk. By reading out 2-D arrays of bits using an image capturing device, very large data transfer rates can be obtained, up to lGbit/sec. In addition, acousto-optic beam steering devices are capable of addressing each of the stored pages in a few microseconds, providing phenomenally short access times to blocks of data.
The advantages of digital holographic data storage were recognized almost immediately after the inception of off-axis holography. Much work has been done to overcome the principal challenges to holographic storage, namely maintaining data integrity during readout using light sensitive media. Components such as spatial light modulators for a page composers, charge coupled devices for data detection, lasers, and beam shaping and steering devices all have reached a level of maturity that, at least in principle, allow high performance systems to be constructed. Most recently, several demonstrations of complete systems making use of these improved components have been reported, starting with the work at Stanford University [1], and followed by demonstrations at Optitek[2], IBM[3] and Rockwell[4], Lucent[5] and others All these demonstrations used LiNb03 as the recording medium in either a 90 degree or transmission geometry. In the 90 degree arrangement scatter is minimized and signal to noise ratios are sufficiently high to achieve reasonable data storage densities and data transfer rates similar to those of magnetic and optical devices. In these demonstrations, total capacities were typically on the order of 0.5 to 1 GB as mechanical transport mechanisms for spatial multiplexing were not implemented. This seemingly small matter turns out to be a very important issue. As the mass of the recording medium is on the order of a few hundred grams, access times are sacrificed and limited to values on the order of a few hundred milliseconds by the ability to accelerate the recording medium. This is only acceptable in a commercial product if the stored capacity per surface area is very large, on the order of a few GB. From an overall systems perspective this implies that other approaches need to be considered, and lighter materials are needed to achieve high performance.
Disk based rotating storage systems are attractive for their similarity with current magneto-optical and magnetic storage disk drives. By using a spinning disk access times 0-7803-4950-4/98/110.00 1998 IEEE 251

can be made short, but very high-powered lasers are needed to freeze disk motion during page recording, or a stop-and-go architecture is required at the expense of access time. The tradeoffs outlined in broad terms here bring up a critical question: What are the fundamental limitations and tradeoffs for designing a digital holographic data storage system?
In this paper we address this issue by computing the number of photons per bit required to achieve a certain signal to noise ratio at a minimal SNR and at a certain transfer rate. The results can be expressed as the number of pages than can be superimposed to achieve the required bit error rate, and is given by:
# pages = r (M/#)2eQEPrjoptJ?fixtread2^
/2
where M/# is a variable based on system and materials parameters, 6>is the number of photons per watt , QE the quantum efficiency of the detector array, T}opt the optical efficiency of the imaging system, Tfo is the fixing efficiency, tread'is the read time of the recalled data, M and N are the number of rows and columns on the data page, and pmi„ denotes the number of photo-electrons needed to get a 20dB SNR, and P is the power of the readout beam. It is assumed that bit patterns are balanced (although this does not have to be the case) and half the pixels in a page are on and half are off. From this equation, the tradeoff between capacity and data transfer rate is determined.
For thick media like LiNb03 in the 90 degree geometry this assumes that capacity is limited by crosstalk and noise rather than the number of holograms that can be superimposed by multiplexing. For thin media, such as photopolymers, however, this is not the case, and the number of holograms that can be superimposed is largely determined by the limited number of degrees of freedom available for multiplexing. Angular multiplexing in the transmission geometry does not allow sufficient data storage density but shift or perisrophic multiplexing could to be implemented. Unfortunately, the displacements necessary for achieving low crosstalk in thin media are still too large and require the undesirable stop-and-go architecture for rotating disks. To avoid this problem a very sensitive, relatively thick storage medium is needed. Recent developments in the DARPA funded PRISM consortium have made substantial steps forward towards achieving such a medium for recording in the red region of the spectrum using a few hundred milliwatts of power. Photopolymers exhibit shrinkage, however, and this limits the number of holograms that can be superimposed. To achieve recording during constant rotation of the disk, a new multiplexing technique was implemented based on a phase modulated reference beam. In such an architecture, performance can be readily compared to more conventional technologies.
We have analyzed the number of photons required per bit for the 90 degree LiNb03 geometry, and thin photopolymer disk systems as a function of data density, data transfer rate, and access time at a certain signal to noise ratio. These results are compared with other recording technologies, including magneto-optic recording, near-field recording and DVD. Fundamental limitations to page based systems are elucidated which tend to limit
252

the achievable storage capacity to a few tens of Gbytes in a system having no moving parts and sub-millisecond access times and high data transfer rates. Rotating disk based holographic systems have limitations similar to those imposed by conventional storage approaches, but with much higher data densities.
To test the results of this analysis, several experimental systems have been implemented at Optitek, Inc. and Stanford University demonstrating critical elements of a practical system. A 90 degree LiNb03 system has been built at Optitek with a capacity of a few GB in a form factor of a 31/2" diskdrive. This system demonstrates that a functional system can be integrated into a small physical package, as shown in Figure 1. Fixing is achieved by either thermal processes or by highly efficient gated optical recording in stoichiometric LiNb03 as described by Orlov et al[2]. A second system build at Optitek and Stanford University demonstrates lGbit/sec readout rates in a 90 degree LiNb03 configuration using a IKxlKxlK CCD detector array developed by Kodak, and a lKxlK SLM developed by IBM as part of the HDSS consortium. This system has a fully implemented electronic readout system incorporating both channel code and ECC capability using 64 parallel channels in a bench top demonstration. In a third demonstration, thin photopolymers are used with a phase encoded reference beam to achieve extremely high shift selectivity compared with previous approaches.
On the basis of the experimental results and the analysis fundamental issues are elucidated, and conclusions presented concerning the consequences for the various system architectures. Signal processing and coding approaches are discussed for overcoming some of the noise degradations. And tradeoffs between materials and systems performance characteristics are presented to achieve a competitive storage device. This work is partially funded by the DARPA/NSIC/Industry/University PRISM and HDSS Consortia.
References 111 J. F. Heanuc, M. C. Bashaw, and L. Hesselink, Science 265, 749-752 (1994). [2| S. S. Orlov, L. Hesselink, A. Akella, and R. R. Neurgaonkar, "High Sensitivity non- Volatile Two-Color Recording in Lithium Niobate", Conference on Lasers and Electro- Optics'97, Baltimore, MD, postdeadline paper CPD29.
[3] G. W. Burr, J. Ashley, H. Coufal, R. K. Grygier, J. A. Hoffnagle, C. M. Jefferson, and B. Marcus, Opt. Lett. 22, 639-641 (1997).
[4] Rockwell, private communication
Figure 1, Compact form factor Demonstration device
n
253

WA2 (Invited) 8:30am - 9:00am
PHOTOREFRACTIVE CRYSTALS FOR HOLOGRAPHIC STORAGE:
WHAT ARE THE PERFORMANCE LIMITS?
K. Buse
Universität Osnabrück, Fachbereich Physik, Barbarastr. 7, D-49069 Osnabrück, Germany phone +49-(0)541-969-2654, fax +49-(0)541-969-2670, e-mail [email protected]
FUNDAMENTALS
Practical volume holographic storage devices are becoming more and more feasible because of the availability of cheap and efficient lasers, spatial light modulators, and electronic cameras.1 The critical issue is still the recording material. Phase holograms are necessary to minimize losses due to absorption and to get good diffraction efficiencies. Desired properties of the phase recording medium are a large dynamic range and a high speed. A measure for the dynamic range is the M/# (Ref. 2): multiplexing of M holograms of equal diffraction efficiency t] yields for each hologram 77 = (M/# / A4)2, if the diffraction efficiencies are much smaller than 1, which is always the case in storage applications. Here TJ is the ratio between the intensities of diffracted and incident light beams, i.e. absorption losses are considered. A measure for the speed is the response time r, which is the time required to reach 1-1/e of the saturation value of the refractive index changes.
Further desired features of the recording material are excellent optical homogeneity, to avoid image distortions, and high stability against environmental attacks like temperature changes, mechanical shocks and chemically active atmospheres, to ensure data safety. Additional requirements are reversibility, nonvolatile readout and the ability of permanent fixing.
Photosensitive polymers and photorefractive crystals are investigated intensively as media for volume holographic storage. Low manufacturing costs and many opportunities for flexible design of their properties are strong arguments in favor of polymers. Dynamic ranges and response times are excellent. However, the homogeneity, especially of large samples, and the stability of polymers are still not satisfactory. 0-7803-4950-4/98/110.00 1998 IEEE 254
Inhomogeneous illumination of photorefractive crystals redistributes charge, space-charge fields build up and modulate the refractive index via the electrooptic effect. Impurities or intrinsic defects in different valence states are sources and traps of the charge carriers,3 e.g. electrons are excited in lithium niobate (LiNb03) from Fe2+ into the conduction band and trapped by Fe3+. The bulk photovoltaic effect, diffusion and drift are responsible for movement of the charge carriers. No development or further processing is required.
Photorefractive crystals suffer a lower dynamic range and a much lower speed. However, the performance of crystals used in demonstrator systems is far below from their physical limits. Iron-doped LiNb03 appears to be the best photorefractive material for storage applications so far. For several reasons: good availability, reproducible properties, excellent optical homogeneity, and detailed knowledge of the charge transport processes. Thus the analysis will be concentrated on this material.
DYNAMIC RANGE
The M/# of photorefractive crystals is given by
M/# = n And -ad/2 *x
where An is the amplitude of a single refractive index grating recorded into saturation, d is the effective thickness of the material, a is the intensity absorption coefficient, and xr and xe are the time constants of recording and erasure, respectively.
The time constants can be complex? recording and erasure are governed by| l-exp[-t(l/r+ico)]| and |exp[-t(l/rH©))]|, respectively. Amplitude and phase position of the holograms vary with

time; the holograms are moving. A recording / erasure asymmetry is expected (see Fig. 1).
Figure 1: Recording / erasure curves of refractive index gratings for time constants with different
complex contributions.
At first, this effect looks promising to improve the MM. However, in multiplexing experiments, erasure is caused by recording of subsequent holograms. The inhomogeneous erasure light yields fast movement of the charge in the bright and slow movement in the darker regions; the holograms are more quickly destroyed than for homogeneous illumination. Large modulation degrees of the light pattern are required to optimize the M/#, and in this case the time constants rx and re are always almost equal. This simplifies the formula for the M/#.
The refractive index changes result from the electrooptic effect. On one hand, large concentrations of Fe2+ are desired to have enough electrons for build-up of the space charge fields. On the other hand, large concentrations of Fe2+
cause strong absorption of light, which decreases the diffraction efficiencies. Thus an optimum Fe concentration exists.
,2+
Analysis yields for the optimum conditions
1 1 Mm n e r?r
£0 exp(l) s A K S
e is the elementary charge
and ad = 2,
where e is the elementary charge, e0 the permittivity of free space, n the refractive index, r the electrooptic coefficient, 8 the static dielectric constant, X, the vacuum wavelength, K the spatial frequency, and S the photon absorption cross section per Fe2+ ion. The right-hand side of the
equation is organized in the following way: constants, parameters of LiNb03, experimental parameters, impurity parameters. For optimized LiNb03:Fe under typical experimental conditions, the M/# is 10. Successful storage and retrieval of up to 10,000 holograms at a single location in crystals with an M/# of about 1 has been demonstrated. Thus a tenfold increase should be possible. All parameters are determined mostly by the material and by the experimental configuration. The S plays a crucial role. It is realistic to reduce this S by a factor of 10, which would yield an outstanding M/# = 100. This would allow for storage of 1 million holograms at a single location. Assuming 1000x1000 pixels per hologram, we get a raw storage density of about 100 GByte at a single location.
Internal break-downs limit the space charge field in LiNb03 to about 100 kV/cm.5 This yields an upper limit for the A« value of the first recorded grating and the M/# is limited to about 10, if the conventional recording schedule is used. A modified recording schedule, which is illustrated in Fig. 2, is required to overcome this problem. All holograms are recorded several times for short and equal duration. Multiple recording of the same hologram requires precise locking of the interference pattern to the original position, which can be achieved easily with the help of beam- coupling.6
Figure 2: Recording schedule for M/# > 10.
c <
0.4 • I— i I i i
Recording of hologram number
1 2 3 1 2 3 1 2 3 1 2 3
0.3
S ;
y
N
v
0.2
<^
/ /
/
' N /•-. ;
0.1
r\ n
-1/ 2/ /
/
3> ^ ••
' 0 1/3 2/3 1 4/3 5/3 2 t/T
RESPONSE TIME
Many different dopants in photorefractive crystals have been tried with the aim to improve the response time, but no substantial improvement has
255

been obtained. A typical response time of LiNb03
is T = 3 s (0.01 wt. % Fe203, Fe2+/Fe3+
concentration ratio 0.1 [as grown crystal], intensity level of 1 W/cm2, green light).7 Is there a magic dopant for LiNb03, not discovered so far, which improves the speed dramatically? This can be answered, if we know the reason for the low speed of photorefractive crystals.
Recently a very complete picture of the charge transport in cerium-doped strontium-barium niobate crystals (Sro.eiBao^^Oe, SBN) has been obtained.8 Photoconductivity measurements with continuous wave and pulsed excitation, absorption measurements, X-ray photoelectron spectroscopy, neutron activation analysis, investigations with non-steady-state photocurrents and Hall measurements were required to get a full insight into the processes. Figure 3 illustrates the results in a band diagram (CB: conduction band, VB: valence band, e": Electron, hv: Photon).
J3x, h 111$ 33000 _ 3+ 32983
Ce
shallow levels ^
Ce 4+
t^-s-r ""- ■" WWi* 33FÜS
VB
Figure 3: Charge transport in SBN:Ce.
It is very reasonable that the outcomes are valid not only for SBN:Ce, but for all photorefractive oxidic crystals: Only some of the absorbed photons yield an excited electron; this is a problem, because by this effect light intensity is lost and the sensitivity is reduced. The trapping of free electrons is very efficient; the electrons are attracted, even if there are several atomic layers between them and the trap. This reduces the conductivity and increases the response times T.
A substantial improvement of the photorefractive response time for new crystal systems or dopants is not expected.
The response time can be reduced simply by an increase of the light intensity. However, the crystal is heated appreciably even at 1 W/cm , and
256
a further increase of the light intensity would cause thermal problems.
The overall recording time of 100,000 holograms (M/# - 10) is about 15xx due to the exposure schedule. This yields a raw storage rate of about 250 MByte/s for 1000x1000 pixel holograms and x = 3 s. Readout will have roughly the same speed: With r| = 10~8 and the assumption that 20 photons are required for detection of an ON state, we end up with reading rates of 250 MByte/s.
CONCLUDING REMARKS
The performance limits of LiNb03 for holographic data storage are not yet reached experimentally. Optimization of the crystals and of the experimental conditions are necessary. Problems regarding holographic scattering and screening fields must be overcome. From the material point of view, LiNbO} has the potential to yield a storage density of 100 GByte at a single location and continuous storage/readout rates up to 250 MBytes/s.
REFERENCES
[1] D. Psaltis and F. Mok, "Holographic memories", Scientific American 273,70-76 (November 1995)
[2] F. H. Mok, G. W. Burr, and D. Psaltis, "System metric for holographic memory systems", Opt. Lett. 21,896-898 (1996)
[3] K. Buse, "Light-induced charge transport processes in photorefractive cyrstals", Appl. Phys. B 64, 273-291 and 391- 407(1997)
[4] N. V. Kukhtarev, V. B. Markov, S. G. Odoulov, M. S. Soskin, and V. L. Vinetskii, "Holographic storage in electrooptic crystals", Ferroelectrics 22,949,961 (1979)
[5] K. Buse, S. Breer, K. Peithmann, S. Kapphan, M. Gao, and E. Krätzig, "Origin of thermal fixing in photorefractive lithium niobate crystals", Phys. Rev. B 56,1225-1235 (1997)
[6] P. M. Garcia, K. Buse, D. Kip, and J. Frejlich, "Self-stabilized holographic recording in LiNb03:Fe crystals", Opt. Commun. 117,235-240(1995),
[7] R. Sommerfeldt, L. Holtmann, E. Krätzig, and B. C. Grabmaier, "Influence of Mg doping and composition on the light-induced charge transport in LiNb03", phys. stat. sol. (a) 106, 89-98 (1988)
[8] K. Buse, A. Gerwens, S. Wevering, and E. Krätzig, "Charge transport parameters of photorefractive strontium-barium niobate crystals doped with cerium", submitted for publication in J. Opt. Soc. Am. B

WA3 (Invited) 9:00am - 9:30am
Science and Engineering of Two Photon 3D Storage Devices
A. S. Dvornikov, I. Cokgor and P. M. Rentzepis University of California, Irvine and Call/Recall Inc.
Materials and Method: Many commercial and military applications generate enormous amounts of data that need to be stored for rapid and parallel access and every fast processing. However, at the present time, CD-ROMs and DVDs and even the most advanced optical storage system, i. e. the 4.5GB DVD, is not sufficient to fulfill some of the strigent demands imposed today by multimedia, medical and other applications. To circumvent this deficiency we have developed a high density fast read-out 3D optical storage memory. Our method relies on the non-linear absorption of two photons which causes changes in the structure and spectra of the excited molecule, figure 1. The two states of the binary code, 0 and 1, are formed by the photo-chemical changes which lead to two distinct structures of the molecular species used as the storage medium. The stored information is read by illuminating the written bits with either one photon of the energy necessary to induce fluorescence, or by simply intersecting two optical beams at that point. In the case of the organic materials to be described the information is stored in the form of binary code. The non-linear, i.e. two photon virtual absorption, makes possible the storage of data inside the volume of the 3D device and in fact enables the selection of any arbitrary location within the device to where data is to be written. By this means, two- photon 3-D memory devices with over 100 2D planes, within an 8 mm cube, have been written, a few microns apart from each other.
This optical storage memory has the capability of dynamic parallel-access needed to accommodate the demands of today's technologies. We may expect that by this means it is possible to construct an optical memory which could
provide a data capacity of 1 Gbit/cm3with a 10ns-l msaccess time and a 10Tbit/s data rate. System: Two-photon 3-D memories are characterized by high density, data content
stored in the form of numerous 2D planes, simple fabrication, parallel access and high transfer rates. Although single bits may be stored and read, parallel access of columns or planes of data is naturally achieved in two-photon 3-D memories, resulting in very high data transfer rates. Diffraction of the addressing beam as it propagates through the data image, imposes limits in the volumetric density of the memory and the parallelism, or data transfer rate. Writing, reading, and erasure of 3-D memory data has been demonstrated, and recently we have begun to evaluate the practical potential associated with this technology.
S2.
S-|.
'write' absorption n
532 nm
So —
—X-
I .Si
1064nm .read.
fluorescence
1064nm .s0
CH3 CH3
N02
CH3 CH3
crt3
NO2
Figure 1: Two photon absorption (left) and readout (right) processes.
0-7803-4950-4/98/$10.00 1998 IEEE 257

An automated recording and reading system has been constructed which is used to store 3
data in 10x10x10 rrm samples. These cubes are fabricated by dispersing the photochromic molecule in a Polymethylmethacrylate, PMMA matrix, which is subsequently molded and polished, into 1/10, cube.
Green HeNe \
ROM cube [
1> I.,iin...mini mi,ini,IM
üääOTä SSK9S8»
smsm&iititsäsiSffss
AM««»'
K^«-i.'^Äi-^^^^Ä
Diial-speed stage
Figure 2. Portable 3D Reading System
Chrome or photographic film masks were illuminated by the 1064 nmbeam of a mode- locked Nd:YAG laser and imaged into the media to form 4 mm x 4 mm data planes where they intersected with the SHG, 532 rm, of the same laser. The memory, mask, and imaging lens closest to the 3D storage cube were mounted on motor driven linear stages. Retrieval and analysis of the data is performed by illumination of the plane to be read with the 543 rm beam of a He/Ne laser. The induced fluorescence is imaged onto a simple CCD camera and subsequently processed. Retrieval of images from the memory has also been done using the portable ROM systems shown in figure 2. This and more sophisticated systems use a simple stepper motor driven stage, a He/Ne laser or diode laser and a low cost video camera.
Even though there are several limitations to the materials and system presently employed, there is strong evidence to suggest that the practical application of two photon 3D memory devices is feasible.
258

WA4 9:30am - 9:45am
Recording of Permanent Holographic Gratings in Liquid Crystals
EJiimojii, O.Francescangeli, L.Lucchetti, S.Slussarenko and Yu.Reznikoy*
Dipartimenlo di Scienze dei Maleriali e della Terra e Istilulo Nationale per la Fisica della Materia, Universitä di Ancona,
Via Brecce Bianche, 60131 Ancona, Italy Tel +39-71-2204736 / Fax +39-71-2204714 institute of Physics, Academy of Sciences of Ukraine, Prospect Nauki 46, Kyiv, Ukraine
SUMMARY
It has been previously shownM that in nematic liquid crystals doped with a small amount of azodye (<1%) it is possible to obtain a permanent surface orientation of the liquid crystal molecules in a direction parallel to the polarization of an exciting light beam. This effect seems to be caused by the adsorption on the surface of the excited dye molecules, which, in the process, align the liquid crystal molecules. This light-induced reorientation can be exploited to record permanent holographic gratings in a liquid crystal cell.
The experiments were carried out using a sandwich glass cell 50u.m thick, filled with a mixture of nematic 5CB and azodye Methyl Red as dopant (1%). The inner surface of the first glass (the control surface) was coated by an isotropic nonrubbed layer of poly(vynil)-cinnammate, while the inner surface of the second glass (the reference surface) was coated by a polymide layer and rubbed to get strong planar anchoring. This surface determined the initial planar alignment of the cell. A conventional Mach-Zender geometry was used to produce in the sample the interference pattern of two beams originated from a He-Cd laser (X=0.422 u,m) and crossing each other at a small angle 0. The maximum light power of each beam was 0.5 mW , with a spot size
diameter of 2 mm. By using parallel polarizations of the two beams it was possible to write
permanent intensity gratings on the samplet2] ; the grating efficiency was measured by a He-Ne probe beam: a detectable diffraction was observed after
less than 1 minute of illumination.
0-7803-4950-4/98/110.00 1998 IEEE £59

The origin of the appearance of the grating is the modulation of the molecular director orientation induced by the light and occurs if the direction of the impinging light polarization is different from the initial planar orientation of the sample. In fact the appearance of a preferred orientation
(easy axis) on the control surface occurs only at the interference maxima. This new surface orientation gives rise to a twisted structure along the sample thickness since the orientation is fixed on the reference surface. On the contrary the sample orientation remains planar in correspondence of the interference minima. In this way regions of different average refractive index are created with a period which depends on the crossing angle 6 between the
beams, giving rise to a phase grating. The achievable spatial resolution is also strongly affected by nonlocal effects in liquid crystal where molecules "feels" the orientation of other molecules at long distances. However by this techique a diffraction efficiency r| = 3% was achieved with a resolution higher than 100 lines/mm.
Higher sensitivity and higher resolution has been achieved bv usin^ orthogonal polarization of the interferring beams. In this case the intensity is uniform in the irradiated area while the polarization state varies periodically as function of the phase delay between the waves, from linear to elliptical to circular and so on.
The features of the polarization grating^] which appears in this case are different from the ones of the intensity grating. In fact in the former case the surface director orientation pattern results from the periodic modulation of the anchoring energy associated to the easy axis; the orientation of this latter is fixed by the linear incident polarization and remains constant throughout the whole illuminated area. Differently, in the polarization grating the light- induced anchoring energy is spatially uniform because of the uniform intensity distribution over the illuminated surface; on the other hand, the induced easy axis is now modulated since it depends on the light polarization at the control surface, varying in agreement with the modulation of the long axis of the polarization ellipse.
In case of polarization grating a maximum diffraction efficiency r|=12% was obtained for a grating constant A = 20 urn. , but a the value T-|=8%
was still measured A = 1 urn., corresponding to a spatial resolution of 1000 lines/mm. The density energy E required to get 50% of the maximum efficiency was about 0.3 J/cm2.
260

In order to compare the storage capabilities of different materials can be used the parameter g=E 0i)1/2 , where E is the surface energy density corresponding to the diffraction efficiency T|. In our case g>l cm2/J, which is among the highest ever obtained in nonlinear materials.
The presented method has been succesfully exploited to write binary images. By exploiting the high sensitivity of the medium, permanent recording has been also achieved by using a single pulse (4 ns) of the second harmonic of
a Nd-YAG laser. In conclusion we have demonstrated that dye-doped liquid crystals have
very interesting storage capabilities : no image degradation after more than one year, high spatial resolution, high sensitivity, polarization sensitivity.
References
[1] - D. Voloshchenko, A.Khyzhnyak, Yu.Reznikov and V.Reshetnyak, Jpn. J. Appl. Phys. 34, 566 (1995) [2] - F.Simoni, O.Francescangeli, Y.Reznikov and S.Slussarenko,
Opt.Lett. 22, 549.(1997) [3] - S.Slussarenko, O.Francescangeli, F.Simoni and Y.Reznikov, Appl.Phys.Lett. 22, 549 (1997)
261

WA5 9:45am - 10:00am
A novel method for non-volatile holographic recording in lithium niobate
AH Adibi, Karsten Buse, and Demetri Psaltis
Department of Electrical Engineering, Mail Stop 136-93
California Institute of Technology, Pasadena, CA 91125
Phone: 626-395-3889, FAX: 626-568-8437
Photorefractive materials are of high interest for read-write holographic data storage. One
of the main problems that makes the practical implementation of these memories difficult
is the erasure of stored information during read-out. Several solutions like thermal fixing,
electrical fixing, and two-step recording have been proposed for this problem1-3, but they
need some special requirements like heating the crystal, using high electric fields, or high
light intensities.
We present here a simple and practical solution to the erasure problem. The idea is
to use two different deep traps, for example iron and manganese in lithium niobate. The
energy band diagram for such a system is depicted in Fig. 1. The electrons are initially in
the deeper traps. Light of short wavelength (with high energy photons) can transfer some
of these electrons to the shallower traps via the conduction band. This makes the recording
of the holograms using longer wavelength light feasible. The final hologram is recorded in
the deeper traps, and therefore is not erased during the read-out by the recording (long
wavelength) light.
We performed experiments with a 0.85 mm thick LiNb03 crystal doped with 0.075 wt.%
Fe203 and 0.01 wt.% MnO. The crystal is sensitized for recording by homogeneous illumi-
nation with 365 nm light of a 100 W mercury lamp. The intensity of this illumination is
20 mW/cm2. The recording beams are two plane waves at 633 nm with equal intensities
of 300 mW/cm2. The read-out is performed by one of these beams while the other one is
blocked. The recording and read-out beams are all ordinarily polarized.
Initial illumination with homogeneous ultraviolet light sensitizes the crystal by transfer-
ring some of the electrons from the manganese sites to the iron traps. If we then record the
0-7803-4950-4/98/$10.00 1998 IEEE 262

Mit 2+/3+
»&»SK&HMWM'M'H£
iÜ
Figure 1: Energy band diagram for a doubly-doped lithium niobate crystal
hologram by red beams without simultaneous ultraviolet illumination, the final diffraction
efficiency is very small as shown in Fig. 2. This is due to the total bleaching of the crystal, i.e.
at first the electrons in the iron traps are transferred to the manganese centers at the high
intensity regions, and then the same thing occurs for the low intensity regions. Therefore,
all electrons move by approximately the same distance and are re-trapped by manganese
centers. This results in a very small space charge field and diffraction efficiency. However, if
we keep the ultraviolet light on during recording, the re-excitation of the electrons trapped
in the manganese centers would be possible. This results in higher diffraction efficiencies.
Finally, we block the ultraviolet light and illuminate the crystal with a homogeneous red
beam to transfer the electrons from iron traps to the manganese centers. This in fact reduces
the diffraction efficiency of the hologram, but the final hologram can not be erased by the
read-out at red, since it is stored in the manganese centers. This is shown in Fig. 2.
If we use extraordinary polarization for the read-out beam, we can achieve a final diffrac-
tion efficiency of 32 %. This is due to the larger corresponding electro-optic coefficient.
Besides the good diffraction efficiency, this method does not suffer from holographic scatter-
ing and screening fields due to the presence of the ultraviolet light.
263

T 1 Recording
red it uv
1 1 r Reading
-
I 8 o c • I
-
£ 6 v -
c
|\ red, only
X^_ red, only 5 4 o s i 2 -
n red, only
60 120 180 240 300 Time (min)
360
Figure 2: Holographic recording and read-out curves for doubly-doped lithium niobate
The theoretical analysis indicates that the final diffraction efficiency depends only on the
ratio of the intensities of the sensitizing (ultraviolet) and recording (red) beams and not
on the absolute intensities. Depending on the traps and their corresponding doping levels,
there is an optimum value for this intensity ratio that results in the maximum achievable
diffraction efficiency.
References:
1. J. J. Amodei and D. L. Staebler, Holographic pattern fixing in electrooptic crystals. Appl.
Phys. Lett. 18, 540-542 (1971).
2. F. Micherson and G. Bismuth, Electrical control of fixation and erasure of holographic
patterns in ferroelectric materials. Appl. Phys. Lett. 20, 79-81 (1972)
3. D. Von der Linde, A. Glass, and K. F. Rodgers, Multiphoton photorefractive processes
for optical storage in LiNb03. Appl. Phys. Lett. 25, 155-157 (1974)
264

WB2 11:00am-11:15am
Robust high-power and wavelength-tunable femtosecond fiber system based on engineerable PPLN devices
A. Galvanauskas, M. E. Fermann, M. A. Arbore*. M. M. Fejer*, J. D. Minelly**, J. E. Caplen**, K. K. Wong andD. Harter
IMRA America, Inc., 1044 Woodridge Avenue, Ann Arbor, Michigan 48105 phone: (734) 930-2589, fax: (734) 930-9957, e-mail: [email protected]
* E. L. Ginzton Laboratory, Stanford University, Stanford, CA 94305 ♦♦Optoelectronics Research Centre, University of Southampton, Southampton S017 1BJ, U.K.
Introduction
Synchronously-pumped optical parametric oscillators (OPO) were traditionally regarded as being the only approach for providing wavelength tunable high-average-power and high-repetition-rate pulses from compact femtosecond laser systems. Relatively low peak powers are required by OPO for efficient frequency conversion. In contrast, an alternative approach based on optical parametric generation (OPG) was traditionally considered to be disadvantageous in this respect as being limited to low average power, low repetition rate and requiring complex table-top size femtosecond lasers for delivering high-energy pump pulses.
However, the concept of parametric generation possesses a significant potential advantage due to the simplicity and robustness of OPG compared to femtosecond OPO. Stability of synchronously pumped femtosecond OPO depends critically on matching the lengths of the femtosecond oscillator and parametric oscillator cavities, which constitutes a substantial hindrance for developing robust commercial devices based on this scheme.
Here we report a robust high-power, high-repetition rate and wavelength-tunable femtosecond laser system based on optical parametric generation and a compact fiber chirped- pulse-amplification circuit, both implemented using engineered PPLN devices.
Parametric generation using a compact fiber CPA system
The main advantage of using PPLN for OPG is that it requires substantially less pump energy than other available nonlinear materials. For femtosecond pulses an OPG-threshold of -50 nJ has been experimentally demonstrated [1]. Efficient (20 %) energy conversion has been obtained with 100 nJ pump pulses from a table-top, diffraction-grating based fiber CPA system [1].
Chirped pulse amplification is essential for femtosecond pulse amplification in fiber amplifiers due to the limited peak power allowed by the limited cross-sectional area of a guided- wave mode. Previous implementations of compact fiber CPA using chirped fiber gratings [2] could not reach parametric generation thresholds due to the peak-power limitations in a fiber grating itself.
Here we use a compact CPA circuit based on a chirped-period, quasi-phase-matched (QPM) grating compressor in electric-field poled lithium niobate [3]. Unlike waveguide devices, bulk QPM compressors do not have limitations on the mode size and, therefore, on the recompressable pulse energies. Additionally, such a QPM compressor combines second- harmonic generation and pulse compression in one crystal, efficiently producing the 780 nm pump pulses required for 1 - 3 urn tunable OPG.
0-7803-4950-4/98/110.00 1998 IEEE 2g5

Experimental set-up
The compact fiber CPA system is shown in Fig. 1. It consists of a mode-locked femtosecond Er- fiber oscillator, Er-fiber preamplifier, high-power cladding-pumped Er/Yb fiber amplifier and a CPPLN pulse compressor. The simplicity and compactness of this frequency-doubled fiber CPA system is apparent. Essentially, it has the same number of components as direct pulse amplification in a fiber would require.
A 5 MHz oscillator produces 180 fs, 100 pJ seed pulses at 1560 nm, which are stretched in 12 meters of a positive-dispersion fiber (ß2 = + 0.108 ps /m) to about 18 ps. Pulse compression is accomplished at the output of the power amplifier by passing the amplified stretched pulse through a 6 cm long CPPLN crystal. The recompressed second-harmonic pulses at 780 nm are 380 fs long (assuming a Gaussian pulse shape). This pulse broadening occurs due to spectral gain narrowing in the fiber amplifier.
The important feature of the current system is that a specially designed large-core fiber was used in the power amplification stage. The maximum energy extractable from a fiber amplifier without nonlinear distortions is proportional to the stretched-pulse duration, which currently is limited by the maximum available CPPLN crystal length of ~6 cm. By using a 24 urn mode-size fiber, we were able to scale-up the maximum extractable energy for 18 ps stretched pulses in order to obtain efficient parametric generation.
Also shown in Fig. 1 is an optical parametric generator based on a 3 mm-long PPLN crystal. We used a set of filters to suppress 1550 nm throughput into the OPG crystal, and thus to avoid unwanted parametric amplification at this wavelength. OPG has been achieved using a multiple-grating device with QPM periods from 19.5 to 21.5 Jim for wavelength tuning at a fixed temperature.
Experimental results
Fig. 2 shows compressed-pulse, second-harmonic output power as a function of stretched-pulse input power at the fundamental wavelength for CPPLN compressor. Up to 0.5 W of 780 nm output has been obtained for 1.2 W of fundamental amplified input internally in the PPLN crystal. This was achieved at 10 W of cladding-coupled 976 nm pump power from a broad-stripe diode array and 30 mW of injected preamplified signal into an Er/Yb power amplifier. Pulse energy extraction of this CPA system has been tested in a separate measurement yielding distortion-free pulses of up to 0.4 uJ at 1560 nm.
100 nJ second-harmonic pump pulses at 780 nm were sufficient to achieve ~ 20 % OPG conversion efficiency yielding up to 94 mW of wavelength-tunable output from the current system. A typical wavelength tuning curve obtained with a multigrating PPLN is shown in Fig. 3.
Conclusions
Combined use of conventional unchirped and chirped PPLN structures facilitates the implementation of compact and robust fiber-CPA systems, producing high average power and high repetition rate, femtosecond output tunable from 1-3 urn. The achievable pulse energies and average powers can be scaled further by increasing the stretched pulse duration, amplifier- fiber core size and by using higher power diode-laser arrays.
266

References
1. A. Galvanauskas, M. A. Arbore, M. M. Fejer, M. E. Fermann and D. Harter, Opt. Lett. 22,105 (1997) 2. A. Galvanauskas, M. E. Fermann, D. Harter, J. D.Minelly, G. G. Vienne, J. E. Caplen, in Conference
on Lasers and Electro-Optics: Opt. Soc. Am. Technical Digest Series 9,495 (1996) 3. M. A. Arbore, A. Galvanauskas, D. Harter, M. H. Chou and M. M. Fejer, Opt. Lett. 22, 1341 (1997)
Signal & Idler 1-3(im
Parametric generator
Filters
Fiber oscillator
I Pump
.—(HllHHpK
Er-fiber Double-clad Fiber preamplifier large-core
stretcher Er/Yb fiber
1 mmvy-r
QPM compressor
Broad-stripe diode array
Fig. 1 Compact wavelength tunable fiber CPA system
600
500
400
I 300 o
*200
100
"0 200 400 600 800 1000 1200 Fundamental power, mW
19 19.5 20 20.5 21 QPM period, um
21.5
Fig. 2 CPPLN compressor power characteristics Fig. 3 Typical OPG tuning characteristics
267
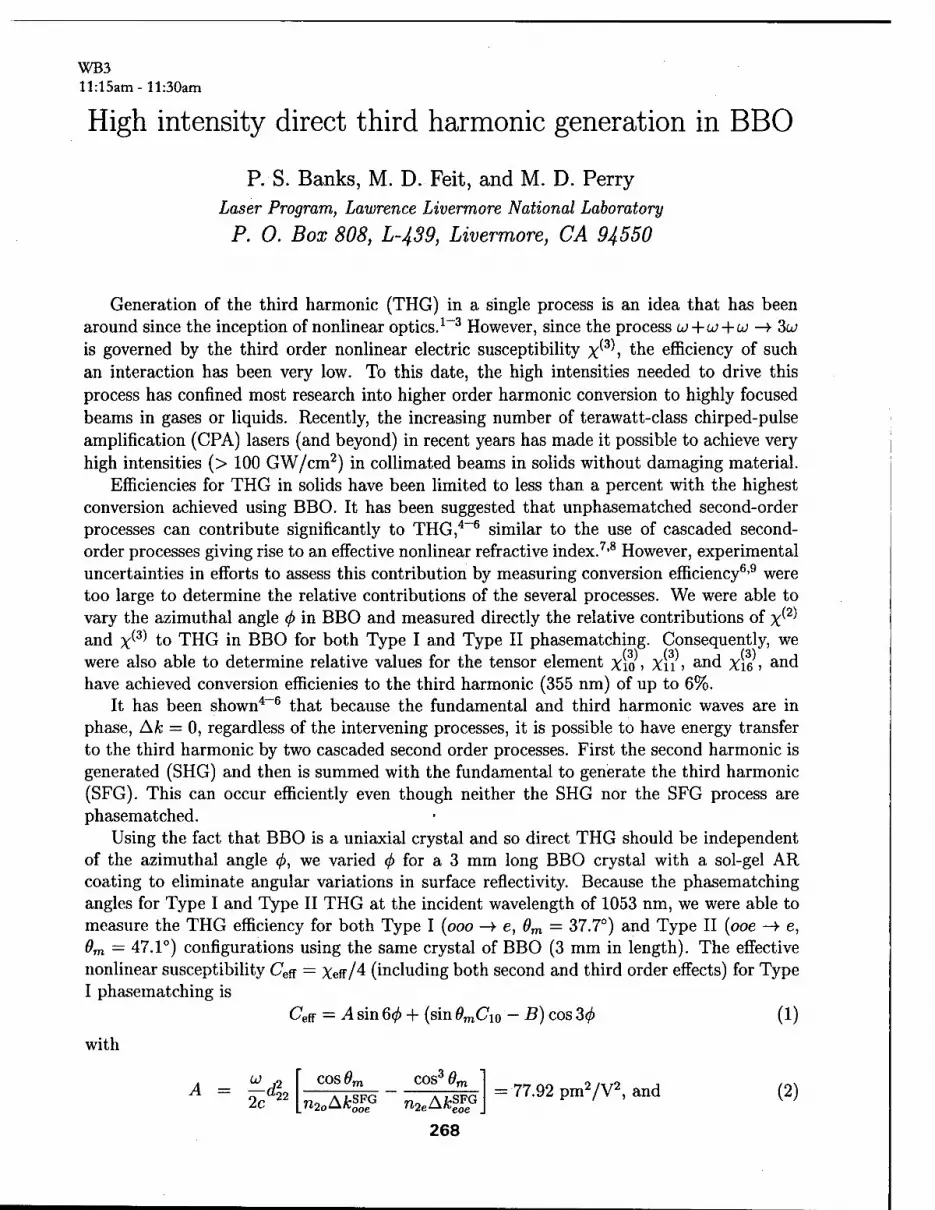
WB3 11:15am-11:30am
High intensity direct third harmonic generation in BBO
P. S. Banks, M. D. Feit, and M. D. Perry Laser Program, Lawrence Livermore National Laboratory
P. 0. Box 808, L-439, Livermore, CA 94550
Generation of the third harmonic (THG) in a single process is an idea that has been around since the inception of nonlinear optics.1-3 However, since the process u+ui+u —»■ 3a; is governed by the third order nonlinear electric susceptibility x^3\ the efficiency of such an interaction has been very low. To this date, the high intensities needed to drive this process has confined most research into higher order harmonic conversion to highly focused beams in gases or liquids. Recently, the increasing number of terawatt-class chirped-pulse amplification (CPA) lasers (and beyond) in recent years has made it possible to achieve very high intensities (> 100 GW/cm2) in collimated beams in solids without damaging material.
Efficiencies for THG in solids have been limited to less than a percent with the highest conversion achieved using BBO. It has been suggested that unphasematched second-order processes can contribute significantly to THG,4-6 similar to the use of cascaded second- order processes giving rise to an effective nonlinear refractive index.7'8 However, experimental uncertainties in efforts to assess this contribution by measuring conversion efficiency6'9 were too large to determine the relative contributions of the several processes. We were able to vary the azimuthal angle $ in BBO and measured directly the relative contributions of x^ and x^ to THG in BBO for both Type I and Type II phasematching. Consequently, we were also able to determine relative values for the tensor element Xio > Xn > an<3 Xi6 > and have achieved conversion efficienies to the third harmonic (355 nm) of up to 6%.
It has been shown4-6 that because the fundamental and third harmonic waves are in phase, Ak = 0, regardless of the intervening processes, it is possible to have energy transfer to the third harmonic by two cascaded second order processes. First the second harmonic is generated (SHG) and then is summed with the fundamental to generate the third harmonic (SFG). This can occur efficiently even though neither the SHG nor the SFG process are phasematched.
Using the fact that BBO is a uniaxial crystal and so direct THG should be independent of the azimuthal angle <j>, we varied 0 for a 3 mm long BBO crystal with a sol-gel AR coating to eliminate angular variations in surface reflectivity. Because the phasematching angles for Type I and Type II THG at the incident wavelength of 1053 nm, we were able to measure the THG efficiency for both Type I (ooo -¥ e, 9m = 37.7°) and Type II (ooe -> e, 0m = 47.1°) configurations using the same crystal of BBO (3 mm in length). The effective nonlinear susceptibility Ceff = Xeff/4 (including both second and third order effects) for Type I phasematching is
Ceff = A sin 6<f> + (sin 0mClo - B) cos 30 (1)
with
. u )2 [ cos 9m cos3 6m 1 „„ ^ n ,„ r0 , ,nS A = £* [S^M|gJ - ^A#J = 77-92 "»'/V. and (2) 268

15 -10
Figure 1: Effective nonlinear coupling for internal azimuthal angle 0jnt for (a) Type I and (b) Type II phasematching.
CO B = —rf22^15 2c
sin A, cos20msin0„
~n2oAkf0?~ n2eAkZG = -8.76 pm2/V2 (3)
The values used for d22 and di5 for BBO were 2.2 pm/V and .16 pm/V,10 respectively. The nonlinear coupling for Type I THG as a function of <j) is shown in Fig. 1. Fitting Eq. (1) to the measured data gives a value for Cw = Xio /4 of 1.1 x 10⁻²³ m2/V2. This compares to an effective value for the cascaded second order coupling of 8 x 10~23 m2/V2.
Similarly, for Type II phasematching, the effective nonlinear coupling is given by (ne- glecting all terms proportional to df5)
a eff Acos23(f> + Bsm2S(j)
+ sin 30 [D + Edzz + 3CW sin 20m]
+ i%3 + 3 -^ cos2 9m + Cw sin2 6. O
m (4)
where
A =
B =
D
E =
F =
2TT
^2u>o
2
2TT
^2w0
2
-o* IT
cos2 0„ ,cos4flm
n^Ak5
cos2 9m „ n3A&7 n^Ake
n3Ak8
cos4 0m
d\\ = 49.9 pm2/V2,
d\2 = -21.8 pm2/V2,
sin 6m cos3 9m sin 2A,
\2o;0 L n4Ak6
2TT sin30mcos0m - T T-j «22
A2u,0 n4AA;6
2TT sin4 A
+ d22dl5 = 2.0 pm2/V2, T^A/i^
—2.6 pm/V, and
^2ü;0 n^Ake
di5 = .20 pm/V. (5)
The value for Cio can be used from the Type I measurements since this is the same crystal. However, d33 is unknown and must be used as a parameter for the fit. We obtain a value for
269

Input energy (mJ) 4 6
Input energy (mJ)
SO 100 150 200
Input Intensity (QW/cm*) (a) SO 100 150 200 250
Input Intensity (GW/cm!) (b)
Figure 2: Energy output from single BBO crystal at 351 nm along with cubic fit to low drive points, (a) Type I phasematching with </>int = -15°. (b) Type II phasematching (<f>-mt = 0).
Cii cos2 9m + Cie sin2 9m of 4 x 10~23 m2/V2 with d33 = l.lpm/V. With this method, there is no way to further separate the contributions of C\\ and CIQ.
For both Type I and Type II processes, it is evident that the cascaded, second-order interactions can contribute strongly to THG. In fact, for Type I phasematching, there are configurations where it dominates over the expected third-order coupling and can lead to efficient generation of the third harmonic, major contribution to the THG observed is the cascaded process, not the third order process. Finally, Figs. 2(a) and 2(b) show conversion efficiency to the third harmonic (355 nm) from the fundamental (1055 nm) for 350 fs pulses. In both cases, efficiencies of 5-6% were achieved with saturation beginning to have an effect above 200 GW/cm2.
References
1. R. W. Terhune, P. D. Maker, and C. M. Savage, Appl. Phys. Lett. 2, 54 (1963).
2. P. D. Maker and R. W. Terhune, Phys. Rev. 137, A801 (1965).
3. R. C. Eckardt and C. H. Lee, Appl. Phys. Lett. 15, 425 (1969).
4. C. Flytzanis and N. Bloembergen, Prog. Quant. Electr. 4, 271 (1976).
5. G. R. Meredith, J. Chem. Phys. 77, 5863 (1982).
6. P. Qiu and A. Penzkofer, Appl. Phys. B 45, 225 (1988).
7. F. Hache, A. Zeboulon, G. Gallot, and G. M. Gale, Opt. Lett. 20, 1556 (1995).
8. R. DeSalvo, D. J. Hagan, M. Sheik-Bahae, G. Stegeman, and E. W. Van Stryland, Opt. Lett. 17, 28 (1992).
9. I. V. Tomov, B. Van Wonterghem, and P. M. Rentzepis, Appl. Opt. 31, 4172 (1992).
10. Y. X. Fan, R. C. Eckardt, R. L. Byer, C. Chen, A. D. Jiang, IEEE J. Quantum Electron. QE-25, 1196 (1986).
270

WB4 11:30am-11:45am
Phase-matched Generation of Short Wavelength, Ultrashort-pulse Light in Capillary Waveguides
CG. Durfee III, A. Rundquist, S. Backus, C. Herne, Z. Chang, M. Murnane, and H. Kapteyn Center for Ultrafast Optical Science, University Of Michigan
2200 Bonisteel Blvd., Ann Arbor, MI 48109-2099 Ph. (734) 763-4875 Fax (734) 763-4876
In recent work[l], we demonstrated a new technique for phase-matched frequency conversion of ultrashort laser pulses in a gas-filled capillary waveguide. Here we present several major new developments that demonstrate that this technique can be used to efficiently upconvert light into the deep-UV and the XUV. This technique is particularly well suited to the generation of very short 10-20fs pulses, making it possible to leverage recent advances in near- infrared ultrashort-pulse lasers[2]. In the past, third harmonic generation by sum-frequency mixing in nonlinear crystals has been the primary means for the generation of uJ-level light in the deep-ultraviolet[3]. However, maintaining reasonable efficiency along with ultrashort pulse durations (<100fs) has proven difficult. In contrast, frequency conversion in gases exhibits a dramatically lower group velocity walkoff, making it possible to generate much shorter UV pulses[4, 5]. However, due to poor phase matching in a simple focused beam configuration, the conversion efficiency is relatively low (0.1%).
In our novel phase-matching technique[l] light is generated in the deep-UV through nonlinear parametric amplification (atognai= 2(üpwip-(Old\er) in a gas-filled capillary waveguide. Phase-matching is achieved through a balance between the waveguide dispersion of the lowest order mode with the pressure-dependent gas dispersion. This results in near-Gaussian beam quality and high conversion efficiency. In these new results, by using a larger-bore capillary, we have increased the conversion efficiency from the 400nm pump light into 267nm to 18%, with a pulse energy of lOuJ at 1 kHz. This pulse energy can be generated using only ~0.5mJ at 800nm. Using self-diffraction frequency-resolved optical gating, we have measured the 267nm pulse at <40fs, with a linear chirp that would allow compression to < 25fs. Due to the nonresonant nature
1 -i
220 240 260 signal wavelength (nm)
Figure 1: Normalized spectra of mixing signal with 400nm pump and various idler wavelengths.
0-7803-4950-4/98/$10.00 1998 IEEE 271
300

of the phase matching in this configuration, and small degree of group velocity walkoff, we expect to obtain sub 10-fs pulses by optimizing the chirp and energy of the input pulses.
We have also demonstrated that this technique can generate light tunable throughout the ultraviolet, by mixing 400nm output with the light from an infrared optical parametric amplifier. A 300um BBO crystal was used to frequency double the kilohertz multipass amplifier[6-8] output, with 20% conversion efficiency. After separation of the two colors, the blue light was combined with the output (signal, idler or their second harmonics) of a two-pass BBO OPA (Spectra-Physics) in the gas-filled capillary. Representative spectra from the output are shown in Figure 1. The full tuning range for this four-wave mixing process is 217 to 305nm. Also shown is a spectrum at 200nm resulting from a phase-matched x(5) process (3co(400)-2<a(800)). Similar higher-order mixing processes promise to allow efficient ultrafast conversion throughout the VUV, up to 50eV photon energy.
1000000 ■
£ 100000 C
I 10000-
•| loooA
100-1
10
Argon transmission for 40 torr in 1 cm
38 torr
° O j/
a 12 torr 8
i i i'l i i i I i i i | i i i | i i i | i i i | i i i | i M | i i i | i i i |
23 25 27 29 31 33 35 37 39 41 43 harmonic number
Figure 2: Harmonic spectra from a capillary waveguide filled with 12 and 38 torr of argon. Transmision curve for argon is also shown (solid line).
Finally, we have evidence for phase matching of high-order harmonic generation in a capillary waveguide. For photon energies well above the ionization potential, the refractive index of neutral or partially ionized gas is very close to unity. Phase matching of high-order harmonics is therefore possible by making k/und = kvacuum- Pressure tuning allows the gas dispersion to balance that of the waveguide. This can be achieved with up to a few percent of ionization, so we expect phase-matched HHG to be possible for those mid-plateau harmonics that are generated before strong ionization occurs. The capillary cell used in the experiment is of a novel design that allows a relatively high gas pressure within the capillary while greatly restricting the flow of gas into the vacuum regions at either end. Three sections of capillary were held in a V-groove with ~1 mm spacing between the segments. This allowed a guided laser beam to pass from one section to another with minimal loss. Figure 2 shows the harmonic spectrum generated in argon in a 150um core diameter capillary. At low pressure, the harmonics show the typical plateau structure seen with gas jet targets. At higher pressure, there is a strong increase in the mid-range harmonics, in contrast to the lower harmonic orders that are dominated by gas absorption and the higher harmonics which are more affected by strong ionization effects such as dispersion. The output beam in these experiments showed no effect of defocusing found at high density in gas jet experiments. In very recent experiments, we have obtained a significant improvement in the harmonic yield in this manner [9].
272

References: [1] C. G. Durfee, S. Backus, M. M. Murnane and H.C.. Kapteyn, Opt. Lett. 22,1565 (1997). [2] S. Backus, C. Durfee, M. M. Murnane and H.C. Kapteyn, Rev. Sei. Instrum. to be
published (1998). [3] J. Ringling, 0. Kittelmann, F. Noack, G. Korn and J. Squier, Opt. Lett. 18, 2035 (1993). [4] S. Backus, J. Peatross, E. Zeek, A. Rundquist, G. Taft, M.M. Murnane, and H. C.
Kapteyn, Opt. Lett. 21, 665 (1996). [5] C. W. Siders, N. Turner III, M. Downer, A. Babine, A. Stepanov, A. M. Sergeev, J. Opt.
Soc. Am. B 12, 330 (1996). [6] S. Backus, J. Peatross, C. P. Huang, H.C. Kapteyn, and M.M. Murnane, Opt. Lett. 20,
2000 (1995). [7] S. Backus, C. Durfee, G. Mourou, H. Kapteyn and M. Murnane, Opt. Lett. 22, 1256
(1997). [8] C. Durfee, S. Backus, M. M. Murnane, and H.C. Kapteyn, IEEE J. Sei. Top. in Quant.
Elect., to be published (1998). [9] A. Rundquist, C. Durfee, S. Backus, C. Herne, Z. Chang, M. Murnane, and H. C.
Kapetyn, Science, submitted (1998).
273

WC1 (Invited) 1:30pm - 2:00pm
Chi-3's: Their Characterization and Understanding
Eric W. Van Stryland, Raluca Negres, Edward Miesak and David J. Hagan
CREOL P.O. Box 162700
University of Central Florida Orlando, Florida 32816-2700
(407)823-6814 FAX (407)823-6800
and
Mansoor Sheik-Bahae Department of Physics and Astronomy
University of New Mexico Albuquerque, New Mexico 87109
This paper will discuss in general the so-called third-order nonlinear optical
susceptibility x(3)- Values for this quantity are often quoted that vary wildly in magnitude
depending on the material and source used, in particular the source pulsewidth. It would
be "nice" if x(3) were constant rather than depending on the illumination parameters. [1]
So, when does it make sense to quote x(3), and/or when is it convenient to use x(3)? We
will look at ultrafast and slow nonlinearities, for example, two-photon absorption and
excited-state absorption, along with the nonlinear refraction associated with each of
these. In this regard, we will look at the causal relations between the refractive and
absorptive components and show experiments where the dispersion of the nonlinear
refraction can be directly calculated from the nonlinear absorption spectrum. [2] This is
possible for both slow (cumulative) and ultrafast nonlinearities. It is important to note
that the nonlinear spectrum needed to apply causality and obtain Kramers-Kronig
relations is the nondegenerate spectrum, i.e. the change in absorption at all frequencies co
due to the presence of a strong excitation beam at frequency coe. This is true for ultrafast
0-7803-4950-4/98/$10.00 1998 IEEE 274

and slow nonlinearities, however, for cumulative nonlinearities the excitation may be
followed by other dynamic processes that can mask the value of toe, for example,
intramolecular relaxation. In such a case the nonlinear refraction and absorption spectra
may be insensitive to the excitation frequency and depend only on the density of excited
states.
A method for directly obtaining nonlinear spectra as well as determining the
response time of the nonlinearity is to use a fixed frequency pump and a white-light-
continuum probe. By temporally delaying the probe the ultrafast and cumulative
nonlinearities, such as two-photon absorption and excited-state absorption, can be
separated even though both represent third-order responses.
One conclusion from this work is that x(3) is very much overused and can often be
replaced by more physical quantities that are material constants.
[1] J. Armstrong, N. Bloembergen, N. Ducuing, and P. Pershan, "Interactions between light waves in a nonlinear dielectric", Phys. Rev. 127, 1918-1939(1962).
[2] M. Sheik-Bahae, D.C. Hutchings, D.J. Hagan, and E.W. Van Stryland, "Dispersion of Bound Electronic Nonlinear Refraction in Solids", JQE, QE-27,1296-1309 (1991).
275

WC2 2:00pm - 2:15pm
Tunable Parametric Downconverter with Photon-Conversion Efficiencies Greater Than 100%
M. E. Dearborn, Karl Koch, and Gerald T. Moore AF Research Laboratory/DELO, 3550 Aberdeen Avenue, SE, Kirtland AFB, NM 87117-5776
ph: (505) 846-9303, FAX: (505) 846-1191
J. C. Diels University of New Mexico, Department of Physics and Astronomy, Albuquerque, NM 87131
The optical parametric oscillator (OPO) is a device for tunably downconverting light of frequency u)v to two frequencies, the signal frequency us and the idler frequency U{ which sum to up. We use the convention that oos > uji and assume the signal wave is resonated in the OPO cavity. The Manley-Rowe relations for the three-wave mixing process indicate that one signal and one idler photon are generated for each pump photon that is converted. This limits the idler photon-conversion efficiency rji — the number of idler photons out of the device divided by the number of pump photons incident on the device — to a maximum of 100% for an OPO. In this paper we report on a device that uses intracavity difference- frequency mixing (DFM) between the signal and idler frequencies to better this maximum performance. In the DFM interaction u>d = us — w» not only is radiation produced at the difference frequency, but for each difference-frequency photon produced an additional idler photon is produced allowing for idler photon-conversion efficiencies greater than 100%.
We recently reported theoretical results indicating that a DFM process inside the OPO cavity resonant for the signal wave has the advantage of providing maximum energy ex- traction at the idler frequency. [1] Using a plane-wave model, we found that operation at high conversion efficiency occurs over a large dynamic range of incident pump intensity for proper choices of the ratio of the coupling parameters between the OPO and DFM pro- cesses. A high-Q cavity is used, since no linear out-coupling at us is necessary. Here we report experimental results of the device called an OPO-DFM, which is a singly resonant OPO cavity with an intracavity crystal that mixes the signal and idler waves, enhancing the idler power-conversion efficiency.
Figure 1 is a sketch of the experimental set-up which has been described in detail else- where. [2] The OPO and DFM interactions are quasi-phasematched (QPM) with periodically poled lithium niobate (PPLN). The OPO and DFM crystals are placed in separate ovens that are independently controlled, allowing temperature tuning of the device. The cavity is high-Q and singly resonant for the signal radiation. Mirror M2 is >93% transmitting at the idler frequency. Mirror M4 is on a translation stage.
Figure 2 shows pump depletion and idler power versus pump power for the OPO and OPO-DFM. For these plots OPO-DFM operation is defined by setting the OPO crystal temperature at 72.5° C and the DFM crystal temperature to an experimentally determined phasematching temperature of 125° C with a grating period of 33.7 /mi. We define OPO operation by setting the DFM crystal on a grating period which is far from the phasematching grating period. At full pump power, the idler power of the OPO-DFM device is 5.8 W, 80% greater than the idler output of the OPO. Also, pump depletion of the OPO-DFM device has increased from 65% for the OPO to 79% and appears to be still increasing at the maximum pump power. Pump depletion for the OPO falls off at pump powers greater than 8.3 W
0-7803-4950-4/98/110.00 1998 IEEE 2?g

because of back-conversion of the pump. Back-conversion of the pump in the OPO-DFM is mitigated due to resonated signal being nonlinearly outcoupled in the DFM interaction.
In Fig. 3 we plot photon-conversion efficiencies for the idler as a function of incident power for the two cases when the DFM interaction is and is not phasematched, and the difference- frequency photon-conversion efficiency when the DFM interaction is phasematched. The phasematched idler photon-conversion efficiency rn is determined two separate ways. First, the measured wavelengths and powers of the idler and incident pump are used directly to calculate a photon-conversion efficiency. Second, an independent determination for r}t (and the only determination for the photon-conversion efficiency for the difference radiation r)d) can be inferred. Inferred calculations are made by employing Manley-Rowe equations and closure relations for the OPO and the OPO-DFM, as well as the measured ratios of the transmitted pump and signal with and without DFM, and the ratio of transmitted to incident pump in the OPO. Both methods for r}{ are in good agreement. The outstanding feature in Fig. 3 is that the idler photon-conversion efficiency for the OPO-DFM is greater than 100% for pump powers higher than 11.0 W. At full pump power it reaches 110% and is still increasing.
We temperature tuned the OPO-DFM device. In Fig. 4 we plot the signal, idler and difference-frequency wavelengths versus OPO crystal temperature. The solid curve is calcu- lated from Sellmeier relations[3] and thermal expansion relations for LiNB03.[4] To tune the OPO-DFM device over the entire wavelength range it was necessary to translate the DFM crystal to access several grating periods. Fine tuning on the appropriate DFM grating so that the interaction was phasematched was accomplished with temperature control.
Figure 5(a) plots contours of room-temperature DFM grating periods necessary to phase- match the DFM interaction for the respective idler wavelength. The solid contour lines are calculated as in Fig. 4. Figure 5(b) is a typical temperature bandwidth plot for the DFM interaction. For this plot the idler wavelength is A, = 3.46 /xm and the DFM grating period is 33.7 /an. The FWHM temperature bandwidth of 30° C was constant over the idler tuning range of 3.2-3.5 /im and agrees well with calculated results. The dip in the powers at 117° C is due to third-order QPM in the DFM crystal for sum-frequency generation of red light.
We have demonstrated, for the first time to our knowledge, operation of a synchronously pumped OPO-DFM device. The OPO-DFM device is designed to maximize power-conversion efficiency from the pump to the idler in the mid-infrared. The OPO-DFM device has the same threshold as the OPO and operates with an idler photon-conversion efficiency over one, producing 80% more idler radiation than the OPO. Suppression of back-conversion of the pump increases pump depletion from 65% to 79% when the DFM interaction is phase- matched. With a multi-grating DFM PPLN crystal, the OPO-DFM device was continuously tunable, and able to produce mid-infrared idler radiation with enhanced efficiency from 3.2- 3.5 /im. In addition the OPO-DFM device produced signal radiation (1.5-1.6 /im) and difference-frequency radiation (2.7-3.2 /im). [1.] K. Koch, G. T. Moore, and E. C. Cheung, J. Opt. Soc. Am. B, 12, 2268-2273 (1995). [2.] M. E. Dearborn, K. Koch, G. T. Moore, and J. C. Diels, submitted to Opt. Lett.
Jan. 1998. [3.] D. H. Jundt, Opt. Lett., 22, 1553-1555 (1997). 4. Y. S. Kim and R. T. Smith, J. App. Phys., 40, 4637-4641 (1969).
277

OPO PPLN: 13 mm long A = 29.75 urn DFM PPLN: 10 mm long A = 33.95, 33.9,
33.8, 33 7|im
100 ps pulses 76 MHz
1.1 m
Fig. 1. Schematic diagram of experimental setup.
A half-wave plate and polarizer (HWPP) are used
to adjust the power from the laser, MML is the
mode matching optics, and DIAG represents the
diagnostics for the measurements.
120f
-, 100
CO
cr
4 8 12 16 incident pump power [W]
Fig. 3. Measured (circles) and inferred (squares)
idler photon-conversion efficiencies for the OPO
(open symbols) and OPO-DFM (filled symbols)
and difference-frequency photon-conversion efficiency
(filled diamonds) for the OPO-DFM as a function
of incident pump power.
40 60 80 100 120 140 160 DFM crystal temperature [°C]
Fig. 5.(a) DFM grating contours, (b) Idler and
temperature.
o a. CO
TJ Q.
a CD
i CD
4 8 12 incident pump power [W]
Fig. 2. Percent pump depletion (squares) and idler
powers (circles) for the OPO (open symbols) and
OPO-DFM (filled symbols) versus incident pump
power.
1.59
1.58 <2
CQ
1.57 g
1.56 | cp_
1.55 §
1.54 ~ 3,
1.53
1.52 40 80 120 160
OPO crystal temperature [°C]
Fig. 4. Idler, difference-frequency, and signal wave-
lengths versus OPO crystal temperature.
■g- 3.6 _' i ■ i ■ i ■ i '- a .c r* B) 3.4
^^^^^L - | 3.2
idler X.
signal ><£*'* -
ü c ■NX? ^f <& S> 3.0 a>
ifc .X*** ^***&^ ■D j<("* ^^fi*^*
■g 2.8 ^z&'^x ra - sp*1^ difference
2 2.6 i i i . i .-
■e
CD
I a
idler frequency
60 80 100 120 140 160 DFM-crystal temperature [°C]
difference-frequency power versus DFM crystal
278

WC3 2:15pm - 2:30pm
Nonlinear optical activity induced by linearly and circularly polarized light
Martti Kauranen, Thierry Verbiest, and Andre Persoons
Laboratory of Chemical and Biological Dynamics and Center for Research on Molecular
Electronics and Photonics, University of Leuven, B-3001 Heverlee, Belgium
Tel.: +32-16-327508, Fax: +32-16-327982
E-mail: [email protected]. kuleuven. ac. be
Chiral systems possess no mirror planes and occur in two enantiomers that are mirror images
of each other. Chirality is usually associated with molecular structure. In linear optics, chiral
molecules exhibit optical activity, e.g., rotation of the plane of polarization as the light trav-
erses the chiral medium. Optical activity arises from the different interaction of chiral media
with left- and right-hand circularly polarized light. Such circular-difference effects can occur
also in nonlinear optics, e.g., in second-harmonic generation from thin chiral films [1].
Optical activity can occur also when the material is achiral. This is possible if the ex-
perimental arrangement is chiral, i.e., it possesses a definite handedness and is characterized
by three non-coplanar vectors. For example, the efficiency of photoelectron emission from
oriented molecules is different for left- and right-hand circularly polarized light when the
molecular axis, the wave vector of incoming light, and the direction of detection of photoe-
lectrons are non-coplanar [2]. In nonlinear optics, similar circular-difference effects were re-
cently observed in second-harmonic generation from achiral but anisotropic surfaces when
the orientation of the sample made the setup chiral [3]. Atoms (and molecules of high symmetry) have no preferred axis. However, optical ac-
tivity in photoelectron emission can nevertheless occur if the atoms are prepared in an angu-
lar-momentum-aligned state before photoionization with a probe beam. The alignment is
achieved by a control beam, whose direction of polarization provides the third vector to de-
fine the handedness of the experiment. A circularly polarized control beam is characterized
by its spin, which is directed parallel or antiparallel with respect to the wave vector. Hence,
circularly polarized control beams should not lead to optical activity [4]. On the other hand,
one can argue that circularly polarized light must possess a handedness associated with the
sense of polarization rotation [5]. In this paper, we use two-beam coherent second-harmonic generation from achiral thin
films with in-plane isotropy to investigate how the polarization of a light beam induces chi-
rality on an experimental setup. We show that optical activity occurs when the polarization
breaks the reflection symmetry of an otherwise achiral setup. As expected from the analogy
with photoelectron emission experiments [5], the symmetry can be broken using appropriate
linear polarizations. In addition, we show that the symmetry can also be broken using circu-
lar polarizations. 0-7803-4950-4/98/J10.00 1998 IEEE 279
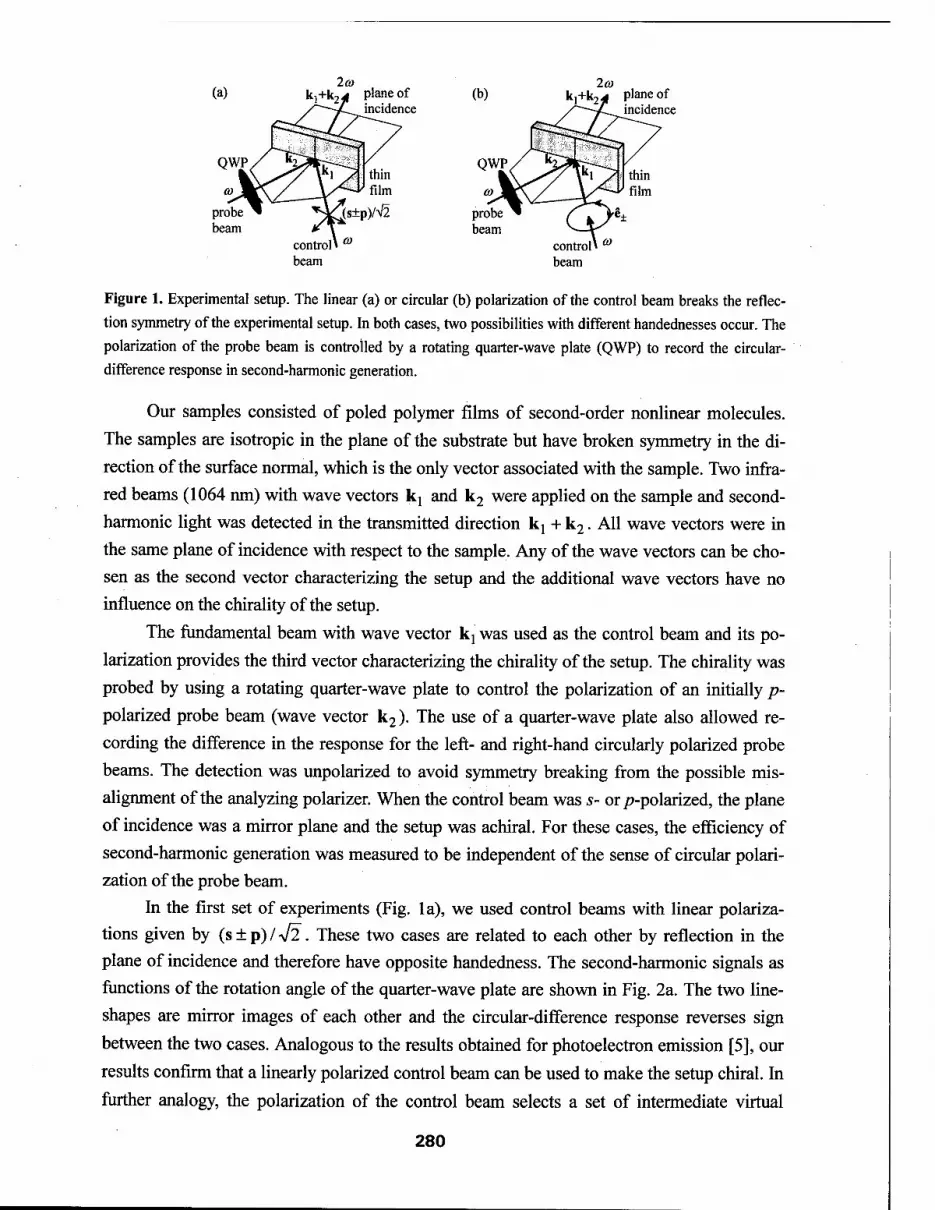
2(0 2a (a) kj+k2 plane of
incidence (b) k,+k24 plane of
incidence
QWP/
<i)lf\ ̂ T thin film
QWP/
-^vZ thin film
probe ^ beam
control» beam
is±
a
pW2 probe ^ beam
control» m
beam
±
Figure 1. Experimental setup. The linear (a) or circular (b) polarization of the control beam breaks the reflec- tion symmetry of the experimental setup. In both cases, two possibilities with different handednesses occur. The polarization of the probe beam is controlled by a rotating quarter-wave plate (QWP) to record the circular- difference response in second-harmonic generation.
Our samples consisted of poled polymer films of second-order nonlinear molecules.
The samples are isotropic in the plane of the substrate but have broken symmetry in the di-
rection of the surface normal, which is the only vector associated with the sample. Two infra-
red beams (1064 nm) with wave vectors kj and k2 were applied on the sample and second-
harmonic light was detected in the transmitted direction k! + k2. All wave vectors were in
the same plane of incidence with respect to the sample. Any of the wave vectors can be cho-
sen as the second vector characterizing the setup and the additional wave vectors have no
influence on the chirality of the setup.
The fundamental beam with wave vector kj was used as the control beam and its po-
larization provides the third vector characterizing the chirality of the setup. The chirality was
probed by using a rotating quarter-wave plate to control the polarization of an initially p-
polarized probe beam (wave vector k2). The use of a quarter-wave plate also allowed re-
cording the difference in the response for the left- and right-hand circularly polarized probe
beams. The detection was unpolarized to avoid symmetry breaking from the possible mis-
alignment of the analyzing polarizer. When the control beam was s- or/?-polarized, the plane
of incidence was a mirror plane and the setup was achiral. For these cases, the efficiency of
second-harmonic generation was measured to be independent of the sense of circular polari-
zation of the probe beam.
In the first set of experiments (Fig. la), we used control beams with linear polariza-
tions given by (s±p)/V2 . These two cases are related to each other by reflection in the
plane of incidence and therefore have opposite handedness. The second-harmonic signals as
functions of the rotation angle of the quarter-wave plate are shown in Fig. 2a. The two line-
shapes are mirror images of each other and the circular-difference response reverses sign
between the two cases. Analogous to the results obtained for photoelectron emission [5], our
results confirm that a linearly polarized control beam can be used to make the setup chiral. In
further analogy, the polarization of the control beam selects a set of intermediate virtual
280

a o o u
o O 1000 1 1
500 \d? ^£/ "
0 .(a) I ■ ■ >"
T3 a o
o o 1000
500
0
\ / %. / ■ \S \s ■ .(b)
■ i i i i
-90 -45 0 45 90
rotation angle of wave plate (degrees)
-90 -45 0 45 90
rotation angle of wave plate (degrees)
Figure 2. Second-harmonic intensities as functions of the rotation angle of the quarter-wave plate. The rotation
angles of -45° and 45° correspond to the left- and right-hand circularly polarized probe beams, respectively.
Circular-difference effects are evident in all cases, (a) Linearly polarized control beams (s+p)/V2 (solid dots)
and (s-p)/V2 (open dots), (b) Circularly polarized control beams e+ (solid dots) and e. (open dots).
states with symmetry such that one of the circular polarizations of the probe beam is favor-
able to complete the process of second-harmonic generation.
In the second set of experiments, circularly polarized control beams were used (Fig.
lb) and the second-harmonic signals are shown in Fig. 2b. The two lineshapes are again seen
to be mirror images of each other and the circular-difference effects are seen to reverse sign
between the two circular polarizations of the control beam. These results clearly show that
circularly polarized control beams can also be used to break the symmetry of the setup. To
our knowledge, this is the first experimental demonstration of the use of circularly polarized
control beams to induce chirality in any type of experiment.
We recall that, for both circular polarizations, the spin vector lies in the plane of inci-
dence and one can argue that the symmetry should not be broken [4]. This contradiction is
easily resolved by noting that the spin vector is an axial, not a polar, vector. Therefore, it in-
herently possesses a handedness, which is also evident when the sense of rotation of the cir-
cular polarization is considered.
In conclusion, we have used second-harmonic generation from isotropic achiral thin
films to investigate optical activity induced by light polarization. Coherent second-harmonic
generation between a control beam and a probe beam is sensitive to the sense of circular po-
larization of the probe beam when the polarization of the control beam induces chirality on
the otherwise achiral setup. Both linearly and circularly polarized control beams can be used
to induce chirality.
1. M. Kauranen, J. J. Maki, T. Verbiest, S. Van Elshocht, and A. Persoons, Phys. Rev. B 55, R1985 (1997).
2. R. L. Dubs, S. N. Dixit, and V. McKoy, Phys. Rev. Lett. 54, 1249 (1985).
3. T. Verbiest, M. Kauranen, Y. Van Rompaey, and A. Persoons, Phys. Rev. Lett. 77, 1456-1459 (1996).
4. N. A. Cherepkov and V. Kuznetsov, J. Chem. Phys. 95, 3046 (1991).
5. C. S. Feigerle, R. N. Compton, L. E. Cuellar, N. A. Cherepkov, and L. V. Chernysheva, Phys. Rev. A 53,
4183(1996).
281

WC4 2:30pm - 2:45pm
Nonlinear effects due to optical pumping of sodium vapor by single-pass laser beams
R. Holzner, S. Dangel Physik-Institut, Universität Zürich, Winterthurerstrasse 190, CH-8057 Zürich,
Switzerland, Tel. ++41-1-635 45 88, Fax ++41-1-635 57 04,
e-mail: [email protected]
Circularly polarized laser beams propagating through sodium vapor and tuned to the buffergas broadened atomic Dl transition can optically pump sodium atoms into a nonabsorbing groundstate. The corresponding groundstate populations depend on the intensity distribution, the polarization and the magnetic fields. They lead to refractive index gradients along as well as transverse to the laser beam propagation direction and therefore modify the light path (Fig.l) giving rise to a number of nonlinear spatio- temporal intensity and polarization pattern creating processes [1,2].
y radiation field
\
f \ absorption and
diffraction
optical pumping
\
\ ;
i complex refractive index
of sodium vapor
Fig. 1 Basic mechanism of the interaction between laser light and sodium atoms
Surprizing effects also occur when weak magnetic fields influence the alignement of optical pumping induced atomic magnetic dipols. Fig. 2 shows several experimental arrangements.
In the case of a single circularly polarized laser beam we have studied the dynamics of optical pumping and observed self-focusing and defocusing, the transformation of incident Gaussian beam intensity profiles into ring profiles, a large shift of the maximum of the absorption profile when suitable magnetic fields are applied, and the deflection of a beam by the inhomogeneous transverse magnetic field of a current carrying wire [3].
0-7803-4950-4/98/$10.00 1998 IEEE 282

one beam
D or [] pumping dynamics
CD
M]
CCD PM
nngs
two beams
beam switching all optical logical XOR gate switching frequency doubler optical transistor
beam bouncing
beam attraction
beam splitting
beam dancing 3 beams linearly polarized
one beam and magnetic field
D
^ , i i i beam deflection
frequency shift in absorption profile
Fig.2 Collection of observed effects. CCD: recording by a CCD camera, PM: recording by a photo multiplyer.
When two beams of opposite circular polarization co-propagate and partly overlap astonishing effects like the mutual extinction of both beams (beam switching), the mutual deflection of both beams (beam bouncing), the mutual attraction of initially overlapping beams (beam attraction) and the separation of both beams (beam splitting) can be observed. While most of the effects are well described for the stationary state by a J=l/2 to J=l/2 atomic transition model, the correct description of the dynamics requires the consideration of all hyper fine states [4] as indicated in Fig.3.
This new model is used to investigate the role of fluctuations in pattern formation processes. Of partcular interest is the case of spontaneous symmetry breaking of a linearly polarized laser beam into two beams of opposite circular polarization. Up to now it is not understood why this break-up occurs without buffergas [5] but does not occur if Ar buffergas is present. With Ar buffergas, the beam break-up only takes place if the linearly polarized beam consists of the superposition two individual left and right hand circularly polarized beams [6] .
283

Fig.3 Schematic representation of the sodium Di atomic transition : Top: neglecting the hyperfine structure leaves only 4 states (J=l/2 to J=l/2 model). Optical pumping by circularly polarized light can occur directly between both ground states. Bottom: full model with all hyperfine levels. Optical pumping occurs in several steps and is about an order of magnitude slower than in the J=l/2 to J=l/2 model.
[1] R. Holzner, J. Simonet, L. Flepp, B. Röhricht, P. Eschle, S. Dangel, U. Rusch, H. Schmid, E. Brun. Using nuclear spins, radio waves, sodium atoms, and laser light to investigate spatiotemporal nonlinear systems, Opt. Engineering 34, 2315-2323 (1995)
[2] R. Holzner, S. Dangel. Optical pumping-induced spatio-temporal modifications to propagation, polarization and intensity of laser beams in sodium vapor, to be published in Quantum Semiclass. Opt. 10 (1998)
[3] R. Holzner, P. Eschle, S. Dangel, R. Richard, H. Schmid, U. Rusch, B. Röhricht, R. J. Ballagh, A. W. McCord, W. J. Sandle. Observation of magnetic-field-induced laser beam deflection in sodium vapor, Phys.Rev.Lett. 78, 3451-3454 (1997)
[4] S. Dangel, R. Holzner. Semiclassical theory for the interaction dynamics of laser light and sodium atoms including the hyperfine structure, Phys. Rev. A 56, 3937-3949 (1997)
[5] A.C. Tarn, W. Happen Long-range interactions between CW self-focused laser beams in atomic vapour, Phys. Rev. Lett. 38, 278-282 (1977)
[6] B. Röhricht, A.W. McCord, M. Brambilla, F. Prati, S. Dangel, P. Eschle, R. Holzner. Spatial separation of circularly polarized laser beams in sodium vapor, Opt. Commun. 118, 601-606(1995)
284

WC5 2:45pm - 3:00pm
Measurements of SBS Reflectivity and Phase Conjugation Fidelity in Light Guides
Metin S. Mangir
Communications and Photonics Laboratory HRL Research Laboratories 3011 Malibu Canyon Road
Malibu,CA 90265
Telephone: (310)317-5086 Fax: (310)317-5679
E-mail: [email protected]
SBS phase conjugation is a widely used technique with Q-switched pulses to correct aberrations in amplifiers. For a mildly aberrated beam with peak power > lOOkW, simple bulk focusing in an appropriate medium to generate SBS works sufficiently well. On the other hand for low peak power laser pulses (100W to lOOkW) or very highly aberrated beams (20 to 100 times DL) to be phase conjugated, a light guide can be used in principle to obtain a long interaction length to reach the SBS threshold. Previously we had demonstrated an SBS threshold lower than 100 W using a CS2 filled capillary [1]. We found that phase conjugation fidelity is low in these light guides if the input beam is highly aberrated, so that the input beam fills a significant fraction (~l/3) of the numerical aperture of the guide. The same limitation is also observed in multimode fibers used as phase conjugate mirrors (PCM). Thus we have undertaken a study of reflectivity and phase conjugate (PC) fidelity of light guides as a function of input power, angle of incidence with respect to the guide axis, and input beam polarization.
The experimental setup is shown schematically in figure 1. The input beam is generated by a passively Q-switched Nd: YLF oscillator, producing single longitudinal and transverse mode output beam in a 65 ns FWHM pulse. The 3 mm dia. input beam is aberrated by an etched glass plate so that there is no SBS due to bulk focusing from the region in front of the light guide. The fast lens (5 cm efl) images the aberrator to the entrance of the 0.53 mm diameter, 2m long CS2 filled quartz capillary. By inserting a A/4 plate in front of the capillary, we choose between a linearly or circularly polarized input into the light guide.
2 m long, CSa filled
{^capillary
5 cm efl, fast lens
to far field fidelity diagnostics
aberrator A
phase conjugate beam diagnostics
nonphase conjugate^ beam diagnostics
TEMQO input beam
FIGURE 1
0-7803-4950-4/98/$10.00 1998 IEEE 285

Metin Mangir," Measurements of SBS Reflectivity and Phase Conjugation Fidelity..."
The reflectivity of the SBS beam as a function of the input energy at different angles between the light guide axis and the linearly polarized input beam is depicted in figure 2. Note that the
numerical aperture of this light guide corresponds to -60 degrees, and the input beam subtends ~4 degrees full angle. The data clearly indicates that as the incidence angle increases, the SBS threshold increases and the reflectivity decreases for the same input energy. Also maximum reflectivity saturates at a lower value. Even when the input energy is normalized to the SBS threshold energy, we find that the reflectivity is lower at higher incidence angles although the difference is not as pronounced. By replacing the A/4 plate in figure 1 with a A/2 plate and rotating the direction of linear polarization we determined that there was no directional dependence of reflectivity on the orientation of the linearly polarized light. In a PCM to obtain good fidelity all parts of the input beam must have equal reflectivity. Thus to fulfill this condition in a light guide PCM, we can use only a small fraction of the available numerical aperture.
At large incidence angles (~15 degrees) we found that there is substantial differences in SBS reflectivity, PC fidelity, and pulse shapes depending on the input polarization state. For circularly polarized input, SBS threshold is 1.5 times lower than linearly polarized input, but once the input
energy exceeds the SBS threshold, depletion of the input pulse transmitted through the capillary follow the same curve as shown in figure 3.
0.7
^0.6
| 0.5
a°4
& 0.3 oc
0.2
0.1
■ ■ i ) d ßfl.
9
» > i MO d( ■ *
9 i ■■ 15 de
« ■ ' i
*1 9 c eg ■ i 4 ■ it
"A * k
( ) 1 INI
]
2 3
>UT ENERGY (mJ)
Figure 2.
Figure 3. Transmitted power through the capillary as a
function of normalized input energy. 100
c o «5 CO
1 (0 c IB i_
80
60
40
20
T*—i ■ 1 1
■ Circ. Pol.
x Lin. Pol. - ■ X
■ 3 [
a "x
0.0 5.0 10.0 15.0 20.0
E_in/E_threshold
On the other hand with circularly polarized input beam, on the average more than 50 % of the energy in the reflected SBS light is in a nonphase conjugate beam emitted along the capillary axis as indicated in figure 1. The non phase conjugate (NPC) beam always starts earlier, has the characteristic sharp rise time of SBS pulses, and its shape fluctuates from pulse to pulse. In contrast, the phase conjugate pulse starts later and ends earlier than the NPC pulse. PC pulse has a repeatable Gaussian-like pulse, with a slow risetime. Nevertheless both the conjugate and nonphase conjugate beams are highly (>98%)
polarized. These data indicate that PC beam is generated via some Brillioun enhanced four-wave mixing (BEFM).
With linearly polarized input, on the average more 90% of the SBS reflected light is in the phase conjugate (PC) beam which is also >99% polarized, whereas the NPC beam which is emitted broadly along the light guide axis, carries only 8 to 10% of the energy, and this NPC beam is depolarized. Both PC and NPC pulses start simultaneously with a sharp rising front edge typical of transient SBS turn on. PC and NPC pulses are in competition to convert the input pulse power. This competition becomes especially obvious during phase jumps [2] in the PC pulse, when power in the PC pulse is momentarily reduced with a corresponding increase in the NPC pulse power.
286

Metin Mangir," Measurements of SBS Reflectivity and Phase Conjugation Fidelity..."
The representative pulse shapes with circular and linear polarized beams incident at 15 degrees are shown in figure 4 a and 4b.
' Refa Zoom: d.5XVert 'tf.OX Hofz
40.0mV 25.0ns
Fig. 4a. PC and NPC signals are on the same scale.
125.0GS/5 ET 20 Acqs
40.0mV 25.0ns
Figure 4b. The signal for NPC pulses were amplified lOx for clarity
Although currently there is no quantitative model to fit our data, observations are consistent with the effect of depolarization of the beam propagating in a light guide and the consequent loss of PC fidelity [1,3]. Our results confirm why only a small fraction (<l/5) of the numerical aperture can be used in SBS light guide PCM.
REFERENCES
1. D. Crispin Jones, Metin S. Mangir, and David A. Rockwell, "A Stimulated Brillouin Scattering Phase-Conjugate Mirror Having a Peak-Power Threshold <100W", Opt. Comm._23_, 175-181, (1995)
2. M.S. Mangir, J.J. Ottusch, D.C. Jones, and D.A. Rockwell. "Time-Resolved Measurements of SBS Phase Jumps During an Individual Laser Pulse," Ph. Rev. Lett. 6_£, 1702-1705, (1992).
3. B. Ya. Zel'dovich, V. A. Krovoshchekov, A. V. Mamaev, M. A. Melnikov, N. F. Pilipetski and V. V. Skhunov, Sov. Ph. Jetp Lett. 42,17, (1986).
287

WC6 3:00pm-3:15pm
Phase Conjugation of Depolarized Light with a Loop PCM
Alexander A. Betin, Steven C. Matthews and Metin S. Mangir
Communications and Photonics Laboratory HRL Research Laboratories 3011 Malibu Canyon Road
Malibu,CA 90265
Telephone: (310) 317-5028 Fax: (310)317-5679
E-mail: [email protected]
The loop phase conjugate mirror (PCM) has attracted much of attention recently for application to high power solid state lasers, because of its ability to work with a unique combination of laser radiation parameters, such as high aberrations, Q-switched through CW pulse formats, low peak and high average powers, broad spectral bandwidths [1,2]. Another challenge for any kind of PCM in general is to accommodate depolarized laser beams, especially, that the commonly used technique, first shown for SBS [3], and based on the transformation of depolarized light before entering a PCM into linear polarized component, is very difficult to apply for a loop type of PCM. In [4] we suggested an idea how to modify the basic loop PCM optical scheme in order to work with depolarized radiation. In this paper we present experimental results showing near 100% polarization conjugation fidelity, in combination with compensation of phase distortions and high reflectivity.
Basically, loop PCM is a laser that is seeded and triggered by an external signal beam, which we want to be phase conjugated. The optical scheme is shown in Fig.l. The ring resonator of this laser contains a nonlinear medium, which acts as one of the resonator mirrors after the signal beam writes a hologram (or grating) in it. The signal beam Ej enters the loop, passes through the nonlinear medium, reflects from mirrors, and then as beam E3 it intersects with Et inside the nonlinear medium. The interference pattern of these two beams records a hologram via a nonlinear mechanism. When the hologram reflectivity, combined with the gain of laser amplifier fulfills a threshold condition, spontaneous emission builds up, giving rise of a strong return E2, which, under certain conditions, may be close to a phase conjugate replica of the signal beam E,. A leaky" optical diode (which usually consists of a Faraday rotator, polarizers, and other optical elements) inside the resonator serves to prevent saturation of the amplifier by the input signal E15 and to support only unidirectional generation of the return beam E2, providing controllable attenuation for the input signal and insignificant losses for the generated return E2.
For an arbitrary polarized signal beam, we actually have two loop resonators operating in parallel: one for the S and another for the P polarization components, which are wraped up together in one optical scheme. To accommodate the loop scheme with this situation, we first modified the optical diode to allow it to work with two independent S and P polarization components of the input and return beams. In addition, we placed a half-wave plate inside the loop resonator to serve as a polarization mixing element. This 0-7803-4950-4/98/$10.00 1998 IEEE 288
Nonlinear medium -,*
EI,-»CJI Input G^J» \B
n - index gratings
Optical ^2.« Diode
nj T M -^L\
TlP «j>
Amplifier
**•///**> Tpolarizatfon mixer ** i.e. A/2 plate
Figure 1

Alexander A. Betin etal.," Phase Conjugation of Depolarized Light with a Loop PCM"
half-wave plate plays very important role, providing controllable coupling between the two loop resonators. Rotation of the half-wave plate allows controllable energy exchange up to 100% between the S and P components. For a general depolarized input, there are two holograms formed inside the nonlinear medium as a result of the interference of the S components of beams E, and E3, and the P components of beams E{ and E3. Rotation of the half-wave plate causes each of the holograms to contain information about the spatial distribution of phase and amplitude for both S and P components of the input beam Ex. As a result, when the S and P components of the generated beam E2 diffract from the S and P holograms respectively, they also contain spatial information about the entire input beam E^ Also, the exchange of energy between S and P components of beam E4 at the half-wave plate provides coupled generation of both components of beam E2. Ultimately, this leads to a phase locking of the independent polarization components of the generated beam E2, resulting in a vector phase conjugated return of the input beam Et. In addition, any depolarizing or biefringent optical elements inside the loop PCM itself, such as a laser amplifier under high pumping level, will be automatically compensated.
Correct polarization,
m Absorption plate Cell °P*Jal
Output,—-\v Diode
14— Wrongs w«*0«» polarization Y D
m plate
Nd:YAG Amplifier
- Input: 30 nsec; SL.M; 3.3 mm diameter; TEM«,, linear polarized - Cell: acetone with copper nitrate; ~ 0.2mm thick; transmission ~ 80% - Optical diode: Faraday rotator, W2 plate, polarizers; - Amplifier: single pass small signal gain up to 20
Figure 2
Corn ict pola ization
WfQlfl pola rlzation
. . 0.800 >;
, . 0.600 S
1.000
0.400
' ■ 0.200 i
0.000
For this scheme to work well, it is also necessary to minimize the cross-talk for reading S and P holograms (in the nonlinear medium) by S and P components of beam E2. For this, one can use any or a combination of three methods: (a) spatial or (b) angular separation of the two holograms, and (c) reflection selectivity of the volume holograms recorded by highly aberrated beams with a spatial correlation length much less than total length of hologram.
We successfully demonstrated the feasibility of vector phase conjugation for a loop PCM at 1.06|im using a Nd:YAG laser amplifier and recording thermal holograms in the nonlinear medium, consisting of a mixture of acetone and copper nitrate. At first, we started with relatively simple situation, shown in Fig.2. A quarter-wave plate was placed in the beam path prior to the loop PCM in order to convert the linear polarized Gaussian beam from master oscillator to an ellipticalry or circularly polarized input beam. We measured the polarization conjugation by comparing the relative energy in the correct polarization, that is coaligned with polarization state of initial signal beam, with the wrong (orthogonal) polarization of the return beam from the loop PCM after it passed the quarter-wave plate in backward direction. We found that the loop PCM generation was quite sensitive to alignment of loop resonator elements, and the polarization conjugation strongly depended on the angle of half-wave plate inside the loop. Rotating this half- wave plate, we were able to get polarization conjugation fidelity better than 96% for an arbitrary elliptically polarized input beam, including circular polarization (see Fig.3). We used the setup,
-80 -60 -40 -20 0 20 Half-wave plate In the loop PCM (degrees)
Figure 3
INPUT: 1ms,TEMa
linear polarized
0.6mmX10m Fiber Absorption
Cell
DIAGNOSTICS ~30mrad
Ctlfi plate Nd:YAG Optical Diode
Amplifier, 21 dB
Figure 4
289

Alexander A. Betin etal.," Phase Conjugation of Depolarized Light with a Loop PCM"
Perpendicular
Non-conjugate pedestal
Polarization restoration better than 99.5%
Figure 5
Conjugate central maximum with 24 dB attenuation
shown in Fig.4, to demonstrate phase Anaiizing Polarizer conjugation for totally depolarized, highly aberrated (up to lOOmmXmrad) beams from a multimode fiber (0.6 mm diameter, 10m long) and found that in this case the loop PCM return was not so sensitive to alignment of loop resonator and even to the rotating angle position of half-wave plate, unless it was close to the position, where there was no energy exchange between the S and P polarization components. We observed that phase conjugated return had practically 100% polarization conjugation fidelity (see Fig.5). We achieved 50% overall phase conjugation fidelity (see Fig.6) and the reflected energy from the loop PCM 2-3 times the input energy.
This work was partially supported by a consortium agreement with DARPA (MDA972-94-3-0020).
REFERENCES
1. A.A. Betin, and M.S. Mangir, "Q- switched Nd:YAG loop laser with a thermal holographic mirror," CLEO'96, Anaheim, June 1996, Proc. p.448. 2. S.C. Matthews, A.A. Betin, and M.S. Mangir, "Aberration correction of ms pulses at l.Oö^un using a loop conjugator with thermal gratings," CLEO'96, Anaheim, June 1996, Proc. p.510. 3. N.G. Basov et.al. "Inversion of wavefront in SMBS of a depolarized pump," JETP Lett. 28, p. 197 (1978). 4. A.A. Betin, S.C. Matthews, and M.S. Mangir, "Vector phase conjugation with loop laser geometry," CLEO'96, Baltimore, May 1997, Proc. p. 102.
•■»■■' Input to loop , '\^ j. (from fiber)
Input to fiber
Overall PC ■ ■$!&&&> fidelity ~ 50%. ■ ^^F^ß^^' ■
. ■*.'
return from fiber
Figure 6
290

WC7 3:15pm - 3:30pm
Visualization of the Frequency-Doubling Space-Charge Region in Thermally Poled Fused Silica: Measurement Technique and Model
Thomas G. Alley and S.R.J. Brueck Center for High Technology Materials, University of New Mexico
Albuquerque, NM 87106 Tel: 505-272-7800; Fax: 505-272-7801
A large second-order nonlinearity is induced in fused silica glass under electrical poling at elevated temperature (thermal poling).1 This technique has been applied in both bulk fused silica and optical fibers. In optical fibers, this technique has been used to demonstrate an electrooptically active fiber2 (for switching or modulation) as well as quasi-phase matching by periodic poling3. Investigations in bulk fused silica have shown that a thin (~ 10 fxm) region with a %(2) ~ 1 pm/V is formed under the positive electrode.
The initial measurement1 indicated that the nonlinearity peaked at the surface and extended a few micrometers into the glass. Subsequent measurements have shown a buried nonlinearity.4"7 However, all of the techniques used to date lack sufficient resolution to detail the extent of the affected nonlinear region. We report a technique that allows visualization of the details of the nonlinear region with atomic force microscope resolution.
After poling, type II fused silica (Hereaus T08) cover slips were cleaved and etched in 49% hydrofluoric acid for 30 s. The topography of cover slip cross-sections was examined after etching with an atomic force microscope. Peaked ridges, one near the anodic surface edge and a second deeper in the sample, were identified (Figure 1). The ridges correspond to slower etch rates compared to the remainder of the glass. Several samples with different poling times were studied. The second ridge moves deeper into the glass with increased poling time (Figure 2). The position of the first ridge shows some relatively small variation as well but does not show a consistent trend with poling time. For long poling times (> 60 min), additional features are seen including a very deep etched groove between the two peaks that is approximately 2 |im wide and 1 |im deep (in contrast to the approximately 200-300 nm vertical extent of the ridge heights), indicating a much faster etch rate than of that of the bulk material. Interestingly, the sidewalls of this groove are very well defined (sidewall angle ~ 45 degrees) indicating a strongly localized region in the sample.
Earlier studies found that etching rates in glass are affected by the space charge region that forms in poled glass5. Changes in glass etch rates have been attributed to fictive temperature, hydrostatic pressure, and structural stress8, as well as to local electric fields9. We use the second peaked ridge as an indicator of the depth of the space charge region. This ridge, shows that a steady state is not achieved on the same short time scale that characterizes the growth of the second-order nonlinearity.
Previously, the formation of the region in bulk fused silica has been explained by a single-ion carrier model involving sodium ions, mobile at the elevated poling temperature, responding to the applied electric field to give a negative space-charge region under the anode. The exposed space charge in the depletion region results in a large electric field (peak value Edc ~ 107 V/cm) which grows as sodium ions move until
0-7803-4950-4/98/$10.00 1998 IEEE 291

essentially all the applied voltage drops across this depletion region. The electric field leads to a second-order nonlinearity through %(2) = 3%(3)£dC, or also possibly through the orientation of polar defects.
We have recently presented a model that extends this single-ion carrier model and allows for ion exchange of hydrogenated ions at or under the surface as the large field grows.10 The hydrogenated ions have a mobility several orders of magnitude (~ 104) smaller than sodium. Hydrogenated ions can be supplied either from surface hydration or from moisture in the environment. The model predicts continual depth increase in the space-charge region over long periods of poling time, when a source of hydrogenated ions is available. As the space charge region extends deeper into the glass, the strength of the electric field decreases, but the integrated electric field (voltage drop) remains the same over the region. Because the second harmonic (SH) power is proportional to the
integrated electric field strength (PSH °c J Edceläkxdx), the SH signal remains relatively
constant as long as the nonlinearity depth is less than the coherence length (~ 24 |im). The experimental observation that the space-charge depth lacks a short term steady state agrees with this ion exchange model.
14
I 12 Q)
■o O c to
■a c 3
a. a
10
• data y= 3.644 tog(x) + 6.366 H-exchange model
0.1 1 10 100
Poling Time (min)
1000
Figure 1. Atomic force microscope profile for etched cross section of a sample poled for Vi min at
4.3 kV and ~ 275 °C. x = 0 indicates anodic surface.
Figure 2. Depth of second ridge under anodic surface versus period of time poled. Error bars
indicate estimation of variation in ridge depth over poled region.
R.A. Myers, N. Mukherjee, and S.R.J. Brueck, "Large second-order nonlinearity in poled fused silica," Opt. Lett. 15, 1733(1991).
X.-C. Long, R. A. Myers, S. R. J. Brueck, "Large-signal phase retardation with a poled electrooptic fiber," IEEE Photon. Technol. Lett., 9, 767 (1997)
P.G. Kazansky, V. Pruneri, and R.St J. Russell, "Blue-light generation by quasi-phase-matched frequency doubling in thermally poled optical fibres," Opt. Lett. 20, 843 (1995).
4 D. Pureur, A.C. Liu, M.J.F. Digonnet, and G.S. Kino, "Absolute prism-assisted maker fringe measurements of the nonlinear profile in thermally poled silica," in Bragg Gratings, Photosensitivity, and Poling in Glass Fibers and Waveguides: Applications and Fundamentals, OSA Technical
292

Digest Series Vol. 17, 302 (1997). 5 W. Margulis and F. Laurell, "Interferometric study of poled glass under etching," Opt. Lett. 21, 1786
(1996). 6 P.G. Kazansky, A.R. Smith, P.St.J. Russell, G.M. Yang, and G.M. Sessler, "Thermally poled silica glass:
Laser-induced pressure pulse probe of charge-distribution," Appl. Phys. Lett. 68, 269 (1996). 7 P.G. Kazansky, A. Kamal and P.St.J. Russell, "Erasure of thermally poled second-order nonlinearity in
fused silica by electron implantation," Optics Lett. 18, 1141 (1993). 8 A. Agarwal and M. Tomozawa, "Correlation of silica glass properties with the infrared spectra," J. Non-
Cryst. Solids 209, 166 (1997). 9 B. Lesche, F.C. Garcia, E.N. Hering, W. Margulis, I.C.S. Carvalho, and F. Laurell, "Etching of silica glass
under electric fields," Phys. Rev. Lett. 78, 2172 (1997). 10 T.G. Alley, RA. Myers, and S.R.J. Brueck, "An ion exchange model for extended-duration thermal
poling of bulk fused silica,"in: Bragg Gratings, Photosensitivity, and Poling in Glass Fibersand Waveguides: Applications and Fundamentals, OSA Technical Digest Series Vol. 17, 293 (1997).
293

WD1 (Invited) 3:30pm - 4:00pm
Applications of Terahertz Imaging
Daniel M. Mittleman, Ramesh Neelamani, and Richard G. Baraniuk Rice University
Electrical and Computer Engineering Dept, MS366 6100 Main St., Houston, TX 77005
Phone:(713)285-5452 FAX: (713) 524-5237 E-mail: [email protected]
Martin C. Nuss Bell Laboratories - Lucent Technologies
Room 4B-429, 101 Crawfords Comer Rd., Holmdel NJ 07733
1. Introduction The recent advances involving imaging with sub-picosecond terahertz pulses [1,2] have opened up a wide
range of possibilities in the applications of far-infrared technology. For the first time, a commercially viable terahertz imaging spectrometer seems a realizable prospect. However, several substantial engineering research challenges remain to be overcome before this goal can be achieved. One of these involves the necessity for a femtosecond laser system, required for gating the emitter and receiver antennas used in the THz-TDS system. Although the solid-state mode-locked laser systems have made substantial progress in recent years, they may not yet be suitable for a commercially viable spectrometer. An alternative laser source, the erbium-doped fiber laser is a better option, but adapting the THz-TDS system for use with this laser is not trivial.
A second challenge to be faced involves the signal processing used to extract information from measured THz waveforms. The demonstration experiments performed to date have employed rather crude signal processing algorithms. The shortcomings of these are evident in some of the results presented here, highlighting the need for a more sophisticated treatment. Although the details of the signal processing procedures will depend to a great degree on the particular application of interest, there are several core issues that are common to a wide range of problems. These include the deconvolution of instrument response functions and the implementation of effective noise removal procedures. Since the underlying waveforms in the THz system (e.g. Figure 1) closely resemble the elements of a wavelet basis, wavelet-based signal processing strategies are likely to be extremely effective.
2. Applications of THz Imaging
One of the most interesting characteristics of THz-TDS is the extremely short duration of the THz pulses. Because many materials have strong absorption or dispersion features in the far infrared, the temporal distortions which are imposed on the sub- picosecond pulses are characteristic of the materials with which the radiation has interacted. As a consequence, the distortions of the time-domain THz waveform can be used to identify or characterize the materials [3]. An example is shown in Figure 1, which depicts the waveforms (a) incident on and (b) transmitted through a block of epoxy.
Time (psec) Time (psec)
Figure 1 THz waveforms (a) incident on and
Position (mm)
Figure 2 THz image of a portion of an automobile dashboard, in which a small bubble in the impact foam is clearly evident (white area, at left).
0-7803-4950-4/98/110.00 1998 IEEE
(b) transmitted through a block of epoxy. The chirp imposed on the waveform is characteristic of the material, and may be used for materials identification, in conjunction with imaging.
The strongly frequency-dependent refractive index of this material is evident in the 'chirp' exhibited by the transmitted waveform.
Many industries require monitoring technologies which can perform quality control inspections through opaque materials such as cardboard or plastic. Because these materials are transparent in the THz range, this technology is well suited for such applications. An example is shown in Figure 2, which is a THz image of a portion of a dashboard from an automobile; this structure consists of two molded hard plastic shells with a soft shock-absorbent foam filling the region in between. An air bubble in the foam filling, invisible through the opaque plastic shells, is easily visible in the THz image. This image was generated using real-time signal processing on the transmitted terahertz waveforms [1,2].
This technique is quite general; images can be generated of a wide range of samples, including many packaged food products, and countless plastic and composite parts such as the packaging for
294

40
? 20-
-20-
-40-
(a)
(b) fi x3
(c) back cover
front cover \ floppy disk
~\—■" 10 15 20
Delay (psec) 25
-r~ 30 35
Figure 3 THz waveforms (a) incident on and (b) reflected from a 3.5-inch floppy disk. Curve (c) represents curve (b) after deconvolution of the instrument response.
integrated circuit chips. Images can also be generated in a reflection rather than transmission, geometry. The sub-picosecond duration of the reflected waveform can be used in a tomographic imaging mode, to construct a three-dimensional image of the sample [4]. Figure 3 shows an example, in which an incident waveform (a) is reflected off of a conventional 3.5-inch floppy disk. Each of the dielectric interfaces which comprise the sample is visible in the reflected waveform (b), including the front and back surfaces of both the front and rear plastic cover, and the magnetic recording material. Curve (c) represents the results of curve (b) after deconvolution of the instrument response, represented by (a). This procedure permits resolution of the front and back surfaces of the thin magnetic recording material, unresolved in the raw waveform (b). This highlights the importance of a robust deconvolution procedure, which can be implemented in a real-time imaging mode.
The unique aspects of this new imaging technology have attracted interest from a number of industries, primarily in the manufacturing sector. The ability to image through most common packaging materials without the need for x-rays or other ionizing
radiation is attractive in many quality control applications, particularly in consumer products manufacturing. The cohent deteS of the THz waveform also permits imaging of thermally active media, an ability possessed by no oSXXed detection system. This may be of interest in high temperature materials processing such as cemmic smtering or in the monitoring of moderate to high density plasmas. The extreme sensitivity of THz mSon to Sqrid water is of interest to the plastics industry. Other applications include cutaneous imaging for biomedical diagnostics, agricultural monitoring, and gas sensing and detection [3].
3. Towards a Commercially Viable THz Imaging System A number of improvements must be made to the next generation THz-TDS system in order for any of the
applications under consideration to be feasible. Primary among these is the issue of the femtosecond laser system SSSTta exists no femtosecond laser that is sufficiently isolated from mechanical perturbation, except for the SS55 Aber laser systems. However, adapting the THz-TDS system for operation with a fiber aser rai es a nunTr of significant engineering challenges. Of equal importance is the need for robust signal Processing meTods for extraction of meaningful data from the measured THz waveforms. The signal processingchallenge; in Te T^ system?dLsses the following question: given an input waveform (which may be taken as charactenzuig rhe ystem response) and a reflected or transmitted waveform (which has been modified by interaction^ with^a Sample), what is the optimal procedure for extracting the desired information about the sample under study? Of coTse,me information to be extracted varies with each application. Despite this, a number of common issues exist, including noise reduction, artifact removal, and deconvolution.
tte engineering challenges which arise in modifying the THz-TDS system for use with a fiber la er he primarily in the THz transmitter antenna. These antennas are typically lithographically defined on a gallium Sde (GaAs) or low-temperature-grown GaAs (LT-GaAs) substrate, which acts as the photoconductive switch Zteg^lnvZL However,8these semiconductors do not absorb light at me wavekngth of the fiber laser.
One strategy for dealing with this difficulty involves shifting the wavelength of the output pulses via non- linear mixing Frequency doubling the output of a femtosecond fiber laser has been explored by a number of rSeSchers rLntly [5 6] Average powers as high as 8 mW have been reported in the second harmonic pulses at -780 r^^ Seffcü> power level is not sufficient for THz generation and detection, the recent advances in the develonment of periodically-poled non-linear materials are quite promising. dP A seCOnd strategy is to develop new materials which are active at 1.55 urn. For a photoconductor to efficiently generate and detect femtosecond electrical transients, it must meet the following benchmarks: 1) earner lifetime less than one picosecond, 2) mobility greater than 100 cm2/V-s, 3) resistivity greater than 10 Q-cm, and 4) optical absorption greater than 104 cm"'. Non-stoichiometric GaAs (LT-GaAs) possesses all of these qualities when pumped at a wavelength near 800 nm, as do other semiconductors of comparable band gap, suei aW> [7L O&e materials such as InSb [8], have been explored at longer pump wavelengths. A number of candidate materials exist for opeStto^i.tlto fiber laser wavelength, including ion-implanted germanium [9] and low-temperature-grown
quantum weUsJlO^ ^ me measured THz waveformS; ^^ noise removal, artifact and system
response deconvolution, and advanced image formation, are a crucial component of a useful THz system.
295

Traditionally, signal processing has been carried out in the frequency domain using the Fourier transform, which analyzes and represents signals in terms of sinusoids of different frequencies. While the narrowband sinusoids of the Fourier representation may be an excellent match for continuous wave signals, these functions do not match the broadband, transient nature of THz pulses. Since THz pulses are localized in both time and frequency, they are naturally suited to signal processing methods based on wavelets. The wavelet transform performs a 'local Fourier analysis' by analyzing and representing signals in terms of shifted and dilated versions of time-localized, oscillating functions. It has been shown that noise removal, compression, and signal recovery methods based on wavelet coefficient shrinkage or wavelet series truncation enjoy excellent asymptotic performance and moreover, do not introduce excessive artifacts in the signal reconstruction [11]. The same properties are not shared by the Fourier representation. Thus wavelets are a natural tool for addressing the challenges presented by the THz-TDS system.
An excellent example of a case where wavelet signal processing will be extremely beneficial is in signal denoising. White Gaussian noise can arise in signal acquisition from a number of intrinsic sources, such as Johnson noise in the detectors. A simple yet effective approach to dealing with this is wavelet thresholding [12]. Since the basis functions of a wavelet analysis closely match the transient pulses of a THz waveform, the wavelet transforms of the THz waveforms are strongly peaked, with only a few coefficients of large amplitude required to represent the waveform. In contrast, the wavelet transform of white noise is distributed, with many coefficients of smaller amplitude. Thus, a simple strategy to separate signal from noise is to threshold the wavelet transform of the noisy signal. Figure 4 is an example which demonstrates the power of wavelet thresholding in signal denoising.
Another important source of noise in these measurements is the pulse-to-pulse amplitude fluctuations of the femtosecond laser. The spectrum of this noise source closely resembles a 1/f source [13]. Current wavelet denoising strategies are not optimized for colored noise, and so modified algorithms must be developed.
5 10 15 20 25 30
Delay (picoseconds)
Figure 4 (a) Raw signal (typical waveform reflected from floppy disk; see Figure 3). (b) Curve a, supplemented by additive white Gaussian noise, to artificially simulate noisy data (c) Signal denoised with a Fourier method (convolution with a Butterworth filter) (d) Signal denoised using wavelet thresholding. Note how in addition wavelet thresholding can be used to remove most of the signal artifacts.
[I] Hu, B.-B. and Nuss, M. C, "Imaging with terahertz waves," Opt. Lett, 20, 1716 (1995). [2] Mittleman, D. M., Jacobsen, R. H., and Nuss, M. C, "T-ray imaging," IEEE J. Sei. Top. Quant. Elec, 2, 679
(1996). [3] Jacobsen, R. H., Mittleman, D. M, and Nuss, M. C, "Chemical recognition of gases and gas mixtures using
terahertz waveforms," Opt. Lett., 21, 2011 (1996). [4] Mittleman, D. M., Hunsche, S., Boivin, L., and Nuss, M. C, "T-ray tomography," Opt. Lett, 22, 904 (1997). [5]Arbore, M. A., Fejer, M. M., Fermann, M. E., Haribaran, A., Galvanauskas, A., and Harter, D., "Frequency
doubling of femtosecond erbium-fiber soliton lasers in periodically poled lithium niobate," Opt. Lett., 22, 13 (1997).
[6] Nelson, L. E., Fleischer, S. B., Lenz, G., and Ippen, E. P., "Efficient frequency doubling of a femtosecond fiber laser," Opt. Lett., 21, 1759 (1996).
[7] Keil, U. D., and Dykaar, D. R., "Ultrafast pulse generation in photoconductive switches," IEEEJ. Quant Elec, 32, 1664 (1996).
[8] Howells, S. C, and Schlie, L. A., "Temperature dependence of terahertz pulses produced by difference- frequency mixing in \r&b," Appl. Phys. Lett, 67, 3688 (1995).
[9] Sekine, N., Hirakawa, K., Sogawa, F., Arakawa, Y., Usami, N, Shiraki, Y., and Katoda, T., "Ultrashort lifetime photocarriers in Ge thin films," Appl. Phys. Lett, 68, 3419 (1996).
[10] Takahashi, R., Kawamura, Y., and Iwamura, H., "Ultrafast 1.55 mm all-optical switching using low- temperature-grown multiple quantum wells," Appl. Phys. Lett, 68, 153 (1996).
[II] Donoho, D., "De-noising by soft-thresholding," IEEE Trans. Info. Theory, 41, 613 (1995). [12] Ghael, S., Sayeed, A. M., and Baraniuk, R. G., "Improved wavelet denoising via empirical Wiener filtering,"
Proc. SPIE, San Diego, July 1997. [13] Yu, C. X., Namiki, S., and Haus, H. A., "Noise of the stretched-pulse fiber laser: Part II - Experiments," IEEE
J. Quant. Elec., 33, 660 (1997).
296

WD3 4:30pm - 4:45pm
THz Pulse Measurement with a Chirped Optical Beam Zhiping Jiang and X.-C. Zhang
Physics Department, Rensselaer Polytechnic Institute, Troy, NY 12180-3590
Tel: (518) 276-3079; Fax: (518) 276-6680; Email:[email protected]
Summary
Electro-optic sampling is a powerful technique for the characterization of a repetitive electrical waveform, such as an electrical signal in an integrated circuit [1,2] or a THz beam in a free-space environment [3-5]. However, due to the nature of the repetitive measurement of the sampling system, for each time-delay between the electrical signal and a synchronized optical probe pulse, only a small portion of the temporal signal is measured. The entire waveform is reassembled by sequentially plotting the signal versus the time- delay. Until now, there has been no report of a successful measurement of a picosecond electrical pulse on a single-shot basis.
One possible way to perform a single-shot measurement is by parallel sampling. With the introduction of a chirped optical probe beam in the electro-optic sampling experiment [6,7], it is finally possible to achieve a single-shot THz pulse measurement. Using a linearly chirped optical probe pulse in free-space electro-optic measurements, a temporal waveform of a co-propagating THz field is linearly encoded onto the frequency spectrum of the optical probe pulse, and then decoded by dispersing the probe beam from a grating to a detector array. We achieve acquisition of picosecond THz field pulses without using mechanical time-delay device. We also demonstrate a single-shot electro-optic measurement of the temporal waveform of a THz pulse.
Figure 1 schematically illustrates electro-optic sampling with a chirped optical probe beam. A femtosecond laser beam is split into pump and probe beams. The pump beam is used to generate THz beam from an emitter, then focused onto the electro-optic sensor by a polylens. The probe beam is frequency chirped and temporally stretched by a grating pair. The linearly chirped pulse is equivalent to a series of sub-pulses that have different wavelengths and are temporally delayed. When the chirped probe beam and a THz pulse co- propagate in the electro-optic crystal, the different wavelength components of the chirped pulse are modulated by different portions of the THz pulse through the Pockels effect. Therefore, the THz waveform is encoded onto the wavelength spectrum of the probe beam. A spectrometer (here, a lens-grating combination) and a detector array are used to measure the spectral distribution. The THz waveform is obtained by subtracting the spectral distributions with and without the THz pulse applied on the electro- optic crystal. The fixed delay-line is used only for positioning the THz pulse within the duration of the chirped pulse and for temporal calibration.
Grating Ultrashort Beam
Laser Splitter j Mirror
Spectral Distribution Detector
Array
Delay Line
Grating Emitter TT " Polarizer I Pellicle
THz Waveform M'rror THz Modulated Chirped Pulse
Fig. 1: Schematic illustration of the electro-optic sampling system with a chirped probe beam.
0-7803-4950-4/98/$10.00 1998 IEEE 297

Figure 2 plots the spectral distributions of the chirped probe pulse measured by the linear diode array, with and without the present of the THz pulse in ZnTe crystal. The fine structure on the waveform peak comes from the spectrum of the Rega amplified laser.
- with THz field without THz field
200 800 1000 400 600
Pixel Fig. 2: Spectral distribution of the chirped probe pulse with and without a co-propagating THz field pulse.
To get a single laser pulse, laser low repetition rate of 10 kHz is used. An optical chopper with 1:220 on/off ratio reduces the repetition rate to 45 Hz. Therefore, if the exposure time of the detector is less than 22 ms, only one pulse is captured for single exposure. The minimum 10 ms shutter-time of the PI CCD-1242 camera satisfies this condition. This camera has 576x1242 pixels and dynamic range of 18 bits. The THz emitter is an 8-mm wide GaAs photoconductor with a biased voltage of 3 kV. The electro-optic crystal is a 4-mm thick <110> ZnTe.
3 -5- "05 c O)
CO
100 200 300 400 Pixel
500 600
Fig. 3: Three single-shot measurements of the THz pulses by adjusting the fixed time delay with a step of 3.3 ps. The waveforms are vertically offset for better display.
Figure 3 plots the measured THz pulses at three different fixed time-delays with a step of 3.3 ps in the single-shot arrangement. The total spectrum on the 600 pixels corresponds to a 44-ps temporal window. The measured signal has a 2-ps rise time (10% to 90%) with a signal-to-noise ratio better than 60:1. In this system, the optimal temporal resolution equals to the square root of the product of the original optical pulse duration and the chirped pulse duration. A chirped optical pulse, without a mechanical moving element for the time delay, measures the temporal waveform of a THz pulse.
298

A chirped optical pulse, without a mechanical moving element for the time delay, measures the temporal waveform of a THz pulse. The single-shot measurement capability allows us to capture a THz pulse with an unprecedented data acquisition rate.
References 1. B.H. Kölner and D.M. Bloom, IEEE J. Quantum Electron., QE-22,69 (1986). 2. J.A. Valdmanis and G. A. Mourou, IEEE J. Quantum Electron., QE-22,79 (1986). 3. Q. Wu and X.-C. Zhang, Appl. Phys. Lett., 67, 2523 (1995). 4. A. Nahata, D.H. Auston, T.F. Heinz, and C.J. Wu, Appl. Phys. Lett., 68, 150 (1996). 5. P. U. Jepsen, C. Winnewisser, M. Schall, V. Schyja, S. R. Keiding and H. Helm, Phys.
Rev. E, 53, pp. R3052 - R3054, 1996. 6. J. A. Valdmanis, Proceeding of Ultrafast Phenomena V, Springer-Verlag, 82 (1986); Solid State
Technology / Test & Measurement World, Nov. S40, (1986). 7. Galvanauskas, J.A. Tellefsen, Jr., A. Krotkus, M. Oberg, and B. Broberg, Appl. Phys. Lett., 60, 145
(1992).
299

WD4 4:45pm - 5:00pm
Spectrum control of intense THz-radiation from InAs under magnetic field irradiated
with stretched femtosecond laser pulses
Hideyuki OHTAKE, Zhenlin LIU, Shinji IZUMIDA, Shingo ONO, and Nobuhiko SARUKURA
Institute for Molecular Science (IMS), Myodaiji, Okazaki, 444-8585 Japan e-mail, [email protected]
Various THz-radiation sources have been intensively studied including photo conductive switches irradiated with ultrashort optical pulses. 1.2 por applications to sensing or imaging^ and time-resolved spectroscopy in the far infrared region, an intense, compact, and simple light source is required. Zhang et al. reported quadratic dependence of the laser induced THz-radiation on the magnetic field.4 In this presentation, we report the significant enhancement of THz-radiation power from InAs under magnetic field irradiated with femtosecond optical pulses. The power reaches sub-mW in a 1.7-T magnetic field with 1.5-W excitation power. This is the highest average power ever achieved in THz radiation at around a 100- MHz repetition rate. Furthermore, spectrum of this intense THz-radiation is well- controlled by the width of the excitation pulses.
The experimental setup for the THz-radiation emitter in a magnetic field is shown in Fig. 1. A Ti:sapphire laser delivered 70-fsec pulses at 800 nm with an 80- MHz repetition rate using 1.5-W average power for the excitation. The sample was non-doped bulk InAs with a (100) surface. The InAs sample itself is highly reflective. The reflectivity of the THz radiation was measured to be approximately 70% for a 45 degree incidence angle. Therefore, the THz radiation was totally generated in the reflection direction. A liquid-helium-cooled InSb bolometer was provided for detection. The InAs sample was placed 45 degrees to the magnetic field, and the excitation laser was parallel to the magnetic field. In this geometry, the THz radiation was detected even without the magnetic field, similar to GaAs in ref. 5. In this case, the mechanism of the THz radiation was attributed to the carrier motion in the surface depletion electric field.6,7 The THz-radiation power dependence on the excitation power was measured in a 1.7-T magnetic field as shown in Fig. 2. The radiation power exhibits almost quadratic dependence on the excitation power. We have also found that the power of the THz radiation from an InAs sample in a magnetic field is over one order of magnitude higher than that from non-doped GaAs with a (100) surface in the same conditions shown in Fig. 2. The magnetic-field dependence of the THz-radiation power is shown in Fig. 3. The 0-7803-4950-4/98/$10.00 1998 IEEE 300

radiation power is quadratically related to the higher magnetic field region as was the case for GaAs.4 Owing to this quadratic dependence on the magnetic field and the excitation power, the total THz-radiation power reaches 650 \iW. The spectra of the horizontal and vertical components of the THz radiation were obtained by a Polarizing Michelson interferometer. The spectral shape for the different magnetic field was almost identical. However, the spectral shapes for different polarization components are significantly different as shown in Figs. 4(a) and (b). The higher frequency spectrum is enhanced in horizontal polarization components. For this optical configuration, the ellipticity of the THz radiation was measured for the different magnetic field using two wire-grid polarizers. In the zero field, the radiation was completely polarized parallel to the magnetic field. At around 0.25 T, the radiation polarization became nearly circular as shown in Fig. 5. This elliptical polarization nature can be attributed to the vertical and horizontal projections of the photo current in semiconductor surface caused by the magnetic field and surface depletion electric field as described in ref. 4. For the control of the spectrum of this intense THz radiation, we introduced a high dispersion prism pair to stretch the pulse duration. The pulse duration was changed from 260 to 1100 fsec (FWHM) in autocorrelation. With this stretched pulse for the excitation, we can control center frequency of THz-radiation as shown in Fig. 6
In conclusion, we have demonstrated a new, simple, and intense THz- radiation source just using bulk InAs. An average power of 650-fj.W was achieved, owing to the quadratic relationship to the magnetic field and excitation laser power, the high reflectivity of InAs, and smaller effective mass of the electron in InAs. A dramatic change of ellipticity was also observed for different magnetic fields. Furthermore, the radiation spectrum is well-controlled by the excitation pulsewidth. Further increase of magnetic field and excitation power will increase the THz radiation. Development of such simple and intense radiation sources will open up new applications of THz radiation.
1. For example, D. H. Auston, Appl. Phys. Lett. 43, 713 (1983). 2. For example, I. Brener, D. Dykaar, A. Frommer, L. N. Pfeiffer, J. Lopata,
J. Wynn, and K. West, and M. C. Nuss, Opt. Lett. 21, 1924 (1996). 3. D. M. Mittleman, S. Hunsche, L. Boivin, and M. C. Nuss, Opt. Lett. 22, 904 (1997). 4. X. -C. Zhang, Y. Lin, T. D. Hewitt, T. Sangsiri, L. E. Kingsley, and M. Weiner,
Appl. Phys. Lett. 62, 2003 (1993). 5. N. Sarukura, Z. Liu, Y.Segawa, S. Koshihara, K. Shimoyama, Y. Kondo, Y. Shibata,
T. Takahashi, S. Hasebe, M. Ikezawa, 22nd International Conference on the physics of semiconductors, 1237, (1994).
6. X. -C. Zhang and D. H. Auston, J. Appl. Phys. 71, 326 (1992). 7. S. L. Chuang, S. Schmitt-Rink, B. I. Greene, P. N. Saeta, and A. J. Levi,
Phys. Rev. Lett. 68, 102 (1992).
301

800-nm 70-fsec optical pulse
Horizontal 1 polarization of excitation
Fig. 1 The experimental setup for THz-radiation emitter in a magnetic field. The sample was non- doped bulk InAs with a (100) surface. A liquid- helium-cooled InSb bolometer with calibrated sensitivity was provided for detection. The maximum field of the electric magnet was 1.7 T, and the magnetic field can also be applied in the opposite direction.
1000 E
._ 100
5 o Q. C o
'■5 io CO T> CO 1— ■ N I
0.1 1
Excitation Power (W) Fig. 2 Excitation-power dependence of THz- radiation power. THz radiation from InAs (circle) increases rapidly as excitation-power increases. THz radiation from GaAs (square) is also shown for comparison. The dotted line indicates slope 2.
1000
Magnetic Field 1.7 T /■■"^ / ■ Sm
/*•
J*
o o
■ o :
• o ■ InAs (100)
o ° GaAs (100) — slope2 i
Magnetic field (T)
Fig. 3 Magnetic field dependence of THz- radiation power. THz radiation from InAs (solid squares) increases dramatically as magnetic field increases. The solid line indicates slope 2.
—. 1.0 w
C 0.8
'55 § 0.2
~i r T r~ Horizontal polarization
InAs
1.0 1.5 Frequency (THz)
1.0
§ 0.8
fl 0-6
in c a> o.2
Vertical polarization InAs
Frequency (THz) Fig. 4 Spectrum of THz radiation from InAs in a 1.7- T magnetic field obtained by Fourier transformation of the autocorrelation using a Polarizing Michelson interferometer, (a) Horizontal polarization, (b) Vertical polarization. The dips correspond to water vapor absorption.
ö '•£3 Q.
W
u
5
1 1 1 I —1—
• <P: Ellipticity JJ° D 9: Phase difference ,"
InAs •
D •
1 1
D
• - •
0 DDSDO nn DO _p no
-
• _
5!
1
,nnD . .
D „ V D
—i 1 a 1 L_ i i
90
60 CD CO lm
O) 30 CO
T3
eu u 1) c
CD ^ V
-:«) »^ ■o cu
■60 CO Cfl
JC a. "1'° -1.5 -1.0 -0.5 0 0.5 1.0 1.5
Magnetic Field (T) Fig. 5 Ellipticity of THz radiation from InAs. The ellipticity changes dramatically.
1.0
2 °-8 - c 3
■S 0.6
g 0.4 0)
-90
0.2
0
1100fs 630 fs 260 fs .-.•
- \t\ > '; Vertical polarization / • InAs
- 'A 1 / ' 1 ■ i\ ••'•
\ \ « f^r-^/^j.^^, _.
0.5 1.0 1.5 Frequency (THz)
2.0
Fig. 6 Spectrum of THz radiation excited with different pulse duration.
302

THURSDAY, 13 August
ThA New Materials ThB Panel Discussion Session ThC Poster Session III ThD Photorefractives ThE Nonlinear Dynamics

Tuesday Papers Not Available
TuA1
TuB1
TuD1
TuD2
TuD4
Quantum Cascade Microlazers with Deformed Chaotic Resonators Federico Capasso and Claire Gmachl, Bell Laboratories, Lucent Technologies, Murray Hill, NJ
The Latest Nonlinearities to Rear Their Ugly Heads in Lightwave Communication Systems
Andy Chraplyvy, Bell Laboratories, Lucent Technologies, Holmdel, NJ
Astronomical Interferometry
Chalres Townes, University of California, Berkeley, CA
Spatial Solitons and Light Guiding Light Allan W. Snyder, Australian National University, Canberra, Australia
Squeezed Phonon Fields: Controlling Quantum Lattice Fluctuations With Light Pulses R. Merlin, G. A. Garrett and J. F. Whitaker, University of Michigan, Ann Arbor, Ml

ThA1 (Invited) 8:00am - 8:30am
Efficient wavelength shifting through cascaded second-order nonlinear
processes in organic and inorganic crystals
G. P. Banfi, P. K.Datta, V. Degiorgio*, D. Fortusini, Dipartimento di Elettronica, Universitä di Pavia, Via Ferrata 1, 27100 Pavia, Italy. *phone: (+39)382-505208; fax: (+39)382-422583; e-mail: [email protected]
J. N. Sherwood Department of Pure and Applied Chemistry, University of Strathclyde, Glasgow Gl 1XL, UK
We report an investigation on wavelength-shifting based on cascaded second-order
processes.1 In our experiment a pump pulse/? at frequency &p and a signal pulse s at as*(üp
interact to generate the frequency-shifted signal/at G>f=2 &p - &s. This takes place through
the generation of the second-harmonic (sh) of p and subsequent parametric amplification,
driven by sh, of s. In the latter process/is generated and amplified as well. Defining n as the
ratio of the energy of/ at the output to s at the input, the goal is to achieve rj«l with a
moderate pump intensity.
The materials we investigated are an organic N-(4-nitrophenyl)-L-prolinol crystal
(denoted NPP) with a length L=2.8 mm, and a periodically-poled lithium niobate (PPLN)
crystal with L=19mm. By exploiting the large effective nonlinearities of these materials,
wavelength shifting with n«l was obtained with a pump pulse intensity lp below 10
MW/cm2, and signal amplification of the order of 50 was achieved for lp » 50 MW/cm .
In our experiment beams/» and s were provided by two synchronous optical parametric
oscillators (both pumped by a frequency-doubled Nd:YAG laser) delivering 20 ps pulses.
The beams were spatially filtered, combined and focused into the sample. At the output, /
was separated from/? and s by a monochromator.
In the case of NPP we used X=\.\5 um (to achieve noncritical phase-matching for
second-harmonic generation) and V=1.16 urn.3 Figure 1 shows the dependence of the
efficiency n on the peak intensity of the pump pulse. The solid line is the result of a
numerical simulation performed by solving the coupled propagation equations and by
integrating the solution in space and time to account for the pulse profile. In the simulation
0-7803-4950-4/98/$10.00 1998 IEEE 305
i2

we adopted, for the effective second-order coefficient deff, the value 48 pm/V which we
obtained from second-harmonic generation measurements.
50 -i
40 -
30 -
p 20 -
I [MW/cm2]
Figure 1: Wavelength shifting efficiency of the 2.8-mm NPP crystal as a function of the pump intensity. Solid line: the result of the numerical simulation. Inset, enlarged view of the low-intensity regime.
The experiment on PPLN was performed following a similar procedure, but we had to
use ^=1.8 urn to comply with the poling period A=25.5 urn of the available crystal. From
second-harmonic-generation we measured deff = 10.5 pm/V. The obtained r\ is similar to the
one achieved with NPP. In fact, the longer propagation length, allowed by the lower
dispersion of PPLN compared to NPP, compensates for the lower deff.
It should be noted that the solution of the propagation equations depends on the
normalized intensities i^d^L2AT2n~3: the applicability of such a scaling rule can be
checked by plotting the measured r\ as a function of the normalized intensity for both NPP
and PPLN, and also for the data of previous experiments performed with ß-barium borate
(BBO) and with the organic crystal MBA-NP.5 As shown in Figure 2, all the experimental
data seem to fall on a single master curve, in agreement with the scaling rule.
306

10' -=
10° -=
10"
10"'
QD_ ^oo_ B%Q.tft- ■
oo<oa>
o
O m
<S>
ONPP, L=2.8mm,Xr =1.15 |im
■ PPLN, L=19mm, fc=1.81 urn
XBBO, L=10mm, A,= =1.06 um (Ref. 4) A MBA-NP, L=3.2 mm, fc=1.06 um (Ref. 5)
0.0 -r* 5.0x10"
—T" 1.0xl0": 1.5xl0"3
Ip d2ef{L
2 X~2 ri3 [S.I. units]
Figure 2: Wavelength shifting efficiency of different crystals as a function of the normalized pump intensity
In conclusion, we performed experiments of wavelength shifting in novel second-order
materials possessing high nonlinearities. Results are encouraging for applications to optical
signal processing, especially for PPLN in view of the possible realization of waveguide
devices.
References
1. G.I. Stegeman, DJ. Hagan, and L. Tomer, Optical and Quantum Elecronics 28,1691 (1996).
2. J. Zyss, J.F. Nicoud, and M. Coquillay, J. Chem. Phys. 81, 4160 (1984).
3. G. P. Banfi, P. K.Datta, V. Degiorgio, G. Donelli, D. Fortusini, and J. N. Sherwood, "Frequency shifting through cascaded second-order processes in a N-(4-nitrophenyl)-L-prolinol crystal", to appear in Opt. Lett.
4. H. Tan, G.P. Banfi, and A. Tomaselli, Appl. Phys. Lett. 63, 2472 (1993).
5. S. Nitti, H.M. Tan, G.P. Banfi and V. Degiorgio, Opt. Comm. 106, 263 (1994).
307
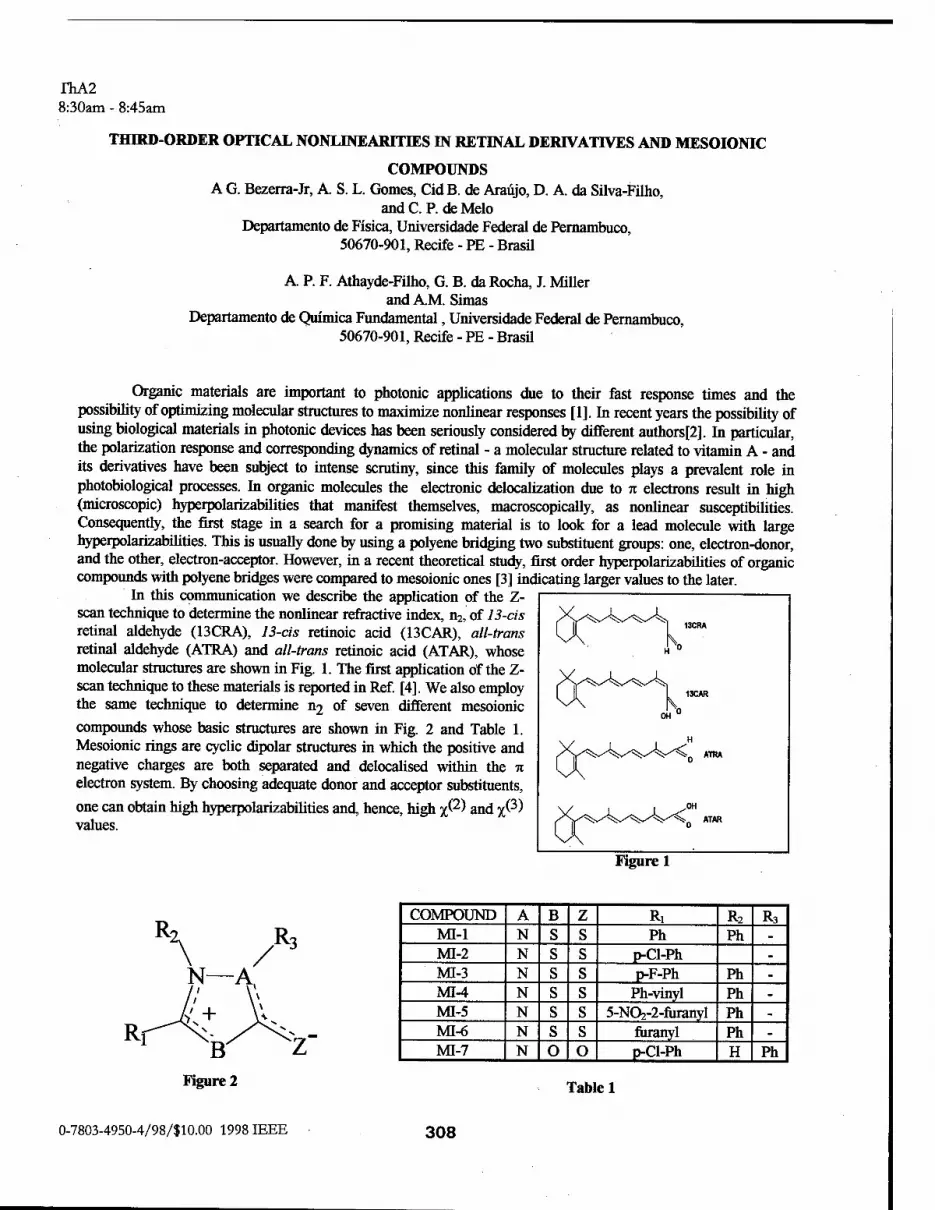
fhA2 8:30am - 8:45am
THIRD-ORDER OPTICAL NONLINEARITIES IN RETINAL DERIVATIVES AND MESOIONIC
COMPOUNDS A G. Bezerra-Jr, A S. L. Gomes, CidB. de Araüjo, D. A. da Silva-Filho,
and C. P. de Melo Departamento de Fisica, Universidade Federal de Pemambuco,
50670-901, Recife - PE - Brasü
A P. F. Athayde-Filho, G. B. da Rocha, J. Miller and AM. Simas
Departamento de Quimica Fundamental, Universidade Federal de Pernambuco, 50670-901, Recife - PE - Brasil
Organic materials are important to photonic applications due to their fast response times and the possibility of optimizing molecular structures to maximize nonlinear responses [1]. In recent years the possibility of using biological materials in photonic devices has been seriously considered by different authors[2]. In particular, the polarization response and corresponding dynamics of retinal - a molecular structure related to vitamin A - and its derivatives have been subject to intense scrutiny, since this family of molecules plays a prevalent role in photobiological processes. In organic molecules the electronic delocalization due to n electrons result in high (microscopic) hyperpolarizabilities that manifest themselves, macroscopically, as nonlinear susceptibilities. Consequently, the first stage in a search for a promising material is to look for a lead molecule with large hyperpolarizabilities. This is usually done by using a polyene bridging two substituent groups: one, electron-donor, and the other, electron-acceptor. However, in a recent theoretical study, first order hyperpolarizabilities of organic compounds with polyene bridges were compared to mesoionic ones [3] indicating larger values to the later.
In this communication we describe the application of the Z- scan technique to determine the nonlinear refractive index, n2, of 13-cis retinal aldehyde (13CRA), 13-cis retinoic acid (13CAR), all-trans retinal aldehyde (ATRA) and all-trans retinoic acid (ATAR), whose molecular structures are shown in Fig. 1. The first application of the Z- scan technique to these materials is reported in Ref. [4]. We also employ the same technique to determine n2 of seven different mesoionic compounds whose basic structures are shown in Fig. 2 and Table 1. Mesoionic rings are cyclic dipolar structures in which the positive and negative charges are both separated and delocalised within the n electron system. By choosing adequate donor and acceptor substituents,
one can obtain high hyperpolarizabilities and hence, high yP) and yp^ values.
Figure 1
MY^ -^v '■<;*~ r 13CRA
N rr^ '^%v
/5%>- '^Ss.
MI 1 13CAR
0H°
v 1 J* or ^ •^v- ATRA
or -V "^ -V^0 ATAR
COMPOUND A B z Ri R2 R, MI-1 N S s Ph Ph - MI-2 N s s p-Cl-Ph - MI-3 N s s p-F-Ph Ph - MI-4 N s s Ph-vinyl Ph . MI-5 N s s 5-N02-2-furanyl Ph - MI-6 N s s furanyl Ph . MI-7 N o o p-Cl-Ph H Ph
Table 1
0-7803-4950-4/98/$10.00 1998 IEEE 308

The Z-scan method exploits the photon-matter interaction so that a single incident beam induces a phase distortion inside the sample which gives origin to an amplitude distortion of the beam due to the sample nonlinearity. By the measurement of the transmitted beam intensity through a circular aperture in front of a detector placed in the far-field region, the Z-scan method yields directly the sign and the absolute value of the magnitude of both the nonlinear refraction and the nonlinear absorption.
The light source used in the experiments was the second harmonic of a cw pumped Q-switched and mode- locked Nd:YAG laser delivering pulses of lOOps (FWHM) at 532nm, in pulse trains containing ~20 pulses. A single pulse at a 5 Hz repetition rate was selected using a "pulse picker". The use of a single lOOps pulse avoids inducing thermal effects.
The retinal derivatives samples (acquired from Sigma-Aldrich) were dissolved in chloroform with concentrations around 1019 molecules/cm3 and the linear absorption coefficient at the pump wavelength is about 0.1cm"1 for all the samples. The observed peak-to-valley shape of the transmitance variation as a function of the linear displacement of the sample along the propagation direction, Z-axis, as shown in figure 3 is characteristic of a self-defocusing (negative) nonlinearity. The measured values of n2 are of the order of 10"14cm2/W.
3 COL
8
'E
.S 0.2
1.4
1.2
1.0
0.8
0.6
0.4
0.0
-0.2
-0.4
1 '-
-15
ATRA (21.68 mgfail) -i 1 1 1 ■
lm(n2)=-1cm/GW
P*ilii««firjuu*^s=i 1*s~*
division
W*"8" Re(n2)=-3.5xia14cm2/W
- Figure 3
V . s+*
-10 0
Z(mm)
10 15
The macroscopic and microscopic third order optical nonlinear coefficients can be related to each other through x(3) = Nfy , where f is a local field correction factor given by f = [r^2 (ro) + 2] / 3, N is the number of
3 molecules per cm and n,j is the linear index of refraction. Using this relation we have determined the values of the
second order hyperpolarizability, y, which are shown in table 2. This table also shows our quantum chemical calculations of y by using the AM1-TDHF method. We have found that the hyperpolarizabilities in the trans molecules are
greater than those in eis molecules, a result that can be understood in terms of the more linear Table 2 character of the trans chain. Also the aldehydes have higher hyperpolarizabilities than the corresponding acids due to a higher electronic delocalization of n electrons in aldehyde compounds.
The mesoionic samples were synthetized in our laboratory, based on quantum chemical AM1-TDHF calculated structures [3]. Solutions in DMSO with concentrations around 1019 molecules/cm3 were prepared.
COMPOUND YEXP.(esu) YAMI-TDHF. (esu) ATRA 1.6 x 10"32 0.53 x 10"32
ATAR 0.5 x 10"32 0.45 x 10"32
13CRA 0.9 x 10"32 0.39 x 10"32
13CAR 0.3 x IQ"32 0.45 xlO"32
309

Typical sample length varied between 0.2mm and 5mm. The linear absorption coefficient at the pump wavelength
varies between 0.4cm"1 and 60cm"1 for all the samples. The observed peak-to-valley shape of the transmitance variation as a function of the linear displacement of the sample along the propagation direction, Z-axis, shown in figure 4, is characteristic of a self-defocusing (negative) nonlinearity. The measured values of n2 are given in Table 3.
Figure 4
Z(mm)
The macroscopic and microscopic third order optical nonlinear coefficients can be related to each other, as before, through yy) = Nf y . Using this relation we have estimated the values of the second order hyperpolarizability, y, which are also presented in Table 3. Notice, for instance, that our results indicate that a structure like MI-7, which is planar, presents a better disposition of the donor and acceptor groups when compared to MI-2, a non-planar structure, and thus a larger nonlinearity is expected for structure MI-7.
COMPOUND MOLAR CONCENTRATION (xlO'M)
a (cm1)
^2
(xlO"14 cm2/W) y
(xl0""esu) MI-1 10- 0.4 0.1 1.8 MI-2 1 0.4 1.7 1.7 MI-3 1 0.4 2.0 2.0 MI-4 1 0.4 0.6 0.8 MI-5 1 60.0 111.3 146.4 MI-6 1 8.0 10.5 13.8 MI-7 lo-1 0.4 0.1 10.0
Table 3
Finally we note that in a recent theoretical study [3], first order hyperpolarizabilities of organic compounds with polyene bridges were compared to mesoionic ones indicating larger values to the later. This may be related to the intrinsic push-pull characteristics of mesoionic rings which must influence higher order hyperpolarizabilities too. So it is also interesting to compare, from the point of view of basic physics and applications, the magnitude of the second order hyperpolarizabilities for the different organic materials studied in this work In general, they are bigger for the mesoionic compounds which is in a good agreement with our theoretical predictions. The facility to engineer and synthesize these mesoionic materials may lead to the highest possible nonlinear susceptibilities for these structures, which may have potential applications to photonics. References [1] P. N. Prasad and D. J. Williams, Introduction to Nonlinear Optical Effects in Molecules and Polymers, (Wiley- Interscience, New York 1991). [2] J. L. Bredas, C. Adant, P. Tackx and A. Persoons, Chem. Rev.94 (1994) 243. [3] G.L.C. Moura, AM. Simas and J. Miller, Chem. Phys. Lett. 257 (1996) 639. [4] A G. Bezerra-Jr, A S. L. Gomes, C. P. de Melo and Cid B. de Araüjo, Chem. Phys. Lett. 276 (1997) 445.
310

Cumulative Grating Strength 1mm thick sample
ThA3 8:45am - 9:00am
A Birefringent Polymer for Holographic Recording Gregory J. Steckman, Iouri Solomatine, Gan Zhou, Demetri Psaltis California Institute of Technology Department of Electrical Engineering, Mail Stop 136-93 Pasadena, CA 91125 Telephone: (626) 395-3889 Fax: (626) 568-8437
Polymer based holographic recording materials are promising media for data storage applications. Among these, PMMA based materials have a long history. We present new results with one such material, consisting of PMMA with phenanthrenequinone (PQ) molecules1. Specifically, the suit- ability of this material for holographic data storage will be discussed as well as applications to optical correlation systems.
The M/# is a commonly used measure to characterize a materials ability to store multiple holographic data pages within a single recording location. One hundred peristrophically multiplexed2 holograms were recorded in samples of various thicknesses, and with varying exposure energies. After recording, samples are baked for 24 hours at 55 degrees centigrade to reveal the holograms via a PQ diffusion process. For each sample, the dif- fraction efficiency of each hologram is mea- sured, and the square roots of the diffraction efficiency of each summed to form a running cumulative grating strength with exposure energy. A typical example is shown in Figure 1, yielding an M/# of approximately 1.1. This experiment was repeated with multiple sam- ples, each being recorded to a different cumu- lative exposure energy. The result is a measure of the M/# as a function of exposure energy, shown in Figure 2 for 1mm and 3mm sample thicknesses.
When exposed to a single linearly polarized beam, the material becomes birefringent. The mechanism believed to be responsible for this is a preferential absorption by the PQ molecules based on their orientation relative to the polarization of the incident light. Before exposure the material is isotropic and homogeneous. During exposure, those PQ molecules with a certain ori- entation relative to the incident polarization are absorbed more strongly, and bond to the polymer matrix. The material will now tend to have bonds with PQ molecules that are in a similar orienta- tion, breaking the symmetry and causing birefringence. This effect was measured in a 3mm thick sample by monitoring in real-time the increasing birefringence. The effect was induced by a 488nm beam and measured by a 633nm beam which is outside the absorption band of the mate- rial. Figure 3 is a plot of the change in the difference between ordinary and extraordinary indices of refraction (for 633nm) as a function of exposure energy of the 488nm beam.
Exposure Energy (J)
Figure 1 - Cumulative grating strength measurement
0-7803-4950-4/98/$10.00 1998 IEEE 311

Cumulative Grating Strength vs. Total Exposure Energy An vs. Exposure Energy
12 3 4
Total Exposure Energy (J)
Cumulative Grating Strength vs. Exposure Energy
Total Exposure Energy (J)
Figure 2 - Cumulative grating strength varia- tions with total exposure energy for 1mm (top) and 3mm (bottom) thick samples.
References
Exposure Energy (J)
Figure 3 - Optically induced birefringence
1. Jacques E. Ludman, et. al., "Very thick holographic nonspatial filtering of laser beams," Opt. Eng. 36(6), 1700-1705 (1997). 2. Kevin Curtis, Allen Pu, and Demetri Psaltis, "A method for holographic storage using peristrophic multiplexing," Opt. Lett. 19(13), 993-994 (1994).
312

ThA4 9:00am - 9:15am
Light-Induced Index Change in a Waveguide of a Novel Organic Quinoid Dye
and its Applications to All-Optical Devices with Localized Nonlinearity
HiroshiMURATAa> and MasayukiIZUTSUb)
a)Department of Physical Science, Graduate School of Engineering Science, Osaka University 1-3 Machikaneyama, Toyonaka, Osaka 560-8531, Japan
TEL +81-6-850-6328 FAX +81-6-850-6341 E-mail murata@ee. es. osaka-u. ac.jp b) Communications Research Laboratory
4-2-1 Nukuikitamachi, Koganei, Tokyo 184-8795, Japan TEL+81-423-27-7932 FAX+81-423-27-6106 E-mail [email protected]
L Introduction
All-optical guided-wave devices are attractive to potential applications in optical
communication and high-speed optical signal processing systems. A lot of nonlinear
materials have been implemented to fabrications of optical waveguides and their third order
optical nonlinearities have been measured. However, there are few reports of nonlinear
optical waveguides exhibiting a light-induced phase shift of more than %, which is necessary to
drive the all-optical operation, because of the saturation of the nonlinearity, the presence of
other competitive nonlinear effects, a large propagation loss of the waveguides, and so on.
We have studied optical nonlinearities in a waveguide fabricated from a thin film of a
novel quinoid dye and conventional glass materials, and reported a light-induced phase shift of
over 2% with a response time below lOps in the waveguide [1]. However, there was a large
insertion loss over 20dB in the waveguide of 25mm length, which may become a problem for
applications to all-optical functional devices. Here, we report an improvement of the
propagation characteristics and further measurements of the nonlinearity in the quinoid dye
waveguide. Applications to all-optical devices are also discussed.
2. Fabrication of the waveguide
The structure of the organic quinoid dye used in the study, 4,8-dihydroxy-2,6-
bis(butylamino)-l,5-naphthoquinone is shown in Fig. 1. This dye has been reported to show
relatively large third order optical nonlinearity compared to conventional dyes measured by
THG method at a fundamental wavelength of 2.1 urn [2]. A schematic of the fabricated
waveguide is also shown in Fig. 1. It consists of a base linear glass waveguide and a thin film
of the quinoid dye as the nonlinear material. The base waveguide was fabricated by using the
K+/Na+ ion-exchanged method. The ion-exchanged core was about l.lum thick and 3.5um
wide. A quinoid dye film 0. lum thick was fabricated on the base glass waveguide by vapor
0-7803-4950-4/98/$10.00 1998 IEEE 313

deposition. In our previous reports [1], there was a large propagation loss in the waveguide,
because the quality of the crystal in the dye film was not so good; the dye film was
polycrystalline and the orientation of the crystal in each domain was at random, which we
believe was one of main reasons for large propagation loss of the waveguide. To improve
the quality of the crystal in the dye film, we rubbed the surface of the waveguide with a Teflon
plate just before depositing the dye film and heated the waveguide at about 160°C during the
vapor deposition. Adopting the rubbing and the substrate heating techniques, the orientation
of the crystal in each domain of the polycrystalline dye film became to be parallel to the
direction of the rubbing, which was clearly observed by using a polarizing microscope, and the
insertion loss of a 23mm long single-mode waveguide was reduced by about 8dB. The
refractive indices of the dye film parallel and vertical to the rubbing direction in the substrate
plane were 2.31 and 2.27 at 780nm respectively measured by the prism coupling method.
4,8-dihydroxy- inn^»,*,,^ mm IRcamera 2,6-bis(butylamino)- 1,5-naphthoquinone
ion-exchanged core (3.5x1.1 urn)
0H ° NHBIW7
soda glass | bOQ~\
/7-BuHN 0 OH
delay
i B.S
"" X20 shutter
■apfriHH—i B.S
synchroscan waveguide variab|eatt !"*•&**, streak camera
Fig. 1. Structure of the quinoid dye and the waveguide. Fig. 2. Experimental setup for measuring the nonlinear index change.
3. Measurement of optical nonlinearity
For measuring light induced phase shifts in the fabricated waveguide, we used a
Mach-Zehnder interferometer with a mode-locked Ti: AI2O3 laser (a pulse energy of about 2nJ,
a pulse width of about lOps, a repetition rate of 80MHz) and a synchroscan streak camera of
a pico-second time resolution as shown in Fig. 2. By changing the average input light power
launched to the waveguide and monitoring the transient variation in the envelopes of output
pulses from the interferometer by the streak camera, we can measure both an amount of the
nonlinear phase shift of the light from the waveguide and its response time. The measured
nonlinearity were strongly dependent on the polarization of light propagating the waveguides.
Light induced phase shifts greater than 2n with a response time of less than lOps were clearly
observed by using TM light ( an averaged input power of about 150mW, wavelengths of
780nm and 800nm), however, we could not observe a nonlinear phase shift of TE light in the
measured power range. We believe that one of the main reasons for the dependence of the
314

nonlinearity to the polarization is the planer molecular stacking structure in the dye crystal
films [2]. Nonlinear absorption effects were also measured. The nonlinear coefficients of
the dye and the figures of merits of the waveguide were estimated using the measured results
taking into account the propagation loss of the guide and the structure of the guide in cross
section. The obtained results are shown in Table 1.
Table 1. Estimated values of the nonlinear coefficients of the dye and the figures of merits of the waveguide.
wavelength (nm)
Polarization n2dye
(cm2/W) a2dye(cmlW) W = n2
efflmax / a°effX
T =
780 TE — — — —
800 TE — — — ■ —
780 TM -1.7xl0-12 — >1.1 <0.4
800 TM -1.4x10⁻¹² — >0.88 <0.5
740 TM — -8.7xl0-9 — • —
4. AoDlicati ons to all-onti calintegrate d devices
Utilizing the observed large and fast light-induced index change, we can construct
all-optical functional devices. The structure of the dye waveguide is suitable for changing the
distribution of optical nonlinearity by control of the pattern of the dye films, so with this guide
it is possible to realize all-optical guided-wave devices with the localized nonlinearity that we
have proposed [3]. One of the promising scheme to the all-optical devices with the localized
nonlinearity is shown in Fig. 3. Making a thick upper cladding layer selectively on a base
guide and depositing a dye film on it, we can obtain the structure with the localized
nonlinearity. We are now fabricating all-optical integrated Mach-Zehnder interferometers
and measuring their performances. The results will be presented at the conference.
References [1] H.Murata and Mlzutsu, "Light-Induced Index Change with a Fast Response Time and Nonlinear Absorption in the Waveguide of a Novel Organic Quinoid Dye," J.Opt.Soc.Am.B, Vol.15, No.2, pp.884- 888(1998). [2] M.Matsuoka, AOshida, A.Mizuguchi, Y.Hattori and A.Nishimura, "Molecular Design of Quinoid Dyes for 3rd Order NLO Materials," Nonlinear Optics, 10, pp. 109-114 (1995). [3] KMurata, MJzutsu and T.Sueta, "Optical Bistability and All- Optical Switching in Novel Waveguide Junctions with Localized Optical Nonlinearity," IEEE/OSA J.Lightwave Technol, submitted
input
A. with cladding (linear)
*
JL/j Blast «ubcfralB : - •
fl,.1.50t (WeOnm)
kxitxchanged core .nrl.519 T*
<fc.i.2fun
SiOacladeSng :<i(-"i.4ss ;
output
B. without cladding (non inear)
it A glas» sutotraJ*
njfct.501 -..(>,»78Qnro)
ton-exchaoged core «c-LOOO
Fig. 3. Structure of the all-optical integrated Mach-Zehnder interferometer with localized nonlinearity using the dye guide.
315

ThA5 9:15am - 9:30am
Two-Photon Organic Photochemistry for 2-D Spatial Multiplexing
in Volume Holographic Storage
John H. Hong, Tallis Y. Chang, Hong-Son Ryang, Ten-Luen Lio and Ian McMichael
Rockwell Science Center, 1049 Camino Dos Rios, Thousand Oaks, CA 91360 Phone (805) 373-4508, Fax (805) 373-4423
To minimize scattering into the detector array that retrieves data in volume holographic storage,
a geometry is used where the reference beam and image bearing beam are at 90 degrees with
respect to each other. However, when doing 2-d spatial multiplexing in the recording medium,
the reference beam will propagate through previously recorded regions and cause erasure. One
way to avoid this problem is to record in separate media and to construct a larger media from
them. This is unattractive due to the assembly required and also due to the optical quality surface
preparation that must be done for every piece used to construct the larger media. A more
attractive solution is to use a two-photon process for the storage media in which light of one
wavelength, the sensitizing wavelength, must be present in order to sensitize the media for
writing at some other wavelength (the writing wavelength). In a holographic storage system, a
beam at the sensitizing wavelength is used to illuminate only the region of the recording media
where writing is desired, and thus erasure by the reference beam does not take place outside of
this region. We describe the study of organic photochemistry exhibiting irreversible reactions in
the presence of two light beams of different wavelengths that indicate the potential of this class
of materials as holographic storage media for 2-d spatial multiplexing. In addition to the
promising results with respect to diffraction efficiency, these materials are much easier to make
and thus much less expensive than the single crystal photorefractives that are currently being
used to study holographic storage systems.
The organic photochemistry of o-methylbenzophenone that we studied is shown in Fig. 1. Under
exposure to UV at approximately 340 um, the ketone is excited to the n -» n* triplet state from
which it undergoes a chemical reaction to form the enols 2a-b via the intermediates 4a-b. In the
dark, the enol will revert to 1. The enol has an absorption in the deep blue, and if exposed it will
undergo a photchemical reaction to form the final product 3.
0-7803-4950-4/98/$10.00 1998 IEEE 316

hu
X
uu CH2
OH
,CH2
k Kr k
c Ph 4a
2a 2b
4b
^v^"112 /v CH2
Uk OH
Ph
Fig. 1. Photochemistry of o-Methylbenzophenone
To determine the potential of the system as a holographic storage medium, we made
measurements of the diffraction efficiency of holographic gratings. The exciting wavelength was
obtained from a HeCd laser operating at 325 nm, and the gratings were written using an argon
ion laser operating at 477 nm. The UV power was 5 mW and the spot size was 1.2 mm. The
angle between the two visible writing beams was 30 degrees, they had powers of 5 and 10 mW,
and their spot size was 2.5 mm.
We obtained a nearly saturated diffraction efficiency of 2x10⁻³ after a 100 s exposure using a 0.5
mm thick sample of 20% by weight o-methylbenzophenone that was coated on quartz. If we
assume that a reduction in the diffraction efficiency by a factor of 4 results from the incomplete
overlap of the UV beam with the visible beams (spot diameters differ by a factor of 2) and we
further assume that the saturated diffraction efficiency goes like sin2 of some constant times the
sample length, then we project that a thickness of 4 mm would be sufficient to obtain a
diffraction efficiency of 50%. Numbers like these indicate that the system is a potential
candidate for holographic storage media. However, the diffraction efficiency noted above is that
obtained immediately after exposure. This initial diffraction efficiency decays by a factor of two
in approximately 10 minutes, and within a day it appears to reach a steady state value equal to
approximately 5% of the initial value. The nature of the decay is currently under investigation
and this must be solved before these materials can be can be considered useful for holographic 317 storage.

Thick samples of 10% by weight o-methylbenzophenone in PMMA were also studied. We obtained an initial diffraction efficiency of 3% using a sample that was 13 mm thick. Correcting for the incomplete overlap of the UV and visible beams, we project that a diffraction efficiency of 12% should be possible in this sample. However, the initial diffraction efficiency decayed in
this sample much like it did in the 0.5 mm sample. In the 0.5 mm sample the absorption of the
UV exciting wavelength was about 50%. Therefore, it is likely that the effective interaction
length and thus the diffraction efficiency in the thick sample were limited by absorption of the
UV exciting wavelength. One method to avoid this problem would be to use either a shorter or a
longer wavelength where the UV absorption is lower. However, the use of a longer wavelength
may not be possible, since it is likely to cause erasure by overlapping with the deep blue absorption that is responsible for writing.
In conclusion, the two-photon photochemistry described here is a potential candidate for 2-d spatial multiplexing in volume holographic storage. The initial diffraction efficiency obtained in these materials is promising. Issues remain with understanding and avoiding the decay of the initial diffraction efficiency, and with reducing the absorption of the exciting wavelength without
simultaneously reducing the diffraction efficiency. The ease of manufacture of the two-photon
photochemical system compared with the inorganic photorefractives makes them attractive for the holographic storage application.
318

ThA6 9:30am - 9:45am
Anomalous nonlinearity in hierarchical J-aggregates of three-level porphyrin
Takayoshi Kobayashi and Kazuhiko Misawa
Department of Physics, University of Tokyo, 7-3-1 Hongo, Bunkyo-ku, Tokyo 113, Japan
phone 81-3-3812-2111 ex.4227, fax 81-3-3818-7812 email: [email protected]. u-tokyo.ac.jp
Summary Ultrafast optical nonlinearity of molecular J-aggregates has recently
attracted increasing interest of many scientists [1]. A simple model described by a one-dimensional chain of two-level molecules has been used to discuss femtosecond nonlinear absorption in cyanine J-aggregates [2]. The optical nonlinearlity of excited exciton (S2 exciton) in three-level molecules was discussed theoretically [3], but no experimental study has been reported.
In the present paper, we report ultrafast two-photon nonlinearity in one- dimensional J-aggregates of three-level molecules. The molecule studied is tetraphenyl porphine sulfonic acid (TPPS), which is also very important as a model material for solar cells and light-harvesting systems.
The sample was aqueous solution of TPPS J-aggregates stabilized with KC1. The excitation and probe pulses were both derived from a Ti:sapphire regenerative amplifier seeded by a mode-locked Er-doped fiber laser. The wavelength, pulse energy, and temporal duration of the amplifier output were 775nm, 200 |xJ, and 130 fs, respectively. The incident light was sub-resonant with the excitonic transition (Q-band) of the TPPS J-aggregates at 706 nm. Experiment is performed in a Kerr-shutter configuration.
Figure 1 shows the time dependence of the Kerr signal intensity measured at several excitation power densities. At 19 GW/cm2 and other intensity levels, the decay profile can be fitted to a convolution of the system response function with a sum of instantaneous response and two exponential decay components as,
AtSW + Afi^+Aie'^*. The time constant of the slow component, %i, was determined to be about 50 ps, which agrees with the luminescence lifetime previously reported. The decay constant of the fast component \\ was 1.2+0.1 ps. Below 5.8 GW/cm2, the amount of the fast component was negligibly small.
The main feature to be emphasized is that the contribution of the fast component is strongly dependent on the excitation power. The obtained
0-7803-4950-4/98/$10.00 1998 IEEE 319 . . - ■

amplitudes of the three contributions are plotted as a function of the excitation power density in Fig. 2(a). The signal amplitude of the fast component shows the remarkable quadratic dependence, while the amplitudes of the instantaneous response and slow component are propotional to the incident power. Using the experimental data together with others not shown here, the three components were assigned in the following way. The hierarchical structure of J-aggregates proposed by the present author is a key to the assignment of these relaxation channels [4]. The slow component (~ 50 ps) corresponds to the Si-exciton lifetime in the isolated mesoaggregates, where the decay channel is internal conversion from Si to So- The short relaxation time in the order of 1 ps is due to an exciton in macroaggregates with two photons. The two-photon accessible S2-exciton (excited state of an exciton) relaxes to the Si-exciton state in mesoaggregates composing the macroaggregate within the time resolution of the measurement. The fast component is due to bi-excitonic annihilation among inhomogeneously distributed mesoaggregates in a macroaggregates [2, 5]. Figure 2(b) shows the excitation power dependence of the decay constant of the fast component. The lifetime depends only weekly on the excitation density, indicating that the annihilation rate is not determined by the exciton concentration as previously observed in our group [2]. The 1-ps decay time corresponds to the energy transfer time of excitons among mesoaggregates in a macroaggregate, and is consistent with our previous experiment of the anomalous wavelength dependence of hole-burning experiment.
We also measured time-resolved complex nonlinear susceptibility using a Sagnac interferometer [6]. As shown in Fig. 3, the real part changes its sign around zero delay. The instantaneous nonlinearity is considered to come from the solvent. From the polarization selection, the contribution from diffusional motion of J-aggregates was found to be negligible.
In conclusion, we observed 1-ps relaxation due to energy transfer in three- level porphyrin macroaggregates, which shows a quadratic excitation power dependence.
References [1] J-aggregates, ed. T. Kobayashi (World Scientific, Singapore (1996)). [2] K. Minoshima, M. Taiji, K. Misawa, and T. Kobayashi, Chem. Phys. Lett. 218, 67(1994). [3] J. Knoester and F.C. Spano, Phys. Rev. Lett. 74, 2780 (1995). [4] T. Kobayashi and K. Misawa, J. Lumin. 72, 38 (1997). [5] V. Sundström, T. Gillbro, R.A. Gadonas, and A. Piskarskas, J. Ghem. Phys. 89, 2754 (1988). [6] K. Misawa and T. Kobayashi, Opt. Lett. 20,1550 (1995).
320

3.0
0.0
0.0
i i i i I i i i i i '■ i i i I i i i i i i i f ( rTTTTT
13 GW/cm2
9.6 GW/cm2
-A- 5.8 GW/cm2
■ ■«■!»«■ ■
-1.0 0.0 1.0 2.0 3.0 4.0 5.0 6.0 7.0 Delay (ps)
>.1.0
Fig. 1: Time dependence of the Kerr signal intensity at 19, 13, 9.6, and 5.8 GW/cm . Thin lines represent the instantaneous (Ao) and two exponential (Ai and A2) components of the numerical fits.
2.0
in a.
I1.0
CO o 0) Q
1 1 1 1 | 1 1 1 1 I 1 1 ■ ■ | 1 ■ 1 1
A1 component
•»•
■J. „1 1. 1, ,„l , I„.,.,I i. i. 1 1
.0 5.0 10.0 15.0 20.0 Peak power density (GW/cm2)
0.0L
0.0 5.0 10.0 15.0 20.0 Peak power density (GW/cm2)
Fig. 2: (a) Excitation power density dependence of the amplitudes of the instantaneous response (Ao), fast (Ai) and slow (A2) components, (b) Excitation power density dependence of the time constant of the fast decay components.
5.0
Fig. 3: Transient response corresponding to [ , .7:., 1 , , , 1 ^ the real (AO) and imaginary (AK) parts of
-1.0 0.0 1.0 2.0 3.0 4.0 5.0 6.0 7.0 nonlinear optical susceptibility measured Delay (pS) with a femtosecond Sagnac interferometer.
321

ThA7 9:45am - 10:00am
HYPERPOLARIZABILITY OF GENETICALLY ENGINEERED BACTERIORHODOPSIN
Kuo Chung Hsu, and G.W. Rayfield
Physics Department, University of Oregon, Eugene OR 97403, phone 541-346-4749 fax 541-346-3422
Introduction Materials with large nonlinear optical (NLO) coefficients are needed for a variety of
photonic applications such as: frequency doubling, optical switches and electrooptic devices. Organic chromophores have the potential to meet this need by suitable modification of their structure to optimize the hyperpolarizability, ß. In particular, it has been shown that the synthesis of chromophores with large ß depends on optimum tuning between the donor-acceptor strengths and the jt-electron system (Marder, et al., 1994).
Bacteriorhodopsin (BR), a material of biological origin, has been used in a number of photonic applications (Oesterhelt, et al., 1991; Downie, 1995; Lindvold and Ramanujam, 1995) and has very large nonlinear optical (NLO) coefficients, among the largest yet found (Birge, et al., 1990; Schmidt and Rayfield, 1994; Aranda, et al., 1995). The large hyperpolarizablilty of BR is due to the interaction of the retinal chromophore with the opsin or amino acid structure surrounding it (Chen, et al., 1994). This suggests that amino acid substitution in the opsin rather than modification of the chromophore could optimize the NLO properties of BR. The result described below shows that this is indeed the case. Genetic engineering can be used to enhance the hyperpolarizablity of BR.
Background Bacteriorhodopsin is a protein found in the cell membrane wall of Halobacterium halobium
where it functions as a light driven proton pump (Lanyi, 1993). A single BR molecule, or monomer, consists of two parts: 1) the opsin, and 2) a retinal chromophore. Opsin is a seven- alpha helical array of 248 amino acids and has a molecular weight of 26,000. Each of the seven alpha helices spans the membrane and is roughly perpendicular to it. The retinal chromophore lies in a pocket formed by the seven alpha helices (Henderson, et al., 1990; Landau, et al., 1997). A Schiff base, which is normally protonated, binds the retinal to the opsin at Lys 216. The retinal chromophore is responsible for visible-light absorption by BR and interaction between it and the opsin causes the absorption spectrum of the retinal to be strongly red shifted from that of free retinal. Within the cell membrane wall the BR molecules are arranged in a two-dimensional crystalline sheet called the purple membrane (PM). Each PM is approximately one micron in diameter, 45 angstroms thick and contains about 105 BR molecules. The BR molecules are vectorially oriented in the PM to pump protons from the cytoplasmic side to the extracellular side of the cell membrane wall. BR molecules in the PM are located on a hexagonal lattice with three BR molecules -a trimer-at each lattice site. The region between trimers is filled with lipid which accounts for about 15% of the PM by weight. The crystalline structure of the PM is retained after it is isolated from the bacteria and the BR molecules are still functional in an aqueous suspension of PM.
Expression System Genetic engineering of the wild type bop gene was done using pUC19 plasmids, E. Coli
XL-Blue cells and polymerase chain reactions (PCR). Primers containing the desired DNA sequence were ordered from Biosource in Camarillo, CA. The modified bop gene was cut and pasted into an expression vector for H.halobium. This expression vector contains the H. halobium
plasmid pUBP2 (obtained as a gift from M. Betlack). The selective marker is Mevr, a gene conferring resistance to the HMG-CoA reductase inhibitor mevinolin (6-alpha-methylcompactin) in H. halobium\r\. Mevinolin or lovastatin was obtained from an inexpensive commercial drug (Mevacor) manufactured by Merck Sharpe & Dohm. The pUBP2 plasmid containing the modified bop gene is used to transform L33 H. halobium cells which are bop minus.
H. halobium cells containing the modified bop gene were grown following the same protocol as that used to grow wild type BR (Becher and Cassim, 1975). Typical yields of mutant BR's in this system are about the same as that for wild type BR i.e. 10-20 mg/l. Mutant BR was 0-7803-4950-4/98/$10.00 1998 IEEE 322

BR's in this system are about the same as that for wild type BR i.e. 10-20 mg/l. Mutant BR was purified from the cells following previously established protocols for wild type BR (Becher and Cassim, 1975). Aqueous samples of mutant BR were prepared at a concentration of 0.8 mg/ml (OD=2).
Hyper-Rayleigh light scattering Hyper-Rayleigh light scattering from an aqueous PM suspension was used to measure
the hyperpolarizability, ß, of BR mutants relative to WT (3). Figure 1 shows the experimental apparatus. Determining the hyperpolarizability using light scattering from a PM suspension
PMT Detector I
Box Car Integrator
532 4n„an„e 1064 Aqueous „„ pass VM pass filter sample ,ilter
Nd-Yag Laser "7 ]/
Digital Storage
Oscilliscope
Figure 1 The hyper-Rayleigh light scattering apparatus is shown.
requires a knowledge of the PM size (Schmidt and Rayfield, 1994). This is because light scattered from different PM's is incoherent while light scattered by individual BR molecules in a PM is coherent. Initially, we assumed that the isolated PM patches all have the same size. However electron microscopy experiments showed that this was not so. Efforts to correct the data were difficult because of uncertainties in using an "average size PM". In order to overcome this problem we used detergent to solubilize all the PM fragments into BR monomers (Clays, et al., 1993). Determining the hyperpolarizablity using light scattering from BR monomers requires a knowledge only of the molar concentration. However, less light is scattered from the BR monomer solution and this requires an increase in the sensitivity of the experimental apparatus (Schmidt and Rayfield, 1994).
Results and Conclusions The hyperpolarizability of the following BR mutants was measured: G31R, G31R/D96N,
D38R, 38R/155D, L93T, G155D, E166G, Y185F. All the mutants except Y185F had ß=ß(WT). Y185F had a significantly larger hyperpolarizability than that of WT BR:
ß(WT) = 2.1 ± 0.4 x 10'27 esu
ß(Y185F) = 6.4 ± 0.1 x 10"27 esu
This is a significant increase for a material (BR) that already has a large hyperpolarizability compared to other materials and demonstrates the potential of genetic engineering to develop new NLO materials.
323

References
Aranda, F. J., D. V. G. L. N. Rao, C. L. Wong, P. Zhou, Z. Chen, J. A. Akkara, D. L. Kaplan, and J. F. Roach. 1995. Nonlinear optical interactions in bacteriorhodopsin using Z-scan. Opt. Rev. (1995 ). 2:204-206.
Becher, B. M. and J. Y. Cassim. 1975. Improved isolation procedures for the purple membane of Halobacterium Halobium. Prep. Biochem. 5:161-178.
Birge, R. R., P. A. Fleitz, A. F. Lawrence, M. A. Masthay, and C. F. Zhang. 1990. Nonlinear optical properties of bacteriorhodopsin : assignment of second order hyperpolarizabilities of randomly oriented systems using two-photon spectroscopy. Mol. Cryst. Liq. Cryst. 189:107-122.
Chen, Z., M. Sheves, A. Lewis, and O. Bouevitch. 1994. A comparison of the second harmonic generation from light-adapted, dark-adapted, blue, and acid purple membrane. Biophys. J. 67:1155-1160.
Clays, K., E. Hendrickx, M. Triest, T. Verbiest, A. Persoons, C. Dehu, and J. L. Bredas. 1993. Nonlinear optical properties of proteins measured by hyper-Rayleigh scattering in solution. Science (Washington. 262:1419-1422.
Downie, J. D. 1995. Optical logarithmic transformation of speckle images with bacteriorhodopsin films. Opt. Lett. 20:201-203.
Henderson, R., J. M. Baldwin, T. A. Ceska, F. Zemlin, E. Beckmann, and K. H. Downing. 1990. Model for the structure of bacteriorhodopsin based on high-resolution electron cryo-microscopy. J. Mol. Biol. 213:899-929.
Landau, E. M., G. Rummel, J. P. Rosenbusch, and S. W. Cowan-Jacob. 1997. Crystallization of a Polar Protein and Small Molecules from the Aqueous Compartment of Lipidic Cubic Phases. J. Phys. Chem. B. 101:1935-1937.
Lanyi, J. K. 1993. Proton translocation mechanism and energetics in the light-driven pump bacteriorhodopsin. Biochim. Biophys. Acta. 1183:241-261.
Lindvold, L. R. and P. S. Ramanujam. 1995. The use of bacteriorhodopsin in optical processing: A review. J. Sei. Ind. Res. 54:55-66.
Marder, S. R., L. T. Cheng, B. G. Tiemann, A. C. Friedli, M. Blanchard-Desce, J. W. Perry, and J. Skindhoj. 1994. Large First Hyperpolarizabilities in Push-Pull Polyenes by Tuning of the Bond Length Alternation and Aromaticity. Science. 263:511-514.
Oesterhelt, D., C. Braeuchle, and N. Hampp. 1991. Bacteriorhodopsin : a biological material for information processing. Q. Rev. Biophys. 24:425-478.
Schmidt, P. K. and G. W. Rayfield. 1994. Hyper-Rayleigh light scattering from an aqueous suspension of purple membrane. Applied Optics. 33:4286-4292.
324

ThCl 12:30pm - 2:30pm
A theoretical analysis of optical clock extraction using a self pulsating laser diode
P.Rees1, P.McEvoy2, A.Valle3,1.Pierce1, P.Spencer1, J.O'Gorman2, S.Lynch2, P.Landais2, L.Pesquera3 and J.Hegarty2
1 School of Electronic Engineering and Computer Systems, University of Wales Bangor, Dean Street, Bangor, Gwynedd, LL571UT, UK.
2 Optronics Ireland, Department of Physics, Trinity College Dublin, Dublin 2, Ireland
3 Instituto de Fisica de Cantabria, CSIC-UC Facultadde Ciencias, Avda. Los Castros s/n, E- 39005, Santander, Spain
The ever increasing demand for higher rates of data transfer has led to a significant research effort in the area of all optical communications. It is widely believed that the low cost and availability of certain types of self-pulsating laser diodes means that these devices will play a major role in all optical subsystems. The potential for optical clock extraction and clock distribution by the synchronization of a self pulsating laser diode (SPLD) has already been demonstrated [1,2]. In this paper we have used a standard model for a SPLD to examine the dynamics of the laser when an optical synchronizing signal is applied and how the synchronization is effected by changes in the optical input signal. This allows us to assess their potential for use in optical clock extraction subsystems and to optimize the laser operating conditions for low bit error transmission.
Self-pulsation occurs in compact disk (CD) lasers under normal dc biasing conditions due to saturable absorption [3]. The optical field in the electrically pumped active region of the laser expands and overlaps the neighboring unpumped regions, which act as a distributed saturable absorber. Self-pulsation occurs when the electric field overlaps a large enough portion of the saturation absorber. Carrier diffusion and gain guiding can also play an important role in the process. The photon and carrier dynamics of such a laser can be described using three rate- equations [3]. Two equations govern the rate of change of the carrier density in the central active region and the neighboring absorbing regions, while a third equation governs the rate of change of the photon density in the laser cavity. We have previously used this kind of calculation to successfully predict the behavior of the both electrical and optical synchronization of a compact disk (CD) self-pulsating laser diode [4,5].
In order to be able to read each data bit in an optical data signal the receiver must know the precise time at which to detect if the signal is '0' or '1'. The receiver must therefore produce a periodic signal of exactly the same frequency as the data stream which can trigger the detector. If a periodic optical signal is applied to a free-running IPLD then providing the power of the optical signal is sufficient and the difference between the applied and free running SPLD frequencies is not too great, the laser output will synchronize to the applied signal. We have investigated the possibility of synchronizing a SPLD to a received data stream and using the synchronized output of the laser diode to generate a clock in order to trigger the decision making process on each data bit.
First we investigate the effect of the application and removal of the optical synchronising signal on the dynamics of the CD laser output. Typical results are shown in figure 1 where a 2GHz optical signal is applied at pulse 20 and removed at pulse 100. We have plotted the instantaneous frequency versus the pulse number; the instantaneous frequency being the inverse of the time between successive pulses which allows us to monitor the laser output frequency on the pulse to pulse level. It is clear that when the optical signal is turned on, the frequency of the SP is
0-7803-4950-4/98/f 10.00 1998 IEEE 325

modified to the input frequency. When the applied signal and laser output pulses are unsynchronised the system cannot make a decision about any data bits received and so this gives an indication of how many redundant pulses must be sent before the data can be transmitted.
2.05
2.00
"sp
1.95
1.90 10 30 40 50
Pulse number
Fig. 1. The instantaneous self pulsation frequency is shown versus pulse number for three free running self pulsation frequencies of 1.922, 1.955 and 1.987GHz. The optical synchronisation signal of2GHz is applied at pulse 20 and removed at pulse 100.
We will outline our previous work [4] showing that a phase difference (time delay) exists between the input signal and the output pulse which is dependent on the input power and frequency detuning. The consequences of this phase difference on the performance of clock extraction sub system will be outlined in this presentation.
In figure 1 we show that when the synchronizing optical signal is removed the SPLD reverts back to it's free running pulsation frequency within a couple of pulses. Initially this would suggest that the laser can no longer be used to successfully produce a clock for the read process. Figure 2 shows the instantaneous phase difference between the input optical signal and die laser output after the synchronizing signal is removed at pulse number 100. We see that when the signal detuning is very small, the phase introduced between the signal and laser output is reasonably small thus avoiding read errors. This over simplifies the problem somewhat and we highlight what are the optimal properties of the data signal for efficient clock generation.
The effect of the detuning between the signal and free running self pulsation frequencies can be clearly seen in figure 1. In this presentation we will also demonstrate that increasing the power of the input signal reduces the time it takes for the laser to lock to the synchronizing signal which is desirable in order to reduce errors in clock extraction systems. We also identify a problem with achieving lock when the input signal is too powerful and so a precise operating signal power must be identified.
326

300 i
Zero Bit Pulse count
Fig. 2. The instantaneous phase difference between the input optical signal and the laser output after the synchronizing signal is removed at pulse number 25. Curves are shown for free running frequencies of 1.99, 1.996 and 1.9975GHz. The solid and broken lines represent results with and without the inclusion of spontaneous emission noise respectively.
Finally we including noise sources in the model and simulate the synchronization of a self pulsating laser diode to a pseudo random data signal in order to perform a full bit error calculation for the data signal using the clock generated by the laser diode. Our investigation enables us to make recommendations about the properties of the data signal relative to the laser output in order to reduce read errors due to a miss-timed clock.
1. P.E.Barnsley, G.E.Wickens, H.J.Wickes, and D.M. Spirit, "All-optical clock recovery from a 5GB/s RZ data signal using a self-pulsating 1.56um laser diode," IEEE Photonics Tech. Lett., Vol. 3, No. 10, pp. 942-945, 1991.
2. G.Farrell, P.Phelan, J.Hegarty and J.Shields "All-optical timing extraction with frequency division using a twin section laser diode," IEEE Photonics Tech. Lett., Vol. 5, No. 6, pp. 718- 721, 1993.
3. M.Yamada, "A theoretical analysis of self-sustained pulsation phenomena in narrow-stripe semiconductor lasers," IEEE Journal of Quantum Electron., Vol. 29, No. 5, pp. 1330-1336, 1993.
4. A.Egan, M.Harley-Stead, P.Rees, S.Lynch, P,McEvoy, J.O'Gorman and LHegarty, "All- Optical Synchronization Of Self-Pulsating Laser Diodes", Appl. Phys. Lett. Vol.68, No.25, pp3534-3536, 1996.
5. A.Egan, MHarley-Stead, P.Rees, S.Lynch, J.O'Gorman and LHegarty, "An experimental and theoretical analysis of jitter in self-pulsating lasers synchronised to periodic electrical signals", IEE Photonics Tech. Lett., Vol. 8, No. 6,, pp, 758-760, 1996.
327

ThC2 12:30pm - 2:30pm
Self-Consistent Analysis of Nonlinear Multimode Dynamics in External Cavity
Laser Diodes
P.S.Spencer, P.Rees, I.Pierce and K.A.Shore
University of Wales, Bangor, School of Electronic Engineering and Computer Systems,
Bangor, U.K. LL57 1UT.
Semiconductor lasers exposed to external optical feedback have been found to ex- hibit a wide variety of behaviour. In particular dramatic spectral broadening has been observed over a large range of feedback levels. This phenomenon, commonly referred to as Coherence Collapse, [1], has been found to be a consequence of chaotic dynamics.
Experimentally, back reflections of the order of 10~4 of the emitted power have been found to be sufficient to induce Coherence Collapse. Typically the laser's linewidth broadens from a few MHz to a few tens of GHz [2]. This vulnerability places severe demands on the optical isolation required for applications, like coherent communication systems, that require narrow linewidth operation. However, coherence collapse is not always detrimental; for example, it is an essential ingredient in chaotic data encryption schemes for secure data communication.
Semiconductor lasers subjected to external optical feedback have also been stud- ied from a more fundamental perspective because they are an important example of an active type of delayed feedback system, with behaviour quite different from other well known nonlinear dynamical systems, (eg. Ikeda system, [3]). The phase space associated with a delayed feedback system is of infinite dimension, which makes an- alytic investigations very difficult. Consequently, in order to gain insight into the behaviour of the system theoretical investigations have usually been based around the Lang-Kobayashi rate equations for a single longitudinal mode laser [4,5]. Alternative single mode models have also been used and have shown good qualitative agreement with the Lang-Kobayashi model and experiment, [6]. However, the broad gain band- width and weak longitudinal mode selection of conventional Fabry-Perot semiconductor lasers ensures that, experimentally they operate in a multi-mode manner, i.e. several longitudinal modes läse simultaneously.
Recently, considerable debate has arisen concerning the validity of the single mode models and their ability to fully describe all the relevant dynamics of the configura- tion. Particular attention has been focussed on the Low Frequency fluctuations (LFF) observed in the coherence collapse regime when laser diodes are biased near threshold
0-7803-4950-4/98/$10.00 1998 IEEE 328

[7]. Some experimental results have indicated that LFF is a multi-mode phenomenon [8], while others have indicated a single mode nature [7,9].
The few multi-mode theoretical studies that have been undertaken have used models that generally ignore any interaction between the modes, and use phenoraenological models to describe the phase-amplitude coupling present in semiconductors [6,10-12]. These models neglect the complicated inter-dependence of the optical susceptibility and longitudinal modes of the optical cavity. In particular, the models ignore the frequency dependence of the phase-amplitude coupling and the effect of spectral hole burning on the gain. Both features need to be addressed to obtain a better description of multi-mode laser diode dynamics.
The model presented in this paper views the system as a coupled-cavity problem, and self-consistently calculates the longitudinal modes of the cavity and the optical susceptibility. The optical susceptibility is calculated over the full frequency range of expected optical cavity modes and includes many-body effects [13]. In this way the evolution of the mode spectrum from spontaneous emission can be obtained.
The model is applied to a specific topical phenomenon—the observation of low frequency fluctuations, and the results are compared with those of single mode models, in order to assess the importance of multi-mode effects on LFF dynamics.
References
[1] D.Lenstra, B.H.Verbeek, and A.J.den Boef, "Coherence collapse in single mode semiconductor lasers due to feedback," IEEE J. Quant. Elec, QE-21, 674-679, (1985).
[2] P. Besnard, B. Meziane, and G.M.Stephan "Feedback phenomena in a semiconduc- tor laser induced by distant reflectors," IEEE J, Quant. Elec, QE-29, 1271-1284, (1993).
[3] M.Le Berre, E.Ressayre, A.Tallet, and H.M.Gibbs, "High-dimension chaotic at- tractors of a nonlinear ring cavity," Phys. Rev. Lett., 56, 272-277, (1983).
[4] R.Lang and K.Kobayashi, "External optical feedback effects on semiconductor injection laser properties," IEEE J. Quant. Elec, QE-16, 347-355, (1980).
[5] P.M.Alsing, V.Kovanis, A.Gavrielides, and T.Erneux, "Lang and Kobayashi phase equation," Phys. Rev. A., 53, 4429-4434, (1996).
[6] P.S.Spencer and K.A.Shore "Multi-mode iterative analysis of the dynamic and noise properties of laser diodes subject to optical feedback," J. Euro. Opt. Soc B, 9, 819-830, (1997).
[7] G.H.M. van Tartwijk, A.M.Levine and D.Lenstra, "Sisyphus effect in semiconduc- tor laser with optical feedback," IEEE J. Sei. Topics Quant. Elec, 1, 466-472, (1995).
329

[8] G.Huyet, S.Hegarty, M.Giudici, B.De Bruyn and J.G.McInemey, " Statistical properties of the dynamics of semiconductor lasers with optical feedback," Eu- rophys. Lett., 40, 619-624, (1997).
[9] I.Fischer, G.H.M. van Tartwijk, A.M.Levine, W.Elsasser, E.Gobel, and D.Lenstra, "Fast pulsing and chaotic itinerancy with a drift in the coherence collapse of semiconductor lasers," Phys. Rev. Lett., 76, 220-223, (1996).
[10] A.T.Ryan, G.P.Agrawal, G.R.Gray, and E.C.Gage "Optical-Feedback-Induced Chaos and its control in multimode semiconductor lasers," IEEE J. Quant. Elec, QE-30, 668-679, (1994).
[11] M.Homar, J.V.Moloney and M. San Miguel, "Travelling wave model of a multi- mode Fabry-Perot laser in free running and external cavity configuration," IEEE J. Quant. Elec, QE-32, 553-566, (1996)
[12] S.E.Hodge, M.Munroe, J.Cooper, and M.G.Raymer, "Multimode laser model with coupled cavities and quantum noise," J. Opt. Soc. Am. B, 14, 191-199, (1997).
[13] H.Haug and S.W.Koch, "Quantum theory of the optical and electrical properties of semiconductors" World Scientific:Singapore, (1990).
330

ThC3 12:30pm - 2:30pm
Modelling Pulse Propagation in Optical Communication Systems using Wavelets
I. Pierce, P. Rees, P.S. Spencer and K.A. Shore University of Wales, Bangor
School of Electronic Engineering and Computer Systems Bangor, Gwynedd LL57 1UT
United Kingdom email: [email protected]
tel: +44 1248 351151 x 2719 fax: +44 1248 361429
The process of designing optical communication systems requires extensive simulations of the effect of system components such as optical fibres and semi- conductor optical amplifiers on the propagating pulses. Optical fibres introduce loss, group velocity dispersion and self-phase modulation due to the nonlinear refractive index. These effects are described by the nonlinear Schrödinger equa- tion [1]. Semiconductor optical amplifiers (SOAs) lead to pulse shaping in the time domain, and to changes in the pulse spectrum. Pulse shaping in SOAs is described in this work by an extension of the nonlinear Schrödinger equation proposed by Hong et. al. [2]. The split-step Fourier method [1, 3] is the method of choice for solving the nonlinear Schrödinger equation at present, due mostly to the existence of fast algorithms for performing the discrete Fourier transform. This paper describes an alternative solution method based on wavelets and the fast wavelet transform.
The transform at the heart of the algorithm splits a signal into 'wavelets' rather than frequencies that stretch over the whole width of the signal [4, 5]. Some wavelets in a basis set are broad, with only a few required to cover the whole pulse width and correspond to a large scale approximation of the signal. Other wavelets are narrow and only cover a small fraction of the same time in- terval, and correspond to local, high-frequency details in the signal. A strength of this representation is that only a subset of the possible wavelets are required to adequately describe an optical signal. The wide wavelets give a large scale ap- proximation, which is refined only where needed by smaller scale, narrow wavelets. This means that the wavelet tranform of an optical signal is a sparse representa- tion.
When a signal is represented by N samples the FFT method is executed in 0{Nlog N) operations. In contrast the present method requires 0{N) operations [6] with an associated speed advantage.
Figure 1 shows the wavelet-calculated evolution of a 1.55/xm wavelength hy- perbolic cosecant pulse of initial width 5 x 10_11s and inital power lO.OmW along
0-7803-4950-4/98/$10.00 1998 IEEE 331

125km of standard communications fibre. It shows reduced pulse broadening com- pared with a purely dispersive analysis due to the combined effects of anomalous dispersion and self-phase modulation. These results are in close agreement with those obtained from the split-step Fourier method.
Figure 2 shows the wavelet-calculated output of an SOA (whose parameters are given in [2]) for a hyperbolic cosecant input pulse. This result is again in close agreement with the Fourier method, as reported in [7].
This paper presents results from a wavelet based model for pulse propagation in optical fibres and semiconductor optical amplifiers that agree closely with split- step Fourier results. The propagation is simulated with O(N) computational complexity compared with the 0(N\ogN) complexity of fast Fourier transform based methods, yielding a possible speed advantage, especially if JV is large. The method could be extended to other optical communications components, e.g. the Ginzberg-Landau equations for propagation in fibre amplifiers [1].
References
[1] G. P. Agrawal. Non Linear Fiber Optics. Optics and photonics series. Aca- demic Press Inc., second edition, 1995.
[2] M.Y. Hong, Y.H. Chang, A. Dienes, J.P. Heritage, and P.J. Delfyett. Subpi- cosecond Pulse Amplification in Semiconductor Laser Amplifiers: Theory and Experiment. IEEE Journal of Quantum Electronics, 30(4):1122-1131, 1994.
[3] R.H. Hardin and F.D. Tappert. Application of the Split-Step Fourier Method to the Numerical Solution of Nonlinear and Variable Coefficient Wave Equa- tions. SIAM Rev. Chronicle, 15:423, 1973.
[4] G. Kaiser. A Friendly Guide to Wavelets. Parkhäuser, 1994.
[5] G. Strang and T.Q. Nguyen. Wavelets and Filter Banks. Wellesley Cambridge Press, 1996.
[6] G. Beylkin, R. Coifman, and V. Rokhlin. Fast Wavelet Transforms and Numerical Analysis I. Comm. on Pure and Applied Mathematics, XLIV:141- 183, 1991.
[7] I. Pierce and K.A. Shore. Modelling Pulse Propagation in Semiconductor Optical Amlpifiers using Wavelets. To appear in IEE Proc. Optoelectronics, February 1998.
332

z(km) 0 0 t(sec)
Figure 1: Pulse propagation in optical fibre.
Time (ps)
Figure 2: Semiconductor optical amplifier output pulse.
333

ThC4 12:30pm - 2:30pm
Spatial soliton arrays in a ring shaped complex nonlinear medium
D. Arbel, J. Scheuer and M. Orenstein Department of Electrical Engineering, Technion, Haifa 32000, Israel
Tel. 972-4-8294696, Fax. 972-4-8323041, E-mail: [email protected]
Spatial solitons were extensively studied in Kerr like media[l]. Here we explore solitons evolution in media characterized by a complex non-linearity. Specifically, we choose to model solitons formation in semiconductor lasers where both gain and index of refraction are nonlinear. Vertical cavity surface emitting laser (VCSEL) is an ideal micro-laboratory to test the formation of the spatial soliton arrays - since the VCSEL can be shaped in arbitrary 2D forms, supports a single longitudal mode and has high internal light intensity due the high quality mirrors. A related subject of filamentation in broad area semiconductor lasers was studied in the past years [e.g. 2-5] attributing the main nonlinear mechanism to the gain saturation (spatial hole burning). Here we show that as a result of this mechanism - a ring VCSEL has two thresholds - the first is the lasing threshold and the second is the solitonic threshold, where the VCSEL switches to be a soliton laser.
We modeled the evolution of spatial solitons in the semiconductor laser medium using the ID wave equation which is applicable for large enough ring shaped lasers. The paraxial wave equation, which is applicable for the VCSEL geometry, is written for the electrical field:
<3i / <?2E IT-I2
T- lr i T-, knn, 1^12^ /\ ä-sx^-ik»n'iEi E-ife.-«-]-E~j[
i-l=l E 0)
where ko is the wave number, n0 - the linear index of refraction, R - the anti-guiding factor and atot - the loses. g0 is the unsaturated gain defined as #o(Np)=ra:-(Np -N0) where T is the confinement factor, a - the differential gain,
Np - the carrier density due to the pump and N0 - the carrier density for transparency.
n2 the effective nonlinear refraction index is given by n2 = — ? where Isat is the 2k0Isat
saturation energy - Isat = hv/(rarsp).
Equation (1) is similar to the conventional nonlinear Schrodinger (NLS) equation, however in addition to the self phase modulation (self focusing) compensation of the diffraction terms, the gain hole-burning has to be compensated as well. This equation exhibits solitary wave solutions, which are not the conventional sech functions and due to the nonlinear gain, they have a non-uniform phase profile. A surprising feature of Eq. (1) is that although it is based on a self-focusing term (n2>0), it supports also dark solitary wave solutions:
0-7803-4950-4/98/$10.00 1998 IEEE 334

E^M^A-sech^ 'x"l in2k0A<i+-l-].z 3R-V9R2+8 I 3„Rj M = VWs^
Edark(x>z)=Btanh
4k„n
'x>
vwsy
f .. "N •sech c-vo
vw*y
2k0n2B ,2 3R + V9R2+8 M Q{ W J ^ = (2)
go «« 3R A2' (AWJ="2^ 2knnnn 0"0"2
S.-«,„ = ^B>, (BwJ=#4 2k0n0n2
A, B and ws are the solitons amplitudes and width respectively, n can be interpreted as the chirp parameter of the soliton. The solitary wave intensity and phase distributions are depicted in Fig. (1).
In Eq. (1) has also a uniform steady state solution- |A0| = -y/R-(g0 -atot)/2k0n
order to find the soliton formation threshold we analyzed the stability of the uniform solution to small spatial harmonic perturbation. A field component with a spatial frequency k will experience modulation instability (MI) if it is lower than a certain frequency kmaX, which depends on the pumping and laser parameters:
•^rnax < no'C0 (go a„ T) (3)
Thus we see that a necessary condition for achieving the solitonic threshold is R>1, satisfied by all semiconductor lasers, however may be not satisfied for other types of lasers. Furthermore - in a ring, due to the cyclic boundary conditions, only discrete spatial frequencies are supported with a minimal frequency of kmin -2K 11 where 1 is the laser's perimeter. For low injected currents, kmin will exceed the kmax
value and the soliton threshold will not be reached.
Figure 2 shows BPM simulation of Eq. (1) when the current is below the solitonic threshold. The perturbed electric field reached a uniform steady state distribution and in Fig. 3 - the BPM simulation above the solitonic threshold evolved into four oscillating solitons.
All the above predictions were tested and verified experimentally. The near-field intensity pattern emerging from a proton implanted ring shaped VCSELs (20-40um in diameter) with three 8nm Ino.2Gao.8As QW, emitting at -0.95 (im [6] were monitored. The near-field patterns were examined at room temperature under pulsed operation.
A non solitonic near-field was registered until the injected current was increased to -1.5 times the threshold current. Then the pattern switched to ordered arrays of solitons - equally spaced on the ring perimeter and with equal width. As the current was increased, the number of solitons in the array increased, but not monotonically. The number of the spatial solitons was always even, implying a % phase shift between two solitons. Fig. 4 shows the near-field intensity pattern of 40um and 28jam diameter lasers recorded at various currents. In Fig. 5 we plot the width of solitons in the cyclic solitonic array, predicted analytically by the above theory (formula will be given in the talk) and compared to the measured values, as a function of the injected current. Again - a good match is demonstrated. References:
[1] A.H. PaxtonandG. C. Dente, J. Appl. Phys. 70, 2921 (1991).
335

[2] H. Adachihara, O. Hess, E. Abraham, P. Ru and J.V. Moloney, J. Opt. Soc. Am B. 10, 658 (1993).
[3] J. R. Maricante and G. P. Agrawal, IEEE J. Quantum Electron. 32, 590 (1996).
[4] J. R. Maricante and G. P. Agrawal, Appl. Phys. Lett. 69, 593 (1996).
[5] J. R. Maricante and G. P. Agrawal, IEEE J. Quantum Electron. 33,1174 (1997).
[6] P. Coullet, L. Gill, and F. Rocca, Opt. Commun., 73 (1989) 403.
0.45
0.4
0.35
5 0.3 < "0.25
-300 -200 -100 0 100 200 300 um
Figure la - Bright soliton; Amplitude (solid) and phase (dashed) distributions
| 0.2
I 0.15 < 0.1
0.05
0
l\ n / <i /i/ /i '/ ''
\ 1 I \ .VI ' ' * I 1 \ '/ 'i
■1 ' \ \
V 1 \ \ /i /I' > 1 \ \ --'/ : / ! * 1 » \ / ! ' * 1 » \ / ! ' * ^ \ / ' > \ \ / ' ' ' \ \ \ / ' ' / * » \ / i / i /
\ » \ / i / i >. ,1 v \ 1 i / i' V \ \ / i' i' 1 VV. / 1' 1
Rads
3
2
1
0
-1
-2
-3
-300 -200 -100 0 100 200 300 um
Figure lb - Dark soliton; Amplitude (solid) and phase (dashed) distributions
Transverse axis
'"" ü Propagation distance [urn] xio" Figure 2 - Stability for current below the solitonic threshold, Isat
=20, 1=100, g0=0.0101, atot=0.01
-so Transverse coordinate °
[u.m] so
1 1.5 2 2.5 3 Figure 3 - Stability at current above the solitonic threshold
3.5 Propagation
distance [cm]
28um
40um
Ilh=40mA I/Ith=l.5,n=24 I/Ith=2.5, n=30 I/Ith=3, n=38 Figure 4 - Ring VCSEL near-field patterns - experimental results
336
A 40(xm ring • 28|im ring
3ßV" l4
16 18 Theory
0.5 1.5 l/(I/Ith-l)
1/2
Figure 5 - Soliton width - Theory Vs. Experiment

ThC5 12:30pm - 2:30pm
Saturation and oscillation of SBS reflectivity in fiber phase conjugators
HJ. Eichler, B. Liu, O. Wittler, Q. Zhu
Optisches Institut, Technische Universität Berlin, Strasse des 17. Juni 135, D-10623 Berlin, Germany
(telephone: +49-30-31422498; fax: +49-30-31426888)
Undoped multimode quartz fibers based on stimulated Brillouin-scattering (SBS) are effective
phase conjugators with low power threshold and high fidelity in a broad wavelength range
from the near infrared over the visible down to the near ultraviolet [1-3], offering a good
alternative to fluid and gaseous SBS-media that are toxic or operated under high pressure.
In the first investigation of fiber phase conjugators for input pulses with a coherence
length of about 50 cm at 1064 nm wavelength [1], saturation of the SBS reflectivity was
observed at a value of about 50 %, not considering the reflection losses on the fiber surface.
The following investigation of temporal and spectral structures of the transmitted and
reflected light from fiber phase conjugators indicates that saturation of SBS reflectivity is due
to oscillations in the temporal structure of the SBS reflected and transmitted light.
Experimental results
Commercial all-silica multimode glass fibers with a step-index structure, core diameters of
100 um and 200 urn and cladding diameters of 110 urn and 220 urn were used. The numerical
aperture NA is 0.22. The lengths of both investigated fibers were more than 2 m. A third all-
silica multimode glass fiber with a tapered structure from a core diameter of 400 urn tapered
down to 100 urn over 1 m length and a corresponding cladding diameter of 440 urn down to
110 urn was also investigated. The numerical aperture NA of the non-tapered end is 0.22. The
whole length of the tapered fiber is 2 m.
Fig. 1 shows the experimental set-up. The laser system for the measurement of SBS
parameters at 1064 nm was described already in Ref. 1. The spectrum of a SBS-reflected
beam at 1064 nm was resolved with Fabry-Perot-Interferometer and a CCD camera. Also by
the fiber phase conjugator transmitted radiation was investigated by these devices.
The saturation behavior of the SBS reflectivity was observed for all investigated fibers.
However, the incident powers for the on-set of the saturation and the saturation reflectivities
were different depending on the pulse width of incident beams and fiber parameters.
0-7803-4950-4/98/$10.00 1998 IEEE 337

Oscillator- Amplifier-System
X,=1064nm, E=1-30mJ T™Hu=31ns Lcoh>20cm
SHG up to 10mJ THG up to 2mJ
Glan- Taylor- Faraday-
Polarisator Rotator 21
/■
HR (532nm, 45°)
Wedge | \ Plate I \
D3 1 '* E.
~7 KTP
/ HR (1063 nm, 45°)
Fabry-Perot- Interferometer
V41 fl CCD u Telescope Filter Imaging
Lens
Fig. J: Experimental set-up
Fig. 2 shows the Fabry-Perot ring patterns of both the transmitted pulse and the SBS
reflected pulse for the 100 ^m fiber. The two ring systems of the transmitted and the SBS
reflected pulses are shifted against each other with a frequency difference of 16 GFiz, which
corresponds to the Brillouin shift of quartz. Furthermore, two additional weak rings with a
larger frequency and a smaller frequency of about ±16 GHz were observed for the transmitted
pulse. These frequency components are related to reflections of the fiber surfaces and the
excited sound wave. Second order SBS could not be observed in the interference ring pattern
of the transmitted pulse, because no ring with a frequency shift of 32 GHz was present. This
implies that the reflectivity saturation of fiber phase conjugators is not due to the generation of
second order SBS. Similar results were also obtained with the 200 urn fibers.
reflected transmitted
x[rrm]
Fig. 2: Interference ring patterns of both the transmitted pulse and the SBS reflected pulse
338

Fig. 3 shows that the time resolved structure in the transmitted and reflected pulses for
the tapered fiber for different powers of 30 ns long incident pulses. More complicated time
structures were observed with the 200 urn fiber for a longer incident pulse. This is probably
due to the fact that the SBS process can be excited several times insidi the fiber at an increasing input power, which may result in a less efficient conversion of input energy into the
reflected pulse.
reflected transmitted
13
CO c
Incident fl Power \
133 kW I
t 16ns
I \ 10ns
75 kW V
■ ■ 0.00 0.04 0.08 0.12 0.00
Time [us] Time [ps]
Fig. 3: Temporal structures of the transmitted and the SBS reflected pulses
at input powers of 75 and 133 kW
The observed oscillation of the power of the reflected pulse has been observed in a
theoretical analysis on pulse compression in waveguides [4],
References 1. HJ. Eichler, J.Kunde, B.Liu, Opt. Comm. 139,327-334(1997)
2. H.J. Eichler, J. Kunde, B. Liu, Opt. Lett., Vol. 22, No. 8, 495-497 (1997) 3. H.J. Eichler, J. Kunde, B. Liu, CLEO/Pacific Rim'97, Technical Digest, 114-115 (1997)
4. M.J. Damzen, H. Hutchinson, J. Quantum Electron. QE-19, 7-14 (1983)
339
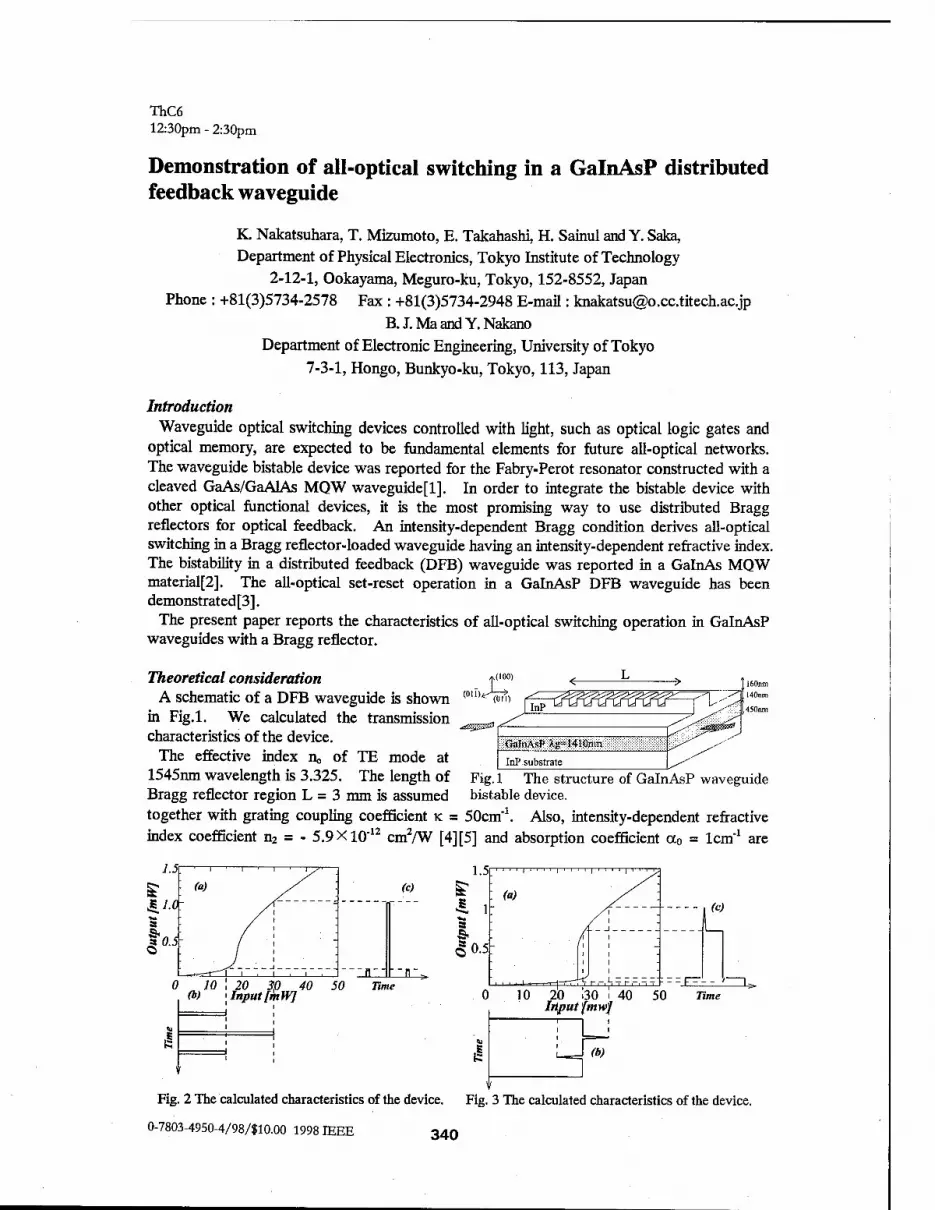
ThC6 12:30pm - 2:30pm
Demonstration of all-optical switching in a GalnAsP distributed feedback waveguide
K. Nakatsuhara, T. Mizumoto, E. Takahashi, H. Sainul and Y. Saka,
Department of Physical Electronics, Tokyo Institute of Technology
2-12-1, Ookayama, Meguro-ku, Tokyo, 152-8552, Japan
Phone : +81(3)5734-2578 Fax : +81(3)5734-2948 E-mail: [email protected]
B. J. Ma and Y. Nakano
Department of Electronic Engineering, University of Tokyo
7-3-1, Hongo, Bunkyo-ku, Tokyo, 113, Japan
Introduction Waveguide optical switching devices controlled with light, such as optical logic gates and
optical memory, are expected to be fundamental elements for future all-optical networks. The waveguide bistable device was reported for the Fabry-Perot resonator constructed with a cleaved GaAs/GaAlAs MQW waveguide[l]. In order to integrate the bistable device with other optical functional devices, it is the most promising way to use distributed Bragg reflectors for optical feedback. An intensity-dependent Bragg condition derives all-optical switching in a Bragg reflector-loaded waveguide having an intensity-dependent refractive index. The bistability in a distributed feedback (DFB) waveguide was reported in a GalnAs MQW material[2]. The all-optical set-reset operation in a GalnAsP DFB waveguide has been demonstrated[3].
The present paper reports the characteristics of all-optical switching operation in GalnAsP waveguides with a Bragg reflector.
A(I00 (100)
(ÖM) JlnP =?V
ifiatnAsP *.g»t410nm:
160nm
I40nm
Theoretical consideration A schematic of a DFB waveguide is shown
in Fig.l. We calculated the transmission characteristics of the device.
The effective index no of TE mode at | inPsubstrate 1545nm wavelength is 3.325. The length of Fig. 1 The structure of GalnAsP waveguide Bragg reflector region L = 3 mm is assumed bistable device. together with grating coupling coefficient K = 50cm"1. Also, intensity-dependent refractive index coefficient n2 = - 5.9 X10"12 cm2/W [4][5] and absorption coefficient a0 = 1cm"1 are
0 10 \ 20 30 40 0» i Input [mW] 10 20 i30 i 40
IrtputfmwJ
Fig. 2 The calculated characteristics of the device. Fig. 3 The calculated characteristics of the device.
0-7803-4950-4/98/$10.00 1998 IEEE 340

assumed. The calculated transmission characteristic for detuning An/no = -0.037% is shown in Fig.2 as
a function of input power together with the corresponding threshold operation. Fig. 2(b) shows temporal input light waveform which includes pluses with different amplitude. High and low pulses have peak power of 30 and 15 mW, respectively. The lower one gets suppressed as shown in the output waveform (Fig. 2(c)).
Fig. 3 shows a typical bistable characteristic as a function of input intensity together with the corresponding set-reset operation. The detuning An/no is assumed to be -0.0365%.
Optical fiber Experiment The device is fabricated using a
GalnAsP/InP wafer, in which a 300 nm- thick InP upper cladding layer and a 450 nm-thick GalnAsP \Xg =1410 nm) guiding layer are grown on a (100) InP substrate. After the grating pattern was produced by the electron beam exposure technique, it was transferred on the cladding layer by CH4/H2-RIE. The grating periodicity and depth are 233nm and 50nm, respectively. The strip-loaded waveguide with 160 nm strip height was also fabricated using the Fig. 4 Experimental setup for the observation electron beam exposure procedure followed of optical bistability in GalnAsP DFB byCH4/H2-RIE. waveguide
The intensity-dependent transmission characteristic of a completed device was measured. The experimental set-up is shown in Fig. 4. We used a CW tunable semiconductor laser as a light source. An electro-optic modulator was used to generate a desired temporal pulse pattern. The generated input pulse stream was amplified by EDFA. The input power is estimated by taking into account the coupling loss between a fiber and a waveguide and the branching ratio of fiber coupler. The waveguides were mounted on a Cu heat sink whose temperature was maintained at 20 °C.
Fig. 5 shows the temporal profile of input and transmitted light observed in a 1.5 |j.m-width
80
^ 60-
a 40-
20-
£0.8 Ü0.6-
(a)
■(b)
'A =1543.80nm '
;.. JU^JL4^J|JU^
—**~~*J 200 W^-ggr ~40~0 600
Time [ns]
U»-I>A»»J^JL»M«
800
1.0-
I0-5 a O
0
Waveguide width = 1.5 [ßm]
'A =1543.88 [nm] LGrating=2.8 [mm]
o
/? =1543.80 [nm]
60
Fig. 5 Measured (a) input and (b) output temporal waveforms.
20 40 Input [mW]
Fig. 6 Dependency of the transmitted peak power on the corresponding input peak power at 1543.88nm (closed circle) and 1543.80nm(open circle)
341

waveguide at 1543.80nm wavelength. It is clearly shown that all-optical threshold operation was obtained. The transmitted output peak power of the input pulse with high peak power is 0.7 mW and that of low peak power input pulse is less than 0.1 mW, respectively. The temporal width of pulses is 8 nsec. The transmission spectrum for low input power has a stopband with a center wavelength of 1543.36 nm and a width of 0.95 nm (-lOdB). Wavelength dependence of input-output characteristic was also examined. It is concluded that the device does exhibit optical threshold operation due to the intensity-dependent Bragg condition. Fig. 6 shows the dependency of the transmitted peak power on the input peak power observed at 1543.88nm and 1543.80nm. It is found that threshold input power observed at 1543.88nm wavelength is less than at 1543.80nm, since 1543.88nm wavelength is closer to the stop band edge.
Fig. 7 shows the all-optical set-reset operation having the lowest off-state of transmitted light. The waveguide width of the device is 2.0 |im. The temporal profiles of input and transmitted light are observed at 1544.88 nm wavelength. The transmitted output power holds on- state (0.15 mW) after being switched with set pulses. After being switched with reset pulses, the transmitted light is well suppressed. The temporal width of set and reset pulses is 8 nsec. Wavelength dependence of input- output characteristic was also examined. It is concluded that the device does exhibit optical bistability due to the distributed feedback structure.
400 600 Time [ns]
Fig. 7 Measured waveforms.
(a)
400 600 800 Time [ns]
input and (b) output temporal
Conclusions
All-Optical threshold operation and set-reset operation are successfully demonstrated in a GalnAsP waveguide with a Bragg reflector. Further study toward improving the on-state transmittance is now under way.
References [1] P. Li Kam Wa, P. N. Robson, J. P. R. David, G. Hill, P. Mistry, M. A. Pate, J. S. Roberts,
Electronics Letters Vol., 22, No. 21, pp. 1129-1130, (1986). [2] C. Coriasso, D. Campi, C. Cacciatore, L. Faustini, G. Leo, F. Buscaglia, C. Rigo and A. Stano,
"Butterfly bistability in an InGaAs/InP multiple-quantum well waveguide with distributed feedback," Appl. Phys. Lett., Vol. 67, No. 5, pp. 585-587, (1995).
[3] K. Nakatsuhara, T. Mizumoto, R. Munakata, Y. Kigure and Y. Naito, IEEE Photon. Tech. Lett., Vol. 10, No. 1, pp.78-80, (1998).
[4] K. Nakatsuhara, T. Mizumoto, R. Munakata, Y. Kigure and Y. Naito, OECC'96(Optoelectronics and communications conference, July, 1996, Chiba, Japan), 18P-13
[5] C. Aversa, J. E. Sipe, M. Sheik-Bahae, and E. W. Van Stryland, Physical Review B, Vol. 50, No. 24, pp. 18073-18082, (1994).
342

ThC7
12:30pm - 2:30pm
All-solid-state tunable ultraviolet Ce activated fluoride laser systems directly pumped
by the fourth and fifth harmonic of Nd:YAG lasers
Zhenlin LIU, Hideyuki OHTAKE, and Nobuhiko SARUKURA Institute for Molecular Science (IMS), Myodaiji, Okazaki 444, Japan
Telephone: +81 564 55 7480 Facsimile: +81 564 53 5727 e-mail [email protected] Mark A. DUBINSKII
USAF Research Laboratory AFRL/SNJT, 2700 D Street, Suite 2, Wright-Patterson AFB, OH 45433-7405,
Ravü Yu. ABDULSABIROV and Stella L. KORABLEVA Kazan State University, Kremlevskaya Street 18, 420008 Kazan, Russia
New solid-state tunable ultraviolet laser materials based on Cerium activated fluoride crystals have been extensively studied for practical laser systems. Their wide tunability is attractive for ultrashort pulse generation and amplification just like Ti:sapphire lasers. In this sense, Ce-activated fluoride lasers such as Ce3+:LiCaAlF6 (Ce:LiCAF) 1 and Ce3+:LiLuF4 (Ce:LLF) 2 in the ultraviolet region can potentially be the second core ultrafast lasers. Among all such known laser media, only Ce:LiCAF and Ce:LiSAF are suitable for direct excitation by solid-state lasers, and their practical tuning region is 280 to 315 nm. Ce:LLF which we recently found to be pumped with the fifth harmonic of Nd:YAG lasers instead of KrF excimer lasers has a longer-wavelength tuning region of around 308 to 330 nm. They are attractive for spectroscopy of wide band-gap semiconductors such as GaN used for the blue laser diodes and laser radar application for the environmental measurements. Moreover, the fifth and fourth harmonic of Nd:YAG lasers for the pumping sources of these new laser media have become practical due to the improved efficiency and stability, with the recent development of new nonlinear borate crystal materials such as CsLiBöOlO and Li2B407. In this presentation, we will report tunable short pulse generation from Ce:LiCAF and Ce:LLF laser systems and deep ultraviolet light generation by sum- frequency process.
Ce:LiCAF and Ce:LLF have large effective gain cross-section compared with Ti:sapphire, which is favorable for oscillators. They have larger saturation fluence (-100 mJ/cm2) compared with organic dyes, which is attractive feature for power amplifiers. Their bandwidth is large enough to sustain 10-fsec pulse generation and amplification. However, direct ultrashort-pulse generation has not been obtained from these ultraviolet solid-state lasers as it has been for near infrared tunable laser materials such as Ti:sapphire. This is due to the difficulty of obtaining CW laser operation, which is required for Kerr lens mode-locking schemes. Therefore, we have chosen completely different approach by constructing low-Q short cavity laser. The 0-7803-4950-4/98/110.00 1998 IEEE 343

experimental setup of the low-Q, short-cavity Ce:LiCAF and Ce:LLF lasers are shown in Fig. 1. The Ce:LiCAF laser consisted of a Littrow prism with a high reflection coating at one face used as the end mirror and a 10-mm-long Brewster-cut Ce:LiCAF crystal (Fig. la). The 266-nm pulses from a Q-switched Nd:YAG laser were focused longitudinally from the output mirror side. The Ce:LLF crystal was cut to form a cylinder with a flat polished window on the side (Fig. lb). To increase the efficiency of side pumping, we geometrically reduced the effective pumping penetration depth using the novel tilted-incidence-angle side pumping scheme. Using a cylindrical lens also tilted to be parallel to the side window of the laser crystal, the pumping pulse at 213 nm was focused down to a line-shaped area at a 70-degree incidence angle. The obvious advantages of the above-mentioned tilted-incidence- angle, side-pumping scheme are very simple focusing geometry, reduced pumping fluence at the rod surface, and reduced risk of damaging optics. Under the appropriate pumping fluence control, satellite-free tunable subnanosecond pulses (Ce:LiCAF 700 ps, Ce:LLF 880 ps) were observed from the spectrally and temporally resolved streak camera image in both cases. (Tunability is shown in Fig. 2) 3
For obtaining higher energy, we designed Ce:LiCAF MOPA system using a similar Ce:LiCAF laser as a master oscillator stage. The power amplifier with 20-dB small-signal gain was designed with a confocal double-pass configuration. The pumping source of the amplifier was another Q-switched Nd:YAG laser operated synchronously to the Nd:YAG laser for pumping the oscillator. -40 mJ, 266-nm pulses from each side were weakly focused. The amplifier consisted of a gain medium located at the beam waist of a confocal lens pair and a roof-reflector for a small vertical displacement of each pass. This configuration allowed the signal beams from different passes to overlap well in a small pumped region. The 1.0-nsec, 1-mJ input pulse was amplified up to 14-mJ with 14 MW peak power. The energy- extraction efficiency in the amplifier stage exceeded 18%, which is sufficient for practical use. 4
For generating much shorter wavelength, we have also developed another Ce:LiCAF MOPA system pumped with a single Nd:YAG laser (40 mJ, @266nm). The demonstrated tuning range was 281 nm to 314 nm with 4 mJ after the double- pass amplifier. The tuning from 223 nm to 232 nm was realized by the sum- frequency-mixing of the Ce:LiCAF laser and the Q-sw Nd:YAG laser using a 45- degree cut BBO crystal. 5
In conclusion, we have demonstrated the direct generation, efficient amplification, and SFG of tunable UV short pulses from the all-solid-state Ce- activated laser system pumped by Q-switched Nd:YAG lasers. These approach will open up new possibility of ultrashort pulse lasers in ultraviolet region.
344

References
1. M. A. Dubinskii, V. V. Semashko, A. K. Naumov, R. Y. Abdulsabirov, and S.L. Korableva, OSA proceedings on Advanced Solid-State Lasers, A. A. Pinto and T.Y. Fan, eds. (OSA 1993), vol. 15, 195; M. A. Dubinskii, V. V. Semashko, A. K. Naumov, et al. - J. Mod. Opt., 40, 1, (1993).
2. M. A. Dubinskii, R. Y. Abdulsabirov, S. L. Korableva, A. K. Naumov, and V. V. Semashko, IQEC '92, Paper FrL2; M. A. Dubinskii, V. V. Semashko, A. K. Naumov, et al. - Laser Phys. 4,480, (1994).
3. Z. Liu, H. Ohtake, S. Izumida, T. Yamanaka, N. Sarukura, M. A. Dubinskii, R. Y. Abdulsabirov, and S. L. Korableva, submitted to CLEO (OSA) '98.
4. N. Sarukura, Z. Liu, H. Ohtake, Y. Segawa, M. A. Dubinskii, R. Y. Abdulsabirov, S. L. Korableva, A. K. Naumov, and V. V. Semashko, Opt. Lett. 22, 994 (1997).
5. Z. Liu, N. Sarukura, M. A. Dubinskii, V. V. Semashko, A. K. Naumov, S. L. Korableva, and R. Y. Abdulsabirov, Jpn. J. Appl. Phys. 37, L36 (1998).
4co Of Q-SW Nd:YAG laser
High reflection coating
(280-320 nm)
Coupler f:20 cm
Output
High reflection coating
| Littrow y*^ prism
Ce:LLF 0^>
Output coupler
_ .. . . . 5coofQ-sw y|ens Nd:YAG laser
(f=20 cm)
(a) (b) Fig. 1. Experimental setup of the tunable, short-cavity (a) Ce:LiCAF and (b) Ce:LLF laser systems
pumped by the fourth or fifth harmonics of a Q-switched Nd:YAG laser.
100
S 10 E
O) i_ 0) c
UJ a w 3 a.
1
0.1 r
0.01 -
0.001
SFGof Ce:LiCAF
& Nd:YAG (1.0 ns)
Es~115 mJ/cm* (Ce:LiCAF)
Ce:LiCAF MOPA (25 mJ)
Tunable CerLiCAF MOPA
(1.6 ns)
Ce:LiCAF A MOPA I .
(14 mJ, 1ns) Es-SOmJ/cm^ (Ce:LLF)
220
Tunable CerLiCAF oscillator
(1.0 ns)
240 260 300 280 Wavelength (nm)
Fig. 2. Tuning curves for Ce activated laser systems.
Tunable Ce:LLF (880 ps)
320 340
345

ThC8 12:30pm - 2:30pm
Limit of amplitude squeezing in quasi-phase-matched device for harmonic generation
Joji Maeda, Yutaka Fukuchi and Sumio Kogoshi
Faculty of Science and Technology, Science University of Tokyo, 2641 Yamazaki, Noda, Chiba 2788510 Japan
TEL: +81-471-24-1501 ext.3701, FAX: +81-471-24-7380
Quasi-phase-matched (QPM) nonlinear optical devices have been attracting great attention for their large effective nonlinearity. Recently, they have been used not only for wavelength conversion but for control of quantum state of light. [1,2] The- oretical analyses of squeezing in QPM devices have been performed so far, [3,4] though they have not mentioned nonuniformity of domain lengths that is inevitable in real devices.
In this paper, we numerically study amplitude squeezing characteristics of a periodically-poled QPM device designed for the harmonic generation, and discuss a relation between precision of the do- main length and available amplitude squeezing.
We consider a periodically poled device as shown in Fig. 1. Boundaries of domains are assumed to be planar, [5] and domain lengths have normal distri- bution with an average and a standard deviation of d and ad, respectively. Total length of the device is
The fundamental field and the harmonic field are assumed to propagate into +z direction, and are confined in xy plane within a cross section of S. Spatial mode profiles in the xy plane are neglected.
We denote the electric field of the fundamental field and that of the harmonic field as [6]
di &z d3 d4 ds d6 d7 ds
E\ = i\ / dw a(z,w)exp{iu)(niz/c — i)} V 2€0SnicJ
+h-c, (1)
= i\l-—- /dw b(z,u))exp{iu(n2z/c — t)} V zeoSn^c J
+h.c, (2)
E:
respectively, where eo is the dielectric constant of vacuum, c is the speed of light in vacuum, % is Planck's constant, h.c. means Hermitian conjugate, and «i and ni are refractive index for the funda- mental field and that for the harmonic field, respec- tively. The origin of the z axis is at the input end of
H ♦ m ♦ ♦ •« / ►:
Adn=dn-d
dü=d, Ädl = a2d2
Fig.l: Model of the device under consideration. Up arrows and down arrows indicate the normal and the inverted polarization, respectively.
the device. Commutation relations for a{z,u) and b(z, w) are
[a(z,u),a(z,u')] = [d*(z, u),a\z, u>')] = 0, (3)
[o(z,«),at(*,w')] = «(w-«,)> (4)
[b(z, «), b(z, u,')] = [&t(z, u), b\z, u/)] = 0, (5)
\b(z,u),b\z,J)) = 6{u}-u'). (6)
Propagation of the fields inside the crystal under the presence of a phase mismatch Ak are described
by [7]
y U' =pn do/a* (z, c/)6(z, u + u')
x exp(-iAfcz), (7)
db(z,w) K I' , , , —^-—- = — p— / da» a(z, uj )a[z, w — u )
x exp(iAkz), (8)
where the coupling coefficient n is related to con- ventional parameters by
X(2)^o I %w0 ~
V 2l^eoSn2C, (9)
0-7803-4950-4/98/$10.00 1998 IEEE 346
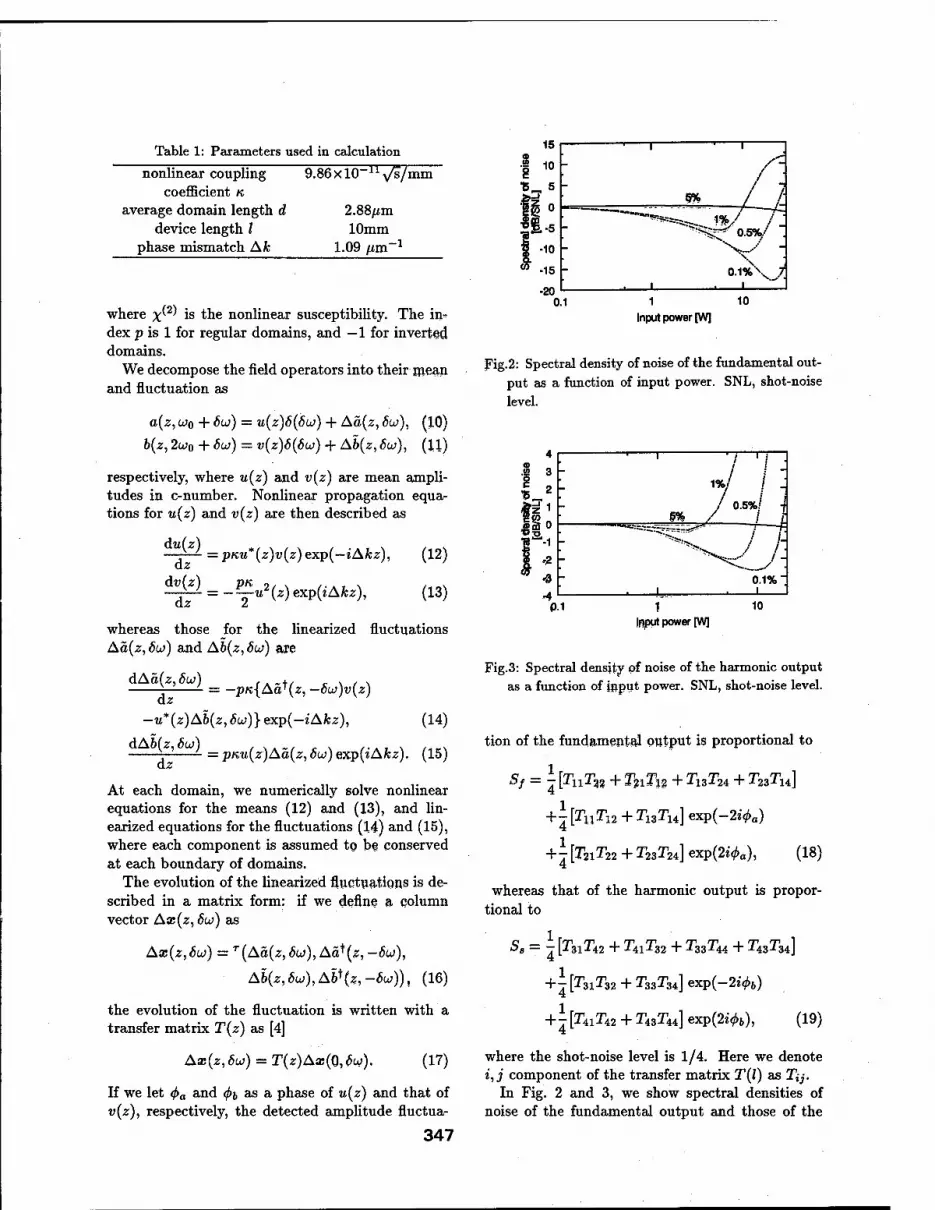
Table 1: Parameters used in calculation
nonlinear coupling coefficient K
average domain length d device length I
phase mismatch Afc
'^M>äÖ=Tr^sJmm'
2.88fim 10mm
1.09 /xm-1
where x^ is the nonlinear susceptibility. The in- dex p is 1 for regular domains, and —1 for inverted domains.
We decompose the field operators into their mean and fluctuation as
a(z, u>o + Su>) = u(z)6(6u>) + Aa(z, 6w), (10)
b(z, 2w0 + Su) = v(z)S(6(j) + Ab(z, 6w), (11)
respectively, where u(z) and v(z) are mean ampli- tudes in c-number. Nonlinear propagation equa- tions for u{z) and v{z) are then described as
du(z) dz
dv(z)
= pKu*(z)v(z)exp(—iAkz), (12)
(13) = — — u2(z) exp(iAfez),
whereas those for the linearized fluctuations Aö(z, 6u>) and Ab(z,6w) are
dAä(z,6w) dl
= —pK,{Aa'(z, —6w)v(z)
—u*(z)Ab(z,6w)}exp(—iAkz), (14)
j-2—- = pnu(z)Aä(z, 6w)exp(iAkz). (15)
At each domain, we numerically solve nonlinear equations for the means (12) and (13), and lin- earized equations for the fluctuations (14) and (15), where each component is assumed to bt conserved at each boundary of domains.
The evolution of the linearized fluctuations is de- scribed in a matrix form: if we define a column vector Ax(z, 6u>) as
Ax(z, 6u) = T (Aä(z, 6u), Aä^z, —Su>),
Ab(z,6u),Atf(z,-6u})), (16)
the evolution of the fluctuation is written with a transfer matrix T(z) as [4]
Ax(z,6u) = T(z)Ax(Q,$u>). (17)
If we let <f>a and <j>i as a phase of u(z) and that of v(z), respectively, the detected amplitude fluctua-
347
1 10
Input power [W]
JTig.2: Spectral density of noise of the fundamental out- put as a function of input power. SNL, shot-noise level.
g
4
3 2
'l 0 1
•2 •9 -4
P1
• ■ ' ■/ '/ ■
• 1%/ / -
- /J ■/ Ift / / £
- \^/i " 0.1%"
1 1
1 Input power [W]
10
Fig.3: Spectral density of noise of the harmonic output as a function of input power. SNL, shot-noise level.
tion of the fundamental output is proportional to
Sf = - [TuTw + TfiTii + Ti3T24 + T23T14J
+\ [r„Ti2 + T13TU] exp(-2^„)
+\ [T21T22 + TnTH] exP(2i<f>a), (18)
whereas that of the harmonic output is propor- tional to
Ss = 7 [231T42 + 141^32 + T33T44 + T43T34]
+\ [T3iT32 + T33T3i] exp(-2*>6)
+\ [T41T42 + Ti3T4i] exp(2i<j>b), (19)
where the shot-noise level is 1/4. Here we denote i, j component of the transfer matrix T(l) as Tij.
In Fig. 2 and 3, we show spectral densities of noise of the fundamental output and those of the

U Ci—•
■oz
11 w E 3 E
0
-5
■10
-15
-20
-25 0.001 0.01 0.1 1
Domain length error [%]
I -*-■*■■■ ,
- Harmonic J^
ry^^ _
rf Fundamental "■ ^r -
-^^^ _
■ i ■ « i •
10
Fig.4: The minimum spectral density of noise as a function of the variation of domain lengths. SNL, shot-noise level.
23456789 10 Reallxio's'"2]
(a)
■1.5 -1 -0.5 0 0.5 Real [X10V"2]
(b)
Fig.5: Spatial evolution of mean amplitude of the fun- damental field (a) and that of the harmonic field (b).
harmonic output, respectively, as a function of the input power. Used parameters, which correspond to those required by the first order quasi-phase- matching in LiNb03 waveguide (cross section S = 25(im) for the harmonic conversion from 850nm to 425nm, are summarized in Table 1.
The curve for 5% variation scarcely decreases be- low the shot-noise level. Fig. 4 shows the minimum spectral density of noise of the fundamental output with respect to the variation of the domain length. The result suggests that the amplitude squeezing is available only if the variation of domain length is less than 5%.
To investigate the mechanism of the degradation, we consider the spatial evolution of the mean ampli- tudes u{z) and v(z), shown in Fig. 5(a) and (b), re- spectively. The mean amplitudes for an error of 1% experience large phase rotation due to large fluctu- ation of the domain lengths. As a result, the phase of the amplified/compressed component is also fluc- tuated, hence the compression of the quantum noise
348
becomes less effective. The origin of the degradation for an error of 0.1%
is more complicated. As the amplitude of the har- monic grows, the cascaded x^ effect that forces phase rotation of the fundamental field is enlarged. Only a slight error of the domain length leads to a large phase rotation, and consequently causes the parametric amplification of the quadrature compo- nent that is orthogonal to the incident amplitude in phase. As a result, the amplitude noise of the funda- mental field is no more decreased, nor reaching the theoretical limit (the fundamental: 100%, the har- monic: 50%) for birefringence-phase-matched de- vices.
In conclusion, we have numerically studied am- plitude squeezing of a quasi-phase-matched nonlin- ear device used for the harmonic generation. It is predicted that the amplitude squeezing would be scarcely observed for several per cent of domain length variation. Even if the further precision was achieved, the maximum squeezing would be limited to a finite value because of parametric amplification of the quadrature amplitude.
References
[1] D. K. Serkland, P. Kumar, M. A. Arbore, and M. M. Fejer, Opt. Lett. 22, 1497 (1997).
[2] D. K. Serkland, M. M. Fejer, R. L. Byer, and Y. Yamamoto, Opt. Lett. 20, 1649 (1995).
[3] L. Noirie, P. Bidakovic, and J. A. Levenson, J. Opt. Soc. Am. B 14, 1 (1997).
[4] T. Suhara et al, IEEE J. Quantum Electron. 32, 690 (1996).
[5] M. M. Fejer, G. A. Magel, D. H. Jundt, and R. L. Byer, IEEE J. Quantum Electron. 28, 2631 (1991).
[6] J. Maeda and K. Kikuchi, J. Opt. Soc. Am. B 14,481(1997).
[7] Z. Y. Ou, Phys. Rev. A 49, 2106 (1994).
Memo

ThC9 12:30pm - 2:30pm
Numerical Study of Second Harmonic Generation in Semiconductor Waveguides
F.A. Katsriku, B.M.A. Rahman and K.T.V. Grattan
City University Department of Electrical, Electronic and Information Engineering
Northampton Square, London, EC IV OHB Tel: +44-171-477-8123 Fax:+44-171-477-8568
e-mail: [email protected]
Introduction Since it was first observed, the exploitation of second harmonic generation (SHG) has been made difficult by technological problems, as well as finding suitable materials that meet the required phase matching conditions[l]. Besides the importance of SHG for optical storage, it has also generated interest in all optical switching using cascaded effects. Earlier research into SHG has mainly been focused on anisotropic materials where the natural birefringence of material allows the refractive indexes of the waves to be matched. Birefringent phase matching is an optical technique, based on the difference in refractive index of orthogonally polarized waves in birefringent crystals. It is thus possible to have the phase velocities of the interacting waves to be equal [2]. For a given material, the wavelength range over which birefringent phase matching can be achieved practically is very narrow, thereby limiting the use of materials which could otherwise be attractive.
Recent advances in fabricating technology have led to a growing interest in semiconductor materials with a reasonable nonlinear coefficients such as GaAs. In such materials, because of normal dispersion, the phase matching conditions cannot be satisfied since the refractive index is frequency dependent [2]. It is therefore necessary to correct the phase mismatch at regular intervals. One technique used to achieve this is known as quasi-phase matching (QPM), in which the relative phase is corrected at regular intervals by means of a structural periodicity built into the non-linear material at the stage of fabrication. The effect of this is to compensate for the phase mismatch and hence allow for coherent mixing over the entire device length. The device performance is therefore not dependent on the birefringent properties of the material, hence making it possible to use the material over its entire transparency range rather than over the range for which birefringent phase matching only is possible. Another technique is domain disordering in which the nonlinear susceptibility tensor is periodically destroyed in alternate half periods of the waveguide structure [3]. Generation of the second harmonic wave by this method is ideal for use in integrated optics due to its tightly confined modes. It also requires, however, that the waveguide parameters are tightly controlled.
In this paper we report on the use of the finite element based beam propagation method to model second harmonic generation in a waveguide of practical interest. We show how the design of such a waveguide could be optimized with respect to the various guide parameters. The finite element method has previously been shown to be a powerful, accurate and versatile method [4] and has been used to model waveguides of arbitrary guide parameters [5] and in the modelling of second harmonic generation in LiNbC<3 waveguides. The modal solution for optical waveguides with 2-D confinement is best done using the vector H-field formulation. This method has been discussed in detail in earlier work [4,5]. However for the evolution of the harmonic field, the finite element based beam propagation method is most suitable. This method is discussed in detail in a recent paper [1].
Results The waveguide under consideration is as shown in Fig. 1. Such a waveguide has an air cladding, the substrate is made of Ga Al}_ As and the core is GaAs. Wis the guide width, h is the height of the rib and t is the height of the slab waveguide underneath. The refractive index of the substrate depends on 0-7803-4950-4/98/J10.00 1998 IEEE 349

the fractional aluminum concentration. From [6] the following values of refractive indexes are obtained for the substrate and core respectively for a fractional aluminum concentration of JC=0.2 at a fundamental wavelength of 1.064|xw, «s=3.13 and ng=3.54. The fundamental field confinement obtained from modal analysis is shown in Fig. 1 for W=l.0[Lm, h=l.0\im, t=0.2\im. In Fig 2 the profile of the generated second harmonic field after one coherence length of propagation is illustrated.
It is well known that the generated second harmonic power depends critically on the waveguide parameters [1,7], where the generated power could be optimized with respect to the various guide parameters. It has been observed that for a guide height of h=l.0\im and rib height of t=0.2\im, greater second harmonic efficiency is obtained when the guide width W=0.S\im, where the power has been calculated after one coherence length. The guide could also be optimized with respect to both the rib height and the height of the arm for particular values of the width. Using the values thus obtained, the spot size of both the fundamental and second harmonic waves as well as the overlap between the two modal profiles for the fundamental and second harmonic waves were calculated along the propagation direction. Since the fundamental wave is assumed to be independent of the direction of propagation, its spot size remains unchanged. The variation of the second harmonic power, the spot size of the harmonic field, and the overlap between the fundamental and harmonic with propagation direction, is shown in Fig.3.
In Fig. 4 two schemes are illustrated by which greater second harmonic efficiency can be achieved in a semiconductor waveguide. The waveguide considered is as described earlier, with h=l.0[im, t=0.2\im, W=0.$\Ltn, «s=3.05 and «g=3.5. In the first scheme, labelled A, the nonlinear coefficient is periodically reversed after each coherence length. Fabricating technology might render this technique difficult to realize and in that case a second method, labelled B, of domain dispersion can be considered. In this scheme, the nonlinear coefficient is destroyed in alternate half periods of the waveguide. It can be seen that the first method achieves a much greater efficiency.
Conclusion An accurate and efficient numerical method has been described for the study of second harmonic generation in semiconductor waveguides. Although there has been an enormous amount of research work carried out to achieve optical switching using the third order nonlinearity, the unavailability of suitable material with high nonlinear coefficients has made it difficult to achieve low power optical switching. This has led to a shift of interest to the use of cascaded second order nonlinear effects for all optical switching. The numerical approach presented here will help in the study and optimization of such devices.
References [1] F.A. Katsriku, B.M.A. Rahman and K.T.V. Grattan, "Modeling second-order nonlinear effects in optical waveguides using a parallel-processing beam propagation method", IEEE J. Quantum Electron., QE-33, pp.1727-1733, Oct. 1997. [2] A.F. Harvey, Coherent Light. London: Wiley, 1970. [3] H.M. Masoudi and J.M. Arnold, "Modeling second-order nonlinear effects in optical waveguides using a parallel-processing beam propagation method", IEEE J. Quantum Electron., QE-32, pp. 2107-2113, Dec. 1995. [4] B.M.A. Rahman and J.B. Davies, "Finite-element solution of integrated optical waveguides", J. Lightwave Technoi, LT-2, pp. 682-688, Oct. 1984. [5] F.A. Katsriku, B.M.A. Rahman and K.T.V. Grattan, "Finite element analysis of diffused anisotropic optical waveguides", J. Lightwave Technoi., LT-14, pp. 780-786, May 1996. [6] D.W. Jenkins, "Optical constants of AljG^As", /. Appl. Phys. 68 (4), Aug. 1990 pp. 1848-1853. [7] K.Hayata and M. Koshiba, "Numerical study of guided-wave sum-frequency generation through second-order nonlinear parametric processes", J.Opt. Soc. Am., B vol. 8, pp. 449-458, Feb. 1991.
350

3.5-
0.0 > i i i i I i i i i I i i i i I I i i i I i I i i I i i i i
-1.5 -1.0 -0.5 0.0 0.5 1.0 1.5
Fig. 1 The field profile of the fundamental mode. Fig.2 The field profile for the second harmonic wave.
1.0-1
0.8-
0.6-
0.4-
0.2
P,„ - Second harmonic power, in arbitrary unit
T - Overlap #„ 0,„, dimensionless
o* - Spot size in /an*
^y _^ 0.0-r r—"—i T r—"—i 1
0.0 0.5 1.0 f.5 2.0 2.5 3.0
^— Z'mßtn
Fig.3 The variation of the optical parameters along the propagation direction.
1.6*10"-
1.4*10*-
1.2M0''-
a 1.0*10'*- c <D
ä a. 8.0*10'-
2 g 6.0*10'- O
4.0*10'-
2.0*10''-
0.0*10°-
B
i ^ i -^ i r—r=—r r* 0 20 40 60 80 100 120 140
Propagation distance, 0.1VZ
Fig.4 The phase matching scheme: (A) QPM, (B) Domain disordered, (C) with out phase matching.
351
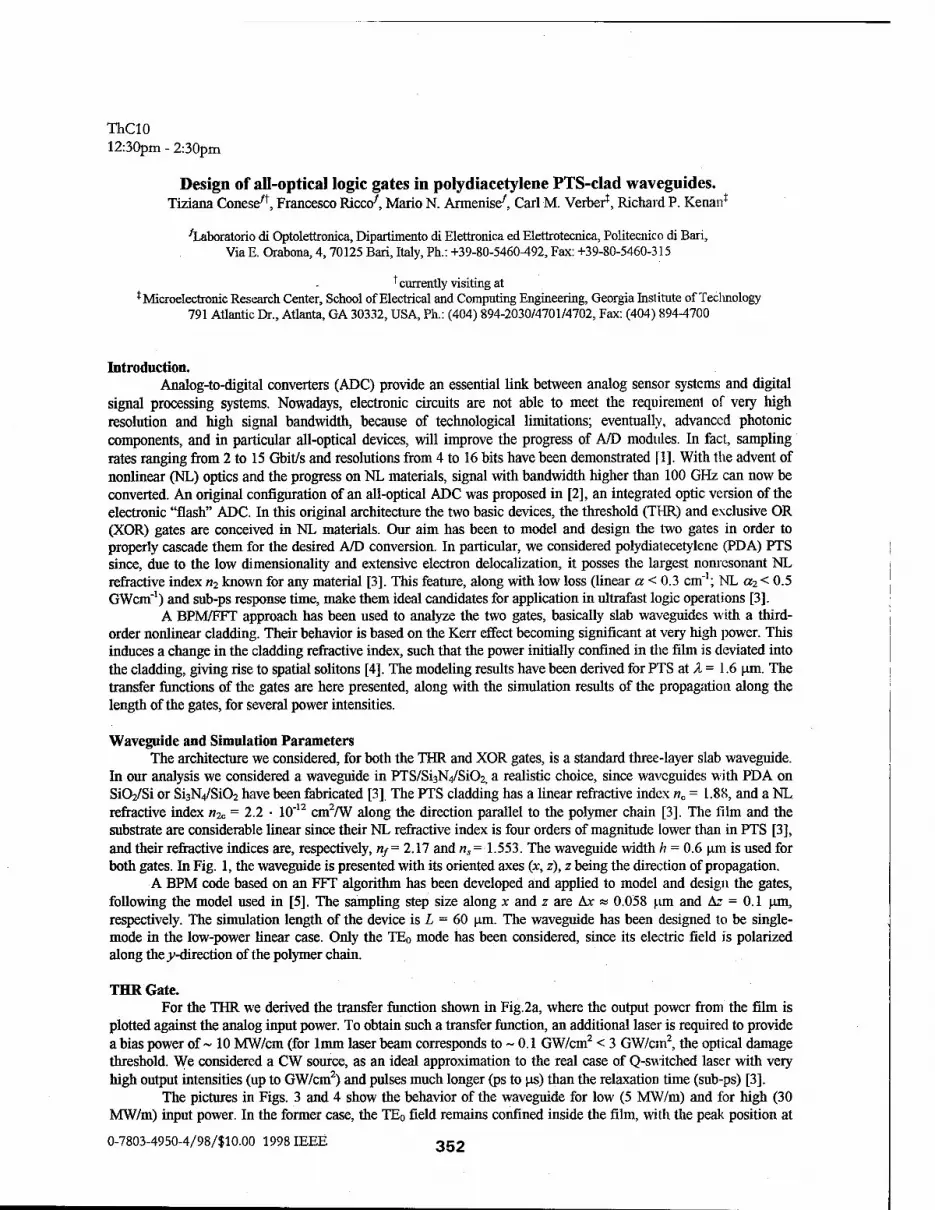
ThCIO 12:30pm - 2:30pm
Design of all-optical logic gates in polydiacetylene PTS-clad waveguides. Tiziana Conese^, Francesco Rico/, Mario N. ArmeruW, Carl M. Verber*, Richard P. Kenan*
'Laboratorio di Optolettronica, Dipartimento di Elettronica ed Elettrotecnica, Politecnico di Bari, Via E. Orabona, 4,70125 Bari, Italy, Ph.: +39-80-5460^92, Fax: +39-80-5460-315
^currentiy visiting at * Microelectronic Research Center, School of Electrical and Computing Engineering, Georgia Institute of Teclinology
791 Atiantic Dr., Atlanta, GA 30332, USA, Ph.: (404) 894-2030/4701/4702, Fax: (404) 894-4700
Introduction. Analog-to-digital converters (ADC) provide an essential link between analog sensor systems and digital
signal processing systems. Nowadays, electronic circuits are not able to meet the requirement of very high resolution and high signal bandwidth, because of technological limitations; eventually, advanced photonic components, and in particular all-optical devices, will improve the progress of A/D modules. In fact, sampling rates ranging from 2 to 15 Gbit/s and resolutions from 4 to 16 bits have been demonstrated 11]. With the advent of nonlinear (ML) optics and the progress on NL materials, signal with bandwidth higher than 100 GHz can now be converted. An original configuration of an all-optical ADC was proposed in [2], an integrated optic version of the electronic "flash" ADC. In this original architecture the two basic devices, the threshold (THR) and exclusive OR (XOR) gates are conceived in NL materials. Our aim has been to model and design the two gates in order to properly cascade them for the desired A/D conversion. In particular, we considered polydiatecetylene (PDA) PTS since, due to the low dimensionality and extensive electron delocalization, it posses the largest nonresonant NL refractive index n2 known for any material [3]. This feature, along with low loss (linear a < 0.3 cm"1; NLa2< 0.5 GWcm"1) and sub-ps response time, make them ideal candidates for application in ultrafast logic operations [3].
A BPM/FFT approach has been used to analyze the two gates, basically slab waveguides with a third- order nonlinear cladding. Their behavior is based on the Kerr effect becoming significant at very high power. This induces a change in the cladding refractive index, such that the power initially confined in the film is deviated into the cladding, giving rise to spatial solitons [4]. The modeling results have been derived for PTS at A = 1.6 pm. The transfer functions of the gates are here presented, along with the simulation results of the propagation along the length of the gates, for several power intensities.
Waveguide and Simulation Parameters The architecture we considered, for both the THR and XOR gates, is a standard three-layer slab waveguide.
In our analysis we considered a waveguide in PTS/Si3N4/Si02, a realistic choice, since waveguides with PDA on Si02/Si or Si3N4/Si02 have been fabricated [3]. The PTS cladding has a linear refractive index «c = 1.88, and a NL refractive index «2c = 2.2 • 10"12 cm2/W along the direction parallel to the polymer chain [3]. The film and the substrate are considerable linear since their NL refractive index is four orders of magnitude lower than in PTS [3], and their refractive indices are, respectively, «/= 2.17 and «,=■ 1.553. The waveguide width h = 0.6 um is used for both gates. In Fig. 1, the waveguide is presented with its oriented axes (x, z), z being the direction of propagation.
A BPM code based on an FFT algorithm has been developed and applied to model and design the gates, following the model used in [5]. The sampling step size along x and z are Ax » 0.058 j.im and Ar = 0.1 ^un, respectively. The simulation length of the device is L = 60 um. The waveguide has been designed to be single- mode in the low-power linear case. Only the TE0 mode has been considered, since its electric field is polarized along the ^-direction of the polymer chain.
THRGate. For the THR we derived the transfer function shown in Fig. 2a, where the output power from the film is
plotted against the analog input power. To obtain such a transfer function, an additional laser is required to provide a bias power of ~ 10 MW/cm (for 1mm laser beam corresponds to ~ 0.1 GW/cm2 < 3 GW/cm2, the optical damage threshold. We considered a CW source, as an ideal approximation to the real case of Q-switched laser with very high output intensities (up to GW/cm2) and pulses much longer (ps to us) than the relaxation time (sub-ps) [3].
The pictures in Figs. 3 and 4 show the behavior of the waveguide for low (5 MW/m) and for high (30 MW/m) input power. In the former case, the TE0 field remains confined inside the film, with the peak position at
0-7803-4950-4/98/$10.00 1998 IEEE 352

xinax = 0.29 um. Inversely, for the latter case, after a propagation along L, the field is inside the cladding with JW
= 0.79 um. The oscillations observable in the propagation plots, are due to the instability of the nonlinear waveguide, related to the negative slope of the dispersion curves of the NL waveguide [4].
XOR Gate. The transfer function for the XOR is shown in Fig.2b. This gate has been designed to be cascaded with a
pair of THR gates for ADC applications. In fact, the XOR gate input we considered in the simulations, is the sum of the powers coming out from two THRs. The input to the XOR is indicated by the pairs (00), (01), (11), depending on whether the output from each THR is high (1) or low (0). The behavior of the XOR for input (11) and (01) is shown in Figs. 5 and 6, in which the soliton split-off from the film into the cladding is better observed.
Conclusions. We have demonstrated the behavior of a standard slab waveguide as either a THR or XOR gate, for all-
optical ADC applications. The two transfer functions suggest the possibility of high accuracy and resolution in the quantization and encoding phases of ADCs . The designed devices offer a high degree of integration, since each gate can be as short as 60 urn. The total propagation loss for a pair of cascaded gates is < 0.028 dB, considering both one-photon and two-photon absorption. The response time of the cascaded gates is of the order of ps, with comparable relaxation time and transit time (~ 0.8 ps). Hence, a terahertz signal could be eventually processed. A more detailed dynamic analysis of the devices will follow. The experimental verification of these simulations will be pursued. Additional research will also regard the analysis and design of the gates in channel waveguides, where the higher confinement requires low powers. The design and optimization of ADCs, in terms of signal resolution and conversion time and error, will be considered as well.
References. [1] H.F. Taylor, Proceed. IEEE, vol. 75, no. 11, pp. 1524-34, Nov. 1987; P.E. Pace et al.. Opt. Engin., vol. 33, no. 8, pp. 2639-45, Aug. 1994; B.L. Shoopetal.,,4/>p7. Opt., vol31,no. 26,pp. 5654-60, Sept 1992. [2] C. M. Verber, USA Patent, no. 4,712,089, Dec. 1987. [3] G.M. Carter et td.,Appl. Phys. Lett., vol. 47, no. 5, pp.457-9, Sept 1985; M. Thakur et al.,Appl. Phys. Lett., vol. 56, no. 12, pp. 1187-8, Mar. 1990; B.L. Lawrence et al., EL Lett., vol. 30, no. 5, pp. 447-8, Mar. 1994; W. Krug, et al., J, Opt. Soc. Am. B, vol. 6, no. 4, pp. 726-8, April 1989; Polydiacetylenefor lightwave and integrated optics: technology and applications, L. A Hornak Ed., M. Dekker Inc., New York, 1992, pp. 664-80. [4] J.V. Moloney et al., Opt. Lett, vol. 11, no.5, pp. 315-7, May 1986. [5] B. Hermansson et al., Opt. Quant. El, vol. 16, pp. 525-534, Nov. 1984; T.R. Taha, J. Cotnp. Phys., vol. 55, pp. 203-30,1984.
4.5
4
E" •
I 3 «s I 2.5 Q.
I 2 ° 1.5 E E 1
0.5
0,
X10
4/ -' £-,/
cr 1 1 -"H
i._.._..-__i_i______._____«. _______—i ■ \i i i
i 4 ; i i
<. .-'._L__. « !
, , 1 f 1
Fig.l Waveguide structure.
xl0*
x10 Input analog signal power [W/m]
a) Input analog signal power fW/m]
b) Fig.2 a) Transfer function for the THG gate; b) transfer function for the XOR gate.
353

; 5 MW/m Pin = 30 MW/m
a)
Fig.3. THG: a) propagation of the field
b) distribution at z=60u.m.
x10s
ES!-
P—SMW/m. _3|_.
2!-
TV
1! 77 1.5 -1 -0.5 0 0.5 1 1.5
x[|im]
b)
X109
(108
a.. 8
„7 E6
I5 w
a)
Fig.4. THG: a) propagation of the field
b) distribution at z=60|xm. Pjj^OMW/m.
*.10"r —r r ;—,""""":
•' | | j-/-"\ j 4 L ;. ■ ■ / ' !\ !
2;....|
1- X 0__1 _,K.: • i -1.5 -1 -0.5 0 0.5 1 1.5
x[H
b)
Tt
* I i t-\
(10«
12
10
I'
■1 1 1 ll
-j 1 i- --j- 4
\ i r -i r
: }'/ i -H^-4 ! : —
-1.5-1 -0.5 0 0.5 1 1.5 X[uffl]
b)
-1.5 -1 -0.5 0 0.5 1 1.5 xfcim]
c)
Fig.5 XOR: a) field propagation, b) field distribution at input, and c) output sections, for input (1 1)
*109
h iVfl
9 8 7
¥6 £.5 ÜJ4 ~3
2 1
■f-/hVt
-I--/4
4-X -;-A- r
-1.5 -1 -0.5 0 0.5 1 1.5 x[pm]
b)
-1.5 -1 -0.5 0 0.5 1 1.5 x[jim]
c)
Fig.6 XOR: a) field propagation, b) field distribution at input, and c) output sections, for input (0 1).
354

ThCll 12:30pm - 2:30pm
Photorefractive gratings recording in reversible polymer films containing 4-keto bacteriorhodopsin under absorption saturation.
Yu.O.Barmenkov1, V.-P.Leppanen2, T.Jaaskelainen2, N.M.Kozhevnikov3, AN.Starodumov1.
^entro de Investigaciones en Optica, Leon, Gto, 37150 Mexico Tel.: (52-47) 73 1017; Fax: (52-47) 17 5000; e-mail: [email protected]
2 University of Joensuu, P.O.Box 111, FIN-80101, Finland Tel: +358 13 251 3223; Fax: +358 13 251 3290
3St.Petersburg State Technical University, St.Petersburg, 195251 Russia.
Bacteriorhodopsin (BR) films belong to the class of reversible photosensitive media. BR has been widely investigated for use in real-time holography [1], erasable optical storage [2], dynamic holography interferometry [3], etc. These media has high photosensitivity (up to 10"3 J/cm2), excellent reversibility, spatial resolution more then 5xl03 lines/mm, and suitable interval of recording time (from 10"3 to 103s).
Usually the optical nonlinearity of bacteriorhodopsin is analyzed in terms of one photocycle and simplified two-level model of absorbing centers [4, 5]. A number of authors discuss the few-photocycles model of the BR molecule excitation [6]. After excitation with light, molecules of BR passes through several short-lived intermediates to metastable M-state. From there it relaxes thermally to the initial B-state. The nonlinear local photoresponse of BR is due to the difference of the dipole moments of the BR molecules found in the initial and photoexcited states. Because the change in the dielectric constant of the medium is proportional to the concentration of BR molecules in photoexcited state, the absorption saturation leads to steady-state amplitudes of phase grating written in BR by sufficiently intense light beams. Here we describe peculiarities of the initial stage of the grating writing under the absorption saturation, which can be explained by existence of two photocycles.
The theoretical analysis based on two-level photoexcitation model gives the stationary amplitude of fundamental spatial harmonic of photoexcited BR molecule concentration (/?/) for the contrast of interferometric pattern closed to unit in the form:
«, 2IS
n I0
f !+/„//,.._^ Vl + 2/0//,
where n is the total concentration of BR molecules, h is averaged intensity of writing beams, Is = hv/av is the saturation intensity, a is the absorption cross-section of BR molecules, r is the thermal relaxation time. Analysis of this equation shows that the stationary amplitude of the fundamental spatial harmonic n} has a maximum corresponding
to the light intensity I0 = (I+V2 )IS. If the light intensity is more then this value, n, is decreased due to a considerable of the photoexcited molecules grating (Fig.l). During the recording process the photoexcited molecules grating shape goes through all its stages from sinusoidal form at low amplitude to a little curved form at the maximum of its
0-7803-4950-4/98/110.00 1998 IEEE
355

fundamental spatial harmonic, and then to the strong shape curvature at smaller amplitude of the fundamental harmonic.
o 1 2
Length across the grating, in units of the spatial period
, He-Ne laser! W.VWW1
Sinusoidal voltage Generator
Oscilloscope
Two-channel Photodetector
Selective Amplifier
Fig.l. Numerical simulation of the shape of the photoexcited molecules grating. Curves from bottom to top corresponds to the light intensities of 0.5, 1, 2, 1+V2, 10 and 100 times of saturation intensity.
Fig.2. Experimental setup of the holographic interferometer utilizing phase-modulated beam method.
The experimental study of photorefractive grating recording in polymer films containing 4-keto BR was done using the high sensitivity phase-modulated beams method [5], which consist in the study of spectral composition of the output beams oscillation upon a high-frequency (Q»l/x, where x is the relaxation time) harmonic modulation of the mutual phase difference of the writing beams. The relative amplitudes of the first harmonic IQ/I0 of the intensity modulation of output beams is proportional to the recorded phase gratings amplitude averaged over the interaction length of the beams. The experimental setup of the two-beam interferometer utilizing phase-modulated beams method for experimental studying of photoresponse is shown in Fig. 2. To record photorefractive grating being studied, radiation from He-Ne laser was divided by semitransparent plate 2 into two beams I+J = I_i = I0/2, which were sent by mirrors 3 and 4 to BR-containing polymer film 5. Mirror 4 was attached to an electromagnetic modulator, which was connected to a sinusoidal voltage generator for the output voltage frequency of O. For decreasing a laser noise influence a two-channel differential photodetector and a selective amplifier were used. Photodetector output voltage of the interferometer at the first harmonic of the external phase modulation is proportional to the averaged refractive index grating amplitude.
The experimental results describing the refractive grating recording were obtained for polymer films containing 4-keto BR [4]. This BR-variant was prepared by replacement of the all-fraws-retinal of native chromoprotein with the 4-keto retinal analogue. The measurements were taken under continuous 543 nm laser intensity of 5 mW/mm2. In fact, after a preliminary dark adaptation we observed two independent maxima of the interferometer output signal amplitude. These maxima have a difference of a photoresponse time of two orders (Fig.3a). Such behavior of the grating recording can be
356

explained by superposition of the photoresponses corresponding respectively to the fast and to the slow photocycles. The fast photocycle defines the first maximum of the photoexcited molecules grating, the slow photocycle defines the second maximum. The saturation absorption effect is observed for both photoexcited molecule gratings.
There was made also a numerical simulation for the initial stage of grating recording at the average light intensity corresponding to 20 times of the saturation intensity for the first photocycle and at the relaxation time difference of 100 times (Fig.3b). It is easy to see that the shape of the theoretical curve obtained for specified above parameters looks like the shape of the interferometer output signal envelop.
0 20 40 60 80
£ Time, in units of relaxation time of the first photocycle
a b
FIG.3. Temporal dependence of the output interferometer signal at the first harmonic of the phase modulation frequency (a) and the numerical simulation of the fundamental spatial harmonic of the photoexcited molecules concentration grating (b) for the initial stage of the grating recording.
Thus, it is experimentally showed that under the absorption saturation there are observed two maxima of the photoresponse during initial stage of the photorefractive grating recording in the film containing 4-keto BR. This effect can be explained using two- photocycles model of photoexcitation of BR molecules. These two photocycles determines different photoresponse amplitudes for the very different relaxation time.
References.
1. J.E.Millerd, N.J.Brock, M.S.Brown, P.DeBarber, Opt. Lett., 20, 626, 1995. 2. Z.Chen, ALewis, H.Takei, I.Nebenzahl, Appl. Opt., 30, 5188, 1991. 3. Yu.O Barmenkov, V.Zosimov, N.M.Kozhevnikov, M.Yu.Lipovskaya, L.M.Lyamshev,
Opt. Spectrosc. (USSR), 64, 792, 1988. 4. T.Jaaskelainen, V.P.Leppanen, S.Parkkinen, J.P.S.Parkkinen, AKhodonov, Optical
Materials, 6, 339, 1996. 5. S.Yu.Zaitsev, N.M.Kozhevnikov, Yu.O.Barmenkov, M.Yu.Lipovskaya, Photochem.
Photobiol., 55, 851, 1992. 6. A.B.Druzhko, S.K.Chamorovski, BioSystems, 35, 133, 1995.
357

ThC12 12:30pm - 2:30pm
All-fiber optical switch based on Raman scattering A.N.Starodumov, Yu.O.Barmenkov, A.Martinez, I.Torres
Centro de Investigaciones en Optica, 37150 Leon, Gto, Mexico Tel: (52)- (47) -17-5823, Fax: 52 - 47 -17-5000,
E-mail: [email protected]
Fiber Sagnac interferometers, known also as the nonlinear loop mirror (NOLM), have been proposed for all-optical switching owing to their excellent stability and simplicity of fabrication [1,2]. The standard NOLM uses cross-phase modulation between co-propagating control and signal pulses to switch a signal pulse from one arm to the other. Since operation of this device depends on phase relation between two counter-propagating pulses, the NOLM transmission is an oscillating Junction of the control pulse power. Here we demonstrate for the first time to our knowledge a nonlinear optical switch based on the Raman effect in a Sagnac loop with highly-Ge02-doped fiber. In addition to providing all-optical switching, this device also amplifies the signal pulse. Because the Raman amplification dominates over the Ken- effect in highly-germanium-doped fibers, the transfer function of this switch exhibits a behavior different to that of the purely Kerr switch.
The experimental setup is shown in Fig.l. A mode-locked Nd-YAG laser with pulses of 120 ps length at wavelength of 1064 nm was used in order to generate signal pulses at the first Stokes wavelength. Pump pulses with peak power of 130 W produced Stokes signal pulses in 20 mol.% germanium-doped fiber of 6m length. A wavelength division multiplexer (WDM) with a coupling ratio of 97:3 for the pump wave and of 1:99 for the Stokes wave was used in the optical scheme in order to separate control (pump) and signal (Stokes) pulse trains. An attenuator and a polarization controller were placed in the upper arm in order to vary control pulse intensity. The loop consisted of 16m length of the 20mol.% Ge02-doped fiber (fiber 2) with a core radius a=1.4 um and a numerical aperture of 0.27.Taking into account the phase shifts of the fields into a coupler, the transmission transfer function of a 50:50 loop can be written as
T=0.25 ß [1+exp x -2exp(x/2) cos ax]
where a=2kn2/g, x=gIpL, k is the wavenumber of the signal pulse, n2 is the nonlinear Ken- coefficient, g is the Raman gain, L is the length of the fiber 2, Ip is the control pulse intensity in the fiber 2, ß is the total loss coefficient. Coefficient a characterizes the ratio between the Ken- effect and the Raman amplification. We have analyzed the a coefficient behavior with germanium concentration growth. The Raman gain in Ge02-doped silica glass is proportional to its doping ratio and may be presented as
gmax(cmAV)=8.83xl012(l+0.08 X)
where X(mol.%) is the germanium concentration. Assuming that the nonlinear refractive index
0-7803-4950-4/98/$10.00 1998 IEEE 358

Fiber 1 Nd-YAG , . . An pr 1064 nm Isolator ^\ ATT PO
-^H-^H-tXr-^^ *"■"" »»* www \ (»»» p —► 11 c Pump Chopper MO
Est \l
ESt /50/5o\ 4 ' \
Epump
I Fiber 2
WDM
Fig. 1. Experimental setup.
of the germanium-doped silica changes linearly with the amount of dopant, a is given by
a=3.45 (1+0.02 X)/(l+0.08 X)
An increase of germanium concentration lowers the a coefficient. The a value changes from 3.45 for pure silica to 1.62 for 30mol.% Ge02- doped silica. At greater values of this coefficient the loop transfer function is an oscillating function of the switching pulse power. With the germanium concentration growth stimulated Raman scattering prevails over the Ken- effect in the transfer function.
The experimentally obtained transfer function is presented in Fig.2 as a function of a normalized Raman gain gmaxIpL. The signal pulse growth owing to the Raman amplification in highly-germanium-doped fiber occurs more rapidly than phase changes caused by cross-phase modulation. As a result, the transfer function oscillations become less pronounced, resulting in an exponential growth at greater Raman gains. The control pulse power, which is necessary in order to switch the signal pulse and get an amplification factor of 2.75, is of the same order as for the pure Kerr switching.
In conclusion, we have demonstrated a new device for all-optical switching, based on stimulated Raman scattering and the Kerr effect in a fiber loop mirror. Raman switching is shown to dominate over Kerr switching in the loop with highly-germanium-doped fibers. An optical switching of picosecond pulses with an amplification factor of 10 have been
359

demonstrated in 20mol.% Ge02-doped fiber. This required a control pulse intensity of only x2.35 the intensity required for purely Kerr switching.
a Q
t-H
0.10
0.08 -
0.06
0.04
0.02
0.00 0 1 2 3 4
Raman gain
Fig. 2. The NOLM transfer function over Raman gain.
References.
1. N.J.Doran, D.Wood, Opt.Lett., 13, 56 (1988). 2. M.N.Islam, Ultrafast Fiber Switching Devices and Systems (Cambridge University Press, Cambridge, UK, 1992). 3. A.N.Starodumov, Yu.Barmenkov, A.Martinez, I.Torres, L.Zenteno, Opt. Lett. 23, 1998 (to be published).
360

ThC13 12:30pm - 2:30pm
Spontaneous vortice arrays formation in broad area vertical cavity semiconductor lasers
J. Scheuer and M. Orenstein
Department of Electrical Engineering, Technion, Haifa 32000, Israel
Tel. 972-4-8294696, Fax. 972-4-8323041, E-mail: [email protected]
The formation of a variety of stable complex transverse light patterns in nonlinear optical cavities was studied [1-2]. A laser, which is based on a nonlinear resonator, can emit spontaneously some of these patterns [3]. Vertical cavity surface emitting lasers (VCSELs) - unique within the family of semiconductor lasers by having a 2- dimensional resonator - may emit these patterns and thus can serve as a tool for the exploration and exploitation of these fields. The patterns described here, consisted mainly of ordered arrays of optical vortices, and are shown to stem from the non- linear induced mode-locking of transverse modes. Within the laser medium the field is consisting of arrays of vortex solitons.
We examined experimentally the transverse intensity patterns emerging from a proton implanted, broad area (20|im diameter) VCSELs with three 8nm Ino.2Gao.8As wells, emitting at ~0.95fim[4]. The near-field and the spectrally resolved near-field intensity patterns were examined at room temperature under CW operation.
As the injection current was increased, the near-field lasing pattern switched from the conventional modes (e.g. Hermit-Gaussian mode) to a "single mode" but with a more complex pattern, characterized by a grid of "dark" peaks rather than the grid of "bright" peaks of a conventional mode. The first complex pattern family to emerge (2p+l=2 as explained below) (Fig. 1), had patterns with field singularities of charge "0" or "2". Increasing the current further resulted in patterns consisting of combinations of functions from the 2p+l=3 family (Fig. 2), characterized by singularities of charge "1" or "3" and include arrays of 3, 5, 7 vortices. Increasing the current further resulted in a multi-mode operation - yet the near-field preserved its high regularity, exhibiting arrays of dark hexagons (Fig. 3).
To understand the evolution of the complex sequence of patterns, we modeled a broad area circular VCSEL. The transverse field was represented as a combination of the Gauss-Laguerre functions:
A>,cp)=-J=L°p(2r2).,
V* . /' »x , fe^
A-M-£«*>^| -L,>2)- e-J-1
e-ilp i = 2
where p, 1 are the radial, angular index, and L'p are Laguerre polynomials. Modes
satisfying 2p +1 = const, are degenerated and have the same propagation constant.
The VCSEL non-linear rate equations,
0-7803-4950-4/98/$10.00 1998 IEEE 361

E =■ ^
Re[(fg-|^n|2ds^atot).En]+Re[2EmJg^m-^;-ei^-<I,»)ds
+ -RIm SX-Jg.^X-e^*" 'ds
6 =£. 1 Im
g = - ra(N-Nj
XE^g.^.'F.'.e^-^ds -R.Jg-fF.fds
N = ed T,
'2ck0fc
k0fc e„-a-(N-Nj.|E|:
,. <E>„ - the n* field coefficient, phase, modal field and N - the carrier density, were solved assuming the field is a linear combination of the Gauss-Lagurre functions within a particular degenerated family. It should be mentioned that these functions are not the self modes of the actual laser, thus their degeneracy is removed. However here comes the non-linearity of the laser - mainly the index of refraction accompanying the gain saturation and induces the locking of the close-to-degenerate mode family, which will be described in details. Thus a stable solution, supported by the non-linearities of the VCSEL, was a transverse mode-locked solution consisting of a specific mode combination within the family. When varying the current density J or its lateral extent G, a different combination of the family modes was mode-locked (see Figs. 1-2 theoretical part).
The theoretical results agree with the experimental observations as can be seen from comparing A and B of Figs. 1,2 and the dark spots were confirmed to have phase singularities. We will present the turn-on mechanism of the mode-locking by the laser non-linearities and the coupled non-linear wave equation extracted from the non- linear rate equations - supporting vortex soliton arrays as stable solution. It should be emphasized that the formation of these specific patterns is generic rather than specific since the same patterns were obtained for passive non-linearity as well as for Sodium laser where the non-linear mechanisms were substantially different.
REFERENCES
[1] W. J. Firth et al, Europhys. Lett. 26 (1994) 521.
[2] G. D'Alessandro et al Phys. Rev. A46 (1992) 537.
[3] E. Pampaloni et al, Europhys. Lett. 24 (1993) 647.
[4] M. Orenstein et al, Appl. Phys. Lett. 56 (1990) 2384.
362

t 20|i
1
A Figure 1 - patterns of the 2p+l=2 family;
theoretical (A) and experimental (B);
Figure 2 - patterns of the 2p+l=2 family; theoretical (A) and experimental (B);
25mA<I<29mA
Figure 3 - multimode patterns; I>30mA 363
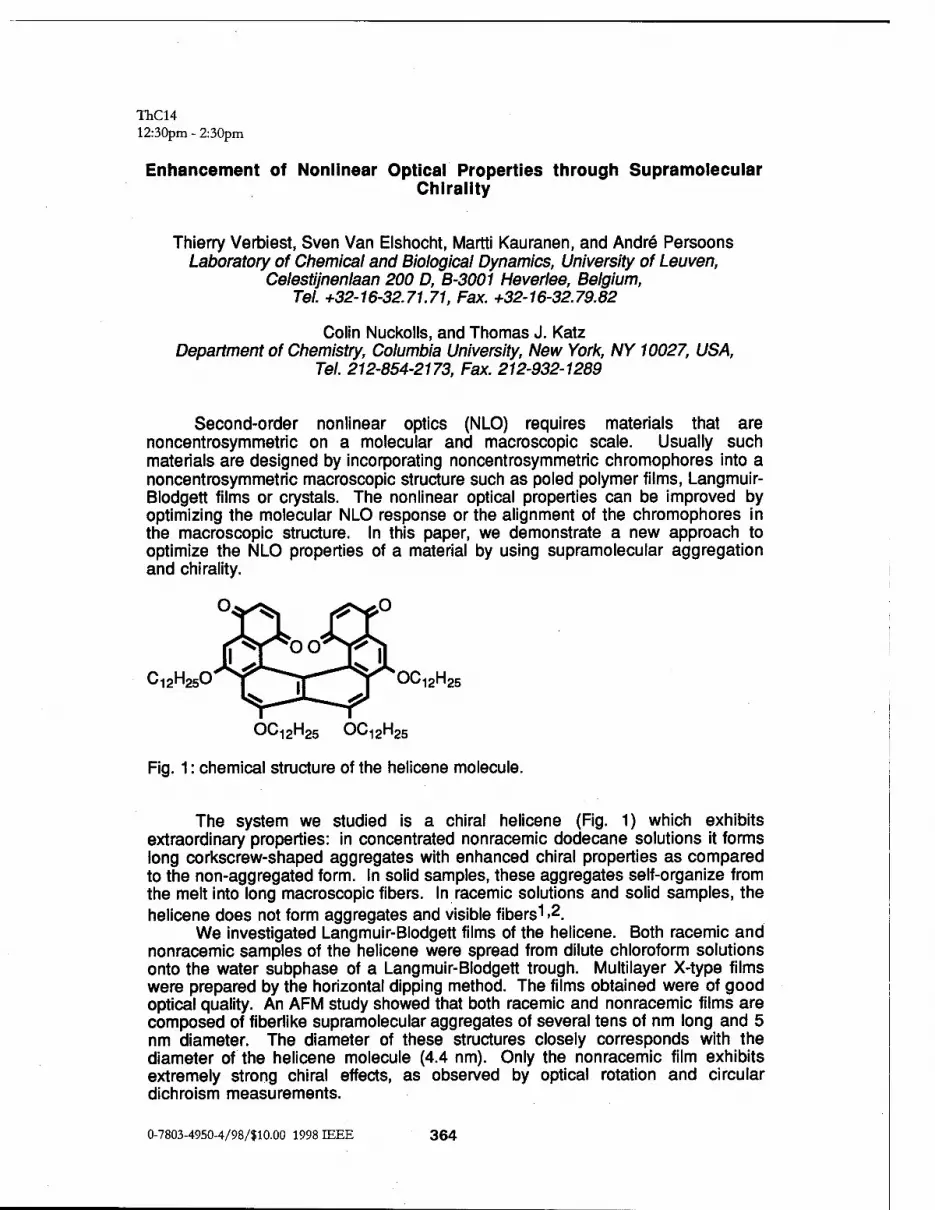
ThC14 12:30pm - 2:30pm
Enhancement of Nonlinear Optical Properties through Supramolecular Chirality
Thierry Verbiest, Sven Van Elshocht, Martti Kauranen, and Andre Persoons Laboratory of Chemical and Biological Dynamics, University of Leuven,
Celestijnenlaan 200 D, B-3001 Heverlee, Belgium, Tel. +32-16-32.71.71, Fax. +32-16-32.79.82
Colin Nuckolls, and Thomas J. Katz Department of Chemistry, Columbia University, New York, NY 10027, USA,
Tel. 212-854-2173, Fax. 212-932-1289
Second-order nonlinear optics (NLO) requires materials that are noncentrosymmetric on a molecular and macroscopic scale. Usually such materials are designed by incorporating noncentrosymmetric chromophores into a noncentrosymmetric macroscopic structure such as poled polymer films, Langmuir- Blodgett films or crystals. The nonlinear optical properties can be improved by optimizing the molecular NLO response or the alignment of the chromophores in the macroscopic structure. In this paper, we demonstrate a new approach to optimize the NLO properties of a material by using supramolecular aggregation and chirality.
C12H250 y^ jr-""^ y^ OCi2H25
OCi2H25 OCi2H25
Fig. 1: chemical structure of the helicene molecule.
The system we studied is a chiral helicene (Fig. 1) which exhibits extraordinary properties: in concentrated nonracemic dodecane solutions it forms long corkscrew-shaped aggregates with enhanced chiral properties as compared to the non-aggregated form. In solid samples, these aggregates self-organize from the melt into long macroscopic fibers, In racemic solutions and solid samples, the helicene does not form aggregates and visible fibers1 >2.
We investigated Langmuir-Blodgett films of the helicene. Both racemic and nonracemic samples of the helicene were spread from dilute chloroform solutions onto the water subphase of a Langmuir-Blodgett trough. Multilayer X-type films were prepared by the horizontal dipping method. The films obtained were of good optical quality. An AFM study showed that both racemic and nonracemic films are composed of fiberlike supramolecular aggregates of several tens of nm long and 5 nm diameter. The diameter of these structures closely corresponds with the diameter of the helicene molecule (4.4 nm). Only the nonracemic film exhibits extremely strong chiral effects, as observed by optical rotation and circular dichroism measurements.
0-7803-4950-4/98/J10.00 1998 IEEE 364

Second-harmonic generation (SHG) from the films was measured in transmission with a Nd:YAG laser. The fundamental beam was incident on the sample at an angle of 45°. The nonracemic films exhibited strong SHG which increased quadratically with the number of layers, indicating good film quality and X-packing arrangement. On the other hand, SHG from the racemic films was very weak. The highest SHG-signal from a 1 layer nonracemic film was more than three orders of magnitude higher than the signal from a racemic film. This is a suprising result, since in both films the individual molecules have the same structure and are organized in similar aggregates.
The surface symmetry of the highly efficient nonracemic films was determined by rotating the film about the surface normal while monitoring the second-harmonic signal. The azimuthal rotation pattern for p-polarized fundamental and s-polarized second-harmonic light (Fig. 2) has a 180° periodicity, which indicates a chiral C2-symmetry. Note also, that for an achiral sample, this particular signal must vanish for some azimuthal angle. Therefore, the rotation pattern implies that chirality contributes significantly to the nonlinearity of the film.
if 'in c 01
1000
800 ,-• • • •« • •
■ i
• .*
c • .# • •» o c 600 •••
•••• {= 400 _ co
■C
V 200 - - 8 (0 0 i i i i
0 60 120 180 240 300 360
azimuthal rotation angle (degrees)
Fig. 2: Azimuthal rotation pattern for p-polarized fundamental and s-polarized second-harmonic light.
Using a recently developed measuring procedure, we were able to determine relative values of all susceptibility components of a 5-layer nonracemic film3. Because of the low symmetry of the film, the choice of coordinate system is not obvious. We fixed the z-axis parallel to the surface normal, while the x and y axes were arbitrarily chosen in the plane of the film. Since the choice of coordinate system affects the values of the susceptibility components, we calculated combinations of susceptibility components that are invariant under rotation about the surface normal. These are given in Table 1. From Table 1 it is clear that the nonlinearity is dominated by a combination of chiral tensor components, which are an order of magnitude larger than the achiral components. If we assume that both racemic and nonracemic films are composed of similar supramolecular units, the enhancement in SHG from the nonracemic film can easily be explained in terms of the chiral and achiral components. In the nonracemic film, the dominant chiral tensor components add up. On the other hand, in the racemic films these components average to zero and only the weak achiral components survive. Therefore, the SHG effciency of the nonracemic film is several orders of magnitude higher than that of the nonracemic film. Hence, we
365

conclude that supramolecular chirality can be profitably used to enhance the nonlinear optical response of thin films.
Table 1: (complex) relative values of the nonvanishing combinations of tensorcomponents of a nonracemic film. The chirality classification indicates if a certain component is only allowed in a chiral sample (chiral) or not (achiral). For simplicity, the susceptibility components are represented by their cartesian indices.
tensor component chirality classification relative value
zzz achiral -4.8-1.8/
zxx+zyy achiral 7.2-1.6/
xxz+yyz achiral 1.8+0.4/
xyz-yxz chiral 61.1+3.7/
zxy chiral 3.5-1.2/
References
1) C. Nuckolls, T.J. Katz, L. Castellanos, J. Am. Chem. Soc. 118, 3767 (1996) 2) A.J. Lovinger, C. Nuckolls, T.J. Katz, J. Am. Chem. Soc, in press 3) J.J. Maki, M. Kauranen, A. Persoons, Phys. Rev. B 51,1425 (1995)
366

ThC15 12:30pm - 2:30pm
Computational Modeling of Vertical-Cavity Surface-Emitting Lasers
Peter M. Goorjian NASA Ames Research Center, M.S. T27B-1, Moffett Field, CA 94035-1000 Phone: (650) 604-5547, Fax: (650) 604-1095, Email: [email protected]
Cun-Zheng Ning NASA Ames Research Center, M.S. T27A-1, Moffett Field, CA 94035-1000
Phone: (650) 604-3983, Fax: (650) 604-3957, Email: [email protected] http://www.nas.nasa.gov/cning
Vertical-Cavity Surface-Emitting Lasers (VCSELs) have become increasingly im- portant for many applications, such as optical interconnects and optical data storages. In many applications, critical requirements are very often high beam quality and/or high output powers. To help the design and optimization of VCSELs for such applications, it is essential to have a simulation model that includes the time evolution of the transverse space dependence of the beam. Such models allow arbitrary transverse profiles of laser intensity or carrier density to develop in time without any a priori assumption about the number and types of transverse modes. In addition, extensive research [1] in the past has shown that many-body effects are important in influencing the optical gain and the refractive index of semiconductor quantum wells. It is thus important to include the key many-body effects in simulation models for semiconductor lasers.
There are basically two approaches to developing models with the above features. The first is to solve the coupled Maxwell-Semiconductor Bloch equations [1] directly. This has been done either with an envelope equation or with the original Maxwell-Semiconductor Bloch equations [2-4]. An example of the past simulation based on this second approach for the case of femtosecond pulse propagation is shown in Fig.l. However, due to the time scales and the large set of equations involved, it is only feasible to solve this set of equations for a time development of up to picoseconds for a 1-dimensional simulation. It becomes increasingly impractical to simulate semiconductor lasers for a time development longer than nanoseconds, at which time scale most of the interesting features of lasers occur.
An alternative model, called Maxwell-Effective Bloch Equations (MEBE) was de- veloped recently [5]. This model combines the space-time resolution with microscopic many-body effects in a way that is both accurate enough and computationally manage- able. This model has been used to simulate edge-emitting high power lasers recently [6,7]. We note that different models based on rate equations were used by other researchers [9] to simulate multi-mode dynamics of VCSELs.
0-7803-4950-4/98/$10.00 1998 IEEE 367

In this paper, we report our recent progress in applying this model to VCSELs. In our approach, the MEBE-model is adapted to VCSEL situation by assuming a fixed mode profile along the longitudinal direction in VCSELs. This is a valid approximation for VCSELs since after about a picosecond, the longitudinal mode structure is established [8]. Not much deviation from the assumed mode structure occurs thereafter, because of very large mode spacing between the adjacent longitudinal modes. The resulting equations [5] are given as follows:
dPjjt) dt
nqdE i „ „ „ iKT , „ „ v
T^^vis-^ + ^CPo + P,) (1)
= [-Tj(N) + i[80 - 8j(N)]] Pj(t) - ieoebAj(N)E(t) (2)
^ = V±DN Vi N + ^ + ^ [(Po + Pi)*E + (P0 + Pl)E*] (3)
where E and N are laser field envelope and carrier density, respectively. Po and Pi are effective material polarizations constructed from microscopic theory [5]. J is the pumping current density, Vj_ 1S the Laplacian in the transverse plane, T is the confinement factor, and L is the cavity length. Many-body effects and quantum well structure information are contained in the density dependent coefficients Tj, Sj, and Aj [5]. In our simulation, we first compute the optical gain and refractive index using the microscopic many-body theory including the realistic bandstructure for the given quantum well structure. A sample new result of the calculated gain is shown in Fig. 2. The parameterization of the computed gain and refractive index in terms of Lorentzian oscillators allows determination of these density dependent functions. The other parameters are well-known and explained elsewhere [6].
A new finite-difference algorithm has been developed for solving Eqs. (l)-(3) and will be shown in the presentation. That algorithm will be used to calculate the detailed time evolution of the transverse mode profiles of VCSELs. The VCSELs are based on InGaAs/GaAs quantum well structures. Effects of pumping current and refractive index profiles will be investigated in detail. The simulation results will be compared with other results the use the rate-equation model.
References
1. W.W. Chow, S.W. Koch and M. Sargent, Semiconductor Laser Physics, Springer, Heidelberg, Berlin, (1994).
2. Goorjian, P. M. and Agrawal, G. P.: "Computational Modeling of Ultrashort Op- tical Pulse Propagation in Nonlinear Optical Materials," Paper NME31, Nonlinear Optics Topical Meeting, Maui, HI, July 8-12, 1996. Also, Nonlinear Optics: Ma- terials, Fundamentals, and Applications, Vol. 11 of 1996 OSA Technical Digest Series (Optical Society of America, Washington, D.C., 1996), pp. 132-133.
368

3. Goorjian, Peter M., and Agrawal, Govind P., "Computational Modeling of Ul- trafast Optical Pulse Propagation in Semiconductor Materials," Paper QThE9, Quantum Optoelectronics, Spring Topical Meeting, Sponsored by the Optical So- ciety of America (OSA), at Hyatt Lake Tahoe, Nevada, on March 17-21, 1997.
4. Goorjian, Peter M., and Agrawal, Govind P., "Maxwell-Bloch Equations Modeling of Ultrashort Optical Pulse Propagation in Semiconductor Materials," Paper WB2, Optical Society of America (OSA) 1997 Annual Meeting, Long Beach, CA, October 12-17, 1997.
5. C.Z. Ning, R.A. Indik and J.V. Moloney, "Effective Bloch-equations for semicon- ductor lasers and amplifiers," IEEE J. Quan. Electron. 33, 1543 (1997).
6. C.Z. Ning, J. V. Moloney, R.A. Indik, "A first-principles fully space-time resolved model of a semiconductor laser", Quantum Semiclass. Opt., 9, 681(1997)
7. J.V. Moloney, R.A. Indik and C.Z. Ning, "Full space-time simulation for high brightness semiconductor lasers," IEEE Photon. Tech. Lett., 9, 731(1997); A. Egan, C.Z. Ning, J.V. Moloney, R.A. Indik, M.W. Wright, D.J. Bossert and J.G. Mclnerney, "Dynamic Instabilities in MFA-MOPA Semiconductor Lasers," IEEE J. Quant. Electr. 34, 166, (1998)
8. C.Z. Ning, S. Bischoff, S.W. Koch, G. K. Harkness, J.V. Moloney, and W.W. Chow "Microscopic Modeling of VCSELs: Many-body interaction, plasma heating, and transverse dynamics", to appear in Optical Engineering, April, 1998
.9 J.Y. Law, G.H.M. van Tartwijk, and G. P. Agrawal, " Effects of transverse-mode competition on the injection dynamics of vertical-cavity surface-emitting lasers", Quantum Semiclass. Opt., 9, 737 (1997)
Propagating Strong Pulse
20 30 Distance (microns)
o.ooo -
. -0.002
-0.004
-0.006 1200.0 1250.0 1300.0
Photon energy (meV)
Fig. 1. Nonlinear effects on pulse propa- gation
Fig. 2. Computed gain spectra (dashed lines) and parameter gain spectra (solid lines)
369

ThC16 12:30pm - 2:30pm
Large Second-Order Susceptibility in Poled ZF7 Lead Silica for Sum-Frequency Generation
Mingxin Qiu, Toru Mizunami, and Hidefumi Koya Department of Electronics, Kyushu Institute of Technology
1-1 Sensui-cho, Tobata-ku, 804 Kitakyushu, Japan Tel. 0081-93-884-3298, Fax. 0081-93-884-3203, Email. [email protected]
F. Pi and G. Orriols Grup d'Optica, Dpt. deFisica, Universität Autonoma de Barcelona
Edifici C, 08193 Bellaterra (Barcelona), Spain
Second harmonic generation from a poled glass causes a wide attention due to its application prospect and its mechanism. By poling the second order susceptibility (SOS) in the surface layer of glass at anode side can be comparable with that in a KDP crystal.1"4 There is also another method for changing the glass surface layer into the second order of nonlinear material is by scanning electron beam on it.5
We report the SOS in poled ZF7 lead silica is as large as to 7 pm/V by calibrating with a quartz plate, which is seven times of x(2) 123 in KDP crystal, the largest value obtained in the poled glass. As we know, it is the first time to use a poled glass in generating the sum-frequency at 355 nm, with the pumping lights at 1.064 um and 0.532 nm. The SOS in lead silica glass has an exponential relation with the lead percentage.
17 Fig. 1 The experimental arrangement for sum-frequency generation
18
The method for poling a glass was described in the many previous papers such as Ref.l- 3. The poling temperature, voltage and duration in our experiments are 350° C, 3.5 kV and 15 min respectively. In sum-frequency generation (SFG) the pumping lights are 1.064 urn from a Nd3+: YAG laser with the pulse width of 33 ns in 10 Hz, and its frequency doubling, 0.532 nm. Fig. 1 is the diagram of the experimental arrangement for measuring SFG and that for detecting SHG is the same equipment except that there is no output at 0.532 nm from the Nd3+:YAG laser by switching the laser into another operational mode. (1) is Nd3+: YAG laser, (2) glass filters, (3) beam splitter, (4) photodiode, (5) aperture, (6) and (11) are dichromatic beam splitters, (7) and (8) mirrors, (9) is half-wave plate at 0.532 nm, (10) and (12) are attenuation plates, (13) is lens, (15) filters, (16) photomultiplier (PMT), (17) storage oscilloscope, (18) computer, (14) sample.
By splitting the green light from the Nd3+:YAG laser beam with a dichromatic mirror (6),
0-7803-4950-4/98/J10.00 1998 IEEE 370

through which the pumping light at 1.064 urn transmits with the transparency of 90 % and on which the pumping light at 0.532 nm is reflected with a reflectivity 99 %, Then the green light is reflected from a mirror (7) to pass through a half-wave plate (9) for rotating its polarization direction into the horizontal direction for getting the maximum output of sum-frequency. The polarization direction of infrared light does not change, which is parallel to horizontal direction. At last two pumping lights are mixed into one single beam again by another dichromatic mirror (11), and the lens (13) with focus length of 10 cm focusses the pumping lights onto the sample The incident angle of light beam on a sample is about 60 degree. The focus point is adjusted
according to the infrared light, where the size of 1.064 urn light is about 40 p.m. It is a distance away from the focus point of green light for enlarging its spot size. Before the entrance of PMT there are three pieces of filters (15). Two are glass filters for blocking up the pumping lights at 1.064 urn and at 0.532 ran and one interference filter at wavelength of 0.355 nm with the band width of 10 nm is near the PMT (16).
1 ' 1 ' läy O/OO '
Sign
al
'
r ' c*%° (b)-
Time of Rel. Intensities \ XI2
0 0.05 0.1 Time of Rel. Intensities \ XI2
Fig. 2 The relations between the sum-frequency signal and the multiplier between the light intensities at 1.064 um and 0.532 nm in silica (a) and in ZF7 glass(b).
The SFG is described in many books.6 The relation between the sum frequency signal at 0.355 nm and the multiplier between the intensities of the pumping light at 1.064 urn and at 0.532 nm in a pure silica, Fig.2a, and in a ZF7 glass, Fig. 2b. The SFG in pure silica is for a comparison. They should be linear functions from the equation below.7 The pure silica used in our experiment is Chinese silica made by gas-fusing, the transmittance band of which, to 160 nm, is close to that of Suprasil silica by Schott Glass in Germany and its poled SOS is 0.2 pm/V at the poling condition indicated above.
. 2AkL jm?ixi2(itf
sin—2~~ '= nnnX2c ( ^AkL
1 2 s s
(1)
where Is is the intensity of sum-frequency, and I,, I2 are those of the pumping lights, n, is the refractive index of sum-frequency, and n,, n2 are those of the pumping lights in the material, L is the active depth, Xg the wavelength of sum-frequency, c the light velocity in vacuum, % the SOS of the sample, A k L is the phase missing in sum-frequency process. (%L)Z and (xL)s are proportional to the square root of the line slopes in Fig. 2 and their ratio can be got by an approximation of neglecting the phase factor for the active distance within the coherent length.
371

w\_»lz»Ä',2\zr, la m, / -1/2
JS =( ) — [(——) (—^) ] (2) ^L\ "lAAs Ks JJ2z V: 2S
where Z, S denote ZF7 glass and pure silica respectively. There are two sets of attenuation plates for changing the light intensities in either route. The
intensity of the sum-frequency is detected by the PMT (16) and its signal is stored in a storage oscilloscope (17) and then a computer (18) treats it. The maximum intensities of the green and infrared lights in pure silica can reach 1.1 and 1.3 mJ respectively. The damage threshold of ZF7
glass is much lower than that of pure silica so that the maximum light intensities are reduced to 1/5 and 1/40 of those in pure silica respectively. By etching in a dilute solution of HF, 0.5 % in weight, the glass surface can maintain the original optical quality. The layer depth in the poled ZF7 glass is 2.8 urn and that in the poled pure silica 12 urn. The coherent lengths calculated are 1.8 urn in ZF7 glass and 10 urn in pure silica for SFG, and those for SHG are 7 urn in ZF7
glass and 22 urn in pure silica. The coefficients before square bracket at the right side of Eq.2 are 0.93 and 0.91 for SFG and for SHG respectively. From Fig. 2 and Eq. 2 we have (%L)Z / (%L)s = 5.3, and we get %z = 29 Xs f°r SFG by considering the active distances of 1.8 urn in ZF7
glass and 10 urn in pure silica. The signal ratio in both materials from SHG is 49, and so (%L)Z
/ (xL)s = 6.4. Thus, we have %z = 27 %sby considering that the active distances are 2.8 um in ZF7
glass and 12 urn on pure silica glass. The differences of %z and %s from SFG and SHG are within the measurement errors.
By scanning the electron beam on the lead silica we obtained that their SOS are proportional to the lead percentage and the maximum value of SOS is 4 pm/V for ZF7 glass,8 but from the poling results the relation between SOS and the lead percentage is exponential. By poling we obtained a large SOS, 7 pm/V from ZF7 glass for the lead percentage of 70.93 %. The SOS in a poled ZF6 lead silica under the same poling condition is only 0.2 pm/V, or 3 % ofthat of the poled ZF7 glass, for the lead percentage of 56.66 %. The SOS in a poled SF2 lead silica even drops to 0.02 pm/V, or 0.3 % of the poled ZF7 glass, for the lead percentage of 51.18%. The SOS in a poled F2 lead silica becomes zero, which has the lead percentage of 46.65 %. If x = 7 exp [- (0.7093 - p)a], from the values of ZF6, a = 25 and from that of SF2, a = 29.5 . It is reasonable for the value got in poled F2 glass, which is under the testing noise.
The mechanism of poling process is still not very clear yet. It was supposed that the negative permanent particles are related with the radical of Si-O".9 The SOS in ZF7 glass are larger both in poling and in scanning and this may connect with its high percentage of lead oxide.
REFERENCE 1, R. A. Myers, N. Mukherjee, and S. R. J. Brueck, Opt. Lett. 16,1732 (1991). 2, L. J. Henry, A. D. Devilbiss, and T. E. Tsai, J. Opt. Soc. Am. B12, 2037 (1995). 3, H. Nasu, H. Okamoto, K. Kurachi, J. Matsuoka, K. Kamiya, A. Moto and H. Hosono,
J. Opt. Soc. Am. B12, 644 (1995). 4, Aokada, K. Ishii, K. Mito, and K. Sasaki, Appl. Phys. Lett. 60,2853 (1992). 5, P. G. Kazansky, Kamal, and P. St. J. Brussell, Opt. Lett. 18, 693 (1993) 6, The principles of nonlinear optics, Y.R.Shen, John Wiley & Sons, New York, p.67,1984. 7, Nonlinear optics, R. W. Boyd, Academic Press, New York, P. 66, 1992. 8, Mingxin Qiu, F. Pi, and G. Orriols, to be published. 9, W. Olthuis, and P. Bergveld, IEEE Transactions on Electrical Insulation, 27, 691, (1992).
372

ThC17 12:30pm - 2:30pm
Quasi-Phase-Matched Backward Second-Harmonic and Sum-frequency Generation in Periodically-Poled Lithium Niobate
Xinhua Gu, Yujie J. Ding, Jin U. Kangw, and Jacob B. Khurgin^ Department of Physics and Astronomy; Centers for Materials and Photochemical Sciences
Bowling Green State University, Bowling Green, OH 43403 Telephone Number: (419)-3 72-8785 FAX Number: (419)-372-9938
Since quasi-phase-matching (QPM) was introduced in 1962 [1], it has become an important scheme for achieving efficient second-harmonic generation (SHG) in various nonlinear optical materials [2]. Most of the results obtained so far are based on the forward configuration. Recently, it was shown in Ref. [3] that backward SHG is also possible, i.e. SH beam can propagate in a direction opposite to the fundamental beam. Most recently, we observed backward SHG in periodically-poled LiNb03 (PPLN) using subpicosecond laser pulses [4]. However, due to the severe temporal walk-off between the fundamental and SH pulses, the maximum conversion efficiency was only about 0.02%. Here we present our new results on the backward SHG and sum-frequency generation (SFG) in PPLN using nanosecond laser pulses. Three PPLN samples with different length (L = 3 mm, 4 mm, and 5.5 mm) were used in the study of backward SHG and another PPLN sample with L = 4.2 mm was used to generate backward sum-frequency (SF). All the PPLNs have the same spatial period (A = 3.3 um), and were prepared on the 6-mm-long z-cut LiNb03 with a thickness of 230 um. A 3.3-um-period Al grating was patterned upon the +C face, and an Al ground plane was patterned upon the -c face. The poling was done by applying eight 300-|is electric pulses at 25.6 kV/mm. The backward SH and SF beams were generated by using the idler from an optical parametric oscillator (MOPO-730, Spectra-Physics Lasers) as a pump beam with a pulse width of 9 ns and repetition rate of 10 Hz. A dichroic mirror was placed before the sample to pick off the backward propagating SH and SF beams. We first measured the backward SH (BSH) intensities for pump wavelength range of 1.4 -1.8 urn. From the wavelength
20th 19th 18th -T—'—i—'—r
17th 16th —'—i—'—i—'—ra—r
ISM 1472 ISM 1130 1718 Wavelength, nm
laoo
Fig. 1 Measurement of backward SH phase- matching spectrum approximately normalized by the square of the pump intensity for the PPLN sample with L = 5.5 nm. Arrows mark the positions of our theoretical results. 0-7803-4950-4/98/$10.00 1998 IEEE
1—i—i—i—i—i—i—■—i—i—i—■—i—i—1—■—r
I i 1 i I 0 100MOMOMQM0000700000000 1000
Input Intensity, MW/cm2
Fig. 2 Conversion efficiencies were measured vs. pump intensity for the order of 16th (filled diamonds), 17th (open squares), 18th (filled squares). 19th (open circles), and 20th (filled circles). Each type of lines corresponds to our theoretical result for the respective order.
373

scan, we have identified five phase-matching BSH peaks located around 1768.1 nm, 1673.5 nm, 1569.2 nm, 1490.2 nm, and 1436.0 nm, as shown in Fig. 1. These results are consistent with the theoretical prediction (marked by arrows in Fig. 1) based on quasi-phase-matching condition:
k2(a + 2k.» = 27im/A (1) where m is the order of the domain gratings used to achieve QPM for the backward SHG, and equals 16, 17, 18, 19, and 20, respectively.
Second, we measured the BSH pulse energy vs. the pump intensity at each peak wavelength. The dependence of BSH pulse energy on the pump intensity was found to be nearly quadratic which is consistent with our theoretical result. We have then determined the conversion efficiencies and plotted them vs. the pump intensity in Fig. 2 for all the five orders. One can see that for the fixed pump intensity, the conversion efficiencies are more or less the same for all five orders. The maximum conversion efficiency is ~ 0.3% at the pump intensity of 984 MW/cm2 for the 16th order with L = 4 mm, which is about one order of magnitude larger than that achieved by using subpicosecond laser pulses [4]. Fig. 3 shows the measured dependences of conversion efficiency on the sample length, which can be well fitted by quadratic dependences.
29th 28th 27th 26th 25th
0 1 2 S 4 6 Domain Length, mm
Fig. 3 BSH Conversion efficiency vs. sample length for the 16th order at the pump intensity of 325 MW/cm2 (pump wavelength: 1768.1 nm, filled circles) and the 18th order at the pump intensity of 415 MW/cm2 (pump wavelength: 1569.2 nm, filled diamonds). The dashed lines correspond to our theoretical results.
1650 1600 1660 1700 1760 1800 1860
Pump Wavelength, nm
Fig. 4 Measurement of backward sum-frequency phase-matching spectrum approximately normalized by the cube of pump intensity for the PPLN sample with L = 4.2 mm. Arrows mark the positions predicted by our theory.
While generating backward SH beam, the pump beam also generates unphase-matched forward SH beam. This forward SH beam can interact with the fundamental beam and can generate backward sum-frequency beam. We have measured the phase-matching spectrum for this process within the pump wavelength range of 1.5 - 1.8 urn in the PPLN with L = 4.2 mm. As shown in Fig. 4, we have also observed five dominant peaks located at 1793.9 nm, 1706.1 nm, 1659 nm, 1593.5 nm, and 1536.7 nm for this process. The configuration for this process is shown in Fig. 5. Note that the backward sum-frequency generation is phase-matched, even though the
374

forward SHG is not phase-matched. It can be readily shown that the phase-matching condition for the backward sum-frequency generation is:
3ka) + k30) = 27c(m'-l)/A (2) where m' is the order of the domain gratings used for achieving QPM for backward SFG. Based on Eq.(2), we have determined the positions of the phase-matching peaks for m' = 25, 26, 27, 28, and 29, as marked by arrows in Fig. 4. Therefore, the measured phase-matching peak wavelengths are quite consistent with our theoretical results.
Km K2io
S3(D
kQM= 2MD//A
84 -M
.C 84 D •e 54
< <U
& 44 s c 34 w iR 34
Ou u u. 24 CO
1 i 1JI
14 ^i a 04 03
A m'=25 In
a ■'■» • m'=27 ■
O ■■'<■ 28
■ »'=2» / •
- mf
■
- j S -
-J'j*-*^ -
Fig. 5 Configuration for backward sum-frequency generation.
04 20 30 40 SO 60 70 80 10 100 110 12
Pump Pulse Energy, u. J
Fig. 6 Backward sum-frequency pulse-energy vs. pump pulse energy for the order of m' = 25,26, 27, 28, and 29, respectively. Each solid curve corresponds to cubic fit to the data at the respective order.
We have also measured the backward sum-frequency pulse energy at each peak wavelength vs. the pump energy per pulse, as shown in Fig. 6. Each set of the data at each order can be well fitted by cubic dependence, which is characteristic for this process since the second-harmonic pulse energy is proportional to the square of the pump pulse energy for the process of forward SHG.
This work has been supported by AFOSR and ONR.
[1] J. A. Armstrong, N. Bloembergen, J. Ducuing, and P. S. Pershan, Phys. Rev. 127, 1918 (1962).
[2] M. M. Fejer, G. A. Magel, D. H. Jundt, and R. L. Byer, ffiEE J. Quantum Electron. 28, 2631 (1992).
[3] Y. J. Ding and J. B. Khurgin, Opt. Lett. 2JL, 1445 (1996). [4] J. U. Rang, Y. J. Ding, W. K. Burns, and J. S. Melinger, Opt. Lett. 22, 862 (1997).
°°Code 5672, Naval Research Laboratory, Washington, DC 20375. department of Electrical and Computer Engineering, The Johns Hopkins University, Baltimore, MD 21218.
375

ThC18 12:30pm - 2:30pm
Near-field Optical Second-harmonic Generation
in Semiconductor Quantum Dots
Ansheng Liu and Garnett W. Bryant
National Institute of Standards and Technology
Atomic Physics Division, A267 Physics, Gaithersburg, Maryland 20899
Phone (301) 975 5029 Fax (301) 990 1350
In a conventional nonlinear optical experiment such as second-harmonic generation
(SHG), the nonlinear materials are usually illuminated by a far field (laser beam) and the
second-harmonic (SH) signal is also collected in the far-field region. In such a situation, it
is well known that the second-order optical nonlinear effects are absent in the electric dipole
approximation in materials exhibiting central inversion symmetry. For a quantum dot (QD)
structure with a rectangular potential profile in three dimensions excited by a far field, the
SH nonlinear susceptibility arising from interband and intersubband transitions vanishes
because of the definite parity of the wave functions. In order to observe the second-order
nonlinearity in such a system, one has to break the symmetry by means of the driving field.
Here we show that, if the QD is excited by a near field produced by a fiber tip of a near-field
scanning microscope, a second-order nonlinear response is generated in a QD system because
the tip field (driving field) varies rapidly over the QD domain.
We consider a GaAs/AlxGai_a;As QD structure having GaAs layer widths of Lx, Ly and
Lz along the x-, y- and ^-directions, respectively. In the one-band effective mass approx-
imation, the wave function of electrons (e), heavy holes (hh), and light holes (Ih) can be
written as
*6«(r) = ub{r)Fa(f) , b = e, hh, Ih , (1)
where u(r) and F(r) are the periodic Bloch and envelope parts of the wave functions. We use
the infinite-barrier model to calculate the eigenenergy (Ea) and the corresponding envelope
function of electrons and holes, neglecting the band mixing and electron-hole correlation
0-7803-4950-4/98/$10.00 1998 IEEE 375

effects. In calculating hole states, we include the anisotropy of the effective masses for both
the heavy and light holes. When the QD is excited by a tip field of angular frequency of
w, the near field [£{r)\ induces a SH nonlinear current density across the QD system. The
nonlinear current density stemming from combined interband and intersubband transitions
is given by
( 'r)~»\h, h(2u; + i/T)-Eaß
(2) fojEy) - f0(Ea) f0(Eß) - fp(E,) h(u + i/r) - Eay h(u> + i/r) - Eyß
where jaß(r) is the transition current density between state a and state ß, a represents the
spin, /o is the Fermi-Dirac distribution function, r is the relaxation time, and Eaß = Ea — Eß.
If we are interested in the SH signal observed in the far-field region that is excited by the
near-field of a tip and neglect local-field effects at the SH frequency, the radiation strength
of the SHG is proportional to the square of the integrated nonlinear current density or
polarization. Therefore it is physically meaningful to define an effective susceptibility tensor
(X) via
1— / J*L(2u;, r)d3r = e0 X: E0E0 , (3) 2UJ LxLyuz
where E0 denotes the incident field that drives the fiber tip. In this work we have used a
single dipole model and the Bethe-Bouwkamp model to describe the tip field. For a GaAs
QD with Lx=50 nm, Ly=10 nm, and Lz=5 nm, we have performed numerical calculations
of the effective SH susceptibility by varying the frequency and by scanning the tip over the
QD. Typical results are shown in Figs. 1 and 2. For a given frequency, the magnitude of the
SH susceptibility is strongly dependent on the tip position. The overlap of the local tip field
and the QD wave functions, which determines the radiation strength of the SHG, changes
drastically as the tip is scanned. Using near-field microscopy to generate nonlinear optical
response should provide an effective new probe of quantum nanostructures.
377

1.00
■1.50 -0.75 0.00 0.75 1.50
X/L
0.00 ■1.50 -0.75 0.00 0.75 1.50
X/L
Fig. 1. Magnitude of the xzz-component of the effective SH susceptibility tensor of a QD
with 1^=50 nm, Ly=l0 nm, and Lz=5 nm when a tip (a dielectric sphere) is scanned along
the x direction over the QD at a height of 20 nm. The tip field is calculated based on a
single dipole model. The radius of the sphere is 10 nm, and the index of refraction is 1.5.
The photon energy is hu = 0.93 eV. The polarization of the incident field is along the x
axis.
Fig. 2. Magnitude of the zscc-component of the effective SH susceptibility tensor of a QD
with Lx=50 nm, Ly=10 nm, and Lz=5 nm when a tip (a dielectric sphere) is scanned along
the x direction over the QD at a height of 20 nm. The tip field is calculated based on a
single dipole model. The radius of the sphere is 10 nm, and the index of refraction is 1.5.
The photon energy is hu = 0.96 eV. The polarization of the incident field is along the x
axis.
378

ThCl9 12:30pm - 2:30pm
Dye-Doped Glasses: Nonlinear Optical Material for Spatial Soliton Applications
Paul A. Tick* Corning, Inc., Corning, NY 14831
Elna M. Nagasako and Robert W. Boyd The Institute of Optics, University of Rochester, Rochester, NY 14627
Spatial solitons are light beams that propagate with a constant transverse profile as a consequence of an exact balance between diffraction and self focusing effects. Such beams hold great promise for applications [1-3] such as optical interconnects, optical switching, and steerable optical waveguides. However, the generation of spatial optical solitons places especially stringent constraints on the material properties of the nonlinear optical material used to support the propagation of the solitons. In addition to the usual requirements that the nonlinear optical material possess a large nonlinear susceptibility and low attenuation losses, materials suitable for the propagation of spatial solitons in two transverse spatial dimensions must possess additional properties to render the soliton stable against collapse. Several methods have been proposed to render the propagation of solitons stable. These include the use of a saturating optical nonlinearity, the use of photorefractive materials, or the use of cascaded optical nonlinearities. In our work, we have concentrated on the development of materials with a saturating optical nonlinearity, that is, a material for which the change in refractive index induced by a material of intensity / is described by the equation
An = ^I—. (1) l + I/Isat
We have developed a material system that is uniquely suited to supporting the propagation of spatial solitons. This material system is based on the use of lead tin fluorophosphate glass [4] as the host material. This material possesses a low melting temperature in the range 100 to 1500 C (depending on the glass concentration), is relatively stable in a laboratory environment, and is available in samples of good optical quality. Because of its low melting temperature, we are able to embed a variety of organic molecules into this glass as dopants [5]. In this paper, we report our use of acridine orange in concentrations of the order of 1 to 10 parts per million (by weight) as the dopant that imparts a nonlinear optical response to the material. We have found that such a material can exhibit a saturation intensity of 75 mW/cm and an extremely large third order susceptibility of order of 0.01 esu.
* Corresponding author: 607-974-3251 (voice), 607-974-3675 (fax).
0-7803-4950-4/98/$10.00 1998 IEEE 379

-194 |tW - 119 |tW •• 45.9 |tW - 37.9 »iW • 11.3 |tW - 9.6 |iW -R9 |iW - 5£ jiW
• 3.8 t»W • 2.3 |iW
Fig. 1. Beam profile after propagating through 1 cm of the nonlinear optical material, for varying beam power. The spacing between tick marks on the horizontal axis is 120 \im.
4= ' I T ... ,,
ISO -
140 -
130 -
120 -
110
100
-
1 +f 91 ,„l" _JL_ 0
400 800 Power (uW)
1200
Fig. 2. Variation of output beam diameter with the incident laser power.
We have recently performed a series of measurements to demonstrate the potential of these materials for the propagation of spatial solitons. A laser beam is brought to a focus near the entrance plane of the material sample, and the beam profile after propagating through the 1-cm-thick sample is measured with a beam profiler. The results of these measurements are shown in Figs. 1 and 2. As the incident power is increased, the output beam first shrinks (as expected of any self focusing process) and then stabilizes at a value of approximately 100 ]im. This region of constant output diameter with increasing incident intensity is suggestive of the formation of a stable spatial soliton. Experiments aimed at corroborating this conclusion are currently in progress.
In summary, we report that acridine-doped lead tin fluorophosphate glass is a promising nonlinear optical material for use in the study of spatial solitons.
References 1. R. de la Fuente, A. Barthelemy, and C. Froehly, OptLett. 16,793,1991 2. M. Shalaby and A. Barthelemy, Opt. Commun. 94, 341,1992. 3. R. McLeod, K. Wagner, and S. Blair, Phys. Rev. A 52,3254,1995. 4. P. A. Tick, Phys. Chem. Glasses, 25,6,1984. 5. W. R. Tompkin, R.W. Boyd, D.W. Hall, and P.A.Tick, J. Opt. Soc. Am., B 4,1030,1987.
380

ThC20 12:30pm - 2:30pm
Two Wavelength KGd(W04)2 and PbW04 Raman Lasers in the IR and Visible
under efficient picosecond excitation
J. Findeisen, HJ. Eichler
Optisches Institut, Technische Universität Berlin, Strasse des 17. Juni 135, D-10623 Berlin, Germany
(fax: +49-30-31426888)
A.A. Kaminskii
Institute of Crystallography, Russian Academy of Sciences, Leninskypr. 59, 117333 Moscow, Russia
(fax:+7-095-1351011).
Anisotropie /(3)-active crystals are promising laser materials for the generation of pico- and nanosecond
Raman shifted Stokes-and anti-Stokes-emission [1-3], which is of great interest for lidar techniques,
applications in fiber optics, as pump source for upconversion fiber experiments and in x(3)-active fibers
for the generation of white light continuums. Two promising candidates KGd(W04)2 and PbW04 are
examined in a detailed way concerning their suitibility as Raman laser medium. Single pump pulses of
Ep = 1 - 10 mJ and Tp = 110 ps were provided by a flashlamp pumped Nd:YAG cavity dumping laser
system to excite SRS activity (see fig. 1).
For internal cavity Raman laser experiments we took the cavity dumper (i.e. Pockels cell and thin film
polarizer) out of the master oscillator and put in the Raman active crystal with the quasi plane parallel
polished end surfaces (ß<0.25° in Table 1). The reflectivity of the HR@1064nm mirrors at
X = 1180 nm was 92% and at X, = 1160 nm 94%. KGd(W04)2 and PbW04 showed stable intracavity
picosecond laser action at X = 1177 nm, X = 1159 nm and X = 1176 nm, respectively.
mode-locked Nd3*:Y3AI5012 master oscillator
P HR mirror + saturable absorber pockels cell
acousto-optical- modulator
Nd^YjAljO,! amplifier
optional
optional frequency doubler
=acfcy~ rea >|
[^-activecrystal]
Raman laser Fig. 1: Experimental setup
0-7803-4950-4/98/$10.00 1998 IEEE 381

External cavity Raman laser action was realized in the longitudinally pumped setup shown in fig. 1.
The laser beam is focussed into the Raman active crystal inside a plane concave resonator with a length
1 = 200 mm by a lens with a focal length of 12 mm, resulting in a beam waist of approximately 25 um.
The flat mirror has an AR-coating to couple in the pump wavelength of 1064 nm and a HR-coating for
the first Stokes wavelengths of 1159 and 1177 nm. As outcoupler for these Raman laser lines we used a
mirror with r = 500 mm, R = 78% @1177 nm, R = 91% @1159 nm and HR@1064 nm.
We realized a good overlap of the pump and Raman laser mode inside the KGd(W04)2- and PbW04
rods. The intensity of several 100 GW/cm2 is high enough to generate efficient scattering into the first
Stokes component. We obtained the best laser activity of all samples with external cavity Raman laser
action.
Crystal size [mm] axis: a,b,c
Optical, axis Ethr[mJ] Eout [mJ] Tl [%] Eout [mJ] (SHG)
KGd(W04)2 4 x 47 x 5 b-axis 1 2.1 1.7
70@1177nm 50@1159nm
0,3 0,2
PbW04 6x9x30 c-axis 2 1 40@1176nm 0,1
Table 1: Raman active laser crystals and laser characteristics in the external cavity configuration
Energies of slightly more than 2 mJ in KGdW04)2 were reached. Under normal steady-state conditions
and moderate pump intensities the parametric four wave mixing gain is lower than the stimulated
Stokes emission gain. Stokes emission is additionally supported by the sharp wavelength cutoff of the
high quality dielectric mirrors developed especially for this purpose. The two different vibrational
modes of the optical phonons tnvi = 901 cm"1 with pump beam polarization Ep± c-axis and
tn^ = 768 cm"1 with Ep _L a-axis in KGd(W04)2 are generated seperately from each other due to the
selection rules.
The intensity corresponding to the Raman threshold pump pulse energy of E^l mJ with xp=110 ps
and a pump beam diameter of 60 urn at the flat end surfaces ensures that the Raman gain is
exp[GssIp(0) IJm exp[30] with Gss« 6 cm/GW required as lower limit for amplification of the
spontaneous Stokes scattering. Raman laser action in 30 mm long PbW04 generates pulses with an
output energy of 1 mJ. As in KGd(W04)2 we received also better results with external cavity Raman
laser action than with intracavity Raman laser action. This is in general due to the lower intensities of
the laser mode inside the master oscillator compared to the external cavity arrangement. In this crystal
only one vibrational mode with an energy of tnv=895 cm'1 interacts in the SRS process. As the Raman
gain Gss is comparable to KGd(W04)2, the reduced laser performance is due to the small interaction
length. We suppose, that the crystal length considering normal values for the Resonator losses should
be at least 60 mm as used in [4]or longer for efficient Raman laser action if the resonator design is
optimized.
382

The beam cross sections of the external cavity KGd(W04)2 and the PbW04 Raman laser show
Gaussian profiles. Both of the KGd(W04)2 and the PbW04 Stokes emissions were frequency doubled
by non-critical phase matching with a 12 mm long LBO sample. Thus, Raman lines were converted
preserving the good beam profile to 580 nm and 589 nm generated from the Stokes emission of
KGd(W04)2 and to 588 nm generated from the Stokes emission of PbW04. Raman pulses showed high
polarization parallel to the pump polarization.
Pumped by a single external pulse, Raman laser action is generated by the circulating pump pulse in the
in the steady state limit T2« TP with T2 = Raman transition response time. In total four Raman Pulses
are emitted with a time separation equal to the round trip in the resonator with the geometrical length
LR = 200 mm. The time separation xe between the Raman pulses satisfies the following formula for
Tp « Te.
2-lL, +(„-,)■/,] c
where n is refractive index and lc the length of the laser crystal. The duration of the four emmitted
Raman pulses with a distance of xe = 1.33 ns is then approximately 4 ns [5] calculated by xe-(r-l)+ TP
(r a {1,2,3,....} equals the number of emitted pulses).
The very short life times of the Raman levels can be estimated from the linewidth of the different
vibration modes measured in the spontaneous Raman scattering experiments [6] according to
T2 > (2-7I-C- ABJR)"1 (AT3R: spectral width of Raman line in wave numbers). For KGd(W04)2 we obtain
T2>1.5ps for TOvi = 768 cm"1 and Ati^S-Scm"1 as well as T2>1.2ps for ravi = 901 cm"1 and
ATIJ = 4.5 cm'1. For PbW04 we obtain T2 > 1.3 ps for TOVI = 895 cm"1 and ATO = 4.0 cm"1.
This study shows, that PbW04, a new presented material is a very promising candidate for efficient
Raman lasers having shown good laser results with respect to its crystal length, which is very short in
comparison to usual solid state Raman lasers [4]. First tunable multiwavelength picosecond Raman
laser action in anisotropic KGd(W04)2 emphasizes the potentiality of Raman lasers in the visible.
References [1] K.A. Stankov, G. Marowsky, Appl. Phys. B 61, pp. 213-215, 1995 [2] IT. Murray, R.C. Powell, N. Peyghambarian, J. of Luminescence, 66&67, pp. 89-93,1996 [3] C. He, T. H. Chyba, Optics Communications 135, pp. 273-278, 1997 [4] P.G. Zverev, J.T. Murray, R.C. Powell, R.J. Reeves, and T.T. Basiev, Optics Communications 97,
pp. 59-64, 1993 [5] J. Findeisen, HJ. Eichler, A.A. Kaminskii, to be published [6] P. G. Zverev, T.T. Basiev, W. Jia, and H. Liu, OSA TOPS, Advanced Solid State Lasers, pp. 554-
559,1996
383

ThC21 12:30pm - 2:30pm
Electrostatic Effects in the Dynamics of Wall Defects in Liquid Crystal Optical Devices
Nagendra Singh and W. C. Leung Department of Electrical and Computer Engineering
University of Alabama in Huntsville, Huntsville, AL 35899 Plione: (205)890-6678 Fax: (205)890-6803 e-mail: [email protected]
In optical devices with a complex electrode geometry generating inhomogeneous electric fields, wall defects and disclinations form The wall defects separate the domains having distinctly different orientations of the LC molecules. Lindquist et al.1 have experimentally studied such wall defects in connection with the IC vision project at the University of Alabama in Huntsville. However, there is a complete lack of theory and modeling for the formation and dynamics of the defects. We have performed simulations on the formation and dynamics for the geometry of a LC cell shown in Fig. 1. We solve the problem for the homogeneous orientation. The bottom electrode (y = 0) is at the potential V=0, while at the top (y = d) the electrode is segmented having potentials V2 = 0 and V\ = 5.4 V. This sets.up inhomogeneous electric fields inside the cell having both Ex and Ey components. Under the influence of these fields, the nematic molecules polarize. There are two consequences of this polarization; one is the torques on the molecules given by P x E, which is the torque on the material in terms of the polarization vector P. The other consequence is the generation of polarization charge in the material given by p4 = -V-P, which generates its own electric field and modifies the electric fields set up by the electrodes. We demonstrate here that the dynamics of the wall defects is critically influenced by the perturbation in the electric field generated by pb.
In order to simulate the dynamics of the LC material we divide the material into a large number of particles, each of which represent a fairly large number of nematic molecules. Each particle represents the local behavior of the material averaged over the molecules enclosed in an effective volume associate with them. Knowing the permittivities Eg and EX parallel and perpendicular to the long molecular axis in a nematic material, the polarization vector P is easily calculated: Px = (eg cos2 9, + EX sin2 9, -l)Ex +(sn -eL) sin9jcos9I£'>, and Py = fen -e± )sin9j cos6,-£x + (Eg sin2 9, +BX COS
2 Qt -l)Ey, where 9, is the orientation of a particle. Note that
9, is essentially the angle of director field n(x,y) commonly used in theoretical treatments of liquid crystals. The orientation of the particles are calculated using the torque balance equation2
y(dßi/dt) = xeta+rtee
where y is the viscosity coefficient, electric torque xtt,=PxE, and the elastic torque is determined as follows. The orientations of the particles 9, are averaged over a cell of size A*x Ay giving 6]Jc at the grid points (j,k). The elastic torque is found by differencing xaa = K(d2B/dx2 +d2Q/dy2), where K is the elastic constant and it is assumed that elastic constants for the splay and bend deformation are the same. This gives the torques on the grid points; the torque at the location of a particle is found by interpolating from the neighboring grid points to the particle's location using standard interpolation technique.3 The electric field inside the cell is obtained by solving the Poisson equation
VV = -p6/B0=V.;P/E0
and E = -VK. In previous dynamic models of LC materials the Laplace equation V • s • W = 0 was solved.4 The Poisson formulation used here is analogous to the use of Laplace equation. However, the Poisson formulation is found to be numerically superior to the Laplace one because the latter contains large gradients of the permittivity tensor E near a defect wall. On the other hand, in the Poisson equation the gradients in P, namely dPx ldx~ and dPy Idy, appear in the source term, which are integrated to determine V(x,y). The details of the numerical technique used here can be found in a recent PhD. thesis.5 The simulation method was validated by accurately reproducing the threshold effect for the Fredericksz transition.5,6
Figs. 2a to 2c show the evolution of the angular orientation leading to the formation of a defect wall for a pretilt angle 9p = 0. Note that the wall forms near the midplane x = Lx/2 = 6.4jim, and it stays there separating the two domains of angular deformations having 9 > 0 and 9 <0 on the left and right hand sides of the wall, respectively. The two domains, separated by a defect wall, are the consequence of Fredericksz transition6 Fig. 2d shows the steady state distribution of the electric fields Ex(x) and Ey(x) along the line y = 0.5um. The noteworthy features of the electric field distributions are the appearance of the perturbations centered at x = 6.4um colocated with the wall in Fig. 2c. The perturbation in Ex is bipolar. This perturbation is generated by the polarization charge pb =-V-P = dPx/dx. As the wall steepens (see Figs. 2b and 2c), the x-component of P
0-7803-4950-4/98/$10.00 1998 IEEE 384

develops a relatively large gradient near x = 6Aiaa. The evolution leading to the build-up of pb with the steepening of the wall is shown in Fig. 2e.
For a non-zero pretilt angle Qp, the wall forms away from the midplane. For Qp < 0° and 8 p > 0°, the wall forms on the left- and right-hand sides of the midplane (x = 6.4jun ), respectively. Figs. 3a to 3b show the evolution of the wall for a positive pretilt angle 0, = 2°, for which a moving wall forms, as shown by the snapshots of the particle orientations represented by the bars. The arrows indicate the location of the wall at the respective times indicated in the figures. The motion of the wall is accompanied by the motion of an electric field perturbation, as shown in Fig. 3c on an expanded horizontal scale. After its formation before / = 3 ms, the perturbation moves with ever decreasing velocity and eventually it stops when it penetrates into the large horizontal electric fields set up by the electrodes. The velocity of the wall at early times is about 20 um/s.
For Qp = 0°, the perturbation in Ex has a mirror symmetry with respect to the midplane x = 6.4um (Fig 2d). When 0^ * 0°, the mirror symmetry in the bipolar perturbation is lost (Fig. 3c). We find that for 0^, * 0° the wall motion is driven by this loss of the mirror symmetry in the bipolar perturbation in Ex. The mirror symmetry is destroyed because of the superposition of the bipolar electric field perturbation on top of the horizontal electric field for x > 6.4pm set up by the electrodes. Fig. 3d shows the torque balance near the wall. The curve for 0 shows the deformation angle 0(x) along the line y = 0.5 um; the wall is centered at 0 = 0 (marked by the diamond symbol). The dotted and solid line curves give the electric and elastic torques, respectively. The net torque xUa +xtte is plotted by the dashed curve. On the left of the wall, the electric torque dominates giving a net positive torque which rotates molecules anticlockwise increasing 0. On the right hand side near the wall, elastic torque dominates and the net torque remains positive on this side of the wall too. This reduces the negative angles, and close to the wall it rotates the molecules and makes them even positive. The electric field perturbation plays the key role in generating the surplus torques on either side of the wall. On the left side, the positive perturbation in Ex in combination with the induced polarization P generates a positive torque perturbation. On the other hand, on the right side the perturbation reduces the net electric field Ex, thus reducing the electric torque and making the positive elastic torque to dominate.
In summary, the main purpose of this paper is to show that the self-consistently generated electric field perturbations play a significant role in the formation and dynamics of defect walls in LC devices operating in strongly nonuniform electric fields. Normally in the literature on liquid crystals the location of the wall defect is obtained by minimizing the total free energy in the steady state. In our time-dependent simulations, the formation, motion and the steady state structure containing the wall defect are obtained by self-consistently solving the equation of rotation for the nematic material and the Poisson equatioa
References 1. R. G. Lindquist, J. H. Kulick, G. P. Nordin, J. M. Jarem, S, T. Kowel, and M Friends, Optics Letters, Optical
Society of America, Vol. 19, No. 9, pp. 670-672, May 1994. 2. Lui Lam and J. Prost, Solitons in Liquid Crystals, Spring Verlag, New York, 1992. 3. C. K. Birdsall and A. B. Langdon, Plasma Physics Via Computer Simulations, McGraw-Hill, New York, 1985; 4. G. Haas, H. Wohlen, M W. Fritsch, and D. A. Mlynski, Proc. SID, 81,301,1990. 5. W. C. Leung, Feasibility of using particle-in-cell technique for modeling liquid crystal devices, Ph.D. Thesis,
University of Alabama in Huntsville, 1997. 6. P. G. DeGennes and Prost, The physics of Liquid Crystals, Clarendon Press, Oxford, UK, 1993.
V, V2
"I «•!"
™-j—....J... ™-yMM..-j~—~t~M,,,„th M—At rrytJ _._j_.._j..._..4. j..—...
-U M -I- 1- «I -I. t. 4 -I- i- -i -F-
T 'Electrode
T IT
i 385
Fig. 1. Geometry of simulation. The bottom electrode at y=0 is at the zero potential. The top electrode is segmented to generate inhomogeneous electric fields. The bars show the initial orientation of the particles, which represent a volume element of the liquid crystal material. We used Z,x=12.8 urn and Ly=l urn in our calculations.

1.0 "a o.B
(a) | o.e I o.*F >. 0.2
0.0
(b)
(c)
1.0 0.8 0.6 0.4 0.2 0.0
1.0 0.8 0.6 0.4 0.2 0.0
| 0.4 --
v, '■ V.
II11
1 III
!!!!! »
! 1 1 1 1 1 4
-1
LJ_U
.II 1 1
—»/««.——.—,ssvs,.„ __
jw;54msi,::zzzzzrzzzzz;:::;zzzzz
— — *f*HH //<"-W W W W W.-----
0.0 3.2 6.4 X (micron)
9.6 12.8
9.24ms
12.8
Fig. 2. Evolution of the angular deformation in the liquid crystal material: (a) t=0, (b) t=1.54ms, (c) t=6.16ms; the wall is indicated by a vertical arrow at x=6.4|im. (d) Steady state perturbations in the horizontal (Ex) and vertical (Ey) components of the electric fields. The perturbation associated with the wall defect in Fig. 2c is centered at x=6.4|im. (e) Evolution of the bound charge generating the perturbations in Ex and Ey. Note that as the defect wall steepens as shown in Figs. (2a) to (2c), the waveform of the perturbation in charge centered at x=6.4|im narrows.
(a)
(b)
v2 vx v2 1.0
"ö 0.8 §0.6
1 °-4
X> 0-2
——————* * * * ***f *><*>* + «--••--_> _-_»-_ «•-_.._.____.. -— — — — ~* * * * S ******* ****'JL.^*,~.~.~^.^^ -- — — -'• • ••/•••••••••X^-'-N**-.-.-.-.«.- —- — — *»y ///////////////, -. «*^*_ ■•-__■-___ - — — —*»•/ ************ **^m.^-^-m.^^ — — - * -_I *- * *********** + *~A *.-.—_.
0.0 1.0
§" °-8
_ 0.6
1 °-4
X* 0.2
•"""^-■—** *****************'*. — —*>*.*»+. --—- — -»•//// *********** * **i-- — __ --——-/////////// ////// •-------_ ------*-*** ///////////// / s --—•------- -——""•///////// /////•//.--.-.____.. -Rtt,™B ******************.——,--,__.
0.0 0.0 3.2 6.4
X (micron) 9.6 12.8
(C) £
1 ti t= 1.54ms t=3.08ms ».. t=30.8ms JJ-S' 1.0 t=92.4ms /TÜ^Ä
0.5 ,->(A^' \ "N / «' y\ / ' **v
/ r if , • / ^L
0.0 .■■S^.£*r p ^S»_
V-.y y=0.5p.m
-0.5 7.0 B.3 9.5
X (Mm) 10.8 12.0
X
(d) '£ lb
lh'
10 T_. ^ ■
5 -i-4:._ __ T* s' y=0.5p.m ""*■'* ~~~S^
*^J( ~~ 0 /^. *~~ — —- —_ _Z ^^ *'^
^^ - -x.
_X^ "* **"* -5 >^ - (T.+f.ta)*5'--..^--.^
0-/5 """•-.. "~ 1(1
9.0 9.2 9.4 X (ßia)
9.6 9.8
Fig3. The angular deformations for pretilt angle 0P=2°: at (a) early time t= 1.54ms and (b) late time t=92.4ms. The wall is marked by an arrow, (c) The moving electric field perturbation in Ex associated with the evolution of the wall from that shown in Fig 3a to that in Fig. 3b. Note that the perturbation is shown on an expanded horizontal scale for x>7|im. The perturbation forms before t=3.08ms and then it sets into motion, (d) The torque balance near the wall: The location of the wall is indicated by the diamond symbol on the curve for (0° /5). The electric torque is positive on the left hand side of the wall and it is negative on the right. On the other hand, the elastic torque has the reverse signs. The electric torque dominates over the elastic torque on the left side of the wall while the latter dominates on the right- hand side. This leads to the counterclockwise rotation of the molecules in the vicinity of the wall, making it to move to the right.
386

ThC22 12:30pm - 2:30pm
Summary of NLO'98
Scattering noise reduction in phase conjugators photo-induced density redistribution in atomic ya| via photo-induced density redistribution in atomic yapors
Mitsuhiro Yokota Department of Electrical and Electronic Engineering
Miyazaki University, Miyazaki, 889-2155, Japan E-mail: yokota@esl,miyazaki-u.ac.jp
Tel: +81-985-58-2811 Ext. 4425, FAX: +81-985-58-0913
Ppchi Yeh Department of Electrical and Computer Engineering
University of California, Santa Barbara, CA 93106, USA E-mail: [email protected]
1 Introduction Low noise phase conjugators require nonlinear optical materials with a large field- induced index change, fast response time at reasonable operation power. Photorefractive crystals are one of the most efficient materials for optical phase conjugation. However, most photorefractive crystals are relatively slow [1] at low intensity operations. To improve the response time, atomic vapors of alkali metals like Na have been considered as candidate materials. These atomic media have fast response time ranging from sub-microseconds to nanoseconds. Alkali metal vapors have been studied in self-focusing, self-trapping [2], self-phase modulation [3], and related topics.
In this paper, we investigate the noise due to Rayieigh scattering and its reduction via the spatial redistribution of atoms due to the standing wave pattern of the pump beams. For operation near the resonance, the interaction of the induced atomic dipole with the optical field (U = —yr\@\/2, where fr
is the real part of the polarizability) leads to a periodic potential for the atoms due to the interference standing wave pattern. An assumption of Boltzmann distribution yields a periodic distribution of the number density of atoms. In this paper, we investigate thcj effect of detuning and saturation on the noise due to Rayieigh scattering and address the issue of signal to noise ratio in nonlinear optical phase conjugation. We also investigate the minimum incident intensity needed to achieve a signal to noise ratio
ofone(S/N=l).
2 Rayieigh scattered power by atomic vapors For nonlinear optical four wave mixing in atomic vapors as shown in Fig. 1, the intensities of the pump waves are often larger than those of probe and conjugate wave in general. So, the main source of noise is due to Rayieigh scattering of the pump waves by the atomic vapor. The two pump waves interfere with each other to form a periodic intensity pattern. This leads to a periodic variation of the number density of atoms. In what follows, Rayieigh scattering reduction due to redistribution of atoms is considered.
We consider the situation where the atomic beam is along the j/-axis and the optical pump beams propagate along the z-axis. The atoms are driven to regions of minimum optical intensity for blue- detuning in some laser cooling configuration. Based on this assumption, the number density of atoms follows a Boltzmann distribution given by
"M = "—Blf} <" where N0 is a normalization constant. kB and T are the Boltzmann constant and the absolute tempera- ture. 7r is the real part of the polarizability 7 of the atom (or molegule) which is related to the electric
' susceptibility \ [4][5]:
eoX = 7r-J7i , X =
a0 -j + A jgr- = 7r Jh , X - k() l + A? Iju PEI73 :2 (2)
where NA is the total number of the atoms, Es is the saturation electric field, a0 is the unsaturated absorption coefficient, and A = (w0 -u)T2 (T2 is the dipole-dephasing time) is the normalized frequency detuning from line center, w is the frequency of light and u0 is the resonance frequency of the atom.
We note that, according to Eq. (2), the atomic polarizability depends on the optical intensity. This is known as the saturation. In a standing wave pattern with periodic intensity variation, the atomic
0-7803-4950-4/98/?!0.00 1998 IEEE 337

polarizability depends on the location of the atoms as a result of the saturation. In a cell of atomic vapors, the scattered power per solid angle is given by
^-/(a)*™"" (3)
where da/dO. is the differential scattering cross section and the intensity I(z) is given by
I(z) = h+I2+2y/hhcos Kz (4)
where K = 2fc0. Note, in the case h = I2, Eq. (4) yields I(z) oc 4cos2fc02. We obtain the following expression for the total scattered power,
PR = eJbg < W2N(ZW> > T^v (5)
where V = AL is the volume of the interaction region and the bracket <> represents a spatial average over a period. .F(q) is the structure factor given by
.F(q) = 4A [ N(z) cos2 k0zdz (6) Jo
In this paper, the averaged value is calculated numerically, because it is hard to evaluate the integration analytically.
When we consider the reduction of the scattering noise due to the redistribution of atoms by the pump intensity, it is convenient to define the following ratio r} as r\ = P2/P1 where Pi is the scattered power in the absence of beam interference and P2 is the scattered power in the presence of beam interference.
The parameter 77 is a measure of the reduction of the total scattered power due to the interference of the pump waves. The effect of the interference on the scattered power will be examined in the following section.
3 Numerical results In this section, the effect of the pump intensity and normalized frequency de- tuning on the scattering noise reduction ratio 77 is examined numerically. And then the minimum signal intensity needed to obtain S/N = 1 is estimated by using the results. As a numerical example, we consider Na atomic vapor with equal pump intensities {I\ = I2 = I) and the following parameters [6]: a0 = 0.02 [cm"1], NA = 1010 [cm"3], A = 589 [nm], Iso = 49 [W/cm2] and V = 1 [cm3].
Figures 2(a) and (b) show that the scattering ratio r/ as a function of the normalized frequency detuning from line center A for the temperature 1°K at various pump intensities /. We note that Rayleigh scattering can indeed be reduced in some frequency detuning regions. For low pump intensities, 77 is almost independent of the temperature, since the dipole potential energy of the atoms is near zero. At very low intensities (near zero), there is no reduction in the scattering (77 ~ 1). As the intensity increases near the saturation intensity, x starts to decrease at high intensity regions. This leads to a decrease in the total scattering (77 < 1). We also note that at even higher intensities, 77 becomes greater than 1 in the region near small A. It is important to note that \ depends on the pump intensity as well due to saturation, regardless of interference. When the normalized frequency A is small, the atom number density is almost uniform due to fr = 0. The average value of |x|2 is lower due to the saturation. The beam interference leads to an enhanced |x|2 in the low intensity regions. This results in an enhanced Rayleigh scattering, leading to 1 < 77 near small A.
By using Rayleigh scattered noise power, we can estimate the signal intensity needed to achieve a signal to noise ratio of 1. The power of the phase conjugate signal wave Ppc for degenerate four wave mixing is given by [4]
PPC = PSR . (7)
where R is the power reflection coefficient and Ps is the signal power. The signal intensity per unit solid angle dIs/N=l/dQ for S/N = 1 is defined as follows:
d!s/N=i _ dPN 1 dQ. ~ du RA
where dPN K
388
(8)
< h\2N(z)I(z) > -^(q)V (9)

dPN/dSl is the noise power per unit solid angle for the perpendicular polarization, which is related to the differential scattered power with perpendicular polarization. The intensity for the perpendicular polarization is uniform in all direction in the plane of incidence and larger than that of the parallel polarization. So, d/s/JV=1/dfi for the parallel polarization is less than that of perpendicular polarization.
Figure 3 is dIs/N=1/dü as a function of the pump intensity / for the normalized frequency detuning A = 10. The solid line is dIs/N=xldü with interference and the circle dots are that without interference. The absolute temperature is 1°K. We can see that the signal intensity per unit solid angle d/s/jv=i/dfi has a minimum value for certain A. This dependency is originated from the power reflection coefficient R- dIs/N=i/dü can be small for the resonant frequency while it is larger for the high pump intensity. These results are useful for the design of low-noise phase conjugators using atomic vapors.
4 Conclusion We have investigated the reduction of the Rayleigh scattering noise in atomic vapors due to the redistribution of atoms by the interference of the pump wave. The numerical results show that the scattering ratio has an optimum value for certain normalized frequency detuning regions. This means that the background noise can be reduced by choosing the suitable normalized frequency detuning. By using the scattered power, the signal intensity per solid angle dIs/N=i/dü for large pump intensities and at the resonant frequency can be minimised: This work is supported, in part, by a grant from US Office of Naval Research (ONR).
References
[1] P.Yeh, "Fundamental limit of the speed of photorefractive effect and its impact on device applications and material research," Appl. Opt. 26, 602-604 (1987).
[2] D. Grischkoesky and J. A. Armstrong, "Self-defocusing of light by adiab&fcic following in rubidium vapor," Phys. Rev. A 6, 1566-1570 (1972).
[3] F. Shimizu, "Frequency broadening in liquids by a short light pulse," Phys. Rev. Lett. 19, 1097-1100 (1967).
[4] R. L. Abrams and R. C. Lind, "Degenerate four-wave mixing in absorbing meate? Opt- Lett. 2, 94-96 (1978).
[5] R. Saxena, I. McMichael, and P.Yeh, "Dynamics of refraetive-index changes and two-beam coupling in resonant media," Appl. Phys. B 51, 243-253 (1990).
[6] T. Y. Chang, "Fast self-induced refractive index changes in optical media: a survey," Opt. Eng. 20, 220-232 (1981).
I (Pump Wave 2).
(Pump Wave 1)
Fig. 1 Four-wave mixing in atomic vapor.
pM/arr^tfmdlmn]
"^40 -20 0 20 40 Normalized freq. detuning A
(a)
103
- I = | I? 10! !?IQ2
ft1-5
■1
6,6
8
I.
i,-' ii
102 103 104 10B 10° 10' Pump Intensity I [W/em2]
Normalized freq. detuning AlxlO*]
(b)
Fig. 3 Minimum detectable intensity per unit solid Fig. 2 Reduction factor as a function of the normal- angle dIs/N=i/dQ as a function of pump intensity ized frequency detuning A for various pump inten- /. sities I.
389

ThC23 12:30pm - 2:30pm
A New Bifunctional Chromophore Working at Short Wavelength in
Photorefractive Polymer Composite
Qihuang Gong, Zhijian Chen and Feng Wang
Department of Physics, Mesoscopic Physics Laboratory, Peking University
Beijing 100871 ,P. R. China
Tel: 86-10-62757172, Fax: 86-10-62751615
Yiwang Chen and Huiying Chen
Department of Chemistry, Peking University, Beijing 100871, P. R. China
Great progress has been achieved in the investigations on organic
photorefractive ( PR ) materials in the past few years [1,2]. In 1994, a low glass
transition temperature polymer composite has been proved to exhibit steady-state
diffraction efficiency close to 100% , and tow-beam coupling gain as high as
220cm"1, was reported by K.Meerholz et al[2]. Since then, a lot electro-optic (EO)
chromophores have been synthesized and their behaviors in polymeric PR composites
have been investigated widely. However, most of the work was performed at
wavelength longer than 632.8nm. Up to now, few materials have been reported to
work at short wavelength[3,4]. In this report, we synthesized a new EO chromophore
ß,ß-diacetyl-4-methoxylstyrene (DAMST), the absorption peak of which is 320nm,
as shown in Fig.l together with its chemical structure. From the absorption
spectrum, we note that the absorption cut-off wavelength is around 380nm. Thus, this
chromophore is fit for working at short wavelength. Meanwhile, DAMST is a
bifunctional chromophore. It can not only perform EO effect, but also serve as a
plasticizer. A three-component PR composite was formed by using ploy(N-
vinylcarbazole) (PVK) as photoconducting matrix, 2,4,7-trinitro-9-fluorenone (TNF)
as photosensitizer and doped with the bifunctional chromophore DAMST. The Tg of
the composite was measured to be 20°C by Shimadzu DSC-50. A lOOum-thickness
film sandwiched between two ITO coated glass plates was fabricated and its
photorefractive properties were studied at wavelengths 543nm, 593nmand612nm,
0-7803-4950-4/98/$10.00 1998 IEEE 390

respectively. The two-beam coupling gain (Tp) at the three wavelengths were shown
in fig.2. A value as large as 31 cm"1 forTp at 543nm was obtained. It was larger than
previous reports at short wavelength.
.250 300 350 400 450 500
Wavelength (ran)
Fig.l The chemical structure and
absorption spectrum of DAMST
35 -,
^-30- 0 X=543nm
E 25 o
o X.=393nm
X.=612nm
ing
coef
ficie
nt (
o
e
n
o
/s^ E^V/ura
coup
o
en
\^ ,01593:.01432:01327
P , 1 1 1— ■ 20 40 60 80
applied field (V/nm)
100
Fig.2 Two-beam coupling gain at three
wavelengths
In conclusion, we has successfully synthesized a new bifunctional
chromophore DAMST and fabricated the photorefractive polymer film doped with
this chromophore. This composite was proved to possess good photorefractive
properties on short wavelength. A research at 440nm wavelength is on its progress.
The work was supported by National Natural Science Foundation of China and
State Science and Technology Commission of China.
REFERENCES
[1]. A.MCox, R.D.Blackburm, D.P.West and T.A.King. F.A.Wade and D.A.Leigh.
Appl.Phys.Lett. 68(20),13 May(1996)2081.
[2]. K.Meerholz, B.L.Volodin, Sandalphon, B.Kippelen and N.Peyghambarian, Nature 371
(1994) 497.
[3]. Yiping Cui, Bogdan Swedek, Ning Chen, Kie-Soo Kim, and Paras N.Prasad, J. Phys.
Chem.B. 101(1997)3530.
[4]. Ryszard Burzynski, Yue Zhang, Saswait Ghosäl and Martin K.Casstevens. J. Appl.
Phys. 78 (12) (1995) 6903.
391

ThC24 12:30pm - 2:30pm
Extreme Large Enhancement on Optical Nonlinearity of Fullerene by
Forming Charge Transfer Complex
Qihuang Gong, Jainliang Li, Shufeng Wang and Hong Yang
Department of Physics, Mesoscopic Physics Lab., Peking University, Beijing
100871, China
Fax: 86-10-62751615, Tel: 86-10-62757172
email: [email protected]
Xing An, Huiying Chen and Di Qiang*
Department of Chemistry, Peking University, Beijing 100871, China
These years, fullerene is an arguable material on its third order optical nonlinearity. A
discrepancy of several orders of magnitude for its second-order hyperpolarizability y was
found in various measurements^"51 with different wavelength and laser pulse duration.
Recently, Geng and Wright[1] offered a value of 3.7x10"35 esu for the upper bounder of y by
non-degenerate four-wave mixing experiment in C6o solution with an excimer laser at 308nm.
This result was consistent with recent theoretical calculation given by Gisbergen et al.[6], in
which a chosen value 6.67x10"36 esu was reported for y of C6o- While, Couris et al.[2]
reported a value of 2.3x10"32 esu for COO employing transient degenerate four-wave-mixing
using 0.5ps laser pulses at wavelength of 497nm.
In this report, we measured the third-order optical nonlinearity of pure COO solution and
its derivative C6o-polyaminonitrile at 810nm wavelength. The light source was a
femtosecond Ti:Sapphire laser. The light beam from the laser was split into two beams,
0-7803-4950-4/98/$10.00 1998 IEEE 392

strong one and weak one. Their intensity ratio was about 10:1. The strong one was used as
pump beam, which was polarized at 45° with respect to the weak one. The weak beam was
acted as a probe beam. Two beams were focused to overlap in the sample filled in a lmm-
thickness cell. After going through a delay-line, the optical length of strong beam is variable,
so that the relative delay time between the two pulsed laser beams can be adjusted. The zero
delay point was determined by the signal of autocorrelation by replacing the sample cell with
a BBO crystal. The pulse duration of the laser beams was also obtained to be 120fs.The
probe beam , after interaction, passed through a polarizer, the polarization of which is 90p
with respect to polarization of the probe beam. The generated cross-polarized component
ÖKE signal, was then detected by the photodiode, which was placed behind the polarizer.
The signal from photodiode was extracted by a Lock-in amplifier. To improve the ratio of
signal to noise, two beams were chopped with different frequencies simultaneously. All of
the data was recorded by a personal computer that was also used to control the delay line .
In the experiment, we found that the optical nonlinearity contributed from COO was too
low to be detected as shown in Fig.l. And thus an up-limit for electronic contributed y of COO
1.2
ft, * XYL 1.0 ifityL
ini ° ^*0 3 08 to I A ra IT A\
1 0.6 it IV O) fi y ^^^v
III U4 J 7 V "' inr-n^MfrifcL. *: if I 'te& °0.2 J ^"**—-nrfciui
0.0 I.I.I.
0 1000 2000
Delay Time (fs) Delay "lime (fs)
Fig. 1 The OKE signals of COO solution in Fig.2 The OKE signals of C6o derivative solution
o-xylene and o-xylene. Two curves exhibit and solvent.
same OKE response 393

was obtained as 9.0x10"35 esu. This is consistent with both the experimental value reported
by Geng and Wright and the latest theoretical calculation of Gisbergen et al.. On the other
hand, we synthesized and studied the nonlinearity of C6o-poly-aminitrile simultaneously. A
significantly large OKE signal contributed from C6o-poly-aminonitrile was experimentally
observed as shown in Fig.2 and a value of y=3.2xl0"33 esu was deduced for the
derivative molecule. This value, in some degree, agrees with the latest results reported by
Lascola and Wright[7], in which the y for the fullerene anion C6o" was obtained to be
2,4x10"33 esu. This great enhancement was in good agreement with the previous reports that
large optical nonlinearity could be obtained by forming a charge transfer complexes18"101.
The work was supported by National Natural Science Foundation of China under grant
No. 19525412, National 86.3 High-Tech Young Scholar Foundation and State Science and
Technology Commission, China
References:
[1] Lei Geng, Johm C.Wright. Chemical Physics Letter. 249(1996)105.
[2] S Couris, E Koudoumas, F Dong and S Leach. J. Phys. B. 29(1996)5033.
[3] Qihuang Gong, Yuxing Sun, Zongju Xia, Zou Y.H., Zhennan Gu, Xihuang Zhou
and Di Qiang. J. Appl. Phys., 71(1992)3025.
[4] Houjin Huang, Gang Gu, Shihe Yang, Jishi Fu, Ping Yu, George K. L. Wong,
and Youwi Du, Chem. Phys. Lett. 272(1997)427.
[5] F. Kajzar, C. Taliani, R. Danieli, S. Rossini and R. Zamboni, Chem. Phys. Lett.
217(1994)418.
[6] S. J. A. van Gisbergen, J. G. Snijders and E. J. Baerends. Phys. Rev. Lett. 78
(1997)3097.
[7] Lascola-R, Wright-JC. Chemical Physics Letter. 269(1997)79.
[8] T. Gotoh, T.Kondoh and K. Egawa, J. Opt. Soc. Am. B 6(1989)703
[9] Q. Gong, Z. Xia, Y. Zou, X. Meng, L. Wei and F. Li, Appl. Phys. Lett. 59(1991)381
[10] S. Park, T. Wada and H. Sasabe,Mol. Cryst. Liq. Cryst. 227(1993)151
394

ThC25 12:30pm - 2:30pm
photogeneration quantum efficiency of C6o:poly(iV-vinyIcarbazole) photoconductive composite
Feng Wang3, Yiping Cuib, Zhengming Yangb, Qihuang Gonga
department of Physics, Mesoscopic Physics Laboratory, Peking University, Beijing 100871, P.R.China.
fax:+86-10-62751615 tel:+86-10-62757172
bDepartment of Electric Engineering, Southeast University, Nanjing 210096, P.R.China.
For the performance of the PR effect, materials must exhibit the photoconductivity (PC) and the linear electrooptic response (EO) simultaneously[l]. To supply the PC property in PR composites, the photosensitive molecule and the transport agent are necessary. Up to now, several photosensitizers have been used such as TNF[2], C6o[3,4], BDK[5], TCNQ[6], PDCI[6], TPY and others. As early as in 1992, Wang has suggested that C6o is a excellent hole generator for a polymeric photoconductor, especially doped in PVK [PVK stands for po\y(N- vinylcarbazole)][7]. Almost at the same time, Zhang et al.[3] and Silence et al.[4] used it as the PR potosensitizer in different composites, in which they both implied that COO is an excellent PR photosensitizer.
The photogeneration quantum efficiency (PGQE) <|> is an important parameter in photoconductivity property of a material, which has been regarded to follow Onsager model[8] or Braun modified Onsager model [9]. However, because of the assumptions in Ref. 9 including i) <)> is independent of the illumination intensity and ii) the mobility ^ is temperature- independent, the latter is also not a perfect model.
In this paper, we presented the experimental demonstration of the PGQE in the composite of C6o:PVK. 4 mg C6o was dissolved in 2 ml chlorobezene, then 90mg PVK was added in the filtered solution while stirred and heated. The solution was spin coated onto indium-tin-oxide (ITO) covered slide with a set of circular silver electrodes vacuum deposited on the top of the polymer film. The film thickness was measured to be -4.25 um, dielectric constant 2.43 at 1.5KHz, and glass transition temperature (Tg) in the scale of 80-90 °C.
The studies of the PGQE was carried out via the photoconductivity by measuring the photocurrent through the sample as used in Ref. 10. Applied field dependence of the PGQE in C6o:PVK system with a weight ratio 4:90 was carried out at room temperature (20 °C) with the illumination intensity of 5 mW/cm2. The applied field varied from 50 V to 100V between the ITO and silver electrodes (with a distance of 4.25 UJTI). Experimental data were fitted by both Onsager model as shown in Fig. 1, the values of $>=0.9 and r0=1.625 nm were estimated, which were in excellent agreement with $)=0.91 and r0=l .6 nm obtained by Wang[7].
The intensity-dependence was demonstrated at an applied field of 12 MV/m at 20 °C, and the result was represented in Fig. 2. Two different behaviors were exhibited in different intensity levels. At extent of weak illumination intensity, (7</o=13mW/cm2), <f> behaved intensity independently with a value of ~2.5xl0"4. For £>7o=13mW/cm2, a decrease appeared along with the increasing of the illumination intensity, which could be fitted in form of a sublinear variation of </>=0o"I^. The solid line in Fig. 3 was calculated with ^o"=4.9xl0"4 and ^=0.28. Tamura et al. reported also the decreasing trend, but they did not mention the phenomenon of intensity-independence [11].
In both Onsager theory[8] and Braun theory[9,12], the intensity-independent assumption of the PGQE was employed. However, this was not consistent with our experimental
0-7803-4950-4/98/$10.00 1998 IEEE 395

observation in C6o:PVK polymeric composite. Thus both the two theory are valid only at weak illumination intensity region, where the PGQE does not depend on the illuminating intensity. Furthermore, the sublinear dependence has been observed in PR crystal BaTi03[13], and was reported widely in PR polymeric composites[4,14,15], which was usually attributed to the presence of shallow traps (or acceptors). Considering the number density of the photogenerated carrier n as ~I<HI) we obtained that n~f n, which was same as the intensity dependence in PR composite of PVK:DEANST:TPY[14].
Ö 'S
<u o it 01 E 3 c ro 3 o
experimental data
- fitted curve using Onsager Model
((>0=0.9, r0=1.625nm
3.0x10"4
12 15 18 21
applied field (MV/m)
24
2.5x1 (T -
•§ 2.0x10"4!-
E 1.5X10"4
ro <3 1.0x10-"
5.0x10"
experimental data
-<K/)=4.9x10"4/"°3
10 100 1000
Intensity (mW/cm2)
Fig. 1. PGQE as function of applied field. Solid line is the theoretical fitting by (a).Onsager model of Eq. (2) with $)=0.9, ro=1.625nm;
Fig. 2. PGQE as function of illumination intensity. At/</o=13mW/cm2, ^is intensity independent; for 7>/o=13mW/cm2, a sublinearly decrease of if) appears along with the increasing of the illumination intensity. Solid line was fitted in form of 05-4.9x1O"4/028.
The temperature dependence of the PGQE was measured in the range approximately 8 °C to 65 °C (below the Tg ) at an applied field of 12MV/m with the illumination intensity of 5 mW/cm2. The result was presented in Fig. 3. However, experimental data could not be fitted by Onsager model with the primary quantum yield ^ as a constant. Considering ^o to be a temperature dependent parameter in form of 0o=0exp[-ß(l/T-l/To)], we fitted it well. The best fitted result was obtained as ^=0.9, r0=T .6 nm, ß=2.05x 10³, and Jb=31 OK. However, as shown in Fig. 3, when the temperature was high than 44 °C, $> was larger than 1. This can not occur physically. It can be attributed to the increase of thermal-induced ionization at high temperature due to the existence of shallow traps. We supposed that a great number of traps whose energy levels are around kT blow the ionization level, so thermal ionization increase distinctly along with the increase of the temperature. Similar behaviors has also been reported in PVK by Borsenberger[16]. He gave an activation energy of 0.05 eV. Based on this manner, from our measurements the activation energy was calculated to be 0.18 eV, a much high value. The difference should lie in the existence of traps, especial shallow traps in our sample owing the doping of C60.
396

1(T
§io-3
o it LL)
E ■2 10-4
«j
a 10'
experimental data
-(|l0(7)=ll,exp[-ß(1/r-1/ro)]
((.=0.9, /=1.6nm, p=2.05x10³, 7"0=310K
■ --a ■
260 280 300 320 340
Temperature (K)
10z
101
10°
360
Fig. 3. PGQE and <j)0 as functions of temperature. The theoretical fit was based on Onsager model but $) was modified to be temperature-dependent in form of fc=fcxp[-ftl/T-l/T0)l The best fitted result is obtained as ^0.9, ro=1.6 nm, ß=2.05xl03
37o=310K.
With the system of Lexan:TPA:DPBDK, Goliber and Perlstein declared that Braun model predicted a more consistent temperature dependence than Onsager model[12]. However, since the assumption of temperature-independent mobility in Braun model, which is not conformable in our system, it was not a undoubted conclusion for C6o:PVK.
References [1]. For example, see P. Günter and J. P. Huignard, eds, Photorefractive Materials and Their
Applications I and II, (Springer-Verlag, Berlin, 1989). [2]. K. Meerholz, B. L. Volodin, Sandalphon, B. Kippelen, N. Peyghambarian, Nature
(London)371,497 (1994). [3]. Y. Zhang, Y. Cui, P. N. Prasad, Phys. Rev. B 46, 9900 (1992). [4]. S. M. Silence, C. A. Walsh, J. C. Scott, W. E. Moerner, Appl. Phys. Lett. 61,2967 (1992). [5]. Y. Cui, Y. Zhang, P. N. Prasad, Appl. Phys. Lett, 61, 2132 (1992). [6]. S. M. Silence, F. Hache, M. C. J. M. Donckers, C. A. Walsh, D. M. Burland, G. C.
Bjorklund, R. J. Twieg, W. E. Moerner, Proc. SPIE 1852, 253 (1993). [7]. Y.Wang, Nature 356, 585(1992). [8]. L. Onsager, Phys. Rev. 54, 554(1938). [9]. C. L. Braun, J. Chem. Phys. 80,4157(1984). [10]. J. S. Schildkraut, Appl. Phys. Lett. 58, 340 (1991). [11]. K. Tamura, et al., Appl. Phys. Lett. 60,1803 (1992). [12]. T. E. Goliber, J. H. Perlstein, J. Chem. Phys. 80, 4162 (1984). [13]. S. Ducharme, J. Feinberg, J. Appl. Phys. 56, 839 (1984). [14]. Y. Zhang, C. A. Spencer, S. Ghosal, M. K. Casstevens, R. Burzynski, J. Appl. Phys. 76,
671 (1994). [15]. F. Wang, Z. Chen, Z. Huang. Q. Gong, Y. Chen. H. Chen, "High photorefractive
performance of low glass transition temperature polymeric composite doped with bifunctional chromophore," submitted to J. Phys. B.
[16]. P. M. Borsenberger, A. I. Ateya, J. Appl. Phys. 49, 4035 (1978).
397

ThC26
12:30pm - 2:30pm
Squeezing enhancement for the light interacting with a polarizable confined system
Stefano Mancini
With the development of crystal growth technologies, it has become possible to investi-
gate cavity embedded interacting electron systems [1]. The quantum well exciton-cavity
system has some fundamental differences with respect to the much simpler two level
atom-single mode cavity system; however, coherent linear dynamics of the two systems
is very similar dispite the complexity of the electronic states of the semiconductor. In
fact, a weak light beam of a given wave vector can excite only one-exciton states, and,
owing to the conservation of the in-plane momentum k, only the exciton state with
the same wave vector of incident light interacts. Instead, nonlinear dynamics does
not mantain the simple picture of two (linearly) coupled fields. However, a simpli-
fied model could account the excitonic nonlinearity, coming from Coulomb interaction
between electrons, by introducing a Kerr-type term for the exciton mode in the Hamil-
tonian [2]. Hence, denoting with a the radiation mode and with b the exciton mode,
the Hamiltonian we wish to consider is
H hu>a(Va + hu)bb*b + HK (<vb + abn
+ hX (tfb\ + h (ee-^'at + eV^'a) , (1)
where K and x are respectively, the coupling constant, and the strength of the exciton
nonlinearity. The last term in Eq. (1) represents the pump effect.
We expect that the light could be squeezed due to the nonlinearity present on the
exciton mode.
In the realistic case one should include the losses on both modes, though of different
nature; then the equations of motion will be
/-y
a = -itia -~a- tub -ie + \fy~aain , (2)
b = -^b-iKa + ix(b + 2bhA+^Tbbin, (3) 0-7803-4950-4/98/110.00 1998 IEEE 398

where ü = w0 - ub = u)a — up, while ja, % are the damping constants, and ain, bin the
input noise operators with correlations assumed as
{al(t)ain(t')) = na6{t-t'), {ain(t)ain(t')) = 0; (4)
(bUt)bin(t')) = nb6(t-t'), (bin(t)bin(t'))=0. (5)
It is now possible to linearize the system of equations (2), (3) around the steady
state and calculate the output quadrature correlation for the radiation mode, which is
measurable by the homodyne detection. A noise level below the vacuum is expected.
However, as a consequence of the environmental effects the squeeezing on the radiation
mode will be degradated (as well as other eventual nonclassical features). In particular,
if the strength x, of the exciton nonlinearity determining the squeezing, is very small,
as usually occours, the noise reduction on the output light becomes not visible.
To recognize this nonclassical effect, we propose [3] to feed back into the cavity,
part of the homodyne output signal [4]. Then, by considering the feedback action as a
driving [5] on the radiation quadrature characterized by a phase <p and having a gain
g, Eqs. (2) and (3) should be rewritten as
ä = -iüa - i8üa - -^a - inb -it- 2ig*a} + \JYaAin (6)
* = -f b - ina + i\ (b + 2bh2} + y/Tbhn (7)
where Ta = 7„(1 - g sin ip), SÜ - (^ya/2)gcos(p, and g = (ja/4)ge iv. Furthermore Eq.
(4) should be replaced by
(Al(t)Ain(t')) - Na6(t - if), (Ain(t)Ain(t')) = Ma6(t - t'), (8)
with
It becomes clear from the above equations that the feedback mechanism mimics the
effects of a squeezed bath [6] for the radiation mode. Thus, with an appropriate choice
399

of <p, it can reduce the deteriorating noisy effects on the squeezing. Along this line we
will analyze several situations.
In conclusion we propose a model, which could be achieved, e.g. by tailoring the
(micro)cavity with a variable transmittivity driven by the homodyne photocurrent, to
prevent weak nonlinear effects from the action of environmental correlations. That
practically corresponds to the enhancement of the squeezing in the outgoing light. The
method could be also useful to evidence eventual nonclassical features in semiconductor
laser light.
References
[1] see e.g. Y. Yamamoto and R. Slusher, Phys. Today 46, No. 6, 66 (1993).
[2] E. Giacobino, talk given at 1st. Workshop on "Microlaser and cavity QED", Les
Houches, Prance, 21-25 April 1997.
[3] S. Mancini, P. Tombesi and E. Giacobino, in preparation.
[4] H. M. Wiseman and G. J. Milburn, Phys. Rev. Lett. 70, 548 (1993).
[5] P. Goetsch, P. Tombesi and D. Vitali, Phys. Rev. A, 54, 4519 (1996).
[6] P. Tombesi and D. Vitali, Phys. Rev. A 51, 4913 (1995).
400

ThC27 12:30pm - 2:30pm
Mid-Infrared THz Pulse
P.Y. Han and X.-C. Zhang Physics Department, Rensselaer Polytechnic Institute, Troy, NY 12180-3590
Tel: (518) 276-3079; Fax: (518) 276-6680; Email:[email protected]
Summary
Recently, generation of broadband mid-IR radiation through optical rectification has been demonstrated [1-3]. Free- space electro-optic sampling, as a coherent detection technique, on the other hand, can provide ultrafast response from DC to mid-IR [4,5]. In this presentation, we demonstrate the coherent detection of mid-infrared THz pulses (as short as 30 fs) with a spectrum from near DC to 40 THz. We also present the results from different sensor materials.
Figure 1 schematically illustrates the experimental setup for mid-infrared spectroscopy. Optical beam from a 12 fs Ti:sapphire laser is divided into two: one is incident upon an electro-optic crystal as a pump beam, another is used as the probe beam. The pump beam is focused to 10 micron by a parabolic mirror with an effective focal length of 2 inches. We use a pellicle to collinearly combine the optical and THz beam, then focus them on a 27-um thick ZnTe by another parabolic mirror. The electro-optic modulation induced by the Pockels effect is detected by a pair of balanced photodiodes and a lock-in amplifier.
Filter
THz Beam
Pellicle
A Emitter Sensor
X/4 plate
Wollaston
Pump Probe \y Detector
Fig. 1: Setup for generation and detection of mid- infrared THz pulses. The laser pump and probe beams have 10-15 fs optical pulse duration.
Time (fs) Fig. 2: Temporal waveform of the THz radiation measured by a 30-um ZnTe sensor. The shortest oscillation period is 31 fs.
Figure 2 is a plot of mid-infrared THz pulses emitted from a 450-|xm oriented <111> GaAs and measured by a 30-pm thick <110> ZnTe. Period as short as 31 fs can be resolved.
4 30 urn ZnTe emitter (a) 27 um ZnTe sensor
< 2 A 1A —H l|\^^>/\hAV^---~-
O „ HI -2 - 1
-4 i ' . i i
1 2 Time (ps)
30 jim ZnTe emitter (b) 27 urn ZnTe sensor
Fig. 3(a): Mid-infrared radiation from thin ZnTe.
0-7803-4950-4/98/$10.00 1998 IEEE 4Q1
Fig. 3(b): Amplitude spectrum of Fig. 2(a)

Figure 3(a) is a plot of temporal waveform, emitted from a 30-|im ZnTe and measured by a 27-|im thick ZnTe, and Figure 3(b) is the amplitude spectrum. Since emitter and sensor are the same material, and there is only one phonon band at 5.3 THz. Also emitter and sensor are very thin, the propagation dispersion is weaker.
3
■o
Q. E <
450 urn GaAs emitter (a)
2000 urn ZnTe sensor
lOOOjjm ZnTe sensor
250 urn ZnTe sensor
60 um ZnTe sensor
30 urn ZnTe sensor
40 50
j 27 urn ZnTe sensor (b)
^^
I4 CD
A/V, /
p ]j \- 250 urn ZnTe emitter
J k n
f 1 \ 60 urn ZnTe emitter tl—W!. I . . ^^T^—-—>~-~~—,-i „—,
10 40 50 THz
Fig. 4(a): Spectrum amplitude versus sensor thickness.
20 30 THz
Fig. 4(b): Spectrum amplitude versus emitter thickness.
Figures 4(a) and 4(b) plot spectrum amplitude versus thickness of emitters and sensors, respectively. It is clear that thin emitters and sensors are essential. Theoretical calculation indicates a 10-|xm thick ZnTe is the optimal condition for a 30 THz sensor with 820-nm optical probe beam [6].
30 urn ZnTe emitter 27 urn ZnTe sensor
Fig. 5: Transmission after a Si or GaAs wafer placed in the mid-infrared beam path. Curve (with Si) is offset.
20 30 THz
Finally, we will report our preliminary application of this system in mid-infrared spectroscopy. Figure 5 shows spectral amplitude after a high resistively silicon wafer or a semi-insulating GaAs wafer placed in the mid-infrared beam path. It is clear that the silicon is more transparent than GaAs in this frequency range.
References
1. A. Bonvalet, M. Joffre, J. L. Martin, and A. Migus, Appl. Phys. Lett., 67, 2907 (1995). 2. A. Bonvalet, J. Nagle, V. Berger, A. Migus, J. L. Martin, and M. Joffre, Phys. Rev. Lett, 76,4392 (1996). 3. M. Joffre, A. Bonvalet, A. Migus, and J. L. Martin, Opt. Lett., 21,964 (1996). 4. Q. Wu and X.-C. Zhang, Appl. Phys. Lett., 70, 1784, (1997). 5. Q. Wu and X.-C. Zhang, Appl. Phys. Lett., 71, 1285, (1997). 6. Q. Wu and X.-C. Zhang, IEEEJ. Selected Topics in Quantum Electron. , 2, 693, (1996).
402

ThDl (Invited) 7:00pm - 7:30pm
Four-wave mixing with partially coherent waves in photorefractive crystals: (I) transmission grating approximation
Jianhua Zhao, Xianmin Yi, Xiaonong Shen, Ruibo Wang, Pochi Yeh Department of Electrical and Computer Engineering, University of California at Santa Barbara,
Santa Barbara, CA 93106, Tel: (805)-893-7015, FAX: (805)-893-3262
Wave mixing in photorefractive crystals is an important and useful nonlinear optical phenomenon for many applications!!]. For reasons of mathematical simplicity, the theoretical study in this area has been focused on wave mixing with monochromatic waves, or waves with full coherence. However, for some applications, the effect of grating formation due to partial coherence must be included in the coupling processing. Two wave mixing in photorefractive crystal with partially coherent waves has been thoroughly studied by some researchers [2-6]. But as of to date, there is no reported work on the four wave mixing with partially coherent waves except some papers which deal with mutually pump phase conjugation without taking into account the propagation of mutual coherence[7-10]. In this paper, we consider four wave mixing with partially coherent wave in photorefractive crystals with transmission grating approximation.
The interaction configuration of four wave mixing is shown schematically in Fig. 1. We assume that all the waves are extraordinarily polarized and all the wave vectors are in the same plane with k3 = -k2,k4 = -kv The coupled wave equations for the slowly varying amplitudes in a purely diffusive photorefractive medium can be written as a^cz.o | i ayz,*) = Y QMz>t) (i_i)
dz v dt 2 I0
dA2(z,t) | 1 dA2(z,t) = Y Q*Mz,t) Q_2) dz v dt 2 I0
3A3 (z, t) 1 dA3 (z, t)^yQA4(z,t) ^^ dz v dt 2 IQ
dA,(z,t) ldA4(z,t) = yQ*A3(z,t) (j_4) dz v dt 2 I0
Where Ai, A2, A3, A4 are the amplitude of the waves, Y is the intensity coupling constant, v is the group velocity, Q is a measure of the index grating. Consider a stationary random process with the coherence time Sco"1 being substantially less than the relaxation time of the material (i.e. l« 8coxp)[l 1]. The profile of the dynamic index grating Q can be assumed to be temporally stationary. In this approximation, we can replace Q with its ensemble average Q = (Q) = (44* + A3A'A) [3].
We define the self coherence and mutual coherence as rm„(z,T) = (Am(z,r1)A*(z,?2)),where m,n=l,2,3,4, x is time delay, x = tl-t2. With these definitions, we obtain: the index grating ß = r12(z,0)+r34(z,0), and the beam intensities /1=r11(z,0),/2=r22(z,0), h = r33 (z. 0) > h = r44 (z> °) • The differential equations describing the propagation of the self- coherence and the mutual coherence can be obtained, according to Eqs. (l-l)-(l-4),
^i^ = ^-ß[r11(z,x)-r22(z,x)] (2-1) dz 2/0
^l2=-^ör;2(z,-x)-^-ö*rI2(z,x)] (2-2) dz 2/0 2/0
^2^ = ^-ör;2(z,-T)+-^-ö*r12(z)x)] (2-3) az 2/0 2/0
0-7803-4950-4/98/$10.00 1998 IEEE 403

^^a-^-ßtr<<taT)-rJ>(t,T)] (2-4)
where we keep only the six relevant equations.
With two wave mixing approximation!!] and non-depleted approximation, (A3A4*) « (AX)
(AA*)> {A4Al)«{A2Ai)> (^3^3)» and assuming the incident angles of the four beams are very small, the solutions of the above set of equations can be written,
rn(z,o)=rn(o,o)e~iz (3-1)
r„ (z, o) = - r12 (o, o)r;2 (o, ox*-* -1)+ru (o, o) (3-2)
r22(z,o) = r22(o,o) (3-3) r33(z,o) = r33(L,o) (3-4)
r44(z,0)=-ir12(o,o)r;2(o,o)r33(L>o)(C^ _eiL)2 (3_5)
TJ4 (z, 0) = — ri2 (0,0)r33 (L, 0)(e~Z - e^L) (3-6)
In addition, the normalized mutually coherence functions are
r (-»>- |r'2(z'0)| - 1 (AU F-(z'0) Vr„fco,rafco,-J^-^^ ™
r34„(z.Q)= , |r34(z'0)| =1 (4-2)
and the phase conjugation reflectivity is given by
In the above, we assume a boundary condition of A4 (L) = 0.
We also obtain numerical solution of the coupled equations by using the shooting method. Fig. 2 shows the dependence of phase conjugation reflectivity on the mutual coherence. For small coupling constants, the results are identical to those of Eq.(5). We note that the phase conjugation reflectivity is an increasing function of the initial mutual coherence r12„(0,0). Fig.3 shows the phase conjugation reflectivity as a function of yL at various beam ratios. As a result of the coupling, the mutual coherence functions rmn(z,T) are now dependent on z. The mutual coherence may be increased or decreased depending on the interaction configurations. Generally speaking, the partial coherence of the waves will weaken the wave mixing. However, in some special cases, one still can get a very high phase conjugation reflectivity.
In conclusion, we have studied the four wave mixing with partially coherent waves in photorefractive crystals with transmission grating approximation theoretically and numerically. The phase conjugation reflectivity depends much on the initial mutual coherence of the signal beam and the pump beam. The beam intensity and mutual coherence of the interacting waves are also obtained.
404

References 1. Pochi Yeh, "Introduction to Photorefractive Nonlinear Optics", (Wiley, New York, 1993) 2. Xianmin Yi, Shiuan Huei Lin, and Pochi Yeh, Ken Yuh Hsu, Opt. Lett. 21,1123(1996) 3. Xianmin Yi, Changxi Yang, Pochi Yeh, Shiuan-Huei Lin and Ken Yuh Hsu, J. Opt. Soc. Am. B14 1396(1997) 4. N.V. Bogodaev, L.I. Ivleva, A.S. Korshunov, N.M. Plolzkov and V.V. Shkunov, J. Opt. Soc. Am. BIO, 2287(1993) 5. Mark Cronin-Golomb, Hongzhi Kong and Wieslaw Krolikowski, J. Opt. Soc. Am. B9, 1698(1992) 6. Hongzhi Kong, Cunkai Wu and Mark Cronin-Golomb, Opt. Lett. 16, 1183(1991) 7. Mark T. Gruneisen, Edward D. Seeberger, John F. Mileski and Karl Koch, Opt. Lett., 16, 597(1991) 8. Q.B. He and P. Yeh, Appl. Phys. B60,47(1995) 9. S.D.L. Cruz, S. MacCormack, J. Feinberg, Q. B. He, H.K. Liu and P. Yeh, J. Opt. Soc. Am., B12, 1363(1995) 10. G. Lera and M. Nieto-Vesperinas, Phys. Rev. A 41,6400(1990) 11. P. Yeh, Appl. Opt. 26, 602(1987)
Fig. 1. Four wave mixing in photorefractive media via Fig2. The dependence of the phase conjugation on the transmission gratings approximation. The gratings are initial mutual coherence of the signal beam and pump formed by beam pair(AiA2) and/or pair(A3,A4) beam. 12=12=10.0,13=1.0
o £ 1.5
c o
c o o
a> (0 to
0.5
Solid curves: r12n(0,0)=1.0 ■ Dashed curves: r (0,0)=0.5 a/ ^
■ ■ I
12rT
b i- r— -» ■*- ■*-
-10 -5 0 10
Fig3. Phase conjugation reflectivity versus yL with different intensity ratios a(a'): I1=I2=1.0,I3=10.0; b(b'):Ii=I3=1.0,12=10.0; c(c'): I^^LO
405

ThD2 (Invited) 7:30pm - 8:00pm
Photorefractive and charge transport properties of the organic crystal
4-N,N-dimethylamino-4'-N'-methylstilbazoliumtoluene-p-sulfonate
S. Follonier, Ch. Bosshard, M. Fierz, I. Biaggio, and P. Günter Nonlinear Optics Laboratory, Institute of Quantum Electronics
ETH Hönggerberg,
CH-8093 Zürich, Switzerland
4-N,N-dimethylamino-4'-N'-methylstilbazolium toluene-p-sulfonate (DAST) is an
organic salt that consists of the nonlinear optical stilbazolium cation and the tosylate anion needed to induce a non centrosymmetric packing (Fig.l) [1]. It shows an enormous potential for electro-optical [2] applications in the near infrared range due to an almost parallel alignment of the highly nonlinear chromophores along the polar a-axis (the angle between the molecular charge transfer axis and the polar axis is of about 20°). In spite of the constant improvement of the photorefractive sensitivity of organic crystals since 1990 [3], the obtained values are still far smaller than the theoretical expectation for optimized organic molecular crystals, which predicts a gain of several tens per centimeter for a response time
of less than a second at an illumination intensity of 1 W/cm2. In order to improve the photorefractive sensitivity of organic crystals, the photogeneration and charge transport
properties of the charge carriers are of prime importance and are investigated in this contribution for the case of the organic salt DAST.
£% £* £%
o- flafo &m? &*&
-: B
Figure 1: Crystal packing and molecular structure of DAST. The projection of two unit cells along the crystallographic a-axis reveals the perfect alignement of the chromophores with respect to the polar axis. The stilbazolium cations and tosylate anions are packed in alternating planar layers.
0-7803-4950-4/98/$10.00 1998 IEEE 406

We report on the photorefractive properties of the organic salt DAST over a large spectral range of incident light (from X=632.8 nm up to A,=1064 nm). From the polarization
dependence of the absorption and the wavelength dependence of the coupling," we identify
the photogeneration process in the salt with the chromophore species. The charge carrier transport is investigated in DC photoconductivity as well as transient photocurrent experiments in large size DAST crystals and in a-platelets polished down to thicknesses of less than 200 |j,m. The results are correlated to the microscopic intermolecular binding forces
and to the layer structure of the tosylate and stilbazolium molecules. The strong anisotropy
revealed in the crystal packing is directly related to the dark conductivity of the crystal (<*dark,a > ^dark.b.c)- Moreover, the sublinear dependence of the photoconductivity versus
intensity is in agreement with the intensity dependence of the photorefractive writing times
(Fig. 2).
The charge transport results are combined with the microscopic parameters obtained in photorefractive two-beam coupling experiments leading to values of the recombination time of the charge carriers of x=4±2 ns, of the mobility of the order of 1 cm2/Vs and of the
quantum efficiency of less than 10-3 at X,=750 nm. Combining these material parameters, we
obtain an experimental value of the gain of 2.2 cm-1 at light intensities of 300 mW/cm2 at a wavelength of A,=750 nm for grating buildup times below Is [4], comparable to some of the
best inorganic crystals.
7T—r—i—i—i—i—i—i—i—i—r
1/tal0-5
101 fa||||| 1—I I I 11111 1—I I I III!
100 r
10-iLuiü ■ ■■■■■■■ I I I I llll
icr2 io-1 io° Intensity [W/cm2
j l i i i i_
0.2 0.3
Intensity [W/cm2]
0.5
Figure 2: Intensity dependence of the grating buildup time in DAST. The inset shows a log-log plot to determine the power exponent of T'=In (n=0.5).
Taking advantage of the good mechanical stability of the organic salt in a wide range of
temperatures without observable deterioration of its quality, temperature dependent photo-
407

and dark conductivity were performed between 300 and 5 K. Preliminary results in the
temperature range between 200 and 300 K hint towards a thermally activated conduction process (Fig. 3).
300
Ö
£ 10-10 , o "D C o Ü
« 10"11 - (0 ■a •o c (0 o o .c 10-12l . L J ■ i ■ i
Dark conductivity
Photoconductivity
j I i L
3.3 3.4 3.5 3.6 3.7 3.8 3.9 4.0 4.1 4.2
1/Temperature [10-3 K"1]
Figure 3: Dark- and photoconductivity as a function of the inverse of the temperature measured for light polarised along the polar axis of the crystal (at a wavelength k-710 nm), in a 2.25 mm thick polished DAST sample with electrodes on the (100) surfaces (electrode distance of 4.2 mm). The curves represent an exponentially activated process.
Our results show that mobility and lifetime of the photoexcited carriers are comparable to those of the best inorganic crystals such as BaTi03, KNbC>3 or Bii2SiO20- Thus, the most important factor limiting the photorefractive sensitivity in DAST is the small efficiency of charge carrier photogeneration, described by a quantum efficiency smaller than 10-3. Improvement of this parameter by appropriate doping of DAST could lead to orders of magnitude improvement of its photorefractive sensitivity.
References [1] S.R. Marder, J.W. Perry, and W.P. Schaeffer, Science 245 , 626-628 (1989).
[2] R. Spreiter, C. Bosshard, F. Pan and P. Günter, Opt. Lett. 22,564 (1997).
[3] K. Sutter, J. Hulliger, and P. Günter, Solid State Commun. 74 (8), 867-870 (1990). [4] S. Follonier, C. Bosshard, F. Pan and P. Günter, Opt. Lett. 21,1655 (1996).
408

ThD3 8:00pm-8:15pm
tfcm&nwr Optics '98 "Materials, fundamentals and Applications'; <Prinavi!k, Xgwi, Jiawaii, USA, August 10-14,1998
m o.8 z Ui
0.6
0.4
0.2
1,1 "I ' '"I"""
(CHü)I£H3
Multifunctional Carbazole Oligomers and Polymers for Photorefractive Applications
Tatsuo Wada, Yadong Zhang, Tetsuya Aoyama and Hiroyuki Sasabe Core Research for Evolutional Science and Technology (CREST), JST, and
Frontier Research Program, The Institute of Physical and Chemical Research (RIKEN) 2-1 Hirosawa, Wako, Saitama 351-0198, JAPAN (Tel: +81-48-467-9600; FAX: +81-48-464-6391)
In the future optical information processing technologies, the physics of photorefractive effect gives attractive clues to the development of self-diffraction, phase conjugation, dynamic holo- graphy, holographic memory, optical image amplification, adaptive optical processors and so forth. The basic nature of photorefractive effect is simply described by an interaction between optical interference patterns and photoexcited charge carriers generated in the material which exhibits the second-order optical nonlinearity (Pockels effect). Therefore the requirement for photorefractive materials is to have both photoconductive properties and Pockels effect at the same time. Typical organic photorefractive materials developed in the past are multicomponent systems such as charge-transfer (CT) complex crystals and poled polymers. These poled polymers consist of three components: the first is a nonlinear optically active chromophore to provide an electro-optic response, the second is a hole transporting molecule and the third is a photosensitizer which exhibits photoconductive properties. Although these multi-component systems have good film-forming properties, they have multistep carrier hopping processes which reduce the carrier mobility due to various traps. In order to create effective space charge modulation, efficient photocarrier generation and large drift mobilities are key factors. There is a limitation of the maximum concentration of chromophores due to phase separation in multi- component systems, which leads to the reduction of optical quality. Therefore the multifunctional chromophores with both photoconductive and electro- optic properties, so called 'monolithic' photorefractive molecules should be developed. Among various kinds of materials developed in our laboratory, carbazole derivatives are most promising for photo- refractice application. In this paper, we will describe molecular design of carbazole derivatives (oligomers and polymers) and their photorefractive properties.
Carbazole compounds are well-known to exhibit good hole transporting properties and their photocarrier generation efficiency can be sensitized by Figure 1. SH Maker fringe pattern for formation of charge transfer complexes. Recently we conjugated carbazole trimer. synthesized a cyclic carbazole oligomer as well as head-to-tail carbazole dimers, trimers and main-chain polymers. Acceptor-introduced carbazoles appeared to be very promising for second-order nonlinear optical chromophores. We also synthesized carbazole dendrimers, conjugated trimers and polymers as a multifunctional chromophore. Though functionalized polymers have been developed as a macroscopic material, they have distributions of molecular weight, amount and size of free volume, and molecular structures. On the other hand carbazole oligomers can be considered as a perfectly defined structure. We obtained efficient photorefractive effects using conjugated carbazole trimers. Electric field-induced alignment and thermal relaxation of supramolecules _ „._ . ,. n . , can be controlled by the molecular-level tuning of the Flgu
ure 2. Intensity of beam 1 monitored size, shape, surface chemistry and topology. as beam 2 is switched on at time t=0 sec
Second-order nonlinear optical responses were anaoriatt-z:D. ü-3:5 v/um.
0-7803-4950-4/98/110.00 1998 IEEE 4Qg
-70 -35 0 35 INCIDENT ANGLE f
1.6
1.4
1 ■ ' I ' ■ ■ ' I
■ Beam 2 on
1.2 -
0.8 -
0.4
i i i i I i i i i i i i i i Beam 2 off 3eam
V
T Beam 1
06 T Beam 1 on
V Beam 2
-LLXJ.JJ 'SL earn 1 off ;.li I I I
100 200 TIME
300
/sec
400 500

Nonlinear Optics '98 "Materials, fundamentals and Applications", fPrinceville, Xfluai, Hawaii, USA, August 10-14,1998
0 10 20 APPLIED ELECTRIC FIELD
30 /V/|im
0 5 10 15 20 25 APPLIED ELECTRIC FIELD
30 35 V/nm
Figure 3. Field dependences of two-beam coupling gain (a) and diffraction efficiency (b) in carbazole trimer derivative.
examined on these thin films by spectroscopic method and second-harmonic generation (SHG) (For example, Figure 1 for a conjugated carbazole trimer film; excitation wavelength = 1064 nm, poling electric field = 23 V/um). Their SHG signal decay consists of two components: a fast one corresponding to a local rotation of individual chromophores around the chain direction and a slow one resulting from the gross micro-Brownian motion of the main chain. The values of the second-order nonlinear optical coefficients (dy) changed depending on the acceptor groups. Although the optimal poling was not achieved, large dy values (ca. 50 pm/V) were obtained due to the high density of nonlinear optical chromophores.
The photorefractive properties of the carbazole films were characterized by a two-beam coupling and a four-wave mixing. In th two-beam coupling experiment, an asymmetric energy transfer between the two beams was observed when an electric field applied. Figure 2 shows a typical asymmetric behavior for monolithic carbazole trimer at an applied electric field of 33 V/um. The two-beam coupling gain coefficient could be estimated from the asymmetric energy transfer. It increases monotonously with the applied field as shown in Figure 3 (a). At 33 V/um, the photorefractive gain of 35.0 cm-1 was obtained. Since the absorption coefficient for this trimer was 8.2 cnr1, the net gain coefficient became 26.8 cm-1. As shown in Figure 3 (b), the diffraction efficiency reaches 13.2 % at 33.3 V/um.
We have demonstrated the optical image reconstruction of distorted images due to phase conjugation using a four-wave mixing setup, the optical associative memory based on phase conjugation and the angle multiplexed holographic recording. Figure 4 indicates an example of the optical associative momory using a conjugated carbazole trimer film. The film stores the hologram images A by multiple exposure in bulk. When the imperfect image is intro- duced to the film, the beam is diffracted to the direction of strongest interaction with the perfect image in A and behaves as a probe beam. The reference beam B is reflected by the phase conjugation (PC) mirror and produces the perfect image (conjugated image A*).
Figure 4. Demonstration of optical associative memory.
Stored Image
PC Mirror
410

ThD4 8:15pm -8:30pm
Photorefractive Diffusion-Driven Self-Focusing and Self- Trapping in Near-Transition Paraelectric Crystals
Bruno Crosignani, Eugenio DelRe and Paolo Di Porto-Universitä degli Studi dell'Aquila, Dipartimento di Fisica, L 'Aquila, Italy, andINFM, Unitä di Roma I, Rome, Italy Mario Tamburrim-Fondazione Ugo Bordoni, Rome, Italy Antonio Degasperis-Universitä degli di Roma "La Sapienza", Dipartimento di Fisica, Rome, Italy and INFN, Sezione di Roma I, Rome, Italy Aharon Agraaat-Hebrew University of Jerusalem, Department of Applied Physics, Israel Mordechai Segev-Princeton University, Department of Electrical Engineering and POEM, Princeton, USA
return address : Bruno Crosignani, Universitä degli Studi di Roma "La Sapienza", Dipartimento di Fisica, Piazzale Aldo Moro 2, 00185 Roma, Italy. Tel. +39649913469, fax. +3964463158.
In the last few years, nonlinear optical propagation in photorefractive (PR) crystals has been the object of an extensive research effort which has eventually demonstrated the possibility of achieving self-focusing and self-trapping of optical beams' . Among the intriguing phenomena observed, two dimensional self-trapping, white-light self-trapping, and soliton- soliton spiraling have aroused much attention. To this date, all steady-state spatial soliton and soliton-like behavior in PR crystals has been obtained making use of the so-called "screening nonlinearity". An external field applied to the crystal (or, for some samples, the photovoltaic field) is screened by the local light-induced charge separation giving rise to a point dependent internal electric field that, by means of the linear electro-optic effect, generates a "guiding" index of refraction pattern. Most recently, self-confinement in biased centrosymmetric PR crystals exhibiting quadratic (and not linear) electro-optic effect has been investigated both theoretically and experimentally' ' . These solitons have been observed in the typical screening configuration relatively far from the ferroelectric- paraelectric phase transition. In this paper we report the observation of self-focusing and self-trapping in KLTN in the very-near-transition paraelectric phase without any external applied field and without any sort of artificial background illumination. We show that this behavior depends only on the temperature T of the sample and is independent on beam intensity and beam size. In order to explain this peculiar phenomenon we make use of the PR paraelectric diffusion nonlinearity, obtaining solutions that describe self-focusing and that eventually lead to the formation of "diffusion-driven solitons". In our experiments we focus a A,=515nm laser beam from an Ar-ion laser by means of a cylindrical lens onto the input facet of a zero-cut sample of (3.7(x) x 4.6(y) x 2.4(z)) mm potassium lithium tantalate niobate (KLTN) kept at a constant temperature T by means of a current controlled Peltier junction. The crystal has a first-order ferroelectric-paraelectric phase transition at TC=11°C. The laser beam confined and polarized in the x direction is made to propagate in the z direction. The crystal has a measured value of index of refraction n=2.5 and an effective quadratic electro-optic coefficient (considering the self-generated internal field approximately parallel to the x axis) g=0.15m4C"2. We screen the crystal from spurious light beams and image the input and output facets onto the sensitive area of a CCD camera. Given a beam size at the input facet, we monitor its diffraction at the output facet as a function of temperature. In Fig.l we show input and diffraction photographs at different temperatures T. The input beam has an intensity Full-Width-Half-Maximum (FWHM) of 11 urn and diffracts to 23 um at T=36°C, as expected from linear Gaussian diffraction. As the
0-7803-4950-4/98/$!0.00 1998 IEEE 411

temperature decreases towards Tc diffraction decreases until Tsol=12°C is reached, at which point the output beam width is the same as the input. At this point diffraction has been compensated and we observe a spatial solitary wave. For T<Tsol we observe beam breakup similar to that observed when excessive external voltage is applied in the screening soliton case. For TsTc the crystal begins to scatter due to quasi-domain formation and no clear beam dynamics is observable. In order to get some insight as to the nature of this diffraction compensating process, similar experiments have been performed changing the size of the input beam width, obtaining similar results. Finally we studied the effect of background illumination. When illuminating the entire crystal with a y polarized uniform beam of the same intensity as the focused beam we observed a diminished diffraction compensation with a resultant FWHM of 14 urn at T=12°C. Background illumination is filtered out by means of a polarizer placed in front of the camera.
Input T=36°C FWHM=llfim
Output T=36°C FWHM=23um
Output T=16°C FWHM=14jum
Output T=12°C FWHM=llnm
Figure 1: Photographs and profiles of input and output light intensity distribution for various crystal temperatures.
Because the crystal is in the centrosymmetric paraelectric phase, no bulk photovoltaic effect is present. The only standard PR mechanism present is driven by the light-induced diffusion field Esc=-(KbT/e)V[ln(I+Id)/Id], where I is the optical intensity and Id is the dark irradiance of the crystal. This field, that in the standard noncentrosymmetric screening-soliton formation process plays a negligible role and can at most give rise to self-bending nondiffracting planar propagation" being inherently asymmetric, in the paraelectric phase gives rise to symmetric index modulation (being proportional to Esc ) and can possibly lead to diffraction compensation. In centrosymmetric media, the photoinduced change of refractive index is given by[2] An=-(l/2)n3gs0
2(sr-l)2 Esc
2, where er is the low frequency dielectric constant. Inserting this expression into the parabolic wave equation for the one transverse dimensional case , describing the evolution of the slowly-varying amplitude A of the propagating optical field Eopt=A(x,z)exp(ikz-i<öt)+c.c, where k==n©/c, we obtain
TU + Y- - la?+'d? ur ■A = 0, (1)
412

where £=kz, £=V2kx, and Y==-n2k2ge02(er-l)
2(KbT/e)2 (<0). This model equation applies if we neglect the dark irradiance Id with respect to the intensity I=|A| , a condition which requires the peak intensity I0 to be much larger than Id. Because of the structure of Eq.(l), the influence of the loss term iocA, which has been omitted, can always be accounted for by multiplying its solutions by exp(-aQ. Moreover, if A(£,Q is a solution, then also aA(p(£- ^o)>P2(£-Co)) solves Eq.(l) for arbitrary real p, £0, and ^ and complex a. This property implies that localised self-guiding solutions (when they exists, see below) will not obey a peak amplitude width relation. In order to solve Eq.(l), it is expedient to introduce the new independent variable B through the transformation A=B^ where u=l/(l+4y). Different types of solutions can be associated with the sign of parameter |j.. Let us consider the case of u>0, i.e. y>-l/4. A particular solution of Eq.(l) reads
MZO- -„. .L . ^ ( r nv 4>exp
A({,0 Ö2(l +16£2 /juö4)
\ 1/4 H„ (-) /" ö(l + l6C2 /iiS4)
in , (2)
where AQ and 5 are arbitrary parameters fixed by the Q=0 boundary beam profile and Hn are the Hermite polynomials and
4£f rt£0 = - 7/1/2(« + l/2)arctg(4^///,/2(J2). (3)
//£4(l + 16^2///£4) In our experimental configuration the boundary condition has a Gaussian form, therefore n=0 and 8 is the normalised Gaussian beam width. For JLL=1 (y=0) Eq.(2) describes linear Gaussian diffraction. For positive values of u. (-l/4<y) it leads to partial diffraction compensation, and for y=-l/4 leads to the formation of diffusion-driven solitons. Near the phase transition, y is a strong function of T (through sr), that can take very high values close to Tc. In particular for decreasing values of T towards Tc, the value of y takes on decreasing values and therefore Eq.(2) qualitatively explains the behavior observed and reported in Fig.l. Quantitatively, we can predict the value of Tsol that in our theoretical description coincides with the temperature at which y=-l/4. Using the values of the crystal parameters we obtain a critical value of sr =7.6x10 . Measured values of sr as a function T give for our sample at most sr
exps3xl04, however this value is obtained by measuring the capacitance of the crystal as a whole at a given temperature. Our crystal thermalization system cannot eliminate a transverse temperature gradient across the crystal of a fraction of a degree. Therefore, whereas the nonlinear interaction for a limited crystal area can be interpreted as happening at a given T, the measurement of sr will be inevitably smeared-out, and therefore drastically reduced, close to Tc. Finally the presence of a background illumination increases the value of Ib and makes the model of Eq.(l) fail. Numerical integration of the "full" equation shows that this essentially decreases the value of y at which quasi-soliton like propagation occurs (in this case strictly speaking no solitons exist) thus qualitatively explaining the decreased focusing observed.
[1] For an up-to-date bibliography see, e.g. B.Crosignani, P.Di Porto, A.Degasperis, M.Segev, and S.Trillo, J.Opt.Soc.Am.B 14, 3078 (1997).
[2] M.Segev and AAgranat, OptXett. 21, 1299(1997). [3] E.DelRe, B.Crosignani, M.Tamburrini, M.Mitchell, M.Segev, E.Refaeli, A.Agranat,
Opt.Lett. 23, 421 (1998). [4] D.N.Christodoulides and T.H.Coskun, Opt.Lett. 21, 1460(1996).
413

ThEl 9:00pm - 9:15pm
Multiple birth of nonlinear optical vortices
Anton M. Deykoon\ M. S. Soskin^, and Grover A. Swartzlander, JrJ
(1) Department of Physics WPI, 100 Institute Road, Worcester, MA 01609
(508) 831-5420 (voice) -5886 (fax)
(2) Institute of Physics National Acad. Sei. Ukraine 46
Prospect Nauki, 252650, Kiev-22, Ukraine
The spontaneous formation of optical vortex quadrupoles in an initially smooth elliptical Gaussian beam was observed in the near-field regime within a self-defocusing medium. Two characteristically different nonlinear phenomena were observed, namely the appearance of large-core vortices on the periphery of the beam for a weakly nonlinear system (see Fig. 1), and small soliton-like vortices in the beam interior for a high power beam (see Fig. 2). The former case is attributed to nonlinear lensing, and we attribute the latter to a Kelvin-Helmholtz type optical instability.
The spontaneous formation of optical vortices in the near-field region for a beam having no initial vorticity in the phase structure was discovered by destabilizing dark soliton stripes [1]. The basis for this instability, namely the intensity dependent velocity of dark solitons, was first described using a linearized instability analysis of the nonlinear Schrodinger equation [2], and later a numerical nonlinear analysis [3]. To our knowledge, all experimental observations of this instability introduced perturbed beams containing, for example, a dark stripe or stripes across the beam to initiate the process. Here we describe means of achieving this instability on a smooth beam. The observed phenomenon may occur in self-defocusing medium such as slightly absorbing liquid or gas, and thus may be important in the control of laser propagation through the air or sea.
[1] G.A.Swartzlander Jr. and C.T.Law, "Optical Vortex Solitons Observed in Kerr Nonlinear Media", Phys. Rev. Lett. vol. 69, 2503 (1992).
[2]. E.A. Kuznetsov and S.K. Turitsyn "Instability and collapse of solitons in media with a defocusing nonlinearity", Sov. Phys. JETP 67 (8), 1583 (1988).
[3]. C.T. Law and G.A. Swartzlander, Jr, "Optical vortex solitons and the stability of dark soliton stripes", Opt. Lett. vol. 18,586(1993).
0-7803-4950-4/98/$10.00 1998 IEEE 414

Figure 1 An elliptical laser beam in (a) self-defocuses at different rates, resulting in a aberrated self-induced lens which produces deflects, or vortices, on the perimeter of the output beam in (b) when the system is weakly nonlinear.
Figure 2 At roughly four times the power used in Fig. 1(b), the near-field beam exhibits elliptical rings which interfere and create pairs of nodes in the interior of the beam. As the beam propagates, these node evolve into solitary optical vortices. The interferograms in (c) show that the four vortices in (b) form a quadrupole structure.
415

ThE2
9:15pm - 9:30pm
The Optical Whistle: A Novel Transverse Oscillation in Nonlinear Optical Cavities
Jack Boyce and Raymond Y. Chiao Department of Physics, University of California, Berkeley, California 94720
Voice: (510) 642-5620 Fax: (510) 642-5620
1 Introduction
In the 1980's a great deal of work concentrated on transverse structure and dynamics in nonlinear cavities, in order to incorporate the phenomena of self-(de)focusing and diffraction. In particular, McLaughlin et al demonstrated in 1985 that a finite-width Gaussian input beam incident on a cavity with a single transverse dimension gives rise to a transverse instability in the cavity field; this process is a form of modulational instability.
However, their linearized analysis leaves an important question unanswered: What happens when these perturbations grow large? What type of asymptotic state does the field profile approach? We have found that a number of solutions are possible: The system can approach a steady state, it can exhibit intermittency and chaos, or it can undergo periodic oscillations. We term a cavity driven into the latter solution an optical whistle. Within this periodic mode the oscillation frequency is roughly proportional to the input field amplitude; hence the nonlinear cavity acts here as a light-controlled oscillator. Experiments are underway to observe this effect.
2 The Nonlinear Cavity Equation
For concreteness consider a hemicylindrical Fabry-Perot cavity consisting of two mirrors, one planar and the other concave and cylindrical. Let x lie along the cylindrical mirror axis, z along the cavity longitudinal axis (normal to the plane mirror), and y along the other transverse direction. The equation governing the evolution of the cavity's internal field is (in CGS units)
d£ ic 82£
' ft=üd^-r'£ + i{Aw')S + T'£drive + iu,n2lSl2£' (1)
where S is the internal cavity field amplitude, k is the longitudinal wavenumber, V — cT/L is the amplitude decay rate from the cavity (T is the amplitude transmission at each mirror, assumed equal, and L is the cavity length), u is the field angular frequency, Aw' = u -wCav is the detuning of the laser from linear cavity resonance, and n?, is the nonlinear index inside the cavity. This equation is the time-dependent version of that found by Haelterman et al (1990) from their modal theory.
We now make this equation dimensionless by choosing an arbitrary distance scale xo and relating the time and field scales t0 and \£0\ to it using t0 = kx\/c and |£0| = l/kxo^/\n2\. After rescaling the cavity equation takes on the dimensionless form
* = 1V2* + «V|*|2* + iAwtf - T(# - Vdrive) , (2)
0-7803-4950-4/98/$10.00 1998 IEEE 416

2.0 -j
1.0
0.0
Steady-State
-1.4 —p- -1.2 -1.0 -0.8 -0.6 -0.4 -0.2 0.0
detuning
Figure 1: Asymptotic behavior of cavity field, for a = +1, T = 0.14, and an initially empty cavity. Labels indicate regions of steady-state, period 1 oscillation (1), period 2 oscillation (2), and chaos (C).
where cr = +1(—1) for self-focusing (-defocusing). This equation is similar in structure to the nonlinear Schrodinger equation (NLSE). We solve it numerically using a modified split-step Fourier method, which does the V2 diffraction term in Fourier space and the nonlinear |*|2 term in real space.
3 The Optical Whistle
For a Gaussian driving field recall that the choice of distance scale XQ is arbitrary, so we can choose it to be the waist size of the input beam. Then we have ^drive = 9 exp (-a;2) where q is a real, dimensionless driving amplitude. Our model is then characterized by the four dimensionless quantities <r, T, Aw, and q. All of the numerical results presented below assume cr = +1 and T = 0.14, and all assume an initially empty cavity.
The asymptotic solutions are summarized in Figure 1. The regions have complex boundaries and indicate the following behaviors: (1) steady-state solutions, (2) period 1 oscillations, (3) period 2 oscillations, and (4) chaotic (intermittent) oscillations. Points near the borders of the "chaotic" regions show particularly interesting behaviors: At the borders with steady-state regions lie oscillations of very long period, and at the borders with the normal oscillating regions there is evidence of period-doubling. Period 3 oscillations have also been observed. Time series of examples are shown in Figure 2. Snapshots of the cavity field amplitude for the period 1 oscillation are shown in Figure 3; the "breathing" appearance of the field profile is reminiscent of the breather soli ton.
Experiments are currently underway to observe the optical whistle and test its feasibility as a light- controlled microwave oscillator.
417

(a) detuning = -0.6, q = 4.0
0.05 300 320 340 360 380 400
time 420
0.3
0.25
0.2
J. 0.15 0.
(c) detuning = -0.32, q = 4.2
0.1
0.05 I ■ ■■■ I .... I .... I ■
250 300 350 400 450 time
500
(b) detuning = -0.2, q = 4.0
300 320 340 360 380 400 420 time
(d) detuning = -0.32, q
0.04 300 350 400 450
time 500 550
Figure 2: Time series of total power output for specified parameters.
time = 325 time = 327
time = 329 2.5
2
.5 1.5 'S.
1 -
0.5 - \
Figure 3: Cavity field amplitude profiles for the period 1 oscillation shown in Figure 2. 418

ThE3 9:30pm - 9:45pm
Self-focusing and limiting at nanowatt laser power and image conversion with nWatt/cm2 optical
intensity using nematic liquid crystal fdms
Nematic liquid crystal films containing photo-excitable dopants exhibit numerous
interesting nonlinear optical phenomena [1-2]. In particular, Rudenko, and Khoo et al [2]
observed an effective refractive index change coefficient n2 on the order of 10"3 to 10*2
cm2/Watt in nematic liquid crystal films under a small dc bias voltage.However, the necessity of
using dc bias voltages close to the threshold for dynamic scattering is an undesirable feature,
especially for practical application.
Here we report the observation of an extraordinarily large purely optically induced
refractive index change mechanism in methyl-red dye doped nematic liquid crystal film. A
refractive index change coefficient n2 of 6cm2AVatt is obtained. Visually observable self
diffraction and holographic grating diffraction, incoherent->coherent image conversion and
optical limiting effects can be generated with optical intensity as low as 40 (iW/cm2. The
response times are measured to be in the milliseconds regime.
The liquid crystal used is 5CB, Pentyl Cyano Biphenyl with traces of the laser dye
Methyl-red dissolved in it at a concentration of about 1
%. The liquid crystal cell is homeotropically aligned,
i.e., the crystal's director axis is perpendicular to the cell
wall. The transmission of the 25 \im thick film is over
85 %, with most of the losses coming from the ITO
electrode coating and interface reflection. For grating
diffraction effect, a linearly polarized Argon laser is
divided into two equal power writing beams. These
beams, propagating in the in the y-z plane, are
overlapped on the liquid crystal film at an angle a, as
shown in Figure 1. A linearly polarized 5 mW He-Ne
laser is used to probe the grating.
In general, easily observable grating diffractions are generated with total input power as
low as 2 liWatts [ intensity of 40uW/cm2]. We have ruled out thermal effects accompanying
photo-absorption by the polarization dependence and response times of the diffraction effect. The
effect is attributed to nematic director axis reorientation by the optically induced space charge
fields [2], although other mechanism such as laser induced reorientation of the dye molecules,
and their subsequent action on the surface alignment of the nematic liquid crystal axis has not yet
been ruled out [3]. The dynamics of the grating formation depend on the writing beam intensity. At an
intensity of 2 mW/cm2, the writing time (to achieve 50% of maximum) is found to be 150 ms.
The writing time is reduced with higher intensities; at 20 mW/cm2, the writing time is 10
ms.These response times are found to correlate well with the dynamics of the photovoltage
created by the incident optical field T3]. 0-7803-4950-4/98/J10.00 1998 IEEE 419
Ar* Laser Writing "SC Beams'
He-Nc Probe L^L Methyl red Beam ^Nloped nematic
liquid crystal Figure 1. Schematic depiction of the optical wave mixing interaction geometry

Such reorientational effect can be enhanced with the application of an ac field across the ITO electrodes. Figure 2 shows the first order probe diffraction power as a function of the ac
frequency for various ac voltages, from a 25 urn thick film. At such low writing beam power,
there is no diffraction when the ac voltage is off. For ac frequencies in the range of 10 -104 Hz,
the diffraction increases as the applied ac voltage is raised; for frequency above 104 Hz, the
diffraction vanishes. This dependence on the frequency of the AC applied voltage is attributed to
the dispersion of the dielectric anisotropy Ae. For low frequency [<104 Hz], the anisotropy of the
dye-doped nematic film is negative, and so its reorientation by the optically induced space charge
field is aided by the ac voltage across the ITO windows. At high frequency [>104 Hz], the
dielectric anisotropy Ae is positive, and thus the ac voltage tends to realign the liquid crystal to
the original direction, i.e. perpendicular to the cell walls. This therefore diminishes the grating diffraction effect.
s I ? I4 E
0.
I E Q
!
0<
'JJ 20 V, pp
m 10V, w
• ? i
15VB
! . i
I ' • i ■•:
!5V„ • • I* -0—o-o-
100 1000 10000 100000
An estimate of the effective refractive index.change coefficient n2 can be obtained from Figure 2. For this case, the grating spacing
Xg=30 |im [crossing angle ~ 1 degree] and
the diffraction is in the Raman-Nath
regime. The first order diffraction efficiency T| is thus given by rj= Jj2 (phase
shift) ~ (nAnd/X)2 . From Figure 2, we
note that a diffraction efficiency r|= 10"3 is
obtained for the case where ac voltage =
20 Vpp case. Inserting all the values for d, X, and T| in (1), we obtain An - 2x 10*4.
This gives n2 = 6cra2/Watt since the intensity of the writing beam is - 44
^Watt/cm2. In the following experiment
on external self-phase modulation effect, the sign for n2 obtained is determined to be negative.
Such extraordinarily large nonlinearity enables us to observe nonlinear optical effects at unprecedented low threshold value. The insert in Figure 3 shows a typical optical limiting set up using external self-defocusing effect. A linearly polarized laser beam is focused by a 15 cm focal length input lens to a spot diameter of 0.1 mm onto a 25 ^m thick liquid crystal film placed just behind the focal plane of the input lens. The nematic film is tiled so that the incident beam makes
an angle of 45 degrees with the normal to the cell; this enhances the nonlinear refractive index
change experienced by the extraordinary incident ray [4]. An aperture of 5 mm diameter is placed
at 40 cm behind the sample to monitor the central region of the transmitted beam. Above an input 420
Frequency (Hz) Figure 2. Observed diffracted power versus applied ac frequency for different ac voltages. Argon [488 nm] writing beam power 2 uWatt each; beam diameter 3 mm. He-Ne probe beam power: 5 mWatt. All beams co-polarized along y-direction.

0.010
0.008 ■
0.006-
0.004-
0.002
0.000 0.00 0.02 0.04 0.06 0.08 0.10 0.12 0.14 0.16 0.18 0.20 0.22 0.24
P»(HW) Figure 3. Plot of detected output power versus input laser power. Insert shows the experimental set up for optical limiting action using external self-defocusing effect.
power of - 70 nanoWatt, it is observed that the central region of the transmitted beam becomes
progressively darkened, and the beam divergence increases dramatically.
Figure 3 shows an output versus input curve for cw input laser clearly demonstrating a
typical limiting behavior. The
threshold of 70 nanoWatt is
among the lowest of all known
materials. The response time is
dependent on the beam intensity.
We observed that the transmitted
on-axis power decreases to =
almost vanishing value in 1.5 sec &!
for an input laser power of 0.3
uWatt. In other words, less than
0.3 nJoule is transmitted through
the limiter. At higher input
power/intensity, the response time
is correspondingly shortened. The
net effect is that « 1 pJoule of the
input laser energy will reach the
detector/sensor. This is well below the sensor/eye damage level for long pulse-cw laser.
Using these dye-doped films, we have demonstrated incoherent to coherent image
conversion with laser intensities as low as 90 uWatt/cm^, which is comparable to the intensity
level required for the operation of commercial [and much more expensive] liquid crystal light
valve. Since many dyes exist that will cover the entire visible spectrum, such dye-doped nematic
films are highly promising candidates for application as very broadband optical modulator and
limiters. The effect is also potentially useful for other adaptive optics and coherent wave mixing
devices.
References [1] I. Janossy and T. Kosa, Opt. Lett. 17, 1183-1992; W. M. Gibbons, P. J. Shannon, S. T.
Sun and B. J. Swetlin, Nature 351, pp.49-50, 1991; A. G. Chen and D. J. Brady, Opt. Lett. 17, ppl231-1233, 1992
[2] E. V. Rudenko, A. V. Sukhov, "Optically induced spatial charge separation in a nematic and the resultant orientational nonlinearity," JETP 78, 6, pp. 875-882, 1994; I. C. Khoo, H. Li, Y. Liang, Opt. Lett. 19, pp. 1723-1725,1994. I.C. Khoo, IEEE J. Quant. Elect., 32, pp. 525-534,1996.
[3] I.C. Khoo, S. Slussarenko*. B. D. Guenther and W.V. Wood, Opt. Letts., 23, pp. 253- 255,1998.
[4] I. C. Khoo, " Liquid Crystals: Physical Properties and Nonlinear Optical Phenomena" Wiley Interscience, NY [11/94].
421

ThE4 9:45pm - 10:00pm
Interactions of coherent or incoherent spatial soliton pairs in the viscidity of a non-linear interface
J. Scheuer and M. Orenstein Department of Electrical Engineering, Technion, Haifa 32000, Israel
Tel. 972-4-8294696, Fax. 972-4-8323041, E-mail: [email protected]
Soliton switching due to soliton - soliton interaction was suggested before [1,2]. More efficient "digital" switching can be achieved when the soliton interaction is taking place in the viscidity of a non-linear interface. When a single spatial soliton is incident at an oblique angle on an interface separating two positive Kerr like media, it will be transmitted, reflected or trapped by the interface depending on its intensity. Particle-like model was developed [3] to yield an equation of motion for the soliton's average location while the interface acts as a potential barrier. Here we study the interactions of two solitons near a non-linear interface both by a numerical solution as well as by deriving a new potential for the combined two particle and interface interactions. The results predict efficient soliton-controlled soliton-switching.
First we examined numerically the interaction of two coherent/incoherent spatial solitons with a non-linear interface. The initial conditions - the separation between the solitons and their angle of incidence - were set to yield interactions only close to the interface. The interaction of non-equal amplitude spatial solitons - which are typical to the switching scenario - with an interface was studied. The presence of a second (control) soliton near the interface was found to have a remarkable effect on the first soliton. Although solitons with different amplitudes are known to have no or little interaction with each other while copropagating [4], in the presence of the interface we were able to control completely the transmission characteristics of a soliton by the other. The presence of the control soliton near the interface may cause the first soliton to be transmitted through the barrier even if by itself it would be reflected.
Figure la shows the reflection of a high power spatial soliton from a non-linear interface. Figure lb shows the transmission of a lower power soliton through the same interface and incidence angle.
Figure 2 shows the result of the simultaneous incidence of the two non-equal-amplitudes incoherent spatial solitons of Fig. 1. The presence of the control soliton switched the main soliton trajectory from reflection to transmission. The control soliton can be either transmitted or reflected depending on the initial conditions and its amplitude. Higher amplitude control solitons will be reflected while lower power solitons may be reflected or transmitted. Since the control soliton can be marked (e.g. by a different optical frequency), its specific destiny is not relevant for the switch.
Incoherent spatial solitons interact through the mutual change of the medium index of refraction. The results of Fig. 2 were obtained by solving the coupled non-linear Schrödinger (NLS) evolution equations: . 3A d A _ . i.i2 L. („^ . ,,. ,^- + —+ 2A.|A| =(V-|B| ).A (1)
iffl+|^ + 2B.^=(v_|Af).B
where A and B are the electrical fields of the solitons, x is the normalized coordinate in the propagation direction and V is the interface - soliton potential[3]:
0-7803-4950-4/98/$! 0.00 1998 IEEE 422

v = /.
^-«o,-2 "02 "22
n0, • n2,
-1 I |2 A medium 1
(2)
0 medium 2
n0i and n2i are the linear and non-linear indices of refraction respectively in medium i where i=l is the medium of incidence. It is important to emphasize that Eq. 1 is different from the relevant equations in all references that we know of by a missing factor of 2 multiplying usually the A2 and B2 terms. This difference is due to a real incoherency (not only difference in wavelengths) that can be encountered only in spatial solitons and is going to be discussed further in the presentation. We simulated also the interaction of two coherent solitons and an interface. In this case the coherent version of Eq. 1 was solved under similar conditions and the results obtained (Fig. 3) were similar to these of the incoherent case. The two solitons which are of different amplitudes are interacting almost solely by intensity related effects. The results were completely different when the 2 solitons were identical, and then real phase related interactions came into effect as will be discussed.
An analytical particle-like model was developed for the coupled NLS equations (1). The resulting equation of motion for solitons A B are:
^% = _A.jl.(v-|B|2).|A|2dx (3)
—-^- = — IV-A l-B dx ax2 pB Jaxv ' l/M
where x is the soliton's position, A = 2r]0 ■ Sech(2r/0 (x - x)), P - the soliton's power. From Eq. (3) we derived the forces between the two incoherent spatial solitons. The force, on a soliton located in xA, due to a similar soliton located in xB is:
F-8^ f3Cosh[2Tv(xB-xA)] , , Cosh[4T1-(xB-xA)]+2] F-8T1lsinh3[2iV(xB-xA)]-2Tl(XB~Xj SinhWfc-J] J W
This force is always attracting and decays to zero when the distance between the solitons is very large. For medium distance F oc-2x • e~*, which agrees with the results of reference [5]. Integrating Eq.(4) yields the potential between the two solitons as a function of the distance x = xB - xA:
V = Ö ,{2TiCosh[2rix]x-Sinh[2Tix]} (5) Sinh3|2r|-xJ
The potential function Vfor the n = V2 case is depicted in Fig. 4. Adding this potential to the interface potential given by Eq. (2) yields an analytic set of equations that describe the interaction of the two incoherent solitons in the vicinity of the interface. The effect of the control soliton is to reduce the effective barrier potential such that a
low kinetic energy soliton can overcome the barrier. The detailed results of the analytical results and similarity to the simulation will be presented. The above effects may be used to construct an all-optical switching device that controls the transmission or reflection of a spatial soliton beam. The advantage of this
423

mechanism is that it is based on incoherent interactions, enhanced by the interface and enables two distinct soliton sources to effect each other.
References: [1] T. T. Shi and S. Chi, Opt. Lett., 15, 1123 (1990). [2] L. Lefort and A. Barthelemy, Photonics Technology Letters, 9,1364 (1997). [3] D.B Ostrowsky and R. Reinich (Ed.), "Guided Wave Nonlinear Optics", (NATO ASI Series,
Kluwer Academic Publishers, 1992). [4] A. Hasegawa, "Optical Solitons in Fibers" (2nd ed., Springer-Verlag, Berlin 1990). [5] D. Anderson and M. Lisak, Physica Scripta. 33, 193 (1986).
-40 -20 0 20 40 |i.m Figure la - soliton reflection; A=0.8,
noi=1.45,no2=1.449 n2=0.0625, 6=2.18°
-40 -20 0 20 40 M-Hl Figure lb - soliton transmission; A=0.56,
other parameters - same as in Fig. la
-4o -20 o 20 40 H-m Figure 2a - simultaneous incoherent solitons of Fig. 1. The control soliton
(dashed line) is detailed in Fig. 2b
-40 -20 0 20 40 Figure 2b - The control incoherent
soliton; parameters of Fig. lb
-40 -20 o 20 40 M-m Figure 3 - simultaneous two coherent
solitons of Fig. 1
o
-005
-0.1
-0.15 Normalized
Energy °2
-0.25
-0.3
-0.35
424
0 . 2 4 6 8 10 X [normalized distance]
Figure 4 - the potential well between two identical incoherent solitons; r|=0.5

FRIDAY, 14 August
FA Applications II FB Semiconductors II

FA1 (Invited) 8:00am - 8:30am
Life at 10lüW/cm2: Low-damage microscopy in living specimens using multi-photon microscopy
Winfried Denk Bell Laboratories, Lucent Technologies
600 Mountain Ave. Murray Hill, NJ 07974
Summary
Multi-photon excitation microscopy (Denk, Strickler et al. 1990) provides optical sectioning by excitation confinement alone and therefore allows fluorescence imaging of biological samples with minial photodamage. Generation of fluorescence requires molecular excitation, which for organic chromophores is always accompanied by the possibility of photochemical side reactions. Such reactions can lead to the destruction of the fluorophore itself (photobleaching) or to damage to surrounding biological molecules (photodynamic damage). Photobleaching and photodynamic damage can often be reduced by the removal of oxygen, which is, however, often incompatble with biological viability.Because only molecules in the focal plane are excited with in the multi-photon microscope no spatial discrimination is necessary during the detection process leading to efficient utilization of fluorescence photons. This is different from the confocal microscope, which is very wasteful with fluorescence photons and, in particular for thicker samples,
uses only a small fraction of the total fluorescence generated.
We have used multi-photon excitation microsopy to investigate a number of biological samples where low-damage high-resolution imaging was crucial to the question at hand. In cultured cell we imaged the distribution of neurotransmitter-gated ion channels by two- photon scanning photochemical microscopy (Denk 1994; (Denk, Piston et al. 1995; (Denk 1996; (Denk and Svoboda 1997). In hippocampal and cerebellar brain slices we examined chemical information processing in synaptic spines (Denk, Sugimori et al. 1995; (Yuste and Denk 1995; (Svoboda, Tank et al. 1996). In mechano-sensory hair cells of the inner
ear we examined the location of the transduction channels (Denk, Holt et al. 1995). In living rats we studied the [Ca++] dynamics in the dendrites of various sub-types of cortical pyramidal neurons during sensory stimulation. In zebrafish embryos we followed the [Ca++] dynamics in three spatial dimensions continuously during the first 20h of
development (Denk, Aksay, Baker, Tank, unpublished data). 0-7803-4950-4/98/$10.00 1998 IEEE 427

References
Denk, W. (1994). 'Two-photon scanning photochemical microscopy: mapping ligand- gated ion channel distributions." Proc. Natl. Acad. Sei. (USA) 91: 6629-6633.
Denk, W. (1996). 'Two-Photon Excitation in Functional Biological Imaging." J. Biomed. Opt. 1(3): 296-304.
Denk, W., Holt, J. R., Shepherd, G. M. G. and Corey, D. P. (1995). "Calcium imaging of single stereocilia in hair cells: localization of transduction channels at both ends of tip links." Neuron 15: 1311-1321.
Denk, W., Piston, D. W. and Webb, W. W. (1995). Two-photon molecular excitation in laser scanning microscopy, in, The Handbook of Confocal Microscopy. Pawley, J., eds, New York, Plenum. 2nd, 445-458.
Denk, W., Strickler, J. H. and Webb, W. W. (1990). "Two-photon laser scanning fluorescence microscopy." Science 248: 73-76.
Denk, W., Sugimori, M. and Llinas, R. (1995). 'Two types of calcium response limited to single spines in cerebellar Purkinje cells." Proc. Natl. Acad. Sei. (USA) 92(18): 8279- 8282.
Denk, W. and Svoboda, K. (1997). "Photon upmanship: why multiphoton imaging is more than a gimmick." Neuron 18: 351-357.
Svoboda, K., Tank, D. W. and Denk, W. (1996). "Direct measurement of coupling between dendritic spines and shaft." Science 272(5262): 716-719.
Yuste, R. and Denk, W. (1995). "Dendritic spines as basic functional units of neuronal integration." Nature 375(6533): 682-684.
428

FA2 8:30am - 8:45am
FLUORESCENT TWO-PHOTON 2.5 D OPTICAL DATA STORAGE: A «REAL WORLD» APPLICATION OF FEMTOSECOND NONLINEAR OPTICS
N.I. Koroteev, S.A. Krikunov, S.A. Magnitskii, D.V. Malakhov, V.V. Shubin
International Laser Center, M. V. Lomonosov Moscow State University, Moscow 119 899, Russia
Three-dimensional optical data storage offers the potential for large recording capacity. Digital three-dimensional (3D) holographic data storage has received a great deal of attention recently [1],
thus opening up the use of optical phase recording in 3D memory devices. The alternative - «amplitude»- attitude to the creation of 3D optical memory devices has received
incomparably less attention so far [2, 3]. However, in spite of the significant progress, nearly 30 years of intensive research in «phase», or holographic digital 3D optical memory has not resulted yet in the development of practical, competitive, compact, high-information-capacity optical data storage devices able to replace conventional 2D magnetic, magneto-optical or optical memory devices (magnetic types and disks, optical compact disks etc.).
That is why we have attempted in the development of a working prototype of a quasi-3D (multilayered) digital «amplitude» optical data storage system. We have used a tightly focused single beam of femtosecond laser radiation to stimulate the two-photon-induced «coloration» of a photochromic substance in the vicinity of beam's waist to write l's as volumetric pixel, or «voxel», of colored form of photochromic material. The 0's has been presented by the same voxel filled with uncolored form of the material. The readout has been performed via forming fluorescence images of pre-recorded two-dimensional arrays, or pages, of binary voxels, onto a receptor of a CCD camera, taking the advantage of well-pronounced difference in fluorescence spectra of colored and uncolored forms of a photochromic material.
The similar attitude has been developed earlier by P. Rentzepis's group [2]. Though there are attractive features in such method of page-by-page information recording, it requires
rearrangement in modern computer architecture. Besides, the method developed in [2] provides the volume density of information (1.4107 bit/cm3), which is many orders of magnitude below the principal diffraction limit ( ~ 1012
bit/cm3). Data arrangement in the page density for systems with parallel recording (~104 bit/cm2) is also several orders of magnitude less than the theoretical diffraction limit.
The use of single beam single-frequency bit-by-bit sequential recording the information into multilayered structures with photoactive layers alternated by non-photoactive inert polymer layers is a promising alternative method of reaching the goal of creating optical data storage with enhanced information capacity [3]. Localization of bits of information is provided by both the non-linearity of two-photon light absorption and by a small thickness of photoactive informative layers. The page of binary information in such media may be recorded with the diffraction limit density and the volumetric density of information may be set closely to the mentioned above limit by decreasing the distance between informative layers. Hereafter we will call multilayer data storage media 2.5- dimensional ones. This class of memory devices may be constructed to be compatible with CD and DVD technologies and they are certainly enter-capable into the architecture of existing digital computers. That is why we call our attitude a «real world» application of nonlinear optics.
Diffraction limited tightly focused beam containing the continuous trains of ultra-short light pulses from KLM mode-locked TirSapphire laser are used in our single-beam writing 2.5D optical memory device. This allows us to approach the diffraction limit of digital optical information density and to use the maximally compressed power of femtosecond light pulses to enhance the efficiency of non-linear photocoloration process.
Information readout is performed by the registration of fluorescence of colored form with single- or two- photon excitation. With single-photon excitation, the parallel (page-by-page) reading is realized.
The prototype created makes it possible to test photosensitive materials and to simulate the processes of recording, reading and erasing the information in the devices of 2.5D optical data storage.
The prototype is a table top bench. It's basic elements are as follows: lasers for recording, erasing and reading the information, optical gates, an universal unit used for writing and fluorescence registration (universal head), precision 3D platen with multilayer media sample holder and a computer for control and information processing. In Fig. 1 the schematics of prototype is depicted.
An average power of a femtosecond Titanium-doped sapphire laser (X = 800 - 860 nm) is ~ 150 mW, pulse duration is 100 fs, pulse repetition rate is 100 MHz. The laser is pumped
0-7803-4950-4/98/$10.00 1998 IEEE 429

by a 5.6 W cw argon-ion laser («Innova-316» from «Coherent»). Writing beam is
Argon-ion Laser
I Ti: sapphire Laser
Electrooptic 1 gate I
CCD camera ■
Acoustooptic _ gate I i
Univesal head
Princeton Instr.
3 coordinate step drive
if X=860 nm ||
Objective
Multilayer polymer
I *\ matrix
L
Objective
A.=514nm
Multila-^r polymer matrix
Fig.l. The scheme of setup (up). Universal head in writing regime (left) and in readout regime (right).
focused by a microscopic objective (x40; N.A. = 0.65). In the left inserted panel in Fig.l the schematics of universal head action in writing regime is given. Here the radiation of writing laser beam after electro-optical gate is formed by lens system into a beam that fill the major part of objective aperture and possess the divergence corresponding to a minimum of objective's aberrations. In the universal head unit this beam is reflected by a dichroic mirror and is directed into the objective to irradiate the sample.
The measured waist diameter at the half of maximum of light intensity is approximately 1.5 urn. Thus the writing parameters are close to the CD standard. The light pulse duration, that was measured with the help of autocorrelator after beam propagation through electro-optical gate and objective, is approximately 200 fs.
The energy of the writing pulses has been varied in the interval 10-500 pJ per pulse, so the radiation flux density in the photochromic layer may be varied from 2 to 100 GW/cm2. The duration of pulse trains varied, in their turn, in the range 1-10000 us that corresponds to the change of number of pulses in train from 100 to 1000000.
The fluorescent image readout from various layers of the sample is performed by focusing chosen layer image onto the surface of a CCD camera receptor. This image transfer is done with the help of the same microscopic objective that has been used for the writing beam focusing. The schematics of the universal head operation in the readout regime is depicted in the right inserted panel in Fig. 1.
Information reading (under single-photon excitation of pohotochromic material colored form fluorescence) is performed with the use of the radiation of the argon-ion laser at wavelength 514 nm. This radiation is directed onto the sample at Brewster angle from the opposite side of the microscopic objective position through the transparent quartz substrate (page dimensions are 110x160 urn2).
Writing beam scanning and choice of page for readout is performed by moving the sample in 3 dimensions. Sample movement is fulfilled with the help of precision 3D step motor driven platen under the computer control. The displacement accuracy is 0.22 urn.
The samples used for data storage are transparent multilayer polymeric structures with photochromic substance introduced into thin informative layers (naphthacenepyridone (NP) derivatives [4] in PMMA and other
430

polymers). The structures are produced by multilayer spin coating of round quartz substrates with 20 mm diameter and 5 mm thickness. ,
At Fig.2 the results are shown of page-by-page fluorescence reading of two and three consecutive layers m an optical matrix pre-recorded in the same bit-by-bit manner described above, with the according variation of the depth of focus of the recording objective. The conditions of recording and readout were the same as described above. The ultimate information capacity of the created 5-layer optical matrix is limited by the dimensions of a single binary voxel which in our experiment has a diameter of 1.5 urn. These results in the surface density of the stored information in binary code in the order of 0.2 G bit/ cm2. Due to relatively high contrast ratio of the fluorescence images, there is a possibility of using gray level encoding which may result in higher information density of the stored optical data.
cMirribi»AHW6
/Mjmi „ *Uffj <.•*■' .'
' - ! '.. *■. U: iffiv^ttfjVMI
■mm '-t>
■',' lid my- TAST".1 ■
a) b) Fig. 2. Examples of fluorescent images obtained from matrices containing two (a) and three (b) informative layers.
Actual sizes of recorded pages inside multilayered matrices are 110x160 urn .
In conclusion, we have demonstrated the reliable operation of the designed prototype of the device for multilayered digital rewritable optical data storage . Writing of optical data in each of up to five consecutive layers of photochromic-doped polymer matrix with the equivalent information density of 0.2 G bit/ cm was performed point-by-point with tightly focused beam of a quasi^cw (rep. rate 100 MHz) femtosecondTi:Sapphire laser.
The work was financially supported by «Memory Devices Inc. of Constellation Group GmbH» (Austria)
References: 1. G. Burr, F. Mok, and D. Psaltis, Opt, Commun., v.117, p.49 (1995),J. Heanue, M. Bashaw, and L.
Hesselink, Science, v.265, p.749 (1994), R. M. Shelby, J. A. Hoffhage et al.,Opt. Lett, v.22, p. 1509 (1997), and references therein.
2. AS.Dvornikov, P.M.Rentzepis. Opt. Lett, v.22, p.558 (1997), and references therein.
3. N. I. Koroteev, S. A. Krikunov, S. A. Magnitskii et al., Opt. Lett., (1998) (submitted for publication). 4. N.I.Koroteev, S.A.Magnitskii, V.V.Shubin et al. Jpn. J. Appl. Phys. V. 36, p. 423 (1997).
431

FA3 8:45am - 9:00am
ENHANCING THE DETECTABILITY OF BALLISTIC PHOTONS
TRAVELLING THROUGH HIGHLY SCATTERING MEDIA
BY FREQUENCY-DOUBLING THEIR FAR-FD2LD PATTERN
Alessandra Andreoni, Maria Bondani and Marco Potenza Istituto di Scienze Matematiche, Fisiche e Chimiche, University ofMilano,
Via Lucini, 3, 22100 Como, Italy Phone: +39 (31) 326225; Fax: +39 (31) 326230; ANDREONI@FIS. UNICO.IT
Alexei Lukashev General Physics Institute, Russian Academy of Sciences
38 VavilovSt., 117942 Moscow, Russia Phone: +7 (095) 1353038; Fax: +7(095) 1352055; [email protected]
Fulvia Villani I.N.F.M., Via Sergio Pansini, 5,1-80131 Napoli
Phone and Fax: +39 (81) 7463476; [email protected]
The quality of an image of an object immersed in a scattering medium is generally
degraded because light signals in such a medium split into a coherent (ballistic) and an
incoherent components, of which only the former one brings information about the
object. Different techniques have been proposed to enhance the detection of the ballistic
signal by selecting it in time, first by picosecond Kerr gating [1] and, till recently, by
cross-correlation time gating, with femtosecond resolution, via non-linear optical
interactions (namely, second harmonic generation [2] and parametric amplification [3]).
We made experiments in which the part of a Nd laser pulse (1 mm spot size, either 1.2 ps
at 1.055 urn or 19 ps at 1.064 urn) emerging undeviated from a cell (1-cm path)
containing micellar suspensions of Intralipid (Pharmacia, Italy) at different concentrations
was cross-correlated with the incident pulse in a non-collinearly phase-matched BBO
type I crystal. The set-up is sketched in Fig. 1. Thus the transmitted pulse collected
under an angle of about 9 mrad, was frequency doubled and detected with a fast
photomultiplier (PMT). We obtained cross-correlated SH pulses of duration virtually
identical to that of the auto-correlated incident pulses. The absence of signal at greater
delays, at which the diffuse component is expected, suggests that only ballistic photons
contribute to the detected SH signal. To further prove this, we inserted a needle of 0.78
mm in diameter into the cell and cross-correlated the diffracted pulse as above. By using 0-7803-4950-4/98/J10.00 1998 IEEE 432
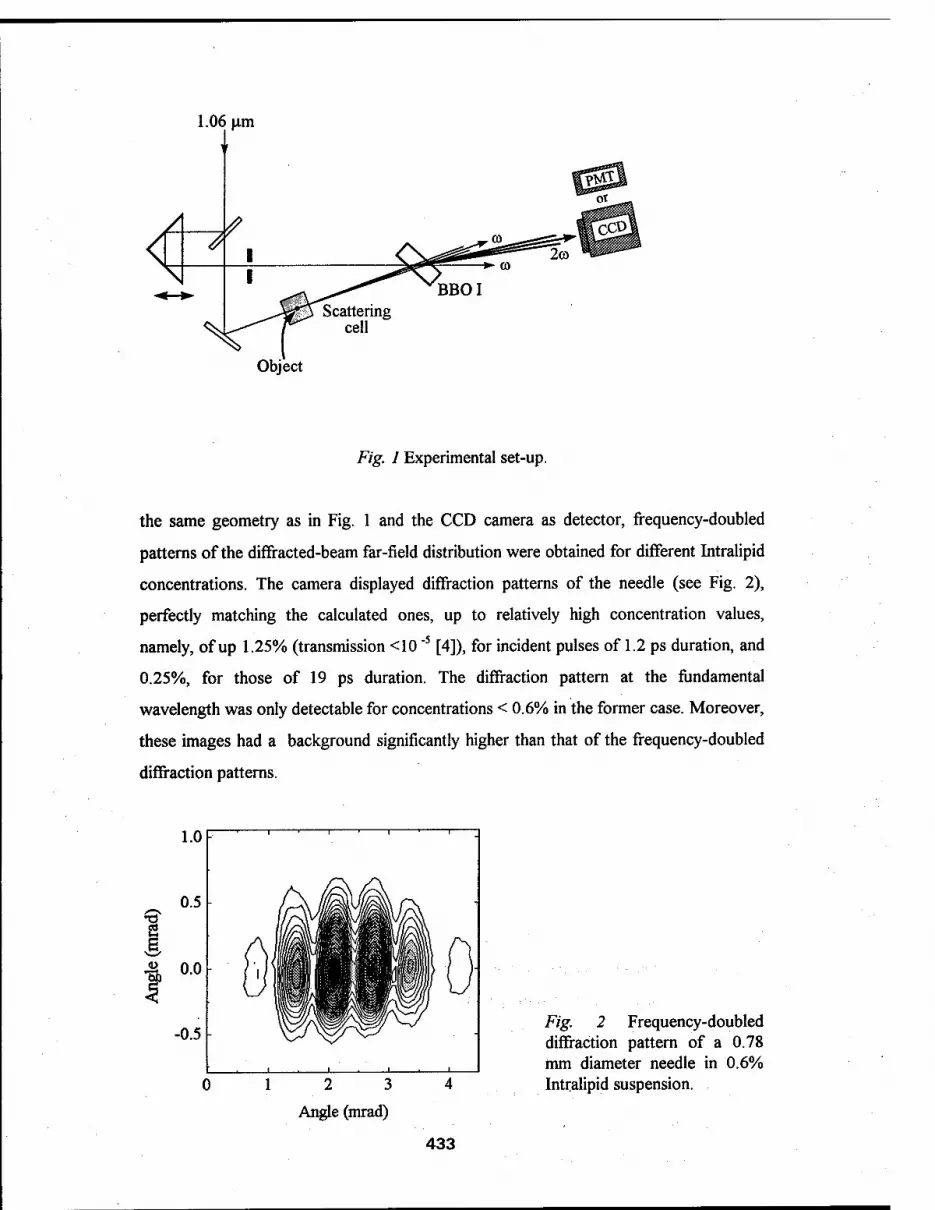
Object
Fig. 1 Experimental set-up.
the same geometry as in Fig. 1 and the CCD camera as detector, frequency-doubled
patterns of the diffracted-beam far-field distribution were obtained for different Intralipid
concentrations. The camera displayed diffraction patterns of the needle (see Fig. 2),
perfectly matching the calculated ones, up to relatively high concentration values,
namely, of up 1.25% (transmission <10 '5 [4]), for incident pulses of 1.2 ps duration, and
0.25%, for those of 19 ps duration. The diffraction pattern at the fundamental
wavelength was only detectable for concentrations < 0.6% in the former case. Moreover,
these images had a background significantly higher than that of the frequency-doubled
diffraction patterns.
13
■a °-°
1 2 3
Angle (mrad)
Fig. 2 Frequency-doubled diffraction pattern of a 0.78 mm diameter needle in 0.6% Intralipid suspension.
433

Though in the experiments performed with the shorter pulse we used intensity values just
below the threshold of self-focusing in the optical components, again the signals were
detectable only for time delays within the incident pulse duration. The absence of
detectable tails in the forward-scattered light [5] and the improvement in signal-to-noise
ratio seem to suggest that the angular selection we operated on the Ä-vectors of the
diffracted TR pulse is more relevant than time-gating is to distinguish ballistic from
diffuse photons. Experiments with 10 ns pulses are in progress to substantiate this idea.
[1] L.M. Wang, P.P. Ho, C. Liu, G. Zhang, R.R. Alfano, Science 253, 768 (1991)
[2] K.M. Yoo, QirongXing, R.R. Alfano, Opt. Letters 16, 1019 (1991)
[3] E.Lanz, F.Devaux, G.Le Tolguenec, H.Maillotte, in OSA TOPS on Adv. in Optical
Imaging and Photon Migration, Vol. 2, ed. RR.Alfano, J.G.Fujimoto, pp. 99-102, 1996
[4] H.J. van Staveren, C.J.M. Moes, J. van Marie, S.A. Prahl, M.J.C. van Gemert, Appl.
Optics 30, 4507 (1991)
[5] K.M. Yoo, R.R. Alfano, Opt. Letters 15, 320 (1990)
434

FA4 9:00am-9:15am
Surface Second Harmonic Generation as a Probe of Anodic Oxidation of Si(001).
S. A. Mitchell,1 S. Janz,2 and J. A. Bardwell2
^teacie Institute for Molecular Sciences and institute for Microstructural Sciences, National Research Council of Canada, Ottawa, Ontario, Canada, Kl A OR6. Tel. (613) 991-5119; Fax (613) 954-5242.
SUMMARY
Anodic oxidation of Si(001) has been well studied by traditional electrochemical techniques.1 A detailed description of the process is however lacking due to insufficient knowledge of the state of the silicon surface during the course of the reaction. In the present work, we employ surface second harmonic generation (SHG) to monitor the oxidation process in situ. Our recent work2 has clearly shown that the variation of the SHG signal during oxidation is largely determined by the evolution of the space charge field in the silicon. This result is consistent with the experiments of previous workers that demonstrate that the nonlinear optical response of Si/Si02 interfaces is sensitive to the presence of electric fields in the space charge region (SCR) of silicon.3"7 By enabling us to monitor the surface potential in the Si during oxide growth, these in situ optical experiments reveal details of the oxidation mechanism that are difficult or impossible to study by using purely electrochemical methods.
The experimental arrangement for in situ monitoring of anodic oxidation by surface SHG is shown in Figure 1. Anodic oxide growths were carried out in a three electrode electrochemical cell containing 0.1 M HC1 electrolyte. The potential between the p-doped (7 x 1014 cm*3) Si(001) wafer and a saturated calomel electrode (SCE) was varied by using a computer controlled potentiostat. Prior to each experiment, the Si wafer was etched in 1% HF to remove the existing oxide and leave a H-terminated surface.
TI:SAPPHIRE LASER I X/2-PLATE ■
POLARIZER
>' LENS
POLARIZER
PMT
(sf— SCE
FILTER LENS
RECTROCHEMICALCaL
Figure 1. Experimental arrangement for in situ monitoring of anodic oxidation by surface second harmonic generation.
0-7803-4950-4/98/J10.00 1998 IEEE 435

The incident light source was a mode-locked Ti: Sapphire laser tunable in the wavelength range 720 - 1000 nm. A p-polarized probe beam was incident on the Si surface at 45 degree incidence, and the p-polarized component of the second harmonic light radiated from the surface was measured by using a photomultiplier tube. The Si wafer was oriented with the (100) axis parallel to the plane of incidence. In this configuration the bulk, interface and space charge region will contribute to the total second harmonic response.3
We recorded the SHG intensity for freshly prepared and electrochemically treated H- terminated silicon surfaces as the applied potential was scanned from -1 to +2 VSCE (potential in volts relative to the SCE). Figure 2 shows the resulting data for a series of different electrochemical treatments. Immediately prior to each scan the fresh H-terminated Si wafer was held for ~15 minutes at various potentials in the range -1 to +2 VSCE- At strongly cathodic potentials, this conditioning treatment produces no change in the H-terminated Si surface. On the other hand, treatment at anodic potentials produces a stable oxide layer. The thickness of this oxide varies linearly with potential from 10 A at +1 VSCE to 35 A at +4 VSCE
1 The oxide growth
is also self-limiting, the thickness being approximately independent of time for anodic growth intervals between 1 and 30 minutes.1 The scan rate was ~2 mV/sec, which ensured that the limiting oxide thickness was continuously maintained during the scan. As shown in Figure 2, the prior oxide growth caused large changes in the variation of the SHG response with potential. The individual traces are offset vertically in Figure 2 for clarity. The zero of SHG intensity is indicated for each trace by a short horizontal line near 0 V.
-1000 -soo
f o X V)
-1000 -500 500 1000
Voltage / mV
Figure 2. SHG intensity as a function of applied potential following conditioning of the sample for 15 min. at the indicated potentials. The zeros of intensity for the various traces are indicated. The applied potential is relative to SCE. The fundamental wavelength was 785 nm.
Previous spectroscopic studies2 on this system indicate that the SHG signals shown in Figure 2 are dominated by the electric field induced SHG from the silicon SCR adjacent to the Si/oxide or Si/electrolyte interface. The qualitative features of the curves in Figure 2 can
436

therefore be interpreted in terms of the evolution of the Si surface potential Vs as the applied electrochemical potential is varied. The approximately quadratic dependence of the SHG signal on potential for potentials less than + 0.5 VSCE is consistent with a simple electric field induced SH (EFISH) response as described in references 3 and 4. The quadratic response arises because the EFISH susceptibility is linear in applied electric field. Obvious deviations from this quadratic behavior occur for samples conditioned at potentials greater than 0.5 VSCE, and for all samples when the scanned potential exceeds 0.5 VSCE. The slow decrease of the SH intensity at anodic potentials in excess of+0.5 VSCE has already been attributed to the screening of the Si surface by mobile charges in the oxide layer.2 As the conditioning potential exceeds +0.2 VSCE, the SH intensity (and hence Vs) becomes increasingly independent of applied potential near 0 VSCE- This suggests that pinning of Vs by interface states is significant for these anodically grown oxides. A closer analysis of the data in Figure 2 at potentials below 0.5 VSCE reveals subtle deviations from the approximately quadratic behavior predicted by EFISH theory.3,4 A careful examination of these anomalies is of particular importance in terms of understanding the fundamental electrochemical processes, since they allow us to identify the electrochemical potentials for H desorption and the onset of oxide growth, and the transition from depletion to accumulation in the Si SCR.
From the results in Figure 2, we can therefore identify three regimes of applied potential U: i) H-terminated surface for U < -0.5 VSCE; ii) initial onset of oxide growth at U = -0.3 VSCE , possibly involving OH-termination of the surface; and iii) irreversible oxide growth for U > -0.25 VSCE- Further details of the interpretation of the SHG results will be described in the contributed paper.
References
1. J. A. Bardwell, N. Draper, and P. Schmuki, J. Appl. Phys. 79, 8761 (1996). 2. S. Janz and J. A. Bardwell, in In Situ Process Diagnostics and Intelligent Materials
Processing, Materials Research Society Symposia Proceedings (in press, 1998); S. Janz and J.A. Bardwell, in Quantum Electronics and Laser Science Conference, Vol. 12, 1997 OSA Technical Digest Series, 89 (Optical Society of America, Washington, D.C., 1997).
3. O. A. Aktsipetrov, A. A. Fedyanin, J. I. Dadap, and M. C. Downer, Laser Physics 6,1142 (1996).
4. J. I. Dadap, X. F. Hu, M. H Anderson, M. C. Downer, J. K. Lowell, and O. A. Aktsipetrov, Phys. Rev. B 53, R7607 (1996).
5. J. L. Daschbach, P. R. Fischer, D. E. Gragson, D. Demarest, and G. L. Richmond, J. Phys. Chem. 99, 3240 (1995).
6. P. R. Fischer, J. L. Daschbach, D. E. Gragson, and 0, L Richmond, J. Vac. Sei. Technol. A 12,2617(1994).
7. P. R. Fischer, J. L. Daschbach, and G L. Richmond, Chem. Phys. Lett. 218,200 (1994).
437

FA5 9:15am-9:30am
Femtosecond incoherent second-order nonlinear light scattering: opportunities for molecular and device characterization
Koen Clays, Geert Olbrechts, and Andre Persoons,
Laboratory of Chemical and Biological Dynamics, Center for Research in Molecular
Electronics and Photonics, Department of Chemistry, University of Leuven,
Celestijnenlaan 200D, B-3001 Leuven, Belgium
tel.: 321-6327508, fax: 321-6327982
e-mail: [email protected]
SUMMARY:
Incoherent second-order nonlinear optical scattering, also known as hyper-
Rayleigh scattering (HRS)1, has become widely accepted as an experimental technique
for the determination of the molecular second-order nonlinear optical polarizability (first
hyperpolarizability). The generic laser type used for this experiment is a Q-switched
nanosecond pulse laser, due to the low quantum efficiency of the process. Hyper-
Rayleigh scattering is not only simpler than the previously developed Electric-Field-
Induced Second-Harmonic Generation (EFISHG) technique (no need for knowledge of
dipole moment, local field correction factors, third-order nonlinear polarizability), it is
also complementary to it, providing values for individual elements of the third-rank
second-order hyperpolarizability tensor.3'4 Moreover, it is the only experimental
technique applicable to ionic or apolar species. Hence, HRS has provided a wealth of
information on the tensor properties of the hyperpolarizability of molecules of all types of
symmetry, it has proven indispensable for the experimental verification of the octopolar
paradigm in second-order nonlinear optics,5 and it has been instrumental in relating the
bulk susceptibility of ionic materials to the molecular hyperpolarizability of the constituting ions.6
In this field of molecular characterization by incoherent second-order nonlinear
light scattering, the multiphoton fluorescence contribution to the hyper-Rayleigh
scattering signal has become recognized as an experimental problem.7 A number of very
large hyperpolarizabilities have been suspected to be caused by fluorescence contribution
to the incoherently scattered second-harmonic intensity. A very elegant solution to this
problem had been proposed based on the temporal difference between the immediate
scattering and the time-delayed fluorescence. Only the photons detected in an early and
narrow time window are regarded as due to scattering. We now demonstrate a novel
technique in the frequency-domain for the suppression of the multi-photon fluorescence
contribution in hyper-Rayleigh scattering experiments. The technique takes advantages
of the demodulation and the phase-shift in the frequency-domain of the time-delayed
0-7803-4950-4/98/$10.00 1998 IEEE

(multi-photon) fluorescence in the time-domain. For this technique, we use the improved
temporal resolution offered by the femtosecond pulse versus the nanosecond pulse. We
demonstrate the effectiveness of the demodulation of the fluorescence at high modulation
frequencies of the fundamental laser beam by determining the molecular second-order nonlinear polarizability for a reference molecule under fluorescent conditions. The value that was obtained for crystal-violet in methanol with 9,10-diphenylanthracene added as a
centrosymmetric fluorophore (338 ± 80 x 10"30 esu), compares very well with the values
that were previously obtained. The frequency-dependence of the retrieved value shows
both the overestimation at DC and low modulation frequencies and the convergence
towards the fluorescence-free value at high modulation frequencies. Experimental results
on fluorescent non-centrosymmetric mono-, bi-, and terchromophoric compounds will be
discussed. The possibility of complete suppression of all fluorescence, based on phase-
sensitive measurement in quadrature with the fluorescence, is also proposed. By adding the high-frequency demodulation for suppression of the multiphoton
fluorescence contribution in hyper-Rayleigh scattering, we have further improved this
experimentally simple, yet widely applicable technique, to be capable of measuring the
first hyperpolarizability of fluorescent molecules also. Therefore, femtosecond
incoherent second-order nonlinear scattering has become an invaluable tool for the
experimental verification of the engineering guidelines in molecular second-order
nonlinear optics. Apart from this opportunity offered by femtosecond incoherent scattering for
molecular characterization, relating to the temporal resolution offered by a shorter pulse,
another possibility is offered through the high peak power available from a moderate
energy content is such a short pulse.9 It is now possible to measure incoherent hyper-
Rayleigh scattering from solid samples. This allows us to probe the orientational
correlation between individual chromophores in a bulk arrangement. An attractive format
for nonlinear optics is a thin film waveguide. We have used femtosecond pulses (10
nanoJoule energy, but 100 kilowatt peak power in a 100 femtosecond pulse) to study the spatial orientational correlation length between chromophores as a function of poling and relaxation in a polymer matrix. The positive influence of the degree of poling is clearly
evidenced as an increase in the orientational correlation length between the
chromophores.10 Due to temporal relaxation in the polymer film, the correlation length
decreases after the poling.11 The relaxation time, retrieved from this incoherent scattering
experiment, has been compared with the relaxation time from coherent second-harmonic
generation.12 The difference in relaxation time has now been rationalized in terms of
translational diffusion of the local free volume in the polymer matrix and the rotational
diffusion of the chromophores in this free volume. This rationalization is based on the ratio of the relaxation times, that is equal to the ratio of the characteristic length in the two
types of experiment. For the incoherent scattering experiment, the only characteristic
439

length is the wavelength (800 nm for a Titanium-sapphire laser), while for coherent second-harmonic generation, the relevant length is the coherence length (10 p.m for
polymethylmethacrylaat at this wavelength). The ratio of the relaxation times was 0.006,
the square of the ratio the characteristic lengths. This points unequivocally to
translational diffusion, governed by relation between diffusion length x, time interval t
and translational diffusion coefficient D, <ct2> = 2Dt. However, due to symmetry
requirements for second-order effects, a rotational relaxation needs to be invoked at the
molecular level. The combination can be understood as the molecular reorientation in the
free volume, that exhibits translation diffusion with diffusion coefficient D that is, off
course, independent of measurement technique. What is specific for the experiment, is
the characteristic length of the experiment, leading to different relaxation times.
This second opportunity for second-order nonlinear femtosecond incoherent
scattering is on the level of the bulk arrangement of chromophores. The correlation
experiments provides guidelines for the optimal arrangement of chromophores, and for
techniques to provide for this arrangement. In combination with the opportunity at the
molecular level, providing guidelines for molecular engineering, femtosecond incoherent
nonlinear scattering is an invaluable experimental tool in second-order nonlinear optics.
References: 1 K. Clays and A. Persoons, Phys. Rev. Lett. 66, 2980 (1991). 2 K. Clays and A. Persoons, Rev. Sei. Instrum. 63, 3285 (1992). 3 E. Hendrickx, C. Boutton, K. Clays, A. Persoons, S. van Es, T. Biemans and B. Meijer, Chem. Phys. Lett. 270, 241 (1997). 4 C. Boutton, K. Clays, A. Persoons, T. Wada and H. Sasabe, Chem. Phys. Lett, accepted for publication, (1998). 5 T. Verbiest, K. Clays, C. Samyn, J. Wolff, D. Reinhoudt and A. Persoons, J. Am. Chem. Soc. 116, 9320 (1994). 6 X.-M. Duan, S. Okada, H. Nakanishi, A. Watanabe, M. Matsuda, K. Clays and A. Persoons, Proc. Soc. Photo-Opt. Instrum. Eng. 2143, 41 (1994). 7 M.C. Flipse, R. de Jonge, R.H. Woudenberg, A.W. Marsman, C.A. van Walree and L.W. Jenneskens, Chem. Phys. Lett. 245, 297 (1995). 8 O.F.J. Noordman and N.F. van Hülst, Chem. Phys. Lett. 253, 145 (1996). 9 K. Clays and A. Persoons, Rev. Sei. Instrum. 65, 2190 (1994). 10 G. Olbrechts, E.J.H. Put, K. Clays, A. Persoons and N. Matsuda, Chem. Phys. Lett. 253, 135 (1996). 11 N. Matsuda, G. Olbrechts, E.J.H. Put, K. Clays and A. Persoons, Appl. Phys. Lett. 69, 4145 (1996). 12 G. Olbrechts, E.J.H. Put, D.Van Steenwinckel, K. Clays, A. Persoons, C. Samyn and N. Matsuda, J. Opt. Soc. Am. B 15, 369 (1998).
440

FA6 9:30am - 9:45am
Efficient second-harmonic generation for generating ultrafast blue light in
periodically-poled bulk and waveguide potassium titanyl phosphate
V. Petrov, Y. Wang, Y. J. Ding, Y. Zheng, J. B. Khurgin00, and W. P. Risk(b)
Department of Physics & Astronomy; Centers for Materials & Photochemical Sciences
Bowling Green State University, Bowling Green, OH 43403
Telephone Number : (419) 372-8785 Fax Number : (419) 372-9938
Recently, periodically-poled LiNb03 (PPLN) crystals were intensively used for efficient
second-harmonic generation (SHG) [1,2]. On the other hand, there are less reports on SHG in
periodically-poled KTiOP04 (KTP). This material has certain advantages over PPLN for SHG.
Since PPLN may be damaged due to photorefractive effect, periodically-poled KTP may have a
higher damage threshold over PPLN. In addition, the electric field required to produce domain
inversion in KTP is substantially lower than that in LiNb03. Here, we report the first results of
SHG in short-period periodically-poled KTP for efficiently generating blue light using
subpicosecond laser pulses. The uniqueness of our results lies in the combination of short-period
periodically-poled KTP crystals and an ultrafast pump beam for efficient generation of blue
light. The hydrothermally-grown KTP substrate was poled by applying several 2.1 kV pulses of
400 us duration with the poling period of 4.0 |im. Channel waveguides (perpendicular to the
domain-inverted grating) with the width of - 4 (im were fabricated on the original +z face of the
substrate by the standard ion-exchange process in a RbN03/Ba(N03)2 melt. Periodically-poled
KTP crystals with the same spatial period and dimensions were used to achieve SHG in bulk [3]
and waveguide [4] using a CW laser. For our SHG experiments, we used mode-locked
Ti:Sapphire laser with a pulse width of ~ 136 fs. For the sample length of 3.6mm, Fig. 1 shows
our measured phase-matching spectra for SHG in bulk and waveguide KTP crystals. The full
width at half maximum (FWHM) in bulk and waveguide is ~ 85 Ä and ~ 90 A, respectively, due
to large linewidth of our subpicosecond laser. The respective peak wavelength determined from
Fig. 1 is 8421 Ä and 8472 Ä for the bulk and waveguide KTP, respectively. The 51-Ä difference
between the peak wavelengths for the bulk and waveguide KTP is mainly due to the difference in
dispersions between KTP and RTP. At the peak wavelength of 8421 A or 8472 A , we measured
the average SH output power vs. the average pump power, see Figs. 2 and 3. For the average
0-7803-4950-4/98/$10.00 1998 IEEE 441

pump power of ~ 720 mW in the bulk, the maximum conversion efficiency is about ~ 5.5%,
which is about two orders of magnitude higher than that in Ref. [3]. On the other hand, for the
average pump power of 48 mW in the waveguide, the maximum conversion efficiency is ~ 32%,
which is about a factor of four higher than that in Ref. [4]. As we increase the average pump
power further for another waveguide of the shorter length (~ 2.6 mm), we observed a severe
saturation of the conversion efficiency, see inset of Fig. 3. This is probably due to the depletion
and absorption of the pump and/or SH beams by the waveguide. If the peak wavelength (k0) is
quasi-phase-matched and the spatial depletion of the pump is neglected, the conversion
efficiency defined in terms of the average pump and SH powers can be shown to be [2,5]
_ rc2cd323JPn,oL
1 ^nfnjf.liA,, (1)
where Jp is the laser energy per pulse, Aeff is the effective laser beam area, L = 3.6 mm or 2.6
mm, r|o is the vacuum impedance, and fn is the dispersion factor: fn = n2 - r^ + (Adn/dÄ,)^ -
(^dn/dX,)xo/2 with n index of refraction. To obtain Eq.(l), we have assumed loose focusing for
bulk interaction, sine pulse shape for simplicity, and L » Lw, where Lw = xc/fn is the group-
velocity walk-off length with % pulse width. Using d33 « 18 prn/V, and the effective laser beam
area of ~ 2.5xl0"5 cm2 (bulk) or - 2.4xl0"7 cm2 (waveguide), we have plotted the conversion
efficiency vs. the average pump power (Pave = JpR where R = 76 MHz is the laser repetition rate)
based on Eq.(l) in Figs. 2 and 3. Our theoretical results are in excellent agreement with our
measurements for the bulk KTP. But, there are noticeable differences between two for the
waveguide KTP. They are probably due to neglected spatial depletion, approximated spatial
profiles of the beams in the waveguide (modes), and existence of waveguide multi-modes.
This work is supported by AFOSR.
[1] L. Goldberg, R. W. McElhanon, and W. K. Burns, Electron. Lett. 31, 1576 (1995).
[2] M. A. Arbore, M. M. Fejer, M. E. Fermann, A. Hariharan, A. Galvanouskos, and D. Harter,
Opt. Lett. 22, 13 (1997).
[3] Q. Chen and W. P. Risk, Electron. Lett. 30, 1516 (1994).
[4] Q. Chen and W. P. Risk, Electron. Lett. 32, 107 (1996).
[5] G. D. Boyd and D. A. Kleinman, J. Appl. Phys. 39, 3597 (1968). (a)Department of Electrical and Computer Engineering, The Johns Hopkins University,
Baltimore, MD 21218. ^IBM Corporation, Almaden Research Center, San Jose, CA 95120.
442

e D >* I- a u
u o it o
X o et u V > <
Fig. usin
8200
e D
c3 u
• iH
IH U
o a- a U (30 cd
u > <
8300 8400 8500 8600
Pump Wavelength (Ä)
8700 8200 8700 8300 8400 8500 8600
Pump Wavelength (Ä)
1 Phase-matching spectrum for SHG in (a) bulk and (b) waveguide periodically-poled KTP
ig a subpicosecond laser.
a 14
o PL,
C o 6 a X •Ö e o u <u
C/3 U 00 CO 14 u 3
45
40
35
30
25
20
15
10
5
Bulk / /
i
50 150 250 350 450 550 650 750 Average Pump Power (mW)
! U u i* o
PH o c o a »4 a X "O c o o V
o M cä
u >
16
14
12
10
8
6
4
2
g " Waveguide ■
20 30 40 SO 60 70 60 90 Average Pump Power (mW)
10 20 30 40 50 Average Pump Power (mW)
Fig. 2 At the peak wavelength determined in Fig. Fig. 3 At the peak wavelength determined in Fig. 1 (a), average SH power vs. average pump power 1 (b), average SH power vs. average pump power for the bulk KTP (filled squares). The dashed for the waveguide KTP of the length of ~ 3.6 line corresponds to our theoretical result. mm (filled squares). The dashed line corresponds
to our theoretical result. Inset: at the pump wave- length of 8472 Ä in another KTP waveguide of the length of ~ 2.6 mm, the conversion efficiency is measured vs. the average pump power. The dashed line corresponds to our theoretical result.
443

FA7 9:45am - 10:00am
"Nonlinear optical adaptive photodetectors for remote
sensing: Application to ultrasound detection"
by
D. M. Pepper*, G.J. Dunning, M. Chiao, T.R. O'Meara HRL Laboratories
3011 Malibu Canyon Road Malibu, California 90265 USA
*point-of-contact: 310/317-5125 FAX: 310/317-5485
e-mail: [email protected]
P.V. Mitchell PPL
Chatsworth, California USA
I. Lahiri, D.D. Nolte Purdue University
W. Lafayette, Indiana
G.D. Bacher, M.B. Klein Lasson, Inc.
Pacific Palisades, California USA
Summary In recent years, there has been a need for improved basic materials
evaluation during and after processing, as well as a growing industrial market pull for improved quality assurance and process control in the flexible manufacturing arena. In particular, there is a need for nondestructive, noncontact characterization of critical materials without mechanical loading, inspection of welds, surface treatments of metals, as well as in-process evaluation of composites and microelectronics components for elastic properties, material flaws and delamination. We will highlight a novel all-optical technology in this regard: laser-based ultrasonic inspection of critical materials, bonds, and processes. One means
0-7803-4950-4/98/J10.00 1998 IEEE 444

Pepper, et. al "NLO Adaptive Photodetectors..."
by which to make laser-based ultrasound practical is to augment the basic architecture with nonlinear optical techniques to enable precision laboratory measurements to be made under in-factory conditions, including high temperatures, vacuum, relative platform motion, and speckle from scattering off rough-cut objects with complex surfaces. Finally, by probing the surface of objects at several locations with multiple laser beams, the possibility exists for phased-array precision imaging of internal features in otherwise opaque materials. We discuss results of simulations on the spatial resolution of phased array detection of localized buried acoustic sources using this optical detection scheme.
We will discuss the use of semiconductor-based nonsteady-state photo-emf sensors (photo-emf) and two-wave mixers for compensated laser-ultrasonic vibrometry, and present results of experiments that prove the feasibility of this noncontact, nondestructive inspection diagnostic to function under in-process and manufacturing conditions. The photo-emf sensor performs the operations of wavefront compensation and detection in a single element. Real-time compensation is realized via the formation of space-charge fields in response to a dynamic optical interference pattern, in a manner similar to that of the conventional photorefractive effect. In the presence of a transient lateral movement of this optical pattern, a finite photocurrent is generated, which can be detected by surrounding the crystal with electrodes and coupled into a high-gain transimpedance amplifier. Thus, the operations of compensation and detection are achieved in a single element. We report on the results of experimental investigations of this novel sensor, including its sensitivity, detection bandwidth, linearity, and compensation bandwidth. In the latter case, we have quantified the performance of the sensor via the simultaneous application of a dithering interference pattern using an E-0 modulator (to simulate a given ultrasonic signal) and a globally moving pattern via a pair of frequency offset A-O modulators (to simulate relative platform motion to be "tracked" by the sensor). Results indicate a detection bandwidth in excess of 80 MHz, and a compensation bandwidth which is consistent with that of the space-charge formation time in a photorefractive crystal, which has an inverse intensity dependence. For these measurements, bulk and GaAs-based multiple quantum well
445

Pepper, et. al "NLO Adaptive Photodetectors..."
structures were employed as detector elements. Discrete as well as hybridized electronic packages were used to study the effects of stray impedances on the detector performance.
In another set of experiments, a GaAs-based multiple quantum well structure was used as a two-wave mixer to realize an adaptive beam coupling element. This element was used to dynamically wavefront-match a signal beam (which has been phase modulated) to that of a coherent local oscillator. The wavefront-matched beams were then directed to a
conventional photodetector for demodulation. Although this basic
geometry has been known for some time, we report on the ability of using the frequency dependence of the two-wave mixing process at a near-MQW
resonance feature to realize a controllable phase-shift "bias" between the two incident beams to the MQW. In this manner, one can "tune" the system to be operating under optimal coherent detection conditions: that is, the local oscillator and phase-modulated signal beams can be placed into near-quadrature for maximum detection sensitivity. Using this basic approach, we have achieved near shot-noise-limited detection performance, with a noise-equivalent surface displacement sensitivity of 9.4 x lO"7 Ä V(W/Hz).
In this presentation, we will also compare and contrast the performance of these two classes of adaptive photodetectors, against each other, as well as against other nonlinear optical schemes (phase conjugation) and conventional laser ultrasonic sensors (e.g., Fabry-Perot time-delay interferometric detectors).
446

FBI (Invited) 10:30am-11:00am
Femtosecond Optical Parametric Oscillator in the Mid-Infrared and the Dynamics of Holes in GaAs
C. L. Tang, F. Ganikhanov, and K. C. Burr Cornell University, Ithaca, NY 14853
tel/FAX: (607) 255-5120
In this talk recent results on broadly tunable mid-IR femtosecond optical parametric oscillators will first be reviewed1,2. This will be followed by a report on the most recent results on the use of such sources in studying the ultrafast relaxation dynamics of light- and -heavy-holes by probing these holes from the split-off band following femtosecond excitations from the valence to conduction band.
The study of ultrafast relaxation dynamics of free carriers in semiconductors is a subject of fundamental importance and is being investigated extensively. Until recently most studies have focused on the investigation of the dynamics of electrons, while information about hole thermalization has remained scarce.
In typical ultrafast experiments, a pump pulse excites electrons and holes by valence-to- conduction band transitions. Either the resulting conduction-to-valence band luminescence is time-resolved or transmission of a second pulse, which probes the valence-to-conduction band transition, is measured as a function of time. In either case, the task of deducing the hole dynamics is not simple because the measured ultrafast signals are influenced by the time-evolving distribution functions of both the holes and the electrons, unless specific measures are taken to eliminate the electron contribution. A variety of methods have been used in previous studies to reduce or eliminate the electron contribution3"5, but these methods have had limitations such as severely restricting the hole energies that can be probed or requiring highly doped samples. The use of doped samples limits measurements to low carrier concentrations and is also undesirable
because the analysis of the carrier dynamics is complicated by the interaction of the excited carriers with the background cold plasma of doped carriers.
This paper reports results on ultrafast dynamics of holes in GaAs measured using well synchronized femtosecond pulses at near-infrared and mid-infrared wavelengths which are available from a recently developed broadly tunable femtosecond optical parametric oscillator (OPO) pumped by a mode-locked Ti:sapphire laser1. With this source, it is possible to pump valence-to-conduction band transitions with near-IR pulses and probe the generated holes with mid-IR pulses (see Fig. 1) which can be tuned to resonance transitions between the heavy- or light-hole (HH, LH) bands and the split-off (SO) band. The clear advantage of this scheme is that, with suitably chosen pump and probe wavelengths, only carriers in the heavy- and light-hole bands interact with both pump and probe photons. Thus, the measured signal is completely free from contributions from the pump-photon-excited electrons. The differential absorption of the probe photons through the sample
k-vectorlK^cm'1]
fig« 1 Calculated valence band structure of GaAs. Bold areas show excited and probed k-states for different probe wavelengths. Inset schematically depicts band structure of GaAs and quantum diagram of excitation and probe photons.
0-7803-4950-4/98/$10.00 1998 IEEE 447

following pump-pulse excitation is given by:
Aa(mjpr)= ähh-so(hvpr)xAfhh+ äih-soOiUpr)*^ (1) where ähh-so(huPr), äih-so(hupr) are proportional to the corres-ponding transition probabilities for the HH-to-SO and LH-to-SO transitions at the probe photon energy hupr; fm, fih are HH and LH distribution functions, respectively.
We used a 400 urn-thick bulk pure GaAs sample (ne<1014 cm"3) which was antireflection coated in the mid-IR (3-4 urn range). The sample was pumped by pulses at 815 nm from the Ti:sapphire laser, and probed by pulses in the 3-4 urn range from the OPO. The pump pulse excites holes in the HH and LH bands with excess energies of -12 meV and ~44 meV, respectively. For short probe wavelengths (Xpr<3.6 um) the band filling factor due to LH (Afih) in eqn. (1) is relatively small because of the large separation in k-space between the excitation and the probing points in the LH band (Fig. 1), and therefore the HH contribution to the differential absorption signal is dominant. For long probe wavelengths (Xp,>3.6 um) the HH contribution vanishes because the probe photon energy moves off resonance for direct HH-to-SO transitions. Thus, there are two distinct probe wavelength regions in which it is possible to measure a response primarily from holes in only one band (LH or HH). The transient spectra at different delay times and differential transmission signals (AT/T) for different probe wavelengths are shown in Fig. 2 and 3, respectively, for a total hole concentration level of ~3xl017 cm"3. The ratio of carrier density in the HH and LH bands is estimated to be 2:1 for our pump wavelength. The data in Fig. 2 show a rapid hole burning effect followed by the establishment of a quasi-equilibrium in less than 300-400 fs. The quasi-equilibrium level in the transient signal shown in Fig. 3 is on the
o.o
-100 fs -5.0x10"4L ••
-1.0x10'3
-200 fs
t:-i.5xi0"3
-2.0x10"3
-2.5x10"'
-3.0x10"; VlOOfs
~B_ -200 fe —•-- -100 fe —A— Ofs •••▼■•• 100 fe
200 fe 300 fe
-*- 1000 fe
Fig. 2 Transient spectra plotted for different probe pulse delays.
3000 3200 3400 3600 3800 4000
probe wavelength [nm] 2500 3600 -v«"
Fig. 3 Differential transmission signals at probe wavelengths corresponding to probing primarily (a) heavy- and (b) light-hole bands.
448

order of ~2xl0"3 at ~3 fim probe wavelength, which is in good agreement with estimates using the absorption coefficient data reported in Ref. [6] for p-doped GaAs at approximately the same carrier density. The clear minimum in the amplitude of AT/T at Xpr~3.6 ^m for all delay times is an indication of significantly reduced probabilities for HH-to-SO and LH-to-SO transitions close to the zone center where intravalence transitions are forbidden by selection rules. The corresponding AT/T amplitude of lxlO"3 at this wavelength is an integrated contribution of all HH and LH states with a k-vector value from near the zone center up to 1.8xl06 cm"1 due to the wide spectrum (>150 nm) of the femtosecond probe pulse. At wavelengths longer than 3.6 jim (light hole probe) the transient signal amplitude increases, reaching a level of ~2.5xl0" at Xpr~3.8 u,m. This increase in the light hole signal, which results in a larger amplitude than for the heavy-hole signal (despite a factor of two lower hole concentration in the LH band compared to the HH band), is explained by the enhanced transition probability for LH-to-SQ band transitions. Using calculated valence band wavefunctions based on Kane's k#p model, we calculate an enhancement factor au,.,«,/ ähhSO~3.5 - 3.7 for k-vectors ranging up to lxlO7 cm'1.7
Turning to the initial ultrafast part of the signals, for the data shown in Fig. 3, a simple fitting process which consists of convolving the experimentally measured crosscorrelation with a model single exponential decay function of the form [-Ao-Aixexp(-t/tr)] results in a time constant tr in the range of 80-90 fs. An example of the fit is shown in Fig. 4. The magnitude of the peak in the transient signal is clearly dependent on the wavelength of the probe and reaches a maximum when the probe wavelength matches the point of initial excitation in
k-space (Fig. 1). Numerical simulations show that a smaller relative decrease in amplitude from its peak for the case of the LH band probe is explained by the
combined effects of a higher quasi-equilibrium level and a faster initial decay for the light holes. The first effect is due to a narrower spread of initially injected light holes in k-space compared to the heavy holes because of differences in the band structure of the LH and HH band near the zone center. The second effect is caused by LH-to-HH carrier scattering by phonon emission, which was calculated to be extremely fast (<50 fs) by a model accounting for band nonparabolicity.8 We have taken data for different excited carrier densities (2xl016 - 4.5xl017 cm"3) which also will be discussed in the talk.
0.0
—i 1 1 1 ■ 1 1 1 ■ 1 r— 1 ' 1 ■—1 '— 1
- ■02 • experiment
'S ■a
fit t,=85 te
crosscorr "
2 -0.8
< ■0.8
-1.0
1 ■ -. —' ■— 1 . -L 1 . 1 . 1
"
-400 -300 -200 0 100 200 probe delay [Is]
Fig. 4 Example of experimental differential transmission data and fitting curve with model function (t,= 85 fs).
References: 1. D. E. Spence, S. Wielandy, C. L. Tang, C. Bosshard, and P. Günter, Appl. Phys. Lett. 68,452 (1996). 2. K. C. Burr, C. L. Tang, M. A. Arbore, and M. M. Fejer, Opt. Lett. 22,1458 (1997). 3. A. Chebira, J. Chesnoy, and G. M. Gale, Phys. Rev. B 46, 4559 (1992). 4. M. Woerner, W. Frey, M. T. Portella, C. Ludwig, T. Elsaesser, and W. Kaiser, Phys. Rev. B 49,17007 (1994). 5. P. Langot, R. Tommasi, and F. Vallee, Phys. Rev. B 54,1775 (1996). 6. R. Braunstein, J. Phys. Chem. Solids 8, 280 (1959); R. Braunstein, and E O. Kane, J. Phys. Chem. Solids 23,
1423(1962). 7. E. O. Kane, J. Phys. Chem. Solids 1, 82 (1956); S. Wielandy, (unpublished). 8. R. Scholz, J. Appl. Phys. 77, 3219 (1995).
449
FB2
11:00am - 11:30am
Coherent Dynamics of Excitons in Radiatively Coupled Multiple Quantum Well Structures and Microcavities
J. Kuhl, M. Hübner, and D. Ammerlahn Max-Planck-Institut für Festkörperforschung, D-70569 Stuttgart, Germany
T. Stroucken, B. Grote, S. Haas, and S.W. Koch Department of Physics and Materials Science Center,Philipps University,
D-35032 Marburg, Germany
G. Khitrova and H. Gibbs Optical Sciences Center, University of Arizona, Tucson, AZ 85721, USA;
R. Hey and K. Ploog Paul-Drude-Institut für Festkörperelektronik, D-10177 Berlin, Germany
The linear and nonlinear optical properties as well as the dephasing dynamics of coherent excitons in multiple quantum well (MQW) Bragg samples which consist of a large number N of identical quantum wells (QW) spaced by d= X/2 (A, is the exciton transition wavelength) are remarkably different from those of single QW (SQW) excitons since photon coupling between excitons which are spatially separated by integer multiples of X/2 leads to collective relaxation phenomena. In a perfect Bragg sample, the exciton/photon coupling would create one superradiant mode with an N time enhanced radiative decay rate whereas the residual N-l modes are optically inactive [1,2]. Due to the disorder present even in high-quality real-world samples, a finite part of the oscillator strength is transfered to these „dark" modes the radiative decay of which is even slower than in a SQW. We present a comprehensive experimental and theoretical study which utilizes time-integrated, time-resolved or spectrally resolved degenerate four-wave mixing (DFWM) experiments as well as linear and nonlinear transmission and reflection measurements to explore this novel phenomenon. All experiments were performed with 700 fs pulses from a Kerr lens mode-locked Ti: sapphire laser. We used two different N=10 GaAs/AlxGai.xAs Bragg samples with 20 nm well width and x=0.3, and two (In,Ga)As/GaAs Bragg samples with 10 and 30 QWs with a width of 8 nm and an In content of 3%. For identification of the exciton/photon coupling induced dynamical and spectral features, the measured signals are compared to corresponding curves taken on several high-quality GaAs SQWs. The (In,Ga)As were intentionally wedge shaped so that the barrier width varied continously with sample position thus enabling systematic studies of the coupled exciton/photon modes in dependence on the mismatch between d and X/2. DFWM on the GaAs SQW and MQW samples is performed in the backward diffraction geometry because of the absorbing substrate. The time-integrated curves reveal a double exponential decay [3]. The initial rapid drop with a decay time of 2.5 ps reflects the depletion of the superradiant mode. The remaining signal due to the subradiant modes decays with a time constant of 9 ps which gives an upper limit of 40 ueV for disorder-induced scattering to the homogeneous linewidth. The interwell exciton photon coupling is a pronounced low excitation phenomenon and rapidly disappears with increasing excitation intensity because of efficient phase coherence loss due to intrawell exciton/exciton Coulomb scattering. Our investigations prove that the radiative lifetime of 2D excitons in SQW is approximately 10-15 ps in GaAs/(Al,Ga)As SQWs and is distinctly shortened to a few ps or even less in Bragg structures with N= 10 Qws. Thus radiative recombination provides the dominating contribution to exciton dephasing in high-quality samples in contrast to previous interpretations which attributed the dephasing rates observed at low temperature and low excitation density to scattering by defects, interface roughness and alloy fluctuations. 0-7803-4950-4/98/$! 0.00 1998 IEEE 450

Time-resolved DFWM traces measured on the GaAs MQW Bragg samples display a complex transition from a free polarization decay to a photon echo in real time. As long as the response is dominated by the superradiant mode (approximately 2 ps), the exciton transition is homogeneously broadened due to ultrafast radiative recombination. After depletion of the superradiant mode, the surviving subradiant modes create a photon echo since their radiative linewidth is small compared to the inhomogeneous broadening associated with their mode energy splitting. DFWM with linearly polarized laser pulses on a GaAs SQW and the corresponding Bragg structure in a Brewster angle geometry reveal significant changes of the signal shape if the electric field polarization is switched from parallel to perpendicular to the plane of incidence This effect may most likely originate from radiative coupling due to partial reflection of the coherent emission at the sample air interface. Therefore trad for identical SQWs is expected to vary with the thickness of the upper cladding layer. Intensity dependent transmission and reflection experiments on the wedge-shaped (In,Ga)As samples reveal strong variations of the exciton linewidth with sample position in the low density regime which disappear at higher excitation intensities. The line width data are in accordance with the dephasing rates measured in TI-DFWM at the same sample positions. For the N= 30 QW sample, the superradiant state decays at the resonance position with a typical time as fast as 0.65 ps over more than 1 order of magnitude followed by the decay of the subradiant modes (decay time 4 ps). Comparison of DFWM signals measured in backward and forward diffraction geometry show remarkable differences for both the temporal evolution as well as the spectral distribution of the intensity if d deviates from A/2 by only 1-2 %. Because of wavevector conservation the superradiant emission is confined to the transmission and reflection direction of the incident beam. It has been analyzed in time-resolved linear reflection [4]. At low intensity, the GaAs MQW Bragg structure exhibits an enhancement of the reflectivity as compared to a single QW by approximately 20 % which is due to the suparradiant emission. In pump-probe experiments a gradually increasing suppression of the supperadiant state has been observed for pump pulse energies in the range of 1- 25 pj. Such a pump-induced contrast of more than 20% in low intensity reflection from MQW Bragg samples may have potential for future all optical switching devices. Theoretically the optical response of a Bragg structure to excitation by short light pulses tuned to resonance with the lowest exciton transition in the QWs is modeled by calculating the interband polarization from the semicondcutor Bloch equations and solving Maxwell's equations to determine the self-consistent local field which contains besides the incident laser field the retarded time derivatives of the induced interband polarizations in the different QW's. Sample disorder is taken into account by averaging the signals calculated for a large number of parallel channels with stochastically varying QW and barrier thicknesses. Finally we included reflections at the sample air interface that modify the radiative recombination dynamics similarly as the mirrors uin microcavity samples. All our experimental data are fairly well reproduced by solutions of the SMBE. Investigations of the changed exciton/exciton and exciton/phonon coupling for Qws inserted in microcavities in dependence on the exciton/photon coupling strength are currently underway.
1. E.L. Ivchenko et al., Phys. Sol. State 36,1156 (1994 2. T. Stroucken et al., Phys. Rev. B53, 2026 (1996) 3. M Hübner et al, Phys. Rev Lett. 76,4199(1996) 4. M. Hübner et al.,Sol. State Commun. 105, 105 (1998)
451

FB4 Smirl, Chen, & Buccafusca 11:45am- 12:00noon
Polarization Dynamics of the Nonlinear Coherent Emission from Uniaxially-Strained Quantum Wells
Arthur L. Smirl, X. Chen, and O. Buccafusca Laboratory for Photonics and Quantum Electronics, 138IATL, University of Iowa, Iowa City, IA 52242
Phone: (319) 335-3460 Fax: (319) 335-3462 E-mail: [email protected]
Conventional nonlinear techniques, such as four-wave-mixing (FWM), have provided considerable information about the spectral and temporal amplitudes of ultrafast coherent radiation emitted by semiconductors and multiple quantum wells (MQW's), but they typically provide no information about the temporal or spectral phases of the nonlinear signal. In addition, conventional techniques have been used to address the dependence of the magnitude of the FWM signal (or its spectrum) on the relative polarizations of the incident pulses, but there have been few attempts to measure the polarization state of the FWM signal itself.
Recently, however, we have used direct time-resolved ellipsometric1,2 and spectrally-resolved interferometric techniques3,4 to characterize the amplitude, phase and polarization state of the weak coherent nonlinear FWM emission from GaAs/AlGaAs MQW's. From these studies, a self consistent picture of the temporal dynamics of the amplitude, phase and polarization state of the nonlinear signal is obtained that delineates the roles of many body effects, such as local field corrections, excitation-induced dephasing and biexcitons, in determining the excitonic dynamics. Such studies have established the sensitivity of polarization-based nonlinear techniques for studying many body and biexcitonic processes. Most recently, we also have reported the observation of dramatic time-resolved light-hole-heavy-hole quantum beats in each of the parameters that describes the polarization state of the nonlinear signal. For example, during each beat period (in the strong quantum beat regime), the ellipticity is found to oscillate twice between linear and almost circular polarization, the orientation of the polarization ellipse rotates through a complete 180°, and the sense of rotation changes from left to right circular polarization.
To date, however, our experiments have been performed in conventional [001]-oriented unstrained GaAs/AlGaAs MQW's. MQW structures grown along the [001]-direction possess no intrinsic in-plane anisotropy in their linear absorptive or refractive properties. Even though quantum confinement breaks the symmetry along the growth direction, the in-plane linear optical properties remain isotropic. It has been shown5, however, that the application of a uniaxial stress in the plane of the wells will reduce the in-plane symmetry by mixing the heavy-hole and light-hole valence band states to produce large linear and nonlinear optical anisotropies. Here, we describe the first measurements of the dynamics of the amplitude, phase and polarization state of the coherent nonlinear emission from an anisotropic uniaxially-strained GaAs-AlGaAs MQW. We use time-resolved polarimetry to identify and to study two different links between the macroscopic changes in the vectorial nature of the emitted nonlinear signal and the microscopic materials processes. One source of the polarization changes is the anisotropy in the bandstructure introduced by the noncubic uniaxial strain. The other is the microscopic dynamics of many body processes.
In our experiments, we divide each -150 fs pulse from our laser into three parts. Two of the pulses with wavevectors ki and k2 are used to produce the third-order FWM signal in the direction 2k2-ki in the usual manner. We then use a dual-channel spectral interferometric technique (which has been described elsewhere3) to obtain the spectral amplitudes and phases of the x- and y-components of the nonlinear FWM signal. The temporal amplitude and the temporal phase of each component is then obtained by inverse Fourier transformation. Using this technique, we have time-resolved the amplitude, phase and polarization state of the nonlinear FWM emission as the polarization states of the two incident pulses and the sample orientation were systematically varied.
The sample used in this study consists of 10 periods of ~10-nm-wide GaAs wells alternating with 17-nm-thick Alo.3Gao.7As barriers. The uniaxial in-plane strain was obtained following growth by
0-7803-4950-4/98/$10.00 1998 IEEE -52

"Polarization Dynamics of Nonlinear Emission. Smirl, Chen, & Buccafusca
bonding the MQW structure to a transparent uniaxial lithium tantalate (LiTa03) substrate and subsequently removing the semiconductor substrate on which the sample was grown by selective etching. The LiTa03 substrate was cut such that the thermal expansion coefficient along one direction approximately matched that of the MQW, but along the orthogonal direction it did not. A thermally- induced uniaxial strain was then obtained by operating the device at a temperature (-100 K) different from the bonding temperature (-300 K). The linear absorption coefficient for light polarized along the strained axis is measured to be more than twice that for light polarized along the unstrained axis (when the wavelength is tuned to the peak of the exciton).
Typical measurements of the parameters that directly determine the time-resolved polarization state of the FWM emission from the uniaxially-strained MQW are shown in Fig. 1 and Fig. 2 for selected angles 6i2 between the two linearly polarized input pulses. For the measurements shown in Fig. 1, the sample was oriented so that the strong absorption axis (denoted by the vector a in the inset) was aligned parallel to the fixed polarization of the £2-pulse, while for Fig. 2, the sample was rotated by 90° so that a was orthogonal to the /^-polarization.
1000
Time (fs)
Fig. 1. The azimuthal angle 8sig) ellipticity angle e, and the total intensity S0 as a function of time for selected angles 0^ between the input polarizations. The inset shows the sample orientation and the polarizations of the incident fields.
500 1500 1000
Time (fs)
Fig. 2. The same measurements as in Fig. 1 except that the sample has been rotated by 90° as shown in the inset. The second inset indicates the notation used to specify the polarization ellipse for the emitted FWM signal.
Notice that both the ellipticity and the orientation of the polarization ellipse vary substantially with time in both figures. This is in contrast to what one would expect for either an isotropic or
453

"Polarization Dynamics of Nonlinear Emission..." Smirl, Chen, & Buccafusca
anisotropic sample in the absence of many body effects. The FWM emission from a sample that is isotropic is expected to be linearly polarized with an orientation that is constant in time (without the inclusion of many body effects). By comparison, for a sample with a static anisotropy (for example, as the result of uniaxial strain), the orientation 0sig of the polarization ellipse and the ellipticity angle e are expected to vary with the sample orientation and input polarization; however, for fixed sample orientation and input polarizations the orientation of the ellipse and the ellipticity are expected to remain constant in time. Consequently, the time-varying ellipticity and orientation shown in Figs. 1 and 2 indicate the presence of a dynamic induced anisotropy. In fact, they are definitive signatures of many body effects and indicate that such must be taken into account.
The dramatic influences of the static strain-induced anisotropy are also apparent in these figures (and others not shown). For the sample orientation of Fig. 1, when Ej is rotated counter-clockwise to a positive angle 9sig with respect to E2, notice that the FWM polarization is initially oriented at a negative angle, then it proceeds to rotate counter-clockwise towards more positive angles. For this sample orientation (Fig. 1), the magnitude of the ellipticity increases then decreases with time, but is always negative (corresponding to a clockwise, or left circular, rotation). When the sample is rotated by 90°, these features are reversed. Namely, the orientation of the polarization begins at positive angles then rotates to more negative angles, and the ellipticity is positive (right circular).
The influence of the static anisotropy is also apparent in the temporal evolution of the total intensity S0. When the strong absorption axis is oriented parallel to the fixed jE2-polarization (Fig. 1), the nonlinear FWM intensity is largest when the two input polarizations are parallel and the smallest when they are orthogonal. When the sample is rotated so that the weak axis is parallel to E2 (Fig. 2), S0 is largest when the two input polarizations are orthogonal and smallest when they are parallel. By comparison, when the measurements are repeated in an identical unstrained control sample, the maximum value for S0 is independent of sample orientation and is roughly independent of the angle between the linear input polarizations.
Taken together, Fig. 1 and 2 illustrate that the vectorial dynamics are determined by (and therefore contain information about) both static and induced dynamic anisotropies. In this case, the former is associated with the strain-induced band mixing, and the latter with many body effects. Finally, we emphasize that a knowledge of the temporal phases of both the x and y components of the radiation are necessary for determining the vectorial dynamics (i.e., the polarization state) portrayed in Fig. 1 and 2 and that this information is not provided by conventional techniques.
1. J. A. Bolger, A. E. Paul, and A L. Smirl, Phys. Rev. B 54,11666 (1996). 2. A. E. Paul, J. A. Bolger and A. L. Smirl, J. Opt. Soc. Am. B 13,1016 (1996). 3. W. J. Walecki, D. N. Fittinghoff, A. L. Smirl, and R. Trebino, Opt. Lett. 22, 81 (1997). 4. O. Buccafusca, X. Chen, W. J. Walecki, and A. L. Smirl, to be published in J. Opt. Soc. Am. B (1998). 5. H. Shen, M. Wraback, J. Pamulapati, P. G. Newman, M. Dutta, Y. Lu and H. C. Kuo, Phys. Rev. 47,
13933 (1993).
454

FB5 (Invited) 12:00pm - 12:30pm
Electron-Phonon Quantum Kinetics in Semiconductors
Martin Wegener
Institut für Angewandte Physik, Univ. Karlsruhe, D-76128 Karlsruhe, Germany
Summary
Scattering processes in semiconductors, such as electron-phonon scattering, are often thought
of as being inherently irreversible. Here we discuss experiments on a 10 fs timescale which
show that scattering is reversible for early times.
In order to get an intuitive understanding for the electron-phonon interaction, it is useful
to consider the analogy with the electron-photon interaction. When a short optical pulse
excites a semiconductor at t = 0 a coherent oscillation of the interband transition amplitude
is triggered. As long as the quantum mechanical phase of the associated polarization has
not been destroyed, the "absorption" process is not completed. Thus an interference with a
second time-delayed and phase-locked pulse can reverse (destructive interference) or enhance
(constructive interference) the uncompleted absorption process. This technique, called cohe-
rent control of the electron (or exciton) density, has indeed been used[l,2]. In the Quantum
Kinetics regime[3-7] one does not only expect a coherent oscillation of the transition ampli-
tude, but also a coherent oscillation of the scattering amplitude containing the thermal bath
degrees of freedom. Its decay determines the memory time of the sub-system rm. For times
t < Tm it should be possible to adjust the phase of the two components of the scattering
amplitude, generated by the two phase-locked pulses, such that they interfere destructively
0-7803-4950-4/98/$10.00 1998 IEEE 455

(constructively). This would reverse (enhance) a scattering process that has already started
after the first pulse.
How do we realize the pair of copropagating phase-locked pulses? On one hand the relative
timing has to be kept constant to better than, say A/30, equivalent to 100 attoseconds time
delay or equivalent to a movement of one of the mirrors of «10 nm in real space. On the
other hand we want to be able to scan this time delay. These two somewhat conflicting
requirements can be met by an apparatus that can be considered as an optical screw[8].
It takes advantage of the geometrical Pancharatnam phase, the optical analogue to Berry's
phase for electrons.
Coherent control experiments within a four-wave mixing (FWM) geometry are performed on
bulk GaAs[3,7], with blue 10.0fs pulses[9] on bulk ZnSe[10] and on GaAs quantum wells[ll].
For GaAs one is within the weak coupling limit, for ZnSe the electron-phonon coupling is
about an order of magnitude larger and we expect effects of multiple-phonon scattering
events. Furthermore coherent control allows to distinguish between electron-phonon quan-
tum kinetics and effects of coherent phonons. In a pure quantum kinetics process phonon
oscilations occur even if the phonons are in thermal equilibrium. Nonequilibrium coherent
phonons also can modulate electronic degrees of freedom even in the absence of correlations
between electrons and phonons. These two processes can be distinguished experimentally
by the phase of the modulation of the phonon visibility with respect to the FWM-signal
strength[ll]. This is relevant in quantum wells where coherent phonons can not be ruled out
by symmetry reasons.
The experiments are compard with microscopic theories [3] and with a simple model of
electron-phonon quantum kinetics[7].
456

References
[1] W.S. Warren et al., Science 259, 1581 (1993)
[2] A. P. Heberle et al., Phys. Rev. Lett. 75, 2598 (1995)
[3] L. Bänyai et al., Phys. Rev. Lett. 75, 2188 (1995)
[4] F.X. Camescasse et al., Phys. Rev. Lett. 77, 5429 (1996)
[5] C. Fürst et al., Phys. Rev. Lett. 78, 3733 (1997)
[6] P. Kner et al., Phys. Rev. Lett. 78, 1319 (1997)
[7] M.U. Wehner et al, Phys. Rev. Lett. 80, 1992 (1998)
[8] M.U. Wehner et al., Opt. Lett. 22 1455 (1997)
[9] D. Steinbach et al., J. Optical Soc. Am. B 15, 1231 (1998)
[10] M. Wegener et al., unpublished
[11] M.U. Wehner et al., Phys. Rev. Lett., submitted (1998)
457

FB6
12:30pm. 12:45pm
Coherent Wavepackets and Phonons in Superlattices
T. Dekorsy, A. Bartels, H. Kurz
Institut für Halbleitertechnik, RWTH Aachen, D-52056 Aachen, Germany,
Tel.+49-241-807806, e-mail [email protected]
K. Köhler
Fraunhoferinstitut für Angewandte Festkörperphysik, D-79108 Freiburg, Germany
Semiconductor superlattices exhibit zone folding of the electronic and phononic dispersion relations along the growth direction of the artificial periodic structure. Within the so-called mini-Brillouin zone distinct minibands for electrons and holes are formed with energetic widths tunable by the coupling between the wells of the superlattice. In the presence of a static electric field along the growth direction, the minibands brake up into distinct Wannier-Stark states. A coherent superposition of several Wannier-Stark states with a fs laser pulse leads to the formation of Bloch oscillations. They offer the potential to be tunable sources of THz radiation and exhibit dephasing times in the ps range at low temperatures [1]. Superlattices with miniband widths larger than the LO phonon energy (36 meV in GaAs) allow to tune the Bloch frequency in resonance with the phonon, where coupled Bloch-LO phonon modes are observed. The coupling leads to a stabilization of the electronic coherence in resonance, enabling the observation of coupled modes even at room temperature. In unbiased superlattices, coherent acoustic phonons are generated via resonant impulsive Raman scattering. These low-energy excitations are of great relevance as the final states of energy relaxation in these systems. In contrast to the rapid electronic dephasing their dephasing times are in excess of 100 ps at room temperature.
Coupled Bloch-phonon modes are investigated in GaAs/AltuGaojAs superlattices with electronic miniband widths larger than the GaAs LO phonon energy of 36 meV. Bloch oscillations are excited by a 50 fs laser pulse from a Tirsapphire laser with the excitation energy tuned in resonance with the lower branches of the Wannier-Stark ladder [2]. The dynamics of the coherent motion of the Bloch wavepackets is traced in time-resolved electro- optic transmission [3] and reflectivity experiments. Figure 1 depicts the oscillatory traces of the electro-optic transmission changes versus applied reverse bias voltage at 10 K. The frequency increase of the oscillations with increasing external bias is clearly visible. A decrease of the oscillation amplitude stems from the increased Stark localization of the wavefunctions at higher fields leading to a reduced dipole moment associated with the Bloch oscillations. Figure 2 shows Fourier transforms of the data of Fig. 1. Only a single frequency maximum occurs at fields, where the oscillation frequency is below 8 THz (TO frequency of GaAs). In this field range the frequency obeys the Bloch relation v=eFd/h, with d the superlattice period and F the applied electric field. At higher fields, a mode splitting occurs with the higher frequency above the LO frequency. In addition, in resonance the dephasing time of the coupled modes increase instead of decreasing due to LO phonon assisted relaxation between the Wannier-Stark states. Above the resonance
0-7803-4950-4/98/$! 0.00 1998 IEEE 458
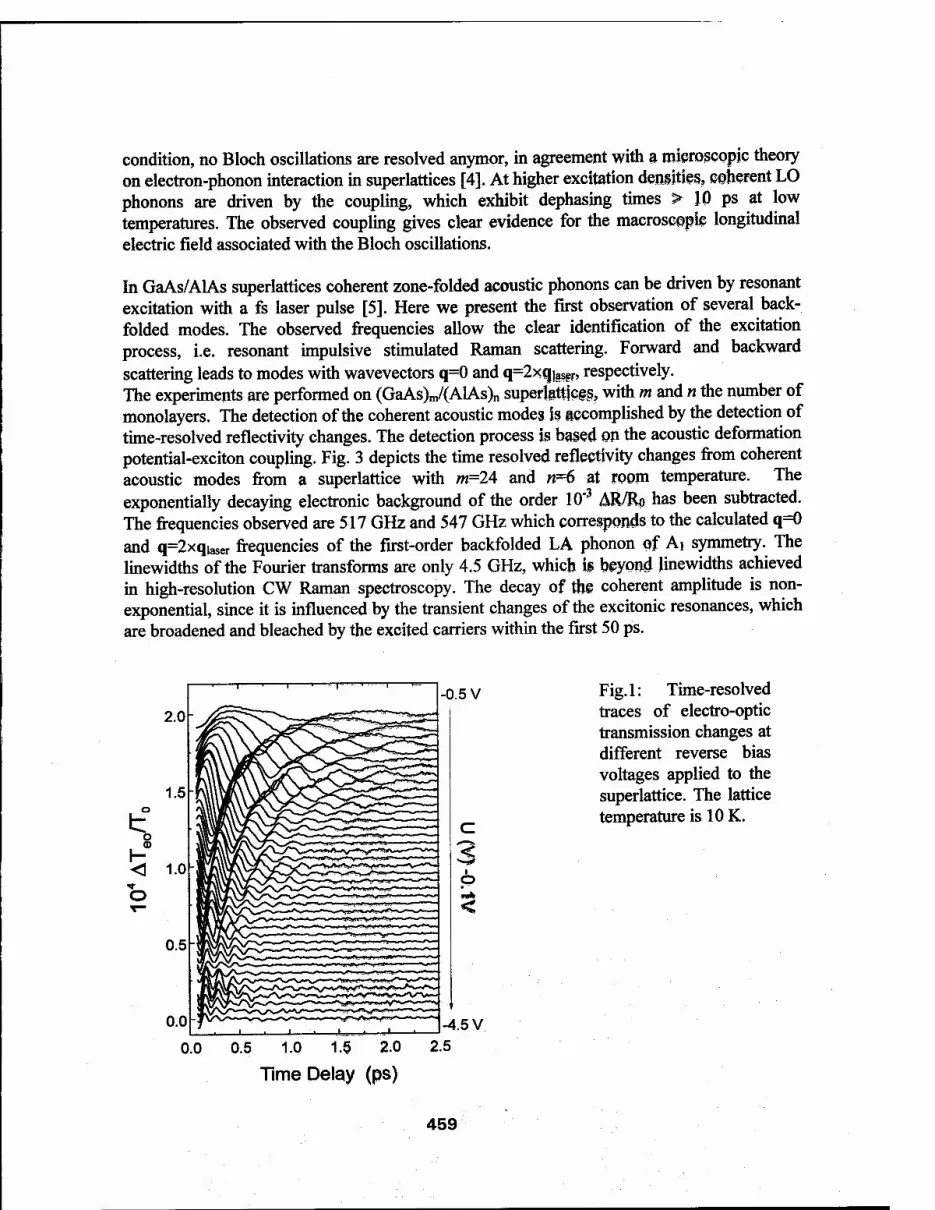
condition, no Bloch oscillations are resolved anymor, in agreement with a microscopic theory on electron-phonon interaction in superlattices [4]. At higher excitation densities, coherent LO phonons are driven by the coupling, which exhibit dephasing times > 10 ps at low temperatures. The observed coupling gives clear evidence for the macroscopic longitudinal electric field associated with the Bloch oscillations.
In GaAs/AlAs superlattices coherent zone-folded acoustic phonons can be driven by resonant excitation with a fs laser pulse [5]. Here we present the first observation of several back- folded modes. The observed frequencies allow the clear identification of the excitation process, i.e. resonant impulsive stimulated Raman scattering. Forward and backward scattering leads to modes with wavevectors q=0 and q=2xqiasgr» respectively. The experiments are performed on (GaAs)m/(AlAs)„ superlattice^ with m and n the number of monolayers. The detection of the coherent acoustic modes is accomplished by the detection of time-resolved reflectivity changes. The detection process is based on the acoustic deformation potential-exciton coupling. Fig. 3 depicts the time resolved reflectivity changes from coherent acoustic modes from a superlattice with /w=24 and «=6 at room temperature. The exponentially decaying electronic background of the order 10"3 &R/Ro has been subtracted. The frequencies observed are 517 GHz and 547 GHz which corresponds to the calculated q=0 and q=2xqiaser frequencies of the first-order backfolded LA phonon of Ai symmetry. The linewidths of the Fourier transforms are only 4.5 GHz, which is beyond hnewidths achieved in high-resolution CW Raman spectroscopy. The decay of the coherent amplitude is non- exponential, since it is influenced by the transient changes of the excitonic resonances, which are broadened and bleached by the excited carriers within the first 50 ps.
0.5 V
o
<D
r- < O
-4.5 V 0.0 0.5 1.0 1,9 2.0
Time Delay (ps)
Fig. 1: Time-resolved traces of electro-optic transmission changes at different reverse bias voltages applied to the superlattice. The lattice temperature is 10 K.
459

0
■1.0 Fig. 2: Numerical Fourier transform of the time-resolved
& data in Fig. 1.
0.51
0.0 4
2 4 6 8 10 12 Frequency (THz) A0
& #
^
Fig. 3: Extracted acoustic phonon oscillations from a (GaAs)24(AlAs)6 superlattice at room temperature. The insert shows the numerical Fourier transform of the time domain data.
50 100 150
Time Delay (ps)
200
References: [1] C. Waschke et al., Phys. Rev. Lett. 70, 3319 (1993). [2] E.E. Mendez et al., Phys. Rev. Lett. 60, 2426 (1988). [3] T. Dekorsy et al., Phys. Rev. B 50, 8106 (1994). [4] J. Hader et al. Phys. Rev. B 55,13799 (1997). [5] A. Yamamoto et al., Phys. Rev. Lett. 73, 740 (1994).
460

FB7 12:45pm - 1:00pm
Anisotropie Electron-Hole Wavepackets in Quantum Wells for
Multiple-Harmonic-Generation in the Terahertz Regime
S. Hughes and D.S. Citrin
Department of Physics, Washington State University
Pullman, Washington 99164, USA
Tel: +1 509 335-7014, Fax: +1 509 335-7816, E-mail: [email protected]
Recently, teraherz (THz) pulses have proven useful for a wide variety of applications, including
FIR/time-domain spectroscopy, study and control of Rydberg atoms [1], and T-ray imaging of opti-
cal materials. In this talk, we investigate theoretically the simultaneous exposure of a quantum well
(QW) to a broadband (rp = 50 fs) optical pulse — to excite both free and Coulombically bound electron-
hole (e-h) pairs (excitons) from the crystal ground state — and a £Q ~ 1 kVcm-1, w0 «v 1 THz driving
field to enable the generation of sub-ps ~ 1-20 THz (4-80 meV) electromagnetic (EM) transients. The
double excitation scenario produces quantum beating, e-h relative motion wavepackets whose anisotropic
structure can be coherently controlled to manifest in unique spectral and time-dependent features in both
the optical and THz regimes of the EM spectrum. Our theoretical approach is based on a unified, nu-
merical solution of the 2D-anisotropic semiconductor Bloch equations in the presense of both an optical
pulse and a THz driving field. We study QW excitation by realistic driving frequencies with arbitrary
polarisations. New and intriguing carrier dynamics emerge, and a series of relative motion wavepackets
will be depicted and analysed.
In the optical regime, we verify the existence of a dynamical Franz-Keldysh effect [2] whose experimen-
tal signature appears via oscillations in the absorption above the semiconductor bandgap and a series of
sideband frequencies resulting from non-linear wavemixing. In the THz regime (see Fig. 1), the emitted
field exibits a strong peak at around the lS-excitonic binding energy of the semiconductor. In addition,
a rich variety of harmonic spectra also appears — depending on the relative phase (at t=0: centre of
the optical pulse) and frequency of the driving field: £°{x, t) - £0 cos(2irvt + <j>) X; note that <f> = 0 and
<f> = 7r/2 are shown here for a linear-polarised driving field with v = 1.5 THz. Fig. 1(a) shows the emitted
THz field (absolute value) verses energy, and Fig. 1(b) displays the corresponding time-dependent field.
Terahertz driving fields have recently been employed from the free-electron laser to generate somewhat
similar harmonic-generation from confined magnetoexcitons [3].
0-7803-4950-4/98/$10.00 1998 IEEE 461

Fig. 1
-e co -e
CO
0.04 0.08 Energy (eV)
-500 0 500 100O Time (fs)
In Fig. 2 we show examples of the e-h wavepacket (probability density) at several snap-shots in time
corresponding to Fig. 1 ((p — ir/2 scenario); the driving field was chosen to be linearly polarised in the
X-direction. Shortly after the optical pulse has gone (t — 90 fs) the probability density is concentrated
near the centre (where there is a high probability of finding the electron and hole at the same relative
position). Sometime later (t = 230 fs), the quantum beating between the excitonic and free-carrier
wavepacket can be recognized; more importantly the quantum beating wavepacket is highly anisotropic
because of the applied field, and, consequently, there is a net dipole moment which results in the THz
transients shown in Fig. 1. At later times (t — 360,620 fs), side lobes can be seen in the wavepacket;
these are formed by the combination of slow transverse spreading, the relatively fast field driven motion
in the polarisation direction, and the excitonic attraction (Coulombic rescattering). The influence of the
ellipticity of the driving field on the emitted high harmonic generation (HHG) will be shown pictorially;
and as will be demonstrated, efficient HHG is impossible for high degrees of ellipticity since the required
Coulombic recollisions are reduced. These results are in agreement with similar work performed for the
atomic case using quantum tunneling interferences and classical dodging [4,5].
These initial studies have a wide range of applications including the investigation and application of
interplaying THz (intraband) and optical (interband) carrier dynamics, polarisation-sensitive, intraband
optical stark effect [6], and the generation of upshifted THz transients (coherently controlled) whose
peak dipole moments are estimated to be about an order of magnitude larger than standard schemes for
THz generation in QWs (charge oscillations and optical rectification); this stems from the fact that the
wavefunctions can be displaced by much larger distances in the quantum well plane (see Fig. 2) — in
comparison to a displacement in the growth direction (~ 10 nm maximum as limited by the QW width.).
Other applications will be discussed.
462

Fig. 2
Probability density (x 100), t = 90 fs Probability density (x 100), t = 230 fs
I I |IIII|IMI|
-20 -10 0 10 20 X(nm)
-10 0 10 X(nm)
Probability density (x 100), t = 360 fs Probability density (x 100), t = 620 fs
B
30- " 1 1 ' I1 1'"
■
20- ■
io- - :
0- *| \ > I: " . ■
-10- -
-20- - ■
-30 ..... -30 -20 -10 0 10 20 30
X(nm)
[1] J. L. Krause, K. J. Schäfer, M. Ben-Nun, and K. R. Wilson, Phys. Rev. Lett. 79, 4978 (1998).
[2] A. P. Jauho and K. Johnsen, Phys. Rev. Lett. 24, 4576 (1997).
[3] J. Kono, M. Y. Su, T. Inoshita, T. Noda, M. S. Sherwin, S. J. Allen, Jr, and H. Sakaki, Phys. Rev.
Lett. 79, 1758(1997).
[4] M. Protopapas, D. G. Lappas, and P. L. Knight, Phys. Rev. Lett. 23, 4550 (1997).
[5] G. G. Paulus, F. Zacher, H. Walther, A. Lohr, W. Becker, and M. Kleber, Phys. Rev. Lett. 80,
484(1998).
[6] D. Fröhlich, S. Spitzer, B. Uebbing, and R. Zimmermann, Phys. Stat. Sol. (b) 173, 83 (1992).
463

AUTHOR INDEX
Abdulsabirov, R. ThC7 Byer, R. WB1 Di Vito, A. MC26
Ablowitz, M. TuCl Caetano, D. MC32 Diels, J. WC2
Abraham, E. TuC20 Caplen, J. WB2 Dikmelik, Y. TuC18
Adibi, A. WA5 Carosella, C. MC17 Ding, Y. FA6,ThC17
Agranat, A. ThD4 Cavalcanti, S. MC31.MC32 Dubinskii, M. ThC7
Akgün, G. TuCl 8 Chan, L. TuC17 Duncan, S. TuAl
Akhmediev, N. TuB3 Chang, T. ThB5 Dunning, G. FA7
Akmaloni, A. TuC17 Chang, Z. WB4 Dunstan, M. MAI
Alley, T. WC7 Chen, C. MC21 Durfee III, C. WB4
Ammerlahn, D. FB2 Chen, H. ThC23,ThC24 Dvornikov, A. WA3
An,X. ThC24 Chen, J-J MC20 Ebihara, M. TuC24
Anderson, R. TuC8 Chen, M. MC20 Eggleton, B. TuD3
Andreoni, A. FA3 Chen, P. ThE3 Eichler, H. ThC5,ThC20
Aoyama, T. ThD3 Chen, S-H TuCll El Sayed, K. FB3
Arbel, D. ThC4 Chen, X. FB4 Erna, K. TuC25,TuC26,TuC27
Arbore, M. WB2 Chen, Y. ThC23 Endo, M. MC12
Arecchi, F. MA5 Chen, Z. ThC23 Feit, M. WB3
Armenise, M. ThCIO Chiao, M. FA7 Fejer, M. WB2
Athayde-Filho, A. ThB2 Chiao, R. MA3,ThE2 Feldman, L. MC22
Aytür, 0. Bacher, G.
TuC18 Choi, S. TuC3 Feldmann, J. MB1
FA7 Chraplyvy, A. TuBl Fermann, M. WB2
Backus, S. WB4 Chrostowski, J. TuC16 Fierz, M. ThD2
Banfi, G. ThBl Chu, S. SuAl Findeisen, J. ThC20
Banks, P. WB3 Citrin, D. FB7 Finnan, C. MC10
Baraniuk, R. WD1 Clays, K. FA5 Flytzanis, C. MB4
Bardwell, J. Barmenkov, Y. Barnes, N.
FA4 ThCll,ThC12
MCI
Cokgor, I. Collett, M. Collings, B.
WA3 MAI TuB3
Follonier, S. Fortusini, D. Francescangeli, O.
ThD2 ThBl WA4
Bartels, A. Baxter, G. Bender, M.
FB6 Collins, S. MC28 Fu, C-M MC20
MC28 Conese, T. ThCIO Fukuchi, Y. ThC8
MB3.MC2 Cook, G. MC10,MC25 Furuhashi, H. TuC4
Bergman, K. Bertolotti, M.
MA4 Crosignani, B. ThD4 Günter, P. ThD2
MC26 Cui, Y. ThC25 Gallagher, H. MC10
Betin, A. WC6 Cundiff, S. TuB3 Galvanauskas, A. WB2
Bezerra Jr., A. ThB2 Curri, V. TuC21 Ganihanov, F. FBI
Bhowmik, A. TuC12 Da Rocha, G. ThB2 Garzia, F. MC26
Biaggio, I. Biondini, G.
ThD2 Da Silva-Filho, D. ThB2 Gershoni, D. TuA2
TuCl Dangel, S. WC4 Ghosh, G. MC12
Blair, S. MC18,TuCl Datta,P. ThBl Gibbs,H. FB2
Bloembergen, N. Blow, K. Bondani, M.
MD1 TuB7
De Araüjo, C. De Melo, C.
ThB2 ThB2
Gomes, A. muz Gong, Q. ThC23,ThC24,ThC25
FA3 de Oliveira, J. MC31 Gonokami, M. TuC26
Boothroyd, S. Bosenberg, W.
TuC16,TuC17 TuC7
de Souza, R. De Yoreo, J.
MC32 MC14
Goorjian, P. Grattan, K.
ThC15 MC28,ThC9
Bosshard, Ch. ThD2 Dearborn, M. WC2 Gregory, D. MC2
Boyce, J. Boyd, R. M Brilliant, N.
ThE2 Degasperis, A. ThD4 Grigoryan, V. TuB2
B3,MC2,ThC18 MC8
Degiorgio, V. Dekorsy, T.
ThBl FB6
Grote, B. Gu,X.
FB2 ThC17
Brown, R. ThAl DelFatti.N. MB4 Guenther, B. ThE3
Brueck, S. WC7 Delgado, G. TuC14 Hübner, M. FB2
Bryant, G. Buccafusca, 0.
ThC18 DelRe, E. ThD4 Haas, S. FB2
FB4 Demos, S. MC12.MC14 Haglund Jr., R. MC21
Burkett, W. TuC6 Denk, W. FA1 Hamada, H. MC27
Burr, K. FBI Deykoon, A. ThEl Han, P. ThC27
Buse, K. WA2.WA5 Di Porto, P. ThD4 Han, T. MC10
465

AUTHOR INDEX
Harris, S. MD2 Kim, D. TuC3 Ma,B. ThC6 Harter, D. WB2 Kim, S. MC29,TuC3 Macdonald, R. MC23 Harvey, J. TuB6 Kimble, J. MA2 Maeda, A. TuC4 Hayakawa, T. TuC23 Kir'yanov, A. MC30 Maeda, H. MC27 Hegarty, J. ThCl Kishino, S. TuC25 Maeda, J. ThC8 Heid, C. TuC8 Kiziyalli, I. MC22 Magnitskii, S. FA2 Herman, G. MCI Klein, M. FA7 Magruder III, R. MC21 Herne, C. WB4 Klimov, V. MC9,TuA3 Mahadervan, A. TuC13 Hesselink, L. MC15,MC16,WA1 Knies, D. MC17 Makarov, V. MC24 Hey, R. FB2 Knox, W. TuB3 Malakhov, D. FA2 Hickman, J. MC31.MC32 Kobayashi, T. TuC10,ThB6 Malomed, B. TuB5 Hjelme, D. TuB4 Koch, K. MC7,MC8,WC2 Mancini, S. ThC26 Hollberg, L. TuC7 Koch, S. TuA5,FB2 Mangir, M. WC5.WC6 Holzner, R. WC4 Kogelnik, H. ThA3 Manning, R. TuB7 Hong, H-K MC29 Kogoshi, S. ThC8 Marhic, M. TuC21 Hong, J. ThB5 Koh, S. TuC24 Martinez, A. ThC12 Hsu, C-C MC19,MC20 Kojima, K. TuC4 Matera, F. TuB5,TuC5 Hsu, C-H TuCll Kondo, T. TuC24,TuC27 Matsumoto, H. TuC20 Huang, T-H MC19.MC20 Korableva, S. ThC7 Matthews, C. WC6 Hughes, S. FB7 Koroteev, N. MC24.FA2 Mayeri, D. TuC14 Ieda, M. TuC4 Korte.F. TuC15 McBranch, D. MC9,TuA3 Ikegami, T. ThA2 Koya, H. ThC16 McEvoy, P. ThCl Il'ichev, N. MC30 Kozhevnikov, N. ThCll Mcleod, R. MC18 Ishi, J. TuC27 Kraabel, B. MC9 McMichael, I. ThB5 Ito, R. TuC24,TuC27 Krikunov, S. FA2 McMorrow, D. MC3 Izumida, S. WD4 Krylov, D. MA4 Meindl, P. MC23 Izutsu, M. ThB4 Kühl, J. FB2 Melinger, J. MC3,MC17 Jaaskelainen, T. ThCll Kuklov, A. TuC2 Menyuk, C. TuB2 Janz, S. FA4 Kunugita,H. TuC25,TuC26,TuC27 Merlin, R. TuD4 Jiang, Z. WD3 Kurgin, J. WD2 Midrio, M. TuC5 Jo,J. TuC3 Kurz, H. FB6 Miller, J. ThB2 Jones, D. MC10 LÜ,B. TuC6 Minelly, J. WB2 Jonusauskas, G. TuC20 Lüpke, G. MC21.MC22 Minoshima, K. TuC20 Joshi, C. MD3 Lahiri, I. FA7 Misawa, K. TuC10,ThB6 Köprülü, K. TuC18 Lai, Y. TuCll Mitchell, M. MA3 Kaminskii, A. ThC20 Landais, P. ThCl Mitchell, P. FA7 Kang, J. ThC17 Lee, H. TuC14 Mitchell, S. FA4 Kang, J. TuC9 Leonhardt, R. TuB6 Mittleman, D. WD1
Kapteyn, H. WB4 Leppanen, V. ThCll Mizumoto, T. ThC6
Kartaloglu, T. TuC18 Leung, W. ThC21 Mizunami, T. ThC16
Katayama, R. TuC24 Levenson, M. TuC7 Mizutani, T. TuC4
Katsriku, F. ThC9 Levine, A. TuC2 Mlynek, J. WB5
Katz, T. ThC14 Li, H. MC12 Moore, G. WC2
Kauranen, M. ThC14,WC3 Li, He. MC13 Morita, R. TuC22
Kauzlarich, S. TuC14 Li, J. ThC24 Morre, G. MC7.MC8
Kawaguchi, H. TuC23 Lin, H. TuC9 Mozume, T. TuA4
Kawazoe, T. TuC23 Lio, T-L ThB5 Murata, H. ThB4
Kazovsky, L. TuC21 Liu, A. ThC 18 Murdoch, S. TuB6
Kelly, A. TuB7 Liu, B. THC5 Murnane, M. WB4
Kenan, R. ThCIO Liu, S. MC19 Nagai, M. TuC26
Kenrow, J. FB3.MC6 Liu, Z. WD4,ThC7 Nagasako, E. ThC18
Ketchel, B. TuC8 Lucchetti, L. WA4 Nakano, Y. ThC6
Khitrova, G. FB2 Luh, T-Y MC19 Nakatsuhara, K. ThC6
Khoo, I. ThE3 Lukashev, A. FA3 Neelamani, R. WD1
Khurgin, TuC9,FA6,ThC17 Lynch, S. ThCl Neogi, A. Ning, C-Z
TuA4 ThC15
466

AUTHOR INDEX
Nolte, D. Nuckolls, C. O'Gorman, J. O'Meara, T. Ochiai, K. Ochiai, S. Ogata, N. Ohashi, A. Ohtake, H. Okamoto, T. Okumura, N. Olbrechts, G. Ono, S. Orenstein, M. Orriols, G. Osborne, D. Palmer, A. Paraschis, L. Parkins, A. Pashinin, P. Pepper, D. Perakis, I. Perry, M. Persoons, A. Pesquera, L. Petrov, V. Pfister, O. Pi,F. Pierce, I. Ploog, K. Potenza, M. Poustie, A. Psaltis, D. Qiang, D. Qiu, M. R0yset, A. Radousky, H. Rahman, B. Rebic, S. Rees, P. Reich, M. Rentzepis, P. Reznikov, Y. Ricco, F. Rikukawa, M. Risk, W. Rong, Z. Rulliere, C. Rundquist, A. Ryang, H-S Sainul, H. Saka,Y. Sakai, M. Salamo, G. Sandford, S.
FA7 ThC14 ThCl FA7 TuC25 TuC4 TuC25 TuC4
WD4,ThC7 TuC16 TuC4 FA5 WD4
ThC4,ThC13,ThE4 ThC16 MC21 MC28
MC15.MC16 MAI MC30 FA7 MC5 WB3
WC3,ThC14,FA5 ThCl FA6 TuC7 ThC16
ThCl,ThC2,ThC3 FB2 FA3 TuB7
WA5,ThB3 ThC24 ThC16 TuB4 MC14 ThC9 MAI
ThCl,ThC2,ThC3 TuC15 WA3 WA4 ThCIO TuC25 FA6 TuB6 TuC20 WB4 ThB5 ThC6 ThC6 TuC26 TuC8 MCI
Sano, K. Sanui, K. Sarkisov, S. Sarukura, N. Sarychev, A. Sasabe, H. Sato,H. Sattigeri, J. Sayed, K. Scheuer, J. Schiestel, S. Schwarz, C. Scully, M. Segev, M. Settembre, M. Shahbazyan, T. Shahriar, M. Shalaev, V, Shen, R. Shen, X. Shen, Y. Sherwood, J. Shiau, C-W Shigekawa, H. Shih, M-Y Shore, K. Shubin, V. Sibilia, C. Simas, A. Simoni, F. Singh, N. Skirtach, A. Slusher, R. Slussarenko, S. Smirl, A. Smith, D. Snyder, A. Solomatine, I. Soskin, M. Soto-Crespo, J. Spencer, P. Spitz, E. Staggs, M. Stanton, C. Starodumov, A. Steckman, G. Stroucken, T. Stroud, C. Stroud, R. Sun, T. Swartzlander, G. Tiinnermann, A. Tabuchi, Y. Takahashi, E. Tamburrini, M.
TuC27 TuC25
MC2.MC4 WD4,ThC7
MB2 ThD3 TuC25 MC19 MC6
ThC4,ThC13,ThE4 MC17 TuA3 MD5 ThD4
TuB5,TuC5 MC5 TuC28 MB2 SuA3
MCll.ThDl TuCll ThBl MC19 TuC22 ThE3
ThC2,ThC3 FA2 MC26 ThB2 WA4 ThC21
TuC16,TuC17 TuD3 WA4 FB4
MB3.MC2 TuD2 ThB3 ThEl TuB3
ThCl,ThC2,ThC3 ThA4 MC14
MC6.FB3 ThCll,ThC12
TuC9,ThB3 FB2 SuA2 MC17 MC28 ThEl TuC15 TuC25 ThC6 ThD4
Tanaka, K. Tanaka, Y. Tang, C. Taylor, B. Thakur, M. Thantu, N. Thielen, P. Tick, P. Tolk,N. Torres, I. Townes, C. Uchida,Y. Ueda, M. Ueno, Y. Valle, A. Vailee, F. Van Baak, D. Van Elshoct, S. Van Stryland, E. Verber, C. Verbiest,T. Villani, F. Volkov, S. Vrijen, R. Wada, CX Wada, T. Wade, S. Wagner, K. Walls, D. Wang, F. Wang, R. Wang, S. Wang, W. Wang, Y. Wegener, M. Wei, T-H Wells, J. Weverka, R. Wilkosz, A. Wittier, O. Wong, K. Wood, G. Wood, W. Xiao, M. Xiao, R. Xu, J. Yablonovitch, E. Yamashita, M. Yan,M. Yanagisawa, H. Yang, C. Yang, C-S Yang,H. Yang.Z. Yasui.T. Yasumoto, K.
TuC27 MC12 FBI TuC14
TuC12,TuC13 MC3 TuC14 ThC18 MC22 ThC12 TuDl TuC4 TuC23 TuC25 ThCl MB4 TuC7 ThC14
MC29.WC1 ThCIO
WC3,ThC14 FA3 MC24 MD4 TuA4 ThD3 MC28 MC18 MAI
ThC23,ThC25 MCll.ThDl
ThC24 MC22 FA6 FB5 MC20 TuC7
. MC18 MC4 ThC5 WB2 TuC8 ThE3 TuC6 MC2 TuC13 MD4 TuC22 MC14 TuC22 TuC9 TuC14 ThC24 ThC25 TuC20 MC27
467

AUTHOR INDEX
Yeh, F-F MC19 Yeh, P. MCll,ThC22,ThDl Yi,X. MCll.ThDl Yin,G. MD2 Yokota, M. ThC22 Yoon, C. MC29 Yoshidä, H. TuA4 Yoshikawa, T. TuC4 Zhang, X-C WD3,ThC27 Zhang, Y. ThD3 Zhang, Z. MC28 Zhao, J. MCll,ThDl Zheng, Y. FA6 Zhou, F. MC12,MC13 Zhou, G. ThB3 Zhou, L. TuC13 Zhu, Q. THC5 Zitelli, M. TuB5 Zuhr, R. MC21
468