spectroscopic analysis of roads at traffic speed - centaur
TRANSCRIPT
Spectroscopic Analysis of Roads at Traffic
Speed
PhD Chemistry
Department of Chemistry
A thesis submitted in part fulfilment of the degree of Doctor of
Philosophy
Hannah Bowden
Supervised by Professors Matthew Almond and Wayne Hayes
February 2019

i
Declaration
I confirm that the research presented in this report is my own work and that the use of all
materials from other sources has been properly and fully acknowledged.
Hannah Bowden

ii
Acknowledgements
I would like to thank a number of people for their help and support throughout these three
years. Firstly I need to extend a very big thank you to my supervisor Matthew Almond. He
has supported me throughout my seven total years at the University of Reading, and every one
of my successes I owe to him. Thank you also to Professor Wayne Hayes, Stuart McRobbie
and Helen Viner for project supervision and technical advice throughout this project. Thank
you to Donald Burton at Highways England for project management and development.
I would also like to thank John Prime and Damien Bateman for advice throughout this work.
Thank you also to Phil Parker, James Nichols, Ali Palmer and everyone at the Surrey County
Council Highways Lab for lots of help and guidance with the mechanical testing and for
accommodating and teaching me the techniques. For help with scanning electron microscopy
and asphalt sample cutting thank you to Amanpreet and John Jack.
I need to extend a massive thank you to Tahkur Sing Babra and Oli Balmford for their
technical support and expertise. This work would have looked a lot different without their
motivating and inspiring presence in the lab and the office.
I dedicate this thesis to Jessi Godleman, the Patsy to my Eddie, it would not exist without her
and I am incredibly proud of how she has continued to dedicate herself to her work regardless
of life’s obstacles. Thank you for the cocktails and shopping in first year, the coffee breaks in
second year, and the dinner dates in third year!
Thank you to Sam Burholt and Iain Hopkins for many years of friendship throughout our long
time in Reading.
Everyone in the G06/07 office has made the past year so much fun, it has been wonderful
working with everyone in there and all the staff in the department throughout my time at the
University.
I have been incredibly lucky to have the love and support of my husband Lewis throughout
this part of my career. Thank you to him for consistently keeping me sane and grounded.
iii
Abstract
Currently in the UK road surfaces are monitored visually for defects and signs of failure.
However the time between detection of road degradation (e.g cracks and potholes), and
complete failure of the road surface is very short. Therefore rejuvenation techniques that may
initially be favourable are ineffective and a total resurfacing is the required. It is therefore of
interest to be able to predict the condition of the road surface in an attempt to better plan and
schedule the rejuvenation techniques and effectively save money, and maintain safer, more
comfortable roads.
Road surfaces can fail in many different ways as a result of many different factors. The
chemical oxidation of bitumen, the main binding component of asphalt road surfaces, is a
major contributor to the age hardening and ultimate failure of the roads.
There is an abundance of research in the literature that has identified the use of infrared
spectroscopy as an analytical technique to monitor the oxidation of bitumen and therefore this
research looks to explore the feasibility of utilising this technique as a detection method for
the oxidation of bitumen within asphalt road surfaces. Diffuse reflectance infrared
spectroscopy has been utilised in this project in order to identify any possible oxidation
product markers present within the infrared spectra collected.
The project initially involved ageing bitumen artificially and naturally and analysing the
changes with Diffuse Reflectance Infrared Fourier Transform (DRIFT) spectroscopy. Once
chemical oxidation markers had been identified the project then focused upon the artificial
and natural ageing of asphalt. The same chemical markers were identified and quantified with
regards to the solar exposure. Mechanical testing of bitumen and asphalt has also been carried
out in order to compare the chemical changes to standardised physical property changes that
correspond to deterioration of the bitumen.
The project also develops a method for analysis of real road surfaces outside of the laboratory.
A trolley has been built in order to support a handheld spectrometer close to the surface for
data collection. A number of different roads have been analysed in this way.
This report will outline the results obtained from these experiments and the data analysis. The
recommendations and future work are also included within this report.
iv
Abbreviations
TRL – Transport Research Laboratory
HRA – Hot Rolled Asphalt
SMA – Stone Mastic Asphalt
W/CMA – Warm/Cold Mix Asphalt
SARA – Saturates, Aromatics, Resins and Asphaltene fractions of bitumen
DSR – Dynamic Shear Rheometer
RTFO test - Rolling Thin Film Oven test
RCAT – Rotating Cylinder Ageing Test
PAV – Pressure Ageing Vessel
E-RTFO test- Extended Rolling Thin Film Oven test
Rpm – Revolutions per minute
UV/Vis light – Ultra violet/Visible light
IR – Infrared
ATR – Attenuated Total Reflectance
FTIR – Fourier Transform Infrared
DRIFT Spectroscopy-Diffuse Reflectance Infrared Fourier Transform Spectroscopy
CAF – Chemical Analysis Facility
SEM – Scanning Electron Microscopy
EDX – Electron Dispersive X-Ray
GPC – Gel Permeation Chromatography
THF-Tetrahydrofuran
BHT – Butylate Hydroxytoluene
DCM-Dichloromethane
TGA – Thermogravimetric Analysis
PDA – Personal Digital Assistant
v
Contents
Chapter 1
Part 1-General Introduction…………………………………………………………….……...1
1.1 Bitumen and road surfaces…………………………………………………..……..1
1.1.1 Road surface failure……………………………………………….…...5
1.1.2 Mechanical property testing………………………………….…….….7
1.1.3 Enhanced ageing……………………………………………….…..…11
1.2 Bitumen oxidation and analysis…………………………………………….….....14
1.2.1 Infrared Spectroscopy for the analysis of bitumen oxidation………...21
1.2.2 Experimental aims……………………………………..………….…...25
Part 2-Sample preparation and experimental parameters……………………….……..………27
1.2.3 Infrared Microscopic analysis…………………………….…………..29
1.2.4 Scanning Electron Microscopy and elemental analysis……..……......30
1.2.5 Gel Permeation Chromatography…………………………………….32
References……………………………………………………………………………………35
Chapter 2
Artificial and natural ageing of bitumen-Infrared Spectroscopic analysis………….…..…....43
2.1 Enhanced ageing of bitumen-Extended rolling thin film oven test…….….…..…44
2.2 Enhanced ageing of bitumen-Ultra-Violet light exposure……….…………....….53
2.3 Natural ageing of bitumen……………………………………….………..…...…67
Summary………………………...…………………………………………….…………....…75
References……………………………………………………………………………………78
Chapter 3
Artificial and natural ageing of bitumen-Mechanical testing………………………………..80
3.1 Mechanical testing methodology……………………………………………..….81
vi
3.1.1 Penetration point test……………………………………………….…..81
3.1.2 Softening point test…………………………………………………….81
3.1.3 Vialit pendulum test……………………………………………….…...82
3.1.4 Intrinsic viscosity…………………………………………………….....83
3.2 Extended rolling thin film oven test-Mechanical test results………………….…84
3.3 Ultra-Violet light enhanced ageing-Mechanical test results………………..……89
3.4 Naturally aged bitumen-Mechanical test results…………………………….…...93
Summary…………………………………………………………………………………......95
References…………………………………………………………………………………...97
Chapter 4
Artificial ageing of asphalt-UV light exposure………………………………………….……98
4.1 Diffuse Reflectance Infrared Spectroscopic analysis………………..……….…...99
4.1.1 4 week UV aged asphalt-Mapping……………………………………...99
4.2 Scanning electron microscopy and elemental analysis………………………….108
4.3 Infrared Microscopy of UV aged asphalt…………………………..……………112
Summary……………………………………………………………………………….……122
References………………………………………………………………………….………..123
Chapter 5
Natural ageing of asphalt slabs…………………………………………………………..…124
5.1 Natural ageing experimental methodology……..…………………………..…..125
5.2 Weather data analysis……………………………..………………………..…...127
5.3 Spectroscopic analysis of naturally aged asphalt…………………...……....…..130
5.3.1 8 week naturally aged asphalt…………………………………...….…131
5.3.2 30 month naturally aged asphalt………………………………………135
5.4 Road surface contamination analysis………………………………....…………142
5.5 Scanning Electron Microscopy and elemental analysis…………….…..……….148
vii
5.6 Infrared Microscopy………………………………………………….……….152
5.7 Mechanical property testing…………………………………….………..…...156
Summary………………………………………………………………..………………...160
References………………………………………………………………………………..162
Chapter 6
Spectroscopic analysis of road cores and live roads ………………………………..……164
6.1 Spectroscopic analysis of road cores……………………………….………....165
6.2 Spectroscopic analysis of live roads……………………………….…………171
Summary……………………………………………………………………….…………177
Conclusions and Further Work
Artificially aged bitumen-E-RTFO test…………………………………………………...178
Artificially aged bitumen-UV Chamber………………………………………….………..178
Naturally aged bitumen………………………………………………………….………...179
Artificially aged asphalt-UV Chamber………………………………………….…….…...180
Naturally aged asphalt………………………………………………………….…….……181
Real road Analysis-Cores and live roads…………………………………………………..181
Future work………………………………………………………………………….……..182
References………………………………………………………………………………….184
1
Chapter 1
This introductory chapter has been separated into two parts. The first part of this chapter
provides the reader with an overview of the motivations for this research, with part two
considering the procedures and equipment used to carry out the research.
Part 1-General Introduction
1.1 Bitumen and road surfaces
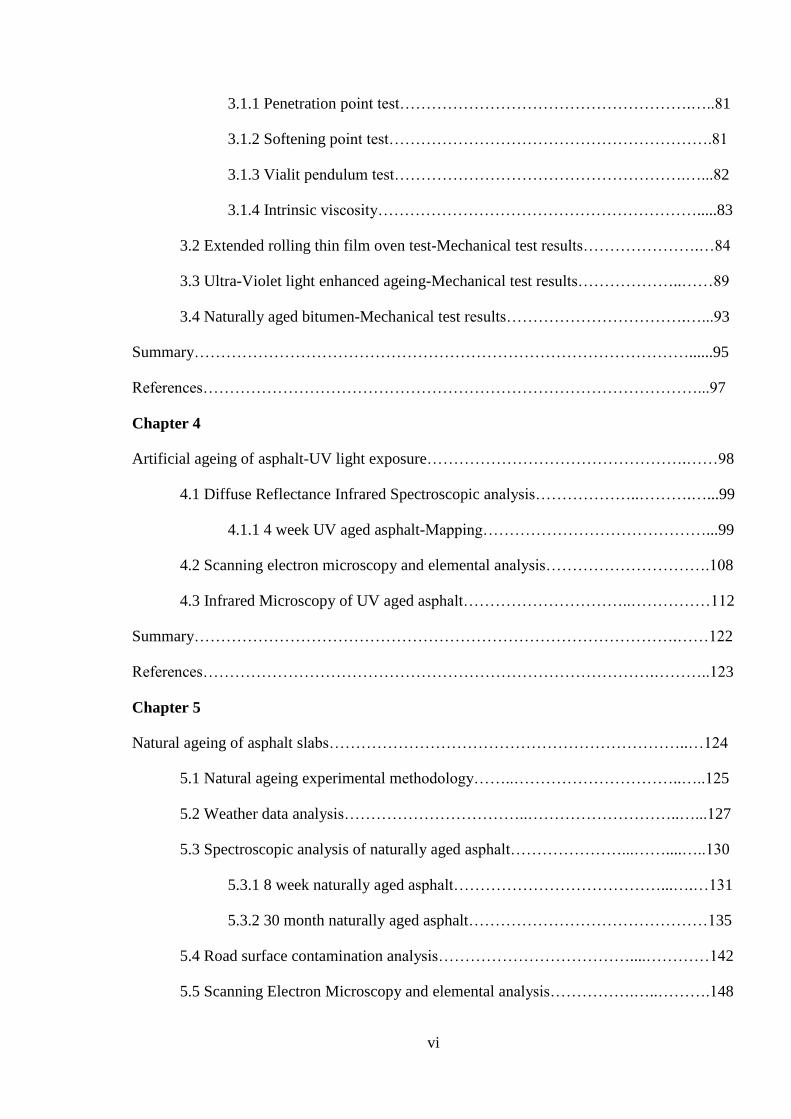
Asphalt pavements are constructed by layering different materials in order to reduce the stress
created by vehicle loads on the naturally occurring material beneath the road (subgrade). In
general, the materials become more complex and expensive the closer to the road surface they
are, starting from graded mixes of unbound aggregate immediately above the subgrade to a
carefully designed combination of aggregate sizes coated with bituminous binder at the
surface. Figure 1.1 is a photograph of a core collected by TRL which clearly shows the
different layers of graded aggregates through a cross section of an asphalt surface.
Figure 1. 1 Photograph of a core collected by the Transport Research Laboratory
2
Simplistically, road surfaces are constructed using three basic components. Bitumen, a
viscous mixture of hydrocarbons obtained through the fractional distillation of crude oil, is
used within road surfaces as a binding agent along with secondary fillers. The filler can be
either crushed mineral carbonate sourced from local quarries or fibres. The addition of the
filler increases the adhesion between the bitumen and the aggregates by filling in the voids
and holes in the aggregate’s surface and also helps to bulk out the bitumen.1 The binder is
then mixed with stone aggregates and then it is ready to be laid. The asphalt mixture is
compacted into the smooth, flat road surface that is then ready to be driven on.
Bitumen has many different uses and some examples include waterproofing, sound deadening
and security ‘anti-climb’ paint. Bitumen’s main use however is as a binder in road surfaces
because of its adhesion and cohesion and also its thermoplastic and visco-elastic properties.
Its thermoplastic ability allows it to be heated and mixed with the required aggregates and
then cooled into the road surface.2 It has the ability to act as a viscous liquid, giving the
pavement flexibility from traffic stresses; however, it is also solid once cooled, giving it the
ability to withstand the traffic loading.
Road surface design can be tailored to make it more suitable for the different kinds of traffic
and environment it will be exposed to throughout its surface life. For example a road surface
being designed for a motorway will experience a very different set of conditions than the
surface roads within a town centre. Factors including traffic speed and intensity, tree cover
and drainage will vary for each location.
There are a number of different asphalt types that can be applied to different road surfaces.
Some examples include Hot Rolled Asphalt (HRA), Stone Mastic Asphalt (SMA), Warm or
Cold Mix Asphalt (W/CMA), and Porous Asphalt. HRA is asphalt that is laid at a high
temperature (160 ˚C) and aggregate chippings are rolled into the surface to give the road
texture. The high binder content and the high application temperature of this mixture allow
the chippings to be embedded well into the surface. HRA is commonly applied to roads that
are highly trafficked, major highways or airfields for example. SMA on the other hand has a
high stone aggregate content and is mixed and laid to produce a surface with more texture
depth than a HRA (0-3 mm). Texture depth is used to describe the deviations from the smooth
and planar surface of the compacted road surface. The increased texture depth of the SMA
allows for efficient water drainage, and skid resistance on the surface. SMA is resistant to
deformation and cracking as a result of the stone skeleton being held together with the
3
bitumen binder and is therefore suitable for a wider range of highway applications, especially
high stress areas such as roundabouts. WMA and CMA have been designed to use emulsifiers
and surfactants, as opposed to high temperature, to decrease the viscosity of the bitumen used
throughout the asphalt construction. The reduction in temperature means that there is a
reduction in fossil fuel consumption and an increase in safety for the construction workers
with fewer hazardous emissions from the hot bitumen. Porous asphalt is asphalt that has been
designed with a high content of interlocking voids within the structure. This allows large
amounts of water to be drained from the surface and is commonly used in car parks and in
locations where storm water or high rainfall and poor drainage are issues. The type of
bitumen, filler, size of aggregate, void and binder content can all be varied to produce the
optimum road surface for the traffic requirements.
Chemically, bitumen is a complex mixture of large hydrocarbons of varying molecular
weight, both long chain and aromatic, within which are a number of heteroatoms including
oxygen, nitrogen, sulfur and trace amounts of some metals such as vanadium and nickel (7-
1590 ppm and 10-139 ppm respectively). 3,4
The exact chemical composition of bitumen is
very difficult to determine as a result of the complex and variable structures of the
hydrocarbons which can vary between crude oil sources and fracking procedures within
refineries.5 Studies have been conducted to investigate the separation of bitumen molecules
into groups dependent upon a specific separation parameter, molecular size or polarity for
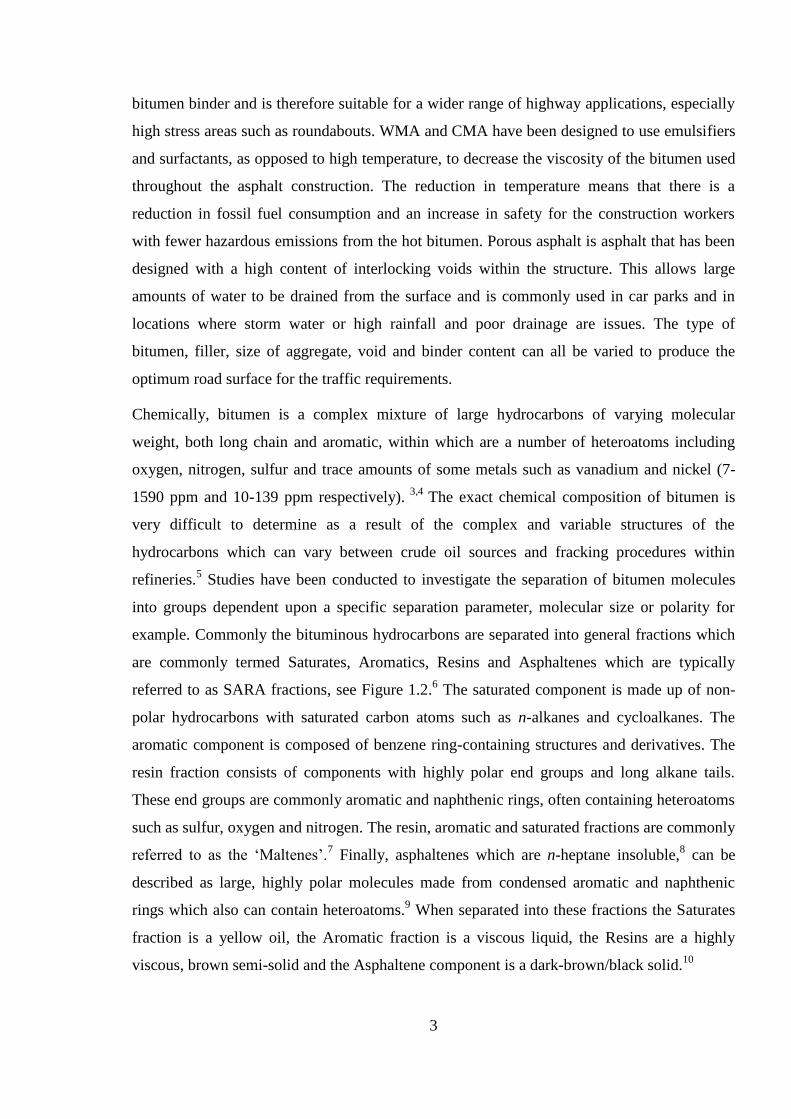
example. Commonly the bituminous hydrocarbons are separated into general fractions which
are commonly termed Saturates, Aromatics, Resins and Asphaltenes which are typically
referred to as SARA fractions, see Figure 1.2.6 The saturated component is made up of non-
polar hydrocarbons with saturated carbon atoms such as n-alkanes and cycloalkanes. The
aromatic component is composed of benzene ring-containing structures and derivatives. The
resin fraction consists of components with highly polar end groups and long alkane tails.
These end groups are commonly aromatic and naphthenic rings, often containing heteroatoms
such as sulfur, oxygen and nitrogen. The resin, aromatic and saturated fractions are commonly
referred to as the ‘Maltenes’.7 Finally, asphaltenes which are n-heptane insoluble,
8 can be
described as large, highly polar molecules made from condensed aromatic and naphthenic
rings which also can contain heteroatoms.9 When separated into these fractions the Saturates
fraction is a yellow oil, the Aromatic fraction is a viscous liquid, the Resins are a highly
viscous, brown semi-solid and the Asphaltene component is a dark-brown/black solid.10
4
Figure 1. 2 Example chemical structures of the four different fractions possible in the composition of bitumen6
The highly aromatic nature of the asphaltenes gives them an almost planar molecular
structure. As a result of the high electron density of these compounds they are able to exhibit
some π-π stacking within the bitumen composition. The formation of the ‘graphite’ like stacks
of asphaltene molecules can develop into micelle-like structures. These micelles are said to be
dispersed into the oily maltene component. The polarity of the asphaltene micelles is
stabilised by the resins in this oily medium. This describes the ‘Yen model of asphaltene
microstructure’11
and can be used to describe the differences in viscosity of bitumen. When
the asphaltene micelles are well dispersed, the viscosity is low; however, when the
asphaltenes align even further and there is interaction between micelles, or when the
asphaltenes become more condensed as a result of higher temperatures during distillation of
the bitumen, there is an increase in bitumen viscosity.7,12
It is questionable whether the separation of fractions into groups is a reliable method for
analysing the chemical composition of bitumen as the separation suggests that there are
defined groups into which the molecules fit. Redelius et al.3
suggested that there is a
continuum of molecular sizes and polarities as opposed to defined cut off points for the
5
named groups. The variation of the time and temperatures used throughout the refining
process of fractional distillation gives every bitumen source a unique chemical composition.
The presence of the heteroatoms such as oxygen, sulfur, vanadium and nickel also vary
greatly between crude oil sources around the world allowing for different properties of the
bitumen.13
The chemical composition of the bitumen can greatly affect the properties of the
bitumen, including the elasticity, viscosity and durability therefore it is important to ensure
that bitumen with the appropriate properties is selected for the road type being designed.
The design of the road surface must be optimised to find a balance between initial road costs
and length of expected service life. The longer the road surface is in service before any
rejuvenation or resurfacing is required, the better value for money the road becomes. Asphalt
road surfaces are known to fail in a number of different ways making them unsafe and
uncomfortable for road users. Pavement design, extensive bitumen and asphalt analysis and
predictive ageing are all essential in order to prevent or reduce the effects of the asphalt road
failure.
1.1.1 Road surface failure
There are many different factors that contribute to the degradation of a pavement making the
pavement performance very difficult to predict. Factors such as the weather, the bitumen
adhesion and cohesion, temperature fluctuations, pavement design, construction and
compaction processes, and traffic loading and intensity,14
all vary greatly between each road
that is constructed.
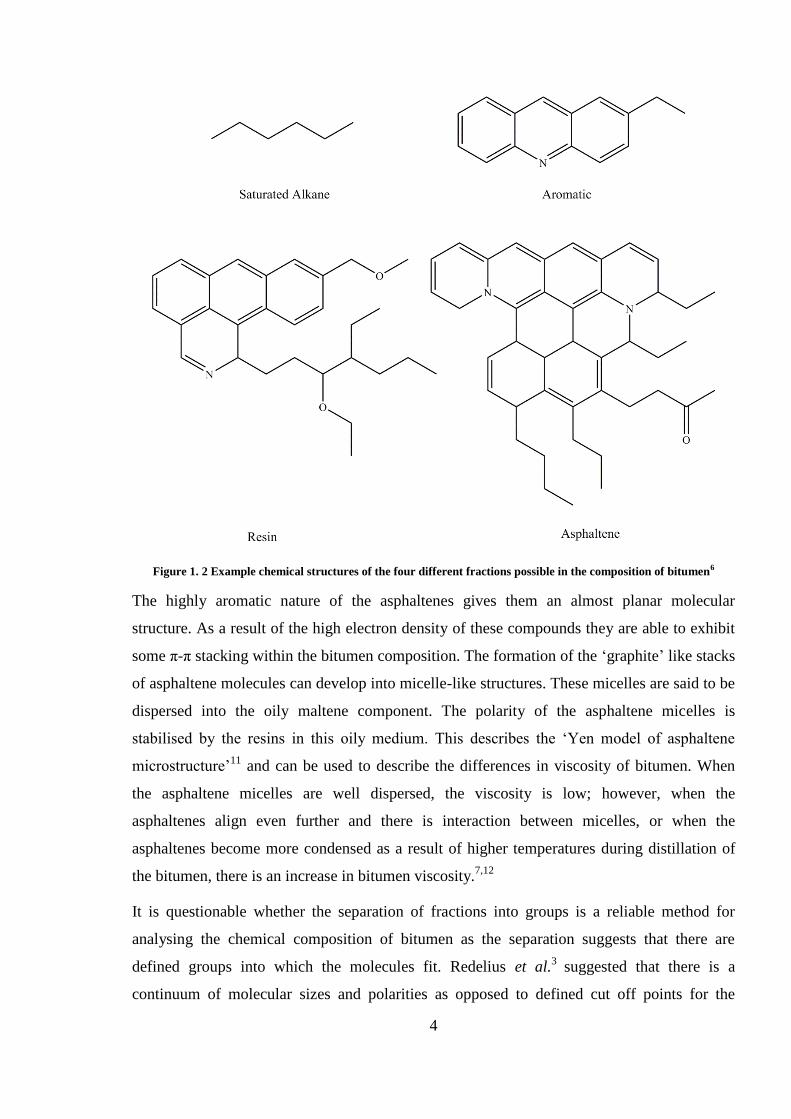
As bitumen ages it loses its elastic properties and becomes more brittle. This reduces the
road’s ability to withstand the traffic-induced stresses and strains and leads to localised
failures in the pavement structure. These failures include fretting, rutting, cracking (fatigue
and low temperature), and permanent deformation.
Figure 1. 3 Photographs of examples of (a) fretting and (b) transverse and longitudinal cracking within a road surface
(a) (b)
6
Fretting, or ravelling, is the progressive loss of surface aggregates from the road, and occurs
when there is low cohesion within the bitumen and/or poor adhesion between the bitumen and
the aggregate.2
The mechanical agitation of trafficking can lead to the removal of these
poorly-bound aggregates from the surface. Fretting is commonly identified in areas of slow
moving traffic, or where traffic is changing direction such as junctions for example. The
physical effect of tyre movement in these areas is greater therefore the aggregates are agitated
and eventually pulled from the surface. This creates a point of weakness as a result of the loss
of aggregates and a pothole is rapidly formed as aggregates are continued to be lost from the
surface. Fretting can be caused by a number of different factors: poor compactions during
construction, high surface temperatures, slow traffic speed, water ingress or brittle bitumen
binder.14
Pavement failure due to cracking has two different mechanisms: fatigue and thermal cracking.
Fatigue cracking occurs when the surface is exposed to repeatedly high tensile stress and
strain at low temperatures. At low temperatures the bitumen is more brittle and therefore less
flexible to the repeated loading of trafficking. Thermal cracking occurs when the fluctuations
in temperature and humidity are extreme and the binder cannot elastically adapt to the sudden
drops in temperature. This is very common in the winter months when the temperatures
fluctuate throughout the day and can reach below 0 ˚C. Cracking in the road surface is also
encouraged by the embrittlement of the bitumen concrete due to ageing.15
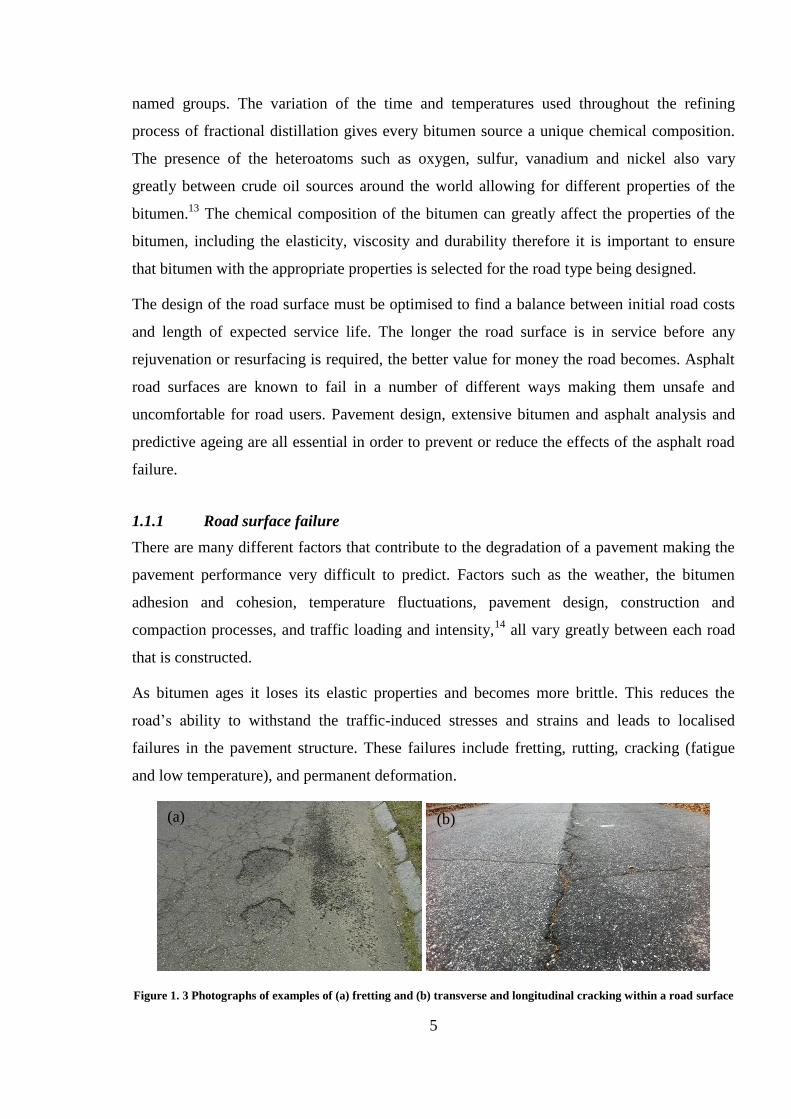
Figure 1. 4 Photographs of examples of rutting in the wheel path of road surfaces. (a) Shows surface rutting and (b)
shows fatigue cracking within a rut. 16
Rutting can be described as the formation of surface depressions in the wheel path of the road.
Rutting can have two main causes; surface rutting and subgrade rutting. Surface rutting occurs
as a result of the surface material failure or mixture and compaction problems throughout
construction, and involves the shearing or uplift of the road surface alongside the wheel path.
Surface ruts can also be developed when the environmental temperature is high, the bitumen
(a) (b)
7
is less viscous and therefore the asphalt can deform under the weight of heavy vehicles.2
Subgrade rutting, however, is caused by structural factors within the lower layers that
compress the subgrade and as traffic loads pass, the surface layers depress into the road.
Rutting is a problem as the depressions in the road surface collect water which presents a
safety issue for road users.17
Subgrade rutting can also lead to fatigue cracking in the ruts, see
photograph in Figure 1.4 (b) as the asphalt moves under the poor support from the subgrade.
Many of these failures are exacerbated by physical and environmental factors; however, the
condition of the bitumen also has a big effect on the asphalt. The mechanical properties of the
bitumen are tested prior to road surface construction and are also monitored throughout the
service life of the road in order to appropriately maintain the surface.
1.1.2 Mechanical property testing
As previously mentioned the chemical composition of the bitumen can greatly affect the
physical performance of the bitumen. As each bitumen source and refinery process is slightly
different all bitumen that is produced from the oil refineries is mechanically tested in order to
determine the physical properties it exhibits. This is carried out using standardised tests that
are widely used to determine the quality of bitumen. Bitumen is commonly classified in
Penetration grades. This is done by analysing the bitumen with the penetration point test, and
the upper and lower limit result of this test become the penetration grade of the bitumen. For
example a soft bitumen would be labelled a 100/150 penetration grade bitumen with a very
high penetration value, whereas a harder bitumen, 40/60, has much lower penetration grade
limits.
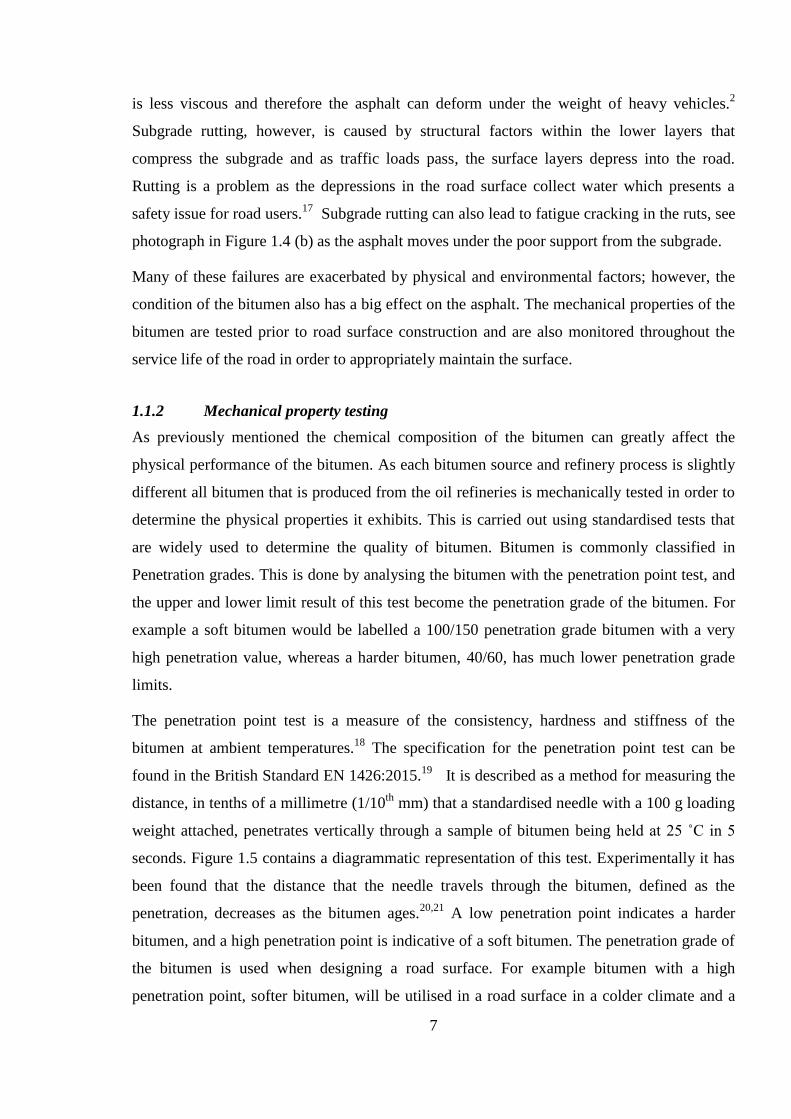
The penetration point test is a measure of the consistency, hardness and stiffness of the
bitumen at ambient temperatures.18
The specification for the penetration point test can be
found in the British Standard EN 1426:2015.19
It is described as a method for measuring the
distance, in tenths of a millimetre (1/10th
mm) that a standardised needle with a 100 g loading
weight attached, penetrates vertically through a sample of bitumen being held at 25 ˚C in 5
seconds. Figure 1.5 contains a diagrammatic representation of this test. Experimentally it has
been found that the distance that the needle travels through the bitumen, defined as the
penetration, decreases as the bitumen ages.20,21
A low penetration point indicates a harder
bitumen, and a high penetration point is indicative of a soft bitumen. The penetration grade of
the bitumen is used when designing a road surface. For example bitumen with a high
penetration point, softer bitumen, will be utilised in a road surface in a colder climate and a
8
hard bitumen with a low penetration point would be better suited in a hotter climate.18
A low
penetration grade bitumen is also suitable in asphalt roads that are to experience sever
trafficking; a hard bitumen in these areas allows a better resistance to deformation from high
traffic loads. Softer bitumen is then utilised in minor roads that experience light traffic and are
then flexible to the sporadic trafficking.7
Figure 1. 5 Diagram of the Penetration point test experiment
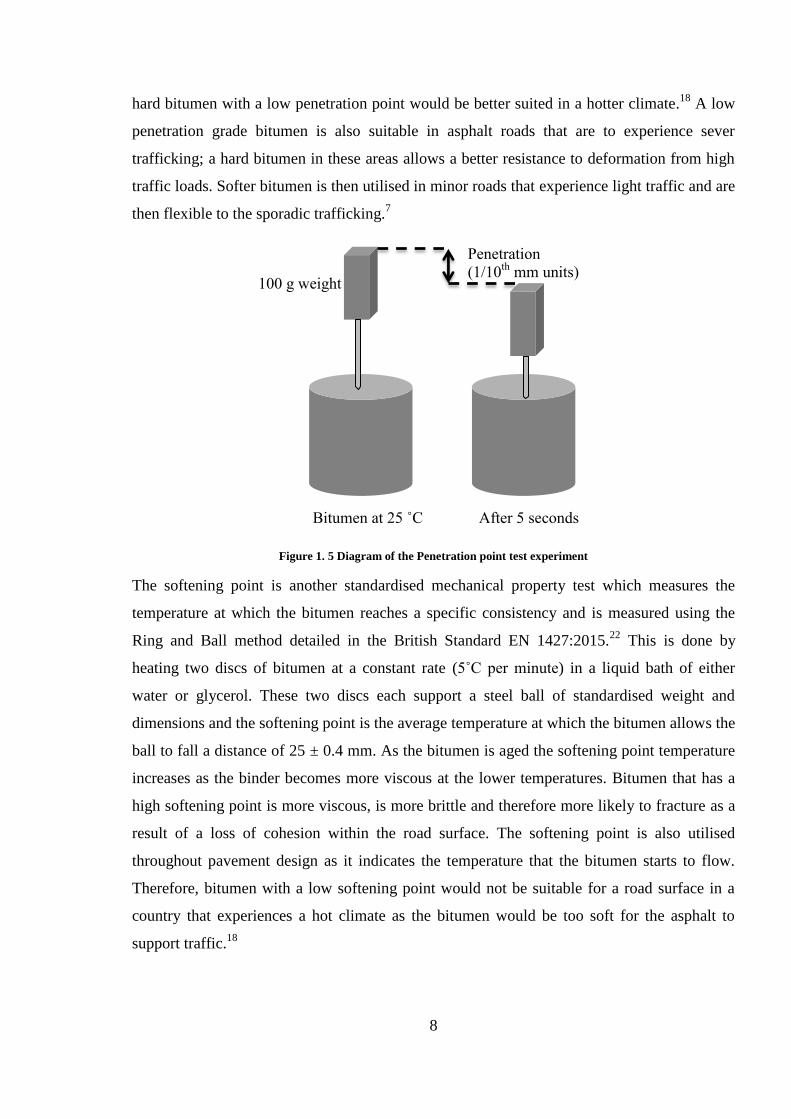
The softening point is another standardised mechanical property test which measures the
temperature at which the bitumen reaches a specific consistency and is measured using the
Ring and Ball method detailed in the British Standard EN 1427:2015.22
This is done by
heating two discs of bitumen at a constant rate (5˚C per minute) in a liquid bath of either
water or glycerol. These two discs each support a steel ball of standardised weight and
dimensions and the softening point is the average temperature at which the bitumen allows the
ball to fall a distance of 25 ± 0.4 mm. As the bitumen is aged the softening point temperature
increases as the binder becomes more viscous at the lower temperatures. Bitumen that has a
high softening point is more viscous, is more brittle and therefore more likely to fracture as a
result of a loss of cohesion within the road surface. The softening point is also utilised
throughout pavement design as it indicates the temperature that the bitumen starts to flow.
Therefore, bitumen with a low softening point would not be suitable for a road surface in a
country that experiences a hot climate as the bitumen would be too soft for the asphalt to
support traffic.18
Penetration (1/10
th mm units)
100 g weight
Bitumen at 25 ˚C After 5 seconds
9
Figure 1. 6 Diagram representing the softening point experimental starting point and ending point. Two discs of
bitumen sit upon a cradle within a bath of water, the temperature of the water bath when the steel balls fall to the
bottom of the cradle is the softening point.
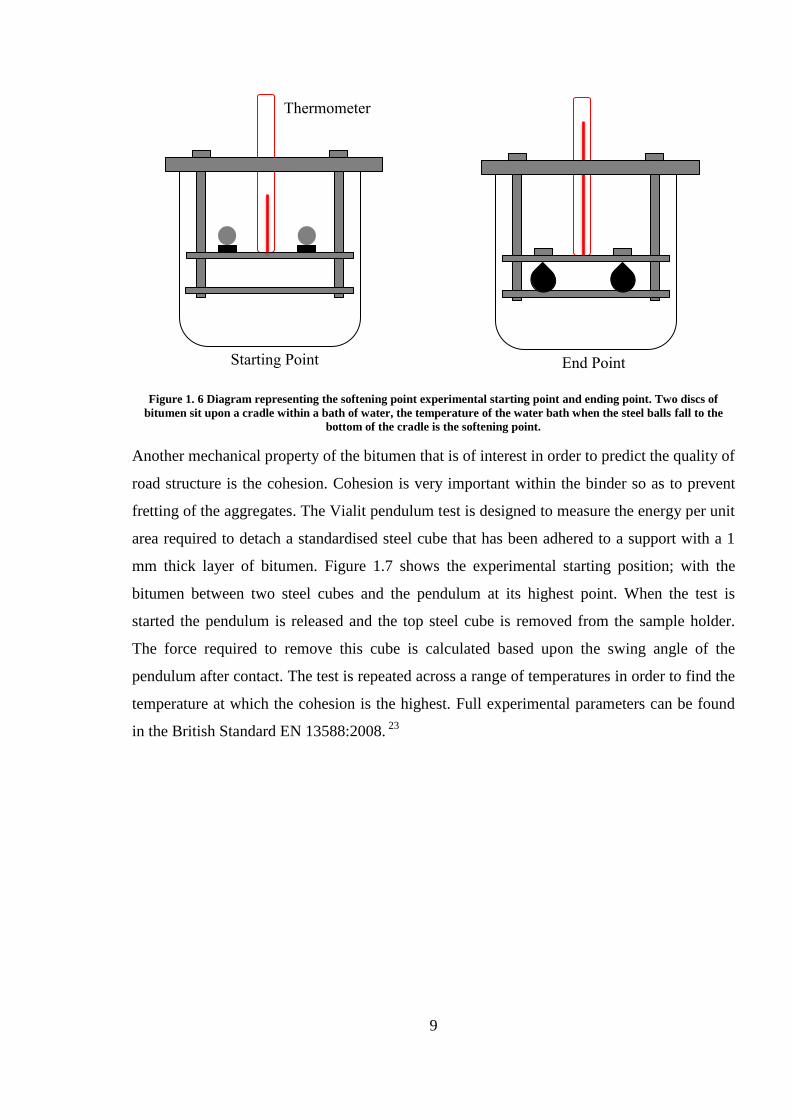
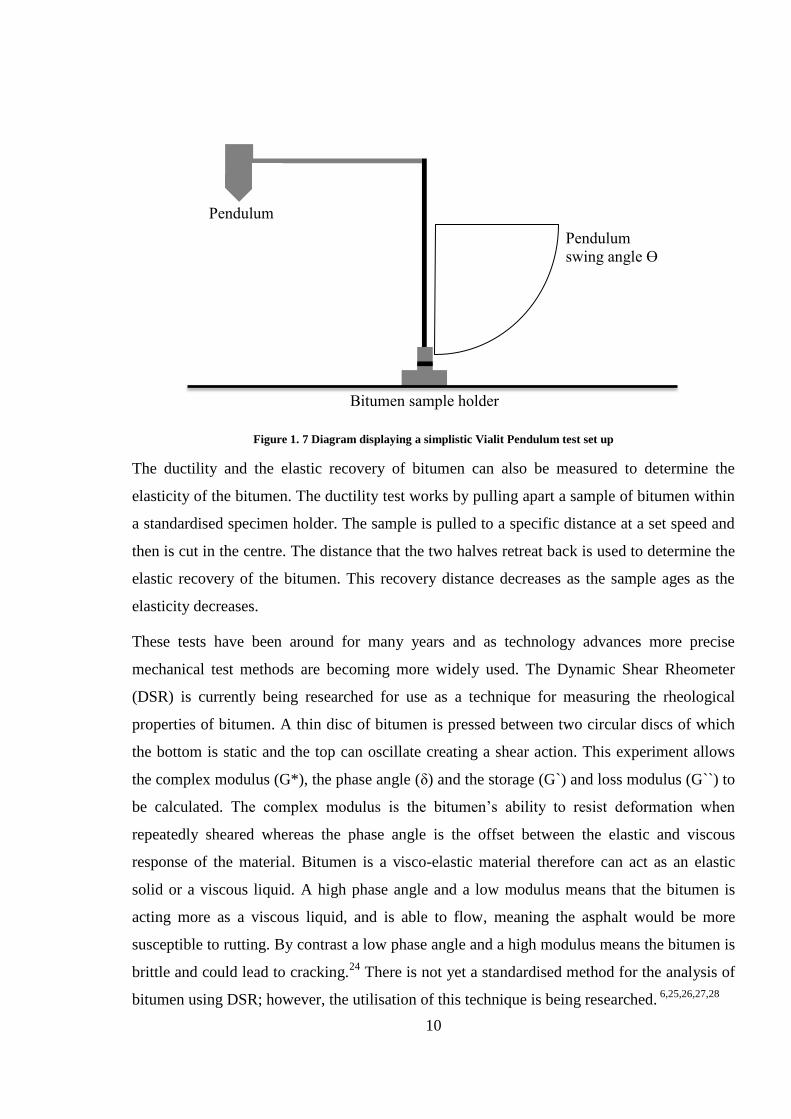
Another mechanical property of the bitumen that is of interest in order to predict the quality of
road structure is the cohesion. Cohesion is very important within the binder so as to prevent
fretting of the aggregates. The Vialit pendulum test is designed to measure the energy per unit
area required to detach a standardised steel cube that has been adhered to a support with a 1
mm thick layer of bitumen. Figure 1.7 shows the experimental starting position; with the
bitumen between two steel cubes and the pendulum at its highest point. When the test is
started the pendulum is released and the top steel cube is removed from the sample holder.
The force required to remove this cube is calculated based upon the swing angle of the
pendulum after contact. The test is repeated across a range of temperatures in order to find the
temperature at which the cohesion is the highest. Full experimental parameters can be found
in the British Standard EN 13588:2008. 23
Thermometer
Starting Point End Point
10
Figure 1. 7 Diagram displaying a simplistic Vialit Pendulum test set up
The ductility and the elastic recovery of bitumen can also be measured to determine the
elasticity of the bitumen. The ductility test works by pulling apart a sample of bitumen within
a standardised specimen holder. The sample is pulled to a specific distance at a set speed and
then is cut in the centre. The distance that the two halves retreat back is used to determine the
elastic recovery of the bitumen. This recovery distance decreases as the sample ages as the
elasticity decreases.
These tests have been around for many years and as technology advances more precise
mechanical test methods are becoming more widely used. The Dynamic Shear Rheometer
(DSR) is currently being researched for use as a technique for measuring the rheological
properties of bitumen. A thin disc of bitumen is pressed between two circular discs of which
the bottom is static and the top can oscillate creating a shear action. This experiment allows
the complex modulus (G*), the phase angle (δ) and the storage (G`) and loss modulus (G``) to
be calculated. The complex modulus is the bitumen’s ability to resist deformation when
repeatedly sheared whereas the phase angle is the offset between the elastic and viscous
response of the material. Bitumen is a visco-elastic material therefore can act as an elastic
solid or a viscous liquid. A high phase angle and a low modulus means that the bitumen is
acting more as a viscous liquid, and is able to flow, meaning the asphalt would be more
susceptible to rutting. By contrast a low phase angle and a high modulus means the bitumen is
brittle and could lead to cracking.24
There is not yet a standardised method for the analysis of
bitumen using DSR; however, the utilisation of this technique is being researched. 6,25,26,27,28
Pendulum
Pendulum
swing angle Ɵ
Bitumen sample holder
11
Once the road surface has been laid the condition of the road throughout its surface life is
mainly monitored visually. This presents a problem as the time between visual detection of a
defect and the complete failure of the road surface is very short. The rapid development of
potholes from fretting is an example of this rapid failure mechanism. The aforementioned
mechanical tests are used while the road is in service, so that analysts can test the condition of
the bitumen throughout its surface life and to monitor any changes to the road. To carry out
these tests a core must be collected from the road. The bitumen is then recovered from this
slab via a binder recovery process. The asphalt core is broken down into smaller chunks and
the bitumen is dissolved in dichloromethane and separated from the aggregates and filler via
filtration and centrifuge separation. This method has been standardised in the British Standard
EN 13074 2:2011.29
The solvent is evaporated from the bitumen with a rotary evaporator and
the bitumen is ready for the penetration point, softening point and the Vialit pendulum test.
Changes within the mechanical property test results for the bitumen in the road surface can be
an indicator of the road’s potential for failure. This process of mechanical testing of asphalt,
however, is very time consuming, expensive and requires man-power and road closures to
collect cores. Therefore it is not ideal. It is of interest to be able to predict the way that the
bitumen will behave in service, prior to laying the road to assist the initial road surface design.
There are a number of standardised tests that have been developed that artificially age the
bitumen allowing analysts to better understand the ageing behaviour of bitumen.
1.1.3 Enhanced ageing
Bitumen ageing occurs in two stages. The first is short-term ageing and occurs while the
bitumen is in transit to the road site. Here the bitumen is kept at high temperatures to prevent
the bitumen from solidifying. Chemical ageing is predominant within this stage and consists
of oxidation of the bitumen. The second is long-term ageing and occurs after the road has
been laid. This ageing mechanism is slower and is affected by external factors including
temperature cycles, rain water, UV light exposure and the physical effects of trafficking. Both
types of ageing affect the properties of the bitumen over time. Enhanced ageing tests have
been developed that allow analysts to predict the effects of ageing, in a much shorter time and
are used to accelerate the mechanical and chemical degradation that that bitumen experiences
in service by using extremes in temperature or pressure. The tests that are used commonly
within the industry include the Rolling Thin Film Oven (RTFO) test, the Rotating Cylinder
Ageing test (RCAT) and the Pressure Ageing Vessel (PAV).
12
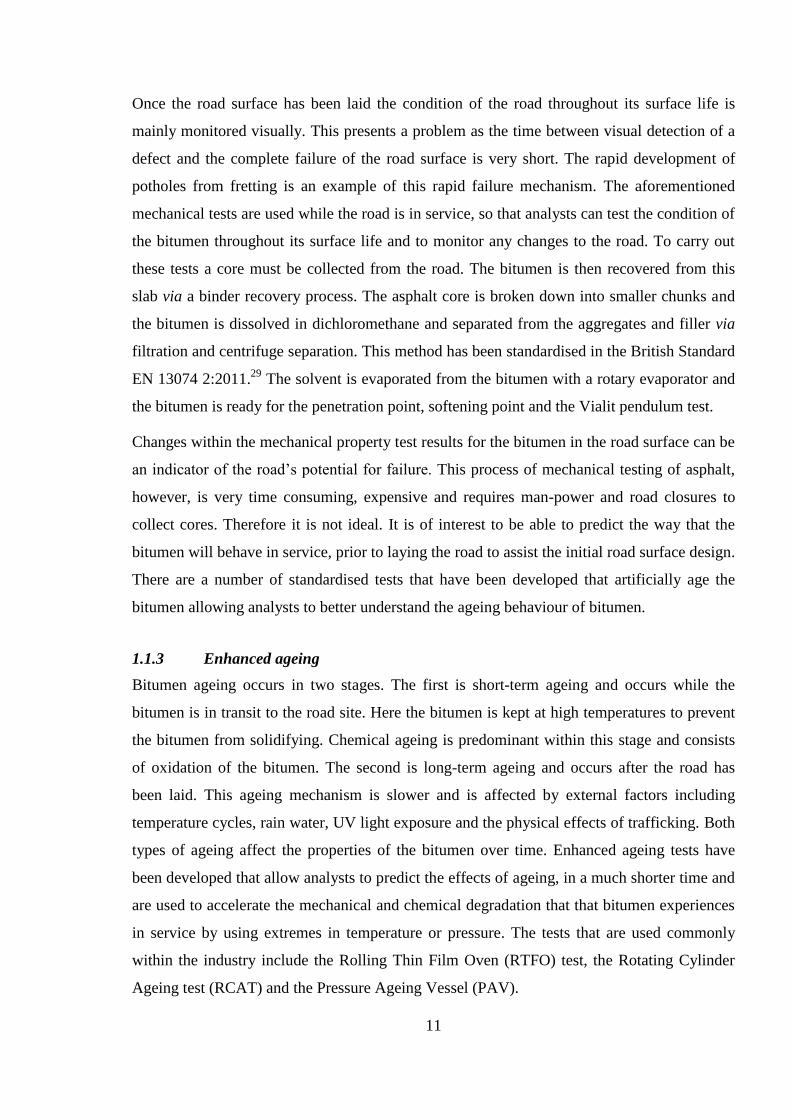
The RTFO test involves heating bitumen at 163 ˚C for 75 minutes with exposure to
continuous air flow.30
This test reasonably replicates the short-term, oxidative ageing that the
bitumen experiences while it is in transit from the supplier to the road site.1 Figure 1.8
contains photographs of the RTFO at the Transport Research Laboratory (TRL).
Figure 1. 8 Photograph of the Rolling Thin Film Oven at the Transport Research Laboratory, Crowthorne House, UK
Within unpublished works at TRL, Gershkoff et al.31
extended the RTFO test to 225 minutes
in order to develop a test which replicates long-term ageing. Changes in mechanical
properties similar to those from bitumen that has been aged in service for 3 years were
reported. A 56 % decrease in penetration point and a 21 % increase in softening point of
bitumen were recorded in this work.
The RCAT test can be used to replicate short and long-term ageing and it has been
standardised in the British Standard EN 15323:2007.32,33
The RCAT involves heating a
cylindrical vessel containing the bitumen sample. The short-term ageing experiment is carried
out at 163 ˚C for 4 hours with an air flow rate of 4 L/min and a rotation rate of 5 rpm. This is
then followed by the long-term ageing experiment which uses a 90 ˚C oven temperature for
140 hours with a flow rate of 4.5 L/min and rotation of 1 rpm.
The PAV test is sometimes used to replicate the long-term ageing of bitumen in service
however, as a result of the complexity of the in-service ageing, the data collected from the
PAV testing is used to compare bitumen rather than for predictive ageing.10
The experiment is
standardised and runs for 20 hours at temperatures of 90, 100 or 110˚C dependent upon the
grade of bitumen being tested, and the pressure is increased to 2.1 MPa within the oven.34
The
PAV test details have been standardised and published within the British Standard EN
14769:2012.35
13
The effect of UV ageing on bitumen has been very widely researched in recent years and has
been identified as a contributing factor in the oxidation of bitumen in road surfaces. Intense
UV light exposure has been investigated as an enhanced ageing technique with mixed results
as there is no standard method for predicting this type of ageing.36
There are a number of
parameters that can be altered by researchers while developing a UV ageing method including
the UV light intensity and energy and the temperature of the experiment. The literature sees a
wide range of different parameters being used, some examples include an intensity range from
0.77-100 W/m2,37,38,39
with very variable UV energy values including 3.08 W 40
and 500 W.41
These published experiments have also all been carried out at different temperatures ranging
between 40-80 ˚C.
Yi-Qiu et al.42
have carried out a thermal and UV ageing comparison on four different
bitumen types. The RTFO test was used for the thermal ageing and UV radiation equipment
outlined by Tan et al.43
was used to UV age the bitumen samples. The samples were held at
73 ˚C for 9 hours, which they equated to 5 months natural ageing in Tibet, China. A 42%
decrease in penetration point and a 22% increase in the softening point were reported after the
UV ageing. The UV ageing also significantly increased the asphaltene content in the bitumen.
Zeng et al.36
have looked into the effect of varying temperature on the UV ageing mechanism.
They identified that when UV light is coupled with a temperature of 70 ˚C there is accelerated
oxidation and volatilisation of the bitumen. Therefore to identify the effects of UV light alone
the experiment must be carried out at a temperature below 50 ˚C.
The effect of UV light has generally been omitted from standardisation as the effect is
localised on the surface layers of the asphalt and bitumen.44,45
However as some failure
mechanisms can propagate from the surface, it seems reasonable to investigate the effect of
UV light on asphalt ageing.
The aforementioned tests have been designed for the ageing of bitumen alone. There is a lack
of standardised tests that reliably age asphalt. This is because there are such a large number of
unpredictable factors that can affect the road while in service and there is no one factor alone
that initiates failure. Weathering chambers have been utilised within the literature to attempt
to include this major influencer into the methodology.46,47
These chambers take into account
the temperature cycling, humidity and UV light exposure of natural weather conditions.
It must be stated that the ageing mechanisms that the bitumen experiences in-service are
vastly different to the mechanisms that are identified via these enhanced ageing tests, but a
14
change in mechanical properties can be measured that may correlate to a specific time of
service life and therefore allow for the prediction of the ageing behaviour.48
Bitumen embrittlement is a major contributor to the failure of road surfaces and the oxidation
of bitumen has been widely researched and has been linked to bitumen embrittlement.
1.2 Bitumen oxidation and analysis
Many researchers have attempted to find the main cause for bitumen age hardening and there
are some contradictory results that have been published over the years. Asphaltenes are the
highly aromatic, high molecular weight compounds within the bitumen composition and an
increase in asphaltene content has been linked to an increase in viscosity. 49
The increase in
oxygen contained within the bitumen composition has also been linked to an increase in
viscosity and it is likely that a combination of these effects contributes to the age hardening of
bitumen.
When discussing bitumen, oxidation refers to the addition of oxygen to a compound. Very
simply this usually involves the reaction of oxygen with an unsaturated hydrocarbon. Oxygen
is an oxidising agent meaning it can remove electrons from a molecule. Unsaturated
hydrocarbons containing groups, such as C=C or aromatic rings, are electron rich and
therefore can react rapidly with oxygen.
Benzyl carbons attached to lower molecular weight, aromatic resins are also susceptible to
oxidation. Ketone functional groups are formed upon oxidation of these carbons. Petersen et
al.,50
state that the ketone functional group formation creates an increase in polarity which
causes an agglomeration of the strongly interacting molecules which leads to an increase in
viscosity of the overall composition. Polar and hydrogen bonding are possible interactions
that can occur between these newly polar, oxygen containing molecules. The introduction of
highly electronegative oxygen will withdraw electrons within the carbonyl bonds and create
charged dipoles upon the oxygen and carbon atoms involved in the bond. These dipoles can
then attract atoms with the opposite charge and create a weak, electrostatic, intermolecular
bond.
Once the polarity becomes sufficiently high, the intermolecular forces increase and there is a
reduction in the mobility of the molecules. If the molecules become insufficiently mobile, the
bitumen can no longer withstand the mechanical stress of trafficking and cracks and fractures
develop.20
15
Bitumen ageing can be split into four groups: short-term, long-term, chemical and physical.
The short-term ageing occurs while the bitumen is in-transit to the road. This involves high
temperatures and exposure to oxygen, and is mainly chemical ageing. Chemical ageing
involves the chemical alteration of the bitumen composition through oxidation. 51
This is an
irreversible process. The long-term ageing occurs throughout the life-span of the road surface.
Once the road is laid the bitumen cools and is exposed to a number of external factors. The
temperatures experienced by the bitumen are much lower than in transit and short term
ageing, and any oxidation is normally UV initiated. The bitumen can experience physical
ageing at these lower temperatures which involves the molecular structuring and arrangement
of the molecules within the bitumen.52
Petersen et al.53
describe a mechanism for the short-term and long-term oxidative ageing of
the bitumen. The conditions for the two types of ageing are very different as previously
mentioned; therefore the oxidation mechanisms are understandably different. During the
short-term ageing the bitumen experiences high temperatures and exposure to oxygen. These
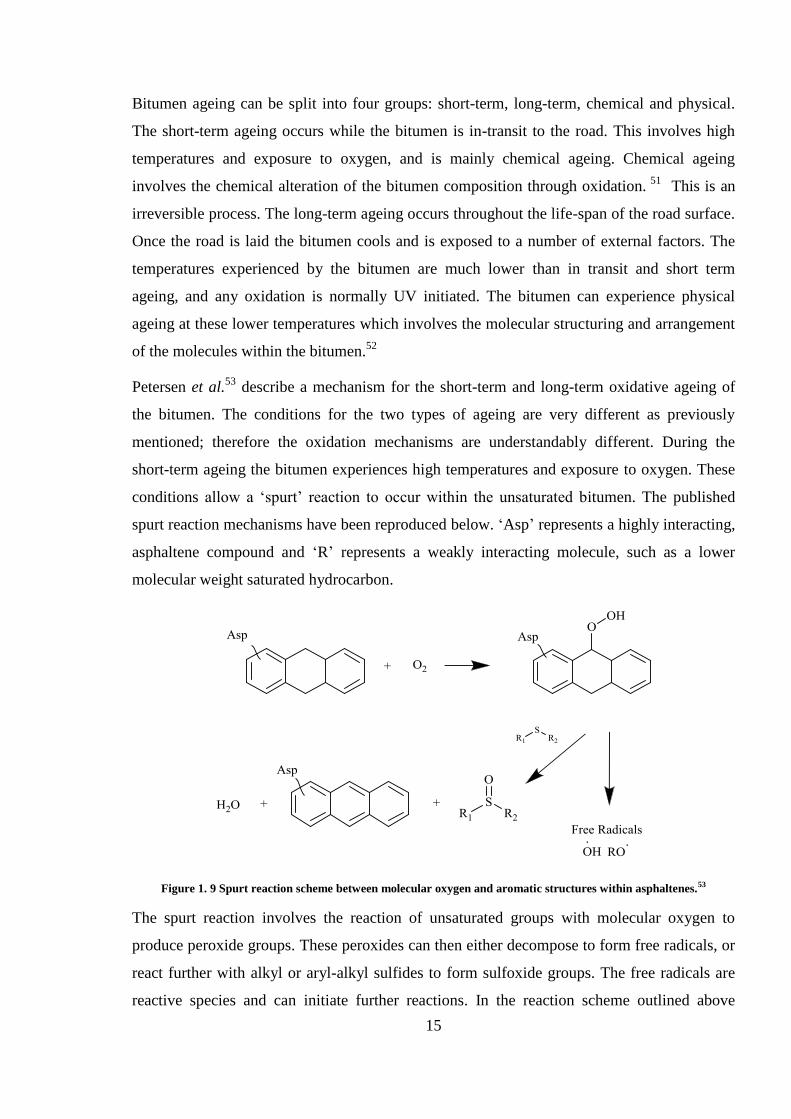
conditions allow a ‘spurt’ reaction to occur within the unsaturated bitumen. The published
spurt reaction mechanisms have been reproduced below. ‘Asp’ represents a highly interacting,
asphaltene compound and ‘R’ represents a weakly interacting molecule, such as a lower
molecular weight saturated hydrocarbon.
Figure 1. 9 Spurt reaction scheme between molecular oxygen and aromatic structures within asphaltenes.53
The spurt reaction involves the reaction of unsaturated groups with molecular oxygen to
produce peroxide groups. These peroxides can then either decompose to form free radicals, or
react further with alkyl or aryl-alkyl sulfides to form sulfoxide groups. The free radicals are
reactive species and can initiate further reactions. In the reaction scheme outlined above
16
(Figure 1.9) the central, strained, non-planar ring is aromatised as a result of the
decomposition of the peroxide group. This increase in aromaticity makes the molecule more
planar and these new unsaturated bonds add electron density to the system. The change in
molecular structure allows the molecule to undergo more intramolecular bonding through this
highly electron rich π-network and therefore the viscosity of the bitumen is increased. Some
work in the literature has stated that these, high molecular weight, aromatic asphaltenes are
the main contributing factor to bitumen age hardening.42,54,55
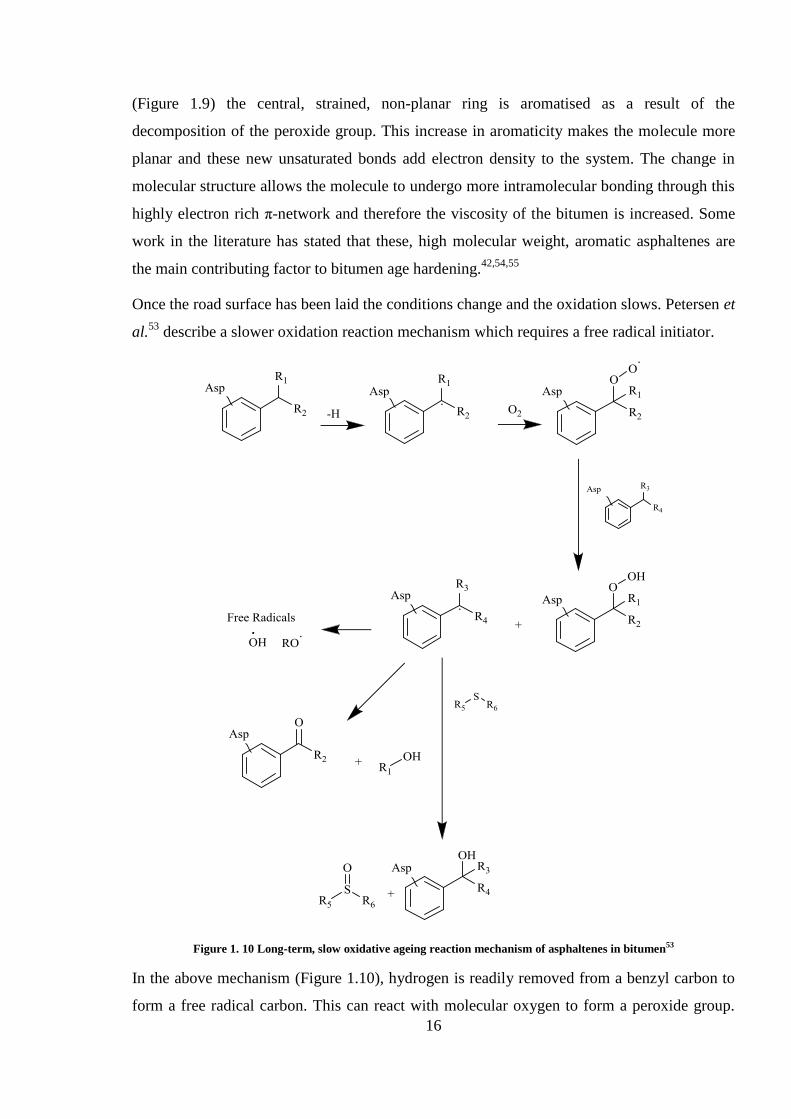
Once the road surface has been laid the conditions change and the oxidation slows. Petersen et
al.53
describe a slower oxidation reaction mechanism which requires a free radical initiator.
Figure 1. 10 Long-term, slow oxidative ageing reaction mechanism of asphaltenes in bitumen53
In the above mechanism (Figure 1.10), hydrogen is readily removed from a benzyl carbon to
form a free radical carbon. This can react with molecular oxygen to form a peroxide group.
17
The peroxide group can decompose, as seen before in the spurt reaction (Figure 1.9),
however, there are some differences as a result of the lower energy of the reaction. Three
different compound types are formed upon the decomposition; ketones (C=O), sulfoxides
(S=O) and alcohols (O-H). The direction of the decomposition is governed by the bitumen’s
chemical composition; sulfur content, the temperature and oxygen availability. The increased
polarity as a result of the increased oxygen content within the composition allows a greater
number of intermolecular interactions that can occur between molecules therefore, increasing
viscosity.
Oxidation reactions require an initiator to provide enough energy to the molecules in order to
break and form new bonds. Within the short-term, spurt reaction, the high temperature can
provide this energy, however within long-term ageing the slow oxidation mechanism requires
an oxidising initiator to enhance the reaction. Some examples of possible oxidising agents that
may have the power and the opportunity to enhance the oxidisation of bitumen within asphalt
road surfaces are singlet oxygen and hydroxyl radicals.
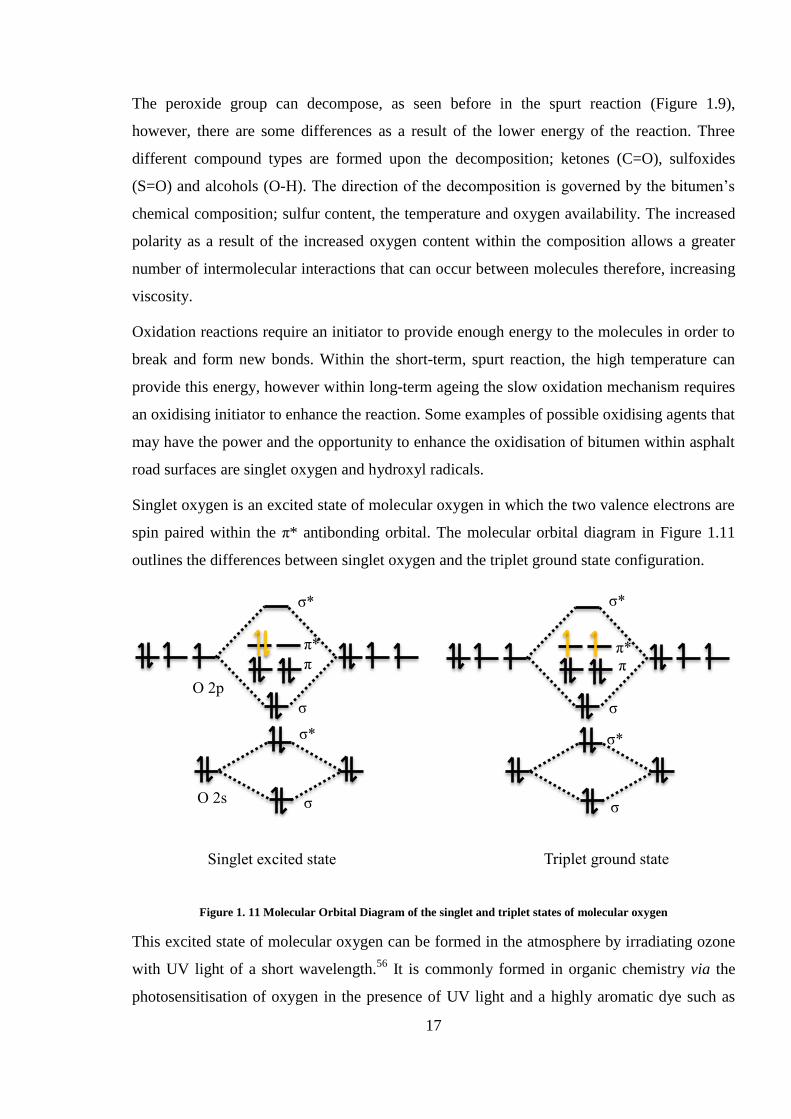
Singlet oxygen is an excited state of molecular oxygen in which the two valence electrons are
spin paired within the π* antibonding orbital. The molecular orbital diagram in Figure 1.11
outlines the differences between singlet oxygen and the triplet ground state configuration.
Figure 1. 11 Molecular Orbital Diagram of the singlet and triplet states of molecular oxygen
This excited state of molecular oxygen can be formed in the atmosphere by irradiating ozone
with UV light of a short wavelength.56
It is commonly formed in organic chemistry via the
photosensitisation of oxygen in the presence of UV light and a highly aromatic dye such as
O 2p
O 2s
π
π*
σ
σ*
σ
σ*
π π*
σ
σ*
σ
σ*
Singlet excited state Triplet ground state
18
Rose Bengal or Methylene Blue. A photosensitiser is a molecule that is capable of absorbing a
photon of light and can then pass this energy onto molecular oxygen to form the excited
singlet oxygen.57
The photosensitiser must be capable of absorbing light in the UV-Visible
wavelength range (190-750 nm) and commonly contains a large delocalised π system. These
properties are all consistent with the asphaltene compounds within bitumen; therefore it could
be the case that the large aromatic compounds of the highly absorbing bitumen are acting as
sensitizers for the photosensitisation of molecular oxygen.
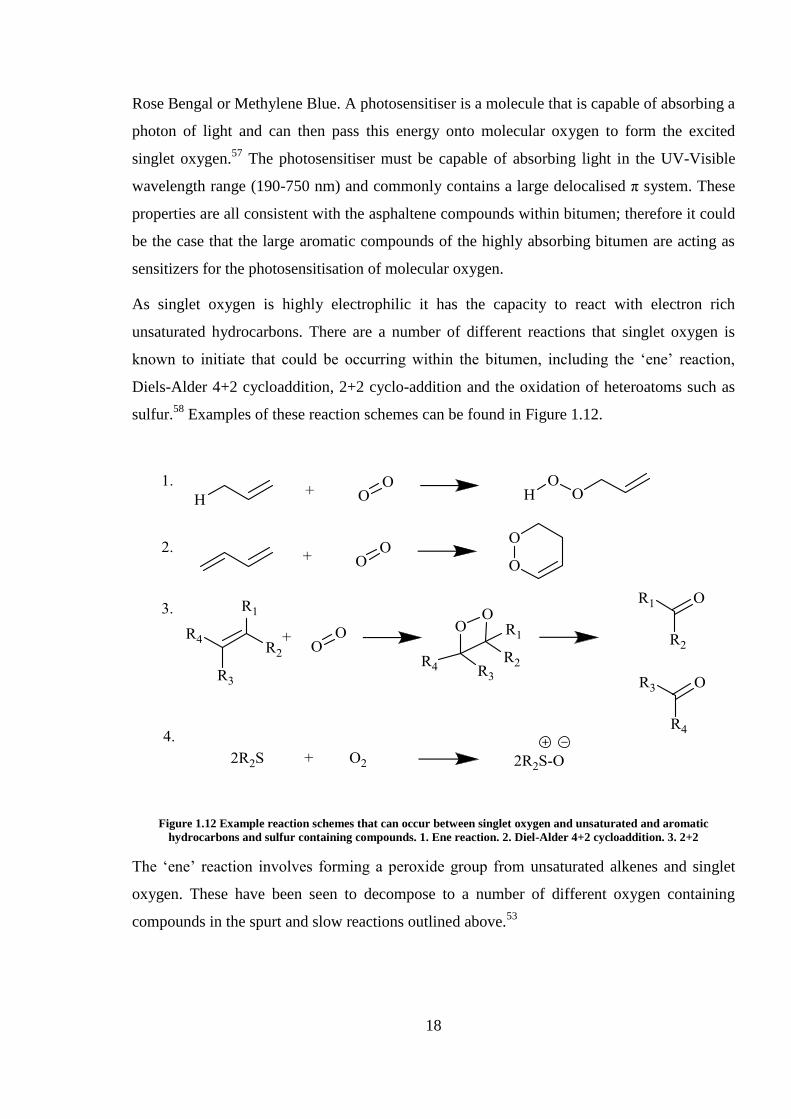
As singlet oxygen is highly electrophilic it has the capacity to react with electron rich
unsaturated hydrocarbons. There are a number of different reactions that singlet oxygen is
known to initiate that could be occurring within the bitumen, including the ‘ene’ reaction,
Diels-Alder 4+2 cycloaddition, 2+2 cyclo-addition and the oxidation of heteroatoms such as
sulfur.58
Examples of these reaction schemes can be found in Figure 1.12.
Figure 1.12 Example reaction schemes that can occur between singlet oxygen and unsaturated and aromatic
hydrocarbons and sulfur containing compounds. 1. Ene reaction. 2. Diel-Alder 4+2 cycloaddition. 3. 2+2
The ‘ene’ reaction involves forming a peroxide group from unsaturated alkenes and singlet
oxygen. These have been seen to decompose to a number of different oxygen containing
compounds in the spurt and slow reactions outlined above.53
19
Diels-Alder reactions can occur between diene functional groups and singlet oxygen to
produce endo-peroxides. This 4+2 cycloaddition with singlet oxygen produces an endo-
peroxide with an O-O functional group.
The third mechanism scheme presented in Figure 1.12 is the 2+2 cyclo addition of singlet
oxygen to an alkene. This produces a 4-membered ring which is quite unstable, and
decomposes to two carbonyl functional groups. These carbonyl bonds are detectable with IR
and can be monitored throughout the oxidation of the bitumen.
The final scheme is that of the oxidation of sulfur containing compounds which can readily
form S-O single bonds with a dipole.59
When in conjunction with an unsaturated system, such
as asphaltenes and resins, this bond can form an S=O double bond through resonance.
As mentioned previously bitumen oxidation is greatly affected by access to oxygen, the
bitumen source, the aggregates and the void content of the asphalt, the temperature and also
UV light exposure. Alongside producing the singlet oxygen required for the previously
mentioned reactions, UV light exposure can also assist in the production of hydroxyl radicals
which can act as oxidising agents for bitumen.
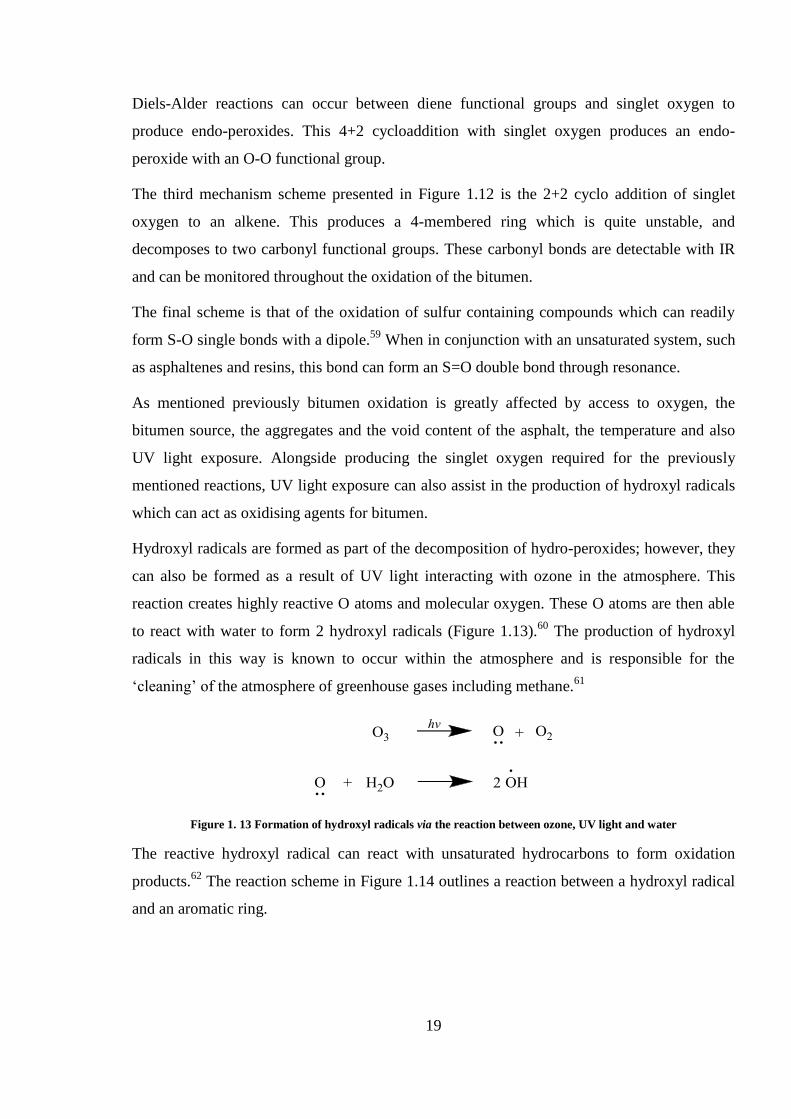
Hydroxyl radicals are formed as part of the decomposition of hydro-peroxides; however, they
can also be formed as a result of UV light interacting with ozone in the atmosphere. This
reaction creates highly reactive O atoms and molecular oxygen. These O atoms are then able
to react with water to form 2 hydroxyl radicals (Figure 1.13).60
The production of hydroxyl
radicals in this way is known to occur within the atmosphere and is responsible for the
‘cleaning’ of the atmosphere of greenhouse gases including methane.61
Figure 1. 13 Formation of hydroxyl radicals via the reaction between ozone, UV light and water
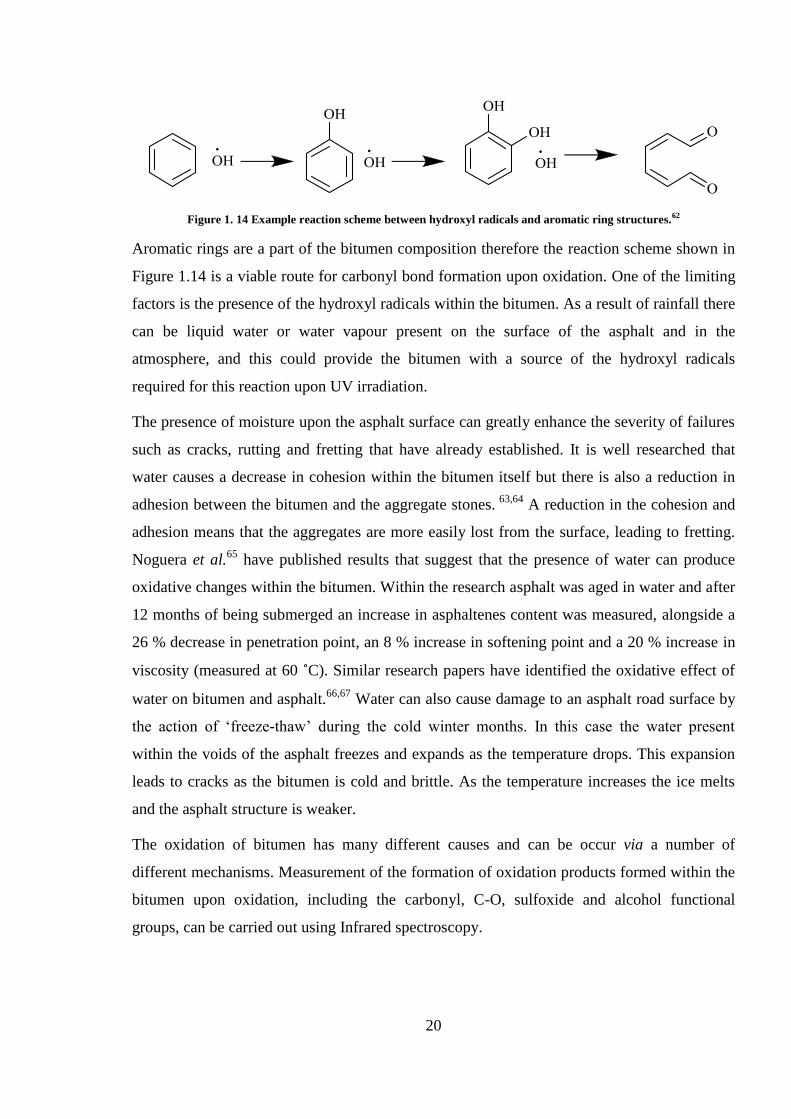
The reactive hydroxyl radical can react with unsaturated hydrocarbons to form oxidation
products.62
The reaction scheme in Figure 1.14 outlines a reaction between a hydroxyl radical
and an aromatic ring.
20
Figure 1. 14 Example reaction scheme between hydroxyl radicals and aromatic ring structures.62
Aromatic rings are a part of the bitumen composition therefore the reaction scheme shown in
Figure 1.14 is a viable route for carbonyl bond formation upon oxidation. One of the limiting
factors is the presence of the hydroxyl radicals within the bitumen. As a result of rainfall there
can be liquid water or water vapour present on the surface of the asphalt and in the
atmosphere, and this could provide the bitumen with a source of the hydroxyl radicals
required for this reaction upon UV irradiation.
The presence of moisture upon the asphalt surface can greatly enhance the severity of failures
such as cracks, rutting and fretting that have already established. It is well researched that
water causes a decrease in cohesion within the bitumen itself but there is also a reduction in
adhesion between the bitumen and the aggregate stones. 63,64
A reduction in the cohesion and
adhesion means that the aggregates are more easily lost from the surface, leading to fretting.
Noguera et al.65
have published results that suggest that the presence of water can produce
oxidative changes within the bitumen. Within the research asphalt was aged in water and after
12 months of being submerged an increase in asphaltenes content was measured, alongside a
26 % decrease in penetration point, an 8 % increase in softening point and a 20 % increase in
viscosity (measured at 60 ˚C). Similar research papers have identified the oxidative effect of
water on bitumen and asphalt.66,67
Water can also cause damage to an asphalt road surface by
the action of ‘freeze-thaw’ during the cold winter months. In this case the water present
within the voids of the asphalt freezes and expands as the temperature drops. This expansion
leads to cracks as the bitumen is cold and brittle. As the temperature increases the ice melts
and the asphalt structure is weaker.
The oxidation of bitumen has many different causes and can be occur via a number of
different mechanisms. Measurement of the formation of oxidation products formed within the
bitumen upon oxidation, including the carbonyl, C-O, sulfoxide and alcohol functional
groups, can be carried out using Infrared spectroscopy.
21
1.2.1 Infrared spectroscopy for the analysis of bitumen oxidation
Infrared (IR) spectroscopy is a very well-known and widely used analytical technique. The
most commonly adopted design for the IR spectrometer is the Michelson interferometer.68
Very simply, this type of spectrometer works by shining a beam of light from an infrared laser
source, through a beam splitter to two sets of mirrors. One of these mirrors is moving, causing
an interference pattern in the recombined infrared light beam, dependent upon the moving
mirror’s position. This beam is then transferred to the sample and then a detector. A Fourier
transform is carried out and an infrared spectrum is produced.
There are many different detection methods for infrared spectroscopy including Attenuated
Total Reflectance, Diffuse Reflectance, Angle Grazing and Non-Dispersive IR analysis.
These adaptations to the spectrometer allow a very diverse array of samples to be analysed. IR
spectrometers can be portable allowing measurements to be taken outside of a laboratory for
applications such as coating monitoring for aeroplanes and Formula 1 car tyres,
archaeological dig site analysis or quality control throughout food production.69,70,71
Infrared spectroscopy works by irradiating a sample with infrared light between 800 nm and 1
mm wavelength range (12500-10 cm-1
), and measuring how much of this light is absorbed by
the sample. This wavelength range include the near, mid and far infrared light regions of the
electromagnetic spectrum, however, commonly only the mid infrared wavelength range is
utilised between (4000-400 cm-1
). Infrared active vibrations within a molecule lead to
absorption of the infrared light at specific wavelengths. Infrared active vibrations are those
which experience a change in dipole moment while vibrating. These normally involve hetero-
atomic bonds in which there is a difference in electronegativity between the atoms. The
simplest IR active vibration is that of a heteronuclear diatomic molecule where the bond
between the atoms can stretch leading to IR absorption. When considering triatomic or
polyatomic molecules the bonds can stretch symmetrically and asymmetrically, and bending
modes are also observed.
Infrared active vibrations have a natural ‘resonant’ vibrating frequency and when the sample
is irradiated with light that has a frequency that matches this, IR light is absorbed, and the
amplitude of the vibration is increased. The resonant frequency is dependent on the reduced
mass of the atoms involved in a vibration and on the force constants of the bonds joining the
atoms together. For a diatomic molecule, assuming harmonic vibration, this may be expressed
by Equation 1.1 where c is the speed of light (m s-1
), f is the force constant (kg m -1
s-1
), and μ
22
is the reduced mass (kg). 72
A harmonic oscillator can be used to describe a system that is
oscillating with a restoring force that is equal in magnitude but opposite in direction to the
displacement from the system’s starting position.
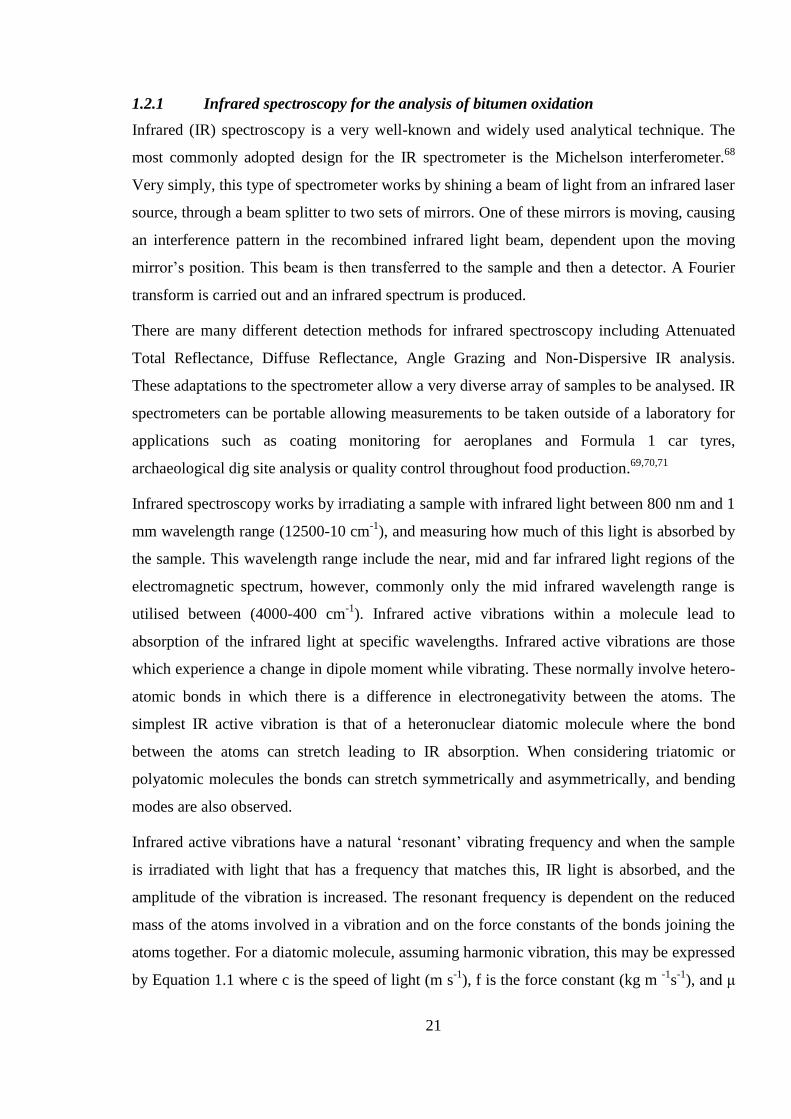
ṽ = 1
2𝜋𝑐 √
𝑓
𝜇
Equation 1. 1 Calculation of circular frequency in wavenumbers, of a diatomic molecule with force constant f, and
reduced mass μ
Thus it is often possible to assign absorbance bands in an IR spectrum to a specific functional
group present in the samples.
This approach has been used to identify oxygen containing functional groups within bitumen
after ageing to prove the presence of oxidation products. Many researchers have identified
groups such as the carbonyl (C=O), carbon-oxygen single bond (C-O), alcohol (O-H) and
sulfoxide (S=O) absorbance bands present in oxidised bitumen. 73,74,75,76
The Beer-Lambert Law states that absorbance is directly proportional to concentration at a constant path length.
This link is shown in Equation 1. 2 Beer-Lambert Law
where A is the absorbance, 𝜀 is the molar extinction coefficient (dm3 mol
-1 cm
-1), c is the
concentration (mol dm-3
) and l is the path length of the light (cm).
𝐴 = 𝜀 ∙ 𝑐 ∙ 𝑙
Equation 1. 2 Beer-Lambert Law
The molar extinction coefficient is a measure of how strongly a molecule can absorb light of a
given frequency. It is possible to quantify the concentration of molecules within a sample
based upon the Beer-Lambert relationship. This can be done by preparing a set of calibration
samples with known concentrations of a specific compound or functional group. The
calibration curve of the absorbance band area vs. concentration, for example, could then be
used to interpolate an unknown sample’s concentration. This methodology works extremely
well within UV/vis spectroscopy, and IR spectroscopy of simple compounds, however there is
a lot more variability within IR spectroscopy, where spectra are typically more complex with
overlapping absorbance bands, therefore this is sometimes less reliable.
In the case of bitumen oxidation, absorbance bands that correspond to the oxidation products
have been successfully quantified by integrating the area underneath the band.77,78,79
This can
be carried out very simply in modern FTIR software which allows two or four base pairs to be
23
selected. The base pairs can be used to indicate to the software the position of the baseline for
the integration. The software will then integrate the area between the base pairs and display
this to the analyst.
Some researchers have calculated indices to better understand the chemical changes occurring
as the bitumen oxidises. Indices are calculated ratios of absorbance bands and can be used to
more reliably compare spectra without the need for normalisation of the data. Niritha et al.80
identified the carbonyl (1678-1725 cm-1
), sulfoxide (1010-1043 cm-1
), aliphatic (1350-1510
cm-1
), aromatic (1535-1625 cm-1
) and long chain (715-733 cm-1
) absorbance band areas as
areas of interest. Within the report each index was calculated by dividing the absorbance band
area by the sum of all of the absorbance bands. This paper reported an increase in the
carbonyl and sulfoxide index of unmodified bitumen after ageing in the RTFO test. Lopes et
al.47
calculated the carbonyl and sulfoxide indices by dividing the absorbance band areas
underneath the carbonyl (1750-1650 cm-1
) and sulfoxide (1045-1020 cm-1
) absorbance bands
by the area underneath the C-H2 and C-H3 (1500-1325 cm-1
) absorbance band. The calculated
indices were both seen to increase after the bitumen samples had been thermally aged at 180
˚C for 24 hours.
It would be extremely difficult to use this quantification to calculate actual concentrations of
these groups within the bitumen composition. The initial bitumen structure is unknown and
different between every source, meaning that the exact oxidation mechanism is unknown.
Therefore the data calculated from the spectra collected can only be compared in order to
determine a change in the functional group quantities rather than give a definite indication of
the exact concentration.
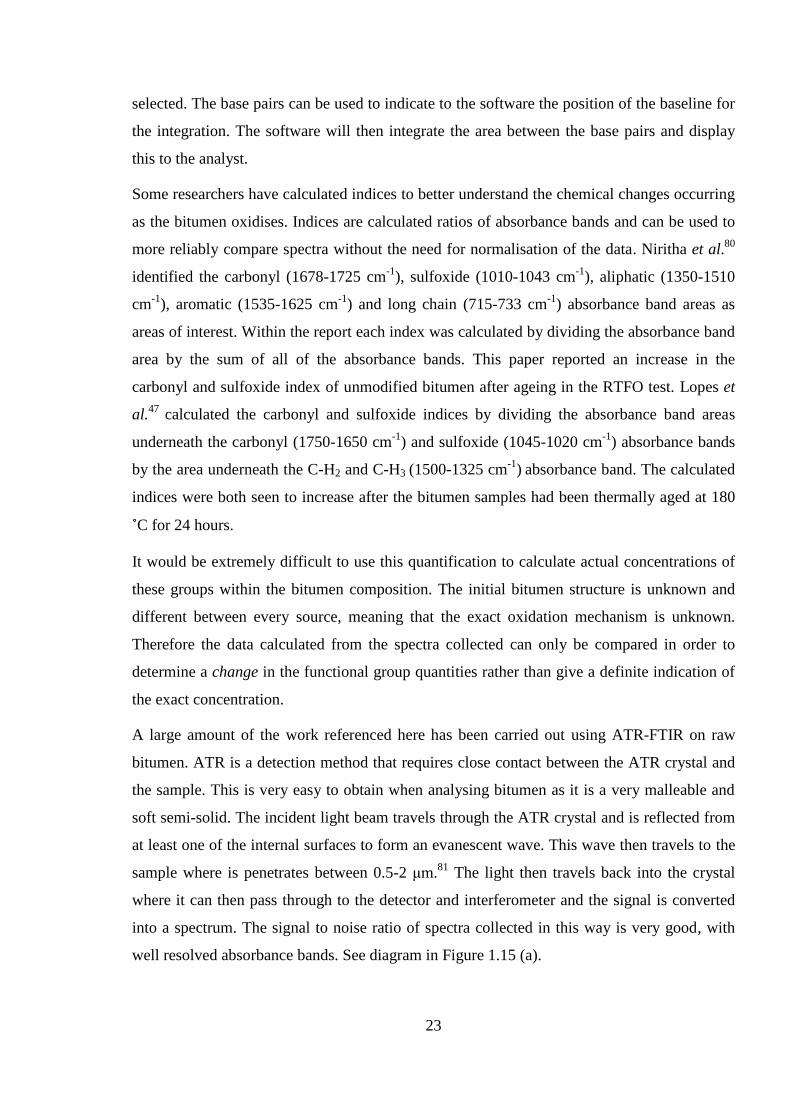
A large amount of the work referenced here has been carried out using ATR-FTIR on raw
bitumen. ATR is a detection method that requires close contact between the ATR crystal and
the sample. This is very easy to obtain when analysing bitumen as it is a very malleable and
soft semi-solid. The incident light beam travels through the ATR crystal and is reflected from
at least one of the internal surfaces to form an evanescent wave. This wave then travels to the
sample where is penetrates between 0.5-2 μm.81
The light then travels back into the crystal
where it can then pass through to the detector and interferometer and the signal is converted
into a spectrum. The signal to noise ratio of spectra collected in this way is very good, with
well resolved absorbance bands. See diagram in Figure 1.15 (a).
24
Asphalt, however, is a combination of bitumen and hard aggregates and therefore has a rough
surface and close contact with an ATR crystal is difficult which leads to poor quality spectra
being collected. Therefore a non-contact detection method is required for asphalt analysis.
Figure 1. 15 Diagram of the total internal reflectance within an ATR spectroscopy crystal (a) and the diffuse
reflectance of light from a rough surface (b)
Diffuse reflectance infrared Fourier transform (DRIFT) spectroscopy is a non-contact
detection method that works by collecting light that is diffusely scattered from the rough
sample surface. The incident light interacts with the sample and is then scattered at angles that
are not equal to the incident angle. See diagram in Figure 1.15 (b). The angles of the
scattering are dependent upon the wavelength of the light and the size properties of the
surface particles. The diffuse reflectance detector has the ability to detect this scattered light
and, after a Fourier transform, an infrared spectrum is produced. Specular reflectance on the
other hand, is another form of reflection which occurs when a smooth, shiny surface is
irradiated with a beam of light. The light is then reflected from the surface at an angle that is
equal to the incident angle.
As a result of the increased path length that the light has to travel to the reflectance detector
there is a reduction in signal to noise ratio for reflectance measurements. This can make
DRIFT spectra more difficult to interpret. The spectra obtained from asphalt samples are
likely to be a mixture of diffuse and specular reflectance as bitumen is shiny and the
aggregates are rough. As such the reflectance spectra of a sample like asphalt can be difficult
to interpret where it appears that some absorbance bands have negative intensities and some
are positive.
The reflectance of light is related to the refractive index of the sample. The refractive index of
the sample changes depending upon the wavelength of light being used.82
Therefore, it is
possible that the sample will experience a change in refractive index along an absorbance
Incident Light Beam
Total Internal Reflectance
Detector
Incident Light Beam
Diffuse
Reflectance
(a) (b)
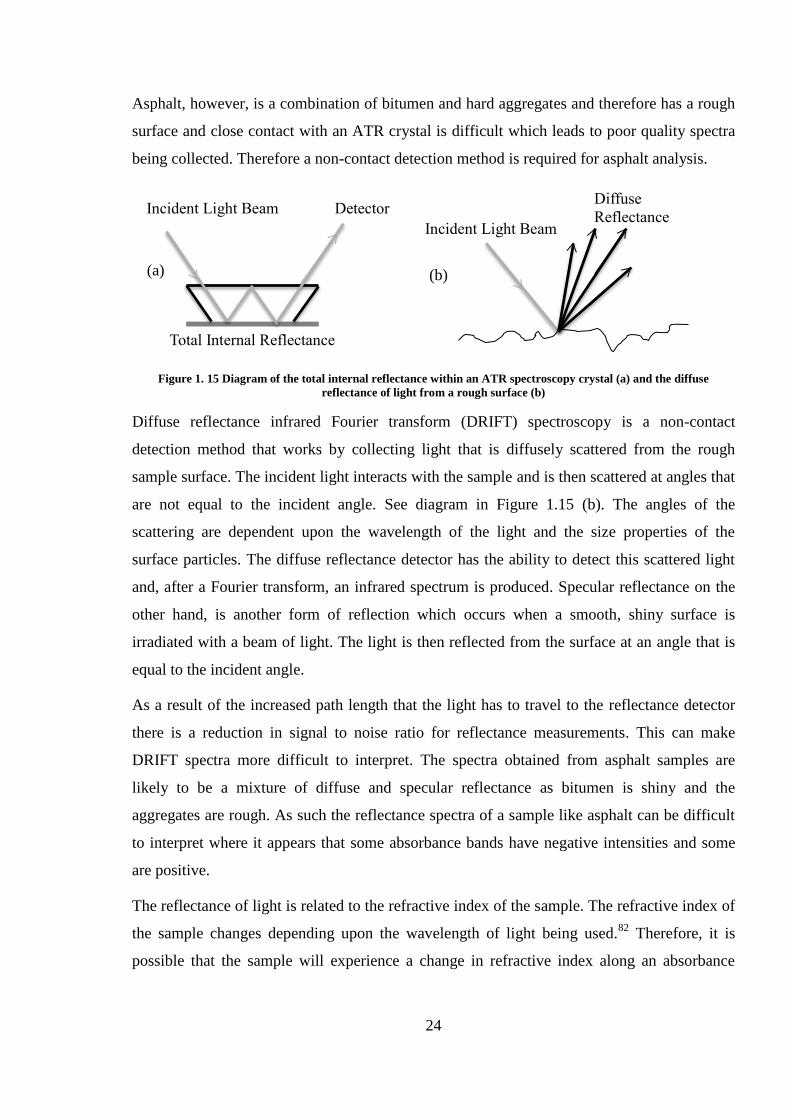
25
band, with a maximum absorbance at a high wavenumber and a minimum at a lower
wavenumber.
Figure 1. 16 Diagrammatic representation of a normal absorbance band and a first derivative graphical curve with
λmax at the 0 position.
This gives the absorbance band a first derivative characteristic with the expected λmax for the
absorbance of the functional group, at the centre of this band (Figure 1.16). 83
1.2.2 Experimental aims
The overall aim for this project is to develop the use of infrared spectroscopy for a traffic
speed detection of asphalt road surfaces, and to determine if this technique can predict failure
prior to visual detection of a defect. In this case the use of Diffuse Reflectance Infrared
Fourier Transform (DRIFT) spectroscopy has been investigated with a number of different
samples that have been aged artificially and naturally.
As asphalt is a mixture of raw bitumen, filler and aggregates of different mineral types, it is
beneficial to reduce the number of external components that may affect the infrared spectrum
of the sample in the first instance. Once any chemical and physical changes have been
identified within the raw bitumen, DRIFT spectroscopy can then be applied to asphalt
samples, which are more complex.
λ max
0 λ
Absorbance
λ max
0 λ
Absorbance

26
This project aims to answer the following research questions;
Can oxidation product functional groups be detected and assigned using ATR and
DRIFT spectra from the surface of raw bitumen that has been aged artificially and
with natural conditions?
Can these changes be appropriately quantified?
Do these chemical changes correspond to mechanical property changes within
the bitumen?
Can DRIFT spectroscopy be used to analyse asphalt, and to determine the chemical
changes in the surface after artificial and natural ageing experiments?
After recovery of the bitumen from these aged asphalt samples, is there a
change in the mechanical properties?
To ascertain if it is possible to utilise a DRIFT system to analyse road surfaces in real
time
What will the issues be for developing DRIFT spectroscopy into a traffic speed
detection method?
27
Part 2-Sample preparation and experimental parameters
40/60 penetration grade bitumen has been used for the testing in this project. Samples for the
bitumen were prepared by heating the bulk bitumen sample at 150 ˚C for approximately 1
hour until the bitumen was viscous enough to pour. Aluminium tins were used to hold the
bitumen, and approximately 150 g was decanted into each tin ready for the different ageing
experiments. The bitumen was allowed to cool before it was subjected to any ageing.
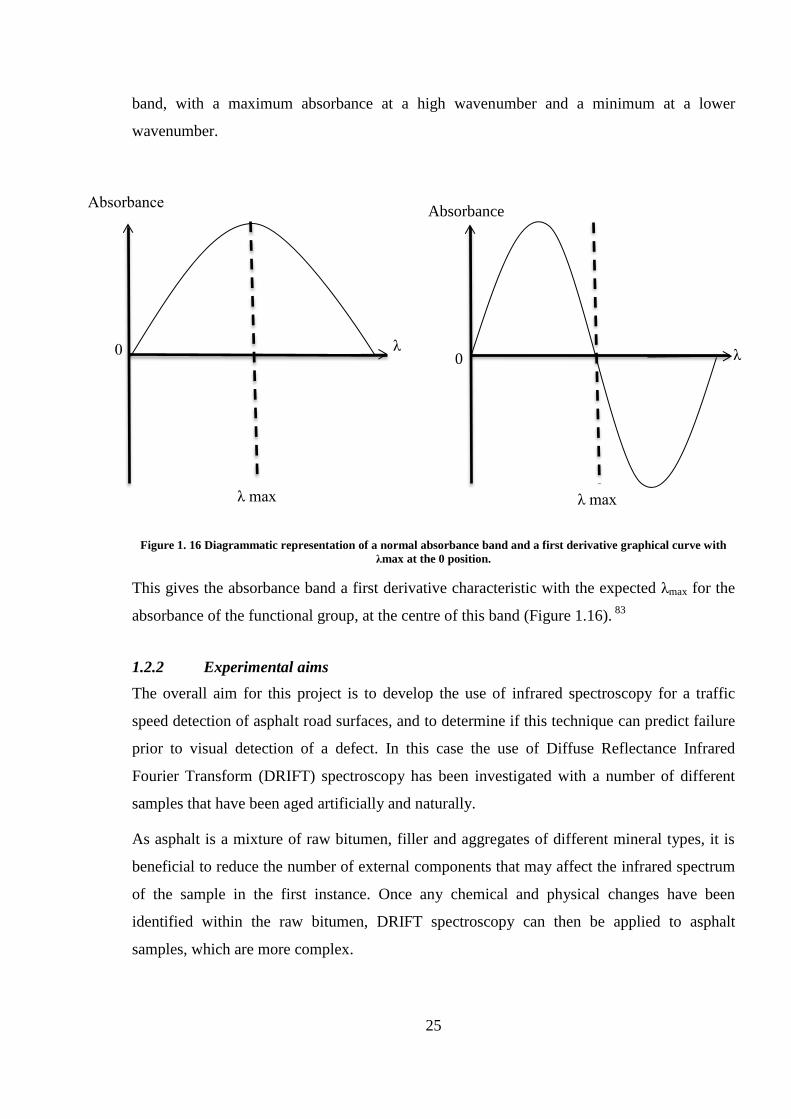
Asphalt samples have been manufactured using a 10 mm stone mastic asphalt (SMA)
purchased from United Asphalt. Stone mastic asphalt is hard, durable asphalt used widely
within Europe as it is resistant to deformation. The samples were compacted into 200 x 200 x
50 mm slabs using a wooden mould shown in Figure 1.17. The samples have been made
according to the parameters outlined in the British Standard EN 13108-1:2006.84
Figure 1. 17 Photographs of the asphalt samples being created at the Transport Research Laboratory (TRL).
The enhanced ageing experiments outlined in the following chapters have been carried out
using the Rolling Thin Film Oven test and ultra-violet light exposure.
The RTFO test was carried out by following the British Standard EN 12607-1, 1999, 30
using
a MATEST Rolling Thin Film oven at TRL.
A UV light chamber was built as part of this project at TRL which contains 8 Sylvia UV
black lights that omit broad-band UV light with a maximum output at 368 nm. The chamber
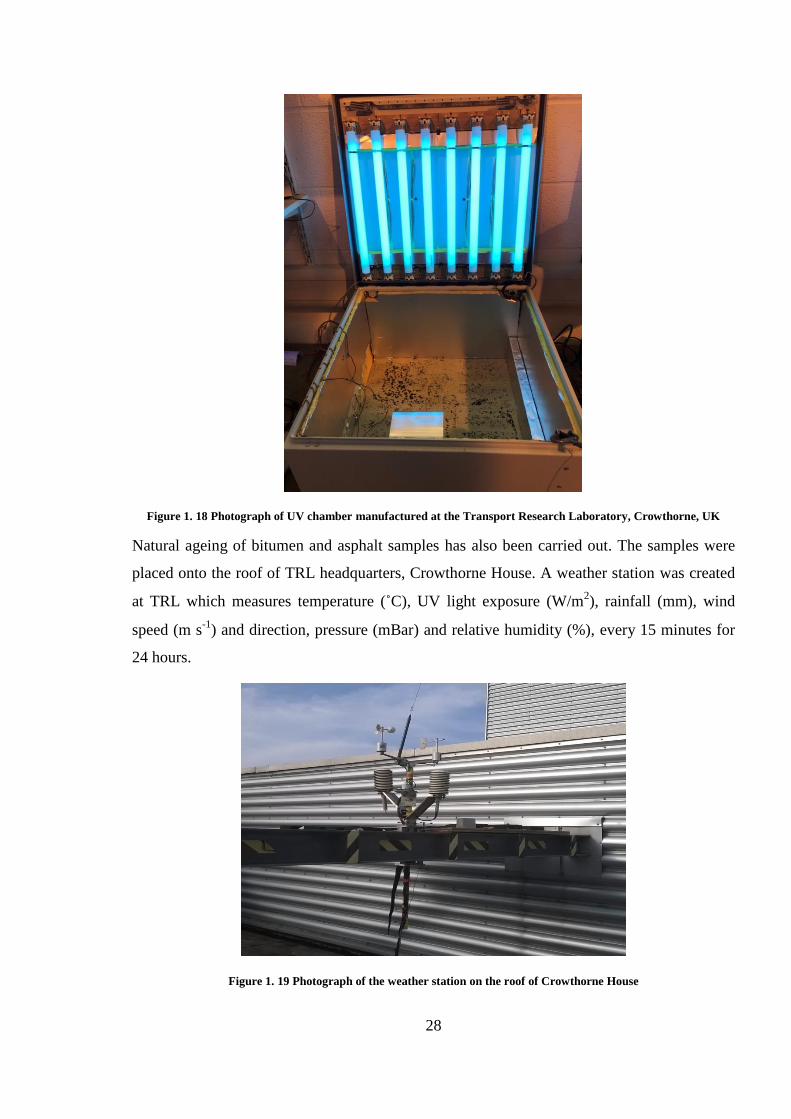
was held at 60 ˚C in order to enhance the ageing of the samples. Figure 1.18 is a photograph
of the UV chamber.
28
Figure 1. 18 Photograph of UV chamber manufactured at the Transport Research Laboratory, Crowthorne, UK
Natural ageing of bitumen and asphalt samples has also been carried out. The samples were
placed onto the roof of TRL headquarters, Crowthorne House. A weather station was created
at TRL which measures temperature (˚C), UV light exposure (W/m2), rainfall (mm), wind
speed (m s-1
) and direction, pressure (mBar) and relative humidity (%), every 15 minutes for
24 hours.
Figure 1. 19 Photograph of the weather station on the roof of Crowthorne House
29
The mechanical properties of the bitumen were measured using the penetration point, the
softening point and the Vialit pendulum test. The mechanical test methods have been carried
out using the British Standards- BSEN 1426:2015, BSEN 1427:2015, and BSEN 13588:2008,
respectively, and will be explained in full in Chapter 3.
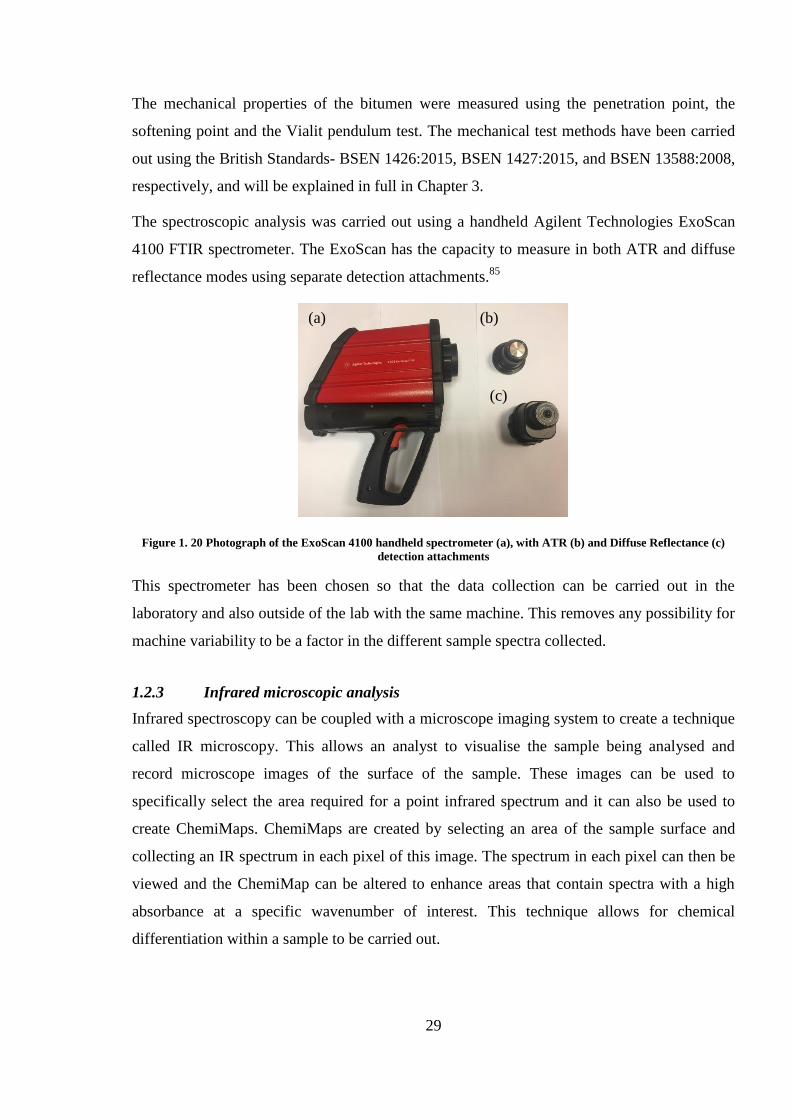
The spectroscopic analysis was carried out using a handheld Agilent Technologies ExoScan
4100 FTIR spectrometer. The ExoScan has the capacity to measure in both ATR and diffuse
reflectance modes using separate detection attachments.85
Figure 1. 20 Photograph of the ExoScan 4100 handheld spectrometer (a), with ATR (b) and Diffuse Reflectance (c)
detection attachments
This spectrometer has been chosen so that the data collection can be carried out in the
laboratory and also outside of the lab with the same machine. This removes any possibility for
machine variability to be a factor in the different sample spectra collected.
1.2.3 Infrared microscopic analysis
Infrared spectroscopy can be coupled with a microscope imaging system to create a technique
called IR microscopy. This allows an analyst to visualise the sample being analysed and
record microscope images of the surface of the sample. These images can be used to
specifically select the area required for a point infrared spectrum and it can also be used to
create ChemiMaps. ChemiMaps are created by selecting an area of the sample surface and
collecting an IR spectrum in each pixel of this image. The spectrum in each pixel can then be
viewed and the ChemiMap can be altered to enhance areas that contain spectra with a high
absorbance at a specific wavenumber of interest. This technique allows for chemical
differentiation within a sample to be carried out.
(a) (b)
(c)
30
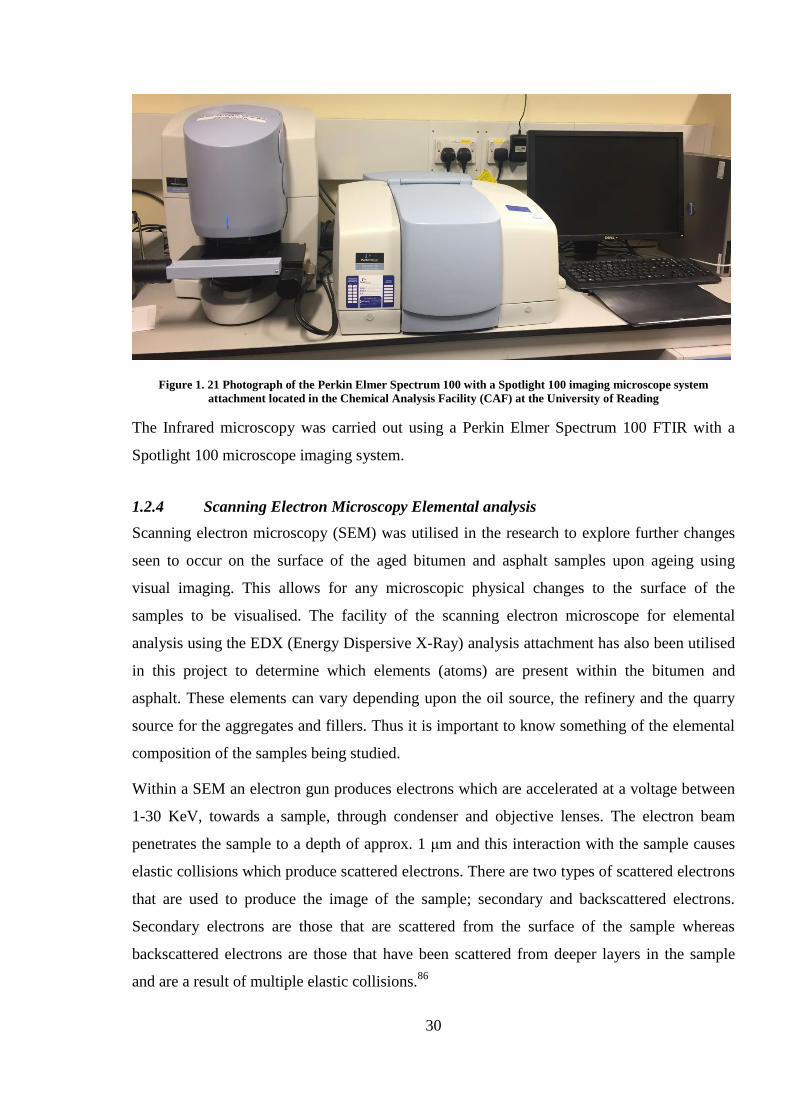
Figure 1. 21 Photograph of the Perkin Elmer Spectrum 100 with a Spotlight 100 imaging microscope system
attachment located in the Chemical Analysis Facility (CAF) at the University of Reading
The Infrared microscopy was carried out using a Perkin Elmer Spectrum 100 FTIR with a
Spotlight 100 microscope imaging system.
1.2.4 Scanning Electron Microscopy Elemental analysis
Scanning electron microscopy (SEM) was utilised in the research to explore further changes
seen to occur on the surface of the aged bitumen and asphalt samples upon ageing using
visual imaging. This allows for any microscopic physical changes to the surface of the
samples to be visualised. The facility of the scanning electron microscope for elemental
analysis using the EDX (Energy Dispersive X-Ray) analysis attachment has also been utilised
in this project to determine which elements (atoms) are present within the bitumen and
asphalt. These elements can vary depending upon the oil source, the refinery and the quarry
source for the aggregates and fillers. Thus it is important to know something of the elemental
composition of the samples being studied.
Within a SEM an electron gun produces electrons which are accelerated at a voltage between
1-30 KeV, towards a sample, through condenser and objective lenses. The electron beam
penetrates the sample to a depth of approx. 1 μm and this interaction with the sample causes
elastic collisions which produce scattered electrons. There are two types of scattered electrons
that are used to produce the image of the sample; secondary and backscattered electrons.
Secondary electrons are those that are scattered from the surface of the sample whereas
backscattered electrons are those that have been scattered from deeper layers in the sample
and are a result of multiple elastic collisions.86
31
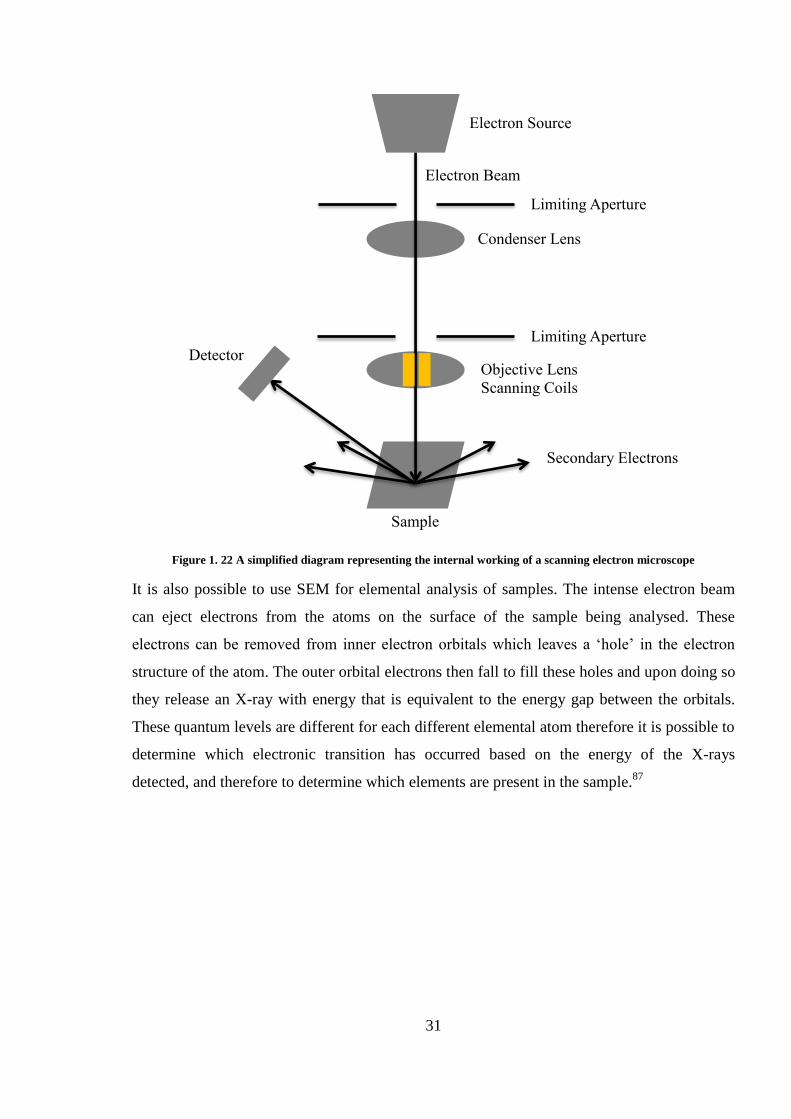
Figure 1. 22 A simplified diagram representing the internal working of a scanning electron microscope
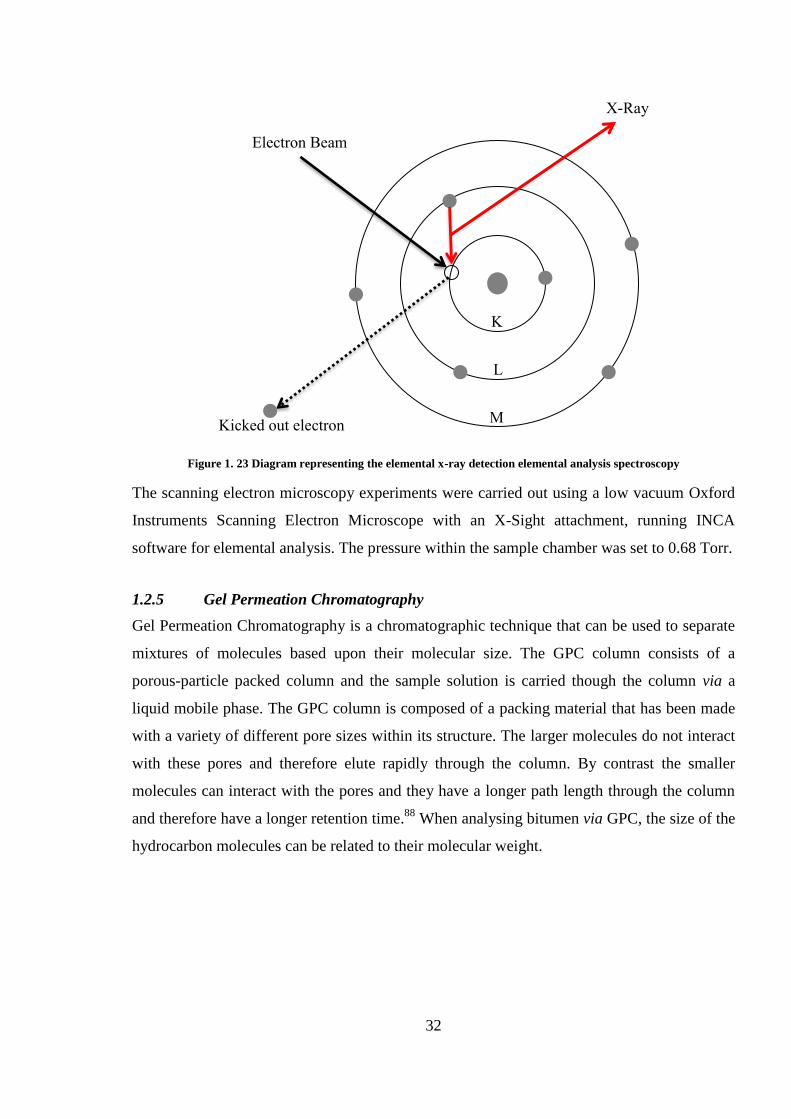
It is also possible to use SEM for elemental analysis of samples. The intense electron beam
can eject electrons from the atoms on the surface of the sample being analysed. These
electrons can be removed from inner electron orbitals which leaves a ‘hole’ in the electron
structure of the atom. The outer orbital electrons then fall to fill these holes and upon doing so
they release an X-ray with energy that is equivalent to the energy gap between the orbitals.
These quantum levels are different for each different elemental atom therefore it is possible to
determine which electronic transition has occurred based on the energy of the X-rays
detected, and therefore to determine which elements are present in the sample.87
Electron Source
Condenser Lens
Limiting Aperture
Limiting Aperture
Objective Lens
Scanning Coils
Detector
Secondary Electrons
Sample
Electron Beam
32
Figure 1. 23 Diagram representing the elemental x-ray detection elemental analysis spectroscopy
The scanning electron microscopy experiments were carried out using a low vacuum Oxford
Instruments Scanning Electron Microscope with an X-Sight attachment, running INCA
software for elemental analysis. The pressure within the sample chamber was set to 0.68 Torr.
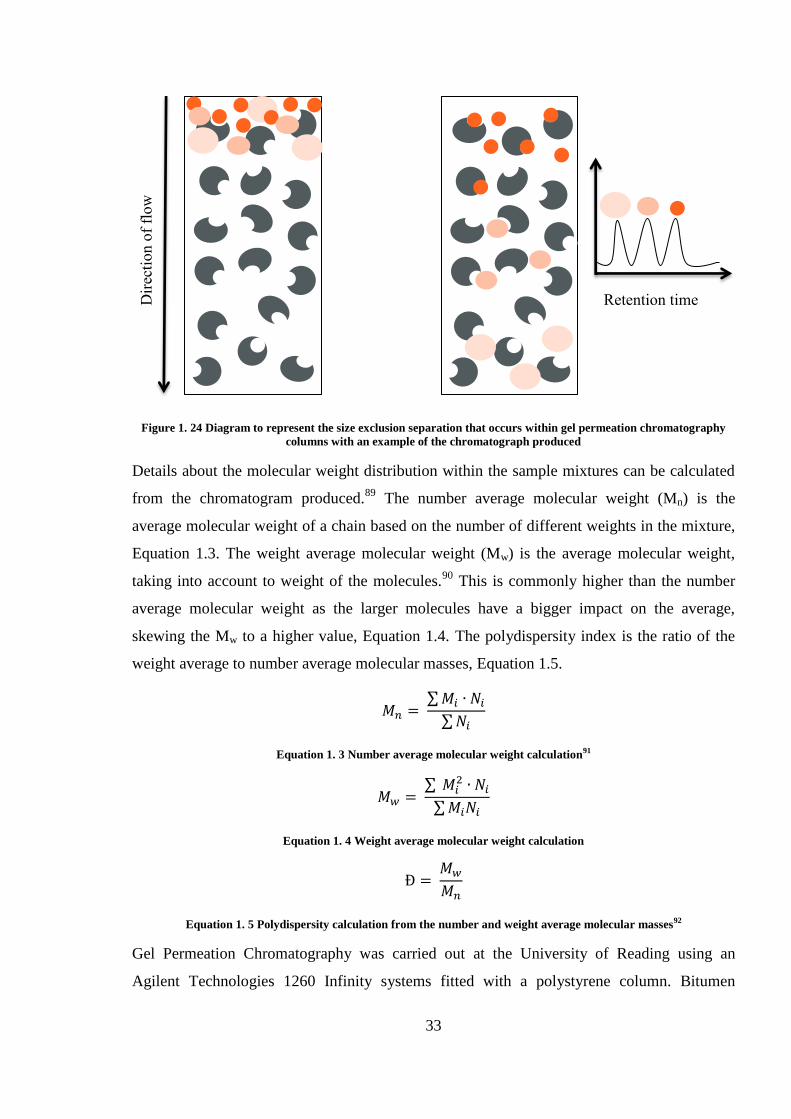
1.2.5 Gel Permeation Chromatography
Gel Permeation Chromatography is a chromatographic technique that can be used to separate
mixtures of molecules based upon their molecular size. The GPC column consists of a
porous-particle packed column and the sample solution is carried though the column via a
liquid mobile phase. The GPC column is composed of a packing material that has been made
with a variety of different pore sizes within its structure. The larger molecules do not interact
with these pores and therefore elute rapidly through the column. By contrast the smaller
molecules can interact with the pores and they have a longer path length through the column
and therefore have a longer retention time.88
When analysing bitumen via GPC, the size of the
hydrocarbon molecules can be related to their molecular weight.
Electron Beam
Kicked out electron
X-Ray
M
L
K
33
Figure 1. 24 Diagram to represent the size exclusion separation that occurs within gel permeation chromatography
columns with an example of the chromatograph produced
Details about the molecular weight distribution within the sample mixtures can be calculated
from the chromatogram produced.89
The number average molecular weight (Mn) is the
average molecular weight of a chain based on the number of different weights in the mixture,
Equation 1.3. The weight average molecular weight (Mw) is the average molecular weight,
taking into account to weight of the molecules.90
This is commonly higher than the number
average molecular weight as the larger molecules have a bigger impact on the average,
skewing the Mw to a higher value, Equation 1.4. The polydispersity index is the ratio of the
weight average to number average molecular masses, Equation 1.5.
𝑀𝑛 = ∑ 𝑀𝑖 ∙ 𝑁𝑖
∑ 𝑁𝑖
Equation 1. 3 Number average molecular weight calculation91
𝑀𝑤 = ∑ 𝑀𝑖
2 ∙ 𝑁𝑖
∑ 𝑀𝑖𝑁𝑖
Equation 1. 4 Weight average molecular weight calculation
Ð = 𝑀𝑤
𝑀𝑛
Equation 1. 5 Polydispersity calculation from the number and weight average molecular masses92
Gel Permeation Chromatography was carried out at the University of Reading using an
Agilent Technologies 1260 Infinity systems fitted with a polystyrene column. Bitumen
Dir
ecti
on o
f fl
ow
Retention time

34
samples were dissolved in Tetrahydrofuran (THF) (2 mg/mL), filtered and then run through
the GPC with a flow rate of 4 mL/min. The molecules were then detected using a refractive
index detector. This works by detecting a change in the refractive index of the sample
compared to a reference of the blank solvent. When a molecule enters the refractometer it
diffracts the light and this change is detected.
35
References
1 J. Reed and D. Whiteoak, The Shell Bitumen Handbook, Shell UK Oil Products Limited,
2003.
2 Mastering bitumen for better roads and innovative application, Road-construction bitumen
characteristics-1-generalities, École des Ponts ParisTech,
https://www.coursera.org/lecture/mastering-bitumen/11-road-construction-bitumens-
characteristics-1-generalities-S3ttR, ACCESSED 27.08.2018, 16:03.
3 P. Redelius and H. Soenen, Relation between bitumen chemistry and performance, Fuel,
140, 2015, 34-43.
4 www.bitumeninstitute.org/wp-content/uploads/IS230_3edition.pdf, ACCESSED 25.01.16
5 A. Kebritchi, A. Jalali-Arani and A. A. Roghanizad, Rheological behaviour and properties
of bitumen modified with polymeric coated precipitated calcium carbonate, Constr. Build,
Mater., 25, 2011, 2875-2882.
6 X. Lu and U. Isacsson, Effect of ageing on bitumen chemistry and rheology, Const. Build.
Mater., 16, 2002, 15-22.
7 J. C. Nicholls, Asphalt Surfacings, A guide to asphalt surfacings and treatments used for the
surface course of road pavements, E & FN SPON, London, 1998.
8 S. Rudyk, Relationships between SARA fractions of conventional oil, heavy oil, natural
bitumen and residues, Fuel, 216, 2018, 330-340.
9 Asphaltenes and Waxes, SPE international, http://petrowiki.org/Asphaltenes_and_waxes,
ACCESSED 23.09.2018.
10 Mastering bitumen for better roads and innovative applications, Road-construstion
bitumens characteristics-4-ageing, https://www.coursera.org/lecture/mastering-bitumen/14-
road-construction-bitumens-characteristics-4-ageing-xmJOU, ACCESSED 27.07.2018, 16:17.
11 O. C. Mullins, Modified Yen Model, Energy and Fuels, 24 (4), 2010, DOI:
10.1021/ef900975e
12 Mastering bitumen for better roads and innovative applications, Composition of bitumen,
École des ParisTech, https://www.coursera.org/lecture/mastering-bitumen/10-composition-of-
bitumen-y2T4y, ACCESSED 28.07.2018, 14:29.
13 J. A Wess, L. D. Olsen and M. H. Sweeney, Concise International Chemical Assessment
Document 59, (Asphalt Bitumen), World Health Organisation, 2005.
14 L. Francken, Bituminous Bitumens and Mixes, E&FN SPON, London, 1998.
36
15 M. Elkashed, R. C. Williams and E. Cochran, Investigation of fatigue and thermal cracking
behaviour of rejuvenated reclaimed asphalt pavement binders and mixtures, Int. J. Fatigue,
108, 2018, 90-95.
16 Roadex Network, Permanent deformation rutting classification, E-Learning lesion 3.1-Why
rutting classification is needed, http://www.roadex.org/e-learning/lessons/permanent-
deformation/permanent-deformation-rutting-classification/, ACCESSED 28.07.2018, 08:29.
17 Pavement Interactive Webpage-Rutting. www.pavementinteractive.org/article/Rutting/
ACCESSED 29.05.2018 13:47.
18 Mastering bitumen for better roads and innovative applications, École des Ponts ParisTech,
Road Construction bitumen characteristics-2-Penetratability and softening point,
https://www.coursera.org/lecture/mastering-bitumen/12-road-construction-bitumens-
characteristics-2-penetrability-softening-point-dmMqA, ACCESSED 28.07.2018, 09:21.
19 British Standard EN 1426:2015, Bitumen and bituminous binders- Determination of needle
penetration.
20 D. Mastrofini and M. Scarsella, Application of Rheology to the evaluation of Bitumen
Ageing, Fuel, 79 (9), 2000, 1005-1015.
21 S. A. Nabavi-Amri, A. Haghighi and M. M. Norouzi, Improving the Ageing resistance of
bitumen by reduction, Pet. Sci. Technol., 33, 2015, 780-786.
22 British Standard EN 1427:2015, Bitumen and bituminous binders- Determination of the
softening point- Ring and Ball method.
23 British Standard EN 13588:2008, Bitumen and bituminous binders- Determination of
cohesion of bituminous binders with pendulum test.
24 Mastering bitumen for better roads and innovative applications, École des Ponts ParisTech,
Rheology of bitumens video, https://www.coursera.org/lecture/mastering-bitumen/17-
rheology-of-bitumens-8J4Ji, ACCESSED 27.07.2018, 14:06.
25 S.Saoula, K. Soudani, S. Haddadi, M. E. Munoz, A. Santamaria, Analysis of the rheological
behaviour of bitumen and predicting the risk of permanent deformation of asphalt, Materials
Sciences and Applications, 4, 2013, 312-318.
26 X. Li, A. Zofka, M. Marasteanu and T. R. Clyne, Evaluation of field ageing effects on
asphalt binder properties, Road Mater. Pavement, EATA, 2006, 57-73.
37
27 A. Kebritchi, A. Jalali-Arani and A. A. Roghanizad, Rheological behaviour and properties
of bitumen modified with polymeric coated precipitated calcium carbonate, Constr. Build,
Mater., 25, 2011, 2875-2882.
28 B. Sengoz, L. Bagayogo, J. Oner and A. Topal, Investigation of rheological properties of
transparent bitumen, Constru. Build. Mater., 154, 2017, 1105-1111.
29 British Standard EN 13074 2:2011, Bitumen and bituminous binders- Recovery of binder
from bituminous emulsion or cut-back or fluxed bituminous binders. Stabilisation after
recovery by evaporation.
30 British Standard, EN. 12607-1: Bitumen and bituminous binders- Determination of the
resistance to hardening under the influence of heat and air, RTFOT method. (2007) British
Standards Institution.
31 D. Gershkoff, A38 Pervious Mecadax Trial 1984: Binder Rheology before and after
artificial hardening, Transport and Road Research Laboratory, Dept. Transport, Unpublished
Work, 1984.
32 A. Verhasselt, “Long-term ageing – Simulation by RCAT ageing tests”. 9th International
Conference on Asphalt Pavements, Conference proceedings in PDF format - vol.1, paper 1: 1-
2 (16 p.), Copenhagen, August 17-22, 2002.
33 British Standard EN 15323:2007, Bitumen and bituminous binders-Accelerated long-term
ageing/ conditioning by the rotating cylinder method (RCAT).
34 ASTM International, Designation: D6521-13, Standard Practice for accelerated ageing of
asphalt binder using a pressure ageing vessel (PAV), 2016.
35 British Standard EN 14769:2012, Bitumen and bituminous binders -Accellerated long-term
Ageing conditioning by a Pressure Ageing Vessel (PAV).
36 W. Zeng, S. Wu, J. Wen and Z. Chen, The temperature effects in ageing index of asphalt
during UV ageing process, Constr. Build Mater., 93,2015, 1125-1131.
37 F. Durrieu, F. Farcas, V. Mouillet, The influence of UV ageing of a
styrene/butadiene/styrene modified bitumen: comparison between laboratory and on site
ageing, Fuel, 86, 2007, 1446-1451.
38 Z. G. Feng, J. Y. Yu, H. L. Zhang, D. L. Kuang and L. H. Xue, Effect of ultraviolet ageing
on rheology, chemistry and morphology of ultraviolet absorber modified bitumen, Mater.
Struct., 46, 2013, 1123-1132.
38
39 X. Lui, S. Wu, L. Pang, Y. Xiao and P. Pan, Fatigue properties of layered double
hydroxides modified asphalt and its mixture, Adv. Mater. Sci. Eng., 2014.
40 F. Ye, J. Yang and P. Huang, Performance of modified asphalt ageing under ultraviolet
radiation. In: Pavement Mechanics and Performance-GeoShanghai International Conference,
2006.
41 J. Y. Yu, P. C. Feng, H. L. Zhang and S. P. Wu, Effect on organo-montmorillonite on
ageing properties of asphalt, Constr. Build Mater., 23, 2009, 2636-2640.
42 T. Yi-Qui, W. Jia-Ni, F. Zhong-Liang and Z. Xing-Ye, Influence and mechanism of
ultraviolet ageing on bitumen performance, 26th
Southern African Transport Conference,
Pretoria South Africa, 2007, 726-735.
43 Y. Tan, F. Zhongliang, Z. Xiingye et al., The evaluation method study of the anti-ultraviolet
ageing ability of asphalt, Science Paper Online, 2003.
44 V. Mouillet, F. Farcas and S. Besson, Ageing by UV radiation of an elastomer modified
bitumen, Fuel, 87, 2008, 2408-2419.
45 V. C. F. Lins, M. F. A. S. Araujo, M. I. Yoshida, V. P. Fessaz, D. M Andrada and F. S.
Lameiras, Photodegradation of hot mix asphalt, Fuel, 87, 2008, 3254-3261.
46 M. F. A. Araujo, V.C.F. Lins, and V. M. D. Pasa, Effect of ageing on porosity of hot mix
asphalt, Brazilian Journal of Petroleum and Gas, 5, 2011, 11-18.
47 M. Lopes, D. Zhao, E. Chailleux, M. Kane, T. Gabet, C. Petiteau and J. Soares,
Characterisation of ageing processes on the asphalt mixture surface, Road Mater. Pavement,
15(3), 2014, 477-487.
48 Y. Hachiya, K. Nomura and J. Shen, Accelerated Ageing tests for bitumen concretes, 6th
RILEM Symposium, PTEBM’03, Zurich, 2003.
49 J. C. Petersen, Chemical composition of asphalt as related to asphalt durability-state of the
art, TRB, 999, 1984, 13-30.
50J. C. Petersen, P. M. Harnsberger and R. E. Robertson, Factors affecting the oxidation and
age hardending kinetics of asphalt and the relative effects of oxidation products on viscosity,
Preprints, Division of Fuel Chemistry, ACS, 41(4), 1986, 1232-1244.
51 S.A. Nabavi-Amri, A. H. Asl, and M. M. Norouzi, Improving the ageing resistance of
bitumen by reduction, Pet. Sci. Technol., 33, 2015, 780-786.
52 Y. R. Kim and J. H. Lee, Evaluation of the effect of ageing on mechanical and fatigue
properties of sand asphalt mixtures, KSCE J. Civ. Eng., 7, 2003, 389-398.
39
53 J. C. Petersen and R. Glaser, Asphalt oxidative mechanisms and the role of oxidation
products on age hardening revisited, Road Mater. Pavement, 12, 2011, 795-819.
54 J. Minglin, Y. Junhe, F. Anzu and S. Meiren, Analysis of ageing behaviour of South Korea
70 asphalt. Part 1. Changes of component and property, Coal Conversion , 24, 2001, 92-95 .
55 J. C. Petersen, Asphalt oxidation-An overview including a new model for oxidation
proposing that physiochemical factors dominate oxidation kinetics, Fuel, 11, 1993, 57-58.
56 R. M. Harrison, Pollution: Causes, Effects & Control, Royal Society of Chemistry,
Cambridge, 1990.
57 M. C. DeRosa and R. J. Crutchley, Photosensitised singlet oxygen and its applications,
Coordin. Chem. Rev., 233-234, 2002, 351-371.
58 C. S. Foote, Mechanisms of addition of singlet oxygen to olefins and other substrates, Pure
Appl. Chem. 27(4), 1971.
59 C. S. Foote and J. W. Peters, Chemistry of singlet oxygen. XIV. Reactive intermediate in
sulphide photooxidation, J. Am. Chem. Soc., 93(15), 1971, 3795-3796.
60 S. Li, J. Matthews and A. Sinha, Atmospheric hydroxyl radical production from
electronically excited NO2 and H2O, Science, 319 (5870), 2008, 165-1660.
61 Forster, P., V. Ramaswamy, P. Artaxo, T. Berntsen, R. Betts, D.W. Fahey, J. Haywood, J.
Lean, D.C. Lowe, G. Myhre, J. Nganga, R. Prinn, G. Raga, M. Schulz and R. Van Dorland,
2007: Changes in Atmospheric Constituents and in Radiative Forcing. In: Climate Change
2007: The Physical Science Basis. Contribution of Working Group I to the Fourth Assessment
Report of the Intergovernmental Panel on Climate Change [Solomon, S., D. Qin, M.
Manning, Z. Chen, M. Marquis, K.B. Averyt, M.Tignor and H.L. Miller (eds.)]. Cambridge
University Press, Cambridge, United Kingdom and New York, NY, USA.
62 Solarchem Environmental Systems, The UV/ Oxidation handbook,
http://infohouse.p2ric.org/ref/27/26568.pdf, ACCESSED 11.06.2018, 10:15.
63 J. Zhang, A. K. Apeagyei, G. D. Airey and J. R. A. Grenfell, Influence of aggregate
mineralogical composition on water resistance of aggregate-bitumen adhesion, Int. J. Adhe.
Adhe., 62, 2015, 45-54.
64 J. Zhang, A. K. Apeagyei, H. Grenfell and G. D. Airey, Experimental study of moisture
sensitivity of aggregate-bitumen bonding strength using a new pull-off test, in the 8th
RILEM
International Symposium on Testing and Characterisation of Sustainable and Innovative
Bituminous Materials, RILEM Bookseries 11, DOI 10.1007/978-94-017-7342-3_58.
40
65 J. A. H. Noguera, H. A. R. Quintana and W. D. F. Gomez, The influence of water on the
oxidation of asphalt cements, Const. Build. Mater., 71, 2014, 451-455.
66 J.G. Geng, H. Li, W.G. Li, Aging characteristic of styrene-butadiene-styrene modified
asphalt under thermal-humidity conditions, Int. J. Pavement Res. Technol. 7 (5) (2014) 376–
380.
67 Q. Wang, S. Li, X. Wu, S. Wang and C. Ouyang, Weather ageing resistance of different
rubber modified asphalts, Constr. Build Mater., 106, 2016, 443-448.
68 B. Stuart, B. George and P. McIntyre, Modern Infrared Spectroscopy, John Wiley and
Sons, Chichester, 1996.
69 S. Richard and P. T. Leung, Identification and evaluation of coatings using handheld FTIR,
Agilent Technologies Inc, Publ. 5990-8075EN, 2011.
70 A. Rein and F. Higgins, At site rock and mineral analysis measurement using a handheld
Agilent FTIR analyser, Agilent Technologies Inc, Publ, 5990-7794EN, 2011.
71 A. Rein, FTIR analysis provides rabid QA/QC and authentication of food ingredients prior
to processing, Agilent Technologies Inc., Publ., 5991-1246 EN, 2012.
72 K. Nakamoto, Infrared and Raman Spectra of inorganic and coordination compounds,
John Wiley and Sons, New York, USA, 1986.
73 S. M. Dorrence, F. A. Barbour and J. C. Petersen, Direct evidence of ketones in oxidized
asphalts, Analytical Chemistry, 46, 1974, 2242-2244.
74 J. C. Petersen, Quantitative method using differential infrared spectrometry for
determination of the compound types absorbing in the carbonyl region in asphalts, Analytical
Chemistry, 47, 1975, 112-117.
75 H. Plancher, E. L. Green and J. C. Petersen, reduction of oxidative hardening of asphalts by
treatment with hydrated lime: a mechanistic study, Proc., Association of asphalt paving
technologist, 45, 1976, 1-24.
76 J. C. Petersen and H. Plancher, Quantification determination of carboxylic acids by
selective chemical reactions and differential infrared spectrometry, Analytical Chemistry, 53,
1981, 786-789.
77 M. Lui, M. A. Ferry, R. R. Davison, C. J Glover and J. A. Bullin, Oxygen uptake as
correlated to carbonyl growth in aged asphalts and asphalt Corbett fractions, Ind. Eng. Chem.
Res, 37, 1998, 4669-4674.
41
78 R. Karlsson, and U. Isacsson, Investigations on bitumen rejuvenator diffusion and structural
stability (with discussion), J., Assoc., Asphalt Pav., 72, 2003, 463-501.
79 K. Yamaguchi, I. Sasaki and S. Meiarashi, Photodegradation test of asphalt binder using
pressed thin film samples, Can., J., Civ., Eng., 32, 2005, 1166-1169.
80 M. R. Nivitha, E. Prasad and J. M. Krishnan, Ageing in modified bitumen using FTIR
spectroscopy, Int. J. Pav. Eng., 565-577, 17 (7), 2015.
81 F. M. Mirabella, Internal Reflection Spectroscopy: Theory and Applications, Practical
Spectroscopy Series, Marcel Dekker Inc, 1992.
82 Molecular Expressions, Optical Microscopy Primer, Physical of Light and Colour,
Interactive tutorial, Refraction of Light,
http://micro.magnet.fsu.edu/primer/java/refraction/refractionangles/index.html, ACCESSED
13.07.2018, 09:32.
83 Perkin Elmer Technical Note, Reflection Measurements in IR spectroscopy, R. Spragg,
Perkin Elmer Inc. Seer Green, UK, https://www.perkinelmer.com/CMSResources/Images/44-
153348TCH_reflection-Measurements.pdf ACCESSED 30.05.2018 17:12.
84 British Standard EN 13108-1:2006, Bituminous mixtures, Asphalt Concrete.
85 Agilent 4100 ExoScan FTIR, Operation Manual, Agilent Technologies,
https://www.agilent.com/cs/library/usermanuals/Public/0023-401.pdf, ACCESSED
13.07.2018, 09:56.
86 A. Khursheed, Scanning Electron Microscope optics and spectrometers, World Scientific
Publishing Co Pte Ltd, Singapore, 2014, EBOOK ISBN 9789812836687.
87 R. F. Egerton, Physical Principlesof Electron Microscopy: An Introduction to TEM, SEM
and AEM, Springer, New York, 2006, EBOOK ISBN 9780387260167.
88 A. Striegel, W. W. Yau, J. J. Kirkland and D. D. Bly, Modern Size-Exclusion Liquid
Chromatography: Practice of Gel Permeation and Gel Filtration Chromatography, Wiley,
New Jersey, 2009, EBOOK ISBN 9780470442838.
89 J. W. Nicholson, The Chemistry of Polymers, Royal Society of Chemistry, United
Kingdom, 2017, ISBN 9781788011143.
90 Technical Overview, Polymer Molecular Weight Distribution and Definitions of MW
Averages, Agilent Technologies Inc., USA, 2015, 5990-7890EN,
https://www.agilent.com/cs/library/technicaloverviews/Public/5990-7890EN.pdf.
91 R.J. Young and P.A. Lovell, Introduction to Polymers, Taylor & Francis, London, 1991.

42
92 R. F. T. Stepto, R. G. Gilbert, M. Hess, A. D. Jenkins, R. G. Jones and P. Kratochvíl,
Dispersity in Polymer Science, Pure Appl. Chem. 81 (2), 351–353.
43
Chapter 2
Artificial and natural ageing of bitumen-Infrared
spectroscopic analysis
This chapter outlines the experimental procedures and the results obtained from the ageing
experiments on raw bitumen. The aim of these experiments was to determine whether
Attenuated Total Reflectance (ATR) and Diffuse Reflectance Infrared Fourier Transform
(DRIFT) spectroscopy can be utilised to monitor chemical changes that occur upon oxidation
of bitumen.
The experimental approach to this project began by ageing raw bitumen and identifying any
chemical changes as a result of oxidation. The ageing experiments have been devised to
expose raw bitumen to extremely harsh conditions in order to maximise the amount of
oxidation within the bitumen and enhance the measureable change in the infrared spectra and
physical properties. This will allow the areas of interest within the infrared spectrum that
correspond to chemical oxidation to be identified. Once these areas have been highlighted it is
possible to look for smaller changes within samples that have been aged less harshly, for
example in the case of natural ageing.
The Extended Rolling Thin Film Oven (E-RTFO) test and UV light exposure have been used
here as enhanced ageing techniques in order to attempt to mimic the thermal cycling of
bitumen when being applied to road surfaces and also the environmental conditions. The
results from these artificial ageing tests have also been compared to those measured from
naturally aged raw bitumen.
Gel Permeation Chromatographic (GPC) analysis has been carried out on all of the samples in
order to assess the molecular weight changes of the molecules within the bitumen
composition as the bitumen is aged. Scanning Electron Microscopy (SEM) has been carried
out on the test samples in order to visualise the surface structure of the bitumen and to
determine whether or not changes in physical microstructure may be related to chemical
changes. SEM-EDX analysis was also carried out in order to characterise the elemental
composition of the raw bitumen.
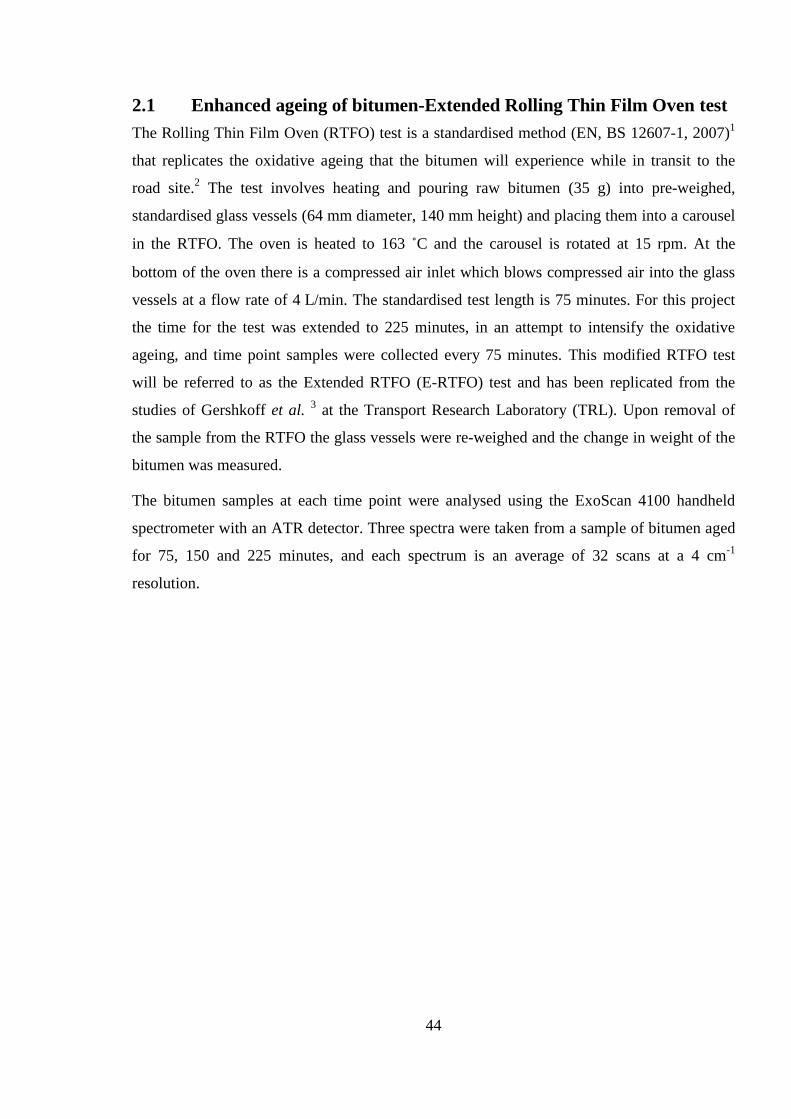
44
2.1 Enhanced ageing of bitumen-Extended Rolling Thin Film Oven test
The Rolling Thin Film Oven (RTFO) test is a standardised method (EN, BS 12607-1, 2007)1
that replicates the oxidative ageing that the bitumen will experience while in transit to the
road site.2 The test involves heating and pouring raw bitumen (35 g) into pre-weighed,
standardised glass vessels (64 mm diameter, 140 mm height) and placing them into a carousel
in the RTFO. The oven is heated to 163 ˚C and the carousel is rotated at 15 rpm. At the
bottom of the oven there is a compressed air inlet which blows compressed air into the glass
vessels at a flow rate of 4 L/min. The standardised test length is 75 minutes. For this project
the time for the test was extended to 225 minutes, in an attempt to intensify the oxidative
ageing, and time point samples were collected every 75 minutes. This modified RTFO test
will be referred to as the Extended RTFO (E-RTFO) test and has been replicated from the
studies of Gershkoff et al. 3 at the Transport Research Laboratory (TRL). Upon removal of
the sample from the RTFO the glass vessels were re-weighed and the change in weight of the
bitumen was measured.
The bitumen samples at each time point were analysed using the ExoScan 4100 handheld
spectrometer with an ATR detector. Three spectra were taken from a sample of bitumen aged
for 75, 150 and 225 minutes, and each spectrum is an average of 32 scans at a 4 cm-1
resolution.
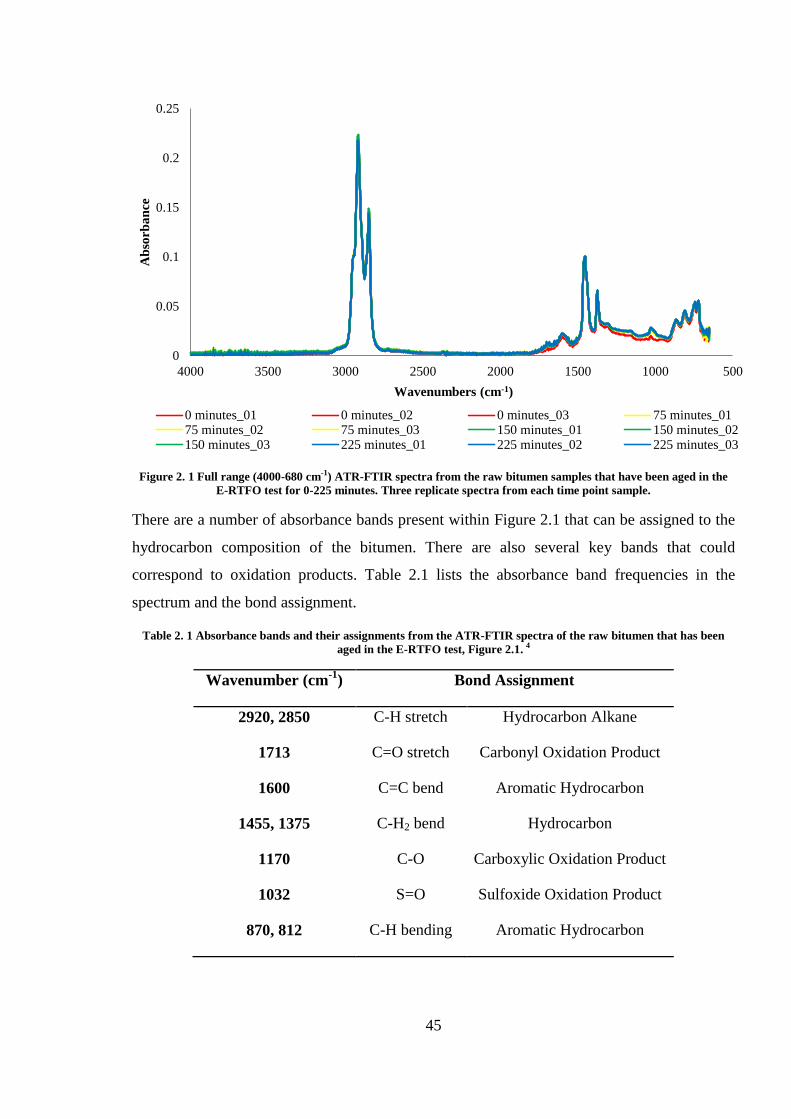
45
Figure 2. 1 Full range (4000-680 cm-1) ATR-FTIR spectra from the raw bitumen samples that have been aged in the
E-RTFO test for 0-225 minutes. Three replicate spectra from each time point sample.
There are a number of absorbance bands present within Figure 2.1 that can be assigned to the
hydrocarbon composition of the bitumen. There are also several key bands that could
correspond to oxidation products. Table 2.1 lists the absorbance band frequencies in the
spectrum and the bond assignment.
Table 2. 1 Absorbance bands and their assignments from the ATR-FTIR spectra of the raw bitumen that has been
aged in the E-RTFO test, Figure 2.1. 4
Wavenumber (cm-1
) Bond Assignment
2920, 2850 C-H stretch Hydrocarbon Alkane
1713 C=O stretch Carbonyl Oxidation Product
1600 C=C bend Aromatic Hydrocarbon
1455, 1375 C-H2 bend Hydrocarbon
1170 C-O Carboxylic Oxidation Product
1032 S=O Sulfoxide Oxidation Product
870, 812 C-H bending Aromatic Hydrocarbon
0
0.05
0.1
0.15
0.2
0.25
5001000150020002500300035004000
Ab
sorb
an
ce
Wavenumbers (cm-1)
0 minutes_01 0 minutes_02 0 minutes_03 75 minutes_0175 minutes_02 75 minutes_03 150 minutes_01 150 minutes_02150 minutes_03 225 minutes_01 225 minutes_02 225 minutes_03
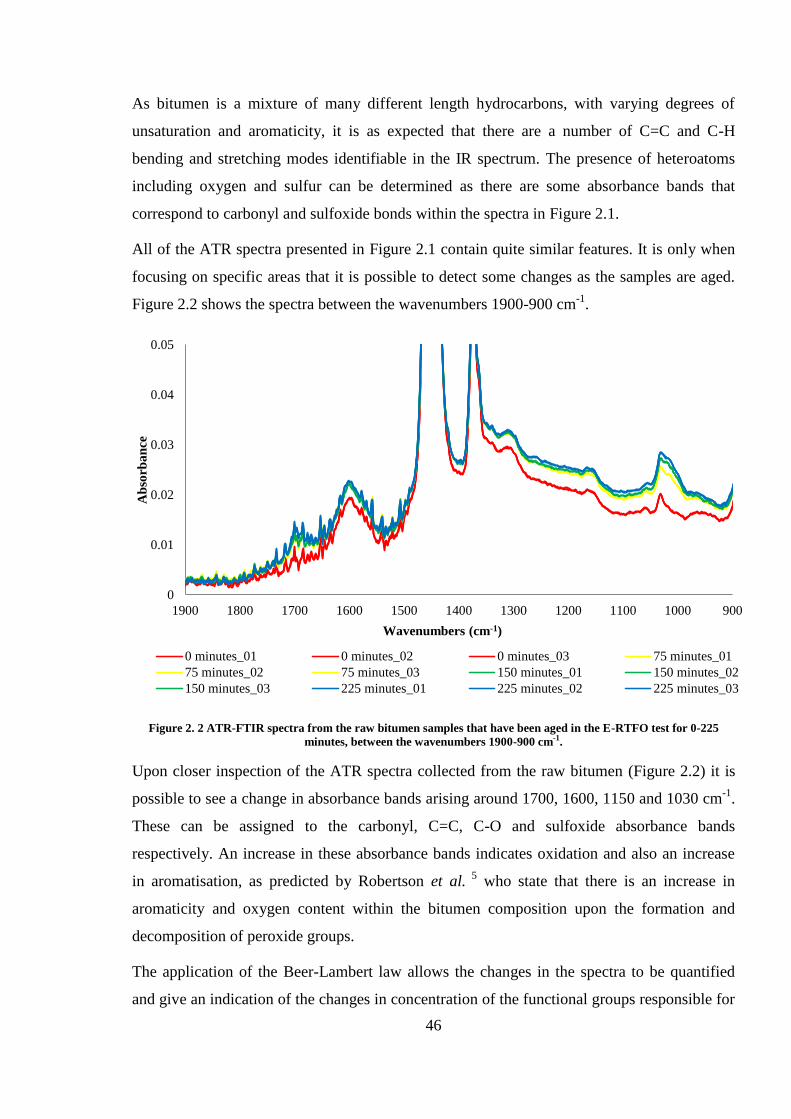
46
As bitumen is a mixture of many different length hydrocarbons, with varying degrees of
unsaturation and aromaticity, it is as expected that there are a number of C=C and C-H
bending and stretching modes identifiable in the IR spectrum. The presence of heteroatoms
including oxygen and sulfur can be determined as there are some absorbance bands that
correspond to carbonyl and sulfoxide bonds within the spectra in Figure 2.1.
All of the ATR spectra presented in Figure 2.1 contain quite similar features. It is only when
focusing on specific areas that it is possible to detect some changes as the samples are aged.
Figure 2.2 shows the spectra between the wavenumbers 1900-900 cm-1
.
Figure 2. 2 ATR-FTIR spectra from the raw bitumen samples that have been aged in the E-RTFO test for 0-225
minutes, between the wavenumbers 1900-900 cm-1.
Upon closer inspection of the ATR spectra collected from the raw bitumen (Figure 2.2) it is
possible to see a change in absorbance bands arising around 1700, 1600, 1150 and 1030 cm-1
.
These can be assigned to the carbonyl, C=C, C-O and sulfoxide absorbance bands
respectively. An increase in these absorbance bands indicates oxidation and also an increase
in aromatisation, as predicted by Robertson et al. 5
who state that there is an increase in
aromaticity and oxygen content within the bitumen composition upon the formation and
decomposition of peroxide groups.
The application of the Beer-Lambert law allows the changes in the spectra to be quantified
and give an indication of the changes in concentration of the functional groups responsible for
0
0.01
0.02
0.03
0.04
0.05
9001000110012001300140015001600170018001900
Ab
sorb
an
ce
Wavenumbers (cm-1)
0 minutes_01 0 minutes_02 0 minutes_03 75 minutes_01
75 minutes_02 75 minutes_03 150 minutes_01 150 minutes_02
150 minutes_03 225 minutes_01 225 minutes_02 225 minutes_03
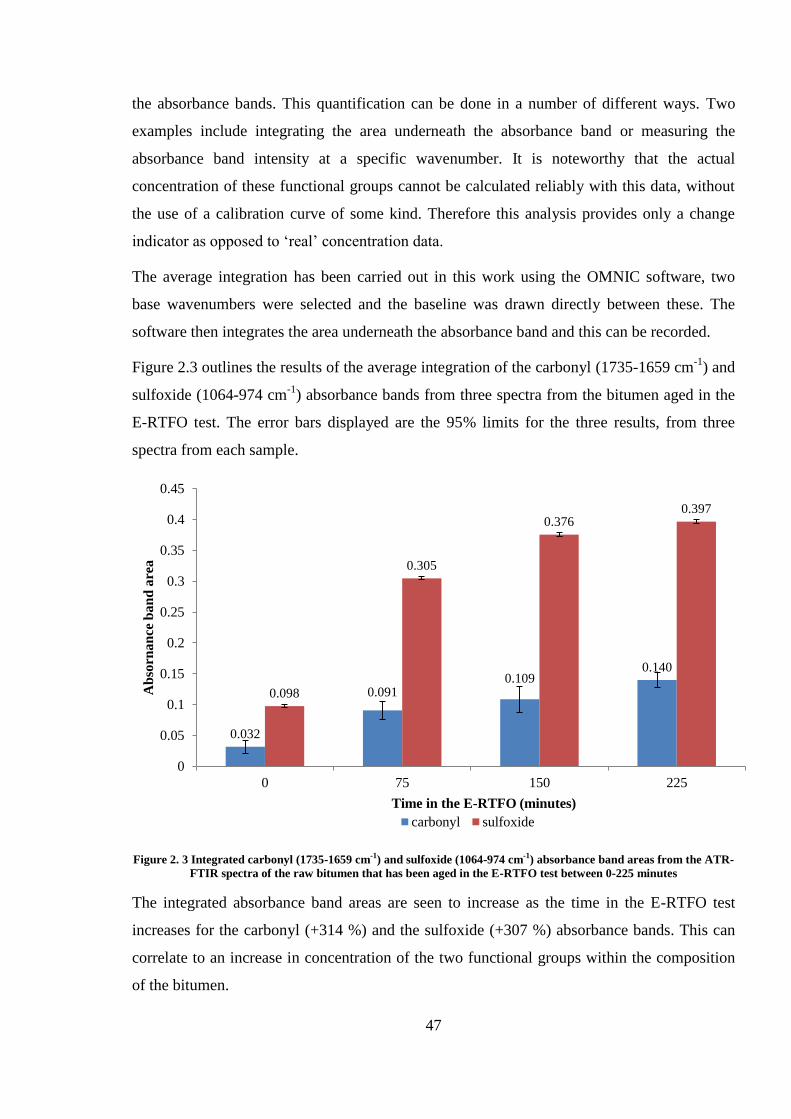
47
the absorbance bands. This quantification can be done in a number of different ways. Two
examples include integrating the area underneath the absorbance band or measuring the
absorbance band intensity at a specific wavenumber. It is noteworthy that the actual
concentration of these functional groups cannot be calculated reliably with this data, without
the use of a calibration curve of some kind. Therefore this analysis provides only a change
indicator as opposed to ‘real’ concentration data.
The average integration has been carried out in this work using the OMNIC software, two
base wavenumbers were selected and the baseline was drawn directly between these. The
software then integrates the area underneath the absorbance band and this can be recorded.
Figure 2.3 outlines the results of the average integration of the carbonyl (1735-1659 cm-1
) and
sulfoxide (1064-974 cm-1
) absorbance bands from three spectra from the bitumen aged in the
E-RTFO test. The error bars displayed are the 95% limits for the three results, from three
spectra from each sample.
Figure 2. 3 Integrated carbonyl (1735-1659 cm-1) and sulfoxide (1064-974 cm-1) absorbance band areas from the ATR-
FTIR spectra of the raw bitumen that has been aged in the E-RTFO test between 0-225 minutes
The integrated absorbance band areas are seen to increase as the time in the E-RTFO test
increases for the carbonyl (+314 %) and the sulfoxide (+307 %) absorbance bands. This can
correlate to an increase in concentration of the two functional groups within the composition
of the bitumen.
0.032
0.091 0.109
0.140
0.098
0.305
0.376 0.397
0
0.05
0.1
0.15
0.2
0.25
0.3
0.35
0.4
0.45
0 75 150 225
Ab
sorn
an
ce b
an
d a
rea
Time in the E-RTFO (minutes)
carbonyl sulfoxide
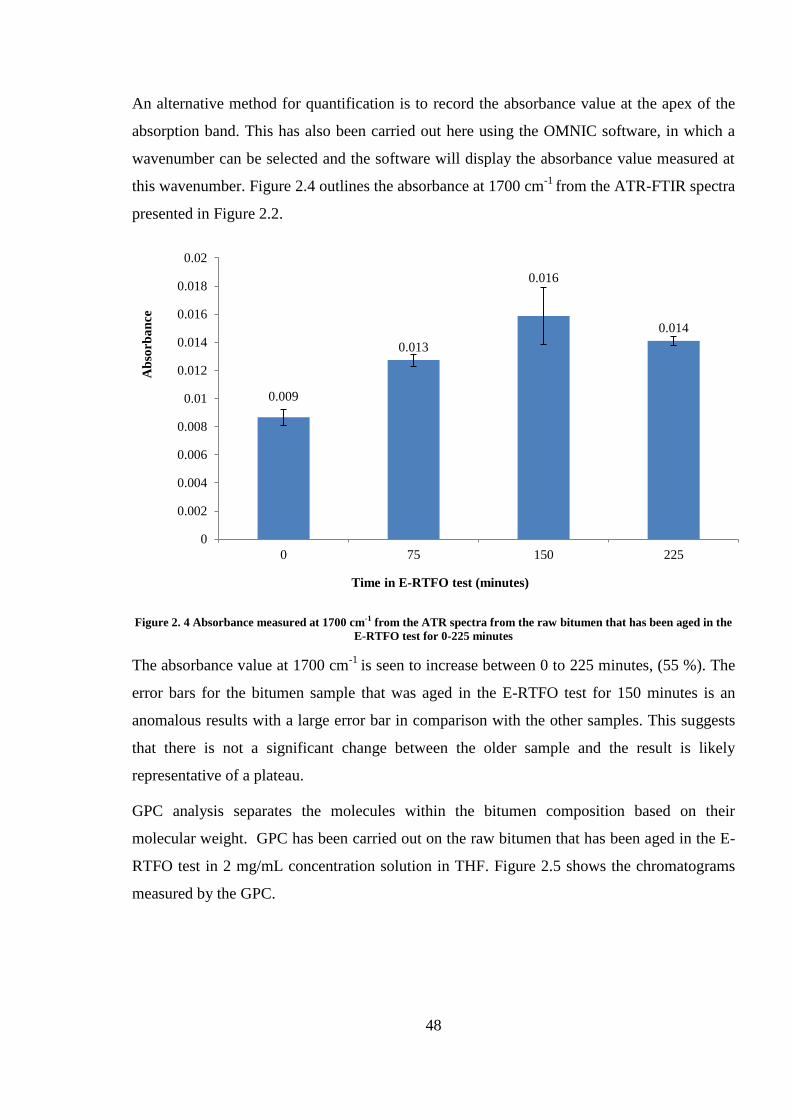
48
An alternative method for quantification is to record the absorbance value at the apex of the
absorption band. This has also been carried out here using the OMNIC software, in which a
wavenumber can be selected and the software will display the absorbance value measured at
this wavenumber. Figure 2.4 outlines the absorbance at 1700 cm-1
from the ATR-FTIR spectra
presented in Figure 2.2.
Figure 2. 4 Absorbance measured at 1700 cm-1 from the ATR spectra from the raw bitumen that has been aged in the
E-RTFO test for 0-225 minutes
The absorbance value at 1700 cm-1
is seen to increase between 0 to 225 minutes, (55 %). The
error bars for the bitumen sample that was aged in the E-RTFO test for 150 minutes is an
anomalous results with a large error bar in comparison with the other samples. This suggests
that there is not a significant change between the older sample and the result is likely
representative of a plateau.
GPC analysis separates the molecules within the bitumen composition based on their
molecular weight. GPC has been carried out on the raw bitumen that has been aged in the E-
RTFO test in 2 mg/mL concentration solution in THF. Figure 2.5 shows the chromatograms
measured by the GPC.
0.009
0.013
0.016
0.014
0
0.002
0.004
0.006
0.008
0.01
0.012
0.014
0.016
0.018
0.02
0 75 150 225
Ab
sorb
an
ce
Time in E-RTFO test (minutes)
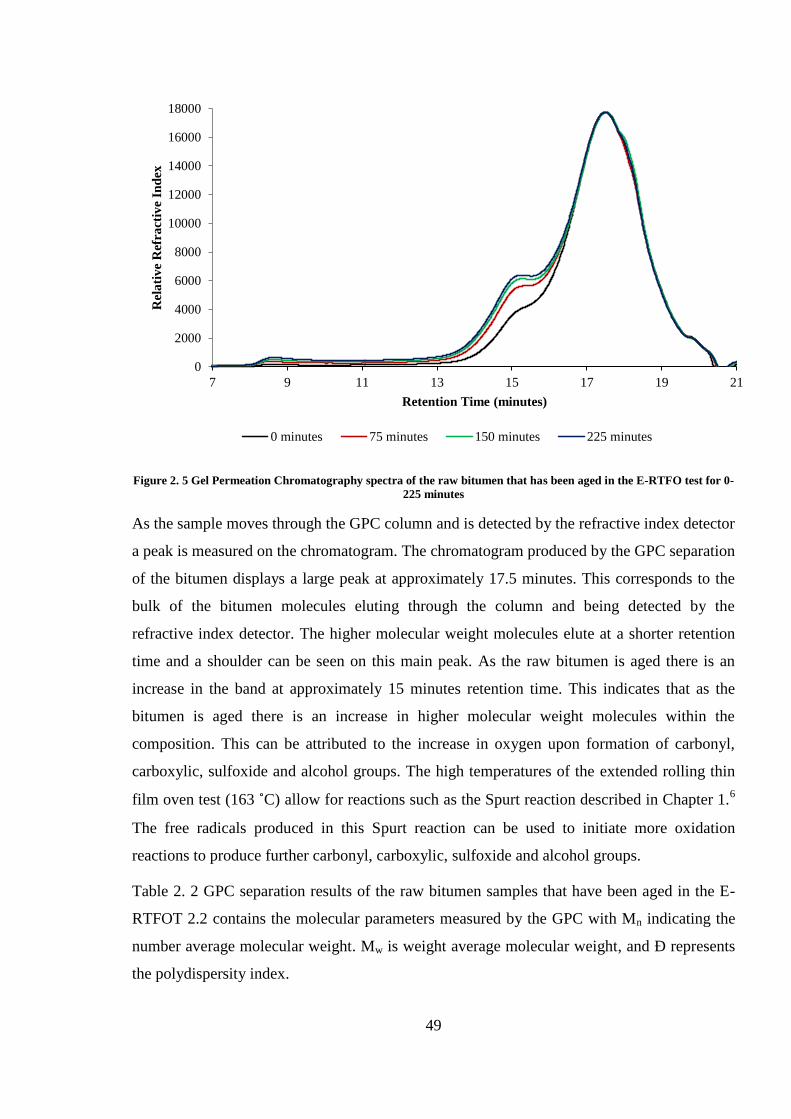
49
Figure 2. 5 Gel Permeation Chromatography spectra of the raw bitumen that has been aged in the E-RTFO test for 0-
225 minutes
As the sample moves through the GPC column and is detected by the refractive index detector
a peak is measured on the chromatogram. The chromatogram produced by the GPC separation
of the bitumen displays a large peak at approximately 17.5 minutes. This corresponds to the
bulk of the bitumen molecules eluting through the column and being detected by the
refractive index detector. The higher molecular weight molecules elute at a shorter retention
time and a shoulder can be seen on this main peak. As the raw bitumen is aged there is an
increase in the band at approximately 15 minutes retention time. This indicates that as the
bitumen is aged there is an increase in higher molecular weight molecules within the
composition. This can be attributed to the increase in oxygen upon formation of carbonyl,
carboxylic, sulfoxide and alcohol groups. The high temperatures of the extended rolling thin
film oven test (163 ˚C) allow for reactions such as the Spurt reaction described in Chapter 1.6
The free radicals produced in this Spurt reaction can be used to initiate more oxidation
reactions to produce further carbonyl, carboxylic, sulfoxide and alcohol groups.
Table 2. 2 GPC separation results of the raw bitumen samples that have been aged in the E-
RTFOT 2.2 contains the molecular parameters measured by the GPC with Mn indicating the
number average molecular weight. Mw is weight average molecular weight, and Ð represents
the polydispersity index.
0
2000
4000
6000
8000
10000
12000
14000
16000
18000
7 9 11 13 15 17 19 21
Rel
ati
ve
Ref
ract
ive
Ind
ex
Retention Time (minutes)
0 minutes 75 minutes 150 minutes 225 minutes
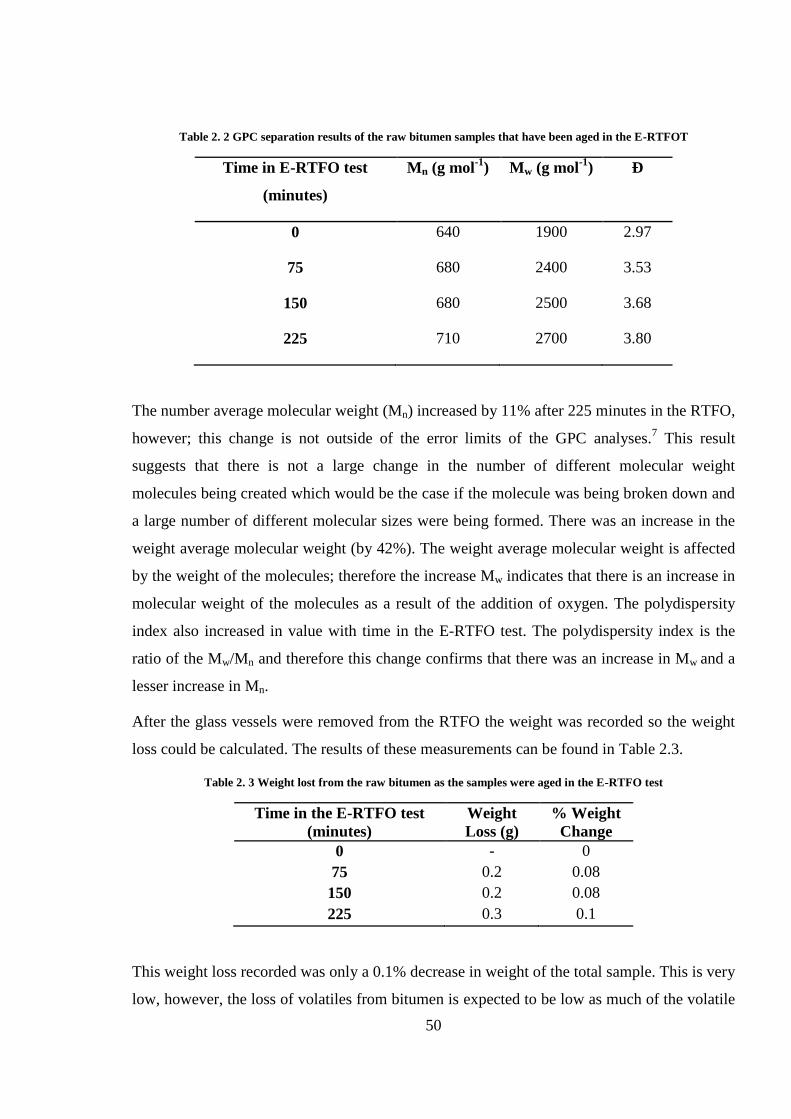
50
Table 2. 2 GPC separation results of the raw bitumen samples that have been aged in the E-RTFOT
Time in E-RTFO test
(minutes)
Mn (g mol-1
) Mw (g mol-1
) Ð
0 640 1900 2.97
75 680 2400 3.53
150 680 2500 3.68
225 710 2700 3.80
The number average molecular weight (Mn) increased by 11% after 225 minutes in the RTFO,
however; this change is not outside of the error limits of the GPC analyses.7 This result
suggests that there is not a large change in the number of different molecular weight
molecules being created which would be the case if the molecule was being broken down and
a large number of different molecular sizes were being formed. There was an increase in the
weight average molecular weight (by 42%). The weight average molecular weight is affected
by the weight of the molecules; therefore the increase Mw indicates that there is an increase in
molecular weight of the molecules as a result of the addition of oxygen. The polydispersity
index also increased in value with time in the E-RTFO test. The polydispersity index is the
ratio of the Mw/Mn and therefore this change confirms that there was an increase in Mw and a
lesser increase in Mn.
After the glass vessels were removed from the RTFO the weight was recorded so the weight
loss could be calculated. The results of these measurements can be found in Table 2.3.
Table 2. 3 Weight lost from the raw bitumen as the samples were aged in the E-RTFO test
Time in the E-RTFO test
(minutes)
Weight
Loss (g)
% Weight
Change
0 - 0
75 0.2 0.08
150 0.2 0.08
225 0.3 0.1
This weight loss recorded was only a 0.1% decrease in weight of the total sample. This is very
low, however, the loss of volatiles from bitumen is expected to be low as much of the volatile
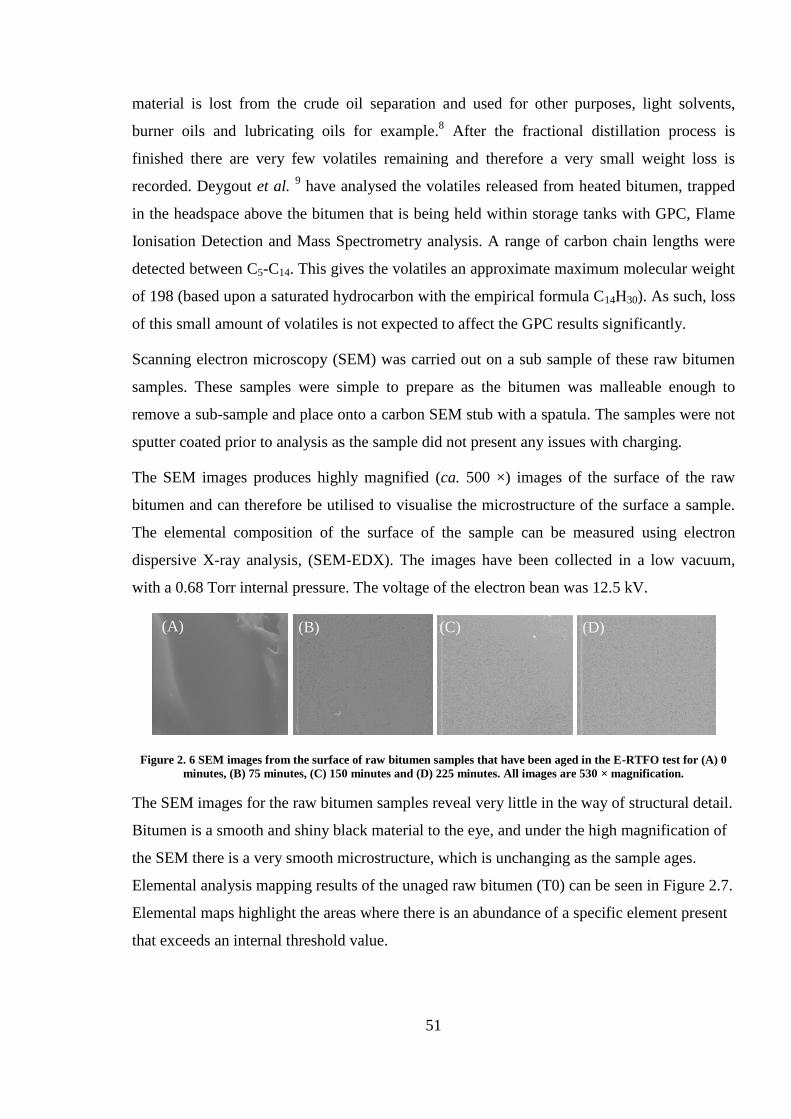
51
material is lost from the crude oil separation and used for other purposes, light solvents,
burner oils and lubricating oils for example.8 After the fractional distillation process is
finished there are very few volatiles remaining and therefore a very small weight loss is
recorded. Deygout et al. 9 have analysed the volatiles released from heated bitumen, trapped
in the headspace above the bitumen that is being held within storage tanks with GPC, Flame
Ionisation Detection and Mass Spectrometry analysis. A range of carbon chain lengths were
detected between C5-C14. This gives the volatiles an approximate maximum molecular weight
of 198 (based upon a saturated hydrocarbon with the empirical formula C14H30). As such, loss
of this small amount of volatiles is not expected to affect the GPC results significantly.
Scanning electron microscopy (SEM) was carried out on a sub sample of these raw bitumen
samples. These samples were simple to prepare as the bitumen was malleable enough to
remove a sub-sample and place onto a carbon SEM stub with a spatula. The samples were not
sputter coated prior to analysis as the sample did not present any issues with charging.
The SEM images produces highly magnified (ca. 500 ×) images of the surface of the raw
bitumen and can therefore be utilised to visualise the microstructure of the surface a sample.
The elemental composition of the surface of the sample can be measured using electron
dispersive X-ray analysis, (SEM-EDX). The images have been collected in a low vacuum,
with a 0.68 Torr internal pressure. The voltage of the electron bean was 12.5 kV.
Figure 2. 6 SEM images from the surface of raw bitumen samples that have been aged in the E-RTFO test for (A) 0
minutes, (B) 75 minutes, (C) 150 minutes and (D) 225 minutes. All images are 530 × magnification.
The SEM images for the raw bitumen samples reveal very little in the way of structural detail.
Bitumen is a smooth and shiny black material to the eye, and under the high magnification of
the SEM there is a very smooth microstructure, which is unchanging as the sample ages.
Elemental analysis mapping results of the unaged raw bitumen (T0) can be seen in Figure 2.7.
Elemental maps highlight the areas where there is an abundance of a specific element present
that exceeds an internal threshold value.
(A) (B) (C) (D)
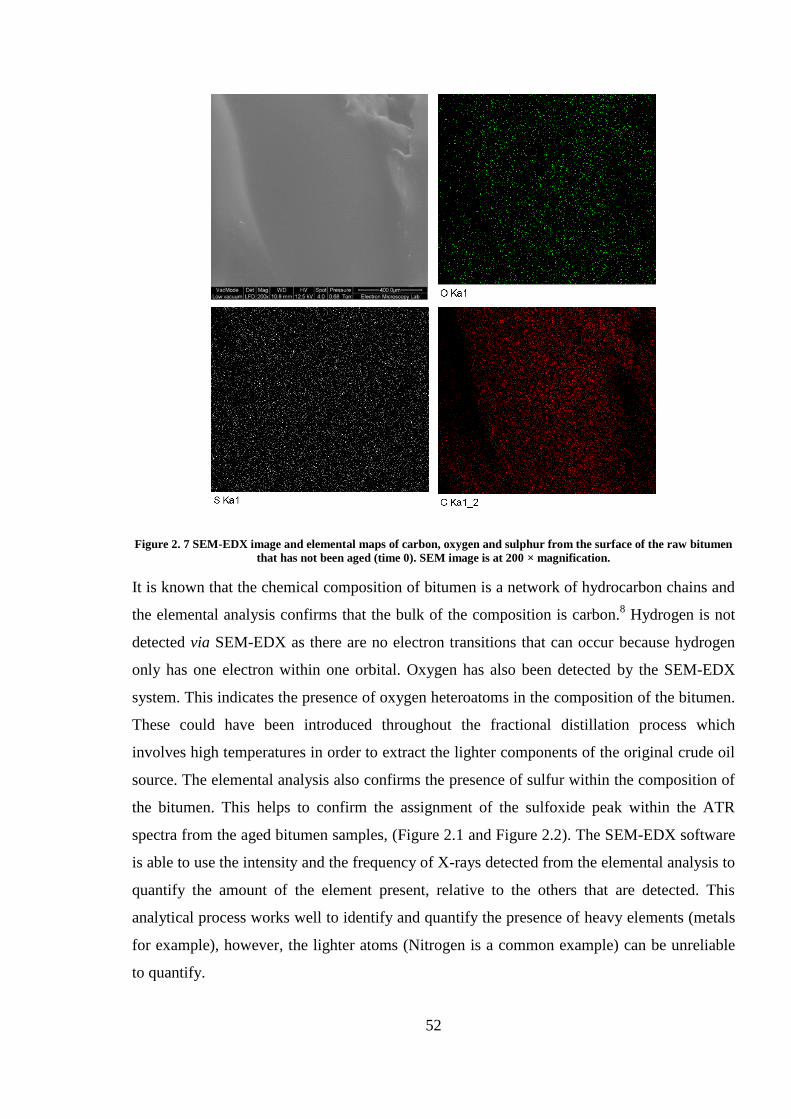
52
Figure 2. 7 SEM-EDX image and elemental maps of carbon, oxygen and sulphur from the surface of the raw bitumen
that has not been aged (time 0). SEM image is at 200 × magnification.
It is known that the chemical composition of bitumen is a network of hydrocarbon chains and
the elemental analysis confirms that the bulk of the composition is carbon.8 Hydrogen is not
detected via SEM-EDX as there are no electron transitions that can occur because hydrogen
only has one electron within one orbital. Oxygen has also been detected by the SEM-EDX
system. This indicates the presence of oxygen heteroatoms in the composition of the bitumen.
These could have been introduced throughout the fractional distillation process which
involves high temperatures in order to extract the lighter components of the original crude oil
source. The elemental analysis also confirms the presence of sulfur within the composition of
the bitumen. This helps to confirm the assignment of the sulfoxide peak within the ATR
spectra from the aged bitumen samples, (Figure 2.1 and Figure 2.2). The SEM-EDX software
is able to use the intensity and the frequency of X-rays detected from the elemental analysis to
quantify the amount of the element present, relative to the others that are detected. This
analytical process works well to identify and quantify the presence of heavy elements (metals
for example), however, the lighter atoms (Nitrogen is a common example) can be unreliable
to quantify.
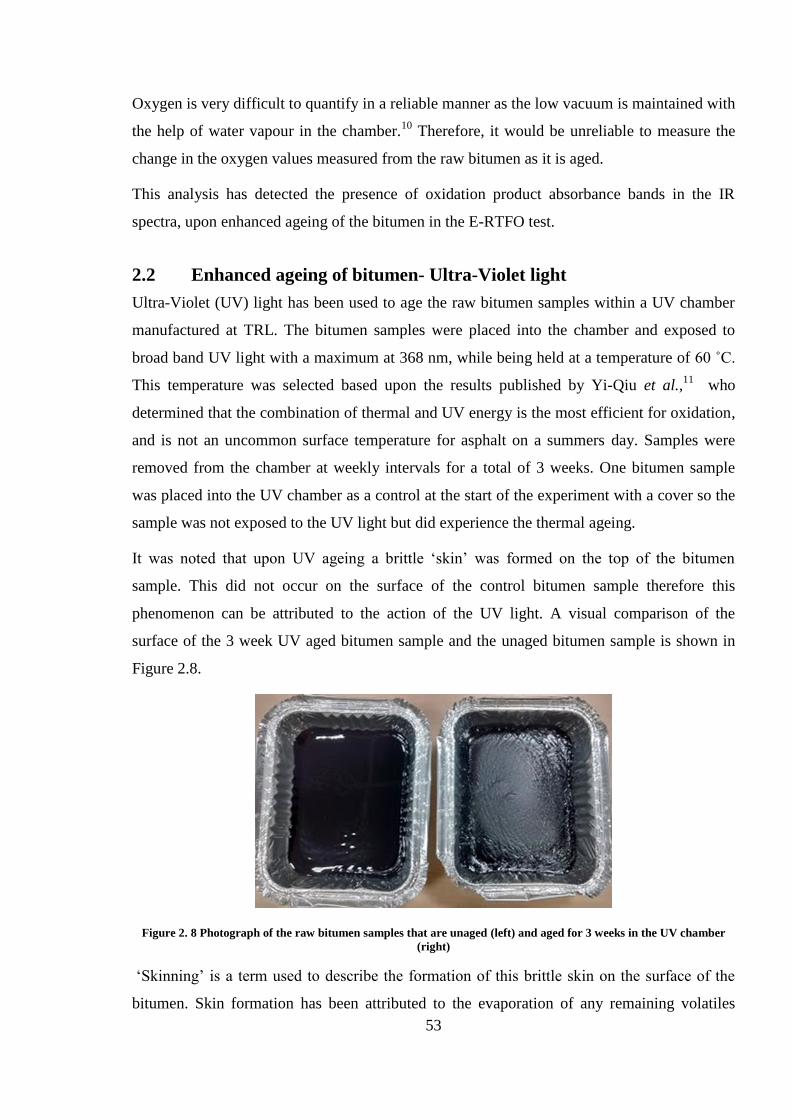
53
Oxygen is very difficult to quantify in a reliable manner as the low vacuum is maintained with
the help of water vapour in the chamber.10
Therefore, it would be unreliable to measure the
change in the oxygen values measured from the raw bitumen as it is aged.
This analysis has detected the presence of oxidation product absorbance bands in the IR
spectra, upon enhanced ageing of the bitumen in the E-RTFO test.
2.2 Enhanced ageing of bitumen- Ultra-Violet light
Ultra-Violet (UV) light has been used to age the raw bitumen samples within a UV chamber
manufactured at TRL. The bitumen samples were placed into the chamber and exposed to
broad band UV light with a maximum at 368 nm, while being held at a temperature of 60 ˚C.
This temperature was selected based upon the results published by Yi-Qiu et al.,11
who
determined that the combination of thermal and UV energy is the most efficient for oxidation,
and is not an uncommon surface temperature for asphalt on a summers day. Samples were
removed from the chamber at weekly intervals for a total of 3 weeks. One bitumen sample
was placed into the UV chamber as a control at the start of the experiment with a cover so the
sample was not exposed to the UV light but did experience the thermal ageing.
It was noted that upon UV ageing a brittle ‘skin’ was formed on the top of the bitumen
sample. This did not occur on the surface of the control bitumen sample therefore this
phenomenon can be attributed to the action of the UV light. A visual comparison of the
surface of the 3 week UV aged bitumen sample and the unaged bitumen sample is shown in
Figure 2.8.
Figure 2. 8 Photograph of the raw bitumen samples that are unaged (left) and aged for 3 weeks in the UV chamber
(right)
‘Skinning’ is a term used to describe the formation of this brittle skin on the surface of the
bitumen. Skin formation has been attributed to the evaporation of any remaining volatiles
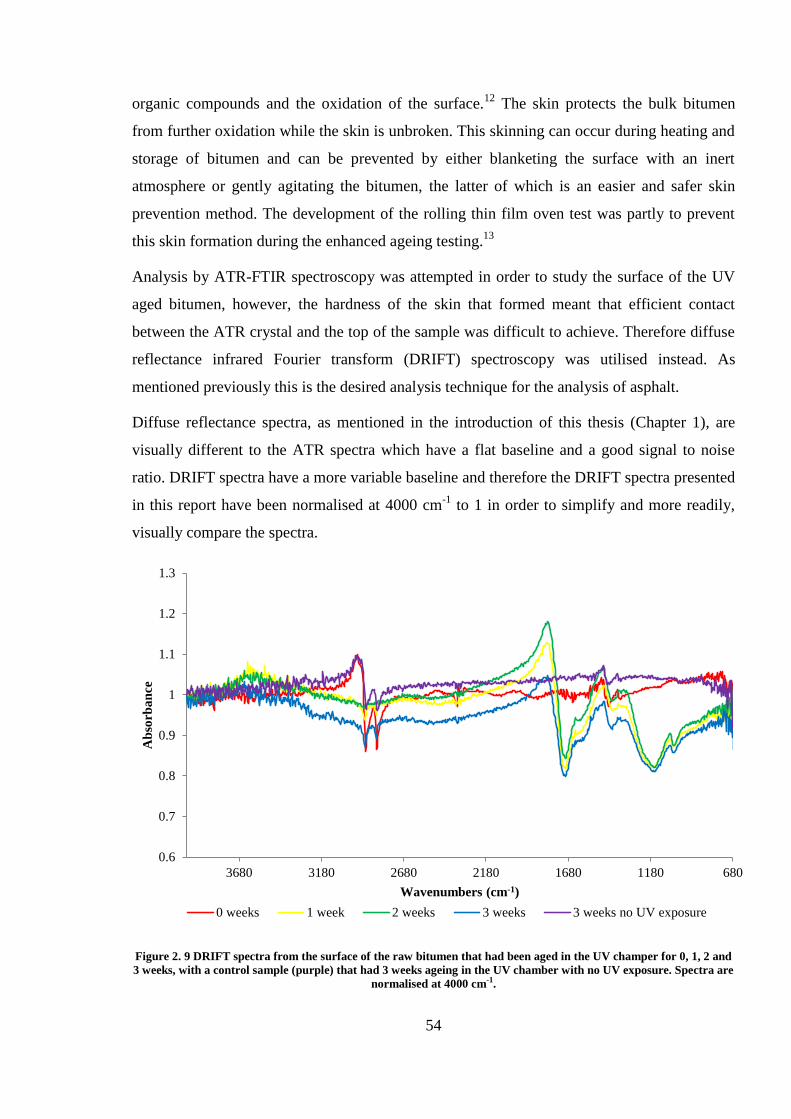
54
organic compounds and the oxidation of the surface.12
The skin protects the bulk bitumen
from further oxidation while the skin is unbroken. This skinning can occur during heating and
storage of bitumen and can be prevented by either blanketing the surface with an inert
atmosphere or gently agitating the bitumen, the latter of which is an easier and safer skin
prevention method. The development of the rolling thin film oven test was partly to prevent
this skin formation during the enhanced ageing testing.13
Analysis by ATR-FTIR spectroscopy was attempted in order to study the surface of the UV
aged bitumen, however, the hardness of the skin that formed meant that efficient contact
between the ATR crystal and the top of the sample was difficult to achieve. Therefore diffuse
reflectance infrared Fourier transform (DRIFT) spectroscopy was utilised instead. As
mentioned previously this is the desired analysis technique for the analysis of asphalt.
Diffuse reflectance spectra, as mentioned in the introduction of this thesis (Chapter 1), are
visually different to the ATR spectra which have a flat baseline and a good signal to noise
ratio. DRIFT spectra have a more variable baseline and therefore the DRIFT spectra presented
in this report have been normalised at 4000 cm-1
to 1 in order to simplify and more readily,
visually compare the spectra.
Figure 2. 9 DRIFT spectra from the surface of the raw bitumen that had been aged in the UV champer for 0, 1, 2 and
3 weeks, with a control sample (purple) that had 3 weeks ageing in the UV chamber with no UV exposure. Spectra are
normalised at 4000 cm-1.
0.6
0.7
0.8
0.9
1
1.1
1.2
1.3
680118016802180268031803680
Ab
sorb
an
ce
Wavenumbers (cm-1)
0 weeks 1 week 2 weeks 3 weeks 3 weeks no UV exposure
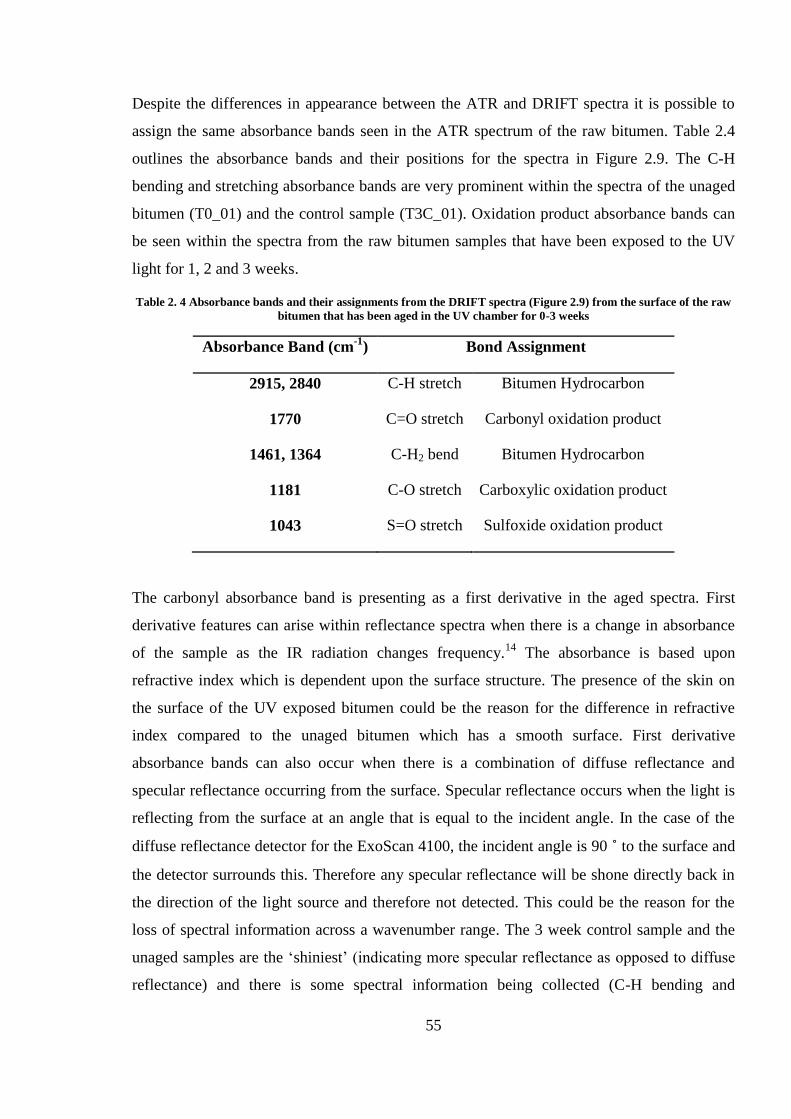
55
Despite the differences in appearance between the ATR and DRIFT spectra it is possible to
assign the same absorbance bands seen in the ATR spectrum of the raw bitumen. Table 2.4
outlines the absorbance bands and their positions for the spectra in Figure 2.9. The C-H
bending and stretching absorbance bands are very prominent within the spectra of the unaged
bitumen (T0_01) and the control sample (T3C_01). Oxidation product absorbance bands can
be seen within the spectra from the raw bitumen samples that have been exposed to the UV
light for 1, 2 and 3 weeks.
Table 2. 4 Absorbance bands and their assignments from the DRIFT spectra (Figure 2.9) from the surface of the raw
bitumen that has been aged in the UV chamber for 0-3 weeks
Absorbance Band (cm-1
) Bond Assignment
2915, 2840 C-H stretch Bitumen Hydrocarbon
1770 C=O stretch Carbonyl oxidation product
1461, 1364 C-H2 bend Bitumen Hydrocarbon
1181 C-O stretch Carboxylic oxidation product
1043 S=O stretch Sulfoxide oxidation product
The carbonyl absorbance band is presenting as a first derivative in the aged spectra. First
derivative features can arise within reflectance spectra when there is a change in absorbance
of the sample as the IR radiation changes frequency.14
The absorbance is based upon
refractive index which is dependent upon the surface structure. The presence of the skin on
the surface of the UV exposed bitumen could be the reason for the difference in refractive
index compared to the unaged bitumen which has a smooth surface. First derivative
absorbance bands can also occur when there is a combination of diffuse reflectance and
specular reflectance occurring from the surface. Specular reflectance occurs when the light is
reflecting from the surface at an angle that is equal to the incident angle. In the case of the
diffuse reflectance detector for the ExoScan 4100, the incident angle is 90 ˚ to the surface and
the detector surrounds this. Therefore any specular reflectance will be shone directly back in
the direction of the light source and therefore not detected. This could be the reason for the
loss of spectral information across a wavenumber range. The 3 week control sample and the
unaged samples are the ‘shiniest’ (indicating more specular reflectance as opposed to diffuse
reflectance) and there is some spectral information being collected (C-H bending and
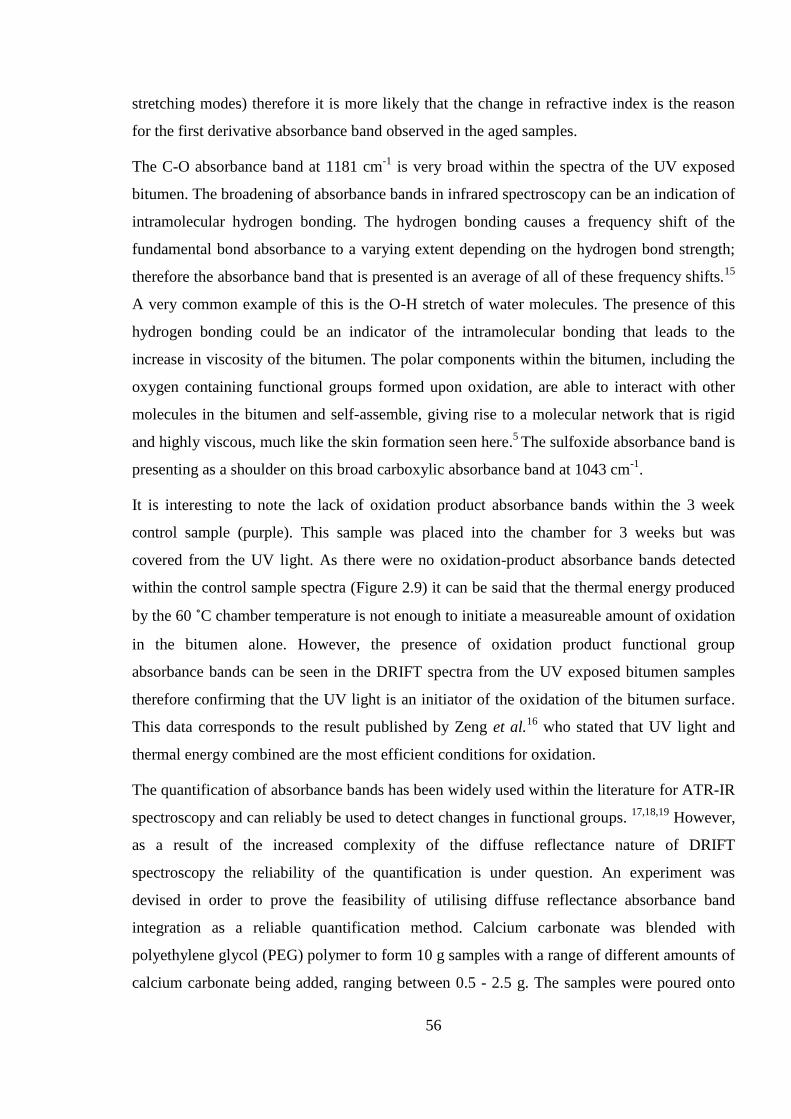
56
stretching modes) therefore it is more likely that the change in refractive index is the reason
for the first derivative absorbance band observed in the aged samples.
The C-O absorbance band at 1181 cm-1
is very broad within the spectra of the UV exposed
bitumen. The broadening of absorbance bands in infrared spectroscopy can be an indication of
intramolecular hydrogen bonding. The hydrogen bonding causes a frequency shift of the
fundamental bond absorbance to a varying extent depending on the hydrogen bond strength;
therefore the absorbance band that is presented is an average of all of these frequency shifts.15
A very common example of this is the O-H stretch of water molecules. The presence of this
hydrogen bonding could be an indicator of the intramolecular bonding that leads to the
increase in viscosity of the bitumen. The polar components within the bitumen, including the
oxygen containing functional groups formed upon oxidation, are able to interact with other
molecules in the bitumen and self-assemble, giving rise to a molecular network that is rigid
and highly viscous, much like the skin formation seen here.5
The sulfoxide absorbance band is
presenting as a shoulder on this broad carboxylic absorbance band at 1043 cm-1
.
It is interesting to note the lack of oxidation product absorbance bands within the 3 week
control sample (purple). This sample was placed into the chamber for 3 weeks but was
covered from the UV light. As there were no oxidation-product absorbance bands detected
within the control sample spectra (Figure 2.9) it can be said that the thermal energy produced
by the 60 ˚C chamber temperature is not enough to initiate a measureable amount of oxidation
in the bitumen alone. However, the presence of oxidation product functional group
absorbance bands can be seen in the DRIFT spectra from the UV exposed bitumen samples
therefore confirming that the UV light is an initiator of the oxidation of the bitumen surface.
This data corresponds to the result published by Zeng et al.16
who stated that UV light and
thermal energy combined are the most efficient conditions for oxidation.
The quantification of absorbance bands has been widely used within the literature for ATR-IR
spectroscopy and can reliably be used to detect changes in functional groups. 17,18,19
However,
as a result of the increased complexity of the diffuse reflectance nature of DRIFT
spectroscopy the reliability of the quantification is under question. An experiment was
devised in order to prove the feasibility of utilising diffuse reflectance absorbance band
integration as a reliable quantification method. Calcium carbonate was blended with
polyethylene glycol (PEG) polymer to form 10 g samples with a range of different amounts of
calcium carbonate being added, ranging between 0.5 - 2.5 g. The samples were poured onto
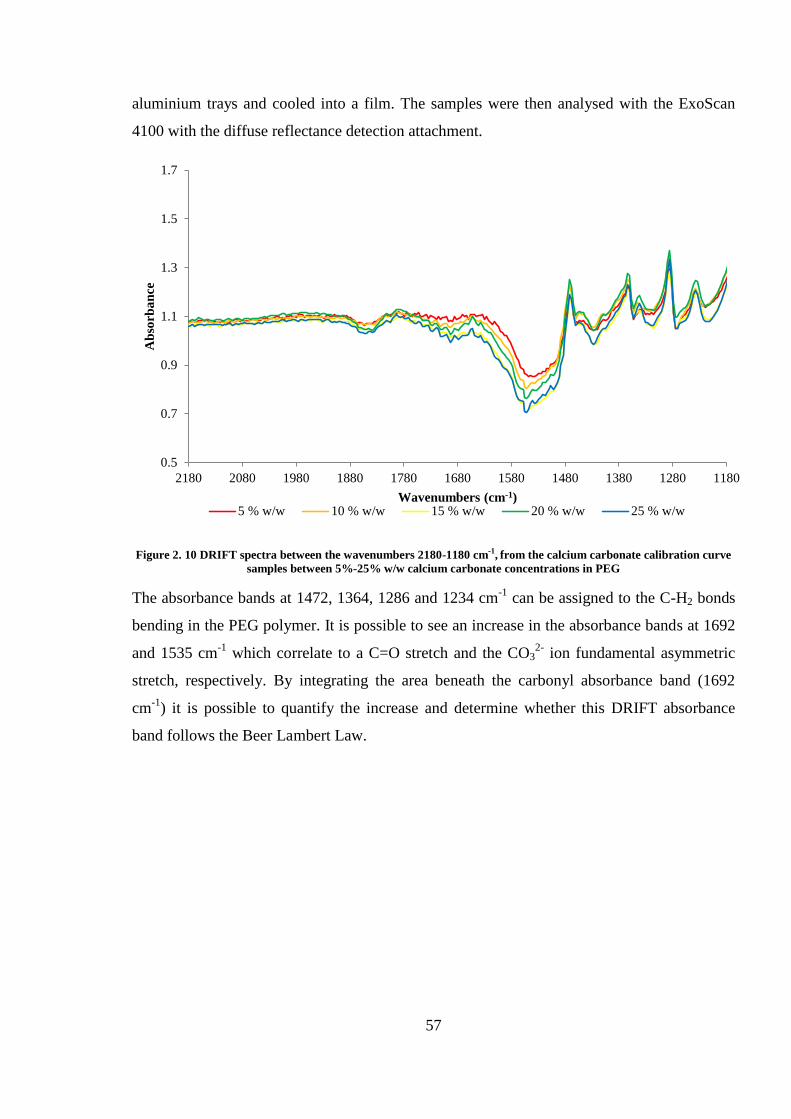
57
aluminium trays and cooled into a film. The samples were then analysed with the ExoScan
4100 with the diffuse reflectance detection attachment.
Figure 2. 10 DRIFT spectra between the wavenumbers 2180-1180 cm-1, from the calcium carbonate calibration curve
samples between 5%-25% w/w calcium carbonate concentrations in PEG
The absorbance bands at 1472, 1364, 1286 and 1234 cm-1
can be assigned to the C-H2 bonds
bending in the PEG polymer. It is possible to see an increase in the absorbance bands at 1692
and 1535 cm-1
which correlate to a C=O stretch and the CO32-
ion fundamental asymmetric
stretch, respectively. By integrating the area beneath the carbonyl absorbance band (1692
cm-1
) it is possible to quantify the increase and determine whether this DRIFT absorbance
band follows the Beer Lambert Law.
0.5
0.7
0.9
1.1
1.3
1.5
1.7
11801280138014801580168017801880198020802180
Ab
sorb
an
ce
Wavenumbers (cm-1) 5 % w/w 10 % w/w 15 % w/w 20 % w/w 25 % w/w
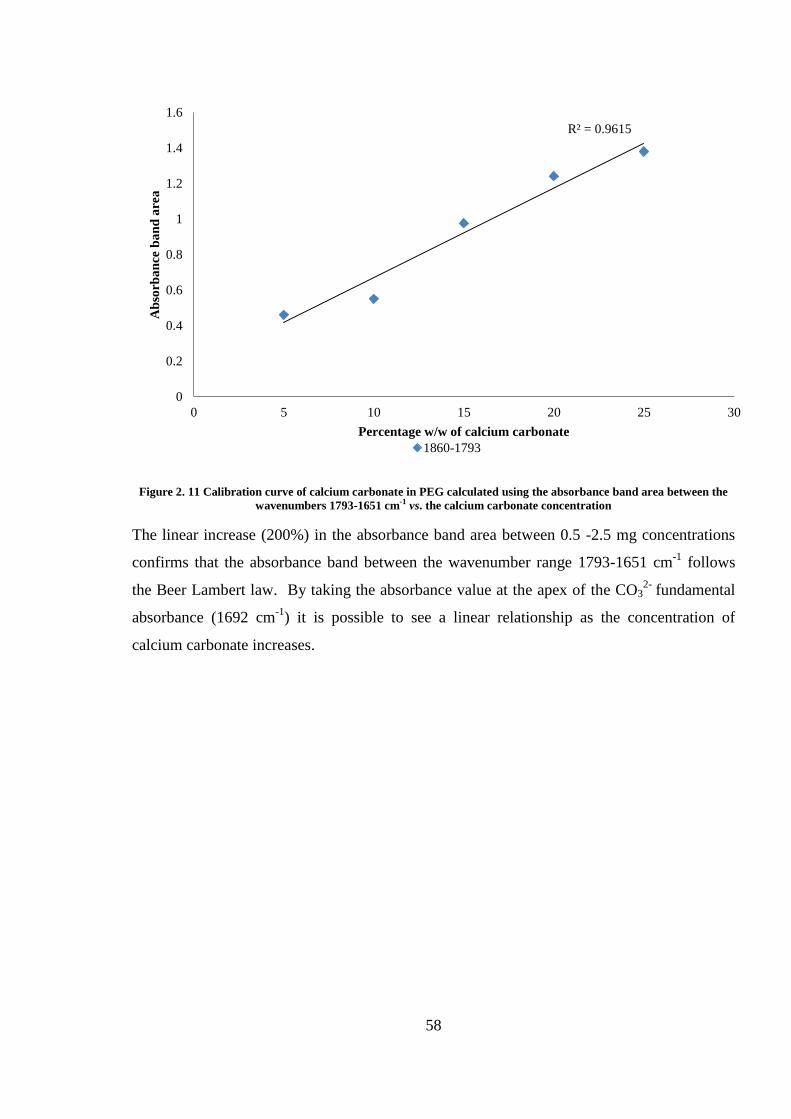
58
Figure 2. 11 Calibration curve of calcium carbonate in PEG calculated using the absorbance band area between the
wavenumbers 1793-1651 cm-1 vs. the calcium carbonate concentration
The linear increase (200%) in the absorbance band area between 0.5 -2.5 mg concentrations
confirms that the absorbance band between the wavenumber range 1793-1651 cm-1
follows
the Beer Lambert law. By taking the absorbance value at the apex of the CO32-
fundamental
absorbance (1692 cm-1
) it is possible to see a linear relationship as the concentration of
calcium carbonate increases.
R² = 0.9615
0
0.2
0.4
0.6
0.8
1
1.2
1.4
1.6
0 5 10 15 20 25 30
Ab
sorb
an
ce b
an
d a
rea
Percentage w/w of calcium carbonate
1860-1793
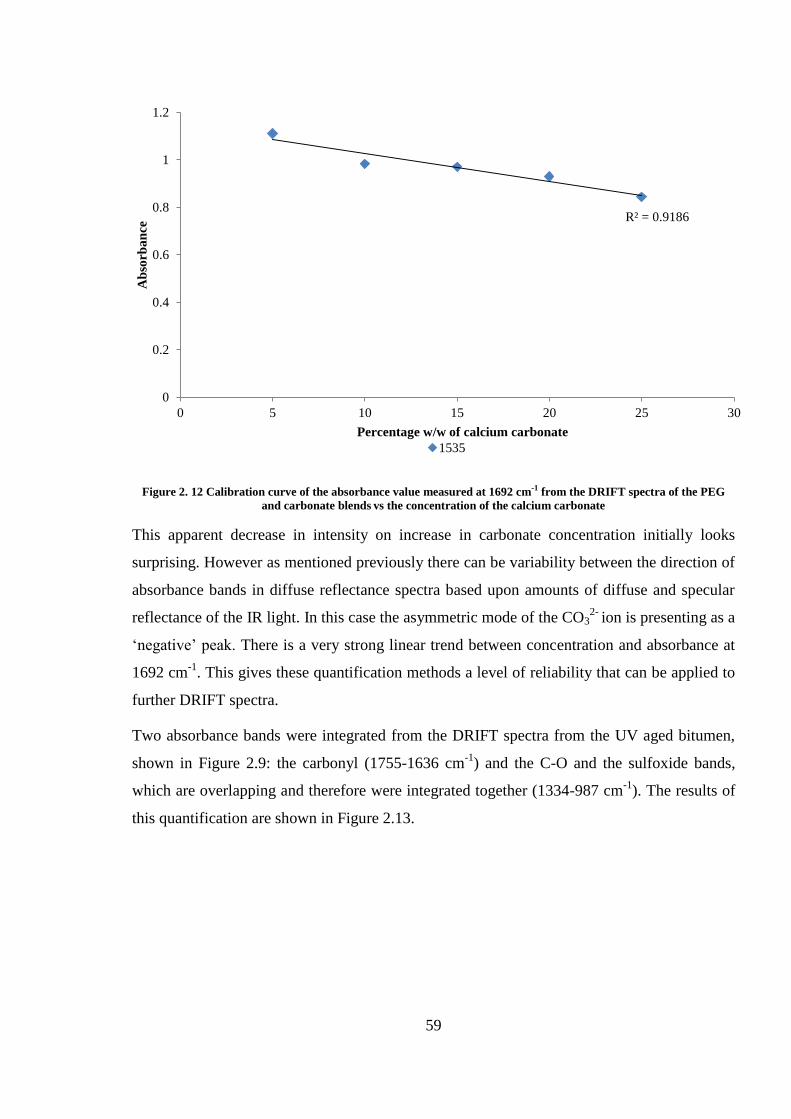
59
Figure 2. 12 Calibration curve of the absorbance value measured at 1692 cm-1 from the DRIFT spectra of the PEG
and carbonate blends vs the concentration of the calcium carbonate
This apparent decrease in intensity on increase in carbonate concentration initially looks
surprising. However as mentioned previously there can be variability between the direction of
absorbance bands in diffuse reflectance spectra based upon amounts of diffuse and specular
reflectance of the IR light. In this case the asymmetric mode of the CO32-
ion is presenting as a
‘negative’ peak. There is a very strong linear trend between concentration and absorbance at
1692 cm-1
. This gives these quantification methods a level of reliability that can be applied to
further DRIFT spectra.
Two absorbance bands were integrated from the DRIFT spectra from the UV aged bitumen,
shown in Figure 2.9: the carbonyl (1755-1636 cm-1
) and the C-O and the sulfoxide bands,
which are overlapping and therefore were integrated together (1334-987 cm-1
). The results of
this quantification are shown in Figure 2.13.
R² = 0.9186
0
0.2
0.4
0.6
0.8
1
1.2
0 5 10 15 20 25 30
Ab
sorb
an
ce
Percentage w/w of calcium carbonate
1535
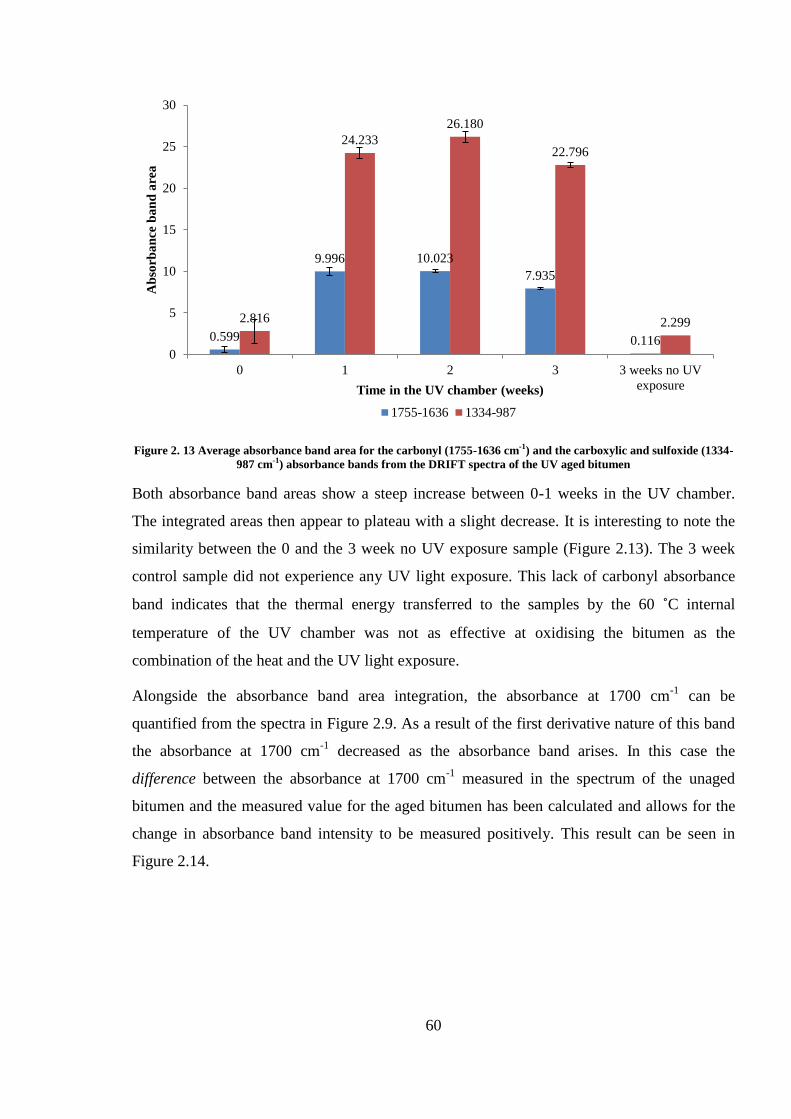
60
Figure 2. 13 Average absorbance band area for the carbonyl (1755-1636 cm-1) and the carboxylic and sulfoxide (1334-
987 cm-1) absorbance bands from the DRIFT spectra of the UV aged bitumen
Both absorbance band areas show a steep increase between 0-1 weeks in the UV chamber.
The integrated areas then appear to plateau with a slight decrease. It is interesting to note the
similarity between the 0 and the 3 week no UV exposure sample (Figure 2.13). The 3 week
control sample did not experience any UV light exposure. This lack of carbonyl absorbance
band indicates that the thermal energy transferred to the samples by the 60 ˚C internal
temperature of the UV chamber was not as effective at oxidising the bitumen as the
combination of the heat and the UV light exposure.
Alongside the absorbance band area integration, the absorbance at 1700 cm-1
can be
quantified from the spectra in Figure 2.9. As a result of the first derivative nature of this band
the absorbance at 1700 cm-1
decreased as the absorbance band arises. In this case the
difference between the absorbance at 1700 cm-1
measured in the spectrum of the unaged
bitumen and the measured value for the aged bitumen has been calculated and allows for the
change in absorbance band intensity to be measured positively. This result can be seen in
Figure 2.14.
0.599
9.996 10.023
7.935
0.116
2.816
24.233
26.180
22.796
2.299
0
5
10
15
20
25
30
0 1 2 3 3 weeks no UV
exposure
Ab
sorb
an
ce b
an
d a
rea
Time in the UV chamber (weeks)
1755-1636 1334-987
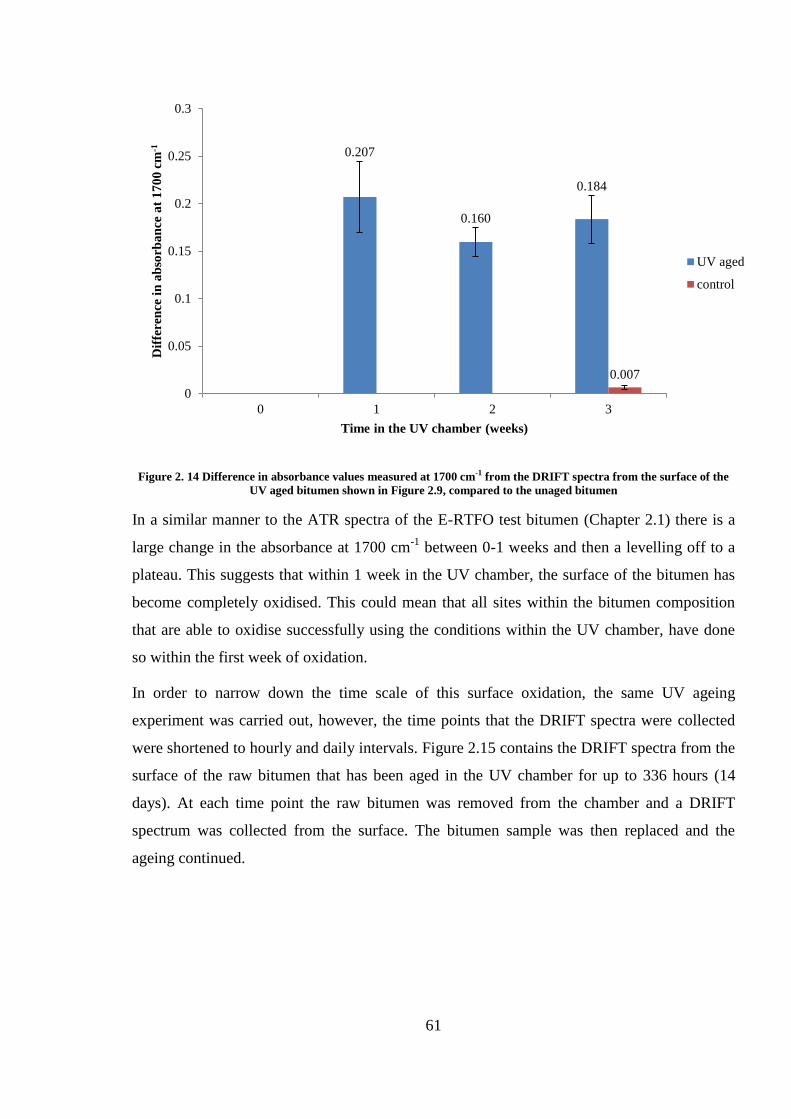
61
Figure 2. 14 Difference in absorbance values measured at 1700 cm-1 from the DRIFT spectra from the surface of the
UV aged bitumen shown in Figure 2.9, compared to the unaged bitumen
In a similar manner to the ATR spectra of the E-RTFO test bitumen (Chapter 2.1) there is a
large change in the absorbance at 1700 cm-1
between 0-1 weeks and then a levelling off to a
plateau. This suggests that within 1 week in the UV chamber, the surface of the bitumen has
become completely oxidised. This could mean that all sites within the bitumen composition
that are able to oxidise successfully using the conditions within the UV chamber, have done
so within the first week of oxidation.
In order to narrow down the time scale of this surface oxidation, the same UV ageing
experiment was carried out, however, the time points that the DRIFT spectra were collected
were shortened to hourly and daily intervals. Figure 2.15 contains the DRIFT spectra from the
surface of the raw bitumen that has been aged in the UV chamber for up to 336 hours (14
days). At each time point the raw bitumen was removed from the chamber and a DRIFT
spectrum was collected from the surface. The bitumen sample was then replaced and the
ageing continued.
0.207
0.160
0.184
0.007
0
0.05
0.1
0.15
0.2
0.25
0.3
0 1 2 3
Dif
feren
ce i
n a
bso
rba
nce
at
17
00
cm
-1
Time in the UV chamber (weeks)
UV aged
control
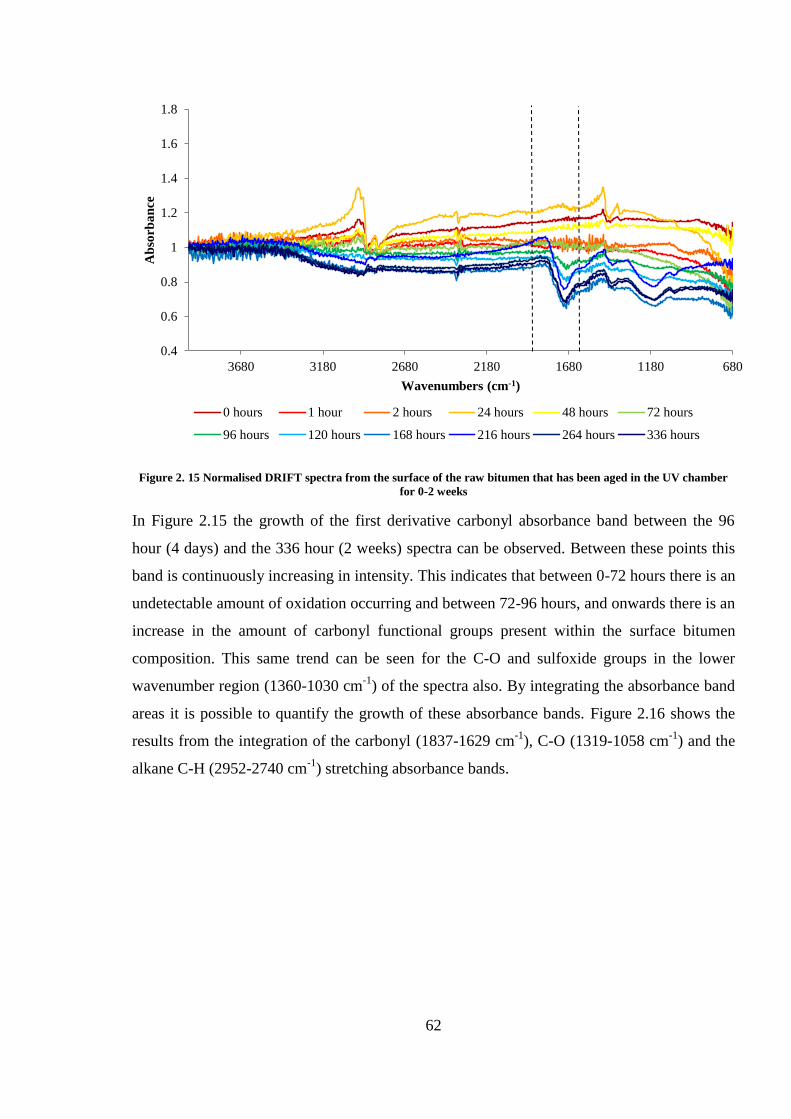
62
Figure 2. 15 Normalised DRIFT spectra from the surface of the raw bitumen that has been aged in the UV chamber
for 0-2 weeks
In Figure 2.15 the growth of the first derivative carbonyl absorbance band between the 96
hour (4 days) and the 336 hour (2 weeks) spectra can be observed. Between these points this
band is continuously increasing in intensity. This indicates that between 0-72 hours there is an
undetectable amount of oxidation occurring and between 72-96 hours, and onwards there is an
increase in the amount of carbonyl functional groups present within the surface bitumen
composition. This same trend can be seen for the C-O and sulfoxide groups in the lower
wavenumber region (1360-1030 cm-1
) of the spectra also. By integrating the absorbance band
areas it is possible to quantify the growth of these absorbance bands. Figure 2.16 shows the
results from the integration of the carbonyl (1837-1629 cm-1
), C-O (1319-1058 cm-1
) and the
alkane C-H (2952-2740 cm-1
) stretching absorbance bands.
0.4
0.6
0.8
1
1.2
1.4
1.6
1.8
680118016802180268031803680
Ab
sorb
an
ce
Wavenumbers (cm-1)
0 hours 1 hour 2 hours 24 hours 48 hours 72 hours
96 hours 120 hours 168 hours 216 hours 264 hours 336 hours
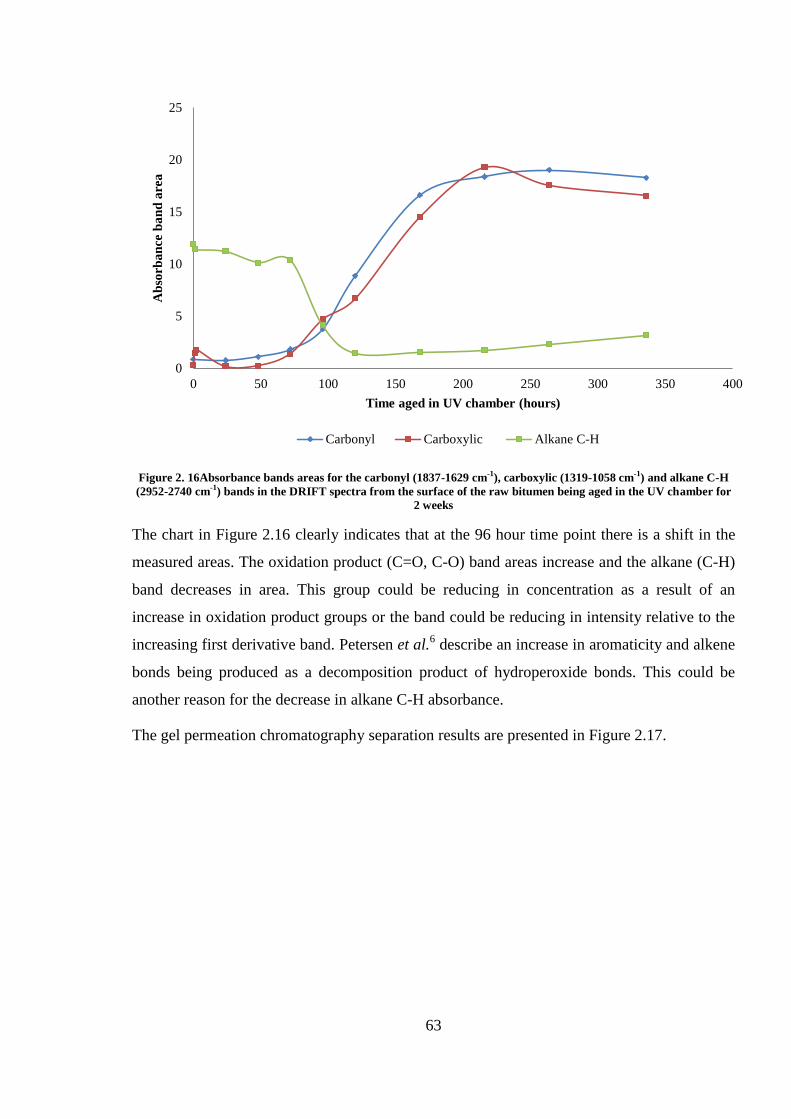
63
Figure 2. 16Absorbance bands areas for the carbonyl (1837-1629 cm-1), carboxylic (1319-1058 cm-1) and alkane C-H
(2952-2740 cm-1) bands in the DRIFT spectra from the surface of the raw bitumen being aged in the UV chamber for
2 weeks
The chart in Figure 2.16 clearly indicates that at the 96 hour time point there is a shift in the
measured areas. The oxidation product (C=O, C-O) band areas increase and the alkane (C-H)
band decreases in area. This group could be reducing in concentration as a result of an
increase in oxidation product groups or the band could be reducing in intensity relative to the
increasing first derivative band. Petersen et al.6 describe an increase in aromaticity and alkene
bonds being produced as a decomposition product of hydroperoxide bonds. This could be
another reason for the decrease in alkane C-H absorbance.
The gel permeation chromatography separation results are presented in Figure 2.17.
0
5
10
15
20
25
0 50 100 150 200 250 300 350 400
Ab
sorb
an
ce b
an
d a
rea
Time aged in UV chamber (hours)
Carbonyl Carboxylic Alkane C-H
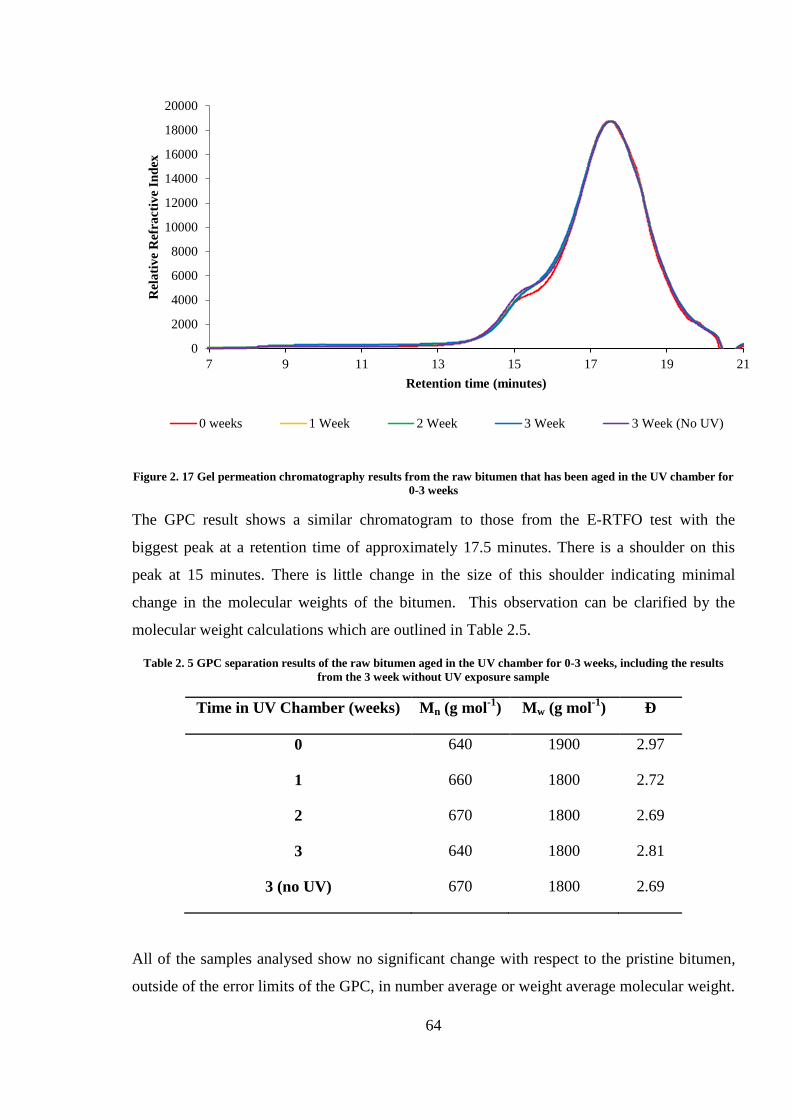
64
Figure 2. 17 Gel permeation chromatography results from the raw bitumen that has been aged in the UV chamber for
0-3 weeks
The GPC result shows a similar chromatogram to those from the E-RTFO test with the
biggest peak at a retention time of approximately 17.5 minutes. There is a shoulder on this
peak at 15 minutes. There is little change in the size of this shoulder indicating minimal
change in the molecular weights of the bitumen. This observation can be clarified by the
molecular weight calculations which are outlined in Table 2.5.
Table 2. 5 GPC separation results of the raw bitumen aged in the UV chamber for 0-3 weeks, including the results
from the 3 week without UV exposure sample
Time in UV Chamber (weeks) Mn (g mol-1
) Mw (g mol-1
) Ð
0 640 1900 2.97
1 660 1800 2.72
2 670 1800 2.69
3 640 1800 2.81
3 (no UV) 670 1800 2.69
All of the samples analysed show no significant change with respect to the pristine bitumen,
outside of the error limits of the GPC, in number average or weight average molecular weight.
0
2000
4000
6000
8000
10000
12000
14000
16000
18000
20000
7 9 11 13 15 17 19 21
Rel
ati
ve
Ref
ract
ive
Ind
ex
Retention time (minutes)
0 weeks 1 Week 2 Week 3 Week 3 Week (No UV)
65
This result contradicts the increase in carbonyl absorbance band measured in the DRIFT
spectroscopy and shows that the oxidation has only occurred at the surface and the change is
not reliably measurable by GPC which is a bulk technique. By contrast the E-RTFO test
procedure causes oxidation to the bulk, which has been detected by GPC. The skin has
protected the bulk bitumen therefore the oxidation is localised to the surface only. The
molecular interactions that are occurring within the oxidised surface, giving the surface a
higher viscosity and brittleness, are likely to be broken down when the sample is dissolved
into the THF solvent. This would suggest that the increase in viscosity of the UV oxidised
surface is a physical property of the bitumen as opposed to the presence of oxygen.
There is a visual difference in the surface of the UV aged bitumen as a result of the brittle
skin forming, (see photograph in Figure 2.8). This visual change can be examined in more
detail by using SEM. The images shown in Figure 2.18 have been obtained via SEM analysis
and clearly show this structural difference.
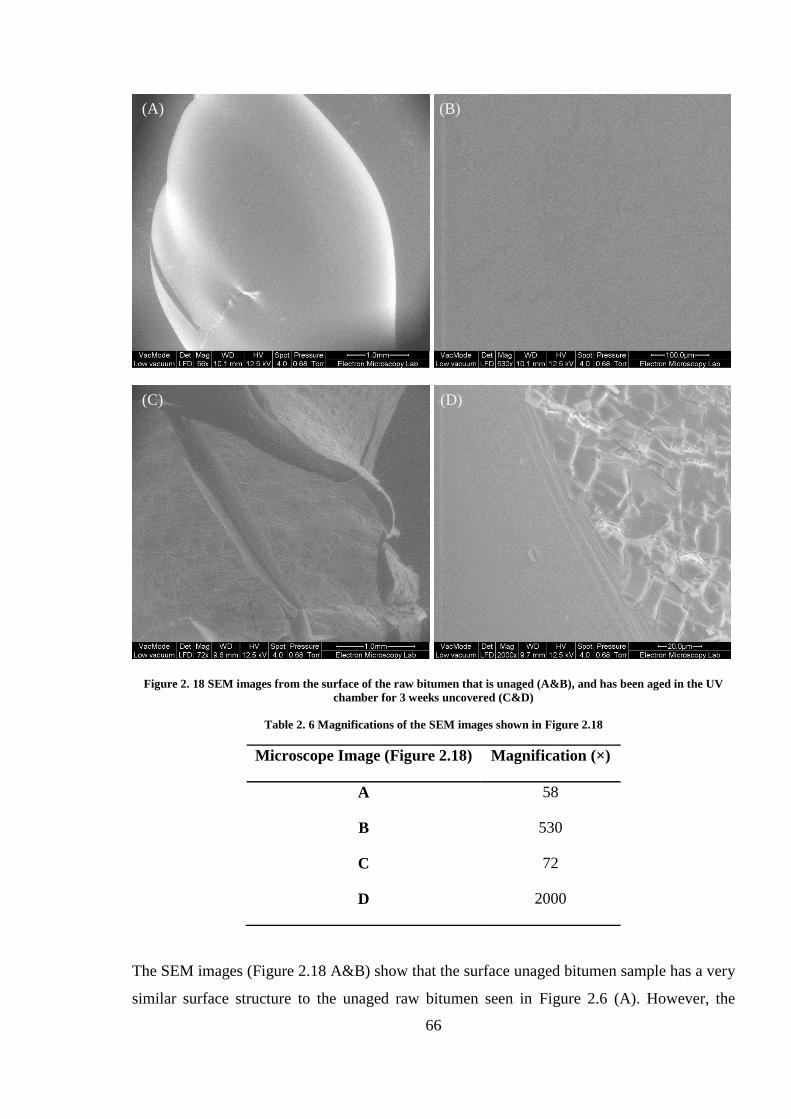
66
Figure 2. 18 SEM images from the surface of the raw bitumen that is unaged (A&B), and has been aged in the UV
chamber for 3 weeks uncovered (C&D)
Table 2. 6 Magnifications of the SEM images shown in Figure 2.18
Microscope Image (Figure 2.18) Magnification (×)
A 58
B 530
C 72
D 2000
The SEM images (Figure 2.18 A&B) show that the surface unaged bitumen sample has a very
similar surface structure to the unaged raw bitumen seen in Figure 2.6 (A). However, the
(A) (B)
(C) (D)
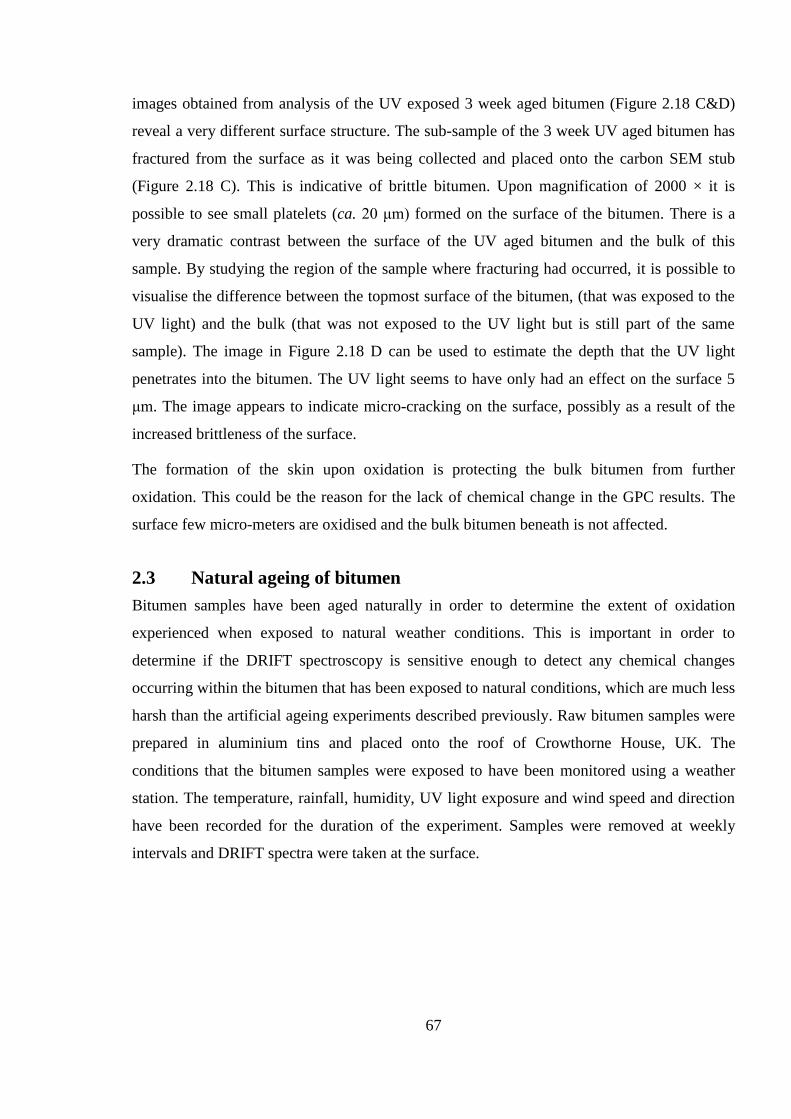
67
images obtained from analysis of the UV exposed 3 week aged bitumen (Figure 2.18 C&D)
reveal a very different surface structure. The sub-sample of the 3 week UV aged bitumen has
fractured from the surface as it was being collected and placed onto the carbon SEM stub
(Figure 2.18 C). This is indicative of brittle bitumen. Upon magnification of 2000 × it is
possible to see small platelets (ca. 20 μm) formed on the surface of the bitumen. There is a
very dramatic contrast between the surface of the UV aged bitumen and the bulk of this
sample. By studying the region of the sample where fracturing had occurred, it is possible to
visualise the difference between the topmost surface of the bitumen, (that was exposed to the
UV light) and the bulk (that was not exposed to the UV light but is still part of the same
sample). The image in Figure 2.18 D can be used to estimate the depth that the UV light
penetrates into the bitumen. The UV light seems to have only had an effect on the surface 5
μm. The image appears to indicate micro-cracking on the surface, possibly as a result of the
increased brittleness of the surface.
The formation of the skin upon oxidation is protecting the bulk bitumen from further
oxidation. This could be the reason for the lack of chemical change in the GPC results. The
surface few micro-meters are oxidised and the bulk bitumen beneath is not affected.
2.3 Natural ageing of bitumen
Bitumen samples have been aged naturally in order to determine the extent of oxidation
experienced when exposed to natural weather conditions. This is important in order to
determine if the DRIFT spectroscopy is sensitive enough to detect any chemical changes
occurring within the bitumen that has been exposed to natural conditions, which are much less
harsh than the artificial ageing experiments described previously. Raw bitumen samples were
prepared in aluminium tins and placed onto the roof of Crowthorne House, UK. The
conditions that the bitumen samples were exposed to have been monitored using a weather
station. The temperature, rainfall, humidity, UV light exposure and wind speed and direction
have been recorded for the duration of the experiment. Samples were removed at weekly
intervals and DRIFT spectra were taken at the surface.
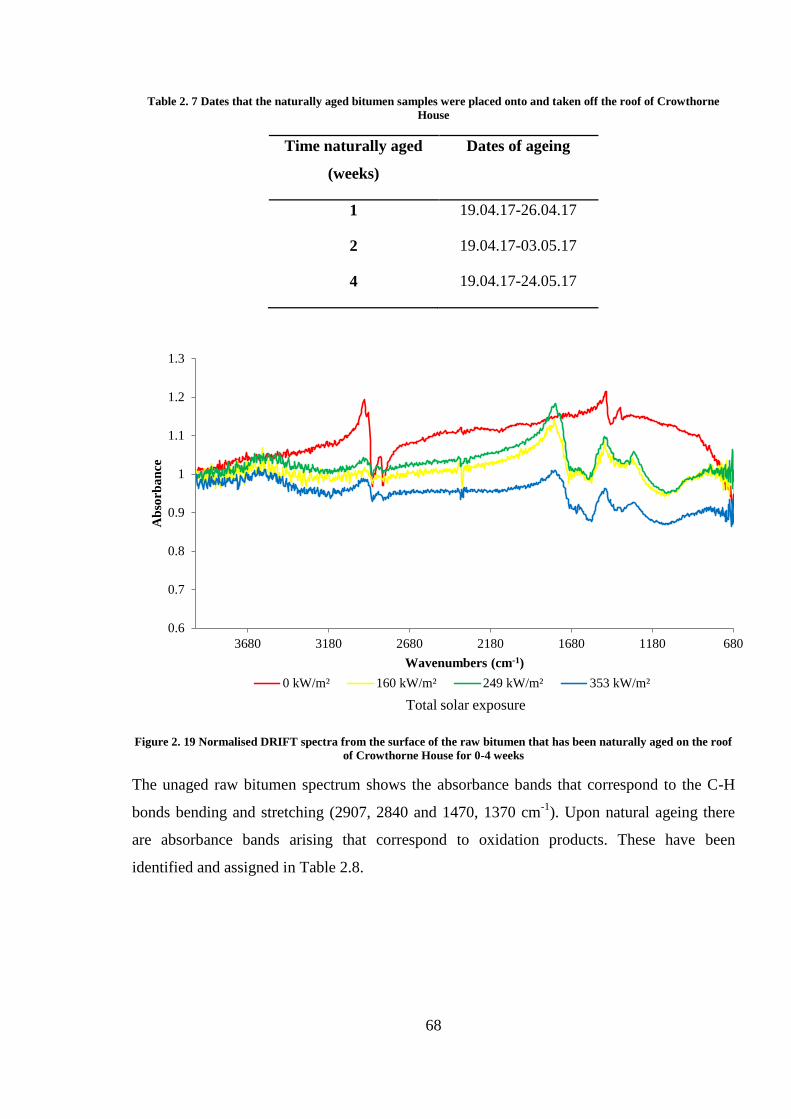
68
Table 2. 7 Dates that the naturally aged bitumen samples were placed onto and taken off the roof of Crowthorne
House
Time naturally aged
(weeks)
Dates of ageing
1 19.04.17-26.04.17
2 19.04.17-03.05.17
4 19.04.17-24.05.17
Figure 2. 19 Normalised DRIFT spectra from the surface of the raw bitumen that has been naturally aged on the roof
of Crowthorne House for 0-4 weeks
The unaged raw bitumen spectrum shows the absorbance bands that correspond to the C-H
bonds bending and stretching (2907, 2840 and 1470, 1370 cm-1
). Upon natural ageing there
are absorbance bands arising that correspond to oxidation products. These have been
identified and assigned in Table 2.8.
0.6
0.7
0.8
0.9
1
1.1
1.2
1.3
680118016802180268031803680
Ab
sorb
an
ce
Wavenumbers (cm-1)
0 kW/m² 160 kW/m² 249 kW/m² 353 kW/m²
Total solar exposure
69
Table 2. 8 Absorbance bands and their assignments from the DRIFT spectra from the surface of the raw bitumen
(Figure 2.19) that has been naturally aged on the roof of Crowthorne House, UK
Absorbance Band (cm-1
) Bond Assignment
2911, 2837 C-H stretch Bitumen Hydrocarbon
1737 C=O stretch Carbonyl oxidation product
1472, 1394 C-H2 bend Bitumen Hydrocarbon
1103 (broad) C-O, S=O Carboxylic and sulfoxide oxidation products
The carbonyl absorbance band appears again as a first derivative, as seen before in the spectra
from the UV aged bitumen, (Section 2.2). This suggests that the surface of the naturally aged
bitumen is physically similar to that of the UV aged asphalt. A skin was seen to form over the
surface of the bitumen as it was naturally aged in a similar manner to the UV aged bitumen.
As before changes in refractive index at the surface could be the reason for the first derivative
nature of the carbonyl absorbance band. The C-O and the sulfoxide bond absorbance bands
are overlapping in Figure 2.19 and a broad absorbance band can be observed between 1323
and 928 cm-1
. The broad band suggests the presence of hydrogen bonding and intermolecular
interactions. This molecular self-assembly could be the reason for the rigid and brittle skin on
the surface.6
As UV irradiation has been proven to induce changes on the surface of the bitumen it is
important to look at the solar exposure that the bitumen has experienced throughout the
natural ageing experiment. The solar meter used for this research has recorded the intensity of
the UV light in Watts per meter squared (W m-2
) at 15 minute intervals, 24 hours a day. The
total solar exposure experienced by the bitumen samples has been calculated by adding the
solar exposure that was recorded by the weather station for the duration of the ageing
experiment. The total solar exposure experienced by the naturally aged bitumen samples can
be found in Figure 2.20.
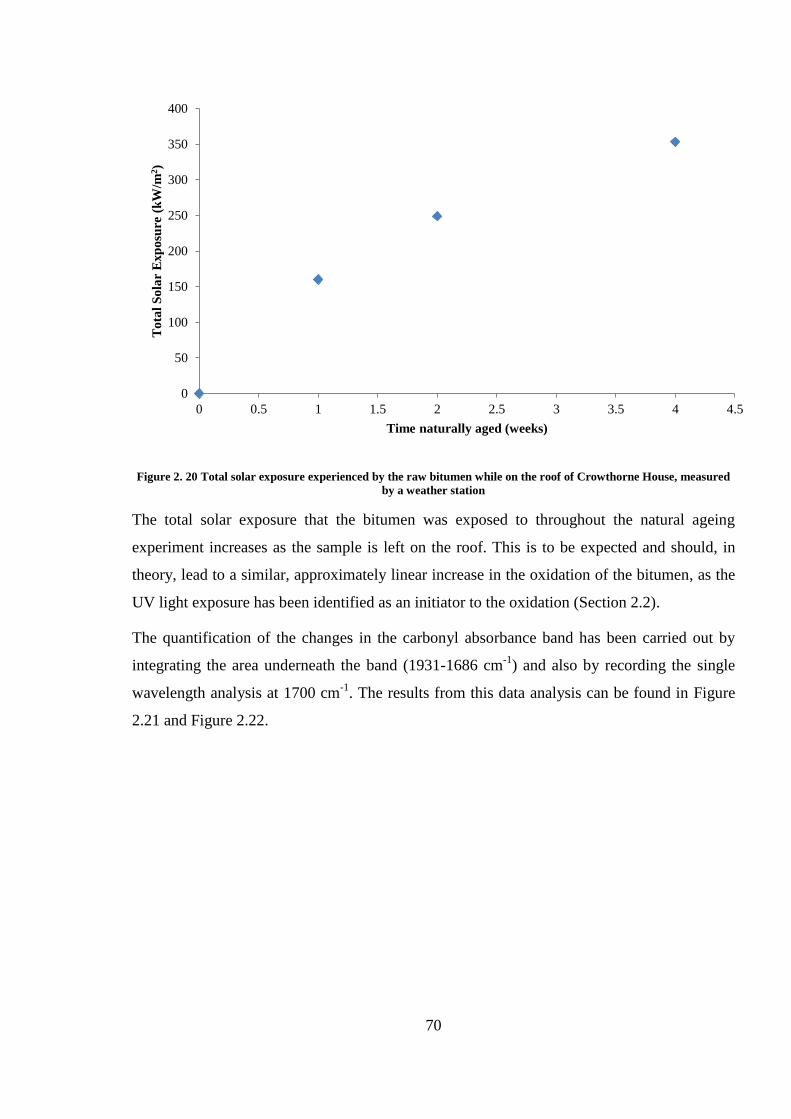
70
Figure 2. 20 Total solar exposure experienced by the raw bitumen while on the roof of Crowthorne House, measured
by a weather station
The total solar exposure that the bitumen was exposed to throughout the natural ageing
experiment increases as the sample is left on the roof. This is to be expected and should, in
theory, lead to a similar, approximately linear increase in the oxidation of the bitumen, as the
UV light exposure has been identified as an initiator to the oxidation (Section 2.2).
The quantification of the changes in the carbonyl absorbance band has been carried out by
integrating the area underneath the band (1931-1686 cm-1
) and also by recording the single
wavelength analysis at 1700 cm-1
. The results from this data analysis can be found in Figure
2.21 and Figure 2.22.
0
50
100
150
200
250
300
350
400
0 0.5 1 1.5 2 2.5 3 3.5 4 4.5
To
tal
So
lar
Exp
osu
re (
kW
/m2)
Time naturally aged (weeks)
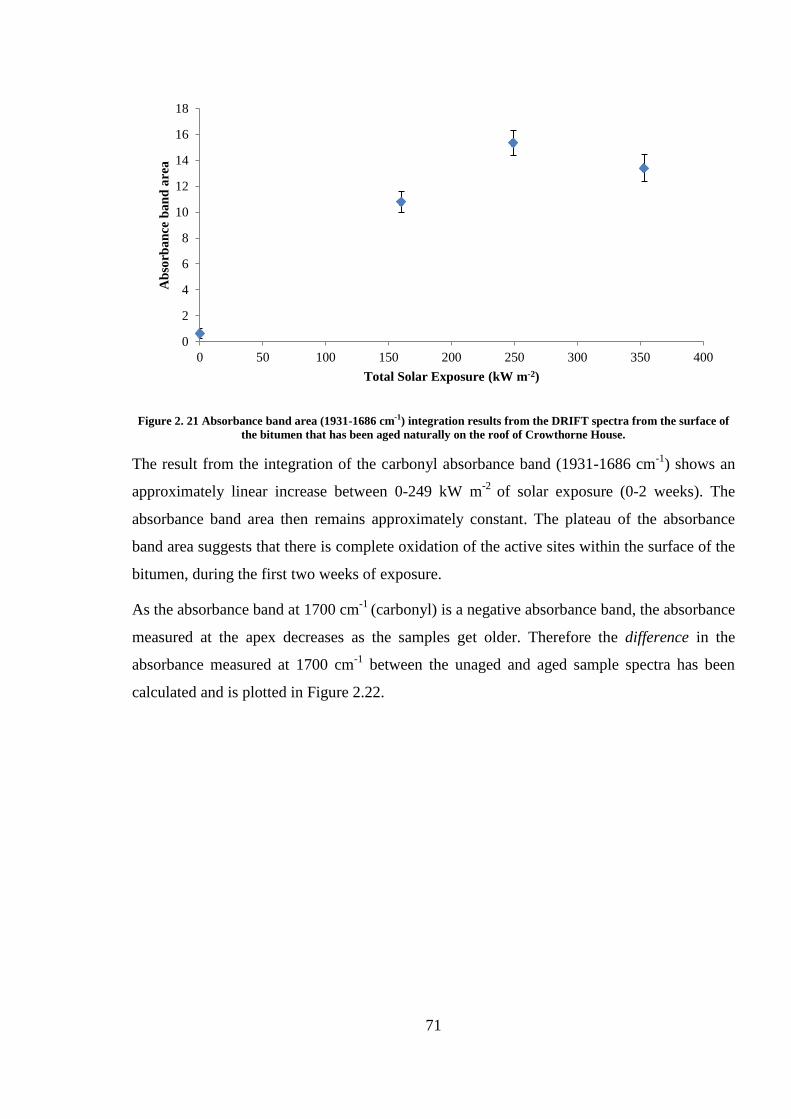
71
Figure 2. 21 Absorbance band area (1931-1686 cm-1) integration results from the DRIFT spectra from the surface of
the bitumen that has been aged naturally on the roof of Crowthorne House.
The result from the integration of the carbonyl absorbance band (1931-1686 cm-1
) shows an
approximately linear increase between 0-249 kW m-2
of solar exposure (0-2 weeks). The
absorbance band area then remains approximately constant. The plateau of the absorbance
band area suggests that there is complete oxidation of the active sites within the surface of the
bitumen, during the first two weeks of exposure.
As the absorbance band at 1700 cm-1
(carbonyl) is a negative absorbance band, the absorbance
measured at the apex decreases as the samples get older. Therefore the difference in the
absorbance measured at 1700 cm-1
between the unaged and aged sample spectra has been
calculated and is plotted in Figure 2.22.
0
2
4
6
8
10
12
14
16
18
0 50 100 150 200 250 300 350 400
Ab
sorb
an
ce b
an
d a
rea
Total Solar Exposure (kW m-2)
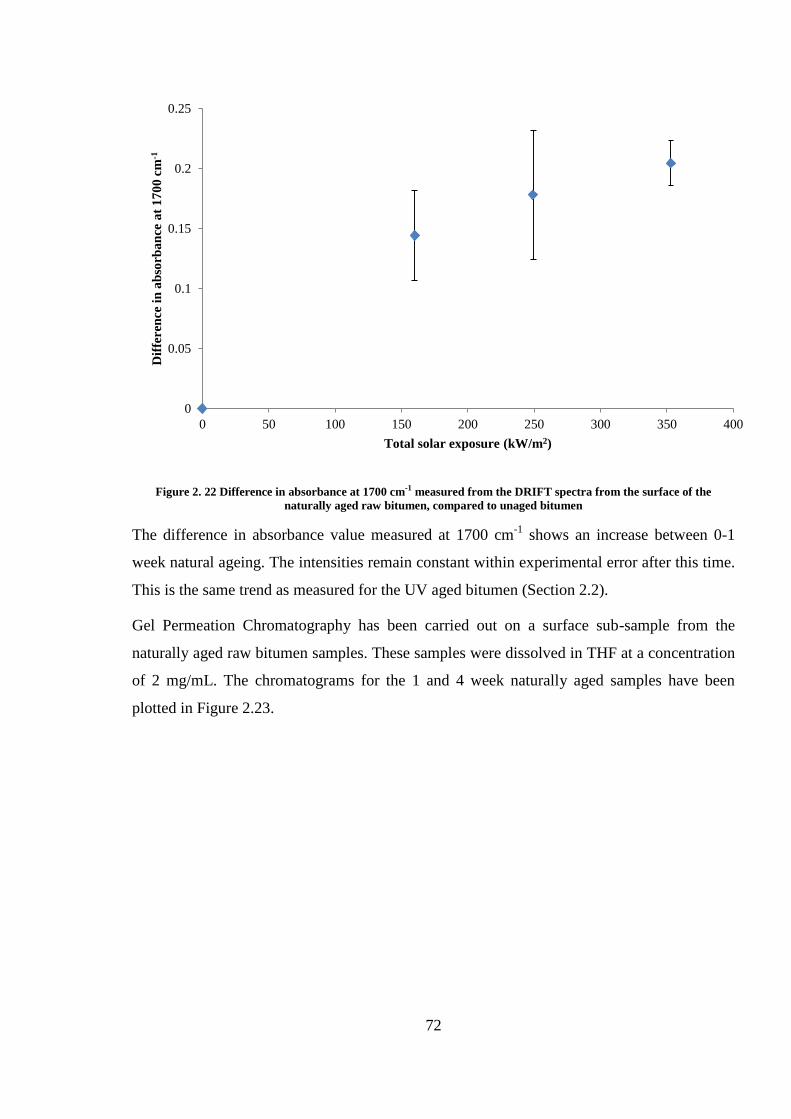
72
Figure 2. 22 Difference in absorbance at 1700 cm-1 measured from the DRIFT spectra from the surface of the
naturally aged raw bitumen, compared to unaged bitumen
The difference in absorbance value measured at 1700 cm-1
shows an increase between 0-1
week natural ageing. The intensities remain constant within experimental error after this time.
This is the same trend as measured for the UV aged bitumen (Section 2.2).
Gel Permeation Chromatography has been carried out on a surface sub-sample from the
naturally aged raw bitumen samples. These samples were dissolved in THF at a concentration
of 2 mg/mL. The chromatograms for the 1 and 4 week naturally aged samples have been
plotted in Figure 2.23.
0
0.05
0.1
0.15
0.2
0.25
0 50 100 150 200 250 300 350 400
Dif
feren
ce i
n a
bso
rba
nce
at
17
00
cm
-1
Total solar exposure (kW/m2)
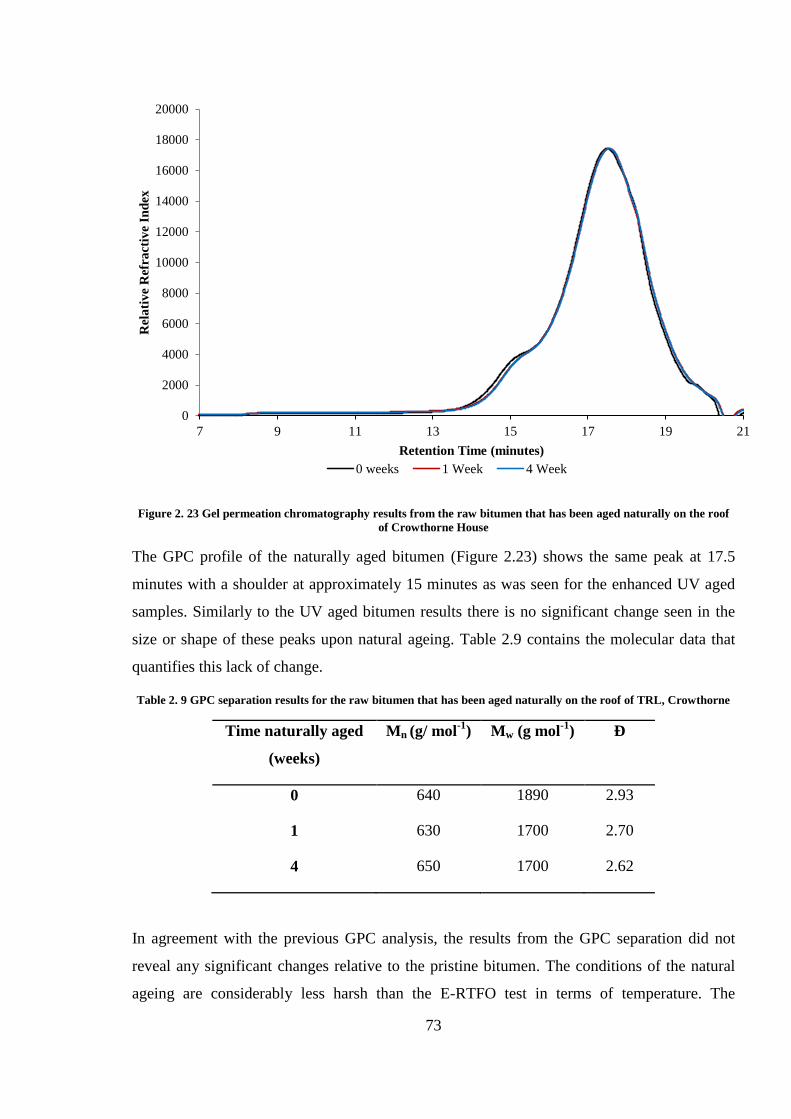
73
Figure 2. 23 Gel permeation chromatography results from the raw bitumen that has been aged naturally on the roof
of Crowthorne House
The GPC profile of the naturally aged bitumen (Figure 2.23) shows the same peak at 17.5
minutes with a shoulder at approximately 15 minutes as was seen for the enhanced UV aged
samples. Similarly to the UV aged bitumen results there is no significant change seen in the
size or shape of these peaks upon natural ageing. Table 2.9 contains the molecular data that
quantifies this lack of change.
Table 2. 9 GPC separation results for the raw bitumen that has been aged naturally on the roof of TRL, Crowthorne
Time naturally aged
(weeks)
Mn (g/ mol-1
) Mw (g mol-1
) Ð
0 640 1890 2.93
1 630 1700 2.70
4 650 1700 2.62
In agreement with the previous GPC analysis, the results from the GPC separation did not
reveal any significant changes relative to the pristine bitumen. The conditions of the natural
ageing are considerably less harsh than the E-RTFO test in terms of temperature. The
0
2000
4000
6000
8000
10000
12000
14000
16000
18000
20000
7 9 11 13 15 17 19 21
Rel
ati
ve
Ref
ract
ive
Ind
ex
Retention Time (minutes)
0 weeks 1 Week 4 Week
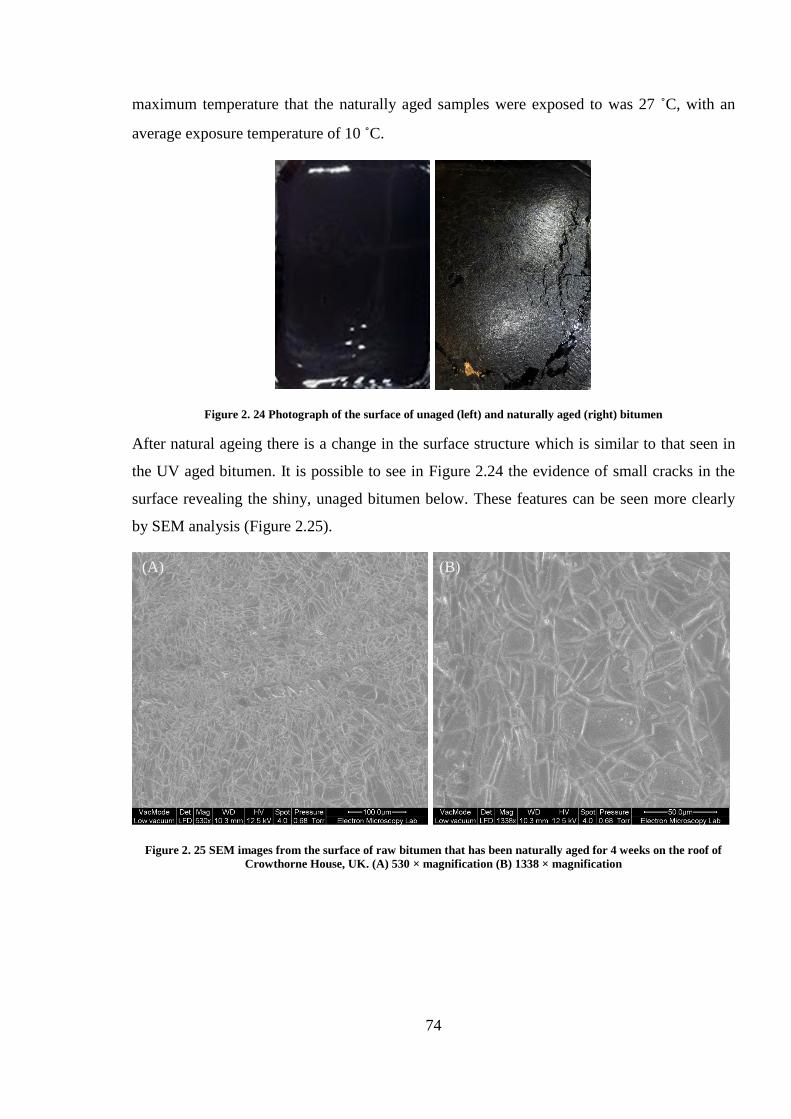
74
maximum temperature that the naturally aged samples were exposed to was 27 ˚C, with an
average exposure temperature of 10 ˚C.
Figure 2. 24 Photograph of the surface of unaged (left) and naturally aged (right) bitumen
After natural ageing there is a change in the surface structure which is similar to that seen in
the UV aged bitumen. It is possible to see in Figure 2.24 the evidence of small cracks in the
surface revealing the shiny, unaged bitumen below. These features can be seen more clearly
by SEM analysis (Figure 2.25).
Figure 2. 25 SEM images from the surface of raw bitumen that has been naturally aged for 4 weeks on the roof of
Crowthorne House, UK. (A) 530 × magnification (B) 1338 × magnification
(A) (B)
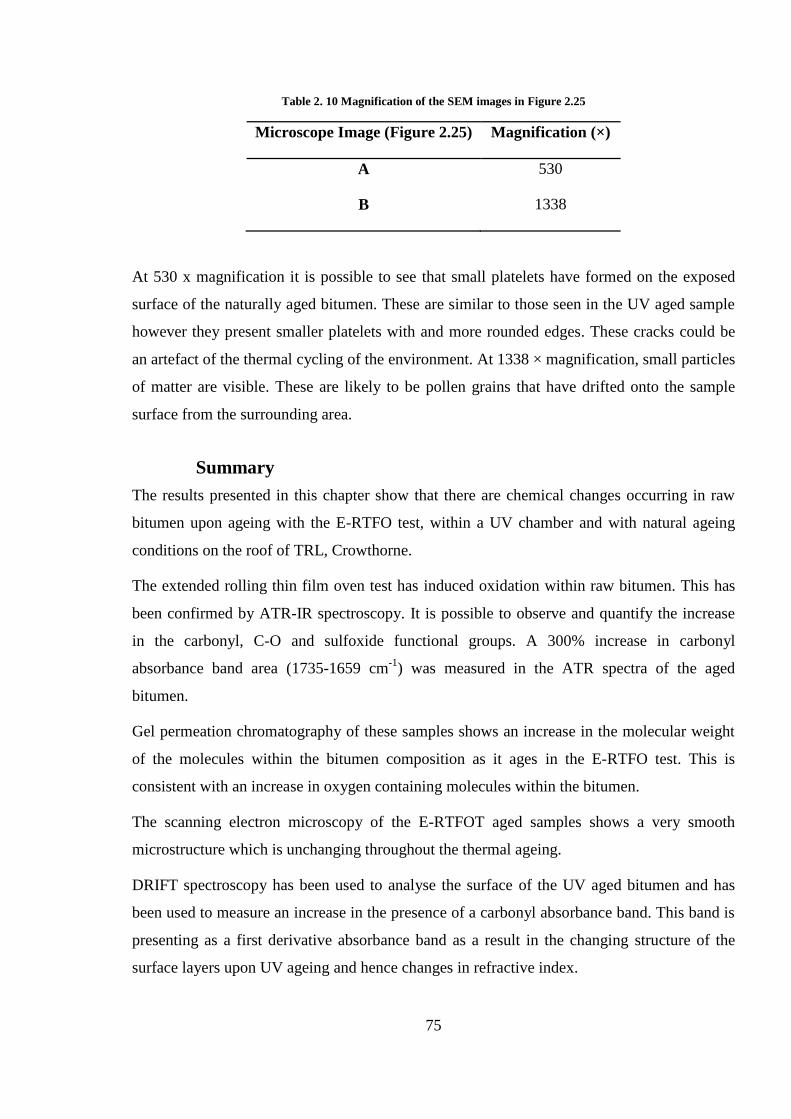
75
Table 2. 10 Magnification of the SEM images in Figure 2.25
Microscope Image (Figure 2.25) Magnification (×)
A 530
B 1338
At 530 x magnification it is possible to see that small platelets have formed on the exposed
surface of the naturally aged bitumen. These are similar to those seen in the UV aged sample
however they present smaller platelets with and more rounded edges. These cracks could be
an artefact of the thermal cycling of the environment. At 1338 × magnification, small particles
of matter are visible. These are likely to be pollen grains that have drifted onto the sample
surface from the surrounding area.
Summary
The results presented in this chapter show that there are chemical changes occurring in raw
bitumen upon ageing with the E-RTFO test, within a UV chamber and with natural ageing
conditions on the roof of TRL, Crowthorne.
The extended rolling thin film oven test has induced oxidation within raw bitumen. This has
been confirmed by ATR-IR spectroscopy. It is possible to observe and quantify the increase
in the carbonyl, C-O and sulfoxide functional groups. A 300% increase in carbonyl
absorbance band area (1735-1659 cm-1
) was measured in the ATR spectra of the aged
bitumen.
Gel permeation chromatography of these samples shows an increase in the molecular weight
of the molecules within the bitumen composition as it ages in the E-RTFO test. This is
consistent with an increase in oxygen containing molecules within the bitumen.
The scanning electron microscopy of the E-RTFOT aged samples shows a very smooth
microstructure which is unchanging throughout the thermal ageing.
DRIFT spectroscopy has been used to analyse the surface of the UV aged bitumen and has
been used to measure an increase in the presence of a carbonyl absorbance band. This band is
presenting as a first derivative absorbance band as a result in the changing structure of the
surface layers upon UV ageing and hence changes in refractive index.
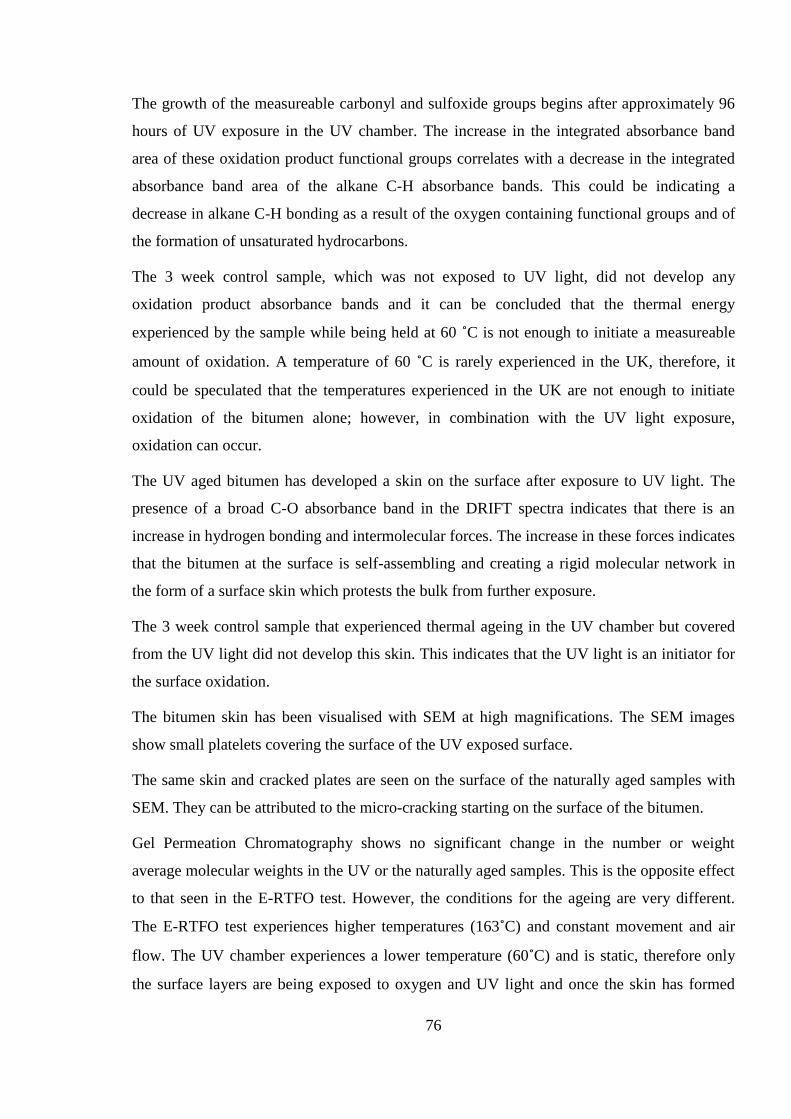
76
The growth of the measureable carbonyl and sulfoxide groups begins after approximately 96
hours of UV exposure in the UV chamber. The increase in the integrated absorbance band
area of these oxidation product functional groups correlates with a decrease in the integrated
absorbance band area of the alkane C-H absorbance bands. This could be indicating a
decrease in alkane C-H bonding as a result of the oxygen containing functional groups and of
the formation of unsaturated hydrocarbons.
The 3 week control sample, which was not exposed to UV light, did not develop any
oxidation product absorbance bands and it can be concluded that the thermal energy
experienced by the sample while being held at 60 ˚C is not enough to initiate a measureable
amount of oxidation. A temperature of 60 ˚C is rarely experienced in the UK, therefore, it
could be speculated that the temperatures experienced in the UK are not enough to initiate
oxidation of the bitumen alone; however, in combination with the UV light exposure,
oxidation can occur.
The UV aged bitumen has developed a skin on the surface after exposure to UV light. The
presence of a broad C-O absorbance band in the DRIFT spectra indicates that there is an
increase in hydrogen bonding and intermolecular forces. The increase in these forces indicates
that the bitumen at the surface is self-assembling and creating a rigid molecular network in
the form of a surface skin which protests the bulk from further exposure.
The 3 week control sample that experienced thermal ageing in the UV chamber but covered
from the UV light did not develop this skin. This indicates that the UV light is an initiator for
the surface oxidation.
The bitumen skin has been visualised with SEM at high magnifications. The SEM images
show small platelets covering the surface of the UV exposed surface.
The same skin and cracked plates are seen on the surface of the naturally aged samples with
SEM. They can be attributed to the micro-cracking starting on the surface of the bitumen.
Gel Permeation Chromatography shows no significant change in the number or weight
average molecular weights in the UV or the naturally aged samples. This is the opposite effect
to that seen in the E-RTFO test. However, the conditions for the ageing are very different.
The E-RTFO test experiences higher temperatures (163˚C) and constant movement and air
flow. The UV chamber experiences a lower temperature (60˚C) and is static, therefore only
the surface layers are being exposed to oxygen and UV light and once the skin has formed
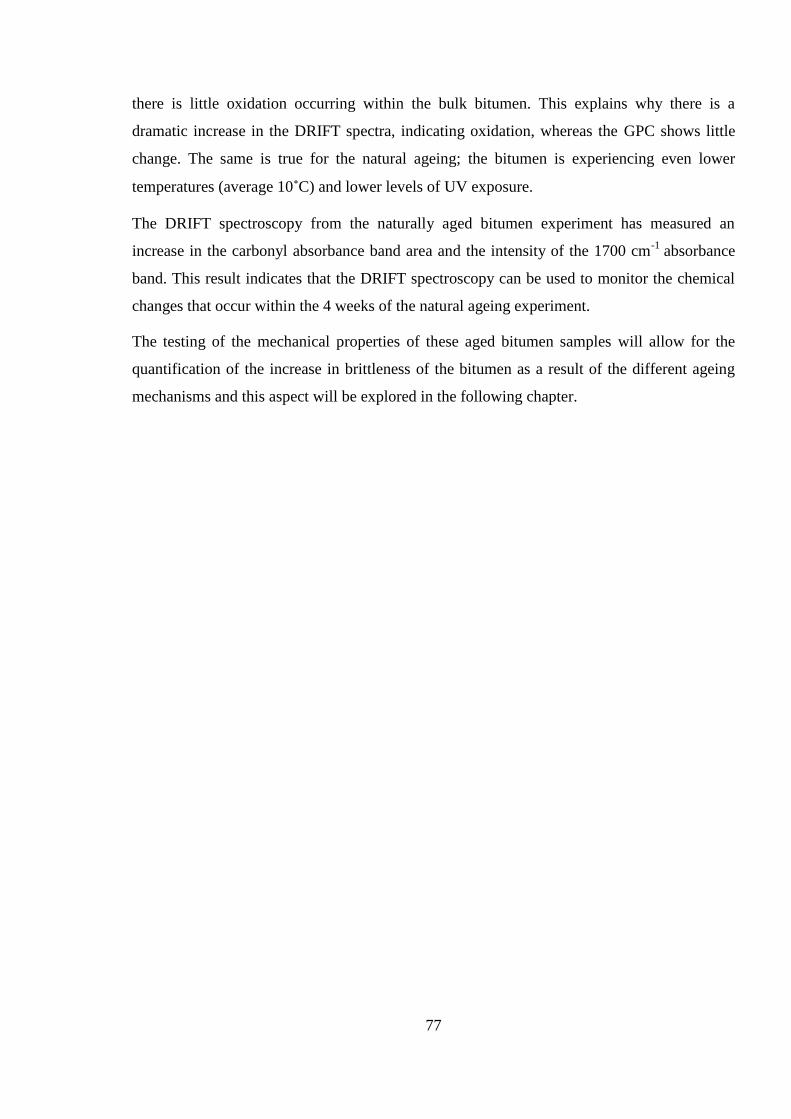
77
there is little oxidation occurring within the bulk bitumen. This explains why there is a
dramatic increase in the DRIFT spectra, indicating oxidation, whereas the GPC shows little
change. The same is true for the natural ageing; the bitumen is experiencing even lower
temperatures (average 10˚C) and lower levels of UV exposure.
The DRIFT spectroscopy from the naturally aged bitumen experiment has measured an
increase in the carbonyl absorbance band area and the intensity of the 1700 cm-1
absorbance
band. This result indicates that the DRIFT spectroscopy can be used to monitor the chemical
changes that occur within the 4 weeks of the natural ageing experiment.
The testing of the mechanical properties of these aged bitumen samples will allow for the
quantification of the increase in brittleness of the bitumen as a result of the different ageing
mechanisms and this aspect will be explored in the following chapter.
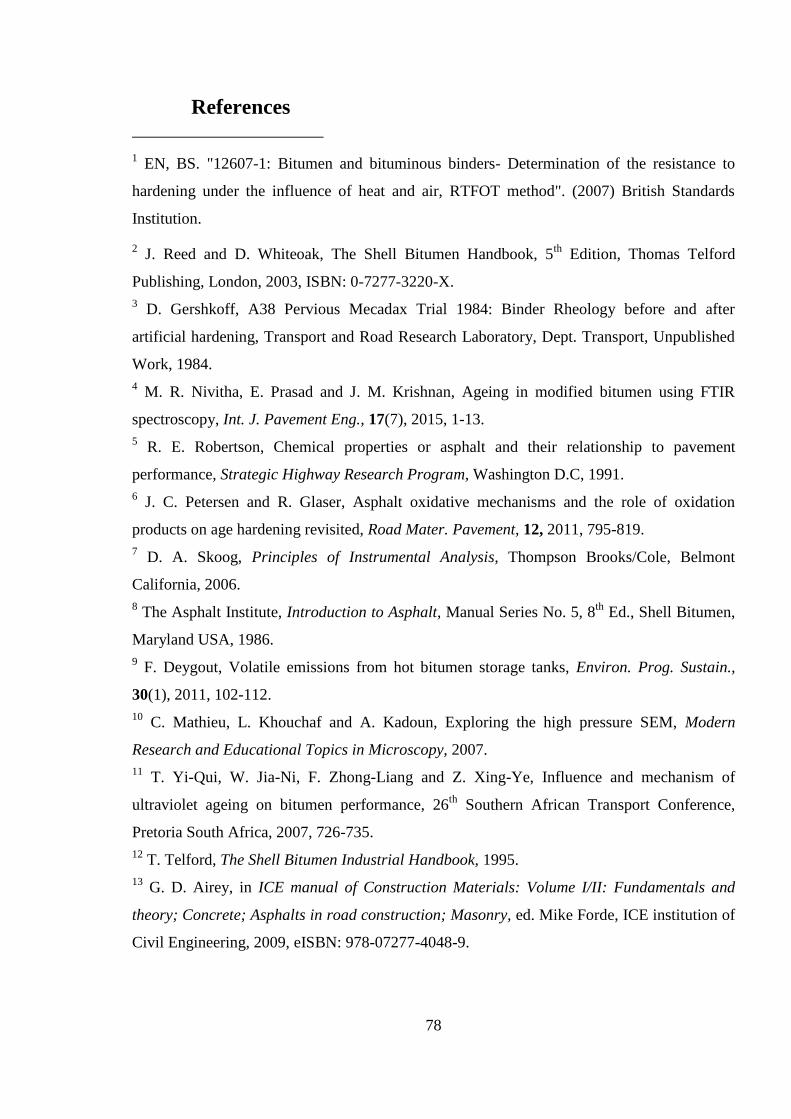
78
References
1 EN, BS. "12607-1: Bitumen and bituminous binders- Determination of the resistance to
hardening under the influence of heat and air, RTFOT method". (2007) British Standards
Institution.
2 J. Reed and D. Whiteoak, The Shell Bitumen Handbook, 5
th Edition, Thomas Telford
Publishing, London, 2003, ISBN: 0-7277-3220-X.
3 D. Gershkoff, A38 Pervious Mecadax Trial 1984: Binder Rheology before and after
artificial hardening, Transport and Road Research Laboratory, Dept. Transport, Unpublished
Work, 1984.
4 M. R. Nivitha, E. Prasad and J. M. Krishnan, Ageing in modified bitumen using FTIR
spectroscopy, Int. J. Pavement Eng., 17(7), 2015, 1-13.
5 R. E. Robertson, Chemical properties or asphalt and their relationship to pavement
performance, Strategic Highway Research Program, Washington D.C, 1991.
6 J. C. Petersen and R. Glaser, Asphalt oxidative mechanisms and the role of oxidation
products on age hardening revisited, Road Mater. Pavement, 12, 2011, 795-819.
7 D. A. Skoog, Principles of Instrumental Analysis, Thompson Brooks/Cole, Belmont
California, 2006.
8 The Asphalt Institute, Introduction to Asphalt, Manual Series No. 5, 8
th Ed., Shell Bitumen,
Maryland USA, 1986.
9 F. Deygout, Volatile emissions from hot bitumen storage tanks, Environ. Prog. Sustain.,
30(1), 2011, 102-112.
10 C. Mathieu, L. Khouchaf and A. Kadoun, Exploring the high pressure SEM, Modern
Research and Educational Topics in Microscopy, 2007.
11 T. Yi-Qui, W. Jia-Ni, F. Zhong-Liang and Z. Xing-Ye, Influence and mechanism of
ultraviolet ageing on bitumen performance, 26th
Southern African Transport Conference,
Pretoria South Africa, 2007, 726-735.
12 T. Telford, The Shell Bitumen Industrial Handbook, 1995.
13 G. D. Airey, in ICE manual of Construction Materials: Volume I/II: Fundamentals and
theory; Concrete; Asphalts in road construction; Masonry, ed. Mike Forde, ICE institution of
Civil Engineering, 2009, eISBN: 978-07277-4048-9.
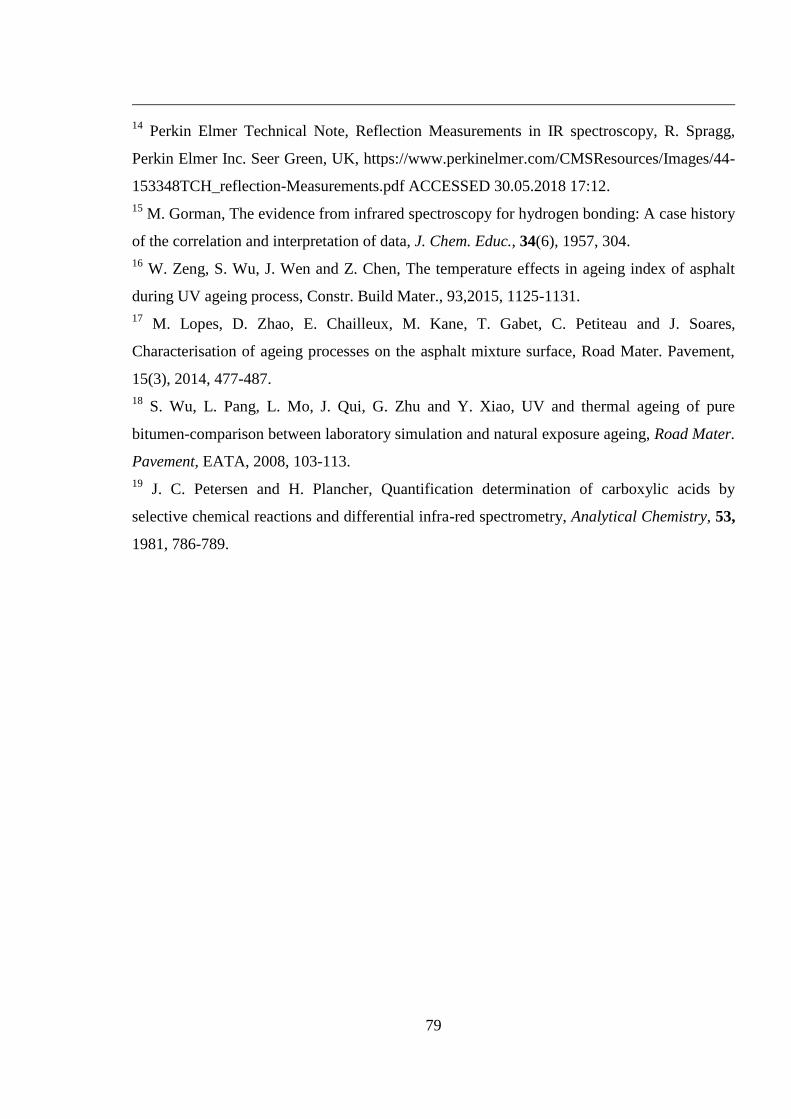
79
14 Perkin Elmer Technical Note, Reflection Measurements in IR spectroscopy, R. Spragg,
Perkin Elmer Inc. Seer Green, UK, https://www.perkinelmer.com/CMSResources/Images/44-
153348TCH_reflection-Measurements.pdf ACCESSED 30.05.2018 17:12.
15 M. Gorman, The evidence from infrared spectroscopy for hydrogen bonding: A case history
of the correlation and interpretation of data, J. Chem. Educ., 34(6), 1957, 304.
16 W. Zeng, S. Wu, J. Wen and Z. Chen, The temperature effects in ageing index of asphalt
during UV ageing process, Constr. Build Mater., 93,2015, 1125-1131.
17 M. Lopes, D. Zhao, E. Chailleux, M. Kane, T. Gabet, C. Petiteau and J. Soares,
Characterisation of ageing processes on the asphalt mixture surface, Road Mater. Pavement,
15(3), 2014, 477-487.
18 S. Wu, L. Pang, L. Mo, J. Qui, G. Zhu and Y. Xiao, UV and thermal ageing of pure
bitumen-comparison between laboratory simulation and natural exposure ageing, Road Mater.
Pavement, EATA, 2008, 103-113.
19 J. C. Petersen and H. Plancher, Quantification determination of carboxylic acids by
selective chemical reactions and differential infra-red spectrometry, Analytical Chemistry, 53,
1981, 786-789.

80
Chapter 3
Artificial and natural ageing of bitumen- Mechanical
property testing
The chemical analysis which was reported in Chapter 2 has identified a degree of chemical
oxidation within the bitumen that had been aged in the E-RTFO test, the UV chamber and
also naturally. It is now of interest to determine the mechanical effect that these chemical
changes have had on the physical properties of the bitumen.
The mechanical properties of bitumen can be related to the intermolecular interactions and
structuring within the bitumen composition. There are two methods of age hardening that can
occur within bitumen; oxidative hardening and organisational hardening. The first has been
described in Chapters 1 and 2, and involves the increase in aromaticity and oxygen content
within the bitumen composition. The increase in electron density and polar, oxygen-
containing groups increases the amount and strength of intermolecular interactions that are
possible and therefore increases the viscosity.1 The chemical ageing is irreversible. By
contrast the organisational hardening is reversible. Organisational hardening is the result of
the intermolecular interactions between the polar groups and the electron dense groups within
the bitumen. In this way the molecules are able to organise and stack themselves into a
composition that is stable and immobile. The agglomerates formed from this arrangement are
sometimes termed colloids or micelles however the use of these terms is somewhat
misleading as the structures formed within bitumen are different to the structures that a
surface or colloidal chemist might describe as a colloid or a micelle.2,3
The molecular
organisation is susceptible to rearrangement with the energy supplied from high temperatures
and physical stresses, such as trafficking. The highly interacting molecular network becomes
very rigid and cannot heal or deform elastically. This means that the bitumen and asphalt are
more likely to crack under the stress of trafficking.
There are standardised mechanical tests that are used regularly in industry which allow a
highways company, such as Highways England in the UK, to determine the physical
characteristics of the bitumen being used on their road network. The most commonly used are
81
the Penetration point, Softening point and, less commonly, the Vialit pendulum test. These
tests are used to measure the stiffness, viscosity and cohesion of the bitumen, respectively.
The viscosity of the bitumen is also measured in order to characterise the bitumen being
utilised within road surfaces. There are two standardised tests that allow for the measurement
of bitumen viscosity, the dynamic viscosity,4 and the kinematic viscosity
5 tests. They both
involve measuring the time that it takes for a volume of bitumen to travel through a capillary
tube.
This chapter outlines the mechanical tests have been carried out on the bitumen samples that
have been aged artificially and naturally and the results are presented in this chapter.
3.1 Mechanical testing methodology
3.1.1 Penetration point test
The penetration point test has been carried using the British Standard method EN 1426:2015.6
This method involves heating and pouring raw bitumen into standardised sample tins. The tins
have a 55 mm diameter and a 35 mm depth. This is then cooled for at least 1 hour and is then
placed into a water bath, set to 25 ˚C, for 1 hour to allow the sample to equilibrate in
temperature. The sample is then placed underneath a standardised needle with a 100 g weight
attached. The needle is brought down to touch the surface of the bitumen which just breaks
the surface tension of the bitumen. The needle is then released and allowed to drop into the
bitumen for 5 seconds. The distance that the needle travels in this time is recorded in 1/10th
millimetre units. This is repeated 3 times in 3 different locations on the bitumen surface, at
least 1 cm apart, and the average penetration point is calculated.
3.1.2 Softening point test
The softening point test described in the British Standard EN 1427:2015 7 requires two discs
of bitumen to be formed within standardised steel rings. These are poured and cooled for at
least 1 hour before being placed into the softening point cradle which is then held in a water
bath at 5 ˚C. At the start of the test a steel ball is placed on the top of each of the bitumen
discs (Figure 3.1 A) and the water bath is heated at a rate of 5˚C per minute while stirring to
ensure efficient heat distribution.
82
Figure 3. 1 Photographs indicating the softening point test experimental set up at the start of the test (A) and the end
point (B)
The temperature of the water bath is heated until the two steel balls reach the bottom of the
cradle which is approx. 2.5 cm away from the starting position (Figure 3.1 B). The
temperature of the water bath at this point is recorded as the softening point.
3.1.3 Vialit Pendulum test
The pendulum test has been standardised and is described within the British Standard EN
13588:2008.8 It is started by preparing steel block sample holders with bitumen. The steel
blocks are heated in an oven for at least an hour to ensure the bitumen does not cool too
quickly when placed, with a scalpel on to the sample holder. A top steel block is then placed
on top of the bitumen sample and any excess bitumen is carefully cut away.
Figure 3. 2 Diagram representation of the sample holder for the Vialit Pendulum test (a). Bitumen is placed onto the
grooved surface of the bottom cube, and then the top cube is pressed onto the bitumen.
(A) (B)
(a)
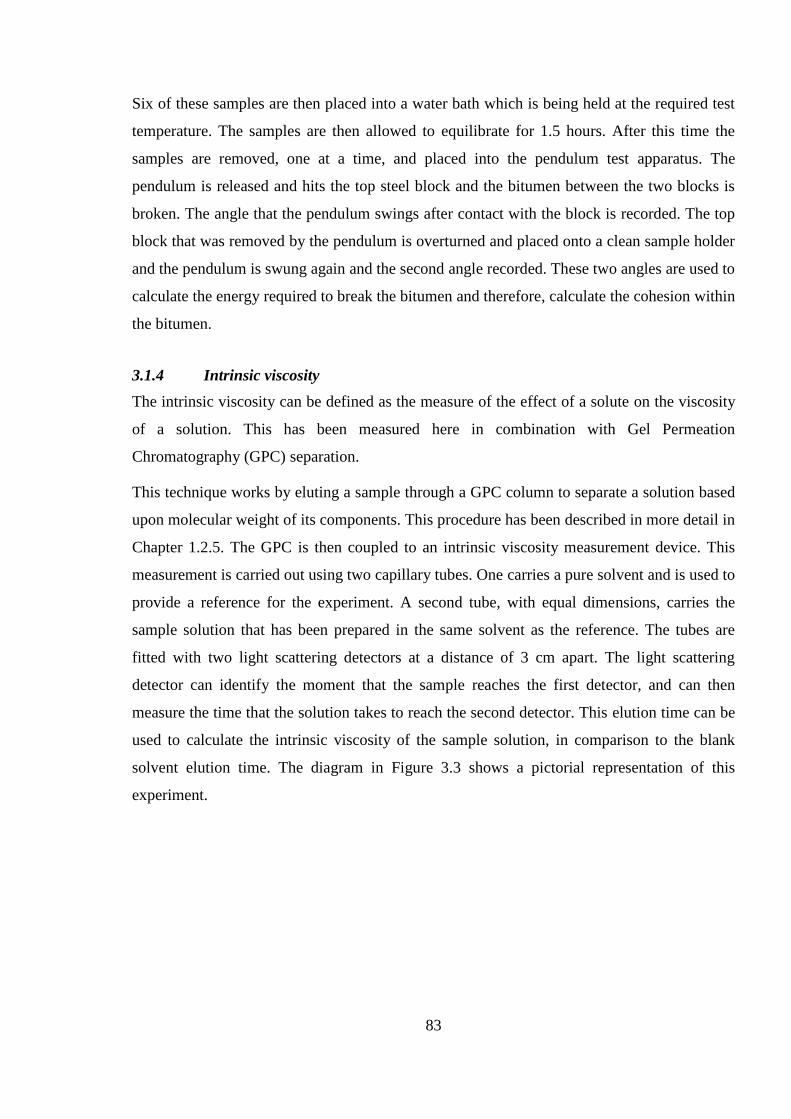
83
Six of these samples are then placed into a water bath which is being held at the required test
temperature. The samples are then allowed to equilibrate for 1.5 hours. After this time the
samples are removed, one at a time, and placed into the pendulum test apparatus. The
pendulum is released and hits the top steel block and the bitumen between the two blocks is
broken. The angle that the pendulum swings after contact with the block is recorded. The top
block that was removed by the pendulum is overturned and placed onto a clean sample holder
and the pendulum is swung again and the second angle recorded. These two angles are used to
calculate the energy required to break the bitumen and therefore, calculate the cohesion within
the bitumen.
3.1.4 Intrinsic viscosity
The intrinsic viscosity can be defined as the measure of the effect of a solute on the viscosity
of a solution. This has been measured here in combination with Gel Permeation
Chromatography (GPC) separation.
This technique works by eluting a sample through a GPC column to separate a solution based
upon molecular weight of its components. This procedure has been described in more detail in
Chapter 1.2.5. The GPC is then coupled to an intrinsic viscosity measurement device. This
measurement is carried out using two capillary tubes. One carries a pure solvent and is used to
provide a reference for the experiment. A second tube, with equal dimensions, carries the
sample solution that has been prepared in the same solvent as the reference. The tubes are
fitted with two light scattering detectors at a distance of 3 cm apart. The light scattering
detector can identify the moment that the sample reaches the first detector, and can then
measure the time that the solution takes to reach the second detector. This elution time can be
used to calculate the intrinsic viscosity of the sample solution, in comparison to the blank
solvent elution time. The diagram in Figure 3.3 shows a pictorial representation of this
experiment.
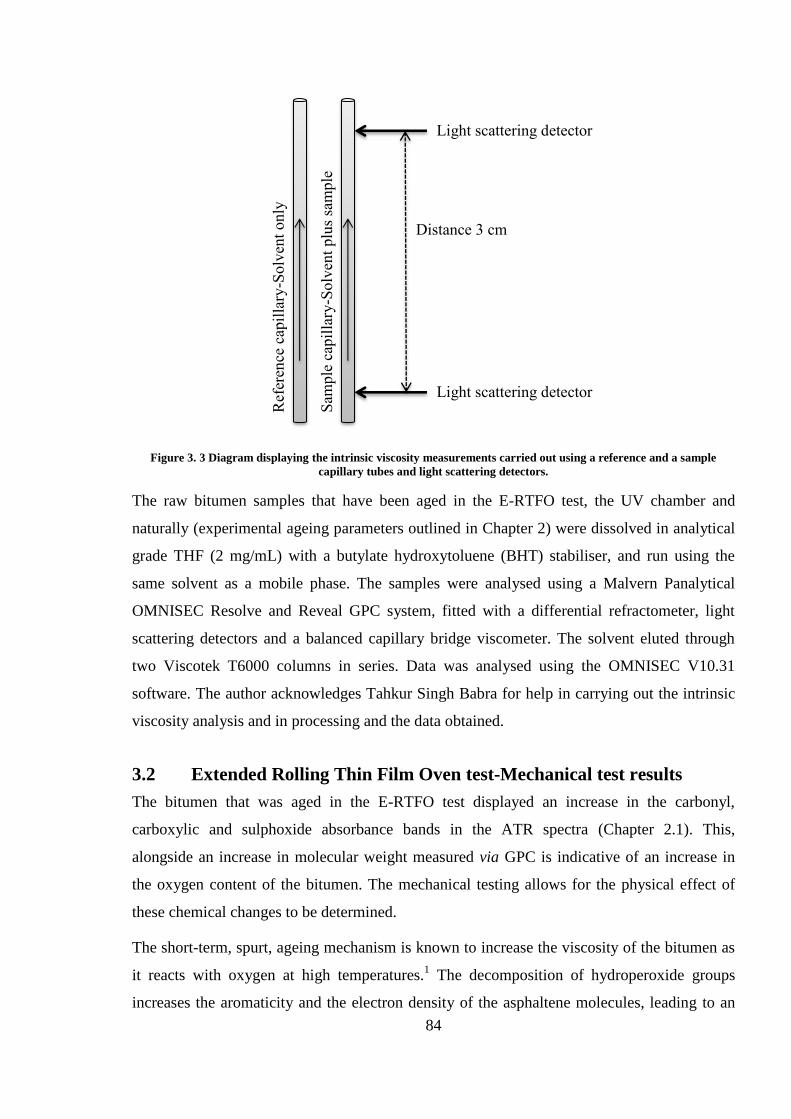
84
Figure 3. 3 Diagram displaying the intrinsic viscosity measurements carried out using a reference and a sample
capillary tubes and light scattering detectors.
The raw bitumen samples that have been aged in the E-RTFO test, the UV chamber and
naturally (experimental ageing parameters outlined in Chapter 2) were dissolved in analytical
grade THF (2 mg/mL) with a butylate hydroxytoluene (BHT) stabiliser, and run using the
same solvent as a mobile phase. The samples were analysed using a Malvern Panalytical
OMNISEC Resolve and Reveal GPC system, fitted with a differential refractometer, light
scattering detectors and a balanced capillary bridge viscometer. The solvent eluted through
two Viscotek T6000 columns in series. Data was analysed using the OMNISEC V10.31
software. The author acknowledges Tahkur Singh Babra for help in carrying out the intrinsic
viscosity analysis and in processing and the data obtained.
3.2 Extended Rolling Thin Film Oven test-Mechanical test results
The bitumen that was aged in the E-RTFO test displayed an increase in the carbonyl,
carboxylic and sulphoxide absorbance bands in the ATR spectra (Chapter 2.1). This,
alongside an increase in molecular weight measured via GPC is indicative of an increase in
the oxygen content of the bitumen. The mechanical testing allows for the physical effect of
these chemical changes to be determined.
The short-term, spurt, ageing mechanism is known to increase the viscosity of the bitumen as
it reacts with oxygen at high temperatures.1 The decomposition of hydroperoxide groups
increases the aromaticity and the electron density of the asphaltene molecules, leading to an
Ref
eren
ce c
apil
lary
-Solv
ent
only
Sam
ple
cap
illa
ry-S
olv
ent
plu
s sa
mple
Light scattering detector
Light scattering detector
Distance 3 cm
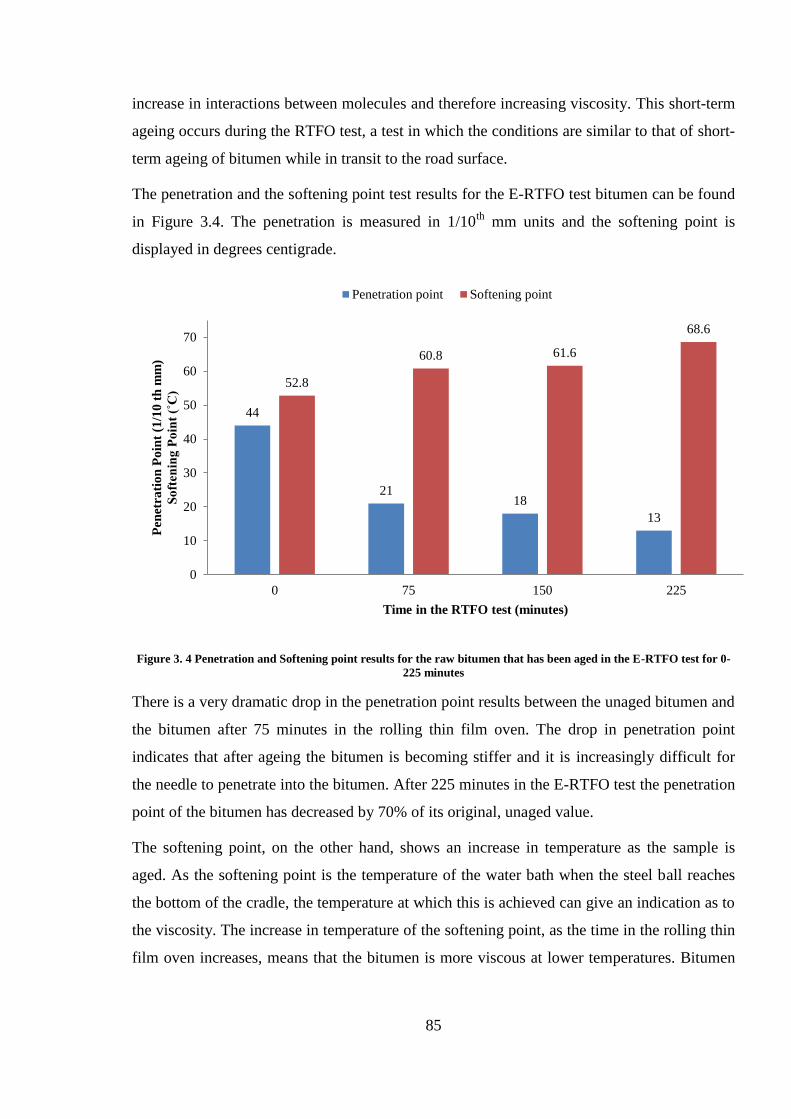
85
increase in interactions between molecules and therefore increasing viscosity. This short-term
ageing occurs during the RTFO test, a test in which the conditions are similar to that of short-
term ageing of bitumen while in transit to the road surface.
The penetration and the softening point test results for the E-RTFO test bitumen can be found
in Figure 3.4. The penetration is measured in 1/10th
mm units and the softening point is
displayed in degrees centigrade.
Figure 3. 4 Penetration and Softening point results for the raw bitumen that has been aged in the E-RTFO test for 0-
225 minutes
There is a very dramatic drop in the penetration point results between the unaged bitumen and
the bitumen after 75 minutes in the rolling thin film oven. The drop in penetration point
indicates that after ageing the bitumen is becoming stiffer and it is increasingly difficult for
the needle to penetrate into the bitumen. After 225 minutes in the E-RTFO test the penetration
point of the bitumen has decreased by 70% of its original, unaged value.
The softening point, on the other hand, shows an increase in temperature as the sample is
aged. As the softening point is the temperature of the water bath when the steel ball reaches
the bottom of the cradle, the temperature at which this is achieved can give an indication as to
the viscosity. The increase in temperature of the softening point, as the time in the rolling thin
film oven increases, means that the bitumen is more viscous at lower temperatures. Bitumen
44
21 18
13
52.8
60.8 61.6
68.6
0
10
20
30
40
50
60
70
0 75 150 225
Pen
etra
tio
n P
oin
t (1
/10
th
mm
)
So
ften
ing
Po
int
(˚C
)
Time in the RTFO test (minutes)
Penetration point Softening point
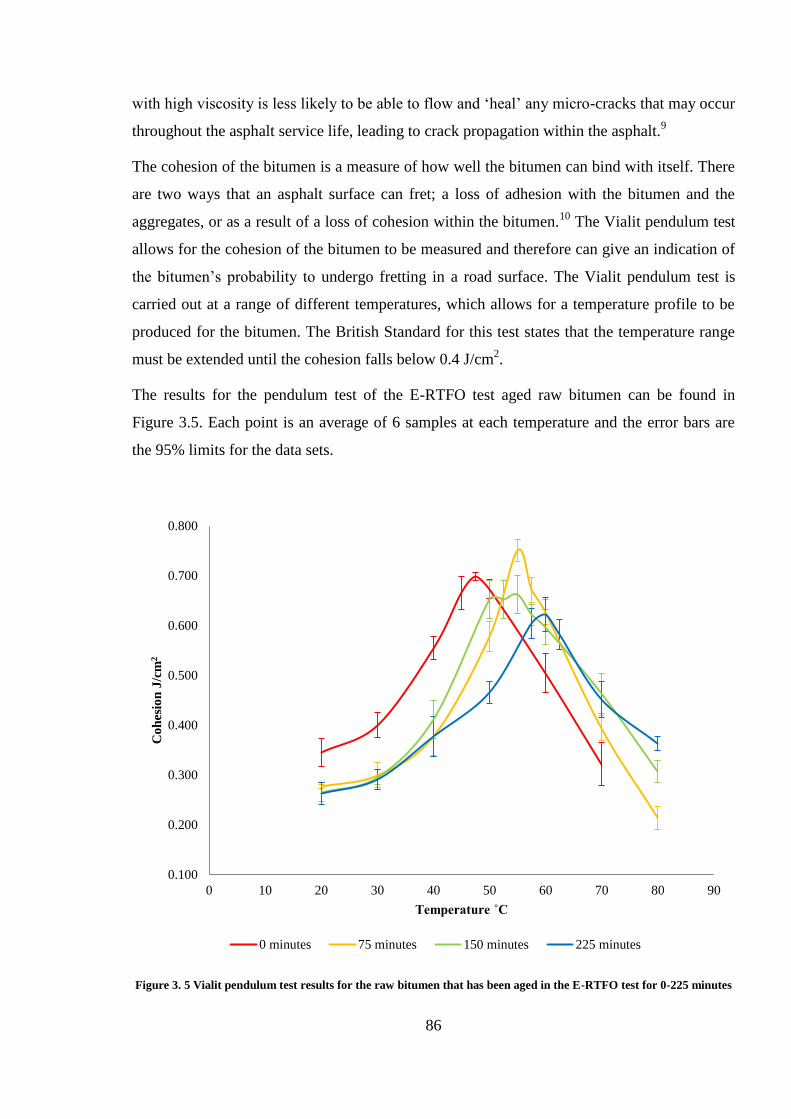
86
with high viscosity is less likely to be able to flow and ‘heal’ any micro-cracks that may occur
throughout the asphalt service life, leading to crack propagation within the asphalt.9
The cohesion of the bitumen is a measure of how well the bitumen can bind with itself. There
are two ways that an asphalt surface can fret; a loss of adhesion with the bitumen and the
aggregates, or as a result of a loss of cohesion within the bitumen.10
The Vialit pendulum test
allows for the cohesion of the bitumen to be measured and therefore can give an indication of
the bitumen’s probability to undergo fretting in a road surface. The Vialit pendulum test is
carried out at a range of different temperatures, which allows for a temperature profile to be
produced for the bitumen. The British Standard for this test states that the temperature range
must be extended until the cohesion falls below 0.4 J/cm2.
The results for the pendulum test of the E-RTFO test aged raw bitumen can be found in
Figure 3.5. Each point is an average of 6 samples at each temperature and the error bars are
the 95% limits for the data sets.
Figure 3. 5 Vialit pendulum test results for the raw bitumen that has been aged in the E-RTFO test for 0-225 minutes
0.100
0.200
0.300
0.400
0.500
0.600
0.700
0.800
0 10 20 30 40 50 60 70 80 90
Co
hes
ion
J/c
m2
Temperature ˚C
0 minutes 75 minutes 150 minutes 225 minutes
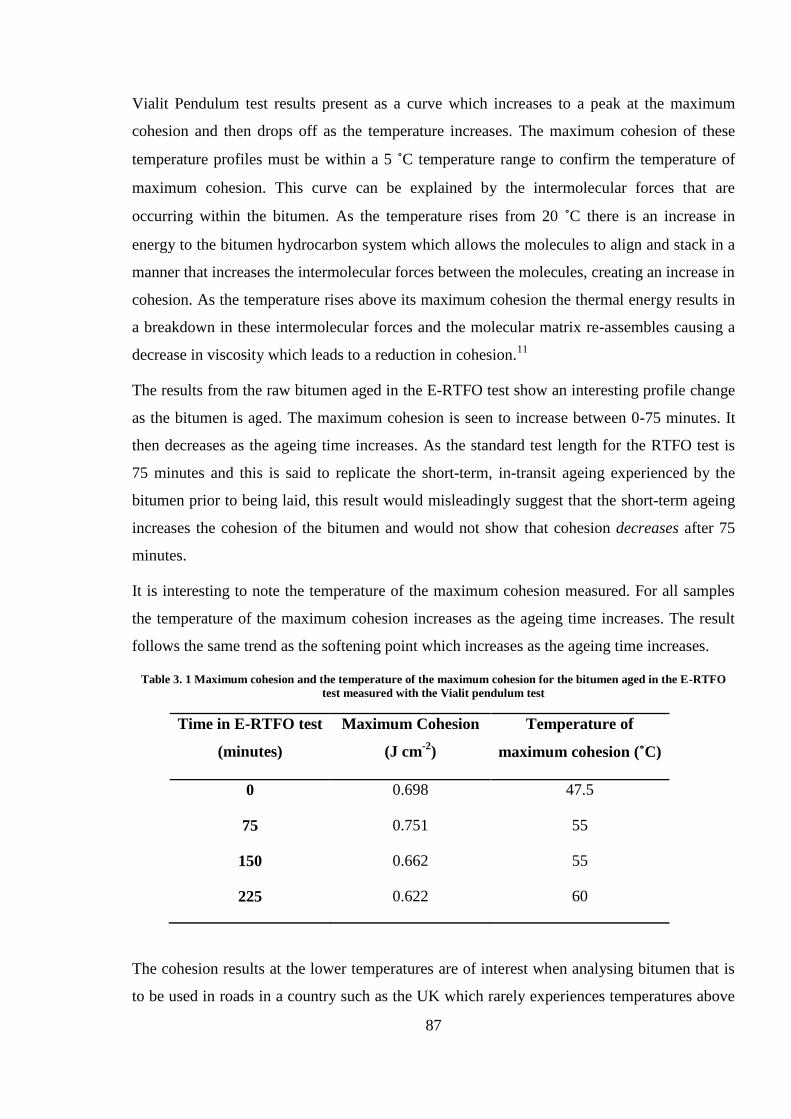
87
Vialit Pendulum test results present as a curve which increases to a peak at the maximum
cohesion and then drops off as the temperature increases. The maximum cohesion of these
temperature profiles must be within a 5 ˚C temperature range to confirm the temperature of
maximum cohesion. This curve can be explained by the intermolecular forces that are
occurring within the bitumen. As the temperature rises from 20 ˚C there is an increase in
energy to the bitumen hydrocarbon system which allows the molecules to align and stack in a
manner that increases the intermolecular forces between the molecules, creating an increase in
cohesion. As the temperature rises above its maximum cohesion the thermal energy results in
a breakdown in these intermolecular forces and the molecular matrix re-assembles causing a
decrease in viscosity which leads to a reduction in cohesion.11
The results from the raw bitumen aged in the E-RTFO test show an interesting profile change
as the bitumen is aged. The maximum cohesion is seen to increase between 0-75 minutes. It
then decreases as the ageing time increases. As the standard test length for the RTFO test is
75 minutes and this is said to replicate the short-term, in-transit ageing experienced by the
bitumen prior to being laid, this result would misleadingly suggest that the short-term ageing
increases the cohesion of the bitumen and would not show that cohesion decreases after 75
minutes.
It is interesting to note the temperature of the maximum cohesion measured. For all samples
the temperature of the maximum cohesion increases as the ageing time increases. The result
follows the same trend as the softening point which increases as the ageing time increases.
Table 3. 1 Maximum cohesion and the temperature of the maximum cohesion for the bitumen aged in the E-RTFO
test measured with the Vialit pendulum test
Time in E-RTFO test
(minutes)
Maximum Cohesion
(J cm-2
)
Temperature of
maximum cohesion (˚C)
0 0.698 47.5
75 0.751 55
150 0.662 55
225 0.622 60
The cohesion results at the lower temperatures are of interest when analysing bitumen that is
to be used in roads in a country such as the UK which rarely experiences temperatures above
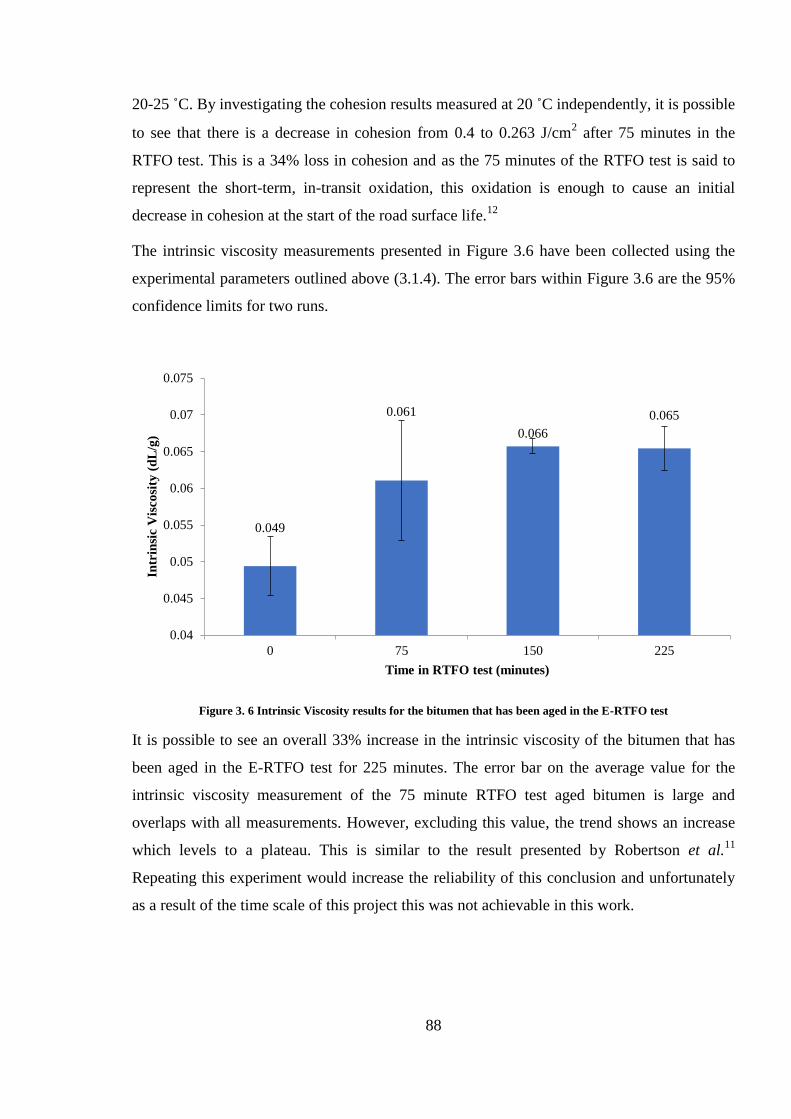
88
20-25 ˚C. By investigating the cohesion results measured at 20 ˚C independently, it is possible
to see that there is a decrease in cohesion from 0.4 to 0.263 J/cm2 after 75 minutes in the
RTFO test. This is a 34% loss in cohesion and as the 75 minutes of the RTFO test is said to
represent the short-term, in-transit oxidation, this oxidation is enough to cause an initial
decrease in cohesion at the start of the road surface life.12
The intrinsic viscosity measurements presented in Figure 3.6 have been collected using the
experimental parameters outlined above (3.1.4). The error bars within Figure 3.6 are the 95%
confidence limits for two runs.
Figure 3. 6 Intrinsic Viscosity results for the bitumen that has been aged in the E-RTFO test
It is possible to see an overall 33% increase in the intrinsic viscosity of the bitumen that has
been aged in the E-RTFO test for 225 minutes. The error bar on the average value for the
intrinsic viscosity measurement of the 75 minute RTFO test aged bitumen is large and
overlaps with all measurements. However, excluding this value, the trend shows an increase
which levels to a plateau. This is similar to the result presented by Robertson et al.11
Repeating this experiment would increase the reliability of this conclusion and unfortunately
as a result of the time scale of this project this was not achievable in this work.
0.049
0.061
0.066
0.065
0.04
0.045
0.05
0.055
0.06
0.065
0.07
0.075
0 75 150 225
Intr
insi
c V
isco
sity
(d
L/g
)
Time in RTFO test (minutes)
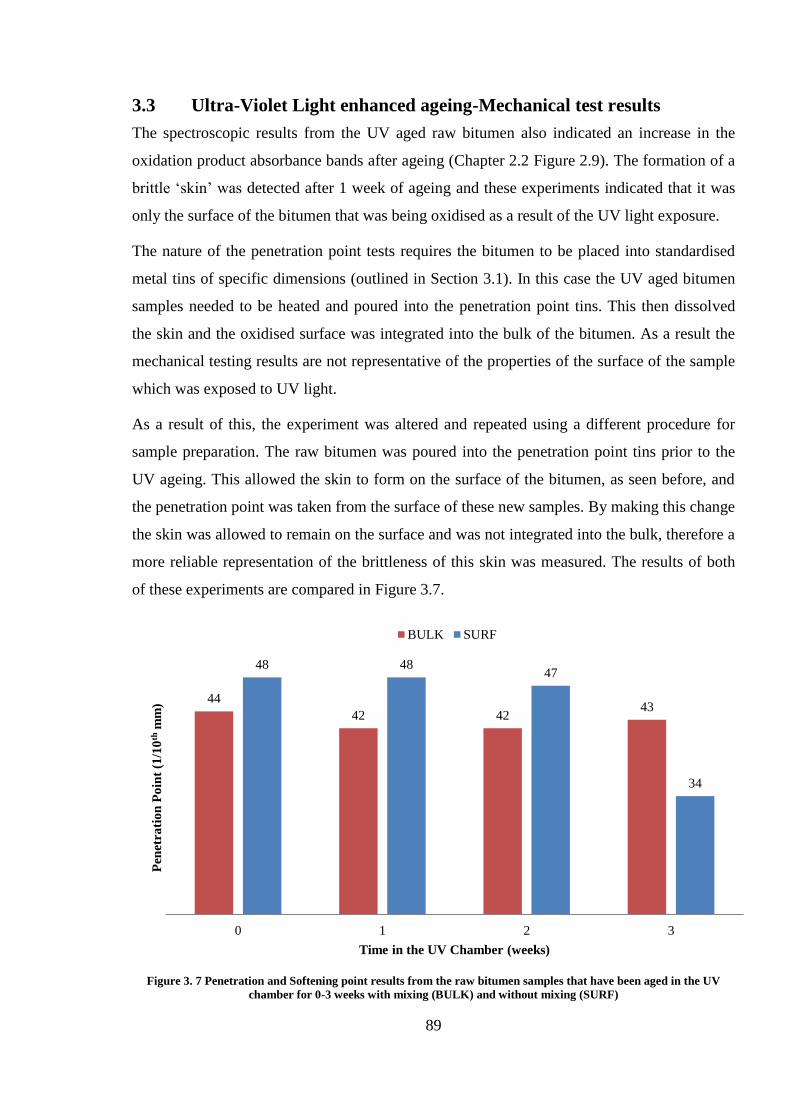
89
3.3 Ultra-Violet Light enhanced ageing-Mechanical test results
The spectroscopic results from the UV aged raw bitumen also indicated an increase in the
oxidation product absorbance bands after ageing (Chapter 2.2 Figure 2.9). The formation of a
brittle ‘skin’ was detected after 1 week of ageing and these experiments indicated that it was
only the surface of the bitumen that was being oxidised as a result of the UV light exposure.
The nature of the penetration point tests requires the bitumen to be placed into standardised
metal tins of specific dimensions (outlined in Section 3.1). In this case the UV aged bitumen
samples needed to be heated and poured into the penetration point tins. This then dissolved
the skin and the oxidised surface was integrated into the bulk of the bitumen. As a result the
mechanical testing results are not representative of the properties of the surface of the sample
which was exposed to UV light.
As a result of this, the experiment was altered and repeated using a different procedure for
sample preparation. The raw bitumen was poured into the penetration point tins prior to the
UV ageing. This allowed the skin to form on the surface of the bitumen, as seen before, and
the penetration point was taken from the surface of these new samples. By making this change
the skin was allowed to remain on the surface and was not integrated into the bulk, therefore a
more reliable representation of the brittleness of this skin was measured. The results of both
of these experiments are compared in Figure 3.7.
Figure 3. 7 Penetration and Softening point results from the raw bitumen samples that have been aged in the UV
chamber for 0-3 weeks with mixing (BULK) and without mixing (SURF)
44
42 42 43
48 48 47
34
0 1 2 3
Pen
etra
tio
n P
oin
t (1
/10
th m
m)
Time in the UV Chamber (weeks)
BULK SURF

90
As predicted the bulk results show very little change in the penetration point. There is only a
4% decrease between the unaged bitumen and the bitumen after 1 week of ageing. The
penetration point then increases at 3 weeks of UV ageing, which suggests that the change in
penetration point for these samples is not outside of the error of the test. When the surface is
oxidised and the oxidised skin is not mixed into the bulk the surface penetration does show a
decrease with increasing ageing time. The overall penetration drops from 43 to 34 (1/10th
mm) after the 3 weeks of UV exposure which is a 29% decrease in penetration. By comparing
these results and combining them with the chemical information from the DRIFT
spectroscopy, (Chapter 2.2), it seems very likely that the UV exposure of the bitumen oxidises
the surface layer only. This creates a brittle skin on the surface and this skin then protects the
bulk bitumen from further oxidation. This brittle skin is made from a combination of
molecular stacking of the bitumen asphaltene molecules, with strong intermolecular
interactions holding the network together. When this is heated the molecular framework
breaks down resulting in a less viscous material.11
In order to measure the softening point of the bitumen it is necessary to heat the sample. The
softening point rings were then be prepared using the bulk bitumen mixture. The results of
this test for the UV aged bitumen can be found in Figure 3.8.
Figure 3. 8 Softening point results of the raw bitumen that has been aged in the UV chamber for 0-3 weeks
52.8
54 54 54.2
53.5
0 1 2 3
So
ften
ing
Po
int
(˚C
)
Time in the UV Chamber (weeks)
UV aged Control
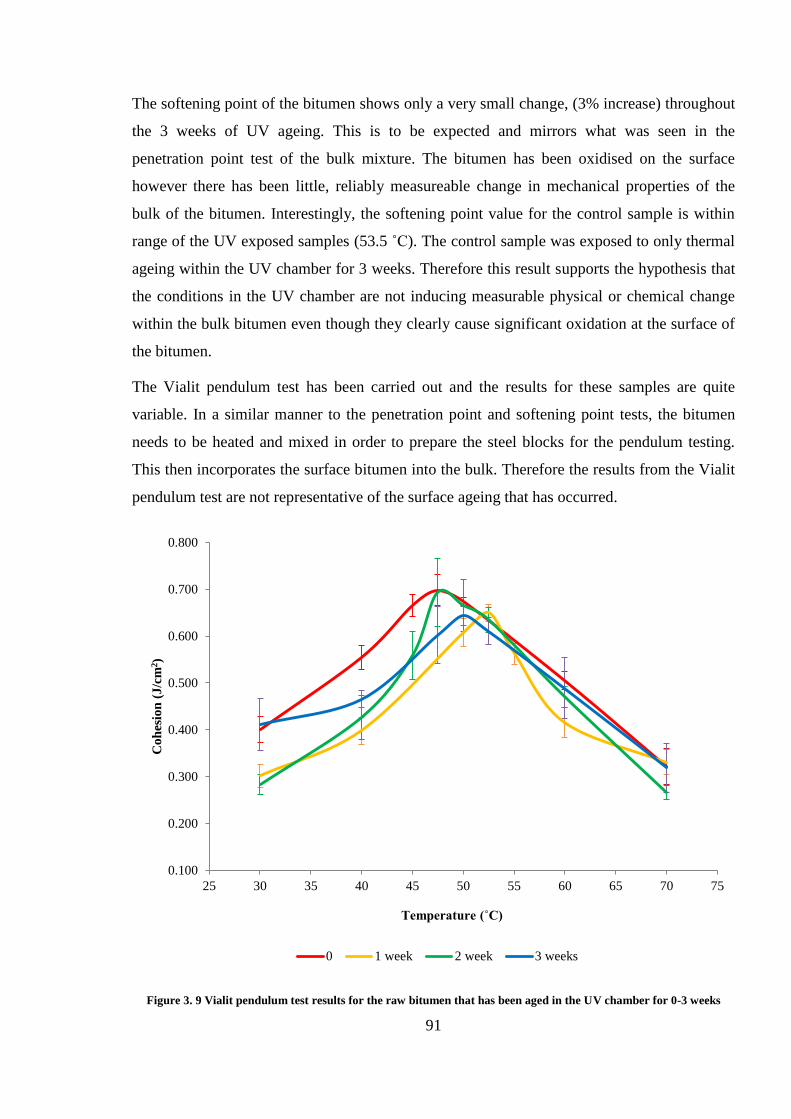
91
The softening point of the bitumen shows only a very small change, (3% increase) throughout
the 3 weeks of UV ageing. This is to be expected and mirrors what was seen in the
penetration point test of the bulk mixture. The bitumen has been oxidised on the surface
however there has been little, reliably measureable change in mechanical properties of the
bulk of the bitumen. Interestingly, the softening point value for the control sample is within
range of the UV exposed samples (53.5 ˚C). The control sample was exposed to only thermal
ageing within the UV chamber for 3 weeks. Therefore this result supports the hypothesis that
the conditions in the UV chamber are not inducing measurable physical or chemical change
within the bulk bitumen even though they clearly cause significant oxidation at the surface of
the bitumen.
The Vialit pendulum test has been carried out and the results for these samples are quite
variable. In a similar manner to the penetration point and softening point tests, the bitumen
needs to be heated and mixed in order to prepare the steel blocks for the pendulum testing.
This then incorporates the surface bitumen into the bulk. Therefore the results from the Vialit
pendulum test are not representative of the surface ageing that has occurred.
Figure 3. 9 Vialit pendulum test results for the raw bitumen that has been aged in the UV chamber for 0-3 weeks
0.100
0.200
0.300
0.400
0.500
0.600
0.700
0.800
25 30 35 40 45 50 55 60 65 70 75
Co
hes
ion
(J
/cm
2)
Temperature (˚C)
0 1 week 2 week 3 weeks
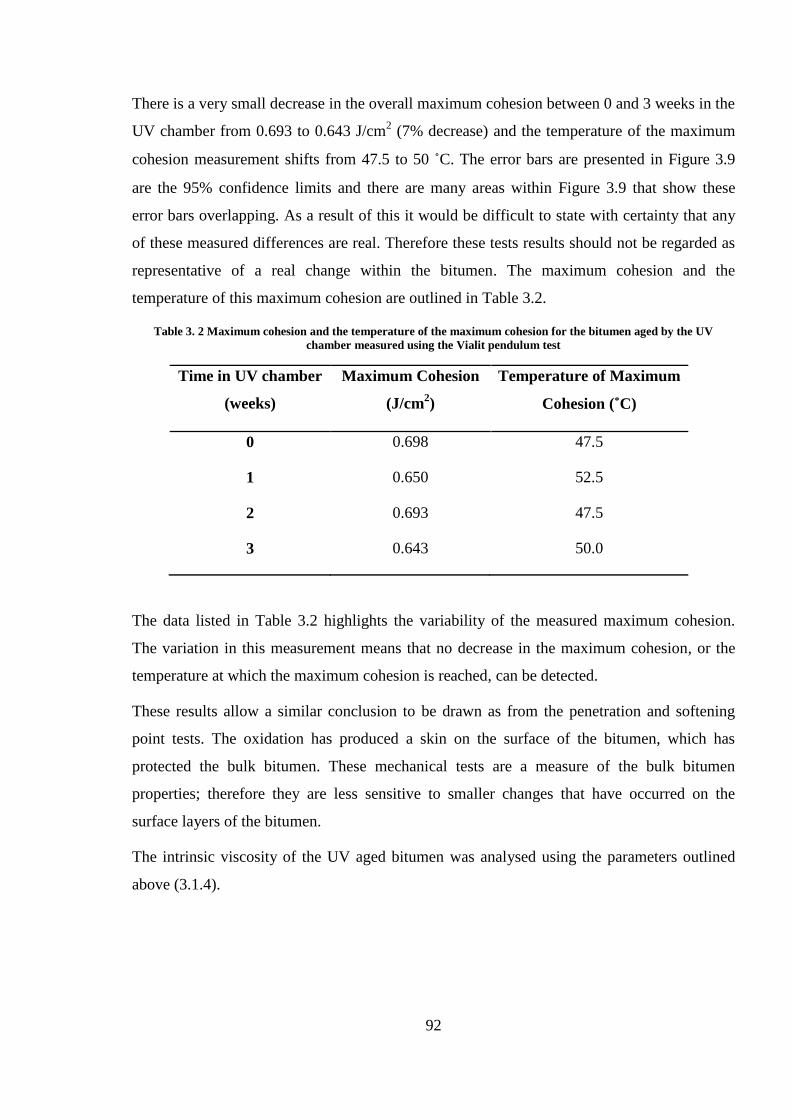
92
There is a very small decrease in the overall maximum cohesion between 0 and 3 weeks in the
UV chamber from 0.693 to 0.643 J/cm2 (7% decrease) and the temperature of the maximum
cohesion measurement shifts from 47.5 to 50 ˚C. The error bars are presented in Figure 3.9
are the 95% confidence limits and there are many areas within Figure 3.9 that show these
error bars overlapping. As a result of this it would be difficult to state with certainty that any
of these measured differences are real. Therefore these tests results should not be regarded as
representative of a real change within the bitumen. The maximum cohesion and the
temperature of this maximum cohesion are outlined in Table 3.2.
Table 3. 2 Maximum cohesion and the temperature of the maximum cohesion for the bitumen aged by the UV
chamber measured using the Vialit pendulum test
Time in UV chamber
(weeks)
Maximum Cohesion
(J/cm2)
Temperature of Maximum
Cohesion (˚C)
0 0.698 47.5
1 0.650 52.5
2 0.693 47.5
3 0.643 50.0
The data listed in Table 3.2 highlights the variability of the measured maximum cohesion.
The variation in this measurement means that no decrease in the maximum cohesion, or the
temperature at which the maximum cohesion is reached, can be detected.
These results allow a similar conclusion to be drawn as from the penetration and softening
point tests. The oxidation has produced a skin on the surface of the bitumen, which has
protected the bulk bitumen. These mechanical tests are a measure of the bulk bitumen
properties; therefore they are less sensitive to smaller changes that have occurred on the
surface layers of the bitumen.
The intrinsic viscosity of the UV aged bitumen was analysed using the parameters outlined
above (3.1.4).
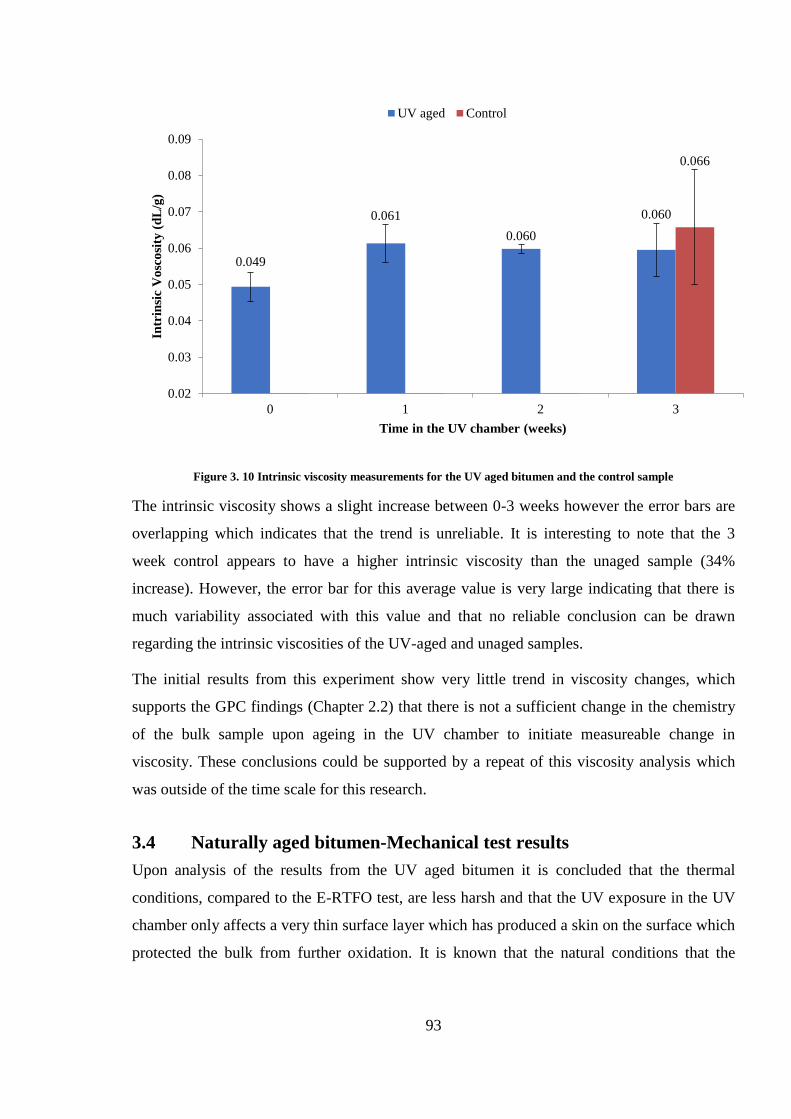
93
Figure 3. 10 Intrinsic viscosity measurements for the UV aged bitumen and the control sample
The intrinsic viscosity shows a slight increase between 0-3 weeks however the error bars are
overlapping which indicates that the trend is unreliable. It is interesting to note that the 3
week control appears to have a higher intrinsic viscosity than the unaged sample (34%
increase). However, the error bar for this average value is very large indicating that there is
much variability associated with this value and that no reliable conclusion can be drawn
regarding the intrinsic viscosities of the UV-aged and unaged samples.
The initial results from this experiment show very little trend in viscosity changes, which
supports the GPC findings (Chapter 2.2) that there is not a sufficient change in the chemistry
of the bulk sample upon ageing in the UV chamber to initiate measureable change in
viscosity. These conclusions could be supported by a repeat of this viscosity analysis which
was outside of the time scale for this research.
3.4 Naturally aged bitumen-Mechanical test results
Upon analysis of the results from the UV aged bitumen it is concluded that the thermal
conditions, compared to the E-RTFO test, are less harsh and that the UV exposure in the UV
chamber only affects a very thin surface layer which has produced a skin on the surface which
protected the bulk from further oxidation. It is known that the natural conditions that the
0.049
0.061
0.060
0.060
0.066
0.02
0.03
0.04
0.05
0.06
0.07
0.08
0.09
0 1 2 3
Intr
insi
c V
osc
osi
ty (
dL
/g)
Time in the UV chamber (weeks)
UV aged Control
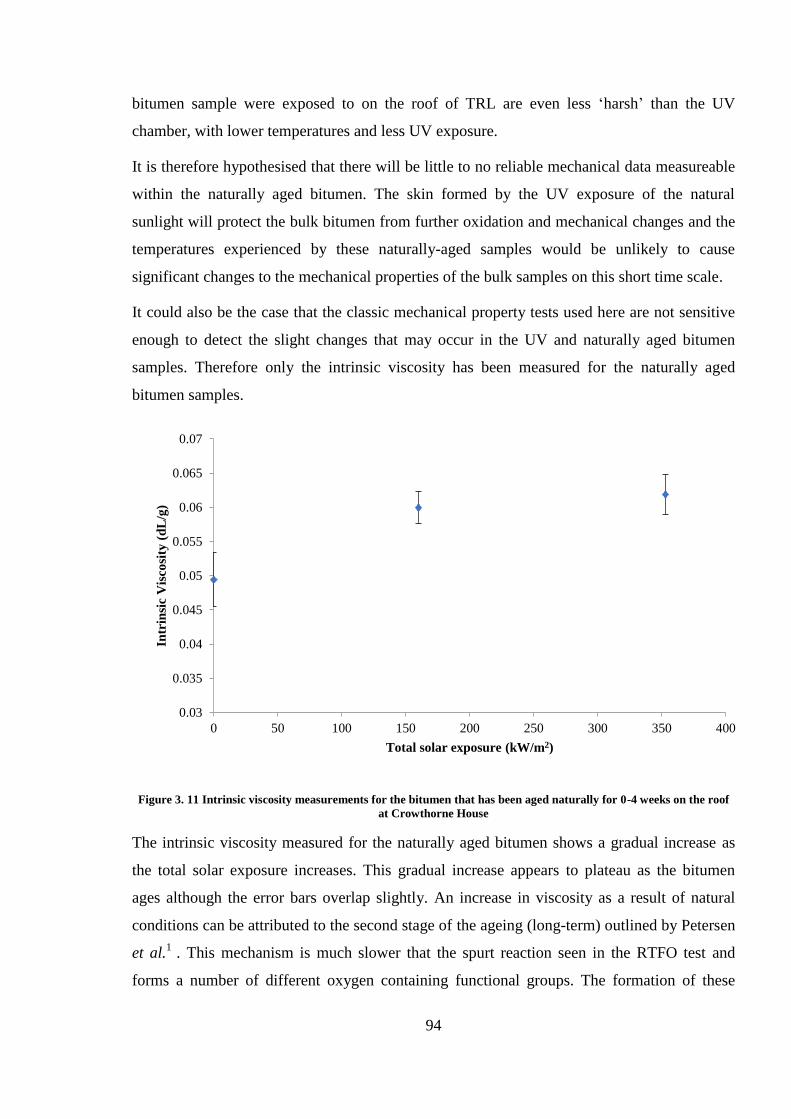
94
bitumen sample were exposed to on the roof of TRL are even less ‘harsh’ than the UV
chamber, with lower temperatures and less UV exposure.
It is therefore hypothesised that there will be little to no reliable mechanical data measureable
within the naturally aged bitumen. The skin formed by the UV exposure of the natural
sunlight will protect the bulk bitumen from further oxidation and mechanical changes and the
temperatures experienced by these naturally-aged samples would be unlikely to cause
significant changes to the mechanical properties of the bulk samples on this short time scale.
It could also be the case that the classic mechanical property tests used here are not sensitive
enough to detect the slight changes that may occur in the UV and naturally aged bitumen
samples. Therefore only the intrinsic viscosity has been measured for the naturally aged
bitumen samples.
Figure 3. 11 Intrinsic viscosity measurements for the bitumen that has been aged naturally for 0-4 weeks on the roof
at Crowthorne House
The intrinsic viscosity measured for the naturally aged bitumen shows a gradual increase as
the total solar exposure increases. This gradual increase appears to plateau as the bitumen
ages although the error bars overlap slightly. An increase in viscosity as a result of natural
conditions can be attributed to the second stage of the ageing (long-term) outlined by Petersen
et al.1
. This mechanism is much slower that the spurt reaction seen in the RTFO test and
forms a number of different oxygen containing functional groups. The formation of these
0.03
0.035
0.04
0.045
0.05
0.055
0.06
0.065
0.07
0 50 100 150 200 250 300 350 400
Intr
insi
c V
isco
sity
(d
L/g
)
Total solar exposure (kW/m2)
95
oxidation product absorbance bands have been seen in the DRIFT spectra from the surface of
the naturally aged bitumen samples (Chapter 2.3). The increase in oxygen within the bitumen
composition has caused an increase in polarity of the asphaltene molecules which leads to an
increase in interactions within the molecules and therefore an increase in the viscosity. More
repeats would be required to determine the reliability of this conclusion.
Summary
The mechanical tests on the E-RTFO test aged bitumen show a decrease in penetration point
and an increase in softening point. This shows that there is an increase in stiffness and an
increase in viscosity. There is also a measureable decrease in maximum cohesion measured
with the Vialit pendulum test. This confirms that the viscosity is increasing. It is concluded
that the bitumen cohesion decreases as a result of this increased viscosity. The intrinsic
viscosity measurements have also confirmed an increase in viscosity as the time in the E-
RTFO test increases. It is possible that under these ageing conditions the bitumen has become
highly viscous, and therefore would be more likely to incur cracking and fracturing if this
bitumen was present within an asphalt road surface. The physical change is recorded with all
mechanical tests; therefore it is the case that the change in viscosity is as a result of the
chemical change that has occurred within the bitumen composition.
The penetration point, softening point and the Vialit pendulum tests have not been able to
measure a reliable trend in mechanical properties of the bitumen that has been aged in the UV
chamber. The oxidation has been localised on the surface of the bitumen and a brittle surface
skin has formed.
The property of the surface skin of the UV aged bitumen has been measured using the
penetration point test and a dramatic decrease in penetration was measured. This highlights
the physical change occurring on the surface. However, the oxidation only affects the first 4-5
μm and the bulk is unaffected.13
Once the bitumen surface skin is heated and blended into the bulk the mechanical property
test results are inconclusive. This indicates that the brittleness of the surface skin that formed
upon UV exposure was a result of physical interactions between the thin oxidised layers at the
surface.
The intrinsic viscosity measurement of the bitumen aged in the UV chamber also shows no
reliable trend in viscosity change. This test is a more advanced measure of viscosity than the
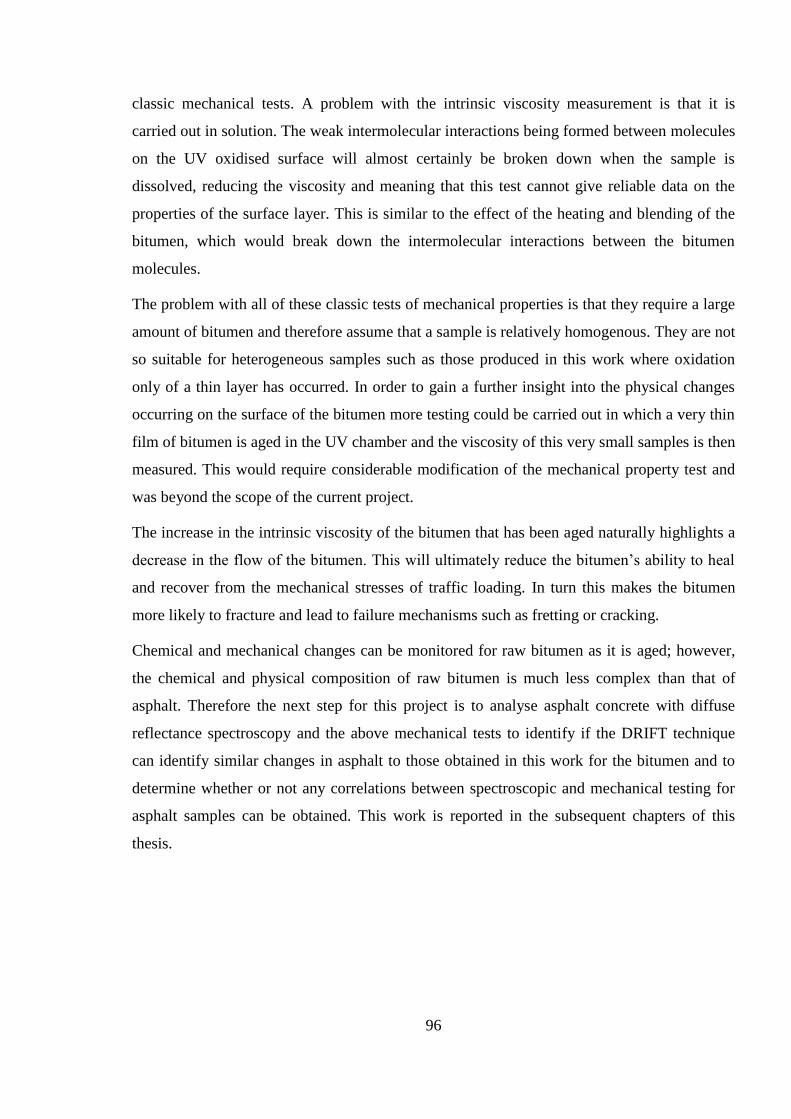
96
classic mechanical tests. A problem with the intrinsic viscosity measurement is that it is
carried out in solution. The weak intermolecular interactions being formed between molecules
on the UV oxidised surface will almost certainly be broken down when the sample is
dissolved, reducing the viscosity and meaning that this test cannot give reliable data on the
properties of the surface layer. This is similar to the effect of the heating and blending of the
bitumen, which would break down the intermolecular interactions between the bitumen
molecules.
The problem with all of these classic tests of mechanical properties is that they require a large
amount of bitumen and therefore assume that a sample is relatively homogenous. They are not
so suitable for heterogeneous samples such as those produced in this work where oxidation
only of a thin layer has occurred. In order to gain a further insight into the physical changes
occurring on the surface of the bitumen more testing could be carried out in which a very thin
film of bitumen is aged in the UV chamber and the viscosity of this very small samples is then
measured. This would require considerable modification of the mechanical property test and
was beyond the scope of the current project.
The increase in the intrinsic viscosity of the bitumen that has been aged naturally highlights a
decrease in the flow of the bitumen. This will ultimately reduce the bitumen’s ability to heal
and recover from the mechanical stresses of traffic loading. In turn this makes the bitumen
more likely to fracture and lead to failure mechanisms such as fretting or cracking.
Chemical and mechanical changes can be monitored for raw bitumen as it is aged; however,
the chemical and physical composition of raw bitumen is much less complex than that of
asphalt. Therefore the next step for this project is to analyse asphalt concrete with diffuse
reflectance spectroscopy and the above mechanical tests to identify if the DRIFT technique
can identify similar changes in asphalt to those obtained in this work for the bitumen and to
determine whether or not any correlations between spectroscopic and mechanical testing for
asphalt samples can be obtained. This work is reported in the subsequent chapters of this
thesis.
97
References
1 J. C. Petersen and R. Glaser, Asphalt oxidative mechanisms and the role of oxidation
products on age hardening revisited, Road Mater. Pavement, 12, 2011, 795-819.
2 P. Redelius, The structure of asphaltenes in bitumen, Road Mater. Pav. Des., 7, 2006, 143-
162.
3 J. L. Creek, Freedon of action in the state of asphaltenes: Escape from conventional wisdom,
Energy and Fuels, 19, 2005, 1212-1224.
4 British Standard, EN 12596:2007, Bitumen and bituminous binders- Determination of
dynamic viscosity by vacuum capillary.
5 British Standard EN 12595:2007, Bitumen and bituminous binders- Determination of
kinematic viscosity.
6 British Standard EN 1426:2015, Bitumen and bituminous binders- Determination of needle
penetration.
7 British Standard EN 1427:2015, Bitumen and bituminous binders- Determination of the
softening point- Ring and Ball method.
8 British Standard EN 13588:2008, Bitumen and bituminous binders- Determination of
cohesion of bituminous binders with pendulum test.
9 C. Li, S. Wu, G. Tao and Y. Xiao, Initial self-healing temperatures of asphalt mastics based
on flow behaviour index, Materials, 11(6), 2018, 917.
10 H. Bahia, R. Moraes and R. Velasquez, presented in part at the 5
th Eurasphalt and
Eurobitume Congress, June, 2012.
11 R. E. Robertson, Chemical properties of asphalts and their relationship to pavement
performance, Strategic Highway Research Program, Washington, DC, 1991, Research Paper
12 J. Reed and D. Whiteoak, The Shell Bitumen Handbook, 5
th Edition, Thomas Telford
Publishing, London, 2003, ISBN: 0-7277-3220-X.
13 W. Zeng, S. Wu, L. Pang, H. Chen, J. Hu and Y. Sun, Research on ultra violet (UV) ageing
depth of asphalt, Constr., Build., Mater., 160, 2018, 620-627.
98
Chapter 4
Artificial ageing of asphalt- Ultra-Violet light
Following the study of the ageing of the bitumen the next step for this project was to
determine if similar changes could be detected in asphalt samples. Asphalt samples are more
complex than raw bitumen as a result of the addition of filler and aggregates to make up the
asphalt mixture. The presence of these materials will have an effect on the infrared spectra
collected from the samples. It is therefore necessary to be able to identify the chemical
changes occurring as a result of the oxidation of the bitumen component of the asphalt in IR
spectra alongside the absorbance bands that correspond to the fillers.
Asphalt samples were produced using a 10 mm Stone Mastic Asphalt (SMA) mixture from
United Asphalt. Bitumen was mixed with carbonate filler and 10-mm stone aggregates. This
was then weighed into 4 kg samples which were then compressed with an industrial pavement
roller (Benford, WPH roller) into a wooden mould with 200 x 200 x 50 mm dimensions. The
bitumen content was approximately 6% and the asphalt contained an approximate void
content of 12%. The asphalt slabs were made in accordance with the British Standard EN
13108-1:2006.1
This asphalt was aged using the UV chamber built by engineers at TRL used previously for
the UV-ageing on bitumen samples (see Chapter 2.2). The chamber is maintained at an
internal temperature of 60 ˚C while exposing the asphalt to UV light with a maximum
wavelength of 368 nm. The slab was aged between 0-4 weeks and diffuse reflectance
spectroscopy was used to map the asphalt throughout the ageing experiment to monitor any
chemical changes that occur.
This mapping involves placing an asphalt slab into an x, y table built at TRL. The table can
move in x and y directions, and the spectrometer is fixed at the centre and the co-ordinate
location of the focal point can be recorded.
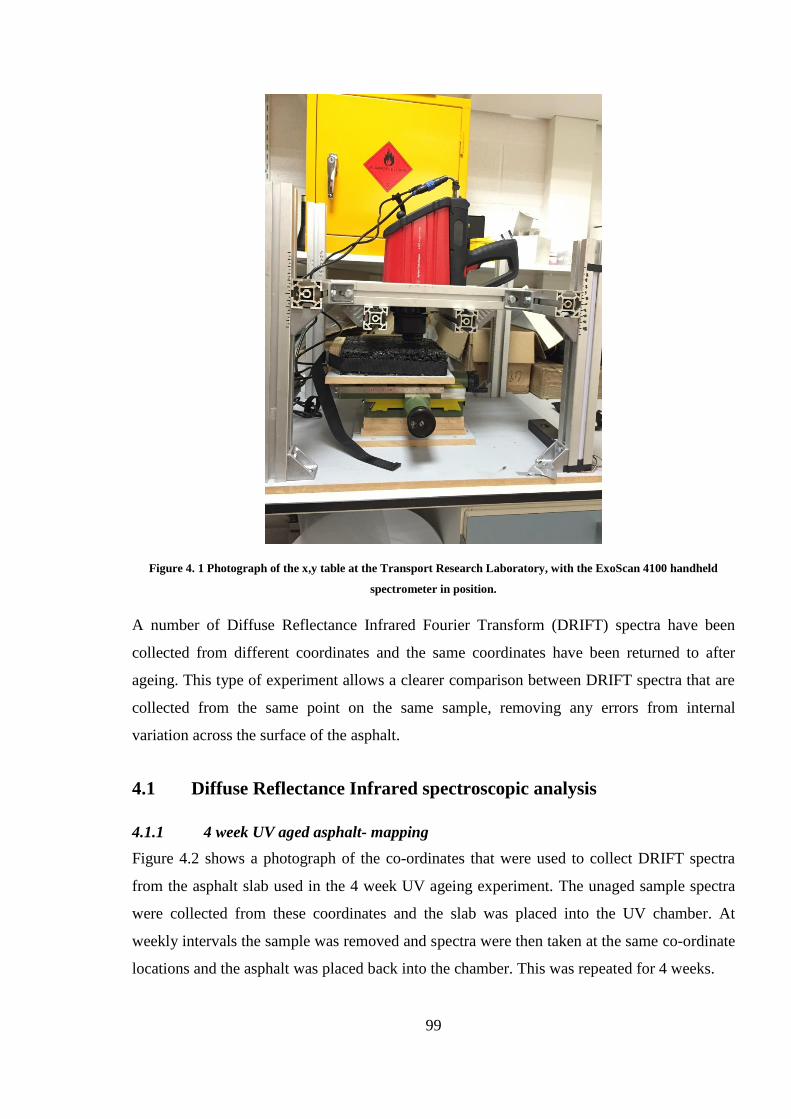
99
Figure 4. 1 Photograph of the x,y table at the Transport Research Laboratory, with the ExoScan 4100 handheld
spectrometer in position.
A number of Diffuse Reflectance Infrared Fourier Transform (DRIFT) spectra have been
collected from different coordinates and the same coordinates have been returned to after
ageing. This type of experiment allows a clearer comparison between DRIFT spectra that are
collected from the same point on the same sample, removing any errors from internal
variation across the surface of the asphalt.
4.1 Diffuse Reflectance Infrared spectroscopic analysis
4.1.1 4 week UV aged asphalt- mapping
Figure 4.2 shows a photograph of the co-ordinates that were used to collect DRIFT spectra
from the asphalt slab used in the 4 week UV ageing experiment. The unaged sample spectra
were collected from these coordinates and the slab was placed into the UV chamber. At
weekly intervals the sample was removed and spectra were then taken at the same co-ordinate
locations and the asphalt was placed back into the chamber. This was repeated for 4 weeks.
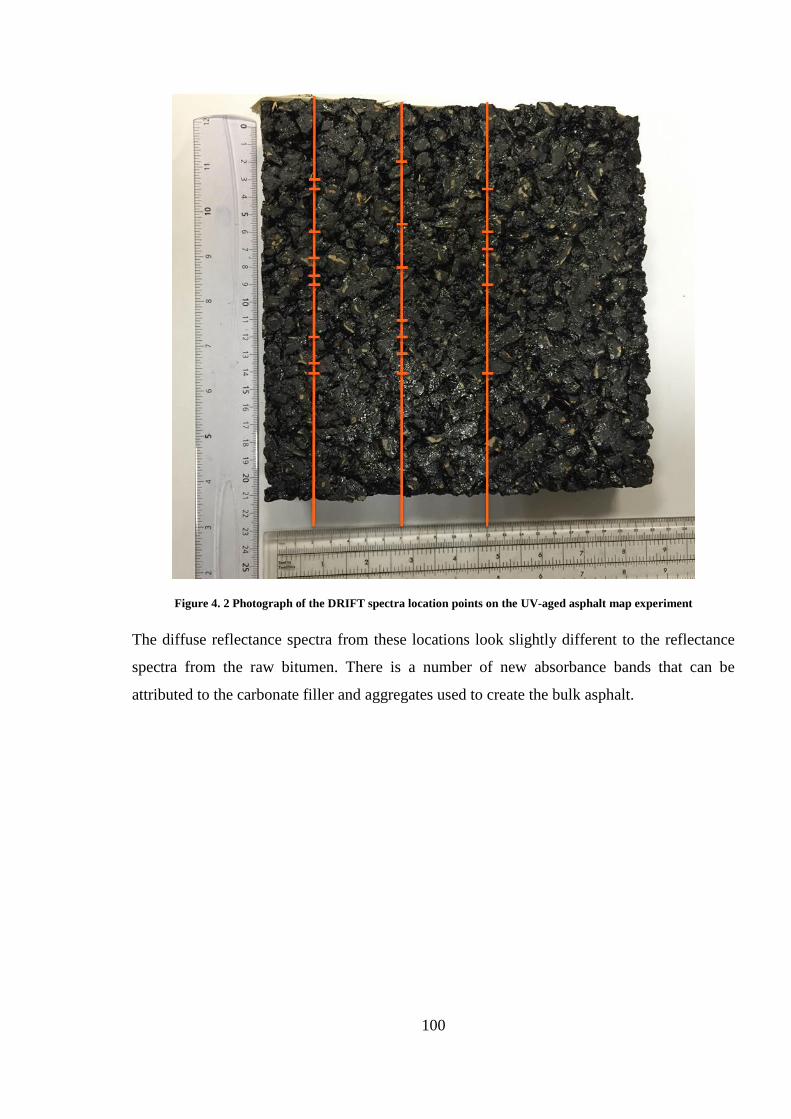
100
Figure 4. 2 Photograph of the DRIFT spectra location points on the UV-aged asphalt map experiment
The diffuse reflectance spectra from these locations look slightly different to the reflectance
spectra from the raw bitumen. There is a number of new absorbance bands that can be
attributed to the carbonate filler and aggregates used to create the bulk asphalt.
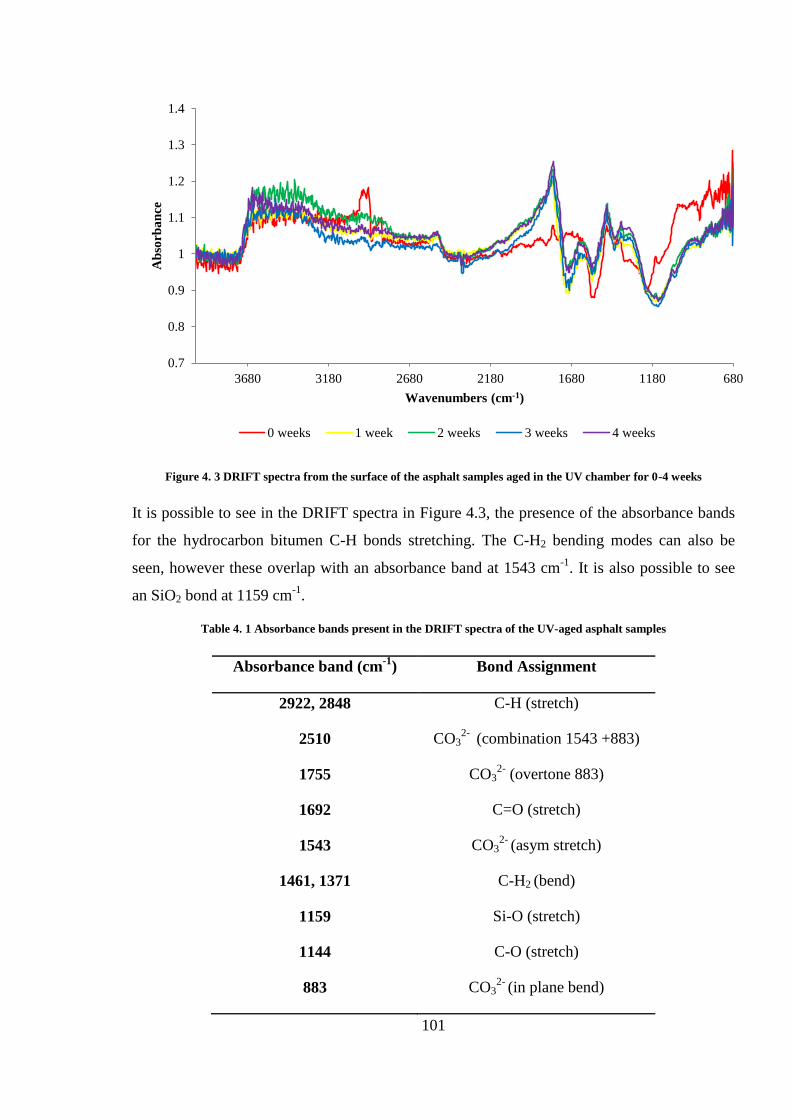
101
Figure 4. 3 DRIFT spectra from the surface of the asphalt samples aged in the UV chamber for 0-4 weeks
It is possible to see in the DRIFT spectra in Figure 4.3, the presence of the absorbance bands
for the hydrocarbon bitumen C-H bonds stretching. The C-H2 bending modes can also be
seen, however these overlap with an absorbance band at 1543 cm-1
. It is also possible to see
an SiO2 bond at 1159 cm-1
.
Table 4. 1 Absorbance bands present in the DRIFT spectra of the UV-aged asphalt samples
Absorbance band (cm-1
) Bond Assignment
2922, 2848 C-H (stretch)
2510 CO32-
(combination 1543 +883)
1755 CO32-
(overtone 883)
1692 C=O (stretch)
1543 CO32-
(asym stretch)
1461, 1371 C-H2 (bend)
1159 Si-O (stretch)
1144 C-O (stretch)
883 CO32-
(in plane bend)
0.7
0.8
0.9
1
1.1
1.2
1.3
1.4
680118016802180268031803680
Ab
sorb
an
ce
Wavenumbers (cm-1)
0 weeks 1 week 2 weeks 3 weeks 4 weeks
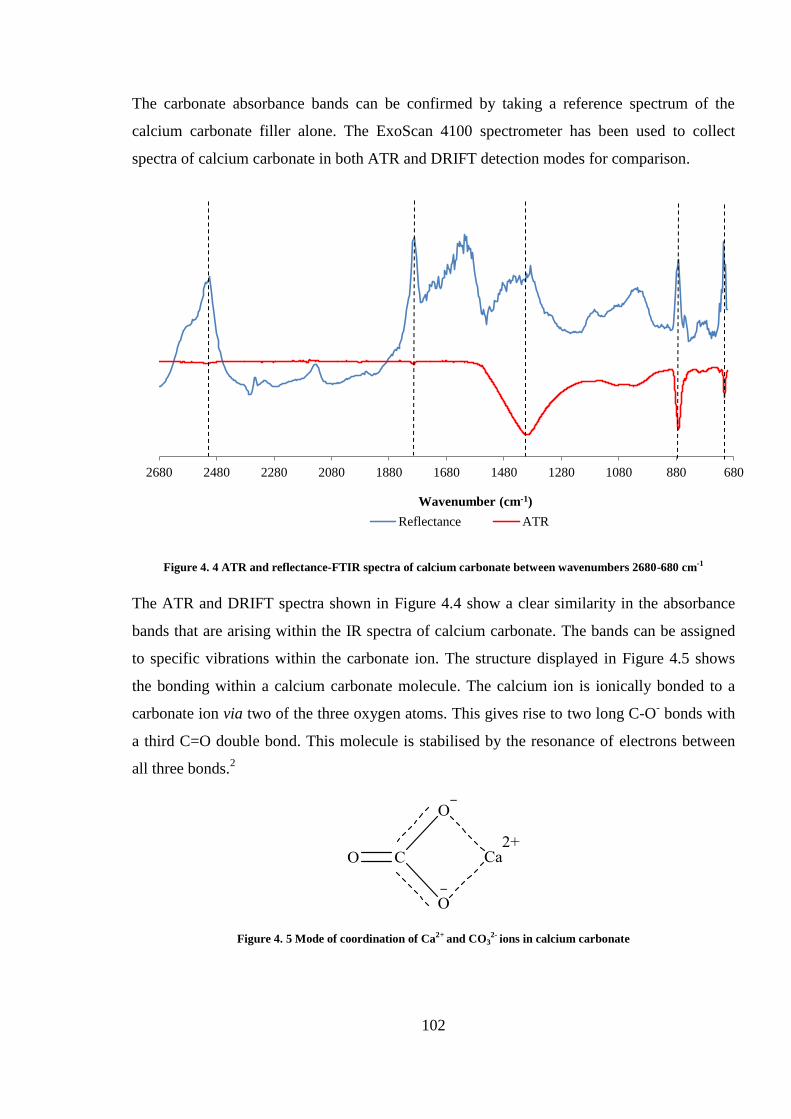
102
The carbonate absorbance bands can be confirmed by taking a reference spectrum of the
calcium carbonate filler alone. The ExoScan 4100 spectrometer has been used to collect
spectra of calcium carbonate in both ATR and DRIFT detection modes for comparison.
Figure 4. 4 ATR and reflectance-FTIR spectra of calcium carbonate between wavenumbers 2680-680 cm-1
The ATR and DRIFT spectra shown in Figure 4.4 show a clear similarity in the absorbance
bands that are arising within the IR spectra of calcium carbonate. The bands can be assigned
to specific vibrations within the carbonate ion. The structure displayed in Figure 4.5 shows
the bonding within a calcium carbonate molecule. The calcium ion is ionically bonded to a
carbonate ion via two of the three oxygen atoms. This gives rise to two long C-O- bonds with
a third C=O double bond. This molecule is stabilised by the resonance of electrons between
all three bonds.2
Figure 4. 5 Mode of coordination of Ca2+ and CO32- ions in calcium carbonate
680880108012801480168018802080228024802680
Wavenumber (cm-1)
Reflectance ATR
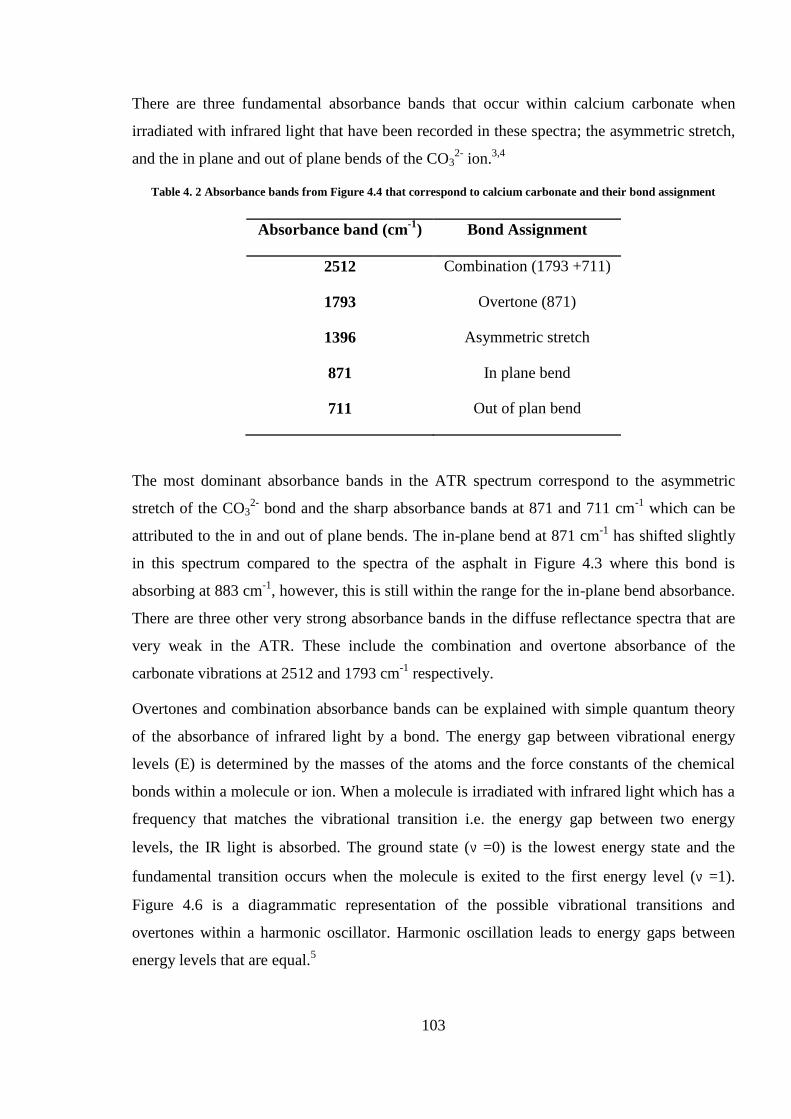
103
There are three fundamental absorbance bands that occur within calcium carbonate when
irradiated with infrared light that have been recorded in these spectra; the asymmetric stretch,
and the in plane and out of plane bends of the CO32-
ion.3,4
Table 4. 2 Absorbance bands from Figure 4.4 that correspond to calcium carbonate and their bond assignment
Absorbance band (cm-1
) Bond Assignment
2512 Combination (1793 +711)
1793 Overtone (871)
1396 Asymmetric stretch
871 In plane bend
711 Out of plan bend
The most dominant absorbance bands in the ATR spectrum correspond to the asymmetric
stretch of the CO32-
bond and the sharp absorbance bands at 871 and 711 cm-1
which can be
attributed to the in and out of plane bends. The in-plane bend at 871 cm-1
has shifted slightly
in this spectrum compared to the spectra of the asphalt in Figure 4.3 where this bond is
absorbing at 883 cm-1
, however, this is still within the range for the in-plane bend absorbance.
There are three other very strong absorbance bands in the diffuse reflectance spectra that are
very weak in the ATR. These include the combination and overtone absorbance of the
carbonate vibrations at 2512 and 1793 cm-1
respectively.
Overtones and combination absorbance bands can be explained with simple quantum theory
of the absorbance of infrared light by a bond. The energy gap between vibrational energy
levels (E) is determined by the masses of the atoms and the force constants of the chemical
bonds within a molecule or ion. When a molecule is irradiated with infrared light which has a
frequency that matches the vibrational transition i.e. the energy gap between two energy
levels, the IR light is absorbed. The ground state (ʋ =0) is the lowest energy state and the
fundamental transition occurs when the molecule is exited to the first energy level (ʋ =1).
Figure 4.6 is a diagrammatic representation of the possible vibrational transitions and
overtones within a harmonic oscillator. Harmonic oscillation leads to energy gaps between
energy levels that are equal.5
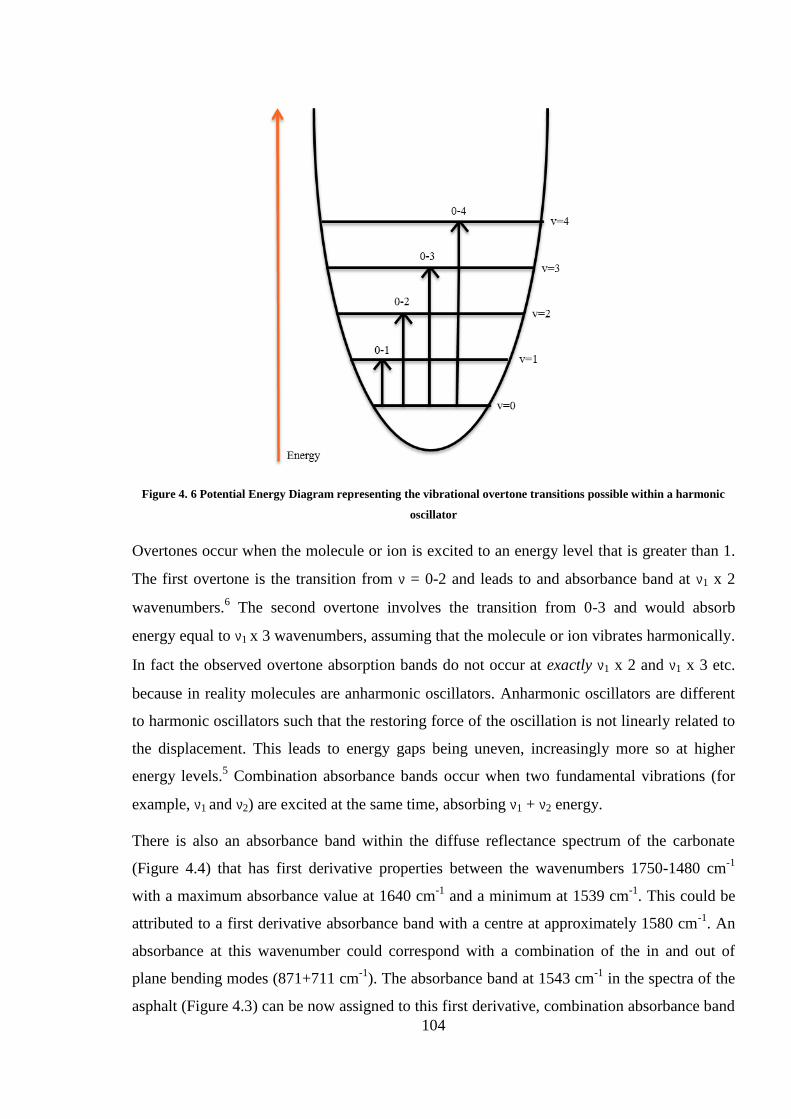
104
Figure 4. 6 Potential Energy Diagram representing the vibrational overtone transitions possible within a harmonic
oscillator
Overtones occur when the molecule or ion is excited to an energy level that is greater than 1.
The first overtone is the transition from ʋ = 0-2 and leads to and absorbance band at ʋ1 x 2
wavenumbers.6 The second overtone involves the transition from 0-3 and would absorb
energy equal to ʋ1 x 3 wavenumbers, assuming that the molecule or ion vibrates harmonically.
In fact the observed overtone absorption bands do not occur at exactly ʋ1 x 2 and ʋ1 x 3 etc.
because in reality molecules are anharmonic oscillators. Anharmonic oscillators are different
to harmonic oscillators such that the restoring force of the oscillation is not linearly related to
the displacement. This leads to energy gaps being uneven, increasingly more so at higher
energy levels.5 Combination absorbance bands occur when two fundamental vibrations (for
example, ʋ1 and ʋ2) are excited at the same time, absorbing ʋ1 + ʋ2 energy.
There is also an absorbance band within the diffuse reflectance spectrum of the carbonate
(Figure 4.4) that has first derivative properties between the wavenumbers 1750-1480 cm-1
with a maximum absorbance value at 1640 cm-1
and a minimum at 1539 cm-1
. This could be
attributed to a first derivative absorbance band with a centre at approximately 1580 cm-1
. An
absorbance at this wavenumber could correspond with a combination of the in and out of
plane bending modes (871+711 cm-1
). The absorbance band at 1543 cm-1
in the spectra of the
asphalt (Figure 4.3) can be now assigned to this first derivative, combination absorbance band
105
as opposed to the asymmetric stretch which would be absorbing at a lower wavenumber at
approximately 1460 cm-1
and overlapping with the C-H2 bending modes.
It is now possible to confidently assign the absorbance bands in the DRIFT spectra from the
surface of the UV aged asphalt, Figure 4.3. The small sharp absorbance band at 1755 cm-1
can
be assigned to the first carbonate CO32-
overtone of the in plane bending mode at 871 cm-1
.
This overlaps with a carbonyl absorbance band which is seen in the DRIFT spectra after
ageing in the UV chamber.
The carbonyl absorbance band is presenting as a first derivative as seen previously within the
DRIFT spectra from the UV-aged raw bitumen. It is also possible that the surface
characteristics are changing as a result of the UV light exposure, as seen before with the
formation of the surface skin on the UV aged bitumen (Chapter 2.2). This would be altering
the refractive index of the sample surface, leading to a change in the scattering and the
absorbance of the infrared light by the sample.7
It is now possible to attempt to quantify the intensity of the absorbance band of this carbonyl
functional group. This has been done in two ways; by integrating the area underneath the
absorbance band and by recording the absorbance intensity at a specific wavenumber.
The absorbance band area has been measured between the wavenumbers 1826-1763 cm-1
which is the higher wavenumber section of the first derivative carbonyl band. Only half of
this first derivative absorbance band has been integrated here. If the absorbance band is a true
first derivative, in theory the area across the entire wavelength will be equal to 0 as a result of
the positive and negative directions of the wave feature.
The results of the area integration for each spectra from each coordinate analysed on the
asphalt sample can be found in Figure 4.7. The spider graph displays the x, y co-ordinates,
where the spectrum was collected, around the circumference of the chart and the absorbance
band area measured from this spectrum is recorded on the radial axis.
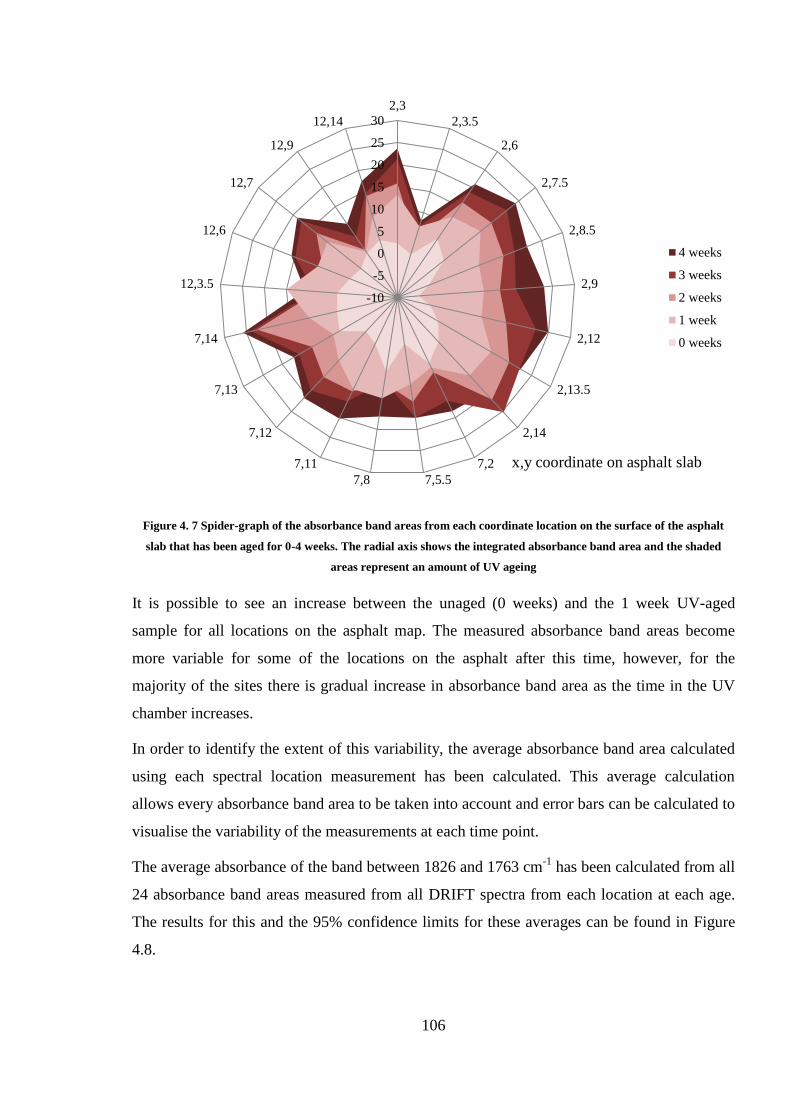
106
Figure 4. 7 Spider-graph of the absorbance band areas from each coordinate location on the surface of the asphalt
slab that has been aged for 0-4 weeks. The radial axis shows the integrated absorbance band area and the shaded
areas represent an amount of UV ageing
It is possible to see an increase between the unaged (0 weeks) and the 1 week UV-aged
sample for all locations on the asphalt map. The measured absorbance band areas become
more variable for some of the locations on the asphalt after this time, however, for the
majority of the sites there is gradual increase in absorbance band area as the time in the UV
chamber increases.
In order to identify the extent of this variability, the average absorbance band area calculated
using each spectral location measurement has been calculated. This average calculation
allows every absorbance band area to be taken into account and error bars can be calculated to
visualise the variability of the measurements at each time point.
The average absorbance of the band between 1826 and 1763 cm-1
has been calculated from all
24 absorbance band areas measured from all DRIFT spectra from each location at each age.
The results for this and the 95% confidence limits for these averages can be found in Figure
4.8.
-10
-5
0
5
10
15
20
25
30
2,3
2,3.5
2,6
2,7.5
2,8.5
2,9
2,12
2,13.5
2,14
7,2
7,5.57,8
7,11
7,12
7,13
7,14
12,3.5
12,6
12,7
12,9
12,14
4 weeks
3 weeks
2 weeks
1 week
0 weeks
x,y coordinate on asphalt slab
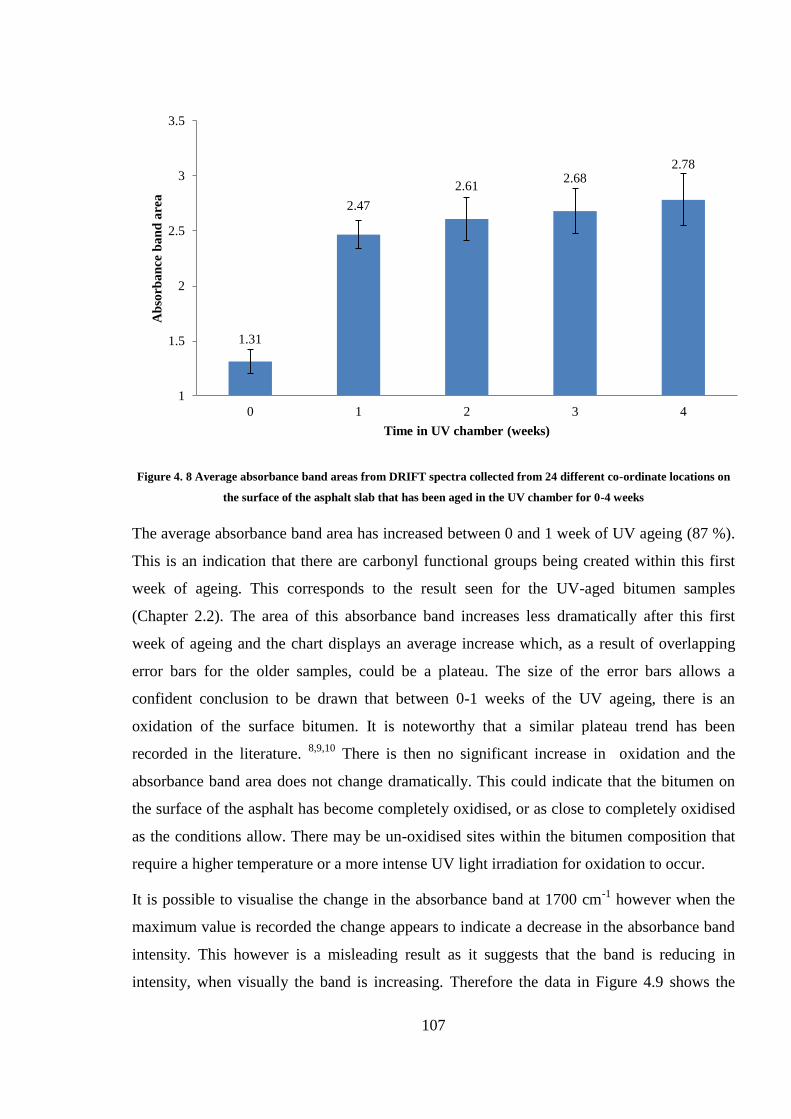
107
Figure 4. 8 Average absorbance band areas from DRIFT spectra collected from 24 different co-ordinate locations on
the surface of the asphalt slab that has been aged in the UV chamber for 0-4 weeks
The average absorbance band area has increased between 0 and 1 week of UV ageing (87 %).
This is an indication that there are carbonyl functional groups being created within this first
week of ageing. This corresponds to the result seen for the UV-aged bitumen samples
(Chapter 2.2). The area of this absorbance band increases less dramatically after this first
week of ageing and the chart displays an average increase which, as a result of overlapping
error bars for the older samples, could be a plateau. The size of the error bars allows a
confident conclusion to be drawn that between 0-1 weeks of the UV ageing, there is an
oxidation of the surface bitumen. It is noteworthy that a similar plateau trend has been
recorded in the literature. 8,9,10
There is then no significant increase in oxidation and the
absorbance band area does not change dramatically. This could indicate that the bitumen on
the surface of the asphalt has become completely oxidised, or as close to completely oxidised
as the conditions allow. There may be un-oxidised sites within the bitumen composition that
require a higher temperature or a more intense UV light irradiation for oxidation to occur.
It is possible to visualise the change in the absorbance band at 1700 cm-1
however when the
maximum value is recorded the change appears to indicate a decrease in the absorbance band
intensity. This however is a misleading result as it suggests that the band is reducing in
intensity, when visually the band is increasing. Therefore the data in Figure 4.9 shows the
1.31
2.47
2.61 2.68
2.78
1
1.5
2
2.5
3
3.5
0 1 2 3 4
Ab
sorb
an
ce b
an
d a
rea
Time in UV chamber (weeks)
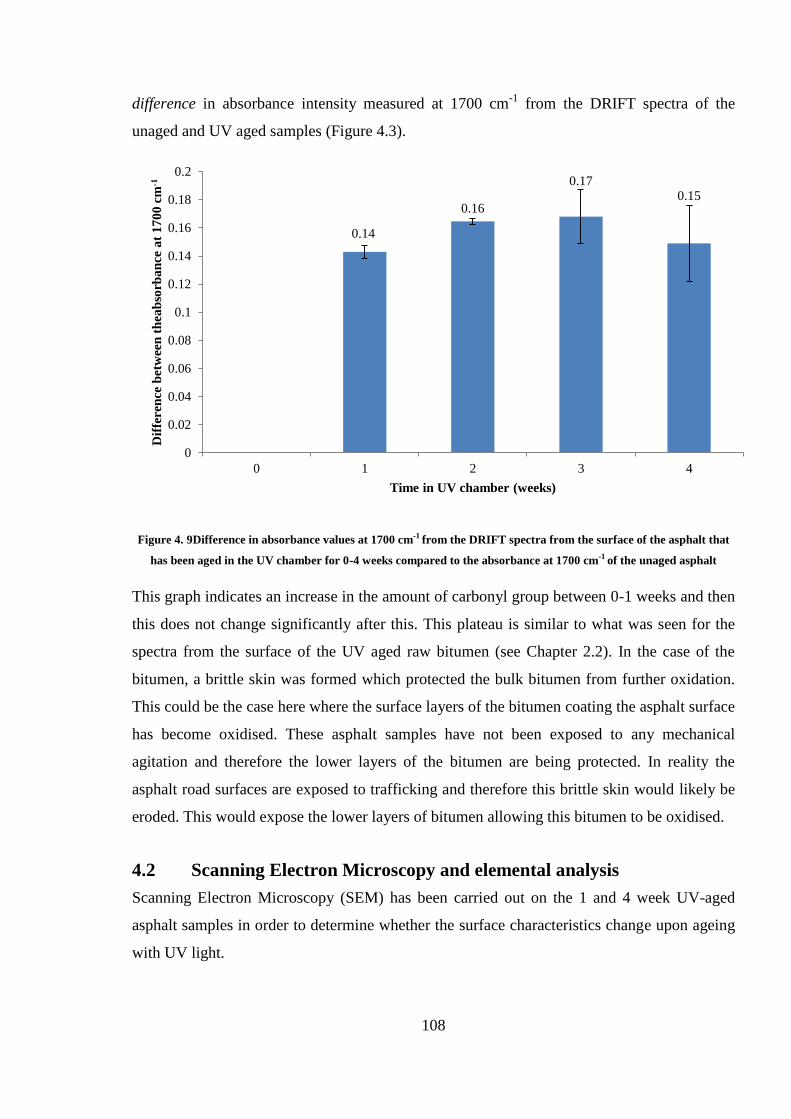
108
difference in absorbance intensity measured at 1700 cm-1
from the DRIFT spectra of the
unaged and UV aged samples (Figure 4.3).
Figure 4. 9Difference in absorbance values at 1700 cm-1 from the DRIFT spectra from the surface of the asphalt that
has been aged in the UV chamber for 0-4 weeks compared to the absorbance at 1700 cm-1 of the unaged asphalt
This graph indicates an increase in the amount of carbonyl group between 0-1 weeks and then
this does not change significantly after this. This plateau is similar to what was seen for the
spectra from the surface of the UV aged raw bitumen (see Chapter 2.2). In the case of the
bitumen, a brittle skin was formed which protected the bulk bitumen from further oxidation.
This could be the case here where the surface layers of the bitumen coating the asphalt surface
has become oxidised. These asphalt samples have not been exposed to any mechanical
agitation and therefore the lower layers of the bitumen are being protected. In reality the
asphalt road surfaces are exposed to trafficking and therefore this brittle skin would likely be
eroded. This would expose the lower layers of bitumen allowing this bitumen to be oxidised.
4.2 Scanning Electron Microscopy and elemental analysis
Scanning Electron Microscopy (SEM) has been carried out on the 1 and 4 week UV-aged
asphalt samples in order to determine whether the surface characteristics change upon ageing
with UV light.
0.14
0.16
0.17 0.15
0
0.02
0.04
0.06
0.08
0.1
0.12
0.14
0.16
0.18
0.2
0 1 2 3 4
Dif
feren
ce b
etw
een
th
eab
sorb
an
ce a
t 1
70
0 c
m-1
Time in UV chamber (weeks)
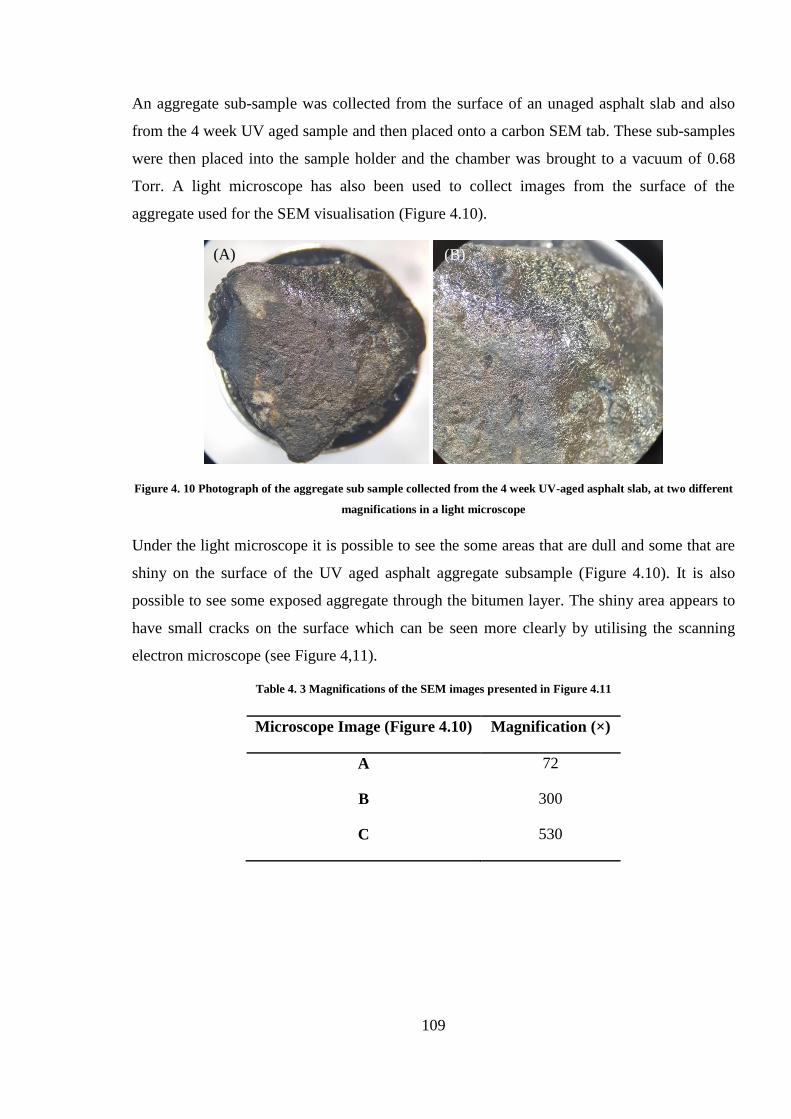
109
An aggregate sub-sample was collected from the surface of an unaged asphalt slab and also
from the 4 week UV aged sample and then placed onto a carbon SEM tab. These sub-samples
were then placed into the sample holder and the chamber was brought to a vacuum of 0.68
Torr. A light microscope has also been used to collect images from the surface of the
aggregate used for the SEM visualisation (Figure 4.10).
Figure 4. 10 Photograph of the aggregate sub sample collected from the 4 week UV-aged asphalt slab, at two different
magnifications in a light microscope
Under the light microscope it is possible to see the some areas that are dull and some that are
shiny on the surface of the UV aged asphalt aggregate subsample (Figure 4.10). It is also
possible to see some exposed aggregate through the bitumen layer. The shiny area appears to
have small cracks on the surface which can be seen more clearly by utilising the scanning
electron microscope (see Figure 4,11).
Table 4. 3 Magnifications of the SEM images presented in Figure 4.11
Microscope Image (Figure 4.10) Magnification (×)
A 72
B 300
C 530
(A) (B)
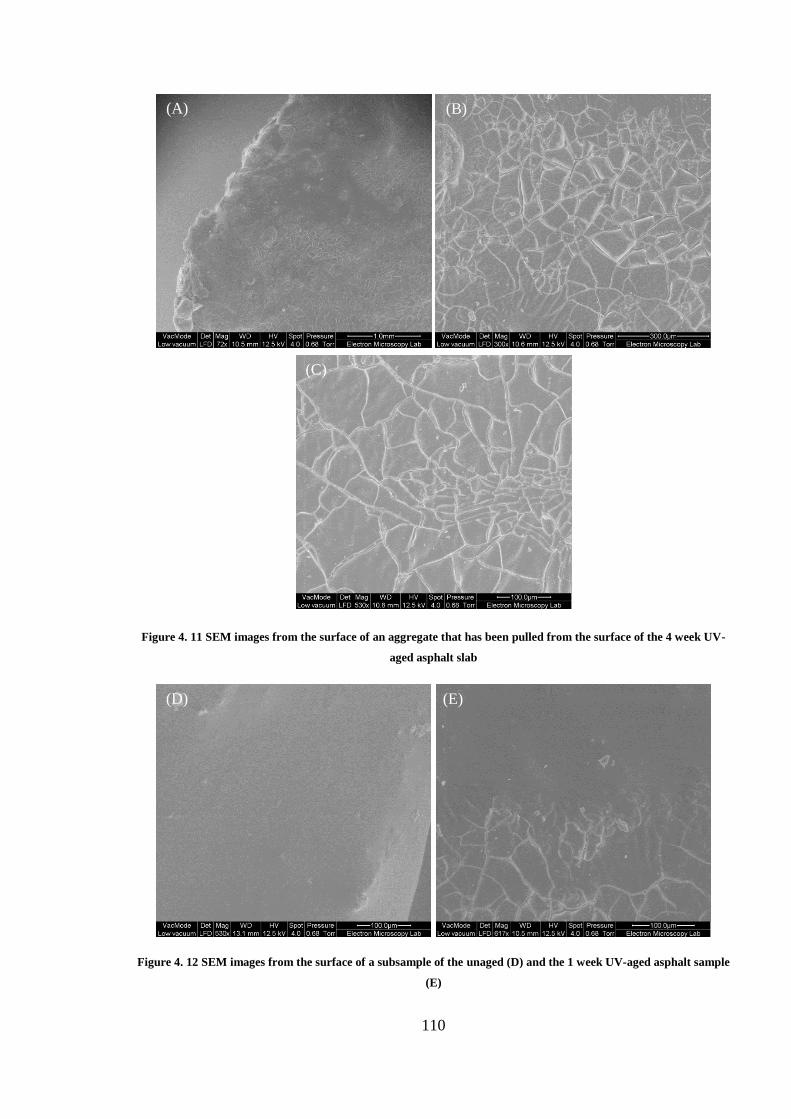
110
Figure 4. 11 SEM images from the surface of an aggregate that has been pulled from the surface of the 4 week UV-
aged asphalt slab
Figure 4. 12 SEM images from the surface of a subsample of the unaged (D) and the 1 week UV-aged asphalt sample
(E)
(A) (B)
(C)
(D) (E)
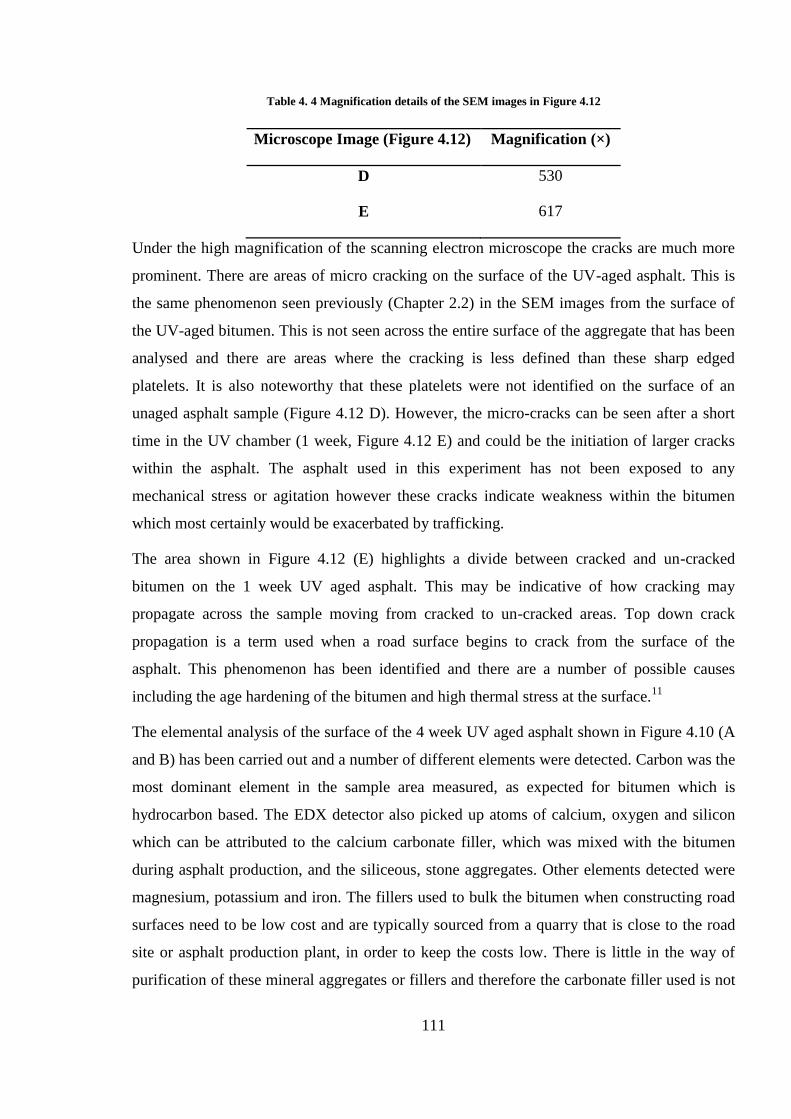
111
Table 4. 4 Magnification details of the SEM images in Figure 4.12
Microscope Image (Figure 4.12) Magnification (×)
D 530
E 617
Under the high magnification of the scanning electron microscope the cracks are much more
prominent. There are areas of micro cracking on the surface of the UV-aged asphalt. This is
the same phenomenon seen previously (Chapter 2.2) in the SEM images from the surface of
the UV-aged bitumen. This is not seen across the entire surface of the aggregate that has been
analysed and there are areas where the cracking is less defined than these sharp edged
platelets. It is also noteworthy that these platelets were not identified on the surface of an
unaged asphalt sample (Figure 4.12 D). However, the micro-cracks can be seen after a short
time in the UV chamber (1 week, Figure 4.12 E) and could be the initiation of larger cracks
within the asphalt. The asphalt used in this experiment has not been exposed to any
mechanical stress or agitation however these cracks indicate weakness within the bitumen
which most certainly would be exacerbated by trafficking.
The area shown in Figure 4.12 (E) highlights a divide between cracked and un-cracked
bitumen on the 1 week UV aged asphalt. This may be indicative of how cracking may
propagate across the sample moving from cracked to un-cracked areas. Top down crack
propagation is a term used when a road surface begins to crack from the surface of the
asphalt. This phenomenon has been identified and there are a number of possible causes
including the age hardening of the bitumen and high thermal stress at the surface.11
The elemental analysis of the surface of the 4 week UV aged asphalt shown in Figure 4.10 (A
and B) has been carried out and a number of different elements were detected. Carbon was the
most dominant element in the sample area measured, as expected for bitumen which is
hydrocarbon based. The EDX detector also picked up atoms of calcium, oxygen and silicon
which can be attributed to the calcium carbonate filler, which was mixed with the bitumen
during asphalt production, and the siliceous, stone aggregates. Other elements detected were
magnesium, potassium and iron. The fillers used to bulk the bitumen when constructing road
surfaces need to be low cost and are typically sourced from a quarry that is close to the road
site or asphalt production plant, in order to keep the costs low. There is little in the way of
purification of these mineral aggregates or fillers and therefore the carbonate filler used is not
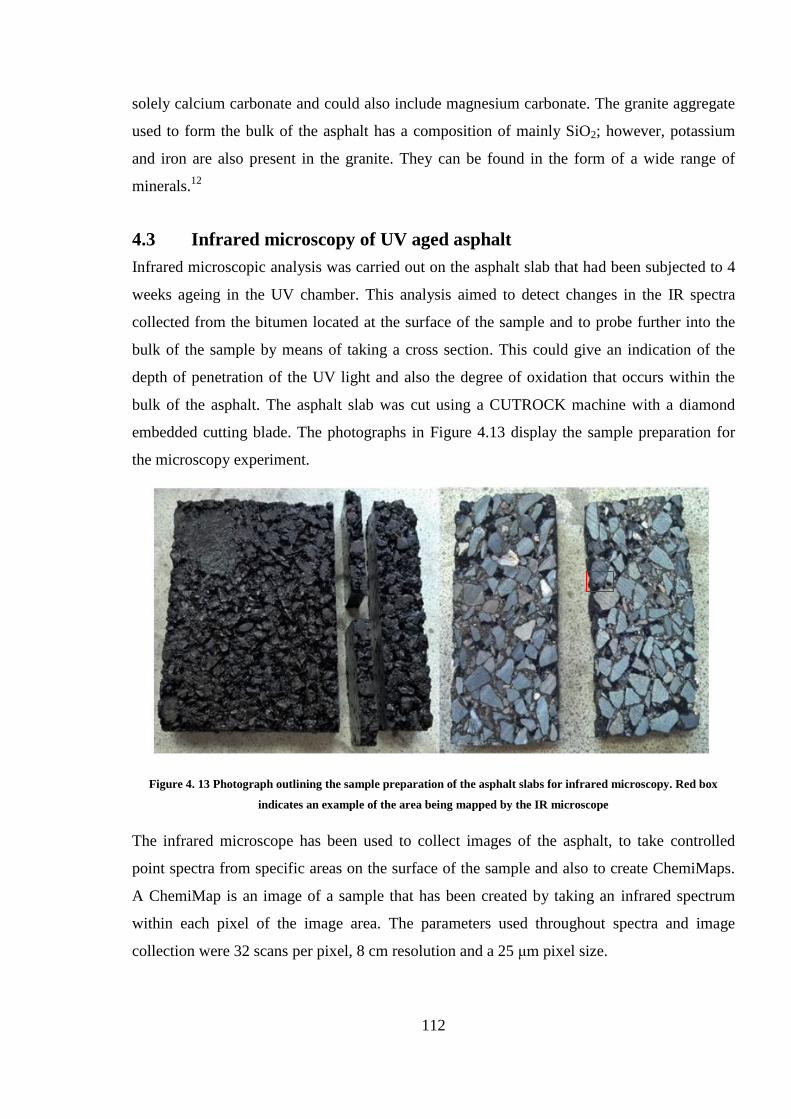
112
solely calcium carbonate and could also include magnesium carbonate. The granite aggregate
used to form the bulk of the asphalt has a composition of mainly SiO2; however, potassium
and iron are also present in the granite. They can be found in the form of a wide range of
minerals.12
4.3 Infrared microscopy of UV aged asphalt
Infrared microscopic analysis was carried out on the asphalt slab that had been subjected to 4
weeks ageing in the UV chamber. This analysis aimed to detect changes in the IR spectra
collected from the bitumen located at the surface of the sample and to probe further into the
bulk of the sample by means of taking a cross section. This could give an indication of the
depth of penetration of the UV light and also the degree of oxidation that occurs within the
bulk of the asphalt. The asphalt slab was cut using a CUTROCK machine with a diamond
embedded cutting blade. The photographs in Figure 4.13 display the sample preparation for
the microscopy experiment.
Figure 4. 13 Photograph outlining the sample preparation of the asphalt slabs for infrared microscopy. Red box
indicates an example of the area being mapped by the IR microscope
The infrared microscope has been used to collect images of the asphalt, to take controlled
point spectra from specific areas on the surface of the sample and also to create ChemiMaps.
A ChemiMap is an image of a sample that has been created by taking an infrared spectrum
within each pixel of the image area. The parameters used throughout spectra and image
collection were 32 scans per pixel, 8 cm resolution and a 25 μm pixel size.
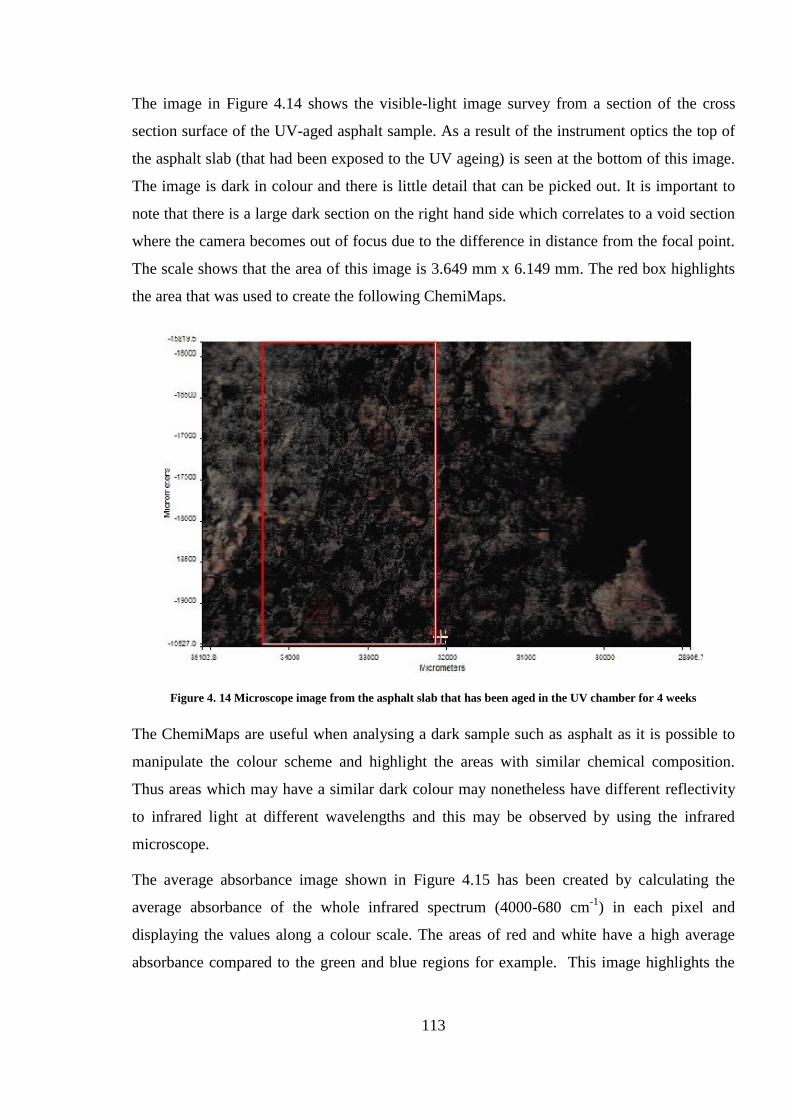
113
The image in Figure 4.14 shows the visible-light image survey from a section of the cross
section surface of the UV-aged asphalt sample. As a result of the instrument optics the top of
the asphalt slab (that had been exposed to the UV ageing) is seen at the bottom of this image.
The image is dark in colour and there is little detail that can be picked out. It is important to
note that there is a large dark section on the right hand side which correlates to a void section
where the camera becomes out of focus due to the difference in distance from the focal point.
The scale shows that the area of this image is 3.649 mm x 6.149 mm. The red box highlights
the area that was used to create the following ChemiMaps.
Figure 4. 14 Microscope image from the asphalt slab that has been aged in the UV chamber for 4 weeks
The ChemiMaps are useful when analysing a dark sample such as asphalt as it is possible to
manipulate the colour scheme and highlight the areas with similar chemical composition.
Thus areas which may have a similar dark colour may nonetheless have different reflectivity
to infrared light at different wavelengths and this may be observed by using the infrared
microscope.
The average absorbance image shown in Figure 4.15 has been created by calculating the
average absorbance of the whole infrared spectrum (4000-680 cm-1
) in each pixel and
displaying the values along a colour scale. The areas of red and white have a high average
absorbance compared to the green and blue regions for example. This image highlights the
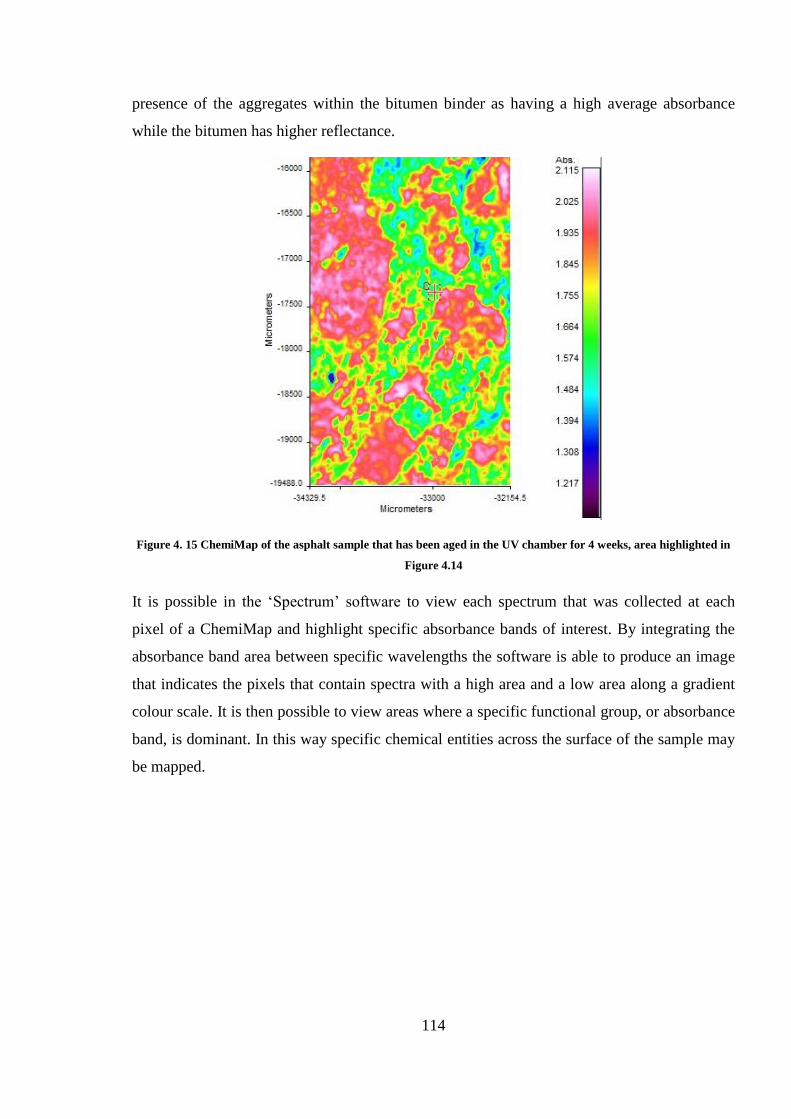
114
presence of the aggregates within the bitumen binder as having a high average absorbance
while the bitumen has higher reflectance.
Figure 4. 15 ChemiMap of the asphalt sample that has been aged in the UV chamber for 4 weeks, area highlighted in
Figure 4.14
It is possible in the ‘Spectrum’ software to view each spectrum that was collected at each
pixel of a ChemiMap and highlight specific absorbance bands of interest. By integrating the
absorbance band area between specific wavelengths the software is able to produce an image
that indicates the pixels that contain spectra with a high area and a low area along a gradient
colour scale. It is then possible to view areas where a specific functional group, or absorbance
band, is dominant. In this way specific chemical entities across the surface of the sample may
be mapped.
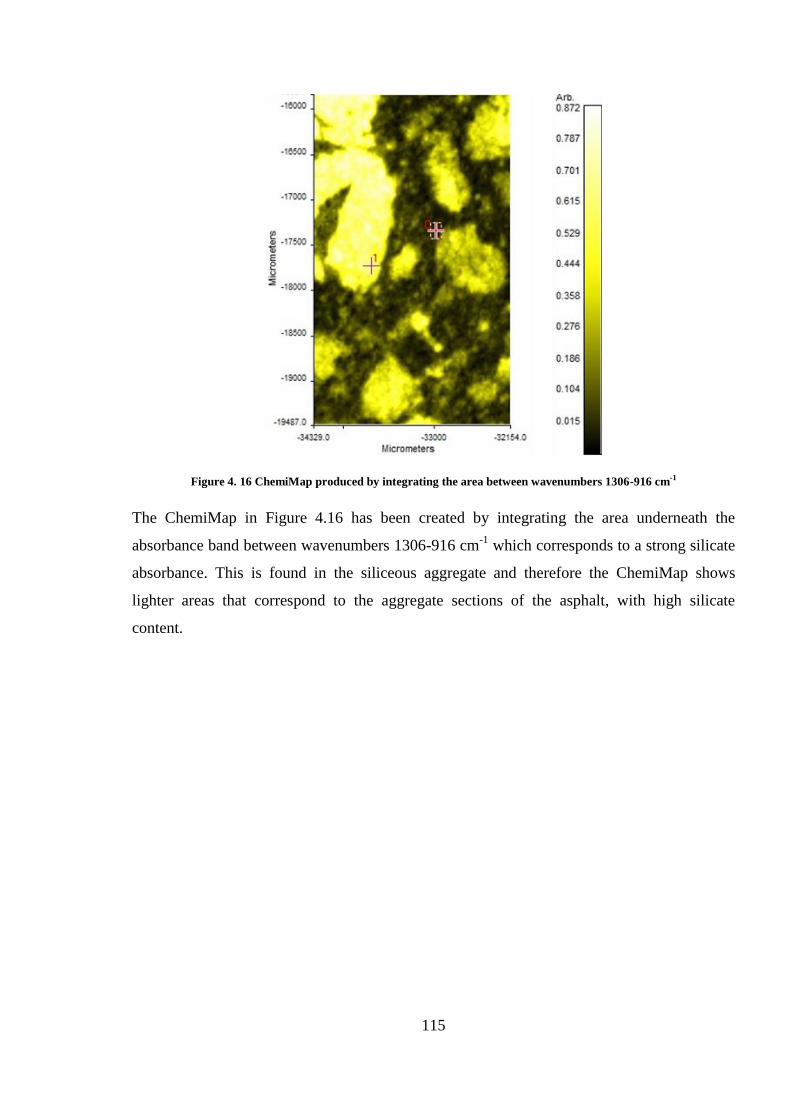
115
Figure 4. 16 ChemiMap produced by integrating the area between wavenumbers 1306-916 cm-1
The ChemiMap in Figure 4.16 has been created by integrating the area underneath the
absorbance band between wavenumbers 1306-916 cm-1
which corresponds to a strong silicate
absorbance. This is found in the siliceous aggregate and therefore the ChemiMap shows
lighter areas that correspond to the aggregate sections of the asphalt, with high silicate
content.
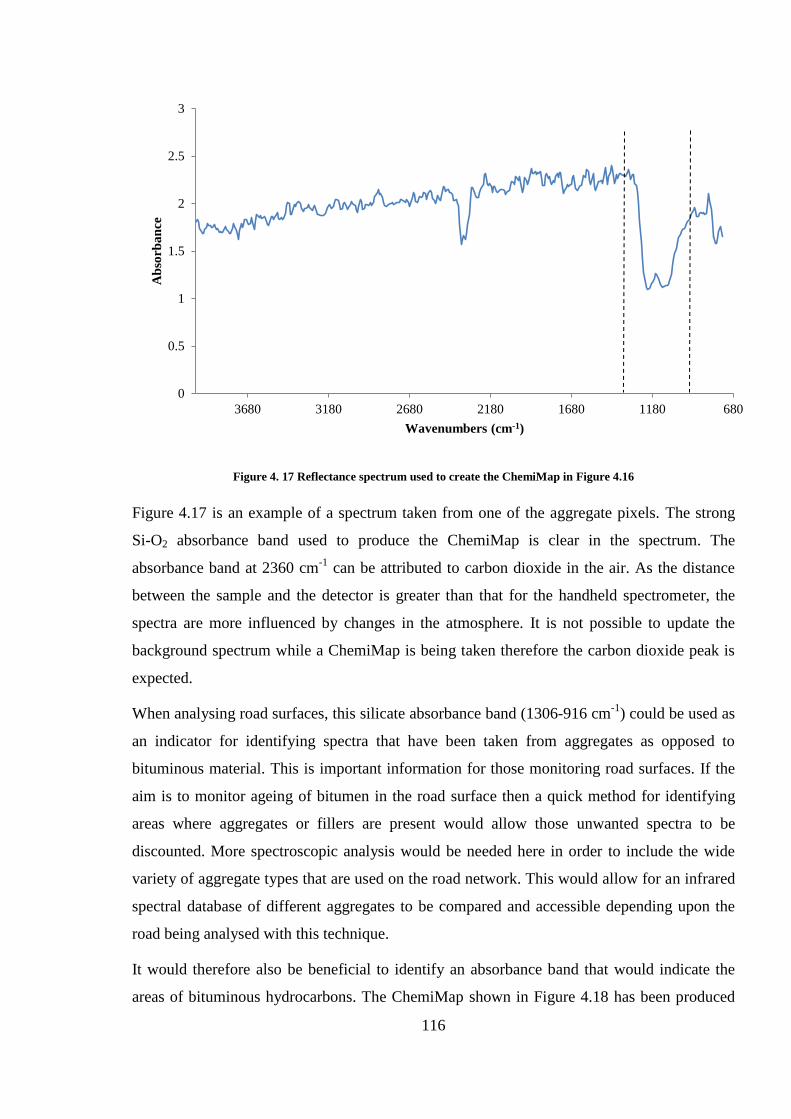
116
Figure 4. 17 Reflectance spectrum used to create the ChemiMap in Figure 4.16
Figure 4.17 is an example of a spectrum taken from one of the aggregate pixels. The strong
Si-O2 absorbance band used to produce the ChemiMap is clear in the spectrum. The
absorbance band at 2360 cm-1
can be attributed to carbon dioxide in the air. As the distance
between the sample and the detector is greater than that for the handheld spectrometer, the
spectra are more influenced by changes in the atmosphere. It is not possible to update the
background spectrum while a ChemiMap is being taken therefore the carbon dioxide peak is
expected.
When analysing road surfaces, this silicate absorbance band (1306-916 cm-1
) could be used as
an indicator for identifying spectra that have been taken from aggregates as opposed to
bituminous material. This is important information for those monitoring road surfaces. If the
aim is to monitor ageing of bitumen in the road surface then a quick method for identifying
areas where aggregates or fillers are present would allow those unwanted spectra to be
discounted. More spectroscopic analysis would be needed here in order to include the wide
variety of aggregate types that are used on the road network. This would allow for an infrared
spectral database of different aggregates to be compared and accessible depending upon the
road being analysed with this technique.
It would therefore also be beneficial to identify an absorbance band that would indicate the
areas of bituminous hydrocarbons. The ChemiMap shown in Figure 4.18 has been produced
0
0.5
1
1.5
2
2.5
3
680118016802180268031803680
Ab
sorb
an
ce
Wavenumbers (cm-1)
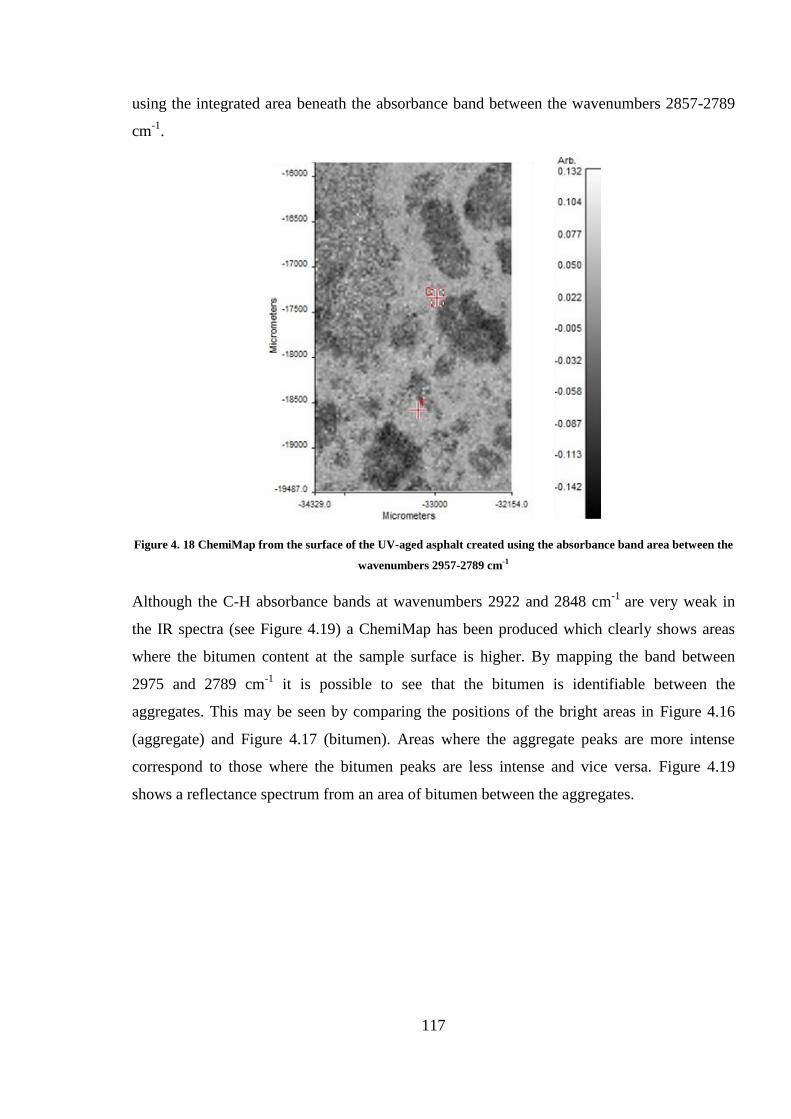
117
using the integrated area beneath the absorbance band between the wavenumbers 2857-2789
cm-1
.
Figure 4. 18 ChemiMap from the surface of the UV-aged asphalt created using the absorbance band area between the
wavenumbers 2957-2789 cm-1
Although the C-H absorbance bands at wavenumbers 2922 and 2848 cm-1
are very weak in
the IR spectra (see Figure 4.19) a ChemiMap has been produced which clearly shows areas
where the bitumen content at the sample surface is higher. By mapping the band between
2975 and 2789 cm-1
it is possible to see that the bitumen is identifiable between the
aggregates. This may be seen by comparing the positions of the bright areas in Figure 4.16
(aggregate) and Figure 4.17 (bitumen). Areas where the aggregate peaks are more intense
correspond to those where the bitumen peaks are less intense and vice versa. Figure 4.19
shows a reflectance spectrum from an area of bitumen between the aggregates.
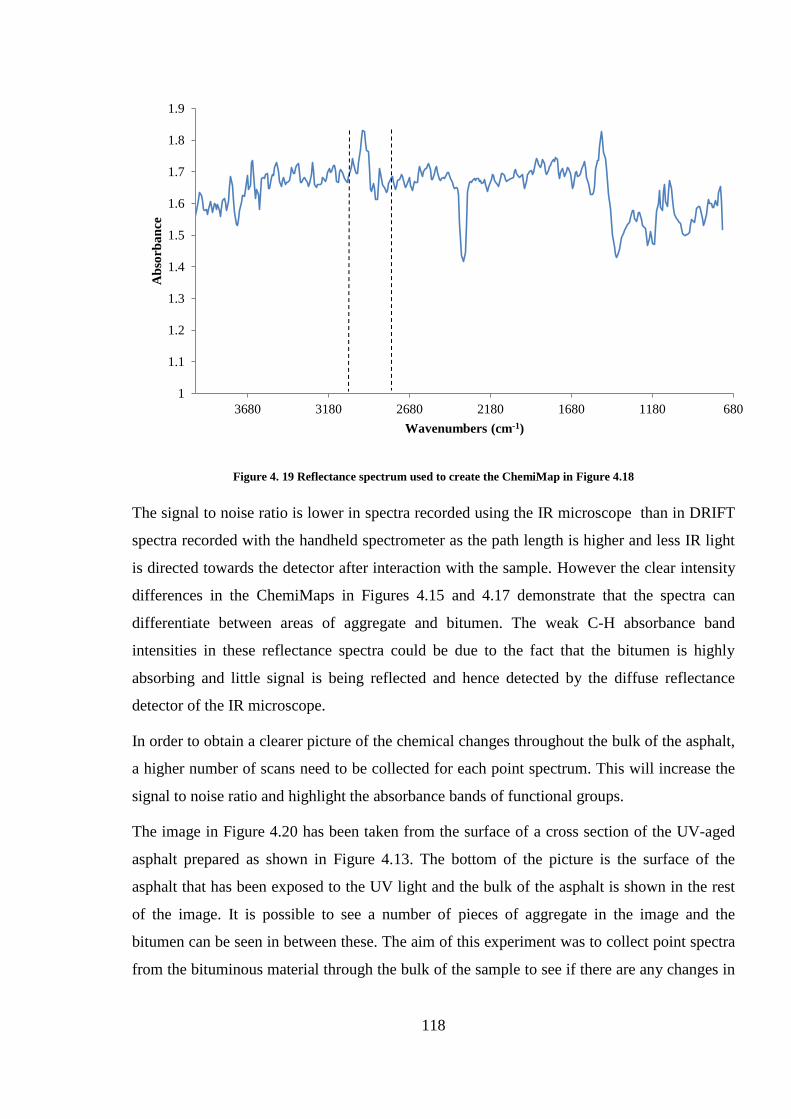
118
Figure 4. 19 Reflectance spectrum used to create the ChemiMap in Figure 4.18
The signal to noise ratio is lower in spectra recorded using the IR microscope than in DRIFT
spectra recorded with the handheld spectrometer as the path length is higher and less IR light
is directed towards the detector after interaction with the sample. However the clear intensity
differences in the ChemiMaps in Figures 4.15 and 4.17 demonstrate that the spectra can
differentiate between areas of aggregate and bitumen. The weak C-H absorbance band
intensities in these reflectance spectra could be due to the fact that the bitumen is highly
absorbing and little signal is being reflected and hence detected by the diffuse reflectance
detector of the IR microscope.
In order to obtain a clearer picture of the chemical changes throughout the bulk of the asphalt,
a higher number of scans need to be collected for each point spectrum. This will increase the
signal to noise ratio and highlight the absorbance bands of functional groups.
The image in Figure 4.20 has been taken from the surface of a cross section of the UV-aged
asphalt prepared as shown in Figure 4.13. The bottom of the picture is the surface of the
asphalt that has been exposed to the UV light and the bulk of the asphalt is shown in the rest
of the image. It is possible to see a number of pieces of aggregate in the image and the
bitumen can be seen in between these. The aim of this experiment was to collect point spectra
from the bituminous material through the bulk of the sample to see if there are any changes in
1
1.1
1.2
1.3
1.4
1.5
1.6
1.7
1.8
1.9
680118016802180268031803680
Ab
sorb
an
ce
Wavenumbers (cm-1)
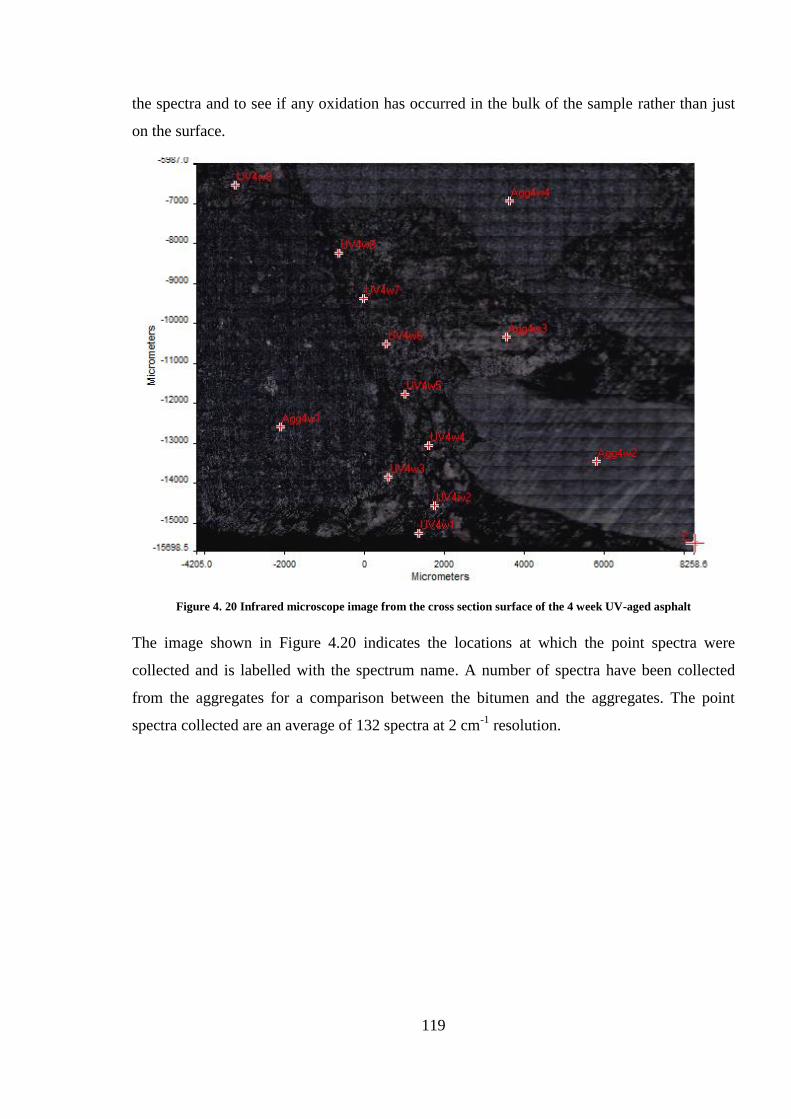
119
the spectra and to see if any oxidation has occurred in the bulk of the sample rather than just
on the surface.
Figure 4. 20 Infrared microscope image from the cross section surface of the 4 week UV-aged asphalt
The image shown in Figure 4.20 indicates the locations at which the point spectra were
collected and is labelled with the spectrum name. A number of spectra have been collected
from the aggregates for a comparison between the bitumen and the aggregates. The point
spectra collected are an average of 132 spectra at 2 cm-1
resolution.
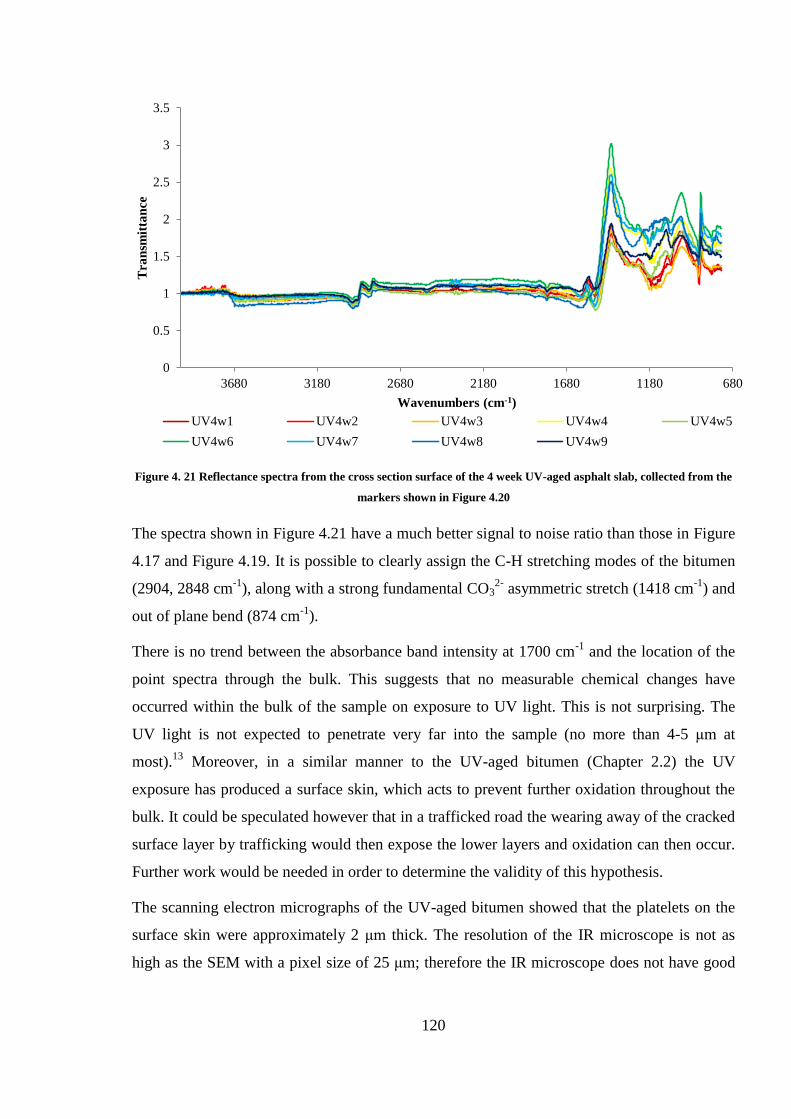
120
Figure 4. 21 Reflectance spectra from the cross section surface of the 4 week UV-aged asphalt slab, collected from the
markers shown in Figure 4.20
The spectra shown in Figure 4.21 have a much better signal to noise ratio than those in Figure
4.17 and Figure 4.19. It is possible to clearly assign the C-H stretching modes of the bitumen
(2904, 2848 cm-1
), along with a strong fundamental CO32-
asymmetric stretch (1418 cm-1
) and
out of plane bend (874 cm-1
).
There is no trend between the absorbance band intensity at 1700 cm-1
and the location of the
point spectra through the bulk. This suggests that no measurable chemical changes have
occurred within the bulk of the sample on exposure to UV light. This is not surprising. The
UV light is not expected to penetrate very far into the sample (no more than 4-5 μm at
most).13
Moreover, in a similar manner to the UV-aged bitumen (Chapter 2.2) the UV
exposure has produced a surface skin, which acts to prevent further oxidation throughout the
bulk. It could be speculated however that in a trafficked road the wearing away of the cracked
surface layer by trafficking would then expose the lower layers and oxidation can then occur.
Further work would be needed in order to determine the validity of this hypothesis.
The scanning electron micrographs of the UV-aged bitumen showed that the platelets on the
surface skin were approximately 2 μm thick. The resolution of the IR microscope is not as
high as the SEM with a pixel size of 25 μm; therefore the IR microscope does not have good
0
0.5
1
1.5
2
2.5
3
3.5
680118016802180268031803680
Tra
nsm
itta
nce
Wavenumbers (cm-1)
UV4w1 UV4w2 UV4w3 UV4w4 UV4w5
UV4w6 UV4w7 UV4w8 UV4w9
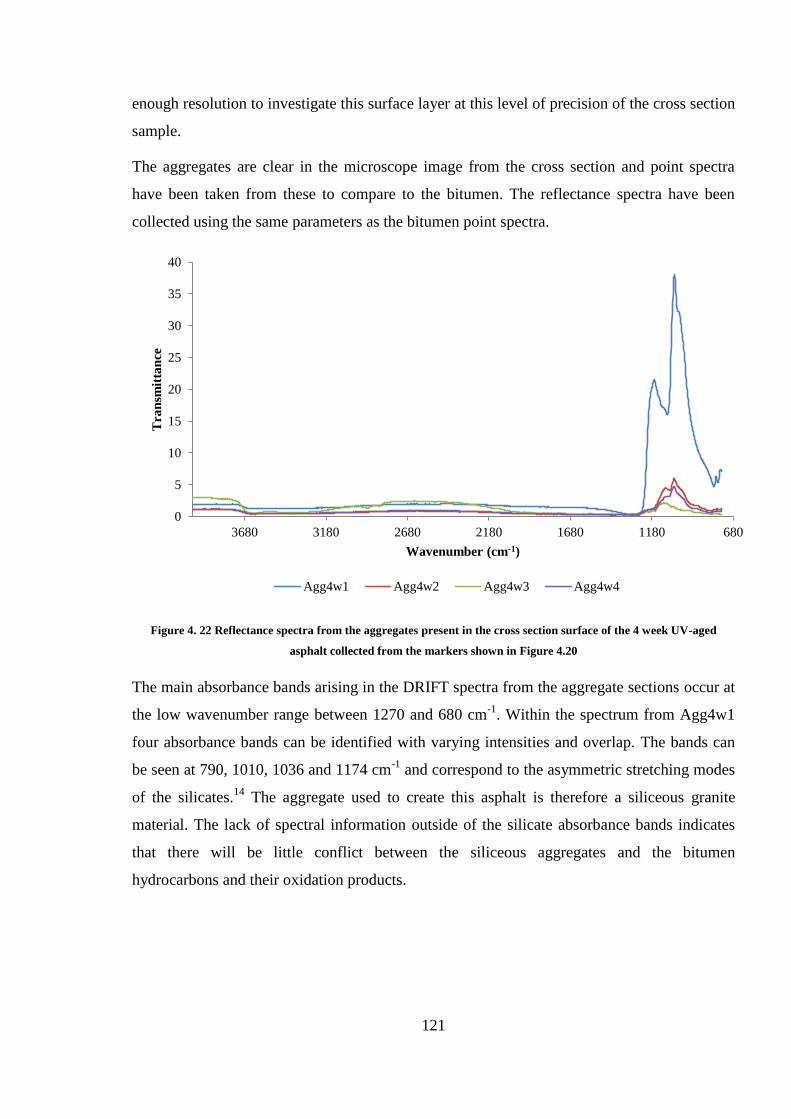
121
enough resolution to investigate this surface layer at this level of precision of the cross section
sample.
The aggregates are clear in the microscope image from the cross section and point spectra
have been taken from these to compare to the bitumen. The reflectance spectra have been
collected using the same parameters as the bitumen point spectra.
Figure 4. 22 Reflectance spectra from the aggregates present in the cross section surface of the 4 week UV-aged
asphalt collected from the markers shown in Figure 4.20
The main absorbance bands arising in the DRIFT spectra from the aggregate sections occur at
the low wavenumber range between 1270 and 680 cm-1
. Within the spectrum from Agg4w1
four absorbance bands can be identified with varying intensities and overlap. The bands can
be seen at 790, 1010, 1036 and 1174 cm-1
and correspond to the asymmetric stretching modes
of the silicates.14
The aggregate used to create this asphalt is therefore a siliceous granite
material. The lack of spectral information outside of the silicate absorbance bands indicates
that there will be little conflict between the siliceous aggregates and the bitumen
hydrocarbons and their oxidation products.
0
5
10
15
20
25
30
35
40
680118016802180268031803680
Tra
nsm
itta
nce
Wavenumber (cm-1)
Agg4w1 Agg4w2 Agg4w3 Agg4w4
122
Summary
The aim for this chapter was to identify the feasibility of diffuse reflectance infrared
spectroscopy for the detection of oxidation product absorbance bands in the spectra.
It has been possible to identify the absorbance bands that correspond to the carbonate fillers
and siliceous aggregates within the DRIFT spectra from the surface of asphalt. It is also
possible to see a new absorbance band occurring after 1 week of artificial ageing in the UV
chamber which is separate from the carbonate bands. This absorbance band can be attributed
to a carbonyl functional group within the bitumen at 1692 cm-1
.
This absorbance band is seen as a first derivative, in the spectra of the UV-aged raw bitumen
spectra. The first derivative is similar to that seen in the spectra from the UV-aged bitumen
(Chapter 2.2). This is possibly as a result of the shiny surface of the UV-aged asphalt and the
absorbance band being a mixture of specular and diffuse reflectance or a change in surface
structure leading to a change in refractive index of the surface of the bitumen.
This absorbance band can be quantified and the results show a steep increase in intensity
between 0-1 week and after this there is a plateau as the concentration of the carbonyl
functional group does not change between weeks 1-4.
The light and scanning electron microscopy experiments have provided enhanced visual
information on the surface of the asphalt samples. Within the SEM images it is possible to see
small micro-cracking on the UV exposed bitumen that coats a surface aggregate. This
replicates what was seen on the surface of the UV-aged bitumen. This micro-cracking could
be an initial cause of more significant cracking of the road surface. The surface bitumen could
become cracked and brittle by UV exposure and hence incorporate weaknesses within the
structure of the bitumen. By adding the mechanical agitation of trafficking, the road surface is
weakened on a micro-level and the cracks begin to propagate. The weakened surface is then
likely to erode away as a result of the trafficking and expose the lower layers of bitumen to
oxidation and eventually expose the aggregates below.
IR-microscopy has identified wavenumber regions that could be useful in differentiating
between spectra from aggregate and bituminous material. ChemiMaps with a good contrast
between the aggregate and bitumen have been produced. The DRIFT spectra throughout the
bulk have been measured and show no real trend throughout the bulk. Indicating that, as
expected, exposure to UV light only causes oxidation at the sample surface.
123
References
1 British Standard EN 13108-1:2006, Bituminous mixtures, Asphalt Concrete.
2 PubChem Open Chemistry Database, Carbonate Ion, Compound Summary for CID 19660
https://pubchem.ncbi.nlm.nih.gov/compound/carbonate#section=Top ACCESSED 21.05.2018
14:46.
3 J. Godleman, M. Almond and W. Matthews, An infrared micro spectroscopic study of
plasters and pigments from the Neolithic site of Bestansur, Iraq, J. Archaeol. Sci: Reports, 7,
2016, 195-204.
4 E. Anderson, M. J. Almond, W. Matthews, Elemental and spectroscopic characterization of
plasters from Fatih Mosque-Istanbul (Turkey) by combined micro-Ramen, FTIR and EDXRF
techniques, Spectrochim. Acta A, 133, 2014, 326-334.
5 N. Colthup, L. H. Daly and S. E. Wiberley, Introduction to infrared and ramen
spectroscopy, Elsevier Science and Technology, London, 1975, EBOOK ISBN:
9780323161602.
6 B. Stuart, Infrared Spectroscopy: Fundamentals and Applications, John Wiley and Sons Ltd,
2004, ISBN 9780470854280.
7 Perkin Elmer Technical Note, Richard Spragg, PerkinElmer. Inc, Seer Green, UK,
Reflection Measurements in IR Spectroscopy,
https://www.perkinelmer.com/CMSResources/Images/44-153348TCH_reflection-
Measurements.pdf ACCESSED 21.05.2018 15:25.
8 V. Mouillet, F. Farcas and S. Besson, Ageing by UV radiation of an elastomer modified
bitumen, Fuel, 87, 2008, 2408-2419.
9 F. Durrieu, F. Farcas and V. Mouillet, The influence of UV ageing of a
Styrene/Butadiene/Styrene modified bitumen: Comparison between laboratory and on site
ageing, Fuel, 86, 2007, 1446-1451.
10 M. Lopes, D. Zhao, E. Chailleux, M. Kane, T. Gabet, C. Petiteau and J. Soares,
Characterisation of ageing processes on the asphalt mixture surface, Road Mater. Pavement,
15 (3), 2014, 477-487.
11 D. Harmelink, S. Shuler and T. Aschenbrener, Top-down cracking in asphalt pavements:
Causes, Effects and Cures, J. Transp. Eng., 134, 2008.
12 H. Blatt and R. J. Tracey, Petrology: Ingenuous, Sedimentary and Metamorphic, 2
nd Ed,
Freeman, ISBN: 0716724383.

124
13 W. Zeng, S. Wu, L. Pang, H. Chen, J. Hu, Y. Sun and Z. Chen, Research on ultra violet
(UV) ageing depths of asphalts, Constr. Build. Mater., 160, 2018, 620-627.
14 M. A. Karakassides, D. Gournis and D. Petridis, An infrared reflectance study of Si-O
vibrations in thermally treated alkali-saturated montmorillonites, Clay Minerals, 34, 1999,
429-438.
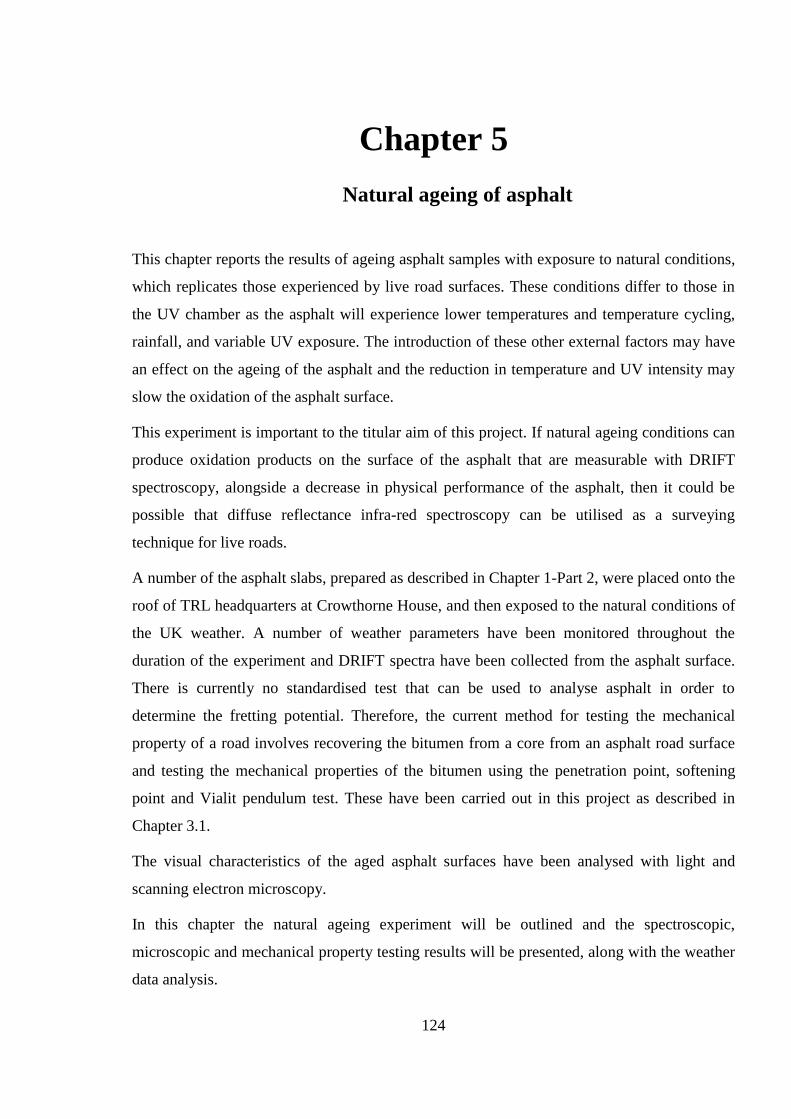
124
Chapter 5
Natural ageing of asphalt
This chapter reports the results of ageing asphalt samples with exposure to natural conditions,
which replicates those experienced by live road surfaces. These conditions differ to those in
the UV chamber as the asphalt will experience lower temperatures and temperature cycling,
rainfall, and variable UV exposure. The introduction of these other external factors may have
an effect on the ageing of the asphalt and the reduction in temperature and UV intensity may
slow the oxidation of the asphalt surface.
This experiment is important to the titular aim of this project. If natural ageing conditions can
produce oxidation products on the surface of the asphalt that are measurable with DRIFT
spectroscopy, alongside a decrease in physical performance of the asphalt, then it could be
possible that diffuse reflectance infra-red spectroscopy can be utilised as a surveying
technique for live roads.
A number of the asphalt slabs, prepared as described in Chapter 1-Part 2, were placed onto the
roof of TRL headquarters at Crowthorne House, and then exposed to the natural conditions of
the UK weather. A number of weather parameters have been monitored throughout the
duration of the experiment and DRIFT spectra have been collected from the asphalt surface.
There is currently no standardised test that can be used to analyse asphalt in order to
determine the fretting potential. Therefore, the current method for testing the mechanical
property of a road involves recovering the bitumen from a core from an asphalt road surface
and testing the mechanical properties of the bitumen using the penetration point, softening
point and Vialit pendulum test. These have been carried out in this project as described in
Chapter 3.1.
The visual characteristics of the aged asphalt surfaces have been analysed with light and
scanning electron microscopy.
In this chapter the natural ageing experiment will be outlined and the spectroscopic,
microscopic and mechanical property testing results will be presented, along with the weather
data analysis.
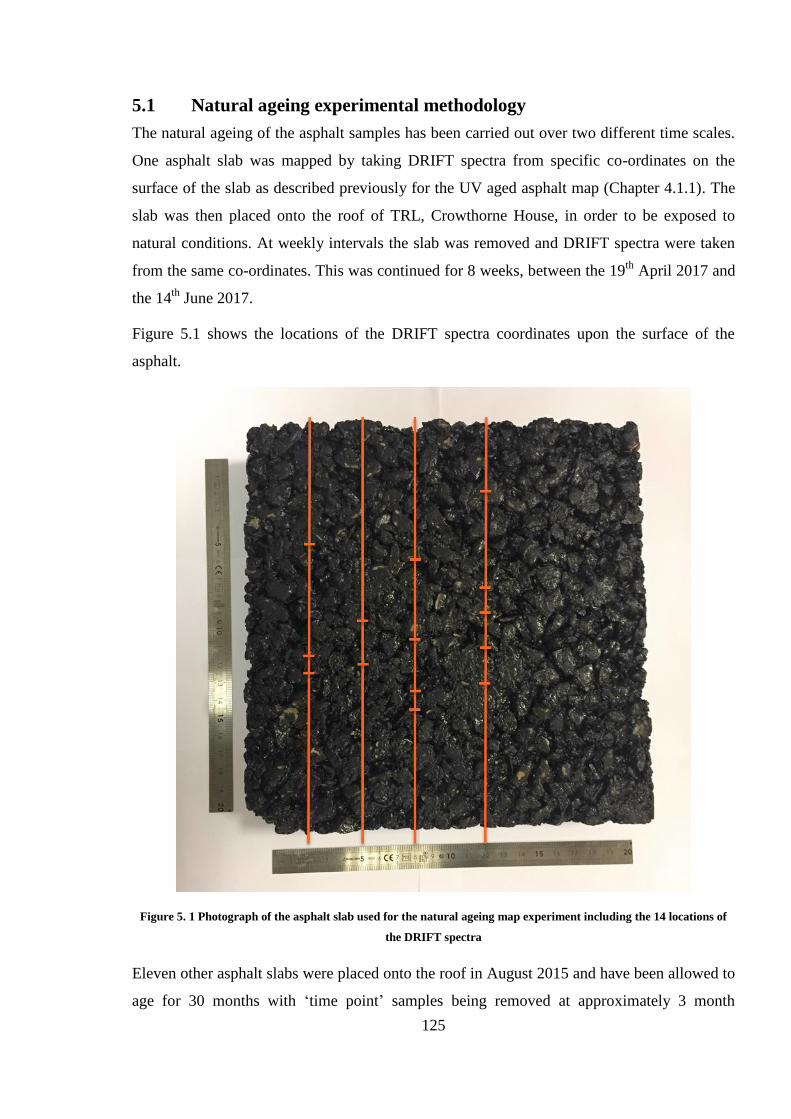
125
5.1 Natural ageing experimental methodology
The natural ageing of the asphalt samples has been carried out over two different time scales.
One asphalt slab was mapped by taking DRIFT spectra from specific co-ordinates on the
surface of the slab as described previously for the UV aged asphalt map (Chapter 4.1.1). The
slab was then placed onto the roof of TRL, Crowthorne House, in order to be exposed to
natural conditions. At weekly intervals the slab was removed and DRIFT spectra were taken
from the same co-ordinates. This was continued for 8 weeks, between the 19th
April 2017 and
the 14th
June 2017.
Figure 5.1 shows the locations of the DRIFT spectra coordinates upon the surface of the
asphalt.
Figure 5. 1 Photograph of the asphalt slab used for the natural ageing map experiment including the 14 locations of
the DRIFT spectra
Eleven other asphalt slabs were placed onto the roof in August 2015 and have been allowed to
age for 30 months with ‘time point’ samples being removed at approximately 3 month
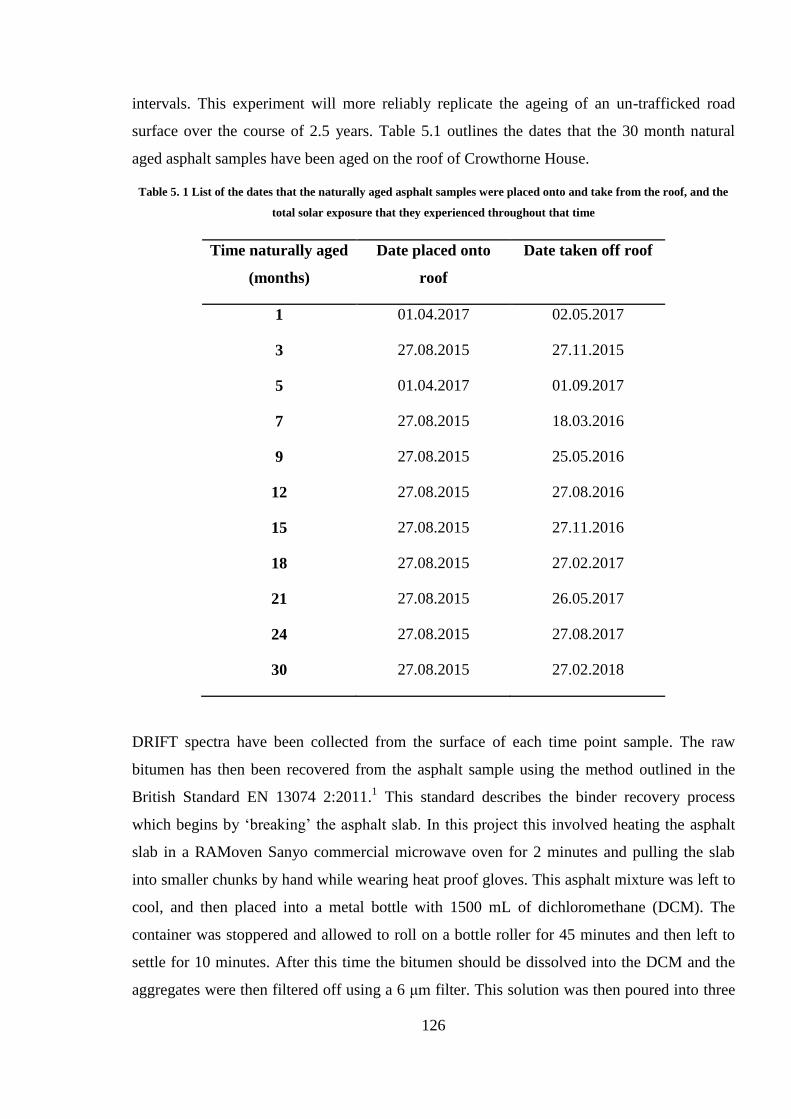
126
intervals. This experiment will more reliably replicate the ageing of an un-trafficked road
surface over the course of 2.5 years. Table 5.1 outlines the dates that the 30 month natural
aged asphalt samples have been aged on the roof of Crowthorne House.
Table 5. 1 List of the dates that the naturally aged asphalt samples were placed onto and take from the roof, and the
total solar exposure that they experienced throughout that time
Time naturally aged
(months)
Date placed onto
roof
Date taken off roof
1 01.04.2017 02.05.2017
3 27.08.2015 27.11.2015
5 01.04.2017 01.09.2017
7 27.08.2015 18.03.2016
9 27.08.2015 25.05.2016
12 27.08.2015 27.08.2016
15 27.08.2015 27.11.2016
18 27.08.2015 27.02.2017
21 27.08.2015 26.05.2017
24 27.08.2015 27.08.2017
30 27.08.2015 27.02.2018
DRIFT spectra have been collected from the surface of each time point sample. The raw
bitumen has then been recovered from the asphalt sample using the method outlined in the
British Standard EN 13074 2:2011.1 This standard describes the binder recovery process
which begins by ‘breaking’ the asphalt slab. In this project this involved heating the asphalt
slab in a RAMoven Sanyo commercial microwave oven for 2 minutes and pulling the slab
into smaller chunks by hand while wearing heat proof gloves. This asphalt mixture was left to
cool, and then placed into a metal bottle with 1500 mL of dichloromethane (DCM). The
container was stoppered and allowed to roll on a bottle roller for 45 minutes and then left to
settle for 10 minutes. After this time the bitumen should be dissolved into the DCM and the
aggregates were then filtered off using a 6 μm filter. This solution was then poured into three
127
500 mL, twist cap containers and placed into a Centurion Scientific K3 Series centrifuge. The
solutions were centrifuged at 15000 m s-2
, 4000 rpm for 18 minutes in order to separate the
calcium carbonate filler from the bitumen in the solvent. Following this separation the solvent
was then evaporated from the bitumen with the use of a rotary evaporator. The solution was
added gradually into a round bottom flask being heated to 120 ˚C by an oil bath, under a
vacuum of 850 mbar. Once all of the solution had been added to the round bottom flask the
pressure is reduced to 13 mbar and the temperature increased to 155 ˚C. This new set of
conditions was used until the bubbling inside the round bottom flask has ceased then they
were continued for a further 15 minutes. The bitumen was then cooled for 1 hour and is then
ready for further testing.
The mechanical properties of the recovered bitumen were then measured using the penetration
point, softening point and Vialit pendulum tests (methodologies described in Chapter 3.1).
5.2 Weather data analysis
The weather parameters measured by the weather station at Crowthorne House were the UV
exposure, temperature, humidity, rainfall, pressure and wind speed and direction. The
literature has identified that the temperature, UV exposure and the presence of rainwater are
three of the main environmental factors that contribute to the age hardening and failure of
asphalt road surfaces.2 Therefore these parameters were looked at in more detail for the
duration of the, long-term, naturally aged asphalt experiment.
The solar exposure (W/m2) was recorded every 15 minutes for 24 hours a day throughout the
experiment, starting from the 14th
September 2015. This data can be presented in many ways.
Every 15 minutes the UV monitor records a data point, all of which can be summed for the
day, month or year of natural ageing. This has been carried out for each month of the
experiment and has been plotted in Figure 5.2.

128
Figure 5. 2 Column graph containing the total solar exposure measured throughout each month of the natural ageing
experiment
The variable nature of the solar exposure throughout the year is highlighted in the chart in
Figure 5.2. This is to be expected as the seasons change, the days shorten in the winter and
there is less solar energy reaching the earth. In the summer months, days lengthen and total
solar intensity increases. This cyclisation means that the solar exposure intensity that the
asphalt road surfaces experiences is variable and this is one of the reasons why a standardised
UV enhanced ageing method is very difficult to develop.
Another variable and contributing factor to the oxidation of the surface of asphalt is the
temperature. The temperature has also been recorded every 15 minutes of the ageing
experiment, and the maximum, minimum and average temperatures for each month
throughout the ageing experiment have been plotted into the column graph in Figure 5.3.
0
100
200
300
400
500
600
Sep
-15
Oct
-15
No
v-1
5
Dec
-15
Jan
-16
Feb
-16
Mar
-16
Ap
r-1
6
May
-16
Jun
-16
Jul-
16
Au
g-1
6
Sep
-16
Oct
-16
No
v-1
6
Dec
-16
Jan
-17
Feb
-17
Mar
-17
Ap
r-1
7
May
-17
Jun
-17
Jul-
17
Au
g-1
7
Sep
-17
Oct
-17
No
v-1
7
Dec
-17
Jan
-18
Feb
-18
To
tal
So
lar
Exp
osu
re (
kW
/m2)
Month-Year
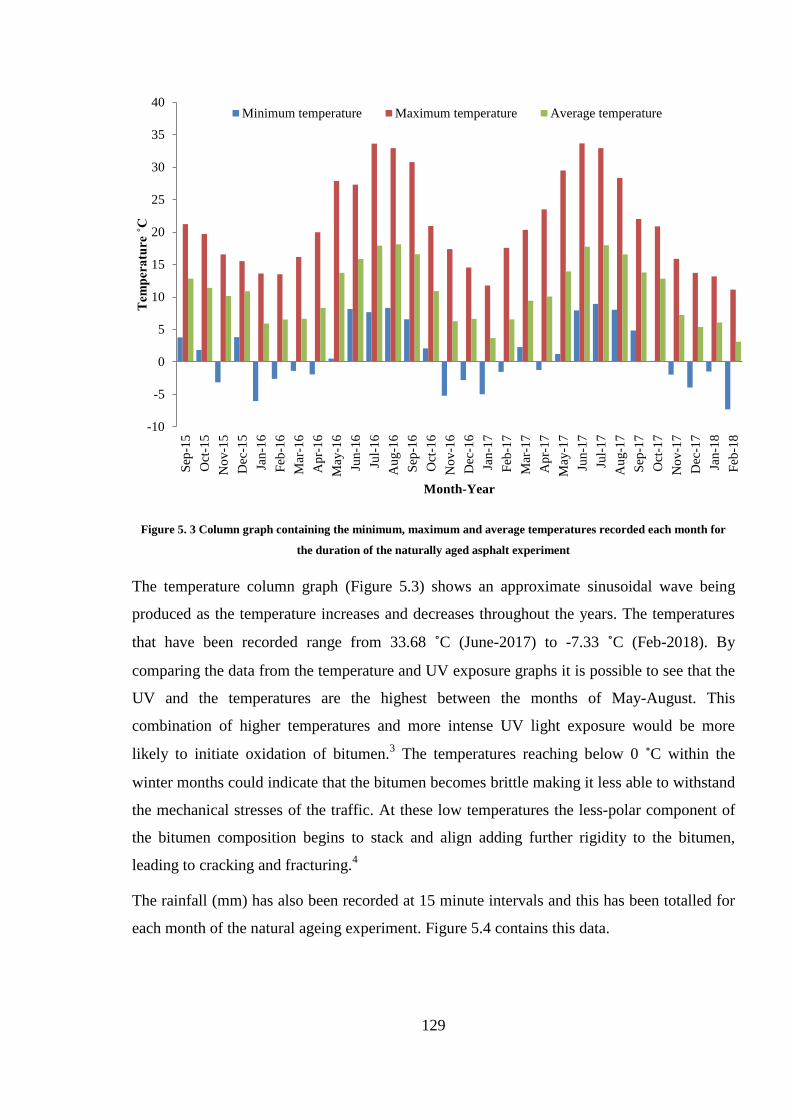
129
Figure 5. 3 Column graph containing the minimum, maximum and average temperatures recorded each month for
the duration of the naturally aged asphalt experiment
The temperature column graph (Figure 5.3) shows an approximate sinusoidal wave being
produced as the temperature increases and decreases throughout the years. The temperatures
that have been recorded range from 33.68 ˚C (June-2017) to -7.33 ˚C (Feb-2018). By
comparing the data from the temperature and UV exposure graphs it is possible to see that the
UV and the temperatures are the highest between the months of May-August. This
combination of higher temperatures and more intense UV light exposure would be more
likely to initiate oxidation of bitumen.3 The temperatures reaching below 0 ˚C within the
winter months could indicate that the bitumen becomes brittle making it less able to withstand
the mechanical stresses of the traffic. At these low temperatures the less-polar component of
the bitumen composition begins to stack and align adding further rigidity to the bitumen,
leading to cracking and fracturing.4
The rainfall (mm) has also been recorded at 15 minute intervals and this has been totalled for
each month of the natural ageing experiment. Figure 5.4 contains this data.
-10
-5
0
5
10
15
20
25
30
35
40
Sep
-15
Oct
-15
No
v-1
5
Dec
-15
Jan
-16
Feb
-16
Mar
-16
Ap
r-1
6
May
-16
Jun
-16
Jul-
16
Au
g-1
6
Sep
-16
Oct
-16
No
v-1
6
Dec
-16
Jan
-17
Feb
-17
Mar
-17
Ap
r-1
7
May
-17
Jun
-17
Jul-
17
Au
g-1
7
Sep
-17
Oct
-17
No
v-1
7
Dec
-17
Jan
-18
Feb
-18
Tem
per
atu
re ˚
C
Month-Year
Minimum temperature Maximum temperature Average temperature
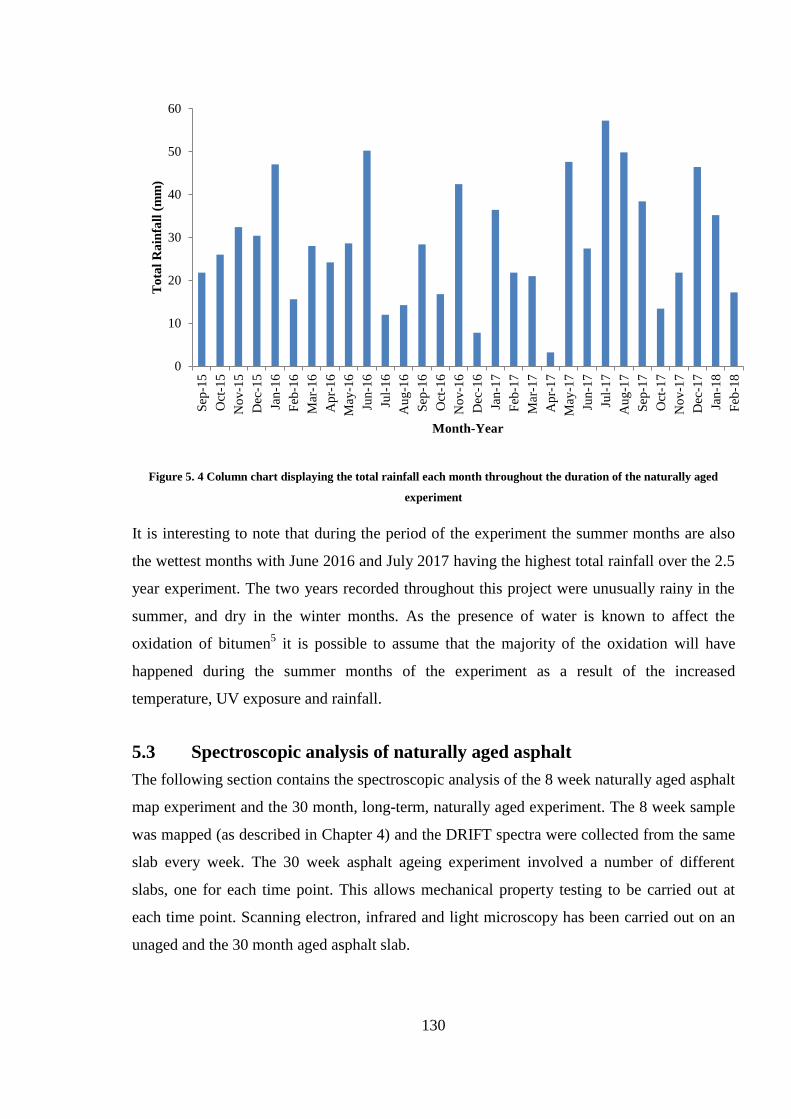
130
Figure 5. 4 Column chart displaying the total rainfall each month throughout the duration of the naturally aged
experiment
It is interesting to note that during the period of the experiment the summer months are also
the wettest months with June 2016 and July 2017 having the highest total rainfall over the 2.5
year experiment. The two years recorded throughout this project were unusually rainy in the
summer, and dry in the winter months. As the presence of water is known to affect the
oxidation of bitumen5 it is possible to assume that the majority of the oxidation will have
happened during the summer months of the experiment as a result of the increased
temperature, UV exposure and rainfall.
5.3 Spectroscopic analysis of naturally aged asphalt
The following section contains the spectroscopic analysis of the 8 week naturally aged asphalt
map experiment and the 30 month, long-term, naturally aged experiment. The 8 week sample
was mapped (as described in Chapter 4) and the DRIFT spectra were collected from the same
slab every week. The 30 week asphalt ageing experiment involved a number of different
slabs, one for each time point. This allows mechanical property testing to be carried out at
each time point. Scanning electron, infrared and light microscopy has been carried out on an
unaged and the 30 month aged asphalt slab.
0
10
20
30
40
50
60
Sep
-15
Oct
-15
No
v-1
5
Dec
-15
Jan
-16
Feb
-16
Mar
-16
Ap
r-1
6
May
-16
Jun
-16
Jul-
16
Au
g-1
6
Sep
-16
Oct
-16
No
v-1
6
Dec
-16
Jan
-17
Feb
-17
Mar
-17
Ap
r-1
7
May
-17
Jun
-17
Jul-
17
Au
g-1
7
Sep
-17
Oct
-17
No
v-1
7
Dec
-17
Jan
-18
Feb
-18
To
tal
Ra
infa
ll (
mm
)
Month-Year
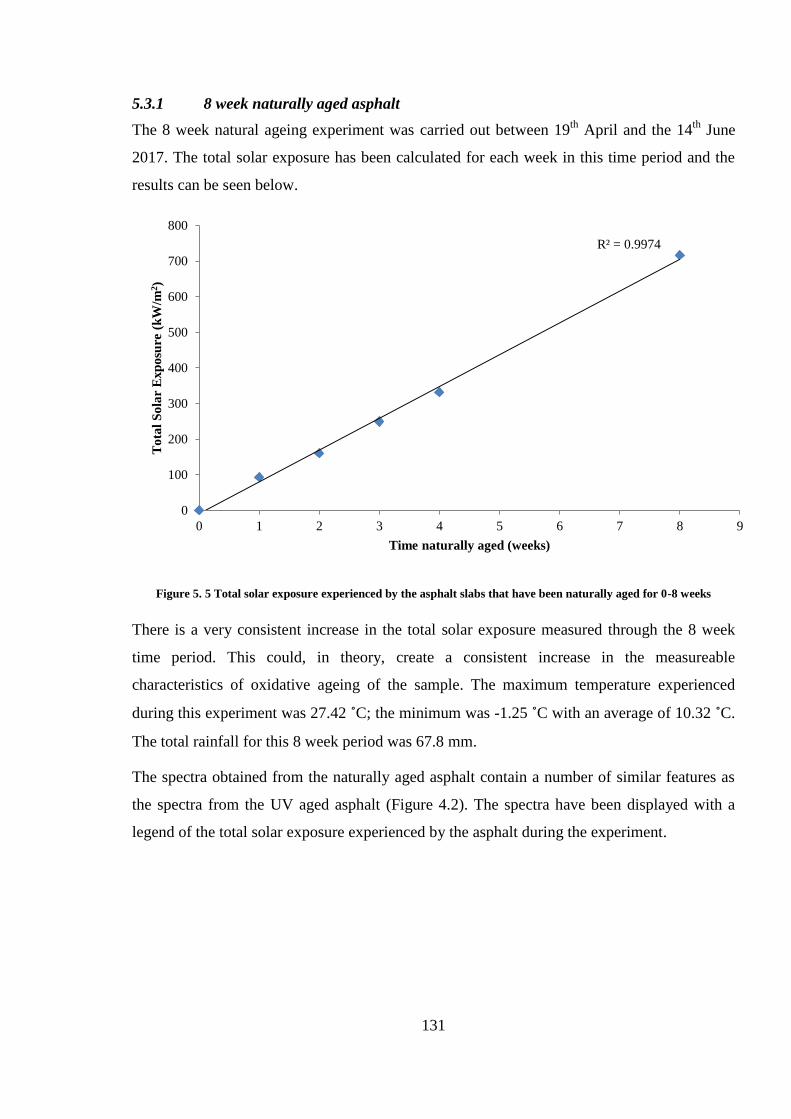
131
5.3.1 8 week naturally aged asphalt
The 8 week natural ageing experiment was carried out between 19th
April and the 14th
June
2017. The total solar exposure has been calculated for each week in this time period and the
results can be seen below.
Figure 5. 5 Total solar exposure experienced by the asphalt slabs that have been naturally aged for 0-8 weeks
There is a very consistent increase in the total solar exposure measured through the 8 week
time period. This could, in theory, create a consistent increase in the measureable
characteristics of oxidative ageing of the sample. The maximum temperature experienced
during this experiment was 27.42 ˚C; the minimum was -1.25 ˚C with an average of 10.32 ˚C.
The total rainfall for this 8 week period was 67.8 mm.
The spectra obtained from the naturally aged asphalt contain a number of similar features as
the spectra from the UV aged asphalt (Figure 4.2). The spectra have been displayed with a
legend of the total solar exposure experienced by the asphalt during the experiment.
R² = 0.9974
0
100
200
300
400
500
600
700
800
0 1 2 3 4 5 6 7 8 9
To
tal
So
lar
Exp
osu
re (
kW
/m2)
Time naturally aged (weeks)
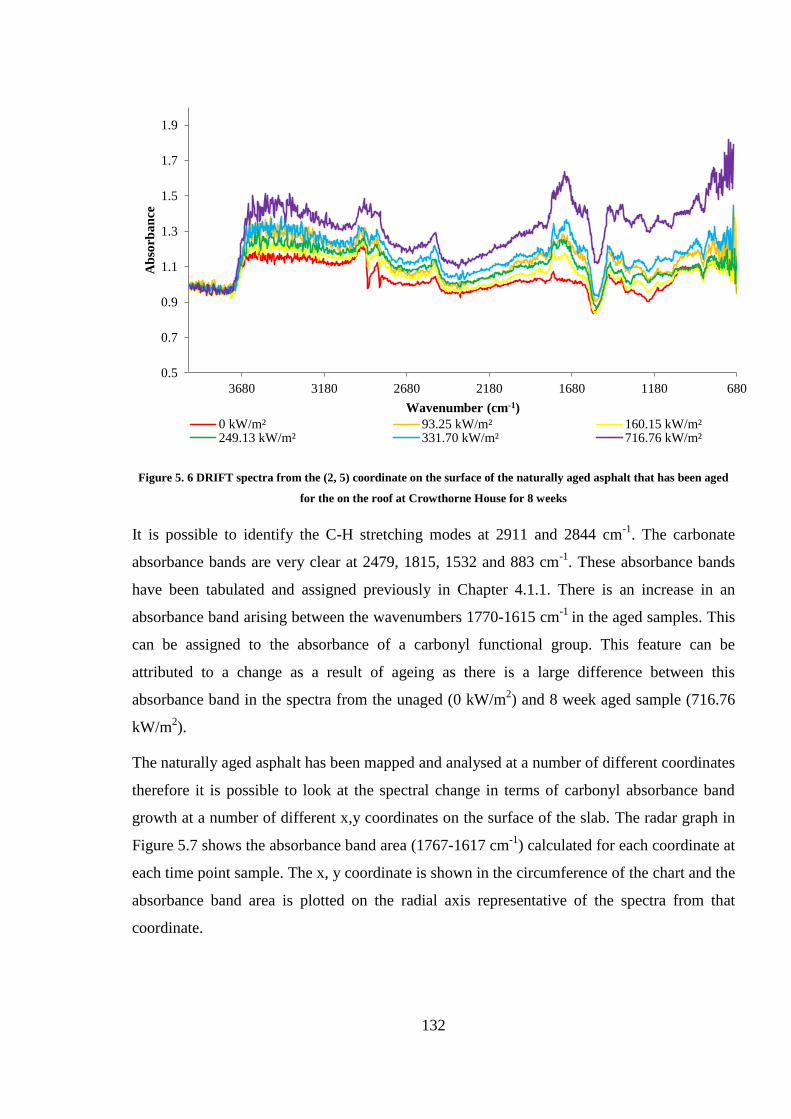
132
Figure 5. 6 DRIFT spectra from the (2, 5) coordinate on the surface of the naturally aged asphalt that has been aged
for the on the roof at Crowthorne House for 8 weeks
It is possible to identify the C-H stretching modes at 2911 and 2844 cm-1
. The carbonate
absorbance bands are very clear at 2479, 1815, 1532 and 883 cm-1
. These absorbance bands
have been tabulated and assigned previously in Chapter 4.1.1. There is an increase in an
absorbance band arising between the wavenumbers 1770-1615 cm-1
in the aged samples. This
can be assigned to the absorbance of a carbonyl functional group. This feature can be
attributed to a change as a result of ageing as there is a large difference between this
absorbance band in the spectra from the unaged (0 kW/m2) and 8 week aged sample (716.76
kW/m2).
The naturally aged asphalt has been mapped and analysed at a number of different coordinates
therefore it is possible to look at the spectral change in terms of carbonyl absorbance band
growth at a number of different x,y coordinates on the surface of the slab. The radar graph in
Figure 5.7 shows the absorbance band area (1767-1617 cm-1
) calculated for each coordinate at
each time point sample. The x, y coordinate is shown in the circumference of the chart and the
absorbance band area is plotted on the radial axis representative of the spectra from that
coordinate.
0.5
0.7
0.9
1.1
1.3
1.5
1.7
1.9
680118016802180268031803680
Ab
sorb
an
ce
Wavenumber (cm-1)
0 kW/m² 93.25 kW/m² 160.15 kW/m²249.13 kW/m² 331.70 kW/m² 716.76 kW/m²
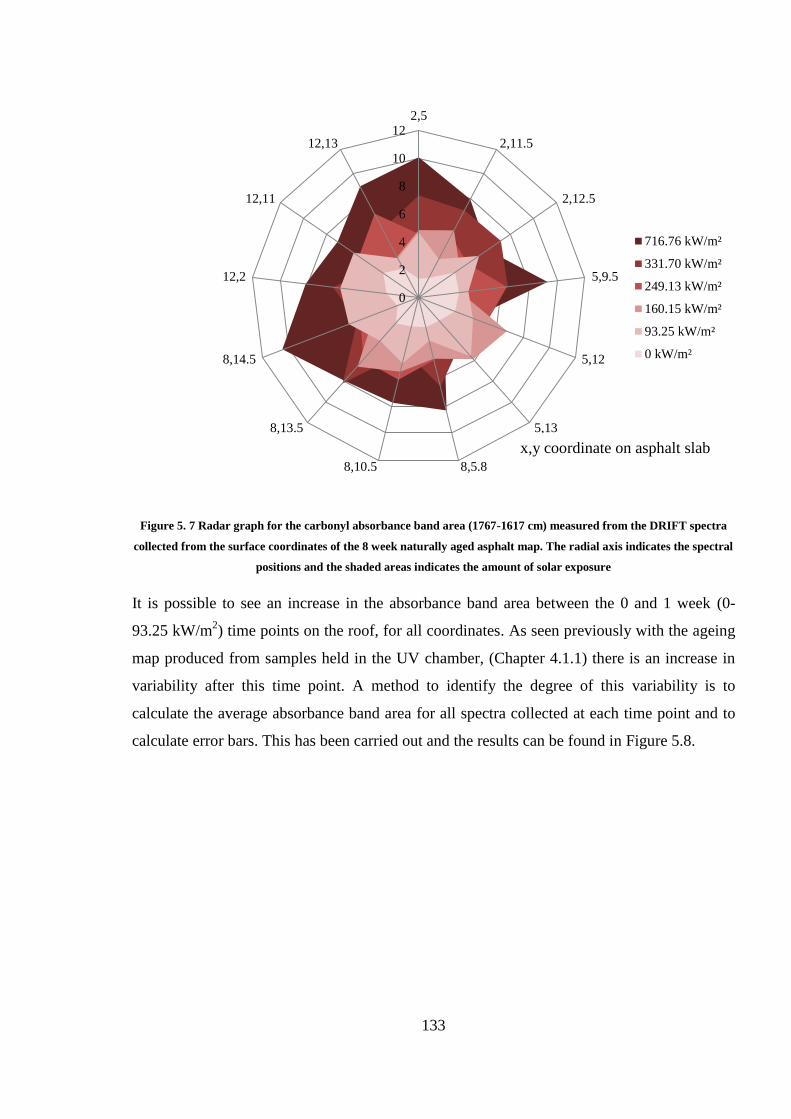
133
Figure 5. 7 Radar graph for the carbonyl absorbance band area (1767-1617 cm) measured from the DRIFT spectra
collected from the surface coordinates of the 8 week naturally aged asphalt map. The radial axis indicates the spectral
positions and the shaded areas indicates the amount of solar exposure
It is possible to see an increase in the absorbance band area between the 0 and 1 week (0-
93.25 kW/m2) time points on the roof, for all coordinates. As seen previously with the ageing
map produced from samples held in the UV chamber, (Chapter 4.1.1) there is an increase in
variability after this time point. A method to identify the degree of this variability is to
calculate the average absorbance band area for all spectra collected at each time point and to
calculate error bars. This has been carried out and the results can be found in Figure 5.8.
0
2
4
6
8
10
122,5
2,11.5
2,12.5
5,9.5
5,12
5,13
8,5.88,10.5
8,13.5
8,14.5
12,2
12,11
12,13
716.76 kW/m²
331.70 kW/m²
249.13 kW/m²
160.15 kW/m²
93.25 kW/m²
0 kW/m²
x,y coordinate on asphalt slab
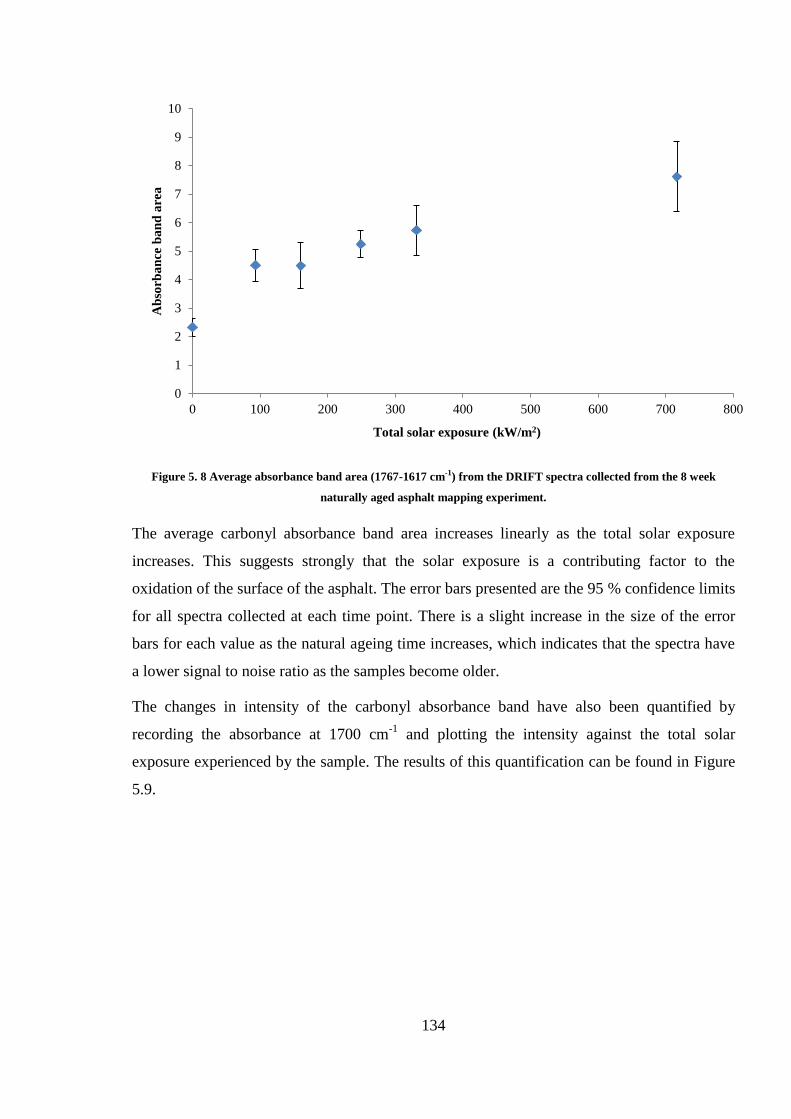
134
Figure 5. 8 Average absorbance band area (1767-1617 cm-1) from the DRIFT spectra collected from the 8 week
naturally aged asphalt mapping experiment.
The average carbonyl absorbance band area increases linearly as the total solar exposure
increases. This suggests strongly that the solar exposure is a contributing factor to the
oxidation of the surface of the asphalt. The error bars presented are the 95 % confidence limits
for all spectra collected at each time point. There is a slight increase in the size of the error
bars for each value as the natural ageing time increases, which indicates that the spectra have
a lower signal to noise ratio as the samples become older.
The changes in intensity of the carbonyl absorbance band have also been quantified by
recording the absorbance at 1700 cm-1
and plotting the intensity against the total solar
exposure experienced by the sample. The results of this quantification can be found in Figure
5.9.
0
1
2
3
4
5
6
7
8
9
10
0 100 200 300 400 500 600 700 800
Ab
sorb
an
ce b
an
d a
rea
Total solar exposure (kW/m2)
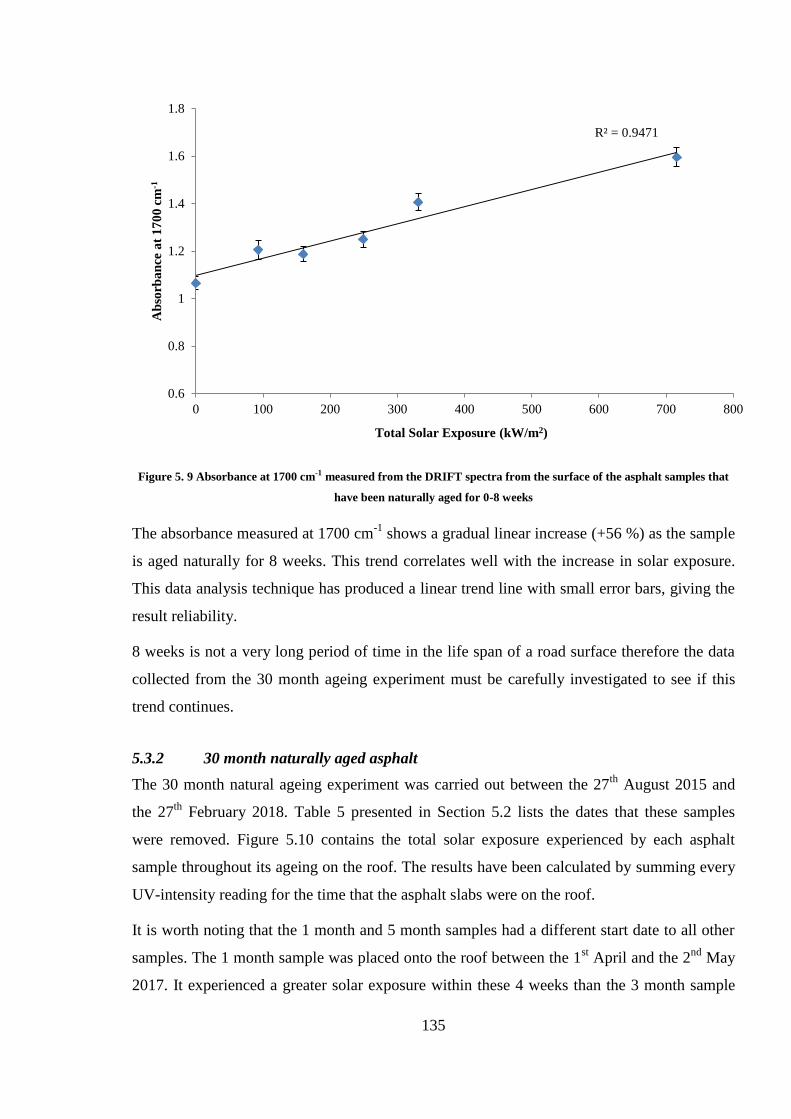
135
Figure 5. 9 Absorbance at 1700 cm-1 measured from the DRIFT spectra from the surface of the asphalt samples that
have been naturally aged for 0-8 weeks
The absorbance measured at 1700 cm-1
shows a gradual linear increase (+56 %) as the sample
is aged naturally for 8 weeks. This trend correlates well with the increase in solar exposure.
This data analysis technique has produced a linear trend line with small error bars, giving the
result reliability.
8 weeks is not a very long period of time in the life span of a road surface therefore the data
collected from the 30 month ageing experiment must be carefully investigated to see if this
trend continues.
5.3.2 30 month naturally aged asphalt
The 30 month natural ageing experiment was carried out between the 27th
August 2015 and
the 27th
February 2018. Table 5 presented in Section 5.2 lists the dates that these samples
were removed. Figure 5.10 contains the total solar exposure experienced by each asphalt
sample throughout its ageing on the roof. The results have been calculated by summing every
UV-intensity reading for the time that the asphalt slabs were on the roof.
It is worth noting that the 1 month and 5 month samples had a different start date to all other
samples. The 1 month sample was placed onto the roof between the 1st April and the 2
nd May
2017. It experienced a greater solar exposure within these 4 weeks than the 3 month sample
R² = 0.9471
0.6
0.8
1
1.2
1.4
1.6
1.8
0 100 200 300 400 500 600 700 800
Ab
sorb
an
ce a
t 1
70
0 c
m-1
Total Solar Exposure (kW/m2)
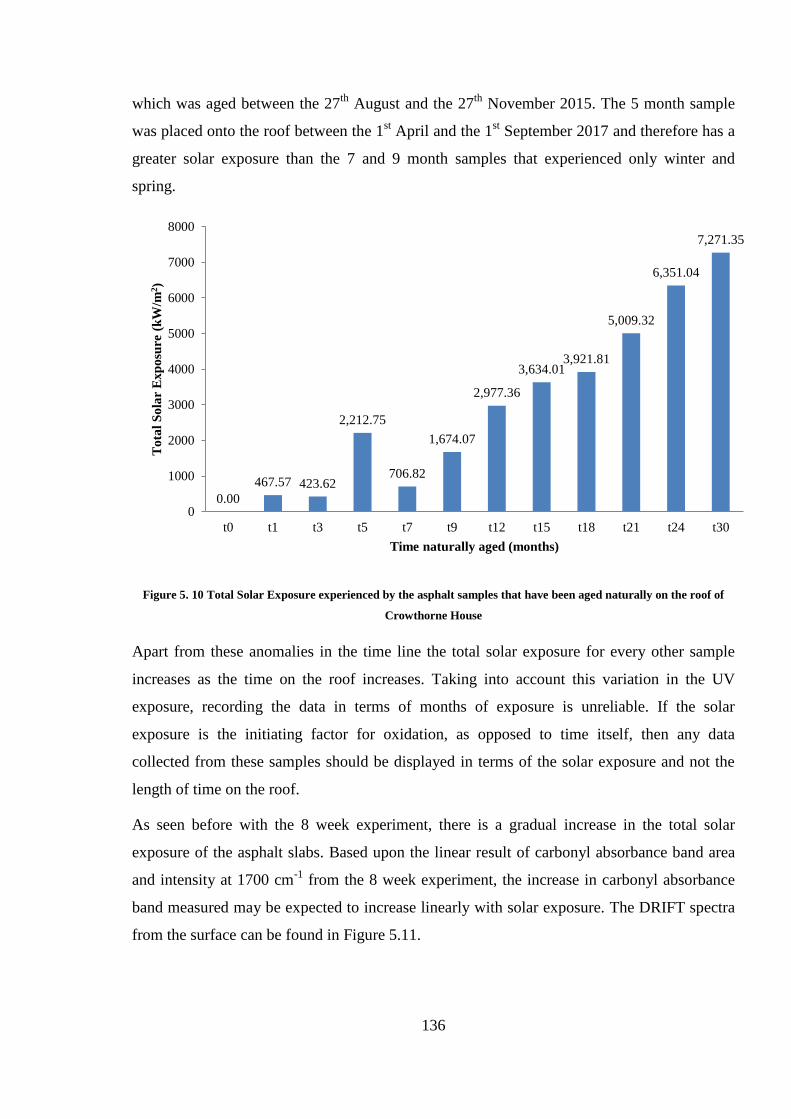
136
which was aged between the 27th
August and the 27th
November 2015. The 5 month sample
was placed onto the roof between the 1st April and the 1
st September 2017 and therefore has a
greater solar exposure than the 7 and 9 month samples that experienced only winter and
spring.
Figure 5. 10 Total Solar Exposure experienced by the asphalt samples that have been aged naturally on the roof of
Crowthorne House
Apart from these anomalies in the time line the total solar exposure for every other sample
increases as the time on the roof increases. Taking into account this variation in the UV
exposure, recording the data in terms of months of exposure is unreliable. If the solar
exposure is the initiating factor for oxidation, as opposed to time itself, then any data
collected from these samples should be displayed in terms of the solar exposure and not the
length of time on the roof.
As seen before with the 8 week experiment, there is a gradual increase in the total solar
exposure of the asphalt slabs. Based upon the linear result of carbonyl absorbance band area
and intensity at 1700 cm-1
from the 8 week experiment, the increase in carbonyl absorbance
band measured may be expected to increase linearly with solar exposure. The DRIFT spectra
from the surface can be found in Figure 5.11.
0.00
467.57 423.62
2,212.75
706.82
1,674.07
2,977.36
3,634.01 3,921.81
5,009.32
6,351.04
7,271.35
0
1000
2000
3000
4000
5000
6000
7000
8000
t0 t1 t3 t5 t7 t9 t12 t15 t18 t21 t24 t30
To
tal
So
lar
Exp
osu
re (
kW
/m2)
Time naturally aged (months)
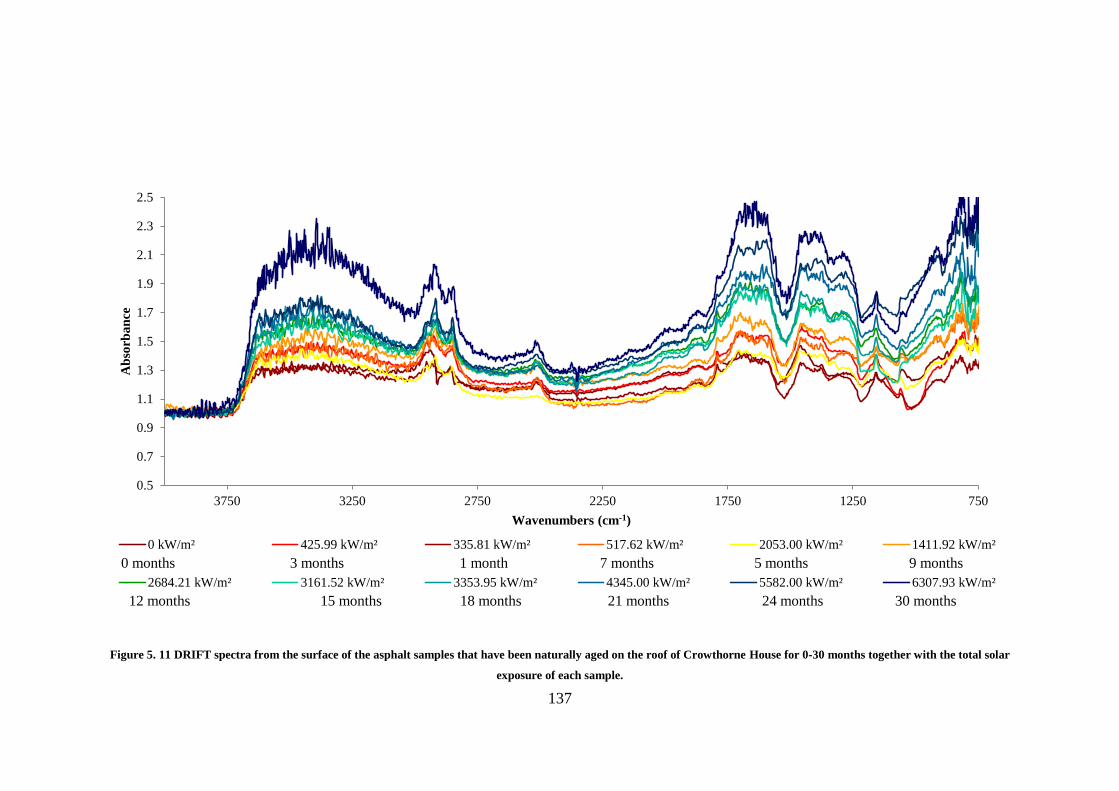
137
Figure 5. 11 DRIFT spectra from the surface of the asphalt samples that have been naturally aged on the roof of Crowthorne House for 0-30 months together with the total solar
exposure of each sample.
0.5
0.7
0.9
1.1
1.3
1.5
1.7
1.9
2.1
2.3
2.5
750125017502250275032503750
Ab
sorb
an
ce
Wavenumbers (cm-1)
0 kW/m² 425.99 kW/m² 335.81 kW/m² 517.62 kW/m² 2053.00 kW/m² 1411.92 kW/m²
2684.21 kW/m² 3161.52 kW/m² 3353.95 kW/m² 4345.00 kW/m² 5582.00 kW/m² 6307.93 kW/m²
0 months 3 months 1 month 7 months 5 months 9 months
12 months 15 months 18 months 21 months 24 months 30 months
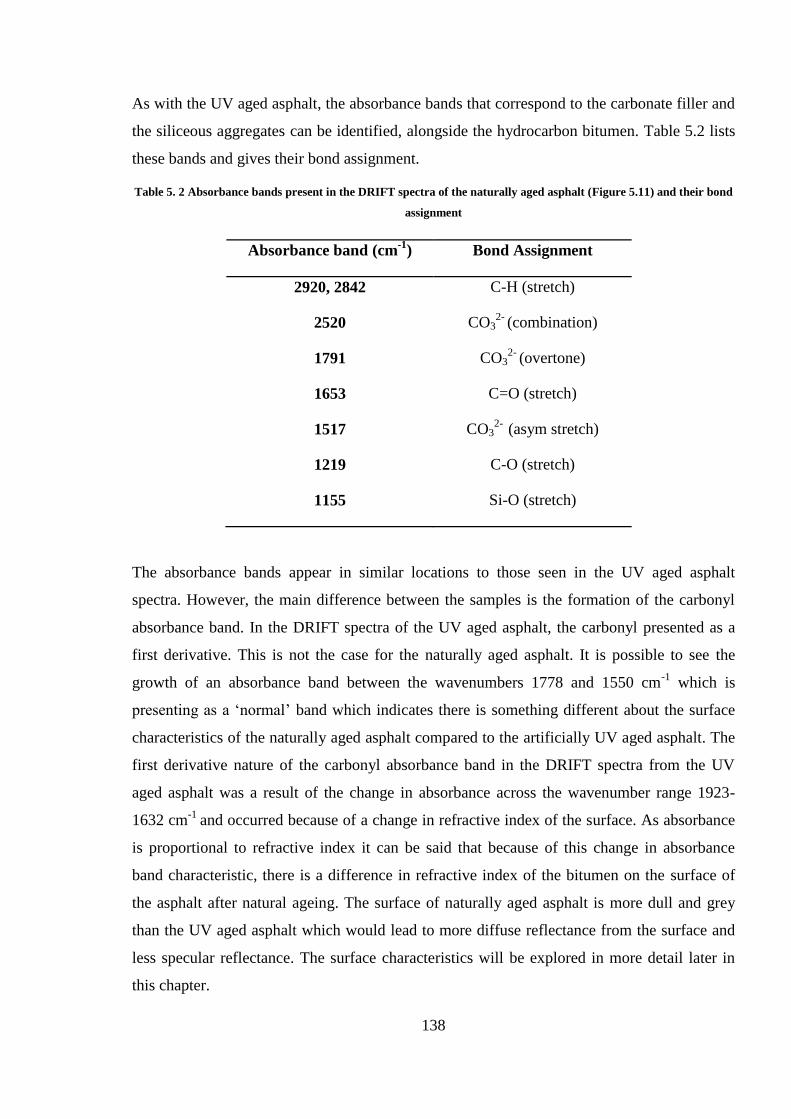
138
As with the UV aged asphalt, the absorbance bands that correspond to the carbonate filler and
the siliceous aggregates can be identified, alongside the hydrocarbon bitumen. Table 5.2 lists
these bands and gives their bond assignment.
Table 5. 2 Absorbance bands present in the DRIFT spectra of the naturally aged asphalt (Figure 5.11) and their bond
assignment
Absorbance band (cm-1
) Bond Assignment
2920, 2842 C-H (stretch)
2520 CO32-
(combination)
1791 CO32-
(overtone)
1653 C=O (stretch)
1517 CO32-
(asym stretch)
1219 C-O (stretch)
1155 Si-O (stretch)
The absorbance bands appear in similar locations to those seen in the UV aged asphalt
spectra. However, the main difference between the samples is the formation of the carbonyl
absorbance band. In the DRIFT spectra of the UV aged asphalt, the carbonyl presented as a
first derivative. This is not the case for the naturally aged asphalt. It is possible to see the
growth of an absorbance band between the wavenumbers 1778 and 1550 cm-1
which is
presenting as a ‘normal’ band which indicates there is something different about the surface
characteristics of the naturally aged asphalt compared to the artificially UV aged asphalt. The
first derivative nature of the carbonyl absorbance band in the DRIFT spectra from the UV
aged asphalt was a result of the change in absorbance across the wavenumber range 1923-
1632 cm-1
and occurred because of a change in refractive index of the surface. As absorbance
is proportional to refractive index it can be said that because of this change in absorbance
band characteristic, there is a difference in refractive index of the bitumen on the surface of
the asphalt after natural ageing. The surface of naturally aged asphalt is more dull and grey
than the UV aged asphalt which would lead to more diffuse reflectance from the surface and
less specular reflectance. The surface characteristics will be explored in more detail later in
this chapter.
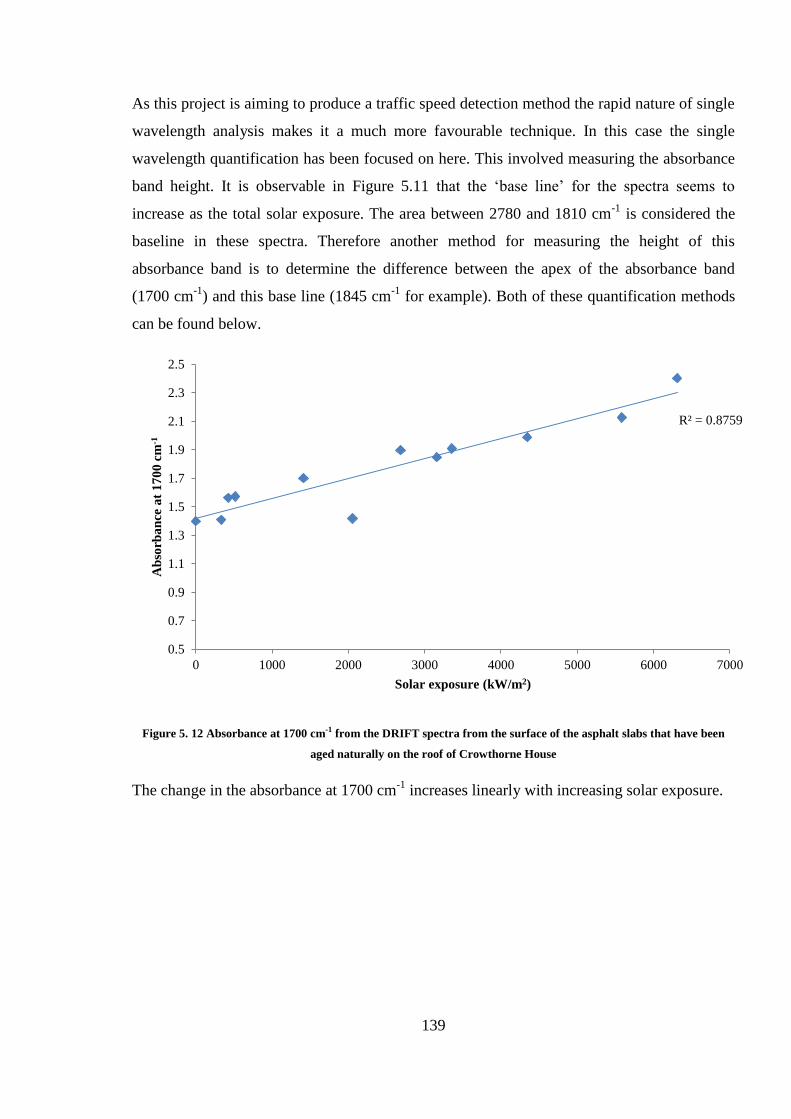
139
As this project is aiming to produce a traffic speed detection method the rapid nature of single
wavelength analysis makes it a much more favourable technique. In this case the single
wavelength quantification has been focused on here. This involved measuring the absorbance
band height. It is observable in Figure 5.11 that the ‘base line’ for the spectra seems to
increase as the total solar exposure. The area between 2780 and 1810 cm-1
is considered the
baseline in these spectra. Therefore another method for measuring the height of this
absorbance band is to determine the difference between the apex of the absorbance band
(1700 cm-1
) and this base line (1845 cm-1
for example). Both of these quantification methods
can be found below.
Figure 5. 12 Absorbance at 1700 cm-1 from the DRIFT spectra from the surface of the asphalt slabs that have been
aged naturally on the roof of Crowthorne House
The change in the absorbance at 1700 cm-1
increases linearly with increasing solar exposure.
R² = 0.8759
0.5
0.7
0.9
1.1
1.3
1.5
1.7
1.9
2.1
2.3
2.5
0 1000 2000 3000 4000 5000 6000 7000
Ab
sorb
an
ce a
t 1
70
0 c
m-1
Solar exposure (kW/m2)
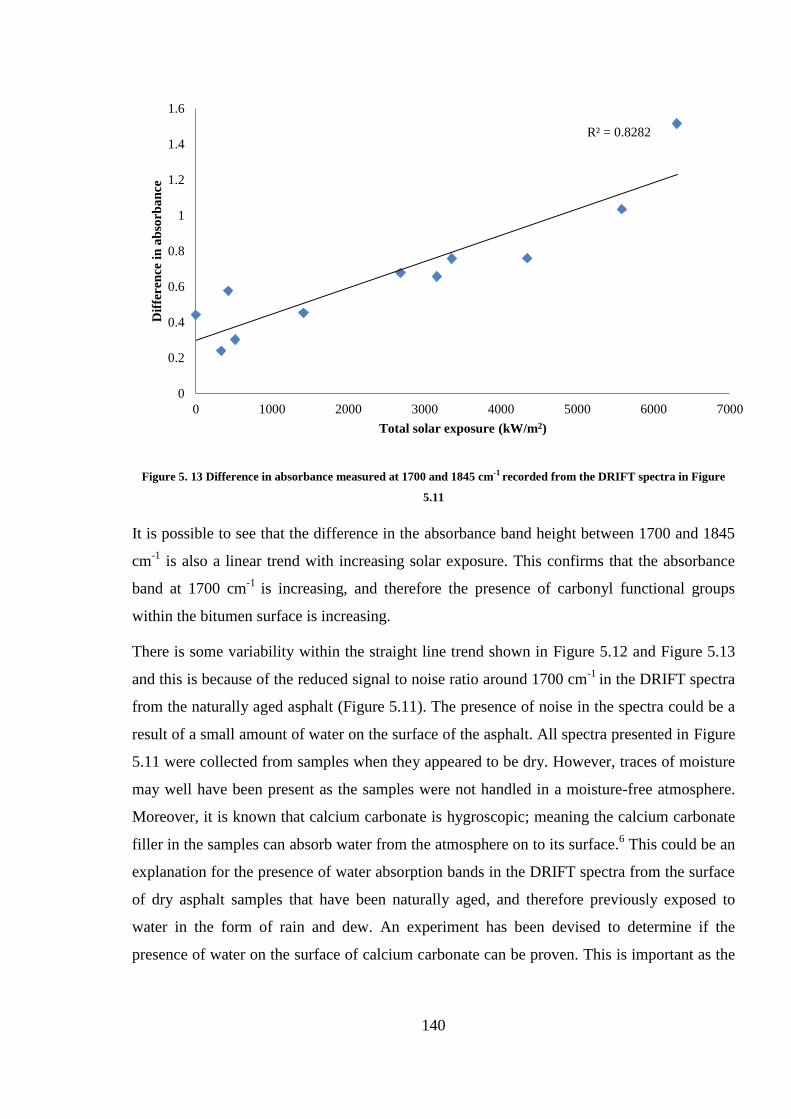
140
Figure 5. 13 Difference in absorbance measured at 1700 and 1845 cm-1 recorded from the DRIFT spectra in Figure
5.11
It is possible to see that the difference in the absorbance band height between 1700 and 1845
cm-1
is also a linear trend with increasing solar exposure. This confirms that the absorbance
band at 1700 cm-1
is increasing, and therefore the presence of carbonyl functional groups
within the bitumen surface is increasing.
There is some variability within the straight line trend shown in Figure 5.12 and Figure 5.13
and this is because of the reduced signal to noise ratio around 1700 cm-1
in the DRIFT spectra
from the naturally aged asphalt (Figure 5.11). The presence of noise in the spectra could be a
result of a small amount of water on the surface of the asphalt. All spectra presented in Figure
5.11 were collected from samples when they appeared to be dry. However, traces of moisture
may well have been present as the samples were not handled in a moisture-free atmosphere.
Moreover, it is known that calcium carbonate is hygroscopic; meaning the calcium carbonate
filler in the samples can absorb water from the atmosphere on to its surface.6 This could be an
explanation for the presence of water absorption bands in the DRIFT spectra from the surface
of dry asphalt samples that have been naturally aged, and therefore previously exposed to
water in the form of rain and dew. An experiment has been devised to determine if the
presence of water on the surface of calcium carbonate can be proven. This is important as the
R² = 0.8282
0
0.2
0.4
0.6
0.8
1
1.2
1.4
1.6
0 1000 2000 3000 4000 5000 6000 7000
Dif
feren
ce i
n a
bso
rba
nce
Total solar exposure (kW/m2)
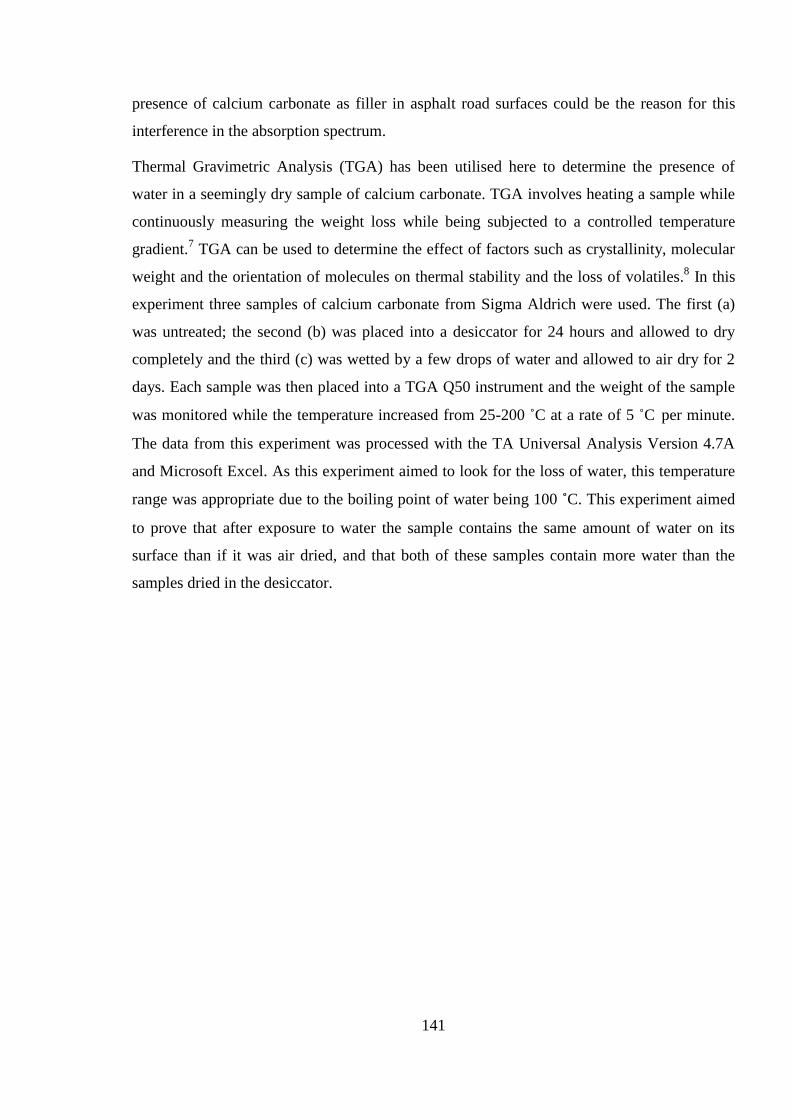
141
presence of calcium carbonate as filler in asphalt road surfaces could be the reason for this
interference in the absorption spectrum.
Thermal Gravimetric Analysis (TGA) has been utilised here to determine the presence of
water in a seemingly dry sample of calcium carbonate. TGA involves heating a sample while
continuously measuring the weight loss while being subjected to a controlled temperature
gradient.7 TGA can be used to determine the effect of factors such as crystallinity, molecular
weight and the orientation of molecules on thermal stability and the loss of volatiles.8 In this
experiment three samples of calcium carbonate from Sigma Aldrich were used. The first (a)
was untreated; the second (b) was placed into a desiccator for 24 hours and allowed to dry
completely and the third (c) was wetted by a few drops of water and allowed to air dry for 2
days. Each sample was then placed into a TGA Q50 instrument and the weight of the sample
was monitored while the temperature increased from 25-200 ˚C at a rate of 5 ˚C per minute.
The data from this experiment was processed with the TA Universal Analysis Version 4.7A
and Microsoft Excel. As this experiment aimed to look for the loss of water, this temperature
range was appropriate due to the boiling point of water being 100 ˚C. This experiment aimed
to prove that after exposure to water the sample contains the same amount of water on its
surface than if it was air dried, and that both of these samples contain more water than the
samples dried in the desiccator.
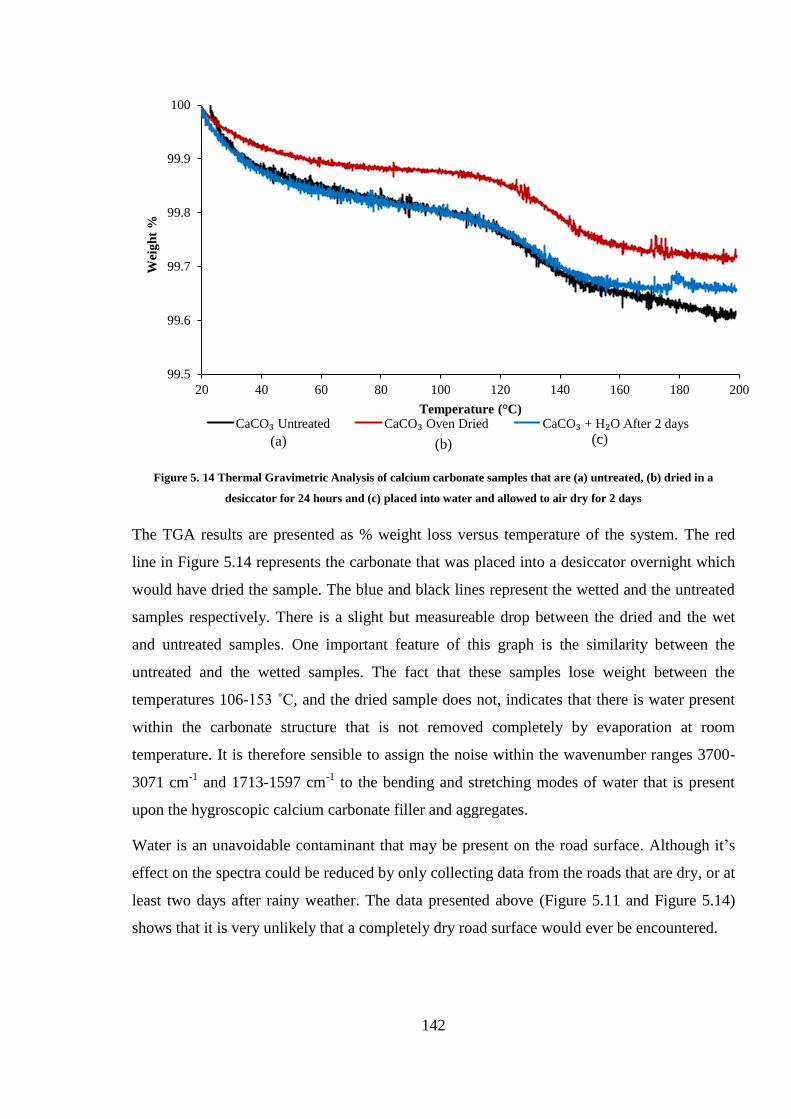
142
Figure 5. 14 Thermal Gravimetric Analysis of calcium carbonate samples that are (a) untreated, (b) dried in a
desiccator for 24 hours and (c) placed into water and allowed to air dry for 2 days
The TGA results are presented as % weight loss versus temperature of the system. The red
line in Figure 5.14 represents the carbonate that was placed into a desiccator overnight which
would have dried the sample. The blue and black lines represent the wetted and the untreated
samples respectively. There is a slight but measureable drop between the dried and the wet
and untreated samples. One important feature of this graph is the similarity between the
untreated and the wetted samples. The fact that these samples lose weight between the
temperatures 106-153 ˚C, and the dried sample does not, indicates that there is water present
within the carbonate structure that is not removed completely by evaporation at room
temperature. It is therefore sensible to assign the noise within the wavenumber ranges 3700-
3071 cm-1
and 1713-1597 cm-1
to the bending and stretching modes of water that is present
upon the hygroscopic calcium carbonate filler and aggregates.
Water is an unavoidable contaminant that may be present on the road surface. Although it’s
effect on the spectra could be reduced by only collecting data from the roads that are dry, or at
least two days after rainy weather. The data presented above (Figure 5.11 and Figure 5.14)
shows that it is very unlikely that a completely dry road surface would ever be encountered.
99.5
99.6
99.7
99.8
99.9
100
20 40 60 80 100 120 140 160 180 200
Wei
gh
t %
Temperature (°C) CaCO₃ Untreated CaCO₃ Oven Dried CaCO₃ + H₂O After 2 days
(a) (b) (c)
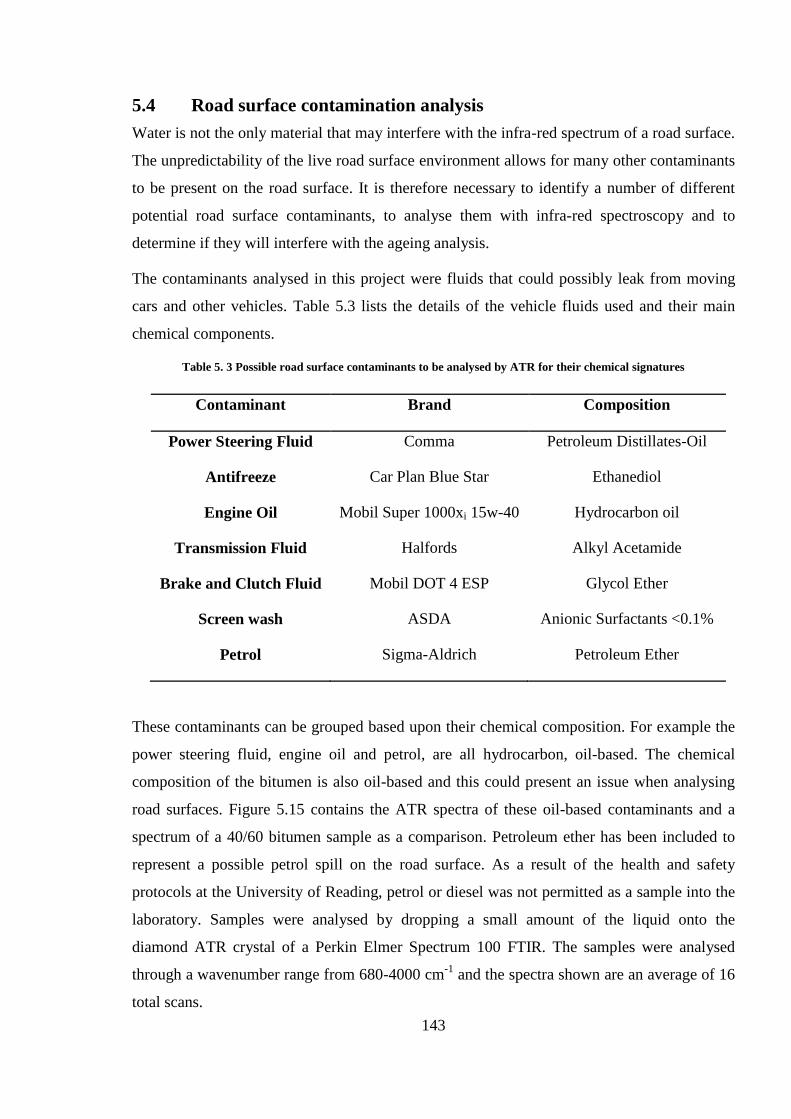
143
5.4 Road surface contamination analysis
Water is not the only material that may interfere with the infra-red spectrum of a road surface.
The unpredictability of the live road surface environment allows for many other contaminants
to be present on the road surface. It is therefore necessary to identify a number of different
potential road surface contaminants, to analyse them with infra-red spectroscopy and to
determine if they will interfere with the ageing analysis.
The contaminants analysed in this project were fluids that could possibly leak from moving
cars and other vehicles. Table 5.3 lists the details of the vehicle fluids used and their main
chemical components.
Table 5. 3 Possible road surface contaminants to be analysed by ATR for their chemical signatures
Contaminant Brand Composition
Power Steering Fluid Comma Petroleum Distillates-Oil
Antifreeze Car Plan Blue Star Ethanediol
Engine Oil Mobil Super 1000xi 15w-40 Hydrocarbon oil
Transmission Fluid Halfords Alkyl Acetamide
Brake and Clutch Fluid Mobil DOT 4 ESP Glycol Ether
Screen wash ASDA Anionic Surfactants <0.1%
Petrol Sigma-Aldrich Petroleum Ether
These contaminants can be grouped based upon their chemical composition. For example the
power steering fluid, engine oil and petrol, are all hydrocarbon, oil-based. The chemical
composition of the bitumen is also oil-based and this could present an issue when analysing
road surfaces. Figure 5.15 contains the ATR spectra of these oil-based contaminants and a
spectrum of a 40/60 bitumen sample as a comparison. Petroleum ether has been included to
represent a possible petrol spill on the road surface. As a result of the health and safety
protocols at the University of Reading, petrol or diesel was not permitted as a sample into the
laboratory. Samples were analysed by dropping a small amount of the liquid onto the
diamond ATR crystal of a Perkin Elmer Spectrum 100 FTIR. The samples were analysed
through a wavenumber range from 680-4000 cm-1
and the spectra shown are an average of 16
total scans.
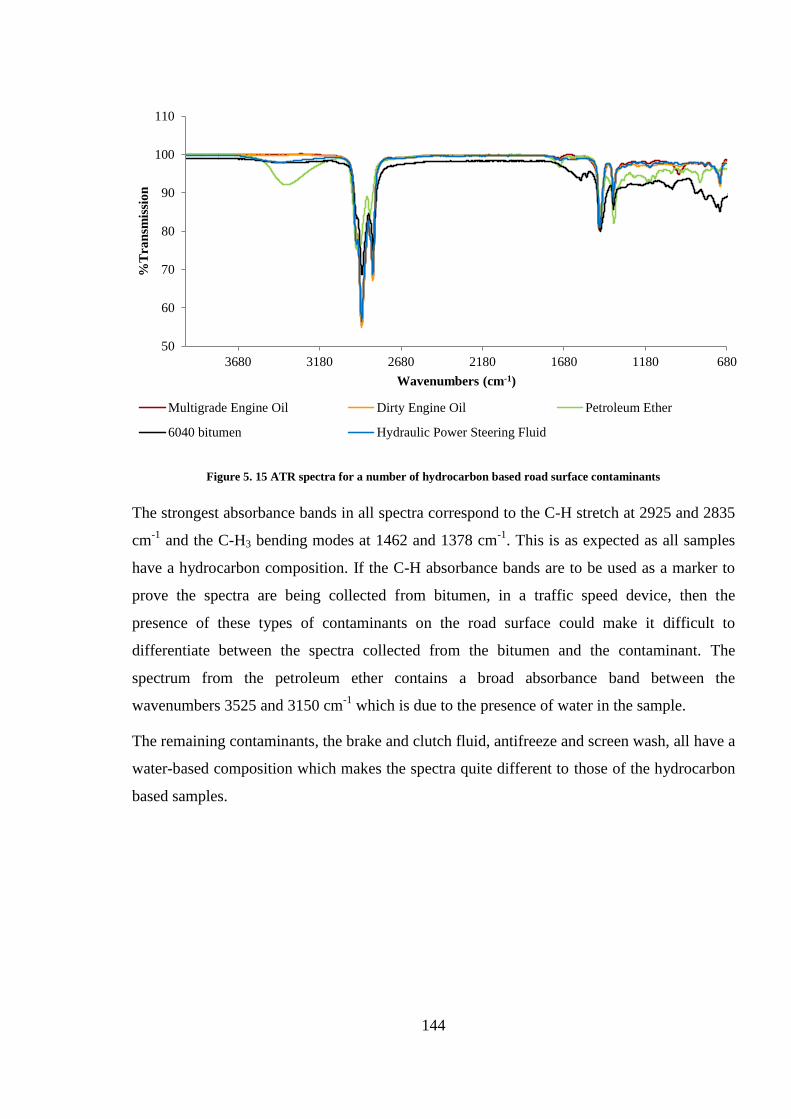
144
Figure 5. 15 ATR spectra for a number of hydrocarbon based road surface contaminants
The strongest absorbance bands in all spectra correspond to the C-H stretch at 2925 and 2835
cm-1
and the C-H3 bending modes at 1462 and 1378 cm-1
. This is as expected as all samples
have a hydrocarbon composition. If the C-H absorbance bands are to be used as a marker to
prove the spectra are being collected from bitumen, in a traffic speed device, then the
presence of these types of contaminants on the road surface could make it difficult to
differentiate between the spectra collected from the bitumen and the contaminant. The
spectrum from the petroleum ether contains a broad absorbance band between the
wavenumbers 3525 and 3150 cm-1
which is due to the presence of water in the sample.
The remaining contaminants, the brake and clutch fluid, antifreeze and screen wash, all have a
water-based composition which makes the spectra quite different to those of the hydrocarbon
based samples.
50
60
70
80
90
100
110
680118016802180268031803680
%T
ran
smis
sio
n
Wavenumbers (cm-1)
Multigrade Engine Oil Dirty Engine Oil Petroleum Ether
6040 bitumen Hydraulic Power Steering Fluid
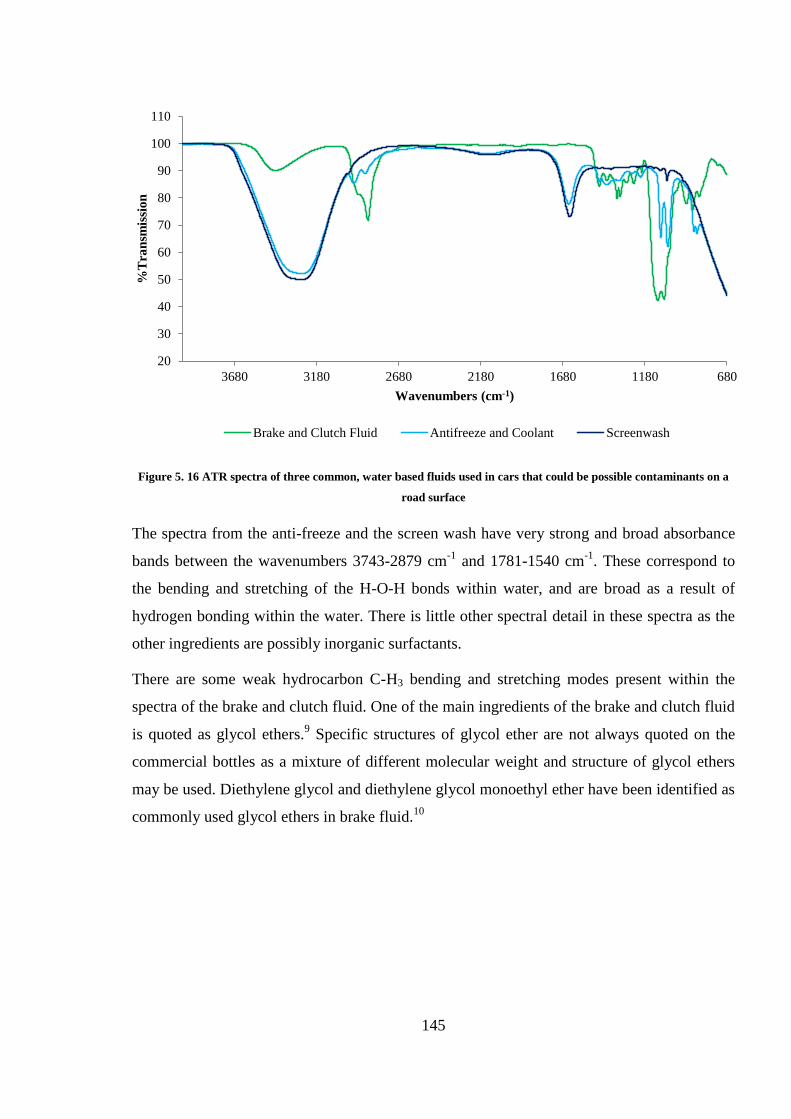
145
Figure 5. 16 ATR spectra of three common, water based fluids used in cars that could be possible contaminants on a
road surface
The spectra from the anti-freeze and the screen wash have very strong and broad absorbance
bands between the wavenumbers 3743-2879 cm-1
and 1781-1540 cm-1
. These correspond to
the bending and stretching of the H-O-H bonds within water, and are broad as a result of
hydrogen bonding within the water. There is little other spectral detail in these spectra as the
other ingredients are possibly inorganic surfactants.
There are some weak hydrocarbon C-H3 bending and stretching modes present within the
spectra of the brake and clutch fluid. One of the main ingredients of the brake and clutch fluid
is quoted as glycol ethers.9 Specific structures of glycol ether are not always quoted on the
commercial bottles as a mixture of different molecular weight and structure of glycol ethers
may be used. Diethylene glycol and diethylene glycol monoethyl ether have been identified as
commonly used glycol ethers in brake fluid.10
20
30
40
50
60
70
80
90
100
110
680118016802180268031803680
%T
ran
smis
sio
n
Wavenumbers (cm-1)
Brake and Clutch Fluid Antifreeze and Coolant Screenwash
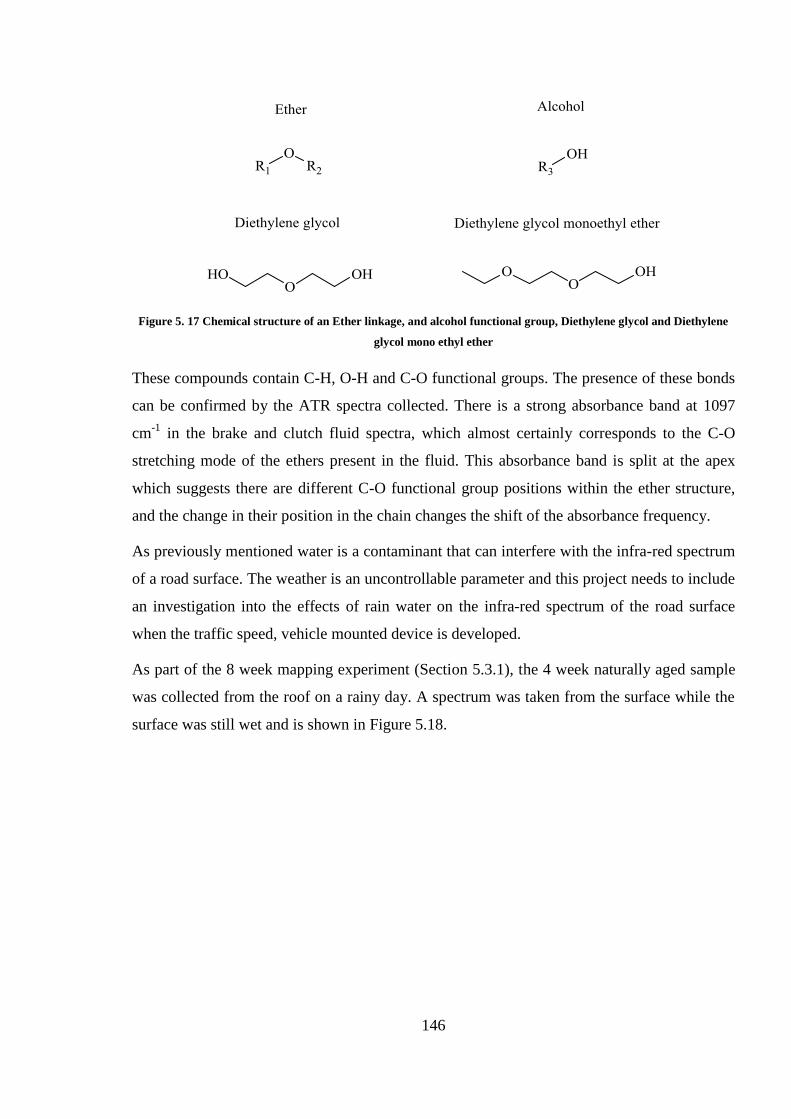
146
Figure 5. 17 Chemical structure of an Ether linkage, and alcohol functional group, Diethylene glycol and Diethylene
glycol mono ethyl ether
These compounds contain C-H, O-H and C-O functional groups. The presence of these bonds
can be confirmed by the ATR spectra collected. There is a strong absorbance band at 1097
cm-1
in the brake and clutch fluid spectra, which almost certainly corresponds to the C-O
stretching mode of the ethers present in the fluid. This absorbance band is split at the apex
which suggests there are different C-O functional group positions within the ether structure,
and the change in their position in the chain changes the shift of the absorbance frequency.
As previously mentioned water is a contaminant that can interfere with the infra-red spectrum
of a road surface. The weather is an uncontrollable parameter and this project needs to include
an investigation into the effects of rain water on the infra-red spectrum of the road surface
when the traffic speed, vehicle mounted device is developed.
As part of the 8 week mapping experiment (Section 5.3.1), the 4 week naturally aged sample
was collected from the roof on a rainy day. A spectrum was taken from the surface while the
surface was still wet and is shown in Figure 5.18.
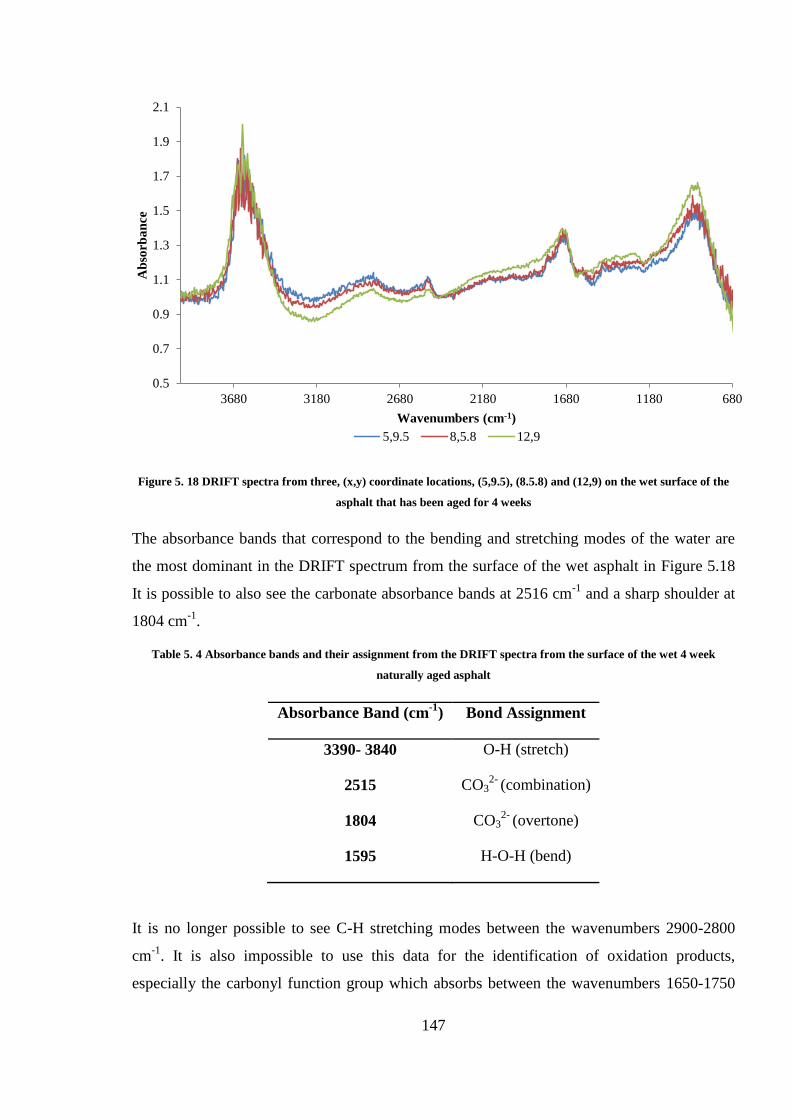
147
Figure 5. 18 DRIFT spectra from three, (x,y) coordinate locations, (5,9.5), (8.5.8) and (12,9) on the wet surface of the
asphalt that has been aged for 4 weeks
The absorbance bands that correspond to the bending and stretching modes of the water are
the most dominant in the DRIFT spectrum from the surface of the wet asphalt in Figure 5.18
It is possible to also see the carbonate absorbance bands at 2516 cm-1
and a sharp shoulder at
1804 cm-1
.
Table 5. 4 Absorbance bands and their assignment from the DRIFT spectra from the surface of the wet 4 week
naturally aged asphalt
Absorbance Band (cm-1
) Bond Assignment
3390- 3840 O-H (stretch)
2515 CO32-
(combination)
1804 CO32-
(overtone)
1595 H-O-H (bend)
It is no longer possible to see C-H stretching modes between the wavenumbers 2900-2800
cm-1
. It is also impossible to use this data for the identification of oxidation products,
especially the carbonyl function group which absorbs between the wavenumbers 1650-1750
0.5
0.7
0.9
1.1
1.3
1.5
1.7
1.9
2.1
680118016802180268031803680
Ab
sorb
an
ce
Wavenumbers (cm-1)
5,9.5 8,5.8 12,9
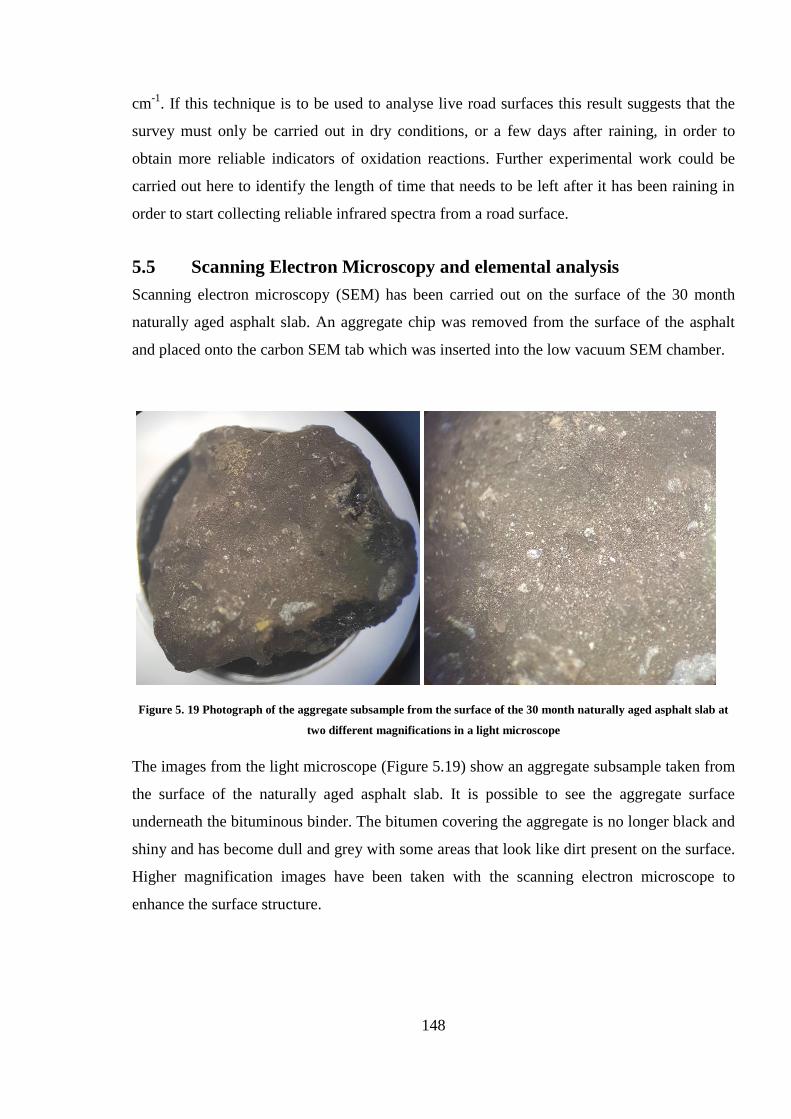
148
cm-1
. If this technique is to be used to analyse live road surfaces this result suggests that the
survey must only be carried out in dry conditions, or a few days after raining, in order to
obtain more reliable indicators of oxidation reactions. Further experimental work could be
carried out here to identify the length of time that needs to be left after it has been raining in
order to start collecting reliable infrared spectra from a road surface.
5.5 Scanning Electron Microscopy and elemental analysis
Scanning electron microscopy (SEM) has been carried out on the surface of the 30 month
naturally aged asphalt slab. An aggregate chip was removed from the surface of the asphalt
and placed onto the carbon SEM tab which was inserted into the low vacuum SEM chamber.
Figure 5. 19 Photograph of the aggregate subsample from the surface of the 30 month naturally aged asphalt slab at
two different magnifications in a light microscope
The images from the light microscope (Figure 5.19) show an aggregate subsample taken from
the surface of the naturally aged asphalt slab. It is possible to see the aggregate surface
underneath the bituminous binder. The bitumen covering the aggregate is no longer black and
shiny and has become dull and grey with some areas that look like dirt present on the surface.
Higher magnification images have been taken with the scanning electron microscope to
enhance the surface structure.
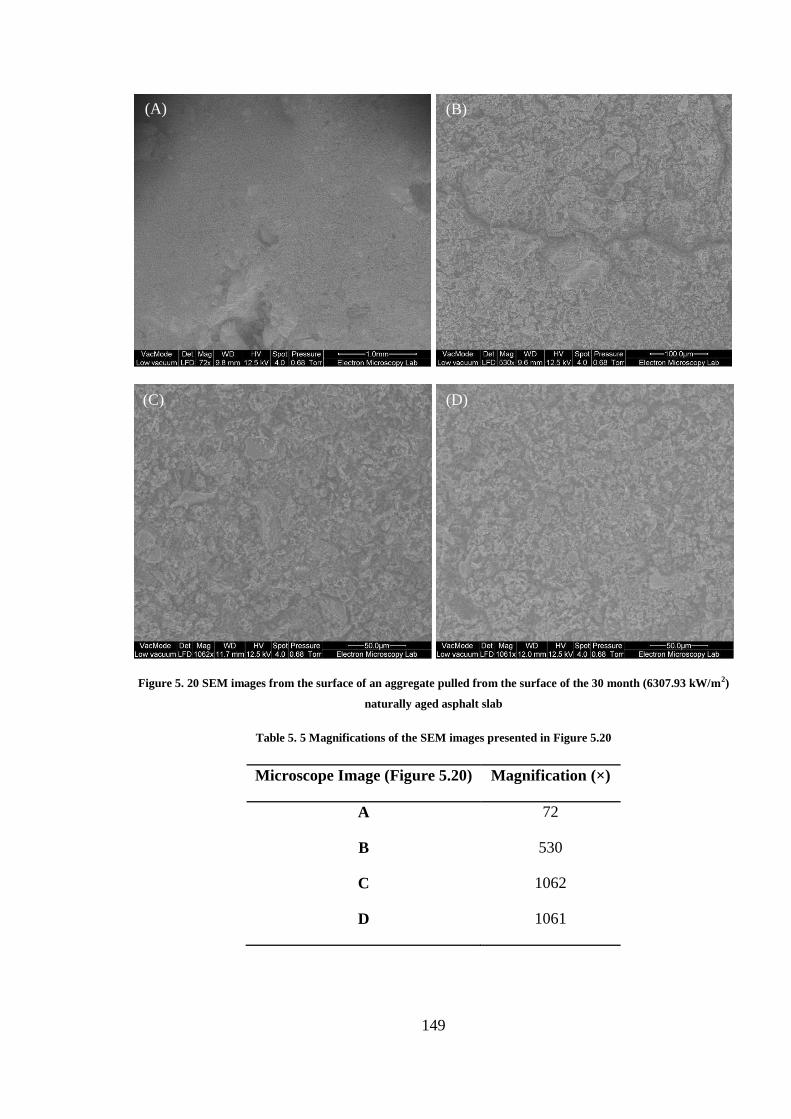
149
Figure 5. 20 SEM images from the surface of an aggregate pulled from the surface of the 30 month (6307.93 kW/m2)
naturally aged asphalt slab
Table 5. 5 Magnifications of the SEM images presented in Figure 5.20
Microscope Image (Figure 5.20) Magnification (×)
A 72
B 530
C 1062
D 1061
(A) (B)
(C) (D)
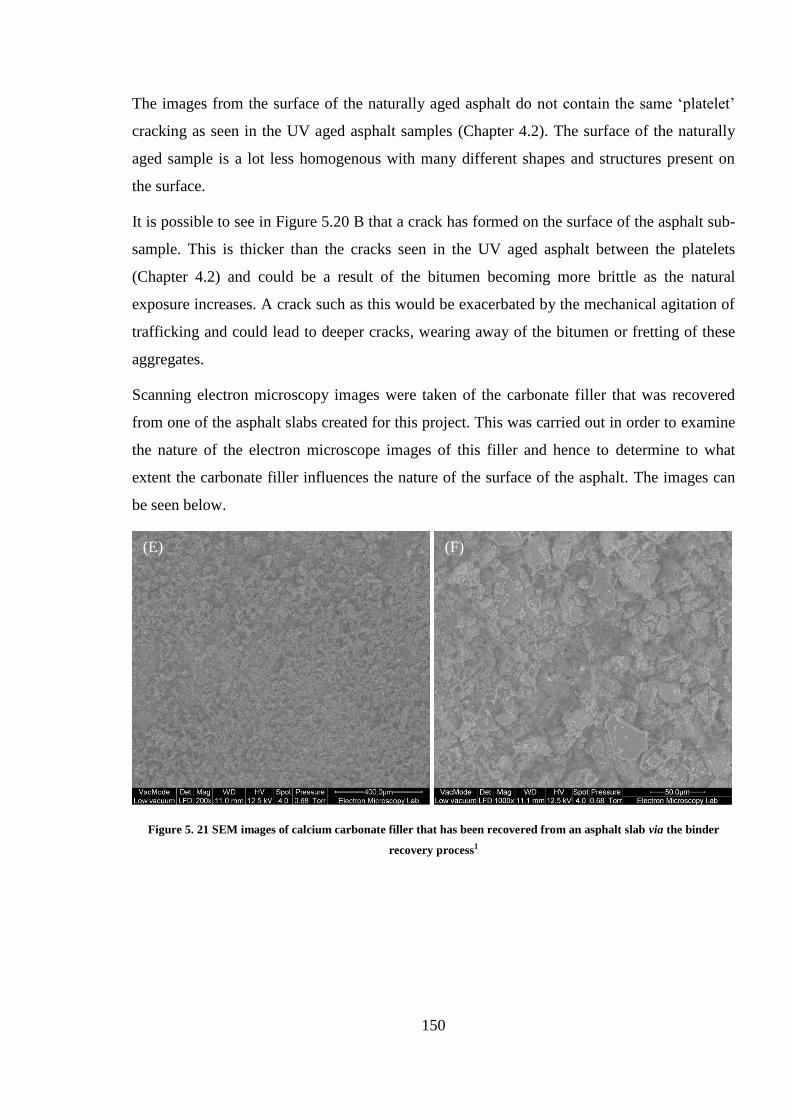
150
The images from the surface of the naturally aged asphalt do not contain the same ‘platelet’
cracking as seen in the UV aged asphalt samples (Chapter 4.2). The surface of the naturally
aged sample is a lot less homogenous with many different shapes and structures present on
the surface.
It is possible to see in Figure 5.20 B that a crack has formed on the surface of the asphalt sub-
sample. This is thicker than the cracks seen in the UV aged asphalt between the platelets
(Chapter 4.2) and could be a result of the bitumen becoming more brittle as the natural
exposure increases. A crack such as this would be exacerbated by the mechanical agitation of
trafficking and could lead to deeper cracks, wearing away of the bitumen or fretting of these
aggregates.
Scanning electron microscopy images were taken of the carbonate filler that was recovered
from one of the asphalt slabs created for this project. This was carried out in order to examine
the nature of the electron microscope images of this filler and hence to determine to what
extent the carbonate filler influences the nature of the surface of the asphalt. The images can
be seen below.
Figure 5. 21 SEM images of calcium carbonate filler that has been recovered from an asphalt slab via the binder
recovery process1
(E) (F)
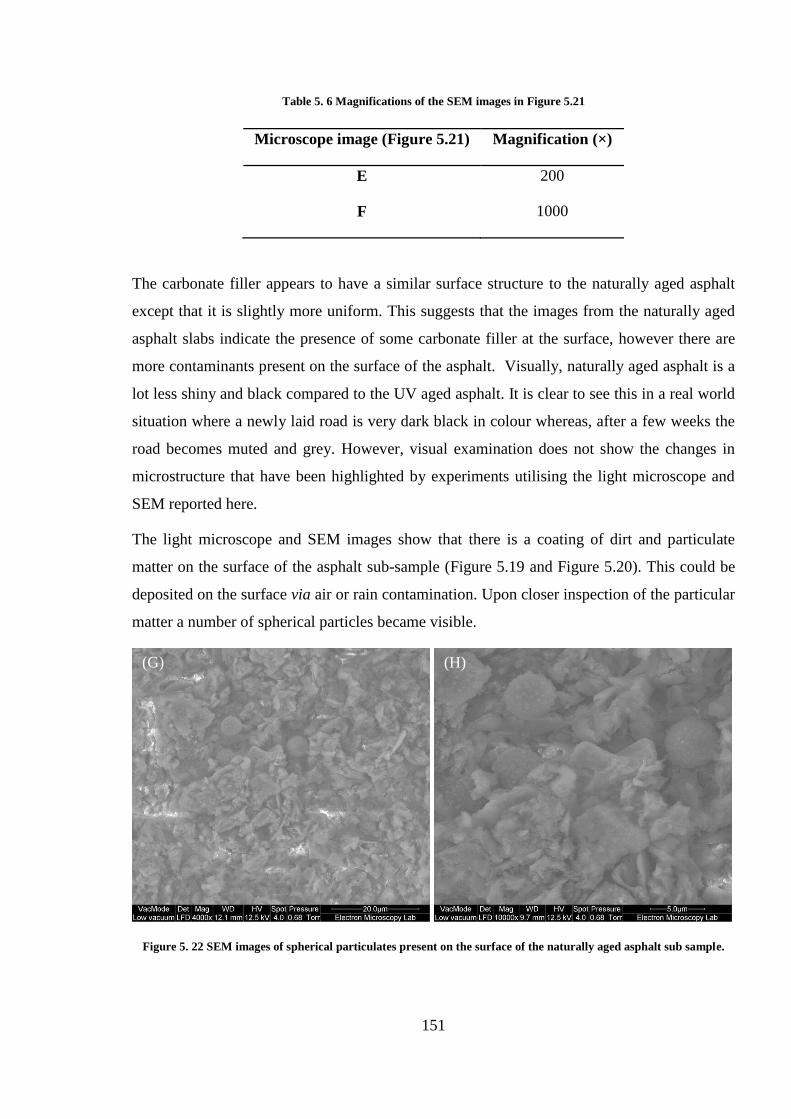
151
Table 5. 6 Magnifications of the SEM images in Figure 5.21
Microscope image (Figure 5.21) Magnification (×)
E 200
F 1000
The carbonate filler appears to have a similar surface structure to the naturally aged asphalt
except that it is slightly more uniform. This suggests that the images from the naturally aged
asphalt slabs indicate the presence of some carbonate filler at the surface, however there are
more contaminants present on the surface of the asphalt. Visually, naturally aged asphalt is a
lot less shiny and black compared to the UV aged asphalt. It is clear to see this in a real world
situation where a newly laid road is very dark black in colour whereas, after a few weeks the
road becomes muted and grey. However, visual examination does not show the changes in
microstructure that have been highlighted by experiments utilising the light microscope and
SEM reported here.
The light microscope and SEM images show that there is a coating of dirt and particulate
matter on the surface of the asphalt sub-sample (Figure 5.19 and Figure 5.20). This could be
deposited on the surface via air or rain contamination. Upon closer inspection of the particular
matter a number of spherical particles became visible.
Figure 5. 22 SEM images of spherical particulates present on the surface of the naturally aged asphalt sub sample.
(G) (H)
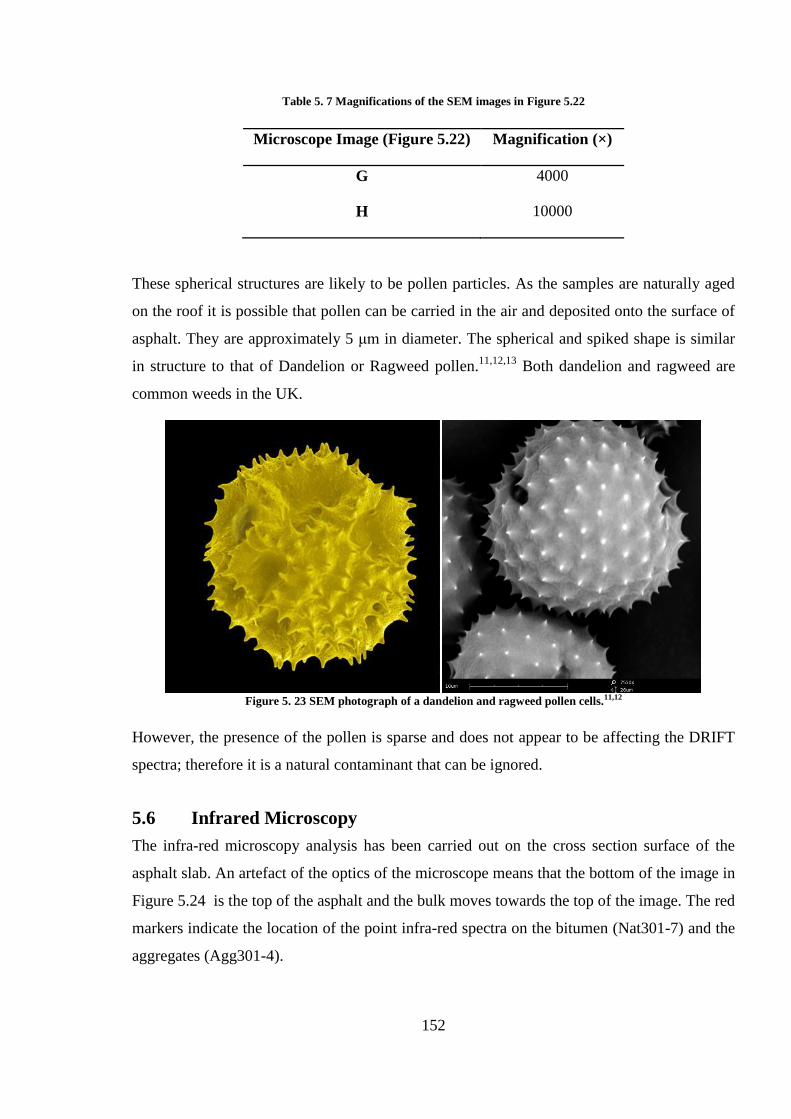
152
Table 5. 7 Magnifications of the SEM images in Figure 5.22
Microscope Image (Figure 5.22) Magnification (×)
G 4000
H 10000
These spherical structures are likely to be pollen particles. As the samples are naturally aged
on the roof it is possible that pollen can be carried in the air and deposited onto the surface of
asphalt. They are approximately 5 μm in diameter. The spherical and spiked shape is similar
in structure to that of Dandelion or Ragweed pollen.11,12,13
Both dandelion and ragweed are
common weeds in the UK.
Figure 5. 23 SEM photograph of a dandelion and ragweed pollen cells.11,12
However, the presence of the pollen is sparse and does not appear to be affecting the DRIFT
spectra; therefore it is a natural contaminant that can be ignored.
5.6 Infrared Microscopy
The infra-red microscopy analysis has been carried out on the cross section surface of the
asphalt slab. An artefact of the optics of the microscope means that the bottom of the image in
Figure 5.24 is the top of the asphalt and the bulk moves towards the top of the image. The red
markers indicate the location of the point infra-red spectra on the bitumen (Nat301-7) and the
aggregates (Agg301-4).
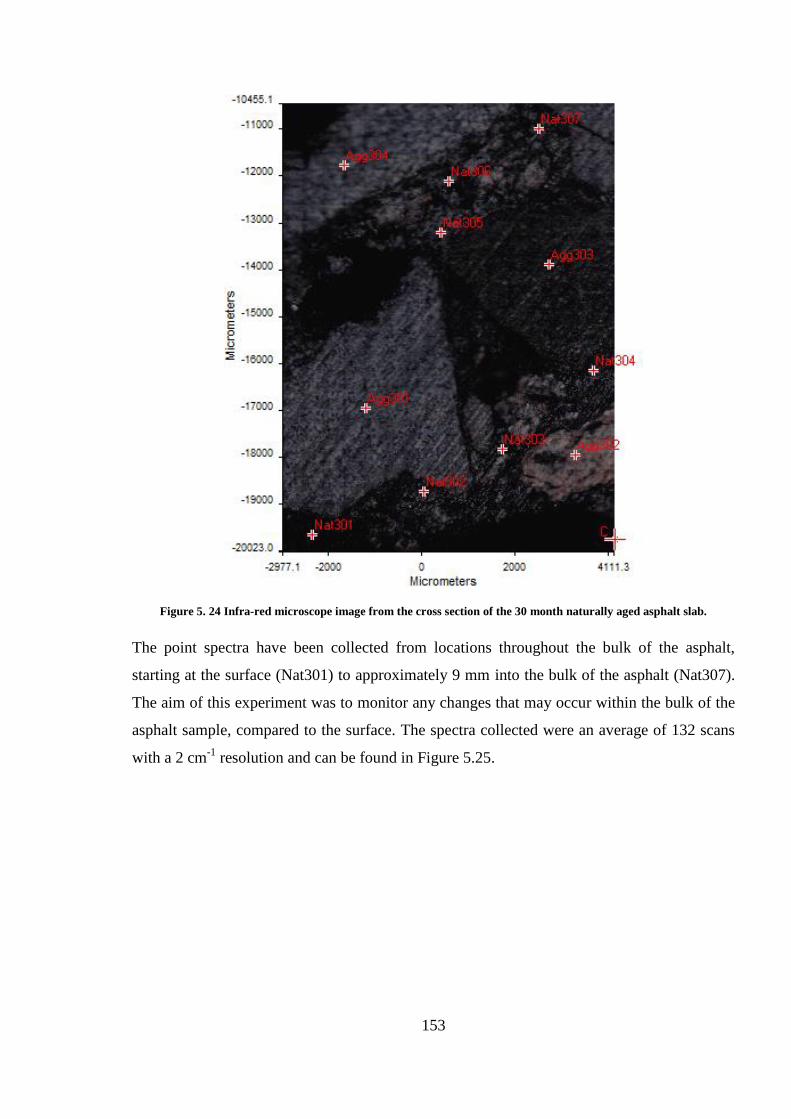
153
Figure 5. 24 Infra-red microscope image from the cross section of the 30 month naturally aged asphalt slab.
The point spectra have been collected from locations throughout the bulk of the asphalt,
starting at the surface (Nat301) to approximately 9 mm into the bulk of the asphalt (Nat307).
The aim of this experiment was to monitor any changes that may occur within the bulk of the
asphalt sample, compared to the surface. The spectra collected were an average of 132 scans
with a 2 cm-1
resolution and can be found in Figure 5.25.
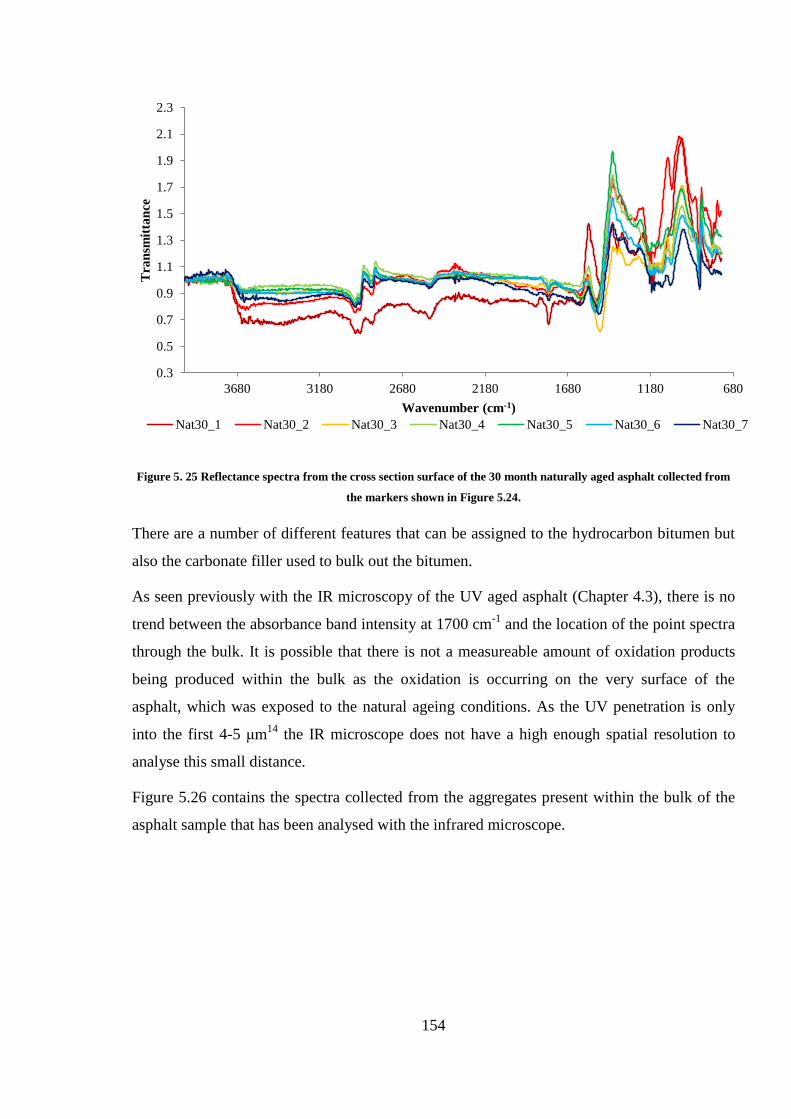
154
Figure 5. 25 Reflectance spectra from the cross section surface of the 30 month naturally aged asphalt collected from
the markers shown in Figure 5.24.
There are a number of different features that can be assigned to the hydrocarbon bitumen but
also the carbonate filler used to bulk out the bitumen.
As seen previously with the IR microscopy of the UV aged asphalt (Chapter 4.3), there is no
trend between the absorbance band intensity at 1700 cm-1
and the location of the point spectra
through the bulk. It is possible that there is not a measureable amount of oxidation products
being produced within the bulk as the oxidation is occurring on the very surface of the
asphalt, which was exposed to the natural ageing conditions. As the UV penetration is only
into the first 4-5 μm14
the IR microscope does not have a high enough spatial resolution to
analyse this small distance.
Figure 5.26 contains the spectra collected from the aggregates present within the bulk of the
asphalt sample that has been analysed with the infrared microscope.
0.3
0.5
0.7
0.9
1.1
1.3
1.5
1.7
1.9
2.1
2.3
680118016802180268031803680
Tra
nsm
itta
nce
Wavenumber (cm-1)
Nat30_1 Nat30_2 Nat30_3 Nat30_4 Nat30_5 Nat30_6 Nat30_7
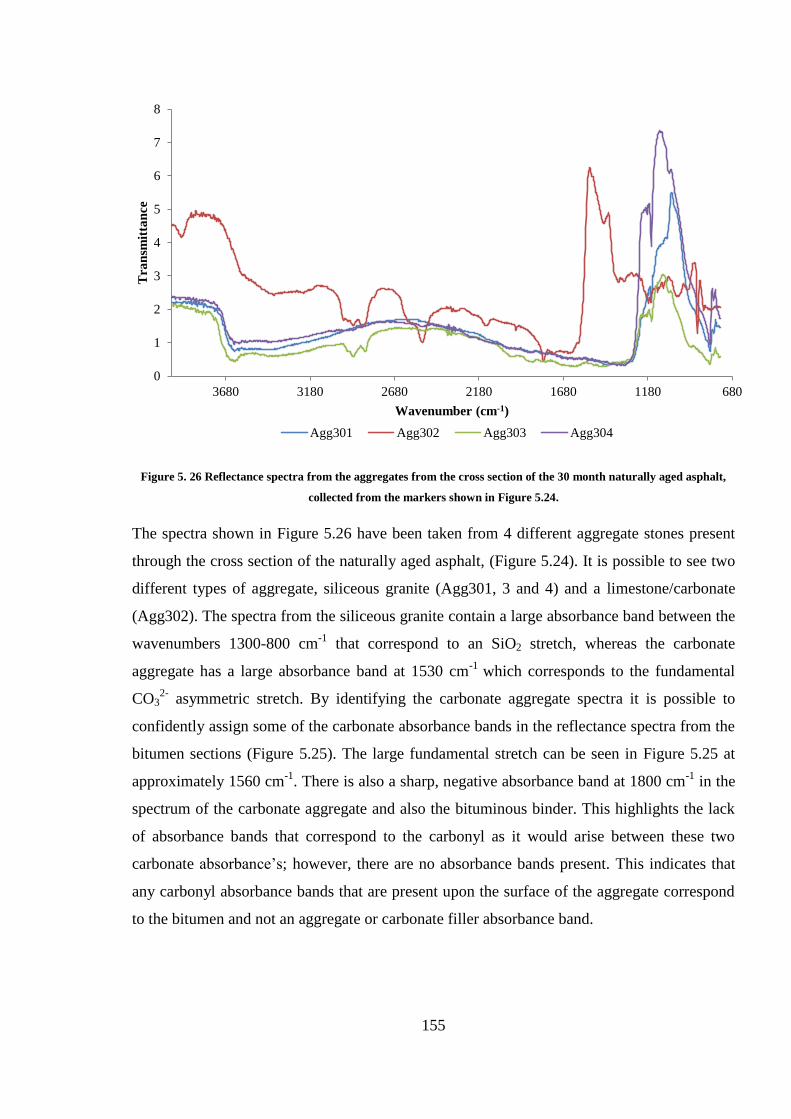
155
Figure 5. 26 Reflectance spectra from the aggregates from the cross section of the 30 month naturally aged asphalt,
collected from the markers shown in Figure 5.24.
The spectra shown in Figure 5.26 have been taken from 4 different aggregate stones present
through the cross section of the naturally aged asphalt, (Figure 5.24). It is possible to see two
different types of aggregate, siliceous granite (Agg301, 3 and 4) and a limestone/carbonate
(Agg302). The spectra from the siliceous granite contain a large absorbance band between the
wavenumbers 1300-800 cm-1
that correspond to an SiO2 stretch, whereas the carbonate
aggregate has a large absorbance band at 1530 cm-1
which corresponds to the fundamental
CO32-
asymmetric stretch. By identifying the carbonate aggregate spectra it is possible to
confidently assign some of the carbonate absorbance bands in the reflectance spectra from the
bitumen sections (Figure 5.25). The large fundamental stretch can be seen in Figure 5.25 at
approximately 1560 cm-1
. There is also a sharp, negative absorbance band at 1800 cm-1
in the
spectrum of the carbonate aggregate and also the bituminous binder. This highlights the lack
of absorbance bands that correspond to the carbonyl as it would arise between these two
carbonate absorbance’s; however, there are no absorbance bands present. This indicates that
any carbonyl absorbance bands that are present upon the surface of the aggregate correspond
to the bitumen and not an aggregate or carbonate filler absorbance band.
0
1
2
3
4
5
6
7
8
680118016802180268031803680
Tra
nsm
itta
nce
Wavenumber (cm-1)
Agg301 Agg302 Agg303 Agg304
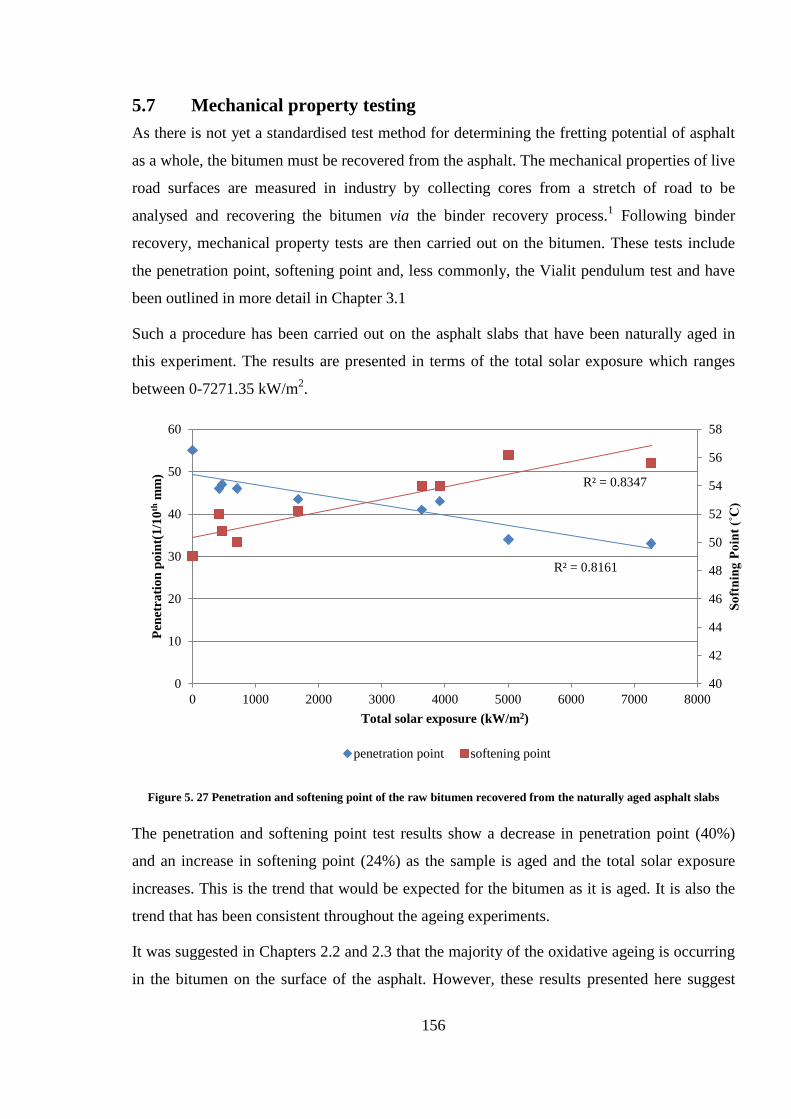
156
5.7 Mechanical property testing
As there is not yet a standardised test method for determining the fretting potential of asphalt
as a whole, the bitumen must be recovered from the asphalt. The mechanical properties of live
road surfaces are measured in industry by collecting cores from a stretch of road to be
analysed and recovering the bitumen via the binder recovery process.1 Following binder
recovery, mechanical property tests are then carried out on the bitumen. These tests include
the penetration point, softening point and, less commonly, the Vialit pendulum test and have
been outlined in more detail in Chapter 3.1
Such a procedure has been carried out on the asphalt slabs that have been naturally aged in
this experiment. The results are presented in terms of the total solar exposure which ranges
between 0-7271.35 kW/m2.
Figure 5. 27 Penetration and softening point of the raw bitumen recovered from the naturally aged asphalt slabs
The penetration and softening point test results show a decrease in penetration point (40%)
and an increase in softening point (24%) as the sample is aged and the total solar exposure
increases. This is the trend that would be expected for the bitumen as it is aged. It is also the
trend that has been consistent throughout the ageing experiments.
It was suggested in Chapters 2.2 and 2.3 that the majority of the oxidative ageing is occurring
in the bitumen on the surface of the asphalt. However, these results presented here suggest
R² = 0.8161
R² = 0.8347
40
42
44
46
48
50
52
54
56
58
0
10
20
30
40
50
60
0 1000 2000 3000 4000 5000 6000 7000 8000
So
ftn
ing
Po
int
(˚C
)
Pen
etra
tio
n p
oin
t(1
/10
th m
m)
Total solar exposure (kW/m2)
penetration point softening point
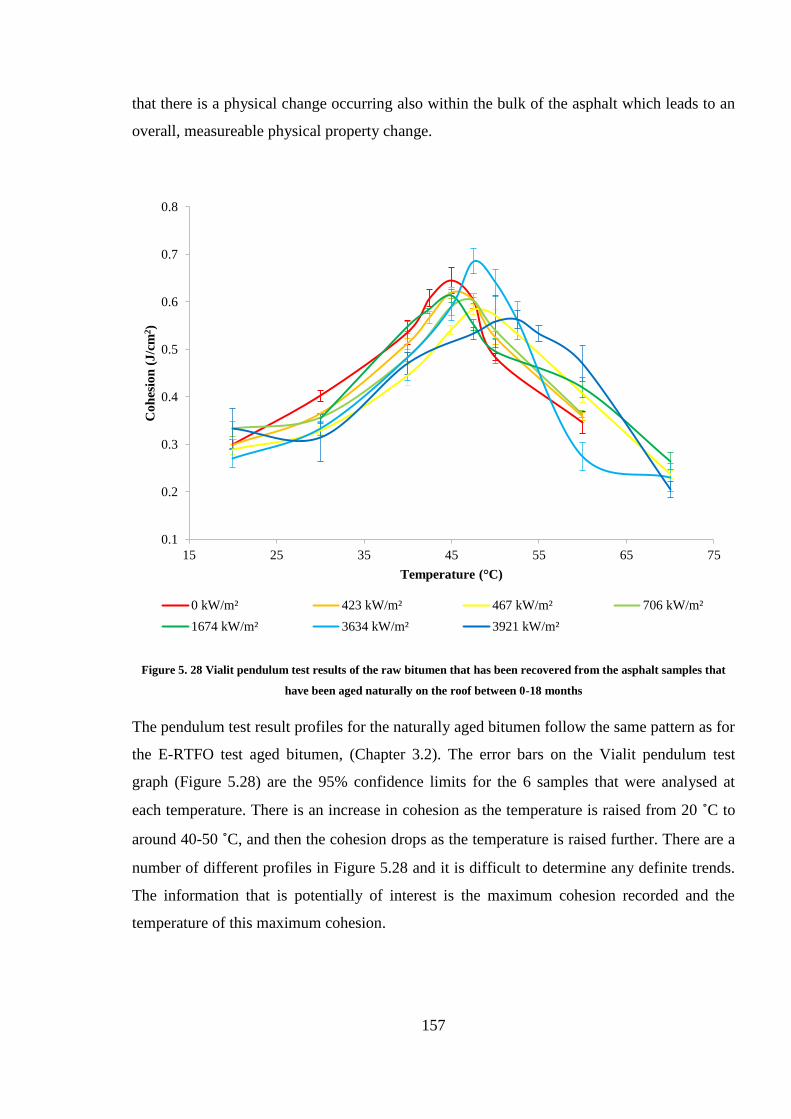
157
that there is a physical change occurring also within the bulk of the asphalt which leads to an
overall, measureable physical property change.
Figure 5. 28 Vialit pendulum test results of the raw bitumen that has been recovered from the asphalt samples that
have been aged naturally on the roof between 0-18 months
The pendulum test result profiles for the naturally aged bitumen follow the same pattern as for
the E-RTFO test aged bitumen, (Chapter 3.2). The error bars on the Vialit pendulum test
graph (Figure 5.28) are the 95% confidence limits for the 6 samples that were analysed at
each temperature. There is an increase in cohesion as the temperature is raised from 20 ˚C to
around 40-50 ˚C, and then the cohesion drops as the temperature is raised further. There are a
number of different profiles in Figure 5.28 and it is difficult to determine any definite trends.
The information that is potentially of interest is the maximum cohesion recorded and the
temperature of this maximum cohesion.
0.1
0.2
0.3
0.4
0.5
0.6
0.7
0.8
15 25 35 45 55 65 75
Co
hes
ion
(J
/cm
2)
Temperature (°C)
0 kW/m² 423 kW/m² 467 kW/m² 706 kW/m²
1674 kW/m² 3634 kW/m² 3921 kW/m²
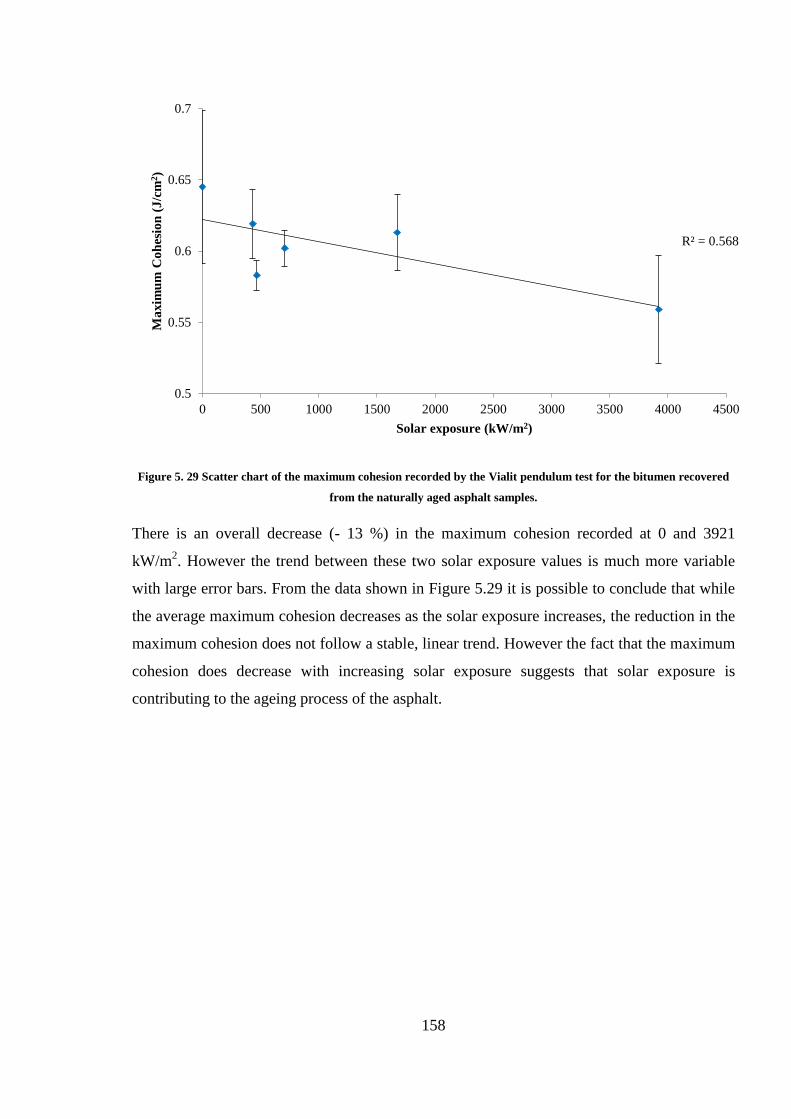
158
Figure 5. 29 Scatter chart of the maximum cohesion recorded by the Vialit pendulum test for the bitumen recovered
from the naturally aged asphalt samples.
There is an overall decrease (- 13 %) in the maximum cohesion recorded at 0 and 3921
kW/m2. However the trend between these two solar exposure values is much more variable
with large error bars. From the data shown in Figure 5.29 it is possible to conclude that while
the average maximum cohesion decreases as the solar exposure increases, the reduction in the
maximum cohesion does not follow a stable, linear trend. However the fact that the maximum
cohesion does decrease with increasing solar exposure suggests that solar exposure is
contributing to the ageing process of the asphalt.
R² = 0.568
0.5
0.55
0.6
0.65
0.7
0 500 1000 1500 2000 2500 3000 3500 4000 4500
Ma
xim
um
Co
hes
ion
(J
/cm
2)
Solar exposure (kW/m2)
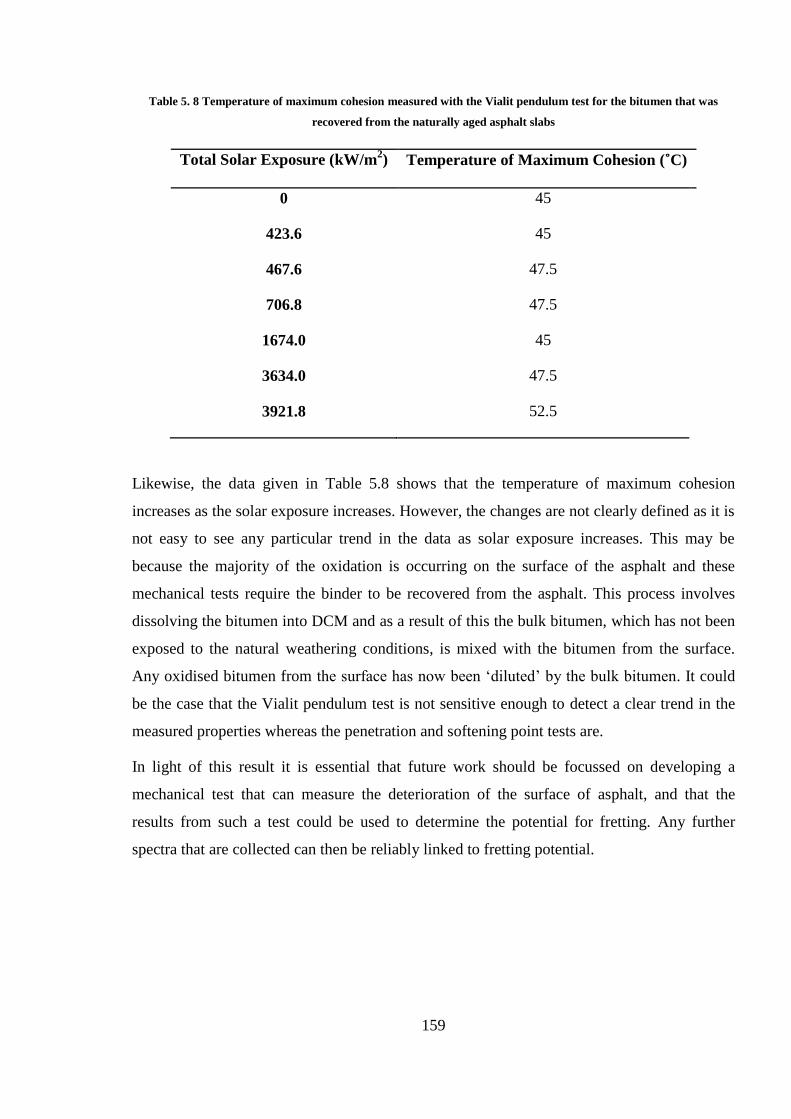
159
Table 5. 8 Temperature of maximum cohesion measured with the Vialit pendulum test for the bitumen that was
recovered from the naturally aged asphalt slabs
Total Solar Exposure (kW/m2) Temperature of Maximum Cohesion (˚C)
0 45
423.6 45
467.6 47.5
706.8 47.5
1674.0 45
3634.0 47.5
3921.8 52.5
Likewise, the data given in Table 5.8 shows that the temperature of maximum cohesion
increases as the solar exposure increases. However, the changes are not clearly defined as it is
not easy to see any particular trend in the data as solar exposure increases. This may be
because the majority of the oxidation is occurring on the surface of the asphalt and these
mechanical tests require the binder to be recovered from the asphalt. This process involves
dissolving the bitumen into DCM and as a result of this the bulk bitumen, which has not been
exposed to the natural weathering conditions, is mixed with the bitumen from the surface.
Any oxidised bitumen from the surface has now been ‘diluted’ by the bulk bitumen. It could
be the case that the Vialit pendulum test is not sensitive enough to detect a clear trend in the
measured properties whereas the penetration and softening point tests are.
In light of this result it is essential that future work should be focussed on developing a
mechanical test that can measure the deterioration of the surface of asphalt, and that the
results from such a test could be used to determine the potential for fretting. Any further
spectra that are collected can then be reliably linked to fretting potential.
160
Summary
The results presented in this chapter allow a number of conclusions to be drawn.
The weather data collected highlights that the months between May-August are the hottest
and have the most total UV exposure. In the years studied these also happened to be the
wettest months. These conditions provide the optimum conditions for the oxidation of
bitumen.
The 8-week naturally aged asphalt experiment (Chapter 5.3.1) shows a linear increase
between the carbonyl absorbance band area and the absorbance at 1700 cm-1
in the DRIFT
spectra of the surface as the total solar exposure increases.
When this experiment is extended to 30 months, (Chapter 5.3.2) the measured absorbance at a
fixed wavenumber (1700 cm-1
) increases as the total solar exposure increases. The increase in
the height of this absorbance band indicates that the amount of carbonyl present in the
bitumen at the surface of the asphalt is increasing with increasing solar exposure.
As this project is directed at producing a method that can be used on a vehicle travelling at
traffic speed; intensity measured at a single wavelength data collection method such as the
single wavelength analysis presented here could be of great use to the Transport Research
Laboratory and Highways England in developing such a method. The data collection would
be rapid and the use of multiple, single wavelength diodes could provide more data in order to
calculate indices and ratios and also to indicate spectra that are contaminated and therefore
not reliable.
The SEM of the naturally aged asphalt showed a higher number of contaminants present on
the sample surface. These can be identified as dirt and pollen from plant matter that has been
deposited by rainfall and air pollution, with the help of scanning electron microscopy.
However, it was felt that these would have little bearing on the ageing of the sample. It is
possible that contaminants such as water, oil based vehicle fluids and water based vehicle
fluids may make some surface infra-red measurements more difficult to interpret and interfere
with oxidation product absorbance bands identification. Therefore, visual road surface
analysis should be carried out alongside or prior to, the spectroscopic analysis.
The scanning electron microscopy analysis also identified the presence of cracks developing
on the surface of the bitumen. The surface structure no longer contained small platelet cracks
but it does seem to be covered in a layer of natural contaminants that could be attributed to
161
dirt and pollen or plant matter. The development of larger cracks on the surface could be an
indication of early failure and a point of weakness in the road surface.
The mechanical testing of the bitumen recovered from the naturally aged 30 month slabs
recorded a decrease in penetration point and an increase in softening point: trends that are
representative of the bitumen becoming more brittle and viscous at ambient temperatures.
The results of the Vialit pendulum test however contains a higher amount of error, therefore is
less sensitive and the results from this test are less conclusive. There is, however, evidence
that cohesion decreases as solar exposure increases. This lack of sensitivity may be because
the bulk bitumen dilutes the oxidised surface bitumen making it difficult for the Vialit
pendulum test to distinguish between the samples.
Collection of 64 infra-red spectra at 4 cm-1
resolution can take between 30-60 seconds,
depending upon the quality of the signal being received which is not a suitable time frame for
a traffic speed data collection. Therefore a link should be explored between a number of
different absorbance bands and their relation to the quality of the asphalt road surface. In this
way a single-point infra-red method could possibly be developed for traffic-speed
measurements.
162
References
1 British Standard EN 13074 2:2011, Bitumen and bituminous binders- Recovery of binder
from bituminous emulsion or cut-back or fluxed bituminous binders. Stabilisation after
recovery by evaporation.
2 J. Zhang, A. K. Apeagyei, G. D. Airey and J. R. A. Grenfell, Influence of aggregate
mineralogical composition on water resistance of aggregate-bitumen adhesion, Int. J. Adhe.
Adhe., 62, 2015, 45-54.
3 W. Zeng, S. Wu, J. Wen and Z. Chen, The temperature effects in ageing index of asphalt
during UV ageing process, Constr. Build Mater., 93,2015, 1125-1131.
4 R. E. Robertson, Chemical properties of asphalts and their relationship to pavement
performance, Strategic Highway Research Program, Washington, DC, 1991, Research Paper
5 J. A. H. Noguera, H. A. R. Quintana and W. D. F. Gomez, The influence of water on the
oxidation of asphalt cements, Const. Build. Mater., 71, 2014, 451-455.
6 ASCOM Carbonate and Chemicals manufacturing, Materials Safety Data Sheet, Calcium
Carbonate, https://www.accm.com.eg/pdf/ACM_MSDS.pdf, ACCESSED 07.07.2018, 12:40
7 P. Haines, P. G. Laye, S. B. Warrington, R. Heal, D. M. Price and R. Wilson, Principles of
Thermal Analysis and Calorimetry, Royal Society of Chemistry, Cambridge, 2002, ISBN
0854046100.
8 T. R. Crompton, Thermal Methods of Polymer Analysis, Smithers Rapra Publishing, United
Kingdom, 2013, EBOOK ISBN 9781847356635.
9 Mobil Brake Fluid DOT 4 ESP, Material Safety Data Sheet, Exxon Mobil, http://www.my-
sds.co.uk/Admin/ViewDocument.aspx?ID=4db141e9-6443-42de-aa63-
d8d68d55d2ef&primaryReportId=0, ACCESSED 07.07.2018, 13:03 .
10 D. Stoye, “Solvents”, Ullmann’s Encyclopaedia of Industrial Chemistry, Weinheim: Wiley-
VCH, 2005.
11 Morphological characteristics of pollen, Radbound University Nijmegen,
http://www.vcbio.science.ru.nl/en/virtuallessons/pollenmorphology/ ACCESSED 11.06.2018,
11:22.
12 H. Lin, Z. Qu and J. C. Metedith, Pressure sensitive micro particle adhesion through
biomimicry of the pollen-stigma interaction, Soft Matter, 12, 2016, 2965.
13 Nanoscience Instruments SEM gallery, https://www.nanoscience.com/products/sem/why-
phenom-sem/gallery/, ACCESSED 11.06.2018, 12:01.

163
14 W. Zeng, S. Wu, L. Pang, H. Chen, J. Hu, Y. Sun and Z. Chen, Research on Ultra Violet
(UV) ageing depth of asphalts, Constr. Build. Mater., 160, 2018, 620-627.
164
Chapter 6
Spectroscopic analysis of road cores and live roads
The research presented in the previous chapters of this thesis has developed the use of diffuse
reflectance infrared (DRIFT) spectroscopy for the analysis of asphalt that has been aged
artificially and naturally. The results have led to the conclusion that oxidation products can be
observed and quantified using DRIFT spectroscopy. These experiments however have been
carried out using the ExoScan 4100, handheld spectrometer to collect data from bitumen and
asphalt samples only in the laboratory.
The next logical step for this research is to use the handheld spectrometer to analyse live road
samples. A live road is one that is still currently in use and open to traffic. Collecting DRIFT
spectra from asphalt samples that are on the road network, will allow for a database of spectra
to be developed and analysis of this data could be carried out to determine the link between
the chemical signature and mechanical condition of the road surface.
The data collection from real roads has been approached in two ways for this research. The
first method involves collecting DRIFT spectra from the surface of cores that have been
collected from live roads and brought to the lab. Road cores are collected by TRL as part of
other research projects being carried out on the live road network. The ExoScan handheld
spectrometer has been used to analyse the topmost surface of these cores that has been
exposed to natural weathering conditions and trafficking throughout its service life.
The second method involves taking the ExoScan outside the laboratory and collecting data
from live roads. A trolley was designed by the engineers at TRL which supported the
ExoScan at the correct focal distance from the road surface. The trolley was designed to be
able to be pushed along a stretch of road and to collect DRIFT spectra at periodic locations.
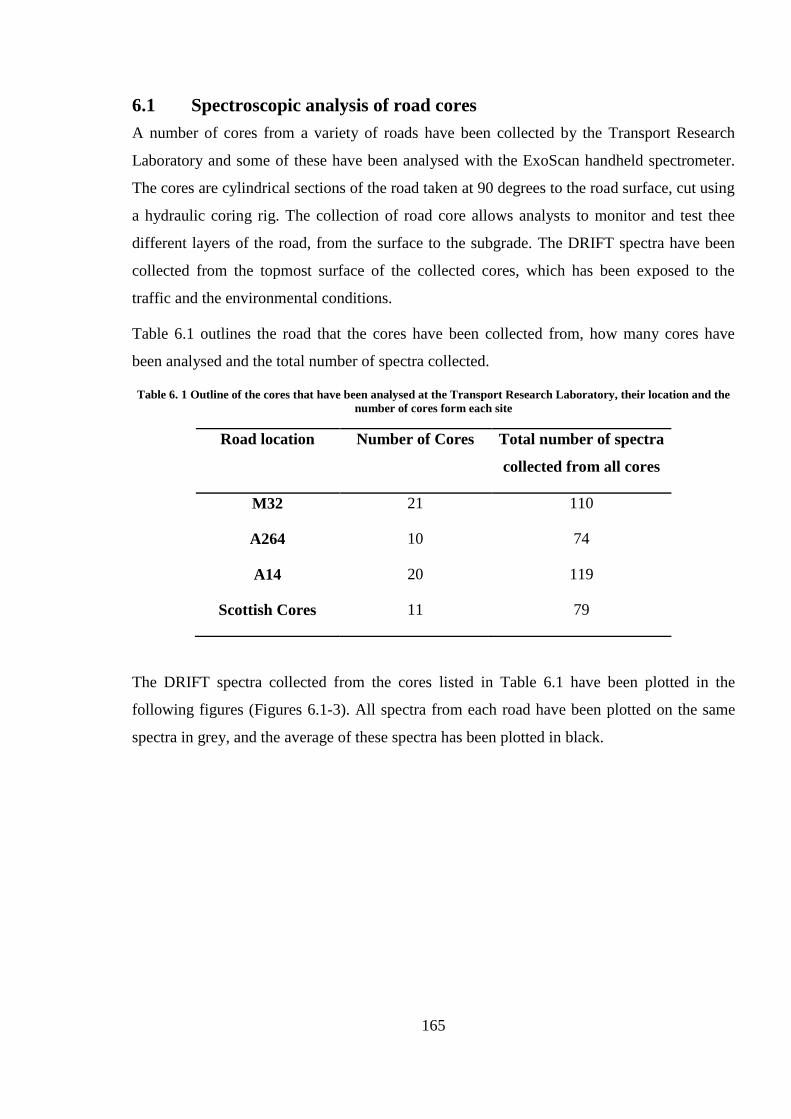
165
6.1 Spectroscopic analysis of road cores
A number of cores from a variety of roads have been collected by the Transport Research
Laboratory and some of these have been analysed with the ExoScan handheld spectrometer.
The cores are cylindrical sections of the road taken at 90 degrees to the road surface, cut using
a hydraulic coring rig. The collection of road core allows analysts to monitor and test thee
different layers of the road, from the surface to the subgrade. The DRIFT spectra have been
collected from the topmost surface of the collected cores, which has been exposed to the
traffic and the environmental conditions.
Table 6.1 outlines the road that the cores have been collected from, how many cores have
been analysed and the total number of spectra collected.
Table 6. 1 Outline of the cores that have been analysed at the Transport Research Laboratory, their location and the
number of cores form each site
Road location Number of Cores Total number of spectra
collected from all cores
M32 21 110
A264 10 74
A14 20 119
Scottish Cores 11 79
The DRIFT spectra collected from the cores listed in Table 6.1 have been plotted in the
following figures (Figures 6.1-3). All spectra from each road have been plotted on the same
spectra in grey, and the average of these spectra has been plotted in black.

166
Figure 6. 1 DRIFT spectra from the surface of cores collected from the M32
110 individual spectra were collected from the cores sampled from the M32. The spectra from
the M32 contain many of the absorbance bands seen in the naturally aged asphalt spectra
(Chapter 5). The carbonate and silicate absorbance bands (2520, 1790, 1530, and 1150 cm-1
)
are prominent in all 110 spectra collected from the different cores from the M32 road surface.
This spectrum highlights the internal variation of a road surface. The difference in reflectivity
can be seen between the samples with the ‘baseline’ absorbance at 4000 cm-1
varying from
approximately 1.35 to 0.35.
0
0.5
1
1.5
2
2.5
649984131916541989232426602995333036654000
Ab
sorb
an
ce
Wavenumber (cm-1)
M32 cores
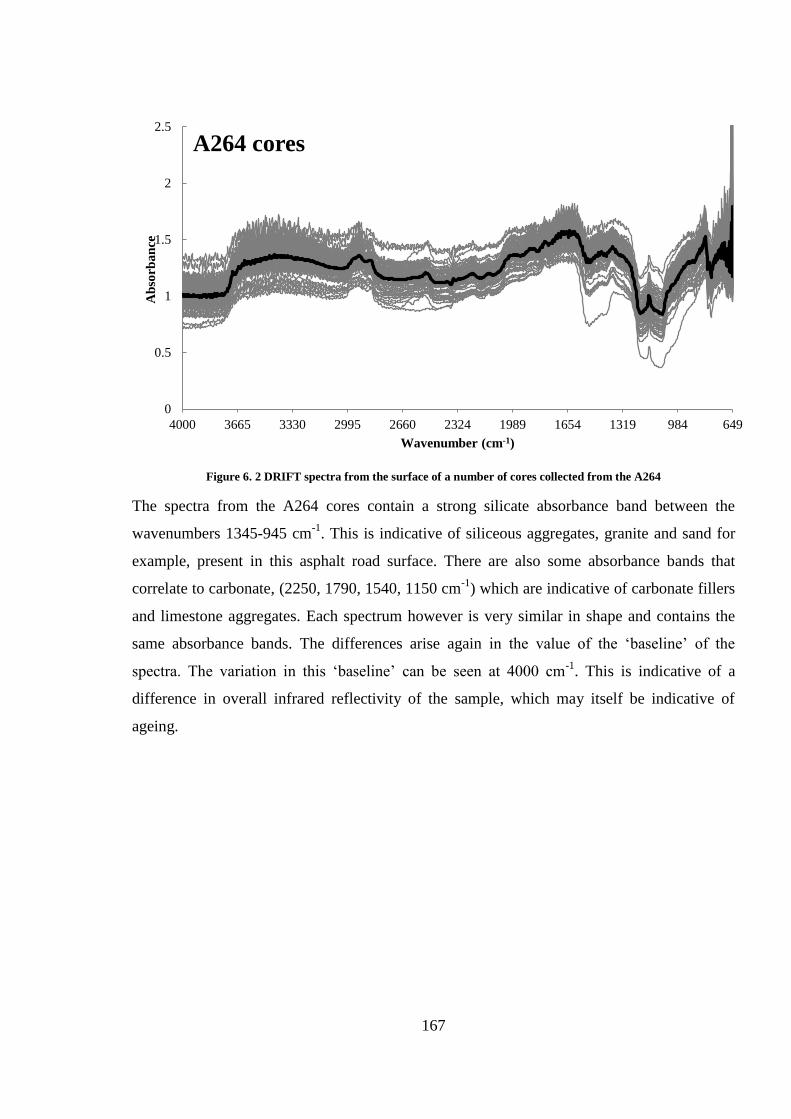
167
Figure 6. 2 DRIFT spectra from the surface of a number of cores collected from the A264
The spectra from the A264 cores contain a strong silicate absorbance band between the
wavenumbers 1345-945 cm-1
. This is indicative of siliceous aggregates, granite and sand for
example, present in this asphalt road surface. There are also some absorbance bands that
correlate to carbonate, (2250, 1790, 1540, 1150 cm-1
) which are indicative of carbonate fillers
and limestone aggregates. Each spectrum however is very similar in shape and contains the
same absorbance bands. The differences arise again in the value of the ‘baseline’ of the
spectra. The variation in this ‘baseline’ can be seen at 4000 cm-1
. This is indicative of a
difference in overall infrared reflectivity of the sample, which may itself be indicative of
ageing.
0
0.5
1
1.5
2
2.5
649984131916541989232426602995333036654000
Ab
sorb
an
ce
Wavenumber (cm-1)
A264 cores
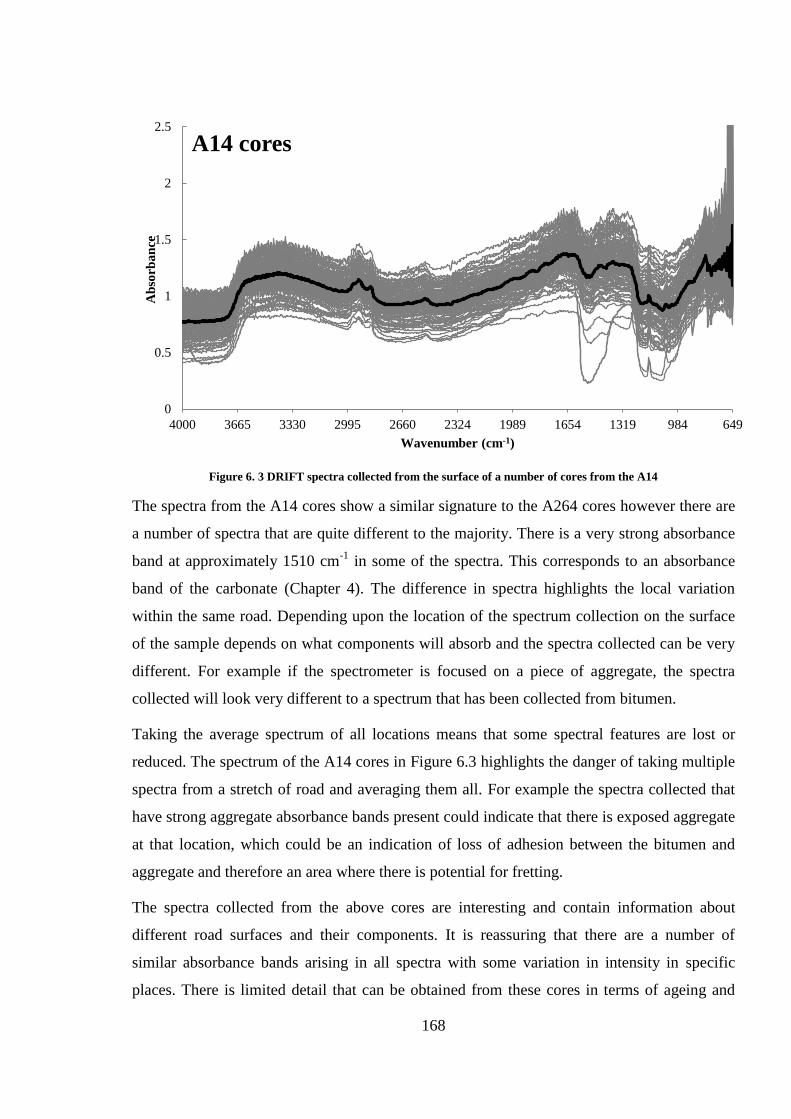
168
Figure 6. 3 DRIFT spectra collected from the surface of a number of cores from the A14
The spectra from the A14 cores show a similar signature to the A264 cores however there are
a number of spectra that are quite different to the majority. There is a very strong absorbance
band at approximately 1510 cm-1
in some of the spectra. This corresponds to an absorbance
band of the carbonate (Chapter 4). The difference in spectra highlights the local variation
within the same road. Depending upon the location of the spectrum collection on the surface
of the sample depends on what components will absorb and the spectra collected can be very
different. For example if the spectrometer is focused on a piece of aggregate, the spectra
collected will look very different to a spectrum that has been collected from bitumen.
Taking the average spectrum of all locations means that some spectral features are lost or
reduced. The spectrum of the A14 cores in Figure 6.3 highlights the danger of taking multiple
spectra from a stretch of road and averaging them all. For example the spectra collected that
have strong aggregate absorbance bands present could indicate that there is exposed aggregate
at that location, which could be an indication of loss of adhesion between the bitumen and
aggregate and therefore an area where there is potential for fretting.
The spectra collected from the above cores are interesting and contain information about
different road surfaces and their components. It is reassuring that there are a number of
similar absorbance bands arising in all spectra with some variation in intensity in specific
places. There is limited detail that can be obtained from these cores in terms of ageing and
0
0.5
1
1.5
2
2.5
649984131916541989232426602995333036654000
Ab
sorb
an
ce
Wavenumber (cm-1)
A14 cores
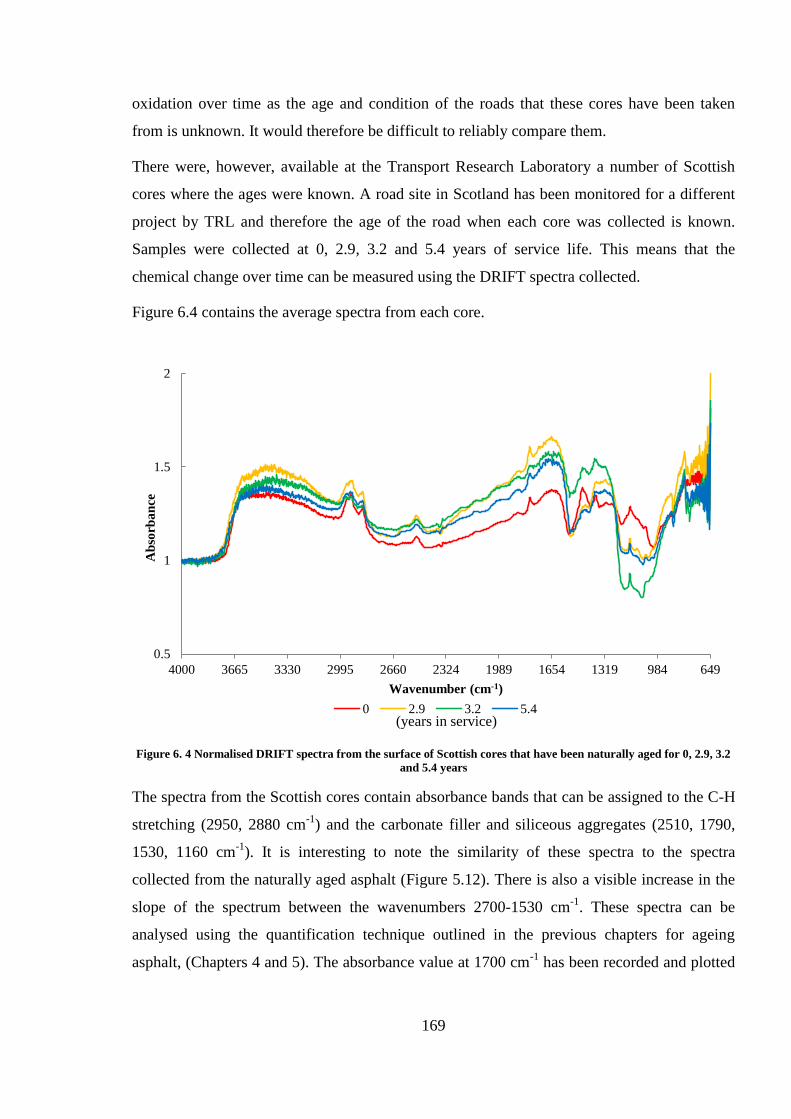
169
oxidation over time as the age and condition of the roads that these cores have been taken
from is unknown. It would therefore be difficult to reliably compare them.
There were, however, available at the Transport Research Laboratory a number of Scottish
cores where the ages were known. A road site in Scotland has been monitored for a different
project by TRL and therefore the age of the road when each core was collected is known.
Samples were collected at 0, 2.9, 3.2 and 5.4 years of service life. This means that the
chemical change over time can be measured using the DRIFT spectra collected.
Figure 6.4 contains the average spectra from each core.
Figure 6. 4 Normalised DRIFT spectra from the surface of Scottish cores that have been naturally aged for 0, 2.9, 3.2
and 5.4 years
The spectra from the Scottish cores contain absorbance bands that can be assigned to the C-H
stretching (2950, 2880 cm-1
) and the carbonate filler and siliceous aggregates (2510, 1790,
1530, 1160 cm-1
). It is interesting to note the similarity of these spectra to the spectra
collected from the naturally aged asphalt (Figure 5.12). There is also a visible increase in the
slope of the spectrum between the wavenumbers 2700-1530 cm-1
. These spectra can be
analysed using the quantification technique outlined in the previous chapters for ageing
asphalt, (Chapters 4 and 5). The absorbance value at 1700 cm-1
has been recorded and plotted
0.5
1
1.5
2
649984131916541989232426602995333036654000
Ab
sorb
an
ce
Wavenumber (cm-1)
0 2.9 3.2 5.4(years in service)
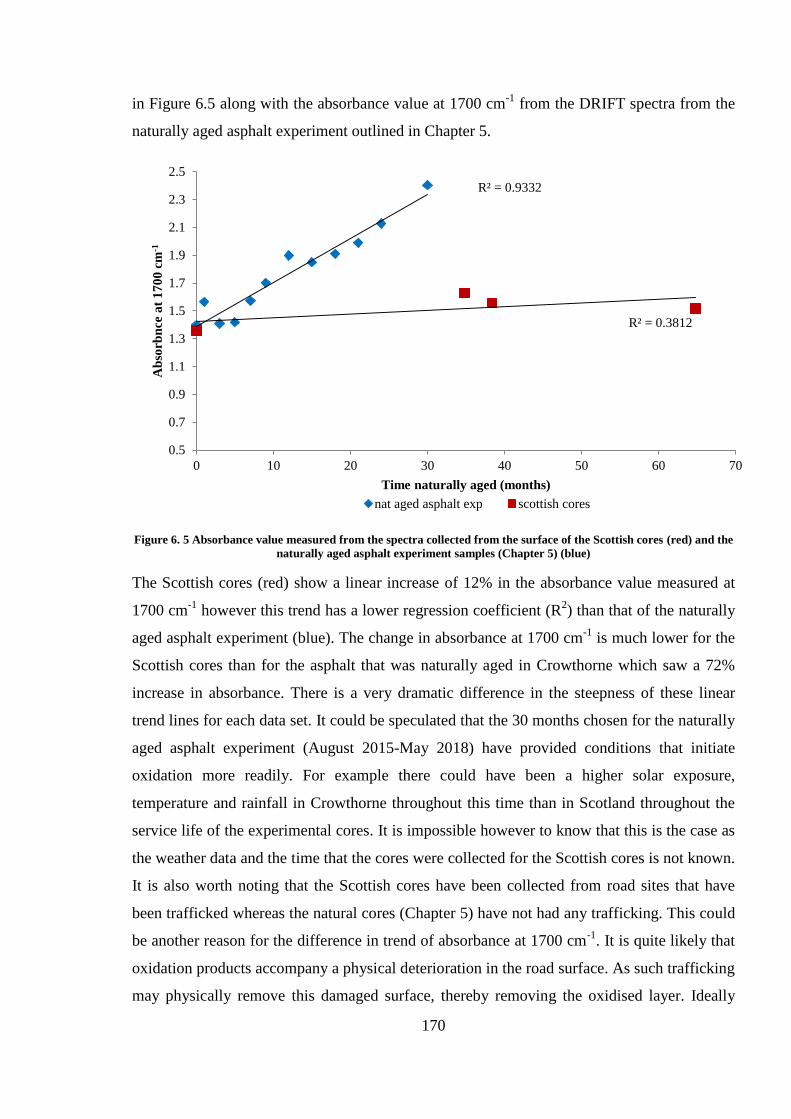
170
in Figure 6.5 along with the absorbance value at 1700 cm-1
from the DRIFT spectra from the
naturally aged asphalt experiment outlined in Chapter 5.
Figure 6. 5 Absorbance value measured from the spectra collected from the surface of the Scottish cores (red) and the
naturally aged asphalt experiment samples (Chapter 5) (blue)
The Scottish cores (red) show a linear increase of 12% in the absorbance value measured at
1700 cm-1
however this trend has a lower regression coefficient (R2) than that of the naturally
aged asphalt experiment (blue). The change in absorbance at 1700 cm-1
is much lower for the
Scottish cores than for the asphalt that was naturally aged in Crowthorne which saw a 72%
increase in absorbance. There is a very dramatic difference in the steepness of these linear
trend lines for each data set. It could be speculated that the 30 months chosen for the naturally
aged asphalt experiment (August 2015-May 2018) have provided conditions that initiate
oxidation more readily. For example there could have been a higher solar exposure,
temperature and rainfall in Crowthorne throughout this time than in Scotland throughout the
service life of the experimental cores. It is impossible however to know that this is the case as
the weather data and the time that the cores were collected for the Scottish cores is not known.
It is also worth noting that the Scottish cores have been collected from road sites that have
been trafficked whereas the natural cores (Chapter 5) have not had any trafficking. This could
be another reason for the difference in trend of absorbance at 1700 cm-1
. It is quite likely that
oxidation products accompany a physical deterioration in the road surface. As such trafficking
may physically remove this damaged surface, thereby removing the oxidised layer. Ideally
R² = 0.9332
R² = 0.3812
0.5
0.7
0.9
1.1
1.3
1.5
1.7
1.9
2.1
2.3
2.5
0 10 20 30 40 50 60 70
Ab
sorb
nce
at
17
00
cm
-1
Time naturally aged (months)
nat aged asphalt exp scottish cores
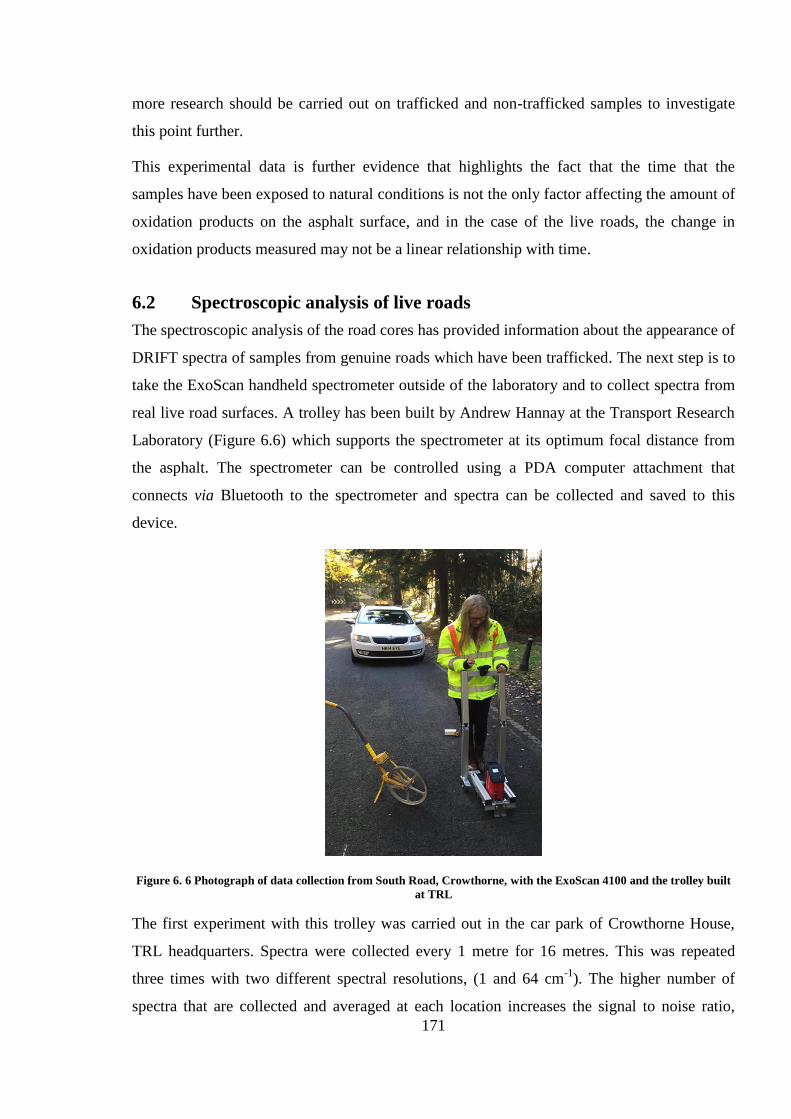
171
more research should be carried out on trafficked and non-trafficked samples to investigate
this point further.
This experimental data is further evidence that highlights the fact that the time that the
samples have been exposed to natural conditions is not the only factor affecting the amount of
oxidation products on the asphalt surface, and in the case of the live roads, the change in
oxidation products measured may not be a linear relationship with time.
6.2 Spectroscopic analysis of live roads
The spectroscopic analysis of the road cores has provided information about the appearance of
DRIFT spectra of samples from genuine roads which have been trafficked. The next step is to
take the ExoScan handheld spectrometer outside of the laboratory and to collect spectra from
real live road surfaces. A trolley has been built by Andrew Hannay at the Transport Research
Laboratory (Figure 6.6) which supports the spectrometer at its optimum focal distance from
the asphalt. The spectrometer can be controlled using a PDA computer attachment that
connects via Bluetooth to the spectrometer and spectra can be collected and saved to this
device.
Figure 6. 6 Photograph of data collection from South Road, Crowthorne, with the ExoScan 4100 and the trolley built
at TRL
The first experiment with this trolley was carried out in the car park of Crowthorne House,
TRL headquarters. Spectra were collected every 1 metre for 16 metres. This was repeated
three times with two different spectral resolutions, (1 and 64 cm-1
). The higher number of
spectra that are collected and averaged at each location increases the signal to noise ratio,
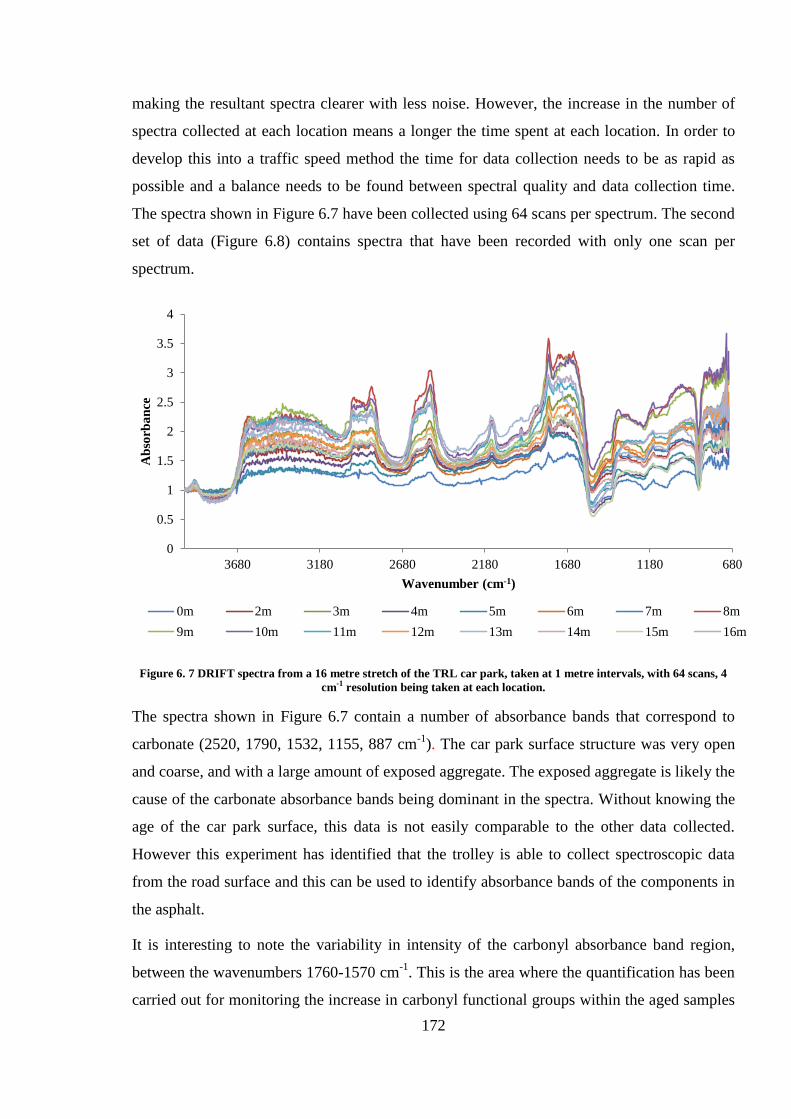
172
making the resultant spectra clearer with less noise. However, the increase in the number of
spectra collected at each location means a longer the time spent at each location. In order to
develop this into a traffic speed method the time for data collection needs to be as rapid as
possible and a balance needs to be found between spectral quality and data collection time.
The spectra shown in Figure 6.7 have been collected using 64 scans per spectrum. The second
set of data (Figure 6.8) contains spectra that have been recorded with only one scan per
spectrum.
Figure 6. 7 DRIFT spectra from a 16 metre stretch of the TRL car park, taken at 1 metre intervals, with 64 scans, 4
cm-1 resolution being taken at each location.
The spectra shown in Figure 6.7 contain a number of absorbance bands that correspond to
carbonate (2520, 1790, 1532, 1155, 887 cm-1
). The car park surface structure was very open
and coarse, and with a large amount of exposed aggregate. The exposed aggregate is likely the
cause of the carbonate absorbance bands being dominant in the spectra. Without knowing the
age of the car park surface, this data is not easily comparable to the other data collected.
However this experiment has identified that the trolley is able to collect spectroscopic data
from the road surface and this can be used to identify absorbance bands of the components in
the asphalt.
It is interesting to note the variability in intensity of the carbonyl absorbance band region,
between the wavenumbers 1760-1570 cm-1
. This is the area where the quantification has been
carried out for monitoring the increase in carbonyl functional groups within the aged samples
0
0.5
1
1.5
2
2.5
3
3.5
4
680118016802180268031803680
Ab
sorb
an
ce
Wavenumber (cm-1)
0m 2m 3m 4m 5m 6m 7m 8m
9m 10m 11m 12m 13m 14m 15m 16m
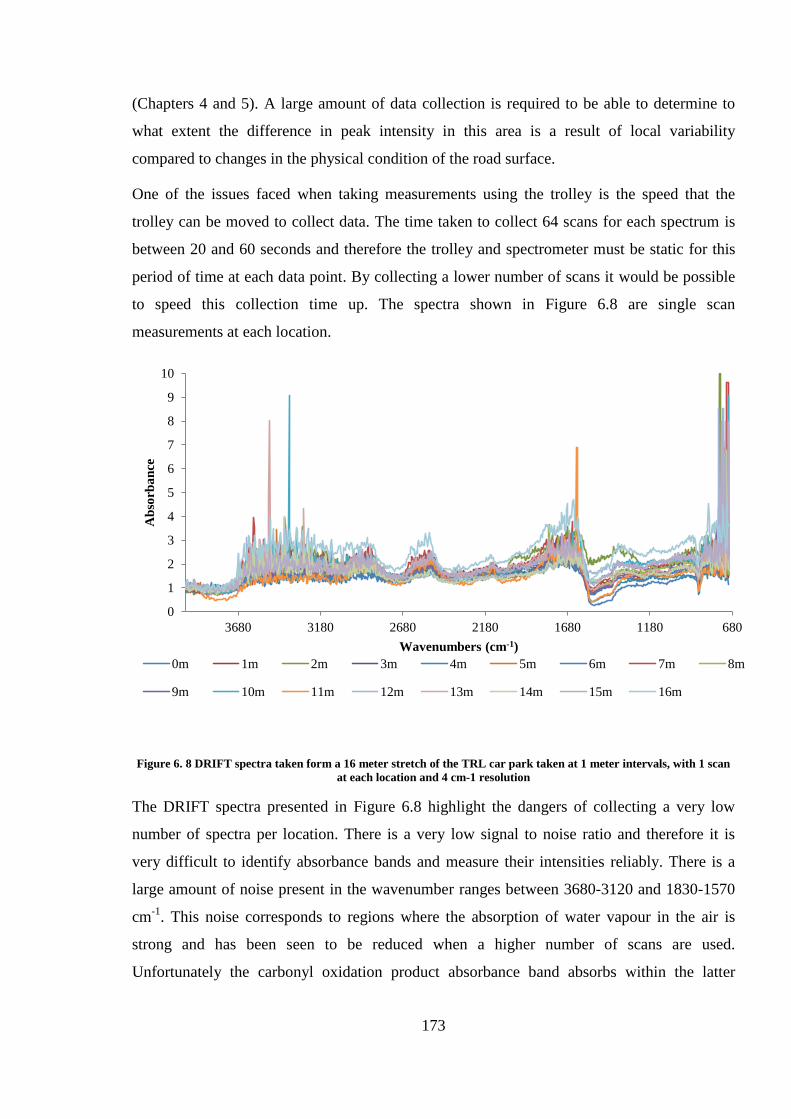
173
(Chapters 4 and 5). A large amount of data collection is required to be able to determine to
what extent the difference in peak intensity in this area is a result of local variability
compared to changes in the physical condition of the road surface.
One of the issues faced when taking measurements using the trolley is the speed that the
trolley can be moved to collect data. The time taken to collect 64 scans for each spectrum is
between 20 and 60 seconds and therefore the trolley and spectrometer must be static for this
period of time at each data point. By collecting a lower number of scans it would be possible
to speed this collection time up. The spectra shown in Figure 6.8 are single scan
measurements at each location.
Figure 6. 8 DRIFT spectra taken form a 16 meter stretch of the TRL car park taken at 1 meter intervals, with 1 scan
at each location and 4 cm-1 resolution
The DRIFT spectra presented in Figure 6.8 highlight the dangers of collecting a very low
number of spectra per location. There is a very low signal to noise ratio and therefore it is
very difficult to identify absorbance bands and measure their intensities reliably. There is a
large amount of noise present in the wavenumber ranges between 3680-3120 and 1830-1570
cm-1
. This noise corresponds to regions where the absorption of water vapour in the air is
strong and has been seen to be reduced when a higher number of scans are used.
Unfortunately the carbonyl oxidation product absorbance band absorbs within the latter
0
1
2
3
4
5
6
7
8
9
10
680118016802180268031803680
Ab
sorb
an
ce
Wavenumbers (cm-1)
0m 1m 2m 3m 4m 5m 6m 7m 8m
9m 10m 11m 12m 13m 14m 15m 16m
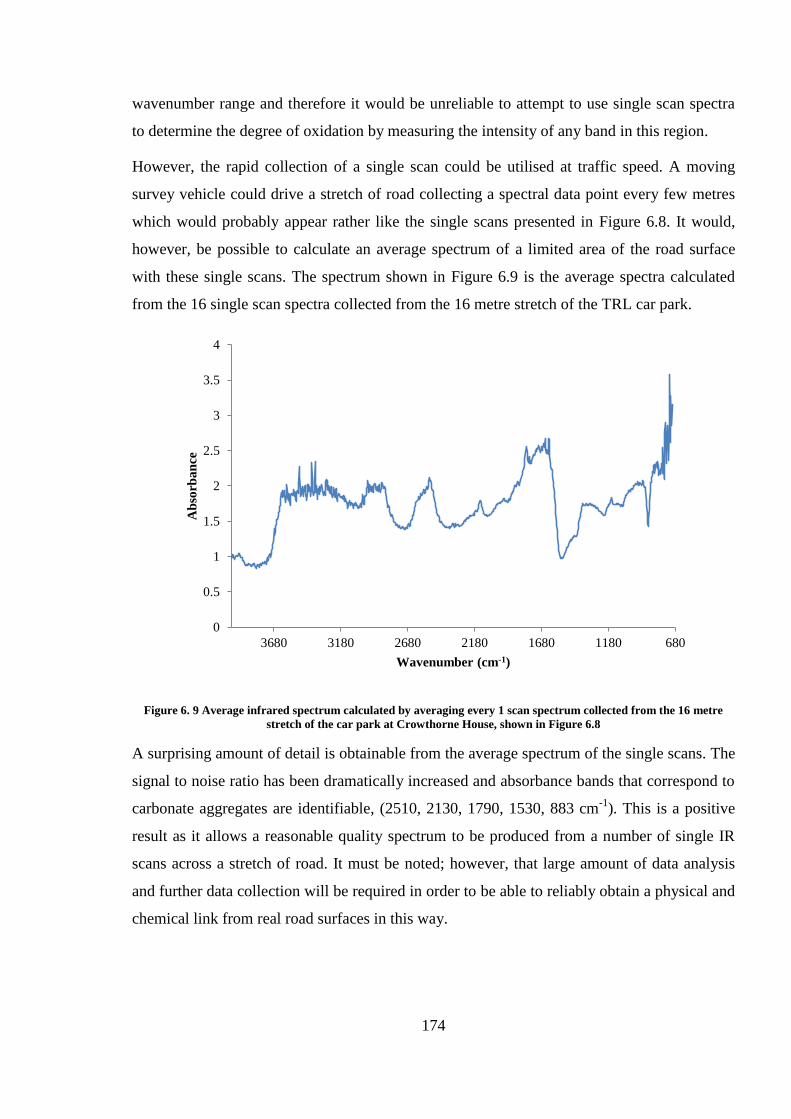
174
wavenumber range and therefore it would be unreliable to attempt to use single scan spectra
to determine the degree of oxidation by measuring the intensity of any band in this region.
However, the rapid collection of a single scan could be utilised at traffic speed. A moving
survey vehicle could drive a stretch of road collecting a spectral data point every few metres
which would probably appear rather like the single scans presented in Figure 6.8. It would,
however, be possible to calculate an average spectrum of a limited area of the road surface
with these single scans. The spectrum shown in Figure 6.9 is the average spectra calculated
from the 16 single scan spectra collected from the 16 metre stretch of the TRL car park.
Figure 6. 9 Average infrared spectrum calculated by averaging every 1 scan spectrum collected from the 16 metre
stretch of the car park at Crowthorne House, shown in Figure 6.8
A surprising amount of detail is obtainable from the average spectrum of the single scans. The
signal to noise ratio has been dramatically increased and absorbance bands that correspond to
carbonate aggregates are identifiable, (2510, 2130, 1790, 1530, 883 cm-1
). This is a positive
result as it allows a reasonable quality spectrum to be produced from a number of single IR
scans across a stretch of road. It must be noted; however, that large amount of data analysis
and further data collection will be required in order to be able to reliably obtain a physical and
chemical link from real road surfaces in this way.
0
0.5
1
1.5
2
2.5
3
3.5
4
680118016802180268031803680
Ab
sorb
an
ce
Wavenumber (cm-1)
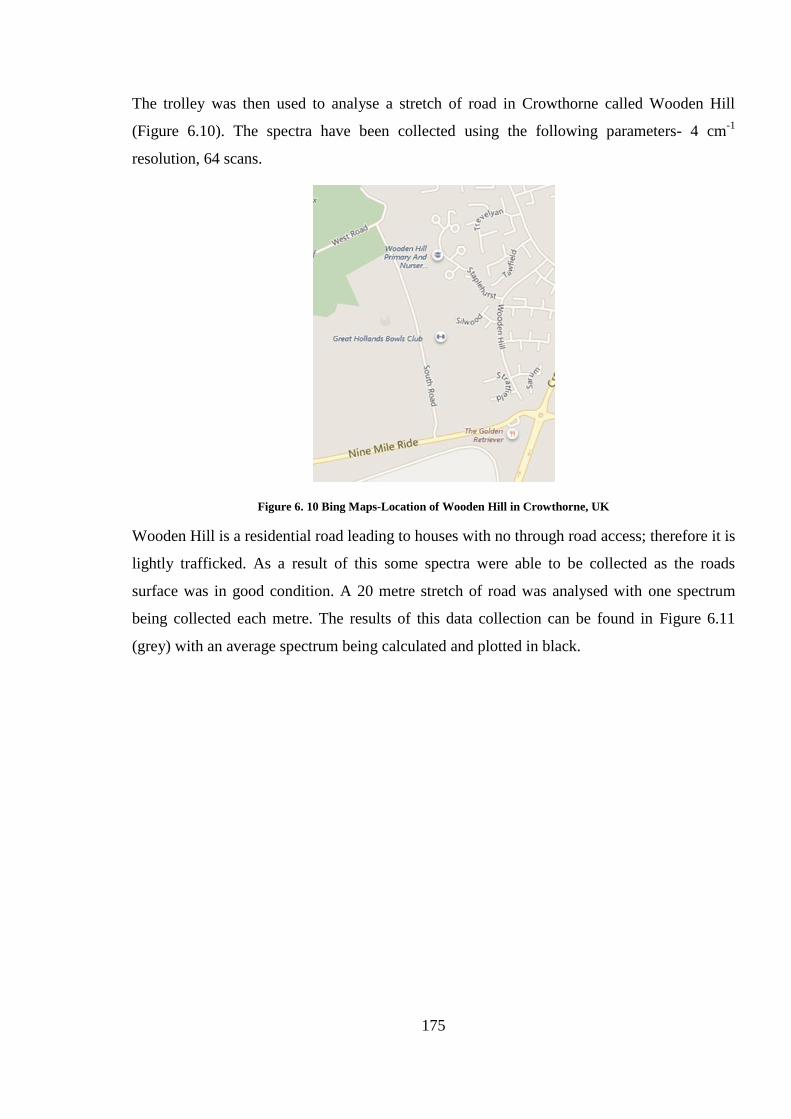
175
The trolley was then used to analyse a stretch of road in Crowthorne called Wooden Hill
(Figure 6.10). The spectra have been collected using the following parameters- 4 cm-1
resolution, 64 scans.
Figure 6. 10 Bing Maps-Location of Wooden Hill in Crowthorne, UK
Wooden Hill is a residential road leading to houses with no through road access; therefore it is
lightly trafficked. As a result of this some spectra were able to be collected as the roads
surface was in good condition. A 20 metre stretch of road was analysed with one spectrum
being collected each metre. The results of this data collection can be found in Figure 6.11
(grey) with an average spectrum being calculated and plotted in black.
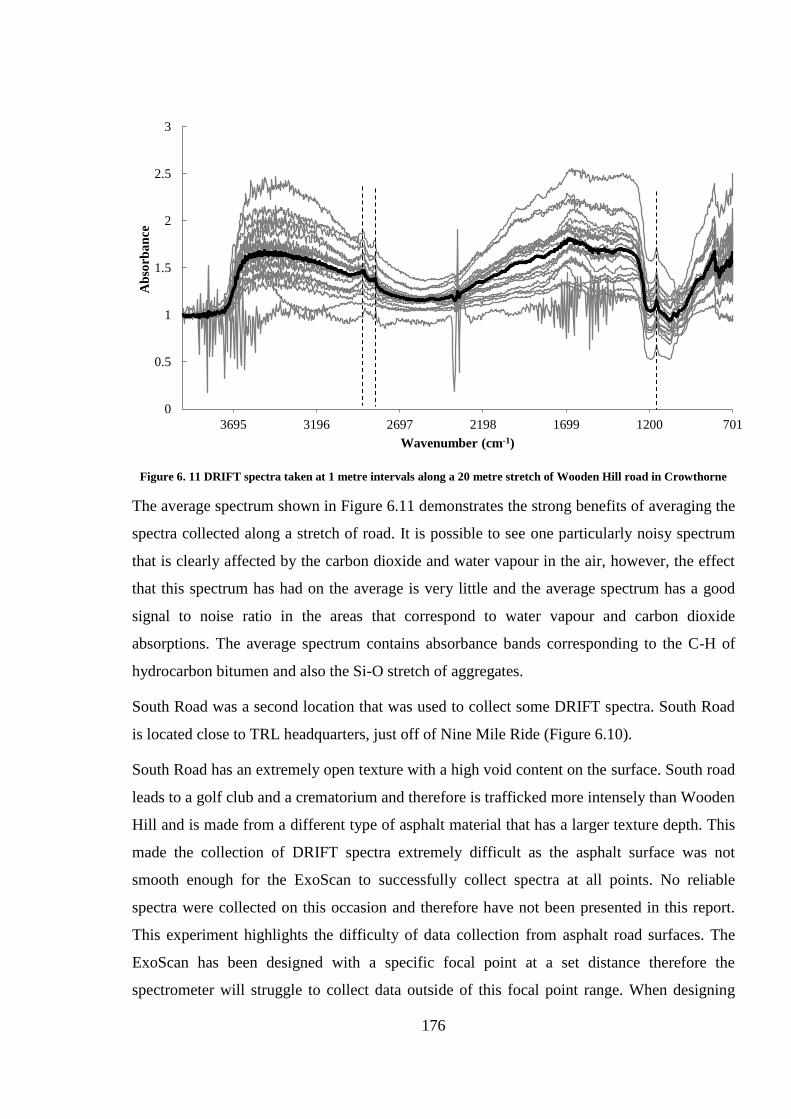
176
Figure 6. 11 DRIFT spectra taken at 1 metre intervals along a 20 metre stretch of Wooden Hill road in Crowthorne
The average spectrum shown in Figure 6.11 demonstrates the strong benefits of averaging the
spectra collected along a stretch of road. It is possible to see one particularly noisy spectrum
that is clearly affected by the carbon dioxide and water vapour in the air, however, the effect
that this spectrum has had on the average is very little and the average spectrum has a good
signal to noise ratio in the areas that correspond to water vapour and carbon dioxide
absorptions. The average spectrum contains absorbance bands corresponding to the C-H of
hydrocarbon bitumen and also the Si-O stretch of aggregates.
South Road was a second location that was used to collect some DRIFT spectra. South Road
is located close to TRL headquarters, just off of Nine Mile Ride (Figure 6.10).
South Road has an extremely open texture with a high void content on the surface. South road
leads to a golf club and a crematorium and therefore is trafficked more intensely than Wooden
Hill and is made from a different type of asphalt material that has a larger texture depth. This
made the collection of DRIFT spectra extremely difficult as the asphalt surface was not
smooth enough for the ExoScan to successfully collect spectra at all points. No reliable
spectra were collected on this occasion and therefore have not been presented in this report.
This experiment highlights the difficulty of data collection from asphalt road surfaces. The
ExoScan has been designed with a specific focal point at a set distance therefore the
spectrometer will struggle to collect data outside of this focal point range. When designing
0
0.5
1
1.5
2
2.5
3
701120016992198269731963695
Ab
sorb
an
ce
Wavenumber (cm-1)
177
this technology to be at traffic speed there would need to be considerations regarding the focal
ranges of the infrared light and the detectors.
Summary
While much of the work presented in this chapter is speculative, there are a number of
conclusions that can be drawn that are both positive and negative;
Good quality spectra are able to be collected from road cores and live roads that have been
exposed to genuine road surface conditions. The carbonate and silicate absorbance bands of
the aggregates can be identified confidently.
Collecting good quality spectra requires a high scan count to achieve a good signal to noise
ratio, which takes time requiring the spectrometer to be static. However, good quality spectra
can also be produced from single scans collected along a stretch of road which are then
averaged.
Care must be taken when averaging multiple spectra from a stretch of road as there might be
localised detail that is being missed. Many more spectra need to be collected in this way from
roads with varying conditions in order to determine the effect of this averaging in more detail.
A change in reflectivity can also be seen in the un-normalised spectra. This base reflectivity
of infrared light might be an indicator of ageing, and is therefore worth investigating in the
future work.
It has not been determined reliably within this work whether the change in oxidation products
can be identified in the DRIFT spectra from ‘real’ road surfaces. Much more data collection
on road surfaces with known condition and age is required to make this assignment
confidently. The eroding of the bitumen from the surface of the asphalt surface might be the
reason for this lack of carbonyl absorbance band. The oxidation of the surface layers would
increase the viscosity, and repeated trafficking would wear this more brittle layer away. This
means that the carbonyl absorbance band detected is less intense than if the oxidised bitumen
remained on the surface.
178
Conclusions and further work
The research presented within this thesis allows for a number of conclusions to be drawn:
Artificially aged bitumen-E-RTFO test
The literature review carried out for this project identified the lack of research using diffuse
reflectance infrared spectroscopy for the analysis of bitumen oxidation in asphalt.
The investigation was started by looking into the artificial and natural ageing of bitumen. This
involved the E-RTFO test, UV light exposure and natural ageing of the bitumen samples on
the roof of Crowthorne House.
The E-RTFO test oxidised the raw bitumen and oxidation products were detected using ATR-
FTIR. Carbonyl, C-O and sulfoxide absorbance bands were identified and quantified from the
ATR spectra. An increase in the integrated absorbance band area and absorbance at 1700 cm-1
were measured as time in the E-RTFO increased.
The GPC results from the thermally aged bitumen showed an increased in molecular weight
that corresponded to an increase in oxygen within the bitumen composition.
The mechanical properties of the E-RTFO test aged bitumen were measured and showed an
increase in viscosity of the bitumen as it was aged. The penetration point decreased (-70 %),
the softening point increased (+30 %), the maximum cohesion decreased (- 34 %) and the
intrinsic viscosity of the samples increased (33 %) as time in the RTFO increased.
Artificially aged bitumen-UV light exposure
The UV-aged bitumen has been analysed using DRIFT spectroscopy. The reflectance spectra
collected from the surface of the UV aged bitumen contained absorbance bands that
correspond to the carbonyl, C-O and sulfoxide functional groups. The C-O band is very broad
which is indicative of some intermolecular hydrogen bonding. The carbonyl absorbance band
presents as a first derivative. This band was initially detected between 72-96 hours of UV
ageing. The presence of first derivative absorbance bands in reflectance spectra is indicative
of a surface structure property giving rise to specular reflectance and of refractive index
change.
179
Upon UV exposure a brittle skin was formed on the surface of the bitumen. The brittle skin
was measured with the penetration point test and results proved that the skin was much more
difficult to penetrate (-29 % penetration point) as the sample was exposed to a longer time in
the UV chamber. The skin was also analysed with SEM and small cracks forming platelets,
were visible on the surface of the UV exposed bitumen. The formation of this skin could be
attributed to molecular stacking of the oxidised asphaltene molecules within the bitumen
composition.
The UV aged bitumen samples needed to be heated in order to prepare the samples for the
mechanical property tests. This heating meant that the surface skin was melted and mixed into
the bulk. The mechanical test results were then inconclusive, with no reliable change being
measured between samples. This suggests that the thermal energy being applied to the
bitumen has broken down the intermolecular interactions occurring within the oxidised
bitumen on the surface, and therefore reversing any viscosity changes.
The GPC, softening point, Vialit pendulum test and the intrinsic viscosity results of the UV
aged bitumen are also inconclusive with no reliable change being measured. This could again
be a result of the intermolecular forces being broken down as the surface sample is heated,
mixed and dissolved into solution.
The ageing effects of UV exposure is localised on the surface of the bitumen as a result of the
UV light only penetrating the first 4.5 μm of the sample.1 There is also the possibility that
singlet oxygen is an initiator of the UV initiated oxidation and this species can only be formed
on the surface, where there is exposure to molecular oxygen and UV light.
Naturally aged bitumen
Similar chemical and mechanical test results have been obtained for the raw bitumen samples
that have been aged naturally as for those that were aged artificially. DRIFT spectroscopy
detected carbonyl, C-O and sulfoxide absorbance bands; the C-O band is broad, indicating
molecular interactions within the bitumen composition. A skin also develops on the surface
which is similar to that seen on the artificially UV-aged bitumen. The presence of this skin
and the increase in oxidation product functional groups in the DRIFT spectra prove that the
bitumen has been oxidised by the natural weather conditions, and that these conditions have
induced a physical change in the surface structure and molecular network of bitumen
hydrocarbon molecules.
180
SEM of the naturally aged surface indicated the same micro-cracks forming on the surface as
in the artificially UV-aged bitumen, with small platelet features being produced.
GPC results showed no definitive change in molecular weight of the bitumen composition and
intrinsic viscosity is seen to increase as the sample is aged. This could be a result of the
molecular stacking and intermolecular interactions holding together the brittle, oxidised
surface skin being broken down as the bitumen is dissolved into solution. However repeats of
this experiment are required in order to support this result.
Artificially aged asphalt-UV light exposure
The DRIFT spectra collected from artificially UV-aged asphalt have been used to identify the
absorbance bands from the carbonate filler and the siliceous aggregates. Upon exposure to
UV light the reflectance spectra have also been used to identify oxidation products. The
carbonyl, C-O and sulfoxide absorbance bands have been identified and the changes in the
carbonyl absorbance band have been quantified as the sample is aged. The increase is steep
during the first week of exposure in the UV chamber and following this time the absorbance
is seen to plateau. This could be an indication of the surface becoming completely oxidised or
reaching the maximum level of oxidation under the conditions of the experiment.
The carbonyl absorbance band also presents as a first derivative in the reflectance spectra
from the asphalt. The surface was analysed with SEM (530 x) and micro-cracking platelet
formation was observed. It is also possible to see some of these cracks with a light
microscope suggesting that the cracks are able to propagate into larger cracks that are visible
at lower magnifications.
Infrared microscopy of a cross section of UV-aged asphalt has identified different absorbance
bands that could be used to differentiate between spectra that have been collected from
aggregates from those collected from bitumen. The infrared microscope does not work at a
small enough spatial resolution to differentiate between the oxidised surface layers and the
bulk bitumen below. To achieve a better spatial resolution experiments using an infrared
microscope with a much brighter Synchrotron source, such as the Diamond Light Source,
could have been carried out. Such experiments were unfortunately impossible on the time
scale of this project.
181
Naturally aged asphalt
The conditions used for the natural ageing of asphalt showed that throughout the 3 years
recorded for this project (2015-2018), the summer months (May-Aug) had the highest
temperature, rainfall and UV light exposure. The DRIFT spectra collected from the surface of
the naturally aged asphalt showed a linear trend in the absorbance measured at 1700 cm-1
and
the total solar exposure.
The quantification of the carbonyl absorbance band from the DRIFT spectra collected from
the surface of the naturally aged asphalt has identified an increase as the total solar exposure
increases. This has been carried out using single wavelength analysis at 1700 cm-1
. Single
wavelength analysis is a rapid method for quantifying absorbance bands and could be an
efficient traffic speed detection method. By comparing the difference between two single
wavelengths could increase the reliability of the size of the absorbance band by allowing
comparison to a ‘baseline’.
The analysis of the surface of the naturally aged asphalt showed a large amount of surface
contamination. This could be sediment from rain water evaporation and pollen from nearby
plants. Cracks were also visible in the bitumen regions on the surface of the naturally aged
asphalt, which could be the result of micro-cracks propagating into larger cracks on the
surface of the asphalt.
Mechanical property testing on the bitumen that was recovered from the naturally aged
asphalt slabs was carried out. The tests measured a 40 % decrease in penetration point, a 13 %
rise in softening point and a 13 % decrease in maximum cohesion after the 30 months of
natural ageing. However the last of these values is unreliable and should be supported by
further mechanical testing of the asphalt. These tests require the bitumen to be recovered from
the asphalt sample and therefore might be misleading with regard to the surface structure of
asphalt and the likelihood of the surface of an asphalt sample to fret.
Real road analysis-Cores and live roads
The analysis of real road surfaces has been carried out using a trolley built specifically to hold
the ExoScan handheld spectrometer at the appropriate distance from the road surface. Spectra
were collected that contain similar absorbance bands to those collected in the laboratory based
experiments. Carbonate and silicate absorbance band have been identified. The spectra
collected highlight the internal variability of the same road surface.
182
Data collection was carried out on the car park of the Transport Research Laboratory, at
different scan rates and a big difference in signal to noise was recorded with 64 scans, giving
good quality spectra at each location while 1 scan gave very poor spectra with a low signal to
noise ratio. The averaging of these 16, 1 scan spectra produced a very good quality spectrum,
however, repetition of this type of averaging is required in order to determine the effect of the
averaging on localised differences. This point needs to be considered when moving forward
towards collecting data from roads at traffic speed.
A series of Scottish cores were collected at known stages within the life span of the road and
therefore could be analysed for a chemical change with age more reliably. However, simply
measuring the time that a sample has been aged does not give a full picture of the exposure
conditions such as total solar exposure and trafficking. This was highlighted in the results
obtained from naturally aged asphalt which were presented in Chapter 5, where ageing was
related to the total solar exposure and not the total time of ageing. Another difference between
the lab based experiments and the experiments on cores from real roads is the effect of
trafficking on the asphalt. The lower change in absorbance at 1700 cm-1
could be as a result of
trafficking eroding the brittle, oxidised bitumen on the surface of the asphalt.
Future work
Further work for this project could involve collecting many more spectra from roads that have
a known age and of varying condition. This needs to be done extensively, and it is imperative
that the age is known. The ‘age’ of the road would include details about when the road was
first laid, along with any rejuvenation and resurfacing works that have been carried out on the
road throughout its service life. This would allow analysts at TRL to identify a chemical
change in the spectra that can correlate to physical condition or age of the road surface.
Collection of spectra from roads that are in a poor physical condition will allow these to be
compared to newer road surfaces. This comparison would allow the analyst to identify the
chemical markers that are consistent with a poor road condition.
Once a database of spectra has been collected, data analysis needs to be carried out in order to
try and correlate the mechanical properties of the asphalt to the chemical signature. This could
be done with single wavelength analysis, intensity ratios of two or more fixed wavenumbers
and calculation of indices, or baseline reflectivity measurements.
183
Single wavelength diodes could be used to target specific wavenumbers and can be used to
collect absorbance data from the road surface for specific functional groups. By comparing
this absorbance data to the condition of the road, a potential failure marker could be
developed. If such an experiment is successful it then needs to be trialled extensively at traffic
speed to ensure the reliability of data collection and the accuracy of the results.
A mechanical test needs to be developed that will measure the fretting potential of the asphalt.
This test could be a variation of a shear test,2 which works by measuring the force required to
shear the surface layers from the lower layers, or a pull off test which measures the force
required to pull an aggregate from the surface.3 Both of these methods have different issues
that make them unsuitable therefore development of a suitable test that is reliable and
represents the type of failure that the asphalt road surface would experience.
184
References
1 W. Zeng, S. Wu, L. Pang, H. Chen, J. Hu and Y. Sun, Research on ultra violet (UV) ageing
depths of asphalts, Constr., Build Mater., 160, 2018, 620-627.
2 British Standard 1377-7 (1990). Methods of test for soils for civil engineering purposes –
Part 7: Shear strength tests (total stress), BSI, London.
3 J. Zhang, A. K. Apeagyei, J. Grenfell and G. D. Airey, Experimental study of moisture
sensitivity of aggregate-bitumen bonding strength using a new pull-off test, in the 8th
RILEM
International Symposium on Testing and Characterisation of Sustainable and Innovative
Bituminous Materials, RILEM Book Series 11, DOI 10.1007/978-94-017-7342-3_58.