spectral imaging by synchronizing capture and illumination
TRANSCRIPT
Spectral imaging by synchronizing captureand illumination
Shoji Tominaga* and Takahiko Horiuchi
Division of Information Sciences, Graduate School of Advanced Integration Science, Chiba University, 1-33,Yayoi-cho, Inage-ku, Chiba 263-8522, Japan
*Corresponding author: [email protected]‑u.jp
Received May 25, 2012; revised July 15, 2012; accepted July 16, 2012;posted July 16, 2012 (Doc. ID 169374); published August 7, 2012
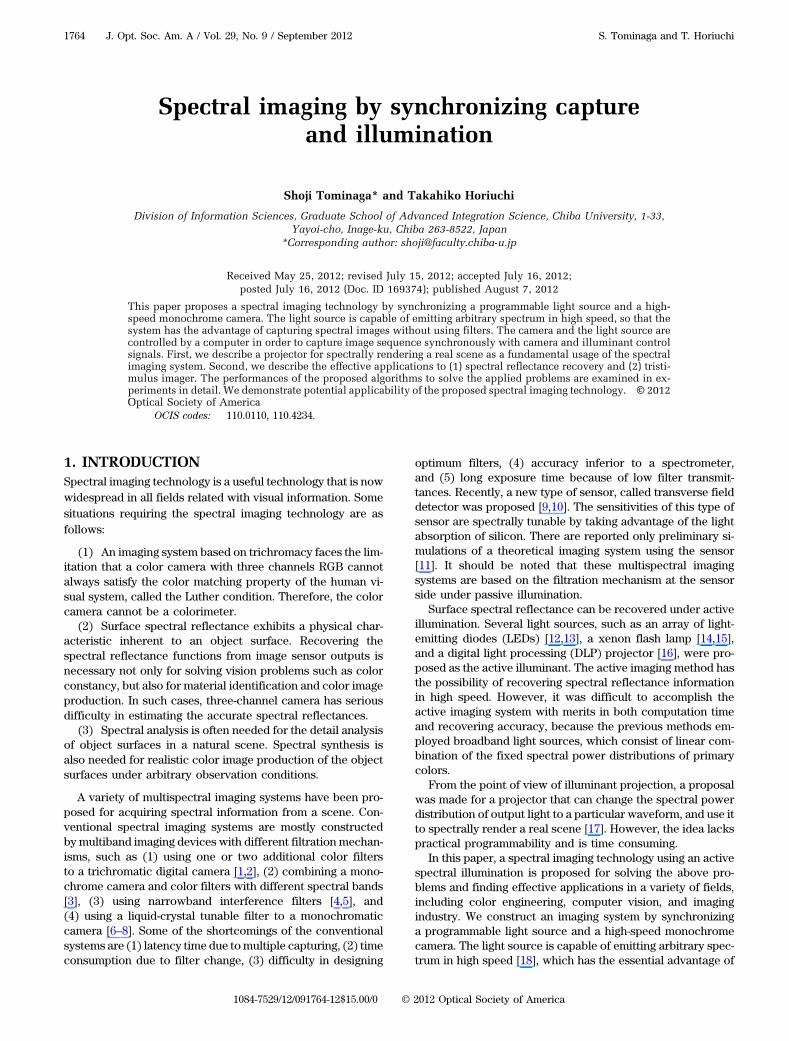
This paper proposes a spectral imaging technology by synchronizing a programmable light source and a high-speed monochrome camera. The light source is capable of emitting arbitrary spectrum in high speed, so that thesystem has the advantage of capturing spectral images without using filters. The camera and the light source arecontrolled by a computer in order to capture image sequence synchronously with camera and illuminant controlsignals. First, we describe a projector for spectrally rendering a real scene as a fundamental usage of the spectralimaging system. Second, we describe the effective applications to (1) spectral reflectance recovery and (2) tristi-mulus imager. The performances of the proposed algorithms to solve the applied problems are examined in ex-periments in detail. We demonstrate potential applicability of the proposed spectral imaging technology. © 2012Optical Society of America
OCIS codes: 110.0110, 110.4234.
1. INTRODUCTIONSpectral imaging technology is a useful technology that is nowwidespread in all fields related with visual information. Somesituations requiring the spectral imaging technology are asfollows:
(1) An imaging system based on trichromacy faces the lim-itation that a color camera with three channels RGB cannotalways satisfy the color matching property of the human vi-sual system, called the Luther condition. Therefore, the colorcamera cannot be a colorimeter.
(2) Surface spectral reflectance exhibits a physical char-acteristic inherent to an object surface. Recovering thespectral reflectance functions from image sensor outputs isnecessary not only for solving vision problems such as colorconstancy, but also for material identification and color imageproduction. In such cases, three-channel camera has seriousdifficulty in estimating the accurate spectral reflectances.
(3) Spectral analysis is often needed for the detail analysisof object surfaces in a natural scene. Spectral synthesis isalso needed for realistic color image production of the objectsurfaces under arbitrary observation conditions.
A variety of multispectral imaging systems have been pro-posed for acquiring spectral information from a scene. Con-ventional spectral imaging systems are mostly constructedby multiband imaging devices with different filtration mechan-isms, such as (1) using one or two additional color filtersto a trichromatic digital camera [1,2], (2) combining a mono-chrome camera and color filters with different spectral bands[3], (3) using narrowband interference filters [4,5], and(4) using a liquid-crystal tunable filter to a monochromaticcamera [6–8]. Some of the shortcomings of the conventionalsystems are (1) latency time due tomultiple capturing, (2) timeconsumption due to filter change, (3) difficulty in designing
optimum filters, (4) accuracy inferior to a spectrometer,and (5) long exposure time because of low filter transmit-tances. Recently, a new type of sensor, called transverse fielddetector was proposed [9,10]. The sensitivities of this type ofsensor are spectrally tunable by taking advantage of the lightabsorption of silicon. There are reported only preliminary si-mulations of a theoretical imaging system using the sensor[11]. It should be noted that these multispectral imagingsystems are based on the filtration mechanism at the sensorside under passive illumination.
Surface spectral reflectance can be recovered under activeillumination. Several light sources, such as an array of light-emitting diodes (LEDs) [12,13], a xenon flash lamp [14,15],and a digital light processing (DLP) projector [16], were pro-posed as the active illuminant. The active imaging method hasthe possibility of recovering spectral reflectance informationin high speed. However, it was difficult to accomplish theactive imaging system with merits in both computation timeand recovering accuracy, because the previous methods em-ployed broadband light sources, which consist of linear com-bination of the fixed spectral power distributions of primarycolors.
From the point of view of illuminant projection, a proposalwas made for a projector that can change the spectral powerdistribution of output light to a particular waveform, and use itto spectrally render a real scene [17]. However, the idea lackspractical programmability and is time consuming.
In this paper, a spectral imaging technology using an activespectral illumination is proposed for solving the above pro-blems and finding effective applications in a variety of fields,including color engineering, computer vision, and imagingindustry. We construct an imaging system by synchronizinga programmable light source and a high-speed monochromecamera. The light source is capable of emitting arbitrary spec-trum in high speed [18], which has the essential advantage of
1764 J. Opt. Soc. Am. A / Vol. 29, No. 9 / September 2012 S. Tominaga and T. Horiuchi
1084-7529/12/091764-12$15.00/0 © 2012 Optical Society of America
capturing spectral images without using filters in high framerates. As a result, we can acquire spectral information from ascene quickly and exactly. In this paper, we design the emis-sion of illuminant spectra in two modes of time sequence:steady-state and time-varying, and then devise an automaticcalibration mechanism to accurately produce the spectralfunctions.
First, we describe a projector for spectrally rendering a realscene as a fundamental usage of the spectral imaging system.Human visual assessment of object surface appearance wasoften performed under such limited light sources as illuminantA and illuminant D65. Here, we can observe three-dimensional(3D) object surfaces in a real scene under a light source witharbitrary spectral power distribution produced by the presentsystem. We show the accuracy of the produced illuminantsand the effectiveness of spectral rendering of a real scene.
Second, we describe the effective applications to (1) spec-tral reflectance recovery and (2) tristimulus imager, and theiralgorithms using this imaging system.
(1) The reflectance estimation is to solve an inverse pro-blem for camera outputs. The difficulty in solving the problemon the traditional systems is caused by the elimination of thecamera and illumination influences from the camera outputs.The programmable light source enables us to design arbitraryspectral functions. If the reciprocal function of the camera isprojected onto surfaces as a time sequence of spectrum, wecan obtain the spectral reflectance at the spatial resolution ofcamera pixels, without the computational difficulty of elimi-nating the camera and illumination influences. This direct re-flectance recovery has advantages in both computational timeand estimation accuracy over the previous methods employ-ing broadband light sources. A linear finite-dimensional modelof spectral reflectances is useful for accelerating the recoveryprocess.
(2) We propose a new technology for colorimetry, insteadof the traditional technology based on colorimeter and spec-trometer, where color values are obtained for a single broadarea on an object surface. If the color-matching functions areprojected onto object surfaces as spectral illuminants, the col-or values can be obtained at the spatial resolution of camerapixels directly from the camera outputs. We can realize ahigh-speed and high-spatial resolution measurement systemof object colors by using the integrated imaging system. Thissystem is called the tristimulus imager or the CIE-XYZimager. The colorimetric technique is based on the projectionof the color-matching functions as illuminant, while the tradi-tional colorimetry performs the color-matching computationfor light reflected from an object surface.
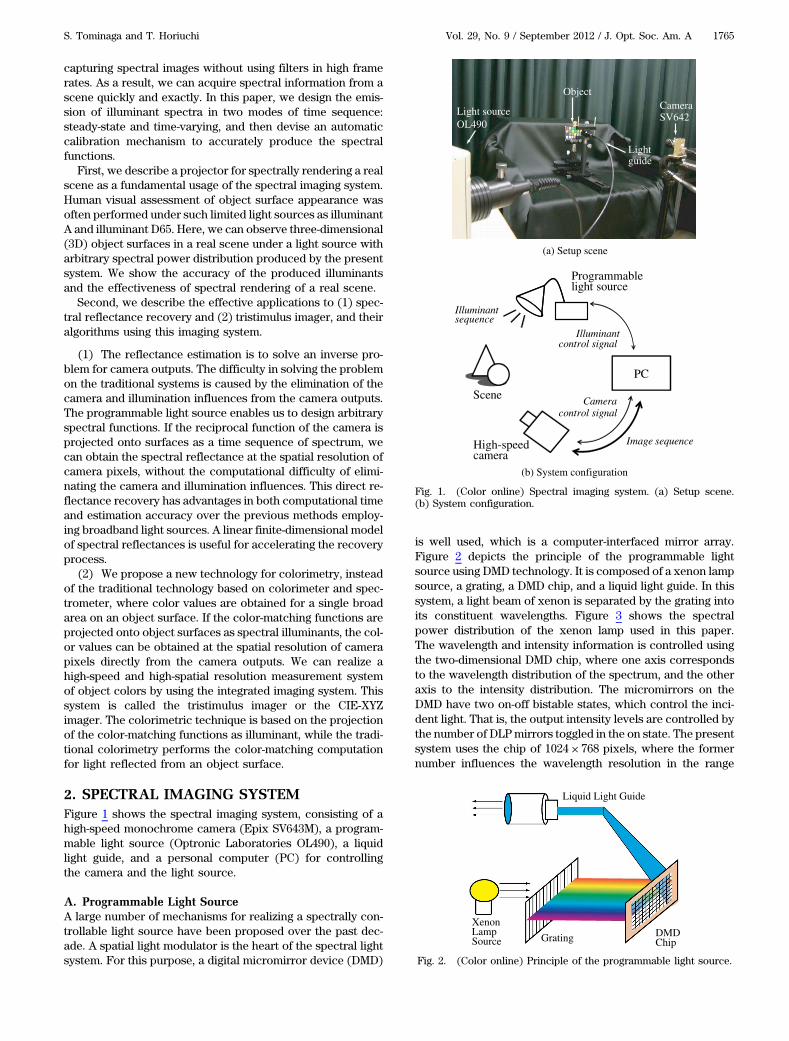
2. SPECTRAL IMAGING SYSTEMFigure 1 shows the spectral imaging system, consisting of ahigh-speed monochrome camera (Epix SV643M), a program-mable light source (Optronic Laboratories OL490), a liquidlight guide, and a personal computer (PC) for controllingthe camera and the light source.
A. Programmable Light SourceA large number of mechanisms for realizing a spectrally con-trollable light source have been proposed over the past dec-ade. A spatial light modulator is the heart of the spectral lightsystem. For this purpose, a digital micromirror device (DMD)
is well used, which is a computer-interfaced mirror array.Figure 2 depicts the principle of the programmable lightsource using DMD technology. It is composed of a xenon lampsource, a grating, a DMD chip, and a liquid light guide. In thissystem, a light beam of xenon is separated by the grating intoits constituent wavelengths. Figure 3 shows the spectralpower distribution of the xenon lamp used in this paper.The wavelength and intensity information is controlled usingthe two-dimensional DMD chip, where one axis correspondsto the wavelength distribution of the spectrum, and the otheraxis to the intensity distribution. The micromirrors on theDMD have two on-off bistable states, which control the inci-dent light. That is, the output intensity levels are controlled bythe number of DLPmirrors toggled in the on state. The presentsystem uses the chip of 1024 × 768 pixels, where the formernumber influences the wavelength resolution in the range
Light sourceOL490
Lightguide
CameraSV642
Object
Illuminantsequence
Illuminantcontrol signal
Cameracontrol signal
Image sequenceHigh-speedcamera
Scene
Programmablelight source
PC
(a) Setup scene
(b) System configuration
Fig. 1. (Color online) Spectral imaging system. (a) Setup scene.(b) System configuration.
XenonLampSource Grating
Liquid Light Guide
DMDChip
Fig. 2. (Color online) Principle of the programmable light source.
S. Tominaga and T. Horiuchi Vol. 29, No. 9 / September 2012 / J. Opt. Soc. Am. A 1765
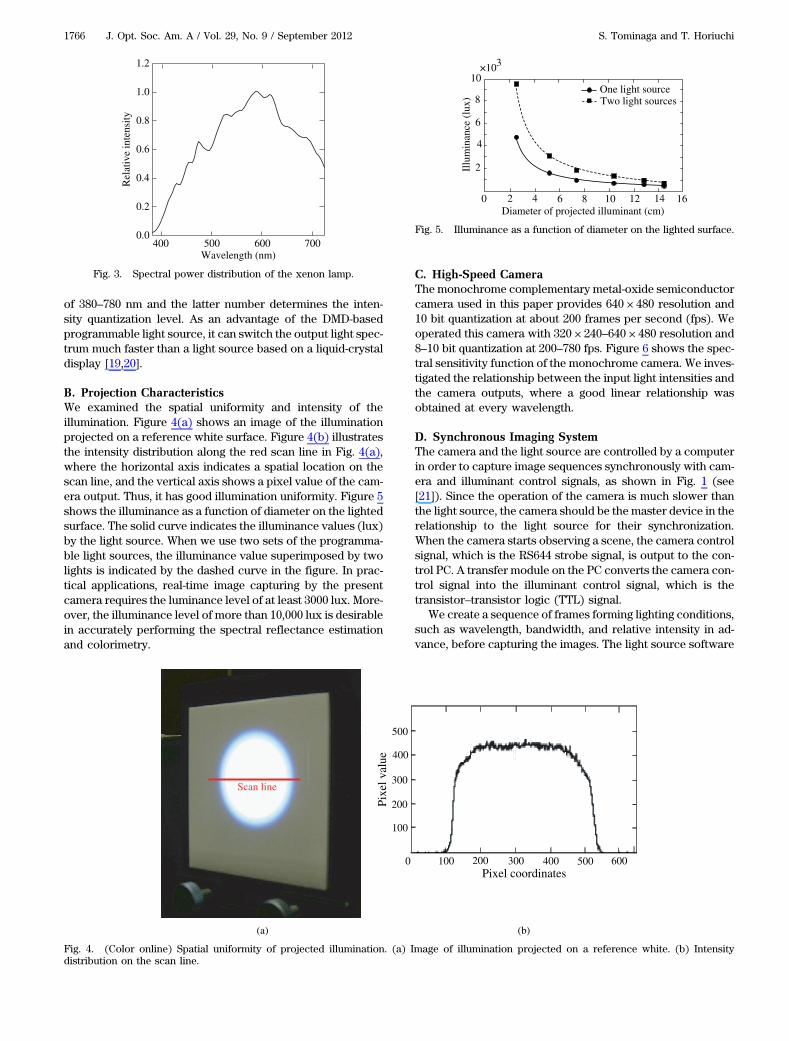
of 380–780 nm and the latter number determines the inten-sity quantization level. As an advantage of the DMD-basedprogrammable light source, it can switch the output light spec-trum much faster than a light source based on a liquid-crystaldisplay [19,20].
B. Projection CharacteristicsWe examined the spatial uniformity and intensity of theillumination. Figure 4(a) shows an image of the illuminationprojected on a reference white surface. Figure 4(b) illustratesthe intensity distribution along the red scan line in Fig. 4(a),where the horizontal axis indicates a spatial location on thescan line, and the vertical axis shows a pixel value of the cam-era output. Thus, it has good illumination uniformity. Figure 5shows the illuminance as a function of diameter on the lightedsurface. The solid curve indicates the illuminance values (lux)by the light source. When we use two sets of the programma-ble light sources, the illuminance value superimposed by twolights is indicated by the dashed curve in the figure. In prac-tical applications, real-time image capturing by the presentcamera requires the luminance level of at least 3000 lux. More-over, the illuminance level of more than 10,000 lux is desirablein accurately performing the spectral reflectance estimationand colorimetry.
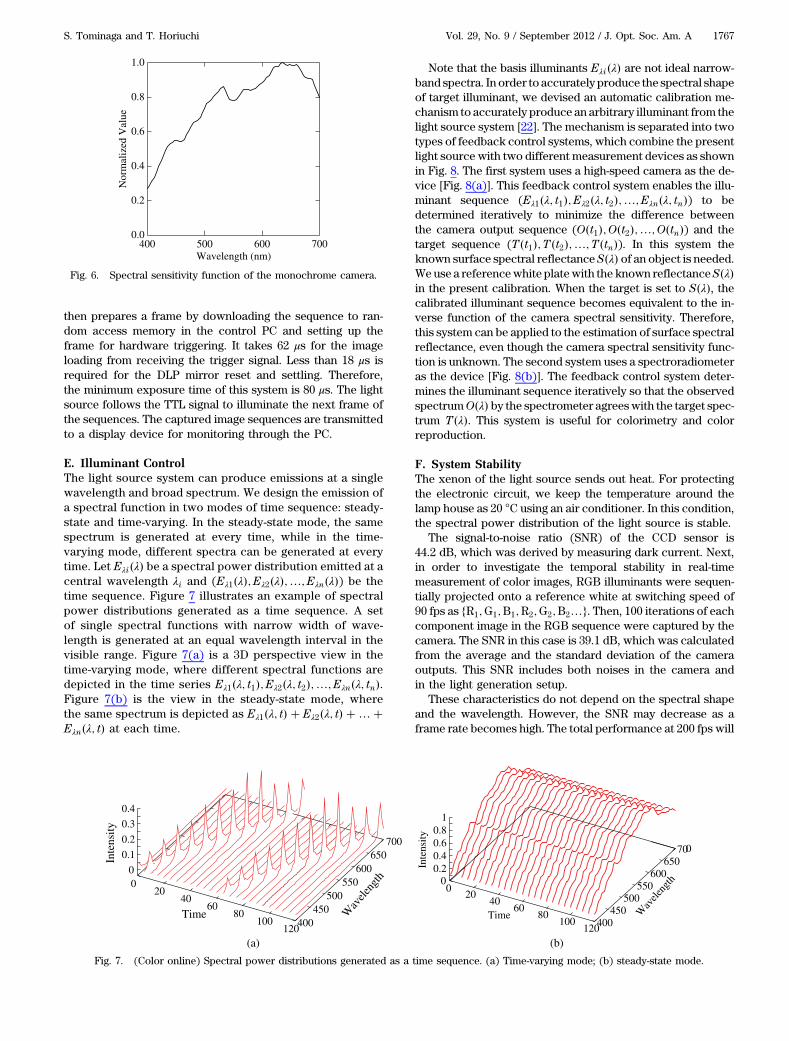
C. High-Speed CameraThe monochrome complementary metal-oxide semiconductorcamera used in this paper provides 640 × 480 resolution and10 bit quantization at about 200 frames per second (fps). Weoperated this camera with 320 × 240–640 × 480 resolution and8–10 bit quantization at 200–780 fps. Figure 6 shows the spec-tral sensitivity function of the monochrome camera. We inves-tigated the relationship between the input light intensities andthe camera outputs, where a good linear relationship wasobtained at every wavelength.
D. Synchronous Imaging SystemThe camera and the light source are controlled by a computerin order to capture image sequences synchronously with cam-era and illuminant control signals, as shown in Fig. 1 (see[21]). Since the operation of the camera is much slower thanthe light source, the camera should be the master device in therelationship to the light source for their synchronization.When the camera starts observing a scene, the camera controlsignal, which is the RS644 strobe signal, is output to the con-trol PC. A transfer module on the PC converts the camera con-trol signal into the illuminant control signal, which is thetransistor–transistor logic (TTL) signal.
We create a sequence of frames forming lighting conditions,such as wavelength, bandwidth, and relative intensity in ad-vance, before capturing the images. The light source software
400 500 600 7000.0
0.2
0.4
0.6
0.8
1.0
1.2
Rel
ativ
e in
tens
ity
Wavelength (nm)
Fig. 3. Spectral power distribution of the xenon lamp.
Scan line
100
200
300
400
500
100 200 300 400 500 600
Pixe
l val
ue
Pixel coordinates0
(a) (b)
Fig. 4. (Color online) Spatial uniformity of projected illumination. (a) Image of illumination projected on a reference white. (b) Intensitydistribution on the scan line.
0 62 4 8 10 12 14 16Diameter of projected illuminant (cm)
2
4
6
8
10×103
Illu
min
ance
(lu
x)
One light sourceTwo light sources
Fig. 5. Illuminance as a function of diameter on the lighted surface.
1766 J. Opt. Soc. Am. A / Vol. 29, No. 9 / September 2012 S. Tominaga and T. Horiuchi
then prepares a frame by downloading the sequence to ran-dom access memory in the control PC and setting up theframe for hardware triggering. It takes 62 μs for the imageloading from receiving the trigger signal. Less than 18 μs isrequired for the DLP mirror reset and settling. Therefore,the minimum exposure time of this system is 80 μs. The lightsource follows the TTL signal to illuminate the next frame ofthe sequences. The captured image sequences are transmittedto a display device for monitoring through the PC.
E. Illuminant ControlThe light source system can produce emissions at a singlewavelength and broad spectrum. We design the emission ofa spectral function in two modes of time sequence: steady-state and time-varying. In the steady-state mode, the samespectrum is generated at every time, while in the time-varying mode, different spectra can be generated at everytime. Let Eλi�λ� be a spectral power distribution emitted at acentral wavelength λi and (Eλ1�λ�; Eλ2�λ�;…; Eλn�λ�) be thetime sequence. Figure 7 illustrates an example of spectralpower distributions generated as a time sequence. A setof single spectral functions with narrow width of wave-length is generated at an equal wavelength interval in thevisible range. Figure 7(a) is a 3D perspective view in thetime-varying mode, where different spectral functions aredepicted in the time series Eλ1�λ; t1�; Eλ2�λ; t2�;…; Eλn�λ; tn�.Figure 7(b) is the view in the steady-state mode, wherethe same spectrum is depicted as Eλ1�λ; t� � Eλ2�λ; t� �…�Eλn�λ; t� at each time.
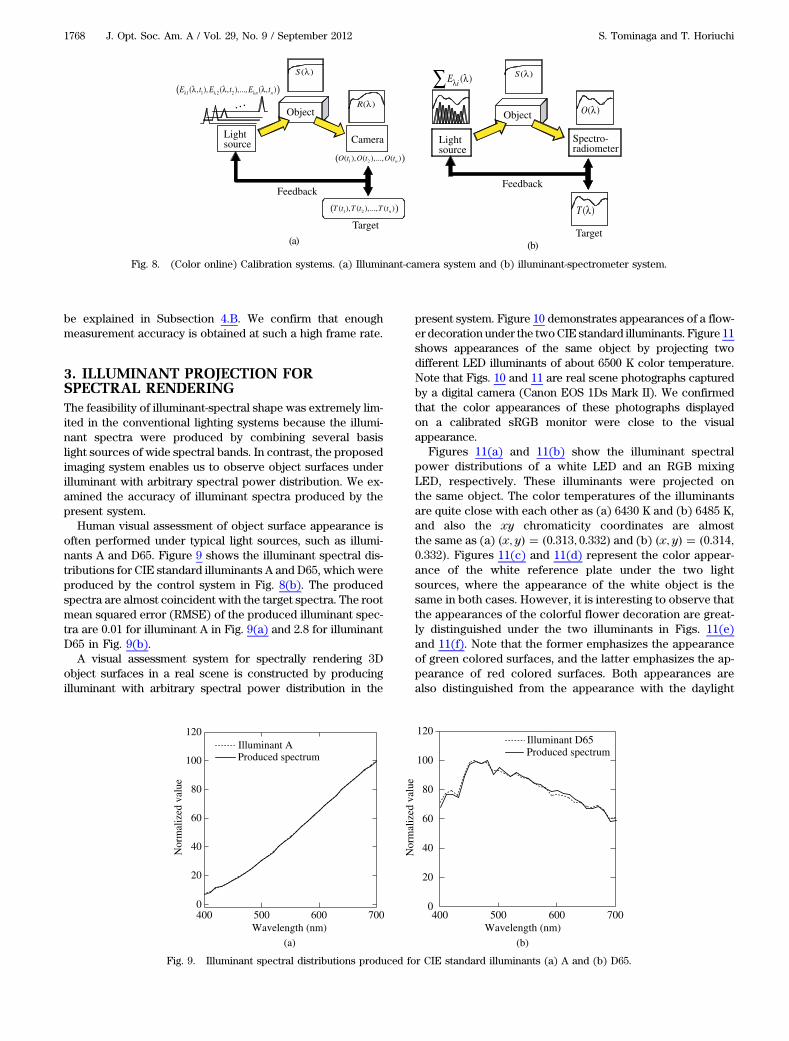
Note that the basis illuminants Eλi�λ� are not ideal narrow-band spectra. In order to accurately produce the spectral shapeof target illuminant, we devised an automatic calibration me-chanism to accurately produce an arbitrary illuminant from thelight source system [22]. The mechanism is separated into twotypes of feedback control systems, which combine the presentlight source with two different measurement devices as shownin Fig. 8. The first system uses a high-speed camera as the de-vice [Fig. 8(a)]. This feedback control system enables the illu-minant sequence (Eλ1�λ; t1�; Eλ2�λ; t2�;…; Eλn�λ; tn�) to bedetermined iteratively to minimize the difference betweenthe camera output sequence (O�t1�; O�t2�;…; O�tn�) and thetarget sequence (T�t1�; T�t2�;…; T�tn�). In this system theknown surface spectral reflectance S�λ� of an object is needed.We use a referencewhite platewith the known reflectance S�λ�in the present calibration. When the target is set to S�λ�, thecalibrated illuminant sequence becomes equivalent to the in-verse function of the camera spectral sensitivity. Therefore,this system can be applied to the estimation of surface spectralreflectance, even though the camera spectral sensitivity func-tion is unknown. The second system uses a spectroradiometeras the device [Fig. 8(b)]. The feedback control system deter-mines the illuminant sequence iteratively so that the observedspectrumO�λ� by the spectrometer agreeswith the target spec-trum T�λ�. This system is useful for colorimetry and colorreproduction.
F. System StabilityThe xenon of the light source sends out heat. For protectingthe electronic circuit, we keep the temperature around thelamp house as 20 °C using an air conditioner. In this condition,the spectral power distribution of the light source is stable.
The signal-to-noise ratio (SNR) of the CCD sensor is44.2 dB, which was derived by measuring dark current. Next,in order to investigate the temporal stability in real-timemeasurement of color images, RGB illuminants were sequen-tially projected onto a reference white at switching speed of90 fps as fR1;G1;B1;R2;G2;B2…g. Then, 100 iterations of eachcomponent image in the RGB sequence were captured by thecamera. The SNR in this case is 39.1 dB, which was calculatedfrom the average and the standard deviation of the cameraoutputs. This SNR includes both noises in the camera andin the light generation setup.
These characteristics do not depend on the spectral shapeand the wavelength. However, the SNR may decrease as aframe rate becomes high. The total performance at 200 fps will
Wavelength (nm)
Nor
mal
ized
Val
ue
400 500 600 7000.0
0.2
0.4
0.6
0.8
1.0
Fig. 6. Spectral sensitivity function of the monochrome camera.
0 20
40 60
80 100
120 400 450
500 550
600 650
700
0
0.1
0.2
0.3
0.4
Time
(a) (b)
Wav
eleng
th
Inte
nsity
0 20
40 60
80 100
120 400 450
500 550
600 650
700
0.2 0.4 0.6 0.8
1
0
Time Wav
eleng
th
Inte
nsity
Fig. 7. (Color online) Spectral power distributions generated as a time sequence. (a) Time-varying mode; (b) steady-state mode.
S. Tominaga and T. Horiuchi Vol. 29, No. 9 / September 2012 / J. Opt. Soc. Am. A 1767
be explained in Subsection 4.B. We confirm that enoughmeasurement accuracy is obtained at such a high frame rate.
3. ILLUMINANT PROJECTION FORSPECTRAL RENDERINGThe feasibility of illuminant-spectral shape was extremely lim-ited in the conventional lighting systems because the illumi-nant spectra were produced by combining several basislight sources of wide spectral bands. In contrast, the proposedimaging system enables us to observe object surfaces underilluminant with arbitrary spectral power distribution. We ex-amined the accuracy of illuminant spectra produced by thepresent system.
Human visual assessment of object surface appearance isoften performed under typical light sources, such as illumi-nants A and D65. Figure 9 shows the illuminant spectral dis-tributions for CIE standard illuminants A and D65, which wereproduced by the control system in Fig. 8(b). The producedspectra are almost coincident with the target spectra. The rootmean squared error (RMSE) of the produced illuminant spec-tra are 0.01 for illuminant A in Fig. 9(a) and 2.8 for illuminantD65 in Fig. 9(b).
A visual assessment system for spectrally rendering 3Dobject surfaces in a real scene is constructed by producingilluminant with arbitrary spectral power distribution in the
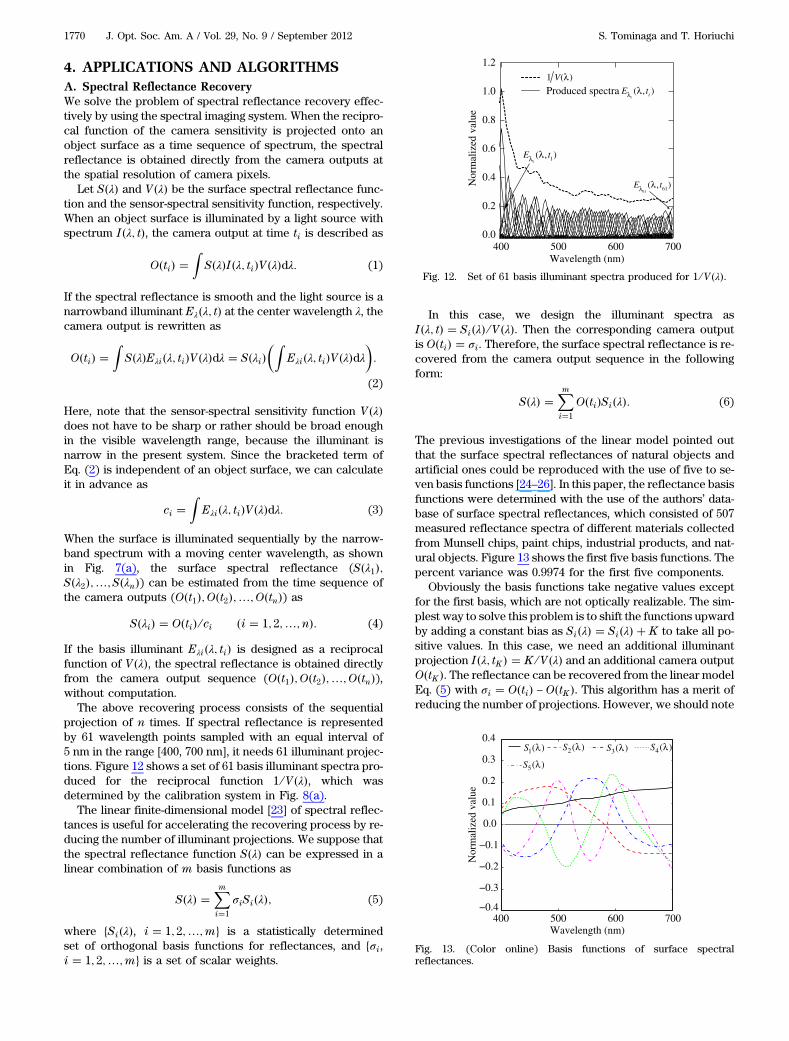
present system. Figure 10 demonstrates appearances of a flow-er decoration under the twoCIE standard illuminants. Figure 11shows appearances of the same object by projecting twodifferent LED illuminants of about 6500 K color temperature.Note that Figs. 10 and 11 are real scene photographs capturedby a digital camera (Canon EOS 1Ds Mark II). We confirmedthat the color appearances of these photographs displayedon a calibrated sRGB monitor were close to the visualappearance.
Figures 11(a) and 11(b) show the illuminant spectralpower distributions of a white LED and an RGB mixingLED, respectively. These illuminants were projected onthe same object. The color temperatures of the illuminantsare quite close with each other as (a) 6430 K and (b) 6485 K,and also the xy chromaticity coordinates are almostthe same as (a) �x; y� � �0.313; 0.332� and (b) �x; y� � �0.314;0.332�. Figures 11(c) and 11(d) represent the color appear-ance of the white reference plate under the two lightsources, where the appearance of the white object is thesame in both cases. However, it is interesting to observe thatthe appearances of the colorful flower decoration are great-ly distinguished under the two illuminants in Figs. 11(e)and 11(f). Note that the former emphasizes the appearanceof green colored surfaces, and the latter emphasizes the ap-pearance of red colored surfaces. Both appearances arealso distinguished from the appearance with the daylight
Lightsource
Object
Camera
Target
(a) (b)
Feedback
( )1 1 2 2( , ), ( , ),..., ( , )n nE t E t E tλ λ λλ λ λ
( )1 2( ), ( ),..., ( )nO t O t O t
( )1 2( ), ( ),..., ( )nT t T t T t
( )R λ
( )S λ
Lightsource
Object
Spectro-radiometer
Target
Feedback
( )O λ
( )T λ
( )iEλ λ∑ ( )S λ
Fig. 8. (Color online) Calibration systems. (a) Illuminant-camera system and (b) illuminant-spectrometer system.
Wavelength (nm)
(a) (b)
Nor
mal
ized
val
ue
400 500 600 7000
20
40
60
80
100
120Illuminant AProduced spectrum
Wavelength (nm)
Nor
mal
ized
val
ue
400 500 600 7000
20
40
60
80
100
120Illuminant D65Produced spectrum
Fig. 9. Illuminant spectral distributions produced for CIE standard illuminants (a) A and (b) D65.
1768 J. Opt. Soc. Am. A / Vol. 29, No. 9 / September 2012 S. Tominaga and T. Horiuchi
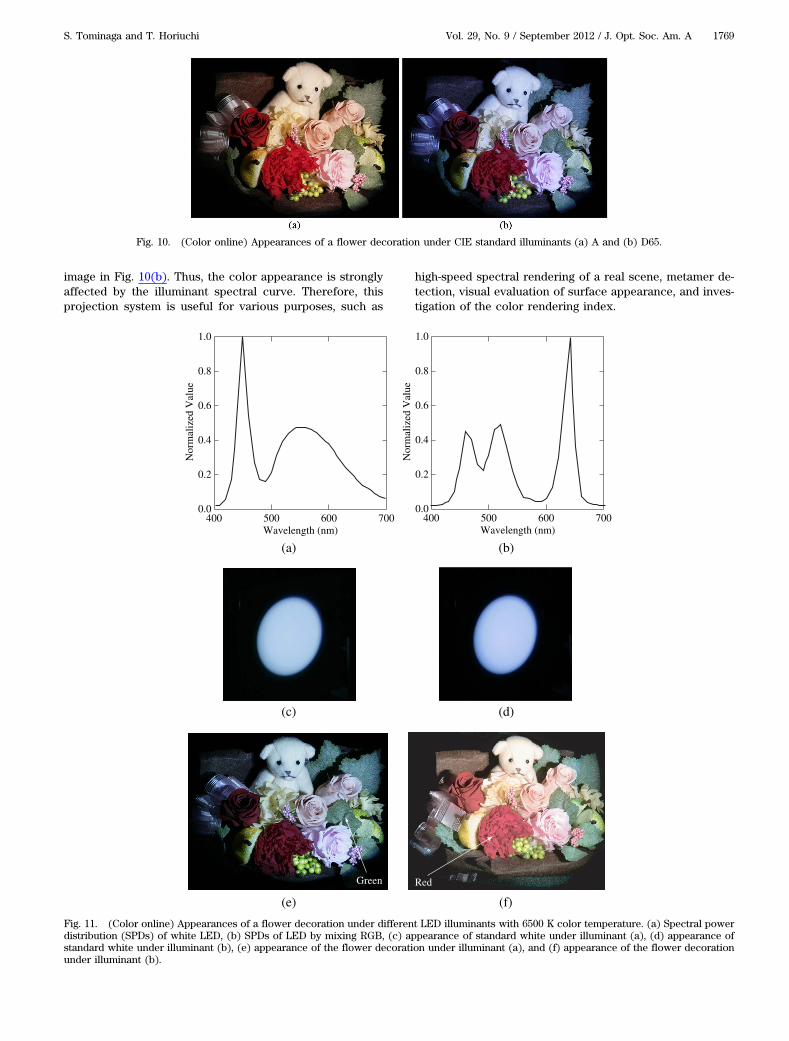
image in Fig. 10(b). Thus, the color appearance is stronglyaffected by the illuminant spectral curve. Therefore, thisprojection system is useful for various purposes, such as
high-speed spectral rendering of a real scene, metamer de-tection, visual evaluation of surface appearance, and inves-tigation of the color rendering index.
Fig. 10. (Color online) Appearances of a flower decoration under CIE standard illuminants (a) A and (b) D65.
Wavelength (nm)
Nor
mal
ized
Val
ue
400 500 600 7000.0
0.2
0.4
0.6
0.8
1.0
Wavelength (nm)
Nor
mal
ized
Val
ue
400 500 600 7000.0
0.2
0.4
0.6
0.8
1.0
Green Red
(e) (f)
(c) (d)
(a) (b)
Fig. 11. (Color online) Appearances of a flower decoration under different LED illuminants with 6500 K color temperature. (a) Spectral powerdistribution (SPDs) of white LED, (b) SPDs of LED by mixing RGB, (c) appearance of standard white under illuminant (a), (d) appearance ofstandard white under illuminant (b), (e) appearance of the flower decoration under illuminant (a), and (f) appearance of the flower decorationunder illuminant (b).
S. Tominaga and T. Horiuchi Vol. 29, No. 9 / September 2012 / J. Opt. Soc. Am. A 1769
4. APPLICATIONS AND ALGORITHMSA. Spectral Reflectance RecoveryWe solve the problem of spectral reflectance recovery effec-tively by using the spectral imaging system. When the recipro-cal function of the camera sensitivity is projected onto anobject surface as a time sequence of spectrum, the spectralreflectance is obtained directly from the camera outputs atthe spatial resolution of camera pixels.
Let S�λ� and V�λ� be the surface spectral reflectance func-tion and the sensor-spectral sensitivity function, respectively.When an object surface is illuminated by a light source withspectrum I�λ; t�, the camera output at time ti is described as
O�ti� �Z
S�λ�I�λ; ti�V�λ�dλ: (1)
If the spectral reflectance is smooth and the light source is anarrowband illuminant Eλ�λ; t� at the center wavelength λ, thecamera output is rewritten as
O�ti� �Z
S�λ�Eλi�λ; ti�V�λ�dλ � S�λi��Z
Eλi�λ; ti�V�λ�dλ�:
(2)
Here, note that the sensor-spectral sensitivity function V�λ�does not have to be sharp or rather should be broad enoughin the visible wavelength range, because the illuminant isnarrow in the present system. Since the bracketed term ofEq. (2) is independent of an object surface, we can calculateit in advance as
ci �Z
Eλi�λ; ti�V�λ�dλ: (3)
When the surface is illuminated sequentially by the narrow-band spectrum with a moving center wavelength, as shownin Fig. 7(a), the surface spectral reflectance (S�λ1�;S�λ2�;…; S�λn�) can be estimated from the time sequence ofthe camera outputs (O�t1�; O�t2�;…; O�tn�) as
S�λi� � O�ti� ∕ ci �i � 1; 2;…; n�: (4)
If the basis illuminant Eλi�λ; ti� is designed as a reciprocalfunction of V�λ�, the spectral reflectance is obtained directlyfrom the camera output sequence (O�t1�; O�t2�;…; O�tn�),without computation.
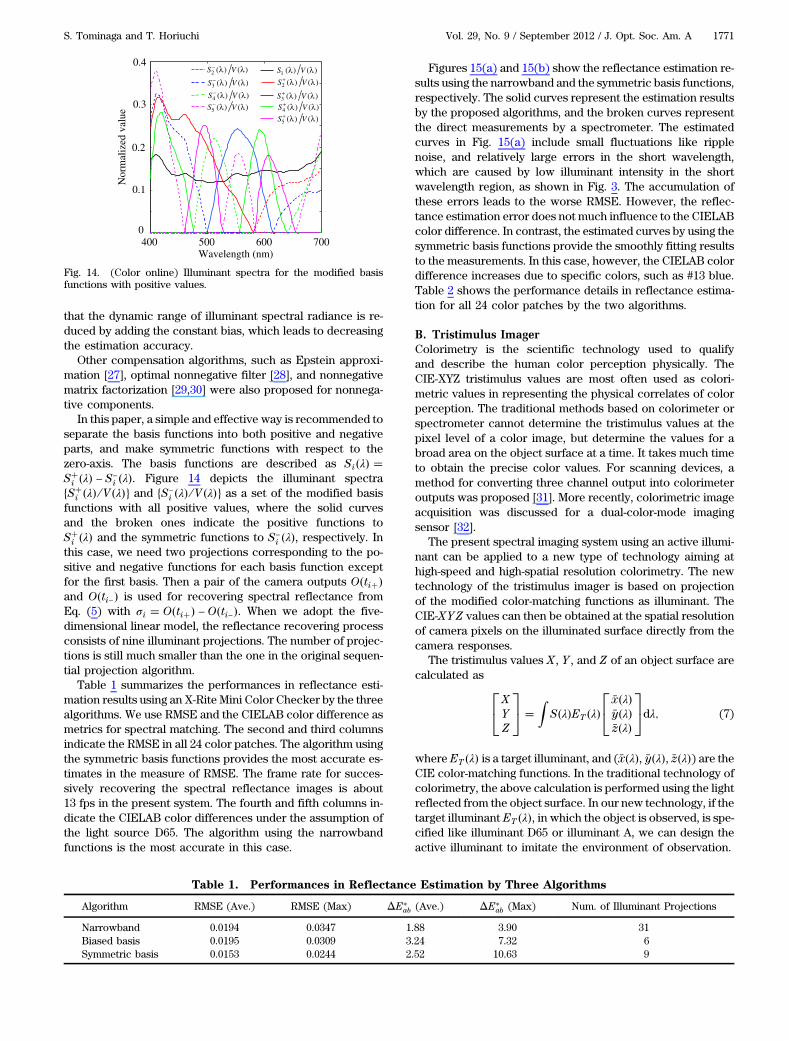
The above recovering process consists of the sequentialprojection of n times. If spectral reflectance is representedby 61 wavelength points sampled with an equal interval of5 nm in the range [400, 700 nm], it needs 61 illuminant projec-tions. Figure 12 shows a set of 61 basis illuminant spectra pro-duced for the reciprocal function 1 ∕V�λ�, which wasdetermined by the calibration system in Fig. 8(a).
The linear finite-dimensional model [23] of spectral reflec-tances is useful for accelerating the recovering process by re-ducing the number of illuminant projections. We suppose thatthe spectral reflectance function S�λ� can be expressed in alinear combination of m basis functions as
S�λ� �Xmi�1
σiSi�λ�; (5)
where {Si�λ�, i � 1; 2;…;m} is a statistically determinedset of orthogonal basis functions for reflectances, and {σi,i � 1; 2;…;m} is a set of scalar weights.
In this case, we design the illuminant spectra asI�λ; t� � Si�λ� ∕V�λ�. Then the corresponding camera outputis O�ti� � σi. Therefore, the surface spectral reflectance is re-covered from the camera output sequence in the followingform:
S�λ� �Xmi�1
O�ti�Si�λ�: (6)
The previous investigations of the linear model pointed outthat the surface spectral reflectances of natural objects andartificial ones could be reproduced with the use of five to se-ven basis functions [24–26]. In this paper, the reflectance basisfunctions were determined with the use of the authors’ data-base of surface spectral reflectances, which consisted of 507measured reflectance spectra of different materials collectedfrom Munsell chips, paint chips, industrial products, and nat-ural objects. Figure 13 shows the first five basis functions. Thepercent variance was 0.9974 for the first five components.
Obviously the basis functions take negative values exceptfor the first basis, which are not optically realizable. The sim-plest way to solve this problem is to shift the functions upwardby adding a constant bias as Si�λ� � Si�λ� � K to take all po-sitive values. In this case, we need an additional illuminantprojection I�λ; tK � � K ∕V�λ� and an additional camera outputO�tK �. The reflectance can be recovered from the linear modelEq. (5) with σi � O�ti� − O�tK �. This algorithm has a merit ofreducing the number of projections. However, we should note
400 500 600 7000.0
0.2
0.4
0.6
0.8
1.0
1.2
Wavelength (nm)
Nor
mal
ized
val
ue
Produced spectra1 ( )V λ
6161( , )E tλ λ
11( , )E tλ λ
( , )i
iE tλ λ
Fig. 12. Set of 61 basis illuminant spectra produced for 1 ∕ V�λ�.
−0.4
−0.3
−0.2
−0.1
0.0
0.1
0.2
0.3
0.4
Nor
mal
ized
val
ue
400 500 600 700Wavelength (nm)
1( )S λ 2( )S λ 3( )S λ 4( )S λ
5( )S λ
Fig. 13. (Color online) Basis functions of surface spectralreflectances.
1770 J. Opt. Soc. Am. A / Vol. 29, No. 9 / September 2012 S. Tominaga and T. Horiuchi
that the dynamic range of illuminant spectral radiance is re-duced by adding the constant bias, which leads to decreasingthe estimation accuracy.
Other compensation algorithms, such as Epstein approxi-mation [27], optimal nonnegative filter [28], and nonnegativematrix factorization [29,30] were also proposed for nonnega-tive components.
In this paper, a simple and effective way is recommended toseparate the basis functions into both positive and negativeparts, and make symmetric functions with respect to thezero-axis. The basis functions are described as Si�λ� �S�i �λ� − S−
i �λ�. Figure 14 depicts the illuminant spectra{S�
i �λ� ∕V�λ�} and {S−
i �λ� ∕V�λ�} as a set of the modified basisfunctions with all positive values, where the solid curvesand the broken ones indicate the positive functions toS�i �λ� and the symmetric functions to S−
i �λ�, respectively. Inthis case, we need two projections corresponding to the po-sitive and negative functions for each basis function exceptfor the first basis. Then a pair of the camera outputs O�ti��and O�ti−� is used for recovering spectral reflectance fromEq. (5) with σi � O�ti�� − O�ti−�. When we adopt the five-dimensional linear model, the reflectance recovering processconsists of nine illuminant projections. The number of projec-tions is still much smaller than the one in the original sequen-tial projection algorithm.
Table 1 summarizes the performances in reflectance esti-mation results using an X-Rite Mini Color Checker by the threealgorithms. We use RMSE and the CIELAB color difference asmetrics for spectral matching. The second and third columnsindicate the RMSE in all 24 color patches. The algorithm usingthe symmetric basis functions provides the most accurate es-timates in the measure of RMSE. The frame rate for succes-sively recovering the spectral reflectance images is about13 fps in the present system. The fourth and fifth columns in-dicate the CIELAB color differences under the assumption ofthe light source D65. The algorithm using the narrowbandfunctions is the most accurate in this case.
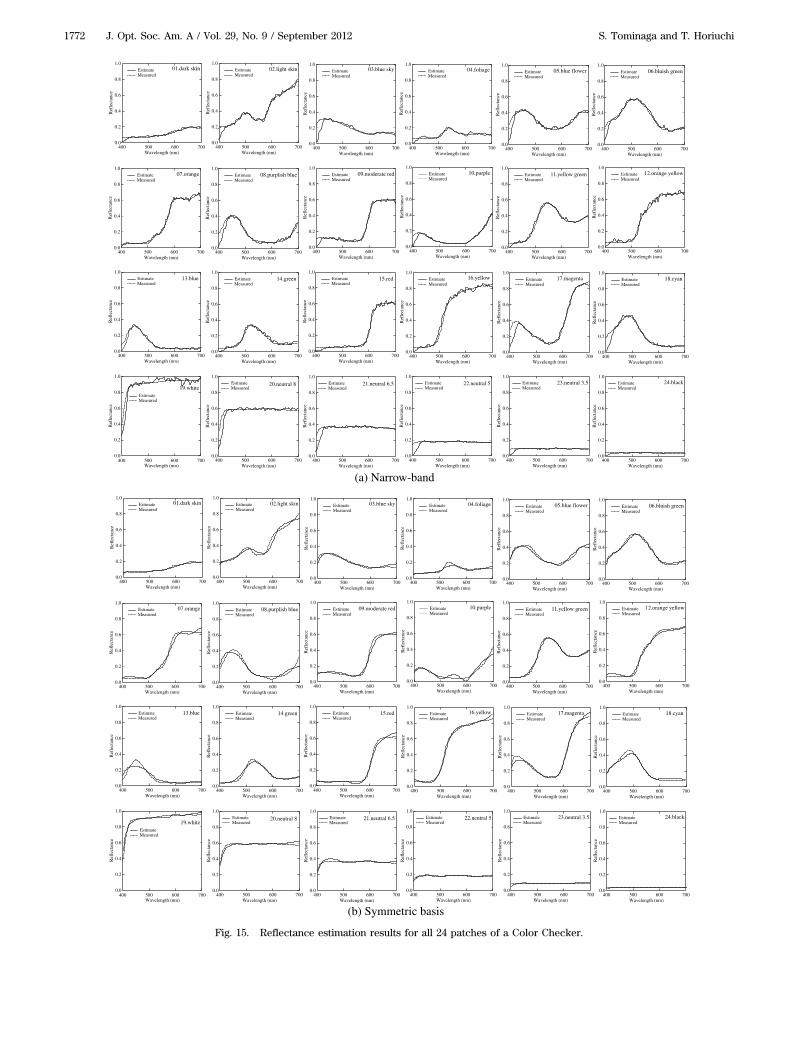
Figures 15(a) and 15(b) show the reflectance estimation re-sults using the narrowband and the symmetric basis functions,respectively. The solid curves represent the estimation resultsby the proposed algorithms, and the broken curves representthe direct measurements by a spectrometer. The estimatedcurves in Fig. 15(a) include small fluctuations like ripplenoise, and relatively large errors in the short wavelength,which are caused by low illuminant intensity in the shortwavelength region, as shown in Fig. 3. The accumulation ofthese errors leads to the worse RMSE. However, the reflec-tance estimation error does not much influence to the CIELABcolor difference. In contrast, the estimated curves by using thesymmetric basis functions provide the smoothly fitting resultsto the measurements. In this case, however, the CIELAB colordifference increases due to specific colors, such as #13 blue.Table 2 shows the performance details in reflectance estima-tion for all 24 color patches by the two algorithms.
B. Tristimulus ImagerColorimetry is the scientific technology used to qualifyand describe the human color perception physically. TheCIE-XYZ tristimulus values are most often used as colori-metric values in representing the physical correlates of colorperception. The traditional methods based on colorimeter orspectrometer cannot determine the tristimulus values at thepixel level of a color image, but determine the values for abroad area on the object surface at a time. It takes much timeto obtain the precise color values. For scanning devices, amethod for converting three channel output into colorimeteroutputs was proposed [31]. More recently, colorimetric imageacquisition was discussed for a dual-color-mode imagingsensor [32].
The present spectral imaging system using an active illumi-nant can be applied to a new type of technology aiming athigh-speed and high-spatial resolution colorimetry. The newtechnology of the tristimulus imager is based on projectionof the modified color-matching functions as illuminant. TheCIE-XYZ values can then be obtained at the spatial resolutionof camera pixels on the illuminated surface directly from thecamera responses.
The tristimulus values X , Y , and Z of an object surface arecalculated as
24XYZ
35 �
ZS�λ�ET �λ�
24 x�λ�y�λ�z�λ�
35dλ; (7)
where ET �λ� is a target illuminant, and (x�λ�, y�λ�, z�λ�) are theCIE color-matching functions. In the traditional technology ofcolorimetry, the above calculation is performed using the lightreflected from the object surface. In our new technology, if thetarget illuminant ET �λ�, in which the object is observed, is spe-cified like illuminant D65 or illuminant A, we can design theactive illuminant to imitate the environment of observation.
0
0.1
0.2
0.3
0.4
Nor
mal
ized
val
ue
400 500 600 700Wavelength (nm)
2 ( ) ( )S Vλ λ−
3 ( ) ( )S Vλ λ−
4 ( ) ( )S Vλ λ−
5 ( ) ( )S Vλ λ−
2 ( ) ( )S Vλ λ+
3 ( ) ( )S Vλ λ+
4 ( ) ( )S Vλ λ+
5 ( ) ( )S Vλ λ+
1 ( ) ( )S Vλ λ
Fig. 14. (Color online) Illuminant spectra for the modified basisfunctions with positive values.
Table 1. Performances in Reflectance Estimation by Three Algorithms
Algorithm RMSE (Ave.) RMSE (Max) ΔE�ab (Ave.) ΔE�
ab (Max) Num. of Illuminant Projections
Narrowband 0.0194 0.0347 1.88 3.90 31Biased basis 0.0195 0.0309 3.24 7.32 6Symmetric basis 0.0153 0.0244 2.52 10.63 9
S. Tominaga and T. Horiuchi Vol. 29, No. 9 / September 2012 / J. Opt. Soc. Am. A 1771
Wavelength (nm)
Ref
lect
ance
400 500 600 7000.0
0.2
0.4
0.6
0.8
1.0EstimateMeasured
01.dark skin
Wavelength (nm)
Ref
lect
ance
400 500 600 7000.0
0.2
0.4
0.6
0.8
1.0EstimateMeasured
02.light skin
Wavelength (nm)
Ref
lect
ance
400 500 600 7000.0
0.2
0.4
0.6
0.8
1.0EstimateMeasured
03.blue sky
Wavelength (nm)
Ref
lect
ance
400 500 600 7000.0
0.2
0.4
0.6
0.8
1.0EstimateMeasured
04.foliage
Wavelength (nm)
Ref
lect
ance
400 500 600 7000.0
0.2
0.4
0.6
0.8
1.0EstimateMeasured
05.blue flower
Wavelength (nm)
Ref
lect
ance
400 500 600 7000.0
0.2
0.4
0.6
0.8
1.0EstimateMeasured
06.bluish green
Wavelength (nm)
Ref
lect
ance
400 500 600 7000.0
0.2
0.4
0.6
0.8
1.0EstimateMeasured
07.orange
Wavelength (nm)
Ref
lect
ance
400 500 600 7000.0
0.2
0.4
0.6
0.8
1.0EstimateMeasured
08.purplish blue
Wavelength (nm)
Ref
lect
ance
400 500 600 7000.0
0.2
0.4
0.6
0.8
1.0EstimateMeasured
09.moderate red
Wavelength (nm)
Ref
lect
ance
400 500 600 7000.0
0.2
0.4
0.6
0.8
1.0EstimateMeasured
10.purple
Wavelength (nm)
Ref
lect
ance
400 500 600 7000.0
0.2
0.4
0.6
0.8
1.0EstimateMeasured
11.yellow green
Wavelength (nm)
Ref
lect
ance
400 500 600 7000.0
0.2
0.4
0.6
0.8
1.0EstimateMeasured
12.orange yellow
Wavelength (nm)
Ref
lect
ance
400 500 600 7000.0
0.2
0.4
0.6
0.8
1.0EstimateMeasured
13.blue
Wavelength (nm)
Ref
lect
ance
400 500 600 7000.0
0.2
0.4
0.6
0.8
1.0EstimateMeasured
14.green
Wavelength (nm)
Ref
lect
ance
400 500 600 7000.0
0.2
0.4
0.6
0.8
1.0EstimateMeasured
15.red
Wavelength (nm)
Ref
lect
ance
400 500 600 7000.0
0.2
0.4
0.6
0.8
1.0EstimateMeasured
16.yellow
Wavelength (nm)
Ref
lect
ance
400 500 600 7000.0
0.2
0.4
0.6
0.8
1.0EstimateMeasured
17.magenta
Wavelength (nm)
Ref
lect
ance
400 500 600 7000.0
0.2
0.4
0.6
0.8
1.0EstimateMeasured
18.cyan
Wavelength (nm)
Ref
lect
ance
400 500 600 7000.0
0.2
0.4
0.6
0.8
1.0
EstimateMeasured
19.white
Wavelength (nm)
Ref
lect
ance
400 500 600 7000.0
0.2
0.4
0.6
0.8
1.0EstimateMeasured
20.neutral 8
Wavelength (nm)
Ref
lect
ance
400 500 600 7000.0
0.2
0.4
0.6
0.8
1.0EstimateMeasured
21.neutral 6.5
Wavelength (nm)
Ref
lect
ance
400 500 600 7000.0
0.2
0.4
0.6
0.8
1.0EstimateMeasured
22.neutral 5
Wavelength (nm)
Ref
lect
ance
400 500 600 7000.0
0.2
0.4
0.6
0.8
1.0EstimateMeasured
23.neutral 3.5
Wavelength (nm)
Ref
lect
ance
400 500 600 7000.0
0.2
0.4
0.6
0.8
1.0EstimateMeasured
24.black
Wavelength (nm)
Ref
lect
ance
400 500 600 7000.0
0.2
0.4
0.6
0.8
1.0EstimateMeasured
01.dark skin
Wavelength (nm)
Ref
lect
ance
400 500 600 7000.0
0.2
0.4
0.6
0.8
1.0EstimateMeasured
02.light skin
Wavelength (nm)
Ref
lect
ance
400 500 600 7000.0
0.2
0.4
0.6
0.8
1.0EstimateMeasured
03.blue sky
Wavelength (nm)
Ref
lect
ance
400 500 600 7000.0
0.2
0.4
0.6
0.8
1.0EstimateMeasured
04.foliage
Wavelength (nm)
Ref
lect
ance
400 500 600 7000.0
0.2
0.4
0.6
0.8
1.0EstimateMeasured
05.blue flower
Wavelength (nm)R
efle
ctan
ce
400 500 600 7000.0
0.2
0.4
0.6
0.8
1.0EstimateMeasured
06.bluish green
Wavelength (nm)
Ref
lect
ance
400 500 600 7000.0
0.2
0.4
0.6
0.8
1.0EstimateMeasured
07.orange
Wavelength (nm)
Ref
lect
ance
400 500 600 7000.0
0.2
0.4
0.6
0.8
1.0EstimateMeasured
08.purplish blue
Wavelength (nm)
Ref
lect
ance
400 500 600 7000.0
0.2
0.4
0.6
0.8
1.0EstimateMeasured
09.moderate red
Wavelength (nm)
Ref
lect
ance
400 500 600 7000.0
0.2
0.4
0.6
0.8
1.0EstimateMeasured
10.purple
Wavelength (nm)
Ref
lect
ance
400 500 600 7000.0
0.2
0.4
0.6
0.8
1.0EstimateMeasured
11.yellow green
Wavelength (nm)
Ref
lect
ance
400 500 600 7000.0
0.2
0.4
0.6
0.8
1.0EstimateMeasured
12.orange yellow
Wavelength (nm)
Ref
lect
ance
400 500 600 7000.0
0.2
0.4
0.6
0.8
1.0EstimateMeasured
13.blue
Wavelength (nm)
Ref
lect
ance
400 500 600 7000.0
0.2
0.4
0.6
0.8
1.0EstimateMeasured
14.green
Wavelength (nm)
Ref
lect
ance
400 500 600 7000.0
0.2
0.4
0.6
0.8
1.0EstimateMeasured
15.red
Wavelength (nm)
Ref
lect
ance
400 500 600 7000.0
0.2
0.4
0.6
0.8
1.0EstimateMeasured
16.yellow
Wavelength (nm)
Ref
lect
ance
400 500 600 7000.0
0.2
0.4
0.6
0.8
1.0EstimateMeasured
17.magenta
Wavelength (nm)
Ref
lect
ance
400 500 600 7000.0
0.2
0.4
0.6
0.8
1.0EstimateMeasured
18.cyan
Wavelength (nm)
Ref
lect
ance
400 500 600 7000.0
0.2
0.4
0.6
0.8
1.0
EstimateMeasured
19.white
Wavelength (nm)
Ref
lect
ance
400 500 600 7000.0
0.2
0.4
0.6
0.8
1.0EstimateMeasured
20.neutral 8
Wavelength (nm)
Ref
lect
ance
400 500 600 7000.0
0.2
0.4
0.6
0.8
1.0EstimateMeasured
21.neutral 6.5
Wavelength (nm)
Ref
lect
ance
400 500 600 7000.0
0.2
0.4
0.6
0.8
1.0EstimateMeasured
22.neutral 5
Wavelength (nm)
Ref
lect
ance
400 500 600 7000.0
0.2
0.4
0.6
0.8
1.0EstimateMeasured
23.neutral 3.5
Wavelength (nm)
Ref
lect
ance
400 500 600 7000.0
0.2
0.4
0.6
0.8
1.0EstimateMeasured
24.black
(a) Narrow-band
(b) Symmetric basis
Fig. 15. Reflectance estimation results for all 24 patches of a Color Checker.
1772 J. Opt. Soc. Am. A / Vol. 29, No. 9 / September 2012 S. Tominaga and T. Horiuchi
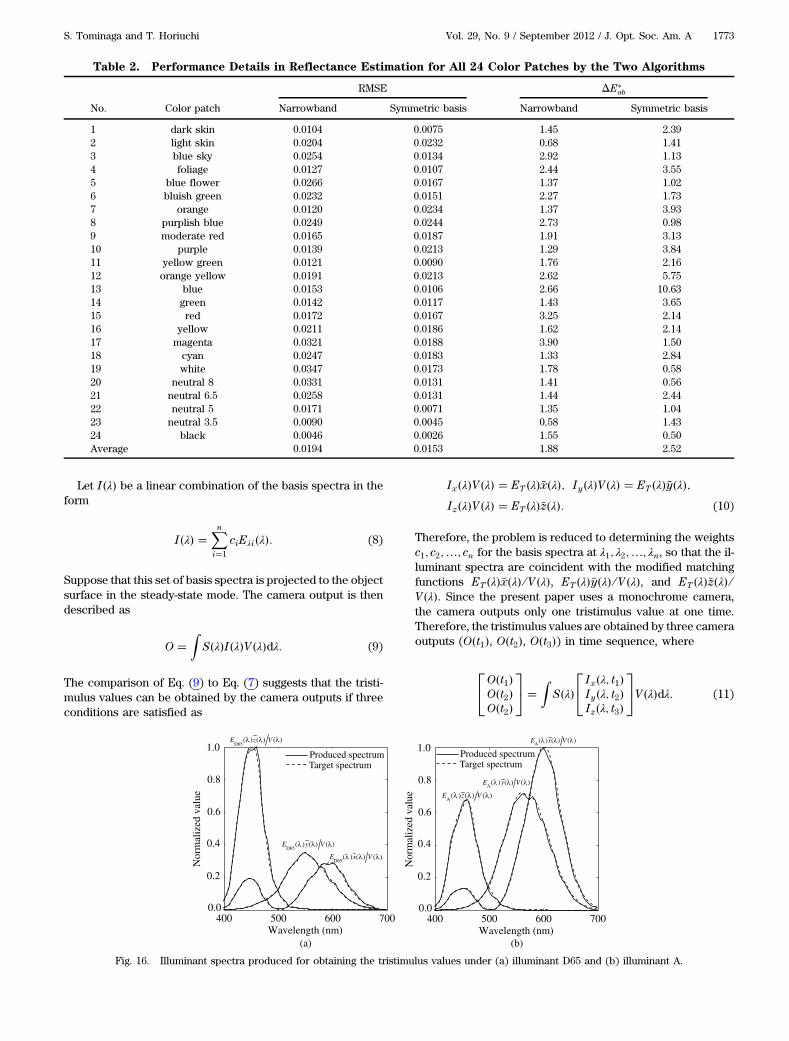
Let I�λ� be a linear combination of the basis spectra in theform
I�λ� �Xni�1
ciEλi�λ�: (8)
Suppose that this set of basis spectra is projected to the objectsurface in the steady-state mode. The camera output is thendescribed as
O �Z
S�λ�I�λ�V�λ�dλ: (9)
The comparison of Eq. (9) to Eq. (7) suggests that the tristi-mulus values can be obtained by the camera outputs if threeconditions are satisfied as
Ix�λ�V�λ� � ET �λ�x�λ�; Iy�λ�V�λ� � ET �λ�y�λ�;Iz�λ�V�λ� � ET �λ�z�λ�: (10)
Therefore, the problem is reduced to determining the weightsc1; c2;…; cn for the basis spectra at λ1; λ2;…; λn, so that the il-luminant spectra are coincident with the modified matchingfunctions ET �λ�x�λ� ∕V�λ�, ET �λ�y�λ� ∕V�λ�, and ET �λ�z�λ� ∕V�λ�. Since the present paper uses a monochrome camera,the camera outputs only one tristimulus value at one time.Therefore, the tristimulus values are obtained by three cameraoutputs (O�t1�, O�t2�, O�t3�) in time sequence, where
24O�t1�O�t2�O�t2�
35 �
ZS�λ�
24 Ix�λ; t1�Iy�λ; t2�Iz�λ; t3�
35V�λ�dλ: (11)
Table 2. Performance Details in Reflectance Estimation for All 24 Color Patches by the Two Algorithms
RMSE ΔE�ab
No. Color patch Narrowband Symmetric basis Narrowband Symmetric basis
1 dark skin 0.0104 0.0075 1.45 2.392 light skin 0.0204 0.0232 0.68 1.413 blue sky 0.0254 0.0134 2.92 1.134 foliage 0.0127 0.0107 2.44 3.555 blue flower 0.0266 0.0167 1.37 1.026 bluish green 0.0232 0.0151 2.27 1.737 orange 0.0120 0.0234 1.37 3.938 purplish blue 0.0249 0.0244 2.73 0.989 moderate red 0.0165 0.0187 1.91 3.1310 purple 0.0139 0.0213 1.29 3.8411 yellow green 0.0121 0.0090 1.76 2.1612 orange yellow 0.0191 0.0213 2.62 5.7513 blue 0.0153 0.0106 2.66 10.6314 green 0.0142 0.0117 1.43 3.6515 red 0.0172 0.0167 3.25 2.1416 yellow 0.0211 0.0186 1.62 2.1417 magenta 0.0321 0.0188 3.90 1.5018 cyan 0.0247 0.0183 1.33 2.8419 white 0.0347 0.0173 1.78 0.5820 neutral 8 0.0331 0.0131 1.41 0.5621 neutral 6.5 0.0258 0.0131 1.44 2.4422 neutral 5 0.0171 0.0071 1.35 1.0423 neutral 3.5 0.0090 0.0045 0.58 1.4324 black 0.0046 0.0026 1.55 0.50Average 0.0194 0.0153 1.88 2.52
400 500 600 7000.0
0.2
0.4
0.6
0.8
1.0
Wavelength (nm)(a) (b)
Nor
mal
ized
val
ue
Target spectrumProduced spectrum
D65( ) ( ) ( )E x Vλ λ λ
D65( ) ( ) ( )E y Vλ λ λ
D65( ) ( ) ( )E z Vλ λ λ
400 500 600 7000.0
0.2
0.4
0.6
0.8
1.0
Wavelength (nm)
Nor
mal
ized
val
ue
Target spectrumProduced spectrum
A( ) ( ) ( )E x Vλ λ λ
A( ) ( ) ( )E y Vλ λ λ
A( ) ( ) ( )E z Vλ λ λ
Fig. 16. Illuminant spectra produced for obtaining the tristimulus values under (a) illuminant D65 and (b) illuminant A.
S. Tominaga and T. Horiuchi Vol. 29, No. 9 / September 2012 / J. Opt. Soc. Am. A 1773
The tristimulus values are obtained at every pixel point of theobject surfaces in an image.
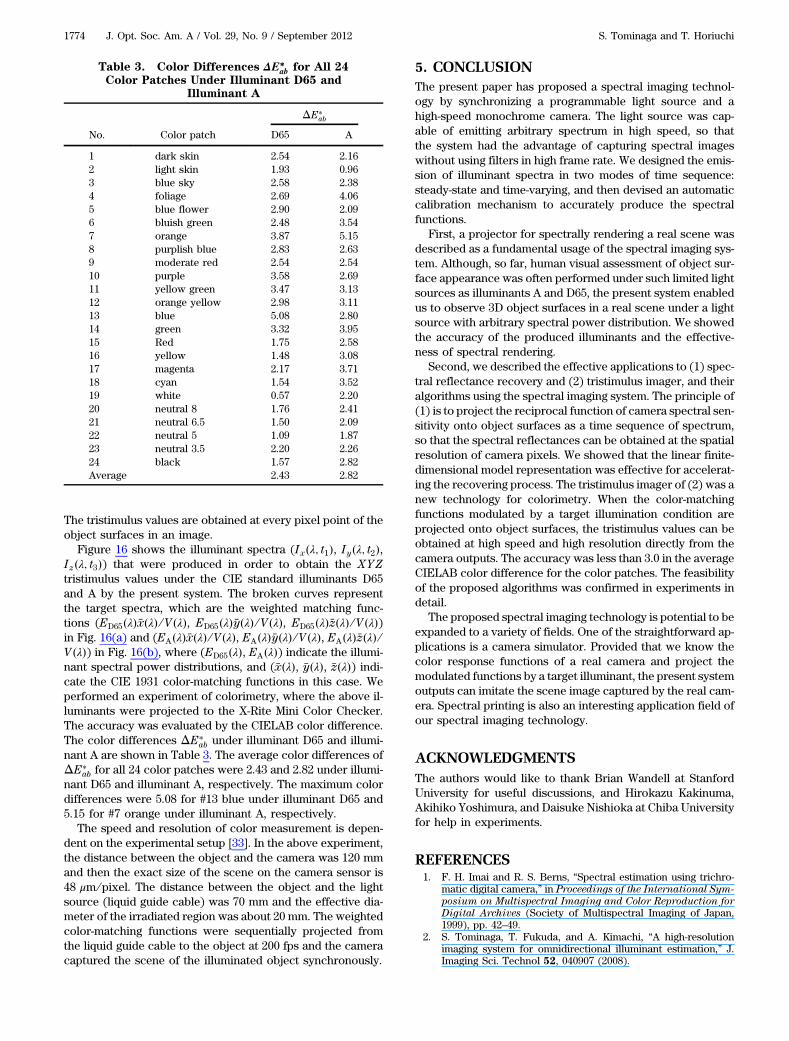
Figure 16 shows the illuminant spectra (Ix�λ; t1�, Iy�λ; t2�,Iz�λ; t3�) that were produced in order to obtain the XYZtristimulus values under the CIE standard illuminants D65and A by the present system. The broken curves representthe target spectra, which are the weighted matching func-tions (ED65�λ�x�λ� ∕V�λ�, ED65�λ�y�λ� ∕V�λ�, ED65�λ�z�λ� ∕V�λ�)in Fig. 16(a) and (EA�λ�x�λ� ∕V�λ�, EA�λ�y�λ� ∕V�λ�, EA�λ�z�λ� ∕V�λ�) in Fig. 16(b), where (ED65�λ�, EA�λ�) indicate the illumi-nant spectral power distributions, and (x�λ�, y�λ�, z�λ�) indi-cate the CIE 1931 color-matching functions in this case. Weperformed an experiment of colorimetry, where the above il-luminants were projected to the X-Rite Mini Color Checker.The accuracy was evaluated by the CIELAB color difference.The color differences ΔE�
ab under illuminant D65 and illumi-nant A are shown in Table 3. The average color differences ofΔE�
ab for all 24 color patches were 2.43 and 2.82 under illumi-nant D65 and illuminant A, respectively. The maximum colordifferences were 5.08 for #13 blue under illuminant D65 and5.15 for #7 orange under illuminant A, respectively.
The speed and resolution of color measurement is depen-dent on the experimental setup [33]. In the above experiment,the distance between the object and the camera was 120 mmand then the exact size of the scene on the camera sensor is48 μm ∕ pixel. The distance between the object and the lightsource (liquid guide cable) was 70 mm and the effective dia-meter of the irradiated region was about 20 mm. The weightedcolor-matching functions were sequentially projected fromthe liquid guide cable to the object at 200 fps and the cameracaptured the scene of the illuminated object synchronously.
5. CONCLUSIONThe present paper has proposed a spectral imaging technol-ogy by synchronizing a programmable light source and ahigh-speed monochrome camera. The light source was cap-able of emitting arbitrary spectrum in high speed, so thatthe system had the advantage of capturing spectral imageswithout using filters in high frame rate. We designed the emis-sion of illuminant spectra in two modes of time sequence:steady-state and time-varying, and then devised an automaticcalibration mechanism to accurately produce the spectralfunctions.
First, a projector for spectrally rendering a real scene wasdescribed as a fundamental usage of the spectral imaging sys-tem. Although, so far, human visual assessment of object sur-face appearance was often performed under such limited lightsources as illuminants A and D65, the present system enabledus to observe 3D object surfaces in a real scene under a lightsource with arbitrary spectral power distribution. We showedthe accuracy of the produced illuminants and the effective-ness of spectral rendering.
Second, we described the effective applications to (1) spec-tral reflectance recovery and (2) tristimulus imager, and theiralgorithms using the spectral imaging system. The principle of(1) is to project the reciprocal function of camera spectral sen-sitivity onto object surfaces as a time sequence of spectrum,so that the spectral reflectances can be obtained at the spatialresolution of camera pixels. We showed that the linear finite-dimensional model representation was effective for accelerat-ing the recovering process. The tristimulus imager of (2) was anew technology for colorimetry. When the color-matchingfunctions modulated by a target illumination condition areprojected onto object surfaces, the tristimulus values can beobtained at high speed and high resolution directly from thecamera outputs. The accuracy was less than 3.0 in the averageCIELAB color difference for the color patches. The feasibilityof the proposed algorithms was confirmed in experiments indetail.
The proposed spectral imaging technology is potential to beexpanded to a variety of fields. One of the straightforward ap-plications is a camera simulator. Provided that we know thecolor response functions of a real camera and project themodulated functions by a target illuminant, the present systemoutputs can imitate the scene image captured by the real cam-era. Spectral printing is also an interesting application field ofour spectral imaging technology.
ACKNOWLEDGMENTSThe authors would like to thank Brian Wandell at StanfordUniversity for useful discussions, and Hirokazu Kakinuma,Akihiko Yoshimura, and Daisuke Nishioka at Chiba Universityfor help in experiments.
REFERENCES1. F. H. Imai and R. S. Berns, “Spectral estimation using trichro-
matic digital camera,” in Proceedings of the International Sym-
posium on Multispectral Imaging and Color Reproduction for
Digital Archives (Society of Multispectral Imaging of Japan,1999), pp. 42–49.
2. S. Tominaga, T. Fukuda, and A. Kimachi, “A high-resolutionimaging system for omnidirectional illuminant estimation,” J.Imaging Sci. Technol 52, 040907 (2008).
Table 3. Color Differences ΔE�ab for All 24
Color Patches Under Illuminant D65 and
Illuminant A
ΔE�ab
No. Color patch D65 A
1 dark skin 2.54 2.162 light skin 1.93 0.963 blue sky 2.58 2.384 foliage 2.69 4.065 blue flower 2.90 2.096 bluish green 2.48 3.547 orange 3.87 5.158 purplish blue 2.83 2.639 moderate red 2.54 2.5410 purple 3.58 2.6911 yellow green 3.47 3.1312 orange yellow 2.98 3.1113 blue 5.08 2.8014 green 3.32 3.9515 Red 1.75 2.5816 yellow 1.48 3.0817 magenta 2.17 3.7118 cyan 1.54 3.5219 white 0.57 2.2020 neutral 8 1.76 2.4121 neutral 6.5 1.50 2.0922 neutral 5 1.09 1.8723 neutral 3.5 2.20 2.2624 black 1.57 2.82Average 2.43 2.82
1774 J. Opt. Soc. Am. A / Vol. 29, No. 9 / September 2012 S. Tominaga and T. Horiuchi

3. S. Tominaga, “Multichannel vision system for estimating surfaceand illuminant functions,” J. Opt. Soc. Am. A 13, 2163–2173(1996).
4. S. Nishi and S. Tominaga, “Calibration of a multispectral camerasystem using interference filters and its application,” in Proceed-
ings of the Congress of the International Colour Association
(International Colour Association, 2009), CD-ROM.5. N. Shimano, K. Terai, and M. Hironaga, “Recovery of spectral
reflectances of objects being imaged by multispectral cameras,”J. Opt. Soc. Am. A 24, 3211–3219 (2007).
6. S. Tominaga, “Spectral imaging by a multi-channel camera,” J.Electron. Imaging 8, 332–341 (1999).
7. M. A. López-Álvarez, J. Hernández-Andrés, and J. Romero, “De-veloping an optimum computer-designed multispectral systemcomprising a monochrome CCD camera and a liquid-crystaltunable filter,” Appl. Opt. 47, 4381–4390 (2008).
8. M. A. López-Álvarez, J. Hernández-Andrés, J. Romero, J. Campos,and A. Pons, “Calibrating the elements of a multispectral imagingsystem,” J. Imaging Sci. Technol. 53, 031102 (2009).
9. A. Longoni, F. Zaraga, G. Langfelder, and L. Bombelli, “Thetransverse field detector (TFD): A novel color-sensitive CMOSdevice,” IEEE Electron. Device Lett. 29, 1306–1308 (2008).
10. G. Langfelder, A. F. Longoni, and F. Zaraga, “Implementation ofa multi-spectral color imaging device without color filter array,”in Proceedings of Electronic Imaging (SPIE-IS&T, 2011),p. 787606.
11. A. L. Lin and F. Imai, “Efficient spectral imaging based on imag-ing systems with scene adaptation using tunable color pixels,” inProceedings of the 19th Color Imaging Conference (Society forImaging Science and Technology, 2011), pp. 332–338.
12. F. Xiao, J. M. DiCarlo, P. B. Catrysse, and B. A. Wandell, “Imageanalysis using modulated light sources,” Proc. SPIE 4306, 22–30.
13. J.-I. Park, M.-H. Lee, M. D. Grossberg, and S. K. Nayar, “Multi-spectral imaging using multiplexed illumination,” in Proceedings
of IEEE International Conference on Computer Vision (IEEE,2007), pp. 1–8.
14. J. M. DiCarlo, F. Xiao, and B. A. Wandell, “Illuminating illumina-tion,” in Proceedings of the 9th Color Imaging Conference
(Society for Imaging Science and Technology, 2001), pp. 27–34.15. C. Chi, H. Yoo, and M. Ben-Ezra, “Multi-spectral imaging by op-
timized wide band illumination,” Int. J. Comput. Vis. 86, 140–151(2010).
16. S. Han, I. Sato, T. Okabe, and Y. Sato, “Fast spectral reflectancerecovery using DLP projector,” in Proceedings of IEEE Asian
Conference on Computer Vision (IEEE, 2010), pp. 323–335.17. A. Mohan, R. Raskar, and J. Tumblin, “Agile spectrum imaging:
programmable wavelength modulation for cameras and projec-tors,” Comput. Graph. Forum 27, 709–717 (2008).
18. A. Fong, B. Bronson, and E. Wachman, “Advanced photonictools for hyperspectral imaging in the life sciences,” SPIE News-room (2008).
19. M. Hauta-Kasari, K. Miyazawa, S. Toyooka, and J. Parkkinen,“Spectral vision system for measuring color images,” J. Opt.Soc. Am. A 16, 2352–2362 (1999).
20. I. Farup, J. H. Wold, T. Seim, and T. Søndrol, “Generating lightwith a specified spectral power distribution,” Appl. Opt. 46,2411–2422 (2007).
21. S. Tominaga, T. Horiuchi, H. Kakinuma, and A. Kimachi, “Spec-tral imaging with a programmable light source,” in Proceedings
of the 17th Color Imaging Conference (Society for ImagingScience and Technology, 2009), pp. 133–138.
22. T. Horiuchi, H. Kakinuma, and S. Tominaga, “Effective illumina-tion control for an active spectral imaging system,” in Proceed-
ings of the 12th International Symposium on Multispectral
Color Science (Society for Imaging Science and Technology,2010), pp. 529–534.
23. B. A. Wandell, Foundations of Vision (Sinauer Associates, 1995).24. L. T. Maloney, “Evaluation of linear models of surface spectral
reflectance with small numbers of parameters,” J. Opt. Soc. Am.A 3, 1673–1683 (1986).
25. J. P. S. Parkkinen, J. Hallikainen, and T. Jaaskelainen, “Charac-teristic spectra of Munsell colors,” J. Opt. Soc. Am. A 6, 318–322(1989).
26. M. J. Vrhel, R. Gershon, and L. S. Iwan, “Measurement and ana-lysis of object reflectance spectra,” Color Res. Appl. 19, 4–9(1994).
27. D. W. Epstein, “Colorimetric analysis of RCA color televisionsystem,” RCA Rev. 14, 227–258 (1953).
28. G. Sharma, H. J. Trussell, and M. J. Vrhel, “Optimal nonnegativecolor scanning filters,” IEEE Trans. Image Process. 7, 129–133(1998).
29. D. D. Lee and H. S. Seung, “Learning the parts of objects by non-negative matrix factorization,” Nature 401, 788–791 (1999).
30. G. Buchsbaum and O. Bloch, “Color categories revealed by non-negative matrix factorization of Munsell color spectra,” Vis. Res.42, 559–563 (2002).
31. J. Farrell, D. Sherman, and B. Wandell, “How to turn your scan-ner into a colorimeter,” in Proceedings of the Tenth Interna-
tional Congress on Advances in Non-Impact Printing
Technologies (Society for Imaging Science and Technology,1994), pp. 579–581.
32. G. Langfelder, “Spectrally reconfigurable pixels for dual-color-mode imaging sensors,” Appl. Opt. 51, A91–A98 (2012).
33. S. Tominaga, T. Horiuchi, and A. Yoshimura, “Real-time colormeasurement using active illuminant,” Proc. SPIE 7528,752809 (2010).
S. Tominaga and T. Horiuchi Vol. 29, No. 9 / September 2012 / J. Opt. Soc. Am. A 1775