spectral amplitude measures of adductor spasmodic dysphonic speech
TRANSCRIPT
Spectral Amplitude Measures of Adductor SpasmodicDysphonic Speech
Michael P. Cannito, Eugene H. Buder, and Lesya B. Chorna
Memphis, Tennessee
Summary: Spectral amplitude measures are sensitive to varying degrees ofvocal fold adduction in normal speakers. This study examined the applicabilityof harmonic amplitude differences to adductor spasmodic dysphonia (ADSD)in comparison with normal controls. Amplitudes of the first and second har-monics (H1, H2) and of harmonics affiliated with the first, second, and thirdformants (A1, A2, A3) were obtained from spectra of vowels /�/ and /i/excerpted from connected speech. Results indicated that these measures couldbe made reliably in ADSD. With the exception of H1*-H2*, harmonic ampli-tude differences (H1*-A1, H1*-A2, and H1*-A3*) exhibited significant nega-tive linear relationships (P � 0.05) with clinical judgments of overall severity.The four harmonic amplitude differences significantly differentiated betweenpre-BT and post-BT productions (P � 0.05). After treatment, measurementsfrom /�/ detected significant differences between ADSD and normal controls(P � 0.05), but measurements from /i/ did not. LTAS analysis of ADSDpatients’ speech samples proved a good fit with harmonic amplitude differencemeasures. Harmonic amplitude differences also significantly correlated withperceptual judgments of breathiness and roughness (P � 0.05). These findingsdemonstrate high clinical applicability for harmonic amplitude differences forcharacterizing phonation in the speech of persons with ADSD, as well asnormal speakers, and they suggest promise for future application to othervoice pathologies.
Key Words: Voice quality—Adductor spasmodic dysphonia—Harmonic am-plitude differences—Breathiness—Roughness—Long-term average spectrum.
Accepted for publication July 9, 2004.From The University of Memphis, Memphis, Tennessee.Supported by a grant from the National Institutes of Health
(NIDCD Area Grant 1-R15-DC/OD02299-01A1).Address correspondence and reprint requests to Michael P.
Cannito, School of Audiology and Speech Pathology, The Uni-versity of Memphis, 807 Jefferson Avenue, Memphis, TN38105. E-mail: [email protected]
Journal of Voice, Vol. 19, No. 3, pp. 391–4100892-1997/$30.00� 2005 The Voice Foundationdoi:10.1016/j.jvoice.2004.07.001
391
INTRODUCTION
Adductor spasmodic dysphonia (ADSD) is a dis-order of laryngeal motor control, characterized byabnormal, excessive involuntary contraction of thevocal folds. The resultant voice is disrupted bythe intermittent occurrence of voice breaks, associ-ated with complete glottal closure during vowelproduction, and variable dysphonia that has beencharacterized as pressed, tense, squeezed, strained-strangled,1 or laryngealized.2 In addition, there areintermittent moments of more normal (modal) pho-nation. Although ADSD has proven resistant to be-havioral voice intervention, surgical and chemical

MICHAEL P. CANNITO ET AL392
denervation procedures have been beneficial in re-ducing the glottal hyperadduction and in providinga more functional voice. Today, injection of the vocalfolds with botulium toxin A (BT) is generally re-garded as the preferred treatment for ADSD.3 Thetoxin blocks release acetylcholine at the neuromus-cular junction, inducing a temporary, partial vocalfold paralysis, usually associated with some degreeof breathiness. The toxin effect gradually wears offafter a period of 2 to 3 months, and reinjection isnecessary.
In untreated ADSD, phonation is characterizedacoustically by marked aperiodicity and irregularityof vocal fold vibration.4,5 Sustained vowel produc-tions in ADSD have been shown to exhibit increasedjitter and shimmer, reduced harmonic-to-noiseratios, increased standard deviations of fundamentalfrequency,6 and widely and irregularly spaced funda-mental pitch periods.7 Although similar effects havebeen noted in connected speech, these have beenmore difficult to quantify because of the inapplica-bility of automated pitch extraction-based algo-rithms to connected speech, wherein phonations areof brief duration and are disrupted by consonantproductions and intersyllabic junctures. Acousticspeech analyses have also been limited by the inter-mittently nonmodal nature of ADSD vowel produc-tions. One approach to this problem has involvedcounting frequency of occurrence of abnormalvowel segments (eg, voice breaks, aperiodicity) inADSD speech samples.4 This method has provideduseful information, but the dichotomous nature ofthe data (eg, � aperiodic, � voice break) fails tocapture varying degrees of abnormality or to distin-guish quantitatively between qualitatively differentvoice types.
It is often assumed that vocal qualities (such asmodal, breathy, whispery, pressed, creaky, laryn-gealized, tense/lax voice, etc.) originate as percep-tual labels and that they should therefore be definedwith respect to perceptual criteria. Many authorita-tive texts such as Titze,8 Laver,9 and Ni Chasaideand Gobl,10 however, invoke physiological basesfor distinguishing phonation types, and Buder11 hasargued that vocal quality terms might be better linkedto glottal configurations than to the more traditionalperceptual bases. Spectral measurements have beenparticularly promising as indicators of glottal status.
Journal of Voice, Vol. 19, No. 3, 2005
Specifically, differences in amplitudes of the firstand second harmonics (H1, H2) and the harmonicamplitudes located at the first, second, and thirdformant frequencies (A1, A2, A3) of the voice spec-trum are useful for quantification of degree of glottaladduction in voices perceived to be breathy, modal, orpressed.12–14 Harmonic amplitude difference mea-sures were employed for analysis of normal pho-nation with different degrees of breathiness12 orto assess gender differences.13 Recently, harmonicamplitude differences have been shown to be clini-cally useful in characterizing breathiness in individ-uals with unilateral vocal fold paralysis15 and vocalnodules.16
Spectral amplitude measures are particularlysuited for ADSD because of theoretical linkage be-tween such measures and the abduction–adductioncontinuum of glottal configurations.17 Roughly, theenergy of the first harmonic can be associated withdegrees of vocal fold excursion during the overallglottal cycle, whereas the energies of the higherharmonics can be associated with the discontinuitythat occurs with vocal fold impact.18 Excessive ad-ductory tone resulting from ADSD would thereforebe expected to reduce the amplitude of the firstharmonic and elevate the amplitude of upper har-monics in the vicinities of the formants.
Hanson12 extends this reasoning and specifies arelationship between the relative level of the secondharmonic and the open quotient (longer openingphase leading to a reduced H2 amplitude). In thiswork, a very dominant H1 was associated with abreathy mode of phonation. In contrast, H2 higherthan H1 amplitude suggests tense or creaky voice.10
This work also contributes further theoretical andempirical details by exploring relations of harmonicenergies in the vicinities of the first and third for-mants: (1) The first formant resonance can bedamped by glottal configurations that are relativelyopen (either at the cartilaginous glottis or by in-complete closure along the membranous glottis),therefore reducing the relative levels of harmonicamplitudes in the vicinity of this resonance. (2) Har-monics in the vicinity of the third formant reso-nances may be lowered by reduced adduction, butthis picture is complicated by the increased energythat might be expected in this spectral region bybreathy turbulence sources that may originate from

ADDUCTOR SPASMODIC DYSPHONIC SPEECH 393
glottal leakages. Formant-related harmonic differ-ences tend to be large and positive for breathyvoices, but small or negative for creaky voices.10,19
As detailed in Hanson,12 correction factors for for-mant resonance effects are necessary on H1 and A3to support comparisons across different vowels andspeakers, and following the conventions of thatwork, such corrections are denoted by asterisks onH1*, H2*, and A3*.
Although Hanson and Stevens’ work has not re-sulted in clear predictions regarding expected har-monic amplitudes in the vicinity of the secondformant, it can be anticipated that adductory dyspho-nia would also result in observable effects in thisregion, and others have measured harmonic ampli-tudes in this region to look for normal variations.19
Theoretical and empirical work by Henrich et al35
has suggested that relative amplitude of H2 is af-fected by changes not only in open quotient but alsoin opening/closing phase asymmetry. Henrich et alobserve that the scope of the theoretical models onwhich spectral amplitude measures have been basedis limited. Moreover, the open quotient and asymme-try values found in naturally occurring voice typesare likely to exceed the theoretical range over whichspectral amplitude measures have been specified,suggesting that observations in pathological voicequalities may be especially informative relative tonormative theory. Although extensive acoustical re-search has now been conducted using these typesof measures, to our best knowledge, the analysis ofharmonic amplitude differences as introduced byHanson12 has not been applied to ADSD. Thesemeasures are of particular interest because they pro-vide precise acoustic verification of a range of vocalqualities associated with degrees of medial compres-sion that are intrinsic to untreated ADSD. ADSDspeech typically exhibits pressed voice quality (oroverpressure)1 as a result of the intermittently hyp-eradductive glottis during phonation. The extent ofhyperadduction appears to vary as a function of theoverall severity of the disorder. BT injection causestemporary, partial paralysis of the vocal fold(s), re-ducing overpressure, whereas breathiness may beincreased. Consequently, harmonic amplitude differ-ences should be sensitive to differences betweenvarying severities of ADSD, and to differences inADSD voices before and after BT injection (eg,
pressed vs. breathy qualities), as well as distinguish-ing between ADSD and nondysphonic voices.
A study of long-term average spectra (LTAS) ofconnected speech in ADSD has provided evidencethat BT injection increases the relative energy ofphonation in the region of the fundamental whiledecreasing the relative spectral energies in formantfrequency regions.20 To the extent that the focusedanalysis of harmonic amplitudes parallels LTAS re-sults, the current study may support the generaliz-ability of harmonic amplitude measures. Theirclinical utility also may be supported if the measuresvary systematically in association with clinicians’perceptual ratings of breathiness and roughness inpathological voices. Previous investigations haveidentified positive associations of spectral ampli-tudes with breathiness ratings,16 whereas roughnesshas been shown to correlate negatively with H1-H2.21
Therefore, the primary purpose of this study wasto evaluate the clinical applicability of harmonic am-plitude measures to ADSD. Specifically, it was ofinterest to demonstrate that harmonic amplitude mea-sures could be made reliably in pathologic voices,were sensitive to differences between normal voicesand varying degrees of severity of untreated ADSD,and were sensitive to the effects of an establishedtreatment (i.e., BT injection). It also was of interest toassess whether the measures would generalize acrossdifferent vowel configurations (/�/ vs. /i/), whetherthey compared favorably with the more establishedand global LTAS technique, and whether they corre-lated with perceptual judgments of breathiness androughness.
PredictionsIt can be expected that hyperadducted phonation
by persons with untreated ADSD will have verysmall open quotients and high-speed quotientscaused by greater degrees of adductive musculartension and increased medial compression.10 It isalso expected that hyperadducted “pressed” phona-tion by persons with untreated ADSD will exhibitrelatively complete and abrupt closures. The modelfor spectral energies,12 therefore, predicts strong har-monic energy on higher frequencies and low energyin the first harmonic. This will result, initially, inrelatively small or negative values of H1*-H2*,
Journal of Voice, Vol. 19, No. 3, 2005

MICHAEL P. CANNITO ET AL394
H1*-A1, H1*-A3*, and probably of H1*-A2. AfterBT injection, measures of phonations by the samepersons can be expected to move toward normalvalues. As BT injections do not completely resolvethe dysphonia, it is not expected that these phonationmeasures would become entirely normal; it iseven possible that the measures may overshootnormal values as the therapy can result in excessivebreathiness.3 Before therapy, it is hypothesized thatmeasures will be inversely related to ADSD severityand that more severely adducted voices should ex-hibit reduced differences between H1 and highercomponent amplitudes in comparison with less af-fected voices.
Because of the overall severity of the impact ofADSD on voice acoustics, it is anticipated that pri-mary treatment and severity effects observed in /�/tokens will generalize to vowels such as /i/; however,the specific formant characteristics of the high frontvowel may render it less sensitive to some harmonicamplitude differences. It can also be predicted thatthe measures will parallel LTAS results reported forlonger connected speech samples by showing de-creased energies in low-frequency bands and in-creased higher frequency energies in pretreatmentvoices compared with posttreatment. Finally, it canbe anticipated that the measures will replicate re-ported positive correlations with breathiness12,16 butyield negative correlations with roughness.21
MATERIAL AND METHODS
ParticipantsSpeech recordings from 16 female subjects whose
conditions were diagnosed as ADSD for at least 2years prior to the study were selected from a largerdatabase of 42 consecutive cases with ADSD whounderwent initial BT injection. Their clinical charac-teristics are provided in Table 1. An otolaryngologistand a speech pathologist after flexible endoscopy andvoice evaluation diagnosed all participants withADSD. All speakers were judged to be free of laryn-geal tremor and did not exhibit movement disorderselsewhere in the body. ADSD speakers underwentEMG-guided transcutaneous injection of BT A intoeither the left (n � 10) or both (n � 6) vocal foldsadministered by a licensed otolaryngologist who
Journal of Voice, Vol. 19, No. 3, 2005
was familiar with the procedure, with dosages vary-ing from 1.5 Units to 30 Units.
All 16 speakers in the present study were female,thereby eliminating the possibility that gender differ-ences in harmonic amplitude measures would beconfounded with the effects of interest,13 as well aswith other clinical characteristics. Speakers olderthan 65 years of age were excluded to reduce agingvoice effects that interact with BT treatment.22,23
Recordings consisted of an oral reading of the firstparagraph of the Rainbow Passage.24 The selectedrecordings represented a full severity range of thedisease, based on an ordinal rating scale, wherein“0” is normal, “1” is mild (n � 6), “2” is moderate(n � 2), “3” is severe (n � 4), and “4” is profoundimpairment (n � 4). ADSD severity ratings wereestablished by consensus of two speech pathologistsfamiliar with the disorder and have been shown to bereliable in previous research.4,25 This yielded equalsample sizes in the mild-to-moderate and severe-to-profound ranges. In addition, all selected speechsamples were required to exhibit the full set of voweltokens targeted for acoustical analysis. Samples inwhich the target syllables were omitted, because ofreading errors or prolonged glottalization, or inwhich the vowel nuclei were not analyzable becauseof voice breaks, disfluency, or compete absence ofglottal pulsing were excluded.
Voices were recorded approximately 2 weeksbefore and 3 to 6 weeks after BT injection of thethyroarytenoid muscle(s). This period was selectedbecause it spanned a time when Botox inducedbreathiness and other side effects diminished,26–28
and yet during which most ADSD speakers reportpeak voice benefit after initial injection.29 Mean pre-injection severity rating was 2.4, and mean postin-jection severity rating was 1.3. A normal controlgroup consisting of 6 female participants who wereapproximately equated with the patient group forage (range 28 to 64 years, with the mean of 48.3)was also included. They reported no past or presenthistory of laryngeal, speech, or neurological disor-ders. All control speech samples received an overallseverity rating of “0” (normal voice). All participantswere native speakers of American English. Data forthis study were obtained under a protocol approvedby an appropriate Institutional Review Board.

ADDUCTOR SPASMODIC DYSPHONIC SPEECH 395
TABLE 1. Clinical Characteristics of 16 Female Speakers with ADSD
Speaker Age Preseverity Postseverity TPO Injection Type Total Units TPI
1 64 4 1 10 Unilateral 15 292 52 1 1 19 Bilateral 1.5 343 28 1 1 3 Unilateral 2.5 364 41 4 1 16 Bilateral 2.5 345 32 1 1 2 Bilateral 5 326 31 1 1 2 Unilateral 5 317 38 3 2 9 Unilateral 15 388 63 2 2 11 Unilateral 15 319 63 3 2 9 Bilateral 5 17
10 56 4 2 16 Unilateral 30 3411 64 4 2 11 Bilateral 2.5 2712 56 2 1 13 Unilateral 15 3113 45 3 1 12 Unilateral 15 4514 42 1 1 4 Unilateral 2.5 2715 41 1 0 4 Bilateral 10 4416 60 3 2 6 Unilateral 15 37
Severity: 0—normal; 1—mild; 2—moderate; 3—severe; 4—profound. TPO—time postonset of SD, years; TPI—time postinjec-tion, days.
ProceduresEach speaker was seated comfortably in a chair
and instructed to speak at a comfortable effort level.Voice productions were obtained using a high-quality cardioid type microphone (Sony ICM 50;Sony Corporation, Tokyo, Japan) mounted on anadjustable headpiece, with a constant distance (ap-proximately 4 cm) from the corner of the subject’smouth and out of the breath stream. The samples werepreamplified (Shure PP43; Shure Incorporated,Niles, IL) and recorded to an audiocassette recorder(Nakamichi CR5A; Nakamichi, Singapore). Theanalog signals were digitized using Kay Elemetrics’Computerized Speech Lab (CSL) (Model 4300B;Kay Elemetrics Corporation, Lincoln Park, NJ) ata sampling rate of 20 kHz. Antialiasing was accom-plished using the built-in filtering of the 4300Bsystem. A total of 48 paragraph readings (16 ADSDspeakers [pre and post] � 16 matched controls) wasobtained and served as the corpus for furtheranalyses.
The vowels /�/ and /i/ (low back vs. high front)were chosen for analysis of harmonic amplitudes.Low vowels such as /�/ are ideal for harmonic ampli-tude inspections with source spectra in mind becausethe first formant is well separated from the firstharmonic and the third formant is separated from
the second. Standard formant frequency correctionfactors were applied (following Hanson12) to com-pensate for the fact that the formants still have somevariable effects on source-related harmonic ampli-tude, but the formant distributions of low vowelshelp to minimize such effects. To correct for theboosting of harmonic amplitudes (H1, H2), Hansondeveloped the following equations, where f is thefrequency of the corresponding harmonics H1, H2:
H1* � H1 � 20 log10 ( F12
F12 � f 2) (1)
H2* � H2 � 20 log10 ( F12
F12 � f 2) (2)
To correct for the influence of the first and thesecond formant on the amplitude of the third formantA3, Hanson developed the formula:
A3* � A3 � 20 log10 ([1 � (F3
F1)2][1 � (F3
F2)2][1 � (F3
F̃1)2][1 � (F3
F̃2)2])(3)
where F̃1 and F̃2 are the first- and second-formantfrequencies of a neutral vowel.30
Journal of Voice, Vol. 19, No. 3, 2005

MICHAEL P. CANNITO ET AL396
The high vowel /i/ was nonetheless chosen forsupplemental comparison purposes to check if a dif-ferent configuration of the vocal tract reveals similartrends for harmonic amplitude differences (therebyextending the generalizability of the results). In thecase of /i/, the first formant is low and tends to boostthe amplitude of the lower frequency harmonicsand the second formant is high, tending to boost third-formant amplitudes. Although the formant frequencycorrection factors should help compensate for theseeffects, some variability may remain.
Five tokens of the vowel /�/ were obtained fromeach recorded reading from the following words:“raindrops” (from the first sentence), “beyond”(from the third sentence), “pot” (from the fourthsentence), and “beyond” and “pot” (from the sixthsentence). This yielded a total of 190 tokens of /�/(80 pre � 80 post � 30 control). Tokens of /i/ wereobtained from three different words: “these” (fromthe third sentence), “people” (from the fifth sen-tence), and “reach” (from the sixth sentence). Thisyielded a total of 114 tokens of /i/ (48 pre � 48post � 18 control). All occurrences of /�/ and /i/ inCVC or CCVCC environments within the passagewere used. Stress and intonation were free to varyacross linguistic context and speaker to provide arobust test of the clinical utility of the acousticmeasures.
Fourier spectra were calculated for the vowelnuclei of the target tokens of /�/ and /i/ using the CSLModel 4300, version 2.5.1.31 Spectra were obtainedby applying a Blackman window to the vowel, and bycomputing the 1024-point discrete Fourier transform(DFT). This window length was chosen so that 50ms of the vowel segment were submitted to the DFT.H1 and H2 as well as the strongest harmonics inthe vicinity of the first three formant frequencies,F1, F2, and F3, were identified; their frequency andintensity results were recorded. Figure 1 presentsexamples of speech waveforms (A) and correspond-ing spectra (B) produced by a normal female speaker(top), an ADSD speaker before the injection (middle),and the same ADSD speaker after the injection(bottom). The acoustic parameters are labeled in thespectra. In some spectra, signal characteristics occa-sionally obscured clarity of the prominent harmonicsand caused difficulties in harmonic identification,especially in speech signals from speakers with
Journal of Voice, Vol. 19, No. 3, 2005
ADSD. These factors were irregularity in harmonicstructure, presence of subharmonics, and presenceof interharmonic noise. To overcome such difficult-ies, the fundamental frequency of the speech signal(which corresponds to H1) was identified from thespeech waveform before spectral inspection. Forexample, inspection of the pretreatment waveform(Figure 1) reveals that even for this noisy sourcesignal, the fundamental period can be readily identi-fied. In such cases, H1 frequency determinationswere based not only on the spectrum, but also onthe calculated value from the waveform. Possiblemistakes in identifying subharmonics as true H1were also reduced using this approach. The acousticmeasurements were otherwise made using proce-dures described by Hanson.12 For H1*-H2*, H1*-A1, H1*-A2, and H1*-A3*, the asterisks indicatethat H1, H2, and A3 amplitude values were correctedfor formant frequency effects following Hanson’sformulas.12
After obtaining measurements for individualtokens, the mean values for /�/ and /i/ were computedfor a given patient’s pre-BT sample, post-BT sample,and for eachcontrol sample. Theseaverages served asthe observational units for the subsequent statisticalanalyses, with the exception of the reliability analy-sis, which was based on direct token-to-token com-parisons. An alpha level of 0.05 was employed forall statistical comparisons.
ReliabilityIn order to determine whether analysts were able
produce reliable measures of spectral componentsof ADSD voices, both intrajudge and interjudgereliabilities were evaluated. Reliabilities were firstevaluated for frequency locations of the relevantharmonics to assure the researchers were consistentin their identification of H1, H2, A1, A2, and A3.It was assumed that if the underlying harmonicamplitudes were found to be reliable, the differencemetrics also could be considered reliable. Intra-judge reliability was established by having the sameanalyst remeasure a subset of vowel tokens (approxi-mately 10% of ADSD sample) after a 3-month inter-val, without reference to the original measurements.Interjudge reliability was established by having asecond analyst measure the same subset of voweltokens after training on vowel samples that were

ADDUCTOR SPASMODIC DYSPHONIC SPEECH 397
FIGURE 1. Examples of vowel /�/ from the word “beyond” produced by a normal female speaker (top panel) and a female ADSDspeaker before treatment (middle panel) and after treatment (bottom panel). Waveforms (A) and corresponding FFT spectra (B)illustrate relationships between the distinct sources and their associated harmonics (H1, H2, A1, A2, A3).
Journal of Voice, Vol. 19, No. 3, 2005

MICHAEL P. CANNITO ET AL398
not part of the reliability subset. Reliability mea-surements were performed on 14 /�/ and ten /i/vowel tokens, sampled systematically from the 16patients to represent the full range of ADSD severity.
Methodological comparisonsThe same recordings from the 16 female ADSD
speakers were analyzed for LTAS using CSL. Eachspeech signal, representing the entire reading pas-sage (also digitized at a sampling rate of 20 kHz),was processed. Before analysis, all speech signalswere inspected for nonspeech sounds. Nonspeechsounds were edited out of each sound file, guidedby spectrographic and auditory inspection. If an in-terval contained only breath noises such as gasps,grunts, coughs, other incident noise (eg, the rustlingof paper sheets), or prolonged silence, it was digi-tally excised from the sound file and thereby ex-cluded from LTAS analysis. All cuts were done inlocations that had voltage at or near to zero in orderto minimize the introduction of editing artifacts. Thespeech signal was then analyzed in frames of 51.2-ms duration (1024 points). CSL calculates the long-term average spectrum by applying sliding Blackmanwindows to the signal, computing 1024-point dis-crete Fourier transforms with block smoothing, andaveraging the results. This yielded intensity valuesin decibels for 513 frequency intervals of approxi-mately 19.5 Hz, each across 10,000 Hz, and resultswere saved in ASCII files.
Each LTAS file was normalized within speakerand condition (pre vs. post) to generate z-scores(mean � 0, SD � 1) for the entire spectrum. Nor-malization assured that, for each speaker, it was thedistribution of the frequency components betweenconditions that was compared, rather than absoluteintensity differences. To facilitate further statisticalanalyses, the frequency intervals were then collapsedinto larger bins of 230 Hz by calculating the arithme-tic average the original intervals contained within a230-Hz bin. Visual inspection revealed conspicuousdifferences in nine frequency bins. The first fre-quency bin represented the expected vicinity of f0
(110–340 Hz), whereas the remaining eight binsrepresented frequency ranges associated with F1, F2,and F3 for female English vowels (eight consecutivebins from 1015 Hz to 2880 Hz).
Journal of Voice, Vol. 19, No. 3, 2005
Perceptual scaling judgments of amount ofroughness and breathiness occurring in recordingsof the Rainbow Passage were available for the cur-rent 16 speakers with ADSD from a previous study32
that had been completed on the larger data set con-sisting of 42 ADSD cases (pre-BT and post-BT).In that study, three certified speech pathologists,holding the Ph.D. degree and having 5 to 30 years ofclinical and academic experience in voice disorders,served as listeners (judges). Listeners were “blind”as to treatment conditions of the speech samples.Listeners were tested independently while seated ina sound-treated booth facing a computer monitor thatdisplayed a custom software-based visual analogscaling protocol. After hearing a speech sample, thelistener positioned a mouse-driven cursor, clickingon vertically oriented histograms of 100 mm inlength, to indicate degree of relative voice impair-ment. The end points of the histograms were labeled“breathiness: absent/pervasive” and “roughness: absent/pervasive.” Absence of breathiness or roughness wasassigned a score of 0, and pervasive breathiness orroughness was assigned a score of 100, such thatupward-going, lower numbers represented bettervoice qualities.
Speech samples were randomized and playedback as stimuli, in a different randomized order foreach listener, in the sound field at conversationalloudness (approximately 55-dB RMS). After hearinga sample, listeners entered their responses, whichwere automatically recorded and stored by the com-puter, and the next playback was initiated. Eachlistener completed an extensive training sessionprior to the scaling experiment. For the larger dataset, intralistener reliability was demonstrated usingPearson’s r to be r � 0.84 (P � 0.001) for breathin-ess and r � 0.92 for roughness (P � 0.001). Interlis-tener reliability was demonstrated using intraclasscorrelation to be ric � 0.89 (P � 0.001) for breathin-ess and ric � 0.97 (P � 0.001) for roughness. Itshould be noted that in the listening experiment,roughness was defined as “audible occurrence ofacoustic aperiodicity including such percepts as harsh,gruff or stained-strangled qualities,” whereas breathin-ess was defined as “audible occurrence of breath noiseor acoustic turbulence including such percepts aswhispery or murmured qualities.” The present studycompared the perceptual data fromthe previousstudy32

ADDUCTOR SPASMODIC DYSPHONIC SPEECH 399
TABLE 2. Reliability on Spectral Measures Performed on 10% of Vowel Tokens
Correlations Mean Absolute Difference*
Acoustic measures Intraresearcher Interresearcher Intraresearcher Interresearcher
H1, Hz 0.98 0.96 4.88 (8.64) 6.51 (14.87)H2, Hz 0.99 0.89 9.77 (14.11) 33.37 (38.41)F1, Hz 0.99 0.96 9.77 (12.88) 18.72 (27.31)F2, Hz 0.99 0.99 32.55 (32.41) 40.69 (44.95)F3, Hz 0.98 0.92 36.62 (51.93) 73.24 (88.89)H1, dB 0.92 0.95 1.8 (3.19) 1.50 (2.25)H2, db 0.87 0.83 3.07 (4.94) 3.51 (4.69)A1, dB 0.93 0.96 1.97 (1.89) 2.58 (3.22)A2, dB 0.87 0.88 3.57 (3.90) 2.7 (4.48)A3, dB 0.89 0.92 2.86 (2.46) 2.19 (2.03)
*SD is given in parenthesesNOTE: All correlations were significant (P � 0.001).
with the harmonic amplitude difference measures (forvowel /�/) herein reported for the current subsampleof 16 speakers with ADSD. It should be emphasizedthat both sets of data (ie, perceptual vs. acoustic)were obtained from the same speech recordings madebefore and after BT injection.
RESULTS
Reliability of acoustic measurementsResults of intrajudge and interjudge reliability
analyses are provided in Table 2. Pearson’s product-moment correlation coefficients were calculated toestimate consistency between two sets of measure-ments done by the same analyst. High positive in-trajudge correlations were observed for harmonicfrequencies, ranging from r � 0.98 to 0.99 (df � 22;P � 0.001). This indicated that the analyst wasconsistent in identifying the frequency locations ofthe intended harmonics. High correlations were alsoobserved for the two sets of harmonic amplitudemeasures, ranging from r � 0.87 to 0.93 (df � 22;P � 0.001). Pearson product-moment correlationcoefficients for the two sets of vowel measurementsmade by different analysts were also high and posi-tive. High interjudge correlation coefficients wereobserved for harmonic frequencies, ranging fromr � 0.92 to 0.99 (df � 22; P � 0.001). This indi-cated that the two analysts were consistent in iden-tifying the intended harmonics. High correlationswere also observed for harmonic amplitude mea-sures, ranging from r � 0.83 to 0.96 (df � 22; P �
0.001). Mean absolute values of the within- andbetween-analyst differences and their standard devi-ations are also provided in Table 2. Paired-samplet tests (df � 23; P � 0.05) demonstrated no signifi-cant differences for any measure within or betweenanalysts. These results suggest that there is an ac-ceptable degree of intrajudge and interjudge reliabil-ity for the harmonic amplitude measurements forspeakers with ADSD.
Ratings of overall severityTo evaluate the sensitivity of harmonic amplitude
difference measures to overall severity grade, the datawere cast into three groups, including normal voice(0 average rating, n � 6), mild-to-moderate dyspho-nia (1.5 average rating; n � 8), and severe-to-profound dysphonia (3.5 average rating; n � 8)using the control and the pretreatment ADSD data.Linear regression analyses were computed to deter-mine if harmonic amplitude differences (independentvariables) were significant predictors of severitygrade (dependent variable). Figure 2 presents the se-verity group means and regression lines for threeseverity levels as a function of the harmonic ampli-tude differences for /�/ (left panel). Inspection ofthe figure suggests a general negative tendency: themore disordered the voice, the smaller the harmonicamplitude differences. Results of the regression anal-yses for /�/ demonstrated that H1*-H2* was notstatistically significant (F � 3.72, r � �0.396;df � 1,20, P � 0.068); however, statistical signifi-cance was attained for H1*-A1 (F � 29.63,
Journal of Voice, Vol. 19, No. 3, 2005

MICHAEL P. CANNITO ET AL400
TABLE 3. Means and Standard Deviations of the Harmonic Amplitude Differences
H1–H2 H1–A1 H1–A2 H1–A3
PRE POST NC PRE POST NC PRE POST NC PRE POST NC
/�/ vowelMean 1.13 7.22 8.51 �1.58 3.38 10.89 0.62 9.06 18.88 15.61 24.45 36.08SD (5.81) (5.98) (2.51) (7.43) (6.10) (5.09) (9.79) (7.86) (7.57) (8.98) (7.95) (4.19)/i/ vowelMean �0.77 1.94 6.83 1.83 6.33 10.09 13.83 24.66 28.39 18.04 27.43 34.66SD (6.23) (5.39) (3.74) (8.06) (7.33) (4.56) (12.09) (5.60) (6.37) (10.21) (6.39) (6.86)
PRE denotes the ADSD group before BT injection, POST denotes the same ADSD group after the BT injection, and NC denotesthe normal control group. The differences for harmonic amplitude differences H1*–H2*, H1*–A1, H1*–A2, H1*–A3* are givenin decibels.
r � �0.773; df � 1,20, P � 0.000), H1*-A2(F � 27.40, r � �0.760; df � 1,20, P � 0.000),and H1*-A3* (F � 33.14, r � �0.790; df � 1,20,P � 0.000). A similar tendency was evident in Figure2 (rightpanel) for /i/.Linear regressionanalyses againdemonstrated a general negative tendency. Resultsindicated that H1*-H2* was not significant(F � 0.72, r � �.187; df � 1,20, P � 0.41); how-ever, statistical significance was observed forH1*-A1 (F � 7.4, r � �.520; df � 1,20, P �0.013), H1*-A2 (F � 11.09, r � �.597; df � 1,20,P � 0.003), and H1*-A3* (F � 15.10, r ��0.656; df � 1,20, P � 0.001).
Response to treatmentMeans and standard deviations of the harmonic
amplitude difference measures for the pre-BT, post-BT, and control conditions for /�/ and /i/ are givenin Table 3 and depicted in Figure 3. The smallestmean differences were observed for the pre-treatment condition. The posttreatment conditiondifferences were larger but did not reach the levelsexhibited by the normal control group. For /�/,for example, H1*-H2* was on average 7.38 dB largerfor controls than for pre-BT and 1.29 dB largerfor controls than for post-BT, whereas for post-BT, H1*-H2* was 6.09 dB larger than for pre-BT.Although actual values varied, this general patternwas exhibited consistently across the four harmonicamplitude measures and across vowels /�/ and /i/.It is also noteworthy that variability was consistently
Journal of Voice, Vol. 19, No. 3, 2005
smaller in the normal controls than in ADSD, al-though it tended to diminish somewhat afterinjection.
To determine statistical significance of the effectsof BT treatment on the harmonic amplitude mea-sures, a repeated measures MANOVA was com-puted, with treatment conditions (pre vs. post) andharmonic amplitude difference measures (H1*-H2*,H1*-A1, H1*-A2, H1*-A3*) as within subjects’ fac-tors. Separate analyses were computed for /�/ and /i/. For /�/, there was a significant main effect oftreatment conditions (F � 18.68, df � 1,15; P �0.001), with larger mean differences observed afterinjection. Expectedly, there also was a significantmain effect of harmonic amplitude difference mea-sures (F � 85.92, df � 3,13; P � 0.000), with differ-ences increasing as a function of higher frequencyof the second term (harmonic) in the comparison.Notably, there was no significant interaction effectof treatment conditions × harmonic amplitudedifference measures (P � 0.131). The same patternof significance (and nonsignificance) was observedfor /i/.
To assess statistical significance of differences be-tween patients and normal controls in harmonic am-plitude difference measures, separate MANOVAs
�
FIGURE 2. Group means and standard deviations (error bars)and regression lines for normal controls and pretreatment ADSDseverity levels for H1*-H2* (top panel), H1*-A1, H1*-A2, andH1*-A3* (bottom panel). Vowel /�/ is depicted on the left and /i/is on the right.


MICHAEL P. CANNITO ET AL402
FIGURE 3. Means and SD of harmonic amplitude differences for normal controls and ADSD speakers before and after BT injection(/�/ vowel—top; /i/ vowel—bottom).
Journal of Voice, Vol. 19, No. 3, 2005

ADDUCTOR SPASMODIC DYSPHONIC SPEECH 403
were computed for /�/ and /i/, comparing pre-BTversus normal controls and post-BT versus normalcontrols. Overall, the control subjects’ harmonic am-plitude differences for /�/ were significantly greaterthan both the pre-BT condition (F � 9.68, df � 1,15,P � 0.001) and the post-BT condition (F � 4.00;df � 1,15, P � 0.05). Univariate F tests demon-strated that these differences held true for each ofthe four measures of harmonic amplitude differencebefore treatment (P � 0.05). After treatment, ADSDsubjects differed significantly from controls for H1*-A1, H1*-A2, and H1*-A3* (P � 0.05). These re-sults are presented in Table 4. For vowel /i/, overall,the controls exhibited significantly greater harmonicamplitude differences than did the pre-BT condition(F � 4.00; df � 1,15; P � 0.017); however, therewas no significant difference between the controlsand the post-BT condition (F � 2.14; df � 1,15;P � .121). Univariate F tests demonstrated a sig-nificant difference (P � 0.05) between pre-BT andcontrols for each of the measures prior to injection,but after injection, a significant univariate differencefrom normal was observed for /i/ only for H1*-A3*(see Table 4). The findings suggest some vowel-specific effects of treatment.
It is possible that there are changes in vocal tractgeometry and laryngeal height in untreated ADSD,and that these may alter after BT therapy.33 Suchchanges may affect the fundamental or formant fre-quencies. Because such effects could conceivablyaccount for altered harmonic amplitudes, statisticalinspection for these trends was needed. The vowel /�/was examined statistically for f0 (H1) and formantfrequencies (F1, F2, F3 associated with A1, A2, A3)using repeated measures ANOVAs. For f0, pre-to-posttreatment means were not significantly different(P � 0.36). Pre-BT f0 was 167 Hz, and post-BT f0
was 171 Hz. The pre-to-posttreatment means alsodid not differ significantly for F1 (P � 0.96) or F2(P � 0.18). A significant difference was observed,however, for F3 (F � 8.50; df � 1,15; P � 0.01).Here the pre-BT mean was 2602 Hz increased to2733 Hz after injection, whereas the standard devia-tion decreased from 200 Hz to 178 Hz. No statisti-cally significant differences were observed betweennormal controls and either pre-BT or post-BT condi-tions for f0 and formant frequencies (P � 0.10). For-mant frequency values are visualized in Figure 4.
TABLE 4. ANOVA Results for Individual HarmonicAmplitude Measures
Condition Measure F df P
/a/ vowelPRE vs NC H1-H2 8.872 1,20 0.007
H1-A1 14.182 1,20 0.001H1-A2 16.880 1,20 0.001H1-A3 28.185 1,20 0.000
POST vs NC H1-H2 0.264 1,20 0.613H1-A1 7.145 1,20 0.015H1-A2 6.925 1,20 0.016H1-A3 11.410 1,20 0.003
/i/ vowelPRE vs NC H1-H2 7.752 1,20 0.011
H1-A1 5.532 1,20 0.029H1-A2 7.721 1,20 0.012H1-A3 13.388 1,20 0.002
POST vs NC H1-H2 4.136 1,20 0.055H1-A1 1.356 1,20 0.258H1-A2 1.804 1,20 0.194H1-A3 5.368 1,20 0.031
PRE denotes the ADSD group before BT injection, POST de-notes the same ADSD group after the BT injection, and NCdxenotes the normal control group.
Despite posttreatment change in F3, it is clear thatdistinctive /�/ vowel quality was maintained in allof the conditions, and that the ADSD formants re-mained within the general ranges exhibited by thenormal speakers. The relatively small frequencyshift exhibited for F3 (less than one standard devia-tion) was not considered to be of sufficient magni-tude to contaminate the H1*-A3* measure.
LTAS findingsLTAS analysis of the Rainbow Passage produced
by ADSD speakers before and after BT injectiondemonstrated strengthening of lower frequency com-ponents and weakening of upper frequency compo-nents after treatment.20 These changes are evidentin Figure 5.
ANOVA verified a significant multivariate treat-ment effect with these bin amplitudes as depen-dent variables (F � 4.46, df � 8,128, P � 0.001).Subsequent discriminant analysis yielded a signifi-cant discrimination function for pre-to-posttreat-ment conditions (Wilke’s l � 0.673; df � 3,32, P �0.010), which included three frequency bins (110-340, 1710-1940, and 2650-2880).
Journal of Voice, Vol. 19, No. 3, 2005

MICHAEL P. CANNITO ET AL404
FIGURE 4. Mean values of F1, F2, and F3 from /�/ vowels for normal controls and ADSD speakers before and after BT injection.
Overall classification success (pre-BT vs. post-BT) of the discriminant equation using the threeLTAS bands was 79%. Predictably, after treatment,there was strengthening of intensity in the lowerfrequency band and weakening of the higher bands.
Correlations with perceived voice qualitiesThe relationships between harmonic amplitude
differences and perceptual scaling judgments ofroughness and breathiness were examined using themethod of set correlation with partialing.34 Set cor-relation is computationally related to canonicalcorrelation. In contrast to canonical correlation,however, set correlation assesses the simultaneousrelationship among a group of variables, while main-taining a partitioning of variance in terms of the
Journal of Voice, Vol. 19, No. 3, 2005
original variables, rather than their canonical trans-formations. Partialing was employed to statisticallycontrol the effects of perceived roughness onbreathiness and conversely to control the effects ofperceived breathiness on roughness, as many of therecordings were perceived to include both voicequalities. For this analysis, correlations were com-puted for the pooled data (pre-BT and post-BT),yielding a total of 32 observations for each percep-tual and acoustic variable.
Set correlation coefficients were calculated forbreathiness (partialing roughness) and for roughness(partialing breathiness), with each of the mean har-monic amplitude difference measures obtained from/�/. All correlations for roughness and breathinesswere significant (df � 35; P � 0.05). Positive partial

ADDUCTOR SPASMODIC DYSPHONIC SPEECH 405
FIGURE 5. Normalized long-term average spectra, pretreatment and posttreatment, for 16 ADSD subjects in the 0–3-kHz fre-quency range.
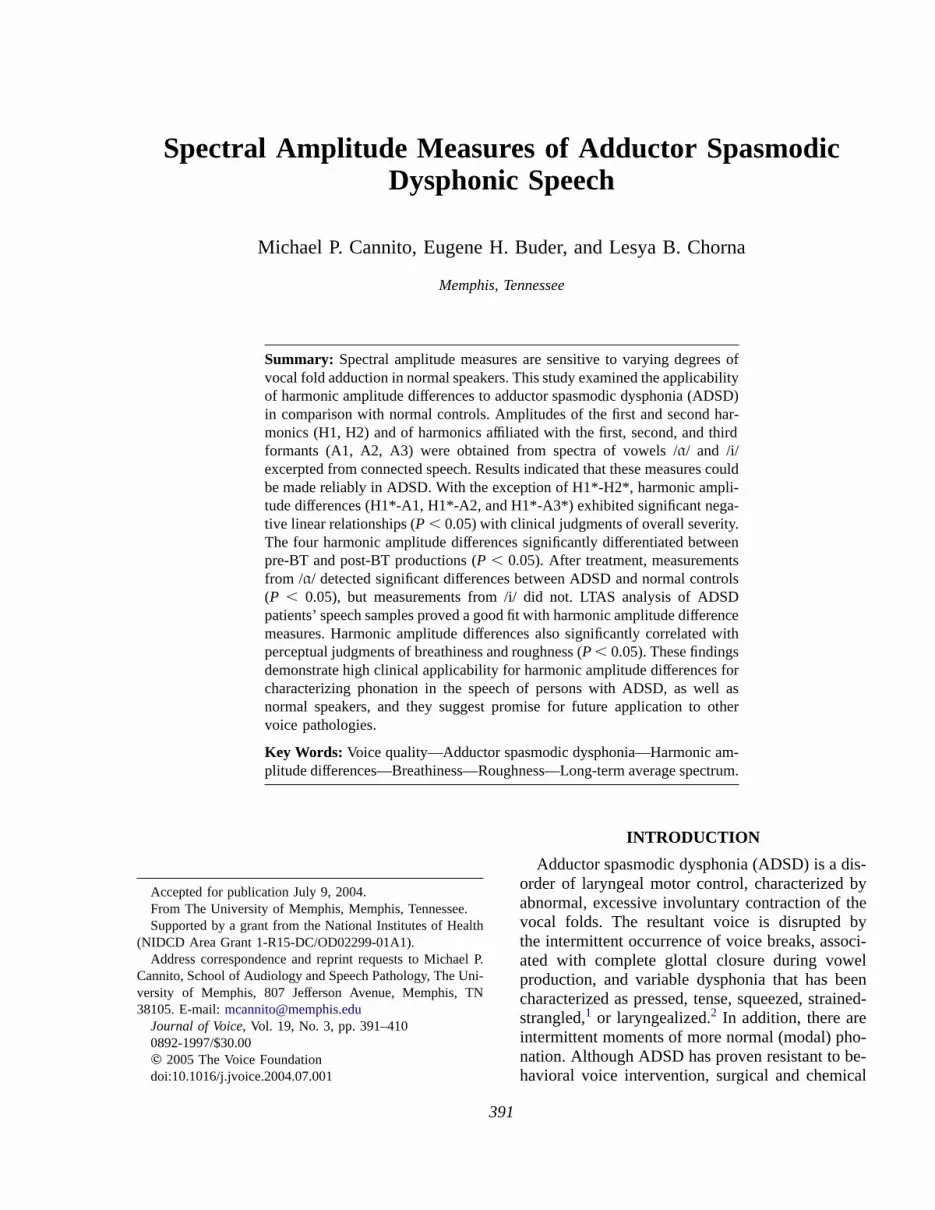
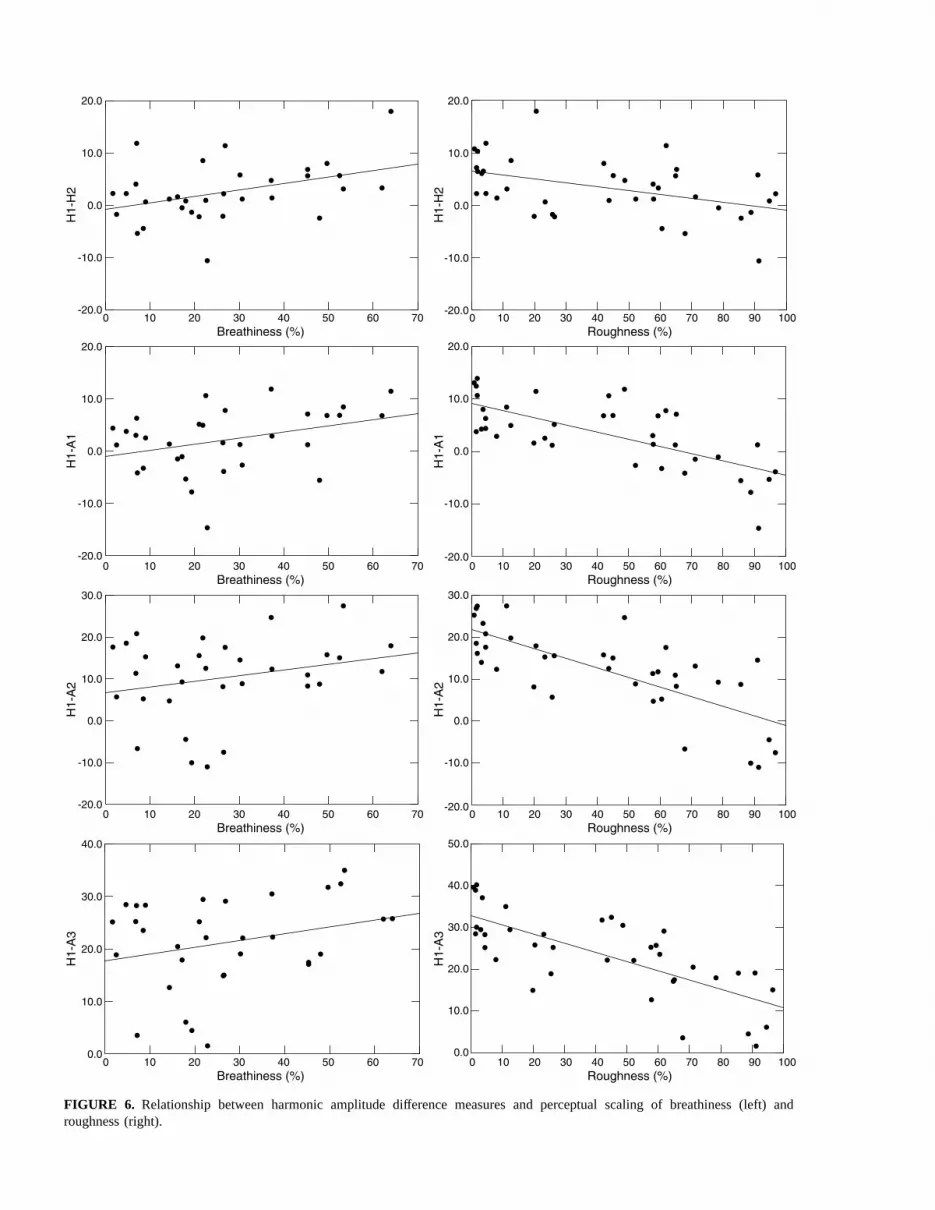
correlation coefficients were observed for breathin-ess: r � 0.44 (F � 7.69, P � 0.009) for H1*-H2*;r � 0.40 (F � 9.84, P � 0.004) for H1*-A1; r �0.31 (F � 6.05, P � 0.020) for H1*-A2; r � 0.32(F � 6.07, P � 0.02) for H1*-A3*. Negative partialcorrelation coefficients were observed for roughness:r � �0.35 (F � 5.05, P � 0.035) for H1*-H2*; r ��0.64 (F � 25.07, P � 0.000) for H1*-A1;r � �0.70 (F � 31.95, P � 0.000) for H1*-A2;and r � �0.66 (F � 25.40, P � 0.000) for H1*-A3*.Figure 6 depicts these relationships.
DISCUSSION
This study demonstrated that harmonic amplitudedifferences could be reliably measured in ADSD,
and that they were sensitive to differences betweennormal and pathological voices, overall clinical se-verity, and to treatment-related change. Moreover,the treatment-related findings could not be explainedaway on the basis of shifts in fundamental and for-mant frequencies and were therefore most likely at-tributable to the hyperadducted glottal status typicalof ADSD. Comparisons of harmonic amplitude differ-ences with other voice analysis techniques obtainedon the same ADSD speech samples, specificallyLTAS and perceptual voice quality ratings, demon-strated substantial congruence between harmonicamplitude differences of specific vowel samples andbroader metrics of connected speech materials.
The fact that harmonic amplitude differences associ-ated with spectral tilt (H1*-A1, H1*-A2, H1*-A3*)
Journal of Voice, Vol. 19, No. 3, 2005
0 10 20 30 40 50 60 70Breathiness (%)
-20.0
-10.0
0.0
10.0
20.0
H1-
H2
0 10 20 30 40 50 60 70 80 90 100Roughness (%)
-20.0
0 10 20 30 40 50 60 70Breathiness (%)
0 10 20 30 40 50 60 70 80 90 100Roughness (%)
-20.0
0 10 20 30 40 50 60 70Breathiness (%)
0 10 20 30 40 50 60 70 80 90 100Roughness (%)
-20.0
0 10 20 30 40 50 60 70Breathiness (%)
0 10 20 30 40 50 60 70 80 90 100Roughness (%)
-10.0
0.0
10.0
20.0
H1-
H2
-20.0
-10.0
0.0
10.0
20.0
H1-
A1
-10.0
0.0
10.0
20.0
H1-
A1
-20.0
-10.0
0.0
10.0
20.0
30.0
H1-
A2
-10.0
0.0
10.0
20.0
30.0
H1-
A2
0.0
10.0
20.0
30.0
40.0
H1-
A3
0.0
10.0
20.0
30.0
40.0
50.0
H1-
A3
FIGURE 6. Relationship between harmonic amplitude difference measures and perceptual scaling of breathiness (left) androughness (right).

ADDUCTOR SPASMODIC DYSPHONIC SPEECH 407
were predictive of overall severity grade suggeststhat these acoustic measures are sensitive to thedegree of adductor tension or medial compressionforce exerted on the vocal folds.16 Although theoriginal models of these measures were developedfor normal variations in glottal configuration withan emphasis on relatively hypoadducted glottal con-figurations (such as longer open quotients, posteriorglottal openings, and anterior–posterior asymmet-ries in glottal closure), the current results extend thedomain of application to phenomena associated withhyperadduction (shorter open quotients and abruptglottal closures).
It seems, however, that the measures did notsimply reflect an overall decrease in spectral tilt, asthe H1*-H2* measurement was not linearly pre-dictive of overall severity. Examination of Figure 2indicates that, for H1*-H2*, values from the severitymid-range (ie, mild-to-moderate ADSD) did notalign with the values observed at the extremes (ie,normal controls and severe-to-profound ADSD).Theoretically, H1*-H2* provides an acoustic indica-tion of the open quotient.12 Expectedly, the normalfemale control voices, also having the lowest over-all severity grade, exhibited the longest open quo-tients, hence, the largest H1*-H2* differences. Thisis consistent with the well-known presence ofbreathiness in normal female voices.16 However,Henrich et al35 review theoretical and empiricalresults suggesting that H1*-H2* may also associatewith glottal pulse asymmetry. As pulse asymmetriesand higher speed quotients may also be found inassociation with hyperadduction, the Henrich et al35
perspective encourages a broader range of interpreta-tions for the current results. Most intriguingly, severelyaffected voices showed the reduced spectral tilt thatwould be expected to result from abrupt glottal clo-sures, whereas the H1*-H2* measures in this groupwere more similar to normal voices than in the lessseverely affected group.
A number of possibilities may account for thisfinding. In an effort to compensate for hyperadduc-tion, severely affected individuals may recruit un-usual levels of antagonist abductory muscles,successfully elongating the opening phase but failingto control the overly abrupt closure that would causeupper frequency spectral amplitudes to remain ex-cessive. Alternatively, elevated degrees of vocal fold
tone and stiffness may exceed the range over whichnormative models would operate linearly. Moreover,effects of glottal pulse asymmetry theorized by Hen-rich et al35 (but not incorporated in Hanson’s model)may be entering into the phonations of severelyaffected speakers with ADSD. These interpretationsshould be addressed empirically by future investiga-tions of ADSD, and they may stimulate further de-velopment of theoretical models.
Before BT injection, ADSD voices exhibited smallH1*-H2* differences, suggesting that, as a group,they had relatively small open quotients in compari-son with normal controls. After BT injection, ADSDvoices had increased absolute energy at lower fre-quencies, yielding significantly larger H1*-H2*values, from which increased open quotients maybe inferred. Interestingly, the H1*-H2* values aftertreatment did not differ significantly from normallevels. Thus, some aspects of phonation appear tohave normalized as a result of BT injection. BecauseH1*-H2* has been shown to be positively associatedwith breathiness in prior studies,12,16 this finding alsosuggests that excessive posttreatment breathinesswas not an issue during the time frame of the presentstudy. As the recordings were made beyond the 2-week postinjection benchmark, it is probable thatexcessive, treatment-related breathiness had alreadysubsided for these patients.
Decreased energy in higher frequency regionswas observed after BT injection, yielding smallervalues of H1*-A1, H1*-A2, and H1*-A3*. Thesefindings are apparently related to a relatively moregradual glottal closure consistent with reducedmedial compression and to reduced upper frequencyenergy as the frequency-domain reflection of rela-tively continuous flow declination (in terms of theFant-Liljencrants model,36 a longer “return phase”).After treatment, these measures demonstrated thegreatest distinction between vowels /�/ and /i/. For/�/, these measures significantly differentiated betweencontrols and treated ADSD, whereas for /i/, they didnot. This distinction might suggest reduced suitabil-ity of high vowels for teasing apart the effects ofresonance from source spectral characteristics. It isnonetheless intriguing that the posttreatment spectralamplitude values for /i/ appeared more normal. It ispossible that there may be vowel-specific effects of
Journal of Voice, Vol. 19, No. 3, 2005

MICHAEL P. CANNITO ET AL408
BT therapy; however, further study will be neededto explore this question.
LTAS findings were generally consistent with theharmonic difference measures, encouraging theview that spectral amplitude measures in voices asseverely affected as those in ADSD may be relevantthroughout the vowel space. In the low-frequencyspectral region, there was a strengthening of ampli-tude specifically in the vicinity of f0 (H1) after BTinjection. This agrees with the increased H1*-H2*mean differences observed after treatment in thepresent study. The posttreatment reduction of energyin spectral bands between 1 kHz and 3 kHz alsogenerally agrees with decreased harmonic amplitudedifferences for H1*-A1, H1*-A2, and H1*-A3*.Thus, consistent pre-to-posttreatment differences inspectral tilt were corroborated across the two acous-tic analysis techniques. It is striking, however, thatharmonic differences excerpted from selected voweltokens should prove to be such a good fit for LTASanalyses derived from the entire speech samples.
It is also noteworthy, however, that LTAS analysisrevealed information that was not necessarily cap-tured by harmonic amplitudes differences alone. Forexample, it was not clear solely from the H1*-H2*difference metric that H1 increases after treatment.It would have been possible to attain the same dif-ference values had H2 decreased. Thus, althoughtreatment-related changes in spectral tilt were con-sistent across methods, direct inspection of harmonicamplitudes should not be abandoned in favor of therelatively crude but more easily obtained LTAS.
Harmonic amplitude difference measures inADSD were correlated with perceptual judgmentsof breathiness and roughness. Positive relation-ships between harmonic amplitude differences andbreathiness had been observed by Hanson et al,16
and they reflect the fact that breathy female voicestend to have a more open glottis. Current findingsagreed: Higher levels of breathiness were associ-ated with larger differences in harmonic amplitudes.Relatively low correlation coefficients observed forbreathiness in the present study probably are causedby the restricted range of the distribution of breathin-ess in comparison with roughness. Althoughbreathiness does occur in untreated ADSD,5 it isless severe and less frequent than the more dominantadductory behaviors (eg, pressed voice) by which
Journal of Voice, Vol. 19, No. 3, 2005
the disorder is defined. Occurrence of breathinessin ADSD may result from overall laryngeal incoordi-nation,2 or as a compensatory strategy by which apatient tries to maintain a more open glottal configu-ration to sustain airflow in the presence of involun-tary adductor spasms.37 This latter interpretation iscompatible with the finding of larger H1*-H2* dif-ferences in patients who were rated as more severelyimpaired (see Figure 3). Of interest in the presentstudy is that, with the perceptual effects of roughnessstatistically controlled, the expected relationships ofharmonic amplitude measures with breathiness weredemonstrated.
In contrast, with breathiness controlled, roughnessexhibited significant negative relationships with allharmonic amplitude differences. A negative correla-tion between roughness and H1-H2 was previouslyobserved by Kreiman and Gerratt.21 The presentfindings generally suggest that as voices becamemore adducted or pressed (eg, H1*-H2* decreasedin association with smaller open quotients), the per-cept of roughness increased. Roughness is usuallyconsidered to be related to the presence of aperiodicnoise in the acoustic signal, particularly in lower tomid-frequency range.14 Roughness ratings in thisstudy were probably dominated by the percept of“strained-strangled voice,” which is associated withoverpressure or glottal hyperadduction in ADSD.Inspection of Figure 1 illustrates that pressed voiceexhibited in the untreated condition was also rela-tively aperiodic, as evidenced by a breakdown ofclear harmonic structure (ie, presence of interhar-monic noise). This contrasts sharply with the normalcase of clear harmonic separation. As glottal squeez-ing increased, harmonic amplitude differences de-creased, interharmonic noise increased, and theperception of roughness became greater. Thus, inaddition to the possibility that the presence of moreenergy in higher frequencies is evidenced by thespectral amplitude measures, we may also interpretthe roughness percept in ADSD to be linked to theaperiodic character of the pressed voice.10 As withmany perceptual terms, it seems that “roughness”may be associated with the acoustic manifestationsof a variety of glottal configurations.
In conclusion, harmonic amplitude differencemeasures demonstrated sensitivity to overall sever-ity and to the effects of treatment in ADSD and were

ADDUCTOR SPASMODIC DYSPHONIC SPEECH 409
shown to be consistent with other voice analysistechniques. They also provided precise quantifica-tion of spectral features that were relevant to thedisorder. This was particularly true of the vowel/�/, which is more amenable to harmonic amplitudeanalysis because of its intrinsic separation of low-frequency harmonics from the formant frequencies.Given that these measures were derived fromvowels produced in connected speech across varyingphonetic and linguistic contexts, the present findingssupport the view that harmonic differences are par-ticularly useful for quantifying nonmodal phonationin connected speech. Differential findings for H1*-H2* versus H1*-A1, H1*-A2, and H1*-A3* supportHanson’s view that these measures are sensitive todifferent aspects of voice production.12 However,there did appear to be considerableoverlap among thelatter three formant-related measurements. Althoughprevious clinical studies have emphasized the uti-lity of these measures for characterizing breathyvoices,15,16 as well as normal voices,12,13 the presentfindings suggest that these measures are equally ap-plicable for quantification of clinical characteristicsand changes in a severe voice disorder at the pressedend of the continuum of glottal closure. Moreover,they provided insights into potential laryngeal be-havior in ADSD that should motivate further studyusing direct physiological observation techniques,as well as an expanded range for theoretical models.Based on previous and present findings, it is sug-gested that the analysis of harmonic amplitude dif-ferences holds great promise for the clinicalcharacterization of disordered voices.
Acknowledgment: The authors gratefully acknowledgeGayle E. Woodson, M.D., and Tom Murry, Ph.D., forproviding patient recordings and clinical data forthe study. We are also grateful to Dr. Merlin Taylor andDr. Brenda Bender for contributions toward the develop-ment and implementation of the acoustic analyses. NanWillis and Christie Burdell also assisted with preliminarydata analyses.
REFERENCES
1. Izdebski K. Symptomatology of adductor spasmodic dys-phonia: a physiologic model. J Voice. 1992;6(4):306–319.
2. Cannito MP, Johnson JP. Spastic dysphonia: a continuumdisorder. J Commun Dis. 1981;14:215–223.
3. Cannito MP, Woodson GE. The spasmodic dysphonias.In: Kent RD, Ball MJ, editors. Voice Quality Measure-ment. San Diego, CA: Singular Publishing Group; 2000:411–430.
4. Sapienza CM, Cannito MP, Murry T, Branski R, WoodsonG. Acoustic variations in reading produced by speakerswith spasmodic dysphonia pre-botox injection and withinearly stages of post-botox injection. J Speech Hear Res.2002;45:830–843.
5. Langveldt TPN, van Rossum MMA, Houtman EH, Zwind-erman AH, Briaire JJ. Baatenburg de Jong RJ. Evaluationof voice quality in adductor spasmodic dysphonia beforeand after botulinum toxin treatment. Ann Otol RhynolLaryngol. 2001;110:627–634.
6. Zwirner P, Murry T, Swenson M, Woodson GE. Acousticchanges in spasmodic dysphonia after botulinum toxin in-jection. J Voice. 1991;5:78–84.
7. Wolfe VI, Ratushnik DL, Feldman H. Acoustical and per-ceptual comparison of chronic and incipient spastic dyspho-nia. Laryngoscope. 1979;89:1478–1486.
8. Titze IR. Workshop on Acoustic Voice Analysis: SummaryStatement. Iowa City, IA: National Center for Voice andSpeech; 1995.
9. Laver J. The Phonetic Description of Voice Quality. Cam-bridge, England: Cambridge University Press; 1980.
10. Nı́ Chasaide A, Gobl C. Voice source variation. In: Hard-castle WJ, Laver J, editors. The Handbook of PhoneticSciences. Oxford, U.K.: Blackwell Publishers, Ltd.; 1997:427–461.
11. Buder EH. Acoustic assesment of voice. In: Kent RD, editor.The MIT Encyclopedi of Communication Disorders. Cam-bridge: The MIT Press; 2004:3–5.
12. Hanson HM. Glottal characteristics of female speakers:acoustic correlates. J Acoust Soc Am. 1997;101(2):466–481.
13. Hanson HM, Chuang ES. Glottal characteristics of malespeakers: acoustic correlates and comparison with femaledata. J Acoust Soc Am. 1999;106(2):1064–1077.
14. de Krom G. Some spectral correlates of pathologicalbreathy and rough voice quality for different types ofvowel fragments. J Speech Hear Res. 1995;38:794–811.
15. Hartl DH, Hans S, Vaissiere J, Riquet M, Brasnu DF. Objec-tive voice quality analysis before and after onset of unilat-eral vocal fold paralysis. J Voice. 2001;15(3):351–361.
16. Hanson HM, Stevens KN, Hong-Kwang JK, Chen MY,Slifka J. Towards models of phonation. J Phonet. 2001;29:451–480.
17. Stevens KN, Hanson HM. Voice Acoustics. In: Kent RD,editor. The MIT Encyclopedia of Communication Disor-ders. Cambridge: The MIT Press; 2004:63–67.
18. Gauffin J, Sundberg J. Spectral correlates of glottal voicesource waveform characteristics. J Speech Hear Res.1989;32:556–565.
19. Epstein MA, Payri BG. The effects of vowel quality andpitch on spectral and glottal flow measurements of thevoice source. Poster presented at 141st Meeting AcousticalSociety of America Chicago; June 2001.
Journal of Voice, Vol. 19, No. 3, 2005

MICHAEL P. CANNITO ET AL410
20. Buder EH, Cannito MP, Taylor ML, Woodson GE,Murry T. Assessment of BOTOX effects on adductor spas-modic dysphonia using LTAS guided analysis. Paper pre-sented at: the 137th meething of Acoustical Society ofAmerica and the 2nd Convention of the European AcousticAssociation: Form Acousticum. Berlin: Germany; March1999.
21. Kreiman J, Gerrat B. Measuring vocal quality. In: KentRD, Ball MJ, editors. Voice Quality Measurement. SanDiego, CA: Singular Publishing Group; 2000:73–101.
22. Lundy DS, Lu FL, Casiano RR, Xue JW. The effect ofpatient factors on response outcomes to Botox treatmentof spasmodic dysphonia. J Voice. 1998;12:460–466.
23. Ford CN, Bless DM, Ptel NY. Botulimun toxin treatmentof spasmodic dysphonia: techniques, indications, efficacy.J Voice. 1992;6:370–376.
24. Fairbanks G. Voice and Articulation Drillbook. New York:Harper and Brothers; 1960.
25. Cannito MP, Burch AR, Watts C, Rappold PW, HoodSB, Sherrard K. Disfluency in spasmodic dysphonia: amultivariate analysis. J Speech Lang Hear Res. 1997;40:627–641.
26. Ludlow CL. Management of spasmodic dysphonias. In:Rubin JC, Sataloff RT, Korovin GS, Gould W, editors.Diagnosis and Treatment of Voice Disorders. New York:Igaku-Shoin Medical Publishing; 1995:436–454.
27. Fisher KV, Scherer R, Swank PR, Giddens C, Patten D.Electroglottographic tracking of response to botox. J Voice.1999;6:370–376.
28. Liu TC, Irish JC, Adams SG, Durkin LC, Hunt EJ. Prospec-tive study of patient subjective responses to botulinum toxin
Journal of Voice, Vol. 19, No. 3, 2005
injection for spasmodic dysphonia. J Otolaryngol. 1996;25:66–74.
29. Aronson AE, McCaffrey TV, Litchey WJ, Lipton RJ. Botuli-num toxin injection for adductor spasmodic dysphonia:patient self-ratingof voice and phonatory effort after threesuccessive injections. Laryngoscope. 1993;103:683–691.
30. Peteson GE, Barney HE. Control methods used in a studyof vowels. J Acoust Soc Am. 1952;24:175–184.
31. CSL: Computerized Speech Laboratory, Model 4300 [com-puter program]. Version 5.0.. Lincoln Park, NJ: Kay Eleme-trics Corporation; 1991.
32. Cannito MP, Woodson GE, Murry T. Perceptual scalingof spasmodic dysphonia before and after botulinum toxintreatment. In: Dejonckere P, Peters HFM, editors. Commu-nication and its Disorders: A Science in Progress, Vol .1.Nijmegen: University Press Nijmegen (161–163).
33. Crary MA, Kotzur IM, Gauger M, Burton S. Dynamicmagnetic resonance imaging in the study of vocal tractconfiguration. J Voice. 1996;10(4):378–388.
34. Cohen J, Wilkinson L. Set and canonical correlation. In:SYSTAT 10: Statistics II. Chicago, IL: SPSS Inc; 2000:395–418.
35. Henrich N, d’Alessandro C, Doval B. Spectral correlatesof voice open quotient and glottal flow asymmetry: theory,limits and experimental data. Paper presented at EUROS-PEECH’01. Denmark, 2001.
36. Fant G, Liljencrants J, Lin Q. A four-parameter model ofglottal flow. Speech Transmission Lab Quart Progr StatusRep. 1985;4:1–13.
37. Blitzer A, Brin MF. The dystonic larynx. J Voice. 1992;6(4):294–297.