species–environment relationships and potential for distribution modelling in coastal waters
TRANSCRIPT
Journal of Sea Research 85 (2014) 116–125
Contents lists available at ScienceDirect
Journal of Sea Research
j ourna l homepage: www.e lsev ie r .com/ locate /seares
Species–environment relationships and potential for distribution modelling incoastal waters
M. Snickars a,⁎, M. Gullström b, G. Sundblad c, U. Bergström d, A.-L. Downie e, M. Lindegarth f, J. Mattila a
a Husö Biological Station, Department of Biosciences, Åbo Akademi University, FI-20520 Åbo, Finlandb Department of Ecology, Environment and Plant Sciences; Stockholm University, SE-106 91 Stockholm, Swedenc AquaBiota Water Research, SE-11550 Stockholm, Swedend Department of Aquatic Resources, Swedish University of Agricultural Sciences, SE-742 42 Öregrund, Swedene Finnish Environment Institute, SYKE, FI-00251 Helsinki, Finlandf Department of Marine Ecology, Tjärnö, University of Gothenburg, SE-452 96 Strömstad, Sweden
⁎ Corresponding author. Tel.: +358 2 215 4604.E-mail address: [email protected] (M. Snickars)
1385-1101/$ – see front matter © 2013 Elsevier B.V. Allhttp://dx.doi.org/10.1016/j.seares.2013.04.008
a b s t r a c t
a r t i c l e i n f oArticle history:Received 13 November 2012Received in revised form 27 March 2013Accepted 8 April 2013Available online 24 April 2013
Keywords:Baltic SeaEnvironmental gradientsPredictionsReviewBenthosBiophysical relationships
Due to increasing pressure on themarine environment there is a growing need to understand species–environmentrelationships. To provide background for prioritising among variables (predictors) for use in distributionmodels, therelevance of predictors for benthic specieswas reviewed using the coastal Baltic Sea as a case-study area. Significantrelationships for three response groups (fish, macroinvertebrates, macrovegetation) and six predictor categories(bottom topography, biotic features, hydrography, wave exposure, substrate and spatiotemporal variability) wereextracted from 145 queried peer-reviewed field-studies covering three decades and six subregions. In addition,the occurrence of interaction among predictors was analysed. Hydrography was most often found in significant re-lationships, had low level of interaction with other predictors, but also had the most non-significant relationships.Depth and wave exposure were important in all subregions and are readily available, increasing their applicabilityfor cross-regionalmodelling efforts. Otherwise, effort tomodel species distributionsmay prove challenging at largerscale as the relevance of predictors differed among both response groups and regions. Fish and hard bottommacrovegetation have the largest modelling potential, as they are structured by a set of predictors that at thesame time are accurately mapped. A general importance of biotic features implies that these need to be accountedfor in distributionmodelling, but the mapping of most biotic features is challenging, which currently lowers the ap-plicability. The presence of interactions suggests that predictive methods allowing for interactive effects are prefer-able. Detailing these complexities is important for future distribution modelling.
© 2013 Elsevier B.V. All rights reserved.
Contents
1. Introduction . . . . . . . . . . . . . . . . . . . . . . . . . . . . . . . . . . . . . . . . . . . . . . . . . . . . . . . . . . . . . . 1172. Material and methods . . . . . . . . . . . . . . . . . . . . . . . . . . . . . . . . . . . . . . . . . . . . . . . . . . . . . . . . . 117
2.1. Literature search . . . . . . . . . . . . . . . . . . . . . . . . . . . . . . . . . . . . . . . . . . . . . . . . . . . . . . . . 1172.2. Data analysis . . . . . . . . . . . . . . . . . . . . . . . . . . . . . . . . . . . . . . . . . . . . . . . . . . . . . . . . . . 117
3. Results . . . . . . . . . . . . . . . . . . . . . . . . . . . . . . . . . . . . . . . . . . . . . . . . . . . . . . . . . . . . . . . . 1193.1. Studies of species–environment relationships in the Baltic Sea . . . . . . . . . . . . . . . . . . . . . . . . . . . . . . . . . . . 1193.2. General and regional patterns on importance of predictors . . . . . . . . . . . . . . . . . . . . . . . . . . . . . . . . . . . . . 1193.3. Differences in predictor importance within and among response groups . . . . . . . . . . . . . . . . . . . . . . . . . . . . . . . 1193.4. Interactions and independent effects of predictors . . . . . . . . . . . . . . . . . . . . . . . . . . . . . . . . . . . . . . . . . 119
4. Discussion . . . . . . . . . . . . . . . . . . . . . . . . . . . . . . . . . . . . . . . . . . . . . . . . . . . . . . . . . . . . . . . 121Acknowledgements . . . . . . . . . . . . . . . . . . . . . . . . . . . . . . . . . . . . . . . . . . . . . . . . . . . . . . . . . . . . . 123Appendix A. Supplementary data . . . . . . . . . . . . . . . . . . . . . . . . . . . . . . . . . . . . . . . . . . . . . . . . . . . . . 123References . . . . . . . . . . . . . . . . . . . . . . . . . . . . . . . . . . . . . . . . . . . . . . . . . . . . . . . . . . . . . . . . . 123
.
rights reserved.
117M. Snickars et al. / Journal of Sea Research 85 (2014) 116–125
1. Introduction
With today's pressure on the coastal environment, there is a funda-mental need to understand the existence, strength and consequences ofspecies–environment relationships (Crowder and Norse, 2008; Halpernet al., 2009). The main challenge lies in understanding how patterns inthe variation of biotic and abiotic factors together influence the distribu-tion of species andassemblages in timeand space (Mitchell, 2005). In spa-tial planning of e.g. sea areas there is a general call for managementinitiatives that require spatial data andknowledge of ecosystemprocessesand habitat dynamics (Foley et al., 2010). Efforts are being made to ad-dress these data requirements, via the use of Geographical InformationSystems and species distribution models, to produce regional coveragemaps of the distributions of species and habitats (Pittman and Brown,2011). The ecological relevance of these analyses should be assessed,and the opportunities and limitations of existing data determined (Elithand Leathwick, 2009). Thus, efforts on predictivemodelling of species dis-tributions need to incorporate the best available scientific knowledgeabout the relationships between the spatial distribution of species andhabitats (Kissling et al., 2012; Wisz et al., 2012), and relevant environ-mental predictors that can be used to predict such distribution patterns.
The Baltic Sea region has been extensively studied with respect to thelarge-scale horizontal and vertical environmental gradients. These studieshave revealed basin-wide differences in diversity and function of speciesassemblages caused by large-scale environmental gradients in salinityand coastal morphology (e.g. Bonsdorff, 2006; Ojaveer et al., 2010). Forexample, the salinity gradient affects species composition as the numberof marine species decreases towards the less saline northern parts of theBaltic Sea. In this sense, the sea to some degree resembles a large estuarywith clear gradients and species turnover (Heck et al., 1995; Rakocinskiet al., 1992).
Studies of local and regional patterns show that a variety of environ-mental predictors, e.g. temperature, salinity, depth and vegetation are im-portant in structuring coastal benthic species at these scales (Eastwoodet al., 2001; Lehmann, 1998). Nevertheless, a comprehensive view ofthe relevance of predictors is often lacking concerning the mechanisticand correlative species–environment relationships.
In this case-study, we synthesised species–environment relationshipsfocusing on benthic organisms in awell-studied sea, the Baltic Sea region.Ourmain purposewas to explore the generality and relevance andnature(main or interaction effect) of encountered environmental variables (pre-dictors) on benthic organisms in different parts of the sea by compilingpublished analyses of significant relationships between organism groupsand predictors. Although the present approach to use the number ofsignificant relationships in studies as ameasure of the importance of pre-dictors has potential shortcomings, such as that significant results aremore easily accepted for publication than are negative results (Suttonet al., 2000), it may still be used as a measure of the accumulated scien-tific knowledge and data availability, given that the published recordsreflect ecologically relevant relationships. With this approach, an ap-plied meta-analysis for field studies (Fernandez-Duque and Valeggia,1994) was not applicable because the frequency of encountered signif-icant predictors was uneven and some were found in only a few signif-icant relationships. The study setup of the reviewed studies showedhigh variability in terms of varying objectives of the studies. Insteadthe focus of this study was put on presenting an overview regardingthe present knowledge concerning species–environment relationships,which may form a basis for species distribution modelling. As speciesdistribution modelling requires large spatial datasets for training andvalidation, the significant relationships in field-studies also provides in-formation of the potential availability of relevant predictors across thestudied sea, which is important considering any efforts of poolinglocal and regional datasets and scaling up predictions. Thus, we wantedto find out if relationships between benthic species and predictors areequally common throughout the sea, and how the importance of pre-dictors differs among subregions and organism groups, thus having
implications for the success of species distribution models at these sub-regional scales, i.e. tens to hundreds of kilometres.
2. Material and methods
2.1. Literature search
The search of studies covered a 30-year period from 1979 to Febru-ary 2010 (with about two thirds published in 2000 and afterwards).Peer-viewed studies from the Baltic Sea region, including Kattegat andpartly Skagerrak, were searched from the database Aquatic Sciencesand Fisheries Abstracts. The Baltic Sea was divided into six subregions(Fig. 1) based on HELCOM's Baltic Sea subdivisions and Bonsdorff et al.(2002). Potential papers were identified using the keywords ‘BalticSea’ (AND) ‘Fish*’ (OR) ‘Macroinvertebrate*’ (OR) ‘Macrofauna*’ (OR)‘*benthos’ (OR) ‘Macrophyte*’ (OR) ‘Macroalga*’ (Macrovegetation),which were the three major response group levels. Thus, we assuredthat studies with alternative regional or local sea names were coveredby the search. Each paperwas then sorted according to the six subregionsby refining the search result using each of the subregion names, andman-ually by screening the studies. Fish papers were additionally screened sothat only studies with a benthic focus were included, excluding studieson pelagic species. The results of the sorted papers were searched for a)significant empirical species- or assemblage–environment relationshipsin field studies (not field experiments), resulting in a database of fieldstudies presenting at least one significant relationship (as no paper wasfound presenting a studywith statistical analysis without at least one sig-nificant result). Non-significant relationships were noted. In case a paperincluded significant results for more than one species, the paper wasregarded as two separate studies only if the species were tested individu-ally. Otherwise >1 species were regarded as assemblages. Only studieswith b) spatial replication, i.e. includingmore than one study site, rangingfrom 5 m to tens of kilometres apart were included in the database. Timeseries or seasonal studies were included c) only if both a) and b) weretrue, i.e. a significant response was spatially linked to one or several envi-ronmental predictors and this relationship was separated from the tem-poral one in the results. It is important to note that the database ofstudies does not provide an exhaustive list of all field studies on signifi-cant species-environment relationships in the regions of the Baltic Seasince late 1970s, but a representative sample based on the criteria men-tioned above, i.e. spatially replicated field study of one or several benthicspecies with a significant response to one or several environment predic-tors. The database did not include descriptive studies with no statisticalanalysis.
2.2. Data analysis
The search identified a total of 17 predictors that showed a significantrelationship with a species/assemblage in at least one study. The 17 pre-dictorswerepooled into six general categories, includingbottomtopogra-phy (water depth and slope), biotic features (biological processes suchas predator–prey relationships, macrovegetation cover and cover of fila-mentous algae), hydrography (pH, nutrient content, oxygen, salinity,Secchi depth, sedimentation and water temperature), exposure (waveexposure), substrate (sediment type and substrate) and spatiotemporalvariability (site and time), e.g. differences between two or more geo-graphical locations or differences between two or more sampling dates(Table 1). The latter of these categories incorporates effects of an un-known number of deterministic or stochastic environmental gradientsand is not particularly well suited for predictive purposes. Themagnitudeof spatiotemporal variability is informative for how patterns of biologicalassemblages are analysed in contemporary research, and for how fre-quently effects of various environmental factorsmay interact with spatialand temporal components. For macrovegetation, macrovegetation coverand cover of filamentous algae were excluded as predictors. For eachof the individual predictors we summed the number of studies with
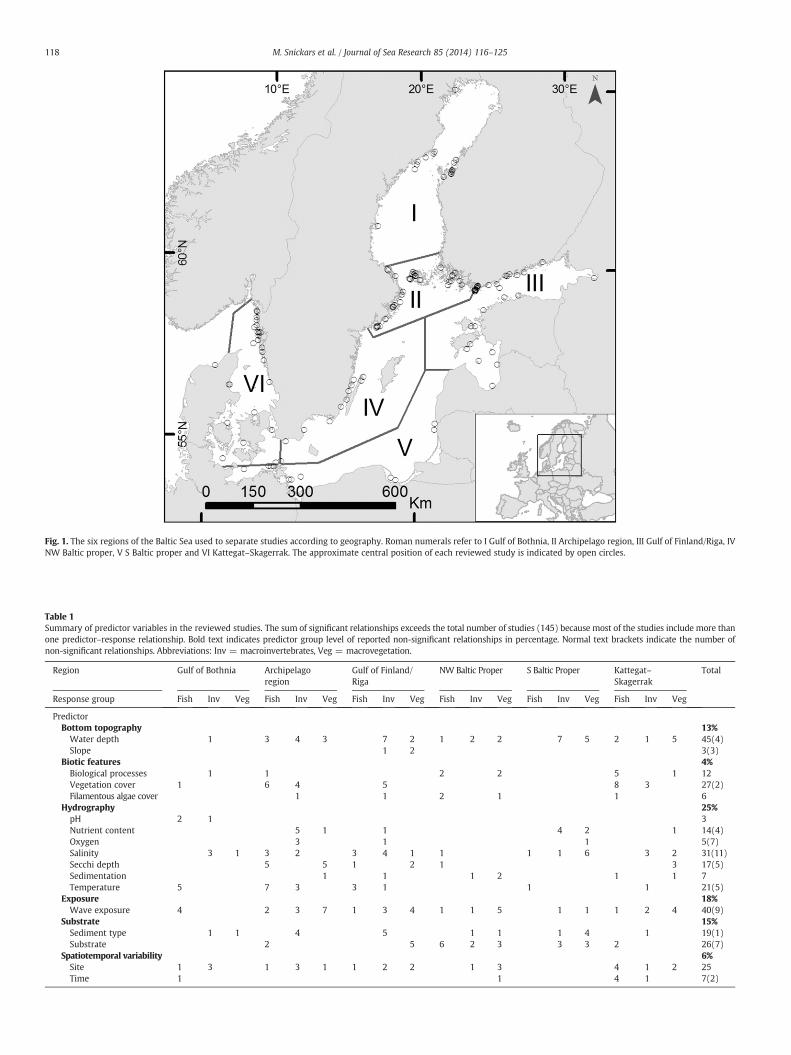
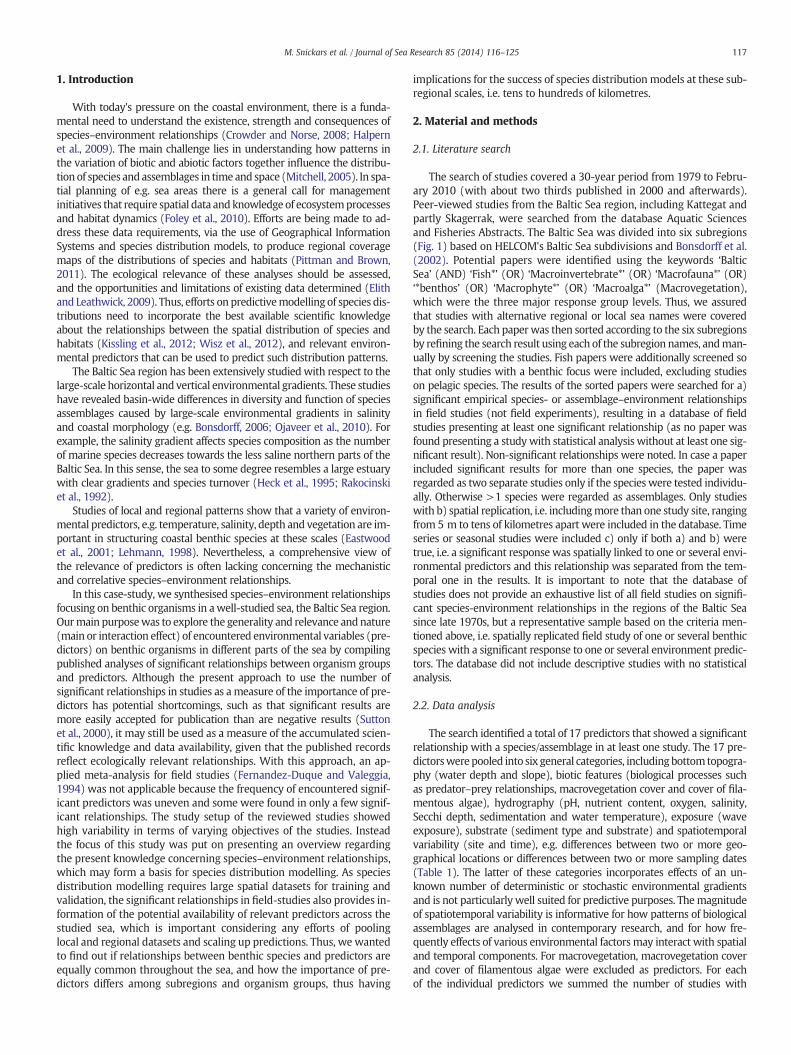
Fig. 1. The six regions of the Baltic Sea used to separate studies according to geography. Roman numerals refer to I Gulf of Bothnia, II Archipelago region, III Gulf of Finland/Riga, IVNW Baltic proper, V S Baltic proper and VI Kattegat–Skagerrak. The approximate central position of each reviewed study is indicated by open circles.
Table 1Summary of predictor variables in the reviewed studies. The sum of significant relationships exceeds the total number of studies (145) because most of the studies include more thanone predictor–response relationship. Bold text indicates predictor group level of reported non-significant relationships in percentage. Normal text brackets indicate the number ofnon-significant relationships. Abbreviations: Inv = macroinvertebrates, Veg = macrovegetation.
Region Gulf of Bothnia Archipelagoregion
Gulf of Finland/Riga
NW Baltic Proper S Baltic Proper Kattegat–Skagerrak
Total
Response group Fish Inv Veg Fish Inv Veg Fish Inv Veg Fish Inv Veg Fish Inv Veg Fish Inv Veg
PredictorBottom topography 13%Water depth 1 3 4 3 7 2 1 2 2 7 5 2 1 5 45(4)Slope 1 2 3(3)
Biotic features 4%Biological processes 1 1 2 2 5 1 12Vegetation cover 1 6 4 5 8 3 27(2)Filamentous algae cover 1 1 2 1 1 6
Hydrography 25%pH 2 1 3Nutrient content 5 1 1 4 2 1 14(4)Oxygen 3 1 1 5(7)Salinity 3 1 3 2 3 4 1 1 1 1 6 3 2 31(11)Secchi depth 5 5 1 2 1 3 17(5)Sedimentation 1 1 1 2 1 1 7Temperature 5 7 3 3 1 1 1 21(5)
Exposure 18%Wave exposure 4 2 3 7 1 3 4 1 1 5 1 1 1 2 4 40(9)
Substrate 15%Sediment type 1 1 4 5 1 1 1 4 1 19(1)Substrate 2 5 6 2 3 3 3 2 26(7)
Spatiotemporal variability 6%Site 1 3 1 3 1 1 2 2 1 3 4 1 2 25Time 1 1 4 1 7(2)
118 M. Snickars et al. / Journal of Sea Research 85 (2014) 116–125
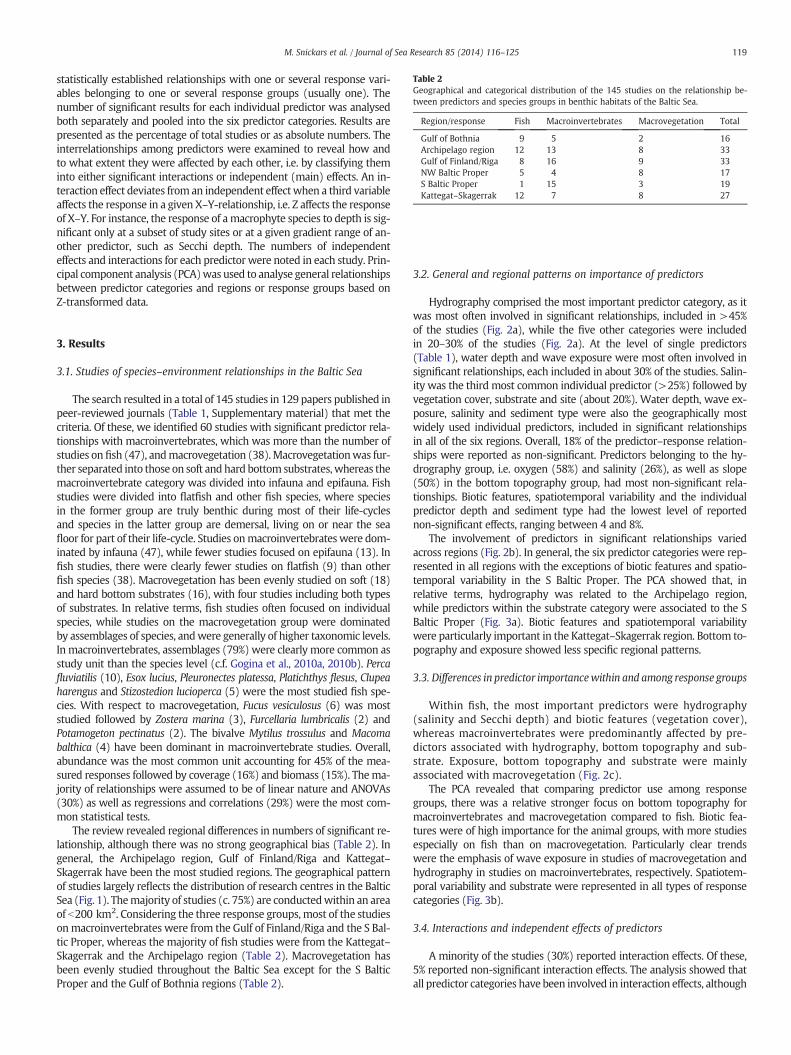
Table 2Geographical and categorical distribution of the 145 studies on the relationship be-tween predictors and species groups in benthic habitats of the Baltic Sea.
Region/response Fish Macroinvertebrates Macrovegetation Total
Gulf of Bothnia 9 5 2 16Archipelago region 12 13 8 33Gulf of Finland/Riga 8 16 9 33NW Baltic Proper 5 4 8 17S Baltic Proper 1 15 3 19Kattegat–Skagerrak 12 7 8 27
119M. Snickars et al. / Journal of Sea Research 85 (2014) 116–125
statistically established relationships with one or several response vari-ables belonging to one or several response groups (usually one). Thenumber of significant results for each individual predictor was analysedboth separately and pooled into the six predictor categories. Results arepresented as the percentage of total studies or as absolute numbers. Theinterrelationships among predictors were examined to reveal how andto what extent they were affected by each other, i.e. by classifying theminto either significant interactions or independent (main) effects. An in-teraction effect deviates from an independent effectwhen a third variableaffects the response in a given X–Y-relationship, i.e. Z affects the responseof X–Y. For instance, the response of amacrophyte species to depth is sig-nificant only at a subset of study sites or at a given gradient range of an-other predictor, such as Secchi depth. The numbers of independenteffects and interactions for each predictor were noted in each study. Prin-cipal component analysis (PCA)was used to analyse general relationshipsbetween predictor categories and regions or response groups based onZ-transformed data.
3. Results
3.1. Studies of species–environment relationships in the Baltic Sea
The search resulted in a total of 145 studies in 129 papers published inpeer-reviewed journals (Table 1, Supplementary material) that met thecriteria. Of these, we identified 60 studies with significant predictor rela-tionships with macroinvertebrates, which was more than the number ofstudies on fish (47), andmacrovegetation (38).Macrovegetationwas fur-ther separated into those on soft and hard bottom substrates,whereas themacroinvertebrate category was divided into infauna and epifauna. Fishstudies were divided into flatfish and other fish species, where speciesin the former group are truly benthic during most of their life-cyclesand species in the latter group are demersal, living on or near the seafloor for part of their life-cycle. Studies onmacroinvertebrateswere dom-inated by infauna (47), while fewer studies focused on epifauna (13). Infish studies, there were clearly fewer studies on flatfish (9) than otherfish species (38). Macrovegetation has been evenly studied on soft (18)and hard bottom substrates (16), with four studies including both typesof substrates. In relative terms, fish studies often focused on individualspecies, while studies on the macrovegetation group were dominatedby assemblages of species, andwere generally of higher taxonomic levels.In macroinvertebrates, assemblages (79%) were clearly more common asstudy unit than the species level (c.f. Gogina et al., 2010a, 2010b). Percafluviatilis (10), Esox lucius, Pleuronectes platessa, Platichthys flesus, Clupeaharengus and Stizostedion lucioperca (5) were the most studied fish spe-cies. With respect to macrovegetation, Fucus vesiculosus (6) was moststudied followed by Zostera marina (3), Furcellaria lumbricalis (2) andPotamogeton pectinatus (2). The bivalve Mytilus trossulus and Macomabalthica (4) have been dominant in macroinvertebrate studies. Overall,abundance was the most common unit accounting for 45% of the mea-sured responses followed by coverage (16%) and biomass (15%). Thema-jority of relationships were assumed to be of linear nature and ANOVAs(30%) as well as regressions and correlations (29%) were the most com-mon statistical tests.
The review revealed regional differences in numbers of significant re-lationship, although there was no strong geographical bias (Table 2). Ingeneral, the Archipelago region, Gulf of Finland/Riga and Kattegat–Skagerrak have been the most studied regions. The geographical patternof studies largely reflects the distribution of research centres in the BalticSea (Fig. 1). Themajority of studies (c. 75%) are conductedwithin an areaof b200 km2. Considering the three response groups, most of the studiesonmacroinvertebrates were from the Gulf of Finland/Riga and the S Bal-tic Proper, whereas the majority of fish studies were from the Kattegat–Skagerrak and the Archipelago region (Table 2). Macrovegetation hasbeen evenly studied throughout the Baltic Sea except for the S BalticProper and the Gulf of Bothnia regions (Table 2).
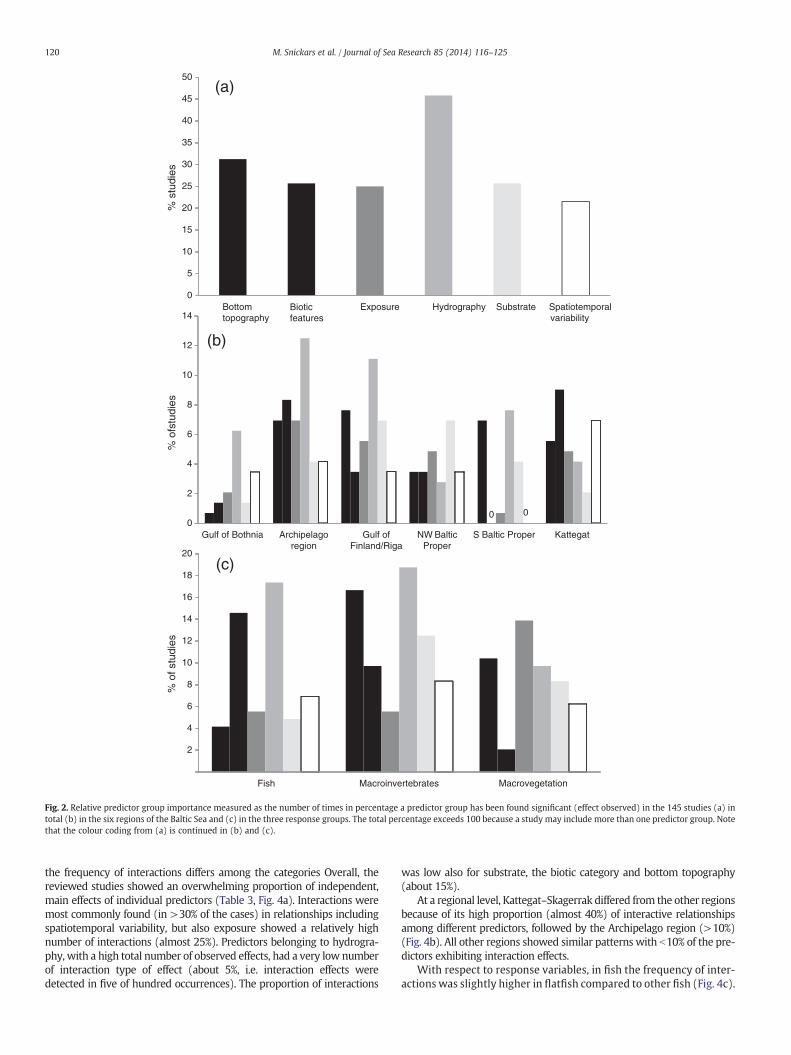
3.2. General and regional patterns on importance of predictors
Hydrography comprised the most important predictor category, as itwas most often involved in significant relationships, included in >45%of the studies (Fig. 2a), while the five other categories were includedin 20–30% of the studies (Fig. 2a). At the level of single predictors(Table 1), water depth and wave exposure were most often involved insignificant relationships, each included in about 30% of the studies. Salin-ity was the third most common individual predictor (>25%) followed byvegetation cover, substrate and site (about 20%). Water depth, wave ex-posure, salinity and sediment type were also the geographically mostwidely used individual predictors, included in significant relationshipsin all of the six regions. Overall, 18% of the predictor–response relation-ships were reported as non-significant. Predictors belonging to the hy-drography group, i.e. oxygen (58%) and salinity (26%), as well as slope(50%) in the bottom topography group, had most non-significant rela-tionships. Biotic features, spatiotemporal variability and the individualpredictor depth and sediment type had the lowest level of reportednon-significant effects, ranging between 4 and 8%.
The involvement of predictors in significant relationships variedacross regions (Fig. 2b). In general, the six predictor categories were rep-resented in all regions with the exceptions of biotic features and spatio-temporal variability in the S Baltic Proper. The PCA showed that, inrelative terms, hydrography was related to the Archipelago region,while predictors within the substrate category were associated to the SBaltic Proper (Fig. 3a). Biotic features and spatiotemporal variabilitywere particularly important in the Kattegat–Skagerrak region. Bottom to-pography and exposure showed less specific regional patterns.
3.3. Differences in predictor importancewithin and among response groups
Within fish, the most important predictors were hydrography(salinity and Secchi depth) and biotic features (vegetation cover),whereas macroinvertebrates were predominantly affected by pre-dictors associated with hydrography, bottom topography and sub-strate. Exposure, bottom topography and substrate were mainlyassociated with macrovegetation (Fig. 2c).
The PCA revealed that comparing predictor use among responsegroups, there was a relative stronger focus on bottom topography formacroinvertebrates and macrovegetation compared to fish. Biotic fea-tures were of high importance for the animal groups, with more studiesespecially on fish than on macrovegetation. Particularly clear trendswere the emphasis of wave exposure in studies of macrovegetation andhydrography in studies on macroinvertebrates, respectively. Spatiotem-poral variability and substrate were represented in all types of responsecategories (Fig. 3b).
3.4. Interactions and independent effects of predictors
A minority of the studies (30%) reported interaction effects. Of these,5% reported non-significant interaction effects. The analysis showed thatall predictor categories have been involved in interaction effects, although
2
4
6
8
10
12
14
16
18
20
Fish Macroinvertebrates Macrovegetation
% o
f stu
dies
0 0
2
4
6
8
10
12
14
Gulf of Bothnia Archipelagoregion
Gulf ofFinland/Riga
NW BalticProper
S Baltic Proper Kattegat
% o
fstu
dies
0
5
10
15
20
25
30
35
40
45
50
Bottomtopography
Bioticfeatures
Exposure Hydrography Substrate Spatiotemporalvariability
% s
tudi
es
(a)
(b)
(c)
0
Fig. 2. Relative predictor group importance measured as the number of times in percentage a predictor group has been found significant (effect observed) in the 145 studies (a) intotal (b) in the six regions of the Baltic Sea and (c) in the three response groups. The total percentage exceeds 100 because a study may include more than one predictor group. Notethat the colour coding from (a) is continued in (b) and (c).
120 M. Snickars et al. / Journal of Sea Research 85 (2014) 116–125
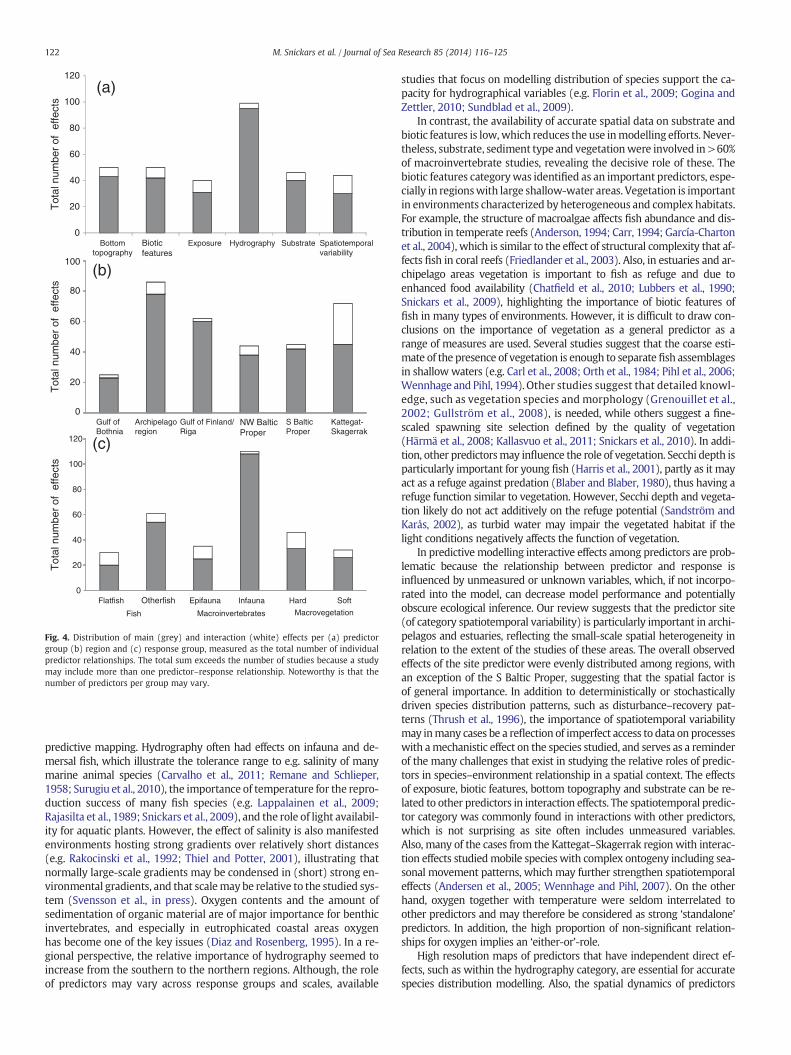
the frequency of interactions differs among the categories Overall, thereviewed studies showed an overwhelming proportion of independent,main effects of individual predictors (Table 3, Fig. 4a). Interactions weremost commonly found (in >30% of the cases) in relationships includingspatiotemporal variability, but also exposure showed a relatively highnumber of interactions (almost 25%). Predictors belonging to hydrogra-phy, with a high total number of observed effects, had a very low numberof interaction type of effect (about 5%, i.e. interaction effects weredetected in five of hundred occurrences). The proportion of interactions
was low also for substrate, the biotic category and bottom topography(about 15%).
At a regional level, Kattegat–Skagerrak differed from the other regionsbecause of its high proportion (almost 40%) of interactive relationshipsamong different predictors, followed by the Archipelago region (>10%)(Fig. 4b). All other regions showed similar patterns with b10% of the pre-dictors exhibiting interaction effects.
With respect to response variables, in fish the frequency of inter-actions was slightly higher in flatfish compared to other fish (Fig. 4c).
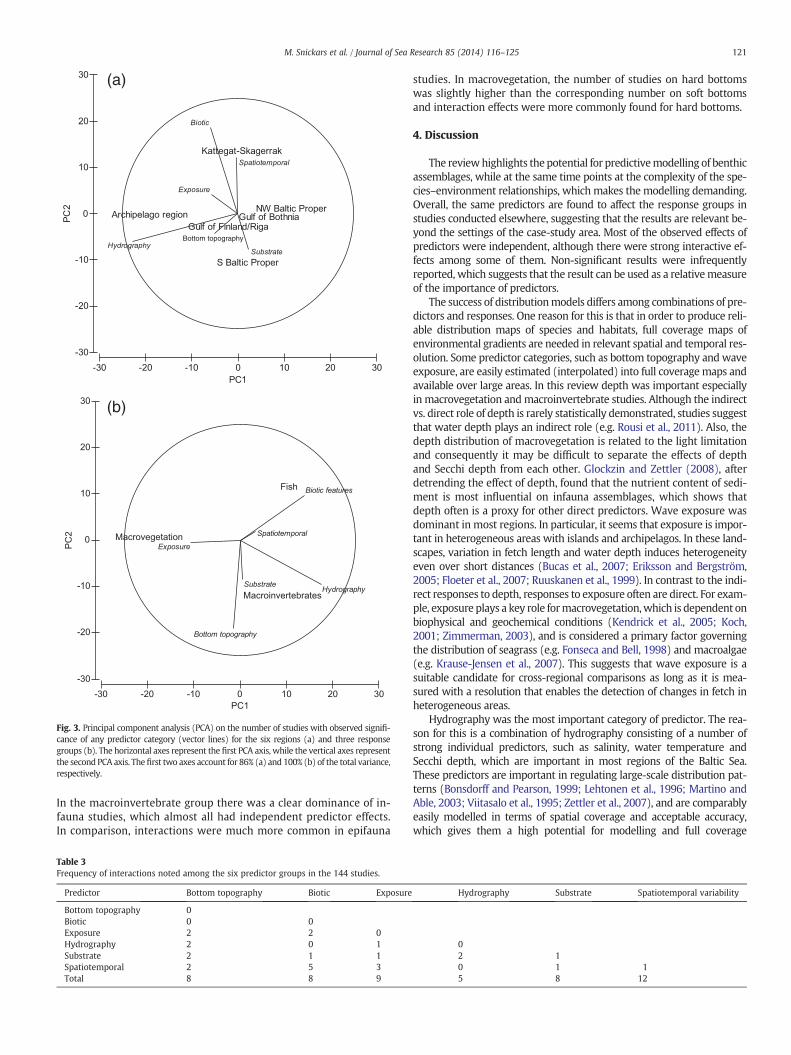
Bottom topography
(a)
(b)
Fig. 3. Principal component analysis (PCA) on the number of studies with observed signifi-cance of any predictor category (vector lines) for the six regions (a) and three responsegroups (b). The horizontal axes represent the first PCA axis, while the vertical axes representthe second PCA axis. Thefirst two axes account for 86% (a) and 100% (b) of the total variance,respectively.
121M. Snickars et al. / Journal of Sea Research 85 (2014) 116–125
In the macroinvertebrate group there was a clear dominance of in-fauna studies, which almost all had independent predictor effects.In comparison, interactions were much more common in epifauna
Table 3Frequency of interactions noted among the six predictor groups in the 144 studies.
Predictor Bottom topography Biotic Exposure
Bottom topography 0Biotic 0 0Exposure 2 2 0Hydrography 2 0 1Substrate 2 1 1Spatiotemporal 2 5 3Total 8 8 9
studies. In macrovegetation, the number of studies on hard bottomswas slightly higher than the corresponding number on soft bottomsand interaction effects were more commonly found for hard bottoms.
4. Discussion
The reviewhighlights the potential for predictivemodelling of benthicassemblages, while at the same time points at the complexity of the spe-cies–environment relationships, which makes the modelling demanding.Overall, the same predictors are found to affect the response groups instudies conducted elsewhere, suggesting that the results are relevant be-yond the settings of the case-study area. Most of the observed effects ofpredictors were independent, although there were strong interactive ef-fects among some of them. Non-significant results were infrequentlyreported, which suggests that the result can be used as a relativemeasureof the importance of predictors.
The success of distributionmodels differs among combinations of pre-dictors and responses. One reason for this is that in order to produce reli-able distribution maps of species and habitats, full coverage maps ofenvironmental gradients are needed in relevant spatial and temporal res-olution. Some predictor categories, such as bottom topography and waveexposure, are easily estimated (interpolated) into full coveragemaps andavailable over large areas. In this review depth was important especiallyin macrovegetation andmacroinvertebrate studies. Although the indirectvs. direct role of depth is rarely statistically demonstrated, studies suggestthat water depth plays an indirect role (e.g. Rousi et al., 2011). Also, thedepth distribution of macrovegetation is related to the light limitationand consequently it may be difficult to separate the effects of depthand Secchi depth from each other. Glockzin and Zettler (2008), afterdetrending the effect of depth, found that the nutrient content of sedi-ment is most influential on infauna assemblages, which shows thatdepth often is a proxy for other direct predictors. Wave exposure wasdominant in most regions. In particular, it seems that exposure is impor-tant in heterogeneous areas with islands and archipelagos. In these land-scapes, variation in fetch length and water depth induces heterogeneityeven over short distances (Bucas et al., 2007; Eriksson and Bergström,2005; Floeter et al., 2007; Ruuskanen et al., 1999). In contrast to the indi-rect responses to depth, responses to exposure often are direct. For exam-ple, exposure plays a key role formacrovegetation,which is dependent onbiophysical and geochemical conditions (Kendrick et al., 2005; Koch,2001; Zimmerman, 2003), and is considered a primary factor governingthe distribution of seagrass (e.g. Fonseca and Bell, 1998) and macroalgae(e.g. Krause-Jensen et al., 2007). This suggests that wave exposure is asuitable candidate for cross-regional comparisons as long as it is mea-sured with a resolution that enables the detection of changes in fetch inheterogeneous areas.
Hydrography was the most important category of predictor. The rea-son for this is a combination of hydrography consisting of a number ofstrong individual predictors, such as salinity, water temperature andSecchi depth, which are important in most regions of the Baltic Sea.These predictors are important in regulating large-scale distribution pat-terns (Bonsdorff and Pearson, 1999; Lehtonen et al., 1996; Martino andAble, 2003; Viitasalo et al., 1995; Zettler et al., 2007), and are comparablyeasily modelled in terms of spatial coverage and acceptable accuracy,which gives them a high potential for modelling and full coverage
Hydrography Substrate Spatiotemporal variability
02 10 1 15 8 12
0
20
40
60
80
100
120
Flatfish Otherfish Epifauna Infauna Hard Soft
Fish Macroinvertebrates Macrovegetation
Gulf of Bothnia
Archipelagoregion
Gulf of Finland/Riga
NW BalticProper
S BalticProper
Kattegat-Skagerrak
(b)
(c)
0
20
40
60
80
100
120
Bottomtopography
Biotic features
Exposure Hydrography Substrate Spatiotemporalvariability
Tot
al n
umbe
r of
effe
cts
(a)
Tot
al n
umbe
r of
effe
cts
Tot
al n
umbe
r of
effe
cts
0
20
40
60
80
100
Fig. 4. Distribution of main (grey) and interaction (white) effects per (a) predictorgroup (b) region and (c) response group, measured as the total number of individualpredictor relationships. The total sum exceeds the number of studies because a studymay include more than one predictor–response relationship. Noteworthy is that thenumber of predictors per group may vary.
122 M. Snickars et al. / Journal of Sea Research 85 (2014) 116–125
predictive mapping. Hydrography often had effects on infauna and de-mersal fish, which illustrate the tolerance range to e.g. salinity of manymarine animal species (Carvalho et al., 2011; Remane and Schlieper,1958; Surugiu et al., 2010), the importance of temperature for the repro-duction success of many fish species (e.g. Lappalainen et al., 2009;Rajasilta et al., 1989; Snickars et al., 2009), and the role of light availabil-ity for aquatic plants. However, the effect of salinity is also manifestedenvironments hosting strong gradients over relatively short distances(e.g. Rakocinski et al., 1992; Thiel and Potter, 2001), illustrating thatnormally large-scale gradients may be condensed in (short) strong en-vironmental gradients, and that scalemay be relative to the studied sys-tem (Svensson et al., in press). Oxygen contents and the amount ofsedimentation of organic material are of major importance for benthicinvertebrates, and especially in eutrophicated coastal areas oxygenhas become one of the key issues (Diaz and Rosenberg, 1995). In a re-gional perspective, the relative importance of hydrography seemed toincrease from the southern to the northern regions. Although, the roleof predictors may vary across response groups and scales, available
studies that focus on modelling distribution of species support the ca-pacity for hydrographical variables (e.g. Florin et al., 2009; Gogina andZettler, 2010; Sundblad et al., 2009).
In contrast, the availability of accurate spatial data on substrate andbiotic features is low,which reduces the use inmodelling efforts. Never-theless, substrate, sediment type and vegetationwere involved in>60%of macroinvertebrate studies, revealing the decisive role of these. Thebiotic features categorywas identified as an important predictors, espe-cially in regionswith large shallow-water areas. Vegetation is importantin environments characterized by heterogeneous and complex habitats.For example, the structure of macroalgae affects fish abundance and dis-tribution in temperate reefs (Anderson, 1994; Carr, 1994; García-Chartonet al., 2004), which is similar to the effect of structural complexity that af-fects fish in coral reefs (Friedlander et al., 2003). Also, in estuaries and ar-chipelago areas vegetation is important to fish as refuge and due toenhanced food availability (Chatfield et al., 2010; Lubbers et al., 1990;Snickars et al., 2009), highlighting the importance of biotic features offish in many types of environments. However, it is difficult to draw con-clusions on the importance of vegetation as a general predictor as arange of measures are used. Several studies suggest that the coarse esti-mate of the presence of vegetation is enough to separate fish assemblagesin shallowwaters (e.g. Carl et al., 2008; Orth et al., 1984; Pihl et al., 2006;Wennhage and Pihl, 1994). Other studies suggest that detailed knowl-edge, such as vegetation species and morphology (Grenouillet et al.,2002; Gullström et al., 2008), is needed, while others suggest a fine-scaled spawning site selection defined by the quality of vegetation(Härmä et al., 2008; Kallasvuo et al., 2011; Snickars et al., 2010). In addi-tion, other predictorsmay influence the role of vegetation. Secchi depth isparticularly important for young fish (Harris et al., 2001), partly as it mayact as a refuge against predation (Blaber and Blaber, 1980), thus having arefuge function similar to vegetation. However, Secchi depth and vegeta-tion likely do not act additively on the refuge potential (Sandström andKarås, 2002), as turbid water may impair the vegetated habitat if thelight conditions negatively affects the function of vegetation.
In predictive modelling interactive effects among predictors are prob-lematic because the relationship between predictor and response isinfluenced by unmeasured or unknown variables, which, if not incorpo-rated into the model, can decrease model performance and potentiallyobscure ecological inference. Our review suggests that the predictor site(of category spatiotemporal variability) is particularly important in archi-pelagos and estuaries, reflecting the small-scale spatial heterogeneity inrelation to the extent of the studies of these areas. The overall observedeffects of the site predictor were evenly distributed among regions, withan exception of the S Baltic Proper, suggesting that the spatial factor isof general importance. In addition to deterministically or stochasticallydriven species distribution patterns, such as disturbance–recovery pat-terns (Thrush et al., 1996), the importance of spatiotemporal variabilitymay inmany cases be a reflection of imperfect access to data on processeswith amechanistic effect on the species studied, and serves as a reminderof the many challenges that exist in studying the relative roles of predic-tors in species–environment relationship in a spatial context. The effectsof exposure, biotic features, bottom topography and substrate can be re-lated to other predictors in interaction effects. The spatiotemporal predic-tor category was commonly found in interactions with other predictors,which is not surprising as site often includes unmeasured variables.Also, many of the cases from the Kattegat–Skagerrak region with interac-tion effects studiedmobile species with complex ontogeny including sea-sonal movement patterns, which may further strengthen spatiotemporaleffects (Andersen et al., 2005; Wennhage and Pihl, 2007). On the otherhand, oxygen together with temperature were seldom interrelated toother predictors and may therefore be considered as strong ‘standalone’predictors. In addition, the high proportion of non-significant relation-ships for oxygen implies an ‘either-or’-role.
High resolution maps of predictors that have independent direct ef-fects, such as within the hydrography category, are essential for accuratespecies distribution modelling. Also, the spatial dynamics of predictors
123M. Snickars et al. / Journal of Sea Research 85 (2014) 116–125
need to be considered so that relevant scales for the response are used(e.g. Nyström Sandman et al., 2012; Svensson et al., in press). For exam-ple, temperature had an intermediate importance probably due to moststudies being conducted at a scale not able to capture the larger-scale ef-fect of the predictor. Similarly, another predictor responsible for large-scale species distribution patterns, salinity, had the highest number ofnon-significant results, underlying the scale-dependency in the ecologicalrelevance ofmany predictors. In seaswith strong seasonal dynamics, cap-turing the temporal aspect is a challenge that needs to be a future priorityin modelling efforts, also in the face of climate change. Thus, in order topredict effects of climate change on the distribution of species, differentscenario approaches and lagged predictors may be applied (Coreauet al., 2009; Gröger and Rumohr, 2006; Gröger et al., 2007). In addition,the findings point to that care should be taken in ensuring a proper sam-pling design, scale and use of adequate statistical technique, which mayhandle interactive effects, including biotic interactions (Kissling et al.,2012; Wisz et al., 2012).
The review illustrates that there are gaps in the knowledge regard-ingmany response–predictors relationships. For example, soft substratemacrovegetation holds the fewest studies of all sub-groups and is muchless studied than hard substrate macrovegetation, which directly mayreduce the potential of modelling soft substrate vegetation. Indirectlythis limitation may affect the modelling of other response groups, asvegetation also is an important predictor. In addition, substrate is akey variable formacrovegetation distribution, but the current limitationfor predictivemodelling is a lack of detailed substratemaps.While priorecological knowledge would be essential in order to reduce the com-plexity of species distribution modelling including biotic interactions(Kissling et al., 2012; Wisz et al., 2012), field studies focusing on bioticfeatures other than vegetation are limited in number. Biotic featureswere most commonly studied in fish, implying that features such aspredation and food composition are important parallel to the abioticpredictors for this group. Other studies show that both intra- and inter-specific interactions influence species distribution in macroinvertebrates(e.g. Bergström et al., 2002; Thrush, 1991). Similar effects of biotic fea-tures, such as species composition and mesopredator release, onmacrovegetation have been shown experimentally (e.g. Duffy,2002; Eriksson et al., 2009; Moksnes et al., 2008; Salo et al., 2009),and may also follow from high fishing impact (e.g. Micheli et al.,2005). These results suggest a strong role of biotic features thattoday are underrepresented in terms of relevance in species distribu-tion modelling (Elith and Leathwick, 2009). Biotic features need to bebetter accounted for in distribution predictions, e.g. by focusing on thestructuring role of predator–prey or plant–herbivore relationships in thedistribution of species (e.g. Kissling et al., 2012; MacGarvin, 1982; Wiszet al., 2012).
This review suggests that extrapolating models outside the calibrat-ed range of predictors or outside the study area may prove difficult.This may be true especially in the case of indirect predictors, as the re-sponse to indirect predictors such as depth is sensitive to scale in thatthe effect may differ from region to region (Nyström Sandman et al.,2012; Sundblad et al., 2009). We also found that time and site were in-volved in a considerable part of the studies. Unmeasured site-specificconditions increase uncertainty and decrease the distribution modelsgenerality and the ability to transfer it from one area to another.Sundblad et al. (2009) showed, for two coastal areas, the importanceof considering differences in the environmental presence range, i.e. thegeographical distribution of a species along predictor gradients, becausethis can affect the shape of the response and transferability success. Sim-ilarly, direction-specific transferability success has been observed in ter-restrial studies (Randin et al., 2006), demonstrating the importance ofcovering the full environmental distribution range and using predictorswith mechanistic effects. Compared to extrapolating outside the sam-pled range, pooling datasets from neighbouring regions may increasethe predictive performance when applied to an adjacent new region(Graf et al., 2006). However, combining information from local areas
increases model performance by increasing generality at the regionalscale up to the point (scale) where the heterogeneity of predictors gen-erate differences in local responses (Osborne and Suarez-Seoane, 2002).Studies on species–environment relationships in the Baltic Sea had apatchy geographic coverage, concentrating around research centres.Predictive modelling efforts need to consider that the available datasets,whichmostly are collected for particular purposes, contain specific spaceand time scales that may infer restrictions on their applicability for awide synthesis. Spatially clustered data may result in autocorrelation,whereby assumptions of independence are violated and may lead to bi-ased estimates and inflatedmodel performance, also with seemingly in-dependent test data (Bahn and McGill, 2013). As the environmentalpredictors also contain a spatial structure, they can reduce or removethe models residual autocorrelation, although it is recommended thatthis is always investigated before the final acceptance of a model(Diniz-Filho et al., 2003).
In summary, the review covers studies involving varying objectives,methods andmeasures, addressing complex predictor–response relation-ships.Whilemodelling these relationshipsmaybe demanding, the resultsshow that the detection of ecologically relevant relationships relies on aset of data quality aspects, including scale issues and prior knowledge.Our analysis shows that hard bottommacrovegetation and fish may cur-rently have the largest potential for predictive modelling, as the distribu-tion of these groups depends on a restricted set of strong predictors, someof which presently are accurately mapped at regional and subregionalscales. Macrovegetation seems structured by the smallest set of predic-tors, dominated by depth, wave exposure and secchi depth, suggestingthat as a group macrovegetation could be efficiently modelled usingonly these predictors. While there is information on the empirical rela-tionships between predictors and benthic assemblages, geographicallyskewed data and the lack of accurate full coverage maps may reducethe transferability among subregions and organism groups. Away to in-crease the utility of distributionmaps formanagement and spatial plan-ning is to coordinate efforts among research centres and countries,combining local datasets for regional and cross-border predictions,thus moving towards a more comprehensive knowledge of speciesdistributions.
Acknowledgements
The research leading to these results was conducted within thePREHAB project, which has received funding from the EuropeanCommunity's Seventh Framework Programme (FP/2007-2013) undergrant agreement no 217246 made with the joint Baltic Sea researchand development programme BONUS, the Academy of Finland, andThe Swedish Research Council.
Appendix A. Supplementary data
Supplementary data to this article can be found online at http://dx.doi.org/10.1016/j.seares.2013.04.008.
References
Andersen, B.S., Carl, J.D., Grönkjaer, P., Stöttrup, J.G., 2005. Feeding ecology and growth of age0 year Platichthys flesus (L) in a vegetated and a bare sand habitat in a nutrient rich fjord.Journal of Fish Biology 66, 531–552.
Anderson, T.W., 1994. Role of macroalgal structure in the distribution and abundanceof a temperate reef fish. Marine Ecology Progress Series 113, 279–290.
Bahn, V., McGill, B.J., 2013. Testing the predictive performance of distribution models.Oikos 122, 321–331.
Bergström, U., Englund, G., Bonsdorff, E., 2002. Baltic Sea zoobenthos— inferring pro-cesses from patterns. Journal of Experimental Marine Biology and Ecology 281,123–136.
Blaber, S.J.M., Blaber, T.G., 1980. Factors affecting the distribution of juvenile estuarineand inshore fish. Journal of Fish Biology 17, 143–162.
Bonsdorff, E., 2006. Zoobenthic diversity-gradients in the Baltic Sea: continuous post-glacialsuccession in a stressed ecosystem. Journal of Experimental Marine Biology and Ecology330, 383–391.
124 M. Snickars et al. / Journal of Sea Research 85 (2014) 116–125
Bonsdorff, E., Pearson, T.H., 1999. Variation in the sublittoral macrozoobenthos of the BalticSea along environmental gradients: a functional-group approach. Australian Journal ofEcology 24, 312–326.
Bonsdorff, E., Rönnberg, C., Aarnio, K., 2002. Some ecological properties in relation toeutrophication in the Baltic Sea. Hydrobiologia 475 (476), 371–377.
Bucas, M., Daunys, D., Olenin, S., 2007. Overgrowth patterns of the red algae Furcellarialumbricalis at an exposed Baltic Sea coast: the results of a remote underwater videodata analysis. Estuarine, Coastal and Shelf Science 75, 308–316.
Carl, J.D., Sparrevohn, C.R., Nicolajsen, H., Stotterup, J.G., 2008. Substratum selection by juve-nile flounder Platichthys flesus (L): effect of ephemeral filamentous macroalgae. Journalof Fish Biology 72, 2570–2578.
Carr, M.H., 1994. Effects of macroalgal dynamics on recruitment of a temperate reeffish. Ecology 75, 1320–1333.
Carvalho, S., Pereira, P., Pereira, F., de Pablo, H., Vale, C., Gaspar, M.B., 2011. Factors structur-ing temporal and spatial dynamics of macrobenthic communities in a eutrophic coastallagoon (Óbidos lagoon, Portugal). Marine Environmental Research 71, 97–110.
Chatfield, B.S., Van Niel, K.P., Kendrick, G.A., Harvey, E.S., 2010. Combining environmentalgradients to explain and predict the structure of demersal fish distributions. Journalof Biogeography 37, 593–605.
Coreau, A., Pinay, G., Thompson, J.D., Cheptou, P.-O., Mermet, L., 2009. The rise of researchon futures in ecology: rebalancing scenarios and predictions. Ecology Letters 12,1277–1286.
Crowder, L., Norse, E., 2008. Essential ecological insights for marine ecosystem-basedmanagement and marine spatial planning. Marine Policy 32, 772–778.
Diaz, R., Rosenberg, R., 1995. Marine benthic hypoxia: a review of its ecological effectsand the behavioural responses of benthic macrofauna. Oceanography and MarineBiology Annual Review 33, 245–303.
Diniz-Filho, J.A.F., Bini, L.M., Hawkins, B.A., 2003. Spatial autocorrelation and red herringsin geographical ecology. Global Ecology and Biogeography 12, 53–64.
Duffy, J.E., 2002. Biodiversity and ecosystem function: the consumer connection. Oikos99, 201–219.
Eastwood, P.D., Meaden, G.J., Grioche, A., 2001. Modelling spatial variations in spawninghabitat suitability for the sole (Solea solea) using regression quantiles and GIS proce-dures. Marine Ecology Progress Series 224, 251–266.
Elith, J., Leathwick, J.R., 2009. Species distributionmodels: ecological explanation and pre-diction across space and time. Annual Review of Ecology, Evolution, and Systematics40, 677–697.
Eriksson, B.K., Bergström, L., 2005. Local distribution patterns of macroalgae in relation toenvironmental variables in the northern Baltic Proper. Estuarine, Coastal and ShelfScience 62, 109–117.
Eriksson, B.K., Ljunggren, L., Sandström, A., Johansson, G., Mattila, J., Rubach, A., Råberg, S.,Snickars, M., 2009. Declines in predatory fish promote bloom-forming macroalgae.Ecological Applications 19, 1975–1988.
Fernandez-Duque, E., Valeggia, C., 1994. Meta-analysis: a valuable tool in conservationresearch. Conservation Biology 8, 555–561.
Floeter, S.R., Krohling, W., Gasparini, J.L., Ferreira, C.E.L., Zalmon, I.R., 2007. Reef fish com-munity structure on coastal islands of the southeastern Brazil: the influence of expo-sure and benthic cover. Environmental Biology of Fishes 78, 147–160.
Florin, A.B., Sundblad, G., Bergström, U., 2009. Characterisation of juvenile flatfish habitatsin the Baltic Sea. Estuarine, Coastal and Shelf Science 82, 294–300.
Foley, M.M., Halpern, B.S., Micheli, F., Armsby, M.H., Caldwell, M.R., Crain, C.M., Prahler, E.,Rohr, N., Sivas, D., Beck, M.W., Carr, M.H., Crowder, L.B., Emmett Duffy, J., Hacker, S.D.,McLeod, K.L., Palumbi, S.R., Peterson, C.H., Regan, H.M., Ruckelshaus, M.H., Sandifer,P.A., Steneck, R.S., 2010. Guiding ecological principles for marine spatial planning. Ma-rine Policy 34, 955–966.
Fonseca, M.S., Bell, S.S., 1998. Influence of physical setting on seagrass landscapes nearBeaufort, North Carolina, USA. Marine Ecology Progress Series 171, 109–121.
Friedlander, A.M., Brown, E.K., Jokiel, P.L., Smith, W.R., Rodgers, K.S., 2003. Effects of hab-itat, wave exposure, and marine protected area status on coral reef fish assemblagesin the Hawaiian archipelago. Coral Reefs 22, 291–305.
García-Charton, J.A., Pérez-Ruzafa, Á., Sánchez-Jerez, P., Bayle-Sempere, J.T., Reñones,O., Moreno, D., 2004. Multi-scale spatial heterogeneity, habitat structure, and theeffect of marine reserves on Western Mediterranean rocky reef fish assemblages.Marine Biology 161–182.
Glockzin, M., Zettler, M.L., 2008. Spatial macrozoobenthic distribution patterns in relationto major environmental factors — a case study from the Pomeranian Bay (southernBaltic Sea). Journal of Sea Research 59, 144–161.
Gogina, M., Zettler, M., 2010. Diversity and distribution of benthic macrofauna in the Bal-tic Sea— data inventory and its use for species distribution modelling and prediction.Journal of Sea Research 64, 313–321.
Gogina, M.A., Glockzin, M., Zettler, M.L., 2010a. Distribution of benthic macrofaunalcommunities in the western Baltic Sea with regard to near-bottom environ-mental parameters. 2. Modeling and prediction. Journal of Marine Systems 79,112–123.
Gogina, M.A., Glockzin, M., Zettler, M.L., 2010b. Distribution of benthic macrofaunalcommunities in the western Baltic Sea with regard to near-bottom environmentalparameters. 1. Causal analysis. Journal of Marine Systems 80, 57–70.
Graf, R.F., Bollmann, K., Sachot, S., Suter, W., Bugmann, H., 2006. On the generality of habitatdistribution models: a case study of capercaillie in three Swiss regions. Ecography 29,319–328.
Grenouillet, G.L., Pont, D., Seip, K.L., 2002. Abundance and species richness as a function offood resources and vegetation structure: juvenile fish assemblages in rivers. Ecography25, 641–650.
Gröger, J., Rumohr, H., 2006. Modelling and forecasting long-term dynamics of WesternBaltic macrobenthic fauna in relation to climate signals and environmental change.Journal of Sea Research 55, 266–277.
Gröger, J.P., Winkler, H., Rountree, R.A., 2007. Population dynamics of pikeperch (Sand-er lucioperca) and its linkage to fishery driven and climatic influences in a southernBaltic lagoon of the Darss-Zingst Bodden Chain. Fisheries Research 84, 189–201.
Gullström, M., Bodin, M., Nilsson, P.G., Öhman, M.C., 2008. Seagrass structural complexityand landscape configuration as determinants of tropical fish assemblage composi-tion. Marine Ecology Progress Series 363, 241–255.
Halpern, B.S., Kappel, C.V., Selkoe, K.A., Micheli, F., Ebert, C.M., Kontgis, C., Crain, C.M.,Martone, R.G., Shearer, C., Teck, S.J., 2009. Mapping cumulative human impacts toCalifornia Current marine ecosystems. Conservation Letters 2, 138–148.
Härmä, M., Lappalainen, A., Urho, L., 2008. Reproduction areas of roach (Rutilus rutilus)in the northern Baltic Sea: potential effects of climate change. Canadian Journal ofFisheries and Aquatic Sciences 65, 2678–2688.
Harris, S.A., Cyrus, D.P., Beckley, L.E., 2001. Horizontal trends in larval fish diversity andabundance along an ocean-estuarine gradient on the northern KwaZulu-Natalcoast, South Africa. Estuarine, Coastal and Shelf Science 53, 221–235.
Heck Jr., K.L., Abele, K.W., Roman, C.T., Fahay, M.P., 1995. Composition, abundance, biomassand production of macrofauna in a New England estuary: comparisons among eelgrassmeadows and other nursery habitats. Estuaries 18, 379–389.
Kallasvuo, M., Lappalainen, A., Urho, L., 2011. Coastal reed belts as important fish repro-duction habitats. Boreal Environment Research 16, 1–14.
Kendrick, G.A., Duarte, C.M., Marbà, N., 2005. Clonality in seagrasses, emergent proper-ties and seagrass landscapes. Marine Ecology Progress Series 290, 291–296.
Kissling, W.D., Dormann, C.F., Groeneveld, J., Hickler, T., Kuhn, I., McInerny, G.J., Montoya,J.M., Römermann, C., Schiffers, K., Schurr, F.M., Singer, A., Svenning, J.C., Zimmermann,N.E., O’Hara, R.B., 2012. Towards novel approaches to modelling biotic interactionsin multispecies assemblages at large spatial extents. Journal of Biogeography 39,2163–2178.
Koch, E.W., 2001. Beyond light: physical, geological and geochemical parameters aspossible submersed aquatic vegetation habitat requirements. Estuaries 24,1–17.
Krause-Jensen, D., Middelboe, A.L., Carstensen, J., Dahl, K., 2007. Spatial patterns ofmacroalgal abundance in relation to eutrophication. Marine Biology 152, 25–36.
Lappalainen, J., Milardi, M., Nyberg, K., Venäläinen, A., 2009. Effects of water temperature onyear-class strengths and growth patterns of pikeperch (Sander lucioperca (L)) in thebrackish Baltic Sea. Aquatic Ecology 43, 181–191.
Lehmann, A., 1998. GIS modeling of submerged macrophyte distribution using GeneralizedAdditive Models. Plant Ecology 139, 113–124.
Lehtonen, H., Hansson, S., Winkler, H., 1996. Biology and exploitation of pikeperch,Stizostedion lucioperca (L), in the Baltic Sea area. Annales Zoologici Fennici 33, 525–535.
Lubbers, L., Boynton, W.R., Kemp, W.M., 1990. Variations in structure of estuarine fishcommunities in relation to abundance of submersed vascular plants. Marine Ecol-ogy Progress Series 65, 1–14.
MacGarvin, M., 1982. Species-area relationships of insects on host plants: herbivoreson rosebay willowherb. The Journal of Animal Ecology 51, 207–223.
Martino, E.J., Able, K.W., 2003. Fish assemblages across the marine to low salinitytransition zone of a temperate estuary. Estuarine, Coastal and Shelf Science 56,969–987.
Micheli, F., Benedetti-Cecchi, L., Gambaccini, S., Bertocci, I., Borsini, C., Osio, G.C., Roman, F.,2005. Cascading human impacts, marine protected areas, and the structure of Mediter-ranean reef assemblages. Ecological Monographs 75, 81–102.
Mitchell, S.C., 2005. How useful is the concept of habitat? — a critique. Oikos 110,634–638.
Moksnes, P.-O., Gullström, M., Tryman, K., Baden, S., 2008. Trophic cascades in a tem-perate seagrass community. Oikos 117, 763–777.
Nyström Sandman, A., Wikström, S.A., Blomqvist, M., Kautsky, H., Isaeus, M., 2012. Scale-dependent influence of environmental variables on species distribution: a casestudy on five coastal benthic species in the Baltic Sea. Ecography. http://dx.doi.org/10.1111/j.1600-0587.2012.07053.x.
Ojaveer, H., Jaanus, A., MacKenzie, B.R., Martin, G., Olenin, S., Radziejewska, T., Telesh, I.,Zettler, M.L., Zaiko, A., 2010. Status of biodiversity in the Baltic Sea. PLoS One 5, e12467.
Orth, R.J., Heck Jr., K.L., Van Montfrans, J., 1984. Faunal communities in seagrass beds: a re-view of the influence of plant structure and prey characteristics on predator–prey rela-tionships. Estuaries 7, 339–350.
Osborne, P.E., Suarez-Seoane, S., 2002. Should data be partitioned spatially beforebuilding large-scale distribution models? Ecological Modelling 157, 249–259.
Pihl, L., Baden, S., Kautsky, N., Rönnbäck, P., Söderqvist, T., Troell, M., Wennhage, H.,2006. Shift in fish assemblage structure due to loss of seagrass Zostera marina hab-itats in Sweden. Estuarine, Coastal and Shelf Science 67, 123–132.
Pittman, S.J., Brown, K.A., 2011. Multi-scale approach for predicting fish species distri-butions across coral reef seascapes. PLoS One 6, e20583.
Rajasilta, M., Eklund, J., Kaeaeriae, J., Ranta-Aho, K., 1989. The deposition and mortality ofthe eggs of the Baltic herring, Clupea harengus membras L, on different substrates inthe south-west archipelago of Finland. Journal of Fish Biology 34, 417–427.
Rakocinski, C.F., Baltz, D.M., Fleeger, J.W., 1992. Correspondence between environmentalgradients and community structure of marsh-edge fishes in a Louisiana estuary.Marine Ecology Progress Series 80, 135–148.
Randin, C.F., Dirnböck, T., Dullinger, S., Zimmermann, N.E., Zappa, M., Guisan, A., 2006. Areniche-based species distribution models transferable in space? Journal of Biogeography33, 1689–1703.
Remane, A., Schlieper, C., 1958. Die Biologie des Brackwassers. SchwiezerbartscheVerlagsbuchhandlung, Stuttgart (348 pp.).
Rousi, H., Peltonen, H., Mattila, J., Bäck, S., Bonsdorff, E., 2011. Impacts of physical envi-ronmental characteristics on the distribution of benthic fauna in the northern Bal-tic Sea. Boreal Environment Research 16, 521–533.
Ruuskanen, A., Bäck, S., Reitalu, T., 1999. A comparison of two cartographic exposuremethods using Fucus vesiculosus as an indicator. Marine Biology 134, 139–145.
125M. Snickars et al. / Journal of Sea Research 85 (2014) 116–125
Salo, T., Gustafsson, C., Boström, C., 2009. Effects of plant diversity on primary produc-tion and species interactions in brackish water angiosperm communities. MarineEcology Progress Series 396, 261–272.
Sandström, A., Karås, P., 2002. Effects of eutrophication on young-of-the-year freshwa-ter fish communities in coastal areas of the Baltic. Environmental Biology of Fishes63, 89–101.
Snickars, M., Sandström, A., Lappalainen, A., Mattila, J., Rosqvist, K., Urho, L., 2009. Fishassemblages in coastal lagoons in land-uplift succession: the relative importance oflocal and regional environmental gradients. Estuarine, Coastal and Shelf Science81, 247–256.
Snickars, M., Sundblad, G., Sandström, A., Ljunggren, L., Bergström, U., Johansson, G., Mattila,J., 2010. Habitat selectivity of substrate spawning fish —modelling requirements of theEurasian perch, Perca fluviatilis. Marine Ecology Progress Series 398, 235–243.
Sundblad, G., Härmä,M., Lappalainen, A., Urho, L., Bergström, U., 2009. Transferability of pre-dictive fish distribution models in two coastal systems. Estuarine, Coastal and Shelf Sci-ence 83, 90–96.
Surugiu, V., Revkov, N., Todorova, V., Papageorgiou, N., Valavanis, V., Arvanitidis, C.,2010. Spatial patterns of biodiversity in the Black Sea: an assessment using benthicpolychaetes. Estuarine, Coastal and Shelf Science 88, 165–174.
Sutton, A.J., Song, F., Gilbody, S.M., Abrams, K.R., 2000. Modelling publication bias inmeta-analysis: a review. Statistical Methods in Medical Research 9, 421–445.
Svensson, J.R., Jonsson, L., Lindegarth, M., 2013. Excessive spatial resolution decreaseperformance of quantitative models, contrary to expectations from error analyses.Marine Ecology Progress Series. http://dx.doi.org/10.3354/meps10307 (in press).
Thiel, R., Potter, I.C., 2001. The ichthyofaunal composition of the Elbe estuary: an analysis inspace and time. Marine Biology 138, 603–616.
Thrush, S., 1991. Spatial patterns in soft-bottom communities. Trends in Ecology & Evolution6, 75–79.
Thrush, S.F., Whitlatch, R.B., Pridmore, R.D., Hewitt, J.E., Cummings, V.J., Wilkinson, M.R.,1996. Scale-dependent recolonization: the role of sediment stability in a dynamicsandflat habitat. Ecology 77, 2472–2487.
Viitasalo, M., Vuorinen, I., Saesmaa, S., 1995. Mesozooplankton dynamics in the northernBaltic Sea — implications of variations in hydrography and climate. Journal of Plank-ton Research 17, 1857–1878.
Wennhage, H., Pihl, L., 1994. Substratum selection by juvenile plaice (Pleuronectesplatessa L): impact of benthic microalgae and filamentous macroalgae. NetherlandsJournal of Sea Research 32, 343–351.
Wennhage, H., Pihl, L., 2007. From flatfish to sticklebacks: assemblage structure ofepibenthic fauna in relation to macroalgal blooms. Marine Ecology Progress Series335, 187–198.
Wisz, M.S., Pottier, J., Kissling, W.D., Pellissier, L., Lenoir, J., Damgaard, C.F., Dormann, C.F.,Forchhammer, M.C., Grytnes, J.-A., Guisan, A., Heikkinen, R.K., Høye, T.T., Kuhn, I.,Luoto, M., Maiorano, L., Nilsson, M.C., Normand, S., Öckinger, E., Schmidt, N.M.,Termansen, M., Timmermann, A., Wardle, D.A., Aastrup, P., Svenning, J.-C., 2012. Therole of biotic interactions in shaping distributions and realised assemblages of spe-cies: implications for species distribution modelling. Biological Reviews 88, 15–30.
Zettler, M.L., Schiedek, D., Bobertz, B., 2007. Benthic biodiversity indices versus salinitygradient in the southern Baltic Sea. Marine Pollution Bulletin 55, 258–270.
Zimmerman, R.C., 2003. A biophysical model of irradiance distribution and photosyn-thesis in seagrass canopies. Limnology and Oceanography 48, 568–585.