species and gene divergence in littorina snails detected by array comparative genomic hybridization
TRANSCRIPT

Panova et al. BMC Genomics 2014, 15:687http://www.biomedcentral.com/1471-2164/15/687
RESEARCH ARTICLE Open Access
Species and gene divergence in Littorina snailsdetected by array comparative genomichybridizationMarina Panova1*, Tomas Johansson2, Björn Canbäck2, Johan Bentzer2, Magnus Alm Rosenblad3, Kerstin Johannesson1,Anders Tunlid2 and Carl André1
Abstract
Background: Array comparative genomic hybridization (aCGH) is commonly used to screen different types ofgenetic variation in humans and model species. Here, we performed aCGH using an oligonucleotide gene-expressionarray for a non-model species, the intertidal snail Littorina saxatilis. First, we tested what types of genetic variation canbe detected by this method using direct re-sequencing and comparison to the Littorina genome draft. Secondly, weperformed a genome-wide comparison of four closely related Littorina species: L. fabalis, L. compressa, L. arcana andL. saxatilis and of populations of L. saxatilis found in Spain, Britain and Sweden. Finally, we tested whether we couldidentify genetic variation underlying “Crab” and “Wave” ecotypes of L. saxatilis.
Results: We could reliably detect copy number variations, deletions and high sequence divergence (i.e. above 3%),but not single nucleotide polymorphisms. The overall hybridization pattern and number of significantly diverged geneswere in close agreement with earlier phylogenetic reconstructions based on single genes. The trichotomy of L. arcana,L. compressa and L. saxatilis could not be resolved and we argue that these divergence events have occurred recentlyand very close in time. We found evidence for high levels of segmental duplication in the Littorina genome (10% ofthe transcripts represented on the array and up to 23% of the analyzed genomic fragments); duplicated genesand regions were mostly the same in all analyzed species. Finally, this method discriminated geographicallydistant populations of L. saxatilis, but we did not detect any significant genome divergence associated withecotypes of L. saxatilis.
Conclusions: The present study provides new information on the sensitivity and the potential use of oligonucleotidearrays for genotyping of non-model organisms. Applying this method to Littorina species yields insights into genomeevolution following the recent species radiation and supports earlier single-gene based phylogenies. Geneticdifferentiation of L. saxatilis ecotypes was not detected in this study, despite pronounced innate phenotypicdifferences. The reason may be that these differences are due to single-nucleotide polymorphisms.
Keywords: Comparative genomic hybridization, Oligonucleotide arrays, Littorina, Ecotypes, Genome evolution,Gene divergence
* Correspondence: [email protected] of Biological and Environmental Sciences - Tjärnö, GothenburgUniversity, Gothenburg, SwedenFull list of author information is available at the end of the article
© 2014 Panova et al.; licensee BioMed Central Ltd. This is an Open Access article distributed under the terms of the CreativeCommons Attribution License (http://creativecommons.org/licenses/by/4.0), which permits unrestricted use, distribution, andreproduction in any medium, provided the original work is properly credited. The Creative Commons Public DomainDedication waiver (http://creativecommons.org/publicdomain/zero/1.0/) applies to the data made available in this article,unless otherwise stated.

Panova et al. BMC Genomics 2014, 15:687 Page 2 of 21http://www.biomedcentral.com/1471-2164/15/687
BackgroundChanges in genes and genomes associated with permanentsplits of evolutionary lineages contribute key informationfor our understanding of the evolution of new species [1].Following speciation, large parts of the genomes still haveparaphyletic genealogies but, with time, an increasingnumber of genes will convert to monophyly by lineagesorting [2]. However, lineage sorting takes time, particu-larly if populations are large, and the reciprocal mono-phyly criterion cannot be applied for species delimitationin recent radiations [3,4]. In addition, it is now widelyaccepted that conflicting gene genealogies may existwithin a given species tree, which complicates phylo-genetic inferences and may even lead to an incorrectspecies tree [5,6]. In current approaches, phylogeneticand phylogeographic inferences more and more oftenrely on a large number of genes, sampled across thegenome, e.g. [7-9]. Nevertheless, the vast majority ofphylogenies published recently using molecular systemat-ics, for various groups of organisms, are based on one orvery few genes. We can now test and pose a timely ques-tion: whether we can trust phylogenies based on mtDNAand single nuclear gene variation in the era of genomics.In particular, the utility of mitochondrial DNA (mtDNA)markers for phylogenetic and phylogeographic inferenceshas been questioned, e.g. [10,11].In addition to random variation in lineage sorting across
the genome, diversifying selection is another processleading to discordance between genealogies and the truephylogeny of lineages [12-14]. Genes that contribute tobarriers against gene flow between incipient or recentlyseparated species will evolve at higher rates comparedto neutral genomic regions [15,16]. Further, these genesmay drive divergence of surrounding genomic regions[17-19]. Genome-wide approaches have recently beenused to identify loci with elevated degrees of divergencein several systems, e.g. [20-23]. Closely related lineageswith various splitting times are of special interest instudying the progress of genome evolution [22]. Parallelprocesses of divergence in demographically independentsystems give an opportunity to test whether the sameor alternative genomic architectures have been used inrepeated adaptations to similar environments [24].The snail genus Littorina provides ample opportunities
for genomic studies of divergence, adaptive radiation andecotype formation. In the North-Atlantic region, thereis one planktotrophic species L. littorea and the fivenon-planktotrophic species of the subgenus Neritrema: L.fabalis. L obtusata, L. saxatilis, L. arcana and L. compressa[25]. The evolutionary history of these five species includesa split between two sister clades, 2 to 4 Mya, one contai-ning L. fabalis and L. obtusata and the other containing L.saxatilis, L. arcana and L. compressa [25,26]. Divergenceof the sister-species L. fabalis and L. obtusata and between
the three sibling species L. arcana, L. compressa andL. saxatilis is even more recent, 1.7 – 0.06 Mya bydifferent estimates (Figure 1a,b). In both clades, studies ofmtDNA variation revealed lack of reciprocal monophylyand shared alleles, likely due to incomplete lineage sorting[27-29]. However, shared haplotypes may also indicaterare hybridization between species, as has been suggestedfor L. saxatilis and L. arcana [30].The relationships between the three sibling species L.
saxatilis, L. arcana and L. compressa are especially inter-esting. All three species live in sympatry over large partsof their distribution and are morphologically very similaralthough L. compressa often can be distinguished by acharacteristic shell pattern [25]. Species identification ofL. saxatilis and L. arcana is possible only in the case ofmature females, which have a jelly gland in egg-laying L.arcana and a brood pouch with embryos in ovovivipa-rous L. saxatilis [25]. A DNA marker has been suggestedfor discrimination of these two species, but 12-14% ofanalyzed individuals deviate from species-specific amplifi-cation patterns [30]. Notably, comprehensive phylogeniesreconstructed from morphology and several types of gen-etic markers place either L. arcana and L. compressa or L.saxatilis and L. arcana as sister taxa (see Figure 1b), andhitherto this trichotomy has remained unresolved [26,31].All species of the subgenus Neritrema are polymorphic
[25], but the most pronounced example of intraspecificvariation is found in L. saxatilis. In particular, distinct“Crab” and “Wave” ecotypes have evolved in parapatricmicrohabitats as adaptation to crab predation or waveexposure [32]. Pairs of these ecotypes have been exten-sively studied in Britain, on the Galician coast of Spain,and on the west coast of Sweden to address mechanismsof ecotype formation and incipient speciation (reviewedin [33,34]). The phylogeographic reconstruction of thespecies’ history based on mtDNA data suggests a closephylogenetic relationship through shared glacial refugiabetween British and Swedish populations, and a historyof long isolation for Galician populations [28,29]. A recentcomprehensive study based on three nuclear introns,mtDNA and AFLP data showed that ecotypes most likelyhave evolved independently in the three regions as a resultof local adaptations in the face of gene flow [35].Thus Crab and Wave ecotypes of L. saxatilis present
an opportunity to study mechanisms and genes involvedin local adaptation and in the evolution of reproductivebarriers in parallel systems. The genomic architectureof the adaptive variation in L. saxatilis is hithertounknown, but transcriptome sequencing of the Britishecotypes indicated a number of SNP’s associated withthe ecotypes [36]. A genome scan of the British eco-types using amplified fragment length polymorphism(AFLP) markers also revealed several outlying loci [37].Two of them have been further characterized through

Figure 1 Phylogeny of five North-Atlantic species of Littorina subgenus Neritrema. a) Dendrogram representing the phylogeny of the fiveNorth-Atlantic species of Littorina, subgenus Neritrema. Numbers indicate divergence times in Ma, estimated from molecular data in previous studies.b) Possible relationships between the three sibling species of the “saxatilis” complex, suggested by analyses of different molecular markers.
Panova et al. BMC Genomics 2014, 15:687 Page 3 of 21http://www.biomedcentral.com/1471-2164/15/687
sequencing of large genomic fragments around the out-liers from a bacterial artificial chromosome library (BAC),but candidate genes could not be identified [38].The application of genomic approaches in Littorina
snails is needed to clarify phylogenetic relationshipsbetween closely related species and populations thathave so far been based on one or a few loci. Furthermore,comprehensive genome-wide studies will be necessary foridentification of genes and genome regions that are underdiversifying selection and/or involved in recent or on-going speciation events. One way to search for genomicdivergence between species and populations is by usingarray comparative genomic hybridization (aCGH), whichis based on hybridization of labeled genomic DNAfragments to a microarray, representing a subset of thegenome of the target species. aCGH has been widely usedin model organisms and in human medical genetics [39].
Depending on the array design and platform used, aCGHcan target different types of genomic variation – fromchromosomal rearrangements and copy number variants(CNVs) to single nucleotide polymorphisms (SNPs)[40-42]. Probe design varies depending on the targetedtype of variation, e.g. reliable SNP detection requiresshort (≤50 nt) probes with relatively low GC contentand multiple tiling probes per target SNP [43-45]. Onthe contrary, oligonucleotide probes in a gene expressionarray are usually longer (50 -100 nt) and have higher GCcontent in order to tolerate single mismatches and providereliable estimates of gene expression despite variation inDNA sequence among individuals [45-48].aCGH has been used to detect gene loss and acquisition
and highly polymorphic genes in bacteria [49], CNVsbetween different cultivars of rice [50] and for genotypingknown SNPs in Caenorhabditis elegans [44]. Since aCGH

Panova et al. BMC Genomics 2014, 15:687 Page 4 of 21http://www.biomedcentral.com/1471-2164/15/687
design requires the reference genome, this method hasnot been available for non-model organisms. However, forspecies with existing transcriptome libraries and gene ex-pression arrays, genomic DNA can be hybridized usingtranscriptome arrays to detect CNVs (by hybridizationsignal well above the average) and, to some extent, se-quence divergence in coding parts of the genome (by anhybridization signal below the average). This approachhas been applied successfully to identify rapidly evolvinggenes and CNVs in different strains of the ectomycor-rhizal fungus Paxillus involutus [51,52].In the present study, we applied aCGH analysis to
explore genome divergence at different evolutionaryscales: species that are easily recognized by morphologicalcharacters and show reciprocal monophyly in traditionalsingle-gene phylogenies (L. fabalis vs. three other Littorinaspecies); recently diverged sibling species with unclearphylogenetic relationship (L. saxatilis, L. arcana and L.compressa), geographically distant populations of a specieswith high level of population structure (L. saxatilis) and,finally, L. saxatilis ecotypes that have evolved repeatedlyin the three different regions. The goals of the study are todetect overall patterns of genome divergence (how manygenes show divergence at different evolutionary scales;how these numbers correspond to previous single-genephylogenies; whether the same genes show elevated ratesof evolution in different species) and to identify outliersfor future studies.For the experiments, we used a high-density oligo-
nucleotide gene-expression array for L. saxatilis, repre-senting more than 25,000 partial transcripts. To ourknowledge, expression oligoarrays have not been usedfor aCGH before and the sensitivity of this method isunknown. The obvious advantage of this approach isthat the array represents the coding part of the genome.The pitfalls are that intron/exon boundaries within theprobes may have a large effect and we need to distinguishCNV’s from sequence divergence. To investigate this, weincluded in the array design the genomic sequences thatare available for the species (see below) and mitochondrialDNA probes with mismatches. At the time of dataanalyses, we had produced the first preliminary draftof the L. saxatilis genome, which gave us an opportunityto explore in more detail what types of genetic variationwas detected by our method. Specifically, we address thefollowing questions:
1. What type of genetic variation can be detected byhybridization of genomic DNA to oligonucleotidetranscriptomic arrays?
2. Does aCGH analysis confirm phylogeneticrelationships among and within closely relatedspecies inferred from analyses of only a fewgenes?
3. Can we resolve the trichotomy between the threesister species L. arcana, L. compressa and L. saxatilis?
4. Does aCGH analysis confirm the high divergencebetween Galician and the two more northernpopulations of L. saxatilis?
5. Can we use this approach to detect adaptivevariation underlying Crab and Wave ecotypesof L. saxatilis and test for parallelism ofadaptations?
6. Are there genes with elevated rates of evolutionin this lineage of Littorina and, if so, are similaror different genes involved in different speciespairs?
MethodsArray design and genome information representedWe used an oligonucleotide microarray platform forL. saxatilis that was developed by NimbleGen Roche(090824_L_saxatilis_expr_HX12, 12X135K array format)and contained sequence information based on 25,205partial transcripts, hereafter referred to as “genes”, fromThe Littorina Sequence Database, LSD [53,54]. Thesetranscripts were obtained mainly by 454 sequencing(454/Roche) of cDNA libraries from pooled tissues andindividuals of British Crab and Wave ecotypes of L. saxati-lis (see [54] for details). In addition to sequence informationon transcripts, we added L. saxatilis genome sequences thatwere available in public databases at the time of the arraydesign: 577,000 nt in total from four sequenced BACclones: CH317-88D12, -123M16, -148L122 and -10N19[38] [GenBank:CT476813, GenBank:CT757510, GenBank:CR974470, GenBank:CT027673]. This library was con-structed using genomic DNA of four Crab-ecotypeindividuals from one British population (ThornwickBay). In the array design, these BAC clones were di-vided into 578 fragments of 1,000 nt each, which forsimplicity are also referred to as “genes”, althoughmost of these fragments constitute non-coding DNA[38]. An 8,022 nt long mt genome sequence of L. saxa-tilis, also from a British population [55] [Genbank:AJ132137] was divided into 16 “genes” of 500 nt eachand these were also included on the array, along with14 transcripts from other mollusks and 19 flanking re-gions of microsatellites, developed for L. saxatilis [56]and L. subrotundata [57] and earlier used in populationstudies of L. saxatilis [58,59].Each “gene” was represented on the array by five non-
overlapping 60-nt probes, except for transcripts with thetotal length <300 bp, for which probes overlapped. Toprovide optimal hybridization, probes were designed with44% GC content, unless the whole fragment had lowerGC content. In total, each array contained approximately135,000 probes representing 25,835 “genes”, and each slidecontained 12 identical subarrays.

Panova et al. BMC Genomics 2014, 15:687 Page 5 of 21http://www.biomedcentral.com/1471-2164/15/687
Sample collection, preparation and hybridization tomicroarrayLittorina fabalis were collected in the vicinity of theTjärnö marine research station (University of Gothenburg).Littorina arcana and L. compressa were obtained fromthe east coast of Britain; since the males cannot be distin-guished from L. saxatilis, we used only mature females ofthese species. For each of these species, four snails wereincluded in the experiment (Table 1). Littorina saxatilissamples were obtained from three regions (Britain, Swedenand Spain) as pairs of local Crab and Wave ecotypes(Table 1). For each group (region X ecotype), we used fourrandomly chosen individuals; in total 24 individuals of L.saxatilis. Thus, the whole experiment included 36 snails forwhich genomic DNA extracts were individually hybridizedto the array.Genomic DNA was extracted from foot muscle tissue
using a CTAB extraction method modified from [60] toinclude RNAase treatment and to increase DNA yield(protocol available upon request). DNA concentration andpurity were assessed using a NanoDrop spectrophotometer(Thermo Scientific) and agarose-gel electrophoresis. Foreach group (species, population or ecotype, see Table 1)two individual DNA samples were labeled with Cy3 andtwo with the Cy5 dye. Labeling was performed with a start-ing amount of 1 μg of genomic DNA per sample, 5′-Cyrandom primers and Klenow fragments (NimbleGen/RocheDual label kit), following the manufacturer’s protocol.Individuals from the different groups were randomly
distributed between the subarrays, i.e. each subarrayhosted two individual samples, one labeled with Cy5 andone with Cy3; no common reference sample was includedin the experiment. This experimental design was chosenin order to conduct intensity-based analyses of datainstead of ratio-based analyses. Ratio-based analysis fordual-colour microarrays has been used commonly tocontrol for the high inter-array variation in earlier micro-array platforms. However, in high density syntheticoligoarrays the inter-array variance is much lower [61],
Table 1 Littorina samples used for aCGH (n = 4 foreach group)
Species Geographic region Location name Ecotype
L. fabalis West coast of Sweden Saltö -
L. compressa East coast of Britain Black Rock -
L. arcana East coast of Britain Great Castle Head -
L. saxatilis East coast of Britain Thornwick Bay Wave (H)
L. saxatilis East coast of Britain Thornwick Bay Crab (M)
L. saxatilis Galician coast, Spain Baiona Wave (SU)
L. saxatilis Galician coast, Spain Baiona Crab (RB)
L. saxatilis West coast of Sweden Saltö Wave (E)
L. saxatilis West coast of Sweden Saltö Crab (S)
which removes the need for reference sample and allowsthe use of intensity data from separate channels [62]. Thisdesign also helps to separate more reliably the types ofgenetic variation behind the low-hybridization signals inthe absence of a reference genome. For example, in thereference design, low sample-to-reference ratios can bedue to high sequence divergence in the sample or highernumber of copies in the reference. Using normalized sig-nal intensities instead of ratios, multiple-copy regions canbe detected in all samples, as having signals twice or abovethe average, single-copy level.For hybridization, 20 μg of Cy3- and Cy5-labeled DNA
of two samples for each subarray were combined,vacuum-dried and resuspended in 12 μl of hybridizationsolution, of which 6 μl was applied onto a subarray forhybridization. Hybridization was performed in aNimbleGen Hybridization System at 42° for 48 hours fol-lowing the manufacturer’s protocol (NimbleGen/Roche).After hybridization the slides were washed using theNimbleGen Washing kit and immediately scanned at2-μm resolution using an Agilent G2565AA microarrayscanner (Agilent Technologies, Santa Clara, CA).
Image processing and data normalizationThe array images were processed using the NimbleScanv.2.5 software (NimbleGen/Roche). First, we assessed thequality of the images according to the manufacturer’sguidelines and discarded images with signal intensity orother metrics outside the recommended range. (For thosesamples, we performed new labeling reactions and con-ducted hybridization on an additional slide; in total threeslides were used in the experiment). After quality control,the signal intensity data for each channel were correctedfor the local background signal, log2-transformed andused for normalization.Normalization of microarray data is necessary to remove
differences in signal intensity between individual slidesand subarrays as well as the systematic difference in signalintensities of the Cy3 and Cy5 dyes. There are numerousalgorithms for data normalization serving this purpose, in-cluding the Robust Multi-Array normalization algorithm(RMA; [63]), implemented in the NimbleScan software.RMA adjusts the raw signal data using a quantile methodso that signal intensity data for all individual samples havesimilar normal distributions [64]. The assumption ofsimilar signal intensity distributions in all samples islikely to hold for gene expression data sets, when manygenes are expressed at similar levels in all samples andthere are roughly equal numbers of sample-specificup- and down-regulated genes (though there may beexceptions, see [65]). For expression data conforming tothis general pattern, RMA has been shown to performvery well [64]. For our data, however, based on hybridiza-tions of genomic DNA to a transcriptomic array, we did

Panova et al. BMC Genomics 2014, 15:687 Page 6 of 21http://www.biomedcentral.com/1471-2164/15/687
not know a priori whether the assumption of similarsignal intensity distributions would be met. In theory,heterologous hybridizations (i.e. when a DNA samplefrom one species is hybridized to an array developed foranother species) may produce signal intensity distributionsskewed towards low values, if interspecific sequence diver-gence is large enough to lower hybridization efficiency inmany genes.To test this, we compared the normalization by the
RMA procedure in NimbleScan to a method that is notbased on the assumption of similar signal intensity dis-tributions in all samples. For this, we used an ANOVAnormalization, i.e. fitting the “normalization” ANOVAmodel, that estimates non-biological variation due toDye [Fixed] and Subarray [Random] and saving theresiduals [66]. Normalization was carried out for theeffect of the subarray and not of the array since therewas no systematic difference between the three slides(arrays) used in the experiment, although we did observesignificant variation in signal strength between subarrayswithin each slide. The interaction term Dye*Subarray wasnot included because it defines a single sample in theexperiment and thus is confounded with levels ofbiological variation (between species and populations).In all samples, both normalization methods produced
signal intensity distributions of similar shape: slightlybimodal with a second right peak of high signal andwith a left tail with the low-signal data (Additional file 1:Figure S1 shows an example of the two distributions inone sample). Moreover, there was a high correlation be-tween RMA-normalized and ANOVA-normalized signalper gene (R2 ≥ 0.95 in all individual samples, p < 0.00001).Thus, we concluded that both normalization methodsperformed similarly on our dataset and used the RMA-normalized data in the subsequent analyses.Usually, in the second step of the RMA algorithm, the
signal intensities for individual probes (n = 5 per gene)are summarized to obtain a single value for each geneusing the method of Irizarry et al. [63]. This step is basedon the assumption that, in gene expression data, the truesignal intensity level for all probes, representing one gene,should be the same. In aCGH data, however, hybridizationefficiency for individual probes depends on sequence simi-larity between them and the hybridized DNA and thuscan vary between probes that come from differentfragments of one gene. For this reason we performed bothgene-level and probe-level data analyses.
Statistical analyses of genomic divergence betweenspecies and populationsTo test whether genome divergence between L. saxatilisand the other studied Littorina species lowered the suc-cess of heterologous (interspecific) DNA hybridization,the variation of average log2-signal intensities between
the samples was analyzed by fitting a mixed analysis ofvariance (ANOVA) model with Species [Fixed] + Dye[Fixed] + Subarray [Random] using the JMP 10.0.0 soft-ware (SAS Institute, Inc.). All three factors had highlysignificant effects (p < 0.0001), and signal intensity levelswere compared between the species using Student’s t-teston residuals after the effects of Dye and Subarray hadbeen removed.Principal component analysis (PCA) using the Qlucore
Omics Explorer 2.1 (Qlucore AB, Lund, Sweden) wasapplied to visualize the variation in hybridization successbetween species and populations (treating each gene as avariable). PCA across all variables is useful to detect verystrong patterns in the dataset, but many individual effectsare likely to be obscured by the high total variation in adataset with very many variables (25,801 variables in thiscase). Hence, to further explore patterns in the data, PCAwas also performed including only genes that showed sig-nificant differences in hybridization signal intensities be-tween the groups. These genes were identified by one-wayANOVA for each genes and applying a false-discovery rateq = 0.05 cut off across the tests [67]. Signal intensity datafor the genes with significant variation in the species pairswere used to produce a heat map (representing thestrength of hybridization signal in different samples) usingthe Qlucore Omics Explorer. In addition, we performedhierarchical clustering analyses of different species andpopulations based on hybridization signal intensity in allgenes and with 20,000 bootstrap permutations of the data.This was done using Euclidean distance and the singlelinkage clustering algorithm in the maanova package [68]in R [69].Finally, we identified genes with significant differences
in hybridization success for pairs of species and for eachsample against the British L. saxatilis sample (since boththe BAC library and most of the transcript libraries, usedfor the array design, were based on the British L. saxatilisecotypes) by performing t-tests for each gene and setting acut-off at q = 0.05 in the Qlucore Omics Explorer. Thenumber of significant genes in pair-wise comparisons wasused for neighbour-joining clustering of species and popu-lations in the package APE v.3.0.7 [70] in R [69]. To testwhether the same genes show elevated divergence ratesbetween different species, lists of pair-wise significantgenes were compared using Venn diagrams using theBioVenn tool [71].
Sensitivity analysis and identification of candidateduplicated genesFor single-copy genes, divergence between the hybridizedDNA sample and probes on the array results in a lowerhybridization signal. Since a majority of the probes weredesigned from cDNA sequence information, we expectthat some probes will span exon-intron boundaries in the

Figure 2 aCGH hybridization signals in Littorina saxatilis(average of 24 individuals). Frequency histogram shows distributionof log-2 normalized and centred signals (zero corresponds to overallsignal average); colour curves – a fitted mixture of three normaldistributions from mixtools R package. Red curve – low signals,blue curve – normal signals (single-copy genes), green curve – highsignals due to multiple gene copies.
Panova et al. BMC Genomics 2014, 15:687 Page 7 of 21http://www.biomedcentral.com/1471-2164/15/687
genome. In such cases only a part of the labeled genomicDNA fragment is complementary to the probe and thisshould significantly reduce hybridization. In addition,mismatches at the nucleotide level between the probeon the array and the hybridized DNA can decrease thehybridization efficiency. One mismatch per 60 nt (probelength) is hardly detected [41], but several mismatchesper probe are likely to have a negative effect on thehybridization [43]. In addition to the number of mis-matches, other factors, such as type of base changesbetween the probe and the hybridized DNA, their po-sition within the probe and the GC content of the probehave been shown to have large effects on hybridizationsuccess for long-oligonucleotide arrays [41,43].To investigate what types of genomic variation were
detected by our aCGH-method, we used two approaches:comparing sequences of the array probes with low andhigh signal intensities to the draft genome of L. saxatilisand re-sequencing fragments of the mitochondrial cyto-chrome b gene, represented on the array, in the analyzedindividuals. The Littorina saxatilis genome sequencingproject is currently being carried out by the LinneausCentre for Marine Evolutionary Biology at GothenburgUniversity [72]. At the time of the data analyses presentedhere, the available assembly was performed on 101 Gbp ofIllumina reads from a 300 nt-insert library using the CLCAssembly Cell v 4.0.6, and produced a total assembly sizeof 473 Mbp and N50 contig size of 916 nt. Sequencedgenomic DNA comes from a single individual of theSwedish Crab-ecotype of L. saxatilis from the island Saltö,which is the same population as included in the presentCGH experiment. While there is certainly much geneticvariation within any population, many protein-coding se-quences are likely to be invariable. Given the large amountof cDNA sequence information on our array we assumedthat the genome sequences of the snails in our aCGHexperiment were basically the same as in the genomeassembly. Hence, we correlated differences betweenprobes on the array (representing the British L. saxatilispopulations) and the genome sequences (representing theSwedish L. saxatilis Crab-ecotypes) with the hybridizationsignal intensities of the Swedish L. saxatilis Crab-ecotypes.Genome contigs corresponding to different probes fromthe array were identified as the top hit using BLASTN2.2.25+ algorithm [73]. We calculated correlations betweenhybridization signal intensities and BLASTN top hitparameters (query match length, identity and numberof mismatches) as well as with GC content of the probesin JMP 10.0.0.For the mitochondrial cytochrome b gene fragments,
we included several sequence variants on the arrayrepresenting previously detected variants of this gene inLittorina [29]. We amplified and sequenced the cytochromeb fragment (as described in [29]) in 34 of the 36 individuals
used in the aCGH, counted the number of actual mis-matches between the obtained sequences and array probes,and compared the hybridization signal intensities betweenprobes with different numbers of mismatches. The haploidmtDNA fragment was chosen for this sensitivity analysis inorder to avoid potential heterozygotes.Finally, array sequences representing duplicated genes
and multiple-copy variants are expected to producetwo-fold or higher hybridization signals than single-copy variants. To detect such genes we fitted a modelwith a mixture of three normal distributions, representingaverage-signal genes, low-signal outliers (for example, dueto exon-intron boundaries, see above) and high-signaloutliers (candidate multiple-copy genes) to signal distri-butions in hybridized samples. This was done using theEM algorithm in the mixtools package [74] for R [69].High-signal outliers were defined as genes showing sig-nal levels greater than or equal to the mean minus twostandard deviations of the right hand peak (Figure 2).Lists of candidate genes were obtained for each of thegroups (species, population, ecotypes) and the lists werecompared between the groups. In the data on theSwedish L. saxatilis Crab-ecotype, we calculated sequen-cing coverage of genome contigs, containing genes withthe normal signal level and compared it to sequencingcoverage of genome contigs containing genes with highsignal level (likely to be present in multiple copies in thegenome).

Panova et al. BMC Genomics 2014, 15:687 Page 8 of 21http://www.biomedcentral.com/1471-2164/15/687
ResultsGenes with low hybridization signalIn order to conduct genomic comparisons of populationsand species we first needed to understand what typeof genome variation was causing the variation inhybridization signal. To do this, we compared sequenceson the array that showed low hybridization signal in theSwedish Crab ecotype to the genome sequences from apreliminary L. saxatilis genome assembly made from anindividual of the same ecotype and from the same locality.In these analyses we assume that the genomes of the se-quenced individual and of the snails used for the aCGHexperiment are identical.The log2-transformed signal intensity per gene, aver-
aged over the four snails of the Swedish L. saxatilisCrab-ecotype, had an average of 13.03 ± 1.34 (±standarddeviation (SD)). We defined low hybridization signal to bebelow 10.35 (i.e. 2 × SD below the average), which corre-sponds to a drop of more than six-times in the fluorescentintensity on an absolute scale. We chose this methodinstead of using parameters of a left-side distribution fromthe mixed-distribution model since the left peak was notclearly defined and largely overlapped with the main peak(Figure 2). This resulted in 973 “genes” on the array ofwhich 137 came from the CH317-123M16 BAC-clone,828 came from L. saxatilis transcripts, seven from hetero-logous sequences and a random class of oligonucleotideswith 44%-GC content that are included on NimbleGenoligoarrays as standard procedure.The CH317-123M16 BAC-fragment [GenBank:CT757510]
has a total length of 218,205 nt and was divided into 218fragments (“genes”), each 1,000-nt long, on the array.Inspection of data for all fragments of this BAC cloneshowed that hybridization success in Crab ecotype-snails varied along the BAC clone, with two regions ofvery low hybridization signal (1 – 108,000 nt and186,000 – 211,000 nt) and two regions of average orhigh hybridization signals (108,000 – 186,000 nt and211,000 – 218,205 nt); see Figure 3a, red line. We per-formed BLASTN searches for the 1,000-nt fragmentsof this BAC-clone against the L. saxatilis draft genomeassembly (in order to obtain all matches, word size wasset to seven and filters for repeats and low informationcontent were switched off ). The fragments with lowhybridization signals had only short matches to thegenome sequence that were likely to occur by chancewhile the fragments with high hybridization successhad long matches with high similarity to the genome data,as represented by alignment bits scores in Figure 3b.Overall, the distribution of alignment bit score alongthe BAC clone closely followed hybridization success(Figure 3b). However, the genome draft assembly atpresent has a total size of 473 Mbp, while the haploidgenome size estimated by flow cytometry is 1.3 Gbp
[75], indicating that some regions are problematic to as-semble from short reads and are missing in the assembly.To test whether this was the reason why we did not findsome BAC fragments in the genome assembly, we mappedIllumina reads from the genome sequencing to theCH317-123M16 BAC clone using Qualimap [76]. How-ever, the regions of the BAC clone that were not found byBLASTN also had zero coverage by unassembled reads(Figure 3c).Thus, it is likely that two large fragments of the
CH317-123M16 genomic region are absent in the gen-ome of the Swedish Crab-ecotype snails that were usedin our aCGH experiment as well as in the genome ofanother Crab-ecotype individual that is being sequencedin the genome project. The CH317-123M16 BAC clonewas originally characterized for the British Crab-ecotype[38]. Surprisingly, the hybridization success along CH317-123M16 for four snails of the British Crab-ecotype werevery similar to the one described for the Swedish Crab-snailindividuals (Figure 3a, blue line). This suggests that theremay be an insertion-deletion polymorphism for largegenomic regions in L. saxatilis, and the deletion variantmay be rather common. Alternatively, there may be anartifact in the BAC assembly.Low hybridization success of genomic DNA from the
Swedish L. saxatilis Crab-ecotype snails was also observedfor 828 “genes” on the array representing transcripts. Forthese, we retrieved probe sequences (five for each tran-script) and performed BLASTN search in the Littorinagenome assembly with default BLASTN parameters. Forcomparison, we performed the same analyses for thetranscripts that had hybridization signal intensity aroundthe average. Probes representing four of the low-signaltranscripts were not found in the genome; the rest of thelow-signal probes showed only partial similarity to thegenome contigs (Figure 4a, median hit length = 26 ntwhile probe length = 60 nt), although often with highidentity (Figure 4c; median identity = 98.3%). The majorityof the probes yielding average-signal transcripts had full-length or nearly full length-matches to contigs from thegenome assembly (Figure 4b, median hit length = 57 nt)and identity close to 100% (Figure 4d, median identity =99.3%). Since the probes were derived from transcriptsequences, partial matches with high similarity to thegenome contigs are expected when a particular probespanned the boundary between two exons. In such cases,5′ or 3′ ends of hybridized genomic DNA fragments con-tained an intron sequence and did not match the probe.Analyses of the BLASTN results for probes with partialsimilarity to the genome (hit length < 50 nt, 3276 probes)showed that in most cases (3,131 probes) the secondBLASTN hit, including the other (5′ or 3′) end of theprobe, was on a different scaffold. In a few cases (145probes), the second BLASTN hit was on the same

Figure 3 Low aCGH signal for CH317_123M16 fragments suggests deletions in Littorina saxatilis genome. a) Centered hybridizationsignals in Crab ecotypes of L. saxatilis from Sweden (red line) and Britain (blue line) calculated for 1,000-nt intervals of CH317_123M16 BAC.b) Results of BLASTN search in L. saxatilis genome assembly for 1,000-nt intervals of CH317_123M16 BAC, represented by a bit score of the tophit. c) Mapping of reads from the Illumina sequencing of 300-nt genomic library to CH317_123M16 BAC.
Panova et al. BMC Genomics 2014, 15:687 Page 9 of 21http://www.biomedcentral.com/1471-2164/15/687
scaffold. This result is expected given that the genomescaffolds at present are very short (N50 = 916 nt) andconsecutive exons are likely to be on different scaffolds.Thus, the transcripts with lower hybridization successseem to be the ones where all or a majority of theprobes happened to span exon boundaries.However, some of the low-signal probes (642 out of
4,176, see Figure 4a) had full-length matches to the ge-nome contigs. For those we calculated the GC contentand the number of mismatches to the genome sequenceand compared them to the same parameters for 2,520probes with average hybridization signal and full-lengthmatch to the genome sequences. While the average num-ber of mismatches in the low-signal probes was only
slightly higher compared to the average-signal probes (1.1vs. 0.4 nt out of 60, t-test p < 0.0001), the GC-content ofthe low-signal probes was low compared to the average-signal probes (35.1% vs. 43.8%, t-test p < 0.0001). The opti-mal GC-content for NimbleGen oligoarray-probes is 44%,and average-signal probes were all close to this value.However, due to variation in GC-content of partial tran-scripts used in the array design, some probes had a lower,i.e. sub-optimal, GC-content and this appears to have hada large negative effect on hybridization.
Effect of mismatches on the hybridization signalAs shown above, genes with very low hybridizationefficiency in the Swedish Crab-ecotype of L. saxatilis

Figure 4 Exon/intron boundaries cause low hybridization to 60-nt probes in Littorina aCGH. Sequences of aCGH probes with low (a, c) andnormal (b, d) signal in the Swedish Crab ecotype of L. saxatilis were compared to the Littorina genome draft by BLASTN. Low-signal probes had shorterlengths of the top hit than normal-signal probes (a vs. b), indicating exon/intron boundaries within low-signal probes. Identity scores for low-signal probeswere slightly lower than for normal-signal probes (c vs. d). Each distribution is shown as a frequency histogram and a box plot (top panels), showing 25%and 75% quantiles (box), mean ± C.I. (diamond), median (vertical line), outliers (dots) and the densest region of the distribution (red bracket).
Panova et al. BMC Genomics 2014, 15:687 Page 10 of 21http://www.biomedcentral.com/1471-2164/15/687
depended on occurrences of exon-intron boundarieswithin the probe sequences or low GC-content ofthe probes. To further investigate the sensitivity inhybridization of 60-nt probes to sequence divergence(i.e. occurrence of one or more substitutions betweenhybridized DNA fragment and the probe), we looked atthe correlation between signal intensity and the numberof substitutions for the probes that had full-lengthmatches to the genome sequences (excluding the probescoming from putatively duplicated genes, see below).We identified 68,898 such probes with 0 up to 10 ntdifferences compared to the genome sequence. Amongthese the hybridization signal intensity did not decreasewith the number of substitutions (R = 0.02, p = 0.0002)but correlated positively with the GC content of theprobe (R = 0.42, p < 0.0001).In the analyses above we did not know the actual
genome sequences of the individual snails used forhybridization, although we expected that they werehighly similar to the genome of the sequenced SwedishCrab-ecotype individual, originating from exactly thesame locality. To test directly how the number of mis-matches affected the hybridization, we sequenced afragment of the mt cytochrome b gene for 34 out of 36individuals used in our experiment and calculated thenumber of mismatches between these sequences andthe cytochrome b probes on the array. For this gene,the array contained two sets of probes designed from twonon-overlapping fragments, and each set contained fivesequence variants that differed from each other by 1-4
SNPs, making a total of 10 probes. In addition, five ofthese probes were included on the array twice. Forreplicated probes, there was a high consistency ofhybridization for identical probe replicates (Figure 5a,R2 = 0.99, p < 0001). The direct sequencing of thesefragments in the DNA samples revealed up to six mis-matches between the probe and hybridized DNA. Singlemismatches did not affect the success of hybridization(Figure 5b, t-test p > 0.05) while two or more mis-matches significantly decreased the hybridization effi-ciency (Figure 5b; t-test p < 0.05). However, there washigh variation in hybridization efficiency within eachmismatch class of probes. This could not be explainedby the length of the perfect match, the position of thefirst mismatch relative the 5′ end of the probe or bychange in the GC content caused by the mismatches(tested by linear correlations, p > 0.05). However, probeswith lower GC content (28-35%) were more sensitiveto mismatches than probes with higher GC content(40-48%). To test whether the level of variation in themt cytochrome b gene is representative for other genesin the Littorina genome, we calculated the proportionsof variable sites in the British population of L. saxatilisin the cytochrome b fragment using data from [29] andfor the transcripts used in the array design based ondata from [36]. The proportions were similar: 0.03 forcytochrome b and 0.01 on average for the transcripts.Altogether our sensitivity analysis showed that occur-
rences of exon-intron boundaries and the GC-content ofprobes had major effects on the hybridization success

Figure 5 Effect of mismatches on aCGH signal in Littorina inre-sequenced cytochrome b probes. A fragment of the mitochondrialcytochrome b gene was re-sequenced in 34 Littorina individuals andcompared to the probe sequences to identify mismatches. a) Signalsfrom two replicates of identical probes; b) The effect of 1-6 mismatcheswithin the probe on the hybridization signal (blue lines show averageand SD for each class; asterisks denote significant decrease in signalbetween the two levels, t-test, p < 0.05).
Panova et al. BMC Genomics 2014, 15:687 Page 11 of 21http://www.biomedcentral.com/1471-2164/15/687
when using genomic DNA for hybridization. Occurrenceof two or more nt mismatches within the probe maydecrease hybridization efficiency, but to a smaller extent,and this effect varied widely among the probes.
Candidates for gene duplicationIn addition to the genes with low hybridization signal inten-sities there were a number of genes showing hybridizationsignals far above the average, possibly resulting fromsegmental duplications in the genome. The overallsignal intensity distribution for each sample could bedescribed as a mixture of three normal distributions: asmall low-signal peak of genes, a major peak in thecenter and a high-signal peak of genes with intensitieswell above the average. Figure 2 shows the mean signalintensity distribution for the 24 L. saxatilis individualstogether with a fitted model; distributions for otherspecies were similar and are not shown. Parameters forthe fitted distributions for each species are presented inTable 2. After fitting the model, we defined high-signal
genes as those with intensities greater than or equal to themean minus two standard deviations of the right sidedistribution and normal-signal genes as those withintwo standard deviations of the mean for the centraldistribution. The cut-off at two standard deviationswas chosen in order to include 95% of the distributionsand at the same time avoid a large overlap between thethresholds (i.e. number of genes included in both groups).A relatively high number of genes on the array, approx.
10%, showed a high hybridization signal and thus indicatemultiple copies in the Littorina genomes (Table 2). Forthe Swedish Crab-ecotype of L. saxatilis, 3,315 genesbelonged to the high-signal peak of the distribution,compared to the 20,122 genes in the middle peak, thenormal-signal distribution (333 genes were included inboth groups). For these two groups of genes, we first re-trieved genome sequences from the Littorina genomeassembly corresponding to these array sequences (basedon the top BLASTN hit with E-value set at 1e-10). Ofthe genes with normal signal levels, 94% were found inthe genome assembly producing 13,956 putatively single-copy genome contigs. Of genes showing high signals, 90%were found in the genome assembly producing 2,067genome contigs that possibly contain segmental dupli-cations. (Some transcripts and BAC fragments weremapped to the same genome contig). Second, we com-pared the genome sequencing coverage for these twogroups. Median sequencing coverage for single-copycontigs was 50× (i.e. close to the calculated average se-quencing coverage, 67×), while multiple-copy genomecontigs had generally higher coverage with median at880× (Additional file 2: Figure S2).In the analysis of all L. saxatilis individuals together
we identified 2,345 genes as potentially present in manycopies. Of these only 133 showed similarity to knownproteins, and mainly to reverse transcriptases found invarious organisms (see Additional file 3: Table S1, annota-tions were taken from [45]). Reverse-transcriptase genesare known to be present in eukaryotic genomes in manycopies as a part of retrotransposons and long interspersedelements (LINEs). Similarly, the E10 genomic fragment[GenBank: EF428423], coming from genome scans of theBritish ecotypes of L. saxatilis and containing signaturesof SINE-retrotransposon elements [38], showed evidenceof multiple copies in aCGH (Table 2). Thus, at least someof the segmental duplications in the Littorina genomesuggested here by aCGH are likely to be associated withdifferent types of repeats and transposable elements.A more surprising finding is that a large proportion of
genome regions available from a previously characterizedL. saxatilis BAC-library suggest high copy numbers: 133kb of 577 kb, or 23%, in L. saxatilis. (A list of transcriptsand BAC regions with high hybridization signal in L. saxa-tilis is provided in Additional file 3: Table S1). In addition,

Table 2 Identification of potentially duplicated genes and genomic regions in Littorina
Species m1 ± S.D. m2 ± S.D. m3 ± S.D. N totaldupl.
% oftotal
Overlap withL. saxatilis, %
Transcripts BAC regions mtDNA Other
L. saxatilis −2.29 ± 1.62 −0.01 ± 0.88 2.28 ± 0.33 2573 10.0 2435 134 (incl.E10) 3 1 (Lsub16)
L. compressa −2.64 ± 1.79 −0.2 ± 0.84 1.85 ± 0.28 2763 10.7 85.1 2618 142 (incl.E10) 2 1 (Lsub16)
L. arcana −2.64 ± 2.02 0.21 ± 0.81 2.22 ± 0.29 2000 7.7 93.2 1903 93 (incl.E10) 3 1 (Lsub16)
L. fabalis −2.43 ± 1.97 0.02 ± 0.93 2.37 ± 0.38 1756 6.8 92.8 1672 81 (incl.E10) 2 1 (Lsub16)
A model with three mixed normal distributions was fitted to overall distributions of hybridization signal intensity in each species: 1 – low signal genes, 2 – normalsignal genes (single-copy), 3 – high signal (potentially multiple-copy) genes, in bold. See also colour curves in Figure 2. m ± S.D are means and standard deviationsfor three normal curves in each species.
Panova et al. BMC Genomics 2014, 15:687 Page 12 of 21http://www.biomedcentral.com/1471-2164/15/687
three regions of mtDNA, containing tRNAs, NADH-6 andcytochrome b genes showed high hybridization signals inall species. High hybridization signal for mitochondrialgenes on the array is expected since the mitochondrialgenome is present in more copies per cell than the nucleargenome. Additional inspection of signal data also revealedsignal intensities that were two times the average for othermitochondrial genes (COI, COII, ATPase-6, ATPas-8and NADH-1). At the same time, mitochondrial re-gions containing genes for small and large subunits ofribosomal RNAs hybridized at a level of half or less, ofthe average, possibly due to a propensity of these DNAfragments to form secondary structures that impedehybridization.
Genome divergence between four closely related LittorinaspeciesOverall hybridization success (measured as average signalintensities after removing the effect of dye and subarray)varied among the species (ANOVA p < 0.001) and wassignificantly lower for DNA samples of L. fabalis and L.compressa than for DNA samples of L. saxatilis and L.arcana (t-test p < 0.05; Figure 6). However, the drop ofsignal was small, e.g. the differences in average hybridizationsignal intensity between L. fabalis and L. saxatilis was 0.45on a log-2 scale, or 1.4 times on an absolute scale.Neighbour-joining clustering based on the number
of genes that differed significantly in all pair-wise con-trasts between the species and populations (Figure 7a)
Figure 6 Overall comparative genomic hybridization levels infour Littorina species. 1 – L. saxatilis, 2 - L. arcana, 3 – L. compressa,4 – L. fabalis. Bars show 95% confidence intervals.
corroborated the phylogeny of this group (Figure 1a).Interestingly, differentiation between the British andSpanish populations of L. saxatilis in this analysis wasof similar magnitude to that among the sibling species.Hierarchical clustering based on hybridization signal in-tensities from all genes on the array also produced a treesimilar to the phylogeny of the group but the order ofsplits between L.arcana, L. compressa and L. saxatilis hadlow support and could not be resolved (Figure 7b).In PCA plots based on signal intensity variation across
all sequences on the array, L. fabalis was well separatedfrom the other three species (Figure 8a). Similar resultswere obtained when we included only sequences represent-ing transcripts (this plot was identical to the one includingall genes, but is not shown), or including only BAC se-quences, containing mainly non-coding regions (Figure 8b).PCA based on mitochondrial genes only, however, did notshow separation between species, except for the outlyingL. fabalis individuals (Figure 8c). This can be partly due toa low number of mitochondrial genes on the array (only16, as compared to 25,205 genes for transcripts and 580for BAC fragments) and partly due to the fact that diver-gence in mitochondrial gene sequences is mainly at thesubstitution level, which in the sensitivity analyses abovewas found to affect hybridization less than gene duplica-tions and genomic deletions.The three sibling species L. saxatilis, L. arcana and L.
compressa did not show separation in PCA analysisbased on all genes. However, after excluding the L.fabalis samples, and using only 1,094 genes that showedsignificant differences in hybridization among the threeremaining species (per gene ANOVA, q = 0.05 level), L.arcana, L. compressa and L. saxatilis formed distinctgroups, separated along the different axes (Figure 8d).To compare the degree of divergence between thesesibling species with the intraspecific variation in L.saxatilis, we repeated the analysis with L. saxatilisdivided into the three geographic regions. Notably, inthis case the samples from the Spanish population ofL. saxatilis also formed a distinct group, with themagnitude of separation close to that among thethree sister species (Figure 8e).

Figure 7 Clustering of Littorina species and populations basedon aCGH data. a) Neighbour-joining clustering by the number ofdivergent genes between Littorina species. Genes with significantlydifferent hybridization signal were identified in comparisons of speciesand populations against L. saxatilis-Britain (applied cut-off q = 0.05).Numbers of divergent genes and their percentage of the total numberof genes on the array are shown along the branches. b) Consensustree of 20,000 bootstrap replicates based on all genes on the array.Numbers showed proportion of trees containing each cluster.
Panova et al. BMC Genomics 2014, 15:687 Page 13 of 21http://www.biomedcentral.com/1471-2164/15/687
Variation in L. saxatilis due to geographic regions andecotypesIn the analysis including only L. saxatilis individuals, wefound genome divergence among the three geographicregions (Spain, Britain and Sweden) in 756 genes (pergene ANOVA, q = 0.05). In the PCA based on thesegenes, the Spanish population separated from the othertwo populations along the first axis explaining 45% ofthe variation, while the British and Swedish populationsseparated along the second axis explaining 15% of thevariation (Figure 8f, the third axis is not shown in thisplot since it explained only 6% of the variation).No genes showed significant differences in hybridization
between the ecotypes of L. saxatilis, neither in the com-parison of Crab vs. Wave ecotypes across the threeregions, nor in separate comparisons of the ecotypes
within each region (per gene ANOVA, q = 0.05 level).However, we found some indication that there may beCNVs between the ecotypes across all the regions: therewere 328 genes that showed evidence of multiple copiesin one but not the other ecotype (Additional file 3:Table S1). Of these, only 17 had annotations in LSD andmainly to proteins containing the reverse-transcriptasedomain (Additional file 3: Table S1).
Genes with high divergence ratesSignificant differences in aCGH signal intensities betweenthe species indicate genes and genome regions withelevated divergence rates and/or CNVs. We identifiedsuch genes in different species and populations incomparison to the L. saxatilis samples from Britain,since the array design was based on sequence datafrom the British population. The highest number ofgenes that differed significantly from the British L. saxati-lis was found in L. fabalis; the numbers in L. arcana andL. compressa were roughly an order of magnitude lower(Figure 7a).We compared cohorts of genes that showed significant
differences between the British populations of L. saxatilisand one of the other three species (full lists are given inAdditional file 4: Table S2). Of 3,469 genes, 266 werefound in two comparisons and 35 showed divergence be-tween L. saxatilis and all three other species (Figure 9a);most of the genes showed significance for only one pair ofspecies. Similar results were obtained from a heat map ofthe signal strength for the 3,469 genes in different samples(with green colour corresponding to a signal intensitybelow average and red colour to a signal intensity aboveaverage: green and red clusters are mainly species-specific(Figure 9b)). For most of the genes with significant vari-ation the hybridization efficiency was higher in L. saxatilisthan in the compared species (indicated by green colourin Figure 8 and positive differences in Additional file 4:Table S2). However, a number of genes showed differencesin the opposite direction, especially in L. fabalis, possiblydue to higher copy numbers in this species compared toL. saxatilis or mutations increasing GC content of thesequences.For different Littorina species, the high-signal portion
of the distribution contained 1,756 – 2,763 genes (Table 2),which is approximately 10% of all sequences representedon the array. In general, there was a large overlap betweenthe species suggesting that expansion of these genomeregions occurred before the diversification of this littorinidlineage (Table 2).
DiscussionIn the present study we applied hybridization of gen-omic DNA from several species and populations of theNorth-Atlantic Littorina to an oligonucleotide array

Figure 8 PCA plots comparing genomic hybridizations of Littorina species. a) Four species, all sequences (25,801 genes). b) Four species,only BAC fragments (580 genes). c) Four species, only mt DNA sequences (16 genes). d) Three sibling species, based on genes with significantvariation among species (n = 1,094). e) Three sibling species and geographic populations of L. saxatilis, based on genes with significant variationamong these groups (n = 2,232). f) Geographic populations of L. saxatilis, based on genes with significant variation among groups (n = 756). Alsoshown are numbers of significant genes for pairwise comparison of the populations.
Panova et al. BMC Genomics 2014, 15:687 Page 14 of 21http://www.biomedcentral.com/1471-2164/15/687
representing mainly L. saxatilis transcriptional sequenceinformation. We showed that this approach can success-fully detect CNVs, deletion and high sequence divergence(>1 substitution per 60 nt) but that it is not sensitive
enough to detect single SNPs. Using this method wefound a close agreement between patterns of genomichybridization and previous phylogenetic reconstructionsfor this group based on only one or a few genes. However,
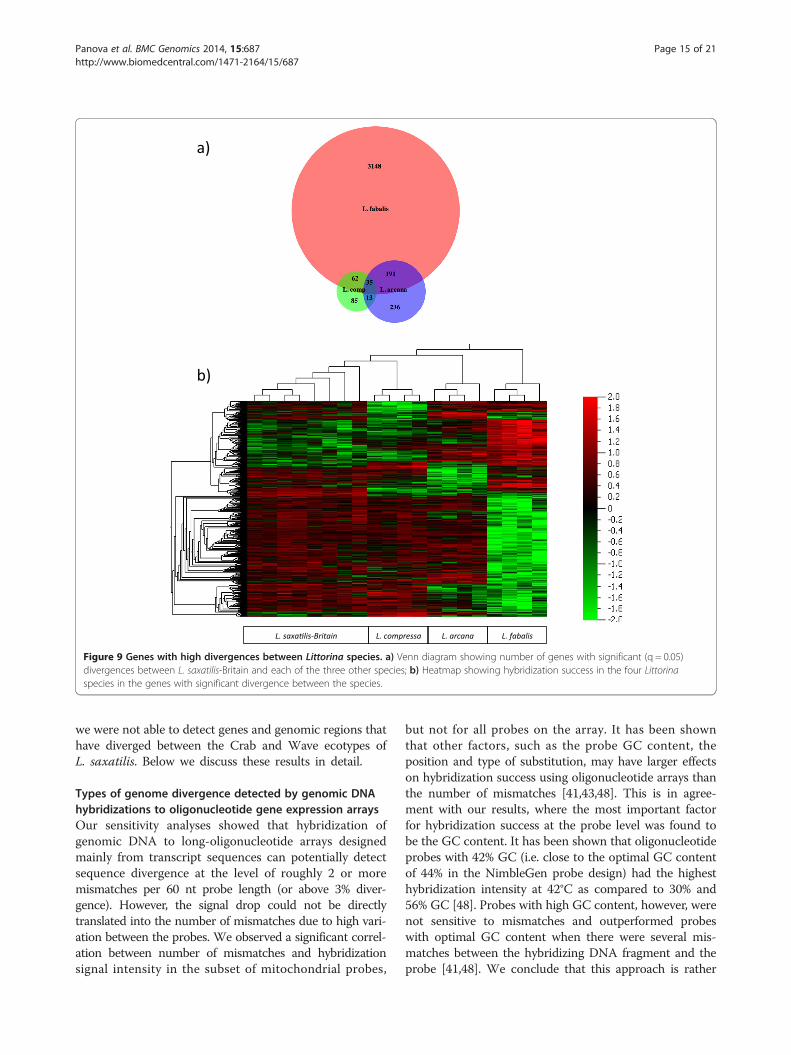
Figure 9 Genes with high divergences between Littorina species. a) Venn diagram showing number of genes with significant (q = 0.05)divergences between L. saxatilis-Britain and each of the three other species; b) Heatmap showing hybridization success in the four Littorinaspecies in the genes with significant divergence between the species.
Panova et al. BMC Genomics 2014, 15:687 Page 15 of 21http://www.biomedcentral.com/1471-2164/15/687
we were not able to detect genes and genomic regions thathave diverged between the Crab and Wave ecotypes ofL. saxatilis. Below we discuss these results in detail.
Types of genome divergence detected by genomic DNAhybridizations to oligonucleotide gene expression arraysOur sensitivity analyses showed that hybridization ofgenomic DNA to long-oligonucleotide arrays designedmainly from transcript sequences can potentially detectsequence divergence at the level of roughly 2 or moremismatches per 60 nt probe length (or above 3% diver-gence). However, the signal drop could not be directlytranslated into the number of mismatches due to high vari-ation between the probes. We observed a significant correl-ation between number of mismatches and hybridizationsignal intensity in the subset of mitochondrial probes,
but not for all probes on the array. It has been shownthat other factors, such as the probe GC content, theposition and type of substitution, may have larger effectson hybridization success using oligonucleotide arrays thanthe number of mismatches [41,43,48]. This is in agree-ment with our results, where the most important factorfor hybridization success at the probe level was found tobe the GC content. It has been shown that oligonucleotideprobes with 42% GC (i.e. close to the optimal GC contentof 44% in the NimbleGen probe design) had the highesthybridization intensity at 42°C as compared to 30% and56% GC [48]. Probes with high GC content, however, werenot sensitive to mismatches and outperformed probeswith optimal GC content when there were several mis-matches between the hybridizing DNA fragment and theprobe [41,48]. We conclude that this approach is rather

Panova et al. BMC Genomics 2014, 15:687 Page 16 of 21http://www.biomedcentral.com/1471-2164/15/687
conservative at the SNP level and identifies only geneswith high divergence and is likely to miss single SNPs.Secondly, we were able to reliably detect genetic vari-
ation above the SNP level, such as segmental duplicationsand deletions. Genes and regions showing high signalintensity (putatively present in many copies) had highercoverage in the Littorina genome sequencing and some ofthem had been previously annotated as transposon-likeelements in Littorina [38,54]. Genomic regions with signalintensity at the background level (putative deletions)were absent in the Littorina genome assembly. Inaddition, hybridization of genomic DNA fragments tothe transcriptome-based array provided informationon the position of exon-intron boundaries.To conclude, using an oligoarray platform, it is possible
to detect large deletions, segmental duplications and highdivergence between sequences. Owing to the rapid de-velopment of Next Generation Sequencing techniques,future methods to study genome divergence betweenclosely related species and populations are likely to em-ploy low coverage genome re-sequencing and reducedrepresentation sequencing approaches. Still our analysesshow that long oligonucleotide genomic arrays can be auseful tool for genotyping different types of genetic vari-ation simultaneously, especially if probe length is opti-mized for SNP detection. For example, a 50-nt tiling arrayhas been designed for single SNP genotyping in Caenor-habditis elegans [44] and a tiling array with various probelengths has been used to screen for novel deletions,chromosomal breakpoints and SNPs in the fungus Tricho-derma reesei [45].
Genome divergence and phylogenetic relationships inclosely related North-Atlantic Littorina speciesThe overall genome divergence pattern of the fourclosely related North-Atlantic Littorina species includedhere corresponds well to the phylogenetic reconstruc-tions based on only a few genes [26,31]. Littorina fabalis,which diverged from L. saxatilis 2-4 Mya, showed lowerhybridization success to the L. saxatilis array and wasclearly separated by PCA. Littorina arcana and L. com-pressa, with divergence times from L. saxatilis estimatedto be 0.06-1.42 Ma, did not show separation from L. sax-atilis by PCA when all genes were taken into account.However, there were a number of genes with significantsignal variation among the three sibling species, and spe-cies separation was much more pronounced (both innumber of significant genes and in PCA clustering) thanbetween British and Swedish populations of L. saxatilis.This suggests that some genes have diverged but a largepart of the genome still shares ancestral variation in thesesibling species. This finding is in agreement with earlierreports on shared genetic variation in allozymes, nuclearintrons and mtDNA [28,29,77-80].
Our genome-wide analysis could not resolve the trichot-omy between these three species. On one hand, the overallhybridization success was lower in L. compressa than inthe other two species, likely due to a higher sequencedivergence. This would imply that L. compressa was firstto split out within this group, as was suggested byKnight & Ward [77] and Wilding et al. [79,80]. On theother hand, there were more genes with significant diver-gence between L. arcana and L. saxatilis than between L.compressa and L. saxatilis. Finally, our hierarchical clus-tering analyses based on all genes could not resolve theorder of splits between these species, and the degree ofseparation by PCA was roughly similar for all pairwisespecies comparisons. Solving the phylogenetic relation-ships between these sibling species is further complicatedby the fact that the number of diverged genes can reflectboth the on-going process of lineage sorting [2] ordivergent selection in newly formed species [12,14].The geographic ranges of L. compressa and L. arcanaare much more limited than that of L. saxatilis and,when all three species co-exist on the same shore, theirmicro-zonal distributions are only partly overlapping[25]. This may indicate differences in ecological andmicrohabitat preferences between these species. Underdiversifying selection some genes may have achievedhigher divergence between L. arcana and L. saxatilis,while others have diverged more between L. compressaand L. saxatilis, which is supported by our comparisonof the genes with pair-wise divergence between the spe-cies (see below). At this point we agree with Reid et al.[26,31] that the phylogenetic relationships between thesethree species are best represented as a trichotomy, reflect-ing the fact that the two divergence events occurred re-cently and very close in time, and that their order cannotbe resolved. Hence, we predict that if more genes areanalyzed in the future, the genealogies will continue toproduce conflicting phylogenies for this group.Altogether, the neighbour-joining tree of the studied
Littorina lineage based on the aCGH data is very similarto earlier phylogenetic trees based on a few loci for speciesrelationships [26,31] or even on single mtDNA locusfor regional variation in L. saxatilis [28,29]. Even dis-crepancies between markers, as in case of the threesibling species that had earlier led to conclusion of anunresolved trichotomy, have support by the observedgenome-wide pattern. Thus, this study provides one ofthe first comparisons of genome-wide variation tosingle locus estimates. Together with other studies de-monstrating the utility of, for example, mtDNA markersin phylogeny and phylogeography [81,82], our resultssuggest that single-gene phylogenies can indeed beinformative and reliable, and even in the future mayserve as useful tools for at least pilot phylogeneticreconstructions.

Panova et al. BMC Genomics 2014, 15:687 Page 17 of 21http://www.biomedcentral.com/1471-2164/15/687
Geographic variation in L. saxatilisThe Spanish population of L. saxatilis appears to be gen-etically distinct from the two more northern populationsalmost to the same degree as the three sibling speciesincluded in this study (by PCA plots and the number ofgenes identified as diverged). This confirms the conclusionfrom mtDNA analyses of a long independent evolutionaryhistory of the Spanish L. saxatilis population and diver-gence time estimates of approx. 0.25 Ma [28,29]. Inter-estingly, a breeding experiment showed that crossesbetween Spanish and Swedish snails produce viable andfertile offspring (K. Johannesson, unpublished observation).The two other populations of L. saxatilis, from Britainand Sweden, did not show any divergence at all in ouranalyses. This agrees with a hypothesis that these popula-tions were established through relatively recent, post-glacialcolonization events from a shared refugium or refugia otherthan the Spanish coast [29].Local forms of Crab and Wave ecotypes of L. saxatilis
exist in Spain, Britain and Sweden and a key issue iswhether or not these ecotypes have evolved repeatedlyor have one common origin [33,34]. Genome divergenceof the Spanish populations from the two northern popu-lations, detected in this study, clearly supports a recentfinding [35] that the Crab and Wave ecotypes of Spainvs. Sweden/Britain, have evolved independently of eachother and possibly from different genetic backgrounds,despite similar phenotypic characteristics.
Rapidly evolving and duplicated genes in the studiedLittorina lineageMost of the genes showing significant divergence in thestudied Littorina lineage were specific to pairs of species.This might be due to random accumulation of differenceswith time or due to species-specific selection regimes (andin which case we can identify genes and genome regionsinvolved in adaptations of the different species). Moreover,35 genes showed elevated divergence in all pair-wisespecies comparisons. These come from the transcrip-tome library and did not show similarity to any knowproteins, probably due to their short length, and will bea focus in future studies.We did not find any genes with significant array
hybridization differences between Crab and Wave eco-types. However, there is evidence for a genetic basis ofecotype differences [83-86] and of limited gene exchangebetween the ecotypes [37,58,59,87,88]. Given that ouraCGH approach was not sensitive enough to detect singleSNPs, our results suggest that the genetic variation behindthe ecotype differences is likely to be at the level of singlemutations in coding or regulatory sequences, that mayhave large phenotypic effects [89,90]. Indeed, an earlierstudy detected SNP variation in transcript sequencesbetween the ecotypes in Britain [36]. Another type of
genetic variation that may facilitate adaptive divergence ischromosomal inversions. This has been suggested e.g. forecotypes of L. fabalis, although direct evidence for it islacking [91,92]. Our aCGH method cannot provide anyinformation on chromosomal inversions, and the im-portance of this mechanism in the evolution of Littorinaecotypes is yet to be investigated.The hybridization pattern along the CH317-123M16
BAC-clone indicated an insertion-deletion polymorphismfor a large genomic region in L. saxatilis. The deleted re-gion, identified in this study, does not appear to containany open reading frames [38]. The CH317-123M16 frag-ment has been identified previously by an AFLP-scan foroutliers between the British ecotypes of L. saxatilis [37]and contains insertions of repeated transposable elementsoutside the putatively deleted regions [38]. Although ourdata support an insertion-deletion polymorphism andtransposable elements in this region, we did not observeany differences between the ecotypes, and deletion vari-ants appear to be common in both British and Swedishpopulations. An alternative explanation to the lack ofhybridization to this fragment is that there is an artifact inBAC assembly.In contrast to the cohort of rapidly evolving genes,
multiple-copy genes were mostly shared between thestudied Littorina species. We found evidence that thesnail genome probably contains a high level of segmentalduplications, as 23% of BAC regions had high signals,which is not surprising given the relatively large genomesize of 1.3 Gbp [75]. Further, our data indicate that at leastsome of the duplicated regions in the Littorina genomeare associated with transposable elements and repeats.High abundance of repeats and multiple-copy regions hasbeen found in the recently published genomes of themollusks Conus bullatus [93] and Crassostrea gigas[94]. Our analyses produced a list of over 2,000 genesthat are likely to be present in multiple copies in thesnail genome. However, due to the short length of tran-scripts used for the array design, several transcriptsmay correspond to the same gene [54], or differentmembers of gene families may be represented by thesame partial transcript. Thus, the number of dupli-cated genes in the snail genome will require furtherinvestigation.A few percent of the analyzed genes appear to be du-
plicated in only one species, suggesting that there areCNVs between these closely related littorinid species.Finally, in the comparisons of duplicated genes we foundsome indication for CNVs between the Crab and Waveecotypes. This will require further confirmation sincethese differences were not significant in the ANOVA, butthey are generally in agreement with the earlier observa-tion of transposable element variation associated with theBritish ecotypes [38].

Panova et al. BMC Genomics 2014, 15:687 Page 18 of 21http://www.biomedcentral.com/1471-2164/15/687
Presently, the low annotation success of Littorinatranscripts (below 10%, see [54] for possible reasons)limits the biological and functional information thatwe can extract from the present dataset, i.e. we do notknow the function of genes that show signs of duplicationand/or rapid divergence in the analyzed littorinid species.However, on-going de novo genome sequencing and se-veral transcriptome characterization projects in Littorinawill potentially change the situation in the near future.When these resources become available, the next stepwill be to map the candidate sequences, identified in thepresent study, to annotated genes. Further, the identifiedcandidate genes with high divergence between the specieswill be used in re-sequencing studies in order to distin-guish signatures of diversifying selection from incompletelineage sorting.
ConclusionsIn the present study we showed that aCGH can beperformed for non-model organisms by hybridizationof labeled genomic DNA to transcriptome oligonucleo-tide arrays. We used this approach to study genomedivergence in the North-Atlantic intertidal species ofLittorina snails (L. fabalis, L. arcana, L. compressa andL. saxatilis) as well as among geographic populationsof L. saxatilis, representing radiation events from appro-ximately 2-4 Mya to very recent post-glacial events. Inaddition, we looked for genome differentiation betweenthe two common ecotypes of L. saxatilis.
1. By comparisons of probe hybridization signals to theLittorina genome draft and the direct re-sequencingof probes we showed that aCGH can successfullydetect copy number variations, segmental deletionsand high sequence divergence (i.e. at the level ofseveral nucleotides per 60 nt probe length). However,the method is not sensitive enough to detect singleSNPs.
2. Overall, genomic hybridization patterns are inagreement with the single-gene phylogenies andmolecular estimates of divergence times for theseclosely related species, which lends credibility to thenumerous phylogenies that have been, and still are,based on only one or a few genes.
3. We were not able to resolve conflicting phylogeniesproduced by different markers for the three siblingspecies L. saxatilis, L. arcana and L. compressa.We hypothesize that there is high variation betweenindividual gene genealogies in this group owing tovery incomplete processes of lineage sorting and/ordiversifying selection, and the order of the speciessplits may not be resolvable.
4. We detected a surprisingly high level of genomicdivergence between the Spanish and the
British/Swedish populations of L. saxatilis, in factsimilar to divergences among the sibling species.This lends strong support to the hypothesis of longisolation of the Spanish populations andindependent evolution of snail ecotypes in Spain andin the two other regions.
5. While there are multiple sources of evidence for agenetic basis of the L. saxatilis ecotype variation,this variation could not be detected by the presentmethod and is likely to be on the level of singleSNPs.
6. Finally, we found 35 genes that could be candidatesfor rapidly evolving genes within the entire Littorina(Neritrema) lineage. However, many more genesshowed elevated divergence between pairs of thespecies compared. On the other hand, duplicatedgenes were mainly shared between all the speciesstudied here. Our analyses indicated a high degreeof segmental duplication in the Littorina genome(23% of the analyzed genomic fragments) and likelyto be associated with transposable elements.
To conclude, the results of the present study providenew information on the sensitivity and potential use oflong oligonucleotide arrays for genotyping in non-modelorganisms. Applying this method to Littorina sp. providedthe first insight into genome evolution of a recentlyspeciated genus and an ongoing radiation within one ofthe species, L. saxatilis.
Availability of supporting dataThe full dataset from the oligonucleotide aCGH experi-ment has been submitted to the NCBI gene ExpressionOmnibus [95,96] under the accession ID GSE59825.
Additional files
Additional file 1: Figure S1. Example of signal distributions afterANOVA and RMA normalizations.
Additional file 2: Figure S2. Genome sequencing coverage for geneswith normal and high aCGH signal intensities.
Additional file 3: Table S1. Lists of genes with high aCGH signal inLittorina species, populations and ecotypes.
Additional file 4: Table S2. Lists of genes with significant (q = 0.05)aCGH differences between Littorina species.
AbbreviationsaCGH: Array comparative genomic hybridization; AFLP: Amplified fragmentlength polymorphism; ANOVA: Analysis of variance; BAC: Bacterial artificialchromosome; CNVs: Copy number variants; mtDNA: Mitochondrial DNA;PCA: Principal component analysis; SNPs: Single nucleotide polymorphisms.
Competing interestsThe authors declare that they have no competing interests.

Panova et al. BMC Genomics 2014, 15:687 Page 19 of 21http://www.biomedcentral.com/1471-2164/15/687
Authors’ contributionsMP, CA, KJ, TJ, AT conceived the study, discussed the experiment design andthe initial strategy for data analyses. BC, TJ, MP, CA designed the microarray.MP and TJ conducted the experiments and analyzed the microarray data.MP performed the statistical analyses with advises and support from MAR,BC and JB. MAR provided the Littorina genome draft. JB analyzed thecoverage. MP drafted the manuscript. All authors read and approved thefinal manuscript.
AcknowledgementsThe authors wish to thank John Grahame at Leeds University and JuanGalindo at Vigo University for providing Littorina samples from Britain andRoger Butlin from Sheffield University for helpful comments on themanuscript and language corrections. This work was supported by theSwedish Research Council (VR) grants to CA and KJ. Littorina saxatilis genomesequencing project is carried out within the Linnaeus Centre for MarineEvolutionary Biology [72] at Gothenburg University with financial supportfrom the Swedish Research Councils (VR and Formas). Part of the work wasalso done within the Linnaeus Centre for Marine Evolutionary Biology.
Author details1Department of Biological and Environmental Sciences - Tjärnö, GothenburgUniversity, Gothenburg, Sweden. 2Department of Biology, Microbial EcologyGroup, Lund University, Lund, Sweden. 3Department of Chemistry andMolecular Biology, Gothenburg University, Gothenburg, Sweden.
Received: 6 February 2014 Accepted: 11 August 2014Published: 18 August 2014
References1. Nosil P, Schluter D: The genes underlying the process of speciation.
Trends Ecol Evol 2011, 26:160–167.2. Avise JC, Ball MR Jr: Principles of genealogical concordance in species
concepts and biological taxonomy. In Oxford Survey of Evolutionary Biology.Edited by Futuyma DJ, Antonovics J. New York: Oxford University Press;1990:45–67.
3. Knowles LL, Carstens BC: Delimiting species without monophyletic genetrees. Syst Biol 2007, 56:887–895.
4. Shaffer HB, Thomson RC: Delimiting species in recent radiations. Syst Biol2007, 56:896–906.
5. Nichols R: Gene tress and species trees are not the same. Trends Ecol Evol2001, 16:358–364.
6. Degnan JH, Rosenberg NA: Gene tree discordance, phylogenetic inferenceand the multispecies coalescent. Trends Ecol Evol 2009, 24:332–340.
7. Dunn CW, Hejnol A, Matus DQ, Pang K, Browne WE, Smith SA, Seaver E, RouseGW, Obst M, Edgecombe GD, Sørensen MV, Haddock SHD, Schmidt-Rhaesa A,Okusu A, Kristensen RM, Wheeler WC, Martindale MQ, Gonzalo G: Broadphylogenetic sampling improves resolution of the animal tree of life.Nature 2008, 452:745–750.
8. Emerson KJ, Merz CR, Catchen JM, Hohenlohe PA, Cresko WA, Bradshaw WE,Holzapfel CM: Resolving post-glacial phylogeography using high-throughputsequencing. Proc Natl Acad Sci U S A 2010, 107:16196–16200.
9. McCormack JE, Hird SM, Zellmer AJ, Carstens BC, Brumfield RT: Applicationsof the next-generation sequencing to phylogeography and phylogenetics.Mol Phylogenet Evol 2013, 66:526–538.
10. Ballard JWO, Whitlock MC: The incomplete natural history ofmitochondria. Mol Ecol 2004, 13:729–744.
11. Galtier N, Nabholz B, Glemin S, Hurst GDD: Mitochondrial DNA as a markerof molecular diversity: a reappraisal. Mol Ecol 2009, 18:4541–4550.
12. Nordborg M, Innan H: The genealogy of sequences containing multiplesites subject to strong selection in a subdivided population. Genetics2003, 163:1201–1213.
13. Nielsen R: Molecular signatures of natural selection. Annu Rev Genet 2005,39:197–218.
14. Hohenlohe PA, Phillips PC, Cresco WA: Using population genomics todetect selection in natural populations: key concepts andmethodological considerations. Int J Plant Sci 2010, 171:1059–1071.
15. Nosil P, Funk DJ, Ortiz-Barrientos D: Divergent selection and heterogeneousgenomic divergence. Mol Ecol 2009, 18:375–402.
16. Via S: Natural selection in action during speciation. Proc Natl Acad SciU S A 2009, 106:9939–9946.
17. Smadja CM, Butlin RK: A framework for comparing processes withspeciation in the presence of gene flow. Mol Ecol 2011, 20:5123–5140.
18. Nosil P, Feder JL: Genomic divergence during speciation: causesand consequences. Philos Trans R Soc Lond B Biol Sci 2012,367:332–342.
19. Abbott R, Albach D, Ansell S, Arntzen JW, Baird SJE, Bierne N, BoughmanJW, Brelsford A, Buerkle CA, Buggs R, Butlin RK, Dieckmann U, EroukhmanoffF, Grill A, Cahan SH, Hermansen JS, Hewitt G, Hudson AG, Jiggins C, Jones J,Keller B, Marczewski T, Mallet J, Martinez-Rodriguez P, Most M, Mullen S,Nichols R, Nolte AW, Parisod C, Pfennig K, et al: Hybridization andspeciation. J Evol Biol 2013, 26:229–246.
20. Fan S, Elmer KR, Meyer A: Genomics of adaptation and speciation incichlid fishes: recent advances and analyses in African and Neotropicallineages. Philos Trans R Soc Lond B Biol Sci 2012, 367:385–394.
21. Nadeau NJ, Whibley A, Jones RT, Davey JW, Dasmahapatra KK, Baxter SW,Quail MA, Joron M, Ffrench-Constant RH, Blaxter ML, Mallet J, Jiggins CD:Genomic islands of divergence in hybridizing Heliuconius butterfliesidentified by large-scale targeted sequencing. Philos Trans R Soc Lond BBiol Sci 2012, 367:343–353.
22. Renaut S, Maillet N, Normandeau E, Sauvage C, Derome N, Rogers SM,Bernatchez L: Genome-wide patterns of divergence during speciation:the lake whitefish case study. Philos Trans R Soc Lond B Biol Sci 2012,367:354–363.
23. Strasburg JL, Sherman NA, Wright KM, Moyle LC, Willis JH, Rieseberg LH:What can patterns of differentiation across plant genomes tell us aboutadaptation and speciation? Philos Trans R Soc Lond B Biol Sci 2012,367:364–373.
24. Hohenlohe PA, Bassham S, Currey M, Cresko WA: Extensive linkagedisequilibrium and parallel adaptive divergence across threespinestickleback genomes. Philos Trans R Soc Lond B Biol Sci 2012, 367:395–408.
25. Reid DG: Systematic and Evolution of Littorina. London: Ray Society; 1996.26. Reid DG, Rumbak E, Thomas RH: DNA, morphology and fossils: phylogeny
and evolutionary rates of the gastropod genus Littorina. Philos Trans RSoc Lond B Biol Sci 1996, 351:877–895.
27. Kemppainen P, Panova M, Hollander J, Johannesson K: Complete lack ofmitochondrial divergence between two species of NE Atlantic marineintertidal gastropods. J Evol Biol 2009, 22:2000–2011.
28. Doellman MM, Trussel GC, Grahame JW, Vollmer SV: Phylogenetic analysisreveals a deep lineage split within North Atlantic Littorina saxatilis. Proc RSoc Lond B Biol Sci 2011, 278:3175–3183.
29. Panova M, Blakeslee AMH, Miller AW, Mäkinen T, Ruiz GM, Johannesson K,André C: Glacial history of the North Atlantic marine snail, Littorinasaxatilis, inferred from distribution of mitochondrial DNA lineages.PLoS ONE 2011, 6:e17511.
30. Mikhailova NA, Gracheva YA, Backeljau T, Granovitch AI: A potentialspecies-specific molecular marker suggests interspecific hybridizationbetween the sibling species Littorina arcana and L. saxatilis(Mollusca, Caenogastropoda) in natural populations. Genetica 2009,137:333–340.
31. Reid DG, Dyal P, Williams ST: A global molecular phylogeny of 147periwinkle species (Gastropoda, Littorininae). Zool Scripta 2012, 41:125–136.
32. Johannesson K: Evolution in Littorina: ecology matters. J Sea Research2003, 49:107–117.
33. Butlin RK, Galindo J, Grahame JW: Sympatric, parapatric or allopatric:the most important way to classify speciation? Philos Trans R Soc Lond BBiol Sci 2008, 363:2997–3007.
34. Johannesson K, Panova M, Kemppainen P, André C, Rolán-Alvarez E, ButlinRK: Repeated evolution of reproductive isolation in a marine snail:unveiling mechanisms of speciation. Philos Trans R Soc Lond B Biol Sci2010, 365:1735–1747.
35. Butlin RK, Saura M, Charrier G, Jackson B, André C, Caballero A, Coyne JA,Galindo J, Grahame JW, Hollander J, Kemppainen P, Martínez-Fernández M,Panova M, Quesada H, Johannesson K, Rolán-Alvarez E: Parallel evolution oflocal adaptation and reproductive isolation in the face of gene flow.Evolution 2014, 68:935–949.
36. Galindo J, Grahame JW, Butlin RK: An EST-based genome scan using 454sequencing in the marine snail Littorina saxatilis. J Evol Biol 2010,23:2004–2016.
37. Wilding CS, Butlin RK, Grahame JW: Differential gene exchange betweenparapatric morphs of Littorina saxatilis detected using AFLP markers.J Evol Biol 2001, 14:611–619.

Panova et al. BMC Genomics 2014, 15:687 Page 20 of 21http://www.biomedcentral.com/1471-2164/15/687
38. Wood HM, Grahame JW, Humphray S, Rogers J, Butlin RK: Sequencedifferentiation in regions identified by a genome scan for localadaptation. Mol Ecol 2008, 17:3123–3135.
39. Gresham D, Dunham MJ, Botstein D: Comparing whole genomes usingDNA microarrays. Nat Rev Genet 2008, 9:291–302.
40. Aradhya S, Cherry AM: Array-based comparative genomic hybridization:clinical contexts for targeted and whole-genome designs. Genet Med2007, 9:553–559.
41. Tan JC, Patel JJ, Tan A, Blain JC, Albert TJ, Lobo NF, Ferdig MT: Optimizingcomparative genomic hybridization probes for genotyping and SNPdetection in Plasmodium falciparum. Genomics 2009, 93:543–550.
42. McDonnell SK, Riska SM, Klee EW, Thorland EC, Kay NE, Thibodeau SN,Parker AS, Eckel-Passow JE: Experimental designs for array comparativegenomic hybridization technology. Cytogenet Genome Res 2013,139:250–257.
43. Rennie C, Noyes HA, Kemp SJ, Hulme H, Brass A, Hoyle DC: Strongposition-dependent effects of sequence mismatches on signal ratiosmeasured using long oligonucleotide microarrays. BMC Genomics 2008,9:317.
44. Flibotte S, Edgley ML, Maydan J, Taylor J, Zapf R, Waterston R, Moerman DG:Rapid high resolution single nucleotide polymorphism-comparativegenome hybridization mapping in Caenorhabditis elegans. Genetics 2009,181:33–37.
45. Vitikainen M, Arvas M, Pakula T, Oja M, Penttilä M, Saloheimo M: Arraycomparative genomic hybridization analysis of Trichoderma reesei strainswith enhanced cellulase production properties. BMC Genomics 2010,11:441.
46. Kane MD, Jatkoe TA, Stumpf CR, Lu J, Thomas JD, Madore SJ: Assessmentof sensitivity and specificity of oligonucleotide (50mer) microarrays.Nucleic Acids Res 2000, 28:4552–4557.
47. Hughes TR, Mao M, Jones AR, Burchard J, Marton MJ, Shannon KW,Lefkowitz SM, Ziman M, Schelter JM, Meyer MR, Kobayashi S, Davis C, Dai H,He YD, Stephaniants SB, Cavet G, Walker WL, West A, Coffey E, ShoemakerDD, Stoughton R, Blanchard AP, Friend SH, Linsley PS: Expression profilingusing microarrays fabricated by an ink-jet oligonucleotide synthesizer.Nat Biotechnol 2001, 19:342–347.
48. Letowski J, Brousseau R, Masson L: Designing better probes: effectof probe size, mismatch position and number on hybridizationin DNA oligonucleotide microarrays. J Microbiol Methods 2004,57:269–278.
49. Carter B, Wu G, Woodward MJ, Anjum MF: A process for analysis ofmicroarray comparative genomics hybridization studies for bacterialgenomes. BMC Genomics 2008, 9:53.
50. Yu P, Wang C-H, Xu Q, Feng Y, Yuan X-P, Yu H-Y, Wang Y-P, Tang S-X, WeiX-H: Genome-wide copy number variations in Oriza sativa L. BMCGenomics 2013, 14:649.
51. Le Quéré A, Astrup-Eriksen K, Rajashekar B, Schützendübel A, Canbäck B,Johansson T, Tunlid A: Screening for rapidly evolving genes in theectomycorrhizal fungus Paxillus involutus using cDNA microarrays.Mol Ecol 2006, 15:535–550.
52. Hedh J, Johansson T, Tunlid A: Variation in host specificity and genecontent in strains from genetically isolated lineages of theectomycorrhizal fungus Paxillus involutus s. lat. Mycorrhiza 2009,19:549–558.
53. LSD - The Littorina sequence database. [http://mbio-serv2.mbioekol.lu.se/Littorina1/]
54. Canbäck B, André C, Galindo J, Johannesson K, Johansson T, Panova M,Tunlid A, Butlin R: The Littorina sequence database (LSD) – an onlineresource for genomic data. Mol Ecol Resour 2012, 12:142–148.
55. Wilding CS, Mill PJ, Grahame JW: Partial sequence of the mitochondrialgenome of Littorina saxatilis: relevance to gastropod phylogenetics.J Mol Evol 1999, 48:348–359.
56. Sokolov EP, Sokolova IM, Portner HO: Polymorphic microsatellite DNAmarkers from the marine gastropod Littorina saxatilis. Mol Ecol Notes2002, 2:27–29.
57. Tie AD, Boulding EG, Naish KA: Polymorphic microsatellite DNA markersfor the marine gastropod Littorina subrotundata. Mol Ecol 2000,9:108–110.
58. Panova M, Hollander J, Johannesson K: Site-specific genetic divergence inparallel hybrid zones suggests nonallopatric evolution of reproductivebarriers. Mol Ecol 2006, 15:4021–4031.
59. Mäkinen T, Panova M, Johannesson K, Tatarenkov A, Appelqvist C, André C:Genetic differentiation on multiple spatial scales in an ecotype-formingmarine snail with limited dispersal: Littorina saxatilis. Biol J Linn Soc Lond2008, 94:31–40.
60. Levitan DR, Grosberg RK: The analysis of paternity and maternity in themarine hydrozoan Hydractinia symbiolongicarpus using randomlyamplified polymorphic DNA (RAPD) markers. Mol Ecol 1993, 2:315–326.
61. Patterson TA, Lobenhofer EK, Fulmer-Smentek SB, Collins PJ, Chu TM, BaoW, Fang H, Kawasaki ES, Hager J, Tikhonova IR, Walker SJ, Zhang LA, HurbanP, de Longuevill F, Fuscoe JC, Tong WD, Shi LM, Wolfinger RD: Performancecomparison of one-color and two-color platforms within the MicroArrayQuality Control (MAQC) project. Nat Biotechnol 2006, 24:1140–1150.
62. Buffart TE, Israeli D, Tijssen M, Vosse SJ, Mrsic A, Meijer GA, Ylstra B:Across array comparative genomic hybridizations: a strategy to reducereference sample channel hybridization. Genes Chromosomes Cancer 2008,47:994–1004.
63. Irizarry RA, Hobbs B, Colin F, Beazer-Barclay YD, Antonellis K, Scherf U, SpeedTP: Exploration, normalization and summaries of high densityoligonucleotide array probe level data. Biostatistics 2003, 4:249–264.
64. Bolstad BM, Irizarry RA, Åstrand M, Speed TP: A comparison ofnormalization methods for high density oligonucleotide array based onvariance and bias. Bioinformatics 2003, 19:185–193.
65. Pelz CR, Kulesz-Martin M, Bagby G, Sears RC: Global rank-invariant setnormalization (GRSN) to reduce systematic distortions in microarraydata. BMC Bioinformatics 2008, 9:520.
66. Wolfinger RD, Gibson G, Wolfinger ED, Bennett L, Hamadeh H, Bushel P,Afshari C, Paules RS: Assessing gene significance from cDNA microarrayexpression data via mixed models. J Comp Biol 2001, 8:625–637.
67. Benjamini Y, Hochberg Y: Controlling the false discovery rate: a powerfuland practical approach to multiple testing. J R Stat Soc Series B StatMethodol 1995, 57:289–300.
68. Wu H, Yang H, Sheppard K, Churchill G, Kerr K, Cui X: Tools for analyzingMicro Array experiments. R package version 1.33.2. [http://research.jax.org/faculty/churchill]
69. R Development Core Team: R: A Language and Environment for StatisticalComputing. Vienna, Austria: R Foundation for Statistical Computing; 2012[http://www.R-project.org]
70. Paradis E, Claude J, Strimmer K: APE: analyses of phylogenetics andevolution in R language. Bioinformatics 2004, 20:289–290.
71. Hulsen T, de Vlieg J, Alkema W: BioVenn – a web application for thecomparison and visualization of biological lists using area-proportionalVenn diagrams. BMC Genomics 2008, 9:488.
72. The Linneaus Centre for Marine Evolutionary Biology at GothenburgUniversity. [http://www.cemeb.science.gu.se]
73. Altschul SF, Gish W, Miller W, Myers EW, Lipman DJ: Basic local alignmentsearch tool. J Mol Biol 1990, 215:403–410.
74. Benaglia T, Chauveau D, Hunter DR, Young DS: mixtools: an R package foranalyzing mixture models. J Stat Softw 2009, 32:1–29.
75. Vitturi R, Libertini A, Panozzo M, Mezzapelle G: Karyotype analysis andgenome size in three Mediterranean species of periwinkles(Prosobranchia: Mesogastropoda). Malacologia 1995, 37:123–132.
76. García-Alcalde F, Okonechnikov K, Carbonell J, Cruz LM, Götz S, Tarazona S,Dopazo J, Meyer TF, Conesa A: Qualimap: evaluating next-generationsequencing alignment data. Bioinformatics 2012, 28:2678–2679.
77. Knight AJ, Ward RD: The genetic relationships of the three taxa in theLittorina saxatilis species complex (Prosobranchia: Littorinidae).J Molluscan Stud 1991, 57:81–91.
78. Small MP, Gosling EM: Genetic structure and relationships in the snailspecies complex Littorina arcana Hannaford Ellis, L. compressa Jeffreysand L. saxatilis (Olivi) in the British Isles using SSCPs of cytochrome-bfragments. Heredity 2000, 84:692–701.
79. Wilding CS, Grahame JW, Mill PJ: Mitochondrial DNA CoI haplotypevariation in sibling species of rough periwinkles. Heredity 2000,85:62–74.
80. Wilding CS, Grahame JW, Mill PJ: Nuclear DNA restriction sitepolymorphisms and the phylogeny and population structure of anintertidal snail species complex (Littorina). Hereditas 2000, 133:9–18.
81. Zink RM, Barrowclough GF: Mitochondrial DNA under siege in avianphylogeography. Mol Ecol 2008, 17:2107–2121.
82. Baker AJ, Tavares ES, Elbourne RF: Countering criticisms of singlemitochondrial DNA barcoding in birds. Mol Ecol Resour 2009, 9:257–268.

Panova et al. BMC Genomics 2014, 15:687 Page 21 of 21http://www.biomedcentral.com/1471-2164/15/687
83. Janson K: Genetic and environmental effects on the growth rate ofLittorina saxatilis Olivi. Mar Biol 1982, 69:73–78.
84. Johannesson B, Johannesson K: Population differences in behaviour andmorphology in Littorina saxatilis: Phenotypic plasticity or geneticdifferentiation? J Zool 1996, 240:475–493.
85. Carballo M, García C, Rolán-Alvarez E: Heritability of shell traits in wildLittorina saxatilis populations: results across a hybrid zone. J ShellfishResearch 2001, 20:415–422.
86. Conde-Padín P, Carvajal-Rodríguez A, Carballo M, Caballero A, Rolán-AlvarezE: Genetic variation for shell traits in a direct-developing marine snailinvolved in a putative sympatric ecological speciation process. Evol Ecol2007, 21:635–650.
87. Grahame JW, Wilding CS, Butler RK: Adaptation to a steep environmentalgradient and an associated barrier to gene exchange in Littorinasaxatilis. Evolution 2006, 60:268–278.
88. Quesada H, Posada D, Caballero A, Morán P, Rolán-Alvarez E: Phylogeneticevidence for multiple sympatric ecological diversification in a marinesnail. Evolution 2007, 61:1600–1612.
89. Hoekstra HE, Coyne JA: The locus of evolution: Evo devo and the geneticsof adaptation. Evolution 2007, 61:995–1016.
90. Wray GA: The evolutionary significance of cis-regulatory mutations.Nat Rev Genet 2007, 8:206–216.
91. Tatarenkov A, Johannesson K: Micro- and macrogeographical allozymevariation in Littorina fabalis; do sheltered and exposed forms hybridize?Biol J Linn Soc Lond 1999, 67:199–212.
92. Johannesson K, Mikhailova N: Habitat-related genetic substructuring in amarine snail (Littorina fabalis) involving a tight link between an allozymeand a DNA locus. Biol J Linn Soc Lond 2004, 81:301–306.
93. Hu H, Bandyopadhyay PK, Olivera BM, Yandell M: Characterization of theConus bullatus genome and its venom-duct transcriptome. BMCGenomics 2011, 12:60.
94. Zhang G, Fang X, Guo X, Li L, Luo R, Xu F, Yang P, Zhang L, Wang X, Qi H,Xiong Z, Que H, Xie Y, Holland PWH, Paps J, Zhu Y, Wu F, Chen Y, Wang J,Peng C, Meng J, Yang L, Liu J, Wen B, Zhang N, Huang Z, Zhu Q, Feng Y,Mount A, Hedgecock D, et al: The oyster genome reveals stressadaptation and complexity of shell formation. Nature 2012, 490:49–54.
95. GEO - The NCBI Gene Expression Omnibus. [http://www.ncbi.nlm.nih.gov/geo]
96. Barrett T, Troup DB, Wilhite SE, Ledoux P, Rudnev D, Evangelista C, Kim IF,Soboleva A, Tomashevsky M, Marshall KA, Phillippy KH, Sherman PM,Muertter RN, Edgar R: NCBI GEO: archive for high-throughput functionalgenomic data. Nucleic Acids Res 2009, 37:D885–D890.
doi:10.1186/1471-2164-15-687Cite this article as: Panova et al.: Species and gene divergence inLittorina snails detected by array comparative genomic hybridization.BMC Genomics 2014 15:687.
Submit your next manuscript to BioMed Centraland take full advantage of:
• Convenient online submission
• Thorough peer review
• No space constraints or color figure charges
• Immediate publication on acceptance
• Inclusion in PubMed, CAS, Scopus and Google Scholar
• Research which is freely available for redistribution
Submit your manuscript at www.biomedcentral.com/submit