special topic: edge intelligence for internet of things - zte
TRANSCRIPT

ISSN 1673-5188CN 34-1294/ TN
ZTE COMMUNICATIONSJune 2021, Vol. 19 No. 2
Special Topic:Edge Intelligence for Internet of Things
An International ICT R&D Journal Sponsored by ZTE Corporation
中兴通讯技术(英文版)
ZTECOMMUNICATIO
NS
VOLU
ME19
NUMBER
2JU
NE
2021中兴通讯技术(英文版)

Members (Surname in Alphabetical Order)
•••••••
•••••••
•••••••
•••••••
•••••••
•••••••
•••••••
•••••••
•••••••
•••••••
•••••••
•••••••
•••••••
•••••••
•••••••
•••••••
•••••••
•••••••
•••••••
•••••••
•••••••
•••••••
•••••••
•••••••
•••••••
•••••••
•••••••
•••••••
•••••••
•••••••
•••••••
•••••••
•••••••
•••••••
•••••••
•••••••
•••••••
•••••••
•••••••
•••••••
•••••••
•••••••
•••••••
•••••••
•••••••
•••••••
•••••••
•••••••
•••••••
•••••••
•••••••
•••••••
•••••••
•••••••
•••••••
•••••••
•••••••
The 8th Editorial Board of ZTE Communications
AI BoCAO JiannongCHEN Chang WenCHEN YanCHI NanCUI ShuguangGAOWenGAO YangGE XiaohuHWANG Jenq⁃NengVictor C. M. LEUNGLI GuifangLI XiangyangLI ZixueLIN XiaodongLIU ChiLIU JianLIU MingMA JianhuaMA ZhengNIU ZhishengPAN YiREN FujiREN KuiSHENG MinSONGWenzhanSUN HuifangSUN ZhiliTAO MeixiaWANG HaimingWANG XiangWANG XiaodongWANG XiyuWANG YongjinWANG ZhengdaoXU ChengzhongXU ZiyangYANG KunYUAN JinhongZENGWenjunZHANG ChengqiZHANG HonggangZHANG JianhuaZHANG YuepingZHOUWanleiZHUANGWeihua
Beijing Jiaotong University (China)Hong Kong Polytechnic University (China)The State University of New York at Buffalo (USA)Northwestern University (USA)Fudan University (China)UC Davis (USA) and The Chinese University of Hong Kong, Shenzhen (China)Peking University (China)Nanjing University (China)Huazhong University of Science and Technology (China)University of Washington (USA)The University of British Columbia (Canada)University of Central Florida (USA)University of Science and Technology of China (China)ZTE Corporation (China)ZTE Corporation (China)Beijing Institute of Technology (China)ZTE Corporation (China)Institute of Microelectronics of the Chinese Academy of Sciences (China)Hosei University (Japan)Southwest Jiaotong University (China)Tsinghua University (China)Shenzhen Institute of Advanced Technology, Chinese Academy of Sciences (China)Tokushima University (Japan)Zhejiang University (China)Xidian University (China)University of Georgia (USA)Mitsubishi Electric Research Laboratories (USA)University of Surrey (UK)Shanghai Jiao Tong University (China)Southeast University (China)ZTE Corporation (China)Columbia University (USA)ZTE Corporation (China)Nanjing University of Posts and Telecommunications (China)Iowa State University (USA)University of Macau (China)ZTE Corporation (China)University of Essex (UK)University of New South Wales (Australia)Microsoft Research Asia (China)University of Technology Sydney (Australia)Zhejiang University (China)Beijing University of Posts and Telecommunications (China)Nanyang Technological University (Singapore)City University of Macau (China)University of Waterloo (Canada)
GAOWen, Peking University (China)XU Ziyang, ZTE Corporation (China) | XU Chengzhong, University of Macau (China)
Chairman
Vice Chairmen
ZTE COMMUNICATIONS June 2021 Vol. 19 No. 2 (Issue 74)
CONTENTS
Submission of a manuscript implies that the submitted work has not been published before (except as part of a thesis or lecture note or report or in the form of anabstract); that it is not under consideration for publication elsewhere; that its publication has been approved by all co-authors as well as by the authorities at theinstitute where the work has been carried out; that, if and when the manuscript is accepted for publication, the authors hand over the transferable copyrights of theaccepted manuscript to ZTE Communications; and that the manuscript or parts thereof will not be published elsewhere in any language without the consent of thecopyright holder. Copyrights include, without spatial or timely limitation, the mechanical, electronic and visual reproduction and distribution; electronic storage andretrieval; and all other forms of electronic publication or any other types of publication including all subsidiary rights.Responsibility for content rests on authors of signed articles and not on the editorial board of ZTE Communications or its sponsors.All rights reserved.
Special TopicEdge Intelligence for Internet of Things
EditorialLIU Chi
RecCac: Recommendation-Empowered CooperativeEdge Caching for Internet of Things
Cooperative edge caching jointing the neighbor edge server is regard⁃ed as a promising technique to improve cache hit and reduce conges⁃tion of the networks. The authors investigate the issue of joint cooper⁃ative edge caching and recommender systems to achieve additionalcache gains by the soft caching framework. To measure the cache
profits, the optimization problem is formulated as a 0–1 ILP, whichis NP-hard. Specifically, the method of processing content requests isdefined as server actions, the authors determine the server actions tomaximize the QoE and propose a cache-friendly heuristic algorithm
to solve it.HAN Suning, LI Xiuhua, SUN Chuan, WANG Xiaofei,
Victor C. M. LEUNG
Cost-Effective Task Scheduling forCollaborative Cross-Edge Analytics
To explicitly leverage the price heterogeneity for WAN cost minimiza⁃tion, the authors propose to schedule analytic tasks based on bothprice and bandwidth heterogeneities. Unfortunately, the problem ofWAN cost minimization underperformance constraint is shown NP-
hard, thus computationally intractable for large inputs. To addressthis challenge, PPGA, an efficient task scheduling heuristic that im⁃proves the cost-efficiency of IoT data analytic jobs across edge data⁃centers is proposed. The authors implement PPGA based on ApacheSpark and conduct extensive experiments on Amazon EC2 to verify
the efficacy of PPGA.ZHAO Kongyang, GAO Bin, ZHOU Zhi
BPPF: Bilateral Privacy-Preserving Frameworkfor Mobile CrowdsensingIn this paper, the authors study privacy protection in MCS. The mainchallenge is to assign the most suitable worker to a task without knowingthe task and the actual location of the worker. The authors propose a bi⁃lateral privacy protection framework based on matrix multiplication,which can protect the location privacy between task and worker, andkeep their relative distance between task and worker unchanged.LIU Junyu, YANG Yongjian, WANG En
Maximum-Profit Advertising Strategy UsingCrowdsensing Trajectory DataThe authors propose some effective advertising strategies for selecting aneffective set of billboards under the advertising budget to maximize com⁃mercial profit for the advertiser. First, the authors extract potential custom⁃ers' implicit information and then study the billboard selection problem un⁃der two situations. Extensive experiments based on three real-world datasets verify that the proposed advertising strategies can achieve the superiorcommercial profit compared with the state-of-the-art strategies.LOU Kaihao, YANG Yongjian, YANG Funing, ZHANG Xingliang
Speed Estimation Using Commercial Wi⁃FiDevice in Smart HomeA direction independent indoor speed estimation system in terms of EMwave statistical theory is proposed. Based on the statistical characteris⁃tics of EM waves, the authors establish the deterministic relationship be⁃tween the ACF of CSI and the speed of moving target. Extensive experi⁃ments show that the system achieves a median error of 0.18 m/s for de⁃vice-free single target walking speed estimation.TIAN Zengshan, YE Chenglin, ZHANG Gongzhui, HE Wei, JIN Yue
01
02
20
11
29
44
ZTE COMMUNICATIONS June 2021 Vol. 19 No. 2 (Issue 74)
CONTENTS
This magazine is a free publication for you. If you do not want to receive it in the future, you can send the“TD unsubscribe”mail to [email protected]. We will not send you this magazine again after receivingyour email. Thank you for your support.Statement
Analysis of Industrial Internet ofThings and Digital Twins
In this paper, the efforts of 3GPP are introduced for the development ofuRLLC in reducing delay and enhancing reliability, as well as the re⁃search on little jitter and high transmission efficiency. The enhanced
key technologies required in the IIoT are also analyzed. Finally, digitaltwins are analyzed according to the actual IIoT situation.
TAN Jie, SHA Xiubin, DAI Bo, LU Ting
Higher Speed Passive Optical Networks forLow Latency Services
Latency sensitive services have attracted much attention lately and im⁃posed stringent requirements on the access network design. PON pro⁃vides a potential long-term solution for the underlying transport net⁃work supporting these services. This paper discusses latency limita⁃
tions in PON and recent progress in PON standardization to improve la⁃tency. Experimental results of a low latency PON system are presented
as a proof of concept.ZHANG Weiliang, YUAN Liquan
Differentially Authorized DeduplicationSystem Based on Blockchain
To further refine the usage scenarios for various user permissions andenhance user’s data security, the authors propose a blockchain-
based differential authorized deduplication system, which optimizesthe traditional PoV consensus algorithm and simplifies the existingdifferential authorization process to realize credible management anddynamic update of authority. Based on the decentralized property of
blockchain, the authors overcome the centralized single point faultproblem of traditional differentially authorized deduplication system.Besides, the operations of legitimate users are recorded in blocks toensure the traceability of behaviors.ZHAO Tian, LI Hui, YANG Xin, WANG Han, ZENG Ming,GUO Haisheng, WANG Dezheng
A Novel De-Embedding Technique ofPackaged GaN TransistorsThis paper presents a novel de-embedding technique of packagedhigh-power transistors. Different from the conventional technique ofparasitic extraction, the proposed technique only requires externalmeasurements. The frequency independent characteristic of DID isverified and the IPN is modeled and calibrated for a 50 W GaN tran⁃sistor. At last, a broadband Doherty PA is fabricated with the de-em⁃bedding technique. According to the measured results, the PA exhib⁃its satisfactory power and efficiency performance.WEI Xinghui, CHEN Xiaofan, CHEN Wenhua, ZHOU Junmin
Flexible Multiplexing Mechanism forCoexistence of URLLC and EMBB Services in5G NetworksA dynamic 2-dimension bitmap resource indication is propesed tocancel eMBB services with a finer uplink cancellation granularityand a lower probability of false cancellation. Meanwhile, a re⁃source indication based power control method is introduced to dy⁃namically indicate different power control parameters to the UEbased on different time-frequency resource groups and the propor⁃tion of overlapping resources. Furthermore, a dynamic selectionmechanism is proposed to accommodate the varying cases in differ⁃ent scenarios. Extensive system level simulations are conductedand the results show that about 10.54% more URLLC UEs satisfythe requirements, and the perceived throughput of eMBB UEs is in⁃creased by 23.26%.XIAO Kai, LIU Xing, HAN Xianghui, HAO Peng, ZHANG Junfeng,ZHOU Dong, WEI Xingguang
Review
Research Paper
Ser ia l parameters :CN 34-1294/TN*2003*q*16*90*en*P*¥20.00*2200*11*2021-06
53
61
67
82
77
ZTE COMMUNICATIONSJune 2021 Vol. 19 No. 2
Edge Intelligence for Internet of Things Special Topic
Chi Harold LIU
EditorialEditorial:: Special Topic onSpecial Topic onEdge Intelligence for Internet of ThingsEdge Intelligence for Internet of Things
LIU Chi received the Ph.D. degree from Imperial College London, UK in 2010, and the B.Eng. degree from Tsinghua University,China in 2006. He is currently a full professor and Vice Dean at the School of Computer Science and Technology, Beijing Instituteof Technology, China. He is also the Director of IBM Mainframe Excellence Center (Beijing) and Director of IBM Big Data Tech⁃nology Center. Before moving to academia, he joined IBM Research—China as a staff researcher and project manager, after work⁃ing as a postdoctoral researcher at Deutsche Telekom Laboratories, Germany and a visiting scholar at IBM T. J. Watson ResearchCenter, USA. His current research interests include the big data analytics, mobile computing, and deep learning. He received theDistinguished Young Scholar Award in 2013, IBM First Plateau Invention Achievement Award in 2012, and was interviewed byEEWeb.com as the Featured Engineer in 2011. He has published more than 200 prestigious conference and journal papers andowned more than 14 EU/US/UK/China patents, with Google H index 26. He currently serves as the symposium chair for IEEE ICC2020 Next Generation Networking, an area editor for KSII Transactions on Internet and Information Systems and the book editorfor six books published by Taylor & Francis Group, USA and China Machinery Press. He has also served as the general chair of
IEEE SECON’13 workshop on IoT Networking and Control, IEEE WCNC’12 workshop on IoT Enabling Technologies, and ACM UbiComp’11 Work⁃shop on Networking and Object Memories for IoT. He served as the consultant to Asian Development Bank, Bain & Company, and KPMG, USA, andthe peer reviewer for Qatar National Research Foundation, and National Science Foundation, China. Dr. LIU is a fellow of IET and a fellow of RoyalSociety of the Arts.
With the fast development of the Internet of Things(IoT), increasing numbers of devices are connect⁃ed to the IoT network and generate massiveamounts of data. The traditional centralized cloud
computing architecture cannot meet the requirements of bothlatency and data security. Within this context, edge computingand edge intelligence can shift data processing, computing ap⁃plications and services from centralized cloud servers to theedge of a network. Depending on the processing requirements,the data generated by an edge device is either processed at thedevice itself or the local node deployed at the periphery of thenetwork. This enables the analysis to be performed near thedata source to avoid the delay caused by moving data to thecloud. It also allows sensitive data to be processed locally, andonly non-sensitive data will be transmitted to the data centerfor centralized processing. On the other hand, the applicationof edge intelligence still faces many challenges, such as incon⁃sistent IoT technical standards, serious energy consumptionand pollution, heterogeneous IoT network and data, and datasecurity and privacy protection.To overcome these challenges, the first paper“RecCac:
Recommendation-Empowered Cooperative Edge Caching forInternet of Things”by LI Xiuhua et al. focuses on the jointproblem of cooperative edge caching and recommender sys⁃tems to achieve additional cache gains and increase“effec⁃tive”cache size. This paper supports massive content accessin mobile edge networks and addresses rapidly growing IoT
services and content applications.The second paper is dedicated to reducing the cost of cross-
edge analysis.“Cost-Effective Task Scheduling for Collabora⁃tive Cross-Edge Analytics”by ZHAO Kongyang et al. empiri⁃cally demonstrates that reducing either analytics responsetime or network traffic volume cannot necessarily minimizethe wide area network (WAN) traffic cost, due to price hetero⁃geneity of WAN links, so they propose to schedule analytictasks based on both price and bandwidth heterogeneities.The remaining three papers mainly study the application of
edge intelligence.“BPPF: Bilateral Privacy-Preserving Frame⁃work for Mobile Crowdsensing”by LIU Junyu et al. studiesprivacy protection in Mobile Crowdsensing (MCS) and propos⁃es a bilateral privacy protection framework (BPPF) based onmatrix multiplication for protecting the location privacy be⁃tween the task and the worker, and keep their relative dis⁃tance unchanged.“Maximum-Profit Advertising Strategy Us⁃ing Crowdsensing Trajectory Data”by LOU Kaihao et al. alsoworks with MCS and proposes some effective advertising strat⁃egies to help maximize commercial profit for the advertiser byattracting potential customers using out-door billboard adver⁃tising.“Speed Estimation Using Commercial Wi-Fi Device inSmart Home”by TIAN Zengshan et al. studies Wi-Fi-basedapproaches to measure the speed of the moving target and pro⁃poses a direction independent indoor speed estimation systemin terms of electromagnetic wave statistical theory.Finally, we would like to thank all the authors for contribut⁃
ing their papers to this special issue and the external review⁃ers for volunteering their time to review the submissions.
DOI: 10.12142/ZTECOM.202102001Citation(IEEE Format):C. Liu,“Editorial: special topic on edge intelli⁃gence for Internet of Things,”ZTE Communications, vol. 19, no. 2, pp. 01–01, Jun. 2021. doi: 10.12142/ZTECOM.202102001.
Guest Editor
01
ZTE COMMUNICATIONSJune 2021 Vol. 19 No. 2
RecCacRecCac:: RecommendationRecommendation--Empowered Cooperative EdgeEmpowered Cooperative EdgeCaching for Internet of ThingsCaching for Internet of Things
HAN Suning1, LI Xiuhua1, SUN Chuan1, WANG Xiaofei2, Victor C. M. LEUNG 3,4
(1. Chongqing University, Chongqing 400000, China;2. Tianjin University, Tianjin 300072, China;3. Shenzhen University, Shenzhen 518000, China;4. The University of British Columbia, Vancouver V6T 1Z4, Canada)
Abstract: Edge caching is an emerging technology for supporting massive content access inmobile edge networks to address rapidly growing Internet of Things (IoT) services and con⁃tent applications. However, the edge server is limited with the computation/storage capacity,which causes a low cache hit. Cooperative edge caching jointing neighbor edge servers is re⁃garded as a promising technique to improve cache hit and reduce congestion of the net⁃works. Further, recommender systems can provide personalized content services to meet us⁃er’s requirements in the entertainment-oriented mobile networks. Therefore, we investigatethe issue of joint cooperative edge caching and recommender systems to achieve additionalcache gains by the soft caching framework. To measure the cache profits, the optimizationproblem is formulated as a 0–1 Integer Linear Programming (ILP), which is NP-hard. Spe⁃cifically, the method of processing content requests is defined as server actions, we deter⁃mine the server actions to maximize the quality of experience (QoE). We propose a cache-friendly heuristic algorithm to solve it. Simulation results demonstrate that the proposedframework has superior performance in improving the QoE.Keywords: IoT; recommender systems; cooperative edge caching; soft caching
Citation (IEEE Format): S. N. Han, X. H. Li, C. Sun, et al.“RecCac: recommendation-empowered cooperative edge caching for In⁃ternet of Things,”ZTE Communications, vol. 19, no. 2, pp. 02–10, Jun. 2021. doi: 10.12142/ZTECOM.202102002.
1 Introduction
As the development trend of future networks, the In⁃ternet of things (IoT) has become a hot research top⁃ic in the industry and academia in recent years[1].The emergence of“IoT”paradigm makes accessi⁃
bility of various IoT sensors (e. g., smart cameras and tem⁃perature sensors) universal, and thus enables intelligent ser⁃vices to improve the life quality of humans[2]. Billions of IoTdevices (IDs) generate a tremendous number of monitoringdata while a great many end-users are consuming these da⁃ta. However, countless electronic devices are anticipated togenerate a sheer volume of traffic loads, and the aggregateload on core networks is expected to be large. Therefore, itis important to reduce congestion and transmission delayfor network providers[3–5].As we have stated above, mobile edge networks are faced
with the challenge of the explosive growth of IoT data re⁃quests from the IDs, especially in the current backhaul net⁃
DOI: 10.12142/ZTECOM.202102002
https://kns.cnki.net/kcms/detail/34.1294.TN.20210525.1320.002.html, publishedonline May 26, 2021
Manuscript received: 2021-03-01
This work is supported in part by National Key R&D Program of China un⁃der Grant Nos. 2018YFB2100100 and 2018YFF0214700, National NSFC un⁃der Grant Nos. 61902044 and 62072060, Chongqing Research Program ofBasic Research and Frontier Technology under Grant No. CSTC2019-jcyjm⁃sxmX0589, Key Research Program of Chongqing Science and TechnologyCommission under Grant Nos. CSTC2017jcyjBX0025 and CSTC2019jscx-zdztzxX0031, Fundamental Research Funds for the Central Universities un⁃der Grant No. 2020CDJQY-A022, Chinese National Engineering Laboratoryfor Big Data System Computing Technology, and Canadian NSERC.
02
RecCac: Recommendation-empowered Cooperative Edge Caching for Internet of Things Special Topic
HAN Suning, LI Xiuhua, SUN Chuan, WANG Xiaofei, Victor C. M. LEUNG
ZTE COMMUNICATIONSJune 2021 Vol. 19 No. 2
works[6]. According to the research, most of the high load inthe mobile networks is generated by downloading the samecontent and data. To solve this problem, it is necessary toput forward new revolutionary methods in network structureand data transmission[7]. As one of the rapidly developingtechnologies, edge caching has drawn growing attention.Edge caching technology can reduce repeated downloadingand transmission by caching contents in advance[8]. Howev⁃er, as content providers (CPs) provide growing content, andthe storage and computing capacity of a cell (e.g., edge serv⁃er) are limited, we still face great challenges to solve theabove problems. Many researchers are looking for addition⁃al cache gains in this area. Some current research (e. g.,FemtoCache[9]) focuses on caching contents in the edge serv⁃er of base stations (BSs). However, it only focuses on the ba⁃sic cell cache, and the understanding of inter-cell coopera⁃tion is not deep.Besides, how to use the cached contents to achieve more
cache gains is also a problem we have to consider. It is diffi⁃cult to improve the caching performance only by focusingon the content popularity in the entertainment-oriented mo⁃bile networks. To solve this problem, the recommender sys⁃tems provide an effective method that can provide personal⁃ized content recommendations through historical behavior,e.g., users may have evaluated or scored different contents.However, some related content, such as two similar comedymovies or two short videos of the same type, might have sim⁃ilar utility for a user. We use the term—soft cach⁃ing[10], which means that if the local BS doesn’t cache the re⁃quested content, the BS can send other relevant contentsavailable locally. If the user likes or accepts the relevantcontents (under a certain threshold) instead of the contentwhich was originally requested, a soft cache hit will occur.This scheme may give up some content relevance, but itavoids the“expensive”connection of the IDs to get the re⁃quested content from the backhaul network. Actually, somerecent experimental evidence suggests that IDs may be will⁃ing to trade off some content relevance for a better qualityof experience (QoE)[11].More specifically in this paper, the cooperative edge
caching and recommender systems are used to alleviate thepressure of the backhaul network and get related contentsto achieve soft caching, respectively. We combine coopera⁃tive edge caching with recommender systems to improvethe QoE. Recently, some researchers consider the interac⁃tion between edge caching and recommender systems to op⁃timize cache or recommender systems[10–17]. However, mostof the research only focuses on one side of the problem, e.g., caching-friendly recommendations[10, 12–13, 15, 17] or recom⁃mendation-aware caching policies[16]. The real joint treat⁃ment of both is tried in Refs. [11] and [14], but their stud⁃ies on hierarchical mobile edge networks are not deepenough.
To sum up, different from the existing studies on edgecaching and recommender systems, we focus on improvingthe QoE by judiciously selecting server actions. Our maincontributions are summarized as follows:1) We combine cooperative edge caching with soft cach⁃
ing for IoT systems. To measure cache profits, we propose ageneric metric of QoE that depends on the quality of service(QoS) and the quality of recommendation (QoR).2) We formulate the problem of optimally choosing the
server actions towards maximizing the QoE. While suchjoint caching and recommendation problems have beenproved to be NP-hard, we have proposed a cache-friendlyhierarchical heuristic algorithm.3) Trace-driven evaluation results demonstrate that our
proposed scheme has superior performance on improvingthe cache hits and QoE finally.The remainder of this paper is organized as follows. Sec⁃
tion 2 discusses the proposed hierarchical cooperative edgecaching model and formulates the optimization problem.Section 3 introduces a cache-friendly hierarchical heuristicalgorithm to solve the problem. Section 4 evaluates the per⁃formance of the proposed framework and Section 5 con⁃cludes this paper.2 System Model and Problem FormulationIn this section, we introduce the system model of edge
caching. Specifically, we present the hierarchical coopera⁃tive edge caching architecture and topology in Section 2.1.Section 2.2 introduces the recommendation-aware contentrequest processing model. Then we propose a QoE model,considering delay and recommendation in Section 2.3. Fi⁃nally, Section 2.4 gives the problem formulation. Some keyparameters are listed in Table 1.
Notation
N
M
F
C
Dfpf
am,n
sn,f
wm,f
vm,nπm,n,f
dLm,n,f , dEf , dCfrLm,n,f , rEm,n,f , rCm,f
Definition
Number of BSsNumber of IDs
Total number of contentsCache size of a BSSize of the content f
The content f requested probabilityThe association of the ID and the BS
The cache state of the content f in the BS nRating (i.e., preference) for the content f of the ID m
The wireless transmission rate between the ID and the BSSystem action
Transmission delay of the content f between the BS n and the ID m,BS and BS, BS and CS, respectively
Content satisfaction in different server actions
▼Table 1. Key Parameters
BS: base station CS: cloud server
03
Special Topic RecCac: Recommendation-empowered Cooperative Edge Caching for Internet of Things
HAN Suning, LI Xiuhua, SUN Chuan, WANG Xiaofei, Victor C. M. LEUNG
ZTE COMMUNICATIONSJune 2021 Vol. 19 No. 2
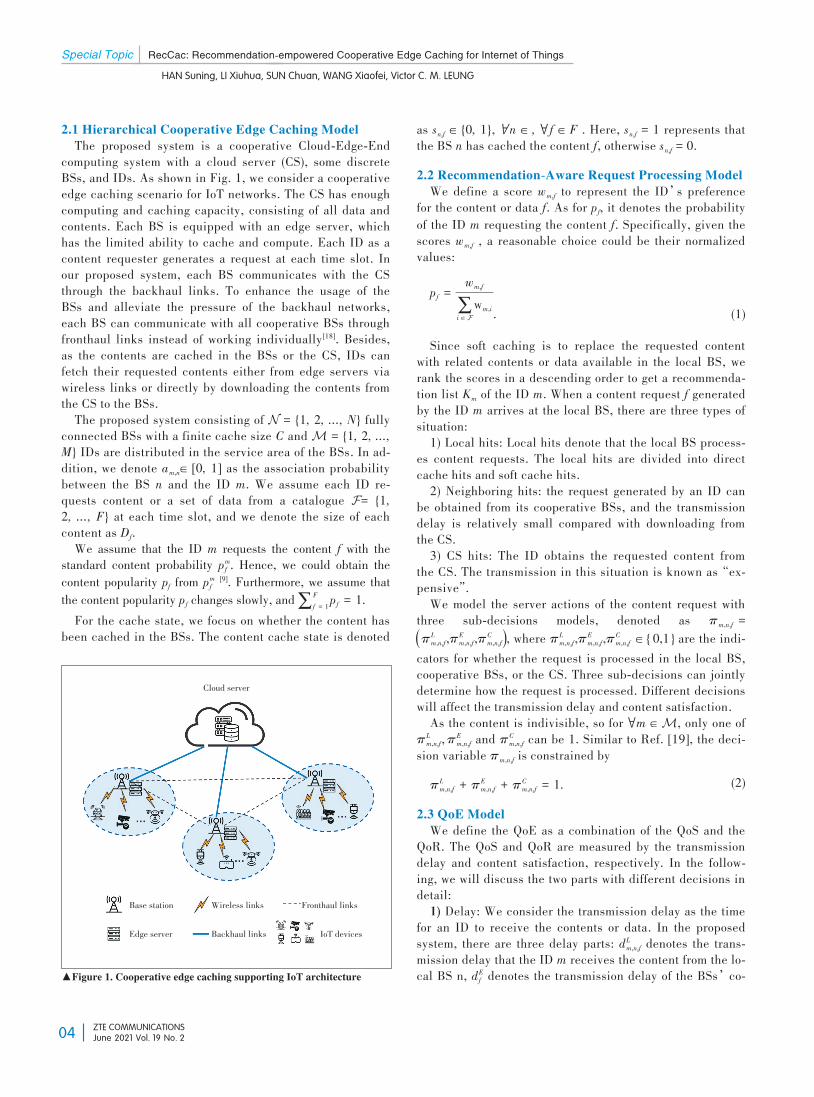
2.1 Hierarchical Cooperative Edge Caching ModelThe proposed system is a cooperative Cloud-Edge-End
computing system with a cloud server (CS), some discreteBSs, and IDs. As shown in Fig. 1, we consider a cooperativeedge caching scenario for IoT networks. The CS has enoughcomputing and caching capacity, consisting of all data andcontents. Each BS is equipped with an edge server, whichhas the limited ability to cache and compute. Each ID as acontent requester generates a request at each time slot. Inour proposed system, each BS communicates with the CSthrough the backhaul links. To enhance the usage of theBSs and alleviate the pressure of the backhaul networks,each BS can communicate with all cooperative BSs throughfronthaul links instead of working individually[18]. Besides,as the contents are cached in the BSs or the CS, IDs canfetch their requested contents either from edge servers viawireless links or directly by downloading the contents fromthe CS to the BSs.The proposed system consisting of N = {1, 2, ..., N} fully
connected BSs with a finite cache size C andM = {1, 2, ...,M} IDs are distributed in the service area of the BSs. In ad⁃dition, we denote am,n∈ [0, 1] as the association probabilitybetween the BS n and the ID m. We assume each ID re⁃quests content or a set of data from a catalogue F= {1,2, ..., F} at each time slot, and we denote the size of eachcontent as Df.We assume that the ID m requests the content f with thestandard content probability pmf . Hence, we could obtain thecontent popularity pf from pmf [9]. Furthermore, we assume thatthe content popularity pf changes slowly, and∑f = 1
F pf = 1.For the cache state, we focus on whether the content has
been cached in the BSs. The content cache state is denoted
as sn,f ∈ {0, 1}, ∀n ∈ , ∀ f ∈ F . Here, sn,f = 1 represents thatthe BS n has cached the content f, otherwise sn,f = 0.2.2 Recommendation-Aware Request Processing ModelWe define a score wm,f to represent the ID’s preferencefor the content or data f. As for pf, it denotes the probabilityof the ID m requesting the content f. Specifically, given the
scores wm,f , a reasonable choice could be their normalizedvalues:pf = wm,f∑
i ∈ Fwm,i . (1)
Since soft caching is to replace the requested contentwith related contents or data available in the local BS, werank the scores in a descending order to get a recommenda⁃tion list Km of the ID m. When a content request f generatedby the ID m arrives at the local BS, there are three types ofsituation:1) Local hits: Local hits denote that the local BS process⁃
es content requests. The local hits are divided into directcache hits and soft cache hits.2) Neighboring hits: the request generated by an ID can
be obtained from its cooperative BSs, and the transmissiondelay is relatively small compared with downloading fromthe CS.3) CS hits: The ID obtains the requested content from
the CS. The transmission in this situation is known as“ex⁃pensive”.We model the server actions of the content request with
three sub-decisions models, denoted as πm,n,f =(πL
m,n,f,πEm,n,f,πC
m,n,f), where πLm,n,f,πE
m,n,f,πCm,n,f ∈ { 0,1 } are the indi⁃
cators for whether the request is processed in the local BS,cooperative BSs, or the CS. Three sub-decisions can jointlydetermine how the request is processed. Different decisionswill affect the transmission delay and content satisfaction.As the content is indivisible, so for ∀m ∈M, only one of
πLm,n,f,πE
m,n,f and πCm,n,f can be 1. Similar to Ref. [19], the deci⁃sion variable πm,n,f is constrained by
πLm,n,f + πE
m,n,f + πCm,n,f = 1. (2)
2.3 QoE ModelWe define the QoE as a combination of the QoS and the
QoR. The QoS and QoR are measured by the transmissiondelay and content satisfaction, respectively. In the follow⁃ing, we will discuss the two parts with different decisions indetail:1) Delay: We consider the transmission delay as the time
for an ID to receive the contents or data. In the proposedsystem, there are three delay parts: dLm,n,f denotes the trans⁃mission delay that the ID m receives the content from the lo⁃cal BS n, dEf denotes the transmission delay of the BSs’co⁃▲Figure 1. Cooperative edge caching supporting IoT architecture
Cloud server
Base station
Edge server
Wireless links
Backhaul links
Fronthaul links
IoT devices
04
RecCac: Recommendation-empowered Cooperative Edge Caching for Internet of Things Special Topic
HAN Suning, LI Xiuhua, SUN Chuan, WANG Xiaofei, Victor C. M. LEUNG
ZTE COMMUNICATIONSJune 2021 Vol. 19 No. 2
operation, and dCf denotes the transmission delay betweenthe BS and the CS.Specifically, we assume that the wireless channel has
been deployed. Similar to Ref. [20], we can get the transmis⁃sion rate between the ID m and the local BS n as follow:vm,n = B log2 (1 + Pmgm,nσ2 ), (3)
where B denotes the channel bandwidth; σ2 denotes thebackground noise power; Pm denotes the power consump⁃tion of the BS n transmission to the ID m. The channel gaingm,n is estimated by the distance lm,n between the local BS nand the IDm.Thus, the delay of transferring the content m between the
ID f and the local BS n is denoted as:dLm,n,f = am,n sn,f Df
vm,n . (4)The transmission among the cooperative BSs is through
fronthaul links with high bandwidth. In terms of the trans⁃mission between the CS and the BSs, the CS is usually de⁃ployed at a further distance, and a large amount of traffic istransmitted through multiple intermediate nodes; We ex⁃press these two parts in terms of the average rate; ve denotesthe average transmission rate between two BSs. Therefore,the transmission delay between cooperative BSs can be ex⁃pressed as follow:dEf = Df
ve. (5)
Similarly, vc denotes the average transmission rate be⁃tween the BSs and the CS. The transmission delay betweenthe BSs and the CS can be expressed as:dCf = Df
vc. (6)
2) Recommendation: If the content requested by the ID isnot cached locally, the similar contents cached locallycould be alternated.Specifically, for local hits, considering the soft caching,
we define the content satisfaction as:rLm,n,f = am,n sn,fwm,f. (7)Similarly, for neighboring BSs cache hits, we define the
content satisfaction as:rEm,n,f = sn,fwm,f. (8)For downloading the content f from the CS, we define the
content satisfaction as:
rCm,f = wm,f. (9)2.4 Problem FormulationIn the proposed system, our goal is to find the best server
actions to improve the QoE. As we have discussed above,transmission delay and content satisfaction are major fac⁃tors. We express these two parts as follows:dm,n,f = π
Lm,n,fdLm,n,f
+ πEm,n,f
dLm,n,f + dEf +πCm,n,f
dLm,n,f + dCf , (10)
rm,n,f = rLm,n,fπLm,n,f + rEm,n,fπE
m,n,f + rCm,fπCm,n,f, (11)
where Eq. (10) denotes the QoS, which is expressed as thereciprocal of the delay of content transmission (i. e., whenthe delay of the content transmission is small, the largerQoS can be obtained), (dEf + dLm,n,f) denotes the transmissiondelay when the content is sent through the cooperative BSs,and (dCf + dLm,n,f) denotes the transmission delay when thecontent is downloaded from the CS. Eq. (11) denotes theQoR.To improve the QoE, we need to trade off the QoS and the
QoR (i. e., find the balance between low transmission delayand high content satisfaction) by optimizing the server ac⁃tions πm,n,f. To maximize the QoE, we formulate the optimiza⁃tion problem as:P: max
Π ∑m ∈M∑n ∈ N∑f ∈ Fpf ( )αdm,n,f + βrm,n,f (12a)
s.t. α + β = 1, (12b)sn,f ∈ { 0,1 } ,∀n ∈ N,∀f ∈ F, (12c)∀πLm,n,f ∈ { 0,1 } ,∀πE
m,n,f ∈ { 0,1 } ,∀πCm,n,f ∈ { 0,1 }, (12d)
∑n ∈ N∑f ∈ Fπm,n,f = 1,∀m ∈M, (12e)
∑f ∈ Fπm,n,fDf ≤ C,∀m ∈M,∀n ∈ N, (12f)
where pf denotes the probability of the content or data f re⁃quested. In Eq. (12b), α and β are the scalar parameters tobalance transmission delay and content satisfaction. Eq.(12c) denotes the cache state. Eqs. (12d) and (12e) denotethe constraints of the server actions. Eq. (12f) denotes thecache ability.To represent the server actions of the system, we denote
Π = (ΠL,ΠE,...,ΠC) as the entire selection, where ΠL =(ΠL1 ,ΠL2 ,...,ΠL
M), ΠE = (ΠE1 ,ΠE2 ,...,ΠEM), and ΠC =
(ΠC1 ,ΠC2 ,...,ΠCM). And we denote ΠL
m = {πLm,n,f |∀n ∈ N,∀f ∈ F},
05
Special Topic RecCac: Recommendation-empowered Cooperative Edge Caching for Internet of Things
HAN Suning, LI Xiuhua, SUN Chuan, WANG Xiaofei, Victor C. M. LEUNG
ZTE COMMUNICATIONSJune 2021 Vol. 19 No. 2
ΠEm = {πE
m,n,f|∀n ∈ N,∀f ∈ F}, and ΠCm = {πC
m,n,f|∀n ∈ N,∀f ∈ F}.Lemma 1: The QoE problem is equivalent to the 0–1 In⁃
teger Linear Programming (ILP) problem.Proof: As mentioned above, different server actions will
affect the transmission delay and content satisfaction. Wedenote positive constants A1m,n,f = α/ am,n sn,fDf
log2 ( )1 + Pmgm,nσ2
+
βam,n sn,fwm,f, A2m,n,f =é
ë
ê
ê
ê
êêêêêα/
æ
è
ç
ç
ç
çççç
ç am,n sn,fDf
log2 ( )1 + Pmgm,nσ2
+ Df
ve
ö
ø
÷
÷
÷
÷÷÷÷
÷
ù
û
ú
ú
ú
úúúúú + βsn,fwm,f,
and A3m,n,f =é
ë
ê
ê
ê
êêêêêα/
æ
è
ç
ç
ç
çççç
ç am,n sn,fDf
log2 ( )1 + Pmgm,nσ2
+ Df
vc
ö
ø
÷
÷
÷
÷÷÷÷
÷
ù
û
ú
ú
ú
úúúúú + βwm,f. To com⁃
bine optimization objectives with decision variables, the op⁃timization objective of the problem in Eq. (12) can be ex⁃pressed as:P: max
Π ∑m ∈M∑n ∈ N∑f ∈ Fpf ( )A1m,n,fπL
m,n,f + A2m,n,fπEm,n,f + A3m,n,fπC
m,n,f ,(13a)
s.t. the same as Eq.s (12b) , (12c) , (12d) , (12e) , and (12f) .(13b)
Thus, the problem can be described as selecting optimalserver actions for processing requests with jointing trans⁃mission delay and content satisfaction. This is a 0–1 ILPproblem, which is NP-hard. Because the number of IDs,BSs, and contents can be large, it is of high complexity toget the optimal solution by using exact methods.3 Proposed Framework DesignThe proposed system is a hierarchical cooperation orches⁃
trated computing topology. We focus on improving the QoEby judiciously selecting the server actions. Different serverand content selections affect the final server actions. Thus,to address the above complex optimization Eq. (13), we de⁃compose it into two simpler subproblems as below.1) Inner algorithm for recommendation list. First, we ob⁃
tain the recommendation list Km for the ID m from the con⁃tent or data catalog, which is implemented by the collabora⁃tive filtering algorithm based on items-Inverse User Fre⁃quency (ItemCF-IUF). The inner algorithm is mainly divid⁃ed into two steps: calculating the similarity between twocontents and generating the recommendation list. When cal⁃culating the similarity, we consider the influence of the ID
m activity on content similarity. We use the improved co⁃sine formula to calculate the similarity between the contenti and f as:
sim i,f =∑
m ∈ Ni ∩ Nf
1log1 + ||N ( )m
||Ni ∪ ||Nf
,(14)
where Ni denotes the number of IDs that like the content i,Nf denotes the number of IDs that like the content f, and|Ni | ∪ |Nf | denotes the number of IDs that both like contenti and f. Then the score of the content f will be calculated.Then we sort wm,f in a descending order to generate the fi⁃nal recommendation list of the ID m. The details of the pro⁃
posed method for solving the inner problem are shown in Al⁃gorithm 1. The internal of the loop consists of |F | calcula⁃tions. Next, the complexity of the sorting step is O (log |F |)in a pre-ordered list. Since these steps are repeated for ev⁃ery ID m, the total complexity of the algorithm isO (|M||F |).Algorithm 1: Inner Algorithm for Recommendation.
Input:M , F , and all IDs’information.Output: { K } M × R.1 Initialization: { K } M × R← 0M × R;2 for the ID m ∈M do
3 for each content pair of (i, f ), ∀i, f ∈ F do4 Calculate sim i,f and wm,f;5 Sort wm,f in decreasing order;6 Choose the top R contents into the Km;7 Add Km to { K } M × R;8 end9 end2) Server actions. We optimize the server actions. As
mentioned above, Π has 3MNF possible selections. It maybe easy to find the optimal solution in a small scenario.Since the number of IDs, BSs, and contents can be large, itwill take abundant time to converge if we use the general ex⁃haustive methods (e. g., checking each combination of vari⁃ables with a value of 0 or 1, and comparing the value of theobjective function to obtain the optimal solution). To solvethe problem, we propose a cache-friendly heuristic algo⁃rithm with the branch and bound (BNB) strategy.Lemma 2: Eq. (13) can be divided into M independent
subproblems as:P: max Zm = ∑
n ∈ N∑f ∈ F
pf ( )A1m,n,fπLm,n,f + A2m,n,fπE
m,n,f + A3m,n,fπCm,n,f
,
(15a)
06
RecCac: Recommendation-empowered Cooperative Edge Caching for Internet of Things Special Topic
HAN Suning, LI Xiuhua, SUN Chuan, WANG Xiaofei, Victor C. M. LEUNG
ZTE COMMUNICATIONSJune 2021 Vol. 19 No. 2
s.t. the same with Problems (12b) , (12c) , (12d) , (12e) , and (12f) .(15b)
Obviously, we have Z* = ∑m ∈M
Zm.Proof: For each ID m , we seek the best strategy to satisfy
its request and then it can benefit the whole cache system.Therefore, Eq. (13) can be separated, i.e., the sub-decisionfor each ID does not affect other IDs because there is no rel⁃evance between them.Specifically, for a content or a data request generated by
the ID m , we search server and content selections Π layerby layer. After initialization, we first determine whether alocal direct hit occurs according to the cache state. If itdoes not happen, we consider whether the soft cache hitsoccur. If neither of the above two situations occurs, re⁃quest processing will be completed through cooperativeBSs or the CS. This procedure is repeated until the cacheis full. To reduce unnecessary searches, we use the BNBstrategy. In Eq. (15), when a feasible solution is deter⁃mined by using the heuristic algorithm, the value of Zm iscalculated and denoted as Zψ
m. Thus, Zψm will be added tothe constraint as the lower bound of the target value. Any
solution with Zm < Zψm can be deleted without verifyingwhether it meets other constraints. By continuously im⁃
proving the lower bound of the target value, the constraintconditions can be improved and the amount of calculationcan be reduced.The details of the proposed method for solving the whole
problem are shown in Algorithm 2. And the computationcomplexity of Algorithm 2 is O (|M ||N ||K |).Algorithm 2: Cache-Friendly Hierarchical HeuristicAlgorithm.
Input: C, N, M, F, K, content request probability {pf},content cache status {sn,f}.
Output: {Π*}.1 Initialization: ΠL = 1;2 while the ID m = 1, 2, ..., M do3 for the BS n ∈ N do4 for the content f ∈ KM do5 Calculate Zm (πL
m,n,f) by Algorithm 1;6 Store it as Zψ
m in a sorted list;7 According to the cache state sn,f, update πm,n,f;8 Calculate Zm (πm,n,f);9 if Zm (πm,n,f) > Zψ
m then10 Swap and update πm,n,f;11 Add πm,n,f to Π ;12 end13 end14 if πm,n,fDf > C then
15 break;16 end17 end18 end19 Π ← argmaxZ* (Π);20 Π * ← Π.
4 Simulation ResultsFor simulation purposes, all parameters are selected ac⁃
cording to the real-world scenario. Numerical experimentsare provided to evaluate the performance of the proposedscheme. We consider several BSs, each of which has themaximum coverage of a circle with a radius of 250 meters.And more than 400 IDs are randomly distributed within thecoverage area of the BSs. We determine the local BS ofeach ID according to the association probability am,n. Thechannel gain is modeled as gm,n = 30.6 + 36.7 log (lm,n) dB,where lm,n is the distance between the ID m and the BS n.The distance is randomly set as [0, 250] m. The wirelessbandwidth, transmit power of each ID, and noise power isset as 20 MHz, [1.0, 1.5] W, and 10-13 W, respectively.For IoT data, we consider a real data set consisting of
457 users and more than 9 000 video contents. And thesecontents are randomly cached in the BSs. The content sizeis randomly set as [2, 5] Mbit. Further, the cache constraintof the BS is set to a percentage θ of the total storage size.Besides, we use itemCF-IUF to get the recommendation listfor each ID, and we get the corresponding score wm,f. The pa⁃rameter of Algorithm 1 is set as R = 2 . To verify the experi⁃mental effect of the recommendation algorithm, we calcu⁃late the accuracy rate, recall rate, and their weighted har⁃monic average. And the results are respectively 0.4,0.1311, and 0.1975.To evaluate our proposed framework, we consider the fol⁃
lowing three baseline schemes: 1) File popularity distribu⁃tion (FPD) strategy. As mentioned in Ref. [21], when a con⁃tent request is generated by the ID, the cache system willdistribute popular contents according to the popularity ofcontents. However, this strategy processes requests withoutconsidering content preferences and soft caching; 2) User-centric optimization (UCO) strategy. Similar to our paper, asimple QoE metric has been proposed for combining con⁃tent caching with the recommender systems in Ref. [11].They weigh the QoS and QoR, but the work of cooperativeedge caching is missing; 3) Random scheme. The content re⁃quest is randomly processed at the local BS, cooperativeBSs, or the CS. Π is randomly set under the constraints inEqs. (12d), (12e), and (12f).In Fig. 2, we study different server selection schemes un⁃
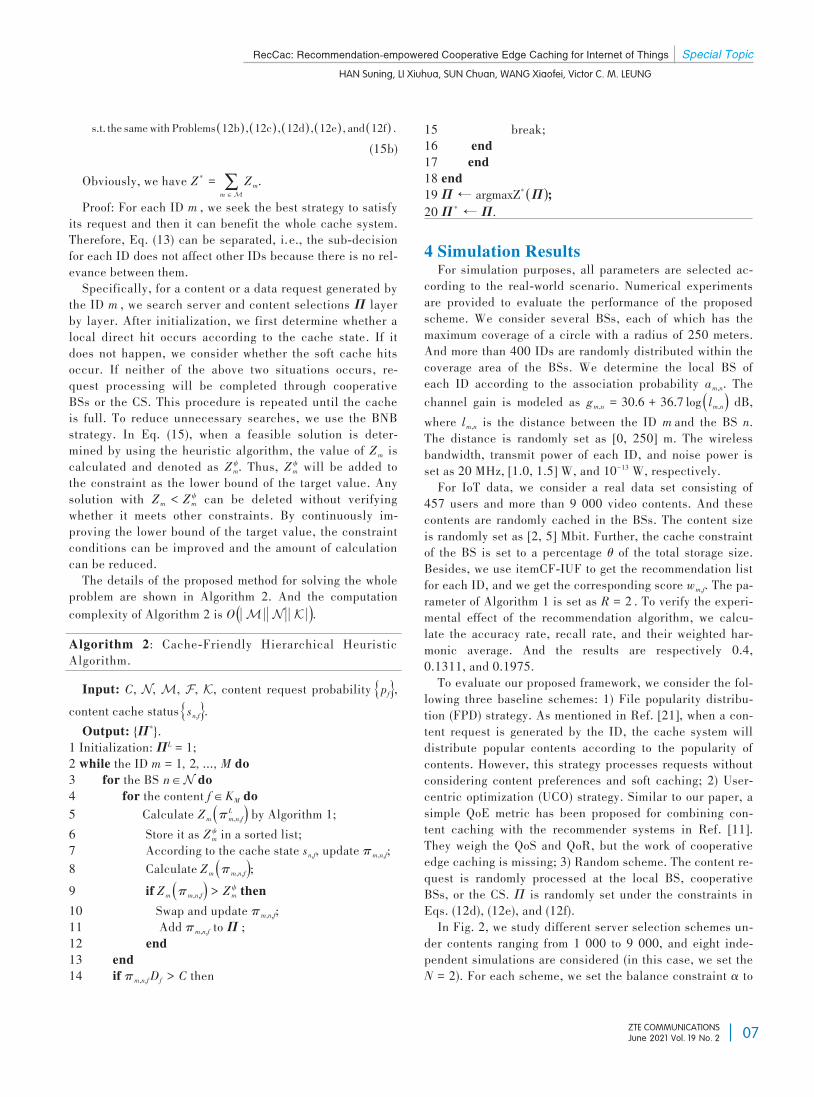
der contents ranging from 1 000 to 9 000, and eight inde⁃pendent simulations are considered (in this case, we set theN = 2). For each scheme, we set the balance constraint α to
07
Special Topic RecCac: Recommendation-empowered Cooperative Edge Caching for Internet of Things
HAN Suning, LI Xiuhua, SUN Chuan, WANG Xiaofei, Victor C. M. LEUNG
ZTE COMMUNICATIONSJune 2021 Vol. 19 No. 2
0.1 and 0.2 respectively. We observe that the QoE increas⁃es rapidly with the increase of the contents in our proposedscheme, mainly because a tremendous amount of contentscan provide more accurate references for recommendation(e.g., more historical behaviors). In the random scheme, theresult fluctuates obviously because the decision is random.The experimental effect of our proposed scheme is also bet⁃ter than other schemes. In particular, the proposed schemehas an overall performance improvement of about 30% com⁃pared with the FPD scheme. The reason is that the softcache fully considers content preferences, ensuring thatcontent preferences are controllable and the distortion isminimized.Next, we investigate whether the proposed scheme has
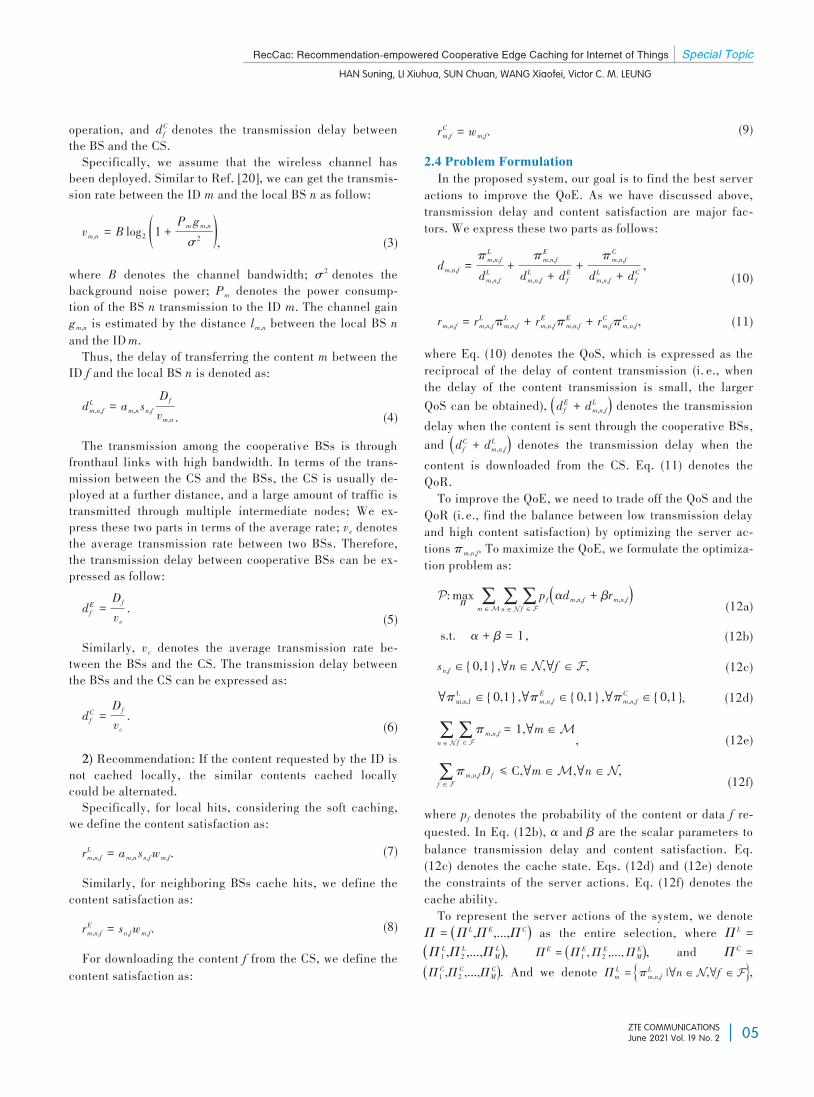
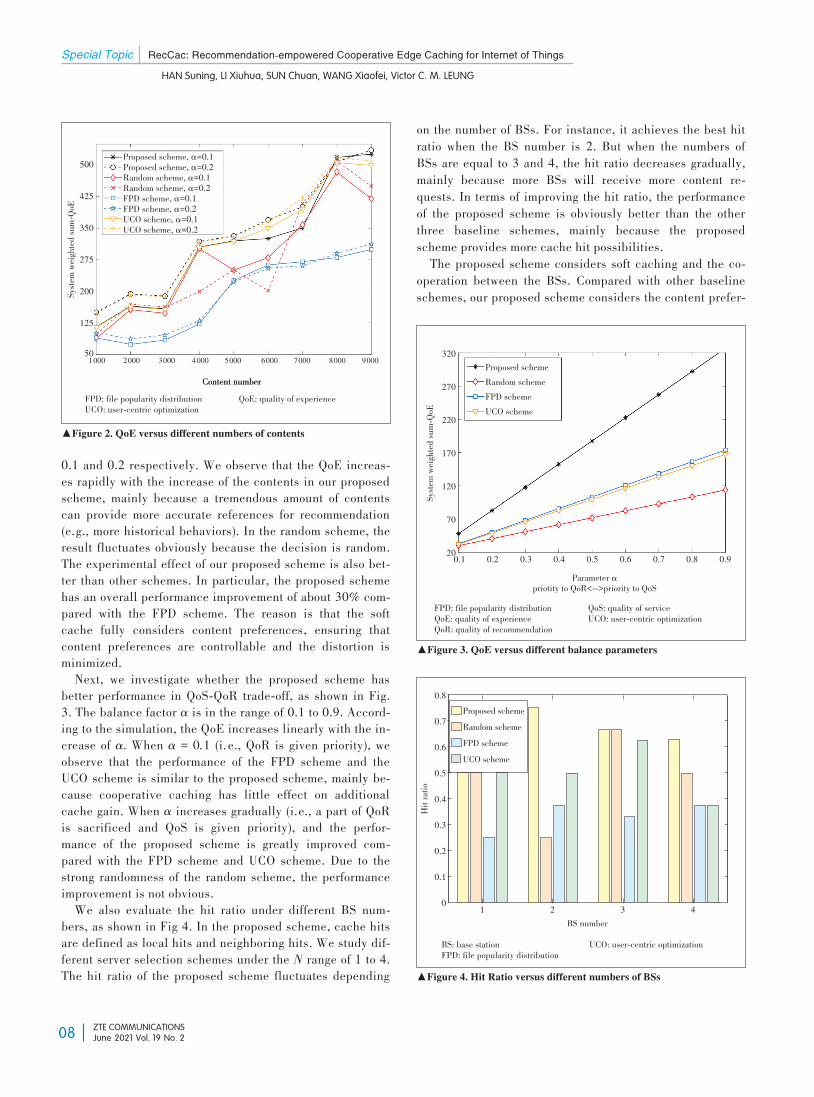
better performance in QoS-QoR trade-off, as shown in Fig.3. The balance factor α is in the range of 0.1 to 0.9. Accord⁃ing to the simulation, the QoE increases linearly with the in⁃crease of α. When α = 0.1 (i. e., QoR is given priority), weobserve that the performance of the FPD scheme and theUCO scheme is similar to the proposed scheme, mainly be⁃cause cooperative caching has little effect on additionalcache gain. When α increases gradually (i.e., a part of QoRis sacrificed and QoS is given priority), and the perfor⁃mance of the proposed scheme is greatly improved com⁃pared with the FPD scheme and UCO scheme. Due to thestrong randomness of the random scheme, the performanceimprovement is not obvious.We also evaluate the hit ratio under different BS num⁃
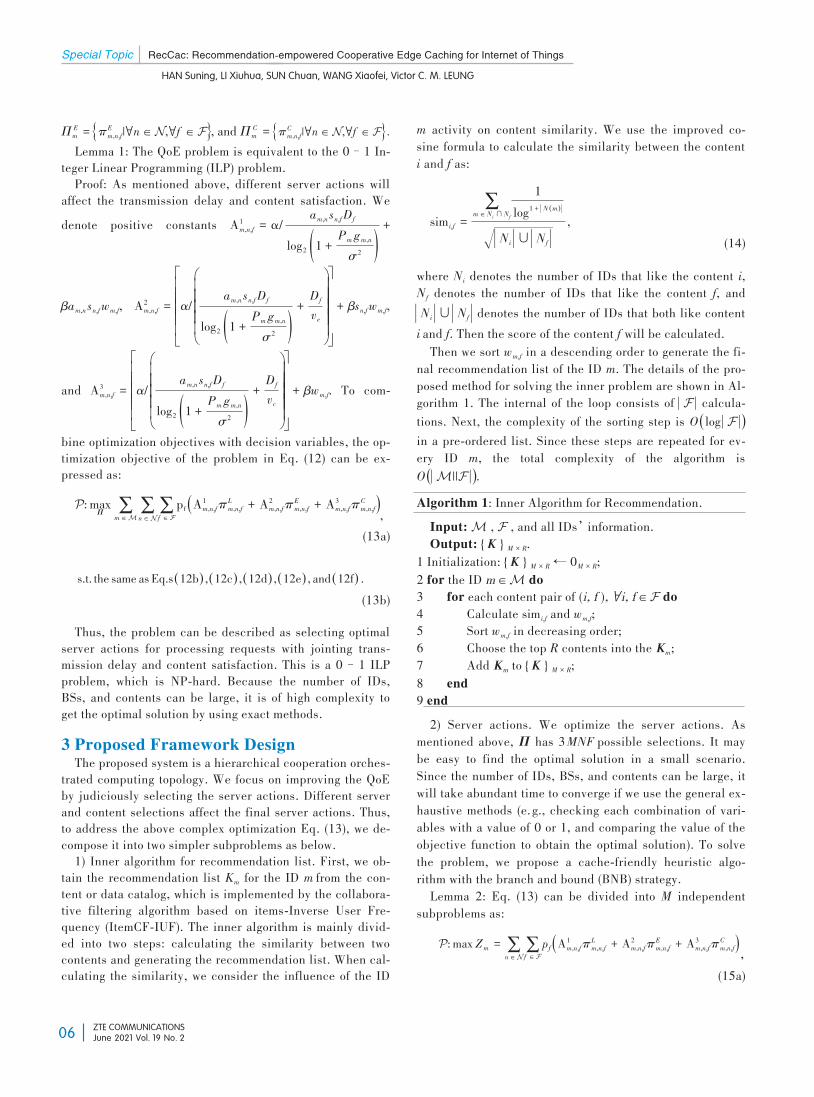
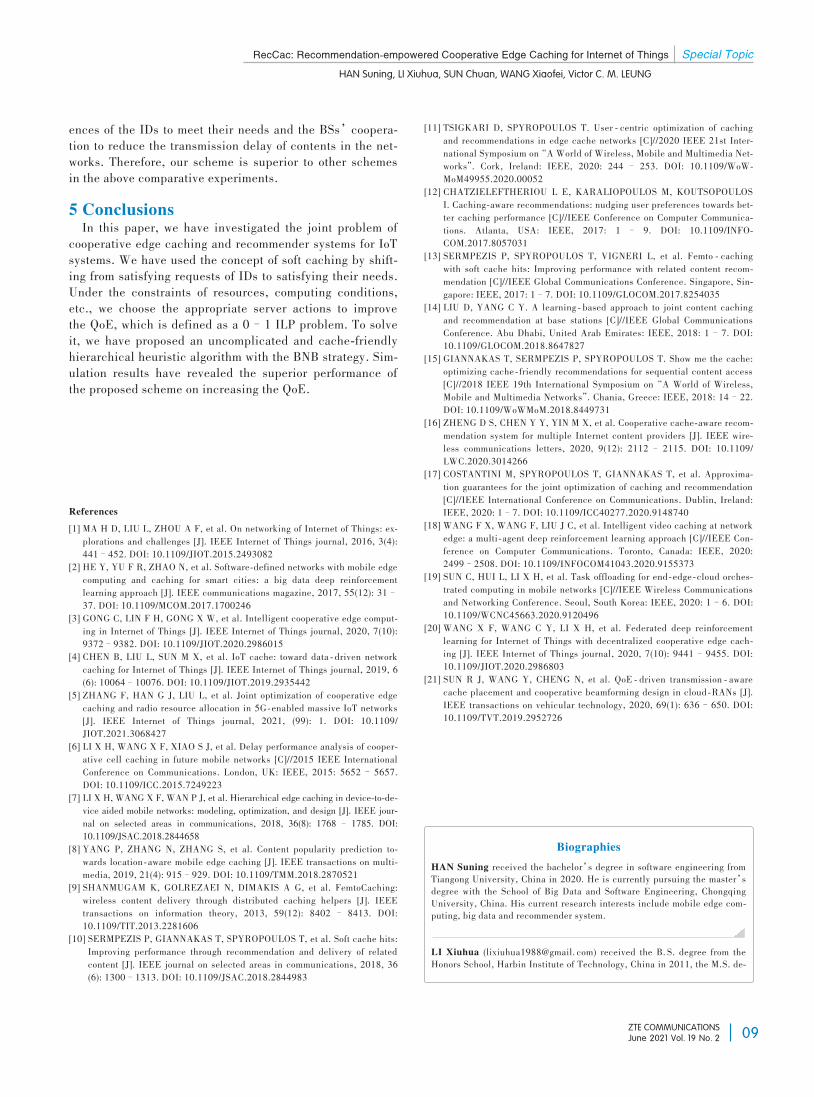
bers, as shown in Fig 4. In the proposed scheme, cache hitsare defined as local hits and neighboring hits. We study dif⁃ferent server selection schemes under the N range of 1 to 4.The hit ratio of the proposed scheme fluctuates depending
on the number of BSs. For instance, it achieves the best hitratio when the BS number is 2. But when the numbers ofBSs are equal to 3 and 4, the hit ratio decreases gradually,mainly because more BSs will receive more content re⁃quests. In terms of improving the hit ratio, the performanceof the proposed scheme is obviously better than the otherthree baseline schemes, mainly because the proposedscheme provides more cache hit possibilities.The proposed scheme considers soft caching and the co⁃
operation between the BSs. Compared with other baselineschemes, our proposed scheme considers the content prefer⁃
▲Figure 3. QoE versus different balance parameters
FPD: file popularity distributionQoE: quality of experienceQoR: quality of recommendationQoS: quality of serviceUCO: user-centric optimization
Proposed schemeRandom schemeFPD schemeUCO scheme
320
270
220
170
120
70
20Parameter αpriotity to QoR<-->priority to QoS
0.1 0.2 0.3 0.4 0.5 0.6 0.7 0.8 0.9
System
weightedsum
-QoE
▲Figure 4. Hit Ratio versus different numbers of BSs
BS: base stationFPD: file popularity distribution
BS number1 2 3 4
0.80.70.60.50.40.30.20.10
Hitratio
Proposed schemeRandom schemeFPD schemeUCO scheme
UCO: user-centric optimization
▲Figure 2. QoE versus different numbers of contents
FPD: file popularity distributionUCO: user-centric optimization QoE: quality of experienceContent number
1000 2000 3000 4000 5000 6000 7000 8000 9000
Proposed scheme, α=0.1Proposed scheme, α=0.2Random scheme, α=0.1Random scheme, α=0.2FPD scheme, α=0.1FPD scheme, α=0.2UCO scheme, α=0.1UCO scheme, α=0.2
System
weightedsum
-QoE
500
425
350
275
200
125
50
Content number
08
RecCac: Recommendation-empowered Cooperative Edge Caching for Internet of Things Special Topic
HAN Suning, LI Xiuhua, SUN Chuan, WANG Xiaofei, Victor C. M. LEUNG
ZTE COMMUNICATIONSJune 2021 Vol. 19 No. 2
ences of the IDs to meet their needs and the BSs’coopera⁃tion to reduce the transmission delay of contents in the net⁃works. Therefore, our scheme is superior to other schemesin the above comparative experiments.5 ConclusionsIn this paper, we have investigated the joint problem of
cooperative edge caching and recommender systems for IoTsystems. We have used the concept of soft caching by shift⁃ing from satisfying requests of IDs to satisfying their needs.Under the constraints of resources, computing conditions,etc., we choose the appropriate server actions to improvethe QoE, which is defined as a 0–1 ILP problem. To solveit, we have proposed an uncomplicated and cache-friendlyhierarchical heuristic algorithm with the BNB strategy. Sim⁃ulation results have revealed the superior performance ofthe proposed scheme on increasing the QoE.
References[1] MA H D, LIU L, ZHOU A F, et al. On networking of Internet of Things: ex⁃plorations and challenges [J]. IEEE Internet of Things journal, 2016, 3(4):441–452. DOI: 10.1109/JIOT.2015.2493082
[2] HE Y, YU F R, ZHAO N, et al. Software⁃defined networks with mobile edgecomputing and caching for smart cities: a big data deep reinforcementlearning approach [J]. IEEE communications magazine, 2017, 55(12): 31–37. DOI: 10.1109/MCOM.2017.1700246
[3] GONG C, LIN F H, GONG X W, et al. Intelligent cooperative edge comput⁃ing in Internet of Things [J]. IEEE Internet of Things journal, 2020, 7(10):9372–9382. DOI: 10.1109/JIOT.2020.2986015
[4] CHEN B, LIU L, SUN M X, et al. IoT cache: toward data ⁃ driven networkcaching for Internet of Things [J]. IEEE Internet of Things journal, 2019, 6(6): 10064–10076. DOI: 10.1109/JIOT.2019.2935442
[5] ZHANG F, HAN G J, LIU L, et al. Joint optimization of cooperative edgecaching and radio resource allocation in 5G⁃enabled massive IoT networks[J]. IEEE Internet of Things journal, 2021, (99): 1. DOI: 10.1109/JIOT.2021.3068427
[6] LI X H, WANG X F, XIAO S J, et al. Delay performance analysis of cooper⁃ative cell caching in future mobile networks [C]//2015 IEEE InternationalConference on Communications. London, UK: IEEE, 2015: 5652– 5657.DOI: 10.1109/ICC.2015.7249223
[7] LI X H, WANG X F, WAN P J, et al. Hierarchical edge caching in device⁃to⁃de⁃vice aided mobile networks: modeling, optimization, and design [J]. IEEE jour⁃nal on selected areas in communications, 2018, 36(8): 1768– 1785. DOI:10.1109/JSAC.2018.2844658
[8] YANG P, ZHANG N, ZHANG S, et al. Content popularity prediction to⁃wards location⁃aware mobile edge caching [J]. IEEE transactions on multi⁃media, 2019, 21(4): 915–929. DOI: 10.1109/TMM.2018.2870521
[9] SHANMUGAM K, GOLREZAEI N, DIMAKIS A G, et al. FemtoCaching:wireless content delivery through distributed caching helpers [J]. IEEEtransactions on information theory, 2013, 59(12): 8402 – 8413. DOI:10.1109/TIT.2013.2281606
[10] SERMPEZIS P, GIANNAKAS T, SPYROPOULOS T, et al. Soft cache hits:Improving performance through recommendation and delivery of relatedcontent [J]. IEEE journal on selected areas in communications, 2018, 36(6): 1300–1313. DOI: 10.1109/JSAC.2018.2844983
[11] TSIGKARI D, SPYROPOULOS T. User ⁃ centric optimization of cachingand recommendations in edge cache networks [C]//2020 IEEE 21st Inter⁃national Symposium on“A World of Wireless, Mobile and Multimedia Net⁃works”. Cork, Ireland: IEEE, 2020: 244 – 253. DOI: 10.1109/WoW⁃MoM49955.2020.00052
[12] CHATZIELEFTHERIOU L E, KARALIOPOULOS M, KOUTSOPOULOSI. Caching⁃aware recommendations: nudging user preferences towards bet⁃ter caching performance [C]//IEEE Conference on Computer Communica⁃tions. Atlanta, USA: IEEE, 2017: 1 – 9. DOI: 10.1109/INFO⁃COM.2017.8057031
[13] SERMPEZIS P, SPYROPOULOS T, VIGNERI L, et al. Femto ⁃ cachingwith soft cache hits: Improving performance with related content recom⁃mendation [C]//IEEE Global Communications Conference. Singapore, Sin⁃gapore: IEEE, 2017: 1–7. DOI: 10.1109/GLOCOM.2017.8254035
[14] LIU D, YANG C Y. A learning ⁃ based approach to joint content cachingand recommendation at base stations [C]//IEEE Global CommunicationsConference. Abu Dhabi, United Arab Emirates: IEEE, 2018: 1–7. DOI:10.1109/GLOCOM.2018.8647827
[15] GIANNAKAS T, SERMPEZIS P, SPYROPOULOS T. Show me the cache:optimizing cache⁃ friendly recommendations for sequential content access[C]//2018 IEEE 19th International Symposium on“A World of Wireless,Mobile and Multimedia Networks”. Chania, Greece: IEEE, 2018: 14–22.DOI: 10.1109/WoWMoM.2018.8449731
[16] ZHENG D S, CHEN Y Y, YIN M X, et al. Cooperative cache⁃aware recom⁃mendation system for multiple Internet content providers [J]. IEEE wire⁃less communications letters, 2020, 9(12): 2112– 2115. DOI: 10.1109/LWC.2020.3014266
[17] COSTANTINI M, SPYROPOULOS T, GIANNAKAS T, et al. Approxima⁃tion guarantees for the joint optimization of caching and recommendation[C]//IEEE International Conference on Communications. Dublin, Ireland:IEEE, 2020: 1–7. DOI: 10.1109/ICC40277.2020.9148740
[18] WANG F X, WANG F, LIU J C, et al. Intelligent video caching at networkedge: a multi⁃agent deep reinforcement learning approach [C]//IEEE Con⁃ference on Computer Communications. Toronto, Canada: IEEE, 2020:2499–2508. DOI: 10.1109/INFOCOM41043.2020.9155373
[19] SUN C, HUI L, LI X H, et al. Task offloading for end⁃edge⁃cloud orches⁃trated computing in mobile networks [C]//IEEE Wireless Communicationsand Networking Conference. Seoul, South Korea: IEEE, 2020: 1–6. DOI:10.1109/WCNC45663.2020.9120496
[20] WANG X F, WANG C Y, LI X H, et al. Federated deep reinforcementlearning for Internet of Things with decentralized cooperative edge cach⁃ing [J]. IEEE Internet of Things journal, 2020, 7(10): 9441–9455. DOI:10.1109/JIOT.2020.2986803
[21] SUN R J, WANG Y, CHENG N, et al. QoE ⁃ driven transmission ⁃ awarecache placement and cooperative beamforming design in cloud⁃RANs [J].IEEE transactions on vehicular technology, 2020, 69(1): 636–650. DOI:10.1109/TVT.2019.2952726
BiographiesHAN Suning received the bachelor’s degree in software engineering fromTiangong University, China in 2020. He is currently pursuing the master’sdegree with the School of Big Data and Software Engineering, ChongqingUniversity, China. His current research interests include mobile edge com⁃puting, big data and recommender system.
LI Xiuhua (lixiuhua1988@gmail. com) received the B. S. degree from theHonors School, Harbin Institute of Technology, China in 2011, the M.S. de⁃
09
Special Topic RecCac: Recommendation-empowered Cooperative Edge Caching for Internet of Things
HAN Suning, LI Xiuhua, SUN Chuan, WANG Xiaofei, Victor C. M. LEUNG
ZTE COMMUNICATIONSJune 2021 Vol. 19 No. 2
gree from the School of Electronics and Information Engineering, Harbin In⁃stitute of Technology, in 2013, and the Ph.D. degree from the Departmentof Electrical and Computer Engineering, The University of British Colum⁃bia, Canada in 2018. He joined Chongqing University through One-Hun⁃dred Talents Plan of Chongqing University, China in 2019. He is currentlya tenure-track Assistant Professor with the School of Big Data & SoftwareEngineering, and the Dean of the Institute of Intelligent Network and EdgeComputing at Key Laboratory of Dependable Service Computing in CyberPhysical Society, Chongqing University. His current research interests are5G/B5G mobile Internet, mobile edge computing and caching, big data ana⁃lytics, and machine learning.
SUN Chuan is a Ph.D. student with the School of Big Data & Software En⁃gineering, Chongqing University, China. He received his B. S. degree fromWuhan University of Science and Technology, China in 2017. His currentresearch interests include multi-access edge computing, recommender sys⁃tems, and machine learning.
WANG Xiaofei is currently a professor with the Tianjin Key Laboratory ofAdvanced Networking, School of Computer Science and Technology, Tian⁃jin University, China. He got his master’s and doctoral degrees from Seoul
National University, South Korea in 2006 and 2013, and was a postdoctoralfellow at The University of British Columbia, Canada from 2014 to 2016.Focusing on research of social-aware cloud computing, cooperative cellcaching, and mobile traffic offloading, he has authored over 100 technicalpapers in IEEE JSAC, IEEE TWC, IEEE Wireless Communications, IEEECommunications Magazine, IEEE TMM, IEEE INFOCOM, and IEEE SEC⁃ON. He was a recipient of the National Thousand Talents Plan (Youth) ofChina. He received the Scholarship for Excellent Foreign Students in theIT Field from NIPA of South Korea from 2008 to 2011, the Global Outstand⁃ing Chinese Ph.D. Student Award of the Ministry of Education of China in2012, and the Peiyang Scholar of Tianjin University. In 2017, he receivedthe Fred W. Ellersick Prize from the IEEE Communication Society.
Victor C. M. LEUNG is currently a Distinguished Professor of computer sci⁃ence and software engineering with Shenzhen University, China. He is also anEmeritus Professor of electrical and computer engineering and the Director ofthe Laboratory for Wireless Networks and Mobile Systems, The University ofBritish Columbia, Canada. His research is in the broad areas of wireless net⁃works and mobile systems. He has published widely in archival journals and ref⁃ereed conference proceedings in these areas; several of his papers have wonBest Paper Awards. He is a fellow of the Royal Society of Canada, CanadianAcademy of Engineering, and Engineering Institute of Canada.
10
ZTE COMMUNICATIONSJune 2021 Vol. 19 No. 2
CostCost--Effective Task Scheduling forEffective Task Scheduling forCollaborative CrossCollaborative Cross--EdgeEdge
AnalyticsAnalytics
ZHAO Kongyang1, GAO Bin2, ZHOU Zhi1
(1. Sun Yat-sen University, Guangzhou 510275, China;2. National University of Singapore, Singapore 119077, Singapore)
Abstract: Collaborative cross-edge analytics is a new computing paradigm in which Inter⁃net of Things (IoT) data analytics is performed across multiple geographically dispersededge clouds. Existing work on collaborative cross-edge analytics mostly focuses on reduc⁃ing either analytics response time or wide-area network (WAN) traffic volume. In thiswork, we empirically demonstrate that reducing either analytics response time or networktraffic volume does not necessarily minimize the WAN traffic cost, due to the price hetero⁃geneity of WAN links. To explicitly leverage the price heterogeneity for WAN cost minimi⁃zation, we propose to schedule analytic tasks based on both price and bandwidth heteroge⁃neities. Unfortunately, the problem of WAN cost minimization underperformance con⁃straint is shown non-deterministic polynomial (NP)-hard and thus computationally intrac⁃table for large inputs. To address this challenge, we propose price- and performance-aware geo-distributed analytics (PPGA) , an efficient task scheduling heuristic that im⁃proves the cost-efficiency of IoT data analytic jobs across edge datacenters. We imple⁃ment PPGA based on Apache Spark and conduct extensive experiments on Amazon EC2to verify the efficacy of PPGA.Keywords: collaborative cross-edge analytics; Internet of Things; task scheduling
Citation (IEEE Format): K. Y. Zhao, B. Gao and Z. Zhou.“Cost-effective task scheduling for collaborative cross-edge analytics,”ZTECommunications, vol. 19, no. 2, pp. 11–19, Jun. 2021. doi: 10.12142/ZTECOM.202102003.
1 Introduction
With the fast burgeoning as well as acceleratingconvergence of artificial intelligence (AI) and theInternet of Things (IoT), unprecedented prosperi⁃ty of AI of Things or AI-empowered IoT applica⁃
tions has emerged recently. This new trend is coined asAIoT, which pushes the frontier of AI from the centralized
cloud to the ubiquitous IoT devices, paving the last mile de⁃livery of AI capabilities. Recently, AIoT has gained mount⁃ing attention from industrial giants and boosted many intelli⁃gent applications as exemplified by intelligent personal assis⁃tants, personalized shopping recommendations, video surveil⁃lance and smart home appliances, which are significantlychanging our daily life. For example, by bringing live videoanalytics to urban traffic management, Microsoft[1], Baidu,and Alibaba remarkably improve commuting efficiency andsafety in Bevellue (a city outside of Seattle), Beijing, andHangzhou, respectively.Specifically, for many emerging collaborative AIoT appli⁃
DOI: 10.12142/ZTECOM.202102003
https://kns.cnki.net/kcms/detail/34.1294.TN.20210607.1503.002.html, publishedonline June 9, 2021
Manuscript received: 2021-04-09
This work was supported in part by the National Natural Science Founda⁃tion of China under Grant No.61802449 and the Guangdong Natural Sci⁃ence Funds under Grant No. 2021A1515011912.
11
Special Topic Cost-Effective Task Scheduling for Collaborative Cross-Edge Analytics
ZHAO Kongyang, GAO Bin, ZHOU Zhi
ZTE COMMUNICATIONSJune 2021 Vol. 19 No. 2
cations spanning across multiple regions and edge datacen⁃ters[2–3], the raw data generated at each datacenter can behuge, redundant and unlabeled[4]. For example, for urban traf⁃fic control and management, the raw data born at each edgedatacenter contains only the ID and timestamp of the vehi⁃cles traversing this region, but not the global trajectory ofeach vehicle, which can be used to learn the vehicle behav⁃ior. While for the smart retail application, the raw data ofeach unmanned store only contains the shopping record ofeach user and item information of each good, rather than theuser preference and item popularity data that can be used tolearn the user’s shopping behavior. To extract the labeleddata (e.g., vehicle trajectory, user preference and item popu⁃larity data over multiple stores) that can be used to train anAI model in such collaborative cross-region scenarios, weneed to perform preprocessing to the raw data stored at cross-region edge datacenters to obtain some statistical query re⁃sults (i.e., labeled data, such as the item popularity over mul⁃tiple stores), employing data-parallel frameworks such asMap-Reduce, Spark and Flink.In this paper, we propose to empower AIoT by optimizing
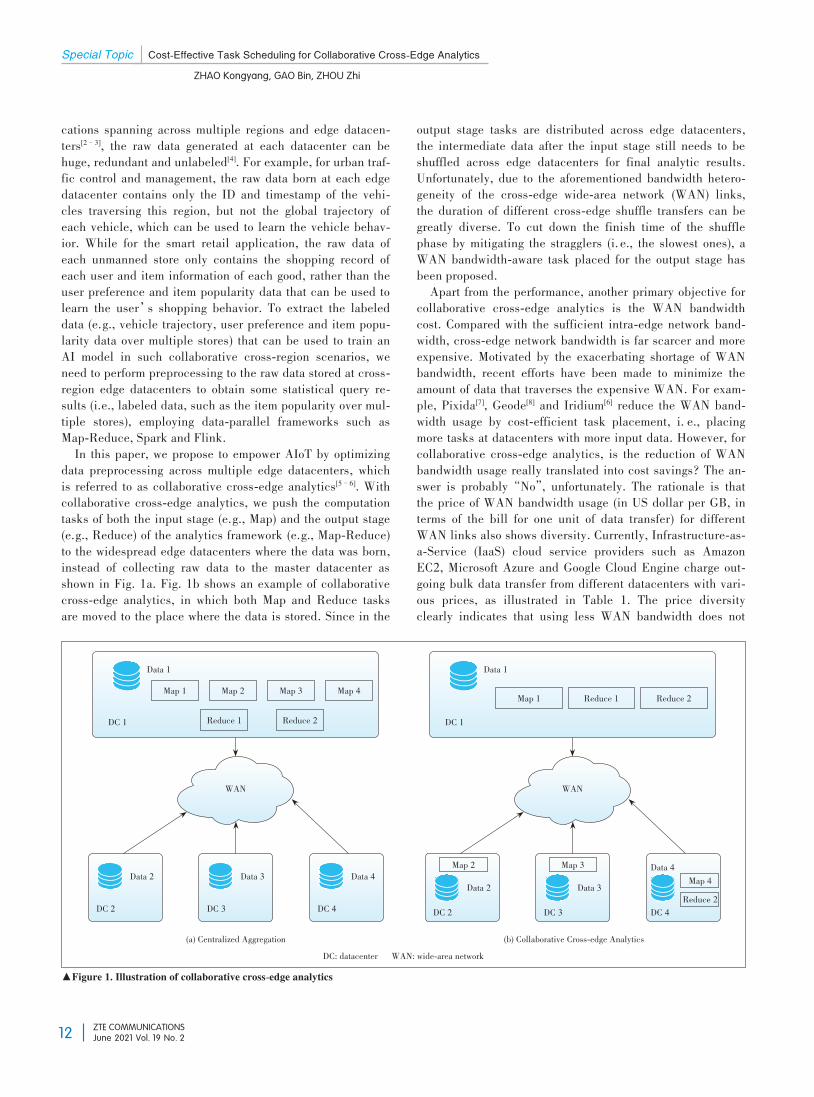
data preprocessing across multiple edge datacenters, whichis referred to as collaborative cross-edge analytics[5–6]. Withcollaborative cross-edge analytics, we push the computationtasks of both the input stage (e.g., Map) and the output stage(e.g., Reduce) of the analytics framework (e.g., Map-Reduce)to the widespread edge datacenters where the data was born,instead of collecting raw data to the master datacenter asshown in Fig. 1a. Fig. 1b shows an example of collaborativecross-edge analytics, in which both Map and Reduce tasksare moved to the place where the data is stored. Since in the
output stage tasks are distributed across edge datacenters,the intermediate data after the input stage still needs to beshuffled across edge datacenters for final analytic results.Unfortunately, due to the aforementioned bandwidth hetero⁃geneity of the cross-edge wide-area network (WAN) links,the duration of different cross-edge shuffle transfers can begreatly diverse. To cut down the finish time of the shufflephase by mitigating the stragglers (i. e., the slowest ones), aWAN bandwidth-aware task placed for the output stage hasbeen proposed.Apart from the performance, another primary objective for
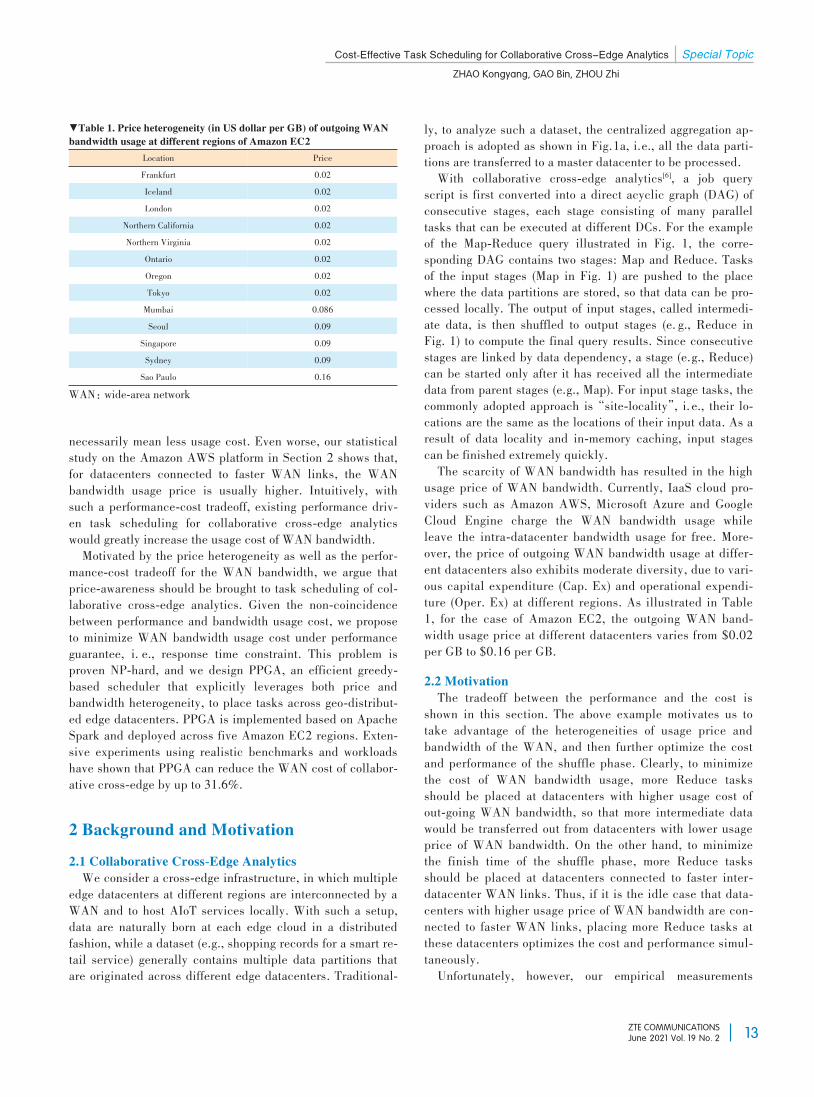
collaborative cross-edge analytics is the WAN bandwidthcost. Compared with the sufficient intra-edge network band⁃width, cross-edge network bandwidth is far scarcer and moreexpensive. Motivated by the exacerbating shortage of WANbandwidth, recent efforts have been made to minimize theamount of data that traverses the expensive WAN. For exam⁃ple, Pixida[7], Geode[8] and Iridium[6] reduce the WAN band⁃width usage by cost-efficient task placement, i. e., placingmore tasks at datacenters with more input data. However, forcollaborative cross-edge analytics, is the reduction of WANbandwidth usage really translated into cost savings? The an⁃swer is probably“No”, unfortunately. The rationale is thatthe price of WAN bandwidth usage (in US dollar per GB, interms of the bill for one unit of data transfer) for differentWAN links also shows diversity. Currently, Infrastructure-as-a-Service (IaaS) cloud service providers such as AmazonEC2, Microsoft Azure and Google Cloud Engine charge out⁃going bulk data transfer from different datacenters with vari⁃ous prices, as illustrated in Table 1. The price diversityclearly indicates that using less WAN bandwidth does not
DC: datacenter WAN: wide-area network(a) Centralized Aggregation
▲Figure 1. Illustration of collaborative cross-edge analytics
(b) Collaborative Cross-edge Analytics
Data 1
DC 1
Map 1 Map 2 Map 3 Map 4
Reduce 1 Reduce 2
WAN
Data 2
DC 2
Data 3
DC 3
Data 4
DC 4
Data 1
DC 1Map 1 Reduce 1 Reduce 2
WAN
Data 2DC 2
Data 3DC 3
Data 4
DC 4
Map 2 Map 3Map 4Reduce 2
12
Cost-Effective Task Scheduling for Collaborative Cross-Edge Analytics Special Topic
ZHAO Kongyang, GAO Bin, ZHOU Zhi
ZTE COMMUNICATIONSJune 2021 Vol. 19 No. 2
necessarily mean less usage cost. Even worse, our statisticalstudy on the Amazon AWS platform in Section 2 shows that,for datacenters connected to faster WAN links, the WANbandwidth usage price is usually higher. Intuitively, withsuch a performance-cost tradeoff, existing performance driv⁃en task scheduling for collaborative cross-edge analyticswould greatly increase the usage cost of WAN bandwidth.Motivated by the price heterogeneity as well as the perfor⁃
mance-cost tradeoff for the WAN bandwidth, we argue thatprice-awareness should be brought to task scheduling of col⁃laborative cross-edge analytics. Given the non-coincidencebetween performance and bandwidth usage cost, we proposeto minimize WAN bandwidth usage cost under performanceguarantee, i. e., response time constraint. This problem isproven NP-hard, and we design PPGA, an efficient greedy-based scheduler that explicitly leverages both price andbandwidth heterogeneity, to place tasks across geo-distribut⁃ed edge datacenters. PPGA is implemented based on ApacheSpark and deployed across five Amazon EC2 regions. Exten⁃sive experiments using realistic benchmarks and workloadshave shown that PPGA can reduce the WAN cost of collabor⁃ative cross-edge by up to 31.6%.
2 Background and Motivation
2.1 Collaborative Cross-Edge AnalyticsWe consider a cross-edge infrastructure, in which multiple
edge datacenters at different regions are interconnected by aWAN and to host AIoT services locally. With such a setup,data are naturally born at each edge cloud in a distributedfashion, while a dataset (e.g., shopping records for a smart re⁃tail service) generally contains multiple data partitions thatare originated across different edge datacenters. Traditional⁃
ly, to analyze such a dataset, the centralized aggregation ap⁃proach is adopted as shown in Fig.1a, i.e., all the data parti⁃tions are transferred to a master datacenter to be processed.With collaborative cross-edge analytics[6], a job query
script is first converted into a direct acyclic graph (DAG) ofconsecutive stages, each stage consisting of many paralleltasks that can be executed at different DCs. For the exampleof the Map-Reduce query illustrated in Fig. 1, the corre⁃sponding DAG contains two stages: Map and Reduce. Tasksof the input stages (Map in Fig. 1) are pushed to the placewhere the data partitions are stored, so that data can be pro⁃cessed locally. The output of input stages, called intermedi⁃ate data, is then shuffled to output stages (e. g., Reduce inFig. 1) to compute the final query results. Since consecutivestages are linked by data dependency, a stage (e.g., Reduce)can be started only after it has received all the intermediatedata from parent stages (e.g., Map). For input stage tasks, thecommonly adopted approach is“site-locality”, i. e., their lo⁃cations are the same as the locations of their input data. As aresult of data locality and in-memory caching, input stagescan be finished extremely quickly.The scarcity of WAN bandwidth has resulted in the high
usage price of WAN bandwidth. Currently, IaaS cloud pro⁃viders such as Amazon AWS, Microsoft Azure and GoogleCloud Engine charge the WAN bandwidth usage whileleave the intra-datacenter bandwidth usage for free. More⁃over, the price of outgoing WAN bandwidth usage at differ⁃ent datacenters also exhibits moderate diversity, due to vari⁃ous capital expenditure (Cap. Ex) and operational expendi⁃ture (Oper. Ex) at different regions. As illustrated in Table1, for the case of Amazon EC2, the outgoing WAN band⁃width usage price at different datacenters varies from $0.02per GB to $0.16 per GB.2.2 MotivationThe tradeoff between the performance and the cost is
shown in this section. The above example motivates us totake advantage of the heterogeneities of usage price andbandwidth of the WAN, and then further optimize the costand performance of the shuffle phase. Clearly, to minimizethe cost of WAN bandwidth usage, more Reduce tasksshould be placed at datacenters with higher usage cost ofout-going WAN bandwidth, so that more intermediate datawould be transferred out from datacenters with lower usageprice of WAN bandwidth. On the other hand, to minimizethe finish time of the shuffle phase, more Reduce tasksshould be placed at datacenters connected to faster inter-datacenter WAN links. Thus, if it is the idle case that data⁃centers with higher usage price of WAN bandwidth are con⁃nected to faster WAN links, placing more Reduce tasks atthese datacenters optimizes the cost and performance simul⁃taneously.Unfortunately, however, our empirical measurements
▼Table 1. Price heterogeneity (in US dollar per GB) of outgoing WANbandwidth usage at different regions of Amazon EC2
LocationFrankfurtIcelandLondon
Northern CaliforniaNorthern Virginia
OntarioOregonTokyoMumbaiSeoul
SingaporeSydneySao Paulo
Price0.020.020.020.020.020.020.020.020.0860.090.090.090.16
WAN:wide-area network
13
Special Topic Cost-Effective Task Scheduling for Collaborative Cross-Edge Analytics
ZHAO Kongyang, GAO Bin, ZHOU Zhi
ZTE COMMUNICATIONSJune 2021 Vol. 19 No. 2
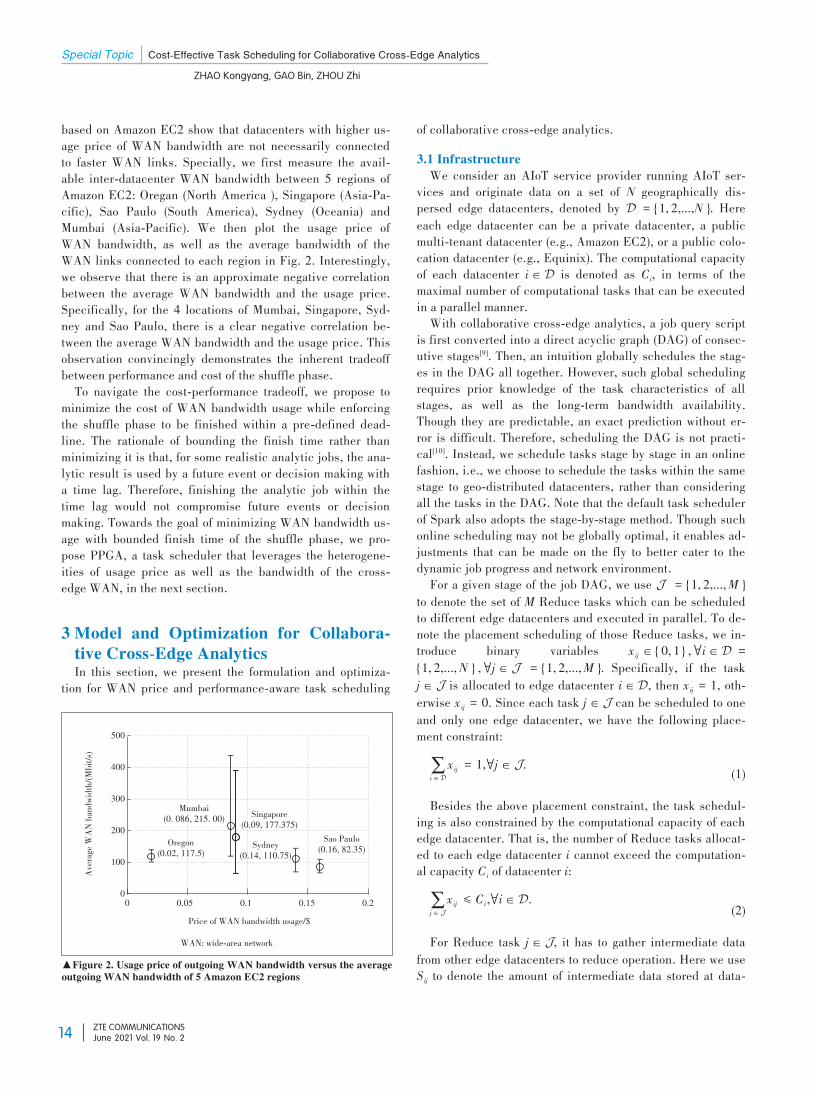
based on Amazon EC2 show that datacenters with higher us⁃age price of WAN bandwidth are not necessarily connectedto faster WAN links. Specially, we first measure the avail⁃able inter-datacenter WAN bandwidth between 5 regions ofAmazon EC2: Oregan (North America ), Singapore (Asia-Pa⁃cific), Sao Paulo (South America), Sydney (Oceania) andMumbai (Asia-Pacific). We then plot the usage price ofWAN bandwidth, as well as the average bandwidth of theWAN links connected to each region in Fig. 2. Interestingly,we observe that there is an approximate negative correlationbetween the average WAN bandwidth and the usage price.Specifically, for the 4 locations of Mumbai, Singapore, Syd⁃ney and Sao Paulo, there is a clear negative correlation be⁃tween the average WAN bandwidth and the usage price. Thisobservation convincingly demonstrates the inherent tradeoffbetween performance and cost of the shuffle phase.To navigate the cost-performance tradeoff, we propose to
minimize the cost of WAN bandwidth usage while enforcingthe shuffle phase to be finished within a pre-defined dead⁃line. The rationale of bounding the finish time rather thanminimizing it is that, for some realistic analytic jobs, the ana⁃lytic result is used by a future event or decision making witha time lag. Therefore, finishing the analytic job within thetime lag would not compromise future events or decisionmaking. Towards the goal of minimizing WAN bandwidth us⁃age with bounded finish time of the shuffle phase, we pro⁃pose PPGA, a task scheduler that leverages the heterogene⁃ities of usage price as well as the bandwidth of the cross-edge WAN, in the next section.
3 Model and Optimization for Collabora⁃tive Cross-Edge AnalyticsIn this section, we present the formulation and optimiza⁃
tion for WAN price and performance-aware task scheduling
of collaborative cross-edge analytics.3.1 InfrastructureWe consider an AIoT service provider running AIoT ser⁃
vices and originate data on a set of N geographically dis⁃persed edge datacenters, denoted by D = {1, 2,...,N }. Hereeach edge datacenter can be a private datacenter, a publicmulti-tenant datacenter (e.g., Amazon EC2), or a public colo⁃cation datacenter (e.g., Equinix). The computational capacityof each datacenter i ∈ D is denoted as Ci, in terms of themaximal number of computational tasks that can be executedin a parallel manner.With collaborative cross-edge analytics, a job query script
is first converted into a direct acyclic graph (DAG) of consec⁃utive stages[9]. Then, an intuition globally schedules the stag⁃es in the DAG all together. However, such global schedulingrequires prior knowledge of the task characteristics of allstages, as well as the long-term bandwidth availability.Though they are predictable, an exact prediction without er⁃ror is difficult. Therefore, scheduling the DAG is not practi⁃cal[10]. Instead, we schedule tasks stage by stage in an onlinefashion, i.e., we choose to schedule the tasks within the samestage to geo-distributed datacenters, rather than consideringall the tasks in the DAG. Note that the default task schedulerof Spark also adopts the stage⁃by⁃stage method. Though suchonline scheduling may not be globally optimal, it enables ad⁃justments that can be made on the fly to better cater to thedynamic job progress and network environment.For a given stage of the job DAG, we use J = {1, 2,...,M }
to denote the set of M Reduce tasks which can be scheduledto different edge datacenters and executed in parallel. To de⁃note the placement scheduling of those Reduce tasks, we in⁃troduce binary variables xij ∈ { 0, 1 } , ∀i ∈ D ={1, 2,...,N } , ∀j ∈ J = {1, 2,...,M }. Specifically, if the taskj ∈ J is allocated to edge datacenter i ∈ D, then xij = 1, oth⁃erwise xij = 0. Since each task j ∈ J can be scheduled to oneand only one edge datacenter, we have the following place⁃ment constraint:∑i ∈ Dxij = 1,∀j ∈ J. (1)
Besides the above placement constraint, the task schedul⁃ing is also constrained by the computational capacity of eachedge datacenter. That is, the number of Reduce tasks allocat⁃ed to each edge datacenter i cannot exceed the computation⁃al capacity Ci of datacenter i:∑j ∈ Jxij ≤ Ci,∀i ∈ D. (2)
For Reduce task j ∈ J, it has to gather intermediate datafrom other edge datacenters to reduce operation. Here we useSij to denote the amount of intermediate data stored at data⁃
WAN: wide-area network▲Figure 2. Usage price of outgoing WAN bandwidth versus the averageoutgoing WAN bandwidth of 5 Amazon EC2 regions
Price of WAN bandwidth usage/$0 0.05 0.1 0.15 0.2
500
400
300
200
100
0
Mumbai(0. 086, 215. 00)Oregon(0.02, 117.5)
Singapore(0.09, 177.375)Sydney(0.14, 110.75)
Sao Paulo(0.16, 82.35)
AverageW
ANbandwidth/(Mbit/s)
14
Cost-Effective Task Scheduling for Collaborative Cross-Edge Analytics Special Topic
ZHAO Kongyang, GAO Bin, ZHOU Zhi
ZTE COMMUNICATIONSJune 2021 Vol. 19 No. 2
center i and to be collected by Reduce task j. For the shufflephase where intermediate data are transferred across edgedatacenters and given the source edge datacenter i and desti⁃nation edge datacenter k, the amount of intermediate datatransferred from edge datacenter i to edge datacenter k canbe denoted as∑
j ∈ DSij xkj.
3.2 Performance of Shuffle PhaseGiven the available pair-wise bandwidth of the WAN link
from edge datacenter i to edge datacenter k, Bik, and togetherwith the amount of intermediate data traversing this WANlink, the duration of the corresponding intermediate datatransfer can be denoted as
∑j ∈ DSij xkj
Bik. Since the performance,
in terms of the finish time of the intermediate data shufflephase, is determined by the slowest intermediate data trans⁃fer, it can be formulated as:
z = maxi ∈ D maxk ∈ D
∑j ∈ DSij xkj
Bik . (3)Here if i = k, it means that the corresponding intermediate
data transfer is an intra-edge transfer rather than a cross-edge WAN transfer. Since the intra-edge network bandwidthtypically far more overweighs the cross-edge WAN band⁃width, the former can be finished very soon.If we enforce the shuffle phase to be finished before the
deadline W, each intermediate data transfered from edgedatacenter i to edge datacenter k should be finished withinthis deadline W, that is:∑j ∈ DSij xkj
Bik≤ W, ∀i,k ∈ D. (4)
3.3 Cost of WAN Bandwidth UsageUnlike the moderately sufficient intra-edge bandwidth, the
cross-edge WAN bandwidth represents a scarce resourcethat incurs high capital and operational expenditure. For thisreason, internet service providers (ISP) and IaaS edge cloudproviders typically charge WAN bandwidth usage accordingto the bytes transferred, i. e., the amount of data transferredacross the WAN. Specifically, for IaaS edge cloud providerssuch as Amazon AWS, Microsoft Azure and Google CloudEngine (GCE), the price for inter-datacenter WAN transfer isdependent on the source datacenter of the transfer, and dif⁃ferent source datacenters usually have various prices. Herewe use Pi to denote the WAN bandwidth usage price for traf⁃fic going out of datacenter i, and Pi exhibits geographical di⁃versity across datacenters. Given the amount of∑
j ∈ DSij xkj of in⁃
termediate data transferred from edge datacenter i to edge
datacenter k, the WAN bandwidth usage cost is given byPi∑
j ∈ DSij xkj. Considering all the inter-datacenter WAN trans⁃
fers, the total cost of WAN bandwidth usage can be comput⁃ed by:∑i ∈ D∑
k ∈ D, k ≠ i
Pi∑j ∈ D
Sij xkj. (5)3.4 Problem FormulationThe objective of optimizing the task scheduling of collabor⁃
ative cross-edge analytics is twofold: shortening the finishtime of the shuffle phase and reducing the cost of WAN band⁃width usage. Here comes the question that whether the abovetwo objectives are coincident. To answer this question, wefirst look at the performance formulation and cost formula⁃tion. Intuitively, to reduce the finish time of the shufflephase, we should place more Reduce tasks at edge datacen⁃ters connected to higher bandwidth (i.e., Bik) WAN links. Onthe other hand, to minimize the cost of WAN bandwidth us⁃age, we should place more Reduce tasks at datacenters withlower bandwidth usage prices (i.e., Pi). Unfortunately, as wehave empirically demonstrated in Section 2, the bandwidthusage price at the datacenter with faster WAN links is typi⁃cally higher and thus the performance goal is consequentlynot aligned to the cost goal.To address the challenge of contradictory performance and
cost objectives, we propose to minimize the cost of WANbandwidth usage while enforcinge the shuffle phase to be fin⁃ished within a pre-defined deadline. Formally, such a perfor⁃mance-cost tradeoff problem can be formulated as the follow⁃ing integer programming (IP):min ∑
i ∈ D∑
k ∈ D, k ≠ i∑j ∈ D
PiSij xkj
s.t. ∑k ∈ Dxkj = 1,∀j ∈ J
∑j ∈ Jxkj ≤ Ck,∀k ∈ D
∑j ∈ DSij xkj
Bik≤ W,∀i,k ∈ D
xkj ∈ { 0,1 } ,∀k ∈ D,j ∈ J. (6)Remark: A widely adopted alternative approach to navigat⁃
ing the performance-cost tradeoff is to transform the finishtime into monetary cost, and then minimize the total cost. Itis however nontrivial to precisely map the finish time of theshuffle phase to economic cost. In contrast, our model is
15
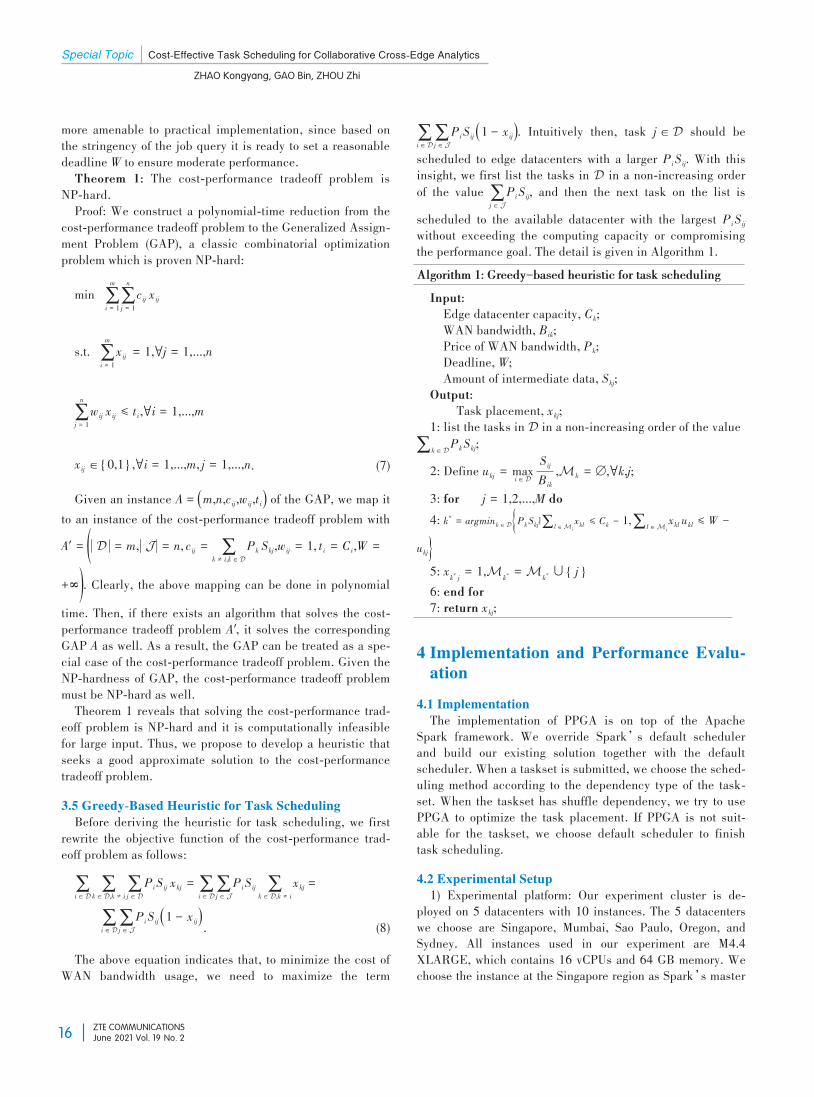
Special Topic Cost-Effective Task Scheduling for Collaborative Cross-Edge Analytics
ZHAO Kongyang, GAO Bin, ZHOU Zhi
ZTE COMMUNICATIONSJune 2021 Vol. 19 No. 2
more amenable to practical implementation, since based onthe stringency of the job query it is ready to set a reasonabledeadline W to ensure moderate performance.Theorem 1: The cost-performance tradeoff problem is
NP-hard.Proof: We construct a polynomial-time reduction from the
cost-performance tradeoff problem to the Generalized Assign⁃ment Problem (GAP), a classic combinatorial optimizationproblem which is proven NP-hard:min ∑
i = 1
m∑j = 1
n
cij xij
s.t. ∑i = 1
m
xij = 1,∀j = 1,...,n
∑j = 1
n
wij xij ≤ ti,∀i = 1,...,m
xij ∈ { 0,1 } ,∀i = 1,...,m, j = 1,...,n. (7)Given an instance A = (m,n,cij,wij,ti) of the GAP, we map it
to an instance of the cost-performance tradeoff problem withA' = (|D | = m, |J | = n, cij = ∑
k ≠ i,k ∈ DPk Skj,wij = 1, ti = Ci,W =
+∞). Clearly, the above mapping can be done in polynomialtime. Then, if there exists an algorithm that solves the cost-performance tradeoff problem A', it solves the correspondingGAP A as well. As a result, the GAP can be treated as a spe⁃cial case of the cost-performance tradeoff problem. Given theNP-hardness of GAP, the cost-performance tradeoff problemmust be NP-hard as well.Theorem 1 reveals that solving the cost-performance trad⁃
eoff problem is NP-hard and it is computationally infeasiblefor large input. Thus, we propose to develop a heuristic thatseeks a good approximate solution to the cost-performancetradeoff problem.3.5 Greedy-Based Heuristic for Task SchedulingBefore deriving the heuristic for task scheduling, we first
rewrite the objective function of the cost-performance trad⁃eoff problem as follows:∑i ∈ D∑
k ∈ D,k ≠ i∑j ∈ DPiSij xkj =∑
i ∈ D∑j ∈ JPiSij ∑
k ∈ D,k ≠ ixkj =
∑i ∈ D∑j ∈ JPiSij ( )1 - xij . (8)
The above equation indicates that, to minimize the cost ofWAN bandwidth usage, we need to maximize the term
∑i ∈ D∑j ∈ JPiSij ( )1 - xij . Intuitively then, task j ∈ D should be
scheduled to edge datacenters with a larger PiSij. With thisinsight, we first list the tasks in D in a non-increasing orderof the value ∑
j ∈ JPiSij, and then the next task on the list is
scheduled to the available datacenter with the largest PiSijwithout exceeding the computing capacity or compromisingthe performance goal. The detail is given in Algorithm 1.Algorithm 1: Greedy-based heuristic for task scheduling
Input:Edge datacenter capacity, Ck;WAN bandwidth, Bik;Price of WAN bandwidth, Pk;Deadline, W;Amount of intermediate data, Skj;
Output:Task placement, xkj;1: list the tasks in D in a non-increasing order of the value∑k ∈ DPkSkj;
2: Define ukj = maxi ∈ DSijBik,Mk = ∅,∀k,j;
3: for j = 1,2,...,M do4: k* = argmink ∈ D{PkSkj|∑l ∈M i
xkl ≤ Ck - 1,∑l ∈M ixkl ukl ≤ W -
ukj}5: xk* j = 1,Mk* =Mk* ∪ { j }6: end for7: return xkj;
4 Implementation and Performance Evalu⁃ation
4.1 ImplementationThe implementation of PPGA is on top of the Apache
Spark framework. We override Spark’s default schedulerand build our existing solution together with the defaultscheduler. When a taskset is submitted, we choose the sched⁃uling method according to the dependency type of the task⁃set. When the taskset has shuffle dependency, we try to usePPGA to optimize the task placement. If PPGA is not suit⁃able for the taskset, we choose default scheduler to finishtask scheduling.4.2 Experimental Setup1) Experimental platform: Our experiment cluster is de⁃
ployed on 5 datacenters with 10 instances. The 5 datacenterswe choose are Singapore, Mumbai, Sao Paulo, Oregon, andSydney. All instances used in our experiment are M4.4XLARGE, which contains 16 vCPUs and 64 GB memory. Wechoose the instance at the Singapore region as Spark’s master
16
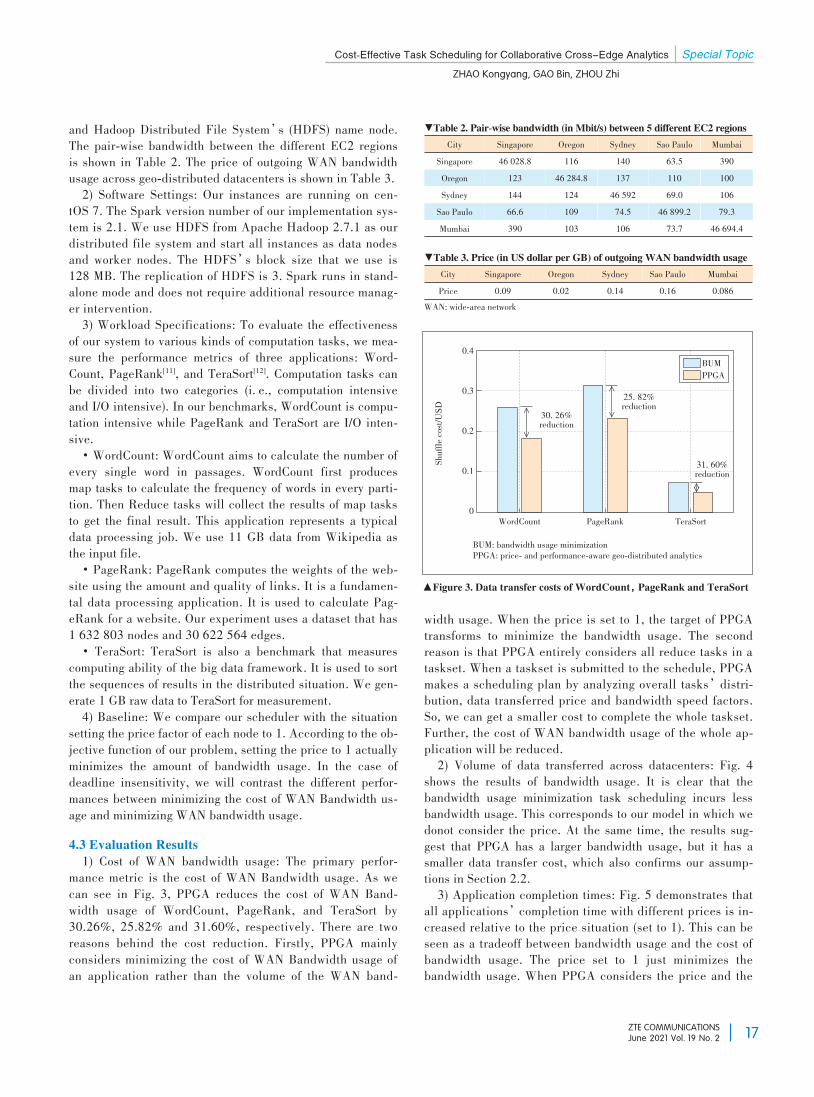
Cost-Effective Task Scheduling for Collaborative Cross-Edge Analytics Special Topic
ZHAO Kongyang, GAO Bin, ZHOU Zhi
ZTE COMMUNICATIONSJune 2021 Vol. 19 No. 2
and Hadoop Distributed File System’s (HDFS) name node.The pair-wise bandwidth between the different EC2 regionsis shown in Table 2. The price of outgoing WAN bandwidthusage across geo-distributed datacenters is shown in Table 3.2) Software Settings: Our instances are running on cen⁃
tOS 7. The Spark version number of our implementation sys⁃tem is 2.1. We use HDFS from Apache Hadoop 2.7.1 as ourdistributed file system and start all instances as data nodesand worker nodes. The HDFS’s block size that we use is128 MB. The replication of HDFS is 3. Spark runs in stand⁃alone mode and does not require additional resource manag⁃er intervention.3) Workload Specifications: To evaluate the effectiveness
of our system to various kinds of computation tasks, we mea⁃sure the performance metrics of three applications: Word⁃Count, PageRank[11], and TeraSort[12]. Computation tasks canbe divided into two categories (i. e., computation intensiveand I/O intensive). In our benchmarks, WordCount is compu⁃tation intensive while PageRank and TeraSort are I/O inten⁃sive.• WordCount: WordCount aims to calculate the number of
every single word in passages. WordCount first producesmap tasks to calculate the frequency of words in every parti⁃tion. Then Reduce tasks will collect the results of map tasksto get the final result. This application represents a typicaldata processing job. We use 11 GB data from Wikipedia asthe input file.• PageRank: PageRank computes the weights of the web⁃
site using the amount and quality of links. It is a fundamen⁃tal data processing application. It is used to calculate Pag⁃eRank for a website. Our experiment uses a dataset that has1 632 803 nodes and 30 622 564 edges.• TeraSort: TeraSort is also a benchmark that measures
computing ability of the big data framework. It is used to sortthe sequences of results in the distributed situation. We gen⁃erate 1 GB raw data to TeraSort for measurement.4) Baseline: We compare our scheduler with the situation
setting the price factor of each node to 1. According to the ob⁃jective function of our problem, setting the price to 1 actuallyminimizes the amount of bandwidth usage. In the case ofdeadline insensitivity, we will contrast the different perfor⁃mances between minimizing the cost of WAN Bandwidth us⁃age and minimizing WAN bandwidth usage.4.3 Evaluation Results1) Cost of WAN bandwidth usage: The primary perfor⁃
mance metric is the cost of WAN Bandwidth usage. As wecan see in Fig. 3, PPGA reduces the cost of WAN Band⁃width usage of WordCount, PageRank, and TeraSort by30.26%, 25.82% and 31.60%, respectively. There are tworeasons behind the cost reduction. Firstly, PPGA mainlyconsiders minimizing the cost of WAN Bandwidth usage ofan application rather than the volume of the WAN band⁃
width usage. When the price is set to 1, the target of PPGAtransforms to minimize the bandwidth usage. The secondreason is that PPGA entirely considers all reduce tasks in ataskset. When a taskset is submitted to the schedule, PPGAmakes a scheduling plan by analyzing overall tasks’distri⁃bution, data transferred price and bandwidth speed factors.So, we can get a smaller cost to complete the whole taskset.Further, the cost of WAN bandwidth usage of the whole ap⁃plication will be reduced.2) Volume of data transferred across datacenters: Fig. 4
shows the results of bandwidth usage. It is clear that thebandwidth usage minimization task scheduling incurs lessbandwidth usage. This corresponds to our model in which wedonot consider the price. At the same time, the results sug⁃gest that PPGA has a larger bandwidth usage, but it has asmaller data transfer cost, which also confirms our assump⁃tions in Section 2.2.3) Application completion times: Fig. 5 demonstrates that
all applications’completion time with different prices is in⁃creased relative to the price situation (set to 1). This can beseen as a tradeoff between bandwidth usage and the cost ofbandwidth usage. The price set to 1 just minimizes thebandwidth usage. When PPGA considers the price and the
▼Table 2. Pair-wise bandwidth (in Mbit/s) between 5 different EC2 regionsCity
SingaporeOregonSydneySao PauloMumbai
Singapore46 028.812314466.6390
Oregon116
46 284.8124109103
Sydney14013746 59274.5106
Sao Paulo63.511069.0
46 899.273.7
Mumbai39010010679.3
46 694.4
▼Table 3. Price (in US dollar per GB) of outgoing WAN bandwidth usageCityPrice
Singapore0.09
Oregon0.02
Sydney0.14
Sao Paulo0.16
Mumbai0.086
WAN: wide-area network
▲Figure 3. Data transfer costs of WordCount,PageRank and TeraSort
BUM: bandwidth usage minimizationPPGA: price- and performance-aware geo-distributed analytics
WordCount PageRank TeraSort
BUMPPGA
30. 26%reduction
25. 82%reduction
31. 60%reduction
Shufflecost/U
SD
0.4
0.3
0.2
0.1
0
17
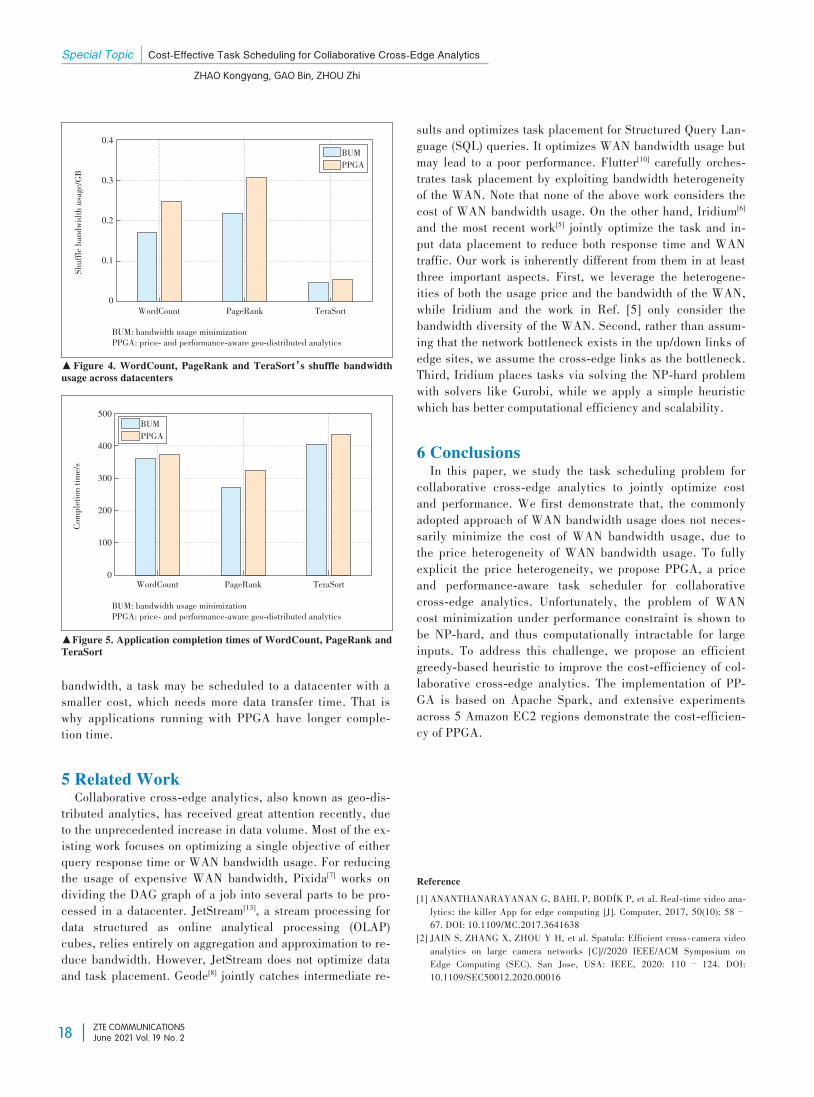
Special Topic Cost-Effective Task Scheduling for Collaborative Cross-Edge Analytics
ZHAO Kongyang, GAO Bin, ZHOU Zhi
ZTE COMMUNICATIONSJune 2021 Vol. 19 No. 2
bandwidth, a task may be scheduled to a datacenter with asmaller cost, which needs more data transfer time. That iswhy applications running with PPGA have longer comple⁃tion time.
5 Related WorkCollaborative cross-edge analytics, also known as geo-dis⁃
tributed analytics, has received great attention recently, dueto the unprecedented increase in data volume. Most of the ex⁃isting work focuses on optimizing a single objective of eitherquery response time or WAN bandwidth usage. For reducingthe usage of expensive WAN bandwidth, Pixida[7] works ondividing the DAG graph of a job into several parts to be pro⁃cessed in a datacenter. JetStream[13], a stream processing fordata structured as online analytical processing (OLAP)cubes, relies entirely on aggregation and approximation to re⁃duce bandwidth. However, JetStream does not optimize dataand task placement. Geode[8] jointly catches intermediate re⁃
sults and optimizes task placement for Structured Query Lan⁃guage (SQL) queries. It optimizes WAN bandwidth usage butmay lead to a poor performance. Flutter[10] carefully orches⁃trates task placement by exploiting bandwidth heterogeneityof the WAN. Note that none of the above work considers thecost of WAN bandwidth usage. On the other hand, Iridium[6]and the most recent work[5] jointly optimize the task and in⁃put data placement to reduce both response time and WANtraffic. Our work is inherently different from them in at leastthree important aspects. First, we leverage the heterogene⁃ities of both the usage price and the bandwidth of the WAN,while Iridium and the work in Ref. [5] only consider thebandwidth diversity of the WAN. Second, rather than assum⁃ing that the network bottleneck exists in the up/down links ofedge sites, we assume the cross-edge links as the bottleneck.Third, Iridium places tasks via solving the NP-hard problemwith solvers like Gurobi, while we apply a simple heuristicwhich has better computational efficiency and scalability.
6 ConclusionsIn this paper, we study the task scheduling problem for
collaborative cross-edge analytics to jointly optimize costand performance. We first demonstrate that, the commonlyadopted approach of WAN bandwidth usage does not neces⁃sarily minimize the cost of WAN bandwidth usage, due tothe price heterogeneity of WAN bandwidth usage. To fullyexplicit the price heterogeneity, we propose PPGA, a priceand performance-aware task scheduler for collaborativecross-edge analytics. Unfortunately, the problem of WANcost minimization under performance constraint is shown tobe NP-hard, and thus computationally intractable for largeinputs. To address this challenge, we propose an efficientgreedy-based heuristic to improve the cost-efficiency of col⁃laborative cross-edge analytics. The implementation of PP⁃GA is based on Apache Spark, and extensive experimentsacross 5 Amazon EC2 regions demonstrate the cost-efficien⁃cy of PPGA.
Reference
[1] ANANTHANARAYANAN G, BAHL P, BODÍK P, et al. Real⁃time video ana⁃lytics: the killer App for edge computing [J]. Computer, 2017, 50(10): 58–67. DOI: 10.1109/MC.2017.3641638
[2] JAIN S, ZHANG X, ZHOU Y H, et al. Spatula: Efficient cross⁃camera videoanalytics on large camera networks [C]//2020 IEEE/ACM Symposium onEdge Computing (SEC). San Jose, USA: IEEE, 2020: 110 – 124. DOI:10.1109/SEC50012.2020.00016
▲Figure 5. Application completion times of WordCount, PageRank andTeraSort
BUM: bandwidth usage minimizationPPGA: price- and performance-aware geo-distributed analytics
BUM: bandwidth usage minimizationPPGA: price- and performance-aware geo-distributed analytics▲Figure 4. WordCount, PageRank and TeraSort’s shuffle bandwidthusage across datacenters
WordCount PageRank TeraSort
BUMPPGA
Shufflebandwidth
usage/GB
0.4
0.3
0.2
0.1
0
WordCount PageRank TeraSort
BUMPPGA
Completion
time/s
500
400
300
200
100
0
18
Cost-Effective Task Scheduling for Collaborative Cross-Edge Analytics Special Topic
ZHAO Kongyang, GAO Bin, ZHOU Zhi
ZTE COMMUNICATIONSJune 2021 Vol. 19 No. 2
[3] JIANG J C, ANANTHANARAYANAN G, BODIK P, et al. Chameleon: scalableadaptation of video analytics [C]//2018 Conference of the ACM Special InterestGroup on Data Communication. Budapest, Hungary: ACM, 2018: 253– 266.DOI: 10.1145/3230543.3230574
[4] ZHOU Z, CHEN X, LI E, et al. Edge intelligence: paving the last mile of arti⁃ficial intelligence with edge computing [J]. Proceedings of the IEEE, 2019,107(8): 1738–1762. DOI: 10.1109/JPROC.2019.2918951
[5] JIN H, JIA L, ZHOU Z. Boosting edge intelligence with collaborative cross ⁃edge analytics [J]. IEEE Internet of Things journal, 2021, 8(4): 2444–2458.DOI: 10.1109/JIOT.2020.3034891
[6] PU Q F, ANANTHANARAYANAN G, BODIK P, et al. Low latency geo⁃dis⁃tributed data analytics [C]//Proceedings of the 2015 ACM Conference on Spe⁃cial Interest Group on Data Communication. London, United Kingdom: ACM,2015: 421–434. DOI: 10.1145/2785956.2787505
[7] KLOUDAS K, MAMEDE M, PREGUIÇA N, et al. Pixida [J]. Proceedings ofthe VLDB endowment, 2015, 9(2): 72–83. DOI: 10.14778/2850578.2850582
[8] VULIMIRI A, CURINO C, GODFREY PB, et al. Global analytics in the faceof bandwidth and regulatory constraints [C]//The 12th USENIX Symposiumon Networked Systems Design and Implementation (NSDI). Oakland, USA:USENIX, 2015:323–336. DOI: 10.1109/TST.2016.7442496
[9] MAO H Z, SCHWARZKOPF M, VENKATAKRISHNAN S B, et al. Learningscheduling algorithms for data processing clusters [C]//The ACM Special In⁃terest Group on Data Communication. Beijing, China: ACM, 2019: 270–288.DOI: 10.1145/3341302.3342080
[10] HU Z M, LI B C, LUO J. Flutter: Scheduling tasks closer to data across geo⁃distributed datacenters [C]//The 35th Annual IEEE International Confer⁃ence on Computer Communications. San Francisco, USA: IEEE, 2016: 1–9. DOI: 10.1109/INFOCOM.2016.7524469
[11] PAGE L, BRIN S, MOTWANI R, et al. The PageRank citation ranking:bringing order to the Web. Technical report [R]. 1919
[12] O’MALLEY O. Terabyte sort on apache Hadoop [EB/OL]. [2021 ⁃ 01 ⁃ 04].http://sortbenchmark.org/YahooHadoop.pdf
[13] RABKIN A, ARYE M, SEN S, et al. Aggregation and degradation in Jet⁃Stream: streaming analytics in the wide area [C]//Usenix Conference on Net⁃
worked Systems Design & Implementation. Seattle, USA: USENIX Associa⁃tion, 2014
BiographiesZHAO Kongyang received the B.E. degree from the South China Universityof Technology, China in 2020. He is currently pursuing his master’s degreein Sun Yat-sen University, China. His research interests include edge com⁃puting, edge intelligence, and serverless computing.
GAO Bin is now a research assistant of School of Computing in National Uni⁃versity of Singapore (NUS). Before this, he received the master’s degree andbachelor’s degree from Huazhong University of Science and Technology(HUST), China in 2017 and 2020, respectively. His research interests in⁃clude operation system, mobile edge computing, cloud computing, and geo-distributed data analytics.
ZHOU Zhi ([email protected]) received the B.S., M.E., and Ph.D.degrees in 2012, 2014, and 2017, respectively, all from the School of Comput⁃er Science and Technology at Huazhong University of Science and Technolo⁃gy (HUST), China. He is currently an associate professor in the School ofComputer Science and Engineering at Sun Yat-sen University, China. In2016, he was a visiting scholar at University of Goettingen, Germany. He wasnominated for the 2019 CCF Outstanding Doctoral Dissertation Award, thesole recipient of the 2018 ACM Wuhan & Hubei Computer Society DoctoralDissertation Award, and a recipient of the Best Paper Award of IEEE UIC2018. His research interests include edge computing, cloud computing, anddistributed systems.
19

ZTE COMMUNICATIONSJune 2021 Vol. 19 No. 2
BPPFBPPF:: Bilateral PrivacyBilateral Privacy--PreservingPreservingFramework forFramework forMobile CrowdsensingMobile Crowdsensing
LIU Junyu, YANG Yongjian, WANG En
(Jilin University, Changchun 130012, China)
Abstract: With the emergence of mobile crowdsensing (MCS), merchants can use their mo⁃bile devices to collect data that customers are interested in. Now there are many mobilecrowdsensing platforms in the market, such as Gigwalk, Uber and Checkpoint, which pub⁃lish and select the right workers to complete the task of some specific locations (for example,taking photos to collect the price of goods in a shopping mall). In mobile crowdsensing, in or⁃der to select the right workers, the platform needs the actual location information of workersand tasks, which poses a risk to the location privacy of workers and tasks. In this paper, westudy privacy protection in MCS. The main challenge is to assign the most suitable worker toa task without knowing the task and the actual location of the worker. We propose a bilateralprivacy protection framework based on matrix multiplication, which can protect the locationprivacy between the task and the worker, and keep their relative distance unchanged.Keywords: mobile crowdsensing; task allocation; privacy preserving
Citation (IEEE Format): J. Y. Liu, Y. J. Yang, and E. Wang.“BPPF: bilateral privacy-preserving framework for mobile crowdsensing,”ZTE Communications, vol. 19, no. 2, pp. 20–28, Jun. 2021. doi: 10.12142/ZTECOM.202102004.
1 Introduction
Mobile crowdsensing (MCS), as a critical componentof the Internet of Things (IoT) [1], relies on varioussensors in mobile devices to collect and transmitdata through a wireless network. Nowadays, mo⁃
bile devices are essential for our daily activities, includingbusinesses, communications, and entertainments. Accordingto Gartner statistics, the number of worldwide smartphonessales in 2018 was 1. 55 billion. Anyone with a smartphonecan become a participant in the MCS system with wide cover⁃age, which has gained popularity in recent years and becomean appealing paradigm for sensing and collecting data[2].In the traditional mobile crowdsensing, there are three enti⁃
ties: the crowdsensing platform, the worker, and the task re⁃quester. The task requester has some tasks to be completed in
some places and is willing to pay for the task, the worker isthe person who registers on the mobile crowdsensing platformto get the reward for completing the task, and the crowdsens⁃ing platform provides services for the task requester. The pur⁃pose of the platform is to recruit suitable workers for the taskrequester to complete the task under the condition of the mini⁃mum compensation. The distance between workers and tasksis highly related to the cost of workers who complete tasks.Most of the existing recruitment mechanisms take the distancebetween tasks and workers as the cost of workers completingtasks. Therefore, the total distance between workers and tasksis taken as the optimization objective of the algorithm in hopeof minimizing the total cost of workers.In order to recruit suitable workers for the task, the platform
needs the location information of the task and workers. If us⁃
DOI: 10.12142/ZTECOM.202102004
https://kns.cnki.net/kcms/detail/34.1294.TN.20210517.1615.002.html, publishedonline May 17, 2021
Manuscript received: 2021-03-11
20
BPPF: Bilateral Privacy-Preserving Framework for Mobile Crowdsensing Special Topic
LIU Junyu, YANG Yongjian, WANG En
ZTE COMMUNICATIONSJune 2021 Vol. 19 No. 2
ers upload their actual location, it will bring danger to the us⁃er’s privacy and eliminate the user’s enthusiasm to partici⁃pate in mobile crowdsensing activities. The invasion of the pri⁃vacy of workers may occur when a worker uploads his or heractual location information on the platform, which may inferthe worker’s identity and preference based on the worker’s lo⁃cation information, and disclose the privacy information to athird party for profit. On the other hand, to select the rightworker, the task requester publishes the task information onthe platform, and the platform and all workers can see the in⁃formation, which poses a risk to the privacy of the task re⁃quester, because in certain cases the location and content ofthe task needs to be protected for the requester. For example,people with health problems at home can seek help throughmobile crowdsensing, but publishing her health problems andher home address clearly violates her privacy.Therefore, many privacy protection methods have been pro⁃
posed to deal with the problem of privacy leakage in mobilecrowdsensing,such as anonymity, obfuscation and encryp⁃tion[3]. By adding noise to the user’s actual location and con⁃fusing it with other locations[4], the secret sharing technology isused to encrypt the privacy information[5], and k-anonymity isused to cluster a group of users to protect the user’s privacyinformation[6]. However, most of the existing privacy protectionwork mainly focuses on the privacy protection of workers withlittle consideration of task privacy protection. Some works[7]consider the privacy of both workers and tasks, but they needan online trusted third party (TTP) to assist in the task alloca⁃tion phase, which undoubtedly leads to high communicationoverhead and unnecessary delay in the task allocation phase.Inspired by the privacy protection problem, we focus on de⁃
signing a bilateral privacy protection framework, which choos⁃es the right worker to minimize the total moving distancewhile protecting the location information of workers and taskswithout an online TTP in the task allocation phase. Specifical⁃ly, the whole geographic space is divided into several sub-re⁃gions. The task requester maps the location of the task to thesub-region, uses a matrix to transfer the location information,then hides the actual location matrix, and uploads the confus⁃ing location matrix. Similarly, workers also map their positionsto their sub-regions, use a matrix to transfer the position infor⁃mation, hide the actual location matrix,and upload the con⁃fusing location matrix. After receiving the confusing locationmatrix from the task requester and the worker, the platform us⁃es the confusing location information instead of the actual lo⁃cation information to select the appropriate worker.Obviously, if the location of the task and the location of the
worker are both confusing, it is difficult for the platform tochoose the right worker. Therefore, the first challenge of thebilateral privacy protection framework is to solve this problem:how to protect the location information of tasks and workerswhile keeping the relative distance constant. In this regard, wedesign a novel privacy protection method based on matrix mul⁃
tiplication, with which we can protect not only the location pri⁃vacy of workers, but also the location privacy of tasks. At thesame time, we can ensure that the platform can accuratelymeasure the relative distance between tasks and workersthrough the confusing location matrix, so that the platform canselect the right workers to minimize the total moving distance.The contributions of our work are summarized as follows:1) We propose a privacy protection framework to protect the
location privacy of tasks and workers without an online TTP inthe task allocation phase.2) We design a novel location privacy protection method
based on matrix multiplication, which can protect the locationprivacy of tasks and workers at the same time and retain therelative distance information after confusing the location, sothat the platform can quantify the relative distance betweenworkers and tasks through the confused location.3) We have done a lot of experiments on real datasets to ver⁃
ify our proposed method. The experimental results show thatour method outperforms the state-of-the-art method.
2 Related WorkIn this section, we briefly introduce the related work of task
allocation optimization and privacy protection.2.1 Task Allocation OptimizationTask allocation aims to allocate appropriate workers to
tasks based on some optimization objectives, such as the costof recruiting tasks on the platform, the task coverage, and thequality of task completion. In Ref. [8], the authors take thenumber of recruited workers as the optimization objective inthe task allocation stage. The fewer the number of workers, theless the recruitment cost. The platform focuses on selecting aminimum number of workers and ensures that tasks can becovered. In Ref. [9], the authors propose a task coverage ori⁃ented assignment method based on the worker analysis andworker attribute model. They propose to migrate certain quali⁃fied workers to the less popular tasks for increasing the taskcoverage, and meanwhile optimize other performance factors.In Ref. [10], the authors take the quality of task completion asthe optimization objective of task allocation.In the location-based mobile crowdsensing task allocation,
the recruited workers often need to move from their current lo⁃cation to the task location to complete the data collection task.Therefore, in this kind of mobile sensing, the cost of workerscompleting the task is closely related to the workers’movingdistance. Therefore, in order to minimize the recruitment cost,the platform often takes minimizing the total moving distanceas the priority of task allocation. In Ref. [11], the authors pro⁃pose a tabu search algorithm to select workers, consideringvarious task requirements (sensors, location accessibility andreliability) and work specifications (available sensor set andspeed) as well as task completion sequence, and the total mov⁃
21
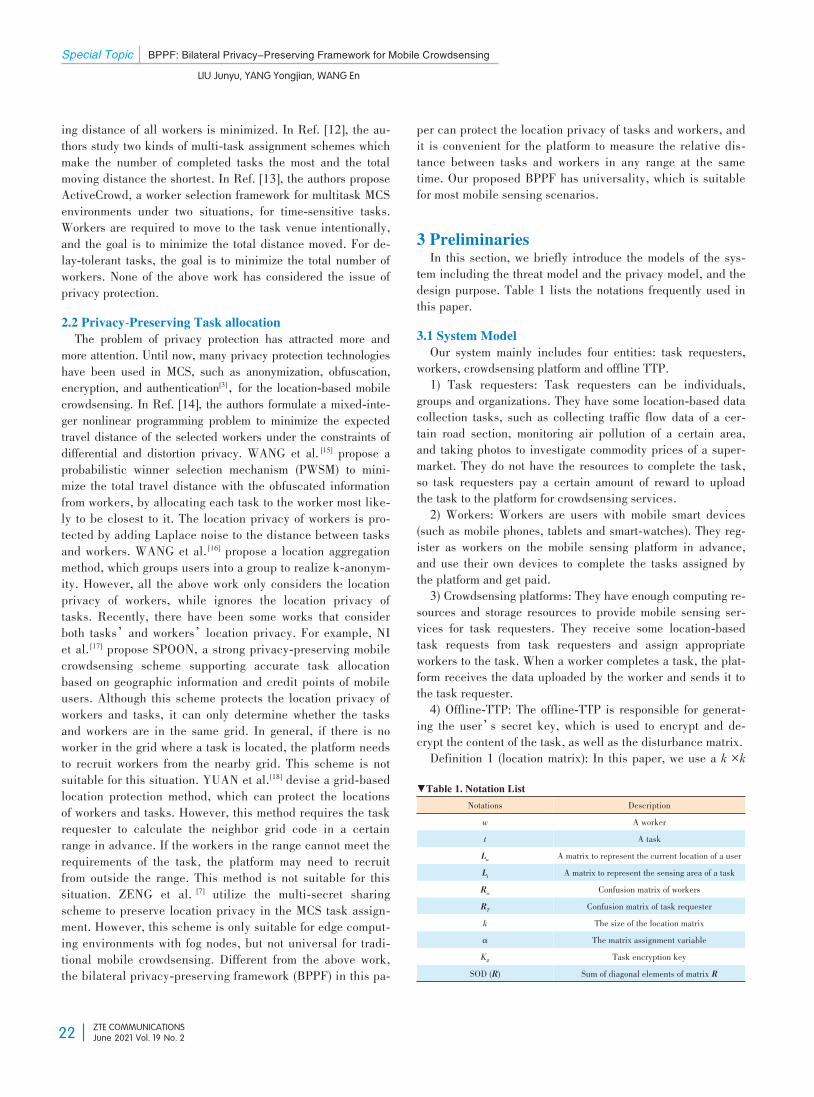
Special Topic BPPF: Bilateral Privacy-Preserving Framework for Mobile Crowdsensing
LIU Junyu, YANG Yongjian, WANG En
ZTE COMMUNICATIONSJune 2021 Vol. 19 No. 2
ing distance of all workers is minimized. In Ref. [12], the au⁃thors study two kinds of multi-task assignment schemes whichmake the number of completed tasks the most and the totalmoving distance the shortest. In Ref. [13], the authors proposeActiveCrowd, a worker selection framework for multitask MCSenvironments under two situations, for time-sensitive tasks.Workers are required to move to the task venue intentionally,and the goal is to minimize the total distance moved. For de⁃lay-tolerant tasks, the goal is to minimize the total number ofworkers. None of the above work has considered the issue ofprivacy protection.2.2 Privacy-Preserving Task allocationThe problem of privacy protection has attracted more and
more attention. Until now, many privacy protection technologieshave been used in MCS, such as anonymization, obfuscation,encryption, and authentication[3],for the location-based mobilecrowdsensing. In Ref. [14], the authors formulate a mixed-inte⁃ger nonlinear programming problem to minimize the expectedtravel distance of the selected workers under the constraints ofdifferential and distortion privacy. WANG et al. [15] propose aprobabilistic winner selection mechanism (PWSM) to mini⁃mize the total travel distance with the obfuscated informationfrom workers, by allocating each task to the worker most like⁃ly to be closest to it. The location privacy of workers is pro⁃tected by adding Laplace noise to the distance between tasksand workers. WANG et al. [16] propose a location aggregationmethod, which groups users into a group to realize k-anonym⁃ity. However, all the above work only considers the locationprivacy of workers, while ignores the location privacy oftasks. Recently, there have been some works that considerboth tasks’and workers’location privacy. For example, NIet al. [17] propose SPOON, a strong privacy-preserving mobilecrowdsensing scheme supporting accurate task allocationbased on geographic information and credit points of mobileusers. Although this scheme protects the location privacy ofworkers and tasks, it can only determine whether the tasksand workers are in the same grid. In general, if there is noworker in the grid where a task is located, the platform needsto recruit workers from the nearby grid. This scheme is notsuitable for this situation. YUAN et al.[18] devise a grid-basedlocation protection method, which can protect the locationsof workers and tasks. However, this method requires the taskrequester to calculate the neighbor grid code in a certainrange in advance. If the workers in the range cannot meet therequirements of the task, the platform may need to recruitfrom outside the range. This method is not suitable for thissituation. ZENG et al. [7] utilize the multi-secret sharingscheme to preserve location privacy in the MCS task assign⁃ment. However, this scheme is only suitable for edge comput⁃ing environments with fog nodes, but not universal for tradi⁃tional mobile crowdsensing. Different from the above work,the bilateral privacy-preserving framework (BPPF) in this pa⁃
per can protect the location privacy of tasks and workers, andit is convenient for the platform to measure the relative dis⁃tance between tasks and workers in any range at the sametime. Our proposed BPPF has universality, which is suitablefor most mobile sensing scenarios.
3 PreliminariesIn this section, we briefly introduce the models of the sys⁃
tem including the threat model and the privacy model, and thedesign purpose. Table 1 lists the notations frequently used inthis paper.3.1 System ModelOur system mainly includes four entities: task requesters,
workers, crowdsensing platform and offline TTP.1) Task requesters: Task requesters can be individuals,
groups and organizations. They have some location-based datacollection tasks, such as collecting traffic flow data of a cer⁃tain road section, monitoring air pollution of a certain area,and taking photos to investigate commodity prices of a super⁃market. They do not have the resources to complete the task,so task requesters pay a certain amount of reward to uploadthe task to the platform for crowdsensing services.2) Workers: Workers are users with mobile smart devices
(such as mobile phones, tablets and smart-watches). They reg⁃ister as workers on the mobile sensing platform in advance,and use their own devices to complete the tasks assigned bythe platform and get paid.3) Crowdsensing platforms: They have enough computing re⁃
sources and storage resources to provide mobile sensing ser⁃vices for task requesters. They receive some location-basedtask requests from task requesters and assign appropriateworkers to the task. When a worker completes a task, the plat⁃form receives the data uploaded by the worker and sends it tothe task requester.4) Offline-TTP: The offline-TTP is responsible for generat⁃
ing the user’s secret key, which is used to encrypt and de⁃crypt the content of the task, as well as the disturbance matrix.Definition 1 (location matrix): In this paper, we use a k ×k
▼Table 1. Notation ListNotations
w
t
Lw
Lt
Rw
RT
k
α
K#SOD (R)
DescriptionA workerA task
A matrix to represent the current location of a userA matrix to represent the sensing area of a task
Confusion matrix of workersConfusion matrix of task requesterThe size of the location matrixThe matrix assignment variable
Task encryption keySum of diagonal elements of matrix R
22
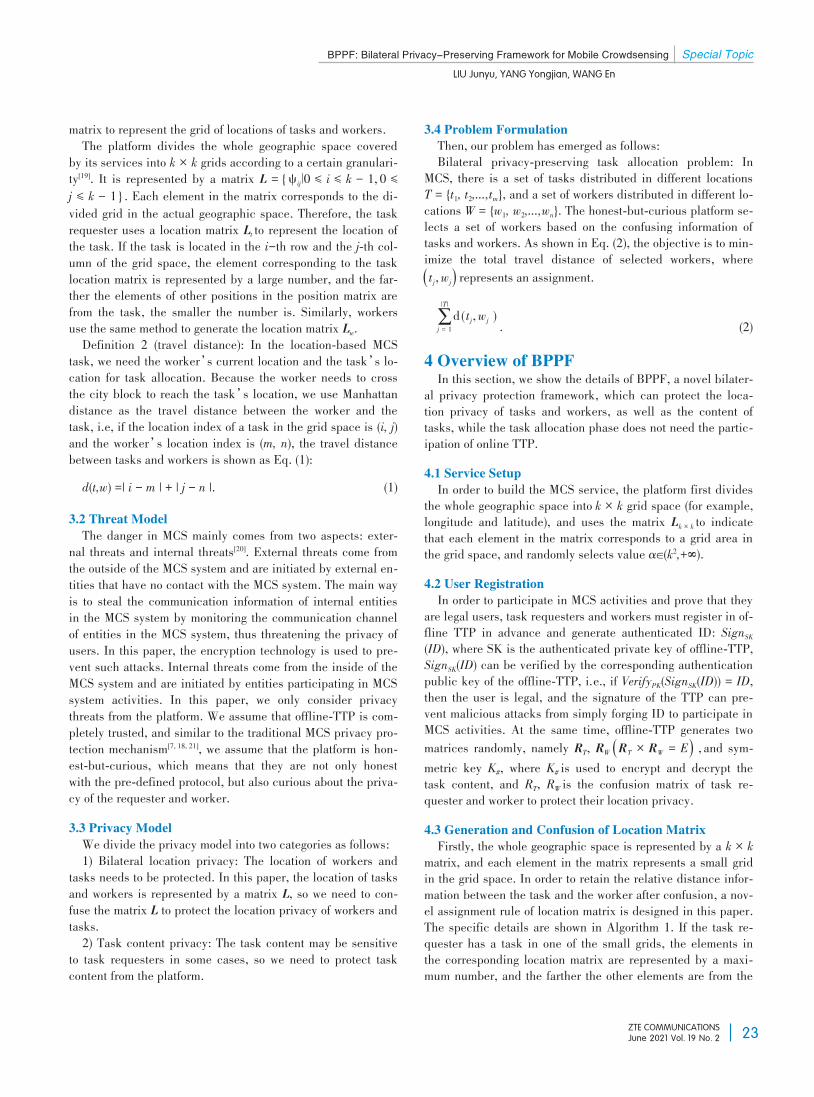
BPPF: Bilateral Privacy-Preserving Framework for Mobile Crowdsensing Special Topic
LIU Junyu, YANG Yongjian, WANG En
ZTE COMMUNICATIONSJune 2021 Vol. 19 No. 2
matrix to represent the grid of locations of tasks and workers.The platform divides the whole geographic space covered
by its services into k × k grids according to a certain granulari⁃ty[19]. It is represented by a matrix L = { ψ ij∣0 ≤ i ≤ k - 1, 0 ≤j ≤ k - 1} . Each element in the matrix corresponds to the di⁃vided grid in the actual geographic space. Therefore, the taskrequester uses a location matrix Lt to represent the location ofthe task. If the task is located in the i-th row and the j-th col⁃umn of the grid space, the element corresponding to the tasklocation matrix is represented by a large number, and the far⁃ther the elements of other positions in the position matrix arefrom the task, the smaller the number is. Similarly, workersuse the same method to generate the location matrix Lw.Definition 2 (travel distance): In the location-based MCStask, we need the worker’s current location and the task’s lo⁃cation for task allocation. Because the worker needs to crossthe city block to reach the task’s location, we use Manhattandistance as the travel distance between the worker and thetask, i.e, if the location index of a task in the grid space is (i, j)and the worker’s location index is (m, n), the travel distancebetween tasks and workers is shown as Eq. (1):d(t,w) =| i − m | + | j − n |. (1)
3.2 Threat ModelThe danger in MCS mainly comes from two aspects: exter⁃
nal threats and internal threats[20]. External threats come fromthe outside of the MCS system and are initiated by external en⁃tities that have no contact with the MCS system. The main wayis to steal the communication information of internal entitiesin the MCS system by monitoring the communication channelof entities in the MCS system, thus threatening the privacy ofusers. In this paper, the encryption technology is used to pre⁃vent such attacks. Internal threats come from the inside of theMCS system and are initiated by entities participating in MCSsystem activities. In this paper, we only consider privacythreats from the platform. We assume that offline-TTP is com⁃pletely trusted, and similar to the traditional MCS privacy pro⁃tection mechanism[7, 18, 21], we assume that the platform is hon⁃est-but-curious, which means that they are not only honestwith the pre-defined protocol, but also curious about the priva⁃cy of the requester and worker.3.3 Privacy ModelWe divide the privacy model into two categories as follows:1) Bilateral location privacy: The location of workers and
tasks needs to be protected. In this paper, the location of tasksand workers is represented by a matrix L, so we need to con⁃fuse the matrix L to protect the location privacy of workers andtasks.2) Task content privacy: The task content may be sensitive
to task requesters in some cases, so we need to protect taskcontent from the platform.
3.4 Problem FormulationThen, our problem has emerged as follows:Bilateral privacy-preserving task allocation problem: In
MCS, there is a set of tasks distributed in different locationsT = {t1, t2,...,tm}, and a set of workers distributed in different lo⁃cations W = {w1, w2,...,wn}. The honest-but-curious platform se⁃lects a set of workers based on the confusing information oftasks and workers. As shown in Eq. (2), the objective is to min⁃imize the total travel distance of selected workers, where(tj,wj) represents an assignment.
∑j = 1
|T| d ( tj,wj ) . (2)4 Overview of BPPFIn this section, we show the details of BPPF, a novel bilater⁃
al privacy protection framework, which can protect the loca⁃tion privacy of tasks and workers, as well as the content oftasks, while the task allocation phase does not need the partic⁃ipation of online TTP.4.1 Service SetupIn order to build the MCS service, the platform first divides
the whole geographic space into k × k grid space (for example,longitude and latitude), and uses the matrix Lk × k to indicatethat each element in the matrix corresponds to a grid area inthe grid space, and randomly selects value α∈(k2,+∞).4.2 User RegistrationIn order to participate in MCS activities and prove that they
are legal users, task requesters and workers must register in of⁃fline TTP in advance and generate authenticated ID: SignSK(ID), where SK is the authenticated private key of offline-TTP,SignSK(ID) can be verified by the corresponding authenticationpublic key of the offline-TTP, i.e., if VerifyPK(SignSK(ID)) = ID,then the user is legal, and the signature of the TTP can pre⁃vent malicious attacks from simply forging ID to participate inMCS activities. At the same time, offline-TTP generates twomatrices randomly, namely RT, RW (RT × RW = E) , and sym⁃metric key K#, where K# is used to encrypt and decrypt thetask content, and RT, RW is the confusion matrix of task re⁃quester and worker to protect their location privacy.4.3 Generation and Confusion of Location MatrixFirstly, the whole geographic space is represented by a k × k
matrix, and each element in the matrix represents a small gridin the grid space. In order to retain the relative distance infor⁃mation between the task and the worker after confusion, a nov⁃el assignment rule of location matrix is designed in this paper.The specific details are shown in Algorithm 1. If the task re⁃quester has a task in one of the small grids, the elements inthe corresponding location matrix are represented by a maxi⁃mum number, and the farther the other elements are from the
23
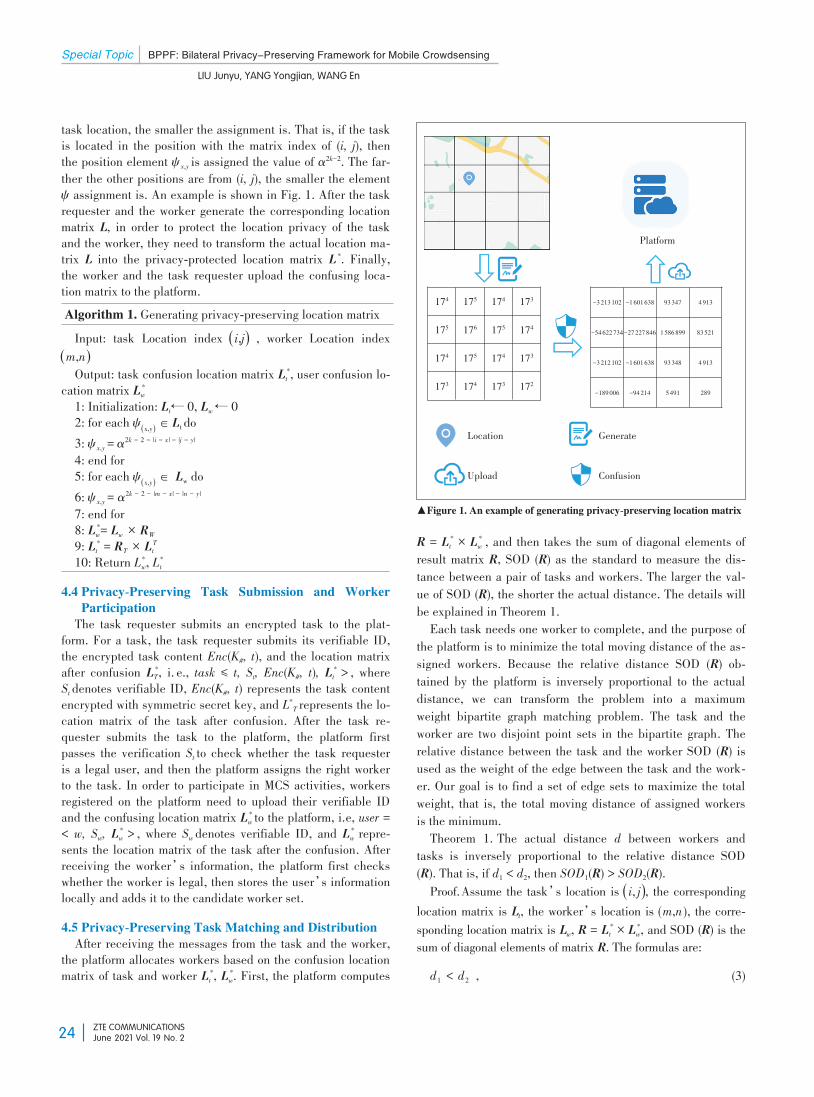
Special Topic BPPF: Bilateral Privacy-Preserving Framework for Mobile Crowdsensing
LIU Junyu, YANG Yongjian, WANG En
ZTE COMMUNICATIONSJune 2021 Vol. 19 No. 2
task location, the smaller the assignment is. That is, if the taskis located in the position with the matrix index of (i, j), thenthe position element ψx,y is assigned the value of α2k−2. The far⁃ther the other positions are from (i, j), the smaller the elementψ assignment is. An example is shown in Fig. 1. After the taskrequester and the worker generate the corresponding locationmatrix L, in order to protect the location privacy of the taskand the worker, they need to transform the actual location ma⁃trix L into the privacy-protected location matrix L *. Finally,the worker and the task requester upload the confusing loca⁃tion matrix to the platform.Algorithm 1. Generating privacy-preserving location matrixInput: task Location index (i,j) , worker Location index
(m,n)Output: task confusion location matrix L *t , user confusion lo⁃cation matrix L *
w1: Initialization: L t← 0, Lw← 02: for each ψ( )x,y ∈ L t do3: ψx,y= α2k - 2 - |i - x| - |j - y|4: end for5: for each ψ( )x,y ∈ Lw do6: ψx,y= α2k - 2 - |m - x| - |n - y|7: end for8: L *
w= Lw × RW9: L *t = RT × L T
t10: Return L*w, L*t4.4 Privacy-Preserving Task Submission and Worker
ParticipationThe task requester submits an encrypted task to the plat⁃
form. For a task, the task requester submits its verifiable ID,the encrypted task content Enc(K#, t), and the location matrixafter confusion L *
T, i. e., task ≤ t, St, Enc(K#, t), L *t > , where
St denotes verifiable ID, Enc(K#, t) represents the task contentencrypted with symmetric secret key, and L*T represents the lo⁃cation matrix of the task after confusion. After the task re⁃quester submits the task to the platform, the platform firstpasses the verification St to check whether the task requesteris a legal user, and then the platform assigns the right workerto the task. In order to participate in MCS activities, workersregistered on the platform need to upload their verifiable IDand the confusing location matrix L *
w to the platform, i.e, user =< w, Sw, L *
w > , where Sw denotes verifiable ID, and L *w repre⁃sents the location matrix of the task after the confusion. After
receiving the worker’s information, the platform first checkswhether the worker is legal, then stores the user’s informationlocally and adds it to the candidate worker set.4.5 Privacy-Preserving Task Matching and DistributionAfter receiving the messages from the task and the worker,
the platform allocates workers based on the confusion locationmatrix of task and worker L *
t , L *w. First, the platform computes
R = L *t × L *
w , and then takes the sum of diagonal elements ofresult matrix R, SOD (R) as the standard to measure the dis⁃tance between a pair of tasks and workers. The larger the val⁃ue of SOD (R), the shorter the actual distance. The details willbe explained in Theorem 1.Each task needs one worker to complete, and the purpose of
the platform is to minimize the total moving distance of the as⁃signed workers. Because the relative distance SOD (R) ob⁃tained by the platform is inversely proportional to the actualdistance, we can transform the problem into a maximumweight bipartite graph matching problem. The task and theworker are two disjoint point sets in the bipartite graph. Therelative distance between the task and the worker SOD (R) isused as the weight of the edge between the task and the work⁃er. Our goal is to find a set of edge sets to maximize the totalweight, that is, the total moving distance of assigned workersis the minimum.Theorem 1. The actual distance d between workers and
tasks is inversely proportional to the relative distance SOD(R). That is, if d1 < d2, then SOD1(R) > SOD2(R).Proof.Assume the task’s location is (i, j), the corresponding
location matrix is Lt, the worker’s location is (m,n ), the corre⁃sponding location matrix is Lw, R = L *
t × L *w, and SOD (R) is thesum of diagonal elements of matrix R. The formulas are:
d1 < d2 , (3)
▲Figure 1. An example of generating privacy-preserving location matrix
174
175
174
173
175
176
175
174
174
175
174
173
173
174
173
172
-3213102
-54622734
-3212102
-189006
-1601638
-27227846
-1601638
-94214
93347
1586899
93348
5491
4913
83521
4913
289
Location
Upload
Generate
Confusion
Platform
24
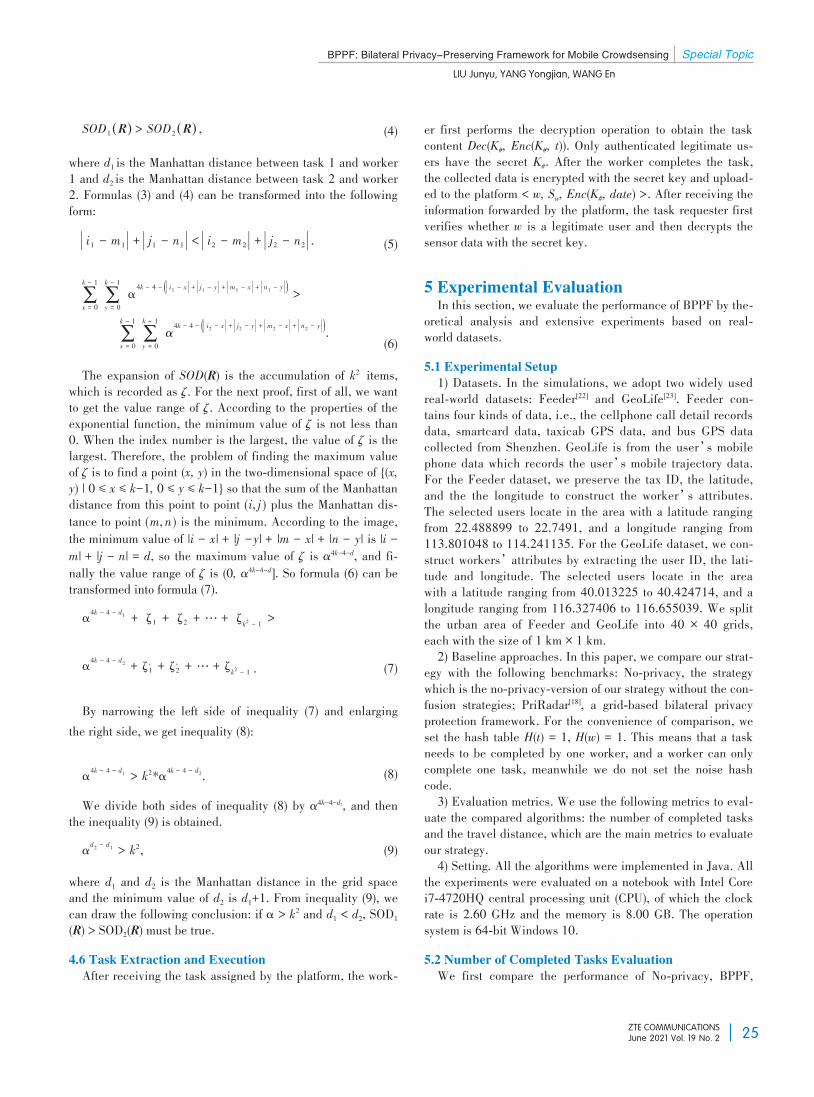
BPPF: Bilateral Privacy-Preserving Framework for Mobile Crowdsensing Special Topic
LIU Junyu, YANG Yongjian, WANG En
ZTE COMMUNICATIONSJune 2021 Vol. 19 No. 2
SOD1 (R) > SOD2 (R) , (4)where d1 is the Manhattan distance between task 1 and worker1 and d2 is the Manhattan distance between task 2 and worker2. Formulas (3) and (4) can be transformed into the followingform:| i1 - m1 | + | j1 - n1 | < | i2 - m2 | + | j2 - n2 |. (5)
∑x = 0
k - 1 ∑y = 0
k - 1 α4k - 4 - ( )||
|| i1 - x + |
||| j1 - y + |
|||m1 - x + |
||| n1 - y >
∑x = 0
k - 1 ∑y = 0
k - 1α4k - 4 - ( )|
||| i2 - x + |
||| j2 - y + |
|||m2 - x + |
||| n2 - y . (6)
The expansion of SOD(R) is the accumulation of k2 items,which is recorded as ζ. For the next proof, first of all, we wantto get the value range of ζ. According to the properties of theexponential function, the minimum value of ζ is not less than0. When the index number is the largest, the value of ζ is thelargest. Therefore, the problem of finding the maximum valueof ζ is to find a point (x, y) in the two-dimensional space of {(x,y) | 0 ≤ x ≤ k−1, 0 ≤ y ≤ k−1} so that the sum of the Manhattandistance from this point to point (i, j ) plus the Manhattan dis⁃tance to point (m, n ) is the minimum. According to the image,the minimum value of |i - x| + |j -y| + |m - x| + |n - y| is |i -m| + |j - n| = d, so the maximum value of ζ is α4k−4−d, and fi⁃nally the value range of ζ is (0, α4k−4−d]. So formula (6) can betransformed into formula (7).α4k - 4 - d1 + ζ1 + ζ2 + … + ζk2 - 1 >
α4k - 4 - d2 + ζ,1 + ζ,2 + … + ζk2 - 1 . (7)
By narrowing the left side of inequality (7) and enlargingthe right side, we get inequality (8):
α4k - 4 - d1 > k2*α4k - 4 - d2. (8)We divide both sides of inequality (8) by α4k−4−d2, and then
the inequality (9) is obtained.αd2 - d1 > k2, (9)
where d1 and d2 is the Manhattan distance in the grid spaceand the minimum value of d2 is d1+1. From inequality (9), wecan draw the following conclusion: if α > k2 and d1 < d2, SOD1(R) > SOD2(R) must be true.4.6 Task Extraction and ExecutionAfter receiving the task assigned by the platform, the work⁃
er first performs the decryption operation to obtain the taskcontent Dec(K#, Enc(K#, t)). Only authenticated legitimate us⁃ers have the secret K#. After the worker completes the task,the collected data is encrypted with the secret key and upload⁃ed to the platform < w, Sw, Enc(K#, date) >. After receiving theinformation forwarded by the platform, the task requester firstverifies whether w is a legitimate user and then decrypts thesensor data with the secret key.
5 Experimental EvaluationIn this section, we evaluate the performance of BPPF by the⁃
oretical analysis and extensive experiments based on real⁃world datasets.5.1 Experimental Setup1) Datasets. In the simulations, we adopt two widely used
real-world datasets: Feeder[22] and GeoLife[23]. Feeder con⁃tains four kinds of data, i.e., the cellphone call detail recordsdata, smartcard data, taxicab GPS data, and bus GPS datacollected from Shenzhen. GeoLife is from the user’s mobilephone data which records the user’s mobile trajectory data.For the Feeder dataset, we preserve the tax ID, the latitude,and the the longitude to construct the worker’s attributes.The selected users locate in the area with a latitude rangingfrom 22.488899 to 22.7491, and a longitude ranging from113.801048 to 114.241135. For the GeoLife dataset, we con⁃struct workers’attributes by extracting the user ID, the lati⁃tude and longitude. The selected users locate in the areawith a latitude ranging from 40.013225 to 40.424714, and alongitude ranging from 116.327406 to 116.655039. We splitthe urban area of Feeder and GeoLife into 40 × 40 grids,each with the size of 1 km × 1 km.2) Baseline approaches. In this paper, we compare our strat⁃
egy with the following benchmarks: No-privacy, the strategywhich is the no-privacy-version of our strategy without the con⁃fusion strategies; PriRadar[18], a grid-based bilateral privacyprotection framework. For the convenience of comparison, weset the hash table H(t) = 1, H(w) = 1. This means that a taskneeds to be completed by one worker, and a worker can onlycomplete one task, meanwhile we do not set the noise hashcode.3) Evaluation metrics. We use the following metrics to eval⁃
uate the compared algorithms: the number of completed tasksand the travel distance, which are the main metrics to evaluateour strategy.4) Setting. All the algorithms were implemented in Java. All
the experiments were evaluated on a notebook with Intel Corei7-4720HQ central processing unit (CPU), of which the clockrate is 2.60 GHz and the memory is 8.00 GB. The operationsystem is 64-bit Windows 10.5.2 Number of Completed Tasks EvaluationWe first compare the performance of No-privacy, BPPF,
25
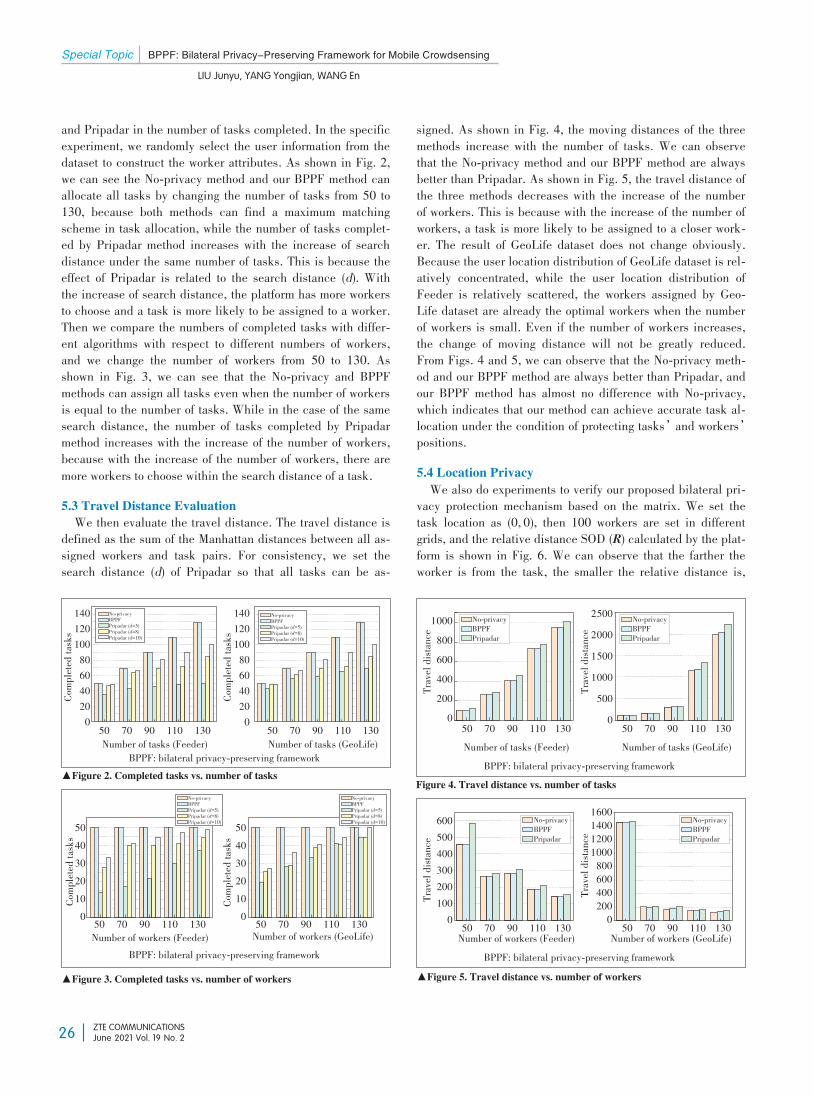
Special Topic BPPF: Bilateral Privacy-Preserving Framework for Mobile Crowdsensing
LIU Junyu, YANG Yongjian, WANG En
ZTE COMMUNICATIONSJune 2021 Vol. 19 No. 2
and Pripadar in the number of tasks completed. In the specificexperiment, we randomly select the user information from thedataset to construct the worker attributes. As shown in Fig. 2,we can see the No-privacy method and our BPPF method canallocate all tasks by changing the number of tasks from 50 to130, because both methods can find a maximum matchingscheme in task allocation, while the number of tasks complet⁃ed by Pripadar method increases with the increase of searchdistance under the same number of tasks. This is because theeffect of Pripadar is related to the search distance (d). Withthe increase of search distance, the platform has more workersto choose and a task is more likely to be assigned to a worker.Then we compare the numbers of completed tasks with differ⁃ent algorithms with respect to different numbers of workers,and we change the number of workers from 50 to 130. Asshown in Fig. 3, we can see that the No-privacy and BPPFmethods can assign all tasks even when the number of workersis equal to the number of tasks. While in the case of the samesearch distance, the number of tasks completed by Pripadarmethod increases with the increase of the number of workers,because with the increase of the number of workers, there aremore workers to choose within the search distance of a task.5.3 Travel Distance EvaluationWe then evaluate the travel distance. The travel distance is
defined as the sum of the Manhattan distances between all as⁃signed workers and task pairs. For consistency, we set thesearch distance (d) of Pripadar so that all tasks can be as⁃
signed. As shown in Fig. 4, the moving distances of the threemethods increase with the number of tasks. We can observethat the No-privacy method and our BPPF method are alwaysbetter than Pripadar. As shown in Fig. 5, the travel distance ofthe three methods decreases with the increase of the numberof workers. This is because with the increase of the number ofworkers, a task is more likely to be assigned to a closer work⁃er. The result of GeoLife dataset does not change obviously.Because the user location distribution of GeoLife dataset is rel⁃atively concentrated, while the user location distribution ofFeeder is relatively scattered, the workers assigned by Geo⁃Life dataset are already the optimal workers when the numberof workers is small. Even if the number of workers increases,the change of moving distance will not be greatly reduced.From Figs. 4 and 5, we can observe that the No-privacy meth⁃od and our BPPF method are always better than Pripadar, andour BPPF method has almost no difference with No-privacy,which indicates that our method can achieve accurate task al⁃location under the condition of protecting tasks’and workers’positions.5.4 Location PrivacyWe also do experiments to verify our proposed bilateral pri⁃
vacy protection mechanism based on the matrix. We set thetask location as (0, 0), then 100 workers are set in differentgrids, and the relative distance SOD (R) calculated by the plat⁃form is shown in Fig. 6. We can observe that the farther theworker is from the task, the smaller the relative distance is,
50 70 90 110 130
▲Figure 2. Completed tasks vs. number of tasks
▲Figure 3. Completed tasks vs. number of workers
Figure 4. Travel distance vs. number of tasks
▲Figure 5. Travel distance vs. number of workers
Number of tasks (Feeder)50 70 90 110 130
Traveldistance
10008006004002000
Traveldistance
25002000150010005000
50 70 90 110 130
6005004003002001000
Traveldistance
No-privacyBPPFPripadar
16001400120010008006004002000
Traveldistance
50 70 90 110 130
No-privacyBPPFPripadar
No-privacyBPPFPripadar
No-privacyBPPFPripadar
BPPF: bilateral privacy-preserving framework BPPF: bilateral privacy-preserving framework
BPPF: bilateral privacy-preserving framework BPPF: bilateral privacy-preserving framework
Completedtask
s
140120100806040200 50 70 90 110 130
No-privacyBPPFPripadar (d=5)Pripadar (d=8)Pripadar (d=10)
No-privacyBPPFPripadar (d=5)Pripadar (d=8)Pripadar (d=10)
Completedtask
s
140120100806040200 50 70 90 110 130
Number of tasks (GeoLife)
50 70 90 110 130Number of workers (Feeder)
Completedtask
s 50403020100
No-privacyBPPFPripadar (d=5)Pripadar (d=8)Pripadar (d=10)
Completedtask
s 50403020100Number of workers (GeoLife)50 70 90 110 130
No-privacyBPPFPripadar (d=5)Pripadar (d=8)Pripadar (d=10)
Number of tasks (Feeder) Number of tasks (GeoLife)
Number of workers (Feeder) Number of workers (GeoLife)
26
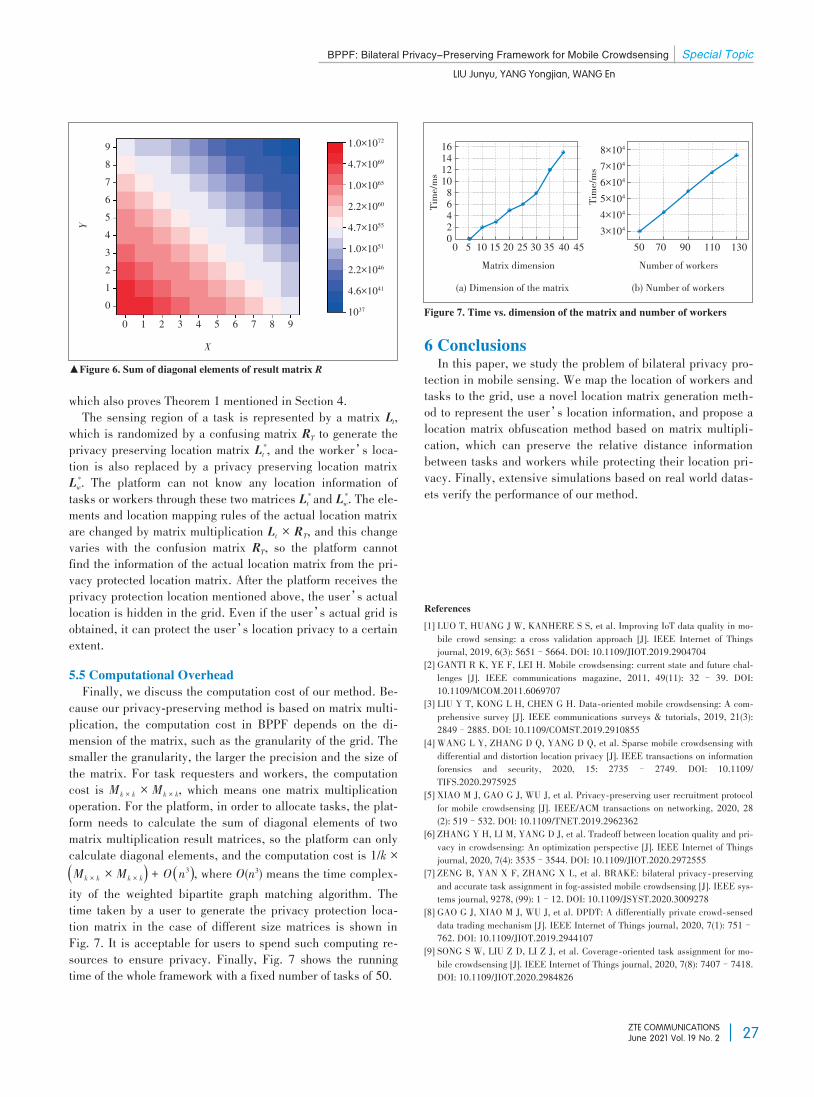
BPPF: Bilateral Privacy-Preserving Framework for Mobile Crowdsensing Special Topic
LIU Junyu, YANG Yongjian, WANG En
ZTE COMMUNICATIONSJune 2021 Vol. 19 No. 2
which also proves Theorem 1 mentioned in Section 4.The sensing region of a task is represented by a matrix Lt,which is randomized by a confusing matrix RT to generate theprivacy preserving location matrix L *
t , and the worker’s loca⁃tion is also replaced by a privacy preserving location matrixL *w. The platform can not know any location information oftasks or workers through these two matrices L *
t and L *w. The ele⁃ments and location mapping rules of the actual location matrix
are changed by matrix multiplication L t × RT, and this changevaries with the confusion matrix RT, so the platform cannotfind the information of the actual location matrix from the pri⁃vacy protected location matrix. After the platform receives theprivacy protection location mentioned above, the user’s actuallocation is hidden in the grid. Even if the user’s actual grid isobtained, it can protect the user’s location privacy to a certainextent.5.5 Computational OverheadFinally, we discuss the computation cost of our method. Be⁃
cause our privacy-preserving method is based on matrix multi⁃plication, the computation cost in BPPF depends on the di⁃mension of the matrix, such as the granularity of the grid. Thesmaller the granularity, the larger the precision and the size ofthe matrix. For task requesters and workers, the computationcost is Mk × k × Mk × k, which means one matrix multiplicationoperation. For the platform, in order to allocate tasks, the plat⁃form needs to calculate the sum of diagonal elements of twomatrix multiplication result matrices, so the platform can onlycalculate diagonal elements, and the computation cost is 1/k ×(Mk × k × Mk × k) + O (n3), where O(n3) means the time complex⁃ity of the weighted bipartite graph matching algorithm. Thetime taken by a user to generate the privacy protection loca⁃tion matrix in the case of different size matrices is shown inFig. 7. It is acceptable for users to spend such computing re⁃sources to ensure privacy. Finally, Fig. 7 shows the runningtime of the whole framework with a fixed number of tasks of 50.
6 ConclusionsIn this paper, we study the problem of bilateral privacy pro⁃
tection in mobile sensing. We map the location of workers andtasks to the grid, use a novel location matrix generation meth⁃od to represent the user’s location information, and propose alocation matrix obfuscation method based on matrix multipli⁃cation, which can preserve the relative distance informationbetween tasks and workers while protecting their location pri⁃vacy. Finally, extensive simulations based on real world datas⁃ets verify the performance of our method.
References
[1] LUO T, HUANG J W, KANHERE S S, et al. Improving IoT data quality in mo⁃bile crowd sensing: a cross validation approach [J]. IEEE Internet of Thingsjournal, 2019, 6(3): 5651–5664. DOI: 10.1109/JIOT.2019.2904704
[2] GANTI R K, YE F, LEI H. Mobile crowdsensing: current state and future chal⁃lenges [J]. IEEE communications magazine, 2011, 49(11): 32 – 39. DOI:10.1109/MCOM.2011.6069707
[3] LIU Y T, KONG L H, CHEN G H. Data⁃oriented mobile crowdsensing: A com⁃prehensive survey [J]. IEEE communications surveys & tutorials, 2019, 21(3):2849–2885. DOI: 10.1109/COMST.2019.2910855
[4] WANG L Y, ZHANG D Q, YANG D Q, et al. Sparse mobile crowdsensing withdifferential and distortion location privacy [J]. IEEE transactions on informationforensics and security, 2020, 15: 2735 – 2749. DOI: 10.1109/TIFS.2020.2975925
[5] XIAO M J, GAO G J, WU J, et al. Privacy⁃preserving user recruitment protocolfor mobile crowdsensing [J]. IEEE/ACM transactions on networking, 2020, 28(2): 519–532. DOI: 10.1109/TNET.2019.2962362
[6] ZHANG Y H, LI M, YANG D J, et al. Tradeoff between location quality and pri⁃vacy in crowdsensing: An optimization perspective [J]. IEEE Internet of Thingsjournal, 2020, 7(4): 3535–3544. DOI: 10.1109/JIOT.2020.2972555
[7] ZENG B, YAN X F, ZHANG X L, et al. BRAKE: bilateral privacy⁃preservingand accurate task assignment in fog⁃assisted mobile crowdsensing [J]. IEEE sys⁃tems journal, 9278, (99): 1–12. DOI: 10.1109/JSYST.2020.3009278
[8] GAO G J, XIAO M J, WU J, et al. DPDT: A differentially private crowd⁃senseddata trading mechanism [J]. IEEE Internet of Things journal, 2020, 7(1): 751–762. DOI: 10.1109/JIOT.2019.2944107
[9] SONG S W, LIU Z D, LI Z J, et al. Coverage⁃oriented task assignment for mo⁃bile crowdsensing [J]. IEEE Internet of Things journal, 2020, 7(8): 7407–7418.DOI: 10.1109/JIOT.2020.2984826
▲Figure 6. Sum of diagonal elements of result matrix R
Figure 7. Time vs. dimension of the matrix and number of workers
9876543210
Y
0 1 2 3 4 5 6 7 8 9X
1.0×10724.7×10691.0×10652.2×10604.7×10551.0×10512.2×10464.6×10411037
Matrix dimension(a) Dimension of the matrix (b) Number of workers
Number of workers50 70 90 110 130
Time/ms
8×1047×1046×1045×1044×1043×104
1614121086420
Time/ms
0 5 10 15 20 25 30 35 40 45
27
Special Topic BPPF: Bilateral Privacy-Preserving Framework for Mobile Crowdsensing
LIU Junyu, YANG Yongjian, WANG En
ZTE COMMUNICATIONSJune 2021 Vol. 19 No. 2
[10] WANG T, XIE X K, CAO X, et al. On efficient and scalable time⁃continuousspatial crowdsourcing: full version [EB/OL]. (2020⁃10⁃29) [2021⁃01⁃25]. https://arxiv.org/abs/2010.15404
[11] AKTER S, YOON S. Location ⁃ aware task assignment and routing in mobilecrowd sensing [C]//2020 International Conference on Information and Communi⁃cation Technology Convergence (ICTC). Jeju, Korea (South): IEEE, 2020: 51–53. DOI: 10.1109/ICTC49870.2020.9289316
[12] LIU Y, GUO B, WANG Y, et al. TaskMe: multi ⁃ task allocation in mobilecrowd sensing[C]//Proceedings of the 2016 ACM International Joint Confer⁃ence on Pervasive and Ubiquitous Computing. Heidelberg, Germany: ACM,2016: 403–414. DOI: 10.1145/2971648.2971709
[13] GUO B, LIU Y, WU W L, et al. ActiveCrowd: A framework for optimized multi⁃task allocation in mobile crowdsensing systems [J]. IEEE transactions on hu⁃man ⁃ machine systems, 2017, 47(3): 392 – 403. DOI: 10.1109/THMS.2016.2599489
[14] WANG L Y, YANG D Q, HAN X, et al. Mobile crowdsourcing task allocationwith differential ⁃ and ⁃ distortion geoobfuscation [J]. IEEE transactions on de⁃pendable and secure computing, 2021, 18(2): 967– 981. DOI: 10.1109/TD⁃SC.2019.2912886
[15] WANG Z B, HU J H, LV R, et al. Personalized privacy⁃preserving task alloca⁃tion for mobile crowdsensing [J]. IEEE transactions on mobile computing,2019, 18(6): 1330–1341. DOI: 10.1109/TMC.2018.2861393
[16] WANG X, LIU Z, TIAN X H, et al. Incentivizing crowdsensing with location⁃privacy preserving [J]. IEEE transactions on wireless communications, 2017,16(10): 6940–6952. DOI: 10.1109/TWC.2017.2734758
[17] NI J B, ZHANG K, XIA Q, et al. Enabling strong privacy preservation and ac⁃curate task allocation for mobile crowdsensing [J]. IEEE transactions on mo⁃bile computing, 2020, 19(6): 1317–1331. DOI: 10.1109/TMC.2019.2908638
[18] YUAN D, LI Q, LI G L, et al. PriRadar: A privacy⁃preserving framework forspatial crowdsourcing [J]. IEEE transactions on information forensics and secu⁃rity, 2020, 15: 299–314. DOI: 10.1109/TIFS.2019.2913232
[19] YAN K, LUO G C, ZHENG X, et al. A comprehensive location⁃privacy⁃aware⁃ness task selection mechanism in mobile crowd ⁃ sensing [J]. IEEE access,2019, 7: 77541–77554. DOI: 10.1109/ACCESS.2019.2921274
[20] GISDAKIS S, GIANNETSOS T, PAPADIMITRATOS P. Security, privacy, andincentive provision for mobile crowd sensing systems [J]. IEEE Internet ofThings journal, 2016, 3(5): 839–853. DOI: 10.1109/JIOT.2016.2560768
[21] ZHUO G Q, JIA Q, GUO L K, et al. Privacy⁃preserving verifiable data aggrega⁃tion and analysis for cloud ⁃ assisted mobile crowdsourcing[C]//IEEE INFO⁃COM 2016 ⁃ The 35th Annual IEEE International Conference on ComputerCommunications. San Francisco, USA: IEEE, 2016: 1–9. DOI: 10.1109/IN⁃FOCOM.2016.7524547
[22] ZHANG D S, ZHAO J J, ZHANG F, et al. Feeder: supporting last⁃mile transitwith extreme⁃scale urban infrastructure data [C]//Proceedings of the 14th Inter⁃national Conference on Information Processing in Sensor Networks. Seattle,USA: IPSN, 2015: 226–237. DOI: 10.1145/2737095.2737121
[23] ZHENG Y, ZHANG L Z, XIE X, et al. Mining interesting locations and travelsequences from GPS trajectories [C]//Proceedings of the 18th international con⁃ference on World Wide Web. Madrid, Spain: ACM, 2009: 791– 800. DOI:10.1145/1526709.1526816
BiographiesLIU Junyu received his bachelor’s degree in computer science and technologyfrom Jilin University, China in 2019. Currently, he is pursuing for the master’sdegree in computer science and technology at Jilin University. His current re⁃search interests include mobile crowdsensing and privacy preserving in mobilecomputing.
YANG Yongjian received his B.E. degree in automatization from Jilin Univer⁃sity of Technology, China in 1983, M. E. degree in computer communicationfrom Beijing University of Post and Telecommunications, China in 1991, andPh.D. in software and theory of computer from Jilin University, China in 2005.He is currently a professor and a Ph.D. supervisor at Jilin University, Directorof Key lab under the Ministry of Information Industry, and Standing Director ofthe Communication Academy. His research interests include network intelli⁃gence management, wireless mobile communication and services, and wirelessmobile communication.
WANG En ([email protected]) received his B.E. degree in software engineer⁃ing from Jilin University, China in 2011, and his M.E. degree and Ph.D. in com⁃puter science and technology from Jilin University in 2013 and 2016. He is cur⁃rently an associate professor in the Department of Computer Science and Tech⁃nology, Jilin University. His current research interests include the efficient utili⁃zation of network resources, scheduling and drop strategy in terms of buffer-management, energy-efficient communication between human-carried devices,and mobile crowdsensing.
28
ZTE COMMUNICATIONSJune 2021 Vol. 19 No. 2
MaximumMaximum--Profit AdvertisingProfit AdvertisingStrategy Using CrowdsensingStrategy Using Crowdsensing
Trajectory DataTrajectory Data
LOU Kaihao1, YANG Yongjian1, YANG Funing1, ZHANG Xingliang2
(1. Jilin University, Changchun 130012, China;2. China Mobile Group Jilin Co., Ltd., Changchun 130021, China)
Abstract: Out-door billboard advertising plays an important role in attracting potential cus⁃tomers. However, whether a customer can be attracted is influenced by many factors, such asthe probability that he/she sees the billboard, the degree of his/her interest, and the detour dis⁃tance for buying the product. Taking the above factors into account, we propose advertisingstrategies for selecting an effective set of billboards under the advertising budget to maximizecommercial profit. By using the data collected by Mobile Crowdsensing (MCS), we extract po⁃tential customers’implicit information, such as their trajectories and preferences. We thenstudy the billboard selection problem under two situations, where the advertiser may have onlyone or multiple products. When only one kind of product needs advertising, the billboard se⁃lection problem is formulated as the probabilistic set coverage problem. We propose two heu⁃ristic advertising strategies to greedily select advertising billboards, which achieves the expect⁃ed maximum commercial profit with the lowest cost. When the advertiser has multiple prod⁃ucts, we formulate the problem as searching for an optimal solution and adopt the simulatedannealing algorithm to search for global optimum instead of local optimum. Extensive experi⁃ments based on three real-world data sets verify that our proposed advertising strategies canachieve the superior commercial profit compared with the state-of-the-art strategies.Keywords: billboard advertising; mobile Crowdsensing; probabilistic set coverage problem; simulated annealing; optimization problem
Citation (IEEE Format): K. H. Lou, Y. J. Yang, F. N. Yang, et al.,“Maximum-profit advertising strategy using crowdsensing trajectory da⁃ta,”ZTE Communications, vol. 19, no. 2, pp. 29–43, Jun. 2021. doi: 10.12142/ZTECOM.202102005.
1 Introduction
Out-door billboards are one of the most effective toolsfor advertising. According to PQ Media[1], global dig⁃ital roadside billboard advertising industry grew by alarge margin in 2017; specifically, digital roadside
billboard advertising sales have increased by 10% to a totalamount of 3. 2 billion dollars in the US. Compared with otheradvertising methods, the out-door billboard can easily make adeeper impression on potential customers, since it providesthe strong visual impact, long placement duration and rich in⁃formation content.By advertising on out-door billboards, an advertiser can at⁃
tract potential customers for his/her products. For some prod⁃ucts or activities such as temporary promotion, potential cus⁃tomers may immediately decide whether to go to the shop topurchase products after seeing the advertisement. In this situa⁃tion, once a potential customer is attracted by the advertise⁃ment on the billboard, he/she will purchase the relative prod⁃
DOI: 10.12142/ZTECOM.202102005
https://kns.cnki.net/kcms/detail/34.1294.TN.20210629.1639.002.html, publishedonline June 30, 2021
Manuscript received: 2021-03-11
This work is supported by Jilin Science and Technology Department KeyTechnology Project (20190304127YY), the National Natural Science Founda⁃tions of China (1772230, 61972450 and 62072209), Natural Science Founda⁃tions of Jilin Province (20190201022JC), National Science Key Lab Fund Proj⁃ect (61421010418), Innovation Capacity Building Project of Jilin Province De⁃velopment and Reform Commission (2020C017-2), Changchun Science andTechnology Development Project (18DY005), Key Laboratory of Defense Sci⁃ence and Technology Foundations (61421010418), and Jilin Province YoungTalents Lifting Projec (3D4196993421).A conference version of the paper appeared in Proceedings of SocialSec[2].
29
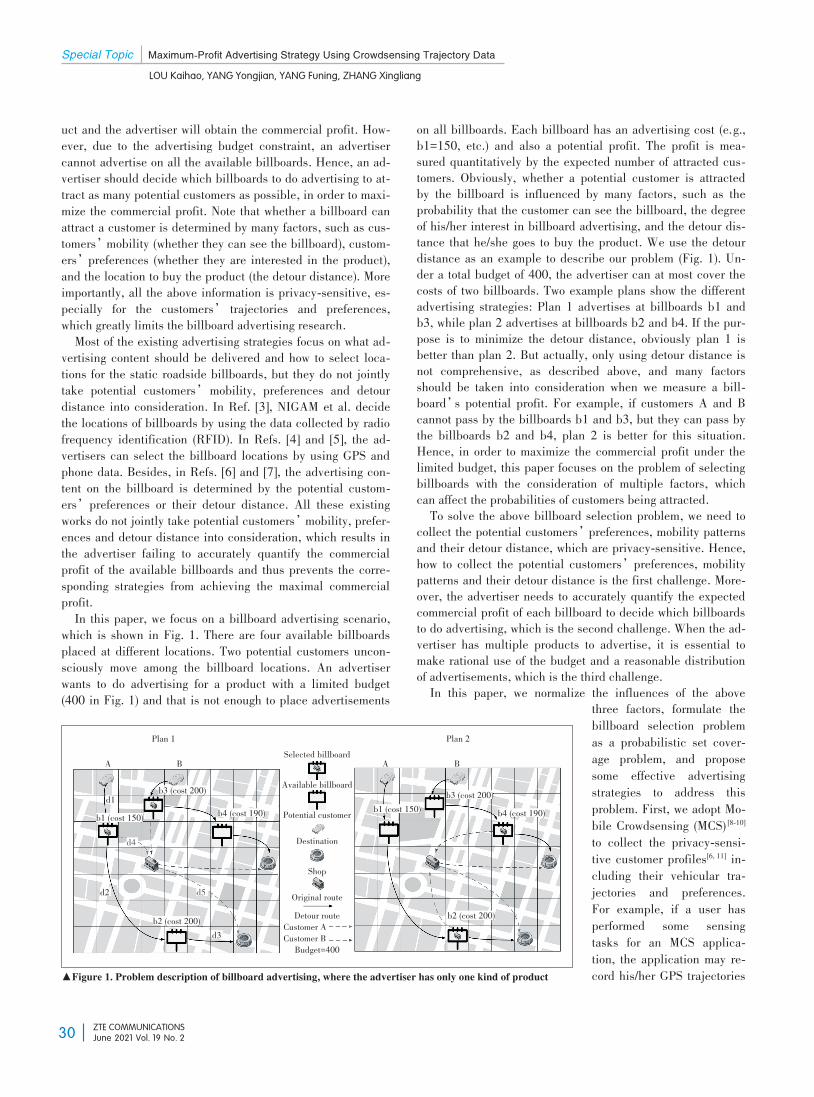
Special Topic Maximum-Profit Advertising Strategy Using Crowdsensing Trajectory Data
LOU Kaihao, YANG Yongjian, YANG Funing, ZHANG Xingliang
ZTE COMMUNICATIONSJune 2021 Vol. 19 No. 2
uct and the advertiser will obtain the commercial profit. How⁃ever, due to the advertising budget constraint, an advertisercannot advertise on all the available billboards. Hence, an ad⁃vertiser should decide which billboards to do advertising to at⁃tract as many potential customers as possible, in order to maxi⁃mize the commercial profit. Note that whether a billboard canattract a customer is determined by many factors, such as cus⁃tomers’mobility (whether they can see the billboard), custom⁃ers’preferences (whether they are interested in the product),and the location to buy the product (the detour distance). Moreimportantly, all the above information is privacy-sensitive, es⁃pecially for the customers’ trajectories and preferences,which greatly limits the billboard advertising research.Most of the existing advertising strategies focus on what ad⁃
vertising content should be delivered and how to select loca⁃tions for the static roadside billboards, but they do not jointlytake potential customers’mobility, preferences and detourdistance into consideration. In Ref. [3], NIGAM et al. decidethe locations of billboards by using the data collected by radiofrequency identification (RFID). In Refs. [4] and [5], the ad⁃vertisers can select the billboard locations by using GPS andphone data. Besides, in Refs. [6] and [7], the advertising con⁃tent on the billboard is determined by the potential custom⁃ers’preferences or their detour distance. All these existingworks do not jointly take potential customers’mobility, prefer⁃ences and detour distance into consideration, which results inthe advertiser failing to accurately quantify the commercialprofit of the available billboards and thus prevents the corre⁃sponding strategies from achieving the maximal commercialprofit.In this paper, we focus on a billboard advertising scenario,
which is shown in Fig. 1. There are four available billboardsplaced at different locations. Two potential customers uncon⁃sciously move among the billboard locations. An advertiserwants to do advertising for a product with a limited budget(400 in Fig. 1) and that is not enough to place advertisements
on all billboards. Each billboard has an advertising cost (e.g.,b1=150, etc.) and also a potential profit. The profit is mea⁃sured quantitatively by the expected number of attracted cus⁃tomers. Obviously, whether a potential customer is attractedby the billboard is influenced by many factors, such as theprobability that the customer can see the billboard, the degreeof his/her interest in billboard advertising, and the detour dis⁃tance that he/she goes to buy the product. We use the detourdistance as an example to describe our problem (Fig. 1). Un⁃der a total budget of 400, the advertiser can at most cover thecosts of two billboards. Two example plans show the differentadvertising strategies: Plan 1 advertises at billboards b1 andb3, while plan 2 advertises at billboards b2 and b4. If the pur⁃pose is to minimize the detour distance, obviously plan 1 isbetter than plan 2. But actually, only using detour distance isnot comprehensive, as described above, and many factorsshould be taken into consideration when we measure a bill⁃board’s potential profit. For example, if customers A and Bcannot pass by the billboards b1 and b3, but they can pass bythe billboards b2 and b4, plan 2 is better for this situation.Hence, in order to maximize the commercial profit under thelimited budget, this paper focuses on the problem of selectingbillboards with the consideration of multiple factors, whichcan affect the probabilities of customers being attracted.To solve the above billboard selection problem, we need to
collect the potential customers’preferences, mobility patternsand their detour distance, which are privacy-sensitive. Hence,how to collect the potential customers’preferences, mobilitypatterns and their detour distance is the first challenge. More⁃over, the advertiser needs to accurately quantify the expectedcommercial profit of each billboard to decide which billboardsto do advertising, which is the second challenge. When the ad⁃vertiser has multiple products to advertise, it is essential tomake rational use of the budget and a reasonable distributionof advertisements, which is the third challenge.In this paper, we normalize the influences of the above
three factors, formulate thebillboard selection problemas a probabilistic set cover⁃age problem, and proposesome effective advertisingstrategies to address thisproblem. First, we adopt Mo⁃bile Crowdsensing (MCS) [8-10]to collect the privacy-sensi⁃tive customer profiles[6, 11] in⁃cluding their vehicular tra⁃jectories and preferences.For example, if a user hasperformed some sensingtasks for an MCS applica⁃tion, the application may re⁃cord his/her GPS trajectories▲Figure 1. Problem description of billboard advertising, where the advertiser has only one kind of product
Plan 1 Plan 2A B Selected billboard
Available billboard
Potential customerDestination
ShopOriginal routeDetour route
Customer ACustomer BBudget=400
d1
d2
d3
d5
d4
b2 (cost 200)
b4 (cost 190)b3 (cost 200)
b1 (cost 150)
A B
b1 (cost 150)b3 (cost 200)
b4 (cost 190)
b2 (cost 200)
30
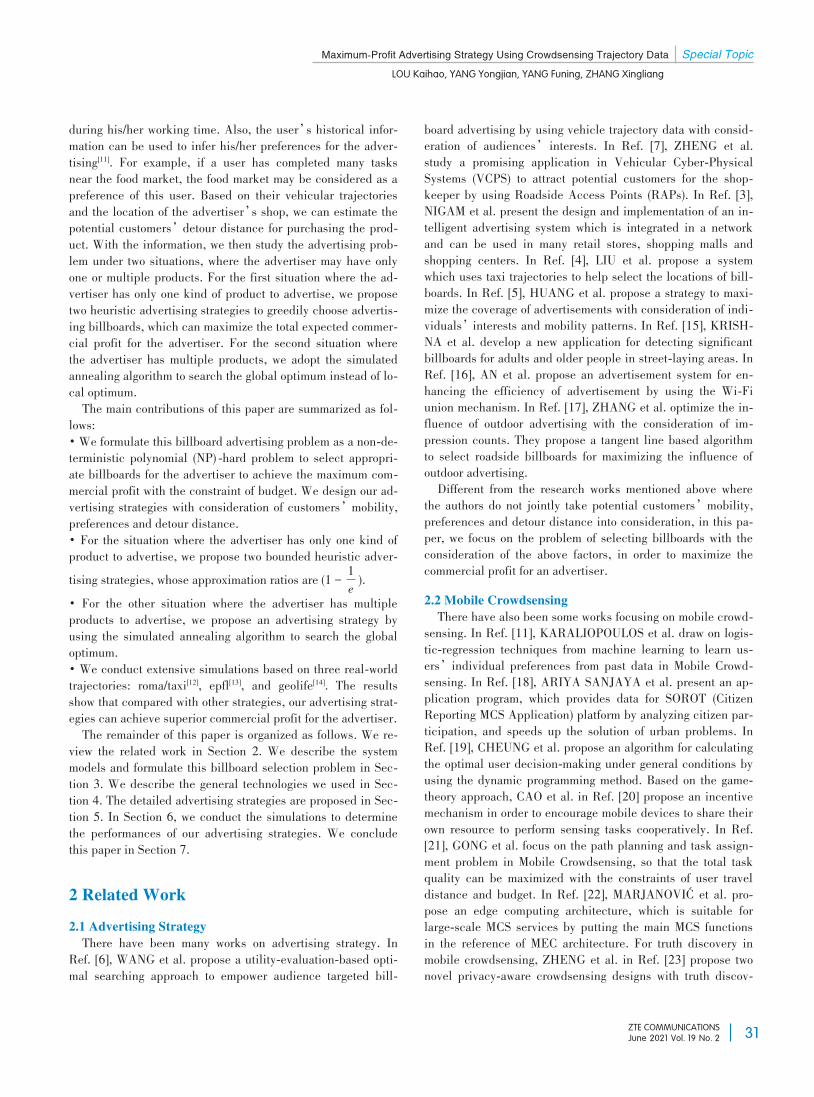
Maximum-Profit Advertising Strategy Using Crowdsensing Trajectory Data Special Topic
LOU Kaihao, YANG Yongjian, YANG Funing, ZHANG Xingliang
ZTE COMMUNICATIONSJune 2021 Vol. 19 No. 2
during his/her working time. Also, the user’s historical infor⁃mation can be used to infer his/her preferences for the adver⁃tising[11]. For example, if a user has completed many tasksnear the food market, the food market may be considered as apreference of this user. Based on their vehicular trajectoriesand the location of the advertiser’s shop, we can estimate thepotential customers’detour distance for purchasing the prod⁃uct. With the information, we then study the advertising prob⁃lem under two situations, where the advertiser may have onlyone or multiple products. For the first situation where the ad⁃vertiser has only one kind of product to advertise, we proposetwo heuristic advertising strategies to greedily choose advertis⁃ing billboards, which can maximize the total expected commer⁃cial profit for the advertiser. For the second situation wherethe advertiser has multiple products, we adopt the simulatedannealing algorithm to search the global optimum instead of lo⁃cal optimum.The main contributions of this paper are summarized as fol⁃
lows:• We formulate this billboard advertising problem as a non-de⁃terministic polynomial (NP) -hard problem to select appropri⁃ate billboards for the advertiser to achieve the maximum com⁃mercial profit with the constraint of budget. We design our ad⁃vertising strategies with consideration of customers’mobility,preferences and detour distance.• For the situation where the advertiser has only one kind ofproduct to advertise, we propose two bounded heuristic adver⁃tising strategies, whose approximation ratios are (1 - 1
e).
• For the other situation where the advertiser has multipleproducts to advertise, we propose an advertising strategy byusing the simulated annealing algorithm to search the globaloptimum.• We conduct extensive simulations based on three real-worldtrajectories: roma/taxi[12], epfl[13], and geolife[14]. The resultsshow that compared with other strategies, our advertising strat⁃egies can achieve superior commercial profit for the advertiser.The remainder of this paper is organized as follows. We re⁃
view the related work in Section 2. We describe the systemmodels and formulate this billboard selection problem in Sec⁃tion 3. We describe the general technologies we used in Sec⁃tion 4. The detailed advertising strategies are proposed in Sec⁃tion 5. In Section 6, we conduct the simulations to determinethe performances of our advertising strategies. We concludethis paper in Section 7.
2 Related Work
2.1 Advertising StrategyThere have been many works on advertising strategy. In
Ref. [6], WANG et al. propose a utility-evaluation-based opti⁃mal searching approach to empower audience targeted bill⁃
board advertising by using vehicle trajectory data with consid⁃eration of audiences’interests. In Ref. [7], ZHENG et al.study a promising application in Vehicular Cyber-PhysicalSystems (VCPS) to attract potential customers for the shop⁃keeper by using Roadside Access Points (RAPs). In Ref. [3],NIGAM et al. present the design and implementation of an in⁃telligent advertising system which is integrated in a networkand can be used in many retail stores, shopping malls andshopping centers. In Ref. [4], LIU et al. propose a systemwhich uses taxi trajectories to help select the locations of bill⁃boards. In Ref. [5], HUANG et al. propose a strategy to maxi⁃mize the coverage of advertisements with consideration of indi⁃viduals’interests and mobility patterns. In Ref. [15], KRISH⁃NA et al. develop a new application for detecting significantbillboards for adults and older people in street-laying areas. InRef. [16], AN et al. propose an advertisement system for en⁃hancing the efficiency of advertisement by using the Wi-Fiunion mechanism. In Ref. [17], ZHANG et al. optimize the in⁃fluence of outdoor advertising with the consideration of im⁃pression counts. They propose a tangent line based algorithmto select roadside billboards for maximizing the influence ofoutdoor advertising.Different from the research works mentioned above where
the authors do not jointly take potential customers’mobility,preferences and detour distance into consideration, in this pa⁃per, we focus on the problem of selecting billboards with theconsideration of the above factors, in order to maximize thecommercial profit for an advertiser.2.2 Mobile CrowdsensingThere have also been some works focusing on mobile crowd⁃
sensing. In Ref. [11], KARALIOPOULOS et al. draw on logis⁃tic-regression techniques from machine learning to learn us⁃ers’individual preferences from past data in Mobile Crowd⁃sensing. In Ref. [18], ARIYA SANJAYA et al. present an ap⁃plication program, which provides data for SOROT (CitizenReporting MCS Application) platform by analyzing citizen par⁃ticipation, and speeds up the solution of urban problems. InRef. [19], CHEUNG et al. propose an algorithm for calculatingthe optimal user decision-making under general conditions byusing the dynamic programming method. Based on the game-theory approach, CAO et al. in Ref. [20] propose an incentivemechanism in order to encourage mobile devices to share theirown resource to perform sensing tasks cooperatively. In Ref.[21], GONG et al. focus on the path planning and task assign⁃ment problem in Mobile Crowdsensing, so that the total taskquality can be maximized with the constraints of user traveldistance and budget. In Ref. [22], MARJANOVIĆ et al. pro⁃pose an edge computing architecture, which is suitable forlarge-scale MCS services by putting the main MCS functionsin the reference of MEC architecture. For truth discovery inmobile crowdsensing, ZHENG et al. in Ref. [23] propose twonovel privacy-aware crowdsensing designs with truth discov⁃
31
Special Topic Maximum-Profit Advertising Strategy Using Crowdsensing Trajectory Data
LOU Kaihao, YANG Yongjian, YANG Funing, ZHANG Xingliang
ZTE COMMUNICATIONSJune 2021 Vol. 19 No. 2
ery so that the bandwidth and computation performance on in⁃dividual users can be significantly improved. In Ref. [24],WANG et al. propose a two-stage solution to the heteroge⁃neous multi-task assignment (HMTA) problem, which utilizesthe implicit spatiotemporal correlation between heterogeneoustasks to effectively handle multiple concurrent tasks in sharedresource pools. In Ref. [25], WANG et al. propose a newframework of participatory perceptual multi-task allocation,which coordinates the allocation of multiple tasks on the multi-task PS platform to maximize the overall effectiveness of thesystem.These works we mention above focus on different areas of
mobile crowdsensing, while we attempt to extract potentialcustomers’implicit information, such as their trajectories andpreferences, by using the MCS data, in order to select appro⁃priate billboards for the advertiser.
3 System Model and Problem Formulation
3.1 System ModelConsider that there is an advertising system which is com⁃
posed of a crowd of potential customers, denoted by the setU = { u1, u2,..., un} and a set of available billboards V ={ v1, v2,..., vm}. The costs of available billboards are denoted byC = { c1, c2,..., cm}. The different areas in the map can be repre⁃sented as L = { l1, l2,..., lh}. All billboards are located at differ⁃ent areas and each area has only one billboard. Moreover, thepreference types are denoted by the set A = { a1, a2,..., aj}.Hence, without the loss of generality, we denote the preferenc⁃es of potential customer ui as Aui ⊆ A. We suppose that eachkind of products has an advertisement which can be denotedby T = { t1, t2,..., tr}, and the attributes of product tx can be de⁃noted by Atx ⊆ A. Meanwhile, each billboard is available foronly one advertisement.In our scenario, at the beginning, each potential customer uistarts moving from his/her initial location, and goes to his/her
destination. Every time a potential customer sees an advertise⁃ment for a product, he/she will decide whether to buy the prod⁃uct. The detour distance is an important factor affecting thecustomer’s decision, and then we use d (ui ) to denote the de⁃tour distance for ui, which represents how much more distanceui needs to go than his/her original route for buying the prod⁃uct. If a potential customer has been attracted to buy the prod⁃uct, this customer cannot be attracted by the same advertise⁃ment again. In other words, each potential customer can be at⁃tracted by a product at most once. The attracted customers aredenoted by Uattr.3.2 Problem DescriptionWith the limit of budget, which is denoted by B, we attempt
to choose a set of billboards denoted by S = { s1, s2,..., sk} fromV for advertising. When the advertiser has multiple products,
we also need to choose the advertisements for the selected bill⁃boards to maximize the commercial profit. In this paper, wesuppose that if a billboard vi is selected in S, then it will deliv⁃er advertisement content to those potential customers whoselocations are in its area until the deadline. The deadline ishow long the advertiser can use a billboard, and we supposethat all billboards have the same deadline. Our purpose is tofind the best advertising strategy for the following billboard se⁃lection problem:Maximize F =∑i = 1
Uattr∑x = 1r ϕf tx - B
s.t.∑j = 1k csj ≤ B, ∀sj ∈ S, S ⊆ V, ϕ ∈ {0, 1}, (1)
where F is the total commercial profit for the advertiser frombillboard advertising. The problem is that an advertiser shouldattract potential customers as many as possible with limitedbudget B. In this paper, we assume that if a customer is at⁃tracted after he/she sees the advertisement, then the advertiserwill obtain a profit from the customer. If a potential customeris attracted by an advertisement tx, the profit that the advertis⁃er can get is denoted by f tx and ϕ = 1. If the customer is not at⁃tracted, ϕ = 0. In order to reduce the complexity of the calcu⁃lation, we suppose that the customers attracted by the same ad⁃vertisements can create the same profit for the advertiser, andthe customers attracted by the different advertisements maycreate different profits for the advertiser. In other words, it canbe denoted by f tx = f ty, ∀tx ∈ T, ∀ty ∈ T or f tx ≠ f ty,∀tx ∈ T, ∀ty ∈ T. Our advertising strategies aim at finding thebest set of billboards to deliver the advertisements, so that thecommercial profit for the advertiser is maximized, with theconstraint that the total costs of selected billboards should beless or equal to the budget.3.3 NP-Hard ProofBefore solving the above optimization problem, we first at⁃
tempt to prove that the billboard selection problem is NP-hard, which is shown as follows:First of all, we formulate this problem in Eq. (1) as the prob⁃
abilistic set coverage problem, which includes a collection ofelement sets X = { X1,X2,...,Xm} with the corresponding costsc = { c1, c2,..., cm}. Xi consists of a lot of elements, which is de⁃noted by O = {O1,O2,...,On}. The associated possibilities thatthe elements can be covered are denoted by p = { p1, p2,..., pn}and the associated weights of elements are denoted by W ={ w1,w2,...,wn}. The objective is to select a subcollection of Xunder the budget constraint B to maximize the weights of cov⁃ered elements.Then, we reconsider the billboard selection problem in this
paper. First of all, we consider the situation where the adver⁃tiser has only one type of product. Since the commercial profitdepends on the number of attracted customers, we can regard
32
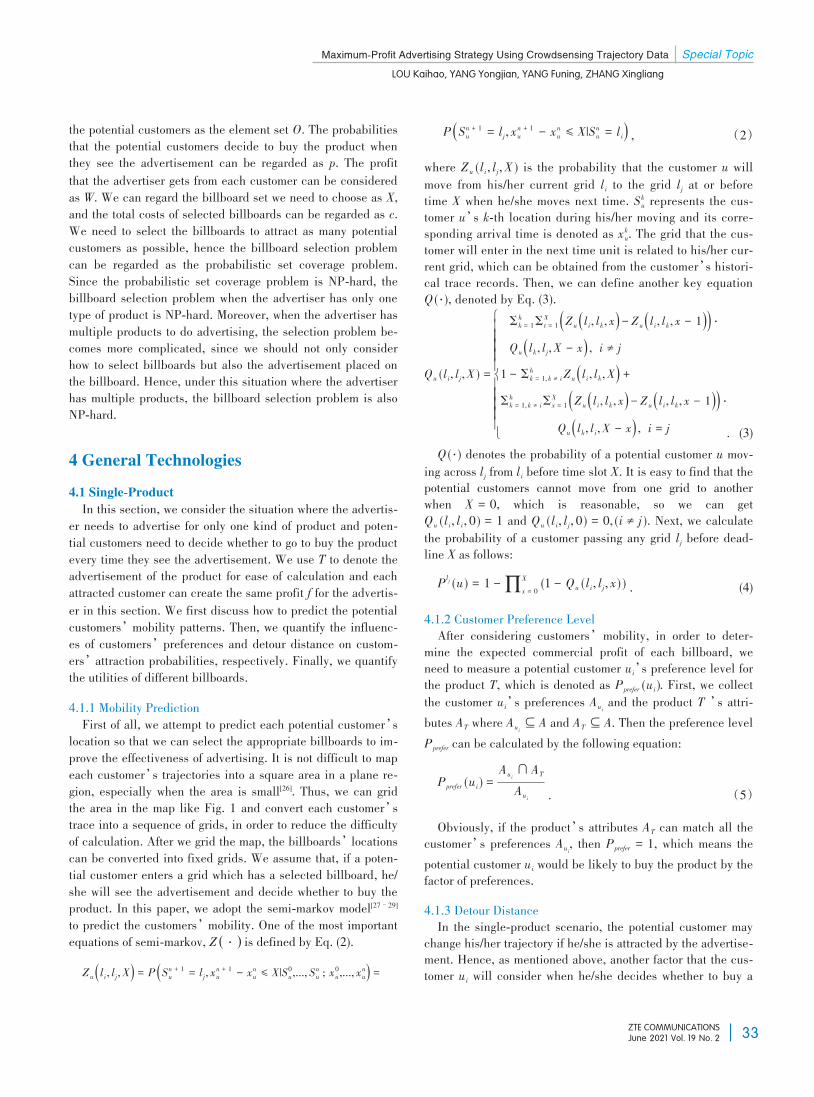
Maximum-Profit Advertising Strategy Using Crowdsensing Trajectory Data Special Topic
LOU Kaihao, YANG Yongjian, YANG Funing, ZHANG Xingliang
ZTE COMMUNICATIONSJune 2021 Vol. 19 No. 2
the potential customers as the element set O. The probabilitiesthat the potential customers decide to buy the product whenthey see the advertisement can be regarded as p. The profitthat the advertiser gets from each customer can be consideredas W. We can regard the billboard set we need to choose as X,and the total costs of selected billboards can be regarded as c.We need to select the billboards to attract as many potentialcustomers as possible, hence the billboard selection problemcan be regarded as the probabilistic set coverage problem.Since the probabilistic set coverage problem is NP-hard, thebillboard selection problem when the advertiser has only onetype of product is NP-hard. Moreover, when the advertiser hasmultiple products to do advertising, the selection problem be⁃comes more complicated, since we should not only considerhow to select billboards but also the advertisement placed onthe billboard. Hence, under this situation where the advertiserhas multiple products, the billboard selection problem is alsoNP-hard.
4 General Technologies
4.1 Single-ProductIn this section, we consider the situation where the advertis⁃
er needs to advertise for only one kind of product and poten⁃tial customers need to decide whether to go to buy the productevery time they see the advertisement. We use T to denote theadvertisement of the product for ease of calculation and eachattracted customer can create the same profit f for the advertis⁃er in this section. We first discuss how to predict the potentialcustomers’mobility patterns. Then, we quantify the influenc⁃es of customers’preferences and detour distance on custom⁃ers’attraction probabilities, respectively. Finally, we quantifythe utilities of different billboards.4.1.1 Mobility PredictionFirst of all, we attempt to predict each potential customer’s
location so that we can select the appropriate billboards to im⁃prove the effectiveness of advertising. It is not difficult to mapeach customer’s trajectories into a square area in a plane re⁃gion, especially when the area is small[26]. Thus, we can gridthe area in the map like Fig. 1 and convert each customer’strace into a sequence of grids, in order to reduce the difficultyof calculation. After we grid the map, the billboards’locationscan be converted into fixed grids. We assume that, if a poten⁃tial customer enters a grid which has a selected billboard, he/she will see the advertisement and decide whether to buy theproduct. In this paper, we adopt the semi-markov model[27–29]to predict the customers’mobility. One of the most importantequations of semi-markov, Z ( ⋅ ) is defined by Eq. (2).Zu (li, lj,X) = P (Sn + 1u = lj, xn + 1u - xnu ≤ X|S0u,..., Snu ; x0u,..., xnu) =
P (Sn + 1u = lj, xn + 1u - xnu ≤ X|Snu = li) , (2)where Zu ( li, lj,X ) is the probability that the customer u willmove from his/her current grid li to the grid lj at or beforetime X when he/she moves next time. Sku represents the cus⁃tomer u’s k-th location during his/her moving and its corre⁃sponding arrival time is denoted as xku. The grid that the cus⁃tomer will enter in the next time unit is related to his/her cur⁃rent grid, which can be obtained from the customer’s histori⁃cal trace records. Then, we can define another key equationQ ( ⋅ ), denoted by Eq. (3).
Qu ( li, lj,X ) =
ì
í
î
ï
ï
ï
ïïïïï
ï
ï
ï
ïïïïï
Σhk = 1ΣX
t = 1 ( )Zu ( )li, lk, x - Zu ( )li, lk, x - 1 ⋅Qu ( )lk, lj,X - x , i ≠ j1 - Σh
k = 1, k ≠ iZu ( )li, lk,X +Σhk = 1, k ≠ iΣX
x = 1 ( )Zu ( )li, lk, x - Zu ( )li, lk, x - 1 ⋅Qu ( )lk, li,X - x , i = j . (3)
Q ( ⋅ ) denotes the probability of a potential customer u mov⁃ing across lj from li before time slot X. It is easy to find that thepotential customers cannot move from one grid to anotherwhen X = 0, which is reasonable, so we can getQu ( li, li, 0 ) = 1 and Qu ( li, lj, 0 ) = 0, (i ≠ j ). Next, we calculatethe probability of a customer passing any grid lj before dead⁃line X as follows:Plj (u ) = 1 -∏x = 0
X (1 - Qu ( li, lj, x ) ) . (4)4.1.2 Customer Preference LevelAfter considering customers’mobility, in order to deter⁃
mine the expected commercial profit of each billboard, weneed to measure a potential customer ui’s preference level forthe product T, which is denoted as Pprefer (ui ). First, we collectthe customer ui’s preferences Aui and the product T ’s attri⁃butes AT where Aui ⊆ A and AT ⊆ A. Then the preference levelPprefer can be calculated by the following equation:Pprefer (ui ) = Aui ∩ ATAui . (5)Obviously, if the product’s attributes AT can match all thecustomer’s preferences Aui, then Pprefer = 1, which means the
potential customer ui would be likely to buy the product by thefactor of preferences.4.1.3 Detour DistanceIn the single-product scenario, the potential customer may
change his/her trajectory if he/she is attracted by the advertise⁃ment. Hence, as mentioned above, another factor that the cus⁃tomer ui will consider when he/she decides whether to buy a
33
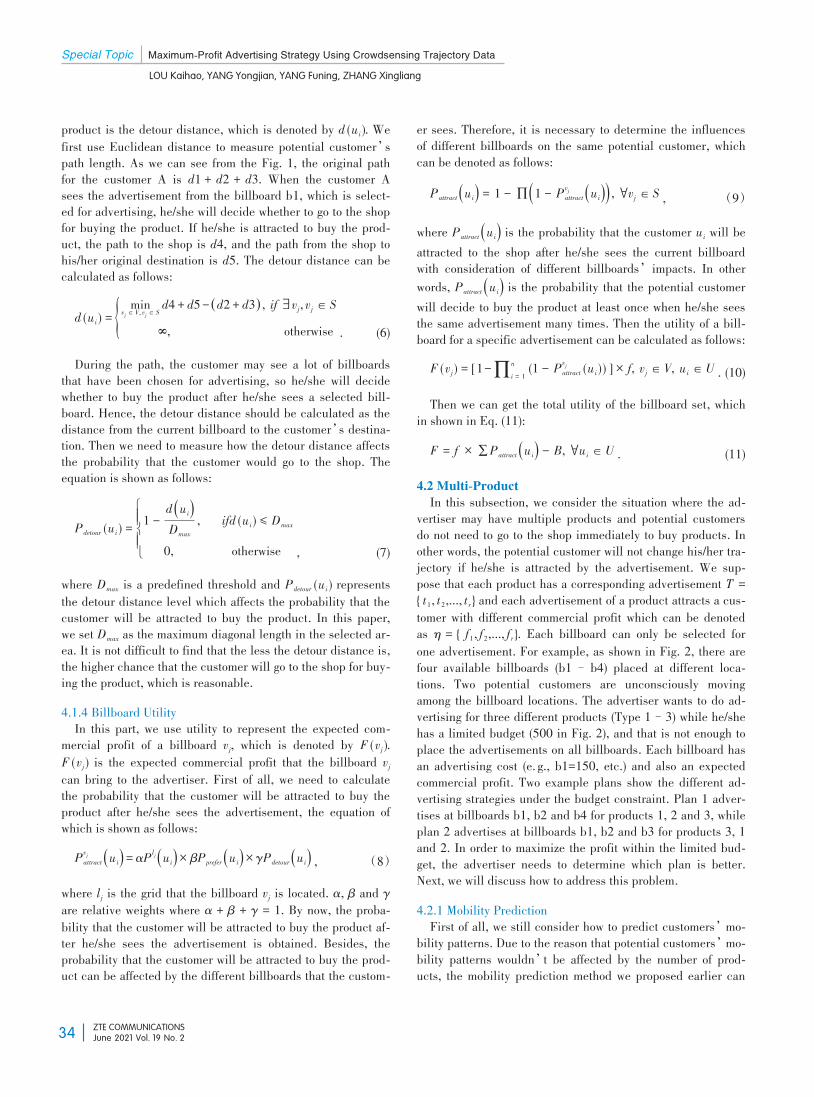
Special Topic Maximum-Profit Advertising Strategy Using Crowdsensing Trajectory Data
LOU Kaihao, YANG Yongjian, YANG Funing, ZHANG Xingliang
ZTE COMMUNICATIONSJune 2021 Vol. 19 No. 2
product is the detour distance, which is denoted by d (ui ). Wefirst use Euclidean distance to measure potential customer’spath length. As we can see from the Fig. 1, the original pathfor the customer A is d1 + d2 + d3. When the customer Asees the advertisement from the billboard b1, which is select⁃ed for advertising, he/she will decide whether to go to the shopfor buying the product. If he/she is attracted to buy the prod⁃uct, the path to the shop is d4, and the path from the shop tohis/her original destination is d5. The detour distance can becalculated as follows:
d (ui ) = { minvj ∈ V, vj ∈ S d4 + d5- ( )d2 + d3 , if ∃ vj, vj ∈ S
∞, otherwise . (6)During the path, the customer may see a lot of billboards
that have been chosen for advertising, so he/she will decidewhether to buy the product after he/she sees a selected bill⁃board. Hence, the detour distance should be calculated as thedistance from the current billboard to the customer’s destina⁃tion. Then we need to measure how the detour distance affectsthe probability that the customer would go to the shop. Theequation is shown as follows:
Pdetour (ui ) =ì
í
î
ïïïï
1 - d ( )uiDmax
, ifd (ui ) ≤ Dmax
0, otherwise , (7)where Dmax is a predefined threshold and Pdetour (ui ) representsthe detour distance level which affects the probability that thecustomer will be attracted to buy the product. In this paper,we set Dmax as the maximum diagonal length in the selected ar⁃ea. It is not difficult to find that the less the detour distance is,the higher chance that the customer will go to the shop for buy⁃ing the product, which is reasonable.4.1.4 Billboard UtilityIn this part, we use utility to represent the expected com⁃
mercial profit of a billboard vj, which is denoted by F ( vj ).F ( vj ) is the expected commercial profit that the billboard vjcan bring to the advertiser. First of all, we need to calculatethe probability that the customer will be attracted to buy theproduct after he/she sees the advertisement, the equation ofwhich is shown as follows:Pvjattract (ui) = αPlj (ui) × βPprefer (ui) × γPdetour (ui) , (8)
where lj is the grid that the billboard vj is located. α, β and γare relative weights where α + β + γ = 1. By now, the proba⁃bility that the customer will be attracted to buy the product af⁃ter he/she sees the advertisement is obtained. Besides, theprobability that the customer will be attracted to buy the prod⁃uct can be affected by the different billboards that the custom⁃
er sees. Therefore, it is necessary to determine the influencesof different billboards on the same potential customer, whichcan be denoted as follows:Pattract (ui) = 1 - ∏(1 - Pvjattract (ui)) , ∀vj ∈ S , (9)
where Pattract (ui) is the probability that the customer ui will beattracted to the shop after he/she sees the current billboardwith consideration of different billboards’impacts. In otherwords, Pattract (ui) is the probability that the potential customerwill decide to buy the product at least once when he/she seesthe same advertisement many times. Then the utility of a bill⁃board for a specific advertisement can be calculated as follows:F ( vj ) = [1-∏i = 1
n (1 - Pvjattract (ui )) ] × f, vj ∈ V, ui ∈ U . (10)Then we can get the total utility of the billboard set, which
in shown in Eq. (11):F = f × ∑Pattract (ui) - B, ∀ui ∈ U . (11)
4.2 Multi-ProductIn this subsection, we consider the situation where the ad⁃
vertiser may have multiple products and potential customersdo not need to go to the shop immediately to buy products. Inother words, the potential customer will not change his/her tra⁃jectory if he/she is attracted by the advertisement. We sup⁃pose that each product has a corresponding advertisement T ={ t1, t2,..., tr} and each advertisement of a product attracts a cus⁃tomer with different commercial profit which can be denotedas η = { f1, f2,..., fr}. Each billboard can only be selected forone advertisement. For example, as shown in Fig. 2, there arefour available billboards (b1– b4) placed at different loca⁃tions. Two potential customers are unconsciously movingamong the billboard locations. The advertiser wants to do ad⁃vertising for three different products (Type 1–3) while he/shehas a limited budget (500 in Fig. 2), and that is not enough toplace the advertisements on all billboards. Each billboard hasan advertising cost (e. g., b1=150, etc.) and also an expectedcommercial profit. Two example plans show the different ad⁃vertising strategies under the budget constraint. Plan 1 adver⁃tises at billboards b1, b2 and b4 for products 1, 2 and 3, whileplan 2 advertises at billboards b1, b2 and b3 for products 3, 1and 2. In order to maximize the profit within the limited bud⁃get, the advertiser needs to determine which plan is better.Next, we will discuss how to address this problem.4.2.1 Mobility PredictionFirst of all, we still consider how to predict customers’mo⁃
bility patterns. Due to the reason that potential customers’mo⁃bility patterns wouldn’t be affected by the number of prod⁃ucts, the mobility prediction method we proposed earlier can
34
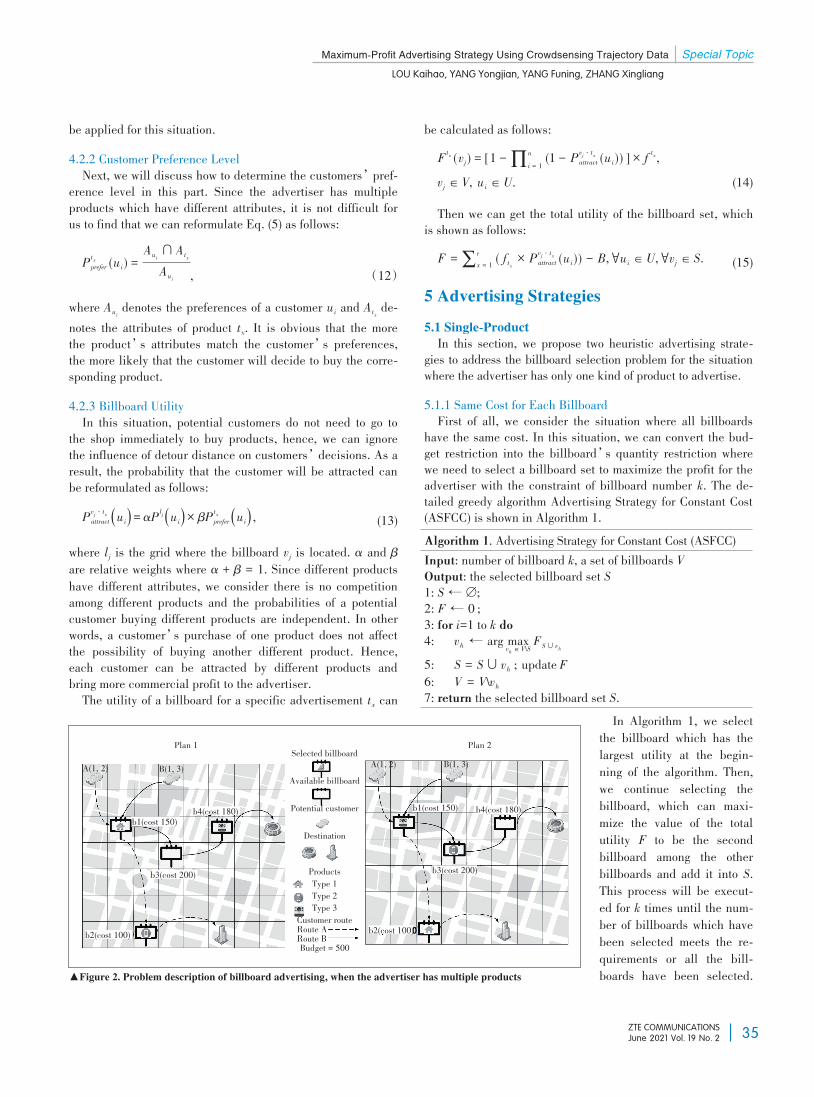
Maximum-Profit Advertising Strategy Using Crowdsensing Trajectory Data Special Topic
LOU Kaihao, YANG Yongjian, YANG Funing, ZHANG Xingliang
ZTE COMMUNICATIONSJune 2021 Vol. 19 No. 2
be applied for this situation.4.2.2 Customer Preference LevelNext, we will discuss how to determine the customers’pref⁃
erence level in this part. Since the advertiser has multipleproducts which have different attributes, it is not difficult forus to find that we can reformulate Eq. (5) as follows:Ptxprefer (ui ) = Aui ∩ AtxAui , (12)
where Aui denotes the preferences of a customer ui and Atx de⁃notes the attributes of product tx. It is obvious that the morethe product’s attributes match the customer’s preferences,the more likely that the customer will decide to buy the corre⁃sponding product.4.2.3 Billboard UtilityIn this situation, potential customers do not need to go to
the shop immediately to buy products, hence, we can ignorethe influence of detour distance on customers’decisions. As aresult, the probability that the customer will be attracted canbe reformulated as follows:Pvj ⋅ txattract (ui) = αPlj (ui) × βPtxprefer (ui) , (13)
where lj is the grid where the billboard vj is located. α and βare relative weights where α + β = 1. Since different productshave different attributes, we consider there is no competitionamong different products and the probabilities of a potentialcustomer buying different products are independent. In otherwords, a customer’s purchase of one product does not affectthe possibility of buying another different product. Hence,each customer can be attracted by different products andbring more commercial profit to the advertiser.The utility of a billboard for a specific advertisement tx can
be calculated as follows:Ftx ( vj ) = [1 -∏i = 1
n (1 - Pvj ⋅ txattract (ui )) ] × f tx,vj ∈ V, ui ∈ U. (14)Then we can get the total utility of the billboard set, which
is shown as follows:F =∑x = 1
r ( ftx × Pvj ⋅ txattract (ui )) - B, ∀ui ∈ U, ∀vj ∈ S. (15)5 Advertising Strategies
5.1 Single-ProductIn this section, we propose two heuristic advertising strate⁃
gies to address the billboard selection problem for the situationwhere the advertiser has only one kind of product to advertise.5.1.1 Same Cost for Each BillboardFirst of all, we consider the situation where all billboards
have the same cost. In this situation, we can convert the bud⁃get restriction into the billboard’s quantity restriction wherewe need to select a billboard set to maximize the profit for theadvertiser with the constraint of billboard number k. The de⁃tailed greedy algorithm Advertising Strategy for Constant Cost(ASFCC) is shown in Algorithm 1.Algorithm 1. Advertising Strategy for Constant Cost (ASFCC)Input: number of billboard k, a set of billboards VOutput: the selected billboard set S1: S ← ∅;2: F ← 0 ;3: for i=1 to k do4: vh ← arg max
vh ∈ V\S FS ∪ vh5: S = S ∪ vh ; update F6: V = V\vh7: return the selected billboard set S.In Algorithm 1, we select
the billboard which has thelargest utility at the begin⁃ning of the algorithm. Then,we continue selecting thebillboard, which can maxi⁃mize the value of the totalutility F to be the secondbillboard among the otherbillboards and add it into S.This process will be execut⁃ed for k times until the num⁃ber of billboards which havebeen selected meets the re⁃quirements or all the bill⁃boards have been selected.▲Figure 2. Problem description of billboard advertising, when the advertiser has multiple products
Plan 1 Plan 2Selected billboard
Available billboard
Potential customer
Destination
ProductsType 1Type 2Type 3
Customer routeRoute ARoute BBudget = 500
b4(cost 180)
A(1, 2) B(1, 3)
b1(cost 150)
b3(cost 200)
b2(cost 100)
A(1, 2) B(1, 3)
b1(cost 150) b4(cost 180)
b3(cost 200)
b2(cost 100)
35
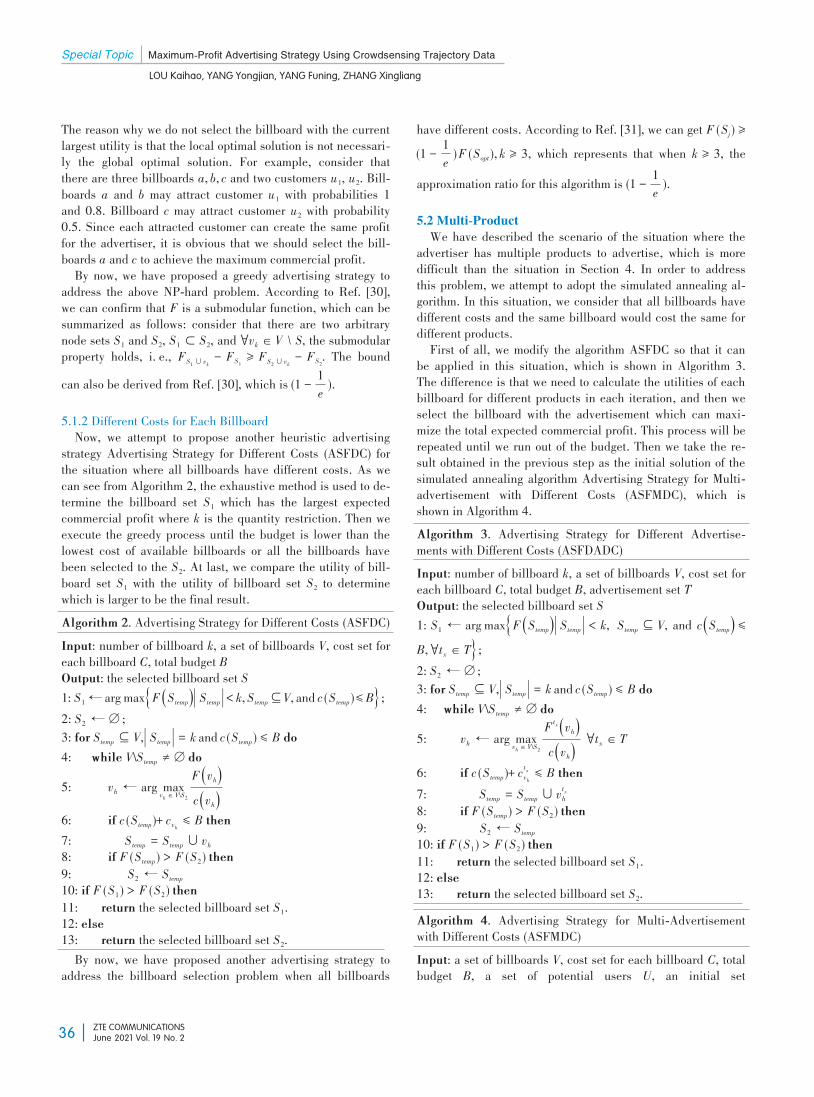
Special Topic Maximum-Profit Advertising Strategy Using Crowdsensing Trajectory Data
LOU Kaihao, YANG Yongjian, YANG Funing, ZHANG Xingliang
ZTE COMMUNICATIONSJune 2021 Vol. 19 No. 2
The reason why we do not select the billboard with the currentlargest utility is that the local optimal solution is not necessari⁃ly the global optimal solution. For example, consider thatthere are three billboards a, b, c and two customers u1, u2. Bill⁃boards a and b may attract customer u1 with probabilities 1and 0.8. Billboard c may attract customer u2 with probability0.5. Since each attracted customer can create the same profitfor the advertiser, it is obvious that we should select the bill⁃boards a and c to achieve the maximum commercial profit.By now, we have proposed a greedy advertising strategy to
address the above NP-hard problem. According to Ref. [30],we can confirm that F is a submodular function, which can besummarized as follows: consider that there are two arbitrarynode sets S1 and S2, S1 ⊂ S2, and ∀vk ∈ V ∖ S, the submodularproperty holds, i. e., FS1 ∪ vk - FS1 ≥ FS2 ∪ vk - FS2. The boundcan also be derived from Ref. [30], which is (1 - 1
e).
5.1.2 Different Costs for Each BillboardNow, we attempt to propose another heuristic advertising
strategy Advertising Strategy for Different Costs (ASFDC) forthe situation where all billboards have different costs. As wecan see from Algorithm 2, the exhaustive method is used to de⁃termine the billboard set S1 which has the largest expectedcommercial profit where k is the quantity restriction. Then weexecute the greedy process until the budget is lower than thelowest cost of available billboards or all the billboards havebeen selected to the S2. At last, we compare the utility of bill⁃board set S1 with the utility of billboard set S2 to determinewhich is larger to be the final result.Algorithm 2. Advertising Strategy for Different Costs (ASFDC)Input: number of billboard k, a set of billboards V, cost set foreach billboard C, total budget BOutput: the selected billboard set S1: S1 ← arg max{F (Stemp)| Stemp |< k, Stemp ⊆ V, and c (Stemp )≤ B} ;2: S2 ← ∅ ;3: for Stemp ⊆ V, | Stemp | = k and c (Stemp ) ≤ B do4: while V\Stemp ≠ ∅ do5: vh ← arg max
vh ∈ V\S2F ( )vhc ( )vh
6: if c (Stemp )+ cvh ≤ B then7: Stemp = Stemp ∪ vh8: if F (Stemp ) > F (S2 ) then9: S2 ← Stemp10: if F (S1 ) > F (S2 ) then11: return the selected billboard set S1.12: else13: return the selected billboard set S2.By now, we have proposed another advertising strategy to
address the billboard selection problem when all billboards
have different costs. According to Ref. [31], we can get F (Sj ) ≥(1 - 1
e)F (Sopt ), k ≥ 3, which represents that when k ≥ 3, the
approximation ratio for this algorithm is (1 - 1e).
5.2 Multi-ProductWe have described the scenario of the situation where the
advertiser has multiple products to advertise, which is moredifficult than the situation in Section 4. In order to addressthis problem, we attempt to adopt the simulated annealing al⁃gorithm. In this situation, we consider that all billboards havedifferent costs and the same billboard would cost the same fordifferent products.First of all, we modify the algorithm ASFDC so that it can
be applied in this situation, which is shown in Algorithm 3.The difference is that we need to calculate the utilities of eachbillboard for different products in each iteration, and then weselect the billboard with the advertisement which can maxi⁃mize the total expected commercial profit. This process will berepeated until we run out of the budget. Then we take the re⁃sult obtained in the previous step as the initial solution of thesimulated annealing algorithm Advertising Strategy for Multi-advertisement with Different Costs (ASFMDC), which isshown in Algorithm 4.Algorithm 3. Advertising Strategy for Different Advertise⁃ments with Different Costs (ASFDADC)Input: number of billboard k, a set of billboards V, cost set foreach billboard C, total budget B, advertisement set TOutput: the selected billboard set S1: S1 ← arg max{F (Stemp)| Stemp | < k, Stemp ⊆ V, and c (Stemp) ≤B, ∀tx ∈ T} ;2: S2 ← ∅ ;3: for Stemp ⊆ V, | Stemp | = k and c (Stemp ) ≤ B do4: while V\Stemp ≠ ∅ do5: vh ← arg max
vh ∈ V\S2Ftx ( )vhc ( )vh
∀tx ∈ T6: if c (Stemp )+ ctxvh ≤ B then7: Stemp = Stemp ∪ vtxh8: if F (Stemp ) > F (S2 ) then9: S2 ← Stemp10: if F (S1 ) > F (S2 ) then11: return the selected billboard set S1.12: else13: return the selected billboard set S2.Algorithm 4. Advertising Strategy for Multi-Advertisementwith Different Costs (ASFMDC)Input: a set of billboards V, cost set for each billboard C, totalbudget B, a set of potential users U, an initial set
36
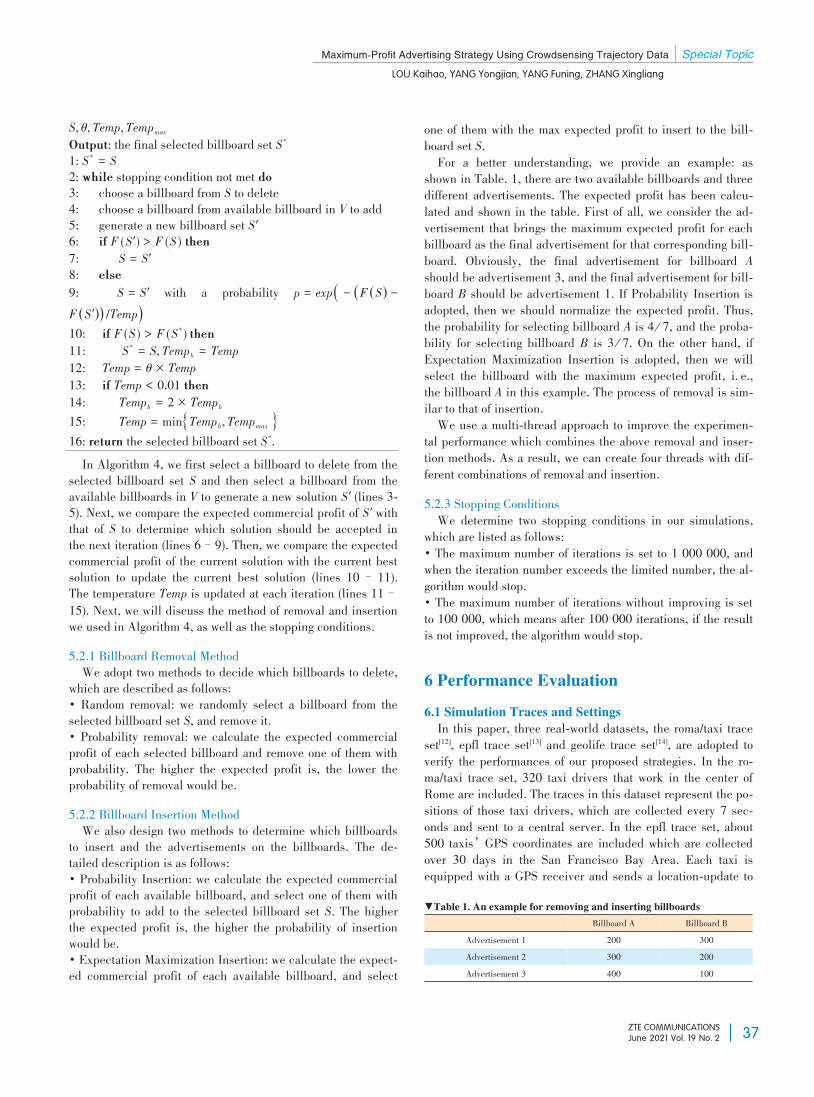
Maximum-Profit Advertising Strategy Using Crowdsensing Trajectory Data Special Topic
LOU Kaihao, YANG Yongjian, YANG Funing, ZHANG Xingliang
ZTE COMMUNICATIONSJune 2021 Vol. 19 No. 2
S, θ, Temp, TempmaxOutput: the final selected billboard set S*1: S* = S2: while stopping condition not met do3: choose a billboard from S to delete4: choose a billboard from available billboard in V to add5: generate a new billboard set S'6: if F (S') > F (S ) then7: S = S'8: else9: S = S' with a probability p = exp ( - (F (S) -F (S')) /Temp)10: if F (S ) > F (S* ) then11: S* = S, Tempb = Temp12: Temp = θ × Temp13: if Temp < 0.01 then14: Tempb = 2 × Tempb15: Temp = min{Tempb, Tempmax }16: return the selected billboard set S*.In Algorithm 4, we first select a billboard to delete from the
selected billboard set S and then select a billboard from theavailable billboards in V to generate a new solution S' (lines 3-5). Next, we compare the expected commercial profit of S'withthat of S to determine which solution should be accepted inthe next iteration (lines 6–9). Then, we compare the expectedcommercial profit of the current solution with the current bestsolution to update the current best solution (lines 10– 11).The temperature Temp is updated at each iteration (lines 11–15). Next, we will discuss the method of removal and insertionwe used in Algorithm 4, as well as the stopping conditions.5.2.1 Billboard Removal MethodWe adopt two methods to decide which billboards to delete,
which are described as follows:• Random removal: we randomly select a billboard from theselected billboard set S, and remove it.• Probability removal: we calculate the expected commercialprofit of each selected billboard and remove one of them withprobability. The higher the expected profit is, the lower theprobability of removal would be.5.2.2 Billboard Insertion MethodWe also design two methods to determine which billboards
to insert and the advertisements on the billboards. The de⁃tailed description is as follows:• Probability Insertion: we calculate the expected commercialprofit of each available billboard, and select one of them withprobability to add to the selected billboard set S. The higherthe expected profit is, the higher the probability of insertionwould be.• Expectation Maximization Insertion: we calculate the expect⁃ed commercial profit of each available billboard, and select
one of them with the max expected profit to insert to the bill⁃board set S.For a better understanding, we provide an example: as
shown in Table. 1, there are two available billboards and threedifferent advertisements. The expected profit has been calcu⁃lated and shown in the table. First of all, we consider the ad⁃vertisement that brings the maximum expected profit for eachbillboard as the final advertisement for that corresponding bill⁃board. Obviously, the final advertisement for billboard Ashould be advertisement 3, and the final advertisement for bill⁃board B should be advertisement 1. If Probability Insertion isadopted, then we should normalize the expected profit. Thus,the probability for selecting billboard A is 4 7, and the proba⁃bility for selecting billboard B is 3 7. On the other hand, ifExpectation Maximization Insertion is adopted, then we willselect the billboard with the maximum expected profit, i. e.,the billboard A in this example. The process of removal is sim⁃ilar to that of insertion.We use a multi-thread approach to improve the experimen⁃
tal performance which combines the above removal and inser⁃tion methods. As a result, we can create four threads with dif⁃ferent combinations of removal and insertion.5.2.3 Stopping ConditionsWe determine two stopping conditions in our simulations,
which are listed as follows:• The maximum number of iterations is set to 1 000 000, andwhen the iteration number exceeds the limited number, the al⁃gorithm would stop.• The maximum number of iterations without improving is setto 100 000, which means after 100 000 iterations, if the resultis not improved, the algorithm would stop.
6 Performance Evaluation
6.1 Simulation Traces and SettingsIn this paper, three real-world datasets, the roma/taxi trace
set[12], epfl trace set[13] and geolife trace set[14], are adopted toverify the performances of our proposed strategies. In the ro⁃ma/taxi trace set, 320 taxi drivers that work in the center ofRome are included. The traces in this dataset represent the po⁃sitions of those taxi drivers, which are collected every 7 sec⁃onds and sent to a central server. In the epfl trace set, about500 taxis’GPS coordinates are included which are collectedover 30 days in the San Francisco Bay Area. Each taxi isequipped with a GPS receiver and sends a location-update to▼Table 1. An example for removing and inserting billboards
Advertisement 1Advertisement 2Advertisement 3
Billboard A200300400
Billboard B300200100
37
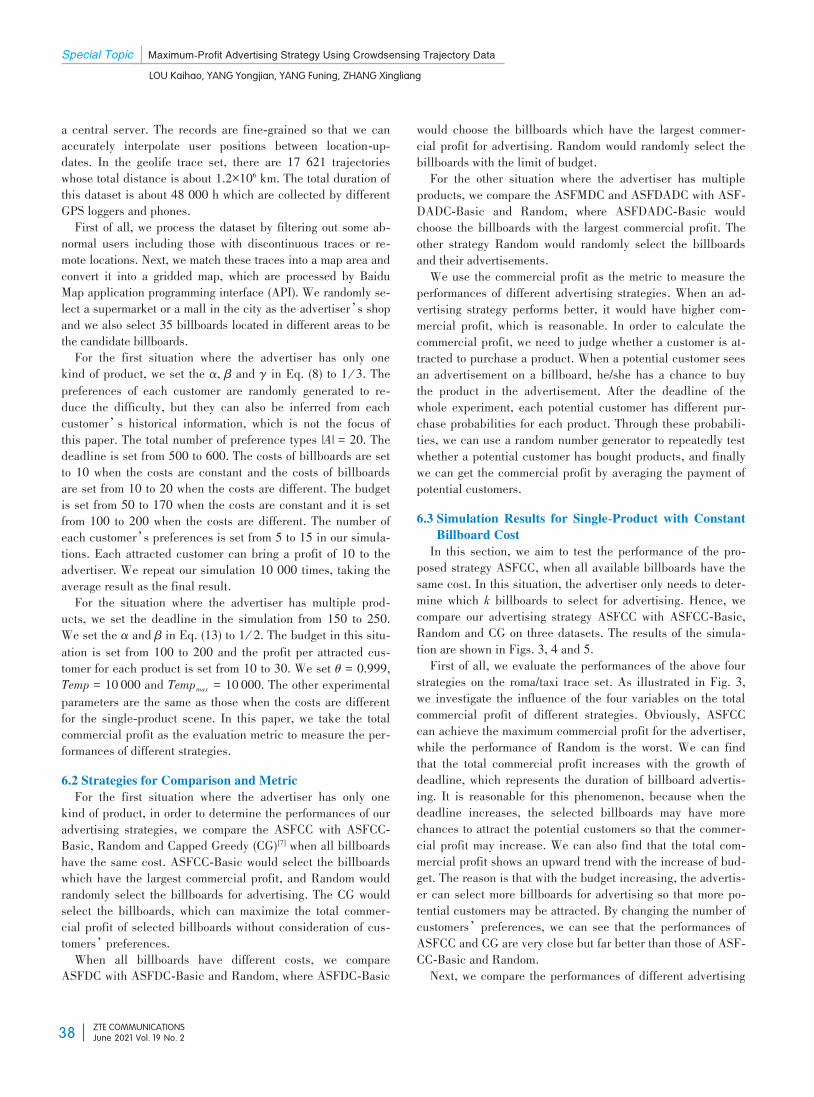
Special Topic Maximum-Profit Advertising Strategy Using Crowdsensing Trajectory Data
LOU Kaihao, YANG Yongjian, YANG Funing, ZHANG Xingliang
ZTE COMMUNICATIONSJune 2021 Vol. 19 No. 2
a central server. The records are fine-grained so that we canaccurately interpolate user positions between location-up⁃dates. In the geolife trace set, there are 17 621 trajectorieswhose total distance is about 1.2×10⁶ km. The total duration ofthis dataset is about 48 000 h which are collected by differentGPS loggers and phones.First of all, we process the dataset by filtering out some ab⁃
normal users including those with discontinuous traces or re⁃mote locations. Next, we match these traces into a map area andconvert it into a gridded map, which are processed by BaiduMap application programming interface (API). We randomly se⁃lect a supermarket or a mall in the city as the advertiser’s shopand we also select 35 billboards located in different areas to bethe candidate billboards.For the first situation where the advertiser has only one
kind of product, we set the α, β and γ in Eq. (8) to 1 3. Thepreferences of each customer are randomly generated to re⁃duce the difficulty, but they can also be inferred from eachcustomer’s historical information, which is not the focus ofthis paper. The total number of preference types |A| = 20. Thedeadline is set from 500 to 600. The costs of billboards are setto 10 when the costs are constant and the costs of billboardsare set from 10 to 20 when the costs are different. The budgetis set from 50 to 170 when the costs are constant and it is setfrom 100 to 200 when the costs are different. The number ofeach customer’s preferences is set from 5 to 15 in our simula⁃tions. Each attracted customer can bring a profit of 10 to theadvertiser. We repeat our simulation 10 000 times, taking theaverage result as the final result.For the situation where the advertiser has multiple prod⁃
ucts, we set the deadline in the simulation from 150 to 250.We set the α and β in Eq. (13) to 1 2. The budget in this situ⁃ation is set from 100 to 200 and the profit per attracted cus⁃tomer for each product is set from 10 to 30. We set θ = 0.999,Temp = 10 000 and Tempmax = 10 000. The other experimentalparameters are the same as those when the costs are differentfor the single-product scene. In this paper, we take the totalcommercial profit as the evaluation metric to measure the per⁃formances of different strategies.6.2 Strategies for Comparison and MetricFor the first situation where the advertiser has only one
kind of product, in order to determine the performances of ouradvertising strategies, we compare the ASFCC with ASFCC-Basic, Random and Capped Greedy (CG)[7] when all billboardshave the same cost. ASFCC-Basic would select the billboardswhich have the largest commercial profit, and Random wouldrandomly select the billboards for advertising. The CG wouldselect the billboards, which can maximize the total commer⁃cial profit of selected billboards without consideration of cus⁃tomers’preferences.When all billboards have different costs, we compare
ASFDC with ASFDC-Basic and Random, where ASFDC-Basic
would choose the billboards which have the largest commer⁃cial profit for advertising. Random would randomly select thebillboards with the limit of budget.For the other situation where the advertiser has multiple
products, we compare the ASFMDC and ASFDADC with ASF⁃DADC-Basic and Random, where ASFDADC-Basic wouldchoose the billboards with the largest commercial profit. Theother strategy Random would randomly select the billboardsand their advertisements.We use the commercial profit as the metric to measure the
performances of different advertising strategies. When an ad⁃vertising strategy performs better, it would have higher com⁃mercial profit, which is reasonable. In order to calculate thecommercial profit, we need to judge whether a customer is at⁃tracted to purchase a product. When a potential customer seesan advertisement on a billboard, he/she has a chance to buythe product in the advertisement. After the deadline of thewhole experiment, each potential customer has different pur⁃chase probabilities for each product. Through these probabili⁃ties, we can use a random number generator to repeatedly testwhether a potential customer has bought products, and finallywe can get the commercial profit by averaging the payment ofpotential customers.6.3 Simulation Results for Single-Product with Constant
Billboard CostIn this section, we aim to test the performance of the pro⁃
posed strategy ASFCC, when all available billboards have thesame cost. In this situation, the advertiser only needs to deter⁃mine which k billboards to select for advertising. Hence, wecompare our advertising strategy ASFCC with ASFCC-Basic,Random and CG on three datasets. The results of the simula⁃tion are shown in Figs. 3, 4 and 5.First of all, we evaluate the performances of the above four
strategies on the roma/taxi trace set. As illustrated in Fig. 3,we investigate the influence of the four variables on the totalcommercial profit of different strategies. Obviously, ASFCCcan achieve the maximum commercial profit for the advertiser,while the performance of Random is the worst. We can findthat the total commercial profit increases with the growth ofdeadline, which represents the duration of billboard advertis⁃ing. It is reasonable for this phenomenon, because when thedeadline increases, the selected billboards may have morechances to attract the potential customers so that the commer⁃cial profit may increase. We can also find that the total com⁃mercial profit shows an upward trend with the increase of bud⁃get. The reason is that with the budget increasing, the advertis⁃er can select more billboards for advertising so that more po⁃tential customers may be attracted. By changing the number ofcustomers’preferences, we can see that the performances ofASFCC and CG are very close but far better than those of ASF⁃CC-Basic and Random.Next, we compare the performances of different advertising
38
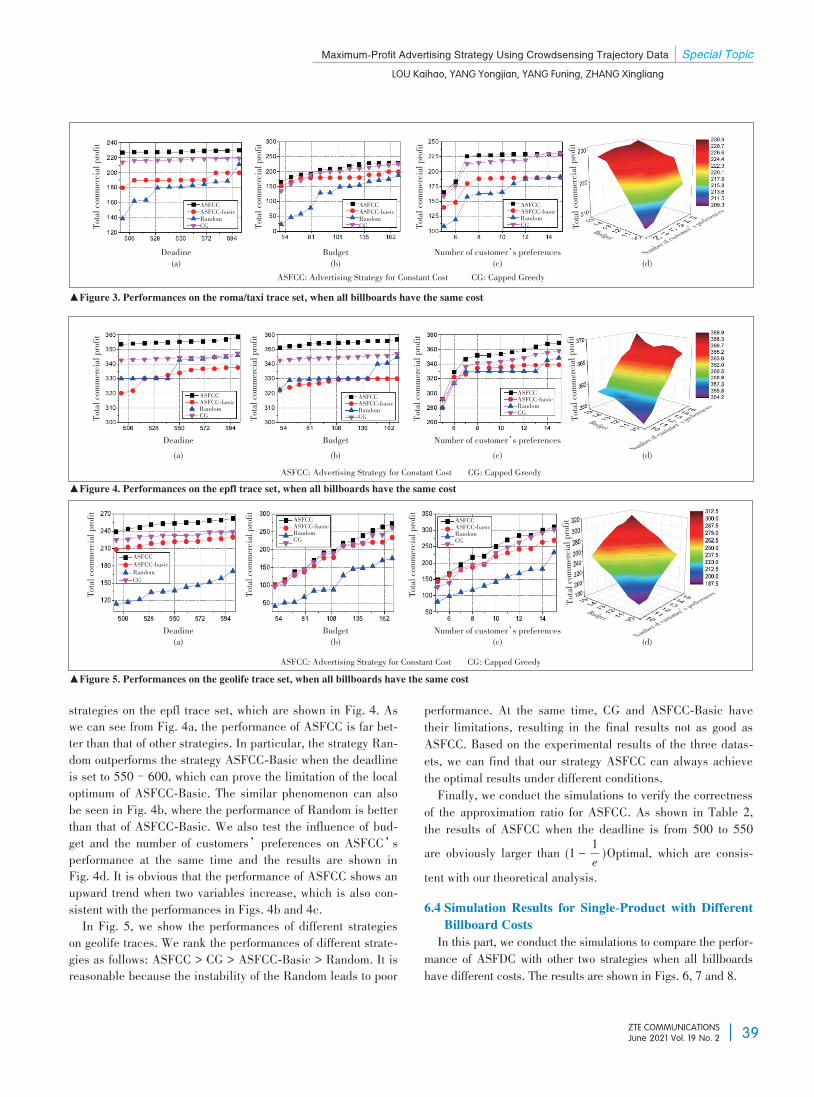
Maximum-Profit Advertising Strategy Using Crowdsensing Trajectory Data Special Topic
LOU Kaihao, YANG Yongjian, YANG Funing, ZHANG Xingliang
ZTE COMMUNICATIONSJune 2021 Vol. 19 No. 2
strategies on the epfl trace set, which are shown in Fig. 4. Aswe can see from Fig. 4a, the performance of ASFCC is far bet⁃ter than that of other strategies. In particular, the strategy Ran⁃dom outperforms the strategy ASFCC-Basic when the deadlineis set to 550–600, which can prove the limitation of the localoptimum of ASFCC-Basic. The similar phenomenon can alsobe seen in Fig. 4b, where the performance of Random is betterthan that of ASFCC-Basic. We also test the influence of bud⁃get and the number of customers’preferences on ASFCC’sperformance at the same time and the results are shown inFig. 4d. It is obvious that the performance of ASFCC shows anupward trend when two variables increase, which is also con⁃sistent with the performances in Figs. 4b and 4c.In Fig. 5, we show the performances of different strategies
on geolife traces. We rank the performances of different strate⁃gies as follows: ASFCC > CG > ASFCC-Basic > Random. It isreasonable because the instability of the Random leads to poor
performance. At the same time, CG and ASFCC-Basic havetheir limitations, resulting in the final results not as good asASFCC. Based on the experimental results of the three datas⁃ets, we can find that our strategy ASFCC can always achievethe optimal results under different conditions.Finally, we conduct the simulations to verify the correctness
of the approximation ratio for ASFCC. As shown in Table 2,the results of ASFCC when the deadline is from 500 to 550are obviously larger than (1 - 1
e)Optimal, which are consis⁃
tent with our theoretical analysis.6.4 Simulation Results for Single-Product with Different
Billboard CostsIn this part, we conduct the simulations to compare the perfor⁃
mance of ASFDC with other two strategies when all billboardshave different costs. The results are shown in Figs. 6, 7 and 8.
▲Figure 3. Performances on the roma/taxi trace set, when all billboards have the same cost
ASFCC: Advertising Strategy for Constant Cost CG: Capped Greedy
▲Figure 4. Performances on the epfl trace set, when all billboards have the same costASFCC: Advertising Strategy for Constant Cost CG: Capped Greedy
▲Figure 5. Performances on the geolife trace set, when all billboards have the same costASFCC: Advertising Strategy for Constant Cost CG: Capped Greedy
Deadine(a)
Totalcommercialprofit
Totalcommercialprofit
(b)Budget
(c)Number of customer’s preferences
(d)Numberof custom
er’s preferencesTot
alcommercialprofit
TotalcommercialprofitASFCCASFCC-basicRandomCG
ASFCCASFCC-basicRandomCGASFCCASFCC-basicRandomCG
Budget
Totalcommercialprofit
Deadine(a) (b)
Budget(c)
Number of customer’s preferences
ASFCCASFCC-basicRandomCGASFCCASFCC-basicRandomCG
ASFCCASFCC-basicRandomCGTotalcommercialprofit
Totalcommercialprofit
BudgetNumber
of customer’s pref
erences
(d)
Totalcommercialprofit
Totalcommercialprofit
Deadine(a)
ASFCCASFCC-basicRandomCG Totalcommercialprofit
ASFCCASFCC-basicRandomCG Totalcommercialprofit
Numberof custom
er’s preferences
BudgetTotalcommercialprofit
(b)Budget
(c)Number of customer’s preferences
(d)
ASFCCASFCC-basicRandomCG
39
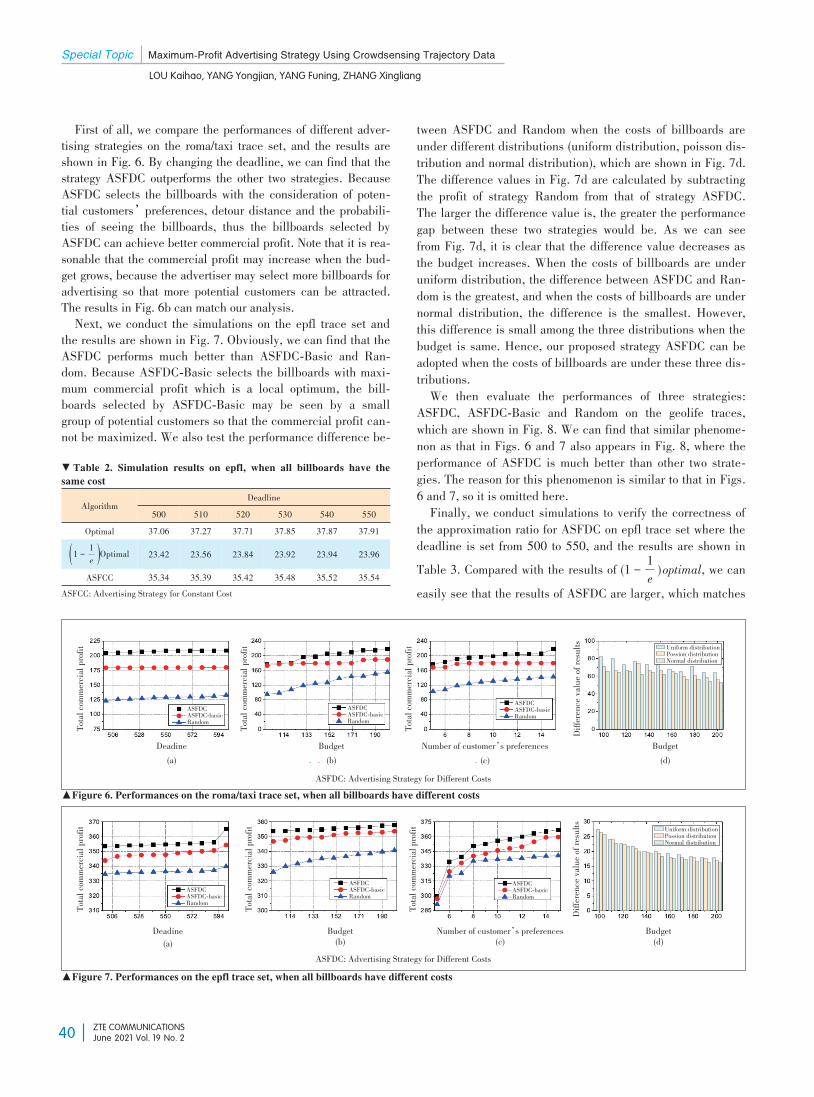
Special Topic Maximum-Profit Advertising Strategy Using Crowdsensing Trajectory Data
LOU Kaihao, YANG Yongjian, YANG Funing, ZHANG Xingliang
ZTE COMMUNICATIONSJune 2021 Vol. 19 No. 2
First of all, we compare the performances of different adver⁃tising strategies on the roma/taxi trace set, and the results areshown in Fig. 6. By changing the deadline, we can find that thestrategy ASFDC outperforms the other two strategies. BecauseASFDC selects the billboards with the consideration of poten⁃tial customers’preferences, detour distance and the probabili⁃ties of seeing the billboards, thus the billboards selected byASFDC can achieve better commercial profit. Note that it is rea⁃sonable that the commercial profit may increase when the bud⁃get grows, because the advertiser may select more billboards foradvertising so that more potential customers can be attracted.The results in Fig. 6b can match our analysis.Next, we conduct the simulations on the epfl trace set and
the results are shown in Fig. 7. Obviously, we can find that theASFDC performs much better than ASFDC-Basic and Ran⁃dom. Because ASFDC-Basic selects the billboards with maxi⁃mum commercial profit which is a local optimum, the bill⁃boards selected by ASFDC-Basic may be seen by a smallgroup of potential customers so that the commercial profit can⁃not be maximized. We also test the performance difference be⁃
tween ASFDC and Random when the costs of billboards areunder different distributions (uniform distribution, poisson dis⁃tribution and normal distribution), which are shown in Fig. 7d.The difference values in Fig. 7d are calculated by subtractingthe profit of strategy Random from that of strategy ASFDC.The larger the difference value is, the greater the performancegap between these two strategies would be. As we can seefrom Fig. 7d, it is clear that the difference value decreases asthe budget increases. When the costs of billboards are underuniform distribution, the difference between ASFDC and Ran⁃dom is the greatest, and when the costs of billboards are undernormal distribution, the difference is the smallest. However,this difference is small among the three distributions when thebudget is same. Hence, our proposed strategy ASFDC can beadopted when the costs of billboards are under these three dis⁃tributions.We then evaluate the performances of three strategies:
ASFDC, ASFDC-Basic and Random on the geolife traces,which are shown in Fig. 8. We can find that similar phenome⁃non as that in Figs. 6 and 7 also appears in Fig. 8, where theperformance of ASFDC is much better than other two strate⁃gies. The reason for this phenomenon is similar to that in Figs.6 and 7, so it is omitted here.Finally, we conduct simulations to verify the correctness of
the approximation ratio for ASFDC on epfl trace set where thedeadline is set from 500 to 550, and the results are shown inTable 3. Compared with the results of (1 - 1
e)optimal, we can
easily see that the results of ASFDC are larger, which matches
▼ Table 2. Simulation results on epfl, when all billboards have thesame cost
AlgorithmOptimal
(1 - 1e )OptimalASFCC
Deadline50037.0623.4235.34
51037.2723.5635.39
52037.7123.8435.42
53037.8523.9235.48
54037.8723.9435.52
55037.9123.9635.54
ASFCC: Advertising Strategy for Constant Cost
▲Figure 6. Performances on the roma/taxi trace set, when all billboards have different costsASFDC: Advertising Strategy for Different Costs
▲Figure 7. Performances on the epfl trace set, when all billboards have different costs
ASFDC: Advertising Strategy for Different Costs
Totalcommercialprofit
(a) (b) (c) (d)
Totalcommercialprofit
Totalcommercialprofit
Budget
ASFDCASFDC-basicRandomASFDCASFDC-basicRandom
ASFDCASFDC-basicRandom
Deadine Number of customer’s preferences
Difference
valueofresults
Budget
Uniform distributionPossion distributionNormal distribution
(a)Deadine
ASFDCASFDC-basicRandomTotalcommercialprofit
Totalcommercialprofit
Totalcommercialprofit
(b)Budget (c)Number of customer’s preferences
ASFDCASFDC-basicRandomASFDCASFDC-basicRandom
Difference
valueofresults
(d)Budget
Uniform distributionPossion distributionNormal distribution
40
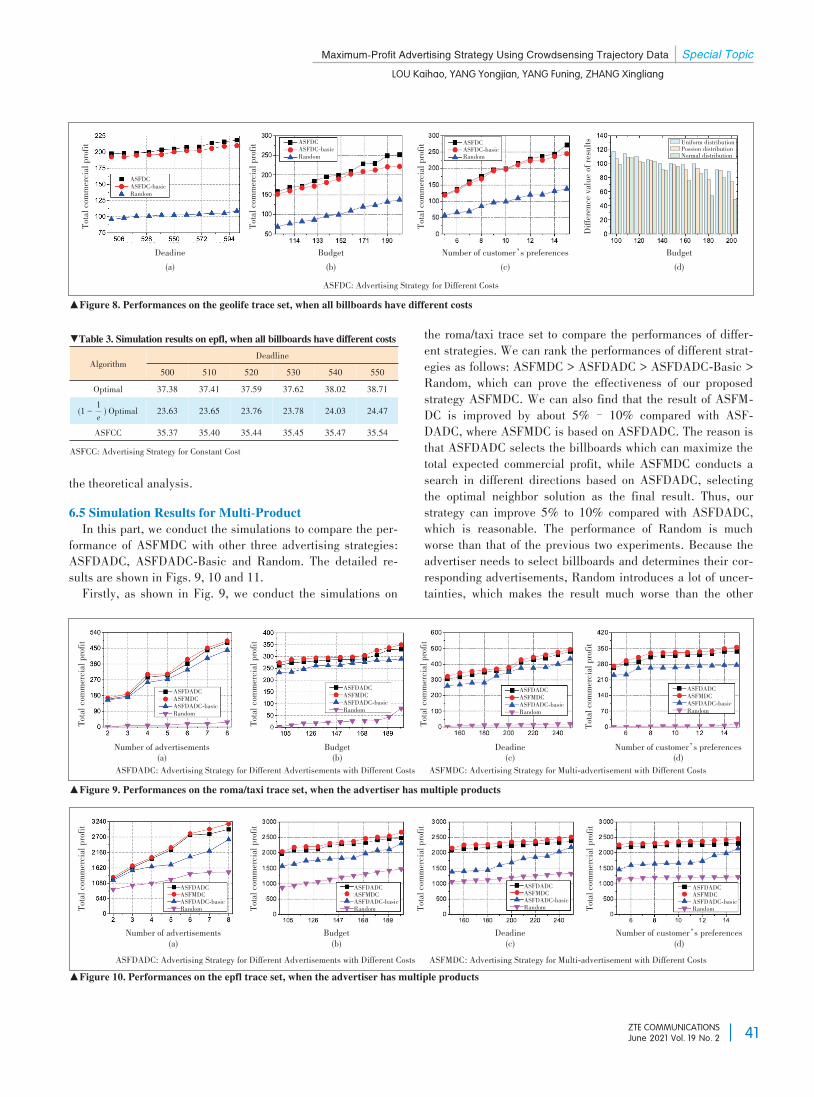
Maximum-Profit Advertising Strategy Using Crowdsensing Trajectory Data Special Topic
LOU Kaihao, YANG Yongjian, YANG Funing, ZHANG Xingliang
ZTE COMMUNICATIONSJune 2021 Vol. 19 No. 2
the theoretical analysis.6.5 Simulation Results for Multi-ProductIn this part, we conduct the simulations to compare the per⁃
formance of ASFMDC with other three advertising strategies:ASFDADC, ASFDADC-Basic and Random. The detailed re⁃sults are shown in Figs. 9, 10 and 11.Firstly, as shown in Fig. 9, we conduct the simulations on
the roma/taxi trace set to compare the performances of differ⁃ent strategies. We can rank the performances of different strat⁃egies as follows: ASFMDC > ASFDADC > ASFDADC-Basic >Random, which can prove the effectiveness of our proposedstrategy ASFMDC. We can also find that the result of ASFM⁃DC is improved by about 5%– 10% compared with ASF⁃DADC, where ASFMDC is based on ASFDADC. The reason isthat ASFDADC selects the billboards which can maximize thetotal expected commercial profit, while ASFMDC conducts asearch in different directions based on ASFDADC, selectingthe optimal neighbor solution as the final result. Thus, ourstrategy can improve 5% to 10% compared with ASFDADC,which is reasonable. The performance of Random is muchworse than that of the previous two experiments. Because theadvertiser needs to select billboards and determines their cor⁃responding advertisements, Random introduces a lot of uncer⁃tainties, which makes the result much worse than the other
▼Table 3. Simulation results on epfl, when all billboards have different costs
AlgorithmOptimal
(1 - 1e) Optimal
ASFCC
Deadline50037.3823.6335.37
51037.4123.6535.40
52037.5923.7635.44
53037.6223.7835.45
54038.0224.0335.47
55038.7124.4735.54
ASFCC: Advertising Strategy for Constant Cost
▲Figure 8. Performances on the geolife trace set, when all billboards have different costs
ASFDC: Advertising Strategy for Different Costs
▲Figure 9. Performances on the roma/taxi trace set, when the advertiser has multiple products
▲Figure 10. Performances on the epfl trace set, when the advertiser has multiple products
ASFDADC: Advertising Strategy for Different Advertisements with Different Costs ASFMDC: Advertising Strategy for Multi-advertisement with Different Costs
ASFDADC: Advertising Strategy for Different Advertisements with Different Costs ASFMDC: Advertising Strategy for Multi-advertisement with Different Costs
Number of customer’s preferences
ASFDCASFDC-basicRandom
Budget Budget(a) (b) (c) (d)
Totalcommercialprofit
Totalcommercialprofit
Totalcommercialprofit
ASFDCASFDC-basicRandomUniform distributionPossion distributionNormal distribution
Difference
valueofresults
Number of advertisements Budget Deadine Number of customer’s preferences(a) (b) (c) (d)
ASFDADCASFMDCASFDADC-basicRandom
ASFDADCASFMDCASFDADC-basicRandom
ASFDADCASFMDCASFDADC-basicRandom
ASFDADCASFMDCASFDADC-basicRandom
Totalcommercialprofit
Totalcommercialprofit
Totalcommercialprofit
Totalcommercialprofit
Number of advertisements Budget Deadine Number of customer’s preferences(a) (b) (c) (d)
ASFDADCASFMDCASFDADC-basicRandom
ASFDADCASFMDCASFDADC-basicRandom
ASFDADCASFMDCASFDADC-basicRandom
ASFDADCASFMDCASFDADC-basicRandomTotalcommercialprofit
Totalcommercialprofit
Totalcommercialprofit
Totalcommercialprofit
Deadine
ASFDCASFDC-basicRandom
41
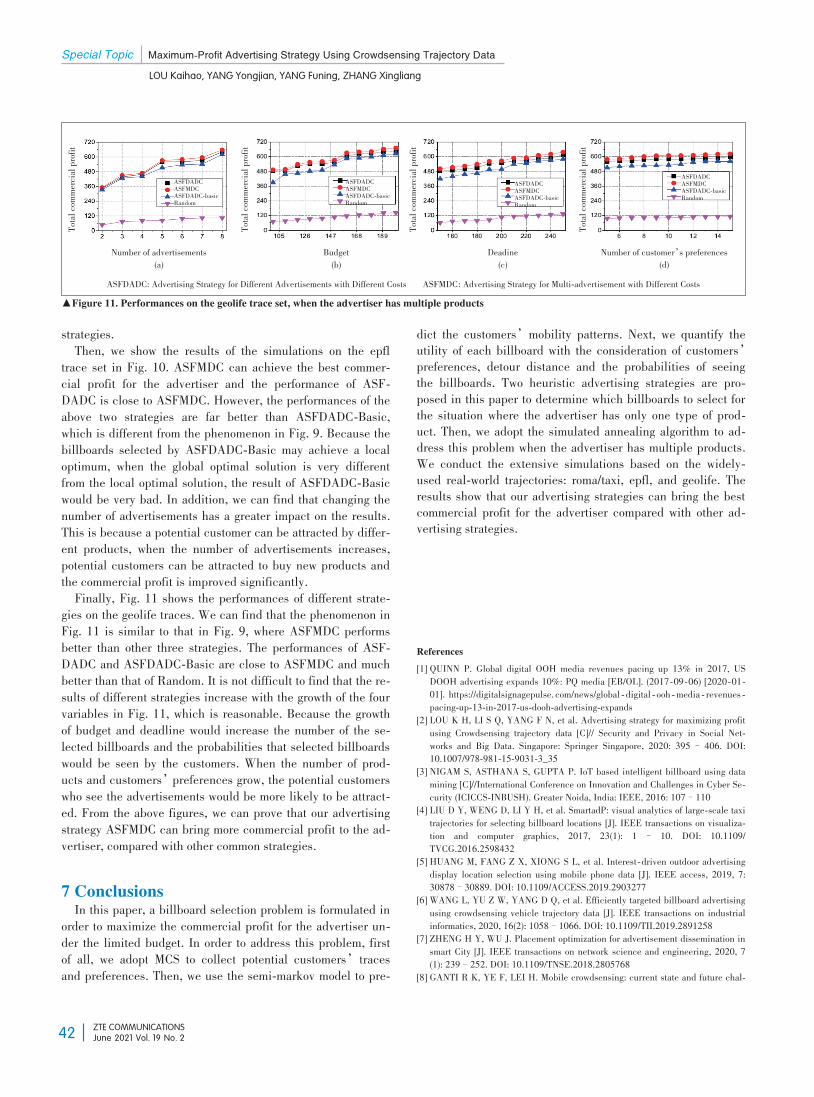
Special Topic Maximum-Profit Advertising Strategy Using Crowdsensing Trajectory Data
LOU Kaihao, YANG Yongjian, YANG Funing, ZHANG Xingliang
ZTE COMMUNICATIONSJune 2021 Vol. 19 No. 2
strategies.Then, we show the results of the simulations on the epfl
trace set in Fig. 10. ASFMDC can achieve the best commer⁃cial profit for the advertiser and the performance of ASF⁃DADC is close to ASFMDC. However, the performances of theabove two strategies are far better than ASFDADC-Basic,which is different from the phenomenon in Fig. 9. Because thebillboards selected by ASFDADC-Basic may achieve a localoptimum, when the global optimal solution is very differentfrom the local optimal solution, the result of ASFDADC-Basicwould be very bad. In addition, we can find that changing thenumber of advertisements has a greater impact on the results.This is because a potential customer can be attracted by differ⁃ent products, when the number of advertisements increases,potential customers can be attracted to buy new products andthe commercial profit is improved significantly.Finally, Fig. 11 shows the performances of different strate⁃
gies on the geolife traces. We can find that the phenomenon inFig. 11 is similar to that in Fig. 9, where ASFMDC performsbetter than other three strategies. The performances of ASF⁃DADC and ASFDADC-Basic are close to ASFMDC and muchbetter than that of Random. It is not difficult to find that the re⁃sults of different strategies increase with the growth of the fourvariables in Fig. 11, which is reasonable. Because the growthof budget and deadline would increase the number of the se⁃lected billboards and the probabilities that selected billboardswould be seen by the customers. When the number of prod⁃ucts and customers’preferences grow, the potential customerswho see the advertisements would be more likely to be attract⁃ed. From the above figures, we can prove that our advertisingstrategy ASFMDC can bring more commercial profit to the ad⁃vertiser, compared with other common strategies.
7 ConclusionsIn this paper, a billboard selection problem is formulated in
order to maximize the commercial profit for the advertiser un⁃der the limited budget. In order to address this problem, firstof all, we adopt MCS to collect potential customers’tracesand preferences. Then, we use the semi-markov model to pre⁃
dict the customers’mobility patterns. Next, we quantify theutility of each billboard with the consideration of customers’preferences, detour distance and the probabilities of seeingthe billboards. Two heuristic advertising strategies are pro⁃posed in this paper to determine which billboards to select forthe situation where the advertiser has only one type of prod⁃uct. Then, we adopt the simulated annealing algorithm to ad⁃dress this problem when the advertiser has multiple products.We conduct the extensive simulations based on the widely-used real-world trajectories: roma/taxi, epfl, and geolife. Theresults show that our advertising strategies can bring the bestcommercial profit for the advertiser compared with other ad⁃vertising strategies.
References
[1] QUINN P. Global digital OOH media revenues pacing up 13% in 2017, USDOOH advertising expands 10%: PQ media [EB/OL]. (2017⁃09⁃06) [2020⁃01⁃01]. https://digitalsignagepulse. com/news/global ⁃ digital ⁃ ooh ⁃media ⁃ revenues ⁃pacing⁃up⁃13⁃in⁃2017⁃us⁃dooh⁃advertising⁃expands
[2] LOU K H, LI S Q, YANG F N, et al. Advertising strategy for maximizing profitusing Crowdsensing trajectory data [C]// Security and Privacy in Social Net⁃works and Big Data. Singapore: Springer Singapore, 2020: 395– 406. DOI:10.1007/978⁃981⁃15⁃9031⁃3_35
[3] NIGAM S, ASTHANA S, GUPTA P. IoT based intelligent billboard using datamining [C]//International Conference on Innovation and Challenges in Cyber Se⁃curity (ICICCS⁃INBUSH). Greater Noida, India: IEEE, 2016: 107–110
[4] LIU D Y, WENG D, LI Y H, et al. SmartadP: visual analytics of large⁃scale taxitrajectories for selecting billboard locations [J]. IEEE transactions on visualiza⁃tion and computer graphics, 2017, 23(1): 1 – 10. DOI: 10.1109/TVCG.2016.2598432
[5] HUANG M, FANG Z X, XIONG S L, et al. Interest⁃driven outdoor advertisingdisplay location selection using mobile phone data [J]. IEEE access, 2019, 7:30878–30889. DOI: 10.1109/ACCESS.2019.2903277
[6] WANG L, YU Z W, YANG D Q, et al. Efficiently targeted billboard advertisingusing crowdsensing vehicle trajectory data [J]. IEEE transactions on industrialinformatics, 2020, 16(2): 1058–1066. DOI: 10.1109/TII.2019.2891258
[7] ZHENG H Y, WU J. Placement optimization for advertisement dissemination insmart City [J]. IEEE transactions on network science and engineering, 2020, 7(1): 239–252. DOI: 10.1109/TNSE.2018.2805768
[8] GANTI R K, YE F, LEI H. Mobile crowdsensing: current state and future chal⁃
▲Figure 11. Performances on the geolife trace set, when the advertiser has multiple products
ASFDADC: Advertising Strategy for Different Advertisements with Different Costs ASFMDC: Advertising Strategy for Multi-advertisement with Different Costs
Number of advertisements(a)
Budget(b)
Deadine(c)
Number of customer’s preferences(d)
ASFDADCASFMDCASFDADC-basicRandom
ASFDADCASFMDCASFDADC-basicRandomASFDADCASFMDCASFDADC-basicRandom
ASFDADCASFMDCASFDADC-basicRandom
Totalcommercialprofit
Totalcommercialprofit
Totalcommercialprofit
Totalcommercialprofit
42
Maximum-Profit Advertising Strategy Using Crowdsensing Trajectory Data Special Topic
LOU Kaihao, YANG Yongjian, YANG Funing, ZHANG Xingliang
ZTE COMMUNICATIONSJune 2021 Vol. 19 No. 2
lenges [J]. IEEE communications magazine, 2011, 49(11): 32 – 39. DOI:10.1109/MCOM.2011.6069707
[9] LIU J W, SHEN H Y, ZHANG X. A survey of mobile crowdsensing techniques:a critical component for the Internet of Things [C]//25th International Confer⁃ence on Computer Communication and Networks (ICCCN). Waikoloa, USA:IEEE, 2016: 1–6. DOI: 10.1109/ICCCN.2016.7568484
[10] CAPPONI A, FIANDRINO C, KANTARCI B, et al. A survey on mobile crowd⁃sensing systems: challenges, solutions, and opportunities [J]. IEEE communi⁃cations surveys & tutorials, 2019, 21(3): 2419 – 2465. DOI: 10.1109/COMST.2019.2914030
[11] KARALIOPOULOS M, KOUTSOPOULOS I, TITSIAS M. First learn thenearn: optimizing mobile crowdsensing campaigns through data⁃driven user pro⁃filing [C]//Proceedings of the 17th ACM International Symposium on MobileAd Hoc Networking and Computing (MobiHoc ’16). New York, USA: ACM,2016: 271–280
[12] BRACCIALE L, BONOLA M, LORETI P, et al. CRAWDAD dataset roma/taxi[EB/OL]. (2014⁃07⁃17) [2020⁃01⁃01]. https://crawdad.org/roma/taxi/20140717
[13] PIORKOWSKI M, SARAFIJANOVIC ⁃ DJUKIC N, GROSSGLAUSER M.CRAWDAD dataset epfl/mobility [EB/OL]. (2009⁃02⁃24)[2020⁃01⁃01]. https://crawdad.org/epfl/mobility/20090224
[14] ZHENG Y, ZHANG L, XIE X, et al. Mining interesting locations and travel se⁃quences from GPS trajectories [C]//Proceedings 13 of the 18th InternationalConference on World Wide Web (WWW’09). New York, USA: ACM, 2009:791–800
[15] KRISHNA O, AIZAWA K. Billboard saliency detection in street videos foradults and elderly [C]//25th IEEE International Conference on Image Process⁃ing (ICIP). Athens, Greece: IEEE, 2018: 2326–2330
[16] AN T T, CHANG C P, LI Y H, et al. Fog computing architecture⁃based Wi⁃Fiunion mechanism for Internet advertising system [C]//International Conferenceon Applied System Innovation (ICASI). Sapporo, Japan: IEEE, 2017: 1024–1027. DOI: 10.1109/ICASI.2017.7988110
[17] ZHANG Y P, LI Y C, BAO Z F, et al. Optimizing impression counts for out⁃door advertising [C]//Proceedings of the 25th ACM SIGKDD International Con⁃ference on Knowledge Discovery & Data Mining. New York, USA: ACM, 2019:1205–1215. DOI: 10.1145/3292500.3330829
[18] ARIYA SANJAYA I M, SUPANGKAT S H, SEMBIRING J. Citizen reportingthrough mobile crowdsensing: a smart city case of bekasi [C]//InternationalConference on ICT for Smart Society (ICISS). Semarang, Indonesia: IEEE,2018: 1–4. DOI: 10.1109/ICTSS.2018.8549976
[19] CHEUNG M H, HOU F, HUANG J W. Delay⁃sensitive mobile crowdsensing:Algorithm design and economics [J]. IEEE transactions on mobile computing,2018, 17(12): 2761–2774. DOI: 10.1109/TMC.2018.2815694
[20] CAO B, XIA S C, HAN J W, et al. A distributed game methodology for crowd⁃sensing in uncertain wireless scenario [J]. IEEE transactions on mobile com⁃puting, 2020, 19(1): 15–28. DOI: 10.1109/TMC.2019.2892953
[21] GONG W, ZHANG B X, LI C. Location⁃based online task assignment and pathplanning for mobile crowdsensing [J]. IEEE transactions on vehicular technolo⁃gy, 2019, 68(2): 1772–1783. DOI: 10.1109/TVT.2018.2884318
[22] MARJANOVIĆ M, ANTONIĆ A, ŽARKO I P. Edge computing architecture formobile crowdsensing [J]. IEEE access, 2018, 6: 10662–10674. DOI: 10.1109/ACCESS.2018.2799707
[23] ZHENG Y F, DUAN H Y, YUAN X L, et al. Privacy⁃aware and efficient mo⁃bile crowdsensing with truth discovery [J]. IEEE transactions on dependableand secure computing, 2020, 17(1): 121 – 133. DOI: 10.1109/TD⁃SC.2017.2753245
[24] WANG L, YU Z W, ZHANG D Q, et al. Heterogeneous multi⁃task assignmentin mobile crowdsensing using spatiotemporal correlation [J]. IEEE transactionson mobile computing, 2019, 18(1): 84–97. DOI: 10.1109/TMC.2018.2827375
[25] WANG J T, WANG Y S, ZHANG D Q, et al. PSAllocator: multi⁃task allocationfor participatory sensing with sensing capability constraints [C]//Proceedingsof the 2017 ACM Conference on Computer Supported Cooperative Work andSocial Computing. New York, USA: ACM, 2017: 1139–1151. DOI: 10.1145/
2998181.2998193[26] LIN M, HSU W ⁃ J, LEE Z Q. Predictability of individuals’mobility with
high⁃resolution positioning data [C]//Proceedings of the 2012 ACM Confer⁃ence on Ubiquitous Computing (UbiComp ’12). New York, USA: ACM,2012: 381–390
[27] WANG E, YANG Y J, WU J, et al. An efficient prediction⁃based user recruit⁃ment for mobile crowdsensing [J]. IEEE transactions on mobile computing,2018, 17(1): 16–28. DOI: 10.1109/TMC.2017.2702613
[28] YUAN Q, CARDEI I, WU J. An efficient prediction⁃based routing in disrup⁃tion ⁃ tolerant networks [J]. IEEE transactions on parallel and distributed sys⁃tems, 2012, 23(1): 19–31. DOI: 10.1109/TPDS.2011.140
[29] YANG Y J, LIU W B, WANG E, et al. A prediction ⁃ based user selectionframework for heterogeneous mobile Crowdsensing [J]. IEEE transactions onmobile computing, 2019, 18(11): 2460 – 2473. DOI: 10.1109/TMC.2018.2879098
[30] YANG Y J, XU Y B, WANG E, et al. Exploring influence maximization in on⁃line and offline double ⁃ layer propagation scheme [J]. Information sciences,2018, 450: 182–199. DOI: 10.1016/j.ins.2018.03.048
[31] KHULLER S, MOSS A, NAOR J S. The budgeted maximum coverage problem[J]. Information processing letters, 1999, 70(1): 39–45. DOI: 10.1016/s0020⁃0190(99)00031⁃9
BiographiesLOU Kaihao ([email protected]) received the B.E. degree in softwareengineering from Jilin University, China in 2017, M.S. degree in computer sci⁃ence and technology from Jilin University in 2020. He is currently pursuing thePh.D. degree in computer science and technology at Jilin University. His cur⁃rent research focuses on mobile crowdsensing and multi-agent reinforcementlearning.
YANG Yongjian received his B.E. degree in automatization from Jilin Univer⁃sity of Technology, China in 1983, M. E. degree in computer communicationfrom Beijing University of Post and Telecommunications, China 1991, and Ph.D. in software and theory of computer from Jilin University, China in 2005. Heis currently a professor and a Ph. D. supervisor at Jilin University, the ViceDean of the Software College of Jilin University, Director of Key lab under theMinistry of Information Industry, Standing Director of the Communication Acad⁃emy, and a member of the Computer Science Academy of Jilin Province. His re⁃search interests include network intelligence management, wireless mobile com⁃munication and services, and wireless mobile communications.
YANG Funing received her B.E. degree in software engineering from Jilin Uni⁃versity, China in 2010 and master’s degree from the school of computer sci⁃ence, Beijing University of Posts and Telecommunications, China in 2013. Sheis currently a teacher at Jilin University, China. Her current research interestsinclude management, mobile crowdsensing, integration and mining of massivetraffic data.
ZHANG Xingliang received his B.E. degree in software engineering from JilinUniversity, China in 2010. He is currently an engineer at the Network Manage⁃ment Center of China Mobile Group Jilin Co., Ltd. His current research inter⁃ests include mobile communication data analysis and big data analysis of 5G.
43
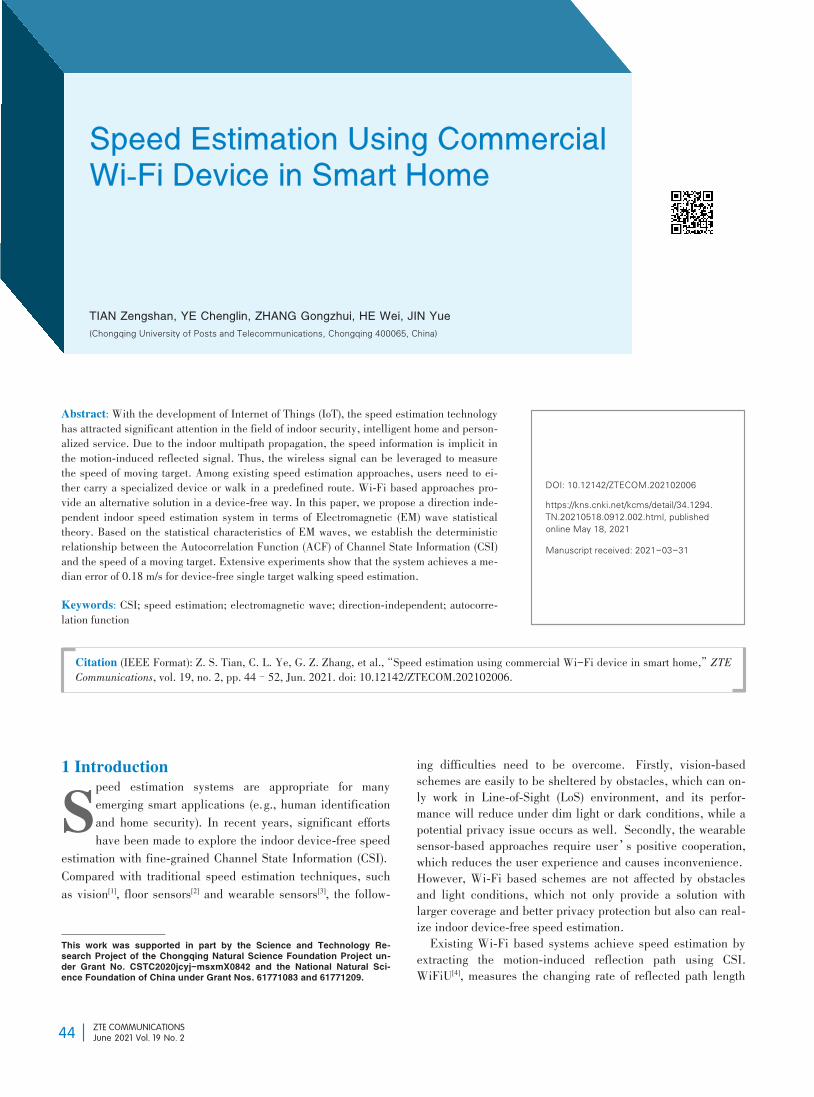
ZTE COMMUNICATIONSJune 2021 Vol. 19 No. 2
Speed Estimation Using CommercialSpeed Estimation Using CommercialWiWi--Fi Device in Smart HomeFi Device in Smart Home
TIAN Zengshan, YE Chenglin, ZHANG Gongzhui, HE Wei, JIN Yue
(Chongqing University of Posts and Telecommunications, Chongqing 400065, China)
Abstract: With the development of Internet of Things (IoT), the speed estimation technologyhas attracted significant attention in the field of indoor security, intelligent home and person⁃alized service. Due to the indoor multipath propagation, the speed information is implicit inthe motion-induced reflected signal. Thus, the wireless signal can be leveraged to measurethe speed of moving target. Among existing speed estimation approaches, users need to ei⁃ther carry a specialized device or walk in a predefined route. Wi-Fi based approaches pro⁃vide an alternative solution in a device-free way. In this paper, we propose a direction inde⁃pendent indoor speed estimation system in terms of Electromagnetic (EM) wave statisticaltheory. Based on the statistical characteristics of EM waves, we establish the deterministicrelationship between the Autocorrelation Function (ACF) of Channel State Information (CSI)and the speed of a moving target. Extensive experiments show that the system achieves a me⁃dian error of 0.18 m/s for device-free single target walking speed estimation.Keywords: CSI; speed estimation; electromagnetic wave; direction-independent; autocorre⁃lation function
Citation (IEEE Format): Z. S. Tian, C. L. Ye, G. Z. Zhang, et al.,“Speed estimation using commercial Wi-Fi device in smart home,”ZTECommunications, vol. 19, no. 2, pp. 44–52, Jun. 2021. doi: 10.12142/ZTECOM.202102006.
1 Introduction
Speed estimation systems are appropriate for manyemerging smart applications (e.g., human identificationand home security). In recent years, significant effortshave been made to explore the indoor device-free speed
estimation with fine-grained Channel State Information (CSI).Compared with traditional speed estimation techniques, suchas vision[1], floor sensors[2] and wearable sensors[3], the follow⁃
ing difficulties need to be overcome. Firstly, vision-basedschemes are easily to be sheltered by obstacles, which can on⁃ly work in Line⁃of⁃Sight (LoS) environment, and its perfor⁃mance will reduce under dim light or dark conditions, while apotential privacy issue occurs as well. Secondly, the wearablesensor⁃based approaches require user’s positive cooperation,which reduces the user experience and causes inconvenience.However, Wi⁃Fi based schemes are not affected by obstaclesand light conditions, which not only provide a solution withlarger coverage and better privacy protection but also can real⁃ize indoor device⁃free speed estimation.Existing Wi⁃Fi based systems achieve speed estimation by
extracting the motion⁃induced reflection path using CSI.WiFiU[4], measures the changing rate of reflected path length
DOI: 10.12142/ZTECOM.202102006
https://kns.cnki.net/kcms/detail/34.1294.TN.20210518.0912.002.html, publishedonline May 18, 2021
Manuscript received: 2021-03-31
This work was supported in part by the Science and Technology Re⁃search Project of the Chongqing Natural Science Foundation Project un⁃der Grant No. CSTC2020jcyj-msxmX0842 and the National Natural Sci⁃ence Foundation of China under Grant Nos. 61771083 and 61771209.
44
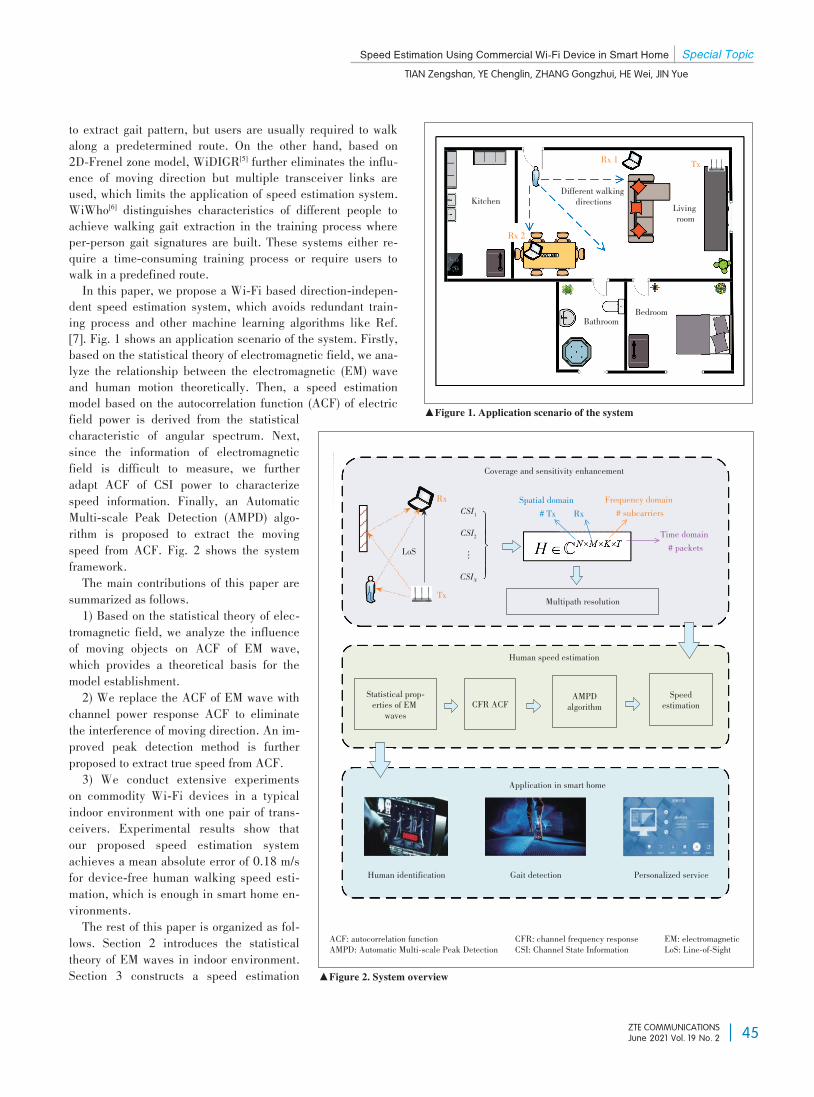
Speed Estimation Using Commercial Wi-Fi Device in Smart Home Special Topic
TIAN Zengshan, YE Chenglin, ZHANG Gongzhui, HE Wei, JIN Yue
ZTE COMMUNICATIONSJune 2021 Vol. 19 No. 2
to extract gait pattern, but users are usually required to walkalong a predetermined route. On the other hand, based on2D⁃Frenel zone model, WiDIGR[5] further eliminates the influ⁃ence of moving direction but multiple transceiver links areused, which limits the application of speed estimation system.WiWho[6] distinguishes characteristics of different people toachieve walking gait extraction in the training process whereper⁃person gait signatures are built. These systems either re⁃quire a time⁃consuming training process or require users towalk in a predefined route.In this paper, we propose a Wi⁃Fi based direction-indepen⁃
dent speed estimation system, which avoids redundant train⁃ing process and other machine learning algorithms like Ref.[7]. Fig. 1 shows an application scenario of the system. Firstly,based on the statistical theory of electromagnetic field, we ana⁃lyze the relationship between the electromagnetic (EM) waveand human motion theoretically. Then, a speed estimationmodel based on the autocorrelation function (ACF) of electricfield power is derived from the statisticalcharacteristic of angular spectrum. Next,since the information of electromagneticfield is difficult to measure, we furtheradapt ACF of CSI power to characterizespeed information. Finally, an AutomaticMulti-scale Peak Detection (AMPD) algo⁃rithm is proposed to extract the movingspeed from ACF. Fig. 2 shows the systemframework.The main contributions of this paper are
summarized as follows.1) Based on the statistical theory of elec⁃
tromagnetic field, we analyze the influenceof moving objects on ACF of EM wave,which provides a theoretical basis for themodel establishment.2) We replace the ACF of EM wave with
channel power response ACF to eliminatethe interference of moving direction. An im⁃proved peak detection method is furtherproposed to extract true speed from ACF.3) We conduct extensive experiments
on commodity Wi-Fi devices in a typicalindoor environment with one pair of trans⁃ceivers. Experimental results show thatour proposed speed estimation systemachieves a mean absolute error of 0.18 m/sfor device-free human walking speed esti⁃mation, which is enough in smart home en⁃vironments.The rest of this paper is organized as fol⁃
lows. Section 2 introduces the statisticaltheory of EM waves in indoor environment.Section 3 constructs a speed estimation
▲Figure 1. Application scenario of the system
ACF: autocorrelation functionAMPD: Automatic Multi⁃scale Peak Detection CFR: channel frequency responseCSI: Channel State Information EM: electromagneticLoS: Line⁃of⁃Sight
▲Figure 2. System overview
Kitchen
Rx 1 Tx
Rx 2
Livingroom
Different walkingdirections
BedroomBathroom
Coverage and sensitivity enhancement
Multipath resolution
CSI1
CSI2
︙CSIN
LoS
Rx
Tx
Frequency domain# subcarriers
Spatial domain# Tx Rx
Time domain# packets
Human speed estimation
Statistical prop⁃erties of EMwavesCFR ACF AMPDalgorithm
Speedestimation
Application in smart home
Human identification Gait detection Personalized service
45
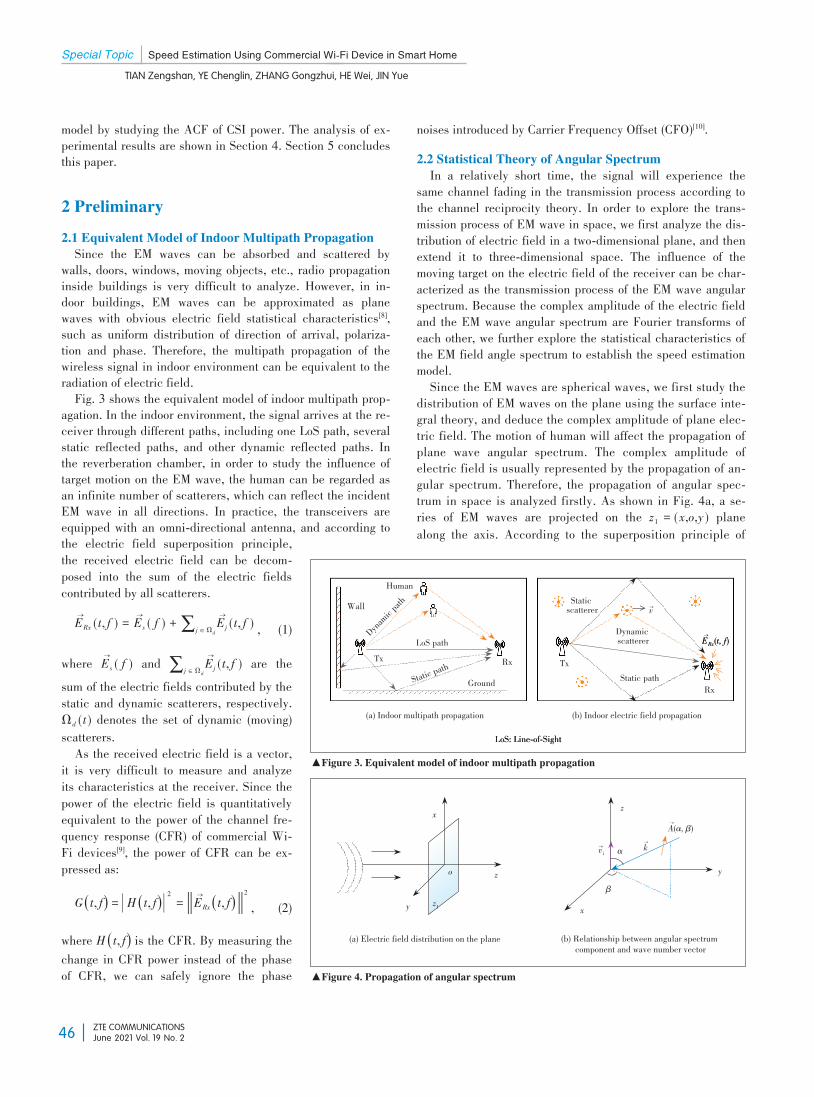
Special Topic Speed Estimation Using Commercial Wi-Fi Device in Smart Home
TIAN Zengshan, YE Chenglin, ZHANG Gongzhui, HE Wei, JIN Yue
ZTE COMMUNICATIONSJune 2021 Vol. 19 No. 2
model by studying the ACF of CSI power. The analysis of ex⁃perimental results are shown in Section 4. Section 5 concludesthis paper.
2 Preliminary
2.1 Equivalent Model of Indoor Multipath PropagationSince the EM waves can be absorbed and scattered by
walls, doors, windows, moving objects, etc., radio propagationinside buildings is very difficult to analyze. However, in in⁃door buildings, EM waves can be approximated as planewaves with obvious electric field statistical characteristics[8],such as uniform distribution of direction of arrival, polariza⁃tion and phase. Therefore, the multipath propagation of thewireless signal in indoor environment can be equivalent to theradiation of electric field.Fig. 3 shows the equivalent model of indoor multipath prop⁃
agation. In the indoor environment, the signal arrives at the re⁃ceiver through different paths, including one LoS path, severalstatic reflected paths, and other dynamic reflected paths. Inthe reverberation chamber, in order to study the influence oftarget motion on the EM wave, the human can be regarded asan infinite number of scatterers, which can reflect the incidentEM wave in all directions. In practice, the transceivers areequipped with an omni-directional antenna, and according tothe electric field superposition principle,the received electric field can be decom⁃posed into the sum of the electric fieldscontributed by all scatterers.ERx ( t, f ) = Es ( f ) +∑j ∈ ΩdE
j ( t, f ) , (1)
where Es ( f ) and ∑j ∈ ΩdEj ( t, f ) are the
sum of the electric fields contributed by thestatic and dynamic scatterers, respectively.Ωd ( t ) denotes the set of dynamic (moving)scatterers.As the received electric field is a vector,
it is very difficult to measure and analyzeits characteristics at the receiver. Since thepower of the electric field is quantitativelyequivalent to the power of the channel fre⁃quency response (CFR) of commercial Wi-Fi devices[9], the power of CFR can be ex⁃pressed as:G (t, f) = |H (t, f) |2 = ERx ( )t, f 2
, (2)where H (t, f) is the CFR. By measuring thechange in CFR power instead of the phaseof CFR, we can safely ignore the phase
noises introduced by Carrier Frequency Offset (CFO)[10].2.2 Statistical Theory of Angular SpectrumIn a relatively short time, the signal will experience the
same channel fading in the transmission process according tothe channel reciprocity theory. In order to explore the trans⁃mission process of EM wave in space, we first analyze the dis⁃tribution of electric field in a two-dimensional plane, and thenextend it to three-dimensional space. The influence of themoving target on the electric field of the receiver can be char⁃acterized as the transmission process of the EM wave angularspectrum. Because the complex amplitude of the electric fieldand the EM wave angular spectrum are Fourier transforms ofeach other, we further explore the statistical characteristics ofthe EM field angle spectrum to establish the speed estimationmodel.Since the EM waves are spherical waves, we first study the
distribution of EM waves on the plane using the surface inte⁃gral theory, and deduce the complex amplitude of plane elec⁃tric field. The motion of human will affect the propagation ofplane wave angular spectrum. The complex amplitude ofelectric field is usually represented by the propagation of an⁃gular spectrum. Therefore, the propagation of angular spec⁃trum in space is analyzed firstly. As shown in Fig. 4a, a se⁃ries of EM waves are projected on the z1 = ( x,o,y ) planealong the axis. According to the superposition principle of
▲Figure 3. Equivalent model of indoor multipath propagation
LoS: Line⁃of⁃Sight
▲Figure 4. Propagation of angular spectrum
(a) Indoor multipath propagation (b) Indoor electric field propagation
GroundRx
WallHuman
LoS path
Static pathTx
StaticscattererDynamicscatterer
RxStatic path
TxERx(t, f)ERx(t, f)
v
LoS: Line⁃of⁃Sight
x
zo
z1y
vi kα
β
y
x
A(α, β)z
(a) Electric field distribution on the plane (b) Relationship between angular spectrumcomponent and wave number vector
Dynamicpath
46
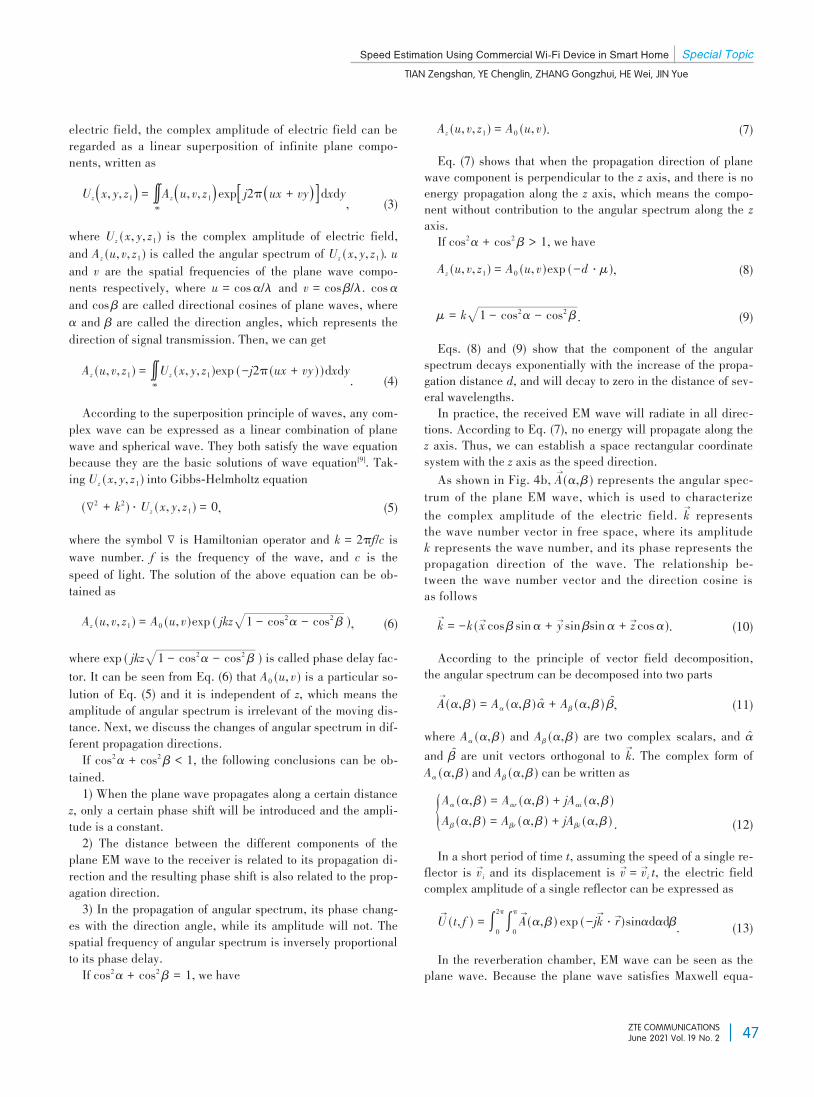
Speed Estimation Using Commercial Wi-Fi Device in Smart Home Special Topic
TIAN Zengshan, YE Chenglin, ZHANG Gongzhui, HE Wei, JIN Yue
ZTE COMMUNICATIONSJune 2021 Vol. 19 No. 2
electric field, the complex amplitude of electric field can beregarded as a linear superposition of infinite plane compo⁃nents, written asUz (x, y, z1) = ∬
∞Az (u, v, z1) exp[ j2π (ux + vy) ]dxdy, (3)
where Uz ( x, y, z1 ) is the complex amplitude of electric field,and Az (u, v, z1 ) is called the angular spectrum of Uz ( x, y, z1 ). uand v are the spatial frequencies of the plane wave compo⁃nents respectively, where u = cos α/λ and v = cos β/λ. cos αand cos β are called directional cosines of plane waves, whereα and β are called the direction angles, which represents thedirection of signal transmission. Then, we can getAz (u, v, z1 ) = ∬
∞Uz ( x, y, z1 )exp ( - j2π(ux + vy ) )dxdy. (4)
According to the superposition principle of waves, any com⁃plex wave can be expressed as a linear combination of planewave and spherical wave. They both satisfy the wave equationbecause they are the basic solutions of wave equation[9]. Tak⁃ing Uz ( x, y, z1 ) into Gibbs-Helmholtz equation(∇2 + k2 ) ⋅ Uz ( x, y, z1 ) = 0, (5)
where the symbol ∇ is Hamiltonian operator and k = 2πf/c iswave number. f is the frequency of the wave, and c is thespeed of light. The solution of the above equation can be ob⁃tained asAz (u, v, z1 ) = A0 (u, v )exp ( jkz 1 - cos2α - cos2 β ), (6)
where exp ( jkz 1 - cos2α - cos2 β ) is called phase delay fac⁃tor. It can be seen from Eq. (6) that A0 (u, v ) is a particular so⁃lution of Eq. (5) and it is independent of z, which means theamplitude of angular spectrum is irrelevant of the moving dis⁃tance. Next, we discuss the changes of angular spectrum in dif⁃ferent propagation directions.If cos2α + cos2 β < 1, the following conclusions can be ob⁃
tained.1) When the plane wave propagates along a certain distance
z, only a certain phase shift will be introduced and the ampli⁃tude is a constant.2) The distance between the different components of the
plane EM wave to the receiver is related to its propagation di⁃rection and the resulting phase shift is also related to the prop⁃agation direction.3) In the propagation of angular spectrum, its phase chang⁃
es with the direction angle, while its amplitude will not. Thespatial frequency of angular spectrum is inversely proportionalto its phase delay.If cos2α + cos2 β = 1, we have
Az (u, v, z1 ) = A0 (u, v ). (7)Eq. (7) shows that when the propagation direction of plane
wave component is perpendicular to the z axis, and there is noenergy propagation along the z axis, which means the compo⁃nent without contribution to the angular spectrum along the zaxis.If cos2α + cos2 β > 1, we haveAz (u, v, z1 ) = A0 (u, v )exp ( -d ⋅ μ ), (8)
μ = k 1 - cos2α - cos2 β . (9)Eqs. (8) and (9) show that the component of the angular
spectrum decays exponentially with the increase of the propa⁃gation distance d, and will decay to zero in the distance of sev⁃eral wavelengths.In practice, the received EM wave will radiate in all direc⁃
tions. According to Eq. (7), no energy will propagate along thez axis. Thus, we can establish a space rectangular coordinatesystem with the z axis as the speed direction.As shown in Fig. 4b, A(α, β ) represents the angular spec⁃
trum of the plane EM wave, which is used to characterizethe complex amplitude of the electric field. k representsthe wave number vector in free space, where its amplitudek represents the wave number, and its phase represents thepropagation direction of the wave. The relationship be⁃tween the wave number vector and the direction cosine isas followsk = -k ( xcos β sin α + ysin βsin α + zcos α ). (10)According to the principle of vector field decomposition,
the angular spectrum can be decomposed into two partsA(α, β ) = Aα (α, β ) α̂ + Aβ (α, β ) β̂, (11)
where Aα (α, β ) and Aβ (α, β ) are two complex scalars, and α̂and β̂ are unit vectors orthogonal to k. The complex form ofAα (α, β ) and Aβ (α, β ) can be written as
{Aα (α, β ) = Aαr (α, β ) + jAαi (α, β )Aβ (α, β ) = Aβr (α, β ) + jAβi (α, β ) . (12)In a short period of time t, assuming the speed of a single re⁃
flector is vi and its displacement is v = vi t, the electric fieldcomplex amplitude of a single reflector can be expressed asU( t, f ) = ∫02π ∫0πA(α, β ) exp ( - jk ⋅ r)sinαdαdβ. (13)In the reverberation chamber, EM wave can be seen as the
plane wave. Because the plane wave satisfies Maxwell equa⁃
47
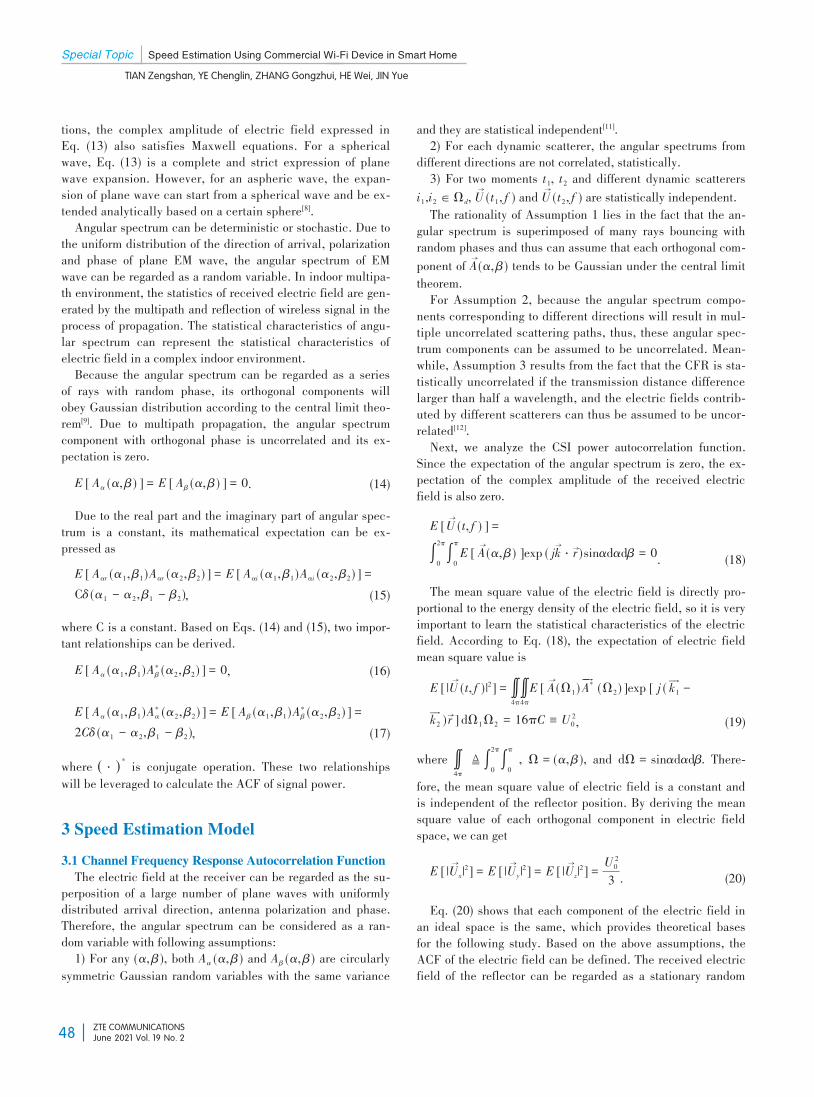
Special Topic Speed Estimation Using Commercial Wi-Fi Device in Smart Home
TIAN Zengshan, YE Chenglin, ZHANG Gongzhui, HE Wei, JIN Yue
ZTE COMMUNICATIONSJune 2021 Vol. 19 No. 2
tions, the complex amplitude of electric field expressed inEq. (13) also satisfies Maxwell equations. For a sphericalwave, Eq. (13) is a complete and strict expression of planewave expansion. However, for an aspheric wave, the expan⁃sion of plane wave can start from a spherical wave and be ex⁃tended analytically based on a certain sphere[8].Angular spectrum can be deterministic or stochastic. Due to
the uniform distribution of the direction of arrival, polarizationand phase of plane EM wave, the angular spectrum of EMwave can be regarded as a random variable. In indoor multipa⁃th environment, the statistics of received electric field are gen⁃erated by the multipath and reflection of wireless signal in theprocess of propagation. The statistical characteristics of angu⁃lar spectrum can represent the statistical characteristics ofelectric field in a complex indoor environment.Because the angular spectrum can be regarded as a series
of rays with random phase, its orthogonal components willobey Gaussian distribution according to the central limit theo⁃rem[9]. Due to multipath propagation, the angular spectrumcomponent with orthogonal phase is uncorrelated and its ex⁃pectation is zero.E [ Aα (α, β ) ] = E [ Aβ (α, β ) ] = 0. (14)Due to the real part and the imaginary part of angular spec⁃
trum is a constant, its mathematical expectation can be ex⁃pressed asE [ Aαr (α1, β1 )Aαr (α2, β2 ) ] = E [ Aαi (α1, β1 )Aαi (α2, β2 ) ] =Cδ (α1 - α2, β1 - β2 ), (15)
where C is a constant. Based on Eqs. (14) and (15), two impor⁃tant relationships can be derived.E [ Aα (α1, β1 )A∗β (α2, β2 ) ] = 0, (16)
E [ Aα (α1, β1 )A∗α (α2, β2 ) ] = E [ Aβ (α1, β1 )A∗β (α2, β2 ) ] =2Cδ (α1 - α2, β1 - β2 ), (17)
where ( ⋅ ) * is conjugate operation. These two relationshipswill be leveraged to calculate the ACF of signal power.
3 Speed Estimation Model
3.1 Channel Frequency Response Autocorrelation FunctionThe electric field at the receiver can be regarded as the su⁃
perposition of a large number of plane waves with uniformlydistributed arrival direction, antenna polarization and phase.Therefore, the angular spectrum can be considered as a ran⁃dom variable with following assumptions:1) For any (α, β ), both Aα (α, β ) and Aβ (α, β ) are circularlysymmetric Gaussian random variables with the same variance
and they are statistical independent[11].2) For each dynamic scatterer, the angular spectrums from
different directions are not correlated, statistically.3) For two moments t1, t2 and different dynamic scatterers
i1,i2 ∈ Ωd, U( t1, f ) and U( t2, f ) are statistically independent.The rationality of Assumption 1 lies in the fact that the an⁃gular spectrum is superimposed of many rays bouncing withrandom phases and thus can assume that each orthogonal com⁃ponent of A(α, β ) tends to be Gaussian under the central limittheorem.For Assumption 2, because the angular spectrum compo⁃
nents corresponding to different directions will result in mul⁃tiple uncorrelated scattering paths, thus, these angular spec⁃trum components can be assumed to be uncorrelated. Mean⁃while, Assumption 3 results from the fact that the CFR is sta⁃tistically uncorrelated if the transmission distance differencelarger than half a wavelength, and the electric fields contrib⁃uted by different scatterers can thus be assumed to be uncor⁃related[12].Next, we analyze the CSI power autocorrelation function.
Since the expectation of the angular spectrum is zero, the ex⁃pectation of the complex amplitude of the received electricfield is also zero.E [U( t, f ) ] =∫02π ∫0πE [ A(α, β ) ]exp ( jk ⋅ r)sinαdαdβ = 0. (18)The mean square value of the electric field is directly pro⁃
portional to the energy density of the electric field, so it is veryimportant to learn the statistical characteristics of the electricfield. According to Eq. (18), the expectation of electric fieldmean square value isE [ |U( t, f )|2 ] = ∬
4π∬4πE [ A(Ω1) A* (Ω2 ) ]exp [ j ( k1 -
k2 ) r] dΩ1Ω2 = 16πC ≡ U 20 , (19)
where ∬4π≜ ∫02π ∫0π , Ω = (α, β ), and dΩ = sinαdαdβ. There⁃
fore, the mean square value of electric field is a constant andis independent of the reflector position. By deriving the meansquare value of each orthogonal component in electric fieldspace, we can getE [ |Ux|2 ] = E [ |Uy|2 ] = E [ |Uz|2 ] = U
203 . (20)
Eq. (20) shows that each component of the electric field inan ideal space is the same, which provides theoretical basesfor the following study. Based on the above assumptions, theACF of the electric field can be defined. The received electricfield of the reflector can be regarded as a stationary random
48
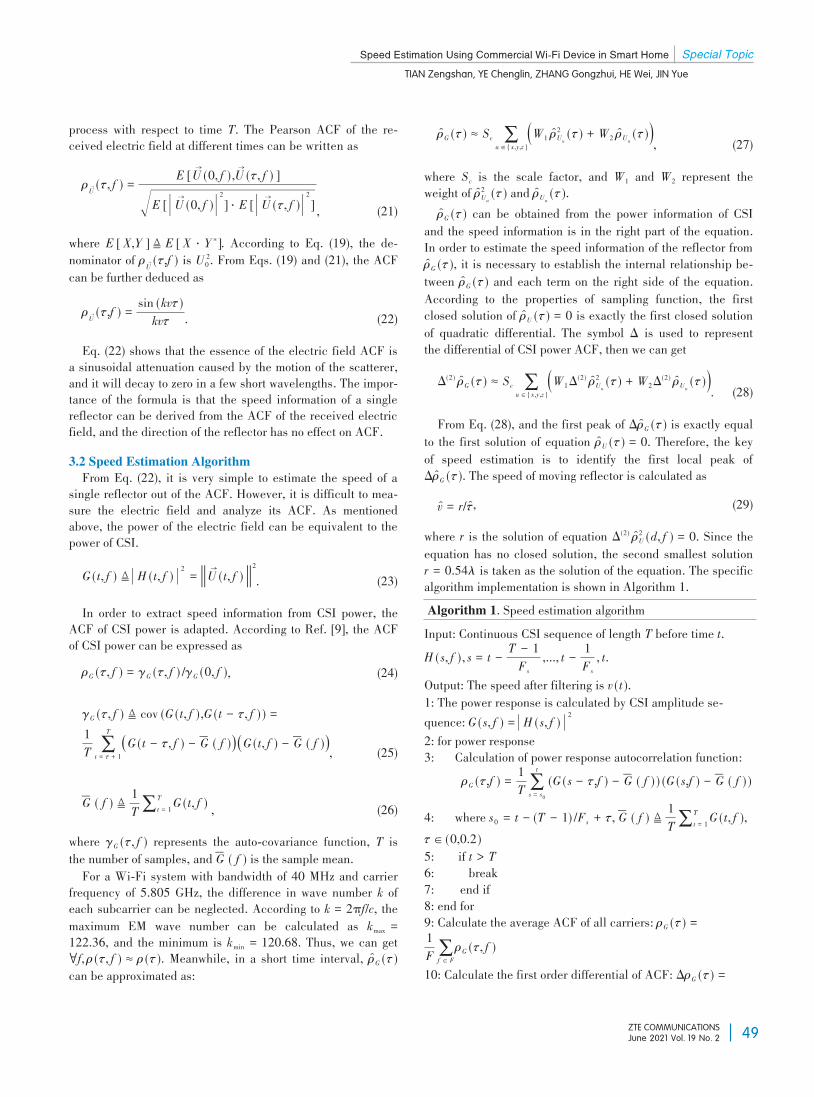
Speed Estimation Using Commercial Wi-Fi Device in Smart Home Special Topic
TIAN Zengshan, YE Chenglin, ZHANG Gongzhui, HE Wei, JIN Yue
ZTE COMMUNICATIONSJune 2021 Vol. 19 No. 2
process with respect to time T. The Pearson ACF of the re⁃ceived electric field at different times can be written as
ρU (τ, f ) = E [U(0, f ),U(τ, f ) ]
E [ ||U(0, f ) 2 ] ⋅ E [ ||U(τ, f ) 2 ] , (21)where E [ X,Y ] ≜ E [ X ⋅ Y ∗ ]. According to Eq. (19), the de⁃nominator of ρ
U (τ,f ) is U 20 . From Eqs. (19) and (21), the ACFcan be further deduced asρU (τ,f ) = sin (kvτ )kvτ . (22)Eq. (22) shows that the essence of the electric field ACF is
a sinusoidal attenuation caused by the motion of the scatterer,and it will decay to zero in a few short wavelengths. The impor⁃tance of the formula is that the speed information of a singlereflector can be derived from the ACF of the received electricfield, and the direction of the reflector has no effect on ACF.3.2 Speed Estimation AlgorithmFrom Eq. (22), it is very simple to estimate the speed of a
single reflector out of the ACF. However, it is difficult to mea⁃sure the electric field and analyze its ACF. As mentionedabove, the power of the electric field can be equivalent to thepower of CSI.G ( t, f ) ≜ |H ( t, f ) |2 = U( t, f ) 2
. (23)In order to extract speed information from CSI power, the
ACF of CSI power is adapted. According to Ref. [9], the ACFof CSI power can be expressed asρG (τ, f ) = γG (τ, f ) /γG (0, f ), (24)
γG (τ, f ) ≜ cov (G ( t, f ),G ( t - τ, f ) ) =1T ∑t = τ + 1
T
( )G ( t - τ, f ) - -G ( f ) ( )G ( t, f ) - -G ( f ) , (25)
-G ( f ) ≜ 1T∑t = 1
T G ( t, f ) , (26)where γG (τ, f ) represents the auto-covariance function, T isthe number of samples, and -G ( f ) is the sample mean.For a Wi-Fi system with bandwidth of 40 MHz and carrier
frequency of 5.805 GHz, the difference in wave number k ofeach subcarrier can be neglected. According to k = 2πf/c, themaximum EM wave number can be calculated as kmax =122.36, and the minimum is kmin = 120.68. Thus, we can get∀f, ρ (τ, f ) ≈ ρ (τ ). Meanwhile, in a short time interval, ρ̂G (τ )can be approximated as:
ρ̂G (τ ) ≈ Sc ∑u ∈ { x,y,z }
( )W1 ρ̂2Uu (τ ) + W2 ρ̂Uu (τ ) , (27)where Sc is the scale factor, and W1 and W2 represent theweight of ρ̂2Uu (τ ) and ρ̂Uu (τ ).ρ̂G (τ ) can be obtained from the power information of CSI
and the speed information is in the right part of the equation.In order to estimate the speed information of the reflector fromρ̂G (τ ), it is necessary to establish the internal relationship be⁃tween ρ̂G (τ ) and each term on the right side of the equation.According to the properties of sampling function, the firstclosed solution of ρ̂U (τ ) = 0 is exactly the first closed solutionof quadratic differential. The symbol Δ is used to representthe differential of CSI power ACF, then we can getΔ(2) ρ̂G (τ ) ≈ Sc ∑
u ∈ { x,y,z }( )W1Δ(2) ρ̂2Uu (τ ) + W2Δ(2) ρ̂Uu (τ ) . (28)
From Eq. (28), and the first peak of Δρ̂G (τ ) is exactly equalto the first solution of equation ρ̂U (τ ) = 0. Therefore, the keyof speed estimation is to identify the first local peak ofΔρ̂G (τ ). The speed of moving reflector is calculated asv̂ = r/τ̂, (29)
where r is the solution of equation Δ(2) ρ̂2U (d, f ) = 0. Since theequation has no closed solution, the second smallest solutionr = 0.54λ is taken as the solution of the equation. The specificalgorithm implementation is shown in Algorithm 1.Algorithm 1. Speed estimation algorithmInput: Continuous CSI sequence of length T before time t.H ( s, f ), s = t - T - 1
Fs,..., t - 1
Fs, t.
Output: The speed after filtering is v ( t ).1: The power response is calculated by CSI amplitude se⁃quence: G ( s, f ) = |H ( s, f ) |22: for power response3: Calculation of power response autocorrelation function:
ρG (τ,f ) = 1T∑s = s0t (G ( s - τ,f ) - -G ( f ) ) (G ( s,f ) - -G ( f ) )
4: where s0 = t - (T - 1) /Fs + τ, -G ( f ) ≜ 1T∑t = 1T G ( t, f ),
τ ∈ (0,0.2)5: if t > T6: break7: end if8: end for9: Calculate the average ACF of all carriers: ρG (τ ) =1F∑f ∈ FρG (τ, f )10: Calculate the first order differential of ACF: ΔρG (τ ) =
49
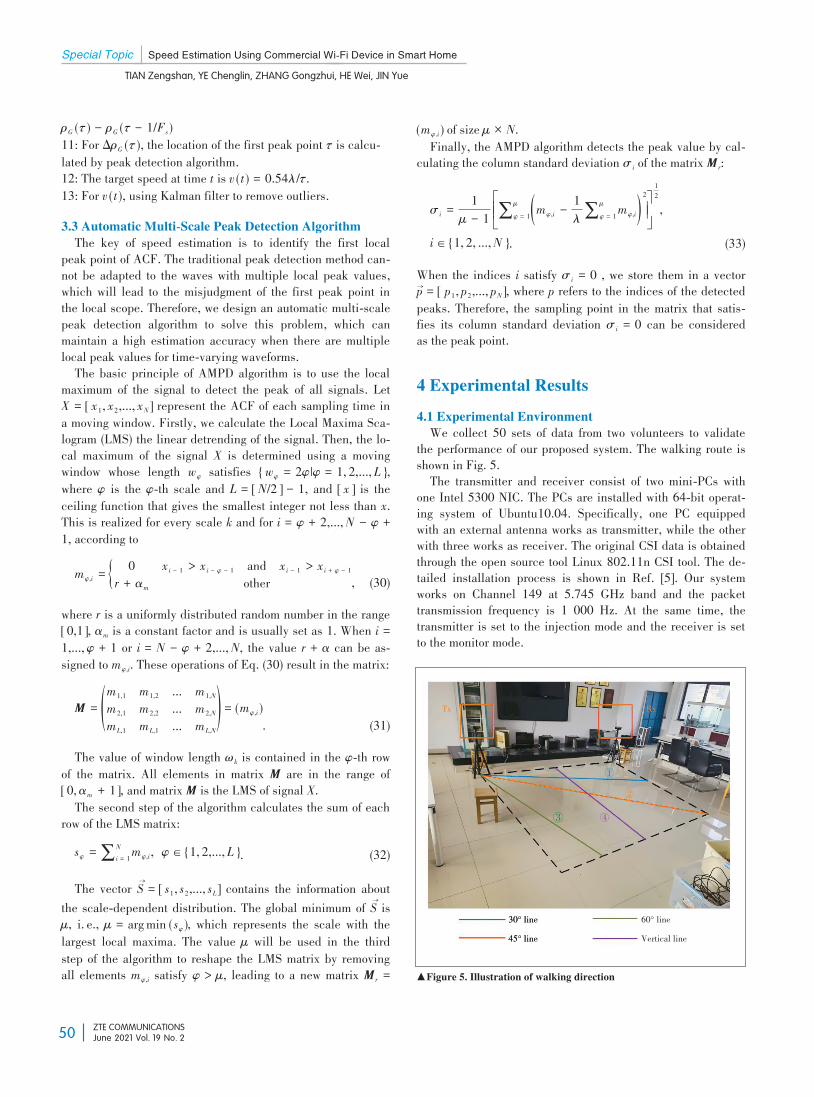
Special Topic Speed Estimation Using Commercial Wi-Fi Device in Smart Home
TIAN Zengshan, YE Chenglin, ZHANG Gongzhui, HE Wei, JIN Yue
ZTE COMMUNICATIONSJune 2021 Vol. 19 No. 2
ρG (τ ) - ρG (τ - 1/Fs )11: For ΔρG (τ ), the location of the first peak point τ is calcu⁃lated by peak detection algorithm.12: The target speed at time t is v ( t ) = 0.54λ/τ.13: For v ( t ), using Kalman filter to remove outliers.3.3 Automatic Multi-Scale Peak Detection AlgorithmThe key of speed estimation is to identify the first local
peak point of ACF. The traditional peak detection method can⁃not be adapted to the waves with multiple local peak values,which will lead to the misjudgment of the first peak point inthe local scope. Therefore, we design an automatic multi-scalepeak detection algorithm to solve this problem, which canmaintain a high estimation accuracy when there are multiplelocal peak values for time-varying waveforms.The basic principle of AMPD algorithm is to use the local
maximum of the signal to detect the peak of all signals. LetX = [ x1, x2,..., xN ] represent the ACF of each sampling time ina moving window. Firstly, we calculate the Local Maxima Sca⁃logram (LMS) the linear detrending of the signal. Then, the lo⁃cal maximum of the signal X is determined using a movingwindow whose length wφ satisfies { wφ = 2φ|φ = 1, 2,..., L },where φ is the φ⁃th scale and L = [ N/2 ] - 1, and [ x ] is theceiling function that gives the smallest integer not less than x.This is realized for every scale k and for i = φ + 2,...,N - φ +1, according tomφ,i = { 0 xi - 1 > xi - φ - 1 and xi - 1 > xi + φ - 1
r + αm other , (30)where r is a uniformly distributed random number in the range[ 0,1 ], αm is a constant factor and is usually set as 1. When i =1,...,φ + 1 or i = N - φ + 2,...,N, the value r + α can be as⁃signed to mφ,i. These operations of Eq. (30) result in the matrix:
M = ( )m1,1 m1,2 ... m1,Nm2,1 m2,2 ... m2,NmL,1 mL,1 ... mL,N
= (mφ,i ). (31)The value of window length ωk is contained in the φ⁃th rowof the matrix. All elements in matrix M are in the range of
[ 0,αm + 1], and matrix M is the LMS of signal X.The second step of the algorithm calculates the sum of eachrow of the LMS matrix:sφ =∑i = 1
N mφ,i, φ ∈ {1, 2,..., L }. (32)The vector S = [ s1, s2,..., sL ] contains the information about
the scale-dependent distribution. The global minimum of S isμ, i. e., μ = arg min ( sφ ), which represents the scale with thelargest local maxima. The value μ will be used in the thirdstep of the algorithm to reshape the LMS matrix by removingall elements mφ,i satisfy φ > μ, leading to a new matrix M r =
(mφ.i ) of size μ × N.Finally, the AMPD algorithm detects the peak value by cal⁃culating the column standard deviation σi of the matrix M r:
σi = 1μ - 1
é
ëêê∑φ = 1
μ ( )mφ,i - 1λ∑φ = 1μ mφ,i
2ù
ûúú
12,
i ∈ {1, 2, ...,N }. (33)When the indices i satisfy σi = 0 , we store them in a vectorp = [ p1, p2,..., pN ], where p refers to the indices of the detectedpeaks. Therefore, the sampling point in the matrix that satis⁃fies its column standard deviation σi = 0 can be consideredas the peak point.
4 Experimental Results
4.1 Experimental EnvironmentWe collect 50 sets of data from two volunteers to validate
the performance of our proposed system. The walking route isshown in Fig. 5.The transmitter and receiver consist of two mini-PCs with
one Intel 5300 NIC. The PCs are installed with 64-bit operat⁃ing system of Ubuntu10.04. Specifically, one PC equippedwith an external antenna works as transmitter, while the otherwith three works as receiver. The original CSI data is obtainedthrough the open source tool Linux 802.11n CSI tool. The de⁃tailed installation process is shown in Ref. [5]. Our systemworks on Channel 149 at 5.745 GHz band and the packettransmission frequency is 1 000 Hz. At the same time, thetransmitter is set to the injection mode and the receiver is setto the monitor mode.
▲Figure 5. Illustration of walking direction
30° line45° line
60° lineVertical line
30° line45° line
Tx Rx
②①
④③
50
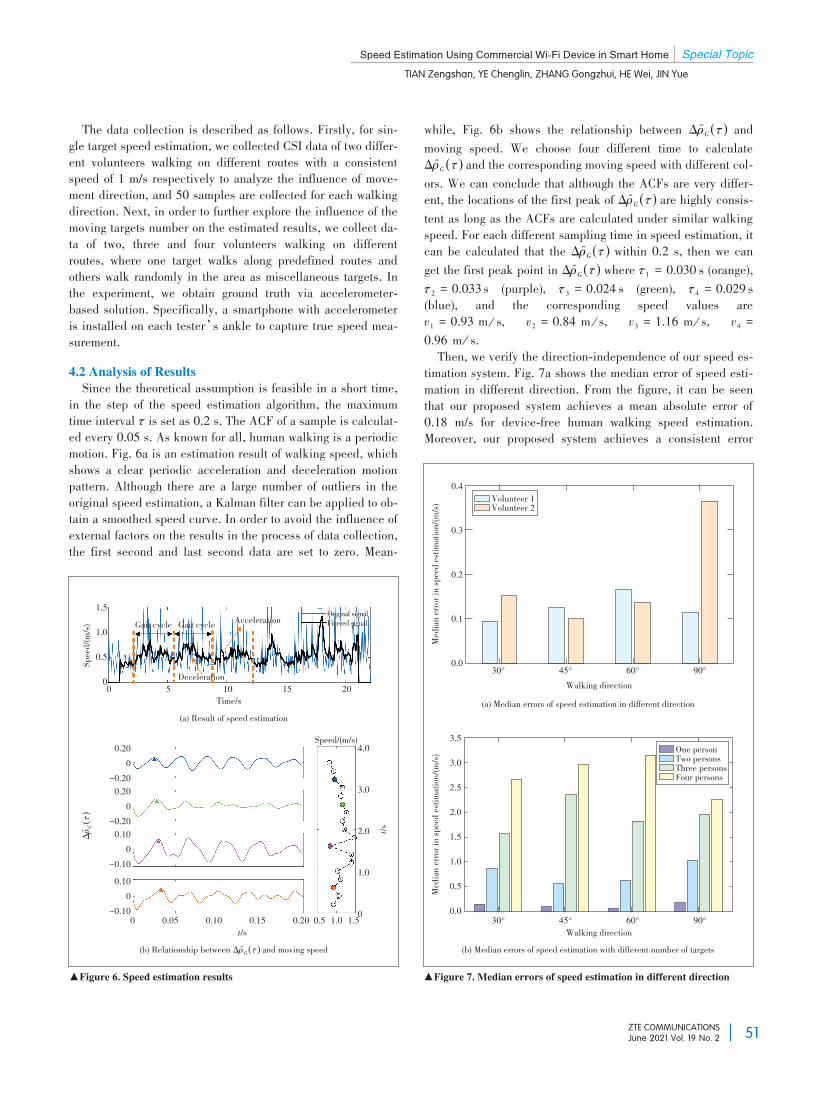
Speed Estimation Using Commercial Wi-Fi Device in Smart Home Special Topic
TIAN Zengshan, YE Chenglin, ZHANG Gongzhui, HE Wei, JIN Yue
ZTE COMMUNICATIONSJune 2021 Vol. 19 No. 2
The data collection is described as follows. Firstly, for sin⁃gle target speed estimation, we collected CSI data of two differ⁃ent volunteers walking on different routes with a consistentspeed of 1 m/s respectively to analyze the influence of move⁃ment direction, and 50 samples are collected for each walkingdirection. Next, in order to further explore the influence of themoving targets number on the estimated results, we collect da⁃ta of two, three and four volunteers walking on differentroutes, where one target walks along predefined routes andothers walk randomly in the area as miscellaneous targets. Inthe experiment, we obtain ground truth via accelerometer-based solution. Specifically, a smartphone with accelerometeris installed on each tester’s ankle to capture true speed mea⁃surement.4.2 Analysis of ResultsSince the theoretical assumption is feasible in a short time,
in the step of the speed estimation algorithm, the maximumtime interval τ is set as 0.2 s. The ACF of a sample is calculat⁃ed every 0.05 s. As known for all, human walking is a periodicmotion. Fig. 6a is an estimation result of walking speed, whichshows a clear periodic acceleration and deceleration motionpattern. Although there are a large number of outliers in theoriginal speed estimation, a Kalman filter can be applied to ob⁃tain a smoothed speed curve. In order to avoid the influence ofexternal factors on the results in the process of data collection,the first second and last second data are set to zero. Mean⁃
while, Fig. 6b shows the relationship between Δρ̂G (τ) andmoving speed. We choose four different time to calculateΔρ̂G (τ) and the corresponding moving speed with different col⁃ors. We can conclude that although the ACFs are very differ⁃ent, the locations of the first peak of Δρ̂G (τ) are highly consis⁃tent as long as the ACFs are calculated under similar walkingspeed. For each different sampling time in speed estimation, itcan be calculated that the Δρ̂G (τ) within 0.2 s, then we canget the first peak point in Δρ̂G (τ) where τ1 = 0.030 s (orange),τ2 = 0.033 s (purple), τ3 = 0.024 s (green), τ4 = 0.029 s(blue), and the corresponding speed values arev1 = 0.93 m s, v2 = 0.84 m s, v3 = 1.16 m s, v4 =0.96 m s.Then, we verify the direction-independence of our speed es⁃
timation system. Fig. 7a shows the median error of speed esti⁃mation in different direction. From the figure, it can be seenthat our proposed system achieves a mean absolute error of0.18 m/s for device-free human walking speed estimation.Moreover, our proposed system achieves a consistent error
▲Figure 6. Speed estimation results ▲Figure 7. Median errors of speed estimation in different direction
Time/s(a) Result of speed estimation
0 5 10 15 20Deceleration
AccelerationGait cycle Gait cycleOriginal signalFiltered signal
1.51.00.50
Speed/(m/s)
(b) Relationship between Δρ̂G ( )τ and moving speedt/s
Speed/(m/s)
t/s
4.0
3.0
2.0
1.0
00 0.05 0.10 0.15 0.20 0.5 1.0 1.5
Δρ̂G() τ
0.200
-0.200.200
-0.200.100
-0.100.100
-0.10
Walking direction
(b) Median errors of speed estimation with different number of targets
(a) Median errors of speed estimation in different direction
Walking direction30° 45° 60° 90°
0.4
0.3
0.2
0.1
0.0
Volunteer 1Volunteer 2
One personTwo personsThree personsFour persons
Medianerror
inspeedestim
ation/(m
/s)Medianerror
inspeedestim
ation/(m
/s)
3.53.02.52.01.51.00.50.0
30° 45° 60° 90°
51
Special Topic Speed Estimation Using Commercial Wi-Fi Device in Smart Home
TIAN Zengshan, YE Chenglin, ZHANG Gongzhui, HE Wei, JIN Yue
ZTE COMMUNICATIONSJune 2021 Vol. 19 No. 2
among different walking directions with the minimum error as0.3 m/s and maximum error as 0.35 m/s (Volunteer 2 in 90°),which is enough in smart home environments.Finally, we verify the influence of the number of moving tar⁃
gets in the environment. Fig. 7b shows the median error ofspeed estimation when there are multiple targets walking inthe area. From the figure, it can be seen that the median errorof speed estimation reaches 0.77 m/s for two targets, 1.92 m/sfor three targets and 2.75 m/s for four targets. This is becausethe speed of moving target is calculated with the first localpeak point of ACF, and the target with larger speed will con⁃tribute more to the ACF components. Thus, the system willtake the target with larger speed as the final estimation resultwhen there are multiple targets walking in the environment,which will lead to a significant reduction in the estimation ac⁃curacy.
5 ConclusionsIn this paper, we propose a direction-independent indoor
speed estimation system based on commercial Wi-Fi devices,which can be used in many fields, such as indoor security andintelligent identification. The system is designed to estimatethe speed of a single moving object in the environment. Ifthere exist multiple moving objects within the coverage of sys⁃tem, it would capture the highest speed among the objects.Firstly, we analyze the relationship between the electric fieldpower and the CSI power, and then introduce the related con⁃cepts of optical angular spectrum to derive the ACF of the EMwave angular spectrum. Secondly, based on the speed modelof EM wave, we derive directional processing in existing sys⁃tems and summarize the robustness of direction indepen⁃dence. Finally, the AMPD peak detection algorithm is used toextract speed information from ACF. A large number of experi⁃ments are carried out in a typical indoor environment. Withlow cost, strong robustness and good real time performance,our system provides a new idea for speed estimation with wire⁃less sense applications especially in smart homme.
References[1] CHAO H, HE Y, ZHANG J, et al. GaitSet: Regarding gait as a set for cross⁃viewgait recognition [C]//AAAI Conference on Artificial Intelligence. Hawaii, USA:AAAI, 2019: 8126–8133. DOI: 10.1609/AAAI.V33I01.33018126
[2] MA H, LIAO W. Human gait modeling and analysis using a semi⁃Markov pro⁃cess with ground reaction forces [C]//International Conference of the IEEE Engi⁃neering in Medicine and Biology Society. Jeju Island, Korea: IEEE, 2017: 597–607. DOI: 10.1109/ICRA.2014.6906616
[3] MUHAMMAD M, RENE M. Smartphone⁃based gait recognition: From authen⁃tication to imitation [J]. IEEE transactions on mobile computing. 2017, 16
(11): 1–1. DOI: 10.1109/TMC.2017.2686855[4] WANG W, LIU A X, MUHAMMAD S. Gait recognition using Wi⁃Fi signals [C]//ACM International Joint Conference on Pervasive and Ubiquitous Computing.Heidelberg, Germany:ACM, 2016: 363–373. DOI: 10.1145/2971648.2971670
[5] ZHANG L, WANG C, MA M, et al. WiDIGR: direction⁃independent gait recog⁃nition system using commercial Wi⁃Fi devices [J]. IEEE Internet of Things jour⁃nal, 2020, 7(2), 1178–1191. DOI: 10.1109/JIOT.2019.2953488
[6] ZENG Y, PARTH H, PRASANT M. WiWho: WiFi⁃based person identificationin smart spaces [C]//15th ACM/IEEE International Conference on InformationProcessing in Sensor Networks. Vienna, Austria:ACM/IEEE, 2016: 1–12. DOI:10.5555/2959355.2959359
[7] WANG W, LIU A X, MUHAMMAD S, et al. Understanding and modeling ofWiFi signal based human activity recognition [C]//21st Annual InternationalConference on Mobile Computing and Networking. Paris, France: ACM, 2015:65–76. DOI: 10.1145/2789168.2790093
[8] PETROV B M, DARIA T. Electromagnetic waves in rotating spherical cavities.E⁃Field [C]//Radiation and Scattering of Electromagnetic Waves. Divnomor⁃skoe, Russia: IEEE, 2019: 12–15. DOI: 10.1109/RSEMW.2019.8792713
[9] ZHANG F, CHEN C, WANG B, et al. WiSpeed: a statistical electromagnetic ap⁃proach for device⁃free indoor speed estimation [J]. IEEE Internet of Things jour⁃nal, 2018, 5(3): 2163–2177. DOI: 10.1109/JIOT.2018.2826227
[10] WANG W, LIU A X, MUHAMMAD S, et al. Device⁃free human activity recog⁃nition using commercial WiFi devices [J]. IEEE journal on selected areas incommunications, 2017, 35(5): 1118 – 1131. DOI: 10.1109/JSAC.2017.2679658
[11] KING C. Fundamentals of wireless communications [C]//67th Annual Confer⁃ence for Protective Relay Engineers. College Station, USA: IEEE, 2014. DOI:10.1109/REPCon.2013.6681855
[12] CHEN C, CHEN Y, HAN Y, et al. Achieving centimeter⁃accuracy indoor local⁃ization on Wi⁃Fi platforms: A multi⁃antenna approach [J]. IEEE Internet ofThings journal, 2017, 4(1): 111–121. DOI: 10.1109/JIOT.2016.2628701
BiographiesTIAN Zengshan is currently a professor of Chongqing University of Posts andTelecommunications, China. His research focuses on localization in a cellularnetwork, personal communication, precise localization and attitude measure⁃ment with GPS, data compression, and deep learning.
YE Chenglin ([email protected]) is currently pursuing the M. S.degree at Chongqing University of Posts and Telecommunications, China. Hisresearch interests include wireless sensing and localization.
ZHANG Gongzhui is currently pursuing the M. S. degree at Chongqing Uni⁃versity of Posts and Telecommunications, China. His research interests includespeed estimation and identity recognition.
HE Wei is an associate professor of Chongqing University of Posts and Tele⁃communications, China. His current research interests include wireless loca⁃tion, signal processing, mobile communication technology and communicationsoftware engineering.
JIN Yue is currently pursuing the Ph. D. degree at Chongqing University ofPosts and Telecommunications, China. Her research interests include indoor in⁃trusion detection and device-free tracking.
52
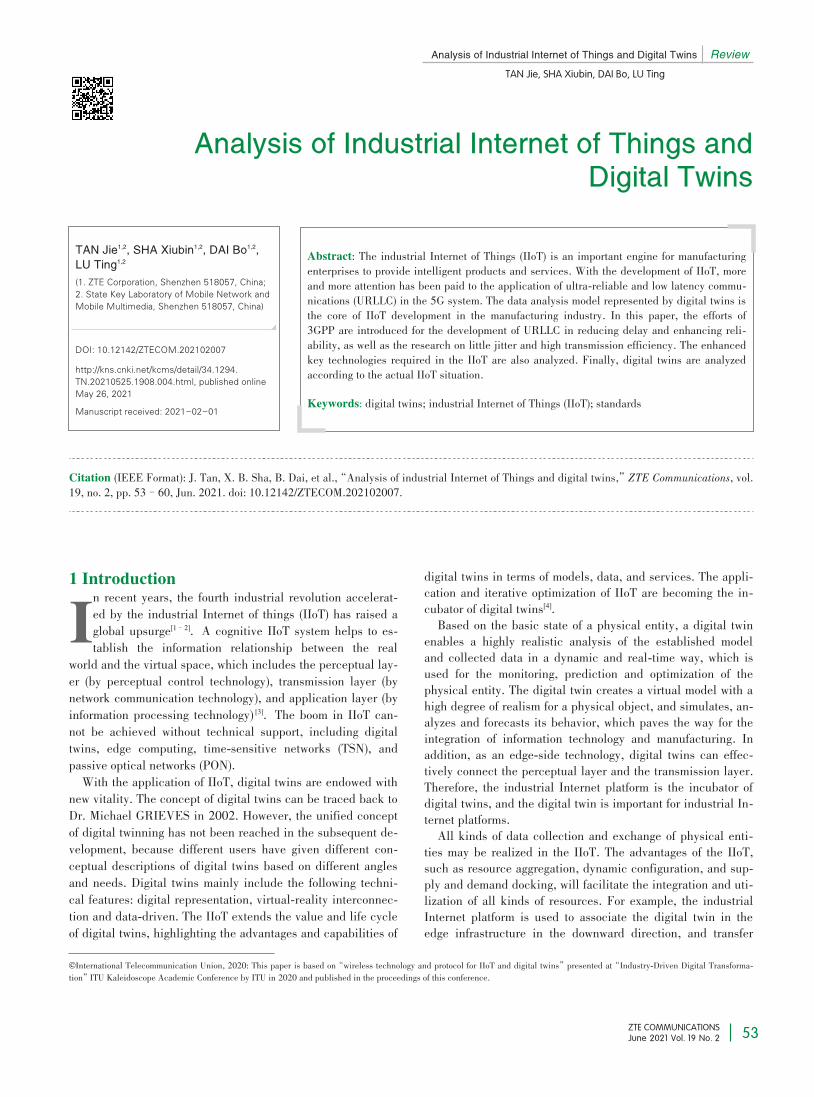
ZTE COMMUNICATIONSJune 2021 Vol. 19 No. 2
Analysis of Industrial Internet of Things and Digital Twins Review
TAN Jie, SHA Xiubin, DAI Bo, LU Ting
Analysis of Industrial Internet of Things andAnalysis of Industrial Internet of Things andDigital TwinsDigital Twins
Abstract: The industrial Internet of Things (IIoT) is an important engine for manufacturingenterprises to provide intelligent products and services. With the development of IIoT, moreand more attention has been paid to the application of ultra-reliable and low latency commu⁃nications (URLLC) in the 5G system. The data analysis model represented by digital twins isthe core of IIoT development in the manufacturing industry. In this paper, the efforts of3GPP are introduced for the development of URLLC in reducing delay and enhancing reli⁃ability, as well as the research on little jitter and high transmission efficiency. The enhancedkey technologies required in the IIoT are also analyzed. Finally, digital twins are analyzedaccording to the actual IIoT situation.Keywords: digital twins; industrial Internet of Things (IIoT); standards
Citation (IEEE Format): J. Tan, X. B. Sha, B. Dai, et al.,“Analysis of industrial Internet of Things and digital twins,”ZTE Communications, vol.19, no. 2, pp. 53–60, Jun. 2021. doi: 10.12142/ZTECOM.202102007.
1 Introduction
In recent years, the fourth industrial revolution accelerat⁃ed by the industrial Internet of things (IIoT) has raised aglobal upsurge[1–2]. A cognitive IIoT system helps to es⁃tablish the information relationship between the real
world and the virtual space, which includes the perceptual lay⁃er (by perceptual control technology), transmission layer (bynetwork communication technology), and application layer (byinformation processing technology) [3]. The boom in IIoT can⁃not be achieved without technical support, including digitaltwins, edge computing, time-sensitive networks (TSN), andpassive optical networks (PON).With the application of IIoT, digital twins are endowed with
new vitality. The concept of digital twins can be traced back toDr. Michael GRIEVES in 2002. However, the unified conceptof digital twinning has not been reached in the subsequent de⁃velopment, because different users have given different con⁃ceptual descriptions of digital twins based on different anglesand needs. Digital twins mainly include the following techni⁃cal features: digital representation, virtual-reality interconnec⁃tion and data-driven. The IIoT extends the value and life cycleof digital twins, highlighting the advantages and capabilities of
digital twins in terms of models, data, and services. The appli⁃cation and iterative optimization of IIoT are becoming the in⁃cubator of digital twins[4].Based on the basic state of a physical entity, a digital twin
enables a highly realistic analysis of the established modeland collected data in a dynamic and real-time way, which isused for the monitoring, prediction and optimization of thephysical entity. The digital twin creates a virtual model with ahigh degree of realism for a physical object, and simulates, an⁃alyzes and forecasts its behavior, which paves the way for theintegration of information technology and manufacturing. Inaddition, as an edge-side technology, digital twins can effec⁃tively connect the perceptual layer and the transmission layer.Therefore, the industrial Internet platform is the incubator ofdigital twins, and the digital twin is important for industrial In⁃ternet platforms.All kinds of data collection and exchange of physical enti⁃
ties may be realized in the IIoT. The advantages of the IIoT,such as resource aggregation, dynamic configuration, and sup⁃ply and demand docking, will facilitate the integration and uti⁃lization of all kinds of resources. For example, the industrialInternet platform is used to associate the digital twin in theedge infrastructure in the downward direction, and transfer
©International Telecommunication Union, 2020: This paper is based on“wireless technology and protocol for IIoT and digital twins”presented at“Industry-Driven Digital Transforma⁃tion”ITU Kaleidoscope Academic Conference by ITU in 2020 and published in the proceedings of this conference.
TAN Jie1,2, SHA Xiubin1,2, DAI Bo1,2,LU Ting1,2
(1. ZTE Corporation, Shenzhen 518057, China;2. State Key Laboratory of Mobile Network andMobile Multimedia, Shenzhen 518057, China)
DOI: 10.12142/ZTECOM.202102007
http://kns.cnki.net/kcms/detail/34.1294.TN.20210525.1908.004.html, published onlineMay 26, 2021
Manuscript received: 2021-02-01
53
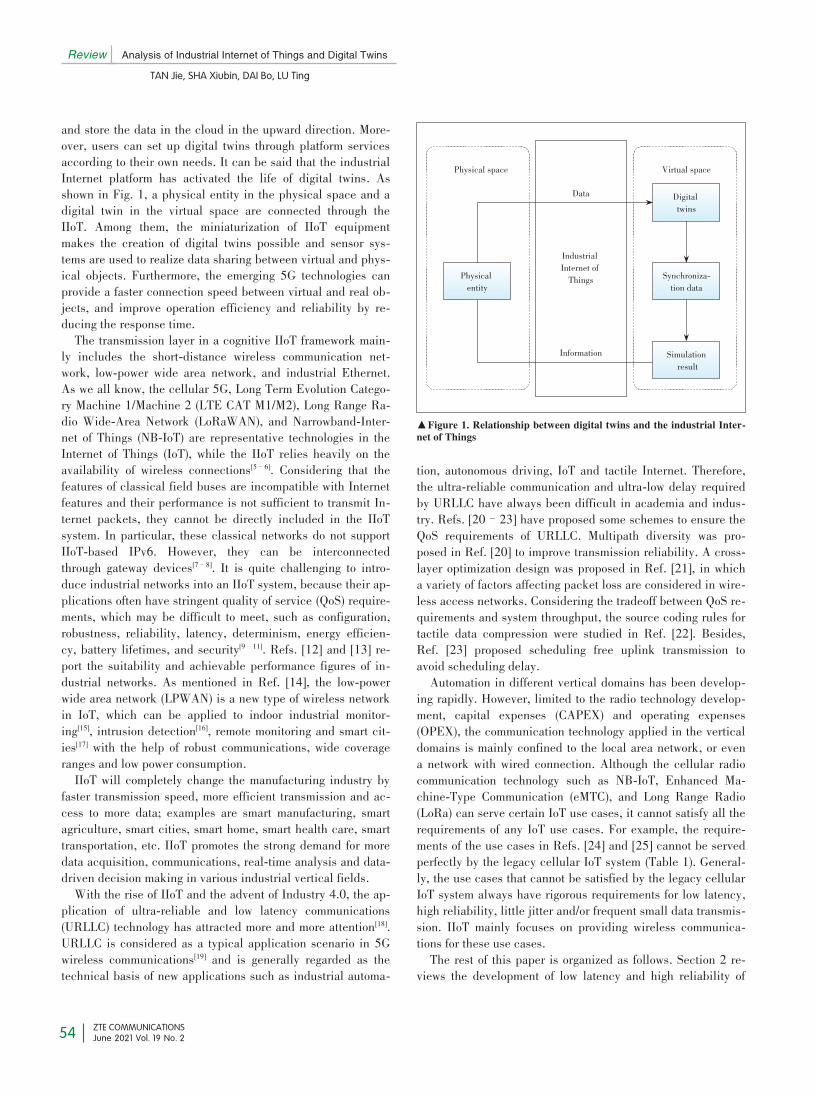
Review Analysis of Industrial Internet of Things and Digital Twins
TAN Jie, SHA Xiubin, DAI Bo, LU Ting
ZTE COMMUNICATIONSJune 2021 Vol. 19 No. 2
and store the data in the cloud in the upward direction. More⁃over, users can set up digital twins through platform servicesaccording to their own needs. It can be said that the industrialInternet platform has activated the life of digital twins. Asshown in Fig. 1, a physical entity in the physical space and adigital twin in the virtual space are connected through theIIoT. Among them, the miniaturization of IIoT equipmentmakes the creation of digital twins possible and sensor sys⁃tems are used to realize data sharing between virtual and phys⁃ical objects. Furthermore, the emerging 5G technologies canprovide a faster connection speed between virtual and real ob⁃jects, and improve operation efficiency and reliability by re⁃ducing the response time.The transmission layer in a cognitive IIoT framework main⁃
ly includes the short-distance wireless communication net⁃work, low-power wide area network, and industrial Ethernet.As we all know, the cellular 5G, Long Term Evolution Catego⁃ry Machine 1/Machine 2 (LTE CAT M1/M2), Long Range Ra⁃dio Wide-Area Network (LoRaWAN), and Narrowband-Inter⁃net of Things (NB-IoT) are representative technologies in theInternet of Things (IoT), while the IIoT relies heavily on theavailability of wireless connections[5–6]. Considering that thefeatures of classical field buses are incompatible with Internetfeatures and their performance is not sufficient to transmit In⁃ternet packets, they cannot be directly included in the IIoTsystem. In particular, these classical networks do not supportIIoT-based IPv6. However, they can be interconnectedthrough gateway devices[7–8]. It is quite challenging to intro⁃duce industrial networks into an IIoT system, because their ap⁃plications often have stringent quality of service (QoS) require⁃ments, which may be difficult to meet, such as configuration,robustness, reliability, latency, determinism, energy efficien⁃cy, battery lifetimes, and security[9–11]. Refs. [12] and [13] re⁃port the suitability and achievable performance figures of in⁃dustrial networks. As mentioned in Ref. [14], the low-powerwide area network (LPWAN) is a new type of wireless networkin IoT, which can be applied to indoor industrial monitor⁃ing[15], intrusion detection[16], remote monitoring and smart cit⁃ies[17] with the help of robust communications, wide coverageranges and low power consumption.IIoT will completely change the manufacturing industry by
faster transmission speed, more efficient transmission and ac⁃cess to more data; examples are smart manufacturing, smartagriculture, smart cities, smart home, smart health care, smarttransportation, etc. IIoT promotes the strong demand for moredata acquisition, communications, real-time analysis and data-driven decision making in various industrial vertical fields.With the rise of IIoT and the advent of Industry 4.0, the ap⁃
plication of ultra-reliable and low latency communications(URLLC) technology has attracted more and more attention[18].URLLC is considered as a typical application scenario in 5Gwireless communications[19] and is generally regarded as thetechnical basis of new applications such as industrial automa⁃
tion, autonomous driving, IoT and tactile Internet. Therefore,the ultra-reliable communication and ultra-low delay requiredby URLLC have always been difficult in academia and indus⁃try. Refs. [20–23] have proposed some schemes to ensure theQoS requirements of URLLC. Multipath diversity was pro⁃posed in Ref. [20] to improve transmission reliability. A cross-layer optimization design was proposed in Ref. [21], in whicha variety of factors affecting packet loss are considered in wire⁃less access networks. Considering the tradeoff between QoS re⁃quirements and system throughput, the source coding rules fortactile data compression were studied in Ref. [22]. Besides,Ref. [23] proposed scheduling free uplink transmission toavoid scheduling delay.Automation in different vertical domains has been develop⁃
ing rapidly. However, limited to the radio technology develop⁃ment, capital expenses (CAPEX) and operating expenses(OPEX), the communication technology applied in the verticaldomains is mainly confined to the local area network, or evena network with wired connection. Although the cellular radiocommunication technology such as NB-IoT, Enhanced Ma⁃chine-Type Communication (eMTC), and Long Range Radio(LoRa) can serve certain IoT use cases, it cannot satisfy all therequirements of any IoT use cases. For example, the require⁃ments of the use cases in Refs. [24] and [25] cannot be servedperfectly by the legacy cellular IoT system (Table 1). General⁃ly, the use cases that cannot be satisfied by the legacy cellularIoT system always have rigorous requirements for low latency,high reliability, little jitter and/or frequent small data transmis⁃sion. IIoT mainly focuses on providing wireless communica⁃tions for these use cases.The rest of this paper is organized as follows. Section 2 re⁃
views the development of low latency and high reliability of
URLLC in the field of IIoT, as well as the research process oflittle jitter and high transmission efficiency. Section 3 discuss⁃es the possible future research directions and objectives in thefield of IIoT. Section 4 discusses the cases and advantages ofthe application of IIoT for digital twins. Section 5 concludesthe paper and shows the cooperation of IIoT technology anddigital twin technology.
2 Development of URLLC for IIoT Tech⁃nology5G URLLC has two basic features: high reliability and low
latency. With high reliability, its block error rate (BLER)reaches 10-5 or even 10-6, and in terms of delay, it can imple⁃ment 1 ms or even 0.5 ms air interface transmission delay. Asone of the three application scenarios of 5G system, URLLC iswidely used in various industries, such as Augmented Reality(AR)/Virtual Reality (VR) in the entertainment industry, in⁃dustrial control system, transportation system, management ofsmart grid and smart home, and interactive telemedicine diag⁃nosis[26]. This paper will introduce the development of 3GPPRelease15 (Rel-15) and Release16 (Rel-16) for URLLC in re⁃ducing delay and enhancing reliability, as well as the researchon little jitter and high transmission efficiency.2.1 Low Latency of URLLCThe 5G URLLC technology achieves a user plane delay of
0.5 ms in both the uplink and downlink between the gNB andthe terminal. The delay refers to the time it takes to successful⁃ly transmit application layer IP packets/messages, specificallyfrom the sender’s 5G wireless protocol layer entry point, tothe receiver’s 5G wireless protocol layer exit point. Amongthem, the delay exists in both the uplink and downlink direc⁃tions. The main technologies used by the 5G URLLC to imple⁃ment low latency include: 1) introducing a smaller time re⁃source unit, such as a mini slot; 2) the no-scheduling permis⁃sion mechanism used for uplink access, with which the termi⁃nal can directly access the channel; 3) supporting an asynchro⁃nous process to save uplink time synchronization overhead; 4)adopting fast hybrid automatic repeat request (HARQ), fast dy⁃namic scheduling, etc.
While 3GPP Rel-15 shows the research progress of URLLCdelay , 3GPP further enhances on URLLC in the Rel-16 phaseand proposes an improved delay reduction scheme[27].2.1.1 3GPP Rel-15The study of URLLC delay supports for a more flexible
frame structure. The 5G new radio (NR) supports the carrierspacing of 15 kHz in the LTE system. It also supports morespacing schemes, including 30 kHz, 60 kHz, 120 kHz, and240 kHz. The higher the carrier spacing, the lower the delayperformance. In addition, 5G NR supports frame structure ad⁃justment. A slot is the minimum scheduling period. Comparedwith the LTE in which a fixed subframe includes 2 slots, theNR can flexibly switch between 1, 2 and 4 slots and configureuplink/downlink ratios, thus reducing the air interface trans⁃mission time of each slot.The study of URLLC delay supports for more flexible sched⁃
uling units. The LTE includes a slot consisting of 14 symbols.However, the NR supports mini-slots. Mini-slots support thelength of 2 symbols, 3 symbols, and 4 symbols, and a shorterslot can reduce the feedback delay.The study of URLLC delay supports for flexible PDCCH
configuration. The search space consists of a group of candi⁃date physical downlink control channels (PDCCH), and thesearch space can be configured with parameters such assearch type, period, slot offset, number of slots, CORESET,and downlink control information (DCI) format. By configuringa reasonable monitoring period and offset of the PDCCH in aslot, the PDCCH monitoring opportunity can be achieveddensely. The slot has multiple PDCCH monitoring moments,which can meet the requirements for the burst service scenari⁃os of the URLLC and meet the requirements for low latency.The study of URLLC delay supports for URLLC high-priori⁃
ty transmission. To meet the URLLC service requirement ofhigh priority, 5G/NR proposes that a URLLC service can pre⁃empt enhanced mobile broadband (eMBB) service resources toreduce the delay.The study of URLLC delay introduces the function of mo⁃
bile edge computing (MEC). In a 5G network, the user-planefunction (UPF) can be deployed on the user side. The edgecomputing server and the UPF are co-located. The UPF recog⁃
▲Figure 1. Relationship between digital twins and the industrial Inter⁃net of Things
Data
IndustrialInternet ofThings
Information
Physical space Virtual space
Digitaltwins
Synchroniza⁃tion data
Simulationresult
Physicalentity
54
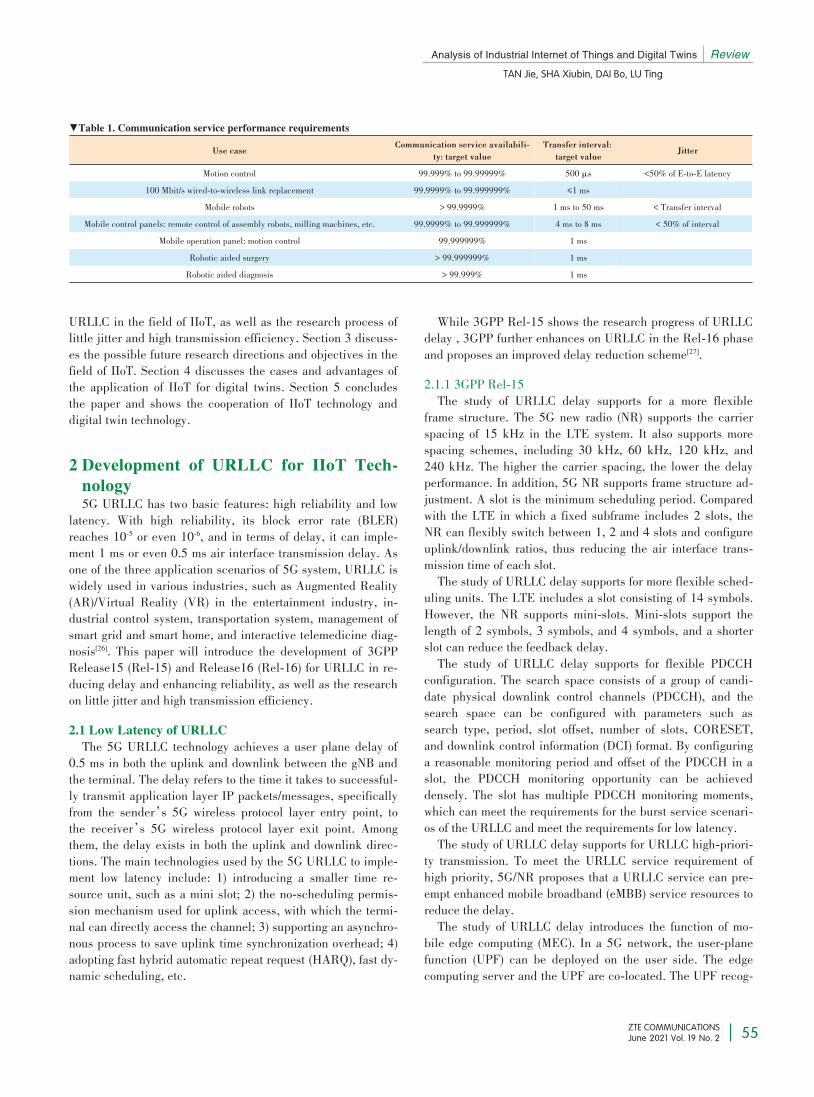
Analysis of Industrial Internet of Things and Digital Twins Review
TAN Jie, SHA Xiubin, DAI Bo, LU Ting
ZTE COMMUNICATIONSJune 2021 Vol. 19 No. 2
URLLC in the field of IIoT, as well as the research process oflittle jitter and high transmission efficiency. Section 3 discuss⁃es the possible future research directions and objectives in thefield of IIoT. Section 4 discusses the cases and advantages ofthe application of IIoT for digital twins. Section 5 concludesthe paper and shows the cooperation of IIoT technology anddigital twin technology.
2 Development of URLLC for IIoT Tech⁃nology5G URLLC has two basic features: high reliability and low
latency. With high reliability, its block error rate (BLER)reaches 10-5 or even 10-6, and in terms of delay, it can imple⁃ment 1 ms or even 0.5 ms air interface transmission delay. Asone of the three application scenarios of 5G system, URLLC iswidely used in various industries, such as Augmented Reality(AR)/Virtual Reality (VR) in the entertainment industry, in⁃dustrial control system, transportation system, management ofsmart grid and smart home, and interactive telemedicine diag⁃nosis[26]. This paper will introduce the development of 3GPPRelease15 (Rel-15) and Release16 (Rel-16) for URLLC in re⁃ducing delay and enhancing reliability, as well as the researchon little jitter and high transmission efficiency.2.1 Low Latency of URLLCThe 5G URLLC technology achieves a user plane delay of
0.5 ms in both the uplink and downlink between the gNB andthe terminal. The delay refers to the time it takes to successful⁃ly transmit application layer IP packets/messages, specificallyfrom the sender’s 5G wireless protocol layer entry point, tothe receiver’s 5G wireless protocol layer exit point. Amongthem, the delay exists in both the uplink and downlink direc⁃tions. The main technologies used by the 5G URLLC to imple⁃ment low latency include: 1) introducing a smaller time re⁃source unit, such as a mini slot; 2) the no-scheduling permis⁃sion mechanism used for uplink access, with which the termi⁃nal can directly access the channel; 3) supporting an asynchro⁃nous process to save uplink time synchronization overhead; 4)adopting fast hybrid automatic repeat request (HARQ), fast dy⁃namic scheduling, etc.
While 3GPP Rel-15 shows the research progress of URLLCdelay , 3GPP further enhances on URLLC in the Rel-16 phaseand proposes an improved delay reduction scheme[27].2.1.1 3GPP Rel-15The study of URLLC delay supports for a more flexible
frame structure. The 5G new radio (NR) supports the carrierspacing of 15 kHz in the LTE system. It also supports morespacing schemes, including 30 kHz, 60 kHz, 120 kHz, and240 kHz. The higher the carrier spacing, the lower the delayperformance. In addition, 5G NR supports frame structure ad⁃justment. A slot is the minimum scheduling period. Comparedwith the LTE in which a fixed subframe includes 2 slots, theNR can flexibly switch between 1, 2 and 4 slots and configureuplink/downlink ratios, thus reducing the air interface trans⁃mission time of each slot.The study of URLLC delay supports for more flexible sched⁃
uling units. The LTE includes a slot consisting of 14 symbols.However, the NR supports mini-slots. Mini-slots support thelength of 2 symbols, 3 symbols, and 4 symbols, and a shorterslot can reduce the feedback delay.The study of URLLC delay supports for flexible PDCCH
configuration. The search space consists of a group of candi⁃date physical downlink control channels (PDCCH), and thesearch space can be configured with parameters such assearch type, period, slot offset, number of slots, CORESET,and downlink control information (DCI) format. By configuringa reasonable monitoring period and offset of the PDCCH in aslot, the PDCCH monitoring opportunity can be achieveddensely. The slot has multiple PDCCH monitoring moments,which can meet the requirements for the burst service scenari⁃os of the URLLC and meet the requirements for low latency.The study of URLLC delay supports for URLLC high-priori⁃
ty transmission. To meet the URLLC service requirement ofhigh priority, 5G/NR proposes that a URLLC service can pre⁃empt enhanced mobile broadband (eMBB) service resources toreduce the delay.The study of URLLC delay introduces the function of mo⁃
bile edge computing (MEC). In a 5G network, the user-planefunction (UPF) can be deployed on the user side. The edgecomputing server and the UPF are co-located. The UPF recog⁃
▼Table 1. Communication service performance requirements
Use case
Motion control100 Mbit/s wired-to-wireless link replacement
Mobile robotsMobile control panels: remote control of assembly robots, milling machines, etc.
Mobile operation panel: motion controlRobotic aided surgeryRobotic aided diagnosis
Communication service availabili⁃ty: target value
99.999% to 99.99999%99.9999% to 99.999999%
> 99.9999%99.9999% to 99.999999%
99.999999%> 99.999999%> 99.999%
Transfer interval:target value
500 μs≤1 ms
1 ms to 50 ms4 ms to 8 ms
1 ms1 ms1 ms
Jitter
<50% of E-to-E latency
< Transfer interval< 50% of interval
55
Review Analysis of Industrial Internet of Things and Digital Twins
TAN Jie, SHA Xiubin, DAI Bo, LU Ting
ZTE COMMUNICATIONSJune 2021 Vol. 19 No. 2
nizes that the destination address of the service flow is local,so it distributes the service to the local edge computing serverfor service processing, which reduces the redundant transmis⁃sion path of the service and the delay.2.1.2 3GPP Rel-16The study of URLLC delay supports for grant-free configura⁃
tion. In the scheduling based on grant configuration, userequipment (UE) needs to obtain resources through the sched⁃uling request. In order to reduce the delay, the resource canbe pre-allocated to UE according to service characteristics[28].The study of URLLC delay supports for intra-UE priority
and multiplex mechanism. In Rel-15, eMBB dynamic granttakes precedence over URLLC configured grant (CG). In orderto ensure the delay of a URLLC service, Rel-16 proposes a se⁃lection scheme based on logical channel prioritization (LCP)to transmit URLLC services with a higher priority.The study of URLLC delay supports for time sensitive net⁃
work (TSN) and 5G convergence. The following mechanismsare adopted to realize TSN: 1) supporting semi-persistentscheduling (SPS) with a shorter period; 2) supporting the con⁃figuration of multiple SPS and CG for a bandwidth part (BWP)of UE; 3) supporting TSN services that do not match the CG/SPS period.2.2 High Reliability of URLLCAt present, the reliability index of 5G URLLC is 99.999%
for a 32-byte packet at the user plane with a delay of 1 ms. Ifthe delay allows, 5G URLLC can also use the retransmissionmechanism to further improve the success rate. In terms of im⁃proving system reliability, 5G URLLC adopts the followingtechnologies: 1) adopting a more robust multi-antenna trans⁃mit diversity mechanism; 2) adopting robust coding and modu⁃lation in order to reduce the bit error rate; 3) adopting superrobust channel state estimation. The reliability of URLLC hasbeen enhanced in Rel-15 and Rel-16 of 3GPP.2.2.1 3GPP Rel-15The study of URLLC reliability supports for PDCP duplica⁃
tion mechanism. The sender replicates the data at the PDCPlayer and then sends the two duplications to two independentlogical channels for transmission, so as to achieve the frequen⁃cy diversity gain and improve reliability.The study of URLLC reliability supports for optimizing
MCS\CQI tables. The modulation and coding scheme (MCS)and channel quality indication (CQI) of the LTE cannot meetthe requirements of NR for system reliability and transmissionrate. Therefore, NR adds two lower bit rates in the CQI table,and the corresponding gNB adds two MCS low-frequency op⁃tions. A lower bit rate can be chosen between the UE and thegNB to ensure reliability.The study of URLLC reliability supports for less load DCI
design. By reducing the DCI overhead and improving the ag⁃gregation level, the PDCCH encoding rate is reduced. The de⁃
coding error rate is reduced and the reliability is improved.2.2.2 3GPP Rel-16The study of URLLC reliability supports for multi-TRP
transmission mode. Rel-16 proposes that transmission blockscan be transmitted repeatedly based on space division, fre⁃quency division, intra-slot division and inter-slot divisionbased on Rel-15. In order to improve the diversity gain, it alsosupports the combination of the above modes and the dynamichandover between different modes (including combinedmodes).The study of URLLC reliability supports for PDCP duplica⁃
tion enhancement mechanism. Rel-15 supports two-branchPDCP duplication, in order to achieve higher reliability. Rel-16 supports up to four-branch PDCP duplication. This mecha⁃nism can be implemented through carrier aggregation (CA) du⁃plication, dual connectivity (DC) duplication and the combina⁃tion of CA duplication and DC duplication.The study of URLLC reliability supports for redundant
transmission scheme. NG-RAN duplicates uplink packets andsends them to the UPF via two redundant link (N3 interface)channels, where each N3 channel is associated with a PDUsession, and two independent N3 channels are established totransmit data. The gNB, SMF and UPF will provide differentroutes for the two links[29].2.3 Little Jitter of URLLCRequirements of time accuracy are typically specified with
two values: the characteristic time and jitter. Characteristictime is the target value of the time parameter, e.g. end-to-endlatency. The jitter is the variation of a (characteristic) time pa⁃rameter and the maximum deviation of a time parameter rela⁃tive to a reference or target value.As depicted in Ref. [25], power distribution poses the jitter
requirements and the traffic pattern is deterministic as well.In such a case, the maximum value of the characteristic timeparameter needs to be known. Sometimes, a minimum valuemay also be given, and should not be undershot. A minimumvalue is only used in particular use cases, for instance, whenputting labels at a specific location on moving objects. In Rel-15, a common understanding in radio access network (RAN) isthat a delay-sensitive URLLC service with periodic traffic canbe accommodated by the semi-persistent CG. That means theperiodicity of the traffic should be a prerequisite in RAN tomeet the data size and jitter requirements. An example is thevariation of the end-to-end latency. If not stated otherwise, jit⁃ter specifies the symmetric value range around the target val⁃ue (target value ± jitter/2). If the actual time value is outsidethis interval, the transmission will not be successful. Ref. [25]shows an example of transmissions with jitter. It should be not⁃ed that the end-to-end latency may scatter even for successfultransmissions.As an important feature of TSN, the jitter requirement is to
provide a deterministic service with bounded delay. Typicalcharacteristic parameters to which jitter values are ascribedare transfer interval, end-to-end latency, and update time. Fur⁃ther, the buffering mechanism is held and forwarded to elimi⁃nate jitter in the TSN. Device-side TSN translator (DS-TT) andnetwork-side TSN translator (NW-TT) support a hold and for⁃ward mechanism to schedule traffic as defined in IEEE802.1Qbv[30], if 5GS is to participate transparently as a bridgein a TSN network. The hold and forward buffering mechanismallows packet delay budget (PDB) based 5GS QoS to be usedfor time-sensitive communication (TSC) traffic since packetsneed only arrive at NW-TT or DS-TT egress prior to theirscheduled transmission time. The way that TSN translator sup⁃ports the hold and forward mechanism depends on the imple⁃mentation.In addition, time synchronization precision is defined be⁃
tween a synchronization master and a synchronization device.The detailed objectives for NR TSC-related enhancements in⁃clude specifying accurate reference timing delivery from gNBto the UE using broadcast and unicasting radio resource con⁃trol (RRC) signaling for the synchronization requirements de⁃fined in Ref. [31]. To meet the high-precision time synchroni⁃zation requirements of the TSN, a high-precision referencetime transmission mechanism is introduced to NR. Broadcastmessages (SIB9) or dedicated RRC messages (DLInformation⁃Transfer messages) with the high-precision time can be sent.The time granularity is enhanced from 10 ms to 10 ns. Accord⁃ing to the simulation result of radio access network work group1 (RAN 1), radio access network work group 2 (RAN 2) as⁃sumes that delay compensation is required in the scenariowhere the service range is greater than 200 m for the user withthe subcarrier interval of 15 kHz. However, in Rel-16, RAN 1only provides transmission delay compensation for the basestation and UE in the Time Division Duplex (TDD) and Fre⁃quency Division Duplex (FDD) scenarios according to half ofthe timing advance, that is, NTA×Tc/2. In addition, althoughRAN 1 discusses a lot about when and how to implement thetransmission delay supplement, this topic has not finished inthe Rel-16 phase.2.4 High Transmission Efficiency of URLLCIn the field of IIoT, the small packets of TSN are transmit⁃
ted frequently in the ordinary communication network. TSN isalso introduced into the 5G system, which has the characteris⁃tics of small packets with frequent transmission, low latencyand high reliability. In this case, reducing the packet over⁃head can effectively improve the effective utilization of systembandwidth. Therefore, for TSN packets, header compressioncan be used to further reduce the size of data packets, thussaving the wireless resources used by a single packet and im⁃prove the utilization of wireless resources. The data streamtransmitted by TSN is mainly an Ethernet data packet, so theEthernet header compression (EHC) is introduced to reduce
the overhead caused by Ethernet header transmission.EHC may be particularly beneficial when the payload size
of an Ethernet frame is small relative to the overall size ofthe frame, which is typical in an Ethernet-based IIoT net⁃work. The EHC protocol compresses the Ethernet header asshown in Fig. 2. The fields that are compressed by the EHCprotocol are Destination Address, Source Address, 802.1QTag, and Length/Type. The fields Preamble, Start of FrameDelimiter (SFD), and Frame Check Sequence (FCS) are nottransmitted in a 3GPP system, and thus not considered in anEHC protocol. There may be more than one 802.1Q Tag fieldin the Ethernet header, and all are compressed by the EHCprotocol. The padding is not compressed by the EHC proto⁃col. The EHC compressor and the EHC decompressor storeoriginal header field information as an“EHC context”. EachEHC context is identified by a unique identifier, called Con⁃text ID (CID). For an Ethernet packet stream, the EHC com⁃pressor establishes the EHC context and associates it withthe CID. Then, the EHC compressor transmits the“FullHeader (FH)”packet to the EHC decompressor including theassociated CID. The EHC compressor keeps transmitting theFH packets until the EHC feedback is received from theEHC decompressor.The source Medium Access Control (MAC) address, destina⁃
tion MAC address and type fields of the Ethernet header
56
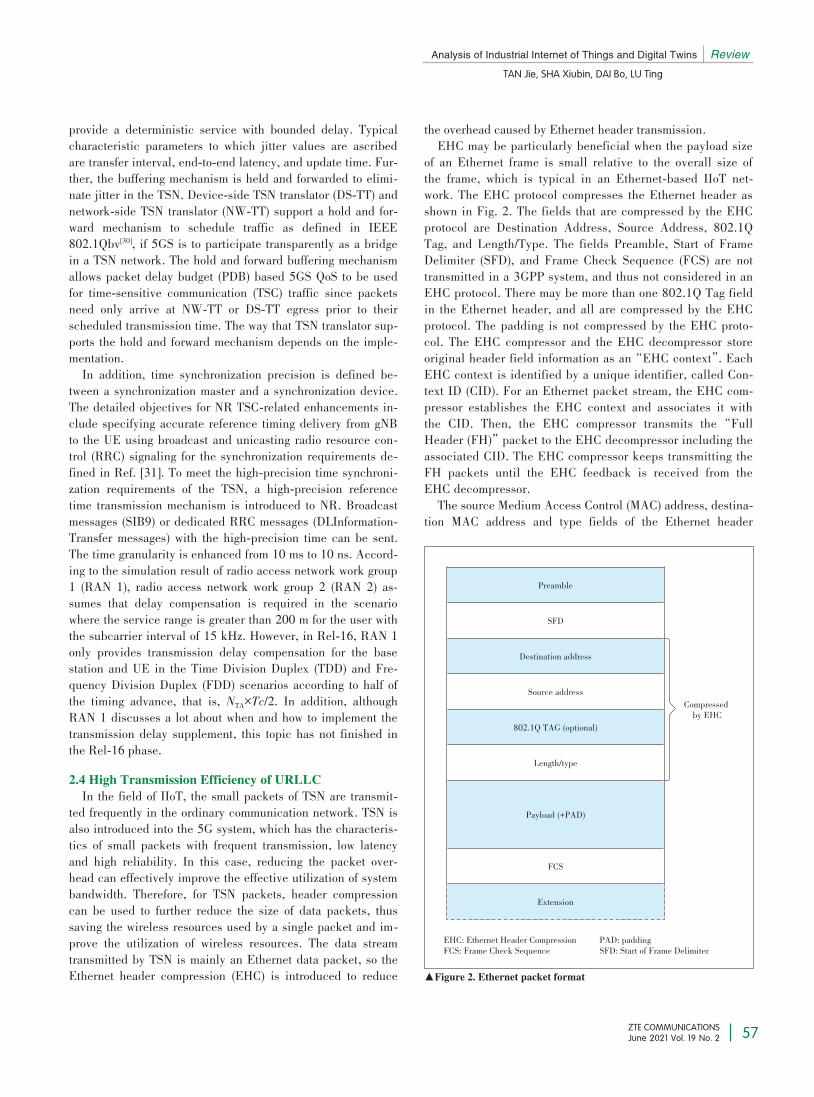
Analysis of Industrial Internet of Things and Digital Twins Review
TAN Jie, SHA Xiubin, DAI Bo, LU Ting
ZTE COMMUNICATIONSJune 2021 Vol. 19 No. 2
provide a deterministic service with bounded delay. Typicalcharacteristic parameters to which jitter values are ascribedare transfer interval, end-to-end latency, and update time. Fur⁃ther, the buffering mechanism is held and forwarded to elimi⁃nate jitter in the TSN. Device-side TSN translator (DS-TT) andnetwork-side TSN translator (NW-TT) support a hold and for⁃ward mechanism to schedule traffic as defined in IEEE802.1Qbv[30], if 5GS is to participate transparently as a bridgein a TSN network. The hold and forward buffering mechanismallows packet delay budget (PDB) based 5GS QoS to be usedfor time-sensitive communication (TSC) traffic since packetsneed only arrive at NW-TT or DS-TT egress prior to theirscheduled transmission time. The way that TSN translator sup⁃ports the hold and forward mechanism depends on the imple⁃mentation.In addition, time synchronization precision is defined be⁃
tween a synchronization master and a synchronization device.The detailed objectives for NR TSC-related enhancements in⁃clude specifying accurate reference timing delivery from gNBto the UE using broadcast and unicasting radio resource con⁃trol (RRC) signaling for the synchronization requirements de⁃fined in Ref. [31]. To meet the high-precision time synchroni⁃zation requirements of the TSN, a high-precision referencetime transmission mechanism is introduced to NR. Broadcastmessages (SIB9) or dedicated RRC messages (DLInformation⁃Transfer messages) with the high-precision time can be sent.The time granularity is enhanced from 10 ms to 10 ns. Accord⁃ing to the simulation result of radio access network work group1 (RAN 1), radio access network work group 2 (RAN 2) as⁃sumes that delay compensation is required in the scenariowhere the service range is greater than 200 m for the user withthe subcarrier interval of 15 kHz. However, in Rel-16, RAN 1only provides transmission delay compensation for the basestation and UE in the Time Division Duplex (TDD) and Fre⁃quency Division Duplex (FDD) scenarios according to half ofthe timing advance, that is, NTA×Tc/2. In addition, althoughRAN 1 discusses a lot about when and how to implement thetransmission delay supplement, this topic has not finished inthe Rel-16 phase.2.4 High Transmission Efficiency of URLLCIn the field of IIoT, the small packets of TSN are transmit⁃
ted frequently in the ordinary communication network. TSN isalso introduced into the 5G system, which has the characteris⁃tics of small packets with frequent transmission, low latencyand high reliability. In this case, reducing the packet over⁃head can effectively improve the effective utilization of systembandwidth. Therefore, for TSN packets, header compressioncan be used to further reduce the size of data packets, thussaving the wireless resources used by a single packet and im⁃prove the utilization of wireless resources. The data streamtransmitted by TSN is mainly an Ethernet data packet, so theEthernet header compression (EHC) is introduced to reduce
the overhead caused by Ethernet header transmission.EHC may be particularly beneficial when the payload size
of an Ethernet frame is small relative to the overall size ofthe frame, which is typical in an Ethernet-based IIoT net⁃work. The EHC protocol compresses the Ethernet header asshown in Fig. 2. The fields that are compressed by the EHCprotocol are Destination Address, Source Address, 802.1QTag, and Length/Type. The fields Preamble, Start of FrameDelimiter (SFD), and Frame Check Sequence (FCS) are nottransmitted in a 3GPP system, and thus not considered in anEHC protocol. There may be more than one 802.1Q Tag fieldin the Ethernet header, and all are compressed by the EHCprotocol. The padding is not compressed by the EHC proto⁃col. The EHC compressor and the EHC decompressor storeoriginal header field information as an“EHC context”. EachEHC context is identified by a unique identifier, called Con⁃text ID (CID). For an Ethernet packet stream, the EHC com⁃pressor establishes the EHC context and associates it withthe CID. Then, the EHC compressor transmits the“FullHeader (FH)”packet to the EHC decompressor including theassociated CID. The EHC compressor keeps transmitting theFH packets until the EHC feedback is received from theEHC decompressor.The source Medium Access Control (MAC) address, destina⁃
tion MAC address and type fields of the Ethernet header
▲Figure 2. Ethernet packet format
EHC: Ethernet Header CompressionFCS: Frame Check Sequence PAD: paddingSFD: Start of Frame Delimiter
Preamble
SFD
Destination address
Source address
802.1Q TAG (optional)
Length/type
Payload (+PAD)
FCS
Extension
Compressedby EHC
57
Review Analysis of Industrial Internet of Things and Digital Twins
TAN Jie, SHA Xiubin, DAI Bo, LU Ting
ZTE COMMUNICATIONSJune 2021 Vol. 19 No. 2
frame are all static and can be compressed, which is also theconclusion of the 3GPP RAN 2. Header compression is essen⁃tially the use of CID instead of Ethernet headers for transmis⁃sion in the communication network.The compression process includes: 1) The configuration of
the CID is completed by the PDCP data PDU; 2) the compres⁃sor sends a full packet containing the full header and the CID;3) the decompressor establishes the relationship between theheader and the CID according to the received FH packet; 4)after the decompressor successfully establishes the context re⁃lationship, it sends the feedback message with the CID, in⁃forming the compressor that it can send the compression pack⁃age; 5) after receiving the feedback information carrying CID,the compressor starts to send the compression packet corre⁃sponding to the CID. The header field in the compressionpacket is replaced by the CID, where the feedback informa⁃tion is sent by PDU control PDCP.
3 Future Research Directions of IIoT Tech⁃nologyAs a breakthrough in the integration of mobile communica⁃
tions and vertical industries, 5G is expected to bring aboutgreat changes to the whole society through URLLC servicessuch as automatic driving, factory automation and smart grid.The research work for the 3GPP Rel-16 has been completed.At this stage, the research in related high-level technologieshas laid a solid foundation for the integration of 5G and IIoT.With the development of IIoT, its services require more strictlatency and are more deterministic, for example, up to99.999999%. To this end, 3GPP has launched its research onstandard technology in Rel-17 to further enhance the low la⁃tency and reliability, so that 5G can meet the various needs ofthe development of IIoT.Considering the directions of the reliable private network of
local service, extensible wireless connections of future plat⁃forms and multiple functions of new cases, a shorter framestructure will be selected in accordance with service develop⁃ment requirements to reduce the air interface delay of servic⁃es. In addition, deep integration with the TSN proposed by theindustry will also be considered to guarantee low transmissiondelay of services. On the road of the integration of 5G and in⁃dustrial Internet TSN, related enhancements will be carriedout in the following aspects: 1) Based on multi-carrier deploy⁃ment, the reliability is further improved by introducing a PD⁃CP layer and higher-level data replication transmission tech⁃nology; 2) the feedback scheme for the physical layer will befurther enhanced; 3) the UE service priority and uplink UCIwill be enhanced; 4) with the NR-Unlicensed (NR-U), the 5GNR will support the licensed frequency, shared frequency do⁃main and license-free spectrum; 5) URLLC will implementlow latency, high reliability and multi-TRP cooperation;. 6)mobility will be enhanced;. 7) wired bus will be replaced by
wireless bus; 8) requirements of network and equipment posi⁃tioning, positioning in IIoT, and intelligent factory/vehicle-to-everything (V2X) centimeter positioning will be met; 9) withthe penetration of artificial intelligence (AI) technology, newdeterministic requirements and key standard technology of AIin IIoT applications will be explored. These will be the key re⁃search directions in the future.
4 Digital Twins in IIoTWith the continuous development of the manufacturing in⁃
dustry, digital twins have become the focus of every digital en⁃terprise, although they have not yet become the mainstreamtechnology. The core of digital twins is model and data, butthe creation of virtual models and data analysis require profes⁃sional knowledge. For those who do not have relevant knowl⁃edge, it is a long way to go to build and use digital twins. IIoTcan just solve the above problems, through the platform toachieve data analysis outsourcing, model sharing and otherservices. For example, the IIoT can be used to associate theedge-side infrastructure downward with the digital twin, and totransfer and store data upward in the cloud. Any users can es⁃tablish digital twins through the IIoT services according totheir own needs. It can be said that the industrial Internet plat⁃form activates the life of digital twins.IIoT is a key link in the process of enterprise digital trans⁃
formation, which accelerates the integration of various ele⁃ments of information technology (IT) and operation technology(OT). Data is the most important binder in the integration pro⁃cess. In order to make the IT and OT integrate better, the hid⁃den asset of data should be handled first. In addition, the IIoTis trying to break the boundaries of enterprises, trying to fillthe gaps between IT and OT, and creating a new ecology ofsoftware definition, data-driven and mode innovation. The digi⁃tal twin just provides the interface of data and technology forthe development of such integration.As we know, when each object (such as cars, airplanes, fac⁃
tories and people) in the real world has a digital twin, thespace-time relationship between the digital twins becomesmore valuable than a single digital twin. When the interac⁃tions between objects are optimized at the same level of a sys⁃tem, compared with the partial or independent optimization ofthe system, the efficiency is greatly improved. But in order torealize the optimization of the whole system, communicationbecomes a crucial factor. As described in Ref. [25], most ofthe communication technologies currently used in industry arestill wired. However, with the advent of Industry 4.0 and 5G,this may change fundamentally, since only wireless connectivi⁃ty can provide the degree of flexibility, mobility, versatilityand ergonomics that are required for the factories of the fu⁃ture. Therefore, with the support of IIoT, the digital twin tech⁃nology has been further promoted in different applicationfields of a“future factory”, such as factory automation, pro⁃
cess automation, hazardous material information system(HMIS) and production, logistics and warehouse, monitoringand maintenance. Fig. 3 contains enterprise resource planning(ERP), manufacturing execution system (MES), computer aid⁃ed quality (CAQ), computer aided manufacturing (CAM), In⁃ternet process connection (IPC), symbolic programming sys⁃tem (SPS), computerized numerical control (CNC), and so on.Fig. 3 also shows the objects in the real production process,such as robots, cameras, mechanical arms, workbenches andmechanical tools. The information status of these objects inwired and wireless networks is uploaded to the Internet/cloudthrough sensors. After a high real-time data exchange, thestate of a real object is simulated by a digital twin, and thenthe digital twin obtains the corresponding fault diagnosis re⁃sults, evaluation and prediction results, behavior control ofmachinery, and other information. The high real-time networkcommunication and the corresponding simulation informationare used to control the production process. The high real-timedata exchange between the real object and digital twin is thebasis and prerequisite for the application of the digital twintechnology. In addition, as an effective way to solve the inter⁃action theory and implementation method of the physicalworld and the information world in the future, digital twins aregradually deepening in practice. This also means that the de⁃mand for network performance in its development is constant⁃
ly improving, and it also promotes the improvement of IIoT re⁃lated project research and standards. Thus, it is necessary tofurther study the low latency and high reliability of the IIoT.Therefore, digital twins can display, predict and analyze the
interaction between a digital model and the physical world.The design based on digital twins is based on virtual mappingof existing physical products. A large amount of data is stud⁃ied to obtain valuable knowledge for product innovation. De⁃signers only need to publish the requirements to the industrialInternet platform, so that platform managers can preciselymatch the data services needed by designers, as well as themodel and algorithm services for data processing. Digitaltwins are effectively applied to product design through servic⁃es to reduce the modification caused by the inconsistency be⁃tween expected behavior and design behavior. It greatly short⁃ens the design cycle and reduces the design cost.
5 ConclusionsThe development of IIoT technology makes the application
scenarios of digital twin technology more extensive, fully dem⁃onstrating the advantages and capabilities of digital twins interms of models, data, and services. As a new digital technolo⁃gy solution and human-computer interaction interface, it willeffectively promote and deepen the further development ofbusiness models. On the basis of reviewing the development ofURLLC and analyzing the future research direction in thefield of IIoT, this paper discusses the application of IIoT indigital twin. The development of digital twin technology isclosely related to the continuous evolution of URLLC technolo⁃gy in IIoT. In other words, the development requirement of dig⁃ital twins also promotes the improvement of IIoT standardsand technologies. Compared with the previous cellular mobilecommunication technology, the 5G URLLC technology hasgreatly improved in terms of delay, reliability, little jitter andhigh transmission efficiency. However, with the developmentof IIoT, the research of delay and reliability technology needsto be further enhanced to meet the needs of various services.
References[1] SISINNI E, SAIFULLAH A, HAN S, et al. Industrial Internet of Things: chal⁃lenges, opportunities, and directions [J]. IEEE transactions on industrial infor⁃matics, 2018, 14(11): 4724–4734. DOI: 10.1109/TII.2018.2852491
[2] TAYEB S, LATIFI S, KIM Y. A survey on IoT communication and computationframeworks: an industrial perspective [C]//IEEE 7th Annual Computing andCommunication Workshop and Conference (CCWC). Las Vegas, USA: IEEE,2017: 1–6. DOI: 10.1109/CCWC.2017.7868354
[3] CHEN B T, WAN J F, LAN Y T, et al. Improving cognitive ability of edge intel⁃ligent IIoT through machine learning [J]. IEEE network, 2019, 33(5): 61–67.DOI: 10.1109/MNET.001.1800505
[4] SAVAZZI S, RAMPA V, SPAGNOLINI U. Wireless cloud networks for the fac⁃
58
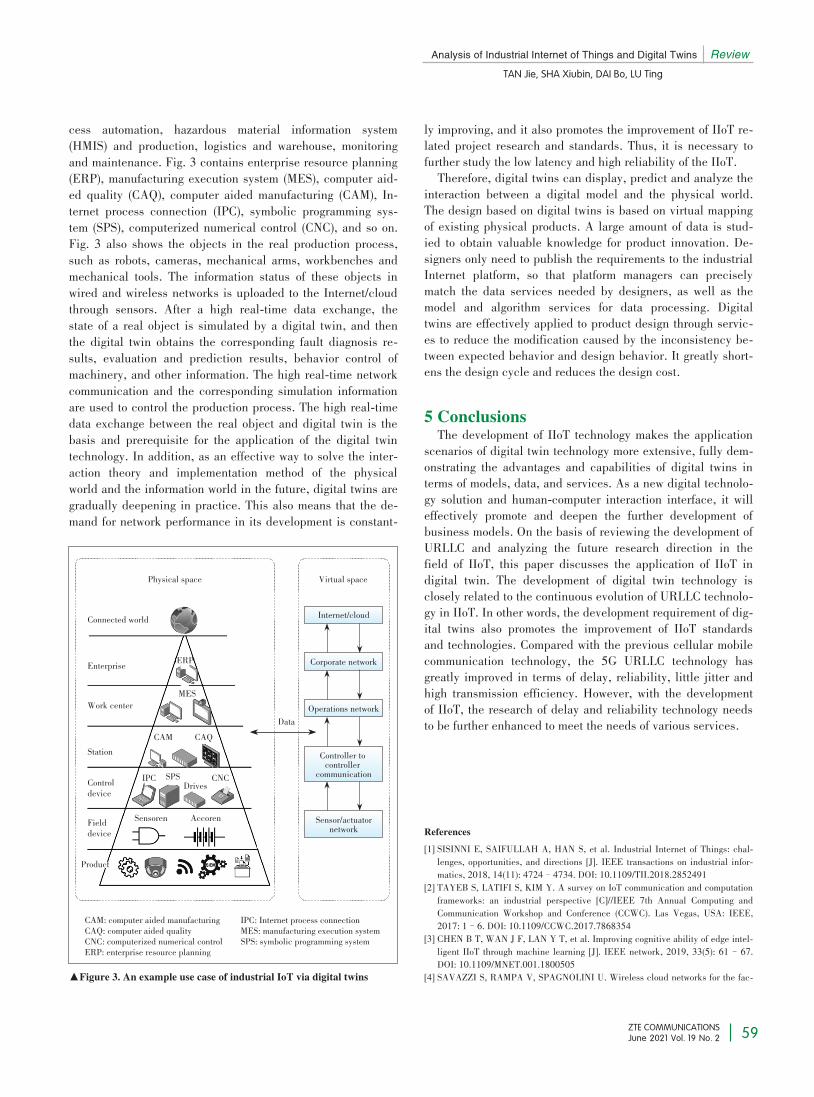
Analysis of Industrial Internet of Things and Digital Twins Review
TAN Jie, SHA Xiubin, DAI Bo, LU Ting
ZTE COMMUNICATIONSJune 2021 Vol. 19 No. 2
cess automation, hazardous material information system(HMIS) and production, logistics and warehouse, monitoringand maintenance. Fig. 3 contains enterprise resource planning(ERP), manufacturing execution system (MES), computer aid⁃ed quality (CAQ), computer aided manufacturing (CAM), In⁃ternet process connection (IPC), symbolic programming sys⁃tem (SPS), computerized numerical control (CNC), and so on.Fig. 3 also shows the objects in the real production process,such as robots, cameras, mechanical arms, workbenches andmechanical tools. The information status of these objects inwired and wireless networks is uploaded to the Internet/cloudthrough sensors. After a high real-time data exchange, thestate of a real object is simulated by a digital twin, and thenthe digital twin obtains the corresponding fault diagnosis re⁃sults, evaluation and prediction results, behavior control ofmachinery, and other information. The high real-time networkcommunication and the corresponding simulation informationare used to control the production process. The high real-timedata exchange between the real object and digital twin is thebasis and prerequisite for the application of the digital twintechnology. In addition, as an effective way to solve the inter⁃action theory and implementation method of the physicalworld and the information world in the future, digital twins aregradually deepening in practice. This also means that the de⁃mand for network performance in its development is constant⁃
ly improving, and it also promotes the improvement of IIoT re⁃lated project research and standards. Thus, it is necessary tofurther study the low latency and high reliability of the IIoT.Therefore, digital twins can display, predict and analyze the
interaction between a digital model and the physical world.The design based on digital twins is based on virtual mappingof existing physical products. A large amount of data is stud⁃ied to obtain valuable knowledge for product innovation. De⁃signers only need to publish the requirements to the industrialInternet platform, so that platform managers can preciselymatch the data services needed by designers, as well as themodel and algorithm services for data processing. Digitaltwins are effectively applied to product design through servic⁃es to reduce the modification caused by the inconsistency be⁃tween expected behavior and design behavior. It greatly short⁃ens the design cycle and reduces the design cost.
5 ConclusionsThe development of IIoT technology makes the application
scenarios of digital twin technology more extensive, fully dem⁃onstrating the advantages and capabilities of digital twins interms of models, data, and services. As a new digital technolo⁃gy solution and human-computer interaction interface, it willeffectively promote and deepen the further development ofbusiness models. On the basis of reviewing the development ofURLLC and analyzing the future research direction in thefield of IIoT, this paper discusses the application of IIoT indigital twin. The development of digital twin technology isclosely related to the continuous evolution of URLLC technolo⁃gy in IIoT. In other words, the development requirement of dig⁃ital twins also promotes the improvement of IIoT standardsand technologies. Compared with the previous cellular mobilecommunication technology, the 5G URLLC technology hasgreatly improved in terms of delay, reliability, little jitter andhigh transmission efficiency. However, with the developmentof IIoT, the research of delay and reliability technology needsto be further enhanced to meet the needs of various services.
References[1] SISINNI E, SAIFULLAH A, HAN S, et al. Industrial Internet of Things: chal⁃lenges, opportunities, and directions [J]. IEEE transactions on industrial infor⁃matics, 2018, 14(11): 4724–4734. DOI: 10.1109/TII.2018.2852491
[2] TAYEB S, LATIFI S, KIM Y. A survey on IoT communication and computationframeworks: an industrial perspective [C]//IEEE 7th Annual Computing andCommunication Workshop and Conference (CCWC). Las Vegas, USA: IEEE,2017: 1–6. DOI: 10.1109/CCWC.2017.7868354
[3] CHEN B T, WAN J F, LAN Y T, et al. Improving cognitive ability of edge intel⁃ligent IIoT through machine learning [J]. IEEE network, 2019, 33(5): 61–67.DOI: 10.1109/MNET.001.1800505
[4] SAVAZZI S, RAMPA V, SPAGNOLINI U. Wireless cloud networks for the fac⁃▲Figure 3. An example use case of industrial IoT via digital twins
CAM: computer aided manufacturingCAQ: computer aided qualityCNC: computerized numerical controlERP: enterprise resource planning
IPC: Internet process connectionMES: manufacturing execution systemSPS: symbolic programming system
Physical space
Connected world
Enterprise
Work center
Station
Controldevice
Fielddevice
Product
Sensoren Accoren
IPC CNCDrivesSPS
CAM CAQ
MES
ERP
Data
Virtual space
Internet/cloud
Corporate network
Operations network
Controller tocontrollercommunication
Sensor/actuatornetwork
59
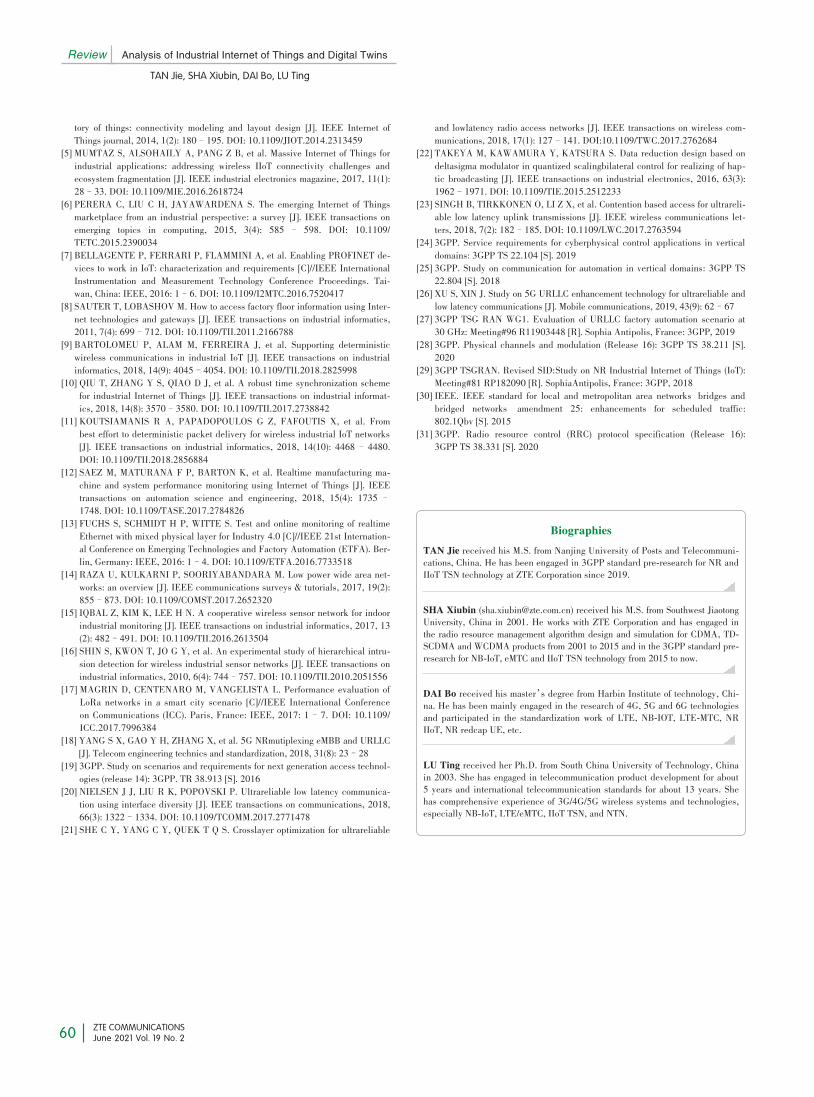
Review Analysis of Industrial Internet of Things and Digital Twins
TAN Jie, SHA Xiubin, DAI Bo, LU Ting
ZTE COMMUNICATIONSJune 2021 Vol. 19 No. 2
tory of things: connectivity modeling and layout design [J]. IEEE Internet ofThings journal, 2014, 1(2): 180–195. DOI: 10.1109/JIOT.2014.2313459
[5] MUMTAZ S, ALSOHAILY A, PANG Z B, et al. Massive Internet of Things forindustrial applications: addressing wireless IIoT connectivity challenges andecosystem fragmentation [J]. IEEE industrial electronics magazine, 2017, 11(1):28–33. DOI: 10.1109/MIE.2016.2618724
[6] PERERA C, LIU C H, JAYAWARDENA S. The emerging Internet of Thingsmarketplace from an industrial perspective: a survey [J]. IEEE transactions onemerging topics in computing, 2015, 3(4): 585 – 598. DOI: 10.1109/TETC.2015.2390034
[7] BELLAGENTE P, FERRARI P, FLAMMINI A, et al. Enabling PROFINET de⁃vices to work in IoT: characterization and requirements [C]//IEEE InternationalInstrumentation and Measurement Technology Conference Proceedings. Tai⁃wan, China: IEEE, 2016: 1–6. DOI: 10.1109/I2MTC.2016.7520417
[8] SAUTER T, LOBASHOV M. How to access factory floor information using Inter⁃net technologies and gateways [J]. IEEE transactions on industrial informatics,2011, 7(4): 699–712. DOI: 10.1109/TII.2011.2166788
[9] BARTOLOMEU P, ALAM M, FERREIRA J, et al. Supporting deterministicwireless communications in industrial IoT [J]. IEEE transactions on industrialinformatics, 2018, 14(9): 4045–4054. DOI: 10.1109/TII.2018.2825998
[10] QIU T, ZHANG Y S, QIAO D J, et al. A robust time synchronization schemefor industrial Internet of Things [J]. IEEE transactions on industrial informat⁃ics, 2018, 14(8): 3570–3580. DOI: 10.1109/TII.2017.2738842
[11] KOUTSIAMANIS R A, PAPADOPOULOS G Z, FAFOUTIS X, et al. Frombest effort to deterministic packet delivery for wireless industrial IoT networks[J]. IEEE transactions on industrial informatics, 2018, 14(10): 4468– 4480.DOI: 10.1109/TII.2018.2856884
[12] SAEZ M, MATURANA F P, BARTON K, et al. Realtime manufacturing ma⁃chine and system performance monitoring using Internet of Things [J]. IEEEtransactions on automation science and engineering, 2018, 15(4): 1735–1748. DOI: 10.1109/TASE.2017.2784826
[13] FUCHS S, SCHMIDT H P, WITTE S. Test and online monitoring of realtimeEthernet with mixed physical layer for Industry 4.0 [C]//IEEE 21st Internation⁃al Conference on Emerging Technologies and Factory Automation (ETFA). Ber⁃lin, Germany: IEEE, 2016: 1–4. DOI: 10.1109/ETFA.2016.7733518
[14] RAZA U, KULKARNI P, SOORIYABANDARA M. Low power wide area net⁃works: an overview [J]. IEEE communications surveys & tutorials, 2017, 19(2):855–873. DOI: 10.1109/COMST.2017.2652320
[15] IQBAL Z, KIM K, LEE H N. A cooperative wireless sensor network for indoorindustrial monitoring [J]. IEEE transactions on industrial informatics, 2017, 13(2): 482–491. DOI: 10.1109/TII.2016.2613504
[16] SHIN S, KWON T, JO G Y, et al. An experimental study of hierarchical intru⁃sion detection for wireless industrial sensor networks [J]. IEEE transactions onindustrial informatics, 2010, 6(4): 744–757. DOI: 10.1109/TII.2010.2051556
[17] MAGRIN D, CENTENARO M, VANGELISTA L. Performance evaluation ofLoRa networks in a smart city scenario [C]//IEEE International Conferenceon Communications (ICC). Paris, France: IEEE, 2017: 1–7. DOI: 10.1109/ICC.2017.7996384
[18] YANG S X, GAO Y H, ZHANG X, et al. 5G NRmutiplexing eMBB and URLLC[J]. Telecom engineering technics and standardization, 2018, 31(8): 23–28
[19] 3GPP. Study on scenarios and requirements for next generation access technol⁃ogies (release 14): 3GPP. TR 38.913 [S]. 2016
[20] NIELSEN J J, LIU R K, POPOVSKI P. Ultrareliable low latency communica⁃tion using interface diversity [J]. IEEE transactions on communications, 2018,66(3): 1322–1334. DOI: 10.1109/TCOMM.2017.2771478
[21] SHE C Y, YANG C Y, QUEK T Q S. Crosslayer optimization for ultrareliable
and lowlatency radio access networks [J]. IEEE transactions on wireless com⁃munications, 2018, 17(1): 127–141. DOI:10.1109/TWC.2017.2762684
[22] TAKEYA M, KAWAMURA Y, KATSURA S. Data reduction design based ondeltasigma modulator in quantized scalingbilateral control for realizing of hap⁃tic broadcasting [J]. IEEE transactions on industrial electronics, 2016, 63(3):1962–1971. DOI: 10.1109/TIE.2015.2512233
[23] SINGH B, TIRKKONEN O, LI Z X, et al. Contention based access for ultrareli⁃able low latency uplink transmissions [J]. IEEE wireless communications let⁃ters, 2018, 7(2): 182–185. DOI: 10.1109/LWC.2017.2763594
[24] 3GPP. Service requirements for cyberphysical control applications in verticaldomains: 3GPP TS 22.104 [S]. 2019
[25] 3GPP. Study on communication for automation in vertical domains: 3GPP TS22.804 [S]. 2018
[26] XU S, XIN J. Study on 5G URLLC enhancement technology for ultrareliable andlow latency communications [J]. Mobile communications, 2019, 43(9): 62–67
[27] 3GPP TSG RAN WG1. Evaluation of URLLC factory automation scenario at30 GHz: Meeting#96 R11903448 [R]. Sophia Antipolis, France: 3GPP, 2019
[28] 3GPP. Physical channels and modulation (Release 16): 3GPP TS 38.211 [S].2020
[29] 3GPP TSGRAN. Revised SID:Study on NR Industrial Internet of Things (IoT):Meeting#81 RP182090 [R]. SophiaAntipolis, France: 3GPP, 2018
[30] IEEE. IEEE standard for local and metropolitan area networks bridges andbridged networks amendment 25: enhancements for scheduled traffic:802.1Qbv [S]. 2015
[31] 3GPP. Radio resource control (RRC) protocol specification (Release 16):3GPP TS 38.331 [S]. 2020
BiographiesTAN Jie received his M.S. from Nanjing University of Posts and Telecommuni⁃cations, China. He has been engaged in 3GPP standard pre-research for NR andIIoT TSN technology at ZTE Corporation since 2019.
SHA Xiubin ([email protected]) received his M.S. from Southwest JiaotongUniversity, China in 2001. He works with ZTE Corporation and has engaged inthe radio resource management algorithm design and simulation for CDMA, TD-SCDMA and WCDMA products from 2001 to 2015 and in the 3GPP standard pre-research for NB-IoT, eMTC and IIoT TSN technology from 2015 to now.
DAI Bo received his master’s degree from Harbin Institute of technology, Chi⁃na. He has been mainly engaged in the research of 4G, 5G and 6G technologiesand participated in the standardization work of LTE, NB-IOT, LTE-MTC, NRIIoT, NR redcap UE, etc.
LU Ting received her Ph.D. from South China University of Technology, Chinain 2003. She has engaged in telecommunication product development for about5 years and international telecommunication standards for about 13 years. Shehas comprehensive experience of 3G/4G/5G wireless systems and technologies,especially NB-IoT, LTE/eMTC, IIoT TSN, and NTN.
60
ZTE COMMUNICATIONSJune 2021 Vol. 19 No. 2
Higher Speed Passive Optical Networks for Low Latency Services Research Paper
ZHANG Weiliang, YUAN Liquan
Higher Speed Passive Optical Networks forHigher Speed Passive Optical Networks forLow Latency ServicesLow Latency Services
Abstract: Latency sensitive services have attracted much attention lately and imposedstringent requirements on the access network design. Passive optical networks (PONs) pro⁃vide a potential long-term solution for the underlying transport network supporting theseservices. This paper discusses latency limitations in PON and recent progress in PONstandardization to improve latency. Experimental results of a low latency PON system arepresented as a proof of concept.Keywords: passive optical networks; time-division multiple access; wavelength-divisionmultiple access; low latency
Citation (IEEE Format): W. L. Zhang and L. Q. Yuan,“Higher speed passive optical networks for low latency services,”ZTE Communica⁃tions, vol. 19, no. 2, pp. 61–66, Jun. 2021. doi: 10.12142/ZTECOM.202102008.
1 Introduction
With the continued growth of new applications andservices over fixed and wireless communicationnetworks, requirements for low latency, high band⁃width, timing and synchronization have taken cen⁃
tral stage in new network architecture design. In 2015, theITU-R laid out its vision on the framework and objectives ofthe development of International Mobile Telecommunications(IMT) for 2020 and beyond[1]. In the IMT-2020 Recommenda⁃tion, diverse services for ultra-reliable low-latency communi⁃cations (URLLC), as well as for enhanced mobile broadband(eMBB) and massive machine type communications (mMTC),are envisioned.These envisioned services translate to stringent require⁃
ments for the underlying transport network layer. Many fixednetwork technologies are being considered for the 5G trans⁃port infrastructure, e. g., point-to-point fibers, active wave⁃length division multiplexing (WDM), and passive optical net⁃works (PONs).Among these options, the PON stands out as a highly suit⁃
able choice. Due to its efficient fiber infrastructure and band⁃width efficiency, the time-division-multiplexed (TDM) PONhas been successfully deployed worldwide to over 626 millionsubscribers as of December 2019. Many of the PON and 4G
devices share the same access office. In addition, PON and5G transport networks share similar network topology. It istherefore attractive to make use of the abundant fiber resourc⁃es in the PON infrastructure.Many industry standards development organizations (SDOs)
are working on new standardization projects to address the in⁃creasing demands of low-latency services[2]. The Full ServiceAccess Network (FSAN) group[3] and the ITU-T Study Group(SG) 15 Question 2 (Q2), which focuses on optical access net⁃works standardization, have conducted several projects tostudy PONs for 5G mobile x-haul transport, which will be dis⁃cussed later in the paper.This paper is structured as follows. We will start with exam⁃
ples of low latency services in Section 2. An overview of pas⁃sive optical networks and their latency properties are dis⁃cussed in Section 3, which is followed by recent progress inPON standards to support low-latency services in Section 4.Finally in Section 5, we describe in more detail a latency re⁃duction method for TDM PON and present experimental re⁃sults as a proof of concept.
2 Low Latency ServicesLow latency services are characterized as services of which
ZHANG Weiliang, YUAN Liquan
(Wireline Product Planning Department, ZTECorporation, Shanghai 201203, China)
DOI: 10.12142/ZTECOM.202102008
http://kns.cnki.net/kcms/detail/34.1294.TN.20210510.1514.002.html, published onlineMay 10, 2021
Manuscript received: 2021-03-16
61
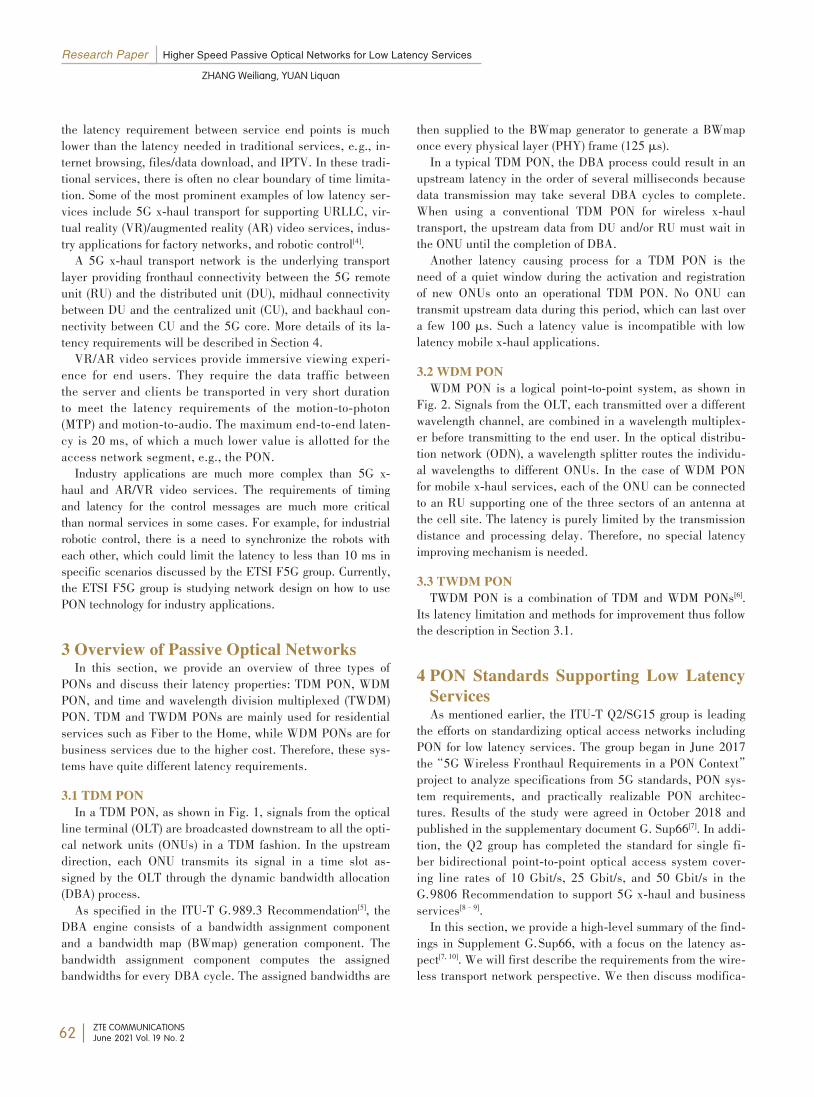
Research Paper Higher Speed Passive Optical Networks for Low Latency Services
ZHANG Weiliang, YUAN Liquan
ZTE COMMUNICATIONSJune 2021 Vol. 19 No. 2
the latency requirement between service end points is muchlower than the latency needed in traditional services, e.g., in⁃ternet browsing, files/data download, and IPTV. In these tradi⁃tional services, there is often no clear boundary of time limita⁃tion. Some of the most prominent examples of low latency ser⁃vices include 5G x-haul transport for supporting URLLC, vir⁃tual reality (VR)/augmented reality (AR) video services, indus⁃try applications for factory networks, and robotic control[4].A 5G x-haul transport network is the underlying transport
layer providing fronthaul connectivity between the 5G remoteunit (RU) and the distributed unit (DU), midhaul connectivitybetween DU and the centralized unit (CU), and backhaul con⁃nectivity between CU and the 5G core. More details of its la⁃tency requirements will be described in Section 4.VR/AR video services provide immersive viewing experi⁃
ence for end users. They require the data traffic betweenthe server and clients be transported in very short durationto meet the latency requirements of the motion-to-photon(MTP) and motion-to-audio. The maximum end-to-end laten⁃cy is 20 ms, of which a much lower value is allotted for theaccess network segment, e.g., the PON.Industry applications are much more complex than 5G x-
haul and AR/VR video services. The requirements of timingand latency for the control messages are much more criticalthan normal services in some cases. For example, for industrialrobotic control, there is a need to synchronize the robots witheach other, which could limit the latency to less than 10 ms inspecific scenarios discussed by the ETSI F5G group. Currently,the ETSI F5G group is studying network design on how to usePON technology for industry applications.
3 Overview of Passive Optical NetworksIn this section, we provide an overview of three types of
PONs and discuss their latency properties: TDM PON, WDMPON, and time and wavelength division multiplexed (TWDM)PON. TDM and TWDM PONs are mainly used for residentialservices such as Fiber to the Home, while WDM PONs are forbusiness services due to the higher cost. Therefore, these sys⁃tems have quite different latency requirements.3.1 TDM PONIn a TDM PON, as shown in Fig. 1, signals from the optical
line terminal (OLT) are broadcasted downstream to all the opti⁃cal network units (ONUs) in a TDM fashion. In the upstreamdirection, each ONU transmits its signal in a time slot as⁃signed by the OLT through the dynamic bandwidth allocation(DBA) process.As specified in the ITU-T G.989.3 Recommendation[5], the
DBA engine consists of a bandwidth assignment componentand a bandwidth map (BWmap) generation component. Thebandwidth assignment component computes the assignedbandwidths for every DBA cycle. The assigned bandwidths are
then supplied to the BWmap generator to generate a BWmaponce every physical layer (PHY) frame (125 μs).In a typical TDM PON, the DBA process could result in an
upstream latency in the order of several milliseconds becausedata transmission may take several DBA cycles to complete.When using a conventional TDM PON for wireless x-haultransport, the upstream data from DU and/or RU must wait inthe ONU until the completion of DBA.Another latency causing process for a TDM PON is the
need of a quiet window during the activation and registrationof new ONUs onto an operational TDM PON. No ONU cantransmit upstream data during this period, which can last overa few 100 μs. Such a latency value is incompatible with lowlatency mobile x-haul applications.3.2 WDM PONWDM PON is a logical point-to-point system, as shown in
Fig. 2. Signals from the OLT, each transmitted over a differentwavelength channel, are combined in a wavelength multiplex⁃er before transmitting to the end user. In the optical distribu⁃tion network (ODN), a wavelength splitter routes the individu⁃al wavelengths to different ONUs. In the case of WDM PONfor mobile x-haul services, each of the ONU can be connectedto an RU supporting one of the three sectors of an antenna atthe cell site. The latency is purely limited by the transmissiondistance and processing delay. Therefore, no special latencyimproving mechanism is needed.3.3 TWDM PONTWDM PON is a combination of TDM and WDM PONs[6].
Its latency limitation and methods for improvement thus followthe description in Section 3.1.
4 PON Standards Supporting Low LatencyServicesAs mentioned earlier, the ITU-T Q2/SG15 group is leading
the efforts on standardizing optical access networks includingPON for low latency services. The group began in June 2017the“5G Wireless Fronthaul Requirements in a PON Context”project to analyze specifications from 5G standards, PON sys⁃tem requirements, and practically realizable PON architec⁃tures. Results of the study were agreed in October 2018 andpublished in the supplementary document G. Sup66[7]. In addi⁃tion, the Q2 group has completed the standard for single fi⁃ber bidirectional point-to-point optical access system cover⁃ing line rates of 10 Gbit/s, 25 Gbit/s, and 50 Gbit/s in theG.9806 Recommendation to support 5G x-haul and businessservices[8–9].In this section, we provide a high-level summary of the find⁃
ings in Supplement G.Sup66, with a focus on the latency as⁃pect[7, 10]. We will first describe the requirements from the wire⁃less transport network perspective. We then discuss modifica⁃
62
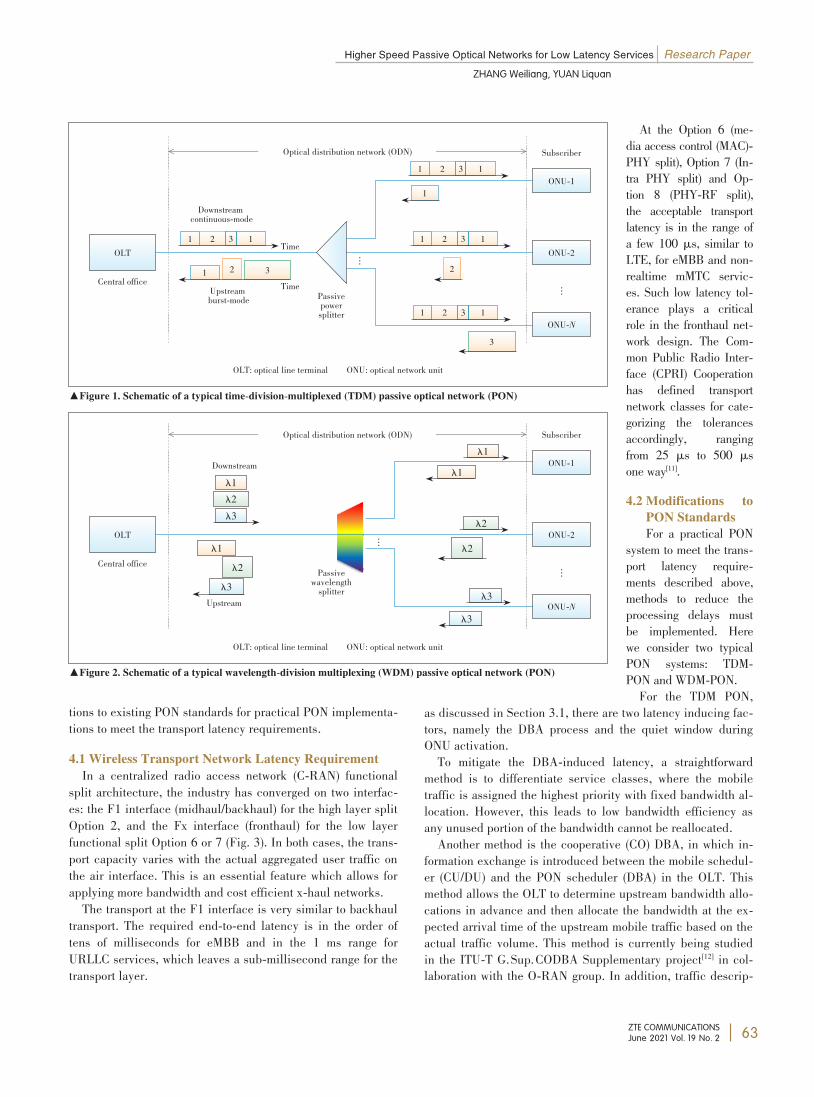
Higher Speed Passive Optical Networks for Low Latency Services Research Paper
ZHANG Weiliang, YUAN Liquan
ZTE COMMUNICATIONSJune 2021 Vol. 19 No. 2
tions to existing PON standards for practical PON implementa⁃tions to meet the transport latency requirements.4.1 Wireless Transport Network Latency RequirementIn a centralized radio access network (C-RAN) functional
split architecture, the industry has converged on two interfac⁃es: the F1 interface (midhaul/backhaul) for the high layer splitOption 2, and the Fx interface (fronthaul) for the low layerfunctional split Option 6 or 7 (Fig. 3). In both cases, the trans⁃port capacity varies with the actual aggregated user traffic onthe air interface. This is an essential feature which allows forapplying more bandwidth and cost efficient x-haul networks.The transport at the F1 interface is very similar to backhaul
transport. The required end-to-end latency is in the order oftens of milliseconds for eMBB and in the 1 ms range forURLLC services, which leaves a sub-millisecond range for thetransport layer.
At the Option 6 (me⁃dia access control (MAC)-PHY split), Option 7 (In⁃tra PHY split) and Op⁃tion 8 (PHY-RF split),the acceptable transportlatency is in the range ofa few 100 μs, similar toLTE, for eMBB and non-realtime mMTC servic⁃es. Such low latency tol⁃erance plays a criticalrole in the fronthaul net⁃work design. The Com⁃mon Public Radio Inter⁃face (CPRI) Cooperationhas defined transportnetwork classes for cate⁃gorizing the tolerancesaccordingly, rangingfrom 25 μs to 500 μsone way[11].4.2 Modifications to
PON StandardsFor a practical PON
system to meet the trans⁃port latency require⁃ments described above,methods to reduce theprocessing delays mustbe implemented. Herewe consider two typicalPON systems: TDM-PON and WDM-PON.For the TDM PON,
as discussed in Section 3.1, there are two latency inducing fac⁃tors, namely the DBA process and the quiet window duringONU activation.To mitigate the DBA-induced latency, a straightforward
method is to differentiate service classes, where the mobiletraffic is assigned the highest priority with fixed bandwidth al⁃location. However, this leads to low bandwidth efficiency asany unused portion of the bandwidth cannot be reallocated.Another method is the cooperative (CO) DBA, in which in⁃
formation exchange is introduced between the mobile schedul⁃er (CU/DU) and the PON scheduler (DBA) in the OLT. Thismethod allows the OLT to determine upstream bandwidth allo⁃cations in advance and then allocate the bandwidth at the ex⁃pected arrival time of the upstream mobile traffic based on theactual traffic volume. This method is currently being studiedin the ITU-T G.Sup.CODBA Supplementary project[12] in col⁃laboration with the O-RAN group. In addition, traffic descrip⁃
▲Figure 1. Schematic of a typical time-division-multiplexed (TDM) passive optical network (PON)
OLT: optical line terminal ONU: optical network unit
OLT
Central office
Downstreamcontinuous-mode
Time1 2 3 1
1 32
1 2 3 1
1 2 3 1
1 2 3 1
1
2
3
PassivepowersplitterUpstreamburst-mode
Time
Optical distribution network (ODN)
ONU-1
Subscriber
ONU-2
ONU-N
︙
︙
▲Figure 2. Schematic of a typical wavelength-division multiplexing (WDM) passive optical network (PON)
OLT: optical line terminal ONU: optical network unit
OLT
Central office
Optical distribution network (ODN)
Downstream
Upstream
Passivewavelengthsplitterλ3λ2
λ1
λ1λ2λ3
λ1
λ2λ2
λ1
λ3λ3
ONU-1
Subscriber
ONU-2
ONU-N
︙
︙
63
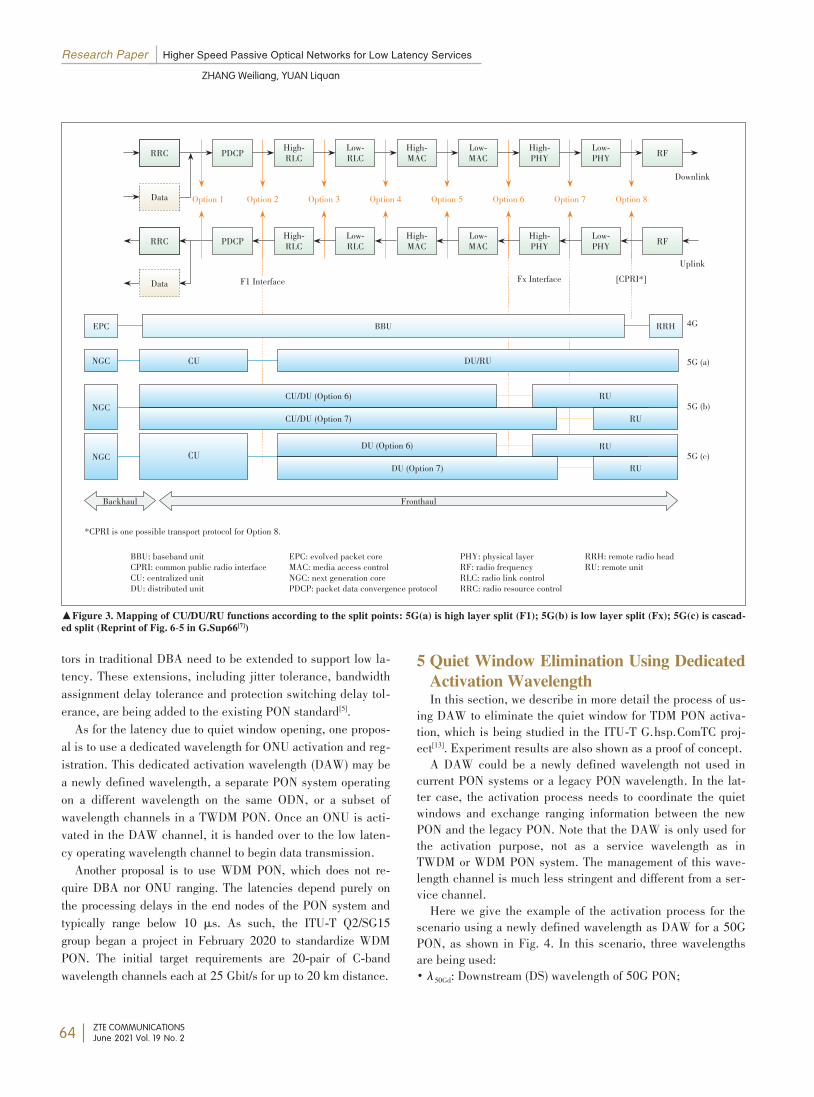
Research Paper Higher Speed Passive Optical Networks for Low Latency Services
ZHANG Weiliang, YUAN Liquan
ZTE COMMUNICATIONSJune 2021 Vol. 19 No. 2
tors in traditional DBA need to be extended to support low la⁃tency. These extensions, including jitter tolerance, bandwidthassignment delay tolerance and protection switching delay tol⁃erance, are being added to the existing PON standard[5].As for the latency due to quiet window opening, one propos⁃
al is to use a dedicated wavelength for ONU activation and reg⁃istration. This dedicated activation wavelength (DAW) may bea newly defined wavelength, a separate PON system operatingon a different wavelength on the same ODN, or a subset ofwavelength channels in a TWDM PON. Once an ONU is acti⁃vated in the DAW channel, it is handed over to the low laten⁃cy operating wavelength channel to begin data transmission.Another proposal is to use WDM PON, which does not re⁃
quire DBA nor ONU ranging. The latencies depend purely onthe processing delays in the end nodes of the PON system andtypically range below 10 μs. As such, the ITU-T Q2/SG15group began a project in February 2020 to standardize WDMPON. The initial target requirements are 20-pair of C-bandwavelength channels each at 25 Gbit/s for up to 20 km distance.
5 Quiet Window Elimination Using DedicatedActivation WavelengthIn this section, we describe in more detail the process of us⁃
ing DAW to eliminate the quiet window for TDM PON activa⁃tion, which is being studied in the ITU-T G.hsp.ComTC proj⁃ect[13]. Experiment results are also shown as a proof of concept.A DAW could be a newly defined wavelength not used in
current PON systems or a legacy PON wavelength. In the lat⁃ter case, the activation process needs to coordinate the quietwindows and exchange ranging information between the newPON and the legacy PON. Note that the DAW is only used forthe activation purpose, not as a service wavelength as inTWDM or WDM PON system. The management of this wave⁃length channel is much less stringent and different from a ser⁃vice channel.Here we give the example of the activation process for the
scenario using a newly defined wavelength as DAW for a 50GPON, as shown in Fig. 4. In this scenario, three wavelengthsare being used:• λ50Gd: Downstream (DS) wavelength of 50G PON;
▲Figure 3. Mapping of CU/DU/RU functions according to the split points: 5G(a) is high layer split (F1); 5G(b) is low layer split (Fx); 5G(c) is cascad⁃ed split (Reprint of Fig. 6-5 in G.Sup66[7])
BBU: baseband unitCPRI: common public radio interfaceCU: centralized unitDU: distributed unit
EPC: evolved packet coreMAC: media access controlNGC: next generation corePDCP: packet data convergence protocol
PHY: physical layerRF: radio frequencyRLC: radio link controlRRC: radio resource control
RRH: remote radio headRU: remote unit
RRC High-RLCPDCP Low-RLC High-MAC Low-MAC High-PHY Low-PHY RFRRCDownlink
Data
RRC High-RLCPDCP Low-RLC High-MAC Low-MAC High-PHY Low-PHY RFRRC
Data
Option 1 Option 2 Option 3 Option 4 Option 5 Option 6 Option 7 Option 8
UplinkF1 Interface Fx Interface
EPC RRH 4G
5G (a)
5G (b)
5G (c)
NGC
NGC
Backhaul Fronthaul
BBU
CU DU/RU
CU/DU (Option 6)CU/DU (Option 7)
RURU
NGC CU DU (Option 6)DU (Option 7)
RURU
[CPRI*]
*CPRI is one possible transport protocol for Option 8.
64
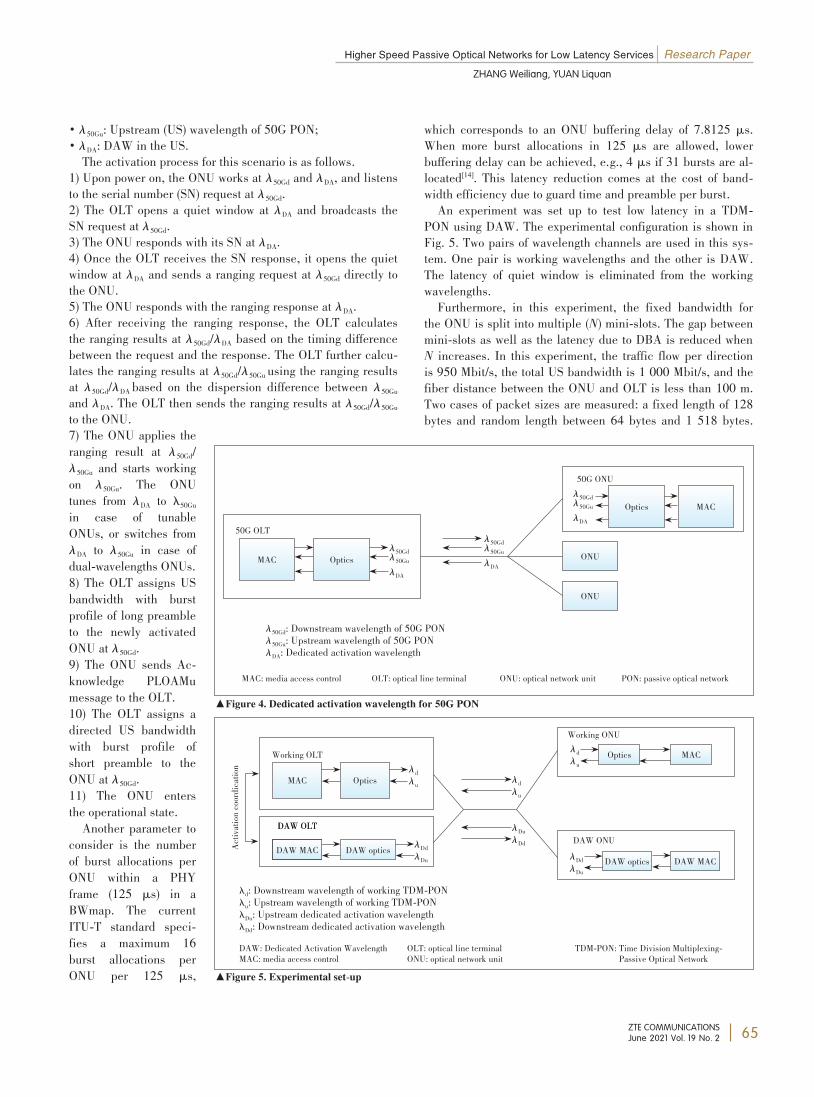
Higher Speed Passive Optical Networks for Low Latency Services Research Paper
ZHANG Weiliang, YUAN Liquan
ZTE COMMUNICATIONSJune 2021 Vol. 19 No. 2
• λ50Gu: Upstream (US) wavelength of 50G PON;• λDA: DAW in the US.The activation process for this scenario is as follows.1) Upon power on, the ONU works at λ50Gd and λDA, and listensto the serial number (SN) request at λ50Gd.2) The OLT opens a quiet window at λDA and broadcasts theSN request at λ50Gd.3) The ONU responds with its SN at λDA.4) Once the OLT receives the SN response, it opens the quietwindow at λDA and sends a ranging request at λ50Gd directly tothe ONU.5) The ONU responds with the ranging response at λDA.6) After receiving the ranging response, the OLT calculatesthe ranging results at λ50Gd/λDA based on the timing differencebetween the request and the response. The OLT further calcu⁃lates the ranging results at λ50Gd/λ50Gu using the ranging resultsat λ50Gd/λDA based on the dispersion difference between λ50Guand λDA. The OLT then sends the ranging results at λ50Gd/λ50Guto the ONU.7) The ONU applies theranging result at λ50Gd/λ50Gu and starts workingon λ50Gu. The ONUtunes from λDA to λ50Guin case of tunableONUs, or switches fromλDA to λ50Gu in case ofdual-wavelengths ONUs.8) The OLT assigns USbandwidth with burstprofile of long preambleto the newly activatedONU at λ50Gd.9) The ONU sends Ac⁃knowledge PLOAMumessage to the OLT.10) The OLT assigns adirected US bandwidthwith burst profile ofshort preamble to theONU at λ50Gd.11) The ONU entersthe operational state.Another parameter to
consider is the numberof burst allocations perONU within a PHYframe (125 μs) in aBWmap. The currentITU-T standard speci⁃fies a maximum 16burst allocations perONU per 125 μs,
which corresponds to an ONU buffering delay of 7.8125 μs.When more burst allocations in 125 μs are allowed, lowerbuffering delay can be achieved, e.g., 4 μs if 31 bursts are al⁃located[14]. This latency reduction comes at the cost of band⁃width efficiency due to guard time and preamble per burst.An experiment was set up to test low latency in a TDM-
PON using DAW. The experimental configuration is shown inFig. 5. Two pairs of wavelength channels are used in this sys⁃tem. One pair is working wavelengths and the other is DAW.The latency of quiet window is eliminated from the workingwavelengths.Furthermore, in this experiment, the fixed bandwidth for
the ONU is split into multiple (N) mini-slots. The gap betweenmini-slots as well as the latency due to DBA is reduced whenN increases. In this experiment, the traffic flow per directionis 950 Mbit/s, the total US bandwidth is 1 000 Mbit/s, and thefiber distance between the ONU and OLT is less than 100 m.Two cases of packet sizes are measured: a fixed length of 128bytes and random length between 64 bytes and 1 518 bytes.
MAC: media access control OLT: optical line terminal ONU: optical network unit PON: passive optical network▲Figure 4. Dedicated activation wavelength for 50G PON
MAC
50G OLT
Opticsλ50Gdλ50GuλDA
Optics MAC
50G ONUλ50Gdλ50GuλDA
ONU
ONU
λ50Gdλ50GuλDA
λ50Gd: Downstream wavelength of 50G PONλ50Gu: Upstream wavelength of 50G PONλDA: Dedicated activation wavelength
DAW: Dedicated Activation WavelengthMAC: media access control OLT: optical line terminalONU: optical network unit TDM-PON: Time Division Multiplexing-Passive Optical Network▲Figure 5. Experimental set-up
MAC OpticsWorking OLT
DAW OLTDAW MAC DAW optics
λd: Downstream wavelength of working TDM-PONλu: Upstream wavelength of working TDM-PONλDu: Upstream dedicated activation wavelengthλDd: Downstream dedicated activation wavelength
λdλu
λDdλDu
Activation
coordic
ation
Working ONUOptics MAC
DAW MACDAW optics DAW MAC
λdλu
λDdλDu
DAW ONUλDuλDd
λdλu
DAW OLT
65
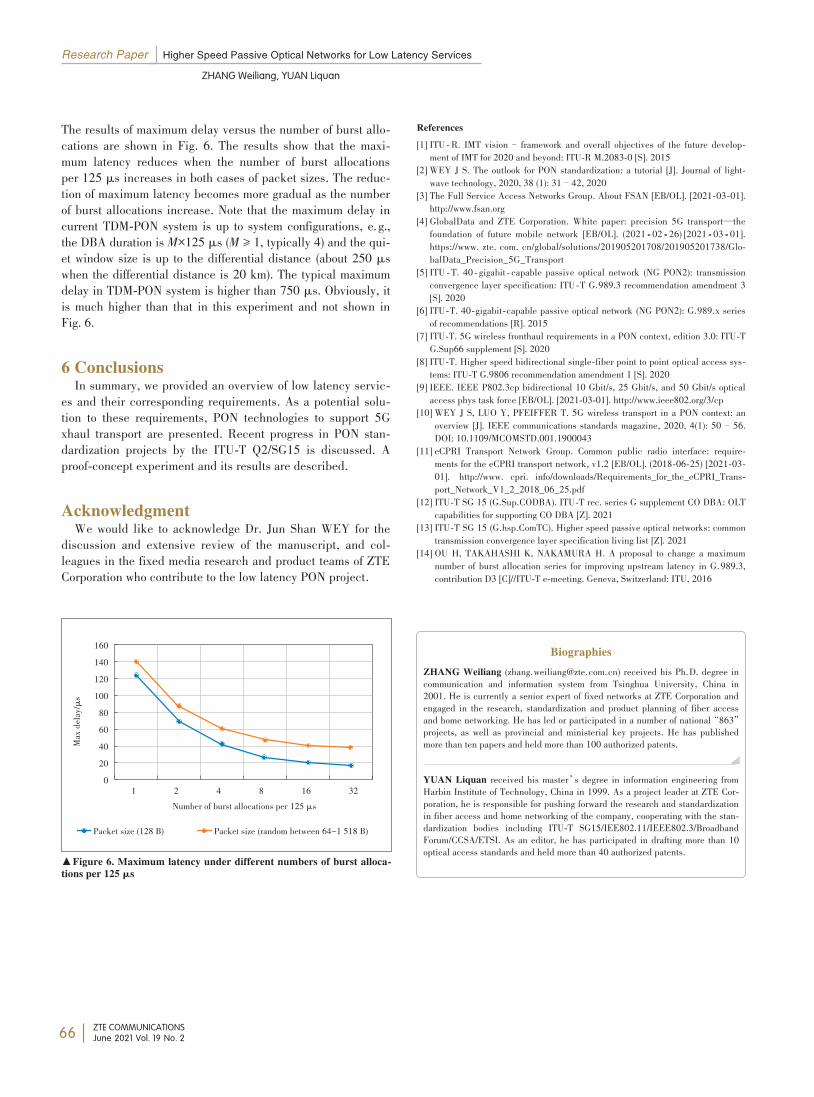
Research Paper Higher Speed Passive Optical Networks for Low Latency Services
ZHANG Weiliang, YUAN Liquan
ZTE COMMUNICATIONSJune 2021 Vol. 19 No. 2
The results of maximum delay versus the number of burst allo⁃cations are shown in Fig. 6. The results show that the maxi⁃mum latency reduces when the number of burst allocationsper 125 μs increases in both cases of packet sizes. The reduc⁃tion of maximum latency becomes more gradual as the numberof burst allocations increase. Note that the maximum delay incurrent TDM-PON system is up to system configurations, e.g.,the DBA duration is M×125 μs (M ≥ 1, typically 4) and the qui⁃et window size is up to the differential distance (about 250 μswhen the differential distance is 20 km). The typical maximumdelay in TDM-PON system is higher than 750 μs. Obviously, itis much higher than that in this experiment and not shown inFig. 6.
6 ConclusionsIn summary, we provided an overview of low latency servic⁃
es and their corresponding requirements. As a potential solu⁃tion to these requirements, PON technologies to support 5Gxhaul transport are presented. Recent progress in PON stan⁃dardization projects by the ITU-T Q2/SG15 is discussed. Aproof-concept experiment and its results are described.
AcknowledgmentWe would like to acknowledge Dr. Jun Shan WEY for the
discussion and extensive review of the manuscript, and col⁃leagues in the fixed media research and product teams of ZTECorporation who contribute to the low latency PON project.
References[1] ITU ⁃R. IMT vision– framework and overall objectives of the future develop⁃ment of IMT for 2020 and beyond: ITU⁃R M.2083⁃0 [S]. 2015
[2] WEY J S. The outlook for PON standardization: a tutorial [J]. Journal of light⁃wave technology, 2020, 38 (1): 31–42, 2020
[3] The Full Service Access Networks Group. About FSAN [EB/OL]. [2021⁃03⁃01].http://www.fsan.org
[4] GlobalData and ZTE Corporation. White paper: precision 5G transport—thefoundation of future mobile network [EB/OL]. (2021 ⁃ 02 ⁃ 26) [2021 ⁃ 03 ⁃ 01].https://www. zte. com. cn/global/solutions/201905201708/201905201738/Glo⁃balData_Precision_5G_Transport
[5] ITU ⁃T. 40 ⁃ gigabit ⁃ capable passive optical network (NG PON2): transmissionconvergence layer specification: ITU⁃T G.989.3 recommendation amendment 3[S]. 2020
[6] ITU⁃T. 40⁃gigabit⁃capable passive optical network (NG PON2): G.989.x seriesof recommendations [R]. 2015
[7] ITU⁃T. 5G wireless fronthaul requirements in a PON context, edition 3.0: ITU⁃TG.Sup66 supplement [S]. 2020
[8] ITU⁃T. Higher speed bidirectional single⁃fiber point to point optical access sys⁃tems: ITU⁃T G.9806 recommendation amendment 1 [S]. 2020
[9] IEEE. IEEE P802.3cp bidirectional 10 Gbit/s, 25 Gbit/s, and 50 Gbit/s opticalaccess phys task force [EB/OL]. [2021⁃03⁃01]. http://www.ieee802.org/3/cp
[10] WEY J S, LUO Y, PFEIFFER T. 5G wireless transport in a PON context: anoverview [J]. IEEE communications standards magazine, 2020, 4(1): 50–56.DOI: 10.1109/MCOMSTD.001.1900043
[11] eCPRI Transport Network Group. Common public radio interface: require⁃ments for the eCPRI transport network, v1.2 [EB/OL]. (2018⁃06⁃25) [2021⁃03⁃01]. http://www. cpri. info/downloads/Requirements_for_the_eCPRI_Trans⁃port_Network_V1_2_2018_06_25.pdf
[12] ITU⁃T SG 15 (G.Sup.CODBA). ITU⁃T rec. series G supplement CO DBA: OLTcapabilities for supporting CO DBA [Z]. 2021
[13] ITU⁃T SG 15 (G.hsp.ComTC). Higher speed passive optical networks: commontransmission convergence layer specification living list [Z]. 2021
[14] OU H, TAKAHASHI K, NAKAMURA H. A proposal to change a maximumnumber of burst allocation series for improving upstream latency in G.989.3,contribution D3 [C]//ITU⁃T e⁃meeting. Geneva, Switzerland: ITU, 2016
BiographiesZHANG Weiliang ([email protected]) received his Ph.D. degree incommunication and information system from Tsinghua University, China in2001. He is currently a senior expert of fixed networks at ZTE Corporation andengaged in the research, standardization and product planning of fiber accessand home networking. He has led or participated in a number of national“863”projects, as well as provincial and ministerial key projects. He has publishedmore than ten papers and held more than 100 authorized patents.
YUAN Liquan received his master’s degree in information engineering fromHarbin Institute of Technology, China in 1999. As a project leader at ZTE Cor⁃poration, he is responsible for pushing forward the research and standardizationin fiber access and home networking of the company, cooperating with the stan⁃dardization bodies including ITU-T SG15/IEE802.11/IEEE802.3/BroadbandForum/CCSA/ETSI. As an editor, he has participated in drafting more than 10optical access standards and held more than 40 authorized patents.▲Figure 6. Maximum latency under different numbers of burst alloca⁃
tions per 125 µs
1 2 4 8 16 32Number of burst allocations per 125 μs
Maxdelay/μs
160140120100806040200
Packet size (128 B) Packet size (random between 64-1 518 B)
66
ZTE COMMUNICATIONSJune 2021 Vol. 19 No. 2
Differentially Authorized Deduplication System Based on Blockchain Research Paper
ZHAO Tian, LI Hui, YANG Xin, WANG Han, ZENG Ming, GUO Haisheng, WANG Dezheng
Differentially Authorized Deduplication SystemDifferentially Authorized Deduplication SystemBased on BlockchainBased on Blockchain
Abstract: In architecture of cloud storage, the deduplication technology encrypted with theconvergent key is one of the important data compression technologies, which effectively im⁃proves the utilization of space and bandwidth. To further refine the usage scenarios for vari⁃ous user permissions and enhance user’s data security, we propose a blockchain-based dif⁃ferential authorized deduplication system. The proposed system optimizes the traditionalProof of Vote (PoV) consensus algorithm and simplifies the existing differential authoriza⁃tion process to realize credible management and dynamic update of authority. Based on thedecentralized property of blockchain, we overcome the centralized single point fault prob⁃lem of traditional differentially authorized deduplication system. Besides, the operations oflegitimate users are recorded in blocks to ensure the traceability of behaviors.Keywords: convergent key; deduplication; blockchain; differential authorization
Citation (IEEE Format): T. zhao, H. Li, C. Yang, et al.,“Differentially authorized deduplication system based on blockchain,”ZTE Commu⁃nications, vol. 19, no. 2, pp. 67–76, Jun. 2021. doi: 10.12142/ZTECOM.202102009.
1 Introduction
In recent years, with the development of cloud storagetechnology, user data are uploaded to the cloud serverand many copies of the data are repeatedly stored by dif⁃ferent users, resulting in the waste of storage space. This
makes the deduplication an urgent problem to be solved[1].However, if the file data is directly stored in the cloud stor⁃
age server, it faces a series of risks such as data theft. There⁃fore, we consider storing the ciphertext of the data in the cloudstorage server.In traditional encryption and decryption algorithms, the
keys are generated independently by users leading to various
ciphertexts of the same data, which makes the deletion of du⁃plicate data difficult. If the cloud storage server generates thekey and encrypts the data uniformly, the security of user datacannot be guaranteed once the cloud storage server is mali⁃ciously attacked and becomes untrustworthy.In order to achieve deduplication under the premise of data
security, a deduplication system based on convergent keys hasbeen proposed in Ref. [2]. The encryption key H(F) is ob⁃tained by hashing the data, and used to encrypt the user data.The convergent encryption makes the consistent ciphertext ofthe same file or data block, and the cloud storage server or ex⁃ternal attackers cannot see the original data. It not only guar⁃antees the confidentiality of the data, but also facilitates thecloud storage server to perform data deduplication by usingthe original data to generate a convergence key.Because the encryption method of the convergent key is vul⁃
nerable to offline brute force cracking, semantic security can⁃not be guaranteed[3, 4]. In recent years, researchers in dedupli⁃cation for convergent encryption have proposed a series of im⁃provements. BELLARE et al. [5] proposed an information lockencryption scheme, which optimized key calculations and en⁃
ZHAO Tian1, LI Hui1, YANG Xin1, WANGHan1, ZENG Ming2, GUO Haisheng2,WANG Dezheng2
(1. Shenzhen Graduate School, Peking University,Shenzhen 518055, China;2. ZTE Corporation, Shenzhen 518057, China)
DOI: 10.12142/ZTECOM.202102009
http://kns.cnki.net/kcms/detail/34.1294.TN.20210519.1626.002.html, published onlineMay 20, 2021
Manuscript received: 2021-01-13
This work was supported by ZTE Industry-University-Institute CooperationFunds under Grant No. 2019ZTE03-01, National Keystone R&D Program ofChina under Grant No. 2017YFB0803204, National Natural Science Foundationof China (NSFC) under Grant No. 61671001, Guangdong Provincial R&D KeyProgram under Grant No. 2019B010137001, Shenzhen Research Programs un⁃der Grant Nos. JCYJ20190808155607340, JSGG20170406144032901, JS⁃GG20170824095858416 and JCYJ20170306092030521, and PCL Future Re⁃gional Network Facilities for Large-scale Experiments and Applications underGrant No. PCL2018KP001.
67
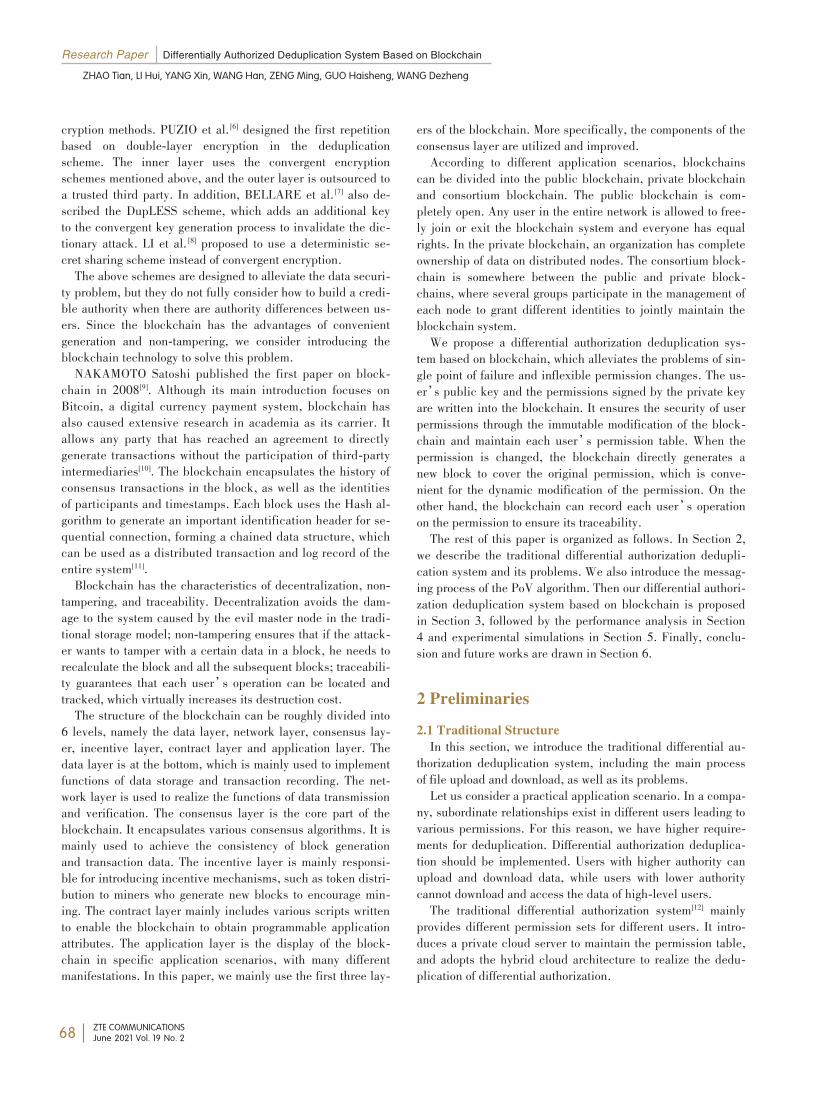
Research Paper Differentially Authorized Deduplication System Based on Blockchain
ZHAO Tian, LI Hui, YANG Xin, WANG Han, ZENG Ming, GUO Haisheng, WANG Dezheng
ZTE COMMUNICATIONSJune 2021 Vol. 19 No. 2
cryption methods. PUZIO et al. [6] designed the first repetitionbased on double-layer encryption in the deduplicationscheme. The inner layer uses the convergent encryptionschemes mentioned above, and the outer layer is outsourced toa trusted third party. In addition, BELLARE et al. [7] also de⁃scribed the DupLESS scheme, which adds an additional keyto the convergent key generation process to invalidate the dic⁃tionary attack. LI et al. [8] proposed to use a deterministic se⁃cret sharing scheme instead of convergent encryption.The above schemes are designed to alleviate the data securi⁃
ty problem, but they do not fully consider how to build a credi⁃ble authority when there are authority differences between us⁃ers. Since the blockchain has the advantages of convenientgeneration and non-tampering, we consider introducing theblockchain technology to solve this problem.NAKAMOTO Satoshi published the first paper on block⁃
chain in 2008[9]. Although its main introduction focuses onBitcoin, a digital currency payment system, blockchain hasalso caused extensive research in academia as its carrier. Itallows any party that has reached an agreement to directlygenerate transactions without the participation of third-partyintermediaries[10]. The blockchain encapsulates the history ofconsensus transactions in the block, as well as the identitiesof participants and timestamps. Each block uses the Hash al⁃gorithm to generate an important identification header for se⁃quential connection, forming a chained data structure, whichcan be used as a distributed transaction and log record of theentire system[11].Blockchain has the characteristics of decentralization, non-
tampering, and traceability. Decentralization avoids the dam⁃age to the system caused by the evil master node in the tradi⁃tional storage model; non-tampering ensures that if the attack⁃er wants to tamper with a certain data in a block, he needs torecalculate the block and all the subsequent blocks; traceabili⁃ty guarantees that each user’s operation can be located andtracked, which virtually increases its destruction cost.The structure of the blockchain can be roughly divided into
6 levels, namely the data layer, network layer, consensus lay⁃er, incentive layer, contract layer and application layer. Thedata layer is at the bottom, which is mainly used to implementfunctions of data storage and transaction recording. The net⁃work layer is used to realize the functions of data transmissionand verification. The consensus layer is the core part of theblockchain. It encapsulates various consensus algorithms. It ismainly used to achieve the consistency of block generationand transaction data. The incentive layer is mainly responsi⁃ble for introducing incentive mechanisms, such as token distri⁃bution to miners who generate new blocks to encourage min⁃ing. The contract layer mainly includes various scripts writtento enable the blockchain to obtain programmable applicationattributes. The application layer is the display of the block⁃chain in specific application scenarios, with many differentmanifestations. In this paper, we mainly use the first three lay⁃
ers of the blockchain. More specifically, the components of theconsensus layer are utilized and improved.According to different application scenarios, blockchains
can be divided into the public blockchain, private blockchainand consortium blockchain. The public blockchain is com⁃pletely open. Any user in the entire network is allowed to free⁃ly join or exit the blockchain system and everyone has equalrights. In the private blockchain, an organization has completeownership of data on distributed nodes. The consortium block⁃chain is somewhere between the public and private block⁃chains, where several groups participate in the management ofeach node to grant different identities to jointly maintain theblockchain system.We propose a differential authorization deduplication sys⁃
tem based on blockchain, which alleviates the problems of sin⁃gle point of failure and inflexible permission changes. The us⁃er’s public key and the permissions signed by the private keyare written into the blockchain. It ensures the security of userpermissions through the immutable modification of the block⁃chain and maintain each user’s permission table. When thepermission is changed, the blockchain directly generates anew block to cover the original permission, which is conve⁃nient for the dynamic modification of the permission. On theother hand, the blockchain can record each user’s operationon the permission to ensure its traceability.The rest of this paper is organized as follows. In Section 2,
we describe the traditional differential authorization dedupli⁃cation system and its problems. We also introduce the messag⁃ing process of the PoV algorithm. Then our differential authori⁃zation deduplication system based on blockchain is proposedin Section 3, followed by the performance analysis in Section4 and experimental simulations in Section 5. Finally, conclu⁃sion and future works are drawn in Section 6.
2 Preliminaries
2.1 Traditional StructureIn this section, we introduce the traditional differential au⁃
thorization deduplication system, including the main processof file upload and download, as well as its problems.Let us consider a practical application scenario. In a compa⁃
ny, subordinate relationships exist in different users leading tovarious permissions. For this reason, we have higher require⁃ments for deduplication. Differential authorization deduplica⁃tion should be implemented. Users with higher authority canupload and download data, while users with lower authoritycannot download and access the data of high-level users.The traditional differential authorization system[12] mainly
provides different permission sets for different users. It intro⁃duces a private cloud server to maintain the permission table,and adopts the hybrid cloud architecture to realize the dedu⁃plication of differential authorization.
68
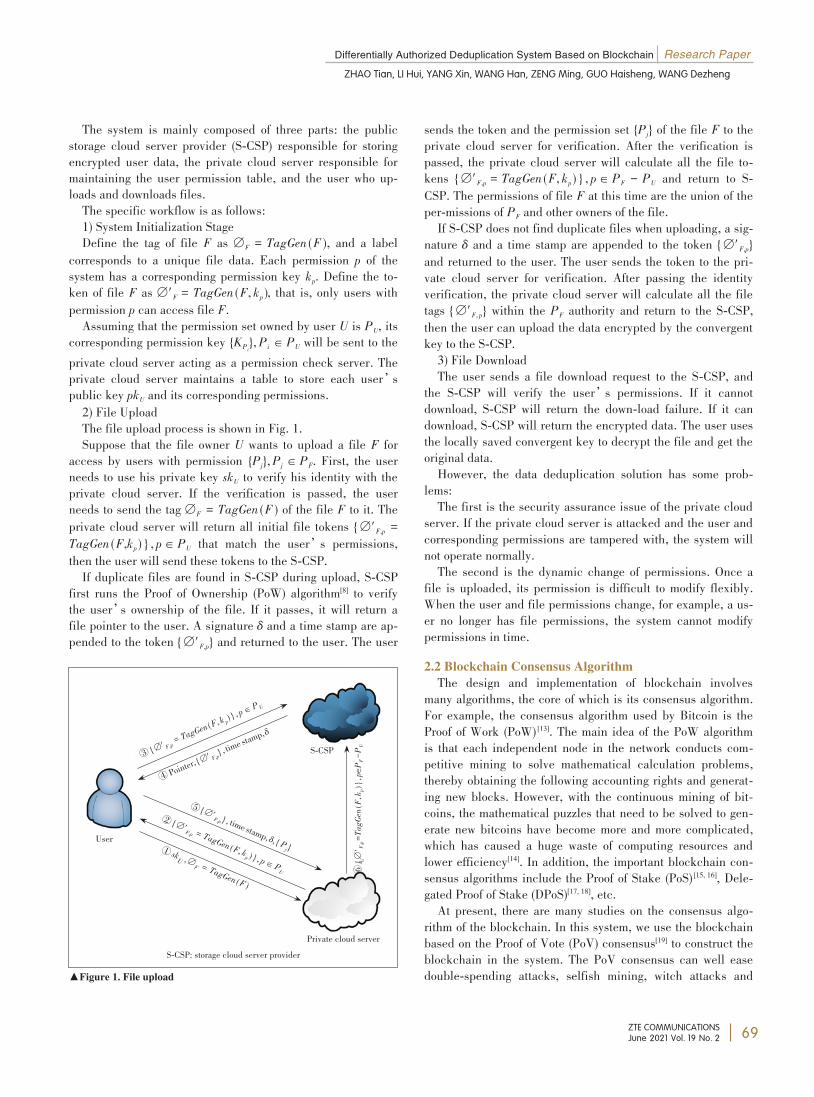
Differentially Authorized Deduplication System Based on Blockchain Research Paper
ZHAO Tian, LI Hui, YANG Xin, WANG Han, ZENG Ming, GUO Haisheng, WANG Dezheng
ZTE COMMUNICATIONSJune 2021 Vol. 19 No. 2
The system is mainly composed of three parts: the publicstorage cloud server provider (S-CSP) responsible for storingencrypted user data, the private cloud server responsible formaintaining the user permission table, and the user who up-loads and downloads files.The specific workflow is as follows:1) System Initialization StageDefine the tag of file F as ∅F = TagGen (F ), and a labelcorresponds to a unique file data. Each permission p of the
system has a corresponding permission key kp. Define the to⁃ken of file F as ∅'F = TagGen (F, kp ), that is, only users withpermission p can access file F.Assuming that the permission set owned by user U is PU, itscorresponding permission key {KPi},Pi ∈ PU will be sent to theprivate cloud server acting as a permission check server. The
private cloud server maintains a table to store each user’spublic key pkU and its corresponding permissions.2) File UploadThe file upload process is shown in Fig. 1.Suppose that the file owner U wants to upload a file F for
access by users with permission {Pj},Pj ∈ PF. First, the userneeds to use his private key skU to verify his identity with theprivate cloud server. If the verification is passed, the userneeds to send the tag ∅F = TagGen (F ) of the file F to it. Theprivate cloud server will return all initial file tokens { ∅'F,p =TagGen (F,kp ) } , p ∈ PU that match the user’s permissions,then the user will send these tokens to the S-CSP.If duplicate files are found in S-CSP during upload, S-CSP
first runs the Proof of Ownership (PoW) algorithm[8] to verifythe user’s ownership of the file. If it passes, it will return afile pointer to the user. A signature δ and a time stamp are ap⁃pended to the token { ∅'F,p} and returned to the user. The user
sends the token and the permission set {Pj} of the file F to theprivate cloud server for verification. After the verification ispassed, the private cloud server will calculate all the file to⁃kens { ∅'F,p = TagGen (F, kp ) } , p ∈ PF - PU and return to S-CSP. The permissions of file F at this time are the union of theper-missions of PF and other owners of the file.If S-CSP does not find duplicate files when uploading, a sig⁃nature δ and a time stamp are appended to the token { ∅'F,p}and returned to the user. The user sends the token to the pri⁃vate cloud server for verification. After passing the identityverification, the private cloud server will calculate all the filetags { ∅'F, p} within the PF authority and return to the S-CSP,then the user can upload the data encrypted by the convergentkey to the S-CSP.3) File DownloadThe user sends a file download request to the S-CSP, and
the S-CSP will verify the user’s permissions. If it cannotdownload, S-CSP will return the down-load failure. If it candownload, S-CSP will return the encrypted data. The user usesthe locally saved convergent key to decrypt the file and get theoriginal data.However, the data deduplication solution has some prob⁃
lems:The first is the security assurance issue of the private cloud
server. If the private cloud server is attacked and the user andcorresponding permissions are tampered with, the system willnot operate normally.The second is the dynamic change of permissions. Once a
file is uploaded, its permission is difficult to modify flexibly.When the user and file permissions change, for example, a us⁃er no longer has file permissions, the system cannot modifypermissions in time.2.2 Blockchain Consensus AlgorithmThe design and implementation of blockchain involves
many algorithms, the core of which is its consensus algorithm.For example, the consensus algorithm used by Bitcoin is theProof of Work (PoW) [13]. The main idea of the PoW algorithmis that each independent node in the network conducts com⁃petitive mining to solve mathematical calculation problems,thereby obtaining the following accounting rights and generat⁃ing new blocks. However, with the continuous mining of bit⁃coins, the mathematical puzzles that need to be solved to gen⁃erate new bitcoins have become more and more complicated,which has caused a huge waste of computing resources andlower efficiency[14]. In addition, the important blockchain con⁃sensus algorithms include the Proof of Stake (PoS) [15, 16], Dele⁃gated Proof of Stake (DPoS)[17, 18], etc.At present, there are many studies on the consensus algo⁃
rithm of the blockchain. In this system, we use the blockchainbased on the Proof of Vote (PoV) consensus[19] to construct theblockchain in the system. The PoV consensus can well easedouble-spending attacks, selfish mining, witch attacks and▲Figure 1. File upload
S-CSP: storage cloud server providerPrivate cloud server
S-CSP④ Point
er, { ∅' F,p} , time s
tamp, δ
⑤{∅'F,p } , time stamp, δ, { Pj }
③ { ∅' F,p= TagG
en (F, k p) } , p ∈ P
U
② {∅'F,p = TagGen (F, kp ) } , p ∈ P
U
① skU , ∅
F = TagGen (F )
⑥{∅' F,p=T
agGen(F
,k p)},p∈P
F-P
U
User
69
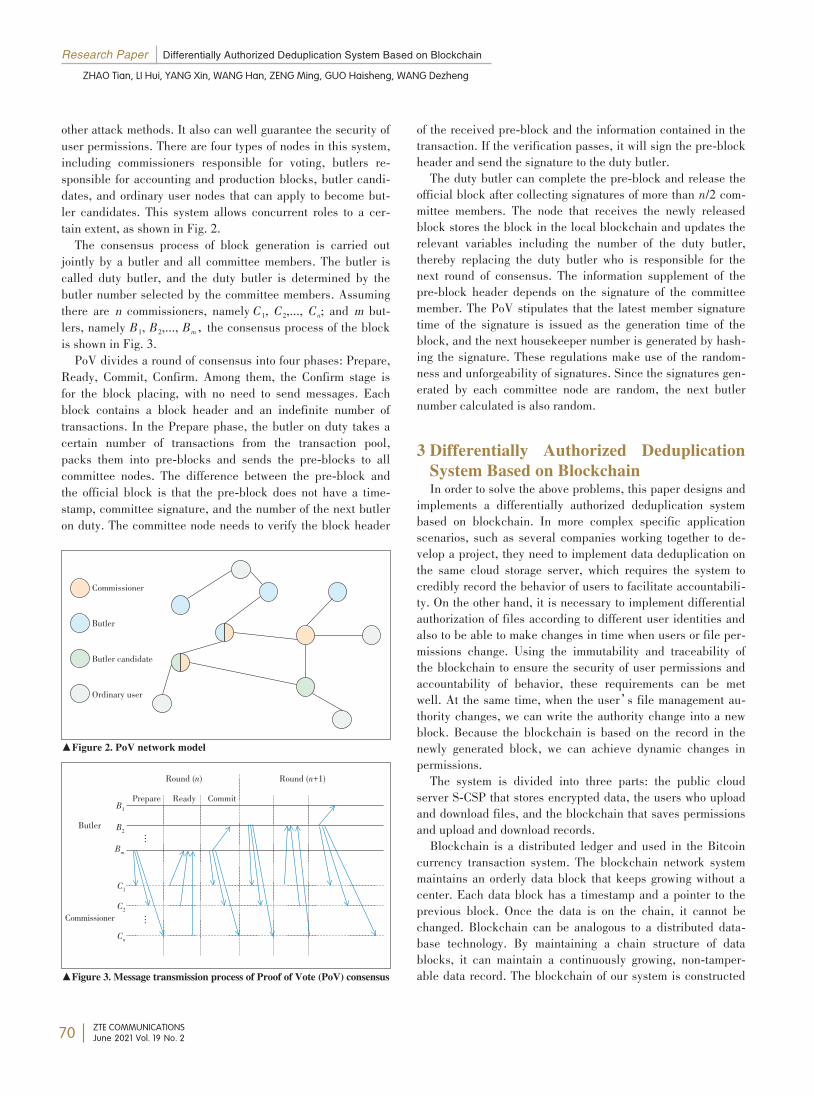
Research Paper Differentially Authorized Deduplication System Based on Blockchain
ZHAO Tian, LI Hui, YANG Xin, WANG Han, ZENG Ming, GUO Haisheng, WANG Dezheng
ZTE COMMUNICATIONSJune 2021 Vol. 19 No. 2
other attack methods. It also can well guarantee the security ofuser permissions. There are four types of nodes in this system,including commissioners responsible for voting, butlers re⁃sponsible for accounting and production blocks, butler candi⁃dates, and ordinary user nodes that can apply to become but⁃ler candidates. This system allows concurrent roles to a cer⁃tain extent, as shown in Fig. 2.The consensus process of block generation is carried out
jointly by a butler and all committee members. The butler iscalled duty butler, and the duty butler is determined by thebutler number selected by the committee members. Assumingthere are n commissioners, namely C1, C2,..., Cn; and m but⁃lers, namely B1, B2,..., Bm,the consensus process of the blockis shown in Fig. 3.PoV divides a round of consensus into four phases: Prepare,
Ready, Commit, Confirm. Among them, the Confirm stage isfor the block placing, with no need to send messages. Eachblock contains a block header and an indefinite number oftransactions. In the Prepare phase, the butler on duty takes acertain number of transactions from the transaction pool,packs them into pre-blocks and sends the pre-blocks to allcommittee nodes. The difference between the pre-block andthe official block is that the pre-block does not have a time⁃stamp, committee signature, and the number of the next butleron duty. The committee node needs to verify the block header
of the received pre-block and the information contained in thetransaction. If the verification passes, it will sign the pre-blockheader and send the signature to the duty butler.The duty butler can complete the pre-block and release the
official block after collecting signatures of more than n/2 com⁃mittee members. The node that receives the newly releasedblock stores the block in the local blockchain and updates therelevant variables including the number of the duty butler,thereby replacing the duty butler who is responsible for thenext round of consensus. The information supplement of thepre-block header depends on the signature of the committeemember. The PoV stipulates that the latest member signaturetime of the signature is issued as the generation time of theblock, and the next housekeeper number is generated by hash⁃ing the signature. These regulations make use of the random⁃ness and unforgeability of signatures. Since the signatures gen⁃erated by each committee node are random, the next butlernumber calculated is also random.
3 Differentially Authorized DeduplicationSystem Based on BlockchainIn order to solve the above problems, this paper designs and
implements a differentially authorized deduplication systembased on blockchain. In more complex specific applicationscenarios, such as several companies working together to de⁃velop a project, they need to implement data deduplication onthe same cloud storage server, which requires the system tocredibly record the behavior of users to facilitate accountabili⁃ty. On the other hand, it is necessary to implement differentialauthorization of files according to different user identities andalso to be able to make changes in time when users or file per⁃missions change. Using the immutability and traceability ofthe blockchain to ensure the security of user permissions andaccountability of behavior, these requirements can be metwell. At the same time, when the user’s file management au⁃thority changes, we can write the authority change into a newblock. Because the blockchain is based on the record in thenewly generated block, we can achieve dynamic changes inpermissions.The system is divided into three parts: the public cloud
server S-CSP that stores encrypted data, the users who uploadand download files, and the blockchain that saves permissionsand upload and download records.Blockchain is a distributed ledger and used in the Bitcoin
currency transaction system. The blockchain network systemmaintains an orderly data block that keeps growing without acenter. Each data block has a timestamp and a pointer to theprevious block. Once the data is on the chain, it cannot bechanged. Blockchain can be analogous to a distributed data⁃base technology. By maintaining a chain structure of datablocks, it can maintain a continuously growing, non-tamper⁃able data record. The blockchain of our system is constructed
▲Figure 2. PoV network model
▲Figure 3. Message transmission process of Proof of Vote (PoV) consensus
Commissioner
Butler
Butler candidate
Ordinary user
Prepare Ready CommitRound (n+1)Round (n)
B1
B2
Bm
Butler
C1
C2
Cn
Commissioner
︙
︙
70
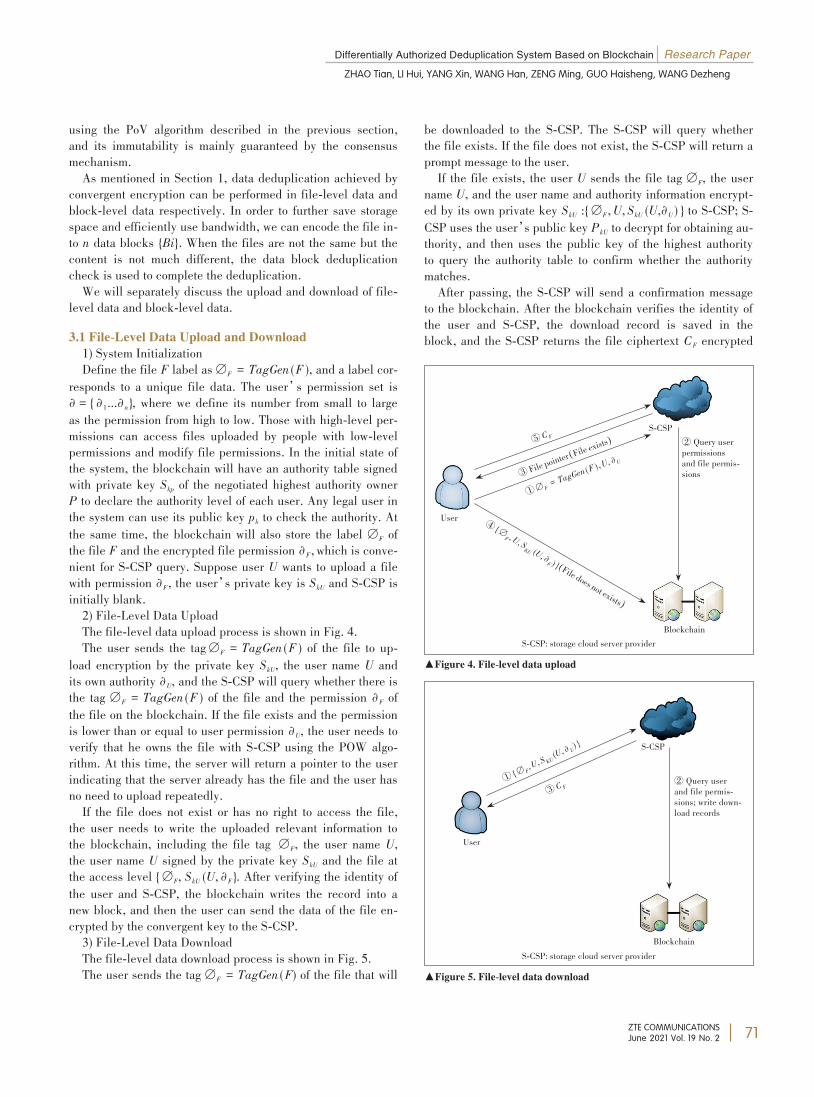
Differentially Authorized Deduplication System Based on Blockchain Research Paper
ZHAO Tian, LI Hui, YANG Xin, WANG Han, ZENG Ming, GUO Haisheng, WANG Dezheng
ZTE COMMUNICATIONSJune 2021 Vol. 19 No. 2
using the PoV algorithm described in the previous section,and its immutability is mainly guaranteed by the consensusmechanism.As mentioned in Section 1, data deduplication achieved by
convergent encryption can be performed in file-level data andblock-level data respectively. In order to further save storagespace and efficiently use bandwidth, we can encode the file in⁃to n data blocks {Bi}. When the files are not the same but thecontent is not much different, the data block deduplicationcheck is used to complete the deduplication.We will separately discuss the upload and download of file-
level data and block-level data.3.1 File-Level Data Upload and Download1) System InitializationDefine the file F label as ∅F = TagGen (F ), and a label cor⁃responds to a unique file data. The user’s permission set is
∂ = { ∂1...∂n}, where we define its number from small to largeas the permission from high to low. Those with high-level per⁃missions can access files uploaded by people with low-levelpermissions and modify file permissions. In the initial state ofthe system, the blockchain will have an authority table signedwith private key Skp of the negotiated highest authority ownerP to declare the authority level of each user. Any legal user inthe system can use its public key pk to check the authority. Atthe same time, the blockchain will also store the label ∅F ofthe file F and the encrypted file permission ∂F, which is conve⁃nient for S-CSP query. Suppose user U wants to upload a filewith permission ∂F, the user’s private key is SkU and S-CSP isinitially blank.2) File-Level Data UploadThe file-level data upload process is shown in Fig. 4.The user sends the tag ∅F = TagGen (F ) of the file to up⁃load encryption by the private key SkU, the user name U andits own authority ∂U, and the S-CSP will query whether there is
the tag ∅F = TagGen (F ) of the file and the permission ∂F ofthe file on the blockchain. If the file exists and the permissionis lower than or equal to user permission ∂U, the user needs toverify that he owns the file with S-CSP using the POW algo⁃rithm. At this time, the server will return a pointer to the userindicating that the server already has the file and the user hasno need to upload repeatedly.If the file does not exist or has no right to access the file,
the user needs to write the uploaded relevant information tothe blockchain, including the file tag ∅F, the user name U,the user name U signed by the private key SkU and the file atthe access level { ∅F, SkU (U, ∂F}. After verifying the identity ofthe user and S-CSP, the blockchain writes the record into anew block, and then the user can send the data of the file en⁃crypted by the convergent key to the S-CSP.3) File-Level Data DownloadThe file-level data download process is shown in Fig. 5.The user sends the tag ∅F = TagGen (F) of the file that will
be downloaded to the S-CSP. The S-CSP will query whetherthe file exists. If the file does not exist, the S-CSP will return aprompt message to the user.If the file exists, the user U sends the file tag ∅F, the username U, and the user name and authority information encrypt⁃
ed by its own private key SkU :{ ∅F,U, SkU (U,∂U ) } to S-CSP; S-CSP uses the user’s public key PkU to decrypt for obtaining au⁃thority, and then uses the public key of the highest authorityto query the authority table to confirm whether the authoritymatches.After passing, the S-CSP will send a confirmation message
to the blockchain. After the blockchain verifies the identity ofthe user and S-CSP, the download record is saved in theblock, and the S-CSP returns the file ciphertext CF encrypted
▲Figure 4. File-level data upload
▲Figure 5. File-level data download
S-CSP
User
Blockchain
⑤ C F
①∅ F= TagGe
n (F ),U,∂ U
③File pointer (
)File exist
s ② Query userpermissionsand file permis⁃sions
④ { ∅F ,U, S
KU (U, ∂F ) } (
)
File does not exists
Blockchain
② Query userand file permis⁃sions; write down⁃load records
S-CSP
User
③ C F① {∅ F
,U, S KU(U, ∂ U)
}
S-CSP: storage cloud server provider
S-CSP: storage cloud server provider
71
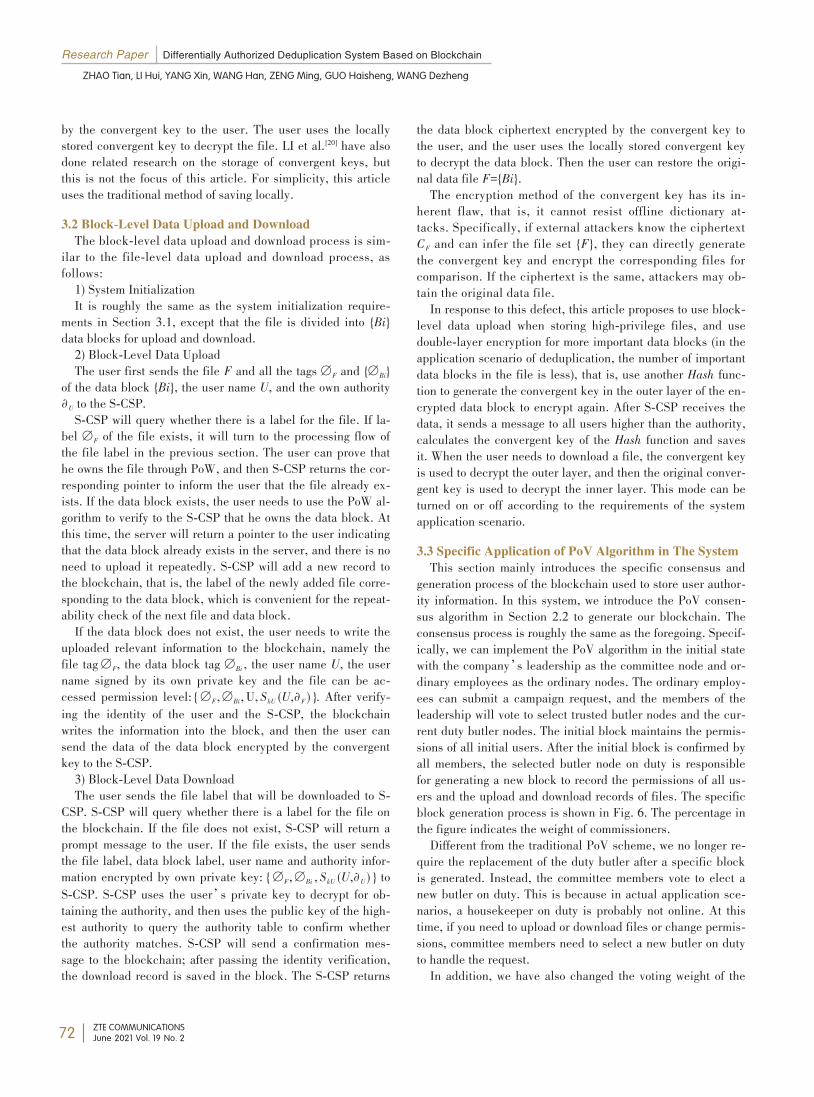
Research Paper Differentially Authorized Deduplication System Based on Blockchain
ZHAO Tian, LI Hui, YANG Xin, WANG Han, ZENG Ming, GUO Haisheng, WANG Dezheng
ZTE COMMUNICATIONSJune 2021 Vol. 19 No. 2
by the convergent key to the user. The user uses the locallystored convergent key to decrypt the file. LI et al.[20] have alsodone related research on the storage of convergent keys, butthis is not the focus of this article. For simplicity, this articleuses the traditional method of saving locally.3.2 Block-Level Data Upload and DownloadThe block-level data upload and download process is sim⁃
ilar to the file-level data upload and download process, asfollows:1) System InitializationIt is roughly the same as the system initialization require⁃
ments in Section 3.1, except that the file is divided into {Bi}data blocks for upload and download.2) Block-Level Data UploadThe user first sends the file F and all the tags ∅F and {∅Bi}of the data block {Bi}, the user name U, and the own authority
∂U to the S-CSP.S-CSP will query whether there is a label for the file. If la⁃
bel ∅F of the file exists, it will turn to the processing flow ofthe file label in the previous section. The user can prove thathe owns the file through PoW, and then S-CSP returns the cor⁃responding pointer to inform the user that the file already ex⁃ists. If the data block exists, the user needs to use the PoW al⁃gorithm to verify to the S-CSP that he owns the data block. Atthis time, the server will return a pointer to the user indicatingthat the data block already exists in the server, and there is noneed to upload it repeatedly. S-CSP will add a new record tothe blockchain, that is, the label of the newly added file corre⁃sponding to the data block, which is convenient for the repeat⁃ability check of the next file and data block.If the data block does not exist, the user needs to write the
uploaded relevant information to the blockchain, namely thefile tag ∅F, the data block tag ∅Bi , the user name U, the username signed by its own private key and the file can be ac⁃cessed permission level: { ∅F, ∅Bi, U, SkU (U,∂F ) }. After verify⁃ing the identity of the user and the S-CSP, the blockchainwrites the information into the block, and then the user cansend the data of the data block encrypted by the convergentkey to the S-CSP.3) Block-Level Data DownloadThe user sends the file label that will be downloaded to S-
CSP. S-CSP will query whether there is a label for the file onthe blockchain. If the file does not exist, S-CSP will return aprompt message to the user. If the file exists, the user sendsthe file label, data block label, user name and authority infor⁃mation encrypted by own private key: { ∅F, ∅Bi , SkU (U,∂U ) } toS-CSP. S-CSP uses the user’s private key to decrypt for ob⁃taining the authority, and then uses the public key of the high⁃est authority to query the authority table to confirm whetherthe authority matches. S-CSP will send a confirmation mes⁃sage to the blockchain; after passing the identity verification,the download record is saved in the block. The S-CSP returns
the data block ciphertext encrypted by the convergent key tothe user, and the user uses the locally stored convergent keyto decrypt the data block. Then the user can restore the origi⁃nal data file F={Bi}.The encryption method of the convergent key has its in⁃
herent flaw, that is, it cannot resist offline dictionary at⁃tacks. Specifically, if external attackers know the ciphertextCF and can infer the file set {F}, they can directly generatethe convergent key and encrypt the corresponding files forcomparison. If the ciphertext is the same, attackers may ob⁃tain the original data file.In response to this defect, this article proposes to use block-
level data upload when storing high-privilege files, and usedouble-layer encryption for more important data blocks (in theapplication scenario of deduplication, the number of importantdata blocks in the file is less), that is, use another Hash func⁃tion to generate the convergent key in the outer layer of the en⁃crypted data block to encrypt again. After S-CSP receives thedata, it sends a message to all users higher than the authority,calculates the convergent key of the Hash function and savesit. When the user needs to download a file, the convergent keyis used to decrypt the outer layer, and then the original conver⁃gent key is used to decrypt the inner layer. This mode can beturned on or off according to the requirements of the systemapplication scenario.3.3 Specific Application of PoV Algorithm in The SystemThis section mainly introduces the specific consensus and
generation process of the blockchain used to store user author⁃ity information. In this system, we introduce the PoV consen⁃sus algorithm in Section 2.2 to generate our blockchain. Theconsensus process is roughly the same as the foregoing. Specif⁃ically, we can implement the PoV algorithm in the initial statewith the company’s leadership as the committee node and or⁃dinary employees as the ordinary nodes. The ordinary employ⁃ees can submit a campaign request, and the members of theleadership will vote to select trusted butler nodes and the cur⁃rent duty butler nodes. The initial block maintains the permis⁃sions of all initial users. After the initial block is confirmed byall members, the selected butler node on duty is responsiblefor generating a new block to record the permissions of all us⁃ers and the upload and download records of files. The specificblock generation process is shown in Fig. 6. The percentage inthe figure indicates the weight of commissioners.Different from the traditional PoV scheme, we no longer re⁃
quire the replacement of the duty butler after a specific blockis generated. Instead, the committee members vote to elect anew butler on duty. This is because in actual application sce⁃narios, a housekeeper on duty is probably not online. At thistime, if you need to upload or download files or change permis⁃sions, committee members need to select a new butler on dutyto handle the request.In addition, we have also changed the voting weight of the
72
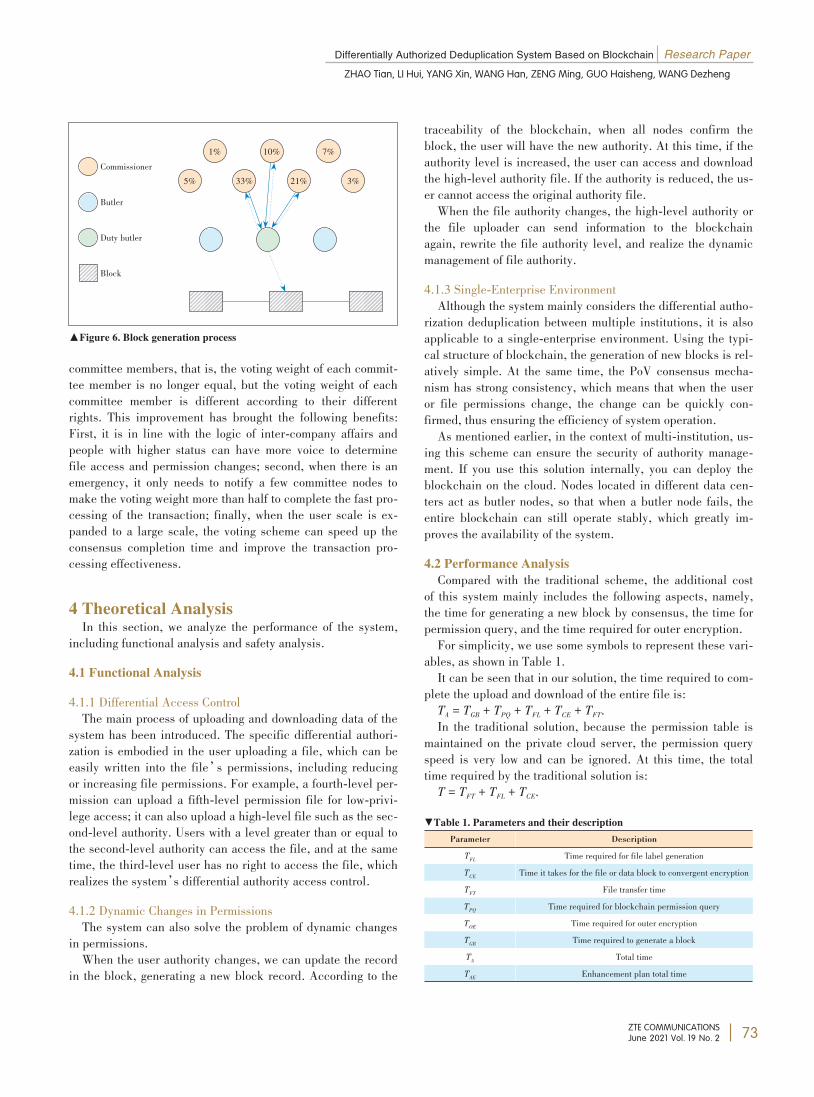
Differentially Authorized Deduplication System Based on Blockchain Research Paper
ZHAO Tian, LI Hui, YANG Xin, WANG Han, ZENG Ming, GUO Haisheng, WANG Dezheng
ZTE COMMUNICATIONSJune 2021 Vol. 19 No. 2
committee members, that is, the voting weight of each commit⁃tee member is no longer equal, but the voting weight of eachcommittee member is different according to their differentrights. This improvement has brought the following benefits:First, it is in line with the logic of inter-company affairs andpeople with higher status can have more voice to determinefile access and permission changes; second, when there is anemergency, it only needs to notify a few committee nodes tomake the voting weight more than half to complete the fast pro⁃cessing of the transaction; finally, when the user scale is ex⁃panded to a large scale, the voting scheme can speed up theconsensus completion time and improve the transaction pro⁃cessing effectiveness.
4 Theoretical AnalysisIn this section, we analyze the performance of the system,
including functional analysis and safety analysis.4.1 Functional Analysis
4.1.1 Differential Access ControlThe main process of uploading and downloading data of the
system has been introduced. The specific differential authori⁃zation is embodied in the user uploading a file, which can beeasily written into the file’s permissions, including reducingor increasing file permissions. For example, a fourth-level per⁃mission can upload a fifth-level permission file for low-privi⁃lege access; it can also upload a high-level file such as the sec⁃ond-level authority. Users with a level greater than or equal tothe second-level authority can access the file, and at the sametime, the third-level user has no right to access the file, whichrealizes the system’s differential authority access control.4.1.2 Dynamic Changes in PermissionsThe system can also solve the problem of dynamic changes
in permissions.When the user authority changes, we can update the record
in the block, generating a new block record. According to the
traceability of the blockchain, when all nodes confirm theblock, the user will have the new authority. At this time, if theauthority level is increased, the user can access and downloadthe high-level authority file. If the authority is reduced, the us⁃er cannot access the original authority file.When the file authority changes, the high-level authority or
the file uploader can send information to the blockchainagain, rewrite the file authority level, and realize the dynamicmanagement of file authority.4.1.3 Single-Enterprise EnvironmentAlthough the system mainly considers the differential autho⁃
rization deduplication between multiple institutions, it is alsoapplicable to a single-enterprise environment. Using the typi⁃cal structure of blockchain, the generation of new blocks is rel⁃atively simple. At the same time, the PoV consensus mecha⁃nism has strong consistency, which means that when the useror file permissions change, the change can be quickly con⁃firmed, thus ensuring the efficiency of system operation.As mentioned earlier, in the context of multi-institution, us⁃
ing this scheme can ensure the security of authority manage⁃ment. If you use this solution internally, you can deploy theblockchain on the cloud. Nodes located in different data cen⁃ters act as butler nodes, so that when a butler node fails, theentire blockchain can still operate stably, which greatly im⁃proves the availability of the system.4.2 Performance AnalysisCompared with the traditional scheme, the additional cost
of this system mainly includes the following aspects, namely,the time for generating a new block by consensus, the time forpermission query, and the time required for outer encryption.For simplicity, we use some symbols to represent these vari⁃
ables, as shown in Table 1.It can be seen that in our solution, the time required to com⁃
plete the upload and download of the entire file is:TA = TGB + TPQ + TFL + TCE + TFT.In the traditional solution, because the permission table is
maintained on the private cloud server, the permission queryspeed is very low and can be ignored. At this time, the totaltime required by the traditional solution is:T = TFT + TFL + TCE.
▼Table 1. Parameters and their descriptionParameter
TFLTCETFTTPQTOETGBTATAE
Description
Time required for file label generationTime it takes for the file or data block to convergent encryption
File transfer timeTime required for blockchain permission query
Time required for outer encryptionTime required to generate a block
Total timeEnhancement plan total time
▲Figure 6. Block generation process
Commissioner
Butler
Duty butler
Block一一一一一一一一一一一一一一一一一一
33%5% 21% 3%
1% 10% 7%
一一一一一一一一一一一一一一一一一一一一一一一一
一一一一一一一一一一一一一一一一一一一一一一一一
一一一一一一一一一一一一一一一一一一一一一一一一
73
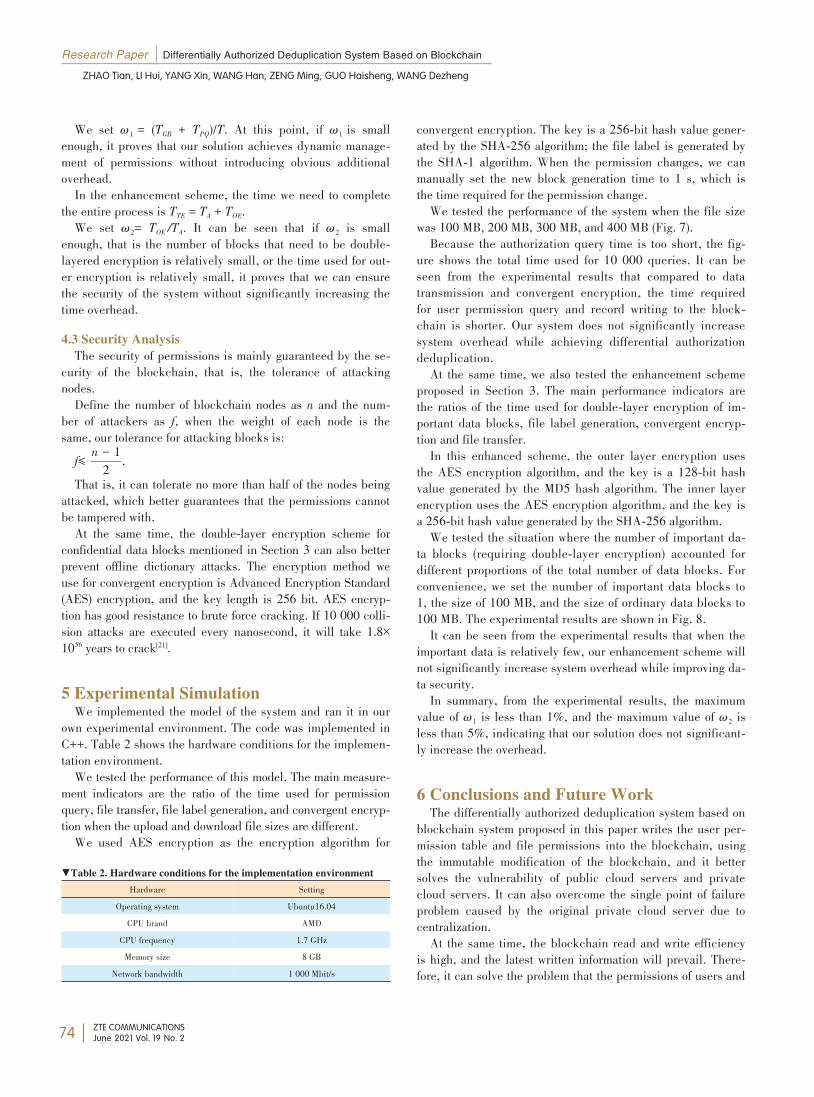
Research Paper Differentially Authorized Deduplication System Based on Blockchain
ZHAO Tian, LI Hui, YANG Xin, WANG Han, ZENG Ming, GUO Haisheng, WANG Dezheng
ZTE COMMUNICATIONSJune 2021 Vol. 19 No. 2
We set ω1 = (TGB + TPQ)/T. At this point, if ω1 is smallenough, it proves that our solution achieves dynamic manage⁃ment of permissions without introducing obvious additionaloverhead.In the enhancement scheme, the time we need to complete
the entire process is TTE = TA + TOE.We set ω2= TOE /TA. It can be seen that if ω2 is smallenough, that is the number of blocks that need to be double-layered encryption is relatively small, or the time used for out⁃er encryption is relatively small, it proves that we can ensurethe security of the system without significantly increasing thetime overhead.4.3 Security AnalysisThe security of permissions is mainly guaranteed by the se⁃
curity of the blockchain, that is, the tolerance of attackingnodes.Define the number of blockchain nodes as n and the num⁃
ber of attackers as f, when the weight of each node is thesame, our tolerance for attacking blocks is:f≤ n - 12 .That is, it can tolerate no more than half of the nodes being
attacked, which better guarantees that the permissions cannotbe tampered with.At the same time, the double-layer encryption scheme for
confidential data blocks mentioned in Section 3 can also betterprevent offline dictionary attacks. The encryption method weuse for convergent encryption is Advanced Encryption Standard(AES) encryption, and the key length is 256 bit. AES encryp⁃tion has good resistance to brute force cracking. If 10 000 colli⁃sion attacks are executed every nanosecond, it will take 1.8×1056 years to crack[21].
5 Experimental SimulationWe implemented the model of the system and ran it in our
own experimental environment. The code was implemented inC++. Table 2 shows the hardware conditions for the implemen⁃tation environment.We tested the performance of this model. The main measure⁃
ment indicators are the ratio of the time used for permissionquery, file transfer, file label generation, and convergent encryp⁃tion when the upload and download file sizes are different.We used AES encryption as the encryption algorithm for
convergent encryption. The key is a 256-bit hash value gener⁃ated by the SHA-256 algorithm; the file label is generated bythe SHA-1 algorithm. When the permission changes, we canmanually set the new block generation time to 1 s, which isthe time required for the permission change.We tested the performance of the system when the file size
was 100 MB, 200 MB, 300 MB, and 400 MB (Fig. 7).Because the authorization query time is too short, the fig⁃
ure shows the total time used for 10 000 queries. It can beseen from the experimental results that compared to datatransmission and convergent encryption, the time requiredfor user permission query and record writing to the block⁃chain is shorter. Our system does not significantly increasesystem overhead while achieving differential authorizationdeduplication.At the same time, we also tested the enhancement scheme
proposed in Section 3. The main performance indicators arethe ratios of the time used for double-layer encryption of im⁃portant data blocks, file label generation, convergent encryp⁃tion and file transfer.In this enhanced scheme, the outer layer encryption uses
the AES encryption algorithm, and the key is a 128-bit hashvalue generated by the MD5 hash algorithm. The inner layerencryption uses the AES encryption algorithm, and the key isa 256-bit hash value generated by the SHA-256 algorithm.We tested the situation where the number of important da⁃
ta blocks (requiring double-layer encryption) accounted fordifferent proportions of the total number of data blocks. Forconvenience, we set the number of important data blocks to1, the size of 100 MB, and the size of ordinary data blocks to100 MB. The experimental results are shown in Fig. 8.It can be seen from the experimental results that when the
important data is relatively few, our enhancement scheme willnot significantly increase system overhead while improving da⁃ta security.In summary, from the experimental results, the maximum
value of ω1 is less than 1%, and the maximum value of ω2 isless than 5%, indicating that our solution does not significant⁃ly increase the overhead.
6 Conclusions and Future WorkThe differentially authorized deduplication system based on
blockchain system proposed in this paper writes the user per⁃mission table and file permissions into the blockchain, usingthe immutable modification of the blockchain, and it bettersolves the vulnerability of public cloud servers and privatecloud servers. It can also overcome the single point of failureproblem caused by the original private cloud server due tocentralization.At the same time, the blockchain read and write efficiency
is high, and the latest written information will prevail. There⁃fore, it can solve the problem that the permissions of users and
▼Table 2. Hardware conditions for the implementation environmentHardware
Operating systemCPU brand
CPU frequencyMemory size
Network bandwidth
SettingUbuntu16.04
AMD1.7 GHz8 GB
1 000 Mbit/s
74
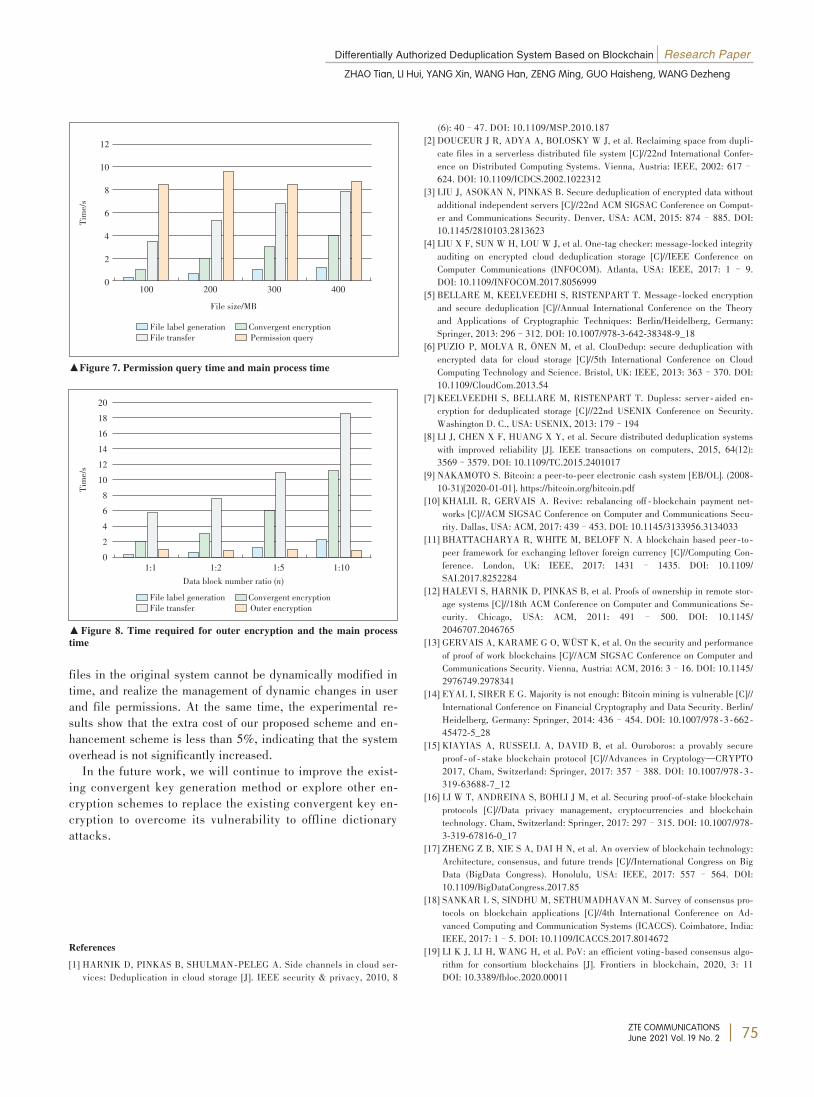
Differentially Authorized Deduplication System Based on Blockchain Research Paper
ZHAO Tian, LI Hui, YANG Xin, WANG Han, ZENG Ming, GUO Haisheng, WANG Dezheng
ZTE COMMUNICATIONSJune 2021 Vol. 19 No. 2
files in the original system cannot be dynamically modified intime, and realize the management of dynamic changes in userand file permissions. At the same time, the experimental re⁃sults show that the extra cost of our proposed scheme and en⁃hancement scheme is less than 5%, indicating that the systemoverhead is not significantly increased.In the future work, we will continue to improve the exist⁃
ing convergent key generation method or explore other en⁃cryption schemes to replace the existing convergent key en⁃cryption to overcome its vulnerability to offline dictionaryattacks.
References[1] HARNIK D, PINKAS B, SHULMAN⁃PELEG A. Side channels in cloud ser⁃vices: Deduplication in cloud storage [J]. IEEE security & privacy, 2010, 8
(6): 40–47. DOI: 10.1109/MSP.2010.187[2] DOUCEUR J R, ADYA A, BOLOSKY W J, et al. Reclaiming space from dupli⁃cate files in a serverless distributed file system [C]//22nd International Confer⁃ence on Distributed Computing Systems. Vienna, Austria: IEEE, 2002: 617–624. DOI: 10.1109/ICDCS.2002.1022312
[3] LIU J, ASOKAN N, PINKAS B. Secure deduplication of encrypted data withoutadditional independent servers [C]//22nd ACM SIGSAC Conference on Comput⁃er and Communications Security. Denver, USA: ACM, 2015: 874–885. DOI:10.1145/2810103.2813623
[4] LIU X F, SUN W H, LOU W J, et al. One⁃tag checker: message⁃locked integrityauditing on encrypted cloud deduplication storage [C]//IEEE Conference onComputer Communications (INFOCOM). Atlanta, USA: IEEE, 2017: 1– 9.DOI: 10.1109/INFOCOM.2017.8056999
[5] BELLARE M, KEELVEEDHI S, RISTENPART T. Message⁃locked encryptionand secure deduplication [C]//Annual International Conference on the Theoryand Applications of Cryptographic Techniques: Berlin/Heidelberg, Germany:Springer, 2013: 296–312. DOI: 10.1007/978⁃3⁃642⁃38348⁃9_18
[6] PUZIO P, MOLVA R, ÖNEN M, et al. ClouDedup: secure deduplication withencrypted data for cloud storage [C]//5th International Conference on CloudComputing Technology and Science. Bristol, UK: IEEE, 2013: 363–370. DOI:10.1109/CloudCom.2013.54
[7] KEELVEEDHI S, BELLARE M, RISTENPART T. Dupless: server ⁃ aided en⁃cryption for deduplicated storage [C]//22nd USENIX Conference on Security.Washington D. C., USA: USENIX, 2013: 179–194
[8] LI J, CHEN X F, HUANG X Y, et al. Secure distributed deduplication systemswith improved reliability [J]. IEEE transactions on computers, 2015, 64(12):3569–3579. DOI: 10.1109/TC.2015.2401017
[9] NAKAMOTO S. Bitcoin: a peer⁃to⁃peer electronic cash system [EB/OL]. (2008⁃10⁃31)[2020⁃01⁃01]. https://bitcoin.org/bitcoin.pdf
[10] KHALIL R, GERVAIS A. Revive: rebalancing off ⁃ blockchain payment net⁃works [C]//ACM SIGSAC Conference on Computer and Communications Secu⁃rity. Dallas, USA: ACM, 2017: 439–453. DOI: 10.1145/3133956.3134033
[11] BHATTACHARYA R, WHITE M, BELOFF N. A blockchain based peer ⁃ to ⁃peer framework for exchanging leftover foreign currency [C]//Computing Con⁃ference. London, UK: IEEE, 2017: 1431 – 1435. DOI: 10.1109/SAI.2017.8252284
[12] HALEVI S, HARNIK D, PINKAS B, et al. Proofs of ownership in remote stor⁃age systems [C]//18th ACM Conference on Computer and Communications Se⁃curity. Chicago, USA: ACM, 2011: 491 – 500. DOI: 10.1145/2046707.2046765
[13] GERVAIS A, KARAME G O, WÜST K, et al. On the security and performanceof proof of work blockchains [C]//ACM SIGSAC Conference on Computer andCommunications Security. Vienna, Austria: ACM, 2016: 3–16. DOI: 10.1145/2976749.2978341
[14] EYAL I, SIRER E G. Majority is not enough: Bitcoin mining is vulnerable [C]//International Conference on Financial Cryptography and Data Security. Berlin/Heidelberg, Germany: Springer, 2014: 436–454. DOI: 10.1007/978⁃3⁃662⁃45472⁃5_28
[15] KIAYIAS A, RUSSELL A, DAVID B, et al. Ouroboros: a provably secureproof ⁃ of ⁃ stake blockchain protocol [C]//Advances in Cryptology—CRYPTO2017, Cham, Switzerland: Springer, 2017: 357–388. DOI: 10.1007/978⁃3⁃319⁃63688⁃7_12
[16] LI W T, ANDREINA S, BOHLI J M, et al. Securing proof⁃of⁃stake blockchainprotocols [C]//Data privacy management, cryptocurrencies and blockchaintechnology. Cham, Switzerland: Springer, 2017: 297–315. DOI: 10.1007/978⁃3⁃319⁃67816⁃0_17
[17] ZHENG Z B, XIE S A, DAI H N, et al. An overview of blockchain technology:Architecture, consensus, and future trends [C]//International Congress on BigData (BigData Congress). Honolulu, USA: IEEE, 2017: 557 – 564. DOI:10.1109/BigDataCongress.2017.85
[18] SANKAR L S, SINDHU M, SETHUMADHAVAN M. Survey of consensus pro⁃tocols on blockchain applications [C]//4th International Conference on Ad⁃vanced Computing and Communication Systems (ICACCS). Coimbatore, India:IEEE, 2017: 1–5. DOI: 10.1109/ICACCS.2017.8014672
[19] LI K J, LI H, WANG H, et al. PoV: an efficient voting⁃based consensus algo⁃rithm for consortium blockchains [J]. Frontiers in blockchain, 2020, 3: 11DOI: 10.3389/fbloc.2020.00011
▲Figure 7. Permission query time and main process time
▲Figure 8. Time required for outer encryption and the main processtime
File size/MB100 200 300 400
Time/s
121086420
File label generation Convergent encryptionFile transfer Permission query
1:1 1:2 1:5 1:10
20181614121086420
Time/s
Data block number ratio (n)File label generation Convergent encryptionFile transfer Outer encryption
75
Research Paper Differentially Authorized Deduplication System Based on Blockchain
ZHAO Tian, LI Hui, YANG Xin, WANG Han, ZENG Ming, GUO Haisheng, WANG Dezheng
ZTE COMMUNICATIONSJune 2021 Vol. 19 No. 2
[20] LI J, CHEN X F, LI M Q, et al. Secure deduplication with efficient and reli⁃able convergent key management [J]. IEEE transactions on parallel and distrib⁃uted systems, 2014, 25(6): 1615–1625. DOI: 10.1109/TPDS.2013.284
[21] KAHATE A. Cryptography and network security [M]. New Delhi, India: TataMcGraw⁃Hill Education, 2013
BiographiesZHAO Tian is a postgraduate of the Shenzhen Graduate School, Peking Uni⁃versity, China. His main research directions are big data applications, block⁃chain, and distributed storage.
LI Hui ([email protected]) is currently a professor and Ph.D. supervisor withthe Shenzhen Graduate School, Peking University, China. His research fields in⁃clude cyberspace security and block-chain technology, artificial intelligenceand future network systems, distributed storage coding theory and systems, intel⁃ligent big data analysis, and data standards.
YANG Xin received the B.Eng. degree from the Department of Computer Sci⁃ence and Engineering, South China University of Technology, China in 2016.She is currently pursuing the Ph.D. degree with the School of Information Sci⁃ence, Peking University, China. She is also the student of the Peng Cheng Labo⁃ratory, China. Her research interests include cyber security, future network ar⁃
chitecture, and distributed storage systems.
WANG Han received the B.Eng. degree from the Department of Communica⁃tion Engineering, Jilin University of Technology, China in 2017. She is current⁃ly pursuing the Ph. D. degree with the School of Information Science, PekingUniversity, China. Her research interests include distributed systems and cybersecurity.
ZENG Ming received his bachelor’s degree from University of Electronic Sci⁃ence and technology, China, majoring in computer science and technology. Heis a system architect of ZTE Corporation and has been engaged in software de⁃velopment and architecture design for more than 16 years. His research inter⁃ests include big data, blockchain and other related technologies fields.
GUO Haisheng received his master’s degree from Nanjing University of Aero⁃nautics and Astronautics, China. He is a project manager of ZTE Corporationand has been engaged in software development, architecture design, projectmanagement for nearly 20 years. His research interests include blockchain andother related technologies fields.
WANG Dezheng received his master’s degree in computer science from Zheji⁃ang University, China. He is a chief engineer of the Center Institute, ZTE Corpo⁃ration and has been engaged in architecture design for more than 20 years. Hisresearch interests include big data and blockchain.
76
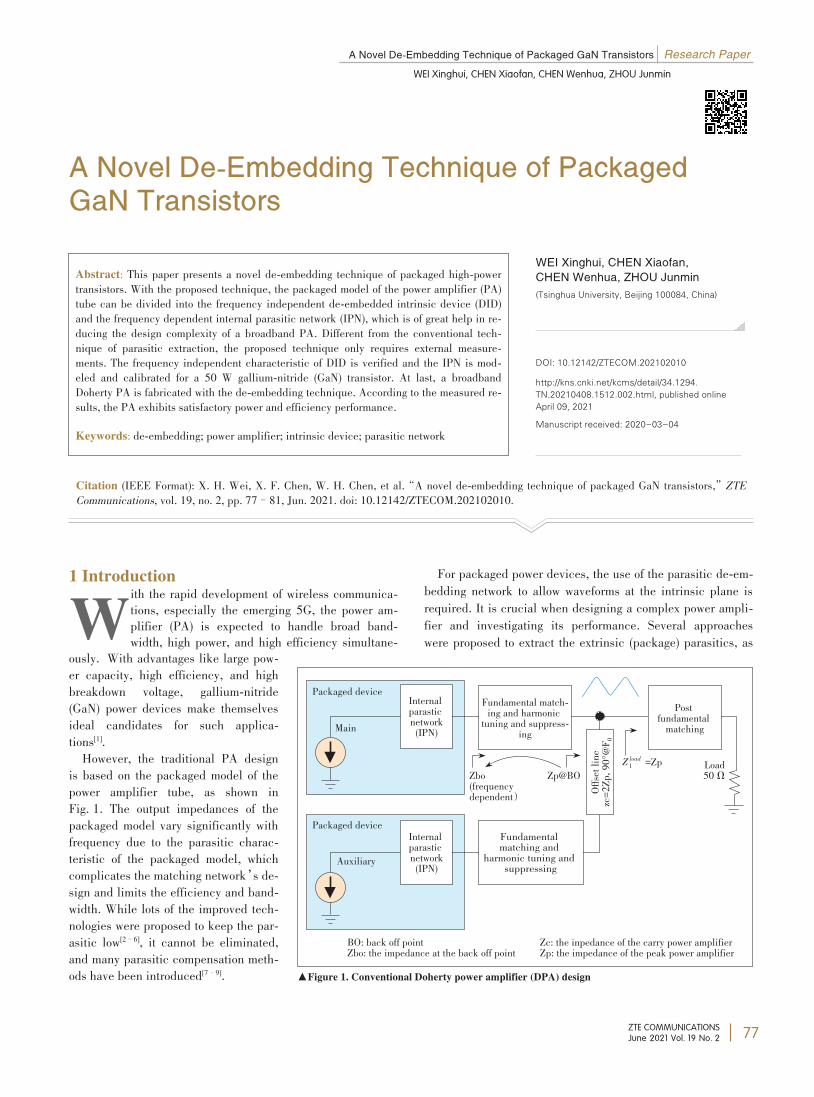
ZTE COMMUNICATIONSJune 2021 Vol. 19 No. 2
A Novel De-Embedding Technique of Packaged GaN Transistors Research Paper
WEI Xinghui, CHEN Xiaofan, CHEN Wenhua, ZHOU Junmin
A Novel DeA Novel De--Embedding Technique of PackagedEmbedding Technique of PackagedGaN TransistorsGaN Transistors
Abstract: This paper presents a novel de-embedding technique of packaged high-powertransistors. With the proposed technique, the packaged model of the power amplifier (PA)tube can be divided into the frequency independent de-embedded intrinsic device (DID)and the frequency dependent internal parasitic network (IPN), which is of great help in re⁃ducing the design complexity of a broadband PA. Different from the conventional tech⁃nique of parasitic extraction, the proposed technique only requires external measure⁃ments. The frequency independent characteristic of DID is verified and the IPN is mod⁃eled and calibrated for a 50 W gallium-nitride (GaN) transistor. At last, a broadbandDoherty PA is fabricated with the de-embedding technique. According to the measured re⁃sults, the PA exhibits satisfactory power and efficiency performance.Keywords: de-embedding; power amplifier; intrinsic device; parasitic network
Citation (IEEE Format): X. H. Wei, X. F. Chen, W. H. Chen, et al.“A novel de-embedding technique of packaged GaN transistors,”ZTECommunications, vol. 19, no. 2, pp. 77–81, Jun. 2021. doi: 10.12142/ZTECOM.202102010.
1 Introduction
With the rapid development of wireless communica⁃tions, especially the emerging 5G, the power am⁃plifier (PA) is expected to handle broad band⁃width, high power, and high efficiency simultane⁃
ously. With advantages like large pow⁃er capacity, high efficiency, and highbreakdown voltage, gallium-nitride(GaN) power devices make themselvesideal candidates for such applica⁃tions[1].However, the traditional PA design
is based on the packaged model of thepower amplifier tube, as shown inFig. 1. The output impedances of thepackaged model vary significantly withfrequency due to the parasitic charac⁃teristic of the packaged model, whichcomplicates the matching network’s de⁃sign and limits the efficiency and band⁃width. While lots of the improved tech⁃nologies were proposed to keep the par⁃asitic low[2–6], it cannot be eliminated,and many parasitic compensation meth⁃ods have been introduced[7–9].
For packaged power devices, the use of the parasitic de-em⁃bedding network to allow waveforms at the intrinsic plane isrequired. It is crucial when designing a complex power ampli⁃fier and investigating its performance. Several approacheswere proposed to extract the extrinsic (package) parasitics, as
WEI Xinghui, CHEN Xiaofan,CHEN Wenhua, ZHOU Junmin
(Tsinghua University, Beijing 100084, China)
DOI: 10.12142/ZTECOM.202102010
http://kns.cnki.net/kcms/detail/34.1294.TN.20210408.1512.002.html, published onlineApril 09, 2021
Manuscript received: 2020-03-04
▲Figure 1. Conventional Doherty power amplifier (DPA) design
BO: back off pointZbo: the impedance at the back off point Zc: the inpedance of the carry power amplifierZp: the impedance of the peak power amplifier
Packaged device
Main
Packaged device
Auxiliary
Zbo(frequencydependent)Zp@BO
=Zp Load50 ΩZload1
Internalparasticnetwork(IPN)
Offsetline
zc=2Zp
,90°@F 0
Internalparasticnetwork(IPN)
Fundamentalmatching andharmonic tuning andsuppressing
Fundamental match⁃ing and harmonictuning and suppress⁃ingPostfundamentalmatching
77
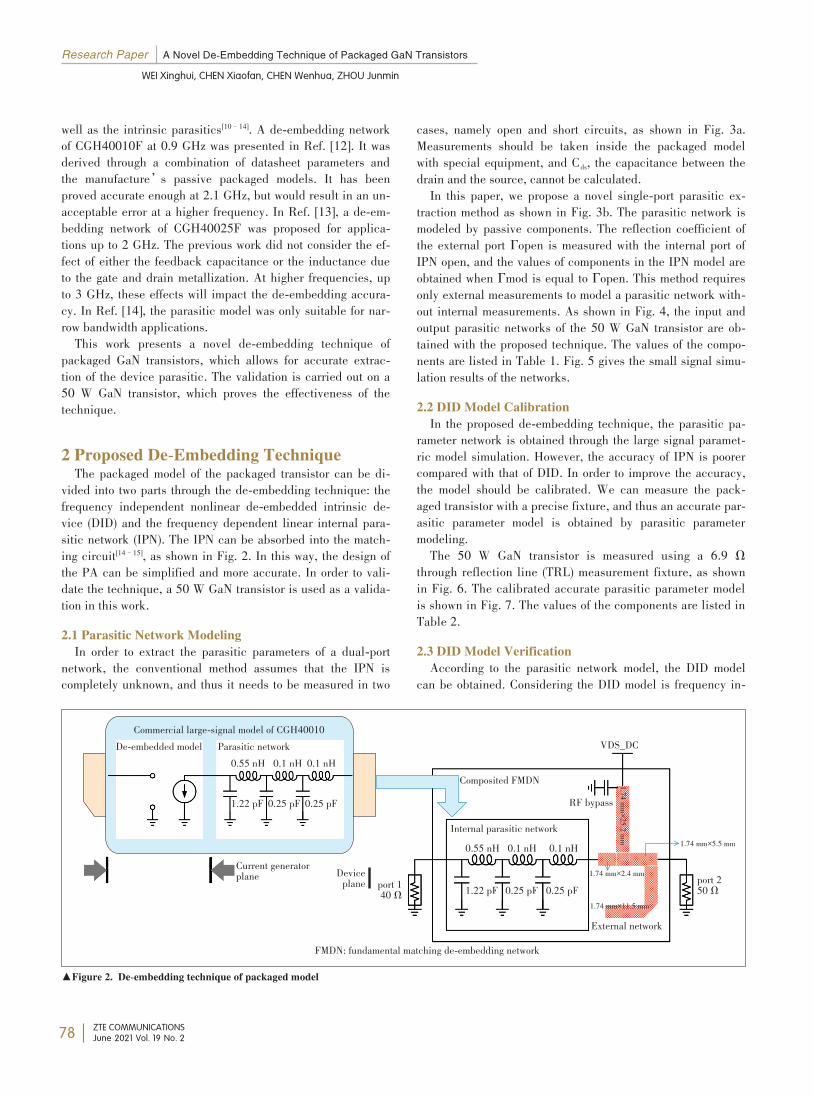
Research Paper A Novel De-Embedding Technique of Packaged GaN Transistors
WEI Xinghui, CHEN Xiaofan, CHEN Wenhua, ZHOU Junmin
ZTE COMMUNICATIONSJune 2021 Vol. 19 No. 2
well as the intrinsic parasitics[10–14]. A de-embedding networkof CGH40010F at 0.9 GHz was presented in Ref. [12]. It wasderived through a combination of datasheet parameters andthe manufacture’s passive packaged models. It has beenproved accurate enough at 2.1 GHz, but would result in an un⁃acceptable error at a higher frequency. In Ref. [13], a de-em⁃bedding network of CGH40025F was proposed for applica⁃tions up to 2 GHz. The previous work did not consider the ef⁃fect of either the feedback capacitance or the inductance dueto the gate and drain metallization. At higher frequencies, upto 3 GHz, these effects will impact the de-embedding accura⁃cy. In Ref. [14], the parasitic model was only suitable for nar⁃row bandwidth applications.This work presents a novel de-embedding technique of
packaged GaN transistors, which allows for accurate extrac⁃tion of the device parasitic. The validation is carried out on a50 W GaN transistor, which proves the effectiveness of thetechnique.
2 Proposed De-Embedding TechniqueThe packaged model of the packaged transistor can be di⁃
vided into two parts through the de-embedding technique: thefrequency independent nonlinear de-embedded intrinsic de⁃vice (DID) and the frequency dependent linear internal para⁃sitic network (IPN). The IPN can be absorbed into the match⁃ing circuit[14–15], as shown in Fig. 2. In this way, the design ofthe PA can be simplified and more accurate. In order to vali⁃date the technique, a 50 W GaN transistor is used as a valida⁃tion in this work.2.1 Parasitic Network ModelingIn order to extract the parasitic parameters of a dual-port
network, the conventional method assumes that the IPN iscompletely unknown, and thus it needs to be measured in two
cases, namely open and short circuits, as shown in Fig. 3a.Measurements should be taken inside the packaged modelwith special equipment, and Cds, the capacitance between thedrain and the source, cannot be calculated.In this paper, we propose a novel single-port parasitic ex⁃
traction method as shown in Fig. 3b. The parasitic network ismodeled by passive components. The reflection coefficient ofthe external port Γopen is measured with the internal port ofIPN open, and the values of components in the IPN model areobtained when Γmod is equal to Γopen. This method requiresonly external measurements to model a parasitic network with⁃out internal measurements. As shown in Fig. 4, the input andoutput parasitic networks of the 50 W GaN transistor are ob⁃tained with the proposed technique. The values of the compo⁃nents are listed in Table 1. Fig. 5 gives the small signal simu⁃lation results of the networks.2.2 DID Model CalibrationIn the proposed de-embedding technique, the parasitic pa⁃
rameter network is obtained through the large signal paramet⁃ric model simulation. However, the accuracy of IPN is poorercompared with that of DID. In order to improve the accuracy,the model should be calibrated. We can measure the pack⁃aged transistor with a precise fixture, and thus an accurate par⁃asitic parameter model is obtained by parasitic parametermodeling.The 50 W GaN transistor is measured using a 6.9 Ω
through reflection line (TRL) measurement fixture, as shownin Fig. 6. The calibrated accurate parasitic parameter modelis shown in Fig. 7. The values of the components are listed inTable 2.2.3 DID Model VerificationAccording to the parasitic network model, the DID model
can be obtained. Considering the DID model is frequency in⁃
Composited FMDNRF bypass
1.74 mm×2.4 mm
External network
VDS_DC
0.55 nH 0.1 nH 0.1 nH
1.22 pF 0.25 pF 0.25 pF
Internal parasitic network1.74 mm×5.5 mm
1.74 mm×11.5 mm
1.74mm×25.2mm
port 140 Ω
Commercial large-signal model of CGH40010De-embedded model Parasitic network
0.55 nH 0.1 nH 0.1 nH
1.22 pF 0.25 pF 0.25 pF
Current generatorplane
▲Figure 2. De-embedding technique of packaged model
FMDN: fundamental matching de-embedding network
Deviceplane port 250 Ω
78
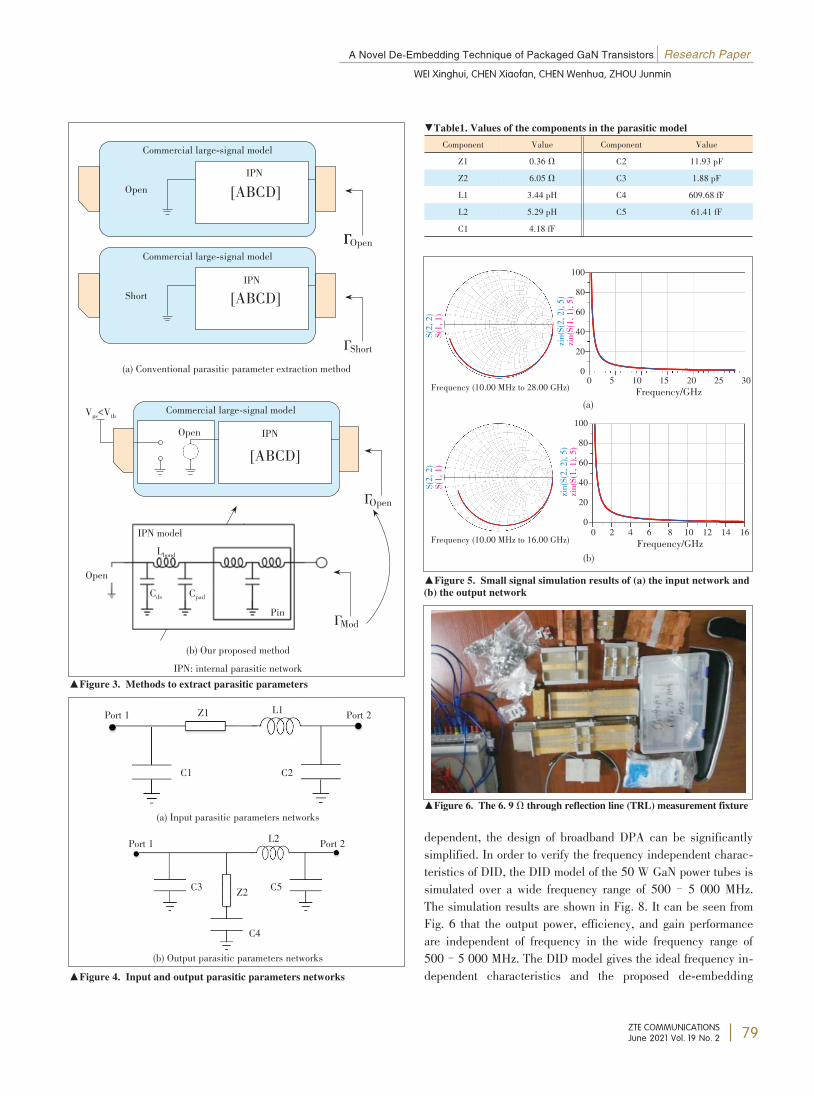
A Novel De-Embedding Technique of Packaged GaN Transistors Research Paper
WEI Xinghui, CHEN Xiaofan, CHEN Wenhua, ZHOU Junmin
ZTE COMMUNICATIONSJune 2021 Vol. 19 No. 2
dependent, the design of broadband DPA can be significantlysimplified. In order to verify the frequency independent charac⁃teristics of DID, the DID model of the 50 W GaN power tubes issimulated over a wide frequency range of 500– 5 000 MHz.The simulation results are shown in Fig. 8. It can be seen fromFig. 6 that the output power, efficiency, and gain performanceare independent of frequency in the wide frequency range of500–5 000 MHz. The DID model gives the ideal frequency in⁃dependent characteristics and the proposed de-embedding
▼Table1. Values of the components in the parasitic modelComponent
Z1Z2L1L2C1
Value0.36 Ω6.05 Ω3.44 pH5.29 pH4.18 fF
ComponentC2C3C4C5
Value11.93 pF1.88 pF609.68 fF61.41 fF
(a) Conventional parasitic parameter extraction method
(b) Our proposed methodIPN: internal parasitic network
▲Figure 3. Methods to extract parasitic parameters
(a) Input parasitic parameters networks
(b) Output parasitic parameters networks▲Figure 4. Input and output parasitic parameters networks
(a)
(b)▲Figure 5. Small signal simulation results of (a) the input network and(b) the output network
Commercial large-signal model
Open [ABCD]
OpenΓCommercial large-signal model
Short [ABCD]
Short
Commercial large-signal modelVgs<Vth
[ABCD]IPN
Open
Open
IPN modelLbond
Cds CpadOpen
Pin Mod
Port 1 Z1 L1
C2C1
Port 2
Port 1 Port 2L2
Z2
C4
C5C3
Frequency/GHz0 5 10 15 20 25 30Frequency (10.00 MHz to 28.00 GHz)
100806040200
zin(S(2
,2),5)
zin(S(1
,1),5)
S(2,2)
S(1,1)
Frequency/GHz0 2 4 6 8 10 12 14 16
100806040200
zin(S(2
,2),5)
zin(S(1
,1),5)
Frequency (10.00 MHz to 16.00 GHz)
S(2,2)
S(1,1)
▲Figure 6. The 6. 9 Ω through reflection line (TRL) measurement fixture
IPN
IPN
Γ
Γ
Γ
Γ
79
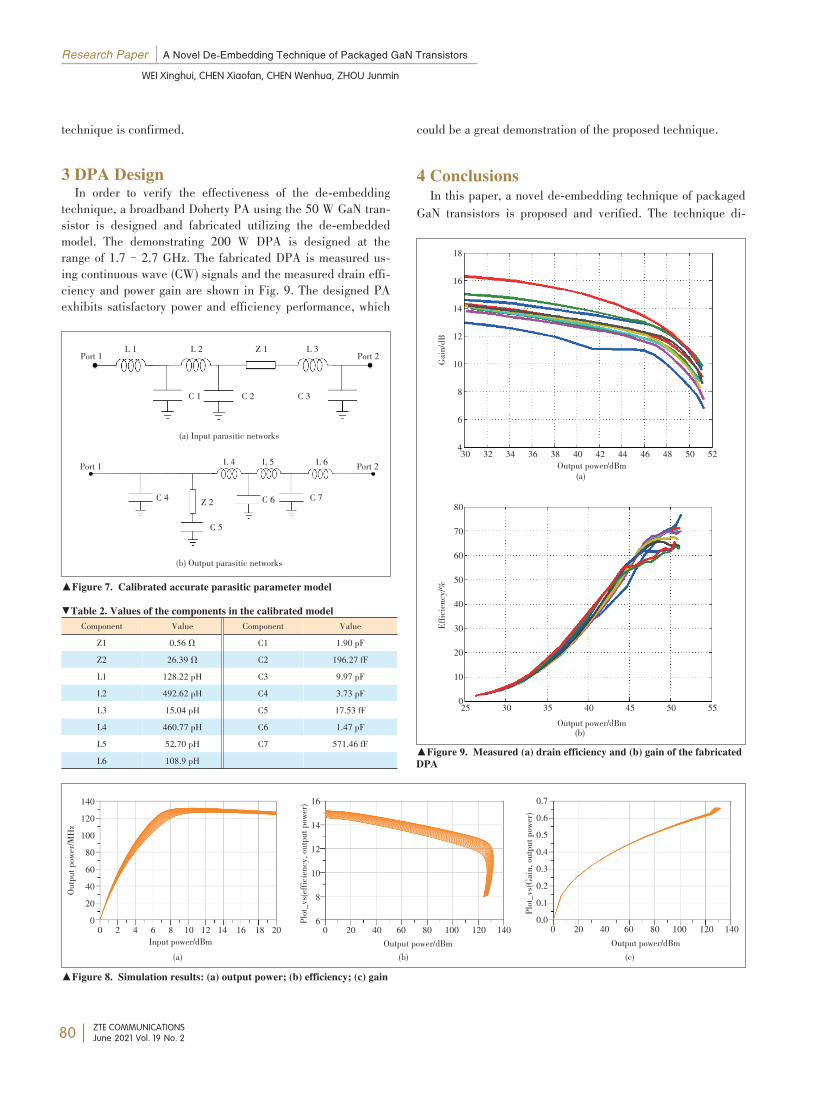
Research Paper A Novel De-Embedding Technique of Packaged GaN Transistors
WEI Xinghui, CHEN Xiaofan, CHEN Wenhua, ZHOU Junmin
ZTE COMMUNICATIONSJune 2021 Vol. 19 No. 2
technique is confirmed.
3 DPA DesignIn order to verify the effectiveness of the de-embedding
technique, a broadband Doherty PA using the 50 W GaN tran⁃sistor is designed and fabricated utilizing the de-embeddedmodel. The demonstrating 200 W DPA is designed at therange of 1.7–2.7 GHz. The fabricated DPA is measured us⁃ing continuous wave (CW) signals and the measured drain effi⁃ciency and power gain are shown in Fig. 9. The designed PAexhibits satisfactory power and efficiency performance, which
could be a great demonstration of the proposed technique.
4 ConclusionsIn this paper, a novel de-embedding technique of packaged
GaN transistors is proposed and verified. The technique di⁃
Port 1 Port 2L 4 L 5 L 6
C 4 Z 2 C 6 C 7
C 5
(a) Input parasitic networks
(b) Output parasitic networks▲Figure 7. Calibrated accurate parasitic parameter model
▼Table 2. Values of the components in the calibrated modelComponent
Z1Z2L1L2L3L4L5L6
Value0.56 Ω26.39 Ω128.22 pH492.62 pH15.04 pH460.77 pH52.70 pH108.9 pH
ComponentC1C2C3C4C5C6C7
Value1.90 pF196.27 fF9.97 pF3.73 pF17.53 fF1.47 pF571.46 fF
(a)
(b)▲Figure 9. Measured (a) drain efficiency and (b) gain of the fabricatedDPA
▲Figure 8. Simulation results: (a) output power; (b) efficiency; (c) gain
(a) (b) (c)
Port 1 L 1 L 2 Z 1 L 3 Port 2
C 1 C 2 C 3
Output power/dBm30 32 34 36 38 40 42 44 46 48 50 52
18
16
14
12
10
8
6
4Gain/dB
25 30 35 40 45 50 55
80706050403020100
Efficiency/%
Output power/dBm
Input power/dBm
Outputpower/MH
z
0 2 4 6 8 10 12 14 16 18 20
140120100806040200 0 20 40 60 80 100 120 140
Output power/dBm0 20 40 60 80 100 120 140
Output power/dBm
Plot_vs(efficiency,outputp
ower) 16
14121086 Plo
t_vs(Gain,outputpower)
0.70.60.50.40.30.20.10.0
80
A Novel De-Embedding Technique of Packaged GaN Transistors Research Paper
WEI Xinghui, CHEN Xiaofan, CHEN Wenhua, ZHOU Junmin
ZTE COMMUNICATIONSJune 2021 Vol. 19 No. 2
vides the packaged device into the frequency independentDID and frequency dependent IPN, which only requires exter⁃nal measurements. The IPN can be absorbed into the match⁃ing circuit, thus the PA design is only based on the DID. Con⁃sidering the frequency independent characteristic of DID, themethod greatly simplifies the design of efficient wideband PA.Regarding the rationale, this method could be expanded to
other packaged microwave power devices.
References[1] PENGELLY R S, WOOD S M, MILLIGAN J W, et al. A review of GaN on SiChigh electron ⁃mobility power transistors and MMICs [J]. IEEE transactions onmicrowave theory and techniques, 2012, 60(6): 1764–1783. DOI: 10.1109/TM⁃TT.2012.2187535
[2] HO S W, YOON S W, ZHOU Q, et al. High RF performance TSV silicon carrierfor high frequency application [C]//Electronic Components and Technology Con⁃ference. Lake Buena Vista, USA, 2008: 1946 – 1952. DOI: 10.1109/ECTC.2008.4550249
[3] WU J H, ALAMO J ADEL. Fabrication and characterization of through ⁃ sub⁃strate interconnects [J]. IEEE transactions on electron devices, 2010, 57(6):1261–1268. DOI: 10.1109/TED.2010.2045671
[4] DONG S, TASKER P J, WANG G, et al. A practicable de⁃embedding networkat higher frequency of a packaged GaN device [C]//IEEE MTT⁃S InternationalWireless Symposium (IWS). Shanghai, China: IEEE, 2016: 1–4. DOI: 10.1109/IEEE⁃IWS.2016.75854735
[5] KAKKAD P, AGGRAWAL E, RAWAT K. De⁃embedded model based class⁃Epower amplifier using waveform engineering [C]//International Conference onComputing, Communication and Networking Technologies (ICCCNT), Delhi, In⁃dia, 2017: 1–4. DOI: 10.1109/ICCCNT.2017.8204012
[6] DONG S W, LEES J, TASKER P J. A de⁃embedding network at higher frequen⁃cy and its error analysis [C]//2016 IEEE International Conference on ElectronicInformation and Communication Technology (ICEICT). Harbin, China: IEEE,2016: 512–514. DOI: 10.1109/ICEICT.2016.7879754
[7] LEE Y S, LEE M W, JEONG Y H. High⁃efficiency class⁃F GaN HEMT amplifi⁃er with simple parasitic⁃compensation circuit [J]. IEEE microwave and wirelesscomponents letters, 2008, 18(1): 55–57. DOI: 10.1109/LMWC.2007.912023
[8] LIU C, CHENG Q F. A novel compensation circuit of high⁃efficiency concurrentdual⁃band class⁃E power amplifiers [J]. IEEE Microwave and Wireless Compo⁃nents Letters, 2018, 28(8): 720–722. DOI: 10.1109/LMWC.2018.2842686
[9] SAYED A S, AHMED H N. Wideband high efficiency power amplifier designusing precise high frequency GaN⁃HEMT parasitics modeling/compensation[C]//2019 IEEE Topical Conference on RF/Microwave Power Amplifiers for Radioand Wireless Applications (PAWR). Orlando, FL, USA: IEEE, 2019: 1⁃4. DOI:10.1109/PAWR.2019.8708722
[10] DAMBRINE G, CAPPY A, HELIODORE F, et al. A new method for determin⁃ing the FET small ⁃ signal equivalent circuit [J]. IEEE transactions on micro⁃wave theory and techniques, 1988, 36(7): 1151–1159. DOI: 10.1109/22.3650
[11] YUAN Y, ZHONG Z, GUO Y X, et al. A novel hybrid parameter extractionmethod for GaAs/GaN HEMT modeling with electromagnetic analysis [C]//2015 Asia ⁃ Pacific Microwave Conference (APMC). Nanjing, China: IEEE,
2015: 1–3. DOI: 10.1109/APMC.2015.7413224[12] TASKER P J, BENEDIKT J. Waveform inspired models and the harmonic bal⁃
ance emulator [J]. IEEE microwave magazine, 2011, 12(2): 38– 54. DOI:10.1109/MMM.2010.940101
[13] CHEN K L, PEROULIS D. Design of highly efficient broadband class⁃E poweramplifier using synthesized low⁃pass matching networks [J]. IEEE transactionson microwave theory and techniques, 2011, 59(12): 3162 – 3173. DOI:10.1109/TMTT.2011.2169080
[14] KURODA K, ISHIKAWA R, HONJO K. Parasitic compensation design tech⁃nique for a C⁃band GaN HEMT class⁃F amplifier [J]. IEEE transactions on mi⁃crowave theory and techniques, 2010, 58(11): 2741–2750. DOI: 10.1109/TM⁃TT.2010.2077951
[15] WU D Y T, BOUMAIZA S. A modified Doherty configuration for broadbandamplification using symmetrical devices [J]. IEEE transactions on microwavetheory and techniques, 2012, 60(10): 3201 – 3213. DOI: 10.1109/TM⁃TT.2012.2209446
BiographiesWEI Xinghui ([email protected]) received the B.S. degree in electronic in⁃formation engineering from Xidian University, China in 2017, and the M.Sc. De⁃gree in electronics and communication engineering from Tsinghua University,China in 2020. Her research interests include the technologies of high efficien⁃cy and high linearity Doherty power amplifiers.
CHEN Xiaofan received the B.S., M.Sc., and Ph.D. degrees in electronic engi⁃neering from Tsinghua University, China in 2005, 2014, and 2017, respectively.From 2005 to 2011, he was a microwave engineer with Tongfang Co., Ltd., Chi⁃na, where he was also with the Broadcasting Transmitters Group and designedhigh-power amplifiers. He is currently a Post-Doctoral Fellow with the Depart⁃ment of Electronic Engineering, Tsinghua University. His current interests in⁃clude broadband/dual-band RF power amplifier (PA) design, linearization of RFPAs, and multimode/multiband transmitting systems.
CHEN Wenhua received the B.S. degree in microwave engineering from theUniversity of Electronic Science and Technology of China in 2001, and the Ph.D. degree in electronic engineering from Tsinghua University, China in 2006.From 2010 to 2011, he was a Post-Doctoral Fellow with the Intelligent RF Ra⁃dio Laboratory, University of Calgary, Canada. He is currently an Associate Pro⁃fessor with the Department of Electronic Engineering, Tsinghua University. Hehas authored or co-authored over 150 journal and conference papers. His cur⁃rent research interests include power-efficiency enhancement for wireless trans⁃mitters, PA predistortion, and smart antennas.
ZHOU Junmin received the B.S. degree in College of Optoelectronic Engineer⁃ing from Chongqing University, China. His current research interests includebroadband high-efficiency RF power amplifier design, and research on integrat⁃ed passive device.
81
ZTE COMMUNICATIONSJune 2021 Vol. 19 No. 2
Research Paper Flexible Multiplexing Mechanism for Coexistence of URLLC and EMBB Services In 5G Networks
XIAO Kai, LIU Xing, HAN Xianghui, HAO Peng, ZHANG Junfeng, ZHOU Dong, WEI Xingguang
Flexible Multiplexing Mechanism for Coexistence ofFlexible Multiplexing Mechanism for Coexistence ofURLLC and EMBB Services inURLLC and EMBB Services in 55G NetworksG Networks
Abstract: 5G mobile networks are envisioned to support both evolved mobile broadband(eMBB) and ultra-reliable and low latency communications (URLLC), which may coexistand interfere with each other in the same service cell in many scenarios. In this paper, wepropose a dynamic 2-dimension bitmap resource indication to cancel eMBB services witha finer uplink cancellation granularity and a lower probability of false cancellation. Mean⁃while, a resource indication based power control method is introduced to dynamically indi⁃cate different power control parameters to the user equipment (UE) based on differenttime-frequency resource groups and the proportion of overlapping resources, by which thereliability of URLLC transmission is guaranteed while the impact on the performance ofthe eMBB service is minimized. Furthermore, a dynamic selection mechanism is proposedto accommodate the varying cases in different scenarios. Extensive system level simula⁃tions are conducted and the results show that about 10.54% more URLLC UE satisfy therequirements, and the perceived throughput of eMBB UE is increased by 23.26%.Keywords: 5G; eMBB; power control; resource indication; uplink cancellation; URLLC
Citation (IEEE Format): K. Xiao, X. Liu, X. H. Han, et al.“Flexible multiplexing mechanism for coexistence of URLLC and eMBB servicesin 5G networks,”ZTE Communications, vol. 19, no. 2, pp. 82–90, Jun. 2021. doi: 10.12142/ZTECOM. 202102011.
1 Introduction
Wireless communication services cover more andmore application scenarios with the developmentof social digitization. Among them, enhanced mo⁃bile broadband (eMBB), ultra-reliable and low la⁃
tency communication (URLLC) and massive machine type ofcommunication (mMTC) have become three major scenariossupported by 5G systems[1–2]. Large flow mobile broadbandservices such as ultra-high definition and 3D video are mainlyincluded in eMBB, providing the ultimate communication ex⁃perience for people. The unmanned driving, industrial auto⁃mation, etc. are mainly covered by URLLC, requiring low-la⁃tency data and an extremely reliable connection, i. e. , one-way latency up to 1 ms with 10-5 outage probability. Thescene of large-scale machine communication in the Internet ofThings is mainly supported by mMTC[3–4]. From the currentdevelopment trend, 5G mainly focuses on eMBB for basic dai⁃ly needs and URLLC for emerging industries. Generally, thepriority of a URLLC service is higher than that of an eMBB
service[5–7]. In the practical application, eMBB services andURLLC services will appear in the same network, and thescheduling of a URLLC service by next-generation Node B(gNB) will inevitably conflict with the eMBB service as thetriggering of the URLLC service is sporadic[8]. Once theURLLC service arrives, the gNB shall allocate appropriate up⁃link (UL) resources to it as soon as possible to meet the strin⁃gent latency requirements. However, the resources may havebeen allocated to uplink data transmission for eMBB in ad⁃vance. The latency and reliability requirement of URLLCtransmission can hardly be guaranteed due to no resource be⁃ing used within a certain time interval[9–10]. Therefore, it isvaluable to study how to multiplex the transmission resourcesbetween a URLLC service and an eMBB service.Currently, power control and UL cancellation indication
(CI) mechanisms are introduced into the Third GenerationPartnership Project (3GPP) protocol as two independent andbasic solutions to URLLC and eMBB service multiplexing[11].However, these baseline methods have some inherent disad⁃
© International Telecommunication Union, 2020: The paper was presented at“Industry-driven digital transformation”ITU Kaleidoscope academic conference by ITU in 2020 and publishedin the proceedings of this conference.
XIAO Kai1,2, LIU Xing1,2, HAN Xianghui1,HAO Peng1, ZHANG Junfeng1,ZHOU Dong1, WEI Xingguang1
(1. ZTE Corporation, Shenzhen 518057, China;2. State Key Laboratory of Mobile Network andMobile Multimedia, Shenzhen 518057, China)
DOI: 10.12142/ZTECOM.202102011
http://kns.cnki.net/kcms/detail/34.1294.TN.20210419.1612.002.html, published onlineApril 20, 2021
Manuscript received: 2021-02-18
82
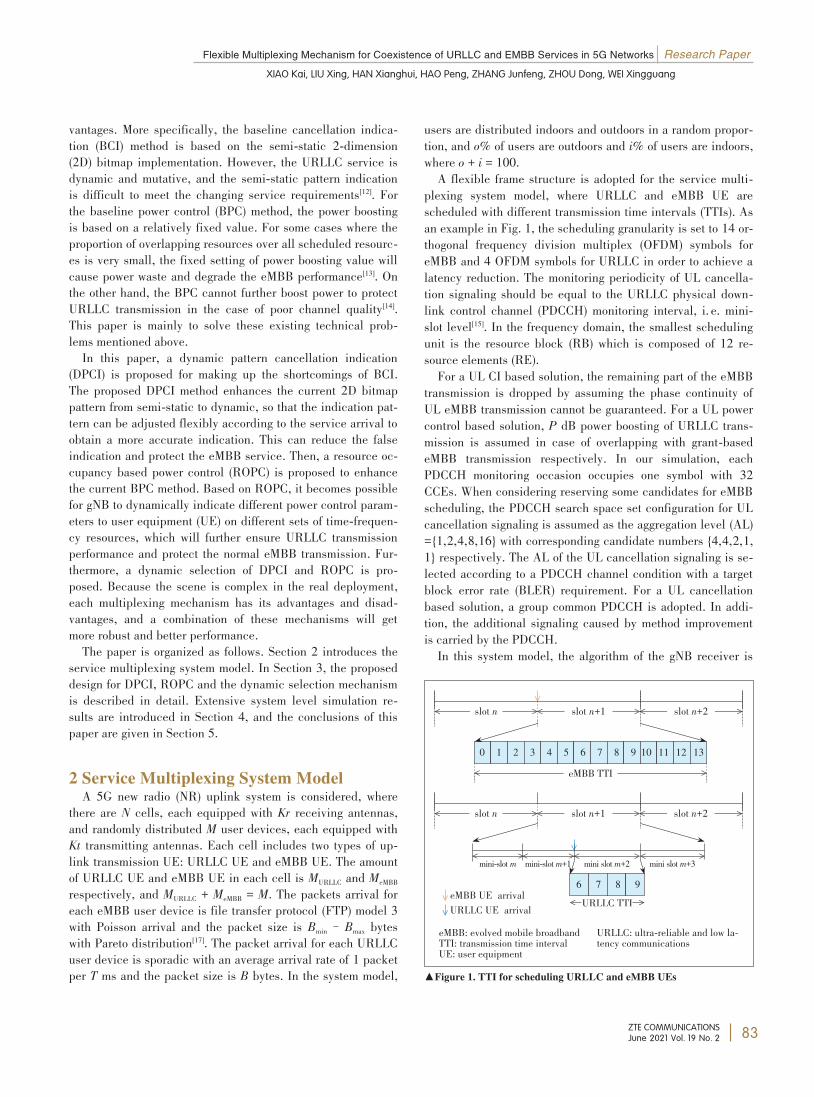
Flexible Multiplexing Mechanism for Coexistence of URLLC and EMBB Services in 5G Networks Research Paper
XIAO Kai, LIU Xing, HAN Xianghui, HAO Peng, ZHANG Junfeng, ZHOU Dong, WEI Xingguang
ZTE COMMUNICATIONSJune 2021 Vol. 19 No. 2
vantages. More specifically, the baseline cancellation indica⁃tion (BCI) method is based on the semi-static 2-dimension(2D) bitmap implementation. However, the URLLC service isdynamic and mutative, and the semi-static pattern indicationis difficult to meet the changing service requirements[12]. Forthe baseline power control (BPC) method, the power boostingis based on a relatively fixed value. For some cases where theproportion of overlapping resources over all scheduled resourc⁃es is very small, the fixed setting of power boosting value willcause power waste and degrade the eMBB performance[13]. Onthe other hand, the BPC cannot further boost power to protectURLLC transmission in the case of poor channel quality[14].This paper is mainly to solve these existing technical prob⁃lems mentioned above.In this paper, a dynamic pattern cancellation indication
(DPCI) is proposed for making up the shortcomings of BCI.The proposed DPCI method enhances the current 2D bitmappattern from semi-static to dynamic, so that the indication pat⁃tern can be adjusted flexibly according to the service arrival toobtain a more accurate indication. This can reduce the falseindication and protect the eMBB service. Then, a resource oc⁃cupancy based power control (ROPC) is proposed to enhancethe current BPC method. Based on ROPC, it becomes possiblefor gNB to dynamically indicate different power control param⁃eters to user equipment (UE) on different sets of time-frequen⁃cy resources, which will further ensure URLLC transmissionperformance and protect the normal eMBB transmission. Fur⁃thermore, a dynamic selection of DPCI and ROPC is pro⁃posed. Because the scene is complex in the real deployment,each multiplexing mechanism has its advantages and disad⁃vantages, and a combination of these mechanisms will getmore robust and better performance.The paper is organized as follows. Section 2 introduces the
service multiplexing system model. In Section 3, the proposeddesign for DPCI, ROPC and the dynamic selection mechanismis described in detail. Extensive system level simulation re⁃sults are introduced in Section 4, and the conclusions of thispaper are given in Section 5.
2 Service Multiplexing System ModelA 5G new radio (NR) uplink system is considered, where
there are N cells, each equipped with Kr receiving antennas,and randomly distributed M user devices, each equipped withKt transmitting antennas. Each cell includes two types of up⁃link transmission UE: URLLC UE and eMBB UE. The amountof URLLC UE and eMBB UE in each cell is MURLLC and MeMBBrespectively, and MURLLC + MeMBB = M. The packets arrival foreach eMBB user device is file transfer protocol (FTP) model 3with Poisson arrival and the packet size is Bmin– Bmax byteswith Pareto distribution[17]. The packet arrival for each URLLCuser device is sporadic with an average arrival rate of 1 packetper T ms and the packet size is B bytes. In the system model,
users are distributed indoors and outdoors in a random propor⁃tion, and o% of users are outdoors and i% of users are indoors,where o + i = 100.A flexible frame structure is adopted for the service multi⁃
plexing system model, where URLLC and eMBB UE arescheduled with different transmission time intervals (TTIs). Asan example in Fig. 1, the scheduling granularity is set to 14 or⁃thogonal frequency division multiplex (OFDM) symbols foreMBB and 4 OFDM symbols for URLLC in order to achieve alatency reduction. The monitoring periodicity of UL cancella⁃tion signaling should be equal to the URLLC physical down⁃link control channel (PDCCH) monitoring interval, i. e. mini-slot level[15]. In the frequency domain, the smallest schedulingunit is the resource block (RB) which is composed of 12 re⁃source elements (RE).For a UL CI based solution, the remaining part of the eMBB
transmission is dropped by assuming the phase continuity ofUL eMBB transmission cannot be guaranteed. For a UL powercontrol based solution, P dB power boosting of URLLC trans⁃mission is assumed in case of overlapping with grant-basedeMBB transmission respectively. In our simulation, eachPDCCH monitoring occasion occupies one symbol with 32CCEs. When considering reserving some candidates for eMBBscheduling, the PDCCH search space set configuration for ULcancellation signaling is assumed as the aggregation level (AL)={1,2,4,8,16} with corresponding candidate numbers {4,4,2,1,1} respectively. The AL of the UL cancellation signaling is se⁃lected according to a PDCCH channel condition with a targetblock error rate (BLER) requirement. For a UL cancellationbased solution, a group common PDCCH is adopted. In addi⁃tion, the additional signaling caused by method improvementis carried by the PDCCH.In this system model, the algorithm of the gNB receiver is
eMBB: evolved mobile broadbandTTI: transmission time intervalUE: user equipmentURLLC: ultra-reliable and low la⁃tency communications
▲Figure 1. TTI for scheduling URLLC and eMBB UEs
0 1 2 3 4 5 6 7 8 9 10 11 12 13eMBB TTI
slot n slot n+1 slot n+2
slot n slot n+1 slot n+2
mini-slotm+1 mini slotm+2mini-slotm mini slotm+36 7 8 9URLLC TTIeMBB UE arrival
URLLC UE arrival
83
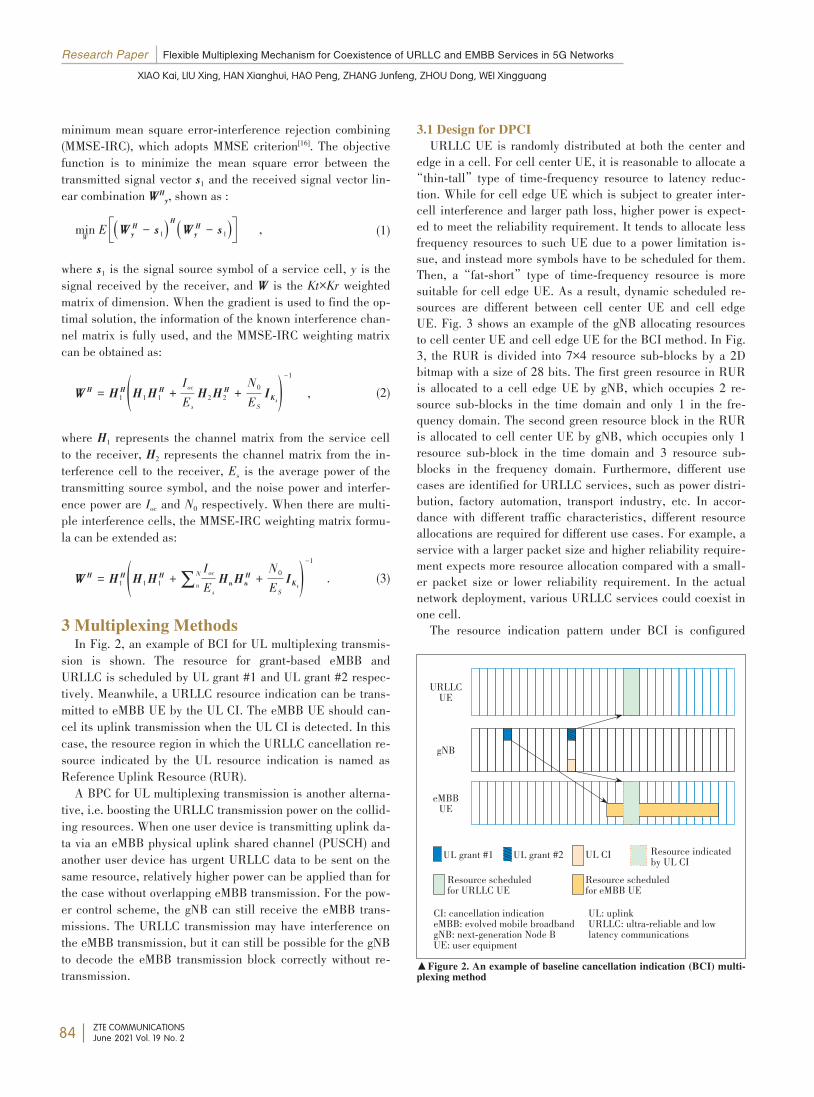
Research Paper Flexible Multiplexing Mechanism for Coexistence of URLLC and EMBB Services in 5G Networks
XIAO Kai, LIU Xing, HAN Xianghui, HAO Peng, ZHANG Junfeng, ZHOU Dong, WEI Xingguang
ZTE COMMUNICATIONSJune 2021 Vol. 19 No. 2
minimum mean square error-interference rejection combining(MMSE-IRC), which adopts MMSE criterion[16]. The objectivefunction is to minimize the mean square error between thetransmitted signal vector s1 and the received signal vector lin⁃ear combination WH
y, shown as :minWE éë(W
Hy - s1)H (WH
y - s1)ùû , (1)
where s1 is the signal source symbol of a service cell, y is thesignal received by the receiver, and W is the Kt×Kr weightedmatrix of dimension. When the gradient is used to find the op⁃timal solution, the information of the known interference chan⁃nel matrix is fully used, and the MMSE-IRC weighting matrixcan be obtained as:
WH = HH1 (H1HH1 + IocEs H2HH2 + N0ES
IKt)-1
, (2)
where H1 represents the channel matrix from the service cellto the receiver, H2 represents the channel matrix from the in⁃terference cell to the receiver, Es is the average power of thetransmitting source symbol, and the noise power and interfer⁃ence power are Ioc and N0 respectively. When there are multi⁃ple interference cells, the MMSE-IRC weighting matrix formu⁃la can be extended as:
WH = HH1 (H1HH1 +∑n
N IocEs
HnHHn + N0
ESIKt)
-1. (3)
3 Multiplexing MethodsIn Fig. 2, an example of BCI for UL multiplexing transmis⁃
sion is shown. The resource for grant-based eMBB andURLLC is scheduled by UL grant #1 and UL grant #2 respec⁃tively. Meanwhile, a URLLC resource indication can be trans⁃mitted to eMBB UE by the UL CI. The eMBB UE should can⁃cel its uplink transmission when the UL CI is detected. In thiscase, the resource region in which the URLLC cancellation re⁃source indicated by the UL resource indication is named asReference Uplink Resource (RUR).A BPC for UL multiplexing transmission is another alterna⁃
tive, i.e. boosting the URLLC transmission power on the collid⁃ing resources. When one user device is transmitting uplink da⁃ta via an eMBB physical uplink shared channel (PUSCH) andanother user device has urgent URLLC data to be sent on thesame resource, relatively higher power can be applied than forthe case without overlapping eMBB transmission. For the pow⁃er control scheme, the gNB can still receive the eMBB trans⁃missions. The URLLC transmission may have interference onthe eMBB transmission, but it can still be possible for the gNBto decode the eMBB transmission block correctly without re⁃transmission.
3.1 Design for DPCIURLLC UE is randomly distributed at both the center and
edge in a cell. For cell center UE, it is reasonable to allocate a“thin-tall”type of time-frequency resource to latency reduc⁃tion. While for cell edge UE which is subject to greater inter-cell interference and larger path loss, higher power is expect⁃ed to meet the reliability requirement. It tends to allocate lessfrequency resources to such UE due to a power limitation is⁃sue, and instead more symbols have to be scheduled for them.Then, a“fat-short”type of time-frequency resource is moresuitable for cell edge UE. As a result, dynamic scheduled re⁃sources are different between cell center UE and cell edgeUE. Fig. 3 shows an example of the gNB allocating resourcesto cell center UE and cell edge UE for the BCI method. In Fig.3, the RUR is divided into 7×4 resource sub-blocks by a 2Dbitmap with a size of 28 bits. The first green resource in RURis allocated to a cell edge UE by gNB, which occupies 2 re⁃source sub-blocks in the time domain and only 1 in the fre⁃quency domain. The second green resource block in the RURis allocated to cell center UE by gNB, which occupies only 1resource sub-block in the time domain and 3 resource sub-blocks in the frequency domain. Furthermore, different usecases are identified for URLLC services, such as power distri⁃bution, factory automation, transport industry, etc. In accor⁃dance with different traffic characteristics, different resourceallocations are required for different use cases. For example, aservice with a larger packet size and higher reliability require⁃ment expects more resource allocation compared with a small⁃er packet size or lower reliability requirement. In the actualnetwork deployment, various URLLC services could coexist inone cell.The resource indication pattern under BCI is configured
▲Figure 2. An example of baseline cancellation indication (BCI) multi⁃plexing method
CI: cancellation indicationeMBB: evolved mobile broadbandgNB: next-generation Node BUE: user equipment
UL: uplinkURLLC: ultra-reliable and lowlatency communications
URLLCUE
gNB
eMBBUE
UL grant #1 UL grant #2 Resource indicatedby UL CIResource scheduledfor URLLC UE Resource scheduledfor eMBB UE
UL CI
84
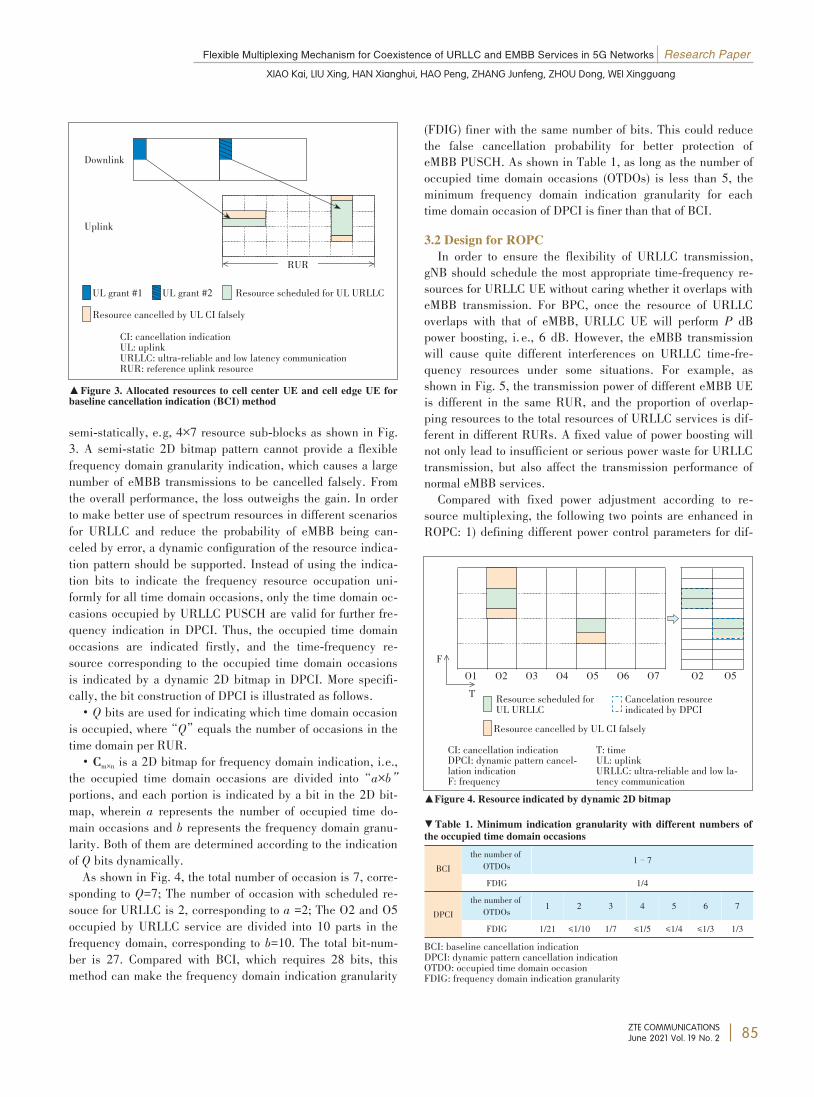
Flexible Multiplexing Mechanism for Coexistence of URLLC and EMBB Services in 5G Networks Research Paper
XIAO Kai, LIU Xing, HAN Xianghui, HAO Peng, ZHANG Junfeng, ZHOU Dong, WEI Xingguang
ZTE COMMUNICATIONSJune 2021 Vol. 19 No. 2
semi-statically, e.g, 4×7 resource sub-blocks as shown in Fig.3. A semi-static 2D bitmap pattern cannot provide a flexiblefrequency domain granularity indication, which causes a largenumber of eMBB transmissions to be cancelled falsely. Fromthe overall performance, the loss outweighs the gain. In orderto make better use of spectrum resources in different scenariosfor URLLC and reduce the probability of eMBB being can⁃celed by error, a dynamic configuration of the resource indica⁃tion pattern should be supported. Instead of using the indica⁃tion bits to indicate the frequency resource occupation uni⁃formly for all time domain occasions, only the time domain oc⁃casions occupied by URLLC PUSCH are valid for further fre⁃quency indication in DPCI. Thus, the occupied time domainoccasions are indicated firstly, and the time-frequency re⁃source corresponding to the occupied time domain occasionsis indicated by a dynamic 2D bitmap in DPCI. More specifi⁃cally, the bit construction of DPCI is illustrated as follows.• Q bits are used for indicating which time domain occasion
is occupied, where“Q”equals the number of occasions in thetime domain per RUR.• Cm×n is a 2D bitmap for frequency domain indication, i.e.,the occupied time domain occasions are divided into“a×b”
portions, and each portion is indicated by a bit in the 2D bit⁃map, wherein a represents the number of occupied time do⁃main occasions and b represents the frequency domain granu⁃larity. Both of them are determined according to the indicationof Q bits dynamically.As shown in Fig. 4, the total number of occasion is 7, corre⁃
sponding to Q=7; The number of occasion with scheduled re⁃souce for URLLC is 2, corresponding to a =2; The O2 and O5occupied by URLLC service are divided into 10 parts in thefrequency domain, corresponding to b=10. The total bit-num⁃ber is 27. Compared with BCI, which requires 28 bits, thismethod can make the frequency domain indication granularity
(FDIG) finer with the same number of bits. This could reducethe false cancellation probability for better protection ofeMBB PUSCH. As shown in Table 1, as long as the number ofoccupied time domain occasions (OTDOs) is less than 5, theminimum frequency domain indication granularity for eachtime domain occasion of DPCI is finer than that of BCI.3.2 Design for ROPCIn order to ensure the flexibility of URLLC transmission,
gNB should schedule the most appropriate time-frequency re⁃sources for URLLC UE without caring whether it overlaps witheMBB transmission. For BPC, once the resource of URLLCoverlaps with that of eMBB, URLLC UE will perform P dBpower boosting, i. e., 6 dB. However, the eMBB transmissionwill cause quite different interferences on URLLC time-fre⁃quency resources under some situations. For example, asshown in Fig. 5, the transmission power of different eMBB UEis different in the same RUR, and the proportion of overlap⁃ping resources to the total resources of URLLC services is dif⁃ferent in different RURs. A fixed value of power boosting willnot only lead to insufficient or serious power waste for URLLCtransmission, but also affect the transmission performance ofnormal eMBB services.Compared with fixed power adjustment according to re⁃
source multiplexing, the following two points are enhanced inROPC: 1) defining different power control parameters for dif⁃
CI: cancellation indicationUL: uplinkURLLC: ultra-reliable and low latency communicationRUR: reference uplink resource▲Figure 3. Allocated resources to cell center UE and cell edge UE forbaseline cancellation indication (BCI) method
CI: cancellation indicationDPCI: dynamic pattern cancel⁃lation indicationF: frequency
T: timeUL: uplinkURLLC: ultra-reliable and low la⁃tency communication▲Figure 4. Resource indicated by dynamic 2D bitmap
BCI
DPCI
the number ofOTDOsFDIG
the number ofOTDOsFDIG
1–71/4
11/21
2≤1/10
31/7
4≤1/5
5≤1/4
6≤1/3
71/3
▼Table 1. Minimum indication granularity with different numbers ofthe occupied time domain occasions
BCI: baseline cancellation indicationDPCI: dynamic pattern cancellation indicationOTDO: occupied time domain occasionFDIG: frequency domain indication granularity
Downlink
Uplink
UL grant #1 UL grant #2 Resource scheduled for UL URLLCResource cancelled by UL CI falsely
RUR
O1 O2 O3 O4 O5 O6 O7 O2 O5Cancelation resourceindicated by DPCIResource scheduled forUL URLLC
Resource cancelled by UL CI falsely
F
T
85
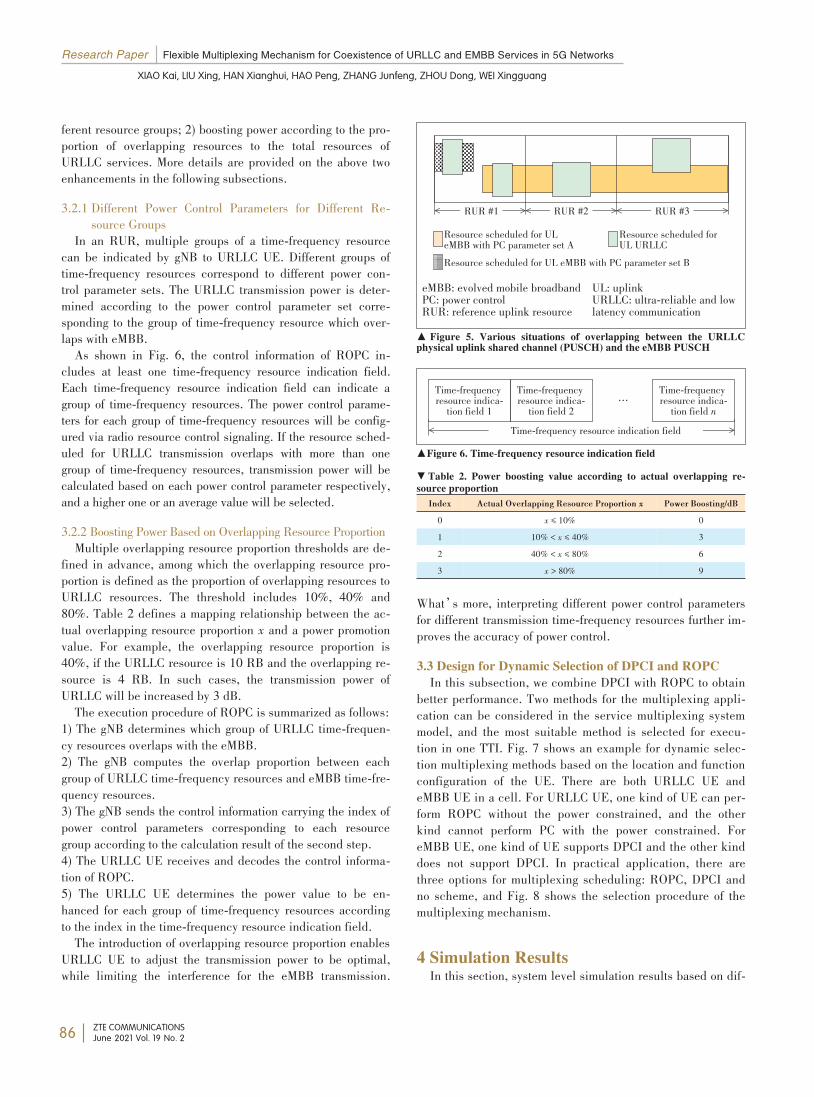
Research Paper Flexible Multiplexing Mechanism for Coexistence of URLLC and EMBB Services in 5G Networks
XIAO Kai, LIU Xing, HAN Xianghui, HAO Peng, ZHANG Junfeng, ZHOU Dong, WEI Xingguang
ZTE COMMUNICATIONSJune 2021 Vol. 19 No. 2
ferent resource groups; 2) boosting power according to the pro⁃portion of overlapping resources to the total resources ofURLLC services. More details are provided on the above twoenhancements in the following subsections.3.2.1 Different Power Control Parameters for Different Re⁃
source GroupsIn an RUR, multiple groups of a time-frequency resource
can be indicated by gNB to URLLC UE. Different groups oftime-frequency resources correspond to different power con⁃trol parameter sets. The URLLC transmission power is deter⁃mined according to the power control parameter set corre⁃sponding to the group of time-frequency resource which over⁃laps with eMBB.As shown in Fig. 6, the control information of ROPC in⁃
cludes at least one time-frequency resource indication field.Each time-frequency resource indication field can indicate agroup of time-frequency resources. The power control parame⁃ters for each group of time-frequency resources will be config⁃ured via radio resource control signaling. If the resource sched⁃uled for URLLC transmission overlaps with more than onegroup of time-frequency resources, transmission power will becalculated based on each power control parameter respectively,and a higher one or an average value will be selected.3.2.2 Boosting Power Based on Overlapping Resource ProportionMultiple overlapping resource proportion thresholds are de⁃
fined in advance, among which the overlapping resource pro⁃portion is defined as the proportion of overlapping resources toURLLC resources. The threshold includes 10%, 40% and80%. Table 2 defines a mapping relationship between the ac⁃tual overlapping resource proportion x and a power promotionvalue. For example, the overlapping resource proportion is40%, if the URLLC resource is 10 RB and the overlapping re⁃source is 4 RB. In such cases, the transmission power ofURLLC will be increased by 3 dB.The execution procedure of ROPC is summarized as follows:
1) The gNB determines which group of URLLC time-frequen⁃cy resources overlaps with the eMBB.2) The gNB computes the overlap proportion between eachgroup of URLLC time-frequency resources and eMBB time-fre⁃quency resources.3) The gNB sends the control information carrying the index ofpower control parameters corresponding to each resourcegroup according to the calculation result of the second step.4) The URLLC UE receives and decodes the control informa⁃tion of ROPC.5) The URLLC UE determines the power value to be en⁃hanced for each group of time-frequency resources accordingto the index in the time-frequency resource indication field.The introduction of overlapping resource proportion enables
URLLC UE to adjust the transmission power to be optimal,while limiting the interference for the eMBB transmission.
What’s more, interpreting different power control parametersfor different transmission time-frequency resources further im⁃proves the accuracy of power control.3.3 Design for Dynamic Selection of DPCI and ROPCIn this subsection, we combine DPCI with ROPC to obtain
better performance. Two methods for the multiplexing appli⁃cation can be considered in the service multiplexing systemmodel, and the most suitable method is selected for execu⁃tion in one TTI. Fig. 7 shows an example for dynamic selec⁃tion multiplexing methods based on the location and functionconfiguration of the UE. There are both URLLC UE andeMBB UE in a cell. For URLLC UE, one kind of UE can per⁃form ROPC without the power constrained, and the otherkind cannot perform PC with the power constrained. ForeMBB UE, one kind of UE supports DPCI and the other kinddoes not support DPCI. In practical application, there arethree options for multiplexing scheduling: ROPC, DPCI andno scheme, and Fig. 8 shows the selection procedure of themultiplexing mechanism.
4 Simulation ResultsIn this section, system level simulation results based on dif⁃
eMBB: evolved mobile broadbandPC: power controlRUR: reference uplink resourceUL: uplinkURLLC: ultra-reliable and lowlatency communication
▲ Figure 5. Various situations of overlapping between the URLLCphysical uplink shared channel (PUSCH) and the eMBB PUSCH
▲Figure 6. Time-frequency resource indication field
万万万万万万万万万万万万万万万万万万万万万万万万万万万万万万万万万万万万万万万万万万万万万万万万万万万万万万万万万万万万万万万万万万万万万万万万万万万万万万万万万万万万万万万万万万万万万万万万万万万万万万万万万万万万万万万万万万万万万万万万万万万万万万万万万万万万万万万万万万万万万万万万万万万万万万万万万万万万万万万万万万万万万万万万万万万万万万万万万万万万万万万万万万万万万万万万万万万万万万万万万万万万万万万万万万万万万万万万
▼ Table 2. Power boosting value according to actual overlapping re⁃source proportionIndex
0123
Actual Overlapping Resource Proportion x
x ≤ 10%10% < x ≤ 40%40% < x ≤ 80%
x > 80%
Power Boosting/dB
0369
RUR #1 RUR #2 RUR #3Resource scheduled for ULeMBB with PC parameter set A Resource scheduled forUL URLLCResource scheduled for UL eMBB with PC parameter set B丈丈丈丈丈丈丈丈
丈丈丈丈丈丈丈丈丈丈丈丈丈丈丈丈丈丈丈丈丈丈丈丈丈丈丈丈丈丈丈丈丈丈丈丈丈丈丈丈
Time-frequencyresource indica⁃tion field 1Time-frequencyresource indica⁃tion field 2
Time-frequencyresource indica⁃tion field n…
Time-frequency resource indication field
86
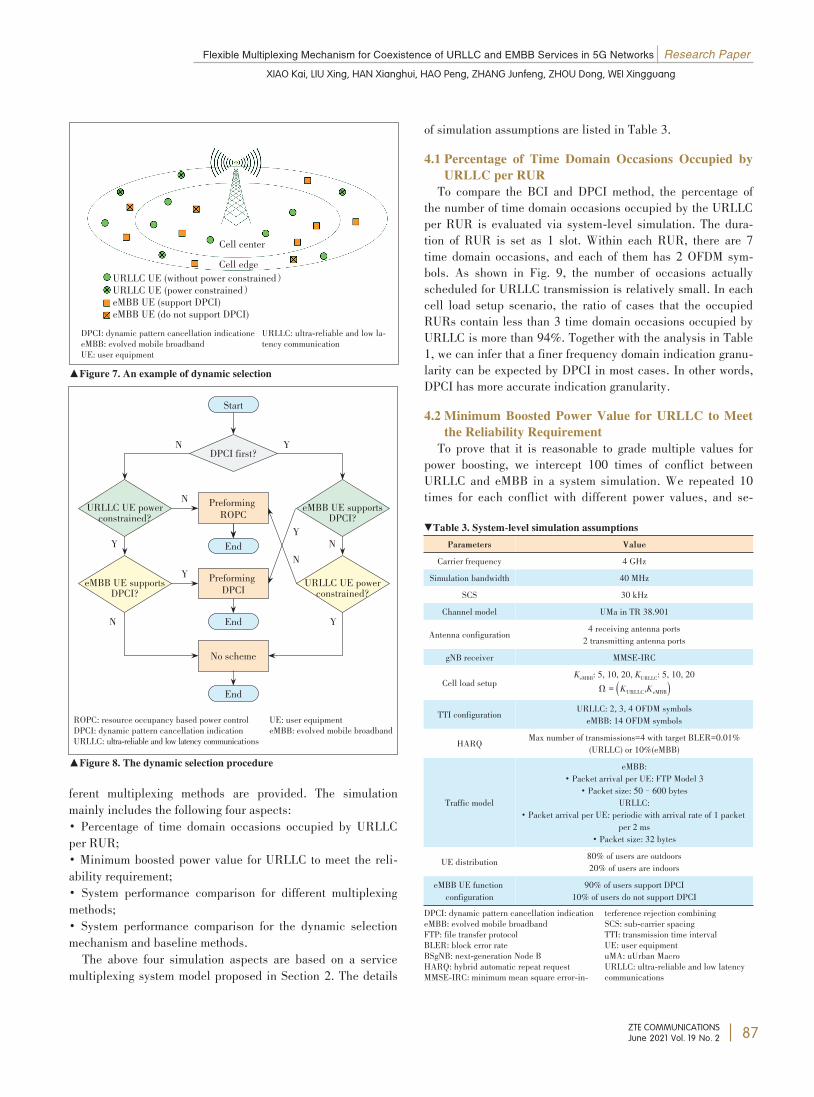
Flexible Multiplexing Mechanism for Coexistence of URLLC and EMBB Services in 5G Networks Research Paper
XIAO Kai, LIU Xing, HAN Xianghui, HAO Peng, ZHANG Junfeng, ZHOU Dong, WEI Xingguang
ZTE COMMUNICATIONSJune 2021 Vol. 19 No. 2
ferent multiplexing methods are provided. The simulationmainly includes the following four aspects:• Percentage of time domain occasions occupied by URLLCper RUR;• Minimum boosted power value for URLLC to meet the reli⁃ability requirement;• System performance comparison for different multiplexingmethods;• System performance comparison for the dynamic selectionmechanism and baseline methods.The above four simulation aspects are based on a service
multiplexing system model proposed in Section 2. The details
of simulation assumptions are listed in Table 3.4.1 Percentage of Time Domain Occasions Occupied by
URLLC per RURTo compare the BCI and DPCI method, the percentage of
the number of time domain occasions occupied by the URLLCper RUR is evaluated via system-level simulation. The dura⁃tion of RUR is set as 1 slot. Within each RUR, there are 7time domain occasions, and each of them has 2 OFDM sym⁃bols. As shown in Fig. 9, the number of occasions actuallyscheduled for URLLC transmission is relatively small. In eachcell load setup scenario, the ratio of cases that the occupiedRURs contain less than 3 time domain occasions occupied byURLLC is more than 94%. Together with the analysis in Table1, we can infer that a finer frequency domain indication granu⁃larity can be expected by DPCI in most cases. In other words,DPCI has more accurate indication granularity.4.2 Minimum Boosted Power Value for URLLC to Meet
the Reliability RequirementTo prove that it is reasonable to grade multiple values for
power boosting, we intercept 100 times of conflict betweenURLLC and eMBB in a system simulation. We repeated 10times for each conflict with different power values, and se⁃
DPCI: dynamic pattern cancellation indicationeeMBB: evolved mobile broadbandUE: user equipmentURLLC: ultra-reliable and low la⁃tency communication
▲Figure 7. An example of dynamic selection
ROPC: resource occupancy based power controlDPCI: dynamic pattern cancellation indicationURLLC: ultra-reliable and low latency communicationsUE: user equipmenteMBB: evolved mobile broadband
▲Figure 8. The dynamic selection procedure
Parameters
Carrier frequencySimulation bandwidth
SCSChannel model
Antenna configurationgNB receiverCell load setup
TTI configuration
HARQ
Traffic model
UE distributioneMBB UE functionconfiguration
Value
4 GHz40 MHz30 kHz
UMa in TR 38.9014 receiving antenna ports2 transmitting antenna ports
MMSE-IRCKeMBB: 5, 10, 20, KURLLC: 5, 10, 20
Ω = (KURLLC,KeMBB)URLLC: 2, 3, 4 OFDM symbolseMBB: 14 OFDM symbols
Max number of transmissions=4 with target BLER=0.01%(URLLC) or 10%(eMBB)
eMBB:• Packet arrival per UE: FTP Model 3
• Packet size: 50–600 bytesURLLC:
• Packet arrival per UE: periodic with arrival rate of 1 packetper 2 ms
• Packet size: 32 bytes80% of users are outdoors20% of users are indoors90% of users support DPCI
10% of users do not support DPCI
▼Table 3. System-level simulation assumptions
DPCI: dynamic pattern cancellation indicationeMBB: evolved mobile broadbandFTP: file transfer protocolBLER: block error rateBSgNB: next-generation Node BHARQ: hybrid automatic repeat requestMMSE-IRC: minimum mean square error-in⁃
terference rejection combiningSCS: sub-carrier spacingTTI: transmission time intervalUE: user equipmentuMA: uUrban MacroURLLC: ultra-reliable and low latencycommunications
URLLC UE (without power constrained)URLLC UE (power constrained)eMBB UE (support DPCI)eMBB UE (do not support DPCI)
Cell centerCell edge
DPCI first?
Start
PreformingROPCURLLC UE powerconstrained?
eMBB UE supportsDPCI?PreformingDPCI
End
End
End
No scheme
URLLC UE powerconstrained?
eMBB UE supportsDPCI?N
Y
YN
N
N Y
Y
N Y
87
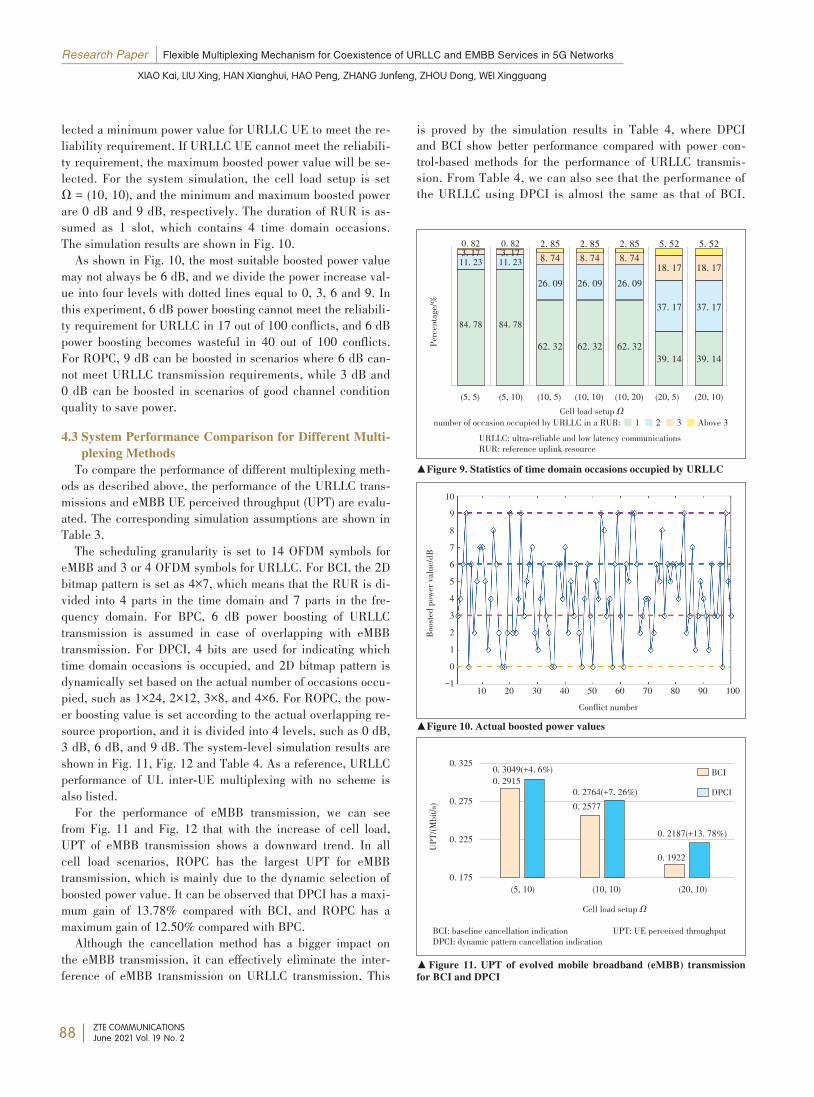
Research Paper Flexible Multiplexing Mechanism for Coexistence of URLLC and EMBB Services in 5G Networks
XIAO Kai, LIU Xing, HAN Xianghui, HAO Peng, ZHANG Junfeng, ZHOU Dong, WEI Xingguang
ZTE COMMUNICATIONSJune 2021 Vol. 19 No. 2
lected a minimum power value for URLLC UE to meet the re⁃liability requirement. If URLLC UE cannot meet the reliabili⁃ty requirement, the maximum boosted power value will be se⁃lected. For the system simulation, the cell load setup is setΩ = (10, 10), and the minimum and maximum boosted powerare 0 dB and 9 dB, respectively. The duration of RUR is as⁃sumed as 1 slot, which contains 4 time domain occasions.The simulation results are shown in Fig. 10.As shown in Fig. 10, the most suitable boosted power value
may not always be 6 dB, and we divide the power increase val⁃ue into four levels with dotted lines equal to 0, 3, 6 and 9. Inthis experiment, 6 dB power boosting cannot meet the reliabili⁃ty requirement for URLLC in 17 out of 100 conflicts, and 6 dBpower boosting becomes wasteful in 40 out of 100 conflicts.For ROPC, 9 dB can be boosted in scenarios where 6 dB can⁃not meet URLLC transmission requirements, while 3 dB and0 dB can be boosted in scenarios of good channel conditionquality to save power.4.3 System Performance Comparison for Different Multi⁃
plexing MethodsTo compare the performance of different multiplexing meth⁃
ods as described above, the performance of the URLLC trans⁃missions and eMBB UE perceived throughput (UPT) are evalu⁃ated. The corresponding simulation assumptions are shown inTable 3.The scheduling granularity is set to 14 OFDM symbols for
eMBB and 3 or 4 OFDM symbols for URLLC. For BCI, the 2Dbitmap pattern is set as 4×7, which means that the RUR is di⁃vided into 4 parts in the time domain and 7 parts in the fre⁃quency domain. For BPC, 6 dB power boosting of URLLCtransmission is assumed in case of overlapping with eMBBtransmission. For DPCI, 4 bits are used for indicating whichtime domain occasions is occupied, and 2D bitmap pattern isdynamically set based on the actual number of occasions occu⁃pied, such as 1×24, 2×12, 3×8, and 4×6. For ROPC, the pow⁃er boosting value is set according to the actual overlapping re⁃source proportion, and it is divided into 4 levels, such as 0 dB,3 dB, 6 dB, and 9 dB. The system-level simulation results areshown in Fig. 11, Fig. 12 and Table 4. As a reference, URLLCperformance of UL inter-UE multiplexing with no scheme isalso listed.For the performance of eMBB transmission, we can see
from Fig. 11 and Fig. 12 that with the increase of cell load,UPT of eMBB transmission shows a downward trend. In allcell load scenarios, ROPC has the largest UPT for eMBBtransmission, which is mainly due to the dynamic selection ofboosted power value. It can be observed that DPCI has a maxi⁃mum gain of 13.78% compared with BCI, and ROPC has amaximum gain of 12.50% compared with BPC.Although the cancellation method has a bigger impact on
the eMBB transmission, it can effectively eliminate the inter⁃ference of eMBB transmission on URLLC transmission. This
is proved by the simulation results in Table 4, where DPCIand BCI show better performance compared with power con⁃trol-based methods for the performance of URLLC transmis⁃sion. From Table 4, we can also see that the performance ofthe URLLC using DPCI is almost the same as that of BCI.
▲Figure 10. Actual boosted power values
109876543210−1
Boosted
powervalue/dB
10 20 30 40 50 60 70 80 90 100Conflict number
URLLC: ultra-reliable and low latency communicationsRUR: reference uplink resource▲Figure 9. Statistics of time domain occasions occupied by URLLC
Cell load setup ΩPercentage/%
(5, 5) (5, 10) (10, 5) (10, 10) (10, 20) (20, 5) (20, 10)
0. 823. 1711. 23
84. 78
0. 823. 1711. 23
84. 78
2. 858. 7426. 09
62. 32
2. 858. 7426. 09
62. 32
2. 858. 7426. 09
62. 32
5. 5218. 17
37. 17
39. 14
5. 5218. 17
37. 17
39. 14
number of occasion occupied by URLLC in a RUR: ■ 1 ■ 2 ■ 3 ■ Above 3
BCI: baseline cancellation indicationDPCI: dynamic pattern cancellation indication UPT: UE perceived throughput
▲Figure 11. UPT of evolved mobile broadband (eMBB) transmissionfor BCI and DPCI
UPT/(M
bit/s)
Cell load setup Ω(5, 10) (10, 10) (20, 10)
0. 325
0. 275
0. 225
0. 175
0. 3049(+4. 6%)0. 2915
0. 2764(+7. 26%)0. 2577
0. 2187(+13. 78%)0. 1922
BCIDPCI
88
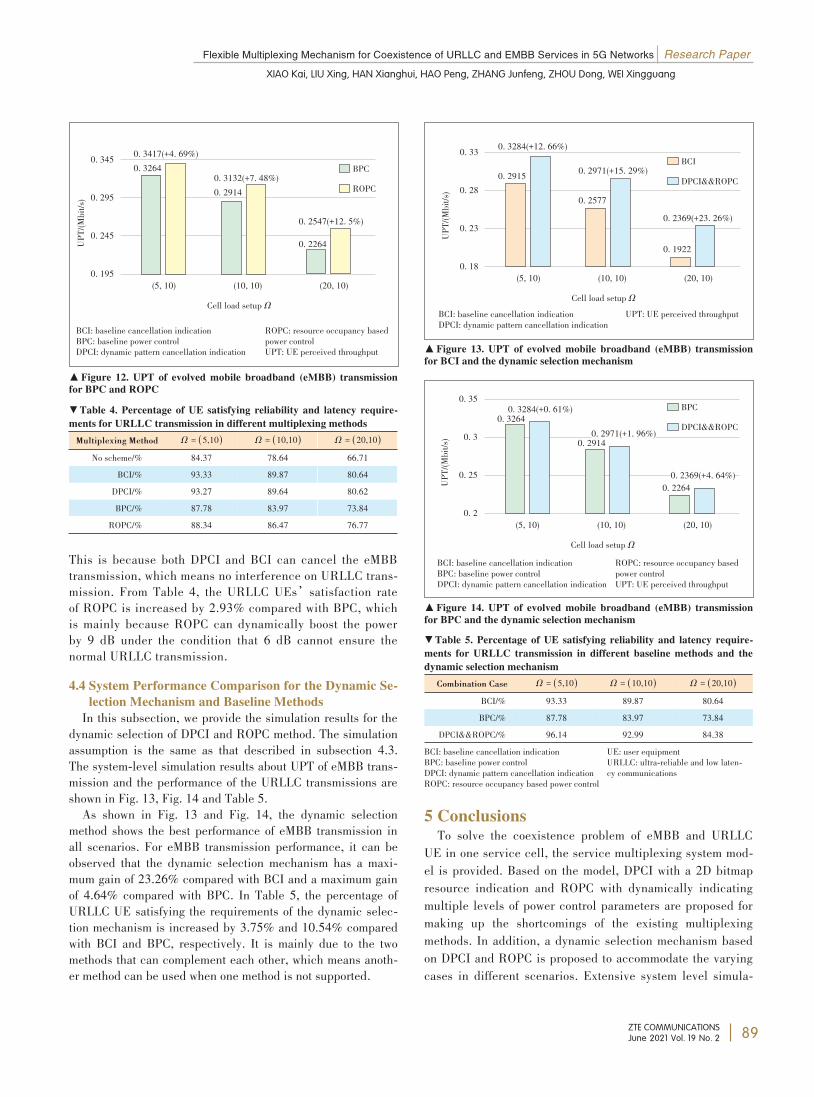
Flexible Multiplexing Mechanism for Coexistence of URLLC and EMBB Services in 5G Networks Research Paper
XIAO Kai, LIU Xing, HAN Xianghui, HAO Peng, ZHANG Junfeng, ZHOU Dong, WEI Xingguang
ZTE COMMUNICATIONSJune 2021 Vol. 19 No. 2
This is because both DPCI and BCI can cancel the eMBBtransmission, which means no interference on URLLC trans⁃mission. From Table 4, the URLLC UEs’satisfaction rateof ROPC is increased by 2.93% compared with BPC, whichis mainly because ROPC can dynamically boost the powerby 9 dB under the condition that 6 dB cannot ensure thenormal URLLC transmission.4.4 System Performance Comparison for the Dynamic Se⁃
lection Mechanism and Baseline MethodsIn this subsection, we provide the simulation results for the
dynamic selection of DPCI and ROPC method. The simulationassumption is the same as that described in subsection 4.3.The system-level simulation results about UPT of eMBB trans⁃mission and the performance of the URLLC transmissions areshown in Fig. 13, Fig. 14 and Table 5.As shown in Fig. 13 and Fig. 14, the dynamic selection
method shows the best performance of eMBB transmission inall scenarios. For eMBB transmission performance, it can beobserved that the dynamic selection mechanism has a maxi⁃mum gain of 23.26% compared with BCI and a maximum gainof 4.64% compared with BPC. In Table 5, the percentage ofURLLC UE satisfying the requirements of the dynamic selec⁃tion mechanism is increased by 3.75% and 10.54% comparedwith BCI and BPC, respectively. It is mainly due to the twomethods that can complement each other, which means anoth⁃er method can be used when one method is not supported.
5 ConclusionsTo solve the coexistence problem of eMBB and URLLC
UE in one service cell, the service multiplexing system mod⁃el is provided. Based on the model, DPCI with a 2D bitmapresource indication and ROPC with dynamically indicatingmultiple levels of power control parameters are proposed formaking up the shortcomings of the existing multiplexingmethods. In addition, a dynamic selection mechanism basedon DPCI and ROPC is proposed to accommodate the varyingcases in different scenarios. Extensive system level simula⁃
▼Table 5. Percentage of UE satisfying reliability and latency require⁃ments for URLLC transmission in different baseline methods and thedynamic selection mechanismCombination Case
BCI/%BPC/%
DPCI&&ROPC/%
Ω = (5,10)93.3387.7896.14
Ω = (10,10)89.8783.9792.99
Ω = (20,10)80.6473.8484.38
▼Table 4. Percentage of UE satisfying reliability and latency require⁃ments for URLLC transmission in different multiplexing methodsMultiplexing Method
No scheme/%BCI/%DPCI/%BPC/%ROPC/%
Ω = (5,10)84.3793.3393.2787.7888.34
Ω = (10,10)78.6489.8789.6483.9786.47
Ω = (20,10)66.7180.6480.6273.8476.77
BCI: baseline cancellation indicationBPC: baseline power controlDPCI: dynamic pattern cancellation indicationROPC: resource occupancy basedpower controlUPT: UE perceived throughput
▲Figure 12. UPT of evolved mobile broadband (eMBB) transmissionfor BPC and ROPC
BCI: baseline cancellation indicationDPCI: dynamic pattern cancellation indication UPT: UE perceived throughput
▲Figure 13. UPT of evolved mobile broadband (eMBB) transmissionfor BCI and the dynamic selection mechanism
BCI: baseline cancellation indicationBPC: baseline power controlDPCI: dynamic pattern cancellation indicationROPC: resource occupancy basedpower controlUPT: UE perceived throughput
▲Figure 14. UPT of evolved mobile broadband (eMBB) transmissionfor BPC and the dynamic selection mechanism
BCI: baseline cancellation indicationBPC: baseline power controlDPCI: dynamic pattern cancellation indicationROPC: resource occupancy based power control
UE: user equipmentURLLC: ultra-reliable and low laten⁃cy communications
UPT/(M
bit/s)
Cell load setup Ω(5, 10) (10, 10) (20, 10)
0. 345
0. 295
0. 245
0. 195
0. 3417(+4. 69%)0. 3264 0. 3132(+7. 48%)
0. 2914
0. 2547(+12. 5%)0. 2264
BPCROPC
UPT/(M
bit/s)
Cell load setup Ω(5, 10) (10, 10) (20, 10)
0. 33
0. 28
0. 23
0. 18
0. 3284(+12. 66%)
0. 2915 0. 2971(+15. 29%)
0. 25770. 2369(+23. 26%)
0. 1922
BCIDPCI&&ROPC
UPT/(M
bit/s)
Cell load setup Ω(5, 10) (10, 10) (20, 10)
0. 35
0. 3
0. 25
0. 2
0. 32640. 2914
0. 2264
BPCDPCI&&ROPC
0. 3284(+0. 61%)0. 2971(+1. 96%)
0. 2369(+4. 64%)0. 2369(+4. 64%)
89
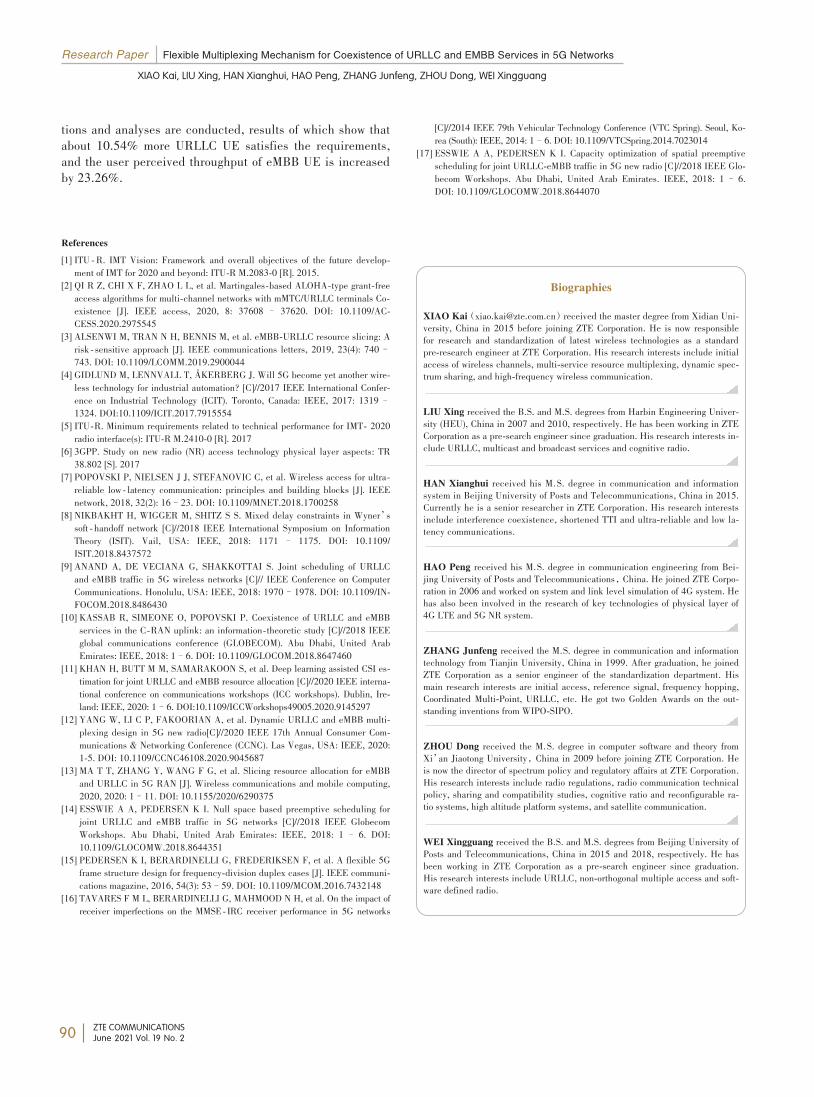
Research Paper Flexible Multiplexing Mechanism for Coexistence of URLLC and EMBB Services in 5G Networks
XIAO Kai, LIU Xing, HAN Xianghui, HAO Peng, ZHANG Junfeng, ZHOU Dong, WEI Xingguang
ZTE COMMUNICATIONSJune 2021 Vol. 19 No. 2
tions and analyses are conducted, results of which show thatabout 10.54% more URLLC UE satisfies the requirements,and the user perceived throughput of eMBB UE is increasedby 23.26%.
References[1] ITU ⁃R. IMT Vision: Framework and overall objectives of the future develop⁃ment of IMT for 2020 and beyond: ITU⁃R M.2083⁃0 [R]. 2015.
[2] QI R Z, CHI X F, ZHAO L L, et al. Martingales⁃based ALOHA⁃type grant⁃freeaccess algorithms for multi⁃channel networks with mMTC/URLLC terminals Co⁃existence [J]. IEEE access, 2020, 8: 37608 – 37620. DOI: 10.1109/AC⁃CESS.2020.2975545
[3] ALSENWI M, TRAN N H, BENNIS M, et al. eMBB⁃URLLC resource slicing: Arisk ⁃ sensitive approach [J]. IEEE communications letters, 2019, 23(4): 740–743. DOI: 10.1109/LCOMM.2019.2900044
[4] GIDLUND M, LENNVALL T, ÅKERBERG J. Will 5G become yet another wire⁃less technology for industrial automation? [C]//2017 IEEE International Confer⁃ence on Industrial Technology (ICIT). Toronto, Canada: IEEE, 2017: 1319–1324. DOI:10.1109/ICIT.2017.7915554
[5] ITU⁃R. Minimum requirements related to technical performance for IMT⁃ 2020radio interface(s): ITU⁃R M.2410⁃0 [R]. 2017
[6] 3GPP. Study on new radio (NR) access technology physical layer aspects: TR38.802 [S]. 2017
[7] POPOVSKI P, NIELSEN J J, STEFANOVIC C, et al. Wireless access for ultra⁃reliable low ⁃ latency communication: principles and building blocks [J]. IEEEnetwork, 2018, 32(2): 16–23. DOI: 10.1109/MNET.2018.1700258
[8] NIKBAKHT H, WIGGER M, SHITZ S S. Mixed delay constraints in Wyner’ssoft ⁃ handoff network [C]//2018 IEEE International Symposium on InformationTheory (ISIT). Vail, USA: IEEE, 2018: 1171 – 1175. DOI: 10.1109/ISIT.2018.8437572
[9] ANAND A, DE VECIANA G, SHAKKOTTAI S. Joint scheduling of URLLCand eMBB traffic in 5G wireless networks [C]// IEEE Conference on ComputerCommunications. Honolulu, USA: IEEE, 2018: 1970–1978. DOI: 10.1109/IN⁃FOCOM.2018.8486430
[10] KASSAB R, SIMEONE O, POPOVSKI P. Coexistence of URLLC and eMBBservices in the C⁃RAN uplink: an information⁃theoretic study [C]//2018 IEEEglobal communications conference (GLOBECOM). Abu Dhabi, United ArabEmirates: IEEE, 2018: 1–6. DOI: 10.1109/GLOCOM.2018.8647460
[11] KHAN H, BUTT M M, SAMARAKOON S, et al. Deep learning assisted CSI es⁃timation for joint URLLC and eMBB resource allocation [C]//2020 IEEE interna⁃tional conference on communications workshops (ICC workshops). Dublin, Ire⁃land: IEEE, 2020: 1–6. DOI:10.1109/ICCWorkshops49005.2020.9145297
[12] YANG W, LI C P, FAKOORIAN A, et al. Dynamic URLLC and eMBB multi⁃plexing design in 5G new radio[C]//2020 IEEE 17th Annual Consumer Com⁃munications & Networking Conference (CCNC). Las Vegas, USA: IEEE, 2020:1⁃5. DOI: 10.1109/CCNC46108.2020.9045687
[13] MA T T, ZHANG Y, WANG F G, et al. Slicing resource allocation for eMBBand URLLC in 5G RAN [J]. Wireless communications and mobile computing,2020, 2020: 1–11. DOI: 10.1155/2020/6290375
[14] ESSWIE A A, PEDERSEN K I. Null space based preemptive scheduling forjoint URLLC and eMBB traffic in 5G networks [C]//2018 IEEE GlobecomWorkshops. Abu Dhabi, United Arab Emirates: IEEE, 2018: 1– 6. DOI:10.1109/GLOCOMW.2018.8644351
[15] PEDERSEN K I, BERARDINELLI G, FREDERIKSEN F, et al. A flexible 5Gframe structure design for frequency⁃division duplex cases [J]. IEEE communi⁃cations magazine, 2016, 54(3): 53–59. DOI: 10.1109/MCOM.2016.7432148
[16] TAVARES F M L, BERARDINELLI G, MAHMOOD N H, et al. On the impact ofreceiver imperfections on the MMSE⁃ IRC receiver performance in 5G networks
[C]//2014 IEEE 79th Vehicular Technology Conference (VTC Spring). Seoul, Ko⁃rea (South): IEEE, 2014: 1–6. DOI: 10.1109/VTCSpring.2014.7023014
[17] ESSWIE A A, PEDERSEN K I. Capacity optimization of spatial preemptivescheduling for joint URLLC⁃eMBB traffic in 5G new radio [C]//2018 IEEE Glo⁃becom Workshops. Abu Dhabi, United Arab Emirates. IEEE, 2018: 1– 6.DOI: 10.1109/GLOCOMW.2018.8644070
Biographies
XIAO Kai([email protected])received the master degree from Xidian Uni⁃versity, China in 2015 before joining ZTE Corporation. He is now responsiblefor research and standardization of latest wireless technologies as a standardpre-research engineer at ZTE Corporation. His research interests include initialaccess of wireless channels, multi-service resource multiplexing, dynamic spec⁃trum sharing, and high-frequency wireless communication.
LIU Xing received the B.S. and M.S. degrees from Harbin Engineering Univer⁃sity (HEU), China in 2007 and 2010, respectively. He has been working in ZTECorporation as a pre-search engineer since graduation. His research interests in⁃clude URLLC, multicast and broadcast services and cognitive radio.
HAN Xianghui received his M.S. degree in communication and informationsystem in Beijing University of Posts and Telecommunications, China in 2015.Currently he is a senior researcher in ZTE Corporation. His research interestsinclude interference coexistence, shortened TTI and ultra-reliable and low la⁃tency communications.
HAO Peng received his M.S. degree in communication engineering from Bei⁃jing University of Posts and Telecommunications,China. He joined ZTE Corpo⁃ration in 2006 and worked on system and link level simulation of 4G system. Hehas also been involved in the research of key technologies of physical layer of4G LTE and 5G NR system.
ZHANG Junfeng received the M.S. degree in communication and informationtechnology from Tianjin University, China in 1999. After graduation, he joinedZTE Corporation as a senior engineer of the standardization department. Hismain research interests are initial access, reference signal, frequency hopping,Coordinated Multi-Point, URLLC, etc. He got two Golden Awards on the out⁃standing inventions from WIPO-SIPO.
ZHOU Dong received the M.S. degree in computer software and theory fromXi’an Jiaotong University,China in 2009 before joining ZTE Corporation. Heis now the director of spectrum policy and regulatory affairs at ZTE Corporation.His research interests include radio regulations, radio communication technicalpolicy, sharing and compatibility studies, cognitive ratio and reconfigurable ra⁃tio systems, high altitude platform systems, and satellite communication.
WEI Xingguang received the B.S. and M.S. degrees from Beijing University ofPosts and Telecommunications, China in 2015 and 2018, respectively. He hasbeen working in ZTE Corporation as a pre-search engineer since graduation.His research interests include URLLC, non-orthogonal multiple access and soft⁃ware defined radio.
90

Remit of JournalZTE Communications publishes original theoretical papers, research findings, and surveys on a broad range of communications topics, includ⁃ing communications and information system design, optical fiber and electro⁃optical engineering, microwave technology, radio wave propaga⁃tion, antenna engineering, electromagnetics, signal and image processing, and power engineering. The journal is designed to be an integratedforum for university academics and industry researchers from around the world.
Manuscript PreparationManuscripts must be typed in English and submitted electronically in MS Word (or compatible) format. The word length is approximately3 000 to 8 000, and no more than 8 figures or tables should be included. Authors are requested to submit mathematical material and graphicsin an editable format.
Abstract and KeywordsEach manuscript must include an abstract of approximately 150 words written as a single paragraph. The abstract should not include mathe⁃matics or references and should not be repeated verbatim in the introduction. The abstract should be a self⁃contained overview of the aims,methods, experimental results, and significance of research outlined in the paper. Five carefully chosen keywords must be provided with theabstract.
ReferencesManuscripts must be referenced at a level that conforms to international academic standards. All references must be numbered sequentially in⁃text and listed in corresponding order at the end of the paper. References that are not cited in⁃text should not be included in the referencelist. References must be complete and formatted according to ZTE Communications Editorial Style. A minimum of 10 references should beprovided. Footnotes should be avoided or kept to a minimum.
Copyright and DeclarationAuthors are responsible for obtaining permission to reproduce any material for which they do not hold copyright. Permission to reproduceany part of this publication for commercial use must be obtained in advance from the editorial office of ZTE Communications. Authors agreethat a) the manuscript is a product of research conducted by themselves and the stated co⁃authors;b) the manuscript has not been publishedelsewhere in its submitted form;c) the manuscript is not currently being considered for publication elsewhere. If the paper is an adaptation ofa speech or presentation, acknowledgement of this is required within the paper. The number of co⁃authors should not exceed five.
Content and StructureZTE Communications seeks to publish original content that may build on existing literature in any field of communications. Authors shouldnot dedicate a disproportionate amount of a paper to fundamental background, historical overviews, or chronologies that may be sufficientlydealt with by references. Authors are also requested to avoid the overuse of bullet points when structuring papers. The conclusion should in⁃clude a commentary on the significance/future implications of the research as well as an overview of the material presented.
Peer Review and EditingAll manuscripts will be subject to a two⁃stage anonymous peer review as well as copyediting, and formatting. Authors may be asked to reviseparts of a manuscript prior to publication.
Biographical InformationAll authors are requested to provide a brief biography (approx. 100 words) that includes email address, educational background, career experi⁃ence, research interests, awards, and publications.
Acknowledgements and FundingA manuscript based on funded research must clearly state the program name, funding body, and grant number. Individuals who contributedto the manuscript should be acknowledged in a brief statement.
Address for Submissionhttp://mc03.manuscriptcentral.com/ztecom
ZTE Communications Guidelines for Authors
•••••••
•••••••
•••••••
•••••••
•••••••
•••••••
•••••••
•••••••
•••••••
•••••••
•••••••
•••••••
•••••••
•••••••
•••••••
•••••••
•••••••
•••••••
•••••••
•••••••
•••••••
•••••••
•••••••
•••••••
•••••••
•••••••
•••••••
•••••••
•••••••
•••••••
•••••••
•••••••
•••••••
•••••••
•••••••
•••••••
•••••••
•••••••
•••••••
•••••••
•••••••
•••••••
•••••••
•••••••
•••••••
•••••••
•••••••
•••••••
•••••••
•••••••
•••••••
•••••••
•••••••
•••••••
•••••••
•••••••
•••••••

ZTE COMMUNICATIONS
ZTE Communications has been indexed in the following databases:
•Abstract Journal•Cambridge Scientific Abstracts (CSA)•China Science and Technology Journal Database•Chinese Journal Fulltext Databases•Index of Copurnicus•Inspec•Ulrich’s Periodicals Directory•Wanfang DataZTE COMMUNICATIONSVol. 19 No. 2 (Issue 74)QuarterlyFirst English Issue Published in 2003Supervised by:Anhui Publishing GroupSponsored by:Time Publishing and Media Co., Ltd.Shenzhen Guangyu Aerospace Industry Co., Ltd.Published by:Anhui Science & Technology Publishing HouseEdited and Circulated (Home and Abroad) by:Magazine House of ZTE CommunicationsStaff Members:General Editor: WANG XiyuEditor⁃in⁃Chief: JIANG XianjunExecutive Editor⁃in⁃Chief: HUANG XinmingEditor⁃in⁃Charge: ZHU LiEditors: REN Xixi, LU Dan, XU Ye, YANG GuangxiProducer: XU YingCirculation Executive: WANG PingpingLiaison Executive: LU DanAssistant: WANG KunEditorial Correspondence:Add: 12F Kaixuan Building, 329 Jinzhai Road,
Hefei 230061, P. R. ChinaTel: +86-551-65533356Email: [email protected]: http://journal13.magtechjournal.com/
Jwk3_zte
Annual Subscription: RMB 80Printed by:Hefei Tiancai Color Printing CompanyPublication Date: June 25, 2021China Standard Serial Number: ISSN 1673-5188
CN 34-1294/TN
中兴通讯技术(英文版)