spatio-temporal event modeling and ranking
TRANSCRIPT
Spatio-temporal Event Modeling and Ranking
Xuefei Li, Hongyun Cai, Zi Huang, Yang Yang, and Xiaofang Zhou
The University of Queensland, QLD 4072 Australia{x.li14,h.cai2}@uq.edu.au
{huang,yang.yang,zxf}@itee.uq.edu.au
Abstract. Effective event modeling allows accurate event identification andmonitoring to enable timely response to emergencies occurring in various ap-plications. Although event identification has been extensively studied in the lastdecade, the triggering relationship among initial and subsequent events has notbeen well studied, which limits the understanding of event evolvements fromboth spatial and temporal dimensions. Furthermore, it is also useful to measurethe impact of events to the public so that the important events can be first seen.In this paper, we propose to systematically study event modeling and ranking ina novel framework. A new method is introduced to effectively identify events byconsidering the spreading effect of event in the spatio-temporal space. To cap-ture the triggering relationships among events, we adapt the self-exciting pointprocess model by jointly considering event spatial, temporal and content similar-ities. As a step further, we define the event impact and rank them at different timestamps. Extensive experimental results on real-life datasets demonstrate promis-ing performance of our proposal in identifying, monitoring and ranking events.
Keywords: Spatio-temporal, Event Identification, Modeling, Ranking.
1 Introduction
Event identification, monitoring and ranking play a critical role in many applicationssuch as health monitoring and environmental management. For example, early warn-ings of impending natural disasters or disease are critical for the safety and securityof populations within the affected areas. Timely access to detailed event informationprovides an aggregated source of information on events of significance to the public,enables rapid response to public emergencies, and facilitates the monitoring of crowdsentiment among affected people. Thus, under a variety of situations, it is in high de-mand to derive an effective approach to identify events, track their evolvements andreport their impact to the public.
In recent years, event identification and tracking in social network has attracted alot of attention from different research communities. With the rapid development ofWeb 2.0, social media has become a common platform for communication and usefulresource for facilitate various database and multimedia applications [19]. The unprece-dented public access to large streams of real-time human communication presents aprime opportunity for automated analysis of important events, their evolving trends,and the corresponding public sentiment [12,16]. Thus, it is promising to detect eventsfrom social media data by utilizing its associated rich information.
X. Lin et al. (Eds.): WISE 2013, Part II, LNCS 8181, pp. 361–374, 2013.c© Springer-Verlag Berlin Heidelberg 2013
362 X. Li et al.
However, the complexities of event detection pose an array of research challenges,including how to incorporate spatio-temporal context and content; how to distinguishdifferent events and model their relationships; how to measure the event impact to thepublic, and so on. Some existing work incorporates temporal or spatial dynamics intoevent detection [9,12,20], while others combine spatio-temporal and content informa-tion into one similarity metric [2,14]. They either do not well address the problem ofmodeling events from a comprehensive spatio-temporal viewpoint or spend too muchtime tuning coefficient of each feature. Furthermore, event relationships and impact tothe public have not been systematically studied.
In this paper, we propose a framework for systematic study of event modeling andranking. Our principle contributions are summarized as follows:
– We propose a new method to effectively identify events from the social media databy jointly considering the spatio-temporal context and textual content. Particularly,spatial and temporal expansions are employed to reflect the natural spreading ofevents in the spatio-temporal space.
– We model the triggering relationships among events by a triggering probabilitygraph. We adapt the self-exciting point process model to capture the spatio-temporaland content triggering relationships among events. Conducting the graph visualiza-tion along the time line, the evolvements of events can be monitored.
– We further define and compute the event impact from the constructed triggeringprobability graph. Events can then be ranked and recommended to users accordingto their impact to the public.
We organize the rest of the paper as follows. Section 2 provides the problem def-inition and introduces the overall framework. We describe event modeling with eventidentification and triggering analysis in Section 3. Event ranking is discussed in Section4. The results are shown in Section 5. The related work is summarized in Section 6,followed by conclusion in Section 7.
2 Definitions and Framework
Definition 1 (Incident). An incident is defined as a spatio-temporal object. It is de-noted as di = {ti, li, ci}, where ti and li are the time and location spot where theincident di takes place respectively, and ci is the content describing the incident.
Definition 2 (Incidents Similarity). Given a set of incidents D = {d1, d2, · · · , dn},∀di, dj ∈ D, we define that two incidents di, dj are similar and denoted as di ↔ dj iffthe difference of di and dj in temporal, spatial and content properties are respectivelynot greater than three given thresholds θt, θl and θc, i.e. |ti − tj | ≤ θt, |li − lj | ≤ θland |ci − cj | ≤ θc.
Definition 3 (Event). An event Ei can be characterized as Ei = {Ti, Li, Ci, Ni},where Ti and Li are the time and location information of all the incidents in Ei, Ci
represents the combination of the content from all the incidents in Ei, and Ni standsfor the total number of incidents in Ei.
Spatio-temporal Event Modeling and Ranking 363
For simplicity, an event’s time is represented as the earliest time of all the incidents, itslocation is represented as the centroid of all the incidents’ location and its content isrepresented by combining all the texts into a single bag-of-word vector.
Definition 4 (Event Relationship). The relationship among events is illustrated byconditional probability matrix P , which indicates the triggering relationship betweenany pair of events. Given a set of N events,Pi,i indicates how possible Ei is an initiativeevent and Pj,i stands for the probability of Ei being triggered by Ej .
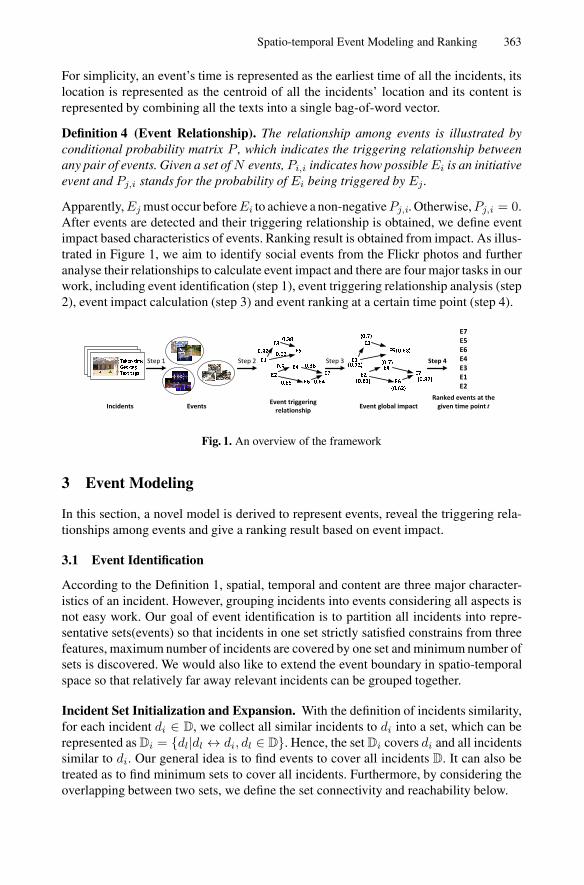
Apparently,Ej must occur beforeEi to achieve a non-negativePj,i. Otherwise,Pj,i = 0.After events are detected and their triggering relationship is obtained, we define eventimpact based characteristics of events. Ranking result is obtained from impact. As illus-trated in Figure 1, we aim to identify social events from the Flickr photos and furtheranalyse their relationships to calculate event impact and there are four major tasks in ourwork, including event identification (step 1), event triggering relationship analysis (step2), event impact calculation (step 3) and event ranking at a certain time point (step 4).
Incidents
Taken time
Geo-tag
Text tags
Events
Step 1 Step 2
Event triggering
relationship
E3
E5
E1
E2
E6
E4E7
0.9
0.85
0.36
0.64
0.92
0.38
0.62
Step 3
E3
E5
E1
E2
E6
E4E7
(0.63) (0.82)
(0.62)
(0.7)
(0.7)(0.72)
(0.68)
Event global impact
Step 4
E7
E5
E6
E4
E3
E1
E2
Ranked events at the
given time point t
Fig. 1. An overview of the framework
3 Event Modeling
In this section, a novel model is derived to represent events, reveal the triggering rela-tionships among events and give a ranking result based on event impact.
3.1 Event Identification
According to the Definition 1, spatial, temporal and content are three major character-istics of an incident. However, grouping incidents into events considering all aspects isnot easy work. Our goal of event identification is to partition all incidents into repre-sentative sets(events) so that incidents in one set strictly satisfied constrains from threefeatures, maximum number of incidents are covered by one set and minimum number ofsets is discovered. We would also like to extend the event boundary in spatio-temporalspace so that relatively far away relevant incidents can be grouped together.
Incident Set Initialization and Expansion. With the definition of incidents similarity,for each incident di ∈ D, we collect all similar incidents to di into a set, which can berepresented as Di = {dl|dl ↔ di, dl ∈ D}. Hence, the set Di covers di and all incidentssimilar to di. Our general idea is to find events to cover all incidents D. It can also betreated as to find minimum sets to cover all incidents. Furthermore, by considering theoverlapping between two sets, we define the set connectivity and reachability below.
364 X. Li et al.
Definition 5 (Set Connectivity). Given two sets Si and Sj , 1 ≤ i, j ≤ n, they areconnected if there exists a bridging dk ∈ D such that dk ∈ Si and dk ∈ Sj .
Definition 6 (Set Reachability). Given set Si and set Sj , they are reachable if thereexists {Sk0 , ..., Skr}, Sk0 = Si and Skr = Sj , such that Skl−1
and Sklare connected
for all 1 ≤ l ≤ r.
For spatial and temporal flexibility, we use set reachability to define spatial and tem-poral expanding as follows, based on which the expanded incident sets are generated.A strict constraint is applied in the spatial/temporal expansion that content dissimilarityfor any two incidents to be grouped together must not be greater than θc. It is becausethat from the perspective of semantics, compared with the spatial and temporal infor-mation, the content information has greater potential to distinguish one incident fromanother in event identification.
Definition 7 (Temporal Expanding). Given a set Si for di, 1 ≤ i ≤ n, it can betemporally expanded by including a number of reachable sets Sk1 ,...,SkZ , 1 ≤ kz ≤n, z = 1 . . . Z where the spatial distance between di and any incident from S
′ =(⋃Z
z=1 Skz ) ∪ Si satisfies θl.
Definition 8 (Spatial Expanding). Given a set Si for di, 1 ≤ i ≤ n, it can be spatiallyexpanded by including a number of reachable sets Sk1 ,...,SkZ , 1 ≤ kz ≤ n, z = 1 . . . Z
where the temporal distance between di and any incident from S′′ = (
⋃Zz=1 Skz ) ∪ Si
satisfies θt.
For each incident di, its initial set Si can be expanded in the spatio-temporal spaceto include more relevant incidents via transitive connectivity. With spatial or temporalexpanding, incidents across different locations or time stamps can still be grouped to-gether, which avoids splitting a complete event into several pieces due to the locationor time threshold.
Event Generation. Given the expanded incident sets {Si}, i = 1 . . . n, we aim to findthe minimal number of sets to cover all incidents, where each set is considered as anevent. This objective can be transferred into a minimum set cover problem. Thus, thebasic idea of our algorithm is to repeatedly select the current largest set to generate anew event and remove the incidents belonging to this set from any other sets until noset is left. The proposed algorithm is greedy in nature, and it has approximation ratio of(1 + ln r), where r is the cardinality of the largest set.
3.2 Event Triggering Analysis
Events can be divided into different types. Some events arise independently while oth-ers are triggered by previous events or influence their subsequent events. One typicalexample is the earthquake model [21] where the outbreak of an fore-shock earthquakeis inevitable to increase the likelihood of the main shock and other aftershocks nearby,and another example is the crime model in criminology [13] where burglars may repeat-edly attack nearby targets. Inspired from the above event models, we believe that socialevents happen in similar ways with more complex mutual relationship. This providesan intuition for analysing the triggering relationship among events.
Spatio-temporal Event Modeling and Ranking 365
Basic Self-exciting Point Process. A point process N(t) is a type of random pro-cess which counts the number of events and the time that these events occur in a giventime interval t. It is generally characterized via its conditional intensity λ(t). The self-exciting point process model [13] is a more appropriate way to model the event evolve-ment, because it also considers the emergence of the history independent events. Everyevent is possible to enhance the emergence chance of its following events and the ker-nel function φ(Δt) models the enhanced chance which spreads in time. The intensityfunction of self-exciting point process model is defined as follows [13]:
Definition 9 (Self-exciting Point Process).
λ(t) = η(t) +∑
i,ti<t
φ(t− ti) (1)
where ti is the occurrence time of the i-th event, η(t) is a Poisson background rateof the event occurs at t, φ is the memory kernel function indicating the increase ratein the intensity triggered by previous events at ti (ti < t), and λ(t) is the conditionalintensity of a point process.
Adapted Self-exciting Model for Social Events. Naturally, the self-exciting pointprocess can also be used to model social events’ evolvements. Here we adapt the self-exciting point process to utilize the spatio-temporal context and content for social eventrelationship analysis.
For each event Ei={Ti, Li, Ci, Ni}, we define its intensity λ as:
λ(Ei) = ηt(Ti)ηl(Li)ηc(Ci) +∑
j
φ(ΔTj , ΔLj , ΔCj) (2)
where ηt(·), ηl(·), and ηc(·) are the Poisson background rates of the event Ei occur-ring at time Ti, in location Li, and with content Ci respectively. φ is the memory kernelfunction indicating the increase rate in the intensity triggered by previous events beforeTi. ΔTi, ΔLi and ΔCi are the distances between Ei and its previous event Ej alongthe temporal, spatial, and content dimensions respectively.
In the above adapted model, the first component ηt(·)ηl(·)ηc(·) can be understood asthe opportunity for the event to self-occur, and the second component φ indicates theprobability of the event being triggered by previous events.
When calculate the intensity of each event, we aim to model the relationships be-tween events by the event relationship matrix P , as defined in Definition 4. For a spe-cific event Ei, it has a probability Pi,i of being a history independent event and Pj,i
indicating the probability of Ei being trigged by Ej . For event Ei, its total sum of Pi,i
and Pj,i should add up to 1. For example, if Pi,i =1, then Ei is self-triggered and it isan isolated event or initiative event.
Based on the adapted self-exciting point process model, Pi,i and Pj,i are calculatedas:
Pi,i =ηt(Ti)ηl(Li)ηc(Ci)
λ(Ei)(3)
366 X. Li et al.
and
Pj,i =φ(ΔTj , ΔLj , ΔCj)
λ(Ei)(4)
To compute P based on the adapted self-exciting point process model, the eventsneed to be separated into two groups: background (or history independent) events Eb
corresponding to the first component, and triggered events E−Eb corresponding to thesecond component in the model. Here we apply the stochastic declustering method [21]to separate events, estimate ηt, ηl, ηc, and φ, and update P iteratively until convergenceis achieved. The scheme is sketched in Algorithm 1.
We first provide an initial guess for P (line 1). With this initial guess, we use anexpectation maximization (EM) algorithm to finalize P . While P is changed from lastiteration, the following E-step and M-step are repeated (lines 2-8). In the E-step, athreshold on Pi,i is firstly generated using Monte Carlo method, and the events whosePi,i values in P are greater than the threshold will be added into Eb and the rest belongto E − Eb (line 4). Based on Eb and E − Eb, ηt, ηl, ηc and φ for each event are thenestimated using the Variable Bandwidth Kernel Density Estimation (VBKDE) (line 5).In the M-step, P is updated from ηt, ηl, ηc, and φ using Equations 4 and 5. These stepsare repeated until P remains unchanged.
Algorithm 1. P EstimationInput : EOutput: P
1 Initialize P ;
2 while P is changed from last iteration do
3 E-step:4 Generate Eb and E− Eb using Monte Carlo method and Pi,i;5 Estimate ηt, ηl, ηc, and φ from P , Eb and E− Eb using VBKDE (Variable Bandwidth
Kernel Density Estimation);
6 M-step:7 Update P from ηt, ηl, ηc, and φ using Equations 4 and 5 ;8 end
We use Kernel Density Estimation (KDE) to estimate the values of both Poissonbackground rates and the increase rate in the intensity triggered by previous events.Kernel density estimation is a non-parametric estimation way to estimate the proba-bility distribution of a random variable [13]. The quality of KDE depends mainly onits bandwidth. Small values of bandwidth lead to very spiky estimates with small biasand large variance while large values of bandwidth lead to small variance and largebias which will cause over-smoothing. Therefore choosing appropriate bandwidth isvery important. Since the memberships of background events Eb and triggered eventsE − Eb change in each iteration, a fixed bandwidth will thus lead to the problem ofover-smoothing or under-smoothing at different iterations. To address this problem, wealso choose Variable Bandwidth KDE as in [13] which is outlined in Algorithm 2.

Spatio-temporal Event Modeling and Ranking 367
Algorithm 2. VBKDEInput : P , Eb and E− Eb
Output: Estimated ηt, ηl, ηc, and φ for each Event
1 Scale inter-event distance to have unit variance and zero mean along temporal, spatial, andcontent dimensions respectively;
2 Compute bandwidths based on scaled data in three dimensions;3 Transfer scaled data back to the original scales;4 Estimate ηt, ηl, ηc, and φ for each event using Gaussian Kernel.
In the above VBKDE, the first three steps are used to generate the bandwidths forthree dimensions. The inter-event distances on different dimensions could be computeddifferently since different applications may have different types of data to representtemporal, spatial and content information. We will present the distance functions forthe tested datasets in the experiment section. For each event, the distance of its k-thnearest neighbor is regarded as the bandwidth for that event. In the fourth step, theGaussian kernel is used to estimate the values of ηt, ηl, ηc, and φ.
The time complexity of computing P based on the adapted self-exciting point pro-cess model is O(iter × N2), where iter is the number of iterations. Based on the factthat people will only care about the top 10 or top 200 events in a ranking, events withsmall impact are ignored and less than 10% of all events remain, which leads to a rathersmall N.
From the generated matrix P , a triggering probability graph can be constructed,where each node represents an event, and the directed edge from one eventEj to anotherevent Ei represents the probability of Ei being triggered by Ej . Recall the three typesof events. Subgraphs with single nodes represent isolated events. Nodes with outgoinglinks but without incoming links are initiative events, and nodes with incoming linksare subsequent events. By visualizing the graph, event relationships and their evolve-ments along time line can be easily monitored. With such a graph, events can also beranked according to their impact to the public so that the most important events can beidentified and recommended earlier.
4 Event Ranking
In this section, we rank events from the triggering probability graph represented by P .
4.1 Event Impact
Numerous new events occur continuously in the world. Some of them have significantimpact to the society while some others fade away quickly with not much effect. Weconsider several factors in determining the event impact. Firstly, it is observed thatif an event has major impact to the society, it usually draws high attention from lotsof people, reflected by the number of photos uploaded for the event and the numberof users who upload the photos. The more photos related to the event and the more
368 X. Li et al.
unique users participating in the event, the more impact an event can gain. Secondly, itis highly expected that events spreading over larger regions and lasting longer can affectthe public in greater spatial and temporal scales. Therefore, here we use four factors todefine the event impact as below.
Definition 10 (Event Impact). Given an event Ei, its impact denoted as I(Ei) is com-puted as:
I(Ei) = α1logNi + α2Nui + α3ρ
li + α4ρ
ti (5)
where Ni is the number of incidents in the event, Nui is the number of unique users
participating in the event, ρli and ρti are the area and the period covered by all theincidents in the event respectively. α1 + α2 + α3 + α4=1. They are the coefficientsof the linear combination. Logarithmic function is used on the number of incidents toavoid the effect of large number of photos uploaded by a single user.
Obviously, the above four factors are not directly comparable. We have to normalizeall of them before they can be combined. They are normalized by dividing by the max-imum values among all the events on each individual factors respectively. The weightsof different factors will be empirically tuned in the experiments.
4.2 Event Ranking
The global event impact reflects the importance of an event in the whole graph. How-ever, the impact of an event at a particular time point could be different. It is usual thatthe impact of an event decays as time goes by. Given an event, to calculate its currentimpact to the society is critical. By taking into account the time decay effect on eventimpact, we derive the following formula to calculate the local impact of event Ei at agiven time point t.
It(Ei)=
{Ik(Ei)× (1− Sigmoid(t− ti)), t ≥ ti
0, t < ti(6)
Where k is the last number of iteration and the sigmoid function is Sigmoid(t) = 11+e−t .
1 - Sigmoid(t− ti) is adopted to model the time decay. Given a time point t, the eventsidentified from the social media data will be ranked according to their It values.
5 Experiments
5.1 Set Up
Data Sets. Three real-life datasets are used in our experiments. All these datasets areextracted from Flickr by applying Flickr search API. (a)London dataset. We extract29,682 photos from Flickr, which were taken between July 1, 2012 to September 15,2012, within the region bounding box from (longitude:-0.557, latitude:51.283) to (lon-gitude:0.327, latitude:51.686). It covers greater London area. (b)Brisbane dataset. Atotal number of 11,330 photos taken between January 1, 2011 to May 1, 2013 are ex-tracted from the online group Brisbanites: Brisbane Photos. (c)New York dataset. Bysetting the search bounding box as (longitude: -74.5, latitude: 40) to (longitude: -73.5,latitude: 41.2) and the time interval as 1 Jan, 2011 to 1 May, 2013, we collect 372,357photos taken in New York City and its neighboring areas.

Spatio-temporal Event Modeling and Ranking 369
All extracted Flickr photos are associated with taken time, location and text tagsand the text tags are pre-processed by removing stop words, splitting compound words,stemming, etc. The proposed algorithms are applied to the above three datasets to iden-tify the events and also calculate their impacts for event ranking.
Distance Functions. To measure the distance between two events, in this paper we usea relatively simple event representation. The earliest of all the incidents’ time stamps inan event is taken as the event’s time, and the centroid of all the incidents’ locations inan event is taken as the event location. An event content is constructed by combining allthe tags from the member incidents and the content distance is measured by the cosinedistance function in the vector space model.
Ground Truth Generation. Two groups of ground truth are generated for event iden-tification and event ranking separately. We manually identify all events for London,Brisbane and New York data sets. A web system is developed to collect the crowd intel-ligence for event ranking ground truth generation. Each event is represented by its mostfrequent tags and four photos which are randomly selected to depict the event. Usersare required to give an impact rate to each event from five levels from 5 to 1 indicatingthe decreasing importance of the event. The final impact of each event is calculated byaveraging the rates from 30 users.
Performance Indicators. Two measures are used for performance indication.
– Event coverage. This indicator is used to measure the effectiveness of the eventidentification algorithm. For each ground truth event and its best matched eventreturned from the algorithm, its coverage is defined as the ratio of the size of theoverlapped incidents to the size of the union of incidents in two events. The av-eraged coverage over all the ground truth events is used as the final indicator toindicate the effectiveness of the algorithm. Note that every event identified by thealgorithm can only be matched at most once with the ground truth events. Obvi-ously, the bigger the value of event coverage, the more effective the algorithm is toidentify events and assign incidents to correct events.
– Normalized Discounted Cumulative Gain (nDCG) [10]. nDCG is used to eval-uate the event ranking performance. It uses a graded relevance scale of events (5levels in our experiments) in the result list, and measures the gain of an event basedon its position in the result list. The gain is accumulated from the top of the resultlist to the bottom with the gain of each result discounted at lower ranks.
Compared Methods. Two different comparison strategies are used in our experimentfor event identification and event ranking respectively.
Event identification. We compare our event identification work with three existingwork [2], [4] and [14]. In [2], a supervised learning method is introduced to learn sim-ilarity metrics for time, location and text features in event identification. [4] analysethe temporal and spatial distributions of tags by means of discrete wavelet transformand identify events from related tag clusters. In [14], a content-similarity graph is firstconstructed by pair-wisely comparing images’ content, followed by applying SCANapproach [18] to do graph clustering. Each generated subgraph is regarded as an event.
370 X. Li et al.
In this paper, we use incremental clustering, wavelet-based clustering and graph clus-tering to refer to the method in [2], [4] and [18] respectively.
Event Ranking. Due to the lack of existing work on event ranking, we evaluate theproposed framework in the way of replacing our proposal in each step by one or severalbaseline algorithms and study their differences on performance. The effect of eventtriggering relationship analysis, the effect of event impact initialization for random walkand the effect of random walk itself are quantitatively analyzed. All the experiments areimplemented on a PC with Windows 7, Intel(R) Core(TM) i7-2600 CPU, and 8GB ofRAM.
5.2 Results on Event Identification
In our event identification algorithm, we have three parameters θt, θl and θc to tune. Ourpreliminary results on textual content only show that a content distance smaller than 0.8can find high quality events from the perspective of semantics. Therefore, we fix θc =0.2 and tune θt and θl in this experiment. Different users may have interest in differentevent types. Those who focus on large global events may provide larger thresholdswhile others who care about local events may provide relatively small thresholds. Herewe aim to tune the thresholds such that events can be identified as many as possible,based on the given ground truth.
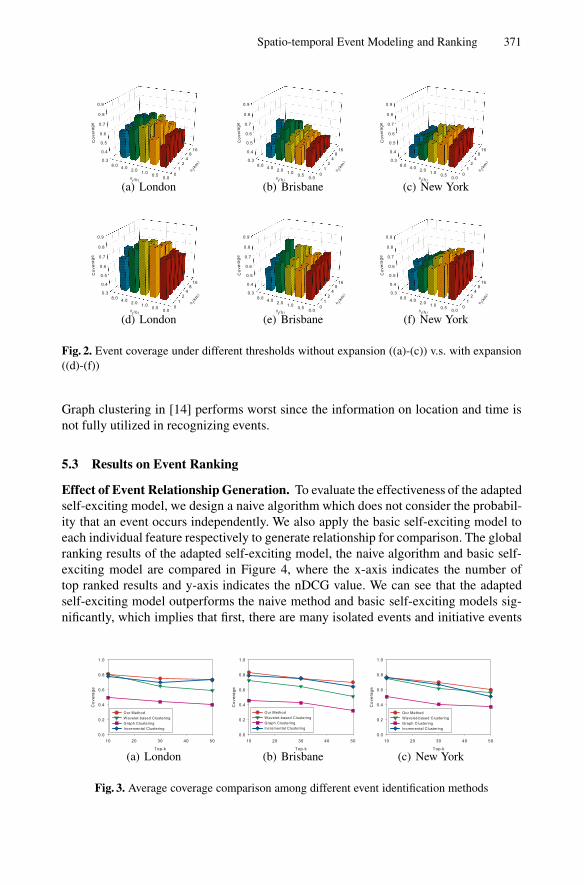
Figure 2 (a)-(c) shows the effects of θt and θl on event coverage without spatial ortemporal expansion, and Figure 2 (d)-(f) shows the results with spatial and temporalexpansions. It is noticed that events in London and New York typically span shortertime period and smaller location range than events in Brisbane. One reason is that thereare less photos in Brisbane dataset which also have a longer time range than the othertwo datasets. Thus, there are less events which potentially last longer in larger area inBrisbane dataset. Comparing (a)-(c) with (d)-(f) in Figure 2, it is clear that the iden-tification algorithm with spatial and temporal expansions improves the base algorithmsignificantly on all three datasets. This confirms that proper expansions can better cap-ture the event in both spatial and temporal dimensions. Based on the results in Figure 2(d)-(f), for London dataset, we set θt=2 hours and θl=1 km. For New York dataset, weset θt=1 hour and θl=2 km. As for Brisbane dataset, we set θt=4 hours and θl=4 km.
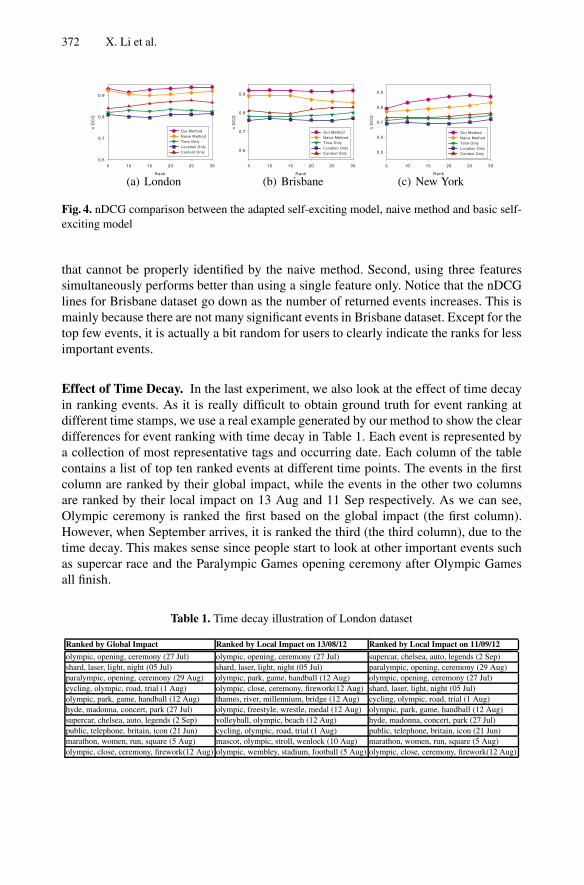
The comparison of average coverage among different methods is illustrated in Figure3. We select top 10, 30, 50 largest events from ground truth and compare them with gen-erated events from three methods. As can be seen, our method outperforms other threemethods consistently. Incremental clustering in [2] applies supervised learning whichrelies on the prior knowledge of ground truth. However, it is still outperformed by ourmethod. One main reason we believe is that the enforced similarity combination fromthree different features using a voting scheme may not work very well. Three featureshave completely different properties. It is not intuitive to combine them in a sensibleway. However, our method deals with different features individually by providing dif-ferent thresholds to them, according to their own properties. This shows that it mightnot be necessary to combine the evidences from different features as a single indicator,when they are not comparable at all. Wavelet-based clustering in [4] analyse spatial andtemporal distribution of tag usage to identify event. Since the periodic events do notmatch the definition of events in our method, it has relatively lower coverage value.
Spatio-temporal Event Modeling and Ranking 371
(a) London (b) Brisbane (c) New York
(d) London (e) Brisbane (f) New York
Fig. 2. Event coverage under different thresholds without expansion ((a)-(c)) v.s. with expansion((d)-(f))
Graph clustering in [14] performs worst since the information on location and time isnot fully utilized in recognizing events.
5.3 Results on Event Ranking
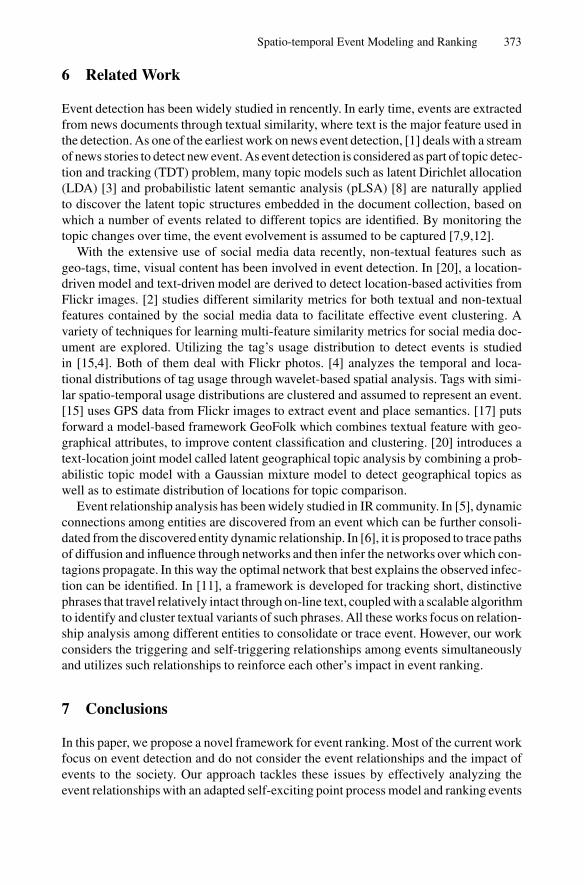
Effect of Event Relationship Generation. To evaluate the effectiveness of the adaptedself-exciting model, we design a naive algorithm which does not consider the probabil-ity that an event occurs independently. We also apply the basic self-exciting model toeach individual feature respectively to generate relationship for comparison. The globalranking results of the adapted self-exciting model, the naive algorithm and basic self-exciting model are compared in Figure 4, where the x-axis indicates the number oftop ranked results and y-axis indicates the nDCG value. We can see that the adaptedself-exciting model outperforms the naive method and basic self-exciting models sig-nificantly, which implies that first, there are many isolated events and initiative events
(a) London (b) Brisbane (c) New York
Fig. 3. Average coverage comparison among different event identification methods
372 X. Li et al.
(a) London (b) Brisbane (c) New York
Fig. 4. nDCG comparison between the adapted self-exciting model, naive method and basic self-exciting model
that cannot be properly identified by the naive method. Second, using three featuressimultaneously performs better than using a single feature only. Notice that the nDCGlines for Brisbane dataset go down as the number of returned events increases. This ismainly because there are not many significant events in Brisbane dataset. Except for thetop few events, it is actually a bit random for users to clearly indicate the ranks for lessimportant events.
Effect of Time Decay. In the last experiment, we also look at the effect of time decayin ranking events. As it is really difficult to obtain ground truth for event ranking atdifferent time stamps, we use a real example generated by our method to show the cleardifferences for event ranking with time decay in Table 1. Each event is represented bya collection of most representative tags and occurring date. Each column of the tablecontains a list of top ten ranked events at different time points. The events in the firstcolumn are ranked by their global impact, while the events in the other two columnsare ranked by their local impact on 13 Aug and 11 Sep respectively. As we can see,Olympic ceremony is ranked the first based on the global impact (the first column).However, when September arrives, it is ranked the third (the third column), due to thetime decay. This makes sense since people start to look at other important events suchas supercar race and the Paralympic Games opening ceremony after Olympic Gamesall finish.
Table 1. Time decay illustration of London dataset
Ranked by Global Impact Ranked by Local Impact on 13/08/12 Ranked by Local Impact on 11/09/12
olympic, opening, ceremony (27 Jul) olympic, opening, ceremony (27 Jul) supercar, chelsea, auto, legends (2 Sep)shard, laser, light, night (05 Jul) shard, laser, light, night (05 Jul) paralympic, opening, ceremony (29 Aug)paralympic, opening, ceremony (29 Aug) olympic, park, game, handball (12 Aug) olympic, opening, ceremony (27 Jul)cycling, olympic, road, trial (1 Aug) olympic, close, ceremony, firework(12 Aug) shard, laser, light, night (05 Jul)olympic, park, game, handball (12 Aug) thames, river, millennium, bridge (12 Aug) cycling, olympic, road, trial (1 Aug)hyde, madonna, concert, park (27 Jul) olympic, freestyle, wrestle, medal (12 Aug) olympic, park, game, handball (12 Aug)supercar, chelsea, auto, legends (2 Sep) volleyball, olympic, beach (12 Aug) hyde, madonna, concert, park (27 Jul)public, telephone, britain, icon (21 Jun) cycling, olympic, road, trial (1 Aug) public, telephone, britain, icon (21 Jun)marathon, women, run, square (5 Aug) mascot, olympic, stroll, wenlock (10 Aug) marathon, women, run, square (5 Aug)olympic, close, ceremony, firework(12 Aug) olympic, wembley, stadium, football (5 Aug) olympic, close, ceremony, firework(12 Aug)
Spatio-temporal Event Modeling and Ranking 373
6 Related Work
Event detection has been widely studied in rencently. In early time, events are extractedfrom news documents through textual similarity, where text is the major feature used inthe detection. As one of the earliest work on news event detection, [1] deals with a streamof news stories to detect new event. As event detection is considered as part of topic detec-tion and tracking (TDT) problem, many topic models such as latent Dirichlet allocation(LDA) [3] and probabilistic latent semantic analysis (pLSA) [8] are naturally appliedto discover the latent topic structures embedded in the document collection, based onwhich a number of events related to different topics are identified. By monitoring thetopic changes over time, the event evolvement is assumed to be captured [7,9,12].
With the extensive use of social media data recently, non-textual features such asgeo-tags, time, visual content has been involved in event detection. In [20], a location-driven model and text-driven model are derived to detect location-based activities fromFlickr images. [2] studies different similarity metrics for both textual and non-textualfeatures contained by the social media data to facilitate effective event clustering. Avariety of techniques for learning multi-feature similarity metrics for social media doc-ument are explored. Utilizing the tag’s usage distribution to detect events is studiedin [15,4]. Both of them deal with Flickr photos. [4] analyzes the temporal and loca-tional distributions of tag usage through wavelet-based spatial analysis. Tags with simi-lar spatio-temporal usage distributions are clustered and assumed to represent an event.[15] uses GPS data from Flickr images to extract event and place semantics. [17] putsforward a model-based framework GeoFolk which combines textual feature with geo-graphical attributes, to improve content classification and clustering. [20] introduces atext-location joint model called latent geographical topic analysis by combining a prob-abilistic topic model with a Gaussian mixture model to detect geographical topics aswell as to estimate distribution of locations for topic comparison.
Event relationship analysis has been widely studied in IR community. In [5], dynamicconnections among entities are discovered from an event which can be further consoli-dated from the discovered entity dynamic relationship. In [6], it is proposed to trace pathsof diffusion and influence through networks and then infer the networks over which con-tagions propagate. In this way the optimal network that best explains the observed infec-tion can be identified. In [11], a framework is developed for tracking short, distinctivephrases that travel relatively intact through on-line text, coupled with a scalable algorithmto identify and cluster textual variants of such phrases. All these works focus on relation-ship analysis among different entities to consolidate or trace event. However, our workconsiders the triggering and self-triggering relationships among events simultaneouslyand utilizes such relationships to reinforce each other’s impact in event ranking.
7 Conclusions
In this paper, we propose a novel framework for event ranking. Most of the current workfocus on event detection and do not consider the event relationships and the impact ofevents to the society. Our approach tackles these issues by effectively analyzing theevent relationships with an adapted self-exciting point process model and ranking events
374 X. Li et al.
with random walk. Our experimental results verify the effectiveness of our method.In future, we plan to study sophisticated event representation models and introducescalable algorithms to detect events from large-scale datasets.
Acknowledgement. This research is partially supported by National 863 High-techProgram (Grant No. 2012AA011001) and the Australian Research Council(DP120102829 and DP110103871).
References
1. Allan, J., Papka, R., Lavrenko, V.: On-line new event detection and tracking. In: SIGIR, pp.37–45 (1998)
2. Becker, H., Naaman, M., Gravano, L.: Learning similarity metrics for event identification insocial media. In: WSDM, pp. 291–300 (2010)
3. Blei, D.M., Ng, A.Y., Jordan, M.I.: Latent dirichlet allocation. JMLR 3, 993–1022 (2003)4. Chen, L., Roy, A.: Event detection from flickr data through wavelet-based spatial analysis.
In: CIKM, pp. 523–532 (2009)5. Sarma, A.D., Jain, A., Yu, C.: Dynamic relationship and event discovery. In: WSDM, pp.
207–216 (2011)6. Rodriguez, M.G., Leskovec, J., Krause, A.: Inferring networks of diffusion and influence. In:
KDD, pp. 1019–1028 (2010)7. Ha-Thuc, V., Mejova, Y., Harris, C., Srinivasan, P.: A relevance-based topic model for news
event tracking. In: SIGIR, pp. 764–765 (2009)8. Hofmann, T.: Probabilistic latent semantic indexing. In: SIGIR, pp. 50–57 (1999)9. Hong, L., Yin, D., Guo, J., Davison, B.D.: Tracking trends: incorporating term volume into
temporal topic models. In: KDD, pp. 484–492 (2011)10. Jarvelin, K., Kekalainen, J.: Cumulated gain-based evaluation of ir techniques. TOIS 20(4),
422–446 (2002)11. Leskovec, J., Backstrom, L., Kleinberg, J.: Meme-tracking and the dynamics of the news
cycle. In: KDD, pp. 497–506 (2009)12. Lin, C.X., Zhao, B., Mei, Q., Han, J.: Pet: a statistical model for popular events tracking in
social communities. In: KDD, pp. 929–938 (2010)13. Mohler, G.O., Short, M.B., Brantingham, P.J., Schoenberg, F.P., Tita, G.E.: Self-exciting
point process modeling of crime. JASA 106(493), 100–108 (2011)14. Papadopoulos, S., Zigkolis, C., Kompatsiaris, Y., Vakali, A.: Cluster-Based Landmark and
Event Detection for Tagged Photo Collections. IEEE MultiMedia 18, 52–63 (2011)15. Rattenbury, T., Good, N., Naaman, M.: Towards automatic extraction of event and place
semantics from flickr tags. In: SIGIR, pp. 103–110 (2007)16. Sakaki, T., Okazaki, M., Matsuo, Y.: Earthquake shakes twitter users: real-time event detec-
tion by social sensors. In: WWW, pp. 851–860 (2010)17. Sizov, S.: Geofolk: latent spatial semantics in web 2.0 social media. In: WSDM, pp. 281–290
(2010)18. Xu, X., Yuruk, N., Feng, Z., Schweiger, T.A.J.: Scan: a structural clustering algorithm for
networks. In: KDD, pp. 824–833. ACM (2007)19. Yang, Y., Yang, Y., Shen, H.T.: Effective transfer tagging from image to video. TOMC-
CAP 9(2), 14 (2013)20. Yin, Z., Cao, L., Han, J., Zhai, C., Huang, T.S.: Geographical topic discovery and compari-
son. In: WWW, pp. 247–256 (2011)21. Zhuang, J., Ogata, Y., Vere-Jones, D.: Stochastic declustering of space-time earthquake oc-
currences. JASA 97(458), 369–380 (2002)