spatial variation in fluid flow and geochemical fluxes across the sediment–seawater interface at...
TRANSCRIPT

Available online at www.sciencedirect.com
www.elsevier.com/locate/gca
Geochimica et Cosmochimica Acta 75 (2011) 1124–1144
Spatial variation in fluid flow and geochemical fluxes acrossthe sediment–seawater interface at the Carlos Ribeiro
mud volcano (Gulf of Cadiz)
Heleen Vanneste a,⇑, Boris A. Kelly-Gerreyn a, Douglas P. Connelly a,Rachael H. James a, Matthias Haeckel b, Rebecca E. Fisher c,
Katja Heeschen a,1, Rachel A. Mills a
a National Oceanography Centre Southampton, University of Southampton, Waterfront Campus, European Way, Southampton SO14 3ZH, UKb Leibniz-Institute of Marine Sciences, IFM-GEOMAR, Wischhofstrabe 1-3, D-24148 Kiel, Germany
c Department of Earth Sciences, Royal Holloway, University of London, Egham, Surrey TW20 0EX, UK
Received 25 May 2010; accepted in revised form 5 November 2010; available online 25 November 2010
Abstract
Submarine mud volcanism is an important pathway for transfer of deep-sourced fluids enriched in hydrocarbons and otherelements into the ocean. Numerous mud volcanoes (MVs) have been discovered along oceanic plate margins, and integratedelemental fluxes are potentially significant for oceanic chemical budgets. Here, we present the first detailed study of the spatialvariation in fluid and chemical fluxes at the Carlos Ribeiro MV in the Gulf of Cadiz. To this end, we combine analyses of thechemical composition of pore fluids with a 1-D transport-reaction model to quantify fluid fluxes, and fluxes of boron, lithiumand methane, across the sediment–seawater interface. The pore fluids are significantly depleted in chloride, but enriched inlithium, boron and hydrocarbons, relative to seawater. Pore water profiles of sulphate, hydrogen sulphide and total alkalinityindicate that anaerobic oxidation of methane occurs at 34–180 cm depth below seafloor. Clay mineral dehydration, and inparticular the transformation of smectite to illite, produces pore fluids that are depleted in chloride and potassium. Profilesof boron, lithium and potassium are closely related, which suggests that lithium and boron are released from the sedimentsduring this transformation. Pore fluids are expelled into the water column by advection; fluid flow velocities are 4 cm yr�1 atthe apex of the MV but they rapidly decrease to 0.4 cm yr�1 at the periphery. The associated fluxes of boron, lithium andmethane vary between 7–301, 0.5–6 and 0–806 mmol m�2 yr�1, respectively. We demonstrate that fluxes of Li and B dueto mud volcanism may be important on a global scale, however, release of methane into the overlying water column is sup-pressed by microbial methanotrophy.� 2010 Elsevier Ltd. All rights reserved.
1. INTRODUCTION
Submarine mud volcanoes (MVs) occur throughout theworld’s oceans (Milkov, 2000; Dimitrov, 2002; Kopf, 2002).
0016-7037/$ - see front matter � 2010 Elsevier Ltd. All rights reserved.
doi:10.1016/j.gca.2010.11.017
⇑ Corresponding author. Tel.: +44 (0)23 8059 6544.E-mail addresses: [email protected], hlaev105@noc.
soton.ac.uk (H. Vanneste).1 Present address: Bundesanstalt fur Geowissenschaften und
Rohstoffe (BGR), Stilleweg 2, DE-30655 Hannover, Germany.
They are usually mound-like features on the seafloor thatare characterized by a central conduit (through whichmud and fluids are extruded), while the mound itself isgenerally made up of clasts in a clay mineral-rich matrix(i.e. mud breccia; Kopf, 2002). The main driving force ofmud volcanism is pore fluid overpressurization at depth.This tends to occur where sediments accumulate rapidly,or in regions that are subject to tectonic stress and/or tohydrocarbon formation, and, as a result, MVs are com-monly found close to subduction zones and orogenic belts

Fluid flow and geochemical fluxes at the Carlos Ribeiro mud volcano 1125
(Hedberg, 1974; von Huene and Lee, 1983; Brown andWestbrook, 1988; Dimitrov, 2002; Kopf, 2002).
Until relatively recently, quantification of fluid andchemical fluxes associated with submarine mud volcanismhas been intractable, principally because of their inaccessi-bility. However, with the advent of remotely operated vehi-cle (ROV) technology, this situation is now beginning tochange, and the results of a number of studies suggest thatmud volcanism can contribute significantly to the transferof fluids and chemical elements from the subsurface tothe ocean (e.g. Kopf and Deyhle, 2002; Aloisi et al., 2004;Sauter et al., 2006). For example, most MV fluids are de-pleted in chloride (Cl) relative to seawater, which has beenvariably attributed to clay mineral dehydration (e.g. Kast-ner et al., 1991; Brown et al., 2001; Dahlmann and deLange, 2003), gas hydrate dissociation (Hesse and Harri-son, 1981) and/or meteoric water inflow (e.g. Aquilinaet al., 1997). In particular, MV fluids tend to have far high-er levels of boron (B, e.g. Kopf and Deyhle, 2002; Hensenet al., 2007) and lithium (Li, e.g. Martin et al., 1996; Youet al., 2004) relative to seawater. Although both elementsare enriched in clay minerals that form at low temperature(Schwarcz et al., 1969; Spivack et al., 1987), they can be re-turned to solution during hydrothermal alteration at rela-tively low temperatures (�50 �C; You et al., 1996b; Jameset al., 2003) and by desorption and mineral dehydrationreactions during burial (James and Palmer, 2000; Deyhleand Kopf, 2002; Teichert et al., 2005). At greater depths,higher temperature reactions with sediments and the oce-anic or continental basement can produce very high concen-trations of pore water Li and B (Stoffyn-Egli andMackenzie, 1984; You et al., 1995a). Nevertheless, althoughexchange of Li and B between the solid phase and porewaters is strongly dependent on temperature, other vari-ables, including pH and mineralogy, can also be important(Seyfried et al., 1984; You et al., 1996a; Vigier et al., 2008).Assessment of the role of mud volcanism in the oceanicbudget of these elements is of pressing importance becausethey are increasingly being used as palaeoceanographictracers of environmental change: B as a proxy for past sea-water pH (Spivack et al., 1993; Pearson and Palmer, 2000)and Li as a proxy for past rates of continental weathering(Hathorne and James, 2006).
In addition to B and Li, MV fluids tend to contain highlevels of methane, CH4. Methane is an important green-house gas and, for this reason, a lot of work has gone intoquantifying the flux of methane from MVs into the overly-ing water column (e.g. Ginsburg et al., 1999; Dimitrov,2002; Haese et al., 2003; Kopf, 2003; Milkov et al., 2003;Milkov and Etiope, 2005). This includes analysis of porewater CH4 concentrations and pore fluid modelling (e.g.Henry et al., 1996), as well as in situ measurements of gasbubbles (e.g. Sauter et al., 2006) and methane consumptionrates (e.g. Linke et al., 2005; Niemann et al., 2006b; Som-mer et al., 2009). It is now recognised that not all of themethane transported from depth in the MV system willbe released into the water column. This is because of anaer-obic oxidation of methane (AOM) by chemosyntheticorganisms in the subsurface (Barnes and Goldberg, 1976;Reeburgh, 1976, 2007; Nauhaus et al., 2002; Treude et al.,
2003). AOM is performed by a consortium of anaerobicmethanotrophic archaea and sulphate reducing bacteria; to-gether, these organisms oxidize methane (ultimately con-verting CH4 to HCO3
�) by the reduction of SO42�
(Hinrichs et al., 1999; Boetius et al., 2000; Orphan et al.,2001). In this way, fluid seepage at MVs supports a uniquechemosynthetic ecosystem (Levin, 2005 and referencestherein) that strongly influences the biodiversity and spatialdistribution of organisms across the MV surface (e.g.Werne et al., 2004; de Beer et al., 2006).
This study focuses on the Carlos Ribeiro MV (CRMV)in the Gulf of Cadiz. To date, there are only a handful ofreports of the chemical composition of pore fluids expelledfrom MVs in the Gulf of Cadiz (Mazurenko et al., 2002;Hensen et al., 2007; Scholz et al., 2009), and these are, forthe most part, based on only a single core, so they providelimited information on the spatial variation in chemical andfluid fluxes. In order to fill this gap, and to provide morerigorous flux estimates, we have analysed a number of coresfrom a transect that runs from the apex of the CRMV to itsperiphery and a mudflow located SE of the summit. Atransport-reaction model is applied to the pore fluid datato obtain estimates of fluid advection velocities, fluxes ofLi, B and CH4 from the subsurface to the overlying watercolumn, and rates of AOM in the subsurface. The effectof AOM on the escape of CH4 into the water column is alsoassessed. Finally, these results are extrapolated across thesurface of the entire MV to assess the impact of mud volca-nism on the Li, B and CH4 inventories of the ocean.
2. GEOLOGICAL SETTING
The Gulf of Cadiz (Fig. 1) is the marine area that sepa-rates the Iberian and African mainlands west of the Gibral-tar Strait, which encompasses the boundary between theEurasian and African plates. It is part of a wide deforma-tion band from the Gorringe Bank to the Alboran Sea (eastof the Gibraltar Strait), which has experienced a complextectonic history since the North Atlantic Ocean began toopen, in the Triassic (200 Ma ago; Heyman, 1989).
The current tectonic plate arrangement in the Gulf ofCadiz was established �20 Ma ago, after the westwardmovement of the Gibraltar Arc domain (Dewey et al.,1989; Maldonado et al., 1999). This emplacement resultedin a complex of imbricated thrusts detached from a decolle-ment surface, resembling a subduction accretionary wedge(Gutscher et al., 2002). The absence of seismicity, and thealmost undeformed sediment seal, suggests that the subduc-tion is currently not active (Zitellini et al., 2009). The pres-ence of MVs (Gardner, 1999; Pinheiro et al., 2003; VanRensbergen et al., 2005), salt diapirs (Flinch et al., 1996;Berastegui et al., 1998) and other fluid escape structures(e.g. pockmarks and carbonate mud-mounds; Baraza andErcilla, 1996; Casas et al., 2003; Dıaz-del-Rıo et al., 2003;Leon et al., 2006; Fernandez-Puga et al., 2007) piercingthe sedimentary cover of the accretionary complex indicatesthat strike-slip and compressional deformation is occurringat the present-day (Gutscher et al., 2009; Rosas et al., 2009).
More than 30 MVs have been discovered in this areaover the last decade. The MVs tend to be clustered on the

Fig. 1. Simplified geological map of the Gulf of Cadiz (NE-Atlantic Ocean) showing the location of the accretionary prism (modified fromMedialdea et al. (2009)) and of known mud volcanoes to date (compilation of Kenyon et al. (2000, 2003, 2006), Pinheiro et al. (2003), Somozaet al. (2003), Van Rensbergen et al. (2005), Akhmetzhanov et al. (2007)). The shaded relief map of the Carlos Ribeiro MV shows the core siteslocated along a 380 m-long transect.
1126 H. Vanneste et al. / Geochimica et Cosmochimica Acta 75 (2011) 1124–1144
slopes of the Gulf, in water depths ranging from �300 to�3800 m. The MVs vary in shape from conical to flat-topped, so-called ‘mud pies’ that range in diameter fromseveral tens of meters to �4 km and heights of up to200 m (Pinheiro et al., 2003). They are mainly constructedfrom grey Miocene age plastic marls (Gardner, 2001; Ovsy-annikov et al., 2003; Pinheiro et al., 2003). Fluids expelledfrom MVs in the Gulf of Cadiz are diverse in composition;they are both enriched and depleted in Cl relative to seawa-ter, with high levels of Cl associated with evaporite dissolu-tion (Hensen et al., 2007; Scholz et al., 2009), particularlyon the Iberian and Moroccan continental margins (Medial-dea et al., 2009). Strong enrichments in B (up to 14 mM;Hensen et al., 2007) and Li (up to 3.3 mM; Scholz et al.,2009) have been recorded in pore waters from the CaptainArutyunov, Mercator and Bonjardim MVs, which havebeen attributed either to input of hydrothermal fluidsand/or to high temperature (>150 �C) alteration of sedi-ments or basement rocks (Hensen et al., 2007; Scholzet al., 2009). Hydrocarbon gases seeping from the MVsare predominantly of thermogenic origin (Mazurenkoet al., 2002; Stadnitskaia et al., 2006; Hensen et al., 2007;Nuzzo et al., 2009). Some studies, based on isotope mea-surements, have suggested that the hydrocarbons may, inpart, be derived from a shallow bacterial source (Stadnits-kaia et al., 2006). However, a recent study has indicatedthat isotope signatures may be affected by partial recycling
of thermogenic CH4 in shallow sediments by AOM-relatedmethanogenic archaea (Nuzzo et al., 2008).
The Carlos Ribeiro MV itself lies on the deep Portu-guese Margin on the lower slope of the accretionary wedgeat 2173 m below sea level (Fig. 1). Morphologically the MVis round with a flat-top, extending to �1500 m in diameterand �80 m in height (Pinheiro et al., 2003). The eye (i.e. thefocus of activity) of the MV lies slightly to the north of itscentre, and it is surrounded by a series of concentric ridgeswhich build up the MV. A mudflow from the summit to thesoutheast flank is visible on the bathymetric map (Fig. 1).
3. MATERIALS AND METHODS
3.1. Sample collection
A series of gravity, piston and multi cores were takenfrom the Carlos Ribeiro MV during RRS James Cook
Cruise 10, in May–June 2007 (Table 1). The cores were ta-ken from five sites, aligned along a transect connecting theeye of the MV with mudflow pathway on its southeast flank(Fig. 1). In addition, one piston and one multi core were ta-ken away from the MV, at a ‘background site’ that lies2.9 km to the southwest of the CRMV (Table 1). Samplingof the cores was undertaken in a cold room (�6 �C)onboard the ship; piston and gravity cores were sampledevery 20 cm while multi cores were sliced into 1–3 cm

Table 1Location of studied coring sites. PC = piston core; GC = gravity core; MC = multi core.
Core code Region of Carlos Ribeiro MV Latitude (�N) Longitude (�W) Water depth (m)
PC-43 2.9 km SW of Carlos Ribeiro MV, reference 35�46.040 8�26.5510 2344MC-44 35�46.0420 8�26.5540 2344GC-52 Summit, eye 35�47.2550 8�25.3270 2173PC-53 35�47.2590 8�25.3200 2174MC-57 35�47.2500 8�25.3240 2175GC-49 Summit, off-centre, SE 35�47.2240 8�25.2900 2177MC-50 35�47.2210 8�25.2920 2176PC-58 Summit, margin, SE 35�47.1960 8�25.2690 2177MC-63 35�471970 8�25.2690 2177PC-59 Summit, slope, SE 35�47.1700 8�25.2480 2179GC-60 Mudflow, SE of summit 35�47.0760 8�25.2290 2189
Fluid flow and geochemical fluxes at the Carlos Ribeiro mud volcano 1127
sections. Sub-samples were taken for hydrocarbon gas anal-yses, pore water chemistry and porosity analyses immedi-ately after the cores were opened. For gas analyses, a slugof sediment (ffi3 cm3) was withdrawn using a cut-off plasticsyringe and placed in a 20 ml glass vial to which 5 ml of 1 MNaOH was added to prevent further microbial activity(Hoehler et al., 2000). The vials were crimped shut, andthe sample was then shaken vigorously for several minutesto release the adsorbed gases. Pore waters were extracted ina glove bag under a N2-atmosphere by pressure-filtrationthrough 0.2 lm cellulose acetate membrane filters, with anN2-pressure of 3–4 bars.
3.2. Analytical procedures
Total alkalinity (TA) was determined immediately afterpore-water extraction by titrating against 0.05 M HCl whilebubbling nitrogen through the sample (Ivanenkov andLyakhin, 1978). Concentrations of hydrogen sulphide(H2S) were also determined immediately, using standardphotometric procedures (Grasshoff et al., 1999) adaptedfor pore waters with high (�mM) levels of dissolvedsulphide.
Concentrations of all other chemical species were deter-mined back onshore at the National Oceanography Centrein Southampton. Anion concentrations ([Cl] and [SO4
2�])were determined by ion chromatography (DionexICS2500). The reproducibility of these measurements(determined by repeat analysis of a seawater standard aswell as single anion standards) is better than 1%. Sodium([Na]), potassium ([K]), lithium ([Li]) and boron ([B]) con-centrations were determined by inductively coupled plasmaoptical emission spectroscopy (ICP-OES; Perkin ElmerOptima 4300DV). The accuracy and precision of these anal-yses is generally better than 5%, determined by replicateanalysis (n = 3) of IAPSO seawater. Analyses of stable oxy-gen (d18O) and hydrogen (dD) isotopes in the pore waterswere carried out at Royal Holloway, University of London.For oxygen isotopes, 0.2 ml of pore water was equilibratedwith 5% CO2 and 95% He for 7 h at 40 �C using a Multiflowinjection system (GV Intruments/Isoprime Ltd.). dD wasdetermined by pyrolysis of 2 ml of pore water. Isotoperatios were determined using an Isoprime isotope ratiomass spectrometer. 18O/16O ratios were normalized to theV-SMOW scale using an internal standard, DEW-1, that
has a d18O value of �8.44&, calibrated to V-SMOW andSLAP. Each sample was measured 7 times; the average pre-cision of the d18O values is �0.07&. dD values were nor-malized to the V-SMOW scale using analyses of referencewaters V-SMOW, GISP and SLAP. A mean precision of0.7& for triplicate analysis of dD was obtained.
Concentrations of headspace hydrocarbon gases (C1–C5) were determined by gas chromatography (Agilent6850). Note that depressurisation and warming of the coreduring sediment retrieval is likely to have led to degassing,so the concentration of CH4 (which is generally oversatu-rated in the pore waters) that we report is the minimumvalue.
Sediment porosity (/) was calculated from the loss ofwater after freeze-drying of the sediment. The densities ofthe sediment and fluid were assumed to be 2.65 and1.00 g cm�3, respectively (note that the fluid evaporatedby freeze-drying is freshwater).
3.3. Geochemical modelling
3.3.1. Modelling of fluid flow velocities
In order to estimate fluid flow velocities across theCRMV, a 1-D transport model was developed in MAT-LAB�, based on the FORTRAN model C.CANDI(Boudreau, 1996; Luff et al., 2001). Flow velocities weredetermined by fitting the model results to the measured porewater profiles of conservative elements, i.e. elements that areunreactive in the sediment column. In this case, this is true forCl, Na and B, at least for the depth of sampling. These specieshave concentration-depth profiles that are well-mixed in theupper part of the core, either increasing or decreasing asymp-totically with depth to a constant value in the lower part ofthe core (Fig. 2). Pore fluids in the shallow sediments arewell-mixed because of bioirrigation (i.e. exchange of poreand bottom water over vertical distances in the surface sedi-ment by the pumping activity and motion of mega andmacro-fauna; Aller, 1980), while the changes in the concen-trations of Cl, Na and B below this mixed surface layer arecharacteristic of upward advection of a fluid with lower[Cl] and [Na], and higher [B], from deeper in the sediment col-umn. The depth distribution of these conservative elementscan thus be described by a partial differential equation thattakes into account molecular diffusion, fluid advection andbioirrigation (e.g. Boudreau, 1996):

K / mM0 4 8 12
0
100
200
300
400
500
Cl / mM200 400 600
fsbmc/
ht peD
0
100
200
300
400
500
Na / mM200 400 600
0
100
200
300
400
500
12
eyeoff-centremarginslopemudflowbackground
a cb
fsbmc/
htpeD
0 100 2000
100
200
300
400
500 e
Li / µM
B / mM0 4 8
0
100
200
300
400
500 d
0 200 300 400 500100 600Distance/m
SENW SN2190
2250
2210
2230eye off-centre
marginslope
mudflow
Fig. 2. Pore water depth profiles of chloride (Cl), sodium (Na), potassium (K), boron (B) and lithium (Li) for the five stations at the CarlosRibeiro mud volcano, and the background station. Vertical arrows indicate seawater values.
1128 H. Vanneste et al. / Geochimica et Cosmochimica Acta 75 (2011) 1124–1144
@uCi
@t¼ Di
@
@xu
#2
@Ci
@x
� �� @uuCi
@x� uaðxÞ � ðCiðxÞ � Cið0ÞÞ
ð1Þ
where Ci is the concentration of the dissolved pore waterspecies i, Di is the diffusion coefficient of species i correctedfor salinity (34.2), temperature (4.3 �C) and pressure(220 bar; Table 2), h2 (= 1 � ln(u2)) is the tortuosity correc-tion for diffusion (Boudreau, 1997), u is the sedimentporosity, u is the velocity of the upward fluid flow, a(x) isthe irrigation exchange coefficient, (Ci(x) � Ci(0)) is the dif-ference between the concentration of species i at depth andin bottom water, t is time and x is sediment depth. Valuesfor each of these model parameters, at each of the core sites,are given in Table 2.
In order to account for the decrease in porosity withdepth, the porosity profiles are approximated by leastsquare fitting the following function to the measured poros-ity data (Boudreau, 1996):
uðxÞ ¼ ðu0 � u1Þe�bx þ u1 ð2Þ
where b is the porosity attenuation coefficient and the sub-scripts 0 and 1 indicate porosity values at the sediment–water interface and at depth, respectively (Table 2).
Burial of pore water by sedimentation and the inducedfluid flow by compaction of surface sediments are muchsmaller at MVs than the upward fluid advection. Thus, they
can be neglected and the pore fluid flow velocity u is thencalculated as:
u ¼ u0 � u0
uðxÞ ð3Þ
where u0 is the velocity of upward fluid flow at the sedi-ment–water interface.
The irrigation exchange coefficient (a(x)) varies withdepth because of changes to burrow geometry, distributionand flushing (Meile et al., 2005) and can be described asfollows:
aðxÞ ¼ a0 � exp½�ðxb � xmixÞ� ð4Þ
where a0 is the pore water mixing coefficient, xb is the depthexceeding the irrigation zone and xmix is the depth of themixing layer.
The discretization of Eq. (1) was achieved by finite differ-encing, using backward differencing for the first-order deriv-atives of the diffusion and advection terms and centraldifferencing for the second-order derivative of the diffusionterm. The sediment surface was taken as the upper boundarywhile the lower boundary was set to the base of the cores re-trieved at each site. Dirichlet boundary conditions (fixedconcentrations) are applied at the top and base of the modeldomain. The vertical resolution of the model grid was set to1 cm sediment depth; i.e. the minimum necessary to achievenumerical stability. The model was run to steady state

Table 2Parameter values used in the numerical model.
Parameter Symbol Unit Eye Off-centre Margin Slope Mudflow
Molecular diffusion coefficient of chloridea DCl [cm2 yr�1] 347.66Molecular diffusion coefficient of sodiuma DNa [cm2 yr�1] 222.13Molecular diffusion coefficient of boronb DB [cm2 yr�1] 182.03Molecular diffusion coefficient of sulphatea DSO4 [cm2 yr]�1 177.95Molecular diffusion coefficient of methanec DCH4 [cm2 yr�1] 289.38Length of model columnd L [cm] 500.5 110 217 120 179.5Porosity at sediment surfacee u0 0.75 0.76 0.75 0.78 0.69Porosity at lower boundarye u1 0.58 0.57 0.53 0.54 0.51Attenuation coefficient for porosity decreasee b [cm�1] 0.0605 0.08 0.05 0.06 0.04Cl concentration at surfacef Cl0 [mM] 551.0 555.0 551.5 557 551.9Cl concentration at depth Lf ClL [mM] 198.7 252.1 296.1 460.7 460.7B concentration at sediment surfacef B0 [mM] 0.5 0.5 0.5 0.6 0.5B concentration at depth Lf BL [mM] 10.0 10.2 8.5 2.3 2.9Na concentration at sediment surfacef Na0 [mM] 473.8 464.4 462.4 463.3 467.8Na concentration at depth Lf NaL [mM] 184.6 228.0 294.0 459.4 432.7CH4 concentration at sediment surfacef CH40 [mM] 0.002 0.002 0.001 – –SO4
2� concentration at sediment surfacef SO40 [mM] 28.2 28.5 28.2 – –SO4
2� concentration at depth Lf SO4L [mM] 0.1 0.2 0.2 – –
–, no data.a Calculated from equations given in Boudreau (1997) considering the in situ T (4.3 �C), S (34.2) and P (220 bar) conditions.b Calculated from equations given in Mackin (1986) and Boudreau and Canfield (1988) considering the in situ T (4.3 �C), S (34.2) and P
(220 bar) conditions.c Calculated from equations given in Hayduk and Laudie (1974) considering the in situ T (4.3 �C), S (34.2) and P (220 bar) conditions.d Length of the sediment core.e Obtained by fitting an exponential equation u(x) = (u0 � u1)e�bx + u1 to the measured porosity depth profile.f Measured in pore-waters extracted from sediment cores from this study.
Fluid flow and geochemical fluxes at the Carlos Ribeiro mud volcano 1129
starting from arbitrary initial conditions. The ordinarydifferential equation (ODE) solver in MATLAB� uses avariable time step and steady state was always reachedwithin 1000 years simulation time. The fluid flow velocity,u0, and irrigation parameters (a and xmix) were determinedby least square fitting the model results to the measured porewater concentration profiles of Cl, Na and B simulta-neously. Additional model runs were performed to testthe sensitivity of the model to variations in the inputparameters. The results of these tests are discussed inSection 4.
3.3.2. Modelling of methane fluxes at the seafloor
In seep environments, the turnover of SO42� and CH4 is
mainly controlled by AOM (e.g. Borowski et al., 1996).Accordingly, the pore water distribution of these speciesis defined by the net stoichiometry of the AOM reaction(Reeburgh, 1976):
CH4 þ SO42� ) HCO3
� þHS� þH2O ð5ÞBecause of degassing during core recovery, concentrationsof CH4 measured in the pore fluids do not representin situ concentrations and they therefore cannot be usedto estimate CH4 fluxes. However, according to Eq. (5),the SO4
2� flux must balance the CH4 flux from below(Borowski et al., 1996). Thus, estimates of CH4 fluxes canpotentially be obtained via modelling pore water profilesof SO4
2�. In addition, SO42� reduction (SR) is likely to
be a negligible pathway in organic matter degradation be-cause (1) the mud breccia from MVs in the Gulf of Cadizhave low TOC levels (0.3 wt.% on average; Stadnitskaia
et al., 2006) and (2) the fresh marine POC deposited atthe sediment surface is highly reactive and therefore oxygenand nitrate are likely to be the most important oxidizers.Nevertheless, SR by organic matter degradation is incorpo-rated into our model for completeness. In order to accom-modate this, the depth distribution of CH4 and SO4
2� isdescribed using a partial differential equation that incorpo-rates an additional reaction term for SR, methanogenesisand AOM (Boudreau, 1996).
@uCi
@t¼ Di
@
@xu
#2
@Ci
@x
� �� @uuCi
@x
� uaðxÞ � ðCiðxÞ � Cið0ÞÞ þ uX
Ri ð6Þ
where
uX
RSO4¼ u � �kG �
Corg
2�
SO42�� �
KSO2�4þ SO4
2�� �� RAOM
!ð7Þ
uX
RCH4¼ u � kG �
Corg
2�
KiSO2�4
KiSO2�4þ SO4
2�� �� RAOM
!ð8Þ
and kG represents the kinetic constant of organic matterdegradation, Corg/2 is the organic matter concentration(mM), KSO4
2� is the half-saturation constant of SR,KiSO4
2� is the inhibition constant for initiation of methano-genesis and RAOM is the reaction rate of AOM. Corg is givena value of 0.3 wt.%; this is the average value recorded inmud breccias from MVs in the Gulf of Cadiz (Stadnitskaiaet al., 2006). As this organic carbon originates from deepwithin the sediment column, it is assumed to be refractory,with a kG value typical of slowly degrading organic carbon
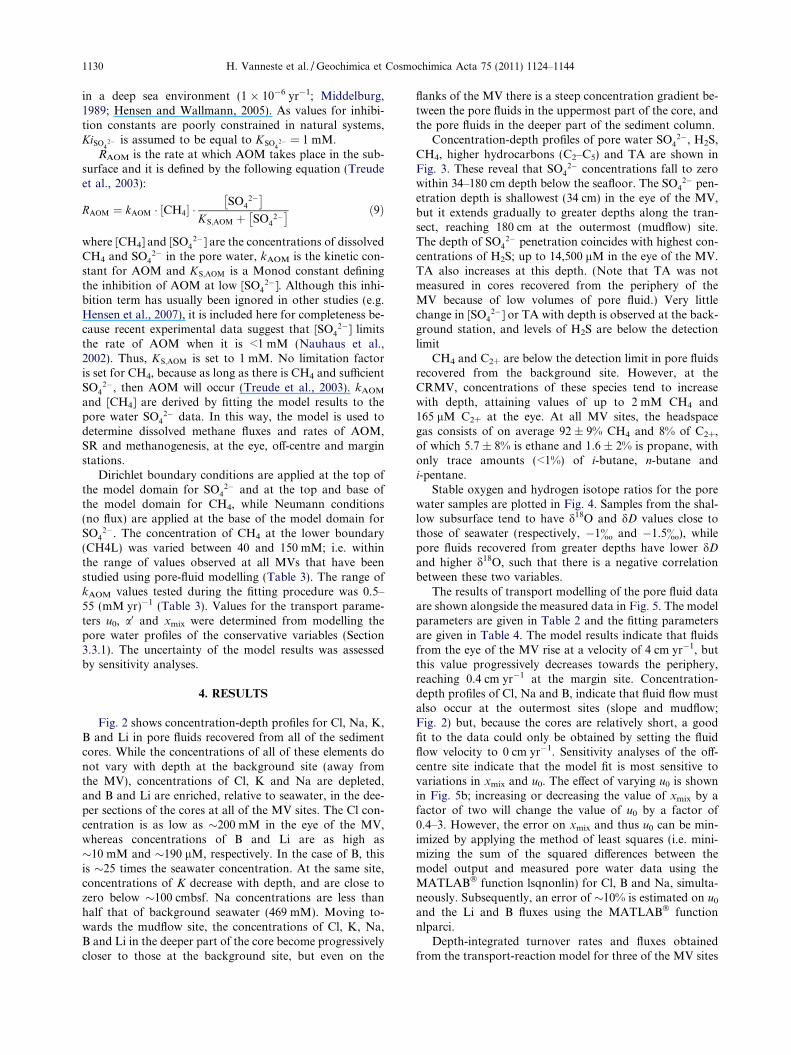
1130 H. Vanneste et al. / Geochimica et Cosmochimica Acta 75 (2011) 1124–1144
in a deep sea environment (1 � 10�6 yr�1; Middelburg,1989; Hensen and Wallmann, 2005). As values for inhibi-tion constants are poorly constrained in natural systems,KiSO4
2� is assumed to be equal to KSO42� = 1 mM.
RAOM is the rate at which AOM takes place in the sub-surface and it is defined by the following equation (Treudeet al., 2003):
RAOM ¼ kAOM � ½CH4� �SO4
2�� �KS;AOM þ SO4
2�� � ð9Þ
where [CH4] and [SO42�] are the concentrations of dissolved
CH4 and SO42� in the pore water, kAOM is the kinetic con-
stant for AOM and KS;AOM is a Monod constant definingthe inhibition of AOM at low [SO4
2�]. Although this inhi-bition term has usually been ignored in other studies (e.g.Hensen et al., 2007), it is included here for completeness be-cause recent experimental data suggest that [SO4
2�] limitsthe rate of AOM when it is <1 mM (Nauhaus et al.,2002). Thus, KS;AOM is set to 1 mM. No limitation factoris set for CH4, because as long as there is CH4 and sufficientSO4
2�, then AOM will occur (Treude et al., 2003). kAOM
and [CH4] are derived by fitting the model results to thepore water SO4
2� data. In this way, the model is used todetermine dissolved methane fluxes and rates of AOM,SR and methanogenesis, at the eye, off-centre and marginstations.
Dirichlet boundary conditions are applied at the top ofthe model domain for SO4
2� and at the top and base ofthe model domain for CH4, while Neumann conditions(no flux) are applied at the base of the model domain forSO4
2�. The concentration of CH4 at the lower boundary(CH4L) was varied between 40 and 150 mM; i.e. withinthe range of values observed at all MVs that have beenstudied using pore-fluid modelling (Table 3). The range ofkAOM values tested during the fitting procedure was 0.5–55 (mM yr)�1 (Table 3). Values for the transport parame-ters u0, a0 and xmix were determined from modelling thepore water profiles of the conservative variables (Section3.3.1). The uncertainty of the model results was assessedby sensitivity analyses.
4. RESULTS
Fig. 2 shows concentration-depth profiles for Cl, Na, K,B and Li in pore fluids recovered from all of the sedimentcores. While the concentrations of all of these elements donot vary with depth at the background site (away fromthe MV), concentrations of Cl, K and Na are depleted,and B and Li are enriched, relative to seawater, in the dee-per sections of the cores at all of the MV sites. The Cl con-centration is as low as �200 mM in the eye of the MV,whereas concentrations of B and Li are as high as�10 mM and �190 lM, respectively. In the case of B, thisis �25 times the seawater concentration. At the same site,concentrations of K decrease with depth, and are close tozero below �100 cmbsf. Na concentrations are less thanhalf that of background seawater (469 mM). Moving to-wards the mudflow site, the concentrations of Cl, K, Na,B and Li in the deeper part of the core become progressivelycloser to those at the background site, but even on the
flanks of the MV there is a steep concentration gradient be-tween the pore fluids in the uppermost part of the core, andthe pore fluids in the deeper part of the sediment column.
Concentration-depth profiles of pore water SO42�, H2S,
CH4, higher hydrocarbons (C2–C5) and TA are shown inFig. 3. These reveal that SO4
2� concentrations fall to zerowithin 34–180 cm depth below the seafloor. The SO4
2� pen-etration depth is shallowest (34 cm) in the eye of the MV,but it extends gradually to greater depths along the tran-sect, reaching 180 cm at the outermost (mudflow) site.The depth of SO4
2� penetration coincides with highest con-centrations of H2S; up to 14,500 lM in the eye of the MV.TA also increases at this depth. (Note that TA was notmeasured in cores recovered from the periphery of theMV because of low volumes of pore fluid.) Very littlechange in [SO4
2�] or TA with depth is observed at the back-ground station, and levels of H2S are below the detectionlimit
CH4 and C2+ are below the detection limit in pore fluidsrecovered from the background site. However, at theCRMV, concentrations of these species tend to increasewith depth, attaining values of up to 2 mM CH4 and165 lM C2+ at the eye. At all MV sites, the headspacegas consists of on average 92 ± 9% CH4 and 8% of C2+,of which 5.7 ± 8% is ethane and 1.6 ± 2% is propane, withonly trace amounts (<1%) of i-butane, n-butane andi-pentane.
Stable oxygen and hydrogen isotope ratios for the porewater samples are plotted in Fig. 4. Samples from the shal-low subsurface tend to have d18O and dD values close tothose of seawater (respectively, �1& and �1.5&), whilepore fluids recovered from greater depths have lower dD
and higher d18O, such that there is a negative correlationbetween these two variables.
The results of transport modelling of the pore fluid dataare shown alongside the measured data in Fig. 5. The modelparameters are given in Table 2 and the fitting parametersare given in Table 4. The model results indicate that fluidsfrom the eye of the MV rise at a velocity of 4 cm yr�1, butthis value progressively decreases towards the periphery,reaching 0.4 cm yr�1 at the margin site. Concentration-depth profiles of Cl, Na and B, indicate that fluid flow mustalso occur at the outermost sites (slope and mudflow;Fig. 2) but, because the cores are relatively short, a goodfit to the data could only be obtained by setting the fluidflow velocity to 0 cm yr�1. Sensitivity analyses of the off-centre site indicate that the model fit is most sensitive tovariations in xmix and u0. The effect of varying u0 is shownin Fig. 5b; increasing or decreasing the value of xmix by afactor of two will change the value of u0 by a factor of0.4–3. However, the error on xmix and thus u0 can be min-imized by applying the method of least squares (i.e. mini-mizing the sum of the squared differences between themodel output and measured pore water data using theMATLAB� function lsqnonlin) for Cl, B and Na, simulta-neously. Subsequently, an error of �10% is estimated on u0
and the Li and B fluxes using the MATLAB� functionnlparci.
Depth-integrated turnover rates and fluxes obtainedfrom the transport-reaction model for three of the MV sites
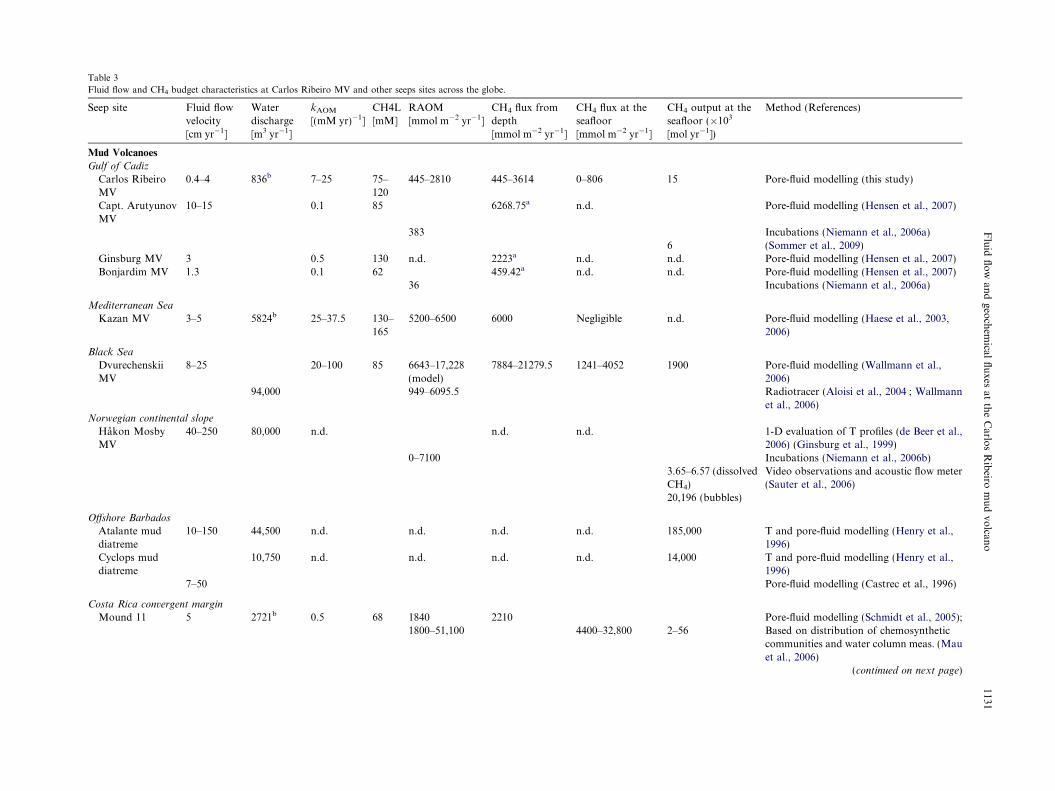
Table 3
Fluid flow and CH4 budget characteristics at Carlos Ribeiro MV and other seeps sites across the globe.
Seep site Fluid flowvelocity[cm yr�1]
Waterdischarge[m3 yr�1]
kAOM
[(mM yr)�1]CH4L[mM]
RAOM[mmol m�2 yr�1]
CH4 flux fromdepth[mmol m�2 yr�1]
CH4 flux at theseafloor[mmol m�2 yr�1]
CH4 output at theseafloor (�103
[mol yr�1])
Method (References)
Mud Volcanoes
Gulf of Cadiz
Carlos RibeiroMV
0.4–4 836b 7–25 75–120
445–2810 445–3614 0–806 15 Pore-fluid modelling (this study)
Capt. ArutyunovMV
10–15 0.1 85 6268.75a n.d. Pore-fluid modelling (Hensen et al., 2007)
383 Incubations (Niemann et al., 2006a)6 (Sommer et al., 2009)
Ginsburg MV 3 0.5 130 n.d. 2223a n.d. n.d. Pore-fluid modelling (Hensen et al., 2007)Bonjardim MV 1.3 0.1 62 459.42a n.d. n.d. Pore-fluid modelling (Hensen et al., 2007)
36 Incubations (Niemann et al., 2006a)
Mediterranean Sea
Kazan MV 3–5 5824b 25–37.5 130–165
5200–6500 6000 Negligible n.d. Pore-fluid modelling (Haese et al., 2003,2006)
Black Sea
DvurechenskiiMV
8–25 20–100 85 6643–17,228(model)
7884–21279.5 1241–4052 1900 Pore-fluid modelling (Wallmann et al.,2006)
94,000 949–6095.5 Radiotracer (Aloisi et al., 2004 ; Wallmannet al., 2006)
Norwegian continental slope
Hakon MosbyMV
40–250 80,000 n.d. n.d. n.d. 1-D evaluation of T profiles (de Beer et al.,2006) (Ginsburg et al., 1999)
0–7100 Incubations (Niemann et al., 2006b)3.65–6.57 (dissolvedCH4)
Video observations and acoustic flow meter(Sauter et al., 2006)
20,196 (bubbles)
Offshore Barbados
Atalante muddiatreme
10–150 44,500 n.d. n.d. n.d. n.d. 185,000 T and pore-fluid modelling (Henry et al.,1996)
Cyclops muddiatreme
10,750 n.d. n.d. n.d. n.d. 14,000 T and pore-fluid modelling (Henry et al.,1996)
7–50 Pore-fluid modelling (Castrec et al., 1996)
Costa Rica convergent margin
Mound 11 5 2721b 0.5 68 1840 2210 Pore-fluid modelling (Schmidt et al., 2005);1800–51,100 4400–32,800 2–56 Based on distribution of chemosynthetic
communities and water column meas. (Mauet al., 2006)
(continued on next page)
Flu
idfl
ow
and
geoch
emical
flu
xesat
the
Carlo
sR
ibeiro
mu
dvo
lcano
1131

Table 3 (continued)
Seep site Fluid flowvelocity[cm yr�1]
Waterdischarge[m3 yr�1]
kAOM
[(mM yr)�1]CH4L[mM]
RAOM[mmol m�2 yr�1]
CH4 flux fromdepth[mmol m�2 yr�1]
CH4 flux at theseafloor[mmol m�2 yr�1]
CH4 output at theseafloor (�103
[mol yr�1])
Method (References)
Mound 12 10 40,715b 3 40 5877 10,330 Pore-fluid modelling (Linke et al., 2005);1800–51,100 4400–32,800 7–164 Based on distribution of chemosynthetic
communities and water column meas.(Mauet al., 2006)
Mound Culebra n.d. n.d. 50–20,400 n.d. 0–200 0–4 Based on distribution of chemosyntheticcommunities and water column meas. (Mauet al., 2006)
Other sites
Cascadia margin
Hydrate Ridge(southern summit)
0.1 68 9250 8733 14 n.d. Pore-fluid modelling (Luff and Wallmann,2003);
10–250 CAT measurements (Tryon et al., 2002)Hydrate Ridge(S + N summit)
n.d. n.d. n.d. n.d. 10,950–36,500(bacterial mats)
21,900 Pore-fluid modelling and benthic barrels(Torres et al., 2002)
<365 (clam fields)Hydrate Ridge(S + N summit)
n.d. n.d. n.d. n.d. n.d. 21,900–32,850 Water column measurements (Heeschenet al., 2005)
Gulf of Mexico
Bush Hill 1.1–36 n.d. n.d. n.d. 890 (mussel field) 5200 In situ measurements (Solomon et al., 2008)29,000 (bacterialmats)
n.d., not determined.a Calculated using the following formula: flux[mmol m�2 yr�1] = porosity * CH4L[mM] * fluid flow velocity[cm yr�1] * 10.b Calculated using the following formula: water discharge[m3 yr�1] = porosity * area[m2] * fluid flow velocity[cm yr�1].
1132H
.V
ann
esteet
al./G
eoch
imica
etC
osm
och
imica
Acta
75(2011)
1124–1144

30
0 6000 12000
0 10 20 30
0 4 8 12 16
0 6000 12000
0 10 20 30
0 1 2
0 6000 12000
0
0 10 20 30
1 2
0 6000 12000
0 10 20 30
0 1 2
0 6000 12000
0
0 10 20 30
0.4 0.8
0 6000 12000
0
50
100
150
200
250
0 10 20
0 1 2
fsbmc/
htpeD
SO / mM42-
H S / µM2 H S / µM2 H S / µM2 H S / µM2 H S / µM2 H S / µM2
SO / mM42- SO / mM4
2- SO / mM42- SO / mM4
2- SO / mM42-
CH / mM4 CH / mM4 CH / mM4 CH / mM4 CH / mM4 CH / mM4
H S2
CH4
SO42-
0 10 20 30
0 25 50 75 100
TAC /µM2+
0 10 20 30
0 25 50 75 100 0 25 50 75 100 0 25 50 75 100
0 10 20 30
C / µM2+C / µM2+ C / µM2+ C / µM2+ C / µM2+
0 10 20 30
fsbm c/
htpeD
0
50
100
150
200
2500 50 100 150 200
TA / mM TA / mM TA / mM TA / mM
Eye Off-centre Margin Slope Mudflow Background
Fig. 3. Pore water profiles of sulphate (SO42�), hydrogen sulphide (H2S), methane (CH4), total alkalinity (TA) and higher hydrocarbons (C2+)
for the five stations on the Carlos Ribeiro mud volcano, and the background station. Vertical arrows indicate seawater values and shadedzones correspond to the sulphate-methane transition zone at the respective sites.
0
500
mc/htpe
D
-2 0 2 4 6 8-25
-20
-15
-10
-5
0
18O / SMOW‰
D/
SMOW
‰
eyeoff-centremarginmudflowseawater
Fig. 4. d18O versus dD (& SMOW) values for the pore fluids atCarlos Ribeiro mud volcano. The value for seawater and themeteoric water line (dD = 8d18O + 10; Savin and Hsieh, 1998) arealso shown.
Fluid flow and geochemical fluxes at the Carlos Ribeiro mud volcano 1133
are summarized in Table 5 and shown in Fig. 5c. In the eyeof the MV, the best fit between the model and the measuredSO4
2� profile was obtained for a CH4 concentration of120 mM at the lower boundary (CH4L) and for kAOM = 7(mM yr)�1. The calculated CH4 flux from depth is3614 mmol m�2 yr�1. However, the majority (78%) of thismethane will be consumed by AOM, which proceeds at a
depth-integrated rate of 2810 mmol m�2 yr�1. Conse-quently, only 806 mmol m�2 yr�1 of CH4 is predicted to es-cape into the overlying water column. At the off-centrestation, the CH4 flux from depth is predicted to be 1.3 timeslower (2738 mmol m�2 yr�1) than it is in the eye. A consid-erably smaller proportion of this methane (14%) escapesfrom AOM and makes it into the overlying water column.Further along the transect, the CH4 supply from depth de-creases sharply (to 445 mmol m�2 yr�1 at the margin sta-tion), largely because of a weakened fluid flow. At allsites, rates of SR are significant lower than rates of AOM(Table 5), suggesting that AOM is the primary control onrates of sulphate reduction at the CRMV. Rates of metha-nogenesis are highest in the eye of the MV (�0.6 mmolm�2 yr�1) and decrease towards the periphery (to �0.1mmol m�2 yr�1). Sensitivity analyses indicate that modelledvalues for methane fluxes at the seafloor are insensitive tovariations (±50%) in KiSO4
2� , KSO42� and KS;AOM, but
changes in CH4L and, to a lesser extent, in kAOM can beimportant. For example, at the off-centre site, a 50% de-crease in CH4L reduces the methane flux by 80%, while a50% increase in CH4L leads to a doubling of the flux re-ported in Table 5. A ±50% change in kAOM will changethe methane flux by a factor of between 0.2 and 2. How-ever, in contrast to the transport model, the goodness offit is not very sensitive to changes in the input parameters,

0 200 400 6000
50
100
150
200
2500 4 8 12
c SO / mM42- SO / mM4
2- SO / mM42-
R / [mM yr ]AOM-1 R / [mM yr ]AOM
-1 R / [mM yr ]AOM-1
Cl / mM
B / mM
Na / mM200 400 600
Cl / mM
B / mM
Na / mM200 400 600
Cl / mM
B / mM
Na / mM200 400 600
Cl / mM
B / mM
Na/ mM200 400 600
Cl / mM
B / mM
Na/ mM200 400 600
fs bmc/
htpeD
b 0 200 400 6000
50
100
150
200
2500 4 8 12
0 200 400 6000
50
100
150
200
2500 4 8 12
0 200 400 6000
50
100
150
200
2500 4 8 12
0 200 400 6000
50
100
150
200
2500 4 8 12
u0 = 3.3 cm/a u0 = 0 cm/a u0 = 0 cm/au = 0.4 cm/a0
0 20 40 60 80 0 20 40 60 80
CH / mM4
0 20 40 60 80
CH / mM4
fsbmc/
htpeD
CH / mM4
0.5 0.6 0.7 0.8 0.9
fsbmc/
htpeD
0
50
100
150
200
250
0.5 0.6 0.7 0.8 0.90
50
100
150
200
250
0.5 0.6 0.7 0.8 0.90
50
100
150
200
250
0.5 0.6 0.7 0.8 0.90
50
100
150
200
250
0.5 0.6 0.7 0.8 0.90
50
100
150
200
250
a
eye off-centre margin slope mudflow
porosity porosity porosity porosity porosity
0 5 10 15 20 25 300
50
100
150
200
2500 40 80 120
0 5 10 15 20 25 300
50
100
150
200
2500 40 80 120
0 5 10 15 20 25 300
50
100
150
200
2500 40 80 120
u0 = 4 cm/a
Fig. 5. Results of numerical modelling of: (a) porosity data; (b) chloride (Cl; shown in black), sodium (Na; shown in dark grey) and boron (B;shown in light grey) data at the five stations investigated in this study. The solid lines represent the best fit between the model and themeasured data; the dashed lines show the effects of doubling and halving the value of the upward fluid flow velocity (u0; cm yr�1) in the modelsimulation; (c) sulphate (SO4
2�; solid line) and methane (CH4; dash-dotted black line) data and reaction rate of anaerobic oxidation ofmethane (RAOM; grey dashed line) at three stations across the CRMV (eye, off-centre and margin station).The grey shading shows the effectsof doubling and halving the value of CH4L in the model simulation. Measured data are represented by symbols.
1134 H. Vanneste et al. / Geochimica et Cosmochimica Acta 75 (2011) 1124–1144
which in this case are kAOM and CH4L (Fig. 5c). The uncer-tainty induced by the error in the fluid flow velocity (i.e.±10%) is quite low, �16%. Overall, these sensitivity testsindicate that accurate measurements of concentrations ofpore water methane, and well-characterized values for therate constant of AOM (kAOM), are essential for meaningfulapplication of 1-D transport-reaction models.
5. DISCUSSION
5.1. Fluid seepage activity at the Carlos Ribeiro MV
Concentration profiles for the non-reactive species areconcave in shape which is indicative of advective transportof fluid from below (Fig. 2). The concentration gradient is
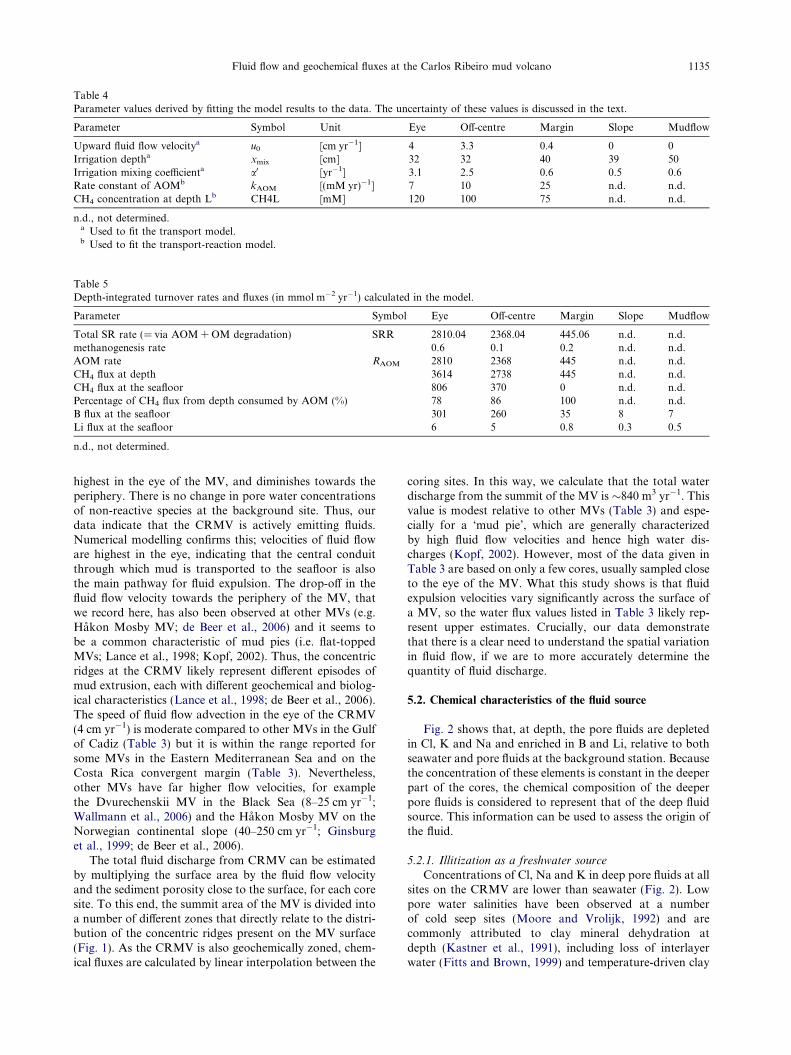
Table 4Parameter values derived by fitting the model results to the data. The uncertainty of these values is discussed in the text.
Parameter Symbol Unit Eye Off-centre Margin Slope Mudflow
Upward fluid flow velocitya u0 [cm yr�1] 4 3.3 0.4 0 0Irrigation deptha xmix [cm] 32 32 40 39 50Irrigation mixing coefficienta a0 [yr�1] 3.1 2.5 0.6 0.5 0.6Rate constant of AOMb kAOM [(mM yr)�1] 7 10 25 n.d. n.d.CH4 concentration at depth Lb CH4L [mM] 120 100 75 n.d. n.d.
n.d., not determined.a Used to fit the transport model.b Used to fit the transport-reaction model.
Table 5Depth-integrated turnover rates and fluxes (in mmol m�2 yr�1) calculated in the model.
Parameter Symbol Eye Off-centre Margin Slope Mudflow
Total SR rate (= via AOM + OM degradation) SRR 2810.04 2368.04 445.06 n.d. n.d.methanogenesis rate 0.6 0.1 0.2 n.d. n.d.AOM rate RAOM 2810 2368 445 n.d. n.d.CH4 flux at depth 3614 2738 445 n.d. n.d.CH4 flux at the seafloor 806 370 0 n.d. n.d.Percentage of CH4 flux from depth consumed by AOM (%) 78 86 100 n.d. n.d.B flux at the seafloor 301 260 35 8 7Li flux at the seafloor 6 5 0.8 0.3 0.5
n.d., not determined.
Fluid flow and geochemical fluxes at the Carlos Ribeiro mud volcano 1135
highest in the eye of the MV, and diminishes towards theperiphery. There is no change in pore water concentrationsof non-reactive species at the background site. Thus, ourdata indicate that the CRMV is actively emitting fluids.Numerical modelling confirms this; velocities of fluid floware highest in the eye, indicating that the central conduitthrough which mud is transported to the seafloor is alsothe main pathway for fluid expulsion. The drop-off in thefluid flow velocity towards the periphery of the MV, thatwe record here, has also been observed at other MVs (e.g.Hakon Mosby MV; de Beer et al., 2006) and it seems tobe a common characteristic of mud pies (i.e. flat-toppedMVs; Lance et al., 1998; Kopf, 2002). Thus, the concentricridges at the CRMV likely represent different episodes ofmud extrusion, each with different geochemical and biolog-ical characteristics (Lance et al., 1998; de Beer et al., 2006).The speed of fluid flow advection in the eye of the CRMV(4 cm yr�1) is moderate compared to other MVs in the Gulfof Cadiz (Table 3) but it is within the range reported forsome MVs in the Eastern Mediterranean Sea and on theCosta Rica convergent margin (Table 3). Nevertheless,other MVs have far higher flow velocities, for examplethe Dvurechenskii MV in the Black Sea (8–25 cm yr�1;Wallmann et al., 2006) and the Hakon Mosby MV on theNorwegian continental slope (40–250 cm yr�1; Ginsburget al., 1999; de Beer et al., 2006).
The total fluid discharge from CRMV can be estimatedby multiplying the surface area by the fluid flow velocityand the sediment porosity close to the surface, for each coresite. To this end, the summit area of the MV is divided intoa number of different zones that directly relate to the distri-bution of the concentric ridges present on the MV surface(Fig. 1). As the CRMV is also geochemically zoned, chem-ical fluxes are calculated by linear interpolation between the
coring sites. In this way, we calculate that the total waterdischarge from the summit of the MV is �840 m3 yr�1. Thisvalue is modest relative to other MVs (Table 3) and espe-cially for a ‘mud pie’, which are generally characterizedby high fluid flow velocities and hence high water dis-charges (Kopf, 2002). However, most of the data given inTable 3 are based on only a few cores, usually sampled closeto the eye of the MV. What this study shows is that fluidexpulsion velocities vary significantly across the surface ofa MV, so the water flux values listed in Table 3 likely rep-resent upper estimates. Crucially, our data demonstratethat there is a clear need to understand the spatial variationin fluid flow, if we are to more accurately determine thequantity of fluid discharge.
5.2. Chemical characteristics of the fluid source
Fig. 2 shows that, at depth, the pore fluids are depletedin Cl, K and Na and enriched in B and Li, relative to bothseawater and pore fluids at the background station. Becausethe concentration of these elements is constant in the deeperpart of the cores, the chemical composition of the deeperpore fluids is considered to represent that of the deep fluidsource. This information can be used to assess the origin ofthe fluid.
5.2.1. Illitization as a freshwater source
Concentrations of Cl, Na and K in deep pore fluids at allsites on the CRMV are lower than seawater (Fig. 2). Lowpore water salinities have been observed at a numberof cold seep sites (Moore and Vrolijk, 1992) and arecommonly attributed to clay mineral dehydration atdepth (Kastner et al., 1991), including loss of interlayerwater (Fitts and Brown, 1999) and temperature-driven clay

0mc/htpe
D
B / mM0 2 4 6 8 10 12
K/mM
0
2
4
6
8
10
12
14
c
Li / M0 50 100 150 200 250
K/mM
0
2
4
6
8
10
12
14
d
Cl / mM Cl / mM
Na/mM
0
100
200
300
400
500
600
b0 100 200 300 400 500 600 0 100 200 300 400 500 600
K/mM
0
2
4
6
8
10
12
14
a
eyeoff-centremarginslopemudflowseawater
R = 0.952
R = 0.922
500
Fig. 6. Pore fluid chloride (Cl) versus (a) potassium (K) and (b) sodium (Na). Dark grey line represents mixing between seawater andfreshwater while the black dotted line represents mixing between seawater and the deep fluid source (grey shading). Pore fluid potassium (K)versus (c) boron (B) and (d) lithium (Li). Black solid lines are regression lines. Symbol colours become lighter with increasing sample depth inthe core.
1136 H. Vanneste et al. / Geochimica et Cosmochimica Acta 75 (2011) 1124–1144
mineral transformations (Perry and Hower, 1972; Colten-Bradley, 1987), gas hydrate dissociation (Hesse and Harri-son, 1981; Martin et al., 1996) and meteoric water input(Moore and Gieskes, 1980; Aquilina et al., 1997). Otherpossible sources of freshwater include clay membrane ionfiltration and opal dehydration (Kastner et al., 1991).
The Cl concentrations of pore waters from the CRMVare as low as �200 mM, i.e. 64% lower than seawater con-centrations. Fig. 4 gives important clues as to which of theprocesses mentioned above could be responsible for the lowlevels of Cl. Firstly, input of meteoric water can be dis-counted, because this would produce pore fluids with posi-tively correlated d18O and dD values, as indicated by themeteoric water line in Fig. 4 (Savin and Hsieh, 1998). Sec-ondly, membrane filtration will produce fluids with lowd18O and low dD (Coplen and Hanshaw, 1973), yet the porefluids from CRMV have high d18O. Thirdly, the low silicacontent of the mud breccias at the CRMV (Ovsyannikovet al., 2003) indicates that silica dehydration is unlikely tobe an important process. Fourthly, gas hydrates are charac-teristically enriched in 18O and D relative to the surround-ing pore water (e.g. Hesse and Harrison, 1981; Kvenvoldenand Kastner, 1990; Maekawa, 2004), so gas hydrate disso-ciation produces low Cl fluids that are enriched in the hea-vier isotopes. As the pore fluids from CRMV show a trendtowards higher d18O but lower dD, a major fresh water con-tribution from gas hydrate dissociation is unlikely.
The negative correlation between d18O and dD is bestexplained in terms of extensive diagenetic fluid–rock reac-tion, in particular the transformation of smectite to illite
(Dahlmann and de Lange, 2003). This is also supportedby Fig. 6a and b: the pore fluids are enriched in Na, and de-pleted in K, relative to Cl. The transformation of smectiteto illite not only lowers pore water salinity (because ofthe release of interlayer and mineral-bound water), it alsoreleases Na from smectite interlayers and removes K, whichis a required interlayer cation in illite (Hower et al., 1976).Thus, our data indicate that the main source of fresh waterat the CRMV is illitization; this process is also thought toproduce pore fluids with low [Cl] at other MVs in the Gulfof Cadiz (e.g. Hensen et al., 2007; Scholz et al., 2009). Gi-ven that illitization occurs at temperatures between �60and 150 �C (Colten-Bradley, 1987; Srodon, 1999), and thegeothermal gradient in the Gulf of Cadiz is on average41 �C km�1 (Leon et al., 2009), the upwelling fluids mustcome from �1.5 to 3.7 km depth.
5.2.2. Boron and lithium enrichment in the deep-sourced fluid
As is the case for other MVs in the Gulf of Cadiz (Hen-sen et al., 2007; Scholz et al., 2009), the pore fluids from theCRMV are enriched in Li and B relative to seawater([Li]sw = 26 lM; [B]sw = 0.42 mM; Fig. 2). During low tem-perature weathering reactions, both B and Li are taken upinto secondary minerals (e.g. Stoffyn-Egli and Mackenzie,1984; Spivack et al., 1987). However, laboratory experi-ments demonstrate that both Li and B can be releasedduring alteration of marine sediments at moderate temper-atures, �50 �C (Chan et al., 1994; You et al., 1996b; Jameset al., 2003). As discussed in Section 5.2.1 there is strongevidence that the deep-sourced fluids rising through the

Fluid flow and geochemical fluxes at the Carlos Ribeiro mud volcano 1137
CRMV have reached temperatures of �60 to 150 �C, soalteration of marine sediments at moderate temperaturecould be a source of Li and B. Experimental work by Chanet al. (1994) suggests that, for a water/rock ratio of 3:1, asmuch as �200 lM of Li is released to the pore fluids by thetime a temperature of 150 �C is reached (�18 days). Sedi-ments from CRMV contain on average 61 ppm Li (Elec-tronic annex EA-1), and their mineralogy is similar to thesediments used in the Chan et al. (1994) experiment. Fora porosity of 35–50% and a mineral density of 2.65 g cm�3,only �0.3–1.1% of the Li hosted within the sediment wouldneed to be mobilized to produce pore waters with �200 lMLi. Moreover, the water/sediment ratio at CRMV is sub-stantially lower than 3:1 (note that sediment porosity is aslow as 0.57 at 5 m depth, Fig. 5a) and reaction times longer.Thus, all of this evidence would indicate that alteration ofmarine sediments at moderate temperature is capable ofenriching the pore fluids in Li (and, by analogy, B). Fur-thermore, the good correlation between pore fluid [B] and[Li] and [K] (Fig. 6c and d) suggests that these elementsare supplied by the same (clay mineral transformation; Sec-tion 5.2.1) process.
Recent work at the Bonjardim and Captain ArutyunovMVs in the Gulf of Cadiz has suggested that hydrothermalfluids (>150 �C) may be an important source of Li and B inthe upwelling pore fluids (Hensen et al., 2007). As hydro-thermal fluids are enriched in Li relative to B (e.g. Germanand Damm, 2003), pore fluids from these MVs are charac-terized by low B/Li ratios (<30) and high Li concentrations(>350 lM; Hensen et al., 2007). Pore fluids from theCRMV have higher B/Li (>50), and lower [Li] (<200lM), which would suggest that any hydrothermal sourceis negligible.
5.3. Benthic geochemical fluxes at the Carlos Ribeiro MV
5.3.1. Quantification of boron and lithium fluxes from the
Carlos Ribeiro MV
The diagenetically altered pore fluids expelled by theCRMV transfer material derived from the Earth’s interiorto the overlying ocean. The question is, is the flux of mate-rial sufficient to affect geochemical cycles on the globalscale? Concentrations of Li and B in pore fluids from theCRMV are, respectively, up to 10 and 25 times higher thanthey are in seawater (Fig. 2) and similar levels have been re-corded at other MVs (Dia et al., 1995; You et al., 2004;Hensen et al., 2007). The flux of Li and B from the CRMVinto the overlying water column can be calculated using thetransport model, and results are given in Table 5. In the eyeof the MV, 301 mmol B m�2 yr�1 and 6 mmol Li m�2 yr�1
are released into the water column, but this value graduallydecreases away from the summit, reaching 7 and 0.5 mmolm�2 yr�1, respectively, at the outermost (mudflow) site. Thetotal flux of Li and B from the CRMV is �170 mol yr�1 ofLi and 8900 mol yr�1 of B. These values are lower thanthose reported for other submarine MVs (Dia et al., 1995;Martin et al., 1996; Aloisi et al., 2004; Hensen et al.,2004); this is presumably due to lower fluid flow velocitiesat the CRMV, as concentrations of B, in particular, areamongst the highest reported to date.
On the global scale, the average water discharge fromsubmarine MVs is �35,000 m3 yr�1 (based on water fluxesfrom the eight MVs described in Table 3). Given that theestimated number of submarine MVs on Earth is 5500(Judd and Hovland, 2007), then the total annual water dis-charge from submarine MVs is �0.2 km3 yr�1. Li and Bconcentrations in deep pore fluids range from 20 to3400 lM and 2 to 14 mM, respectively (Emeis et al., 1996;Hensen et al., 2007; Scholz et al., 2009). Consequently, sub-marine MVs are estimated to contribute on average0.3 � 109 mol Li and 1.5 � 109 mol B per year to theoceans. These values are comparable to fluxes of Li and Bexpelled at convergent margins (Kastner et al., 1991; Mar-tin et al., 1991; You et al., 1993, 1995a; Chan et al., 1994),and represent �5% of the flux of Li and �20% of the flux ofB supplied by hydrothermal vents (Stoffyn-Egli and Mac-kenzie, 1984; Seyfried et al., 1984; Spivack and Edmond,1987; You et al., 1993; Huh et al., 1998; Chan et al.,2002) (Table 6). Although there are large uncertainties inestimates of water discharge from MVs (see Section 5.1),and also in the number of submarine MVs, this study alongwith other work on MVs (Kopf and Deyhle, 2002; Aloisiet al., 2004), indicates that MVs supply �2% of the Liand B delivered to the ocean.
5.3.2. Methane emissions at the Carlos Ribeiro MV
Constraining the CH4 flux at MVs is of dual interest.First, a number of studies have shown that CH4 is animportant energy source for life at MVs (e.g. de Beeret al., 2006) and, secondly, CH4 is a greenhouse gas. Forthese reasons, determinations of fluxes of methane fromMVs are essential in order to understand the biodiversityat MVs and to assess whether MVs are a significant sourceof CH4 in the global carbon budget.
Pore fluids from the CRMV contain elevated levels ofCH4 and higher hydrocarbons relative to the backgroundstation (Fig. 3), indicating that these gases are, in part, ofthermogenic origin (Mazurenko et al., 2002; Stadnitskaiaet al., 2006; Hensen et al., 2007; Nuzzo et al., 2009). Thepore fluid profiles of SO4
2�, H2S and TA suggest thatCH4 is the main driver of SO4
2� consumption at theCRMV; SO4
2� concentrations fall to zero within 34–180 cm depth below the seafloor (Fig. 3), yet they remainhigh throughout the sediment column at the backgroundsite which is not affected by the seepage of hydrocarbon richpore fluids. Additionally, the drop in SO4
2� is accompaniedby a peak in H2S and an increase in TA because HCO3
� isproduced by AOM (Eq. (5)). The presence of anaerobicmethanotrophic archaea supports the geochemical evidencefor AOM at this MV (Vanreusel et al., 2009). AOM hasbeen shown to suppress the release of dissolved CH4 intothe water column also at other MVs in the Gulf of Cadiz(Niemann et al., 2006a) although, in this study, only diffu-sive CH4 fluxes were taken into account. Our data indicatethat the main mass transfer pathway at MVs is actuallyadvective flow. Thus, we use our 1-D transport-reactionmodel to calculate dissolved CH4 fluxes, both at depthand at the seafloor, and to assess the role of AOM in regu-lating the amount of CH4 escaping into the water column atthis MV.

Table 6Boron (B), lithium (Li) and methane (CH4) inputs into the ocean.
B flux(109 mol yr�1)
Li flux(109 mol yr�1)
CH4 flux(1010 mol yr�1)
References
Rivers 54 (49–58) 8 – Huh et al. (1998), Park and Schlesinger (2002)Hydrothermal fluids 7.4 (0.4–12) 6 (3–27) 0.1 Seyfried et al. (1984), Stoffyn-Egli and Mackenzie
(1984), Spivack and Edmond (1987), You et al.(1993), Huh et al. (1998), Chan et al. (2002)
Fluid expulsionat convergent margins
1.9 0.08–0.6 – You et al. (1995b), Chan and Kastner (2000),Park and Schlesinger (2002),Hathorne and James (2006)
Mud volcanoes 1.5 (0.4–2.7)* 0.3 (0.004–0.7)* 15.5 *See text for details; Keir et al. (2005)Seepage atcontinental shelves
– – 205 (10–400) Hovland et al. (1993), Hornafius et al. (1999)
1138 H. Vanneste et al. / Geochimica et Cosmochimica Acta 75 (2011) 1124–1144
For all sites, the model-derived methane concentrationat the lower boundary (CH4L; Table 4) exceeds the meth-ane saturation concentration required to form gas hydratesat CRMV (68 mM, calculated according to the methods de-scribed inTishchenko et al., 2005). As the model presentedhere only simulates the dissolved phase, the values of CH4Lgreater than 68 mM suggest that CH4 as a free gas mustalso be present, within the subsurface at CRMV. This isconsistent with observations that document the coexistenceof free gas and gas hydrates at a number of cold seeps (e.g.Milkov et al., 2004) and streams of gas bubbles escapingfrom the seabed at MVs that are located within the hydratestability zone (e.g. Sauter et al., 2006; Sahling et al., 2009).It is important to note that the model only provides an‘effective’ measure of the methane concentration at the low-er boundary, and it does not simulate the exact physicalprocesses (i.e. gas flow in porous media and subsequent(partial) dissolution). (This would require a model thatincorporates multi-phase flow, which is beyond the scopeof this paper.) Crucially, however, our model can providethe correct methane flux required for AOM, because met-hanotrophic archaea can only utilise dissolved methane(as opposed to methane gas) for AOM. Results of trans-port-reaction modelling (Fig. 5c and Table 5) also indicatethat CH4 fluxes at depth and at the seafloor decrease fromthe eye of the MV towards its periphery. This is partly be-cause of (i) lower CH4 concentrations in the subsurface atthe peripheral sites (CH4L = 75 mM), and (ii) a drop inthe fluid flow velocity towards the periphery (Table 4).Although advective flow could not be modelled at the out-ermost sites (slope and mudflow), SO4
2�, H2S and hydro-carbon data clearly show (Fig. 3) that there is someupward CH4 flow. However, these data may also reflect lat-eral diffusion of solutes from the central vent channel. Nev-ertheless, regardless of the CH4 source, our data indicatethat most of the CH4 is oxidized within the surface sedi-ments, because of the low fluid flow velocities at these sites.Hence, the model outcome underlines the importance ofpore water flow (Luff and Wallmann, 2003). Furthermore,if the supply of CH4 from depth is low, the model predictsthat CH4 is consumed at a lower rate, but more efficiently:RAOM decreases while kAOM increases from the eye of theMV towards its periphery (Table 5). This means that dis-solved CH4 will only escape from the seafloor into the over-lying water column if it is supplied at a faster rate than it is
consumed by CH4 oxidizing archaea. This may be statingthe obvious, but the fact that this is acknowledged by themodel gives us confidence in its ability to reconstruct trans-port and reaction processes at cold seeps.
Derived values for kAOM at the CRMV are consistentwith those obtained by other modelling studies at cold seepsites (Table 3). The depth-integrated rate of AOM is gener-ally low compared to other cold seeps in the Mediterraneanand Black Sea, as well as on the Costa Rica and Cascadiamargins (Table 3). This can be attributed on the one handto lower CH4 concentrations at the lower boundary of themodel (e.g. Carlos Ribeiro MV: CH4L = 75–120 mM ver-sus Kazan MV: CH4L = 130–165 mM) and/or to lowerfluid flow velocities (e.g. Dvurechenskii MV: 8–25 cm yr�1).RAOM and the CH4 flux are intrinsically linked via Eq. (9);higher methane concentrations will result in higher RAOM
values. Thus, the CH4 flux from depth plays an importantrole in setting kAOM and RAOM values in cold seep environ-ments. As it is still difficult to accurately measure CH4 con-centrations in sediment cores, or in situ, modelling is thebest way to constrain these parameters. Furthermore, ratesof AOM obtained from laboratory experiments suffer inthat they are averaged over only a few hours, while modelsare based on pore water data which correspond to time-scales of months to years. Nevertheless, although the mod-els work well, major advances in our understanding of CH4
related processes in cold seep environments will only bepossible with an improvement in our ability to makein situ measurements.
The total CH4 output via quiescent dewatering acrossthe sediment–seawater interface at the CRMV is estimatedto be �15 � 103 mol yr�1 (Table 3); this is 15% of theamount transported to the surface sediments from depth(�100 � 103 mol yr�1). This value is within the range ofthat calculated at the Captain Arutyunov MV (Gulf of Ca-diz), Mound 11 and Mound 12 (Costa Rica), which havesimilar fluid flow velocities (Table 3). MVs with higher fluidflow velocities tend to have considerably higher CH4 emis-sions, e.g. Hakon Mosby MV, Dvurechenskii MV, Atalanteand Cyclops. However, CH4 emissions from Atalante andCyclops are likely to have been overestimated as the major-ity of the CH4 ascending from the periphery of the MVs islikely to have been oxidized by AOM, which was not takeninto account. If all submarine MVs in the Gulf of Cadiz (i.e.>30) are considered to have the same level of activity as

Fig. 7. Spatial distribution of boron (B), lithium (Li) and methane (CH4) fluxes across the Carlos Ribeiro mud volcano surface.
Fluid flow and geochemical fluxes at the Carlos Ribeiro mud volcano 1139
Captain Arutyunov MV and Carlos Ribeiro MV, submar-ine MVs in the Gulf of Cadiz would emit 3.3 � 105
mol yr�1 of CH4 (= 11 � 103 mol yr�1 � 30). This is signif-icantly lower than calculated for the Black Sea (1.2 � 108
mol yr�1; Wallmann et al., 2006) and for the Costa Ricamargin (20 � 106 mol yr�1; Mau et al., 2006).
Wallmann et al. (2006) estimate that the total CH4 emis-sion into the ocean via fluid flow through submarine MVs isof the order of 1010 mol yr�1, excluding the contributionsfrom gas ebullition (�2 � 1010 mol yr�1) and mud extru-sions (�12.5 � 1010 mol yr�1). Thus, although these esti-mates are based on very few data (Kopf and Behrmann,2000; Sauter et al., 2006; Sahling et al., 2009), the magni-tude of methane emissions via quiescent dewatering is verysimilar to gas ebullition. This is most likely because of themore constant and continuous nature of fluid flow and itswidespread occurrence at MVs, in contrast to gaseous fluxeswhich are rich in CH4 but episodic. Accordingly, results fromseep sites such as on the Cascadia margin and in the Gulf ofMexico (Table 3), show that the size of the area of seepage isof key importance in defining the amount of CH4 emittedfrom a single seep site. This is also demonstrated by the dis-tribution of the CH4 output across the CRMV (Fig. 7). Thecontribution of submarine MVs to the global methane bud-get of the ocean is relatively small (�8%) compared to marineseepage at continental shelves (Trotsyuk and Avilov, 1988;Hovland et al., 1993; Hornafius et al., 1999) but significantlyhigher than the input from hydrothermal circulation at mid-ocean ridges (e.g. 150 � emissions from the Mid-AtlanticRidge; Keir et al., 2005) (Table 6).
Nevertheless, more work needs to be done to properlyquantify CH4 emissions from submarine MVs. So farwell-constrained methane fluxes from MVs are limited tothose on land, which have a direct influence on the atmo-spheric methane budget and are easier to study (Dimitrov,2002; Etiope and Klusman, 2002; Etiope and Milkov, 2004;Etiope et al., 2009). Nevertheless, although the contributionof methane emissions of submarine MVs to the atmosphereis likely to be small (McGinnis et al., 2006), they can havean indirect effect on global climate by reducing the bufferingcapacity of the deep ocean (Damm and Budeus, 2003).
6. CONCLUSIONS
The Carlos Ribeiro mud volcano in the Gulf of Cadizhas been systematically sampled along a transect to assessthe spatial variation of fluid flow velocities and elementand methane fluxes. Compared to other MVs, the CRMVcurrently shows only modest fluid expulsion activity. Fluidflow velocities are highest at the eye of the MV and gener-ally decrease towards its periphery. Accordingly, geochem-ical fluxes across the seawater–sediment interface are alsohighest in the eye and very low at the edges. This patternof concentric zonation seems to be a common characteristicof mud pies and needs to be taken into consideration whenassessing the effects of fluid flow on chemical budgets in theocean.
Like other submarine MVs, the CRMV expels fluidswith very low Cl concentrations which are sourced at depthby the transformation of smectite to illite. Illitization takesplace at temperatures of between �60 and 150 �C, which re-sults in leaching of Li and B. Boron attains concentrationsof up to 10 mM at the CRMV, amongst the highest ever re-ported for cold seep environments. We calculate that mudvolcanism is an important source of Li and B to the ocean,supplying up to 20% of the flux of B, and up to 5% of theflux of Li, from high-temperature hydrothermal activity.
Methane emissions into the overlying water column atthe CRMV are relatively low compared to other MVs. Thisis probably because of low velocities of fluid flow coupledwith efficient microbial methanotrophy. Microbial methan-otrophy (or AOM) has been observed at almost all seepsites; understanding the controls on this process is thereforeof urgent need if we are to properly quantify the impact ofcold seeps on the global methane budget.
ACKNOWLEDGMENTS
This project is part of a Ph.D. study, funded by the School ofOcean and Earth Science (University of Southampton) and theHERMES project of the European Commission’s Sixth Frame-work Programme (EC contract No. GOCE-CT-2005-511234).The authors thank the shipboard scientific party (JC-10 cruise)and the officers and crew of the Research Vessel RRS James Cook

1140 H. Vanneste et al. / Geochimica et Cosmochimica Acta 75 (2011) 1124–1144
for their invaluable support at sea. D. Green and B. Alker arethanked for their assistance with shipboard and shore-based chem-ical analyses. All of the core material described in this paper is ar-chived in BOSCORF at the National Oceanography CentreSouthampton.
APPENDIX A. SUPPLEMENTARY DATA
Supplementary data associated with this article can befound, in the online version, at doi:10.1016/j.gca.2010.11.017.
REFERENCES
Akhmetzhanov A. M., Ivanov M., Kenyon N. H. and Mazzini A.(2007) Deep-water cold seeps, sedimentary environments andecosystems of the Black and Tyrrhenian Sea and the Gulf ofCadiz, Preliminary results of investigations during the TTR-15cruise, RV “Prof Logachev”, June–August 2005. In IOC
Technical Series, vol. 72.Aller R. C. (1980) Quantifying solute distributions in the biotur-
bated zone of marine-sediments by defining an average micro-environment. Geochim. Cosmochim. Acta 44, 1955–1965.
Aloisi G., Drews M., Wallmann K. and Bohrmann G. (2004)Fluid expulsion from the Dvurechenskii mud volcano (BlackSea) Part I. Fluid sources and relevance to Li, B, Sr, I anddissolved inorganic nitrogen cycles. Earth Planet. Sci. Lett.
225, 347–363.
Aquilina L., Dia A. N., Boulegue J., Bourgois J. and Fouillac A.M. (1997) Massive barite deposits in the convergent margin offPeru: implications for fluid circulation within subduction zones.Geochim. Cosmochim. Acta 61, 1233–1245.
Baraza J. and Ercilla G. (1996) Gas-charged sediments and largepockmark-like features on the Gulf of Cadiz slope (SW Spain).Mar. Petrol. Geol. 13, 253–261.
Barnes R. O. and Goldberg E. D. (1976) Methane production andconsumption in anoxic marine-sediments. Geology 4, 297–300.
Berastegui X., Banks C. J., Puig C., Taberner C., Waltham D. andFernandez M. (1998) Lateral diapiric emplacement of Triassicevaporites at the southern margin of the Gaudalquivir Basin,Spain. In Cenozoic Foreland Basins of Western Europe, vol. 134(eds. A. Mascle, C. Puigdefabregas, H. P. Luterbacher, and M.Fernandez). Geological Society, London, Special Publications,pp. 49–68.
Boetius A., Ravenschlag K., Schubert C. J., Rickert D., Widdel F.,Gieseke A., Amann R., Jorgensen B. B., Witte U. andPfannkuche O. (2000) A marine microbial consortium appar-ently mediating anaerobic oxidation of methane. Nature 407,
623–626.
Borowski W. S., Paull C. K. and Ussler W. (1996) Marine pore-water sulfate profiles indicate in situ methane flux fromunderlying gas hydrate. Geology 24, 655–658.
Boudreau B. P. (1996) A method-of-lines code for carbon andnutrient diagenesis in aquatic sediments. Comput. Geosci. 22,
479–496.
Boudreau B. P. (1997) Diagenetic Models and Their Implementa-
tion: Modelling Transport and Reactions in Aquatic Sediments.Springer-Verlag, Berlin.
Boudreau B. P. and Canfield D. E. (1988) A provisional diageneticmodel for Ph in anoxic porewaters – application to the foamsite. J. Mar. Res. 46, 429–455.
Brown K. and Westbrook G. K. (1988) Mud diapirism andsubcretion in the Barbados Ridge accretionary complex – therole of fluids in accretionary processes. Tectonics 7, 613–640.
Brown K. M., Saffer D. M. and Bekins B. A. (2001) Smectitediagenesis, pore-water freshening, and fluid flow at the toe ofthe Nankai wedge. Earth Planet. Sci. Lett. 194, 97–109.
Casas D., Ercilla G. and Baraza J. (2003) Acoustic evidences of gasin the continental slope sediments of the Gulf of Cadiz (EAtlantic). Geo-Mar. Lett. 23, 300–310.
Castrec M., Dia A. N. and Boulegue J. (1996) Major- and trace-element and Sr isotope constraints on fluid circulation in theBarbados accretionary complex.2. Circulation rates and fluxes.Earth. Planet. Sci. Lett. 142, 487–499.
Chan L.-H., Alt J. C. and Teagle D. A. H. (2002) Lithium andlithium isotope profiles through the upper oceanic crust: a studyof seawater-basalt exchange at ODP Sites 504B and 896A.Earth Planet. Sci. Lett. 201, 187–201.
Chan L. H. and Kastner M. (2000) Lithium isotopic compositionsof pore fluids and sediments in the Costa Rica subduction zone:implications for fluid processes and sediment contribution tothe arc volcanoes. Earth Planet. Sci. Lett. 183, 275–290.
Chan L. H., Gieskes J. M., You C. F. and Edmond J. M. (1994)Lithium isotope geochemistry of sediments and hydrothermalfluids of the Guaymas basin, Gulf of California. Geochim.
Cosmochim. Acta 58, 4443–4454.
Colten-Bradley V. A. (1987) Role of pressure in smectite dehydra-tion – effects on geopressure and smectite-to-illite transforma-tion. AAPG Bull. 71, 1414–1427.
Coplen T. B. and Hanshaw B. B. (1973) Ultrafiltration by acompacted clay membrane – I. Oxygen and hydrogen isotopicfractionation. Geochim. Cosmochim. Acta 37, 2295–2310.
Dahlmann A. and de Lange G. J. (2003) Fluid–sediment interac-tions at Eastern Mediterranean mud volcanoes: a stable isotopestudy from ODP Leg 160. Earth Planet. Sci. Lett. 212, 377–391.
Damm E. and Budeus G. (2003) Fate of vent-derived methane inseawater above the Hakon Mosby mud volcano (NorwegianSea). Mar. Chem. 82, 1–11.
de Beer D., Sauter E., Niemann H., Kaul N., Foucher J. P., WitteU., Schluter M. and Boetius A. (2006) In situ fluxes andzonation of microbial activity in surface sediments of theHakon Mosby Mud Volcano. Limnol. Oceanogr. 51, 1315–
1331.
Dewey J. F., Helman M. L., Turco E., Hutton D. H. W. and KnottS. D. (1989) Kinematics of the western Mediterranean. InAlpine Tectonics, vol. 45 (eds. M. P. Coward, D. Dietrich, andR. G. Park). Geological Society, London, Special Publication,pp. 265–283.
Deyhle A. and Kopf A. (2002) Strong B enrichment and anom-alous delta B-11 in pore fluids from the Japan Trench forearc.Mar. Geol. 183, 1–15.
Dia A. N., Castrec M., Boulegue J. and Boudou J. P. (1995) Majorand trace-element and Sr isotope constraints on fluid circula-tions in the Barbados accretionary complex. 1. Fluid origin.Earth Planet. Sci. Lett. 134, 69–85.
Dıaz-del-Rıo V., Somoza L., Martınez-Frias J., Mata M. P.,Delgado A., Hernandez-Molina F. J., Lunar R., Martın-Rubı J.A., Maestro A., Fernandez-Puga M. C., Leon R., Llave E.,Medialdea T. and Vazquez J. T. (2003) Vast fields of hydro-carbon-derived carbonate chimneys related to the accretionarywedge/olistostrome of the Gulf of Cadiz. Mar. Geol. 195, 177–
200.
Dimitrov L. I. (2002) Mud volcanoes – the most importantpathway for degassing deeply buried sediments. Earth-Sci. Rev.
59, 49–76.
Emeis K., Robertson A. H. F. and Richter C. (1996) In Proceedings
of the Ocean Drilling Program, Initial Reports, vol. 160. CollegeStation, TX (Ocean Drilling Program).
Etiope G. and Klusman R. W. (2002) Geologic emissions ofmethane to the atmosphere. Chemosphere 49, 777–789.

Fluid flow and geochemical fluxes at the Carlos Ribeiro mud volcano 1141
Etiope G. and Milkov A. V. (2004) A new estimate of globalmethane flux from onshore and shallow submarine mudvolcanoes to the atmosphere. Environ. Geol. 46, 997–1002.
Etiope G., Feyzullayev A. and Baciu C. L. (2009) Terrestrialmethane seeps and mud volcanoes: a global perspective of gasorigin. Mar. Petrol. Geol. 26, 333–344.
Fernandez-Puga M. C., Vazquez J. T., Somoza L., del Rio V. D.,Medialdea T., Mata M. P. and Leon R. (2007) Gas-relatedmorphologies and diapirism in the Gulf of Cadiz. Geo-Mar.
Lett. 27, 213–221.
Fitts T. G. and Brown K. M. (1999) Stress-induced smectitedehydration: ramifications for patterns of freshening and fluidexpulsion in the N-Barbados accretionary wedge. Earth Planet.
Sci. Lett. 172, 179–197.
Flinch J. F., Bally A. W. and Wu S. G. (1996) Emplacement of apassive-margin evaporitic allochton in the Betic Cordillera ofSpain. Geology 24, 67–70.
Gardner J. M. (1999) Mud volcanoes on the Moroccan Margin.EOS Trans. AGU 80, 483.
Gardner J. M. (2001) Mud volcanoes revealed and sampled on theWestern Moroccan continental margin. Geophys. Res. Lett. 28,
339–342.
German C. R. and Damm K. L. V. (2003) Hydrothermal processes.In Treatise on Geochemistry, vol. 6 (eds. H. D. Holland, K. K.Turekian and H. Elderfield). Elsevier–Pergamon, Oxford, pp.
181–222.
Ginsburg G. D., Milkov A. V., Soloviev V. A., Egorov A. V.,Cherkashev G. A., Vogt P. R., Crane K., Lorenson T. D. andKhutorskoy M. D. (1999) Gas hydrate accumulation at theHakon Mosby Mud Volcano. Geo-Mar. Lett. 19, 57–67.
Grasshoff K., Kremling K. and Ehrhardt M., et al. (1999) Methods
of Seawater Analysis, third ed. Wiley–VCH, Weinheim,Germany.
Gutscher M.-A., Dominguez S., Westbrook G. K., Gente P.,Babonneau N., Mulder T., Gonthier E., Bartolome R., Luis J.,Rosas F. and Terrinha P. (2009) Tectonic shortening andgravitational spreading in the Gulf of Cadiz accretionarywedge: observations from multi-beam bathymetry and seismicprofiling. Mar. Petrol. Geol. 26, 647–659.
Gutscher M. A., Malod J., Rehault J. P., Contrucci I., Klingel-hoefer F., Mendes-Victor L. and Spakman W. (2002) Evidencefor active subduction beneath Gibraltar. Geology 30, 1071–
1074.
Haese R. R., Hensen C. and de Lange G. J. (2006) Pore watergeochemistry off eastern Mediterranean mud volcanoes: impli-cations for fluid transport and fluid origin. Mar. Geol. 225, 191–
208.
Haese R. R., Meile C., Van Cappellen P. and de Lange G. J. (2003)Carbon geochemistry of cold seeps: methane fluxes andtransformation in sediments from Kazan mud volcano, easternMediterranean Sea. Earth Planet. Sci. Lett. 212, 361–375.
Hathorne E. C. and James R. H. (2006) Temporal record of lithiumin seawater: a tracer for silicate weathering? Earth Planet. Sci.
Lett. 246, 393–406.
Hayduk W. and Laudie H. (1974) Prediction of diffusion-coeffi-cients for nonelectrolytes in dilute aqueous-solutions. Aiche J.
20, 611–615.
Hedberg H. D. (1974) Relation of methane generation to under-compacted shales, shale diapirs, and mud volcanoes. AAPG
Bull. 58, 661–673.
Heeschen K. U., Collier R. W., Angelis M. A. d., Suess E., RehderG., Linke P. and Klinkhammer G. P. (2005) Methane sources,distribution, and fluxes from cold vent sites at Hydrate Ridge,Cascadia Margin. Global Biogeochem. Cycles 19, GB2016.
Henry P., LePichon X., Lallemant S., Lance S., Martin J. B.,Foucher J. P., FialaMedioni A., Rostek F., Guilhaumou N.,
Pranal and Castrec M. (1996) Fluid flow in and around a mudvolcano field seaward of the Barbados accretionary wedge:results from Manon cruise. J. Geophys. Res. Solid Earth 101,
20297–20323.
Hensen C. and Wallmann K. (2005) Methane formation at CostaRica continental margin-constraints for gas hydrate inventoriesand cross-decollement fluid flow. Earth Planet. Sci. Lett. 236,
41–60.
Hensen C., Wallmann K., Schmidt M., Ranero C. R. and Suess E.(2004) Fluid expulsion related to mud extrusion off Costa Rica– a window to the subducting slab. Geology 32, 201–204.
Hensen C., Nuzzo M., Hornibrook E., Pinheiro L. M., BockB., Magalhaes V. H. and Bruckmann W. (2007) Sources ofmud volcano fluids in the Gulf of Cadiz – indications forhydrothermal imprint. Geochim. Cosmochim. Acta 71, 1232–
1248.
Hesse R. and Harrison W. E. (1981) Gas hydrates (clathrates)causing pore-water freshening and oxygen isotope fractionationin deep-water sedimentary sections of terrigenous continentalmargins. Earth Planet. Sci. Lett. 55, 453–462.
Heyman M. A. W. (1989) Tectonic and depositional history of theMoroccan continental margin. In Extensional Tectonics and
Stratigraphy of the North Atlantic Margins, vol. 46 (eds. A. J.Tankard and H. R. Balkill). American Association of Petro-
leum Geologists, Tulsa, pp. 323–340.
Hinrichs K. U., Hayes J. M., Sylva S. P., Brewer P. G. and DeLongE. F. (1999) Methane-consuming archaebacteria in marinesediments. Nature 398, 802–805.
Hoehler F. K., Borowski C., Alperin M., Rodriguez N. M. andPaull C. K. (2000) Model, stable isotope, and radiotracercharacterization of anaerobic methane oxidation in gashydrate-bearing sediments of the Blake Ridge. In Proceedings
of the Ocean Drilling Program Scientific Results, vol. 164.College Station, TX (Ocean Drilling Program), pp. 79–85.
Hornafius J. S., Quigley D. and Luyendyk B. P. (1999) The world’smost spectacular marine hydrocarbon seeps (Coal Oil Point,Santa Barbara Channel, California): quantification of emis-sions. J. Geophys. Res. 104, 20703–20711.
Hovland M., Judd A. G. and Burke R. A. (1993) The global flux ofmethane from shallow submarine sediments. Chemosphere 26,
559–578.
Hower J., Eslinger E. V., Hower M. E. and Perry E. A. (1976)Mechanism of burial metamorphism of argillaceous sediment.1. Mineralogical and chemical evidence. Geol. Soc. A Bull. 87,
725–737.
Huh Y., Chan L.-H., Zhang L. and Edmond J. M. (1998) Lithiumand its isotopes in major world rivers: implications forweathering and the oceanic budget. Geochim. Cosmochim. Acta
62, 2039–2051.
Ivanenkov V. N. and Lyakhin Y. I. (1978) Determination of totalalkalinity in seawater. In Methods of Hydrochemical Investiga-
tions in the Ocean (eds. O. K. Bordovsky and V. N. Ivanenkov).Nauka Publication House, Moscow, pp. 110–114 (in Russian).
James R. H. and Palmer M. R. (2000) Marine geochemical cyclesof the alkali elements and boron: the role of sediments.Geochim. Cosmochim. Acta 64, 3111–3122.
James R. H., Allen D. E. and Seyfried W. E. (2003) Anexperimental study of alteration of oceanic crust and terrige-nous sediments at moderate temperatures (51 to 350 �C):insights as to chemical processes in near-shore ridge-flankhydrothermal systems. Geochim. Cosmochim. Acta 67, 681–691.
Judd A. and Hovland M. (2007) Seabed Fluid Flow: The Impact of
Geology, Biology and The Marine Environment. CambridgeUniversity Press, Cambridge.
Kastner M., Elderfield H. and Martin J. B. (1991) Fluids inconvergent margins: what do we know about their composition,

1142 H. Vanneste et al. / Geochimica et Cosmochimica Acta 75 (2011) 1124–1144
origin, role in diagenesis and importance for oceanic chemicalfluxes? Philos. Trans. R. Soc. London Ser. A 335, 243–259.
Keir R. S., Greinert J., Rhein M., Petrick G., Sultenfuß J. andFurhaupter K. (2005) Methane and methane carbon isotoperatios in the Northeast Atlantic including the Mid-AtlanticRidge (50�N). Deep-Sea Res. Part I Oceanogr. Res. Pap. 52,
1043–1070.
Kenyon N. H., Ivanov M. K., Akhmetzhanov A. M. andAkhmanov G. G. (2000) Multidisciplinary study of geologicalprocesses on the North East Atlantic and western Mediterra-nean margins. Preliminary results of geological and geophysicalinvestigations during the TTR-9 cruise of R/V “ProfessorLogachev”, June–July, 1999. In IOC Technical Series, vol. 56.
Kenyon N. H., Ivanov M. K., Akhmetzhanov A. M. andAkhmanov G. G. (2003) Interdisciplinary geoscience researchon the north east Atlantic margin, Mediterranean Sea and Mid-Atlantic Ridge. Preliminary results of investigations during theTTR-12 cruise of RV “Professor Logachev”, June–August,2002. In IOC Technical Series, vol. 67.
Kenyon N. H., Ivanov M., Akhmetzhanov A. M. and Kozlova E.V. (2006) Interdisciplinary geoscience studies of the Gulf ofCadiz and Western Mediterranean basins. Preliminary resultsof investigations during the TTR-14 cruise, RV “Prof Loga-chev”, July–September, 2004. In: IOC Technical Series, vol. 70.
Kopf A. (2003) Global methane emission through mud volcanoesand its past and present impact on the Earth’s climate. Int. J.
Earth Sci. 92, 806–816.
Kopf A. and Behrmann J. H. (2000) Extrusion dynamics of mudvolcanoes on the Mediterranean Ridge accretionary complex.In Salt, shale and igneous diapirs in and around Europe (eds. B.Vendeville, Y. Mart and J.-L. Vigneresse). Geological Society,London, Special Publications, 174, pp. 169–204.
Kopf A. and Deyhle A. (2002) Back to the roots: borongeochemistry of mud volcanoes and its implications formobilization depth and global B cycling. Chem. Geol. 192,
195–210.
Kopf A. J. (2002) Significance of mud volcanism. Rev. Geophys. 40,
1005.
Kvenvolden K. A. and Kastner M. (1990) Gas hydrates of thePeruvian outer continental margin. In Proceedings of the Ocean
Drilling Program Scientific Results, vol. 112. College Station,TX (Ocean Drilling Program), pp. 517–526.
Lance S., Henry P., Le Pichon X., Lallemant S., Chamley H.,Rostek F., Faugeres J. C., Gonthier E. and Olu K. (1998)Submersible study of mud volcanoes seaward of the Barbadosaccretionary wedge: sedimentology, structure and rheology.Mar. Geol. 145, 255–292.
Leon R., Somoza L., Medialdea T., Maestro A., Dıaz-del-Rıo V.and Fernandez-Puga M. d. C. (2006) Classification of sea-floorfeatures associated with methane seeps along the Gulf of Cadizcontinental margin. Deep-Sea Res. Part II 53, 1464–1481.
Leon R., Somoza L., Gimenez-Moreno C. J., Dabrio C. J., ErcillaG., Praeg D., Diaz-del-Rio V. and Gomez-Delgado M. (2009)A predictive numerical model for potential mapping of the gashydrate stability zone in the Gulf of Cadiz. Mar. Petrol. Geol.
26, 1564–1579.
Levin L. A. (2005) Ecology of cold seep sediments: interactions offauna with flow, chemistry and microbes. Oceanogr. Mar. Biol.
Annu. Rev. 43, 1–46.
Linke P., Wallmann K., Suess E., Hensen C. and Rehder G. (2005)In situ benthic fluxes from an intermittently active mud volcanoat the Costa Rica convergent margin. Earth Planet. Sci. Lett.
235, 79–95.
Luff R. and Wallmann K. (2003) Fluid flow, methane fluxes,carbonate precipitation and biogeochemical turnover in gashydrate-bearing sediments at Hydrate Ridge, Cascadia Margin:
numerical modeling and mass balances. Geochim. Cosmochim.
Acta 67, 3403–3421.
Luff R., Haeckel M. and Wallmann K. (2001) Robust and fastFORTRAN and MATLAB (R) libraries to calculate pHdistributions in marine systems. Comput. Geosci. 27, 157–169.
Mackin J. E. (1986) The free-solution diffusion-coefficient of boron– influence of dissolved organic-matter. Mar. Chem. 20, 131–
140.
Maekawa T. (2004) Experimental study on isotopic fractionation inwater during gas hydrate formation. Geochem. J. 38, 129–138.
Maldonado A., Somoza L. and Pallares L. (1999) The Betic orogenand the Iberian-African boundary in the Gulf of Cadiz:geological evolution (central North Atlantic). Mar. Geol. 155,
9–43.
Martin J. B., Kastner M. and Elderfield H. (1991) Lithium: sourcesin pore fluids of Peru slope sediments and implications foroceanic fluxes. Mar. Geol. 102, 281–292.
Martin J. B., Kastner M., Henry P., LePichon X. and Lallement S.(1996) Chemical and isotopic evidence for sources of fluids in amud volcano field seaward of the Barbados accretionary wedge.J. Geophys. Res. Solid Earth 101, 20325–20345.
Mau S., Sahling H., Rehder G., Suess E., Linke P. and Soeding E.(2006) Estimates of methane output from mud extrusions at theerosive convergent margin off Costa Rica. Mar. Geol. 225, 129–
144.
Mazurenko L. L., Soloviev V. A., Beienkaya I., Ivanov M. andPinheiro L. M. (2002) Mud volcano gas hydrates in the Gulf ofCadiz. Terra Nova 14, 321–329.
McGinnis D. F., Greinert J., Artemov Y., Beaubien S. E. andWuest A. (2006) Fate of rising methane bubbles in stratifiedwaters: How much methane reaches the atmosphere? J.
Geophys. Res. 111, C09007.
Medialdea T., Somoza L., Pinheiro L. M., Fernandez-Puga M. C.,Vazquez J. T., Leon R., Ivanov M. K., Magalhaes V., Diaz-del-Rio V. and Vegas R. (2009) Tectonics and mud volcanodevelopment in the Gulf of Cadiz. Mar. Geol. 261, 48–63.
Meile C., Berg P., Van Cappellen P. and Tuncay K. (2005) Solute-specific pore water irrigation: implications for chemical cyclingin early diagenesis. J. Mar. Res. 63, 601–621.
Middelburg J. J. (1989) A simple rate model for organic-matterdecomposition in marine-sediments. Geochim. Cosmochim. Acta
53, 1577–1581.
Milkov A. V. (2000) Worldwide distribution of submarine mudvolcanoes and associated gas hydrates. Mar. Geol. 167, 29–42.
Milkov A. V., Dickens G. R., Claypool G. E., Lee Y.-J., BorowskiW. S., Torres M. E., Xu W., Tomaru H., Trehu A. M. andSchultheiss P. (2004) Co-existence of gas hydrate, free gas, andbrine within the regional gas hydrate stability zone at HydrateRidge (Oregon margin): evidence from prolonged degassing ofa pressurized core. Earth Planet. Sci. Lett. 222, 829–843.
Milkov A. V. and Etiope G. (2005) Global methane emissionthrough mud volcanoes and its past and present impact on theEarth’s climate – a comment. Int. J. Earth Sci. 94, 490–492.
Milkov A. V., Sassen R., Apanasovich T. V. and Dadashev F. G.(2003) Global gas flux from mud volcanoes: a significant sourceof fossil methane in the atmosphere and the ocean. Geophys.
Res. Lett. 30, 1037.
Moore G. W. and Gieskes J. M. (1980) Interaction betweensediment and interstitial water near the Japan Trench Leg 57.Init. Rep. Deep Sea Drilling Proj. 56(57), 1269–1275.
Moore J. C. and Vrolijk P. (1992) Fluids in accretionary prisms.Rev. Geophys. 30, 113–135.
Nauhaus K., Boetius A., Kruger M. and Widdel F. (2002) In vitrodemonstration of anaerobic oxidation of methane coupled tosulphate reduction in sediment from a marine gas hydrate area.Environ. Microbiol. 4, 296–305.

Fluid flow and geochemical fluxes at the Carlos Ribeiro mud volcano 1143
Niemann H., Duarte J., Hensen C., Omoregie E., Magalhaes V. H.,Elvert M., Pinheiro L. M., Kopf A. and Boetius A. (2006a)Microbial methane turnover at mud volcanoes of the Gulf ofCadiz. Geochim. Cosmochim. Acta 70, 5336–5355.
Niemann H., Losekann T., de Beer D., Elvert M., Nadalig T.,Knittel K., Amann R., Sauter E. J., Schluter M., Klages M.,Foucher J. P. and Boetius A. (2006b) Novel microbialcommunities of the Haakon Mosby mud volcano and theirrole as a methane sink. Nature 443, 854–858.
Nuzzo M., Hornibrook E. R. C., Gill F., Hensen C., Pancost R.D., Haeckel M., Reitz A., Scholz F., Magalhaes V. H.,Bruckmann W. and Pinheiro L. M. (2009) Origin of lightvolatile hydrocarbon gases in mud volcano fluids, Gulf of Cadiz– evidence for multiple sources and transport mechanisms inactive sedimentary wedges. Chem. Geol. 266, 350–363.
Nuzzo M., Hornibrook E. R. C., Hensen C., Parkes R. J., Cragg B.A., Rinna J., von Deimling J. S., Sommer S., Magalhaes V. H.,Reitz A., Bruckmann W. and Pinheiro L. M. (2008) Shallowmicrobial recycling of deep-sourced carbon in Gulf of Cadizmud volcanoes. Geomicrobiol. J. 25, 283–295.
Orphan V. J., House C. H., Hinrichs K. U., McKeegan K. D. andDeLong E. F. (2001) Methane-consuming archaea revealed bydirectly coupled isotopic and phylogenetic analysis. Science 293,
484–487.
Ovsyannikov D. O., Sadekov A. Yu. and Kozlova E. V. (2003)Rock fragments from mud volcanic deposits of the Gulf ofCadiz: an insight into the Eocene-Pliocene sedimentary succes-sion of the basin. Mar. Geol. 195, 211–221.
Park H. and Schlesinger W. H. (2002) Global biogeochemical cycleof boron. Global Biogeochem. Cycles 16, 1072.
Pearson P. N. and Palmer M. R. (2000) Atmospheric carbondioxide concentrations over the past 60 million years. Nature
406, 695–699.
Perry E. A. and Hower J. (1972) Late-stage dehydration in deeplyburied pelitic sediments. AAPG Bull. 56, 2013–2021.
Pinheiro L. M., Ivanov M., Sautkin A., Akhmanov G., MagalhaesV. H., Volkonskaya A., Monteiro J. H., Somoza L., Gardner J.,Hamouni N. and Cunha M. R. (2003) Mud volcanism in theGulf of Cadiz: results from the TTR-10 cruise. Mar. Geol. 195,
131–151.
Reeburgh W. S. (1976) Methane consumption in Cariaco trenchwaters and sediments. Earth Planet. Sci. Lett. 28, 337–344.
Reeburgh W. S. (2007) Oceanic methane biogeochemistry. Chem.
Rev. 107, 486–513.
Rosas F. M., Duarte J. C., Terrinha P., Valadares V. and Matias L.(2009) Morphotectonic characterization of major bathymetriclineaments in Gulf of Cadiz (Africa-Iberia plate boundary):insights from analogue modelling experiments. Mar. Geol. 261,
33–47.
Sahling H., Bohrmann G., Artemov Y. G., Bahr A., Bruning M.,Klapp S. A., Klaucke I., Kozlova E., Nikolovska A., Pape T.,Reitz A. and Wallmann K. (2009) Vodyanitskii mud volcano,Sorokin trough, Black Sea: geological characterization andquantification of gas bubble streams. Mar. Petrol. Geol. 26,
1799–1811.
Sauter E. J., Muyakshin S. I., Charlou J. L., Schluter M., BoetiusA., Jerosch K., Damm E., Foucher J. P. and Klages M. (2006)Methane discharge from a deep-sea submarine mud volcanointo the upper water column by gas hydrate-coated methanebubbles. Earth Planet. Sci. Lett. 243, 354–365.
Savin S. M. and Hsieh J. C. C. (1998) The hydrogen and oxygenisotope geochemistry of pedogenic clay minerals: principles andtheoretical background. Geoderma 82, 227–253.
Schmidt M., Hensen C., Morz T., Muller C., Grevemeyer I.,Wallmann K., Mau S. and Kaul N. (2005) Methane hydrate
accumulation in “Mound 11” mud volcano, Costa Rica forearc.Mar. Geol. 216, 83–100.
Scholz F., Hensen C., Reitz A., Romer R. L., Liebetrau V.,Meixner A., Weise S. M. and Haeckel M. (2009) Isotopicevidence (Sr-87/Sr-86, delta Li-7) for alteration of the oceaniccrust at deep-rooted mud volcanoes in the Gulf of Cadiz, NEAtlantic Ocean. Geochim. Cosmochim. Acta 73, 5444–5459.
Schwarcz H. P., Agyei E. K. and McMullen C. C. (1969) Boronisotopic fractionation during clay adsorption from sea-water.Earth Planet. Sci. Lett. 6, 1–5.
Seyfried W. E., Janecky D. R. and Mottl M. J. (1984) Alteration ofthe oceanic-crust – implications for geochemical cycles oflithium and boron. Geochim. Cosmochim. Acta 48, 557–569.
Solomon E. A., Kastner M., Jannasch H., Robertson G. andWeinstein Y. (2008) Dynamic fluid flow and chemical fluxesassociated with a seafloor gas hydrate deposit on the northernGulf of Mexico slope. Earth Planet. Sci. Lett. 270, 95–105.
Sommer S., Linke P., Pfannkuche O., Schleicher T., von DeimlingJ. S., Reitz A., Haeckel M., Flogel S. and Hensen C. (2009)Seabed methane emissions and the habitat of frenulatetubeworms on the Captain Arutyunov mud volcano (Gulf ofCadiz). Mar. Ecol. Prog. Ser. 382, 69–86.
Somoza L., Dıaz-del-Rıo V., Leon R., Ivanov M., Fernandez-PugaM. C., Gardner J. M., Hernandez-Molina F. J., Pinheiro L. M.,Rodero J., Lobato A., Maestro A., Vazquez J. T., Medialdea T.and Fernandez-Salas L. M. (2003) Seabed morphology andhydrocarbon seepage in the Gulf of Cadiz mud volcano area:acoustic imagery, multibeam and ultra-high resolution seismicdata. Mar. Geol. 195, 153–176.
Spivack A. J. and Edmond J. M. (1987) Boron isotope exchangebetween seawater and the oceanic-crust. Geochim. Cosmochim.
Acta 51, 1033–1043.
Spivack A. J., Palmer M. R. and Edmond J. M. (1987) Thesedimentary cycle of the boron isotopes. Geochim. Cosmochim.
Acta 51, 1939–1949.
Spivack A. J., You C. F. and Smith J. (1993) Foraminiferal boronisotope ratios as a proxy for surface ocean pH over the past21 Myr. Nature 363, 149–151.
Srodon J. (1999) Nature of mixed-layer clays and mechanisms oftheir formation and alteration. Annu. Rev. Earth Planet. Sci. 27,
19–53.
Stadnitskaia A., Ivanov M. K., Blinova V., Kreulen R. andWeering T. C. E. v. (2006) Molecular and carbon isotopicvariability of hydrocarbon gases from mud volcanoes in theGulf of Cadiz, NE Atlantic. Mar. Petrol. Geol. 23, 281–296.
Stoffyn-Egli P. and Mackenzie F. T. (1984) Mass balance ofdissolved lithium in the oceans. Geochim. Cosmochim. Acta 48,
859–872.
Teichert B. M. A., Torres M. E., Bohrmann G. and Eisenhauer A.(2005) Fluid sources, fluid pathways and diagenetic reactionsacross an accretionary prism revealed by Sr and B geochem-istry. Earth Planet. Sci. Lett. 239, 106–121.
Tishchenko P., Hensen C., Wallmann K. and Wong C. S. (2005)Calculation of the stability and solubility of methane hydrate inseawater. Chem. Geol. 219, 37–52.
Torres M. E., McManus J., Hammond D. E., Angelis M. A. d.,Heeschen K. U., Colbert S. L., Tryon M. D., Brown K. M. andSuess E. (2002) Fluid and chemical fluxes in and out ofsediments hosting methane hydrate deposits on Hydrate Ridge,OR, I: hydrological provinces. Earth Planet. Sci. Lett. 201, 525–
540.
Treude T., Boetius A., Knittel K., Wallmann K. and Jorgensen B.B. (2003) Anaerobic oxidation of methane above gas hydratesat Hydrate Ridge, NE Pacific Ocean. Mar. Ecol. Prog. Ser. 264,
1–14.
1144 H. Vanneste et al. / Geochimica et Cosmochimica Acta 75 (2011) 1124–1144
Trotsyuk V. Y. and Avilov V. I. (1988) Disseminated flux ofhydrocarbon gases from the sea bottom and a method ofmeasuring it. Trans. (Doklady) USSR Acad. Sci. Earth Sci.
Sec. 291, 218–220.
Tryon M. D., Brown K. M. and Torres M. E. (2002) Fluid andchemical flux in and out of sediments hosting methane hydratedeposits on Hydrate Ridge, OR, II: hydrological processes.Earth Planet. Sci. Lett. 201, 541–557.
Van Rensbergen P., Depreiter D., Pannemans B., Moerkerke G.,Van Rooij D., Marsset B., Akhmanov G., Blinova V., IvanovM., Rachidi M., Magalhaes V., Pinheiro L., Cunha M. andHenriet J. P. (2005) The El Arraiche mud volcano field atthe Moroccan Atlantic slope, Gulf of Cadiz. Mar. Geol. 219, 1–
17.
Vanreusel A., Andersen A. C., Boetius A., Connelly D., Cunha M.R., Decker C., Hilario A., Kormas K. A., Maignien L., Olu K.,Pachiadaki M., Ritt B., Rodrigues C., Sarrazin J., Tyler P., VanGaever S. and Vanneste H. (2009) Biodiversity of cold seepecosystems along the European margins. Oceanography 22,
110–127.
Vigier N., Decarreau A., Millot R., Carignan J., Petit S. andFrance-Lanord C. (2008) Quantifying Li isotope fractionationduring smectite formation and implications for the Li cycle.Geochim. Cosmochim. Acta 72, 780–792.
von Huene R. and Lee H. J. (1983) The possible significance ofpore fluid pressures in subduction zones. AAPG Mem. 34, 781–
791.
Wallmann K., Drews M., Aloisi G. and Bohrmann G. (2006)Methane discharge into the Black Sea and the global ocean viafluid flow through submarine mud volcanoes. Earth Planet. Sci.
Lett. 248, 545–560.
Werne J. P., Haese R. R., Zitter T., Aloisi G., Bouloubassi I., HeijsS., Fiala-Medioni A., Pancost R. D., Sinninghe Damste J. S., deLange G., Forney L. J., Gottschal J. C., Foucher J.-P., Mascle
J. and Woodside J. (2004) Life at cold seeps: a synthesis ofbiogeochemical and ecological data from Kazan mud volcano,eastern Mediterranean Sea. Chem. Geol. 205, 367–390.
You C.-F., Gieskes J. M., Lee T., Yui T.-F. and Chen H.-W. (2004)Geochemistry of mud volcano fluids in the Taiwan accretionaryprism. Appl. Geochem. 19, 695–707.
You C. F., Spivack A. J., Smith J. H. and Gieskes J. M. (1993)Mobilization of Boron in Convergent Margins – implicationsfor the Boron Geochemical Cycle. Geology 21, 207–210.
You C. F., Spivack A. J., Gieseke A. and Rosenbauer R. (1995a)Experimental study of boron geochemistry: implications forfluid processes in subduction zones. Geochim. Cosmochim. Acta
59, 2435–2442.
You C. F., Chan L. H., Spivack A. J. and Gieskes J. M. (1995b)Lithium, boron, and their isotopes in sediments and pore watersof ocean drilling program site-808, Nankai Trough – implica-tions for fluid expulsion in accretionary prisms. Geology 23, 37–
40.
You C. F., Spivack A. J., Gieskes J. M., Martin J. B. and DavissonM. L. (1996a) Boron contents and isotopic compositions inpore waters: a new approach to determine temperature inducedartifacts – geochemical implications. Mar. Geol. 129, 351–361.
You C. F., Castillo P. R., Gieskes J. M., Chan L. H. and SpivackA. J. (1996b) Trace element behavior in hydrothermal exper-iments: implications for fluid processes at shallow depths insubduction zones. Earth Planet. Sci. Lett. 140, 41–52.
Zitellini N., Gracia E., Matias L., Terrinha P., Abreu M. A.,DeAlteriis G., Henriet J. P., Danobeitia J. J., Masson D. G.,Mulder T., Ramella R., Somoza L. and Diez S. (2009) Thequest for the Africa-Eurasia plate boundary west of the Strait ofGibraltar. Earth Planet. Sci. Lett. 280, 13–50.
Associate editor: David J. Burdige