spatial planning in gram panchayats
TRANSCRIPT
GOVERNMENT OF INDIA
MINISTRY OF PANCHAYATI RAJ
SPATIAL PLANNING IN GRAM
PANCHAYATS
GUNDUR GRAM PANCHAYAT
(Tiruverumbur taluk, Tiruchirapalli district, Tamil Nadu)
DEPARTMENT OF ARCHITECTURE
NATIONAL INSTITUTE OF TECHNOLOGY
TIRUCHIRAPPALLI
(in collaboration with Regional Remote Sensing Centre - South,
NRSC/ISRO, Govt. of India, Bengaluru)
JANUARY 2021

PROJECT TEAM – NIT, Tiruchirappalli
Overall Co-ordinator: Dr. G. Subbaiyan, Professor
Members:
1. Dr. A. Meenatchi Sundaram Associate Professor
2. Dr. P. Gopalakrishnan Assistant Professor
3. Prof. K. Pudhuma Bharathi Assistant Professor
STUDY TEAM - NRSC
Overall Co-ordination: Dr. Sudha Ravindranath, Scientist ‘SG’
Regional Remote Sensing Centre - South Team, Bengaluru:
1. Dr. K.S. Ramesh Head, Applications
2. Dr. S. Rama Subramoniam Scientist ‘SF’
3. Smt. Manjula V. Bhagwat Scientist ‘SD’
Regional Remote Sensing Centre - North Team, New Delhi:
1. Ms. Khushboo Mirza Scientist ‘SF’
2. Dr. Vinod Kumar Sharma Scientist ‘SE’
3. Mr. Shankar Ram N R Scientist ‘SC’
Overall Technical Guidance:
1. Dr. C. S. Jha Outstanding Scientist & CGM, RCs, NRSC
2. Dr. K. Ganesha Raj General Manager, RC-South
3. Dr V M Chowdary DGM, RRSC-North, NRSC
4. Dr K Chandrasekar Head, RC-Hyderabad, NRSC
ACKNOWLEDGEMENTS
National Institute of Technology Tiruchirappalli, Department of Architecture would like to
thank the Ministry of Panchayati Raj for offering us an opportunity to work on the project
SPATIAL PLANNING IN RURAL AREAS for two-gram panchayats in Tamil Nadu. NIT
Tiruchirappalli is grateful to Mr. Sunil Kumar IAS, Secretary, Mr. Kushwant Singh Sethi IAS,
Joint Secretary and other officials in the Ministry for offering us the opportunity and also for
the encouragement and guidance for successful completion of the project.
We would like to thank the officials and scientists of NRSC and NIC officials for their inputs
and support. We express our sincere and special thanks to the officials and scientists RRSC-
South, Bangalore, NRSC for their continuous help and guidance throughout the project.
NIT Tiruchirappalli would also like to thank officials of Directorate of Rural Development &
Panchayat Raj Department, Government of Tamil Nadu for their support to complete this
project. We would like to thank the elected president of the Gram Panchayat for the excellent
cooperation and help extended for completion of this project. We would like to thank the
Village Administrative Officer (VAO), and office secretary in gram panchayat office for
providing all required information and records. Special thanks to people of the gram panchayat
who helped us in carrying the household surveys and field studies.
We would like to thank the Director, Dean (R&C) for providing us necessary support for the
completion of this project. Special thanks to our technical people Mrs. Aananthi Mohankumar,
Mr. Jose Desouza Aanand and Mr. M. Pandiarajan for their full support and help. We would
like to thank everyone who contributed either directly or indirectly for the completion of this
project.
TABLE OF CONTENTS
CHAPTER 1 INTRODUCTION
1.1 Introduction 01
1.2 Tiruchirappalli District 02
1.3 Tiruverumbur Taluk 05
1.4 Gundur Gram Panchayat 06
1.5 Objectives 06
1.6 Methodology 07
1.6.1 Inventory of Natural Resources using Geospatial Technologies 07
1.6.2 Data Collection 08
CHAPTER 2 PHYSICAL FEATURES AND LANDUSE LAND
COVER DETAILS OF GRAM PANCHAYAT
2.1 Introduction 10
2.2 Physical Extent 10
2.3 Land Use/ Land Cover Details 12
2.4 Inventory of Natural Resources using High Resolution Satellite Data 13
2.4.1. Information Sources for Developmental Planning 13
2.5 Satellite Data Used 15
2.5.1 High Resolution Satellite Data (Hrs Data) 15
2.5.2 Very High-Resolution Satellite Data (Vhrs Data) 16
2.6 Spatial Layers 18
2.6.1 Settlement and Transportation Layer 18
2.6.2 Land Use Land Cover Map (1: 4,000 Scale) 19
2.6.3 Land Use Land Cover Map (1: 50,000 Scale) 21
2.6.4. Drainage Network & Surface Water Bodies 24
2.6.5 Slope Map 25
2.6.6 Geomorphology Map 25
2.6.7 Soil Texture Map 25
2.7 Derived Spatial Layers 29
2.7.1. Agriculture Map 29
2.7.2 Ground Water Quality Well Location Map 30
CHAPTER 3 DEMOGRAPHY
3.1 Introduction 32
3.2 Sex-Ratio 33
3.3 Literacy Rate 34
3.4 Population of Children 35
CHAPTER 4 ECONOMIC DEVELOPMENT OF GRAM PANCHAYAT
4.1 Details of Workers 37
4.1.1 Workers – Classification 37
4.2 Income and Expenditure Pattern of Households 39
4.3 Agriculture 39
4.4 Animal Husbandry 40
4.5 Industries 41
4.6 Self Help Group 43
4.7 Migration Pattern 43
CHAPTER 5 HOUSING
5.1 Introduction 44
5.2 Number of Households 44
5.2.1 House-Hold Size 44
5.3 Length of Residency 45
5.4 Residential Houses – Age of the Buildings 45
5.5 Residential Houses – Conditions 46
5.6 Residential Buildings – Ownership Status 49
5.7 Height of Residential Buildings 49
5.8 Construction of Residential Buildings – Beneficiaries from Govt. Schemes 50
CHAPTER 6 COMMUNITY FACILITIES AND UTILITIES
6.1 Introduction 51
6.2 Water Supply 51
6.3 Solid Waste Disposal 53
6.4 Sanitation 54
6.5 Storm Water Drainage 55
6.6 Power 56
6.7 Street Light 56
6.8 Public Transport 57
6.9 Road Network 57
6.10 Banks/ ATMs 57
6.11 Public Distribution Shop 57
6.12 Educational Facilities 58
6.12.1 Schools 58
6.12.2 Colleges and Universities 59
6.13 Health Facilities 59
6.14 Post Offices 59
6.15 Other Facilities 59
CHAPTER 7 PROJECTIONS AND PROPOSALS
7.1 Introduction 62
7.2 Issues/ Deficiencies And Expectations of Residents 62
7.3 Population Projections 63
7.4 Proposals – Agriculture 64
7.5 Proposals – Agriculture Related Activities 65
7.6 Proposals - Industrial/ Other Economic Activities 65
7.7 Proposals – Housing 66
7.8 Proposals – Infrastructure and Community Facilities 66
7.8.1 Water Supply 66
7.8.2 Electricity 67
7.8.3 Sanitation/ Drainage 67
7.8.4 Storm Water Drainage 68
7.8.5 Solid Waste Disposal 68
7.8.6 Transportation 68
7.8.7 Health 68
7.8.8 Education 69
7.8.9 Banks 69
7.8.10 Community Spaces 69
7.9 Environmental Issues 69
7.10 Overall Development (Landuse/ Land Cover) Proposals 71
7.11 Generation of Comprehensive Development Plan for GP 72
7.11.1 Water Resources Development Plan 72
7.11.2. Land Resources Development Plan (LRDP) 77
7.11.3. Recommendations & Suggestions for Improving
Natural Resources in Gundur GP 80
REFERENCES 82
LIST OF TABLES
Table 2.1 Land Details – Gundur GP 10
Table 2.2: Information sources for development planning 14
Table 2.3: Derived spatial databases required for planning 14
Table 2.4: Estimates of type-wise road length for Gundur GP 18
Table 2.5: Estimates of type-wise rail length for Gundur GP 18
Table 2.6: Area estimates of various LULC classes in Gundur GP (1:4k map) 20
Table 2.7: Estimates of drain length for Gundur GP 24
Table 2.8 Ground water quality parameters of Wells 30
Table 3.1 Demographic Characteristics 32
Table 3.2: Details of Male and Female Population 33
Table 3.3: Decadal wise Literacy Rate 34
Table 3.4: Details of Age Group (0-9) 36
Table 4.1: Details of Total Workers of Gundur 37
Table 4.2: Decadal wise Classification of Workers 38
Table 4.3: Land Area under Agriculture 40
Table 5.1 Habitation wise Distribution of Houses 44
Table 5.2 Number of Households and Household Size 44
Table 5.3 Classification of Residential Houses based on Age of the Buildings 46
Table 7.1: Projected Population –Gundur GP 64
Table 7.2: Future Housing Requirements –Gundur GP 66
Table 7.3 Water Supply Requirement 67
Table 7.4 Additional Educational Requirements 69
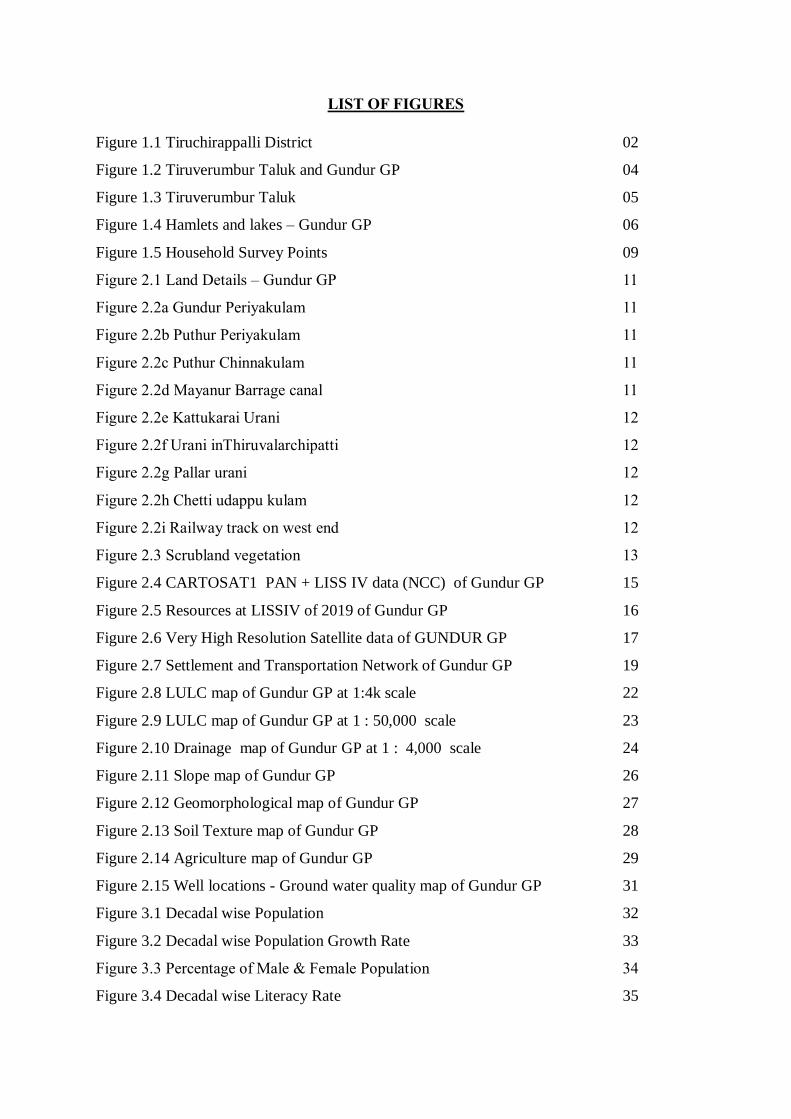
LIST OF FIGURES
Figure 1.1 Tiruchirappalli District 02
Figure 1.2 Tiruverumbur Taluk and Gundur GP 04
Figure 1.3 Tiruverumbur Taluk 05
Figure 1.4 Hamlets and lakes – Gundur GP 06
Figure 1.5 Household Survey Points 09
Figure 2.1 Land Details – Gundur GP 11
Figure 2.2a Gundur Periyakulam 11
Figure 2.2b Puthur Periyakulam 11
Figure 2.2c Puthur Chinnakulam 11
Figure 2.2d Mayanur Barrage canal 11
Figure 2.2e Kattukarai Urani 12
Figure 2.2f Urani inThiruvalarchipatti 12
Figure 2.2g Pallar urani 12
Figure 2.2h Chetti udappu kulam 12
Figure 2.2i Railway track on west end 12
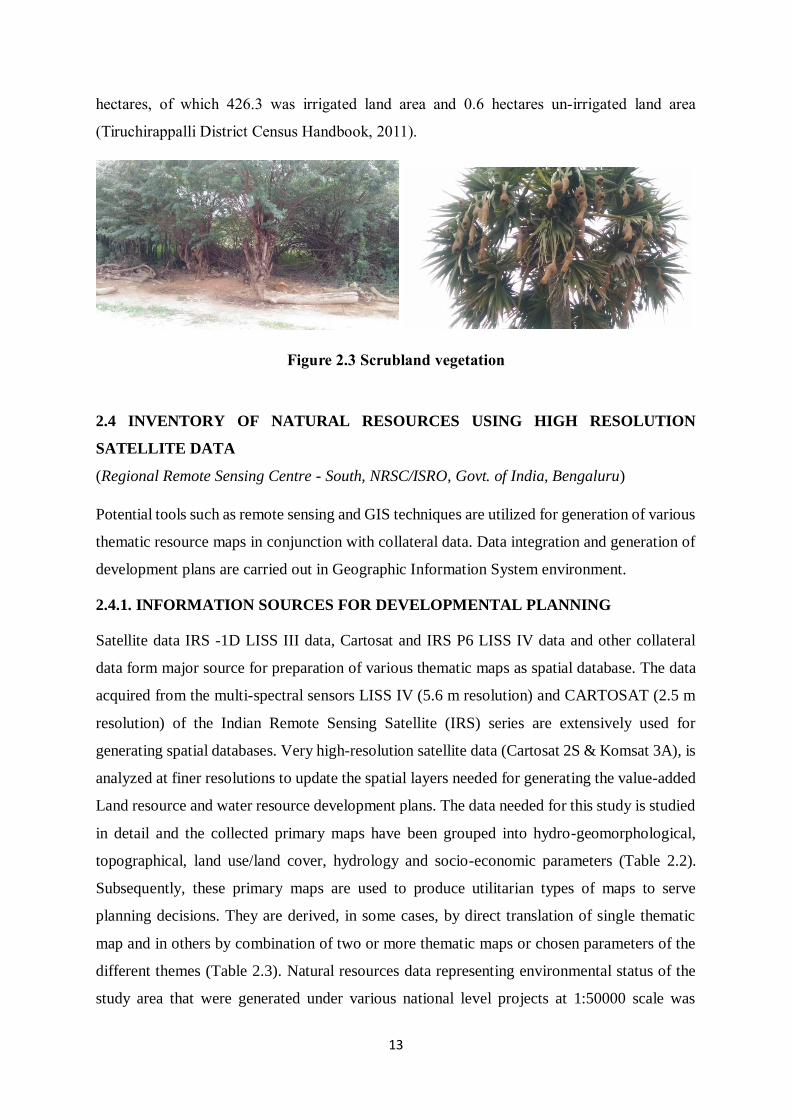
Figure 2.3 Scrubland vegetation 13
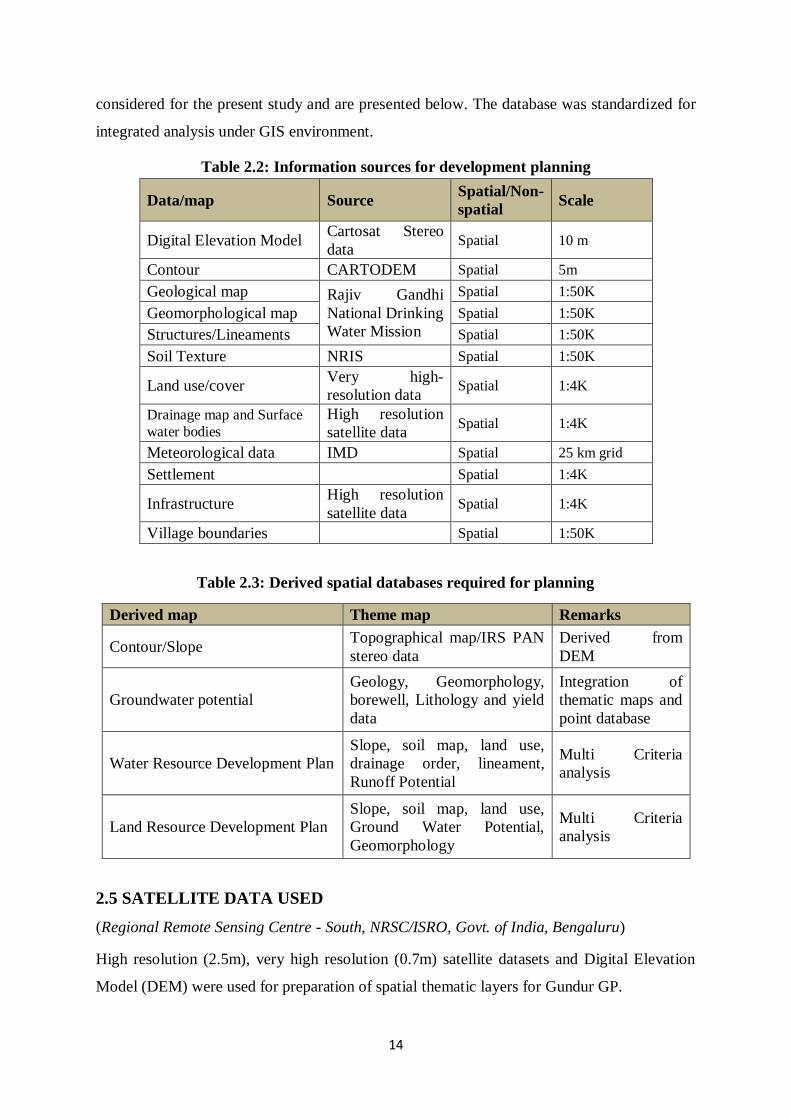
Figure 2.4 CARTOSAT1 PAN + LISS IV data (NCC) of Gundur GP 15
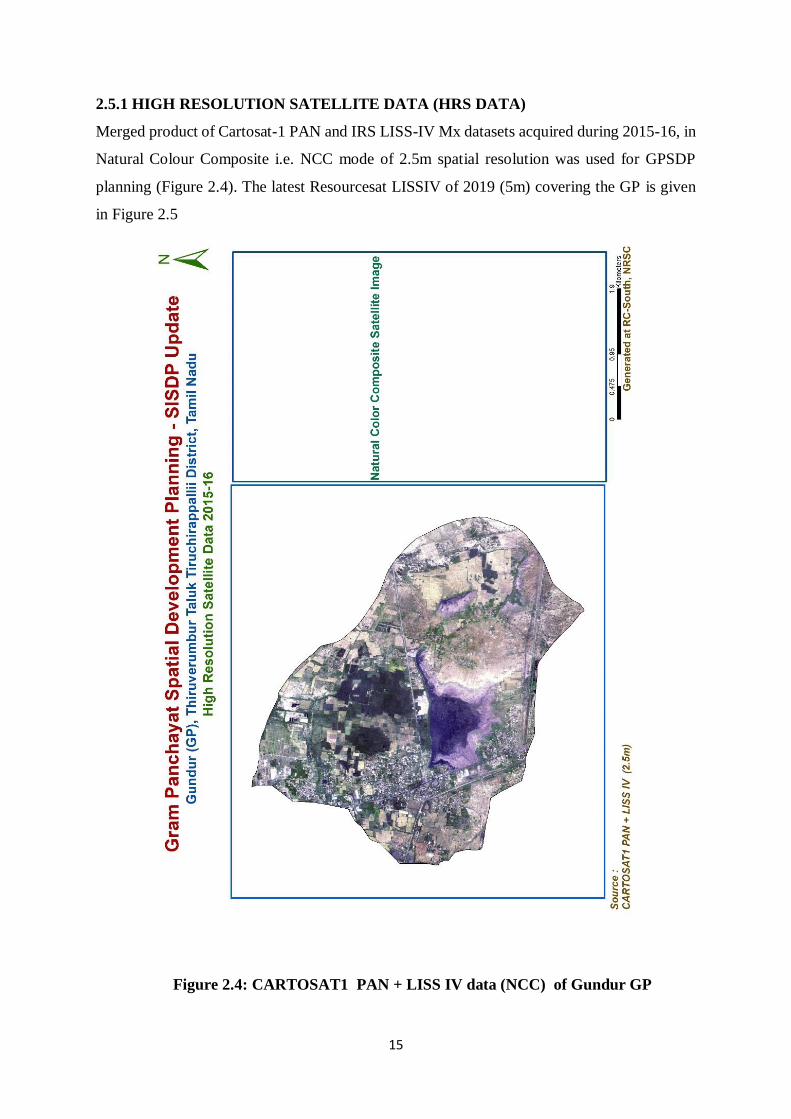
Figure 2.5 Resources at LISSIV of 2019 of Gundur GP 16
Figure 2.6 Very High Resolution Satellite data of GUNDUR GP 17
Figure 2.7 Settlement and Transportation Network of Gundur GP 19
Figure 2.8 LULC map of Gundur GP at 1:4k scale 22
Figure 2.9 LULC map of Gundur GP at 1 : 50,000 scale 23
Figure 2.10 Drainage map of Gundur GP at 1 : 4,000 scale 24
Figure 2.11 Slope map of Gundur GP 26
Figure 2.12 Geomorphological map of Gundur GP 27
Figure 2.13 Soil Texture map of Gundur GP 28
Figure 2.14 Agriculture map of Gundur GP 29
Figure 2.15 Well locations - Ground water quality map of Gundur GP 31
Figure 3.1 Decadal wise Population 32
Figure 3.2 Decadal wise Population Growth Rate 33
Figure 3.3 Percentage of Male & Female Population 34
Figure 3.4 Decadal wise Literacy Rate 35
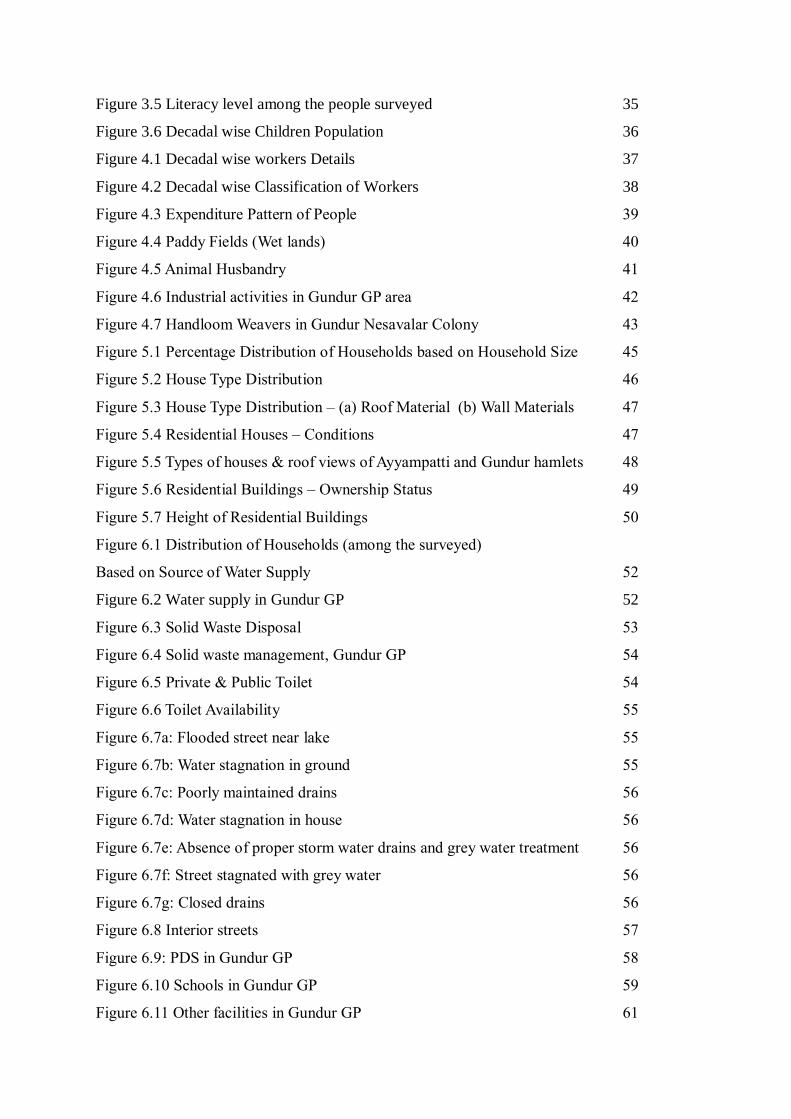
Figure 3.5 Literacy level among the people surveyed 35
Figure 3.6 Decadal wise Children Population 36
Figure 4.1 Decadal wise workers Details 37
Figure 4.2 Decadal wise Classification of Workers 38
Figure 4.3 Expenditure Pattern of People 39
Figure 4.4 Paddy Fields (Wet lands) 40
Figure 4.5 Animal Husbandry 41
Figure 4.6 Industrial activities in Gundur GP area 42
Figure 4.7 Handloom Weavers in Gundur Nesavalar Colony 43
Figure 5.1 Percentage Distribution of Households based on Household Size 45
Figure 5.2 House Type Distribution 46
Figure 5.3 House Type Distribution – (a) Roof Material (b) Wall Materials 47
Figure 5.4 Residential Houses – Conditions 47
Figure 5.5 Types of houses & roof views of Ayyampatti and Gundur hamlets 48
Figure 5.6 Residential Buildings – Ownership Status 49
Figure 5.7 Height of Residential Buildings 50
Figure 6.1 Distribution of Households (among the surveyed)
Based on Source of Water Supply 52
Figure 6.2 Water supply in Gundur GP 52
Figure 6.3 Solid Waste Disposal 53
Figure 6.4 Solid waste management, Gundur GP 54
Figure 6.5 Private & Public Toilet 54
Figure 6.6 Toilet Availability 55
Figure 6.7a: Flooded street near lake 55
Figure 6.7b: Water stagnation in ground 55
Figure 6.7c: Poorly maintained drains 56
Figure 6.7d: Water stagnation in house 56
Figure 6.7e: Absence of proper storm water drains and grey water treatment 56
Figure 6.7f: Street stagnated with grey water 56
Figure 6.7g: Closed drains 56
Figure 6.8 Interior streets 57
Figure 6.9: PDS in Gundur GP 58
Figure 6.10 Schools in Gundur GP 59
Figure 6.11 Other facilities in Gundur GP 61
Figure 6.12 Places of worship, Gundur GP 61
Figure 7.1 Green Cover Proposals 70
Figure 7.2 Development Proposal 71
Figure 7.3: Water Resources Development plan for Gundur GP 76
Figure 7.4: Land resources development plan for Gundur GP 79
List of Abbreviations
DEM Digital Elevation Model
DOP Date of Pass
FCC False Colour Composite
NCC Natural Color Composite
GIS Geographic Information System
GP Gram Panchayat
GPS Global Positioning System
GPSDP Gram Panchayat Spatial Development Plan
ICT Information and Communication Technology
IRS Indian Remote Sensing
LULC Land Use Land Cover
RS Remote Sensing
1
CHAPTER 1
INTRODUCTION
1.1 INTRODUCTION
Remarkable economic growth, with significant achievements in the areas of agriculture, health,
rural development, poverty alleviation, education and science & technology, has been
experienced in India during last few decades. Still the rural poor face unemployment, poor
infrastructure, low literacy level, inequality, low per capita income and consequent low
standards of living. Most of the developments are taking place in urban areas and rate of
development is high in metros and large cities. These developmental activities taking place in
urban areas extend to peri-urban areas as haphazard development mainly in villages adjoining
the urban areas located on NH and major highways and. These haphazard, unregulated
developments also lead to environment and other issues in the rural areas.
The rural areas have vast land area, the natural resource that is indispensable for development
activities. For any nation, effective utilization of natural resources and their management are
extremely essential. Hence, there is a need to catalyze the planning process at grassroots level.
Land is a limited resource and has pressure from social, economic and environmental needs,
including urbanization, industrialization, mining, transportation, rural development, protection
of environmentally sensitive zones and resource areas. Unplanned development in rural, peri-
urban areas and that in the vicinity of national and state highways also has adverse social,
environmental and health hazards. Spatial planning in rural areas is of paramount importance
in order to have well-designed rural communities, as well as scientific and orderly disposition
of land resource. This would in turn foster economic development and contribute to the ease
of living along with improvement in the quality of life.
The professional assessment of the ground situation and proposals for the future sustainable
development within the bounds of demographic, physical, socio-economic, jurisdictional and
financial aspects for the gram panchayat – GUNDUR, located in Tiruverumbur taluk and
Tiruchirappalli district is presented in this report.
2
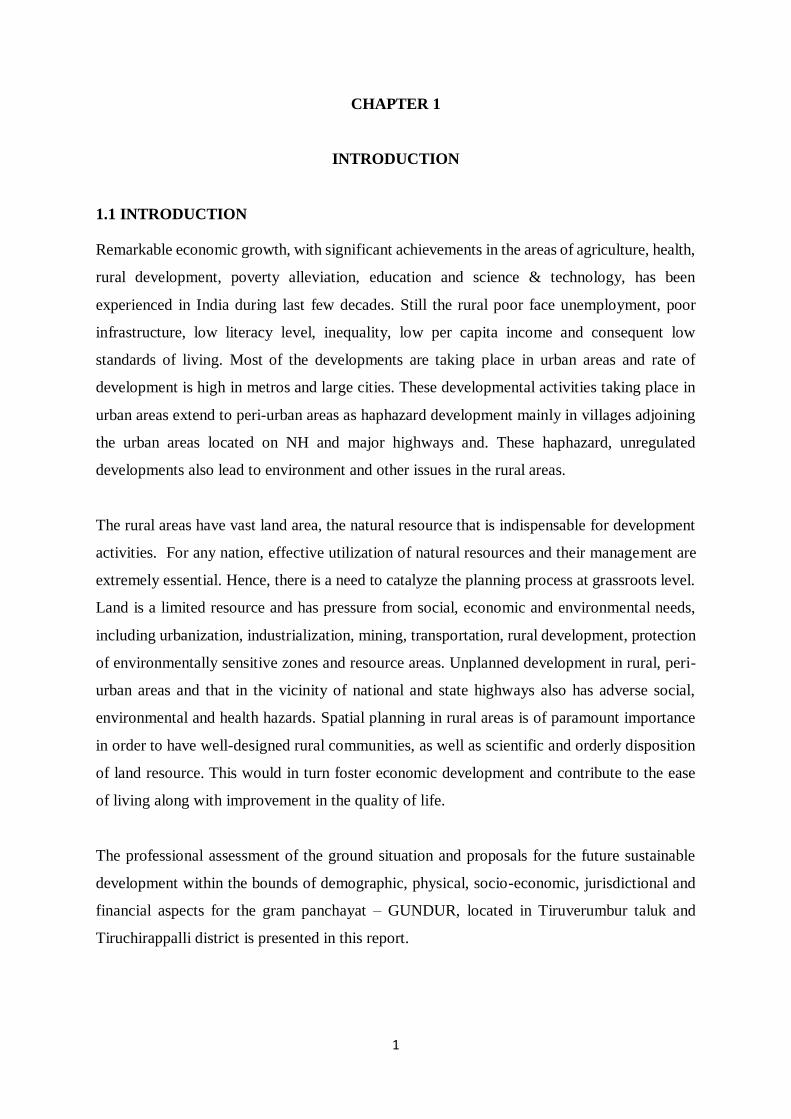
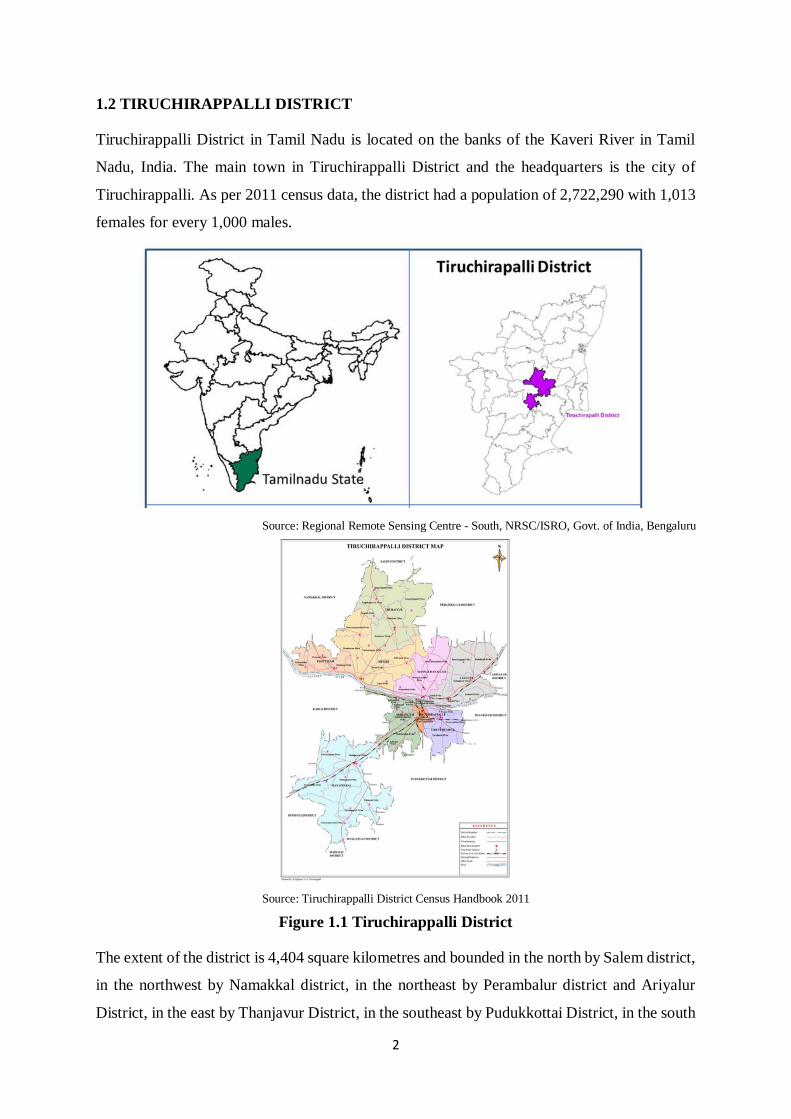
1.2 TIRUCHIRAPPALLI DISTRICT
Tiruchirappalli District in Tamil Nadu is located on the banks of the Kaveri River in Tamil
Nadu, India. The main town in Tiruchirappalli District and the headquarters is the city of
Tiruchirappalli. As per 2011 census data, the district had a population of 2,722,290 with 1,013
females for every 1,000 males.
Source: Regional Remote Sensing Centre - South, NRSC/ISRO, Govt. of India, Bengaluru
Source: Tiruchirappalli District Census Handbook 2011
Figure 1.1 Tiruchirappalli District
The extent of the district is 4,404 square kilometres and bounded in the north by Salem district,
in the northwest by Namakkal district, in the northeast by Perambalur district and Ariyalur
District, in the east by Thanjavur District, in the southeast by Pudukkottai District, in the south
3
by Madurai District and Sivagangai District, in the southwest by Dindigul district and, in the
west by Karur district. The Kaveri river flows through the length of the district and is the
principal source of irrigation and drinking water.
According to 2011 census, Tiruchirappalli district had a population of 2,722,290 with a sex-
ratio of 1,013 females for every 1,000 males. The Scheduled Castes and Scheduled Tribes
accounted for 17.14% and 0.67% of the total population respectively. The average literacy of
the district was 74.9%, compared to the national average of 72.99%. Tiruchirappalli district
had a total of 698,404 households. There were 1,213,979 workers in total, comprising 161,657
cultivators, 319,720 main agricultural labourers, 25,174 in house hold industries, 575,778 other
workers, 131,650 marginal workers, 9,012 marginal cultivators, 59,062 marginal agricultural
labourers, 5,212 marginal workers in household industries and 58,364 other marginal workers
in Tiruchirappalli District according to 2011 census (District Census Handbook 2011).
Tiruchirappalli is a place of historic, cultural and economic importance. The district has a rich
and diverse cultural heritage. The prominent historical monuments in Tiruchirappalli include
the Rock fort, the Ranganathaswamy temple at Srirangam, the Erumbeeswarar Temple at
Tiruverumbur, the Jambukeswarar temple at Thiruvanaikaval and Our Lady of Lourdes
Church. Several temples having religious importance and having heritage values are located
within the district and also in nearby districts. The district has several tourist attractions also.
The tourist places include railway museum, Mukkombu, Kallanai, Pachamalai, Puliyancholai
falls, butterfly park, etc. The district is also known for its exquisite handicrafts, castings and
South Indian musical instruments.
The economy of the district is mainly farming and also metal based and other industries. The
agriculture practice is sustained by a network of irrigation sources and improved methods of
cultivation. The vast tracts of the land in this district are irrigated by the major rivers are Kaveri,
Kollidam and their tributaries. The major crops are rice, sugarcane, banana/plantain, coconut,
cotton, betel, corn, groundnut, etc. With the commissioning of Bharat Heavy Electricals
Limited in the 1960s, the district endured extensive economic development in the industrial
development. Major industries in Tiruchirappalli include Bharat Heavy Electricals Limited
(BHEL), High Energy Projectile Factory (HEPF), Golden Rock Railway Workshop, Ordinance
Factory Tiruchirappalli, Light and heavy metal-based industries, Food Processing, Sugar Mills,
4
Cigar Making, Hosiery and garments, IT/BPO, manufacturing of Synthetic Stones for
Jewellery, etc.
Tiruchirappalli district is also well-known educational centre in Tamil Nadu. The major
educational institutions are National Institute of Technology Tiruchirappalli, Tamil Nadu
National Law School, Indian Institute of Management, Bharathidasan University, Anna
University Tiruchirappalli, Indian Institute of Information Technology Tiruchirappalli,
Government Medical College, National Research centre for banana, and Agricultural College
& Research Institute. The district has a private medical college and several business schools,
engineering, arts and science, polytechnic colleges. The district has several reputed schools
including two Kendriya vidyalayas.
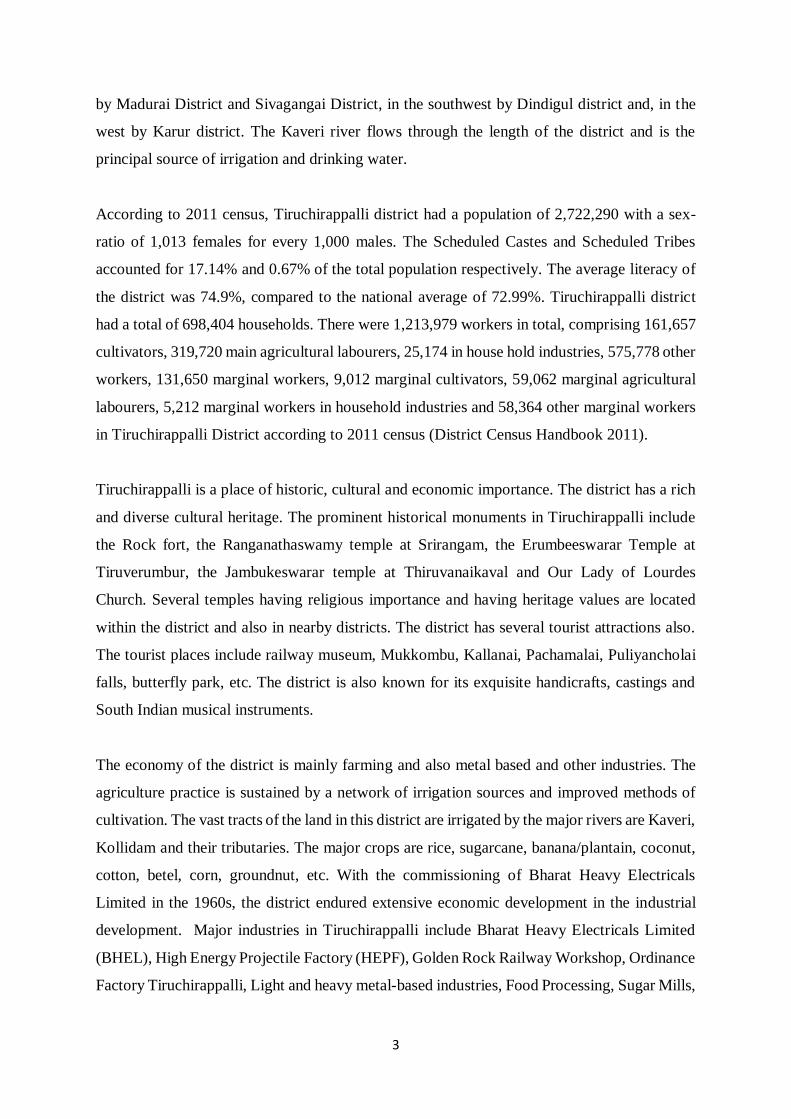
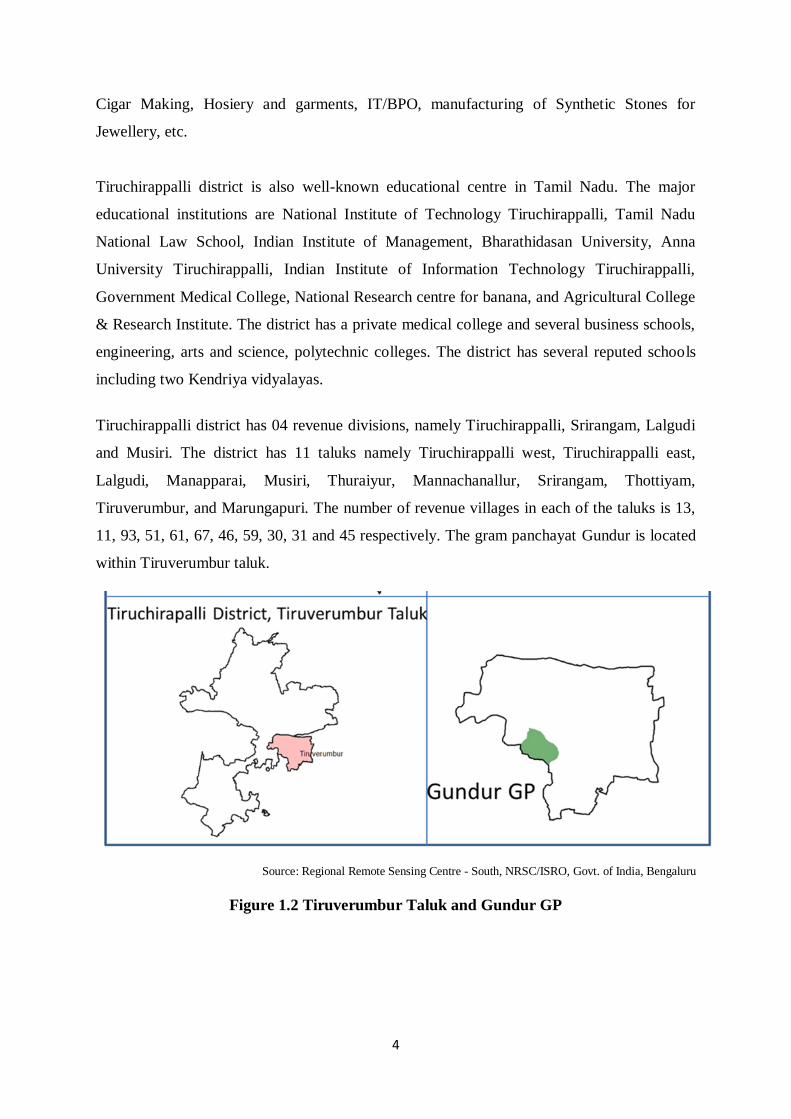
Tiruchirappalli district has 04 revenue divisions, namely Tiruchirappalli, Srirangam, Lalgudi
and Musiri. The district has 11 taluks namely Tiruchirappalli west, Tiruchirappalli east,
Lalgudi, Manapparai, Musiri, Thuraiyur, Mannachanallur, Srirangam, Thottiyam,
Tiruverumbur, and Marungapuri. The number of revenue villages in each of the taluks is 13,
11, 93, 51, 61, 67, 46, 59, 30, 31 and 45 respectively. The gram panchayat Gundur is located
within Tiruverumbur taluk.
Source: Regional Remote Sensing Centre - South, NRSC/ISRO, Govt. of India, Bengaluru
Figure 1.2 Tiruverumbur Taluk and Gundur GP
5
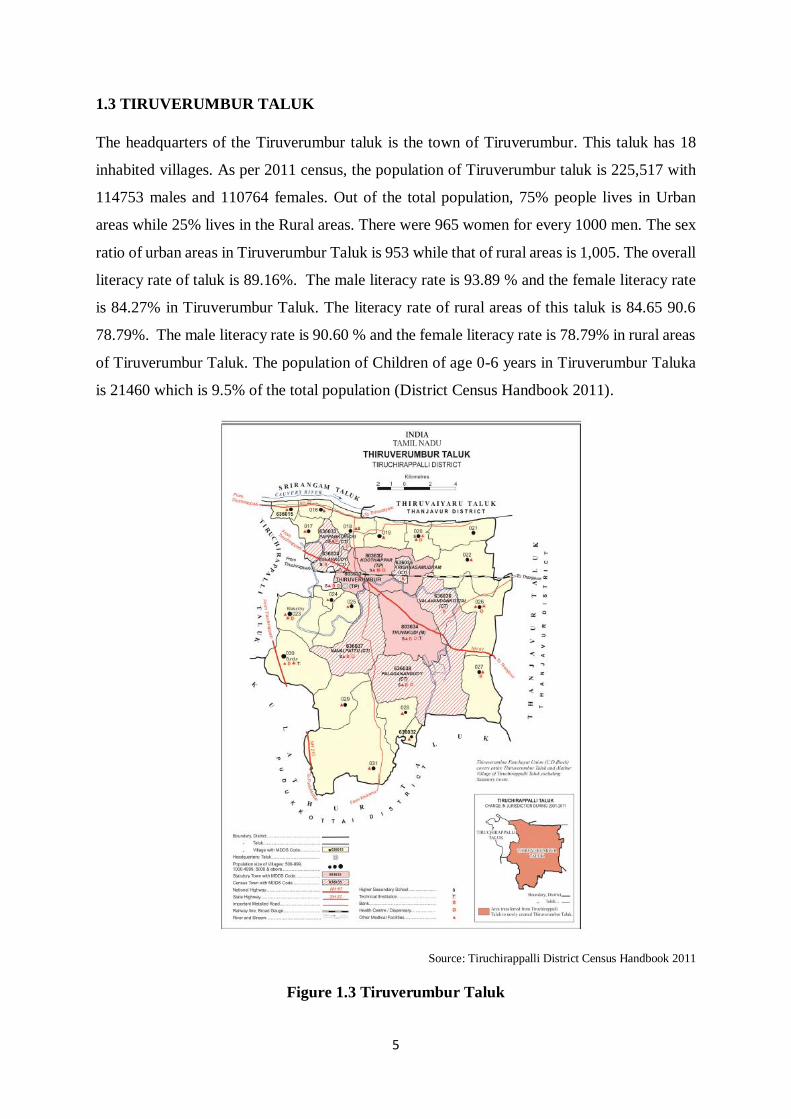
1.3 TIRUVERUMBUR TALUK
The headquarters of the Tiruverumbur taluk is the town of Tiruverumbur. This taluk has 18
inhabited villages. As per 2011 census, the population of Tiruverumbur taluk is 225,517 with
114753 males and 110764 females. Out of the total population, 75% people lives in Urban
areas while 25% lives in the Rural areas. There were 965 women for every 1000 men. The sex
ratio of urban areas in Tiruverumbur Taluk is 953 while that of rural areas is 1,005. The overall
literacy rate of taluk is 89.16%. The male literacy rate is 93.89 % and the female literacy rate
is 84.27% in Tiruverumbur Taluk. The literacy rate of rural areas of this taluk is 84.65 90.6
78.79%. The male literacy rate is 90.60 % and the female literacy rate is 78.79% in rural areas
of Tiruverumbur Taluk. The population of Children of age 0-6 years in Tiruverumbur Taluka
is 21460 which is 9.5% of the total population (District Census Handbook 2011).
Source: Tiruchirappalli District Census Handbook 2011
Figure 1.3 Tiruverumbur Taluk
6
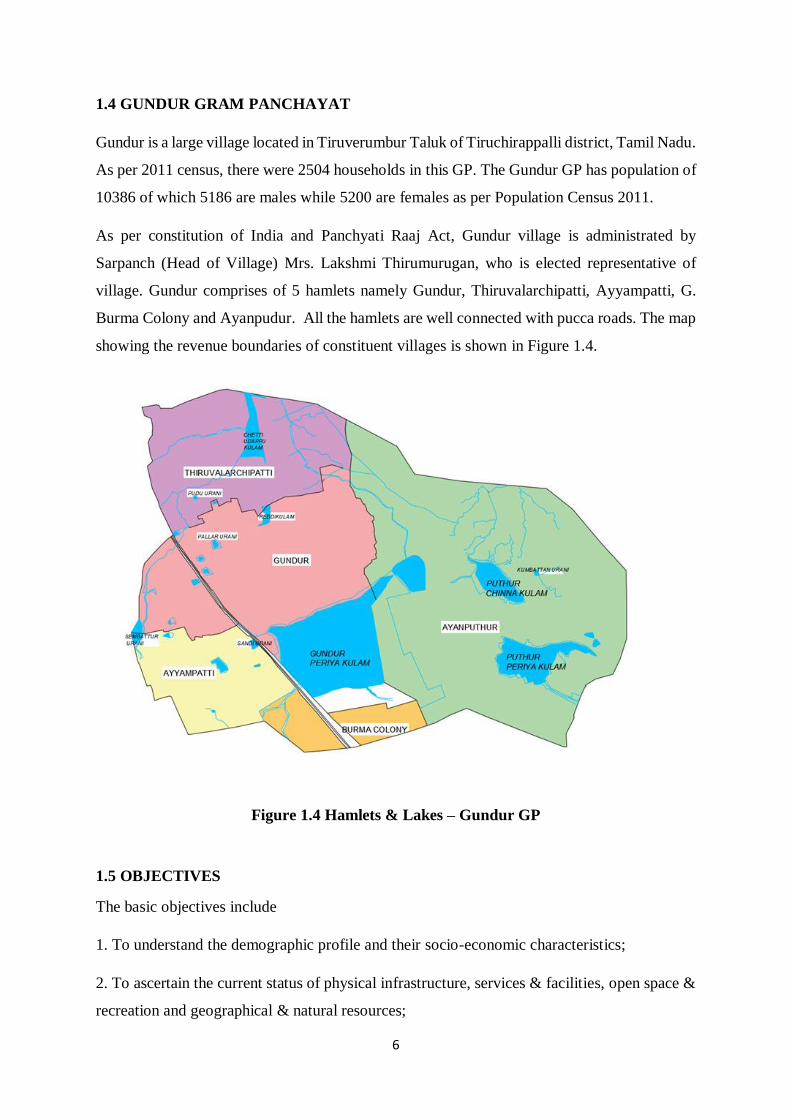
1.4 GUNDUR GRAM PANCHAYAT
Gundur is a large village located in Tiruverumbur Taluk of Tiruchirappalli district, Tamil Nadu.
As per 2011 census, there were 2504 households in this GP. The Gundur GP has population of
10386 of which 5186 are males while 5200 are females as per Population Census 2011.
As per constitution of India and Panchyati Raaj Act, Gundur village is administrated by
Sarpanch (Head of Village) Mrs. Lakshmi Thirumurugan, who is elected representative of
village. Gundur comprises of 5 hamlets namely Gundur, Thiruvalarchipatti, Ayyampatti, G.
Burma Colony and Ayanpudur. All the hamlets are well connected with pucca roads. The map
showing the revenue boundaries of constituent villages is shown in Figure 1.4.
Figure 1.4 Hamlets & Lakes – Gundur GP
1.5 OBJECTIVES
The basic objectives include
1. To understand the demographic profile and their socio-economic characteristics;
2. To ascertain the current status of physical infrastructure, services & facilities, open space &
recreation and geographical & natural resources;
7
3. To assess the present gaps and future needs of this GP in terms of economy, physical
infrastructure, services & facilities, and open space & recreational facilities
4. To propose effective utilisation and management of natural resource of the GP.
5. To propose integrated development strategies for the GP.
As the information on natural resources of a region is crucial to any planning process, the
present study was taken up with the following objectives (Regional Remote Sensing Centre -
South, NRSC/ISRO, Govt. of India, Bengaluru):
1. Inventory and spatial analysis of natural resources that include thematic layers viz.,
infrastructure layers, LU/LC, slope, drainage network & water bodies, contours, soil etc.
2. Generation of Land and Water resource development plans
1.6 METHODOLOGY
1.6.1 INVENTORY OF NATURAL RESOURCES USING GEOSPATIAL
TECHNOLOGIES
(Regional Remote Sensing Centre - South, NRSC/ISRO, Govt. of India, Bengaluru)
Developmental planning is a complex process of decision making based on the information
about the status of resources, socio-economic conditions and institutional constraints.
Reliability of the databases, both the spatial and non-spatial, is therefore crucial to the success
of the developmental planning. Hence, it is necessary to understand various elements of Gram
Panchayat and their interrelationship for ecological planning.
The conventional techniques employed to provide spatial information on natural resources are
highly tedious, time consuming and more often subjective; whereas satellite remote sensing
with synoptic and regular coverage has the requisite potential to provide this information in a
timely and more objective manner. Remote sensing (RS), Geographic Information System
(GIS) and Global Positioning System (GPS) constituting the emerging field of geospatial
technology offer great promise for generating spatial information on natural resources at
national and subsequent disaggregated levels. With advancements in space technology,
availability of high resolution data and advanced processing techniques, the remote sensing
technique has become a powerful tool for mapping and monitoring of natural resources. These
8
techniques have immense potential for providing spatial information on natural resources
resource mapping and monitoring at regular intervals.
GIS is a powerful tool for integrating natural resources for development of spatial decision
support systems. Thus, geospatial technology along with Information and Communication
technology (ICT) has become a very useful technique and powerful tool for providing spatial
information including development of land use information systems, towards decision making.
Further, the system is also highly useful for updating and monitoring the dynamics of land use
changes through the monitoring capabilities of the multi-temporal remote sensing data. Remote
Sensing in conjunction with Geographical Information System (GIS) and other IT tools is also
emerging as flexible, efficient, speedy, cost-effective and reliable technology for obtaining
information on natural resources analysis and modeling. It is an integral part of data
management in large number of applications. Spatial information - images and maps, forms
the foundation and basis for the most planning and implementation of developmental activities;
infrastructure development; disaster management support; environmental monitoring; natural
resources management and many other national activities.
Over the last two decades remote sensing and GIS have been widely used for the preparation
of different types of thematic layers and integrating them for different applications that include
land and water resources planning, agricultural applications, water resource management,
disaster management, forestry applications, watershed management and urban applications etc.
1.6.2 DATA COLLECTION
The required data for spatial planning of gram panchayat was obtained through
1. Field studies: The field studies were carried out mainly to update the land use map,
marking the location various facilities and also to understand the present problems
faced by the people of this GP.
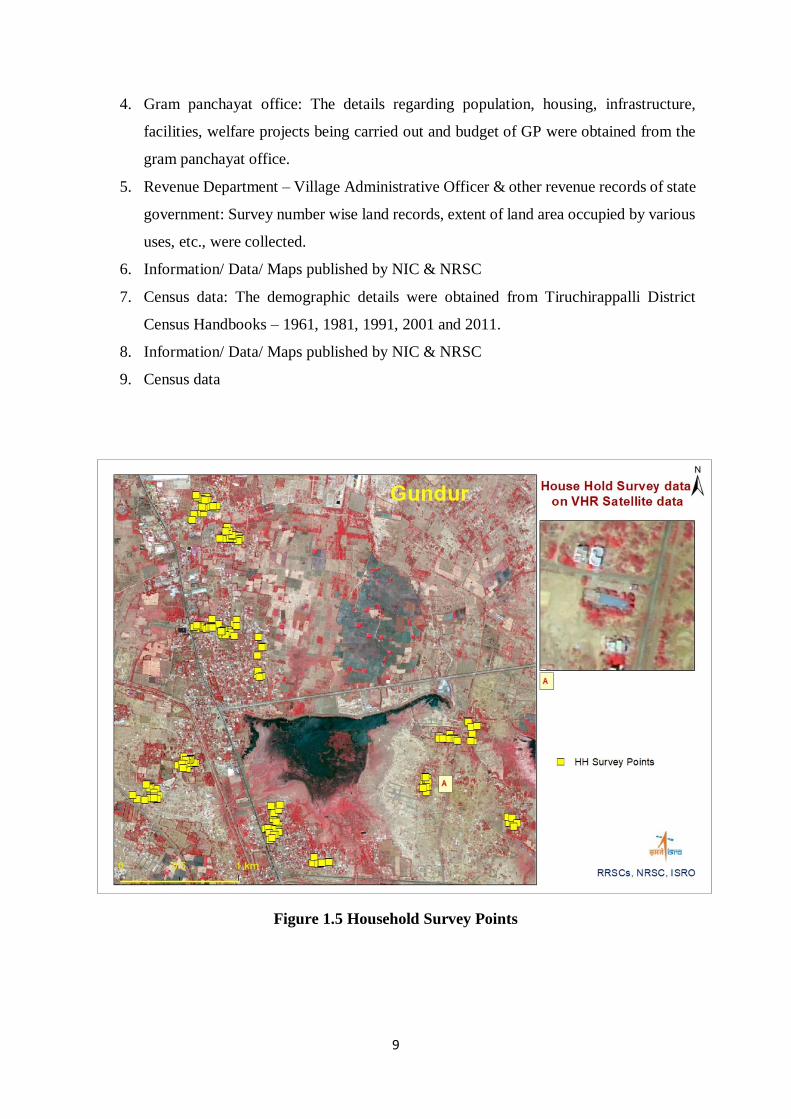
2. Household surveys: Household surveys were carried out in 5% of the households using
the mobile app developed by NRSC. The household survey was carried out in 208
households covering all hamlets, different socio-economic groups of population and
different typologies of houses (Figure 1.5).
3. Discussions/ feedback from various stakeholders: The information regarding the
facilities available, shortcomings and expectations were collected through informal
discussions and feedbacks from different sections of people.
9
4. Gram panchayat office: The details regarding population, housing, infrastructure,
facilities, welfare projects being carried out and budget of GP were obtained from the
gram panchayat office.
5. Revenue Department – Village Administrative Officer & other revenue records of state
government: Survey number wise land records, extent of land area occupied by various
uses, etc., were collected.
6. Information/ Data/ Maps published by NIC & NRSC
7. Census data: The demographic details were obtained from Tiruchirappalli District
Census Handbooks – 1961, 1981, 1991, 2001 and 2011.
8. Information/ Data/ Maps published by NIC & NRSC
9. Census data
Figure 1.5 Household Survey Points
10
CHAPTER 2
PHYSICAL FEATURES AND LANDUSE LAND COVER DETAILS OF GRAM
PANCHAYAT
2.1 INTRODUCTION
Gundur GP is extending on either side of NH336 connecting Tiruchirappalli and Pudukkottai
on the southern direction Tiruchirappalli city, adjacent to Tiruchirappalli International Airport.
Gundur GP extends from 10°44'29.60"N to 10°46'52.68"N latitude and 78°34'40.95"E to
78°37'0.23"E longitude. The geographical area of this GP is 1359.24.5 hectares. This GP is
connected to Tiruchirappalli by NH 336. It is situated 20km away from sub-district headquarter
Tiruverumbur and 10km away from district headquarter Tiruchirappalli.
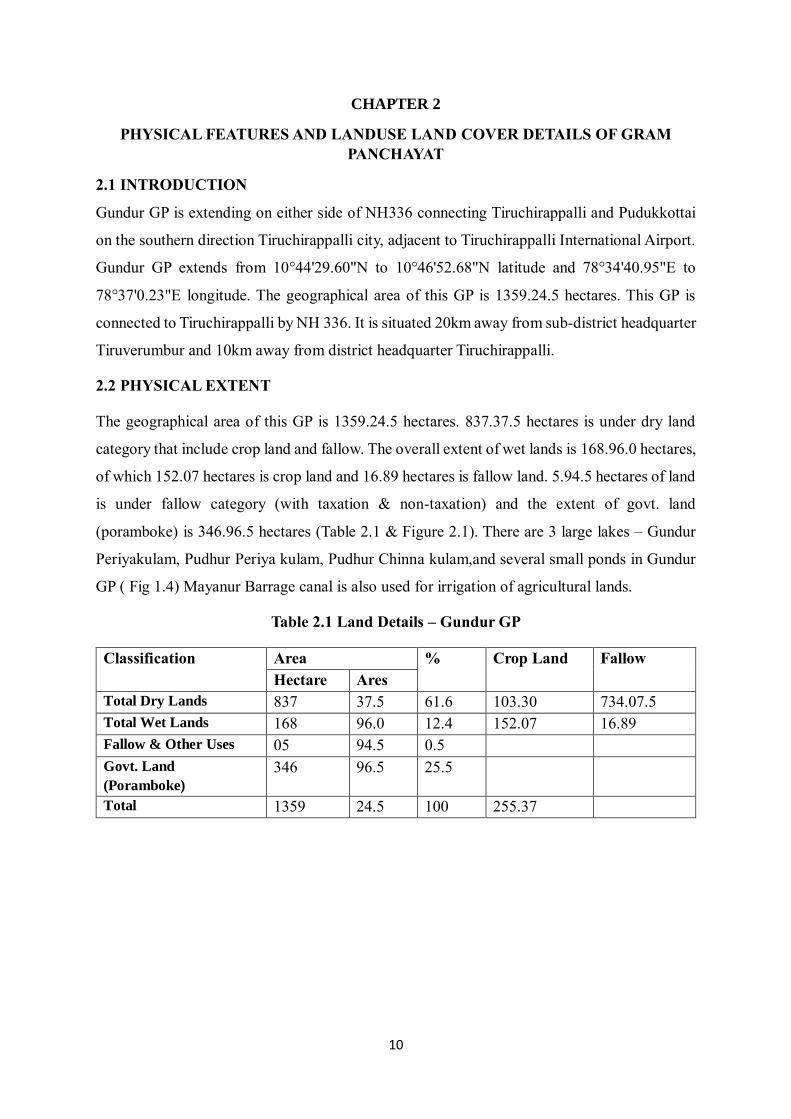
2.2 PHYSICAL EXTENT
The geographical area of this GP is 1359.24.5 hectares. 837.37.5 hectares is under dry land
category that include crop land and fallow. The overall extent of wet lands is 168.96.0 hectares,
of which 152.07 hectares is crop land and 16.89 hectares is fallow land. 5.94.5 hectares of land
is under fallow category (with taxation & non-taxation) and the extent of govt. land
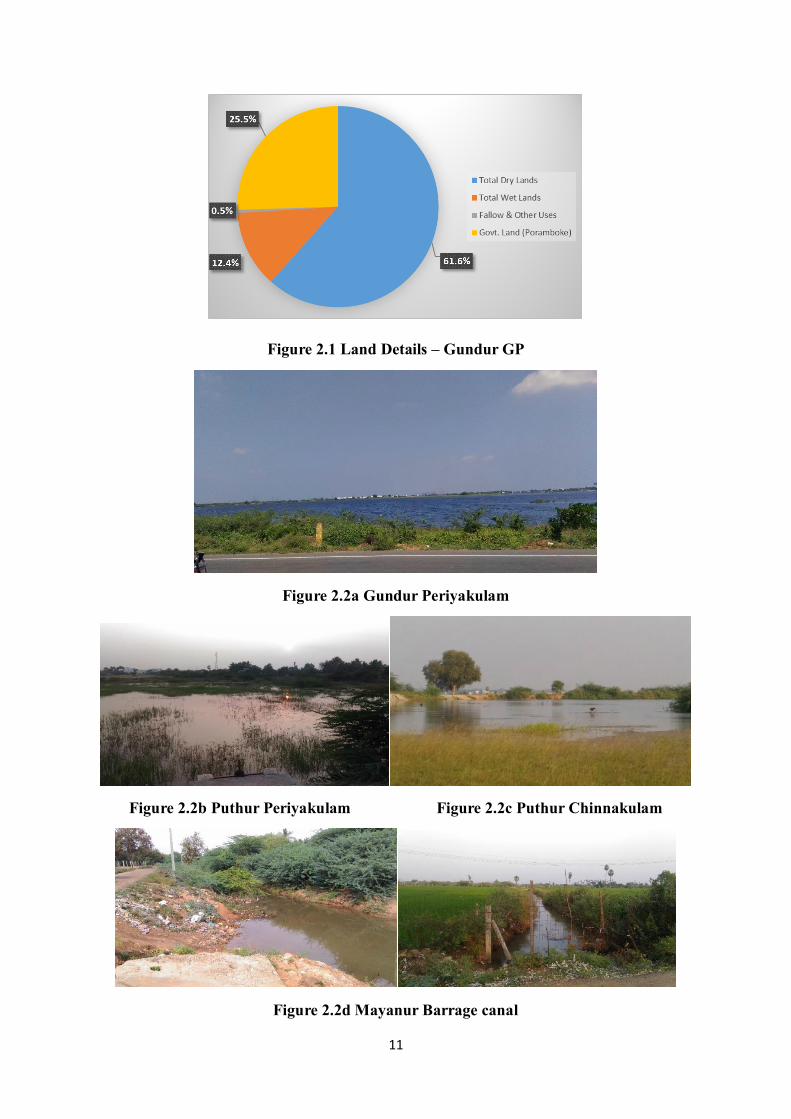
(poramboke) is 346.96.5 hectares (Table 2.1 & Figure 2.1). There are 3 large lakes – Gundur
Periyakulam, Pudhur Periya kulam, Pudhur Chinna kulam,and several small ponds in Gundur
GP ( Fig 1.4) Mayanur Barrage canal is also used for irrigation of agricultural lands.
Table 2.1 Land Details – Gundur GP
Classification Area % Crop Land Fallow
Hectare Ares
Total Dry Lands 837 37.5 61.6 103.30 734.07.5
Total Wet Lands 168 96.0 12.4 152.07 16.89
Fallow & Other Uses 05 94.5 0.5
Govt. Land
(Poramboke)
346 96.5 25.5
Total 1359 24.5 100 255.37
11
Figure 2.1 Land Details – Gundur GP
Figure 2.2a Gundur Periyakulam
Figure 2.2b Puthur Periyakulam Figure 2.2c Puthur Chinnakulam
Figure 2.2d Mayanur Barrage canal
12
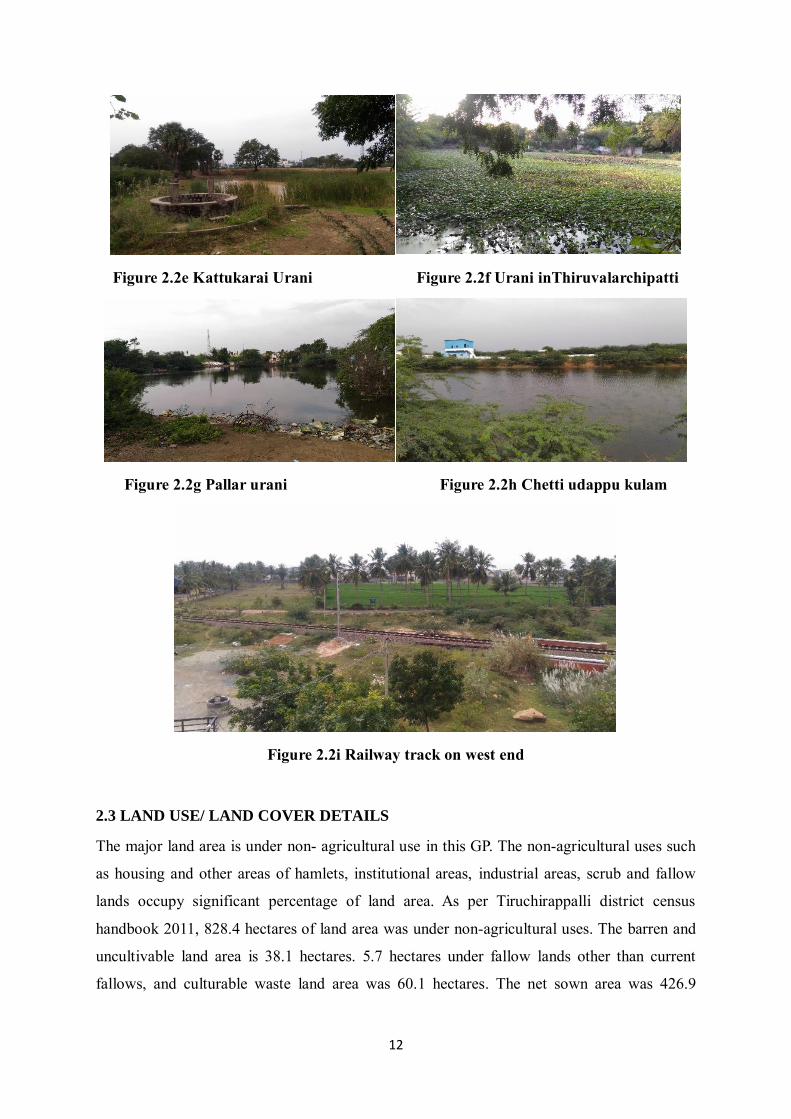
Figure 2.2e Kattukarai Urani Figure 2.2f Urani inThiruvalarchipatti
Figure 2.2g Pallar urani Figure 2.2h Chetti udappu kulam
Figure 2.2i Railway track on west end
2.3 LAND USE/ LAND COVER DETAILS
The major land area is under non- agricultural use in this GP. The non-agricultural uses such
as housing and other areas of hamlets, institutional areas, industrial areas, scrub and fallow
lands occupy significant percentage of land area. As per Tiruchirappalli district census
handbook 2011, 828.4 hectares of land area was under non-agricultural uses. The barren and
uncultivable land area is 38.1 hectares. 5.7 hectares under fallow lands other than current
fallows, and culturable waste land area was 60.1 hectares. The net sown area was 426.9
13
hectares, of which 426.3 was irrigated land area and 0.6 hectares un-irrigated land area
(Tiruchirappalli District Census Handbook, 2011).
Figure 2.3 Scrubland vegetation
2.4 INVENTORY OF NATURAL RESOURCES USING HIGH RESOLUTION
SATELLITE DATA
(Regional Remote Sensing Centre - South, NRSC/ISRO, Govt. of India, Bengaluru)
Potential tools such as remote sensing and GIS techniques are utilized for generation of various
thematic resource maps in conjunction with collateral data. Data integration and generation of
development plans are carried out in Geographic Information System environment.
2.4.1. INFORMATION SOURCES FOR DEVELOPMENTAL PLANNING
Satellite data IRS -1D LISS III data, Cartosat and IRS P6 LISS IV data and other collateral
data form major source for preparation of various thematic maps as spatial database. The data
acquired from the multi-spectral sensors LISS IV (5.6 m resolution) and CARTOSAT (2.5 m
resolution) of the Indian Remote Sensing Satellite (IRS) series are extensively used for
generating spatial databases. Very high-resolution satellite data (Cartosat 2S & Komsat 3A), is
analyzed at finer resolutions to update the spatial layers needed for generating the value-added
Land resource and water resource development plans. The data needed for this study is studied
in detail and the collected primary maps have been grouped into hydro-geomorphological,
topographical, land use/land cover, hydrology and socio-economic parameters (Table 2.2).
Subsequently, these primary maps are used to produce utilitarian types of maps to serve
planning decisions. They are derived, in some cases, by direct translation of single thematic
map and in others by combination of two or more thematic maps or chosen parameters of the
different themes (Table 2.3). Natural resources data representing environmental status of the
study area that were generated under various national level projects at 1:50000 scale was
14
considered for the present study and are presented below. The database was standardized for
integrated analysis under GIS environment.
Table 2.2: Information sources for development planning
Data/map Source Spatial/Non-
spatial Scale
Digital Elevation Model Cartosat Stereo
data Spatial 10 m
Contour CARTODEM Spatial 5m
Geological map Rajiv Gandhi
National Drinking
Water Mission
Spatial 1:50K
Geomorphological map Spatial 1:50K
Structures/Lineaments Spatial 1:50K
Soil Texture NRIS Spatial 1:50K
Land use/cover Very high-
resolution data Spatial 1:4K
Drainage map and Surface
water bodies
High resolution
satellite data Spatial 1:4K
Meteorological data IMD Spatial 25 km grid
Settlement Spatial 1:4K
Infrastructure High resolution
satellite data Spatial 1:4K
Village boundaries Spatial 1:50K
Table 2.3: Derived spatial databases required for planning
Derived map Theme map Remarks
Contour/Slope Topographical map/IRS PAN
stereo data
Derived from
DEM
Groundwater potential
Geology, Geomorphology,
borewell, Lithology and yield
data
Integration of
thematic maps and
point database
Water Resource Development Plan
Slope, soil map, land use,
drainage order, lineament,
Runoff Potential
Multi Criteria
analysis
Land Resource Development Plan
Slope, soil map, land use,
Ground Water Potential,
Geomorphology
Multi Criteria
analysis
2.5 SATELLITE DATA USED
(Regional Remote Sensing Centre - South, NRSC/ISRO, Govt. of India, Bengaluru)
High resolution (2.5m), very high resolution (0.7m) satellite datasets and Digital Elevation
Model (DEM) were used for preparation of spatial thematic layers for Gundur GP.
15
2.5.1 HIGH RESOLUTION SATELLITE DATA (HRS DATA)
Merged product of Cartosat-1 PAN and IRS LISS-IV Mx datasets acquired during 2015-16, in
Natural Colour Composite i.e. NCC mode of 2.5m spatial resolution was used for GPSDP
planning (Figure 2.4). The latest Resourcesat LISSIV of 2019 (5m) covering the GP is given
in Figure 2.5
Figure 2.4: CARTOSAT1 PAN + LISS IV data (NCC) of Gundur GP
16
Figure 2.5: Resourcesat LISSIV of 2019 of Gundur GP
2.5.2 VERY HIGH-RESOLUTION SATELLITE DATA (VHRS DATA)
Resource mapping at 1:4,000 scale was carried out using VHRS data at sub-meter resolution
Fig
ure
3:
RE
SO
UR
CE
SA
T L
ISS
IV
F
CC
im
age
of
Gu
nd
ur
GP
17
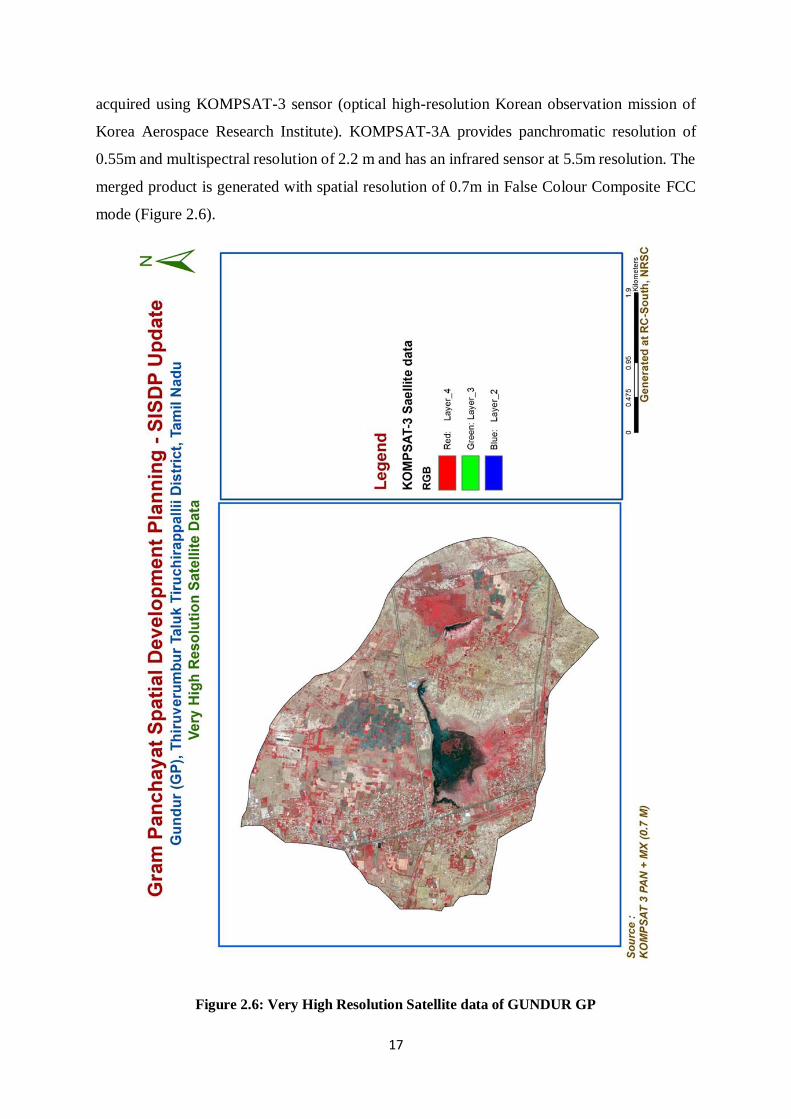
acquired using KOMPSAT-3 sensor (optical high-resolution Korean observation mission of
Korea Aerospace Research Institute). KOMPSAT-3A provides panchromatic resolution of
0.55m and multispectral resolution of 2.2 m and has an infrared sensor at 5.5m resolution. The
merged product is generated with spatial resolution of 0.7m in False Colour Composite FCC
mode (Figure 2.6).
Figure 2.6: Very High Resolution Satellite data of GUNDUR GP
18
2.6 SPATIAL LAYERS
(Regional Remote Sensing Centre - South, NRSC/ISRO, Govt. of India, Bengaluru)
Spatial layers representing the synoptic view of GP were generated at 1:4,000 and 1:10,000
scales.
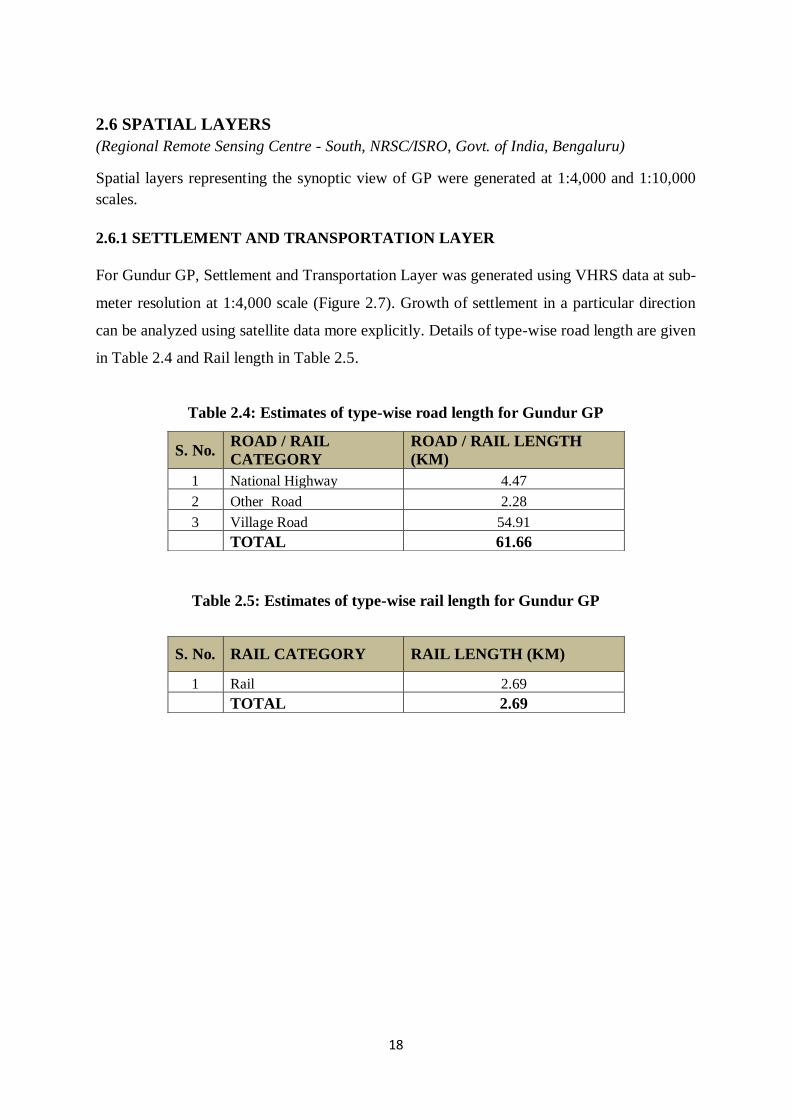
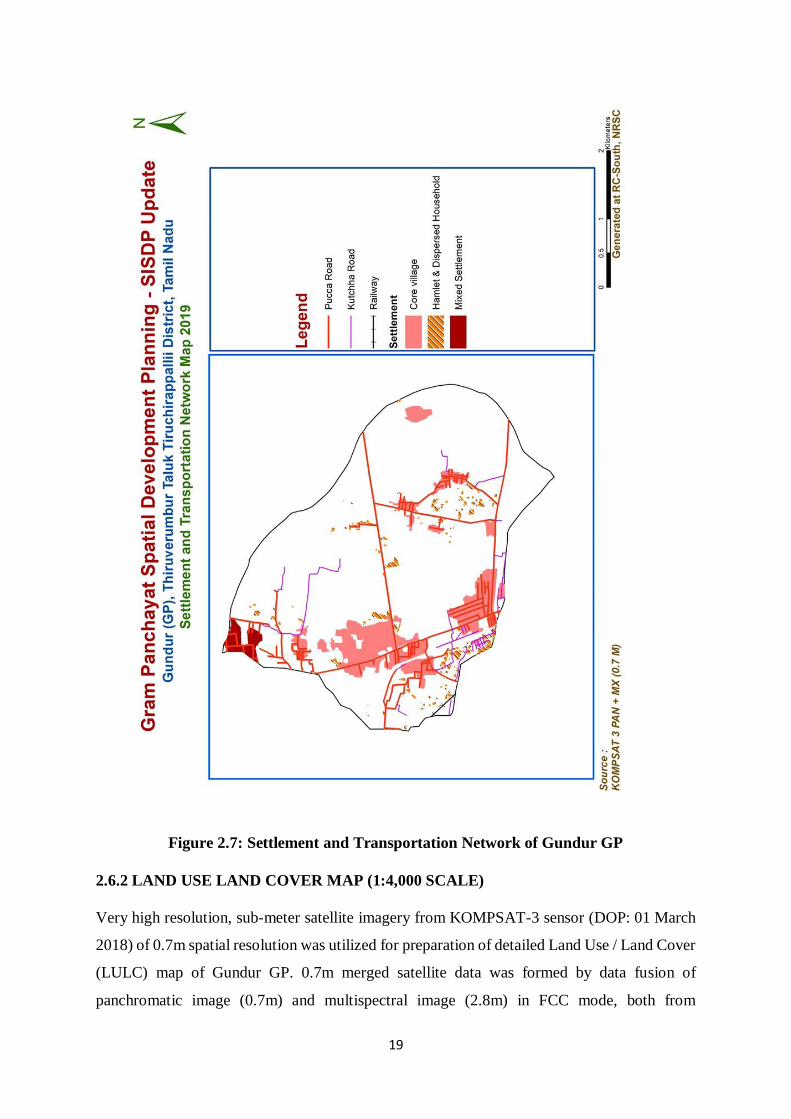
2.6.1 SETTLEMENT AND TRANSPORTATION LAYER
For Gundur GP, Settlement and Transportation Layer was generated using VHRS data at sub-
meter resolution at 1:4,000 scale (Figure 2.7). Growth of settlement in a particular direction
can be analyzed using satellite data more explicitly. Details of type-wise road length are given
in Table 2.4 and Rail length in Table 2.5.
Table 2.4: Estimates of type-wise road length for Gundur GP
Table 2.5: Estimates of type-wise rail length for Gundur GP
S. No. ROAD / RAIL
CATEGORY
ROAD / RAIL LENGTH
(KM)
1 National Highway 4.47
2 Other Road 2.28
3 Village Road 54.91
TOTAL 61.66
S. No. RAIL CATEGORY RAIL LENGTH (KM)
1 Rail 2.69
TOTAL 2.69
19
Figure 2.7: Settlement and Transportation Network of Gundur GP
2.6.2 LAND USE LAND COVER MAP (1:4,000 SCALE)
Very high resolution, sub-meter satellite imagery from KOMPSAT-3 sensor (DOP: 01 March
2018) of 0.7m spatial resolution was utilized for preparation of detailed Land Use / Land Cover
(LULC) map of Gundur GP. 0.7m merged satellite data was formed by data fusion of
panchromatic image (0.7m) and multispectral image (2.8m) in FCC mode, both from
20
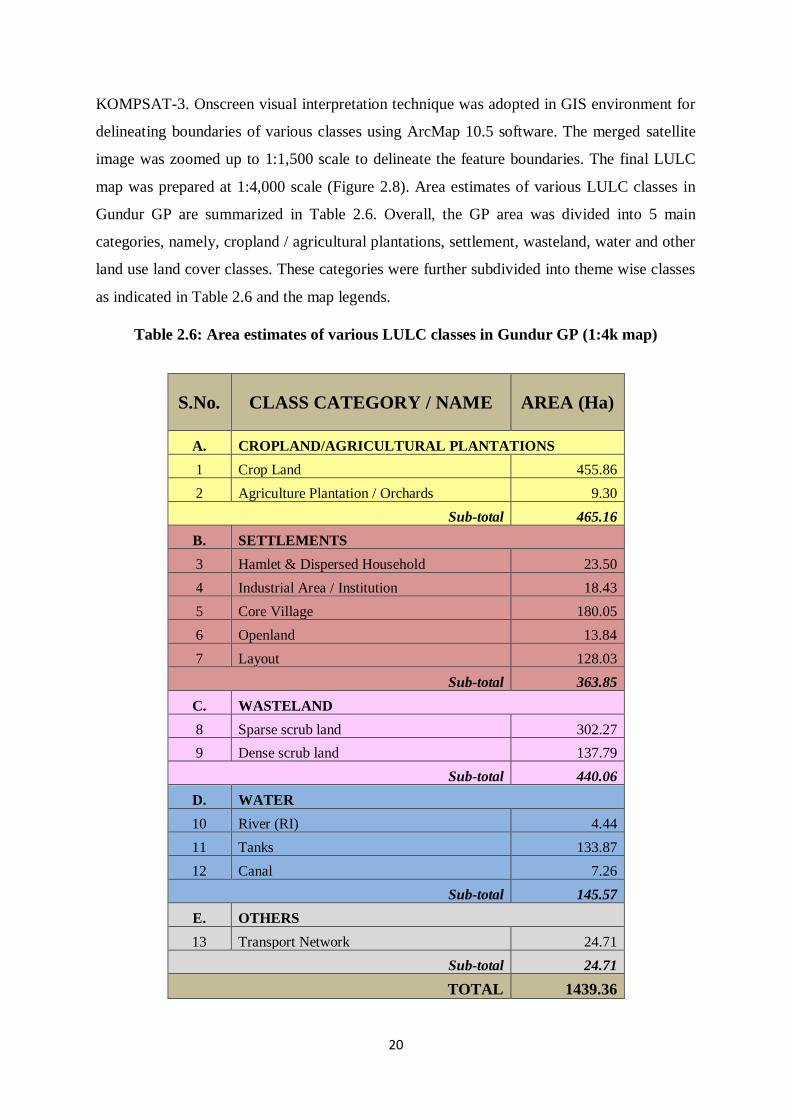
KOMPSAT-3. Onscreen visual interpretation technique was adopted in GIS environment for
delineating boundaries of various classes using ArcMap 10.5 software. The merged satellite
image was zoomed up to 1:1,500 scale to delineate the feature boundaries. The final LULC
map was prepared at 1:4,000 scale (Figure 2.8). Area estimates of various LULC classes in
Gundur GP are summarized in Table 2.6. Overall, the GP area was divided into 5 main
categories, namely, cropland / agricultural plantations, settlement, wasteland, water and other
land use land cover classes. These categories were further subdivided into theme wise classes
as indicated in Table 2.6 and the map legends.
Table 2.6: Area estimates of various LULC classes in Gundur GP (1:4k map)
S.No. CLASS CATEGORY / NAME AREA (Ha)
A. CROPLAND/AGRICULTURAL PLANTATIONS
1 Crop Land 455.86
2 Agriculture Plantation / Orchards 9.30
Sub-total 465.16
B. SETTLEMENTS
3 Hamlet & Dispersed Household 23.50
4 Industrial Area / Institution 18.43
5 Core Village 180.05
6 Openland 13.84
7 Layout 128.03
Sub-total 363.85
C. WASTELAND
8 Sparse scrub land 302.27
9 Dense scrub land 137.79
Sub-total 440.06
D. WATER
10 River (RI) 4.44
11 Tanks 133.87
12 Canal 7.26
Sub-total 145.57
E. OTHERS
13 Transport Network 24.71
Sub-total 24.71
TOTAL 1439.36
21
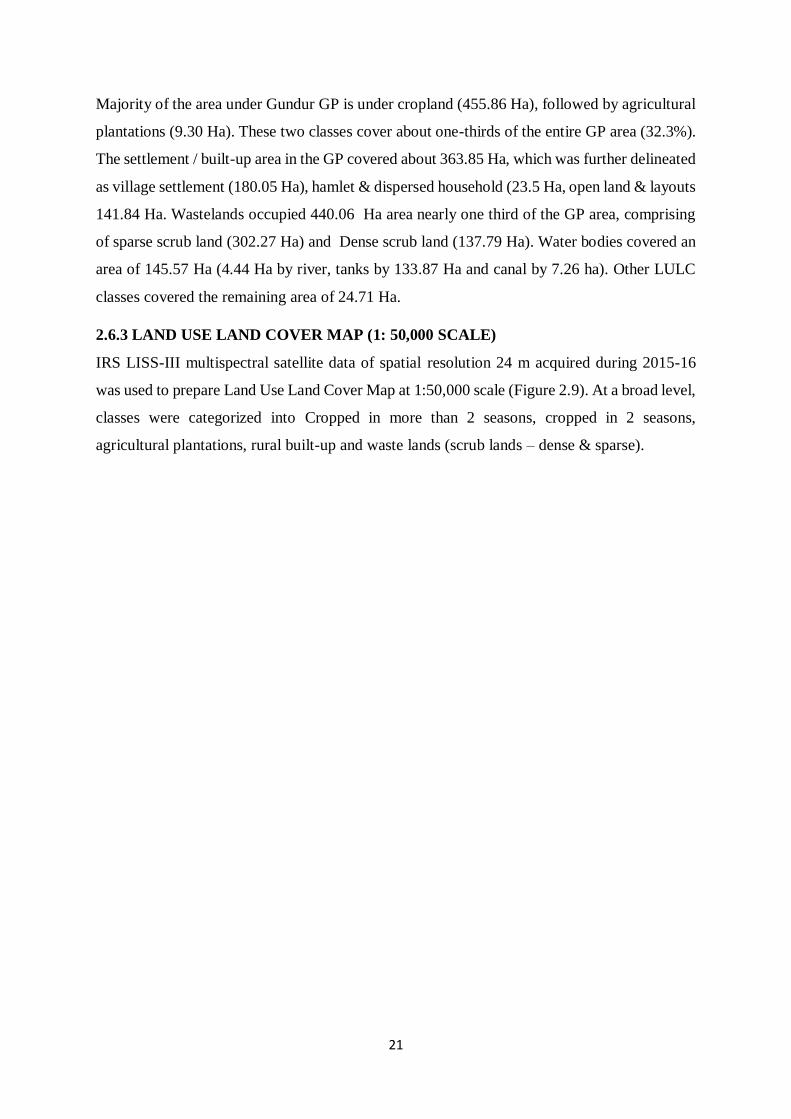
Majority of the area under Gundur GP is under cropland (455.86 Ha), followed by agricultural
plantations (9.30 Ha). These two classes cover about one-thirds of the entire GP area (32.3%).
The settlement / built-up area in the GP covered about 363.85 Ha, which was further delineated
as village settlement (180.05 Ha), hamlet & dispersed household (23.5 Ha, open land & layouts
141.84 Ha. Wastelands occupied 440.06 Ha area nearly one third of the GP area, comprising
of sparse scrub land (302.27 Ha) and Dense scrub land (137.79 Ha). Water bodies covered an
area of 145.57 Ha (4.44 Ha by river, tanks by 133.87 Ha and canal by 7.26 ha). Other LULC
classes covered the remaining area of 24.71 Ha.
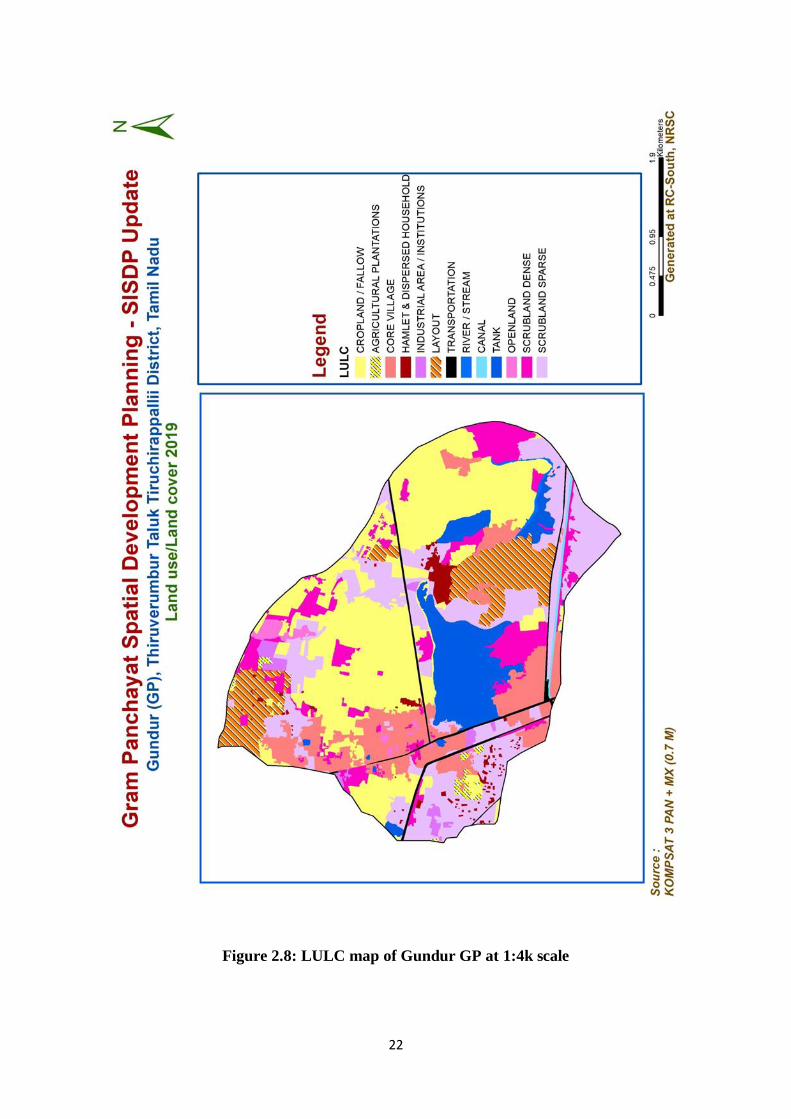
2.6.3 LAND USE LAND COVER MAP (1: 50,000 SCALE)
IRS LISS-III multispectral satellite data of spatial resolution 24 m acquired during 2015-16
was used to prepare Land Use Land Cover Map at 1:50,000 scale (Figure 2.9). At a broad level,
classes were categorized into Cropped in more than 2 seasons, cropped in 2 seasons,
agricultural plantations, rural built-up and waste lands (scrub lands – dense & sparse).
22
Figure 2.8: LULC map of Gundur GP at 1:4k scale
23
Figure 2.9: LULC map of Gundur GP at 1: 50,000 scale
24
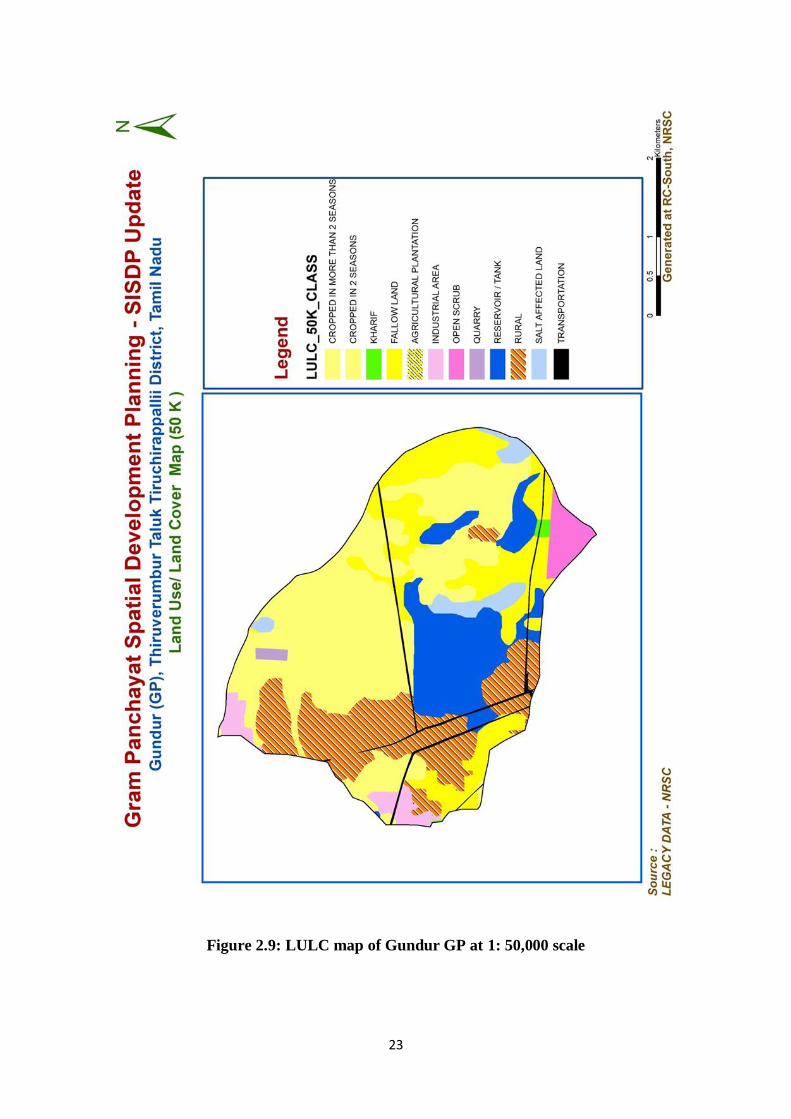
2.6.4. DRAINAGE NETWORK & SURFACE WATER BODIES
Rivers/streams are natural course of water flowing on the land surface along a definite channel
and its spatial distribution in the GP is shown as Figure 2.10. The estimates of drain length are
given in Table 2.7. Three major tanks are present in the GP.
Table 2.7: Estimates of drain length for Gundur GP
S.No. DRAIN CATEGORY DRAIN LENGTH (KM)
1 River /Stream 4.0
2 Canal 19.27
TOTAL 23.27
Figure 2.10: Drainage map of Gundur GP at 1: 4,000 scale
25
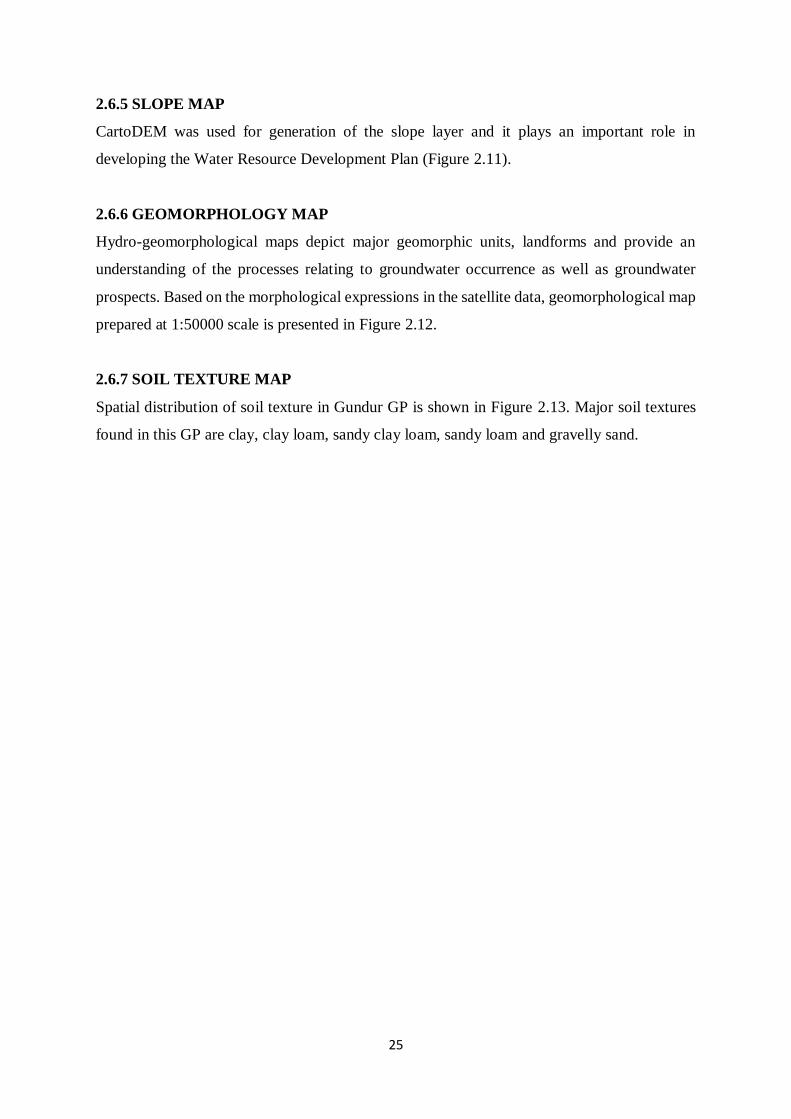
2.6.5 SLOPE MAP
CartoDEM was used for generation of the slope layer and it plays an important role in
developing the Water Resource Development Plan (Figure 2.11).
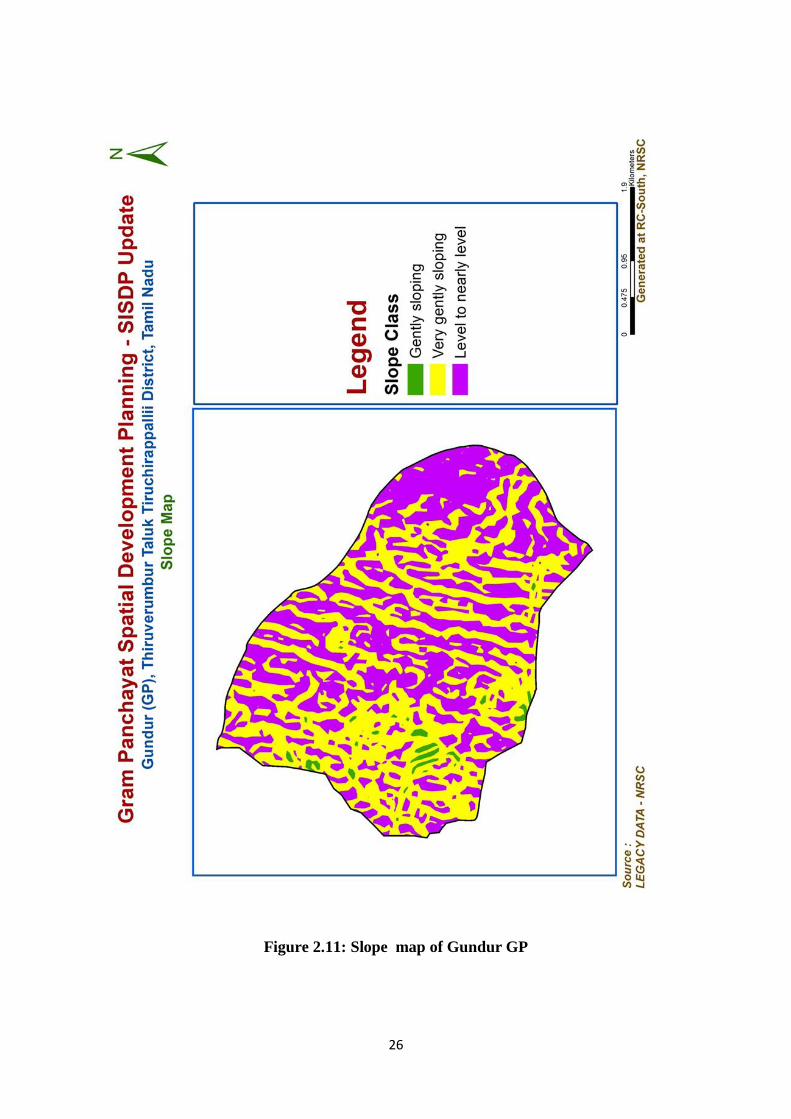
2.6.6 GEOMORPHOLOGY MAP
Hydro-geomorphological maps depict major geomorphic units, landforms and provide an
understanding of the processes relating to groundwater occurrence as well as groundwater
prospects. Based on the morphological expressions in the satellite data, geomorphological map
prepared at 1:50000 scale is presented in Figure 2.12.
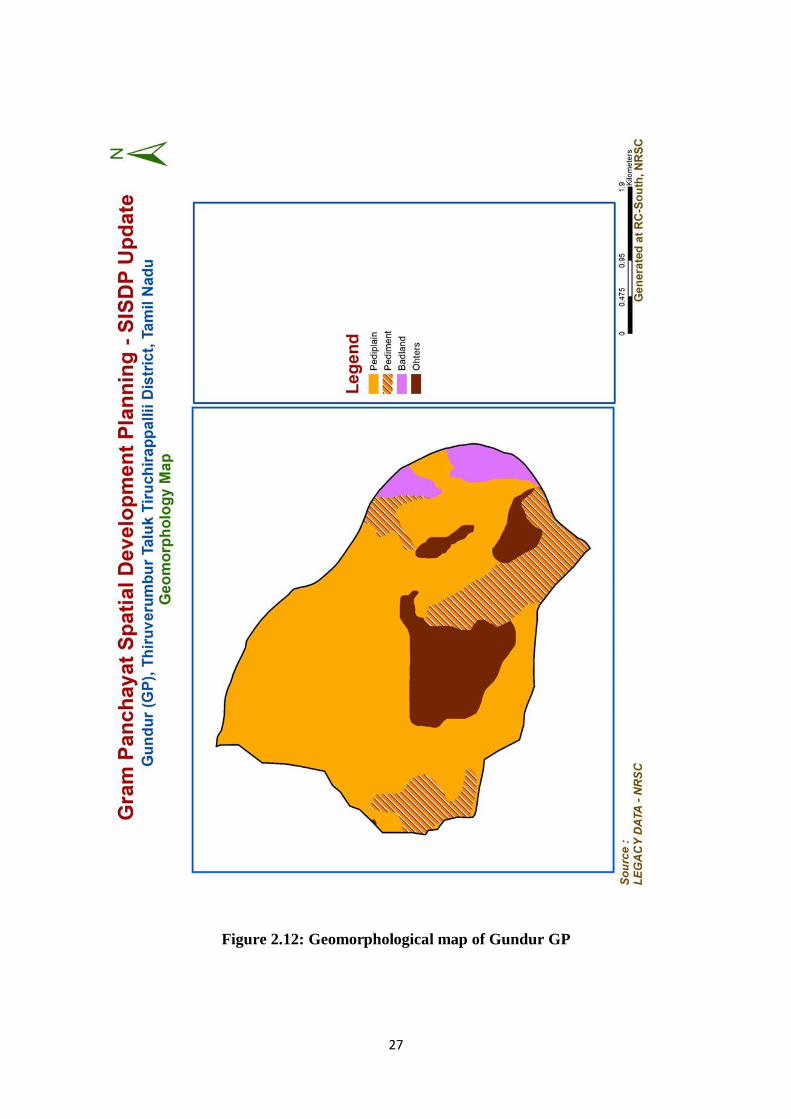
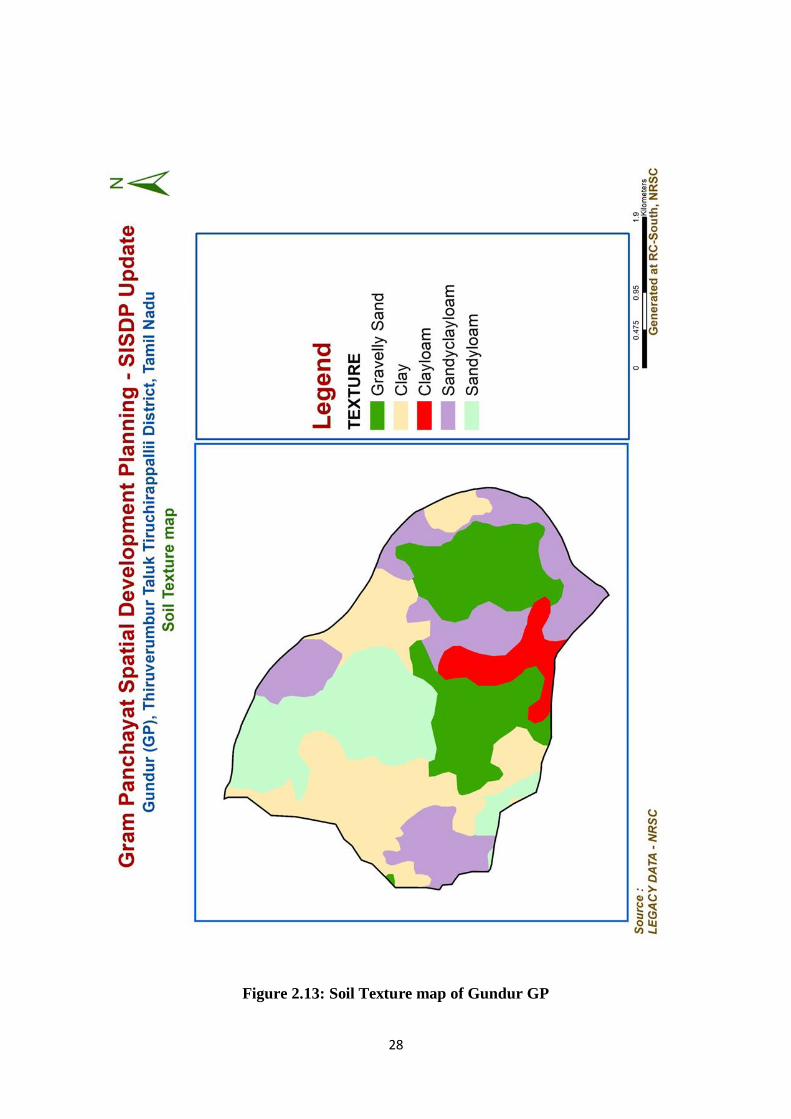
2.6.7 SOIL TEXTURE MAP
Spatial distribution of soil texture in Gundur GP is shown in Figure 2.13. Major soil textures
found in this GP are clay, clay loam, sandy clay loam, sandy loam and gravelly sand.
26
Figure 2.11: Slope map of Gundur GP
27
Figure 2.12: Geomorphological map of Gundur GP
28
Figure 2.13: Soil Texture map of Gundur GP
29
2.7 DERIVED SPATIAL LAYERS
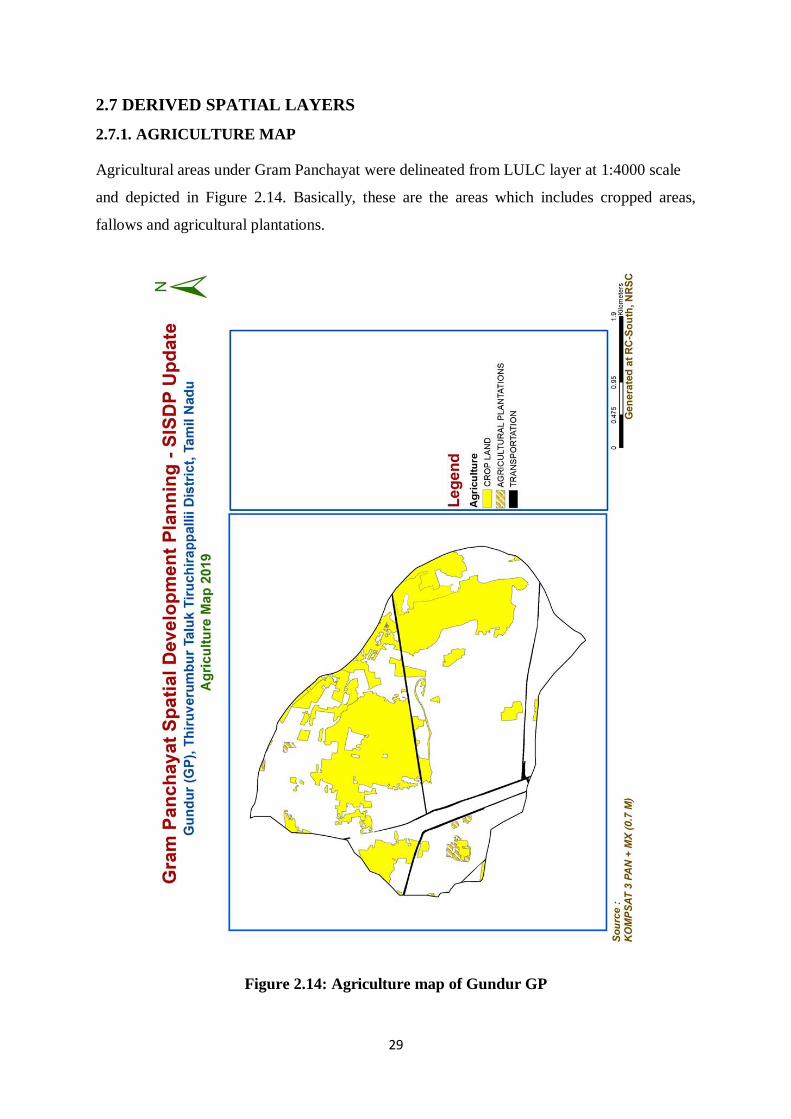
2.7.1. AGRICULTURE MAP
Agricultural areas under Gram Panchayat were delineated from LULC layer at 1:4000 scale
and depicted in Figure 2.14. Basically, these are the areas which includes cropped areas,
fallows and agricultural plantations.
Figure 2.14: Agriculture map of Gundur GP
30
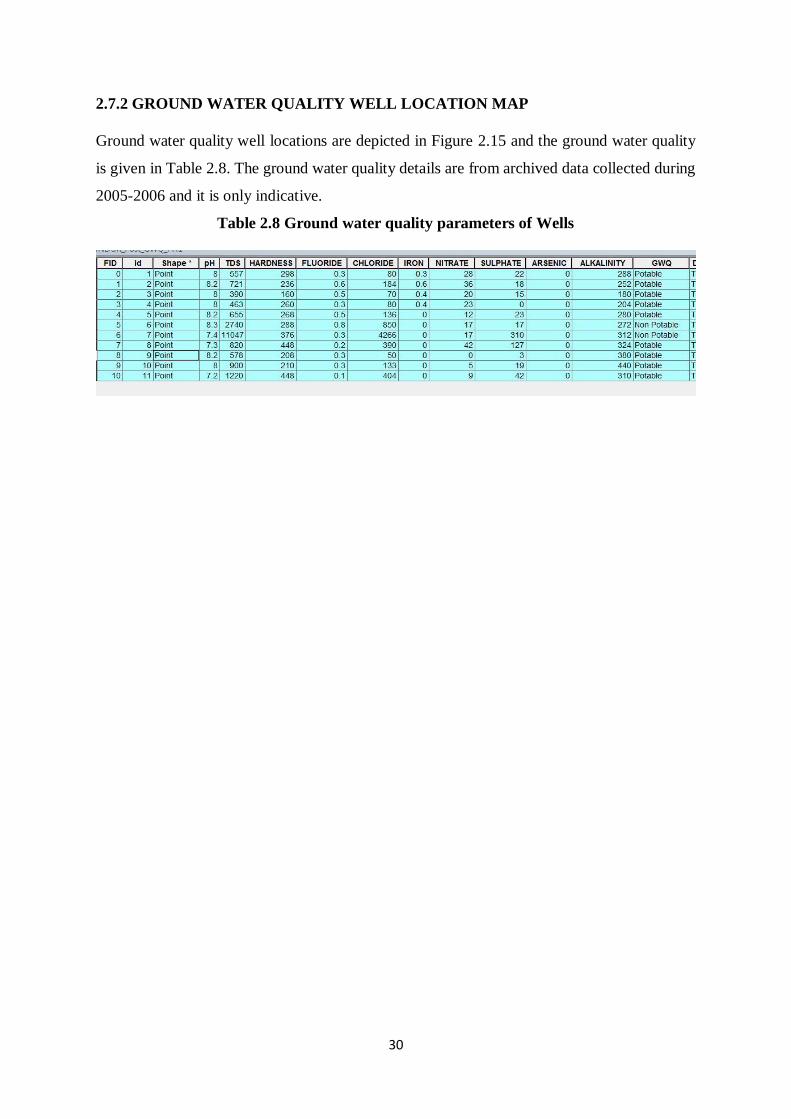
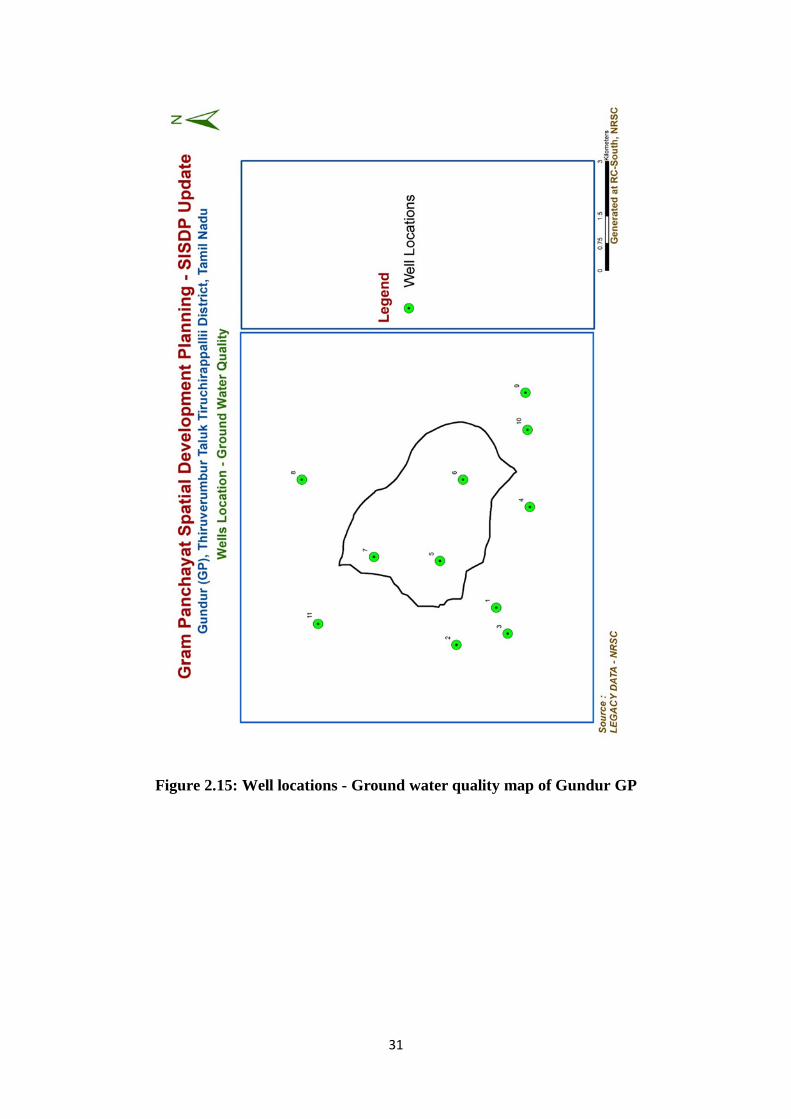
2.7.2 GROUND WATER QUALITY WELL LOCATION MAP
Ground water quality well locations are depicted in Figure 2.15 and the ground water quality
is given in Table 2.8. The ground water quality details are from archived data collected during
2005-2006 and it is only indicative.
Table 2.8 Ground water quality parameters of Wells
31
Figure 2.15: Well locations - Ground water quality map of Gundur GP
32
CHAPTER 3
DEMOGRAPHY
3.1 INTRODUCTION
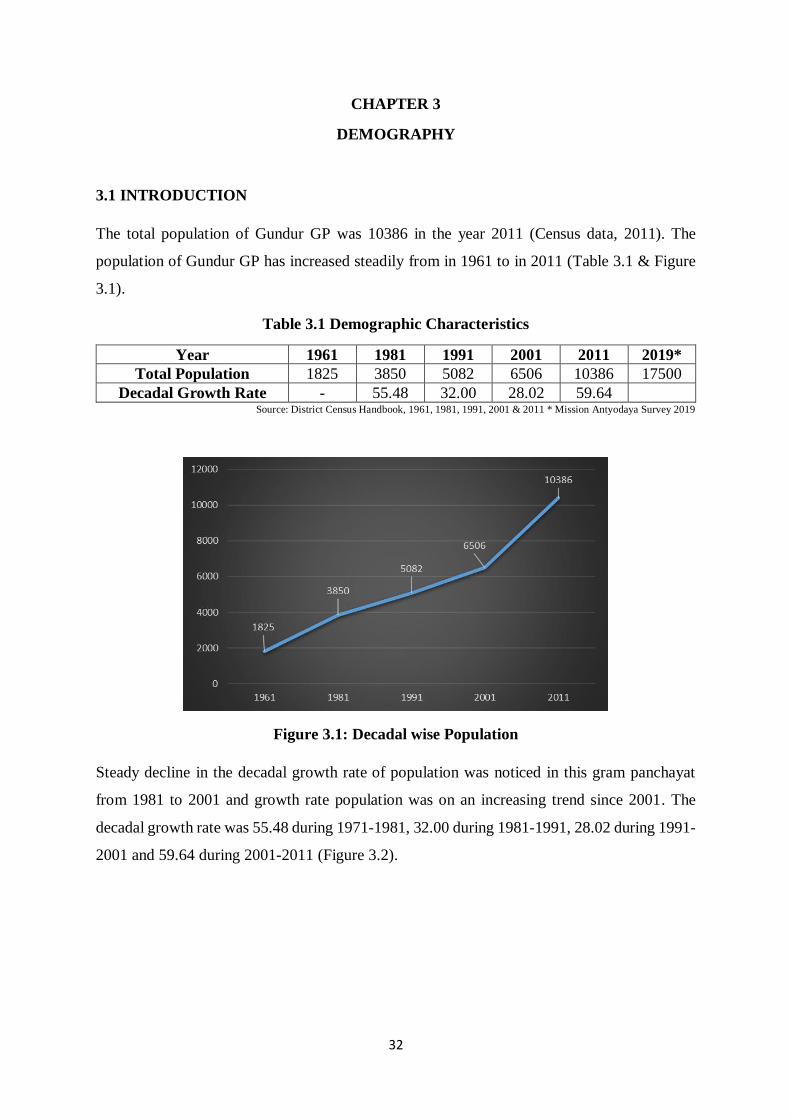
The total population of Gundur GP was 10386 in the year 2011 (Census data, 2011). The
population of Gundur GP has increased steadily from in 1961 to in 2011 (Table 3.1 & Figure
3.1).
Table 3.1 Demographic Characteristics
Year 1961 1981 1991 2001 2011 2019*
Total Population 1825 3850 5082 6506 10386 17500
Decadal Growth Rate - 55.48 32.00 28.02 59.64 Source: District Census Handbook, 1961, 1981, 1991, 2001 & 2011 * Mission Antyodaya Survey 2019
Figure 3.1: Decadal wise Population
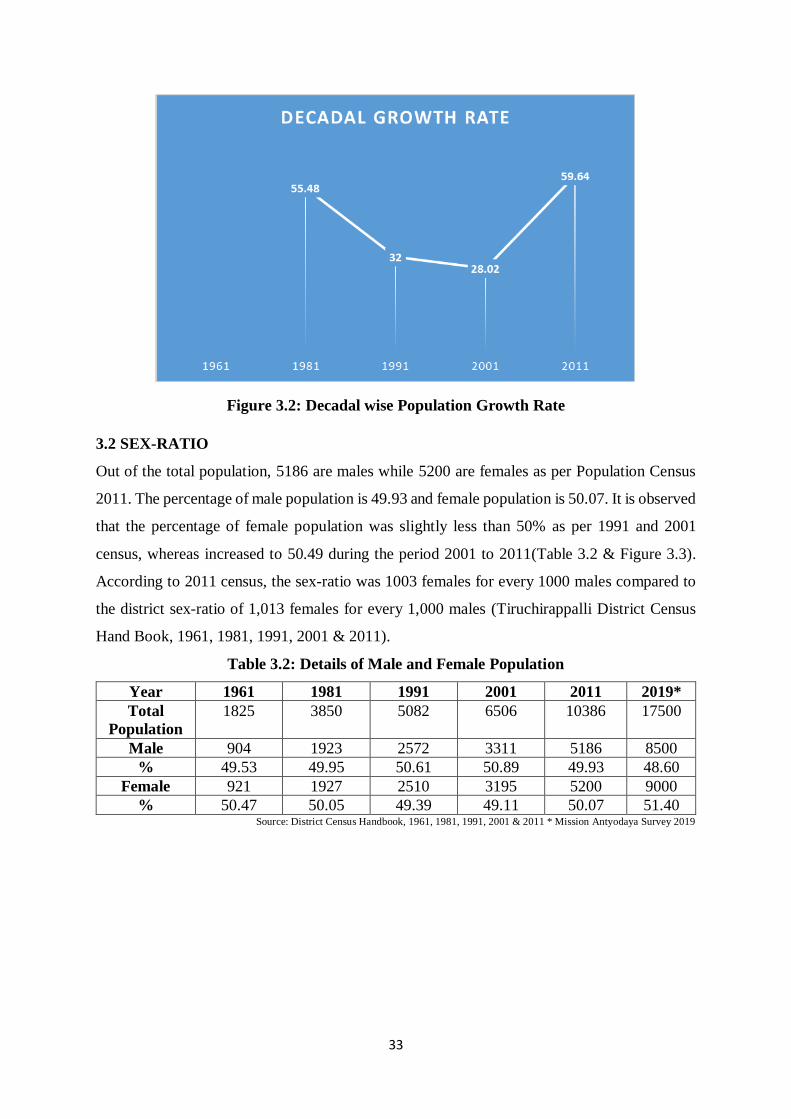
Steady decline in the decadal growth rate of population was noticed in this gram panchayat
from 1981 to 2001 and growth rate population was on an increasing trend since 2001. The
decadal growth rate was 55.48 during 1971-1981, 32.00 during 1981-1991, 28.02 during 1991-
2001 and 59.64 during 2001-2011 (Figure 3.2).
33
Figure 3.2: Decadal wise Population Growth Rate
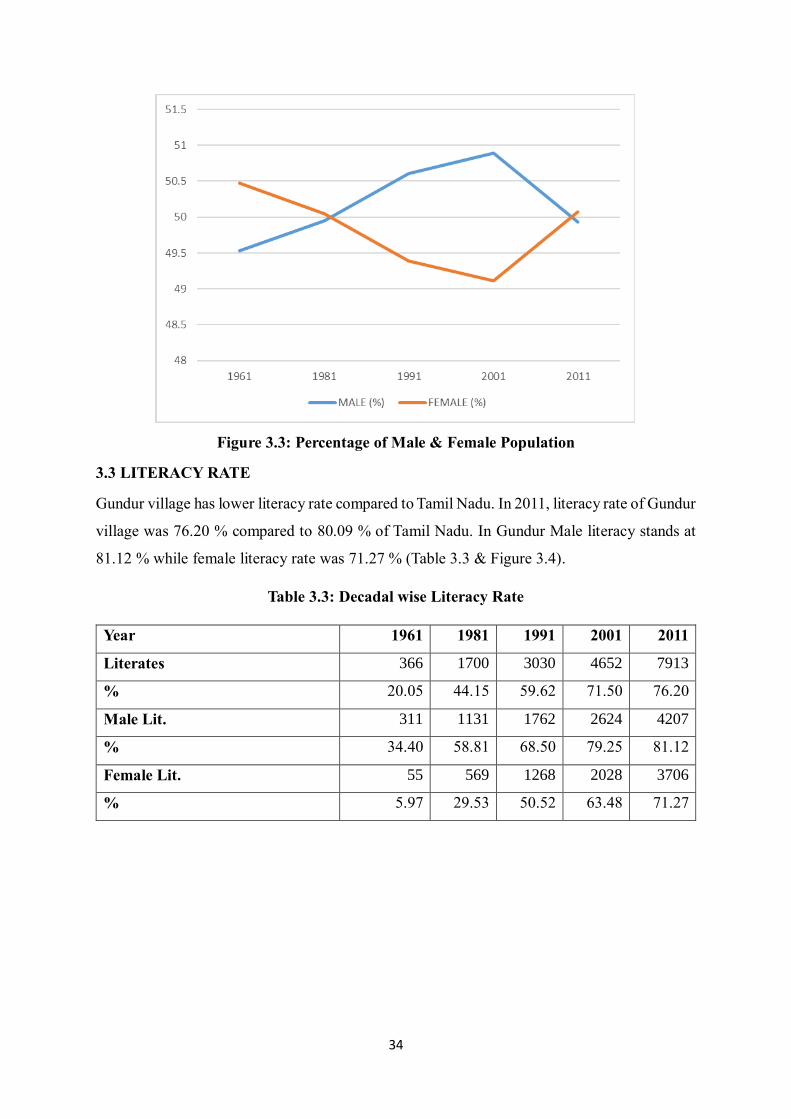
3.2 SEX-RATIO
Out of the total population, 5186 are males while 5200 are females as per Population Census
2011. The percentage of male population is 49.93 and female population is 50.07. It is observed
that the percentage of female population was slightly less than 50% as per 1991 and 2001
census, whereas increased to 50.49 during the period 2001 to 2011(Table 3.2 & Figure 3.3).
According to 2011 census, the sex-ratio was 1003 females for every 1000 males compared to
the district sex-ratio of 1,013 females for every 1,000 males (Tiruchirappalli District Census
Hand Book, 1961, 1981, 1991, 2001 & 2011).
Table 3.2: Details of Male and Female Population
Year 1961 1981 1991 2001 2011 2019*
Total
Population
1825 3850 5082 6506 10386 17500
Male 904 1923 2572 3311 5186 8500
% 49.53 49.95 50.61 50.89 49.93 48.60
Female 921 1927 2510 3195 5200 9000
% 50.47 50.05 49.39 49.11 50.07 51.40 Source: District Census Handbook, 1961, 1981, 1991, 2001 & 2011 * Mission Antyodaya Survey 2019
34
Figure 3.3: Percentage of Male & Female Population
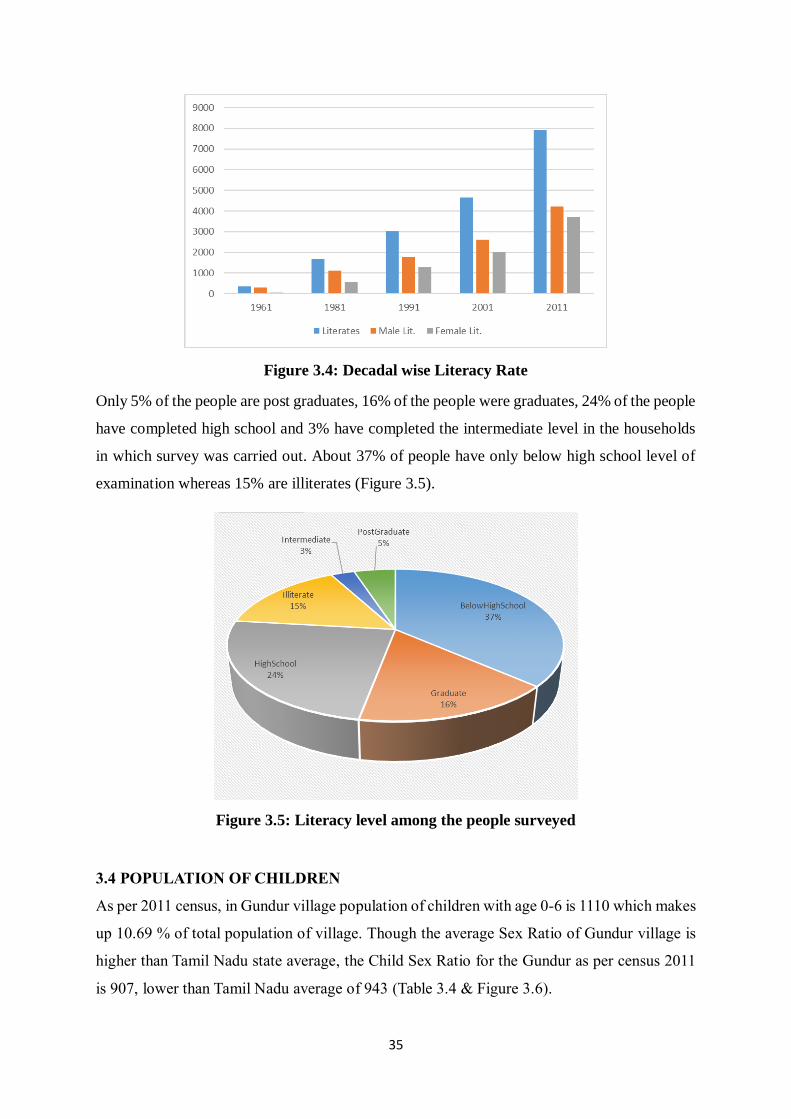
3.3 LITERACY RATE
Gundur village has lower literacy rate compared to Tamil Nadu. In 2011, literacy rate of Gundur
village was 76.20 % compared to 80.09 % of Tamil Nadu. In Gundur Male literacy stands at
81.12 % while female literacy rate was 71.27 % (Table 3.3 & Figure 3.4).
Table 3.3: Decadal wise Literacy Rate
Year 1961 1981 1991 2001 2011
Literates 366 1700 3030 4652 7913
% 20.05 44.15 59.62 71.50 76.20
Male Lit. 311 1131 1762 2624 4207
% 34.40 58.81 68.50 79.25 81.12
Female Lit. 55 569 1268 2028 3706
% 5.97 29.53 50.52 63.48 71.27
35
Figure 3.4: Decadal wise Literacy Rate
Only 5% of the people are post graduates, 16% of the people were graduates, 24% of the people
have completed high school and 3% have completed the intermediate level in the households
in which survey was carried out. About 37% of people have only below high school level of
examination whereas 15% are illiterates (Figure 3.5).
Figure 3.5: Literacy level among the people surveyed
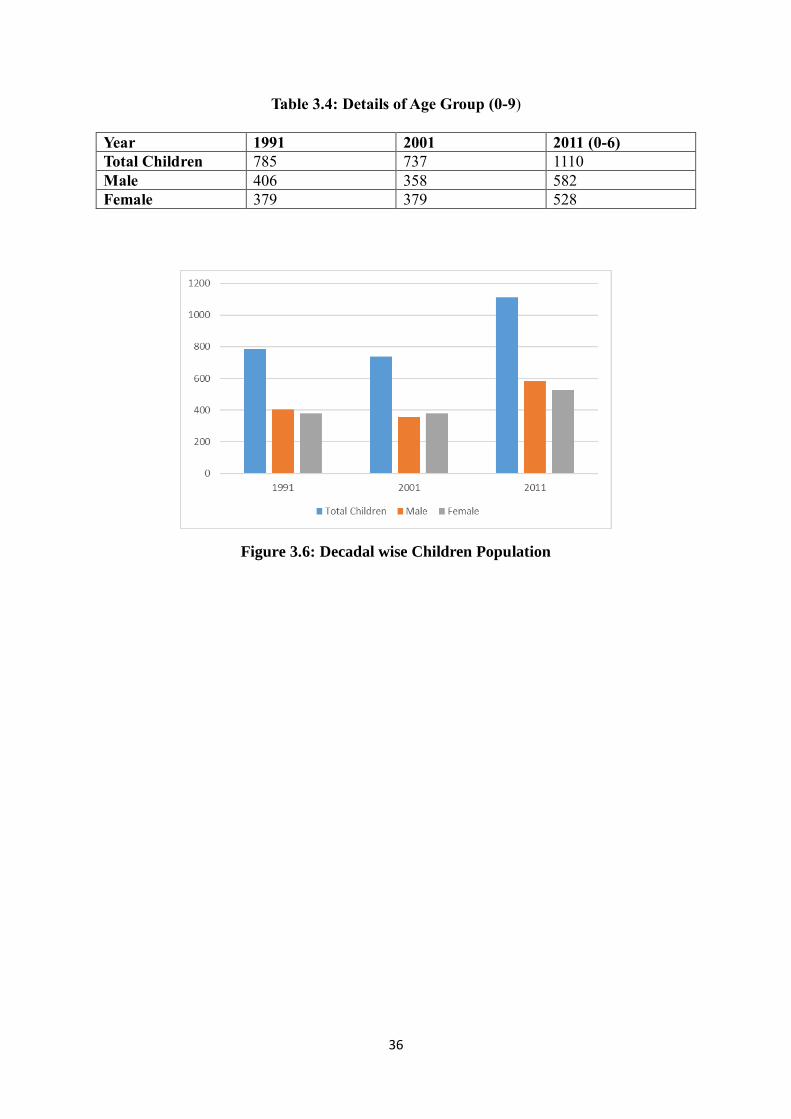
3.4 POPULATION OF CHILDREN
As per 2011 census, in Gundur village population of children with age 0-6 is 1110 which makes
up 10.69 % of total population of village. Though the average Sex Ratio of Gundur village is
higher than Tamil Nadu state average, the Child Sex Ratio for the Gundur as per census 2011
is 907, lower than Tamil Nadu average of 943 (Table 3.4 & Figure 3.6).
36
Table 3.4: Details of Age Group (0-9)
Year 1991 2001 2011 (0-6)
Total Children 785 737 1110
Male 406 358 582
Female 379 379 528
Figure 3.6: Decadal wise Children Population
37
CHAPTER 4
ECONOMIC DEVELOPMENT OF GRAM PANCHAYAT
4.1 DETAILS OF WORKERS
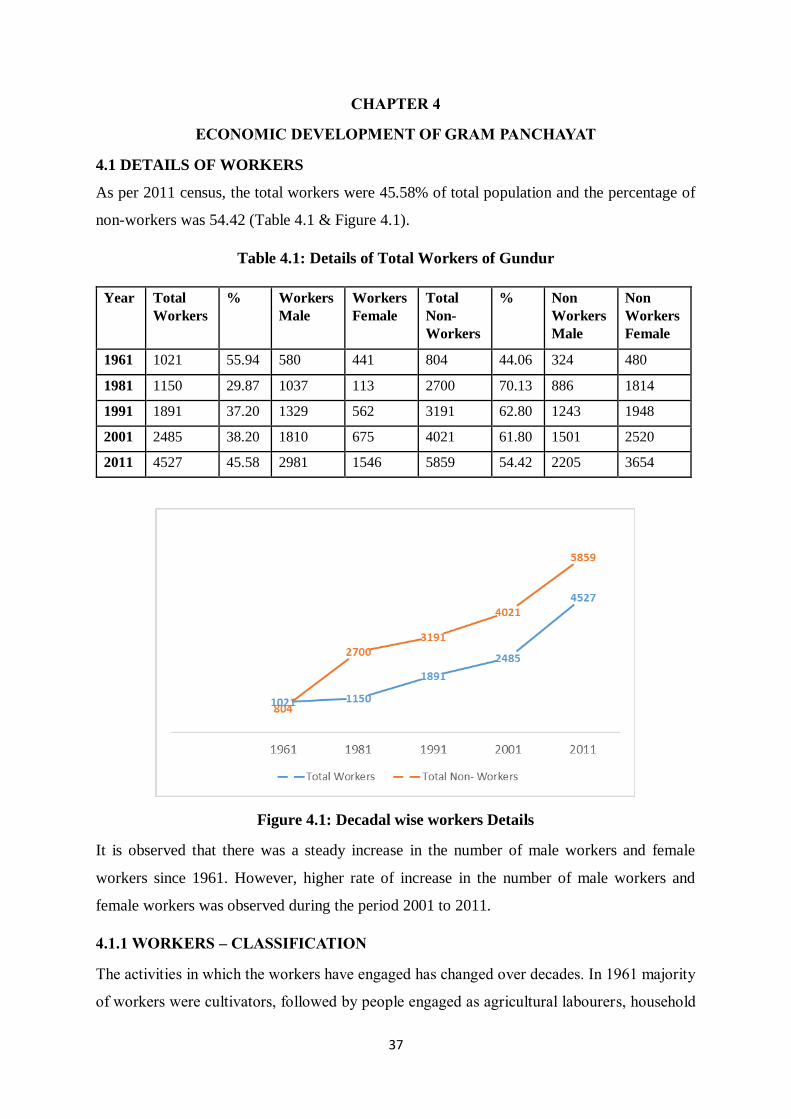
As per 2011 census, the total workers were 45.58% of total population and the percentage of
non-workers was 54.42 (Table 4.1 & Figure 4.1).
Table 4.1: Details of Total Workers of Gundur
Year Total
Workers
% Workers
Male
Workers
Female
Total
Non-
Workers
% Non
Workers
Male
Non
Workers
Female
1961 1021 55.94 580 441 804 44.06 324 480
1981 1150 29.87 1037 113 2700 70.13 886 1814
1991 1891 37.20 1329 562 3191 62.80 1243 1948
2001 2485 38.20 1810 675 4021 61.80 1501 2520
2011 4527 45.58 2981 1546 5859 54.42 2205 3654
Figure 4.1: Decadal wise workers Details
It is observed that there was a steady increase in the number of male workers and female
workers since 1961. However, higher rate of increase in the number of male workers and
female workers was observed during the period 2001 to 2011.
4.1.1 WORKERS – CLASSIFICATION
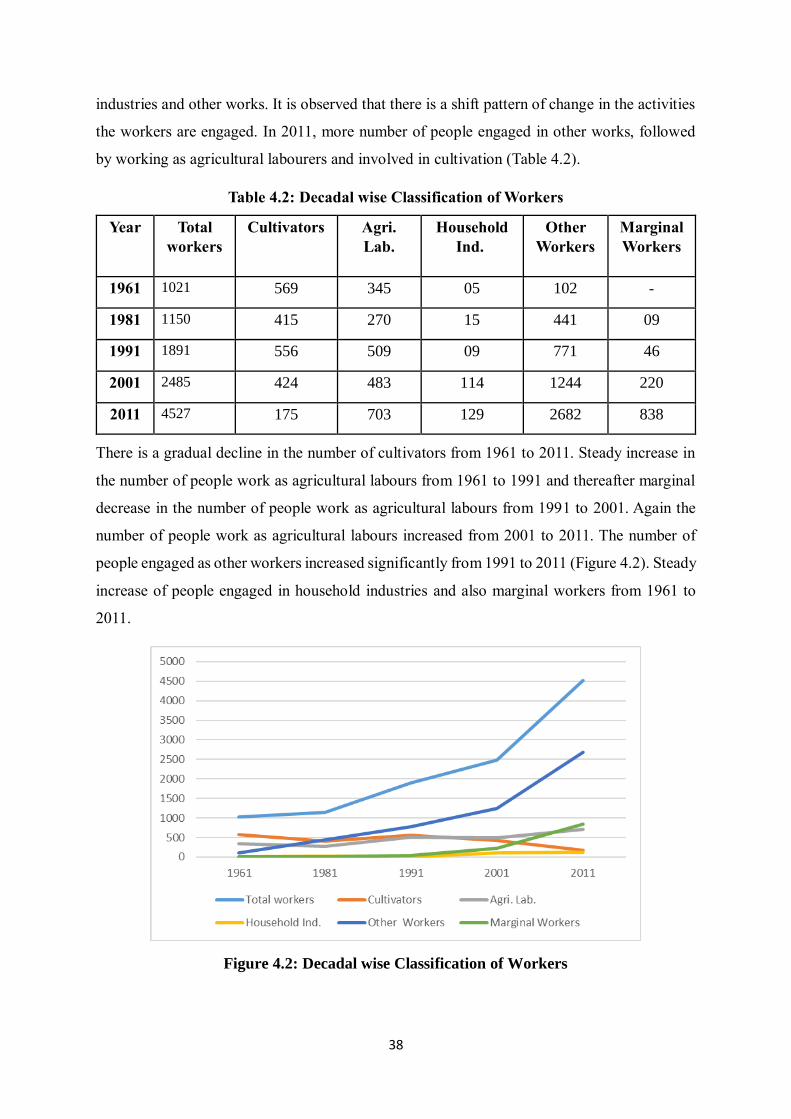
The activities in which the workers have engaged has changed over decades. In 1961 majority
of workers were cultivators, followed by people engaged as agricultural labourers, household
38
industries and other works. It is observed that there is a shift pattern of change in the activities
the workers are engaged. In 2011, more number of people engaged in other works, followed
by working as agricultural labourers and involved in cultivation (Table 4.2).
Table 4.2: Decadal wise Classification of Workers
Year Total
workers
Cultivators
Agri.
Lab.
Household
Ind.
Other
Workers
Marginal
Workers
1961 1021 569 345 05 102 -
1981 1150 415 270 15 441 09
1991 1891 556 509 09 771 46
2001 2485 424 483 114 1244 220
2011 4527 175 703 129 2682 838
There is a gradual decline in the number of cultivators from 1961 to 2011. Steady increase in
the number of people work as agricultural labours from 1961 to 1991 and thereafter marginal
decrease in the number of people work as agricultural labours from 1991 to 2001. Again the
number of people work as agricultural labours increased from 2001 to 2011. The number of
people engaged as other workers increased significantly from 1991 to 2011 (Figure 4.2). Steady
increase of people engaged in household industries and also marginal workers from 1961 to
2011.
Figure 4.2: Decadal wise Classification of Workers
39
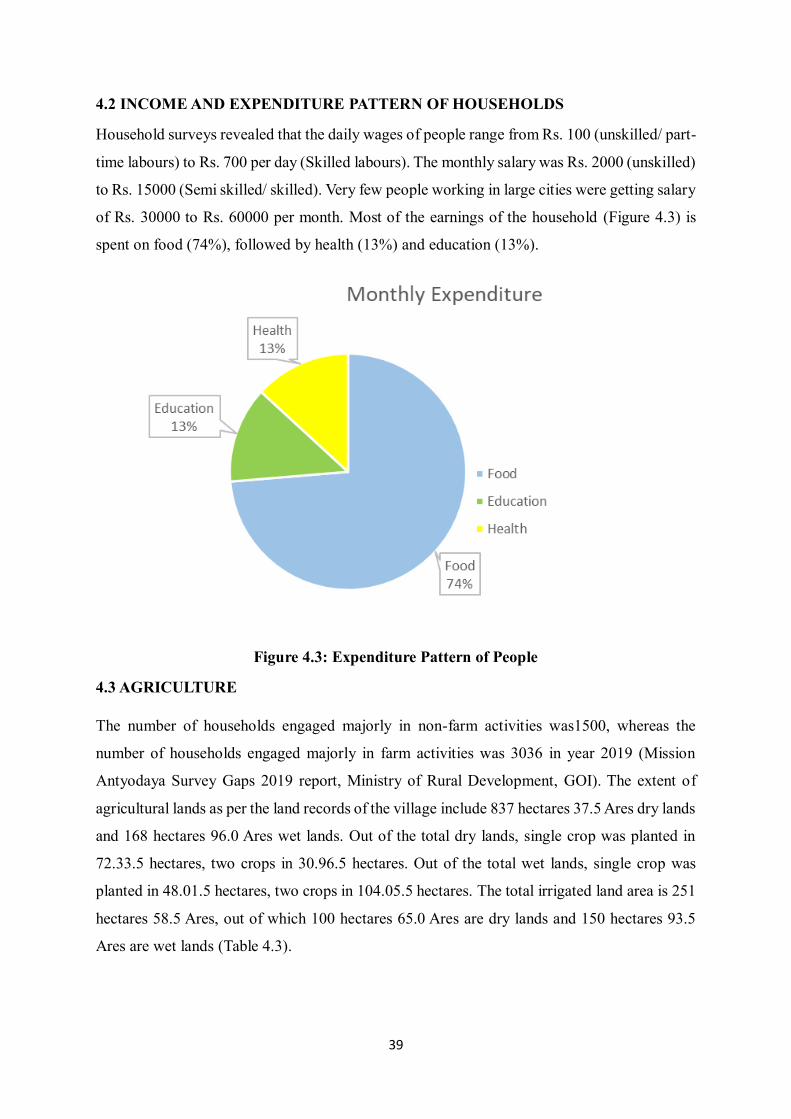
4.2 INCOME AND EXPENDITURE PATTERN OF HOUSEHOLDS
Household surveys revealed that the daily wages of people range from Rs. 100 (unskilled/ part-
time labours) to Rs. 700 per day (Skilled labours). The monthly salary was Rs. 2000 (unskilled)
to Rs. 15000 (Semi skilled/ skilled). Very few people working in large cities were getting salary
of Rs. 30000 to Rs. 60000 per month. Most of the earnings of the household (Figure 4.3) is
spent on food (74%), followed by health (13%) and education (13%).
Figure 4.3: Expenditure Pattern of People
4.3 AGRICULTURE
The number of households engaged majorly in non-farm activities was1500, whereas the
number of households engaged majorly in farm activities was 3036 in year 2019 (Mission
Antyodaya Survey Gaps 2019 report, Ministry of Rural Development, GOI). The extent of
agricultural lands as per the land records of the village include 837 hectares 37.5 Ares dry lands
and 168 hectares 96.0 Ares wet lands. Out of the total dry lands, single crop was planted in
72.33.5 hectares, two crops in 30.96.5 hectares. Out of the total wet lands, single crop was
planted in 48.01.5 hectares, two crops in 104.05.5 hectares. The total irrigated land area is 251
hectares 58.5 Ares, out of which 100 hectares 65.0 Ares are dry lands and 150 hectares 93.5
Ares are wet lands (Table 4.3).
40
Table 4.3: Land Area under Agriculture
Classification Area Crop
Land
% Fallow % First
crop
Second
crop Hectare Ares
Wet Lands 168 96.0 152.07 90.0 16.89 10.0 152.07 104.05.5
Dry Lands 837 37.5 103.30 12.4 734.07.5 87.6 103.30 30.96.5
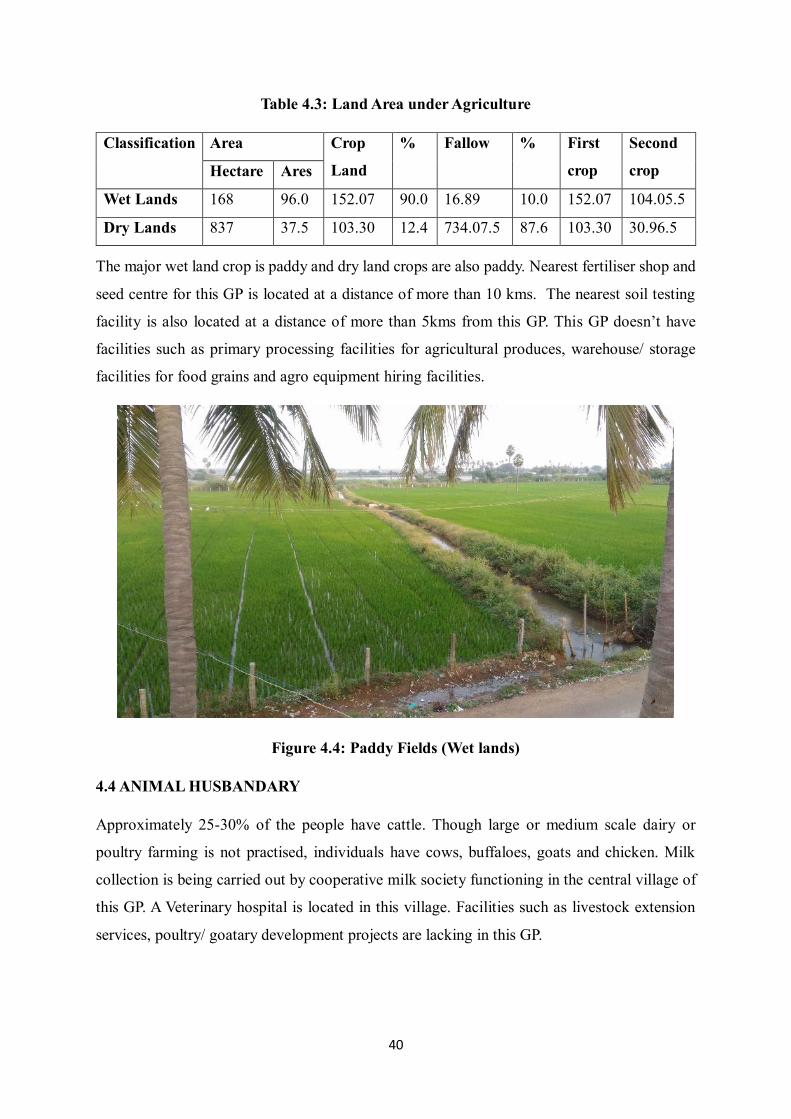
The major wet land crop is paddy and dry land crops are also paddy. Nearest fertiliser shop and
seed centre for this GP is located at a distance of more than 10 kms. The nearest soil testing
facility is also located at a distance of more than 5kms from this GP. This GP doesn’t have
facilities such as primary processing facilities for agricultural produces, warehouse/ storage
facilities for food grains and agro equipment hiring facilities.
Figure 4.4: Paddy Fields (Wet lands)
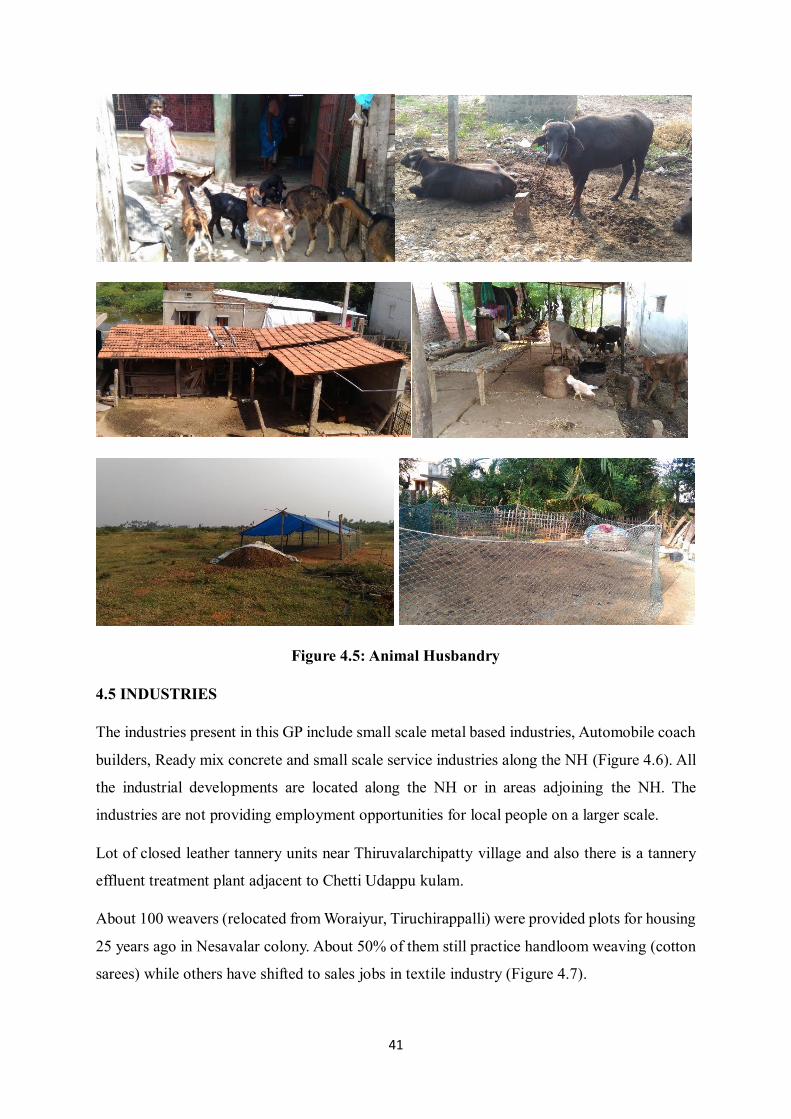
4.4 ANIMAL HUSBANDARY
Approximately 25-30% of the people have cattle. Though large or medium scale dairy or
poultry farming is not practised, individuals have cows, buffaloes, goats and chicken. Milk
collection is being carried out by cooperative milk society functioning in the central village of
this GP. A Veterinary hospital is located in this village. Facilities such as livestock extension
services, poultry/ goatary development projects are lacking in this GP.
41
Figure 4.5: Animal Husbandry
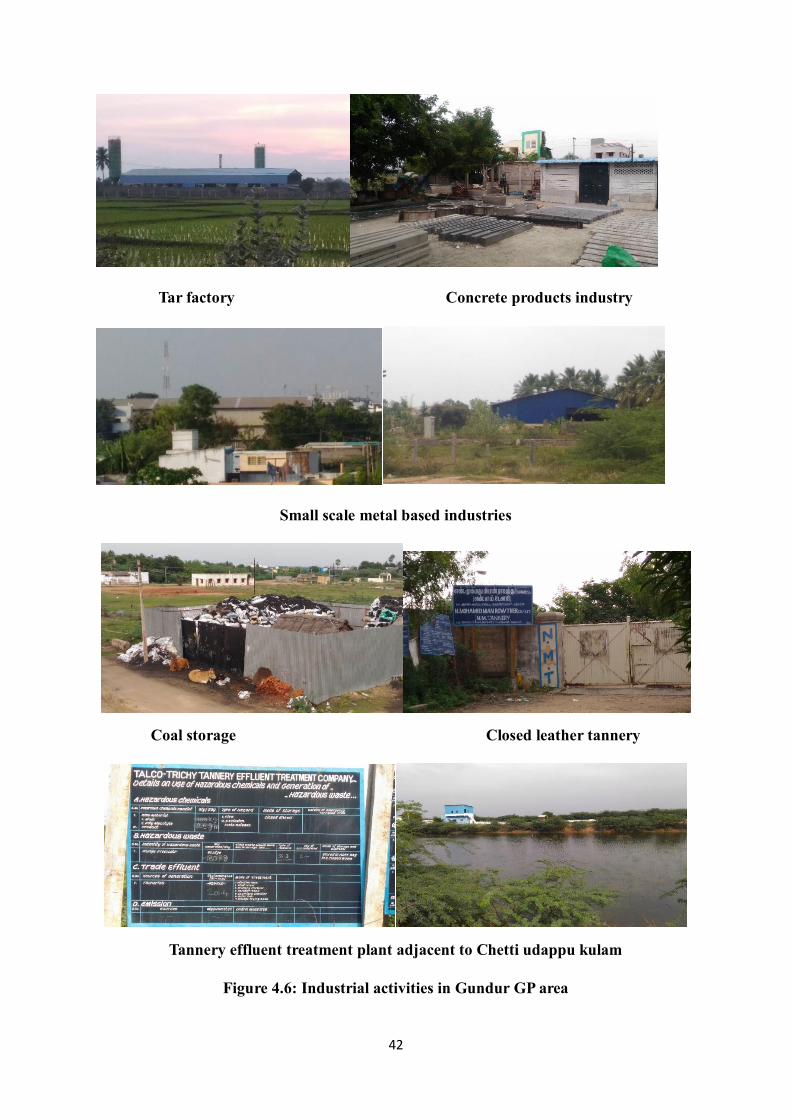
4.5 INDUSTRIES
The industries present in this GP include small scale metal based industries, Automobile coach
builders, Ready mix concrete and small scale service industries along the NH (Figure 4.6). All
the industrial developments are located along the NH or in areas adjoining the NH. The
industries are not providing employment opportunities for local people on a larger scale.
Lot of closed leather tannery units near Thiruvalarchipatty village and also there is a tannery
effluent treatment plant adjacent to Chetti Udappu kulam.
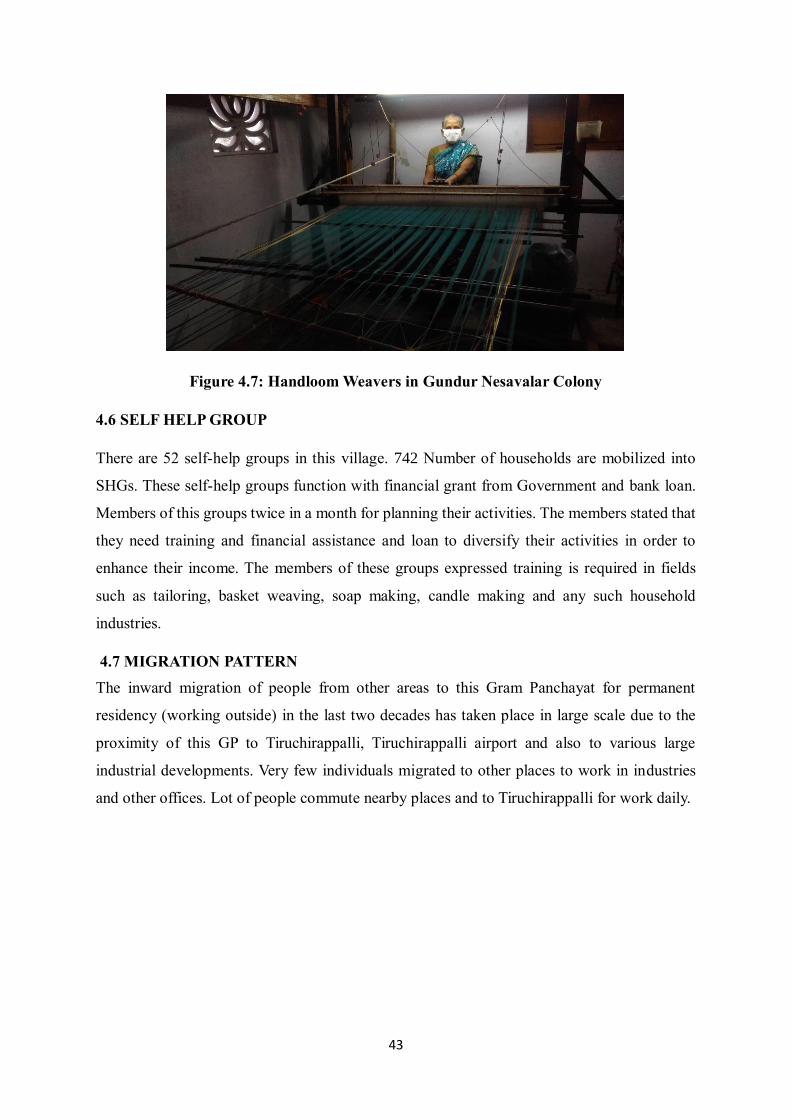
About 100 weavers (relocated from Woraiyur, Tiruchirappalli) were provided plots for housing
25 years ago in Nesavalar colony. About 50% of them still practice handloom weaving (cotton
sarees) while others have shifted to sales jobs in textile industry (Figure 4.7).
42
Tar factory Concrete products industry
Small scale metal based industries
Coal storage Closed leather tannery
Tannery effluent treatment plant adjacent to Chetti udappu kulam
Figure 4.6: Industrial activities in Gundur GP area
43
Figure 4.7: Handloom Weavers in Gundur Nesavalar Colony
4.6 SELF HELP GROUP
There are 52 self-help groups in this village. 742 Number of households are mobilized into
SHGs. These self-help groups function with financial grant from Government and bank loan.
Members of this groups twice in a month for planning their activities. The members stated that
they need training and financial assistance and loan to diversify their activities in order to
enhance their income. The members of these groups expressed training is required in fields
such as tailoring, basket weaving, soap making, candle making and any such household
industries.
4.7 MIGRATION PATTERN
The inward migration of people from other areas to this Gram Panchayat for permanent
residency (working outside) in the last two decades has taken place in large scale due to the
proximity of this GP to Tiruchirappalli, Tiruchirappalli airport and also to various large
industrial developments. Very few individuals migrated to other places to work in industries
and other offices. Lot of people commute nearby places and to Tiruchirappalli for work daily.
44
CHAPTER 5
HOUSING
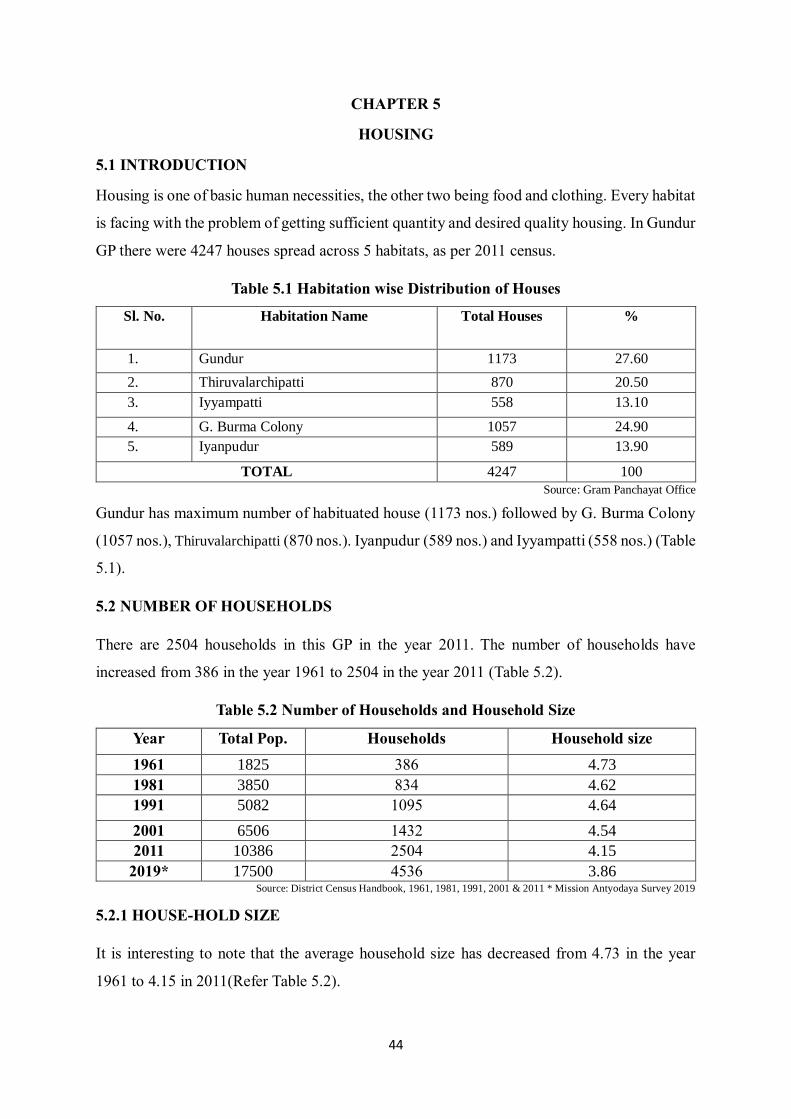
5.1 INTRODUCTION
Housing is one of basic human necessities, the other two being food and clothing. Every habitat
is facing with the problem of getting sufficient quantity and desired quality housing. In Gundur
GP there were 4247 houses spread across 5 habitats, as per 2011 census.
Table 5.1 Habitation wise Distribution of Houses
Sl. No. Habitation Name Total Houses %
1. Gundur 1173 27.60
2. Thiruvalarchipatti 870 20.50
3. Iyyampatti 558 13.10
4. G. Burma Colony 1057 24.90
5. Iyanpudur 589 13.90
TOTAL 4247 100
Source: Gram Panchayat Office
Gundur has maximum number of habituated house (1173 nos.) followed by G. Burma Colony
(1057 nos.), Thiruvalarchipatti (870 nos.). Iyanpudur (589 nos.) and Iyyampatti (558 nos.) (Table
5.1).
5.2 NUMBER OF HOUSEHOLDS
There are 2504 households in this GP in the year 2011. The number of households have
increased from 386 in the year 1961 to 2504 in the year 2011 (Table 5.2).
Table 5.2 Number of Households and Household Size
Year Total Pop. Households Household size
1961 1825 386 4.73
1981 3850 834 4.62
1991 5082 1095 4.64
2001 6506 1432 4.54
2011 10386 2504 4.15
2019* 17500 4536 3.86 Source: District Census Handbook, 1961, 1981, 1991, 2001 & 2011 * Mission Antyodaya Survey 2019
5.2.1 HOUSE-HOLD SIZE
It is interesting to note that the average household size has decreased from 4.73 in the year
1961 to 4.15 in 2011(Refer Table 5.2).
45
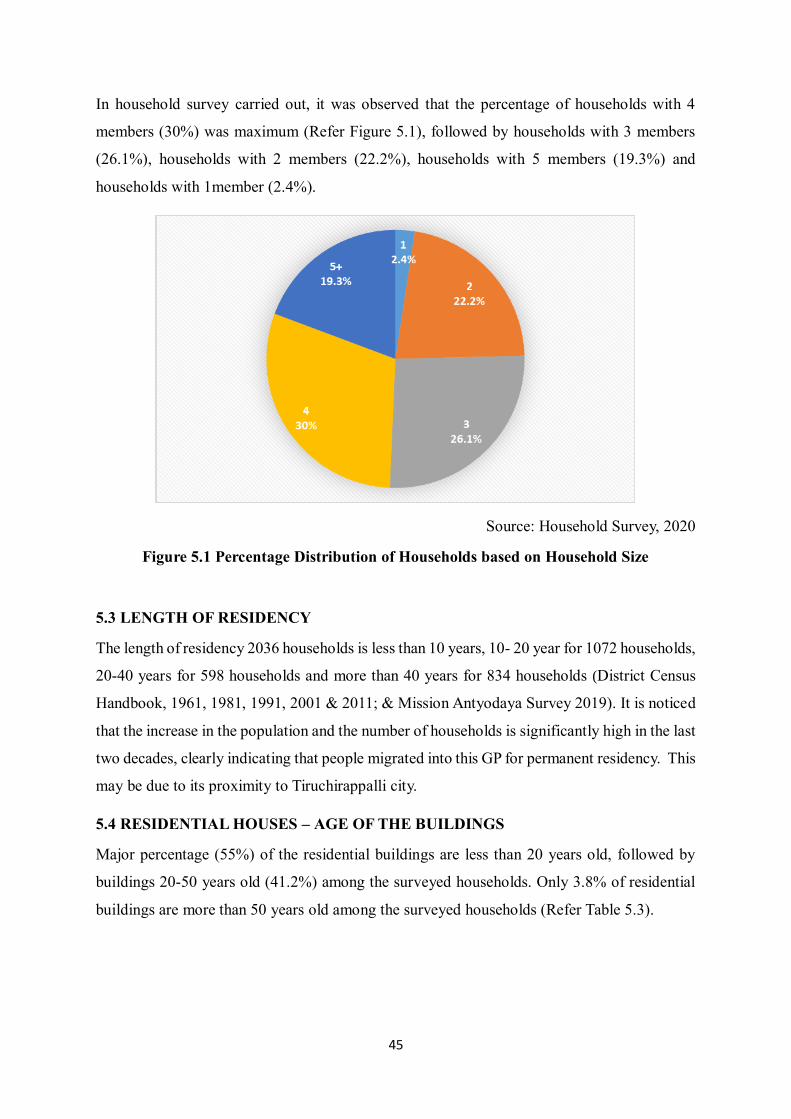
In household survey carried out, it was observed that the percentage of households with 4
members (30%) was maximum (Refer Figure 5.1), followed by households with 3 members
(26.1%), households with 2 members (22.2%), households with 5 members (19.3%) and
households with 1member (2.4%).
Source: Household Survey, 2020
Figure 5.1 Percentage Distribution of Households based on Household Size
5.3 LENGTH OF RESIDENCY
The length of residency 2036 households is less than 10 years, 10- 20 year for 1072 households,
20-40 years for 598 households and more than 40 years for 834 households (District Census
Handbook, 1961, 1981, 1991, 2001 & 2011; & Mission Antyodaya Survey 2019). It is noticed
that the increase in the population and the number of households is significantly high in the last
two decades, clearly indicating that people migrated into this GP for permanent residency. This
may be due to its proximity to Tiruchirappalli city.
5.4 RESIDENTIAL HOUSES – AGE OF THE BUILDINGS
Major percentage (55%) of the residential buildings are less than 20 years old, followed by
buildings 20-50 years old (41.2%) among the surveyed households. Only 3.8% of residential
buildings are more than 50 years old among the surveyed households (Refer Table 5.3).
46
Table 5.3 Classification of Residential Houses based on Age of the Buildings
Sl. No. Age of the Buildings (years) Percentage
1 <20 55.0
3 20 - 50 41.2
4 >50 03.8
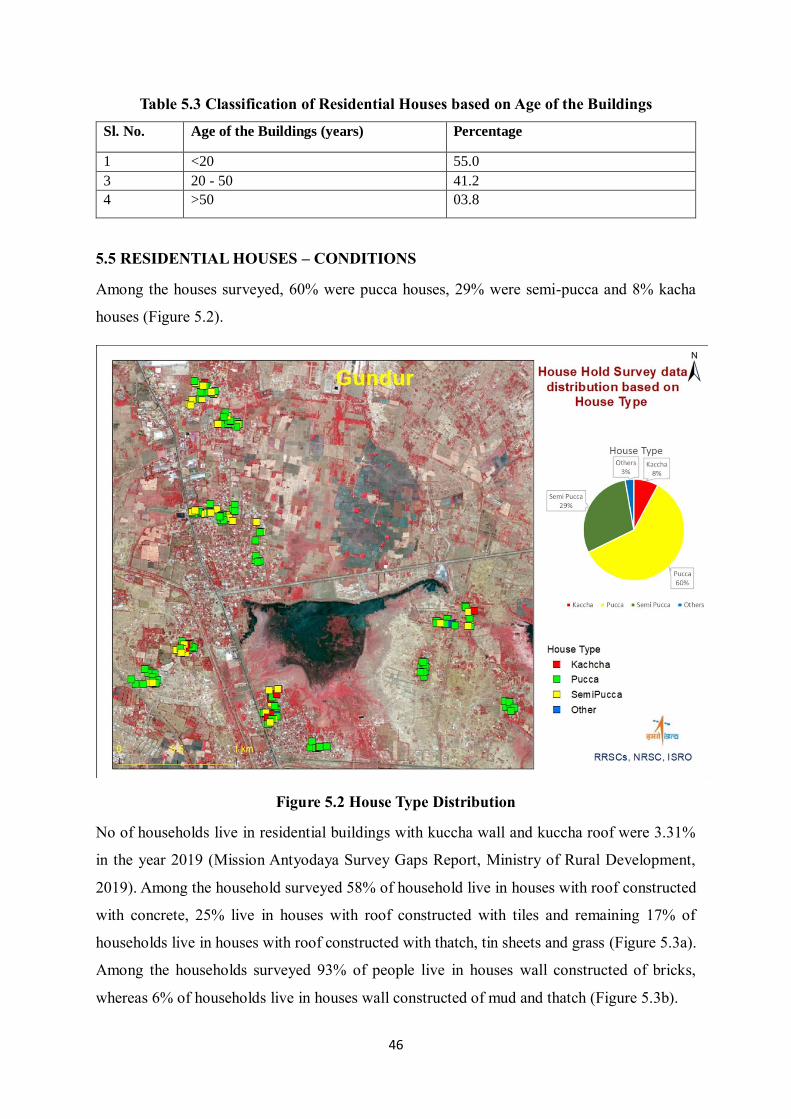
5.5 RESIDENTIAL HOUSES – CONDITIONS
Among the houses surveyed, 60% were pucca houses, 29% were semi-pucca and 8% kacha
houses (Figure 5.2).
Figure 5.2 House Type Distribution
No of households live in residential buildings with kuccha wall and kuccha roof were 3.31%
in the year 2019 (Mission Antyodaya Survey Gaps Report, Ministry of Rural Development,
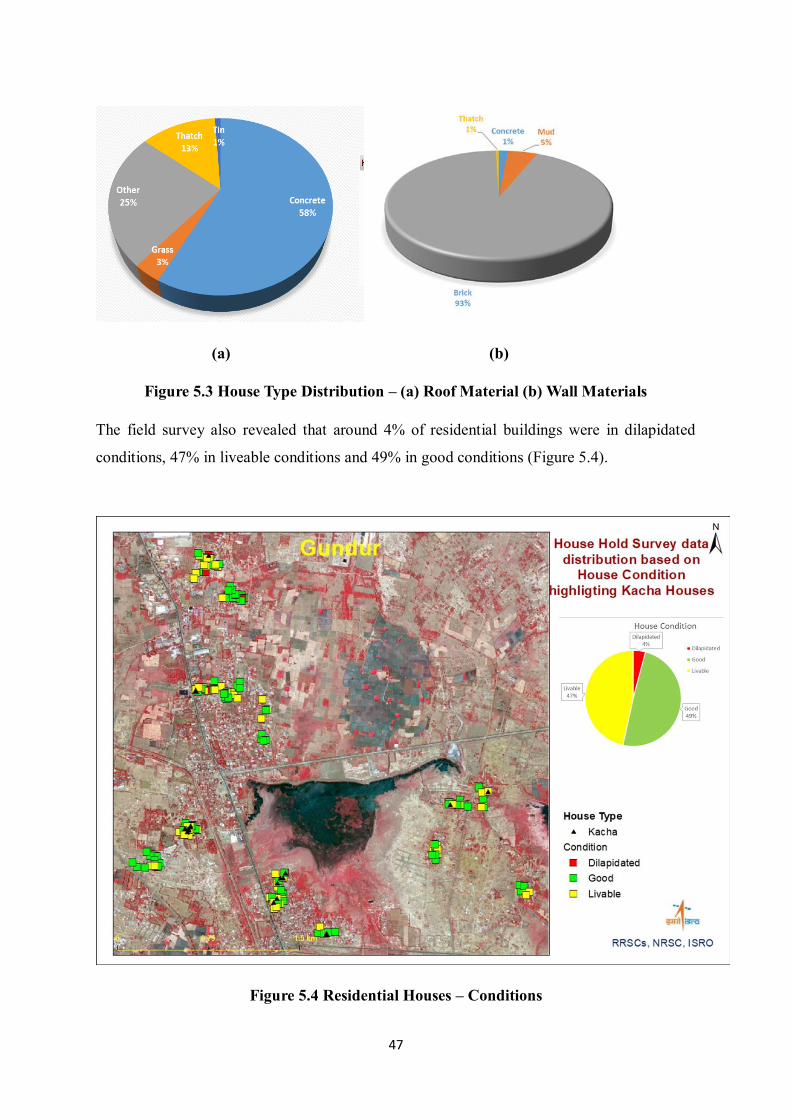
2019). Among the household surveyed 58% of household live in houses with roof constructed
with concrete, 25% live in houses with roof constructed with tiles and remaining 17% of
households live in houses with roof constructed with thatch, tin sheets and grass (Figure 5.3a).
Among the households surveyed 93% of people live in houses wall constructed of bricks,
whereas 6% of households live in houses wall constructed of mud and thatch (Figure 5.3b).
47
(a) (b)
Figure 5.3 House Type Distribution – (a) Roof Material (b) Wall Materials
The field survey also revealed that around 4% of residential buildings were in dilapidated
conditions, 47% in liveable conditions and 49% in good conditions (Figure 5.4).
Figure 5.4 Residential Houses – Conditions
48
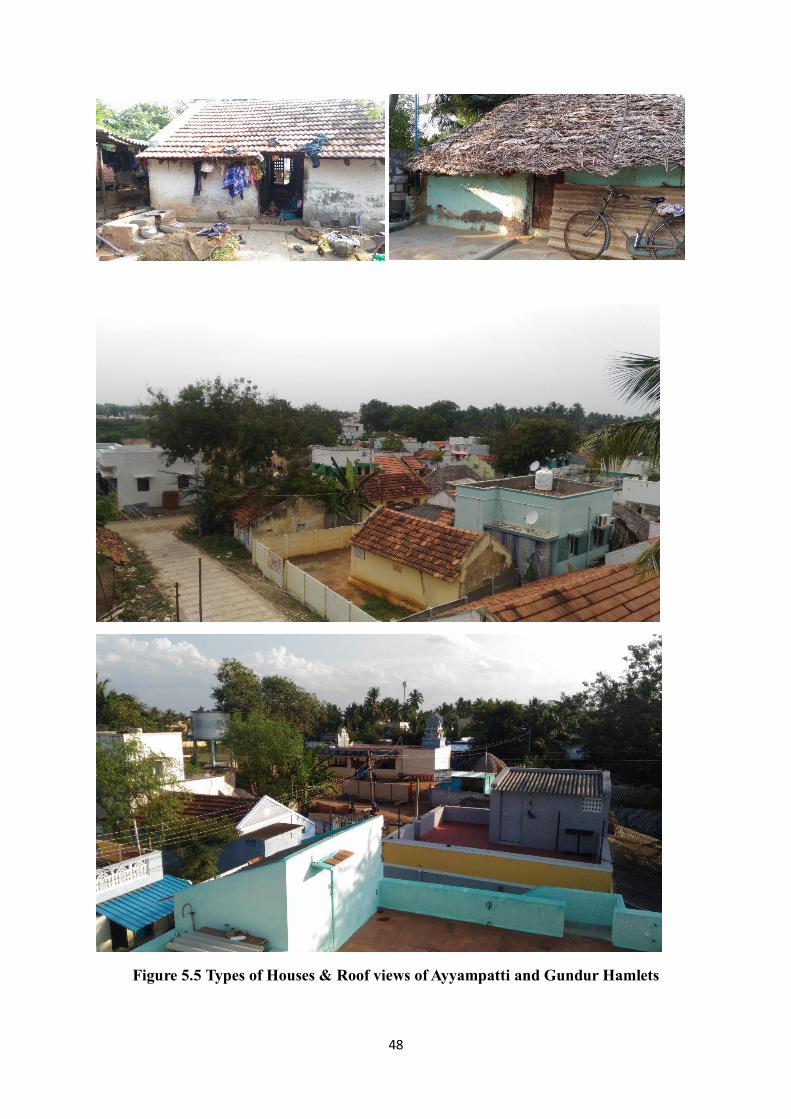
Figure 5.5 Types of Houses & Roof views of Ayyampatti and Gundur Hamlets
49
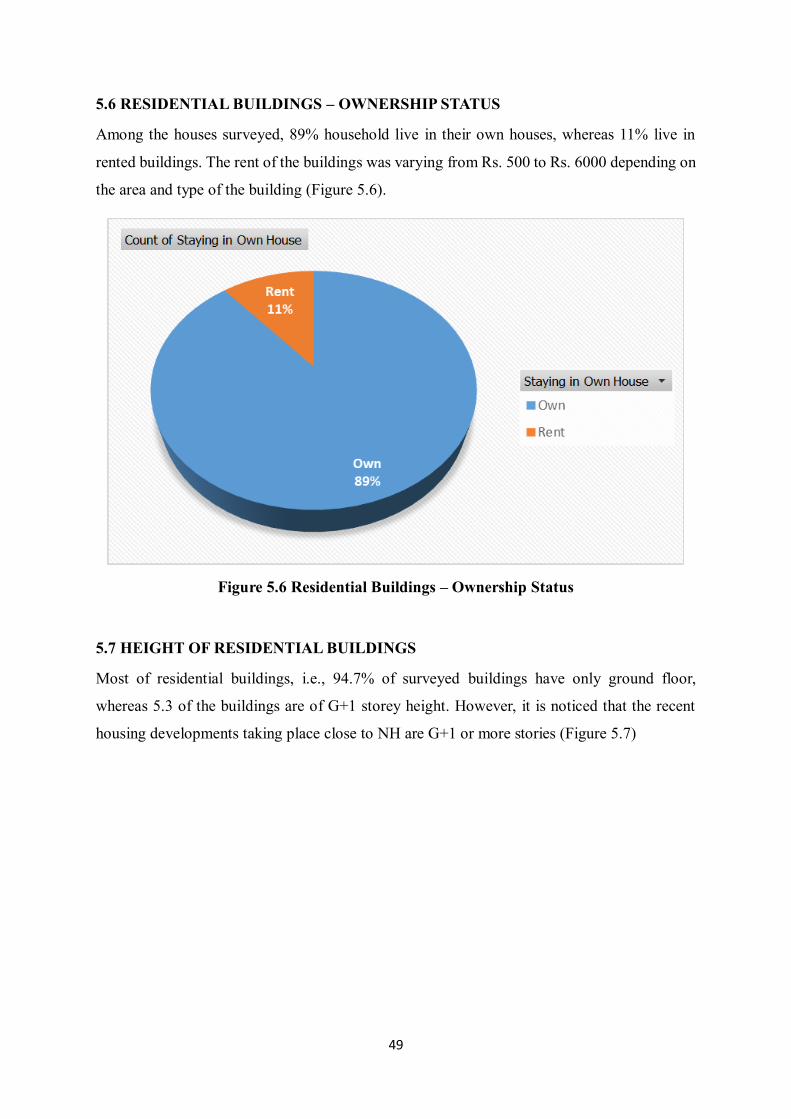
5.6 RESIDENTIAL BUILDINGS – OWNERSHIP STATUS
Among the houses surveyed, 89% household live in their own houses, whereas 11% live in
rented buildings. The rent of the buildings was varying from Rs. 500 to Rs. 6000 depending on
the area and type of the building (Figure 5.6).
Figure 5.6 Residential Buildings – Ownership Status
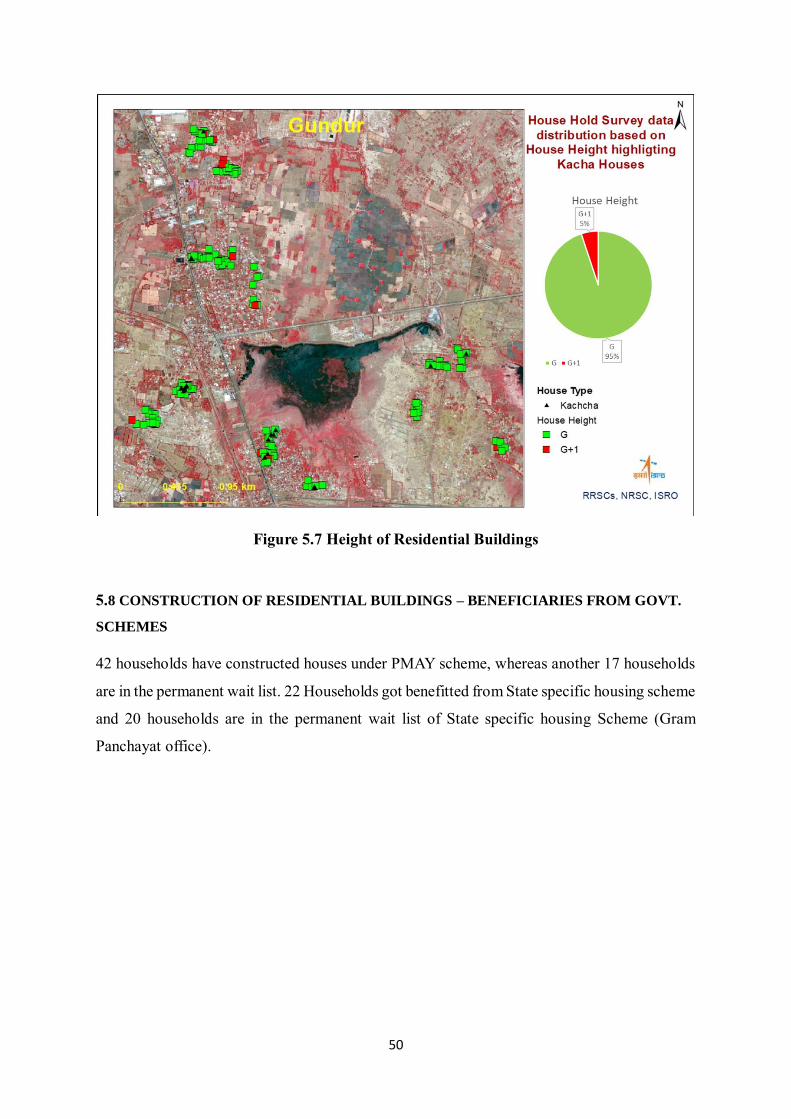
5.7 HEIGHT OF RESIDENTIAL BUILDINGS
Most of residential buildings, i.e., 94.7% of surveyed buildings have only ground floor,
whereas 5.3 of the buildings are of G+1 storey height. However, it is noticed that the recent
housing developments taking place close to NH are G+1 or more stories (Figure 5.7)
50
Figure 5.7 Height of Residential Buildings
5.8 CONSTRUCTION OF RESIDENTIAL BUILDINGS – BENEFICIARIES FROM GOVT.
SCHEMES
42 households have constructed houses under PMAY scheme, whereas another 17 households
are in the permanent wait list. 22 Households got benefitted from State specific housing scheme
and 20 households are in the permanent wait list of State specific housing Scheme (Gram
Panchayat office).
51
CHAPTER 6
COMMUNITY FACILITIES AND UTILITIES
6.1 INTRODUCTION
The details of presence of community facilities and utilities with regard to water supply,
sanitation, drainage, road infrastructure, health services, community facilities, etc., were
obtained from primary survey and secondary sources are presented in this chapter.
6.2 WATER SUPPLY
The gram panchayat has piped water supply scheme covering all the hamlets. The source for
water supply distribution is river Kavery and also bore wells. The water supply distribution
system has 19 overhead tanks with a total storage capacity of 6,80,000litres and 91 public taps
on various streets of all hamlets. More than 50% of the (2460 nos.) individual houses are given
water supply house service connection. In addition, there are about 43 hand pumps provided
for water supply. Most of the areas in all hamlets are provided with water supply for a duration
of 2 hours in a day. The water supply sources include 6 nos. wells also. The distribution of
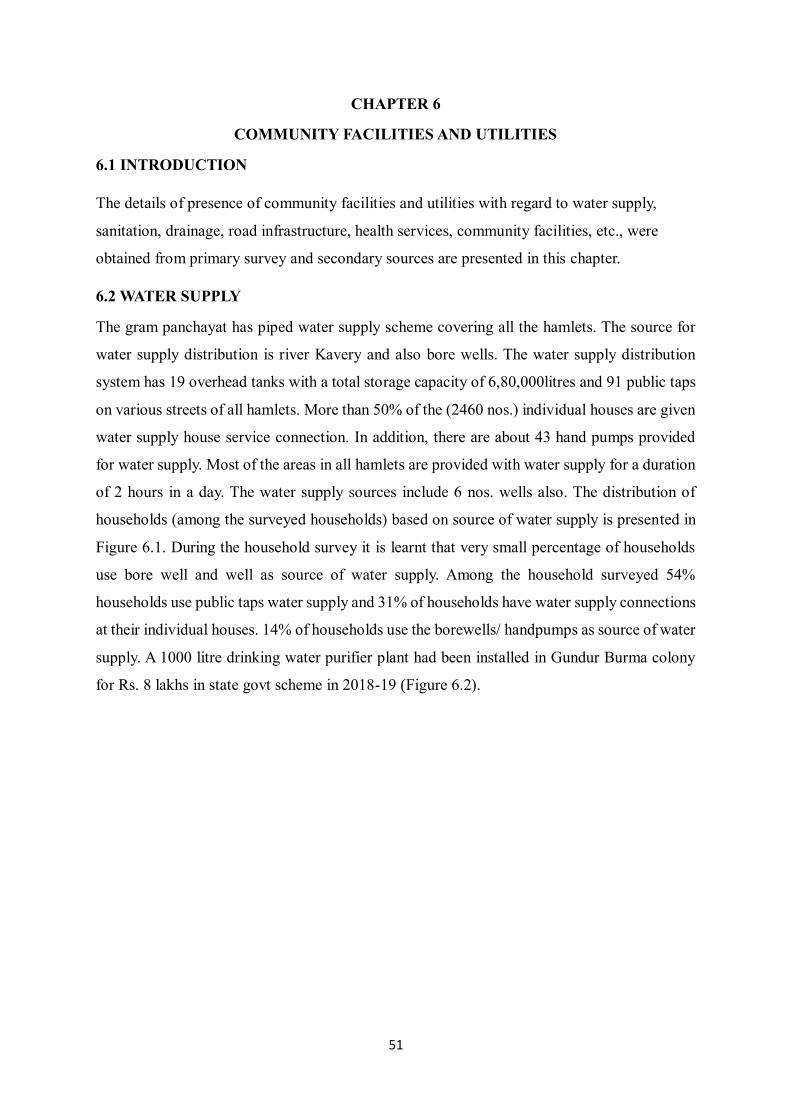
households (among the surveyed households) based on source of water supply is presented in
Figure 6.1. During the household survey it is learnt that very small percentage of households
use bore well and well as source of water supply. Among the household surveyed 54%
households use public taps water supply and 31% of households have water supply connections
at their individual houses. 14% of households use the borewells/ handpumps as source of water
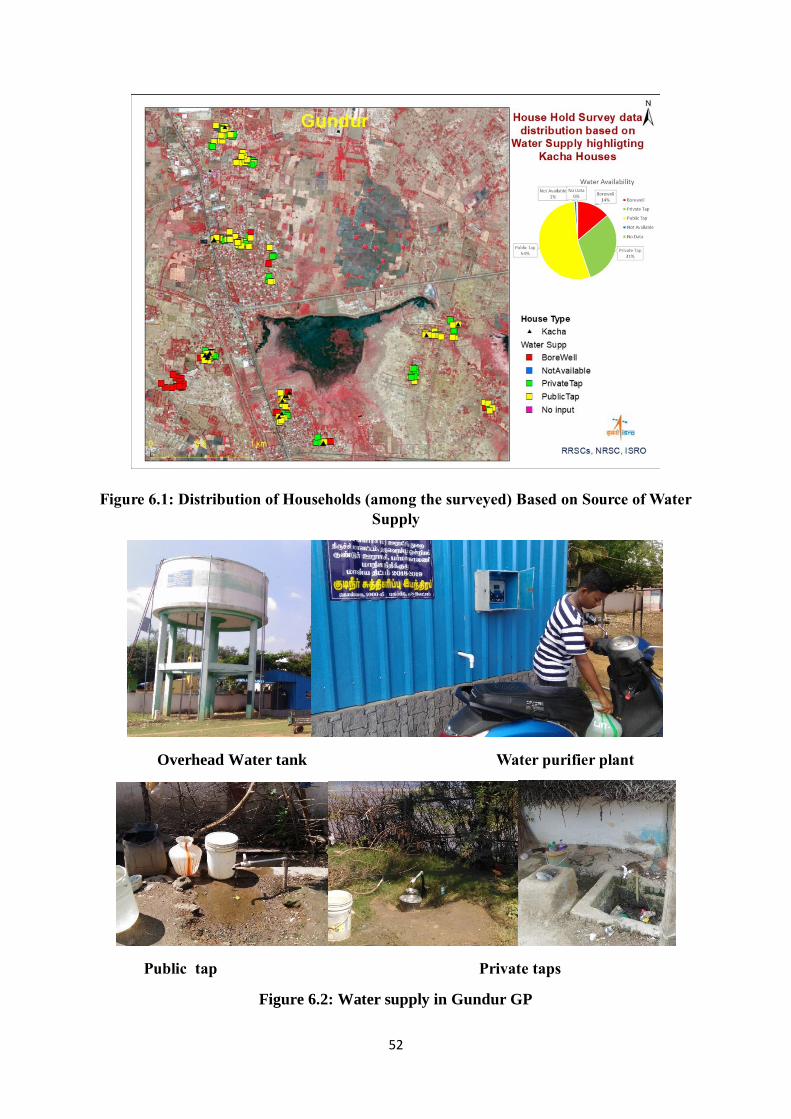
supply. A 1000 litre drinking water purifier plant had been installed in Gundur Burma colony
for Rs. 8 lakhs in state govt scheme in 2018-19 (Figure 6.2).
52
Figure 6.1: Distribution of Households (among the surveyed) Based on Source of Water
Supply
Overhead Water tank Water purifier plant
Public tap Private taps
Figure 6.2: Water supply in Gundur GP
53
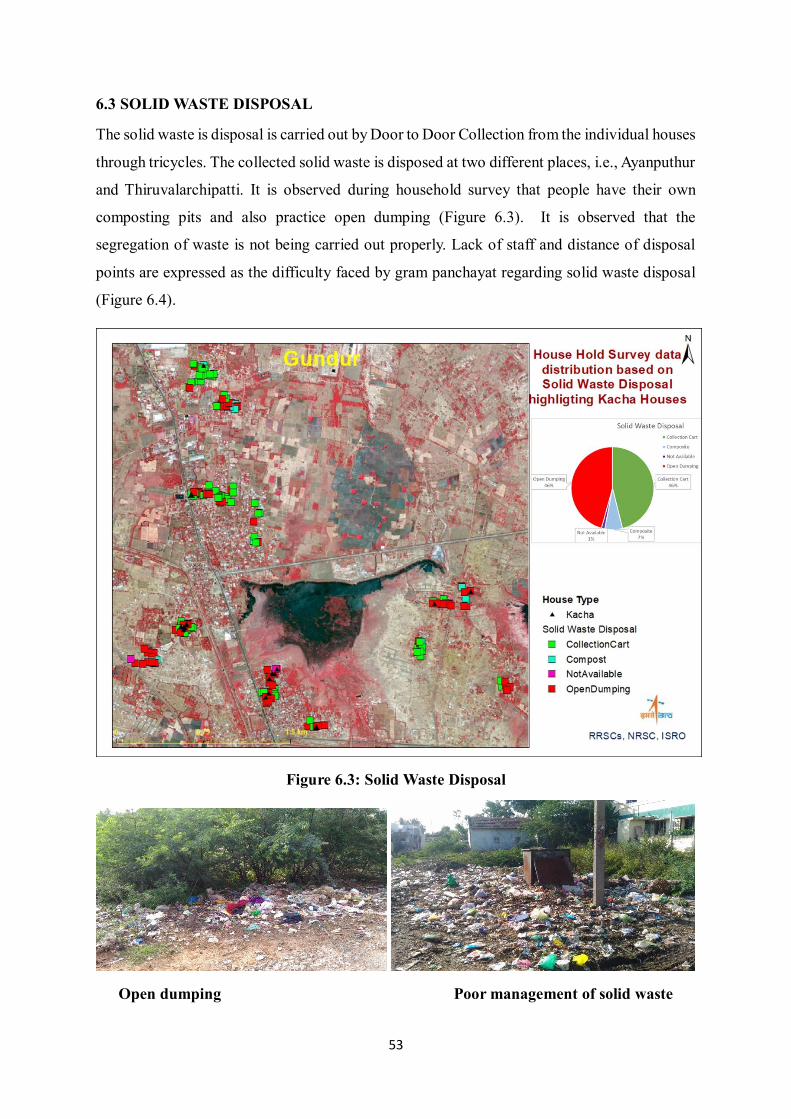
6.3 SOLID WASTE DISPOSAL
The solid waste is disposal is carried out by Door to Door Collection from the individual houses
through tricycles. The collected solid waste is disposed at two different places, i.e., Ayanputhur
and Thiruvalarchipatti. It is observed during household survey that people have their own
composting pits and also practice open dumping (Figure 6.3). It is observed that the
segregation of waste is not being carried out properly. Lack of staff and distance of disposal
points are expressed as the difficulty faced by gram panchayat regarding solid waste disposal
(Figure 6.4).
Figure 6.3: Solid Waste Disposal
Open dumping Poor management of solid waste
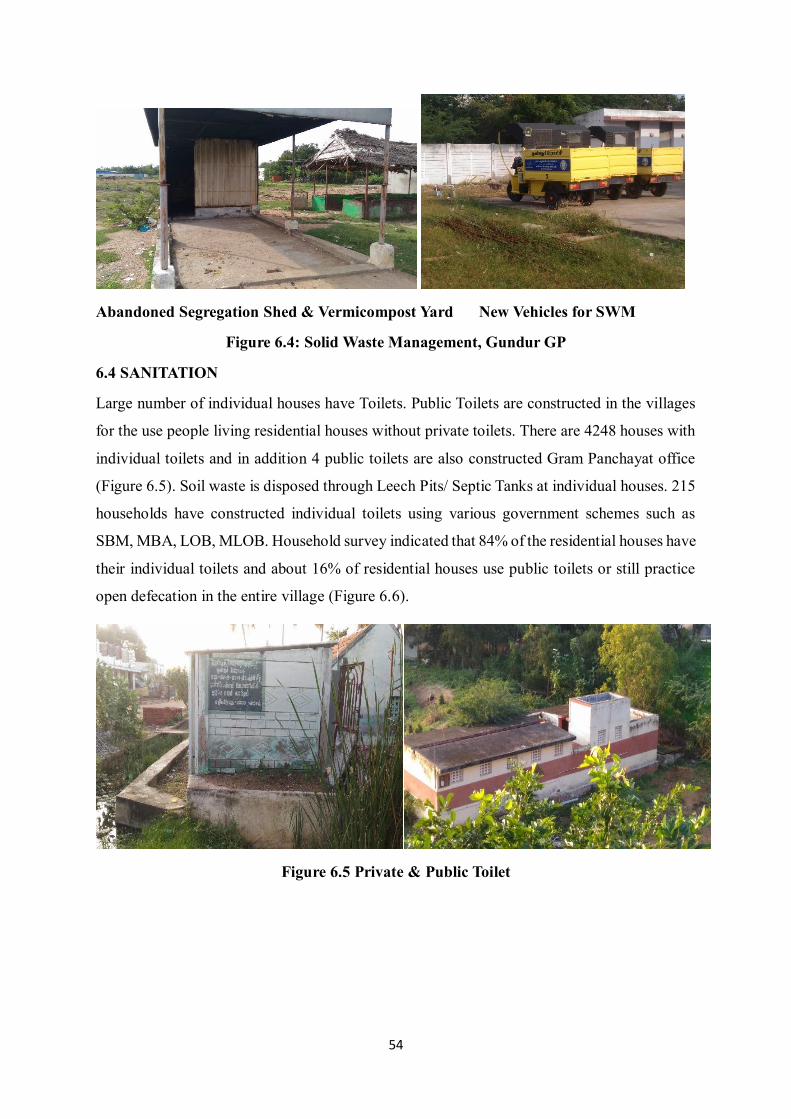
54
Abandoned Segregation Shed & Vermicompost Yard New Vehicles for SWM
Figure 6.4: Solid Waste Management, Gundur GP
6.4 SANITATION
Large number of individual houses have Toilets. Public Toilets are constructed in the villages
for the use people living residential houses without private toilets. There are 4248 houses with
individual toilets and in addition 4 public toilets are also constructed Gram Panchayat office
(Figure 6.5). Soil waste is disposed through Leech Pits/ Septic Tanks at individual houses. 215
households have constructed individual toilets using various government schemes such as
SBM, MBA, LOB, MLOB. Household survey indicated that 84% of the residential houses have
their individual toilets and about 16% of residential houses use public toilets or still practice
open defecation in the entire village (Figure 6.6).
Figure 6.5 Private & Public Toilet
Figure 6.6a: Private toilet Figure 6.6b: Public toilet
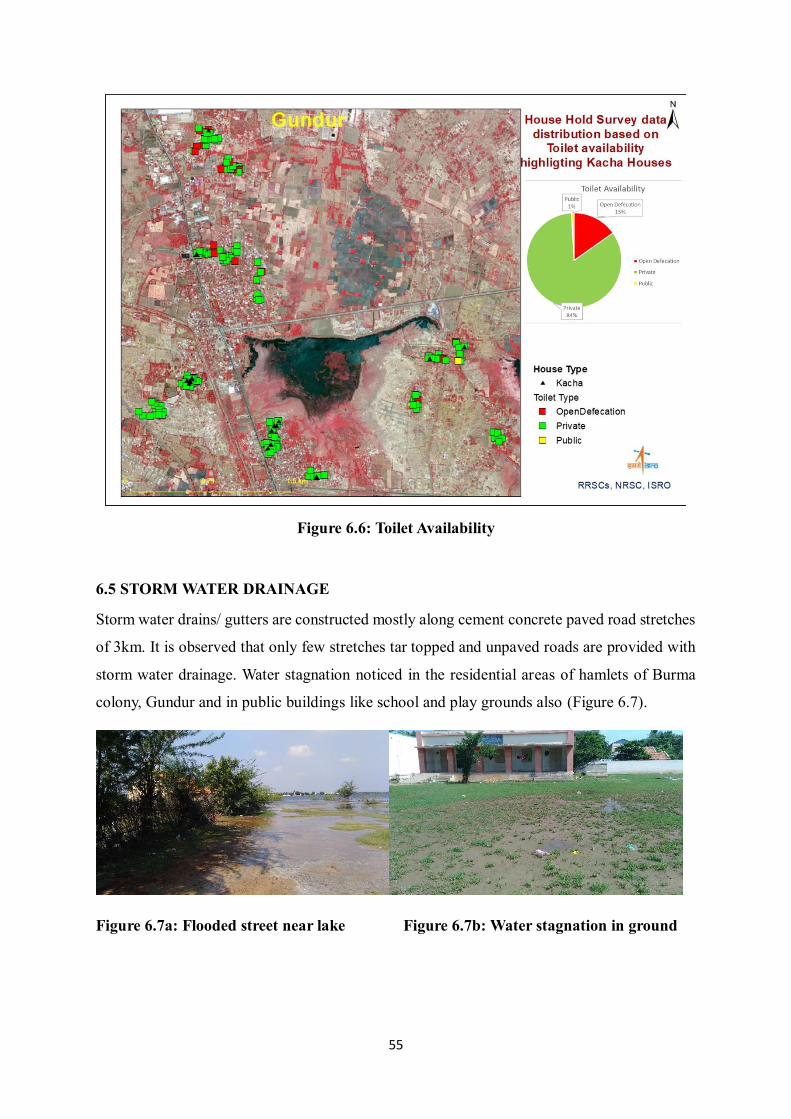
55
Figure 6.6: Toilet Availability
6.5 STORM WATER DRAINAGE
Storm water drains/ gutters are constructed mostly along cement concrete paved road stretches
of 3km. It is observed that only few stretches tar topped and unpaved roads are provided with
storm water drainage. Water stagnation noticed in the residential areas of hamlets of Burma
colony, Gundur and in public buildings like school and play grounds also (Figure 6.7).
Figure 6.7a: Flooded street near lake Figure 6.7b: Water stagnation in ground
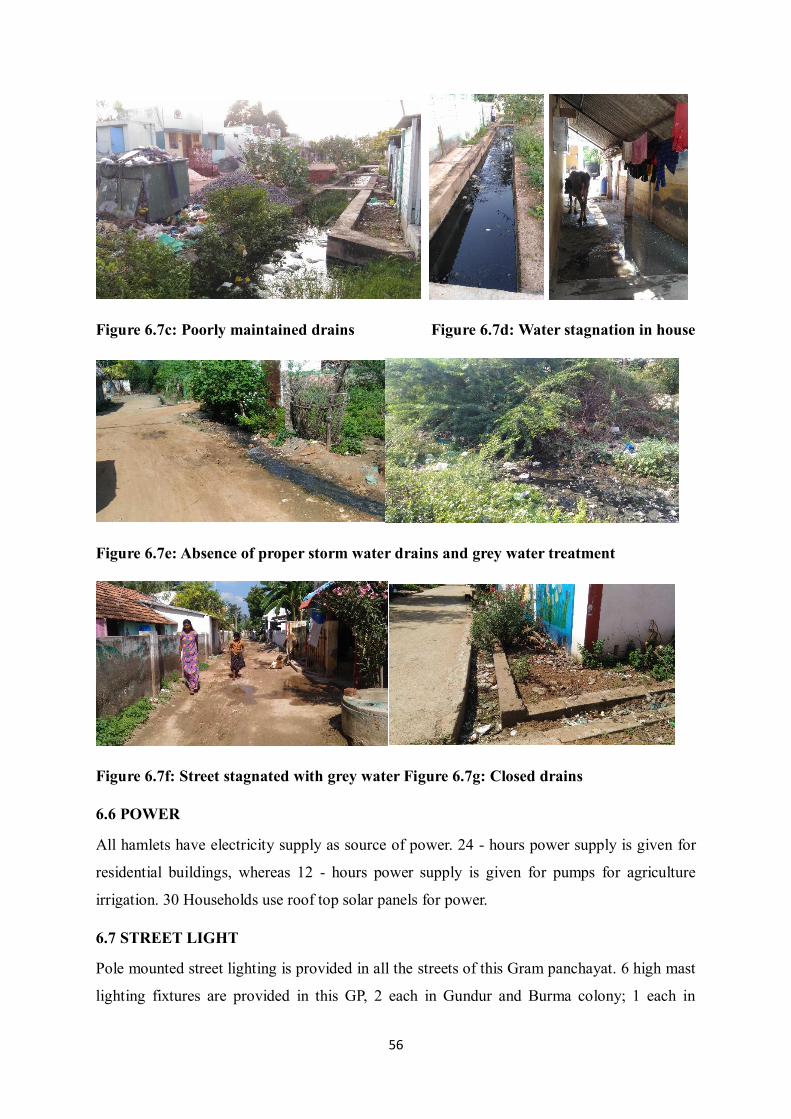
56
Figure 6.7c: Poorly maintained drains Figure 6.7d: Water stagnation in house
Figure 6.7e: Absence of proper storm water drains and grey water treatment
Figure 6.7f: Street stagnated with grey water Figure 6.7g: Closed drains
6.6 POWER
All hamlets have electricity supply as source of power. 24 - hours power supply is given for
residential buildings, whereas 12 - hours power supply is given for pumps for agriculture
irrigation. 30 Households use roof top solar panels for power.
6.7 STREET LIGHT
Pole mounted street lighting is provided in all the streets of this Gram panchayat. 6 high mast
lighting fixtures are provided in this GP, 2 each in Gundur and Burma colony; 1 each in
57
Ayanputhur and Thiruvalarchipatti. The total number of street lighting poles are 1680 and all
the street lighting lamps are energy efficient LEDs (Gram panchayat office).
6.8 PUBLIC TRANSPORT
Bus is the only mode of public transportation available for the people of various hamlets.
Frequent bus services are available along the NH. In addition, bus services are available to the
interior hamlets. The services of private taxis and autos are also available in this GP.
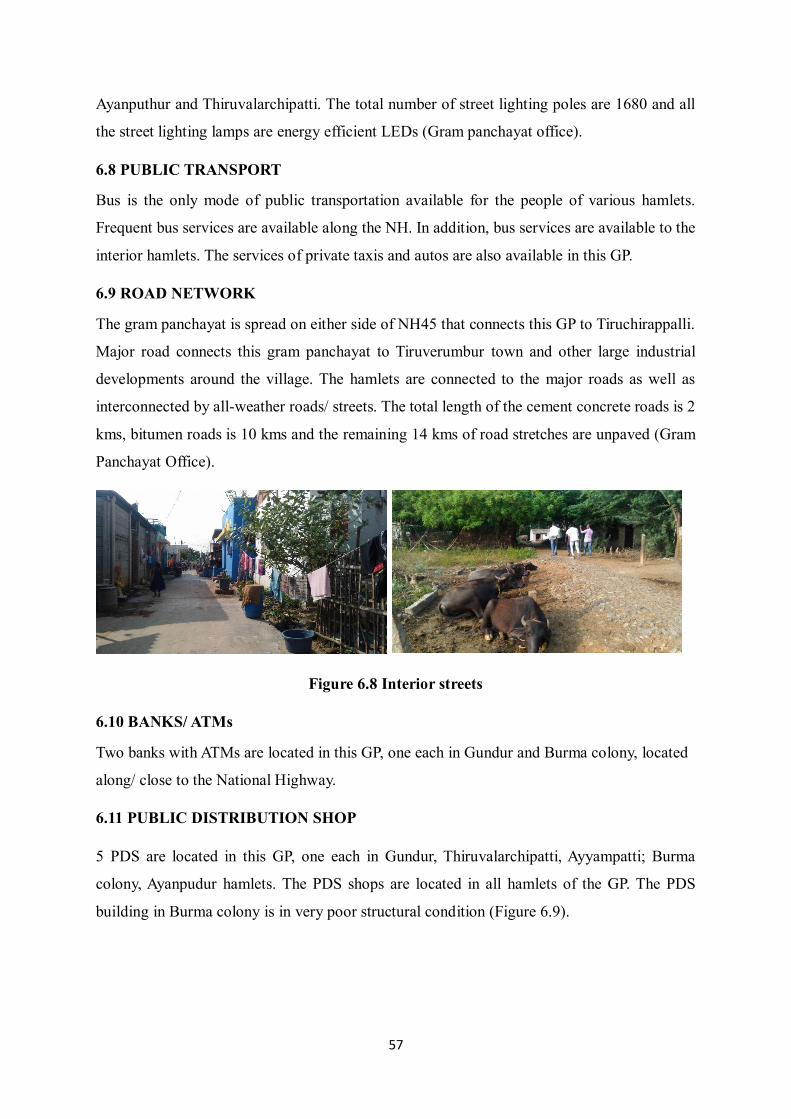
6.9 ROAD NETWORK
The gram panchayat is spread on either side of NH45 that connects this GP to Tiruchirappalli.
Major road connects this gram panchayat to Tiruverumbur town and other large industrial
developments around the village. The hamlets are connected to the major roads as well as
interconnected by all-weather roads/ streets. The total length of the cement concrete roads is 2
kms, bitumen roads is 10 kms and the remaining 14 kms of road stretches are unpaved (Gram
Panchayat Office).
Figure 6.8 Interior streets
6.10 BANKS/ ATMs
Two banks with ATMs are located in this GP, one each in Gundur and Burma colony, located
along/ close to the National Highway.
6.11 PUBLIC DISTRIBUTION SHOP
5 PDS are located in this GP, one each in Gundur, Thiruvalarchipatti, Ayyampatti; Burma
colony, Ayanpudur hamlets. The PDS shops are located in all hamlets of the GP. The PDS
building in Burma colony is in very poor structural condition (Figure 6.9).
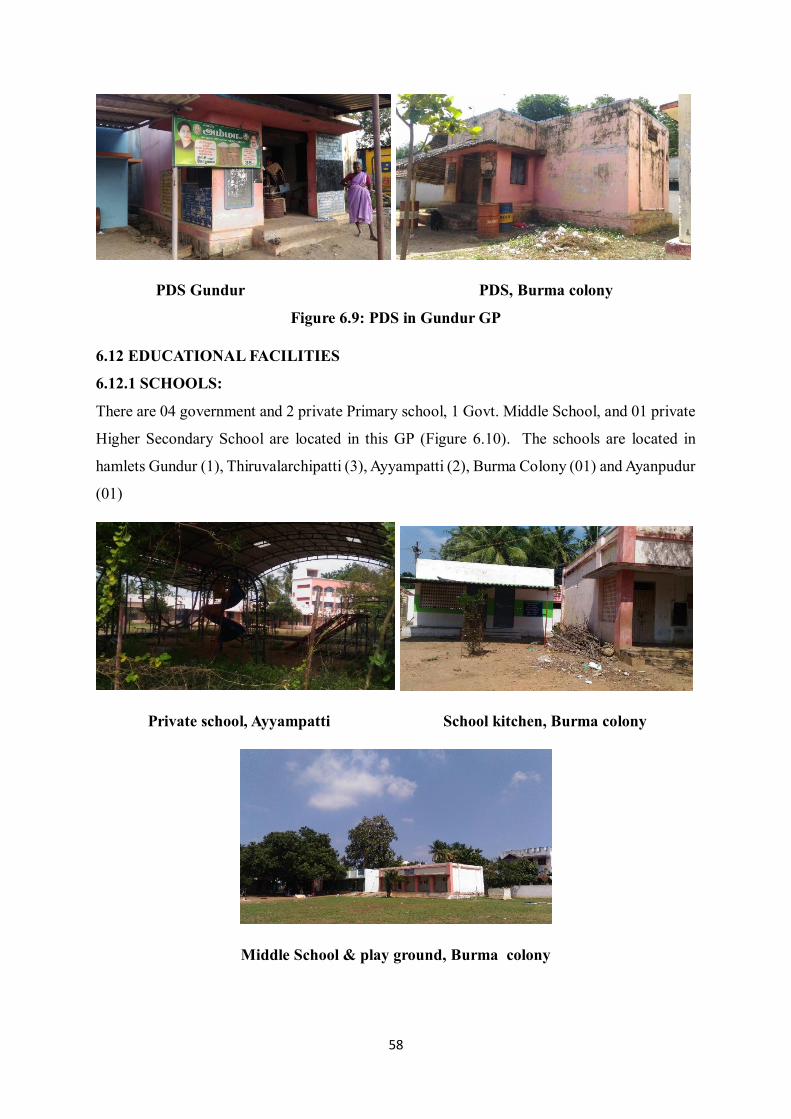
58
PDS Gundur PDS, Burma colony
Figure 6.9: PDS in Gundur GP
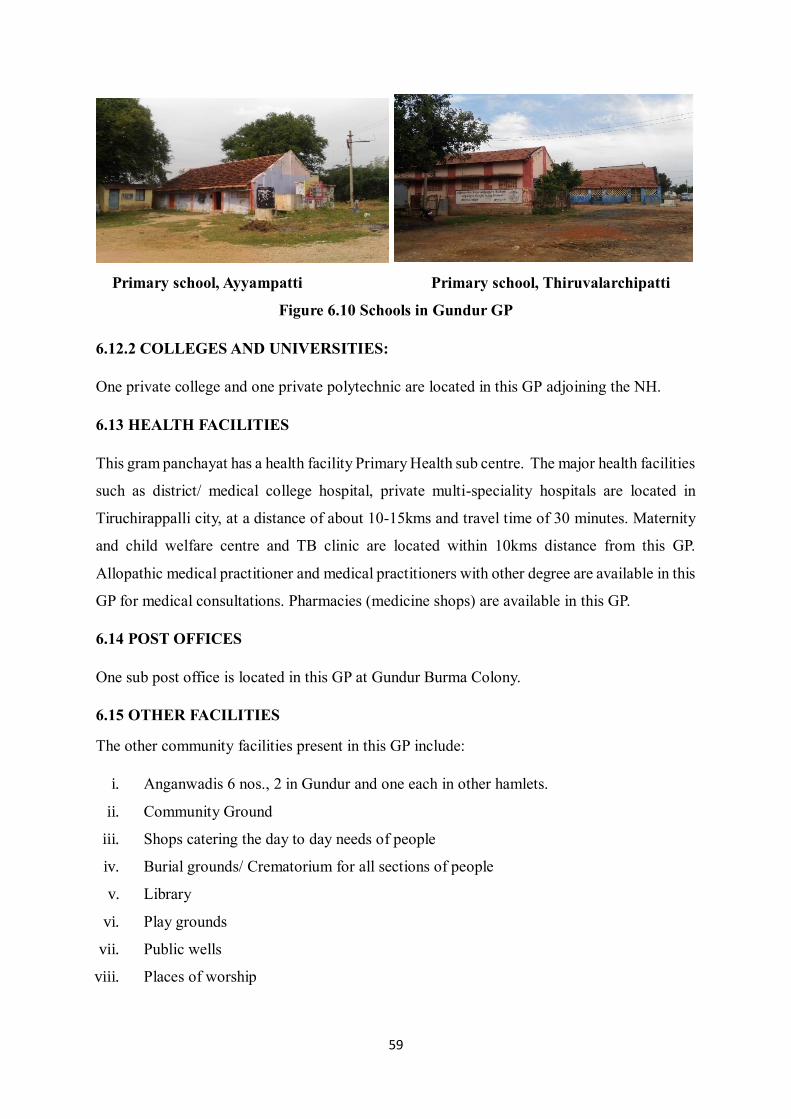
6.12 EDUCATIONAL FACILITIES
6.12.1 SCHOOLS:
There are 04 government and 2 private Primary school, 1 Govt. Middle School, and 01 private
Higher Secondary School are located in this GP (Figure 6.10). The schools are located in
hamlets Gundur (1), Thiruvalarchipatti (3), Ayyampatti (2), Burma Colony (01) and Ayanpudur
(01)
Private school, Ayyampatti School kitchen, Burma colony
Middle School & play ground, Burma colony
59
Primary school, Ayyampatti Primary school, Thiruvalarchipatti
Figure 6.10 Schools in Gundur GP
6.12.2 COLLEGES AND UNIVERSITIES:
One private college and one private polytechnic are located in this GP adjoining the NH.
6.13 HEALTH FACILITIES
This gram panchayat has a health facility Primary Health sub centre. The major health facilities
such as district/ medical college hospital, private multi-speciality hospitals are located in
Tiruchirappalli city, at a distance of about 10-15kms and travel time of 30 minutes. Maternity
and child welfare centre and TB clinic are located within 10kms distance from this GP.
Allopathic medical practitioner and medical practitioners with other degree are available in this
GP for medical consultations. Pharmacies (medicine shops) are available in this GP.
6.14 POST OFFICES
One sub post office is located in this GP at Gundur Burma Colony.
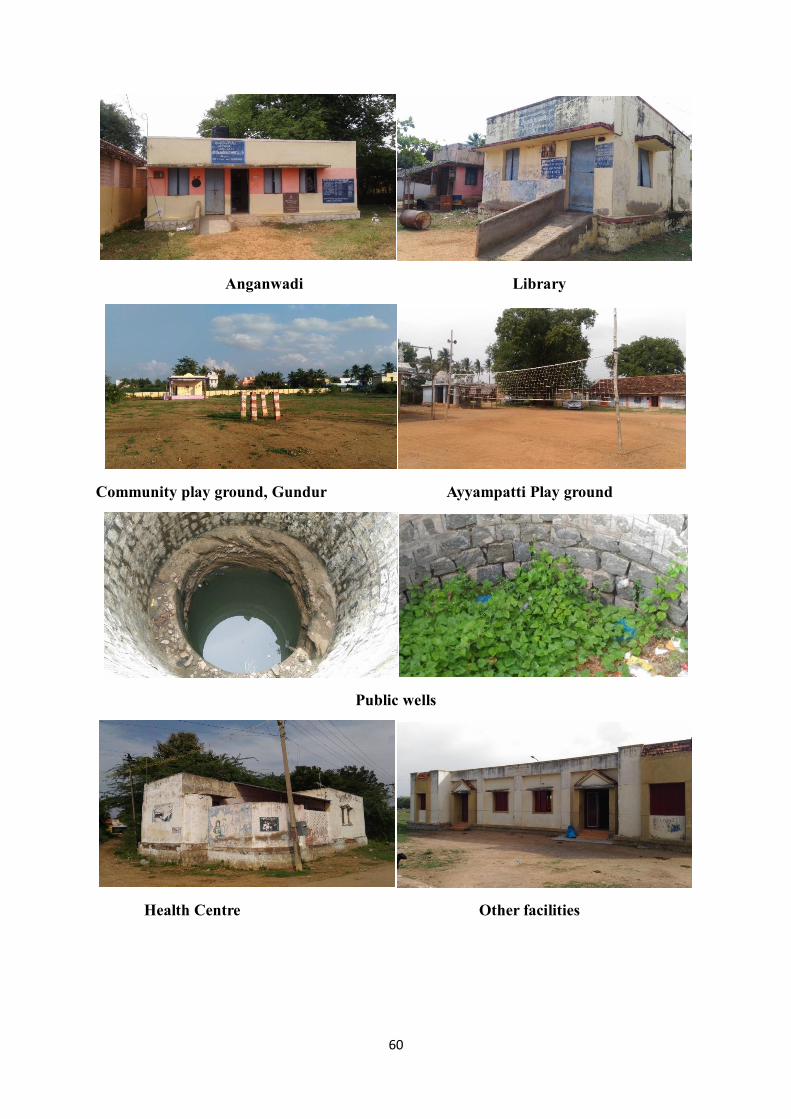
6.15 OTHER FACILITIES
The other community facilities present in this GP include:
i. Anganwadis 6 nos., 2 in Gundur and one each in other hamlets.
ii. Community Ground
iii. Shops catering the day to day needs of people
iv. Burial grounds/ Crematorium for all sections of people
v. Library
vi. Play grounds
vii. Public wells
viii. Places of worship
60
Anganwadi Library
Community play ground, Gundur Ayyampatti Play ground
Public wells
Health Centre Other facilities
61
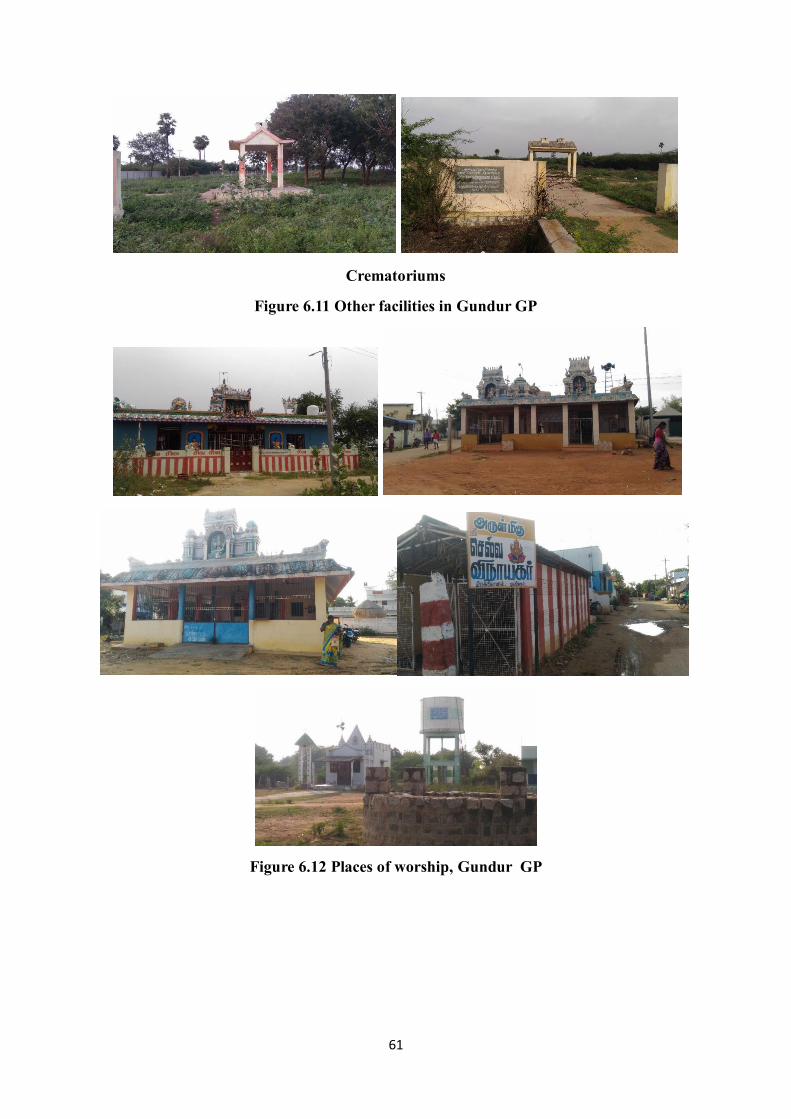
Crematoriums
Figure 6.11 Other facilities in Gundur GP
Figure 6.12 Places of worship, Gundur GP
62
CHAPTER 7
PROJECTIONS AND PROPOSALS
7.1 INTRODUCTION
Agriculture is the major economic activities of the people of this GP. There is a gradual decline
in the number of cultivators from 1961 to 2011. Steady increase in the number of people work
as agricultural labours from 1961 to 1991 and thereafter marginal decrease in the number of
people work as agricultural labours from 1991 to 2001. Again, the number of people work as
agricultural labours increased from 2001 to 2011. The number of people engaged as other
workers increased significantly from 1991 to 2011 People expressed that the profit from
farming is only marginal. As agriculture related works are only seasonal, people shift to
unskilled works in Tiruchirappalli and nearby areas.
In this GP, the literacy rate and skill level of people is low particularly in the population of
residing in this GP for more than 20 years. Weaving is the only household/ Cottage industry
practiced by a small section of the people. The educational institutions and couple of industries
in this GP are offering employment for the local people to a very limited extent due to education
and skill level of the people. Most community facilities, infrastructure and utilities are provided
for in hamlets.
7.2 ISSUES/ DEFICIENCIES AND EXPECTATIONS OF RESIDENTS
The various issues/ deficiencies noticed and also the expectations pointed out by the residents
of this GP are as given below:
i. Conversion of Agricultural lands for housing development: Due to less profit from
Agriculture and related activities and also due to real estate market forces agricultural
dry lands (Fallow) are being converted to housing layouts/ housing development.
Expect better pricing and also nearby marketing place for their agricultural produces.
ii. Lack of Job Opportunities: The farm based actvities and jobs are seasonal and
remaining part the year people find difficult to get employment. People expect more
number of work days under MGNREGS scheme.
iii. Health Centre – As only primary health sub centre is located in this GP people go to
Tiruchirappalli for better facilities. People living inetrior hamlets expect a primary
health centre located in the central village of this GP.
63
iv. Bus Facilities: People informed that they incur expenditure in hiring private vehicles or
using their own vehicles as available bus services connecting all hamlets to
Tiruchirappalli is less frequent. People expressed that more frequent bus services
connecting all hamlets to Tiruchirappalli.
v. Absence of parks in all hamlets of this GP. Only 2 playgrounds are present in the entire
GP. In all hamlets people expressed that parks and paly grounds are required for the
residents.
vi. Storm water drainage: Due to the absence of storm water drains, water gets stagnated
on streets, areas close to water bodies and in other low lying areas during the rainy days.
Some places people let in the waste water from the houses on to the streets.
vii. Dilapidated Houses: Good number of people got a PMAY houses and also houses
(Pasumai Veedu) under state govt. housing scheme. Still very small percentage of
people live in dilapidated houses and they expressed that they need assistance through
government schemes for construction of houses.
viii. Proper road facilities: At present roads length of 14kms are not paved (unpaved mud
roads). People are facing difficulties during rainy season due to water stagnation
(coupled with absence of storm water drains). People expect paved streets with proper
arrangements for drainage.
ix. Lack of greenary (on the roads and forestry)
x. As most working class people are either semi-skilled or unskilled, people expressed
that training may be provided to them to make them either skilled or semi-skilled by
establishing skill development/ job training centres.
xi. Ground water contamination: The ground water is contaminated to some extent in some
parts of the GP.
xii. Efficient drainge system: In few places waste water from residential houses and grey
water are stagnated in empty plots cause health hazards.
xiii. Financial support, i.e., loans and also availability raw materials at subsidised price are
the needs of weaving community present in this GP.
xiv. Absence of community halls, storage godowns for agricultural produces.
7.3 POPULATION PROJECTIONS
The population growth (natural and also net migration) of this GP is calculated using different
population projection models. The population is projected for the next 30 years, i.e., 2051. It is
64
expected that growth rate of this GP will be similar or more than the past two decades due to
its close proximity to the city of Tiruchirappalli. The maximum population arrived from various
models is adopted for this study. The final adopted population is given in the table 7.1.
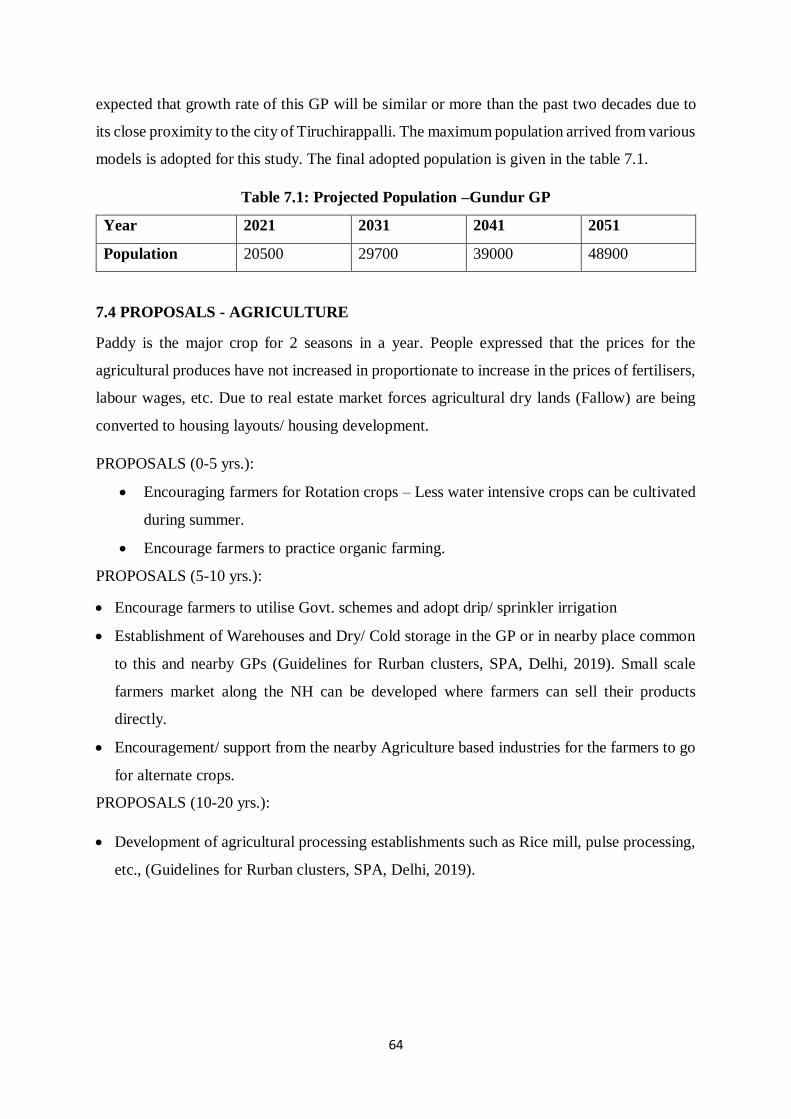
Table 7.1: Projected Population –Gundur GP
Year 2021 2031 2041 2051
Population 20500 29700 39000 48900
7.4 PROPOSALS - AGRICULTURE
Paddy is the major crop for 2 seasons in a year. People expressed that the prices for the
agricultural produces have not increased in proportionate to increase in the prices of fertilisers,
labour wages, etc. Due to real estate market forces agricultural dry lands (Fallow) are being
converted to housing layouts/ housing development.
PROPOSALS (0-5 yrs.):
• Encouraging farmers for Rotation crops – Less water intensive crops can be cultivated
during summer.
• Encourage farmers to practice organic farming.
PROPOSALS (5-10 yrs.):
• Encourage farmers to utilise Govt. schemes and adopt drip/ sprinkler irrigation
• Establishment of Warehouses and Dry/ Cold storage in the GP or in nearby place common
to this and nearby GPs (Guidelines for Rurban clusters, SPA, Delhi, 2019). Small scale
farmers market along the NH can be developed where farmers can sell their products
directly.
• Encouragement/ support from the nearby Agriculture based industries for the farmers to go
for alternate crops.
PROPOSALS (10-20 yrs.):
• Development of agricultural processing establishments such as Rice mill, pulse processing,
etc., (Guidelines for Rurban clusters, SPA, Delhi, 2019).
65
7.5 PROPOSALS – AGRICULTURE RELATED ACTIVITIES
PROPOSALS (0-5 yrs.):
• Encouraging more people/ households to engage in animal husbandry/ Dairying/ Poultry
related activities.
• State Govt. schemes, giving subsidy/ loans for cattle (being implemented) can be
implemented in a large scale.
PROPOSALS (5-10 yrs.):
The self-help groups (SHGs) may be trained and supported for following activities:
• Milk Producers Co-operative Society
• Poultry Farms
• Organic manure can be produced from the waste and sold to farmers at subsidized
rates.
PROPOSALS (10-20 yrs.):
People may be trained and supported for the following:
• Household/ Cottage industries for value added diary/ poultry products
• Feeds for cattle & Poultry (mainly SHGs)
7.6 PROPOSALS - INDUSTRIAL/ OTHER ECONOMIC ACTIVITIES
PROPOSALS (0-5 yrs):
• Support in terms of technical and loans for the existing weaving community for
sustaining the activities.
• Initiatives on enhancing the skill level of the people by imparting training (Ex:
Construction related activities: Masons, Fitters, Welding, Electrical, Plumbing, etc.,) to
enhance their employability. This can be carried out by developing a skill development
workshops in collaboration with nearby technical institutions and industries.
PROPOSALS (5-10 yrs):
• People may be encouraged and supported for the development of Household/ Cottage
industries related to Agriculture and Animal Husbandry and also service industries
close to NH (with employment of local people).
• Skill development centre may be established for this GP or combined one all nearby
GPs (Guidelines for Rurban clusters, SPA, Delhi, 2019).
66
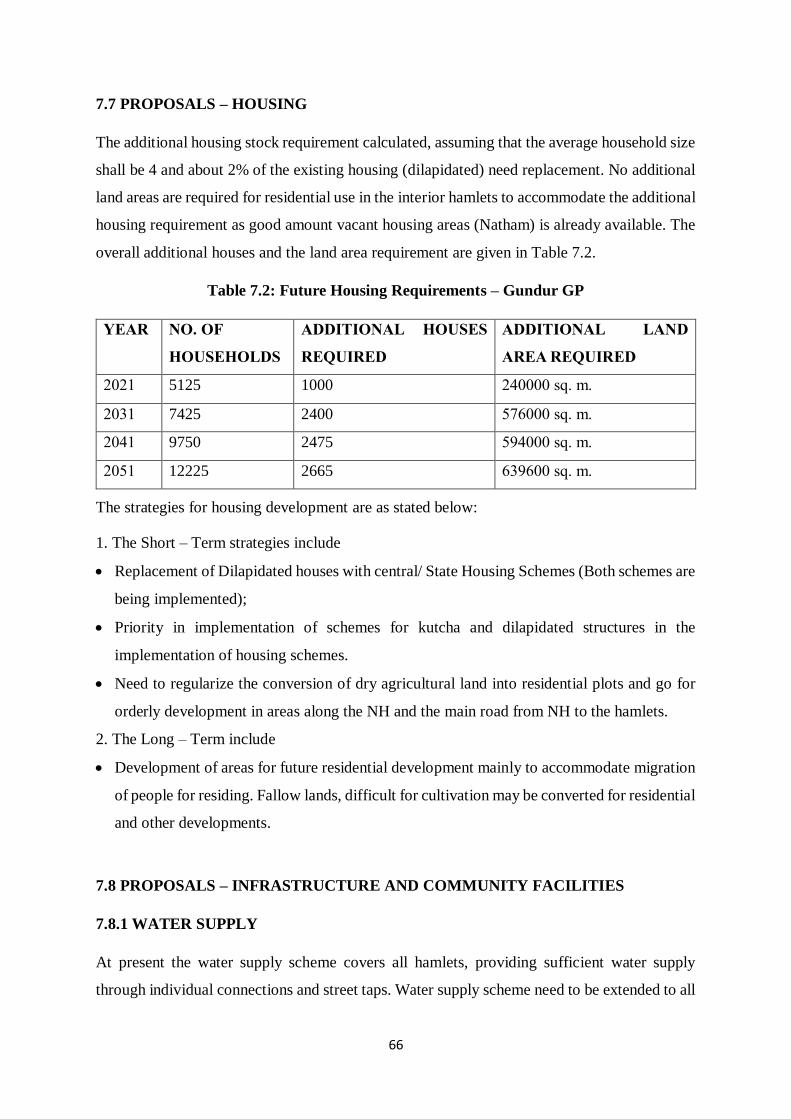
7.7 PROPOSALS – HOUSING
The additional housing stock requirement calculated, assuming that the average household size
shall be 4 and about 2% of the existing housing (dilapidated) need replacement. No additional
land areas are required for residential use in the interior hamlets to accommodate the additional
housing requirement as good amount vacant housing areas (Natham) is already available. The
overall additional houses and the land area requirement are given in Table 7.2.
Table 7.2: Future Housing Requirements – Gundur GP
YEAR NO. OF
HOUSEHOLDS
ADDITIONAL HOUSES
REQUIRED
ADDITIONAL LAND
AREA REQUIRED
2021 5125 1000 240000 sq. m.
2031 7425 2400 576000 sq. m.
2041 9750 2475 594000 sq. m.
2051 12225 2665 639600 sq. m.
The strategies for housing development are as stated below:
1. The Short – Term strategies include
• Replacement of Dilapidated houses with central/ State Housing Schemes (Both schemes are
being implemented);
• Priority in implementation of schemes for kutcha and dilapidated structures in the
implementation of housing schemes.
• Need to regularize the conversion of dry agricultural land into residential plots and go for
orderly development in areas along the NH and the main road from NH to the hamlets.
2. The Long – Term include
• Development of areas for future residential development mainly to accommodate migration
of people for residing. Fallow lands, difficult for cultivation may be converted for residential
and other developments.
7.8 PROPOSALS – INFRASTRUCTURE AND COMMUNITY FACILITIES
7.8.1 WATER SUPPLY
At present the water supply scheme covers all hamlets, providing sufficient water supply
through individual connections and street taps. Water supply scheme need to be extended to all
67
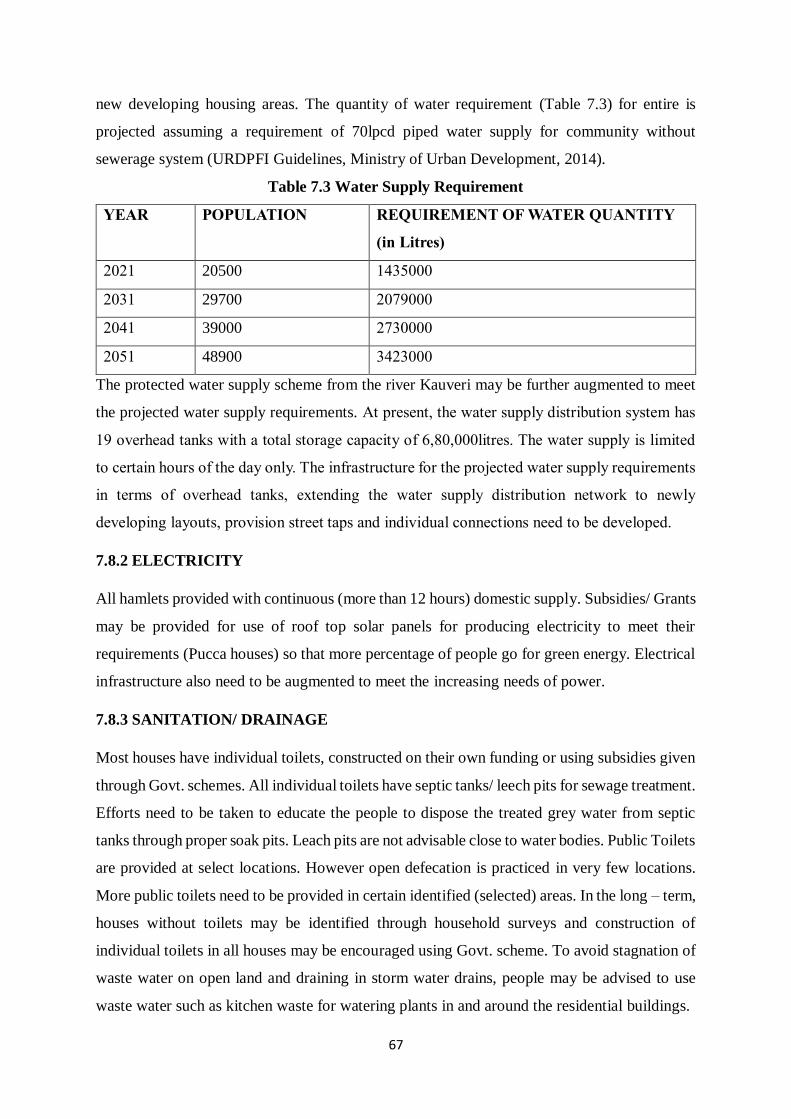
new developing housing areas. The quantity of water requirement (Table 7.3) for entire is
projected assuming a requirement of 70lpcd piped water supply for community without
sewerage system (URDPFI Guidelines, Ministry of Urban Development, 2014).
Table 7.3 Water Supply Requirement
YEAR POPULATION REQUIREMENT OF WATER QUANTITY
(in Litres)
2021 20500 1435000
2031 29700 2079000
2041 39000 2730000
2051 48900 3423000
The protected water supply scheme from the river Kauveri may be further augmented to meet
the projected water supply requirements. At present, the water supply distribution system has
19 overhead tanks with a total storage capacity of 6,80,000litres. The water supply is limited
to certain hours of the day only. The infrastructure for the projected water supply requirements
in terms of overhead tanks, extending the water supply distribution network to newly
developing layouts, provision street taps and individual connections need to be developed.
7.8.2 ELECTRICITY
All hamlets provided with continuous (more than 12 hours) domestic supply. Subsidies/ Grants
may be provided for use of roof top solar panels for producing electricity to meet their
requirements (Pucca houses) so that more percentage of people go for green energy. Electrical
infrastructure also need to be augmented to meet the increasing needs of power.
7.8.3 SANITATION/ DRAINAGE
Most houses have individual toilets, constructed on their own funding or using subsidies given
through Govt. schemes. All individual toilets have septic tanks/ leech pits for sewage treatment.
Efforts need to be taken to educate the people to dispose the treated grey water from septic
tanks through proper soak pits. Leach pits are not advisable close to water bodies. Public Toilets
are provided at select locations. However open defecation is practiced in very few locations.
More public toilets need to be provided in certain identified (selected) areas. In the long – term,
houses without toilets may be identified through household surveys and construction of
individual toilets in all houses may be encouraged using Govt. scheme. To avoid stagnation of
waste water on open land and draining in storm water drains, people may be advised to use
waste water such as kitchen waste for watering plants in and around the residential buildings.
68
7.8.4 STORM WATER DRAINAGE
Only about 3kms of road stretches/ length have storm water drains. The short-term proposals
include cleaning and removing encroachments if any in the storm water natural drainage
channels leading to agricultural fields and water bodies. In the long term, drains may be
constructed in all streets and connecting them to the natural drainage channels leading to
agricultural fields and water bodies.
7.8.5 SOLID WASTE DISPOSAL
The issues faced in this GP is practice of open dumping by few households, segregation at
source and economic sustainability. The solid waste is also effectively segregated and recycled.
The strategies include
• Educating the people to segregate the waste at the household level
• Funds may be generated for employing more people for the collection and segregation
of solid waste
• Development of proper infrastructure for collection, segregation and compost yard in
each of hamlets.
• Production of manure from compost yard to increase the revenue with the
involvement of SHGs
• Allocation of more funds – for efficient door to door collection of solid waste
• To avoid open dumping, community bins can be placed for the people to dispose the
waste that can be collected at periodic intervals for processing and disposal.
7.8.6 TRANSPORTATION
Bus is the mode of public transportation available for the people. State Transport Corporation/
private operators may provide more frequent services connecting all hamlets to Tiruchirappalli.
Alternatively, mini bus & Shared Auto (private) services may be explored.
7.8.7 HEALTH
Primary Health Centres need to be provided for every 30000 population and sub-centre for
every 5000 population (Guidelines for Rurban clusters, SPA, Delhi, 2019). Hence, it is
proposed to have health centre as 24 x 7 facility and also providing free ambulance facilities
by 2031 in addition to the existing primary health sub centre. The land requirement is 0.30
hectares.
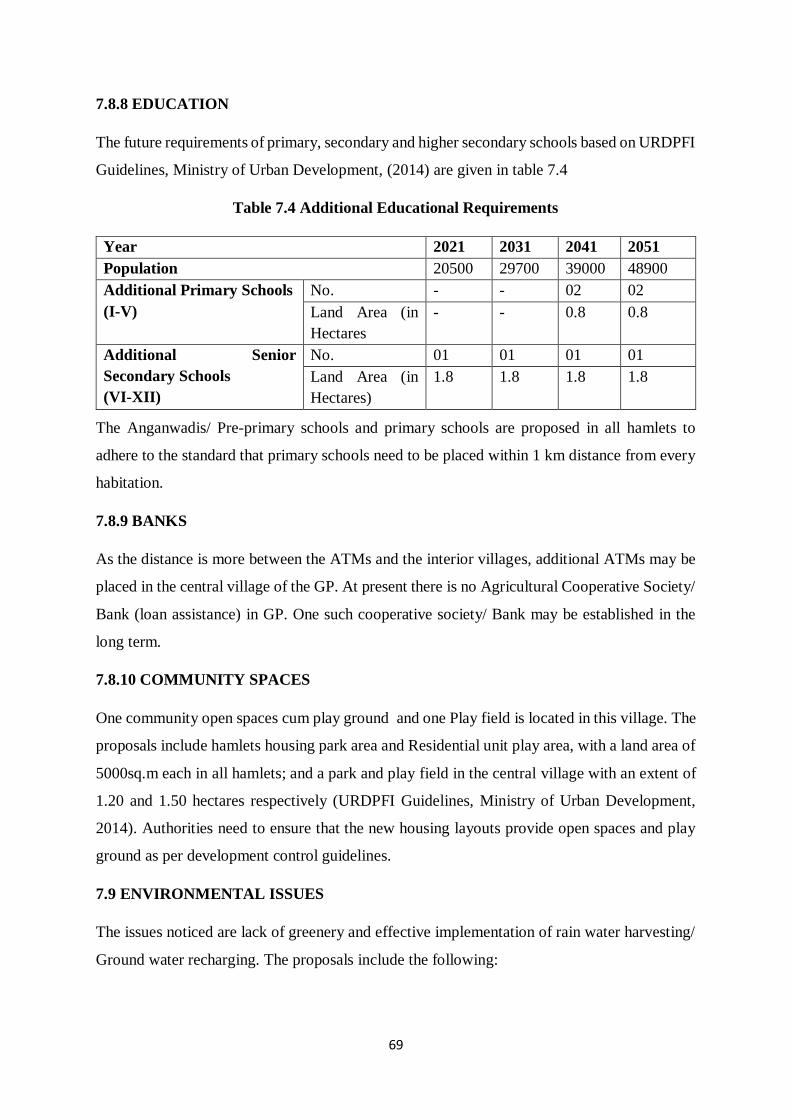
69
7.8.8 EDUCATION
The future requirements of primary, secondary and higher secondary schools based on URDPFI
Guidelines, Ministry of Urban Development, (2014) are given in table 7.4
Table 7.4 Additional Educational Requirements
Year 2021 2031 2041 2051
Population 20500 29700 39000 48900
Additional Primary Schools
(I-V)
No. - - 02 02
Land Area (in
Hectares
- - 0.8 0.8
Additional Senior
Secondary Schools
(VI-XII)
No. 01 01 01 01
Land Area (in
Hectares)
1.8 1.8 1.8 1.8
The Anganwadis/ Pre-primary schools and primary schools are proposed in all hamlets to
adhere to the standard that primary schools need to be placed within 1 km distance from every
habitation.
7.8.9 BANKS
As the distance is more between the ATMs and the interior villages, additional ATMs may be
placed in the central village of the GP. At present there is no Agricultural Cooperative Society/
Bank (loan assistance) in GP. One such cooperative society/ Bank may be established in the
long term.
7.8.10 COMMUNITY SPACES
One community open spaces cum play ground and one Play field is located in this village. The
proposals include hamlets housing park area and Residential unit play area, with a land area of
5000sq.m each in all hamlets; and a park and play field in the central village with an extent of
1.20 and 1.50 hectares respectively (URDPFI Guidelines, Ministry of Urban Development,
2014). Authorities need to ensure that the new housing layouts provide open spaces and play
ground as per development control guidelines.
7.9 ENVIRONMENTAL ISSUES
The issues noticed are lack of greenery and effective implementation of rain water harvesting/
Ground water recharging. The proposals include the following:
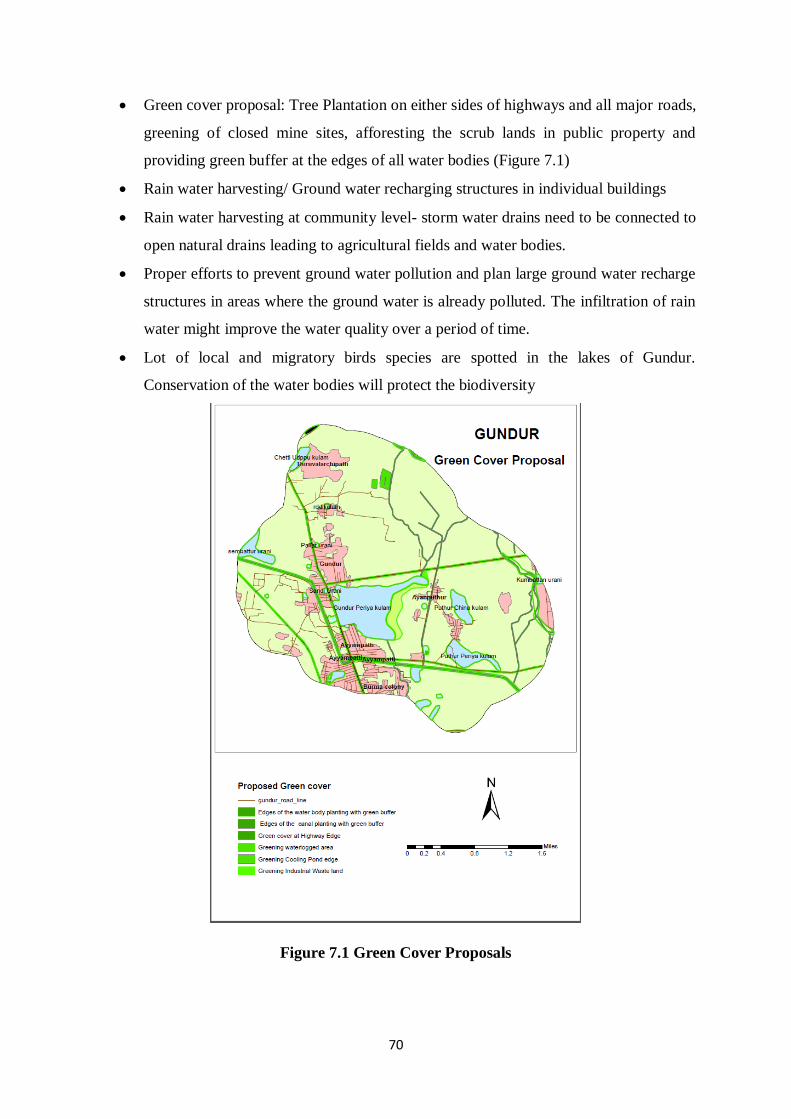
70
• Green cover proposal: Tree Plantation on either sides of highways and all major roads,
greening of closed mine sites, afforesting the scrub lands in public property and
providing green buffer at the edges of all water bodies (Figure 7.1)
• Rain water harvesting/ Ground water recharging structures in individual buildings
• Rain water harvesting at community level- storm water drains need to be connected to
open natural drains leading to agricultural fields and water bodies.
• Proper efforts to prevent ground water pollution and plan large ground water recharge
structures in areas where the ground water is already polluted. The infiltration of rain
water might improve the water quality over a period of time.
• Lot of local and migratory birds species are spotted in the lakes of Gundur.
Conservation of the water bodies will protect the biodiversity
Figure 7.1 Green Cover Proposals
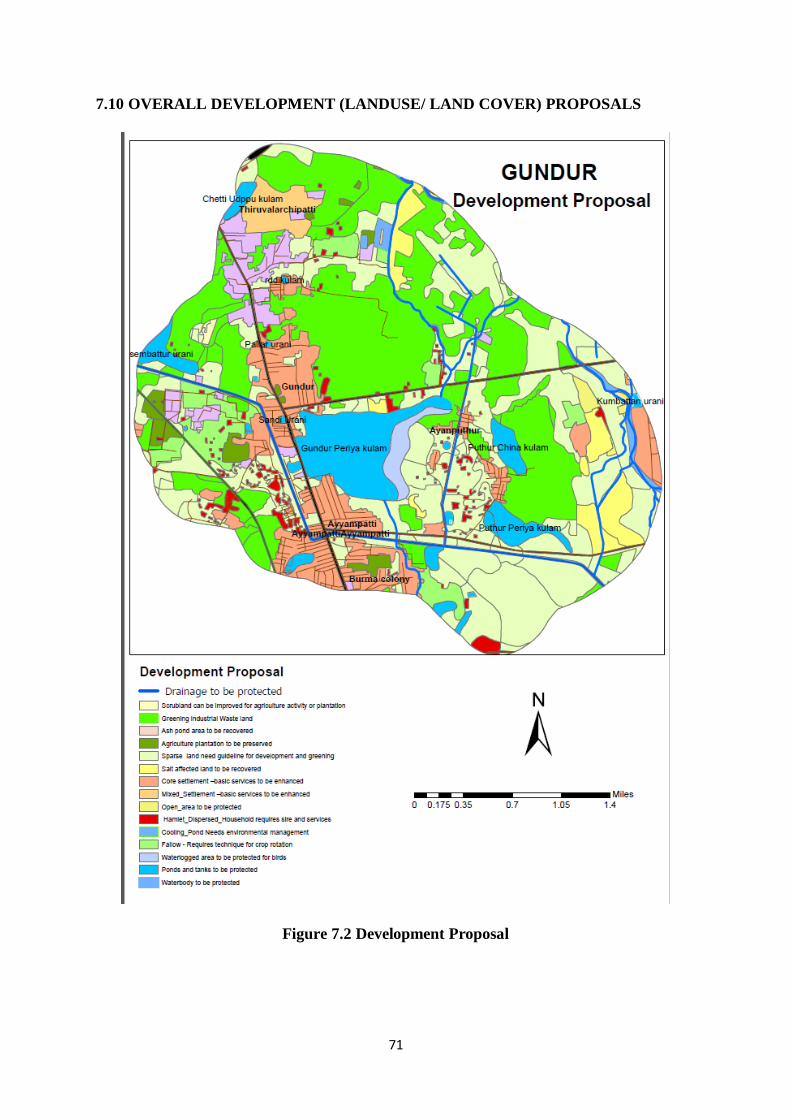
71
7.10 OVERALL DEVELOPMENT (LANDUSE/ LAND COVER) PROPOSALS
Figure 7.2 Development Proposal
72
The overall strategies (Figure 7.2) include:
• Protection of canals and water tanks by proposing suitable green cover around water
bodies;
• Wet lands including marshy lands and Plantation areas to be protected;
• Environmental protection of cooling pond
• Identified areas for future residential, industrial and commercial establishments;
• Development of Community open spaces;
• Residential Development: Areas close to NH and the areas near main access road to
main village to be developed on the principles of sites and services scheme;
• Basic services to be improved in core settlements and mixed settlements.
• Recovery of salt affected lands
• Greening of industrial wasteland
• Desilting of lakes and other ponds for effective storm drainage (to prevent flooding in
the nearby residential and other areas)
7.11 GENERATION OF COMPREHENSIVE DEVELOPMENT PLAN FOR
GP
(Regional Remote Sensing Centre - South, NRSC/ISRO, Govt. of India, Bengaluru)
Conservation and sustainable management practices requires the adoption of basic ecological
principles in the management of natural resources to ensure the sustainability. To improve the
land resources it is imperative to first improve the water resources of the region. So both the
plans should complement each other.
7.11.1 WATER RESOURCES DEVELOPMENT PLAN
In the present study, WRDP has been achieved using a decision model that involves the logical
combination of thematic maps as well as the ground and field knowledge shared by the Partner
institution. The water resource development plan includes identification of suitable zones for
taking up locale specific activities in the study area which are generally the areas, where certain
type of water resource activity is recommended for implementation. Water conservation
measures like check dam, percolation tank, bore wells, dug wells etc. fall under location
specific activities. The main purpose of these activities is to improve the ground water
condition within the GP area which means measures need to be taken to store the water as well
73
as allow water to percolate in to the ground by holding the water in water harvesting structures
as much as possible.
In order to identify the suitable zones for location of recharge structures, different thematic
layers viz., drainage network with drainage order buffer map, soil, slope and land use/cover
and runoff potential were integrated. Subsequently, zones in which the defined conditions of
the different thematic layers were fulfilled are identified for location specific activity. The
guidelines for the selection of suitable zones for planning location specific activities are
adopted from literature (IMSD, 1995). Implementation strategies of some of the
recommendations for improving water resources are given in detail. The water resource
development is shown in Figure 7.3.
1) Rainwater harvesting
Rainwater harvesting in the site has two components viz., harvesting the roof water and the
other, harvesting the surface runoff. In addition, treated waste water is one important source of
water.
a) Roof Water Harvesting to meet drinking water requirement of villages
Roof water from the buildings and other paved areas to be collected and stored in sumps for
reuse and also for recharging the bore wells after filtering (using pebble, charcoal, sand beds).
It would be advantageous to plan this activity while constructing any new building to collect
as much roof water as possible and further for diverting this water to the sumps nearby and to
the bore wells, after necessary filtering. Designs in this regard need to be worked out
separately, taking into consideration of the roof area, rain fall, slope etc.
Roof water could be harvested by connecting the pipes and bringing the rainwater to a common
pipe and then to sumps (size depends on roof area and requirement) after passing through filter
beds. This water can be used for flushing, gardening, washing etc. For the new buildings under
construction, harvesting of roof water, through sumps and recharging borewells could be
planned.
b) Groundwater Recharging through rain water harvested:
Some of the common suggestions for ground water recharge and rain water harvesting to be
adopted are
74
• Depth to Water levels during pre and post rainy seasons of all existing bore wells are to be
monitored at regular intervals
• All existing bore wells to be directly recharged (after filtering the roof water)
• Existing drain / water ways should be cleaned & maintained and linked
• Direct recharging of bore wells will help in recharging depleted fractures and fissures to
have sustainable yield from bore wells
2) Surface Water Harvesting
All pits / percolation ponds, check dams, dugout ponds (existing and the planned new ones)
together will be able to hold considerable quantity of rainwater for recharging the ground water.
Further, the rain water from the study area could be diverted during rainy season to the large
covered under ground / Ground Level Reservoirs/ storage tanks (GLR), located on elevated
locations and then transported to overhead tanks through pumping for water distribution in the
villages. From these GLRs, water could be used for gardening and other purposes through
gravity. Storing water in the GLRs will avoid the loss due to evaporation. For all the tanks, silt
filters could be constructed to avoid silting of the tanks. This will also ensure that the water
stored in the GLRs is free of silt.
3) Setting up of STPs Setting-up of small STPs to recycle waste water which can be used
for secondary uses like gardening, industrial cooling, flushing and other secondary
purposes. A dual water supply systems can be planned within the GP for potable and
non-potable water separately, as a viable option to minimize the pressure on fresh water
supply.
4) Rejuvenation/ Restoration/ Desilting of Tanks:
The Rejuvenation / Restoration / Desilting of tanks is recommended for all bigger tanks which
are partially silted up. Lakes are created basically for hydrological reasons for checking floods,
recharging and maintaining the ground water table. They also act as sediment traps, prevent
clogging up of natural valleys and reduce erosion by regulating runoff. Lakes and Tanks belong
to wetland ecosystem and have a larger biological and ecological role. Hence, measures for
rejuvenation / restoration / desiltation of tanks and lakes in the Gram-Panchayat will definitely
build up ground water resources.
75
5) Drip irrigation
Drip irrigation systems deliver water directly to a plant’s roots, reducing the evaporation that
happens with spray watering systems. Timers can be used to schedule watering for the cooler
parts of the day, further reducing water loss Properly installed drip irrigation can save up to 80
percent more water than conventional irrigation, and can even contribute to increased
crop yields.
6) Farm Ponds / dug out ponds
Capturing and Storing Water in small to medium sized Farm Ponds is another method of storing
water. Polythene sheets were used to reduce the seepage / infiltration losses. Many farms rely
on municipal water or wells (groundwater), while some have built their own ponds to capture
and store rainfall for use throughout the year. Properly managed ponds can also help to
minimize their impact on the surrounding watershed. This practice may be further encouraged
to sustain horticulture, flori-culture & vegetable growing.
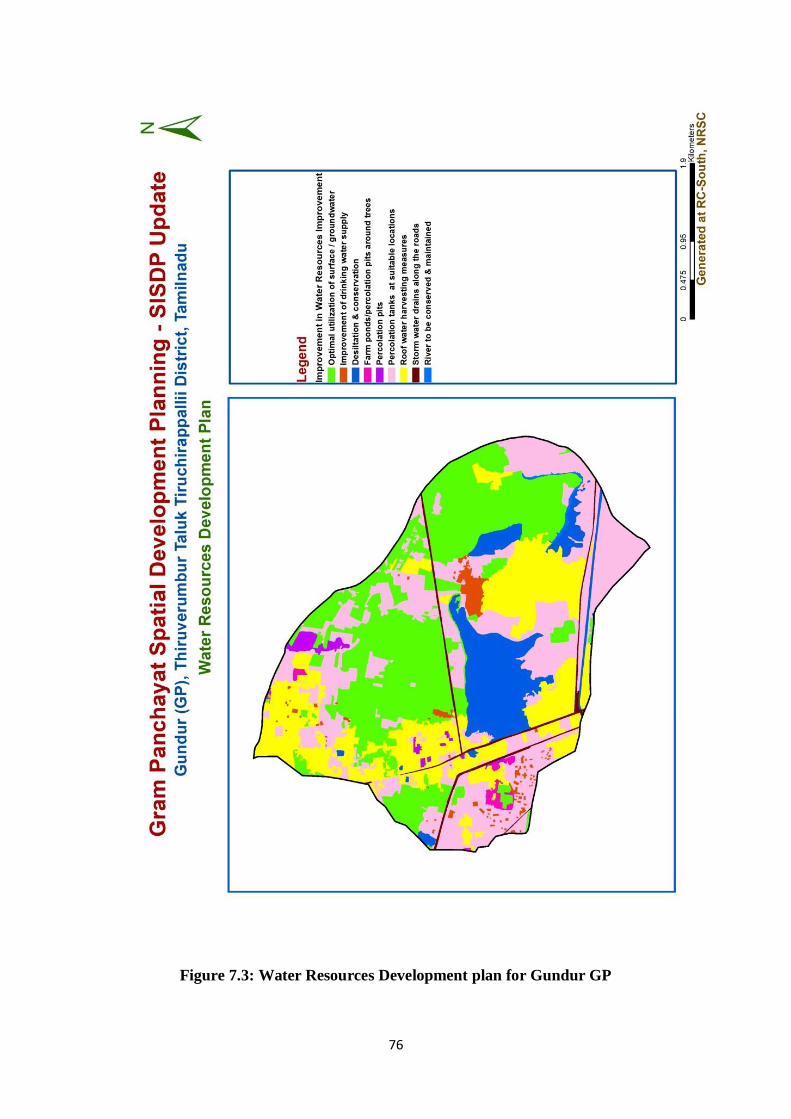
76
Figure 7.3: Water Resources Development plan for Gundur GP
77
7.11.2. LAND RESOURCES DEVELOPMENT PLAN (LRDP)
In the present study, LRDP has been achieved using a decision model that involves the logical
combination of thematic maps as well as the ground and field knowledge shared by the Partner
institution. For arriving at the suitability of a particular land use activity in the study area,
thematic maps viz. land use/cover, soil, slope and groundwater potential maps which were
generated using remote sensing and GIS were integrated. Expert’s knowledge and the field
situation was also considered for formulating the alternate landuse plans. Methodology adopted
from the GIS based land use planning project initiated in India entitled ‘Integrated Mission for
Sustainable Development’, which generates, analyzes and integrates natural resource thematic
data in 1:50000 scale, together with satellite remote sensing data has also been a guiding factor
in the development plan formulations (IMSD, 1995). The land resource development is shown
in Figure 7.4.
Land Resources Development Plan
Some of the general recommendations for LRDP are given below.
1) Improved Agro-horticulture / Agro-forestry practices (Horticulture Forestry plantations
with interspaced cultivation) to bring better returns than the field crops.
2) Intercropping in horticulture plantations with vegetables in both seasons may bring better
benefits to farmers. Different drought resistant tree species are recommended for forest
nurseries.
3) Soil and water conservation measures: The surface run off could be channelized to
recharge the existing and failed bore wells after due filtering. Soil conservation measures
such as boulder / vegetative checks in the upper reaches, pits around trees could also be
taken up in open areas. Vegetation cover to be improved with planting of trees, plants, etc
within the open spaces in the village settlement area.
4) Fodder / Tree Plantations: These are suggested in the marginal lands with poor
groundwater potential areas and not able to sustain crops. The open forest areas may be
converted into grazing lands by over seeding grasses and fuel wood species and these are
recommended to meet the demands of local cattle feeding and fuel requirement of local
people.
5) Afforestation: Afforestation is proposed in the forest blanks / open forest areas to increase
the density of vegetation. These gaps may have been caused due to several reasons which
include grazing in the initial stage and unauthorized tree felling. The economic forest
plantations are suggested for compensating forest degradation.
6) Wasteland development: Land with or without scrub (Scrub Lands) come under this
category. Over seeding of grasses and agro-forestry plantation are recommended on upland
with or without scrub.
78
7) Crop cultivation based on soil texture: Here clay soils are dominant and based on this
Rice based cropping system suggested.
8) Setting up of Industry: Rice processing units and Market facility
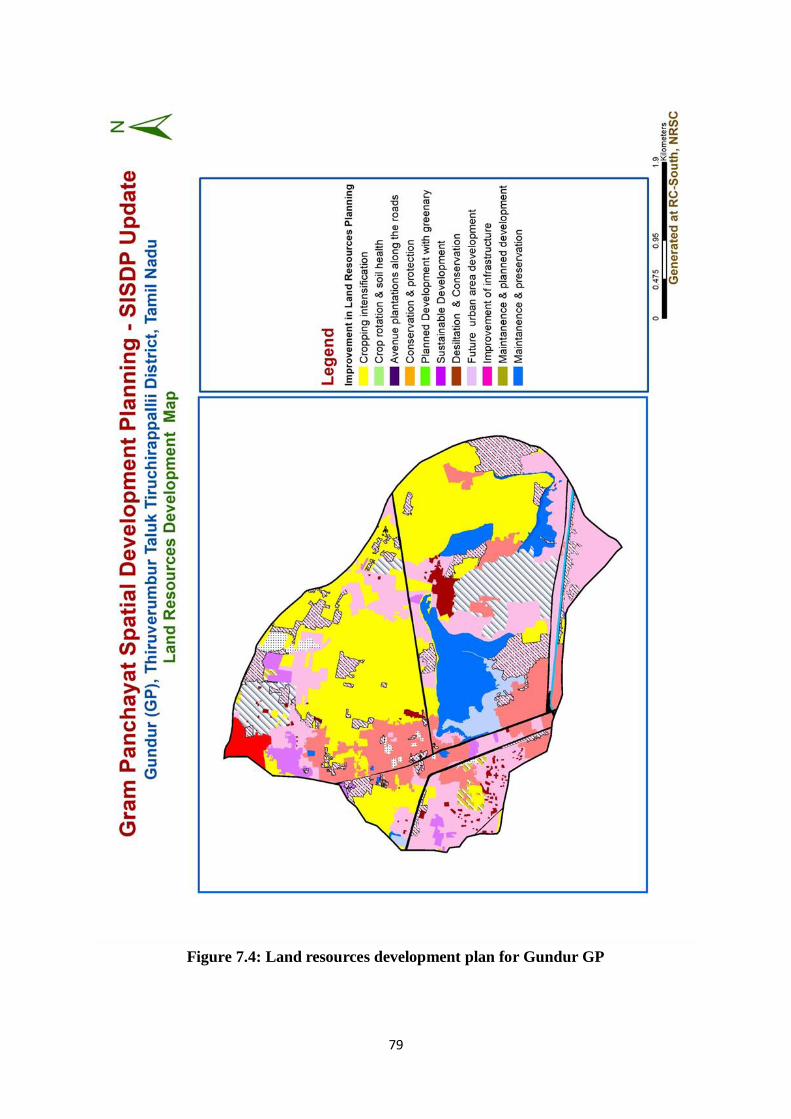
79
Figure 7.4: Land resources development plan for Gundur GP
80
7.11.3. RECOMMENDATIONS & SUGGESTIONS FOR IMPROVING NATURAL
RESOURCES IN GUNDUR GP
Gundur GP is in close proximity to Trichy city. It has one third area under crop land which
includes both cropped areas, fallow lands and agricultural plantations and one third area under
scrub lands. The GP has dominantly clay soil with paddy as the dominant crop grown in two
seasons with canal irrigation from Cauvery river. Some of the recommendations are to have
crop intensification with crop rotation with pulses. In plantation areas it is suggested to go for
intensification and multi tier cropping. The farm advisory and the Agricultural department can
provide advisory to the farmers in their day to day agricultural activities, supply of quality
seeds, monitoring and making available quality chemical fertilizers, bio fertilizers, bio
pesticides besides making available the latest technologies from research institutions with a
view to increase the food production and raw material production to cater to the growing needs
of the food for the population and raw materials for the industries.
The GP needs to maintain and protect the rivers, canals and tanks. Desiltation of tanks needs
to be taken up to protect the fragile tank eco system. The institutional areas need to have
more greenery and follow recycling of water. Industries need to follow environmental norms.
The GP needs improvement of infrastructure and market facilities. Agro based industries like
Rice processing related industries can be set up. Drinking water supply to the core village needs
to be strengthened. In the core village, the pucca houses can follow roof water harvesting
measures to recharge the ground water. Due to close proximity to Trichy the GP has more than
10 % area under layout and open land categories. These areas can have a proper planned
development in terms of green avenues, storm water drains, waste water recycling etc. in place
before actual residential development happens. Storm water drains need to be provided
alongside of the major transportation network.
The farmers in the GP should be made aware of the various developmental schemes available
viz. National Agriculture Development Programme, Pradhan Mantri Krishi Sinchayee Yojana
, Collective Farming Seed Village Scheme, National Food Security Mission , National Mission
On Sustainable Agriculture, Soil Health Card Mission, Soil health improvement through Bio-
fertiliser including Green Manuring, adoption of Integrated Nutrient Management (INM) and
Integrated Pest Management (IPM) technologies to achieve better return and value addition to
81
agricultural produce which in turn improve the economic status of the farming community.
The strategic planning is defined as the future directions for the development of land and water
resources in the GP establishing the long-term objectives and mobilizing the financial resources
and government policy to achieve hierarchical goals. Further, involvement of local people is
quite necessary as part of education, awareness and consensus. Implementation, monitoring
and maintenance of the schemes and evaluation of implemented schemes for their end benefits
are also the part of strategic planning activities.
For successful implementation of land and water resource development plan in the study GP,
suitable working scale needs to be identified for data analysis and implementation within the
GIS framework. Most of the implementation by the implementing authorities of the
government is being carried out with cadastral maps. The large-scale cadastral maps overlaid
on the action plan details would be the best format for implementation.
82
REFERENCES
Abdel Rahman A. (February 2016). The Use of AHP within GIS in Selecting Potential Sites
for Water Harvesting Sites in the Azraq Basin—Jordan. Journal of Geographic Information
System, 2016, 8, 73-88, http://www.scirp.org/journal/jgis,
http://dx.doi.org/10.4236/jgis.2016.81008.
Ahmad I., Verma M. K., 2016. Site Suitability Mapping for Water Storage Structures using
Remote Sensing & GIS for Sheonath Basin in Chhattisgarh State. International Journal of
Applied Engineering Research, 11(6): 4155-4160
Bamne Y., Patil K. A., Vikhe S. D., 2014. Selection of Appropriate Sites for Structures of
Water Harvesting In a Watershed Using Remote Sensing and GIS. International Journal of
Emerging Technology and Advance Engineering, 4(11): 270-275
Birthe Riisnes Erle Kristvik. (2015). Hydrological Assessment of Water Resources in Bergen.
Master of Science in Civil and Environmental Engineering Submission date: 10 June 2015.
Central Ground Water Board (2007). Manual on Artificial Recharge of Ground Water. Ministry
of Water Resources, Government of India, New Delhi.
District census Handbook, Tiruchirappalli Directorate of Census Operations, Tamil Nadu
1961, 1981, 1991, 2001 & 2011
García, A., Sainz, A., Revilla, J.A., Álvarez, C., Juanes, J.A., Puente, A., 2008. Surface water
resources assessment in scarcely gauged basins in the north of Spain. J. Hydrol. 356, 312– 326.
doi:10.1016/j.jhydrol.2008.04.019
Government of India Ministry of Water Resources. Guidelines for Repair, Renovation and
Restoration of Water Bodies with External Assistance. (2009).
ISRO Guest House Report. (2019). Augmentation of water supply at ISRO Guest House,
Devanahalli, Bengaluru, Karnataka Using Geo-spatial Techniques. Indian Space Research
Organisation (ISRO) Hqrs. Department of Space, Bengaluru.
I. Ahmad and M.K. Verma. (2017) GIS based analytic hierarchy process in determination of
suitable site for water storage. European Water 60: 139-146, 2017. © 2017 E.W. Publications.
IMSD, 1995. Integrated Mission for Sustainable Development: Technical Guidelines. NRSA,
Hyderabad, India, 1-27. LULC, Bhuvan (ISRO) - bhuvan.nrsc.gov.in/gis/thematic/index.php
83
James Batchelor. (April 2013). Using GIS and SWAT analysis to assess water scarcity and
WASH services levels in rural Andhra Pradesh.
Kumar, P., Tiwari, K.N. and Pal, D.K. (1997). Establishing SCS runoff curve number from
IRS digital database, Journal of Indian Society of Remote Sensing, 19(4): 246–251.
Manual for Local Level Assessment of Land Degradation, Sustainable Land Management and
Livelihoods Part 2. Water resources assessment. Field methodology and tools. Land
Degradation Assessment in Drylands (Lada) Project.
Murthy, V.V.N. (2003). Land and Water Management Engineering. Kalyani Publishers, New
Delhi.
Narsimha Kota1, Nallaganthula Ramudu, S. Ravikumar, M.Suresh. Hydrogeomorphological
Mapping Upto Cadastral Level, By Using High Resolution Satellite Data In Gokaphaslwada
Watershed, Doulthabad Mandal, Mahabubnagar District. IOSR Journal of Applied Geology
and Geophysics (IOSR-JAGG) e-ISSN: 2321–0990, p-ISSN: 2321–0982.Volume 5, Issue 1
Ver. II (Jan. - Feb. 2017), PP 46-51 www.iosrjournals.org
Nyatuame M, Owusu-Gyimah V and Ampiaw F (2014) Statistical Analysis of Rainfall Trend
for Volta Region in Ghana. Int. J. Atmos. Sci. 67(2) 1-11.
Rajendran V, Venkatasubramani R and Vijayakumar G (2016) Rainfall variation and frequency
analysis study in Dharmapuri district (India). Indian J. Geo. Mar. Sci. 45(11) 15605.
Padmavathy A. S., Ganesha Raj. K., Yogarajan N., Thangavel P., 1993. Check Dam Site
Selection Using GIS Approach. Advance Space Research, 13(11): 123-127
Rao, K.V., Bhattacharya, A.K. and Mishra, K. (1996). Runoff estimation by curve number
method- case studies, Journal of Soil and Water Conservation, 40: 1–7.
Ranjit Kumar Sahu. (May 2015) Hydrological Analysis for Urban Water Management.
Sethupathi A.S, Lakshmi Narasimhan C, Vasanthamohan. (2012) Evaluation of
hydrogeomorphological landforms and lineaments using GIS and Remote Sensing techniques
in Bargur – Mathur subwatersheds, Ponnaiyar River basin, India. International Journal of
Geomatics and Geosciences, Volume 3, No 1, 2012. ISSN 0976 – 4380.
Saraf A.K. et al., (1996). Integrated use of remote sensing and GIS methods for Groundwater
exploration in Hydrology and water resources, New Delhi, 251-259.
84
Shivakumar BL, Artificial recharge of groundwater using rooftop rain water harvesting. RV
College of Engineering, Department of Civil Engineering, Mysore Road, Bengaluru.
Sharma, S.K., Kansal, M.L., Tyagi, A., 2015. Resource assessment and strategic planning for
improvement of water supply to Shimla city in India using geo-spatial techniques. Egypt. J.
Remote Sens. Space Sci. 18, 85–97. doi:10.1016/j.ejrs.2015.04.001
Tera Marahi Moses. (July 2012) Assessment of Water Resources Utilization and Management
in Chahi Sub-Catchment, Kisoro District, Uganda.
ISITE Campus Report. 2017. Water Resources Development and Management Plan for
theISRO Satellite Integration and Test Establishment (ISITE) Campus. RRSC–South, NRSC,
ISRO. Bengaluru.
IPRC Campus Report. 2018. Water Resources Development and Management Plans forISRO
Propulsion Complex (IPRC) Campus, Mahendragiri, Tirunelveli District, Tamil Nadu. RRSC–
South, NRSC, ISRO. Bengaluru. NRSC-RC-REGBANG-RRSC-BANG-APRIL2018-TR-
1138-1.0
MCF Campus Report. 2018. Water Resources Development and Management Plans forMaster
Control Facility (MCF), Hassan district, Karnataka. RRSC–South, NRSC, ISRO. Bengaluru.
NRSC-RC-REGBANG-JAN-2018-TR-1110-1.0.