spatial distribution of marine benthic habitats in the estonian coastal sea, northeastern baltic sea
TRANSCRIPT
Estonian Journal of Ecology, 2013, 62, 3, 165�191 doi: 10.3176/eco.2013.3.01
165
Spatial distribution of marine benthic habitats in the Estonian coastal sea, northeastern Baltic Sea
Georg Martin!, Jonne Kotta, Tiia Möller, and Kristjan Herkül
Estonian Marine Institute, University of Tartu, Mäealuse 14, 12618 Tallinn, Estonia ! Corresponding author, [email protected] Received 8 March 2013, revised 29 May 2013, accepted 5 June 2013 Abstract. In this study six pilot marine areas were mapped in the Estonian coastal sea with the aim of assessing the spatial distribution of shallow-water benthic habitats and analysing how different these habitats are in terms of species composition and dominance structure of macrophytes and benthic invertebrates. Moderately exposed soft-bottom habitats prevailed in the study areas whereas sheltered hard-bottom habitats were the rarest. Habitats that included no habitat-forming species tended to be less diverse compared to those having any of such characteristic species. There were few species that were found in one habitat only. Although the physical environments of the habitats were not necessarily different, the majority of habitats were statistically different either in terms of species composition or dominance structure of benthic macrophyte and invertebrate species. This allows us to conclude that the studied habitats are �real�, i.e. the supported communities are most likely not found under similar abiotic environmental conditions without the habitat-forming species. Key words: Baltic Sea, habitat distribution, benthic invertebrates, benthic macrophytes, EBHAB habitats.
INTRODUCTION
Annex I of the Habitat Directive (Council Directive 92/43/EEC of 21 May 1992 on the conservation of natural habitats and of wild fauna and flora) defines the habitat types of higher importance and in need of conservation within Europe. Together with the Birds Directive this directive forms a solid base for the European nature conservation policy and the Natura 2000 network. In order to implement the requirements of the directive and to resolve the existing needs for local conservation purposes, a benthic habitat classification system EBHAB (Eastern Baltic marine benthic HABitats) was developed in the frame of the multinational EU LIFE project �Marine Protected Areas in the Eastern Baltic Sea (Baltic MPAs)�.
In the current study a detailed inventory of the EBHAB habitat classes was performed within six study areas covering the most valuable nearshore marine areas and including several protected areas, i.e. the Natura 2000 areas in the Estonian coastal range. In general, prior to this inventory the knowledge on the

G. Martin et al.
166
distribution of habitats and associated biota in the coastal areas was very poor including only a few publications each containing a handful sampling sites only (e.g. Martin, 2000; Kotta & Orav, 2001; Kotta et al., 2008, Kovtun et al., 2009). Moreover, the published background information was very scattered and owing to differences in methodologies there was no way to systematize such knowledge. Thus, there was a need to examine the species composition and identify typical communities within their environment. The current inventory allowed us for the first time (1) to summarize the range of large-scale variability of the studied habitats in terms of benthic biodiversity, species composition, and dominance structure; (2) to provide a knowledge base for follow-on biological and ecological studies; and (3) thus, to provide important information for managing our marine resources.
MATERIAL AND METHODS Study area
Altogether six areas representing various environmental and climatic conditions in the northeastern Baltic Sea were studied in detail with the aim of classifying the observed benthic habitats according to the recently established EBHAB classes (Fig. 1). An overview of the study areas is given below.
Fig. 1. Study area.
Spatial distribution of marine benthic habitats
167
Eastern and western Gulf of Finland areas The average depth of the Gulf of Finland is 37 m and the maximum depth 123 m. The coastal slope is quite steep and depths reach over 30 m in all bays of the study area. Sand, silt, or sandy clay bottoms dominate in deeper areas, boulders and stones prevail near the coast. The coastline is diverse and disjuncted by peninsulas, many small islands occur in the area. The eastern gulf receives runoff from a huge drainage area and the western gulf is a direct continuation of the Baltic Proper. Therefore the gulf has a permanent east�west gradient of salinity. The salinity range of the study area is 4.5�6.2. The area is strongly influenced by diffuse and point-source nutrient loads.
West-Estonian Archipelago Sea The area comprises shallow bays with many small islets and mudflats. The average depth of the area is less than 4 m with the maximum close to 20 m. The bottom morphology of the area is flat, with gentle slopes towards deeps. The whole water basin is semi-exposed. Sand and sandy clay sediments prevail in the entire area of the archipelago. Due to the shallowness and clayey sediments already moderate winds result in strong resuspension of bottom sediments and poor underwater light conditions. Salinity varies from 0 to 7, being the lowest in the estuary of the Kasari River in the eastern part of the area and around 6�7 in the western, open-sea area. Haapsalu and Matsalu bays are the most eutrophied bays within the West-Estonian Archipelago Sea.
Western Saaremaa Island Similarly to the previous study area this area consists of small shallow bays with many scattered islets. However, as the entire area is exposed to the Baltic Proper, salinities are relatively high and the values below 7 are rarely recorded. Being situated away from the major pollution sources, the diffuse and point-source nutrient loads are small. The base rock is composed of firm limestone, while offshore islets consist of dolomite banks belonging to the skerry type of islands, which are rare for Estonia. The sediment consists primarily of mixed sand, gravel, and boulders. The climate is maritime and storms occur nearly 60 days every year.
Southern Saaremaa Island This study area is located in the Gulf of Riga and encompasses the coastal sea area of southern and southeastern Saaremaa Island. The coastline is extremely disjuncted with many small bays invading the land. The area is rather shallow, depths over 20 m are reached only within 10 km distance from the coast. The Gulf of Riga is a wide, shallow, semi-enclosed brackish-water ecosystem of the Baltic Sea. The gulf receives fresh water from a large drainage area, primarily entering the southern part of the basin. The average salinity varies from 0.5�2.0 in surface layers in its southern and northeastern areas to 7 in the straits. In most parts, however, the salinity is 5.0�6.5. Sediments are very diverse with inner bays

G. Martin et al.
168
characterized by fine silty�clayey sediments whereas boulder fields are found adjacent to the exposed peninsulas. Because of the limited water exchange, the gulf is more eutrophicated than the Baltic Proper, and the outflow of nutrients through the straits is higher than the inflow. The riverine loading is the most important pathway of nutrients into the Gulf of Riga, exceeding the combined contribution from atmospheric deposition, point emission from cities and industries along the coast, and nitrogen fixation by marine organisms (Olli et al., 2008).
Irbe Strait Similarly to the previous study area the Irbe Strait is also located in the Gulf of Riga but partly in the Baltic Proper. The coastline is slightly disjuncted with some small bays and capes. The area is shallow and depths over 20 m are reached only in the Baltic Proper part of the area. The interaction of water masses from the saline Baltic Proper and the less saline Gulf of Riga defines the salinity dynamics in the Irbe Strait area. The salinity values remain predominantly between 5 and 7. Both inshore and offshore areas are dominated by sandy bottoms with a few boulder and gravel fields down to 15 m.
Quantitative sampling
The total area covered by the current mapping activities was approx. 8400 km2. In total 1220 locations were sampled by means of remote underwater video, grab sampling, and SCUBA diving. The stations and areas were selected so as to cover the full diversity of the benthic habitats and the range of environmental gradients. Information from previous underwater investigations and the available geological maps and nautical charts were also considered. Fieldwork was carried out in July�August 2005�2008.
Quantitative sampling of offshore soft-bottom benthic organisms was performed from the R/V Vilma, otherwise small motorboats were used. Samples of benthic invertebrates (benthic animals whose size exceeds 1 mm) and macrophytes were taken with a 0.1 m2 Van Veen grab sampler (50 kg) or in the case of operating from smaller workboats with a handheld Ekman-Lenz sampler (0.02 m2). All samples were washed through a 0.25-mm mesh sieve and deep frozen at � 20 °C. Further treatment of the material was performed according to HELCOM COMBINE guidelines (HELCOM, 2008). In the laboratory, plants and animals were counted and identified under stereo dissecting microscope. Dry weights (g m�2) of all taxa were obtained after keeping the material for 2 weeks at 60 °C.
SCUBA diving was primarily used to collect samples of benthic organisms from hard-bottom substrates. In every dive the total coverage and the coverage of species and of different substrate types were estimated. Sediment was classified as rock, boulders, stones, gravel, sand, silt, clay, or any combination of these. Biomass samples from macrophyte communities were collected using a 0.04 m2 metal frame (20 × 20 cm2). One to three samples were taken per station. All quantitative samples obtained by SCUBA divers were registered and treated in the same way as indicated for grab samples.

Spatial distribution of marine benthic habitats
169
Remote underwater video surveys were performed using a handheld �drop� camera operated from small motorboats. The �drop� method bases on a �habitat mapping suitcase�, designed by Turvakamera OY in co-operation with the Finnish nature conservation experts and addressed to the special needs of habitat inventories in underwater conditions. This equipment has been further developed to meet the conditions of habitat mapping in the Baltic Sea. Here we used the submersible camera TS-6021PSC together with Archos 5th and 6th generation devices for video recording, the latter being operated on the surface. The camera was set at an angle of 35° below horizontal to maximize the field of view; the range of the forward view was about 2 m in clear waters. The camera sled was towed from a 5-m-long boat 1 m above the sea floor at an average speed of 50 cm s�1. Depth and navigational data (from GPS) were recorded at start and finish during camera deployments. In every station the minimum recording time was one minute. Videos were analysed using a freeware video watching program in the laboratory. The observer estimated the coverage of different sediment types, total community, and macrophyte and invertebrate species.
Supplementary environmental information Among abiotic parameters wave exposure defined the first hierarchical level of habitat classification. Bottom sediment, light availability, and biological parameters such as the coverages of key species were considered on the next hierarchical levels.
The Simplified Wave Model method was used to calculate the wave exposure for mean wind conditions represented by the 10-year period between 1 January 1997 and 31 December 2006 (Isæus, 2004; Nikolopoulos & Isæus, 2008). A nested-grids technique was used to take into account long-distance effects on the local wave exposure regime. The resulting grids had a resolution of 25 m. In the modelling the coastal sea was divided into suitable calculation areas, fetch and wave exposure grids were calculated, and subsequently the separate grids were integrated into a seamless description of wave exposure along the study area. This method results in a pattern where the fetch values are smoothed out to the sides, and around islands and skerries so that refraction and diffraction make waves deflect around islands. In the EBHAB habitat classification system wave exposure was divided into two classes: sheltered and moderately exposed. Based on the Simplified Wave Model, the borderline between sheltered and moderately exposed classes was set at 75 000.
In the EBHAB habitat classification system sediment is divided into hard and soft bottoms. The borderline between hard and soft substrates was set according to the dominating substrate type. Hard bottoms consist of rock, pebbles, cobbles, boulders, or any combination of these. Soft bottoms refer to a dominance of gravel, sand, clay, mud, or any combination of these.
According to the generic knowledge on the underwater light level, the sea area was divided into photic and aphotic zones. In the current classification scheme the borderline between the photic and the aphotic layer was set at 20 m. This

G. Martin et al.
170
level reflects the deepest occurrences of macroalgal species in most of the Estonian coastal range (either nowadays or historically). We acknowledge that such borderline may vary spatially and temporally. Nevertheless, as spatially explicit data on the light level were not available, it was not possible to refine the distinction between photic and aphotic habitats in the current study.
In our study area salinity varies between 2 and 7, being the highest in the open sea of the Baltic Proper and the lowest in the eastern Gulf of Finland and the estuaries of the West-Estonian Archipelago Sea and the Gulf of Riga. Although salinity is not considered as an important driving force within the EBHAB classifi-cation, it was nevertheless recorded to analyse the relevance of salinity in determining the spatial patterns of benthic macroalgal and invertebrate communities.
In addition, based on bathymetry charts (available in the Estonian Marine Institute, University of Tartu), the inclination of coastal slopes was calculated at 50 m pixel resolutions using the Spatial Analyst tool of ArcGIS software (ESRI, 2011). High values of coastal slopes indicate the occurrence of topographic depressions or humps at the measured spatial scale. Low values refer to flat bottoms.
The values of water velocity were obtained from the results of hydrodynamical model calculations. The calculations were based on the COHERENS model (Bendtsen et al., 2009), which is a primitive equation ocean circulation model. It was formulated with spherical coordinates on a 1 × 1 minute horizontal grid and 30 vertical sigma layers. The model was forced with hourly meteorological fields of 2 m air temperature, wind speed, wind stress vector, cloud cover, and relative humidity. The meteorological fields were obtained from an operational atmospheric model. The model was validated against water velocity measurements from the study area.
The Finnish Meteorological Institute provided data on ice cover and thickness over the study area. These data were produced on daily basis at a nominal resolution of 500 m and were based on the most recent available ice chart and a synthetic aperture radar (SAR) image. The ice regions in the ice charts were updated according to a SAR segmentation and new ice parameter values were assigned to each SAR segment based on the SAR backscattering and the ice thickness range at that location.
We used the MODIS satellite-derived water chlorophyll a values as a proxy of eutrophication. The frequency of satellite observations was generally weekly over the whole ice-free period; however, several observations were discarded due to cloudiness. The spatial resolution of satellite data was 1 km. False zeroes were removed from the data prior to the statistical analysis.
Habitat classification If more than one biomass sample (either grab or frame) was collected from a station, the replicate samples were averaged in order to avoid later conflicts on interpolation. Interpolation of benthic sediments and coverages of key habitat-forming species was done within the study area applying Inverse Distance

Spatial distribution of marine benthic habitats
171
Weighting (IDW) (using 12 points maximal). The used IDW interpolation method is robust enough to handle sediment and cover data providing a large number of samples within each study polygon and large-scale mapping purposes.
The coverage of the species had to equal or exceed 10% level in order to be classified as a habitat of this particular species. The use of such borderline is justified for two reasons: (1) a 10% coverage represents the lowest level that can be systematically detected using a standardized sampling effort (e.g. one minute video observations) and (2) a 10% coverage level corresponds to the lowest biomass level that is stable in the yearly scale. In the EBHAB classification macrophytes prevailed over benthic invertebrates, i.e. when a key macrophyte exceeded 10% coverage, this habitat was assigned as the particular macrophyte habitat. Nevertheless, if the key macrophyte species did not reach a 10% cover limit, the habitat could be assigned as the invertebrate habitat in case the invertebrate cover exceeded 10%. The following taxa were considered as the key species (habitat-forming species) in the study area: Fucus vesiculosus, Furcellaria lumbricalis, Zostera marina, other higher plants (Stuckenia pectinata, Potamogeton spp., Ruppia sp., Zannichellia palustris, Myriophyllum spicatum, Ranunculus baudotii, etc.), charophytes, bivalves, and cirripeds (Mytilus trossulus, Dreissena polymorpha, Macoma balthica, Mya arenaria, and Amphibalanus improvisus). The list of habitats according to the EBHAB classification is shown in Table 1.
Table 1. Main characteristics of the EBHAB habitats
Code Habitat Main characteristics
1 Sheltered hard bottoms with Fucus vesiculosus
High biomass and species diversity. F. vesiculosus dominates. Depth range 0.5�6 m
2 Sheltered hard bottoms with bivalves and Amphibalanus improvisus
Medium or high biomasses, high species diversity. Vegetation generally missing. The invertebrates Mytilus trossulus, Dreissena polymorpha, A. improvisis dominate. Depth range 0.3�13 m
3 Sheltered hard bottoms with no particular species dominance
Low biomass and moderate species diversity. Filamentous algae dominate in shallow area. Depth range 0.5�1.5 m
4 Sheltered soft bottoms with higher plants
High biomass and species diversity. Sandy, silty, and muddy substrate with higher plants. Depth range 0.2�8 m
5 Sheltered soft bottoms with charophytes
Medium or high biomass, moderate species diversity. Soft substrates, often mud, dominated by charophytes. Hypoxic conditions common. Depth range 0.4�7 m
6 Sheltered soft bottoms with bivalves
Low biomass and species diversity. Vegetation mostly missing. Sandy and silty substrate dominated by bivalves. Depth range 0.5�22 m
Continued overleaf

G. Martin et al.
172
Table 1. Continued
Code Habitat Main characteristics
7 Sheltered soft bottoms with no particular species dominance
High biomass, low species diversity. Sandy or silty substrate, often hypoxic. Depth range 0.3�14 m
8 Moderately exposed hard bottoms with F. vesiculosus
High biomass and species diversity. F. vesiculosus dominates. Depth range 0.2�12 m
9 Moderately exposed hard bottoms with Furcellaria lumbricalis
Medium biomass and high species diversity. F. lumbricalis dominates. Depth range 0.5�22 m
10 Moderately exposed hard bottoms with bivalves and A. improvisus
Medium to high biomass and medium species diversity. Vegetation generally missing or has low biomass. Depth range 0.3�30 m
11 Moderately exposed hard bottoms in photic zone with no particular species dominance
Low to medium biomass, low species diversity. Filamentous algae may dominate in shallow areas. Depth range 0.5�20 m
12 Moderately exposed hard bottoms in aphotic zone with no particular species dominance
Low biomass and species diversity. Vegetation missing, mussels occur but coverage < 10%. Found in depths > 20 m
13 Moderately exposed soft bottoms with Zostera marina
Medium to high biomass, moderate to high species diversity. Sandy substrate dominated by Z. marina. Depth range 1�9 m
14 Moderately exposed soft bottoms with higher plants excluding Z. marina
Medium to high biomass, high species diversity. Sandy substrate dominated by higher plants (excluding Z. marina). Hypoxic conditions may occur. Depth range 0.2�7.6 m
15 Moderately exposed soft bottoms with charophytes
Medium to high biomass, low to moderate species diversity. Sandy bottoms dominated by charophytes. Depth range 0.2�5 m
16 Moderately exposed soft bottoms with F. lumbricalis
Medium to high biomass, low to moderate species diversity. Sandy substrate dominated by loose F. lumbricalis. Found only in Väinameri area. Depth range 4�10 m
17 Moderately exposed soft bottoms with bivalves
Low to medium biomass, low to moderate species diversity. Sandy and silty substrate dominated by bivalves. Depth range 0�52 m
18 Moderately exposed soft bottoms with no particular species dominance
Low biomass and species diversity. Sandy, silty, or muddy substrates in depth range 0�100 m

Spatial distribution of marine benthic habitats
173
Statistical analyses The CCA analysis was conducted using PRIMER 6 software (Clarke & Gorley, 2006). ANOSIM analysis was used to examine differences in the patterns of variation in species composition and biomass between the EBHAB habitats. Prior to analysis, a Bray�Curtis similarity matrix was calculated using raw data (untransformed) and presence/absence transformation to detect whether the potential differences between the communities were due to differences in relative biomass or species composition. Taxa responsible for the observed differences were identified by SIMPER analysis, where the cut-off percentage was set to 90. Canonical correspondence analysis (CCA) was used to visualize variability of different habitats along a multitude of abiotic environmental gradients. The analyses were done in the statistical software R version 2.15.1 using the vegan package (The R Foundation for Statistical Computing, 2012).
RESULTS Description of the habitats
1. Sheltered hard bottoms with F. vesiculosus The spatial distribution of the sheltered F. vesiculosus and other EBHAB habitats in the study area is shown in Fig. 2. The F. vesiculosus habitat was largely dominated by the habitat-forming brown alga F. vesiculosus. Other species contributed less than 10% of the total biomass. The F. vesiculosus habitat hosted a relatively large number of plant and invertebrate species. Other benthic species that were regularly found in this habitat were the filamentous algae Cladophora glomerata, Ceramium tenuicorne, Polysiphonia fucoides, and Pilayella littoralis; the bivalves M. trossulus and Cerastoderma glaucum; the gastropod Theodoxus fluviatilis; and gammarid amphipods. The sheltered F. vesiculosus habitat was wide-spread on different types of hard substrate: rock, boulders, and stones. Due to the lower water-current velocity the sedimentation is relatively high and thus also the share of soft substrates (sand, mud) is high. As a consequence of decreased physical disturbance due to ice scouring and waves, F. vesiculosus individuals tended to be larger and more branched compared to those from more exposed habitats. The F. vesiculosus habitat was found in a depth range of 0.5�6 m. The lowest salinity tolerance of F. vesiculosus was around 4.
2. Sheltered hard bottoms with bivalves and the cirriped Amphibalanus improvisus Besides the habitat-forming species, this habitat typically hosted either the red alga F. lumbricalis, some green and brown algal species, or higher plants. The number of benthic macrophyte and invertebrate species was high. The substrate ranged from boulders to rock, and due to reduced water movement the share of soft substrates (sand, mud) was relatively high. The habitat was found in a depth range of 0.3�13 m at salinities down to 3.7.

G. Martin et al.
174
Fig. 2. Distribution of the EBHAB habitats in the study areas. Numbers denote the code of the habitat types in the text section and in Table 1.
3. Sheltered hard bottoms with no particular species dominance In this habitat charales and the green filamentous alga C. glomerata were often found; however, the coverage of charales did not exceed 10%. Among benthic invertebrates the snails Lymnaea peregra and T. fluviatilis, gammarids, and chironimids were most common. The habitat hosted a moderate number of plant and invertebrate species. The substrate ranged from boulders to rock, and due to reduced water movement the share of soft substrates (sand, mud) was relatively high. The habitat was found in a depth range of 0�1.5 m at salinities around 5.

Spatial distribution of marine benthic habitats
175
4. Sheltered soft bottoms with higher plants Besides higher plants, the brown alga F. vesiculosus and filamentous algae often occurred. Invertebrate biomass was low and mainly dominated by gastropods and bivalves. The habitat was characterized by a high number of macrophyte and invertebrate species. Soft sand, silt, and clay substrates dominated but patchy presence of hard substrate was not uncommon. The habitat was found in a depth range of 0.2�8 m at salinities down to 3.7. 5. Sheltered soft bottoms with charophytes Besides charophytes, the brown alga F. vesiculosus often occurred. Invertebrate biomasses were low and mainly dominated by gastropods and bivalves. The habitat was characterized by a moderate number of plant and invertebrate species. Sand, silt, and clay substrates dominated but patchy presence of hard substrate was not uncommon. Hypoxic conditions were common. The habitat was found in a depth range of 0.4�7 m and at salinities 4.5�7.3. 6. Sheltered soft bottoms with bivalves Various bivalve species dominated and many gastropods were found in this habitat. The biomass of macrophytes was low. The characteristic plants were filamentous ephemeral algae, the brown perennial alga F. vesiculosus, and the red perennial alga F. lumbricalis either as loose forms or attached to stand-alone stones. The habitat hosted a low number of macrophyte and a moderate number of invertebrate species. Sand and clay substrates dominated but patchy presence of hard substrate was not uncommon. The habitat was found in a depth range of 0.5�22 m at salinities down to 3.8. 7. Sheltered soft bottoms with no particular species dominance This habitat had a high biomass of higher plants, charophytes, filamentous algae, the loose form of the brown alga F. vesiculosus, and the red alga F. lumbricalis. Among invertebrates various bivalve and gastropod species prevailed. The habitat hosted a low number of macrophyte and invertebrate species. Sand and clay substrates dominated and the share of hard substrate varied. The habitat was found in a depth range of 0.3�14 m at salinities down to 3.8. Owing to its sheltered location and high benthic biomasses short-term hypoxic conditions can occasionally develop in this habitat. 8. Moderately exposed hard bottoms with F. vesiculosus This habitat was largely dominated by the brown alga F. vesiculosus and the bivalve M. trossulus. Other species contributed less than 10% of the total biomass. This habitat hosted a large number of plant and invertebrate species. The moderately exposed F. vesiculosus habitat was wide-spread on different types of hard substrate: rock, boulders, and stones. The habitat was found in a depth range of 0.2�12 m at salinities down to 3.7.

G. Martin et al.
176
9. Moderately exposed hard bottoms with F. lumbricalis This habitat was largely dominated by the red alga F. lumbricalis and the bivalve M. trossulus. The brown alga F. vesiculosus also occurred in some areas. Other species contributed less than 10% of the total biomass. This habitat hosted moderate to high numbers of plant and invertebrate species. The habitat usually formed a belt just below the moderately exposed F. vesiculosus habitat. The bottom substrate of the habitat consisted mainly of boulders, stones, and limestone. The habitat was found in a depth range of 0.5�22 m at salinities down to 3.8. 10. Moderately exposed hard bottoms with bivalves and A. improvisus Besides the habitat-forming species, this habitat was often dominated by brown filamentous algae. Other filamentous algae C. tenuicorne, P. fucoides, C. glomerata, and Ectocarpus siliculosus were also common. This habitat hosted moderate numbers of macrophyte and invertebrate species. The bottom substrate of the habitat consisted mainly of rock, boulders, or stones. The habitat was found in a depth range of 0.3�30 m at salinities down to 3.7. 11. Moderately exposed hard bottoms in photic zone with no particular species dominance The prevailing species of the habitat were various filamentous algae. A mass occurrence of filamentous algae in this habitat has a seasonal character supporting occasional outbreaks of herbivorous invertebrates. Besides, different bivalves and gastropods were characteristic of this habitat. The habitat hosted low numbers of macrophytes and invertebrate species. The bottom substrate ranged from rock to pebbles. The habitat was found in a depth range of 0.5�20 m at salinities down to 3.8. 12. Moderately exposed hard bottoms in aphotic zone with no particular species dominance The overview of the habitat is given based on video surveys as no biomass samples were collected from the habitat during the project. This habitat supported very few species and no macrophyte species. Hydrozoans and the bivalve M. trossulus were commonly found with low coverage. The bottom substrate of the habitat consisted mainly of rock or stones. Also dynamic sediments consisting of pebbles, cobbles, and coarse gravel were characteristic. As such sediment may move during storms, conditions are not favourable for the settlement of epifauna. The habitat was found at depths below 20 m at salinities down to 3. 13. Moderately exposed soft bottoms with Z. marina This habitat was largely dominated by the higher plant Z. marina and filamentous brown algae. Other higher plants occurred occasionally. Among invertebrates various bivalves were found but their biomasses were very low. This habitat

Spatial distribution of marine benthic habitats
177
hosted high numbers of plant and invertebrate species. The substrate ranged from fine to coarse sands. The habitat was found in a depth range of 1�9 m at salinities down to 4. 14. Moderately exposed soft bottoms with higher plants excluding Z. marina The habitat hosted a large number of higher plant species. In addition, the loose filamentous algae F. vesiculosus and F. lumbricalis and charophytes were found in this habitat. Among invertebrates various bivalve species prevailed but their biomasses were very low. This habitat hosted a moderate to high number of plant and invertebrate species. The bottom substrate consisted of clay, sand, and gravel. The habitat was found in a depth range of 0.2�7.6 m at salinities down to 4. 15. Moderately exposed soft bottoms with charophytes The habitat hosted a large number of charophyte species and was also charac-terized by the presence of some higher plants. Among benthic invertebrates various bivalve species prevailed but their biomasses were very low. The habitat hosted a moderate to high number of macrophyte and invertebrate species. The bottom substrate consisted of clay, sand, and pebbles. The habitat was found in a depth range of 0.2�5 m at salinities down to 5. 16. Moderately exposed soft bottoms with drifting F. lumbricalis This habitat hosted the drifting red algae F. lumbricalis and Coccotylus truncatus, which formed an up to 0.3-m-thick carpet on the seafloor dominated by soft sediments. The share of the habitat-forming red algal species varied both in space and time but usually about 60�70% of the biomass was made up by F. lumbricalis whereas C. truncatus accounted for 30�35%. The share of other species was usually low, less than 5%. Among invertebrates the bivalves M. balthica, Mya arenaria, and M. trossulus prevailed with high biomasses. This habitat hosted a small number of plant and invertebrate species. The bottom substrate consisted of clay and sand. The habitat was found in a depth range of 4�10 m. This habitat was found at salinities around 6. The habitat is spatially confined to the western part of the West-Estonian Archipelago Sea. 17. Moderately exposed soft bottoms with bivalves Besides bivalves, the habitat occasionally hosted a low to moderate number of macrophyte and benthic invertebrate species. In general, macrophytes had a low and benthic invertebrates a high biomass. The bottom substrate consisted of clay and sand. The habitat was found in a depth range of 0�52 m at salinities down to 3.6. 18. Moderately exposed soft bottoms with no particular species dominance Among macrophytes the most characteristic species were brown filamentous algae but their biomasses were low. Among invertebrates various gastropod
G. Martin et al.
178
and bivalve species prevailed. This habitat hosted a small number of plant and invertebrate species. The substrate consisted of all different mixtures of soft and hard bottoms with a total coverage of hard substrate never exceeding 50%. The habitat was found in a depth range of 0�100 m at salinities down to 3.6.
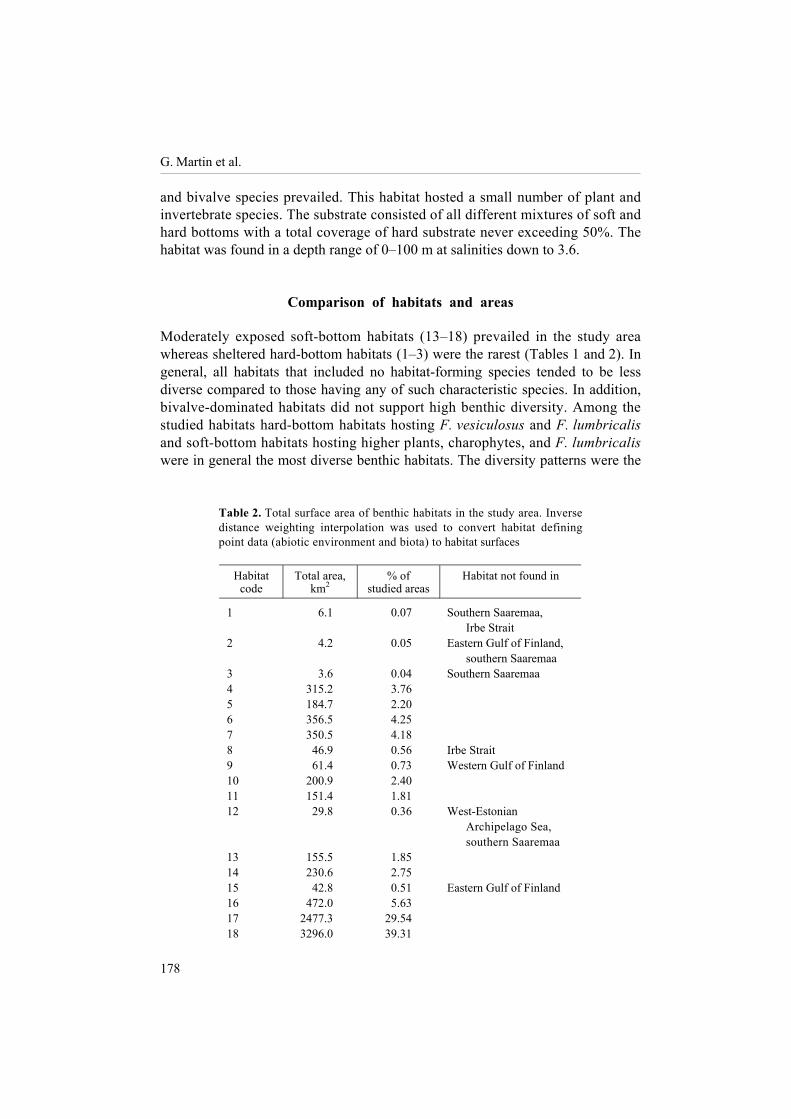
Comparison of habitats and areas Moderately exposed soft-bottom habitats (13�18) prevailed in the study area whereas sheltered hard-bottom habitats (1�3) were the rarest (Tables 1 and 2). In general, all habitats that included no habitat-forming species tended to be less diverse compared to those having any of such characteristic species. In addition, bivalve-dominated habitats did not support high benthic diversity. Among the studied habitats hard-bottom habitats hosting F. vesiculosus and F. lumbricalis and soft-bottom habitats hosting higher plants, charophytes, and F. lumbricalis were in general the most diverse benthic habitats. The diversity patterns were the
Table 2. Total surface area of benthic habitats in the study area. Inverse distance weighting interpolation was used to convert habitat defining point data (abiotic environment and biota) to habitat surfaces
Habitat
code Total area,
km2 % of
studied areas Habitat not found in
1 6.1 0.07 Southern Saaremaa, Irbe Strait
2 4.2 0.05 Eastern Gulf of Finland, southern Saaremaa
3 3.6 0.04 Southern Saaremaa 4 315.2 3.76 5 184.7 2.20 6 356.5 4.25 7 350.5 4.18 8 46.9 0.56 Irbe Strait 9 61.4 0.73 Western Gulf of Finland 10 200.9 2.40 11 151.4 1.81 12 29.8 0.36 West-Estonian
Archipelago Sea, southern Saaremaa
13 155.5 1.85 14 230.6 2.75 15 42.8 0.51 Eastern Gulf of Finland 16 472.0 5.63 17 2477.3 29.54 18 3296.0 39.31

Spatial distribution of marine benthic habitats
179
same regardless of whether macrophyte, benthic invertebrate, or total benthic diversity was considered (Fig. 3). Many habitats hosted the following macrophyte and invertebrate taxa: C. tenuicorne, P. fucoides, C. truncatus, F. lumbricalis, C. glomerata, Ulva intestinalis, P. littoralis, F. vesiculosus, Battersia arctica, T. fluviatilis, M. balthica, M. trossulus, Idotea spp., Hediste diversicolor, Peringia ulvae, and Gammarus spp. (Tables 3, 4). Other species had stronger affinity to specific habitats. Nevertheless, there were very few species that were found in one habitat only (e.g. Chara horrida, R. baudotii).
The ANOSIM tests showed that the majority of EBHAB habitats did not distinguish from each other in terms of the studied abiotic variables (Table 5). In contrast, many habitats were statistically different either in terms of species composition or dominance structure of benthic macrophyte and invertebrate species (Tables 6, 7). Moreover, the degree of dissimilarity in terms of global R values was higher for biotic comparisons than for abiotic environmental data. The SIMPER analysis also identified other than habitat-forming species that contributed most to the similarities within the habitats. In general, these species were the filamentous brown and green algal species P. littoralis and C. glomerata, the amphipod Bathyporeia pilosa, and the gastropod T. fluviatilis (Table 8). Complex interactions between the abiotic environment and the biota were also supported by the CCA analysis showing the presence of a multitude of abiotic environmental gradients and the grouping of different habitats along the observed EBHAB habitat types (Fig. 4).
Fig. 3. Habitat-specific average species number per sample (± SE). Habitat 12 was excluded from the analysis due to the lack of biomass samples in that habitat.
Habitat code
Ave
rage
num
ber o
f spe
cies
per
sam
ple

G. Martin et al.
180

Spatial distribution of marine benthic habitats
181

G. Martin et al.
182

Spatial distribution of marine benthic habitats
183


Spatial distribution of marine benthic habitats
187
Fig. 4. CCA analysis on the environmental conditions and species biomasses within the studied habitats. Each point denotes a centroid of the specific habitat in each study region. The colour code is as follows: red � sheltered habitat, blue � moderately exposed habitat, dark � hard-bottom habitat, light � soft-bottom habitat. Habitat 12 was excluded from the analysis due to the lack of biomass samples in that habitat.

G. Martin et al.
188
Table 8. Biomass of the characteristic benthic macrophyte and invertebrate species of the EBHAH habitats identified by the SIMPER test. Only species that contributed at least 10% of the overall similarity within each habitat were included. Habitat 12 was excluded from the analysis due to the lack of biomass samples in that habitat.
Habitat Species Average
biomass, g m�2
Contribution, %
1 Fucus vesiculosus 177.5 52 Pilayella littoralis 56.0 34 2 Pilayella littoralis 53.4 60 3 Cladophora glomerata 45.1 54 Chara aspera 49.8 42 4 Pilayella littoralis 42.1 40 Stuckenia pectinata 19.1 12 Cerastoderma glaucum 13.7 10 5 Chara aspera 33.6 31 Cladophora glomerata 23.5 18 Cerastoderma glaucum 13.5 13 6 Macoma balthica 20.7 50 Cerastoderma glaucum 6.1 21 7 Bathyporeia pilosa 0.1 94 8 Fucus vesiculosus 235.7 78 9 Mytilus trossulus 97.8 37 Furcellaria lumbricalis 38.0 25 Polysiphonia fucoides 7.5 11 10 Mytilus trossulus 47.6 41 Macoma balthica 5.6 17 Pilayella littoralis 15.2 13 11 Pilayella littoralis 0.8 57 Theodoxus fluviatilis 0.5 43 13 Pilayella littoralis 30.4 40 Macoma balthica 11.5 18 Cerastoderma glaucum 8.0 13 14 Fucus vesiculosus 62.2 39 Pilayella littoralis 33.9 23 15 Pilayella littoralis 38.9 24 Macoma balthica 12.4 20 Cerastoderma glaucum 10.9 17 16 Furcellaria lumbricalis 202.0 60 Coccotylus truncatus 72.8 21 17 Macoma balthica 24.7 58 Mytilus trossulus 12.2 20 18 Theodoxus fluviatilis 0.1 47 Pilayella littoralis 0.8 31 Hediste diversicolor 0.1 14

Spatial distribution of marine benthic habitats
189
DISCUSSION The Baltic Sea lacks important biotic modifiers of seabed structure such as corals and oysters in true marine areas and thus, the type of seabed sediment is believed to primarily define the foundation of benthic habitats in the region (e.g. Kotta & Orav, 2001). Besides, due to strong natural disturbance by waves and ice, physically driven fluxes are believed to control the dynamics of benthic communities (e.g. Herkül et al., 2006). Consequently, another key driver defining benthic habitats is the level at which the area is exposed to such disturbances. Our analyses showed that regardless of the presence of strong physically driven disturbances in the study area, some macrophyte and invertebrate species were capable of creating a specific local environment that enabled colonization of other benthic species. Specifically, although some habitats statistically significantly differed in terms of the abiotic environment, the species composition and dominance structure of benthic invertebrate communities were better explained by the presence of the habitat-forming species than by the ambient abiotic environment. This allows us to conclude that many of the EBHAB habitats are �real�, i.e. each is characterized by its distinct macrophyte and invertebrate communities. Such communities are most likely not found under similar abiotic environmental conditions without the presence of habitat-forming species. These results also suggest that biotic interactions between the key species and associated species are more commonplace in the studied shallow-water areas than was previously thought.
The presented habitat maps should allow an objective and comprehensive biological valuation of a marine area. Some studied habitats can be categorized under habitat types listed in Annex I of the Habitat Directive and thus be of higher importance for the needs of conservation within Europe. Nevertheless, our analyses clearly showed that there were few unique species that were characteristic of a specific habitat only and that many valuable species such as Z. marina and F. vesiculosus were found within a broad range of habitats. Therefore, an efficient protection strategy should focus broader than on the valuable habitat only. It is known that effectively managed protected areas sustain wilderness values and maintain connectivity among habitats whereas the same habitats are highly fragmented elsewhere (Rioja-Nieto & Sheppard, 2008). Thus, in order to have positive effects on biodiversity on a larger scale, the action of designating protected areas should involve analyses of species distribution not just habitat-level mapping. Specifically, some areas need not host the habitat-forming species due to natural succession or anthropogenic disturbances (Kendrick et al., 2000; Kotta et al., 2012). Therefore, it is rewarding to perform a supplementary habitat suitability modelling in order to predict the potential of the environment for the species of high conservation value (Araújo & New, 2007) and use these modelled layers together with the actual mapping results when creating the boundaries of a protected area.
This study aimed at describing large kilometre-scale patterns of benthic habitats. Although large sea areas were mapped, we are still data-limited as only a minor fraction of the studied seascapes were actually sampled and vast areas between sampling stations were left unstudied. The commonly used Inverse Distance

G. Martin et al.
190
Weighting interpolation technique was then used to predict habitat values at those locations where no samples or measurements were taken. We are aware that the obtained interpolation may give an erroneous result if the number of study stations is too low. Nevertheless, as stated above, the current mapping study primarily focussed on the broad habitat patterns. High-resolution hydro-acoustic scanning (multibeam backscatter, sidescan sonar) and high-resolution multi- and hyperspectral imagery collected by means of autonomous underwater vehicles (deeper areas) and airplanes (shallow areas) are the methods to capture small metre-scale variability of benthic habitats. However, these methods were not applicable considering the large spatial extent of the study area, the financial resources, and available time. No benthic habitat maps had been produced for the Estonian sea area before the EU LIFE project �Marine Protected Areas in the Eastern Baltic Sea (Baltic MPAs)�. Considering these constraints and the aim of producing large-scale maps, interpolation was the best option in the current study.
Owing to the complex interactions among the abiotic environment and the biota as well as many biotic interactions involved (Stevens & Connolly, 2004), the traditional biotic mapping still remains the key methodology for the assessment of the distribution of habitat types in the marine realm. In the near future such habitat mapping can be supported by many novel tools, e.g. hyperspectral remote sensing of benthic habitats (Herkül et al., 2013), spatial predictive modelling (Elith et al., 2008), and machine learning capable of effectively handling multiple interactions (Kotta et al., 2013). Such techniques are especially valuable in shallow-water areas where due to the constraints shown above high spatial complexity cannot be covered using the traditional sampling methodology.
ACKNOWLEDGEMENTS
The fieldwork was done in the framework of the LIFE project �Marine Protected Areas in the Eastern Baltic Sea (Baltic MPAs)� (LIFE05NAT/LV/000100). This work was also funded by Institutional research funding IUT02-20 of the Estonian Research Council and partly by the project �The status of marine biodiversity and its potential futures in the Estonian coastal sea� No. 3.2.0801.11-0029 of the Environmental protection and technology programme of the European Regional Fund.
REFERENCES
Araújo, M. B. & New, M. 2007. Ensemble forecasting of species distributions. Trends in Ecology & Evolution, 22, 42�47.
Bendtsen, J., Gustafsson, K. E., Söderkvist, J. & Hansen, J. L. S. 2009. Ventilation of bottom water in the North Sea�Baltic Sea transition zone. Journal of Marine Systems, 75, 138�149.
Clarke, K. R. & Gorley, R. N. 2006. PRIMER v6: User ManualÚTutorial. PRIMER-E, Plymouth, UK.
Elith, J., Leathwick, J. R. & Hastie, T. 2008. A working guide to boosted regression trees. Journal of Animal Ecology, 77, 802�813.

Spatial distribution of marine benthic habitats
191
ESRI. 2011. ArcGIS Desktop: Release 10. Environmental Systems Research Institute, Redlands, CA, USA.
HELCOM. 2008. Manual for Marine Monitoring in the COMBINE Programme of HELCOM. http://www.helcom.fi/groups/monas/CombineManual/en_GB/main/ (accessed 16.06.2012).
Herkül, K., Kotta, J., Kotta, I. & Orav-Kotta, H. 2006. Effects of physical disturbance, isolation and key macrozoobenthic species on community development, recolonisation and sedimentation processes. Oceanologia, 48S, 267�282.
Herkül, K., Kotta, J., Kutser, T. & Vahtmäe, E. 2013. Relating remotely sensed optical variability to marine benthic biodiversity. PLOS ONE, 8, e55624.
Isæus, M. 2004. Factors Structuring Fucus Communities at Open and Complex Coastlines in the Baltic Sea. PhD Thesis, Department of Botany, Stockholm University, Sweden.
Kendrick, G. A., Hegge, B. J., Wyllie, A., Davidson, A. & Lord, D. A. 2000. Changes in seagrass cover on Success and Parmelia Banks, Western Australia between 1965 and 1995. Estuarine, Coastal and Shelf Science, 50, 341�353.
Kotta, J. & Orav, H. 2001. Role of benthic macroalgae in regulating macrozoobenthic assemblages in the Väinameri (north-eastern Baltic Sea). Annales Zoologici Fennici, 38, 163�171.
Kotta, J., Paalme, T., Püss, T., Herkül, K. & Kotta, I. 2008. Contribution of scale-dependent environmental variability on the biomass patterns of drift algae and associated invertebrates in the Gulf of Riga, northern Baltic Sea. Journal of Marine Systems, 74, Supplement 1, S116�S123.
Kotta, J., Lauringson, V., Kaasik, A. & Kotta, I. 2012. Defining the coastal water quality in Estonia based on benthic invertebrate communities. Estonian Journal of Ecology, 61, 86�105.
Kotta, J., Kutser, T., Teeveer, K., Vahtmäe, E. & Pärnoja, M. 2013. Predicting species cover of marine macrophyte and invertebrate species combining hyperspectral remote sensing, machine learning and regression techniques. PLOS ONE, 8, e63946.
Kovtun, A., Torn, K. & Kotta, J. 2009. Long-term changes in a northern Baltic macrophyte community. Estonian Journal of Ecology, 58, 270�285.
Martin, G. 2000. Phytobenthic Communities of the Gulf of Riga and the Inner Sea of the West-Estonian Archipelago. Dissertationes biologicae Universitatis Tartuensis, 64.
Nikolopoulos, A. & Isæus, M. 2008. Wave exposure calculations for the Estonian coast. AquaBiota Water Research. http://www.aquabiota.se/PublikationerSvEng/pdf/EstExp_ABWR_Report200802.pdf (accessed 01.09.2012).
Olli, K., Clarke, A., Danielsson, Å., Aigars, J., Conley, D. J. & Tamminen, T. 2008. Diatom stratigraphy and long-term dissolved silica concentrations in the Baltic Sea. Journal of Marine Systems, 73, 284�299.
The R Foundation for Statistical Computing. 2012. R: A language and environment for statistical computing. R Foundation for Statistical Computing, Vienna, Austria. http://www.R-project.org/ (accessed 29.05.2013).
Rioja-Nieto, R. & Sheppard, C. 2008. Effects of management strategies on the landscape ecology of a Marine Protected Area. Ocean & Coastal Management, 51, 397�404.
Stevens, T. & Connolly, R. M. 2004. Testing the utility of abiotic surrogates for marine habitat mapping at scales relevant to management. Biological Conservation, 119, 351�362.