some spatial analyses of chalcolithic settlement in southern
TRANSCRIPT
Some Spatial Analyses of Chalcolithic Settlement in Southern Israel – R. Fletcher 2007 1
Richard Fletcher
Some Spatial Analyses of Chalcolithic Settlement in Southern Israel.
This paper is a brief investigation of one of the outstanding problems in Chalcolithic archaeology
in the Negev desert of Israel: that of the spatial distribution of sites and the possible relationships
between these sites that may be inferred. Although the region is rich in archaeological data for
the Chalcolithic period, very little work has thus far been undertaken in terms of the
quantification of the archaeological data – a necessary prerequisite for complex spatial analysis.
Nevertheless, simple analysis of settlement patterns using the data presently available for 403
Chalcolithic sites in the Negev is given as an example. Autocorrelation tests measuring
clustering and dispersion of sites shows that the overall impression of clustering is a factor of
access to farming land, water, grazing and Mediterranean maquis, but that smaller-scale analysis
suggests that settlement patterns were essentially random. This makes it difficult to argue in
favour of settlement hierarchies or structured settlement of any kind.
Introduction
Spatial analysis of settlement patterns has undergone revolutionary changes in the last two
decades, being made both more complex and more accessible in Geographic Information
Systems (GIS). Since the rather cumbersome models suggested by Hodder and Orton in the early
seventies, we now have the sophisticated built-in tests available in ArcGIS software packages.
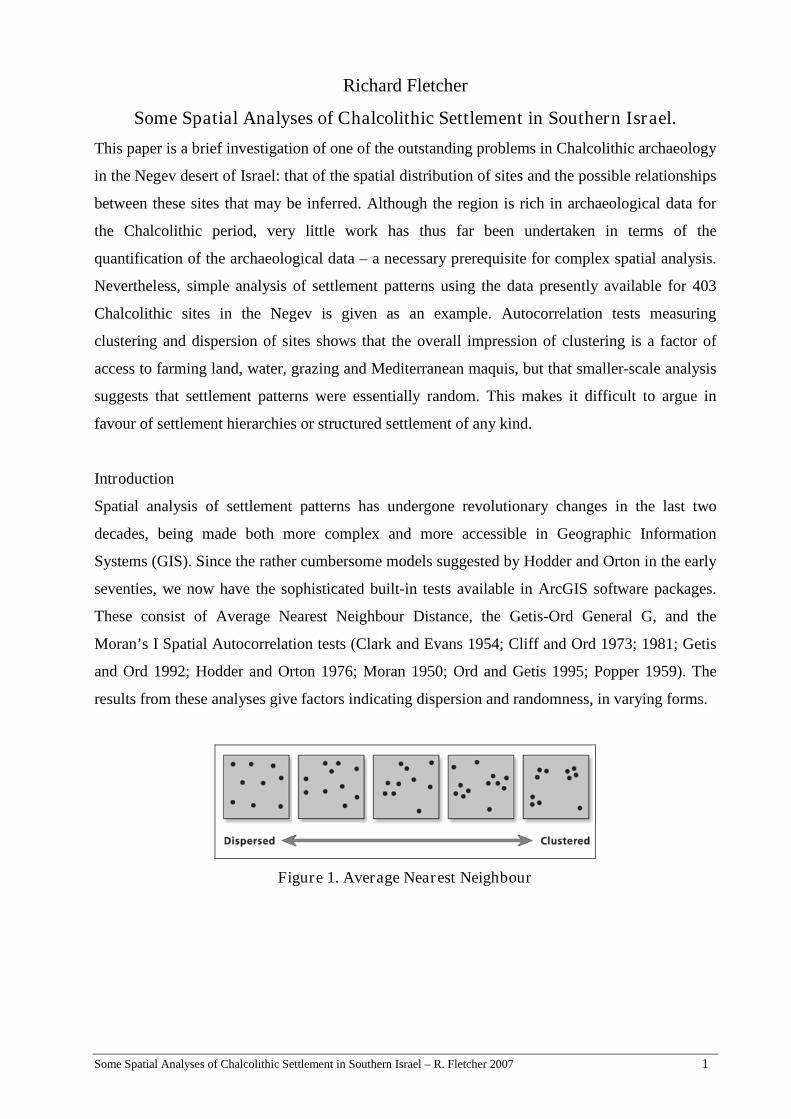
These consist of Average Nearest Neighbour Distance, the Getis-Ord General G, and the
Moran’s I Spatial Autocorrelation tests (Clark and Evans 1954; Cliff and Ord 1973; 1981; Getis
and Ord 1992; Hodder and Orton 1976; Moran 1950; Ord and Getis 1995; Popper 1959). The
results from these analyses give factors indicating dispersion and randomness, in varying forms.
Figure 1. Average Nearest Neighbour
Some Spatial Analyses of Chalcolithic Settlement in Southern Israel – R. Fletcher 2007 2
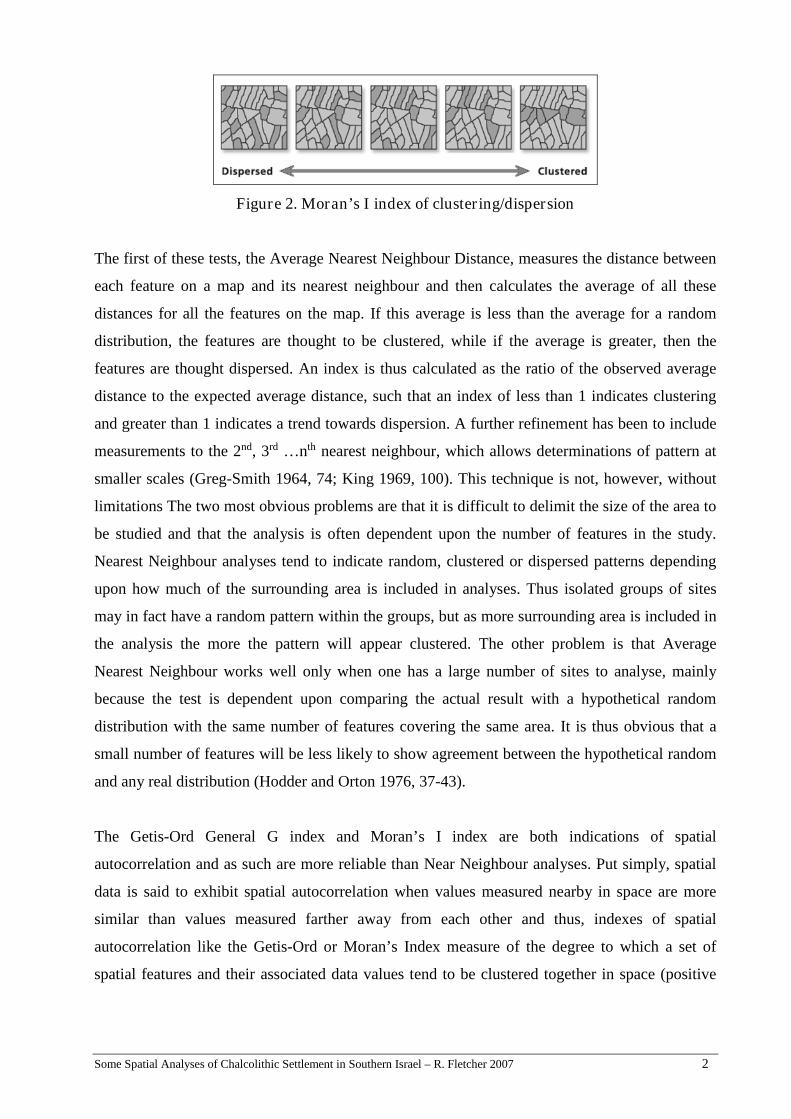
Figure 2. Moran’s I index of clustering/dispersion
The first of these tests, the Average Nearest Neighbour Distance, measures the distance between
each feature on a map and its nearest neighbour and then calculates the average of all these
distances for all the features on the map. If this average is less than the average for a random
distribution, the features are thought to be clustered, while if the average is greater, then the
features are thought dispersed. An index is thus calculated as the ratio of the observed average
distance to the expected average distance, such that an index of less than 1 indicates clustering
and greater than 1 indicates a trend towards dispersion. A further refinement has been to include
measurements to the 2nd, 3rd …nth nearest neighbour, which allows determinations of pattern at
smaller scales (Greg-Smith 1964, 74; King 1969, 100). This technique is not, however, without
limitations The two most obvious problems are that it is difficult to delimit the size of the area to
be studied and that the analysis is often dependent upon the number of features in the study.
Nearest Neighbour analyses tend to indicate random, clustered or dispersed patterns depending
upon how much of the surrounding area is included in analyses. Thus isolated groups of sites
may in fact have a random pattern within the groups, but as more surrounding area is included in
the analysis the more the pattern will appear clustered. The other problem is that Average
Nearest Neighbour works well only when one has a large number of sites to analyse, mainly
because the test is dependent upon comparing the actual result with a hypothetical random
distribution with the same number of features covering the same area. It is thus obvious that a
small number of features will be less likely to show agreement between the hypothetical random
and any real distribution (Hodder and Orton 1976, 37-43).
The Getis-Ord General G index and Moran’s I index are both indications of spatial
autocorrelation and as such are more reliable than Near Neighbour analyses. Put simply, spatial
data is said to exhibit spatial autocorrelation when values measured nearby in space are more
similar than values measured farther away from each other and thus, indexes of spatial
autocorrelation like the Getis-Ord or Moran’s Index measure of the degree to which a set of
spatial features and their associated data values tend to be clustered together in space (positive
Some Spatial Analyses of Chalcolithic Settlement in Southern Israel – R. Fletcher 2007 3
spatial autocorrelation) or dispersed (negative spatial autocorrelation). The Moran’s I index is the
more straightforward of the two and remains the standard for determining spatial autocorrelation
(Moran 1950) while Getis-Ord indicates high-value clustering and low-value clustering (Getis
and Ord 1992; Ord and Getis 1995).
Chalcolithic archaeology in the Negev
The study of the Chalcolithic period (4700-3900 B.C.) started more then 80 years ago, with the
discovery of Teleilat Ghassul in the late 20s by Mallon (Mallon 1929; Mallon et al. 1934;
Neuville and Mallon 1931). At approximately the same time Macdonald discovered and
published several Neolithic-Chalcolithic sites in the Negev (MacDonald 1932). Ever since these
discoveries and thanks to an intensive program of excavation and survey, especially in the Negev
area, a mass of data and research continues to pile up. Roughly, these fields of research may be
divided between questions about society and social structure, technology, cult and ritual,
mortuary practices, settlement practice and structure, and about environmental/ecological
change.
It should go without saying that all of these must be seen as closely interrelating, but some are
more accessible to research. The question of what has been termed ‘cultural ecology’ is most
obviously open to investigation and several specific studies have been undertaken (Butzer 1989;
Crumley 2001; Goldberg and Bar-Yosef 1982; Goldberg 1986; Levy 1983b; Vayda 1969). More
recently, studies of climatic change in the Southern Levant point towards significant changes
occurring during the Chalcolithic (Ayalon et al. 2002; Bar-Matthews et al. 1996; M. Bar-
Matthews and Ayalon 2001; M. Bar-Matthews et al. 2003; Goodfriend 1988; 1991; Schilman et
al. 2001; Vaks et al. 2003). These studies have reached roughly similar conclusions, although
with varying interpretations, degrees of certainty, and within differing chronological
frameworks: that the Chalcolithic saw climatic conditions more favourable to settlement and
agriculture than has been the case since. It is unfortunate that such studies have, on the whole,
failed to link concrete archaeological evidence with ecological and environmental data.
Studies of settlement distribution, practice and structure have been limited (Alon and Levy 1980;
Cohen 1986; 1999; Gilead 1986; 1988b; 1994; Gophna and Portugali 1988; Levy 1983a; Levy and
Alon 1987; Perrot 1984). Settlement in the Negev is well known to be constrained by
environmental factors, the most important of which are access to water and sufficient rainfall. It
Some Spatial Analyses of Chalcolithic Settlement in Southern Israel – R. Fletcher 2007 4
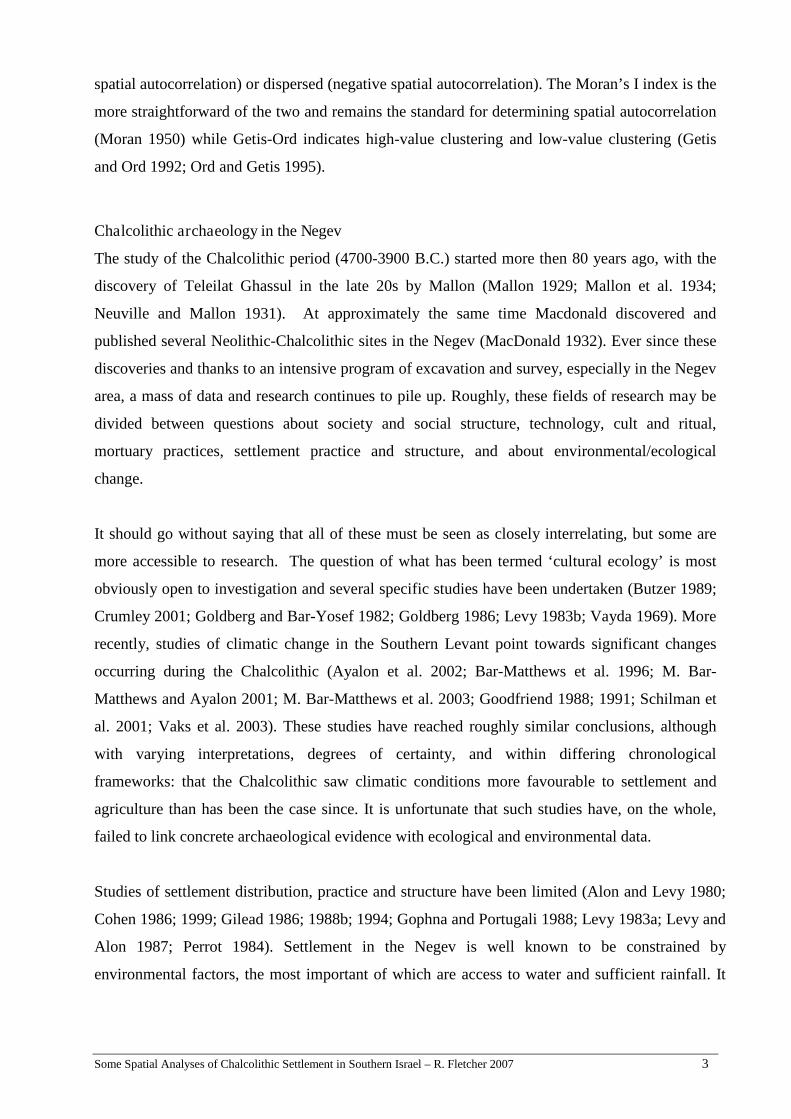
has been noted many times that Chalcolithic settlement is concentrated around the edges of wadis
and water courses in the Negev (figure 3). In fact, more than 65% of known Chalcolithic sites – at
this stage some 403 sites – in the northern and central Negev are within 500 meters of a water
course and about 80% are with 1 km, 88% with 2 km. It is usually assumed that those sites at a
greater distance from watercourses were temporary or camp sites, though there is no compelling
evidence to support this assumption at this stage.1 More careful analyses of environmental factors
in settlement have shown how the presence of grasses and Mediterranean maquis are just as
important. When creating a predictive map based upon the access in terms of cost-distance to
water, alluvial flats for farming, grasses, Mediterranean maquis and loess soils, the vast majority
of sites fit into the predictive high value zone (figure 3). Indeed, of the 403 sites, 41% are found in
the highest classification and 77% in the highest two classifications. If one considers that 310 sites
are in these two high classifications and 84 of the 403 sites have been described as ‘Camp Sites’ –
and all of these are in the lowest classification – then 51.4% of sites may be said to be in the
highest level of predictability and 97.2% in the two highest (Fletcher and Winter forthcoming).
Figure 3. Addition of Cost-Distance maps for Predictive map of settlement
(Light: low probability – Dark: high probability)
1 A study which aims to reconstruct possible Chalcolithic environments under a variety of weather conditions andcompare them to site location is being undertaken at the moment by the author. Such a study may be informativewhen it comes to the sites at a distance from water resources.
Some Spatial Analyses of Chalcolithic Settlement in Southern Israel – R. Fletcher 2007 5
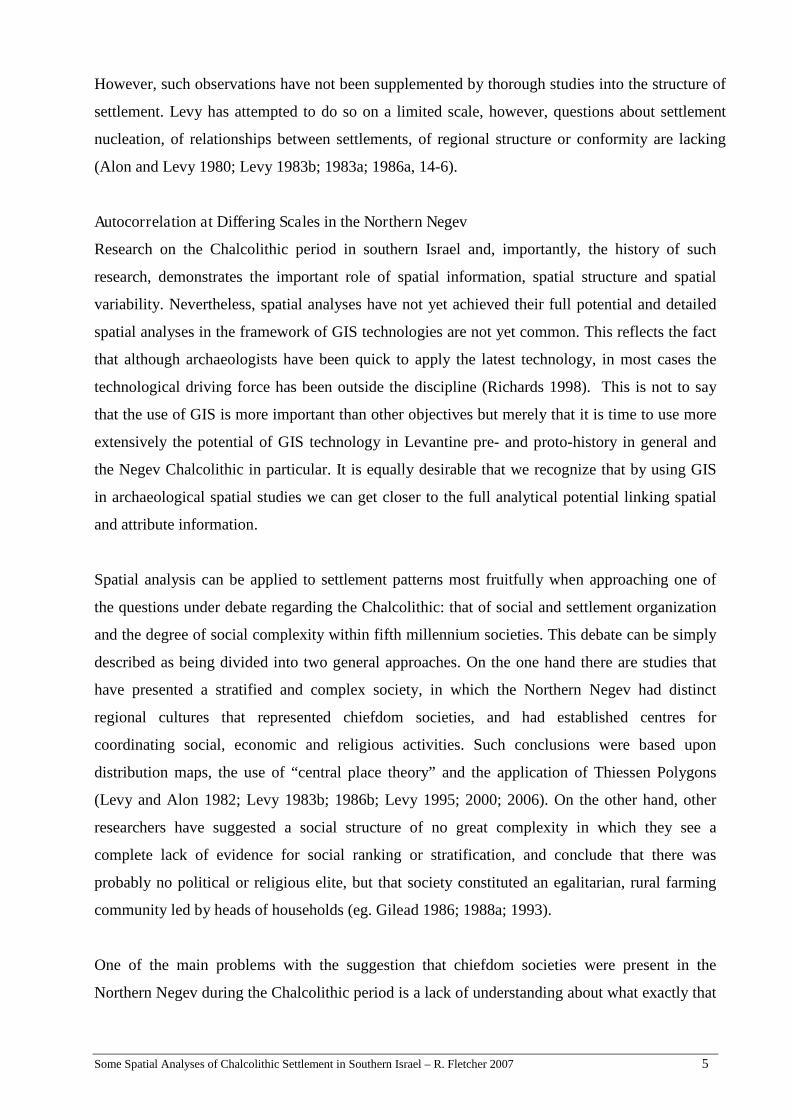
However, such observations have not been supplemented by thorough studies into the structure of
settlement. Levy has attempted to do so on a limited scale, however, questions about settlement
nucleation, of relationships between settlements, of regional structure or conformity are lacking
(Alon and Levy 1980; Levy 1983b; 1983a; 1986a, 14-6).
Autocorrelation at Differing Scales in the Northern Negev
Research on the Chalcolithic period in southern Israel and, importantly, the history of such
research, demonstrates the important role of spatial information, spatial structure and spatial
variability. Nevertheless, spatial analyses have not yet achieved their full potential and detailed
spatial analyses in the framework of GIS technologies are not yet common. This reflects the fact
that although archaeologists have been quick to apply the latest technology, in most cases the
technological driving force has been outside the discipline (Richards 1998). This is not to say
that the use of GIS is more important than other objectives but merely that it is time to use more
extensively the potential of GIS technology in Levantine pre- and proto-history in general and
the Negev Chalcolithic in particular. It is equally desirable that we recognize that by using GIS
in archaeological spatial studies we can get closer to the full analytical potential linking spatial
and attribute information.
Spatial analysis can be applied to settlement patterns most fruitfully when approaching one of
the questions under debate regarding the Chalcolithic: that of social and settlement organization
and the degree of social complexity within fifth millennium societies. This debate can be simply
described as being divided into two general approaches. On the one hand there are studies that
have presented a stratified and complex society, in which the Northern Negev had distinct
regional cultures that represented chiefdom societies, and had established centres for
coordinating social, economic and religious activities. Such conclusions were based upon
distribution maps, the use of “central place theory” and the application of Thiessen Polygons
(Levy and Alon 1982; Levy 1983b; 1986b; Levy 1995; 2000; 2006). On the other hand, other
researchers have suggested a social structure of no great complexity in which they see a
complete lack of evidence for social ranking or stratification, and conclude that there was
probably no political or religious elite, but that society constituted an egalitarian, rural farming
community led by heads of households (eg. Gilead 1986; 1988a; 1993).
One of the main problems with the suggestion that chiefdom societies were present in the
Northern Negev during the Chalcolithic period is a lack of understanding about what exactly that
Some Spatial Analyses of Chalcolithic Settlement in Southern Israel – R. Fletcher 2007 6
may have entailed. Just what kind of chiefdom societies have scholars perceived the Chalcolithic
as having? Simple or complex? From a neoevolutionary perspective, was the chiefdom structure
corporate or network? Scholars such as T. E. Levy and D. Alon, have used what they have
perceived to have been patterns in site distribution for forwarding some far-reaching conclusions
as to the socio-economic mode of the inhabitants of the Southern Levant during Chalcolithic.
These scholars determined that Chalcolithic settlement in this area reflects segregated
"chiefdoms", each one of which was dominated by a core site that controlled a hinterland of
smaller settlements. Yet although this theory fuelled a lively debate that took place during the
1980's and the 1990's, Levy has not given a coherent description of what sort of chiefdom
society he is proposing and his attempts in this regards has always been somewhat blurred (Levy
1995; 2000; 2006, 'Conclusion'). In the concluding chapter to his volume on the site at Gilat,
Levy attributes the "capital" which must have been at the basis of any chiefdom society in the
Chalcolithic to several sources: the Judean mountains to olive oil, the Beer Sheva area to copper,
and the Gilat area to ritual. These have been asserted strenuously, but none can be convincingly
demonstrated on the basis of archaeological evidence.
A recent attempt to use settlement pattern in this debate is available in the recent publication of
excavations of small sites, called ‘Hamlets’, in the vicinity of Shiqmim in the Nahal Beersheva
(Levy et al. 2006). Here, three sites near the site of Shiqmim were examined in order to
demonstrate a “two-tier settlement hierarchy….consistent with the presence of a dynamic
regional chiefdom-level society during the Chalcolithic period” (Levy et al. 2006, 41). This
study is of great importance, since it has shown the possibility of these sites being roughly
contemporary. The archaeological evidence from the sites shows that they belonged to the same
cultural grouping, but this evidence and the C14 dates supplied are not convincing evidence that
these ‘hamlets’ were contemporary with the site of Shiqmim. Moreover, the authors failed to
perform any spatial analysis of the evidence and thus did not show either a two-tier settlement
hierarchy or any evidence for a regional chiefdom-level society.
Some Spatial Analyses of Chalcolithic Settlement in Southern Israel – R. Fletcher 2007 7
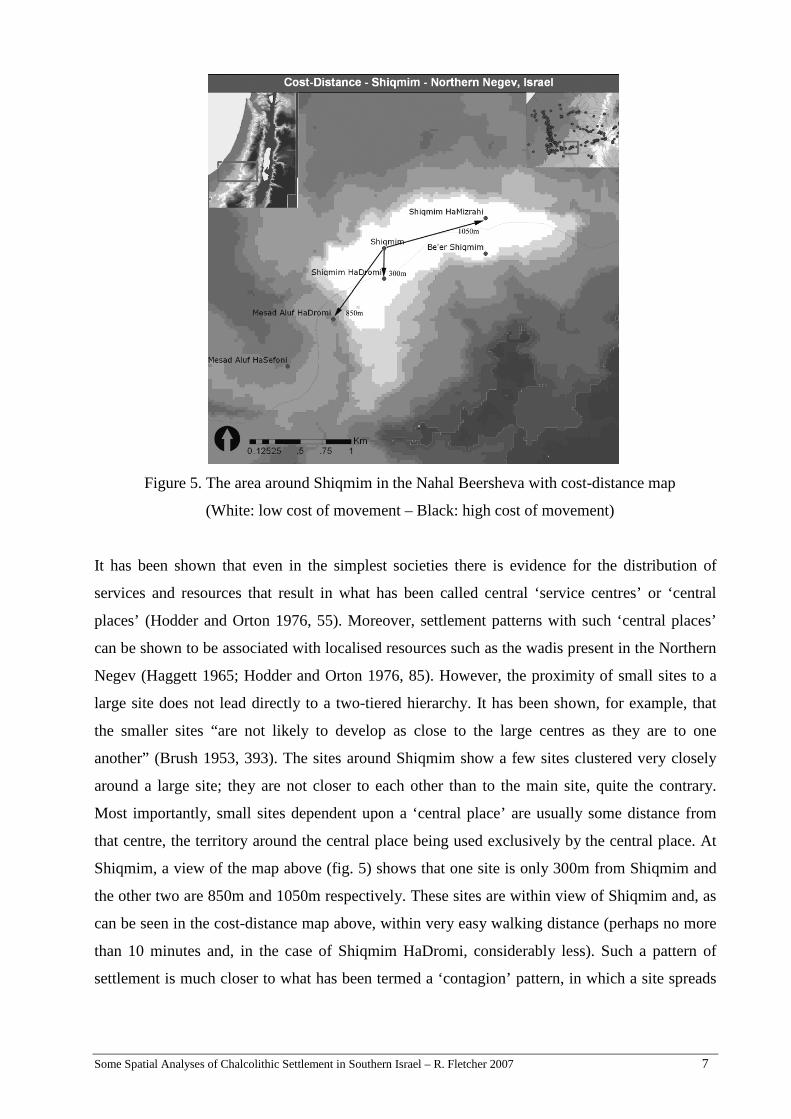
Figure 5. The area around Shiqmim in the Nahal Beersheva with cost-distance map
(White: low cost of movement – Black: high cost of movement)
It has been shown that even in the simplest societies there is evidence for the distribution of
services and resources that result in what has been called central ‘service centres’ or ‘central
places’ (Hodder and Orton 1976, 55). Moreover, settlement patterns with such ‘central places’
can be shown to be associated with localised resources such as the wadis present in the Northern
Negev (Haggett 1965; Hodder and Orton 1976, 85). However, the proximity of small sites to a
large site does not lead directly to a two-tiered hierarchy. It has been shown, for example, that
the smaller sites “are not likely to develop as close to the large centres as they are to one
another” (Brush 1953, 393). The sites around Shiqmim show a few sites clustered very closely
around a large site; they are not closer to each other than to the main site, quite the contrary.
Most importantly, small sites dependent upon a ‘central place’ are usually some distance from
that centre, the territory around the central place being used exclusively by the central place. At
Shiqmim, a view of the map above (fig. 5) shows that one site is only 300m from Shiqmim and
the other two are 850m and 1050m respectively. These sites are within view of Shiqmim and, as
can be seen in the cost-distance map above, within very easy walking distance (perhaps no more
than 10 minutes and, in the case of Shiqmim HaDromi, considerably less). Such a pattern of
settlement is much closer to what has been termed a ‘contagion’ pattern, in which a site spreads
Some Spatial Analyses of Chalcolithic Settlement in Southern Israel – R. Fletcher 2007 8
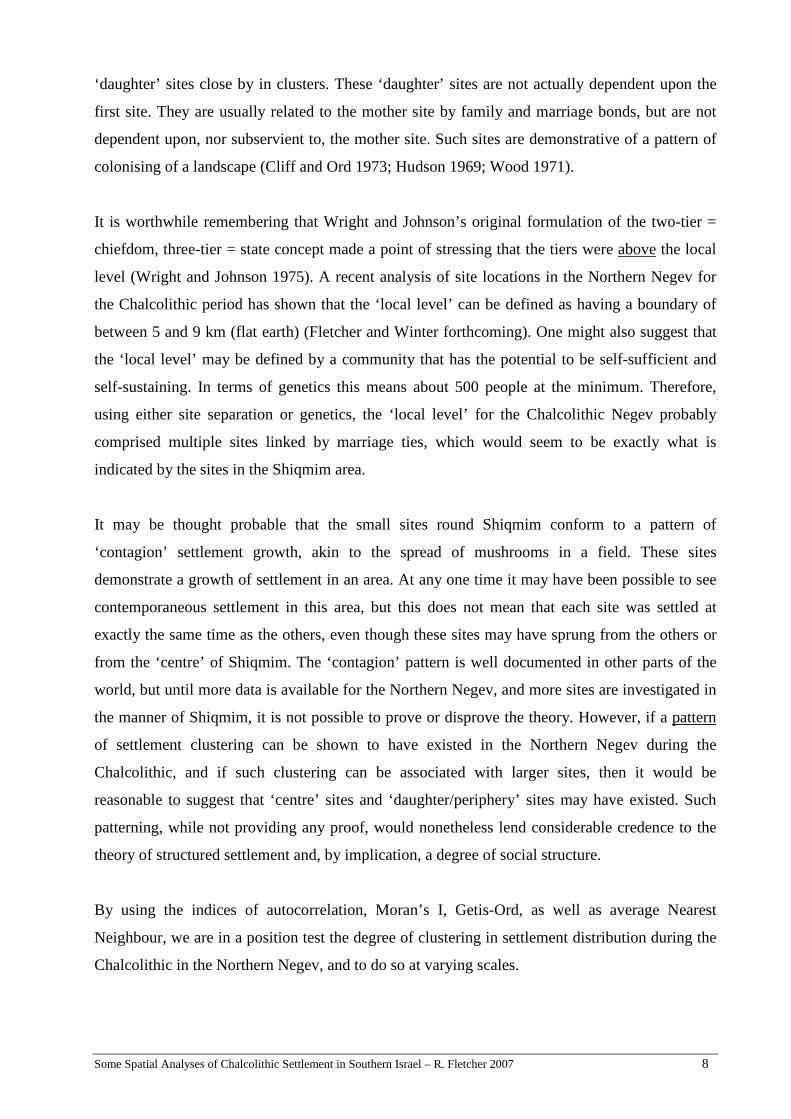
‘daughter’ sites close by in clusters. These ‘daughter’ sites are not actually dependent upon the
first site. They are usually related to the mother site by family and marriage bonds, but are not
dependent upon, nor subservient to, the mother site. Such sites are demonstrative of a pattern of
colonising of a landscape (Cliff and Ord 1973; Hudson 1969; Wood 1971).
It is worthwhile remembering that Wright and Johnson’s original formulation of the two-tier =
chiefdom, three-tier = state concept made a point of stressing that the tiers were above the local
level (Wright and Johnson 1975). A recent analysis of site locations in the Northern Negev for
the Chalcolithic period has shown that the ‘local level’ can be defined as having a boundary of
between 5 and 9 km (flat earth) (Fletcher and Winter forthcoming). One might also suggest that
the ‘local level’ may be defined by a community that has the potential to be self-sufficient and
self-sustaining. In terms of genetics this means about 500 people at the minimum. Therefore,
using either site separation or genetics, the ‘local level’ for the Chalcolithic Negev probably
comprised multiple sites linked by marriage ties, which would seem to be exactly what is
indicated by the sites in the Shiqmim area.
It may be thought probable that the small sites round Shiqmim conform to a pattern of
‘contagion’ settlement growth, akin to the spread of mushrooms in a field. These sites
demonstrate a growth of settlement in an area. At any one time it may have been possible to see
contemporaneous settlement in this area, but this does not mean that each site was settled at
exactly the same time as the others, even though these sites may have sprung from the others or
from the ‘centre’ of Shiqmim. The ‘contagion’ pattern is well documented in other parts of the
world, but until more data is available for the Northern Negev, and more sites are investigated in
the manner of Shiqmim, it is not possible to prove or disprove the theory. However, if a pattern
of settlement clustering can be shown to have existed in the Northern Negev during the
Chalcolithic, and if such clustering can be associated with larger sites, then it would be
reasonable to suggest that ‘centre’ sites and ‘daughter/periphery’ sites may have existed. Such
patterning, while not providing any proof, would nonetheless lend considerable credence to the
theory of structured settlement and, by implication, a degree of social structure.
By using the indices of autocorrelation, Moran’s I, Getis-Ord, as well as average Nearest
Neighbour, we are in a position test the degree of clustering in settlement distribution during the
Chalcolithic in the Northern Negev, and to do so at varying scales.
Some Spatial Analyses of Chalcolithic Settlement in Southern Israel – R. Fletcher 2007 9
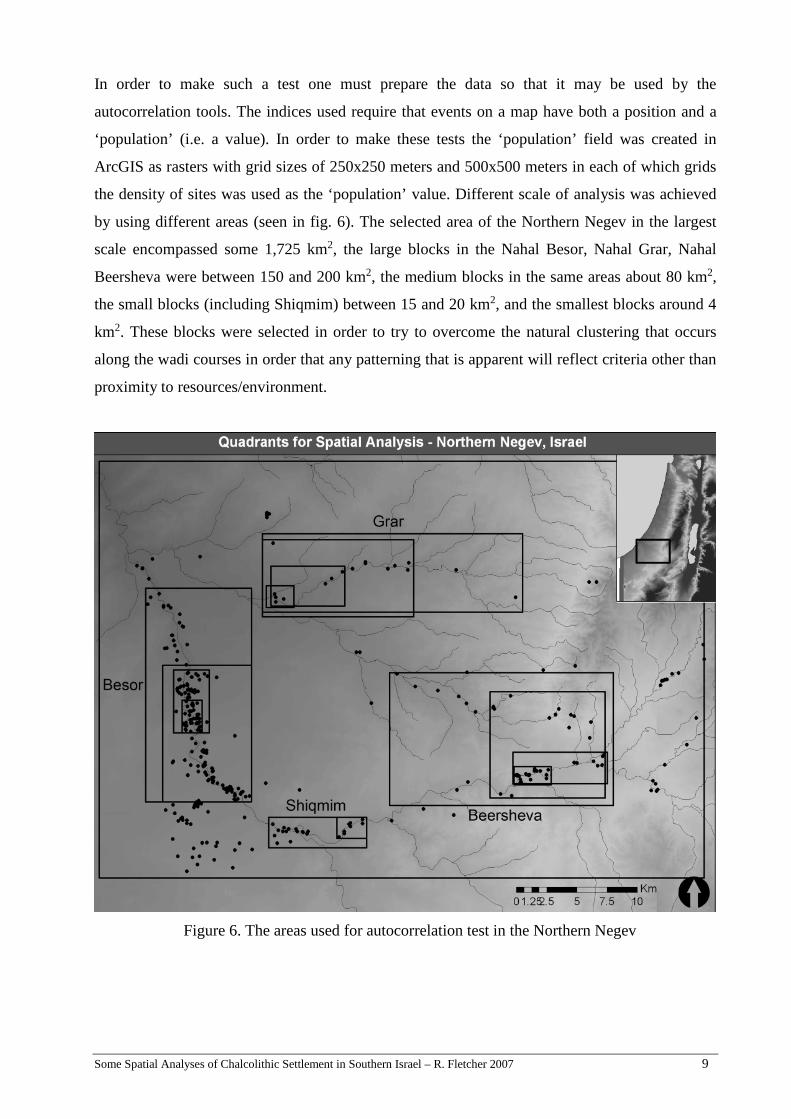
In order to make such a test one must prepare the data so that it may be used by the
autocorrelation tools. The indices used require that events on a map have both a position and a
‘population’ (i.e. a value). In order to make these tests the ‘population’ field was created in
ArcGIS as rasters with grid sizes of 250x250 meters and 500x500 meters in each of which grids
the density of sites was used as the ‘population’ value. Different scale of analysis was achieved
by using different areas (seen in fig. 6). The selected area of the Northern Negev in the largest
scale encompassed some 1,725 km2, the large blocks in the Nahal Besor, Nahal Grar, Nahal
Beersheva were between 150 and 200 km2, the medium blocks in the same areas about 80 km2,
the small blocks (including Shiqmim) between 15 and 20 km2, and the smallest blocks around 4
km2. These blocks were selected in order to try to overcome the natural clustering that occurs
along the wadi courses in order that any patterning that is apparent will reflect criteria other than
proximity to resources/environment.
Figure 6. The areas used for autocorrelation test in the Northern Negev
Some Spatial Analyses of Chalcolithic Settlement in Southern Israel – R. Fletcher 2007 10
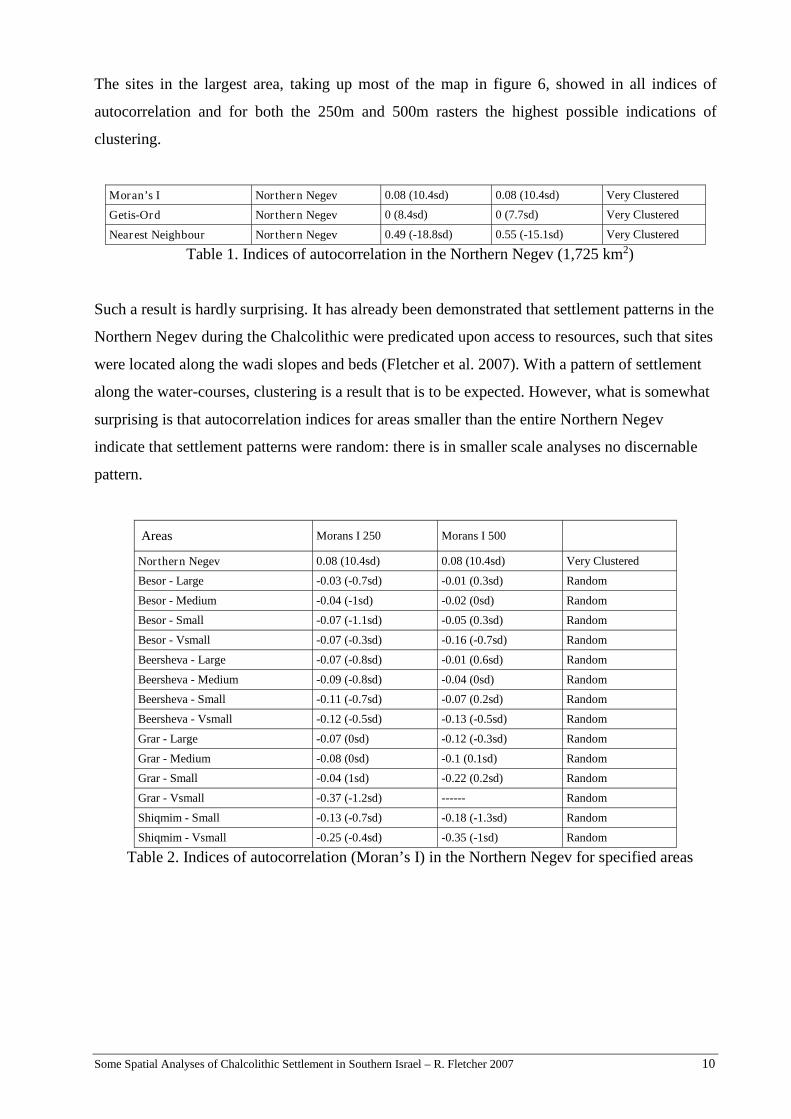
The sites in the largest area, taking up most of the map in figure 6, showed in all indices of
autocorrelation and for both the 250m and 500m rasters the highest possible indications of
clustering.
Moran’s I Northern Negev 0.08 (10.4sd) 0.08 (10.4sd) Very Clustered
Getis-Ord Northern Negev 0 (8.4sd) 0 (7.7sd) Very Clustered
Nearest Neighbour Northern Negev 0.49 (-18.8sd) 0.55 (-15.1sd) Very Clustered
Table 1. Indices of autocorrelation in the Northern Negev (1,725 km2)
Such a result is hardly surprising. It has already been demonstrated that settlement patterns in the
Northern Negev during the Chalcolithic were predicated upon access to resources, such that sites
were located along the wadi slopes and beds (Fletcher et al. 2007). With a pattern of settlement
along the water-courses, clustering is a result that is to be expected. However, what is somewhat
surprising is that autocorrelation indices for areas smaller than the entire Northern Negev
indicate that settlement patterns were random: there is in smaller scale analyses no discernable
pattern.
Areas Morans I 250 Morans I 500
Northern Negev 0.08 (10.4sd) 0.08 (10.4sd) Very Clustered
Besor - Large -0.03 (-0.7sd) -0.01 (0.3sd) Random
Besor - Medium -0.04 (-1sd) -0.02 (0sd) Random
Besor - Small -0.07 (-1.1sd) -0.05 (0.3sd) Random
Besor - Vsmall -0.07 (-0.3sd) -0.16 (-0.7sd) Random
Beersheva - Large -0.07 (-0.8sd) -0.01 (0.6sd) Random
Beersheva - Medium -0.09 (-0.8sd) -0.04 (0sd) Random
Beersheva - Small -0.11 (-0.7sd) -0.07 (0.2sd) Random
Beersheva - Vsmall -0.12 (-0.5sd) -0.13 (-0.5sd) Random
Grar - Large -0.07 (0sd) -0.12 (-0.3sd) Random
Grar - Medium -0.08 (0sd) -0.1 (0.1sd) Random
Grar - Small -0.04 (1sd) -0.22 (0.2sd) Random
Grar - Vsmall -0.37 (-1.2sd) ------ Random
Shiqmim - Small -0.13 (-0.7sd) -0.18 (-1.3sd) Random
Shiqmim - Vsmall -0.25 (-0.4sd) -0.35 (-1sd) Random
Table 2. Indices of autocorrelation (Moran’s I) in the Northern Negev for specified areas
Some Spatial Analyses of Chalcolithic Settlement in Southern Israel – R. Fletcher 2007 11
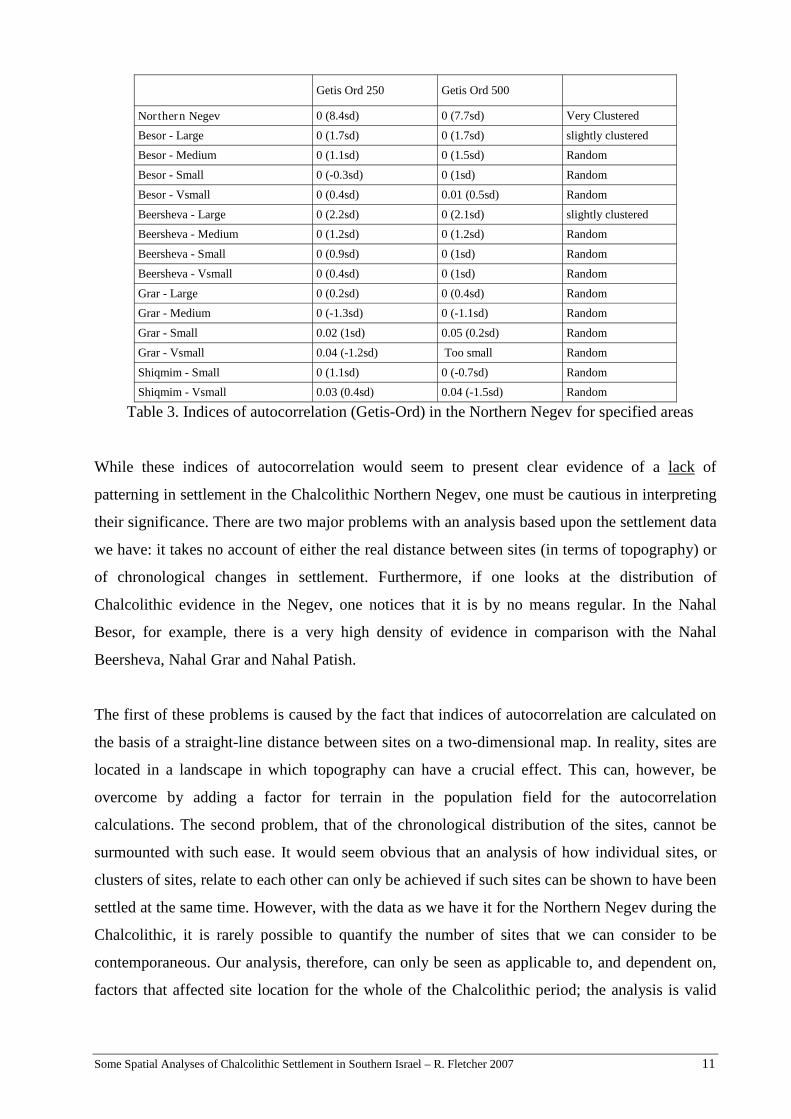
Getis Ord 250 Getis Ord 500
Northern Negev 0 (8.4sd) 0 (7.7sd) Very Clustered
Besor - Large 0 (1.7sd) 0 (1.7sd) slightly clustered
Besor - Medium 0 (1.1sd) 0 (1.5sd) Random
Besor - Small 0 (-0.3sd) 0 (1sd) Random
Besor - Vsmall 0 (0.4sd) 0.01 (0.5sd) Random
Beersheva - Large 0 (2.2sd) 0 (2.1sd) slightly clustered
Beersheva - Medium 0 (1.2sd) 0 (1.2sd) Random
Beersheva - Small 0 (0.9sd) 0 (1sd) Random
Beersheva - Vsmall 0 (0.4sd) 0 (1sd) Random
Grar - Large 0 (0.2sd) 0 (0.4sd) Random
Grar - Medium 0 (-1.3sd) 0 (-1.1sd) Random
Grar - Small 0.02 (1sd) 0.05 (0.2sd) Random
Grar - Vsmall 0.04 (-1.2sd) Too small Random
Shiqmim - Small 0 (1.1sd) 0 (-0.7sd) Random
Shiqmim - Vsmall 0.03 (0.4sd) 0.04 (-1.5sd) Random
Table 3. Indices of autocorrelation (Getis-Ord) in the Northern Negev for specified areas
While these indices of autocorrelation would seem to present clear evidence of a lack of
patterning in settlement in the Chalcolithic Northern Negev, one must be cautious in interpreting
their significance. There are two major problems with an analysis based upon the settlement data
we have: it takes no account of either the real distance between sites (in terms of topography) or
of chronological changes in settlement. Furthermore, if one looks at the distribution of
Chalcolithic evidence in the Negev, one notices that it is by no means regular. In the Nahal
Besor, for example, there is a very high density of evidence in comparison with the Nahal
Beersheva, Nahal Grar and Nahal Patish.
The first of these problems is caused by the fact that indices of autocorrelation are calculated on
the basis of a straight-line distance between sites on a two-dimensional map. In reality, sites are
located in a landscape in which topography can have a crucial effect. This can, however, be
overcome by adding a factor for terrain in the population field for the autocorrelation
calculations. The second problem, that of the chronological distribution of the sites, cannot be
surmounted with such ease. It would seem obvious that an analysis of how individual sites, or
clusters of sites, relate to each other can only be achieved if such sites can be shown to have been
settled at the same time. However, with the data as we have it for the Northern Negev during the
Chalcolithic, it is rarely possible to quantify the number of sites that we can consider to be
contemporaneous. Our analysis, therefore, can only be seen as applicable to, and dependent on,
factors that affected site location for the whole of the Chalcolithic period; the analysis is valid
Some Spatial Analyses of Chalcolithic Settlement in Southern Israel – R. Fletcher 2007 12
only insofar as it shows how sites were located regardless of contemporaneity. This does not
mean that any analysis of settlement patterns in the Northern Negev for the Chalcolithic period is
pointless. The question of scale in chronology is very similar to that of scale in spatial terms;
different scales give different results. The chronological scale for analysis of the Northern Negev
for the Chalcolithic may be forced upon us, but so long as we are dealing with a cultural unit,
even if it is an assumed cultural unit such as the Chalcolithic in the Negev with noticeable
changes before and after, the analysis remains valid. A simple example of how such a process
may have operated is to imagine the historical presence/absence of sites in a region having
affected decisions to use a particular piece of land. Put simply, a site may have been used with
the knowledge that other sites had been used in the vicinity or, conversely, that no sites were in
the vicinity or known to have been nearby
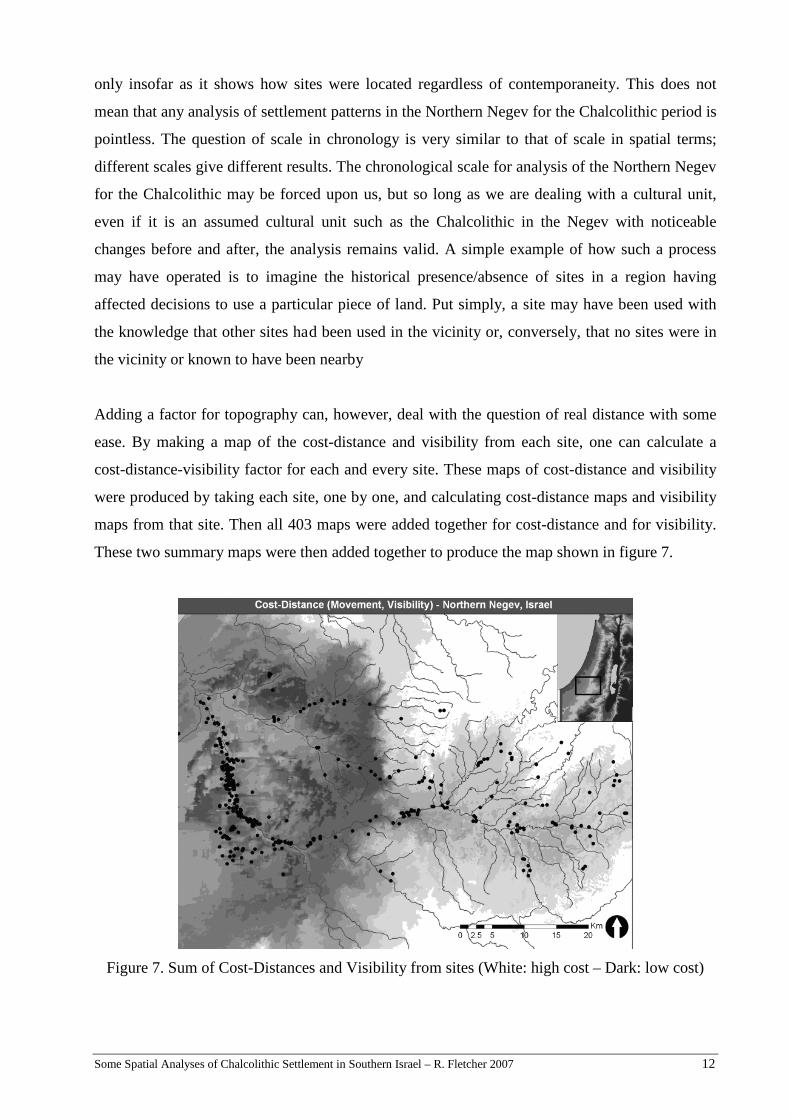
Adding a factor for topography can, however, deal with the question of real distance with some
ease. By making a map of the cost-distance and visibility from each site, one can calculate a
cost-distance-visibility factor for each and every site. These maps of cost-distance and visibility
were produced by taking each site, one by one, and calculating cost-distance maps and visibility
maps from that site. Then all 403 maps were added together for cost-distance and for visibility.
These two summary maps were then added together to produce the map shown in figure 7.
Figure 7. Sum of Cost-Distances and Visibility from sites (White: high cost – Dark: low cost)
Some Spatial Analyses of Chalcolithic Settlement in Southern Israel – R. Fletcher 2007 13
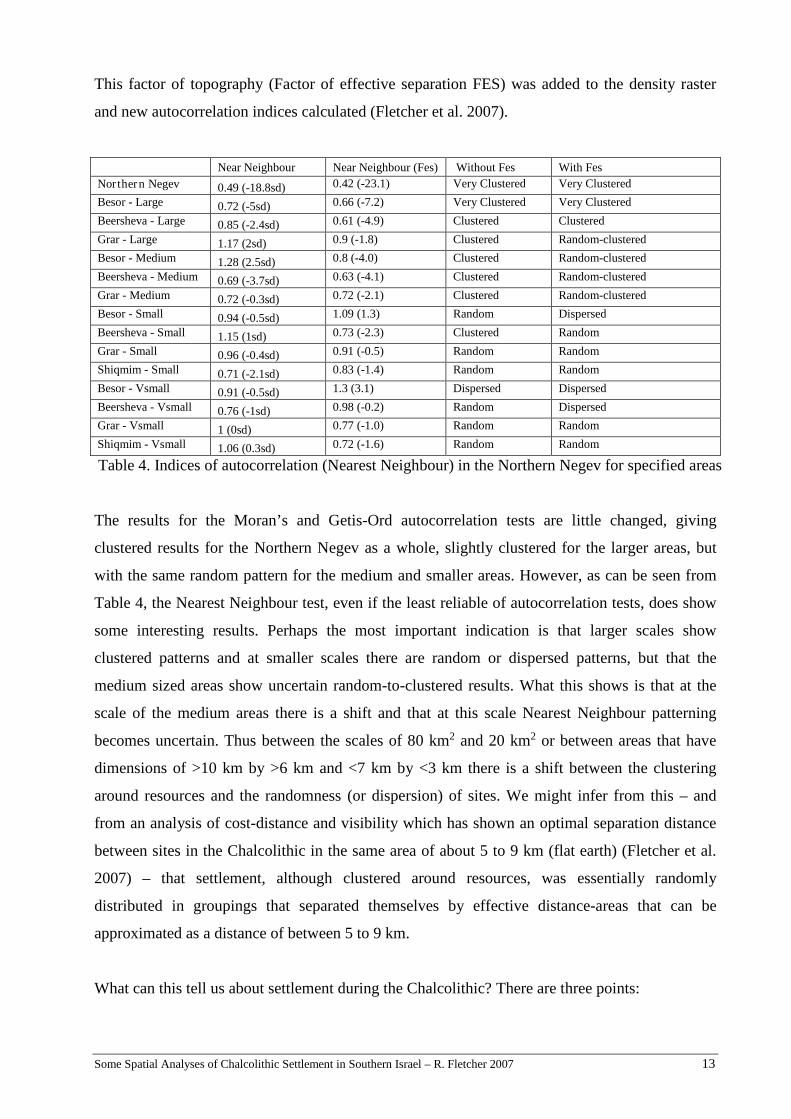
This factor of topography (Factor of effective separation FES) was added to the density raster
and new autocorrelation indices calculated (Fletcher et al. 2007).
Near Neighbour Near Neighbour (Fes) Without Fes With Fes
Northern Negev 0.49 (-18.8sd) 0.42 (-23.1) Very Clustered Very Clustered
Besor - Large 0.72 (-5sd) 0.66 (-7.2) Very Clustered Very Clustered
Beersheva - Large 0.85 (-2.4sd) 0.61 (-4.9) Clustered Clustered
Grar - Large 1.17 (2sd) 0.9 (-1.8) Clustered Random-clustered
Besor - Medium 1.28 (2.5sd) 0.8 (-4.0) Clustered Random-clustered
Beersheva - Medium 0.69 (-3.7sd) 0.63 (-4.1) Clustered Random-clustered
Grar - Medium 0.72 (-0.3sd) 0.72 (-2.1) Clustered Random-clustered
Besor - Small 0.94 (-0.5sd) 1.09 (1.3) Random Dispersed
Beersheva - Small 1.15 (1sd) 0.73 (-2.3) Clustered Random
Grar - Small 0.96 (-0.4sd) 0.91 (-0.5) Random Random
Shiqmim - Small 0.71 (-2.1sd) 0.83 (-1.4) Random Random
Besor - Vsmall 0.91 (-0.5sd) 1.3 (3.1) Dispersed Dispersed
Beersheva - Vsmall 0.76 (-1sd) 0.98 (-0.2) Random Dispersed
Grar - Vsmall 1 (0sd) 0.77 (-1.0) Random Random
Shiqmim - Vsmall 1.06 (0.3sd) 0.72 (-1.6) Random Random
Table 4. Indices of autocorrelation (Nearest Neighbour) in the Northern Negev for specified areas
The results for the Moran’s and Getis-Ord autocorrelation tests are little changed, giving
clustered results for the Northern Negev as a whole, slightly clustered for the larger areas, but
with the same random pattern for the medium and smaller areas. However, as can be seen from
Table 4, the Nearest Neighbour test, even if the least reliable of autocorrelation tests, does show
some interesting results. Perhaps the most important indication is that larger scales show
clustered patterns and at smaller scales there are random or dispersed patterns, but that the
medium sized areas show uncertain random-to-clustered results. What this shows is that at the
scale of the medium areas there is a shift and that at this scale Nearest Neighbour patterning
becomes uncertain. Thus between the scales of 80 km2 and 20 km2 or between areas that have
dimensions of >10 km by >6 km and <7 km by <3 km there is a shift between the clustering
around resources and the randomness (or dispersion) of sites. We might infer from this – and
from an analysis of cost-distance and visibility which has shown an optimal separation distance
between sites in the Chalcolithic in the same area of about 5 to 9 km (flat earth) (Fletcher et al.
2007) – that settlement, although clustered around resources, was essentially randomly
distributed in groupings that separated themselves by effective distance-areas that can be
approximated as a distance of between 5 to 9 km.
What can this tell us about settlement during the Chalcolithic? There are three points:
Some Spatial Analyses of Chalcolithic Settlement in Southern Israel – R. Fletcher 2007 14
1. Chalcolithic settlement in the Northern Negev was clustered around the wadis as a means
of access to resources;
2. At scales of less than 20 km2 settlement would appear to lack any detectable pattern;
3. That spatial analysis of settlement shows that there was a factor of distance between sites,
or groups of sites, that becomes manifest at greater than 20 km2.
A lack of discernable pattern in site distribution at small scales may lead us to dismiss the
analysis as a null hypothesis, therefore indicating nothing. This would be mistaken. A lack of
patterning is a result since it shows that structure in settlement was almost certainly not evident.
Secondly, “random distributions have usually been treated as the statistical null hypothesis,
though several commentators provide good examples of how apparently random distributions
can be conditioned by less-obvious environmental, biological and social variables” and this
could very well be the case here (Conolly and Lake 2006; Daniel 2001; Maschner and Stein
1995; Woodman 2000).
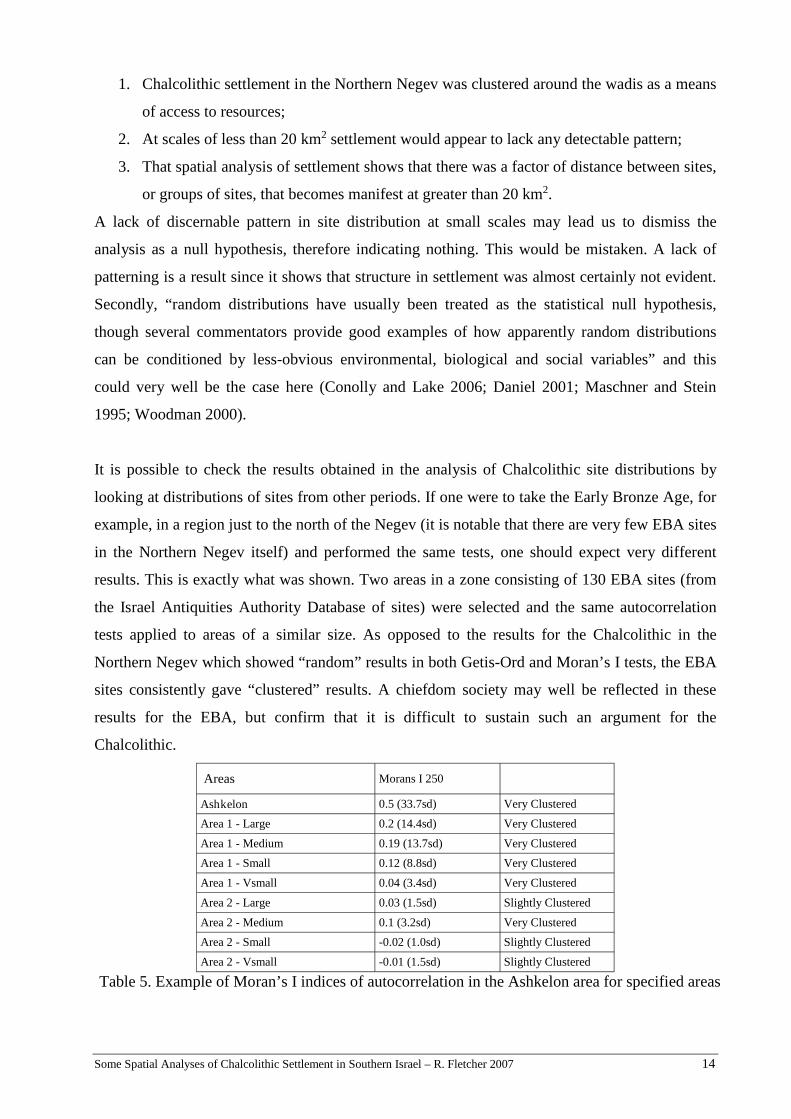
It is possible to check the results obtained in the analysis of Chalcolithic site distributions by
looking at distributions of sites from other periods. If one were to take the Early Bronze Age, for
example, in a region just to the north of the Negev (it is notable that there are very few EBA sites
in the Northern Negev itself) and performed the same tests, one should expect very different
results. This is exactly what was shown. Two areas in a zone consisting of 130 EBA sites (from
the Israel Antiquities Authority Database of sites) were selected and the same autocorrelation
tests applied to areas of a similar size. As opposed to the results for the Chalcolithic in the
Northern Negev which showed “random” results in both Getis-Ord and Moran’s I tests, the EBA
sites consistently gave “clustered” results. A chiefdom society may well be reflected in these
results for the EBA, but confirm that it is difficult to sustain such an argument for the
Chalcolithic.
Areas Morans I 250
Ashkelon 0.5 (33.7sd) Very Clustered
Area 1 - Large 0.2 (14.4sd) Very Clustered
Area 1 - Medium 0.19 (13.7sd) Very Clustered
Area 1 - Small 0.12 (8.8sd) Very Clustered
Area 1 - Vsmall 0.04 (3.4sd) Very Clustered
Area 2 - Large 0.03 (1.5sd) Slightly Clustered
Area 2 - Medium 0.1 (3.2sd) Very Clustered
Area 2 - Small -0.02 (1.0sd) Slightly Clustered
Area 2 - Vsmall -0.01 (1.5sd) Slightly Clustered
Table 5. Example of Moran’s I indices of autocorrelation in the Ashkelon area for specified areas
Some Spatial Analyses of Chalcolithic Settlement in Southern Israel – R. Fletcher 2007 15
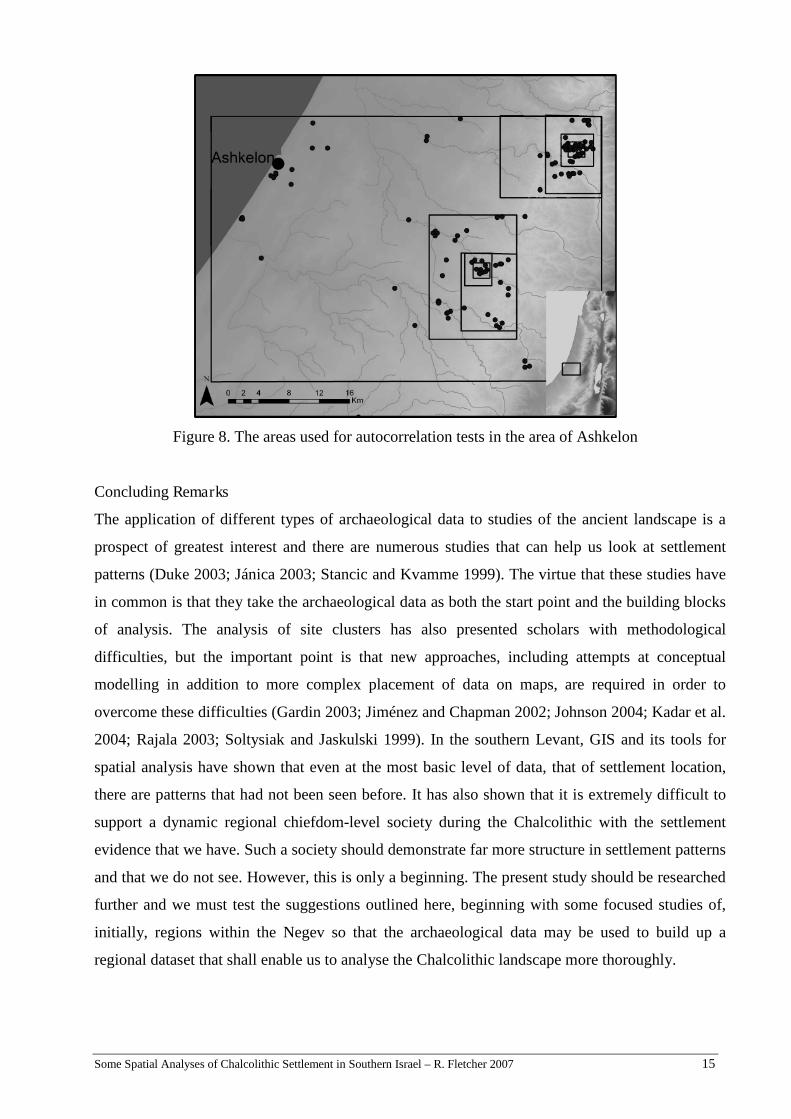
Figure 8. The areas used for autocorrelation tests in the area of Ashkelon
Concluding Remarks
The application of different types of archaeological data to studies of the ancient landscape is a
prospect of greatest interest and there are numerous studies that can help us look at settlement
patterns (Duke 2003; Jánica 2003; Stancic and Kvamme 1999). The virtue that these studies have
in common is that they take the archaeological data as both the start point and the building blocks
of analysis. The analysis of site clusters has also presented scholars with methodological
difficulties, but the important point is that new approaches, including attempts at conceptual
modelling in addition to more complex placement of data on maps, are required in order to
overcome these difficulties (Gardin 2003; Jiménez and Chapman 2002; Johnson 2004; Kadar et al.
2004; Rajala 2003; Soltysiak and Jaskulski 1999). In the southern Levant, GIS and its tools for
spatial analysis have shown that even at the most basic level of data, that of settlement location,
there are patterns that had not been seen before. It has also shown that it is extremely difficult to
support a dynamic regional chiefdom-level society during the Chalcolithic with the settlement
evidence that we have. Such a society should demonstrate far more structure in settlement patterns
and that we do not see. However, this is only a beginning. The present study should be researched
further and we must test the suggestions outlined here, beginning with some focused studies of,
initially, regions within the Negev so that the archaeological data may be used to build up a
regional dataset that shall enable us to analyse the Chalcolithic landscape more thoroughly.

Some Spatial Analyses of Chalcolithic Settlement in Southern Israel – R. Fletcher 2007 16
Richard Fletcher, Marie Curie FellowArchaeological DivisionBen-Gurion University of the NegevIsraelEmail: [email protected]
Some Spatial Analyses of Chalcolithic Settlement in Southern Israel – R. Fletcher 2007 17
References
Alon, D. and Levy, T. E. 1980: 'Preliminary note on the distribution of Chalcolithic sites on theWadi Beer-Sheba-Lower Wadi Besor drainage systems', Israel Exploration Journal, 30(140-47.
Ayalon, A., Bar-Matthews, M., and Kaufman, A. 2002: 'Climatic conditions during marineoxygen isotope stage 6 in the eastern Mediterranean region from the isotopic compositionof speleothems of Soreq Cave, Israel', Geology, 30 (303-06.
Bar-Matthews, M., Ayalon, A., Matthews, A., Sass, E., and Haliez, L. 1996: 'Carbon and oxygenisotope study of the active water-carbonate system in the karstic Mediterranean cave:implications for paleoclimate research in semi-arid regions', Geochimica etCosmochimica Acta, 60 (337-47.
Bar-Matthews, M. and Ayalon, A. 2001: Eastern Mediterranean paleoclimate during the last250,000 years as derived from the petrography, mineralogy, trace element and isotopiccomposition of cave deposits (speleothems), Israel, Geological Survey of Israel ReportGSI/41/01,
Bar-Matthews, M., Ayalon, A., Gilmour, M., Matthews, A., and Hawkesworth, C. J. 2003: 'Sea-land oxygen isotopic relationships from planktonic foraminifera and speleothems in theEastern Mediterranean region and their implication for paleorainfall during interglacialintervals', Geochimica et Cosmochimica Acta, 67 (17), 3181-99.
Brush, J. E. 1953: 'The hierarchy of central places in Southwestern Wisconsin', GeographicalReview, 43 (380-402.
Butzer, K. 1989: 'Cultural ecology', in L. G. Gary and C. J. Willmott (eds.), Geography inAmerica; Columbus: Merrill, 192-208.
Clark, P. J. and Evans, F. C. 1954: 'Distance to nearest neighbour as a measure of spatialrelationships in population', Ecology, 35 (445-53.
Cliff, A. D. and Ord, J. K. 1973: Spatial autocorrelation, London:Cliff, A. D. and Ord, J. K. 1981: Spatial processes : models & applications, London: PionCohen, R. 1986: 'The settlement of the Central Negev in the light of archaeology and literary
sources during the 4th - 1st millennia B.C.E.' (Jerusalem: The Hebrew University (PhDthesis)).
Cohen, R. 1999: Ancient Settlements of the Central Negev Volume 1 the Chalcolithic Period, theEarly Bronze Age and Middle Bronze Age I, . Iaa Reports No. 6., Jerusalem The IsraelAntiquities Authority
Conolly, J. and Lake, M. 2006: Geographical Information Systems in Archaeology, Cambridge:Cambridge University Press
Crumley, C. (ed.), 2001: New directions in anthropology and environment Walnut Creek:AltaMira.
Daniel, I. R. 2001: 'Stone raw material availability and Early Archaic settlement in thesoutheastern United States', American Antiquity, 66 (237-65.
Some Spatial Analyses of Chalcolithic Settlement in Southern Israel – R. Fletcher 2007 18
Duke, C. 2003: 'Quantifying Palaeolithic Landscapes: Computer Approaches to Terrain Analysisand Visualisation', in M. Doerr and A. Sarris (eds.), The Digital Herritage ofArchaeology (CAA 2002); Athens: Hellenic Ministry of Culture, 139-46.
Fletcher, R. and Winter, R. forthcoming: 'Prospects and Problems in GIS Applications inStudying Chalcolithic Archaeology in Southern Israel', Bulletin of the American Schoolsof Oriental Research,
Fletcher, R., Gilead, I., and Winter, R. 2007: 'Patterning Human Behaviour in ChalcolithicSouthern Palestine: Differing scales of physical and environmental analysis', Layers ofPerception. Advanced technological means to illuminate our past (CAA 2007),Forthcoming.
Gardin, J.-C. 2003: 'Archaeological Discourse, Conceptual Modelling and Digitalisation: anlnterim Report of the Logicist Program', in M. Doerr and A. Sarris (eds.), The DigitalHerritage of Archaeology (CAA 2002); Athens: Hellenic Ministry of Culture, 5-11.
Getis, A. and Ord, J. K. 1992: 'The Analysis of Spatial Association by Use of Distance Statistics',Geographical Analysis, 24 (189-206.
Gilead, I. 1986: 'The economic basis of the Chalcolithic settlement in the Norethern Negev',Michmanim, 3 (17-30.
Gilead, I. 1988a: 'Shiqmim and the Chalcolithic period in southern Israel', Journal of the IsraelPrehistoric Society, 21 (145-50.
Gilead, I. 1988b: 'The Chalcolithic period in the Levant', Journal of World Prehistory, 2 (4), 397-443.
Gilead, I. 1993: 'Sociopolitical Organization in the Northern Negev at the End of the ChalcolithicPeriod', in O. Bar-Yosef and A. Khazanov (eds.), Pastoralism in the Levant; Madison:Prehistory Press, 29-41.
Gilead, I. 1994: 'The history of the Chalcolithic settlement in the Nahal Beer Sheva area: theradiocarbon aspect', Bulletin of the American Schools of Oriental Research, 296 (1-13.
Goldberg, P. 1986: 'Late Quaternary environmental history of the southern Levant',Geoarchaeology, 1 (225-44.
Goldberg, P. and Bar-Yosef, O. 1982: 'Environmental and archaeological evidence for climaricchange in the Southern Levant', in Bintliff, J. L., and W. V. Zeist (eds.),Palaeoenvironments and human communities in the Eastern Mediterranean region in laterprehistory, 133; Oxford: BAR International Series 133.
Goodfriend, G. A. 1988: 'Mid-Holocene rainfall in the Negev desert from 13C of land snail shellorganic matter', Nature, 333 (757-60.
Goodfriend, G. A. 1991: 'Holocene trends in 18O in land snail shells from the Negev desert andtheir implications for changes in rainfall source area', Quaternary Research, 35 (417-26.
Some Spatial Analyses of Chalcolithic Settlement in Southern Israel – R. Fletcher 2007 19
Gophna, R. and Portugali, Y. 1988: 'Settlement and Demographic Process in Israel's CoastalPlain from the Chalcolithic to the Middle Bronze Ages', Bulletin of the AmericanSchools of Oriental Research, 269 (11-36.
Greg-Smith, P. 1964: Quantitative plant ecology, London: MethuenHaggett, P. 1965: Location analysis in human geography, London: E. ArnoldHodder, I. and Orton, C. 1976: Spatial analysis in archaeology, Cambridge ; New York:
Cambridge University Press viii, 270 p.
Hudson, J. C. 1969: 'A location theory for rural settlement', Annals of the Association ofAmerican Geographers, 59 (365-81.
Jánica, G. M. 2003: 'Spatial Analysis Utilities: a Quantitative Tool for Studies on ArchaeologicalDistribution', in M. Doerr and A. Sarris (eds.), The Digital Herritage of Archaeology(CAA 2002); Athens: Hellenic Ministry of Culture, 287-93.
Jiménez, D. and Chapman, D. 2002: 'An application of proximity graphs in Archaeologicalspatial analysis', in D. Wheatley, G. Earl, and S. Poppy (eds.), Contemporary Themes inArchaeological Computing; Oxford: Oxbow, 90-99.
Johnson, I. 2004: 'Aoristic Analysis: Seeds of a new approach to mapping archaeologicaldistributions through time', in K. F. Ausserer, et al. (eds.), Enter the Past. The E-way intothe four Dimensions of Cultural Heritage (CAA 2003); Oxford: BAR International Series1227, 448-52.
Kadar, M., Ileana, I., and L.Marina 2004: 'Assessing Cluster Validity in the Study of EneolithicCopper Artifacts from Romania', in K. F. Ausserer, et al. (eds.), Enter the Past. The E-way into the four Dimensions of Cultural Heritage (CAA 2003); Oxford: BARInternational Series 1227, 441-43.
King, L. J. 1969: Statistical analysis in geography, Englewood Cliffs, N.J.: Prentice-HallLevy, T. E. 1983a: 'The Emergence of Specialized Pastoralism in the Southern Levant', World
Archaeology, 15 (1), 15-36.
Levy, T. E. 1983b: 'Chalcolithic settlement patterns in the northern Negev desert', CurrentAnthropology, 24 (105-07.
Levy, T. E. 1986a: 'Social archaeology and the Chalcolithic period: explaining socialorganizational change during the 4th millennium in Israel', Michmanim, 3 (5-20.
Levy, T. E. 1986b: 'The Chalcolithic period', Biblical Archaeologist, 49 (2), 82-108.
Levy, T. E. 1995: 'Cult, Metallurgy and Rank Societies - Chalcolithic Period (ca. 4500 - 3500BCE)', in T. E. Levy (ed.), The Archaeology of Society in the Holy Land; London:Leicester University Press, 226-44.
Levy, T. E. 2000: 'The Emergence of Social Inequality: The Chalcolithic Period in Palestine (ca.4500-3600 B.C.E.)', in D. C. Hopkins (ed.), Emergent Villages and Vast Empires:Archaeology of the Land Called Holy; New York: Routledge Press.
Some Spatial Analyses of Chalcolithic Settlement in Southern Israel – R. Fletcher 2007 20
Levy, T. E. and Alon, D. 1982: 'The Chalcolithic mortuary site near Metzad Aluf, northernNegev desert: a preliminary study', Bulletin of the American Schools of OrientalResearch, 248 (37-59.
Levy, T. E. and Alon, A. 1987: 'Settlement patterns along the Nahal Beersheva-Lower NahalBesor: Models of subsistance in the Northern Negev', in Levy and T. E. (eds.), ShiqmimI, Studies Concerning Chalcolithic Societies in the Northern Negev Desert, Israel;Oxford: BAR International Series 356, 45-138.
Levy, T. E., Burton, M. M., and Rowan, Y. M. 2006: 'Chalcolithic Hamlet Excavations nearShiqmim, Negev Desert, Israel', Journal of Field Archaeology, 31 (41-60.
Levy, T. E. (ed.), 2006: Archaeology, anthropology, and cult :the sanctuary at Gilat, IsraelLondon: Equinox.
Macdonald, E. 1932: Prehistoric Fara, Beth Pelet II, London: The British School of Archaeologyin Egypt
Mallon, A. 1929: 'Notes sur quelques sites du Ghor oriental', Biblica, 10 (94-99, 214-32.
Mallon, A., Koeppel, R., and Neuville, R. 1934: Teleilat Ghassul I, Roma: Institute BibliquePontifical
Maschner, H. D. G. and Stein, J. W. 1995: 'Multivariate approaches to site location on thenorthwest coast of north America', Antiquity, 69 (61-73.
Moran, P. A. P. 1950: 'Notes on continuous stochastic phenomena', Biometrika, 37 (17-23.
Neuville, R. and Mallon, A. 1931: 'Les débuts de l'âge des metaux dans les grottes du désert deJudée', Syria, XII (24-47.
Ord, J. K. and Getis, A. 1995: 'Local Spatial Autocorrelation Statistics: Distributional Issues andan Application', Geographical Analysis, 27 (286-306.
Perrot, J. 1984: 'Structure d'habitat, mode de la vie et environment les villages souterrains despastures de Beershéva dans le sud d'Israel, au IVe millénaire avant l'ère chrétienne',Paleoriént, 10 (75-92.
Popper, K. R. 1959: Logic of scientific discovery, London: HutchinsonRajala, U. 2003: 'Maps, Mental Maps and Sites: Interpreting Ii Pizzo (Nepi, VT, Italy)', in M.
Doerr and A. Sarris (eds.), The Digital Herritage of Archaeology (CAA 2002); Athens:Hellenic Ministry of Culture, 109-12.
Richards, J. 1998: 'Recent trends in computer applications in archaeology', Journal ofArchaeological Research, 6 (4), 331-82.
Schilman, B., Bar-Matthews, M., Almogi-Labin, A., and Luz, B. 2001: 'Global climateinstability reflected by Eastern Mediterranean marine records during the late Holocene',Plaeogeography, Palaeoclimatology, Palaeoecology, 176 (157-76.
Some Spatial Analyses of Chalcolithic Settlement in Southern Israel – R. Fletcher 2007 21
Soltysiak, A. and Jaskulski, P. 1999: 'Czekanowskis Diagram: a Method of MultidimensionalClustering', in J. A. Barceló, I. Briz, and A. Vila (eds.), New Techniques for Old Times(CAA98); Oxford: BAR International Series 757, 175-84.
Stancic, Z. and Kvamme, K. 1999: 'Settlement Pattern Modelling through Boolean Overlays ofSocial and Environmental Variables', in J. A. Barceló, I. Briz, and A. Vila (eds.), NewTechniques for Old Times (CAA98); Oxford: BAR International Series 757, 231-35.
Vaks, A., Bar-Matthews, M., Ayalon, A., Schilman, B., Gilmour, M., Hawkesworth, C. J.,Frumkin, A., Kaufman, A., and Matthews, A. 2003: 'Paleoclimate reconstruction basedon the timing of speleothem growth and oxygen and carbon isotope composition in acave located in the rain shadow in Israel', Quaternary Research, 59 (182-93.
Vayda, A. P. 1969: 'An ecological approach to cultural anthropology', Bucknell Review, 17(112-19.
Wood, J. J. 1971: 'Fitting discrete probability distributions to prehistoric settlement patterns', inG. J. Gumerman (ed.), The distribution of prehistoric population aggregates; PrescottCollege Anthropological Reports, no. 1.
Woodman, P. E. 2000: 'A predictive model for Mesolithic site location on Islay using logisticregression and GIS', in S. Mithen (ed.), Hunter-Gatherer landscape archaeology: theSouthern Hebrides Mesolithic Project 1988-1998, Vol. 2, Archaeological Fieldwork onColonsay, Computer Modelling, Experimental Archaeology and Final Interpretations;Cambridge: McDonald Institute for Archaeological Research.