some observations on colocated and closely spaced strong ground-motion records of the 1999 chi-chi,...
TRANSCRIPT

674
Bulletin of the Seismological Society of America, Vol. 93, No. 2, pp. 674–693, April 2003
Some Observations on Colocated and Closely Spaced Strong Ground-
Motion Records of the 1999 Chi-Chi, Taiwan, Earthquake
by Guo-Quan Wang, David M. Boore, Heiner Igel, and Xi-Yuan Zhou
Abstract The digital accelerograph network installed in Taiwan produced a richset of records from the 20 September 1999 Chi-Chi, Taiwan earthquake (Mw 7.6).Teledyne Geotech model A-800 and A-900A* digital accelerographs were colocatedat 22 stations that recorded this event. Comparisons of the amplitudes, frequencycontent, and baseline offsets show that records from several of the A-800 accelero-graphs are considerably different than those from the colocated A-900A accelero-graphs. On this basis, and in view of the more thorough predeployment testing ofthe newer A-900A instruments, we recommend that the records from the A-800instruments be used with caution in analyses of the mainshock and aftershocks. Atthe Hualien seismic station two A-900A and one A-800 instruments were colocated,along with a Global Positioning System instrument. Although the records from thetwo A-900A instruments are much more similar than those from a colocated A-800instrument, both three-component records contain unpredictable baseline offsets,which produced completely unrealistic ground displacements derived from the ac-celerations by double integration, as do many of the strong-motion data from thisevent; the details of the baseline offsets differ considerably on the two three-component records. There are probably numerous sources of the baseline offsets,including sources external to the instruments, such as tilting or rotation of the ground,and sources internal to the instruments, such as electrical or mechanical hysteresisin the sensors. For the two colocated A-900A records at the Hualien seismic station,however, the differences in the baseline offsets suggest that the principal source issome transient disturbance within the instrument. The baseline offsets generally man-ifest themselves in the acceleration time series as pulses or steps, either singly or incombination. We find a 0.015-Hz low-cut filter can almost completely eliminate theeffects of the baseline offsets, but then information regarding the permanent dis-placements is lost. The causative mechanisms of the baseline offsets are unknownpresently. Hence, it is very difficult to recover the permanent displacements from themodern digital records, although for records close to large earthquakes, the signal-to-noise ratio should theoretically be adequate to obtain ground motions with periodsof hundreds of seconds. This study reinforces our conclusion from previous studiesthat the sources of baseline offsets occurring in digital strong-motion records are verycomplex and often unpredictable, and that, therefore, it is difficult to remove thebaseline effects to maximize the information content of the record. The baselineoffsets only affect very long period motions (e.g., �20 sec), however, and thereforeare of little or no engineering concern.
Introduction
The Chi-Chi, Taiwan earthquake (Mw 7.6, 17:47, 20September 1999, Universal Time (UT); epicenter at 23.86�N, 120.81� E) produced the largest set of digital strong-
*Use of trade, product, or firm names is for descriptive purposes onlyand does not imply endorsement by the U.S. Government.
motion data ever recorded from a single earthquake (Shin etal., 2000). After this event, scientists from Taiwan and theUnited States made an intensive effort to make the dataavailable as soon as possible for scientists worldwide. Forthe mainshock, 441 digital, three-component, free-field,strong-motion records (out of a total of 640 digital acceler-

Some Observations on Colocated and Closely Spaced Strong Ground-Motion Records of the 1999 Chi-Chi, Taiwan Earthquake 675
ographs deployed at the “free-field” sites) were released bythe Central Weather Bureau of Taiwan (CWB) (Lee et al.,1999, 2001a). In our previous studies (Boore, 1999, 2001;Wang, 2001; Wang et al., 2001, 2002), we found that dis-placements derived from near-fault accelerogram recordingsof this event show significant drifts when only the mean ofthe pre-event portion of the record is removed from thewhole record. The appearance of the velocity and displace-ment records suggests that some changes in the relative zerolevel of the accelerations are responsible for these drifts.These changes, although very small in acceleration, will pro-duce large unrealistic displacements derived from the accel-erations by double integration and make it difficult to re-cover permanent displacements from these digital records.In this study, we refer to the changes in the relative zerolevel of the accelerations as baseline offsets. High-dynamic-range, broadband, high-resolution digital accelerogram re-cordings from strong earthquakes have the potential to yieldground displacements accurately over a wide range of fre-quencies in theory, including those so low that the displace-ments give the residual, static deformation following anearthquake (called “residual displacement” by Graizer,1979). The long-period information is of interest to seis-mologists for unravelling the dynamic process of fault rup-ture and may be of interest to engineers for designing largestructures with very-long-period response.
As far as we know, a robust procedure for the correctionof the baseline offsets that can be applicable to digital strong-motion recordings has not been proposed. To develop sucha procedure, the specific sources of the baseline offsets mustbe understood. Among the 441 accelerographs are 22 Tele-dyne Geotech A-800–A-900A pairs installed at the samesite. Comparisons of these colocated records are helpful inunderstanding the problem of baseline offsets occurring innear-fault records of this event (e.g., Boore, 2001). As oneway of contributing to this understanding, we compare care-fully the records from three colocated instruments HWA(A-800), HWA019(A-900A), and HWA2(A-900A) installed atthe Hualien seismic station. In addition, records from twostations (HWA013[A-900] and HWA014[A-900]) that arerelatively very close to the Hualien seismic station are alsoanalyzed. The locations of the sites are shown in Figure 1.
Many researchers have studied the problem of baselineoffsets on records from digital instruments (e.g., Amini andTrifunac, 1985; Novikova and Trifunac, 1992; Chiu, 1997,2001; Boore, 1999, 2001; Wang, 2001; Shakal and Petersen,2001; Trifunac and Todorovska, 2001). These offsets havebeen attributed to a number of sources, such as electricalor mechanical hysteresis in the sensor (Iwan et al., 1985;Shakal and Petersen, 2001), misalignment and cross-sensi-tivity of transducers (Wong and Trifunac, 1977; Todorovskaet al., 1995; Todorovska, 1998), distortions produced by theanalog-to-digital conversion (Boore, 2003), electronic 1/fnoise (J. Evans, oral comm., 2002), and ground tilt and ro-tation (e.g., Bradner and Reichle, 1973; Trifunac and To-dorovska, 2001). Boore (2001) argued that similar trends
in the displacements from two colocated instruments,TCU129(A-900A) and WNT(A-800) (at a station with adistance-to-fault surface of 2.21 km), triggered by the Chi-Chi mainshock were evidence for permanent ground tilt, andthat this caused the baseline offsets at this station. If it isassumed that the baseline offset occurs as a single step, asimple correction can be used based on fitting the linear trendin velocity, after the portion of strong shaking, with a straightline, and then subtracting the slope of the fitted line fromthe acceleration starting at the time at which the line inter-sects the zero axis of the velocity trace (Boore 2001; Shinet al., 2001; Wang, 2001; Wang et al., 2001). Applicationsof this correction scheme to records with strong shakingclose to the fault rupture often result in reasonable displace-ment traces. The baseline offsets can be quite large (on theorder of 1 cm/sec2) and may be associated with ground tiltor ground deformation (F. Wu, oral comm., 2001), in whichcase they are signals rather than systematic noise. Our studyshows that baseline offsets can also occur even for relativelyweak motions, and that the simple correction just mentionedcannot remove the baseline offsets. A combination of effectsmight be related to the level of shaking and to properties ofthe instrument. The latter is what probably occurred on mostof the records that we have studied, and indicates the levelof “random” or aleatory uncertainty in the very-long-perioddisplacements. In this article we present a detailed study ofrecords from colocated and closely located instruments toexplore further the sources causing the baseline offsets.
Data Sources and Processing
Except as discussed later, the data we used came fromLee et al. (2001a). The A-800 accelerograph is a 12-bit dig-ital data recorder and contains three Geotech model S-110accelerometers mounted orthogonally inside a cast alumi-num base. The accelerographs are equipped with piezoelec-tric transducers with a low-cut frequency of 0.02 Hz; in ad-dition, the datalogger includes a 0.1-Hz low-cut filter (J.Kerr, oral comm., 2001; W. H. K. Lee, written comm., 2001).Data are stored in Complementary Metal Oxide Semi-conductor (CMOS) static random access memory (RAM) usinga nondistorting format without data compression. The A-900instruments are upgraded with 16-bit resolution, new Geo-tech DC Force Balanced Accelerometers (FBA), and the ca-pability to use a Global Positioning System (GPS) receiverfor time synchronization. The important differences betweenthe A-900/A and A-800 models are that the A-900 modeluses a Geotech model S-220 FBA, which has a flat responseto DC and does not include a low-cut filter. The A-900Aaccelerograph is an improved version of the A-900, whichhas the following two additional features: it is submersibleto 2 m, and it has a real-time digital data stream in U.S.Geological Survey (USGS) Real-Time Digital TelemetrySystem format. On the A-900 and A-900A instruments, aGPS-1 receiver can be used to synchronize the internal tim-ing (http://www.geoinstr.com/A-900.htm). The dynamic

676 G.-Q. Wang, D. M. Boore, H. Igel, and X.-Y. Zhou
Figure 1. Map showing the locations of accelerographs mentioned in this article. (a) Thestar indicates the epicenter of the Chi-Chi mainshock, and the line represents the causativeChelungpu fault. The solid triangles represent the 441 accelerographs (two are on the smallislands off the main island) for which records were released by the CWB (Lee et al., 1999,2001a). The solid circles represent the 22 colocated A-800–A-900A pairs, for which loca-tions and recorded peak ground accelerations (PGAs) are listed in the Appendix. The flagmarks the Hualien GPS station. (b) The enlargement around the Hualien seismic station.Two A-900A (HWA019 and HWA2) and one A-800 (HWA) accelerographs were installedat the Hualien seismic station, along with one GPS instrument. The coseismic displacementsobtained from the GPS measurements are �0.8 � 0.9 cm, 3.7 � 0.3 cm, and �21.3 �0.3 cm for the north–south, and east–west components, respectively (Yu et al., 2001). Thehorizontal distance between the Hualien station and the HWA013 station is 1.45 km, betweenthe Hualien station and the HWA014 (A-900) station is 0.72 km, and between the HWA013(A-900) station and HWA014 station is 1.0 km.
ranges (� 20 log [Amax/Amin], where Amax and Amin are thelargest and smallest amplitudes that can be recorded) of theA-800 and A-900/A accelerographs equal 72 dB and 92 dB,respectively. The data resolutions are 0.489 and 0.0598 Gal/count for the 12-bit A-800 and the 16-bit A-900/A acceler-ographs (Liu et al., 1999). Some physical parameters of theA-800 and A-900/A models are listed in Table 1.
All of the A-800 and A-900/A accelerographs havethree channels, and the trigger algorithm allows a thresholdsetting for individual channels. In practice, however, a com-mon triggering mechanism is used for the three channels,and all three channels are recorded at the same time(W. H. K. Lee, written comm., 2001). Both the A-800 andA-900/A models use a trigger algorithm and a buffer, so that
the pretrigger part of the ground motion is captured, whichis very important for accurately obtaining the zero referencelevel of accelerogram. Only a fraction of the CWB free-fieldaccelerographs are equipped with a GPS timing device, andthe timing for most of the strong-motion records is based onthe accelerograph’s internal clock, which may not be syn-chronized to UT. The five instruments studied in this articlewere not equipped with GPS units. To make detailed com-parisons of the ground accelerations, velocities, and dis-placements, it is necessary to provide a common time basefor all of the records. Time corrections were determined formost of the records of this event by Lee et al. (2001a), andthe results were used in this research. Basic information re-garding records used in this article, including the accelero-

Some Observations on Colocated and Closely Spaced Strong Ground-Motion Records of the 1999 Chi-Chi, Taiwan Earthquake 677
Table 2Basic Information of Records Studied in This Article (Lee et al., 2001a)
StationSite Condition
(NEHRP)Lat.(�N)
Long.(�E)
Elevation(m)
Epdist.(km)*
Drup†
(km)
Corrected RecordStart Time(UT, h:m:s)
CorrectedP-Arrival Time
(UT, h:m:s)
Pre-eventPortion
(sec)
Length ofRecord(sec)
InstrumentModel
HWA D 23.977 121.605 16 83 54.47 17:47:28.956 17:47:31.381 2.425 103 A-800HWA2 D 23.977 121.605 16 83 54.47 17:47:16.481 17:47:31.381 14,900 133 A-900AHWA019 D 23.977 121.605 16 83 54.47 17:47:16.143 17:47:31.381 15.239 133 A-900AHWA013 D 23.978 121.591 9 81.6 53.08 17:47:15.104 17:47:31.159 16.655 134 A-900HWA014 D 23.973 121.599 3 82.4 54.02 17:47:17.744 17:47:31.279 13.535 131 A-900
*Epdist, distance (km) from Chi-Chi epicenter (23.8603� N, 120.7995� E).†Drup, the shortest distance between the station and the fault rupture surface.
Table 1Characteristics of A-800 and A-900/A Type Accelerographs (Liu et al., 1999)
Model ResolutionFull
ScaleDigital Counts
(cnt) Dynamic RangeSampling Rate
(sps) Memory
A-800 12-bit 1 g 2,048 cnt/g 72 dB 200 1 MBA-900/A 16-bit 2 g 32,768 cnt/g 92 dB 200 8 MB
1 10 100-70
-35
0
35
70
Drup (km)
Dif.
ofco
loca
ted
PG
A(c
m/s
2 )UPNSEW
Dif. of PGA =A900A - A800
Figure 2. Differences (Dif.) of peak ground ac-celerations (PGAs) recorded by the 22 colocated A-900A–A-800 accelerographs. The ordinate representsthe difference of PGAs recorded by colocated A-900A and A-800 instruments; the abscissa representsthe shortest distance from the station to the fault rup-ture surface. The different marks in the figure repre-sent the different components of ground motions.
graph locations, distance to epicenter and rupture, absoluteUT of the record start and P-arriving, record length, andinstrument models, are listed in Table 2.
A preliminary baseline correction has been applied toall acceleration records used in this study by removing themean determined from a segment of the pre-event portionof the original record from the whole original record—thisguarantees that the velocity will be practically zero near thebeginning of the record. For simplicity of expression, theresulting accelerations are called “uncorrected” accelera-tions, although an initial correction has been applied. In turn,velocities and displacements obtained by single and doubleintegration of the uncorrected accelerations are called un-corrected velocities and uncorrected displacements, respec-tively.
Study of Records from Colocated Instruments
An indication that there are systematic differences be-tween the A-800 and A-900A records comes from the dif-ferences of peak ground accelerations (PGAs) from the 22colocated A-800 and A-900A instruments. The specific in-formation for the 22 pairs is listed in the Appendix. Figure2 illustrates the differences of PGAs recorded by the 22 co-located A-900A and A-800 records. The peak accelerationsfor the A-800 instruments tend to be smaller than those fromthe A-900A instruments. Note that the filter used withinA-800 models is a 0.1-Hz low-cut filter, which has nearlyno effect on PGA theoretically. We have made a more de-tailed study of the records from the three colocated instru-ments at the Hualien seismic station. This station is classifiedas a soil site, National Earthquake Hazards Reduction Pro-gram (NEHRP) class D (Building Seismic Safety Council,1998; Lee et al., 2001d), with a distance to the epicenter of
83 km. The instruments HWA(A-800) and HWA019(A-900A) were bolted down to a single concrete seismic pierstrictly according to the manufacturer’s specifications. Thesurface size of the seismic pier is 2.0 m by 3.0 m, with aheight of 0.6 m. The HWA2(A-900A) instrument was a unitthat was deployed in the Hualien station temporarily andhappened to record the Chi-Chi event. It was not bolteddown at the time of the Chi-Chi event. The HWA(A-800)and HWA019(A-900A) models were separated by about 1.0m, and the HWA2(A-900A) model was placed on the same

678 G.-Q. Wang, D. M. Boore, H. Igel, and X.-Y. Zhou
Figure 3. Comparison of the three-component ac-celeration time series obtained from the three colo-cated instruments HWA(A-800), HWA019(A-900A),and HWA2(A-900A). The mean determined from asegment of the pre-event portion of the original recordwas removed from the whole record. These recordsare aligned according to the corrected record starttimes (absolute UT, listed in Table 2).
seismic pier (W. H. K. Lee, written comm., 2001, 2002). AGPS instrument was also installed at the Hualien seismicstation. The coseismic displacements estimated from the GPSmeasurements are �0.8 � 0.9 cm, 3.7 � 0.3 cm, and �21� 0.3 cm for the up–down (negative represents the downdirection), north–south (positive represents the north direc-tion), and east–west (negative represents the west direction)components, respectively (Yu et al., 2001).
Figure 3 illustrates the uncorrected accelerations of thethree colocated instruments HWA(A-800), HWA019(A-900A), and HWA2(A-900A). Unless indicated otherwise, allof the time series illustrated in this study are aligned ac-cording to the corrected absolute start times (UT) of the rec-ords, as given in Table 2. The acceleration time series of thetwo A-900A instruments (HWA019, HWA2) coincide well inboth the amplitude and phase during the whole time seriesaccording to our careful observations of the superimposedaccelerograms. Some striking differences, however, are ap-parent by visual comparison without overlay between the A-800 and A-900A accelerograms for all three components,particularly for long-period components. Note again that theaccelerations of the A-800 have been filtered with a 0.1-Hzlow-cut filter within the instrument. Figure 4 illustrates thedifferences of the accelerograms of the east–west compo-nents of HWA019 and HWA2. Before calculating the differ-ences, the first 62 points (or 62/200 � 0.32 sec) of HWA019-EW have been cut off so that the two traces are alignedaccording to the time corresponding to the PGA. The dif-ference trace oscillates around the relative zero level andperfectly mimics the accelerograms in the individual timeseries. This implies that there are some small differences inthe gains of the two A-900A instruments.
Integrating to velocity and displacement provides a wayof comparing the longer period components of motion. Theresults are shown in Figure 5. At a sufficiently long timeafter the strong shaking, the ground velocities should oscil-late at about the zero level and be essentially zero (the shak-ing has ceased), and the displacement-time series should beconstant and equal to the permanent displacement producedduring the earthquake. However, what we see as a digital“record” is not the actual time series of the ground acceler-ations, but the response or output of the accelerograph to theinput motions, in combination with systematic errors. Asillustrated in Figure 5, our expectations of what the groundmotion should be are not met for the colocated records atHualien station; the latter portions of velocities do not os-cillate around the zero level, and the displacements for allrecords show no signs of leveling off at the end of the rec-ords (at a time well beyond the expected duration of strongshaking), particularly for the traces of the A-800 instrument.These problems are due to what we call baseline offsets—small changes in the reference level of the accelerograms.Baseline offsets occur in both the A-800 and A-900A rec-ords, but they seem more severe for the A-800 records. Be-cause the HWA2(A-900A) instrument was not bolted down,we can not eliminate the possibility that some small slipping

Some Observations on Colocated and Closely Spaced Strong Ground-Motion Records of the 1999 Chi-Chi, Taiwan Earthquake 679
-150
0
150
Uncorrected acceleration: HWA019-EWa)
-150
0
Acc
eler
atio
n(c
m/s
2 )
Uncorrected acceleration: HWA2-EWb)
10 20 30 40 50 60 70 80 90 100-8
-4
0
4
Time (s)
Difference: HWA019-HWA2c)
Figure 4. Acceleration time series and differences of the time series for the east–west components of records from colocated instruments HWA019 (A-900A) andHWA2(A-900A). (a) Acceleration time series of HWA019-EW. (b) Acceleration timeseries of HWA2-EW. (c) Differences of the two accelerograms: HWA019–HWA2. Theaccelerograms have been aligned such that the peak acceleration occurs at the sametime; this was accomplished by deleting the first 62 points (0.32 sec) of HWA019-EW.
or rotation occurred for this instrument during the shock,which could lead to an offset of the baseline. Because thestation is far from the epicenter (the epicentral distance is83 km) and the ground motions at this site were not verystrong (up, 47.7 cm/sec2; north–south, 132.2 cm/sec2; east–west, 129.0 cm/sec2), however, we think that the possibleslipping or rotation of the instrument would have been verysmall, if it occurred at all. At present, further research on thepossible slipping or rotation is nearly impossible. Hence, wewill not discuss the possible slipping or rotation of HWA2in the following analysis.
The previous observations are consistent with accumu-lating experience that the outputs of high-quality digitalinstruments are often plagued by baseline problems (e.g.,Boore, 2001; Boore et al., 2002; Wang, 2001; Wang et al.,2001). The differences in the trends of the displacements forthe same component of motion on the three colocated in-struments indicate that the baseline offsets are not the samefor all instruments, as would be the case if the offsets arecaused by ground rotation or ground tilt, either transient orpermanent (Trifunac and Todorovska, 2001), which suggeststhat the source of the baseline offsets must be internal toeach instrument. The trends in the displacement records fromthe A-800 instrument imply a significant amount of long-period energy in the record. This apparent energy was prob-ably introduced into the record during or after the analog-to-digital (A/D) conversion and not from actual motion ofthe ground, indicating that the problem is in the datalogger.
We are fairly certain of this because the A-800 instrumentuses a low-cut piezoelectric transducer and also includes a0.1-Hz low-cut filter before the A/D conversion (J. Kerr, oralcomm., 2001; W. H. K. Lee, written comm., 2001); we as-sume that electronic noise in the filters is small enough notto produce the long-period trends.
The latter portions of the velocity traces of the up andnorth–south components of the HWA(A-800) instrumenthave the form of a constant step with an amplitude of about3 cm/sec occurring at about 45 and 65 sec, respectively (Fig.5a,c). Such a step could be produced by a short-lived, pulse-like offset in the baseline of the acceleration trace; this wouldgive an unrealistic displacement that grows linearly withtime at the end of record (Fig. 5b,d). The east–west com-ponent velocity trace of the A-800 instrument tends to di-verge from velocity traces of the A-900 instruments evenstarting from the initial arrival time (Fig. 5e). The velocitytraces from the two A-900A recordings show almost no dif-ferences for the UP and NS components (Fig. 5a,c), and onlyslight differences in the amplitudes for the EW componentat times after the strong shaking has ceased (Fig. 5e). Al-though the differences in the velocity traces of the two A-900A models are slight, however, the very small differencesare enlarged in the displacement traces. The displacementtraces from the both A-900A instruments tend to divergeeven starting from the initial arrival time, and significantdivergences occur after about 50 sec (Fig. 5b,d,f).
Estimates of the coseismic displacement calculated

680 G.-Q. Wang, D. M. Boore, H. Igel, and X.-Y. Zhou
0 20 40 60 80 100 120 140-20
-10
0
10
20
Vel
ocity
(cm
/s)
HWA(A-800)HWA019(A-900A)HWA2(A-900A)
a) UP component
0 20 40 60 80 100 120 140-120
-90
-60
-30
0
30
Dis
plac
emen
t(cm
)
GPS-coseismic displacementHWA(A-800)HWA019(A-900A)HWA2(A-900A)
b) UP component
0 20 40 60 80 100 120 140-20
-10
0
10
20
Vel
ocity
(cm
/s)
c) NS component
0 20 40 60 80 100 120 140-90
-60
-30
0
30
60
Dis
plac
emen
t(cm
)
d) NS component
0 20 40 60 80 100 120 140-20
-10
0
10
20
Time (s)
Vel
ocity
(cm
/s)
e) EW component
0 20 40 60 80 100 120 140-60
-30
0
30
60
90
Time (s)
Dis
plac
emen
t(cm
)
f) EW component
Figure 5. Comparison of uncorrected velocities and displacements of the three co-located instruments HWA(A-800), HWA019(A-900A), and HWA2(A-900A). The un-corrected velocities and displacements were obtained by single and double integrationof uncorrected accelerations. The GPS estimates of the coseismic displacements (heavydashed lines) are obtained from a GPS instrument colocated with the accelerographs(Yu et al., 2001).

Some Observations on Colocated and Closely Spaced Strong Ground-Motion Records of the 1999 Chi-Chi, Taiwan Earthquake 681
0.01 0.1 1 100.01
0.1
1
10
100
Fou
rier
acce
lera
tion
spec
tra
(cm
/s)
UP componentHWA2(A-900A)HWA019(A-900A)HWA(A-800)
0.01 0.1 1 100.01
0.1
1
10
100
Fou
rier
acce
lera
tion
spec
tra
(cm
/s)
NS componentHWA2(A-900A)HWA019(A-900A)HWA(A-800)
0.01 0.1 1 100.01
0.1
1
10
100
Frequency (Hz)
Fou
rier
acce
lera
tion
spec
tra
(cm
/s)
EW componentHWA2(A-900A)HWA019(A-900A)HWA(A-800)
Figure 6. Fourier acceleration frequency spectracalculated from the uncorrected accelerations re-corded by the three colocated instruments HWA(A-800), HWA019(A-900A), and HWA2(A-900A).
from the colocated GPS measurements are also illustrated inFigure 5. We say “estimates” because the values were ob-tained as the difference in GPS measurements made one daybefore and one day after the Chi-Chi mainshock (the HualienGPS station is a continuously recording GPS station) (S.-B.Yu, written comm., 2001). The values must contain pre- andpostseismic motions, as well as coseismic motion. Thepostseismic motion could be influenced by fault creep afterthe mainshock and permanent displacements produced by alot of aftershocks. Shortly after the mainshock (17:47, 20September 1999), a series of large- and moderate-magnitudeaftershocks occurred, e.g., aftershocks at 17:57 (mL 6.4),18:03 (mL 6.6), 18:21 (mL 5.2), 18:32 (mL 5.1), 18:34 (mL
4.9), 19:40 (mL 5.3), 19:57 (mL 5.2), 20:21 (mL 5.2), 21:27(mL 5.0), 21:46 (mL 6.6) of 20 September 1999 (Lee et al.,2001b,c). In just the first 6 hr after the mainshock, thousandsof aftershocks occurred and generated about 10,000 records(Lee et al., 2001c). According to the work of Yu et al.(2001), the preseismic and postseismic displacements ofthese events are insignificant compared with the displace-ments produced during the mainshock, particularly for sitesfar from the causative fault. Considering that the Hualienstation is far from the epicenter of this event (the epicentraldistance is 83 km), we assume that the GPS measurementsare a good estimate of the actual coseismic motion, and fromnow on we will refer to the GPS values as “coseismic” dis-placements without qualification. It can be seen from Figure5 that all of the final displacements integrated from accel-eration time series are much larger than the correspondingcoseismic displacements, particularly for the A-800 records.
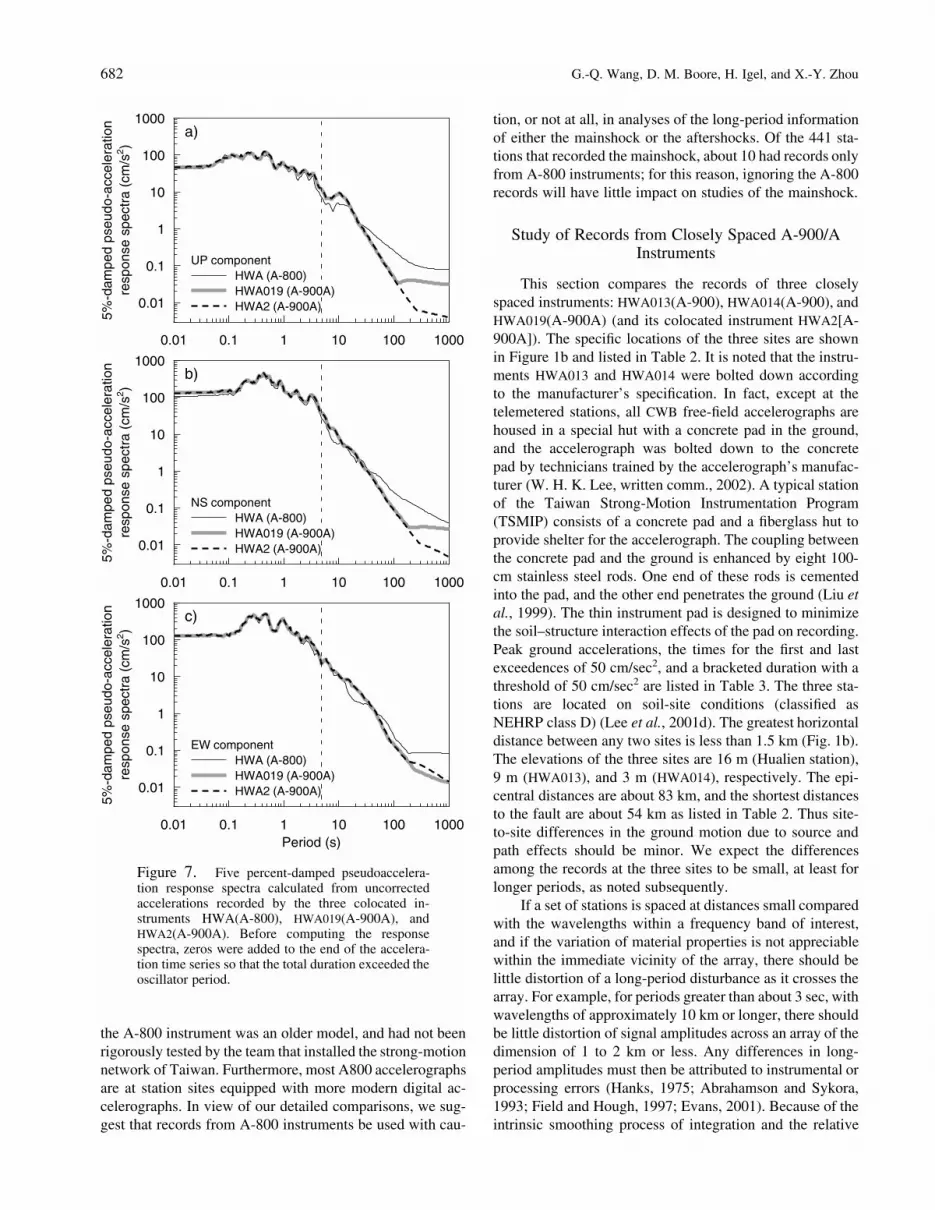
For further analysis of the difference in the amplitudeand frequency content of the three colocated records, westudied their Fourier spectra and response spectra. Figures 6and 7 show the Fourier acceleration spectra and the 5%-damped pseudoacceleration response spectra obtained fromthe uncorrected accelerations of the three colocated instru-ments, respectively. The Fourier spectra from the two A-900A models agree well with one another for frequenciesgreater than 0.01 Hz for the east–west component and 0.02Hz for the up–down and north–south components. There aresignificant differences between Fourier acceleration spectraof the A-800 and A-900A models for frequencies less than0.1 Hz, however. This is partially because of the 0.1-Hz low-cut filtering within the A-800 model. To capture the differ-ences caused by the drifts in the displacements, the responsespectra have been computed for oscillator periods up to 1000sec (before computing the response spectra, enough zeroswere added to the end of the acceleration time series so thatthe total duration exceeded the oscillator period). The re-sponse spectra from the two A-900A records agree very wellfor periods less than 100 sec. The differences between theresponse spectra of A-900A and A-800 instruments begin toappear at periods as short as 5 sec (Fig. 7a,b), however. Thatmeans the bandwidth of the A-800 model is very limited.
These comparisons of the three colocated records in ac-celerations (Figs. 2 and 3), velocities and displacements (Fig.
5), Fourier spectra (Fig. 6), and response spectra (Fig. 7)suggest that there are some problems with the response andcalibration of the A-800 type accelerographs. The analysisdiscussed in the preceding paragraph seems to confirm theadvice of the publishers of the Chi-Chi data—“users are ad-vised not to use the A-800 accelerograph records” (Lee etal., 2001a). This caution was not based on detailed compar-isons such as we have shown here, but rather on the fact that
682 G.-Q. Wang, D. M. Boore, H. Igel, and X.-Y. Zhou
0.01 0.1 1 10 100 1000
0.01
0.1
1
10
100
1000re
spon
sesp
ectr
a(c
m/s
2 )5%
-dam
ped
pseu
do-a
ccel
erat
ion
UP componentHWA (A-800)HWA019 (A-900A)HWA2 (A-900A)
a)
0.01 0.1 1 10 100 1000
0.01
0.1
1
10
100
1000
resp
onse
spec
tra
(cm
/s2 )
5%-d
ampe
dps
eudo
-acc
eler
atio
n
NS componentHWA (A-800)HWA019 (A-900A)HWA2 (A-900A)
b)
0.01 0.1 1 10 100 1000
0.01
0.1
1
10
100
1000
resp
onse
spec
tra
(cm
/s2 )
Period (s)
5%-d
ampe
dps
eudo
-acc
eler
atio
n
EW componentHWA (A-800)HWA019 (A-900A)HWA2 (A-900A)
c)
Figure 7. Five percent-damped pseudoaccelera-tion response spectra calculated from uncorrectedaccelerations recorded by the three colocated in-struments HWA(A-800), HWA019(A-900A), andHWA2(A-900A). Before computing the responsespectra, zeros were added to the end of the accelera-tion time series so that the total duration exceeded theoscillator period.
the A-800 instrument was an older model, and had not beenrigorously tested by the team that installed the strong-motionnetwork of Taiwan. Furthermore, most A800 accelerographsare at station sites equipped with more modern digital ac-celerographs. In view of our detailed comparisons, we sug-gest that records from A-800 instruments be used with cau-
tion, or not at all, in analyses of the long-period informationof either the mainshock or the aftershocks. Of the 441 sta-tions that recorded the mainshock, about 10 had records onlyfrom A-800 instruments; for this reason, ignoring the A-800records will have little impact on studies of the mainshock.
Study of Records from Closely Spaced A-900/AInstruments
This section compares the records of three closelyspaced instruments: HWA013(A-900), HWA014(A-900), andHWA019(A-900A) (and its colocated instrument HWA2[A-900A]). The specific locations of the three sites are shownin Figure 1b and listed in Table 2. It is noted that the instru-ments HWA013 and HWA014 were bolted down accordingto the manufacturer’s specification. In fact, except at thetelemetered stations, all CWB free-field accelerographs arehoused in a special hut with a concrete pad in the ground,and the accelerograph was bolted down to the concretepad by technicians trained by the accelerograph’s manufac-turer (W. H. K. Lee, written comm., 2002). A typical stationof the Taiwan Strong-Motion Instrumentation Program(TSMIP) consists of a concrete pad and a fiberglass hut toprovide shelter for the accelerograph. The coupling betweenthe concrete pad and the ground is enhanced by eight 100-cm stainless steel rods. One end of these rods is cementedinto the pad, and the other end penetrates the ground (Liu etal., 1999). The thin instrument pad is designed to minimizethe soil–structure interaction effects of the pad on recording.Peak ground accelerations, the times for the first and lastexceedences of 50 cm/sec2, and a bracketed duration with athreshold of 50 cm/sec2 are listed in Table 3. The three sta-tions are located on soil-site conditions (classified asNEHRP class D) (Lee et al., 2001d). The greatest horizontaldistance between any two sites is less than 1.5 km (Fig. 1b).The elevations of the three sites are 16 m (Hualien station),9 m (HWA013), and 3 m (HWA014), respectively. The epi-central distances are about 83 km, and the shortest distancesto the fault are about 54 km as listed in Table 2. Thus site-to-site differences in the ground motion due to source andpath effects should be minor. We expect the differencesamong the records at the three sites to be small, at least forlonger periods, as noted subsequently.
If a set of stations is spaced at distances small comparedwith the wavelengths within a frequency band of interest,and if the variation of material properties is not appreciablewithin the immediate vicinity of the array, there should belittle distortion of a long-period disturbance as it crosses thearray. For example, for periods greater than about 3 sec, withwavelengths of approximately 10 km or longer, there shouldbe little distortion of signal amplitudes across an array of thedimension of 1 to 2 km or less. Any differences in long-period amplitudes must then be attributed to instrumental orprocessing errors (Hanks, 1975; Abrahamson and Sykora,1993; Field and Hough, 1997; Evans, 2001). Because of theintrinsic smoothing process of integration and the relative

Some Observations on Colocated and Closely Spaced Strong Ground-Motion Records of the 1999 Chi-Chi, Taiwan Earthquake 683
Table 3Peak Ground Acceleration (PGA), T1, Tp and T2, and Duration of Studied Records
PGA (cm/sec2) T1 (sec)* Tp (sec)* T2 (sec)* Duration (sec)†
UP NS EW UP NS EW UP NS EW UP NS EW UP NS EW
HWA 42.590 �107.672 119.135 22.36 25.31 29.38 27.93 29.34 32.35 38.12 0.0 9.99 12.81HWA2 47.729 �132.190 129.080 35.22 37.22 42.04 40.59 42.05 46.40 51.84 0.0 11.18 14.63HWA019 46.792 �133.568 126.456 35.83 39.78 42.35 40.90 42.36 47.02 51.62 0.0 11.19 11.84HWA013 61.197 �114.156 139.727 42.67 40.15 40.59 42.69 41.64 42.48 42.70 45.96 52.58 0.03 5.81 11.99HWA014 �39.296 �90.113 101.545 37.87 38.35 38.75 42.66 39.91 45.99 48.39 0.0 8.12 10.04
*T1, Tp, and T2 represent the time that absolute value of acceleration first exceeded 50 cm/sec2, got the peak value (PGA), and finally exceeded 50 cm/sec2, respectively. The times are counted from the beginning of the record.
†Duration � T2–T1, a bracketed duration with a threshold of 50 cm/sec2.
increase in the long-period content of the time series, theground displacements should be more coherent than theground velocities, which in turn should be more coherentthan the ground accelerations. Because of this and the smallinterstation spacing, we assume that the actual ground dis-placements at all of the three closely spaced stations werenearly identical.
Figure 8 shows the uncorrected displacements of thefour A-900/A instruments. Calculations of the relative timedelays for P-wave arrivals between the three stations foundthat the delays were smaller than 0.3 sec; therefore, no cor-rection for these differences was made to align the traceswith one another. The graphs in the left column were pro-duced using the “official” distribution of Lee et al. (2001a).In preparing the official data Lee et al. removed from thewhole time series the DC offset computed from 1 sec afterthe start of the record to 1 sec before the P-wave arrival.They stored the DC-corrected data as integers, using a trun-cation subroutine to convert from floating point to integers(W. Lee, written comm., 2002). This procedure leads to asmall error in the data. For example, if the mean had been57.4 counts, a value of 58 counts would have been stored asint(58–57.4) � 0 rather than 58–57.4 � 0.6. After we re-alized this, we obtained from W. Lee (written comm., 2002)the data before the DC correction had been applied to see ifthe results of processing the two sets differed from one an-other. The uncorrected displacements of using these data areshown in the right column of Figure 8. Comparing the leftand right columns of Figure 8 shows that the displacementscan be markedly different. The overall conclusions to bediscussed next, however, are not affected by which set ofdata is used. We call the data from Lee et al. (2001a) the“2001CD” data, and those from W. Lee (written comm.,2002) without the DC offset correction, we call the“2001CDxmean” data (“xmean” � “without mean”). Boththe 2001CD and the 2001CDxmean data are given in digitalcounts, which we converted to acceleration units (cm/sec2)during our processing.
The displacement traces are slightly different from oneanother during the first 50 sec for all three components, par-ticularly for the displacements of the two colocated instru-ments. Beyond about 50 sec, however, the displacement
traces begin to diverge significantly. The trends in some dis-placement traces appear to be parabolic, suggesting a stepchange in the acceleration baseline, and some are nearly lin-ear, as would be caused by a short-duration pulse in theacceleration baseline. Moreover, the characteristics of thetrends (e.g., linear or nonlinear) are different for the samecomponents of the different instruments, as well as for thedifferent components of the same instrument. The form ofthe trend in displacement gives some information about thecause of the baseline offsets, but it does not provide enoughinformation to correct unambiguously for the baseline off-sets. We conclude that the baseline offsets strongly dependnot only on the instrument, but also on the particular com-ponent for each instrument. We also note that the differencesof the trends in the displacements of the EW components areeven larger for the colocated instruments (HWA019 andHWA2) than for the closely spaced, but not colocated instru-ments (HWA019 and HWA013, HWA019 and HWA014).
When we first prepared Figure 8, using only the2001CD data, we noticed that the EW displacements for thestations HWA019 and HWA013 are in close agreement forthe whole time series (Fig. 8e), even though the stations arenot colocated. We thought that this suggested a commonorigin for the baseline offsets and intepreted the lack ofcorrelation for other components to indicate that any non-instrumental offsets are often masked by instrument- andcomponent-specific baseline offsets. Unfortunately, the re-sults from the 2001CDxmean data no longer show agree-ment between the EW components at HWA013 and HWA019(Fig. 8f). Although we still believe that effects of true groundmotion can be masked by other effects, we cannot use thecomparisons in Figure 8e as evidence for the common originof some of the trends seen in displacements.
In an attempt to understand the differences in displace-ments for the 2001CD and 2001CDxmean data sets, we stud-ied the result of subtracting the acceleration time series forthe two data sets. An example is shown in Figure 9, forHWA019 EW. The top graph shows the difference of theacceleration times series straight from the datasets, beforeremoving the pre-event mean and converting to units of ac-celeration. The difference in the acceleration time series re-sembles noise randomly distributed between values of �0.5

684 G.-Q. Wang, D. M. Boore, H. Igel, and X.-Y. Zhou
-60
-30
0
30
60
902001CD data
Dis
plac
emen
t(cm
) a)UP component
-90
-60
-30
0
30
60
Dis
plac
emen
t(cm
) c)NS component
0 20 40 60 80 100 120 140-60
-30
0
30
60
90
Time (s)
Dis
plac
emen
t(cm
) e)EW component
2001CDxmean data
HWA013HWA014HWA019HWA2
b)UP component
HWA013HWA014HWA019HWA2
d)NS component
0 20 40 60 80 100 120 140
Time (s)
HWA013HWA014HWA019HWA2
f)EW component
Figure 8. Comparison of uncorrected displacements obtained from four closelyspaced instruments HWA013(A-900), HWA014(A-900), HWA019(A-900A), andHWA2(A-900A) (HWA2 and HWA019 are colocated). The displacements are obtainedfrom doubly integrated uncorrected accelerations. Note that traces are not adjusted fortravel-time differences. The results in the left and right columns were obtained from2001CD data (Lee et al., 2001a) and 2001CDxmean data supplied by W. Lee (writtencomm., 2002), respectively. (See text for more discussion.)

Some Observations on Colocated and Closely Spaced Strong Ground-Motion Records of the 1999 Chi-Chi, Taiwan Earthquake 685
0 20 40 60 80 100 120 140-251
-250
(cnt
)
(a)
Acc
eler
atio
n
HWA019-EW: 2001CDxmean-2001CD
50 55 60 65 70 75 80-0.035
0
0.035
(cm
/s2 )
(b)
Acc
eler
atio
n
0 20 40 60 80 100 120 140-5
0
5
10
15
(d)Time (s)
disp
lace
men
t(cm
) dis_doubly-integrated (b)dis_doubly-integrated (c)
50 55 60 65 70 75 80-0.035
0
0.035
(c)
(cm
/s2 )
Acc
eler
atio
n
Figure 9. An example of differences between2001CDxmean data and 2001CD data. (a) Accelera-tion differences of HWA019-EW betweenHWA2001CDxmean data and 2001CD data in digitalcounts (cnt), before our removal of pre-event means.(b) Differences of accelerations corresponding to thedisplacements (HWA019-EW) illustrated in Figure 8eand f in cm/sec2; the mean of the pre-event portion ofthe time series has been removed from the whole timeseries and to facilitate comparison with the next timeseries, only a part of whole time series is illustrated.(c) The time series in graph b after removing the over-all mean (0.0018 cm/sec2). (d) Solid line, displace-ments obtained from double integration of the randomnoise shown in graph b (dend � 13.5 cm); dashed line,displacements obtained from double integration of therandom noise after removing the overall mean of0.0018 cm/sec2 (graph c) (dend � �2.4 cm).
event means from each time series. The overall mean of thedifference is not quite 0.0. Removing the mean (0.0018 cm/sec2) results in the difference time series shown in Figure9c. The displacement discrepancies shown in Figure 8 be-tween the 2001CD and the 2001CDxmean datasets appar-ently comprise two parts: the double integration of zero-mean noise distributed between �0.5 counts (adouble-random walk), and the double integration of thesmall DC offset. The contributions of both of these is shownas the solid line in Figure 9d; the displacement is equal tothat computed from the left and right columns in Figure 8.The contribution of the zero-mean noise to the displacement(shown by the dashed line in Fig. 9d) is much smaller thanthe contribution of the small DC offset.
Similar analysis for the other time series shows in allcases that the displacement due to the double-random walkis smaller (usually much smaller) than the displacements dueto the nonzero DC offset. The small values for the final dis-placements due to the double-random walk process are con-sistent with theory. Boore et al. (2002) give the followingformula (A4 in their article) for the standard deviation of thefinal displacement (dend) produced by double integration ofrandom noise:
3T Dtr � r (1)d aend � 3
where T and Dt are the duration of record integrated and thetime spacing between samples, respectively, and ra is thestandard deviation of the noise process. For white noise ran-domly distributed between the two integer values �Q/2 and�Q/2, where Q is the quanta of acceleration correspondingto one digital count (0.06 cm/sec2 in our case), this is
r � Q/2 (2)a
Inserting appropriate numbers (T � 134, Dt � 0.005, Q �0.06 cm/sec2) into equation (1) gives � 1.9 cm, whichrdend
is much smaller than the differences in final displacementsfrom the left and right columns of Figure 8 (our numericalsimulations, not shown here, confirm the result of usingequations 1 and 2).
The source of the nonzero DC bias is not certain, but isprobably associated with the truncation process involved inthe removal of the DC offset in the 2001CD data, as dis-cussed earlier. Recall that the mean determined from the pre-event portions of both the 2001CDxmean and 2001CD data-sets has been removed, so some of the effect of truncationcontained in the 2001CD data has been taken into account.The remaining amount of DC is for the mean of the overalltime series and is not necessarily the same as that from thepre-event portion of the time series. We can conclude thatthe random errors introduced into the 2001CD data (Lee etal., 2001a) by the process of DC offset correction will notproduce large displacements, but that small systematic dif-
counts. Without the truncation operation used in producingthe 2001CD data, the difference in the acceleration time se-ries should be a constant equal to the DC correction. A por-tion of the difference time series is plotted in Figure 9b atan expanded timescale, after removing the mean of the pre-

686 G.-Q. Wang, D. M. Boore, H. Igel, and X.-Y. Zhou
0 20 40 60 80 100 120 140-80
-60
-40
-20
0
20
40
60
80
Time (s)D
ispl
acem
ent(
cm)
HWA013: EW componentusing computed mean (1s--15s): 0.814 cm/s2
using computed mean - 0.1Q: 0.808 cm/s2
using computed mean - 0.2Q: 0.802 cm/s2
using computed mean - 0.3Q: 0.796 cm/s2
(Q=0.06cm/s2, 1 digital count)
Figure 10. Displacements derived from theHWA013-EW accelerations for a series of means re-moved from the whole time series. The means includethe mean computed from the pre-event portion of theacceleration (from 1 to 15 sec), as well as that meanreduced by fractions of 0.1, 0.2, and 0.3 of one digitalcount (as given by the quanta Q, which is 0.06 cm/sec2 per count). The data used were provided by W.Lee (not the data from Lee et al., 2001a).
ferences in the overall mean resulting from the process willproduce a significant effect on displacements.
That the derived displacements can be very sensitive tosmall differences in baselines is obvious when consideringthat the final displacement produced by a shift of da is0.5daT2—a shift of only 0.1Q � 0.006 cm/sec2 (one tenthof a digital count) leads to a final displacement of 59 cm.We show this in Figure 10, which shows displacements ob-tained from 2001CDxmean acceleration data corrected usingthe mean computed from the pre-event portion of the data(the first arrival of the event is at 16.655 sec) and usingmeans that differ from that mean by 0.1, 0.2, and 0.3 digitalcounts. The differences in displacement trends are signifi-cant, which again emphasizes the difficulty in obtaining re-sidual displacements from digital data, at least from instru-ments with no more precision than 16 bits.
A proper model of the differences in the 2001CD and2001CDxmean data is probably more complicated than thesum of random errors plus a residual bias, and would requiremodeling the distortions caused by the analog-to-digital con-version (ADC) when applied to slowly varying signals. Thedifferences are probably related to the ADC applied to asignal with a mean level that may be between two digitalcounts, with added random noise. It is not our intention toexplain exactly why the results of the two datasets are dif-ferent, and the conclusions of our paper stand regardless ofwhich dataset is used. The results in the rest of the paperwere prepared using the 2001CD data from Lee et al.(2001a); similar results are obtained if the 2001CDxmeandata are used.
Figure 11 shows the 5%-damped pseudoacceleration re-sponse spectra of the three closely spaced records HWA013,HWA014, and HWA019. Because the response spectra of thetwo colocated records (HWA019 and HWA2) are similar forperiods to 100 sec (Fig. 7), the spectra of HWA2 are notshown in Figure 11. The spectra of different instrumentsoverlap between about 3 sec and 100 sec, as we would ex-pect given the similarity in the sites, the small distances be-tween stations, and the large source-to-site distances. Thedifferences at shorter periods might be due to differences inlocal-site response, and the differences for periods greaterthan about 100 sec reflect the dissimilar drifts in the dis-placements at long times.
Correcting for Baseline Offsets
The different characters of the drifts in displacements atlong times, even for the same component of motion, impliesthat the sources of the baseline offsets are a form of instru-ment “noise”; therefore, it will be difficult, if not impossible,to correct for the offsets so as to obtain the permanent dis-placements. Despite this, we note that the EW displacementfor HWA019 has an apparently linear trend for both the2001CD and the 2001CDxmean data (Fig. 8e,f), and we ex-plore here whether corrections can be made to recover thereal displacements of the east–west component. We con-
clude that the uncertainties in some of the essential correc-tion parameters make it impossible to recover the displace-ments in the absence of other information. We follow thatwork with a discussion of filtering the records to remove thelong-period components of motion. The displacements fromall of the A-900/A instruments are very similar if energy atfrequencies less than about 0.015 Hz is removed.
Linear trends can be produced by a short-duration pulsein accelerogram, whereas parabolic trends are produced bya step in the accelerogram time series. With this interpreta-tion, we have corrected the record of HWA019-EW by as-suming that a 1.0-sec pulse occurred in acceleration, withamplitude such that the area of the pulse equals the slope ofthe line fit to the displacement. Other pulse durations, suchas 0.5-, 1.5-, and 2.0-sec durations, give very similar resultsas long as the areas of the pulses are constant. A longerduration of the pulse corresponds to smaller amplitude. Fig-ure 12a illustrates the displacements integrated from cor-rected accelerations removing a 1-sec pulse at 20, 55, 65,and 80 sec, respectively. The time at which the pulse occursis a free parameter. As can be seen, the permanent displace-ment is highly sensitive to the location of the pulse. Placingthe pulse at 65 sec gives good agreement with the coseismic

Some Observations on Colocated and Closely Spaced Strong Ground-Motion Records of the 1999 Chi-Chi, Taiwan Earthquake 687
0.01 0.1 1 10 100 1000
0.01
0.1
1
10
100
1000re
spon
sesp
ectr
a(c
m/s
2 )5%
-dam
ped
pseu
do-a
ccel
erat
ion
UP componentHWA013 (A-900)HWA014 (A-900)HWA019 (A-900A)
a)
0.01 0.1 1 10 100 1000
0.01
0.1
1
10
100
1000
resp
onse
spec
tra
(cm
/s2 )
5%-d
ampe
dps
eudo
-acc
eler
atio
n
NS componentHWA013 (A-900)HWA014 (A-900)HWA019 (A-900A)
b)
0.01 0.1 1 10 100 1000
0.01
0.1
1
10
100
1000
resp
onse
spec
tra
(cm
/s2 )
Period (s)
5%-d
ampe
dps
eudo
-acc
eler
atio
n
EW componentHWA013 (A-900)HWA014 (A-900)HWA019 (A-900A)
c)
Figure 11. Five percent-damped acceleration re-sponse spectra calculated from the uncorrected accel-erations recorded by the three closely spaced (but notcolocated) instruments HWA013(A-900), HWA014(A-900), and HWA019(A-900A). The response spectra ofHWA2 are almost equal to those of HWA019 for pe-riods less than 100 sec and are not shown here. (SeeFig. 7 for a comparison over the whole period range.)Before computing the response spectra, zeros wereadded to the end of the acceleration time series so thatthe total duration exceeded the oscillator period.
ceased, we were concerned that the fitted line would be sen-sitive to the segment of the displacement used in the least-squares fit. We tested this by varying the start time of the fit(begin_fit) at 75, 80, 90, 100, and 110 sec, respectively; theslopes of the fitted lines are not sensitive to the line segmentused in the fit, and as a result, neither are the corrected dis-placements (Fig. 12b), mostly because the trend in thedisplacement-time series is linear and the slope is significant.
Another method for correcting of baseline offsets is ageneralization by Boore (1999, 2001) of one proposed byIwan et al. (1985), which assumes that shifts in the baselineoccur during some interval of strong shaking and can beaccounted for by a pulse followed by a step in acceleration(see Boore, 2001, figure 4 for an example). The duration andlocation of the pulse is specified by the first and last occur-rences of acceleration exceeding a threshold acceleration.Iwan et al. (1985) “option 1” used a threshold of 50 cm/sec2, based on the particular instrument that they studied.Because there is no reason to assume that this threshold ap-plies to the A-900 instruments, we used eight differentthresholds: 20, 30, 40, 50, 60, 70, 80, and 90 cm/sec2, re-spectively. The results are shown in Figure 13, which showsthat the correction is not very sensitive to the choice of theexceedence threshold (Fig. 13d). The corrections, however,are sensitive to the time interval used in determining thestraight-line fit, as seen by comparing graphs d and e ofFigure 13, which used 90-sec and 100-sec start times, re-spectively, for fitting the velocity time series. The sensitivityto the start time is due to several factors: 1) the method isbased on fitting a straight line to velocity rather than to dis-placement, as in the previous correction method (Fig. 12b),and the slope of the velocity is very small for the east–westcomponent of HWA019 (the least-squares fitted lines areshown in Fig. 13b,c), and 2) the higher frequency shakinghas not ceased, making the slope of the line fitted to velocitysensitive to the continued shaking superimposed on the over-all trend.
Both correction schemes (removing a pulse or removinga pulse followed by a step) can produce reasonable displace-ments that look similar, with a relatively constant displace-ment after the interval of strong shaking. There is no incon-sistency in this result. If the slope of the velocity later in therecord is very small, the difference between a parabola anda straight line in the displacement trace is not as pronouncedas it would be if the velocity slope were larger. For the samereason, the correction scheme assuming a linear trend, ratherthan a step in velocity (the method of Iwan et al., [1985],Fig. 13b,c), requires a pulse followed by a very small stepin acceleration, just as does the first correction (Fig. 12)method discussed previously. This is shown in Figure 14,which shows the baseline offsets of HWA019-EW corre-sponding to the two correction schemes considered here—removing a pulse (Fig. 14a) or removing a pulse followedby a step (Fig. 14b). Note the difference in scale for theordinate of Figure 14a,b (a factor of 5). In addition, note thesmall amplitudes of the pulses. The pulse heights could be
displacement. In many cases, however, closely spaced orcolocated stations and GPS station are not available; there-fore, there would be no control of the time at which the pulseoccurs. Because the higher-frequency shaking had not

688 G.-Q. Wang, D. M. Boore, H. Igel, and X.-Y. Zhou
20 40 60 80 100 120 140-50
-40
-30
-20
-10
0
10
Time (s)
Dis
plac
emen
t(cm
)Removing a 1-sec pulse at different times
GPS
tp=20s
tp=55s
tp=65s
tp=80s
uncorrected
begin_fit = 75 s (fit displacement)a)
HWA019-EW
20 40 60 80 100 120 140
Time (s)
Removing a 1-sec pulse at 65 s (fit displacement)
GPS
uncorrected
begin_fit = 75,80,90,100,110 s, respectivelyb)
HWA019-EW
Figure 12. Displacements for HWA019-EW, corrected by assuming a 1-sec pulse inthe acceleration baseline. (The area under the pulse produces a step in velocity thatcorresponds to the slope of a line fit to displacement.) (a) Removing a 1-sec pulse at20, 55, 65, and 80 sec, respectively. The area of the pulse is constant and equals theslope of the line fitting the displacements from 75 sec to end. (b) Removing a pulse at65 sec, where the size of the pulse depends on the beginning time used in the least-squares fitting. (The line was fit to the displacements from the beginning time, begin_fit,to the end of the record.)
reduced to a fraction of the indicated heights by increasingthe pulse duration to maintain the same area under thepulses. These pulses would be difficult to detect by lookingat the recorded acceleration time series—the pulses will notstand out as “spikes.” Displacements produced by the twobaseline correction schemes are shown in Figure 14c,d. Thetwo pulse-followed-by-a-step corrections produce very simi-lar displacements, which are roughly comparable with thedisplacement produced by the 1-sec pulse located at 65 sec.As shown earlier (Figs. 12a and 13d), the single pulse at65 sec and the two Iwan step–pulse corrections give reason-able displacements, which agree well with the coseismic dis-placement.
As we have shown, the problems of baseline offsetsgenerally manifest themselves at long periods. Hence, low-cut filtering is often used to minimize the effects of baselineoffsets (e.g., Trifunac, 1971; Converse, 1992; Chiu, 1997;Boore et al., 2002). Such a procedure, however, clearly pre-cludes extracting permanent displacement from the records.In this study, a series of low-cut filters were used to eliminatethe baseline offsets occurring in the records of the fourA-900/A instruments. Figure 15 shows the filtered displace-ment waveforms from the four instruments. A fourth-order,butterworth, causal, low-cut filter was used in this study. Theagreement between the ground displacements at the threestations has been considerably improved after the low-cutfiltering. As the corner frequencies of the filters are in-creased, the overall waveforms of the different componentsbecome more and more consistent. For the two colocatedrecords, a 0.005-Hz low-cut filter can eliminate most of the
differences in the overall character of displacement wave-forms; a 0.01-Hz low-cut filter produces close agreement forall but the north–south component from HWA013; and a0.015-Hz low-cut filter brings all of the traces into goodoverall agreement. Of course, low-cut filtering does notchange the relative differences at high frequencies, whichare particularly pronounced for the north–south component.The east–west component and, in particular, the up–downcomponent waveforms are in excellent agreement for all fre-quencies. An example of response spectra for the variouslow-cut filters is shown in Figure 16. Clearly, the responsespectra for periods of engineering concern (e.g., �20 sec)are not affected at all by the presence of the long-periodnoise.
By low-cut filtering with a filter corner of 0.015 Hz orhigher, baseline “errors” were eliminated, but of course theenergy content below 0.015 Hz was also cut off. We cannotsay, however, that the A-900/A instrument is incapable ofmaking useful recordings of motions at frequencies less thanabout 0.015 Hz; what is important is the relative amplitudeof the signal and the “noise”. Consider a baseline offsetgiven by a step in acceleration—its Fourier spectrum goesas 1/f , and therefore, in displacement the spectrum goes as1/f 3. So although the effect of the “noise” introduced by thebaseline offset exists at all frequencies, it is most importantat low frequencies. Whether the “noise” is important for anyparticular filter cutoff will depend on the amplitude of thesignal compared with the noise. A record close to the faultwill have a much larger long-period signal than one faraway. Therefore, we expect that the frequency at which the

Some Observations on Colocated and Closely Spaced Strong Ground-Motion Records of the 1999 Chi-Chi, Taiwan Earthquake 689
0 20 40 60 80 100 120 140
-150
-100
-50
0
50
100
150
Time (s)
Acc
eler
atio
n(c
m/s
2 )
_+ 20 cm/s2
_+ 90 cm/s2
HWA019-EW (uncorrected acceleration)a)
-20
-10
0
10
20
Vel
ocity
(cm
/s)
line fit from 90 s to end
HWA019-EW (uncorrected velocity)b)
0 20 40 60 80 100 120 140-60
-40
-20
0
20
Time (s)
Dis
plac
emen
t(cm
)
uncorrected
begin_fit =90s (fit velocity)
GPS
exceedance threshold = 20, 30,40,50,60,70,80,90cm/s2
d)Removing a pulse and its followed step
line fit from 100 s to end
HWA019-EW (uncorrected velocity)c)
0 20 40 60 80 100 120 140
Time (s)
uncorrected
begin_fit =100s (fit velocity)
GPS
Removing a pulse and its followed stepe)
Figure 13. Acceleration, velocity, and displacement time series for the HWA019-EW record, applying an Iwan et al. (1985) correction in which a baseline correspondingto a pulse followed by a step in acceleration is removed from the acceleration timeseries. Exceedance levels of 20, 30, 40, 50, 60, 70, 80, and 90 cm/sec2 were used.Graph a shows the 20 and 90 cm/sec2 levels. The velocities are shown in graphs b andc, along with the least-squares lines fit to the later portions of the velocity time series(as indicated on the graphs). The displacements are shown in graphs d and e.
noise overwhelms the signal will be smaller for stations closeto the fault than at distant stations.
Discussion and Conclusions
Modern digital instruments have the potential to recoverthe complete ground displacements from accelerometer rec-ords recorded close to large earthquakes, but baseline offsets
make it difficult, if not impossible, in many cases to do so.It has been recognized from the time that records from theChi-Chi mainshock were first available that baseline offsetsare common in most records of this event, including thoserecorded on 24-bit systems (e.g., Boore, 1999, 2001; Wang,2001; Wang et al., 2001). We also checked some recordsfrom aftershocks of this event released by the CWB (Lee etal., 2001b,c). Baseline errors are also present for these after-

690 G.-Q. Wang, D. M. Boore, H. Igel, and X.-Y. Zhou
shock records. Furthermore, baseline correction on after-shock records would be more difficult than that for themainshock records because the pre-event portion of theaftershock records contains motions from previous events ina lot of cases. Although we can say with certainty that base-line offsets are very common in the digital records, it is notclear whether the baseline offsets are due to somethingwithin the instruments or are the response to actual groundmotion, either elastic, such as rotations, or inelastic, such asslumping or differential compaction, or are result from acombination of sources internal and external to instrument.The observations in this study and our previous studies il-lustrate the difficulties in understanding the true sources ofthe baseline offsets occurring in many digital recordings.
For the records used in this study, we find that the base-line offsets differ for each component of an individual ac-celerograph. Hence, the offsets were most probably pro-duced by some intrinsic mechanism within the instrument,although we do not know the exact mechanism. Because of
the random nature of the baseline offsets, we cannot thinkof a universal correction scheme that can be applied to elim-inate the baseline offsets. We recommend low-cut filteringto reduce the effects of baseline offsets but with the resultingloss of information about the permanent displacements. Be-cause it seems that most often the source of the baselineoffsets is within the instruments, we hope that the manufac-turers will try to fix the problem so that analysis of futurerecordings can take full advantage of the resolution andbandwidth of the instruments. Another possibility is to fol-low the suggestion of Clinton and Heaton (2002) and usevelocity sensors rather than acceleration sensors to extractinformation at long periods.
Acknowledgments
We thank W. H. K. Lee for encouraging us in this study, for providingdata without the means being removed, and for supplying basic informationabout the Hualien seismic station. We also thank Shui-Beih Yu for supply-
0 20 40 60 80 100 120 140-0.5
-0.4
-0.3
-0.2
-0.1
0
0.1
Time (s)
Acc
eler
atio
n(c
m/s
2 )baseline corrections, removing a single1-sec pulse at 20s, 55s, 65s, and 80s, respectively.
a)
0 20 40 60 80 100 120 140-0.1
-0.08
-0.06
-0.04
-0.02
0
0.02
Time (s)
|A| = 20 cm/s2
|A| = 90 cm/s2
baseline corrections, Iwan et al., option 1.b)removing a pulse-step
|A| = exceedance threshold of acc.
0 20 40 60 80 100 120 140-60
-40
-20
0
20
Dis
plac
emen
t(cm
)
displacements integrated from the abovec) 1-sec pulses.
0 20 40 60 80 100 120 140-60
-40
-20
0
20
displacements integrated from the abovepulse-stepsd)
Figure 14. The baseline corrections used to produce the displacements shown inFigures 12 and 13. (a) The single pulses removed from the original baseline of accel-eration at 20, 55, 65, and 80 sec, respectively (Fig. 12a); (b) the pulse steps removedfrom the original baseline of acceleration (Fig. 13d); (c) displacements produced bythe pulses illustrated in graph a; (d) displacements produced by the pulse steps illus-trated in graph b.

Some Observations on Colocated and Closely Spaced Strong Ground-Motion Records of the 1999 Chi-Chi, Taiwan Earthquake 691
ing the coseismic displacement information. Discussions with John Evans,Chris Stephens, and Francis Wu were useful. The careful corrections andthoughtful suggestions of Chris Stephens, Chuck Mueller, and M. I. To-dorovska are deeply appreciated, as was the constructive review of oneanonymous reviewer. The Central Weather Bureau of Taiwan and W. H. K.Lee and colleagues deserve praise for funding, installing, and maintainingthe strong-motion network and for making the data from the mainshockfreely available soon after the earthquake. This research was partiallyfunded by the Natural Science Foundation of China under Project No.50178007. The first author wishes to acknowledge the German AcademicExchange Service (DAAD) for funding through the International QualityNetwork: Georisks (http://www.iqn-georisk.de).
References
Abrahamson, N. A., and D. Sykora (1993). Variations of ground motionsacross individual sites, in Proc. of the DOE Natural Phenomena Haz-ards Mitigation Conf., Atlanta, Georgia, 1 October 1993, 192–198.
Amini, A., and M. D. Trifunac (1985). Analysis of a force balance accel-erometer, Soil Dyn. Earthquake Eng. 4, 82–90.
Boore, D. M. (1999). Effect of baseline corrections on response spectra fortwo recordings of the 1999 Chi-Chi, Taiwan, earthquake, U.S. Geol.Surv. Open-File Rept. 99-545.
Boore, D. M. (2001). Effect of baseline correction on displacement andresponse spectra for several recordings of the 1999 Chi-Chi, Taiwan,earthquake, Bull. Seism. Soc. Am. 91, 1199–1211.
0 40 80 120-15
-10
-5
0
5
10
Dis
plac
emen
t(cm
)
HWA019(A-900A)HWA2(A-900A)HWA014(A-900)HWA013(A-900)
UP component
fourth-order causal
f_cut=0.005Hza)
Butterworth low-cut filter
0 40 80 120-20
-10
0
10
20
NS component
0 40 80 120
-20
0
20
40
EW component
0 40 80 120-15
-10
-5
0
5
10
Dis
plac
emen
t(cm
) f_cut=0.01Hzb)
0 40 80 120-20
-10
0
10
20
0 40 80 120
-20
0
20
40
0 40 80 120-15
-10
-5
0
5
10
Time (s)
Dis
plac
emen
t(cm
) c) f_cut=0.015Hz
0 40 80 120-20
-10
0
10
20
Time (s)
0 40 80 120
-20
0
20
40
Time (s)
Figure 15. The filtered three-component displacements obtained by integration ofthe accelerations recorded by the closely spaced instruments HWA013, HWA014,HWA019, and HWA2 (the latter two are colocated). A fourth-order butterworth causallow-cut filter was applied to the uncorrected accelerations. (a) 0.005-Hz low-cut filter;(b) 0.01-Hz low-cut filter; (c) 0.015-Hz low-cut filter.

692 G.-Q. Wang, D. M. Boore, H. Igel, and X.-Y. Zhou
0.01 0.1 1 10 100 1000
0.01
0.1
1
10
100
1000re
spon
sesp
ectr
a(c
m/s
2 )
Period (s)
5%-d
ampe
dps
eudo
-acc
eler
atio
n
HWA014: EW componentuncorrectedflc=0.005 Hzflc=0.010 Hzflc=0.015 Hz
Figure 16. Five percent-damped pseudoaccelera-tion response spectra calculated from the uncorrectedacceleration time series and a series of low-cut filteredacceleration time series (fourth-order butterworthcausal low-cut filter, fcut � 0.005, 0.010, and 0.015Hz) recorded by the EW component of HWA014 (A-900).
Boore, D. M. (2003). Analog-to-digital conversion as a source of drifts indisplacements derived from digital recordings of ground acceleration,Bull. Seism. Soc. Am. 93, (submitted for publication).
Boore, D. M., C. D. Stephens, and W. B. Joyner (2002). Comments onbaseline correction of digital strong-motion data: examples from the1999 Hector Mine, California, earthquake, Bull. Seism. Soc. Am. 92,1543–1560.
Bradner, H., and M. Reichle (1973). Some methods for determining accel-eration and tilt by use of pendulums and accelerometers, Bull. Seism.Soc. Am. 63, 1–7.
Building Seismic Safety Council (1998). 1997 Edition NEHPR Recom-mended Provisions for Seismic Regulations for New Buildings,FEMA 302/303, developed for the Federal Emergency ManagementAgency, Washington, D.C.
Chiu, H. C. (1997). Stable baseline correction of digital strong-motion data,Bull. Seism. Soc. Am. 87, 932–944.
Chiu, H. C. (2001). Recovery of coseismic ground motions with permanentdisplacement from the strong-motion data of the 1999 Chi-Chi, Tai-wan Earthquake (abstract), Seism. Res. Lett. 72, 235–236.
Clinton, J. F., and T. H. Heaton (2002). Potential advantages of a strong-motion velocity meter over a strong-motion accelerometer, Seism.Res. Lett. 73, 332–342.
Converse, A. M. (1992). BAP–Basic strong-motion accelerogram process-ing software; Version 1.0, U.S. Geol. Surv. Open-File Rept. 92-296A.
Evans, J. R. (2001). Wireless monitoring and low-cost accelerometers forstructures and urban sites, in Strong Motion Instrumentation for CivilEngineering Structures, Proc., NATO Advanced Research Workshop,Istanbul, 2–5 June 1999, M. Erdik, M. Celebi, and V. Mihailov (Ed-itors), Kluwer Academic Publishers, Netherlands, 229–242.
Field, E. H., and S. E. Hough (1997). The variability of PSV responsespectra across a dense array deployed during the Northridge after-shock sequence, Earthquake Spectra 13, 243–258.
Graizer, V. M. (1979). Determination of the true ground displacement byusing strong motion records, Bull. Acad. Sci. USSR Phys. Solid Earth15, 875–885.
Hanks, T. C. (1975). Strong ground motion of the San Fernando, California,earthquake: ground displacements, Bull. Seism. Soc. Am. 65, 193–235.
Iwan, W. D., M. A. Moser, and C.-Y. Peng (1985). Some observations on
strong-motion earthquake measurement using a digital accelerograph,Bull. Seism. Soc. Am. 75, 1225–1246.
Lee, W. H. K., T. C. Shin, K. W. Kuo, and K. C. Chen (1999). CWB Free-Field Strong-Motion Data from the 921 Chi-Chi Earthquake, Vol. 1.Digital acceleration files on CD-ROM, prepublication version, Seis-mology Center, Central Weather Bureau, Taipei, Taiwan, 6 December1999.
Lee, W. H. K., T. C. Shin, K. W. Kuo, K. C. Chen, and C. F. Wu (2001a).CWB Free-Field Strong-Motion Data from the 921 Chi-Chi Earth-quake: Processed Acceleration Files on CD-ROM, CWB Strong-Motion Data Series CD-001, Seismological Observation Center, Cen-tral Weather Bureau, Taipei, Taiwan, 31 March 2001.
Lee, W. H. K., T. C. Shin, and C. F. Wu (2001b). CWB Free-Field Strong-Motion Data from Three Major Aftershocks of the 1999 Chi-ChiEarthquake: Processed Acceleration Data Files on CD-ROM, CWB
Strong-Motion Data Series CD-002, Seismological Observation Cen-ter, Central Weather Bureau, Taipei, Taiwan, 28 August 2001.
Lee, W. H. K., T. C. Shin, and C. F. Wu (2001c). CWB Free-Field Strong-Motion Data from 30 Early Aftershocks of the 1999 Chi-Chi Earth-quake: Processed Acceleration Data Files on CD-ROM, CWB Strong-Motion Data Series CD-003, Seismological Observation Center,Central Weather Bureau, Taipei, Taiwan, 31 August 2001.
Lee, C. T., C. T. Cheng, C. W. Liao, and Y. B. Tsai (2001d). Site classi-fication of Taiwan free-field strong-motion stations, Bull. Seism. Soc.Am. 91, 1283–1297.
Liu K.-S., T.-C. Shin, and Y.-B. Tsai (1999). A free-field strong motionnetwork in Taiwan, TSMIP, Terr., Atmospher. Oceanic Sci. 10, 377–396.
Novikova E. I., and M. D. Trifunac. (1992). Digital instrument responsecorrection for the force-balance accelerometer, Earthquake Spectra8, 429–442.
Shakal, A. F., and C. D. Petersen (2001). Acceleration offsets in someFBA’s during earthquake shaking (abstract), Seism. Res. Lett. 72, 233.
Shin T.-C, K. W. Kuo, W. H. K. Lee, T.-L. Teng, and Y. B. Tsai (2000).A preliminary report on the 1999 Chi-Chi (Taiwan) earthquake,Seism. Res. Lett. 71, 24–30.
Shin, T. C., F. T. Wu, J. K. Chung, R. Y. Chen, Y. M. Wu, C. S. Chang,and T. L. Teng (2001). Ground displacements around the fault of theSeptember 20th, 1999, Chi-Chi Taiwan earthquake, Geophys. Res.Lett. 28, 1651–1654.
Todorovska, M. I., E. I. Novikova, M. D. Trifunac, and S. S. Ivanovic(1995). Correction for misalignment and cross axis sensitivity ofstrong earthquake motion recorded by SMA-1 accelerographs, Uni-versity of Southern California, Report No. CE 95-06, Los Angeles,California.
Todorovska, M. I. (1998). Cross-axis sensitivity of accelerographs withpendulum like transducers–mathematical model and the inverse prob-lem, Earthquake Eng. Struct. Dyn. 27, 1031–1051.
Trifunac, M. D. (1971). Zero baseline correction of strong-motion acceler-ograms, Bull. Seism. Soc. Am. 61, 1201–1211.
Trifunac, M. D., and M. I. Todorovska (2001). A note on the useable dy-namic range of accelerographs recording translation, Soil Dyn. Earth-quake Eng. 21, 275–286.
Wang, G.-Q. (2001). The characteristics of near-fault ground motion causedby the 1999, Chi-Chi, Taiwan earthquake, Ph.D. thesis, Institute ofGeology, China Seismological Bureau (in Chinese).
Wang, G.-Q, X. Y. Zhou, Z. J. Ma, and P. Z. Zhang (2001). Data files from“A preliminary study on the randomness of response spectra of the1999 Chi-Chi, Taiwan, Earthquake”, Bull. Seism. Soc. Am. 91, 1388–1389.
Wang, G.-Q, X. Y. Zhou, P. Z. Zhang, and H. Igel (2002). Characteristicsof amplitude and duration for near fault strong ground motion fromthe 1999 Chi-Chi, Taiwan, Earthquake, Soil Dyn. Earthquake Eng.22, 73–96.
Wong, H. L., and Trifunac, M. D. (1977). Effects of cross-axis sensitivityand misalignment on response of mechanical-optical accelerographs,Bull. Seism. Soc. Am. 67, 929–956.

Some Observations on Colocated and Closely Spaced Strong Ground-Motion Records of the 1999 Chi-Chi, Taiwan Earthquake 693
Yu, S.-B., L.-C. Kuo, Y.-J. Hsu, H.-H. Su, and C.-C. Liu (2001). Preseismicdeformation and coseismic displacements associated with the 1999Chi-Chi, Taiwan Earthquake, Bull. Seism. Soc. Am. 91, 995–1012.
AppendixTable A1
Peak Ground Accelerations Recorded by the 22 A-800–A-900A Pairs in the Chi-Chi Earthquake
StationSite
Class*Lat.(�N)
Long.(�E)
Elev.(km)
Epdist.†
(km)Drup.‡
(km)PGA UP(cm/sec2)
PGA NS(cm/sec2)
PGA EW(cm/sec2)
InstrumentModel
WNT D 23.8783 120.6843 0.11 11.9 2.21 �310.60 �602.00 �920.70 A-800TCU129 D 23.8783 120.6843 0.11 11.9 2.21 �335.00 �610.60 �982.90 A-900ATCU D 24.1475 120.676 0.084 34.2 4.47 �118.20 �186.60 �201.00 A-800TCU082 D 24.1475 120.676 0.084 34.2 4.47 �129.30 192.40 �221.00 A-900ANSY C 24.4162 120.7607 0.311 61.7 9.08 �84.20 �150.30 118.70 A-800TCU128 C 24.4162 120.7607 0.311 61.7 9.08 �90.38 �162.90 141.10 A-900AWGK D 23.6862 120.5622 0.075 30.9 13.31 175.60 446.00 337.80 A-800CHY101 D 23.6862 120.5622 0.075 30.9 13.31 162.10 390.10 �332.70 A-900AALS C 23.5103 120.8052 2.413 38.8 14.37 85.65 �145.50 212.90 A-800CHY074 C 23.5103 120.8052 2.413 38.8 14.37 101.30 158.50 234.60 A-900AWTP B 23.2455 120.6138 0.56 70.7 41.89 30.00 43.55 44.50 A-800CHY102 B 23.2455 120.6138 0.56 70.7 41.89 �23.15 48.45 40.49 A-900AESL D 23.8137 121.4328 0.178 64.7 44.71 56.45 72.25 �66.55 A-800HWA020 D 23.8137 121.4328 0.178 64.7 44.71 52.46 66.63 �56.58 A-900AWSF E 23.638 120.2217 0.006 63.8 47.71 32.06 66.99 �64.60 A-800CHY076 E 23.638 120.2217 0.006 63.8 47.71 31.40 �70.94 �68.61 A-900ANSK B 24.6755 121.3583 0.682 106.6 48.02 39.72 �53.59 �67.95 A-800TCU085 B 24.6755 121.3583 0.682 106.6 48.02 41.39 �52.34 �62.09 A-900ASTY B 23.1625 120.7573 0.64 77.4 50.29 �19.62 39.24 �36.37 A-800KAU050 B 23.1625 120.7573 0.64 77.4 50.29 22.97 37.14 �41.69 A-900AHSN D 24.8022 120.9695 0.034 105.7 53.16 �26.32 �79.91 54.07 A-800TCU081 D 24.8022 120.9695 0.034 105.7 53.16 �36.13 93.13 76.68 A-900AHWA D 23.977 121.605 0.016 83 54.47 42.59 �107.62 119.14 A-800HWA019 D 23.977 121.605 0.016 83 54.47 46.79 �133.57 126.46 A-900AHWA2 D 23.977 121.605 0.016 83 54.47 47.73 �132.19 129.08 A-900ASGS B 23.0817 120.5827 0.278 89 60.29 �19.14 �37.80 �28.23 A-800KAU047 B 23.0817 120.5827 0.278 89 60.29 20.28 �41.93 �32.60 A-900AENA B 24.428 121.7407 0.113 114.5 66.3 53.59 64.60 63.64 A-800ILA050 B 24.428 121.7407 0.113 114.5 66.3 53.35 62.81 �63.58 A-900ACHK D 23.0992 121.3653 0.034 102.2 68.29 �11.96 45.46 �65.56 A-800TTN014 D 23.0992 121.3653 0.034 102.2 68.29 �25.18 43.60 �49.11 A-900ANCU D 24.97 121.1867 0.134 129 73.03 �34.45 98.57 �79.43 A-800TCU083 D 24.97 121.1867 0.134 129 73.03 �33.08 114.70 �89.24 A-900ATAI1 D 23.0402 120.2283 0.008 108 79.31 �20.10 �44.02 87.57 A-800CHY078 D 23.0402 120.2283 0.008 108 79.31 �20.94 �43.78 86.85 A-900ATTN D 22.754 121.1465 0.009 127.6 96.67 14.36 �29.19 29.19 A-800TTN015 D 22.754 121.1465 0.009 127.6 96.67 �14.12 �30.63 25.36 A-900ASGL D 22.7252 120.4908 0.03 129.6 100.83 8.61 �30.15 �28.23 A-800KAU048 D 22.7252 120.4908 0.03 129.6 100.83 �11.78 28.65 38.28 A-900APNG B 23.5672 119.5552 0.011 131 115.8 �14.36 32.54 �29.19 A-800CHY075 B 23.5672 119.5552 0.011 131 115.8 15.19 37.03 �37.03 A-900ATAW B 22.3575 120.8957 0.008 166.7 138.98 �3.35 �5.26 5.26 A-800TTN016 B 22.3575 120.8957 0.008 166.7 138.98 �6.04 �9.75 �7.24 A-900AHEN D 22.0055 120.738 0.022 205.5 178.16 9.09 �24.88 �22.01 A-800KAU046 D 22.0055 120.738 0.022 205.5 178.16 7.84 �22.49 22.25 A-900A
*National Earthquake Hazards Reduction Program Site Class Scheme (BSSC, 1998).†Epdist, distance (km) from the Chi-Chi epicenter (23.8603� N, 120.7995� E).‡Drup, the shortest distance between the station and the fault rupture surface.
Institute of GeophysicsUniversity of MunichMunich, 80333 [email protected]@geophysik.uni-muenchen.de
(G.-Q.W., H.I.)
U.S. Geological Survey, MS 977345 Middlefield RoadMenlo Park, California [email protected]
(D.M.B.)
College of Architectural and Civil EngineeringBeijing Polytechnic UniversityBeijing, 100022 People’s Republic of [email protected]
(X.-Y.Z., G.-Q.W.)
Manuscript received 24 January 2002.