soil fertility/advisory service in negara brunei darussalam
TRANSCRIPT
Soil Fertility Evaluation/Advisory Service in Negara Brunei Darussalam
Volume 2
Soil Management in the Agricultural Development Areas Contract: LTN/6/31/2003(10)
CSIRO Land and Water Department of Agriculture 2008 Brunei Darussalam
Copyright and Disclaimer © 2008 Department of Agriculture, Negara Brunei Darussalam. All rights reserved. No parts of this publication may be reproduced, stored in a retrieval system or transmitted in any form or by any means, electronic, mechanical, photocopying, recording or otherwise without prior permission of the Department of Agriculture.
Important Disclaimer: CSIRO advises that the information contained in this publication comprises general statements based on scientific research. The reader is advised and needs to be aware that such information may be incomplete or unable to be used in any specific situation. No reliance or actions must therefore be made on that information without seeking prior expert professional, scientific and technical advice. To the extent permitted by law, CSIRO (including its employees and consultants) excludes all liability to any person for any consequences, including but not limited to all losses, damages, costs, expenses and any other compensation, arising directly or indirectly from using this publication (in part or in whole) and any information or material contained in it.
Publication information: Ringrose-Voase AJ, Wong MTF, Winston EC, Fitzpatrick RW, Grealish GJ, Hicks WS (2008) ‘Soil Fertility Evaluation/Advisory Service in Negara Brunei Darussalam Volume 2 – Soil Management in the Agricultural Development Areas’. Science Report 58/08. CSIRO Land and Water, Australia.
Soil Fertility Evaluation/Advisory Service in Negara Brunei Darussalam
Volume 2
Soil Management in the Agricultural Development Areas Contract: LTN/6/31/2003(10)
CSIRO Land and Water Department of Agriculture 2008 Brunei Darussalam
Contacts:
Project Director Dr Chris Smith, CSIRO Land and Water, GPO Box 1666, Canberra ACT 2601
Tel: +61-2-6246 5960; e-mail: [email protected]
Project Coordinator Dr Anthony Ringrose-Voase, CSIRO Land and Water, GPO Box 1666, Canberra ACT 2601
Tel: +61-2-6246 5956; e-mail: [email protected] Other project staff:
Project Management Mr Edward A’Bear, URS Australia Pty Limited, Adelaide, SA
Soil Surveyor Mr Gerard Grealish, URS Australia Pty Limited, Perth, WA
Soil Taxonomy Dr Rob Fitzpatrick, CSIRO Land and Water, Adelaide, SA
Soil Fertility Dr Mike Wong, CSIRO Land and Water, Perth, WA
Tropical Crops Mr Ted Winston, URS Australia Pty Limited, Mission Beach, Qld
Acid Sulfate Soils Mr Warren Hicks, CSIRO Land and Water, Canberra, ACT
GIS/Database Mr Rob Kingham/Ms Tania Laity, Bureau of Rural Sciences, Canberra, ACT
Remote Sensing Mr Alan Marks, CSIRO Land and Water, Canberra, ACT
Laboratory Analysis Mr Adrian Beech, CSIRO Land and Water, Adelaide, SA
Quality Control/Assurance Mr Bernie Powell & Dr Phil Moody
Queensland Department of Natural Resources and Water, Brisbane, Queensland
Soil Fertility Evaluation/Advisory Service in Negara Brunei Darussalam Volume 2 – Soils Management in the Agricultural Development Areas Page ii
Acknowledgements This work was commissioned and funded by the Department of Agriculture, Negara Brunei Darussalam.
The authors extend their appreciation and thanks to Hajah Suria binti Zanuddin, Head Soil Science and Plant Nutrition Unit, for her enthusiastic support of the project and for tirelessly making the necessary technical and administrative arrangements for its successful operation. Dr H.M. Thippeswamy, Soil Scientist, is thanked for providing technical advice and information on local agriculture, and for reviewing project reports. The assistance of the staff of the Soil Science and Plant Nutrition Unit, both in the field and in making administrative arrangements, is gratefully acknowledged.
The authors extend their appreciation and gratitude to Hajah Normah Suria Hayati binti PJDSM DSU (Dr) Haji Mohd Jamil Al-Sufri, Acting Director of Agriculture, Hajah Aidah binti Haji Mohd Hanifah, Acting Deputy Director of Agriculture, Pengiran Hajah Rosidah binti Pengiran Haji Metussin, Acting Senior Special Duty Officer, and Fuziah binti Haji Hamdan, Head Division of Crop Development, for their encouragement and support of the project.
Many farmers from the Agricultural Development Areas together with staff from the Department of Agriculture attended project workshops and field visits, and provided useful insights into agricultural practices in Brunei.
Sam Grigg of URS Pty Ltd provided invaluable field assistance during the field survey.
Rob Kingham, Mark Grant and Tania Laity of Bureau of Rural Sciences, Canberra provided database and geographic information system (GIS) support and Alan Marks, CSIRO Land and Water provided remotely sensed imagery.
Adrian Beech, Janice Trafford, Aimee Walker, John Gouzos, Jane Richards and Michelle Smart of the CSIRO Land and Water Analytical Chemistry Unit provided soil chemical analyses. Mark Raven provided x-ray diffraction (mineralogical) analyses. Sean Forrester provided MIR estimates of soil physical properties.
Bernie Powell and Phil Moody, Queensland Department of Natural Resources and Water, thoroughly reviewed this work and suggested many improvements that have enhanced the project outcomes.
Soil Fertility Evaluation/Advisory Service in Negara Brunei Darussalam Volume 2 – Soils Management in the Agricultural Development Areas Page iii
Table of Contents Part 6 Soil and Nutrient Management for Cropping........................................................... 1
6.1 Introduction ............................................................................................................................. 1 6.1.1 Background......................................................................................................................... 1 6.1.2 Objectives ........................................................................................................................... 3
6.2 Land attributes and their management................................................................................... 4 6.2.1 Climate................................................................................................................................ 4 6.2.2 Soil Acidity .......................................................................................................................... 7
6.2.2.1 Effects of Soil Acidity 9 6.2.2.2 Target Soil pH Required to Grow Different Crops 12 6.2.2.3 Lime Requirement to Meet the Target Soil pH 13 6.2.2.4 Managing Acid Soils by Minimising Acid Production 17
6.2.3 Sulfidic Material................................................................................................................. 18 6.2.3.1 Management of Acid Sulfate Soils for Short Duration Crops 19 6.2.3.2 Management of Acid Sulfate Soils for Tree Crops 19
6.2.4 Waterlogging..................................................................................................................... 20 6.2.4.1 Lowering the Watertable 21 6.2.4.2 Improving Surface Drainage 21 6.2.4.3 Artificial Subsurface Drainage 22 6.2.4.4 Improving Soil Permeability 22 6.2.4.5 Use of Raised Beds in Waterlogging Management 23
6.2.5 Water Erosion ................................................................................................................... 24 6.2.5.1 Maintain Plant Cover 24 6.2.5.2 Retain Crop Residues 25 6.2.5.3 Minimise Tillage 25 6.2.5.4 Terracing 25 6.2.5.5 Grassed Waterways 26
6.2.6 Nutrient Management ....................................................................................................... 26 6.2.6.1 Prerequisites 26 6.2.6.2 Sources of Nutrients 26 6.2.6.3 Ameliorating Low Soil Nutrient Reserves 28 6.2.6.4 Maintenance of Soil Nutrients 29 6.2.6.5 Minimising Nutrient Losses 30 6.2.6.6 Nutrient Balance-Based Fertilizer Calculator 32
6.3 Soil Management for Short Duration Crops.......................................................................... 37 6.3.1 Rice................................................................................................................................... 37
6.3.1.1 Land Suitability 37 6.3.1.2 Management of Soil Constraints 39 6.3.1.3 Crop Nutrient Removal 42
6.3.2 Leafy and fruit vegetables................................................................................................. 43 6.3.2.1 Land Suitability 43 6.3.2.2 Management of Soil Constraints 45 6.3.2.3 Crop Nutrient Removal 49
6.3.3 Root vegetables ................................................................................................................ 50 6.3.3.1 Land Suitability 50 6.3.3.2 Management of Soil Constraints 52 6.3.3.3 Crop Nutrient Removal 54
6.3.4 Soya and mung bean........................................................................................................ 55 6.3.4.1 Land Suitability 55 6.3.4.2 Management of Soil Constraints 57 6.3.4.3 Crop Nutrient removal 59
6.3.5 Sweet corn ........................................................................................................................ 60 6.3.5.1 Land Suitability 60 6.3.5.2 Management of Soil Constraints 61 6.3.5.3 Crop Nutrient Removal 63
6.3.6 Ginger and turmeric .......................................................................................................... 65 6.3.6.1 Land Suitability 65 6.3.6.2 Management of Soil Constraints 66 6.3.6.3 Crop Nutrient Removal 68
6.3.7 Cassava and sweet potato ............................................................................................... 70 6.3.7.1 Land Suitability 70 6.3.7.2 Management of Soil Constraints 71
Soil Fertility Evaluation/Advisory Service in Negara Brunei Darussalam Volume 2 – Soils Management in the Agricultural Development Areas Page iv
6.3.7.3 Crop Nutrient Removal 74 6.4 Soil Management for Fruit Crops ......................................................................................... 75
6.4.1 Durian ............................................................................................................................... 75 6.4.1.1 Land Suitability 75 6.4.1.2 Management of Soil Constraints 77 6.4.1.3 Crop Nutrient Removal 79
6.4.2 Rambutan ......................................................................................................................... 80 6.4.2.1 Land Suitability 80 6.4.2.2 Management of Soil Constraints 81 6.4.2.3 Crop Nutrient Removal 83
6.4.3 Citrus ................................................................................................................................ 85 6.4.3.1 Land Suitability 85 6.4.3.2 Management of Soil Constraints 87 6.4.3.3 Crop Nutrient Removal 89
6.4.4 Banana ............................................................................................................................. 91 6.4.4.1 Land Suitability 91 6.4.4.2 Management of Soil Constraints 92 6.4.4.3 Crop Nutrient Removal 95
6.4.5 Coconut ............................................................................................................................ 96 6.4.5.1 Land Suitability 96 6.4.5.2 Management of Soil Constraints 97 6.4.5.3 Crop Nutrient Removal 100
6.4.6 Papaya............................................................................................................................ 101 6.4.6.1 Land Suitability 101 6.4.6.2 Management of Soil Constraints 102 6.4.6.3 Crop Nutrient Removal 104
6.4.7 Pineapple........................................................................................................................ 106 6.4.7.1 Land Suitability 106 6.4.7.2 Management of Soil Constraints 107 6.4.7.3 Crop Nutrient Removal 109
6.4.8 Artocarpus ...................................................................................................................... 111 6.4.8.1 Land Suitability 111 6.4.8.2 Management of Soil Constraints 113 6.4.8.3 Crop Nutrient Removal 115
6.4.9 Star fruit .......................................................................................................................... 116 6.4.9.1 Land Suitability 116 6.4.9.2 Management of Soil Constraints 117 6.4.9.3 Crop Nutrient Removal 119
6.5 Soil Management for Fodder Crops ................................................................................... 120 6.5.1 Grasses for wet areas .................................................................................................... 120
6.5.1.1 Land Suitability 120 6.5.1.2 Management of Soil Constraints 122 6.5.1.3 Crop Nutrient removal 124
6.5.2 Grasses for well drained areas....................................................................................... 125 6.5.2.1 Land Suitability 125 6.5.2.2 Management of Soil Constraints 126 6.5.2.3 Crop Nutrient removal 129
6.5.3 Fodder legumes for wet areas........................................................................................ 130 6.5.3.1 Land Suitability 130 6.5.3.2 Management of Soil Constraints 131 6.5.3.3 Crop Nutrient removal 134
6.5.4 Fodder legumes for well drained areas .......................................................................... 135 6.5.4.1 Land Suitability 135 6.5.4.2 Management of Soil Constraints 136 6.5.4.3 Crop Nutrient removal 138
6.6 Cropping systems............................................................................................................... 140 6.6.1 Rice-based cropping systems ........................................................................................ 140 6.6.2 Continuous rice cropping systems ................................................................................. 141 6.6.3 Other crop sequences .................................................................................................... 141
Part 7 Acid Sulfate Soils................................................................................................... 142 7.1 Introduction......................................................................................................................... 142
7.1.1 Background..................................................................................................................... 142 7.1.2 Objectives and Outputs of this Study ............................................................................. 144
Soil Fertility Evaluation/Advisory Service in Negara Brunei Darussalam Volume 2 – Soils Management in the Agricultural Development Areas Page v
7.1.2.1 Acid Sulfate Soil Risks 144 7.1.2.2 Awareness and Economic Impacts 145
7.2 Methodology ....................................................................................................................... 146 7.2.1 Field Survey .................................................................................................................... 146 7.2.2 Definitions: Soils, Materials, Conditions ......................................................................... 146
7.2.2.1 Organic and Mineral Soils 146 7.2.2.2 Sulfidic Materials and Sulfuric Horizons 147 7.2.2.3 Aquic Conditions 148 7.2.2.4 Soil Cracks, Slickensides and Cracking Clay Soils 149 7.2.2.5 n Value 149 7.2.2.6 Monosulfidic Black Ooze Material in Drain Sediments 149 7.2.2.7 Sulfate-Containing Salt Efflorescences 150
7.2.3 Laboratory Analyses ....................................................................................................... 150 7.2.3.1 Laboratory Soil Analysis Methods 150
7.3 Soil Classification................................................................................................................ 152 7.3.1 Soil Classes Identified .................................................................................................... 152 7.3.2 Soil Identification Key ..................................................................................................... 152
7.4 Major Characteristics of ASS.............................................................................................. 157 7.4.1 Morphology ..................................................................................................................... 157
7.4.1.1 Field Description and Morphology 157 7.4.1.2 Sulfidic Material 157 7.4.1.3 Sulfuric Horizons 157 7.4.1.4 Tests to Identify Sulfidic Material and Predict the Consequences of Disturbance 157
7.4.2 Chemistry........................................................................................................................ 159 7.4.2.1 Soil pH and Electrical Conductivity (EC) 159 7.4.2.2 Sulfur 160 7.4.2.3 Carbon 160 7.4.2.4 Acid–Base Budget 161 7.4.2.5 Arsenic and Cadmium 162
7.5 Management of ASS for Soil Fertility, Agricultural Production and Environmental Protection............................................................................................................................ 163
7.5.1 Management Options ..................................................................................................... 163 7.5.1.1 Avoiding Disturbance 163 7.5.1.2 Minimising Disturbance 163 7.5.1.3 Rehabilitation 164
7.5.2 Acid Sulfate Soil Classification and Management Options............................................. 165 7.5.2.1 ASS Hazard Maps 168
Part 8 On-farm Experiments and Monitoring to Improve Soil Management ................ 175 8.1 Nutrient Management ......................................................................................................... 175 8.2 Soil Acidity .......................................................................................................................... 177 8.3 Watertable Behaviour ......................................................................................................... 177 8.4 Acid Sulfate Soils ................................................................................................................ 178 8.5 Organic Soil Subsidence .................................................................................................... 179 8.6 Soil Distribution and Improving the Utility of the GIS.......................................................... 179
Appendix C Acid Sulfate Soil Data Tables .................................................................. 181 Appendix D Photographic Reference for Brunei Acid Sulfate Soils......................... 193 References.......................................................................................................................... 216
Tables Table 1. Proportion of years (1937-2002) at Kilanas in which dry and wet periods start in a given
month, together with the mean duration of those periods....................................................... 6 Table 2. Causes associated with diagnostic soil pH ranges and possible amelioration strategies
for maintaining productivity (Moody and Cong 2008). (pHW is the pH measured in water). ................................................................................................................................... 12
Table 3. Tolerance (designated ‘×’) to Al saturation (exchangeable aluminium as a percentage of ECEC) in various crops (from Dierolf et al. 2001)............................................................. 13
Table 4. Approximate mean clay content of various field texture (FT) classes..................................... 14 Table 5. pH buffer capacities (pHBC) for each Soil Type based on pHBC estimated from organic
carbon content and clay content (measured or estimated using field texture) using Aitken et al. (1990) and Merry (1997) for 56 topsoils sampled from Agricultural
Soil Fertility Evaluation/Advisory Service in Negara Brunei Darussalam Volume 2 – Soils Management in the Agricultural Development Areas Page vi
Development Areas across Brunei. The values quoted are the median values (where n>1). ...................................................................................................................................... 16
Table 6. Amount of acidity (kmol H+) generated per kg of N or S applied as different fertilizers and the amount of lime required to neutralise this acidity (Fisher et al. 2003). .................... 18
Table 7. Estimated annual nitrogen fixation by some legume crops (Potash and Phosphate Institute 1995) ....................................................................................................................... 27
Table 8. Average concentrations of arsenic (As), cadmium (Cd), chromium (Cr), copper (Cu), lead (Pb), mercury (Hg), nickel (Ni), vanadium (V) and zinc (Zn) in phosphate rock deposits (Mortvedt and Beaton, 1995).................................................................................. 28
Table 9. Levels of extractable soil P (Bray II) and exchangeable K, Ca and Mg considered deficient for a range of crops by Dierolf et al. (2001) and the nutrient applications recommended to amend them.............................................................................................. 29
Table 10. P (Bray II extract) and exchangeable K, Ca and Mg status in the topsoil (0-10 cm depth) of 56 soil profiles sampled from ADAs across Brunei. Nutrient status thresholds according to Dierolf et al. (2001). ........................................................................ 29
Table 11: Soil Taxonomy classifications of surveyed Agricultural Development Areas in Negara Brunei Darussalam. ............................................................................................................ 152
Table 12: Summary soil identification key for major acid sulfate soil types in surveyed Agricultural Development Areas of Negara Brunei Darussalam......................................... 154
Table 13: Soil identification key for acid sulfate soil subtypes in surveyed Agricultural Development Areas of Negara Brunei Darussalam............................................................ 155
Table 14: Soil rating scale for the pHFOX test. ..................................................................................... 158 Table 15: Thresholds indicating the need for an ASS management plan based on texture range
and chromium reducible sulfur concentration (SCr) and amount of soil material disturbed (Dear et al., 2002). .............................................................................................. 160
Table 16: Potential management options based on the soil characteristics of acid sulfate soil types.................................................................................................................................... 165
Table 17: Management and treatment class of acid sulfate soil types in surveyed ADAs. ................ 166 Table 18: Acid Sulfate Soil Hazard Classes........................................................................................ 168 Table 19: Acid Sulfate Soil (ASS) Hazard of the map units of Agricultural Development Areas
(ADAs) where ASS occur.................................................................................................... 170 Table C1.1: Results of laboratory analyses for soil samples – EC, pH, organic C, N, S, reduced
inorganic S (RIS) and titratable actual acidity (TAA). ......................................................... 182 Table C1.2: Results of laboratory analyses for soil samples (exchangeable cations, Al and Mn). .... 184 Table C2: Results for laboratory analyses of selected soluble salts in soil samples. ......................... 186 Table C3: Acid base accounting. (* When pH1:2.5 <5.0 then ANC=0). ................................................ 188 Table C4: Trace metal analyses.......................................................................................................... 190 Table C5: Mineralogical composition of bulk samples, <2 µm (clay) and 63-200 µm fractions.......... 192
Figures Figure 1. Mean monthly rainfall at Kilanas from 1937-2002 ................................................................... 4 Figure 2. Percentiles for monthly rainfall at Kilanas from 1937-2002 compared to the monthly
mean. ...................................................................................................................................... 4 Figure 3 (opposite). Occurrence of wet and dry periods at Kilanas from 1937-2002. ............................ 4 Figure 4. Proportion of years (1937-2002) at Kilanas in which each month is part of a dry,
intermediate or wet period. ..................................................................................................... 6 Figure 5. Mean duration of rain-free periods in each month at Kilanas from 1937-2002........................ 7 Figure 6. Cumulative frequency (per month) of rain-free periods of different durations at Kilanas
from 1937-2002....................................................................................................................... 7 Figure 7. Frequency distribution of topsoil pH (in 1:2.5 soil:water extract) of 61 soil profiles
sampled in surveyed ADAs..................................................................................................... 8 Figure 8. Availability of plant nutrients and aluminium toxicity at different soil pH values (after
BARC 2000)............................................................................................................................ 9 Figure 9. Relationship between percentage aluminium saturation and soil pH (1:2.5 soil:water
extract) for a sample of major Soil Types. Soil Group 1 includes those Soil Types that are acid sulfate soil (Organic, Sulfuric and Sulfidic Soils). Soil Group 2 includes other
Soil Fertility Evaluation/Advisory Service in Negara Brunei Darussalam Volume 2 – Soils Management in the Agricultural Development Areas Page vii
Soil Fertility Evaluation/Advisory Service in Negara Brunei Darussalam Volume 2 – Soils Management in the Agricultural Development Areas Page viii
Soil Types except the White Soils. There is no relationship between exchangeable Al and pH for the White Soils. The relationships shown for Soil Groups 1 and 2 are the regressions of pH on exchangeable Al saturation (minimizing the pH residuals)................. 10
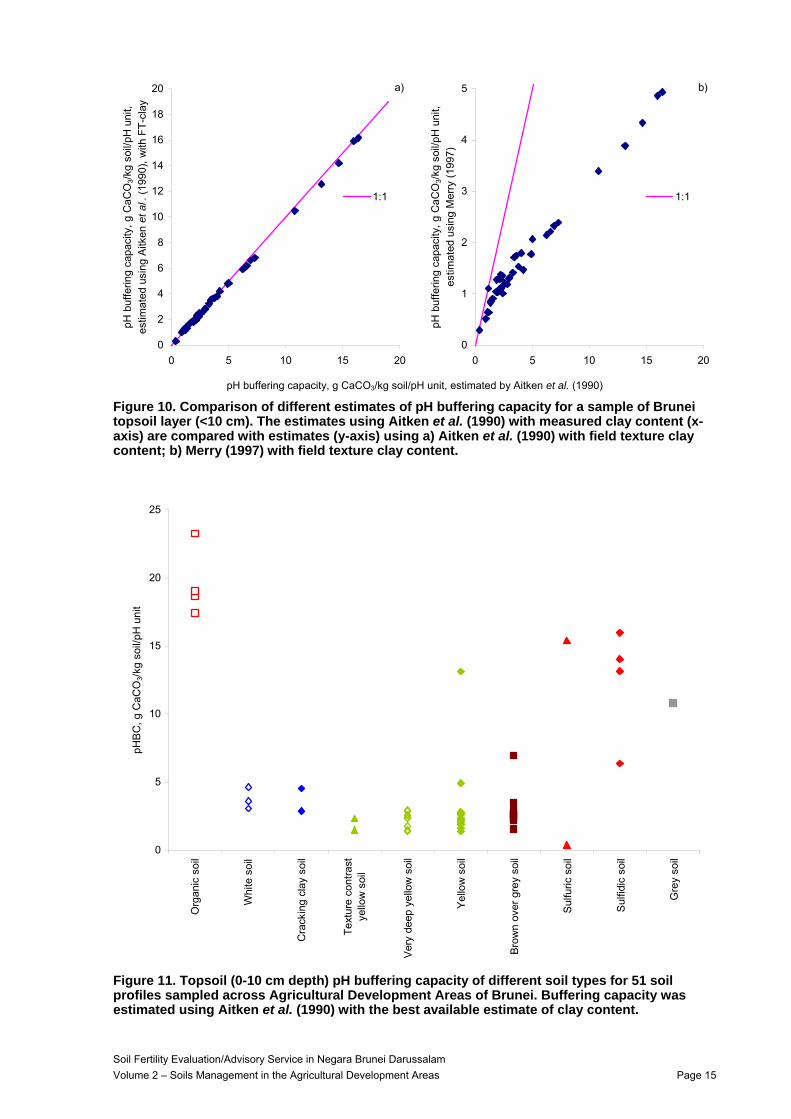
Figure 10. Comparison of different estimates of pH buffering capacity for a sample of Brunei topsoil layer (<10 cm). The estimates using Aitken et al. (1990) with measured clay content (x-axis) are compared with estimates (y-axis) using a) Aitken et al. (1990) with field texture clay content; b) Merry (1997) with field texture clay content...................... 15
Figure 11. Topsoil (0-10 cm depth) pH buffering capacity of different soil types for 51 soil profiles sampled across Agricultural Development Areas of Brunei. Buffering capacity was estimated using Aitken et al. (1990) with the best available estimate of clay content................................................................................................................................... 15
Figure 12: Recently cleared land and excavated drains in the Betumpu Agricultural Development Area showing: (a) good pineapple growth on the higher mounded areas and stunted growth on the lower areas adjacent to the drains with precipitates of iron oxyhydroxysulfate minerals (schwertmannite) on the edges of the drain / wetland margin (pH 3.5–4.2), and (b) close-up view of a sulfuric horizon in spoil bank of a drain showing bright yellow jarosite mottles (pH 3.5) and clear reddish coloured water in the drain (pH 3) with patches of oil-like bacterial surface films. ...................................... 143
Figure 13: Damage to road infrastructures by erosion and corrosion of concrete and road material (pH 3.5 - 4.2) from the exposure (oxidation) of pyrite contained in the pyrite-rich shale at Tungku. ........................................................................................................... 144
Figure 14: Representative sample of sapric material from 30 to 50 cm layer in a Typic Sulfosaprist at Meranking ADA, Belait (Profile 21 0007) mixed with sodium-pyrophosphate in a beaker after extraction on white filter paper. The dark brown colour on the white filter paper has a value and chroma combination that qualifies the material as sapric according to Soil Survey Staff (2003). ................................................... 147
Figure 15: Schematic diagram for the formation of pyrite in anoxic sediments (After Berner 1984) ................................................................................................................................... 148
Figure 16: Photographs of the peroxide field test for the presence of ASS (sulfidic material). Note the change in colour of the pH test strips indicating the drop in pH. .......................... 158
Figure 17: Left hand side: chip tray samples from profiles 23 0001 and 23 0004 after ageing and testing with pH indicator strips, which indicate strongly acidic samples with pH below 3.5 (red colour indicates pH 2.5 to 3.5). Right hand side: Chip tray samples for profile 09 0011 after aging for several months showing bright yellow jarosite mottles and coatings, which is especially evident in the sample at depth 5-20 cm. pH indicator strips confirmed pH values had fallen below 3.5................................................................. 159
Part 6 Soil and Nutrient Management for Cropping 6.1 Introduction Part 6 of this report on the project Soil Fertility Evaluation/Advisory Service in Negara Brunei Darussalam recommends soil management strategies to overcome the limitations to crop production posed by a range of soil attributes. These attributes include those that either cannot be changed or can only be changed over the medium to long term, as well as those that need to be managed on a short-term basis – primarily soil nutrients and soil pH.
The soil and nutrient management recommendations in this report are built on earlier outputs of the project described in Volume 1:
• The major Soil Types found in a soil survey of 27 Agricultural Development Areas (ADAs) are described in Volume 1, Part 4 and mapped in Soil Fertility Evaluation/ Advisory Service in Negara Brunei Darussalam Report P1-1.2 – Soil Maps (Grealish et al. 2007).
• The process for evaluating the suitability of these Soil Types for a range of crops is described in Volume 1, Part 3 and has several components. – The attributes of the Soil Types were assessed using the Fertility Capability
Classification (FCC) of Sanchez et al. (2003) and are given in Volume 1, Part 4. The attributes included only those that are inherent or change over the medium to long term, such as soil texture, waterlogging, slope, erosion risk, the presence of sulfidic material, aluminium toxicity, phosphorus fixation, cracking clay and leaching.
– The degree to which the soil attributes affect each crop is expressed as a series of suitability rules that are described in Volume 1, Appendix A.
– The suitability rules for each crop were applied to the attributes of each Soil Type to assess their overall suitability for each crop, which are given in Volume 1, Part 4.
• The nutrient status of the soil is not generally included in soil surveys or land suitability assessments, because it changes over the short-term due to fertilizer management. Its spatial variability depends less on Soil Type and more on the management imposed in different areas by farmers. Nevertheless, some soil nutrients were measured during the soil survey to give an idea of the overall fertility status of land in the ADAs. These data can be found in the survey database and in Report P1-1.1 – Laboratory Analysis of Soil Chemical and Physical Properties (Beech et al. 2006).
Whilst soil nutrient status is not part of the land suitability assessment, its management must be within the context of both overall land suitability and the limitations to crop production imposed by individual attributes. Clearly, management of fertilizer for a particular crop, or any other soil attribute, is not worthwhile if another attribute renders the land unsuitable for the crop in question. Where land is suitable for the crop, fertilizer inputs should match the expected production taking into account the limitations imposed by other soil attributes.
6.1.1 Background The project Soil Fertility Evaluation/Advisory Service in Negara Brunei Darussalam was commissioned by the Department of Agriculture to further the policy aims of better food security, a greater level of self-sufficiency and improved incomes for farmers. There are two aspects to achieving these goals.
• First is to better match crops to land through assessment of land suitability for a range of crops. This assists policy makers and farmers assess the appropriate crop options for newly developed land and also facilitates the reallocation of developed land to more appropriate uses. Land suitability recommendations for a variety of crops are given in Volume 1, Part 4.
Soil Fertility Evaluation/Advisory Service in Negara Brunei Darussalam Volume 2 – Soils Management in the Agricultural Development Areas Page 1
• The second aspect – and the subject of this report – is to recommend soil management strategies to better utilize suitable land.
Phase 1 of the project investigated the intrinsic properties of the Soil Types found in the ADAs and assessed their suitability for cropping. The soils were classified according to Soil Taxonomy (Soil Survey Staff 2003) and assessed using the Fertility Capability Classification (Sanchez et al. 2003) both of which are widely used internationally. This allows the soil survey information to be correlated with soil management studies world-wide to assist with the transfer of knowledge on soil behaviour and management into a Brunei context. In addition to classifying the soils using Soil Taxonomy, a simple key for soil identification was developed to allow non-experts to allocate soil commonly found in the ADAs to Soil Types (Volume 1, Part 2). The Soil Types are named so as to be easily understood, but nevertheless correspond to Soil Taxonomy subgroups.
The land suitability assessment of the Soil Types (Volume 1, Part 4) shows the potential cropping options for different Soil Types and can assist strategic land use planning by better matching crops to Soil Types. The suitability classes used are as follows (after FAO 1976):
1. Highly suitable land with no significant limitations to sustained application of the specified use.
2. Suitable land with minor limitations to the sustained application of the specified use that will cause a minor reduction of productivity or benefits and will not raise inputs above an acceptable level.
3. Moderately suitable land with major limitations to the sustained application of the specified use that reduce productivity or benefits and increase required inputs to the extent that the overall advantage to be gained from the use, although still attractive, will be significantly less than from Class 1 or 2 land.
4. Marginally suitable land with severe limitations to the sustained application of the specified use that so reduce productivity and benefits, or increase required inputs, that this expenditure will be only marginally justified.
5. Unsuitable land with such severe limitations that they preclude the sustained application of the specified use.
This report addresses soil management for crops being grown on land allocated to suitability classes 2 and 3 – that is land that is suitable but has some degree of limitation on crop production. The management issues addressed are of two types. The first is management of those soil attributes included in the suitability assessment where they are limiting crop production. In some cases, management of these attributes will remove the limitation and raise production to that of Class 1 land, although with lower profitability because of the inputs required. In most cases however, management will only partially overcome the limitation and the expected production will be less than for Class 1 land.
The second type of issue is management of attributes not considered in the land suitability assessment because they can be easily manipulated over the short term. These attributes are mainly crop nutrients. Management of nutrients for each crop needs to be in the context of the production levels expected in a given situation, taking into account any limitations imposed by soil attributes of the first type that cannot be overcome by management. The international literature contains many recommendations about nutrient management for various crops. However, such recommendations should be used with care because they usually do not allow for the conditions found in Brunei and many assume much more favourable conditions than are commonly found there. Common limitations in Brunei include waterlogging, steep slopes, sulfidic material and soil acidity as outlined in Volume 1, Part 4. To the extent that these limitations cannot be ameliorated by management, actual crop yields are likely to be lower than the potential yields quoted in the literature. As a result care should be taken to apply amounts of nutrients appropriate for the yield achievable in a given situation.
Soil Fertility Evaluation/Advisory Service in Negara Brunei Darussalam Volume 2 – Soils Management in the Agricultural Development Areas Page 2
There are very few published studies of research work on crop management in Brunei Darussalam – these are discussed for the relevant crops in Sections 6.3, 6.4 and 6.5. Therefore extensive use is made of the international literature with the proviso that it may not apply to conditions in Brunei.
6.1.2 Objectives Part 6 of this report aims to promote sustainable and profitable use of land for agriculture within the ADAs by recommending soil management strategies that can be used by farmers to overcome, wholly or partially, soil limitations to production. It also aims to provide nutrient management strategies that match fertilizer application rates to crop requirements and by doing so reduce input costs and undesirable, offsite environmental impacts of excessive fertilization. The outputs from this project activity include:
• Generic management recommendations to ameliorate a variety of soil limitations to cropping (Section 6.2). For each limitation a variety of solutions is offered that are applicable to different crops.
• Specific management recommendations for each crop when grown on suitable soils (Sections 6.3, 6.4 and 6.5). These sections indicate the major limitations likely to be encountered on a particular Soil Type and provide cross-references to the most suitable management strategy in Section 6.2. It also discusses the nutrient requirements of the crop and how these are best met.
• A fertilizer and lime calculator for use in providing advice to farmers. The calculator is based on replenishing the nutrients removed by the last crop and building up soil fertility. The minimum inputs required are actual yield of the previous crop, the expected yield of the next crop, the Soil Type and a measurement of soil pH. The calculator provides an estimate of the amount of fertilizer and lime required.
Soil Fertility Evaluation/Advisory Service in Negara Brunei Darussalam Volume 2 – Soils Management in the Agricultural Development Areas Page 3
6.2 Land attributes and their management
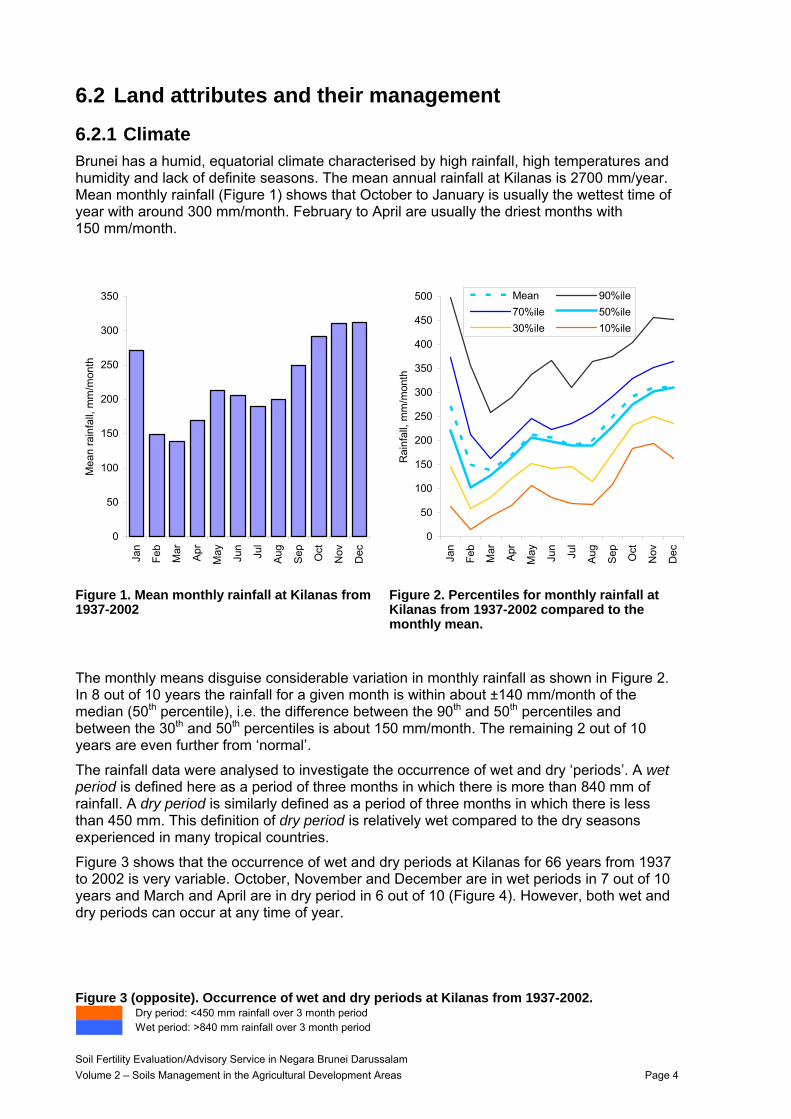
6.2.1 Climate Brunei has a humid, equatorial climate characterised by high rainfall, high temperatures and humidity and lack of definite seasons. The mean annual rainfall at Kilanas is 2700 mm/year. Mean monthly rainfall (Figure 1) shows that October to January is usually the wettest time of year with around 300 mm/month. February to April are usually the driest months with 150 mm/month.
0
50
100
150
200
250
300
350
Jan
Feb
Mar
Apr
May Jun
Jul
Aug
Sep Oct
Nov
Dec
Mea
n ra
infa
ll, m
m/m
onth
0
50
100
150
200
250
300
350
400
450
500
Jan
Feb
Mar
Apr
May Jun
Jul
Aug
Sep Oct
Nov
Dec
Rai
nfal
l, m
m/m
onth
Mean 90%ile70%ile 50%ile30%ile 10%ile
Figure 1. Mean monthly rainfall at Kilanas from 1937-2002
Figure 2. Percentiles for monthly rainfall at Kilanas from 1937-2002 compared to the monthly mean.
The monthly means disguise considerable variation in monthly rainfall as shown in Figure 2. In 8 out of 10 years the rainfall for a given month is within about ±140 mm/month of the median (50th percentile), i.e. the difference between the 90th and 50th percentiles and between the 30th and 50th percentiles is about 150 mm/month. The remaining 2 out of 10 years are even further from ‘normal’.
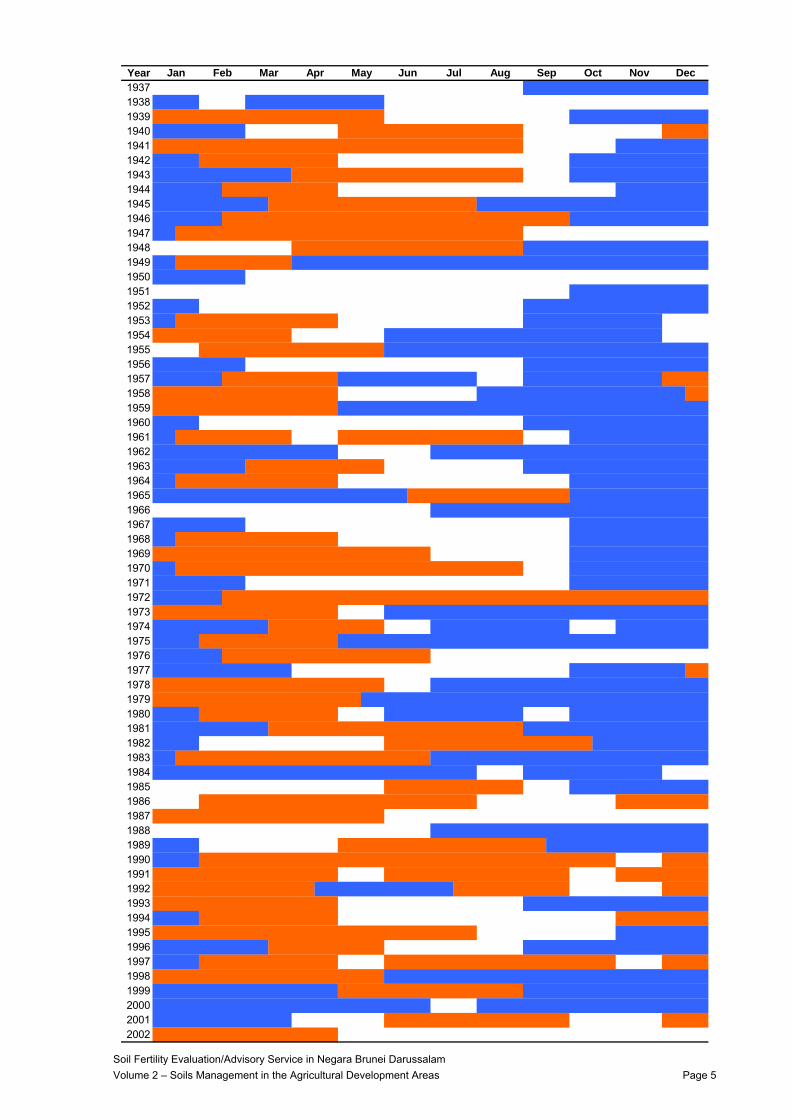
The rainfall data were analysed to investigate the occurrence of wet and dry ‘periods’. A wet period is defined here as a period of three months in which there is more than 840 mm of rainfall. A dry period is similarly defined as a period of three months in which there is less than 450 mm. This definition of dry period is relatively wet compared to the dry seasons experienced in many tropical countries.
Figure 3 shows that the occurrence of wet and dry periods at Kilanas for 66 years from 1937 to 2002 is very variable. October, November and December are in wet periods in 7 out of 10 years and March and April are in dry period in 6 out of 10 (Figure 4). However, both wet and dry periods can occur at any time of year.
Figure 3 (opposite). Occurrence of wet and dry periods at Kilanas from 1937-2002. Dry period: <450 mm rainfall over 3 month periodWet period: >840 mm rainfall over 3 month period
Soil Fertility Evaluation/Advisory Service in Negara Brunei Darussalam Volume 2 – Soils Management in the Agricultural Development Areas Page 4
Year1937 - - - - - - - - - - - - - - - - W W W W W W W W1938 W W - - W W W W W W - - - - - - - - - - - - - -1939 D D D D D D D D D D
D D D D D D D DD D D D D D D D D D D D D D D D
D D D D D D - - - - - -D D D D D D D D D D
D D D D D - - - - - -D D D D D D D D D
D D D D D D D D D D D D D D DD D D D D D D D D D D D D D D
D D D D D D D D D DD D D D D
D D D D D D D - - - - - -D D D D D D - -
D D D D D D D D W W W W
D D D D D D DD D D D D D D D - DD D D D D D D D
D D D D D - - D D D D D D D D
D D D D D DD D D D D D D - - - - - -
D D D D D D D
D D D D D D D - - - - - -D D D D D D D D D D D D
D D D D D D D D D D D D D D D
D D D D D D D D D D D D D D D D D D D D DD D D D D D D D -
D D D D DD D D D D D
D D D D D D D D DD
D D D D D D D D D DD D D D D D D D D
D D D D D D -D D D D D D D D D D D
D D D D D D D D DD D D D D D D D D D D
D D D D D DD D D D D D D D D D D D D D D D
D D D D D D D D D D
D D D D D D D D DD D D D D D D D D D D D D D D D D D D D
D D D D D D D D - - D D D D D D D D D D D DD D D D D D D W D D D D D D DD D D D D D D D - - - - - -
D D D D D D - - - - - - D D D DD D D D D D D D D D D D D D
D D D D DD D D D D D - - D D D D D D D D D D D D
D D D D D D D D D D W W W WD D D D D D D D
D D D D D D D D D DD D D D D D D D - - - - - -
- - - - - - - - W W W W W W1940 W W W W - - - - - - - - - - D D1941 - - - - W W W W1942 W W - - - - W W W W W W1943 W W W W W W - - W W W W W W1944 W W W - - - - - - W W W W1945 W W W W W W W W W W W W W W W1946 W W W W W W W W W1947 W - - - - - - - -1948 - - - - - - W W W W W W W W1949 W W W W W W W W W W W W W W W W W W W1950 W W W W - - - - - - - - - - - - - - - - - - - -1951 - - - - - - - - - - - - - - - - - - W W W W W W1952 W W - - - - - - - - - - - - - - W W W W W W W W1953 W - - W W W W W W - -1954 - - W W W W W W W W W W W W - -1955 - - W W W W W W W W W W1956 W W W W - - - - - - - - - - - - W W W W W W W W1957 W W W W W W W W W - - W W W W W W1958 - - - - - W W W W W W W W W1959 W W W W W W W W W W W W W W W W1960 W W - - - - - - - - - - - - - - W W W W W W W W1961 W - - W W W W W W1962 W W W W W W W W - - - - W W W W W W W W W W W W1963 W W W W - - - - - - W W W W W W W W1964 W - - - - W W W W W W1965 W W W W W W W W W W W W W W W W W1966 - - - - - - - - - - - - W W W W W W W W W W W W1967 W W W W - - - - - - - - - - - - - - W W W W W W1968 W - - - - W W W W W W1969 - - - - - - W W W W W W1970 W - - W W W W W W1971 W W W W - - - - - - - - - - - - - - W W W W W W1972 W W W1973 - W W W W W W W W W W W W W W1974 W W W W W - - W W W W W W - - W W W W1975 W W W W W W W W W W W W W W W W W W1976 W W W - - - - - - - - - - - -1977 W W W W W W - - - - - - - - - - - - W W W W W1978 - - W W W W W W W W W W W W1979 W W W W W W W W W W W W W W W1980 W W - W W W W W W - - W W W W W W1981 W W W W W W W W W W W W W1982 W W - - - - - - - - W W W W W1983 W W W W W W W W W W W W W1984 W W W W W W W W W W W W W W - - W W W W W W - -1985 - - - - - - - - - - - - W W W W W W1986 - - - - - - - -1987 - - - - - - - - - - - - - -1988 - - - - - - - - - - - - W W W W W W W W W W W W1989 W W - - - - - - W W W W W W W1990 W W - -1991 - -1992 W W W W W - - - -1993 - - W W W W W W W W1994 W W - - - - - -1995 - - - - - - W W W W1996 W W W W W - - - - - - W W W W W W W W1997 W W - -1998 W W W W W W W W W W1999 W W W W W W W W W W W W W W W W2000 W W W W W W W W W W W W - - W W W W W W W W W W2001 W W W W W W - - - - - - - -2002 - - - - - - - - - -
Apr DecNovOctSepMarFebJan AugJulJunMay
Soil Fertility Evaluation/Advisory Service in Negara Brunei Darussalam Volume 2 – Soils Management in the Agricultural Development Areas Page 5
0%
10%
20%
30%
40%
50%
60%
70%
80%
Jan
Feb
Mar
Apr
May Jun
Jul
Aug
Sep Oct
Nov
Dec
Pro
porti
on o
f yea
rs
Dry periodIntermediateWet period
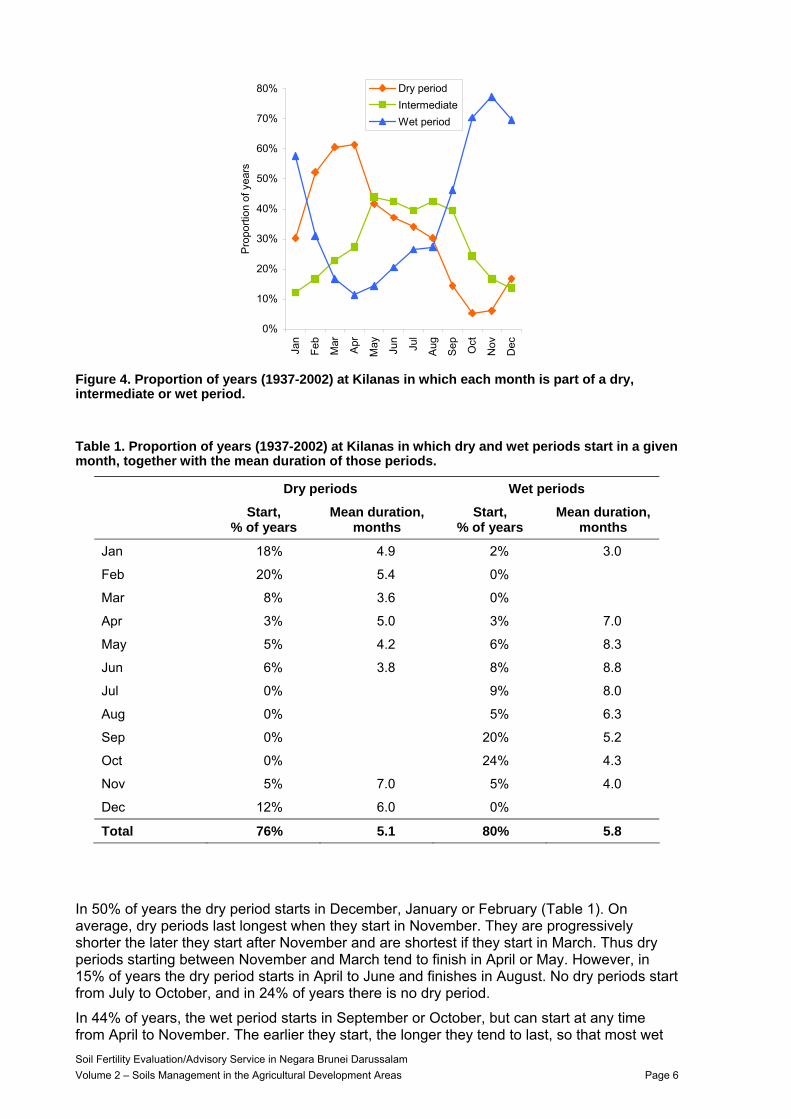
Figure 4. Proportion of years (1937-2002) at Kilanas in which each month is part of a dry, intermediate or wet period.
Table 1. Proportion of years (1937-2002) at Kilanas in which dry and wet periods start in a given month, together with the mean duration of those periods.
Dry periods Wet periods
Start, % of years
Mean duration, months
Start, % of years
Mean duration, months
Jan 18% 4.9 2% 3.0
Feb 20% 5.4 0%
Mar 8% 3.6 0%
Apr 3% 5.0 3% 7.0
May 5% 4.2 6% 8.3
Jun 6% 3.8 8% 8.8
Jul 0% 9% 8.0
Aug 0% 5% 6.3
Sep 0% 20% 5.2
Oct 0% 24% 4.3
Nov 5% 7.0 5% 4.0
Dec 12% 6.0 0%
Total 76% 5.1 80% 5.8
In 50% of years the dry period starts in December, January or February (Table 1). On average, dry periods last longest when they start in November. They are progressively shorter the later they start after November and are shortest if they start in March. Thus dry periods starting between November and March tend to finish in April or May. However, in 15% of years the dry period starts in April to June and finishes in August. No dry periods start from July to October, and in 24% of years there is no dry period.
In 44% of years, the wet period starts in September or October, but can start at any time from April to November. The earlier they start, the longer they tend to last, so that most wet Soil Fertility Evaluation/Advisory Service in Negara Brunei Darussalam Volume 2 – Soils Management in the Agricultural Development Areas Page 6
periods finish in December to February. Very few wet periods starts from December to March. There is no wet period in 20% of years.
This analysis of rainfall indicates that the climate does not have strong seasonality. In particular the timing of dry periods is quite erratic. Thus it is not really possible to define a reliable time of year to grow dry season crops.
The final rainfall statistic worth considering is the occurrence of rain free periods, which affects the need for irrigation, especially for seedlings and shallow rooted crops. In this context, the duration of periods of consecutive rain-free days is more important than the number of rain-free days – a rain-free period of one or two days is unimportant, but as the duration of rain-free periods increases beyond this, the water stress on crops increases.
0.0
0.5
1.0
1.5
2.0
2.5
3.0
3.5
4.0
4.5
Jan
Feb
Mar
Apr
May Jun
Jul
Aug
Sep Oct
Nov
Dec
Mea
n du
ratio
n of
rain
free
per
iods
, day
s
0
1
2
3
4
5
6
7
0 5 10
Duration of rain-free period, days
Cum
ulat
ive
no. p
erio
ds/m
onth
≥
15
Jan-AugSep-Dec
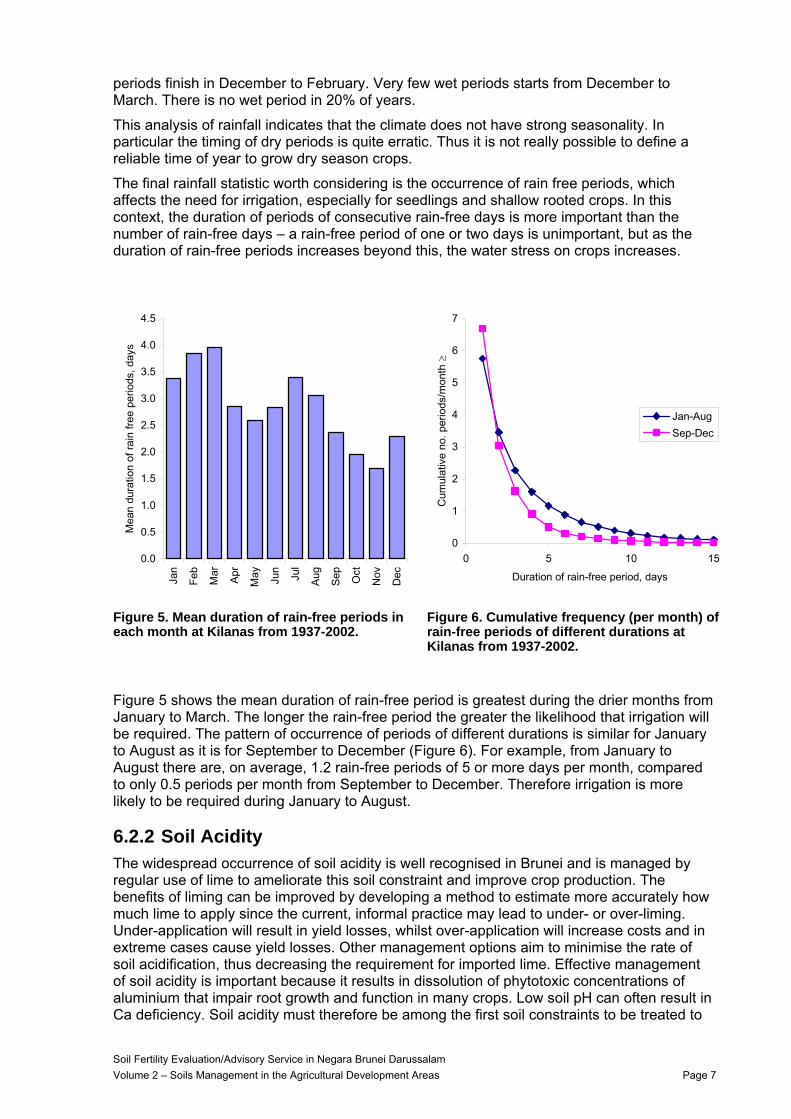
Figure 5. Mean duration of rain-free periods in each month at Kilanas from 1937-2002.
Figure 6. Cumulative frequency (per month) of rain-free periods of different durations at Kilanas from 1937-2002.
Figure 5 shows the mean duration of rain-free period is greatest during the drier months from January to March. The longer the rain-free period the greater the likelihood that irrigation will be required. The pattern of occurrence of periods of different durations is similar for January to August as it is for September to December (Figure 6). For example, from January to August there are, on average, 1.2 rain-free periods of 5 or more days per month, compared to only 0.5 periods per month from September to December. Therefore irrigation is more likely to be required during January to August.
6.2.2 Soil Acidity The widespread occurrence of soil acidity is well recognised in Brunei and is managed by regular use of lime to ameliorate this soil constraint and improve crop production. The benefits of liming can be improved by developing a method to estimate more accurately how much lime to apply since the current, informal practice may lead to under- or over-liming. Under-application will result in yield losses, whilst over-application will increase costs and in extreme cases cause yield losses. Other management options aim to minimise the rate of soil acidification, thus decreasing the requirement for imported lime. Effective management of soil acidity is important because it results in dissolution of phytotoxic concentrations of aluminium that impair root growth and function in many crops. Low soil pH can often result in Ca deficiency. Soil acidity must therefore be among the first soil constraints to be treated to
Soil Fertility Evaluation/Advisory Service in Negara Brunei Darussalam Volume 2 – Soils Management in the Agricultural Development Areas Page 7
allow development of a healthy root system capable of effectively taking up water and nutrients for crop growth and yield.
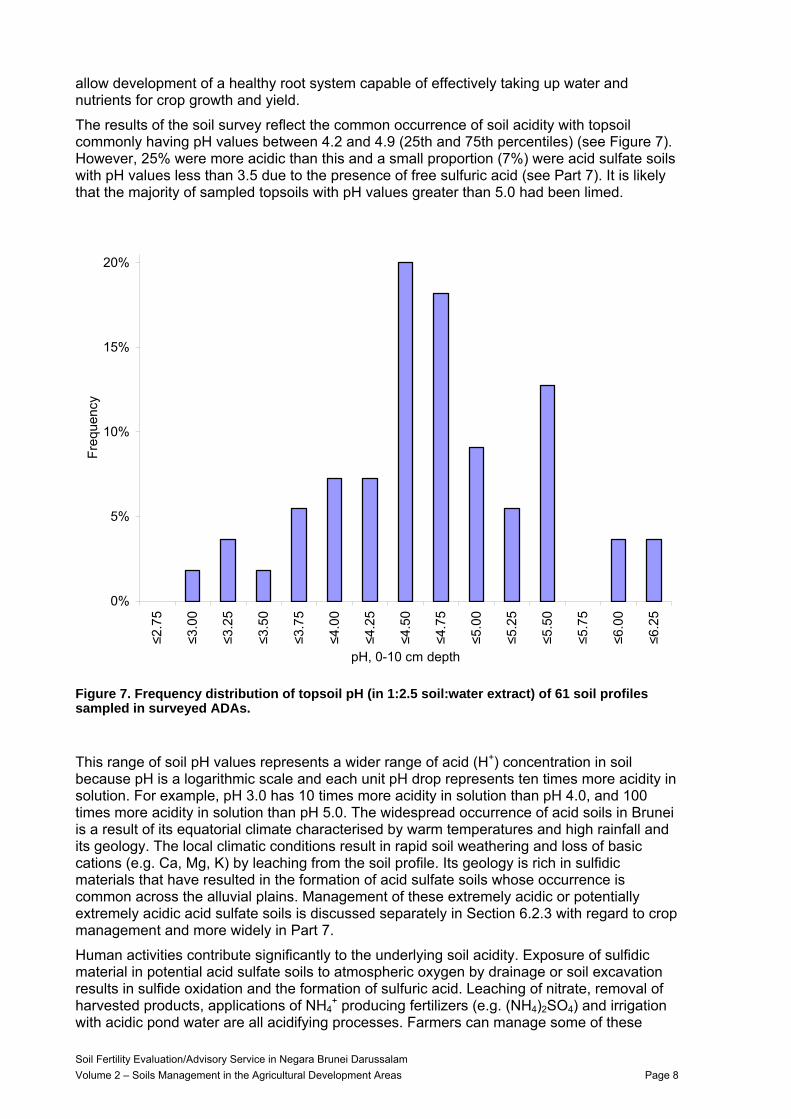
The results of the soil survey reflect the common occurrence of soil acidity with topsoil commonly having pH values between 4.2 and 4.9 (25th and 75th percentiles) (see Figure 7). However, 25% were more acidic than this and a small proportion (7%) were acid sulfate soils with pH values less than 3.5 due to the presence of free sulfuric acid (see Part 7). It is likely that the majority of sampled topsoils with pH values greater than 5.0 had been limed.
0%
5%
10%
15%
20%
≤2.7
5
≤3.0
0
≤3.2
5
≤3.5
0
≤3.7
5
≤4.0
0
≤4.2
5
≤4.5
0
≤4.7
5
≤5.0
0
≤5.2
5
≤5.5
0
≤5.7
5
≤6.0
0
≤6.2
5pH, 0-10 cm depth
Freq
uenc
y
Figure 7. Frequency distribution of topsoil pH (in 1:2.5 soil:water extract) of 61 soil profiles sampled in surveyed ADAs.
This range of soil pH values represents a wider range of acid (H+) concentration in soil because pH is a logarithmic scale and each unit pH drop represents ten times more acidity in solution. For example, pH 3.0 has 10 times more acidity in solution than pH 4.0, and 100 times more acidity in solution than pH 5.0. The widespread occurrence of acid soils in Brunei is a result of its equatorial climate characterised by warm temperatures and high rainfall and its geology. The local climatic conditions result in rapid soil weathering and loss of basic cations (e.g. Ca, Mg, K) by leaching from the soil profile. Its geology is rich in sulfidic materials that have resulted in the formation of acid sulfate soils whose occurrence is common across the alluvial plains. Management of these extremely acidic or potentially extremely acidic acid sulfate soils is discussed separately in Section 6.2.3 with regard to crop management and more widely in Part 7.
Human activities contribute significantly to the underlying soil acidity. Exposure of sulfidic material in potential acid sulfate soils to atmospheric oxygen by drainage or soil excavation results in sulfide oxidation and the formation of sulfuric acid. Leaching of nitrate, removal of harvested products, applications of NH4
+ producing fertilizers (e.g. (NH4)2SO4) and irrigation with acidic pond water are all acidifying processes. Farmers can manage some of these
Soil Fertility Evaluation/Advisory Service in Negara Brunei Darussalam Volume 2 – Soils Management in the Agricultural Development Areas Page 8
anthropogenic (human-induced) factors to decrease the rate of soil acidification on their farm and this is discussed below in more detail.
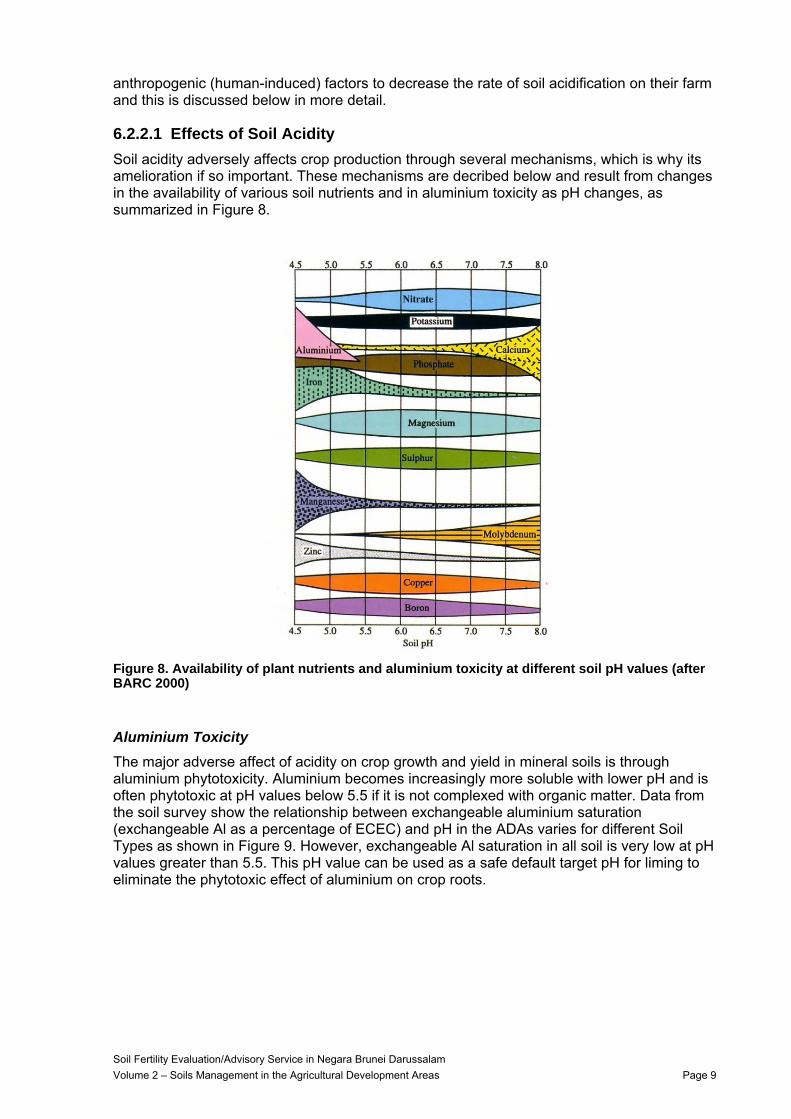
6.2.2.1 Effects of Soil Acidity Soil acidity adversely affects crop production through several mechanisms, which is why its amelioration if so important. These mechanisms are decribed below and result from changes in the availability of various soil nutrients and in aluminium toxicity as pH changes, as summarized in Figure 8.
Figure 8. Availability of plant nutrients and aluminium toxicity at different soil pH values (after BARC 2000)
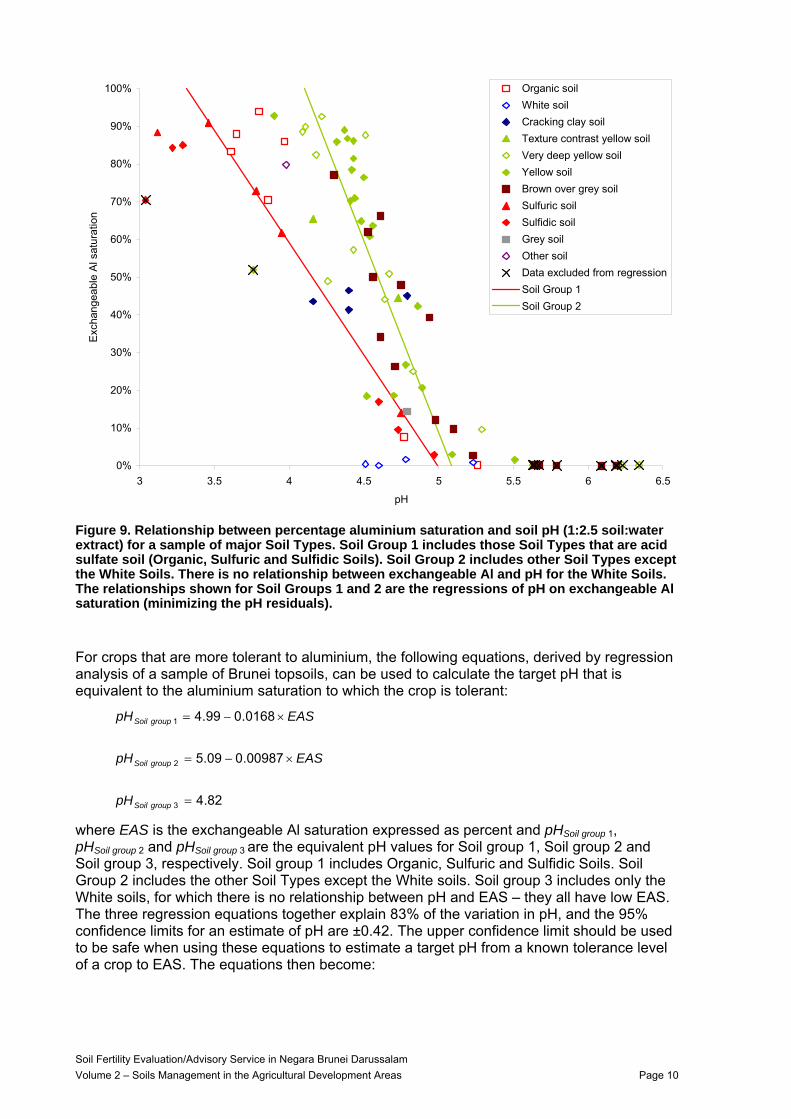
Aluminium Toxicity The major adverse affect of acidity on crop growth and yield in mineral soils is through aluminium phytotoxicity. Aluminium becomes increasingly more soluble with lower pH and is often phytotoxic at pH values below 5.5 if it is not complexed with organic matter. Data from the soil survey show the relationship between exchangeable aluminium saturation (exchangeable Al as a percentage of ECEC) and pH in the ADAs varies for different Soil Types as shown in Figure 9. However, exchangeable Al saturation in all soil is very low at pH values greater than 5.5. This pH value can be used as a safe default target pH for liming to eliminate the phytotoxic effect of aluminium on crop roots.
Soil Fertility Evaluation/Advisory Service in Negara Brunei Darussalam Volume 2 – Soils Management in the Agricultural Development Areas Page 9
0%
10%
20%
30%
40%
50%
60%
70%
80%
90%
100%
3 3.5 4 4.5 5 5.5 6 6
pH
Exc
hang
eabl
e A
l sat
urat
ion
.5
Organic soilWhite soilCracking clay soilTexture contrast yellow soilVery deep yellow soilYellow soilBrown over grey soilSulfuric soilSulfidic soilGrey soilOther soilData excluded from regressionSoil Group 1Soil Group 2
Figure 9. Relationship between percentage aluminium saturation and soil pH (1:2.5 soil:water extract) for a sample of major Soil Types. Soil Group 1 includes those Soil Types that are acid sulfate soil (Organic, Sulfuric and Sulfidic Soils). Soil Group 2 includes other Soil Types except the White Soils. There is no relationship between exchangeable Al and pH for the White Soils. The relationships shown for Soil Groups 1 and 2 are the regressions of pH on exchangeable Al saturation (minimizing the pH residuals).
For crops that are more tolerant to aluminium, the following equations, derived by regression analysis of a sample of Brunei topsoils, can be used to calculate the target pH that is equivalent to the aluminium saturation to which the crop is tolerant:
82.4
00987.009.5
0168.099.4
3
2
1
=
×−=
×−=
groupSoil
groupSoil
groupSoil
pH
EASpH
EASpH
where EAS is the exchangeable Al saturation expressed as percent and pHSoil group 1, pHSoil group 2 and pHSoil group 3 are the equivalent pH values for Soil group 1, Soil group 2 and Soil group 3, respectively. Soil group 1 includes Organic, Sulfuric and Sulfidic Soils. Soil Group 2 includes the other Soil Types except the White soils. Soil group 3 includes only the White soils, for which there is no relationship between pH and EAS – they all have low EAS. The three regression equations together explain 83% of the variation in pH, and the 95% confidence limits for an estimate of pH are ±0.42. The upper confidence limit should be used to be safe when using these equations to estimate a target pH from a known tolerance level of a crop to EAS. The equations then become:
Soil Fertility Evaluation/Advisory Service in Negara Brunei Darussalam Volume 2 – Soils Management in the Agricultural Development Areas Page 10
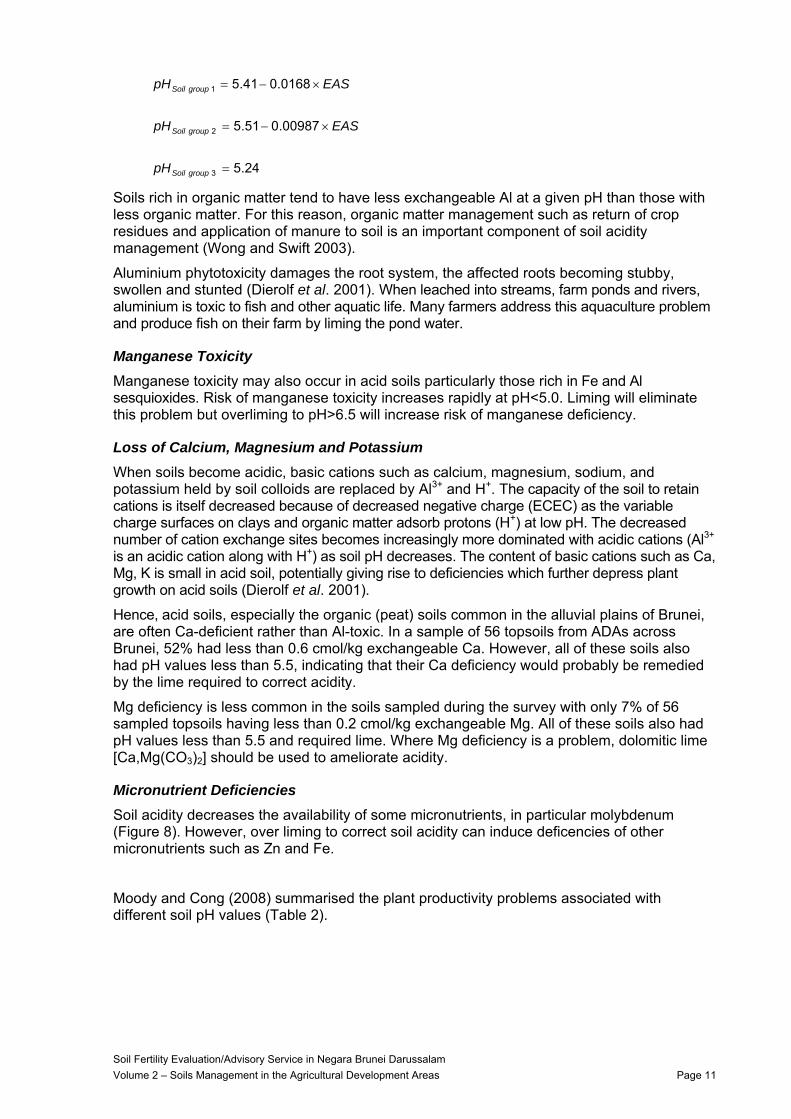
24.5
00987.051.5
0168.041.5
3
2
1
=
×−=
×−=
groupSoil
groupSoil
groupSoil
pH
EASpH
EASpH
Soils rich in organic matter tend to have less exchangeable Al at a given pH than those with less organic matter. For this reason, organic matter management such as return of crop residues and application of manure to soil is an important component of soil acidity management (Wong and Swift 2003).
Aluminium phytotoxicity damages the root system, the affected roots becoming stubby, swollen and stunted (Dierolf et al. 2001). When leached into streams, farm ponds and rivers, aluminium is toxic to fish and other aquatic life. Many farmers address this aquaculture problem and produce fish on their farm by liming the pond water.
Manganese Toxicity Manganese toxicity may also occur in acid soils particularly those rich in Fe and Al sesquioxides. Risk of manganese toxicity increases rapidly at pH<5.0. Liming will eliminate this problem but overliming to pH>6.5 will increase risk of manganese deficiency.
Loss of Calcium, Magnesium and Potassium When soils become acidic, basic cations such as calcium, magnesium, sodium, and potassium held by soil colloids are replaced by Al3+ and H+. The capacity of the soil to retain cations is itself decreased because of decreased negative charge (ECEC) as the variable charge surfaces on clays and organic matter adsorb protons (H+) at low pH. The decreased number of cation exchange sites becomes increasingly more dominated with acidic cations (Al3+ is an acidic cation along with H+) as soil pH decreases. The content of basic cations such as Ca, Mg, K is small in acid soil, potentially giving rise to deficiencies which further depress plant growth on acid soils (Dierolf et al. 2001).
Hence, acid soils, especially the organic (peat) soils common in the alluvial plains of Brunei, are often Ca-deficient rather than Al-toxic. In a sample of 56 topsoils from ADAs across Brunei, 52% had less than 0.6 cmol/kg exchangeable Ca. However, all of these soils also had pH values less than 5.5, indicating that their Ca deficiency would probably be remedied by the lime required to correct acidity.
Mg deficiency is less common in the soils sampled during the survey with only 7% of 56 sampled topsoils having less than 0.2 cmol/kg exchangeable Mg. All of these soils also had pH values less than 5.5 and required lime. Where Mg deficiency is a problem, dolomitic lime [Ca,Mg(CO3)2] should be used to ameliorate acidity.
Micronutrient Deficiencies Soil acidity decreases the availability of some micronutrients, in particular molybdenum (Figure 8). However, over liming to correct soil acidity can induce deficencies of other micronutrients such as Zn and Fe.
Moody and Cong (2008) summarised the plant productivity problems associated with different soil pH values (Table 2).
Soil Fertility Evaluation/Advisory Service in Negara Brunei Darussalam Volume 2 – Soils Management in the Agricultural Development Areas Page 11
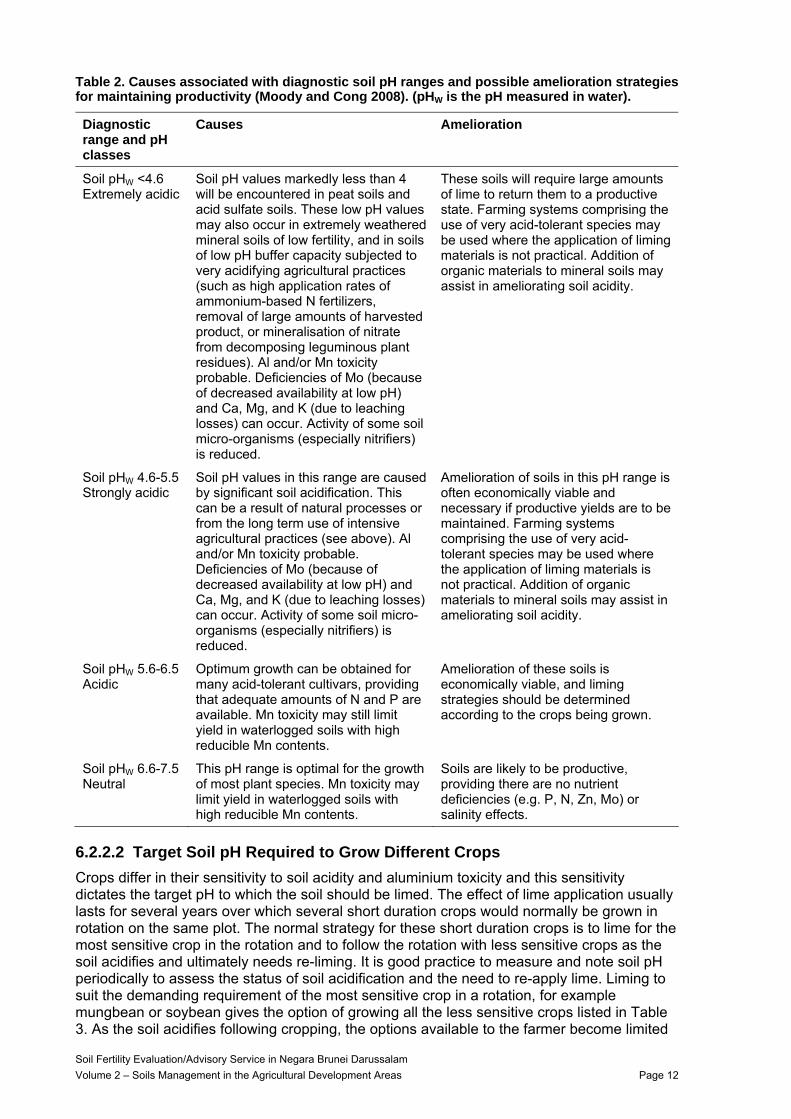
Table 2. Causes associated with diagnostic soil pH ranges and possible amelioration strategies for maintaining productivity (Moody and Cong 2008). (pHW is the pH measured in water).
Diagnostic range and pH classes
Causes Amelioration
Soil pHW <4.6 Extremely acidic
Soil pH values markedly less than 4 will be encountered in peat soils and acid sulfate soils. These low pH values may also occur in extremely weathered mineral soils of low fertility, and in soils of low pH buffer capacity subjected to very acidifying agricultural practices (such as high application rates of ammonium-based N fertilizers, removal of large amounts of harvested product, or mineralisation of nitrate from decomposing leguminous plant residues). Al and/or Mn toxicity probable. Deficiencies of Mo (because of decreased availability at low pH) and Ca, Mg, and K (due to leaching losses) can occur. Activity of some soil micro-organisms (especially nitrifiers) is reduced.
These soils will require large amounts of lime to return them to a productive state. Farming systems comprising the use of very acid-tolerant species may be used where the application of liming materials is not practical. Addition of organic materials to mineral soils may assist in ameliorating soil acidity.
Soil pHW 4.6-5.5 Strongly acidic
Soil pH values in this range are caused by significant soil acidification. This can be a result of natural processes or from the long term use of intensive agricultural practices (see above). Al and/or Mn toxicity probable. Deficiencies of Mo (because of decreased availability at low pH) and Ca, Mg, and K (due to leaching losses) can occur. Activity of some soil micro-organisms (especially nitrifiers) is reduced.
Amelioration of soils in this pH range is often economically viable and necessary if productive yields are to be maintained. Farming systems comprising the use of very acid-tolerant species may be used where the application of liming materials is not practical. Addition of organic materials to mineral soils may assist in ameliorating soil acidity.
Soil pHW 5.6-6.5 Acidic
Optimum growth can be obtained for many acid-tolerant cultivars, providing that adequate amounts of N and P are available. Mn toxicity may still limit yield in waterlogged soils with high reducible Mn contents.
Amelioration of these soils is economically viable, and liming strategies should be determined according to the crops being grown.
Soil pHW 6.6-7.5 Neutral
This pH range is optimal for the growth of most plant species. Mn toxicity may limit yield in waterlogged soils with high reducible Mn contents.
Soils are likely to be productive, providing there are no nutrient deficiencies (e.g. P, N, Zn, Mo) or salinity effects.
6.2.2.2 Target Soil pH Required to Grow Different Crops Crops differ in their sensitivity to soil acidity and aluminium toxicity and this sensitivity dictates the target pH to which the soil should be limed. The effect of lime application usually lasts for several years over which several short duration crops would normally be grown in rotation on the same plot. The normal strategy for these short duration crops is to lime for the most sensitive crop in the rotation and to follow the rotation with less sensitive crops as the soil acidifies and ultimately needs re-liming. It is good practice to measure and note soil pH periodically to assess the status of soil acidification and the need to re-apply lime. Liming to suit the demanding requirement of the most sensitive crop in a rotation, for example mungbean or soybean gives the option of growing all the less sensitive crops listed in Table 3. As the soil acidifies following cropping, the options available to the farmer become limited
Soil Fertility Evaluation/Advisory Service in Negara Brunei Darussalam Volume 2 – Soils Management in the Agricultural Development Areas Page 12
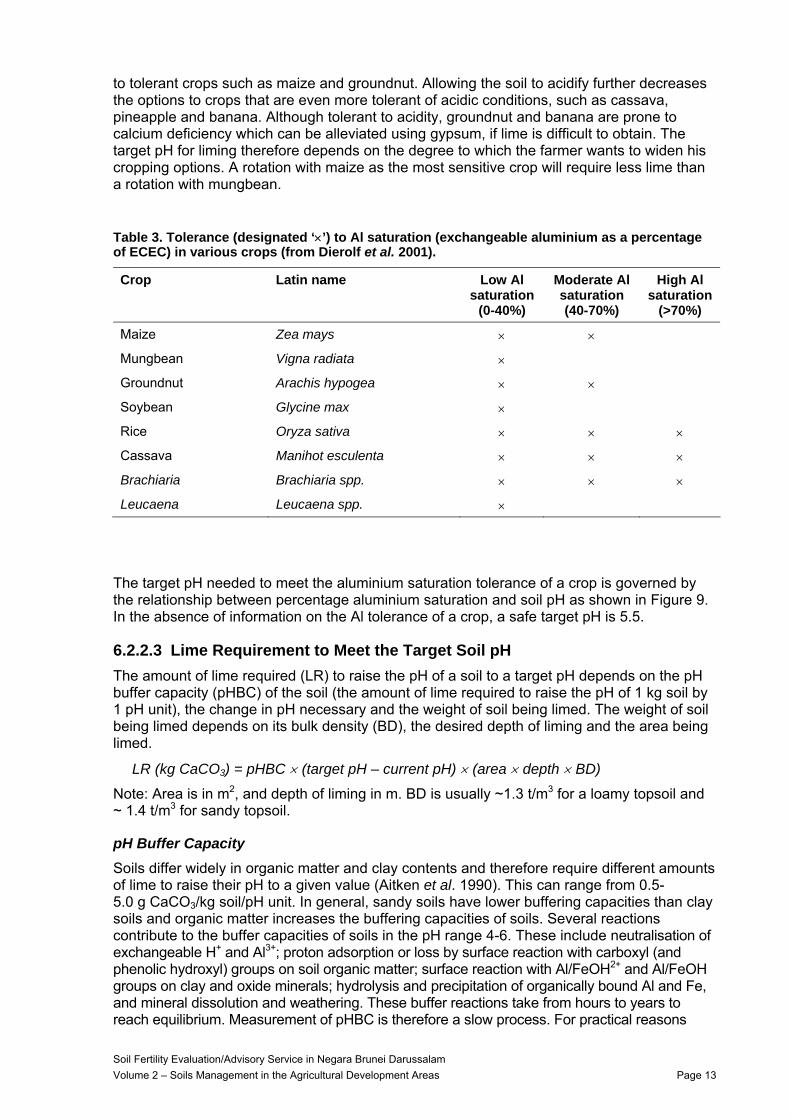
to tolerant crops such as maize and groundnut. Allowing the soil to acidify further decreases the options to crops that are even more tolerant of acidic conditions, such as cassava, pineapple and banana. Although tolerant to acidity, groundnut and banana are prone to calcium deficiency which can be alleviated using gypsum, if lime is difficult to obtain. The target pH for liming therefore depends on the degree to which the farmer wants to widen his cropping options. A rotation with maize as the most sensitive crop will require less lime than a rotation with mungbean.
Table 3. Tolerance (designated ‘×’) to Al saturation (exchangeable aluminium as a percentage of ECEC) in various crops (from Dierolf et al. 2001).
Crop Latin name Low Al saturation
(0-40%)
Moderate Al saturation (40-70%)
High Al saturation
(>70%)
Maize Zea mays × ×
Mungbean Vigna radiata ×
Groundnut Arachis hypogea × ×
Soybean Glycine max ×
Rice Oryza sativa × × ×
Cassava Manihot esculenta × × ×
Brachiaria Brachiaria spp. × × ×
Leucaena Leucaena spp. ×
The target pH needed to meet the aluminium saturation tolerance of a crop is governed by the relationship between percentage aluminium saturation and soil pH as shown in Figure 9. In the absence of information on the Al tolerance of a crop, a safe target pH is 5.5.
6.2.2.3 Lime Requirement to Meet the Target Soil pH The amount of lime required (LR) to raise the pH of a soil to a target pH depends on the pH buffer capacity (pHBC) of the soil (the amount of lime required to raise the pH of 1 kg soil by 1 pH unit), the change in pH necessary and the weight of soil being limed. The weight of soil being limed depends on its bulk density (BD), the desired depth of liming and the area being limed.
LR (kg CaCO3) = pHBC × (target pH – current pH) × (area × depth × BD)
Note: Area is in m2, and depth of liming in m. BD is usually ~1.3 t/m3 for a loamy topsoil and ~ 1.4 t/m3 for sandy topsoil.
pH Buffer Capacity Soils differ widely in organic matter and clay contents and therefore require different amounts of lime to raise their pH to a given value (Aitken et al. 1990). This can range from 0.5-5.0 g CaCO3/kg soil/pH unit. In general, sandy soils have lower buffering capacities than clay soils and organic matter increases the buffering capacities of soils. Several reactions contribute to the buffer capacities of soils in the pH range 4-6. These include neutralisation of exchangeable H+ and Al3+; proton adsorption or loss by surface reaction with carboxyl (and phenolic hydroxyl) groups on soil organic matter; surface reaction with Al/FeOH2+ and Al/FeOH groups on clay and oxide minerals; hydrolysis and precipitation of organically bound Al and Fe, and mineral dissolution and weathering. These buffer reactions take from hours to years to reach equilibrium. Measurement of pHBC is therefore a slow process. For practical reasons
Soil Fertility Evaluation/Advisory Service in Negara Brunei Darussalam Volume 2 – Soils Management in the Agricultural Development Areas Page 13
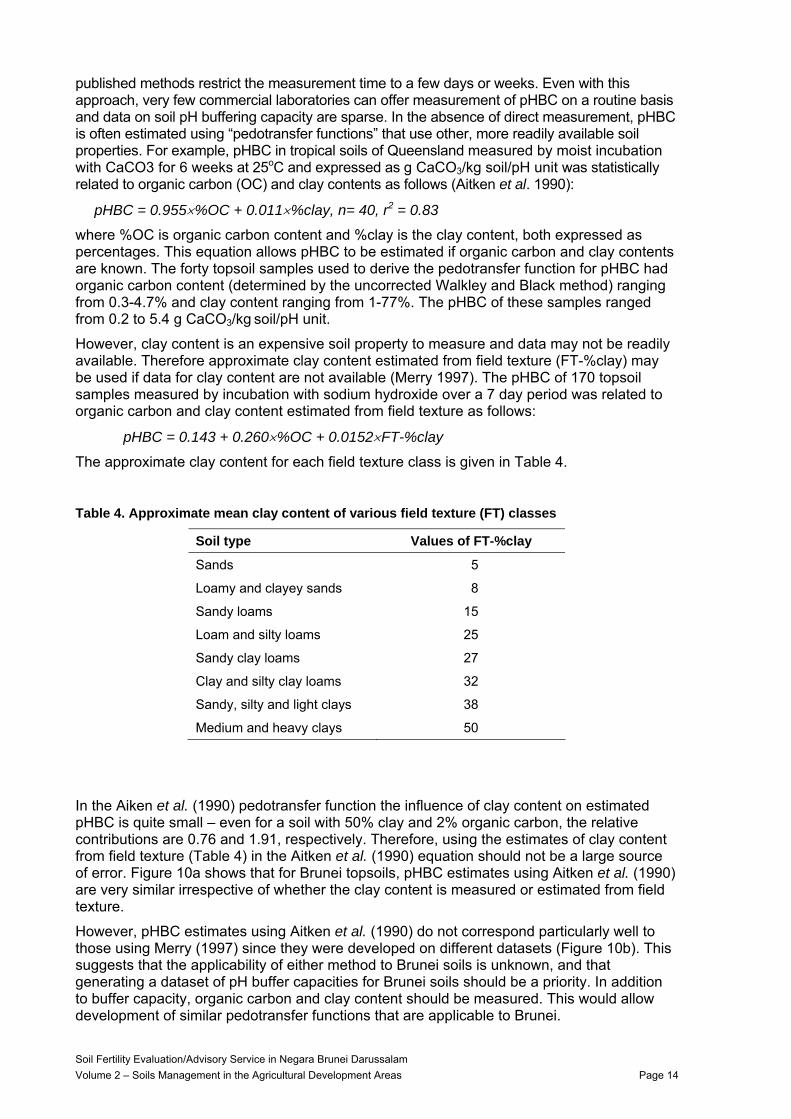
published methods restrict the measurement time to a few days or weeks. Even with this approach, very few commercial laboratories can offer measurement of pHBC on a routine basis and data on soil pH buffering capacity are sparse. In the absence of direct measurement, pHBC is often estimated using “pedotransfer functions” that use other, more readily available soil properties. For example, pHBC in tropical soils of Queensland measured by moist incubation with CaCO3 for 6 weeks at 25oC and expressed as g CaCO3/kg soil/pH unit was statistically related to organic carbon (OC) and clay contents as follows (Aitken et al. 1990):
pHBC = 0.955×%OC + 0.011×%clay, n= 40, r2 = 0.83
where %OC is organic carbon content and %clay is the clay content, both expressed as percentages. This equation allows pHBC to be estimated if organic carbon and clay contents are known. The forty topsoil samples used to derive the pedotransfer function for pHBC had organic carbon content (determined by the uncorrected Walkley and Black method) ranging from 0.3-4.7% and clay content ranging from 1-77%. The pHBC of these samples ranged from 0.2 to 5.4 g CaCO3/kg soil/pH unit.
However, clay content is an expensive soil property to measure and data may not be readily available. Therefore approximate clay content estimated from field texture (FT-%clay) may be used if data for clay content are not available (Merry 1997). The pHBC of 170 topsoil samples measured by incubation with sodium hydroxide over a 7 day period was related to organic carbon and clay content estimated from field texture as follows:
pHBC = 0.143 + 0.260×%OC + 0.0152×FT-%clay
The approximate clay content for each field texture class is given in Table 4.
Table 4. Approximate mean clay content of various field texture (FT) classes
Soil type Values of FT-%clay
Sands 5
Loamy and clayey sands 8
Sandy loams 15
Loam and silty loams 25
Sandy clay loams 27
Clay and silty clay loams 32
Sandy, silty and light clays 38
Medium and heavy clays 50
In the Aiken et al. (1990) pedotransfer function the influence of clay content on estimated pHBC is quite small – even for a soil with 50% clay and 2% organic carbon, the relative contributions are 0.76 and 1.91, respectively. Therefore, using the estimates of clay content from field texture (Table 4) in the Aitken et al. (1990) equation should not be a large source of error. Figure 10a shows that for Brunei topsoils, pHBC estimates using Aitken et al. (1990) are very similar irrespective of whether the clay content is measured or estimated from field texture.
However, pHBC estimates using Aitken et al. (1990) do not correspond particularly well to those using Merry (1997) since they were developed on different datasets (Figure 10b). This suggests that the applicability of either method to Brunei soils is unknown, and that generating a dataset of pH buffer capacities for Brunei soils should be a priority. In addition to buffer capacity, organic carbon and clay content should be measured. This would allow development of similar pedotransfer functions that are applicable to Brunei.
Soil Fertility Evaluation/Advisory Service in Negara Brunei Darussalam Volume 2 – Soils Management in the Agricultural Development Areas Page 14
0
2
4
6
8
10
12
14
16
18
20
0 5 10 15 20
pH b
uffe
ring
capa
city
, g C
aCO
3/kg
soil/
pH u
nit,
estim
ated
usi
ng A
itken
et a
l . (1
990)
, with
FT-
clay
1:1
a)
0
1
2
3
4
5
0 5 10 15 20
pH b
uffe
ring
capa
city
, g C
aCO
3/kg
soil/
pH u
nit,
estim
ated
usi
ng M
erry
(199
7)
1:1
b)
pH buffering capacity, g CaCO3/kg soil/pH unit, estimated by Aitken et al. (1990)
Figure 10. Comparison of different estimates of pH buffering capacity for a sample of Brunei topsoil layer (<10 cm). The estimates using Aitken et al. (1990) with measured clay content (x-axis) are compared with estimates (y-axis) using a) Aitken et al. (1990) with field texture clay content; b) Merry (1997) with field texture clay content.
0
5
10
15
20
pHB
C, g
CaC
O3/k
g so
il/pH
uni
t
Org
anic
soi
l
Whi
te s
oil
Cra
ckin
g cl
ay s
oil
Text
ure
cont
rast
yello
w s
oil
Ver
y de
ep y
ello
w s
oil
Yel
low
soi
l
Brow
n ov
er g
rey
soil
Sul
furic
soi
l
Sul
fidic
soi
l
Gre
y so
il
25
Figure 11. Topsoil (0-10 cm depth) pH buffering capacity of different soil types for 51 soil profiles sampled across Agricultural Development Areas of Brunei. Buffering capacity was estimated using Aitken et al. (1990) with the best available estimate of clay content.
Soil Fertility Evaluation/Advisory Service in Negara Brunei Darussalam Volume 2 – Soils Management in the Agricultural Development Areas Page 15
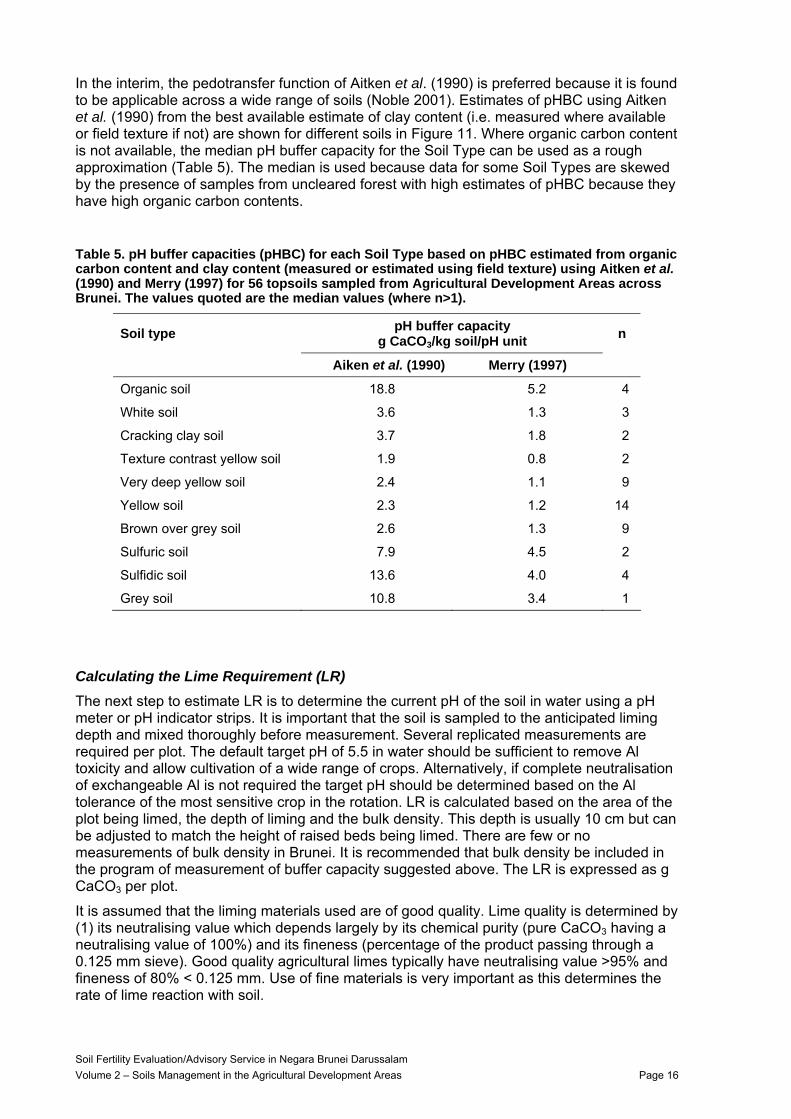
In the interim, the pedotransfer function of Aitken et al. (1990) is preferred because it is found to be applicable across a wide range of soils (Noble 2001). Estimates of pHBC using Aitken et al. (1990) from the best available estimate of clay content (i.e. measured where available or field texture if not) are shown for different soils in Figure 11. Where organic carbon content is not available, the median pH buffer capacity for the Soil Type can be used as a rough approximation (Table 5). The median is used because data for some Soil Types are skewed by the presence of samples from uncleared forest with high estimates of pHBC because they have high organic carbon contents.
Table 5. pH buffer capacities (pHBC) for each Soil Type based on pHBC estimated from organic carbon content and clay content (measured or estimated using field texture) using Aitken et al. (1990) and Merry (1997) for 56 topsoils sampled from Agricultural Development Areas across Brunei. The values quoted are the median values (where n>1).
Soil type pH buffer capacity g CaCO3/kg soil/pH unit n
Aiken et al. (1990) Merry (1997)
Organic soil 18.8 5.2 4
White soil 3.6 1.3 3
Cracking clay soil 3.7 1.8 2
Texture contrast yellow soil 1.9 0.8 2
Very deep yellow soil 2.4 1.1 9
Yellow soil 2.3 1.2 14
Brown over grey soil 2.6 1.3 9
Sulfuric soil 7.9 4.5 2
Sulfidic soil 13.6 4.0 4
Grey soil 10.8 3.4 1
Calculating the Lime Requirement (LR) The next step to estimate LR is to determine the current pH of the soil in water using a pH meter or pH indicator strips. It is important that the soil is sampled to the anticipated liming depth and mixed thoroughly before measurement. Several replicated measurements are required per plot. The default target pH of 5.5 in water should be sufficient to remove Al toxicity and allow cultivation of a wide range of crops. Alternatively, if complete neutralisation of exchangeable Al is not required the target pH should be determined based on the Al tolerance of the most sensitive crop in the rotation. LR is calculated based on the area of the plot being limed, the depth of liming and the bulk density. This depth is usually 10 cm but can be adjusted to match the height of raised beds being limed. There are few or no measurements of bulk density in Brunei. It is recommended that bulk density be included in the program of measurement of buffer capacity suggested above. The LR is expressed as g CaCO3 per plot.
It is assumed that the liming materials used are of good quality. Lime quality is determined by (1) its neutralising value which depends largely by its chemical purity (pure CaCO3 having a neutralising value of 100%) and its fineness (percentage of the product passing through a 0.125 mm sieve). Good quality agricultural limes typically have neutralising value >95% and fineness of 80% < 0.125 mm. Use of fine materials is very important as this determines the rate of lime reaction with soil.
Soil Fertility Evaluation/Advisory Service in Negara Brunei Darussalam Volume 2 – Soils Management in the Agricultural Development Areas Page 16
Lime made from ground calcitic limestone consists mostly of calcium carbonate and less than 8% magnesium. Its neutralizing effect depends on its purity and fineness of grinding. Lime made from ground dolomitic limestone consists of a mixture of calcium carbonate and magnesium carbonate. In some Australian states, it must contain at least 8% Mg to be classified as dolomitic lime. Its neutralizing effect also depends upon its purity and fineness of grinding. It should be used in preference to calcitic lime when topsoils are deficient in Mg.
Lime can take several months to react with the soil and raise pH to the target pH. Therefore sensitive crops should not be planted too soon after liming. In intensive cropping systems where the fallow period between crops may only be a few weeks, pH should be maintained above the target pH, by regular applications of lime. Maximum contact with the soil is essential for neutralization of soil acidity and lime must be mixed into the layer being limed. Surface applied lime is very slow to ameliorate the pH of the soil below.
6.2.2.4 Managing Acid Soils by Minimising Acid Production Farming acidifies the soil and management practices can be implemented to minmise the rate of soil acidification, thus increasing the residual value of lime and decreasing the frequency and/or rate of lime applications. Acidity is produced on-farm through a number of processes associated with the carbon, nitrogen and sulfur cycles. Understanding of these biogeochemical cycles allows management interventions to minimise soil acidification. These management interventions are discussed below for non-acid sulfate soils. Management of acid sulfate soils is discussed in Section 6.2.3 and in more detail in Part 7.
Avoid Over Liming Overliming will result in loss of lime by reaction with carbonic acid. This acid is formed by the dissolution of carbon dioxide produced by soil microbial activity and by plant roots. Protons (H+) are dissociated from carbonic acid which has a pKa value of 6.1. This means that 50% of carbonic acid is dissociated at pH 6.1 and dissociation and release of protons increases at higher pH values. Liming to pH values greater than that needed to neutralise exchangeable aluminium (5.5) will result in increased lime loss from reaction with protons released by carbonic acid and associated loss of bicarbonates by leaching.
Over liming will also induce some micronutrient deficiencies (see Figure 8).
Minimise Removal of Non-Marketable Plant Products (Crop Residues) An important source of acidity related to the carbon cycle is production and removal of plant materials. Acidification occurs when plant materials are produced because plant roots release protons as they take up cations such as K, Ca and Mg in excess of the anion charge. These roots release protons to maintain electroneutrality within the plant. The alkalinity locked in the plant materials is returned to the soil when plant residues are returned to the soil and allowed to decompose. The removal of plant materials from the farm leaves the soil more acidic. This is an unavoidable cause of acidification because marketable produce is removed to generate farm income. Acidification can be minimised by minimising the removal of crop residues from the farm.
The amount of alkalinity removed in harvested products or returned to the soil in the form of crop residues is the product of the amount harvested or returned and the ash alkalinity of these materials. Ash alkalinity is determined by ashing the material, dissolving the residues in acid, and then back-titrating the acid with alkali. Legumes such as mungbeans and soybeans tend to take up more cations in proportion to anions and as a consequence have high ash alkalinities and acidify the soil quickly if residue removal is not minimised.
Minimise Nitrate Leaching The formation of nitrate in soil from urea or ammonium fertilizers or from the decomposition of organic matter is accompanied by the release of 1H+/NO3
- formed (Boland and Hedley 2003). This acidity is neutralised by plant uptake of nitrate but remains in the soil when nitrate is leached and carries with it mobile cations such as Na, K, Ca and Mg. Inputs of
Soil Fertility Evaluation/Advisory Service in Negara Brunei Darussalam Volume 2 – Soils Management in the Agricultural Development Areas Page 17
acidity due to nitrate leaching measured in large lysimeters cropped to a maize-rice rotation under humid tropical conditions can be as high as 10 kmol H+/ha/yr (Wong et al. 2004). This acidity input requires 0.5 t CaCO3/ha/yr to neutralise.
Options to minimise nitrate leaching include splitting the amount and time of N application according to crop needs. This is particularly important in non-waterlogged Soil Types prone to leaching which are as follows:
Texture contrast yellow soils
Sandy very deep yellow soils (somewhat poorly drained and well drained)
Whilst the following waterlogged Soil Types that are prone to leaching, the acidifying effect of leaching nitrate is likely be dwarfed by the alkalizing effect of denitrification due to waterlogging and high organic carbon contents:
Sandy poorly drained white soils
Soft poorly drained sulfuric soils
Organic poorly drained moderately deep sulfidic soils
Another option is to include deep rooted perennials to capture leached nitrate in the farming system.
Use Less Acidifying Forms of Fertilizer Ammonium-based fertilizers and elemental sulfur release protons during oxidation in the soil. Oxidation of ammonium-based fertilizers by nitrification is rapid in slightly acid to neutral soils:
NH4+ + 2O2 = NO3
- + 2H+ + H2O
It is estimated that 3.6 kg of calcium carbonate are required to neutralise the acidity produced by 1 kg of ammonium N (Fisher et al. 2003). A crop requiring 100 kgN/ha needs 360 kg lime to neutralise the acidity produced if the fertilizer used was ammonium sulfate . The amount of acidity generated per kg of N or S applied as different fertilizers, and the amount of lime required to neutralise this acidity are given in Table 6.
Table 6. Amount of acidity (kmol H+) generated per kg of N or S applied as different fertilizers and the amount of lime required to neutralise this acidity (Fisher et al. 2003).
Fertilizer kmol H+/kg Lime required (kg lime/kg N or S)
Ammonium sulfate 1 3.6
Diammonium phosphate 0.5 1.8
Monoammonium phosphate 1 3.6
Urea 0 0
Calcium ammonium nitrate -0.2 -0.7
Elemental sulfur 2 3.1
6.2.3 Sulfidic Material Many soils in the lowlands of Brunei are acid sulfate soils that are characterised by the presence of sulfidic material and/or sulfuric layers. Sulfidic material has a pH >3.5, but when exposed to air over several months the pH falls to <3.5 due to the oxidation of sulfides (initially iron pyrite) to form sulfuric acid. In sulfuric layers this process has already occurred so their pH is <3.5. Oxidation can produce extremely acid soils in which it is difficult for most
Soil Fertility Evaluation/Advisory Service in Negara Brunei Darussalam Volume 2 – Soils Management in the Agricultural Development Areas Page 18
crop species to grow. In addition, acid together with iron and aluminium compounds, also produced by oxidation, can be leached into waterways causing fish kills and damaging infrastructure. The main Soil Types affected in Brunei are Organic, Sulfuric and Sulfidic Soils together with some Cracking clay soils. All these Soil Types also have prolonged waterlogging.
The properties, recognition and management of acid sulfate soils in Brunei are discussed in Part 7. This section briefly summarizes those aspects of management relevant to cropping. There are two basic principles:
• Ideally sulfidic material should remain undisturbed below the watertable where it is harmless. However, this can make cropping difficult where sulfidic material occurs at shallow depths, because they can be exposed when taking steps to alleviate waterlogging, for example using raised beds (see Section 6.2.4.5 below).
• If sulfidic soils are exposed, heavy applications of lime are required to neutralise the acid produced as the sulfidic material oxidises.
During investigations of acid sulfate soils in Brunei (Part 7), the total actual acidity (TAA) and acid generating potential (AGP) of different layers were measured (Section 7.4.2.4). The sum of these is the net acidity (NA). AGP is a measure of the amount of acid that would be produced if the sulfidic material in a soil layer is allowed to oxidise. In the profiles studied, the occurrence of TAA and AGP followed a similar pattern:
• Near surface layers above 50-100 cm depth had already oxidized. Whilst these layers are often acid with NA of 0.15-0.60 mol H+/kg (equivalent to 7.5-30 g CaCO3/kg), most of the acidity was TAA (0.13-0.45. mol H+/kg) with relatively small AGP <0.2 mol H+/kg.
• Layers below 50-100 cm depth often contained considerable amounts of unoxidised sulfidic material. TAA values were similar to overlying layers with 0.05-0.75 mol H+/kg, but AGP values were considerably greater at 0.6-2.2 mol H+/kg. Thus NA values were very high with 0.7-2.9 mol H+/kg (equivalent to 35 -145 g CaCO3/kg).
Because of this pattern, these soils can be utilised for shallow rooted crops and, depending on the depth to sulfidic material, for some trees.
6.2.3.1 Management of Acid Sulfate Soils for Short Duration Crops Managing these soils is a compromise between alleviating waterlogging and preventing oxidation of sulfidic material. Because the surface layers usually have low AGP, they can be used for mounding into raised beds (see Section 6.2.4.5). This provides an aerated environment for the roots of shallow rooted crops, such as vegetables. Whilst the AGP is generally fairly low, these soils are nevertheless acid and require large additions of lime as described in Sections 6.2.2.3 and 7.5.1.3. When replenishing the beds annually, care should be taken not to use sulfidic material from deeper in the profile because neutralising its very high AGP requires considerable amounts of lime. For successful use of these soils the depth to sulfidic material should be determined before the site is developed. Methods for identifying such materials are described in Section 7.4.1.4.
Because the aim is not to lower the watertable but to increase the depth of aerated soil above it, waterlogging after heavy rainfall is likely to remain a problem, unless there is rapid surface drainage to remove excess rainfall before it infiltrates. This is discussed below in Section 6.2.4.2.
6.2.3.2 Management of Acid Sulfate Soils for Tree Crops Cultivation of tree crops on acid sulfate soils is more problematic. Most trees have a deeper root zone than short duration crops and therefore require a greater depth of aerated soil. Whilst it is possible to construct raised beds (see Section 6.2.4.5) – or mounds for individual trees – there are limits on how high these can be. If the sulfidic layer is too shallow relative to the depth of rooting, it may not be possible to successfully grow trees. Because beds or
Soil Fertility Evaluation/Advisory Service in Negara Brunei Darussalam Volume 2 – Soils Management in the Agricultural Development Areas Page 19
mounds need to be higher than for short duration crops, it is even more important to determine the depth to sulfidic material before commencing development.
As for short duration crops, it is essential to ameliorate any acidity (see Secton 6.2.2.3) and to have rapid surface drainage as described in Section 6.2.4.2.
6.2.4 Waterlogging Plant roots require oxygen to live and function. In most crops, oxygen is obtained from the air-filled pore space of the soil surrounding the roots and it is only in very few cases (notably paddy rice) that oxygen is transported from the shoot to meet the requirement of the roots. The soil must therefore be aerated to allow healthy roots to live and function. The amount of air-filled porosity required to meet oxygen needs varies in different crops and stages of crop growth but it is generally accepted that air-filled porosity needs to exceed 8% of the total soil volume to avoid root damage by waterlogging (Hamilton et al. 2005). Waterlogging displaces air from soil pores and the resulting lack of oxygen causes damage and death of the root tips and cessation of root growth. The affected roots appear pruned and have limited ability to take up water and nutrients which translate into lower yields. In extreme cases of prolonged waterlogging, plant death occurs.
The climate, landscape and soil of Brunei predispose a large part of the country to waterlogging. Of the 4423 ha surveyed in ADAs across the country approximately 47% of the area suffers from waterlogging including 29% where waterlogging is prolonged. The major causes of waterlogging are as follows:
High rainfall: Brunei’s equatorial climate is typified by continuously high rainfall. At Kilanas the mean annual rainfall is 2700 mm, with the minimum mean monthly rainfall being 138 mm.
Shallow groundwater: Much of the lowland area of Brunei is at low elevations relative to sea level. These areas have shallow groundwater, commonly less than 0.5 m below the surface. Shallow watertables slow drainage of the surface soil by reducing the hydraulic gradient, even where the soil is inherently permeable. Shallow groundwater is a feature of the Organic, Sulfuric and Sulfidic soils.
Perched watertables: (watertables overlaying unsaturated soil) occur at some sites where the subsoil has low permeability. Like shallow groundwater, perched watertables also slow drainage of the surface soil. Soils prone to perched watertables include the Somewhat poorly drained clayey very deep yellow soils and the Moderately well drained clayey very deep yellow soils which occur on river terraces where the low slope and clayey texture reduce internal drainage even though the soil surface is above the regional watertable. Generally poorly structured clays and silty clays with no visible pores have low permeability and take months to wet up whereas those with a few visible pores take weeks to wet up (Moody and Cong 2008). The White soils also suffer from perched watertables, but these are caused by impermeable layers of sesquioxides at some depth in the profile.
Poor surface drainage: Much of the landscape is characterised by very flat lowlands (slope <2%). The low slopes slow the removal of surface water laterally after heavy rainfall causing the root zone of plants to become intermittently saturated.
Convergent runoff: Another important landscape predisposition to waterlogging is the common occurrence of hills with steep slopes (>15 % slope) which shed rainfall rapidly into relatively narrow valley floors as runoff. This convergence of runoff from a large areas onto the smaller area of valley floor may cause periodic flooding as well as waterlogging. Examples include the ADAs in Tutong and Labu Estate in Temburong.
Waterlogging is alleviated by aerating the soil root zone, using methods tailored to the cause of the waterlogging. The major methods are discussed below, concentrating on those most relevant to on-farm soil and water management in Brunei .
Soil Fertility Evaluation/Advisory Service in Negara Brunei Darussalam Volume 2 – Soils Management in the Agricultural Development Areas Page 20
6.2.4.1 Lowering the Watertable Where waterlogging is caused by shallow watertables, the watertable can be lowered using drains that intercept the watertable. This increases the hydraulic gradient in the surface soil and increases the rate at which water drains through the soil. To be successful the drains have to remove water away from the site – normally into the natural stream network. Where the site has reasonable elevation, this can happen under the influence of gravity provided the network of drains is carefully constructed. Where the site has little elevation, as is the case of the lowland areas of Brunei, there is nowhere for the water to drain by gravity, so pumping is required to remove water from the drains into streams and rivers.
However, lowering the watertable is not recommended in situations in Brunei where there are acid sulfate soils (Organic, Sulfuric and Sulfidic soils). These soil contain sulfidic materials, which, on exposure to air, oxidise and produce sulfuric acid. Apart from acidifying the soil, the acid can also pollute waterways. In addition, lowering the watertable in Organic soils, results in oxidation of peat and subsidence. Therefore the watertable should never be lowered below the depth at which sulfidic material occurs. For more information refer to Section 6.2.3 and Part 7.
6.2.4.2 Improving Surface Drainage Surface drains are intended to rapidly remove excess surface water after heavy rain so that less of it infiltrates into the soil, where it would exacerbate waterlogging. Thus surface drains do not need to intercept the watertable and are not primarily intended to lower it. Effective surface drainage, especially in areas of low elevation and slope requires a network of both on-farm and off-farm drains.
The components of such a network might include the following:
• Interceptor drains on the slopes of surrounding hills to divert runoff before it reaches a lowland agricultural site. These are designed to overcome the problem of convergent runoff discussed above.
• Furrows between raised beds (see below) are part of the surface drainage network by shedding excess rainfall from the beds. If levelled carefully, they should drain into farm drains.
• Relatively small farm drains to capture the runoff from individual fields, including that delivered from furrows. The drains need to have the capacity to remove sufficient runoff after heavy rainfall events so that surface water has disappeared in less than a day, preferably within in a few hours. Capacity is a function of the gradient and drain cross sectional area (width × depth), with steeper gradients requiring less cross sectional area. In areas with acid sulfate soils, where the watertable should not be lowered, the surface drains should be wide and shallow so that they do not intercept the watertable. This applies to areas in Brunei-Muara and also those parts of Belait dominated by Organic, Sulfuric or Sulfidic soils. In other areas, drains can afford to be deeper. This includes drainage of the Brown over grey soils found in the valley floors of Tutong and Temburong. Where possible farm drains should deliver water directly to a stream or river, or to an on-farm storage that can be used for irrigation and aquaculture.
• An effective network of public drains is needed to carry excess water away as local farms are typically small (<10 ha) and have limited capacity to store or dispose of this water without a public infrastructure to provide connectivity between these farms and beyond.
To function effectively all components of a network need to be properly constructed, integrated and maintained. Poor construction or maintenance of any downstream component will cause components upstream to function less effectively. Maintenance of farm drains by farmers and public drains by local authorities should aim to allow unobstructed flow. This involves keeping drains clear of debris and sediment. Drains may need periodic removal of sediment to prevent them gradually becoming shallower.
Soil Fertility Evaluation/Advisory Service in Negara Brunei Darussalam Volume 2 – Soils Management in the Agricultural Development Areas Page 21
6.2.4.3 Artificial Subsurface Drainage Artificial subsurface drainage (tile or mole drains) uses a network of buried pipes through the subsoil to increase the hydraulic gradient. They can be used in situations where the watertable needs to be lowered as well as where the soil permeability is low.The pipes drain by gravity into open collector drains.
Such systems are expensive to construct, and therefore best used in areas where high value crops are grown. They are of limited relevance in Brunei. because they lower the watertable which is not desirable as discussed above in Section 6.2.4.1. Additionally, the depth at which they meet collector drains would, in most, cases be below the watertable, so pumping would be required to keep the collector drains empty and allow the subsurface drains to function.
6.2.4.4 Improving Soil Permeability Improving soil permeability is intended to aerate the root zone by increasing the rate at which water moves through it. This can be done by improving soil structure, which has many additional benefits. In this context, improving soil structure involves the creation and retention of macropores, that drain by gravity. Such pores can have a marked effect on increasing the saturated hydraulic conductivity of the soil. Improvements in conductivity reduce the frequency of waterlogging and its duration. Such improvements are important where waterlogging is caused by slowly permeable subsoils possibly leading to perched watertables. Since the rate of drainage is a function of both the permeability and the hydraulic gradient, improving soil structure and permeability can also help where the hydraulic gradient is small due to shallow groundwater.
Management of soil structure has three aspects: improvement, maintenance and resilience.
Soil structure can be improved by tillage, which breaks open the soil and creates blocks of soil separated by macropores. Tillage is ideally performed when the soil moisture is lower than the soil’s plastic limit (the water content when the soil just becomes plastic). Soils are at the plastic limit when it is possible to roll a sample of the soils into a rod of about 1 cm diameter. If a smaller rod can be formed, the soil is too wet for cultivation. If it cannot be rolled into a rod of about 1 cm diameter, it is too dry for cultivation (Hamilton et al. 2005). Cultivating a soil that is too wet is likely to damage the structure by compaction and shearing, rather than improve it. The soil’s water content is more likely to be below the plastic limit during drier periods. Soils with high clay content tend to be more prone to damage by shearing and compaction than lighter textured soils.
Once improved, soil structure needs to be maintained. Compaction destroys macropores and is due to traffic (mechanical, animal or human) and cultivation when the soil is too wet. Thus compaction should be avoided by using controlled traffic (e.g. by having permanently positioned beds or defined machinery or foot paths) and by avoiding cultivation when the soil is too wet.
Rain-drop impact can cause the formation of a crust on the soil surface, especially in silty soils. Retention of crop residues as a mulch helps to protect the surface from crusting.
All cultivated soils tend to settle over time. Maintenance of a good structure, either requires cultivation at regular intervals or steps to develop more long-lasting macropores. The macropores created by soil fauna and plant roots tend to be longer lasting than those created by tillage. These types of pores can be encouraged by minimizing tillage and allowing roots to decompose in situ. Retention of crop residues also helps by providing a source of food for soil fauna as does addition of organic matter as manure.
The resilience of soil structure refers to its ability not to degrade over time or in response to moderate stresses. Some soil attributes lower resilience, in particular silty texture and sodicity (more than 15% exchangeable sodium). Sodicity is a very specific problem that is not widespread in Brunei. High exchangeable sodium percentage (>15%) is treated by the addition of calcium, either as lime or gypsum. The structural resilience of other soils can usually be improved by the addition of organic matter, which helps to stabilise soil aggregates.
Soil Fertility Evaluation/Advisory Service in Negara Brunei Darussalam Volume 2 – Soils Management in the Agricultural Development Areas Page 22
6.2.4.5 Use of Raised Beds in Waterlogging Management Raised beds are widely used on flat land across Brunei to drain excess water from the root zone and control risk of frequent waterlogging. These beds are designed to create and maintain a deepened root-hospitable soil layer with good aeration and drainage. Good drainage is achieved by allowing a short distance and reasonable height from the centre of the bed to the base of the furrow to create a hydraulic gradient necessary to stimulate lateral drainage into the furrow. Beds are normally <1 m wide and >25 cm above the furrows.
The furrows must be connected with appropriate surface drains with sufficient capacity to carry away all water drained from the raised beds. The amount of water that needs to be transported by the surface drains can be substantial. For example, a 20 mm rainfall event typical of daily rainfall in December, on an already wet soil will generate 10 L drainage per m2 of raised bed if it is assumed that 50% of the rainfall is lost to evapotranspiration. Catch drains collect water flowing from the lower ends of furrows for disposal. They must collect and conduct water from the full width of an area of raised beds. 10 L drainage / m2 raised bed is equivalent to 100 kL drainage /ha. Capacity of the catch drains is therefore important. They typically have wide channels to enhance their capacity to carry water at shallow depth and low velocity. The base of the catch drains are level with or below the furrows.
A precise contour survey is recommended in very flat landscapes to ensure that the drains are consistently in a down-slope direction. The network of catch drains should be engineered to carry the accumulated flow from the raised beds.
The catch drains in turn drain into on-farm and/or off-farm high capacity waterways that take the water to a natural drainage course. The large volumes of water that need to be disposed of, and the very small slope of the land pose significant engineering challenges to the problem of water disposal that are yet to be fully resolved to maximise the benefits of raised beds. Drainage engineers should be consulted for the design and implementation of these drains to ensure that functional and legal requirements are met.
Management of Soil in Raised Beds Raised beds for short duration crops and small, shrubby trees are formed by cultivating the soil and excavating furrows to the depth of cultivation. The spoil from the furrows is levelled over the area of the beds. The depth of cultivation is normally about 20 cm below normal ground surface of the undisturbed soil. This depth can be increased to meet the requirements of deeper rooted crops. Care should be taken to improve or maintain soil structure as described in Section 6.2.4.4.Soil cultivation for the establishment of raised beds provides the opportunity for liming. The amount of lime required should be calculated as described in Section 6.2.2.3.
Management of Raised Beds in Organic and Acid Sulfate Soils In Organic, Sulfuric and Sulfidic soils the formation of raised beds creates a risk of soil and environmental degradation and special consideration must be given to the management of raised beds on these soils. These soils are common on the alluvial plains and swamps of Brunei-Muara and Belait districts. They are characterised by the presence of sulfidic material and shallow watertables, and are composed of either organic soil material (peat) or mineral soil material with high organic matter content.
Avoid oxidation of sulfidic materials: If sulfidic materials (containing pyrite) are brought above the watertable, there is a danger they will oxidise and form sulfuric acid. This will not only acidify the bed, but can potentially acidify local waterways, when acid is flushed from the beds after heavy rain.
The best strategy is to avoid using soil from layers with sulfidic material in the beds. The depth to such layers must be determined before construction a) to avoid exposing them to oxygen and b) to avoid spreading sulfidic material on the surface of the bed.
If the use of sulfidic material in raised beds is unavoidable, it requires treatment with large applications of lime to neutralise the acid produced as it oxidises (see Part 7).
Soil Fertility Evaluation/Advisory Service in Negara Brunei Darussalam Volume 2 – Soils Management in the Agricultural Development Areas Page 23
Minimize oxidation of organic matter: Aeration of Organic soils causes irreversible loss of organic material by oxidation, leading to subsidence and release of large amounts of carbon dioxide. Tie and Kueh (1979) found subsidence of 60 cm in the first two years after reclamation of a drained, deep peat (watertable 75–100 cm below the surface) followed by a rate of 6 cm per year. On this basis, Ambak and Melling (2000) estimated subsidence of approximately 2 m in the first 25 years after reclamation.
Oxidation of organic matter with associated subsidence has several serious consequences.
• The watertable becomes closer to the surface, whilst flooding becomes more difficult to control.
• As the surface subsides, any layers with suldific material come closer to the surface, and it becomes increasingly difficult to find non-sulfidic material with which to replenish raised beds (see above).
• The oxidation of organic material releases large quantities of greenhouse gases (carbon dioxide, methane) into the atmosphere with long term impacts on global climate change.
• Drained peat is prone to fire that is very difficult to extinguish. Peat fires are a common problem in the region.
Whilst the rate of oxidiation and subsidence can be slowed by careful water management to allow economic use of peatlands, these processes are nevertheless inevitable and irreversible (Melling et al. 2002) and place severe limitations on the long term sustainable use of these soils. Worldwide concerns about losses of peat following drainage have led to a movement to discourage the drainage of peat land which serves an important function in carbon sequestration and maintenance of biodiversity.
6.2.5 Water Erosion Farming on land with slope >10% is common in Brunei. Although this places the hill slope in the very high (10-15%) to extreme (>15%) categories of erosion hazard (Moody and Cong 2008), most soils on steep slopes in Brunei are sandy, deep and well drained. These soil properties encourage infiltration and lower the risk of erosion. Furthermore, the humid climate encourages growth of ground cover (vegetation) which further protects the soil from erosion.
Nonetheless, on these steep lands there is considerable risk of erosion, causing loss of topsoil, organic matter and nutrient loss if steps are not taken to control it. Sheet erosion occurs when water movement results in uniform removal of soil across the eroded surface. The hydrology of the hill slope sometimes concentrates water flow into shallow flow lines that erode the soil as rill erosion. Deepening of the rills gives rise to gully erosion. Land use plays an important role in controlling erosion. Sustainable farming on slope land is difficult to achieve using annual crops alone due to interruption in soil surface cover and the very high vulnerability of bare soil to erosion. Several concerted management interventions are required to control erosion on these hill slopes.
6.2.5.1 Maintain Plant Cover Plant cover protects the soil surface from the erosive power of rain drops and of flowing water. The roots of these plants help hold the soil in place. Management practices should maintain protective cover on the soil by using trees, pasture and perennial crops. Annual crops should only be planted on a proportion of the slope to minimise the length of slope that is disturbed by cultivation.
• For perennial crops, such as fruit trees, a ground cover of grass or fodder legumes should be maintained. Apart from guarding against erosion, the ground cover is a potential source of animal feed and can provide a source of mulch for the trees.
Soil Fertility Evaluation/Advisory Service in Negara Brunei Darussalam Volume 2 – Soils Management in the Agricultural Development Areas Page 24
• For annual crops, many farmers use permanent raised beds across the slope and allow controlled growth of grassy weeds in the furrows and on the sides of the beds. Only a small strip on the top of the bed is cultivated by hand to allow annual crops to be sown.
• When clearing new areas of sloping land for agricultural development, care must be taken not to expose large areas of bare soil. Clearing narrow strips a few metres wide across the slope helps to reduce the length of exposed slope. This prevents runoff achieving high velocities, thus lowering its erosive power. The uncleared contour strips help to trap any soil material that has eroded.
6.2.5.2 Retain Crop Residues Similarly to plant cover, crop residues and mulches provide extra protective cover over the soil surface against the impact of rain drops on soil particles and slow the flow of water to allow more infiltration and minimise run-off and erosion (von Uexkull 1985). The return of crop residues to the soil surface also minimises loss of nutrients and organic matter from the soil. Soil organic matter improves soil aggregate stability, which, in turn, prevents crusting of the surface. This aids water infiltration and minimises run-off. Leaving standing stubble and returning crop residues to the field after harvest of annual crops is an important way to protect bare soil from erosive forces.
Retention/return of crop residues is particularly important if harvesting involves soil disturbance, such as during the harvesting of root crops.
6.2.5.3 Minimise Tillage Tillage loosens the soil and the loose soil particles are more easily dislodged and transported by running water. Tillage may also bury any standing stubble and protective crop residue cover. A tree-crop-pasture farming system is currently used on slopes in Brunei. This is an effective way to minimise the need for frequent cultivation and to decrease the likelihood of erosion. Leaf litter produced by trees and perennial vegetation provides a protective cover over the soil surface. The mixed cropping system mimics natural forest conditions in terms of diversity of canopies and keeps the soil surface covered for as long as possible, by the crop canopy and by dead or living mulch. In this system, herbicides such as glyphosate are used to replace tillage to control weeds. The current practice of growing annual crops in strips across a slope, with a cover of grassy weeds between the strips, should be encouraged because it reduces the length of exposed slope which, in turn, reduces the risk of erosion (see section 6.2.5.1). The practice can be enhanced by direct seeding the annual crop into uncultivated soil to minimise soil disturbance.
6.2.5.4 Terracing Mechanical soil conservation in the form of terracing to control surface runoff and erosion is not common in Brunei, although micro-terracing for individual fruit trees is common on steep slopes. The financial returns from crops and availability of effective alternative erosion measures may not justify the high cost of terracing. The advantage of vegetative soil conservation techniques based on ground cover is their lower cost and labour requirement than terracing.
An alley cropping system with hedgerows can build natural terraces by sediment deposition soon after establishment (Rachman et al. 1990). In addition to stabilising the soil by breaking the slope, the hedgerows contribute to fruit and fodder production in Indonesia. Hedgerows can be established about 5 m apart, depending on the steepness of the slope (Santoso and Sukristiyonubowo 1994). In some cases, alley cropping and grass strips are more effective than bench terraces in controlling erosion (Fagi and Mackie 1988; Santoso and Sukristiyonubowo 1994). Vetiver or lemon grass strips can also act as a terrace to reduce soil movement. Trees can be planted on micro-terraces of flat soil about 2-3 m diameter to minimise erosion when they are newly planted.
Soil Fertility Evaluation/Advisory Service in Negara Brunei Darussalam Volume 2 – Soils Management in the Agricultural Development Areas Page 25
6.2.5.5 Grassed Waterways Rill and gully erosion were observed on some farms especially along and across farm tracks. The water channels formed along these tracks were mostly not protected against erosion. A grassed water-way should be used to control this type of erosion. It consists of a wide, shallow grassed channel that can carry a large volume of water quickly down a steep slope. The waterway normally follows the natural drainage paths across the farm. An agricultural engineer is needed to design the shape and size of the waterway to enable it to carry peak runoff without erosion. The design will vary according to the anticipated size of rainstorm events and the area being drained. Steeper sections of the waterway can be lined with heavy duty fabric which is then covered with soil and seeded to grass. A well-built and maintained grassed waterway is very durable and erosion resistant.
6.2.6 Nutrient Management
6.2.6.1 Prerequisites A well-functioning root system is a prerequisite for nutrient uptake. Soil fertility problems that hamper root growth and function should be ameliorated to ensure efficient nutrient uptake by crops and minimal offsite impacts on the environment. Waterlogging and soil acidity in both acid sulfate and non-acid sulfate soils are common in Brunei and affect root growth, and water and nutrient uptake in susceptible crops. Retarded root growth or root death occurs as a result of loss of oxygen and dissolution of toxic metals during waterlogging. In acid soils, retarded root growth or root death occurs as a result of dissolution of root-toxic metals such as aluminium and manganese. Erosion causes the loss of the most fertile topsoil layer together with any applied fertilizer.
These soil constraints need to be remedied for the crop to gain the greatest benefit from fertilizers. The Fertility Capability Classification (FCC, Sanchez et al. 2003) provides a framework to identify and quantify a comprehensive range of fertility-related soil attributes systematically. In Volume 1, Part 3 suitability ratings and crop information were used to assess the likely impact of these attributes on crops that are currently or could potentially be grown in Brunei. This assessment provides both a basis for crop selection and an indication of the extent to which these attributes need to be ameliorated to improve the performance of specific crops, as discussed above. Nutrient management is part of an integral approach to managing soils for better crop and environmental outcomes. This section deals with nutrient aspects of soil fertility management. It is based on first principles to arrive at initial nutrient management recommendations. These initial recommendations will need to be regularly updated as the current lack of local field experimental data is remedied by local field work.
6.2.6.2 Sources of Nutrients An adequate supply of plant nutrients is essential for efficient crop production and may be derived from several sources. Sources include mobilised soil nutrients, biological nitrogen fixation and external inputs of fertilizers and manures. The non-fertilizer sources of nutrients are important and must be taken into account when determining the amount of fertilizer required by a crop.
Fertilizers Fertilizers are concentrated forms of nutrients and are designed for user-convenience. They are easy to transport, store and apply and have a rapid effect on yield. Many compound fertilizers are formulated to supply micronutrients such as copper, zinc, molybdenum and boron as well as more commonly used macronutrients. These benefits, and the low cost in Brunei, are compelling, and have led to the enthusiastic use of fertilizers.
Manure Poultry manure is commonly used by farmers in Brunei to improve their crop. Interviews with farmers suggest that large amounts are normally applied. The typical composition of poultry
Soil Fertility Evaluation/Advisory Service in Negara Brunei Darussalam Volume 2 – Soils Management in the Agricultural Development Areas Page 26
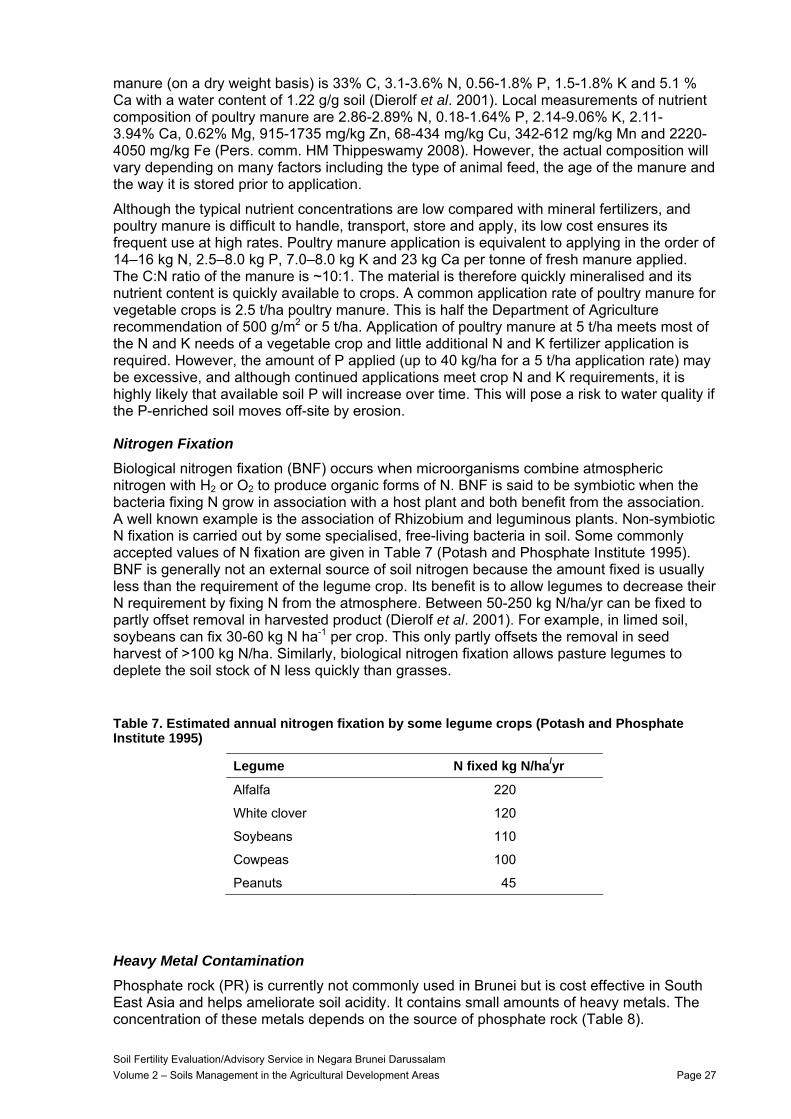
manure (on a dry weight basis) is 33% C, 3.1-3.6% N, 0.56-1.8% P, 1.5-1.8% K and 5.1 % Ca with a water content of 1.22 g/g soil (Dierolf et al. 2001). Local measurements of nutrient composition of poultry manure are 2.86-2.89% N, 0.18-1.64% P, 2.14-9.06% K, 2.11-3.94% Ca, 0.62% Mg, 915-1735 mg/kg Zn, 68-434 mg/kg Cu, 342-612 mg/kg Mn and 2220-4050 mg/kg Fe (Pers. comm. HM Thippeswamy 2008). However, the actual composition will vary depending on many factors including the type of animal feed, the age of the manure and the way it is stored prior to application.
Although the typical nutrient concentrations are low compared with mineral fertilizers, and poultry manure is difficult to handle, transport, store and apply, its low cost ensures its frequent use at high rates. Poultry manure application is equivalent to applying in the order of 14–16 kg N, 2.5–8.0 kg P, 7.0–8.0 kg K and 23 kg Ca per tonne of fresh manure applied. The C:N ratio of the manure is ~10:1. The material is therefore quickly mineralised and its nutrient content is quickly available to crops. A common application rate of poultry manure for vegetable crops is 2.5 t/ha poultry manure. This is half the Department of Agriculture recommendation of 500 g/m2 or 5 t/ha. Application of poultry manure at 5 t/ha meets most of the N and K needs of a vegetable crop and little additional N and K fertilizer application is required. However, the amount of P applied (up to 40 kg/ha for a 5 t/ha application rate) may be excessive, and although continued applications meet crop N and K requirements, it is highly likely that available soil P will increase over time. This will pose a risk to water quality if the P-enriched soil moves off-site by erosion.
Nitrogen Fixation Biological nitrogen fixation (BNF) occurs when microorganisms combine atmospheric nitrogen with H2 or O2 to produce organic forms of N. BNF is said to be symbiotic when the bacteria fixing N grow in association with a host plant and both benefit from the association. A well known example is the association of Rhizobium and leguminous plants. Non-symbiotic N fixation is carried out by some specialised, free-living bacteria in soil. Some commonly accepted values of N fixation are given in Table 7 (Potash and Phosphate Institute 1995). BNF is generally not an external source of soil nitrogen because the amount fixed is usually less than the requirement of the legume crop. Its benefit is to allow legumes to decrease their N requirement by fixing N from the atmosphere. Between 50-250 kg N/ha/yr can be fixed to partly offset removal in harvested product (Dierolf et al. 2001). For example, in limed soil, soybeans can fix 30-60 kg N ha-1 per crop. This only partly offsets the removal in seed harvest of >100 kg N/ha. Similarly, biological nitrogen fixation allows pasture legumes to deplete the soil stock of N less quickly than grasses.
Table 7. Estimated annual nitrogen fixation by some legume crops (Potash and Phosphate Institute 1995)
Legume N fixed kg N/ha/yr
Alfalfa 220
White clover 120
Soybeans 110
Cowpeas 100
Peanuts 45
Heavy Metal Contamination Phosphate rock (PR) is currently not commonly used in Brunei but is cost effective in South East Asia and helps ameliorate soil acidity. It contains small amounts of heavy metals. The concentration of these metals depends on the source of phosphate rock (Table 8).
Soil Fertility Evaluation/Advisory Service in Negara Brunei Darussalam Volume 2 – Soils Management in the Agricultural Development Areas Page 27
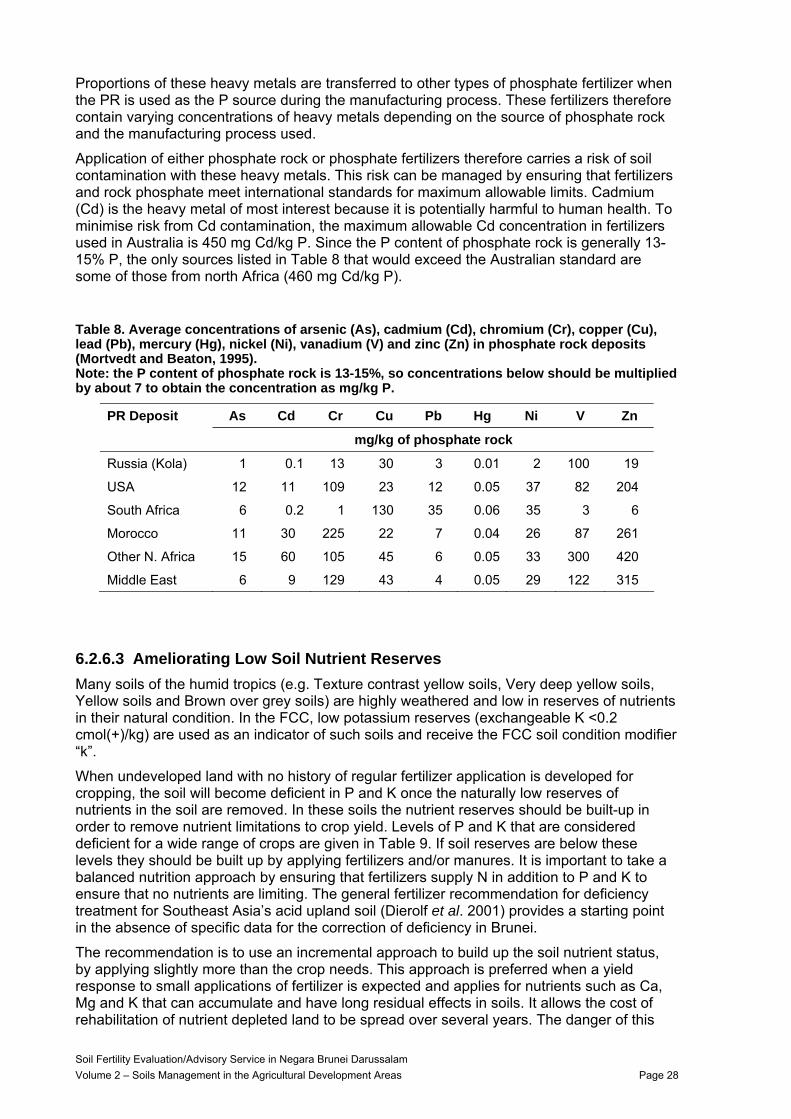
Proportions of these heavy metals are transferred to other types of phosphate fertilizer when the PR is used as the P source during the manufacturing process. These fertilizers therefore contain varying concentrations of heavy metals depending on the source of phosphate rock and the manufacturing process used.
Application of either phosphate rock or phosphate fertilizers therefore carries a risk of soil contamination with these heavy metals. This risk can be managed by ensuring that fertilizers and rock phosphate meet international standards for maximum allowable limits. Cadmium (Cd) is the heavy metal of most interest because it is potentially harmful to human health. To minimise risk from Cd contamination, the maximum allowable Cd concentration in fertilizers used in Australia is 450 mg Cd/kg P. Since the P content of phosphate rock is generally 13-15% P, the only sources listed in Table 8 that would exceed the Australian standard are some of those from north Africa (460 mg Cd/kg P).
Table 8. Average concentrations of arsenic (As), cadmium (Cd), chromium (Cr), copper (Cu), lead (Pb), mercury (Hg), nickel (Ni), vanadium (V) and zinc (Zn) in phosphate rock deposits (Mortvedt and Beaton, 1995). Note: the P content of phosphate rock is 13-15%, so concentrations below should be multiplied by about 7 to obtain the concentration as mg/kg P.
PR Deposit As Cd Cr Cu Pb Hg Ni V Zn
mg/kg of phosphate rock
Russia (Kola) 1 0.1 13 30 3 0.01 2 100 19
USA 12 11 109 23 12 0.05 37 82 204
South Africa 6 0.2 1 130 35 0.06 35 3 6
Morocco 11 30 225 22 7 0.04 26 87 261
Other N. Africa 15 60 105 45 6 0.05 33 300 420
Middle East 6 9 129 43 4 0.05 29 122 315
6.2.6.3 Ameliorating Low Soil Nutrient Reserves Many soils of the humid tropics (e.g. Texture contrast yellow soils, Very deep yellow soils, Yellow soils and Brown over grey soils) are highly weathered and low in reserves of nutrients in their natural condition. In the FCC, low potassium reserves (exchangeable K <0.2 cmol(+)/kg) are used as an indicator of such soils and receive the FCC soil condition modifier “k”.
When undeveloped land with no history of regular fertilizer application is developed for cropping, the soil will become deficient in P and K once the naturally low reserves of nutrients in the soil are removed. In these soils the nutrient reserves should be built-up in order to remove nutrient limitations to crop yield. Levels of P and K that are considered deficient for a wide range of crops are given in Table 9. If soil reserves are below these levels they should be built up by applying fertilizers and/or manures. It is important to take a balanced nutrition approach by ensuring that fertilizers supply N in addition to P and K to ensure that no nutrients are limiting. The general fertilizer recommendation for deficiency treatment for Southeast Asia’s acid upland soil (Dierolf et al. 2001) provides a starting point in the absence of specific data for the correction of deficiency in Brunei.
The recommendation is to use an incremental approach to build up the soil nutrient status, by applying slightly more than the crop needs. This approach is preferred when a yield response to small applications of fertilizer is expected and applies for nutrients such as Ca, Mg and K that can accumulate and have long residual effects in soils. It allows the cost of rehabilitation of nutrient depleted land to be spread over several years. The danger of this
Soil Fertility Evaluation/Advisory Service in Negara Brunei Darussalam Volume 2 – Soils Management in the Agricultural Development Areas Page 28
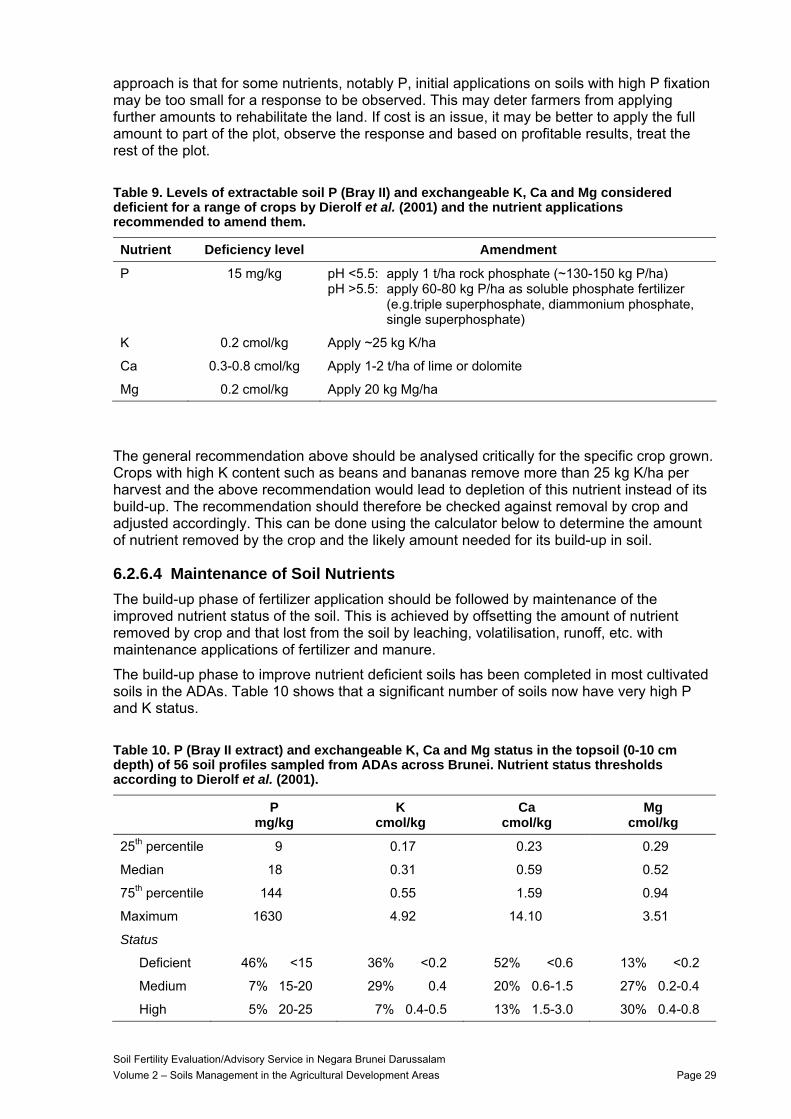
approach is that for some nutrients, notably P, initial applications on soils with high P fixation may be too small for a response to be observed. This may deter farmers from applying further amounts to rehabilitate the land. If cost is an issue, it may be better to apply the full amount to part of the plot, observe the response and based on profitable results, treat the rest of the plot.
Table 9. Levels of extractable soil P (Bray II) and exchangeable K, Ca and Mg considered deficient for a range of crops by Dierolf et al. (2001) and the nutrient applications recommended to amend them.
Nutrient Deficiency level Amendment
P 15 mg/kg pH <5.5: apply 1 t/ha rock phosphate (~130-150 kg P/ha) pH >5.5: apply 60-80 kg P/ha as soluble phosphate fertilizer
(e.g.triple superphosphate, diammonium phosphate, single superphosphate)
K 0.2 cmol/kg Apply ~25 kg K/ha
Ca 0.3-0.8 cmol/kg Apply 1-2 t/ha of lime or dolomite
Mg 0.2 cmol/kg Apply 20 kg Mg/ha
The general recommendation above should be analysed critically for the specific crop grown. Crops with high K content such as beans and bananas remove more than 25 kg K/ha per harvest and the above recommendation would lead to depletion of this nutrient instead of its build-up. The recommendation should therefore be checked against removal by crop and adjusted accordingly. This can be done using the calculator below to determine the amount of nutrient removed by the crop and the likely amount needed for its build-up in soil.
6.2.6.4 Maintenance of Soil Nutrients The build-up phase of fertilizer application should be followed by maintenance of the improved nutrient status of the soil. This is achieved by offsetting the amount of nutrient removed by crop and that lost from the soil by leaching, volatilisation, runoff, etc. with maintenance applications of fertilizer and manure.
The build-up phase to improve nutrient deficient soils has been completed in most cultivated soils in the ADAs. Table 10 shows that a significant number of soils now have very high P and K status.
Table 10. P (Bray II extract) and exchangeable K, Ca and Mg status in the topsoil (0-10 cm depth) of 56 soil profiles sampled from ADAs across Brunei. Nutrient status thresholds according to Dierolf et al. (2001).
P mg/kg
K cmol/kg
Ca cmol/kg
Mg cmol/kg
25th percentile 9 0.17 0.23 0.29
Median 18 0.31 0.59 0.52
75th percentile 144 0.55 1.59 0.94
Maximum 1630 4.92 14.10 3.51
Status
Deficient 46% <15 36% <0.2 52% <0.6 13% <0.2
Medium 7% 15-20 29% 0.4 20% 0.6-1.5 27% 0.2-0.4
High 5% 20-25 7% 0.4-0.5 13% 1.5-3.0 30% 0.4-0.8
Soil Fertility Evaluation/Advisory Service in Negara Brunei Darussalam Volume 2 – Soils Management in the Agricultural Development Areas Page 29
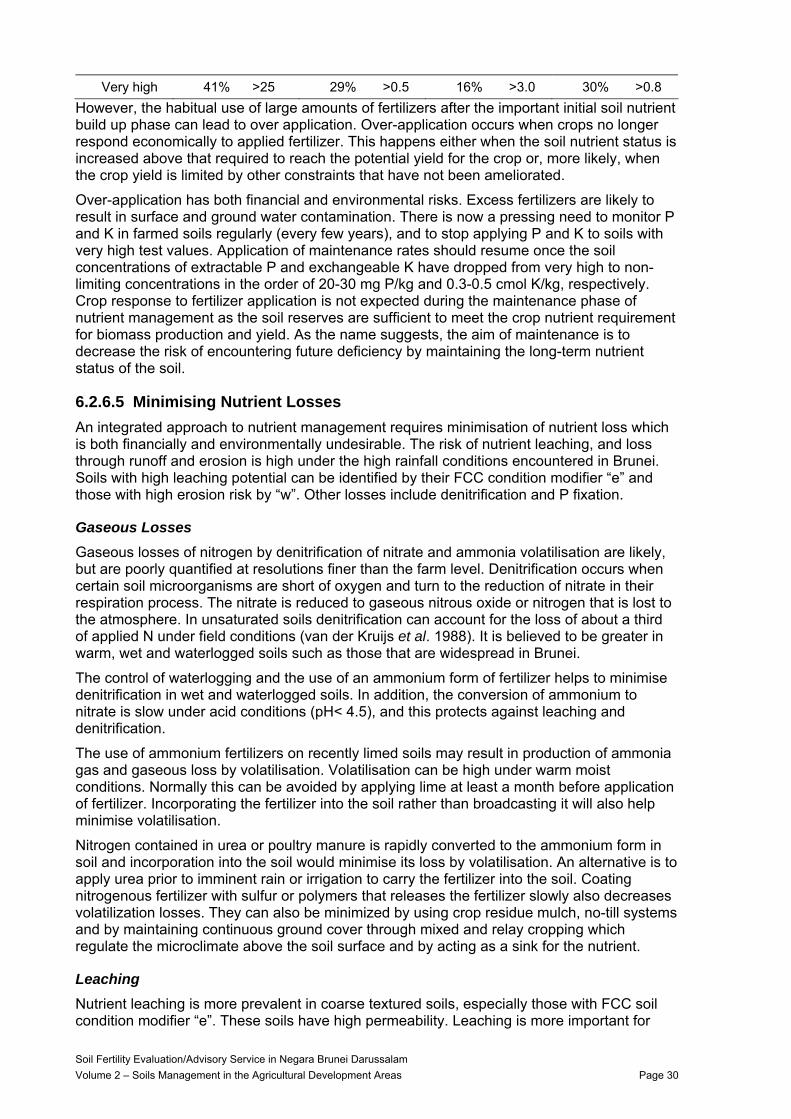
Very high 41% >25 29% >0.5 16% >3.0 30% >0.8 However, the habitual use of large amounts of fertilizers after the important initial soil nutrient build up phase can lead to over application. Over-application occurs when crops no longer respond economically to applied fertilizer. This happens either when the soil nutrient status is increased above that required to reach the potential yield for the crop or, more likely, when the crop yield is limited by other constraints that have not been ameliorated.
Over-application has both financial and environmental risks. Excess fertilizers are likely to result in surface and ground water contamination. There is now a pressing need to monitor P and K in farmed soils regularly (every few years), and to stop applying P and K to soils with very high test values. Application of maintenance rates should resume once the soil concentrations of extractable P and exchangeable K have dropped from very high to non-limiting concentrations in the order of 20-30 mg P/kg and 0.3-0.5 cmol K/kg, respectively. Crop response to fertilizer application is not expected during the maintenance phase of nutrient management as the soil reserves are sufficient to meet the crop nutrient requirement for biomass production and yield. As the name suggests, the aim of maintenance is to decrease the risk of encountering future deficiency by maintaining the long-term nutrient status of the soil.
6.2.6.5 Minimising Nutrient Losses An integrated approach to nutrient management requires minimisation of nutrient loss which is both financially and environmentally undesirable. The risk of nutrient leaching, and loss through runoff and erosion is high under the high rainfall conditions encountered in Brunei. Soils with high leaching potential can be identified by their FCC condition modifier “e” and those with high erosion risk by “w”. Other losses include denitrification and P fixation.
Gaseous Losses Gaseous losses of nitrogen by denitrification of nitrate and ammonia volatilisation are likely, but are poorly quantified at resolutions finer than the farm level. Denitrification occurs when certain soil microorganisms are short of oxygen and turn to the reduction of nitrate in their respiration process. The nitrate is reduced to gaseous nitrous oxide or nitrogen that is lost to the atmosphere. In unsaturated soils denitrification can account for the loss of about a third of applied N under field conditions (van der Kruijs et al. 1988). It is believed to be greater in warm, wet and waterlogged soils such as those that are widespread in Brunei.
The control of waterlogging and the use of an ammonium form of fertilizer helps to minimise denitrification in wet and waterlogged soils. In addition, the conversion of ammonium to nitrate is slow under acid conditions (pH< 4.5), and this protects against leaching and denitrification.
The use of ammonium fertilizers on recently limed soils may result in production of ammonia gas and gaseous loss by volatilisation. Volatilisation can be high under warm moist conditions. Normally this can be avoided by applying lime at least a month before application of fertilizer. Incorporating the fertilizer into the soil rather than broadcasting it will also help minimise volatilisation.
Nitrogen contained in urea or poultry manure is rapidly converted to the ammonium form in soil and incorporation into the soil would minimise its loss by volatilisation. An alternative is to apply urea prior to imminent rain or irrigation to carry the fertilizer into the soil. Coating nitrogenous fertilizer with sulfur or polymers that releases the fertilizer slowly also decreases volatilization losses. They can also be minimized by using crop residue mulch, no-till systems and by maintaining continuous ground cover through mixed and relay cropping which regulate the microclimate above the soil surface and by acting as a sink for the nutrient.
Leaching Nutrient leaching is more prevalent in coarse textured soils, especially those with FCC soil condition modifier “e”. These soils have high permeability. Leaching is more important for
Soil Fertility Evaluation/Advisory Service in Negara Brunei Darussalam Volume 2 – Soils Management in the Agricultural Development Areas Page 30
nutrients that are either not adsorbed (generally the case for nitrate) or weakly adsorbed (potassium). These nutrients are said to be more mobile in soil. In contrast, phosphate is strongly adsorbed in loamy and clayey soils and is generally not leached from these soils. Leaching can account for a third of applied N under humid tropical conditions. The requirement for electroneutrality means that nitrate will carry with it the equivalent amount of cationic nutrients such as Ca, Mg and K (Wong et al. 1992).
Leaching can be minimized by the following soil, crop, irrigation, and fertilizer management techniques.
• As mentioned earlier, soil constraints to root growth must be removed to optimize the crop’s ability to take up nutrients. Hence, maintaining an actively growing crop can reduce leaching.
• The incorporation of deep-rooted crop species in the farming system to capture sub-soil nutrients will also reduce leaching losses.
• Crops should not be over-supplied with fertilizers to minimise the amount of surplus nutrient available for leaching.
• Split fertilizer applications to apply N in small doses that match the needs of each growth stage. If split applications are too laborious to be practical, slow-release formulations such as sulphur-coated urea can be used as an alternative, subject to cost. Timing is less important for P and K. These fertilizers are normally applied when sowing short duration crops. They should be applied after weeding to minimise loss due to uptake by weeds and boosted weed growth. Most K is needed at the time of fruit development in fruit trees and is applied accordingly.
• Avoiding over-irrigation which can leach nutrients beyond the rooting zone of the plant.
Erosion The use of erosion management measures described in Section 6.2.5 can drastically reduce nutrient loss by runoff and erosion. The magnitude of reported nutrient losses through runoff and erosion can be very high because the top few millimetres of soil often contain the highest concentration of nutrients in the soil profile.
In addition to the measures in Section 6.2.5, the risk of large losses of nutrients through runoff and erosion can also be reduced by avoiding high concentrations of nutrients at the soil surface. These can be decreased by incorporating fertilizer into the soil, rather than broadcasting it on the surface, and by splitting nutrient applications to match the nutrient demands of the crop as it grows.
Removal of Crop Residues and Manures Crop residues and animal manures contain plant nutrients such as N, P, K and S as well as micronutrients, so their removal represents a loss of nutrients. Removal of straw and crop residues should be minimised by taking only marketable harvested materials from the field, and, whenever possible, returning all residues to field.
Burning of straw and crop residues is sometimes necessary to destroy pest and diseases and to allow the following crop to be grown. However, much of the C, N and S contained in straw and crop residues are lost during burning. Non-volatile nutrients such as Ca, Mg and K are mostly retained as ashes. If possible, it is preferable to spread the material across the field before burning to avoid uneven ash (and therefore nutrient) distribution. A less labour-demanding option is to burn windrowed residues in different parts of a field in successive seasons. If the straw and residues are fed to animals, the amount of nutrients removed from the field can be minimised by returning the animal manure to the field.
Management of crop residues and manure impacts on the nutrient balance of the farm and the requirement for artificial fertilizer. Crop residues with narrow C:N ratios (<15:1) such as legume residues release N rapidly and are a readily available source of N and other nutrients. Rice and other cereal straws have wide C:N ratios (~80:1 and <1.5% N) and only
Soil Fertility Evaluation/Advisory Service in Negara Brunei Darussalam Volume 2 – Soils Management in the Agricultural Development Areas Page 31
release N slowly. Initially as these residues decompose there may be immobilisation of mineral N and any crops growing at this time will suffer a temporary N deficiency unless N fertiliser is applied. The nutrient composition of these residues and of animal manure is extremely variable and only approximate values can be used to estimate the quantities of nutrients that are removed or returned to the soil.
High P Fixation Phosphorus is strongly adsorbed in soils with FCC soil condition modifier “i”, identified by their high P buffer indices (PBI) >280. These soils contain hydrous oxides of Fe and Al that strongly adsorb P in a form that is only slowly available to crops. The strongly adsorbed P is said to be fixed by the soil. P fixation results in less P being available to crops so that recovery by crops is generally less than 40% of applied P and the fertilizer P requirement is correspondingly larger. The extremely acid state of some soils in Brunei reduces P uptake by plants unless pH is increased by liming.
Under prolonged waterlogging (g+ condition) these soils can dissolve toxic concentrations of iron into the soil solution and have the potential to cause toxicity in rice.
To minimise the effect of P fixation, the contact between soil and fertilizer should be reduced by placement of the fertilizer in the soil as concentrated bands beside and below the crop seeding line to minimise fixation and facilitate uptake. Use of citrate soluble fertilizers such as rock phosphate instead of water soluble fertilizers also minimises loss by fixation. Fixation is also reduced when the soil organic matter content is maintained, and P is applied with readily decomposable organic residues or animal manures. Organic manures such as chicken manure contain approximately 1.3% phosphorus (Douglas 1984; Amour 1996). When large amounts of manure are applied, the addition of P will be significant.
If sufficient P is applied to soil, eventually the P adsorption sites become saturated and additional P applications become increasingly less bound by the soil. This has happened at many intensively used sites in Brunei due to heavy applications of P over many years.
6.2.6.6 Nutrient Balance-Based Fertilizer Calculator Sustainable nutrient management has the following components:
• Correction of nutrient deficiencies, especially in land newly developed for agriculture (Section 6.2.6.3);
• Minimization of nutrient losses through denitrification, leaching, runoff and erosion, removal of crop residues and P fixation (Section 6.2.6.5);
• Replacement of nutrients removed from the field in the harvested parts of crops and by other losses through a maintenance program (Section 6.2.6.4).
Nutrient deficiencies prevent economically sustainable agriculture and should be rectified, starting with the most deficient elements. Negative nutrient balances due to removal of more nutrients by crops than the quantities added to a field as fertilizers and manures are unsustainable and eventually result in nutrient deficiencies. Similarly, additions of more nutrients than are removed from the field result over the long term in accumulation, possible nutrient imbalances in the crop, financial loss and environmental hazards.
Fertilizer recommendations should be based on calculating the nutrient budget. These track the movements of nutrients across the boundaries of a defined area. Nutrient movements include fertilizer additions, product removal, and nutrient losses through leaching, erosion, runoff and denitrification. Nutrient budgets can be calculated at a variety of scales, such as a country, district, catchment, whole farm, field and plot scales depending on the objective of the study. Country, district and catchment scale studies serve policy and management needs, for example to guide research priorities, investment in infrastructure and the pricing structure for fertilizers. As the basis for underpinning fertilizer recommendations for farmers, nutrient balances should be calculated for much smaller areas. Most farms in Brunei have a complex array of field plots supporting different crops that are managed differently. These
Soil Fertility Evaluation/Advisory Service in Negara Brunei Darussalam Volume 2 – Soils Management in the Agricultural Development Areas Page 32
field plots are typically <100 m2. Such plots are the areas for which nutrient balances should be calculated for making fertilizer recommendation. In this context, a plot is defined as a contiguous area of land that is managed in the same way and has the same soil properties. Nutrient budget calculations are performed on an area (m2) basis to take account of small plot sizes and to facilitate interpretation and adoption. The edges of the field plots and the root depth of the majority of crops (<100 cm) are considered as the boundaries.
Calculator Principles At this stage there is uncertainty about many components of the nutrient budget in Brunei because of limited information. To encourage the use of nutrient budgeting where there are such uncertainties, a fertilizer calculator has been developed, which accompanies this report. This calculator is intended to assist Department of Agriculture to make fertilizer recommendations for individual situations. It requires minimal user inputs by gleaning as much information as possible from the literature. However, since the relevance of much of this information to Bruneian conditions is unknown, it leaves open the option of using inputs of locally derived information as it becomes available. Indeed it is intended that, as well as assisting fertilizer recommendations directly, it will help prioritise those topics that require data gathering by the Department to overcome knowledge gaps in the calculator that are uncovered as it is used in real situations.
The principle of the calculator is to recommend amounts of fertilizer to replace those nutrients removed by previous crops and that will be lost during the crop being fertilized. In addition, it assesses the nutrient status of the soil at sowing and where the status of individual nutrients is low it includes extra inputs to build up fertility. For N, it assumes minimal residual N (unless the previous crop was leguminous) and calculates the N input required to match estimated N removal by the next crop together with likely losses during the crop.
Nutrient removal: The amount of nutrient taken up and removed by a crop depends on the yield and tissue concentration of the harvested material and the management of the residues. For example rice grain removes ~2.5 kg K/t but ~25.0 kg K/t of straw removed. A crop of 20 t/ha of banana bunches removes ~115 kg K/ha compared with only 35 kg K/ha by similar yields of papaya or water melon which have lower tissue K concentration. Modern crop varieties often have higher tissue concentrations of nutrients, higher yield potentials, and a larger ratio of harvested material to total biomass (harvest index). For this reason they generally have higher nutrient requirements than traditional varieties.
A major avoidable loss of nutrients from a plot occurs when crop residues are removed. Lack of information on the amounts of residues produced and their management prevents their incorporation in the fertilizer calculator. The assumption is that residues are retained on the plot and that their nutrients return to the soil as they decompose.
Soil nutrient status: Where soil nutrient data have been measured, the nutrient status of the soil is checked against fertility status thresholds for different crops quoted by Dierolf et al. (2001) and the status of each nutrient is classified as low, medium, high or very high. Where soil nutrients have not been measured, soil nutrient status is ranked as ‘low’ if the soil has not been regularly fertilised, and is ranked as ‘medium’ if it has been.
If a nutrient status is ranked ‘low, the nutrient requirement is multiplied by a ‘fertility factor’ of 2 so that the status can be improved to optimal levels.
If the nutrient status is ranked as ‘medium’, the fertility factor is one and the nutrient requirement remains unchanged. If fertilizer to match this requirement is applied, the status of the nutrient should be maintained at the end of the crop.
As already mentioned, many ADA soils have very high contents of nutrients such as P, K, Ca, and Mg and do not need further additions of these nutrients until the soil reserves have decreased to more optimal levels. Therefore, when the status of a nutrient is ranked ‘high’ or ‘very high’, the nutrient requirement is multiplied by fertility factors of 0.5 or zero, respectively, so that nutrient reserves are allowed to decrease.
Soil Fertility Evaluation/Advisory Service in Negara Brunei Darussalam Volume 2 – Soils Management in the Agricultural Development Areas Page 33
Calculator Inputs The calculator requires several inputs that are known with varying degrees of certainty:
• Inputs of nutrients as fertilizer and lime are known with reasonable certainty. They should be estimated as the quanity applied divided by the application area. This can be for a field (in ha), area of raised bed (calculated in m2 as length of beds × their effective width), or per tree.
• Inputs of nutrients as manures and their removal in harvested produce and residues are known with less certainty both in terms of the quantities of manure, produce and residue added or removed and their nutrient contents. To enable calculation of the nutrient balance, the weight of manure added or produce and residues removed should be measured for sample areas. Some examples are:
– For raised beds, measure the weight of manure added to or weight of produce removed from a sample length (e.g. 5 m) of raised bed:
bedbed
produceproduce
bedbed
manuremanure
WidthLengthweightMeasured
removedQuantity
WidthLengthweightMeasured
addedQuantity
×=
×=
where Quantity is in kg/m2, Measured weight in kg, and Lengthbed and Widthbed are in m and refer to a sample of raised bed.
– For field crops, measure the quantity of manure added to or produce removed from a sample area – either the whole field or a measured part of it. Removal is calculated as:
areaarea
produceproduce
areaarea
manuremanure
WidthLengthweightMeasured
removedQuantity
WidthLengthweightMeasured
addedQuantity
×=
×=
where Quantity is is kg/m2, Measured weight is in kg, and Lengtharea and Widtharea are in m and refer to a random, rectangular sample area.
– For tree crops, measure the quantity of manure added to or produce removed from a sample of trees, together with the spacing between trees. Removal is calculated as:
rowsttrees
produceproduce
rowsttrees
manuremanure
DistanceDistanceweightMeasured
removedQuantity
DistanceDistanceweightMeasured
addedQuantity
×=
×=
where Quantity is in kg/m2, Measured weight is in kg. Distancetrees and Distancerows are in m and refer the distances between trees in a row and between rows.
The nutrient contents of the manure and produce (g/kg) are estimated from various sources in the literature. However, in the long-term these estimates should be replaced by a database of such values measured for Brunei crops and manures. It is important to ensure that the nutrient contents used are expressed on the same weight basis (either 'fresh weight' or 'dry weight' ) as the weight estimates obtained above of manure applied/produce removed.
Nutrient addition/removal (g/m2) via these sources is calculated as:
Soil Fertility Evaluation/Advisory Service in Negara Brunei Darussalam Volume 2 – Soils Management in the Agricultural Development Areas Page 34
produceproduceproduce
manuremanuremanure
contentNutrientremovedQuantityremovedNutrientcontentNutrientaddedQuantityaddedNutrient
×=
×=
where Quantity is in kg/m2 and Nutrient content is in g/kg
• Inputs of N through N fixation are uncertain. It can be estimated as a percentage of the N requirement of the next crop. Of the crops included, N fixation is assumed be meet 90% of the crop requirement for fodder legumes, 75% for soya and mung bean and 0% for long bean. The N fixation factor is also zero for non-leguminous crops. In addition, these N-fixing crops also leave residual N in the soil after harvest which is available to following crops. The amount is likely to be quite small and is assumed to be an amount equal to 10% of N removed by fodder legumes, and mung and soya bean. The Residual N factor is zero for other crops.
• The losses of nutrients by leaching, erosion, volatilisation of N, denitrification of N and P fixation are also uncertain. The calculator uses fertilizer efficiency to account for possible losses during the crop: i.e. losses from all sources are estimated as a proportion of nutrient applied equal to 100% minus efficiency. Until locally derived efficiencies are available, the calculator uses reported efficiencies of uptake of nutrients to estimate the amounts to be returned to the soil. Accepted recoveries or uptake efficiencies of applied nutrients are 30-50% for N, 40% for P and 60% for K (Dierolf et al. 2001). The large variability in the recovery of N is caused by variability in leaching losses, gaseous losses and immobilisation. The values used by the calculator are as follows:
N: 50%. This is reduced to 40% if the soil is waterlogged (FCC attribute ‘g’) or 30% if there is prolonged waterlogging (FCC attribute ‘g+’) or high leaching (FCC attribute ‘e’).
P: 40%. This is reduced to 20% if the soil has high P fixation (FCC attribute ‘i’).
K: 60%
Ca: 60%
Mg: 60%
Estimation of Fertilizer Requirements The above sources of information are used to estimate the nutrient requirements of the current crop. For all nutrients except N the requirement is:
factorFertilityefficiencyFertilizer
contentNutrientYieldtRequiremen previousprevious ×
×=
The N requirement is:
( )[ ][ ]
efficiencyFertilizerfactorNResidualcontentNYield
factorfixationNcontentNYield
tRequiremen previouspreviousprevious
currentcurrentcurrent
××−
−××
=
1
The strategy for calculating the fertilizer requirement is to calculate, for a range of compound fertilisers available in Brunei, the minimum amount of fertilizer needed to completely meet the requirements for one nutrient. This is supplemented with single element fertilizers to meet the requirements of the other nutrients. The steps are as follows for each compound fertilizer.
• The amounts of the fertilizer required to meet each nutrient, i, required is calculated. These amounts are:
inutrient
inutrientinutrient contentFertilizer
trequiremenNutrienttrequiremenFertilizer =
where Fertilizer requirementnutrient i is the amount of a given fertilizer required to match the requirement for nutrient i (g/m2); Fertilizer contentnutrient i is the elemental content of
Soil Fertility Evaluation/Advisory Service in Negara Brunei Darussalam Volume 2 – Soils Management in the Agricultural Development Areas Page 35
nutrient i in the fertilizer (%); and Nutrient requirementnutrient i (g/m2) is the amount of nutrient i calculated above.
• Clearly, for compound fertilizers the amount of a fertilizer required to meet the requirements of each nutrient will vary. Therefore, the lowest amount of fertilizer from the previous step is selected, Fertilizer requirementmin. This completely meets the requirement for one nutrient.
• The amounts of supplemental fertilizers needed to meet the nutrient requirements of the other nutrients are then calculated. Urea is used to make up the outstanding N requirement, triple superphosphate the P requirement and either muriate or sulfate of potash the K requirement. The amount required is:
( )
inutrient
inutrient
inutrient
inutrient contentSupplementcontentFertilizertrequiremenFertilizer
trequiremenNutrient
trequiremenalSupplement×−
= min
where Supplement requirementnutrient i is the amount of a supplement fertilizer required to match the outstanding requirement for nutrient i (g/m2) above that supplied by the compound fertilizer; and Supplement contentnutrient i is the elemental content (%) of nutrient i in the supplemental fertilizer.
The selection of muriate or sulfate of potash as the K supplement depends on the crop being grown.
• The steps above are repeated for each compound fertiliser that is locally available. The results consist of an amount of compound fertiliser and the accompanying amounts of supplemental fertiliser required to meet crop requirements.
• By default the calculator selects the combination with the least weight of fertilizer. Alternatively, costing the various compound/ supplementary fertiliser options could be used to select the most profitable combination.
Soil Fertility Evaluation/Advisory Service in Negara Brunei Darussalam Volume 2 – Soils Management in the Agricultural Development Areas Page 36
6.3 Soil Management for Short Duration Crops
6.3.1 Rice SI Number Malay English Botanical
C Padi Rice Oryza sativa
Brunei Studies Rice in Brunei is grown mainly in the Wasan area but also in valleys in Tutong and Belait Districts as well as the coastal lands in Temburong.
Williams (1980a) attributed low rice yields in Brunei to use of peat soils. Other more suitable soils had problems due to low pH and/or acid sulfate, coupled with the low yield potential and long maturity time of the local rice cultivar. He found the yield of swamp rice on acid sulfate soil was increased by liming and could be related to soil pH but was unaffected by drainage and differences in H2S in the soil. Liming also increased spikelet number and grain size to a lesser degree. He also noted that the rice seedling stage was most sensitive to acid, and yield could be dramatically improved by planting mature vigorous seedlings. Survival of seedlings, tillering and panicle formation were the most important yield components affected by liming and acidity. The optimal economic lime level [at that time] for 3-week seedlings was around 4 t/ha but could be lower with 5-week seedlings.
Mohamad Yussof bin Haji Mohiddin (1982) investigated aluminium effects on rice in the Wasan area. He found soils in this area were acid sulfate with Al toxicity, with the other major limitation being low nutrient status, especially phosphorus and calcium due to high aluminium in the soil solution. He speculated that Al reduced root growth and hence nutrient uptake.
Yashima et al. (1989) found rice yields reported by farmers of 2-4 t/ha and agronomists of <1.5 t/ha (over several years of work) to be very low. The productivity of well managed irrigated rice is in the range of 5-8 t/ha during the wet season and 7-10 t/ha during the dry season (Anon. 1996-2006). Factors contributing to low yields in Brunei included engineering problems such as poor land levelling, poor water control and lack of water, especially for off- season rice. The low yield of the local cultivar was another impediment. Poor preparation of seedling nurseries, with insufficiently soft, puddled soil, caused damage to seedlings when transplanted, leading to transplant shock. This was exacerbated because seedlings tended to be older at transplanting to make them less vulnerable to acidity, but with larger root systems that were more easily damaged during transplanting.
6.3.1.1 Land Suitability Worldwide, paddy rice is grown on a great variety of soils and there are few clear relationships between soil type and yield (Williams 1975c). However, sandy soils are not suitable due to rapid water loss while sulfidic soils can have toxic levels of hydrogen sulfide from reduction (Williams 1975c). Peat swamps are generally not suitable due to the need for control of the watertable, the common occurrence of floral sterility and empty panicles in modern domesticated rice varieties (Andriesse 1988).
Paddy rice requires a heavy, relatively impervious waterlogged soil (Skerman and Riveros, 1990), with the best rice soils having an impermeable layer just below the puddled horizon (25 cm) to impede the downward movement of water. Formation of an impermeable layer occurs even in initially permeable sub-soils after long periods of cultivation and has been attributed to mechanical compaction, and leaching of Fe and Mn cementing compounds under reducing (anaerobic) conditions. Some degree of drainage or lateral movement of water is desirable in preventing excessive reduction of the soil and consequential undesirable chemical changes such as development of toxicity from hydrogen sulfide (Williams 1975c).
Soil Fertility Evaluation/Advisory Service in Negara Brunei Darussalam Volume 2 – Soils Management in the Agricultural Development Areas Page 37
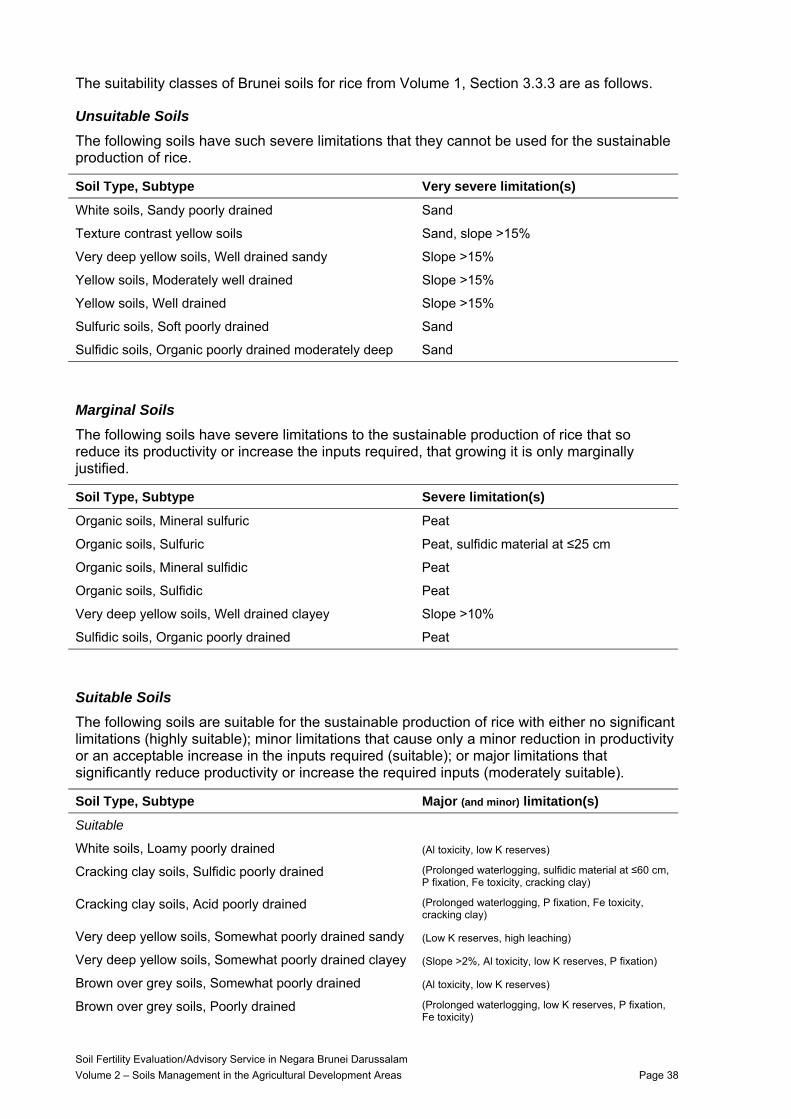
The suitability classes of Brunei soils for rice from Volume 1, Section 3.3.3 are as follows.
Unsuitable Soils The following soils have such severe limitations that they cannot be used for the sustainable production of rice.
Soil Type, Subtype Very severe limitation(s)
White soils, Sandy poorly drained Sand
Texture contrast yellow soils Sand, slope >15%
Very deep yellow soils, Well drained sandy Slope >15%
Yellow soils, Moderately well drained Slope >15%
Yellow soils, Well drained Slope >15%
Sulfuric soils, Soft poorly drained Sand
Sulfidic soils, Organic poorly drained moderately deep Sand
Marginal Soils The following soils have severe limitations to the sustainable production of rice that so reduce its productivity or increase the inputs required, that growing it is only marginally justified.
Soil Type, Subtype Severe limitation(s)
Organic soils, Mineral sulfuric Peat
Organic soils, Sulfuric Peat, sulfidic material at ≤25 cm
Organic soils, Mineral sulfidic Peat
Organic soils, Sulfidic Peat
Very deep yellow soils, Well drained clayey Slope >10%
Sulfidic soils, Organic poorly drained Peat
Suitable Soils The following soils are suitable for the sustainable production of rice with either no significant limitations (highly suitable); minor limitations that cause only a minor reduction in productivity or an acceptable increase in the inputs required (suitable); or major limitations that significantly reduce productivity or increase the required inputs (moderately suitable).
Soil Type, Subtype Major (and minor) limitation(s)
Suitable
White soils, Loamy poorly drained (Al toxicity, low K reserves)
Cracking clay soils, Sulfidic poorly drained (Prolonged waterlogging, sulfidic material at ≤60 cm, P fixation, Fe toxicity, cracking clay)
Cracking clay soils, Acid poorly drained (Prolonged waterlogging, P fixation, Fe toxicity, cracking clay)
Very deep yellow soils, Somewhat poorly drained sandy (Low K reserves, high leaching)
Very deep yellow soils, Somewhat poorly drained clayey (Slope >2%, Al toxicity, low K reserves, P fixation)
Brown over grey soils, Somewhat poorly drained (Al toxicity, low K reserves)
Brown over grey soils, Poorly drained (Prolonged waterlogging, low K reserves, P fixation, Fe toxicity)
Soil Fertility Evaluation/Advisory Service in Negara Brunei Darussalam Volume 2 – Soils Management in the Agricultural Development Areas Page 38
Soil Type, Subtype Major (and minor) limitation(s)
Grey soils, Poorly drained (Al toxicity, low K reserves, P fixation)
Moderately suitable
Very deep yellow soils, Moderately well drained clayey No waterlogging (Al toxicity, low K reserves)
Sulfuric soils, Poorly drained Sulfidic material at ≤35 cm (Al toxicity, P fixation)
Sulfidic soils, Soft poorly drained Sulfidic material at ≤35 cm (prolonged waterlogging, Al toxicity, low K reserves, P fixation)
The limitations listed above are manageable. The Cracking clay soils in the Wasan area are already under rice cultivation. The other soils have good rice potential and are already used for rice.
Suitable soils in narrow valley floors, in particular Brown over grey soils, may be subject to short term flooding from adjacent hill sides which could adversely affect rice cultivation. However, this is not a soil issue but one of the surrounding topography. Local knowledge is paramount in deciding if such locations are suitable for rice, even if the soil scores well on the FCC ratings. Influences such as localized flooding should over-rule favourable FCC ratings.
6.3.1.2 Management of Soil Constraints The major limitations with most soils for paddy rice are either slope (rice needs flat land for flooding); sandy texture that does not readily hold water; or peaty soils where there are problems with control of the watertable and possible sterility of the panicles.
Each of the major and minor limitations of the soils suitable for rice is addressed below and in relevant sub-sections of Section 6.2.
Waterlogging The absence of waterlogging is a major limitation for rice and prolonged waterlogging is a minor limitation.
Rice is different to other crops as it needs to be flooded for most of its growing period. However, soils do need to be drained for soil preparation and for harvest. Where waterlogging is naturally prolonged this may be difficult and will require a network of farm drains and careful levelling to ensure surface water can be removed. Such soils also require some downward movement of water to prevent the accumulation of iron toxicity.
Control of watertables in peat soils is difficult and thus these soils generally are considered marginal for rice.
In some soils the lack of waterlogging is a major limitation. Because they are freely drained, the absence of a shallow watertable means it is difficult to retain water in the field. In most cases this problem is overcome by puddling provided the soil has sufficient clay content for puddling to be effective.
Slope and Water Erosion Risk Slopes >2% are a minor limitation for rice, those >5% a major limitation, those >10% a severe limitation, and those >15% are unsuitable. Slopes with high erosion risk (>30% or >20% if texture contrast) are a major limitation.
Rice needs to be flooded and thus flat land is most suitable. Soils with very slight slopes (≤5%) can be levelled by tractor equipment, or terraced into bays of slightly different elevation. Slightly steeper land ≤10% could be terraced with grass strips separating the different bays. Land is non-sloping on the flooded bays, thus the erosion risk is minimal other
Soil Fertility Evaluation/Advisory Service in Negara Brunei Darussalam Volume 2 – Soils Management in the Agricultural Development Areas Page 39
than during the land preparation phase. Steeper land is generally not suitable for lowland rice without extensive land levelling that requires large investment in earthworks. Furthermore, most steep land in Brunei Darussalam is sandy and therefore unsuitable.
Sulfidic Material Sulfidic material at <60 cm depth is a minor limitation for rice; at <35 cm a major limitation, and at <25 cm a severe limitation.
Soils on flat land in Brunei are likely to have a sulfidic material or a sulfuric horizon. However, since rice is grown in flooded conditions, sulfidic materials are unlikely to oxidise. Futhermore, in most soils that are suitable for rice and have sulfidic material (Cracking clay soils), the sulfidic layer is quite deep in the profile.
Sulfidic soils can have toxic levels of H2S from reduction; however manganese in soil prevents excessive reduction (Williams 1975c). For more detail on management of sulfidic/sulfuric soils refer to Section 6.2.3.
Soil Acidity and Aluminium Toxicity High Al saturation (>60%) is a minor limitation for rice.
Soil acidity and associated aluminium toxicity are common in Brunei. However, soil acidity and aluminium toxicity are generally not important to lowland rice as flooding tends to neutralize acidity (Skerman and Riveros, 1990). Increases of pH by up to 2 units can occur on flooding (Williams 1975c).
While moderately acid soils are not harmful to rice, they are usually associated with low nutrient availability (Williams 1975c). High Al in the soil solution depresses uptake of calcium and phosphorus (Mohamad Yussof bin Haji Mohiddin 1982). Rice tolerates up to 70% Al saturation (Dierolf et al. 2001). It is grown on soils ranging from pH 3.5- 8.5 and there appear to be distinct varietal adaptations to pH (Williams 1975c).
Williams (1980a) conducted experiments in Wasan, finding that the yield of rice on acid sulfate soils is increased by liming and could be related to soil pH but is unaffected by drainage and differences in H2S in the soil. This suggests that soil reduction and the formation of hydrogen sulfide are not the major yield limiting factors in these soils.
Williams (1980a) found the seedling stage is most sensitive to acid, and yields can be dramatically improved by planting mature, vigorous seedlings. Survival of seedlings, tillering and panicle formation are the most important yield components affected by liming and acidity. It appears that the buffering capacity of the rice plant and its ability to exclude aluminium increases rapidly through the seedling stage. Farmers in Brunei are transplanting rice at a much more mature stage than is normally seen in SE Asia.
Whilst aluminium saturation can be reduced to near zero by liming to pH ~5.5 in most soils of the ADAs, lime can be saved by using a lower target pH of 4.2 in Organic, Sulfuric and Sulfidic soils and 4.8 in other soils types to give 70% Al saturation, (see Figure 9).
For more information on methods of managing soil acidity refer to Sections 6.2.2.3 (lime requirement) and 6.2.2.4 (minimising acid production).
Low Nutrient Reserves (indicated by low potassium) Low nutrient reserves are a minor limitation for rice.
Many soils in Brunei have low fertility status as indicated by low K reserves. As part of a sustainable nutrient management plan, the fertility status of such soils should be improved by adding more nutrients than are required to replace those removed by the previous crop. Soil nutrient levels for rice are as follows (Dierolf et al. 2001):
Soil Fertility Evaluation/Advisory Service in Negara Brunei Darussalam Volume 2 – Soils Management in the Agricultural Development Areas Page 40
Nutrient Low Medium High Very high Units
Extractable P <15 <25 <30 >30 mg/kg
Exchangeable K <0.2 <0.4 >0.4 cmol/kg
Exchangeable Ca <0.5 <1.5 <2.0 >2.0 cmol/kg
Exchangeable Mg <0.2 <0.4 <0.8 >0.8 cmol/kg
Once a medium status has been reached, further additions of nutrients should aim to match removal by the previous crop. If the status of a nutrient is very high, the amount of nutrient added should be less than that removed, to allow the status to fall back to medium to high.
For more infomation on building up fertility status refer to Section 6.2.6.3 (ameliorating low soil nutrient reserves) and the fertilizer calculator.
High Phosphorus Fixation High P fixation is a minor limitation for rice.
P fixation is common in many soils suitable for rice. These soils fix applied P so that it is less available to plants. Crops therefore have a higher P requirement on these soils in their natural state. The extremely low pH in many of the soils will also affect P uptake unless pH is increased. In addition, iron toxicity can become a problem in such soils when waterlogged (Sanchez et al., 2003).
For more information on overcoming P fixation refer to Section 6.2.6.5 (minimizing nutrient losses – high P fixation) and the fertilizer calculator.
Cracking clay Cracking clay is a minor limitation for rice.
These soils swell, shrink and crack in response to changes in soil moisture content. When wet, they are very sticky and slow to drain. When dry, they are hard to cultivate and root penetration is difficult (AVRDC 1990). They are difficult soils to manage, but pose only a minor problem for rice since it is grown under flooded conditions. The features of cracking clay soil that make it a problem for other crops – its inherently low permeability and susceptibility to structural damage – are an advantage for rice, since they help reduce drainage and maintain flooded conditions. For rice cultivation the main problems with cracking clay are as follows:
• Once dried, for example at harvest, they can be slow to re-wet. Rewetting has to occur to soften the soil sufficiently for it to be puddled and levelled for the next rice crop. This can be exacerbated if deep cracks are allowed to develop, because much of the water initially flows directly to the subsoil and increases the amount of the water needed to re-wet the topsoil sufficiently for puddling. In Brunei, the absence of a well defined dry season and the shallow watertable where Cracking clay soils occur, mean that deep cracking is unlikely to occur.
• Once puddled, the structure of Cracking clay soils is very difficult to regenerate, which, in turn, makes crop rotation with other dry season crops very difficult (Ringrose-Voase et al. 2000; So and Ringrose-Voase 2000). This is because the soil is hard when dry, so that cultivation requires a large input of energy and tends to produce cloddy seedbeds. However, if cultivated when slightly wetter and softer, cultivation tends to result in shearing and compaction, which futher damages the structure.
These problems indicate that the best cropping system for rice in Brunei would be continuous rice with multiple crops each year. Rotation with dryland crops is not feasible a) because of the absence of a well defined dry season and b) the difficulty of restructuring soil into a state suitable for non-rice crops. The use of a long fallow between rice crops, as is currently a common practice in Brunei, is also not recommended because puddling is more difficult to
Soil Fertility Evaluation/Advisory Service in Negara Brunei Darussalam Volume 2 – Soils Management in the Agricultural Development Areas Page 41
achieve if the soil is allowed to dry during the fallow. In addition, weed growth during the fallow increases the effort required for land clearing.
High Leaching Potential High leaching potential is a minor limitation for rice.
However, none of the soils suitable for rice have high leaching potential.
6.3.1.3 Crop Nutrient Removal Modern high-yielding varieties, in general, remove nutrients to a greater extent than did their traditional counterparts in the past and such a rate of soil exhaustion can limit the long-term sustainability of rice production, unless the removals are replenished by supplementary application of fertilizers (Anon. 1996-2006). Nutrient removal by modern high-yielding varieties are as follows:
Crop Plant part Nutrient uptake/removal
Malay (English) N P K Ca Mg S
kg/t
Straw 7.6 0.47 23.6 2.7 1.4 0.34
Grain 14.6 2.62 2.66 0.10 1.02 0.60
Padi (Rice) – high yielding variety
Total 22.2 3.00 26.2 2.8 2.4 0.94
Source: Anon. (1996-2006, after De Datta, 1989) after conversion of P2O5, K2O, MgO, CaO. Data for var. IR 36 at a yield level of 9.8 t/ha of grain and 8.3 t/ha of straw (in the Philippines)
Crop Plant part Micronutrient uptake/removal
Malay (English) Fe Mn Zn Cu B Si Cl
g/t kg/t
Straw 150 310 20 2 16 41.9 5.5
Grain 200 60 20 25 16 9.8 4.2
Padi (Rice) – high yielding variety
Total 350 370 40 27 32 51.7 9.7
Source: Anon. (1996-2006, after De Datta, 1989) Data for var. IR 36 at a yield level of 9.8 t/ha of grain and 8.3 t/ha of straw (in the Philippines)
Removals of Si (silicon) and K (potassium) are particularly large if the panicles and straw are taken away from the field at harvest. However, if only the grain is removed and the straw is returned and incorporated back into the soil, the removal of Si and K is greatly reduced, although significant amounts of N and P are still removed (Anon. 1996-2006).
The amount of nutrient removed does not take into account leaching, volatilisation losses, fertilizer efficiency, etc. Therefore nutrient requirements are much higher than just nutrient removal.
For more information on calculating the amount of fertilizer required to replace the nutrients removed refer to Section 6.2.6.6 and the fertilizer calculator.
Soil Fertility Evaluation/Advisory Service in Negara Brunei Darussalam Volume 2 – Soils Management in the Agricultural Development Areas Page 42
6.3.2 Leafy and fruit vegetables SI Number Malay English Botanical
Leafy Vegetables
A01 Kobis Cabbage Brassica oleracea var. capitata
A04 Kailan (Italian) Kale Brassica alboglabra
A10 Daun Bawang Shallot shoot Allium cepa L.
A13 Kangkung Water spinach Ipomoea aquatica
A14 Sawi Mustard Brassica spp.
A18 Bayam Spanish spinach Amaranthus spp.
Fruit vegetables
A02 Tomato Tomato Lycopersicum esculentum
A03 Lada Chilli Capsicum annum
A05 Kacang panjang Long bean Vigna sinensis var. sesquipedalis
A07 Terung Eggplant Solanum melongena
A09 Labu kuning Pumpkin Cucurbita spp.
A11 Timun Cucumber Cucumis sativus L.
Brunei Studies Williams (1978a) examined the yield of a local cucumber with supplementary mineral fertilizers following an initial field dressing of 30 t/ha (3 kg/m2) of poultry manure and 4 t/ha (400 g/m2) lime on a peat soil. Phosphorus was suppled at a fixed rate of 56 kg/ha in the supplementary fertilizer and was also present in the poultry manure at about 250 kg/ha.
Significant yield increases were obtained with supplementary N up to 280 kg N/ha but not with K plus Mg above basal rates of 78 plus 10 kg/ha, respectively. Cucumbers yielded over 50 t/ha over a 9 week growing period. The optimal fertilizer rate was then used in 18 successive plantings on the same soils.
Williams concluded that, after taking into account the nutrients in the poultry manure, the requirements for cucumbers were:
N 650 kg/ha P 129 kg/ha (300 kg P2O5) K 166 kg/ha (200 kg K2O) Mg 24.4 kg/ha (40 kg MgO)
He speculated the high fertilizer need was due to the friable nature of the peat and consequent high rate of leaching causing a low fertilizer efficiency.
6.3.2.1 Land Suitability Leafy and fruit vegetables can be grown on a range of soil types and conditions provided soil limitations such as acidity, waterlogging and organic matter content are managed (Tindall 1983; Chin 1999). Loamy and non-cracking clay soils are ideal for leafy and fruit vegetable soils. Peat soils can be used provided they are well drained and crops are grown on raised beds, although these practices will eventually result in the loss of peat by oxidation and subsidence.
Soil Fertility Evaluation/Advisory Service in Negara Brunei Darussalam Volume 2 – Soils Management in the Agricultural Development Areas Page 43
In Brunei leafy and fruit vegetables are currently cultivated on a range of soil types and landscape positions. The suitability classes of Brunei soils for leafy and fruit vegetables from Volume 1, Section 3.3.3 are as follows.
Unsuitable Soils The following soils have such severe limitations that they cannot be used for the sustainable production of leafy and fruit vegetables.
Soil Type, Subtype Very severe limitation(s)
Yellow soils, Well drained Slope >55%
Marginal Soils The following soils have severe limitations to the sustainable production of leafy and fruit vegetables that so reduce their productivity or increase the inputs required that growing them is only marginally justified.
Soil Type, Subtype Severe limitation(s)
Organic soils, Sulfuric Sulfidic material at ≤20 cm
Sulfuric soils, Soft poorly drained Sulfidic material at ≤20 cm
Both Soil Types have limitations due to waterlogging, low pH and high Al toxicity. However, the presence of very shallow sulfidic material makes raised beds impractical as excavation and drainage would result in the formation of extreme acidity by sulfide oxidation.
Suitable Soils The following soils are suitable for the sustainable production of leafy and fruit vegetables with either no significant limitations (highly suitable); minor limitations that cause only a minor reduction in productivity or an acceptable increase in the inputs required (suitable); or major limitations that significantly reduce productivity or increase the required inputs (moderately suitable).
Soil Type, Subtype Major (and minor) limitation(s)
Suitable
Very deep yellow soils, Somewhat poorly drained sandy (Waterlogging, moderate Al toxicity, low K reserves, high leaching)
Moderately suitable
Organic soils, Mineral sulfuric Peat, prolonged waterlogging, sulfidic material at ≤40 cm, Al toxicity (P fixation)
Organic soils, Mineral sulfidic Peat, prolonged waterlogging, sulfidic material at ≤40 cm, Al toxicity (low K reserves, P fixation)
Organic soils, Sulfidic Peat, prolonged waterlogging, sulfidic material at ≤40 cm, Al toxicity (P fixation)
White soils, Loamy poorly drained Al toxicity (waterlogging, low K reserves)
White soils, Sandy poorly drained Prolonged waterlogging (sand, low K reserves, high leaching)
Cracking clay soils, Sulfidic poorly drained Prolonged waterlogging, sulfidic material at ≤40 cm, cracking clay (moderate Al toxicity, P fixation)
Soil Fertility Evaluation/Advisory Service in Negara Brunei Darussalam Volume 2 – Soils Management in the Agricultural Development Areas Page 44
Soil Type, Subtype Major (and minor) limitation(s)
Moderately suitable continued
Cracking clay soils, Acid poorly drained Prolonged waterlogging, cracking clay (moderate Al toxicity, P fixation)
Texture contrast yellow soils Slope >20%, Al toxicity (sand, high erosion risk, low K reserves, high leaching)
Very deep yellow soils, Well drained sandy Slope >20%, Al toxicity (high erosion risk, low K reserves, high leaching)
Very deep yellow soils, Somewhat poorly drained clayey Al toxicity (waterlogging, low K reserves, P fixation)
Very deep yellow soils, Moderately well drained clayey Al toxicity (low K reserves)
Very deep yellow soils, Well drained clayey Al toxicity (slope >10%, high erosion risk, low K reserves, P fixation)
Yellow soils, Moderately well drained Al toxicity (slope >10%, high erosion risk, low K reserves, P fixation)
Brown over grey soils, Somewhat poorly drained Al toxicity (waterlogging, low K reserves)
Brown over grey soils, Poorly drained Prolonged waterlogging (moderate Al toxicity, low K reserves, P fixation)
Sulfuric soils, Poorly drained Sulfidic material at ≤40 cm, Al toxicity (waterlogging, P fixation)
Sulfidic soils, Soft poorly drained Prolonged waterlogging, sulfidic material at ≤40 cm, Al toxicity (low K reserves, P fixation)
Sulfidic soils, Organic poorly drained Peat, sulfidic material at ≤40 cm (waterlogging, moderate Al toxicity, P fixation)
Sulfidic soils, Organic poorly drained moderately deep Al toxicity (sand, waterlogging, low K reserves, high leaching)
Grey soils, Poorly drained Al toxicity (waterlogging, low K reserves, P fixation)
Issues of waterlogging and shallow sulfidic materials can be overcome by draining and use of raised beds utilizing non sulfidic soils. Liming will alleviate acidity and Al toxicity.
6.3.2.2 Management of Soil Constraints The major constraint with most soils for vegetable growing on non-sloping land is the shallowness of the topsoil layer either due to a high watertable and/or shallow sulfidic material. Soil acidity and aluminium toxicity are common in both acid sulfate and non-acid sulfate soils. On sloping land, low pH/Al toxicity and slope are the major constraints.
Each of the major and minor limitations of the soils suitable for vegetables is addressed below and in relevant sub-sections of Section 6.2.
Waterlogging Waterlogging is a minor limitation for vegetables and prolonged waterlogging a major limitation.
Most soils in flat areas in Brunei have a high watertable and thus are waterlogged for either short or long term. High watertables restrict root development, nutrient and oxygen uptake, and increase fungal root rots. Timely surface water removal both from the specific field and from the farm is essential. Most vegetables do not like waterlogged soils. For example,
Soil Fertility Evaluation/Advisory Service in Negara Brunei Darussalam Volume 2 – Soils Management in the Agricultural Development Areas Page 45
tomato will not survive waterlogged conditions for more than 24 hours (Fullelove and Meurant 1998). To overcome this constraint:
1. Use of raised beds is mandatory to reduce subsurface waterlogging damage.
2. Leafy vegetables require about 20 cm of well drained soil above the watertable; cabbages, which are deeper rooted, need closer to 50 cm; while fruit vegetables require about 30-50 cm of well drained soil.
For more information on methods of ameliorating waterlogging refer to Sections 6.2.4.2 (improving surface drainage), 6.2.4.4 (improving soil permeability) and 6.2.4.5 (raised beds).
Slope and Water Erosion Risk Slopes >10% are a minor limitation for vegetables, those >20% a major limitation, those >35% a severe limitation and those >55% are unsuitable. Slopes with high erosion risk (>30% or >20% if texture contrast) are a minor limitation.
Vegetables are best grown on land with gentle slopes due risk of erosion. Slopes of >35% are unsuitable for vegetable production due to erosion risks and difficulty with day to day management of crops. Vegetables can be grown on micro-terraces if planting on less steep slopes and good ground cover is maintained between plots. Steeper land should be avoided, especially with vegetables, which may leave the soil exposed.
If vegetables are grown on slopes subject to erosion, growers need to minimize the time and area of soil that is left exposed to heavy rains. Use of small plot sizes and permanent grass cover between plots is suggested. The use of a net covering after sowing reduces the intensity of tropical downpours. This can prevent seeds being washed away, and also reduces erosion risk.
For more information on methods of minimizing erosion refer to Sections 6.2.5.1 (maintaining plant cover), 6.2.5.2 (retaining crop residues), 6.2.5.3 (minimizing tillage), 6.2.5.4 (terracing) and 6.2.5.5 (grassed waterways).
Sulfidic Material Sulfidic material at <60 cm depth is a minor limitation for vegetables; at <40 cm a major limitation, and at <20 cm a severe limitation.
Soils with shallow sulfidic material or sulfuric layers are, or can become, very acid if not correctly managed. Since these soils also suffer from waterlogging, vegetable crops are best grown on raised beds but care must be taken a) not to use sulfidic material in making the beds and b) not to lower the watertable below the depth at which the sulfidic material occurs. Particular care should be taken if the depth of the sulfidic material is between 20-40 cm. If the material is any shallower than 20 cm, the soil should not be used for vegetables.
If sulfidic material is used, its acid generating potential must be neutralised by heavy applications of lime. Any existing acidity, which can be considerable for sulfuric layers, should also be neutralised by appropriate application of lime.
For more information on managing such soils refer to Section 6.2.3 and the calculator for nutrient and lime management.
Soil Acidity and Aluminium Toxicity Moderate Al saturation (10-60%) is a minor limitation for vegetables and high Al saturation (>60%) a major limitation.
Soil acidity and associated aluminium toxicity are common in Brunei. The ideal pH for each crop varies slightly but the range of 5.5 – 7.0 has been suggested for the leaf and fruit vegetable crops listed above (Tindall 1983; ARVDC 1990; Grattidge 1990; Ainsworth and Lovatt 1991; Vimala et al. 1992; Lim 1997; Moore and Morgan 1997a; Moore and Morgan 1997b; Fullelove and Murant 1998; Chin 1999; Meurant et al. 1999; Anon. 2006a; Anon.
Soil Fertility Evaluation/Advisory Service in Negara Brunei Darussalam Volume 2 – Soils Management in the Agricultural Development Areas Page 46
2006b; Anon. 2006c). Neutralisation of aluminium phytotoxicity can be achieved by liming to pH ~5.5 in most soils of the ADAs (see Figure 9).
For more information on methods of managing soil acidity refer to Sections 6.2.2.3 (lime requirement) and 6.2.2.4 (minimising acid production).
Low Nutrient Reserves (indicated by low potassium) Low nutrient reserves are a minor limitation for vegetables.
Many soils in Brunei have low fertility status as indicated by low K reserves. As part of a sustainable nutrient management plan, the fertility status of such soils should be improved by adding more nutrients than are required to replace those removed by the previous crop. Soil nutrient levels for vegetables are as follows (Dierolf et al. 2001). Although Dierolf et al. (2001) do not give nutrient levels for cabbage, kale, water spinach, mustard, spanish spinach or pumpkin, generic levels for a range of vegetable crops can be used instead.
Nutrient Low Medium High Very high Units
Shallot shoot
Extractable P <15 <25 <30 >30 mg/kg
Exchangeable K <0.2 <0.4 <0.5 >0.5 cmol/kg
Exchangeable Ca <0.5 <1.5 <3.0 >3.0 cmol/kg
Exchangeable Mg <0.2 <0.5 <0.6 >0.6 cmol/kg
Tomato
Extractable P <15 <25 <30 >30 mg/kg
Exchangeable K <0.2 <0.4 >0.4 cmol/kg
Exchangeable Ca <0.5 <1.5 <3.0 >3.0 cmol/kg
Exchangeable Mg <0.2 <0.5 <0.6 >0.6 cmol/kg
Chilli
Extractable P <15 <20 <25 >25 mg/kg
Exchangeable K <0.2 <0.4 <0.5 >0.5 cmol/kg
Exchangeable Ca <0.6 <1.5 <3.0 >3.0 cmol/kg
Exchangeable Mg <0.2 <0.4 <0.8 >0.8 cmol/kg
Long bean
Extractable P <15 <25 <30 >30 mg/kg
Exchangeable K <0.2 <0.4 <0.5 >0.5 cmol/kg
Exchangeable Ca <0.5 <1.5 <3.0 >3.0 cmol/kg
Exchangeable Mg <0.2 <0.4 <0.8 >0.8 cmol/kg
Eggplant
Extractable P <15 <25 <30 >30 mg/kg
Exchangeable K <0.2 <0.4 >0.4 cmol/kg
Exchangeable Ca <0.5 <1.5 <3.0 >3.0 cmol/kg
Exchangeable Mg <0.2 <0.5 <0.8 >0.8 cmol/kg
Soil Fertility Evaluation/Advisory Service in Negara Brunei Darussalam Volume 2 – Soils Management in the Agricultural Development Areas Page 47
Nutrient Low Medium High Very high Units
Cucumber
Extractable P <15 <25 <30 >30 mg/kg
Exchangeable K <0.2 <0.3 >0.3 cmol/kg
Exchangeable Ca <0.4 <1.5 <3.0 >3.0 cmol/kg
Exchangeable Mg <0.2 <0.4 <0.5 >0.5 cmol/kg
Generic (cabbage, kale, water spinach, mustard, spanish spinach, pumpkin)
Extractable P <15 <25 <30 >30 mg/kg
Exchangeable K <0.2 <0.4 <0.5 >0.5 cmol/kg
Exchangeable Ca <0.5 <1.5 <3.0 >3.0 cmol/kg
Exchangeable Mg <0.2 <0.5 <0.8 >0.8 cmol/kg
Once a medium status has been reached, further additions of nutrients should aim to match removal by the previous crop. If the status of a nutrient is very high, the amount of nutrient added should be less than that removed, to allow the status to fall back to medium to high.
For more information on building up fertility status refer to Section 6.2.6.3 (ameliorating low soil nutrient reserves) and the fertilizer calculator.
High Phosphorus Fixation High P fixation is a minor limitation for vegetables.
P fixation is common in many soils suitable for vegetables. These soils fix applied P so that it is less available to plants. Crops therefore have a higher P requirement on these soils in their natural state. The extremely low pH in many of the soils will also affect P uptake unless pH is increased.
For more information on overcoming P fixation refer to Section 6.2.6.5 (minimizing nutrient losses – high P fixation) and the fertilizer calculator.
Cracking clay Cracking clay is a major limitation for vegetables.
These soils swell, shrink and crack in response to changes in soil moisture content. When wet, they are very sticky and slow to drain. When dry, they are hard to cultivate and root penetration is difficult (AVRDC 1990). They are difficult soils to manage, especially in a wet environment such as Brunei where there is high rainfall combined with shallow watertables. In this environment, cracking clay tends to exacerbate waterlogging. Care must be taken to ensure the soil is sufficiently dry before cultivating these soils to avoid damaging their structure by shearing and compaction.
For further information on improving soil permeability see Section 6.2.4.4 (improving soil permeability).
High Leaching Potential High leaching potential is a minor limitation for vegetables.
Soil types with low clay content and low cation exchange capacity lack the ability to retain adequate levels of soil cations such as potassium, calcium and magnesium. Nitrate is also easily leached from such soils especially in high rainfall environments. Fertilizer is best applied in frequent, small doses.
For further information on minimizing nutrient losses through leaching see Section 6.2.6.5 (minimizing nutrient losses – leaching).
Soil Fertility Evaluation/Advisory Service in Negara Brunei Darussalam Volume 2 – Soils Management in the Agricultural Development Areas Page 48
6.3.2.3 Crop Nutrient Removal The amount of nutrient removed per tonne of fresh product is as follows for the vegetables listed. No information is available for water spinach, mustard and Spanish spinach.
Crop Nutrient uptake/removal Ref.
Malay English N P K Ca Mg
kg/t fresh product
Kobis Cabbage 2.05 0.26 1.70 0.40 0.12 1
Kailan (Italian) Kale 5.28 0.56 4.47 1.35 0.34 1
Daun Bawang Shallot shoot 4.00 0.60 3.34 0.37 0.21 1
Tomato Tomato 3.3 0.40 4.20 0.50 0.30 2
1.41 0.24 2.37 0.10 0.11 1
Lada Chilli 2.99 0.43 3.22 0.14 0.23 1
Kacang panjang Long bean 4.6 0.40 2.10 0.50 0.20 2
Terung Eggplant 1.9 0.40 2.30 0.10 0.30 2
1.62 0.25 2.30 0.09 0.14 1
Labu kuning Pumpkin 1.6 0.44 3.40 0.21 0.12 1
Timun Cucumber 1.7 0.20 1.70 0.30 0.20 2
1.04 0.24 1.47 0.16 0.13 1
Sources: 1. Anon. (2007a) assuming the N content of protein is 16% 2. Dierolf et al. (2001)
The amount of nutrient removed does not take into account leaching, volatilisation losses, fertilizer efficiency, etc. Therefore nutrient requirements are much higher than just nutrient removal.
For more information on calculating the amount of fertilizer required to replace the nutrients removed refer to Section 6.2.6.6 and the fertilizer calculator.
Soil Fertility Evaluation/Advisory Service in Negara Brunei Darussalam Volume 2 – Soils Management in the Agricultural Development Areas Page 49
6.3.3 Root vegetables SI Number Malay English Botanical
A08 Lobak Putih Radish, Daikon Raphanus sativus
6.3.3.1 Land Suitability Root vegetables are more demanding in their soil requirements than leaf and fruit vegetables as they require a deeper friable soil for root penetration. For this reason they do not do well on heavy soil types. The most ideal soils for growing radish are lighter loams.
At present there is very little Lobak Putih grown in Brunei.
The suitability classes of Brunei soils for root vegetables from Volume 1, Section 3.3.3 are as follows.
Unsuitable Soils The following soils have such severe limitations that they cannot be used for the sustainable production of root vegetables.
Soil Type, Subtype Very severe limitation(s)
Yellow soils, Well drained Slope >55%
Marginal Soils The following soils have severe limitations to the sustainable production of root vegetables that so reduce their productivity or increase the inputs required, that growing them is only marginally justified.
Soil Type, Subtype Severe limitation(s)
Organic soils, Sulfuric Sulfidic material at ≤20 cm
Cracking clay soils, Sulfidic poorly drained Cracking clay
Cracking clay soils, Acid poorly drained Cracking clay
Sulfuric soils, Soft poorly drained Sulfidic material at ≤20 cm
All these soils also have major limitations due to waterlogging. However, in the case those with very shallow sulfidic material, construction of raised beds to alleviate waterlogging is impractical as excavation and drainage would result in the formation of extreme acidity by sulfide oxidation. If these soils are to be used, heavy liming and addition of organic matter to increase pH and decrease Al toxicity along with raised beds and appropriate drainage are required. It is impractical to grow root crops in Cracking clay soils because of difficulties in harvesting the crop.
Suitable Soils The following soils are suitable for the sustainable production of root vegetables with either no significant limitations (highly suitable); minor limitations that cause only a minor reduction in productivity or an acceptable increase in the inputs required (suitable); or major limitations that significantly reduce productivity or increase the required inputs (moderately suitable).
Soil Fertility Evaluation/Advisory Service in Negara Brunei Darussalam Volume 2 – Soils Management in the Agricultural Development Areas Page 50
Soil Type, Subtype Major (and minor) limitation(s)
Suitable
Very deep yellow soils, Somewhat poorly drained sandy (Waterlogging, moderate Al toxicity, low K reserves, high leaching)
Moderately suitable
Organic soils, Mineral sulfuric Peat, prolonged waterlogging, sulfidic material at ≤40 cm, Al toxicity (P fixation)
Organic soils, Mineral sulfidic Peat, prolonged waterlogging, sulfidic material at ≤40 cm, Al toxicity (low K reserves, P fixation)
Organic soils, Sulfidic Peat, prolonged waterlogging, sulfidic material at ≤40 cm, Al toxicity (P fixation)
White soils, Loamy poorly drained Al toxicity (waterlogging, low K reserves)
White soils, Sandy poorly drained Prolonged waterlogging (sand, low K reserves, high leaching)
Texture contrast yellow soils Slope >20%, high erosion risk, Al toxicity (sand, low K reserves, high leaching)
Very deep yellow soils, Well drained sandy Slope >20%, high erosion risk, Al toxicity (low K reserves, high leaching)
Very deep yellow soils, Somewhat poorly drained clayey Al toxicity (waterlogging, low K reserves, P fixation)
Very deep yellow soils, Moderately well drained clayey Al toxicity (low K reserves)
Very deep yellow soils, Well drained clayey High erosion risk, Al toxicity (slope >10%, low K reserves, P fixation)
Yellow soils, Moderately well drained High erosion risk, Al toxicity (slope >10%, low K reserves, P fixation)
Brown over grey soils, Somewhat poorly drained Al toxicity (clay, waterlogging, low K reserves)
Brown over grey soils, Poorly drained Prolonged waterlogging (clay, moderate Al toxicity, low K reserves, P fixation)
Sulfuric soils, Poorly drained Sulfidic material at ≤40 cm, Al toxicity (waterlogging, P fixation)
Sulfidic soils, Soft poorly drained Prolonged waterlogging, sulfidic material at ≤40 cm, Al toxicity (clay, low K reserves, P fixation)
Sulfidic soils, Organic poorly drained Peat, sulfidic material at ≤40 cm (waterlogging, moderate Al toxicity, P fixation)
Sulfidic soils, Organic poorly drained moderately deep Al toxicity (sand, waterlogging, low K reserves, high leaching)
Grey soils, Poorly drained Al toxicity (clay, waterlogging, low K reserves, P fixation)
Issues of waterlogging and shallow sulfidic materials can be overcome by draining and use of raised beds utilizing non sulfidic soils. Liming will alleviate both Al toxicity and acidity from the sulfidic/sulfuric soil.
Soil Fertility Evaluation/Advisory Service in Negara Brunei Darussalam Volume 2 – Soils Management in the Agricultural Development Areas Page 51
6.3.3.2 Management of Soil Constraints The major issues with most soils for vegetable growing on non sloping land are acidity and the shallowness of the topsoil layer either due to a high watertable and/or shallow Sulfidic or sulfuric horizon. Root penetration is an issue with root vegetables.
Each of the major and minor limitations of the soils suitable for root vegetables is addressed below and in relevant sub-sections of Section 6.2.
Waterlogging Waterlogging is a minor limitation for root vegetables and prolonged waterlogging a major limitation.
Root vegetables are less tolerant of waterlogging than leafy or fruit vegetables. Most soils in flat areas in Brunei have a high watertable and thus are waterlogged either short or long term. High watertables restrict root development, nutrient and oxygen uptake, and increase fungal root rots. To grow radish or other root vegetables on flat land with high watertables requires good field drainage and use of raised beds (a minimum drainage of 30-50 cm from ridging) made with non-sulfidic material.
For more information on methods of ameliorating waterlogging refer to Sections 6.2.4.2 (improving surface drainage), 6.2.4.4 (improving soil permeability) and 6.2.4.5 (raised beds).
Slope and Water Erosion Risk Slopes >10% are a minor limitation for root vegetables, those >20% a major limitation, those >35% a severe limitation and those >55% are unsuitable. Slopes with high erosion risk (>30% or >20% if texture contrast) are a major limitation.
Root vegetables are best grown on land with gentle slopes. The risk of erosion with root vegetables is greater than for leafy and fruit vegetables because major soil disturbance occurs when the roots are harvested. Slopes of >35% are unsuitable for vegetable production due to erosion risks and difficulty with day to day management of crops. Root vegetables can be grown on micro terraces if planting on lesser slopes and good ground cover is maintained between plots. Steeper land should be avoided.
If root vegetables are grown on slopes subject to erosion, growers need to minimize the time and area of soil that is left exposed to heavy rains. Use of small plot sizes and permanent grass cover between plots is suggested. The use of a net covering at planting to reduce the intensity of tropical downpours can prevent seeds being washed away, and will also reduce erosion risk.
For more information on methods of minimizing erosion refer to Sections 6.2.5.1 (maintaining plant cover), 6.2.5.2 (retaining crop residues), 6.2.5.3 (minimizing tillage), 6.2.5.4 (terracing) and 6.2.5.5 (grassed waterways).
Sulfidic Material Sulfidic material at <60 cm depth is a minor limitation for root vegetables; at <40 cm a major limitation, and at <20 cm a severe limitation.
Soils with shallow sulfidic material or sulfuric layers are, or can become, very acid if not correctly managed. Since these soils also suffer from waterlogging, root vegetable crops are best grown on raised beds but care must be taken a) not to use sulfidic material in making the beds and b) not to lower the watertable below the depth at which the sulfidic material occurs. Particular care should be taken if the depth of the sulfidic material is between 20-40 cm. If the material is any shallower than 20 cm, the soil should not be used for root vegetables.
If sulfidic material is used, its acid generating potential must be neutralised by heavy applications of lime. Any existing acidity, which can be considerable for sulfuric layers, should also be neutralised by appropriate application of lime.
Soil Fertility Evaluation/Advisory Service in Negara Brunei Darussalam Volume 2 – Soils Management in the Agricultural Development Areas Page 52
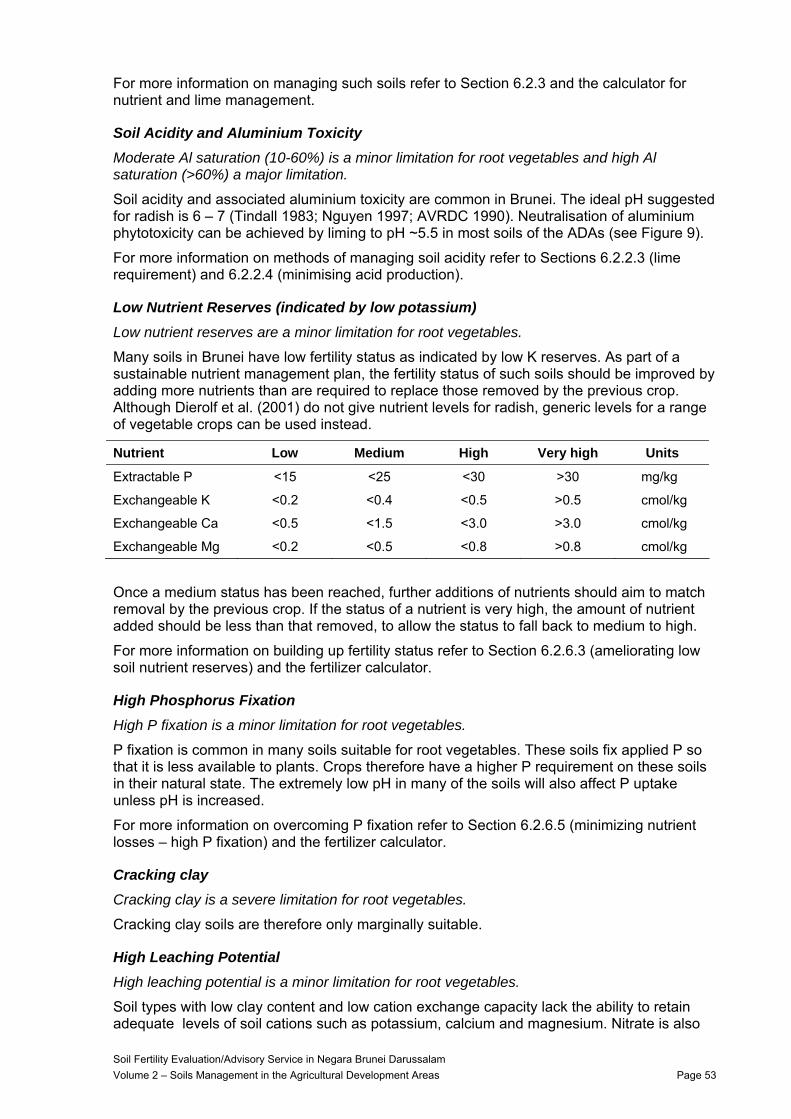
For more information on managing such soils refer to Section 6.2.3 and the calculator for nutrient and lime management.
Soil Acidity and Aluminium Toxicity Moderate Al saturation (10-60%) is a minor limitation for root vegetables and high Al saturation (>60%) a major limitation.
Soil acidity and associated aluminium toxicity are common in Brunei. The ideal pH suggested for radish is 6 – 7 (Tindall 1983; Nguyen 1997; AVRDC 1990). Neutralisation of aluminium phytotoxicity can be achieved by liming to pH ~5.5 in most soils of the ADAs (see Figure 9).
For more information on methods of managing soil acidity refer to Sections 6.2.2.3 (lime requirement) and 6.2.2.4 (minimising acid production).
Low Nutrient Reserves (indicated by low potassium) Low nutrient reserves are a minor limitation for root vegetables.
Many soils in Brunei have low fertility status as indicated by low K reserves. As part of a sustainable nutrient management plan, the fertility status of such soils should be improved by adding more nutrients than are required to replace those removed by the previous crop. Although Dierolf et al. (2001) do not give nutrient levels for radish, generic levels for a range of vegetable crops can be used instead.
Nutrient Low Medium High Very high Units
Extractable P <15 <25 <30 >30 mg/kg
Exchangeable K <0.2 <0.4 <0.5 >0.5 cmol/kg
Exchangeable Ca <0.5 <1.5 <3.0 >3.0 cmol/kg
Exchangeable Mg <0.2 <0.5 <0.8 >0.8 cmol/kg
Once a medium status has been reached, further additions of nutrients should aim to match removal by the previous crop. If the status of a nutrient is very high, the amount of nutrient added should be less than that removed, to allow the status to fall back to medium to high.
For more information on building up fertility status refer to Section 6.2.6.3 (ameliorating low soil nutrient reserves) and the fertilizer calculator.
High Phosphorus Fixation High P fixation is a minor limitation for root vegetables.
P fixation is common in many soils suitable for root vegetables. These soils fix applied P so that it is less available to plants. Crops therefore have a higher P requirement on these soils in their natural state. The extremely low pH in many of the soils will also affect P uptake unless pH is increased.
For more information on overcoming P fixation refer to Section 6.2.6.5 (minimizing nutrient losses – high P fixation) and the fertilizer calculator.
Cracking clay Cracking clay is a severe limitation for root vegetables.
Cracking clay soils are therefore only marginally suitable.
High Leaching Potential High leaching potential is a minor limitation for root vegetables.
Soil types with low clay content and low cation exchange capacity lack the ability to retain adequate levels of soil cations such as potassium, calcium and magnesium. Nitrate is also
Soil Fertility Evaluation/Advisory Service in Negara Brunei Darussalam Volume 2 – Soils Management in the Agricultural Development Areas Page 53
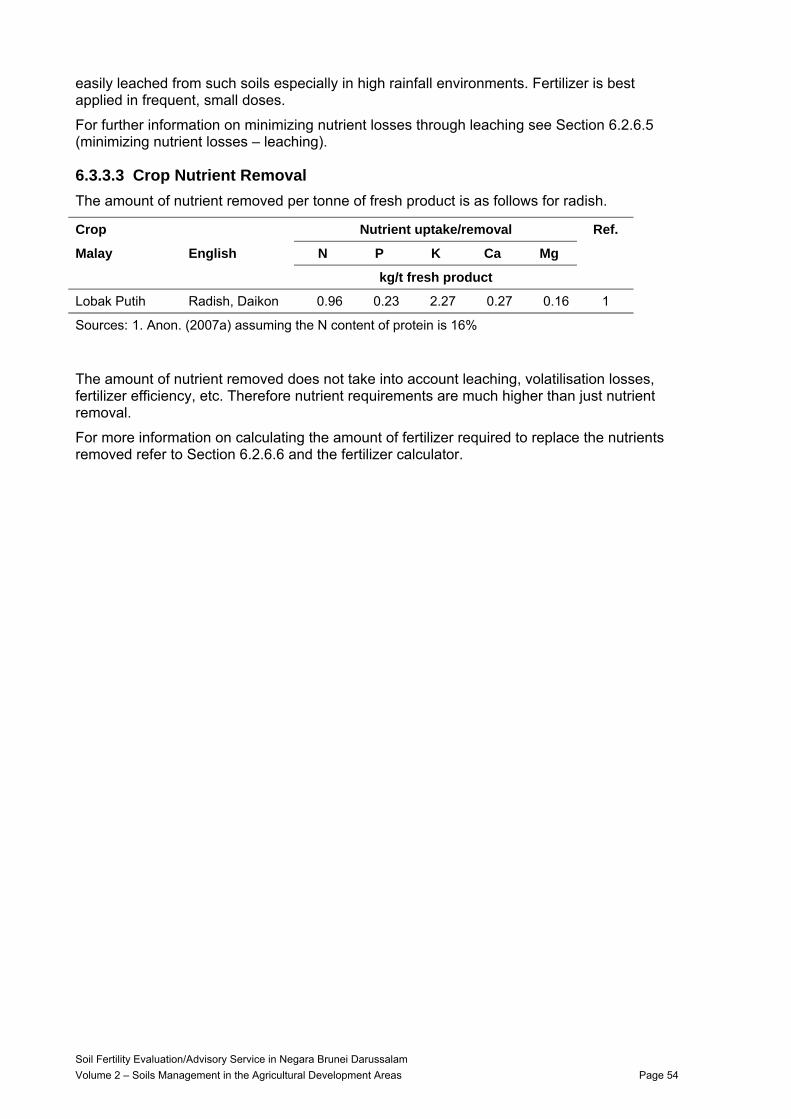
easily leached from such soils especially in high rainfall environments. Fertilizer is best applied in frequent, small doses.
For further information on minimizing nutrient losses through leaching see Section 6.2.6.5 (minimizing nutrient losses – leaching).
6.3.3.3 Crop Nutrient Removal The amount of nutrient removed per tonne of fresh product is as follows for radish.
Crop Nutrient uptake/removal Ref.
Malay English N P K Ca Mg
kg/t fresh product
Lobak Putih Radish, Daikon 0.96 0.23 2.27 0.27 0.16 1
Sources: 1. Anon. (2007a) assuming the N content of protein is 16%
The amount of nutrient removed does not take into account leaching, volatilisation losses, fertilizer efficiency, etc. Therefore nutrient requirements are much higher than just nutrient removal.
For more information on calculating the amount of fertilizer required to replace the nutrients removed refer to Section 6.2.6.6 and the fertilizer calculator.
Soil Fertility Evaluation/Advisory Service in Negara Brunei Darussalam Volume 2 – Soils Management in the Agricultural Development Areas Page 54
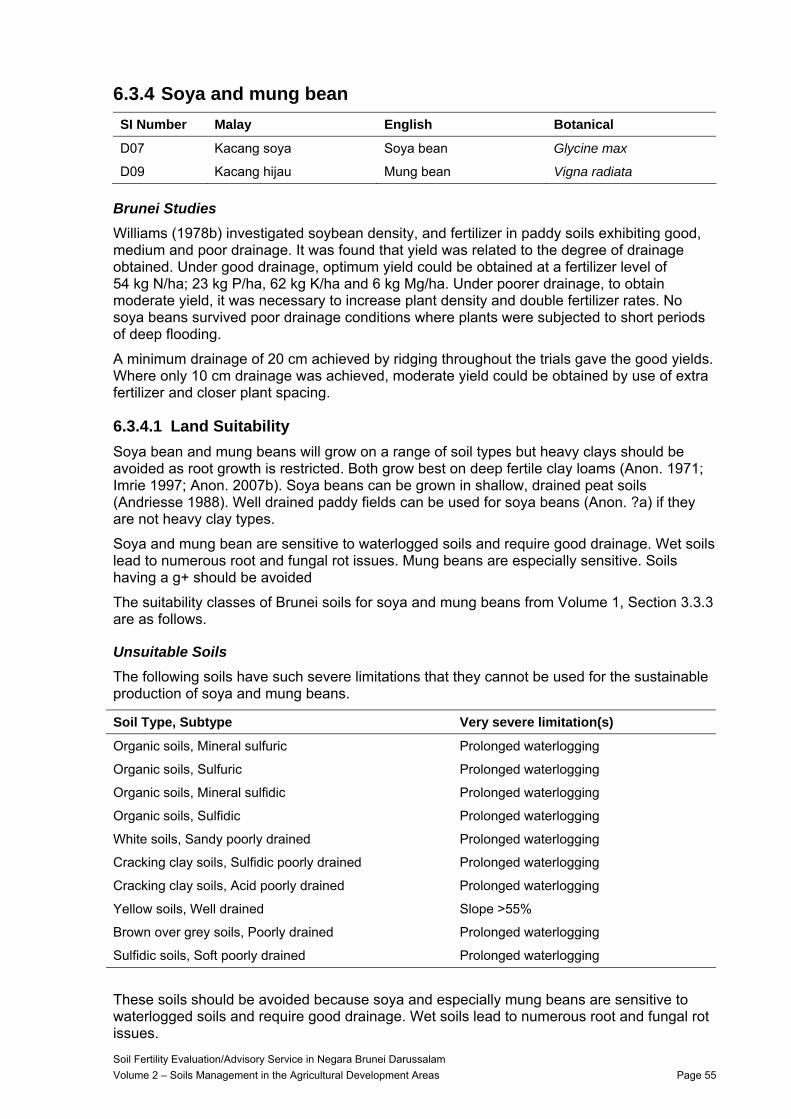
6.3.4 Soya and mung bean SI Number Malay English Botanical
D07 Kacang soya Soya bean Glycine max
D09 Kacang hijau Mung bean Vigna radiata
Brunei Studies Williams (1978b) investigated soybean density, and fertilizer in paddy soils exhibiting good, medium and poor drainage. It was found that yield was related to the degree of drainage obtained. Under good drainage, optimum yield could be obtained at a fertilizer level of 54 kg N/ha; 23 kg P/ha, 62 kg K/ha and 6 kg Mg/ha. Under poorer drainage, to obtain moderate yield, it was necessary to increase plant density and double fertilizer rates. No soya beans survived poor drainage conditions where plants were subjected to short periods of deep flooding.
A minimum drainage of 20 cm achieved by ridging throughout the trials gave the good yields. Where only 10 cm drainage was achieved, moderate yield could be obtained by use of extra fertilizer and closer plant spacing.
6.3.4.1 Land Suitability Soya bean and mung beans will grow on a range of soil types but heavy clays should be avoided as root growth is restricted. Both grow best on deep fertile clay loams (Anon. 1971; Imrie 1997; Anon. 2007b). Soya beans can be grown in shallow, drained peat soils (Andriesse 1988). Well drained paddy fields can be used for soya beans (Anon. ?a) if they are not heavy clay types.
Soya and mung bean are sensitive to waterlogged soils and require good drainage. Wet soils lead to numerous root and fungal rot issues. Mung beans are especially sensitive. Soils having a g+ should be avoided
The suitability classes of Brunei soils for soya and mung beans from Volume 1, Section 3.3.3 are as follows.
Unsuitable Soils The following soils have such severe limitations that they cannot be used for the sustainable production of soya and mung beans.
Soil Type, Subtype Very severe limitation(s)
Organic soils, Mineral sulfuric Prolonged waterlogging
Organic soils, Sulfuric Prolonged waterlogging
Organic soils, Mineral sulfidic Prolonged waterlogging
Organic soils, Sulfidic Prolonged waterlogging
White soils, Sandy poorly drained Prolonged waterlogging
Cracking clay soils, Sulfidic poorly drained Prolonged waterlogging
Cracking clay soils, Acid poorly drained Prolonged waterlogging
Yellow soils, Well drained Slope >55%
Brown over grey soils, Poorly drained Prolonged waterlogging
Sulfidic soils, Soft poorly drained Prolonged waterlogging
These soils should be avoided because soya and especially mung beans are sensitive to waterlogged soils and require good drainage. Wet soils lead to numerous root and fungal rot issues.
Soil Fertility Evaluation/Advisory Service in Negara Brunei Darussalam Volume 2 – Soils Management in the Agricultural Development Areas Page 55
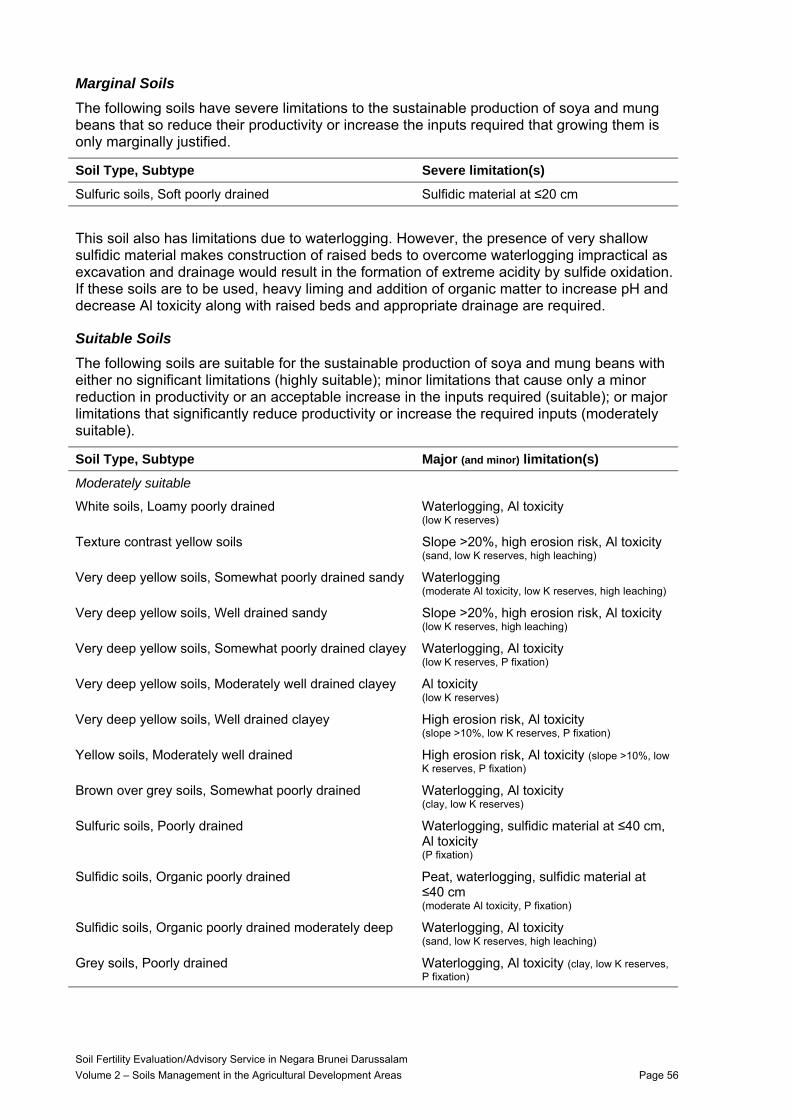
Marginal Soils The following soils have severe limitations to the sustainable production of soya and mung beans that so reduce their productivity or increase the inputs required that growing them is only marginally justified.
Soil Type, Subtype Severe limitation(s)
Sulfuric soils, Soft poorly drained Sulfidic material at ≤20 cm
This soil also has limitations due to waterlogging. However, the presence of very shallow sulfidic material makes construction of raised beds to overcome waterlogging impractical as excavation and drainage would result in the formation of extreme acidity by sulfide oxidation. If these soils are to be used, heavy liming and addition of organic matter to increase pH and decrease Al toxicity along with raised beds and appropriate drainage are required.
Suitable Soils The following soils are suitable for the sustainable production of soya and mung beans with either no significant limitations (highly suitable); minor limitations that cause only a minor reduction in productivity or an acceptable increase in the inputs required (suitable); or major limitations that significantly reduce productivity or increase the required inputs (moderately suitable).
Soil Type, Subtype Major (and minor) limitation(s)
Moderately suitable
White soils, Loamy poorly drained Waterlogging, Al toxicity (low K reserves)
Texture contrast yellow soils Slope >20%, high erosion risk, Al toxicity (sand, low K reserves, high leaching)
Very deep yellow soils, Somewhat poorly drained sandy Waterlogging (moderate Al toxicity, low K reserves, high leaching)
Very deep yellow soils, Well drained sandy Slope >20%, high erosion risk, Al toxicity (low K reserves, high leaching)
Very deep yellow soils, Somewhat poorly drained clayey Waterlogging, Al toxicity (low K reserves, P fixation)
Very deep yellow soils, Moderately well drained clayey Al toxicity (low K reserves)
Very deep yellow soils, Well drained clayey High erosion risk, Al toxicity (slope >10%, low K reserves, P fixation)
Yellow soils, Moderately well drained High erosion risk, Al toxicity (slope >10%, low K reserves, P fixation)
Brown over grey soils, Somewhat poorly drained Waterlogging, Al toxicity (clay, low K reserves)
Sulfuric soils, Poorly drained Waterlogging, sulfidic material at ≤40 cm, Al toxicity (P fixation)
Sulfidic soils, Organic poorly drained Peat, waterlogging, sulfidic material at ≤40 cm (moderate Al toxicity, P fixation)
Sulfidic soils, Organic poorly drained moderately deep Waterlogging, Al toxicity (sand, low K reserves, high leaching)
Grey soils, Poorly drained Waterlogging, Al toxicity (clay, low K reserves, P fixation)
Soil Fertility Evaluation/Advisory Service in Negara Brunei Darussalam Volume 2 – Soils Management in the Agricultural Development Areas Page 56
Issues of short term waterlogging and shallow sulfidic materials can be overcome by draining and use of raised beds utilizing non sulfidic soils. Liming will alleviate both Al toxicity and acidity from the sulfidic/sulfuric soil.
6.3.4.2 Management of Soil Constraints The major issue with most soils for soya and mung bean growing on non sloping land is the shallowness of the topsoil layer either due to a high watertable and/or shallow sulfidic or sulfuric horizon. Soil acidity is a common problem.
Each of the major and minor limitations of the soils suitable for soya and mung beans is addressed below and in relevant sub-sections of Section 6.2.
Waterlogging Waterlogging is a major limitation for soya and mung beans, and prolonged waterlogging is unsuitable.
Soya and mung beans are intolerant of waterlogging, in particular at the seedling stage when they are prone to fungal attack. Most soils in flat areas in Brunei have a high watertable and thus are waterlogged either short or long term. To grow soya or mung beans on flat land with high watertables requires good field drainage and use of raised beds made with non-sulfidic material. From previous Brunei work by Williams (1978b), a minimum drainage of 20 cm from ridging is required. Lower ridging will reduce yields accordingly.
For more information on methods of ameliorating waterlogging refer to Sections 6.2.4.2 (improving surface drainage), 6.2.4.4 (improving soil permeability) and 6.2.4.5 (raised beds).
Slope and Water Erosion Risk Slopes >10% are a minor limitation for soya and mung beans, those >20% a major limitation, those >35% a severe limitation and those >55% are unsuitable. Slopes with high erosion risk (>30% or >20% if texture contrast) are a major limitation.
Soya and mung bean are best grown on land with gentle slopes due risk of erosion. Slopes of >35% are unsuitable due to erosion risks and difficulty with day to day management of the crops. Both can be grown on micro terraces if planting on slopes and good ground cover is maintained between plots. Steeper land should be avoided.
If soya or mung bean are grown on slopes subject to erosion, growers need to minimize the time and area of soil that is left exposed to heavy rains. Use of small plot sizes and permanent grass cover between plots is suggested. Planting on the contour is also suggested.
For more information on methods of minimizing erosion refer to Sections 6.2.5.1 (maintaining plant cover), 6.2.5.2 (retaining crop residues), 6.2.5.3 (minimizing tillage), 6.2.5.4 (terracing) and 6.2.5.5 (grassed waterways).
Sulfidic Material Sulfidic material at <60 cm depth is a minor limitation for soya and mung beans; at <40 cm a major limitation, and at <20 cm a severe limitation.
Soils with shallow sulfidic material or sulfuric layers are, or can become, very acid if not correctly managed. Since these soils also suffer from waterlogging, soya and mung bean are best grown on raised beds but care must be taken a) not to use sulfidic material in making the beds and b) not to lower the watertable below the depth at which the sulfidic material occurs. Particular care should be taken if the depth of the sulfidic material is between 20-40 cm. If the material is any shallower than 20 cm, the soil should not be used for soya and mung beans.
If sulfidic material is used, its acid generating potential must be neutralised by heavy applications of lime. Any existing acidity, which can be considerable for sulfuric layers, should also be neutralised by appropriate application of lime. Soil Fertility Evaluation/Advisory Service in Negara Brunei Darussalam Volume 2 – Soils Management in the Agricultural Development Areas Page 57
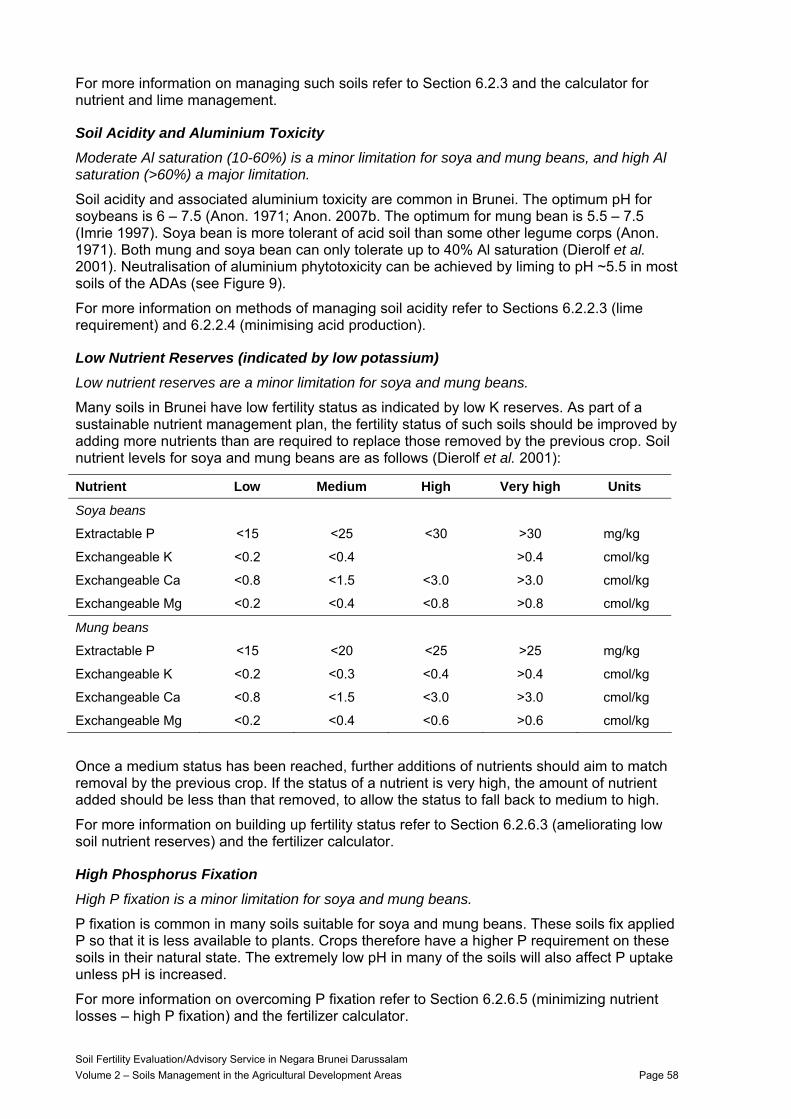
For more information on managing such soils refer to Section 6.2.3 and the calculator for nutrient and lime management.
Soil Acidity and Aluminium Toxicity Moderate Al saturation (10-60%) is a minor limitation for soya and mung beans, and high Al saturation (>60%) a major limitation.
Soil acidity and associated aluminium toxicity are common in Brunei. The optimum pH for soybeans is 6 – 7.5 (Anon. 1971; Anon. 2007b. The optimum for mung bean is 5.5 – 7.5 (Imrie 1997). Soya bean is more tolerant of acid soil than some other legume corps (Anon. 1971). Both mung and soya bean can only tolerate up to 40% Al saturation (Dierolf et al. 2001). Neutralisation of aluminium phytotoxicity can be achieved by liming to pH ~5.5 in most soils of the ADAs (see Figure 9).
For more information on methods of managing soil acidity refer to Sections 6.2.2.3 (lime requirement) and 6.2.2.4 (minimising acid production).
Low Nutrient Reserves (indicated by low potassium) Low nutrient reserves are a minor limitation for soya and mung beans.
Many soils in Brunei have low fertility status as indicated by low K reserves. As part of a sustainable nutrient management plan, the fertility status of such soils should be improved by adding more nutrients than are required to replace those removed by the previous crop. Soil nutrient levels for soya and mung beans are as follows (Dierolf et al. 2001):
Nutrient Low Medium High Very high Units
Soya beans
Extractable P <15 <25 <30 >30 mg/kg
Exchangeable K <0.2 <0.4 >0.4 cmol/kg
Exchangeable Ca <0.8 <1.5 <3.0 >3.0 cmol/kg
Exchangeable Mg <0.2 <0.4 <0.8 >0.8 cmol/kg
Mung beans
Extractable P <15 <20 <25 >25 mg/kg
Exchangeable K <0.2 <0.3 <0.4 >0.4 cmol/kg
Exchangeable Ca <0.8 <1.5 <3.0 >3.0 cmol/kg
Exchangeable Mg <0.2 <0.4 <0.6 >0.6 cmol/kg
Once a medium status has been reached, further additions of nutrients should aim to match removal by the previous crop. If the status of a nutrient is very high, the amount of nutrient added should be less than that removed, to allow the status to fall back to medium to high.
For more information on building up fertility status refer to Section 6.2.6.3 (ameliorating low soil nutrient reserves) and the fertilizer calculator.
High Phosphorus Fixation High P fixation is a minor limitation for soya and mung beans.
P fixation is common in many soils suitable for soya and mung beans. These soils fix applied P so that it is less available to plants. Crops therefore have a higher P requirement on these soils in their natural state. The extremely low pH in many of the soils will also affect P uptake unless pH is increased.
For more information on overcoming P fixation refer to Section 6.2.6.5 (minimizing nutrient losses – high P fixation) and the fertilizer calculator.
Soil Fertility Evaluation/Advisory Service in Negara Brunei Darussalam Volume 2 – Soils Management in the Agricultural Development Areas Page 58
Cracking clay Cracking clay is a major limitation for severe limitation for soya and mung beans.
However, Cracking clay soils are unsuitable anyway due to other constraints.
High Leaching Potential High leaching potential is a minor limitation for soya and mung bean.
Soil types with low clay content and low cation exchange capacity lack the ability to retain adequate levels of soil cations such as potassium, calcium and magnesium. Nitrate is also easily leached from such soils especially in high rainfall environments. Fertilizer is best applied in frequent, small doses.
For further information on minimizing nutrient losses through leaching see Section 6.2.6.5 (minimizing nutrient losses – leaching).
6.3.4.3 Crop Nutrient removal Soya beans have a high P requirement (Anon. ?a) and a high K requirement (Anon. 2007b). The amount of nutrient removed per tonne of fresh product is as follows for soya and mung bean.
Crop Nutrient uptake/removal Ref.
Malay English N P K Ca Mg
kg/t fresh product
Kacang soya Soya bean 50 4 15.3 2.7 2.7 1
66.4 5.24 16.6 3.57 6.36 2
Kacang hijau Mung bean 55 4 17 4 3 1
Sources: 1. Dierolf et al. (2001) 2. Anon. (1996-2006) (mean of 5 sources)
Crop Plant part Micronutrients uptake/removal Ref.
Fe Mn Zn Cu B Mo
g/t dry matter
Grain only n.a. 20 17 16 n.a. n.a. 1
Grain only 110 33 43 16 16 6 2
Total 366 90 61 25 39 7 2
Kacang soya (soya bean)
Grain only n.a. n.a. 24 n.a. n.a. n.a. 3
Sources: 1. Adapted from "The Fertilizer Handbook", TFI, 1982 2. Bataglia and Mascarenhas, 1978 3. Guo Qingyuan, 1991 (personal communication) All quoted by Anon. (1996-2006)
The amount of nutrient removed does not take into account leaching, volatilisation losses, fertilizer efficiency, etc. Therefore nutrient requirements are much higher than just nutrient removal.
For more information on calculating the amount of fertilizer required to replace the nutrients removed refer to Section 6.2.6.6 and the fertilizer calculator.
Soil Fertility Evaluation/Advisory Service in Negara Brunei Darussalam Volume 2 – Soils Management in the Agricultural Development Areas Page 59
6.3.5 Sweet corn SI Number Malay English Botanical
D06 Jagung manis Sweet Corn Zea mays L.
6.3.5.1 Land Suitability Sweet corn is widely grown in Brunei for the fresh market. Sweet corn can be grown on a wide range of soils from sandy to medium clays, but deep medium loams which are well drained, with high organic matter and nutrient are preferable (Berger 1962; Tindall 1983; Skerman and Riveros 1990; Anon. 2005a). Good management can make many other soils suitable for sweet corn (Berger 1962).
Sweet corn is sensitive to flooding and waterlogging, thus good drainage and depth is essential (Skerman and Riveros 1990; Wright et al. 2005). Root zone depth is critical and should preferably be a minimum of 50 cm because sweet corn roots can grow to 1.2 m (Anon. 2005a).
The suitability classes of Brunei soils for sweet corn from Volume 1, Section 3.3.3 are as follows.
Unsuitable Soils The following soils have such severe limitations that they cannot be used for the sustainable production of sweet corn.
Soil Type, Subtype Very severe limitation(s)
Yellow soils, Well drained Slope >55%
Marginal Soils The following soils have severe limitations to the sustainable production of sweet corn that so reduce its productivity or increase the inputs required, that growing it is only marginally justified.
Soil Type, Subtype Severe limitation(s)
Organic soils, Mineral sulfuric Prolonged waterlogging
Organic soils, Sulfuric Prolonged waterlogging, sulfidic material at ≤20 cm
Organic soils, Mineral sulfidic Prolonged waterlogging
Organic soils, Sulfidic Prolonged waterlogging
White soils, Sandy poorly drained Prolonged waterlogging
Cracking clay soils, Sulfidic poorly drained Prolonged waterlogging
Cracking clay soils, Acid poorly drained Prolonged waterlogging
Brown over grey soils, Poorly drained Prolonged waterlogging
Sulfuric soils, Soft poorly drained Sulfidic material at ≤20 cm
Sulfidic soils, Soft poorly drained Prolonged waterlogging
The depth of rooting required by sweet corn means it may be impractical to alleviate waterlogging by raised beds, especially where there is very shallow sulfidic material since drainage of such material would result in the formation of extreme acidity by sulfide oxidation.
Soil Fertility Evaluation/Advisory Service in Negara Brunei Darussalam Volume 2 – Soils Management in the Agricultural Development Areas Page 60
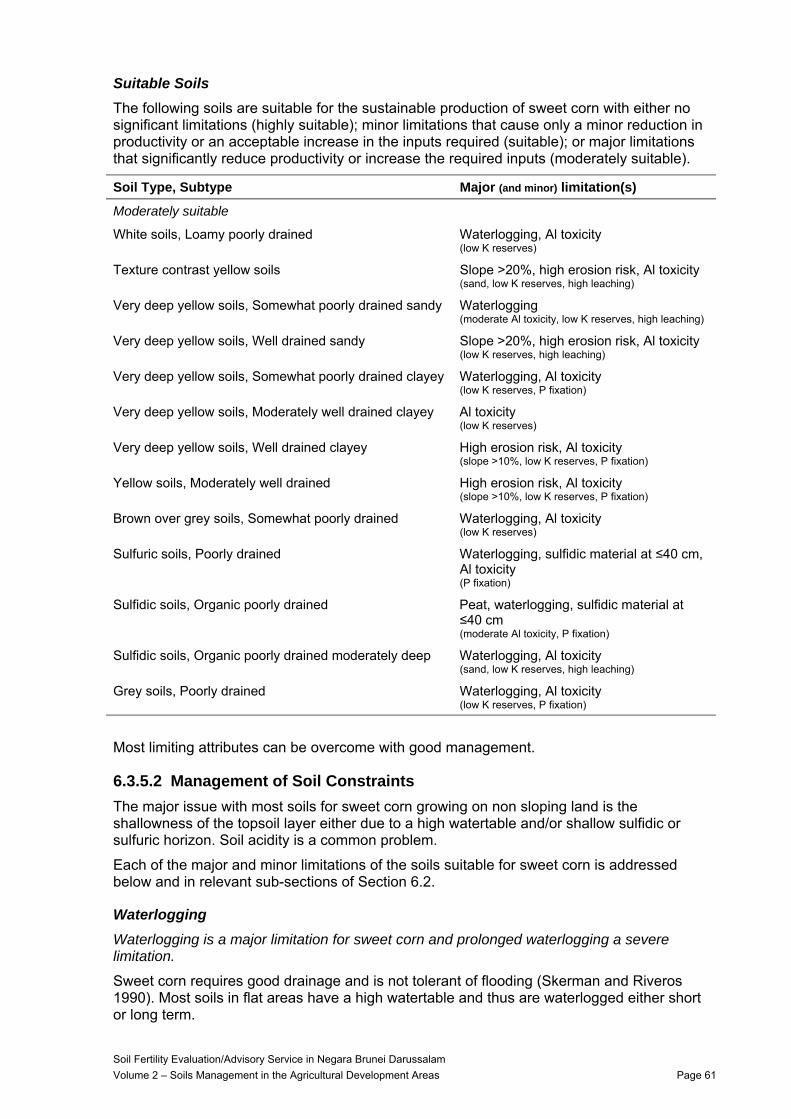
Suitable Soils The following soils are suitable for the sustainable production of sweet corn with either no significant limitations (highly suitable); minor limitations that cause only a minor reduction in productivity or an acceptable increase in the inputs required (suitable); or major limitations that significantly reduce productivity or increase the required inputs (moderately suitable).
Soil Type, Subtype Major (and minor) limitation(s)
Moderately suitable
White soils, Loamy poorly drained Waterlogging, Al toxicity (low K reserves)
Texture contrast yellow soils Slope >20%, high erosion risk, Al toxicity (sand, low K reserves, high leaching)
Very deep yellow soils, Somewhat poorly drained sandy Waterlogging (moderate Al toxicity, low K reserves, high leaching)
Very deep yellow soils, Well drained sandy Slope >20%, high erosion risk, Al toxicity (low K reserves, high leaching)
Very deep yellow soils, Somewhat poorly drained clayey Waterlogging, Al toxicity (low K reserves, P fixation)
Very deep yellow soils, Moderately well drained clayey Al toxicity (low K reserves)
Very deep yellow soils, Well drained clayey High erosion risk, Al toxicity (slope >10%, low K reserves, P fixation)
Yellow soils, Moderately well drained High erosion risk, Al toxicity (slope >10%, low K reserves, P fixation)
Brown over grey soils, Somewhat poorly drained Waterlogging, Al toxicity (low K reserves)
Sulfuric soils, Poorly drained Waterlogging, sulfidic material at ≤40 cm, Al toxicity (P fixation)
Sulfidic soils, Organic poorly drained Peat, waterlogging, sulfidic material at ≤40 cm (moderate Al toxicity, P fixation)
Sulfidic soils, Organic poorly drained moderately deep Waterlogging, Al toxicity (sand, low K reserves, high leaching)
Grey soils, Poorly drained Waterlogging, Al toxicity (low K reserves, P fixation)
Most limiting attributes can be overcome with good management.
6.3.5.2 Management of Soil Constraints The major issue with most soils for sweet corn growing on non sloping land is the shallowness of the topsoil layer either due to a high watertable and/or shallow sulfidic or sulfuric horizon. Soil acidity is a common problem.
Each of the major and minor limitations of the soils suitable for sweet corn is addressed below and in relevant sub-sections of Section 6.2.
Waterlogging Waterlogging is a major limitation for sweet corn and prolonged waterlogging a severe limitation.
Sweet corn requires good drainage and is not tolerant of flooding (Skerman and Riveros 1990). Most soils in flat areas have a high watertable and thus are waterlogged either short or long term.
Soil Fertility Evaluation/Advisory Service in Negara Brunei Darussalam Volume 2 – Soils Management in the Agricultural Development Areas Page 61
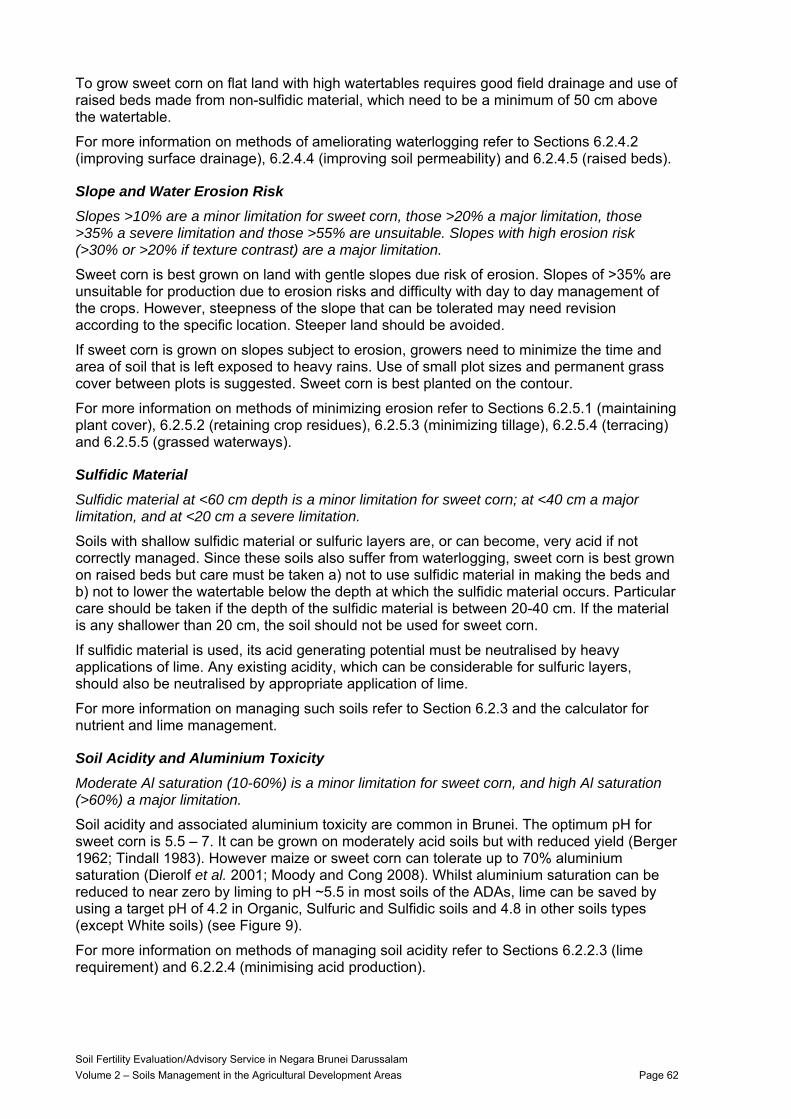
To grow sweet corn on flat land with high watertables requires good field drainage and use of raised beds made from non-sulfidic material, which need to be a minimum of 50 cm above the watertable.
For more information on methods of ameliorating waterlogging refer to Sections 6.2.4.2 (improving surface drainage), 6.2.4.4 (improving soil permeability) and 6.2.4.5 (raised beds).
Slope and Water Erosion Risk Slopes >10% are a minor limitation for sweet corn, those >20% a major limitation, those >35% a severe limitation and those >55% are unsuitable. Slopes with high erosion risk (>30% or >20% if texture contrast) are a major limitation.
Sweet corn is best grown on land with gentle slopes due risk of erosion. Slopes of >35% are unsuitable for production due to erosion risks and difficulty with day to day management of the crops. However, steepness of the slope that can be tolerated may need revision according to the specific location. Steeper land should be avoided.
If sweet corn is grown on slopes subject to erosion, growers need to minimize the time and area of soil that is left exposed to heavy rains. Use of small plot sizes and permanent grass cover between plots is suggested. Sweet corn is best planted on the contour.
For more information on methods of minimizing erosion refer to Sections 6.2.5.1 (maintaining plant cover), 6.2.5.2 (retaining crop residues), 6.2.5.3 (minimizing tillage), 6.2.5.4 (terracing) and 6.2.5.5 (grassed waterways).
Sulfidic Material Sulfidic material at <60 cm depth is a minor limitation for sweet corn; at <40 cm a major limitation, and at <20 cm a severe limitation.
Soils with shallow sulfidic material or sulfuric layers are, or can become, very acid if not correctly managed. Since these soils also suffer from waterlogging, sweet corn is best grown on raised beds but care must be taken a) not to use sulfidic material in making the beds and b) not to lower the watertable below the depth at which the sulfidic material occurs. Particular care should be taken if the depth of the sulfidic material is between 20-40 cm. If the material is any shallower than 20 cm, the soil should not be used for sweet corn.
If sulfidic material is used, its acid generating potential must be neutralised by heavy applications of lime. Any existing acidity, which can be considerable for sulfuric layers, should also be neutralised by appropriate application of lime.
For more information on managing such soils refer to Section 6.2.3 and the calculator for nutrient and lime management.
Soil Acidity and Aluminium Toxicity Moderate Al saturation (10-60%) is a minor limitation for sweet corn, and high Al saturation (>60%) a major limitation.
Soil acidity and associated aluminium toxicity are common in Brunei. The optimum pH for sweet corn is 5.5 – 7. It can be grown on moderately acid soils but with reduced yield (Berger 1962; Tindall 1983). However maize or sweet corn can tolerate up to 70% aluminium saturation (Dierolf et al. 2001; Moody and Cong 2008). Whilst aluminium saturation can be reduced to near zero by liming to pH ~5.5 in most soils of the ADAs, lime can be saved by using a target pH of 4.2 in Organic, Sulfuric and Sulfidic soils and 4.8 in other soils types (except White soils) (see Figure 9).
For more information on methods of managing soil acidity refer to Sections 6.2.2.3 (lime requirement) and 6.2.2.4 (minimising acid production).
Soil Fertility Evaluation/Advisory Service in Negara Brunei Darussalam Volume 2 – Soils Management in the Agricultural Development Areas Page 62
Low Nutrient Reserves (indicated by low potassium) Low nutrient reserves are a minor limitation for sweet corn.
Many soils in Brunei have low fertility status as indicated by low K reserves. As part of a sustainable nutrient management plan, the fertility status of such soils should be improved by adding more nutrients than are required to replace those removed by the previous crop. Soil nutrient levels for sweet corn are as follows (Dierolf et al. 2001):
Nutrient Low Medium High Very high Units
Extractable P <15 <25 <30 >30 mg/kg
Exchangeable K <0.2 <0.4 >0.4 cmol/kg
Exchangeable Ca <0.5 <1.5 <2.0 >2.0 cmol/kg
Exchangeable Mg <0.2 <0.5 <1.0 >1.0 cmol/kg
Once a medium status has been reached, further additions of nutrients should aim to match removal by the previous crop. If the status of a nutrient is very high, the amount of nutrient added should be less than that removed, to allow the status to fall back to medium to high.
For more information on building up fertility status refer to Section 6.2.6.3 (ameliorating low soil nutrient reserves) and the fertilizer calculator.
High Phosphorus Fixation High P fixation is a minor limitation for sweet corn.
P fixation is common in many soils suitable for sweet corn. These soils fix applied P so that it is less available to plants. Crops therefore have a higher P requirement on these soils in their natural state. The extremely low pH in many of the soils will also affect P uptake unless pH is increased.
For more information on overcoming P fixation refer to Section 6.2.6.5 (minimizing nutrient losses – high P fixation) and the fertilizer calculator.
Cracking clay Cracking clay is a major limitation for sweet corn.
However, Cracking clay soils are only marginally suitable anyway due to other constraints.
High Leaching Potential High leaching potential is a minor limitation for sweet corn.
Soil types with low clay content and low cation exchange capacity lack the ability to retain adequate levels of soil cations such as potassium, calcium and magnesium. Nitrate is also easily leached from such soils especially in high rainfall environments. Fertilizer is best applied in frequent, small doses.
For further information on minimizing nutrient losses through leaching see Section 6.2.6.5 (minimizing nutrient losses – leaching).
6.3.5.3 Crop Nutrient Removal Sweet corn has a high K requirement. The amount of nutrient removed per tonne of fresh product is as follows for sweet corn.
Soil Fertility Evaluation/Advisory Service in Negara Brunei Darussalam Volume 2 – Soils Management in the Agricultural Development Areas Page 63
Crop Nutrient uptake/removal Ref.
Malay English N P K Ca Mg
kg/t fresh product
Jagung manis Sweet Corn 4.7 0.5 5 0.4 0.2 1
11.07 1.43 7.5 2
10.4 1.3 9.5 1.5 0.75 3
Sources: 1. Dierolf et al. (2001) 2. Anon. (2005a) 2. Anon. (1996-2006)
The amount of nutrient removed does not take into account leaching, volatilisation losses, fertilizer efficiency, etc. Therefore nutrient requirements are much higher than just nutrient removal.
For more information on calculating the amount of fertilizer required to replace the nutrients removed refer to Section 6.2.6.6 and the fertilizer calculator.
Soil Fertility Evaluation/Advisory Service in Negara Brunei Darussalam Volume 2 – Soils Management in the Agricultural Development Areas Page 64
6.3.6 Ginger and turmeric SI Number Malay English Botanical
D01 Halia Ginger Zingiber officinale
D03 Kunyit Turmeric Curcuma longa
6.3.6.1 Land Suitability Ginger prefers rich, well drained, friable soils with high organic matter content, such as sandy loams (Yamaguchi 1983; Chin 1999; McMahon 2004; Broadley 2005). A minimum topsoil depth of 20-25 cm is required (McMahon 2004).
Turmeric is best on loamy or alluvial, friable soils as it does not tolerate waterlogging (Chin 1999).
The suitability classes of Brunei soils for ginger and turmeric from Volume 1, Section 3.3.3 are as follows.
Unsuitable Soils The following soils have such severe limitations that they cannot be used for the sustainable production of ginger and turmeric.
Soil Type, Subtype Very severe limitation(s)
Yellow soils, Well drained Slope >55%
Marginal Soils The following soils have severe limitations to the sustainable production of ginger and turmeric that so reduce their productivity or increase the inputs required that growing them is only marginally justified.
Soil Type, Subtype Severe limitation(s)
Organic soils, Mineral sulfuric Peat
Organic soils, Sulfuric Peat, sulfidic material at ≤20 cm
Organic soils, Mineral sulfidic Peat
Organic soils, Sulfidic Peat
Cracking clay soils, Sulfidic poorly drained Cracking clay
Cracking clay soils, Acid poorly drained Cracking clay
Sulfuric soils, Soft poorly drained Sulfidic material at ≤20 cm
Sulfidic soils, Organic poorly drained Peat
Suitable Soils The following soils are suitable for the sustainable production of ginger and turmeric with either no significant limitations (highly suitable); minor limitations that cause only a minor reduction in productivity or an acceptable increase in the inputs required (suitable); or major limitations that significantly reduce productivity or increase the required inputs (moderately suitable).
Soil Fertility Evaluation/Advisory Service in Negara Brunei Darussalam Volume 2 – Soils Management in the Agricultural Development Areas Page 65
Soil Type, Subtype Major (and minor) limitation(s)
Suitable
Very deep yellow soils, Somewhat poorly drained sandy (Waterlogging, moderate Al toxicity, low K reserves, high leaching)
Moderately suitable
White soils, Loamy poorly drained Al toxicity (waterlogging, low K reserves)
White soils, Sandy poorly drained Prolonged waterlogging (sand, low K reserves, high leaching)
Texture contrast yellow soils Slope >20%, high erosion risk, Al toxicity (sand, low K reserves, high leaching)
Very deep yellow soils, Well drained sandy Slope >20%, high erosion risk, Al toxicity (low K reserves, high leaching)
Very deep yellow soils, Somewhat poorly drained clayey Al toxicity (waterlogging, low K reserves, P fixation)
Very deep yellow soils, Moderately well drained clayey Al toxicity (low K reserves)
Very deep yellow soils, Well drained clayey High erosion risk, Al toxicity (slope >10%, low K reserves, P fixation)
Yellow soils, Moderately well drained High erosion risk, Al toxicity (slope >10%, low K reserves, P fixation)
Brown over grey soils, Somewhat poorly drained Al toxicity (clay, waterlogging, low K reserves)
Brown over grey soils, Poorly drained Prolonged waterlogging (clay, moderate Al toxicity, low K reserves, P fixation)
Sulfuric soils, Poorly drained Sulfidic material at ≤40 cm, Al toxicity (waterlogging, P fixation)
Sulfidic soils, Soft poorly drained Prolonged waterlogging, sulfidic material at ≤40 cm, Al toxicity (clay, low K reserves, P fixation)
Sulfidic soils, Organic poorly drained moderately deep Al toxicity (sand, waterlogging, low K reserves, high leaching)
Grey soils, Poorly drained Al toxicity (clay, waterlogging, low K reserves, P fixation)
Limiting attributes were short term waterlogging, aluminium toxicity, and in some cases steep slopes. These can be made suitable for ginger and turmeric production with various modifications to the soil attributes.
6.3.6.2 Management of Soil Constraints The major issues with most soils for growing turmeric and ginger on non sloping land is the shallowness of the topsoil layer either due to a high watertable and/or shallow sulfidic or sulfuric horizon along with high Al saturation.
Each of the major and minor limitations of the soils suitable for turmeric and ginger is addressed below and in relevant sub-sections of Section 6.2.
Waterlogging Waterlogging is a minor limitation for ginger and turmeric and prolonged waterlogging a major limitation.
Ginger and turmeric require good drainage and are not tolerant of flooding (Skerman and Riveros 1990). Most soils in flat areas have a high watertable and thus are waterlogged
Soil Fertility Evaluation/Advisory Service in Negara Brunei Darussalam Volume 2 – Soils Management in the Agricultural Development Areas Page 66
either short or long term. To grow ginger or turmeric on flat land with high watertables requires good field drainage and use of raised beds with a minimum of 25 cm ridging.
For more information on methods of ameliorating waterlogging refer to Sections 6.2.4.2 (improving surface drainage), 6.2.4.4 (improving soil permeability) and 6.2.4.5 (raised beds).
Slope and Water Erosion Risk Slopes >10% are a minor limitation for ginger and turmeric, those >20% a major limitation, those >35% a severe limitation and those >55% are unsuitable. Slopes with high erosion risk (>30% or >20% if texture contrast) are a major limitation.
Both ginger and turmeric are best grown on flat land or land with gentle slopes. Because they are root crops the risk of erosion is enhanced as the soil is disturbed during harvest. Slopes of >35% are unsuitable for production due to erosion risks and difficulty with day to day management of the crops. However, steepness of the slope that can be tolerated may need revision according to the specific location. Steeper land should be avoided.
If ginger or turmeric are grown on slopes subject to erosion, growers need to minimize the time and area of soil that is left exposed to heavy rains. Use of small plot sizes and permanent grass cover between plots is suggested. Planting on contours is highly recommended.
For more information on methods of minimizing erosion refer to Sections 6.2.5.1 (maintaining plant cover), 6.2.5.2 (retaining crop residues), 6.2.5.3 (minimizing tillage), 6.2.5.4 (terracing) and 6.2.5.5 (grassed waterways).
Sulfidic Material Sulfidic material at <60 cm depth is a minor limitation for ginger and turmeric; at <40 cm a major limitation, and at <20 cm a severe limitation.
Soils with shallow sulfidic material or sulfuric layers are, or can become, very acid if not correctly managed. Since these soils also suffer from waterlogging, ginger and turmeric are best grown on raised beds but care must be taken a) not to use sulfidic material in making the beds and b) not to lower the watertable below the depth at which the sulfidic material occurs. Particular care should be taken if the depth of the sulfidic material is between 20-40 cm. If the material is any shallower than 20 cm, the soil should not be used for ginger or turmeric.
If sulfidic material is used, its acid generating potential must be neutralised by heavy applications of lime. Any existing acidity, which can be considerable for sulfuric layers, should also be neutralised by appropriate application of lime.
For more information on managing such soils refer to Section 6.2.3 and the calculator for nutrient and lime management.
Soil Acidity and Aluminium Toxicity Moderate Al saturation (10-60%) is a minor limitation for ginger and turmeric, and high Al saturation (>60%) a major limitation.
Soil acidity and associated aluminium toxicity are common in Brunei. The most suitable pH for ginger is 5.5 – 6.5 (Yamaguichi 1983). Manganese-induced iron deficiency is known to occur on poorly drained and acidic manganiferous soils. Correction is by improving drainage and increasing soil pH to 6.5 to 7.0 on such soils (Broadley 2005). Neutralisation of aluminium phytotoxicity can be achieved by liming to pH ~5.5 in most soils of the ADAs (see Figure 9).
For more information on methods of managing soil acidity refer to Sections 6.2.2.3 (lime requirement) and 6.2.2.4 (minimising acid production).
Soil Fertility Evaluation/Advisory Service in Negara Brunei Darussalam Volume 2 – Soils Management in the Agricultural Development Areas Page 67
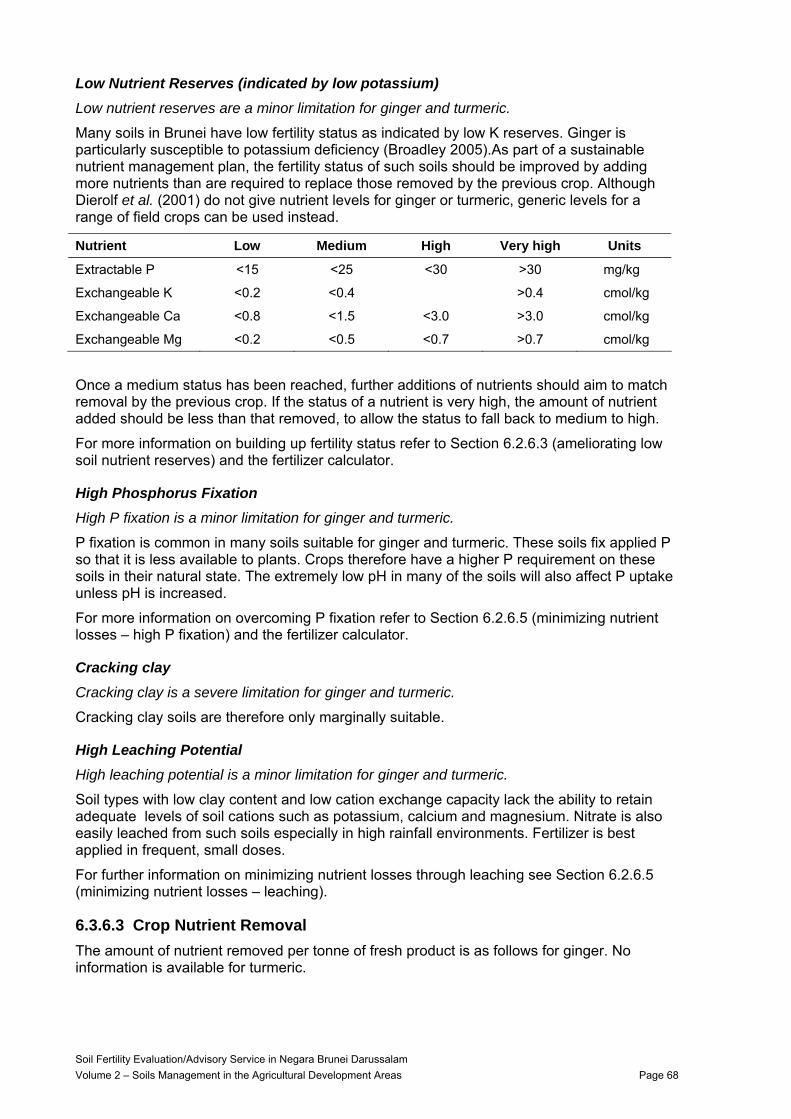
Low Nutrient Reserves (indicated by low potassium) Low nutrient reserves are a minor limitation for ginger and turmeric.
Many soils in Brunei have low fertility status as indicated by low K reserves. Ginger is particularly susceptible to potassium deficiency (Broadley 2005).As part of a sustainable nutrient management plan, the fertility status of such soils should be improved by adding more nutrients than are required to replace those removed by the previous crop. Although Dierolf et al. (2001) do not give nutrient levels for ginger or turmeric, generic levels for a range of field crops can be used instead.
Nutrient Low Medium High Very high Units
Extractable P <15 <25 <30 >30 mg/kg
Exchangeable K <0.2 <0.4 >0.4 cmol/kg
Exchangeable Ca <0.8 <1.5 <3.0 >3.0 cmol/kg
Exchangeable Mg <0.2 <0.5 <0.7 >0.7 cmol/kg
Once a medium status has been reached, further additions of nutrients should aim to match removal by the previous crop. If the status of a nutrient is very high, the amount of nutrient added should be less than that removed, to allow the status to fall back to medium to high.
For more information on building up fertility status refer to Section 6.2.6.3 (ameliorating low soil nutrient reserves) and the fertilizer calculator.
High Phosphorus Fixation High P fixation is a minor limitation for ginger and turmeric.
P fixation is common in many soils suitable for ginger and turmeric. These soils fix applied P so that it is less available to plants. Crops therefore have a higher P requirement on these soils in their natural state. The extremely low pH in many of the soils will also affect P uptake unless pH is increased.
For more information on overcoming P fixation refer to Section 6.2.6.5 (minimizing nutrient losses – high P fixation) and the fertilizer calculator.
Cracking clay Cracking clay is a severe limitation for ginger and turmeric.
Cracking clay soils are therefore only marginally suitable.
High Leaching Potential High leaching potential is a minor limitation for ginger and turmeric.
Soil types with low clay content and low cation exchange capacity lack the ability to retain adequate levels of soil cations such as potassium, calcium and magnesium. Nitrate is also easily leached from such soils especially in high rainfall environments. Fertilizer is best applied in frequent, small doses.
For further information on minimizing nutrient losses through leaching see Section 6.2.6.5 (minimizing nutrient losses – leaching).
6.3.6.3 Crop Nutrient Removal The amount of nutrient removed per tonne of fresh product is as follows for ginger. No information is available for turmeric.
Soil Fertility Evaluation/Advisory Service in Negara Brunei Darussalam Volume 2 – Soils Management in the Agricultural Development Areas Page 68
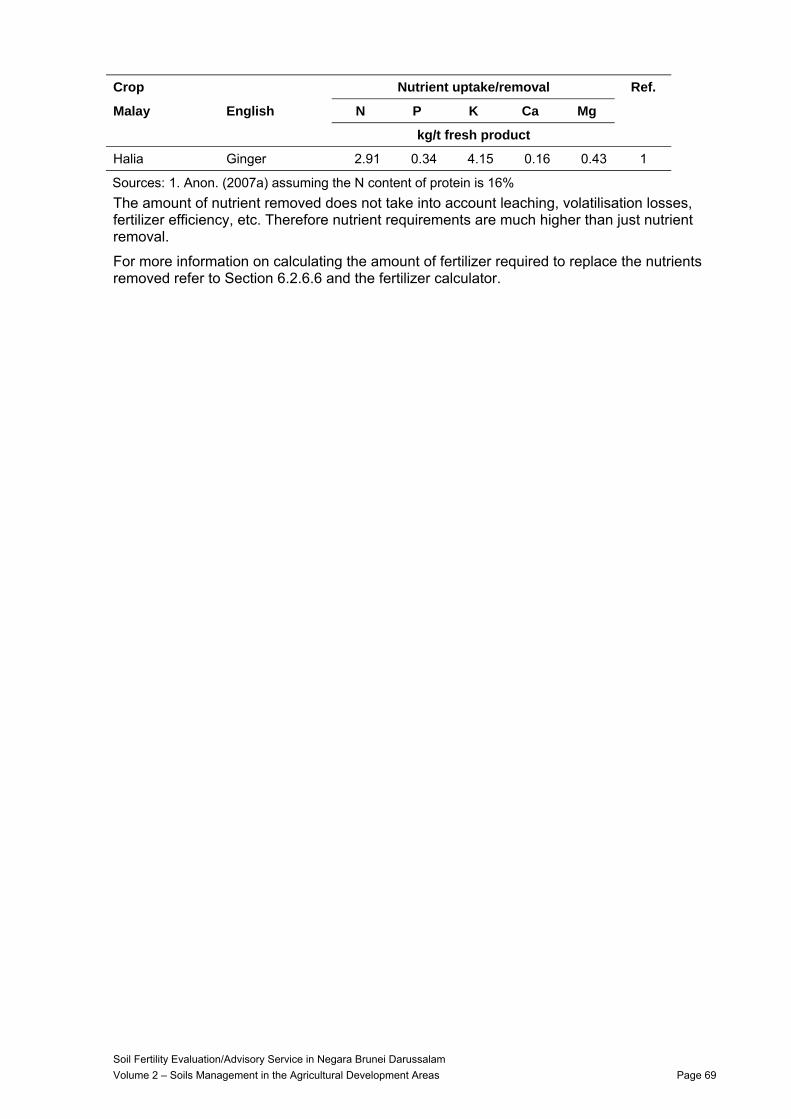
Crop Nutrient uptake/removal Ref.
Malay English N P K Ca Mg
kg/t fresh product
Halia Ginger 2.91 0.34 4.15 0.16 0.43 1
Sources: 1. Anon. (2007a) assuming the N content of protein is 16% The amount of nutrient removed does not take into account leaching, volatilisation losses, fertilizer efficiency, etc. Therefore nutrient requirements are much higher than just nutrient removal.
For more information on calculating the amount of fertilizer required to replace the nutrients removed refer to Section 6.2.6.6 and the fertilizer calculator.
Soil Fertility Evaluation/Advisory Service in Negara Brunei Darussalam Volume 2 – Soils Management in the Agricultural Development Areas Page 69
6.3.7 Cassava and sweet potato SI Number Malay English Botanical
D04 Keledi/Ubi keledi Sweet Potato Ipomoea batatas L. (Lam)
D05 Ubi Kayu Cassava Manihot esculenta Crantz
6.3.7.1 Land Suitability Cassava is grown in Brunei both for shoots and tubers.
Cassava is grown on a wide range of soil types but being a root crop, does best on soils of a friable nature which permit expansion of the tubers. Sandy soils are suitable with fertilization and adequate rainfall. In SE Asia, cassava is sometimes grown on organic soils (lowland oligotropic peat) where it grows well with adequate drainage (watertable below 60 cm) and fertilization. The loose texture of these soils greatly facilitates harvesting (Williams 1975d; Andriesse 1988).
Sweet potato is also tolerant to a wide range of soils but a well drained sandy loam with a moderately clay subsoil is preferable (Tindall 1983).
The suitability classes of Brunei soils for cassava and sweet potato from Volume 1, Section 3.3.3 are as follows.
Unsuitable Soils None of the major Soil Types have such severe limitations that they cannot be used for the sustainable production of cassava and sweet potato.
Marginal Soils The following soils have severe limitations to the sustainable production of cassava and sweet potato that so reduce their productivity or increase the inputs required that growing them is only marginally justified.
Soil Type, Subtype Severe limitation(s)
Organic soils, Mineral sulfuric Prolonged waterlogging
Organic soils, Sulfuric Prolonged waterlogging, sulfidic material at ≤20 cm
Organic soils, Mineral sulfidic Prolonged waterlogging
Organic soils, Sulfidic Prolonged waterlogging
White soils, Sandy poorly drained Prolonged waterlogging
Cracking clay soils, Sulfidic poorly drained Prolonged waterlogging, cracking clay
Cracking clay soils, Acid poorly drained Prolonged waterlogging, cracking clay
Yellow soils, Well drained Slope >55%
Brown over grey soils, Poorly drained Prolonged waterlogging
Sulfuric soils, Soft poorly drained Sulfidic material at ≤20 cm
Sulfidic soils, Soft poorly drained Prolonged waterlogging
Many of these soils also have limitations due to waterlogging, but the depth of rooting required may make it impractical to alleviate waterlogging by constructing raised beds. This is especially the case where there is very shallow sulfidic material because excavation and drainage would result in the formation of extreme acidity by sulfide oxidation. If these soils are to be used, heavy liming and addition of organic matter to increase pH and decrease Al
Soil Fertility Evaluation/Advisory Service in Negara Brunei Darussalam Volume 2 – Soils Management in the Agricultural Development Areas Page 70
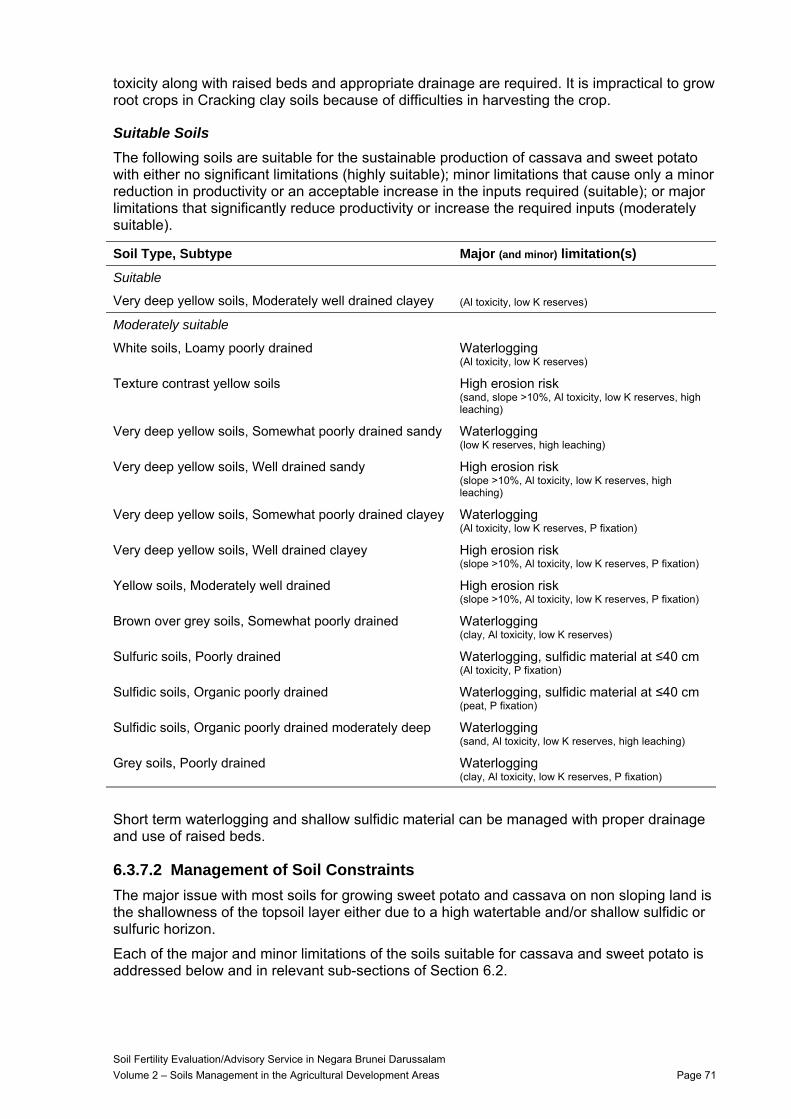
toxicity along with raised beds and appropriate drainage are required. It is impractical to grow root crops in Cracking clay soils because of difficulties in harvesting the crop.
Suitable Soils The following soils are suitable for the sustainable production of cassava and sweet potato with either no significant limitations (highly suitable); minor limitations that cause only a minor reduction in productivity or an acceptable increase in the inputs required (suitable); or major limitations that significantly reduce productivity or increase the required inputs (moderately suitable).
Soil Type, Subtype Major (and minor) limitation(s)
Suitable
Very deep yellow soils, Moderately well drained clayey (Al toxicity, low K reserves)
Moderately suitable
White soils, Loamy poorly drained Waterlogging (Al toxicity, low K reserves)
Texture contrast yellow soils High erosion risk (sand, slope >10%, Al toxicity, low K reserves, high leaching)
Very deep yellow soils, Somewhat poorly drained sandy Waterlogging (low K reserves, high leaching)
Very deep yellow soils, Well drained sandy High erosion risk (slope >10%, Al toxicity, low K reserves, high leaching)
Very deep yellow soils, Somewhat poorly drained clayey Waterlogging (Al toxicity, low K reserves, P fixation)
Very deep yellow soils, Well drained clayey High erosion risk (slope >10%, Al toxicity, low K reserves, P fixation)
Yellow soils, Moderately well drained High erosion risk (slope >10%, Al toxicity, low K reserves, P fixation)
Brown over grey soils, Somewhat poorly drained Waterlogging (clay, Al toxicity, low K reserves)
Sulfuric soils, Poorly drained Waterlogging, sulfidic material at ≤40 cm (Al toxicity, P fixation)
Sulfidic soils, Organic poorly drained Waterlogging, sulfidic material at ≤40 cm (peat, P fixation)
Sulfidic soils, Organic poorly drained moderately deep Waterlogging (sand, Al toxicity, low K reserves, high leaching)
Grey soils, Poorly drained Waterlogging (clay, Al toxicity, low K reserves, P fixation)
Short term waterlogging and shallow sulfidic material can be managed with proper drainage and use of raised beds.
6.3.7.2 Management of Soil Constraints The major issue with most soils for growing sweet potato and cassava on non sloping land is the shallowness of the topsoil layer either due to a high watertable and/or shallow sulfidic or sulfuric horizon.
Each of the major and minor limitations of the soils suitable for cassava and sweet potato is addressed below and in relevant sub-sections of Section 6.2.
Soil Fertility Evaluation/Advisory Service in Negara Brunei Darussalam Volume 2 – Soils Management in the Agricultural Development Areas Page 71
Waterlogging Waterlogging is a major limitation for sweet potato and cassava and prolonged waterlogging a severe limitation.
Cassava does not tolerate flooding (O’Hair 1995). However many tropical lines of sweet potato can tolerate short periods (a few days) of flooding (Martin 1988; ARVDC 1990), but are sensitive to waterlogging.
Most soils in flat areas have a high watertable and thus are waterlogged either short or long term. Cassava and sweet potato while having high water requirements require good drainage. Both crops need >60 cm drainage (Andriesse 1988).
For more information on methods of ameliorating waterlogging refer to Sections 6.2.4.2 (improving surface drainage), 6.2.4.4 (improving soil permeability) and 6.2.4.5 (raised beds).
Slope and Water Erosion Risk Slopes >10% are a minor limitation for sweet potato and cassava, those >35% a major limitation, those >55% a severe limitation and those >85% are unsuitable. Slopes with high erosion risk (>30% or >20% if texture contrast) are a major limitation.
Sweet potato and especially cassava can be grown on steeper slopes than most other crops as is reflected in the FCC rating. In many areas of SE Asia they are grown on very steep slopes. Slopes of >55% are unsuitable for production due to erosion risks and difficulty with day to day management of the crops. However, steepness of the slope that can be tolerated may need revision according to the specific location.
If sweet potato or cassava is grown on slopes subject to erosion, growers need to minimize the time and area of soil that is left exposed to heavy rains. The erosion risk is greatest at time of planting and harvest when there is limited ground cover. Use of small plot sizes and permanent grass cover between plots is suggested. Planting on contours is suggested.
For more information on methods of minimizing erosion refer to Sections 6.2.5.1 (maintaining plant cover), 6.2.5.2 (retaining crop residues), 6.2.5.3 (minimizing tillage), 6.2.5.4 (terracing) and 6.2.5.5 (grassed waterways).
Sulfidic Material Sulfidic material at <60 cm depth is a minor limitation for sweet potato and cassava; at <40 cm a major limitation, and at <20 cm a severe limitation.
Soils with shallow sulfidic material or sulfuric layers are, or can become, very acid if not correctly managed. The extreme levels of acidity that can be generated are not acceptable even for cassava, which is acid tolerant. Since these soils also suffer from waterlogging, cassava and sweet potato are best grown on raised beds but care must be taken a) not to use sulfidic material in making the beds and b) not to lower the watertable below the depth at which the sulfidic material occurs. Particular care should be taken if the depth of the sulfidic material is between 20-40 cm. If the material is any shallower than 20 cm, the soil should not be used for cassava and sweet potato.
If sulfidic material is used, its acid generating potential must be neutralised by heavy applications of lime. Any existing acidity, which can be considerable for sulfuric layers, should also be neutralised by appropriate application of lime.
For more information on managing such soils refer to Section 6.2.3 and the calculator for nutrient and lime management.
Soil Acidity and Aluminium Toxicity High Al saturation (>60%) is a minor limitation for sweet potato and cassava.
Soil acidity and associated aluminium toxicity are common in Brunei. Sweet potato tolerates pH as low as 5.2, but a pH of 5.6-6.6 is optimum (Tindall 1983). Cassava tolerates a wide pH range of 4-8 (O’Hair 1995; Anon. (1996-2006), and up to 70% Al saturation (Moody and
Soil Fertility Evaluation/Advisory Service in Negara Brunei Darussalam Volume 2 – Soils Management in the Agricultural Development Areas Page 72
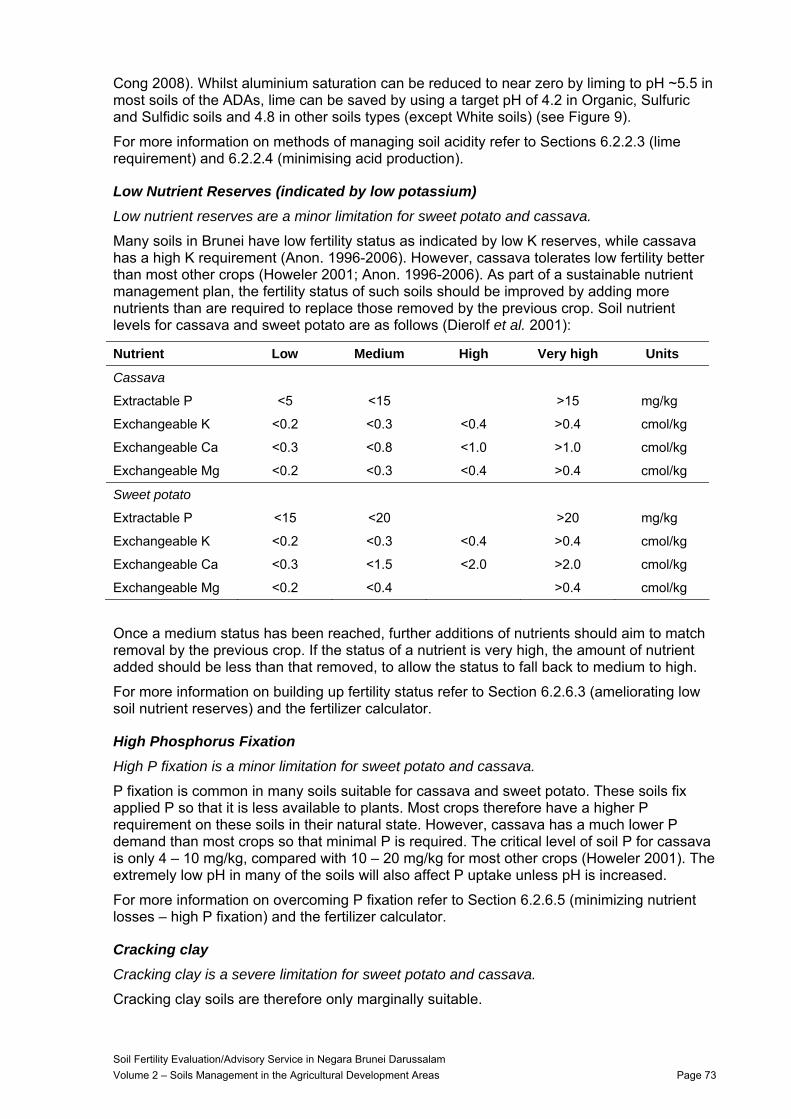
Cong 2008). Whilst aluminium saturation can be reduced to near zero by liming to pH ~5.5 in most soils of the ADAs, lime can be saved by using a target pH of 4.2 in Organic, Sulfuric and Sulfidic soils and 4.8 in other soils types (except White soils) (see Figure 9).
For more information on methods of managing soil acidity refer to Sections 6.2.2.3 (lime requirement) and 6.2.2.4 (minimising acid production).
Low Nutrient Reserves (indicated by low potassium) Low nutrient reserves are a minor limitation for sweet potato and cassava.
Many soils in Brunei have low fertility status as indicated by low K reserves, while cassava has a high K requirement (Anon. 1996-2006). However, cassava tolerates low fertility better than most other crops (Howeler 2001; Anon. 1996-2006). As part of a sustainable nutrient management plan, the fertility status of such soils should be improved by adding more nutrients than are required to replace those removed by the previous crop. Soil nutrient levels for cassava and sweet potato are as follows (Dierolf et al. 2001):
Nutrient Low Medium High Very high Units
Cassava
Extractable P <5 <15 >15 mg/kg
Exchangeable K <0.2 <0.3 <0.4 >0.4 cmol/kg
Exchangeable Ca <0.3 <0.8 <1.0 >1.0 cmol/kg
Exchangeable Mg <0.2 <0.3 <0.4 >0.4 cmol/kg
Sweet potato
Extractable P <15 <20 >20 mg/kg
Exchangeable K <0.2 <0.3 <0.4 >0.4 cmol/kg
Exchangeable Ca <0.3 <1.5 <2.0 >2.0 cmol/kg
Exchangeable Mg <0.2 <0.4 >0.4 cmol/kg
Once a medium status has been reached, further additions of nutrients should aim to match removal by the previous crop. If the status of a nutrient is very high, the amount of nutrient added should be less than that removed, to allow the status to fall back to medium to high.
For more information on building up fertility status refer to Section 6.2.6.3 (ameliorating low soil nutrient reserves) and the fertilizer calculator.
High Phosphorus Fixation High P fixation is a minor limitation for sweet potato and cassava.
P fixation is common in many soils suitable for cassava and sweet potato. These soils fix applied P so that it is less available to plants. Most crops therefore have a higher P requirement on these soils in their natural state. However, cassava has a much lower P demand than most crops so that minimal P is required. The critical level of soil P for cassava is only 4 – 10 mg/kg, compared with 10 – 20 mg/kg for most other crops (Howeler 2001). The extremely low pH in many of the soils will also affect P uptake unless pH is increased.
For more information on overcoming P fixation refer to Section 6.2.6.5 (minimizing nutrient losses – high P fixation) and the fertilizer calculator.
Cracking clay Cracking clay is a severe limitation for sweet potato and cassava.
Cracking clay soils are therefore only marginally suitable.
Soil Fertility Evaluation/Advisory Service in Negara Brunei Darussalam Volume 2 – Soils Management in the Agricultural Development Areas Page 73
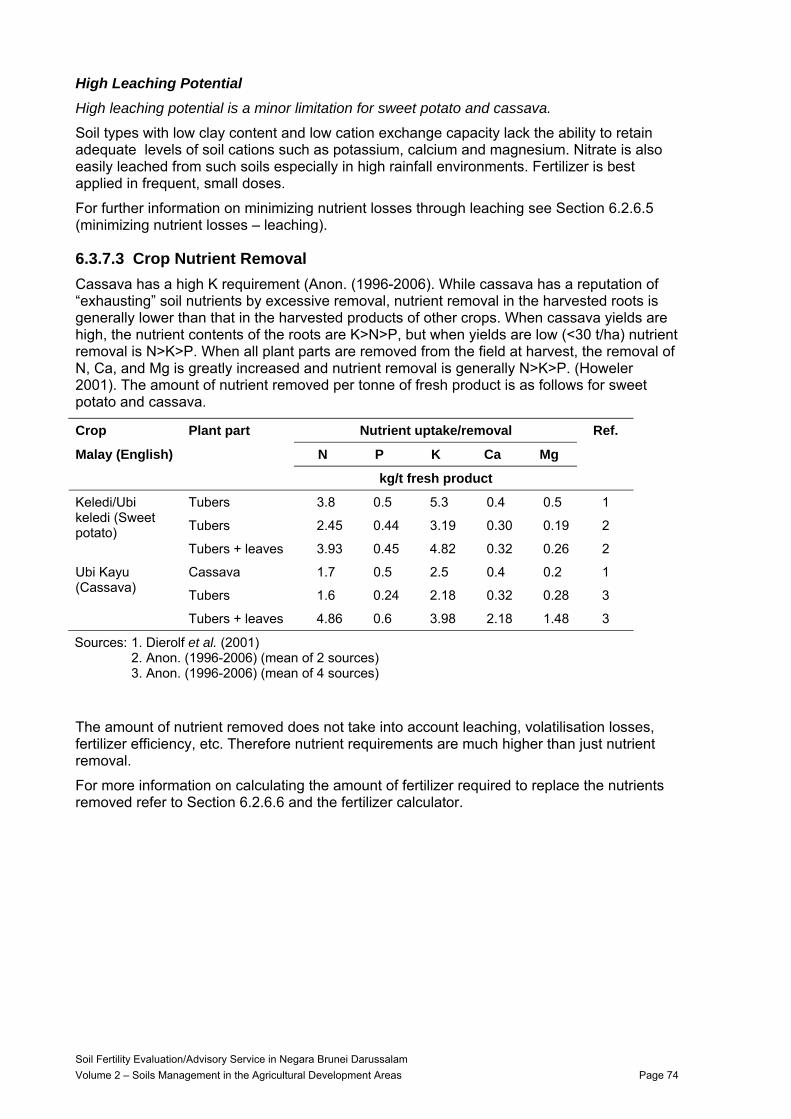
High Leaching Potential High leaching potential is a minor limitation for sweet potato and cassava.
Soil types with low clay content and low cation exchange capacity lack the ability to retain adequate levels of soil cations such as potassium, calcium and magnesium. Nitrate is also easily leached from such soils especially in high rainfall environments. Fertilizer is best applied in frequent, small doses.
For further information on minimizing nutrient losses through leaching see Section 6.2.6.5 (minimizing nutrient losses – leaching).
6.3.7.3 Crop Nutrient Removal Cassava has a high K requirement (Anon. (1996-2006). While cassava has a reputation of “exhausting” soil nutrients by excessive removal, nutrient removal in the harvested roots is generally lower than that in the harvested products of other crops. When cassava yields are high, the nutrient contents of the roots are K>N>P, but when yields are low (<30 t/ha) nutrient removal is N>K>P. When all plant parts are removed from the field at harvest, the removal of N, Ca, and Mg is greatly increased and nutrient removal is generally N>K>P. (Howeler 2001). The amount of nutrient removed per tonne of fresh product is as follows for sweet potato and cassava.
Crop Plant part Nutrient uptake/removal Ref.
Malay (English) N P K Ca Mg
kg/t fresh product
Tubers 3.8 0.5 5.3 0.4 0.5 1
Tubers 2.45 0.44 3.19 0.30 0.19 2
Keledi/Ubi keledi (Sweet potato)
Tubers + leaves 3.93 0.45 4.82 0.32 0.26 2
Cassava 1.7 0.5 2.5 0.4 0.2 1
Tubers 1.6 0.24 2.18 0.32 0.28 3
Ubi Kayu (Cassava)
Tubers + leaves 4.86 0.6 3.98 2.18 1.48 3
Sources: 1. Dierolf et al. (2001) 2. Anon. (1996-2006) (mean of 2 sources) 3. Anon. (1996-2006) (mean of 4 sources)
The amount of nutrient removed does not take into account leaching, volatilisation losses, fertilizer efficiency, etc. Therefore nutrient requirements are much higher than just nutrient removal.
For more information on calculating the amount of fertilizer required to replace the nutrients removed refer to Section 6.2.6.6 and the fertilizer calculator.
Soil Fertility Evaluation/Advisory Service in Negara Brunei Darussalam Volume 2 – Soils Management in the Agricultural Development Areas Page 74
6.4 Soil Management for Fruit Crops
6.4.1 Durian SI Number Malay English Botanical
E01 Durian kuning Durio graveolens
E02 Durian putih Durio zibethinus J. Murr.
E03 Durian sukang Durio oxleyanus
E04 Durian pulu Durio kutejensis
E05 Durian suluk Durio spp. (probably hybrid D. zibethinus and D. graveolens)
Brunei Studies The Durian Quality Assurance Manual (Anon. 1999) provides advice on growing and processing of durian and the various quality assurance systems involved.
6.4.1.1 Land Suitability Durian is a native of SE Asia. Its centre of diversity appears to be the Malay Peninsula, Indonesia and Borneo (Subhadrabandhu and Ketsa 2001). Several indigenous species are present in Brunei as well as imported lines especially from Thailand and Malaysia (Anon. 2004). A number of plantations have been, or are being, established.
Crop suitability and management recommendations are based on Durio zibethinus as there is minimal information on other durian species.
Optimum durian soils are deep (>1 m), well drained sandy loams or clay loams. Clay soils with poor drainage and sandy soils with excessive drainage should be avoided. Durian is generally not found in swamps or peat swamps (Watson 1983; Anon. 1999; Subhadrabandhu and Ketsa 2001; Diczbalis 2004; Jumat Hj. Alim 1994).
In Brunei, Durian suluk performs best on well drained, alluvial soil of riverine areas (Serudin Tinggal 1994). In Belait, durian is found in the Labi area, but none in the coastal region due to sandy soils (Jumat Hj. Alim 1994).
The suitability classes of Brunei soils for durian from Volume 1, Section 3.3.3 are as follows.
Unsuitable Soils The following soils have such severe limitations that they cannot be used for the sustainable production of durian.
Soil Type, Subtype Very severe limitation(s)
Organic soils, Mineral sulfuric Peat, prolonged waterlogging, sulfidic material at ≤50 cm
Organic soils, Sulfuric Peat, prolonged waterlogging, sulfidic material at ≤50 cm
Organic soils, Mineral sulfidic Peat, prolonged waterlogging, sulfidic material at ≤50 cm
Organic soils, Sulfidic Peat, prolonged waterlogging, sulfidic material at ≤50 cm
White soils, Sandy poorly drained Sand, prolonged waterlogging
Soil Fertility Evaluation/Advisory Service in Negara Brunei Darussalam Volume 2 – Soils Management in the Agricultural Development Areas Page 75
Soil Type, Subtype Very severe limitation(s)
Cracking clay soils, Sulfidic poorly drained Prolonged waterlogging, sulfidic material at ≤50 cm
Cracking clay soils, Acid poorly drained Prolonged waterlogging
Texture contrast yellow soils Sand
Brown over grey soils, Poorly drained Prolonged waterlogging
Sulfuric soils, Soft poorly drained Sand, sulfidic material at ≤50 cm
Sulfuric soils, Poorly drained Sulfidic material at ≤50 cm
Sulfidic soils, Soft poorly drained Prolonged waterlogging, sulfidic material at ≤50 cm
Sulfidic soils, Organic poorly drained Peat, sulfidic material at ≤50 cm
Sulfidic soils, Organic poorly drained moderately deep Sand
Marginal Soils The following soils have severe limitations to the sustainable production of durian that so reduce its productivity or increase the inputs required, that growing it is only marginally justified.
Soil Type, Subtype Severe limitation(s)
White soils, Loamy poorly drained Waterlogging
Very deep yellow soils, Somewhat poorly drained sandy Waterlogging
Very deep yellow soils, Somewhat poorly drained clayey Waterlogging
Brown over grey soils, Somewhat poorly drained Waterlogging
Grey soils, Poorly drained Waterlogging
In Brunei durian often appear to have been planted on Soil Types that are only marginally suitable or unsuitable. However, they are often still young and in most instances not thriving. Such Soil Types should be avoided for successful, long term durian cultivation. On some marginally suitable Soil Types durian might be successfully grown after extensive modification to ensure good field drainage and by planting of trees on large, wide, raised beds.
Suitable Soils The following soils are suitable for the sustainable production of durian with either no significant limitations (highly suitable); minor limitations that cause only a minor reduction in productivity or an acceptable increase in the inputs required (suitable); or major limitations that significantly reduce productivity or increase the required inputs (moderately suitable).
Soil Type, Subtype Major (and minor) limitation(s)
Moderately suitable
Very deep yellow soils, Well drained sandy Al toxicity (slope >15%, high erosion risk, low K reserves, high leaching)
Very deep yellow soils, Moderately well drained clayey Al toxicity (low K reserves)
Very deep yellow soils, Well drained clayey Al toxicity (high erosion risk, low K reserves, P fixation)
Soil Fertility Evaluation/Advisory Service in Negara Brunei Darussalam Volume 2 – Soils Management in the Agricultural Development Areas Page 76
Soil Type, Subtype Major (and minor) limitation(s)
Moderately suitable continued
Yellow soils, Moderately well drained Al toxicity (slope >15%, high erosion risk, low K reserves, P fixation)
Yellow soils, Well drained Slope >35%, Al toxicity (high erosion risk, low K reserves, P fixation)
On moderately suitable Soil Types the main constraint is Al toxicity/ low pH which can be rectified by liming.
6.4.1.2 Management of Soil Constraints Each of the major and minor limitations of the soils suitable for durian is addressed below and in relevant sub-sections of Section 6.2.
Waterlogging Waterlogging is a severe limitation for durian and prolonged waterlogging is unsuitable.
Therefore Soil Types with waterlogging are only marginally suitable and those with proplonged waterlogging are unsuitable.
Durian is very intolerant to waterlogging and poor aeration as such soils are conducive to Phytophthora palmivora (Watson 1983; Anon. 1999). Although durian has shallow feeder roots, it does have a long primary root and therefore needs depth >1 m (Anon. 1999; Subhadrabandhu and Ketsa 2001). Unless there is >1 m soil depth above the watertable, such areas should best be avoided. Ideally ground water should be below 2 m (Subhadrabandhu and Ketsa 2001).
However, where durians are grown in conditions with short term waterlogging, they should be planted on wide (3 m) beds with good drains to rapidly remove rain. Beds should be 1+ m above the watertable, ideally 2 m.
For more information on methods of ameliorating waterlogging refer to Sections 6.2.4.2 (improving surface drainage) and 6.2.4.5 (raised beds).
Slope and Water Erosion Risk Slopes >15% are a minor limitation for durian, those >35% a major limitation, those >65% a severe limitation and those >85% are unsuitable. Slopes with high erosion risk (>30% or >20% if texture contrast) are a minor limitation.
Gently sloping land is generally the best location to plant durians as waterlogging issues are avoided. However, durians can be grown on steep land where they are best planted on mini-terraces with permanent cover over the rest of the plantation to minimize erosion. Slopes of >65% are unsuitable for durian production due to land slip and erosion risks and difficulty with day to day management of crops.
For more information on methods of minimizing erosion refer to Sections 6.2.5.1 (maintaining plant cover), 6.2.5.4 (terracing) and 6.2.5.5 (grassed waterways).
Sulfidic Material Sulfidic material at <100 cm depth is a minor limitation for durian; at <75 cm a major limitation, and at <50 cm is unsuitable.
Soil Types with sulfidic material are unsuitable either because the sulfidic material is at <50 cm and/or because of other constraints.
If durian growing is to be attempted on marginal, waterlogged soils, the depth to any sulfidic layer should be >50 cm. They should be grown on raised beds but care must be taken a) not
Soil Fertility Evaluation/Advisory Service in Negara Brunei Darussalam Volume 2 – Soils Management in the Agricultural Development Areas Page 77
to use sulfidic material in making the beds and b) not to lower the watertable below the depth at which the sulfidic material occurs. Particular care should be taken if the depth of the sulfidic material is between 50-75 cm.
If sulfidic material is used, its acid generating potential must be neutralised by heavy applications of lime. Any existing acidity, which can be considerable for sulfuric layers, should also be neutralised by appropriate application of lime.
For more information on managing such soils refer to Section 6.2.3.2 and the calculator for nutrient and lime management.
Soil Acidity and Aluminium Toxicity Moderate Al saturation (10-60%) is a minor limitation for durian and high Al saturation (>60%) a major limitation.
Soil acidity and associated aluminium toxicity are common in Brunei. The range of suitable pHs for durian are 4.5 – 6.5 (Watson 1983; Anon. 1999; Subhadrabandhu and Ketsa 2001). Neutralisation of aluminium phytotoxicity can be achieved by liming to pH ~5.5 in most soils of the ADAs (see Figure 9).
For more information on methods of managing soil acidity refer to Sections 6.2.2.3 (lime requirement) and 6.2.2.4 (minimising acid production).
Low Nutrient Reserves (indicated by low potassium) Low nutrient reserves are a minor limitation for durian.
Many soils in Brunei have low fertility status as indicated by low K reserves. As part of a sustainable nutrient management plan, the fertility status of such soils should be improved by adding more nutrients than are required to replace those removed by the previous crop. Soil nutrient levels for durian are as follows (Dierolf et al. 2001):
Nutrient Low Medium High Very high Units
Extractable P <15 <20 <25 >25 mg/kg
Exchangeable K <0.2 <0.4 >0.4 cmol/kg
Exchangeable Ca <0.5 <1.5 <3.0 >3.0 cmol/kg
Exchangeable Mg <0.2 <0.4 <0.8 >0.8 cmol/kg
Once a medium status has been reached, further additions of nutrients should aim to match removal by the previous crop. If the status of a nutrient is very high, the amount of nutrient added should be less than that removed, to allow the status to fall back to medium to high.
For more importation on building up fertility status refer to Section 6.2.6.3 (ameliorating low soil nutrient reserves) and the fertilizer calculator.
High Phosphorus Fixation High P fixation is a minor limitation for durian.
P fixation is common in many soils suitable for durian. These soils fix applied P so that it is less available to plants. Crops therefore have a higher P requirement on these soils in their natural state. The extremely low pH in many of the soils will also affect P uptake unless pH is increased.
For more information on overcoming P fixation refer to Section 6.2.6.5 (minimizing nutrient losses – high P fixation) and the fertilizer calculator.
Soil Fertility Evaluation/Advisory Service in Negara Brunei Darussalam Volume 2 – Soils Management in the Agricultural Development Areas Page 78
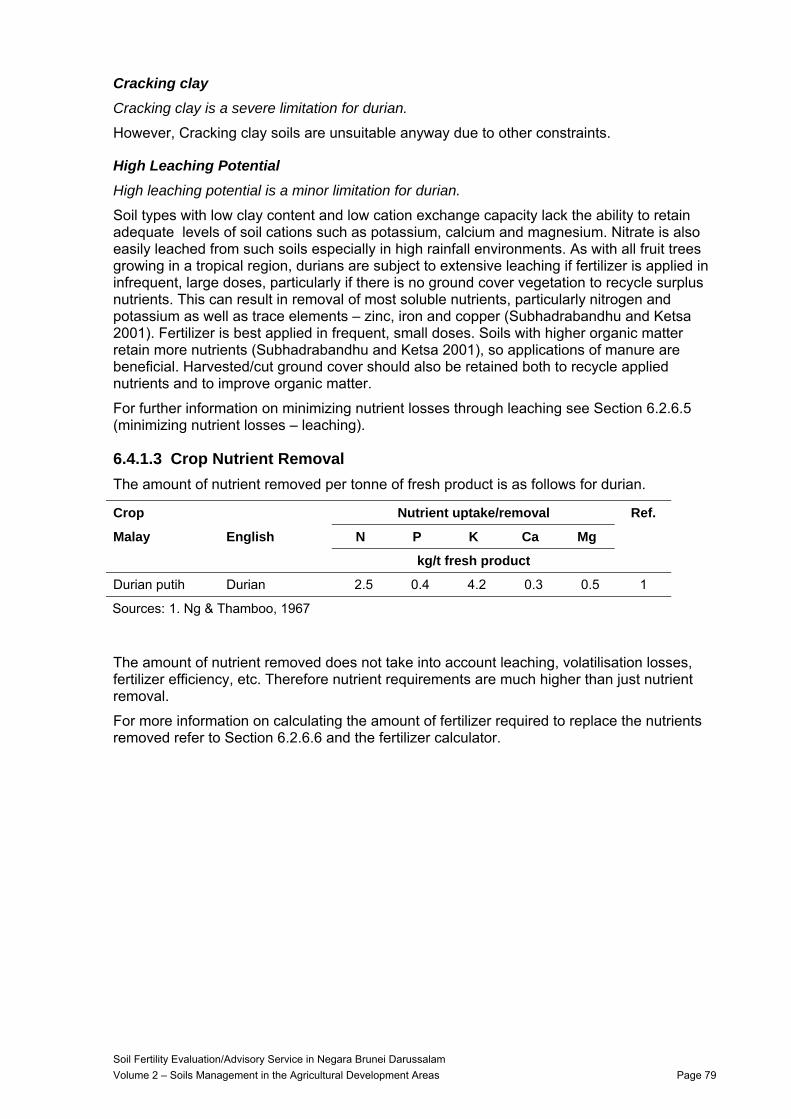
Cracking clay Cracking clay is a severe limitation for durian.
However, Cracking clay soils are unsuitable anyway due to other constraints.
High Leaching Potential High leaching potential is a minor limitation for durian.
Soil types with low clay content and low cation exchange capacity lack the ability to retain adequate levels of soil cations such as potassium, calcium and magnesium. Nitrate is also easily leached from such soils especially in high rainfall environments. As with all fruit trees growing in a tropical region, durians are subject to extensive leaching if fertilizer is applied in infrequent, large doses, particularly if there is no ground cover vegetation to recycle surplus nutrients. This can result in removal of most soluble nutrients, particularly nitrogen and potassium as well as trace elements – zinc, iron and copper (Subhadrabandhu and Ketsa 2001). Fertilizer is best applied in frequent, small doses. Soils with higher organic matter retain more nutrients (Subhadrabandhu and Ketsa 2001), so applications of manure are beneficial. Harvested/cut ground cover should also be retained both to recycle applied nutrients and to improve organic matter.
For further information on minimizing nutrient losses through leaching see Section 6.2.6.5 (minimizing nutrient losses – leaching).
6.4.1.3 Crop Nutrient Removal The amount of nutrient removed per tonne of fresh product is as follows for durian.
Crop Nutrient uptake/removal Ref.
Malay English N P K Ca Mg
kg/t fresh product
Durian putih Durian 2.5 0.4 4.2 0.3 0.5 1
Sources: 1. Ng & Thamboo, 1967
The amount of nutrient removed does not take into account leaching, volatilisation losses, fertilizer efficiency, etc. Therefore nutrient requirements are much higher than just nutrient removal.
For more information on calculating the amount of fertilizer required to replace the nutrients removed refer to Section 6.2.6.6 and the fertilizer calculator.
Soil Fertility Evaluation/Advisory Service in Negara Brunei Darussalam Volume 2 – Soils Management in the Agricultural Development Areas Page 79
6.4.2 Rambutan SI Number Malay English Botanical
E11 Rambutan Rambutan Nephelium lappaceum L.
6.4.2.1 Land Suitability Rambutan tolerates a wide range of soil types but the optimum is a rich, sandy or clay loam high in organic matter with good drainage (Watson 1984a; Watson et al. 1988; Tindal et al. 1994). Rambutan does not like waterlogged soils or peat, nor does it do well in sandy areas (Mohamad Idris bin Zainal Abidin 1990).
The suitability classes of Brunei soils for rambutan from Volume 1, Section 3.3.3 are as follows.
Unsuitable Soils The following soils have such severe limitations that they cannot be used for the sustainable production of rambutan.
Soil Type, Subtype Very severe limitation(s)
Organic soils, Mineral sulfuric Peat, prolonged waterlogging, sulfidic material at ≤30 cm
Organic soils, Sulfuric Peat, prolonged waterlogging, sulfidic material at ≤30 cm
Organic soils, Mineral sulfidic Peat, prolonged waterlogging, sulfidic material at ≤30 cm
Organic soils, Sulfidic Peat, prolonged waterlogging, sulfidic material at ≤30 cm
White soils, Sandy poorly drained Prolonged waterlogging
Cracking clay soils, Sulfidic poorly drained Prolonged waterlogging
Cracking clay soils, Acid poorly drained Prolonged waterlogging
Brown over grey soils, Poorly drained Prolonged waterlogging
Sulfuric soils, Soft poorly drained Sulfidic material at ≤30 cm
Sulfuric soils, Poorly drained Sulfidic material at ≤30 cm
Sulfidic soils, Soft poorly drained Prolonged waterlogging, sulfidic material at ≤30 cm
Sulfidic soils, Organic poorly drained Peat, sulfidic material at ≤30 cm
Marginal Soils None of the major Soil Types have severe limitations to the sustainable production of rambutan that so reduce its productivity or increase the inputs required, that growing it is only marginally justified.
Suitable Soils The following soils are suitable for the sustainable production of rambutan with either no significant limitations (highly suitable); minor limitations that cause only a minor reduction in productivity or an acceptable increase in the inputs required (suitable); or major limitations that significantly reduce productivity or increase the required inputs (moderately suitable).
Soil Fertility Evaluation/Advisory Service in Negara Brunei Darussalam Volume 2 – Soils Management in the Agricultural Development Areas Page 80
Soil Type, Subtype Major (and minor) limitation(s)
Moderately suitable
White soils, Loamy poorly drained Waterlogging, Al toxicity (low K reserves)
Texture contrast yellow soils Sand, Al toxicity (slope >15%, high erosion risk, low K reserves, high leaching)
Very deep yellow soils, Somewhat poorly drained sandy Waterlogging (moderate Al toxicity, low K reserves, high leaching)
Very deep yellow soils, Well drained sandy Al toxicity (slope >15%, high erosion risk, low K reserves, high leaching)
Very deep yellow soils, Somewhat poorly drained clayey Waterlogging, Al toxicity (low K reserves, P fixation)
Very deep yellow soils, Moderately well drained clayey Al toxicity (low K reserves)
Very deep yellow soils, Well drained clayey Al toxicity (high erosion risk, low K reserves, P fixation)
Yellow soils, Moderately well drained Al toxicity (slope >15%, high erosion risk, low K reserves, P fixation)
Yellow soils, Well drained Slope >35%, Al toxicity (high erosion risk, low K reserves, P fixation)
Brown over grey soils, Somewhat poorly drained Waterlogging, Al toxicity (low K reserves)
Sulfidic soils, Organic poorly drained moderately deep Sand, waterlogging, sulfidic material at ≤75 cm, Al toxicity (low K reserves, high leaching)
Grey soils, Poorly drained Waterlogging, Al toxicity (low K reserves, P fixation)
The above Soils Type, except where limited by steep slope >65%, are suitable for rambutan. The main constraints are short term waterlogging and Al toxicity/ low pH. These soils can be limed and drainage improved.
6.4.2.2 Management of Soil Constraints Each of the major and minor limitations of the soils suitable for rambutan is addressed below and in relevant sub-sections of Section 6.2.
Waterlogging Waterlogging is a major limitation for rambutan and prolonged waterlogging is unsuitable.
Short term waterlogging is one of the main constraints of many otherwise suitable soils for growing rambutan. Rambutan is tolerant of poor drainage but will not tolerate waterlogging. (Marshall 1988; Tindal et al. 1994). Soils with long term waterlogging are unsuitable (Mohamad Idris bin Zainal Abidin 1990; Tindal et al. 1994).
The watertable should be 3-4 m from the surface (Tindal et al. 1994). Soil less than 50 cm deep should be avoided (Watson et al. 1988).
Where waterlogging is more short term, rambutan can be planted on wide (3 m) beds with good drains to rapidly remove surface water. Beds should be 50 cm above the watertable.
For more information on methods of ameliorating waterlogging refer to Sections 6.2.4.2 (improving surface drainage) and 6.2.4.5 (raised beds).
Soil Fertility Evaluation/Advisory Service in Negara Brunei Darussalam Volume 2 – Soils Management in the Agricultural Development Areas Page 81
Slope and Water Erosion Risk Slopes >15% are a minor limitation for rambutan, those >35% a major limitation, those >65% a severe limitation and those >85% are unsuitable. Slopes with high erosion risk (>30% or >20% if texture contrast) are a minor limitation.
Rambutan can be planted on steep slopes. Most tree crops have a good root system which helps hold the soil. Provided good management practices such as planting on mini-terraces and having a permanent ground cover are in place, rambutan can be grown on slopes up to 65%. Slopes of >65% are unsuitable for rambutan production due to landslide and erosion risks and difficulty with day to day management of crops.
For more information on methods of minimizing erosion refer to Sections 6.2.5.1 (maintaining plant cover), 6.2.5.4 (terracing) and 6.2.5.5 (grassed waterways).
Sulfidic Material Sulfidic material at <100 cm depth is a minor limitation for rambutan; at <75 cm a major limitation, at <50 cm a severe limitation, and at <30 cm is unsuitable.
Rambutan has some tolerance of waterlogging. However, since acid sulfate soils are waterlogged, some waterlogged soils that might otherwise be suitable can contain sulfidic material or sulfuric layers.
Where rambutan is grown on waterlogged soils, the depth to any sulfidic layer should be >50 cm. They should be grown on raised beds but care must be taken a) not to use sulfidic material in making the beds and b) not to lower the watertable below the depth at which the sulfidic material occurs. Particular care should be taken if the depth of the sulfidic material is between 50-75 cm.
If sulfidic material is used, its acid generating potential must be neutralised by heavy applications of lime. Any existing acidity, which can be considerable for sulfuric layers, should also be neutralised by appropriate application of lime.
For more information on managing such soils refer to Section 6.2.3.2 and the calculator for nutrient and lime management.
Soil Acidity and Aluminium Toxicity Moderate Al saturation (10-60%) is a minor limitation for rambutan and high Al saturation (>60%) a major limitation.
Soil acidity and associated aluminium toxicity are common in Brunei. The optimum pH for rambutan is 4.5- 6.5 (Watson 1984a; Marshall 1988; Tindal et al. 1994). Neutralisation of aluminium phytotoxicity can be achieved by liming to pH ~5.5 in most soils of the ADAs (see Figure 9).
For more information on methods of managing soil acidity refer to Sections 6.2.2.3 (lime requirement) and 6.2.2.4 (minimising acid production).
Low Nutrient Reserves (indicated by low potassium) Low nutrient reserves are a minor limitation for rambutan.
Many soils in Brunei have low fertility status as indicated by low K reserves. As part of a sustainable nutrient management plan, the fertility status of such soils should be improved by adding more nutrients than are required to replace those removed by the previous crop. Soil nutrient levels for rambutan are as follows (Dierolf et al. 2001):
Soil Fertility Evaluation/Advisory Service in Negara Brunei Darussalam Volume 2 – Soils Management in the Agricultural Development Areas Page 82
Nutrient Low Medium High Very high Units
Extractable P <15 <20 >20 mg/kg
Exchangeable K <0.2 <0.3 >0.3 cmol/kg
Exchangeable Ca <0.5 <1.0 <2.0 >2.0 cmol/kg
Exchangeable Mg <0.2 <0.4 <0.6 >0.6 cmol/kg
Once a medium status has been reached, further additions of nutrients should aim to match removal by the previous crop. If the status of a nutrient is very high, the amount of nutrient added should be less than that removed, to allow the status to fall back to medium to high.
For more information on building up fertility status refer to Section 6.2.6.3 (ameliorating low soil nutrient reserves) and the fertilizer calculator.
High Phosphorus Fixation High P fixation is a minor limitation for rambutan.
P fixation is common in many soils suitable for rambutan. These soils fix applied P so that it is less available to plants. Crops therefore have a higher P requirement on these soils in their natural state. The extremely low pH in many of the soils will also affect P uptake unless pH is increased.
For more information on overcoming P fixation refer to Section 6.2.6.5 (minimizing nutrient losses – high P fixation) and the fertilizer calculator.
Cracking clay Cracking clay is a severe limitation for rambutan.
However, Cracking clay soils are unsuitable anyway due to other constraints.
High Leaching Potential High leaching potential is a minor limitation for rambutan.
Soil types with low clay content and low cation exchange capacity lack the ability to retain adequate levels of soil cations such as potassium, calcium and magnesium. Nitrate is also easily leached from such soils especially in high rainfall environments. As with all fruit trees growing in a tropical region, rambutans are subject to extensive leaching if fertilizer is applied in infrequent, large doses, particularly if there is no ground cover vegetation to recycle surplus nutrients. This will result in removal of most soluble nutrients, particularly nitrogen and potassium as well as trace elements – zinc, iron and copper (Subhadrabandhu and Ketsa 2001). Fertilizer is best applied in frequent, small doses. Soils with higher organic matter retain more nutrients (Subhadrabandhu and Ketsa 2001), so applications of manure are beneficial. Harvested/cut ground cover should also be retained both to recycle applied nutrients and to improve organic matter.
For further information on minimizing nutrient losses through leaching see Section 6.2.6.5 (minimizing nutrient losses – leaching).
6.4.2.3 Crop Nutrient Removal The amount of nutrient removed per tonne of fresh product is as follows for rambutan.
Soil Fertility Evaluation/Advisory Service in Negara Brunei Darussalam Volume 2 – Soils Management in the Agricultural Development Areas Page 83
Crop Nutrient uptake/removal Ref.
Malay English N P K Ca Mg
kg/t fresh product
Rambutan Rambutan 2 0.27 1.52 0.7 0.33 1
Sources: 1. Ng & Thamboo, 1967
The amount of nutrient removed does not take into account leaching, volatilisation losses, fertilizer efficiency, etc. Therefore nutrient requirements are much higher than just nutrient removal.
For more information on calculating the amount of fertilizer required to replace the nutrients removed refer to Section 6.2.6.6 and the fertilizer calculator.
Soil Fertility Evaluation/Advisory Service in Negara Brunei Darussalam Volume 2 – Soils Management in the Agricultural Development Areas Page 84
6.4.3 Citrus SI Number Malay English Botanical
E12 Limau manis Sweet Mandarin Citrus reticulata Blanco
F06 Limau kasturi Musk lime Citrus microcarpa or X Citrofortunella mitis
F07 Limau kapas Common lime Citrus aurantifolia (Christm. & Panzer)
F08 Pomelo Citrus grandis Osbeck
6.4.3.1 Land Suitability Citrus, especially sweet oranges or mandarin, are widely planted in Brunei. However, many of these trees are now suffering severe dieback from the greening complex which is probably exacerbated by many of the trees being planted on what, in retrospect, are marginal soils. Trees which have been well managed i.e. good rootstocks, appropriate and adequately maintained drains, mounding, good nutritional programmes, and especially a heavy insecticide spray programme are surviving the best. Weak trees are rapidly succumbing to the greening disease. Kasturi and Pomelo have a much greater tolerance to the greening complex.
Citrus trees need light, friable soils with good drainage such as loams and sands (Williams 1975f, Citrus Information Kit 1999; Owen-Turner 1994). Chuong and Boehme (2005) rated citrus soil types the best being: loam or loamy sand = 1; sand loam, silt loam = 2; silt, clay loam = 3; sand, clay = Not suitable. Heavy clays are not suitable as tree deaths due to root rot occur more often in these soils (Williams 1975f ; Owen-Turner 1994).
Kasturi does well on a wide range of soil types from clay loams in the Philippines to limestone or sand in Florida (Morton 1987).
Pomelo tolerates a wide range of soils from coarse sand to heavy clay. However, the tree prefers deep, fertile soils of medium texture and free from salts such as well drained sandy loams (Jorgensen 1984; Niyomdham 1991). Poorly drained soils are more likely to have root rot (Jorgensen 1984).
The suitability classes of Brunei soils for citrus from Volume 1, Section 3.3.3 are as follows.
Unsuitable Soils The following soils have such severe limitations that they cannot be used for the sustainable production of citrus.
Soil Type, Subtype Very severe limitation(s)
Organic soils, Sulfuric Sulfidic material at ≤20 cm
Sulfuric soils, Soft poorly drained Sulfidic material at ≤20 cm
Marginal Soils The following soils have severe limitations to the sustainable production of citrus that so reduce its productivity or increase the inputs required that growing it is only marginally justified.
Soil Fertility Evaluation/Advisory Service in Negara Brunei Darussalam Volume 2 – Soils Management in the Agricultural Development Areas Page 85
Soil Type, Subtype Severe limitation(s)
Organic soils, Mineral sulfuric Prolonged waterlogging, sulfidic material at ≤30 cm
Organic soils, Mineral sulfidic Prolonged waterlogging, sulfidic material at ≤30 cm
Organic soils, Sulfidic Prolonged waterlogging, sulfidic material at ≤30 cm
White soils, Sandy poorly drained Prolonged waterlogging
Cracking clay soils, Sulfidic poorly drained Clay, prolonged waterlogging, cracking clay
Cracking clay soils, Acid poorly drained Clay, prolonged waterlogging, cracking clay
Yellow soils, Well drained Clay
Brown over grey soils, Somewhat poorly drained Clay
Brown over grey soils, Poorly drained Clay, prolonged waterlogging
Sulfuric soils, Poorly drained Sulfidic material at ≤30 cm
Sulfidic soils, Soft poorly drained Clay, prolonged waterlogging, sulfidic material at ≤30 cm
Sulfidic soils, Organic poorly drained Sulfidic material at ≤30 cm
Grey soils, Poorly drained Clay
In some places mandarins are currently planted on marginal Soil Types. After extensive investment in good field drainage and planting of trees on large raised beds it may be possible to reduce waterlogging sufficiently to grow citrus. However, since many of these soils also have shallow sulfidic material, care should be taken to use non-sulfidic material to make the beds, and/or to use sufficient lime to neutralise any exposed sulfidic material. Clay soils need special attention.
Suitable Soils The following soils are suitable for the sustainable production of citrus with either no significant limitations (highly suitable); minor limitations that cause only a minor reduction in productivity or an acceptable increase in the inputs required (suitable); or major limitations that significantly reduce productivity or increase the required inputs (moderately suitable).
Soil Type, Subtype Major (and minor) limitation(s)
Moderately suitable
White soils, Loamy poorly drained Waterlogging, Al toxicity (low K reserves)
Texture contrast yellow soils Sand, Al toxicity (slope >15%, high erosion risk, low K reserves, high leaching)
Very deep yellow soils, Somewhat poorly drained sandy Waterlogging (moderate Al toxicity, low K reserves, high leaching)
Very deep yellow soils, Well drained sandy Al toxicity (slope >15%, high erosion risk, low K reserves, high leaching)
Very deep yellow soils, Somewhat poorly drained clayey Waterlogging, Al toxicity (low K reserves, P fixation)
Very deep yellow soils, Moderately well drained clayey Al toxicity (low K reserves)
Soil Fertility Evaluation/Advisory Service in Negara Brunei Darussalam Volume 2 – Soils Management in the Agricultural Development Areas Page 86
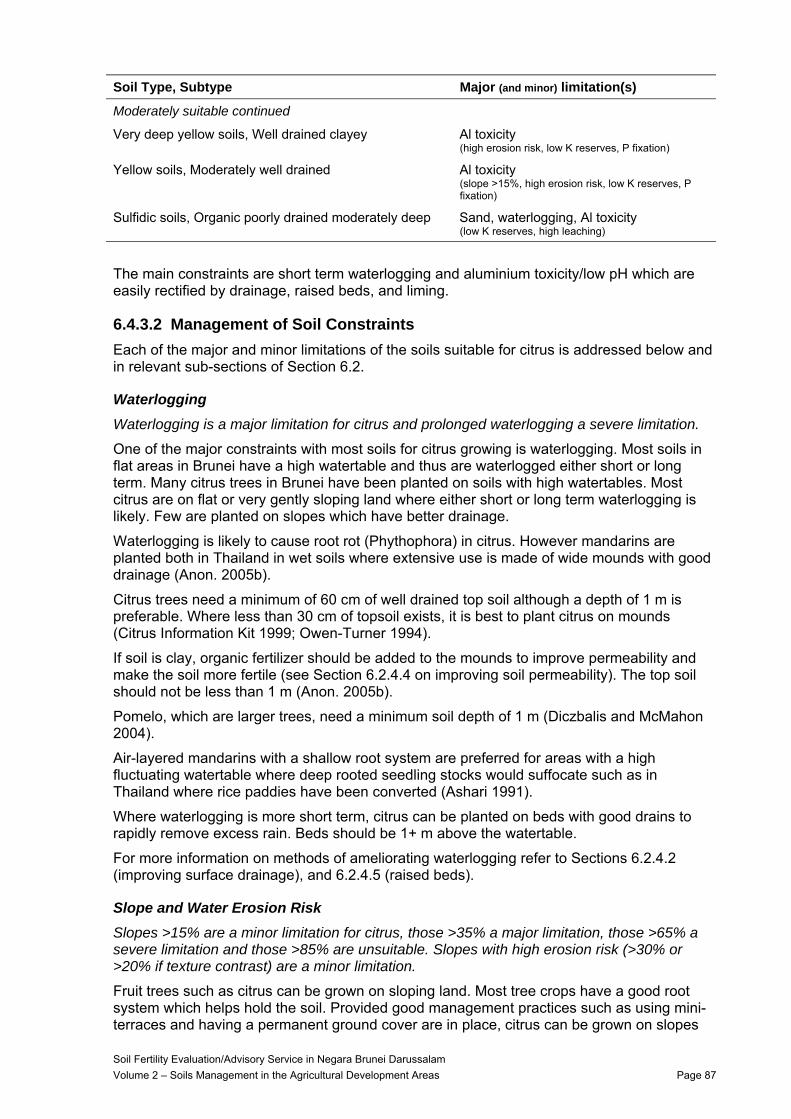
Soil Type, Subtype Major (and minor) limitation(s)
Moderately suitable continued
Very deep yellow soils, Well drained clayey Al toxicity (high erosion risk, low K reserves, P fixation)
Yellow soils, Moderately well drained Al toxicity (slope >15%, high erosion risk, low K reserves, P fixation)
Sulfidic soils, Organic poorly drained moderately deep Sand, waterlogging, Al toxicity (low K reserves, high leaching)
The main constraints are short term waterlogging and aluminium toxicity/low pH which are easily rectified by drainage, raised beds, and liming.
6.4.3.2 Management of Soil Constraints Each of the major and minor limitations of the soils suitable for citrus is addressed below and in relevant sub-sections of Section 6.2.
Waterlogging Waterlogging is a major limitation for citrus and prolonged waterlogging a severe limitation.
One of the major constraints with most soils for citrus growing is waterlogging. Most soils in flat areas in Brunei have a high watertable and thus are waterlogged either short or long term. Many citrus trees in Brunei have been planted on soils with high watertables. Most citrus are on flat or very gently sloping land where either short or long term waterlogging is likely. Few are planted on slopes which have better drainage.
Waterlogging is likely to cause root rot (Phythophora) in citrus. However mandarins are planted both in Thailand in wet soils where extensive use is made of wide mounds with good drainage (Anon. 2005b).
Citrus trees need a minimum of 60 cm of well drained top soil although a depth of 1 m is preferable. Where less than 30 cm of topsoil exists, it is best to plant citrus on mounds (Citrus Information Kit 1999; Owen-Turner 1994).
If soil is clay, organic fertilizer should be added to the mounds to improve permeability and make the soil more fertile (see Section 6.2.4.4 on improving soil permeability). The top soil should not be less than 1 m (Anon. 2005b).
Pomelo, which are larger trees, need a minimum soil depth of 1 m (Diczbalis and McMahon 2004).
Air-layered mandarins with a shallow root system are preferred for areas with a high fluctuating watertable where deep rooted seedling stocks would suffocate such as in Thailand where rice paddies have been converted (Ashari 1991).
Where waterlogging is more short term, citrus can be planted on beds with good drains to rapidly remove excess rain. Beds should be 1+ m above the watertable.
For more information on methods of ameliorating waterlogging refer to Sections 6.2.4.2 (improving surface drainage), and 6.2.4.5 (raised beds).
Slope and Water Erosion Risk Slopes >15% are a minor limitation for citrus, those >35% a major limitation, those >65% a severe limitation and those >85% are unsuitable. Slopes with high erosion risk (>30% or >20% if texture contrast) are a minor limitation.
Fruit trees such as citrus can be grown on sloping land. Most tree crops have a good root system which helps hold the soil. Provided good management practices such as using mini-terraces and having a permanent ground cover are in place, citrus can be grown on slopes
Soil Fertility Evaluation/Advisory Service in Negara Brunei Darussalam Volume 2 – Soils Management in the Agricultural Development Areas Page 87
up to 65%. Slopes of >65% are unsuitable for citrus production due to land slip and erosion risks and difficulty with day to day management of crops.
Planting citrus on land with moderate slopes would avoid many of the management issues on flatter ground caused by high watertables, poor drainage and high sulfidic or sulfuric layers.
For more information on methods of minimizing erosion refer to Sections 6.2.5.1 (maintaining plant cover), 6.2.5.4 (terracing) and 6.2.5.5 (grassed waterways).
Sulfidic Material Sulfidic material at <60 cm depth is a minor limitation for citrus; at <45 cm a major limitation, at <30 cm a severe limitation, and at <20 cm is unsuitable.
Therefore Soil Types with sulfidic material at <20 cm depth are unsuitable. Those with deeper sulfidic material are only marginally suitable either because the sulfidic material is at <30 cm or because of other constraints.
Citrus has relatively shallow roots, so the acceptable depth to a watertable is less than for many fruit trees. Therefore sulfidic material or sulfuric layers could occur in otherwise suitable soils.
If citrus is grown on waterlogged soils, the depth to any sulfidic layer should be >30 cm. They should be grown on wide, 1 m high raised beds but care must be taken a) not to use sulfidic material in making the beds and b) not to lower the watertable below the depth at which the sulfidic material occurs. Particular care should be taken if the depth of the sulfidic material is between 30-45 cm.
If sulfidic material is used, its acid generating potential must be neutralised by heavy applications of lime. Any existing acidity, which can be considerable for sulfuric layers, should also be neutralised by appropriate application of lime.
For more information on managing such soils refer to Section 6.2.3.2 and the calculator for nutrient and lime management.
Soil Acidity and Aluminium Toxicity Moderate Al saturation (10-60%) is a minor limitation for citrus and high Al saturation (>60%) a major limitation.
Soil acidity and associated aluminium toxicity are common in Brunei. Citrus is not well adapted to very acid soils with the optimum pH 6.0 –6.5 (Williams 1975f; Jorgenson 1984; Owen-Turner 1994; Citrus Information Kit 1999; Diczbalis and McMahon 2004; Anon. 2005b). Neutralisation of aluminium phytotoxicity can be achieved by liming to pH ~5.5 in most soils of the ADAs (see Figure 9).
For more information on methods of managing soil acidity refer to Sections 6.2.2.3 (lime requirement) and 6.2.2.4 (minimising acid production).
Low Nutrient Reserves (indicated by low potassium) Low nutrient reserves are a minor limitation for citrus.
Many soils in Brunei have low fertility status as indicated by low K reserves. Deficiency of K makes citrus fruits small, creates excess acid and delays maturity (Chapman 1991). As part of a sustainable nutrient management plan, the fertility status of such soils should be improved by adding more nutrients than are required to replace those removed by the previous crop. Although Dierolf et al. (2001) do not give nutrient levels for citrus, generic levels for a range of fruit tree crops can be used instead.
Soil Fertility Evaluation/Advisory Service in Negara Brunei Darussalam Volume 2 – Soils Management in the Agricultural Development Areas Page 88
Nutrient Low Medium High Very high Units
Extractable P <15 <20 <25 >25 mg/kg
Exchangeable K <0.2 <0.3 >0.3 cmol/kg
Exchangeable Ca <0.5 <1.5 <3.0 >3.0 cmol/kg
Exchangeable Mg <0.2 <0.4 <0.6 >0.6 cmol/kg
Once a medium status has been reached, further additions of nutrients should aim to match removal by the previous crop. If the status of a nutrient is very high, the amount of nutrient added should be less than that removed, to allow the status to fall back to medium to high.
For more information on building up fertility status refer to Section 6.2.6.3 (ameliorating low soil nutrient reserves) and the fertilizer calculator.
High Phosphorus Fixation High P fixation is a minor limitation for citrus.
P fixation is common in many soils suitable for citrus. These soils fix applied P so that it is less available to plants. Most crops therefore have a higher P requirement on these soils in their natural state. This is mitigated somewhat by the low P demand by citrus (Chapman 1991). The extremely low pH in many of the soils will also affect P uptake unless pH is increased.
For more information on overcoming P fixation refer to Section 6.2.6.5 (minimizing nutrient losses – high P fixation) and the fertilizer calculator.
Cracking clay Cracking clay is a severe limitation for citrus.
Cracking clay soils are therefore only marginally suitable.
High Leaching Potential High leaching potential is a minor limitation for citrus.
Soil types with low clay content and low cation exchange capacity lack the ability to retain adequate levels of soil cations such as potassium, calcium and magnesium. Nitrate is also easily leached from such soils especially in high rainfall environments. As with all fruit trees growing in a tropical region, citrus is subject to extensive leaching if fertilizer is applied in infrequent, large doses, particularly if there is no ground cover vegetation to recycle surplus nutrients. This will result in removal of most soluble nutrients, particularly nitrogen and potassium as well as trace elements – zinc, iron and copper (Subhadrabandhu and Ketsa 2001). Fertilizer is best split into frequent, small doses. Soils with higher organic matter retain more nutrients (Subhadrabandhu and Ketsa 2001), so applications of manure are beneficial. Harvested/cut ground cover should also be retained both to recycle applied nutrients and to improve organic matter.
For further information on minimizing nutrient losses through leaching see Section 6.2.6.5 (minimizing nutrient losses – leaching).
6.4.3.3 Crop Nutrient Removal The amount of nutrient removed per tonne of fresh product is as follows for sweet mandarin. No information is available for musk lime, common lime or pomelo.
Soil Fertility Evaluation/Advisory Service in Negara Brunei Darussalam Volume 2 – Soils Management in the Agricultural Development Areas Page 89
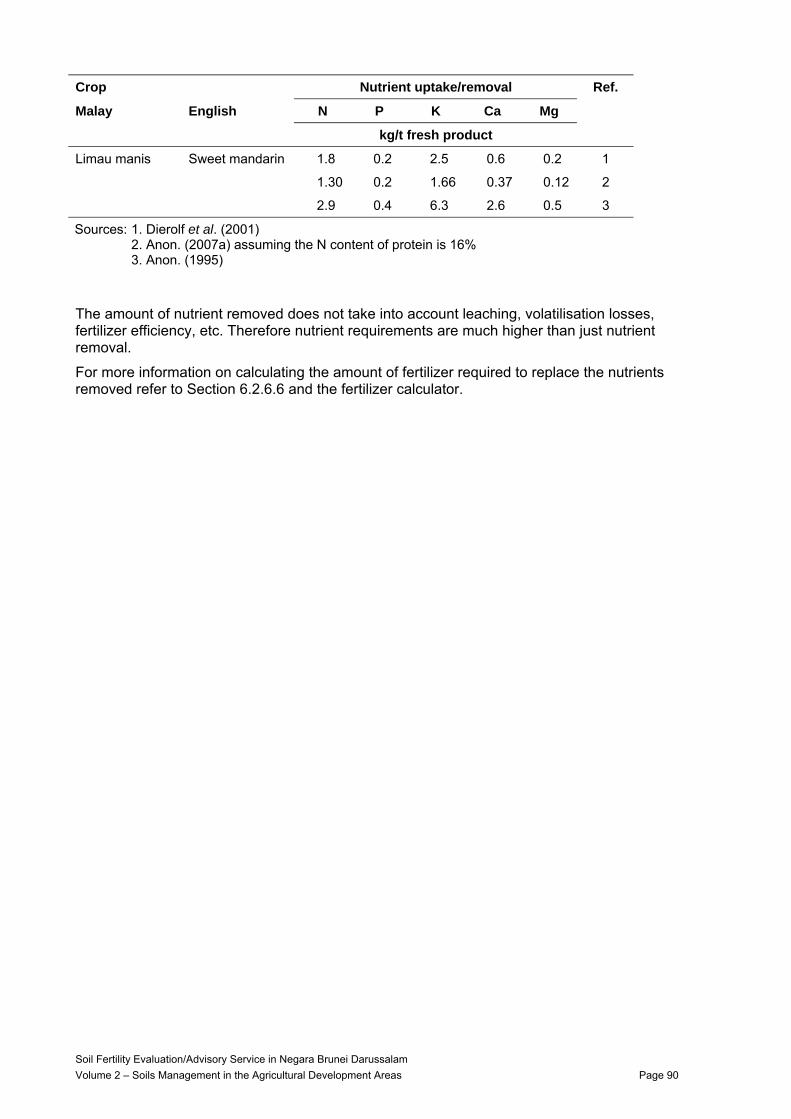
Crop Nutrient uptake/removal Ref.
Malay English N P K Ca Mg
kg/t fresh product
Limau manis Sweet mandarin 1.8 0.2 2.5 0.6 0.2 1
1.30 0.2 1.66 0.37 0.12 2
2.9 0.4 6.3 2.6 0.5 3
Sources: 1. Dierolf et al. (2001) 2. Anon. (2007a) assuming the N content of protein is 16% 3. Anon. (1995)
The amount of nutrient removed does not take into account leaching, volatilisation losses, fertilizer efficiency, etc. Therefore nutrient requirements are much higher than just nutrient removal.
For more information on calculating the amount of fertilizer required to replace the nutrients removed refer to Section 6.2.6.6 and the fertilizer calculator.
Soil Fertility Evaluation/Advisory Service in Negara Brunei Darussalam Volume 2 – Soils Management in the Agricultural Development Areas Page 90
6.4.4 Banana SI Number Malay English Botanical
E14 Pisang Banana Musa spp.
6.4.4.1 Land Suitability A number of banana varieties are widely grown in Brunei.
Bananas can be grown on wide range of soils provided there is good drainage, adequate fertility and moisture. The best soils are deep well drained, water retentive loams with high humus content (Tropical Banana Information Kit 1998; CRC Handbook 1984; Anon. 2001). Bananas can be grown under very poor fertility conditions but will not flourish (Anon. 2001).
The suitability classes of Brunei soils for banana from Volume 1, Section 3.3.3 are as follows.
Unsuitable Soils The following soils have such severe limitations that they cannot be used for the sustainable production of banana.
Soil Type, Subtype Very severe limitation(s)
Organic soils, Sulfuric Sulfidic material at ≤20 cm
Sulfuric soils, Soft poorly drained Sulfidic material at ≤20 cm
Marginal Soils The following soils have severe limitations to the sustainable production of banana that so reduce its productivity or increase the inputs required, that growing it is only marginally justified.
Soil Type, Subtype Severe limitation(s)
Organic soils, Mineral sulfuric Peat, prolonged waterlogging, sulfidic material at ≤30 cm
Organic soils, Mineral sulfidic Peat, prolonged waterlogging, sulfidic material at ≤30 cm
Organic soils, Sulfidic Peat, prolonged waterlogging, sulfidic material at ≤30 cm
White soils, Sandy poorly drained Prolonged waterlogging
Cracking clay soils, Sulfidic poorly drained Prolonged waterlogging
Cracking clay soils, Acid poorly drained Prolonged waterlogging
Brown over grey soils, Poorly drained Prolonged waterlogging
Sulfuric soils, Poorly drained Sulfidic material at ≤30 cm
Sulfidic soils, Soft poorly drained Prolonged waterlogging, sulfidic material at ≤30 cm
Sulfidic soils, Organic poorly drained Peat, sulfidic material at ≤30 cm
Although these Soil Types are only marginally suitable, bananas often appear to be grown on them. After extensive investment in good field drainage and planting on large raised beds it may be possible to reduce waterlogging sufficiently to grow bananas. However, since many of these soils also have shallow sulfidic material, care should be taken to use non-sulfidic
Soil Fertility Evaluation/Advisory Service in Negara Brunei Darussalam Volume 2 – Soils Management in the Agricultural Development Areas Page 91
material to make the beds, and/or to use sufficient lime to neutralise any acidity produced by exposed sulfidic material.
Suitable Soils The following soils are suitable for the sustainable production of banana with either no significant limitations (highly suitable); minor limitations that cause only a minor reduction in productivity or an acceptable increase in the inputs required (suitable); or major limitations that significantly reduce productivity or increase the required inputs (moderately suitable).
Soil Type, Subtype Major (and minor) limitation(s)
Moderately suitable
White soils, Loamy poorly drained Waterlogging, Al toxicity, low K reserves
Texture contrast yellow soils Sand, Al toxicity, low K reserves (slope >15%, high erosion risk, high leaching)
Very deep yellow soils, Somewhat poorly drained sandy Waterlogging, low K reserves (moderate Al toxicity, high leaching)
Very deep yellow soils, Well drained sandy Al toxicity, low K reserves (slope >15%, high erosion risk, high leaching)
Very deep yellow soils, Somewhat poorly drained clayey Waterlogging, Al toxicity, low K reserves (P fixation)
Very deep yellow soils, Moderately well drained clayey Al toxicity, low K reserves
Very deep yellow soils, Well drained clayey Al toxicity, low K reserves (high erosion risk, P fixation)
Yellow soils, Moderately well drained Al toxicity, low K reserves (slope >15%, high erosion risk, P fixation)
Yellow soils, Well drained Slope >35%, Al toxicity, low K reserves (high erosion risk, P fixation)
Brown over grey soils, Somewhat poorly drained Waterlogging, Al toxicity, low K reserves
Sulfidic soils, Organic poorly drained moderately deep Sand, waterlogging, Al toxicity, low K reserves (high leaching)
Grey soils, Poorly drained Waterlogging, Al toxicity, low K reserves (P fixation)
The main constraints where slope is not an issue are short term waterlogging, aluminium toxicity/low pH, and K deficient soils, which are all easily rectified by drainage, raised beds, liming, and a proper nutritional programme.
6.4.4.2 Management of Soil Constraints Each of the major and minor limitations of the soils suitable for banana is addressed below and in relevant sub-sections of Section 6.2.
Waterlogging Waterlogging is a major limitation for banana and prolonged waterlogging a severe limitation.
One of the major constraints with most soils for banana growing is waterlogging. Most soils in flat areas in Brunei have a high watertable and thus are waterlogged either short or long term.
Banana requires good drainage but also a soil with good moisture holding capacity. Organic soils which have permanent high watertables are problematic, as are sandy soils which do not retain moisture unless extra irrigation is applied (Williams 1975a; CRC Handbook 1984 ; Tropical Banana Information Kit 1998; Anon. 2001). Fusarium wilt disease can be an issue where there is flooding or poor drainage for part of year (Boonyanuphap et al. 2004).
Soil Fertility Evaluation/Advisory Service in Negara Brunei Darussalam Volume 2 – Soils Management in the Agricultural Development Areas Page 92
Banana is intolerant to waterlogging. Watertables should be below 1 m. If the watertable rises into the root zone for 24 hours or longer, many roots are killed (Daniells and Evans 1998). Banana does not tolerate flooding.
Soils with permanently shallow watertables should be avoided unless they can be adequately drained. Where waterlogging is more short term, banana can be planted on beds with good drains to rapidly remove surface water. Beds should be >0.6 m about the watertable.
For more information on methods of ameliorating waterlogging refer to Sections 6.2.4.2 (improving surface drainage), 6.2.4.4 (improving soil permeability) and 6.2.4.5 (raised beds).
Slope and Water Erosion Risk Slopes >15% are a minor limitation for banana, those >35% a major limitation, those >65% a severe limitation and those >85% are unsuitable. Slopes with high erosion risk (>30% or >20% if texture contrast) are a minor limitation.
Banana can be grown on both flat and sloping land. Generally for mechanized operations, it is more efficient to plant on flat land or on slight slopes on raised beds to overcome waterlogging problems. To minimize erosion risk, use mini-terraces for planting and maintain permanent cover crops. Planting on the contour is also suggested as long as contours do not prevent drainage.
For more information on methods of minimizing erosion refer to Sections 6.2.5.1 (maintaining plant cover), 6.2.5.4 (terracing) and 6.2.5.5 (grassed waterways).
Sulfidic Material Sulfidic material at <60 cm depth is a minor limitation for banana; at <45 cm a major limitation, at <30 cm a severe limitation, and at <20 cm is unsuitable.
Therefore Soil Types with sulfidic material at <20 cm depth are unsuitable. Those with deeper sulfidic material are only marginally suitable either because the sulfidic material is at <30 cm or because of other constraints.
Bananas have relatively shallow roots, so the acceptable depth to a watertable is less than for many fruit trees. However, since acid sulfate soils are waterlogged, some waterlogged soils that might otherwise be suitable can contain sulfidic material or sulfuric layers.
If bananas are grown on waterlogged soils, the depth to any sulfidic layer should be >30 cm. They should be grown on raised beds but care must be taken a) not to use sulfidic material in making the beds and b) not to lower the watertable below the depth at which the sulfidic material occurs. Particular care should be taken if the depth of the sulfidic material is between 30-45 cm.
Soil Acidity and Aluminium Toxicity Moderate Al saturation (10-60%) is a minor limitation for banana and high Al saturation (>60%) a major limitation.
Soil acidity and associated aluminium toxicity are common in Brunei. Bananas prefer pH 6.0 – 7.5, although in tropical north Queensland a pH of 5.5 – 6.0 is preferred (Tropical Banana Information Kit 1998). Bananas can survive pH 4.5 – 8.0 (Anon. 2001). Some very successful crops are grown on rather acid soils; however Panama disease is more prevalent on acid soils so that susceptible varieties are better confined to non-acid soils (Williams 1975a). Neutralisation of aluminium phytotoxicity can be achieved by liming to pH ~5.5 in most soils of the ADAs (see Figure 9).
For more information on methods of managing soil acidity refer to Sections 6.2.2.3 (lime requirement) and 6.2.2.4 (minimising acid production).
Soil Fertility Evaluation/Advisory Service in Negara Brunei Darussalam Volume 2 – Soils Management in the Agricultural Development Areas Page 93
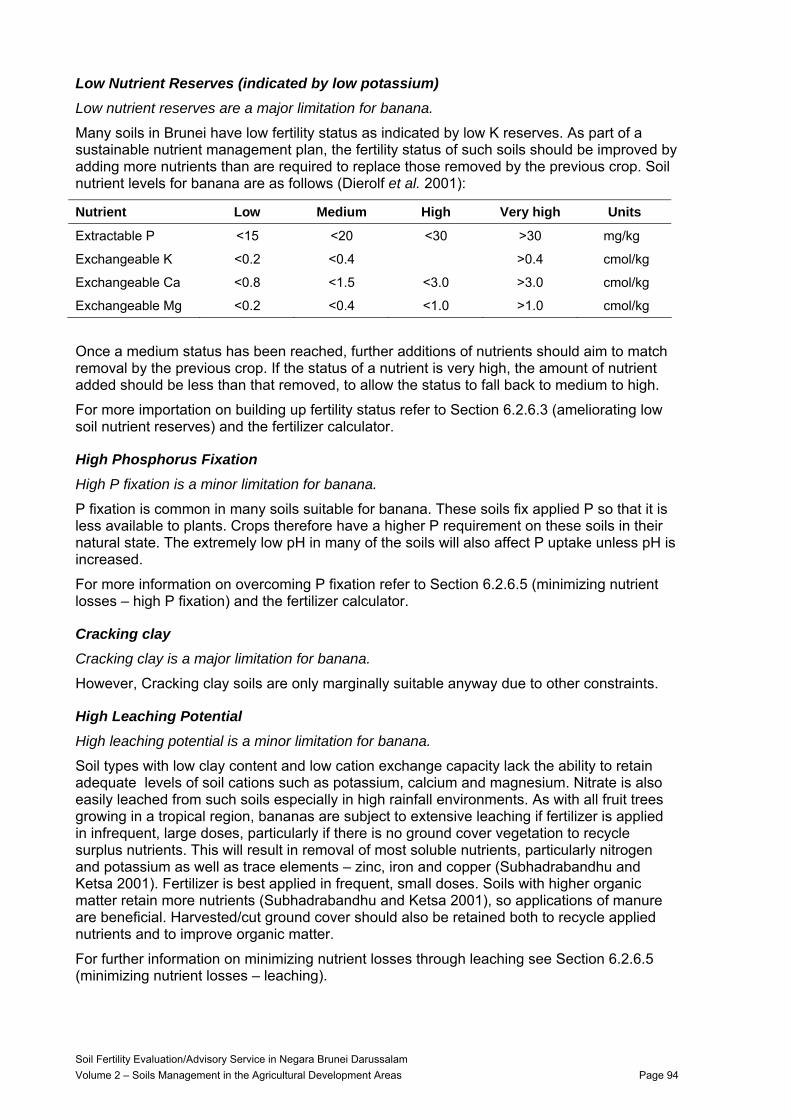
Low Nutrient Reserves (indicated by low potassium) Low nutrient reserves are a major limitation for banana.
Many soils in Brunei have low fertility status as indicated by low K reserves. As part of a sustainable nutrient management plan, the fertility status of such soils should be improved by adding more nutrients than are required to replace those removed by the previous crop. Soil nutrient levels for banana are as follows (Dierolf et al. 2001):
Nutrient Low Medium High Very high Units
Extractable P <15 <20 <30 >30 mg/kg
Exchangeable K <0.2 <0.4 >0.4 cmol/kg
Exchangeable Ca <0.8 <1.5 <3.0 >3.0 cmol/kg
Exchangeable Mg <0.2 <0.4 <1.0 >1.0 cmol/kg
Once a medium status has been reached, further additions of nutrients should aim to match removal by the previous crop. If the status of a nutrient is very high, the amount of nutrient added should be less than that removed, to allow the status to fall back to medium to high.
For more importation on building up fertility status refer to Section 6.2.6.3 (ameliorating low soil nutrient reserves) and the fertilizer calculator.
High Phosphorus Fixation High P fixation is a minor limitation for banana.
P fixation is common in many soils suitable for banana. These soils fix applied P so that it is less available to plants. Crops therefore have a higher P requirement on these soils in their natural state. The extremely low pH in many of the soils will also affect P uptake unless pH is increased.
For more information on overcoming P fixation refer to Section 6.2.6.5 (minimizing nutrient losses – high P fixation) and the fertilizer calculator.
Cracking clay Cracking clay is a major limitation for banana.
However, Cracking clay soils are only marginally suitable anyway due to other constraints.
High Leaching Potential High leaching potential is a minor limitation for banana.
Soil types with low clay content and low cation exchange capacity lack the ability to retain adequate levels of soil cations such as potassium, calcium and magnesium. Nitrate is also easily leached from such soils especially in high rainfall environments. As with all fruit trees growing in a tropical region, bananas are subject to extensive leaching if fertilizer is applied in infrequent, large doses, particularly if there is no ground cover vegetation to recycle surplus nutrients. This will result in removal of most soluble nutrients, particularly nitrogen and potassium as well as trace elements – zinc, iron and copper (Subhadrabandhu and Ketsa 2001). Fertilizer is best applied in frequent, small doses. Soils with higher organic matter retain more nutrients (Subhadrabandhu and Ketsa 2001), so applications of manure are beneficial. Harvested/cut ground cover should also be retained both to recycle applied nutrients and to improve organic matter.
For further information on minimizing nutrient losses through leaching see Section 6.2.6.5 (minimizing nutrient losses – leaching).
Soil Fertility Evaluation/Advisory Service in Negara Brunei Darussalam Volume 2 – Soils Management in the Agricultural Development Areas Page 94
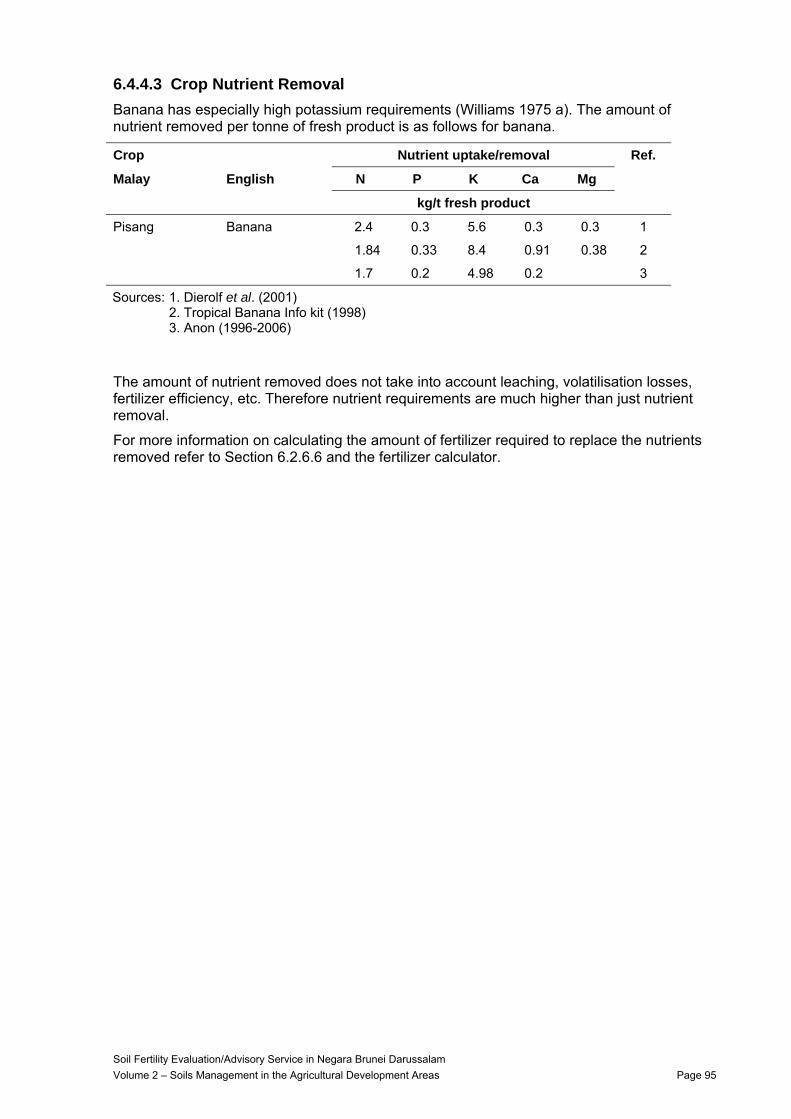
6.4.4.3 Crop Nutrient Removal Banana has especially high potassium requirements (Williams 1975 a). The amount of nutrient removed per tonne of fresh product is as follows for banana.
Crop Nutrient uptake/removal Ref.
Malay English N P K Ca Mg
kg/t fresh product
Pisang Banana 2.4 0.3 5.6 0.3 0.3 1
1.84 0.33 8.4 0.91 0.38 2
1.7 0.2 4.98 0.2 3
Sources: 1. Dierolf et al. (2001) 2. Tropical Banana Info kit (1998) 3. Anon (1996-2006)
The amount of nutrient removed does not take into account leaching, volatilisation losses, fertilizer efficiency, etc. Therefore nutrient requirements are much higher than just nutrient removal.
For more information on calculating the amount of fertilizer required to replace the nutrients removed refer to Section 6.2.6.6 and the fertilizer calculator.
Soil Fertility Evaluation/Advisory Service in Negara Brunei Darussalam Volume 2 – Soils Management in the Agricultural Development Areas Page 95
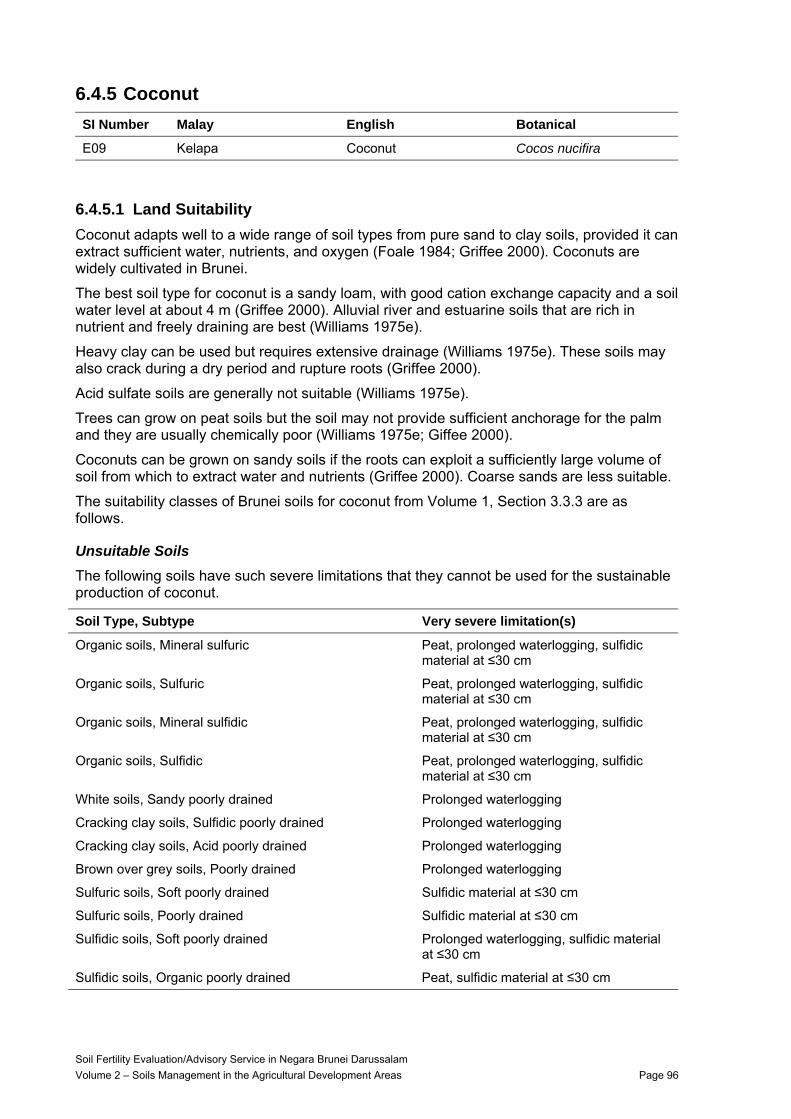
6.4.5 Coconut SI Number Malay English Botanical
E09 Kelapa Coconut Cocos nucifira
6.4.5.1 Land Suitability Coconut adapts well to a wide range of soil types from pure sand to clay soils, provided it can extract sufficient water, nutrients, and oxygen (Foale 1984; Griffee 2000). Coconuts are widely cultivated in Brunei.
The best soil type for coconut is a sandy loam, with good cation exchange capacity and a soil water level at about 4 m (Griffee 2000). Alluvial river and estuarine soils that are rich in nutrient and freely draining are best (Williams 1975e).
Heavy clay can be used but requires extensive drainage (Williams 1975e). These soils may also crack during a dry period and rupture roots (Griffee 2000).
Acid sulfate soils are generally not suitable (Williams 1975e).
Trees can grow on peat soils but the soil may not provide sufficient anchorage for the palm and they are usually chemically poor (Williams 1975e; Giffee 2000).
Coconuts can be grown on sandy soils if the roots can exploit a sufficiently large volume of soil from which to extract water and nutrients (Griffee 2000). Coarse sands are less suitable.
The suitability classes of Brunei soils for coconut from Volume 1, Section 3.3.3 are as follows.
Unsuitable Soils The following soils have such severe limitations that they cannot be used for the sustainable production of coconut.
Soil Type, Subtype Very severe limitation(s)
Organic soils, Mineral sulfuric Peat, prolonged waterlogging, sulfidic material at ≤30 cm
Organic soils, Sulfuric Peat, prolonged waterlogging, sulfidic material at ≤30 cm
Organic soils, Mineral sulfidic Peat, prolonged waterlogging, sulfidic material at ≤30 cm
Organic soils, Sulfidic Peat, prolonged waterlogging, sulfidic material at ≤30 cm
White soils, Sandy poorly drained Prolonged waterlogging
Cracking clay soils, Sulfidic poorly drained Prolonged waterlogging
Cracking clay soils, Acid poorly drained Prolonged waterlogging
Brown over grey soils, Poorly drained Prolonged waterlogging
Sulfuric soils, Soft poorly drained Sulfidic material at ≤30 cm
Sulfuric soils, Poorly drained Sulfidic material at ≤30 cm
Sulfidic soils, Soft poorly drained Prolonged waterlogging, sulfidic material at ≤30 cm
Sulfidic soils, Organic poorly drained Peat, sulfidic material at ≤30 cm
Soil Fertility Evaluation/Advisory Service in Negara Brunei Darussalam Volume 2 – Soils Management in the Agricultural Development Areas Page 96
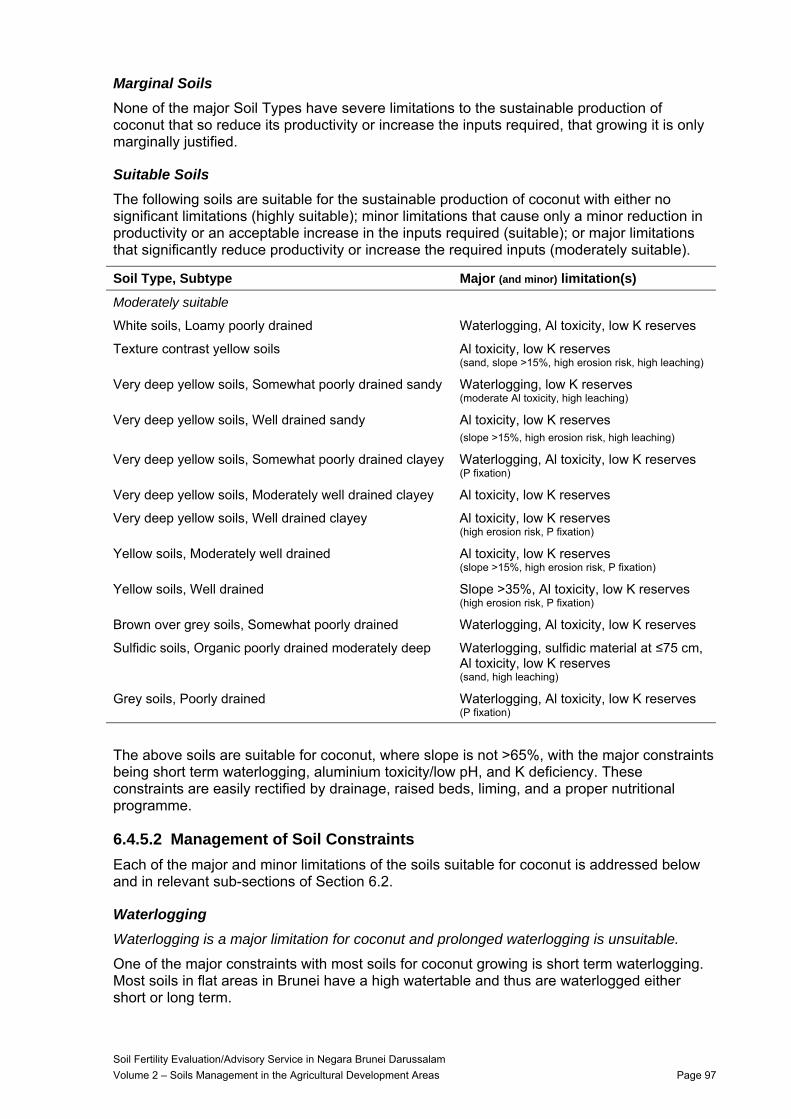
Marginal Soils None of the major Soil Types have severe limitations to the sustainable production of coconut that so reduce its productivity or increase the inputs required, that growing it is only marginally justified.
Suitable Soils The following soils are suitable for the sustainable production of coconut with either no significant limitations (highly suitable); minor limitations that cause only a minor reduction in productivity or an acceptable increase in the inputs required (suitable); or major limitations that significantly reduce productivity or increase the required inputs (moderately suitable).
Soil Type, Subtype Major (and minor) limitation(s)
Moderately suitable
White soils, Loamy poorly drained Waterlogging, Al toxicity, low K reserves
Texture contrast yellow soils Al toxicity, low K reserves (sand, slope >15%, high erosion risk, high leaching)
Very deep yellow soils, Somewhat poorly drained sandy Waterlogging, low K reserves (moderate Al toxicity, high leaching)
Very deep yellow soils, Well drained sandy Al toxicity, low K reserves (slope >15%, high erosion risk, high leaching)
Very deep yellow soils, Somewhat poorly drained clayey Waterlogging, Al toxicity, low K reserves (P fixation)
Very deep yellow soils, Moderately well drained clayey Al toxicity, low K reserves
Very deep yellow soils, Well drained clayey Al toxicity, low K reserves (high erosion risk, P fixation)
Yellow soils, Moderately well drained Al toxicity, low K reserves (slope >15%, high erosion risk, P fixation)
Yellow soils, Well drained Slope >35%, Al toxicity, low K reserves (high erosion risk, P fixation)
Brown over grey soils, Somewhat poorly drained Waterlogging, Al toxicity, low K reserves
Sulfidic soils, Organic poorly drained moderately deep Waterlogging, sulfidic material at ≤75 cm, Al toxicity, low K reserves (sand, high leaching)
Grey soils, Poorly drained Waterlogging, Al toxicity, low K reserves (P fixation)
The above soils are suitable for coconut, where slope is not >65%, with the major constraints being short term waterlogging, aluminium toxicity/low pH, and K deficiency. These constraints are easily rectified by drainage, raised beds, liming, and a proper nutritional programme.
6.4.5.2 Management of Soil Constraints Each of the major and minor limitations of the soils suitable for coconut is addressed below and in relevant sub-sections of Section 6.2.
Waterlogging Waterlogging is a major limitation for coconut and prolonged waterlogging is unsuitable.
One of the major constraints with most soils for coconut growing is short term waterlogging. Most soils in flat areas in Brunei have a high watertable and thus are waterlogged either short or long term.
Soil Fertility Evaluation/Advisory Service in Negara Brunei Darussalam Volume 2 – Soils Management in the Agricultural Development Areas Page 97
Whilst coconut needs a constant water supply (Foale 1984; Williams 1975e; Girffee 2000), it also requires good internal and external drainage. Moving, well-oxygenated soil water will not affect roots, but roots will die in stagnant water (Foale 1984; Griffee 2000). Occasional floods will not harm the roots, provided water is drained within 48 hours. Coconut can grow on soils with a high watertable (40 cm), provided the watertable is kept stable most if not all of the time (Griffee 2000). The best yields are on soils with the highest water holding capacity (Griffee 2000)
In land with short term waterlogging, drainage canals can be made, using the dug out soil to raise the land between the drains. Where subsoils are sulfidic, care should be taken not to spread this material onto the land (Griffee 2000) and drainage canals should not lower the watertable below the sulfidic material
For more information on methods of ameliorating waterlogging refer to Sections 6.2.4.1 (lowering the watertable) and 6.2.4.2 (improving surface drainage).
Slope and Water Erosion Risk Slopes >15% are a minor limitation for coconut, those >35% a major limitation, those >65% a severe limitation and those >85% are unsuitable. Slopes with high erosion risk (>30% or >20% if texture contrast) are a minor limitation.
Coconut can be grown on both flat and sloping land. On sloping land permanent ground cover is required.
For more information on methods of minimizing erosion refer to Sections 6.2.5.1 (maintaining plant cover), 6.2.5.4 (terracing) and 6.2.5.5 (grassed waterways).
Sulfidic Material Sulfidic material at <100 cm depth is a minor limitation for coconut; at <75 cm a major limitation, at <50 cm a severe limitation, and at <30 cm is unsuitable.
Because coconuts can grow where the watertable is fairly high, sulfidic material or sulfuric layers can occur in otherwise suitable soils.
If coconuts are grown where the watertable is shallow, the depth to any sulfidic layer should be >50 cm. They should be grown on raised beds but care must be taken a) not to use sulfidic material in making the beds and b) not to lower the watertable below the depth at which the sulfidic material occurs. Particular care should be taken if the depth of the sulfidic material is between 50-75 cm.
If sulfidic material is used, its acid generating potential must be neutralised by heavy applications of lime. Any existing acidity, which can be considerable for sulfuric layers, should also be neutralised by appropriate application of lime.
For more information on managing such soils refer to Section 6.2.3.2 and the calculator for nutrient and lime management.
Soil Acidity and Aluminium Toxicity Moderate Al saturation (10-60%) is a minor limitation for coconut, and high Al saturation (>60%) a major limitation.
Soil acidity and associated aluminium toxicity are common in Brunei. Coconuts are tolerant to a wide range of soil pH from 3.5 – 8.5 (Griffee 2000, Foale 1984), but the preferred range is 5.5 – 7.0 (Griffee 2000). Williams (1975e) stated that acid sulfate and peat soils are often too acid. Neutralisation of aluminium phytotoxicity can be achieved by liming to pH ~5.5 in most soils of the ADAs (see Figure 9).
For more information on methods of managing soil acidity refer to Sections 6.2.2.3 (lime requirement) and 6.2.2.4 (minimising acid production).
Soil Fertility Evaluation/Advisory Service in Negara Brunei Darussalam Volume 2 – Soils Management in the Agricultural Development Areas Page 98
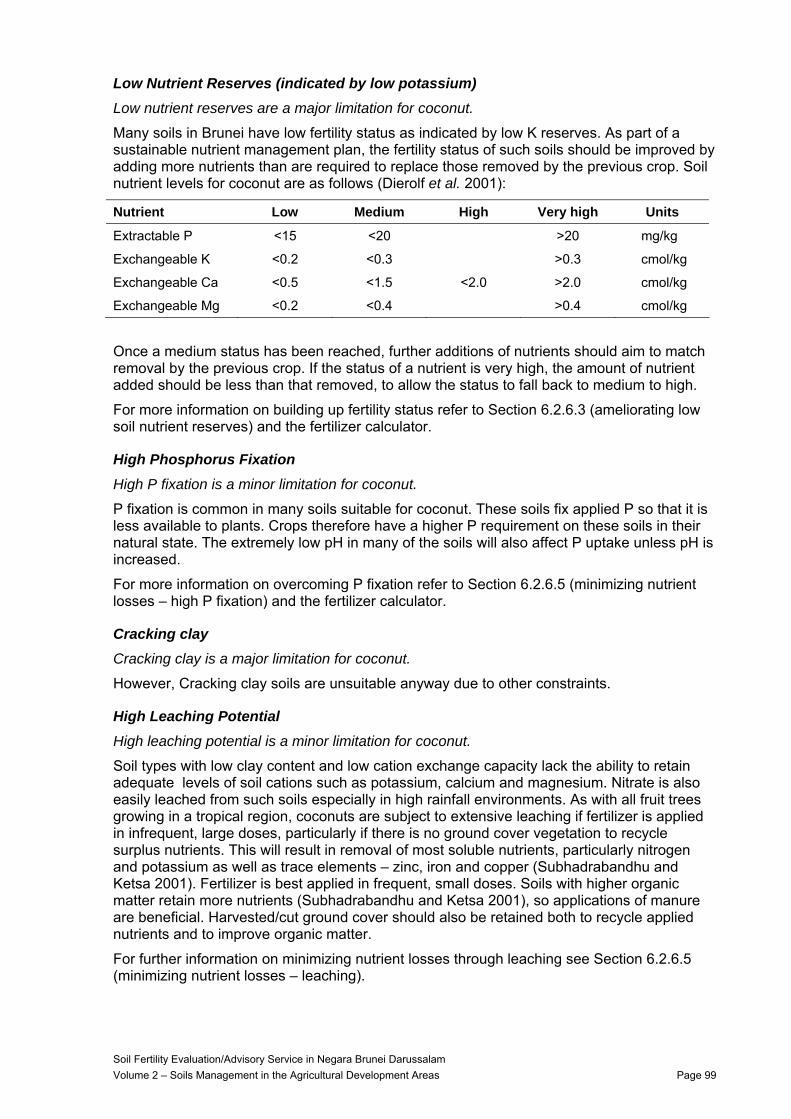
Low Nutrient Reserves (indicated by low potassium) Low nutrient reserves are a major limitation for coconut.
Many soils in Brunei have low fertility status as indicated by low K reserves. As part of a sustainable nutrient management plan, the fertility status of such soils should be improved by adding more nutrients than are required to replace those removed by the previous crop. Soil nutrient levels for coconut are as follows (Dierolf et al. 2001):
Nutrient Low Medium High Very high Units
Extractable P <15 <20 >20 mg/kg
Exchangeable K <0.2 <0.3 >0.3 cmol/kg
Exchangeable Ca <0.5 <1.5 <2.0 >2.0 cmol/kg
Exchangeable Mg <0.2 <0.4 >0.4 cmol/kg
Once a medium status has been reached, further additions of nutrients should aim to match removal by the previous crop. If the status of a nutrient is very high, the amount of nutrient added should be less than that removed, to allow the status to fall back to medium to high.
For more information on building up fertility status refer to Section 6.2.6.3 (ameliorating low soil nutrient reserves) and the fertilizer calculator.
High Phosphorus Fixation High P fixation is a minor limitation for coconut.
P fixation is common in many soils suitable for coconut. These soils fix applied P so that it is less available to plants. Crops therefore have a higher P requirement on these soils in their natural state. The extremely low pH in many of the soils will also affect P uptake unless pH is increased.
For more information on overcoming P fixation refer to Section 6.2.6.5 (minimizing nutrient losses – high P fixation) and the fertilizer calculator.
Cracking clay Cracking clay is a major limitation for coconut.
However, Cracking clay soils are unsuitable anyway due to other constraints.
High Leaching Potential High leaching potential is a minor limitation for coconut.
Soil types with low clay content and low cation exchange capacity lack the ability to retain adequate levels of soil cations such as potassium, calcium and magnesium. Nitrate is also easily leached from such soils especially in high rainfall environments. As with all fruit trees growing in a tropical region, coconuts are subject to extensive leaching if fertilizer is applied in infrequent, large doses, particularly if there is no ground cover vegetation to recycle surplus nutrients. This will result in removal of most soluble nutrients, particularly nitrogen and potassium as well as trace elements – zinc, iron and copper (Subhadrabandhu and Ketsa 2001). Fertilizer is best applied in frequent, small doses. Soils with higher organic matter retain more nutrients (Subhadrabandhu and Ketsa 2001), so applications of manure are beneficial. Harvested/cut ground cover should also be retained both to recycle applied nutrients and to improve organic matter.
For further information on minimizing nutrient losses through leaching see Section 6.2.6.5 (minimizing nutrient losses – leaching).
Soil Fertility Evaluation/Advisory Service in Negara Brunei Darussalam Volume 2 – Soils Management in the Agricultural Development Areas Page 99
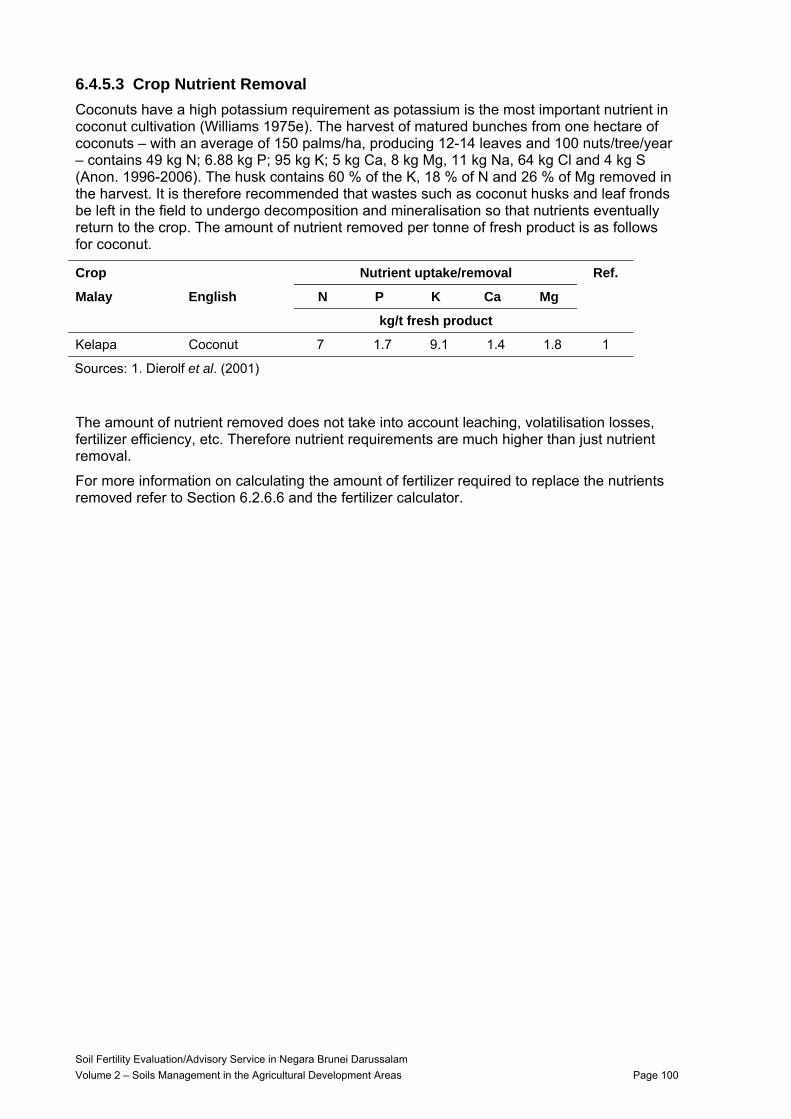
6.4.5.3 Crop Nutrient Removal Coconuts have a high potassium requirement as potassium is the most important nutrient in coconut cultivation (Williams 1975e). The harvest of matured bunches from one hectare of coconuts – with an average of 150 palms/ha, producing 12-14 leaves and 100 nuts/tree/year – contains 49 kg N; 6.88 kg P; 95 kg K; 5 kg Ca, 8 kg Mg, 11 kg Na, 64 kg Cl and 4 kg S (Anon. 1996-2006). The husk contains 60 % of the K, 18 % of N and 26 % of Mg removed in the harvest. It is therefore recommended that wastes such as coconut husks and leaf fronds be left in the field to undergo decomposition and mineralisation so that nutrients eventually return to the crop. The amount of nutrient removed per tonne of fresh product is as follows for coconut.
Crop Nutrient uptake/removal Ref.
Malay English N P K Ca Mg
kg/t fresh product
Kelapa Coconut 7 1.7 9.1 1.4 1.8 1
Sources: 1. Dierolf et al. (2001)
The amount of nutrient removed does not take into account leaching, volatilisation losses, fertilizer efficiency, etc. Therefore nutrient requirements are much higher than just nutrient removal.
For more information on calculating the amount of fertilizer required to replace the nutrients removed refer to Section 6.2.6.6 and the fertilizer calculator.
Soil Fertility Evaluation/Advisory Service in Negara Brunei Darussalam Volume 2 – Soils Management in the Agricultural Development Areas Page 100
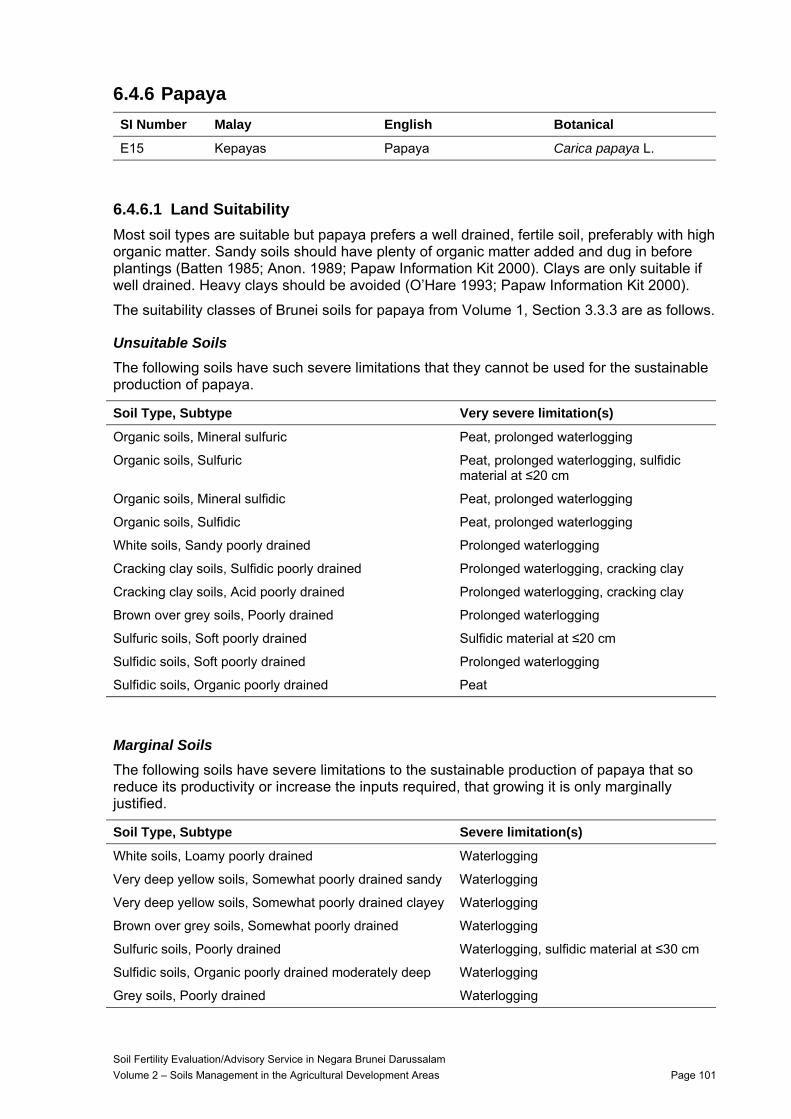
6.4.6 Papaya SI Number Malay English Botanical
E15 Kepayas Papaya Carica papaya L.
6.4.6.1 Land Suitability Most soil types are suitable but papaya prefers a well drained, fertile soil, preferably with high organic matter. Sandy soils should have plenty of organic matter added and dug in before plantings (Batten 1985; Anon. 1989; Papaw Information Kit 2000). Clays are only suitable if well drained. Heavy clays should be avoided (O’Hare 1993; Papaw Information Kit 2000).
The suitability classes of Brunei soils for papaya from Volume 1, Section 3.3.3 are as follows.
Unsuitable Soils The following soils have such severe limitations that they cannot be used for the sustainable production of papaya.
Soil Type, Subtype Very severe limitation(s)
Organic soils, Mineral sulfuric Peat, prolonged waterlogging
Organic soils, Sulfuric Peat, prolonged waterlogging, sulfidic material at ≤20 cm
Organic soils, Mineral sulfidic Peat, prolonged waterlogging
Organic soils, Sulfidic Peat, prolonged waterlogging
White soils, Sandy poorly drained Prolonged waterlogging
Cracking clay soils, Sulfidic poorly drained Prolonged waterlogging, cracking clay
Cracking clay soils, Acid poorly drained Prolonged waterlogging, cracking clay
Brown over grey soils, Poorly drained Prolonged waterlogging
Sulfuric soils, Soft poorly drained Sulfidic material at ≤20 cm
Sulfidic soils, Soft poorly drained Prolonged waterlogging
Sulfidic soils, Organic poorly drained Peat
Marginal Soils The following soils have severe limitations to the sustainable production of papaya that so reduce its productivity or increase the inputs required, that growing it is only marginally justified.
Soil Type, Subtype Severe limitation(s)
White soils, Loamy poorly drained Waterlogging
Very deep yellow soils, Somewhat poorly drained sandy Waterlogging
Very deep yellow soils, Somewhat poorly drained clayey Waterlogging
Brown over grey soils, Somewhat poorly drained Waterlogging
Sulfuric soils, Poorly drained Waterlogging, sulfidic material at ≤30 cm
Sulfidic soils, Organic poorly drained moderately deep Waterlogging
Grey soils, Poorly drained Waterlogging
Soil Fertility Evaluation/Advisory Service in Negara Brunei Darussalam Volume 2 – Soils Management in the Agricultural Development Areas Page 101
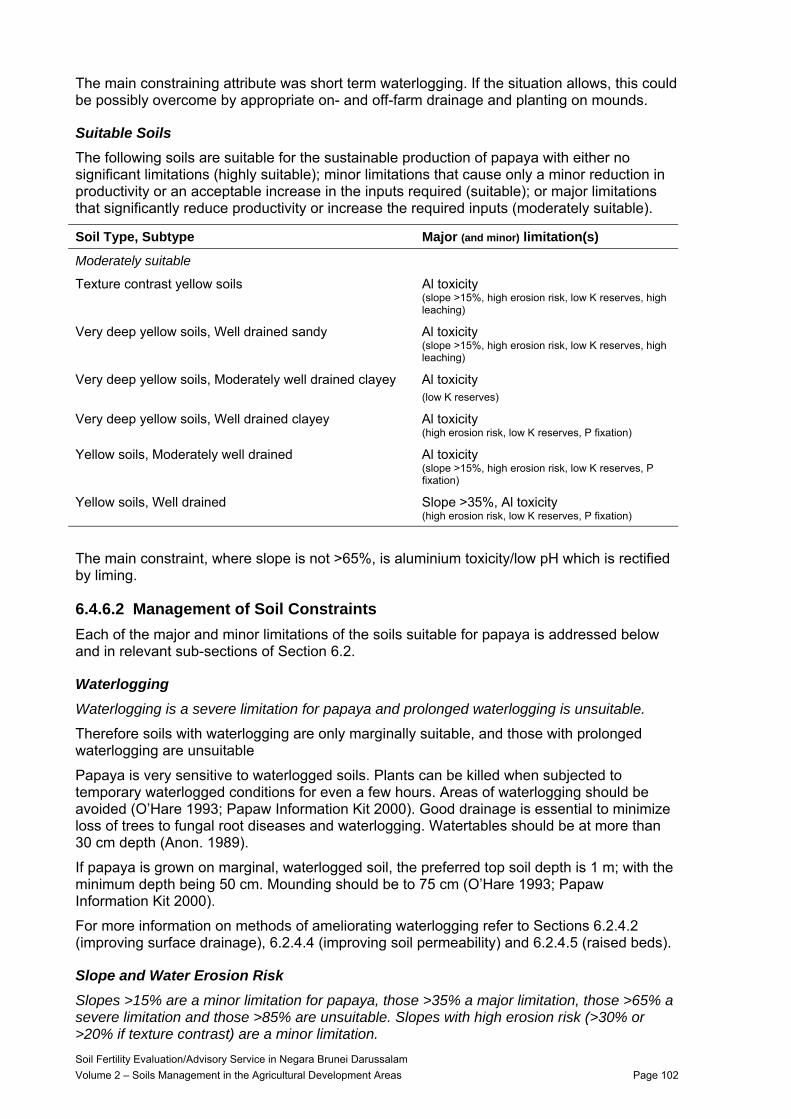
The main constraining attribute was short term waterlogging. If the situation allows, this could be possibly overcome by appropriate on- and off-farm drainage and planting on mounds.
Suitable Soils The following soils are suitable for the sustainable production of papaya with either no significant limitations (highly suitable); minor limitations that cause only a minor reduction in productivity or an acceptable increase in the inputs required (suitable); or major limitations that significantly reduce productivity or increase the required inputs (moderately suitable).
Soil Type, Subtype Major (and minor) limitation(s)
Moderately suitable
Texture contrast yellow soils Al toxicity (slope >15%, high erosion risk, low K reserves, high leaching)
Very deep yellow soils, Well drained sandy Al toxicity (slope >15%, high erosion risk, low K reserves, high leaching)
Very deep yellow soils, Moderately well drained clayey Al toxicity (low K reserves)
Very deep yellow soils, Well drained clayey Al toxicity (high erosion risk, low K reserves, P fixation)
Yellow soils, Moderately well drained Al toxicity (slope >15%, high erosion risk, low K reserves, P fixation)
Yellow soils, Well drained Slope >35%, Al toxicity (high erosion risk, low K reserves, P fixation)
The main constraint, where slope is not >65%, is aluminium toxicity/low pH which is rectified by liming.
6.4.6.2 Management of Soil Constraints Each of the major and minor limitations of the soils suitable for papaya is addressed below and in relevant sub-sections of Section 6.2.
Waterlogging Waterlogging is a severe limitation for papaya and prolonged waterlogging is unsuitable.
Therefore soils with waterlogging are only marginally suitable, and those with prolonged waterlogging are unsuitable
Papaya is very sensitive to waterlogged soils. Plants can be killed when subjected to temporary waterlogged conditions for even a few hours. Areas of waterlogging should be avoided (O’Hare 1993; Papaw Information Kit 2000). Good drainage is essential to minimize loss of trees to fungal root diseases and waterlogging. Watertables should be at more than 30 cm depth (Anon. 1989).
If papaya is grown on marginal, waterlogged soil, the preferred top soil depth is 1 m; with the minimum depth being 50 cm. Mounding should be to 75 cm (O’Hare 1993; Papaw Information Kit 2000).
For more information on methods of ameliorating waterlogging refer to Sections 6.2.4.2 (improving surface drainage), 6.2.4.4 (improving soil permeability) and 6.2.4.5 (raised beds).
Slope and Water Erosion Risk Slopes >15% are a minor limitation for papaya, those >35% a major limitation, those >65% a severe limitation and those >85% are unsuitable. Slopes with high erosion risk (>30% or >20% if texture contrast) are a minor limitation. Soil Fertility Evaluation/Advisory Service in Negara Brunei Darussalam Volume 2 – Soils Management in the Agricultural Development Areas Page 102
Papaya can be grown on both flat and sloping land. . To minimize erosion risk, maintain plant on contoured beds and maintain permanent ground cover.
For more information on methods of minimizing erosion refer to Sections 6.2.5.1 (maintaining plant cover), 6.2.5.4 (terracing) and 6.2.5.5 (grassed waterways).
Sulfidic Material Sulfidic material at <60 cm depth is a minor limitation for papaya; at <45 cm a major limitation, at <30 cm a severe limitation, and at <20 cm is unsuitable.
Therefore Soil Types with sulfidic material at <20 cm depth are unsuitable. Those with deeper sulfidic material are only marginally suitable either because the sulfidic material is at <30 cm or because of other constraints.
If papaya growing is to be attempted on marginal, waterlogged soils, the depth to any sulfidic layer should be >30 cm. They should be grown on raised beds but care must be taken a) not to use sulfidic material in making the beds and b) not to lower the watertable below the depth at which the sulfidic material occurs. Particular care should be taken if the depth of the sulfidic material is between 30-45 cm.
If sulfidic material is used, its acid generating potential must be neutralised by heavy applications of lime. Any existing acidity, which can be considerable for sulfuric layers, should also be neutralised by appropriate application of lime.
For more information on managing such soils refer to Section 6.2.3.2 and the calculator for nutrient and lime management.
Soil Acidity and Aluminium Toxicity Moderate Al saturation (10-60%) is a minor limitation for papaya, and high Al saturation (>60%) a major limitation.
Soil acidity and associated aluminium toxicity are common in Brunei. The optimum pH for papaya is 6 – 6.5 (Batten 1985; Anon. 1996-2006). Neutralisation of aluminium phytotoxicity can be achieved by liming to pH ~5.5 in most soils of the ADAs (see Figure 9).
For more information on methods of managing soil acidity refer to Sections 6.2.2.3 (lime requirement) and 6.2.2.4 (minimising acid production).
Low Nutrient Reserves (indicated by low potassium) Low nutrient reserves are a minor limitation for papaya.
Many soils in Brunei have low fertility status as indicated by low K reserves. As part of a sustainable nutrient management plan, the fertility status of such soils should be improved by adding more nutrients than are required to replace those removed by the previous crop. Soil nutrient levels for papaya are as follows (Dierolf et al. 2001):
Nutrient Low Medium High Very high Units
Extractable P <15 <20 <25 >25 mg/kg
Exchangeable K <0.2 <0.3 >0.3 cmol/kg
Exchangeable Ca <0.5 <1.5 <3.0 >3.0 cmol/kg
Exchangeable Mg <0.2 <0.4 <0.6 >0.6 cmol/kg
Once a medium status has been reached, further additions of nutrients should aim to match removal by the previous crop. If the status of a nutrient is very high, the amount of nutrient added should be less than that removed, to allow the status to fall back to medium to high.
For more information on building up fertility status refer to Section 6.2.6.3 (ameliorating low soil nutrient reserves) and the fertilizer calculator.
Soil Fertility Evaluation/Advisory Service in Negara Brunei Darussalam Volume 2 – Soils Management in the Agricultural Development Areas Page 103
High Phosphorus Fixation High P fixation is a minor limitation for papaya.
P fixation is common in many soils suitable for papaya. These soils fix applied P so that it is less available to plants. Crops therefore have a higher P requirement on these soils in their natural state. The extremely low pH in many of the soils will also affect P uptake unless pH is increased.
For more information on overcoming P fixation refer to Section 6.2.6.5 (minimizing nutrient losses – high P fixation) and the fertilizer calculator.
Cracking clay Cracking clay is unsuitable for papaya.
High Leaching Potential High leaching potential is a minor limitation for papaya.
Soil types with low clay content and low cation exchange capacity lack the ability to retain adequate levels of soil cations such as potassium, calcium and magnesium. Nitrate is also easily leached from such soils especially in high rainfall environments. As with all fruit trees growing in a tropical region, papaya is subject to extensive leaching if fertilizer is applied in infrequent, large doses, particularly if there is no ground cover vegetation to recycle surplus nutrients. This will result in removal of most soluble nutrients, particularly nitrogen and potassium as well as trace elements – zinc, iron and copper (Subhadrabandhu and Ketsa 2001). Fertilizer is best applied in frequent, small doses. Soils with higher organic matter retain more nutrients (Subhadrabandhu and Ketsa 2001), so applications of manure are beneficial. Harvested/cut ground cover should also be retained both to recycle applied nutrients and to improve organic matter.
For further information on minimizing nutrient losses through leaching see Section 6.2.6.5 (minimizing nutrient losses – leaching).
6.4.6.3 Crop Nutrient Removal The amount of nutrient removed per tonne of fresh product is as follows for papaya
Crop Nutrient uptake/removal Ref.
Malay English N P K Ca Mg
kg/t fresh product
Kepayas Papaya 1.7 0.3 1.5 0.4 0.1 1
0.98 0.05 2.57 0.24 0.1 2
Sources: 1. Dierolf et al. (2001) 2. Anon. (2007a) assuming the N content of protein is 16%
The amount of nutrient removed does not take into account leaching, volatilisation losses, fertilizer efficiency, etc. Therefore nutrient requirements are much higher than just nutrient removal.
In Queensland, Australia (Papaya Information Kit, 2000) a 115 t/ha crop over 15 months will require (both for uptake and removal):
N 435 kg/ha P 75 kg/ha K 668 kg/ha Ca 169 kg/ha Mg 133 kg/ha
Soil Fertility Evaluation/Advisory Service in Negara Brunei Darussalam Volume 2 – Soils Management in the Agricultural Development Areas Page 104
For more information on calculating the amount of fertilizer required to replace the nutrients removed refer to Section 6.2.6.6 and the fertilizer calculator.
Soil Fertility Evaluation/Advisory Service in Negara Brunei Darussalam Volume 2 – Soils Management in the Agricultural Development Areas Page 105
6.4.7 Pineapple SI Number Malay English Botanical
E16 Nenas Pineapple Ananas comosus Merr.
6.4.7.1 Land Suitability Pineapples can be grown on a wide range of soil types. In Malaysia they are grown on almost pure organic peat soils (Williams 1975b) provided these are drained to >60 cm depth (Andriesse 1988). In north Queensland high quality fruit are grown on granitic sandy loams. They are also found on volcanic loams in Hawaii and on acid sulfate soils in the Mekong delta in Southern Vietnam.
The best soil is friable, well drained, sandy loam with high organic content and friable to a depth of at least 60 cm. Heavy clay soils with poor internal drainage are to be avoided (Williams 1975b; Morton 1987; Grattidge and Wait 1989; Anon. 1996c).
The suitability classes of Brunei soils for pineapple from Volume 1, Section 3.3.3 are as follows.
Unsuitable Soils The following soils have such severe limitations that they cannot be used for the sustainable production of pineapple.
Soil Type, Subtype Very severe limitation(s)
Organic soils, Sulfuric Sulfidic material at ≤20 cm
Sulfuric soils, Soft poorly drained Sulfidic material at ≤20 cm
Marginal Soils The following soils have severe limitations to the sustainable production of pineapple that so reduce its productivity or increase the inputs required, that growing it is only marginally justified.
Soil Type, Subtype Severe limitation(s)
Organic soils, Mineral sulfuric Prolonged waterlogging, sulfidic material at ≤30 cm
Organic soils, Mineral sulfidic Prolonged waterlogging, sulfidic material at ≤30 cm
Organic soils, Sulfidic Prolonged waterlogging, sulfidic material at ≤30 cm
White soils, Sandy poorly drained Prolonged waterlogging
Cracking clay soils, Sulfidic poorly drained Prolonged waterlogging, cracking clay
Cracking clay soils, Acid poorly drained Prolonged waterlogging, cracking clay
Brown over grey soils, Poorly drained Prolonged waterlogging
Sulfuric soils, Poorly drained Sulfidic material at ≤30 cm
Sulfidic soils, Soft poorly drained Prolonged waterlogging, sulfidic material at ≤30 cm
Sulfidic soils, Organic poorly drained Sulfidic material at ≤30 cm
Soil Fertility Evaluation/Advisory Service in Negara Brunei Darussalam Volume 2 – Soils Management in the Agricultural Development Areas Page 106
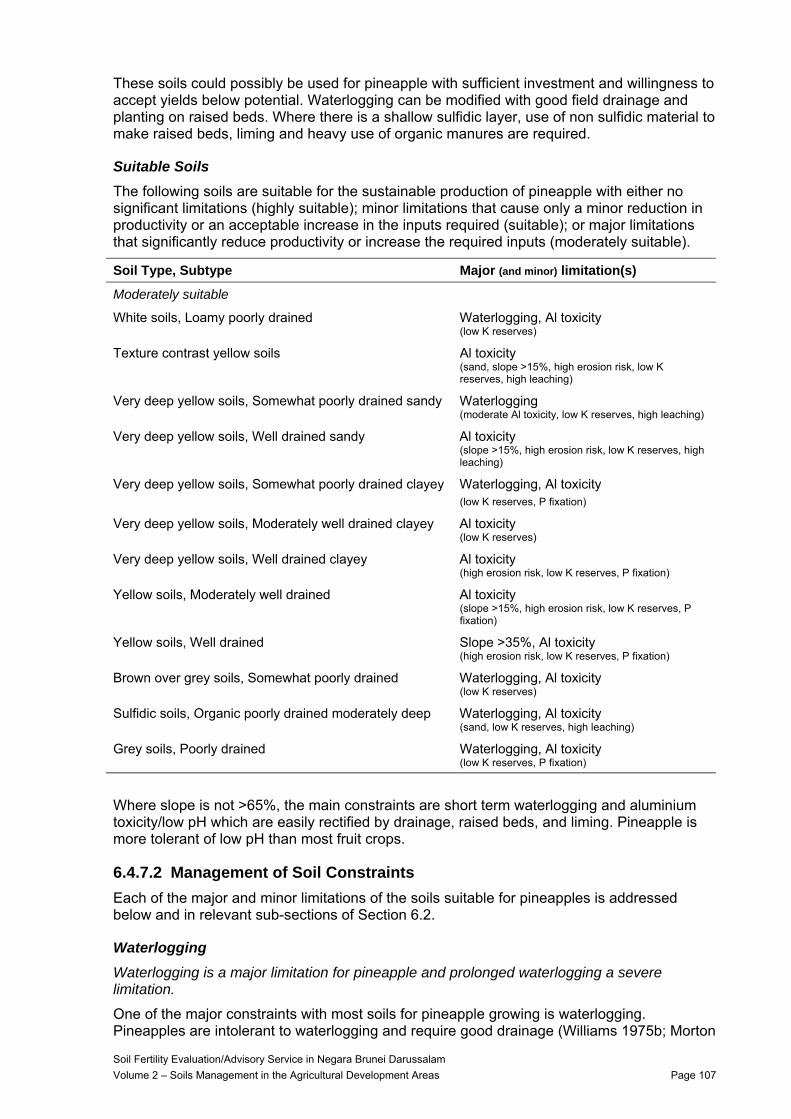
These soils could possibly be used for pineapple with sufficient investment and willingness to accept yields below potential. Waterlogging can be modified with good field drainage and planting on raised beds. Where there is a shallow sulfidic layer, use of non sulfidic material to make raised beds, liming and heavy use of organic manures are required.
Suitable Soils The following soils are suitable for the sustainable production of pineapple with either no significant limitations (highly suitable); minor limitations that cause only a minor reduction in productivity or an acceptable increase in the inputs required (suitable); or major limitations that significantly reduce productivity or increase the required inputs (moderately suitable).
Soil Type, Subtype Major (and minor) limitation(s)
Moderately suitable
White soils, Loamy poorly drained Waterlogging, Al toxicity (low K reserves)
Texture contrast yellow soils Al toxicity (sand, slope >15%, high erosion risk, low K reserves, high leaching)
Very deep yellow soils, Somewhat poorly drained sandy Waterlogging (moderate Al toxicity, low K reserves, high leaching)
Very deep yellow soils, Well drained sandy Al toxicity (slope >15%, high erosion risk, low K reserves, high leaching)
Very deep yellow soils, Somewhat poorly drained clayey Waterlogging, Al toxicity (low K reserves, P fixation)
Very deep yellow soils, Moderately well drained clayey Al toxicity (low K reserves)
Very deep yellow soils, Well drained clayey Al toxicity (high erosion risk, low K reserves, P fixation)
Yellow soils, Moderately well drained Al toxicity (slope >15%, high erosion risk, low K reserves, P fixation)
Yellow soils, Well drained Slope >35%, Al toxicity (high erosion risk, low K reserves, P fixation)
Brown over grey soils, Somewhat poorly drained Waterlogging, Al toxicity (low K reserves)
Sulfidic soils, Organic poorly drained moderately deep Waterlogging, Al toxicity (sand, low K reserves, high leaching)
Grey soils, Poorly drained Waterlogging, Al toxicity (low K reserves, P fixation)
Where slope is not >65%, the main constraints are short term waterlogging and aluminium toxicity/low pH which are easily rectified by drainage, raised beds, and liming. Pineapple is more tolerant of low pH than most fruit crops.
6.4.7.2 Management of Soil Constraints Each of the major and minor limitations of the soils suitable for pineapples is addressed below and in relevant sub-sections of Section 6.2.
Waterlogging Waterlogging is a major limitation for pineapple and prolonged waterlogging a severe limitation.
One of the major constraints with most soils for pineapple growing is waterlogging. Pineapples are intolerant to waterlogging and require good drainage (Williams 1975b; Morton
Soil Fertility Evaluation/Advisory Service in Negara Brunei Darussalam Volume 2 – Soils Management in the Agricultural Development Areas Page 107
1987). Most soils in flat areas in Brunei have a high watertable and thus are waterlogged either short or long term.
Where waterlogging is more short term, pineapples can be planted on raised beds with good drains to rapidly remove water. Beds should be >60 cm above the watertable (Morton 1987).
For more information on methods of ameliorating waterlogging refer to Sections 6.2.4.2 (improving surface drainage), 6.2.4.4 (improving soil permeability) and 6.2.4.5 (raised beds).
Slope and Water Erosion Risk Slopes >15% are a minor limitation for pineapples, those >35% a major limitation, those >65% a severe limitation and those >85% are unsuitable. Slopes with high erosion risk (>30% or >20% if texture contrast) are a minor limitation.
Pineapples in SE Asia are often planted on steep slopes. This serves the effect of having good drainage. Provided there are good management practices, pineapples can be grown on slopes up to 65%. To minimize erosion risk, use mini-terraces for planting and maintain permanent cover crops. Slopes of >65% are unsuitable for pineapple production due to land slip and erosion risks and difficulty with day to day management of crops.
For more information on methods of minimizing erosion refer to Sections 6.2.5.1 (maintaining plant cover), 6.2.5.4 (terracing) and 6.2.5.5 (grassed waterways).
Sulfidic Material Sulfidic material at <60 cm depth is a minor limitation for pineapple; at <45 cm a major limitation, at <30 cm a severe limitation, and at <20 cm is unsuitable.
Therefore Soil Types with sulfidic material at <20 cm depth are unsuitable. Those with deeper sulfidic material are only marginally suitable either because the sulfidic material is at a depth of <30 cm or because of other constraints.
If pineapple is grown on waterlogged soils, the depth to any sulfidic layer should be >30 cm. They should be grown on wide, 1 m high raised beds but care must be taken a) not to use sulfidic material in making the beds and b) not to lower the watertable below the depth at which the sulfidic material occurs. Particular care should be taken if the depth of the sulfidic material is between 30-45 cm.
If sulfidic material is used, its acid generating potential must be neutralised by heavy applications of lime. Any existing acidity, which can be considerable for sulfuric layers, should also be neutralised by appropriate application of lime.
For more information on managing such soils refer to Section 6.2.3.2 and the calculator for nutrient and lime management.
Soil Acidity and Aluminium Toxicity Moderate Al saturation (10-60%) is a minor limitation for pineapples, and high Al saturation (>60%) a major limitation.
Soil acidity and associated aluminium toxicity are common in Brunei. However, pineapples are more tolerant of low pH than most fruit, and are often grown on low pH soils. The optimum pH is in the 4.5 – 5.5 range (CRC Handbook 1984; Morton 1987; Grattidge and Wait 1989). In some locations soils are made more acid with �ulphur for pineapple cultivation. Neutralisation of aluminium phytotoxicity can be achieved by liming to pH ~5.5 in most soils of the ADAs (see Figure 9).
For more information on methods of managing soil acidity refer to Sections 6.2.2.3 (lime requirement) and 6.2.2.4 (minimising acid production).
Soil Fertility Evaluation/Advisory Service in Negara Brunei Darussalam Volume 2 – Soils Management in the Agricultural Development Areas Page 108
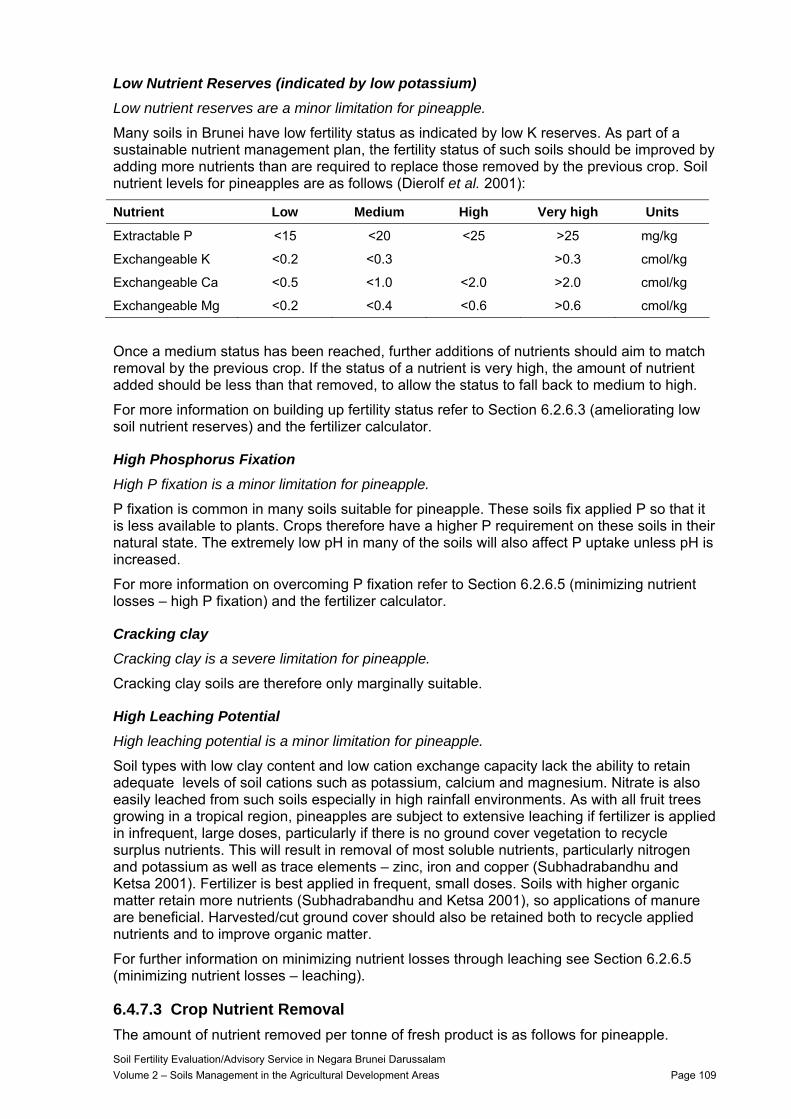
Low Nutrient Reserves (indicated by low potassium) Low nutrient reserves are a minor limitation for pineapple.
Many soils in Brunei have low fertility status as indicated by low K reserves. As part of a sustainable nutrient management plan, the fertility status of such soils should be improved by adding more nutrients than are required to replace those removed by the previous crop. Soil nutrient levels for pineapples are as follows (Dierolf et al. 2001):
Nutrient Low Medium High Very high Units
Extractable P <15 <20 <25 >25 mg/kg
Exchangeable K <0.2 <0.3 >0.3 cmol/kg
Exchangeable Ca <0.5 <1.0 <2.0 >2.0 cmol/kg
Exchangeable Mg <0.2 <0.4 <0.6 >0.6 cmol/kg
Once a medium status has been reached, further additions of nutrients should aim to match removal by the previous crop. If the status of a nutrient is very high, the amount of nutrient added should be less than that removed, to allow the status to fall back to medium to high.
For more information on building up fertility status refer to Section 6.2.6.3 (ameliorating low soil nutrient reserves) and the fertilizer calculator.
High Phosphorus Fixation High P fixation is a minor limitation for pineapple.
P fixation is common in many soils suitable for pineapple. These soils fix applied P so that it is less available to plants. Crops therefore have a higher P requirement on these soils in their natural state. The extremely low pH in many of the soils will also affect P uptake unless pH is increased.
For more information on overcoming P fixation refer to Section 6.2.6.5 (minimizing nutrient losses – high P fixation) and the fertilizer calculator.
Cracking clay Cracking clay is a severe limitation for pineapple.
Cracking clay soils are therefore only marginally suitable.
High Leaching Potential High leaching potential is a minor limitation for pineapple.
Soil types with low clay content and low cation exchange capacity lack the ability to retain adequate levels of soil cations such as potassium, calcium and magnesium. Nitrate is also easily leached from such soils especially in high rainfall environments. As with all fruit trees growing in a tropical region, pineapples are subject to extensive leaching if fertilizer is applied in infrequent, large doses, particularly if there is no ground cover vegetation to recycle surplus nutrients. This will result in removal of most soluble nutrients, particularly nitrogen and potassium as well as trace elements – zinc, iron and copper (Subhadrabandhu and Ketsa 2001). Fertilizer is best applied in frequent, small doses. Soils with higher organic matter retain more nutrients (Subhadrabandhu and Ketsa 2001), so applications of manure are beneficial. Harvested/cut ground cover should also be retained both to recycle applied nutrients and to improve organic matter.
For further information on minimizing nutrient losses through leaching see Section 6.2.6.5 (minimizing nutrient losses – leaching).
6.4.7.3 Crop Nutrient Removal The amount of nutrient removed per tonne of fresh product is as follows for pineapple. Soil Fertility Evaluation/Advisory Service in Negara Brunei Darussalam Volume 2 – Soils Management in the Agricultural Development Areas Page 109
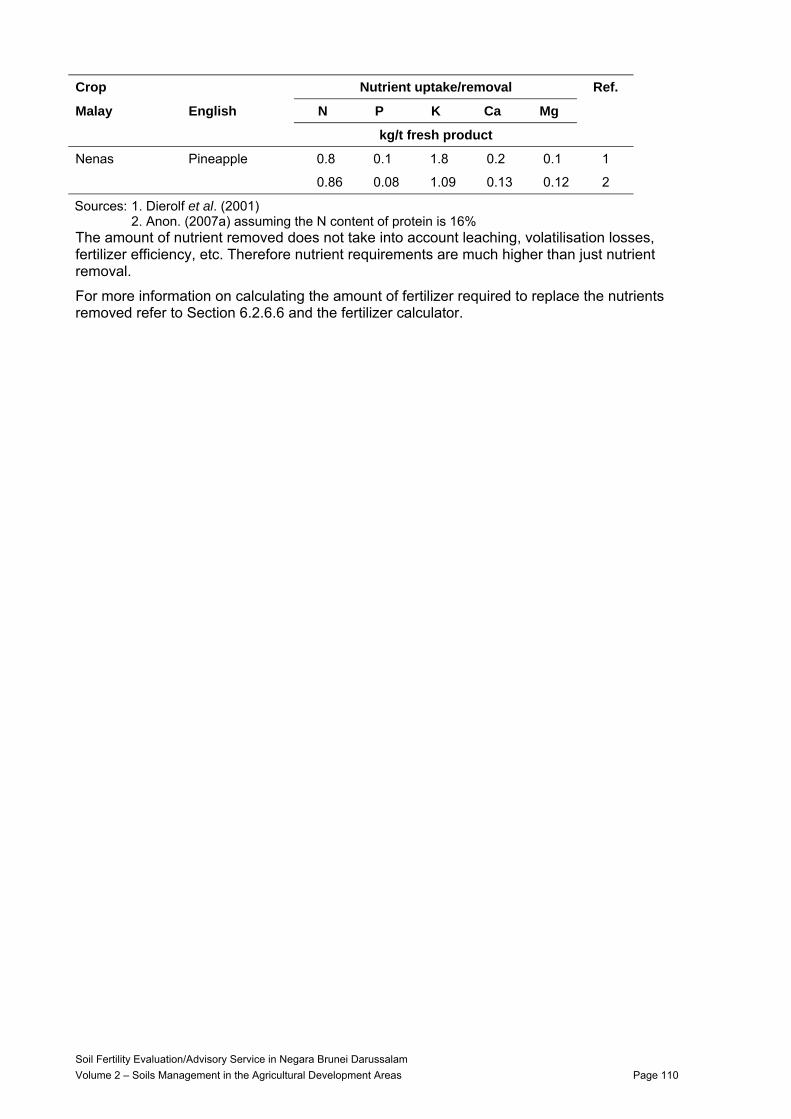
Crop Nutrient uptake/removal Ref.
Malay English N P K Ca Mg
kg/t fresh product
Nenas Pineapple 0.8 0.1 1.8 0.2 0.1 1
0.86 0.08 1.09 0.13 0.12 2
Sources: 1. Dierolf et al. (2001) 2. Anon. (2007a) assuming the N content of protein is 16%
The amount of nutrient removed does not take into account leaching, volatilisation losses, fertilizer efficiency, etc. Therefore nutrient requirements are much higher than just nutrient removal.
For more information on calculating the amount of fertilizer required to replace the nutrients removed refer to Section 6.2.6.6 and the fertilizer calculator.
Soil Fertility Evaluation/Advisory Service in Negara Brunei Darussalam Volume 2 – Soils Management in the Agricultural Development Areas Page 110
6.4.8 Artocarpus SI Number Malay English Botanical
E06 Cempedak Artocarpus integer (Merr.) Synonyms are: A. intgrifolia L.f., A. polyphema P., A. champeden (Lour.) Stokes
E07 Nangka Jackfruit Artocarpus heterophyllus Lam.
F01 Tarap Marang Artocarpus odoratissimus Blanco
6.4.8.1 Land Suitability There are some 50 species of Artocarpus of which at least 5 are cultivated for fruit and seeds. One species i.e. Artocarpus odoratissimus (Tarap) is unique to Brunei. Jackfruit, chempadek, tarap, and the jack fruit x chempadek cross namcham are widely found grown in Brunei which has the ideal climate for their cultivation.
Jack fruit and chempadek flourish on fertile, deep, well drained soils of medium texture, such as deep alluvial soils with an open structure, or coarser texture, such as a deep gravelly or laterite soils (Sedgley 1984a; Morton 1987).
Tarap prefers rich, loamy, well drained soils (Subhadrabandu 2001; Anon. 2004). Tarap in Sarawak is grown on sandy clay soils while in the Philippines it grows best on rich, loamy well drained soils (dela Cruz Jr. 1991).
The suitability classes of Brunei soils for Artocarpus from Volume 1, Section 3.3.3 are as follows.
Unsuitable Soils The following soils have such severe limitations that they cannot be used for the sustainable production of Artocarpus.
Soil Type, Subtype Very severe limitation(s)
Organic soils, Mineral sulfuric Sulfidic material at ≤30 cm
Organic soils, Sulfuric Sulfidic material at ≤30 cm
Organic soils, Mineral sulfidic Sulfidic material at ≤30 cm
Organic soils, Sulfidic Sulfidic material at ≤30 cm
Sulfuric soils, Soft poorly drained Sulfidic material at ≤30 cm
Sulfuric soils, Poorly drained Sulfidic material at ≤30 cm
Sulfidic soils, Soft poorly drained Sulfidic material at ≤30 cm
Sulfidic soils, Organic poorly drained Sulfidic material at ≤30 cm
Marginal Soils The following soils have severe limitations to the sustainable production of Artocarpus that so reduce their productivity or increase the inputs required, that growing them is only marginally justified.
Soil Fertility Evaluation/Advisory Service in Negara Brunei Darussalam Volume 2 – Soils Management in the Agricultural Development Areas Page 111
Soil Type, Subtype Severe limitation(s)
White soils, Sandy poorly drained Prolonged waterlogging
Cracking clay soils, Sulfidic poorly drained Prolonged waterlogging, sulfidic material at ≤50 cm, cracking clay
Cracking clay soils, Acid poorly drained Prolonged waterlogging, cracking clay
Brown over grey soils, Poorly drained Prolonged waterlogging
Artocarpus are unlikely to thrive on these soils. However, overcoming waterlogging with good external and internal drainage and by planting on raised mounds, may raise yield sufficiently to be economic.
Suitable Soils The following soils are suitable for the sustainable production of Artocarpus with either no significant limitations (highly suitable); minor limitations that cause only a minor reduction in productivity or an acceptable increase in the inputs required (suitable); or major limitations that significantly reduce productivity or increase the required inputs (moderately suitable).
Soil Type, Subtype Major (and minor) limitation(s)
Moderately suitable
White soils, Loamy poorly drained Waterlogging, Al toxicity (low K reserves)
Texture contrast yellow soils Sand, Al toxicity (slope >15%, high erosion risk, low K reserves, high leaching)
Very deep yellow soils, Somewhat poorly drained sandy Waterlogging (moderate Al toxicity, low K reserves, high leaching)
Very deep yellow soils, Well drained sandy Al toxicity (slope >15%, high erosion risk, low K reserves, high leaching)
Very deep yellow soils, Somewhat poorly drained clayey Waterlogging, Al toxicity (low K reserves, P fixation)
Very deep yellow soils, Moderately well drained clayey Al toxicity (low K reserves)
Very deep yellow soils, Well drained clayey Al toxicity (high erosion risk, low K reserves, P fixation)
Yellow soils, Moderately well drained Al toxicity (slope >15%, high erosion risk, low K reserves, P fixation)
Yellow soils, Well drained Slope >35%, Al toxicity (high erosion risk, low K reserves, P fixation)
Brown over grey soils, Somewhat poorly drained Waterlogging, Al toxicity (low K reserves)
Sulfidic soils, Organic poorly drained moderately deep Sand, waterlogging, sulfidic material at ≤75 cm, Al toxicity (low K reserves, high leaching)
Grey soils, Poorly drained Waterlogging, Al toxicity (low K reserves, P fixation)
The above soils are suitable for Artocarpus with minor modifications. The main constraints, where slope is not >65%, are short term waterlogging and aluminium toxicity/low pH, which can be rectified by drainage and raised beds, and by liming, respectively.
Soil Fertility Evaluation/Advisory Service in Negara Brunei Darussalam Volume 2 – Soils Management in the Agricultural Development Areas Page 112
6.4.8.2 Management of Soil Constraints Each of the major and minor limitations of the soils suitable for Artocarpus is addressed below and in relevant sub-sections of Section 6.2.
Waterlogging Waterlogging is a major limitation for Artocarpus and prolonged waterlogging a severe limitation.
Most soils in flat areas in Brunei have a high watertable and thus are waterlogged either short or long term. One of the major constraints with most soils for Artocarpus growing is waterlogging. Both jack fruit and chempadek do not tolerate waterlogging, and require a watertable below 0.5 – 2.0 m (Sedgley 1984a; Morton 1987; Jansen 1991; Anon. 1996b; Subhadrabandu 2001).
Good internal and external drainage is very important for both jack fruit and chempadek (Diczbalis and McMahon 2004). Tarap also prefers well drained alluvial soils (Anon. 2004). Champadek can survive periodic flooding, even with acid swamp water (Jansen 1991), and it is likely that both tarap and jack fruit would be similar.
However, soils with permanently shallow watertables should be avoided unless they can be adequately drained. Short term waterlogging requires broad mounds.
For more information on methods of ameliorating waterlogging refer to Sections 6.2.4.2 (improving surface drainage) and 6.2.4.5 (raised beds).
Slope and Water Erosion Risk Slopes >15% are a minor limitation for Artocarpus, those >35% a major limitation, those >65% a severe limitation and those >85% are unsuitable. Slopes with high erosion risk (>30% or >20% if texture contrast) are a minor limitation.
Artocarpus can be grown on both flat and sloping land. However, due to its high water requirement, flatter ground with a watertable that is not too shallow is preferred. On well drained slopes, irrigation may be required. To minimize erosion risk, maintain permanent gound cover.
For more information on methods of minimizing erosion refer to Sections 6.2.5.1 (maintaining plant cover), 6.2.5.4 (terracing) and 6.2.5.5 (grassed waterways).
Sulfidic Material Sulfidic material at <100 cm depth is a minor limitation for Artocarpus; at <75 cm a major limitation, at <50 cm a severe limitation, and at <30 cm is unsuitable.
Artocarpus can tolerate a short periods of waterlogging. However, since acid sulfate soils are waterlogged, some waterlogged soils that might otherwise be suitable can contain sulfidic material or sulfuric layers.
If Artocarpus is grown on waterlogged soils, the depth to any sulfidic layer should be >50 cm. They should be grown on wide raised beds but care must be taken a) not to use sulfidic material in making the beds and b) not to lower the watertable below the depth at which the sulfidic material occurs. Particular care should be taken if the depth of the sulfidic material is between 50-75 cm.
If sulfidic material is used, its acid generating potential must be neutralised by heavy applications of lime. Any existing acidity, which can be considerable for sulfuric layers, should also be neutralised by appropriate application of lime.
For more information on managing such soils refer to Section 6.2.3.2 and the calculator for nutrient and lime management.
Soil Fertility Evaluation/Advisory Service in Negara Brunei Darussalam Volume 2 – Soils Management in the Agricultural Development Areas Page 113
Soil Acidity and Aluminium Toxicity Moderate Al saturation (10-60%) is a minor limitation for Artocarpus, and high Al saturation (>60%) a major limitation.
Soil acidity and associated aluminium toxicity are common in Brunei. The optimum pH for jack fruit and chempadek is 6 – 7.5 (Sedgley 1984a). Neutralisation of aluminium phytotoxicity can be achieved by liming to pH ~5.5 in most soils of the ADAs (see Figure 9).
For more information on methods of managing soil acidity refer to Sections 6.2.2.3 (lime requirement) and 6.2.2.4 (minimising acid production).
Low Nutrient Reserves (indicated by low potassium) Low nutrient reserves are a minor limitation for Artocarpus.
Many soils in Brunei have low fertility status as indicated by low K reserves. As part of a sustainable nutrient management plan, the fertility status of such soils should be improved by adding more nutrients than are required to replace those removed by the previous crop. Although Dierolf et al. (2001) do not give nutrient levels for Artocarpus, generic levels for a range of fruit tree crops can be used instead.
Nutrient Low Medium High Very high Units
Extractable P <15 <20 <25 >25 mg/kg
Exchangeable K <0.2 <0.3 >0.3 cmol/kg
Exchangeable Ca <0.5 <1.5 <3.0 >3.0 cmol/kg
Exchangeable Mg <0.2 <0.4 <0.6 >0.6 cmol/kg
Once a medium status has been reached, further additions of nutrients should aim to match removal by the previous crop. If the status of a nutrient is very high, the amount of nutrient added should be less than that removed, to allow the status to fall back to medium to high.
For more information on building up fertility status refer to Section 6.2.6.3 (ameliorating low soil nutrient reserves) and the fertilizer calculator.
High Phosphorus Fixation High P fixation is a minor limitation for Artocarpus.
P fixation is common in many soils suitable for Artocarpus. These soils fix applied P so that it is less available to plants. Crops therefore have a higher P requirementon these soils in their natural state. The extremely low pH in many of the soils will also affect P uptake unless pH is increased.
For more information on overcoming P fixation refer to Section 6.2.6.5 (minimizing nutrient losses – high P fixation) and the fertilizer calculator.
Cracking clay Cracking clay is a severe limitation for Artocarpus.
Cracking clay soils are therefore only marginally suitable.
High Leaching Potential High leaching potential is a minor limitation for Artocarpus.
Soil types with low clay content and low cation exchange capacity lack the ability to retain adequate levels of soil cations such as potassium, calcium and magnesium. Nitrate is also easily leached from such soils especially in high rainfall environments. As with all fruit trees growing in a tropical region, Artocarpus are subject to extensive leaching if fertilizer is applied in infrequent, large doses, particularly if there is no ground cover vegetation to recycle
Soil Fertility Evaluation/Advisory Service in Negara Brunei Darussalam Volume 2 – Soils Management in the Agricultural Development Areas Page 114
surplus nutrients. This will result in removal of most soluble nutrients, particularly nitrogen and potassium as well as trace elements – zinc, iron and copper (Subhadrabandhu and Ketsa 2001). Fertilizer is best applied in frequent, small doses. Soils with higher organic matter retain more nutrients (Subhadrabandhu and Ketsa 2001), so applications of manure are beneficial. Harvested/cut ground cover should also be retained both to recycle applied nutrients and to improve organic matter.
For further information on minimizing nutrient losses through leaching see Section 6.2.6.5 (minimizing nutrient losses – leaching).
6.4.8.3 Crop Nutrient Removal No data are available on the amount of nutrient removed by Artocarpus.
Soil Fertility Evaluation/Advisory Service in Negara Brunei Darussalam Volume 2 – Soils Management in the Agricultural Development Areas Page 115
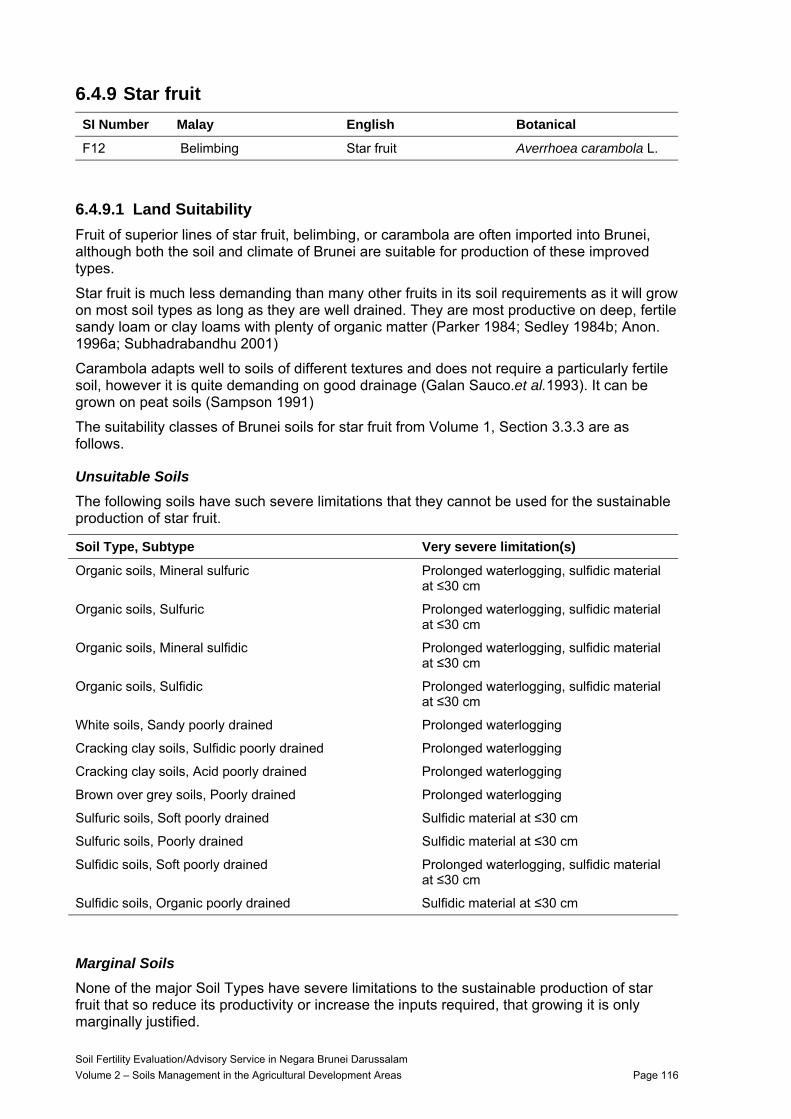
6.4.9 Star fruit SI Number Malay English Botanical
F12 Belimbing Star fruit Averrhoea carambola L.
6.4.9.1 Land Suitability Fruit of superior lines of star fruit, belimbing, or carambola are often imported into Brunei, although both the soil and climate of Brunei are suitable for production of these improved types.
Star fruit is much less demanding than many other fruits in its soil requirements as it will grow on most soil types as long as they are well drained. They are most productive on deep, fertile sandy loam or clay loams with plenty of organic matter (Parker 1984; Sedley 1984b; Anon. 1996a; Subhadrabandhu 2001)
Carambola adapts well to soils of different textures and does not require a particularly fertile soil, however it is quite demanding on good drainage (Galan Sauco.et al.1993). It can be grown on peat soils (Sampson 1991)
The suitability classes of Brunei soils for star fruit from Volume 1, Section 3.3.3 are as follows.
Unsuitable Soils The following soils have such severe limitations that they cannot be used for the sustainable production of star fruit.
Soil Type, Subtype Very severe limitation(s)
Organic soils, Mineral sulfuric Prolonged waterlogging, sulfidic material at ≤30 cm
Organic soils, Sulfuric Prolonged waterlogging, sulfidic material at ≤30 cm
Organic soils, Mineral sulfidic Prolonged waterlogging, sulfidic material at ≤30 cm
Organic soils, Sulfidic Prolonged waterlogging, sulfidic material at ≤30 cm
White soils, Sandy poorly drained Prolonged waterlogging
Cracking clay soils, Sulfidic poorly drained Prolonged waterlogging
Cracking clay soils, Acid poorly drained Prolonged waterlogging
Brown over grey soils, Poorly drained Prolonged waterlogging
Sulfuric soils, Soft poorly drained Sulfidic material at ≤30 cm
Sulfuric soils, Poorly drained Sulfidic material at ≤30 cm
Sulfidic soils, Soft poorly drained Prolonged waterlogging, sulfidic material at ≤30 cm
Sulfidic soils, Organic poorly drained Sulfidic material at ≤30 cm
Marginal Soils None of the major Soil Types have severe limitations to the sustainable production of star fruit that so reduce its productivity or increase the inputs required, that growing it is only marginally justified.
Soil Fertility Evaluation/Advisory Service in Negara Brunei Darussalam Volume 2 – Soils Management in the Agricultural Development Areas Page 116
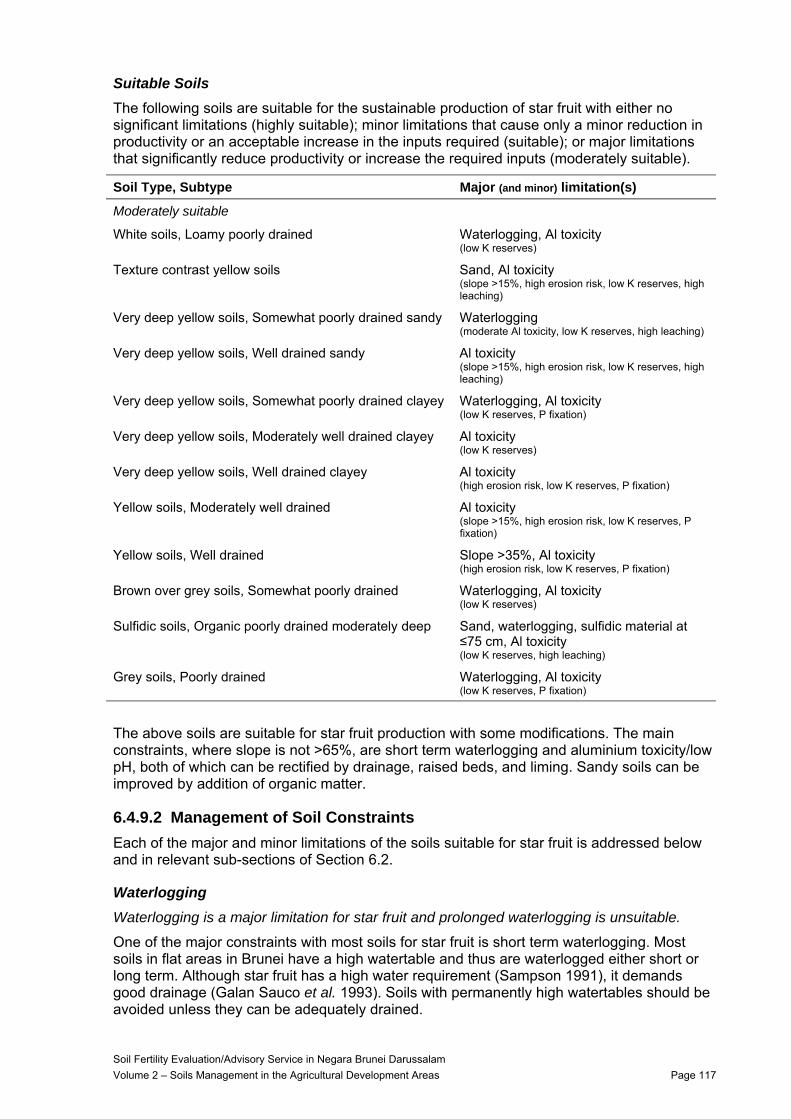
Suitable Soils The following soils are suitable for the sustainable production of star fruit with either no significant limitations (highly suitable); minor limitations that cause only a minor reduction in productivity or an acceptable increase in the inputs required (suitable); or major limitations that significantly reduce productivity or increase the required inputs (moderately suitable).
Soil Type, Subtype Major (and minor) limitation(s)
Moderately suitable
White soils, Loamy poorly drained Waterlogging, Al toxicity (low K reserves)
Texture contrast yellow soils Sand, Al toxicity (slope >15%, high erosion risk, low K reserves, high leaching)
Very deep yellow soils, Somewhat poorly drained sandy Waterlogging (moderate Al toxicity, low K reserves, high leaching)
Very deep yellow soils, Well drained sandy Al toxicity (slope >15%, high erosion risk, low K reserves, high leaching)
Very deep yellow soils, Somewhat poorly drained clayey Waterlogging, Al toxicity (low K reserves, P fixation)
Very deep yellow soils, Moderately well drained clayey Al toxicity (low K reserves)
Very deep yellow soils, Well drained clayey Al toxicity (high erosion risk, low K reserves, P fixation)
Yellow soils, Moderately well drained Al toxicity (slope >15%, high erosion risk, low K reserves, P fixation)
Yellow soils, Well drained Slope >35%, Al toxicity (high erosion risk, low K reserves, P fixation)
Brown over grey soils, Somewhat poorly drained Waterlogging, Al toxicity (low K reserves)
Sulfidic soils, Organic poorly drained moderately deep Sand, waterlogging, sulfidic material at ≤75 cm, Al toxicity (low K reserves, high leaching)
Grey soils, Poorly drained Waterlogging, Al toxicity (low K reserves, P fixation)
The above soils are suitable for star fruit production with some modifications. The main constraints, where slope is not >65%, are short term waterlogging and aluminium toxicity/low pH, both of which can be rectified by drainage, raised beds, and liming. Sandy soils can be improved by addition of organic matter.
6.4.9.2 Management of Soil Constraints Each of the major and minor limitations of the soils suitable for star fruit is addressed below and in relevant sub-sections of Section 6.2.
Waterlogging Waterlogging is a major limitation for star fruit and prolonged waterlogging is unsuitable.
One of the major constraints with most soils for star fruit is short term waterlogging. Most soils in flat areas in Brunei have a high watertable and thus are waterlogged either short or long term. Although star fruit has a high water requirement (Sampson 1991), it demands good drainage (Galan Sauco et al. 1993). Soils with permanently high watertables should be avoided unless they can be adequately drained.
Soil Fertility Evaluation/Advisory Service in Negara Brunei Darussalam Volume 2 – Soils Management in the Agricultural Development Areas Page 117
For more information on methods of ameliorating waterlogging refer to Sections 6.2.4.2 (improving surface drainage) and 6.2.4.5 (raised beds).
Slope and Water Erosion Risk Slopes >15% are a minor limitation for star fruit, those >35% a major limitation, those >65% a severe limitation and those >85% are unsuitable. Slopes with high erosion risk (>30% or >20% if texture contrast) are a minor limitation.
Star fruit can be grown on both flat and sloping land. Due to their high water requirement, flatter ground is preferred. To minimize erosion risk, maintain permanent ground cover. On well drained slopes, irrigation may be required.
For more information on methods of minimizing erosion refer to Sections 6.2.5.1 (maintaining plant cover), 6.2.5.4 (terracing) and 6.2.5.5 (grassed waterways).
Sulfidic Material Sulfidic material at <100 cm depth is a minor limitation for star fruit; at <75 cm a major limitation, at <50 cm a severe limitation, and at <30 cm is unsuitable.
Star fruit can tolerate a little waterlogging, so sulfidic material or sulfuric layers can occur in otherwise moderately suitable soils.
If star fruit is grown on waterlogged soils, the depth to any sulfidic layer should be >50 cm. They should be grown on wide raised beds but care must be taken a) not to use sulfidic material in making the beds and b) not to lower the watertable below the depth at which the sulfidic material occurs. Particular care should be taken if the depth of the sulfidic material is between 50-75 cm.
If sulfidic material is used, its acid generating potential must be neutralised by heavy applications of lime. Any existing acidity, which can be considerable for sulfuric layers, should also be neutralised by appropriate application of lime.
For more information on managing such soils refer to Section 6.2.3.2 and the calculator for nutrient and lime management.
Soil Acidity and Aluminium Toxicity Moderate Al saturation (10-60%) is a minor limitation for star fruit and high Al saturation (>60%) a major limitation.
Soil acidity and associated aluminium toxicity are common in Brunei. While the optimum pH for star fruit is 5.5 – 6.5, in some areas of Malaysia they are grown at pH 4.5 (Galan Sauco et al. 1993). Neutralisation of aluminium phytotoxicity can be achieved by liming to pH ~5.5 in most soils of the ADAs (see Figure 9).
For more information on methods of managing soil acidity refer to Sections 6.2.2.3 (lime requirement) and 6.2.2.4 (minimising acid production).
Low Nutrient Reserves (indicated by low potassium) Low nutrient reserves are a minor limitation for star fruit.
Many soils in Brunei have low fertility status as indicated by low K reserves. As part of a sustainable nutrient management plan, the fertility status of such soils should be improved by adding more nutrients than are required to replace those removed by the previous crop. Although Dierolf et al. (2001) do not give nutrient levels for star fruit, generic levels for a range of fruit tree crops can be used instead.
Soil Fertility Evaluation/Advisory Service in Negara Brunei Darussalam Volume 2 – Soils Management in the Agricultural Development Areas Page 118
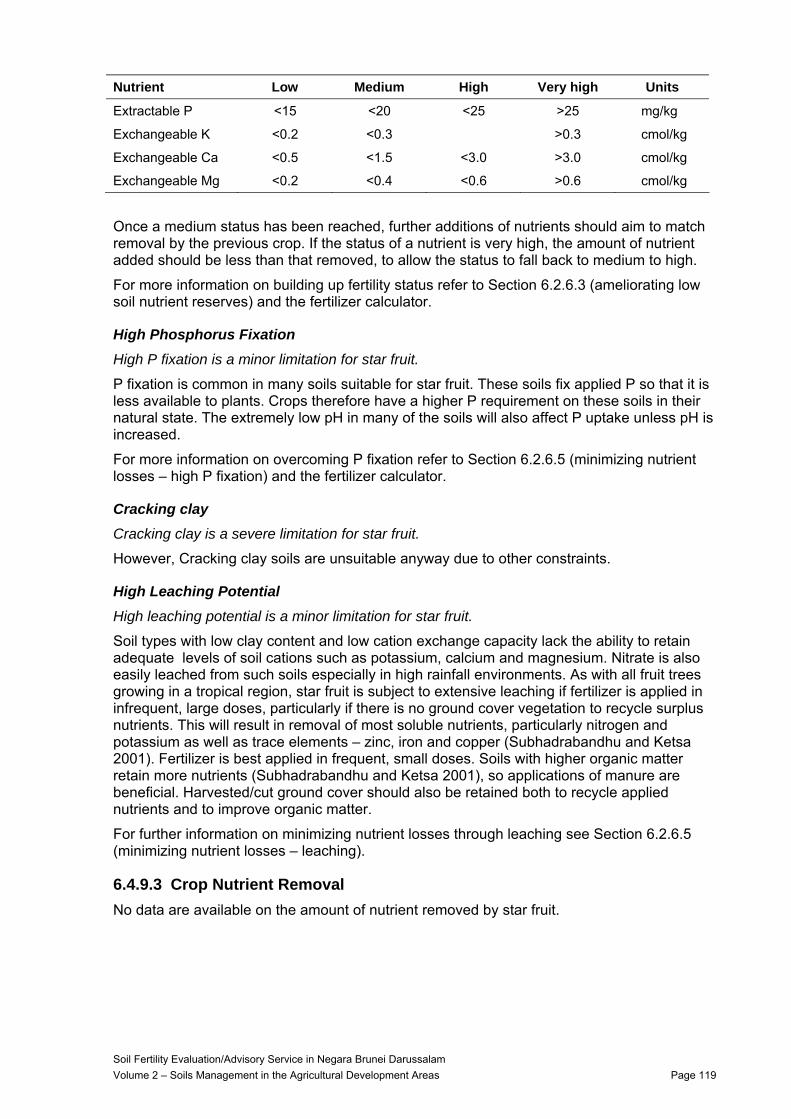
Nutrient Low Medium High Very high Units
Extractable P <15 <20 <25 >25 mg/kg
Exchangeable K <0.2 <0.3 >0.3 cmol/kg
Exchangeable Ca <0.5 <1.5 <3.0 >3.0 cmol/kg
Exchangeable Mg <0.2 <0.4 <0.6 >0.6 cmol/kg
Once a medium status has been reached, further additions of nutrients should aim to match removal by the previous crop. If the status of a nutrient is very high, the amount of nutrient added should be less than that removed, to allow the status to fall back to medium to high.
For more information on building up fertility status refer to Section 6.2.6.3 (ameliorating low soil nutrient reserves) and the fertilizer calculator.
High Phosphorus Fixation High P fixation is a minor limitation for star fruit.
P fixation is common in many soils suitable for star fruit. These soils fix applied P so that it is less available to plants. Crops therefore have a higher P requirement on these soils in their natural state. The extremely low pH in many of the soils will also affect P uptake unless pH is increased.
For more information on overcoming P fixation refer to Section 6.2.6.5 (minimizing nutrient losses – high P fixation) and the fertilizer calculator.
Cracking clay Cracking clay is a severe limitation for star fruit.
However, Cracking clay soils are unsuitable anyway due to other constraints.
High Leaching Potential High leaching potential is a minor limitation for star fruit.
Soil types with low clay content and low cation exchange capacity lack the ability to retain adequate levels of soil cations such as potassium, calcium and magnesium. Nitrate is also easily leached from such soils especially in high rainfall environments. As with all fruit trees growing in a tropical region, star fruit is subject to extensive leaching if fertilizer is applied in infrequent, large doses, particularly if there is no ground cover vegetation to recycle surplus nutrients. This will result in removal of most soluble nutrients, particularly nitrogen and potassium as well as trace elements – zinc, iron and copper (Subhadrabandhu and Ketsa 2001). Fertilizer is best applied in frequent, small doses. Soils with higher organic matter retain more nutrients (Subhadrabandhu and Ketsa 2001), so applications of manure are beneficial. Harvested/cut ground cover should also be retained both to recycle applied nutrients and to improve organic matter.
For further information on minimizing nutrient losses through leaching see Section 6.2.6.5 (minimizing nutrient losses – leaching).
6.4.9.3 Crop Nutrient Removal No data are available on the amount of nutrient removed by star fruit.
Soil Fertility Evaluation/Advisory Service in Negara Brunei Darussalam Volume 2 – Soils Management in the Agricultural Development Areas Page 119
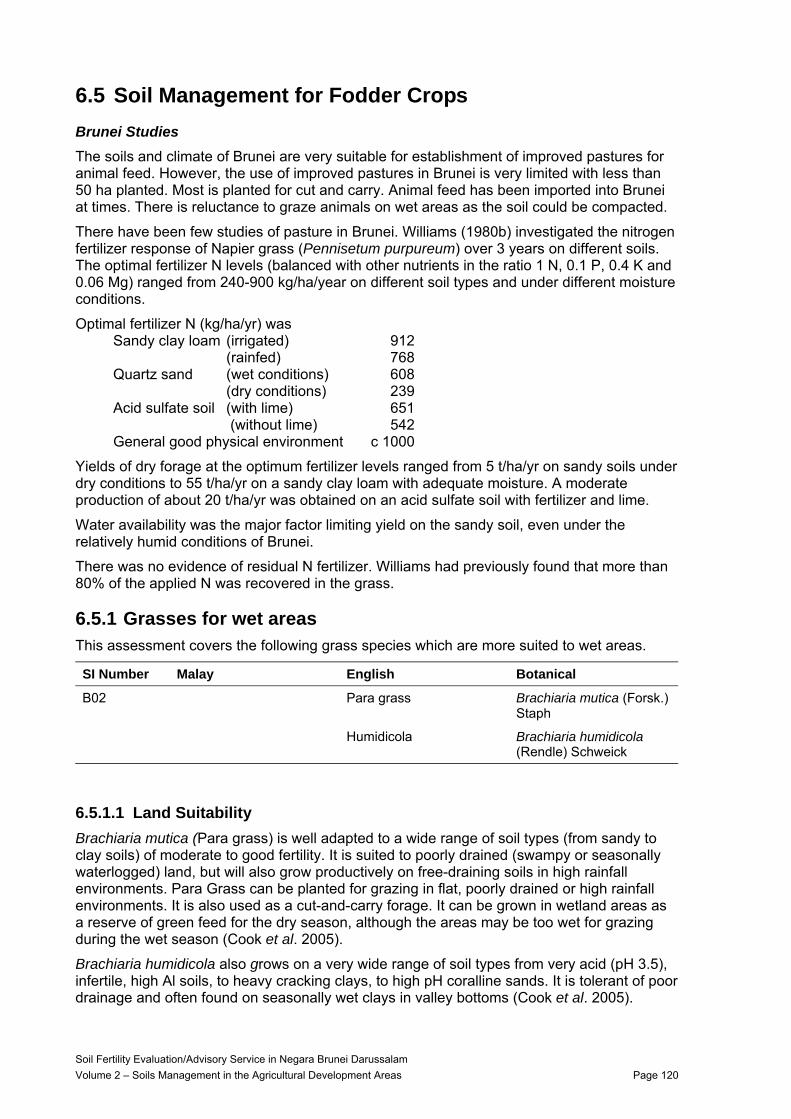
6.5 Soil Management for Fodder Crops Brunei Studies The soils and climate of Brunei are very suitable for establishment of improved pastures for animal feed. However, the use of improved pastures in Brunei is very limited with less than 50 ha planted. Most is planted for cut and carry. Animal feed has been imported into Brunei at times. There is reluctance to graze animals on wet areas as the soil could be compacted.
There have been few studies of pasture in Brunei. Williams (1980b) investigated the nitrogen fertilizer response of Napier grass (Pennisetum purpureum) over 3 years on different soils. The optimal fertilizer N levels (balanced with other nutrients in the ratio 1 N, 0.1 P, 0.4 K and 0.06 Mg) ranged from 240-900 kg/ha/year on different soil types and under different moisture conditions.
Optimal fertilizer N (kg/ha/yr) was Sandy clay loam (irrigated) 912 (rainfed) 768 Quartz sand (wet conditions) 608 (dry conditions) 239 Acid sulfate soil (with lime) 651 (without lime) 542 General good physical environment c 1000
Yields of dry forage at the optimum fertilizer levels ranged from 5 t/ha/yr on sandy soils under dry conditions to 55 t/ha/yr on a sandy clay loam with adequate moisture. A moderate production of about 20 t/ha/yr was obtained on an acid sulfate soil with fertilizer and lime.
Water availability was the major factor limiting yield on the sandy soil, even under the relatively humid conditions of Brunei.
There was no evidence of residual N fertilizer. Williams had previously found that more than 80% of the applied N was recovered in the grass.
6.5.1 Grasses for wet areas This assessment covers the following grass species which are more suited to wet areas.
SI Number Malay English Botanical
B02 Para grass Brachiaria mutica (Forsk.) Staph
Humidicola Brachiaria humidicola (Rendle) Schweick
6.5.1.1 Land Suitability Brachiaria mutica (Para grass) is well adapted to a wide range of soil types (from sandy to clay soils) of moderate to good fertility. It is suited to poorly drained (swampy or seasonally waterlogged) land, but will also grow productively on free-draining soils in high rainfall environments. Para Grass can be planted for grazing in flat, poorly drained or high rainfall environments. It is also used as a cut-and-carry forage. It can be grown in wetland areas as a reserve of green feed for the dry season, although the areas may be too wet for grazing during the wet season (Cook et al. 2005).
Brachiaria humidicola also grows on a very wide range of soil types from very acid (pH 3.5), infertile, high Al soils, to heavy cracking clays, to high pH coralline sands. It is tolerant of poor drainage and often found on seasonally wet clays in valley bottoms (Cook et al. 2005).
Soil Fertility Evaluation/Advisory Service in Negara Brunei Darussalam Volume 2 – Soils Management in the Agricultural Development Areas Page 120
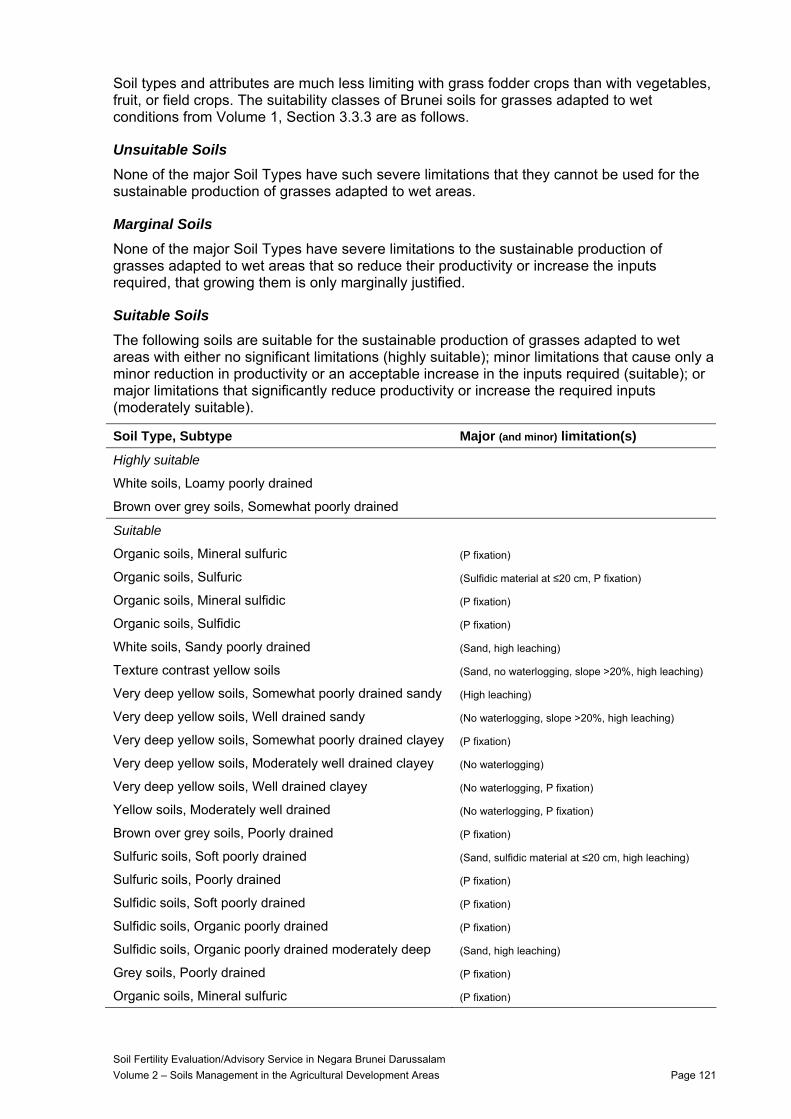
Soil types and attributes are much less limiting with grass fodder crops than with vegetables, fruit, or field crops. The suitability classes of Brunei soils for grasses adapted to wet conditions from Volume 1, Section 3.3.3 are as follows.
Unsuitable Soils None of the major Soil Types have such severe limitations that they cannot be used for the sustainable production of grasses adapted to wet areas.
Marginal Soils None of the major Soil Types have severe limitations to the sustainable production of grasses adapted to wet areas that so reduce their productivity or increase the inputs required, that growing them is only marginally justified.
Suitable Soils The following soils are suitable for the sustainable production of grasses adapted to wet areas with either no significant limitations (highly suitable); minor limitations that cause only a minor reduction in productivity or an acceptable increase in the inputs required (suitable); or major limitations that significantly reduce productivity or increase the required inputs (moderately suitable).
Soil Type, Subtype Major (and minor) limitation(s)
Highly suitable
White soils, Loamy poorly drained
Brown over grey soils, Somewhat poorly drained
Suitable
Organic soils, Mineral sulfuric (P fixation)
Organic soils, Sulfuric (Sulfidic material at ≤20 cm, P fixation)
Organic soils, Mineral sulfidic (P fixation)
Organic soils, Sulfidic (P fixation)
White soils, Sandy poorly drained (Sand, high leaching)
Texture contrast yellow soils (Sand, no waterlogging, slope >20%, high leaching)
Very deep yellow soils, Somewhat poorly drained sandy (High leaching)
Very deep yellow soils, Well drained sandy (No waterlogging, slope >20%, high leaching)
Very deep yellow soils, Somewhat poorly drained clayey (P fixation)
Very deep yellow soils, Moderately well drained clayey (No waterlogging)
Very deep yellow soils, Well drained clayey (No waterlogging, P fixation)
Yellow soils, Moderately well drained (No waterlogging, P fixation)
Brown over grey soils, Poorly drained (P fixation)
Sulfuric soils, Soft poorly drained (Sand, sulfidic material at ≤20 cm, high leaching)
Sulfuric soils, Poorly drained (P fixation)
Sulfidic soils, Soft poorly drained (P fixation)
Sulfidic soils, Organic poorly drained (P fixation)
Sulfidic soils, Organic poorly drained moderately deep (Sand, high leaching)
Grey soils, Poorly drained (P fixation)
Organic soils, Mineral sulfuric (P fixation)
Soil Fertility Evaluation/Advisory Service in Negara Brunei Darussalam Volume 2 – Soils Management in the Agricultural Development Areas Page 121
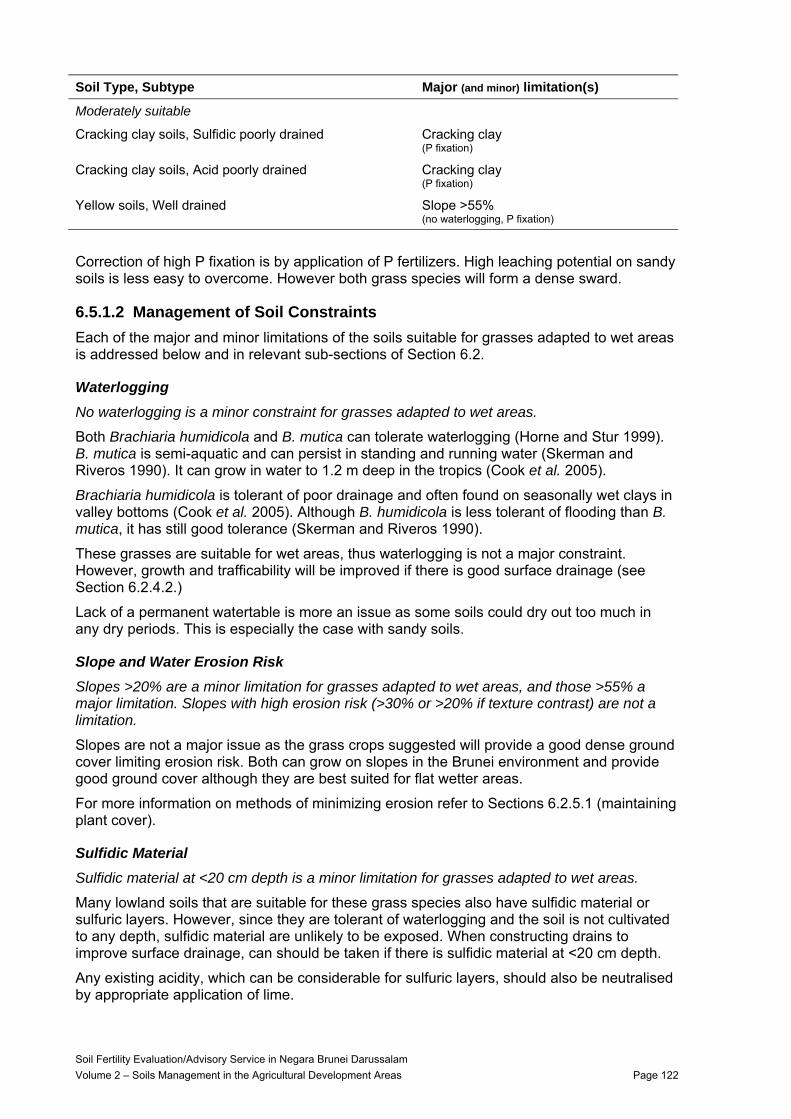
Soil Type, Subtype Major (and minor) limitation(s)
Moderately suitable
Cracking clay soils, Sulfidic poorly drained Cracking clay (P fixation)
Cracking clay soils, Acid poorly drained Cracking clay (P fixation)
Yellow soils, Well drained Slope >55% (no waterlogging, P fixation)
Correction of high P fixation is by application of P fertilizers. High leaching potential on sandy soils is less easy to overcome. However both grass species will form a dense sward.
6.5.1.2 Management of Soil Constraints Each of the major and minor limitations of the soils suitable for grasses adapted to wet areas is addressed below and in relevant sub-sections of Section 6.2.
Waterlogging No waterlogging is a minor constraint for grasses adapted to wet areas.
Both Brachiaria humidicola and B. mutica can tolerate waterlogging (Horne and Stur 1999). B. mutica is semi-aquatic and can persist in standing and running water (Skerman and Riveros 1990). It can grow in water to 1.2 m deep in the tropics (Cook et al. 2005).
Brachiaria humidicola is tolerant of poor drainage and often found on seasonally wet clays in valley bottoms (Cook et al. 2005). Although B. humidicola is less tolerant of flooding than B. mutica, it has still good tolerance (Skerman and Riveros 1990).
These grasses are suitable for wet areas, thus waterlogging is not a major constraint. However, growth and trafficability will be improved if there is good surface drainage (see Section 6.2.4.2.)
Lack of a permanent watertable is more an issue as some soils could dry out too much in any dry periods. This is especially the case with sandy soils.
Slope and Water Erosion Risk Slopes >20% are a minor limitation for grasses adapted to wet areas, and those >55% a major limitation. Slopes with high erosion risk (>30% or >20% if texture contrast) are not a limitation.
Slopes are not a major issue as the grass crops suggested will provide a good dense ground cover limiting erosion risk. Both can grow on slopes in the Brunei environment and provide good ground cover although they are best suited for flat wetter areas.
For more information on methods of minimizing erosion refer to Sections 6.2.5.1 (maintaining plant cover).
Sulfidic Material Sulfidic material at <20 cm depth is a minor limitation for grasses adapted to wet areas.
Many lowland soils that are suitable for these grass species also have sulfidic material or sulfuric layers. However, since they are tolerant of waterlogging and the soil is not cultivated to any depth, sulfidic material are unlikely to be exposed. When constructing drains to improve surface drainage, can should be taken if there is sulfidic material at <20 cm depth.
Any existing acidity, which can be considerable for sulfuric layers, should also be neutralised by appropriate application of lime.
Soil Fertility Evaluation/Advisory Service in Negara Brunei Darussalam Volume 2 – Soils Management in the Agricultural Development Areas Page 122
For more information on managing such soils refer to Section 6.2.3 and the calculator for nutrient and lime management.
Soil Acidity and Aluminium Toxicity Al saturation is not a limitation for grasses adapted to wet areas.
Soil acidity and associated aluminium toxicity are common in Brunei. Aluminium toxicity is not an issue as the grasses suggested are tolerant to high aluminium/low pH (Skerman and Riveros 1990; Cook et al.2005; Moody and Cong 2008). Brachiaria species can grow on soils with >70% aluminium saturation (Moody and Cong 2008). Brachiaria humidicola has a low Ca requirement (Cook et al. 2005). Whilst aluminium saturation can be reduced to near zero by liming to pH ~5.5 in most soils of the ADAs, lime can be saved by using a target pH of 4.2 in Organic, Sulfuric and Sulfidic soils and 4.8 in other soils types (except White soils) (see Figure 9).
For more information on methods of managing soil acidity refer to Sections 6.2.2.3 (lime requirement) and 6.2.2.4 (minimising acid production).
Low Nutrient Reserves (indicated by low potassium) Low nutrient reserves are not a limitation for grasses adapted to wet areas.
Many soils in Brunei have low fertility status as indicated by low K reserves. As part of a sustainable nutrient management plan, the fertility status of such soils should be improved by adding more nutrients than are required to replace those removed by the previous crop. Soil nutrient levels for tropical grasses are as follows (Dierolf et al. 2001):
Nutrient Low Medium High Very high Units
Extractable P <15 <20 <25 >25 mg/kg
Exchangeable K <0.2 <0.4 <0.5 >0.5 cmol/kg
Exchangeable Ca <0.8 <1.5 <3.0 >3.0 cmol/kg
Exchangeable Mg <0.2 <0.4 <0.8 >0.8 cmol/kg
Once a medium status has been reached, further additions of nutrients should aim to match removal by the previous crop. If the status of a nutrient is very high, the amount of nutrient added should be less than that removed, to allow the status to fall back to medium to high.
For more information on building up fertility status refer to Section 6.2.6.3 (ameliorating low soil nutrient reserves) and the fertilizer calculator.
High phosphorus fixation High P fixation is a minor limitation for grasses adapted to wet areas.
P fixation is common in many soils suitable for grasses adapted to wet areas. These soils fix applied P so that it is less available to plants. Most crops therefore have a higher P requirement on these soils in their natural state. Although Brachiaria humidicola grows well in infertile soils with low P levels, it still responds to added P (Cook et al. 2005). The extremely low pH in many of the soils will also affect P uptake unless pH is increased.
For more information on overcoming P fixation refer to Section 6.2.6.5 (minimizing nutrient losses – high P fixation) and the fertilizer calculator.
Cracking clay Cracking clay is a major limitation for grasses adapted to wet areas.
These soils swell, shrink and crack in response to changes in soil moisture content. When wet, they are very sticky and slow to drain. When dry, they are hard to cultivate and root penetration is difficult (AVRDC 1990). They are difficult soils to manage, especially in a wet
Soil Fertility Evaluation/Advisory Service in Negara Brunei Darussalam Volume 2 – Soils Management in the Agricultural Development Areas Page 123
environment such as Brunei where there is high rainfall combined with shallow watertables. In this environment, cracking clay tends to exacerbate waterlogging.
Both Brachiaria species can be grown on cracking clays (Cook et al. 2005). Care must be taken to ensure the soil is sufficiently dry before cultivating these soils prior to sowing, to avoid damaging their structure by shearing and compaction. Once established, the major problem is compaction due to traffic by animals, machinery or humans when the soil is wet. Compaction exacerbates waterlogging by reducing permeability. It also hinders root development which can cause problems with access to water in the subsoil during dry periods. Compaction is best avoided by using controlled traffic and by ‘cut and carry’ harvesting of fodder rather than direct grazing.
For further information on improving soil permeability see Section 6.2.4.4 (improving soil permeability).
High Leaching Potential High leaching potential is a minor limitation for grasses adapted to wet areas.
Soil types with low clay content and low cation exchange capacity lack the ability to retain adequate levels of soil cations such as potassium, calcium and magnesium. Nitrate is also easily leached from such soils especially in high rainfall environments. Although the continuous growth and uptake of nutrients by grasses helps to minimize losses of applied nutrients, fertilizer is still best applied in frequent, small doses.
For further information on minimizing nutrient losses through leaching see Section 6.2.6.5 (minimizing nutrient losses – leaching).
6.5.1.3 Crop Nutrient removal Brachiaria humidicola grows well in infertile soils with low P levels, but will respond to N and P (Cook et al. 2005). Whilst there is no information specifically on Brachiaria spp., the amount of nutrient removed per tonne of fresh product is as follows for tropical grasses in general.
Crop Nutrient uptake/removal Ref.
Malay English N P K Ca Mg
kg/t DM
Tropical grasses 30 3.7 26.7 7.2 5.2 1
22.5 2.5 25 2.5 2.6 2
Sources: 1. Dierolf et al. (2001) 2. Anon. (1996-2006) based on production of 4 t DM/ha
Crop Micronutrient uptake/removal Ref.
Malay English Fe Mn Zn Cu B Mo
g/t DM
Tropical grasses 75 70 30 6.25 20 0.3 1
Source: 1. Anon. (1996-2006) based on production of 4 t DM/ha
The amount of nutrient removed does not take into account leaching, volatilisation losses, fertilizer efficiency, etc. Therefore nutrient requirements are much higher than just nutrient removal.
For more information on calculating the amount of fertilizer required to replace the nutrients removed refer to Section 6.2.6.6 and the fertilizer calculator.
Soil Fertility Evaluation/Advisory Service in Negara Brunei Darussalam Volume 2 – Soils Management in the Agricultural Development Areas Page 124
6.5.2 Grasses for well drained areas SI Number Malay English Botanical
B03 Napier or Elephant grass Pennisetum purpureum Schumach
B04 Guinea grass Panicum maximum Jacq.
6.5.2.1 Land Suitability Pennisetum purpureum Schumach (Napier grass) is mostly planted for cut and carry systems (as practiced in Brunei), and not for long-term grazed pastures. It grows on a wide range of soil types provided fertility is adequate but does best in deep, well-drained friable soils. Although extremely drought tolerant by virtue of a deep root system, it needs good moisture for production (Cook et al. 2005).
Panicum maximum (guinea or elephant grass) is ideal for cut-and-carry, although bristly types may cause discomfort to those collecting it. It can also be used for a long term pasture if fertility is maintained (Cook et al. 2005). P. maximum grows in most soil types providing they are well-drained, moist and fertile, although some varieties are tolerant of lower fertility and poorer drainage. Tolerance of low soil pH and high Al saturation is variable (Skerman and Riveros 1990; Cook et al. 2005).
Large areas of Brunei are suitable for both Napier and Guinea grass. Napier is currently being grown for cut and carry but on a limited scale. It has been observed growing in Brunei in poorly drained areas when the plants were on slight mounds, although it had died out elsewhere where the soil was too wet. A number of selections have been evaluated at Luahan Livestock station for about the last 18 years.
Grass fodder crops are much more tolerant to adverse soil attributes than vegetables, fruit, or field crops. The suitability classes of Brunei soils for grasses adapted to well drained conditions from Volume 1, Section 3.3.3 are as follows.
Unsuitable Soils None of the major Soil Types have such severe limitations that they cannot be used for the sustainable production of grasses adapted to well drained conditions.
Marginal Soils None of the major Soil Types have severe limitations to the sustainable production of grasses adapted to well drained conditions that so reduce their productivity or increase the inputs required, that growing them is only marginally justified.
Suitable Soils The following soils are suitable for the sustainable production of grasses adapted to well drained conditions with either no significant limitations (highly suitable); minor limitations that cause only a minor reduction in productivity or an acceptable increase in the inputs required (suitable); or major limitations that significantly reduce productivity or increase the required inputs (moderately suitable).
Soil Type, Subtype Major (and minor) limitation(s)
Suitable
White soils, Loamy poorly drained (Waterlogging, low K reserves)
Texture contrast yellow soils (Slope >20%, high erosion risk, low K reserves, high leaching)
Very deep yellow soils, Somewhat poorly drained sandy (Waterlogging, low K reserves, high leaching)
Soil Fertility Evaluation/Advisory Service in Negara Brunei Darussalam Volume 2 – Soils Management in the Agricultural Development Areas Page 125
Soil Type, Subtype Major (and minor) limitation(s)
Suitable continued
Very deep yellow soils, Well drained sandy (Slope >20%, high erosion risk, low K reserves, high leaching)
Very deep yellow soils, Somewhat poorly drained clayey (Waterlogging, low K reserves, P fixation)
Very deep yellow soils, Moderately well drained clayey (Low K reserves)
Very deep yellow soils, Well drained clayey (High erosion risk, low K reserves, P fixation)
Yellow soils, Moderately well drained (High erosion risk, low K reserves, P fixation)
Brown over grey soils, Somewhat poorly drained (Clay, waterlogging, low K reserves)
Sulfuric soils, Soft poorly drained (Waterlogging, sulfidic material at ≤20 cm, low K reserves, high leaching)
Sulfuric soils, Poorly drained (Waterlogging, P fixation)
Sulfidic soils, Organic poorly drained moderately deep (Waterlogging, low K reserves, high leaching)
Grey soils, Poorly drained (Clay, waterlogging, low K reserves, P fixation)
Moderately suitable
Organic soils, Mineral sulfuric Peat, prolonged waterlogging (P fixation)
Organic soils, Sulfuric Peat, prolonged waterlogging (sulfidic material at ≤20 cm, P fixation)
Organic soils, Mineral sulfidic Peat, prolonged waterlogging (low K reserves, P fixation)
Organic soils, Sulfidic Peat, prolonged waterlogging (P fixation)
White soils, Sandy poorly drained Prolonged waterlogging (low K reserves, high leaching)
Cracking clay soils, Sulfidic poorly drained Prolonged waterlogging, cracking clay (clay, P fixation)
Cracking clay soils, Acid poorly drained Prolonged waterlogging, cracking clay (clay, P fixation)
Yellow soils, Well drained Slope >55% (clay, high erosion risk, low K reserves, P fixation)
Brown over grey soils, Poorly drained Prolonged waterlogging (clay, low K reserves, P fixation)
Sulfidic soils, Soft poorly drained Prolonged waterlogging (clay, low K reserves, P fixation)
Sulfidic soils, Organic poorly drained Peat (waterlogging, P fixation)
The main limiting factor on the above soils is waterlogging which is an issue for grasses that favour well drained areas. With the above soils, it is possible to use raised beds/mounds for Napier especially as it is a cut and carry fodder crop. Guinea grass could also be grown this way.
Correction of high P fixation and K deficiency is by application of P and K fertilizers in sufficient quantities. Guinea grass is more suitable as a pasture than Napier grass on slopes as Napier grass is planted in clumps which leave considerable exposed area.
6.5.2.2 Management of Soil Constraints The major constraint is waterlogging as the species suggested are adapted to well drained areas.
Soil Fertility Evaluation/Advisory Service in Negara Brunei Darussalam Volume 2 – Soils Management in the Agricultural Development Areas Page 126
Each of the major and minor limitations of the soils suitable for grasses adapted to well drained areas is addressed below and in relevant sub-sections of Section 6.2.
Waterlogging Waterlogging is a minor limitation for grasses adapted to well drained areas and prolonged waterlogging a major limitation.
Many soils in Brunei, especially on flat lands, are waterlogged. Neither species is well suited to areas with high watertables. Napier grass (Pennisetum purpureum) although extremely drought tolerant by virtue of a deep root system (Skerman and Riveros 1990), needs good moisture for production, but does not tolerate prolonged flooding or waterlogging (Cook et al. 2005).
Panicum maximum (Guinea grass) is generally intolerant of prolonged waterlogging although it is tolerant of short term flooding by moving water (Duke 1983a; Cook et al. 2005).
Although these species are not recommended for areas with permanent watertables, areas with intermittent waterlogging can be used if surface drainage is improved (see Section 6.2.4.2 (improving surface drainage).
Slope and Water Erosion Risk Slopes >20% are a minor limitation for grasses adapted to well drained areas, and those >55% a major limitation. Slopes with high erosion risk (>30% or >20% if texture contrast) are a minor limitation.
Slope can be a constraint with Pennisetum (Napier grass) as it normally is planted in clumps and the grass does not form a dense cover but grows in clumps and does not rapidly spread. Steeper land should be avoided for Napier grass. Napier grass is normally planted in rows 0.5-2 m apart, and 0.3-1 m apart within rows. Close spacing is required for soil conservation with contour hedgerows suggested for high rainfall environments (Cook et. al. 2005).
Panicum is more spreading and forms a better ground cover, so it is well adapted to sloping land (Skerman and Riveros 1990).
For more information on methods of minimizing erosion refer to Sections 6.2.5.1 (maintaining plant cover).
Sulfidic Material Sulfidic material at <20 cm depth is a minor limitation for grasses adapted to well drained areas.
Although these grass species are moderately suited to soils with waterlogging, many such soils also have sulfidic material or sulfuric layers. However, since the soil is not cultivated to any depth, sulfidic material is unlikely to be exposed. When constructing drains to improve surface drainage, care should be taken if there is sulfidic material at <20 cm depth.
Any existing acidity, which can be considerable for sulfuric layers, should also be neutralised by appropriate application of lime.
For more information on managing such soils refer to Section 6.2.3 and the calculator for nutrient and lime management.
Soil Acidity and Aluminium Toxicity Al saturation is not a limitation for grasses adapted to well drained areas.
Soil acidity and associated aluminium toxicity are common in Brunei. Panicum maximum tolerates low soil pH and high soil Al saturation if the soil is well drained (Skerman and Riveros 1990), although this varies between cultivars (Cook et al. 2005). There are no readily available data on tolerance of Pennisetum purpureum to high levels of Al and Mn, although it grows in soils with a pH range of 4.5-8.2 (Cook et al. 2005). Neutralisation of aluminium phytotoxicity can be achieved by liming to pH ~5.5 in most soils of the ADAs (see Figure 9).
Soil Fertility Evaluation/Advisory Service in Negara Brunei Darussalam Volume 2 – Soils Management in the Agricultural Development Areas Page 127
For more information on methods of managing soil acidity refer to Sections 6.2.2.3 (lime requirement) and 6.2.2.4 (minimising acid production).
Low Nutrient Reserves (indicated by low potassium) Low nutrient reserves are a minor limitation for grasses adapted to well drained areas.
Many soils in Brunei have low fertility status as indicated by low K reserves. As part of a sustainable nutrient management plan, the fertility status of such soils should be improved by adding more nutrients than are required to replace those removed by the previous crop. Soil nutrient levels for tropical grasses are as follows (Dierolf et al. 2001):
Nutrient Low Medium High Very high Units
Extractable P <15 <20 <25 >25 mg/kg
Exchangeable K <0.2 <0.4 <0.5 >0.5 cmol/kg
Exchangeable Ca <0.8 <1.5 <3.0 >3.0 cmol/kg
Exchangeable Mg <0.2 <0.4 <0.8 >0.8 cmol/kg
Once a medium status has been reached, further additions of nutrients should aim to match removal by the previous crop. If the status of a nutrient is very high, the amount of nutrient added should be less than that removed, to allow the status to fall back to medium to high.
For more information on building up fertility status refer to Section 6.2.6.3 (ameliorating low soil nutrient reserves) and the fertilizer calculator.
High phosphorus fixation High P fixation is a minor limitation for grasses adapted to well drained areas.
P fixation is common in many soils suitable for grasses adapted to well drained areas. These soils fix applied P so that it is less available to plants. Crops therefore have a higher P requirement on these soils in their natural state. The extremely low pH in many of the soils will also affect P uptake unless pH is increased.
For more information on overcoming P fixation refer to Section 6.2.6.5 (minimizing nutrient losses – high P fixation) and the fertilizer calculator.
Cracking clay Cracking clay is a major limitation for grasses adapted to well drained areas.
These soils swell, shrink and crack in response to changes in soil moisture content. When wet, they are very sticky and slow to drain. When dry, they are hard to cultivate and root penetration is difficult (AVRDC 1990). They are difficult soils to manage, especially in a wet environment such as Brunei where there is high rainfall combined with shallow watertables. In this environment, cracking clay tends to exacerbate waterlogging.
Care must be taken to ensure the soil is sufficiently dry before cultivating these soils prior to sowing, to avoid damaging their structure by shearing and compaction. Once established, the major problem is compaction due to traffic by animals, machinery or humans when the soil is wet. Compaction exacerbates waterlogging by reducing permeability. It also hinders root development which can cause problems with access to water in the subsoil during dry periods. Compaction is best avoided by using controlled traffic and by ‘cut and carry’ harvesting of fodder rather than direct grazing.
For further information on improving soil permeability see Section 6.2.4.4 (improving soil permeability).
Soil Fertility Evaluation/Advisory Service in Negara Brunei Darussalam Volume 2 – Soils Management in the Agricultural Development Areas Page 128
High Leaching Potential High leaching potential is a minor limitation for grasses adapted to well drained areas.
Soil types with low clay content and low cation exchange capacity lack the ability to retain adequate levels of soil cations such as potassium, calcium and magnesium. Nitrate is also easily leached from such soils especially in high rainfall environments. Although the continuous growth and uptake of nutrients by grasses helps to minimize losses of applied nutrients, fertilizer is still best applied in frequent, small doses.
For further information on minimizing nutrient losses through leaching see Section 6.2.6.5 (minimizing nutrient losses – leaching).
6.5.2.3 Crop Nutrient removal Whilst there is no information specifically on Panicum maximum or Pennisetum purpureum, the amount of nutrient removed per tonne of fresh product is as follows for tropical grasses in general.
Crop Nutrient uptake/removal Ref.
Malay English N P K Ca Mg
kg/t DM
Tropical grasses 30 3.7 26.7 7.2 5.2 1
22.5 2.5 25 2.5 2.6 2
Sources: 1. Dierolf et al. (2001) 2. Anon. (1996-2006) based on production of 4 t DM/ha
Crop Micronutrient uptake/removal Ref.
Malay English Fe Mn Zn Cu B Mo
g/t DM
Tropical grasses 75 70 30 6.25 20 0.3 1
Source: 1. Anon. (1996-2006) based on production of 4 t DM/ha
The amount of nutrient removed does not take into account leaching, volatilisation losses, fertilizer efficiency, etc. Therefore nutrient requirements are much higher than just nutrient removal.
For more information on calculating the amount of fertilizer required to replace the nutrients removed refer to Section 6.2.6.6 and the fertilizer calculator.
Soil Fertility Evaluation/Advisory Service in Negara Brunei Darussalam Volume 2 – Soils Management in the Agricultural Development Areas Page 129
6.5.3 Fodder legumes for wet areas SI Number Malay English Botanical
Pinto peanuts Arachis pintoi
Indian jointed vetch Aeschynomene indica L.
6.5.3.1 Land Suitability Arachis pintoi in its centre of origin is generally found on sandy loam, river-bottom soils of low to moderate fertility and high aluminium saturation, particularly in low areas, which are wet to flooded during the wet season. However, it is also suitable in better drained areas. In cultivation, Arachis pintoi is not restricted by soil texture. However the fruiting pegs will not penetrate hard, dry ground and shrivel and perish on contact with the soil. Pinto peanut is suitable for permanent pasture for intensive grazing systems, and for ground cover in open situations and under trees. While mostly too low-growing for cut-and-carry, some provenances are used for these systems (Cook et al. 2005).
Pintoi peanut thrives in Brunei where it is commonly used for landscaping. In Australia it is used both as a pasture species and increasingly as a cover crop in fruit tree orchards and also in coffee and banana plantations.
Aeschynomene indica L., also known as Budda Pea, curly indigo, and sensitive vetch, is a freely nodulating nitrogen-fixing species. A. indica can be used as a green manure crop and may also have application as a fodder crop in rotation with rice (Cook et al. 2005). Aeschynomene indica is found on soils with texture ranging from sandy loam to clay with its distribution more determined by moisture availability and drainage than by soil texture. It occurs mostly on soils that are subject to flooding and waterlogging (Cook et al. 2005).
Soil types and attributes are slightly more limiting with legume fodder crops for wet areas than with grasses for similar areas. The suitability classes of Brunei soils for fodder legumes adapted to wet areas from Volume 1, Section 3.3.3 are as follows.
Unsuitable Soils None of the major Soil Types have such severe limitations that they cannot be used for the sustainable production of fodder legumes adapted to wet areas.
Marginal Soils None of the major Soil Types have severe limitations to the sustainable production of fodder legumes adapted to wet areas that so reduce their productivity or increase the inputs required, that growing them is only marginally justified.
Suitable Soils The following soils are suitable for the sustainable production of fodder legumes adapted to wet areas with either no significant limitations (highly suitable); minor limitations that cause only a minor reduction in productivity or an acceptable increase in the inputs required (suitable); or major limitations that significantly reduce productivity or increase the required inputs (moderately suitable).
Soil Fertility Evaluation/Advisory Service in Negara Brunei Darussalam Volume 2 – Soils Management in the Agricultural Development Areas Page 130
Soil Type, Subtype Major (and minor) limitation(s)
Suitable
Organic soils, Mineral sulfuric (Peat, prolonged waterlogging, Al toxicity, P fixation)
Organic soils, Sulfuric (Peat, prolonged waterlogging, sulfidic material at ≤20 cm, Al toxicity, P fixation)
Organic soils, Mineral sulfidic (Peat, prolonged waterlogging, Al toxicity, low K reserves, P fixation)
Organic soils, Sulfidic (Peat, prolonged waterlogging, Al toxicity, P fixation)
White soils, Loamy poorly drained (Al toxicity, low K reserves)
White soils, Sandy poorly drained (Prolonged waterlogging, low K reserves, high leaching)
Texture contrast yellow soils (Slope >20%, high erosion risk, Al toxicity, low K reserves, high leaching)
Very deep yellow soils, Somewhat poorly drained sandy (Low K reserves, high leaching)
Very deep yellow soils, Well drained sandy (Slope >20%, high erosion risk, Al toxicity, low K reserves, high leaching)
Very deep yellow soils, Somewhat poorly drained clayey (Al toxicity, low K reserves, P fixation)
Very deep yellow soils, Moderately well drained clayey (Al toxicity, low K reserves)
Very deep yellow soils, Well drained clayey (High erosion risk, Al toxicity, low K reserves, P fixation)
Yellow soils, Moderately well drained (High erosion risk, Al toxicity, low K reserves, P fixation)
Brown over grey soils, Somewhat poorly drained (Clay, Al toxicity, low K reserves)
Brown over grey soils, Poorly drained (Clay, prolonged waterlogging, low K reserves, P fixation)
Sulfuric soils, Soft poorly drained (Sulfidic material at ≤20 cm, Al toxicity, low K reserves, high leaching)
Sulfuric soils, Poorly drained (Al toxicity, P fixation)
Sulfidic soils, Soft poorly drained (Clay, prolonged waterlogging, Al toxicity, low K reserves, P fixation)
Sulfidic soils, Organic poorly drained (Peat, P fixation)
Sulfidic soils, Organic poorly drained moderately deep (Al toxicity, low K reserves, high leaching)
Grey soils, Poorly drained (Clay, Al toxicity, low K reserves, P fixation)
Moderately suitable
Cracking clay soils, Sulfidic poorly drained Cracking clay (clay, prolonged waterlogging, P fixation)
Cracking clay soils, Acid poorly drained Cracking clay (clay, prolonged waterlogging, P fixation)
Yellow soils, Well drained Slope >55% (clay, high erosion risk, Al toxicity, low K reserves, P fixation)
6.5.3.2 Management of Soil Constraints Each of the major and minor limitations of the soils suitable for fodder legumes adapted to wet areas is addressed below and in relevant sub-sections of Section 6.2.
Soil Fertility Evaluation/Advisory Service in Negara Brunei Darussalam Volume 2 – Soils Management in the Agricultural Development Areas Page 131
Waterlogging Prolonged waterlogging is a minor limitation for fodder legumes adapted to wet areas.
Many soils in Brunei, especially on flat lands, are waterlogged. Both crops under consideration are suitable for wet areas. Arachis pintoi in its centre of origin is generally on river-bottom areas, which are wet to flooded during the wet season (Cook et al. 2005). Aeschynomene occurs mostly on soils that are subject to flooding and waterlogging (Cook et al. 2005)
These legumes are suitable for wet areas, thus waterlogging is not a major constraint. However, growth and trafficability will be improved if there is good surface drainage (see Section 6.2.4.2.)
Lack of a permanent watertable is more an issue as some soils could dry out too much in any dry periods. This is especially the case with sandy soils.
Slope and Water Erosion Risk Slopes >20% are a minor limitation for fodder legumes for wet areas, and those >55% a major limitation. Slopes with high erosion risk (>30% or >20% if texture contrast) are a minor limitation.
Slopes are generally not an issue with the fodder crops suggested. Both Arachis pintoi and Aeschynomene indica can grow on slopes and will provide dense ground cover once established thus limiting erosion risk.
For more information on methods of minimizing erosion refer to Sections 6.2.5.1 (maintaining plant cover).
Sulfidic Material Sulfidic material at <20 cm depth is a minor limitation for fodder legumes adapted to wet areas.
Many lowland soils that are suitable for these legume species also have sulfidic material or sulfuric layers. However, since they are tolerant of waterlogging and the soil is not cultivated to any depth, sulfidic materials are unlikely to be exposed. When constructing drains to improve surface drainage, care should be taken if there is sulfidic material at <20 cm depth.
Any existing acidity, which can be considerable for sulfuric layers, should also be neutralised by appropriate application of lime.
For more information on managing such soils refer to Section 6.2.3 and the calculator for nutrient and lime management.
Soil Acidity and Aluminium Toxicity High Al saturation (>60%) is a minor limitation for fodder legumes adapted to wet areas.
Soil acidity and associated aluminium toxicity are common in Brunei. Arachis pintoi is tolerant of high levels of aluminium and manganese and can be successful on soils with pH ranging from about 4.5-7.2, although growth is reduced below pH 5.4 (Cook et al. 2005). Aeschynomene indica is grown on soils with pH from 4.5-8; but no information is available on Al tolerance (Cook et al. 2005).Neutralisation of aluminium phytotoxicity can be achieved by liming to pH ~5.5 in most soils of the ADAs (see Figure 9).
For more information on methods of managing soil acidity refer to Sections 6.2.2.3 (lime requirement) and 6.2.2.4 (minimising acid production).
Low Nutrient Reserves (indicated by low potassium) Low nutrient reserves are a minor limitation for fodder legumes adapted to wet conditions.
Many soils in Brunei have low fertility status as indicated by low K reserves. As part of a sustainable nutrient management plan, the fertility status of such soils should be improved by
Soil Fertility Evaluation/Advisory Service in Negara Brunei Darussalam Volume 2 – Soils Management in the Agricultural Development Areas Page 132
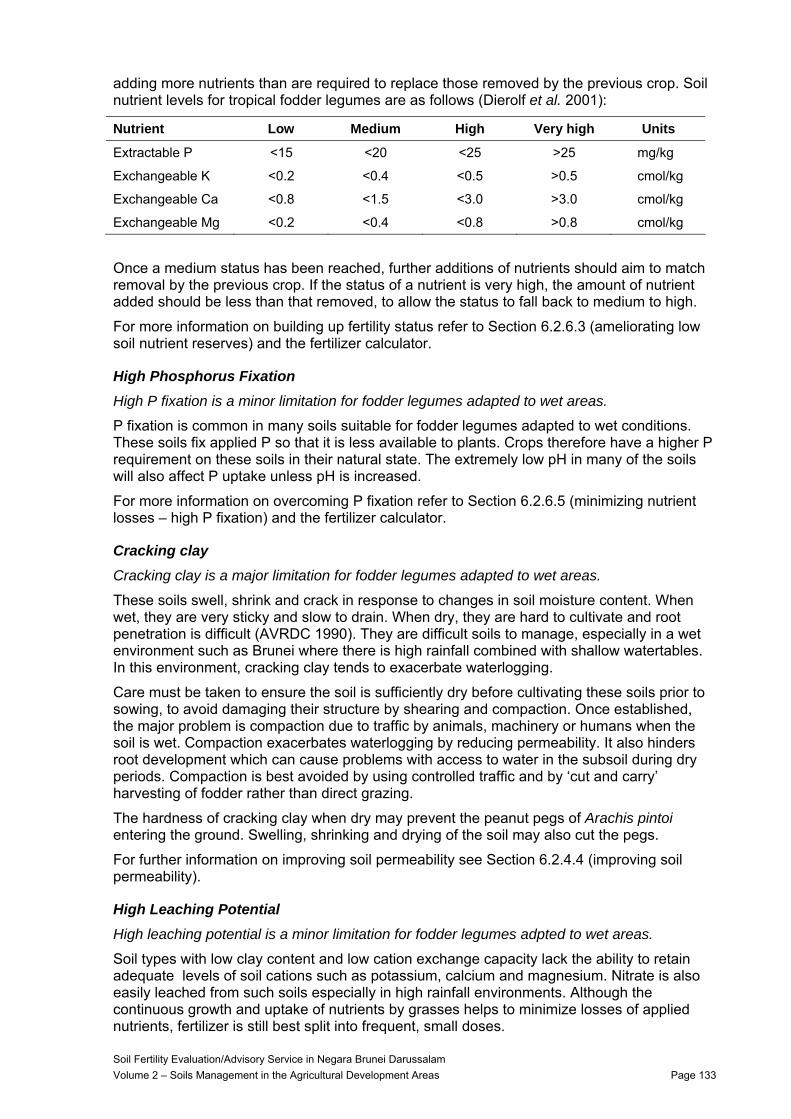
adding more nutrients than are required to replace those removed by the previous crop. Soil nutrient levels for tropical fodder legumes are as follows (Dierolf et al. 2001):
Nutrient Low Medium High Very high Units
Extractable P <15 <20 <25 >25 mg/kg
Exchangeable K <0.2 <0.4 <0.5 >0.5 cmol/kg
Exchangeable Ca <0.8 <1.5 <3.0 >3.0 cmol/kg
Exchangeable Mg <0.2 <0.4 <0.8 >0.8 cmol/kg
Once a medium status has been reached, further additions of nutrients should aim to match removal by the previous crop. If the status of a nutrient is very high, the amount of nutrient added should be less than that removed, to allow the status to fall back to medium to high.
For more information on building up fertility status refer to Section 6.2.6.3 (ameliorating low soil nutrient reserves) and the fertilizer calculator.
High Phosphorus Fixation High P fixation is a minor limitation for fodder legumes adapted to wet areas.
P fixation is common in many soils suitable for fodder legumes adapted to wet conditions. These soils fix applied P so that it is less available to plants. Crops therefore have a higher P requirement on these soils in their natural state. The extremely low pH in many of the soils will also affect P uptake unless pH is increased.
For more information on overcoming P fixation refer to Section 6.2.6.5 (minimizing nutrient losses – high P fixation) and the fertilizer calculator.
Cracking clay Cracking clay is a major limitation for fodder legumes adapted to wet areas.
These soils swell, shrink and crack in response to changes in soil moisture content. When wet, they are very sticky and slow to drain. When dry, they are hard to cultivate and root penetration is difficult (AVRDC 1990). They are difficult soils to manage, especially in a wet environment such as Brunei where there is high rainfall combined with shallow watertables. In this environment, cracking clay tends to exacerbate waterlogging.
Care must be taken to ensure the soil is sufficiently dry before cultivating these soils prior to sowing, to avoid damaging their structure by shearing and compaction. Once established, the major problem is compaction due to traffic by animals, machinery or humans when the soil is wet. Compaction exacerbates waterlogging by reducing permeability. It also hinders root development which can cause problems with access to water in the subsoil during dry periods. Compaction is best avoided by using controlled traffic and by ‘cut and carry’ harvesting of fodder rather than direct grazing.
The hardness of cracking clay when dry may prevent the peanut pegs of Arachis pintoi entering the ground. Swelling, shrinking and drying of the soil may also cut the pegs.
For further information on improving soil permeability see Section 6.2.4.4 (improving soil permeability).
High Leaching Potential High leaching potential is a minor limitation for fodder legumes adpted to wet areas.
Soil types with low clay content and low cation exchange capacity lack the ability to retain adequate levels of soil cations such as potassium, calcium and magnesium. Nitrate is also easily leached from such soils especially in high rainfall environments. Although the continuous growth and uptake of nutrients by grasses helps to minimize losses of applied nutrients, fertilizer is still best split into frequent, small doses.
Soil Fertility Evaluation/Advisory Service in Negara Brunei Darussalam Volume 2 – Soils Management in the Agricultural Development Areas Page 133
For further information on minimizing nutrient losses through leaching see Section 6.2.6.5 (minimizing nutrient losses – leaching).
6.5.3.3 Crop Nutrient removal Whilst there is no information specifically on Arachis pintoi or Aeschynomene indica, the amount of nutrient removed per tonne of fresh product is as follows for tropical forage legume in general.
Crop Nutrient uptake/removal Ref.
Malay English N P K Ca Mg
kg/t DM
Tropical forage legumes 37.5 4.4 33.3 13.4 5.3 1
Sources: 1. Dierolf et al. (2001)
The amount of nutrient removed does not take into account leaching, volatilisation losses, fertilizer efficiency, etc. Therefore nutrient requirements are much higher than just nutrient removal.
For more information on calculating the amount of fertilizer required to replace the nutrients removed refer to Section 6.2.6.6 and the fertilizer calculator.
Soil Fertility Evaluation/Advisory Service in Negara Brunei Darussalam Volume 2 – Soils Management in the Agricultural Development Areas Page 134
6.5.4 Fodder legumes for well drained areas SI Number Malay English Botanical
B10 Apil-Apil Leucaena leucocephala Lam. de Wit.
Pinto peanuts Arachis pintoi
6.5.4.1 Land Suitability Leucaena leucocephala is a long lived tree/shrub up to 18 m tall. It has deep roots and is good for areas with long dry periods. Leucaena does not tolerate infertile, acid soils or soils prone to waterlogging (Horne and Stur 1999; Cook et al. 2005). It is not a ground cover crop.
Leucaena leucocephala is highly valued as a forage and as a fuel wood by farmers throughout Southeast Asia and parts of central Asia and Africa. It is planted in hedgerow systems with grass for cattle production in northern Australia, and as a hedgerow species in parts of SE Asia and Africa. It is often grown in dense rows as a living fence and used to support vine crops such as pepper and passionfruit. It is the most commonly researched species for alley farming systems (Cook et al. 2005).
In its centre of origin, Arachis pintoi is generally found in low areas, which are wet to flooded during the wet season (Cook et al. 2005), so its requirements are discussed in the previous section on legumes for wet areas (6.5.3). However, it also grows well in better drained country as long as there is adequate rainfall or irrigation.
The soil attribute requirements for Leucaena and Arachis pintoi are rather different since the former is shrub and the latter a dense ground cover suitable for most soil conditions. Leucaena has more exacting requirements than Arachis pintoi, whose limitations are given in Section 6.5.3. Therefore the suitability classes of Brunei soils for fodder legumes adapted to well drained areas from Volume 1, Section 3.3.3 relate to Leucaena, and are as follows.
Unsuitable Soils None of the major Soil Types have such severe limitations that they cannot be used for the sustainable production of Leucaena.
Marginal Soils The following soils have severe limitations to the sustainable production of Leucaena that so reduce their productivity or increase the inputs required, that growing them is only marginally justified.
Soil Type, Subtype Severe limitation(s)
Organic soils, Mineral sulfuric Prolonged waterlogging
Organic soils, Sulfuric Prolonged waterlogging
Organic soils, Mineral sulfidic Prolonged waterlogging
Organic soils, Sulfidic Prolonged waterlogging
White soils, Sandy poorly drained Prolonged waterlogging
Cracking clay soils, Sulfidic poorly drained Prolonged waterlogging
Cracking clay soils, Acid poorly drained Prolonged waterlogging
Brown over grey soils, Poorly drained Prolonged waterlogging
Sulfidic soils, Soft poorly drained Prolonged waterlogging
Soil Fertility Evaluation/Advisory Service in Negara Brunei Darussalam Volume 2 – Soils Management in the Agricultural Development Areas Page 135
Suitable Soils The following soils are suitable for the sustainable production of Leucaena with either no significant limitations (highly suitable); minor limitations that cause only a minor reduction in productivity or an acceptable increase in the inputs required (suitable); or major limitations that significantly reduce productivity or increase the required inputs (moderately suitable).
Soil Type, Subtype Major (and minor) limitation(s)
Moderately suitable
White soils, Loamy poorly drained Waterlogging, Al toxicity (low K reserves)
Texture contrast yellow soils High erosion risk, Al toxicity (sand, slope >20%, low K reserves, high leaching)
Very deep yellow soils, Somewhat poorly drained sandy Waterlogging (moderate Al toxicity, low K reserves, high leaching)
Very deep yellow soils, Well drained sandy High erosion risk, Al toxicity (slope >20%, low K reserves, high leaching)
Very deep yellow soils, Somewhat poorly drained clayey Waterlogging, Al toxicity (low K reserves, P fixation)
Very deep yellow soils, Moderately well drained clayey Al toxicity (low K reserves)
Very deep yellow soils, Well drained clayey High erosion risk, Al toxicity (low K reserves, P fixation)
Yellow soils, Moderately well drained High erosion risk, Al toxicity (low K reserves, P fixation)
Yellow soils, Well drained Clay, slope >35%, high erosion risk, Al toxicity (low K reserves, P fixation)
Brown over grey soils, Somewhat poorly drained Clay, waterlogging, Al toxicity (low K reserves)
Sulfuric soils, Soft poorly drained Waterlogging, sulfidic material at ≤20 cm, Al toxicity (sand, low K reserves, high leaching)
Sulfuric soils, Poorly drained Waterlogging, Al toxicity (sulfidic material at ≤30 cm, P fixation)
Sulfidic soils, Organic poorly drained Peat, waterlogging (sulfidic material at ≤30 cm, moderate Al toxicity, P fixation)
Sulfidic soils, Organic poorly drained moderately deep Waterlogging, Al toxicity (sand, low K reserves, high leaching)
Grey soils, Poorly drained Clay, waterlogging, Al toxicity (low K reserves, P fixation)
6.5.4.2 Management of Soil Constraints Each of the major and minor limitations of the soils suitable for Leucaena is addressed below and in relevant sub-sections of Section 6.2.
Waterlogging Waterlogging is a major limitation for Leucaena and prolonged waterlogging a severe limitation.
Leucaena is best suited to well drained areas and does not tolerate waterlogging (Horne and Stur 1999) nor extended flooding, but requires good drainage where roots can reach the watertable (Skerman et al. 1988; Cook et al.2005). Many soils in Brunei, especially on flat
Soil Fertility Evaluation/Advisory Service in Negara Brunei Darussalam Volume 2 – Soils Management in the Agricultural Development Areas Page 136
lands, are waterlogged. Although not recommended for areas with permanent watertables, areas with short term, intermittent waterlogging can be used if surface drainage is improved (see Section 6.2.4.2, improving surface drainage).
Slope and Water Erosion Risk Slopes >20% are a minor limitation for Lucaena, and those >35% a major limitation. Slopes with high erosion risk (>30% or >20% if texture contrast) are a major limitation.
Slope is an issue with Leucaena as it is a shrub or tree, normally planted in hedgerows or rows 4 – 9 m apart, and does not provide a good ground cover. Leucaena needs to be planted either on contours (ideally suited to alley ways) or interplanted with another grass or legume that will provide a dense ground cover.
For more information on methods of minimizing erosion refer to Sections 6.2.5.1 (maintaining plant cover), 6.2.5.4 (terracing) and 6.2.5.5 (grassed waterways).
Sulfidic Material Sulfidic material at <30 cm depth is a minor limitation for Leucaena, and at <20 cm a major limitation.
Although Leucaena is only moderately suited to soils with waterlogging, many such soils also have sulfidic material or sulfuric layers. However, since the soil is not cultivated to any depth, sulfidic materials are unlikely to be exposed. When constructing drains to improve surface drainage, care should be taken if there is sulfidic material at <30 cm depth.
Any existing acidity, which can be considerable for sulfuric layers, should also be neutralised by appropriate application of lime.
For more information on managing such soils refer to Section 6.2.3 and the calculator for nutrient and lime management.
Soil Acidity and Aluminium Toxicity Moderate Al saturation (10-60%) is a minor limitation for Leucaena and high Al saturation (>60%) a major limitation.
Soil acidity and associated aluminium toxicity are common in Brunei. Leucaena leucocephala only tolerates up to 40% aluminium saturation (Dierolf et al. 2001), and requires soils with pH above 5.5, or above 5.0 where aluminium saturation is very low (Cook et al. 2005; Moody and Cong 2008). Leucaena is not suited to acid soil conditions (Horne and Stur 1999; Cook et al. 2005). On acid soils, growth is slow and plants tend to remain a shrub (Skerman et al. 1988). Neutralisation of aluminium phytotoxicity can be achieved by liming to pH ~5.5 in most soils of the ADAs (see Figure 9).
For more information on methods of managing soil acidity refer to Sections 6.2.2.3 (lime requirement) and 6.2.2.4 (minimising acid production).
Low Nutrient Reserves (indicated by low potassium) Low nutrient reserves are a minor limitation for Leucaena.
Many soils in Brunei have low fertility status as indicated by low K reserves. As part of a sustainable nutrient management plan, the fertility status of such soils should be improved by adding more nutrients than are required to replace those removed by the previous crop. Soil nutrient levels for tropical fodder legumes are as follows (Dierolf et al. 2001):
Soil Fertility Evaluation/Advisory Service in Negara Brunei Darussalam Volume 2 – Soils Management in the Agricultural Development Areas Page 137
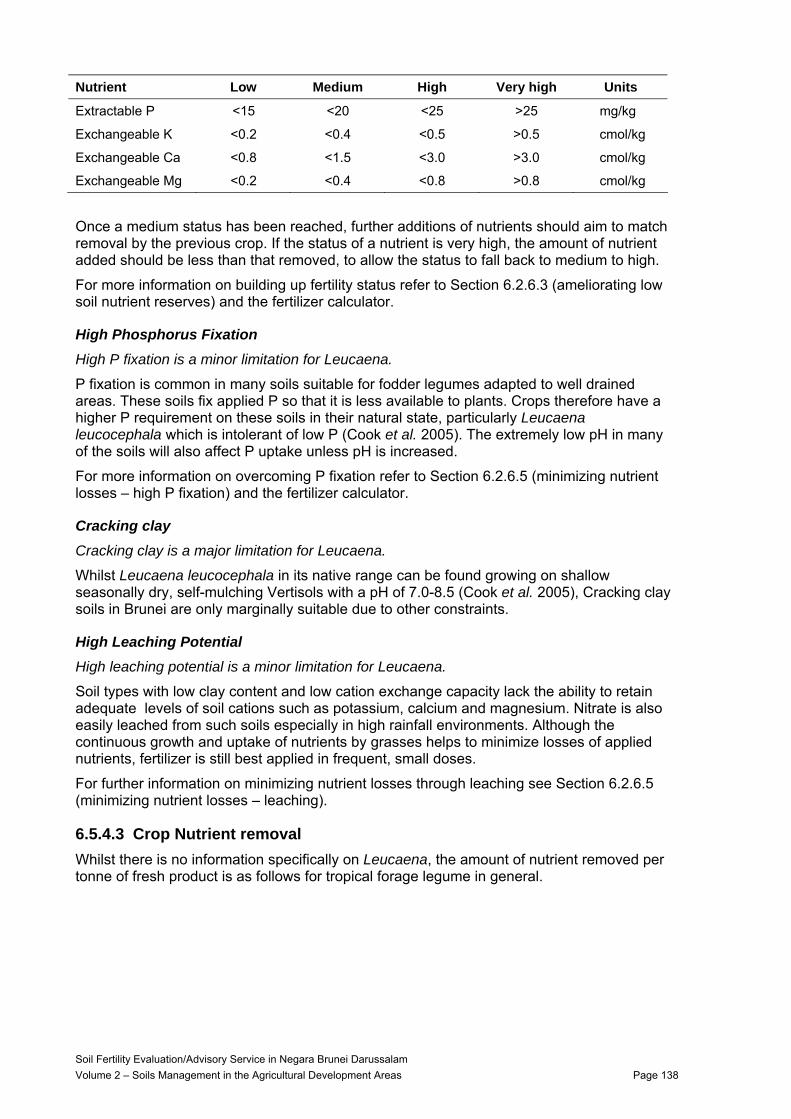
Nutrient Low Medium High Very high Units
Extractable P <15 <20 <25 >25 mg/kg
Exchangeable K <0.2 <0.4 <0.5 >0.5 cmol/kg
Exchangeable Ca <0.8 <1.5 <3.0 >3.0 cmol/kg
Exchangeable Mg <0.2 <0.4 <0.8 >0.8 cmol/kg
Once a medium status has been reached, further additions of nutrients should aim to match removal by the previous crop. If the status of a nutrient is very high, the amount of nutrient added should be less than that removed, to allow the status to fall back to medium to high.
For more information on building up fertility status refer to Section 6.2.6.3 (ameliorating low soil nutrient reserves) and the fertilizer calculator.
High Phosphorus Fixation High P fixation is a minor limitation for Leucaena.
P fixation is common in many soils suitable for fodder legumes adapted to well drained areas. These soils fix applied P so that it is less available to plants. Crops therefore have a higher P requirement on these soils in their natural state, particularly Leucaena leucocephala which is intolerant of low P (Cook et al. 2005). The extremely low pH in many of the soils will also affect P uptake unless pH is increased.
For more information on overcoming P fixation refer to Section 6.2.6.5 (minimizing nutrient losses – high P fixation) and the fertilizer calculator.
Cracking clay Cracking clay is a major limitation for Leucaena.
Whilst Leucaena leucocephala in its native range can be found growing on shallow seasonally dry, self-mulching Vertisols with a pH of 7.0-8.5 (Cook et al. 2005), Cracking clay soils in Brunei are only marginally suitable due to other constraints.
High Leaching Potential High leaching potential is a minor limitation for Leucaena.
Soil types with low clay content and low cation exchange capacity lack the ability to retain adequate levels of soil cations such as potassium, calcium and magnesium. Nitrate is also easily leached from such soils especially in high rainfall environments. Although the continuous growth and uptake of nutrients by grasses helps to minimize losses of applied nutrients, fertilizer is still best applied in frequent, small doses.
For further information on minimizing nutrient losses through leaching see Section 6.2.6.5 (minimizing nutrient losses – leaching).
6.5.4.3 Crop Nutrient removal Whilst there is no information specifically on Leucaena, the amount of nutrient removed per tonne of fresh product is as follows for tropical forage legume in general.
Soil Fertility Evaluation/Advisory Service in Negara Brunei Darussalam Volume 2 – Soils Management in the Agricultural Development Areas Page 138
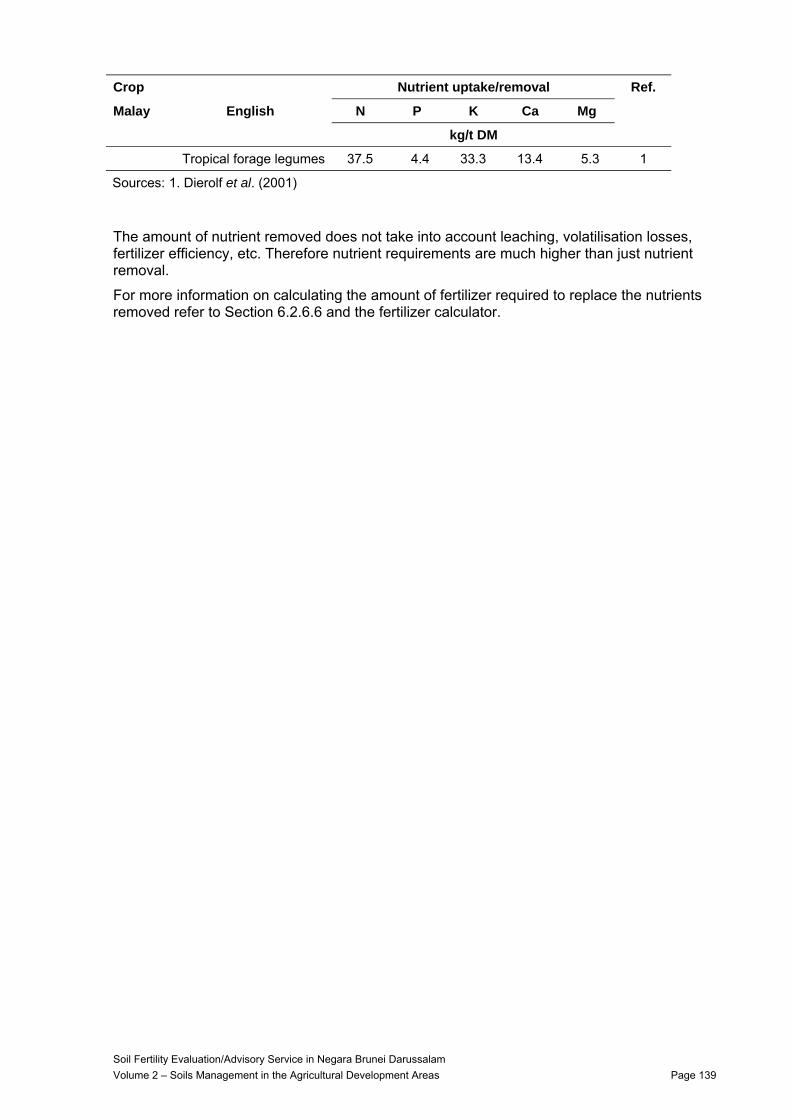
Crop Nutrient uptake/removal Ref.
Malay English N P K Ca Mg
kg/t DM
Tropical forage legumes 37.5 4.4 33.3 13.4 5.3 1
Sources: 1. Dierolf et al. (2001)
The amount of nutrient removed does not take into account leaching, volatilisation losses, fertilizer efficiency, etc. Therefore nutrient requirements are much higher than just nutrient removal.
For more information on calculating the amount of fertilizer required to replace the nutrients removed refer to Section 6.2.6.6 and the fertilizer calculator.
Soil Fertility Evaluation/Advisory Service in Negara Brunei Darussalam Volume 2 – Soils Management in the Agricultural Development Areas Page 139
6.6 Cropping systems In many tropical locations where there are pronounced wet and dry seasons, the different seasons provide an opportunity for tailoring the sequence of crops to match the seasons.
6.6.1 Rice-based cropping systems Rice-based cropping systems are used in many south east Asian countries where irrigation is not available during the dry season. In this situation, rice is grown under flooded conditions during the wet season and is followed by a dryland crop, such as maize, or soya or mung bean in the dry season. Such crops can utilize the residual water in the soil profile during a season when rain would otherwise be inadequate (So and Ringrose-Voase 2000). Whilst these systems have the potential to diversify crops and lead to greater productivity, they are often beset by poor performance of the dryland crop.
A particular problem is the poor soil structure for the succeeding dryland crop, caused by puddling the soil for rice. The previously puddled soil often has poor permeability, and quickly becomes waterlogged after heavy rain (Ringrose-Voase et al. 2000). The poor structure also hinders germination and root development, and the wet conditions encourage fungal disease in the seedlings. These factors lead to poor establishment of the dryland crop. If the crop is able to establish, poor root development into the subsoil can mean that the plant cannot access water stored deeper in the soil profile, so that it becomes water stressed as the dry season progresses. All these problems are exacerbated where the soil texture is heavy clay, in particular where the soil is a Vertisol (cracking clay).
In summary, these cropping systems are prone to difficulties even where there is a defined dry season. However, in Brunei there is no defined dry season, only drier periods, whose timing is somewhat erratic as discussed in Section 6.2.1. The problems associated with dryland crops after rice are likely to be severe, especially on the Cracking clay soils, such as those at Wasan. The unpredictablility of drier conditions means that the difficulties with crop establishment encountered in other countries are likely to be magnified in Brunei.
In a wet environment like Brunei, it is essential that good aeration is maintained in the root zone. To achieve this in a soil that has previously been puddled, there needs to be a long enough dry period for the soil to dry sufficiently that it can be cultivated. However, the probability of this occurring is quite low. Figure 6 shows that, on average, the number of rain-free periods of 6 or more days is only 1.2 per month from January to August. In conclusion:
For the reasons above, dryland cropping after rice is unlikely to successful in Brunei. However, the probability is worse for some Soil Types than others. The provisional suitability for such cropping systems is as follows (only for soils that are suitable for rice).
Soil Type, Subtype Limitations
Unsuitable soils
Cracking clay soils, Sulfidic poorly drained Prolonged waterlogging, cracking clay
Cracking clay soils, Acid poorly drained Prolonged waterlogging, cracking clay
Brown over grey soils, Poorly drained Prolonged waterlogging
Sulfidic soils, Soft poorly drained Prolonged waterlogging, sulfidic material at ≤35 cm
Soil Fertility Evaluation/Advisory Service in Negara Brunei Darussalam Volume 2 – Soils Management in the Agricultural Development Areas Page 140
Soil Type, Subtype Limitations
Marginal soils
White soils, Loamy poorly drained Waterlogging
Very deep yellow soils, Somewhat poorly drained sandy Waterlogging
Very deep yellow soils, Somewhat poorly drained clayey Waterlogging
Brown over grey soils, Somewhat poorly drained Waterlogging
Sulfuric soils, Poorly drained Waterlogging, sulfidic material at ≤35 cm
Grey soils, Poorly drained Waterlogging
Moderately suitable soils
Very deep yellow soils, Moderately well drained clayey No waterlogging
The Soil Type least unsuitable for dryland crops after rice is the Moderately well drained clayey very deep yellow soil, found on river terraces in the ADAs in Temburong, in particular Selangan and Selapon. The better drained landscape position of these soils increases the likelihood that they will dry sufficiently quickly after rice to establish a dryland crop. At the same time, they are flat enough for rice and have sufficient clay content to allow puddling.
6.6.2 Continuous rice cropping systems The current rice cropping system used in Brunei has one crop of a local rice cultivar per year. The crop is transplanted in October or November and harvested six months later. During the months following harvest the soil is left fallow. This period represents an unutilized opportunity for cropping, as there is adequate rain to support a crop, especially where irrigation is available.
As observed above, it is difficult to use this land for dryland cropping, but consideration should be given to growing a second rice crop, especially where irrigation is available. This would need to be an improved, short-duration variety so that it has matured before it is time to plant the next crop of local rice. There are several potential advantages with this system.
• Annual production might be greatly increased because of the second crop. Being an improved variety it may yield more than the local variety.
• The wet season crop of the local variety would not be affected.
• Excessive weed growth during the fallow period would be avoided, which would decrease the effort associated with land cleaning prior to each crop.
• Where investment has been made in providing reliable irrigation, the returns on the investment would be greatly enhanced.
• Brunei’s self-sufficiency in rice would improve as per national policy.
• The utilization of expensive machinery and other farm equipment would be increased.
An alternative, continuous rice system would be three crops per year. However, this would require using improved, short-duration varieties for all crops at the expense of growing the local variety.
6.6.3 Other crop sequences The climatic factors – absence of a dry season and erratic occurrence of drier periods – that mean rice based cropping systems are unsuitable in Brunei also prevent design of other cropping sequences. Such systems are carefully tailored the seasons. Where the seasons are not pronounced or occur erratically, a precise sequence of crops is ‘precisely wrong’ in a large proportion of years.
Soil Fertility Evaluation/Advisory Service in Negara Brunei Darussalam Volume 2 – Soils Management in the Agricultural Development Areas Page 141
Part 7 Acid Sulfate Soils 7.1 Introduction The objective of Part 7 is to define the nature and extent of acid sulfate soils recognised during the field survey for the Soil Fertility Evaluation/Advisory Service in Negara Brunei Darussalam project (Volume 1, Part 2); to discuss the problems associated with them and to recommend management strategies for acid sulfate soil areas.
7.1.1 Background Acid Sulfate Soils (ASS) are all soils in which sulfuric acid may be produced, is being produced, or has been produced in amounts that have a lasting effect on major soil characteristics (Pons 1973). This general definition includes potential, active (or actual), and post-active acid sulfate soils: three broad genetic kinds that continue to be recognized (e.g. Fanning et al. 2002).
ASS form from the interaction of sulfates, usually from seawater, iron from sediments and abundant organic material under permanently waterlogged or saturated conditions. These conditions lead to the formation of sulfide-containing minerals, predominantly iron pyrite (FeS2). Sulfide minerals may also be present in sedimentary rocks (e.g. Setapi shale) as a result of similar processes in the geologic past.
Soil that contains sulfides is called sulfidic material (Soil Survey Staff 2003) and can be environmentally damaging if exposed to air by disturbance. Exposure results in the oxidation of pyrite with each mole of pyrite yielding 4 moles of acidity (i.e. 2 moles of sulfuric acid). This process transforms sulfidic material to a sulfuric horizon when, on oxidation, the material develops a pH of 3.5 or less (Soil Survey Staff 2003). When ASS become strongly acidic (pH <3.5) acid drainage water is produced (Figure 12). This acid, together with toxic elements that are leached from sediments, can kill fish, contaminate shellfish, drinking water and groundwater, and can corrode concrete and steel in buildings and underground pipes, unless it is adequately neutralized by the receiving environment. These impacts can be measured in terms of:
• Loss of agricultural production with poor water quality (Figure 12), damage to water environments and reduction of wetland biodiversity.
• Additional maintenance of community infrastructure affected by acid corrosion (Figure 13).
• The need for rehabilitation of disturbed areas to improve water quality and minimize impacts.
ASS are widespread in Brunei. Blackburn and Baker (1958) identified ASS beneath peats and Phase 1 of the present evaluation (Volume 1, Part 5; Grealish et al. 2007) documented ASS in nine Agricultural Development Areas (ADAs). Apart from the work of Mohamad Yussof bin Haji Mohiddin (1982) little research has been done on the properties, distribution and types of ASS in Brunei. This work concentrated mainly on Al toxicity and P status on two soils from Mulaut Agricultural Station. According to his study, land near Mulaut Agricultural Station was too acid for rice production or other crops and the station was subsequently closed.
Brunei contains a wide range of different types of organic and mineral ASS in various physical settings, which can oxidise and produce acid because of changing hydrological and biogeochemical conditions. This occurs in two broad situations:
i) Drained/partly drained conditions, which develop in natural tidal, intertidal and supratidal zones, and fluvial floodplains or when watertables are artificially lowered for agriculture.
Soil Fertility Evaluation/Advisory Service in Negara Brunei Darussalam Volume 2 – Soils Management in the Agricultural Development Areas Page 142
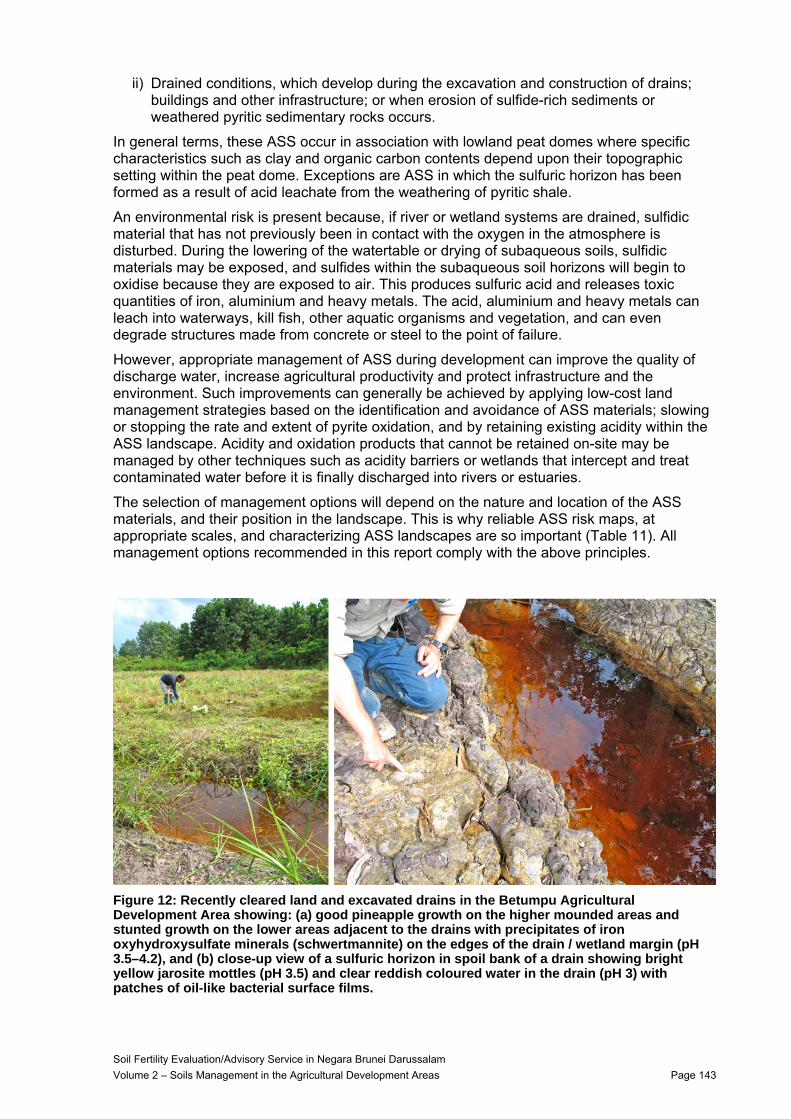
ii) Drained conditions, which develop during the excavation and construction of drains; buildings and other infrastructure; or when erosion of sulfide-rich sediments or weathered pyritic sedimentary rocks occurs.
In general terms, these ASS occur in association with lowland peat domes where specific characteristics such as clay and organic carbon contents depend upon their topographic setting within the peat dome. Exceptions are ASS in which the sulfuric horizon has been formed as a result of acid leachate from the weathering of pyritic shale.
An environmental risk is present because, if river or wetland systems are drained, sulfidic material that has not previously been in contact with the oxygen in the atmosphere is disturbed. During the lowering of the watertable or drying of subaqueous soils, sulfidic materials may be exposed, and sulfides within the subaqueous soil horizons will begin to oxidise because they are exposed to air. This produces sulfuric acid and releases toxic quantities of iron, aluminium and heavy metals. The acid, aluminium and heavy metals can leach into waterways, kill fish, other aquatic organisms and vegetation, and can even degrade structures made from concrete or steel to the point of failure.
However, appropriate management of ASS during development can improve the quality of discharge water, increase agricultural productivity and protect infrastructure and the environment. Such improvements can generally be achieved by applying low-cost land management strategies based on the identification and avoidance of ASS materials; slowing or stopping the rate and extent of pyrite oxidation, and by retaining existing acidity within the ASS landscape. Acidity and oxidation products that cannot be retained on-site may be managed by other techniques such as acidity barriers or wetlands that intercept and treat contaminated water before it is finally discharged into rivers or estuaries.
The selection of management options will depend on the nature and location of the ASS materials, and their position in the landscape. This is why reliable ASS risk maps, at appropriate scales, and characterizing ASS landscapes are so important (Table 11). All management options recommended in this report comply with the above principles.
Figure 12: Recently cleared land and excavated drains in the Betumpu Agricultural Development Area showing: (a) good pineapple growth on the higher mounded areas and stunted growth on the lower areas adjacent to the drains with precipitates of iron oxyhydroxysulfate minerals (schwertmannite) on the edges of the drain / wetland margin (pH 3.5–4.2), and (b) close-up view of a sulfuric horizon in spoil bank of a drain showing bright yellow jarosite mottles (pH 3.5) and clear reddish coloured water in the drain (pH 3) with patches of oil-like bacterial surface films.
Soil Fertility Evaluation/Advisory Service in Negara Brunei Darussalam Volume 2 – Soils Management in the Agricultural Development Areas Page 143
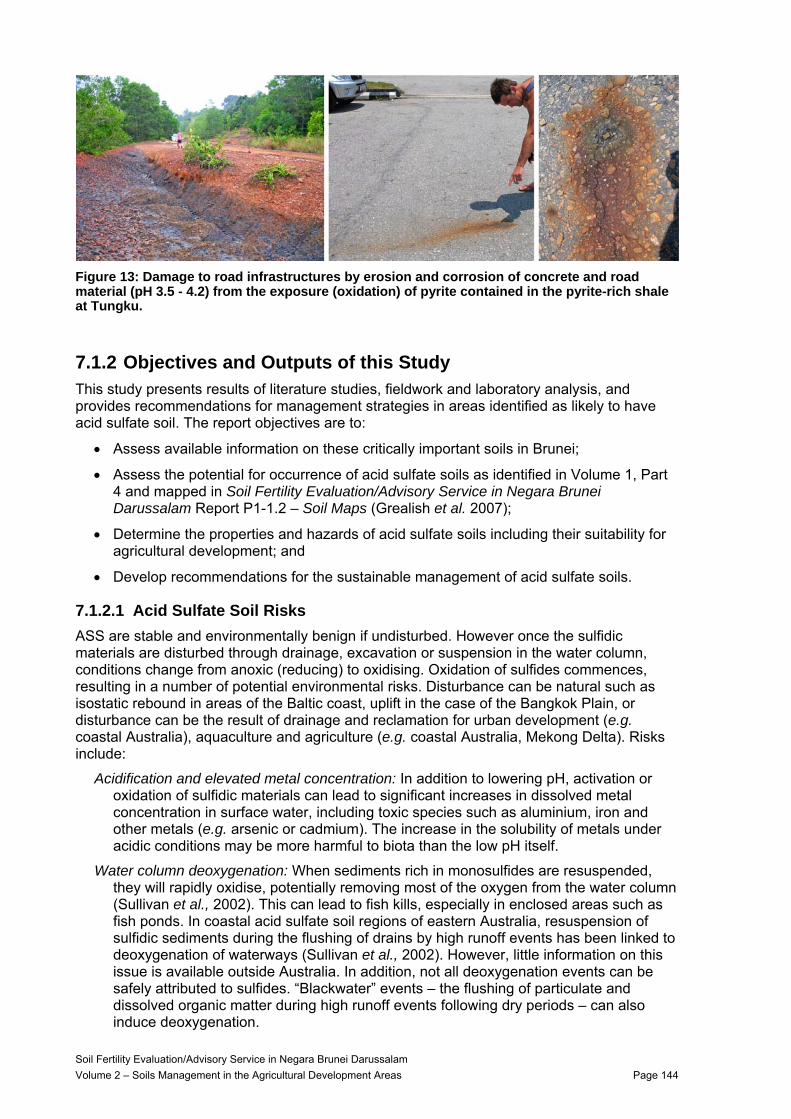
Figure 13: Damage to road infrastructures by erosion and corrosion of concrete and road material (pH 3.5 - 4.2) from the exposure (oxidation) of pyrite contained in the pyrite-rich shale at Tungku.
7.1.2 Objectives and Outputs of this Study This study presents results of literature studies, fieldwork and laboratory analysis, and provides recommendations for management strategies in areas identified as likely to have acid sulfate soil. The report objectives are to:
• Assess available information on these critically important soils in Brunei;
• Assess the potential for occurrence of acid sulfate soils as identified in Volume 1, Part 4 and mapped in Soil Fertility Evaluation/Advisory Service in Negara Brunei Darussalam Report P1-1.2 – Soil Maps (Grealish et al. 2007);
• Determine the properties and hazards of acid sulfate soils including their suitability for agricultural development; and
• Develop recommendations for the sustainable management of acid sulfate soils.
7.1.2.1 Acid Sulfate Soil Risks ASS are stable and environmentally benign if undisturbed. However once the sulfidic materials are disturbed through drainage, excavation or suspension in the water column, conditions change from anoxic (reducing) to oxidising. Oxidation of sulfides commences, resulting in a number of potential environmental risks. Disturbance can be natural such as isostatic rebound in areas of the Baltic coast, uplift in the case of the Bangkok Plain, or disturbance can be the result of drainage and reclamation for urban development (e.g. coastal Australia), aquaculture and agriculture (e.g. coastal Australia, Mekong Delta). Risks include:
Acidification and elevated metal concentration: In addition to lowering pH, activation or oxidation of sulfidic materials can lead to significant increases in dissolved metal concentration in surface water, including toxic species such as aluminium, iron and other metals (e.g. arsenic or cadmium). The increase in the solubility of metals under acidic conditions may be more harmful to biota than the low pH itself.
Water column deoxygenation: When sediments rich in monosulfides are resuspended, they will rapidly oxidise, potentially removing most of the oxygen from the water column (Sullivan et al., 2002). This can lead to fish kills, especially in enclosed areas such as fish ponds. In coastal acid sulfate soil regions of eastern Australia, resuspension of sulfidic sediments during the flushing of drains by high runoff events has been linked to deoxygenation of waterways (Sullivan et al., 2002). However, little information on this issue is available outside Australia. In addition, not all deoxygenation events can be safely attributed to sulfides. “Blackwater” events – the flushing of particulate and dissolved organic matter during high runoff events following dry periods – can also induce deoxygenation.
Soil Fertility Evaluation/Advisory Service in Negara Brunei Darussalam Volume 2 – Soils Management in the Agricultural Development Areas Page 144
7.1.2.2 Awareness and Economic Impacts It is vital for all farmer groups and government agricultural extension officers to be aware of the many impacts that result from disturbance of sulfidic materials. These impacts are important from an environmental, engineering, economic, and quality of life perspective. Because of the extensive level of existing ASS occurrence and planned development in Brunei this could be a critical natural resource management issue for many areas. This is understandable when one adds up the documented potential for disturbed sulfidic materials to destroy wetlands, acidify and deoxygenate waterways and estuaries, increase the incidence of fish kills and disease, contaminate valuable groundwater resources, facilitate the accumulation of heavy metals, corrode, attack and destabilise roads, concrete and steel infrastructure, stimulate blooms of marine blue-green algae, decrease the agricultural productivity of land, and increase mosquito and arbovirus incidence.
Soil Fertility Evaluation/Advisory Service in Negara Brunei Darussalam Volume 2 – Soils Management in the Agricultural Development Areas Page 145
7.2 Methodology
7.2.1 Field Survey The field observations and sampling for this study were confined to the Agricultural Development Areas (ADAs). The rationale for site selection, the number of sites and samples chosen for analysis are given in Volume 1, Part 2 and in Soil Fertility Evaluation/Advisory Service in Negara Brunei Darussalam Report P1-1.1 – Laboratory Analysis of Soil Chemical and Physical Properties (Beech et al. 2006). GPS (geographic positioning system) locations of sampling sites are provided in the project database. Samples for ASS specific analyses were confined to ADAs within Brunei Muara. All soils were described and classified according to Soil Taxonomy. For detailed operational standards and general approach see Volume 1, Part 2.
7.2.2 Definitions: Soils, Materials, Conditions The purpose of this section is to briefly explain: (i) the nature of organic and mineral soils, (ii) the nature of sulfidic materials and sulfuric horizons, (iii) the risks they pose to the environment under certain conditions and (iv) awareness and economic impacts of ASS.
7.2.2.1 Organic and Mineral Soils
Mineral Soil Material Mineral soil material is defined in the Keys to Soil Taxonomy (Soil Survey Staff 2003) as soil material which:
either (i) is saturated with water for less than 30 days (in total) per year;
or (ii) contains: <18% organic carbon if the clay content is >60% <12% + 0.1 x clay%) if the clay content is <60%
Organic Soil Material Soil material that contains more organic matter than described for mineral soil material (including litter) is called organic soil material.
Organic and Mineral Soils Most soils are dominated by mineral soil material but may have horizons of organic material. In this case the relative importance of the mineral and organic materials is based on the type, depth and thickness of the organic material. Generally a soil is classified as organic if more than half of the upper 80 cm of the soil is organic soil material or any thickness if it rests on rock. Detailed criteria are contained in the Keys to Soil Taxonomy (Soil Survey Staff 2003).
All Organic Soils have a histic epipedon (i.e. diagnostic surface Organic horizon) and hence classify as Histosols according to Soil Taxonomy (Soil Survey Staff 2003). These Histosols often contain sulfidic materials (see definition below).
Sapric, Hemic and Fibric Materials Histosols in Brunei can be distinguished according to their fibre content. Sapric organic soil materials are defined as having less than 17% fibre by volume; hemic organic soil materials between 17% and 40% fibre and fibric organic soil materials more than 40% fibre (Soil Survey Staff 2003). Hence horizons that contain predominantly sapric material have a high degree of decomposed organic matter and are given the horizon suffix “a” (e.g. Oa1). Hemic materials contain moderately decomposed organic matter and are given the horizon suffix “e” (e.g. Oe1).
Soil Fertility Evaluation/Advisory Service in Negara Brunei Darussalam Volume 2 – Soils Management in the Agricultural Development Areas Page 146
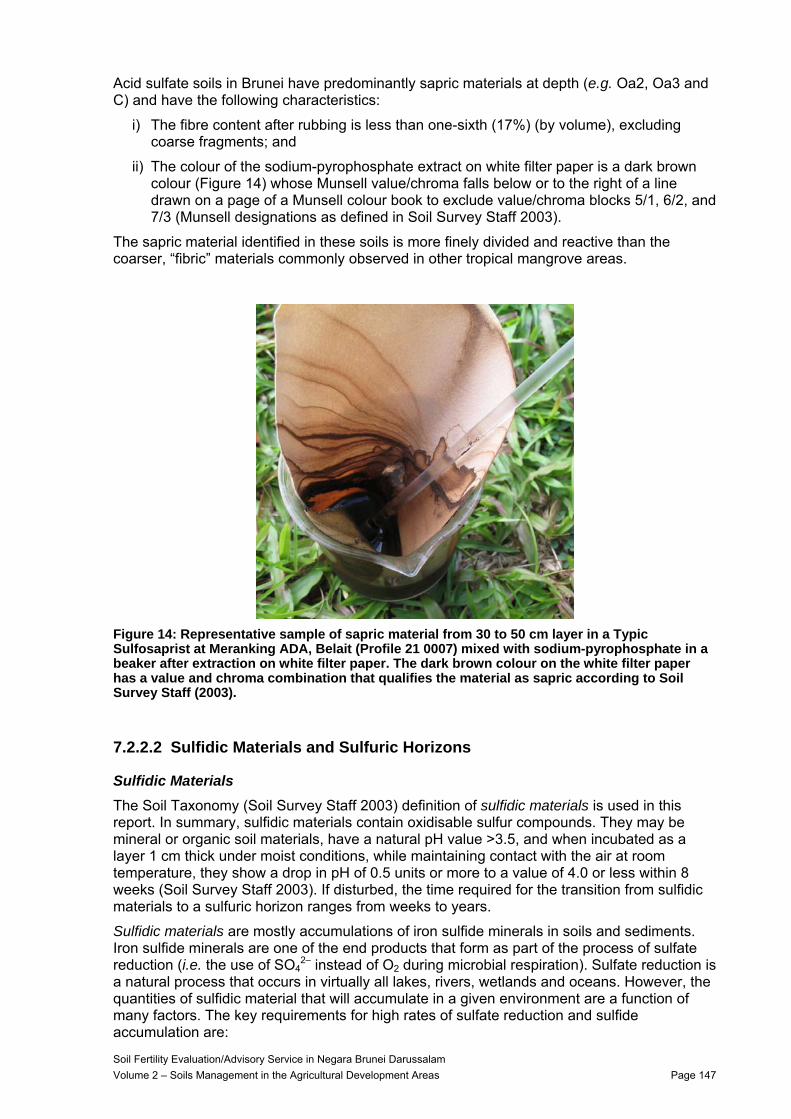
Acid sulfate soils in Brunei have predominantly sapric materials at depth (e.g. Oa2, Oa3 and C) and have the following characteristics:
i) The fibre content after rubbing is less than one-sixth (17%) (by volume), excluding coarse fragments; and
ii) The colour of the sodium-pyrophosphate extract on white filter paper is a dark brown colour (Figure 14) whose Munsell value/chroma falls below or to the right of a line drawn on a page of a Munsell colour book to exclude value/chroma blocks 5/1, 6/2, and 7/3 (Munsell designations as defined in Soil Survey Staff 2003).
The sapric material identified in these soils is more finely divided and reactive than the coarser, “fibric” materials commonly observed in other tropical mangrove areas.
Figure 14: Representative sample of sapric material from 30 to 50 cm layer in a Typic Sulfosaprist at Meranking ADA, Belait (Profile 21 0007) mixed with sodium-pyrophosphate in a beaker after extraction on white filter paper. The dark brown colour on the white filter paper has a value and chroma combination that qualifies the material as sapric according to Soil Survey Staff (2003).
7.2.2.2 Sulfidic Materials and Sulfuric Horizons
Sulfidic Materials The Soil Taxonomy (Soil Survey Staff 2003) definition of sulfidic materials is used in this report. In summary, sulfidic materials contain oxidisable sulfur compounds. They may be mineral or organic soil materials, have a natural pH value >3.5, and when incubated as a layer 1 cm thick under moist conditions, while maintaining contact with the air at room temperature, they show a drop in pH of 0.5 units or more to a value of 4.0 or less within 8 weeks (Soil Survey Staff 2003). If disturbed, the time required for the transition from sulfidic materials to a sulfuric horizon ranges from weeks to years.
Sulfidic materials are mostly accumulations of iron sulfide minerals in soils and sediments. Iron sulfide minerals are one of the end products that form as part of the process of sulfate reduction (i.e. the use of SO4
2– instead of O2 during microbial respiration). Sulfate reduction is a natural process that occurs in virtually all lakes, rivers, wetlands and oceans. However, the quantities of sulfidic material that will accumulate in a given environment are a function of many factors. The key requirements for high rates of sulfate reduction and sulfide accumulation are:
Soil Fertility Evaluation/Advisory Service in Negara Brunei Darussalam Volume 2 – Soils Management in the Agricultural Development Areas Page 147
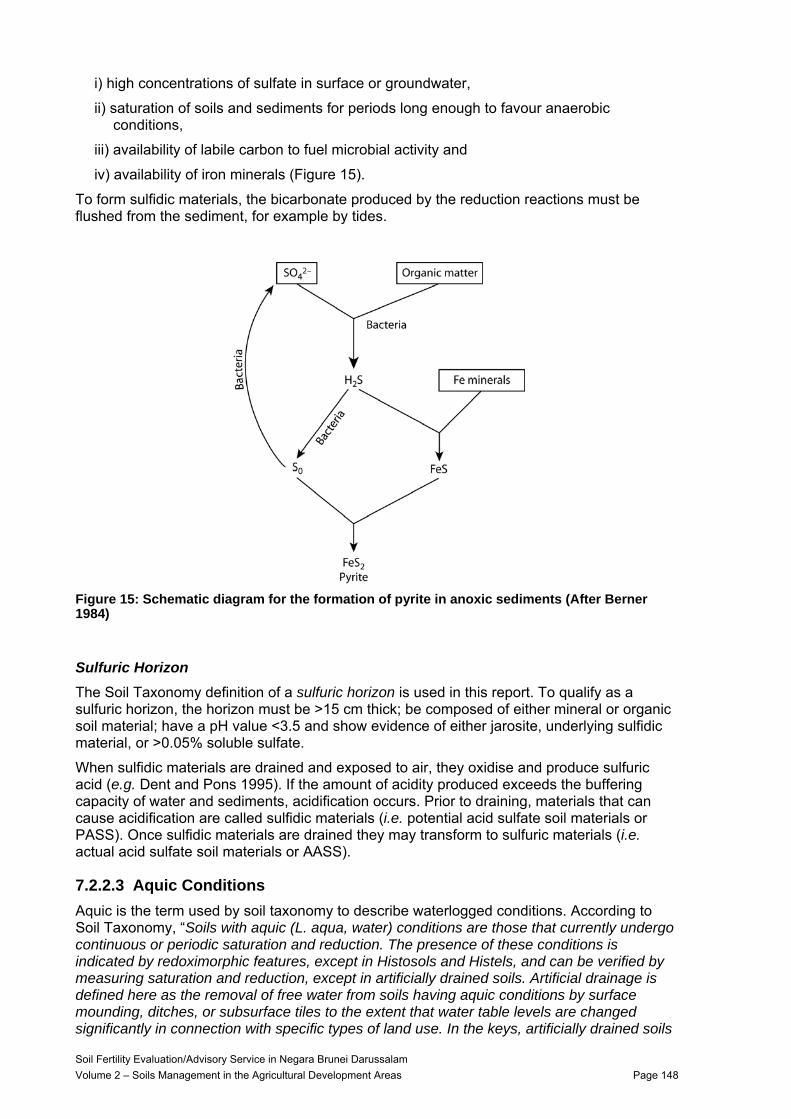
i) high concentrations of sulfate in surface or groundwater,
ii) saturation of soils and sediments for periods long enough to favour anaerobic conditions,
iii) availability of labile carbon to fuel microbial activity and
iv) availability of iron minerals (Figure 15).
To form sulfidic materials, the bicarbonate produced by the reduction reactions must be flushed from the sediment, for example by tides.
Figure 15: Schematic diagram for the formation of pyrite in anoxic sediments (After Berner 1984)
Sulfuric Horizon The Soil Taxonomy definition of a sulfuric horizon is used in this report. To qualify as a sulfuric horizon, the horizon must be >15 cm thick; be composed of either mineral or organic soil material; have a pH value <3.5 and show evidence of either jarosite, underlying sulfidic material, or >0.05% soluble sulfate.
When sulfidic materials are drained and exposed to air, they oxidise and produce sulfuric acid (e.g. Dent and Pons 1995). If the amount of acidity produced exceeds the buffering capacity of water and sediments, acidification occurs. Prior to draining, materials that can cause acidification are called sulfidic materials (i.e. potential acid sulfate soil materials or PASS). Once sulfidic materials are drained they may transform to sulfuric materials (i.e. actual acid sulfate soil materials or AASS).
7.2.2.3 Aquic Conditions Aquic is the term used by soil taxonomy to describe waterlogged conditions. According to Soil Taxonomy, “Soils with aquic (L. aqua, water) conditions are those that currently undergo continuous or periodic saturation and reduction. The presence of these conditions is indicated by redoximorphic features, except in Histosols and Histels, and can be verified by measuring saturation and reduction, except in artificially drained soils. Artificial drainage is defined here as the removal of free water from soils having aquic conditions by surface mounding, ditches, or subsurface tiles to the extent that water table levels are changed significantly in connection with specific types of land use. In the keys, artificially drained soils
Soil Fertility Evaluation/Advisory Service in Negara Brunei Darussalam Volume 2 – Soils Management in the Agricultural Development Areas Page 148
are included with soils that have aquic conditions. … The duration of saturation required for creating aquic conditions varies, depending on the soil environment, and is not specified.”
7.2.2.4 Soil Cracks, Slickensides and Cracking Clay Soils Soil cracks are features that are difficult to observe because they occur at the soil surface only when the soil is dry and often only in subsurface layers. Knowledge about soil behaviour during the year is required to determine if these features exist.
Slickensides: are polished and grooved surfaces that are produced when one soil mass slides past another. Slickensides result directly from the swelling of clay minerals and shear failure. They are common in swelling clays that undergo marked changes in moisture content.
All cracking clay soils contain slickensides and crack when dry. In Brunei, this group of soils contains both acid sulfate and non–acid sulfate members. Only the acid sulfate members are discussed in this report. Cracking clay soils are characterised by swelling on wetting and shrinking on drying with consequent crack formation. This behaviour is caused by the presence of interlayered clay minerals such as smectite.
7.2.2.5 n Value n Value: characterizes the relation between the percentage of water in a soil under field conditions and its percentages of inorganic clay and humus. It is used to predict whether a soil can support loads and what degree of subsidence would occur after drainage. It is defined as (A – 0.2R)/(L + 3H), where A is the percentage soil water content in the field condition (calculated on a dry soil basis), R the percentage of silt plus sand, L the percentage clay and H the percentage of organic matter (or organic carbon × 1.724) (Soil Survey Staff 2003).
An n value of 0.7 or greater indicates that the soil is soft and would subside under a load. The n value can be estimated in the field by squeezing a sample of soil in the hand. If the soil flows easily between the fingers the n value is greater than 1.0. If it can be squeezed between the fingers with difficulty the n value is between 0.7 and 1.0.
7.2.2.6 Monosulfidic Black Ooze Material in Drain Sediments Monosulfidic black ooze (MBO) materials are subaqueous or waterlogged mineral or organic materials that contain mainly oxidisable monosulfides that have a field pH of 4 or more but which will not become extremely acid (pH <4) when drained.
The recognition of the occurrence and importance of monosulfides in soil materials led in 2005 to the inclusion of monosulfidic materials as a distinguishing property within mapping units of the Australian National Atlas of Acid Sulfate Soils (Fitzpatrick et al. 2006). High nutrient environments together with the activity of algae and micro-organisms generate redoximorphic conditions, which result in the formation of black smelly, iron monosulfides. When subaqueous materials rich in monosulfides are resuspended, for example during the flushing of drains by high runoff events, they rapidly oxidise, potentially removing most of the oxygen from the water column (Sullivan et al. 2002). This can lead to fish kills, especially in enclosed areas such as aquaculture ponds or estuaries. Hence, MBO is reactive if exposed to oxygen but is harmless if left undisturbed.
Monosulfidic soil materials have the ability to favourably affect surrounding environments by immobilizing potential metal pollutants (e.g. Simpson et al. 1998). However, when a drain is cleaned, iron and alumino-sulfo salts (e.g. jarosite and alunite), iron oxyhydroxy-sulfate salts (e.g. schwertmannite) precipitate on the soil surface along the drain edges. These soluble salts dissolve during rain events and contribute to MBO formation, acidity and metal content in drainage waters.
Soil Fertility Evaluation/Advisory Service in Negara Brunei Darussalam Volume 2 – Soils Management in the Agricultural Development Areas Page 149
7.2.2.7 Sulfate-Containing Salt Efflorescences While common in drier environments, in the wet tropics of Brunei we have only observed efflorescences in drain spoil (e.g. jarosite) and on the surface of exposed pyritic shale. The significance of the minerals found in these salt efflorescences is that they appear during drier periods and are environmental indicators. A change in the minerals found will indicate a change in the nature of the salts entering the system.
7.2.3 Laboratory Analyses The following analyses were performed using the standard methods of the Analytical Chemistry Unit, CSIRO Land and Water, for:
• 1:2.5 soil–water extracts: pH, EC: 30 samples
• Total carbon and sulfur: 30 samples.
• Total actual acidity: 30 samples.
• Calcium carbonate equivalent: 30 samples.
• Arsenic and cadmium: 12 samples.
The following analysis was performed by the Environmental Analysis Laboratory, Southern Cross University, Lismore NSW Australia:
• Chromium reducible sulfur (SCr): 30 samples.
7.2.3.1 Laboratory Soil Analysis Methods The methods used are summarised below and results of these analyses are presented in the Appendix Tables C1 to C5.
Sample preparation and moisture content: A sub-sample was frozen, transported to Australia and usually within 48 hours of dispatch oven dried at 80°C, then crushed and sieved through a 2 mm sieve to prepare a dry, <2 mm sample for further analysis. Material greater than 2 mm was inspected (mostly coarse organic matter), and proportions recorded. The moisture content was calculated from the measured weight loss on further drying a weighed, representative sub-sample of the material at 105°C. For chromium reducible sulfur, fresh material was sub-sampled, frozen and freeze dried. The freeze dried material was then sieved, sub-sampled and hand ground in a mortar and pestle prior to dispatch to the laboratory for analysis.
Electrical conductivity (EC1:2.5): A 10 g sub-sample was placed in a screw cap container, 25 mL water added and the suspension shaken for one hour (1:2.5 soil:water ratio). The electrical conductivity was measured after calibrating the conductivity meter using 0.1M KCl (12.9 dS m–1); (Method 2B1: Rayment and Higginson 1992, with a modified soil: solution ratio of 1:2.5 to match methods used by the Brunei Soil and Plant Nutrition Unit).
pH1:2.5: The pH meter was calibrated using pH 7.00 and pH 9.00 buffers. The pH was measured on the same suspension as used for EC (Method 4A1: Rayment and Higginson 1992, modified as for EC).
Calcium carbonate equivalent: Sub-samples (1 to 2 g) of soil and pure calcium carbonate were analysed by adding HCl and measuring CO2 gas pressure in a glass vessel using a pressure transducer following a slightly modified method after Sherrod et al. (2002). Results for inorganic carbon are expressed as calcium carbonate equivalent. Note this analysis was only carried out when the soil pH1:2.5 was > 5.0. Where the pH1:2.5 was <5.0 the carbonate content was assumed to be negligible and below the detection limit of the method (0.5% CaCO3).
Total carbon and sulfur: Total C and S were measured using a Leco CS analyser.
Soil Fertility Evaluation/Advisory Service in Negara Brunei Darussalam Volume 2 – Soils Management in the Agricultural Development Areas Page 150
Organic carbon: The organic carbon content was calculated by subtracting the inorganic (carbonate) carbon from the total carbon (Method 6B3: Rayment and Higginson 1992).
Total actual acidity and oxidised sulfur: The method for determining total actual acidity and oxidised sulfur (Sox) (1:40 KCl extractable S) is given by Ahern et al. (2004, Method Codes 23F and 23C respectively). The latter indicates the sulfate concentration including gypsum, jarosite and other sulfate minerals.
Saturation extract oxidized sulphur and chloride: Oxidised sulfur (Sox) and chloride were measured in the saturation extract (Method 4F2: USDA-NCRS 2004). This measure of Sox only include part of the sulfate from gysum, jarosite and other poorly soluble sulfate minerals. The deviation in the ratio of Cl:S from that of seawater (21) indicates an input of sulfate from ASS oxidation.
Chromium reducible sulfur: Methods for analysing soil samples to assess acid generation potential (AGP) are given in Ahern et al. (2004), including the chromium reducible sulfur method (SCr) (Method Code 22B), which measures reduced inorganic sulfur (RIS), and its conversion to AGP.
Net acid generating potential (NAGP): Net acid generating potential was calculated by subtracting the acid neutralising capacity (ANC) from the AGP. The NAGP is conventionally expressed as the calcium carbonate equivalent to neutralise the potential acid generated (Ahern et al. 2004). A positive value for NAGP indicates acid generating potential and the potential for formation of an ASS, while a negative value indicates an excess of neutralising capacity over acidity, with little likelihood of ASS formation. When converted to a lime requirement a safety factor of 1.5 is employed to account for lime purity and reactivity (fineness or particle size).
Arsenic and cadmium: Arsenic and cadmium were determined by flameless AAS and ICP–OES respectively, following microwave assisted acid digestion (Method 3051A: USEPA 1998).
Bulk density: Bulk density, which is required for calculating the lime requirement of soil layers, was estimated from organic carbon content using the method of Avnimelech et al. (2001).
Soil Fertility Evaluation/Advisory Service in Negara Brunei Darussalam Volume 2 – Soils Management in the Agricultural Development Areas Page 151
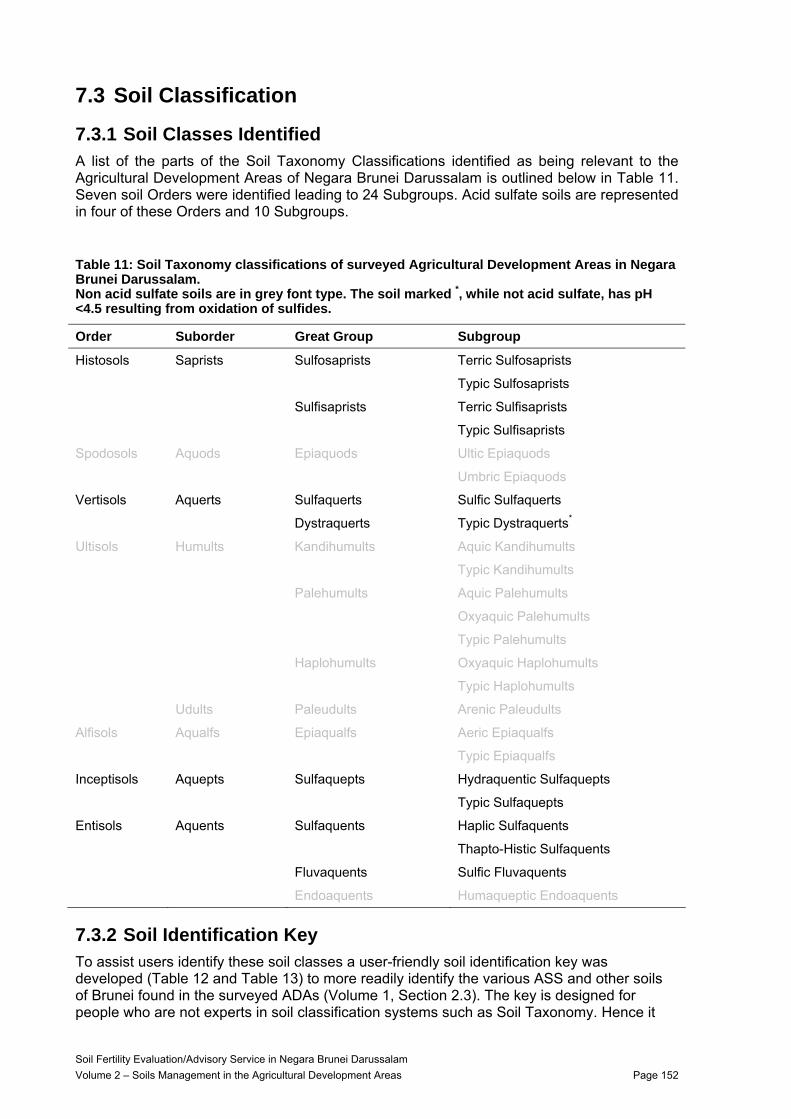
7.3 Soil Classification
7.3.1 Soil Classes Identified A list of the parts of the Soil Taxonomy Classifications identified as being relevant to the Agricultural Development Areas of Negara Brunei Darussalam is outlined below in Table 11. Seven soil Orders were identified leading to 24 Subgroups. Acid sulfate soils are represented in four of these Orders and 10 Subgroups.
Table 11: Soil Taxonomy classifications of surveyed Agricultural Development Areas in Negara Brunei Darussalam. Non acid sulfate soils are in grey font type. The soil marked *, while not acid sulfate, has pH <4.5 resulting from oxidation of sulfides.
Order Suborder Great Group Subgroup
Histosols Saprists Sulfosaprists Terric Sulfosaprists
Typic Sulfosaprists
Sulfisaprists Terric Sulfisaprists
Typic Sulfisaprists
Spodosols Aquods Epiaquods Ultic Epiaquods
Umbric Epiaquods
Vertisols Aquerts Sulfaquerts Sulfic Sulfaquerts
Dystraquerts Typic Dystraquerts*
Ultisols Humults Kandihumults Aquic Kandihumults
Typic Kandihumults
Palehumults Aquic Palehumults
Oxyaquic Palehumults
Typic Palehumults
Haplohumults Oxyaquic Haplohumults
Typic Haplohumults
Udults Paleudults Arenic Paleudults
Alfisols Aqualfs Epiaqualfs Aeric Epiaqualfs
Typic Epiaqualfs
Inceptisols Aquepts Sulfaquepts Hydraquentic Sulfaquepts
Typic Sulfaquepts
Entisols Aquents Sulfaquents Haplic Sulfaquents
Thapto-Histic Sulfaquents
Fluvaquents Sulfic Fluvaquents
Endoaquents Humaqueptic Endoaquents
7.3.2 Soil Identification Key To assist users identify these soil classes a user-friendly soil identification key was developed (Table 12 and Table 13) to more readily identify the various ASS and other soils of Brunei found in the surveyed ADAs (Volume 1, Section 2.3). The key is designed for people who are not experts in soil classification systems such as Soil Taxonomy. Hence it
Soil Fertility Evaluation/Advisory Service in Negara Brunei Darussalam Volume 2 – Soils Management in the Agricultural Development Areas Page 152
Soil Fertility Evaluation/Advisory Service in Negara Brunei Darussalam Volume 2 – Soils Management in the Agricultural Development Areas Page 153
has the potential to deliver soil-specific land development and soil management packages to advisors, planners and engineers working in the ADAs.
The soil identification key uses non-technical terms to categorise ASS and other soils in terms of attributes that can mainly be assessed in the field by people with limited soil classification experience. Attributes include texture, colour, soil cracks, features indicating waterlogging and ‘acid’ status – already acidified, i.e. sulfuric, or with the potential to acidify, i.e. sulfidic) – and the depths at which they occur or change in the soil profile.
The key consists of a systematic arrangement of soils into 4 broad ASS types and 6 other soil types, each of which can be divided into up to 4 soil sub-types. The key layout is bifurcating, being based on the presence or absence of particular soil profile features (i.e. using a series of questions set out in a key). A soil is allocated to the first type whose diagnostic features it matches, even though it may also match diagnostic features further down the key. The soil types and subtypes in the Soil Identification Key are largely in the same order as occurs in the Keys to Soil Taxonomy (Soil Survey Staff 2003). A collection of plain language soil type and subtype names was developed to correspond to the major Soil Taxonomy Suborder and Subgroup classes found in the survey. These names are intended to provide some assistance in understanding the intent and general nature of the soils classified using the Soil Taxonomy classification. The 4 ASS types in the Key are: (i) Organic Soils, (ii) Cracking Clay Soils, (iii) Sulfuric Soils and (iv) Sulfidic Soils. These are further sub-divided into 11 subtypes based on depth to sulfuric/sulfidic horizon; firmness; and drainage (waterlogging).
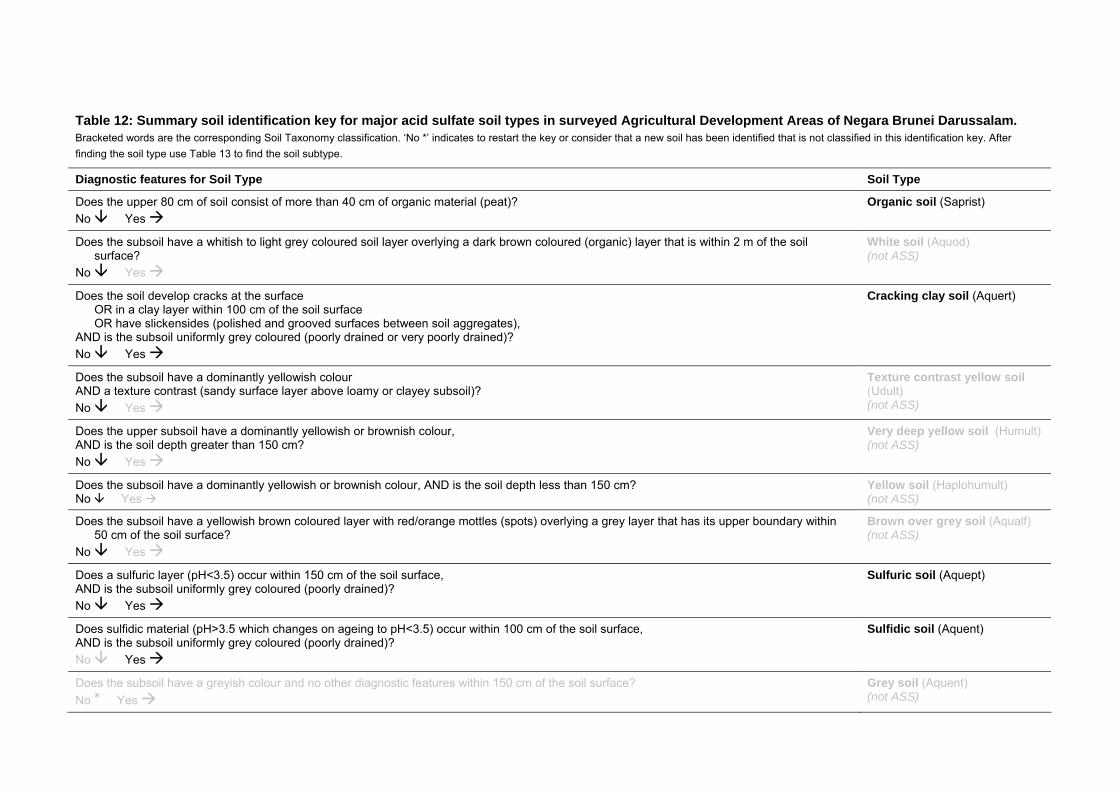
Table 12: Summary soil identification key for major acid sulfate soil types in surveyed Agricultural Development Areas of Negara Brunei Darussalam. Bracketed words are the corresponding Soil Taxonomy classification. ‘No *’ indicates to restart the key or consider that a new soil has been identified that is not classified in this identification key. After finding the soil type use Table 13 to find the soil subtype.
Diagnostic features for Soil Type Soil Type
Does the upper 80 cm of soil consist of more than 40 cm of organic material (peat)? No Yes
Organic soil (Saprist)
Does the subsoil have a whitish to light grey coloured soil layer overlying a dark brown coloured (organic) layer that is within 2 m of the soil surface?
No Yes
White soil (Aquod) (not ASS)
Does the soil develop cracks at the surface OR in a clay layer within 100 cm of the soil surface OR have slickensides (polished and grooved surfaces between soil aggregates),
AND is the subsoil uniformly grey coloured (poorly drained or very poorly drained)? No Yes
Cracking clay soil (Aquert)
Does the subsoil have a dominantly yellowish colour AND a texture contrast (sandy surface layer above loamy or clayey subsoil)? No Yes
Texture contrast yellow soil (Udult) (not ASS)
Does the upper subsoil have a dominantly yellowish or brownish colour, AND is the soil depth greater than 150 cm? No Yes
Very deep yellow soil (Humult) (not ASS)
Does the subsoil have a dominantly yellowish or brownish colour, AND is the soil depth less than 150 cm? No Yes
Yellow soil (Haplohumult) (not ASS)
Does the subsoil have a yellowish brown coloured layer with red/orange mottles (spots) overlying a grey layer that has its upper boundary within 50 cm of the soil surface?
No Yes
Brown over grey soil (Aqualf) (not ASS)
Does a sulfuric layer (pH<3.5) occur within 150 cm of the soil surface, AND is the subsoil uniformly grey coloured (poorly drained)? No Yes
Sulfuric soil (Aquept)
Does sulfidic material (pH>3.5 which changes on ageing to pH<3.5) occur within 100 cm of the soil surface, AND is the subsoil uniformly grey coloured (poorly drained)? No Yes
Sulfidic soil (Aquent)
Does the subsoil have a greyish colour and no other diagnostic features within 150 cm of the soil surface? No * Yes
Grey soil (Aquent) (not ASS)
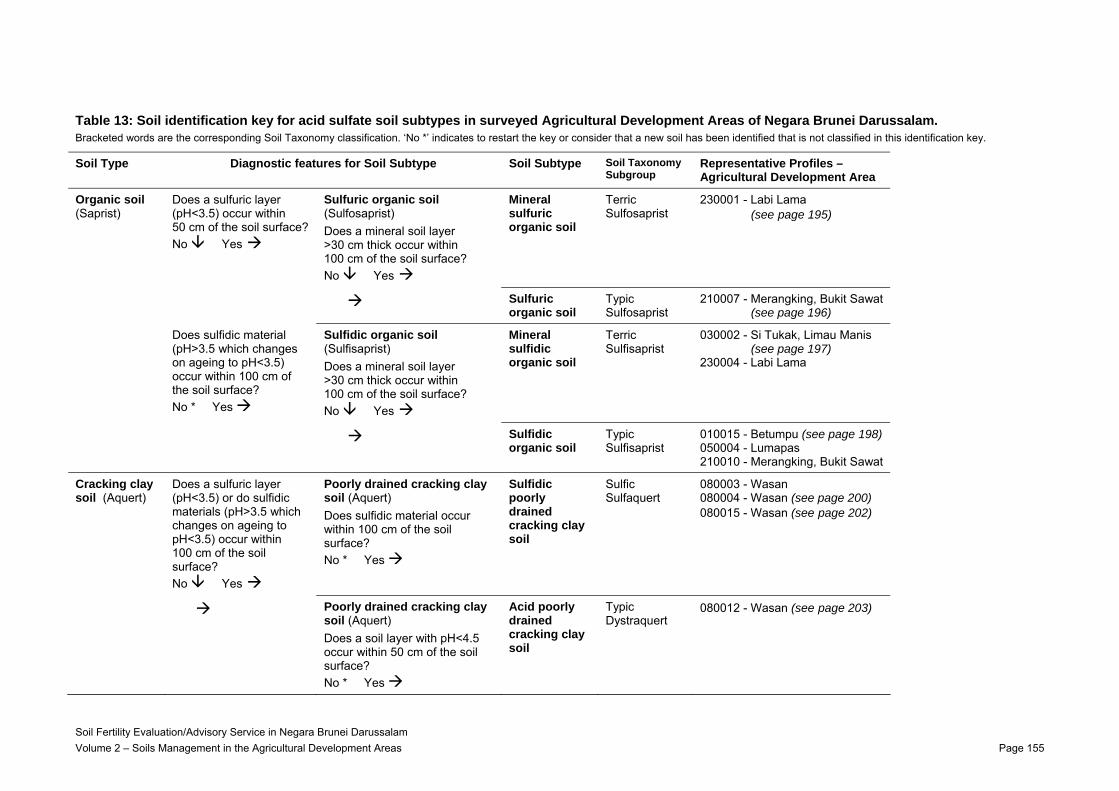
Table 13: Soil identification key for acid sulfate soil subtypes in surveyed Agricultural Development Areas of Negara Brunei Darussalam. Bracketed words are the corresponding Soil Taxonomy classification. ‘No *’ indicates to restart the key or consider that a new soil has been identified that is not classified in this identification key.
Soil Type Diagnostic features for Soil Subtype Soil Subtype Soil Taxonomy Subgroup
Representative Profiles – Agricultural Development Area
Organic soil (Saprist)
Does a sulfuric layer (pH<3.5) occur within 50 cm of the soil surface? No Yes
Sulfuric organic soil (Sulfosaprist) Does a mineral soil layer >30 cm thick occur within 100 cm of the soil surface? No Yes
Mineral sulfuric organic soil
Terric Sulfosaprist
230001 - Labi Lama (see page 195)
Sulfuric organic soil
Typic Sulfosaprist
210007 - Merangking, Bukit Sawat (see page 196)
Does sulfidic material (pH>3.5 which changes on ageing to pH<3.5) occur within 100 cm of the soil surface? No * Yes
Sulfidic organic soil (Sulfisaprist) Does a mineral soil layer >30 cm thick occur within 100 cm of the soil surface? No Yes
Mineral sulfidic organic soil
Terric Sulfisaprist
030002 - Si Tukak, Limau Manis (see page 197)
230004 - Labi Lama
Sulfidic organic soil
Typic Sulfisaprist
010015 - Betumpu (see page 198) 050004 - Lumapas 210010 - Merangking, Bukit Sawat
Cracking clay soil (Aquert)
Does a sulfuric layer (pH<3.5) or do sulfidic materials (pH>3.5 which changes on ageing to pH<3.5) occur within 100 cm of the soil surface? No Yes
Poorly drained cracking clay soil (Aquert) Does sulfidic material occur within 100 cm of the soil surface? No * Yes
Sulfidic poorly drained cracking clay soil
Sulfic Sulfaquert
080003 - Wasan 080004 - Wasan (see page 200) 080015 - Wasan (see page 202)
Poorly drained cracking clay soil (Aquert) Does a soil layer with pH<4.5 occur within 50 cm of the soil surface? No * Yes
Acid poorly drained cracking clay soil
Typic Dystraquert
080012 - Wasan (see page 203)
Soil Fertility Evaluation/Advisory Service in Negara Brunei Darussalam Volume 2 – Soils Management in the Agricultural Development Areas Page 155
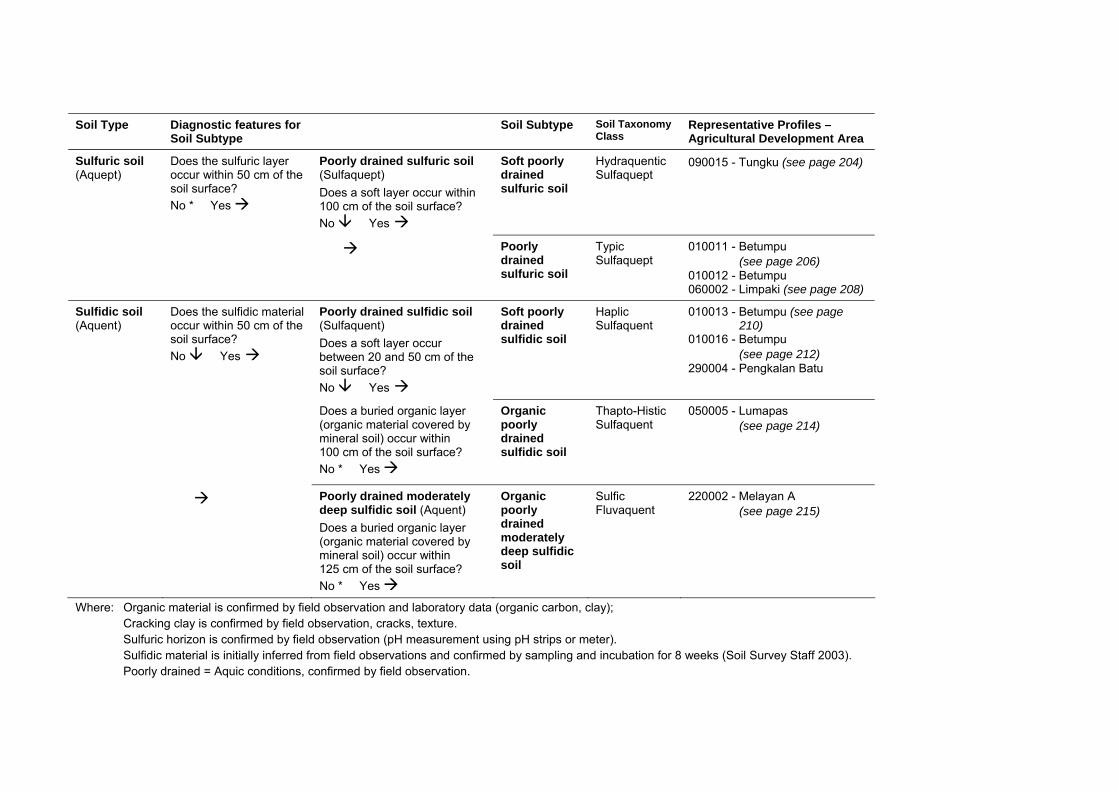
Soil Type Diagnostic features for Soil Subtype
Soil Subtype Soil Taxonomy Class
Representative Profiles – Agricultural Development Area
Sulfuric soil (Aquept)
Does the sulfuric layer occur within 50 cm of the soil surface? No * Yes
Poorly drained sulfuric soil (Sulfaquept) Does a soft layer occur within 100 cm of the soil surface? No Yes
Soft poorly drained sulfuric soil
Hydraquentic Sulfaquept
090015 - Tungku (see page 204)
Poorly drained sulfuric soil
Typic Sulfaquept
010011 - Betumpu (see page 206)
010012 - Betumpu 060002 - Limpaki (see page 208)
Sulfidic soil (Aquent)
Does the sulfidic material occur within 50 cm of the soil surface? No Yes
Poorly drained sulfidic soil (Sulfaquent) Does a soft layer occur between 20 and 50 cm of the soil surface? No Yes
Soft poorly drained sulfidic soil
Haplic Sulfaquent
010013 - Betumpu (see page 210)
010016 - Betumpu (see page 212)
290004 - Pengkalan Batu
Does a buried organic layer (organic material covered by mineral soil) occur within 100 cm of the soil surface? No * Yes
Organic poorly drained sulfidic soil
Thapto-Histic Sulfaquent
050005 - Lumapas (see page 214)
Poorly drained moderately deep sulfidic soil (Aquent) Does a buried organic layer (organic material covered by mineral soil) occur within 125 cm of the soil surface? No * Yes
Organic poorly drained moderately deep sulfidic soil
Sulfic Fluvaquent
220002 - Melayan A (see page 215)
Where: Organic material is confirmed by field observation and laboratory data (organic carbon, clay); Cracking clay is confirmed by field observation, cracks, texture. Sulfuric horizon is confirmed by field observation (pH measurement using pH strips or meter). Sulfidic material is initially inferred from field observations and confirmed by sampling and incubation for 8 weeks (Soil Survey Staff 2003). Poorly drained = Aquic conditions, confirmed by field observation.
7.4 Major Characteristics of ASS ASS were identified at 80 sites in 13 ADAs. Site descriptions for these sites and detailed field soil morphology / profile descriptions for soil pits and cores can be found in the project database. Photographs of type sites including chip trays, soil pits (where available) and landscape setting are provided in Appendix D.
The chemical characteristics are outlined below. Appendix Tables C1 to C5 contain the complete data set for the site and soil profile descriptions and the analyses used in the assessment.
The following information is stored in the GIS database:
• Regional locality map and site summary,
• Site locality map.
7.4.1 Morphology
7.4.1.1 Field Description and Morphology In all soil profiles, distinct layers or master soil horizons with suffix symbols were demarcated, described and summarised in Table 11. Soil colour, structure, texture and consistency along with field pH are the most useful properties for soil identification and appraisal. Soil colour, structure and consistency provide practical indicators of soil redox status and existing acidity. This relates directly to soil aeration and organic matter content in the soils of Brunei. Consequently, these field indicators were used to help develop a user-friendly soil identification key to categorise the various ASS and other soils in section 3 (see Table 12).
7.4.1.2 Sulfidic Material Sulfidic materials (potential acid sulfate soil materials) are common on the floodplain areas of Brunei. In many instances these materials underlie sulfuric horizons. In most cases there has been some oxidation as these materials contain moderate to high amounts of actual acidity, although the pH has not dropped sufficiently for them to form sulfuric horizons (<pH 3.5).
All soils analysed except Tungku (Site 09 0015) contain high enough concentrations of chromium reducible sulfur to require an ASS management plan (Table 15).
7.4.1.3 Sulfuric Horizons Many of the soils described have sulfidic material that has already oxidised and formed a sulfuric horizon.
7.4.1.4 Tests to Identify Sulfidic Material and Predict the Consequences of Disturbance
Field Test – Field pH after oxidation with 30% Hydrogen Peroxide (pHFOX) The peroxide field test is based on artificially accelerating oxidation of sulfidic material to release potential acidity. The pH of a sample after reaction with hydrogen peroxide (with pH adjusted to pH4.5-5.5 before going into the field) is a qualitative indication of the likelihood that a soil material or sediment has the potential to form sulfuric material or an acid sulfate soil when exposed to the atmosphere (e.g. when excavated). The hydrogen peroxide reacts with sulfides to produce sulfuric acid. Sulfuric acid in turn reacts with neutralising agents in the sample, such as carbonates and clay minerals. The final pH and reaction vigour can then be interpreted to qualitatively assess soil or sediment materials (Table 14, Figure 16).
Sulfidic material + hydrogen peroxide sulfuric acid + iron sulfate minerals + heat
Soil Fertility Evaluation/Advisory Service in Negara Brunei Darussalam Volume 2 – Soils Management in the Agricultural Development Areas Page 157
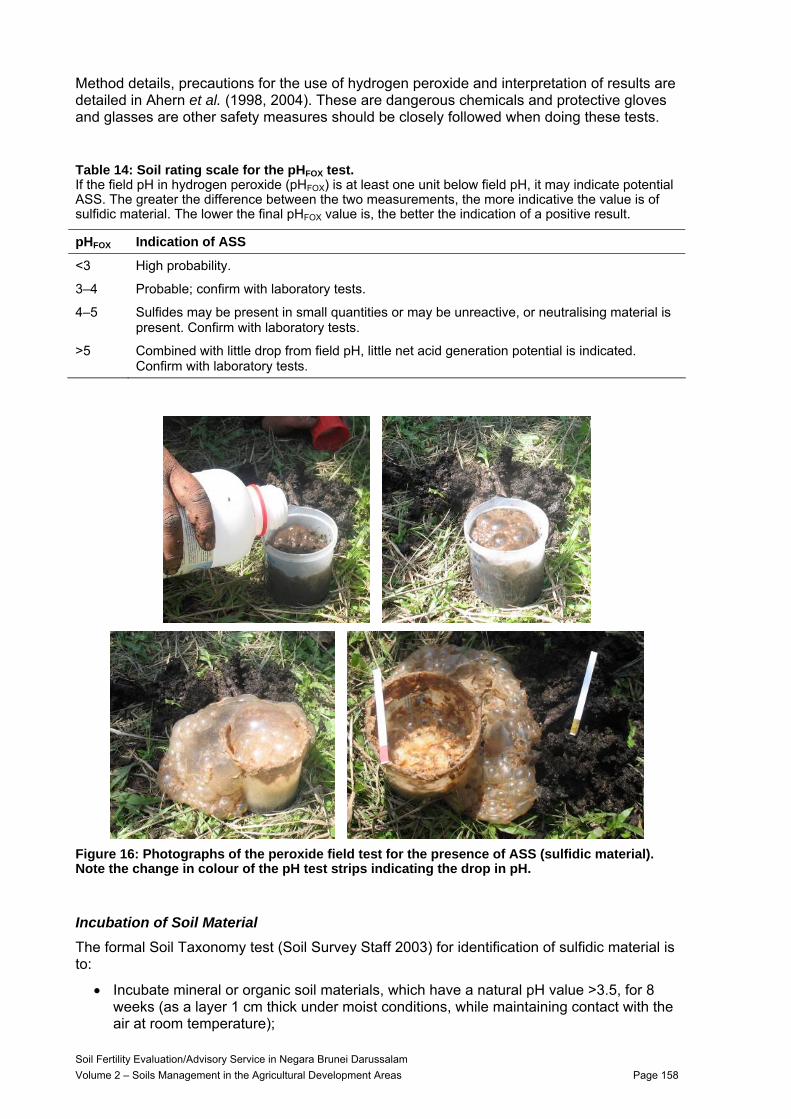
Method details, precautions for the use of hydrogen peroxide and interpretation of results are detailed in Ahern et al. (1998, 2004). These are dangerous chemicals and protective gloves and glasses are other safety measures should be closely followed when doing these tests.
Table 14: Soil rating scale for the pHFOX test. If the field pH in hydrogen peroxide (pHFOX) is at least one unit below field pH, it may indicate potential ASS. The greater the difference between the two measurements, the more indicative the value is of sulfidic material. The lower the final pHFOX value is, the better the indication of a positive result.
pHFOX Indication of ASS
<3 High probability.
3–4 Probable; confirm with laboratory tests.
4–5 Sulfides may be present in small quantities or may be unreactive, or neutralising material is present. Confirm with laboratory tests.
>5 Combined with little drop from field pH, little net acid generation potential is indicated. Confirm with laboratory tests.
Figure 16: Photographs of the peroxide field test for the presence of ASS (sulfidic material). Note the change in colour of the pH test strips indicating the drop in pH.
Incubation of Soil Material The formal Soil Taxonomy test (Soil Survey Staff 2003) for identification of sulfidic material is to:
• Incubate mineral or organic soil materials, which have a natural pH value >3.5, for 8 weeks (as a layer 1 cm thick under moist conditions, while maintaining contact with the air at room temperature);
Soil Fertility Evaluation/Advisory Service in Negara Brunei Darussalam Volume 2 – Soils Management in the Agricultural Development Areas Page 158
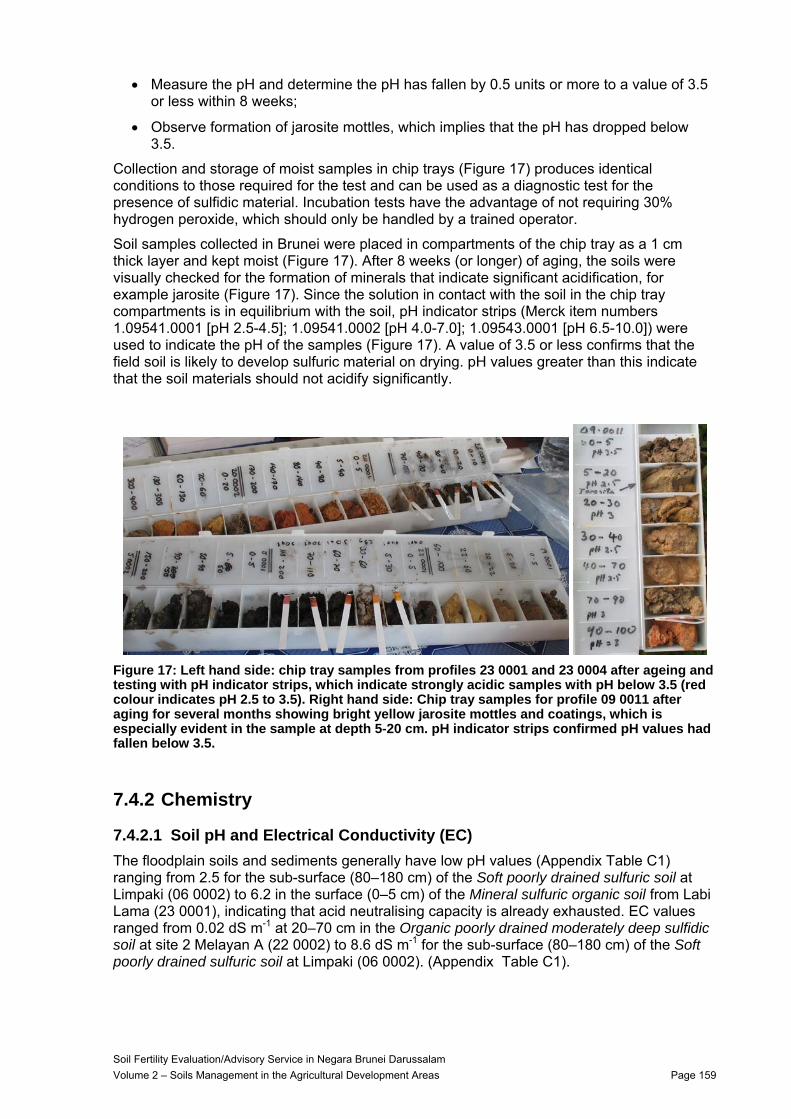
• Measure the pH and determine the pH has fallen by 0.5 units or more to a value of 3.5 or less within 8 weeks;
• Observe formation of jarosite mottles, which implies that the pH has dropped below 3.5.
Collection and storage of moist samples in chip trays (Figure 17) produces identical conditions to those required for the test and can be used as a diagnostic test for the presence of sulfidic material. Incubation tests have the advantage of not requiring 30% hydrogen peroxide, which should only be handled by a trained operator.
Soil samples collected in Brunei were placed in compartments of the chip tray as a 1 cm thick layer and kept moist (Figure 17). After 8 weeks (or longer) of aging, the soils were visually checked for the formation of minerals that indicate significant acidification, for example jarosite (Figure 17). Since the solution in contact with the soil in the chip tray compartments is in equilibrium with the soil, pH indicator strips (Merck item numbers 1.09541.0001 [pH 2.5-4.5]; 1.09541.0002 [pH 4.0-7.0]; 1.09543.0001 [pH 6.5-10.0]) were used to indicate the pH of the samples (Figure 17). A value of 3.5 or less confirms that the field soil is likely to develop sulfuric material on drying. pH values greater than this indicate that the soil materials should not acidify significantly.
Figure 17: Left hand side: chip tray samples from profiles 23 0001 and 23 0004 after ageing and testing with pH indicator strips, which indicate strongly acidic samples with pH below 3.5 (red colour indicates pH 2.5 to 3.5). Right hand side: Chip tray samples for profile 09 0011 after aging for several months showing bright yellow jarosite mottles and coatings, which is especially evident in the sample at depth 5-20 cm. pH indicator strips confirmed pH values had fallen below 3.5.
7.4.2 Chemistry
7.4.2.1 Soil pH and Electrical Conductivity (EC) The floodplain soils and sediments generally have low pH values (Appendix Table C1) ranging from 2.5 for the sub-surface (80–180 cm) of the Soft poorly drained sulfuric soil at Limpaki (06 0002) to 6.2 in the surface (0–5 cm) of the Mineral sulfuric organic soil from Labi Lama (23 0001), indicating that acid neutralising capacity is already exhausted. EC values ranged from 0.02 dS m-1 at 20–70 cm in the Organic poorly drained moderately deep sulfidic soil at site 2 Melayan A (22 0002) to 8.6 dS m-1 for the sub-surface (80–180 cm) of the Soft poorly drained sulfuric soil at Limpaki (06 0002). (Appendix Table C1).
Soil Fertility Evaluation/Advisory Service in Negara Brunei Darussalam Volume 2 – Soils Management in the Agricultural Development Areas Page 159
7.4.2.2 Sulfur In sediments, total sulfur is an inexpensive convenient measure to screen samples for acid sulfate soil potential. However, this analysis estimates the maximum potential environmental risk, so that when a trigger value is exceeded, more detailed analysis is required. Directly measuring the amount of reduced sulfur in a sample using the chromium reduction method has become the accepted standard for further investigation. Chromium reducible sulfur (SCr) is a direct measure of reduced inorganic sulphur (RIS). It can be directly equated with the acid generating potential (AGP) of a soil or sediment, and is one component of the net acidity, the other being the existing or actual acidity. The difference between reduced sulfur and total sulfur is the quantity of sulfate plus organic sulfur in the sample. Further analysis is required to separate the individual contribution of these components. For coastal acid sulfate soils in Australia the following action criteria for the preparation of an ASS management plan have been set (Table 15 below).
Total sulfur values in samples, range from 0.04% below 30 cm at Tungku (09 0015) to 4.4% in the sub-soil (80–180 cm) at Limpaki (06 0002). Chromium reducible sulfur values range from below the detection limit (0.005%) throughout the soil profile at Tungku (09 0015) to 3.4% in the sub-soil (150–200 cm) at Betumpu (01 0015). Generally, chromium reducible sulfur concentrations are lower to around 50 cm depth (<0.05%) and higher below 100 cm (>1%). In the limited number of analysed profiles the exception is Limpaki (ADA 06) where the top 40 cm contains chromium reducible sulfur concentrations >0.2%. The soft poorly drained sulfuric soil at Tungku is also an exception, but here the acid originates in adjacent outcrops of weathering pyritic shale and not in the soil profile.
Table 15: Thresholds indicating the need for an ASS management plan based on texture range and chromium reducible sulfur concentration (SCr) and amount of soil material disturbed (Dear et al., 2002).
SCr (%S) Texture range
<1000 t disturbed soil >1000 t disturbed soil
Coarse: Sands to loamy sands 0.03 0.03
Medium: Sandy loams to light clays 0.06 0.03
Fine: Medium to heavy clays 0.10 0.03
The results and the pH values indicate that all of the soils investigated exceed the thresholds in Table 15 and therefore warrant further investigation based on criteria used for tropical and temperate coastal ASS. However the applicability of these criteria in Brunei where the environment is dominated by highly leached, low pH soils and naturally occurring actual acid sulfate soils is untested particularly in relation to the off-site effects (Appendix Table C1).
7.4.2.3 Carbon Carbonate minerals in a soil are a component of its acid neutralising capacity (ANC). However, in the low pH, highly leached Brunei environment carbonate levels are expected to be low. The exceptions would be soils in proximity to carbonate rich sedimentary rocks or in soil profiles containing shell. In Brunei ASS pH values were too low for measurable carbonate, shells were absent from the profiles and none of the ASS profiles occurred near carbonate rich sedimentary rocks. While shell may be present in soils closer to the coast, it should be noted that carbonate from shell material is usually not a good source of neutralising capacity as it can become unreactive, when acidic waters result in the shell fragments becoming coated with iron and/or gypsum. Repeated wetting and drying cycles in wetlands may similarly armour carbonates with unreactive coatings. Detailed discussion of precautions and factors to be used when using carbonate values as a measure of ANC can be found in manuals and technical documents published for the assessment of coastal acid
Soil Fertility Evaluation/Advisory Service in Negara Brunei Darussalam Volume 2 – Soils Management in the Agricultural Development Areas Page 160
sulfate soils (e.g. Dear et al. 2002). None of the soils examined had measurable acid neutralising capacity (i.e. carbonate minerals in the soil).
In the Organic soils, organic carbon concentrations are (by definition) at least 12% in at least half of the top 80 cm. In the organic soil class, the maximum concentration was 59% organic carbon at 60–80 cm in a Sulfuric organic soil at Meranking (21 0007) and 0.35% at 70–150 cm in a Mineral sulfidic organic soil at Labi Lama (23 0004). Sulfuric soils have a range in carbon concentrations from 0.18% in the Soft poorly drained sulfuric soil from site 15 at Tungku (09 0015) to 17% in a Poorly drained sulfuric soil at site 11 in Betumpu (01 0011). The range in organic carbon found in Sulfidic soils was from 0.14% at 20–70 cm to 24% at 130–200 cm, both in the Organic poorly drained moderately deep sulfidic soil at Melayan A (22 0002). Cracking clay soils contain between 0.94% organic carbon between 20–70 cm at Si Tukak, Limau Manis B (03 0001) and 6.5% between 0–10 cm of the same soil. (See Appendix Table C1.1 for the complete set of results).
7.4.2.4 Acid–Base Budget
Total Actual Acidity Actual acidity is a measure of the existing acidity in acid sulfate soils that have already oxidised. The method measures acidity stored in a number of forms in the soil such as iron and aluminium oxyhydroxides and oxyhydroxysulfate precipitates (e.g. jarosite, schwertmannite and alunite) which dissolve to produce acidity. Because some samples thawed in transit and potentially oxidised before analysis for total actual acidity, this measure as a stand alone variable to assess the current level of acidity in Brunei acid sulfate soils is not reliable. However, it can be applied to the acid–base budget, which uses the total of actual and potential acidity to assess the acid generation potential of a soil. All sites had existing acidity, which ranged from 49 moles H+ t-1 in the sub-surface (30–50 cm) of the Soft poorly drained sulfuric soil at Tungku (09 0015) to 760 moles H+ t-1 in the sub-surface (80–150 cm) of the Sulfidic organic soil at Betumpu (01 0015). (Appendix Table C1).
Acid Neutralising Capacity (ANC) By definition any soil with a pH<6.5 has a zero ANC. All acid sulfate soils examined had pH values of <6.5 throughout the profile.
Acid Generation Potential (AGP) This parameter is calculated from the concentration of reduced sulfur in the sample. Methods for analysing soil samples to assess AGP are given in Ahern et al. (2004), which includes the chromium reducible sulfur (SCr) (Method Code 22B) and its conversion to AGP.
Net Acid Generation Potential (NAGP) NAGP is calculated by subtracting the ANC from the AGP and is a measure of the overall acidification risk of a soil. A positive value indicates an excess of acid and the likelihood of sulfuric materials (or an actual acid sulfate soil material) forming in the soil when it is disturbed and oxidised:
NAGP = AGP – ANC.
Net Acidity The net acidity of a soil where there is existing acidity includes both NAGP and the existing or titratable actual acidity (TAA) so that:
Net Acidity = TAA + AGP – ANC
or
Net Acidity = TAA +NAGP.
Soil Fertility Evaluation/Advisory Service in Negara Brunei Darussalam Volume 2 – Soils Management in the Agricultural Development Areas Page 161
All soils sampled had positive net acidities. Net acidities ranged from 49 moles H+ t-1 in the sub-surface (30–50 cm) of the Soft poorly drained sulfuric soil at Tungku (09 0015) to 2,900 moles H+ t-1 in the sub-surface (150–200 cm) of the Organic sulfidic soil at Betumpu (01 0015). (Appendix Table C3). The soil at Limpaki (ADA 06) had a high acid generating potential, being >500 moles H+ t-1 throughout the profile and >2000 moles H+ t-1 below 80 cm.
7.4.2.5 Arsenic and Cadmium Arsenic concentrations in the acid sulfate soils analysed ranged from 0.1 to 20 mg kg-1. Cadmium concentrations in these soils ranged from less than the detection limit of 0.2 mg kg–1 to 1.8 mg kg-1. Both arsenic and cadmium were below the serious risk concentrations in soil for human and ecotoxicological protection set in soil standards for the Netherlands (576 and 85 mg kg–1 respectively for As and 28 and 13 mg kg-1 respectively for Cd; Lijzen et al. 2001 ) and below the soil investigation levels set in Australia (100 mg kg-1 for As and 20 mg kg-1 for Cd; Imray and Langley 1999). The highest levels of cadmium were found at Labi Lama (23 0001) and may reflect fertilisation of the orchard. There is evidence of over-fertilisation in some intensively used areas, which carries with it the risk of elevated concentrations of cadmium in soil and produce. Such areas may need further investigation. Another difficulty in assessing levels of arsenic and cadmium in the soil of Brunei is the low pH, compared with the soil pH values assumed in developing the standards (pH 7.0 and 6.0 respectively for the Netherlands and Australia). The low pH values (3.9–4.2) of the Brunei soils may increase metal availability and uptake by crops.
Soil Fertility Evaluation/Advisory Service in Negara Brunei Darussalam Volume 2 – Soils Management in the Agricultural Development Areas Page 162
7.5 Management of ASS for Soil Fertility, Agricultural Production and Environmental Protection
7.5.1 Management Options We propose three options for the management of ASS in Brunei. These are to (i) avoid disturbance where tests show high levels of sulfidic material, (ii) minimise disturbance where tests show low levels of sulfidic material and (iii) treat disturbed areas where tests show a sulfuric horizon or acid water.
7.5.1.1 Avoiding Disturbance The preferred management strategy for ASS is to avoid disturbance i.e. do not develop. Any decision to develop ASS should be made in the knowledge of the severe economic and environmental risks posed by them. In the case of organic soils there is a substantial risk of subsidence and eventually complete loss of the resource. The subsidence is accompanied by greenhouse gas emissions from the oxidation of fossil carbon accumulated during the Holocene period. It is important to note that most ASS management strategies are focused on minimising acidic discharges and may be ineffective in controlling either subsidence or greenhouse gas emissions. In the absence of avoidance choices fall to either minimising disturbance or total reclamation. Total reclamation is expensive and development is only likely to be successful if a number of factors are present:
• Strong demand for land;
• No alternative land available;
• Favourable climate;
• Favourable hydrology;
• Availability of lime and fertilizers; and
• Demand for the agricultural products at a price that reflects the true cost of production.
7.5.1.2 Minimising Disturbance Management of ASS relies on managing the acid and iron released into the drainage system; leaching and neutralising acidity in both the soil and drainage water; and preventing further oxidation and acid generation. Water and the water table are the key elements. In Brunei, both the climate and hydrology are favourable for managing water to improve production and protect the environment.
Water table: To minimise the disturbance of ASS the water table must be maintained above the level of sulfidic material to prevent further oxidation. In organic soils this strategy also assists in preventing subsidence through the loss of organic matter from microbiological oxidation and fire. Water tables can be managed by drainage design, weirs, sluices and floodgates and by the use of irrigation water.
Drains: Drain design is a key tool in managing ASS. The main function of drains in controlling water tables is to rapidly remove surface water to prevent infiltration rather than dewatering the soil profile through lateral drainage. Laser levelling combined with reduced drain depth and increased drain width and spacing will result in less aeration (i.e. oxidation) of pyrite and smaller exports of acid oxidation products.
Irrigation water: Root development is always be restricted in ASS environments so that access to irrigation water for use during dry spells can both alleviate plant stress and maintain the water level above the sulfidic layer.
Raised beds: The current practice of constructing raised beds can be assisted by identifying the depth to sulfidic material to maximise the available non-ASS material. Where insufficient depth of material is available, treating soil from sulfuric horizons with lime and/or accelerated
Soil Fertility Evaluation/Advisory Service in Negara Brunei Darussalam Volume 2 – Soils Management in the Agricultural Development Areas Page 163
oxidation of sulfidic material and soil ripening can provide additional soil for raised beds provided the acidic leachate can be managed. For high value crops it may be economic to import non-ASS mineral soils from outside the district to supplement the construction of raised beds. Constructing raised beds from organic soils is only a short term solution because the soil material will rapidly oxidise and subside. Crop choice is also important, with shallow rooted annual crops preferable to perennial tree crops. Sequence farming on new areas starting with acid tolerant crops such as pineapples is another alternative.
Managing ripening ASS: Mineral ASS often has good physical properties, and accelerated oxidation may be viable provided leachate can be controlled. Options for leachate management include collecting and liming leachate, and flushing leachate into drains and neutralising with seawater. The latter option requires well managed drains and control structures plus proximity to seawater to neutralise acidic leachate.
7.5.1.3 Rehabilitation
Basic Principles
The basic principles of rehabilitation are to curtail pyrite oxidation and to neutralise or leach existing acidity.
Pyrite oxidation can only be stopped by removing the oxygen supply. This can be done by re-flooding or capping. After the removal of the oxygen supply, oxidation of pyrite by FeIII may continue for some time. Pyrite oxidation can be slowed by decreasing the rate of FeIII production. Bactericides that inhibit Acidithiobacillus sp. or amendments that complex or precipitate the iron are ways to do this. However, this is only a temporary solution more suited to short term requirements such as stockpiling during engineering works.
Neutralisation can be achieved by the addition of lime (or other alkaline substances) and by the reduction of FeIII oxides which consumes protons.
Leaching is only possible using a water management system that discharges acidic surface water. This is usually done at times of high flow to reduce the environmental impact. Most successful ASS rehabilitation schemes in south east Asia rely on a combination of leaching through sophisticated water management and amendments to the leached soil. Management that relies on the discharge of acidic surface water containing toxic elements may not be an acceptable option for Brunei.
Liming
Soil: In the surface soil (0–50 cm depth interval), the existing acidity ranges from 40 to 100 t CaCO3 ha-1 equivalent and potential acidity from 0 to 42 t CaCO3 ha-1 equivalent. While requiring substantial lime input, in most instances there is little remaining potential acidity, so that once treated, retreatment should only be required if ASS material or acid water is imported. This is in contrast to the sub-soil where substantial reserves of pyrite remain, with in some instances an acid generation potential equivalent to >500 t CaCO3 ha-1 for a 50 cm interval.
Drains: Acidic drain water can be neutralised by the addition of lime. The neutralisation of leachate with lime drains requires costly maintenance as iron precipitates clog drains and coat the surface of the lime making it inactive.
Re-flooding Re-flooding with tidal water has been successful in reducing the production of acid or halting the continued oxidation of pyrite in Australian ASS. Re-flooding of rice paddies with fresh water is also a successful management tool, although there are problems with nutrition and with the toxicity of hydrogen sulfide and dissolved iron. Re-flooding as a management tool relies on establishing conditions where the reduction of the Fe, Mn, S and N can take place. Soil Fertility Evaluation/Advisory Service in Negara Brunei Darussalam Volume 2 – Soils Management in the Agricultural Development Areas Page 164
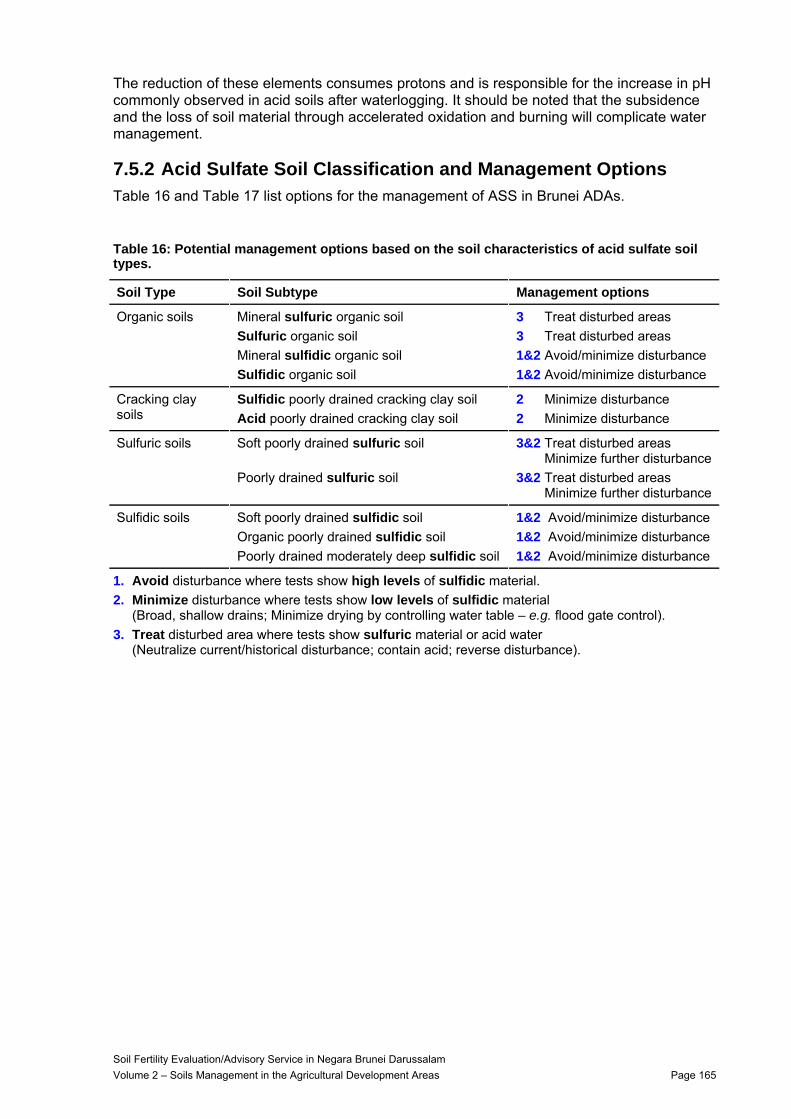
Soil Fertility Evaluation/Advisory Service in Negara Brunei Darussalam Volume 2 – Soils Management in the Agricultural Development Areas Page 165
The reduction of these elements consumes protons and is responsible for the increase in pH commonly observed in acid soils after waterlogging. It should be noted that the subsidence and the loss of soil material through accelerated oxidation and burning will complicate water management.
7.5.2 Acid Sulfate Soil Classification and Management Options Table 16 and Table 17 list options for the management of ASS in Brunei ADAs.
Table 16: Potential management options based on the soil characteristics of acid sulfate soil types.
Soil Type Soil Subtype Management options
Organic soils Mineral sulfuric organic soil Sulfuric organic soil Mineral sulfidic organic soil Sulfidic organic soil
3 Treat disturbed areas 3 Treat disturbed areas 1&2 Avoid/minimize disturbance 1&2 Avoid/minimize disturbance
Cracking clay soils
Sulfidic poorly drained cracking clay soil Acid poorly drained cracking clay soil
2 Minimize disturbance 2 Minimize disturbance
Sulfuric soils Soft poorly drained sulfuric soil
Poorly drained sulfuric soil
3&2 Treat disturbed areas Minimize further disturbance
3&2 Treat disturbed areas Minimize further disturbance
Sulfidic soils Soft poorly drained sulfidic soil Organic poorly drained sulfidic soil Poorly drained moderately deep sulfidic soil
1&2 Avoid/minimize disturbance 1&2 Avoid/minimize disturbance 1&2 Avoid/minimize disturbance
1. Avoid disturbance where tests show high levels of sulfidic material. 2. Minimize disturbance where tests show low levels of sulfidic material
(Broad, shallow drains; Minimize drying by controlling water table – e.g. flood gate control). 3. Treat disturbed area where tests show sulfuric material or acid water
(Neutralize current/historical disturbance; contain acid; reverse disturbance).
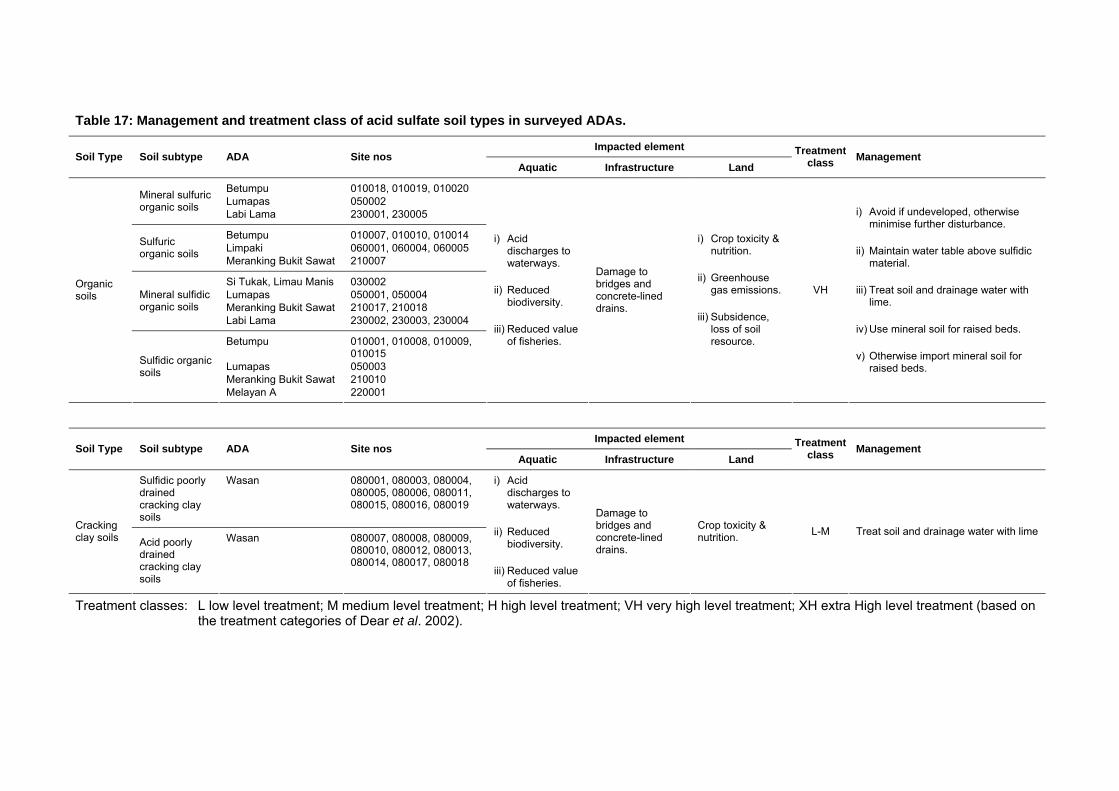
Table 17: Management and treatment class of acid sulfate soil types in surveyed ADAs.
Impacted element Soil Type Soil subtype ADA Site nos
Aquatic Infrastructure Land Treatment
class Management
Betumpu 010018, 010019, 010020 Lumapas 050002 Mineral sulfuric
organic soils Labi Lama 230001, 230005
Betumpu 010007, 010010, 010014 Limpaki 060001, 060004, 060005 Sulfuric
organic soils Meranking Bukit Sawat 210007
Si Tukak, Limau Manis 030002 Lumapas 050001, 050004 Meranking Bukit Sawat 210017, 210018
Mineral sulfidic organic soils
Labi Lama 230002, 230003, 230004
Betumpu 010001, 010008, 010009, 010015
Lumapas 050003 Meranking Bukit Sawat 210010
Organic soils
Sulfidic organic soils
Melayan A 220001
i) Acid discharges to waterways.
ii) Reduced biodiversity.
iii) Reduced value of fisheries.
Damage to bridges and concrete-lined drains.
i) Crop toxicity & nutrition.
ii) Greenhouse gas emissions.
iii) Subsidence, loss of soil resource.
VH
i) Avoid if undeveloped, otherwise minimise further disturbance.
ii) Maintain water table above sulfidic material.
iii) Treat soil and drainage water with lime.
iv) Use mineral soil for raised beds.
v) Otherwise import mineral soil for raised beds.
Impacted element Soil Type Soil subtype ADA Site nos
Aquatic Infrastructure Land Treatment
class Management
Sulfidic poorly drained cracking clay soils
Wasan 080001, 080003, 080004, 080005, 080006, 080011, 080015, 080016, 080019
Cracking clay soils Acid poorly
drained cracking clay soils
Wasan 080007, 080008, 080009, 080010, 080012, 080013, 080014, 080017, 080018
i) Acid discharges to waterways.
ii) Reduced biodiversity.
iii) Reduced value of fisheries.
Damage to bridges and concrete-lined drains.
Crop toxicity & nutrition. L-M Treat soil and drainage water with lime
Treatment classes: L low level treatment; M medium level treatment; H high level treatment; VH very high level treatment; XH extra High level treatment (based on the treatment categories of Dear et al. 2002).
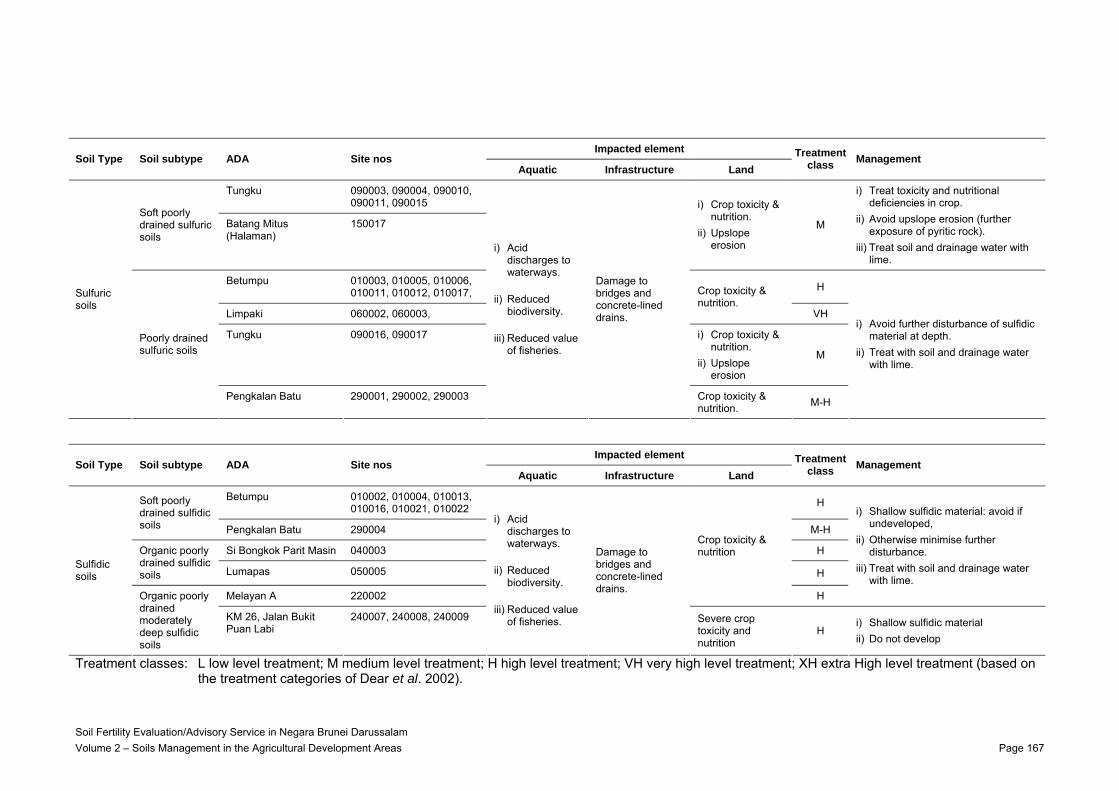
Soil Fertility Evaluation/Advisory Service in Negara Brunei Darussalam Volume 2 – Soils Management in the Agricultural Development Areas Page 167
Impacted element Soil Type Soil subtype ADA Site nos
Aquatic Infrastructure Land Treatment
class Management
Tungku 090003, 090004, 090010, 090011, 090015
Soft poorly drained sulfuric soils
Batang Mitus (Halaman)
150017
i) Crop toxicity & nutrition.
ii) Upslope erosion
M
i) Treat toxicity and nutritional deficiencies in crop.
ii) Avoid upslope erosion (further exposure of pyritic rock).
iii) Treat soil and drainage water with lime.
Betumpu 010003, 010005, 010006, 010011, 010012, 010017, H
Limpaki 060002, 060003,
Crop toxicity & nutrition.
VH
Tungku 090016, 090017 i) Crop toxicity & nutrition.
ii) Upslope erosion
M
Sulfuric soils
Poorly drained sulfuric soils
Pengkalan Batu 290001, 290002, 290003
i) Acid discharges to waterways.
ii) Reduced biodiversity.
iii) Reduced value of fisheries.
Damage to bridges and concrete-lined drains.
Crop toxicity & nutrition. M-H
i) Avoid further disturbance of sulfidic material at depth.
ii) Treat with soil and drainage water with lime.
Impacted element Soil Type Soil subtype ADA Site nos
Aquatic Infrastructure Land Treatment
class Management
Betumpu 010002, 010004, 010013, 010016, 010021, 010022 H Soft poorly
drained sulfidic soils Pengkalan Batu 290004 M-H
Si Bongkok Parit Masin 040003 H Organic poorly drained sulfidic soils Lumapas 050005 H
Melayan A 220002
Crop toxicity & nutrition
H
i) Shallow sulfidic material: avoid if undeveloped,
ii) Otherwise minimise further disturbance.
iii) Treat with soil and drainage water with lime.
Sulfidic soils
Organic poorly drained moderately deep sulfidic soils
KM 26, Jalan Bukit Puan Labi
240007, 240008, 240009
i) Acid discharges to waterways.
ii) Reduced biodiversity.
iii) Reduced value of fisheries.
Damage to bridges and concrete-lined drains.
Severe crop toxicity and nutrition
H i) Shallow sulfidic material ii) Do not develop
Treatment classes: L low level treatment; M medium level treatment; H high level treatment; VH very high level treatment; XH extra High level treatment (based on the treatment categories of Dear et al. 2002).
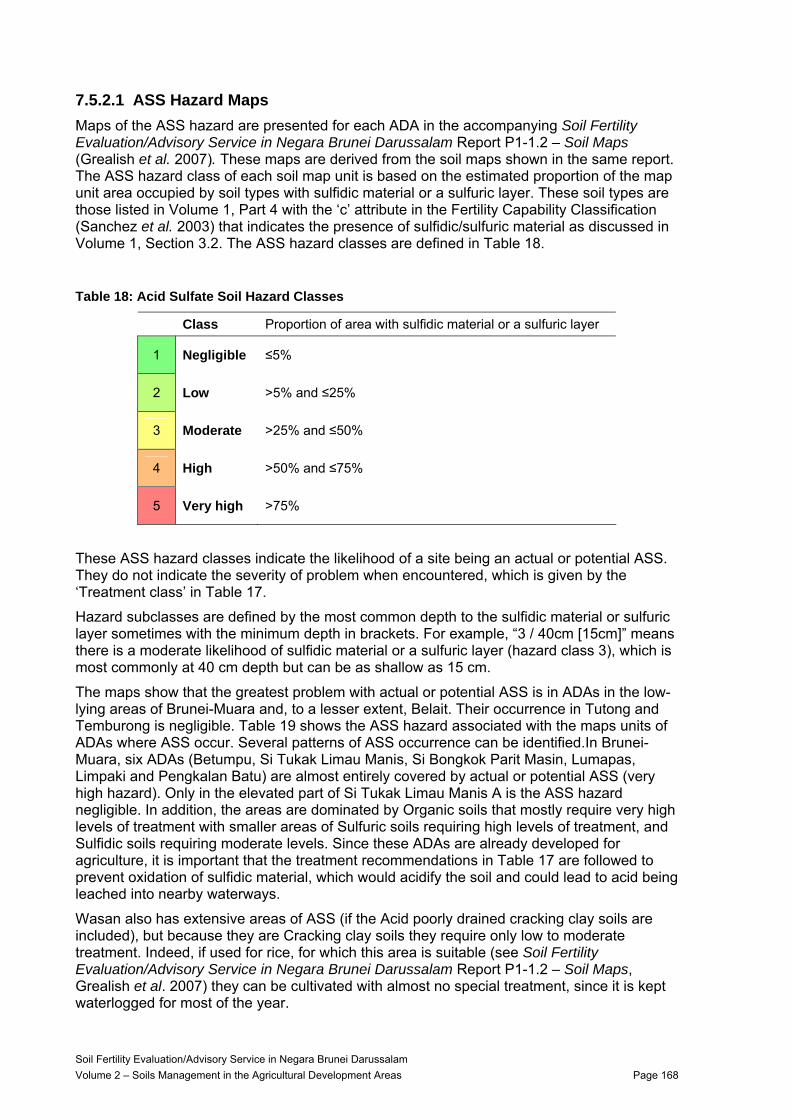
7.5.2.1 ASS Hazard Maps Maps of the ASS hazard are presented for each ADA in the accompanying Soil Fertility Evaluation/Advisory Service in Negara Brunei Darussalam Report P1-1.2 – Soil Maps (Grealish et al. 2007). These maps are derived from the soil maps shown in the same report. The ASS hazard class of each soil map unit is based on the estimated proportion of the map unit area occupied by soil types with sulfidic material or a sulfuric layer. These soil types are those listed in Volume 1, Part 4 with the ‘c’ attribute in the Fertility Capability Classification (Sanchez et al. 2003) that indicates the presence of sulfidic/sulfuric material as discussed in Volume 1, Section 3.2. The ASS hazard classes are defined in Table 18.
Table 18: Acid Sulfate Soil Hazard Classes
Class Proportion of area with sulfidic material or a sulfuric layer
1 Negligible ≤5%
2 Low >5% and ≤25%
3 Moderate >25% and ≤50%
4 High >50% and ≤75%
5 Very high >75%
These ASS hazard classes indicate the likelihood of a site being an actual or potential ASS. They do not indicate the severity of problem when encountered, which is given by the ‘Treatment class’ in Table 17.
Hazard subclasses are defined by the most common depth to the sulfidic material or sulfuric layer sometimes with the minimum depth in brackets. For example, “3 / 40cm [15cm]” means there is a moderate likelihood of sulfidic material or a sulfuric layer (hazard class 3), which is most commonly at 40 cm depth but can be as shallow as 15 cm.
The maps show that the greatest problem with actual or potential ASS is in ADAs in the low-lying areas of Brunei-Muara and, to a lesser extent, Belait. Their occurrence in Tutong and Temburong is negligible. Table 19 shows the ASS hazard associated with the maps units of ADAs where ASS occur. Several patterns of ASS occurrence can be identified.In Brunei-Muara, six ADAs (Betumpu, Si Tukak Limau Manis, Si Bongkok Parit Masin, Lumapas, Limpaki and Pengkalan Batu) are almost entirely covered by actual or potential ASS (very high hazard). Only in the elevated part of Si Tukak Limau Manis A is the ASS hazard negligible. In addition, the areas are dominated by Organic soils that mostly require very high levels of treatment with smaller areas of Sulfuric soils requiring high levels of treatment, and Sulfidic soils requiring moderate levels. Since these ADAs are already developed for agriculture, it is important that the treatment recommendations in Table 17 are followed to prevent oxidation of sulfidic material, which would acidify the soil and could lead to acid being leached into nearby waterways.
Wasan also has extensive areas of ASS (if the Acid poorly drained cracking clay soils are included), but because they are Cracking clay soils they require only low to moderate treatment. Indeed, if used for rice, for which this area is suitable (see Soil Fertility Evaluation/Advisory Service in Negara Brunei Darussalam Report P1-1.2 – Soil Maps, Grealish et al. 2007) they can be cultivated with almost no special treatment, since it is kept waterlogged for most of the year.
Soil Fertility Evaluation/Advisory Service in Negara Brunei Darussalam Volume 2 – Soils Management in the Agricultural Development Areas Page 168
Soil Fertility Evaluation/Advisory Service in Negara Brunei Darussalam Volume 2 – Soils Management in the Agricultural Development Areas Page 169
The pattern of ASS in Tungku is rather different, with ASS being only moderately extensive in most of the ADA. Soft poorly drained sulfuric soils occur in the lower parts of the landscape and require moderate levels of treatment.
In Belait, four ADAs (Tungulian, Melayan A, Labi Lama and Km26 Jalan Bukit Puan Labi) have very high ASS hazard in the lowland areas associated with the AN (be) map unit. This map unit is dominated by Organic soils requiring very high levels of treatment. In Km26 Jalan Bukit Puan Labi there are also pockets of Organic poorly drained moderately deep sulfidic soils that require a high treatment level. Within these four ADAs, much of the area with very high ASS hazard is currently undeveloped for agriculture. Given that very high levels of treatment are necessary to successfully develop these areas, consideration should be given to leaving them undeveloped (see Table 17).
Merangking Bukit Sawat has isolated pockets of ASS, accounting for only a small part of its total area. If this ADA is developed for agriculture, these areas of organic soil would best be left undeveloped, since they require a very high treatment level (see Table 17).
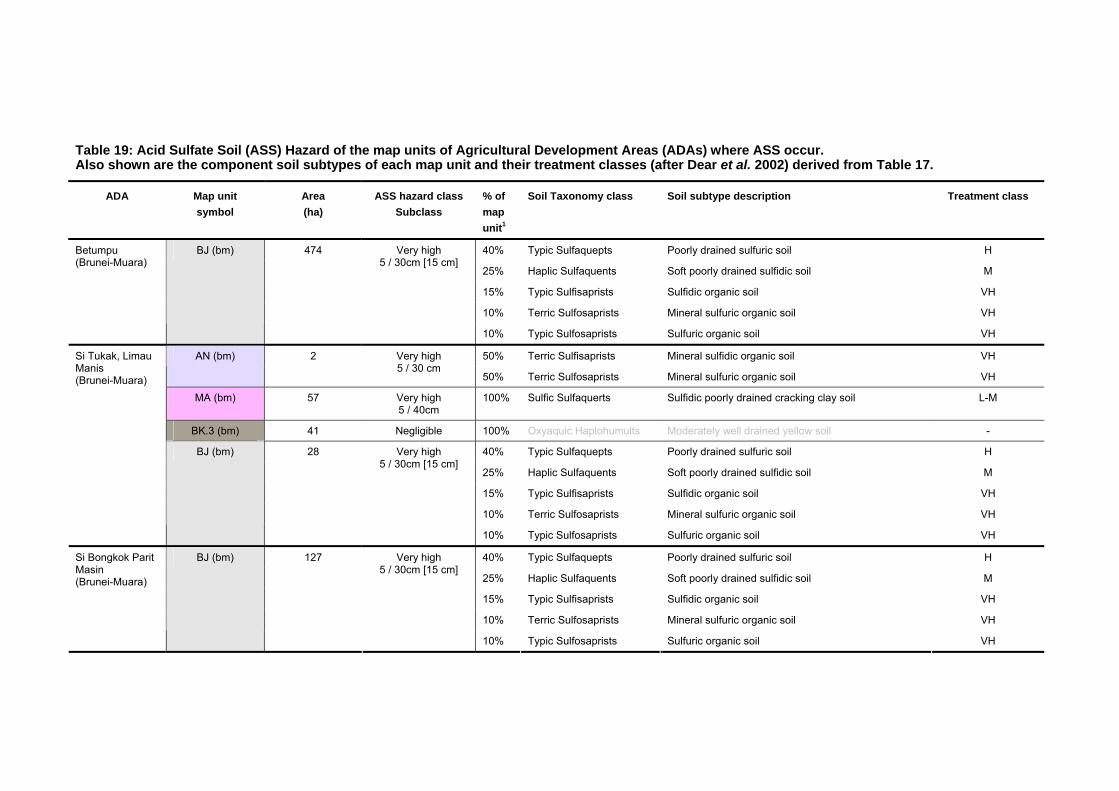
Table 19: Acid Sulfate Soil (ASS) Hazard of the map units of Agricultural Development Areas (ADAs) where ASS occur. Also shown are the component soil subtypes of each map unit and their treatment classes (after Dear et al. 2002) derived from Table 17.
ADA Map unit symbol
Area (ha)
ASS hazard class Subclass
% of map unit1
Soil Taxonomy class Soil subtype description Treatment class
40% Typic Sulfaquepts Poorly drained sulfuric soil H
25% Haplic Sulfaquents Soft poorly drained sulfidic soil M
15% Typic Sulfisaprists Sulfidic organic soil VH
10% Terric Sulfosaprists Mineral sulfuric organic soil VH
Betumpu (Brunei-Muara)
BJ (bm) 474 Very high 5 / 30cm [15 cm]
10% Typic Sulfosaprists Sulfuric organic soil VH
50% Terric Sulfisaprists Mineral sulfidic organic soil VH AN (bm) 2 Very high 5 / 30 cm
50% Terric Sulfosaprists Mineral sulfuric organic soil VH
MA (bm) 57 Very high 5 / 40cm
100% Sulfic Sulfaquerts Sulfidic poorly drained cracking clay soil L-M
BK.3 (bm) 41 Negligible 100% Oxyaquic Haplohumults Moderately well drained yellow soil -
40% Typic Sulfaquepts Poorly drained sulfuric soil H
25% Haplic Sulfaquents Soft poorly drained sulfidic soil M
15% Typic Sulfisaprists Sulfidic organic soil VH
10% Terric Sulfosaprists Mineral sulfuric organic soil VH
Si Tukak, Limau Manis (Brunei-Muara)
BJ (bm) 28 Very high 5 / 30cm [15 cm]
10% Typic Sulfosaprists Sulfuric organic soil VH
40% Typic Sulfaquepts Poorly drained sulfuric soil H
25% Haplic Sulfaquents Soft poorly drained sulfidic soil M
15% Typic Sulfisaprists Sulfidic organic soil VH
10% Terric Sulfosaprists Mineral sulfuric organic soil VH
Si Bongkok Parit Masin (Brunei-Muara)
BJ (bm) 127 Very high 5 / 30cm [15 cm]
10% Typic Sulfosaprists Sulfuric organic soil VH
ADA Map unit symbol
Area (ha)
ASS hazard class Subclass
% of map unit1
Soil Taxonomy class Soil subtype description Treatment class
50% Terric Sulfisaprists Mineral sulfidic organic soil VH AN (bm) 14 Very high 5 / 30 cm
50% Terric Sulfosaprists Mineral sulfuric organic soil VH
40% Typic Sulfaquepts Poorly drained sulfuric soil H
25% Haplic Sulfaquents Soft poorly drained sulfidic soil M
15% Typic Sulfisaprists Sulfidic organic soil VH
10% Terric Sulfosaprists Mineral sulfuric organic soil VH
Lumapas (Brunei-Muara)
BJ (bm) 24 Very high 5 / 30cm [15cm]
10% Typic Sulfosaprists Sulfuric organic soil VH
50% Terric Sulfisaprists Mineral sulfidic organic soil VH AN (bm) 3 Very high 5 / 30 cm
50% Terric Sulfosaprists Mineral sulfuric organic soil VH
MA (bm) 19 Very high 5 / 40cm
100% Sulfic Sulfaquerts Sulfidic poorly drained cracking clay soil L-M
BK.2 (bm) <1 Negligible 100% Oxyaquic Haplohumults Moderately well drained yellow soil -
40% Typic Sulfaquepts Poorly drained sulfuric soil H
25% Haplic Sulfaquents Soft poorly drained sulfidic soil M
15% Typic Sulfisaprists Sulfidic organic soil VH
10% Terric Sulfosaprists Mineral sulfuric organic soil VH
Limpaki (Brunei-Muara)
BJ (bm) 69 Very high 5 / 30cm [15 cm]
10% Typic Sulfosaprists Sulfuric organic soil VH
50% Sulfic Sulfaquerts Sulfidic poorly drained cracking clay soil L-M BJ (wa) 329 Moderate 3 / 40 cm
50% Typic Dystraquerts Acid poorly drained cracking clay soil L-M
MA (bm) 43 Very high 5 / 40cm
100% Sulfic Sulfaquerts Sulfidic poorly drained cracking clay soil L-M
Wasan (Brunei-Muara)
BK.3 (bm) 1 Negligible 100% Oxyaquic Haplohumults Moderately well drained yellow soil -
Soil Fertility Evaluation/Advisory Service in Negara Brunei Darussalam Volume 2 – Soils Management in the Agricultural Development Areas Page 171
ADA Map unit symbol
Area (ha)
ASS hazard class Subclass
% of map unit1
Soil Taxonomy class Soil subtype description Treatment class
60% Ultic Epiaquods Loamy poorly drained podsol soil MR 5 Moderate 3 / 0 cm
40% Hydraquentic Sulfaquepts Soft poorly drained sulfuric soil M
40% Ultic Epiaquods Loamy poorly drained podsol soil -
40% Hydraquentic Sulfaquepts Soft poorly drained sulfuric soil M
LU/BJ 191 Moderate 3 / 0cm
20% Oxyaquic Haplohumults Moderately well drained yellow soil -
70% Oxyaquic Haplohumults Moderately well drained yellow soil - BK/NY.2 60 Negligible
30% Typic Kandihumults Sandy very deep yellow soil -
40% Typic Haplohumults Well drained yellow soil -
30% Typic Kandihumults Sandy very deep yellow soil -
NY.3 4 Negligible
30% Oxyaquic Haplohumults Moderately well drained yellow soil -
40% Typic Sulfaquepts Poorly drained sulfuric soil H
25% Haplic Sulfaquents Soft poorly drained sulfidic soil M
15% Typic Sulfisaprists Sulfidic organic soil VH
10% Terric Sulfosaprists Mineral sulfuric organic soil VH
Tungku (Brunei-Muara)
BJ (bm) 2 Very high 5 / 30cm [15 cm]
10% Typic Sulfosaprists Sulfuric organic soil VH
40% Typic Sulfaquepts Poorly drained sulfuric soil H
25% Haplic Sulfaquents Soft poorly drained sulfidic soil M
15% Typic Sulfisaprists Sulfidic organic soil VH
10% Terric Sulfosaprists Mineral sulfuric organic soil VH
Pengkalan Batu (Brunei-Muara)
BJ (bm) 45 Very high 5 / 30cm [15 cm]
10% Typic Sulfosaprists Sulfuric organic soil VH
ADA Map unit symbol
Area (ha)
ASS hazard class Subclass
% of map unit1
Soil Taxonomy class Soil subtype description Treatment class
40% Terric Sulfisaprists Mineral sulfidic organic soil VH
35% Terric Sulfosaprists Mineral sulfuric organic soil VH
AN (be) 13 High 4 / 30 cm
25% Arenic Paleudults Sandy over loamy yellow soil -
40% Typic Haplohumults Well drained yellow soil -
30% Typic Kandihumults Sandy very deep yellow soil -
Tungulian (Belait)
NY.3 79 Negligible
30% Oxyaquic Haplohumults Moderately well drained yellow soil -
50% Oxyaquic Palehumults Moderately well drained clayey very deep yellow soil - BDG-TTN-1-2 <1 Negligible
50% Typic Epiaqualfs Very deep brown over grey soil -
BKT-BTN-3 BKT-BTN-4
33 Negligible 100% Typic Palehumults Clayey very deep yellow soil -
50% Typic Palehumults Clayey very deep yellow soil - SKN-4 19 Negligible
50% Oxyaquic Palehumults Moderately well drained clayey very deep yellow soil -
35% Typic Palehumults Clayey very deep yellow soil -
35% Oxyaquic Palehumults Moderately well drained clayey very deep yellow soil -
BTN-SKN-4 8 Negligible
30% Typic Epiaqualfs Very deep brown over grey soil -
30% Typic Palehumults Clayey very deep yellow soil -
30% Oxyaquic Palehumults Moderately well drained clayey very deep yellow soil -
30% Typic Epiaqualfs Very deep brown over grey soil -
BTN-3 BTN-4
270 Low 2 / 30 cm
10% Terric Sulfisaprists Mineral sulfidic organic soil VH
40% Typic Epiaqualfs Very deep brown over grey soil -
30% Oxyaquic Palehumults Moderately well drained clayey very deep yellow soil -
Merangking, Bukit Sawat (Belait)
TTN-KDN-1-2 156 Negligible
30% Typic Palehumults Clayey very deep yellow soil -
40% Terric Sulfisaprists Mineral sulfidic organic soil VH
35% Terric Sulfosaprists Mineral sulfuric organic soil VH
AN (be) 11 High 4 / 30 cm
25% Arenic Paleudults Sandy over loamy yellow soil -
Melayan A (Belait)
BK.2/AN 3 Negligible 100% Arenic Paleudults Sandy over loamy yellow soil -
Soil Fertility Evaluation/Advisory Service in Negara Brunei Darussalam Volume 2 – Soils Management in the Agricultural Development Areas Page 173
ADA Map unit symbol
Area (ha)
ASS hazard class Subclass
% of map unit1
Soil Taxonomy class Soil subtype description Treatment class
40% Terric Sulfisaprists Mineral sulfidic organic soil VH
35% Terric Sulfosaprists Mineral sulfuric organic soil VH
AN (be) 40 High 4 / 30 cm
25% Arenic Paleudults Sandy over loamy yellow soil -
Labi Lama (Belait)
BJ (be) MA (be)
10 Negligible 100% Aquic Kandihumults Somewhat poorly drained very deep sandy yellow soil
-
40% Terric Sulfisaprists Mineral sulfidic organic soil VH
35% Terric Sulfosaprists Mineral sulfuric organic soil VH
AN (be) 16 High 4 / 30 cm
25% Arenic Paleudults Sandy over loamy yellow soil -
40% Umbric Epiaquods Sandy poorly drained white soil -
30% Arenic Paleudults Sandy over loamy yellow soil -
KM26 Jalan Bukit Puan Labi (Belait)
BU/MR.1 35 Moderate 3 / 70 cm
30% Sulfic Fluvaquents Organic poorly drained moderately deep sulfidic soil H
Part 8 On-farm Experiments and Monitoring to Improve Soil Management
8.1 Nutrient Management The nutrient management approach described above is not prescriptive but interactive. All the data needed by the fertilizer calculator to calculate fertilizer requirements were derived from the literature and are not necessarily correct for the conditions in Brunei. These data include:
• Amounts of nutrients removed by particular crops;
• Critical soil thresholds for each nutrient;
• Fertilizer efficiency;
• Nutrient content of manure.
A part of the Department of Agriculture’s strategy to improve soil management in the ADAs should be the gradual replacement of data in the fertilizer calculator with locally derived data. Field experiments are needed to evaluate and improve the initial nutrient recommendations made in the current version of the calculator. A cycle of on-going improvement consists of evaluating the follow-up recommendations and development of plans for follow-up action. This process is described in more detail by Dierolf et al. (2001).
Therefore, as well as providing ‘current best estimates’ of nutrient requirements for farmers, the fertilizer calculator provides a framework for on-going experimental work. The advantage of this approach is that, while data is being generated for Brunei, the calculator can still be used to give fertilizer recommendations to farmers. The requirement by the calculator for measured yields and soil observation, involves farmers in the strategy. This gives farmers “ownership” of results and increases the likelihood that they will adopt new recommendations. This also increases farmers’ knowledge of their own farming system, through a cycle of trying a potential improvement; measuring the outcome and refining the improvement. Thus they build up an objective knowledge of which management strategies work best in their situation.
Individual field experiments are best designed through consultation between Department of Agriculture and local farmers on whose land they would be implemented. A jointly agreed plan for an experiment should have a clear statement of what is to be tested, who is responsible for what, and how inputs and outputs are to be measured.
There are some general principles to guide these experiments. Simple experiments to compare improved soil fertility management practices that are feasible for farmers to adopt within current practices are likely to have the greatest impact. These experiments must have a clear aim, for example:
• Test if yield and/or quality is lost if P is not applied on soils with high extractable P concentrations.
• Test if rock P is as good as other P fertilizer forms on acid soils. This needs to be over several cropping cycles, since rock P becomes available at a slower rate.
• Test if N loss can be decreased by incorporating fertilizer into soil.
Field experimental plots need to be large enough and have sufficient replication to convince the farmer of the benefits of improved management e.g. 100-1000 m2 plots (10 x 10 to 25 x 40 m). The trial location must be selected to ensure that differences in yield are attributable to the treatments and not due to soil or location differences. Therefore the treatment plots must be as similar as possible. These plots would typically be on the same Soil Subtype and in the same landscape position, and have had uniform yields with past crops. Avoid old straw
Soil Fertility Evaluation/Advisory Service in Negara Brunei Darussalam Volume 2 – Soils Management in the Agricultural Development Areas Page 175
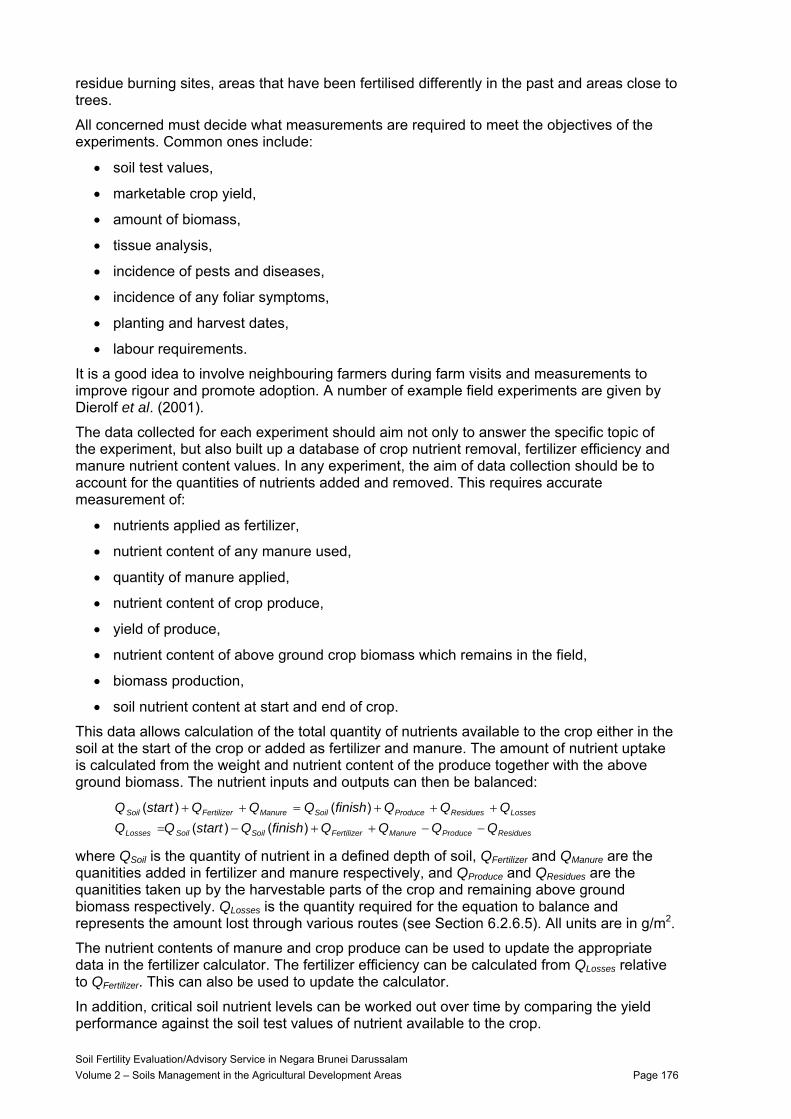
residue burning sites, areas that have been fertilised differently in the past and areas close to trees.
All concerned must decide what measurements are required to meet the objectives of the experiments. Common ones include:
• soil test values,
• marketable crop yield,
• amount of biomass,
• tissue analysis,
• incidence of pests and diseases,
• incidence of any foliar symptoms,
• planting and harvest dates,
• labour requirements.
It is a good idea to involve neighbouring farmers during farm visits and measurements to improve rigour and promote adoption. A number of example field experiments are given by Dierolf et al. (2001).
The data collected for each experiment should aim not only to answer the specific topic of the experiment, but also built up a database of crop nutrient removal, fertilizer efficiency and manure nutrient content values. In any experiment, the aim of data collection should be to account for the quantities of nutrients added and removed. This requires accurate measurement of:
• nutrients applied as fertilizer,
• nutrient content of any manure used,
• quantity of manure applied,
• nutrient content of crop produce,
• yield of produce,
• nutrient content of above ground crop biomass which remains in the field,
• biomass production,
• soil nutrient content at start and end of crop.
This data allows calculation of the total quantity of nutrients available to the crop either in the soil at the start of the crop or added as fertilizer and manure. The amount of nutrient uptake is calculated from the weight and nutrient content of the produce together with the above ground biomass. The nutrient inputs and outputs can then be balanced:
ResiduesProduceManureFertilizerSoilSoilLosses
LossesResiduesProduceSoilManureFertilizerSoil
QQQQfinishQstartQQQQQfinishQQQstartQ
−−++−=
+++=++
)()()()(
where QSoil is the quantity of nutrient in a defined depth of soil, QFertilizer and QManure are the quanitities added in fertilizer and manure respectively, and QProduce and QResidues are the quanitities taken up by the harvestable parts of the crop and remaining above ground biomass respectively. QLosses is the quantity required for the equation to balance and represents the amount lost through various routes (see Section 6.2.6.5). All units are in g/m2.
The nutrient contents of manure and crop produce can be used to update the appropriate data in the fertilizer calculator. The fertilizer efficiency can be calculated from QLosses relative to QFertilizer. This can also be used to update the calculator.
In addition, critical soil nutrient levels can be worked out over time by comparing the yield performance against the soil test values of nutrient available to the crop.
Soil Fertility Evaluation/Advisory Service in Negara Brunei Darussalam Volume 2 – Soils Management in the Agricultural Development Areas Page 176
The assumption is that many experiments are carried out in different ADAs to investigate a range of crops. However, there needs to be an overall strategy that ensures a consistent picture is built up, by compiling a comprehensive dataset for the most important crop-Soil Type combinations .
• The range of crops to be investigated needs to be limited to those of greatest importance in the ADAs. There is little point in initially trying to collect data on too many crops because it will dilute the resources available and take a long time to build up a comprehensive database for any one of them. Better to concentrate on a few key crops and quickly obtain a comprensive database on each that allow the strategy to be assessed.
• Experiments should ideally run over several years since this removes one source of variability from the data.
• The Soil Subtype on which the experiment is conducted should be determined, so that differences in soil behaviour start to become apparent.
• The management of the crop by the farmer (or Departmental staff) should be carefully recorded in a field diary.
• Weather, watertable depth, pH, flooding, disease and any other noteworthy events should also be recorded.
8.2 Soil Acidity Soil acidity is one of most important soil constraints in Brunei. The pH buffering capacity of different Soil Types needs to be measured so that the application rates of lime can be calculated more effectively.
In addition, a program of liming trials should be conducted on a range of important Soil Types in which different rates of lime are applied. Soil pH should be monitored throughout the season to investgate the effectiveness of amelioration. Crop performance should also be carefully monitored and exchangeable Al monitored to determine critical soil thresholds for important crops. A uniform mesh size of lime should be used so that different grades of lime are not being compared.
These investigations should be conducted before, or at least in tandem with, the nutrient experiments outlined above. The nutrient experiments will be most informative if they provide information about nutrient uptake in soils whose acidity is being optimally managed.
The issue of acid sulfate soils is addressed below in Section 8.4.
8.3 Watertable Behaviour The other important soil constraint in Brunei is waterlogging. A major cause of waterlogging in Brunei is the combination of high rainfall and shallow watertables, combined with low gradients in many ADAs. However, little is known about the behaviour of the watertable, for example how sensitive it is to wet periods and how quickly it recedes during dry periods.
Understanding watertable behaviour is critical to understanding crop water requirements. Considerable time is spent by farmers irrigating crops in an environment that is relatively wet. Understanding the causes of water stress will help better tailor irrigation practice to crop needs.
Watertable behaviour also affects the acidification of sulfidic materials. A proper understanding of when sulfidic materials are at risk of exposure due to falling watertables is necessary if management practices are to be developed to protect the environment from the leaching of acid into waterways together with iron and aluminium compounds.
Given the low elevation of many of the flatter areas and the shallowness of the watertable in these areas, watertables can be monitored relatively simply using a network of monitoring wells. Components of the system would include the following:
Soil Fertility Evaluation/Advisory Service in Negara Brunei Darussalam Volume 2 – Soils Management in the Agricultural Development Areas Page 177
• Monitoring wells that are continuously screened and installed to a depth of about 2 m below ground surface. For a new network of wells, only a few should be installed initially to obtain some idea about the frequency and magnitude of fluctuations. To do this the water level in the wells should be automatically measured using water level loggers making hourly measurements. Once the basic behaviour has been determined, the remainder of the network can be planned, in terms of the location of the wells and the frequency of measurement. The wells could be located along transects away from large drains to determine the degree to which the watertable ‘mounds’ between the drains. Once a suitable frequency for monitoring has been decided, decisions can be made on how to measure it. If the appropriate frequency is daily or longer, the level could be measured manually using a dipstick, possibly by local farmers.
• Installation of local benchmarks of known elevation. These could be concrete piles installed to bedrock or static strata. The benchmark is used to determine the absolute elevation of the monitoring wells using an optical or laser level. Given that shallow monitoring wells can move, their elevation should be measured not just at installation, but at regular intervals.
• At the time of installation, hydrogeological investigations should be carried out at the site to determine the geological strata in which the watertable exists.
• It will also be necessary to monitor the water level in the surrounding drains to determine their effectiveness at removing surface water.
• Rainfall and other metereological parameters should be measured for each network using a automatic weather station, with a high frequency pluviometer.
The aim of such a network would be to determine the water balance for crops, which in this case is heavily influenced by the depth to the watertable and the effectiveness of surface drains. Transects of monitoring wells will provide an indication of the hydraulic gradients in the groundwater and to what degree water is flowing towards the drains. It will also help to partition rainfall into that leaving the site as surface water and that infiltrating into the soil. This will help better design drainage systems that remove excess rainfall rapidly, without altering the watertable too greatly. It will also help design irrigation strategies for farmers that save both labour and water.
8.4 Acid Sulfate Soils Many soils, particularly in Brunei-Muara and Belait are acid sulfate (mainly Organic, Sulfuric and Sulfidic soils). Acid sulfate soils have two components to their acidity, actual acidity referred to as TAA and potential acidity referred to as acid generating potential (AGP). Most acid sulfate soils in Brunei only have a small amount of potential acidity remaining in the top 20 cm. Therefore liming to neutralise this acidity should be effective in raising the pH. However, where sulfuric horizons are deeper than 20 cm, fluctuating watertables can transport this acidity into the topsoil and regular additional liming will be required.
• The amount of acid being brought into the topsoil by fluctuating watertables should be investigated at the same time as studies into the behaviour of the watertable outlined in Section 8.3. This would enable better estimation on annual lime requirements.
Whilst the AGP of the topsoils of many acid sulfate soils in Brunei is low, they all have deeper layers containing sulfidic material with very high AGP. Often there are considerable reserves of sulfidic material. It is critically important when managing acid sulfate soils to avoid disturbance of the underlying sulfidic material. Apart from generating more acidity, the disturbance of sulfidic material also generates iron and aluminium precipitates that increase the P-sorption of the soil even after the acid has been neutralised. Therefore, an essential piece of information avoid the disturbance of sulfidic material is the depth to the sulfidic horizon. This information allows informed management of several aspects of farming on acid sulfate soils. It provides the farmer with:
• the maximum depth of excavation before disturbing sulfidic material;
Soil Fertility Evaluation/Advisory Service in Negara Brunei Darussalam Volume 2 – Soils Management in the Agricultural Development Areas Page 178
• the potential on-farm resource of non acid sulfate soil material for making raised beds;
• the critical depth for watertable management (see Section 8.3 above);
• information to assist crop selection (deeper rooted perennials cf. shallow rooted annuals).
This information could be obtained by collecting and testing the soil removed during the installation of monitoring wells (as outlined in Section 8.3) and should be part of the standard procedure for their installation. Simple on-farm testing is also possible using the incubation method (Soil Survey Staff, 2003) to test material sampled from a hand excavated pit.
8.5 Organic Soil Subsidence The subsidence of peat is a major concern in the lowlands of SE Asia, especially Borneo. Development of Organic soils for agriculture necessarily leads to aeration of peat, its oxidation and eventual subsidence. This is undesirable for the reasons outlined in Volume 1, Section 4.1, in particular greenhouse gas emissions, and increasingly difficult watertable management as the surface subsides. Since Organic soils in Brunei are also contain sulfidic material, oxidation and acidification is also a major consequence.
The scale of the problem is unknown in Brunei, but many of the areas with the most intensive vegetable cultivation occur on Organic soils. Monitoring the subsidence of such soils in the period immediately after clearing will provide baseline data, with which to develop informed policy on utilisation of Organic soils.
The recently cleared area at Labi Lama would provide one possible monitoring site. Monitoring requires a fixed benchmark with known elevation (see Section 8.3). Several monitoring sites in the area then need to be chosen and located on a permanent basis. The elevations of these locations are monitored on a regular basis relative to the benchmark, using optical or laser levels. Initially such monitoring should be quite frequent, say monthly, but the frequency can be decreased a) as the rate of subsidence is determined and b) as subsidence slows. Over the long term such monitoring probably only needs to be annual. Measurement of an agricultural land surface may be quite challenging due to short-term changes during the cropping cycle. One measurement tactic for such situations would be to lie a 2 m long beam along a furrow and measure the elevation of the centre of the beam. If an individual monitoring site is about 10 × 10 m, 10 furrows could be measured to increase the overall accuracy.
In addition, to monitoring the surface level, soil properties such as organic matter content and type, clay, silt and sand contents, pH, depth to watertable should be measured at the same time. If possible, the crop management at the locations should remain constant, so that crop performance can be measured over the long term.
8.6 Soil Distribution and Improving the Utility of the GIS This soil survey study has characterised and mapped soils in 27 ADAs covering a small area of Brunei. Approximately 4422 hectares were surveyed out of a total of about 576,500 hectares for the entire country. This project has increased the understanding of Brunei soils, evaluated their suitability for a range of crops, made management recommendations for different crops by soil type, and provided detailed, crop specific strategies for nutrient and fertilizer management. To maximise the benefits of this research and and to consolidate the agricultural recommendations, the management information needs to be transferred to parts of Brunei outside the studied ADAs. The main vehicle for transferring this knowledge on crop suitability and soil management to other parts of Brunei should be the Soil Types.
The soils of the entire country should therefore be mapped in a manner consistent with the methods and classification used in this study. This will provide uniform and complete coverage of the soil distribution throughout the country to assist with decision making, not just for agriculture but for a wide range of other land uses.
Soil Fertility Evaluation/Advisory Service in Negara Brunei Darussalam Volume 2 – Soils Management in the Agricultural Development Areas Page 179
Soil Fertility Evaluation/Advisory Service in Negara Brunei Darussalam Volume 2 – Soils Management in the Agricultural Development Areas Page 180
In parallel with the recommended complete country soil survey, the GIS, database and maps commissioned by this soil fertility study would be expanded and enhanced. Such a database of soil and map information would allow land use decisions to be made for all areas of the country.
There are various ways of conducting such a soil survey whereby areas of greater interest for agriculture are investigated in greater detail than those areas where land use decisions are expected to be less critical. Soil survey and preparation of soil GIS databases is specialised work and should be conducted by a professional soil surveyor.
In addition to the above soil survey to give national coverage, separate farm-scale surveys should be conducted in different landscapes to improve understanding of the detailed spatial distribution of Soil Types.
Appendix C Acid Sulfate Soil Data Tables
Soil Fertility Evaluation/Advisory Service in Negara Brunei Darussalam Volume 2 – Soils Management in the Agricultural Development Areas Page 181
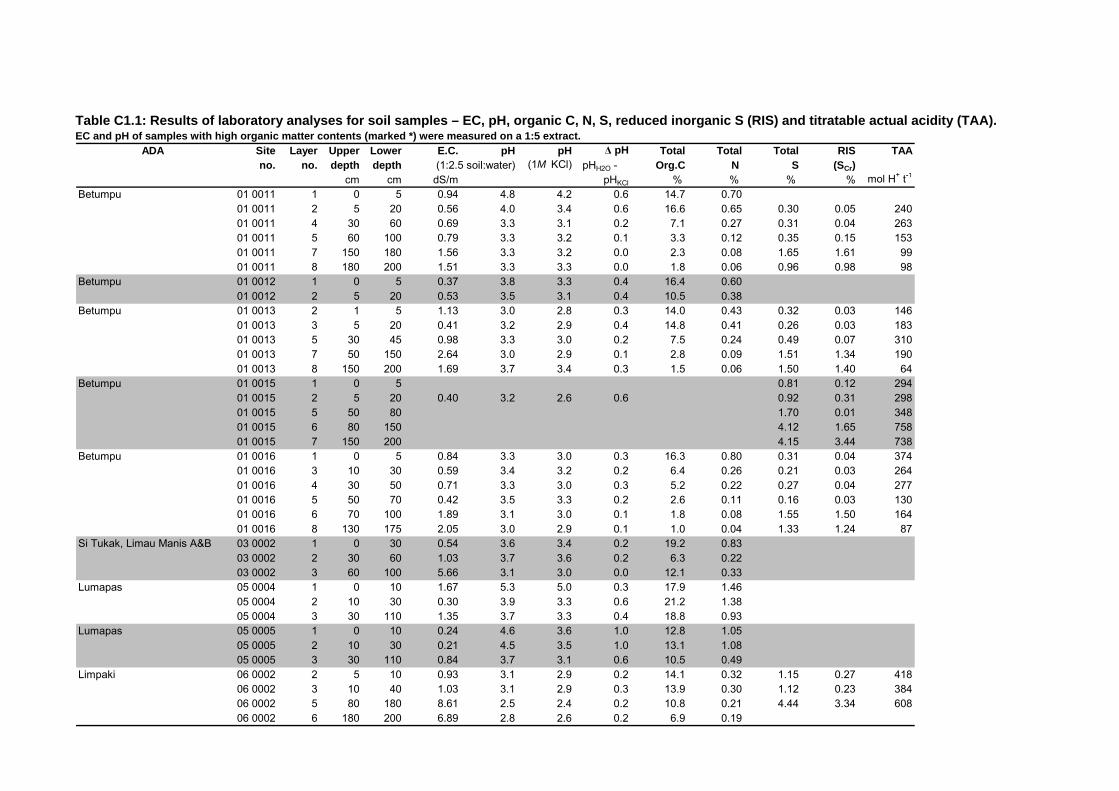
Table C1.1: Results of laboratory analyses for soil samples – EC, pH, organic C, N, S, reduced inorganic S (RIS) and titratable actual acidity (TAA). EC and pH of samples with high organic matter contents (marked *) were measured on a 1:5 extract.
ADA Site Layer Upper Lower E.C. pH pH Δ pH Total Total Total RIS TAAno. no. depth depth (1:2.5 soil:water) (1M KCl) pHH2O - Org.C N S (SCr)
cm cm dS/m pHKCl % % % % mol H+ t-1
Betumpu 01 0011 1 0 5 0.94 4.8 4.2 0.6 14.7 0.7001 0011 2 5 20 0.56 4.0 3.4 0.6 16.6 0.65 0.30 0.05 24001 0011 4 30 60 0.69 3.3 3.1 0.2 7.1 0.27 0.31 0.04 26301 0011 5 60 100 0.79 3.3 3.2 0.1 3.3 0.12 0.35 0.15 15301 0011 7 150 180 1.56 3.3 3.2 0.0 2.3 0.08 1.65 1.61 9901 0011 8 180 200 1.51 3.3 3.3 0.0 1.8 0.06 0.96 0.98 98
Betumpu 01 0012 1 0 5 0.37 3.8 3.3 0.4 16.4 0.6001 0012 2 5 20 0.53 3.5 3.1 0.4 10.5 0.38
Betumpu 01 0013 2 1 5 1.13 3.0 2.8 0.3 14.0 0.43 0.32 0.03 14601 0013 3 5 20 0.41 3.2 2.9 0.4 14.8 0.41 0.26 0.03 18301 0013 5 30 45 0.98 3.3 3.0 0.2 7.5 0.24 0.49 0.07 31001 0013 7 50 150 2.64 3.0 2.9 0.1 2.8 0.09 1.51 1.34 19001 0013 8 150 200 1.69 3.7 3.4 0.3 1.5 0.06 1.50 1.40 64
Betumpu 01 0015 1 0 5 0.81 0.12 29401 0015 2 5 20 0.40 3.2 2.6 0.6 0.92 0.31 29801 0015 5 50 80 1.70 0.01 34801 0015 6 80 150 4.12 1.65 75801 0015 7 150 200 4.15 3.44 738
Betumpu 01 0016 1 0 5 0.84 3.3 3.0 0.3 16.3 0.80 0.31 0.04 37401 0016 3 10 30 0.59 3.4 3.2 0.2 6.4 0.26 0.21 0.03 26401 0016 4 30 50 0.71 3.3 3.0 0.3 5.2 0.22 0.27 0.04 27701 0016 5 50 70 0.42 3.5 3.3 0.2 2.6 0.11 0.16 0.03 13001 0016 6 70 100 1.89 3.1 3.0 0.1 1.8 0.08 1.55 1.50 16401 0016 8 130 175 2.05 3.0 2.9 0.1 1.0 0.04 1.33 1.24 87
Si Tukak, Limau Manis A&B 03 0002 1 0 30 0.54 3.6 3.4 0.2 19.2 0.8303 0002 2 30 60 1.03 3.7 3.6 0.2 6.3 0.2203 0002 3 60 100 5.66 3.1 3.0 0.0 12.1 0.33
Lumapas 05 0004 1 0 10 1.67 5.3 5.0 0.3 17.9 1.4605 0004 2 10 30 0.30 3.9 3.3 0.6 21.2 1.3805 0004 3 30 110 1.35 3.7 3.3 0.4 18.8 0.93
Lumapas 05 0005 1 0 10 0.24 4.6 3.6 1.0 12.8 1.0505 0005 2 10 30 0.21 4.5 3.5 1.0 13.1 1.0805 0005 3 30 110 0.84 3.7 3.1 0.6 10.5 0.49
Limpaki 06 0002 2 5 10 0.93 3.1 2.9 0.2 14.1 0.32 1.15 0.27 41806 0002 3 10 40 1.03 3.1 2.9 0.3 13.9 0.30 1.12 0.23 38406 0002 5 80 180 8.61 2.5 2.4 0.2 10.8 0.21 4.44 3.34 60806 0002 6 180 200 6.89 2.8 2.6 0.2 6.9 0.19
ADA Site Layer Upper Lower E.C. pH pH Δ pH Total Total Total RIS TAAno. no. depth depth (1:2.5 soil:water) (1M KCl) pHH2O - Org.C N S (SCr)
cm cm dS/m pHKCl % % % % mol H+ t-1
Wasan 08 0003 3 10 20 1.62 3.6 3.3 0.4 5.1 0.30Wasan 08 0004 4 50 80 0.58 4.6 3.8 0.8 0.15 0.06 116
08 0004 5 80 90 0.20 0.03 17808 0004 6 90 110 0.27 0.05 240
Wasan 08 0012 2 0 5 0.43 4.2 3.4 0.7 4.5 0.3608 0012 3 5 20 0.21 4.4 3.4 1.0 3.4 0.29
Wasan 08 0015 2 0 5 0.30 4.4 3.6 0.8 3.2 0.3208 0015 3 5 40 0.15 4.8 3.5 1.3 1.4 0.1608 0015 4 40 90 0.29 4.4 3.3 1.1 1.0 0.15
Tungku 09 0015 1 0 10 1.51 2.8 2.7 0.2 0.3 <0.02 0.13 <0.005 20409 0015 3 30 50 0.49 3.5 3.3 0.2 0.2 <0.02 0.04 <0.005 4909 0015 4 50 60 0.54 3.6 3.4 0.2 0.3 0.03 0.04 <0.005 72
Merangking, Bukit Sawat 21 0007 2 0 5 * 0.37 * 3.9 * 3.2 * 0.6 25.4 1.2421 0007 3 5 15 0.18 4.0 3.2 0.7 11.8 0.5321 0007 4 15 30 0.27 3.5 3.0 0.6 24.1 0.8621 0007 5 30 50 48.1 1.4621 0007 6 50 60 * 0.80 * 3.5 54.5 1.3021 0007 7 60 80 * 1.22 * 3.6 * 3.0 * 0.6 59.3 1.0421 0007 8 80 120 * 1.23 * 3.7 * 3.1 * 0.6 55.7 1.6921 0007 9 120 170 46.5 1.4721 0007 10 170 190 24.1 0.6721 0007 11 190 250 47.7 0.74
Merangking, Bukit Sawat 21 0010 1 0 30 0.17 3.8 3.3 0.5 18.5 0.93Melayan A 22 0002 2 10 20 0.07 4.1 3.5 0.6 1.0 0.05
22 0002 3 20 70 0.02 4.8 4.3 0.5 0.1 <0.0222 0002 6 130 200 0.33 3.7 3.3 0.4 24.5 0.59
Labi Lama 23 0001 1 0 5 1.43 6.2 5.9 0.3 14.6 1.0623 0001 2 5 30 * 0.31 * 4.8 * 4.0 * 0.8 23.7 1.1323 0001 3 30 60 0.30 3.7 3.1 0.6 4.8 0.2423 0001 5 70 110 * 1.00 * 3.5 * 3.3 * 0.3 43.9 1.0123 0001 6 110 200 * 2.20 * 3.2 * 3.0 * 0.2 46.6 0.98
Labi Lama 23 0004 1 0 10 0.26 3.7 3.2 0.5 24.2 1.1223 0004 2 10 20 * 0.45 * 3.7 * 3.3 * 0.4 40.4 1.6623 0004 4 30 40 * 0.30 * 3.7 * 3.3 * 0.4 28.2 0.6623 0004 6 70 150 0.13 3.9 3.7 0.1 0.4 <0.02
Pengkalan Batu 29 0004 1 0 5 0.43 5.0 4.1 0.8 6.4 0.4929 0004 2 5 20 0.44 4.7 3.8 0.9 5.8 0.4429 0004 3 20 70 0.19 4.1 3.4 0.8 2.8 0.17
Soil Fertility Evaluation/Advisory Service in Negara Brunei Darussalam Volume 2 – Soils Management in the Agricultural Development Areas Page 183
Table C1.2: Results of laboratory analyses for soil samples (exchangeable cations, Al and Mn). ADA Site Layer Upper Lower E.C.E.C. Exch. Al
no. no. depth depth Ca Mg Na K Total Al Mn percentcm cm
Betumpu 01 0011 1 0 5 2.9 2.1 0.16 0.89 6.1 7.2 1.00 0.06 1401 0011 2 5 20 1.4 1.0 0.21 1.14 3.8 10.0 6.20 0.03 6201 0011 4 30 60 1.0 0.7 0.13 0.20 2.0 14.3 12.23 <0.01 8601 0011 5 60 100 0.8 0.5 0.06 0.12 1.5 7.8 6.35 <0.01 8101 0011 7 150 180 0.9 0.6 0.09 0.09 1.7 6.5 4.78 <0.01 7401 0011 8 180 200 0.9 0.6 0.13 0.08 1.7 5.7 3.91 <0.01 69
Betumpu 01 0012 1 0 5 2.3 1.0 0.26 0.47 4.0 14.9 10.87 0.03 7301 0012 2 5 20 0.2 0.7 0.27 0.27 1.5 16.5 15.04 0.01 91
Betumpu 01 0013 2 1 5 0.5 0.7 0.11 0.23 1.5 5.2 3.64 <0.01 7001 0013 3 5 20 0.3 0.3 0.08 0.10 0.8 5.3 4.50 <0.01 8401 0013 5 30 45 0.9 1.4 0.13 0.21 2.6 14.7 12.07 0.02 8201 0013 7 50 150 1.2 1.1 <0.05 0.12 2.4 11.2 8.76 0.05 7801 0013 8 150 200 1.5 2.5 0.20 0.11 4.2 5.4 1.15 0.03 21
Betumpu 01 0015 1 0 5 2.7 1.5 0.38 0.54 5.1 9.4 4.27 0.03 4601 0015 2 5 20 0.6 0.8 0.25 0.37 2.0 6.7 4.77 0.01 7101 0015 5 50 80 0.9 1.2 0.32 0.34 2.7 15.0 12.23 0.01 8201 0015 6 80 150 1.0 0.6 0.28 0.23 2.1 41.1 38.91 0.03 9501 0015 7 150 200 6.9 5.6 0.55 0.21 13.3 55.8 42.43 0.09 76
Betumpu 01 0016 1 0 5 0.8 0.6 0.20 0.28 1.8 12.3 10.48 0.01 8501 0016 3 10 30 0.4 0.2 0.09 0.17 0.9 14.4 13.52 <0.01 9401 0016 4 30 50 0.3 0.5 0.15 0.17 1.1 11.1 10.00 <0.01 9001 0016 5 50 70 0.6 0.3 0.05 0.13 1.1 6.7 5.65 <0.01 8401 0016 6 70 100 0.6 0.5 <0.05 0.12 1.2 8.8 7.58 0.02 8601 0016 8 130 175 0.7 0.8 0.07 0.06 1.6 4.2 2.63 0.03 62
Si Tukak, Limau Manis A&B 03 0002 1 0 30 0.7 0.8 0.20 0.16 1.9 11.7 9.73 0.04 8303 0002 2 30 60 0.8 1.5 0.18 0.14 2.6 6.6 3.97 0.06 6003 0002 3 60 100 1.2 1.7 0.21 0.13 3.3 24.0 20.60 0.10 86
Lumapas 05 0004 1 0 10 28.2 5.3 0.69 4.92 39.1 39.4 0.09 0.15 005 0004 2 10 30 2.8 1.2 0.14 0.60 4.8 20.0 15.21 0.07 7605 0004 3 30 110 3.9 4.7 0.42 0.56 9.6 19.6 9.78 0.15 50
Lumapas 05 0005 1 0 10 15.9 2.0 0.06 0.99 19.0 23.1 3.91 0.15 1705 0005 2 10 30 11.9 1.9 0.11 0.85 14.8 21.7 6.84 0.09 3205 0005 3 30 110 4.8 4.7 0.34 0.73 10.5 16.8 6.19 0.11 37
Limpaki 06 0002 2 5 10 0.3 1.1 0.45 0.15 2.1 17.9 15.81 0.02 8806 0002 3 10 40 0.3 1.2 0.39 0.15 2.0 18.9 16.81 0.02 8906 0002 5 80 180 3.0 5.5 0.42 <0.05 8.9 36.2 26.94 0.29 7406 0002 6 180 200 5.8 10.4 0.67 0.18 17.0 25.0 7.78 0.19 31
I---------------- Exch.Cations NH4OAc pH 7.0 ----------------I 1M KCl ext
I--------------------------------------- cmol(+)/kg ---------------------------------------I cmol(+)/kg
ADA Site Layer Upper Lower E.C.E.C. Exch. Alno. no. depth depth Ca Mg Na K Total Al Mn percent
cm cmWasan 08 0003 3 10 20 4.0 5.5 0.43 0.35 10.3 15.4 5.03 0.12 33Wasan 08 0004 4 50 80 8.3 4.5 0.46 0.23 13.5 15.1 1.48 0.12 10
08 0004 5 80 90 2.4 3.1 0.45 0.25 6.2 10.8 4.57 0.06 4208 0004 6 90 110 1.9 3.1 0.50 0.19 5.7 14.5 8.70 0.06 60
Wasan 08 0012 2 0 5 2.2 2.9 0.52 0.27 5.9 10.5 4.59 0.06 4408 0012 3 5 20 1.8 2.6 0.59 0.25 5.2 9.9 4.60 0.07 47
Wasan 08 0015 2 0 5 1.4 2.9 0.50 0.43 5.2 9.2 3.79 0.12 4108 0015 3 5 40 1.1 2.8 0.70 0.24 4.9 9.1 4.11 0.10 4508 0015 4 40 90 0.9 4.9 1.16 0.30 7.3 12.1 4.72 0.08 39
Tungku 09 0015 1 0 10 0.1 0.4 0.15 <0.05 0.6 0.609 0015 3 30 50 0.2 0.3 0.31 <0.05 0.9 3.3 2.44 0.01 7409 0015 4 50 60 0.3 0.6 0.17 0.09 1.1 6.0 4.89 0.02 81
Merangking, Bukit Sawat 21 0007 2 0 5 1.3 1.9 0.09 0.83 4.1 14.4 10.17 0.13 7121 0007 3 5 15 0.5 0.7 <0.05 0.21 1.4 10.3 8.86 0.02 8621 0007 4 15 30 0.8 1.3 0.05 0.25 2.3 25.7 23.28 0.06 9121 0007 5 30 50 3.7 2.3 0.05 0.26 6.3 20.2 13.74 0.14 6821 0007 6 50 60 4.8 4.3 0.11 0.10 9.3 22.6 12.92 0.33 5721 0007 7 60 80 3.5 6.3 <0.05 0.11 10.0 10.021 0007 8 80 120 2.6 7.8 0.52 0.14 11.1 11.121 0007 9 120 170 2.2 7.6 0.16 0.32 10.2 20.0 9.54 0.30 4821 0007 10 170 190 2.4 6.6 0.18 0.36 9.5 9.521 0007 11 190 250 2.8 4.4 0.06 0.17 7.5 18.2 10.52 0.19 58
Merangking, Bukit Sawat 21 0010 1 0 30 <0.1 0.9 0.11 0.33 1.4 24.1 22.66 0.03 94Melayan A 22 0002 2 10 20 0.1 0.1 0.31 0.08 0.6 1.7 1.07 <0.01 63
22 0002 3 20 70 <0.1 <0.1 0.35 <0.05 0.5 1.0 0.52 <0.01 5122 0002 6 130 200 0.1 0.3 0.28 0.07 0.8 8.4 7.56 0.01 90
Labi Lama 23 0001 1 0 5 29.1 10.3 0.40 4.65 44.5 44.6 0.02 0.06 023 0001 2 5 30 16.4 3.7 0.23 2.40 22.7 24.8 1.89 0.13 823 0001 3 30 60 1.4 1.2 0.28 1.09 4.0 13.5 9.43 0.06 7023 0001 5 70 110 5.4 4.7 0.60 1.34 12.1 22.3 9.70 0.50 4423 0001 6 110 200 3.4 4.0 0.64 0.53 8.5 8.5
Labi Lama 23 0004 1 0 10 1.0 0.6 <0.05 0.57 2.2 18.9 16.63 0.06 8823 0004 2 10 20 0.6 0.6 <0.05 0.63 1.9 19.9 18.03 0.05 9023 0004 4 30 40 0.6 0.5 0.22 0.88 2.2 18.2 15.96 0.04 8723 0004 6 70 150 0.1 <0.1 0.14 0.05 0.4 0.7 0.34 <0.01 49
Pengkalan Batu 29 0004 1 0 5 10.9 2.3 0.27 1.13 14.6 15.2 0.44 0.17 329 0004 2 5 20 10.8 2.0 0.23 0.88 13.9 15.5 1.48 0.14 1029 0004 3 20 70 2.3 0.6 0.06 0.32 3.2 15.0 11.76 0.02 78
I---------------- Exch.Cations NH4OAc pH 7.0 ----------------I 1M KCl ext
I--------------------------------------- cmol(+)/kg ---------------------------------------I cmol(+)/kg
Soil Fertility Evaluation/Advisory Service in Negara Brunei Darussalam Volume 2 – Soils Management in the Agricultural Development Areas Page 185
Table C2: Results for laboratory analyses of selected soluble salts in soil samples. Sox: Oxidised S (see Section 7.2.3.1)
ADA Site Layer Upper Lower 1:40 KCl ext Cl:Sno. no. depth depth Sox Cl
cm cm % % mg kg-1 mg kg-1
Betumpu 01 0011 1 0 501 0011 2 5 20 0.043 0.016 162 70.5 0.4301 0011 4 30 60 0.046 0.024 241 48.9 0.2001 0011 5 60 100 0.060 0.030 297 26.9 0.0901 0011 7 150 180 0.170 0.075 750 23.5 0.0301 0011 8 180 200 0.170 0.070 703 180.4 0.26
Betumpu 01 0012 1 0 5 0.016 155 62.2 0.4001 0012 2 5 20 0.015 152 31.8 0.21
Betumpu 01 0013 2 1 5 0.070 0.048 485 40.2 0.0801 0013 3 5 20 0.032 0.021 214 24.0 0.1101 0013 5 30 45 0.059 0.038 382 35.0 0.0901 0013 7 50 150 0.31001 0013 8 150 200 0.150
Betumpu 01 0015 1 0 5 0.05401 0015 2 5 20 0.04001 0015 5 50 80 0.07401 0015 6 80 150 0.55001 0015 7 150 200 0.740
Betumpu 01 0016 1 0 5 0.088 0.028 277 34.8 0.1301 0016 3 10 30 0.028 0.015 149 46.5 0.3101 0016 4 30 50 0.044 0.022 225 45.5 0.2001 0016 5 50 70 0.019 0.011 107 22.2 0.2101 0016 6 70 100 0.220 0.127 1268 20.7 0.0201 0016 8 130 175 0.180 1.124 11238 42.4 0.00
Si Tukak, Limau Manis A&B 03 0002 1 0 30 0.023 231 13.3 0.0603 0002 2 30 60 0.040 399 6.4 0.0203 0002 3 60 100 0.419 4191 14.7 0.00
Lumapas 05 0004 1 0 1005 0004 2 10 3005 0004 3 30 110
Lumapas 05 0005 1 0 10 0.008 81 47.4 0.5905 0005 2 10 30 0.006 62 27.7 0.4505 0005 3 30 110 0.026 264 32.5 0.12
Limpaki 06 0002 2 5 10 0.120 0.062 620 56.0 0.0906 0002 3 10 40 0.084 0.052 524 30.1 0.0606 0002 5 80 180 0.910 0.858 8578 89.4 0.01
Saturation extractSox (seawater=21)
06 0002 6 180 200 0.361 3611 109.1 0.03
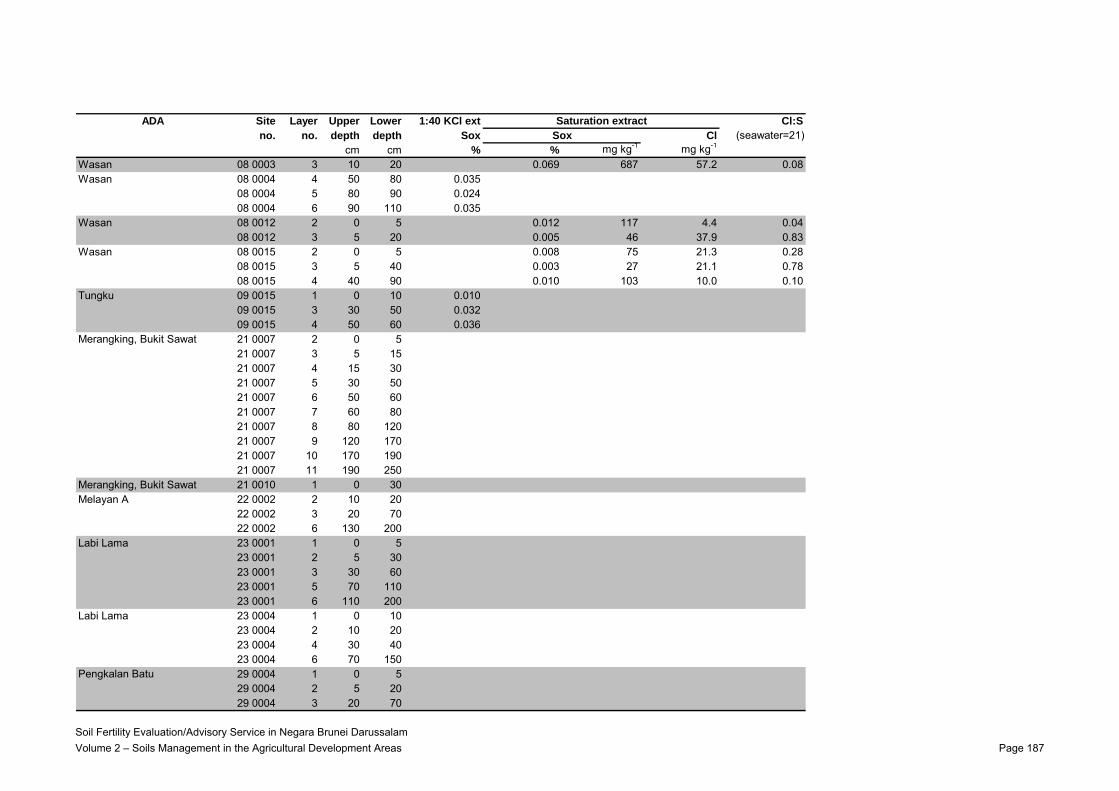
ADA Site Layer Upper Lower 1:40 KCl ext Cl:Sno. no. depth depth Sox Cl
cm cm % % mg kg-1 mg kg-1
Wasan 08 0003 3 10 20 0.069 687 57.2 0.08Wasan 08 0004 4 50 80 0.035
08 0004 5 80 90 0.02408 0004 6 90 110 0.035
Wasan 08 0012 2 0 5 0.012 117 4.4 0.0408 0012 3 5 20 0.005 46 37.9 0.83
Wasan 08 0015 2 0 5 0.008 75 21.3 0.2808 0015 3 5 40 0.003 27 21.1 0.7808 0015 4 40 90 0.010 103 10.0 0.10
Tungku 09 0015 1 0 10 0.01009 0015 3 30 50 0.03209 0015 4 50 60 0.036
Merangking, Bukit Sawat 21 0007 2 0 521 0007 3 5 1521 0007 4 15 3021 0007 5 30 5021 0007 6 50 6021 0007 7 60 8021 0007 8 80 12021 0007 9 120 17021 0007 10 170 19021 0007 11 190 250
Merangking, Bukit Sawat 21 0010 1 0 30Melayan A 22 0002 2 10 20
22 0002 3 20 7022 0002 6 130 200
Labi Lama 23 0001 1 0 523 0001 2 5 3023 0001 3 30 6023 0001 5 70 11023 0001 6 110 200
Labi Lama 23 0004 1 0 1023 0004 2 10 2023 0004 4 30 4023 0004 6 70 150
Pengkalan Batu 29 0004 1 0 529 0004 2 5 2029 0004 3 20 70
Saturation extractSox (seawater=21)
Soil Fertility Evaluation/Advisory Service in Negara Brunei Darussalam Volume 2 – Soils Management in the Agricultural Development Areas Page 187
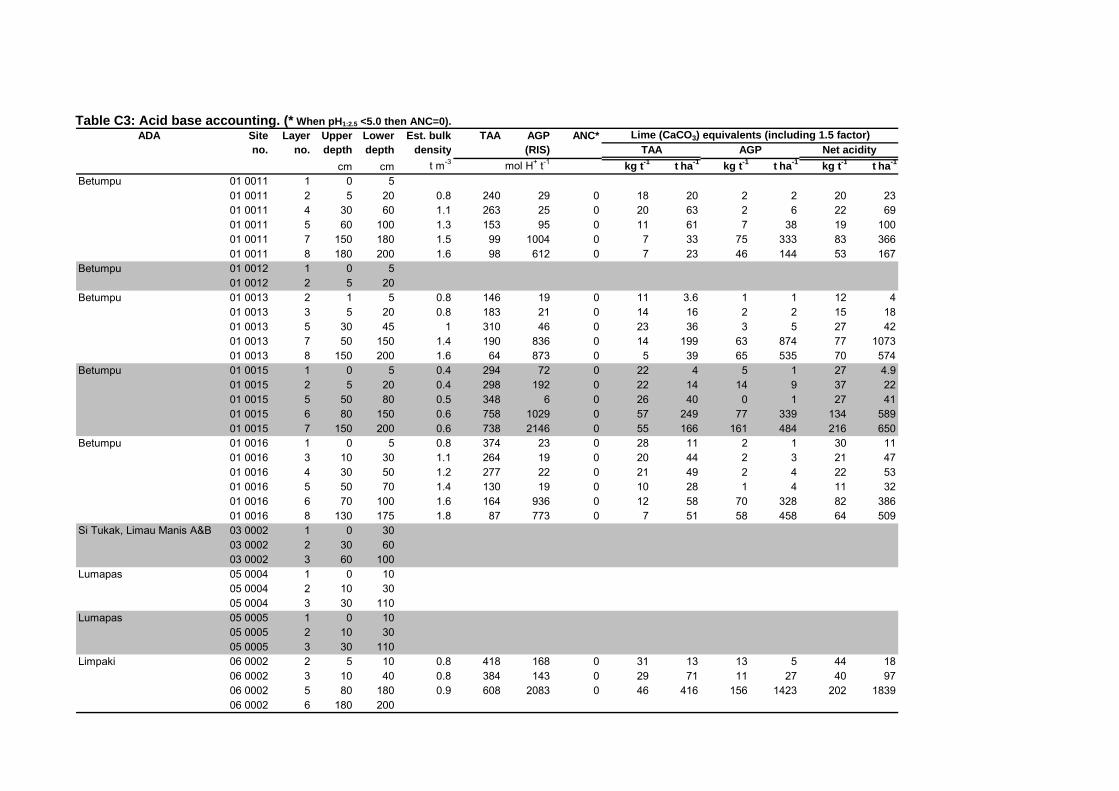
Table C3: Acid base accounting. (* When pH1:2.5 <5.0 then ANC=0). ADA Site Layer Upper Lower Est. bulk TAA AGP ANC*
no. no. depth depth density (RIS)cm cm t m-3 mol H+ t-1 kg t-1 t ha-1 kg t-1 t ha-1 kg t-1 t ha-1
Betumpu 01 0011 1 0 501 0011 2 5 20 0.8 240 29 0 18 20 2 2 20 2301 0011 4 30 60 1.1 263 25 0 20 63 2 6 22 6901 0011 5 60 100 1.3 153 95 0 11 61 7 38 19 10001 0011 7 150 180 1.5 99 1004 0 7 33 75 333 83 36601 0011 8 180 200 1.6 98 612 0 7 23 46 144 53 167
Betumpu 01 0012 1 0 501 0012 2 5 20
Betumpu 01 0013 2 1 5 0.8 146 19 0 11 3.6 1 1 12 401 0013 3 5 20 0.8 183 21 0 14 16 2 2 15 1801 0013 5 30 45 1 310 46 0 23 36 3 5 27 4201 0013 7 50 150 1.4 190 836 0 14 199 63 874 77 107301 0013 8 150 200 1.6 64 873 0 5 39 65 535 70 574
Betumpu 01 0015 1 0 5 0.4 294 72 0 22 4 5 1 27 4.901 0015 2 5 20 0.4 298 192 0 22 14 14 9 37 2201 0015 5 50 80 0.5 348 6 0 26 40 0 1 27 4101 0015 6 80 150 0.6 758 1029 0 57 249 77 339 134 58901 0015 7 150 200 0.6 738 2146 0 55 166 161 484 216 650
Betumpu 01 0016 1 0 5 0.8 374 23 0 28 11 2 1 30 1101 0016 3 10 30 1.1 264 19 0 20 44 2 3 21 4701 0016 4 30 50 1.2 277 22 0 21 49 2 4 22 5301 0016 5 50 70 1.4 130 19 0 10 28 1 4 11 3201 0016 6 70 100 1.6 164 936 0 12 58 70 328 82 38601 0016 8 130 175 1.8 87 773 0 7 51 58 458 64 509
Si Tukak, Limau Manis A&B 03 0002 1 0 3003 0002 2 30 6003 0002 3 60 100
Lumapas 05 0004 1 0 1005 0004 2 10 3005 0004 3 30 110
Lumapas 05 0005 1 0 1005 0005 2 10 3005 0005 3 30 110
Limpaki 06 0002 2 5 10 0.8 418 168 0 31 13 13 5 44 1806 0002 3 10 40 0.8 384 143 0 29 71 11 27 40 9706 0002 5 80 180 0.9 608 2083 0 46 416 156 1423 202 183906 0002 6 180 200
Lime (CaCO3) equivalents (including 1.5 factor)TAA AGP Net acidity
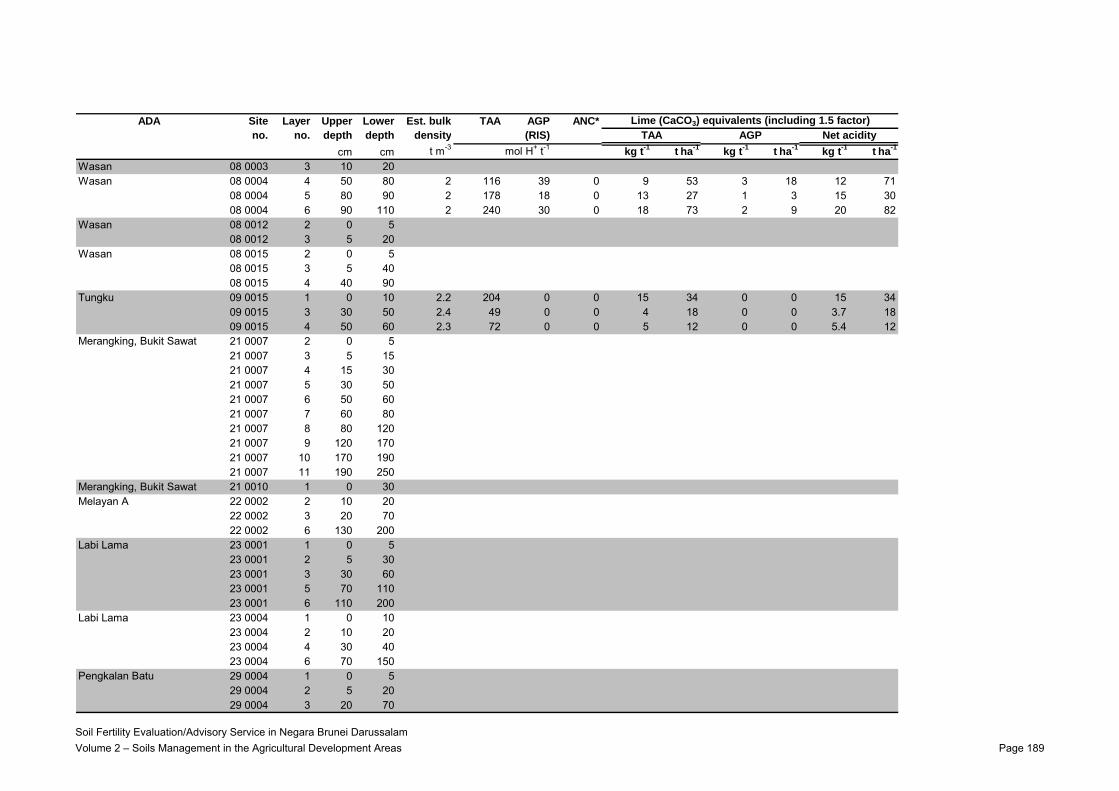
ADA Site Layer Upper Lower Est. bulk TAA AGP ANC*no. no. depth depth density (RIS)
cm cm t m-3 mol H+ t-1 kg t-1 t ha-1 kg t-1 t ha-1 kg t-1 t ha-1
Wasan 08 0003 3 10 20Wasan 08 0004 4 50 80 2 116 39 0 9 53 3 18 12 71
08 0004 5 80 90 2 178 18 0 13 27 1 3 15 3008 0004 6 90 110 2 240 30 0 18 73 2 9 20 82
Wasan 08 0012 2 0 508 0012 3 5 20
Wasan 08 0015 2 0 508 0015 3 5 4008 0015 4 40 90
Tungku 09 0015 1 0 10 2.2 204 0 0 15 34 0 0 15 3409 0015 3 30 50 2.4 49 0 0 4 18 0 0 3.7 1809 0015 4 50 60 2.3 72 0 0 5 12 0 0 5.4 12
Merangking, Bukit Sawat 21 0007 2 0 521 0007 3 5 1521 0007 4 15 3021 0007 5 30 5021 0007 6 50 6021 0007 7 60 8021 0007 8 80 12021 0007 9 120 17021 0007 10 170 19021 0007 11 190 250
Merangking, Bukit Sawat 21 0010 1 0 30Melayan A 22 0002 2 10 20
22 0002 3 20 7022 0002 6 130 200
Labi Lama 23 0001 1 0 523 0001 2 5 3023 0001 3 30 6023 0001 5 70 11023 0001 6 110 200
Labi Lama 23 0004 1 0 1023 0004 2 10 2023 0004 4 30 4023 0004 6 70 150
Pengkalan Batu 29 0004 1 0 529 0004 2 5 2029 0004 3 20 70
Lime (CaCO3) equivalents (including 1.5 factor)TAA AGP Net acidity
Soil Fertility Evaluation/Advisory Service in Negara Brunei Darussalam Volume 2 – Soils Management in the Agricultural Development Areas Page 189
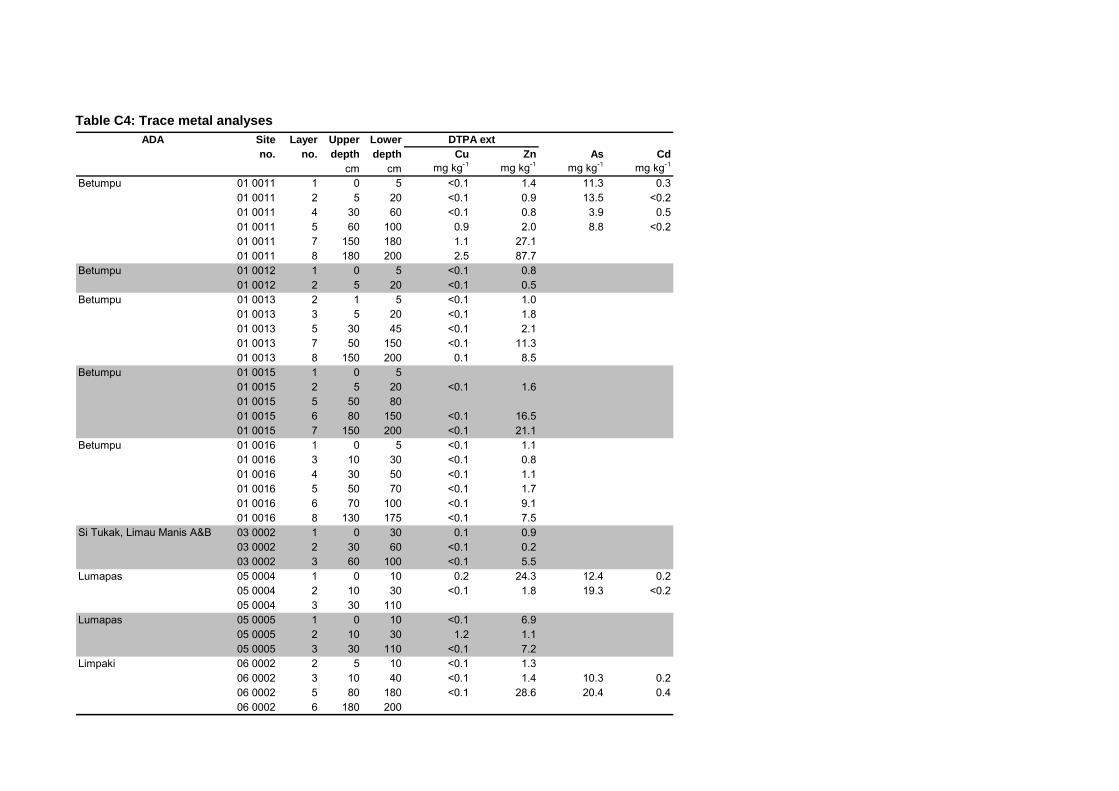
Table C4: Trace metal analyses ADA Site Layer Upper Lower
no. no. depth depth Cu Zn As Cdcm cm mg kg-1 mg kg-1 mg kg-1 mg kg-1
Betumpu 01 0011 1 0 5 <0.1 1.4 11.3 0.301 0011 2 5 20 <0.1 0.9 13.5 <0.201 0011 4 30 60 <0.1 0.8 3.9 0.501 0011 5 60 100 0.9 2.0 8.8 <0.201 0011 7 150 180 1.1 27.101 0011 8 180 200 2.5 87.7
Betumpu 01 0012 1 0 5 <0.1 0.801 0012 2 5 20 <0.1 0.5
Betumpu 01 0013 2 1 5 <0.1 1.001 0013 3 5 20 <0.1 1.801 0013 5 30 45 <0.1 2.101 0013 7 50 150 <0.1 11.301 0013 8 150 200 0.1 8.5
Betumpu 01 0015 1 0 501 0015 2 5 20 <0.1 1.601 0015 5 50 8001 0015 6 80 150 <0.1 16.501 0015 7 150 200 <0.1 21.1
Betumpu 01 0016 1 0 5 <0.1 1.101 0016 3 10 30 <0.1 0.801 0016 4 30 50 <0.1 1.101 0016 5 50 70 <0.1 1.701 0016 6 70 100 <0.1 9.101 0016 8 130 175 <0.1 7.5
Si Tukak, Limau Manis A&B 03 0002 1 0 30 0.1 0.903 0002 2 30 60 <0.1 0.203 0002 3 60 100 <0.1 5.5
Lumapas 05 0004 1 0 10 0.2 24.3 12.4 0.205 0004 2 10 30 <0.1 1.8 19.3 <0.205 0004 3 30 110
Lumapas 05 0005 1 0 10 <0.1 6.905 0005 2 10 30 1.2 1.105 0005 3 30 110 <0.1 7.2
Limpaki 06 0002 2 5 10 <0.1 1.306 0002 3 10 40 <0.1 1.4 10.3 0.206 0002 5 80 180 <0.1 28.6 20.4 0.406 0002 6 180 200
DTPA ext
ADA Site Layer Upper Lowerno. no. depth depth Cu Zn As Cd
cm cm mg kg-1 mg kg-1 mg kg-1 mg kg-1
Wasan 08 0003 3 10 20 <0.1 1.6Wasan 08 0004 4 50 80 <0.1 0.3
08 0004 5 80 9008 0004 6 90 110
Wasan 08 0012 2 0 5 <0.1 0.808 0012 3 5 20 <0.1 0.3
Wasan 08 0015 2 0 5 <0.1 0.408 0015 3 5 40 0.8 0.808 0015 4 40 90 0.8 0.6
Tungku 09 0015 1 0 10 0.1 2.409 0015 3 30 50 0.6 1.209 0015 4 50 60 0.7 2.0
Merangking, Bukit Sawat 21 0007 2 0 5 0.1 2.221 0007 3 5 15 <0.1 0.621 0007 4 15 30 <0.1 3.121 0007 5 30 5021 0007 6 50 6021 0007 7 60 8021 0007 8 80 12021 0007 9 120 17021 0007 10 170 19021 0007 11 190 250
Merangking, Bukit Sawat 21 0010 1 0 30 <0.1 0.8Melayan A 22 0002 2 10 20 <0.1 0.2 1.1 <0.2
22 0002 3 20 70 0.1 <0.1 0.7 <0.222 0002 6 130 200 <0.1 0.6
Labi Lama 23 0001 1 0 5 11.0 32.1 20.0 1.823 0001 2 5 30 1.6 7.1 17.3 0.423 0001 3 30 60 0.2 3.3 4.8 <0.223 0001 5 70 11023 0001 6 110 200
Labi Lama 23 0004 1 0 10 <0.1 0.623 0004 2 10 20 <0.1 0.923 0004 4 30 40 0.6 2.623 0004 6 70 150 <0.1 0.4
Pengkalan Batu 29 0004 1 0 5 4.5 19.4 8.2 0.529 0004 2 5 20 2.6 15.6 10.1 <0.229 0004 3 20 70 0.1 1.4
DTPA ext
Soil Fertility Evaluation/Advisory Service in Negara Brunei Darussalam Volume 2 – Soils Management in the Agricultural Development Areas Page 191
Table C5: Mineralogical composition of bulk samples, <2 µm (clay) and 63-200 µm fractions.
ADA Site Layer Upper Lowerno. no. depth depth
cm cmBetumpu 01 0011 4 30 60 CD T T - T T CD T - M D - T
01 0011 5 60 100 D T T - T T SD ?T - M D T -Betumpu 01 0016 5 50 70 D T T - T T SD M - M D T -Lumapas 05 0005 3 30 110 M T ?T - ?T M D M - SD D M -Limpaki 06 0002 3 10 40 CD T T - T T CD - - M D - -
06 0002 5 80 180 CD T ?T M ?T M CD M - M D M -Wasan 08 0003 3 10 20 CD T - T T M CD M - M D T -Tungku 09 0015 3 30 50 D - - - - T T T - CD CD CD -
09 0015 4 50 60 D - T - T T T T - CD CD CD -Labi Lama 23 0001 3 30 60 M T T - T SD D SD - D SD M -
ADA Site Layer Upper Lowerno. no. depth depth
cm cmWasan 08 0003 3 10 20 CD T - T ?T T CD M - -Labi Lama 23 0001 3 30 60 D T T - - - - M ?T -
Composition of 63-200 µm fraction
Qua
rtz
Alb
ite
Ort
ho-
clas
e
Pyrit
e
Ana
tase
Kao
lin
Mic
a/Ill
ite
Chl
orite
/Ve
rmi-
culit
e
Smec
tite
Composition of bulk sample Composition of <2µm fraction
Goe
thite
Smec
tite
Goe
thite
Kao
lin
Mic
a/Ill
ite
Chl
orite
/Ve
rmi-
culit
e
Ana
tase
Kao
lin
Mic
a/Ill
ite
Chl
orite
/Ve
rmi-
culit
e
Qua
rtz
Alb
ite
Ort
ho-
clas
e
Pyrit
e
D: dominant (>60%); CD: co-dominant (sum of phases >60%); SD: sub-dominant (20-60%); M: minor (5 20%); T: trace (<5%); ?: possible.
Appendix D Photographic Reference for Brunei Acid Sulfate Soils
Soil Fertility Evaluation/Advisory Service in Negara Brunei Darussalam Volume 2 – Soils Management in the Agricultural Development Areas Page 193

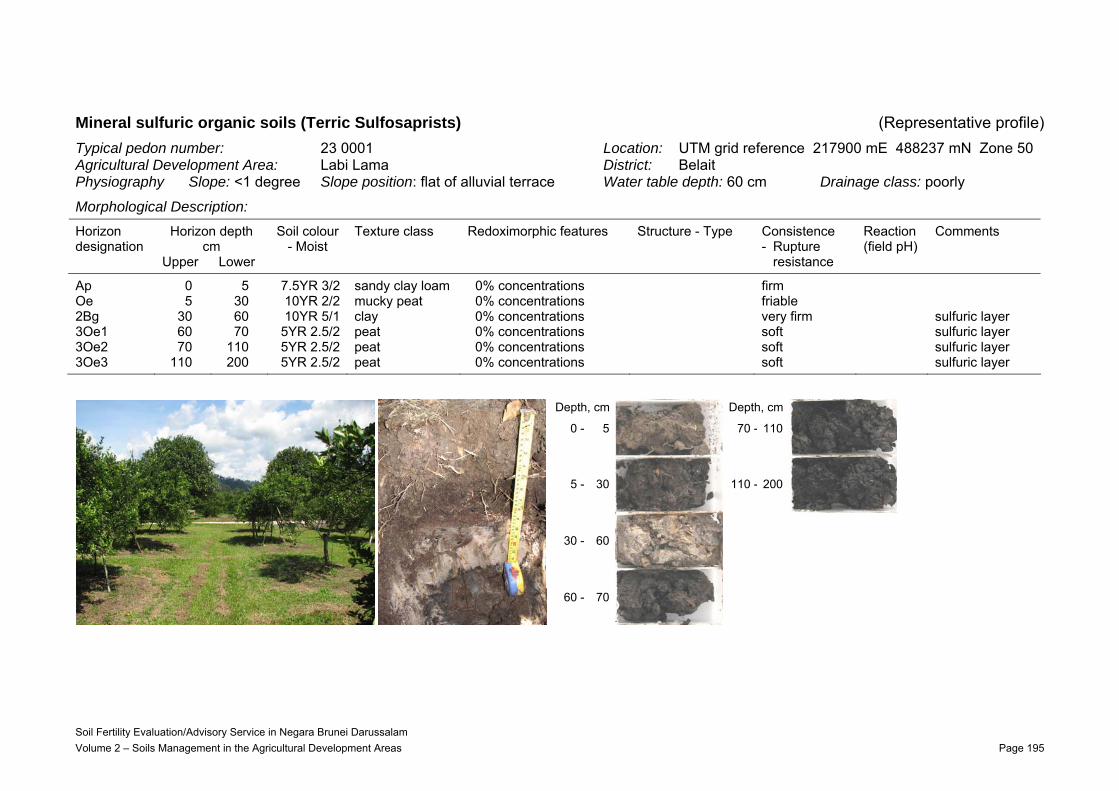
Mineral sulfuric organic soils (Terric Sulfosaprists) (Representative profile) Typical pedon number: 23 0001 Location: UTM grid reference 217900 mE 488237 mN Zone 50 Agricultural Development Area: Labi Lama District: Belait Physiography Slope: <1 degree Slope position: flat of alluvial terrace Water table depth: 60 cm Drainage class: poorly
Morphological Description: Horizon depth
cm Horizon designation
Upper Lower
Soil colour - Moist
Texture class Redoximorphic features Structure - Type Consistence - Rupture
resistance
Reaction (field pH)
Comments
Ap 0 5 7.5YR 3/2 sandy clay loam 0% concentrations firm Oe 5 30 10YR 2/2 mucky peat 0% concentrations friable 2Bg 30 60 10YR 5/1 clay 0% concentrations very firm sulfuric layer 3Oe1 60 70 5YR 2.5/2 peat 0% concentrations soft sulfuric layer 3Oe2 70 110 5YR 2.5/2 peat 0% concentrations soft sulfuric layer 3Oe3 110 200 5YR 2.5/2 peat 0% concentrations soft sulfuric layer
Depth, cm Depth, cm
0 - 5 70 - 110
5 - 30 110 - 200
30 - 60
60 - 70
Soil Fertility Evaluation/Advisory Service in Negara Brunei Darussalam Volume 2 – Soils Management in the Agricultural Development Areas Page 195
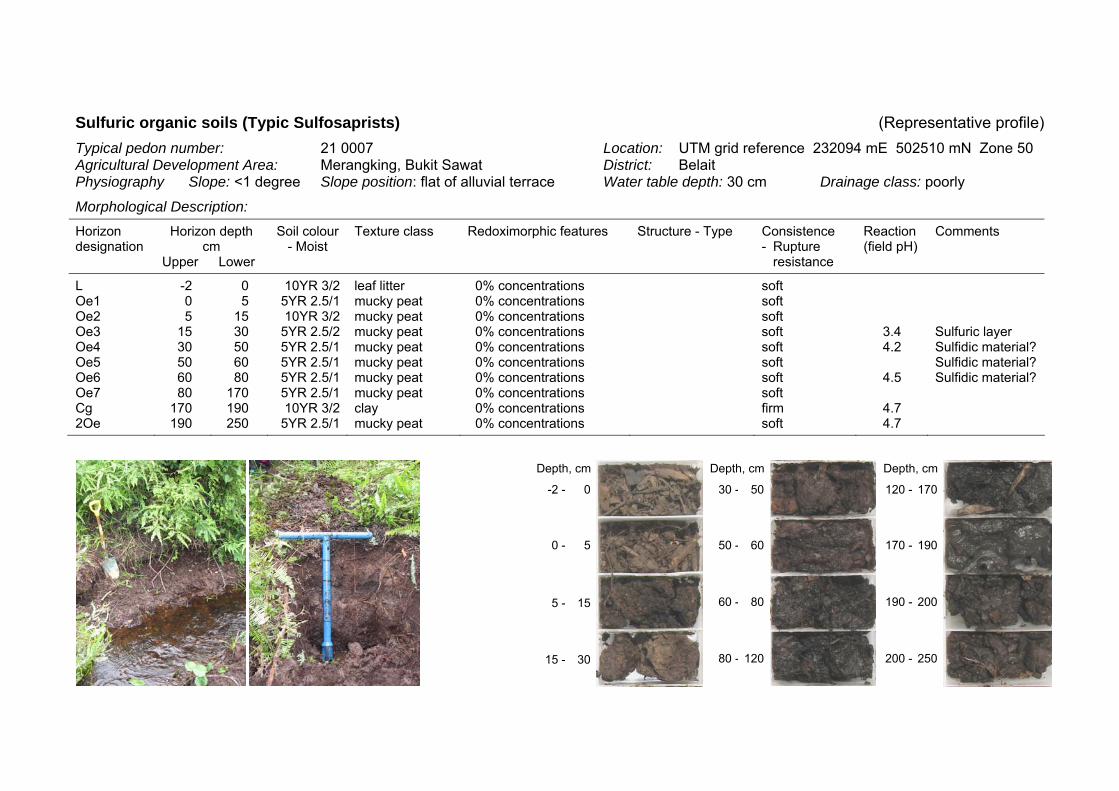
Sulfuric organic soils (Typic Sulfosaprists) (Representative profile) Typical pedon number: 21 0007 Location: UTM grid reference 232094 mE 502510 mN Zone 50 Agricultural Development Area: Merangking, Bukit Sawat District: Belait Physiography Slope: <1 degree Slope position: flat of alluvial terrace Water table depth: 30 cm Drainage class: poorly
Morphological Description: Horizon depth
cm Horizon designation
Upper Lower
Soil colour - Moist
Texture class Redoximorphic features Structure - Type Consistence - Rupture
resistance
Reaction (field pH)
Comments
L -2 0 10YR 3/2 leaf litter 0% concentrations soft Oe1 0 5 5YR 2.5/1 mucky peat 0% concentrations soft Oe2 5 15 10YR 3/2 mucky peat 0% concentrations soft Oe3 15 30 5YR 2.5/2 mucky peat 0% concentrations soft 3.4 Sulfuric layer Oe4 30 50 5YR 2.5/1 mucky peat 0% concentrations soft 4.2 Sulfidic material? Oe5 50 60 5YR 2.5/1 mucky peat 0% concentrations soft Sulfidic material? Oe6 60 80 5YR 2.5/1 mucky peat 0% concentrations soft 4.5 Sulfidic material? Oe7 80 170 5YR 2.5/1 mucky peat 0% concentrations soft Cg 170 190 10YR 3/2 clay 0% concentrations firm 4.7 2Oe 190 250 5YR 2.5/1 mucky peat 0% concentrations soft 4.7
Depth, cm Depth, cm Depth, cm
-2 - 0 30 - 50 120 - 170
0 - 5 50 - 60 170 - 190
5 - 15 60 - 80 190 - 200
15 - 30 80 - 120 200 - 250
Mineral sulfidic organic soils (Terric Sulfisaprists) (Representative profile) Typical pedon number: 03 0002 Location: UTM grid reference 259490 mE 527277 mN Zone 50 Agricultural Development Area: Si Tukak, Limau Manis A & B District: Brunei Muara Physiography Slope: <1 degree Slope position: flat of alluvial terrace Water table depth: 20 cm Drainage class: poorly
Morphological Description: Horizon depth
cm Horizon designation
Upper Lower
Soil colour - Moist
Texture class Redoximorphic features Structure - Type Consistence - Rupture
resistance
Reaction (field pH)
Comments
Oe 0 30 5YR 3/2 peat 0% concentrations soft Be 30 60 10YR 2/2 Clay loam with
moderately decomposed plant material
0% concentrations soft 4.2 Sulfidic material
Bi 60 100 10YR 2/1 slightly decomposed plant material
0% concentrations soft
Depth, cm
0 - 30
30 - 60
60 - 100
Soil Fertility Evaluation/Advisory Service in Negara Brunei Darussalam Volume 2 – Soils Management in the Agricultural Development Areas Page 197
Sulfidic organic soils (Typic Sulfisaprists) (Representative profile and acid-base accounting) Typical pedon number: 01 0015 Location: UTM grid reference 262578 mE 535271 mN Zone 50 Agricultural Development Area: Betumpu District: Brunei Muara Physiography Slope: <1 degree Slope position: flat of alluvial terrace Water table depth: 25 cm Drainage class: very poorly
Morphological Description: Horizon depth
cm Horizon designation
Upper Lower
Soil colour - Moist
Texture class Redoximorphic features Structure - Type Consistence - Rupture
resistance
Reaction (field pH)
Comments
Ap 0 5 10YR 3/2 sandy clay loam 0% concentrations subangular blocky friable Oi1 5 20 5YR 3/2 peat 0% concentrations subangular blocky friable Oi2 20 30 5YR 3/1 peat 0% concentrations massive very friable Oe1 30 50 5YR 3/1 moderately
decomposed plant material
0% concentrations massive very friable Sulfidic material
Oe2 50 80 5YR 2.5/1 moderately decomposed plant material
0% concentrations massive very friable
Oa 80 150 5YR 2.5/1 highly decomposed plant material
0% concentrations massive firm
Bh 150 200 7.5YR 2/0 sandy clay 0% concentrations massive firm
Depth, cm Depth, cm Depth, cm
0 - 5 50 - 80 175 - 200
5 - 10 80 - 100
10 - 30 100 - 150
30 - 50 150 - 175
Site Layer Upper Lower E.C. pH Total Total RIS TAA AGP ANC* Net acidityno. no. depth depth (1:2.5 soil:water) Org.C S (SCr)
cm cm dS/m % % %01 0015 1 0 5 0.81 0.12 294 72 0 36601 0015 2 5 20 0.40 3.2 0.92 0.31 298 192 0 49001 0015 3 20 3001 0015 4 30 5001 0015 5 50 80 1.70 0.01 348 6 0 35401 0015 6 80 150 4.12 1.65 758 1029 0 178701 0015 7 150 200 4.15 3.44 738 2146 0 2884
mol H+ t-1
RIS: Reduced inorganic sulphur TAA: Titratable actual acidity AGP: Acid generating potential (calculated from RIS) ANC: Acid neutralising capacity (* When pH1:2.5 <5.0 then ANC=0) Net acidity: TAA + AGP – ANC.
Soil Fertility Evaluation/Advisory Service in Negara Brunei Darussalam Volume 2 – Soils Management in the Agricultural Development Areas Page 199
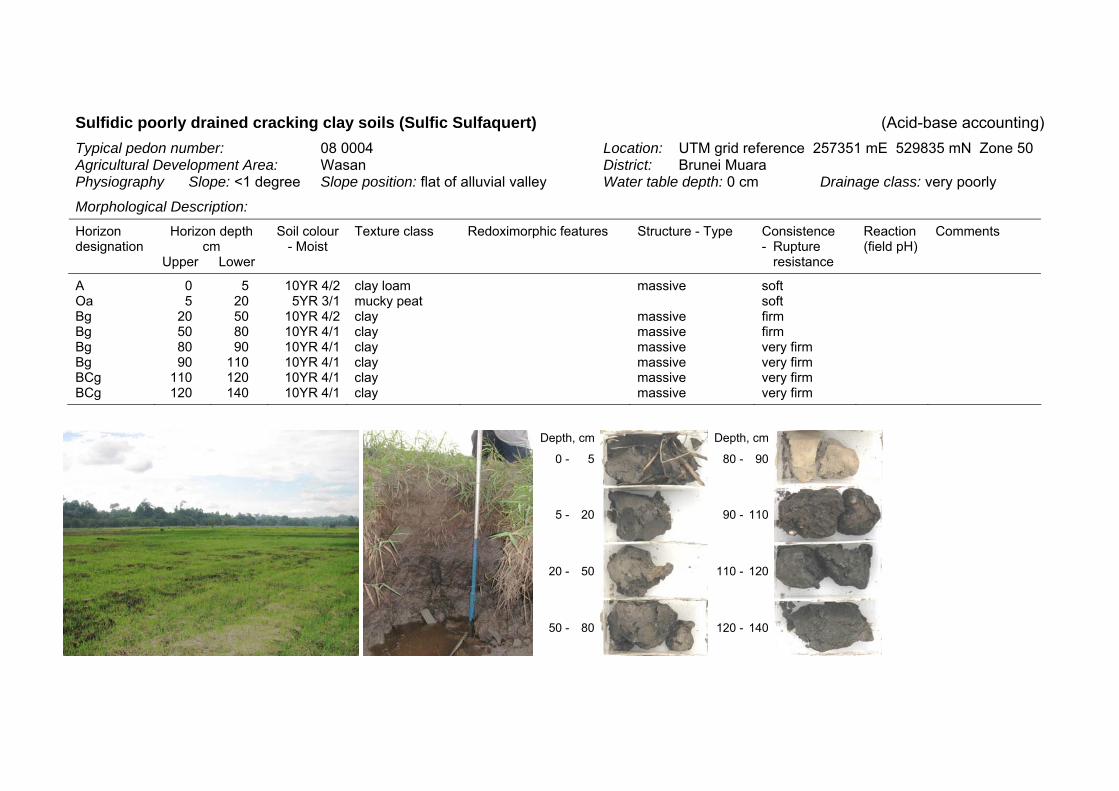
Sulfidic poorly drained cracking clay soils (Sulfic Sulfaquert) (Acid-base accounting) Typical pedon number: 08 0004 Location: UTM grid reference 257351 mE 529835 mN Zone 50 Agricultural Development Area: Wasan District: Brunei Muara Physiography Slope: <1 degree Slope position: flat of alluvial valley Water table depth: 0 cm Drainage class: very poorly
Morphological Description: Horizon depth
cm Horizon designation
Upper Lower
Soil colour - Moist
Texture class Redoximorphic features Structure - Type Consistence - Rupture
resistance
Reaction (field pH)
Comments
A 0 5 10YR 4/2 clay loam massive soft Oa 5 20 5YR 3/1 mucky peat soft Bg 20 50 10YR 4/2 clay massive firm Bg 50 80 10YR 4/1 clay massive firm Bg 80 90 10YR 4/1 clay massive very firm Bg 90 110 10YR 4/1 clay massive very firm BCg 110 120 10YR 4/1 clay massive very firm BCg 120 140 10YR 4/1 clay massive very firm
Depth, cm Depth, cm
0 - 5 80 - 90
5 - 20 90 - 110
20 - 50 110 - 120
50 - 80 120 - 140
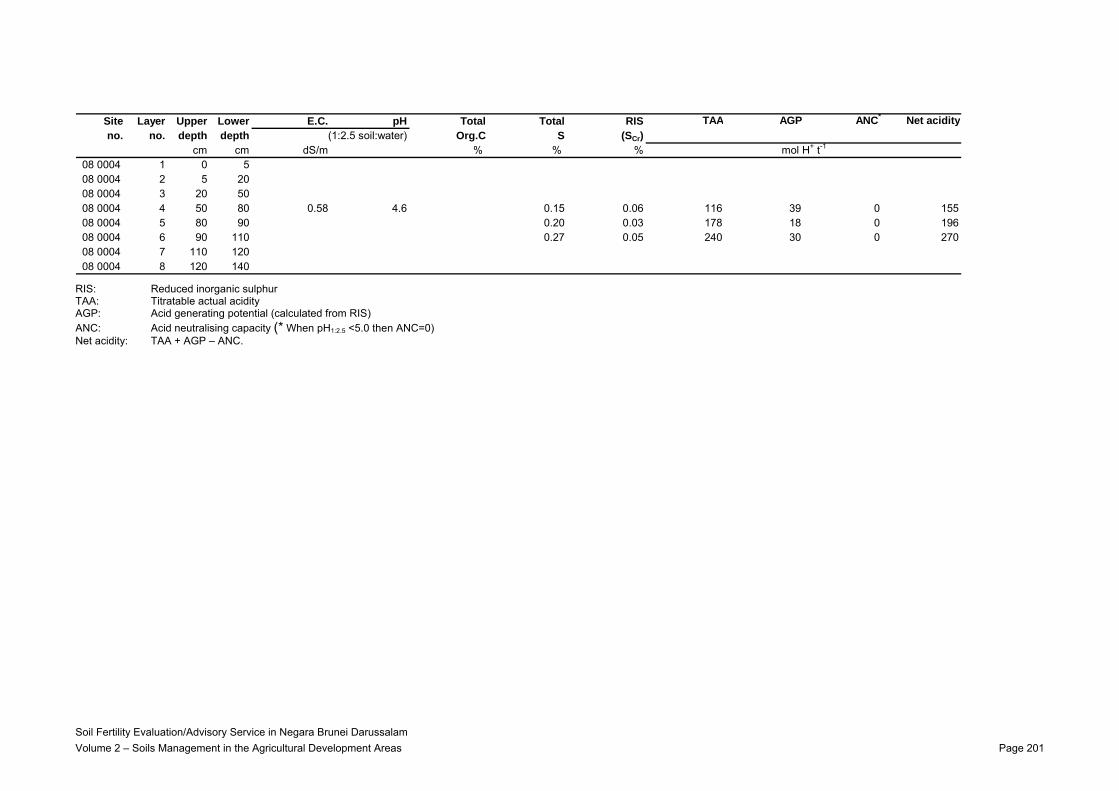
Site Layer Upper Lower E.C. pH Total Total RIS TAA AGP ANC* Net acidityno. no. depth depth (1:2.5 soil:water) Org.C S (SCr)
cm cm dS/m % % %08 0004 1 0 508 0004 2 5 2008 0004 3 20 5008 0004 4 50 80 0.58 4.6 0.15 0.06 116 39 0 15508 0004 5 80 90 0.20 0.03 178 18 0 19608 0004 6 90 110 0.27 0.05 240 30 0 27008 0004 7 110 12008 0004 8 120 140
mol H+ t-1
RIS: Reduced inorganic sulphur TAA: Titratable actual acidity AGP: Acid generating potential (calculated from RIS) ANC: Acid neutralising capacity (* When pH1:2.5 <5.0 then ANC=0) Net acidity: TAA + AGP – ANC.
Soil Fertility Evaluation/Advisory Service in Negara Brunei Darussalam Volume 2 – Soils Management in the Agricultural Development Areas Page 201
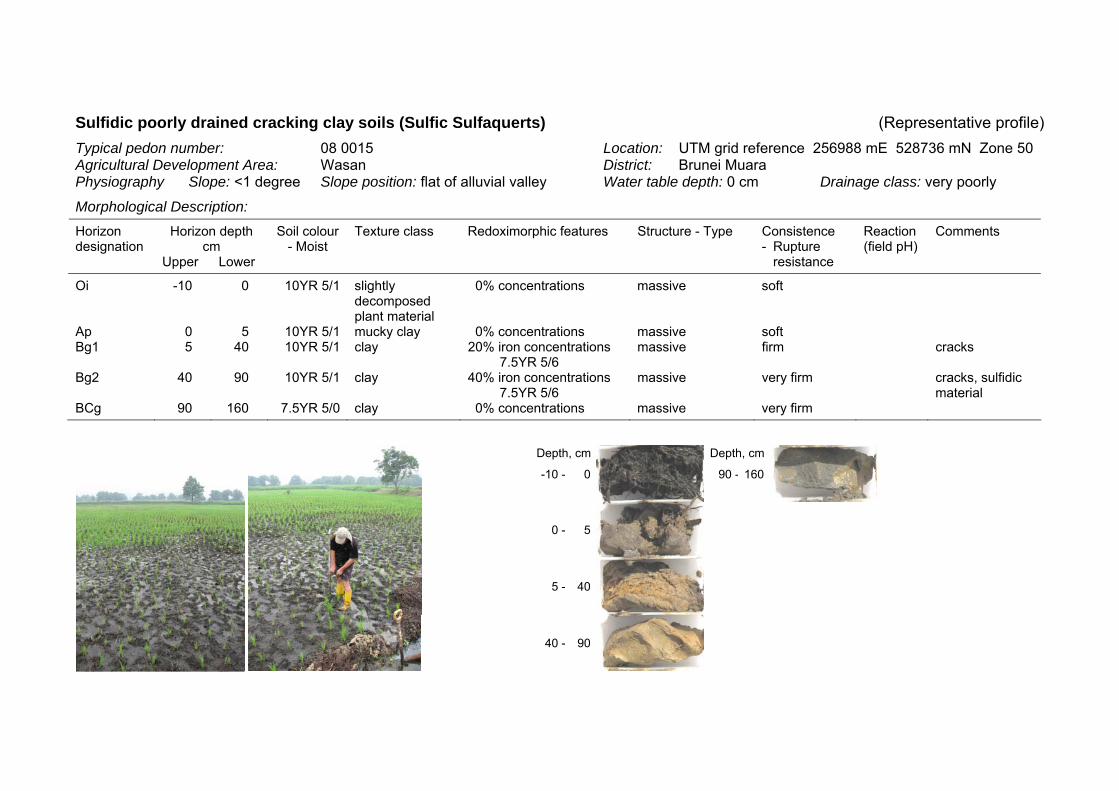
Sulfidic poorly drained cracking clay soils (Sulfic Sulfaquerts) (Representative profile) Typical pedon number: 08 0015 Location: UTM grid reference 256988 mE 528736 mN Zone 50 Agricultural Development Area: Wasan District: Brunei Muara Physiography Slope: <1 degree Slope position: flat of alluvial valley Water table depth: 0 cm Drainage class: very poorly
Morphological Description: Horizon depth
cm Horizon designation
Upper Lower
Soil colour - Moist
Texture class Redoximorphic features Structure - Type Consistence - Rupture
resistance
Reaction (field pH)
Comments
Oi -10 0 10YR 5/1 slightly decomposed plant material
0% concentrations massive soft
Ap 0 5 10YR 5/1 mucky clay 0% concentrations massive soft Bg1 5 40 10YR 5/1 clay 20% iron concentrations
7.5YR 5/6 massive firm cracks
Bg2 40 90 10YR 5/1 clay 40% iron concentrations 7.5YR 5/6
massive very firm cracks, sulfidic material
BCg 90 160 7.5YR 5/0 clay 0% concentrations massive very firm
Depth, cm Depth, cm
-10 - 0 90 - 160
0 - 5
5 - 40
40 - 90
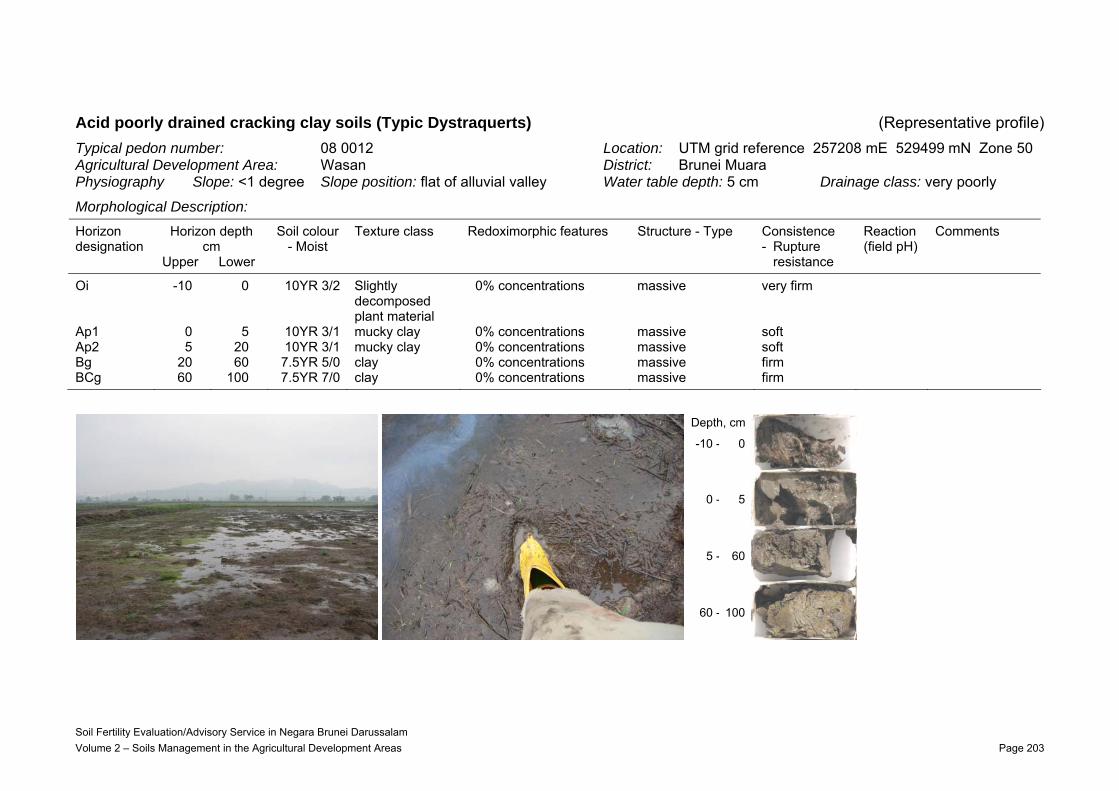
Acid poorly drained cracking clay soils (Typic Dystraquerts) (Representative profile) Typical pedon number: 08 0012 Location: UTM grid reference 257208 mE 529499 mN Zone 50 Agricultural Development Area: Wasan District: Brunei Muara Physiography Slope: <1 degree Slope position: flat of alluvial valley Water table depth: 5 cm Drainage class: very poorly
Morphological Description: Horizon depth
cm Horizon designation
Upper Lower
Soil colour - Moist
Texture class Redoximorphic features Structure - Type Consistence - Rupture
resistance
Reaction (field pH)
Comments
Oi -10 0 10YR 3/2 Slightly decomposed plant material
0% concentrations massive very firm
Ap1 0 5 10YR 3/1 mucky clay 0% concentrations massive soft Ap2 5 20 10YR 3/1 mucky clay 0% concentrations massive soft Bg 20 60 7.5YR 5/0 clay 0% concentrations massive firm BCg 60 100 7.5YR 7/0 clay 0% concentrations massive firm
Depth, cm
-10 - 0
0 - 5
5 - 60
60 - 100
Soil Fertility Evaluation/Advisory Service in Negara Brunei Darussalam Volume 2 – Soils Management in the Agricultural Development Areas Page 203
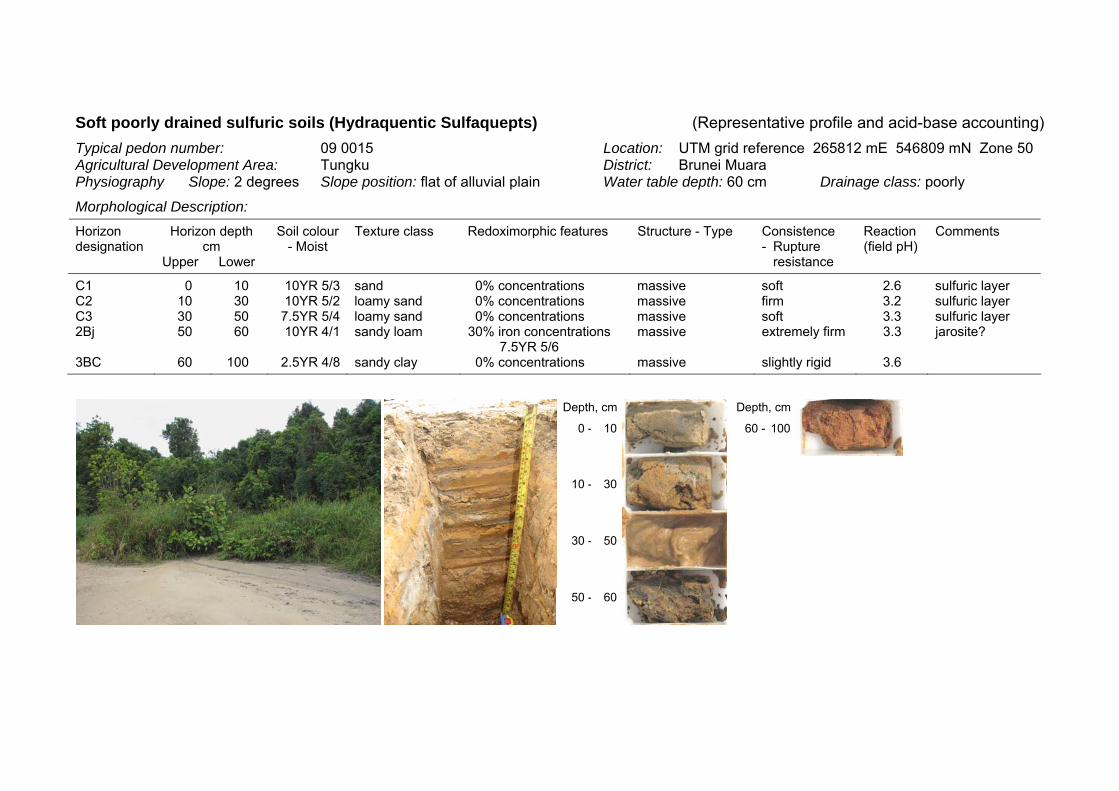
Soft poorly drained sulfuric soils (Hydraquentic Sulfaquepts) (Representative profile and acid-base accounting) Typical pedon number: 09 0015 Location: UTM grid reference 265812 mE 546809 mN Zone 50 Agricultural Development Area: Tungku District: Brunei Muara Physiography Slope: 2 degrees Slope position: flat of alluvial plain Water table depth: 60 cm Drainage class: poorly
Morphological Description: Horizon depth
cm Horizon designation
Upper Lower
Soil colour - Moist
Texture class Redoximorphic features Structure - Type Consistence - Rupture
resistance
Reaction (field pH)
Comments
C1 0 10 10YR 5/3 sand 0% concentrations massive soft 2.6 sulfuric layer C2 10 30 10YR 5/2 loamy sand 0% concentrations massive firm 3.2 sulfuric layer C3 30 50 7.5YR 5/4 loamy sand 0% concentrations massive soft 3.3 sulfuric layer 2Bj 50 60 10YR 4/1 sandy loam 30% iron concentrations
7.5YR 5/6 massive extremely firm 3.3 jarosite?
3BC 60 100 2.5YR 4/8 sandy clay 0% concentrations massive slightly rigid 3.6
Depth, cm Depth, cm
0 - 10 60 - 100
10 - 30
30 - 50
50 - 60
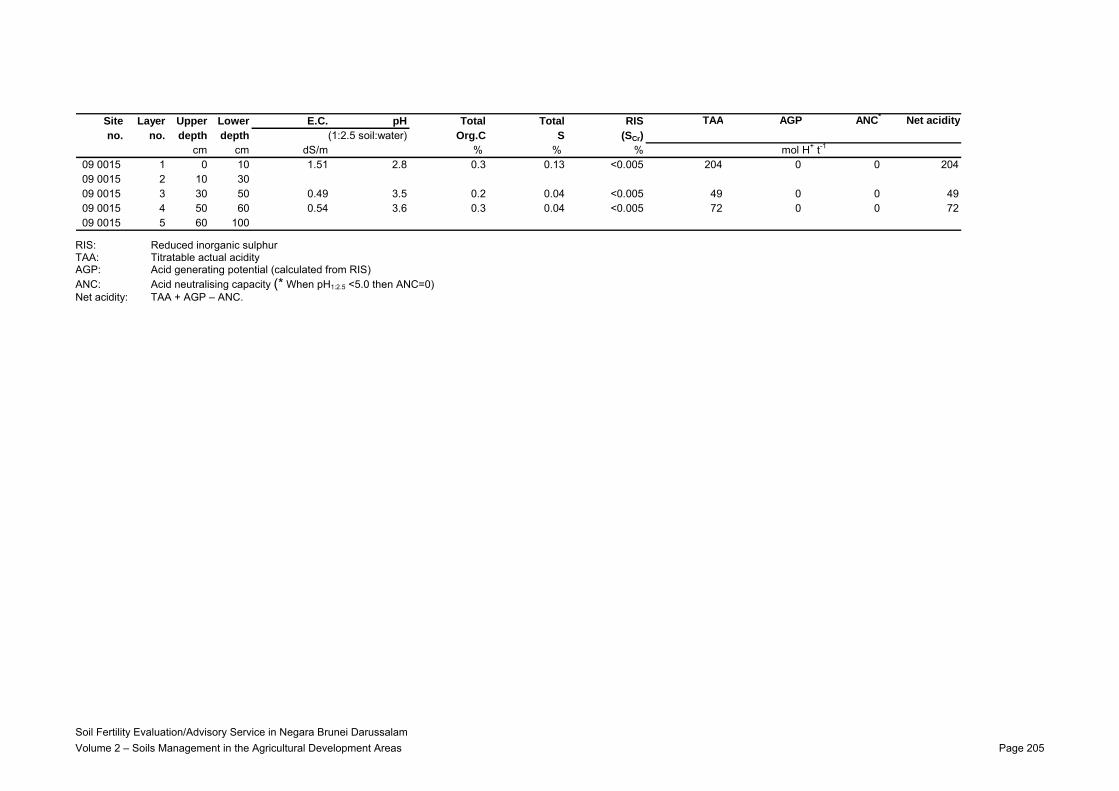
Site Layer Upper Lower E.C. pH Total Total RIS TAA AGP ANC* Net acidityno. no. depth depth (1:2.5 soil:water) Org.C S (SCr)
cm cm dS/m % % %09 0015 1 0 10 1.51 2.8 0.3 0.13 <0.005 204 0 0 20409 0015 2 10 3009 0015 3 30 50 0.49 3.5 0.2 0.04 <0.005 49 0 0 4909 0015 4 50 60 0.54 3.6 0.3 0.04 <0.005 72 0 0 7209 0015 5 60 100
mol H+ t-1
RIS: Reduced inorganic sulphur TAA: Titratable actual acidity AGP: Acid generating potential (calculated from RIS) ANC: Acid neutralising capacity (* When pH1:2.5 <5.0 then ANC=0) Net acidity: TAA + AGP – ANC.
Soil Fertility Evaluation/Advisory Service in Negara Brunei Darussalam Volume 2 – Soils Management in the Agricultural Development Areas Page 205
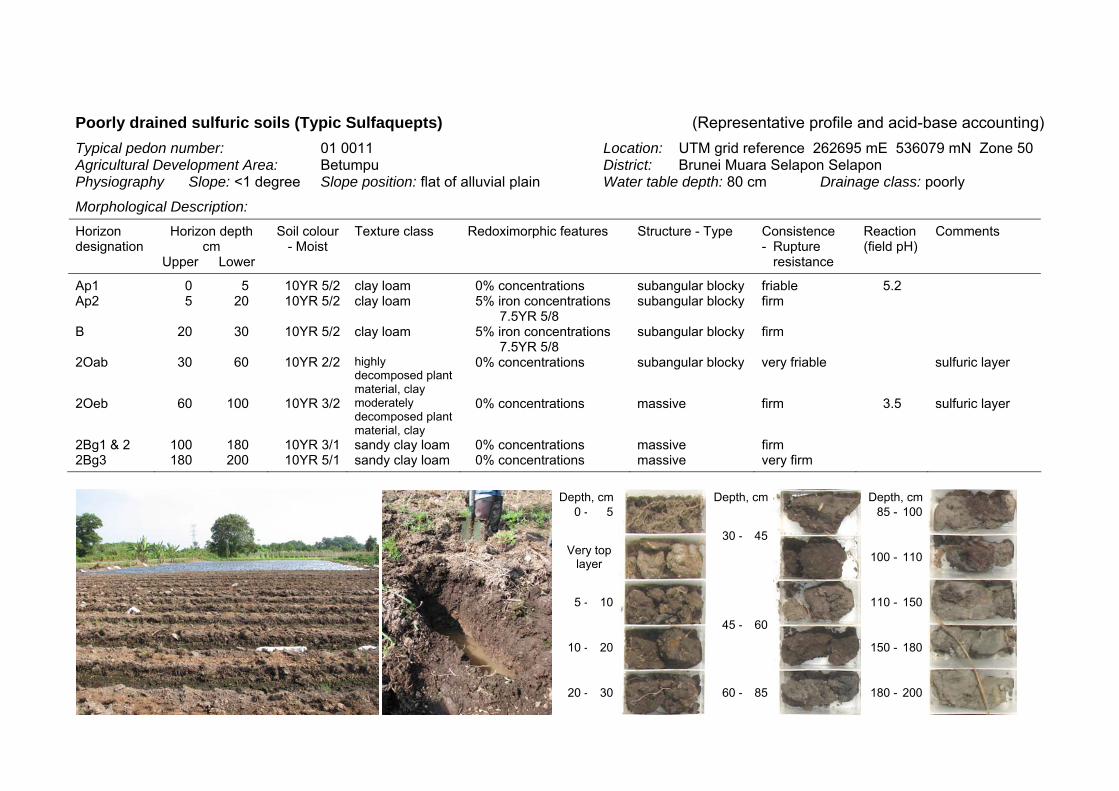
Poorly drained sulfuric soils (Typic Sulfaquepts) (Representative profile and acid-base accounting) Typical pedon number: 01 0011 Location: UTM grid reference 262695 mE 536079 mN Zone 50 Agricultural Development Area: Betumpu District: Brunei Muara Selapon Selapon Physiography Slope: <1 degree Slope position: flat of alluvial plain Water table depth: 80 cm Drainage class: poorly
Morphological Description: Horizon depth
cm Horizon designation
Upper Lower
Soil colour - Moist
Texture class Redoximorphic features Structure - Type Consistence - Rupture
resistance
Reaction (field pH)
Comments
Ap1 0 5 10YR 5/2 clay loam 0% concentrations subangular blocky friable 5.2 Ap2 5 20 10YR 5/2 clay loam 5% iron concentrations
7.5YR 5/8 subangular blocky firm
B 20 30 10YR 5/2 clay loam 5% iron concentrations 7.5YR 5/8
subangular blocky firm
2Oab 30 60 10YR 2/2 highly decomposed plant material, clay
0% concentrations subangular blocky very friable sulfuric layer
2Oeb 60 100 10YR 3/2 moderately decomposed plant material, clay
0% concentrations massive firm 3.5 sulfuric layer
2Bg1 & 2 100 180 10YR 3/1 sandy clay loam 0% concentrations massive firm 2Bg3 180 200 10YR 5/1 sandy clay loam 0% concentrations massive very firm
Depth, cm Depth, cm Depth, cm0 - 5 85 - 100
Very top layer
30 - 45
100 - 110
5 - 10 110 - 150
10 - 20
45 - 60
150 - 180
20 - 30 60 - 85 180 - 200

Site Layer Upper Lower E.C. pH Total Total RIS TAA AGP ANC* Net acidityno. no. depth depth (1:2.5 soil:water) Org.C S (SCr)
cm cm dS/m % % %01 0011 1 0 5 0.94 4.8 14.701 0011 2 5 20 0.56 4.0 16.6 0.30 0.05 240 29 0 26901 0011 3 20 3001 0011 4 30 60 0.69 3.3 7.1 0.31 0.04 263 25 0 28801 0011 5 60 100 0.79 3.3 3.3 0.35 0.15 153 95 0 24801 0011 6 100 15001 0011 7 150 180 1.56 3.3 2.3 1.65 1.61 99 1004 0 110301 0011 8 180 200 1.51 3.3 1.8 0.96 0.98 98 612 0 710
mol H+ t-1
RIS: Reduced inorganic sulphur TAA: Titratable actual acidity AGP: Acid generating potential (calculated from RIS) ANC: Acid neutralising capacity (* When pH1:2.5 <5.0 then ANC=0) Net acidity: TAA + AGP – ANC.
Soil Fertility Evaluation/Advisory Service in Negara Brunei Darussalam Volume 2 – Soils Management in the Agricultural Development Areas Page 207
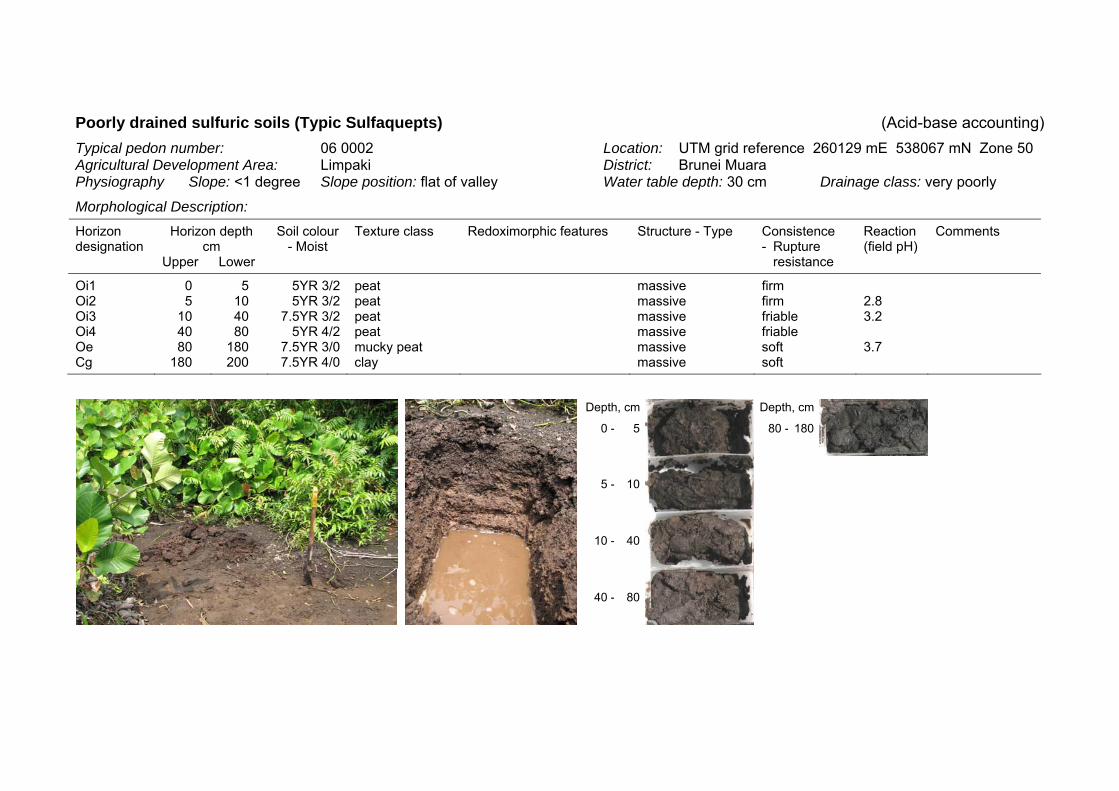
Poorly drained sulfuric soils (Typic Sulfaquepts) (Acid-base accounting) Typical pedon number: 06 0002 Location: UTM grid reference 260129 mE 538067 mN Zone 50 Agricultural Development Area: Limpaki District: Brunei Muara Physiography Slope: <1 degree Slope position: flat of valley Water table depth: 30 cm Drainage class: very poorly
Morphological Description: Horizon depth
cm Horizon designation
Upper Lower
Soil colour - Moist
Texture class Redoximorphic features Structure - Type Consistence - Rupture
resistance
Reaction (field pH)
Comments
Oi1 0 5 5YR 3/2 peat massive firm Oi2 5 10 5YR 3/2 peat massive firm 2.8 Oi3 10 40 7.5YR 3/2 peat massive friable 3.2 Oi4 40 80 5YR 4/2 peat massive friable Oe 80 180 7.5YR 3/0 mucky peat massive soft 3.7 Cg 180 200 7.5YR 4/0 clay massive soft
Depth, cm Depth, cm
0 - 5 80 - 180
5 - 10
10 - 40
40 - 80
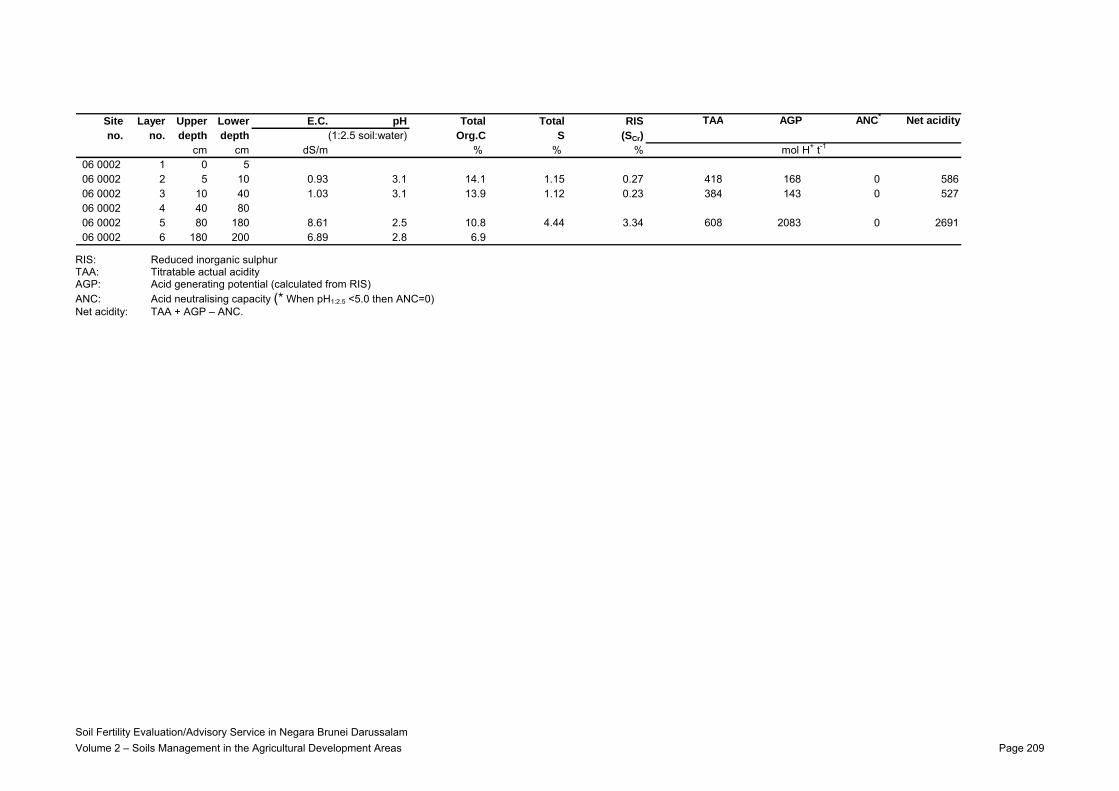
Site Layer Upper Lower E.C. pH Total Total RIS TAA AGP ANC* Net acidityno. no. depth depth (1:2.5 soil:water) Org.C S (SCr)
cm cm dS/m % % %06 0002 1 0 506 0002 2 5 10 0.93 3.1 14.1 1.15 0.27 418 168 0 58606 0002 3 10 40 1.03 3.1 13.9 1.12 0.23 384 143 0 52706 0002 4 40 8006 0002 5 80 180 8.61 2.5 10.8 4.44 3.34 608 2083 0 269106 0002 6 180 200 6.89 2.8 6.9
mol H+ t-1
RIS: Reduced inorganic sulphur TAA: Titratable actual acidity AGP: Acid generating potential (calculated from RIS) ANC: Acid neutralising capacity (* When pH1:2.5 <5.0 then ANC=0) Net acidity: TAA + AGP – ANC.
Soil Fertility Evaluation/Advisory Service in Negara Brunei Darussalam Volume 2 – Soils Management in the Agricultural Development Areas Page 209
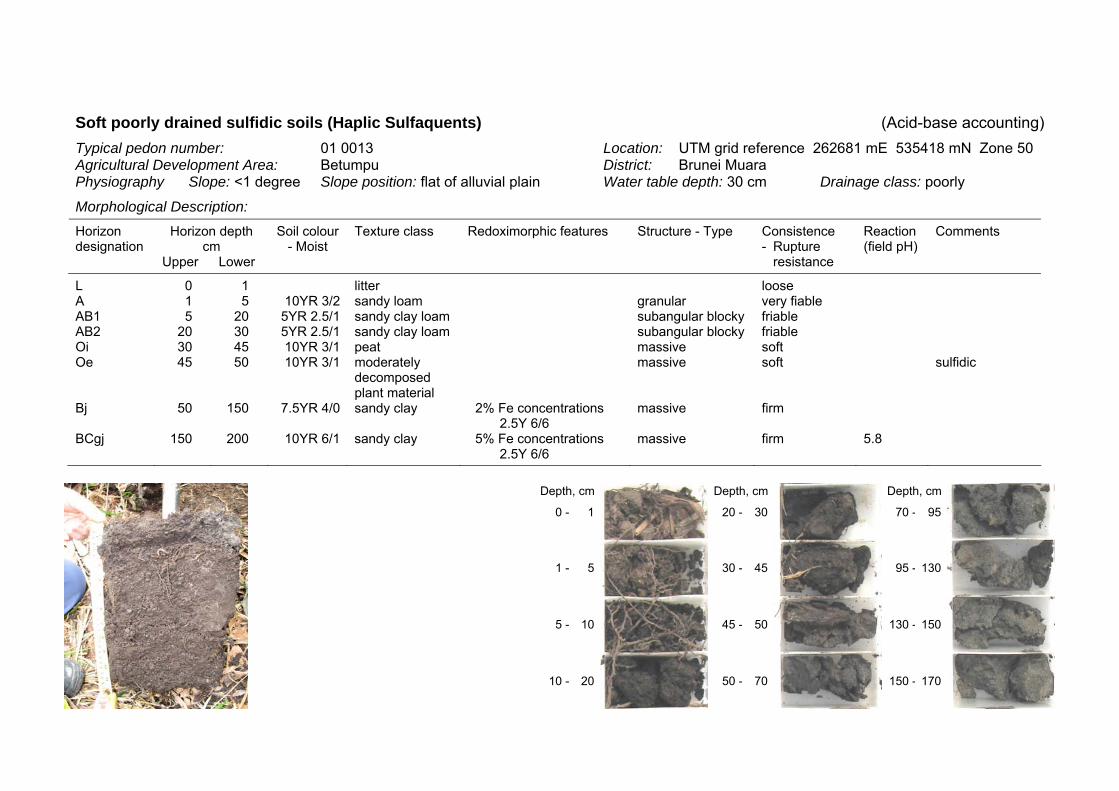
Soft poorly drained sulfidic soils (Haplic Sulfaquents) (Acid-base accounting) Typical pedon number: 01 0013 Location: UTM grid reference 262681 mE 535418 mN Zone 50 Agricultural Development Area: Betumpu District: Brunei Muara Physiography Slope: <1 degree Slope position: flat of alluvial plain Water table depth: 30 cm Drainage class: poorly
Morphological Description: Horizon depth
cm Horizon designation
Upper Lower
Soil colour - Moist
Texture class Redoximorphic features Structure - Type Consistence - Rupture
resistance
Reaction (field pH)
Comments
L 0 1 litter loose A 1 5 10YR 3/2 sandy loam granular very fiable AB1 5 20 5YR 2.5/1 sandy clay loam subangular blocky friable AB2 20 30 5YR 2.5/1 sandy clay loam subangular blocky friable Oi 30 45 10YR 3/1 peat massive soft Oe 45 50 10YR 3/1 moderately
decomposed plant material
massive soft sulfidic
Bj 50 150 7.5YR 4/0 sandy clay 2% Fe concentrations 2.5Y 6/6
massive firm
BCgj 150 200 10YR 6/1 sandy clay 5% Fe concentrations 2.5Y 6/6
massive firm 5.8
Depth, cm Depth, cm Depth, cm
0 - 1 20 - 30 70 - 95
1 - 5 30 - 45 95 - 130
5 - 10 45 - 50 130 - 150
10 - 20 50 - 70 150 - 170
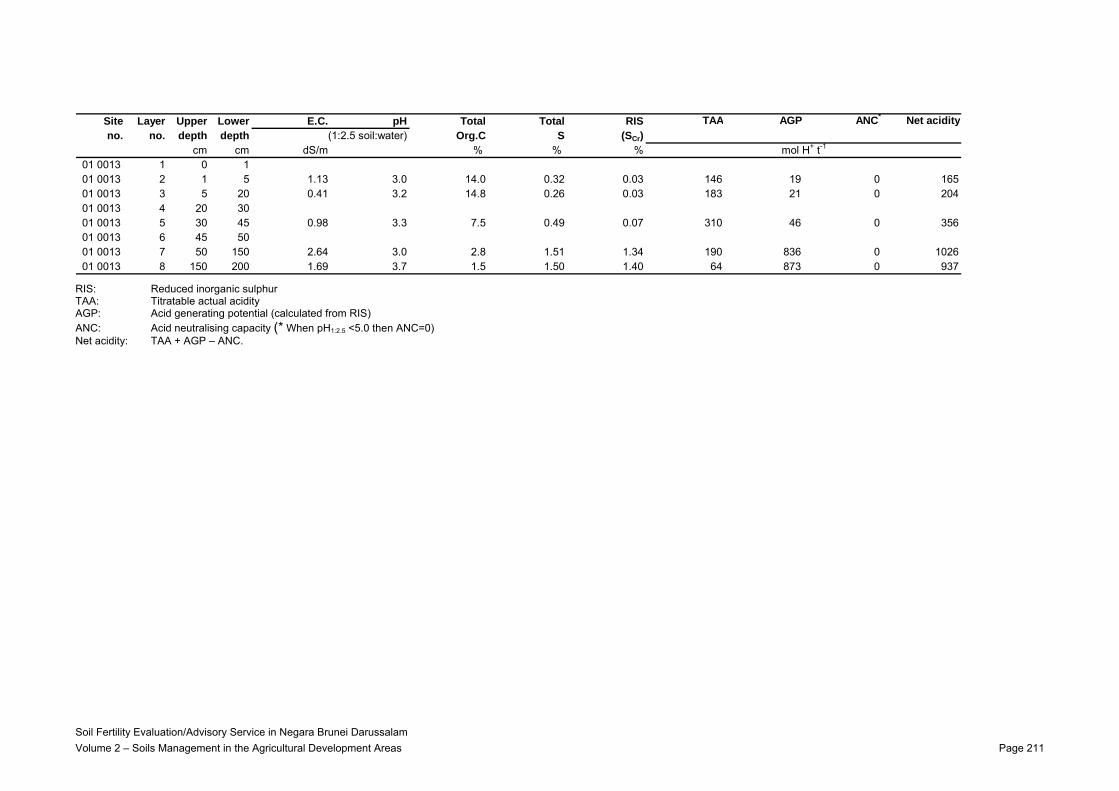
Site Layer Upper Lower E.C. pH Total Total RIS TAA AGP ANC* Net acidityno. no. depth depth (1:2.5 soil:water) Org.C S (SCr)
cm cm dS/m % % %01 0013 1 0 101 0013 2 1 5 1.13 3.0 14.0 0.32 0.03 146 19 0 16501 0013 3 5 20 0.41 3.2 14.8 0.26 0.03 183 21 0 20401 0013 4 20 3001 0013 5 30 45 0.98 3.3 7.5 0.49 0.07 310 46 0 35601 0013 6 45 5001 0013 7 50 150 2.64 3.0 2.8 1.51 1.34 190 836 0 102601 0013 8 150 200 1.69 3.7 1.5 1.50 1.40 64 873 0 937
mol H+ t-1
RIS: Reduced inorganic sulphur TAA: Titratable actual acidity AGP: Acid generating potential (calculated from RIS) ANC: Acid neutralising capacity (* When pH1:2.5 <5.0 then ANC=0) Net acidity: TAA + AGP – ANC.
Soil Fertility Evaluation/Advisory Service in Negara Brunei Darussalam Volume 2 – Soils Management in the Agricultural Development Areas Page 211
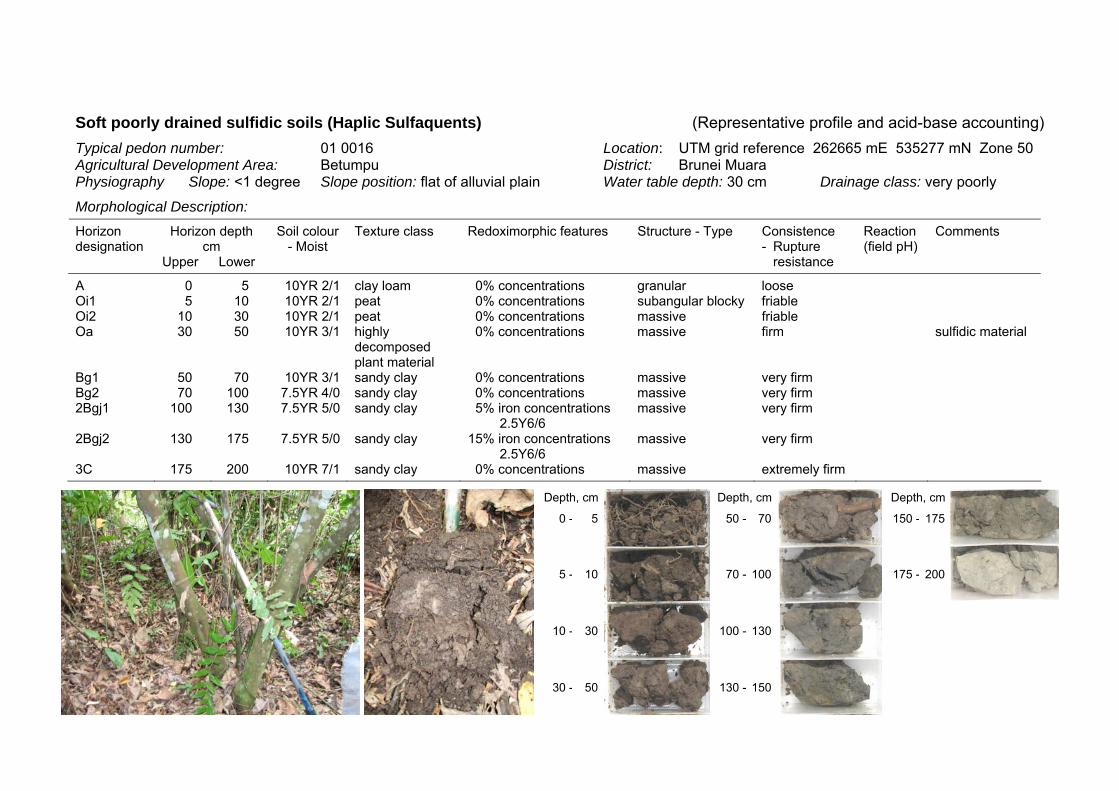
Soft poorly drained sulfidic soils (Haplic Sulfaquents) (Representative profile and acid-base accounting) Typical pedon number: 01 0016 Location: UTM grid reference 262665 mE 535277 mN Zone 50 Agricultural Development Area: Betumpu District: Brunei Muara Physiography Slope: <1 degree Slope position: flat of alluvial plain Water table depth: 30 cm Drainage class: very poorly
Morphological Description: Horizon depth
cm Horizon designation
Upper Lower
Soil colour - Moist
Texture class Redoximorphic features Structure - Type Consistence - Rupture
resistance
Reaction (field pH)
Comments
A 0 5 10YR 2/1 clay loam 0% concentrations granular loose Oi1 5 10 10YR 2/1 peat 0% concentrations subangular blocky friable Oi2 10 30 10YR 2/1 peat 0% concentrations massive friable Oa 30 50 10YR 3/1 highly
decomposed plant material
0% concentrations massive firm sulfidic material
Bg1 50 70 10YR 3/1 sandy clay 0% concentrations massive very firm Bg2 70 100 7.5YR 4/0 sandy clay 0% concentrations massive very firm 2Bgj1 100 130 7.5YR 5/0 sandy clay 5% iron concentrations
2.5Y6/6 massive very firm
2Bgj2 130 175 7.5YR 5/0 sandy clay 15% iron concentrations 2.5Y6/6
massive very firm
3C 175 200 10YR 7/1 sandy clay 0% concentrations massive extremely firm
Depth, cm Depth, cm Depth, cm
0 - 5 50 - 70 150 - 175
5 - 10 70 - 100 175 - 200
10 - 30 100 - 130
30 - 50 130 - 150
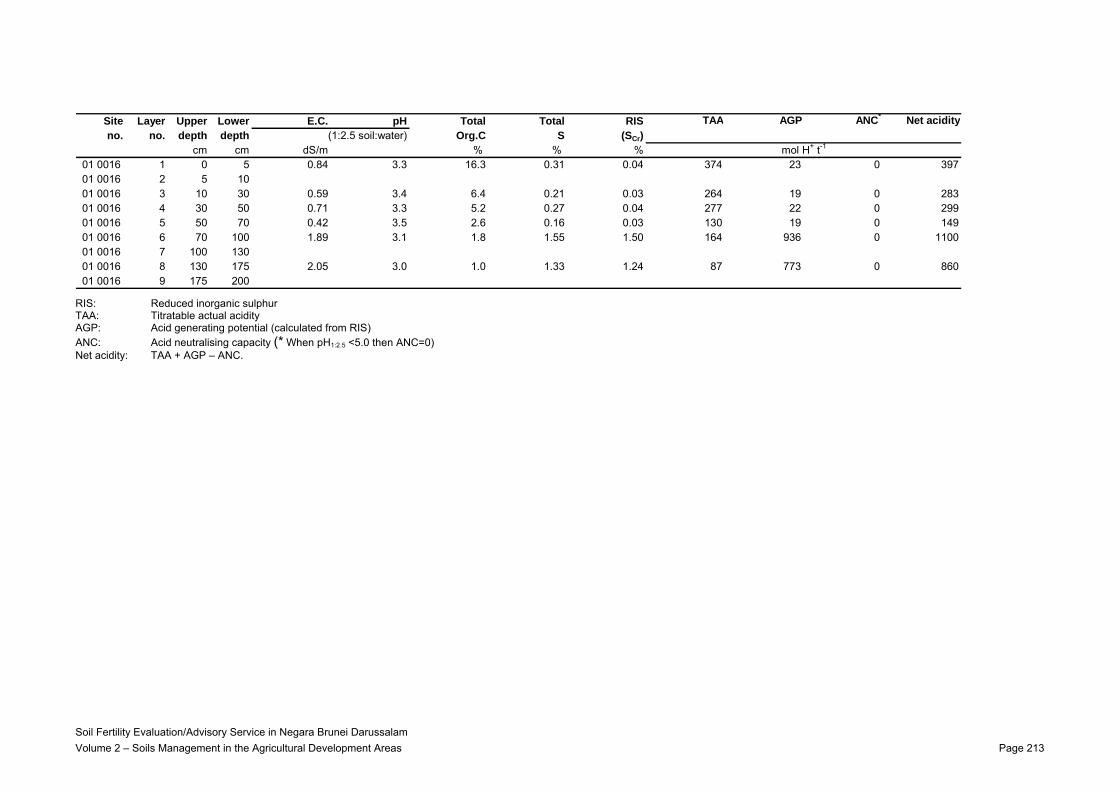
Site Layer Upper Lower E.C. pH Total Total RIS TAA AGP ANC* Net acidityno. no. depth depth (1:2.5 soil:water) Org.C S (SCr)
cm cm dS/m % % %01 0016 1 0 5 0.84 3.3 16.3 0.31 0.04 374 23 0 39701 0016 2 5 1001 0016 3 10 30 0.59 3.4 6.4 0.21 0.03 264 19 0 28301 0016 4 30 50 0.71 3.3 5.2 0.27 0.04 277 22 0 29901 0016 5 50 70 0.42 3.5 2.6 0.16 0.03 130 19 0 14901 0016 6 70 100 1.89 3.1 1.8 1.55 1.50 164 936 0 110001 0016 7 100 13001 0016 8 130 175 2.05 3.0 1.0 1.33 1.24 87 773 0 86001 0016 9 175 200
mol H+ t-1
RIS: Reduced inorganic sulphur TAA: Titratable actual acidity AGP: Acid generating potential (calculated from RIS) ANC: Acid neutralising capacity (* When pH1:2.5 <5.0 then ANC=0) Net acidity: TAA + AGP – ANC.
Soil Fertility Evaluation/Advisory Service in Negara Brunei Darussalam Volume 2 – Soils Management in the Agricultural Development Areas Page 213
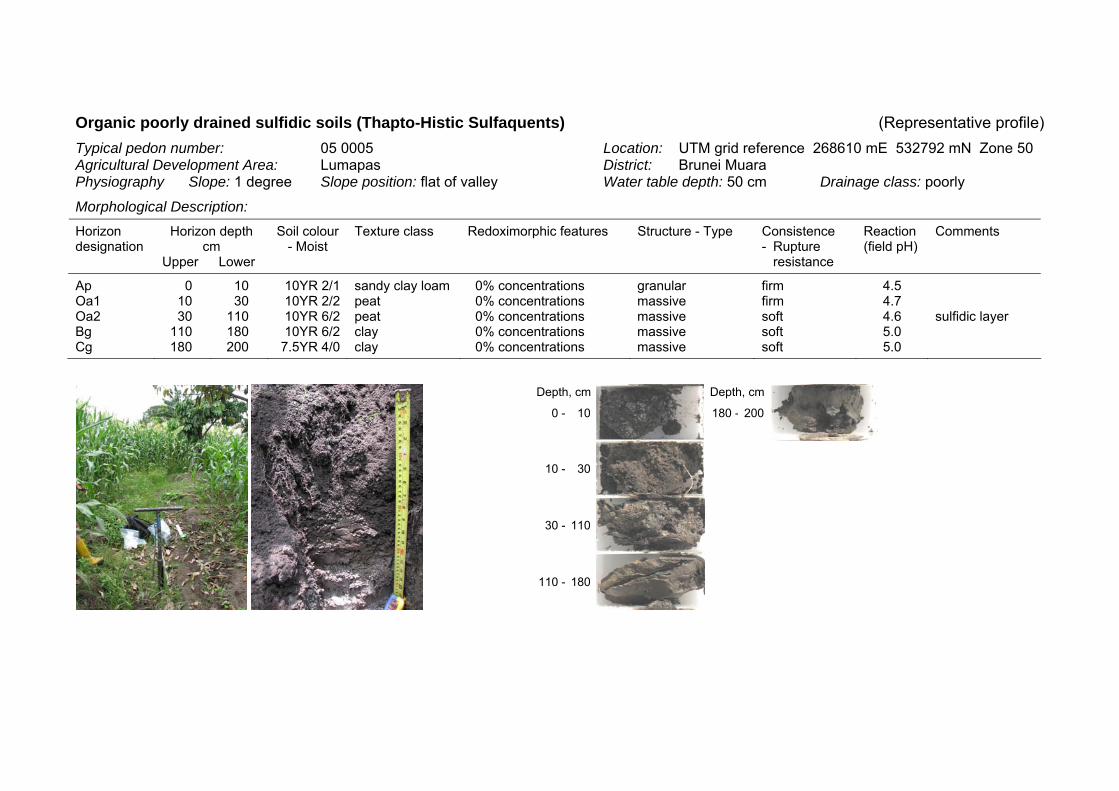
Organic poorly drained sulfidic soils (Thapto-Histic Sulfaquents) (Representative profile) Typical pedon number: 05 0005 Location: UTM grid reference 268610 mE 532792 mN Zone 50 Agricultural Development Area: Lumapas District: Brunei Muara Physiography Slope: 1 degree Slope position: flat of valley Water table depth: 50 cm Drainage class: poorly
Morphological Description: Horizon depth
cm Horizon designation
Upper Lower
Soil colour - Moist
Texture class Redoximorphic features Structure - Type Consistence - Rupture
resistance
Reaction (field pH)
Comments
Ap 0 10 10YR 2/1 sandy clay loam 0% concentrations granular firm 4.5 Oa1 10 30 10YR 2/2 peat 0% concentrations massive firm 4.7 Oa2 30 110 10YR 6/2 peat 0% concentrations massive soft 4.6 sulfidic layer Bg 110 180 10YR 6/2 clay 0% concentrations massive soft 5.0 Cg 180 200 7.5YR 4/0 clay 0% concentrations massive soft 5.0
Depth, cm Depth, cm
0 - 10 180 - 200
10 - 30
30 - 110
110 - 180
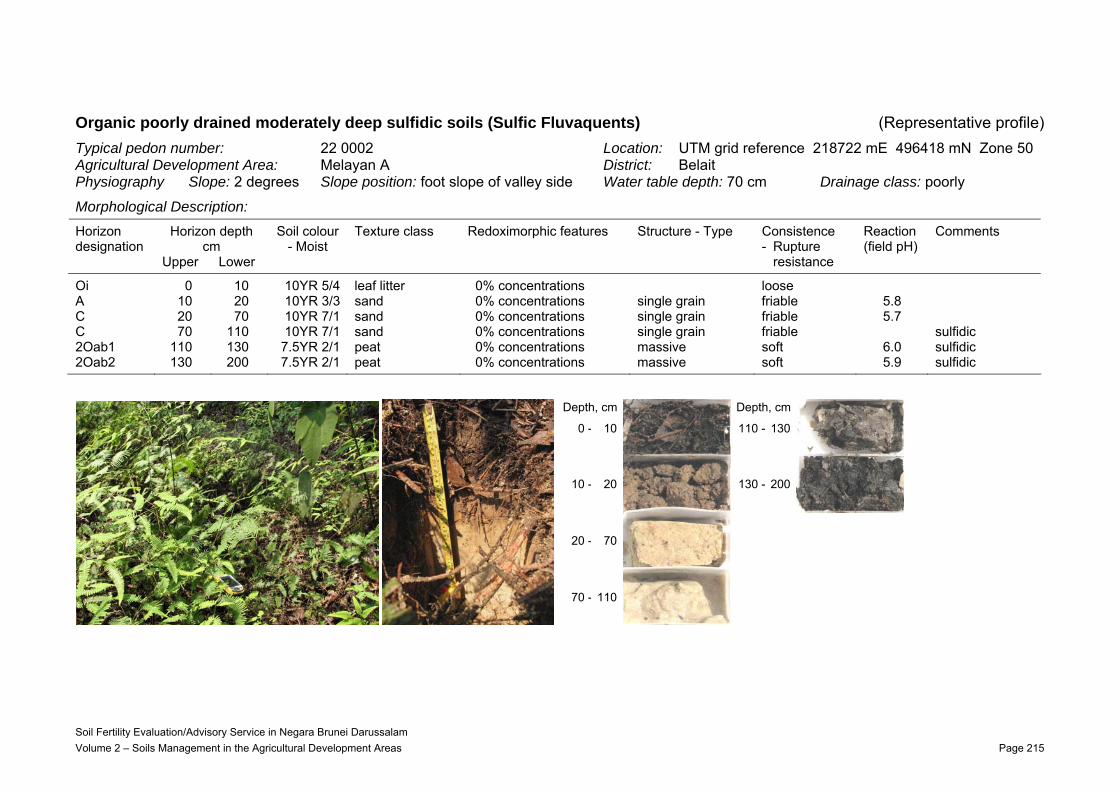
Soil Fertility Evaluation/Advisory Service in Negara Brunei Darussalam Volume 2 – Soils Management in the Agricultural Development Areas Page 215
Organic poorly drained moderately deep sulfidic soils (Sulfic Fluvaquents) (Representative profile)
Horizon depth cm
Horizon designation
Upper Lower
Soil colour - Moist
Texture class Redoximorphic features Structure - Type Consistence - Rupture
resistance
Reaction (field pH)
Comments
Oi 0 10 10YR 5/4 leaf litter 0% concentrations loose A 10 20 10YR 3/3 sand 0% concentrations single grain friable 5.8 C 20 70 10YR 7/1 sand 0% concentrations single grain friable 5.7 C 70 110 10YR 7/1 sand 0% concentrations single grain friable sulfidic 2Oab1 110 130 7.5YR 2/1 peat 0% concentrations massive soft 6.0 sulfidic 2Oab2 130 200 7.5YR 2/1 peat 0% concentrations massive soft 5.9 sulfidic
Typical pedon number: 22 0002 Location: UTM grid reference 218722 mE 496418 mN Zone 50 Agricultural Development Area: Melayan A District: Belait Physiography Slope: 2 degrees Slope position: foot slope of valley side Water table depth: 70 cm Drainage class: poorly
Depth, cm Depth, cm
0 - 10 110 - 130
10 - 20 130 - 200
20 - 70
70 - 110
Morphological Description:
References Ahern CR, Ahern MR, Powell B (1998). ‘Guidelines for Sampling and Analysis of Lowland Acid Sulfate Soils (ASS) in Queensland 1998.’ QASSIT, Department of Natural Resources, Resource Sciences Centre, Indooroopilly, Queensland, Australia. http://www.nrw.qld.gov.au/land/ass/pdfs/sample_analysis_guide.pdf.
Ahern CR, McElnea AE, Sullivan LA (2004). Acid sulfate soils laboratory methods guidelines. In ‘Queensland Acid Sulfate Soils Manual 2004’. Department of Natural Resources, Mines and Energy, Indooroopilly, Queensland, Australia. http://www.nrw.qld.gov.au/land/ass/pdfs/lmg.pdf.
Ainsworth N, Lovatt J (1991) ‘Growing Zucchini, Button Squash and Cucumbers in Queensland.’ RQB91002, Queensland Department of Primary Industries, Brisbane, Australia.
Aitken RL, Moody PW, McKinley PG (1990) Lime requirement of acidic Queensland soils. 1. Relationship between soil properties and pH buffer capacity. Australian Journal of Soil Research 28, 695-701.
Ambak K, Melling L (2000) Management practices for sustainable cultivation of crop plants on tropical peatland. In ‘Proceedings of the International Symposium on Tropical Peatlands, Bogor, Indonesia, 22–23 November 1999.’ pp. 119–134. Hokkaido University and Indonesian Institute of Sciences.
Amour J (1996) Queensland Department of Primary Industries, personnel communication.
Andriesse JP (1988) Agricultural potential. In ‘Nature and Management of Tropical Peat Soils’. FAO Soils Bulletin 59. FAO, Rome.
Anon. (1971) ‘Soybeans’. Queensland Department of Primary Industries Digest, August. Queensland Department of Primary Industries, Brisbane, Australia.
Anon. (1989) ‘Pawpaw Growing in the North Queensland Home Garden’. Queensland Department of Primary Industries Horticulture Branch AGDEX 238/12, Queensland Department of Primary Industries, Brisbane, Australia.
Anon. (1996-2006) World Fertilizer Manual. International Fertilizer Industry Association (IFA). http://www.fertilizer.org/ifa/publicat/html/pubman.
Anon. (1996a) ‘Carambola Fruit Facts’. California Rare Fruits Growers Inc. http://www.crfg.org/pubs/ff/carambola.html.
Anon. (1996b) ‘Jackfruit Fruit Facts’. California Rare Fruit Growers, Inc. http://www.crfg.org/pubs/ff/jackfruit.html.
Anon. (1996c) ‘Pineapple Fruit Facts’. California Rare Fruit Growers Inc. http://www.crfg.org/pubs/ff/pineapple.html.
Anon. (1999) ‘Durian Quality Management Manual. AAECP – Phase III: Quality Assurance Systems for ASEAN Fruits Project (QASAF) – Fresh and Minimally Processed’. Brunei Press Sdn Bhd, Bandar Seri Begawan.
Anon. (2001) ‘Banana Production in Brunei Darussalam’. Crop Information Sheet for Extension, Oct 2001. Brunei Department of Agriculture, Bandar Seri Begawan.
Anon. (2004) ‘Crop Industry’. Brunei Darussalam Small and Medium Enterprise Net. http://www.brunet.bn/org/bsmehp/invest/agroindu/smecrop.htm
Anon. (2005a) Growing Sweet Corn. Agfact H8.1.39 (fourth edition), New South Wales Department of Agriculture. http://www.agric.nsw.gov.au/reader/veg-grow/h8139.htm.
Anon. (2005b) ‘Bangmod Tangerine Orchards’. King Mongkut’s University of Technology, Thonburi, Thailand. http://www.Kmutt.ac.th/community/orange.html.
Soil Fertility Evaluation/Advisory Service in Negara Brunei Darussalam Volume 2 – Soils Management in the Agricultural Development Areas Page 216
Anon. (2006a). Chinese Broccoli Commercial Production. Queensland Department of Primary Industries and Fisheries. Note. http://www2.dpi.qld.gov.au/horticulture/624.html.
Anon. (2006b) Mustard Greens Commercial Production. Queensland Department of Primary Industries and Fisheries. Note. http://www2.dpi.qld.gov.au/horticulture/624.html.
Anon. (2006c) Choy sum commercial production. Queensland Department of Primary Industries and Fisheries. Note. http://www2.dpi.qld.gov.au/horticulture/624.html.
Anon. (2007a) http://www.nal.usda.gov/fnic/foodcomp/cgi-bin/list_nut_edit.pl.
Anon. (2007b) ‘Soybean Basic’. Punjab National Bank, India. http://www.pnbkrishi.com/soybean.htm.
Anon. (?a) ‘Soybean: Glycine Max’. Sri Lanka Department of Agriculture. http://www.agridept.gov.lk/Techinformations/Glegumes/Sbean.htm#fie.
Ashari S (1991) Citrus reticulata Blanco. In ‘Plant Resources of South-East Asia. No 2. Edible Fruits and Nuts’ (Eds EWM Verheij, RE Coronel) pp. 135-138. Pudoc, Wageningen, The Netherlands.
Avnimelech Y, Ritvo G, Meijer LE, Kochba M (2001) Water content, organic carbon and dry bulk density in flooded sediments. Aquacultural Engineering 25, 25–33.
AVRDC (1990) ‘Vegetable Production Training.’ Asian Vegetable Research and Development Center. Shanhua, Taiwan. Reprinted 1992.
BARC (Brunei Agricultural Research Centre) (2008) ‘Liming of Soil.’ Plant and Soil Analysis Fact Sheet No. 2, Brunei Agricultural Research Centre, Department of Agriculture, Kilanas, Negara Brunei Darussalam.
Batten D (1985) New fruit crops factors for survival. Australian Horticulture 83, 16-32.
Beech TA, Raven MD, Trafford JM, Ringrose-Voase AJ, Forrester ST, Gouzos J, Richards SJ, Smart MK, Walker AJ (2006) ‘Soil Fertility Evaluation/Advisory Service in Negara Brunei Darussalam Report P1-1.1 – Laboratory Analysis of Soil Chemical and Physical Properties.’ Science Report 75/06, CSIRO Land and Water, Australia.
Berger J (1962) ‘Maize Production and the Manuring of Maize’. Conzett & Huber, Zurich, Switzerland.
Berner RA (1984). Sedimentary pyrite formation: an update. Geochimica et Cosmochimica Acta 48, 605-615.
Blackburn G, Baker RM (1958) A Soil Survey of Part of Brunei, British Borneo. Soil and Land Use Series No. 25, Division of Soils, CSIRO, Melbourne.
Bolan NS, Hedley MJ (2003) Role of carbon, nitrogen, and sulfur cycles in soil acidification. In ‘Handbook of Soil Acidity’ (Ed. Z Rengel) pp. 29-56. Marcel Dekker Inc, New York.
Boonyanuphap J, Wattanachaiyingcharoen D, Sakurai K (2004) GIS-based land suitability assessment for Musa (ABB group) plantation. J. Appl. Hort. Sci. 6, 3-10.
Broadley R (2005) ‘Ginger in Queensland: Commercial Production’. Queensland Department of Primary Industries and Fisheries Note 7. Queensland Department of Primary Industries and Fisheries, Brisbane, Australia. http://www2.dpi.qld.gov.au/horticulture/624.html.
Chapman JC (1991) ‘Citrus – Major Element Nutrition’. AGDEX 220/540, F83, Queensland Department of Primary Industries, Brisbane, Australia.
Chin HF (1999) ‘Malaysian Vegetables in Colour: A Complete Guide’ (Ed. EEM Yap) Tropical Press SDN. BHD. Kuala Lumpur, Malaysia.
Chuong H van, Boehme M (2005) Evaluation of physical land suitability for the “Thanh Tra” pomelo crop in Hue, Vietnam. In ‘Conference on International Agricultural Research for Development - Tropentag 2005, Stuttgart-Hohenheim’.
Soil Fertility Evaluation/Advisory Service in Negara Brunei Darussalam Volume 2 – Soils Management in the Agricultural Development Areas Page 217
Citrus Information Kit (1999) (Eds N Vock, L Chapman) Agrilink Series. Queensland Department of Primary Industries, Brisbane, Australia.
Cook BG, Pengelly BC, Brown SD, Donnelly JL, Eagles DA, Franco MA, Hanson J, Mullen BF, Partridge IJ, Peters M, Schultze-Kraft R (2005) ‘Tropical Forages: An Interactive Selection Tool.’ CSIRO, DPI&F (Qld), CIAT and ILRI, Brisbane, Australia. http://www.tropicalforages.info/key.
CRC Handbook of Tropical Fruit Crops (1984) (Ed. FW Martin) CRC Press, Baca Raton, Florida, USA.
Daniells J, Evans D (1998) ‘Better Drainage for Banana Plantations’. Agdex 231/550, Queensland Department of Primary Industries, Brisbane, Australia.
Dear SE, Moore NG, Dobos SK, Watling KM, Ahern CR (2002). Soil management guidelines. In ‘Queensland Acid Sulfate Soil Technical Manual.’ Department of Natural Resources and Mines, Indooroopilly, Queensland, Australia. http://www.nrw.qld.gov.au/land/ass/pdfs/soil_mgmt_guidelines_v3_8.pdf.
dela Cruz Jr FS (1991) Artocarpus odoratissimus Blanco. In ‘Plant Resources of South-East Asia. No 2. Edible Fruits and Nuts’ (Eds EWM Verheij, RE Coronel) pp. 94-96. Pudoc, Wageningen, The Netherlands.
Dent DL, Pons LJ (1995) A world perspective on acid sulfate soils. Geoderma 67, 263-276.
Diczbalis Y (2004) Durian. In ‘The New Crop Industries Handbook’ (Eds S Salvin, M. Bourke, T Byrne) pp. 166-173. Rural Industries Research and Development Corporation, Canberra, Australia.
Diczbalis Y, McMahon G (2004) Minor tropical fruits. In ‘The New Crop Industries Handbook’ (Eds S Salvin, M Bourke, T Byrne) pp. 182-189. Rural Industries Research and Development Corporation, Canberra, Australia.
Dierolf TS, Fairhurst TH, Mutert EW (2001) ‘Soil Fertility Kit: A Tool Kit for Soil Fertility Management in Southeast Asia’. Handbook series. Potash and Phosphate Institute, Singapore.
Douglas JS (1984) ‘Advanced Guide to Hydroponics.’ Pelham Books/Stephen Green Press.
Duke JA (1983a) Panicum maximum. Guinea grass – often a serious weed issue in many countries In ‘Handbook of Energy Crops.’ (unpublished) Referenced in ‘Panicum maximum Jacq.’ Purdue Universty, Indiana, USA. http://www.hort.purdue.edu/newcrop/duke_energy/Panicum_maximum.html.
Fagi AM, Mackie C (1988) Watershed management in Java's uplands: past experience and future directions. In ‘Conservation farming on steep lands. Papers originally presented at a workshop held in San Juan, Puerto Rico, March 22-27, 1987’ (Eds WC Moldenhauer, NW Hudson) pp. 254-264. Soil and Water Conservation Society, Ankeny, Iowa, USA.
Fanning DS, Rabenhorst MC, Burch SN, Islam KR, Tangren SA (2002) Sulfides and sulfates. In ‘Soil mineralogy with environmental applications’ (Eds JB Dixon, DG Schulze) pp. 229-260. Soil Science Society of America, Madison, USA.
FAO (1976) ‘A Framework for Land Evaluation.’ Soils Bulletin 32, FAO, Rome.
Fisher J, Diggle A, Bowden B (2003) Quantifying the acid balance for broad-acre agricultural systems. In ‘Handbook of Soil Acidity’ (Ed. Z Rengel) pp. 117-133. Marcel Dekker, New York, USA.
Fitzpatrick RW, Powell B, Marvanek S (2006) Australian Coastal Acid Sulfate Soils - a National Atlas. In ‘Proceeding of the 18th World Congress of Soil Science, July 9-15 2006, Philadelphia, Pennsylvania, USA.’ International Union of Soil Sciences. http://crops.confex.com/crops/wc2006/techprogram/P18511.htm.
Foale MA (1984) Coconut palm. In ‘Tropical Tree Fruits for Australia’ (Ed. PE Page) pp. 136-140. Queensland Department of Primary Industries, Brisbane, Australia.
Soil Fertility Evaluation/Advisory Service in Negara Brunei Darussalam Volume 2 – Soils Management in the Agricultural Development Areas Page 218
Fullelove G, Meurant N (1998) ‘Growing Tomatoes in Queensland.’ Information series QI98005, Queensland Department of Primary Industries, Brisbane, Australia.
Galan Sauco V, Menini UG, Tindall HD (1993) ‘Carambola Cultivation’. FAO Plant Production and Protection Paper 108. FAO, Rome.
Grattidge R (1990) ‘Growing Capsicums and Chilies in Queensland.’ RQT9001, Queensland Department of Primary Industries, Brisbane, Australia.
Grattidge R, Wait AJ (1989) ‘Growing the Fresh Fruit Market Pineapple in North Queensland.’ RQT89004, Queensland Department of Primary Industries, Brisbane, Australia.
Grealish GJ, Ringrose-Voase AJ, Fitzpatrick RW (2007) ‘Soil Fertility Evaluation/Advisory Service in Negara Brunei Darussalam Report P1-1.2 – Soil Maps.’ Science Report 75/07, CSIRO Land and Water, Australia.
Griffee P (2000) EcoPort version of Ohler JG ‘Modern Coconut Management; Palm Cultivation and Products.’ http://ecoport.org/ep?SearchType=earticleView&earticleId=127&page=1285.
Horne PM, Stur WW (1999) ‘Developing forage technologies with smallholder farmers. How to select the best varieties to offer farmers in Southeast Asia.’ ACIAR Monograph No 62, Australian Centre for International Agricultural Research, Canberra, Australia.
Howeler RH (2001) Nutrient inputs and losses in cassava-based cropping systems – examples from Vietnam and Thailand. In ‘International Workshop on Nutrient Balances for Sustainable Agricultural Production and Natural Resource Management in Southeast Asia. Bangkok, Thailand, 20-22 February, 2001’ http://ciat-library.ciat.cgiar.org/Articulos_CIAT/10_20HOWELER_20_RS_2012_10_.pdf.
Imray P, Langley A (1999). ‘Schedule B (7a) - Guideline on Health-Based Investigation Levels’. National Environmental Health Forum Monographs Soil Series No. 1, 3rd edition. National Environment Protection Council, Canberra, Australia. http://www.ephc.gov.au/pdf/cs/cs_07a_health_based_inv.pdf.
Imrie B (1997) Mung Bean. In ‘The New Rural Industries – A Handbook for Farmers and Investors’ (Ed. K Hyde). Rural Industries Research and Development Corporation, Canberra. http://www.rirdc.gov.au/pub/handbook/contents.html.
Jansen PCM (1991) Artocarpus integer (thumb.) Merr. In ‘Plant Resources of South-East Asia. No 2. Edible Fruits and Nuts’ (Eds EWM Verheij, RE Coronel) pp. 91-94. Pudoc, Wageningen, The Netherlands.
Jorgensen KR (1984) Pommelo. In ‘Tropical Tree Fruits for Australia’ (Ed. PE Page) pp. 174-178. Queensland Department of Primary Industries, Brisbane, Australia.
Jumat Hj Alim (1994) Marketing. In ‘Durian - Fruit Development, Postharvest Physiology, Handling and Marketing in ASEAN’ (Ed. Sonthat Nanthachai) pp. 113-115. ASEAN Food Handling Bureau, Kuala Lumpur, Malaysia.
Lijzen JPA, Baars AJ, Otte PF, Rikken MGJ, Swartjes FA, Verbruggen EMJ, van Wezel AP (2001). ‘Technical Evaluation of the Intervention Values for Soil/Sediment and Groundwater, Human and Ecotoxicological Risk Assessment and Derivation of Risk Limits for Soil, Aquatic Sediment and Groundwater.’ Report 711701 023. RIVM; National Institute of Public Health and the Environment Bilthoven, Netherlands. http://www.mnp.nl/bibliotheek/rapporten/711701023.pdf.
Lim TK (1997) Loofahs, gourds, melons and snake beans. In ‘New Rural Industries – A Handbook for Farmers and Investors.’ Rural Industrial Research and Development Corporation. Canberra, Australia. http://www.rirdc.gov.au/pub/handbook/loufas.html.
Marshall J (1988) ‘Rambutan’. Fact Sheet No 1, Rare Fruit Council of Australia. Cairns, Queensland, Australia.
Martin FW (1988) ‘Sweet Potato’. Echo Technical Note. Echo, 17391 Durrance Rd., North Ft. Myers FL 33917, USA. http://www.echonet.org/. Soil Fertility Evaluation/Advisory Service in Negara Brunei Darussalam Volume 2 – Soils Management in the Agricultural Development Areas Page 219
McMahon G (2004) ‘Edible Ginger’. Growing Note, Northern Territory Department of Primary Industry, Fisheries and Mines, Australia.
Melling L, Ryusuke H, Mitsuru O (2002) Sustainable agriculture development on tropical peatland. In ‘Proceedings of 17th World Congress of Soil Science, Bangkok, Thailand, 14-20 August 2002,’ pp. 1919. Soil and Fertilizer Society of Thailand, Bangkok, Thailand.
Merry R (1997) ‘Estimation of Simple Lime Requirement Based on pH Buffer Capacity Measurement and Other Soil Factors’. CSIRO Land and Water Report, Australia.
Meurant N, Hojmark-Anderson J, Looughrey T (1999) ‘Growing Eggplants in Queensland.’ Information series QI99027, Queensland Department of Primary Industries, Australia.
Mohamad Idris bin Zainal Abidin (1987) ‘Cultivation of Tropical Fruits’. Hi-Tech Enterpise, Kuala Lumpur, Malaysia.
Mohamad Yussof bin Haji Mohiddin (1982) ‘The Influence of Aluminium on the Growth of Rice.’ PhD Thesis, University of Western Australia.
Moody PW, Cong PT (2008) ‘Soil Constraints and Management Package (SCAMP): Guideline for Sustainable Management of Tropical Upland Soils’. ACIAR Monograph No. 130, Australian Centre for International Agricultural Research, Canberra, Australia.
Moore S and Morgan W (1997a) Chinese Broccoli. In ‘New Rural Industries – A Handbook for Farmers and Investors.’ pp. 163-165. Rural Industrial Research and Development Corporation, Canberra, Australia.
Moore S, Morgan W (1997b) Chinese Flowering Cabbage. In ‘New Rural Industries – A Handbook for Farmers and Investors.’ pp. 178-180. Rural Industrial Research and Development Corp. Canberra, Australia. http://www.rirdc.gov.au/pub/handbook/chinflow.pdf.
Morton J (1987) ‘Fruits of Warm Climates’. Pub. Julia F Morton, Miami, Florida.
Mortvedt JJ, Beaton JD (1995) Heavy metal and radionuclide contaminants in phosphate fertilizers. In ‘Phosphorus in the Global Environment’ (Ed. H Tiessen). SCOPE, John Wiley & Sons Ltd.
Niyomdham C (1991) Citrus maxima (Burm.) Merr. In ‘Plant Resources of South-East Asia. No 2. Edible Fruits and Nuts’ (Eds EWM Verheij, RE Coronel) pp. 128-131. Pudoc, Wageningen, The Netherlands.
Ng SK, Thamboo S (1967) Nutrient removal studies on Malayan fruits: Durian and rambutan. Malaysian Agr. J. 46,164-82.
Nguyen VQ (1997) Long white radish (Daikon). In ‘New Rural Industries – A Handbook for Farmers and Investors.’ pp. 204-211. Rural Industrial Research and Development Corporation, Canberra, Australia.
Noble AD (2001) ‘Assessment of pH Buffer Capacity. Final Technical Report and Recommendation’. National Land and Water Research Audit Theme 5 Project 4c. Acidic Soils and Acidification. http://www.anra.gov.au/topics/soils/pubs/soil_acid/phbc_report.pdf.
O’Hare P (1993) ‘Growing Papaws in South Queensland’. RQN 92005, Queensland Department of Primary Industries, Brisbane, Australia.
O’Hair K (1995) ‘Cassava’. New Crop Fact Sheet. Purdue University, West Lafayette, Indiana, USA. http://www.hort.purdue.edu/newcrop/CropFactSheets/cassava.html.
Owen-Turner J (1994) Growing Citrus in Queensland. In ‘Queensland Department of Primary Industries, Choices Seminar Series No 6. New Opportunities for the Atherton Tableland, North Region’ pp. 2-5. Queensland Department of Primary Industries, Brisbane, Australia.
Papaw Information Kit (2000) (Coordinating Author P Chey-Prove) Queensland Department of Primary Industries, Brisbane, Australia.
Parker GH (1984) ‘Carambola’. Fact Sheet No 7, Rare Fruit Council of Australia, Cairns Queensland, Australia.
Soil Fertility Evaluation/Advisory Service in Negara Brunei Darussalam Volume 2 – Soils Management in the Agricultural Development Areas Page 220
Pons LJ (1973) Outline of the genesis, characteristics, classification and improvement of acid sulphate soils. In ‘Acid Sulphate Soils. Proceedings of the International Symposium on Acid Sulphate Soils 13-20 August 1972, Wageningen, The Netherlands. I. Introductory Papers and Bibliography.’ pp. 3-27. Publication No.18, International Institute for Land Reclamation and Improvement, Wageningen, The Netherlands.
Potash and Phosphate Institute 1995. ‘International Soil Fertility Manual’. Singapore.
Rachman A, Abdurachman A, Sukmana S (1990) The effects of several soil conservation practices on soil erosion, surface runoff and crop yield on a Typic Eutropept Ungaran. In ‘Proceedings of a Meeting on the Results of Upland Farming and Soil Conservation Research. Upland Agriculture Conservation Project-Farming System Research, Agency for Agricultural Research and Development, Bogor, January 11-13, 1990’ pp. 41-62. Fertiliser and Food Technology Centre, Taiwan.
Rayment GE, Higginson FR (1992). ‘Australian Laboratory Handbook of Soil and Water Chemical Methods.’ Inkata Press, Melbourne.
Ringrose-Voase AJ, Kirby JM, Djoyowasito G, Sanidad WB, Serrano C, Lando TM (2000) Changes to the physical properties of soils puddled for rice during drying. Soil and Tillage Research 56, 83-104.
Sampson JA (1991) Averrhoa L. In ‘Plant Resources of South-East Asia. No 2. Edible Fruits and Nuts’ (Eds EWM Verheij, RE Coronel) pp. 96-98. Pudoc, Wageningen, The Netherlands.
Sanchez PA, Palm CA, Buol SW (2003) Fertility capability soil classification: a tool to help assess soil quality in the tropics. Geoderma 114, 157-185.
Santoso D, Sukristiyonubowo (1994) ‘Soil and Crop Management for Sustainable Slope Land Farming in Indonesia’. Food and Fertilizer Technology Center, Taipei. http://www.agnet.org/library/eb/425/.
Sedgley M (1984a) Moraceae. In ‘Tropical Tree Fruits for Australia’ (Ed. PE Page) pp. 100-107. Queensland Department of Primary Industries, Brisbane, Australia.
Sedgley M (1984b) Oxalidaceae. In ‘Tropical Tree Fruits for Australia’ (Ed. PE Page) pp. 125-128. Queensland Department of Primary Industries, Brisbane, Australia.
Serudin Tinggal (1994) Durian Cultivars in ASEAN - Brunei. In ‘Durian - Fruit Development, Postharvest Physiology, Handling and Marketing in ASEAN’ (Ed. Sonthat Nanthachai) pp. 7-13. ASEAN Food Handling Bureau, Kuala Lumpur, Malaysia.
Sherrod LA, Dunn G, Peterson GA, Kolberg RL (2002) Inorganic carbon analysis by modified pressure-calcimeter method. Soil Science Society of America Journal 66, 299-305.
Simpson SL, Apte SC, Batley GE (1998) Effect of short-term resuspension events on trace metal speciation in polluted anoxic sediments. Environmental Science and Technology 32, 620-625.
Skerman PJ, Cameron DG, Riveros F (1988) ‘Tropical forage legumes.’ FAO Plant Production and Protection Series No 2, FAO, Rome.
Skerman PJ and Riveros F (1990) ‘Tropical Grasses’. FAO Plant Production and Protection Series No. 23, FAO, Rome.
So HB, Ringrose-Voase AJ (2000) Management of clay soils for rainfed, lowland, rice-based cropping systems: An overview. Soil and Tillage Research 56, 3-14.
Soil Survey Staff (2003) ‘Keys to Soil Taxonomy’. 9th Edition. United States Department of Agriculture – Natural Resources Conservation Service.
Subhadrabandhu S (2001) ‘Under-utilized Tropical Fruits of Thailand’. FAO RAP publication 2001/26, FAO, Bangkok.
Subhadrabandhu S, Ketsa S (2001) ‘Durian. King of Tropical Fruit’. CABI Publishing, Wallingford, UK.
Soil Fertility Evaluation/Advisory Service in Negara Brunei Darussalam Volume 2 – Soils Management in the Agricultural Development Areas Page 221
Sullivan LA, Bush RT, Fyfe D (2002) Acid sulfate soil drain ooze: distribution, behaviour and implications for acidification and deoxygenation of waterways. In ‘Acid Sulfate Soils in Australia and China’ (Eds C Lin, MD Melville, LA Sullivan) pp. 91-99. Science Press, Beijing, China.
Tie YL, Kueh HS (1979) ‘A Review of Lowland Organic Soils of Sarawak.’ Technical Paper No. 4, Department of Agriculture Research Branch, Sarawak, Malaysia.
Tindall HD (1983) ‘Vegetables in the Tropics.’ Macmillan Education Ltd., Basingstoke, UK.
Tindall HD, Menini UG, Hodder AJ (1994) ‘Rambutan Cultivation’. FAO Plant Production and Protection Paper 121, FAO, Rome.
Tropical Banana Information Kit (1998) .(Coordinating author I. Kernot) QAL9807, Queensland Department of Primary Industries, Brisbane, Australia.
USEPA (1998 revision) 'Test methods for evaluating solid waste, Physical/ChemicalMethods'. Manual SW-846. US Environmental Protection Agency, Washington, DC. http://www.epa.gov/epaoswer/hazwaste/test/sw846.htm.
Van der Kruijs ACBM, Wong MTF, Juo ASR, Wild A (1988) Recovery of 15N-labelled fertilizer in crops, drainage water and soil using monolith lysimeters in south-east Nigeria. Journal of Soil Science 39, 483-493.
Vimala P,Ting CC, Ibrahim B, Ismail L (1992) Tomato cultivation on acid-sulphate soils. Teknol. Sayur-sayuran. Jil 8, 41-45.
von Uexkull HR (1985) Improvement and maintenance of soil fertility in tropical upland farming systems. In ‘Potassium in the Agricultural Systems of the Humid Tropics.’ pp. 233-250. International Potash Institute, Switzerland.
Watson BJ (1983) ‘Durian’. Fact Sheet No 6, Rare Fruit Council of Australia, Cairns, Queensland, Australia.
Watson BJ (1984a) Rambutan and Pulasan. In ‘Tropical Tree Fruits for Australia’ (Ed. PE Page) pp. 198-203. Queensland Department of Primary Industries, Brisbane, Australia.
Watson BJ, Cunningham IC, Walduck GD, Wait AJ, Goebel RL (1988) ‘Rambutan Culture North Queensland’. AGDEX 238/000, Queensland Department of Primary Industries, Australia.
Williams CN (1975a) Banana. In ‘The Agronomy of the Major Tropical Crops’ pp. 21-37. Oxford University Press, Kuala Lumpur, Malaysia.
Williams CN (1975b) Pineapples. In ‘The Agronomy of the Major Tropical Crops’ pp. 38-49. Oxford University Press, Kuala Lumpur, Malaysia.
Williams CN (1975c) Rice. In ‘The Agronomy of the Major Tropical Crops’ pp. 66-83. Oxford University Press, Kuala Lumpur, Malaysia.
Williams CN (1975d) Tapioca. In ‘The Agronomy of the Major Tropical Crops’ pp. 146-156. Oxford University Press, Kuala Lumpur, Malaysia.
Williams CN (1975e) Coconuts. In ‘The Agronomy of the Major Tropical Crops’ pp. 157-166. Oxford University Press, Kuala Lumpur, Malaysia.
Williams CN (1975f) Citrus. In ‘The Agronomy of the Major Tropical Crops’ pp. 185-199. Oxford University Press, Kuala Lumpur, Malaysia.
Williams CN (1978a) Fertilizer responses of cucumber on peat in Brunei. Experimental Agriculture 14, 299-302.
Williams CN (1978b) Effects of drainage, spacing and fertilizer on soyabeans in paddy soils in Brunei. Experimental Agriculture 14, 303-307.
Williams, CN (1980a) Effects of lime, drainage, manganese dioxide and seedling condition on rice in acid sulphur soils in Brunei. Experimental Agriculture 16, 313-320.
Soil Fertility Evaluation/Advisory Service in Negara Brunei Darussalam Volume 2 – Soils Management in the Agricultural Development Areas Page 222
Soil Fertility Evaluation/Advisory Service in Negara Brunei Darussalam Volume 2 – Soils Management in the Agricultural Development Areas Page 223
Williams CN (1980b) Fertilizer response of Napier grass under different soil conditions in Brunei. Experimental Agriculture 16, 415-423.
Wong MTF, Hairiah K, Allegre J (2004) Managing soil acidity and aluminium toxicity in tree-based agroecosystems. In ‘Below-ground Interactions in Tropical Agroecosystems. Concepts and Models with Multiple Plant Components’ (Eds M van Noordwijk, G Cadisch, CK Ong) pp. 143-156. CABI Publishings, Wallingford, UK.
Wong MTF, Swift RS (2003) Role of organic matter in alleviating soil acidity. In ‘Handbook of Soil Acidity’ (Ed. Z Rengel) pp. 337-358. Marcel Dekker, New York, USA.
Wong MTF, van der Kruijs ACBM, Juo ASR (1992) Leaching loss of calcium, magnesium, potassium and nitrate derived from soil, lime and fertilizers as influenced by urea applied to undisturbed lysimeters in south-east Nigeria. Fertilizer Research 31, 281-289.
Wright R, Deuter P, Lovatt J (2005) ‘Growing Sweet Corn – Before You Start.’ Note. Queensland Department of Primary Industries and Fisheries, Brisbane, Australia. http://www2.dpi.qld.gov.au/horticulture/17703.html.
Yamaguchi M (1983) ‘World Vegetables. Principles, Production, Nutritive Values’. AVI Pub, Westport, Connecticut, USA.
Yashmina S, Matzin S, Burton PW, Kuang S (1989) Technical strategies to increase rice yield in the Wasan Rice Project, Brunei Darussalam. Japan Agricultural Research Quarterly 22, 334-336.