social sector moldova: institutional capacity and polcies-2007
TRANSCRIPT
Budget Analysis of Administrative Institutions
and Sector Policies in the Social Area
Resource Center for Human Rights Centrul de Resurse pentru Drepturile Omului (CReDO)
Al. Hajdeu 95 "A", CHISINAU, MD 2005, Moldova (373 22) 212 816, fax (373 22) 225 257 [email protected], www.CReDO.md
CReDO: Budget Analysis of Administrative Institutions and Sector Policies in the Social Area.
use with reference to Resource Center for Human Rights (CReDO), www.CReDO.md i
About CReDO CReDO is a democracy and human rights nongovernmental organization that provides lobby and consultancy in the implementation of the democratic reform oriented policies. It provides knowledge and solutions in the framework of policy evaluation and assessment, policy management and implementation, developing relevant policy capacities needed to govern efficiently and effectively. Specifically CReDO consultants provide:
- Cost-benefit analysis, - Analysis of current policies, - Analysis of public policy processes, - Budgetary analyis, - Institutional Analysis, - Legislative analysis, regulatory impact analysis, - Functional Analysis.
Among CReDO beneficaries are international institutions, Moldovan Government and various beneficiary groups.
CReDO: Budget Analysis of Administrative Institutions and Sector Policies in the Social Area.
use with reference to Resource Center for Human Rights (CReDO), www.CReDO.md ii
Executive Summary The goal of the report is to make a budgetary analysis of policies in the social sector. The Report is developed with the assistance of UNICEF and is addressed to the ministries from the envisaged areas. The results of the analysis will inform the reader about the efficiency in the use of public expenditures by public administrative institutions within the social sector areas and will foster a clear understanding of the priorities of social budgetary policies in relation to the main beneficiary groups. The social sector includes the social, health, and education areas. The budget analysis has 2 aspects: 1) analysis of administrative budgets of central public authorities from this area and 2) analysis of budget policies regarding the main funding mechanisms and main beneficiary groups of social policies. The report is structured in several chapters. The integral structure of budgets in each area is analyzed in the first chapter. The second chapter contains the analysis of administrative budgets of central executive institutions in the envisaged fields. The main budget mechanisms and main priorities of budget expenditures in the envisaged areas are analyzed in the third chapter. The Report contains inter-sector comparisons. The conclusions of the report are grouped in 3 categories: conclusions on the efficiency of administrative budget use, conclusions on the identification of priorities in budget fund appropriation, and conclusions on the effectiveness of budget funds use. The Report recommends making efficient use of budget expenditures for administrative needs by enhancing productivity within subordinated agencies responsible for policy management. Nowadays the outdated technologies used for administration of policies reveal a high cost and artificial maintenance of a great number of public employees in the subordinated institutions. Another recommendation that results from the analysis of administrative budgets is the mandatory use of procedures for public procurements of services and goods. This category accounts for about 30% of all funds spent. The Report contains well-defined findings regarding the budget priorities for different beneficiary groups. The amounts paid with money or services are identified.
CReDO: Budget Analysis of Administrative Institutions and Sector Policies in the Social Area.
use with reference to Resource Center for Human Rights (CReDO), www.CReDO.md iii
Contents:
EXECUTIVE SUMMARY ..................................................................................................... II 1. INTRODUCTION............................................................................................................1 2. BUDGET POLICIES WITHIN THE SOCIAL SECTOR .........................................................2
2.1 Sector Budget Policies ......................................................................................................................................... 2 2.2 Budget of Social Policies ..................................................................................................................................... 3
3. ANALYSIS OF CENTRAL PUBLIC INSTITUTIONS’ BUDGETS...........................................9 3.1 Social Sector ........................................................................................................................................................ 9 3.2 Comparative analysis......................................................................................................................................... 12
4. BUDGET PRIORITIES ....................................................................................................15 4.1 Priorities of the social budget............................................................................................................................ 15
5. CONCLUSIONS AND RECOMMENDATIONS.............................................................26 6. REFERENCES ............................................................................................................27
CReDO: Budget Analysis of Administrative Institutions and Sector Policies in the Social Area.
use with reference to Resource Center for Human Rights (CReDO), www.CReDO.md 1
1. Introduction The budget policies or treasury policies are important in order to understand who and how much receives or benefits from the public funds. The budget analysis is necessary to ensure the transparency and accessibility for citizen to get to know the governance priorities. The Report uses financial data from 2006-2007 and only in some cases uses expenditures planned for 2008. The information basis of the reports is the public and institutional reports, including financial data, in addition to the statistical data collected during the discussions and interviews with accountable persons from the social sector. The Report does not analyze social policies in the aggregate as it would need to include the tax policies in the Report, together with the main beneficiary groups. At the same time, the Report does not analyze the efficiency and impact of budget policies on the beneficiary groups because this needs a separate mission. The analysis of budget policies’ impact claims the availability of statistical data with breakdown on main beneficiary groups before the consumption of budget policy benefits and their effect after their receipt. However, the assessment exercise of social budget policy impact is difficult to separate from the social policies as a whole. Abbreviations: MSPFC – Ministry of Social Protection, Family and Child NSIH – National Social Insurance House RCMVE – Republican Council for Medical Vitality Expertise MoH – Ministry of Health SMC – Sanitary Management Center NHIC – National Health Insurance Company NCHEA – National Council for Health Evaluation and Accreditation SPCPM - Scientific and Practical Center of Preventive Medicine (CPM) MA – Medicine Agency SB – State Budget SIB – Social Insurance Budget MTEF – Middle Term Expenditures Framework NDS – National Development Strategy MEY – Ministry of Education and Youth ...
CReDO: Budget Analysis of Administrative Institutions and Sector Policies in the Social Area.
use with reference to Resource Center for Human Rights (CReDO), www.CReDO.md 2
2. Budget policies within the social sector This Chapter contains the analysis of the macro-structure of social sector budget from a comparative perspective and from retrospective. The following 3 sections will present the analysis of budget structure and priorities from each area.
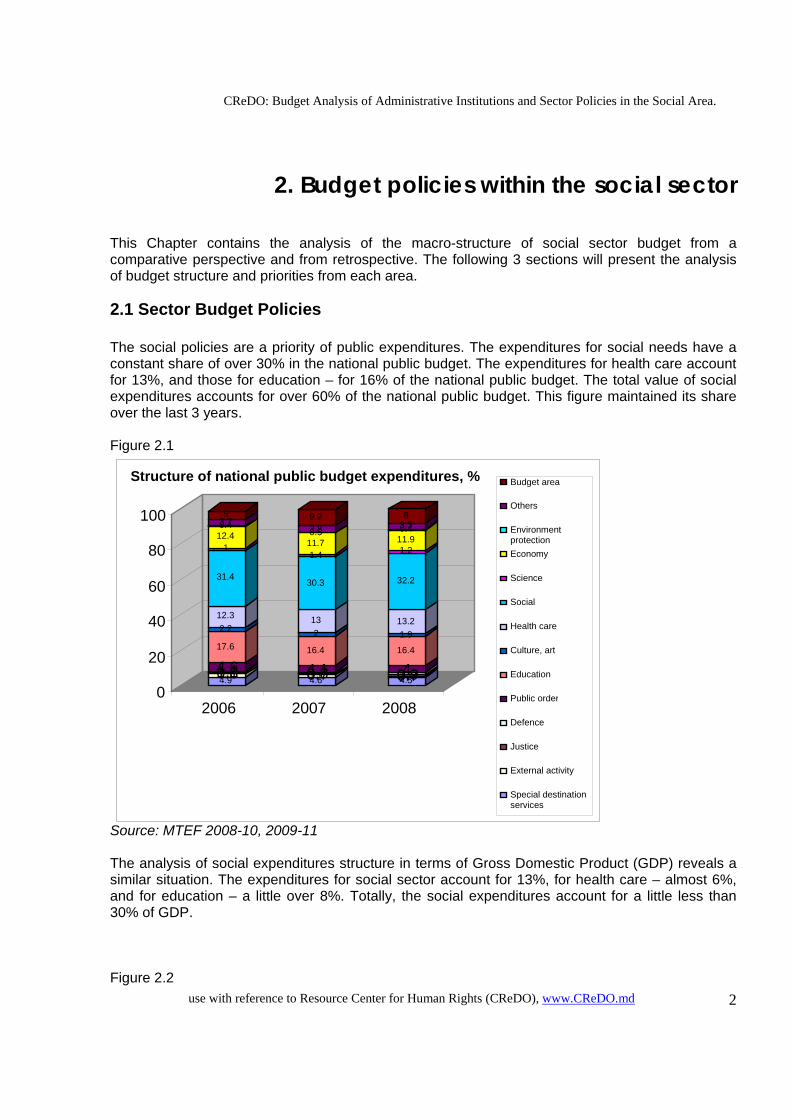
2.1 Sector Budget Policies The social policies are a priority of public expenditures. The expenditures for social needs have a constant share of over 30% in the national public budget. The expenditures for health care account for 13%, and those for education – for 16% of the national public budget. The total value of social expenditures accounts for over 60% of the national public budget. This figure maintained its share over the last 3 years. Figure 2.1
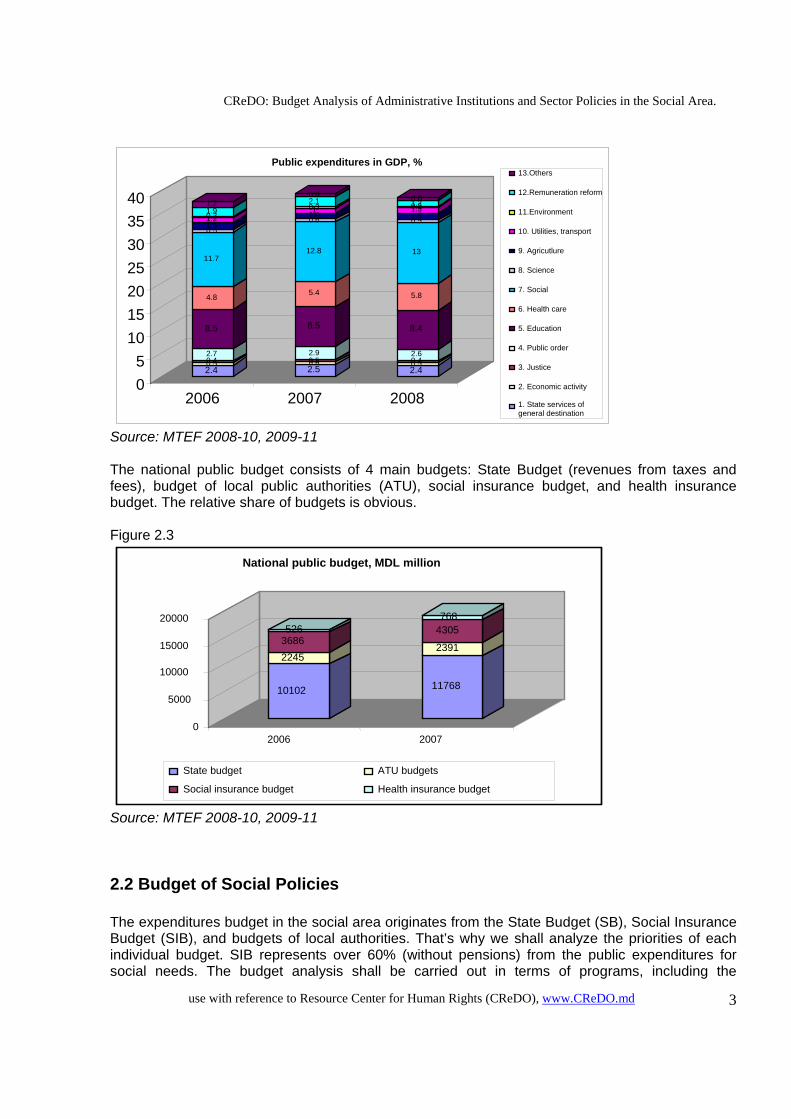
Source: MTEF 2008-10, 2009-11 The analysis of social expenditures structure in terms of Gross Domestic Product (GDP) reveals a similar situation. The expenditures for social sector account for 13%, for health care – almost 6%, and for education – a little over 8%. Totally, the social expenditures account for a little less than 30% of GDP. Figure 2.2
4.91.50.81.14.617.6
2.212.3
31.4
1 12.40.43.75
4.61.10.70.84.116.4
213
30.3
1.411.70.53.89.2
4.51.10.70.9416.4
1.913.2
32.2
1.211.90.43.38
0
20
40
60
80
100
2006 2007 2008
Structure of national public budget expenditures, % Budget area
Others
Environmentprotection Economy
Science
Social
Health care
Culture, art
Education
Public order
Defence
Justice
External activity Special destination services
CReDO: Budget Analysis of Administrative Institutions and Sector Policies in the Social Area.
use with reference to Resource Center for Human Rights (CReDO), www.CReDO.md 3
Source: MTEF 2008-10, 2009-11 The national public budget consists of 4 main budgets: State Budget (revenues from taxes and fees), budget of local public authorities (ATU), social insurance budget, and health insurance budget. The relative share of budgets is obvious. Figure 2.3
Source: MTEF 2008-10, 2009-11
2.2 Budget of Social Policies The expenditures budget in the social area originates from the State Budget (SB), Social Insurance Budget (SIB), and budgets of local authorities. That’s why we shall analyze the priorities of each individual budget. SIB represents over 60% (without pensions) from the public expenditures for social needs. The budget analysis shall be carried out in terms of programs, including the
10102
2245 3686 526
11768
2391
4305768
0
5000
10000
15000
20000
2006 2007
National public budget, MDL million
State budget ATU budgets
Social insurance budget Health insurance budget
2.40.50.42.7
8.5
4.8
11.7
0.51.51.20.21.91.2
2.50.60.52.9
8.5
5.4
12.8
0.61.410.32.10.6
2.40.50.42.6
8.4
5.8
13
0.51.51.30.21.20.6
0 5
10 15 20 25 30 35 40
2006 2007 2008
Public expenditures in GDP, %13.Others
12.Remuneration reform 11.Environment
10. Utilities, transport 9. Agricutlure
8. Science
7. Social
6. Health care
5. Education
4. Public order 3. Justice
2. Economic activity 1. State services of general destination
CReDO: Budget Analysis of Administrative Institutions and Sector Policies in the Social Area.
use with reference to Resource Center for Human Rights (CReDO), www.CReDO.md 4
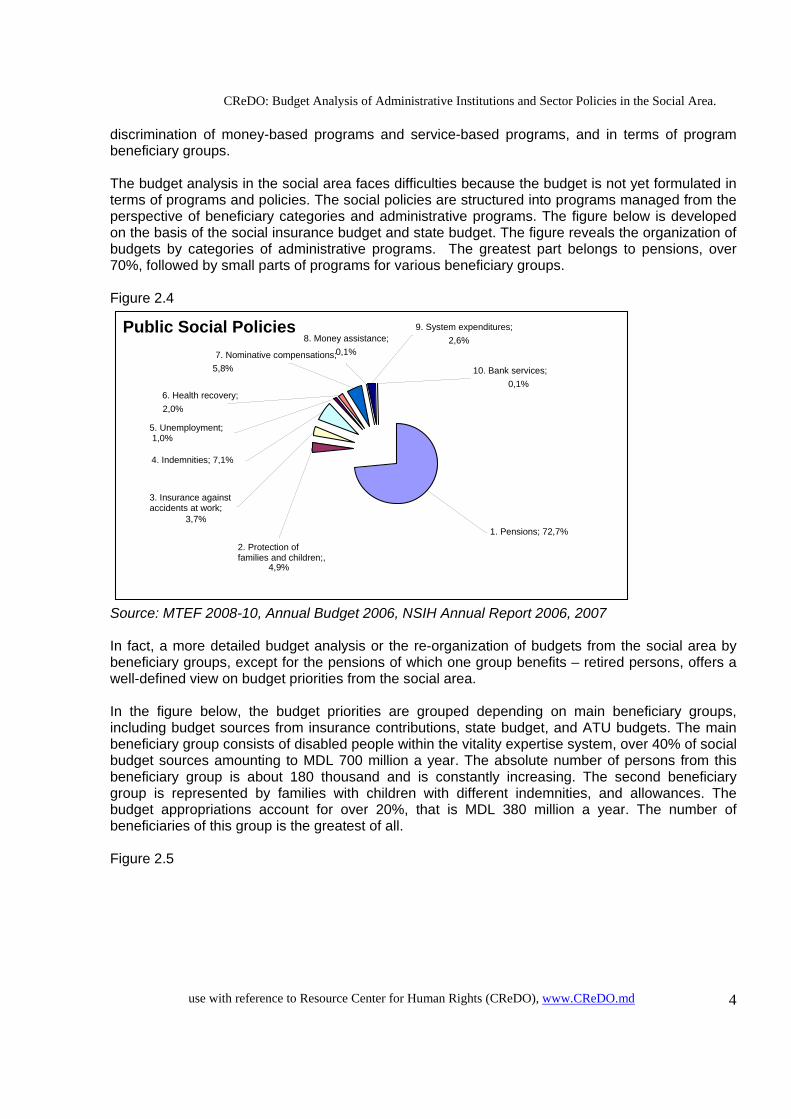
discrimination of money-based programs and service-based programs, and in terms of program beneficiary groups. The budget analysis in the social area faces difficulties because the budget is not yet formulated in terms of programs and policies. The social policies are structured into programs managed from the perspective of beneficiary categories and administrative programs. The figure below is developed on the basis of the social insurance budget and state budget. The figure reveals the organization of budgets by categories of administrative programs. The greatest part belongs to pensions, over 70%, followed by small parts of programs for various beneficiary groups. Figure 2.4
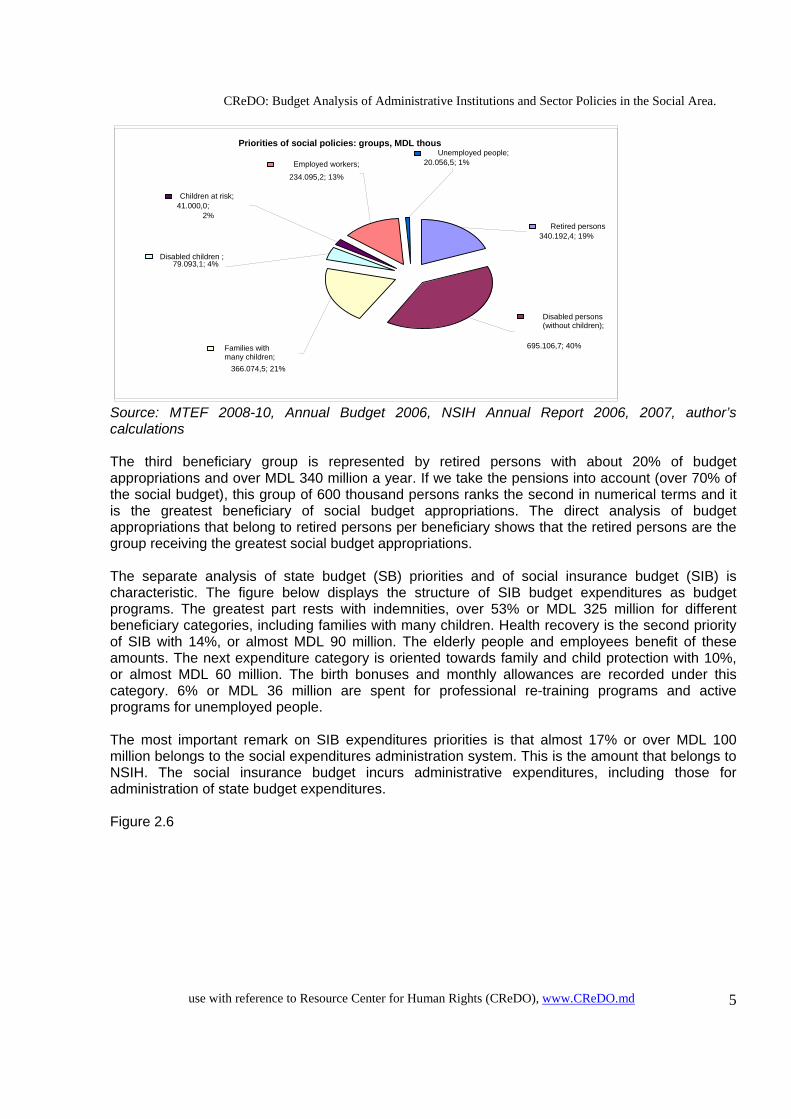
Source: MTEF 2008-10, Annual Budget 2006, NSIH Annual Report 2006, 2007 In fact, a more detailed budget analysis or the re-organization of budgets from the social area by beneficiary groups, except for the pensions of which one group benefits – retired persons, offers a well-defined view on budget priorities from the social area. In the figure below, the budget priorities are grouped depending on main beneficiary groups, including budget sources from insurance contributions, state budget, and ATU budgets. The main beneficiary group consists of disabled people within the vitality expertise system, over 40% of social budget sources amounting to MDL 700 million a year. The absolute number of persons from this beneficiary group is about 180 thousand and is constantly increasing. The second beneficiary group is represented by families with children with different indemnities, and allowances. The budget appropriations account for over 20%, that is MDL 380 million a year. The number of beneficiaries of this group is the greatest of all. Figure 2.5
Public Social Policies
2. Protection of families and children;,
4,9%
3. Insurance against accidents at work;
3,7%
10. Bank services; 0,1%
9. System expenditures; 2,6%8. Money assistance;
0,1%7. Nominative compensations; 5,8%
4. Indemnities; 7,1%
6. Health recovery; 2,0%
1. Pensions; 72,7%
5. Unemployment; 1,0%
CReDO: Budget Analysis of Administrative Institutions and Sector Policies in the Social Area.
use with reference to Resource Center for Human Rights (CReDO), www.CReDO.md 5
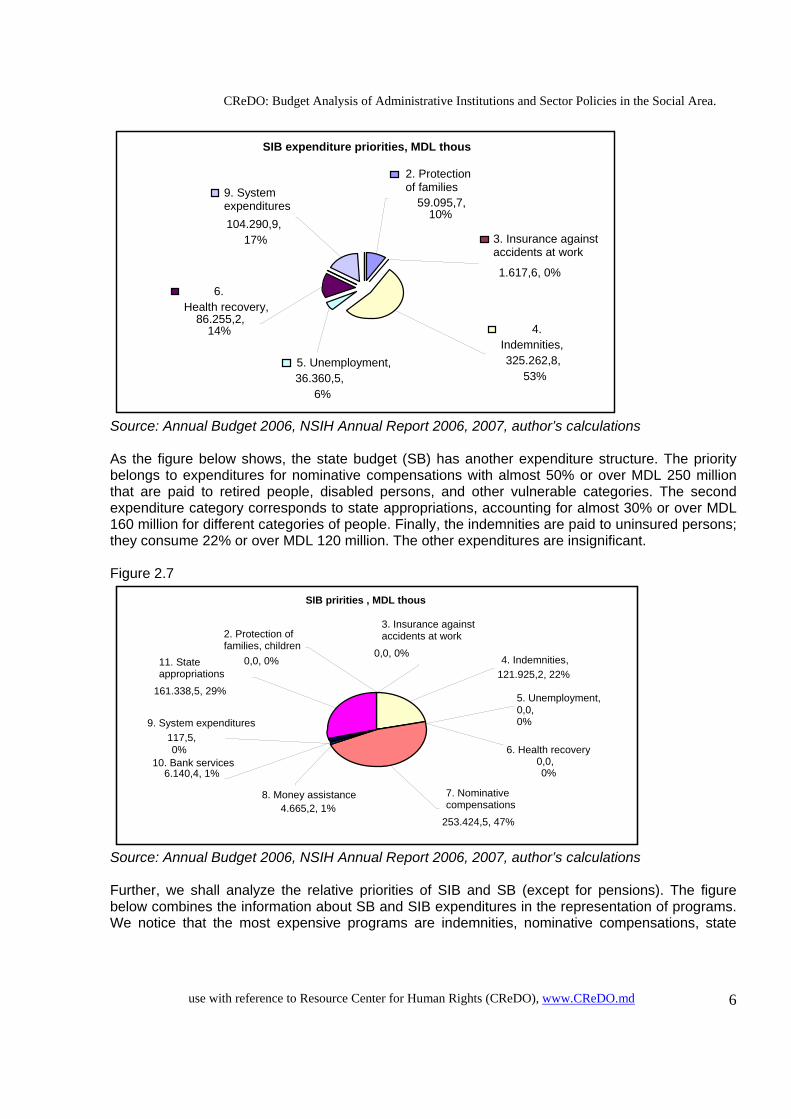
Source: MTEF 2008-10, Annual Budget 2006, NSIH Annual Report 2006, 2007, author’s calculations The third beneficiary group is represented by retired persons with about 20% of budget appropriations and over MDL 340 million a year. If we take the pensions into account (over 70% of the social budget), this group of 600 thousand persons ranks the second in numerical terms and it is the greatest beneficiary of social budget appropriations. The direct analysis of budget appropriations that belong to retired persons per beneficiary shows that the retired persons are the group receiving the greatest social budget appropriations. The separate analysis of state budget (SB) priorities and of social insurance budget (SIB) is characteristic. The figure below displays the structure of SIB budget expenditures as budget programs. The greatest part rests with indemnities, over 53% or MDL 325 million for different beneficiary categories, including families with many children. Health recovery is the second priority of SIB with 14%, or almost MDL 90 million. The elderly people and employees benefit of these amounts. The next expenditure category is oriented towards family and child protection with 10%, or almost MDL 60 million. The birth bonuses and monthly allowances are recorded under this category. 6% or MDL 36 million are spent for professional re-training programs and active programs for unemployed people. The most important remark on SIB expenditures priorities is that almost 17% or over MDL 100 million belongs to the social expenditures administration system. This is the amount that belongs to NSIH. The social insurance budget incurs administrative expenditures, including those for administration of state budget expenditures. Figure 2.6
Priorities of social policies: groups, MDL thous
Retired persons340.192,4; 19%
Disabled persons (without children);
695.106,7; 40%Families with many children;
366.074,5; 21%
Disabled children ;79.093,1; 4%
Children at risk; 41.000,0;
2%
Unemployed people; 20.056,5; 1%Employed workers;
234.095,2; 13%
CReDO: Budget Analysis of Administrative Institutions and Sector Policies in the Social Area.
use with reference to Resource Center for Human Rights (CReDO), www.CReDO.md 6
Source: Annual Budget 2006, NSIH Annual Report 2006, 2007, author’s calculations As the figure below shows, the state budget (SB) has another expenditure structure. The priority belongs to expenditures for nominative compensations with almost 50% or over MDL 250 million that are paid to retired people, disabled persons, and other vulnerable categories. The second expenditure category corresponds to state appropriations, accounting for almost 30% or over MDL 160 million for different categories of people. Finally, the indemnities are paid to uninsured persons; they consume 22% or over MDL 120 million. The other expenditures are insignificant. Figure 2.7
Source: Annual Budget 2006, NSIH Annual Report 2006, 2007, author’s calculations Further, we shall analyze the relative priorities of SIB and SB (except for pensions). The figure below combines the information about SB and SIB expenditures in the representation of programs. We notice that the most expensive programs are indemnities, nominative compensations, state
SIB pririties , MDL thous
8. Money assistance 4.665,2, 1%
5. Unemployment, 0,0, 0%
2. Protection of families, children
0,0, 0% 4. Indemnities, 121.925,2, 22%
9. System expenditures 117,5,
0% 10. Bank services
6.140,4, 1%
11. State appropriations
161.338,5, 29%
3. Insurance against accidents at work
0,0, 0%
6. Health recovery 0,0, 0%
7. Nominative compensations
253.424,5, 47%
SIB expenditure priorities, MDL thous
2. Protection of families
59.095,7, 10%
9. System expenditures 104.290,9,
17%
6. Health recovery,
86.255,2, 14%
5. Unemployment,36.360,5,
6%
3. Insurance against accidents at work 1.617,6, 0%
4. Indemnities, 325.262,8,
53%
CReDO: Budget Analysis of Administrative Institutions and Sector Policies in the Social Area.
use with reference to Resource Center for Human Rights (CReDO), www.CReDO.md 7
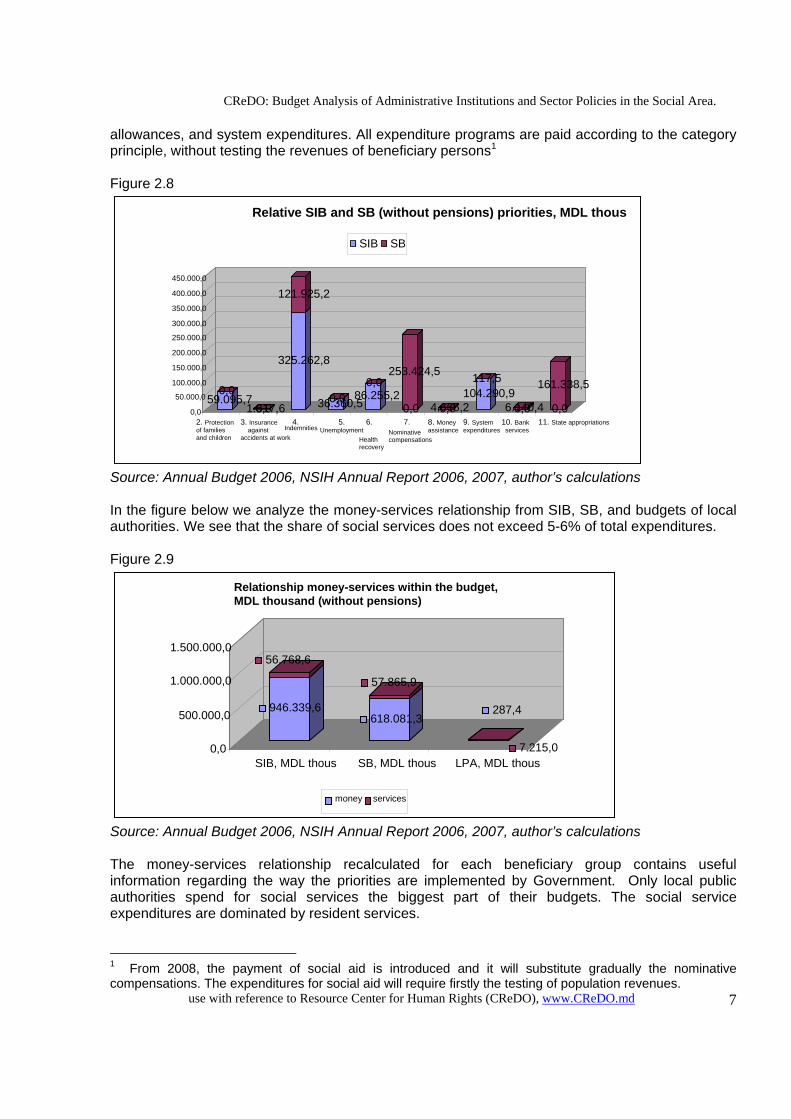
allowances, and system expenditures. All expenditure programs are paid according to the category principle, without testing the revenues of beneficiary persons1 Figure 2.8
Source: Annual Budget 2006, NSIH Annual Report 2006, 2007, author’s calculations In the figure below we analyze the money-services relationship from SIB, SB, and budgets of local authorities. We see that the share of social services does not exceed 5-6% of total expenditures. Figure 2.9
Source: Annual Budget 2006, NSIH Annual Report 2006, 2007, author’s calculations The money-services relationship recalculated for each beneficiary group contains useful information regarding the way the priorities are implemented by Government. Only local public authorities spend for social services the biggest part of their budgets. The social service expenditures are dominated by resident services. 1 From 2008, the payment of social aid is introduced and it will substitute gradually the nominative compensations. The expenditures for social aid will require firstly the testing of population revenues.
946.339,6
56.768,6
618.081,3
57.865,9
287,4
7.215,00,0
500.000,0
1.000.000,0
1.500.000,0
SIB, MDL thous SB, MDL thous LPA, MDL thous
Relationship money-services within the budget, MDL thousand (without pensions)
money services
59.095,7 0,01.617,6 0,0
325.262,8
121.925,2
36.360,50,0 86.255,20,0
0,0
253.424,5
0,04.665,2104.290,9
117,5
0,06.140,4 0,0 161.338,5
0,0
50.000,0 100.000,0
150.000,0
200.000,0
250.000,0
300.000,0
350.000,0
400.000,0
450.000,0
2. Protection of families and children
3. Insurance against accidents at work
4.Indemnities
5. Unemployment
6.
Health recovery
7.Nominative compensations
8. Money assistance
9. System expenditures
10. Bank services
11. State appropriations
Relative SIB and SB (without pensions) priorities, MDL thous
SIB SB
CReDO: Budget Analysis of Administrative Institutions and Sector Policies in the Social Area.
use with reference to Resource Center for Human Rights (CReDO), www.CReDO.md 8
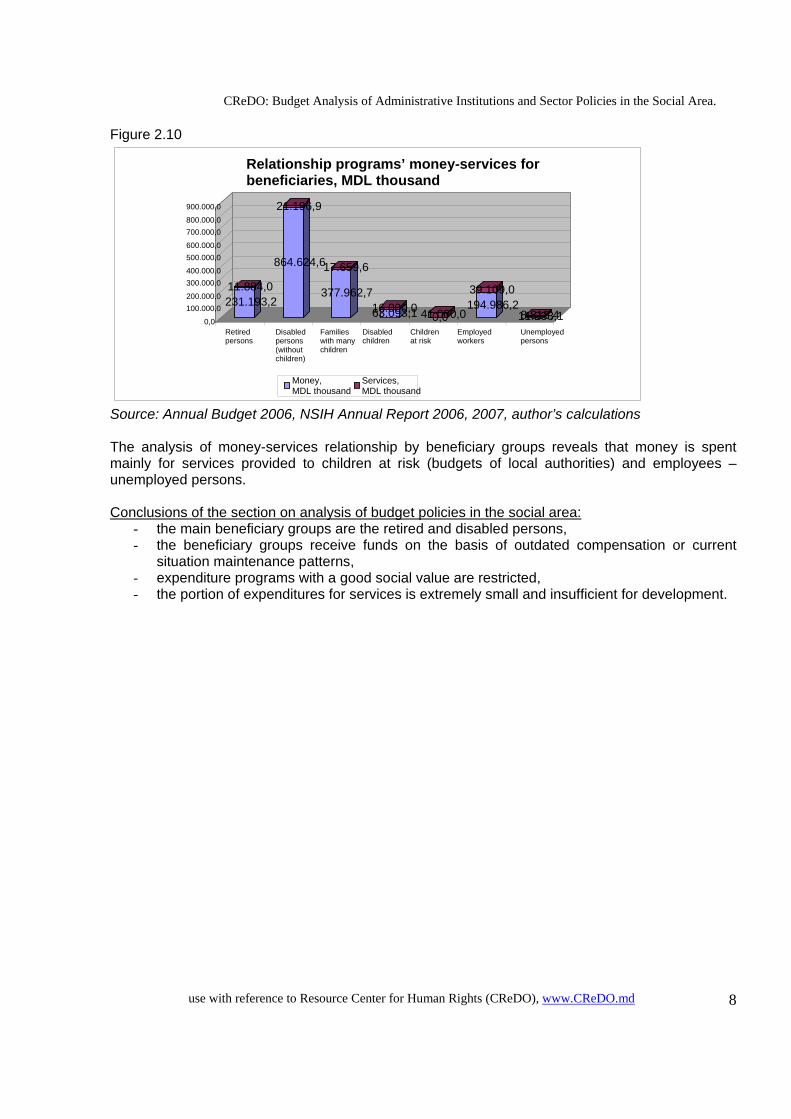
Figure 2.10
Source: Annual Budget 2006, NSIH Annual Report 2006, 2007, author’s calculations The analysis of money-services relationship by beneficiary groups reveals that money is spent mainly for services provided to children at risk (budgets of local authorities) and employees – unemployed persons. Conclusions of the section on analysis of budget policies in the social area:
- the main beneficiary groups are the retired and disabled persons, - the beneficiary groups receive funds on the basis of outdated compensation or current
situation maintenance patterns, - expenditure programs with a good social value are restricted, - the portion of expenditures for services is extremely small and insufficient for development.
231.193,2 11.884,0
864.624,6
21.196,9
377.962,7
17.659,6
63.093,116.000,00,041.000,0
194.986,239.109,0
11.238,1 8.818,40,0
100.000,0200.000,0
300.000,0400.000,0
500.000,0600.000,0
700.000,0800.000,0
900.000,0
Retired persons
Disabled persons (without children)
Families with many children
Disabled children
Children at risk Employed
workers Unemployed persons
Relationship programs’ money-services for beneficiaries, MDL thousand
Money, MDL thousand
Services, MDL thousand
CReDO: Budget Analysis of Administrative Institutions and Sector Policies in the Social Area.
use with reference to Resource Center for Human Rights (CReDO), www.CReDO.md 9
3. Analysis of central public institutions’ budgets The administrative budget expenditures shall be analyzed in this chapter. Within this analysis, the administrative costs of central executive public institutions shall be taken into account. The significance of this analysis is the relative distribution of budget appropriations within executive institutions. The economic analysis of distribution of expenditures for human resources, current expenditures or capital investments offers information and conclusions regarding the efficiency of budget funds use, identifies the main cost centres on the economic budget lines.
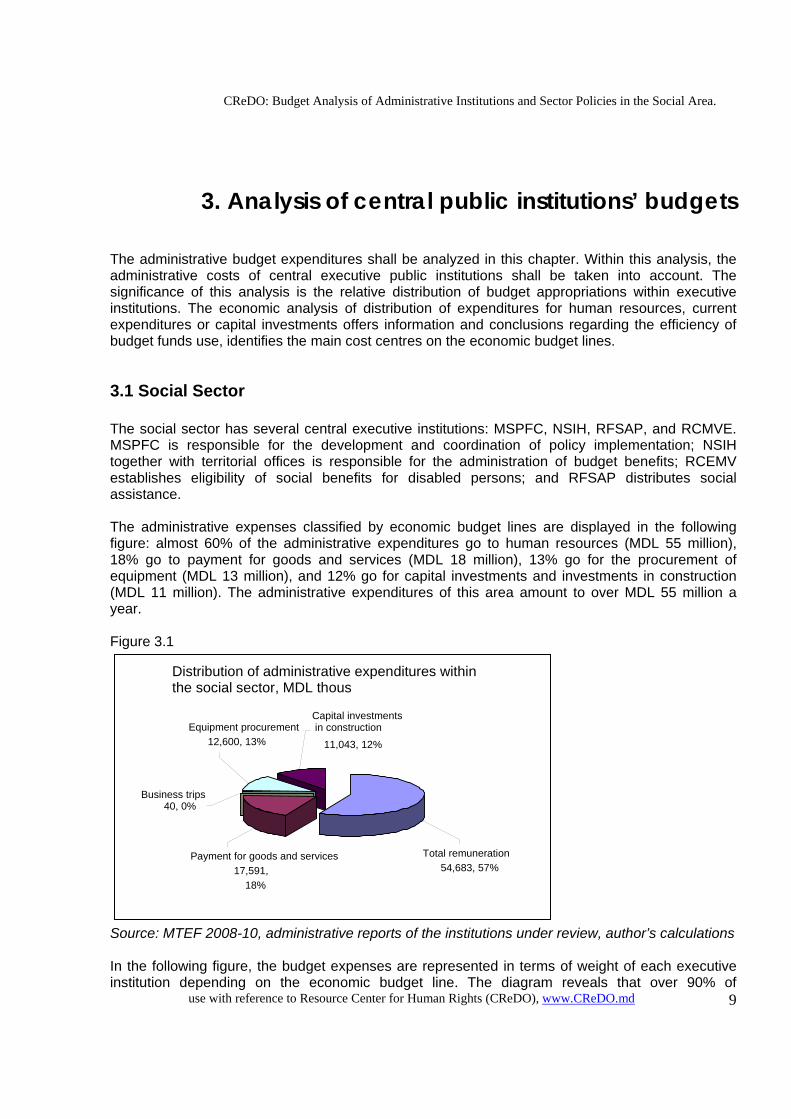
3.1 Social Sector The social sector has several central executive institutions: MSPFC, NSIH, RFSAP, and RCMVE. MSPFC is responsible for the development and coordination of policy implementation; NSIH together with territorial offices is responsible for the administration of budget benefits; RCEMV establishes eligibility of social benefits for disabled persons; and RFSAP distributes social assistance. The administrative expenses classified by economic budget lines are displayed in the following figure: almost 60% of the administrative expenditures go to human resources (MDL 55 million), 18% go to payment for goods and services (MDL 18 million), 13% go for the procurement of equipment (MDL 13 million), and 12% go for capital investments and investments in construction (MDL 11 million). The administrative expenditures of this area amount to over MDL 55 million a year. Figure 3.1
Source: MTEF 2008-10, administrative reports of the institutions under review, author’s calculations In the following figure, the budget expenses are represented in terms of weight of each executive institution depending on the economic budget line. The diagram reveals that over 90% of
Distribution of administrative expenditures within the social sector, MDL thous
Equipment procurement 12,600, 13%
Business trips 40, 0%
Payment for goods and services 17,591,
18%
Capital investments in construction
11,043, 12%
Total remuneration 54,683, 57%
CReDO: Budget Analysis of Administrative Institutions and Sector Policies in the Social Area.
use with reference to Resource Center for Human Rights (CReDO), www.CReDO.md 10
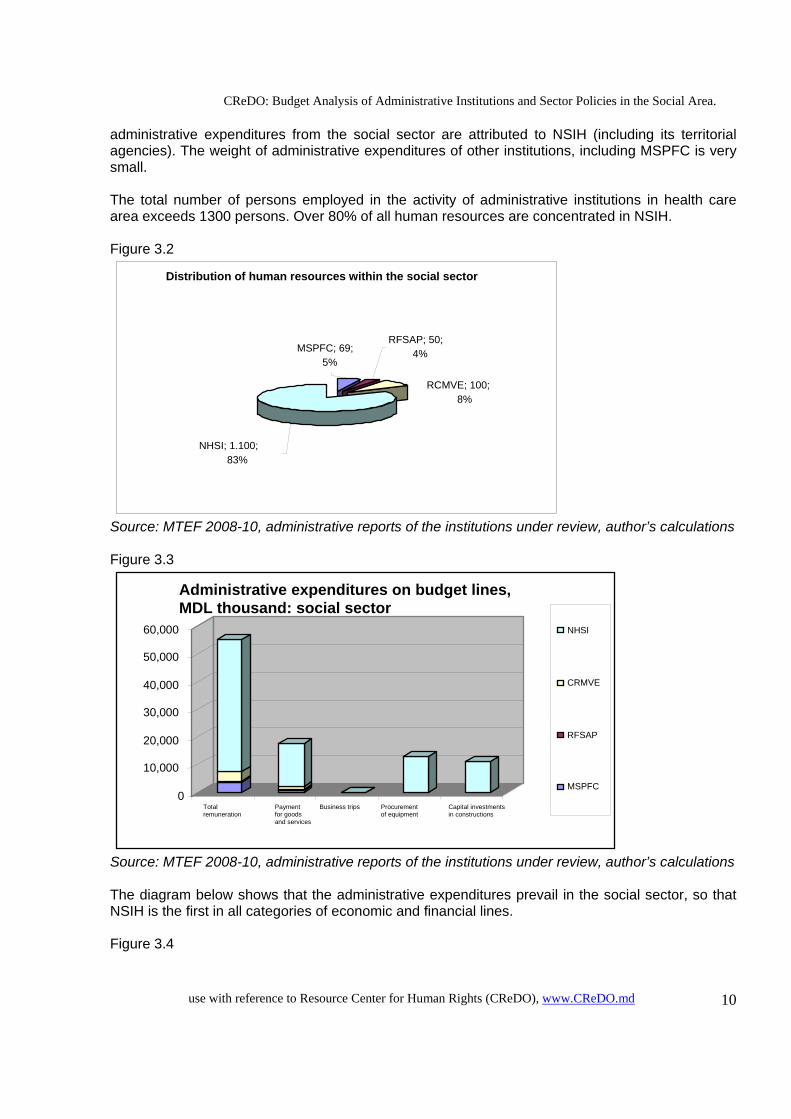
administrative expenditures from the social sector are attributed to NSIH (including its territorial agencies). The weight of administrative expenditures of other institutions, including MSPFC is very small. The total number of persons employed in the activity of administrative institutions in health care area exceeds 1300 persons. Over 80% of all human resources are concentrated in NSIH. Figure 3.2
Source: MTEF 2008-10, administrative reports of the institutions under review, author’s calculations Figure 3.3
Source: MTEF 2008-10, administrative reports of the institutions under review, author’s calculations The diagram below shows that the administrative expenditures prevail in the social sector, so that NSIH is the first in all categories of economic and financial lines. Figure 3.4
0
10,000
20,000
30,000
40,000
50,000
60,000
Total remuneration
Payment for goods and services
Business trips Procurement of equipment
Capital investments in constructions
Administrative expenditures on budget lines, MDL thousand: social sector
NHSI
CRMVE
RFSAP
MSPFC
Distribution of human resources within the social sector
RFSAP; 50; 4%
RCMVE; 100; 8%
MSPFC; 69; 5%
NHSI; 1.100; 83%
CReDO: Budget Analysis of Administrative Institutions and Sector Policies in the Social Area.
use with reference to Resource Center for Human Rights (CReDO), www.CReDO.md 11
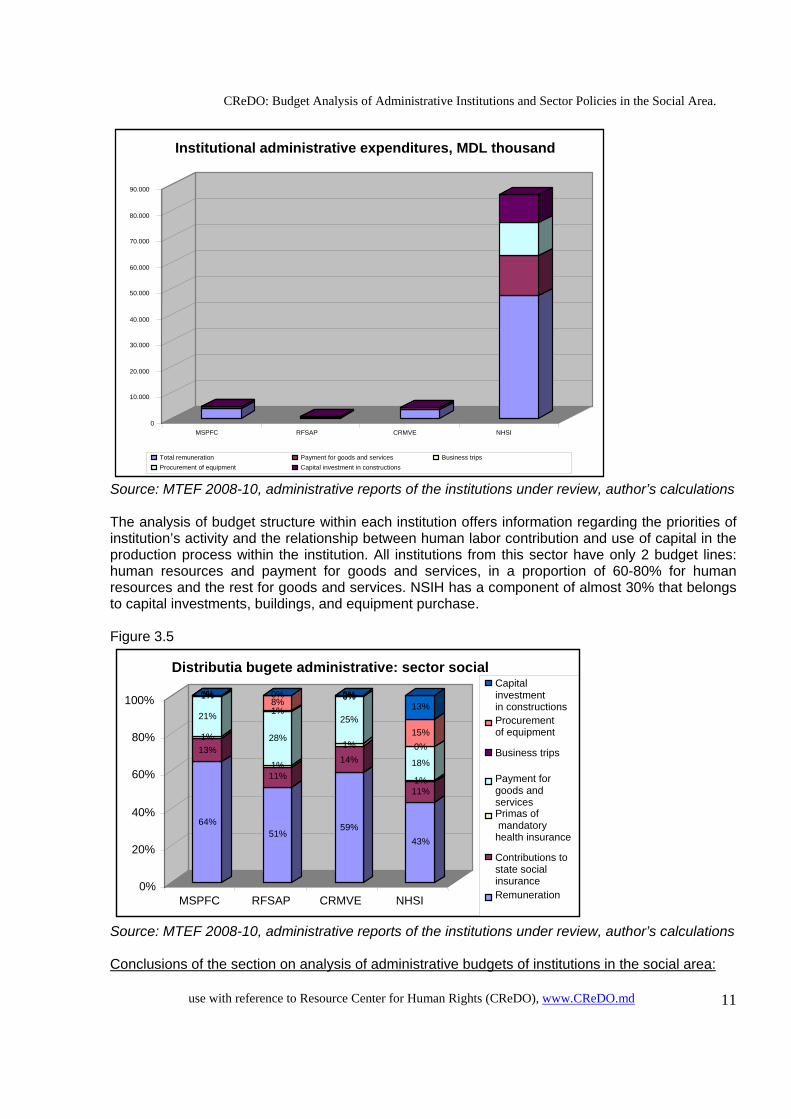
Source: MTEF 2008-10, administrative reports of the institutions under review, author’s calculations The analysis of budget structure within each institution offers information regarding the priorities of institution’s activity and the relationship between human labor contribution and use of capital in the production process within the institution. All institutions from this sector have only 2 budget lines: human resources and payment for goods and services, in a proportion of 60-80% for human resources and the rest for goods and services. NSIH has a component of almost 30% that belongs to capital investments, buildings, and equipment purchase. Figure 3.5
Source: MTEF 2008-10, administrative reports of the institutions under review, author’s calculations Conclusions of the section on analysis of administrative budgets of institutions in the social area:
64%
13%1% 21%
1% 0% 0%
51%
11%1%
28%
1% 8% 0%
59%
14%
1%
25%
0%0%0%
43%
11%1%
18%
0%15%
13%
0%
20%
40%
60%
80%
100%
MSPFC RFSAP CRMVE NHSI
Distributia bugete administrative: sector socialCapital investment in constructionsProcurement of equipment
Business trips
Payment for goods and services Primas of mandatory health insurance Contributions to state social insurance Remuneration
0
10.000
20.000
30.000
40.000
50.000
60.000
70.000
80.000
90.000
MSPFC RFSAP CRMVE NHSI
Institutional administrative expenditures, MDL thousand
Total remuneration Payment for goods and services Business tripsProcurement of equipment Capital investment in constructions
CReDO: Budget Analysis of Administrative Institutions and Sector Policies in the Social Area.
use with reference to Resource Center for Human Rights (CReDO), www.CReDO.md 12
- the efficiency and propriety of the use of the money appropriated for equipment purchase and payment of goods and services within NSIH and RFSAP is a challenge,
- examination of the opportunity to re-distribute the human resources of NSIH to MSPFC, including funding, needs consideration,
- it is necessary to improve productivity within NSIH in order to carry out an upgrading of technologies for budget payments administration,
- introduction of the mandatory procedure of MSPFC notification about the administrative expenditures of the institutions from the social area.
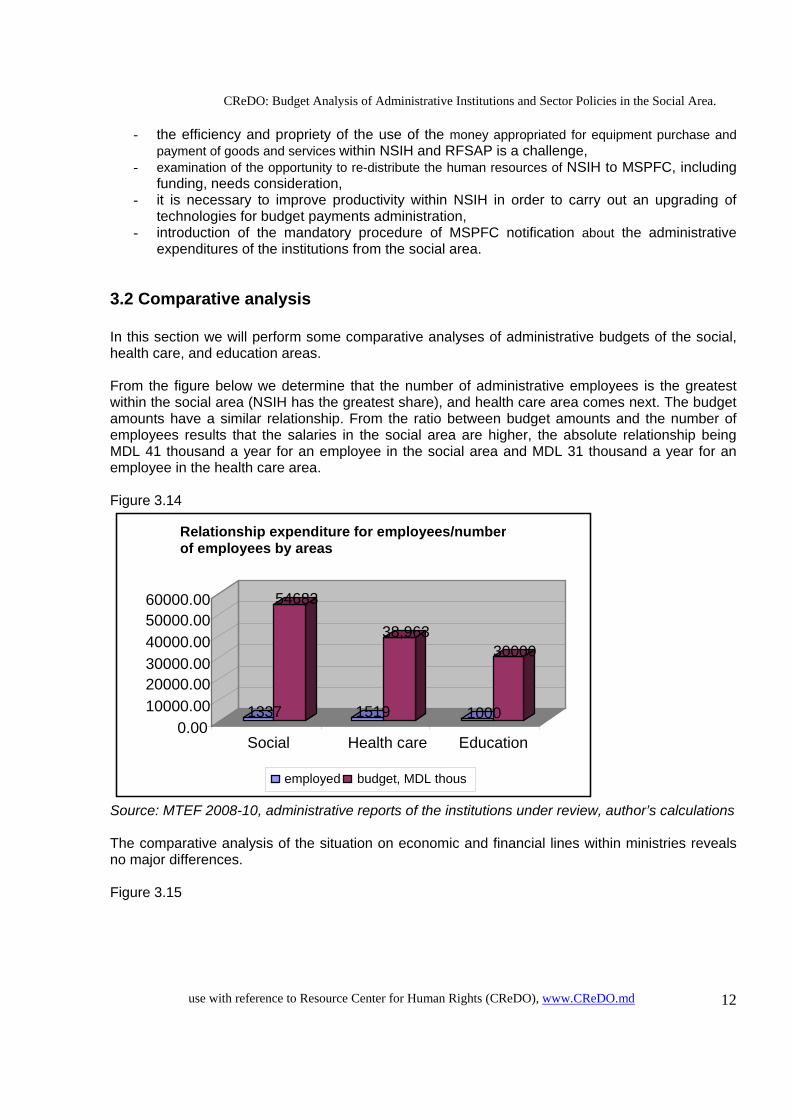
3.2 Comparative analysis In this section we will perform some comparative analyses of administrative budgets of the social, health care, and education areas. From the figure below we determine that the number of administrative employees is the greatest within the social area (NSIH has the greatest share), and health care area comes next. The budget amounts have a similar relationship. From the ratio between budget amounts and the number of employees results that the salaries in the social area are higher, the absolute relationship being MDL 41 thousand a year for an employee in the social area and MDL 31 thousand a year for an employee in the health care area. Figure 3.14
Source: MTEF 2008-10, administrative reports of the institutions under review, author’s calculations The comparative analysis of the situation on economic and financial lines within ministries reveals no major differences. Figure 3.15
1337
54683
1519
38,963
1000
30000
0.00 10000.00 20000.00 30000.00 40000.00 50000.00 60000.00
Social Health care Education
Relationship expenditure for employees/numberof employees by areas
employed budget, MDL thous
CReDO: Budget Analysis of Administrative Institutions and Sector Policies in the Social Area.
use with reference to Resource Center for Human Rights (CReDO), www.CReDO.md 13
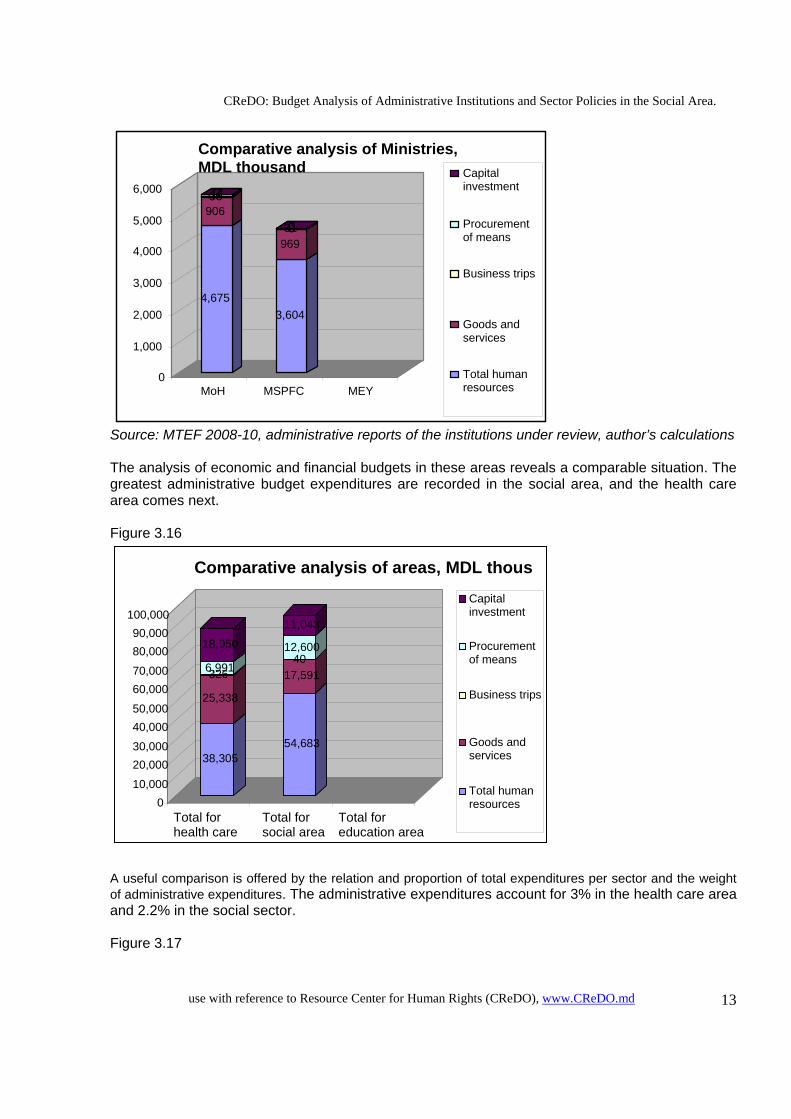
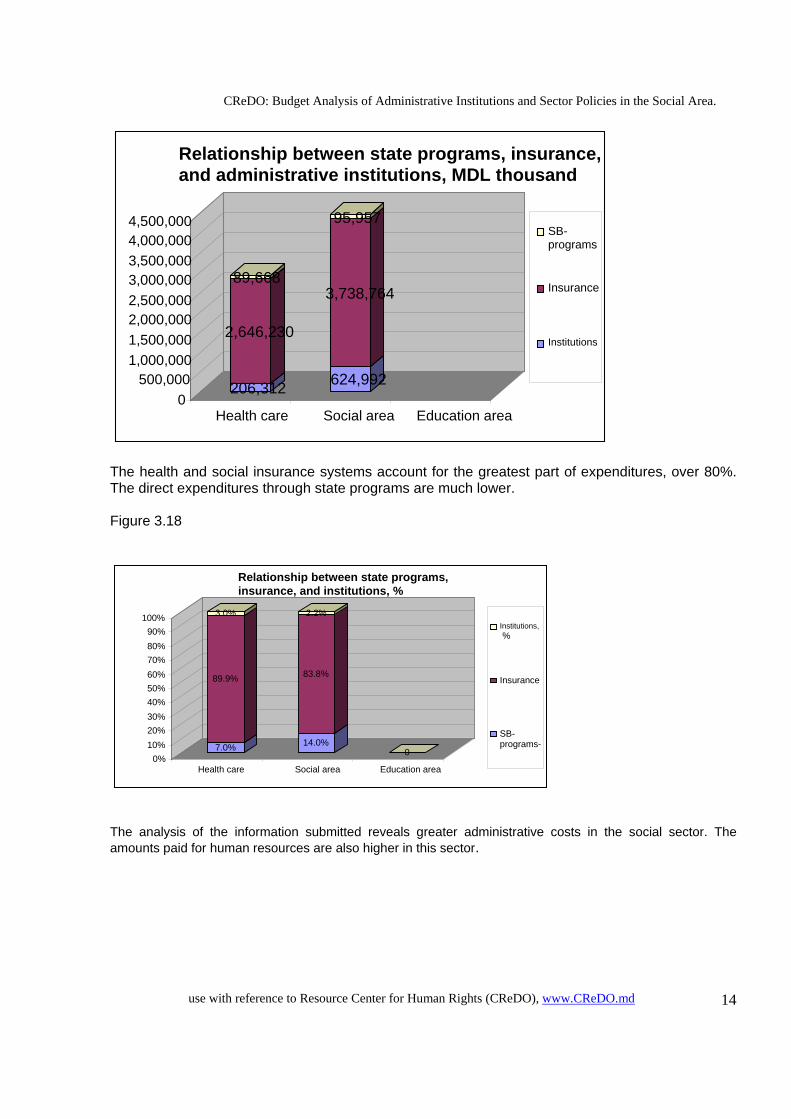
Source: MTEF 2008-10, administrative reports of the institutions under review, author’s calculations The analysis of economic and financial budgets in these areas reveals a comparable situation. The greatest administrative budget expenditures are recorded in the social area, and the health care area comes next. Figure 3.16
A useful comparison is offered by the relation and proportion of total expenditures per sector and the weight of administrative expenditures. The administrative expenditures account for 3% in the health care area and 2.2% in the social sector. Figure 3.17
38,305
25,338
326 6,991
18,050
54,683
17,591 40
12,600 11,043
0 10,000 20,000 30,000 40,000 50,000 60,000 70,000 80,000 90,000
100,000
Total for health care
Total for social area
Total for education area
Comparative analysis of areas, MDL thous
Capital investment
Procurement of means
Business trips
Goods and services
Total human resources
4,675
906 36 44 0
3,604
969 31 00
0
1,000
2,000
3,000
4,000
5,000
6,000
MoH MSPFC MEY
Comparative analysis of Ministries,MDL thousand Capital
investment
Procurement of means
Business trips
Goods and services
Total human resources
CReDO: Budget Analysis of Administrative Institutions and Sector Policies in the Social Area.
use with reference to Resource Center for Human Rights (CReDO), www.CReDO.md 14
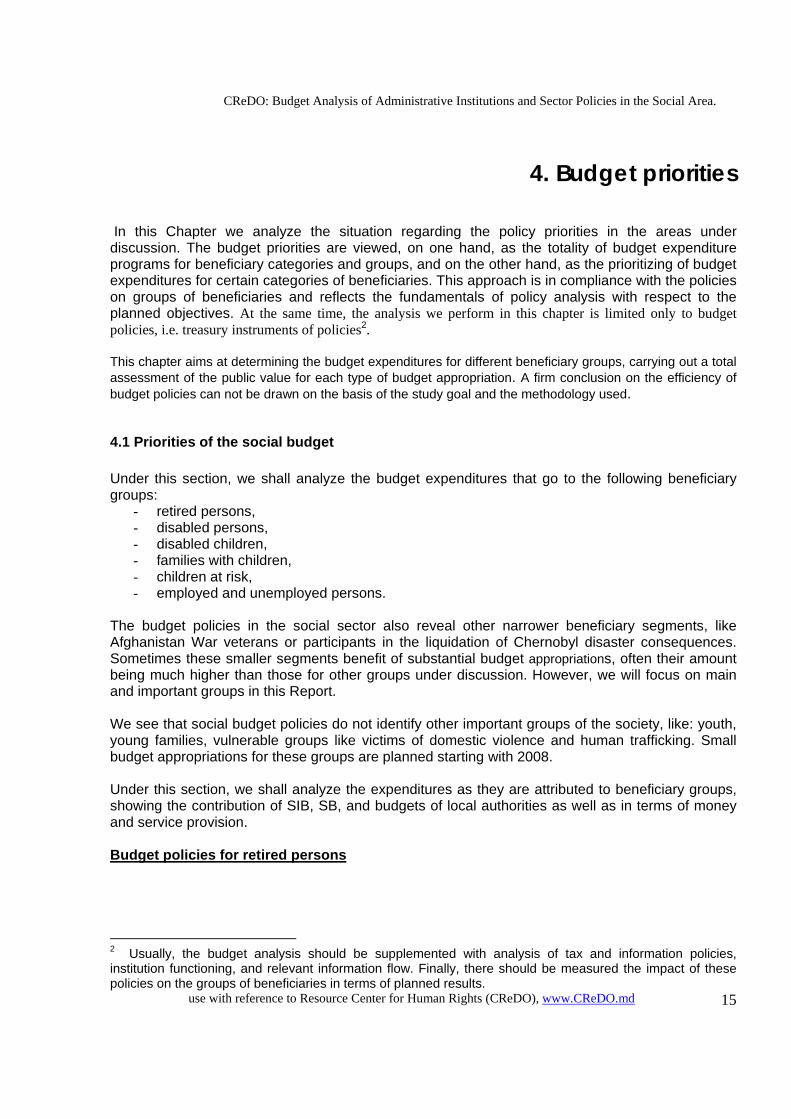
The health and social insurance systems account for the greatest part of expenditures, over 80%. The direct expenditures through state programs are much lower. Figure 3.18
The analysis of the information submitted reveals greater administrative costs in the social sector. The amounts paid for human resources are also higher in this sector.
7.0%
89.9%
3.0%
14.0%
83.8%
2.2%
00%
10%20%30%40%50%60%70%80%90%
100%
Health care Social area Education area
Relationship between state programs, insurance, and institutions, %
Institutions, %
Insurance
SB- programs-
206,312
2,646,230
89,668
624,992
3,738,764
95,957
0 500,000
1,000,000 1,500,000 2,000,000 2,500,000 3,000,000 3,500,000 4,000,000 4,500,000
Health care Social area Education area
Relationship between state programs, insurance, and administrative institutions, MDL thousand
SB- programs
Insurance
Institutions
CReDO: Budget Analysis of Administrative Institutions and Sector Policies in the Social Area.
use with reference to Resource Center for Human Rights (CReDO), www.CReDO.md 15
4. Budget priorities In this Chapter we analyze the situation regarding the policy priorities in the areas under discussion. The budget priorities are viewed, on one hand, as the totality of budget expenditure programs for beneficiary categories and groups, and on the other hand, as the prioritizing of budget expenditures for certain categories of beneficiaries. This approach is in compliance with the policies on groups of beneficiaries and reflects the fundamentals of policy analysis with respect to the planned objectives. At the same time, the analysis we perform in this chapter is limited only to budget policies, i.e. treasury instruments of policies2. This chapter aims at determining the budget expenditures for different beneficiary groups, carrying out a total assessment of the public value for each type of budget appropriation. A firm conclusion on the efficiency of budget policies can not be drawn on the basis of the study goal and the methodology used.
4.1 Priorities of the social budget Under this section, we shall analyze the budget expenditures that go to the following beneficiary groups:
- retired persons, - disabled persons, - disabled children, - families with children, - children at risk, - employed and unemployed persons.
The budget policies in the social sector also reveal other narrower beneficiary segments, like Afghanistan War veterans or participants in the liquidation of Chernobyl disaster consequences. Sometimes these smaller segments benefit of substantial budget appropriations, often their amount being much higher than those for other groups under discussion. However, we will focus on main and important groups in this Report. We see that social budget policies do not identify other important groups of the society, like: youth, young families, vulnerable groups like victims of domestic violence and human trafficking. Small budget appropriations for these groups are planned starting with 2008. Under this section, we shall analyze the expenditures as they are attributed to beneficiary groups, showing the contribution of SIB, SB, and budgets of local authorities as well as in terms of money and service provision. Budget policies for retired persons
2 Usually, the budget analysis should be supplemented with analysis of tax and information policies, institution functioning, and relevant information flow. Finally, there should be measured the impact of these policies on the groups of beneficiaries in terms of planned results.
CReDO: Budget Analysis of Administrative Institutions and Sector Policies in the Social Area.
use with reference to Resource Center for Human Rights (CReDO), www.CReDO.md 16
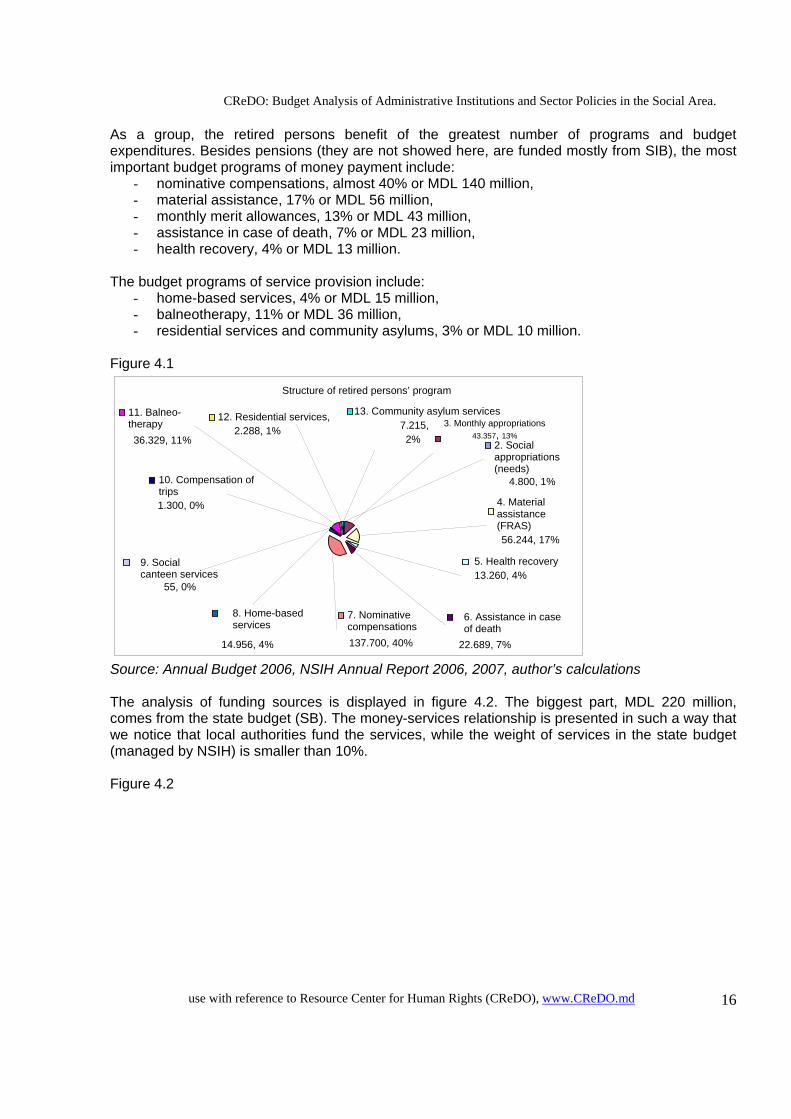
As a group, the retired persons benefit of the greatest number of programs and budget expenditures. Besides pensions (they are not showed here, are funded mostly from SIB), the most important budget programs of money payment include:
- nominative compensations, almost 40% or MDL 140 million, - material assistance, 17% or MDL 56 million, - monthly merit allowances, 13% or MDL 43 million, - assistance in case of death, 7% or MDL 23 million, - health recovery, 4% or MDL 13 million.
The budget programs of service provision include:
- home-based services, 4% or MDL 15 million, - balneotherapy, 11% or MDL 36 million, - residential services and community asylums, 3% or MDL 10 million.
Figure 4.1
Source: Annual Budget 2006, NSIH Annual Report 2006, 2007, author’s calculations The analysis of funding sources is displayed in figure 4.2. The biggest part, MDL 220 million, comes from the state budget (SB). The money-services relationship is presented in such a way that we notice that local authorities fund the services, while the weight of services in the state budget (managed by NSIH) is smaller than 10%. Figure 4.2
Structure of retired persons’ program
9. Social canteen services
55, 0%
8. Home-based services
10. Compensation of trips 1.300, 0%
12. Residential services,2.288, 1%
11. Balneo- therapy 36.329, 11% 2. Social
appropriations (needs)
4.800, 1%
13. Community asylum services 7.215, 2%
3. Monthly appropriations 43.357, 13%
4. Material assistance (FRAS) 56.244, 17%
5. Health recovery 13.260, 4%
6. Assistance in case of death
7. Nominative compensations137.700, 40% 22.689, 7%14.956, 4%
CReDO: Budget Analysis of Administrative Institutions and Sector Policies in the Social Area.
use with reference to Resource Center for Human Rights (CReDO), www.CReDO.md 17
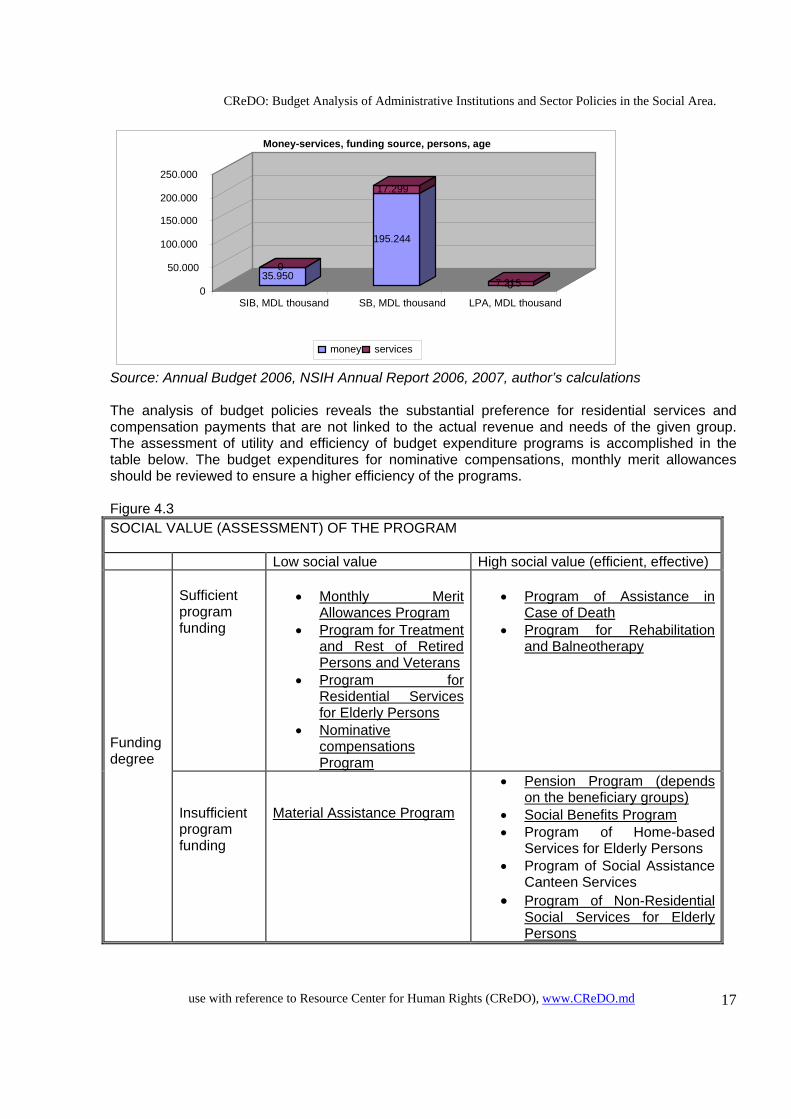
Source: Annual Budget 2006, NSIH Annual Report 2006, 2007, author’s calculations The analysis of budget policies reveals the substantial preference for residential services and compensation payments that are not linked to the actual revenue and needs of the given group. The assessment of utility and efficiency of budget expenditure programs is accomplished in the table below. The budget expenditures for nominative compensations, monthly merit allowances should be reviewed to ensure a higher efficiency of the programs. Figure 4.3 SOCIAL VALUE (ASSESSMENT) OF THE PROGRAM Low social value High social value (efficient, effective)
Sufficient program funding
• Monthly Merit
Allowances Program • Program for Treatment
and Rest of Retired Persons and Veterans
• Program for Residential Services for Elderly Persons
• Nominative compensations Program
• Program of Assistance in
Case of Death • Program for Rehabilitation
and Balneotherapy
Funding degree
Insufficient program funding
Material Assistance Program
• Pension Program (depends on the beneficiary groups)
• Social Benefits Program • Program of Home-based
Services for Elderly Persons • Program of Social Assistance
Canteen Services • Program of Non-Residential
Social Services for Elderly Persons
35.950 0
195.244
17.299
07.2150
50.000 100.000 150.000 200.000 250.000
SIB, MDL thousand SB, MDL thousand LPA, MDL thousand
Money-services, funding source, persons, age
money services
CReDO: Budget Analysis of Administrative Institutions and Sector Policies in the Social Area.
use with reference to Resource Center for Human Rights (CReDO), www.CReDO.md 18
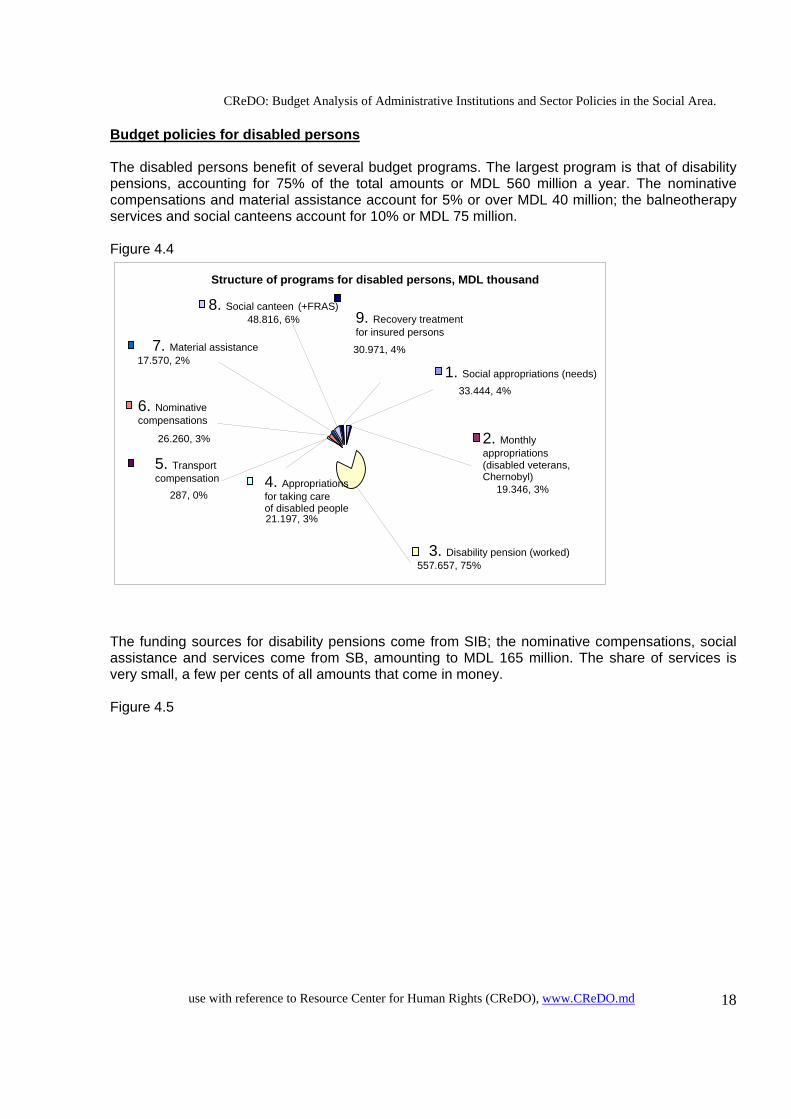
Budget policies for disabled persons The disabled persons benefit of several budget programs. The largest program is that of disability pensions, accounting for 75% of the total amounts or MDL 560 million a year. The nominative compensations and material assistance account for 5% or over MDL 40 million; the balneotherapy services and social canteens account for 10% or MDL 75 million. Figure 4.4
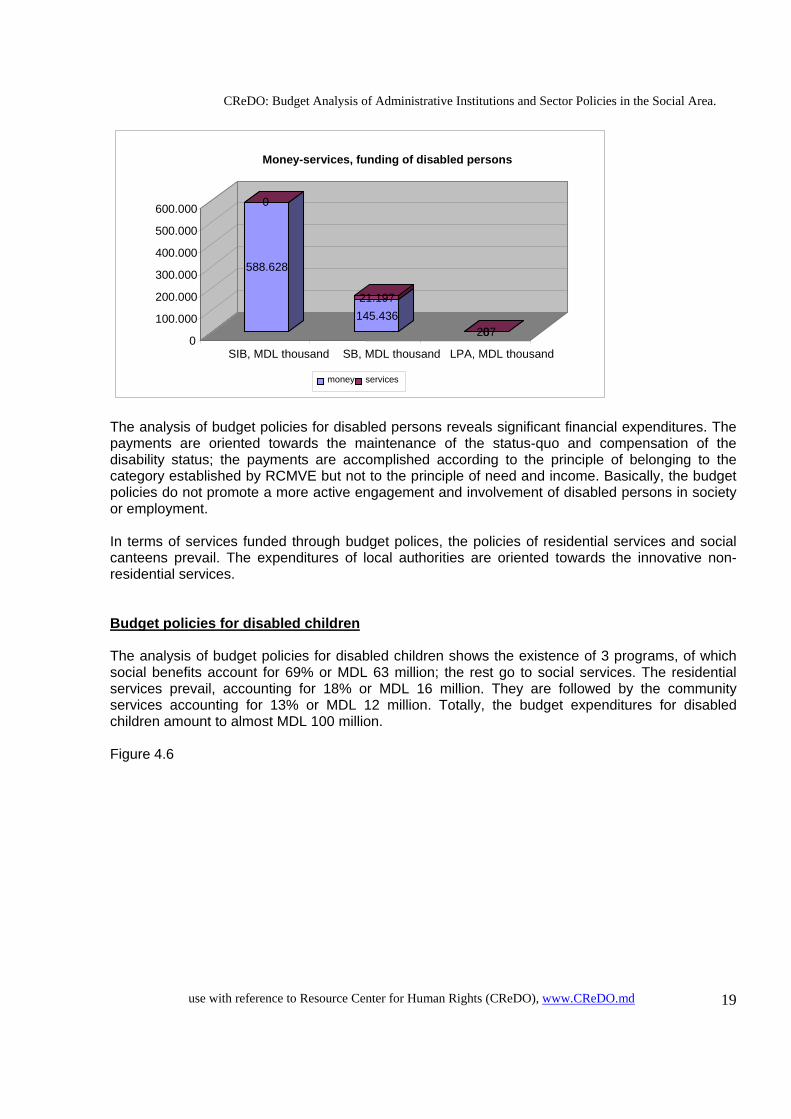
The funding sources for disability pensions come from SIB; the nominative compensations, social assistance and services come from SB, amounting to MDL 165 million. The share of services is very small, a few per cents of all amounts that come in money. Figure 4.5
Structure of programs for disabled persons, MDL thousand
1. Social appropriations (needs)33.444, 4%
6. Nominative compensations
26.260, 3%
7. Material assistance17.570, 2%
8. Social canteen (+FRAS)48.816, 6% 9. Recovery treatment
for insured persons 30.971, 4%
2. Monthly appropriations (disabled veterans, Chernobyl)
19.346, 3%
5. Transport compensation
287, 0% 4. Appropriations for taking care of disabled people21.197, 3%
3. Disability pension (worked) 557.657, 75%
CReDO: Budget Analysis of Administrative Institutions and Sector Policies in the Social Area.
use with reference to Resource Center for Human Rights (CReDO), www.CReDO.md 19
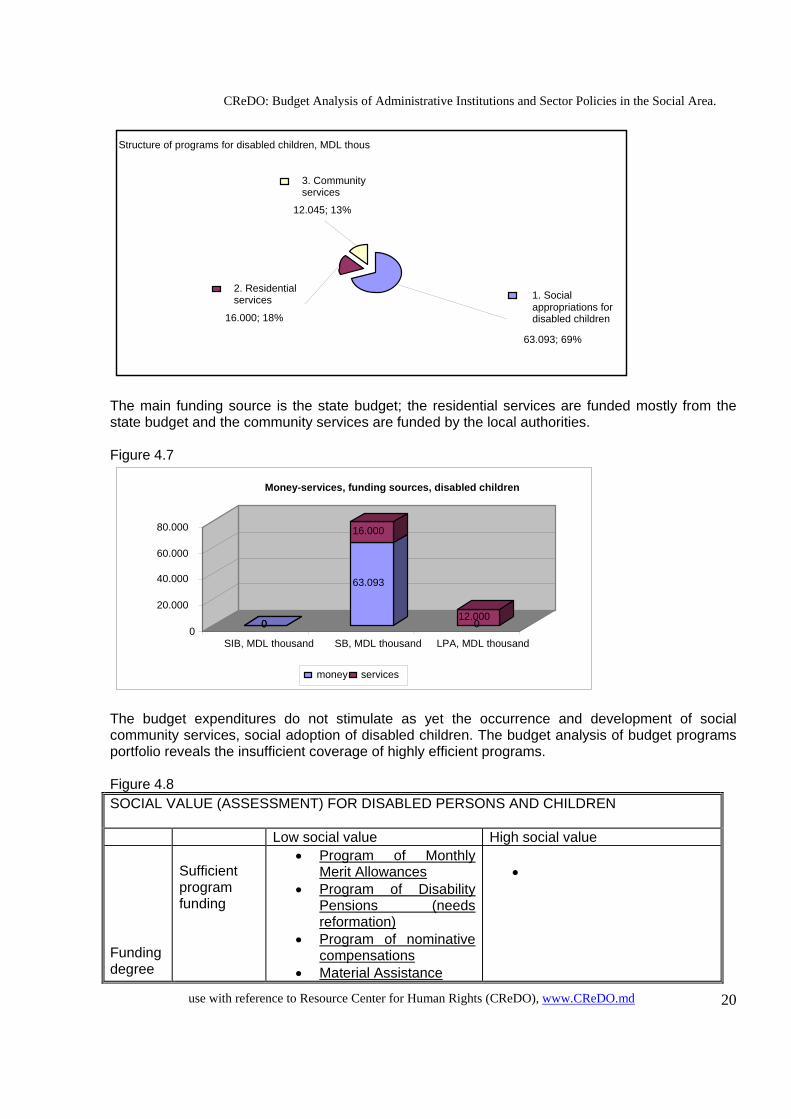
The analysis of budget policies for disabled persons reveals significant financial expenditures. The payments are oriented towards the maintenance of the status-quo and compensation of the disability status; the payments are accomplished according to the principle of belonging to the category established by RCMVE but not to the principle of need and income. Basically, the budget policies do not promote a more active engagement and involvement of disabled persons in society or employment. In terms of services funded through budget polices, the policies of residential services and social canteens prevail. The expenditures of local authorities are oriented towards the innovative non-residential services. Budget policies for disabled children The analysis of budget policies for disabled children shows the existence of 3 programs, of which social benefits account for 69% or MDL 63 million; the rest go to social services. The residential services prevail, accounting for 18% or MDL 16 million. They are followed by the community services accounting for 13% or MDL 12 million. Totally, the budget expenditures for disabled children amount to almost MDL 100 million. Figure 4.6
588.628
0
145.43621.197
28700
100.000 200.000 300.000 400.000 500.000 600.000
SIB, MDL thousand SB, MDL thousand LPA, MDL thousand
Money-services, funding of disabled persons
money services
CReDO: Budget Analysis of Administrative Institutions and Sector Policies in the Social Area.
use with reference to Resource Center for Human Rights (CReDO), www.CReDO.md 20
The main funding source is the state budget; the residential services are funded mostly from the state budget and the community services are funded by the local authorities. Figure 4.7
The budget expenditures do not stimulate as yet the occurrence and development of social community services, social adoption of disabled children. The budget analysis of budget programs portfolio reveals the insufficient coverage of highly efficient programs. Figure 4.8 SOCIAL VALUE (ASSESSMENT) FOR DISABLED PERSONS AND CHILDREN Low social value High social value Funding degree
Sufficient program funding
• Program of Monthly Merit Allowances
• Program of Disability Pensions (needs reformation)
• Program of nominative compensations
• Material Assistance
•
00
63.093
16.000
012.000
0
20.000
40.000 60.000
80.000
SIB, MDL thousand SB, MDL thousand LPA, MDL thousand
Money-services, funding sources, disabled children
money services
Structure of programs for disabled children, MDL thous
2. Residential services
16.000; 18%
3. Community services
12.045; 13%
1. Social appropriations for disabled children
63.093; 69%
CReDO: Budget Analysis of Administrative Institutions and Sector Policies in the Social Area.
use with reference to Resource Center for Human Rights (CReDO), www.CReDO.md 21
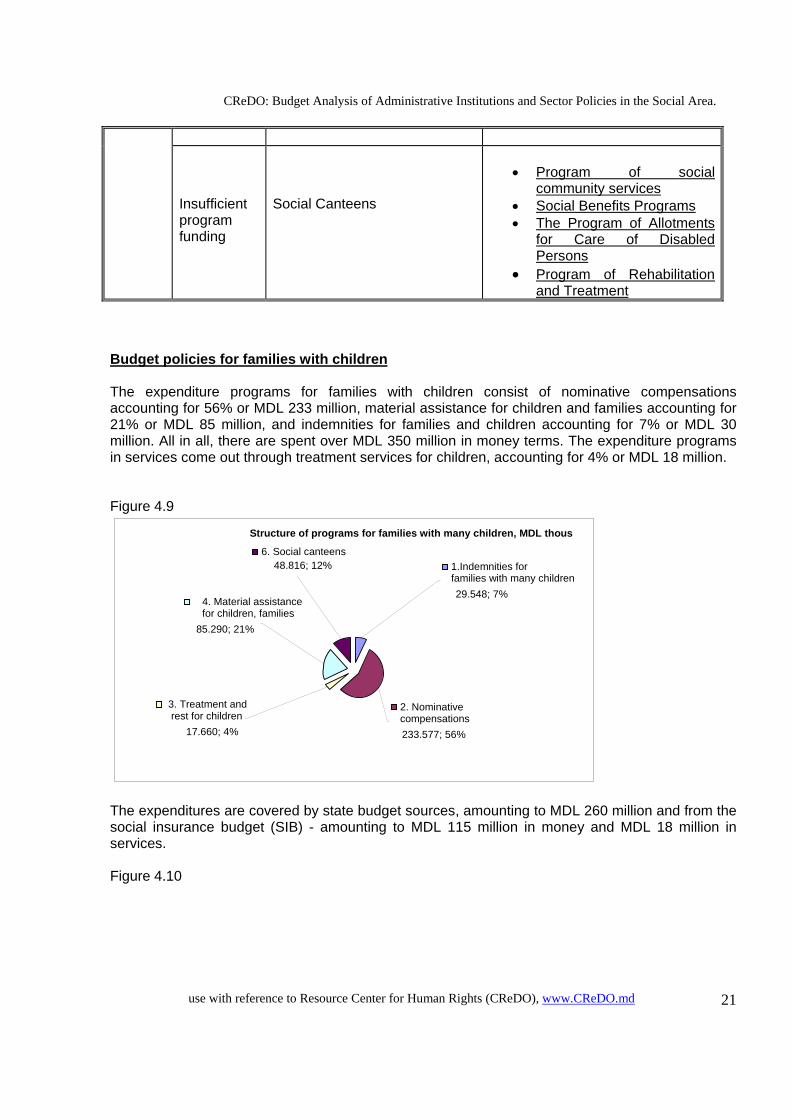
Insufficient program funding
Social Canteens
• Program of social
community services • Social Benefits Programs • The Program of Allotments
for Care of Disabled Persons
• Program of Rehabilitation and Treatment
Budget policies for families with children The expenditure programs for families with children consist of nominative compensations accounting for 56% or MDL 233 million, material assistance for children and families accounting for 21% or MDL 85 million, and indemnities for families and children accounting for 7% or MDL 30 million. All in all, there are spent over MDL 350 million in money terms. The expenditure programs in services come out through treatment services for children, accounting for 4% or MDL 18 million. Figure 4.9
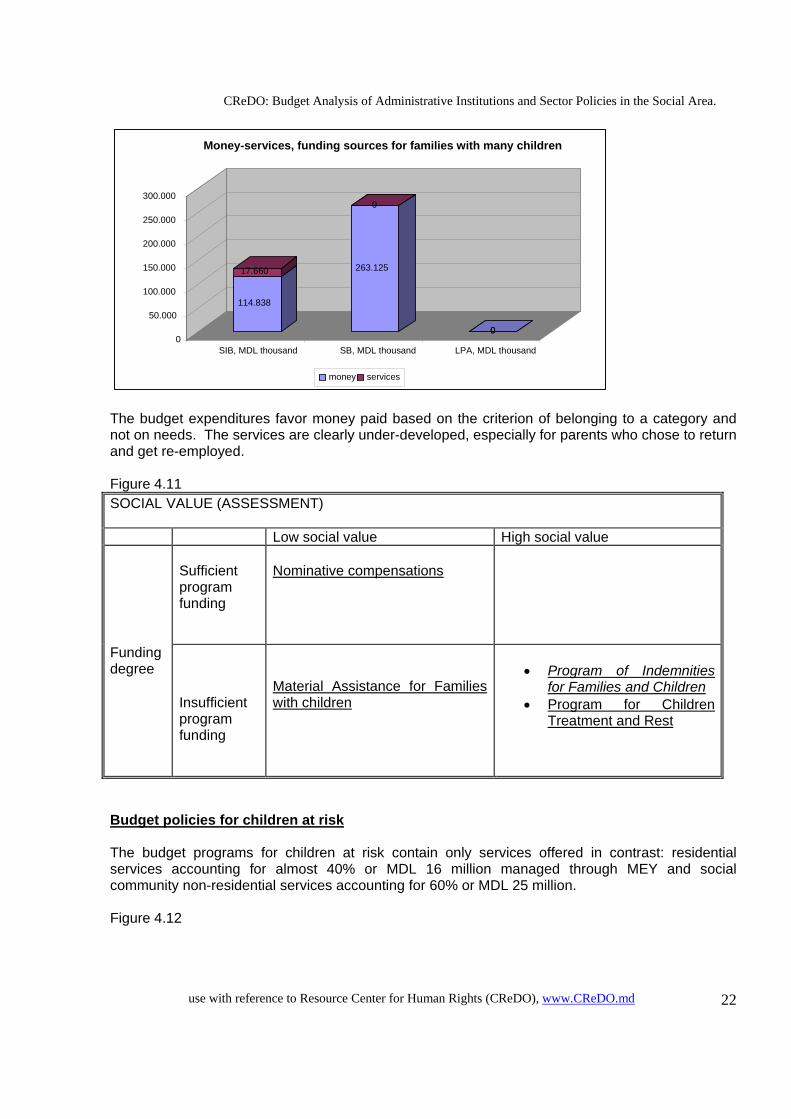
The expenditures are covered by state budget sources, amounting to MDL 260 million and from the social insurance budget (SIB) - amounting to MDL 115 million in money and MDL 18 million in services. Figure 4.10
6. Social canteens48.816; 12%
2. Nominative compensations233.577; 56%
1.Indemnities for families with many children 29.548; 7%
3. Treatment and rest for children
17.660; 4%
4. Material assistance for children, families
85.290; 21%
Structure of programs for families with many children, MDL thous
CReDO: Budget Analysis of Administrative Institutions and Sector Policies in the Social Area.
use with reference to Resource Center for Human Rights (CReDO), www.CReDO.md 22
The budget expenditures favor money paid based on the criterion of belonging to a category and not on needs. The services are clearly under-developed, especially for parents who chose to return and get re-employed. Figure 4.11 SOCIAL VALUE (ASSESSMENT) Low social value High social value
Sufficient program funding
Nominative compensations
Funding degree
Insufficient program funding
Material Assistance for Families with children
• Program of Indemnities
for Families and Children • Program for Children
Treatment and Rest
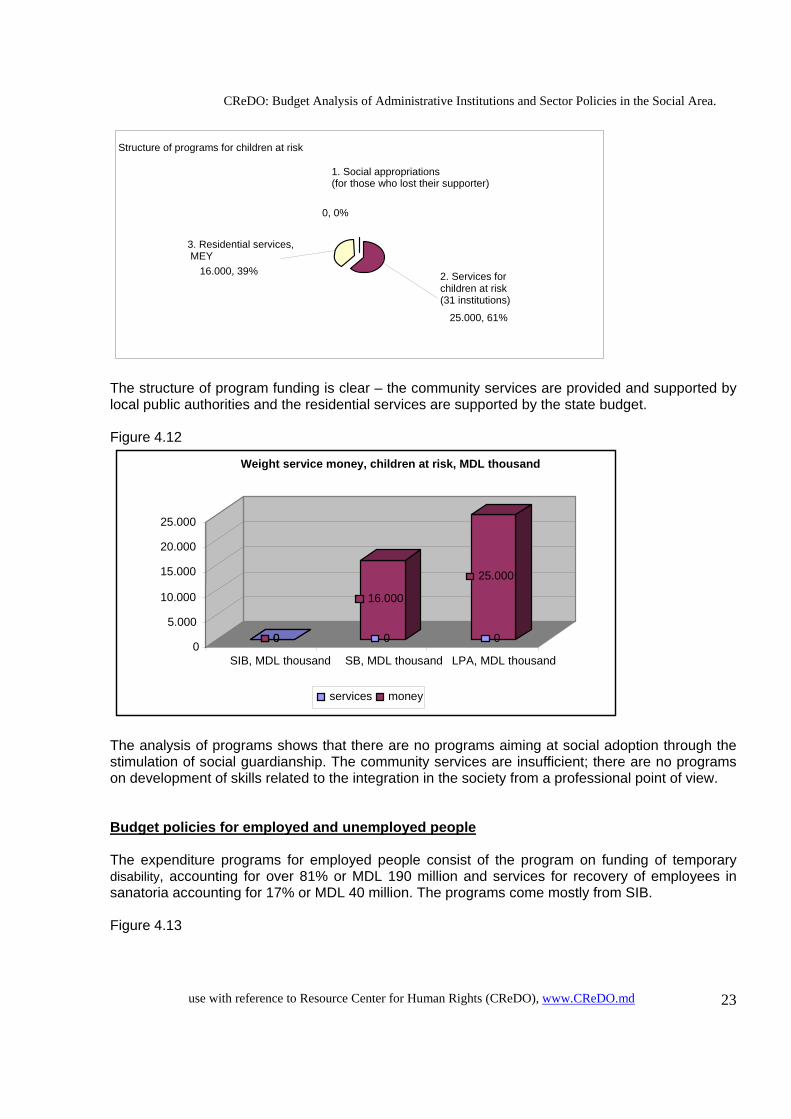
Budget policies for children at risk The budget programs for children at risk contain only services offered in contrast: residential services accounting for almost 40% or MDL 16 million managed through MEY and social community non-residential services accounting for 60% or MDL 25 million. Figure 4.12
114.838
17.660 263.125
0
000
50.000
100.000
150.000
200.000
250.000
300.000
SIB, MDL thousand SB, MDL thousand LPA, MDL thousand
Money-services, funding sources for families with many children
money services
CReDO: Budget Analysis of Administrative Institutions and Sector Policies in the Social Area.
use with reference to Resource Center for Human Rights (CReDO), www.CReDO.md 23
The structure of program funding is clear – the community services are provided and supported by local public authorities and the residential services are supported by the state budget. Figure 4.12
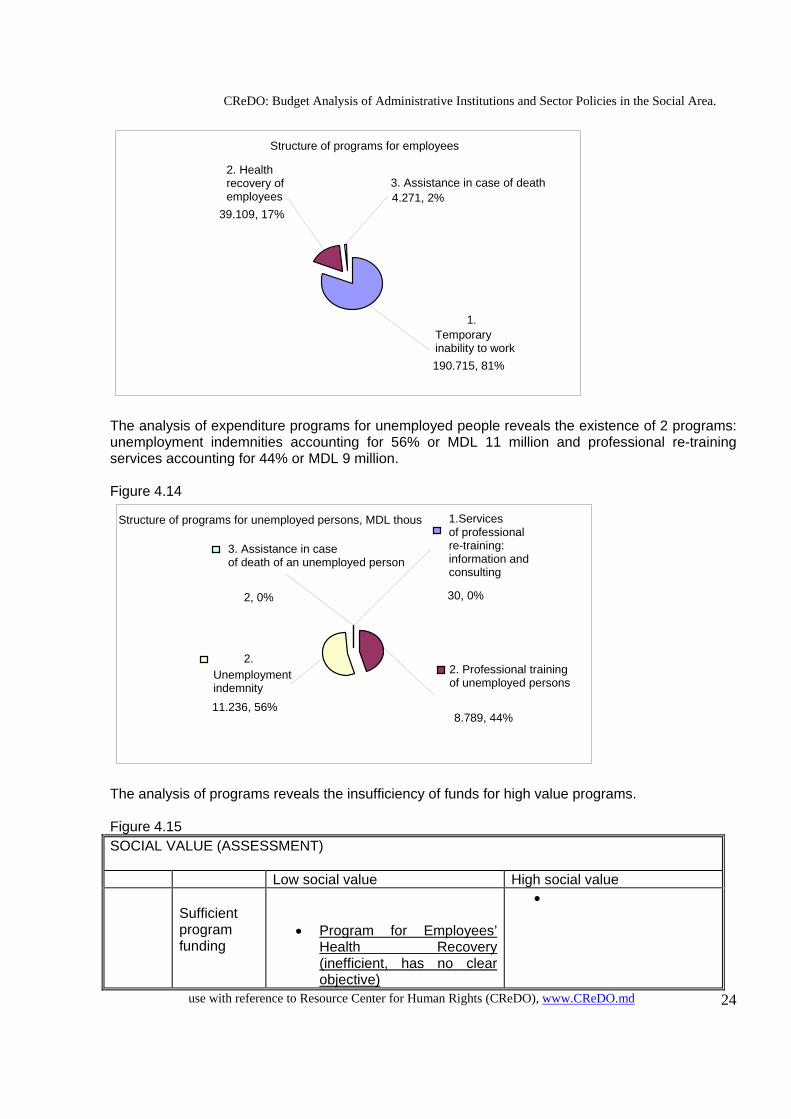
The analysis of programs shows that there are no programs aiming at social adoption through the stimulation of social guardianship. The community services are insufficient; there are no programs on development of skills related to the integration in the society from a professional point of view. Budget policies for employed and unemployed people The expenditure programs for employed people consist of the program on funding of temporary disability, accounting for over 81% or MDL 190 million and services for recovery of employees in sanatoria accounting for 17% or MDL 40 million. The programs come mostly from SIB. Figure 4.13
0 0 0
16.000
0
25.000
0 5.000
10.000
15.000 20.000 25.000
SIB, MDL thousand SB, MDL thousand LPA, MDL thousand
Weight service money, children at risk, MDL thousand
services money
Structure of programs for children at risk
1. Social appropriations (for those who lost their supporter)
0, 0%
2. Services for children at risk (31 institutions)
25.000, 61%
3. Residential services, MEY
16.000, 39%
CReDO: Budget Analysis of Administrative Institutions and Sector Policies in the Social Area.
use with reference to Resource Center for Human Rights (CReDO), www.CReDO.md 24
The analysis of expenditure programs for unemployed people reveals the existence of 2 programs: unemployment indemnities accounting for 56% or MDL 11 million and professional re-training services accounting for 44% or MDL 9 million. Figure 4.14
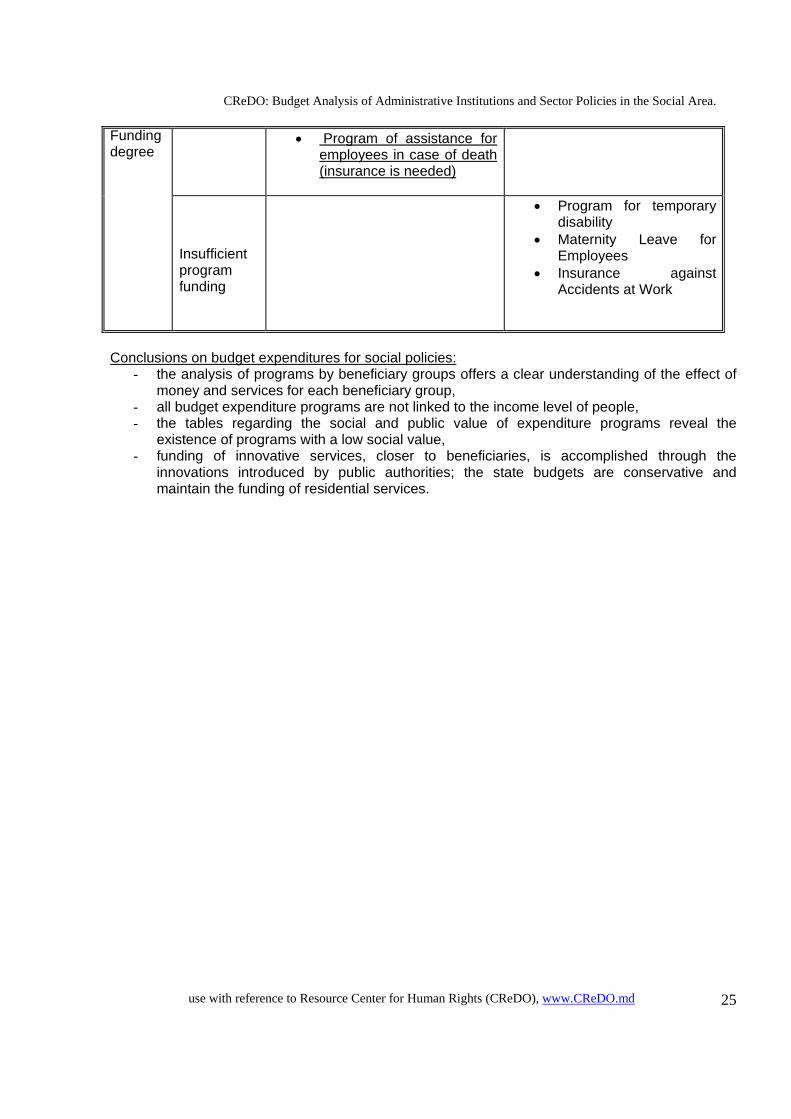
The analysis of programs reveals the insufficiency of funds for high value programs. Figure 4.15 SOCIAL VALUE (ASSESSMENT) Low social value High social value
Sufficient program funding
• Program for Employees’ Health Recovery (inefficient, has no clear objective)
•
Structure of programs for unemployed persons, MDL thous
2. Unemployment indemnity 11.236, 56%
1.Services of professional re-training: information and consulting 30, 0%
3. Assistance in case of death of an unemployed person
2, 0%
2. Professional training of unemployed persons
8.789, 44%
Structure of programs for employees
3. Assistance in case of death 4.271, 2%
2. Health recovery of employees
39.109, 17%
1. Temporary inability to work190.715, 81%
CReDO: Budget Analysis of Administrative Institutions and Sector Policies in the Social Area.
use with reference to Resource Center for Human Rights (CReDO), www.CReDO.md 25
• Program of assistance for employees in case of death (insurance is needed)
Funding degree
Insufficient program funding
• Program for temporary disability
• Maternity Leave for Employees
• Insurance against Accidents at Work
Conclusions on budget expenditures for social policies:
- the analysis of programs by beneficiary groups offers a clear understanding of the effect of money and services for each beneficiary group,
- all budget expenditure programs are not linked to the income level of people, - the tables regarding the social and public value of expenditure programs reveal the
existence of programs with a low social value, - funding of innovative services, closer to beneficiaries, is accomplished through the
innovations introduced by public authorities; the state budgets are conservative and maintain the funding of residential services.
CReDO: Budget Analysis of Administrative Institutions and Sector Policies in the Social Area.
use with reference to Resource Center for Human Rights (CReDO), www.CReDO.md 26
5. Conclusions and Recommendations The information about budget expenditures regarding administrative institutions and policy expenditures is not directly available for the society. The given information needs identification, systematizing, and presentation in this format, a significant effort being necessary. Besides, the authorities should issue reports and make available more information for the public in order to create a better image with respect to budgets and the modality of their use. Conclusions of the section on analysis of budget policies in the social area:
- the main beneficiary groups are the retired and disabled persons, - the beneficiary groups receive funds on the basis of outdated compensation or current
situation maintenance patterns, - expenditure programs with a good social value are restricted, - the portion of expenditures for services is extremely small and insufficient for development.
Conclusions of the section on analysis of administrative budgets of institutions from the social area:
- efficiency and propriety of the use of the money appropriated for equipment purchase and payment for goods and services within NSIH and RFSAP is a challenge,
- examination of the opportunity to re-distribute the human resources of NSIH to MSPFC, including the funding, needs consideration,
- it is necessary to improve productivity within NSIH in order to carry out an upgrading of technologies for administration of budget payments,
- introduction of the mandatory procedure of MSPFC notification about the administrative expenditures of the institutions from the social area.
The analysis of the information submitted reveals greater administrative costs in the social sector. The amounts paid for human resources are also higher in this sector. Conclusions on budget expenditures related to social policies:
- the analysis of programs by beneficiary groups offers a clear understanding of the effect of money and services for each beneficiary group,
- all budget expenditure programs are not linked to the income level of people, - the tables regarding the social and public value of expenditure programs reveal the
existence of programs with a low social value, - funding of innovative services, closer to beneficiaries, is accomplished through innovations
introduced by public authorities; the state budgets are conservative and maintain the funding of residential services.
CReDO: Budget Analysis of Administrative Institutions and Sector Policies in the Social Area.
use with reference to Resource Center for Human Rights (CReDO), www.CReDO.md 27
6. References
1. Report on the Assessment of Institutional Skills of MSPFC, May 2008, CICO-CReDO for
UNICEF, 2. Report on Assessment of Institutional Skills of MoH, May 2008, CICO-CReDO for UNICEF, 3. Report on Assessment of Institutional Skills of MEY, May 2008, CICO-CReDO for UNICEF, 4. Annual Budget 2005, 06, 07, 08, the Government of the Republic of Moldova,
5. Social Insurance Budget 2005, 06, 07, NSIH,
6. MTEF 2008-10, 09-11, Ministry of Finance,
7. Social Annual Report, 2006, 07,
8. Annual Health Care Report, 2006, 07,
9. Institutional and Financial Reports: NSIH, MSPFC, 06, 07,
10. Institutional and Financial Reports: MoH, SPCPM, SMC, MA, NCHEA, 06, 07,
11. Institutional and Financial Reports: MEY, 06, 07,