social capital across the life course: age and gendered patterns of network resources
TRANSCRIPT

1
<LRH>McDonald and Mair
<RRH>Social Capital Across the Life Course
<AT>Social Capital Across the Life Course:Age and Gendered Patterns of Network
Resources1
<AU>Steve McDonald2 and Christine A. Mair2
<ABS>
Despite increasing research interest in network dynamics and cumulative
advantage/disadvantage processes, little remains known about how social capital varies across
the life course. While some researchers suggest that social capital increases with age and others
argue the opposite, this study tests these contradictory assertions by analyzing multiple indicators
of social capital from a nationally representative data set on working-age U.S. respondents. The
findings reveal evidence of both social capital accumulation and decline. Social resources from
occupational contacts tend to increase with age, but eventually level off among older
respondents. Changes in voluntary memberships follow a similar pattern. However, daily social
interaction is negatively associated with age. Overall, the results suggest that social capital
embedded in occupational networks tends to accumulate across the career, even in the face of a
general decline in sociability. The study also uncovers gender differences in these social capital
trajectories that are linked to the distinct life experiences of men and women.
<end ABS>
1Data cited here were collected in the thematic research project, �Social Capital: Its Origins andConsequences� (Grant No: AS-94-TP-Co2; Grant Period: 2004�2007). The project was conducted by theInstitute of Sociology, Academia Sinica, with pilot funding sponsored by the Research Center forHumanities and Social Sciences, Academia Sinica. The principal investigators are Nan Lin, Yang-chih Fu,and Chih-jou Jay Chen. Special thanks to Nan Lin for providing access to the data. An earlier version ofthis article was presented at the International Conference on Social Capital in Taipei, Taiwan. We areindebted to David Warner, Feinian Chen, Glen Elder, Nan Lin, Bonnie Erickson, and Ron Burt for thehelpful comments they provided on an earlier draft of the article. Also, thanks to Karen Cerulo and theanonymous reviewers for their comments and criticisms, which helped to substantially improve this study.

2
<KW>KEY WORDS: biographical and historical context; gender; life course; social capital;
social networks; work.
<H1>INTRODUCTION
Sociologists have recently focused much attention on identifying and explaining patterns
of resource accumulation across the life cycle (for a review, see DiPrete and Eirich, 2006).
Researchers have found, for example, substantial divergence in health (Dupre, 2007; Willson et
al., 2007) and economic resources (Alon and Haberfeld, 2007; Maume, 2004) over the course of
careers. However, little is known about life-course patterns of social capital�that is, resources
embedded within social relationships (Lin, 2001). Insight into trajectories of social capital would
aid in understanding how people navigate the various spheres of their lives (e.g., work, family,
and educational spheres). Furthermore, life-course trajectories of social capital may contribute to
broader patterns of cumulative advantage/disadvantage (O�Rand, 2006), as well as persistent
gender and race inequities, as many have argued (e.g., Bourdieu, 1986).
Despite the increased interest in these processes, few have explored the nuances of social
capital change across the life course; rather, most of the research on social networks has remained
preoccupied with examining how static network configurations and features explain various
outcomes (Smith-Doerr and Powell, 2005). Among the studies that have examined network
change, many focus on examining average changes across history or over time rather than linking
changes in networks to age-related processes. Consequently, such research lacks sensitivity to the
ways that social relationships are structured by age. Research in the social support literature has
examined age variation in social capital (e.g., Cornwell et al., 2008; Kalmijn, 2003), but these
studies examine strong ties to network contacts, which tend to be less salient than weak ties for
understanding attainment processes (Granovetter, 1973). The few studies that focus on change in
work contacts are limited in their generalizability and/or focus on single-item indicators of social
capital. In the end, the findings from the disparate literatures on social capital change over time
have led to a host of contradictory conclusions: some researchers have suggested that social
2Department of Sociology and Anthropology, Box 8107, North Carolina State University, Raleigh, NorthCarolina 27695-8107; e-mail: [email protected].

3
capital tends to accumulate with age (Bridges and Villemez, 1986), others have argued that social
capital tends to depreciate with age (Coleman, 1990; Kalmijn, 2003; Wellman et al., 1997), and
others have suggested both accumulation and decline (Erickson, 2003; Lambert et al., 2006).
Moreover, prior empirical research on variation in occupational contacts has paid relatively little
attention to how patterns of social resource accumulation might vary by gender, despite the
importance of these differences for explaining gender inequality.
The current investigation attempts to overcome the limitations of prior research by using
a nationally representative sample of U.S. residents age 22�65 to examine age variation in social
network resources. Our examination is focused on (but not limited to) occupational network
resources measured via the position generator approach to collecting network data (Lin et al.,
2001; Lin and Dumin, 1986). Prior research indicates that these work-related connections are
highly associated with status attainment (Lin, 1999), whereas emotionally strong connections and
neighborhood contacts can have negligible or even deleterious effects on status attainment
(Elliott, 1999; Smith, 2000). The data analyzed here contain detailed information on the
characteristics of occupational network members, although the cross-sectional nature of the data
limits our ability to distinguish aging trajectories from period and cohort effects. Nonetheless, the
findings are consistent with prior research and robust across various indicators of social capital.
The results suggest that highly valued work-related social resources tend to accumulate over the
course of careers, with diminishing levels of social capital among the most senior respondents.
Voluntary association membership follows an identical pattern. At the same time, the average
amount of daily contact is negatively associated with age. This highlights an important paradox�
that the overall level of social interaction declines across the adult life course, while employment
and work connections expand. The analyses also identify many gender differences in the form of
the relationships between age and social capital, suggesting that gendered careers structure social
capital accumulation processes. The gender differences offer little support for the notion that
women�s work-based social resource trajectories are any more sporadic than men�s, although
patterns of daily contact do appear to be more discontinuous for women than for men.
The article proceeds with a theoretical justification for our analyses. We link the study of
social capital as network resources (Lin, 2001) to a life-course approach aimed at understanding
changing lives within biographical and historical context (Elder and Shanahan, 2006). Next, we
4
describe the empirical research literature on change in social capital and social networks across
time, focusing on the research that has examined age-based social capital trajectories. Based on
the findings from these studies, we develop a set of hypotheses regarding age and gender
variation in social capital, which serves as the basis for our empirical examination.
<H1>SOCIAL CAPITAL AND THE LIFE COURSE
Noting the static character of network studies, Smith-Doerr and Powell (2005) emphasize
the need to incorporate principles of the life course into the study of social networks and
economic life. The life-course perspective is highly compatible with a relational approach to
understanding human behavior (see Emirbayer, 1997). Life-course theory explicitly notes that
lives are lived interdependently (Elder and Shanahan, 2006). An individual�s opportunities are
linked to the fortunes of other people with whom he or she is associated. A life-course
perspective is also useful for understanding how access to social capital is embedded within a
broader set of social and historical processes. Specifically, the theory recognizes that aging is a
lifelong process that is path dependent and cumulative in nature (Elder and Shanahan, 2006;
O�Rand, 2006). People tend to accumulate experiences and resources as they age. Of major
interest then are life-course trajectories�the sequences of related events or experiences in
individual lives (Elder, 1985). Life-course trajectories set people on specific paths in life, helping
individuals to garner experiences, skills, and resources that ultimately structure future
opportunities and decision making. Though path dependent, aging is an agentic process�
individuals are capable of making subtle or even dramatic changes to the paths they are on (Elder
and Shanahan, 2006). Transitions refer to the distinct events in life that denote changes in the
trajectories of social roles. Life-course research is broadly interested in the timing, duration, and
sequencing of trajectories and transitions in people�s lives.
In recent years, life-course research has paid increasing attention to issues related to the
advantages and disadvantages that tend to accumulate as people age (DiPrete and Eirich, 2006).
O�Rand (2006) describes four specific types of capitals (human, social, health, and personal) that
accrue to individuals over the life course. She explains that researchers need to learn more about
the trajectories of these life-course capitals and how they are related to wealth, well-being, and

5
mortality. Also, the specific types of trajectories�such as time based or age based�matter a
great deal. To understand inequality, it is necessary to understand how the accumulation,
maintenance, and erosion of resources are linked to age-related processes. Resource accumulation
and decline are associated with aging processes�which result from the consequences of getting
older�as well as the various events and experiences (such as education, employment,
childbearing, and retirement) that do not occur randomly throughout life, but are instead
fundamentally structured by age (cf. Settersten, 2003). Therefore, research on life-course capitals
should examine age-based trajectories of life-course capitals that follow changes in resource
accumulation as people age. Age-based trajectories are distinct from time-based trajectories,
which describe changes in resource levels over a fixed period of time that is not linked to aging
(George, 2009), or from historical trajectories, which assess changes in attributes across calendar
time. Age-based trajectories are useful because they anchor changes in resource levels to the
context of aging, linking the possession of resources to the life stages people experience.
This study explores age-based trajectories of social capital. Consistent with other scholars
(e.g., Flap and Volker, 2001; Lin, 2001), we view social capital as a set of resources accessible
through social networks. People invest in social relationships for both instrumental and
expressive purposes and tend to receive a variety of benefits from developing and maintaining
these relationships. As such, the resources embedded in social networks (such as information,
influence, status, and support) serve as social capital from which the individual may further invest
in or draw on when needed (Lin, 2001). The theory is not explicit about how social capital might
vary across the life course; it only notes that individuals seek to invest in their social relationships
whenever possible. Although interest in social network dynamics has increased in recent years,
relatively few studies to date have empirically examined change in social capital as people age.
Among those studies that have explored changes in social capital, the changes have rarely been
linked to age-related processes. The approaches to studying social capital change are briefly
outlined here.

6
<H1>HISTORICAL AND TIME-BASED TRAJECTORIES OF SOCIAL CAPITAL
Much empirical research has examined how social capital has changed over time. For
example, Putnam�s (2000) contention that social capital is on the decline in the United States has
garnered a great deal of attention in the empirical research literature. This line of research focuses
on trends in social relationships, trust, and voluntary association memberships across historical
time rather than focusing on how social capital changes across the life course (see, e.g., Paxton,
1999). The same can be said for the more recent debate on the extent of social isolation in the
United States, which maps historical changes in social networks across several decades
(McPherson et al., 2006). Consequently, these studies attempt to answer questions about
historical trajectories rather than age-based trajectories of social capital. Other studies have
examined change in occupational networks across historical time. For example, researchers have
examined how the transition from state socialism to a market-based economy influenced the
nature of occupational networks and their effectiveness in Eastern Europe (Angelusz and Tardos,
2001; Yakubovich and Kozina, 2000).
Another line of research examines changes in networks over time, but does not link these
changes to age or to history. Drawing from a sample of investment bankers, Burt (2000) finds that
social ties are subject to a high level of �decay� or disintegration. Newly formed ties and ties that
are weakly embedded in a given network are more likely to decay (or tend to decay at a faster
rate) than other ties (Burt, 2000, 2002). Social capital tends to accumulate for those who start out
with high levels of social capital and decay is less frequent among those with strong social
capital, such as high-performance bankers. Although these studies are the only examples that
describe and explain individual change in occupational networks over time, they do not address
the issue of change in social capital across the life course, as the ages of the workers in the sample
varied widely.
<H1>AGE-BASED TRAJECTORIES OF SOCIAL CAPITAL
Research on friendship and social support networks has focused more attention on life-
course patterns of social capital. Research in this tradition has examined the ways age, family

7
transitions, career transitions, and historical events affect network configurations. The results
show that life-course transitions can result in major network disruption. Friendships are formed
quickly and easily at young ages (Cairns and Leung, 1995). Drastic transitions, such as those
from grade school to junior high, for example, result in a major upheaval of social networks,
leaving some individuals vulnerable to a lack of emotional support (Cantin and Boivin, 2004).
Prior research suggests that friendship networks tend to shrink as people age (Kalmijn,
2003; Wellman et al., 1997). Socioemotional selectivity theory suggests that older individuals
who have accumulated knowledge and information over the life course are less likely to engage
in social interaction for the sake of information sharing as they age (Carstensen, 1995). Labor
force participation results in more homogeneous networks (Bidart and Lavenu, 2005) and greater
network density leads to higher retention of contacts over time (Martin and Yeung, 2006).
Network reduction with age may therefore reflect the reduction of information-based ties, such as
work acquaintances, rather than the loss of emotion-based ties, such as confidant friendships,
which tend to persist across the life course (Fung et al., 2001). Despite a general decline in
contacts across the life course, older individuals tend to experience increases in neighborhood
socializing, religious attendance, and volunteering from age 57 to 85 (Cornwell et al., 2008) and
older individuals demonstrate a high level of flexibility and adaptability in the maintenance of ties
over time (Wenger and Jerrome, 1999).
Friendship network structure and composition also varies by gender. Women tend to have
greater contact with friends and family than do men (Kalmjn, 2003). Friendship networks also
fluctuate across time as people experience more pronounced changes in their relationships
following major life-course transitions, such as marriage and parenthood. In general, cohabitation
and marriage are associated with a net decline in network friends and contacts (Bidart and
Lavenu, 2005; Fischer and Oliker, 1983; Kalmijn, 2003). At the same time, the percentage of
friends and contacts that a couple shares between each other increases over time (Kalmijn, 2003).
For women, compared to men, the transition to parenthood is associated with a lower percentage
of friend overlap with a spouse (Kalmijn, 2003).
Gendered patterns of labor force participation also influence network characteristics
across work careers. Women tend to have more discontinuous work histories than do men (Han
and Moen, 1999), which can result in lower financial returns and poorer occupational mobility

8
(Parks-Yancy et al., 2006). Also, women�s social capital is particularly vulnerable to changes in
socioeconomic status (Ajrouch et al., 2005). Stronger attachment to the workplace among men
affects their participation in volunteer organizations, an important form of social capital (Son and
Lin, 2008). Men�s work histories are strongly tied to their organizational associations (Rotolo and
Wilson, 2003) and men are less likely than women to participate in expressive forms of civic
action, such as community preservation (Son and Lin, 2008). Although women entering the labor
force gain more opposite-sex friends in their networks compared to men (Kalmijn, 2002), women
are significantly less likely than men to obtain a job through a social capital resource (Parks-
Yancy et al., 2006). Women are more likely to be enmeshed in kin-based networks (Fischer and
Oliker, 1983; McPherson et al., 2006) and even professional women are less likely than men to
socialize with co-workers due to kin-related time constraints at home (Walker, 1990). However,
some research suggests that women employed in higher-status positions tend to retreat from kin-
based networks and become more involved in caring for friend-based contacts (Gerstel, 2000),
many of which may have been formed in the workplace. Yet despite this pattern of reduced
proportion of kinship ties, women in high-status jobs may continue to be isolated from elite
networks (Moore, 1988). Qualitative research on the general population shows that men still have
greater access to social capital and reap more benefits from it (Parks-Yancy et al., 2006), an
effect that likely accumulates across the life course.
Other structural changes related to life-course events, such as parenthood or retirement,
may actually benefit female networks. Although children can be a significant drain on financial
capital, they may act as a form of social capital (Schoen and Tufis, 2003), motivating both
married and single individuals to participate in parenthood (Schoen et al., 1997). Parenthood can
facilitate access to new types of social networks via child-care facilities, informal play-groups,
and other volunteer associations. Because of the gendered division of labor within the home,
women may have better access to volunteer memberships associated with parenthood than will
men. Retirement is also an important life-course transition with gendered outcomes, as it brings
an increase in social ties for women as they gain more friendship connections. Since men are
more likely than women to have social networks based primarily in the workplace, they may
experience network reduction in the transition to retirement (Fischer and Oliker, 1983).

9
To summarize, this line of research demonstrates that social support networks (1) tend to
shrink as people age, (2) are sensitive to life-course transitions, and (3) are structured by gender
and family/work career trajectories. There are, however, a number of limitations of this research.
First, these studies have tended to rely on data from age-specific samples (e.g., Cairns and Leung,
1995; Cornwell et al., 2008), which are unable to fully assess age variation in social capital.
Second, the studies have questionable generalizability for the U.S. context, since the samples are
typically not nationally representative. Third, none of these studies have directly addressed issues
related to changes in occupational networks over time. Rather, these studies focus exclusively on
changes in close friendship ties rather than work-related ties.
The existence and effectiveness of work-related social connections should vary across the
life course, as suggested by research that has examined the importance of timing for conditioning
the effects of social capital. For example, prior research demonstrates that the impact of social
connections on employment outcomes depends on relationship duration (Rhee, 2007), on the age
of the respondent (McDonald and Elder, 2006), and on the interaction between age and
relationship typology (Moerbeek and Flap, 2008).
The number of studies that have examined variation in work-related social resources
across age is quite small, but they all suggest a curvilinear relationship. Research on a sample of
white-collar workers finds that younger and older individuals tended to have the least amount of
diversity in their networks (Lambert et al., 2006), suggesting a curvilinear relationship between
social capital and age. Using data from the Canadian Federal Election Study, Erickson (2003)
also finds that diversity in occupational resources tends to increase with age and then declines
over time. Age-related differences in social capital have also been explored with respect to
voluntary organization memberships, which are often linked to occupational environments and
careers (Rotolo and Wilson, 2003). Putnam�s (2000) analysis of the General Social Survey shows
an inverted U-shaped relationship between age and voluntary association memberships. Popielarz
and McPherson (1995) examine turnover in voluntary group memberships, finding that turnover
decreases with age at a decreasing rate.
These studies are useful because they point to patterns of the accumulation and decay of
work-related contacts over the life course and the contingency of social capital effects on the
timing of employment transitions and relationship formation. However, the evidence is far from

10
conclusive. As with the social support literature, the studies are subject to questionable
generalizability to the U.S. context due to nonrepresentative and/or age-specific sampling. Also,
the analyses tend to rely on singular indicators of social capital, which make the results
vulnerable to idiosyncratic variation in measurement, a serious concern when attempting to
measure a complex and multidimensional concept like social capital. Furthermore, the results
from the two literatures imply that work-related and non-work-related social resources may move
in opposite directions across the life course, which highlights the need to examine both forms of
social capital simultaneously. Finally, more attention needs to be focused on gendered patterns of
network change over time. Given the substantial differences in the life-course experiences of men
and women and the consequences for gender inequality, research should examine how trajectories
of social capital vary for men and women.
<H1>HYPOTHESES
The empirical investigation presented here attempts to build on these prior studies by
utilizing a nationally representative sample of the United States to examine age variation in social
capital and how these life-course patterns vary by gender. We explore a number of
operationalizations of social capital. To begin with, we focus on resources embedded in
occupational networks because (1) relatively little research has examined change in occupational
networks across the life course and (2) these resources are most salient for attainment processes.
In addition to examining the quantity and quality of occupational networks, we also analyze a
number of other features of occupational networks: gender, closeness, density, and trust. The age
patterns for these occupational network resources are also compared to changes in daily contact
and voluntary association membership.
First, we hypothesize that social capital varies across the life course. Based on evidence
from prior empirical investigations, we expect to find a steady accumulation of resources
embedded in occupational networks, though these resources should level out and decline at more
advanced ages (Erickson, 2003; Lambert et al., 2006). Second, research on friendship and social
support networks has found the reverse: declining socialization with age (Kalmijn, 2003;
Wellman et al., 1997). Therefore, we hypothesize that age is negatively associated with daily

11
contact. Finally, prior research suggests that men and women display unique patterns of
socialization over the life course due to gendered careers (Fischer and Oliker, 1983; Han and
Moen, 1999; Kalmijn, 2002). Consequently, we expect to find gender differences in the
relationship between age and social capital. More specifically, the relationship between age and
social capital should be mostly linear for men, whereas the relationship between age and social
capital among women should be more often nonlinear or insignificant, given the greater
discontinuities of women�s work career patterns relative to men. These hypotheses are formalized
below.
<H>
H1: On average, the relationship between age and work-related social capital should be
curvilinear, with social capital increasing across the career followed by leveling off and declining
at advanced working ages.
H2: On average, the relationship between age and daily contact should be negative.
H3: Men and women should experience distinct age-based social capital trajectories, with
men experiencing linear patterns of social capital accumulation/decline and women experiencing
nonlinear patterns of social capital accumulation/decline.
<end H>
<H1>DATA AND METHODOLOGY
We use data from the Social Capital-USA (SC-USA) survey. SC-USA is a national,
random-digit-dialed (RDD) telephone survey of adults in the United States age 22�65 who were
currently or previously employed. The survey was specifically designed to examine social capital
and was part of a three-society (the United States, China, and Taiwan) study, jointly sponsored by
Academia Sinica, Taiwan, and Duke University. The survey was administered from November
2004 to March 2005, averaged 35 minutes to complete, and resulted in 3,000 completed
interviews. The response rate (43%) is comparable to other recent national RDD surveys (see
Groves et al., 2004). To assess the potential bias due to nonresponse, parameter estimates from
12
SC-USA were compared to those obtained from the March 2005 Current Population Survey
(limited to respondents age 22�65). Few significant differences were found, although SC-USA
respondents are more highly educated than the CPS respondents. Therefore, sample weights were
constructed (using the rake procedure in Stata) to match the gender, race, age, marital status, and
education characteristics of SC-USA to the CPS estimates. The sample weights are employed in
the analyses presented here to ensure generalizability. Five cases do not have valid weights due to
missing values and are therefore excluded from the analyses.
<H2>Measurement
The weighted means for the variables used in this analysis are presented in Table I. This
study focuses on age and gendered patterns of social capital. Age is calculated based on the self-
reported year of birth. The sample ranges from age 22 to age 65. We compute squared and cubic
age terms to capture curvilinear variation in the dependent variables across age. Gender also
serves as an independent variable in the analysis and is measured as a dummy variable (female =
1, male = 0).
[NOTE: Place Table I near here.]
The remaining eight variables are measures of social capital and serve as the dependent
variables for the analyses. Most of these variables are drawn from the position generator
methodology, which measures the characteristics of occupational networks (Lin and Dumin,
1986; Lin et al., 2001). The position generator measures resources embedded in occupational
social networks by identifying access to contacts in a list of 22 occupations. Each respondent is
asked: �Do you know anyone among your relatives, friends, or acquaintances that has one of the
following jobs? (�Knowing� means that you and the person can recognize and greet each other. If
you know several persons that have a particular job, please name the person that comes to mind
first.)� The list of jobs is designed to capture the scope of positions in the occupational hierarchy:
from janitors and hairdressers to lawyers and CEOs. Upon identifying a contact with a particular

13
job, respondents are asked a series of follow-up questions about the characteristics of the position
occupant.
We calculate a number of variables based on these questions. First, we calculate a
measure of social resources that taps into the quantity and quality of positions accessed through
occupational networks. Extensity is a measure of the total number of positions accessed by
respondents. Quality is measured by upper reachability of network contacts�that is, the highest
prestige score of the occupations to which respondents had access (using the Standard
International Occupational Prestige Scale). Extensity and upper reachability are highly correlated
(r = .62) and are therefore combined into a single social resource index using principal
component factor analysis with varimax rotation. The factor score was recoded such that values
range from 0 to 5.96, with a mean value of 3.36.
We also include a measure of the proportion of contacts mentioned in the position
generator. The variable ranges from 0 to 1 and is equal to the number of male contacts mentioned
divided by extensity. Male contacts serve as an important source of social capital in the work
sphere given persistent occupational sex segregation (Tomaskovic-Devey et al., 2006) and the
relatively low authority levels maintained by women in the workplace (Smith, 2002).
Consequently, male contacts are more likely to provide access to high-wage jobs (Smith, 2000).
Respondents were also asked about how close they are to each person they mentioned. The
closeness variable was recoded (such that 1 = not close at all, 2 = not close, 3 = so, so, 4 = close,
and 5 = very close) and the average closeness of all contacts mentioned in the position generator
was calculated. The resulting continuous variable ranges from 0 (for individuals with access to
zero positions in the generator) to 5 (for people who reported only very close occupational
contacts).
Density of occupational networks is gleaned from a question asking: �Among the above
people you mentioned [in the position generator], how many know each other?� Higher values on
the density variable indicate a greater degree closure among network contacts. This ordinal-level
variable ranges from a value of 0 (no contacts know each other) to 4 (all contacts know each
other). Trust is measured in a similar way. Respondents were asked: �Among the above people
you mentioned [in the position generator], how many can be trusted?� The values on the trust
variable range from 0 (none can be trusted) to 4 (all can be trusted).

14
We also examine a question on daily contact, which identifies the number of people that
each respondent interacts with in a typical day. The variable spans from a value of 1 (0�4 people)
to 6 (more than 100) and has been shown to be related to expressive and instrumental network
dimensions of other social capital indicators (Fu, 2005). A follow up question asked: �Among
those [daily contacts], how many of those do you make contact with because of work?�
Responses vary from �almost none� (0) to �almost all� (4). This variable serves as an indicator of
work-related contacts. Finally, we include a measure of the number of memberships in voluntary
organizations, which is a count of up to 10 different types of organizations. These include
memberships in political parties, labor unions, professional organizations, religious groups,
leisure/sports/cultural groups, charities, neighborhood organizations, school/PTA organizations,
ethnic/civil rights organizations, or other voluntary organizations.
In the subsequent analyses, the sample size depends on the missing values on the
dependent variables, since the independent variables (age and gender) contain no missing values.
The only variable with substantial missing data (i.e., greater than 7%) is the work-related contact
variable, which is explained by the fact that responses from nonemployed individuals were coded
as �not applicable.� Therefore, the results for work-related contact refer only to currently
employed individuals.
<H2>Analysis
The analysis is divided into three steps. First, the social capital trajectories are presented
graphically to provide a visual representation of how social capital varies across the life course.
Second, the form of the relationship between age and social capital is modeled using ordinary
least squares regression (for continuous dependent variables) and ordinal logistic regression (for
ordinal dependent variables). Third, analyses are split by gender to identify similarity/difference
in the form of the relationships between age and social capital. The figures and tables are
organized according to these three steps, but we describe all three steps for each dependent
variable before moving to the next variable. The dependent variables derived from the position
generator questions are presented first (social resources, proportion male contacts, closeness,
density, and trust). These variables refer specifically to social capital embedded in the

15
occupational networks of respondents. The remaining dependent variables refer to a broader set
of social interactions (amount of daily contact, proportion of daily contact that involves work) as
well as group membership in voluntary organizations. To reiterate, these variables are used to
assess the extent to which: (1) work-based social capital tends to accumulate with age and then
decline among older individuals; (2) daily contact tends to decline across the life course; and (3)
women experience greater discontinuity than do men in their patterns of social capital
accumulation.
<H1>RESULTS
Figures 1 and 2 present visual evidence of how social capital varies across different age
groups. The first figure (Fig. 1A) [AUTHOR: Please note that Fig. 1 is separated into only 1B
and 1D.] graphs the relationship between age and the social resources factor score. Social
resources increase steadily with age, though additional returns to age tend to diminish to the point
where social resources peak (age 46�50) and then drop off among the 50+ population. This
pattern is consistent with our expectations. Interestingly, there is a slight uptick in social
resources among the oldest age group. The functional form of the relationship is modeled using
ordinary least squares regression (see Table II). The best-fitting model includes both a linear age
term and a squared age term. The significant positive age effect captures the pattern of social
resource accumulation with age, while the significant negative age squared effect highlights the
diminishing returns to age among the older respondents. The summary from Table III shows that
this pattern holds for both males and females in the sample. This is illustrated by the positive
linear age term, negative squared age term, and insignificant cubic age term.
[NOTE: Place Figs. 1 and 2 and Tables II and III near here.]
The relationship between age and the proportion of male contacts is displayed in Fig. 1B.
Again, the results reveal a curvilinear relationship: initial steep decline in male contacts followed
by a steady increase to the oldest age group. Overall, this evidence is consistent with prior
expectations. The best-fitting form of this relationship is a positive linear relationship that

16
captures the steady increase in male contacts with age. The results in Table III, however, show
that this relationship is significant for women only. For men, the relationship between age and
proportion of male contacts is statistically insignificant.
The average closeness of occupational networks tends to diminish over time (see Fig.
1C). [AUTHOR: Please note that Fig. 1 is separated into only 1B and 1D.] After an initial rise
from age 22�26 to 27�30, closeness declines and tends to level off around age 46�50. The
significant negative linear age effect best captures this pattern of declining closeness across age
groups (see Table II). The relationship between age and closeness, however, is conditioned by
gender. Only men experience this significant decline in closeness across the life course. Patterns
of network density across age are similar to closeness. Figure 1D shows a general decline in
density, with a steep drop between ages 27 to 40. The decline in closeness and network density
across the life course provides further evidence of the accumulation of social capital in the form
of weakly tied and loosely connected network contacts. Using ordinal logistic regression, we find
that the best fit for the form of the relationship between age and density uses both linear and
squared age variables. The significant negative effect captures the rapid decline in density in the
first half of the work career, whereas the positive squared term illustrates the leveling off of the
effects during the second half of the work career. The gender-specific models (see Table IV)
[AUTHOR: Note that no Table IV was included in my copy of the manuscript.] indicate that
the curvilinear relationship is best for men only. For women, density declines across the career
with less leveling at the end of the career than for men.
[NOTE: Place Table IV near here.]
[AUTHOR: Note that no Table IV was included in my copy of the manuscript.]
Figure 2A [AUTHOR: Please note that Fig. 2 is separated into only 2B and 2D.]
shows that, in general, older respondents are more likely than younger respondents to perceive
their occupational contacts as trustworthy. However, the increase in trust is not consistent across
all age groups. There is an early rise in trust from age 27 to 45, followed by a sharp drop in trust
for the 46�50 age group, and then a steady rise in trust again among the oldest age groups. The
linear pattern of increasing trust across age is confirmed with ordinal logistic regression (see

17
Table III). The results show that, on average, each additional year is associated with higher levels
of trust in occupational networks. Splitting out the results by gender, however, shows that
increasing trust with age is significant for women, but not for men.
The results also show a general decline in the amount of daily contact in which people
engage, though again the pattern is not entirely linear (see Fig. 2B). The highest levels of daily
contact are among the youngest age group. Daily contact dips among 27 to 35 year-olds, then
rises among 36 to 40 year-olds, and steadily declines thereafter. Using OLS regression, the age
pattern of daily contact is best captured by a negative linear term for age (see Table III). Further
analyses summarized in Table IV [AUTHOR: Note that no Table IV was included in my copy
of the manuscript.] reveal gender differences in the form of the relationship between age and
daily contact. For men, the daily contact relationship is best described as linear. For women, the
best-fitting model contains a negative coefficient for the linear age variable, a positive coefficient
for the age * age variable, and a negative coefficient for the age * age * age variable (all of which
are statistically significant). In short, this model predicts an S-curve characterized by an initial
decline, then increase, and finally a decline in daily contact across age. This suggests greater
fluctuation in the daily contact of women across the life course.
Age patterns of daily social interaction are distinct from changes in work-based
interaction. Figure 2C [AUTHOR: Please note that Fig. 2 is separated into only 2B and 2D.]
tracks the proportion of daily contact that is work related and shows a pattern that is more
consistent with what was found for the variables constructed from the position generator. That is,
the proportion of work-related contact tends to increase with age and levels off around age 46. In
spite of the diminishing returns, the ordinal logistic regression model with a single linear age
variable produced the only statistically significant coefficient. Both men and women display
similar linear increases in work-related contact across age.
Finally, we examine age variation in the number of voluntary organization memberships.
Here, the figure shows steady increases in memberships early in the life course, diminishing
returns and a reversal of the trend during the middle years, followed by a slight uptick in
memberships among the oldest age group. This pattern is strikingly similar to what was found for
the social resource factor score. Results from OLS regression show that the relationship is best
described with a positive linear age term and a negative squared age term, which captures the

18
parabolic form of the relationship between age and memberships. Further elaboration by gender
in Table IV [AUTHOR: Note that no Table IV was included in my copy of the manuscript.]
shows a similar relationship for both men and women.
<H1>DISCUSSION
The current study investigates age variation in social capital and the extent to which these
patterns may be conditioned by gender. The analyses are admittedly more descriptive than
explanatory. However, unlike any previous research, our study maps the broad patterns of social
capital variation across the life cycle in a sample nationally representative of the United States.
Furthermore, we use a variety of different social capital indicators and ultimately identify the
general features of social capital accumulation and decline. The results are generally consistent
with our hypotheses. First, social capital embedded in occupational networks tends to accumulate
with age, but eventually levels off (and may also decline) in later ages. Second, daily contact
tends to decline with age. Third, the social capital trajectories generally display distinct patterns
by gender, although the trajectories of work-related social capital of women appear to be no more
discontinuous than those of men. We offer a more explicit interpretation of the results below.
<H2>Age Variation in Social Capital
Both the quantity and quality of occupational networks (as measured by the social
resource factor score) tend to increase with age. Therefore, this finding suggests that social capital
tends to accumulate across the life course. These findings are consistent with prior research
suggesting that work-based social capital increases with experience (Lambert et al., 2006).
However, social resources also appear to level off or decline in later ages (Erickson, 2003). The
age-based trajectory for the social resources factor score is virtually identical to what was found
for voluntary organization memberships. Recent research has identified voluntary organizations
as useful sources of social capital. Extensive work histories and attachment to the labor force are
associated with participation in volunteer organizations (Rotolo and Wilson, 2003; Son and Lin,

19
2008). Voluntary organizations and associations provide opportunities for developing diverse
occupational contacts.
At the same time, the results for social resources and for voluntary memberships reveal a
slight uptick in social capital among the 56�65 age group. This finding is consistent with recent
evidence from the National Social Life, Health and Aging Project (NSHAP), which show an
increase in volunteerism among recent retirees (Cornwell et al., 2008). Also, Moen (2005) notes
that work careers often involve �second acts,� during which people retire from high-pressure jobs
to take on more flexible, enriching work roles. The engagement in �second acts��whether this
takes the form of new work roles or increasing group membership�often results in the making of
new friends and acquaintances. As such, the later life increases in social resources and
organizational memberships are likely explained by life-course patterns of career renewal or
retirement-related transitions. Alternatively, the increase in social resources and volunteer
memberships among the older respondents may also reflect generational differences, resulting
from greater overall civic involvement of the World War II �greatest generation� (Mettler, 2007).
The positive association between age and access to male occupational contacts provides
further support that social capital tends to accumulate across the work career. Female-dominated
occupations (e.g., service and clerical) are common in the early part of careers, while increasing
occupational attainment may lead individuals to male-dominated workplaces, which offer greater
wages and benefits. The steady accumulation of male contacts after age 30 could indicate
movement from female-dominated job types to male-dominated job types with age. Alternatively,
this pattern may reflect changing labor market conditions over time. For example, the decline in
male-dominated manufacturing jobs, the rise in the female-dominated service sector, and
increasing female labor force participation could all contribute to lower proportions of male
contacts in occupational networks among younger cohorts. The relatively high proportion of male
contacts among young adults age 22�26 is more difficult to explain. This may be related to
gender differences in labor force participation or networking behavior among this age group.
Closeness and density are negatively associated with age, further suggesting social capital
accumulation. Both factors are empirically correlated and strength of ties has often been used as a
proxy measure of network density (Burt, 1992). Decline in closeness suggests a general
weakening of ties to occupational contacts across the life course. Weak ties are useful in labor

20
market contexts since they are more likely to provide access to nonredundant information about
employment opportunities (Granovetter, 1973). Further, less dense networks contain structural
holes (Burt, 1992), which are useful for brokering exchanges. The findings suggest that as
individuals gain greater work experience, their occupational networks expand and diversify,
resulting in broader yet more weakly tied networks. Although closeness and density tend to
decline with age, there is evidence of a closeness peak during the late 20s. This early peak may
reflect a hold-over effect from close school-related friendships that later diminish (Cantin and
Boivin, 2004).
Trust in occupational contacts is positively associated with age, which could be
interpreted two ways. Individuals could develop greater trust in their contacts over time or they
could eventually rid their networks of untrustworthy contacts. Both processes (which are not by
necessity mutually exclusive) would result in an increase in average network trust. Regardless of
the process involved, increases in trusting relationships can provide greater access to social
capital, as trust often facilitates the receipt of instrumental support and career sponsorship
(Seibert et al., 2001; Smith, 2005). The findings from the SC-USA data also show a drop in trust
around age 46, which might reflect a historical shift in trust. However, the trend does not mesh
with prior assertions that trust in others has declined in successive cohorts (Putnam, 2000), which
would predict that the later cohorts would have substantially higher levels of trust in their
network contacts than earlier contacts.
Whereas most of the indicators reveal a pattern of social capital accumulation with age,
daily contact is negatively associated with age. This finding is consistent with prior research that
also suggests that social interaction tends to decline with age (Kalmijn, 2003). At the same time,
daily contact that is directly related to work activities increases over time and levels off around
middle age. When taken together, this reveals an interesting paradox: that social interaction
generally declines, but work contact and voluntary organization membership tend to increase
across the life course. This may seem counterintuitive at first glance. However, engaging in social
interaction is quite different from knowing people and being affiliated with groups. The results
presented here suggest that while social networks and organizational affiliations tend to expand
across the life course, people tend to interact with other individuals less frequently as they age.

21
When taken together, the results offer strong and consistent evidence of age-based
structuring of social capital. While we do not deny that generational differences influence life-
course patterns of social capital, Putnam�s (2000) generational hypothesis is unable to fully
explain the patterns identified here due to several inconsistencies. First, the negative association
between age and daily contact runs directly counter to the idea that earlier generations engage in
more social interaction that younger cohorts; rather, these findings are more consistent with the
results from research on age-related patterns of social support. Second, the timing of generational
changes does not match the findings for the other dependent variables. Putnam (2000) argues that
the Boomer generation, born beginning in 1946, represents the beginning of the decline in social
capital and finds that successive generations report lower levels of social capital. Yet the results
presented here (and in subsequent analyses) show that social capital does not always increase
steadily from younger ages to age 59 (the edge of the Boomer generation). Specifically, the
unexpectedly low levels of social capital observed among the 51�55 age group for the social
resources, density, and voluntary organizations variables seems inconsistent with the generational
hypothesis, as does the low level of social capital among the 46�50 year-old group on the trust
variable. Furthermore, our results are strikingly similar to Putnam�s own analysis of the 1972�
1994 GSS data, which reveal a similar pattern of increase in voluntary organization memberships
with age, followed by decline and slight uptick immediately prior to retirement (Putnam,
2000:249). The consistency between the results from the GSS and the SC-USA data highlights
the importance of age-based explanations for social capital change across the life course.
<H2>Gendered Trajectories of Social Capital
The relationship between social capital and age is moderated by gender and may be
explained by the differential life-course experiences of men and women. While there is evidence
of gender consistency in the relationships between age and our social network measures, gender
divergence in these relationships is more common. For example, we find that the proportion of
male contacts increases with age for women but the effect for men is not statistically significant.
This finding helps clarify how social resources accrue differently to men and women by virtue of
their distinctive patterns of social participation in occupational environments across the work

22
career. Women begin with a deficit in male occupational contacts relative to men, but the gap
closes as they age. The early career gap in male occupational contacts may help explain the
slower rates of early promotion among women. The results presented here are consistent with
prior research. As noted earlier, Kalmijn (2002) has found that labor force attachment increases
the number of opposite-sex friends for women, but has no impact on the networks of men. Prior
research also indicates that women often move from female-dominated into male-dominated
employment, especially after experiencing life-course transitions such as having children or
exiting the work force due to family care-giving responsibilities (Rosenfeld and Spenner, 1992).
As women garner more work experience and climb the occupational hierarchy, they are also
likely to have more frequent interaction with male contacts. In the end, the increasing number of
male contacts among women could be due to changes in occupational environments (such as
women moving into male-dominated work environments) or to differential patterns of social
interaction (whereby women garner greater social legitimacy among their male co-workers) (see
Burt, 1998). Or both processes might operate simultaneously. Of course, these prior studies are
merely suggestive of the mechanisms driving these findings; panel analyses would be needed to
provide a more definitive explanation.
Feelings of closeness with occupational contacts decline with age, but only for men.
Trust in network contacts increases with age for women, while trust is unrelated to age for men.
The closeness and trust findings highlight the relative strength of ties between women and their
contacts (Fischer and Oliker, 1983; McPherson et al., 2006). However, these results also indicate
that the overall greater feelings of closeness and trustworthiness among women may be linked to
network changes occurring over the life course. Women may be more likely than men to maintain
their close connections to work contacts and to construct occupational networks of highly trusted
contacts. Alternatively, men may be more likely than women to develop brokerage opportunities
by garnering weak occupational connections. As for network density, both men and women
experience a general decline as they age, though men experience a small increase in network
density during the latter part of careers. This may serve as an indication of the formation of �old
boy� networks among men in later life�that is, dense male networks of influence that control
access to high-status positions within society (Saloner, 1985). Unfortunately, the nature of the
data makes it impossible to identify whether these patterns reflect gender differences in the

23
maintenance of existing relationships or in the development of new relationships. Such issues
would be important to explore in future research.
The above results indicate that men and women experience differing trajectories of social
capital; however, several other social capital indicators show no differences in the patterns for
men and women: social resources, work-based daily contact, and the number of organizational
memberships. Moreover, there is little evidence of greater discontinuity in women�s work-based
social capital trajectories relative to those of men. However, the findings indicate that while daily
contact declines with age at a linear rate for men, women experience an increase in daily contact
in mid-life. This is likely due to the mid-career transitions more commonly experienced by
women�such as childbearing and changes in career paths�which lead women into new social
milieus and have the potential for fostering an increase in social interaction (cf. Schoen and Tufis,
2003). Women often experience more discontinuities in their occupational trajectories compared
to men (Campbell, 1988), which leads to gendered patterns of social capital accumulation.
<H2>Future Directions
The findings presented here provide many opportunities for further elaboration. First, the
paradox of social resource accumulation coupled with the decline in daily social interaction
should be explored in greater detail. Holistic network data might be used to examine life-course
changes in social network structure and assess whether network expansion is concomitant with
peripheralization within networks as people age. Moreover, qualitative research could explore the
changing nature of social resource access and daily interaction within organizational
environments to determine the processes by which these changes occur. Also, it is not merely the
process of aging per se that is implicated here, but also the ways that life-course experiences are
structured by age (Settersten, 2003). In other words, it is not only �getting old� that matters, but
also the kinds of contexts that young, middle-aged, and elderly individuals take part in that are
consequential for the accumulation and decline of social capital. Specifying the events and
experiences that contribute to this paradox offers both challenge and promise for future research.
Second, additional analyses indicate that these social capital trajectories are more orderly
and consistent during the middle years and display greater variance earlier and later in adult lives.

24
This presumably reflects the transitional character of these times in people�s lives. The youth
labor market involves considerable �churning� or �milling about� (Gardecki and Neumark, 1998)
as individuals complete education and attempt to settle on a career. The late career period also
contains numerous transitions out of primary careers and into retirement, secondary careers, and
volunteering (Moen, 2005). Little is known about the role that social capital plays during these
particular transitions.
Third, the findings presented here reveal a striking congruence between social resource
trajectories and those of voluntary association memberships. This finding seems to suggest not
only that retirement transitions may affect both types of associations but also that participation in
voluntary organizations may be causally linked to the expansion of occupational networks
(Rotolo and Wilson, 2003). The link between voluntary organization memberships and
occupational network expansion may reflect unique mechanisms of social capital accumulation.
Also, future research should examine in greater detail how different types of organization
memberships affect social resources across the life course, as prior research has indicated that
various organizations can have distinct consequences for the density and diversity of social
relationships (Glanville, 2004). Future research should also explore the timing and implications of
network decay due to separating from organizations (Popielarz and McPherson, 1995).
Fourth, the explanations we provide for the gender differences in age-related patterns of
social capital identified in this article are largely speculative at this point and should be elaborated
on in future investigations. In particular, researchers should examine how family and work
events/histories contribute to gender-specific social capital trajectories and clarify not only how
social capital accumulates across the life course, but also how these patterns are associated with
other forms of resource accumulation (economic, educational, health, etc.) (O�Rand, 2006).
Divergence and convergence in social capital trajectories likely exists across other social groups
as well (e.g., race/ethnicity and social class) and may serve as a mechanism to reproduce societal
inequalities across the life course.
Our analysis was designed to overcome the limitations of previous research literature on
network dynamism, but retains a number of limitations. Most importantly, this study relies on
cross-sectional data, which does not allow for the separation of age, period, and cohort effects
(Glenn, 2003). Our interpretation of the relationships emphasizes age-related processes by which

25
social capital tends to accumulate/dissolve, but alternative interpretations cannot be ruled out.
Cohort/generational differences and period effects may also influence social capital trajectories.
The greatest impediment to understanding variation in social capital across the life course is a
lack of panel data on social networks. As panel data sets become available, researchers should
attempt to distinguish age-related processes from changes in historical circumstances and enhance
understanding of these life-course processes. Also, the scope of this study does not encompass the
entire life course, as the networks of young people and those over age 65 could not be analyzed
with the data. Nonetheless, the results offer new insights into the ways that social capital is
structured by age. The analysis offers a baseline for further investigation of social capital
accumulation and encourages researchers to consider life-course factors when examining age-
based and gender-based patterns. Moreover, the patterns of social capital accumulation and
decline identified here are likely to vary on a host of additional social factors, including race,
social class, parenthood, and so forth. Future investigations of age-based differences in social
capital have the potential for enhancing knowledge of how social capital contributes to broader
processes of cumulative advantage and disadvantage for diverse populations across the life
course.
<H1>REFERENCES
Ajrouch, Kristine J., Alysia Y. Blandon, and Toni C. Antonucci. 2005. �Social Networks Among
Men and Women: The Effects of Age and Socioeconomic Status,� Journal of Gerontology 60B:
6: S311�S317.
Alon, Sigal, and Yitchak Haberfeld. 2007. �Labor Force Attachment and the Evolving Wage Gap
Between White, Black, and Hispanic Young Women,� Work and Occupations 34: 4: 369�398.
Angelusz, Róbert, and Róbert Tardos. 2001. �Change and Stability in Social Network Resources:
The Case of Hungary Under Transformation,� In Nan Lin, Karen Cook, and Ronald S. Burt
(eds.), Social Capital: Theory and Research: pp. 291�323. New York: DeGruyter.
Bidart, Claire, and Daniel Lavenu. 2005. �Evolutions of Personal Networks and Life Events,�
Social Networks 27: 4: 359�376.

26
Bourdieu, Pierre. 1986. �The Forms of Capital,� In John G. Richardson (ed.), Handbook of
Theory and Research for the Sociology of Education: pp. 241�258. Westport, CT: Greenwood.
Bridges, William P., and Wayne J. Villemez. 1986. �Informal Hiring and Income in the Labor
Market,� American Sociological Review 51: 574�582.
Burt, Ronald S. 1992. Structural Holes. Cambridge, MA: Harvard University Press.
Burt, Ronald S. 1998. �The Gender of Social Capital,� Rationality and Society 10: 1: 5�46.
Burt, Ronald S. 2000. �Decay Functions,� Social Networks 22: 1: 1�28.
Burt, Ronald S. 2002. �Bridge Decay,� Social Networks 24: 4: 333�363.
Cairns, Robert B., and Man-Chi Leung. 1995. �Friendships and Social Networks in Childhood
and Adolescence: Fluidity, Reliability, and Interrelations,� Child Development 66: 5: 1330�1345.
Campbell, Karen E. 1988. �Gender Differences in Job-Related Networks,� Work and
Occupations 15: 179�200.
Cantin, Stéphane, and Michel Boivin. 2004. �Change and Stability in Children�s Social Network
and Self-Perceptions During Transition from Elementary to Junior High School,� International
Journal of Behavioral Development 28: 6: 561�570.
Carstensen, Laura L. 1995. �Evidence for a Life-Span Theory of Socioemotional Selectivity,�
Current Directions in Psychological Science 4: 5: 151�156.
Coleman, James S. 1990. Foundations of Social Theory. Cambridge: Harvard University Press.
Cornwell, Benjamin, Edward O. Laumann, and L. Phillip Schumm. 2008. �The Social
Connectedness of Older Adults: A National Profile,� American Sociological Review 73: 185�203.
DiPrete, Thomas A., and Gregory M. Eirich. 2006. �Cumulative Advantage as a Mechanism for
Inequality: A Review of Theoretical and Empirical Developments,� Annual Review of Sociology
32: 271�297.
Dupre, Matthew E. 2007. � Educational Differences in Age-Related Patterns of Disease:
Reconsidering the Cumulative Disadvantage and Age-as-Leveler Hypotheses,� Journal of Health
and Social Behavior 48: 1: 1�15.
Elder, Glen H., Jr. 1985. �Perspectives on the Life Course,� In Glen H. Elder, Jr. (ed.), Life
Course Dynamics: pp. 23�49. Ithaca, NY: Cornell University Press.
27
Elder, Glen H., Jr., and Michael J. Shanahan. 2006. �The Life Course and Human Development,�
In William Damon and Richard M. Lerner (eds.), The Handbook of Child Psychology: pp. 665�
715. New York: Wiley.
Elliott, James R. 1999. �Social Isolation and Labor Market Insulation: Network and
Neighborhood Effects on Less-Educated Urban Workers,� Sociological Quarterly 40: 2: 199�
216.
Emirbayer, Mustafa. 1997. �Manifesto for Relational Sociology,� American Journal of Sociology
103: 2: 281�317.
Erickson, Bonnie H. 2003. �The Distribution of Gendered Social Capital in Canada,� In Henk
Flap (ed.), Creation and Returns to Social Capital: pp. 27�50. Routledge. [AUTHOR: Where
was this published?]
Fischer, Claude S., and Stacey J. Oliker. 1983. �A Research Note on Friendship, Gender, and the
Life Cycle,� Social Forces 62: 124�132.
Flap, H., and B. Volker. 2001. �Goal Specific Social Capital and Job Satisfaction: Effects of
Different Types of Networks on Instrumental and Social Aspects of Work,� Social Networks 23:
4: 297�320.
Fu, Yang-chih. 2005. �Measuring Personal Networks with Daily Contacts: A Single-Item Survey
Question and the Contact Diary,� Social Networks 27: 3: 169�186.
Fung, Helene H., Laura L. Carstensen, and Frieder R. Lang. 2001. �Age-Related Patterns in
Social Networks Among European Americans and African Americans: Implications for
Socioemotional Selectivity Across the Lifespan,� International Journal of Aging and Human
Development 52: 3: 185�206.
Gardecki, Rosella, and David Neumark. 1998. �Order from Chaos? The Effects of Early Labor
Market Experiences on Adult Labor Market Outcomes,� Industrial and Labor Relations Review
51: 299�322.
George, Linda K. 2009. �Conceptualizing and Measuring Trajectories,� In Janet Z. Giele and
Glen H. Elder, Jr. (eds.), Methods of Life Course Research: Qualitative and Quantitative
Approaches: pp. 163�186. Thousand Oaks, CA: Sage.
Gerstel, Naomi. 2000. �The Third Shift: Gender and Care Work Outside the Home,� Qualitative
Sociology 23: 467�483.

28
Glanville, Jennifer L. 2004. �Voluntary Associations and Social Network Structure: Why
Organizational Location and Type Are Important,� Sociological Forum 19: 3: 465�491.
Glenn, Norval D. 2003. �Distinguishing Age, Period, and Cohort Effects,� In Jeylan T. Mortimer
and Michael J. Shanahan (eds.), Handbook of the Life Course: pp. 465�476. New York: Kluwer
Academic/Plenum Publishers.
Granovetter, Mark S. 1973. �The Strength of Weak Ties,� American Journal of Sociology 78:
1360�1380.
Groves, Robert M., Floyd Fowler Jr., Mick Couper, James Lepkowski, Eleanor Singer, and Roger
Tourangeau. 2004. Survey Methodology. New York: Wiley & Sons.
Han, Shin-Kap, and Phyllis Moen. 1999. �Work and Family Over Time: A Life Course
Approach,� Annals of the American Academy of Political and Social Science 562: 98�110.
Kalmijn, Matthijs. 2002. �Sex Segregation of Friendship Networks: Individual and Structural
Determinants of Having Cross-Sex Friends,� European Sociological Review 18: 1: 101�117.
Kalmijn, Matthijs. 2003. �Shared Friendship Networks and the Life Course: An Analysis of
Survey Data on Married and Cohabiting Couples,� Social Networks 25: 3: 231�249.
Lambert, Tracy A., Lillian T. Eby, and Melissa P. Reeves. 2006. �Predictors of Networking
Intensity and Network Quality Among White-Collar Job Seekers,� Journal of Career
Development 32: 4: 351�365.
Lin, Nan. 1999. �Social Networks and Status Attainment,� Annual Review of Sociology 25: 467�
487.
Lin, Nan. 2001. Social Capital: A Theory of Social Structure and Action. Cambridge: Cambridge
University Press.
Lin, Nan, and Mary Dumin. 1986. �Access to Occupations Through Social Ties,� Social
Networks 8: 365�385.
Lin, Nan, Yang-chih Fu, and Ray-May Hsung. 2001. �The Position Generator: Measurement
Techniques for Investigations of Social Capital,� In Nan Lin, Karen Cook, and Ronald S. Burt
(eds.), Social Capital: Theory and Research: pp. 57�81. New York: De Gruyter.
Martin, John Levi, and King-To Yeung. 2006. �Persistence of Close Personal Ties over a 12-Year
Period,� Social Networks 28: 4: 331�362.

29
Maume, David J. Jr. 2004. �Wage Discrimination Over the Life Course: A Comparison of
Explanations,� Social Problems 51: 4: 505�527.
McDonald, Steve, and Glen H. Elder, Jr. 2006. �When Does Social Capital Matter? Non-
Searching for Jobs Across the Life Course,� Social Forces 85: 1: 521�550.
McPherson, Miller, Lynn Smith-Lovin, and Matthew E. Brashears. 2006. �Social Isolation in
America: Changes in Core Discussion Networks Over Two Decades,� American Sociological
Review 71: 3: 353�375.
Mettler, Suzanne. 2007. Soldiers to Citizens: The G.I. Bill and the Making of the Greatest
Generation. Oxford University Press. [AUTHOR: Where was this published?]
Moen, Phyllis. 2005. �Beyond the Career Mystique: �Time In,� �Time Out,� and �Second Acts�,�
Sociological Forum 20: 2: 189�208.
Moerbeek, Hester, and Henk Flap. 2008. �Social Resources and Their Effect on Occupational
Attainment Through the Life Course,� In Nan Lin and Erickson Bonnie (eds.), Social Capital: An
International Research Program. Oxford: Oxford University Press.
Moore, Gwen. 1988. �Women in Elite Positions: Insiders or Outsiders?� Sociological Forum 3: 4:
566�585.
O�Rand, Angela M. 2006. �Stratification and the Life Course: Life Course Capital, Life Course
Risks, and Social Inequality,� In Robert H. Binstock, Linda K. George, Stephen J. Cutler, Jon
Hendricks, and James H. Schultz (eds.), Handbook of Aging and the Social Sciences: pp. 146�
162. Burlington, MA: Academic Press.
Parks-Yancy, R., N. DiTomaso, and C. Post. 2006. �The Social Capital Resources of Gender and
Class Groups,� Sociological Spectrum 26: 1: 85�113.
Paxton, Pamela. 1999. �Is Social Capital Declining in the United States? A Multiple Indicator
Assessment,� American Journal of Sociology 105: 1: 88�127.
Popielarz, Pamela A., and J. Miller McPherson. 1995. �On the Edge or in Between: Niche
Position, Niche Overlap, and the Duration of Voluntary Association Memberships,� American
Journal of Sociology 101: 3: 698�720.
Putnam, Robert. 2000. Bowling Alone. New York: Simon & Schuster.
Rhee, Mooweon. 2007. �The Time Relevance of Social Capital,� Rationality and Society 19: 3:
367�389.

30
Rosenfeld, Rachel A., and Kenneth I. Spenner. 1992. �Occupational Sex Segregation and
Women�s Early Career Job Shifts,� Work and Occupations 19: 4: 424�449.
Rotolo, Thomas, and John Wilson. 2003. �Work Histories and Voluntary Association
Memberships,� Sociological Forum 18: 4: 603�619.
Saloner, Garth. 1985. �Old Boy Networks as Screening Mechanisms,� Journal of Labor
Economics 3: 3: 255�267.
Schoen, Robert, Young J. Kim, Constance A. Nathanson, Jason Fields, and Nan Marie Astone.
1997. �Why Do Americans Want Children?� Population and Development Review 23: 2: 333�
358.
Schoen, Robert, and Paula Tufis. 2003. �Precursors of Nonmarital Fertility in the United States,�
Journal of Marriage and the Family 65: 4: 1030�1040.
Seibert, Scott E., Maria L. Kraimer, and Robert C. Liden. 2001. �A Social Capital Theory of
Career Success,� Academy of Management Journal 44: 2: 219�237.
Settersten, Richard A., Jr. 2003. �Age Structuring and the Rhythm of the Life Course,� In Jeylan
T. Mortimer and Michael J. Shanahan (eds.), Handbook of the Life Course: pp. 81�98. New
York: Kluwer Academic/Plenum.
Smith, Ryan A. 2002. �Race, Gender, and Authority in the Workplace: Theory and Research,�
Annual Review of Sociology 28: 509�542.
Smith, Sandra S. 2000. �Mobilizing Social Resources: Race, Ethnic, and Gender Differences in
Social Capital and Persisting Wage Inequalities,� Sociological Quarterly 41: 509�537.
Smith, Sandra S. 2005. ��Don�t Put My Name on It�: Social Capital Activation and Job-Finding
Assistance Among the Black Urban Poor,� American Journal of Sociology 111: 1: 1�57.
Smith-Doerr, Laurel, and Walter W. Powell. 2005. �Networks and Economic Life,� In Neil J.
Smelser and Richard Swedberg (eds.), Handbook of Economic Sociology: pp. 379�402. Thousand
Oaks, CA: Sage.
Son, Joonmo, and Nan Lin. 2008. �Social Capital and Civic Action: A Network-Based
Approach,� Social Science Research 37: 1: 330�349.
Tomaskovic-Devey, Donald, Catherine Zimmer, Kevin Stainback, Corre Robinson, Tiffany
Taylor, and Tricia McTague. 2006. �Documenting Desegregation: Segregation in American

31
Workplaces by Race, Ethnicity, and Sex, 1966�2003,� American Sociological Review 71: 4: 565�
588.
Walker, Karen. 1990. �Class, Work and Family in Women�s Lives,� Qualitative Sociology 13:
297�320.
Wellman, Barry, Renita Yuk-lin Wong, David Tindall, and Nancy Nazer. 1997. �A Decade of
Network Change: Turnover, Persistence and Stability in Personal Communities,� Social Networks
19: 27�50.
Wenger, G. Clare, and Dorothy Jerrome. 1999. �Change and Stability in Confidant Relationships:
Findings from the Bangor Longitudinal Study of Ageing,� Journal of Aging Studies 13: 3: 269�
294.
Willson, Andrea E., Kim M. Shuey, and Glen H. Elder, Jr. 2007. �Cumulative Advantage
Processes as Mechanisms of Inequality in Life Course Health,� American Journal of Sociology
112: 6: 1886�1924.
Yakubovich, Valery, and Irina Kozina. 2000. �The Changing Significance of Ties: An
Exploration of the Hiring Channels in the Russian Transitional Labor Market,� International
Sociology 15: 3: 479�500.
<end REFS>

32
Table I. Descriptive Statistics
Variable Description Mean Range N
Age In years 42.38 22�65 2,995
Gender Female = 1, male = 0 .51 0�1 2,995
Social resources Factor score combining number of contacts with
highest prestige from position generator (PG)
3.36 0�6 2,995
Male contacts Proportion of male contacts in PG .49 0�1 2,995
Closeness Closeness of contacts in PG 3.43 0�5 2,995
Density Proportion of contacts in PG that know each other 1.82 0�4 2,812
0 = None know each other
1 = Only a few know each other
2 = About half know each other
3 = Most know each other
4 = All know each other
Trust Trust in contacts in PG 3.23 0�4 2,904
0 = None can be trusted
1 = Most can�t be trusted
2 = Some can be trusted
3 = Most can be trusted
4 = All can be trusted
Daily contact Number of people R makes contact with each day 2.30 0�5 2,995

33
0 = 0�4
1 = 5�9
2 = 10�19
3 = 20�49
4 = 50�99
5 = 100+
Work contact Proportion of daily contact that is work related 2.74 0�4 2,652
0 = Almost none
1 = Few
2 = About half
3 = Most
4 = Almost all
Organizational
memberships
Number of organizational memberships 1.73 0�10 2,995
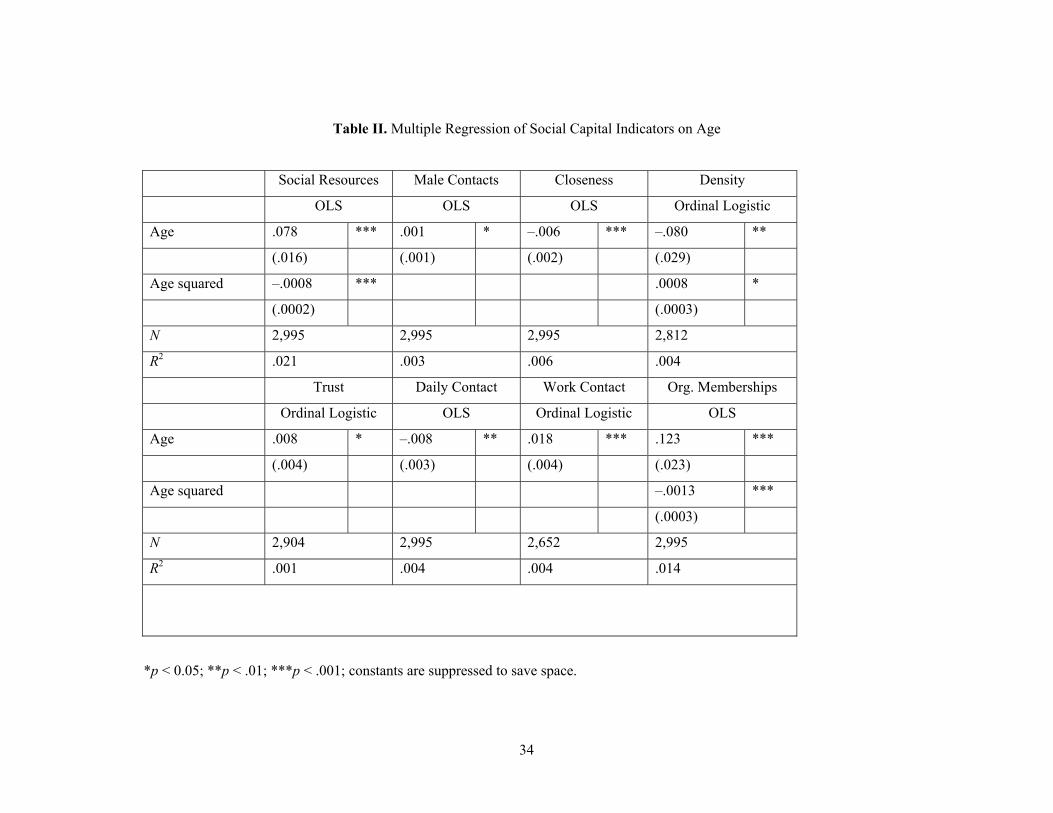
34
Table II. Multiple Regression of Social Capital Indicators on Age
Social Resources Male Contacts Closeness Density
OLS OLS OLS Ordinal Logistic
Age .078 *** .001 * �.006 *** �.080 **
(.016) (.001) (.002) (.029)
Age squared �.0008 *** .0008 *
(.0002) (.0003)
N 2,995 2,995 2,995 2,812
R2 .021 .003 .006 .004
Trust Daily Contact Work Contact Org. Memberships
Ordinal Logistic OLS Ordinal Logistic OLS
Age .008 * �.008 ** .018 *** .123 ***
(.004) (.003) (.004) (.023)
Age squared �.0013 ***
(.0003)
N 2,904 2,995 2,652 2,995
R2 .001 .004 .004 .014
*p < 0.05; **p < .01; ***p < .001; constants are suppressed to save space.

35
Table III. Summary of Gender-Specific Regressions of Social Capital on Age
Social Resources Male Contacts Closeness Density
Male Female Male Female Male Female Male Female
Age + + n.s. + � n.s. � �
Age squared � � n.s. n.s. n.s. n.s. + n.s.
Age cubed n.s. n.s. n.s. n.s. n.s. n.s. n.s. n.s.
Trust Daily Contact Work Contact Org. Memberships
Male Female Male Female Male Female Male Female
Age n.s. + � � + + + +
Age squared n.s. n.s. n.s. + n.s. n.s. � �
Age cubed n.s. n.s. n.s. � n.s. n.s. n.s. n.s.

36
Fig. 1. Social resources, male contact, closeness, and density by age.
2.8
3.0
3.2
3.4
3.6
22-26
27-30
31-35
36-40
41-45
46-50
51-55
56-65
Soci
al re
sour
ce
.44
.46
.48
.50
.52
.54
22-26
27-30
31-35
36-40
41-45
46-50
51-55
56-65
Mal
e co
ntac
t
1A1B

37
3.3
3.4
3.5
3.6
3.7
22-26
27-30
31-35
36-40
41-45
46-50
51-55
56-65
Clo
sene
s
1.6
1.7
1.8
1.9
2.0
2.1
2.2
22-26
27-30
31-35
36-40
41-45
46-50
51-55
56-65
Den
sity
1C1D

38
Fig. 2. Trust, daily contact, work-related contact, and organizational membership by age.
3.1
3.2
3.3
3.4
22-26
27-30
31-35
36-40
41-45
46-50
51-55
56-65
Trus
t
2.0
2.1
2.2
2.3
2.4
2.5
22-26
27-30
31-35
36-40
41-45
46-50
51-55
56-65
Dai
ly c
onta
ct
2A2B

39
2.32.42.52.62.72.82.93.0
22-26
27-30
31-35
36-40
41-45
46-50
51-55
56-65
Wor
k-re
late
d co
ntac
t
1
1.2
1.4
1.6
1.8
2
22-26
27-30
31-35
36-40
41-45
46-50
51-55
56-65
Org
. mem
bers
hi
2C2D