clustering of ldap directory schemas to facilitate information resources interoperability across...
TRANSCRIPT
IEEE TRANSACTIONS ON SYSTEMS, MAN, AND CYBERNETICS—PART A: SYSTEMS AND HUMANS, VOL. 36, NO. 4, JULY 2006 631
Clustering of LDAP Directory Schemas to FacilitateInformation Resources Interoperability
Across OrganizationsJianghua Liang, Vijay K. Vaishnavi, Fellow, IEEE, and Art Vandenberg, Member, IEEE
Abstract—Directories provide a well-defined general mecha-nism for describing organizational resources such as the resourcesof the Internet2 higher education research community and theGrid community. Lightweight directory access protocol direc-tory services enable data sharing by defining the information’smetadata (schema) and access protocol. Interoperability of direc-tory information between organizations is increasingly important.Improved discovery of directory schemas across organizations,better presentation of their semantic meaning, and fast defin-ition and adoption (reuse) of existing schemas promote inter-operability of information resources in directories. This paperfocuses on the discovery of related directory object class schemasand in particular on clustering schemas to facilitate discoveringrelationships and so enable reuse. The results of experimentsexploring the use of self-organizing maps (SOMs) to cluster di-rectory object classes at a level comparable to a set of humanexperts are presented. The results show that it is possible todiscover the values of the parameters of the SOM algorithm soas to cluster directory metadata at a level comparable to humanexperts.
Index Terms—Clustering analysis, clustering evaluation, LDAPdirectories, neural network configuration, self-organizing maps.
I. INTRODUCTION
D IRECTORIES provide a well-defined general mechanismfor describing resources within an organization and for
enabling their discovery by individuals and applications [13].Lightweight directory access protocol (LDAP) directory ser-vices enable data sharing by defining both the informationmetadata (schema) and its access protocol. While arguably asimple concept, the appropriate use of directory services isbeing recognized as a key to competitive advantage [11]. Thisis not surprising given the increasing focus on organizational
Manuscript received August 1, 2003; revised January 9, 2004 and May 26,2004. This work was supported in part by the National Science Foundation(NSF) under ITR Research Grant IIS-0312636, in part by a subaward to NSFGrant ANI-0123937, in part by Sun Microsystems under Academic EquipmentGrant EDUD 7824-010460-US, and in part by Georgia State University throughthe Robinson College of Business and the Department of Information Systemsand Technology. This paper was recommended by Associate Editor C. Hsu.
J. Liang is with Lexmark International, Inc., Lexington, KY 40550 USA(e-mail: [email protected]).
V. K. Vaishnavi is with the Department of Computer Information Systems,Robinson College of Business, Georgia State University, Atlanta, GA 30303USA (e-mail: [email protected]).
A. Vandenberg is with the Information Systems and Technology, GeorgiaState University, Atlanta, GA 30303 USA (e-mail: [email protected]).
Digital Object Identifier 10.1109/TSMCA.2005.851277
learning and the potential for directory services to consolidateimportant facets of organizational knowledge; indeed, a core is-sue in knowledge management is the identification of potentialsources of knowledge [10], [47]. While directory services havefocused on sharing information, they have primarily focused ondoing so within an organization and relatively little attention,until recently, has been given to sharing information acrossorganizational boundaries. Increasingly, a core source of com-petitive advantage is recognized to consist of making optimaluse of internal resources as well as potential external resources.Compelling arguments have been advanced that the appropriateuse of external resources is not only necessary, but also essentialto success in the future business environment [36].
Examples of organizations that use directories to describetheir resources are the Internet2 higher education research com-munity [16] and the Grid community [9], both of which useLDAP structures, respectively, for describing people and Gridcomputing components to support the work of their or-ganizations. The directories working group of the Internet2Middleware Architecture Committee for Education (MACE)considers “Directories . . . the operational linchpin of almost allmiddleware services. They can contain critical customizationinformation for people, processes, resources, and groups” [5].The MACE working groups are developing standard schemas(persons, organizations, videoconferencing, groups, . . .), rec-ommending best practices for metadirectory architecture, andimplementing directory-based federated interorganizational au-thentication and authorization for the higher education researchcommunity [33]. The Grid community’s Globus Toolkit 3.0is delivered with an OpenLDAP directory used to store re-source information of distributed Grid components [8], [37].Other organizations similarly use LDAP as a mechanism fordirectory-enabled authentication, mail, or network managementservices, and indeed, LDAP is a core element of networkservices offered by vendors such as Microsoft or Novell. Whilesuch directory-enabled services can be provided within anorganization, offering or accessing these services beyond thehome organization requires significant coordination of direc-tory architectures and standards for the directory schema. Thefocus of the current work on LDAP directory metadata is inpart based on our working experience with directory initiativesin the Internet2 and Grid communities [51].
A directory (object class) schema is created by one of threesources: a standards body, the vendor of a directory product,or a directory administrator. It may take a long time for any
1083-4427/$20.00 © 2006 IEEE
632 IEEE TRANSACTIONS ON SYSTEMS, MAN, AND CYBERNETICS—PART A: SYSTEMS AND HUMANS, VOL. 36, NO. 4, JULY 2006
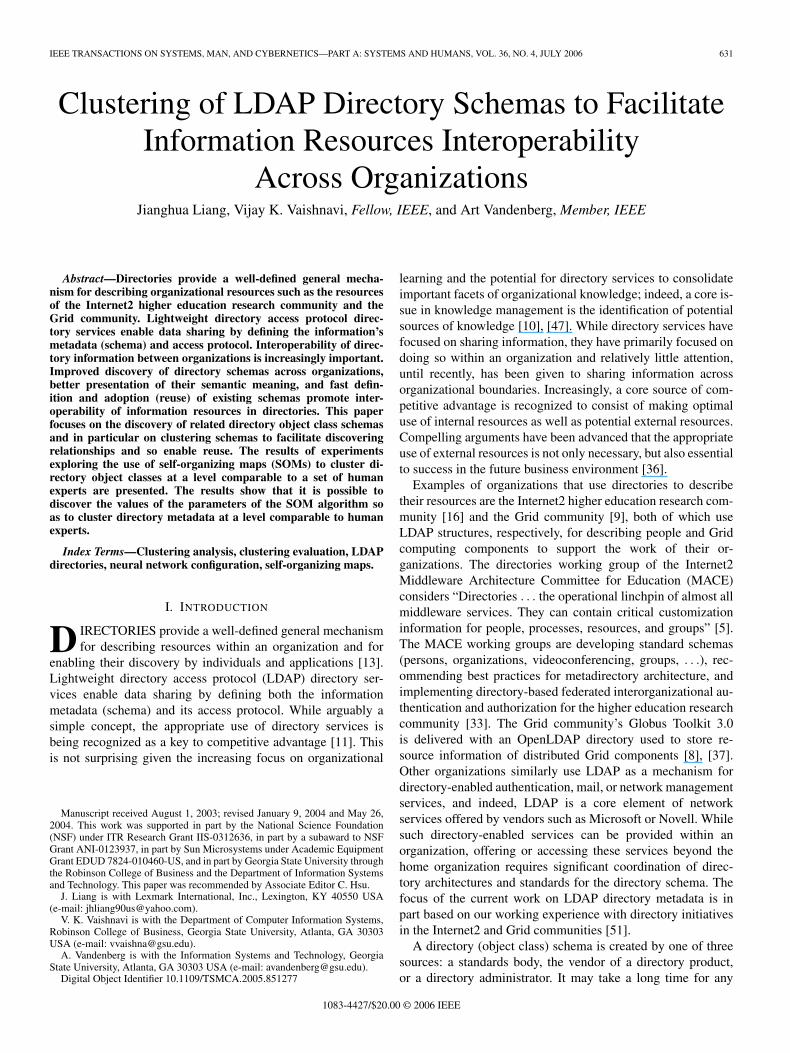
Fig. 1. Taxonomy of clustering approaches [53].
standards body to produce a schema [6]—the EDUCAUSE/Internet2 eduPerson Task Force [7] took 18 months to adopt sixattributes for “eduPerson.” Slow definition of standard schemasmay impede the usability and interoperability of informationresources in interdirectory services. Vendors of LDAP directo-ries may deliver their products in which schemas have alternatenames, include schemas that are specific to their own products,or introduce new schemas, which tend to lag the research anddevelopment community.
A key challenge in directory schema design is for the direc-tory administrator to locate appropriate predefined schemas toreuse [13]. Indeed, directory administrators often create newschemas or extend standard schemas to meet local needs, thusfurther impeding interoperability. Improved discovery of exist-ing schemas, better presentation of semantic meaning, and fastdefinition and adoption (reuse) of schemas across organizationswould promote the usability and interoperability of informationresources in directories.
The objective of this paper is to explore how LDAP objectclasses can be clustered to facilitate discovery of related objectclasses to better enable their reconciliation and reuse. This isa novel approach to an important instance of the metadata inte-gration or the semantic interoperability problem that manydomains have been facing [12], [48]. Our approach intends tointegrate metadata with little prior knowledge of prior semanticrelationships thus seeking to automate aspects of metadataknowledge modeling that is needed in the mediation approachto metadata integration; Rensselaer’s metadatabase systemfor integrating heterogeneous distributed information systems,more specifically manufacturing systems, is a very good exam-ple of the mediation approach [4], [14], [15].
The rest of the paper proceeds as follows: Section II dis-cusses why clustering analysis is a good technique to discoverobject interrelationships, why self-organizing maps (SOMs) is agood clustering technique to use, and our approach to applyingSOM. Section III presents features selection, addresses pre-liminary SOM parameter issues needing resolution, states theresearch question, and discusses the metrics used for evaluatingclustering results. Section IV describes our empirical studyand describes the hypotheses and the experiments conducted
to study the hypotheses. Section V presents the results of ourexperiments. Section VI draws conclusions and makes sugges-tions for further work.
II. CLUSTERING ANALYSIS AND SOM
Clustering analysis is a well-known approach to structurepreviously unknown and unclassified datasets [38]. Clusteringis useful when there is little prior information (e.g., statisticalmodels) available about the data, and the decision maker mustmake as few assumptions about the data as possible. It isunder these restrictions that clustering technology is particu-larly appropriate for the exploration of interrelationships amongthe data points to assess their structure [19]. Since directoryschemas are extensible and there exist no predefined schemacategories, it is appropriate to use clustering techniques tostructure them. This observation has been corroborated by theresearch results of Zhao and Ram. They point out that cluster-ing analysis is more suitable than classification for the iden-tification of schema-level correspondences [53], [54].
Different approaches to clustering data can be described withthe help of the hierarchy shown in Fig. 1 [53].
The availability of such a vast collection of clustering algo-rithms in the literature can easily confound a user attemptingto select an algorithm suitable for the problem at hand [19].Fortunately, researchers have already compared many cluster-ing algorithms against each other and we can draw some usefulconclusions from their work.
Mangiameli et al. compared SOM and seven hierarchicalclustering methods experimentally and found that SOM issuperior to all of the hierarchical clustering methods [34]. Zhaoand Ram compared K-means, hierarchical clustering, and SOMfor clustering relational database attributes. They concludedthat the three methods have similar clustering performancesand SOM is better than the other two methods in visualizingclustering results [53], [54].
SOM is very effective for visualization of high-dimensionaldata. It produces a similarity graph of input data by con-verting the nonlinear statistical relationships between high-dimensional data into simple geometric relationships of their
LIANG et al.: CLUSTERING OF LDAP DIRECTORY SCHEMAS FOR INFORMATION RESOURCES INTEROPERABILITY 633
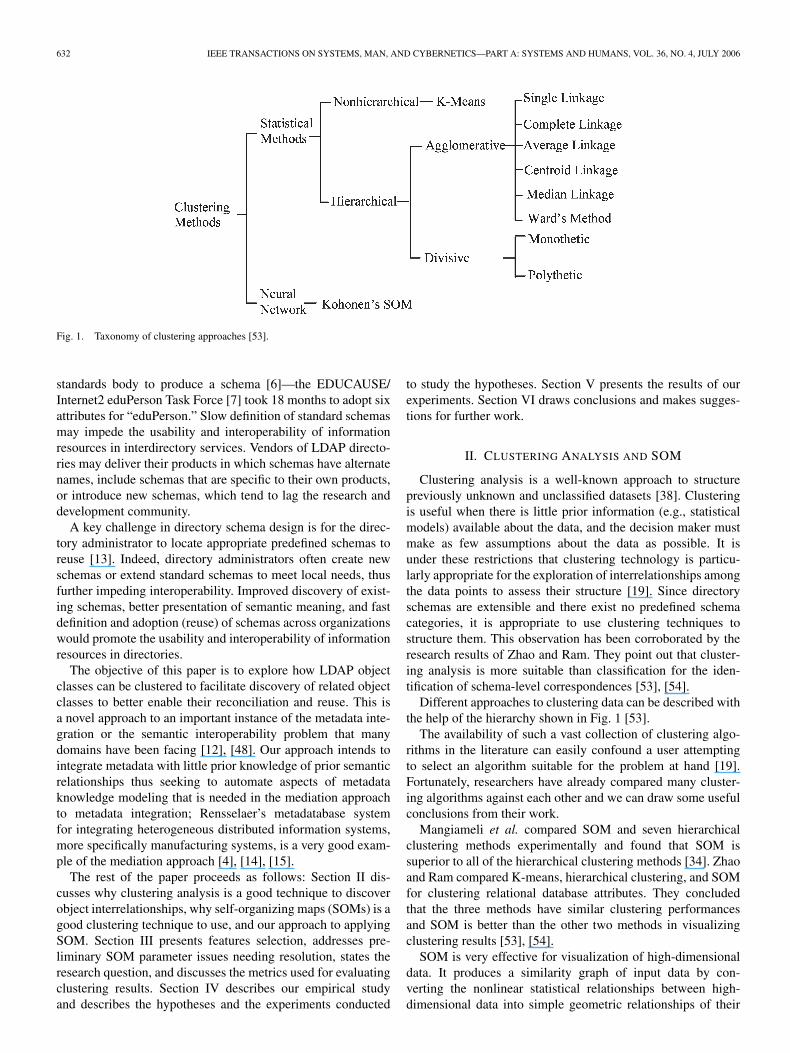
Fig. 2. Kohonen SOM network topology.
image points on a low-dimensional display, usually a regulartwo-dimensional grid of nodes (Fig. 2). Thereby it compressesinformation while preserving the most important topologicaland geometric relationships of the primary data elements onthe display. It is then possible to visually identify clustersfrom the map. The main advantage of such a mapping is thatit is possible to gain some idea of the structure of the databy observing the map, due to the topology-preserving natureof SOM.
SOM is based on the associative neural properties of thebrain. The Kohonen SOM network (Fig. 2) contains two layersof vectors: input vectors and mapping vectors usually in theshape of a two-dimensional grid. An input vector size is equalto the number of unique features associated with the inputobjects. Each vector of the mapping layer has the same numberof features as an input vector. Thus, the input objects and themapping cells can be represented as vectors that contain theinput features.
The mapping vectors are initialized with random numbers.Each actual input is compared with each vector on the mappinggrid. The “winning” mapping vector is defined as that withthe smallest distance (e.g., Euclidean distance) between itselfand the input vector. The input thus maps to a given mappingvector. The value of the mapping vector is then adjusted toreduce the distance and its neighboring vectors may be adjustedproportionally. In this way, the multidimensional (in terms offeatures) input vectors are mapped to a two-dimensional outputgrid. After all of the input is processed (usually after hundredsor thousands of repeated presentations), the result should be aspatial organization of the input data organized into clusters ofsimilar (neighboring) regions [40].
Typically, pattern-clustering activity involves the followingsteps [18]:
1) pattern representation (optionally including feature ex-traction and/or selection);
2) definition of a pattern proximity similarity measure ap-propriate to the data domain;
3) clustering or grouping;
4) data abstraction (if needed); and5) assessment of output (if needed).
There are no theoretical guidelines for the appropriate featureselection and extraction techniques to use in a specific situation[19]. Features selection and extraction strategies are usuallyvery highly dependent on the specific application domain. Inthe case of the LDAP domain, we parse each object class toextract attributes that can be selected for the feature set.
Similarity measure is a key component in clustering analysis.Measures of similarity and distance in vector spaces includecorrelation, direction cosines, Euclidean distance, measuresof similarity in the Minkowski metric, Tanimoto similaritymeasure, weighted measures for similarity, and comparison byoperations of continuous-valued logic [24]. Traditionally, Euc-lidean distance is used in SOM and we too use it in our work.
Effective SOM clustering depends on the parameter valueschosen for a certain application domain [39]. Since users usu-ally are not aware of the structure present in the data (that iswhy clustering analysis is needed), it is not only difficult todetermine what parameter values to use, it is also difficult tosay when the map has organized into a proper cluster structure[1]. Therefore, simulations have to be run several times, usingdifferent parameter values, before selecting the best one [45].
We do not employ any additional data abstraction inour work.
Cluster validity analysis is the assessment of a clustering pro-cedure’s output. Usually cluster validity assessment is objectiveand is performed to determine whether the output is meaning-ful. In our application domain of LDAP directory metadata,the assessment of a clustering procedure’s output against adirectory administrator’s judgment is very important in orderto make our directory metadata clustering tool meaningful anduseful to its users.
Given the foregoing discussion, the focus of this paper is toapply SOM to the clustering of LDAP directory object classesand to determine the efficacy of our approach for finding goodSOM parameter values that result in clustering comparable tohuman experts’ clustering.
634 IEEE TRANSACTIONS ON SYSTEMS, MAN, AND CYBERNETICS—PART A: SYSTEMS AND HUMANS, VOL. 36, NO. 4, JULY 2006
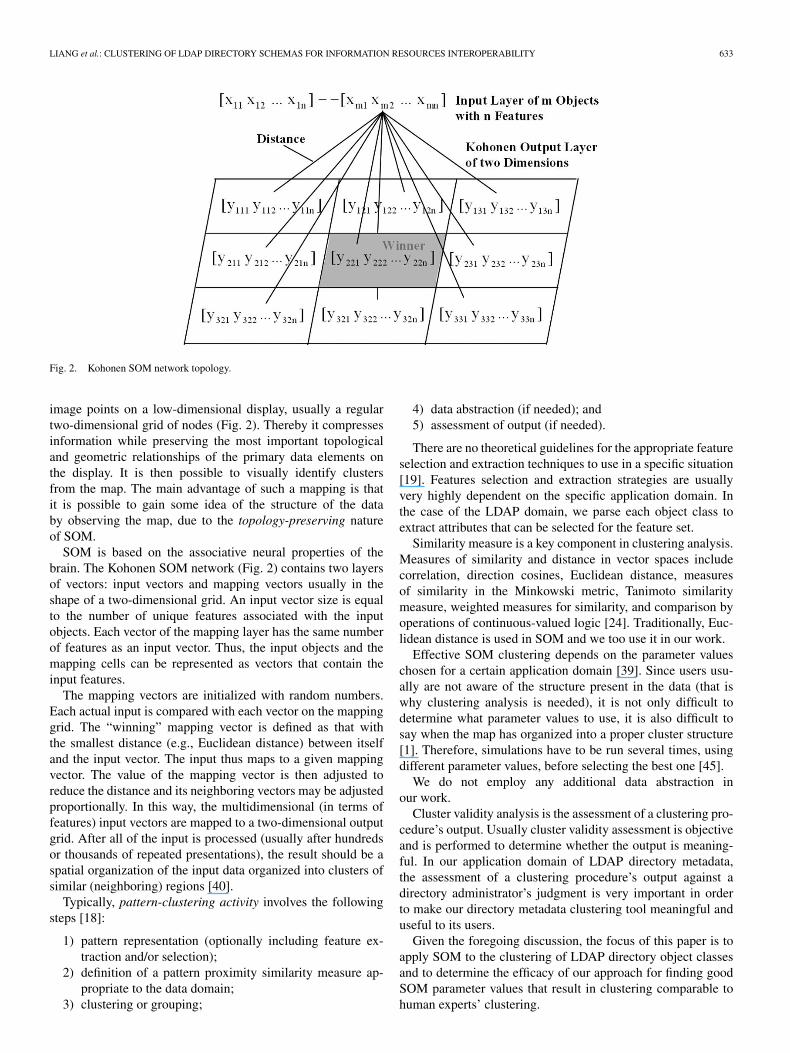
Fig. 3. Object class inheritance [13].
III. USING SOM FOR CLUSTERING
LDAP OBJECT CLASSES
A. SOM Input Features Selection
Features selection is the process of identifying the mosteffective subset of the original features set to use in clustering.Features selection has profound influence on final SOM map-ping results. The aim of good input features selection is toassign similar vector values to similar objects and at the sametime mimic a human expert’s mental model. The purpose offeatures selection and extraction is to gather facts and conjec-tures about the data, optionally perform features selection andextraction, and design the subsequent elements of the clusteringsystem. A careful investigation of the available features andany available transformations (even simple ones) can yieldsignificantly improved clustering results [19].
In LDAP, object classes are used to group related informa-tion. Typically, an object class models some real-world objectsuch as a person, printer, or network device. The definitionof an LDAP object class includes the following pieces ofinformation:
1) an object identifier (OID) that uniquely identifies theclass;
2) a name that also uniquely identifies the class;3) a set of mandatory attributes;4) a set of allowed attributes.
The name of an object class is usually mnemonic and easilyunderstood by humans. A name is the most common way forhumans, clients, and servers to refer to the object class. Someexamples of object class names include person, printer,groupOfNames, and applicationEntity [13].Attributes (also requiring both an OID and a name) that
an object class definition includes must be unique throughoutthe entire directory schema. The set of mandatory (required)attributes is usually fairly short or even empty. The set ofallowed (optional) attributes is often quite long. It is the jobof each directory server to enforce attribute restrictions of anobject class when an entry is added to the directory or modifiedin any way.
One object class can be derived from another, in which case itinherits the characteristics of the other class. This is sometimescalled subclassing, or object class inheritance. An example ofthis is shown in Fig. 3 [13].An Object Class Example: The format for representation of
object classes is defined in X.501 (ITU-T Recommendation
X.501 [17]). One of the most common uses for a directorysystem is to store information about people. An example objectclass schema definition in Sun ONE/iPlanet directory is the“person” objectclass:
objectclasses: (2.5.6.6 NAME “person” DESC “Stan-dard ObjectClass” SUP “top” MUST (objectclass $ sn $cn) MAY (aci $ description $ seeAlso $ telephoneNumber$ userpassword)).
The object class OID is 2.5.6.6. Its name is person. Its DESCvalue is Standard ObjectClass and its superior class is top.Every object class must have at least one MUST attribute.Person’s mandatory attributes are objectclass, sn, and cn andits allowed attributes are access control information (aci), de-scription, seeAlso, telephoneNumber, and userpassword. ($ isused as separator.)
An instantiation of the Person object class may be as shownin Fig. 4 [13]. This object class “represents” a person namedBabs Jensen. It “requires” (MUST) attributes of the objectclass that provide naming information—the person’s surname(sn: Jensen) and common name (cn: Babs Jensen), as well asthe names of its two superior object classes (objectclass: top,person). And it “allows” optional (MAY) attributes that providea description, telephoneNumber, userpassword, and a seeAlso(cross reference to a) related name.Preliminary Decisions: We use OID, NAME, SUP, MUST,
and MAY attributes as input vector features. SUP, MUST,and MAY attributes may be repeated in one or more objectclasses, but only those attributes that appear in at least threeobject classes are included with the input vector features.Although this selection may appear arbitrary (rather than, say,only including those attributes appearing in at least four objectclasses. . . or in just one. . .), experimenting with several kindsof attribute-feature-selection strategies found that this thresholdprovided good SOM clustering results. We included all OIDand NAME values. Even though these were unique to anobject class (and thus did not occur in three or more objectclasses), we observe that people place more emphasis on these“naming” attributes and, indeed, consider similarity in OIDand NAME values as important for understanding the objectclass. For instance, person, organizationalPerson, inetOrgPer-son are seen as similar by virtue of having the string “person”in their NAME. In general, we used Levenshtein’s distancemeasure [31] to measure string similarity between all characterstrings (except OID) contained in an object class and the inputvector features. Because OID numerical strings are semanti-cally like numeric Internet URL addresses, the similarity valuebetween an OID string and an input vector feature is computedby comparing the common characters from the front of bothstrings.
B. Selection of Parameter Values
SOM parameters relate to the size of the map (xdim,y dim) that defines where objects are placed, the relationshipof cells to other nearby cells (neighborhood size), the numberof preliminary and fine-tuning passes used to test an inputobject’s distance to successive cells (initial and final trainingiterations), the speed with which map cells adjust to each other

LIANG et al.: CLUSTERING OF LDAP DIRECTORY SCHEMAS FOR INFORMATION RESOURCES INTEROPERABILITY 635
Fig. 4. Sun ONE/iPlanet person object class.
(initial learning rate that reduces to a final learning rate), andthe format of neighboring cells (neighborhood type—such asrectangular or hexagonal placement of cells). Given an outputmap initialized with random vectors, these SOM parametersgovern how input features train the mapping vectors to theirfinal configuration.
SOM is expected to produce a topologically correct mappingbetween input and output spaces. This mapping is found withthe Kohonen learning rule that is sensitive to its parametervalues. A poor choice of parameter values results in a mappingthat may be topologically unmeaningful to its users [35].
A major drawback of SOM has been the lack of a theoreti-cally justified criterion for parameter values selection. Param-eter values have a decisive effect on the reliability of visualanalysis, which is the main strength of SOM [27]. Differentresearchers have used different SOM parameter values in theirrespective application domains. Lin et al. chose a 20 × 10 gridmap for displaying SOM outputs, based on what would fit onan output screen [32]. Kohonen et al. used a 1 002 240-nodeSOM [26]. Kiang et al. used a 12 × 12 matrix with neigh-borhood size 5 and 20 000 iterations [21]. So, while SOM hasbeen used widely in applications, it suffers from the difficultyof parameter value selection due to its heuristic origins [2], [3],[23]. The SOM parameter values are usually chosen ad hoc bythe user [29] and it is usual practice to run SOM several timeson different sets of parameter values and then pick the optimumone [45].
Although there are reports of successful applications ofSOM algorithms to metadata [53], [54] and textual documentclustering [21], [26], [32], we observe that: 1) evaluation issubjective—a different user may evaluate the same clusteringresult differently; and 2) clustering results depend on the selec-tion of input SOM parameter values.Preliminary Experiments and Decisions: We did some ini-
tial SOM training and mapping experiments for 191 SunONE/iPlanet directory object classes to decide on the neigh-borhood type, the ratio between the final and initial trainingiterations, and the values for the initial and final learningrates. To make these decisions, we especially watched out forperson, organizationalPerson, and inetOrgPerson. Since theseare person-related object classes, they should be clustered to-gether when good SOM parameter values are used in theSOM training process. We used this as the cluster performancecriteria to evaluate the preliminary experiments.
Fixing all the other parameter values, we compared thehexagonal neighborhood type with the rectangular type. We
found that the hexagonal neighborhood type was almost alwaysbetter than the rectangular type. Similarly, when we comparedfinal training iterations with the initial training iterations, wefound that the clustering performance was very good with thefinal training iterations ten times the initial training iterations.We also tried combinations of the initial and final learningrates and found good clustering results with an initial learningrate of 0.05 and a final learning rate of 0.02. So we decidedto vary xdim, y dim, neighborhood size, and final trainingiterations, and keep constant the initial learning rate (0.05), thefinal learning rate (0.02), the neighborhood type (hexagonal),and the ratio for initial to final training iterations (1:10).
Focusing our research on the determination of values forthe parameters xdim, y dim, neighborhood size, and the num-ber of final training iterations, from hereon we will use thephrase “SOM parameter values” to mean these parametervalues only.
C. Research Question
The purpose of our clustering investigation is to understandhow LDAP directory users can better identify and use ex-isting schemas. Associating similar object classes can assistthe directory user in understanding object classes and therebyproactively promote the reuse of existing object classes. Ide-ally, computer-generated clustering of LDAP directory objectclasses should be as good as a human expert’s clustering results.That is, a group of LDAP directory object classes that aregrouped together in an expert’s cluster should also appeartogether in the computer (SOM) cluster.
Thus the research question for the current study is: Can SOMparameter values be identified such that a computer-generatedclustering of LDAP directory object classes is comparable to(as good as) a human expert’s clustering?
D. Metrics for Evaluating Clustering Results
Since any SOM algorithm will, when presented with data,produce clusters—regardless of whether the data contain clus-ters or not—finding out which clustering result is meaningfuland useful to users is important [19]. A number of clusteringevaluation techniques exist in the literature.1 The most com-monly used metrics are Cluster Recall and Cluster Precision[43] along with F-measure used to combine these metrics [30],
1See [20] for a broad comparison of such metrics.

636 IEEE TRANSACTIONS ON SYSTEMS, MAN, AND CYBERNETICS—PART A: SYSTEMS AND HUMANS, VOL. 36, NO. 4, JULY 2006
[46], [49]. There is also literature on the use of human expertsto evaluate computer-clustering performance [41], [42], [52].After a study of the literature, we found the metrics used byRoussinov and Chen [41] particularly relevant and decided touse them in our study.
Roussinov and Chen did an evaluation of document-clustering techniques through experiments with human subjects[41]. They used four metrics, Cluster Error (CE), Normal-ized Cluster Error (NCE), Cluster Recall (CR), and ClusterPrecision (CP), which we also use in this study. They call apartition created by an expert a manual partition. An automaticpartition is one created by a computer. Inside any partition,an association is a pair of documents belonging to the samecluster. Incorrect associations are those that exist in an auto-matic partition but do not exist in a manual partition. Missedassociations are those that exist in a manual partition but donot exist in an automatic partition [41]. For our study, an objectclass corresponds to a document. The definitions of the fourmetrics are shown at the bottom of the page.
The overall clustering performance is measured by theF-measure value [30], [46], [49]. F-measure is a mechanismto provide for an overall estimate of the combined effect ofCP and CR. The F-measure is a standard evaluation metricin the field of information retrieval. The F-measure formula isexpressed as
F-measure =(BETA∧2 + 1) ∗ CR ∗ CP
(BETA∧2 ∗ CP) + CR
where BETA is the relative importance of clustering preci-sion versus clustering recall; the higher the F-measure value,the better the clustering result. A BETA of 0 means that F =Cluster Precision; BETA of ∞ means that F = ClusterRecall. (BETA = 1 means recall and precision are equallyweighted; BETA = 0.5 means recall is less important thanprecision; BETA = 2.0 means recall is more important thanprecision.) In our case, we choose BETA to be 1.0, assigningequal importance to CP and CR.
IV. DESIGN OF THE EMPIRICAL STUDY
A. Hypotheses
Because of the heuristic origins of the SOM algorithm,theoretically generated parameter values do not necessarilyensure the best clustering. This may explain why a theoret-
ical approach is not widely adopted and users still chooseSOM parameter values by ad hoc means that will provideresults judged suitable for their specific domain. We observethat researchers use different SOM parameter values for theirrespective different application domains [21], [26], [32]. Wepropose that when applying SOM to a different (new) domain,we need to select different values, appropriate to the newdomain, for the SOM parameters (xdim, y dim, neighborhoodsize, final training iterations). Further, good SOM parametervalues cannot just be generated theoretically, but should bevalidated in some way, such as by domain experts. We haveour first hypothesis according to this proposition.
H10: Using SOM parameter values that have provided a goodclustering performance in another application domainwill still do as well as human experts when applied tothe domain of LDAP directory object classes.
H11: Using SOM parameter values that have provided a goodclustering performance in another application domainwill, however, not do as well as human experts whenapplied to the domain of LDAP directory object classes.
As discussed later, the results of our experiment (Experi-ment 1) supported the above hypothesis, demonstrating thatSOM parameter values that may work well in one domain,may not work well for a different domain. This suggests thatwe cannot simply borrow the SOM parameter values froma different domain and expect them to work well for a newdomain such as LDAP directory metadata. We must find SOMparameter values specifically for the LDAP directory metadatadomain. We propose that parameter values for the domain ofLDAP directory metadata can be experimentally discovered.This suggests our second hypothesis.
H20: It is not possible, by an experimental approach, to findSOM parameter values that can cluster LDAP directoryobject classes as well as human experts.
H21: It is possible, by an experimental approach, to findSOM parameter values that can cluster LDAP directoryobject classes as well as human experts.
Results of the second experiment supported the above hy-pothesis, showing that, indeed, we can experimentally discoverSOM parameter values for the domain of LDAP directorymetadata such that the clustering results are comparable tothose of the human experts’. This did not, however, suggestthat the SOM parameter values discovered experimentally from
CE =total number of incorrect and missed associations
total number of possible pairs of object classes
NCE =total number of incorrect and missed associations
total number of associations existing in both partitions
CR =total number of correct associations in automatic partition
total number of associations in manual partition
CP =total number of correct associations in automatic partition
total number of associations in automatic partition
LIANG et al.: CLUSTERING OF LDAP DIRECTORY SCHEMAS FOR INFORMATION RESOURCES INTEROPERABILITY 637
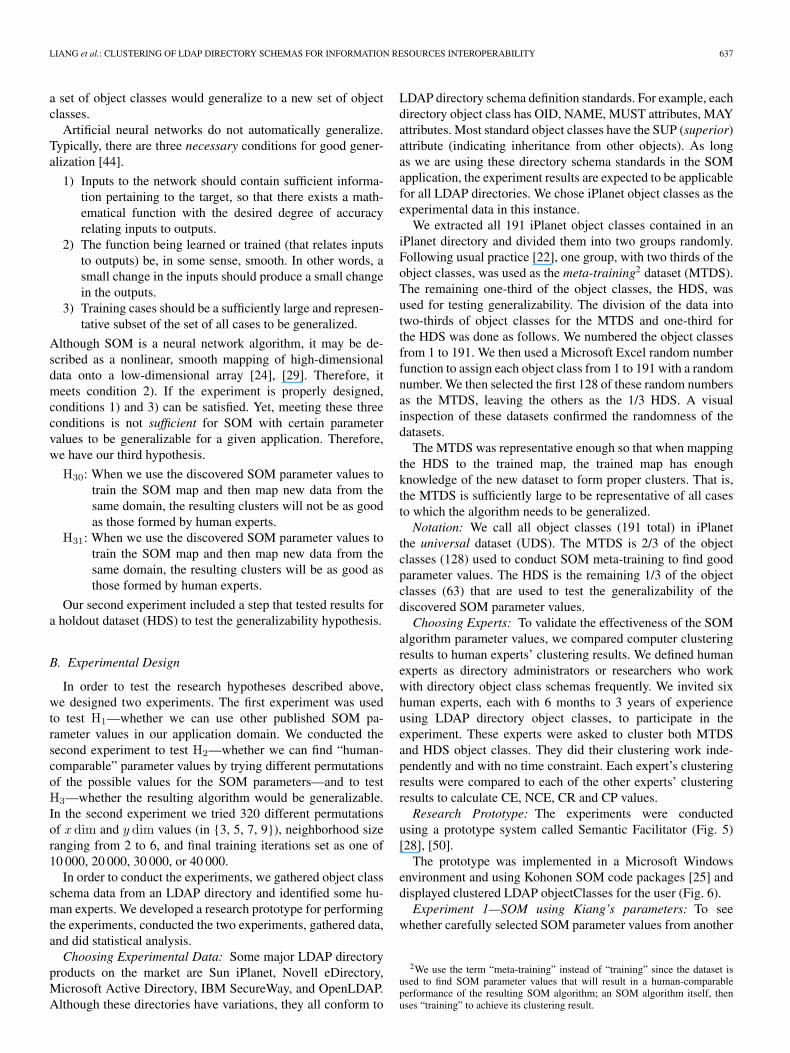
a set of object classes would generalize to a new set of objectclasses.
Artificial neural networks do not automatically generalize.Typically, there are three necessary conditions for good gener-alization [44].
1) Inputs to the network should contain sufficient informa-tion pertaining to the target, so that there exists a math-ematical function with the desired degree of accuracyrelating inputs to outputs.
2) The function being learned or trained (that relates inputsto outputs) be, in some sense, smooth. In other words, asmall change in the inputs should produce a small changein the outputs.
3) Training cases should be a sufficiently large and represen-tative subset of the set of all cases to be generalized.
Although SOM is a neural network algorithm, it may be de-scribed as a nonlinear, smooth mapping of high-dimensionaldata onto a low-dimensional array [24], [29]. Therefore, itmeets condition 2). If the experiment is properly designed,conditions 1) and 3) can be satisfied. Yet, meeting these threeconditions is not sufficient for SOM with certain parametervalues to be generalizable for a given application. Therefore,we have our third hypothesis.
H30: When we use the discovered SOM parameter values totrain the SOM map and then map new data from thesame domain, the resulting clusters will not be as goodas those formed by human experts.
H31: When we use the discovered SOM parameter values totrain the SOM map and then map new data from thesame domain, the resulting clusters will be as good asthose formed by human experts.
Our second experiment included a step that tested results fora holdout dataset (HDS) to test the generalizability hypothesis.
B. Experimental Design
In order to test the research hypotheses described above,we designed two experiments. The first experiment was usedto test H1—whether we can use other published SOM pa-rameter values in our application domain. We conducted thesecond experiment to test H2—whether we can find “human-comparable” parameter values by trying different permutationsof the possible values for the SOM parameters—and to testH3—whether the resulting algorithm would be generalizable.In the second experiment we tried 320 different permutationsof xdim and y dim values (in {3, 5, 7, 9}), neighborhood sizeranging from 2 to 6, and final training iterations set as one of10 000, 20 000, 30 000, or 40 000.
In order to conduct the experiments, we gathered object classschema data from an LDAP directory and identified some hu-man experts. We developed a research prototype for performingthe experiments, conducted the two experiments, gathered data,and did statistical analysis.Choosing Experimental Data: Some major LDAP directory
products on the market are Sun iPlanet, Novell eDirectory,Microsoft Active Directory, IBM SecureWay, and OpenLDAP.Although these directories have variations, they all conform to
LDAP directory schema definition standards. For example, eachdirectory object class has OID, NAME, MUST attributes, MAYattributes. Most standard object classes have the SUP (superior)attribute (indicating inheritance from other objects). As longas we are using these directory schema standards in the SOMapplication, the experiment results are expected to be applicablefor all LDAP directories. We chose iPlanet object classes as theexperimental data in this instance.
We extracted all 191 iPlanet object classes contained in aniPlanet directory and divided them into two groups randomly.Following usual practice [22], one group, with two thirds of theobject classes, was used as the meta-training2 dataset (MTDS).The remaining one-third of the object classes, the HDS, wasused for testing generalizability. The division of the data intotwo-thirds of object classes for the MTDS and one-third forthe HDS was done as follows. We numbered the object classesfrom 1 to 191. We then used a Microsoft Excel random numberfunction to assign each object class from 1 to 191 with a randomnumber. We then selected the first 128 of these random numbersas the MTDS, leaving the others as the 1/3 HDS. A visualinspection of these datasets confirmed the randomness of thedatasets.
The MTDS was representative enough so that when mappingthe HDS to the trained map, the trained map has enoughknowledge of the new dataset to form proper clusters. That is,the MTDS is sufficiently large to be representative of all casesto which the algorithm needs to be generalized.Notation: We call all object classes (191 total) in iPlanet
the universal dataset (UDS). The MTDS is 2/3 of the objectclasses (128) used to conduct SOM meta-training to find goodparameter values. The HDS is the remaining 1/3 of the objectclasses (63) that are used to test the generalizability of thediscovered SOM parameter values.Choosing Experts: To validate the effectiveness of the SOM
algorithm parameter values, we compared computer clusteringresults to human experts’ clustering results. We defined humanexperts as directory administrators or researchers who workwith directory object class schemas frequently. We invited sixhuman experts, each with 6 months to 3 years of experienceusing LDAP directory object classes, to participate in theexperiment. These experts were asked to cluster both MTDSand HDS object classes. They did their clustering work inde-pendently and with no time constraint. Each expert’s clusteringresults were compared to each of the other experts’ clusteringresults to calculate CE, NCE, CR and CP values.Research Prototype: The experiments were conducted
using a prototype system called Semantic Facilitator (Fig. 5)[28], [50].
The prototype was implemented in a Microsoft Windowsenvironment and using Kohonen SOM code packages [25] anddisplayed clustered LDAP objectClasses for the user (Fig. 6).Experiment 1—SOM using Kiang’s parameters: To see
whether carefully selected SOM parameter values from another
2We use the term “meta-training” instead of “training” since the dataset isused to find SOM parameter values that will result in a human-comparableperformance of the resulting SOM algorithm; an SOM algorithm itself, thenuses “training” to achieve its clustering result.

638 IEEE TRANSACTIONS ON SYSTEMS, MAN, AND CYBERNETICS—PART A: SYSTEMS AND HUMANS, VOL. 36, NO. 4, JULY 2006
Fig. 5. Semantic facilitator system architecture [28], [50].
Fig. 6. Semantic facilitator clustered metadata.
application domain work well, Experiment 1 used the parame-ters of Kiang et al. (xdim = 12, y dim = 12, neighborhoodsize = 5, final training iterations = 20 000) [21].Experimental Procedure: First use UDS to develop input
vector features (vector size of 483). Generate input nodes for all128 object classes in MTDS according to input vector features.Run SOM using the parameter values of Kiang et al. to createa map. Map 128 input nodes onto the trained map, creatingan object class cluster map. Calculate CE, NCE, CR, and CPvalues by comparing computer map results to each of the sixhuman experts’ clustering results for MTDS. As the second stepof this experiment, generate 63 input nodes for all object classesin HDS. Project these 63 input nodes onto the map generatedin the first step. Calculate CE, NCE, CR, and CP values bycomparing HDS mapping results to each of the six experts’clustering of the HDS.Experiment 2—SOM using 320 permutations of parameter
value sets: This experiment was conducted to evaluate a wide
TABLE IAVERAGES FOR EXPERT-TO-EXPERT RESULTS
range of SOM parameter value sets by running 320 config-urations and comparing each computer clustering result toeach human expert’s clustering result. Based on Kohonen’ssuggestions [25] and other researchers’ work [21], [32], wechose a set of values across which SOM parameter values couldrange: xdim, y dim values in {3, 5, 7, 9}; neighborhood sizein {2, 3, 4, 5, 6}; final training iterations in {10 000, 20 000,30 000, 40 000}. This resulted in 320 SOM parameter value setpermutations being tested
P 1xdim ∗ P 1
y dim ∗ P 1neighborSize ∗ P 1
trainIterations
= 4 ∗ 4 ∗ 4 ∗ 5 = 320
Experimental Procedure: First use UDS to develop inputvector features (again input vector size is 483). Generate in-put nodes for all 128 object classes in MTDS according toinput vector features. Run SOM using each of 320 parametervalue sets. Map 128 input nodes onto each of the 320 trainedKohonen maps, creating object class cluster maps. CalculateCE, NCE, CR, and CP values for each of the 320 object classmaps by comparing the computer map results to each of thesix experts’ clustering results for MTDS. Sort all 320 maps indescending order of F-measures [30], [46], [49]. The best mapis the topmost map. Record the topmost map’s CE, NCE, CR,and CP values, and its parameter values. As the second step ofthis experiment, generate 63 input nodes for all object classesin HDS. Project these 63 input nodes onto the topmost mapidentified in the first step. Calculate CE, NCE, CR, and CPvalues by comparing computer map results to each of the sixexperts’ clustering of HDS.
V. EXPERIMENTAL RESULTS
A. Baseline Comparison of Clustering by Six Experts
We found considerable variation in the clusters obtained bythe experts; this precluded the use of a “representative expert”or a “consensus” set of clusters. We therefore used the statisticalmean and variance of the results from the human experts’clustering as anonymous input to represent their collectiveresults.
Table I shows the results of comparing the six human ex-perts’ clustering results to each other. The first row shows theMTDS results. The second row shows the HDS results. TheCE values are calculated by averaging all five expert-to-expertCE values, which are computed by comparing each expert’sclustering results to the other five experts’ clustering resultsusing the metric and taking the mean of the metric values.Similarly the NCE, smashCR, and CP are calculated byaveraging all five expert-to-expert corresponding values andtaking their mean.
LIANG et al.: CLUSTERING OF LDAP DIRECTORY SCHEMAS FOR INFORMATION RESOURCES INTEROPERABILITY 639
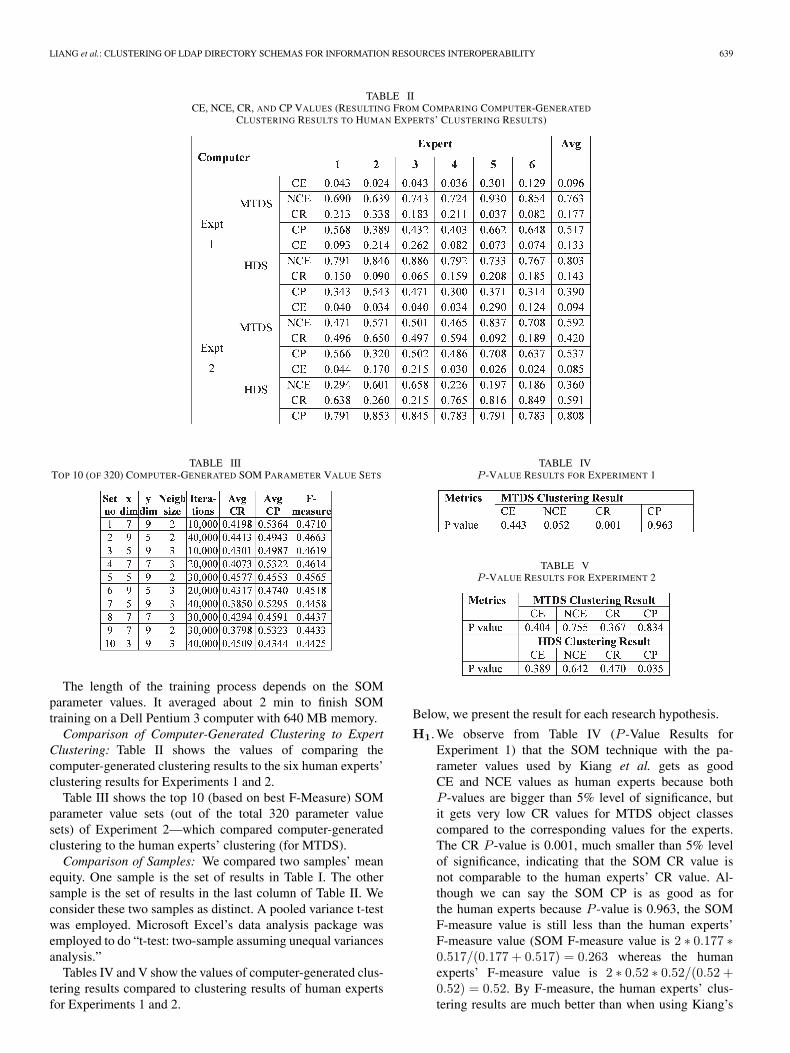
TABLE IICE, NCE, CR, AND CP VALUES (RESULTING FROM COMPARING COMPUTER-GENERATED
CLUSTERING RESULTS TO HUMAN EXPERTS’ CLUSTERING RESULTS)
TABLE IIITOP 10 (OF 320) COMPUTER-GENERATED SOM PARAMETER VALUE SETS
The length of the training process depends on the SOMparameter values. It averaged about 2 min to finish SOMtraining on a Dell Pentium 3 computer with 640 MB memory.Comparison of Computer-Generated Clustering to Expert
Clustering: Table II shows the values of comparing thecomputer-generated clustering results to the six human experts’clustering results for Experiments 1 and 2.
Table III shows the top 10 (based on best F-Measure) SOMparameter value sets (out of the total 320 parameter valuesets) of Experiment 2—which compared computer-generatedclustering to the human experts’ clustering (for MTDS).Comparison of Samples: We compared two samples’ mean
equity. One sample is the set of results in Table I. The othersample is the set of results in the last column of Table II. Weconsider these two samples as distinct. A pooled variance t-testwas employed. Microsoft Excel’s data analysis package wasemployed to do “t-test: two-sample assuming unequal variancesanalysis.”
Tables IV and V show the values of computer-generated clus-tering results compared to clustering results of human expertsfor Experiments 1 and 2.
TABLE IVP -VALUE RESULTS FOR EXPERIMENT 1
TABLE VP -VALUE RESULTS FOR EXPERIMENT 2
Below, we present the result for each research hypothesis.
H1. We observe from Table IV (P -Value Results forExperiment 1) that the SOM technique with the pa-rameter values used by Kiang et al. gets as goodCE and NCE values as human experts because bothP -values are bigger than 5% level of significance, butit gets very low CR values for MTDS object classescompared to the corresponding values for the experts.The CR P -value is 0.001, much smaller than 5% levelof significance, indicating that the SOM CR value isnot comparable to the human experts’ CR value. Al-though we can say the SOM CP is as good as forthe human experts because P -value is 0.963, the SOMF-measure value is still less than the human experts’F-measure value (SOM F-measure value is 2 ∗ 0.177 ∗0.517/(0.177 + 0.517) = 0.263 whereas the humanexperts’ F-measure value is 2 ∗ 0.52 ∗ 0.52/(0.52 +0.52) = 0.52. By F-measure, the human experts’ clus-tering results are much better than when using Kiang’s
640 IEEE TRANSACTIONS ON SYSTEMS, MAN, AND CYBERNETICS—PART A: SYSTEMS AND HUMANS, VOL. 36, NO. 4, JULY 2006
SOM parameter values to obtain clustering results. Con-clusion: Hypothesis 1 is supported by Experiment 1.
H2. The P -values for CE, NCE, CR, and CP in Table Vshow that the SOM clustering performance for MTDSclustering is comparable to that of the human experts’at 5% level of significance. Looking at the CE, NCE,CR, and CP values (see Tables I and II), we find thatthe SOM values are very close to the human experts’values. SOM CE, NCE, and CP values are better thanthose of the human experts’ while the SOM CR valuesare comparable to the corresponding values for the hu-man experts. Conclusion: Hypothesis 2 is supported byExperiment 2.
H3. When we map the HDS object classes to the best trainedmap we found in Experiment 2 (xdim = 7, y dim = 9,neighborhood size = 2, iterations = 10 000), we still getgood cluster results (see Table II, Experiment 2 results).Three metrics (CE, NCE, CR) are as good as the humanexperts’ with P -value at 5% level of significance (seeTable V). While the P -value of CP is low (0.035),yet the SOM average CP value for HDS in Table IIis 0.808 while the human experts’ average CP valuefor HDS in Table I is 0.687. This indicates, indeed,that the SOM CP is better than the human experts’ CP.Further, if we calculate the F-measure value for theHDS in Table I (expert-to-expert results), which is 2 ∗0.687 ∗ 0.687/(0.687 + 0.687) = 0.687, and compareit to the calculated F-measure value for Experiment 2HDS average in Table II (comparing computer-generated clustering results to human experts’ clus-tering results), which is 2 ∗ 0.591 ∗ 0.808/(0.591 +0.808) = 0.683, we corroborate that the computer clus-tering results are comparable to the experts’ cluster-ing results. Conclusion: Hypothesis 3 is supported byExperiment 2.
VI. CONCLUSION AND DISCUSSION
Clustering of LDAP object classes at a level that matcheshuman performance is a particularly important problem forreuse of directory metadata and semantic interoperability. Weare not aware of any work on the clustering of LDAP metadata.There has been work on the clustering of metadata for relationaldatabases [53], [54], but this work cannot be directly appliedto LDAP schemas clustering. Also, it does not attempt toobtain human-comparable SOM parameter values as we do inthe current study. Beyond deciding on how the data shouldbe preprocessed, etc., an important issue is the selection ofSOM parameter values. We investigated if the parameter valueschosen by other researchers for a different domain wouldresult in the performance desired in our LDAP domain. Theresults were negative. We therefore decided to conduct a fairlyexhaustive search of SOM parameter values to find if thereexists a set of parameter values that would meet the neededperformance level. We found such a set of parameter values.This shows that SOM can be used to cluster LDAP metadataat the human-expert performance level. Finally, we looked atthe generalizability of the solution. We set aside an HDS that
did not participate in the training of the SOM mapping nodesusing the MTDS. When this HDS was mapped to the SOMmapping nodes, the results were also favorably comparable tothe human experts’ clustering, indicating the generalizability ofthe solution.Limitations: Using SOM to cluster directory schema has five
steps: 1) pattern representation (optionally including featureextraction and/or selection); 2) definition of a pattern proximitysimilarity measure appropriate to the data domain; 3) clusteringor grouping; 4) data abstraction; and 5) assessment of output.There are many approaches to doing feature extraction andselection, and if we had tried more methods, we might haveachieved even “better” results. We only used Euclidean distancefor similarity measure. In investigating human-comparableSOM clustering, we only varied parameter values for mapdimension size, neighborhood size, and training iterations, anddid not address initial learning rate, final learning rate, or maptopology. In evaluating SOM clustering results, we only usedsix human experts in assessing output. We have not assessedthe external validity of the human experts’ evaluation, such asholding out some human experts to see whether they have thesame evaluation results for the same directory metadata as theother experts.
Clearly, it seems intuitive that including more experts canhave an effect on the collective results. We believe the initialselection of six experts provides a reasonable range of expertinput, and demonstrates the practicality of our experimentalapproach. There is interesting future work in this area as weconsider the influence of the number of experts and theirpotentially varying LDAP domain expertise.
With regard to generalizability, we note that one could arguethat by letting the HDS participate in the building of the featureset, generalizability is lessened. That is, HDS attributes were in-cluded with the MTDS attributes in a UDS from which featureswere extracted. However, several factors need to be considered.First, since we only included attributes that appeared in threeor more object classes, we used only 483 of more than 800attributes. Second, the HDS did not participate in the meta-training to discover SOM parameter values, nor in the SOMtraining of the out layer (the mapping layer). Third, the HDSincluded 63 object classes (1/3 of all the object classes) andall of these still mapped well, demonstrating generalizability.Finally, we observe that the concept of a UDS makes senseand is practical: given a new object class, why not include itin finding optimal parameter values for SOM?Further Research: We are extending our work in several
directions. One is to find human-comparable parameter val-ues using a genetic algorithm. Another is to provide an ex-pert interface so that the SOM algorithm can “learn” as itsees more data and has the benefit of using the expertise ofmore experts. Another is to explore the options for achievinghuman-comparable clustering without recourse to experts di-rectly, such as, perhaps using reference datasets (objects thatwe expect to cluster closely) to measure clustering results.Another area of future work is to investigate approaches forproviding directory schema discovery and management viascaleable web services components in an online, dynamicenvironment.
LIANG et al.: CLUSTERING OF LDAP DIRECTORY SCHEMAS FOR INFORMATION RESOURCES INTEROPERABILITY 641
ACKNOWLEDGMENT
The authors are indebted to the anonymous referees for theircareful reading of the paper and their constructive suggestionsfor its improvement.
The authors gratefully acknowledge Prof. A. Srivastava atGeorgia State University for expert advice on statistical analy-sis. D. Kuechler, a doctoral student in the CIS department atGeorgia State University, contributed to earlier versions of thispaper before his untimely death in November 2002.
REFERENCES
[1] D. Alahahoo and S. K. Halgamuge, “Dynamic self-organizing maps withcontrolled growth for knowledge discovery,” IEEE Trans. Neural Netw.,vol. 11, no. 3, pp. 601–614, May 2000.
[2] C. M. Bishop, Neural Networks for Pattern Recognition. New York:Oxford Univ. Press, 1995.
[3] C. M. Bishop, M. Svensén, and C. G. Williams, “TM: The generativetopographic mapping,”Neural Comput., vol. 10, no. 1, pp. 215–234, 1998.
[4] W. Cheung, S. Bahri, and G. Babin, “An object oriented shell for dis-tributed processing and systems integration,” in Working Paper. Shatin,N.T., Hong Kong: Decision Sci. and Managerial Econ. Dept., ChineseUniv. Hong Kong, 2003.
[5] Internet2. (2004). Directories [Online]. Available: http://middleware.internet2.edu/core/directories.html
[6] Dublin Core Metadata Initiative, Dublin Core Metadata Element Set,Version 1.0: Reference Description, 1995–2003. [Online]. Available:http://dublincore.org/documents/1998/09/dces/
[7] Net@Edu. (2003). eduPerson Object Class [Online]. Available: http://www.educause.edu/eduperson/
[8] I. Foster, C. Kesselman, and S. Tuecke. The anatomy of the grid, en-abling scalable virtual organizations. Int. J. Supercomput. Appl. [Online].15(3), pp. 200–222. Available: http://www.globus.org/research/papers/anatomy.pdf
[9] GLUE Schema. (2002, Oct. 16). The Globus Project [Online]. Available:http://www.globus.org/mds/glueschemalink.html
[10] M. T. Hansen, N. Nohria, and T. Tierney, “What’s your strategy for man-aging knowledge?” Harvard Bus. Rev., vol. 77, no. 2, pp. 106–116, 1999.
[11] S. Hayward, J. Graff, and N. MacDonald, “Business Strategy WillDrive Directory Services,” GartnerGroup, Stamford, CT, TG-07-4615,Mar. 11, 1999.
[12] S. Heiler, “Semantic interoperability,” ACM Comput. Surv., vol. 27, no. 2,pp. 271–273, 1995.
[13] T. Howes, M. Smith, and G. S. Good, Understanding and DeployingLDAP Directory Services, 2nd ed. Boston, MA: Addison-Wesley, 2003.
[14] C. Hsu, M. Bouziane, L. Rattner, and L. Yee, “Information resourcesmanagement in heterogeneous, distributed environments: A metadata-base approach,” IEEE Trans. Softw. Eng., vol. 17, no. 6, pp. 604–625,Jun. 1991.
[15] C. Hsu, Enterprise Integration and Modeling—The Metadatabase Ap-proach. Boston, MA: Kluwer, 1996.
[16] Internet2. (2003). Internet2 Middleware Initiative [Online]. Available:http://www.internet2.edu/middleware/
[17] International Telecommunication Union. (2003). ITU-T Recommenda-tion X.501f [Online]. Available: http://www.itu.int/rec/recommendation.asp?type=folders&lang=e&parent=T-REC-X.501
[18] A. K. Jain and R. C. Dubes, Algorithms for Clustering Data, Prentice-Hall Advanced Reference Series. Upper Saddle River, NJ: Prentice-Hall,1988.
[19] A. K. Jain, M. N. Murty, and P. J. Flynn, “Data clustering: A review,”ACM Comput. Surv., vol. 31, no. 3, pp. 264–323, 1999.
[20] T. C. Jo, “Evaluation of document clustering based on term en-tropy,” in Proc. Int. Symp. Advanced Intelligent Systems, Daejon,Korea, 2001, pp. 302–306 [Online]. Available: http://www.discover.uottawa.ca/~taeho/Publication/ic2001_08.pdf
[21] M. Y. Kiang, U. R. Kulkarni, and K. Y. Tam, “Self-organizing mapnetworks as an interactive clustering tool—An application to grouptechnology,” Dec. Support Syst., vol. 15, no. 4, pp. 351–374, 1995.
[22] R. Kohavi, “A study of cross-validation and bootstrap for accuracy es-timation and model selection,” in Proc. 14th Int. Joint Conf. ArtificialIntelligence (IJCAI), Montreal, Canada, 1995, pp. 1137–1143.
[23] T. Kohonen, Self-Organizing Maps. Berlin, Germany: Springer-Verlag,1995.
[24] ——, Self-Organizing Maps. Berlin, Germany: Springer-Verlag,2001.
[25] T. Kohonen, J. Hynninen, J. Kangas, and J. Laaksonen, SOM_PAK:The Self-Organizing Map Package, Version 3.1. Helsinki, Finland:Prepared by the SOM Programming Team, Helsinki Univ. Technol.,Apr. 7, 1995.
[26] T. Kohonen, S. Kaski, K. Lagus, J. Salojärvi, J. Honkela, V. Paatero, andA. Saarela, “Self organization of a massive document collection,” IEEETrans. Neural Netw., vol. 11, no. 3, pp. 574–585, May 2000.
[27] T. Kostiainen and J. Lampinen, “On the generative probabilitydensity model in the self-organizing map,” Neurocomputing, vol. 48,pp. 217–228, Oct. 2002.
[28] D. Kuechler, V. Vaishnavi, and A. Vandenberg, “An architecture tosupport communities of interest using directory services capabilities,”in Proc. Hawaii Int. Conf. System Sciences, Track 9, Big Island, HI,2003, p. 287b.
[29] J. Lampinen and T. Kostiainen, “Overtraining and model selectionwith the self-organizing map,” in Proc. Int. Joint Conf. Neural Network,Washington, DC, Jul. 1999, pp. 1911–1915.
[30] B. Larsen and A. Aone, “Fast and effective text mining using linear-time document clustering,” in Proc. 5th Association for ComputingMachinery Knowledge Discovery and Data mining (ACM SIGKDD) Int.Conf. Knowledge Discovery and Data Mining, San Diego, CA, 1999,pp. 16–22.
[31] V. I. Levenshtein, “Binary codes capable of correcting deletions, inser-tions and reversals,” Sov. Phys. Dokl., vol. 10, no. 8, pp. 707–710, 1966.
[32] C. Lin, H. Chen, and J. F. Nunamaker, “Verifying the proximity and sizehypothesis for self-organizing maps,” J. Manage Inf. Syst., vol. 16, no. 3,pp. 57–70, 1999.
[33] Internet2. (2004). MACE-Dir [Online]. Available: http://middleware.internet2.edu/dir/
[34] P. Mangiameli, S. K. Chen, and D. West, “A comparison of SOM neuralnetwork and hierarchical clustering methods,” Eur. J. Oper. Res., vol. 93,no. 2, pp. 402–417, 1996.
[35] M. McInerney and A. Dhawan, “Training the self-organizing feature mapusing hybrids of genetic and Kohonen methods,” in Proc. IEEE Int. Conf.Neural Networks, Orlando, FL, 1994, pp. 641–644.
[36] A. Mowshowitz, “Virtual organization: A vision of management in theinformation age,” Inf. Soc., vol. 10, no. 4, pp. 267–288, 1994.
[37] NMI. (2003). NSF Middleware Initiative, NMI-R4 Software DownloadCenter [Online]. Available: http://www.nsf-middleware.org/NMIR4/download.asp
[38] A. Nürnberger, “Clustering of document collections using a growing self-organizing map,” in Proc. Berkeley Initiative Soft Computing (BISC) Int.Workshop Fuzzy Logic and Internet, Berkeley, CA, 2001, pp. 136–141.
[39] D. Polani and T. Uthmann, “Training Kohonen feature maps in differenttopologies: An analysis using genetic algorithms,” in Proc. 5th Int. Conf.Genetic Algorithms, San Mateo, CA, 1993, pp. 326–333.
[40] D. G. Roussinov and H. A. Chen, “A scalable self-organizing map algo-rithm for textual classification: A neural network approach to automaticthesaurus generation,” Commun. Cogn. Artif. Intell. J., vol. 15, no. 1–2,pp. 81–111, 1998.
[41] D. G. Roussinov and H. Chen, “Document clustering for electronic meet-ings: An experimental comparison of two techniques,”Dec. Support Syst.,vol. 27, no. 1–2, pp. 67–79, 1999.
[42] M. Sahami, S. Yusufali, and Q. W. Baldonado, “SONIA: A service fororganizing networked information autonomously,” in Proc. 3rd ACM Int.Conf. Digital Libraries, Pittsburgh, PA, 1998, pp. 237–246.
[43] G. Salton and M. J. McGill, Introduction to Modern Information Re-trieval. New York: McGraw-Hill, 1983.
[44] W. S. Sarle. (2002). How is Generalization Possible? [Online]. Available:http://www.faqs.org/faqs/ai-faq/neural-nets/part3/section-1.html
[45] S. Sestito and T. S. Dillon, Automated Knowledge Acquisition. Engle-wood Cliffs, NJ: Prentice-Hall, 1994.
[46] B. Stein and S. M. Z. Eissen, “Document categorization with MajorCLUST,” in Proc. of the 12th Workshop on Information Technologiesand Systems, Barcelona, Spain, 2002, pp. 91–96.
[47] A. Tiwana and B. Ramesh, “e-Services: Problems, opportunities, anddigital platforms,” in Proc. 34th Annu. Hawaii Int. Conf. System Sciences,Maui, HI, p. 3018.
[48] V. Vaishnavi and W. Kuechler, “Universal enterprise integration: Chal-lenges and approaches to web-enabled virtual organizations,” Inf. Technol.Manage., vol. 6, no. 1, pp. 5–16, 2005.
[49] C. Van Rijsbergen, Information Retrieval, 2nd ed. London, U.K.:Butterworth, 1979.
[50] A. Vandenberg, J. Liang, B. Bolet, H. Kou, V. Vaishnavi, and D. Kuechler,“Research prototype: Semantic facilitator for LDAP Directory Services,”

642 IEEE TRANSACTIONS ON SYSTEMS, MAN, AND CYBERNETICS—PART A: SYSTEMS AND HUMANS, VOL. 36, NO. 4, JULY 2006
in Proc. 12th Annu. Workshop on Information Technologies and Systems,Barcelona, Spain, 2002, p. 251.
[51] A. Vandenberg, V. Vaishnavi, and C. Shaw, “Promoting semantic inter-operability of metatdata for directories of the future,” in Internet2 FallMember Meeting, Indianapolis, IN, 2003 [Online]. Available: http://www.internet2.edu/presentations/fall-03/20031016-Middleware-Vandenberg.htm
[52] O. Zamir, O. Etzioni, O. Madani, and R. M. Karp, “Fast and intuitiveclustering of web documents,” in Proc. 3rd Int. Conf. Knowledge Discov-ery and Data Mining, Newport Beach, CA, 1997, pp. 287–290.
[53] H. Zhao, “Combining schema and instance information for integratingheterogeneous databases: An analytical approach and empirical evalua-tion,” Ph.D. dissertation, Manage. Inform. Syst., Univ. Arizona, Tucson,AZ, 2002.
[54] H. Zhao and S. Ram, “Clustering schema elements for semantic integra-tion of heterogeneous data sources,” J. Database Manage., vol. 15, no. 4,pp. 89–106, 2004.
Jianghua Liang was born in Gaoan, JiangxiProvince, China, in 1973. He received the B.E. de-gree in mining engineering from the Southern In-stitute of Metallurgy, Ganzhou, Jiangxi Province, in1995; the M.E. degree in mining engineering fromthe University of Science and Technology, Beijing,China, in 1998; the Ph.D. degree in geological engi-neering from the University of Arizona, Tucson, in2001; and the M.S. degree in computer informationsystems from Georgia State University, Atlanta, in2003.
He worked as a Graduate Research Assistant at Advanced Campus Servicesof Georgia State University during 2001–2003. He joined Concept World-Wide, Inc. after he graduated from Georgia State University. He is currentlya Senior Software Application Consultant with Lexmark International, Inc.,Lexington, KY.
Dr. Liang is a member of the Atlanta Graduate Business Association.
Vijay K. Vaishnavi (SM’89–F’01) received the BEdegree (with distinction) in electrical engineeringfrom the National Institute of Technology, Srinagar,India, in 1969 and the M.Tech. and Ph.D. degreesin electrical engineering (with a major in computerscience) from the Indian Institute of Technology,Kanpur, India, in 1971 and 1976, respectively. He didpostdoctoral work in computer science for two yearsat McMaster University, Hamilton, ON, Canada.
He is currently the Board of Advisors Professorof Computer Information Systems at the Robinson
College of Business and Professor of Computer Science, Georgia State Univer-sity in Atlanta. The National Science Foundation and private organizations, in-cluding IBM, Nortel, and AT&T, have supported his research. He has authorednumerous papers in these and related areas. His papers have appeared in ACMComputing Surveys, IEEE TRANSACTIONS ON SOFTWARE ENGINEERING,IEEE TRANSACTIONS ON KNOWLEDGE AND DATA ENGINEERING, IEEETRANSACTIONS ON COMPUTERS, SIAM Journal on Computing, Journal ofAlgorithms, and several other major international journals and conferenceproceedings. He is a coauthor of Object Technology Centers of Excellence,(Manning Publications/Prentice-Hall, 1996). His current areas of researchinterest include interorganizational systems (information integration, semanticinteroperability, directory services, web-based virtual communities, coordina-tion, process knowledge management, security), software development (projectmanagement, object-oriented metrics, software specifications and their matu-rity, object-oriented modeling and design), and data structures and algorithms(multisensor networks and fusion).
Dr. Vaishnavi is a member of the IEEE Computer Society, the Associationfor Computing Machinery (ACM), and the Association for Information Sys-tems (AIS). He has been an Associate Editor, Editor, Guest Editor, and EditorialBoard Member of several journals. He is on the program committees of severalconferences and workshops.
Art Vandenberg (M’04) was born in Grasonville,MD, in 1950. He received the B.A. degree in Englishliterature from Swarthmore College, Swarthmore,PA, in 1972, the M.V.A degree in painting and draw-ing from Georgia State University, Atlanta, in 1979,and the M.S. degree in information and computersystems from Georgia Institute of Technology, At-lanta, in 1985.
He has worked in library systems, research, andadministrative computing since 1976, with 15 yearsexperience in various information technology po-
sitions at Georgia Institute of Technology. Since 1997, he has been withInformation Systems and Technology at Georgia State University, Atlanta,where he is Director of Advanced Campus Services charged with implementingmiddleware infrastructure and supporting research computing. In his first twoyears with Georgia State he was responsible for administrative computingand led the campus-wide Y2K remediation project. His current middlewareactivities include participation in the NSF Middleware Initiative’s IntegrationTestbed, deploying directory and Grid components, and collaborating with fac-ulty researchers on middleware research and Grid technology deployment. Heis Co-PI on a National Science Foundation Information Technology Researchgrant investigating a unique approach to resolving metadata heterogeneity.
Mr. Vandenberg is a member of the Association of Computing Machineryand the IEEE Computer Society.