smijesh n. - arxiv
TRANSCRIPT
i
SPECTRAL AND TEMPORAL CHARACTERIZATION OF
NANOSECOND AND FEMTOSECOND LASER PRODUCED
PLASMA FROM METALLIC TARGETS
A THESIS
Submitted by
SMIJESH N.
For the award of the degree of
DOCTOR OF PHILOSOPHY
DEPARTMENT OF PHYSICS NATIONAL INSTITUTE OF TECHNOLOGY CALICUT
NIT CAMPUS P. O., KOZHIKODE KERALA, INDIA 673601
JULY 2014

ii
To my family and teachers
ACKNOWLEDGEMENTS
Keeping a step forward in my academic life and my personal life too, it will be
unfair if I don't remember those people who helped me to succeed in taking this big
step in my life. Prayers, support, encouragement and criticism from people had
always been an asset to help me form myself.
A fraction of my academic achievements is dedicated to Dr. K. Chandrashekaran and
Dr. Reji Philip; my PhD supervisors. Dr. K. Chandrashekaran did his best to help me
complete the formalities and requirements related to my PhD right from the
beginning. The time spent at NIT was made more helpful and promising by this
person who gave his whole hearted support throughout the PhD tenure. Dr. Reji
Philip, my supervisor at the Raman Research Institute, Bangalore, where I did my
entire set of experiments, was a good person to be with. I had been with him since
the time of my M. Tech project, where I developed my interest in the field of plasma
and decided to do my PhD in the field. Whole hearted support from Dr.
Chandrashekaran and Dr. Reji Philip made the initial steps of my PhD smooth.
While Dr. Reji helped me by providing me his lab and other facilities required, the
other side of my PhD work was supported and backed up by Dr. Chandrashekaran.
Dr. Reji and his family were a big mental support to my work during the stay at
Bangalore. They are thanked and are always placed close to my heart. Unforgettable
moments with Reji ; a very good stress buster, especially during the lunch breaks
and tea time are always cherished as they always helped me to relax out of the
strenuous work during hectic times.
I would also like to thank Dr. M. N. Bandyopadhyay, Director, NITC, for providing
all the facilities required to carry out my research, especially the course work related
to the curriculum. I am also thankful to Dr. V. K. Govindan, Dean (Academic) and
Acknowledgements
iv
former Dean Dr. K. Prabhakaran Nair for their extended support throughout my
research work.
Dr. Raghu. C, Dr. M. K Ravi Varma and Dr. Vari Sivaji Reddy, Department of
Physics, NITC; Dr. Parameswaran P, Department of Chemistry, NITC and Dr.
Soney Varghese from SNST, NITC; formed the Doctoral committee for my research
programme. Their fruitful discussions, suggestions and criticisms were live
throughout the time, which helped me improve a lot. I thank them sincerely for their
constructive encouragement. I am grateful to all the teaching and non-teaching staff
of NIT Calicut, for their ever loving support.
Dr. Achamma Kurian, who directed me into research and constantly encouraged me
to join a PhD is one of the reasons for this moment in my life and I remember her
with gratitude and love. I am always indebted to her and her support to me
throughout these years. Dr. S. S. Harilal is yet another person whom I would like to
mention with respect and love, who helped me with methods of writing a good paper
and with some experimental insights.
Heartfelt thanks to Mr. Jinto Thomas; my silent mentor, a good experimentalist and
over all a good person to be with; who helped me with his experimental skills to get
out of dilemmas at some hard times during the course of my experiments. His beauty
of work in the lab and way of executing things were always admired and it inspired
me to take up such experiments for my PhD work. I always remember him with love
and respect as he held me up while entering the experimental works in the field. I
also thank him for providing me the ICCD which helped me to give a good final
form to my thesis.
Suchand Sandeep, my elder brother in life and lab, well wisher and a good friend
always, kept me on track during my PhD days. He really wanted to see me complete
this huge step successfully in my life and hence was a solid support in all ways. I am
happy that I could fulfil his wish satisfactorily and I cherish my sweet times with
him in the lab during the initial days of lab work at the Raman Research Institute.

Acknowledgements
v
Initial period of my work which started from the scratch was carried out with the
help of Aparna, who was a true supporter in experiments and a very good friend in
my life. I cherish the weekends and the workaholic times we spent happily together
at this moment. Later on, Jagdish joined me for a while. His theoretical support and
doubts strengthened my work and he was one of those who accompanied my work
during late nights. Apart from a lab mate and a good supporter, he became my good
friend whom I don't want to miss for this entire lifetime. Jijil and Pranitha who came
for their Master's project work, became my very good experimental partners later on.
I whole heartedly thank them for their support, help and affection. I am also happy to
have Suchand Sangeeth as a friend who spent some nice times with me during the
PhD tenure.
Friends who always kept me live without frustrations are an integral part of my
whole work. Words become utterly helpless to describe these people who are unique
in their own ways. Their ways, presence and friendship can only be felt. Satheesh,
Pramod and Anin are awesome people who are assets to my life. The tea-time, spare
times and group talks are among some memories that I cherish a lot. My room-mate
Aneesh and his friends need special mention as they were the only people who were
with me, once I was back after strenuous work. They were extremely helpful and I
am thankful to them for being in my life. Rekha, Sony chettan, Irshadettan, Sibu,
Rajesh, Jayasree, and Haripadmam also equally helped me to keep my presence of
mind throughout the PhD period. I also thank Jileesh, Suraj, Sunil and Ashok who
joined my life and extended their strong support as they always did. I also like to
specially mention Sreekanth, Nithin, Elizabeth and Anitta who were continuous
supporters and good companions. They kept me live and sporty throughout,
especially during the final times of writing a thesis. The routine of badminton
practice at NITC gifted me a hand full of very good friends. Darshan, Jithin, Praveen
Sir and Madhu sir were good people to be with and they always gave me positive
energy that helped me work happily at NITC. Special regards to Abhilash sir who
was a source of inspiration. The energy, support and energy they gave me in my life
are priceless and unforgettable. I am happy to have them close to my heart always.

Acknowledgements
vi
Labmates help in creating an environment favourable for work. Lab members at
NITC gave me a very huge support and backup. They were my family, friends and
more for the entire time of the PhD. Days that I stayed away from my family were
made easier by them. I personally thank Siji, Sudheesh, Divyechi and Vijisha for
their support and rocking memories. I thank Suhail, Arun, Aneesh J, Issac sir, Shiju,
Praveen, Yoosuf, Lakshmikanth and Nishaina for their cooperation at NITC. I thank
Augustin, Benoy, Aravindan, Ann Mary, Safakath, Athira, Nivya, Shafi and Priya at
the Raman Research Institute for their memorable company. Harini, Shiva and
Manju at RRI were nice to me and helped me in the official works at the institute
and I thank them at this moment. I also thank Sarojini chechi and Abraham chettan
at NITC for their valuable support which helped me a lot.
Family is an important part of life which is a source of inspiration, support and love.
My mother’s love, father’s affection, care from sisters and support from in-laws
filled my mind with peace and love throughout the period. My niece kept me bound
tightly to the family during this period so that I felt the pool of love and my mind
could relax to work more efficiently each day. One good friend for life - Neena and
her family are also remembered with love at this moment for whatever love, care and
support they gave me. I love them all and thank them whole heartedly for supporting
me in my ventures.
Grace of god has not left me blank throughout these days at any point of my life. I
thank one and all who are responsible for my achievements till now and who were
with me to complete this venture successfully. I remember each one of them in my
heart and thank them all whole heartedly.
Smijesh N.

vii
DECLARATION
I hereby declare that this submission is my own work and that, to the best of my
knowledge and belief, it contains no material previously published or written by
another person nor material which has been accepted for the award of any other
degree or diploma of the university or other institute of higher learning, except
where due acknowledgment has been made in the text.
NIT Calicut Smijesh N.
28 July 2014 Reg. No. P110002PH
viii
CERTIFICATE
This is to certify that the thesis entitled "Spectral and temporal characterization of
nanosecond and femtosecond laser produced plasma from metallic targets"
submitted by Mr. Smijesh N to the National Institute of Technology Calicut for the
award of the degree of Doctor of Philosophy is a bona fide record of the research
work carried out by him under our supervision and guidance. The content of the
thesis, in full or parts have not been submitted to any other Institute or University for
the award of any other degree or diploma.
Dr. Reji Philip Associate Professor Ultrafast and Nonlinear Optics Lab Light and Matter Physics Group Raman Research Institute, Bangalore, India
Dr. Chandrasekharan. K Professor Laser and Nonlinear Optics Laboratory Department of Physics National Institute of Technology Calicut Kerala, India
NIT Calicut
28th July 2014
Signature of Head of the Department
ix
CONTENTS
Page
Abstract………………………………………………..……...…………………..xiv
List of Symbols and Abbreviations……………………………………………..xvii
List of Figures…………………………………………………………...…….... .xxi
List of Tables………………………………………………………………...... xxviii
Chapter 1
Introduction…………………………………………………………….................. 1
1.1 Motivation and overview...……………………………………..…….......... 2
1.2 Basic considerations of plasmas………………………..…………............... 3
1.2.1 Electron temperature………………………..………........................ 4
1.2.2 Debye shielding……………………………………………………. 5
1.2.3 The plasma parameter ……………………………………………... 6
1.2.4 Plasma oscillations…………………………………………………. 7
1.3 Criteria for plasmas to exist…………….………………………………….. 8
1.4 Basic plasma phenomena………………………………………………...… 9
1.4.1 Fluid description ….………..….…………………………………... 9
1.4.2 Kinetic description …………………………………………………10
1.5 Types of plasma …………………………………………………………… 11
1.5.1 Cold plasmas …................................................................................. 11
1.5.2 Hot plasma…………………………………………………………..11
1.5.3 Collisional plasma and collisionless plasma……………………….. 12
1.6 Methods of plasma production…………………………………………….. 13
1.6.1 Arc discharge………………………………………………………. 14
1.6.2 Glow discharge…………………………………………………….. 14
1.6.3 RF discharge……………………………………………………….. 15
1.6.4 Using particle beams……………………………………………….. 15
1.6.5 Using intense laser beams………………………………………...... 16
1.6.6 Ohmic Heating……………………………………………………... 16
Contents
x
1.7 Radiations from plasmas…………………………………………………… 16
1.7.1 Black Body Emission………………………………………………. 16
1.7.2 Bremsstrahlung Radiation………………………………………….. 16
1.7.3 Recombination Radiation…………………………………………...17
1.7.4 Line Radiation……………………………………………………… 17
1.7.5 Cyclotron radiation……………………………………………….... 18
1.8 Plasma diagnostics methods………………………………………………...18
1.8.1 Plasma Spectroscopy………………………………………………. 18
1.8.2 Langmuir probe…………………………………………………….. 19
1.8.3 Interferometry……………………………………………………… 20
1.8.4 Thomson scattering………………………………………………… 21
1.8.5 Shadowgraphy……………………………………………………... 21
1.9 Review of laser produced plasmas…………………………………………. 22
1.10 Conclusion…………………………………………………………………. 24
Chapter 2
Instrumentation……………………………………..…………..…………………25
2.1 Introduction……………………………………………………………….. 26
2.2 Laser system……………………………………………………………….. 26
2.2.1 The ultrafast (femtosecond) oscillator……………………………... 27
2.2.2 Pump laser for the ultrafast oscillator……………………………… 28
2.2.3 Nd: YAG laser (Quanta Ray)………………………………………. 29
2.2.4 Chirped Pulse Amplifier (TSA-10)………………………………… 29
2.3 Vacuum chamber…………………………………………………………... 31
2.4 The solid target manipulator……………………………………………….. 32
2.4.1 Target motion controller………………………………………….... 33
2.5 Detection systems…………………………………………………………. 34
2.5.1 Beam profiler………………………………………………………. 34
2.5.2 Laser energy and power meters……………………………………. 34
2.5.3 Spectrometer……………………………………………………….. 34
2.5.4 Digital phosphor oscilloscope……………………………………… 35
2.5.5 Intensified charge coupled device…………………………………. 36
2.6 Conclusion…………………………………………………………………. 36
Contents
xi
Chapter 3
Experimental techniques for the investigation of laser produced plasma…….. 37
3.1 Introduction………………………………………………………...……… 38
3.2 Optical emission spectroscopy (OES)….……………...…………………... 41
3.3 Optical time of flight (OTOF) measurements……………………………… 44
3.4 ICCD imaging……………………………………………………………… 46
3.5 Experimental……………………………………………………………….. 46
3.6 Conclusion…………………………………………………………………. 50
Chapter 4
Influence of ambient pressure and laser pulsewidth on the spectral and
temporal features of a laser produced nickel plasma…………………………... 51
4.1 Introduction………………………………………………………………... 52
4.2 Optical emission spectroscopic studies…………………………………….. 53
4.2.1 Effect of pulse width on the emission intensity …………………… 53
4.2.2 Effect of pressure on emission intensity …………………………... 56
4.2.3 Estimation of electron temperature……………………………….... 60
4.3 Optical time of flight measurements ………………………………………. 61
4.3.1 OTOF studies of neutrals ………………………………………...... 62
4.3.2 Velocities of neutrals ……………………………………………… 63
4.3.3 OTOF studies of ions ……………………………………………… 65
4.4 Expansion of the plasma plume in time……………………………………. 68
4.5 Conclusion…………………………………………………………………. 72
Chapter 5
Influence of ambient pressure and laser pulsewidth on the spectral and
temporal features of a laser produced zinc plasma ……………………………. 74
5.1 Introduction………………………………………………………………… 75
5.2 Optical emission spectroscopy studies……………………………………...75
5.2.1 Optical emission spectra…………………………………………… 76
5.2.2. Effect of ambient pressure on emission intensity………………….. 78
Contents
xii
5.2.3 Dependence of emission intensity on laser pulsewidth……………. 79
5.2.4 Estimation of temperature and number density……………………. 79
5.2.5 Effect of laser pulsewidth on Te and Ne …………………………… 81
5.3 Optical time of flight (OTOF) measurements……………………………… 82
5.3.1 Effect of ambient pressure on TOF signals…………………………83
5.3.2 Effect of pulsewidth on TOF signals………………………………. 86
5.3.3 Velocities of neutrals in the LPP…………………………………... 87
5.4 ICCD imaging of the expanding plasma…………………………………… 90
5.5 Double pulse ultrafast excitation…………………………………………... 94
5.6 Conclusion…………………………………………………………………. 95
Chapter 6
Acceleration of neutrals in laser produced plasmas…………………………… 97
6.1 Introduction……………………………………………………...………… 98
6.2 Effect of laser energy……………………………………………………… 99
6.3 Effect of pressure ………………………………………………………… 104
6.4 Measurements in a Zn target………………………………………………108
6.5 Conclusion................................................................................................... 110
Chapter 7
Optical gain in a laser-produced aluminum plasma: Asynchronous pump-probe
measurements .......................…………………………………………………… 111
7.1 Introduction……………………………………………………………… 112
7.2 Experimental………………………………………………………………112
7.3 Detector calibration………………………………………………………113
7.4 Results and discussion……………………………………………………..116
7.4.1 Dependence on irradiation energy ………………………………...116
7.4.2 Dependence on ambient pressure …………………………………118
7.5 Conclusion…………………………………………………………………120
Chapter 8
Conclusion and Future scope…..…………………..……………………………121

Contents
xiii
References……………………………...……………………………………........125
Curriculum Vitae………………………………………………..…...…………. 140
ABSTRACT
Advent of high power lasers revolutionized several fields of physics related to light-matter
interaction. One among them was the field of ultrafast processes, of which Laser Produced
Plasma (LPP) forms an important part. This leap in ultrafast science leads to the emergence of
fundamental studies of intense field physics.
LPP from nanosecond (ns, short-pulse) irradiations have been a field of study for the last few
decades whereas the femtosecond (fs, ultrafast) LPP has attracted the research community
only recently. Several studies are going on around the globe owing to its wide range of
applications like pulsed laser deposition, nanoparticle generation, nano-imprinting,
generations of light sources, plasma-based accelerators, etc. It is found that nanosecond and
femtosecond LPP are entirely different in terms of the nature of plume generation and
expansion, resulting in various effects that are theoretically predicted. The work presented in
this thesis aims at the generation and characterization of both ns and fs LPPs, facilitating
fundamental studies related to plasma parameters like the calculation of temperature, number
density, identification of the plasma species and their properties etc., helping us to realize the
applications of LPP.
Chapter 1 gives an idea of the motivation behind this work and a brief description of the
same, followed by a formal description of plasma, its fundamental aspects, and parameters
defining plasma behavior. Various methods for generating plasma in the laboratory, radiations
emitted from the plasma, and major diagnostic methods used for characterizing laser
produced plasma, along with their relative merits and demerits, are given in detail. A review
on laser produced plasmas also is included.
Instrumentation required to perform optical emission spectroscopy and optical time of flight
measurements and imaging of the plasma plume, generated by nanosecond/ femtosecond laser
pulses, is discussed in Chapter 2. The laser system, pulse characterization techniques,
synchronization circuits, and instruments used for detecting the emission spectra are
explained in detail.
Abstract
xv
The experimental techniques employed in the thesis for carrying out the experiments are
detailed in Chapter 3. Execution of various techniques like optical emission spectroscopy,
optical time of flight measurements and imaging of the hydrodynamics are explained in
detail.
Experimental characterization and comparison of the temporal features of femtosecond and
nanosecond laser produced plasmas generated from a solid Nickel target, expanding into a
nitrogen background, is presented in Chapter 4. Dynamics of ions and fast and slow neutrals
present in the laser produced nickel plasma is studied by the optical time of flight technique,
using emissions from neutrals and ions, respectively. Velocities of these species are estimated
from the time of flight data. Furthermore, the variation of temperature, number density and
velocity of different species in the plume with respect to variations in ambient pressure, for
both nanosecond and femtosecond irradiation, is also investigated.
A detailed study of femtosecond and nanosecond laser produced Zinc plasmas conducted
using optical emission spectroscopy and optical time of flight techniques is presented in
Chapter 5. Optical emission spectroscopy allows the estimation of temperature and number
density of the plasma, while optical time of flight measurements throw light into the dynamics
of ions and neutrals in the plasma. Imaging done using an intensified charge coupled device
(ICCD) helps observe features of plasma expansion into the ambient gas with high time
resolution.
In Chapter 6, line emission dynamics of neutrals and ions in the ns LPP nitrogen ambient is
measured and compared. Emission from neutrals can be measured to larger axial distances
compared to ions in the expanding plasma. The times of arrival of ionic and neutral species at
larger fluences confirm the occurrence of fast atomic species via recombination of fast ions
with electrons. Moreover, fast atomic species are absent at larger axial distances where ionic
emissions are not detected. The estimated peak velocities of fast neutrals and ions are found
to increase with an increase in the laser energy. Furthermore, an acceleration of fast neutrals
and ions is observed in the plasma at close distances to the target. This is attributed to the
space charge effect and is discussed.
Optical pump-probe technique is the best choice for detecting fast processes that demand a
high time resolution, where fast detectors (except the streak camera) fail. A novel
asynchronous laser plasma pump-probe scheme is employed to study the dynamics and
transient nature of ns LPP, using a very low energy 100 fs, 80 MHz pulse train as the probe
Abstract
xvi
beam, allowing to probe the plasma at every 12.54 ns interval after its generation. It was
found that the plasma acts as gain medium, imparting amplification to the probe beam.
Details of this novel observation are given in Chapter 7.
Finally, Chapter 8 gives a brief conclusion of all the experiments done, their significance of
obtained results to laser plasma literatures and future scope.
xvii
SYMBOLS AND ABBREVIATIONS
r : Distance
ne : Number density of electrons
ni : Number density of ions
Te : Temperature of electrons
B : Magnetic field
Ti : Temperature of ions
Ta : Temperature of atoms
Tg : Temperature of gas molecules
�, u : Velocity of species
νs : Velocity of scattered species
K, KB : Boltzmann constant
m : Mass
me : Mass of electron
mi : Mass of ions
n : Number density of plasma
A : Normalization constant
e : Charge of electron
�� : Debye length
ɸ��� : Electric potential
L : Physical length
ND : Plasma Parameter
ω : Frequency of Plasma oscillations
ωpe : Electron Plasma frequency
ωpi : Ion plasma frequency
ωp : Total plasma frequency
ωc : Cyclotron frequency
fpe : Frequency of oscillations in the plasma
Symbols and Abbreviations
xviii
ε : Dielectric constant
0ε : Permittivity of free space
lε : Linear dielectric permittivity
τ : Mean time between collisions
� : Charge of species
P : Fluid pressure
Γ : Adiabatic constant
V : Volume
E : Electric field
H : Magnetizing field
J : Current density
σ : Surface charge density
λmfp : Mean free path
λ : Wavelength
ä� : Acceleration of species
h : Plank’s constant
υ : Frequency of radiation
χi : Ionization potential
Z : Atomic number
Ii : Intensities of the ith line.
gi : Statistical Weights of emission
Ai : Transition Probabilities
Λ : Wavelength
Ei : Energies of upper level
∆� /� : FWHM
� : Electron impact parameter
� : Ion broadening parameter
�� : Electron number density
∆� : Difference in energy
� : Distance from the target
�� : Constant proportional to the laser energy density
�� : Density of the background gas
Symbols and Abbreviations
xix
� : Time
z0 : Distance moved by the species for the time of the order of the
average life time of excited states.
zf : Stopping distance of the plume
� : Slowing coefficient
�� : Initial velocity of the ejected species
���� : Ablation threshold
� : Density of the material
� : Latent heat of vaporization
! : Thermal diffusivity
∆t : Laser pulse width
αib : Inverse Bremsstrahlung
tei : Electron-ion energy transfer time
th : Heat conduction time
tp : Pulse duration of the laser
2D : 2-Dimensional
AC : Alternating Current
AOM : Acousto-Optic Modulator
CCD : Charged Coupled Device
CDS : Crooke’s Dark Space
CF : Conflat Flange
CTE : Complete Thermodynamic Equilibrium
CW : Continuous Wave
DC : Direct Current
DP : Double Pulse
EUV : Extreme Ultraviolet
FDS : Faraday’s Dark Space
FWHM : Full Width Half Maximum
HIB : Heavy Ion Beam
ICCD : Intensified Charged Coupled Device
IR : Infrared
KDP : Potassium Dihydrogen Phosphate
LA : Laser Ablation
Symbols and Abbreviations
xx
LBO : Lithium Triobate
LIBS : Laser Induced Breakdown Spectroscopy
LPP : Laser Produced Plasma
LTE : Local Thermodynamic Equilibrium
Nd: YAG : Neodymium – doped Yttrium Aluminum Garnet
Nd: YVO4 : Neodymium – doped Yttrium Orthovanadate
Ni : Nickel
NIR : Near Infra Red
NIST : National Institute of Standards and Technology
OE : Optical Emission
OES : Optical Emission Spectroscopy
OTOF : Optical Time of Flight
PLD : Pulsed Laser Deposition
PK1 : Peak 1 (fast peak)
PK2 : Peak 2 (slow peak)
PK3 : Peak 3
PMT : Photomultiplier Tube
REB : Relativistic Electron Beam
RF : Radio Frequency
SDG : Synchronization and Delay Generator
SP : Single Pulse
TEM : Transverse Electromagnetic Mode
Ti : Titanium
TSA : Titanium Sapphire Amplifier
TTL : Transistor Transistor Logic
UV : Ultraviolet
Zn : Zinc
xxi
LIST OF FIGURES
Page
Figure 2.1 The ultrafast oscillator (Tsunami) and the Millennia Pro pump laser.
28
Figure 2.2 The Chirped Pulsed Amplifier (CPA) laser used for the experiments
30
Figure 2.3 Ultrafast laser system used for plasma production. The system consists of a diode pumped Nd: YVO4 laser, Ti: Sapphire femtosecond oscillator, Ti: Sapphire regenerative amplifier, and Q-Switched Nd: YAG laser.
31
Figure 2.4 Chamber pumping unit 32
Figure 2.5 Schematic of the ultra high vacuum compatible solid target manipulator.
33
Figure 2.6 The iHR 320 spectrometer equipped with CCD and PMT detectors.
35
Figure 3.1 Schematic of the experimental set up used for optical emission spectroscopy (OES) and OTOF spectroscopy studies. Here a CCD is used for recording the spectra and a PMT is used for measuring OTOF data.
48
Figure 3.2
Geometry of the present LPP experiment. Focused laser pulses irradiate a solid metal target to form an expanding plasma plume. Spectral measurements of the plume are typically made at distances of 2 mm and 4 mm from the target surface.
49
Figure 3.3 A view of the actual experimental setup used for OES and OTOF studies.
49
Figure 4.1 Ultrafast (fs) laser produced plasma measured at 2 mm distance from the target surface, in the range of relatively low pressures, from 5×10⁻² to 1×10² Torr. The emission intensity is found to increase with pressure.
54
Figure 4.2 Ultrafast (fs) laser produced plasma measured at 2 mm distance from the target surface, in the range of relatively high pressures, from 5×10⁻⁶ Torr to 1×10⁻² Torr.
55
List of Figures
xxii
Figure 4.3 Short-pulse (ns) laser produced plasma at 2 mm distance, for relatively high pressures ranging from 1×10⁻² to 1×10² Torr. The emission intensity is found to increase with pressure.
57
Figure 4.4 Short-pulse (ns) laser produced plasma at 2 mm distance, for relatively low pressures ranging from 1×10⁻⁶ to 5×10⁻³ Torr.
58
Figure 4.5 Emission intensity of the Ni I spectral lines measured at a distance of 2 mm from the target surface, for (a) 7 ns, and (b) 100 fs irradiation. Insets show the 428.5 nm line emitted by the Ni II species. Intensity rises sharply around an ambient pressure of 1 Torr. ns LPP is more intense compared to fs LPP.
59
Figure 4.6
Plasma electron temperature Te calculated for (a) 7 ns and (b) 100 fs irradiations, from plume spectra measured at distances of 2 mm and 4 mm from the target surface.
60
Figure 4.7 Time Resolved emission of the 361.9 nm (3d9(2D) 4p � 3d9(2D) 4s) transition from Ni I, measured in the plasma plume at a distance of 2 mm from the target surface, for 7 ns irradiation. Ambient pressure varies from (a) 10-7 to 10-3 Torr, and (b) 10-3 to 102 Torr.
63
Figure 4.8 Time Resolved emission of the 361.9 nm (3d9(2D) 4p � 3d9(2D) 4s) transition of Ni I, measured in the plasma plume at a distance of 2 mm from the target surface, with 100 fs irradiation. Ambient pressure ranges from (a) 10-7 to 10-3 Torr, and (b) 10-3 to 102 Torr.
63
Figure 4.9 Velocities of the (a) fast and (b) slow Ni I species, measured at axial distances of 2 mm and 4 mm from the target surface, for 7 ns irradiation.
64
Figure 4.10 Velocities of the Ni I species measured at axial distances of 2 mm and 4 mm from the target surface, for 100 fs irradiation.
65
Figure 4.11 Time of flight emission spectra of Ni II at 428.5 nm (3p6 3d6 (3P) �3p63d9) measured in the plasma plume at a distance of 3 mm from the target surface, for (a) 7 ns and (b) 100 fs irradiations.
66
Figure 4.12 Velocity of the Ni II species measured at axial distances of 2 mm and 4 mm from the target surface, for (a) 7 ns and (b) 100 fs irradiation.
67
Figure 4.13 Images of the femtosecond laser produced nickel plasma expanding into nitrogen ambient at 100 Torr pressure, measured for time delays of (a) 50 ns, (b) 100 ns, (c) 150 ns,
69
List of Figures
xxiii
(d) 200 ns, (e) 250 ns, (f) 300 ns, (g) 350 ns, (h) 400 ns, (i) 450 ns, (j) 500 ns, (k) 550 ns, (l) 600 ns, (m) 700 ns, (n) 800 ns, (o) 1000 ns, and (p) 1400 ns (The instant when laser pulse hits the target is taken as zero time delay). An ICCD gate width of 20 ns is used for the measurements. The spatial dimension of the image is 1 cm × 1 cm.
Figure 4.14 Images of the femtosecond laser produced nickel plasma expanding into nitrogen ambient at 5 Torr pressure, measured for time delays of (a) 50 ns, (b) 60 ns, (c) 70 ns, (d) 80 ns, (e) 90 ns, (f) 100 ns, (g) 130 ns, (h) 150 ns, (i) 180 ns, (j) 200 ns, (k) 250 ns, and (l) 290 ns. ICCD gate width used is 20 ns.
70
Figure 4.15 Images of the femtosecond laser produced nickel plasma expanding into nitrogen ambient at 0.05 Torr pressure, measured for time delays of (a) 50 ns, (b) 70 ns, (c) 80 ns, (d) 90 ns, (e) 110 ns, (f) 130 ns, (g) 150 ns, and (h) 170 ns. ICCD gate width used is 20 ns.
70
Figure 4.16 Images of the nanosecond laser produced nickel plasma expanding into nitrogen ambient at 100 Torr pressure, measured for time delays of (a) 50 ns, (b) 100 ns, (c) 150 ns, (d) 200 ns, (e) 250 ns, (f) 300 ns, (g) 350 ns, (h) 400 ns, (i) 450 ns, (j) 500 ns, (k) 550 ns, (l) 600 ns, (m) 650 ns, (n) 700 ns, (o) 750 ns, and (p) 800 ns, for an ICCD gate width of 5 ns.
71
Figure 4.17 Images of the nanosecond laser produced nickel plasma expanding into nitrogen ambient at 5 Torr pressure, measured for time delays of (a) 50 ns, (b) 100 ns, (c) 150 ns, (d) 200 ns, (h) 250 ns, (i) 300 ns, (j) 350 ns, and (k) 400 ns, using an ICCD gate width of 5 ns.
72
Figure 4.18 Images of the nanosecond laser produced nickel plasma expanding into nitrogen ambient at 0.05 Torr pressure, measured for time delays of (a) 50 ns, (b) 100 ns, (c) 150 ns, and (d) 200 ns, for an ICCD gate width of 5 ns.
72
Figure 5.1 Emission in the visible region from an ultrafast Zinc plasma produced by the irradiation of a Zn target by 100 fs laser pulses at 796 nm. Spectra recorded at distances of 2 mm, 4 mm, 6 mm and 8 mm respectively from the target surface, along the expansion direction. Ambient pressure is 10 Torr.
76
Figure 5.2
Emission in the visible region from a nanosecond Zn plasma produced by the irradiation of a Zn target by 7 ns laser pulses at 1064 nm. Spectra recorded at distances 2 mm, 4 mm, 6mm and 8 mm respectively from the target surface, along the expansion direction. Ambient pressure is 10 Torr.
77
List of Figures
xxiv
Figure 5.3 Variation of emission intensity with ambient pressure (plotted in the log scale) for different plasma spectral lines of Zn I species, measured 2 mm away from the target surface, for irradiation by (a) 100 fs and (b) 7 ns laser pulses.
78
Figure 5.4 Lorentzian fit to the Zn I emission profile at 481 nm recorded at 10 Torr, measured at a distance of 2 mm from the target surface. The linewidth (FWHM) is 0.26 nm.
80
Figure 5.5 (a) Electron temperature and (b) number density calculated from plasma emission measured at 2 mm distance from the target surface, plotted as a function of background pressure, for both nanosecond and femtosecond irradiations. Error bars are estimated from multiple measurements.
82
Figure 5.6 Time of flight emission of the 481 nm (4s5s 3S1 → 4s4p 3P2) line of Zn I at different ambient pressures, measured in the plasma plume at distances of (a) 2 mm, (b) 4 mm and (c) 6 mm, respectively, from the target surface, for fs irradiation.
84
Figure 5.7 Line emission intensity from Zn I at 481 nm for different ambient pressures, plotted as a function of time, for ns irradiation.
87
Figure 5.8 Velocity of PK1 at different distances from the target surface, measured for the ambient pressure range of 0.01 to 200 Torr. Error bars are obtained from multiple measurements.
88
Figure 5.9 Velocities of (a) fast and (b) slow species upon irradiation with ns and fs laser pulses, measured at 2 mm distance from the target surface, for an ambient pressure range of 0.01 to 100 Torr. Error bars are obtained from multiple measurements.
89
Figure 5.10 Images of nanosecond laser produced zinc plasma expanding into nitrogen ambient at 0.05 Torr pressure, measured at time delays of (a) 50 ns, (b) 100 ns, (c) 150 ns, (d) 200 ns, (e) 250 ns, (f) 300 ns, (g) 400 ns, (h) 500 ns, (i) 700 ns, and (j) 900 ns after the laser pulse, using an ICCD gatewidth of 5 ns. The spatial dimension of the image is 1 cm × 1.25 cm.
90
Figure 5.11 Images of nanosecond laser produced zinc plasma expanding into nitrogen ambient at 5 Torr pressure, measured at time delays of (a) 50 ns, (b) 100 ns, (c) 150 ns, (d) 200 ns, (e) 300 ns, (f) 400 ns, (g) 500 ns, (h) 800 ns, (i) 1000 ns, (j) 1200 ns, (k) 1600 ns, (l) 2000 ns, (m) 2500 ns, (n) 3000 ns, and (o) 4000 ns after the laser pulse, using an ICCD gatewidth of 5 ns. The spatial dimension of the image is 1 cm × 1.25 cm.
91
List of Figures
xxv
Figure 5.12 Images of nanosecond laser produced zinc plasma expanding
into nitrogen ambient at 100 Torr pressure measured for time delays of (a) 50 ns, (b) 100 ns, (c) 150 ns, (d) 200 ns, (e) 250 ns, (f) 300 ns, (g) 400 ns, (h) 500 ns, (i) 600 ns, (j) 700 ns, (k) 1000 ns, (l) 1600 ns, (m) 200 ns, (n) 3000 ns, and (o) 4000 ns after the laser pulse, using an ICCD gatewidth of 5 ns. The spatial dimension of the image is 1 cm × 1 cm.
91
Figure 5.13 Images of femtosecond laser produced zinc plasma expanding into nitrogen ambient at 0.05 Torr pressure measured for time delays of (a) 50 ns, (b) 100 ns, (c) 150 ns, (d) 200 ns, (e) 250 ns, (f) 300ns, (g) 350 ns, (h) 400 ns, (i) 450 ns, (j) 500 ns, (k) 550 ns, and (l) 600 ns after the laser pulse, using an ICCD gate width of 10 ns. The spatial dimension of the image is 0.5 cm × 0.75 cm.
92
Figure 5.14 Images of femtosecond laser produced zinc plasma expanding into nitrogen ambient at 5 Torr pressure measured for time delays of (a) 50 ns, (b) 100 ns, (c) 150 ns, (d) 200 ns, (e) 250 ns, (f) 300 ns, (g) 350 ns, (h) 400 ns, (i) 450 ns, (j) 500 ns, (k) 550 ns, (l) 600 ns, (m) 650 ns, (n) 700 ns, (o)800 ns, (p) 900 ns, (q) 1000 ns, (r) 1200 ns, (s) 1400 ns, (t) 1600 ns, (u) 1800 ns, and (v) 2000 ns after the laser pulse, an ICCD gate width of 10 ns. The actual spatial dimension of each image is 0.5 cm × 0.75 cm.
93
Figure 5.15 Images of femtosecond laser produced zinc plasma expanding into nitrogen ambient at 100 Torr pressure measured for time delays of (a) 50 ns, (b) 100 ns, (c) 150 ns, (d) 200 ns, (e) 300 ns, (f) 400 ns, (g) 500 ns, (h) 600 ns, (i) 1000 ns, and (j) 2000 ns after the laser pulse, an ICCD gate width of 10 ns. Actual spatial dimension of the image is 0.5 cm × 0.75 cm.
94
Figure 5.16 TOF spectra of 481 nm emission from Zn I at an ambient pressure of 5 Torr, measured using single pulse (SP) and double pulse (DP) excitations, at distances of (a) 2 mm and (b) 4 mm from the target surface.
95
Figure 6.1 Figure 6.1. Time-resolved emission of the (a) 361.9 nm (3d9(2D) 4p � 3d9(2D) 4s)transition from Ni I and (b) 428.5 nm (3p63d8 (3P) 4s � 3p63d94s))transition from Ni II, measured in the plasma plume at 2mm distance from the target surface, for 7 ns irradiation. Ambient pressure is 5 Torr.
100
Figure 6.2 ICCD images of an expanding Laser produced nickel plasma for the laser energies (a) 10 mJ,(b) 20 mJ,(c) 30 mJ,(d) 40 mJ,(e) 50 mJ,(f) 60 mJ,(g) 70 mJ, and (h) 80 mJ, measured using a gate delay of 5 ns. The measurement is done for a
101

List of Figures
xxvi
time delay of 100 ns. Ambient pressure is 5 Torr.
Figure 6.3 Figure 6.3.OTOF of (a) neutral (Ni I) and (b) ionic (Ni II) transitions measured in the plasma plume at various distances from the target surface, for 7 ns irradiation. Ambient pressure is 5 Torr.
102
Figure 6.4 Calculated velocities of fast peaks corresponding to a transition from Ni I and a transition from Ni II, measured in the plasma plume at various distances from the target surface, for 7 ns irradiation. Ambient pressure is 5 Torr, and laser pulse energy is 80 mJ.
103
Figure 6.5. Optical time of flight (OTOF) measurement of the 361.9 nm (3d9(2D) 4p � 3d9(2D) 4s) Ni I (neutral) transition at various axial positions in the plasma, for 0.05 Torr, 1 Torr, 20 Torr and 100 Torr ambient pressures. The arrival of fast and slow neutrals can be seen distinctly at certain pressures and positions.
105
Figure 6.6. Optical time of flight (OTOF) measurement of the 428.5 nm (3p63d8 (3P) 4s � 3p63d94sNi II (ion) transition at various axial positions in the plasma, measured for the ambient pressures 0.05 Torr, 1 Torr, 20 Torr and 100 Torr.
106
Figure 6.7 Velocities of the (a) fast Ni and (b) Ni II species, measured at various axial distances from the target surface, for 7 ns irradiation. Ambient pressures vary from 0.05 Torr to 100 Torr.
107
Figure 6.8 Accelerations of Ni I and Ni II species, measured at various axial distances from the target surface, for 7 ns irradiation. Acceleration of fast neutrals and ions is observed to a certain distance along the axis of the plume.
108
Figure 6.9 Calculated velocities of the peaks in the OTOF signals corresponding to (a) neutral and (b) ionic species in the plume, plotted against various axial positions in a laser produced expanding Zn plasma, for different ambient pressures. The error bar is calculated from multiple measurements.
109
Figure 7.1 Schematic of asynchronous pump-probe measurements on an expanding laser produced plasma. PD2 is placed at a distance of 84 cm from the plasma plume.
113
Figure 7.2. Figure 7.2. Spatial profile of the Tsunami (100 fs, 80 MHz) laser pulses measured using a CCD beam profiler. Insets (b and c) show the intensity distribution measured along the
114
List of Figures
xxvii
horizontal and vertical directions respectively, on the beam cross section.
Figure 7.3. Probe laser pulses of 100 fs FWHM measured using a fast photodiode connected to fast oscilloscope. The measured FWHM is larger (risetime of ~187.4 ps and falltime of ~ 389.8 ps) due to the finite response times of the photodiode and oscilloscope. The mean repetition rate is accurately measured, which is found to be 80 MHz (i.e., period is ~ 12.54 ns).
114
Figure 7.4. Measurement of the spatial intensity distribution of the probe beam (of diameter 1.2 mm) using the small area photodiode (of 0.4 mm diameter active area). Signal voltage is normalized to the maximum value measured at the centre of the probe beam. This measurement is done at a distance of 84 cm from the plasma plume.
115
Figure 7.5. The probe beam (train of 100 fs pulses from the ultrafast oscillator, Tsunami) measured using a fast photodiode, at different positions along the beam diameter, at a distance of 84 cm from the centre of the plasma. LPP background pressure is 50 Torr and laser pulse energy is ~120 mJ. Measurement positions from the centre of the probe beam are, (a) 70 m left, (b) 30 m left, (c) 0 m (centre), (d) 10 m right, (e) 30 m right, and (f) 60 m right. Observed intensity variations show that the probe beam is deflecting in the rightward direction (as seen by the detector) at the instant of plasma formation.
117
Figure 7.6. Variation of the probe beam signal with the pulse energy used for generating LPP: (a) 50 mJ, (b) 88 mJ, (c) 97 mJ, (d) 106 mJ, (e) 114 mJ, and (f) 120 mJ. Photodiode detector is aligned in line with the centre of the probe beam.
118
Figure 7.7. Probe beam signal measured for an LPP energy of 105 mJ, for various ambient pressures: (a) 5 Torr, (b) 20 Torr, (c) 60 Torr, and (d) 85 Torr.
119
xxviii
LIST OF TABLES
Page
Table 5.1 Electron temperature (Te) and number density (Ne) of fs LPP, calculated for different ambient pressures, at increasing distances from the target surface. LTE is found to be valid in all cases.
80
Table 5.2 Electron temperature (Te) and number density (Ne) of ns LPP, calculated for different ambient pressures, at increasing distances from the target surface. LTE is found to be valid in all cases.
81
Table 5.3 Average velocities measured for PK3 at 2 mm distance from the target surface, for fs and ns LPP. Error is calculated from multiple measurements (PK3 was not observed for 50 and 100 Torr background pressures).
89
CHAPTER 1
INTRODUCTION
The motivation for doing this work and a brief description of the same are presented
in this chapter, followed by a formal description of plasma, its fundamental aspects, and
parameters defining plasma behavior. Various methods for generating plasma in the
laboratory, radiations emitted from the plasma, and major diagnostic methods used for
characterizing laser produced plasma, along with their relative merits and demerits, are
given in detail. A review on laser produced plasmas also is included.
Chapter1
2
1.1 MOTIVATION AND OVERVIEW
Plasma is the most common state of matter in the universe. Earth is one of the
planets in this universe where the plasma state does not occur naturally, but about
99% of the universe happens to be in the plasma state. Plasma is a very good
radiation source which can emit in the VISIBLE, IR, UV or X-ray regimes
depending on its nature. Production of plasma in a laboratory can be achieved in
many ways such as ac and dc discharges, particle accelerated plasmas, z –pinch,
theta – pinch etc. Laser produced plasma (LPP) is another important method for
generating plasma. In LPP, an intense laser beam focused onto a small area of the
target ablates its surface within a short time, producing the plasma. The major
applications of LPP include Pulsed Laser Deposition (PLD) [1], higher harmonic
generation [2-5], generation of UV, EUV and X-rays [6-10], and nanoparticle and
nanocluster generation [11-14]. Laser parameters (such as wavelength, fluence,
pulse width, irradiation spot size) can be tuned and the plasma parameters can be
optimized to implement the above mentioned applications successfully.
Nanosecond (ns) LPP has been extensively studied to understand the underlying
fundamental physics of plasma generation such as laser-target energy coupling,
laser-plasma interaction, and its expansion to the surroundings. Study of variations
in the properties of the LPP with respect to changes in laser parameters and ambient
conditions (nature and pressure of ambient gas) has been a hot topic of research for
the last two decades. It was found that the size and distribution of nanoparticles
generated by femtosecond (fs) laser ablation can be tuned and optimized under
certain conditions, and this has become an active area of research in the last ten
years. The generation and expansion of fs LPP is different from those of ns LPP in
many ways, and are these are detailed in the respective chapters which follow. With
a keen interest to understand the fundamental processes behind the generation and
expansion of laser produced metal plasmas, this work mainly focuses on the effects
of pulse width and pressure on the dynamics of both fs and ns LPPs.
Chapter1
3
1.2 BASIC CONSIDERATIONS OF PLASMAS Plasma, more often referred to as the fourth state of matter, is essentially distinct
from the other states, and has thermal energy more than the ionization energy. The
fundamental concepts for explaining the physics of plasmas build up on varied fields
such as mechanics, electrodynamics, statistical mechanics, fluid mechanics, and
kinetic theory of gases. Unlike other states of matter, plasma responds readily to
electric and magnetic fields since it is composed of charged species such as electrons
and ions. A paper by I. Langmuir titled ‘Oscillations in ionized gas’, in the
Proceedings of the National Academy of Sciences (August 1928), reports the
observation of low amplitude voltage oscillations of certain frequencies in a strongly
ionized gas at low pressures. Langmuir and Tonks (1929) then explored collective
behavior and long-range force in a charged system containing free electrons, ions
and neutral species through a series of experiments. They defined plasma as a
“collection of charged particle sufficiently dense such that space charge effects can
result in a strongly coherent behavior”. In other words, plasma is a quasi-neutral gas
of charged and neutral particles which exhibits collective behavior. A fundamental
characteristic behavior of plasma is its ability to shield out electric potentials that are
applied to it, known as Debye Shielding [15-18].
While the macroscopic force is transferred via collisions in a system of neutral gas,
the situation is totally different in plasma. Charges in the plasma move around
creating local concentrations of positive and negative charges, giving rise to electric
fields whose motion generates electric currents, and hence magnetic fields. The
Coulomb field between two slightly charged regions of plasma separated by a
distance r varies as 1/r2 and for a given solid angle the volume of a local region in
the plasma can affect another volume as r3. Thus, the elements of plasma are found
to exert force to larger distances. Movement of species in the plasma not only
depends on the local conditions but also on the state of the plasma in remote regions,
due to the long range Coulomb forces which are much larger than the ordinary
Chapter1
4
collisional forces in ordinary gas. This property is referred to as the ‘collective’
behavior of the plasma.
Plasma properties depend strongly on bulk and average properties, and the
parameters used to define plasma characteristics include the degree of ionization, the
plasma temperature, electron number density (more specifically the electron
temperature and number density under local thermodynamic equilibrium), and
magnetic field in the region of plasma. The fundamental parameters that are used to
characterize plasma are the electron number density (ne), temperature (Te) and steady
state magnetic field (B). Other parameters which are useful in plasma
characterization such as the Debye length, Larmour radius, plasma frequency,
thermal velocity, and the cyclotron frequency can be derived from the fundamental
plasma parameters [15-18].
1.2.1 Electron temperature Plasma consists of various species like the electrons, ions and neutrals (generally
known as the plasma species) that are not heated equally, and hence their mean
kinetic energies are different. The kinetic energy of electrons is much higher than
that of the ions, and the kinetic energy of the ions is higher compared to that of the
neutrals. Since the kinetic energies corresponding to various species are different,
they posses different temperatures, i.e. Te, Ti, and Ta for the electrons, ions and
neutrals respectively, which are in the order Te>Ti>Ta. In plasma, the temperature of
the electrons can be several magnitudes higher than that of the neutrals and ions.
This can be either due to the strong heating of the electrons by the plasma sources or
because of the efficient energy transfer in collisions between the electrons (two-body
collisional energy transfer is much more efficient for collision between particles of
similar masses) [15-18]. The electron temperature Te is usually measured in Kelvin
(K) in or electron volts (eV).
Chapter1
5
In plasma, species are in random motion and if electrons, ions, and neutrals are in
thermal equilibrium, they can be described by the Maxwellian distribution which is
given (in one dimension) by,
������ = � � � ������� � (1.1)
where������ is the number of particles per m3 with a velocity between u and u +
du, 1 2� ��� is the kinetic energy, and K is the Boltzmann constant. Density of
particles per m3 is given by,
� = � �������� � (1.2)
Where A, the normalization constant is given by,
� = � � �������
! �� (1.3)
The width of the distribution is characterized by the temperature of the plasma. 1.2.2 Debye shielding One of the fundamental characteristics of plasma is the shielding out of electric
potentials that are produced upon the introduction of electric charges, by pushing
similar charges away and pulling the opposite charges towards the point of
perturbation. This creates a cloud of positive/negative charge around the perturbed
point which maintains the macroscopic electrical neutrality of the plasma. Unlike
cold plasma, shielding may not be perfect in the case of thermal plasma where the
particles at the edge of the cloud (where the electric field is weak) have enough
thermal energy to escape from the electrostatic potential. At the edge of the cloud
where the potential energy is approximately equal to "#$ of the particle, shielding is

Chapter1
6
imperfect and potentials of the order of ���
$ can leak to the plasma to produce a finite
electric field there. Calculation of the approximate thickness of such a charge cloud
allows to measure the effective shielding distance using Poisson’s equation in one
dimension. This measure, known as the Debye length �%&�, is given by,
%& = �∈(�)��*�$�
! �� (1.4)
where %& is the length over which the Coulomb field is no longer felt in the plasma.
The extent of this screening can be calculated using Poisson’s equations with the
source terms being the test particle and its associated cloud, whose contribution is
determined using the Boltzmann relation for the particles that cause screening. This
is a self-consistent calculation for the potential because the shielding cloud is
affected by its self-potential.
For + ≪ %&; the potential ɸ�.� is identical to the potential of a test particle in
vacuum. For + ≫ %&; the test particle is completely screened by its surrounding
shielding cloud. %& is the radius about which the shielding can be felt in a plasma
and this explanation makes sense only if 01 2�$%&1 ≫ 1 (this is a condition for the
plasma to be collisionless). For the shielding to be relevant, Debye Length (%&� must
be small compared to the overall dimensions of the plasma. If this is not satisfied,
then no point in the plasma could be outside the shielding cloud. The effect of local
concentration of charges or electric potentials present in plasma is shielded out
within a short distance maintaining the quasi neutrality. Plasma is quasi neutral, i. e.
neutral enough that one can consider ni ≃ ne which is equal to the plasma density (n),
but not so neutral that all the electromagnetic forces vanish.
1.2.3 The plasma parameter It is clear that the concept of Debye Length is valid only if there are enough number
of particles in the charge cloud. This is because, if there are only one or two particles
Chapter1
7
in the sheath region (outermost part of the cloud), then the concept of Debye
shielding will be statistically invalid. We can calculate the number of particles (ND,
which is called the plasma parameter) in a “Debye Sphere” (Debye Sphere is an
imaginary sphere whose radius is the Debye Length (%&) mentioned above) as:
4& = 01 �$2%&1 = !.16×!89��: ��
*�; �� (1.5)
where #$ is expressed in oK. This in turn explains the condition for the collective
behavior as 4& ≫ 1. 1.2.4 Plasma oscillations Perturbation applied to a local point in the plasma moves electrons in the plasma,
which are pulled back to the equilibrium position due to columbic attraction, thereby
maintaining the quasi neutrality. These perturbations induce slight deviations from
quasi neutrality which set the electrons into collective oscillation. The electron
plasma frequency of these non-damped Langmuir oscillations is given by,
<=$ = � *�$�∈(�� ! �⁄
(1.6)
and the total plasma frequency is given by,
<=� = <=$� + <=@� (1.7)
where <=, <=$ and <=@ are the total, electron plasma, and ion plasma frequencies
respectively. This can be approximated as <= ≈ <=$ because of the large ion-
electron mass ratio. By substituting standard values in the equation, the frequency of
oscillations in the plasma can be calculated as,
Chapter1
8
�=$�BC� = <=$ 22� = 8.98 × �$! ��
(1.8)
Generally, unmagnetized plasmas support plasma oscillations and electromagnetic
waves. Once the electrons in the plasma are displaced from their mean positions in a
uniform background of ions, field builds up in the opposite direction of the
movement of electrons causing them to oscillate around their equilibrium position.
These collective motions which occur when the equilibrium condition is disturbed
cannot be sustained in the plasma, and hence they break up into a natural frequency
of oscillations known as the plasma frequency. The generated plasma frequency <=,
which is related to the oscillation of electron density can be written as:
<= = F*�$���G( ≈ 50 �$
! �� (1.9)
where �$ is expressed in � 1. It is clear that <= depends only on the number density
in the plasma. Hence, plasma with higher number density will have space charge
oscillation of larger frequency, and vice-versa.
1.3 CRITERIA FOR PLASMAS TO EXIST
For an ionized gas to be called plasma, certain conditions must be satisfied out of
which two conditions are already discussed above. The third condition is related to
collisions in the system. Weakly ionized gas in a jet exhaust, for example, does not
qualify as plasma because the charged particles collide so frequently with the neutral
atoms that their motion is controlled by ordinary hydrodynamic forces rather than by
electromagnetic forces. If ω is the frequency of typical plasma oscillations and τ is
the mean time between collisions with neutral atoms, then the condition <J >1 must be satisfied for the ionized gas to behave like plasma. In addition to the
condition + ≫ %&, “collective behavior” demands the conditions 4& ≫ 1 and
<J > 1 also to be satisfied, for the plasma to exist.
Chapter1
9
1.4 BASIC PLASMA PHENOMENA 1.4.1 Fluid description
In fluid description, plasma is considered to be composed of two or more
interpenetrating fluids (which correspond to the electrons, ions and neutrals
respectively) which can interact via self generated electric and magnetic fields due to
their thermal motion. The fluid picture of plasma is most appropriate when the
plasma is somewhat collisional (where the electrons and ions separately relax to a
local thermodynamic equilibrium on a short time compared to the time in which
substantial changes in the plasma occur and in regions small compared to the
physical length of the plasma). The self consistent equation of motion for such a
system is given by,
�L�L �MNOMP + QL . ∇QL = −TLUV + WQL × XYZ − ∇. [L − �L�L\L]�QL − Q]� (1.10)
where �L and TL are respectively the mass and charge of the species j; [L, �L and QL
are the fluid pressure, density and velocity, respectively, and \L] is the average
frequency of collisions with species k. Pressure [L = L̂�L_#L, wherek is the
Boltzmann constant, Tj is the temperature of the fluid in Kelvin, and L̂ is the
adiabatic constant (equal to 3 for one dimensional, 2 for two dimensional and 5/3 for
three-dimensional plasmas respectively). Plasma temperature ultimately depends on
^ for each species. The dynamics follows conservation of net flux over a volume V,
described by the continuity equation,
`*O`P + ∇. W�LQLY = 0 (1.11)
Along with the Maxwell’s equations,
a8∇. V = b (1.12)
Chapter1
10
∇ × V = Xc (1.13) ∇. X = 0 (1.14) ∇ × B = d + a8Vc (1.15)
Where b = �@T@ + �$T$ andd = �@T@Q@ + �$T$Q$. Movement of charged particles
creates electric and magnetic fields and the particles thus move in the generated
field. Hence all the above equations must be solved simultaneously to get a self-
consistent solution for the dynamics of plasma using the fluid theory.
Fluid dynamics is applicable to plasma in a strong magnetic field perpendicular to
the fluid velocity which allows large collision frequency complementing the
Maxwellian distribution of velocity of species. But this theory will not be sensitive
for any deviation from Maxwellian distribution, i.e., when collision is less, so that
the temperature cannot be described accurately. In general, a deviation from
Maxwellian distribution is always possible and the solution for such a situation is
obtained using a kinetic description.
1.4.2 Kinetic description We can see that the collision time in some cases is so long that we can ignore the
collisions in the plasma. For such plasmas, referred to as collisionless plasmas, the
fluid theory does not give an appropriate theoretical picture. In such cases, the
double adiabatic theory is used which can help to overcome the limitations of the
fluid description to an extent [15-18]. The best way to define such a system with
deviations from Maxwellian distribution is to use the distribution function fj (r, v, t)
for each species (which is a function of seven independent scalar variables) governed
by the Boltzmann equation,
`e`P + Q. ∇� + f
� �V + Q × X�. `e`P = g`e
`Phi (1.16)
Chapter1
11
where g`e`Phirepresents collisions. "Collisionless" plasmas are hot enough so that this
term can be set to zero, in which case eqn. (1.16) is called the Vlasov equation [15-
18].
Though plasmas can often be treated as fluids, plasma physics differs from
hydrodynamics because of the non-Maxwellian distributions that require the kinetic
treatment described above. It differs from electromagnetism as well, because the
details of the dielectric tensor ϵ are treated from the particulate point of view.
Indeed, the complex motions of charged particles in electric and magnetic fields
support a rich variety of wave phenomena that do not occur in ordinary fluids or
dielectrics. An important fact to be noted is that many plasmas are collisionless to a
very good approximation, especially those encountered in astrophysics and space
plasma physics.
1.5 TYPES OF PLASMA
Based on properties such as temperature, degree of ionization etc., plasmas can be
classified into different types as follows.
1.5.1 Cold plasmas
In a low pressure gas discharge the degree of ionization is ~ 10-4 so that the gas
consists mostly of neutral species. Collisions between electrons and gas molecules
are not so frequent and a non-thermal equilibrium exists between the energies of
electrons and gas molecules. Therefore the gas molecules are at room temperature
even though the electronic temperature is very high. This type of plasmas where Te
> Ti > Tg, (Te, Ti and Tg are the temperatures of electron, ion and gas molecules
respectively) are called cold plasmas.
1.5.2 Hot plasma In high pressure gas discharges collisions between electrons and gas molecules occur
so frequently that the temperatures of electrons and gas molecules are approximately
Chapter1
12
equal, and they are in thermal equilibrium. Hence the system approaches Local
thermodynamic equilibrium (LTE), and such plasmas are known as hot plasmas. Hot
plasmas are also called thermal plasmas.
1.5.3 Collisional plasma and collisionless plasma
Collisions between charged particles in a plasma differ fundamentally from those
between molecules in a neutral gas because of the long range Coulomb forces
present in the system. Binary collision processes (i.e. number of collisions is
relatively very low) can be defined only for weakly coupled plasmas. These binary
collision processes are modified by collective effects when the many-particle process
of Debye shielding happens in the system in a crucial manner. For very large values
of the plasma parameter (4&), we can speak of binary collisions and a collision
frequency kllm, which measures the rate at which particles of species n are scattered
by those of species nm,
kl ≅ ∑ kllmqr (1.17)
and for an electron, this can be written as
k$ ≅ ��s��
! �� k@ (1.18)
The collision frequency ν is a measure of the frequency with which the particle
trajectory undergoes major angular change due to Coulomb interactions with the
surrounding particles. Collision frequency is sometimes referred to as the
“90° scattering rate” since it is the inverse of the typical time needed for enough
number of collisions to occur so that the particle trajectory is deviated through 90°.
It is important to define the mean-free-path which measures the typical distance that
a particle travels between collisions (i.e., 90°scattering events), which is given by

Chapter1
13
%�e= = tut (1.19)
If λvwx ≪ L; ,where L is the observation length-scale, then the plasma is referred to
as collision-dominated or collisional plasma. The opposite limit of large mean-free-
path corresponds to collisionless plasma.
The typical magnitude of the collision frequency is k~ {| }~}~ <=; where <= is the
plasma oscillation frequency. The condition k ≪ <= represents weakly coupled
plasma, which follows that the collisions do not interfere seriously with the plasma
oscillations in such systems. If k ≫ <=, then it represents a strongly coupled plasma
where collisions effectively prevent plasma oscillations in the system. This is in
accordance with the basic picture of strongly coupled plasma which can be modeled
as a system dominated by coulomb interactions that does not exhibit conventional
plasma dynamics. Collision frequency can be written in terms of the number density,
the plasma parameter, and the temperature of the plasma, as:
k ≈ $��*}~0�G(��; ��
*���
: �� (1.20)
Thus it is clear that diffuse and high temperature plasmas tend to be collisionless
whereas dense and low temperature plasmas are more likely to be collisional in
nature [19].
1.6 METHODS OF PLASMA PRODUCTION
With few exceptions like lightning or auroras, most of the plasmas on the earth are
man-made. There are various methods by which plasma can be produced in a
laboratory, and these include arc discharge, glow discharge, Radio Frequency (RF)
discharge, heating with particle beams, heating by lasers, ohmic heating, and Pinch
devices.

Chapter1
14
1.6.1 Arc discharge
Electrical discharge that happens at high pressure is referred to as arc discharge,
where a high voltage is applied between two electrodes kept in a tube filled with gas,
at a pressure of hundreds of Torr, generating plasma. The theory of ionization for
this kind of system was explained by Townsend who assumed the following:
ionizing electron starts off between two collisions with zero velocity in the direction
of the field, it loses all its gained energy between two collisions, and the probability
of ionization by electron-atom collision is unity as soon as the kinetic energy of the
electron at the time of impact is equal or greater than the ionization energy of the
atom. Some variants of the arc discharge are brush discharge, spark discharge and
corona discharge.
1.6.2 Glow discharge Electrical discharge produced in gases at low pressures is referred to as glow
discharge. A fixed potential is applied to the tube filled with gas at atmospheric
pressure and then the tube is gradually evacuated. When this is done, initially at
atmospheric pressure no discharge is observed. Irregular streaks with cracking noise
appear in the tube at pressures around 130 mbar, which result from the ionization
caused by stray electrons that have acquired sufficient energy, thereby starting the
process of gas breakdown. Excitation of gas atoms or molecules by the accelerating
electrons creates a luminous column or a positive column in the tube which is
observed around 10 mbar. Cathode glow appears at 3-4 mbar pressure, which is the
result of electrons produced by secondary emissions by the ions hitting the cathode
which ionize the surrounding gas. On further acceleration, they gain sufficient
energy giving rise to what is known as positive column. At around 1 Torr pressure,
positive luminous column shortens, Faraday’s Dark Space (FDS) extends and the
cathode glow detaches itself from the cathode creating Crooke’s Dark Space (CDS).
Further, at around a pressure of 0.1 Torr, CDS increases in length and the positive
column breaks into striations. CDS fills the entire tube and the tube walls start
glowing at still lower pressures, and thereafter, at very low pressures, the whole tube
Chapter1
15
starts conducting. There is not much difference between glow discharge by DC, and
AC up to a frequency of 105 to 106 Hertz. Beyond 106 Hertz the regime of RF
discharges starts which have entirely different characteristics.
1.6.3 RF discharge There are two types of discharges that come under this category, namely, E-Type
and H-Type discharges. To create plasma using an E-Type discharge, an oscillating
electric field is applied across two electrodes, whereas in the case of plasma
production using an H-Type discharge, an oscillating electric field is produced by the
oscillating magnetic field due to a solenoidal current round the gas tube. In the case
of plasma produced by an RF discharge the losses associated with the electrodes are
minimal, and since the electrodes in these systems are located outside the tube,
highly reducing the contamination, RF discharges are used to produce high purity
spectroscopic sources. Since the relatively massive ions are practically immobile on
the RF time scale, a high concentration of ions with very low energy (velocity)
spread is found in the central region of the RF discharge, making it a useful ion
source in accelerators like cyclotrons.
1.6.4 Using particle beams
This is yet another method to produce plasmas which use either Relativistic Electron
Beams (REB) or Heavy Ion Beams (HIB). For plasmas produced using REB, a beam
of high energy (MeV) is produced using a high voltage discharge in a vacuum diode,
using a Marx Bank. Beam focusing is done using electrostatic or magnetic lenses.
REB produces good quality plasmas, but focussability problems due to Columbic
repulsion are a major drawback. HIB can also be used for producing plasma
provided vacuum conditions are met. Plasmas produced using REB or HIB have
temperatures and densities similar to those produced by LPP.
Chapter1
16
1.6.5 Using intense laser beams
This class of plasma is generally referred to as Laser Produced Plasma (LPP), and
can be usually produced using laser pulses of nanoseconds or lower pulse duration. It
is required to focus the laser beam using a lens to obtain a high intensity at a
particular spot on a target. Such a focused beam can have intensity varying between
1012 W/cm2 to 1018 W/cm2. The typical parameters, i.e., number density and
temperature, will be around 1021 cm-3 and 100eV to few KeV, respectively.
1.6.6 Ohmic Heating In ohmic heating, an AC signal is passed through the primary of a transformer and a
load R is connected to the secondary. In such a configuration the load gets heated
which can initiate the production of plasma. This method of plasma production is
used in a Tokamak.
1.7 RADIATIONS FROM PLASMAS Radiations are emitted by plasmas due to the various processes occurring in the
plasma. Emissions observed from various experiments are discussed below.
1.7.1 Black Body Emission Plasmas in Complete Thermal Equilibrium (CTE) emit black body radiation. The
plasma is opaque to radiation and the emission happens from the surface of the
plasma. The wavelength spectrum peaks at %���WÅY = ��88���$�� and the frequency
peaks at <��� = 3.9 × 10!!# ��� "�.��/n. The total emission peak power is found
to be proportional to #0. 1.7.2 Bremsstrahlung Radiation
“Bremsstrahlung” is derived from the German words ‘Bremse’ (brake) and
‘Strahlung’ (radiation), meaning ‘braking radiation’. Radiation is emitted when a
Coulomb field or another charged particle deflects a charged particle. Since the
electron is free before and after the emission, the radiation is also referred to as free-

Chapter1
17
free radiation. In plasmas, Bremsstrahlung radiation generally occurs due to the
deceleration of electrons by the field of ions. Plasma is transparent to the
bremsstrahlung radiation and hence the radiation is emitted by the whole body. Peak
of the wavelength spectrum is given by%��� WÅY = ��88���$��, and the spectrum of
Bremsstrahlung radiation is found to be monotonously decreasing with frequency.
The power emitted in this kind of radiation is found to be ∑ f��ä�����G(i: , where T] is the
charge undergoing an acceleration ä]. The total power of the emitted radiation is
proportional to #$! �� .
1.7.3 Recombination Radiation Recombination radiation is emitted when a free electron combines into the bound
state of an ion. If ε0 is the energy of the free electron and χi is the ionization potential
of the ith level of ion, then the energy of the emitted photon is ℎk = �8 + �@,�,
where �8 = !� �Q�. Since �8 is continuously varying the recombination radiation
spectrum also is continuous. As the electron is free before recombination and bound
afterwards, the radiation is also referred to as free-bound radiation. For low atomic
number and high #$ Bremsstrahlung radiation is predominant over recombination
radiation. But for high atomic number and low #$, recombination radiation
predominates Bremsstrahlung radiation.
1.7.4 Line Radiation
Emissions due to the transition of an electron between two bound states are referred
to as line radiation. Total power available in the line emission is proportional to Z6.
Those transitions to the ground state of the ion are the strongest and they are referred
to as resonance transitions. They are also called bound-bound radiations. The
selection rules are as follows:
∆L=±1(parity must change)
∆j=0, ±1 ( j1 + j2 ≥ 1)

Chapter1
18
∆S=0 (multiplicity should be the same).
Transitions between states of different multiplicity also can take place, and these are
referred to as inter combination transitions.
1.7.5 Cyclotron radiation
In a strong magnetic field (B), electrons will spiral around the magnetic lines of
force (B) with a frequency<� = �$� . When <� > <�, radiation will be emitted by the
plasma. This process is also referred to as Magnetic Bremsstrahlung and the
frequency is approximately equal to 1.76×10¹¹B T rad/s. Ions also emit these
radiations, but since ions are heavier than electrons, the radiation will be feeble. The
radiation is circularly polarized in the direction of the magnetic field, linearly
polarized in the plane perpendicular to the field, and elliptically polarized in other
directions. Unlike in other radiations discussed earlier, cyclotron radiation is
anisotropic in nature.
1.8 PLASMA DIAGNOSTICS METHODS Number density (�$) and Temperature (#$) are the two basic parameters required to
characterize a plasma. Methods employed to estimate these parameters are referred
to as plasma diagnostic techniques, which can be performed either using the
radiation emitted by the plasma or by using external radiation as a probe. One cannot
simultaneously measure �$ and #$ using these techniques, and the presence of
magnetic fields can complicate the measurements. We consider only non-magnetized
plasmas such as laser produced plasma in the following discussion.
1.8.1 Plasma Spectroscopy Spectroscopic techniques provide a variety of methods to diagnose a wide range of
plasmas. Absorption spectroscopy, emission spectroscopy, spectroscopy of scattered
radiation, time-resolved spectroscopy, and time of flight spectroscopy are some of
the commonly used techniques for plasma diagnostics. Plasma spectroscopy is easy
to implement in any plasma system, may it be high or low temperature/density
Chapter1
19
plasma. It can also be employed in magnetically confined plasmas like the tokamaks.
The most commonly used spectroscopic technique is emission spectroscopy which
measures the electromagnetic radiation (which is regarded as the environment of the
radiating species) emitted by the plasma (related to the plasma parameters or
characteristic parameters of the radiating atoms). It is an easy and straightforward
approach to diagnose the plasma but since the emitted radiation is measured, the
information obtained will be integrated over the line of sight of the measurement.
Spectroscopic techniques are particularly useful to establish the relationship between
emitted radiations and plasma parameters such as the number density and
temperature [20].
1.8.2 Langmuir probe Langmuir probe, probably the simplest among electric probe diagnostics to measure
plasma, consists of a wire inserted into the plasma that measures the current at
various applied voltages. The technique is an intrusive one and the wire must be
carefully designed so that it does not interfere with the plasma nor the plasma is
destroyed by it. The interpretation of the measured current-voltage (I-V) curves is
very difficult and has spawned a large literature of theoretical papers. These electric
probes measure the local plasma parameters using a stationary or slow time varying
electric (and/or magnetic) field to emit or collect charged particles from the plasma.
One gets a respective current according to the bias voltage provided to the probe,
from which the plasma parameters (like Te and ne) can be deduced. The electric field
between the plasma and the metallic probe helps the collection of charges which is
dependent on the probe size rp and the thickness (or spatial extension) of the plasma
sheath attached to the collecting surface, which is related to λD. The electron and ion
Larmour radii introduce additional lengths in unmagnetized plasma whereas the
mean free path between collisions plays an important role in collisional and weakly
ionized plasmas. Based on the type of plasma and the nature of the measuring
systems there will be orders of magnitude differences in the measurements done, and
this disparity has lead to the lack of a unified explanation. For instance, interference
Chapter1
20
of the probe with tokamak plasmas can lead to perturbations which serve as source
of impurities to the plasma, which is a major drawback of the technique. These
measurement techniques constitute an active field of research and are particularly
well suited for low density cold plasmas, low pressure electric discharges, and
ionospheric and space plasmas. The most widespread use of Langmuir probes at
present is in the semiconductor industry, where radiofrequency (RF) sources are
used to produce plasmas for etching and deposition. These partially ionized plasmas
require special techniques in probe construction and theory [21-23].
1.8.3 Interferometry Interferometry is another important diagnostic tool which has an advantage that it
does not require local thermodynamic equilibrium (LTE) to be satisfied for the
measurements. The principles of basic laser interferometry are employed and the
analysis of fringe structures allows the study of plasma parameters [24-25]. In an
interferometric set up, a laser pulse/beam is initially split into two and then allowed
to recombine later in space and time, to form the fringes. The expanding plasma is
kept along one of the arms of the interferometer whereas the probe beam is left either
parallel to the target or orthogonal to the plume expansion direction. The underlying
principle used in this method is that the refractive index profile of the expanding
laser produced plasma is directly proportional to the number density of free electrons
in the plasma. The fringe amplitude of the combined probe and reference beams
determines the variation in refractive index, which is in turn related to the change in
phase shift caused in the probe beam by the plasma. A two dimensional map of the
electron density is obtained after performing interferometric analysis of the plasma.
Various configurations used for this purpose are the Michelson Interferometer,
Mach-Zehender interferometer, Nomarski interferometer etc. Even though the
technique is highly useful for analysing plasmas, there are several drawbacks for this
method too. For example, fringe visibility, which is an important factor for
interferometric techniques, is either lost or becomes diminished when the plasma
density approaches a fraction of a percent of the critical density. Similarly, refraction
Chapter1
21
and opacity effects can significantly limit the usefulness of interferometric
diagnostics. This leads to improper measurements with less accuracy which makes
these kinds of techniques difficult to implement, especially in the case of highly
dense plasma. The attenuation of the probe beam also may lead to adverse effects in
measurements. The resolution of interferometric methods depends on the duration of
the probe pulse as well as the gating time of the detector.
1.8.4 Thomson scattering Thomson scattering is a technique that has proved its superiority in the measurement
of electron temperature (Te) and number density (ne) in fusion plasma devices like
tokamaks [26].The method is direct, active, accurate and unambiguous, and is widely
used for localised and simultaneous measurements of the above parameters. The
technique, which is used to measure the number density of fusion plasma, provides
good spatial resolution. As long as the power of the probe beam which produces
electron oscillation is kept low, the measurement will not disturb the plasma. In the
Thomson scattering experiment light scattered by the plasma electrons is used for the
measurements, and the plasma electron temperature is measured from the Doppler
shifted scattered spectrum while the density is measured from the total scattered
intensity. The scattered power is proportional to b��$+, where L is the length of the
plasma traversed by the light beam. This power is too small in scattering
experiments and stray light is a serious issue in such experiments. In practice, the
fraction of incident electrons will not be more than 10-15, taking into consideration
the quantum efficiency of the detector and other experimental conditions. Hence,
while doing diagnostics using Thomson scattering one should be extremely careful
with the experimental conditions and collection of the signals [27].
1.8.5 Shadowgraphy Shadowgraphy can be considered as an alternative technique to derive the
temperature profile, longitudinal expansion velocities etc. of the plasma species [28].
It is the plasma diagnostic technique which yields us the refractive index profile
Chapter1
22
(shadowgraphy is dependent on the second derivative �`�*`�� of the refractive index,
which gives us an idea about the contrast ratio of the technique). Refractive index is
measured using the beam deflection angle measurement, and the shadowgraphy
images are recorded using CCD cameras connected to the PC which are analyzed
using image acquisition software. Expansion velocities are calculated from the
original target surface position and the time taken for recording the shadowgram.
The radiation hydrodynamic model along with the expansion velocities yields the
temperature gradient of the plasma.
1.9 REVIEW OF LASER PRODUCED PLASMAS LPP can be generated by focusing laser pulses onto the target using a lens once the
laser intensity is greater than the ablation threshold of the material. Material ablation,
plasma generation and expansion happen quickly after laser irradiation, in which the
nature of interaction and ablation are dependent on various laser parameters and
surrounding atmosphere. These studies have become one of the promising areas of
research for understanding fundamental and application oriented laser produced
plasma physics. A brief review of laser produced plasmas discussing its origin,
historical developments and the present status are detailed below.
LPP using the ‘giant’ laser pulse was first reported in 1964, and plasma properties
such as absorption of laser energy by the plasma and its magnetic properties were
studied [29]. Soon after this, gas breakdown at optical frequencies
[30-31] and scattering of electromagnetic radiation by LPPs and the corresponding
Doppler shift were reported [32]. A self generated magnetic field associated with a
laser produced spark was also reported in 1966 [33]. Thereafter the field of LPP
became important for various applications including the production of vacuum
ultraviolet radiation, production of X-rays, higher harmonic generation, particle
acceleration etc.
Electron temperature and number density, the important parameters of the plasma,
vary with time and space as the LPP is highly transient in nature. There are several
Chapter1
23
methods available to investigate these parameters which include optical emission
spectroscopy (OES), Optical time of flight (OTOF) measurements, Interferometry,
Thomson scattering, Polarimetry, shadowgraphy, Langmuir probe etc. OES is one
of the best nondestructive methods used for the investigation of temperature and
number density but are not applicable at the earlier stages of plasma expansion due
to the large continuum emission. Interferometry cannot be applied when the number
density is too high or too low, and in this case, selection of the probe wavelength is
also critical. Langmuir probe is a good and effective tool to understand the space
averaged density but it is not possible to measure the density at the plasma core
because the probe disturbs the plasma. Out of the above mentioned techniques
Thomson scattering is the best method, but setting up the experiment and extracting
signal from the noise is very difficult. Therefore for making accurate measurements,
any of the above two methods are employed to understand LPP parameters. Imaging
of the plasma using ICCD is also a good tool to understand the expansion dynamics
of the LPP.
Laser parameters such as the fluence, irradiation spot size, and wavelength largely
affect the properties of LPP. Variation of plasma properties with respect to the above
mentioned parameters using nanosecond (ns) pulses to understand the fundamental
physics of laser ablation was largely studied in the last two decades. It was shown
that the emission intensity, temperature and number density of the plasma increases
with laser wavelength and fluence whereas these parameters decreases with time and
axial expansion direction. [34-40]. It is also reported that ambient conditions (both
the nature and pressure of ambient gas) play an important role in the expansion
dynamics of LPP, which is also an active area of ongoing research. The generation
and expansion of LPP is different for various pulse durations, and this is also an
active area of research for both fundamental (mostly related to dynamics of the
plasma) and application oriented research (Pulsed Laser Deposition (PLD),
nanoparticle and nano-cluster generation etc.). ns LPP has been widely studied but
research related to femtosecond (fs) LPP is relatively scarce, and therefore the
Chapter1
24
emission dynamics of an expanding fs LPP is another major area of ongoing research
work.
Apart from the above, laser wake field acceleration, where particle acceleration is
achieved via laser produced plasma, is an upcoming research field. Similarly,
acceleration of trapped particles using Bessel beam plasmas is a forthcoming
attraction of the field. Moreover, theoretical work and simulation of LPP under
various conditions is an equally fast growing area of plasma physics.
1.10 CONCLUSION Plasma, a distinct state of matter, is introduced and briefly described in this chapter,
giving an insight into various processes that occur in the plasma and various
techniques used to diagnose the plasma, whatever be its nature of origin. The
underlying motivation, which is an important part of any research work, is explained
in detail along with a brief review of the previous works done in the field. A brief
mention of the research possible in the field is also given in the chapter.

CHAPTER 2
INSTRUMENTATION
Instrumentation required to perform optical emission spectroscopy and optical time
of flight measurements and imaging of the plasma plume, generated by
nanosecond/femtosecond laser pulses, is discussed in this chapter. The laser system,
pulse characterization techniques, synchronization circuits, and instruments used to
detect the emission spectra are explained in detail.
Chapter2
26
2.1 INTRODUCTION Laser-produced plasmas (LPP) are formed by focusing a high intensity laser pulse
onto a target (in any form of matter). Such plasmas expand rapidly, and the plasma
parameters vary temporally and spatially, imparting them a transient nature. As soon
as the laser interacts with the target, plasma expands isothermally within the duration
of the incident laser pulse, which turns out to be adiabatic afterwards. High power
laser systems are necessary to generate LPP, and to diagnose the transient plasma
generated, detectors need to be synchronized with the laser pulse using fast
electronic circuits. Details of instruments used such as the laser systems, vacuum
chambers and detectors are described in this chapter.
Optical emission spectroscopy (OES), Optical Time of Flight (OTOF), and imaging
using CCD cameras are the non-destructive measurement techniques employed in
the present work to yield plasma parameters such as the temperature and number
density. The plasma emission is collected using a lens system, which is fed into a
monochromator and Charge Coupled Device (CCD) configuration for OES studies,
and a monochromator, Photo-Multiplier Tube (PMT) and digital storage oscilloscope
(DSO) combination for OTOF studies. The two dimensional expansion of the plasma
plume is simultaneously imaged using an intensified CCD (ICCD) camera. The
recorded signals are digitally saved for further analysis. For the generation and
detection of the plasma, mutual synchronization of the instruments is necessary so
that the timings of the different devices including CCD, PMT and ICCD are under
control. For nanosecond (ns) and femtosecond (fs) laser plasma generation we have
used a Q-Switched Nd: YAG Laser and a mode-locked Ti: Sapphire laser
respectively.
2.2 LASER SYSTEM The laser system is an integral part of the experimental setup, which delivers optical
pulses as short flashes of light. The shortest optical pulse generated in a commercial
laser system so far has a duration of about 5 fs (5×10-15 s), corresponding to a few

Chapter2
27
optical cycles (few-cycle pulses) at the operating wavelength of 800 nm. Due to the
short pulse durations and the potential for tight focusing, ultrafast optical pulses can
be used to obtain extremely high intensities even at moderate pulse energies.
Therefore, amplified fs pulses are essential for high-intensity physics, for studying
phenomena such as multi-photon ionization and higher harmonic generation, and for
generating shorter pulses with attosecond durations. A 100 fs Ti: Sapphire laser and
a 5 ns (5×10⁻⁹ s) Nd: YAG laser have been used for the fs and ns LPP studies
respectively, reported in the present work. Laser pulses of 100 fs width (FWHM) are
initially generated in a mode-locked Ti: Sapphire oscillator, which are then amplified
by a chirped pulse Ti: Sapphire amplifier (CPA) to the required pulse energies which
are orders of magnitude higher in comparison.
2.2.1 The ultrafast (femtosecond) oscillator The Ti: Sapphire laser falls into the category of tunable lasers, with emission in the
red and near-infrared regions between 700 and 1000 nanometers. The femtosecond
oscillator (Tsunami, Spectra Physics, USA) consists of a folded cavity with an
acousto-optic modulator (AOM) and active feedback for generating femtosecond
pulses by the technique of regenerative mode-locking. A one centimeter long Ti:
Sapphire crystal rod pumped by a diode-pumped Nd:YVO4 laser (Millennia Pro S,
Spectra Physics) is the active medium in the system. Titanium ions (Ti3+) in the Ti:
Sapphire crystal is responsible for the laser action. Transitions corresponding to
absorption occur over a broad range of wavelengths from 400 nm to 600 nm. Even
though the fluorescence band starts from 600 nm, lasing action occurs only for
wavelengths beyond 670 nm because the long wavelength side of the absorption
band overlaps the short wavelength side of the fluorescence spectrum. Mode-locking
of the ultrafast optical cavity is achieved through an acousto-optic Modulator (AOM)
in a regenerative mode-locking configuration, which uses an RF signal to drive the
AOM. The ultrafast oscillator produces pulses of 100 fs duration (approximately) at
a repetition rate of 80 MHz. Figure 2.1 shows the ultrafast oscillator along with the
Nd:YVO4 pump laser.
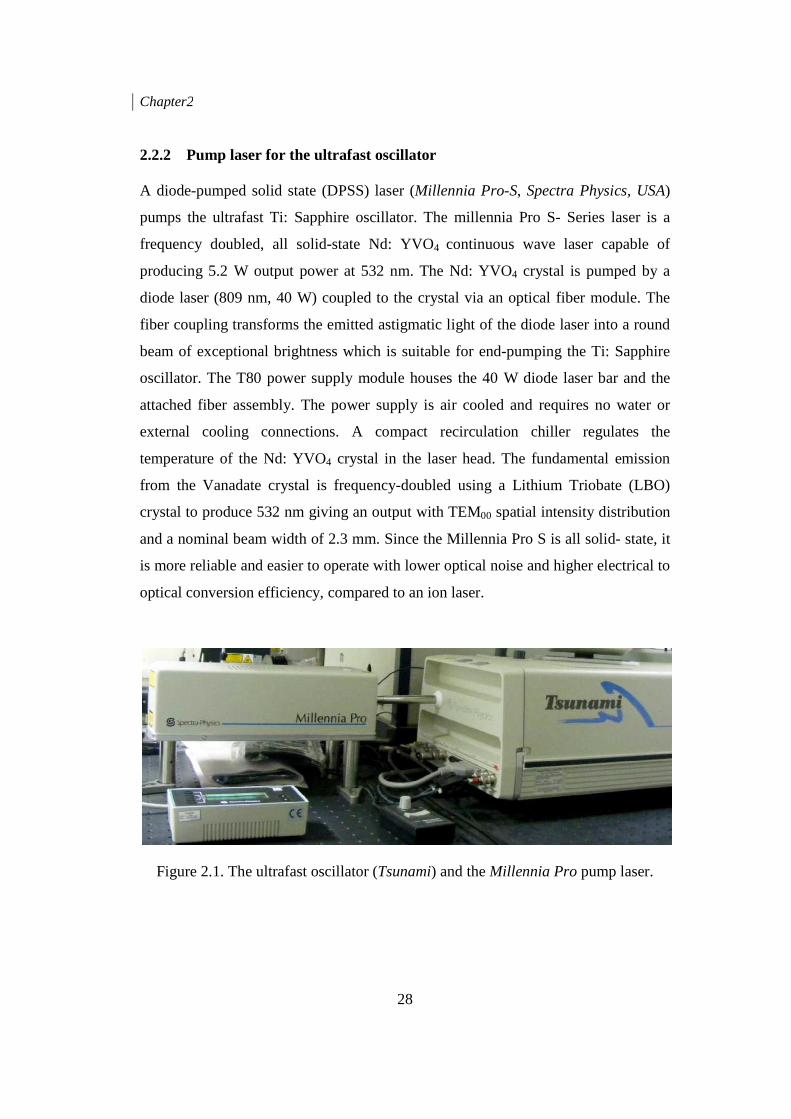
Chapter2
28
2.2.2 Pump laser for the ultrafast oscillator A diode-pumped solid state (DPSS) laser (Millennia Pro-S, Spectra Physics, USA)
pumps the ultrafast Ti: Sapphire oscillator. The millennia Pro S- Series laser is a
frequency doubled, all solid-state Nd: YVO4 continuous wave laser capable of
producing 5.2 W output power at 532 nm. The Nd: YVO4 crystal is pumped by a
diode laser (809 nm, 40 W) coupled to the crystal via an optical fiber module. The
fiber coupling transforms the emitted astigmatic light of the diode laser into a round
beam of exceptional brightness which is suitable for end-pumping the Ti: Sapphire
oscillator. The T80 power supply module houses the 40 W diode laser bar and the
attached fiber assembly. The power supply is air cooled and requires no water or
external cooling connections. A compact recirculation chiller regulates the
temperature of the Nd: YVO4 crystal in the laser head. The fundamental emission
from the Vanadate crystal is frequency-doubled using a Lithium Triobate (LBO)
crystal to produce 532 nm giving an output with TEM00 spatial intensity distribution
and a nominal beam width of 2.3 mm. Since the Millennia Pro S is all solid- state, it
is more reliable and easier to operate with lower optical noise and higher electrical to
optical conversion efficiency, compared to an ion laser.
Figure 2.1. The ultrafast oscillator (Tsunami) and the Millennia Pro pump laser.
Chapter2
29
2.2.3 Nd: YAG laser (Quanta Ray) Amplification by TSA requires a pump radiation which is provided by a frequency
doubled, Q-switched Nd: YAG laser (Quanta Ray, Spectra Physics) operating at 10
Hz with a nominal pulsewidth of 7 ns. This flash lamp pumped laser is capable of
producing pulses ~270 mJ energy at 532 nm (using a KDP crystal for frequency
doubling). The fundamental 1064 nanometers output from the system is used for
short pulse (i.e. ns) LPP generation in the present work. The maximum energy
available from the instrument at 1064 nm is 150 mJ.
Output from the Nd: YAG laser and the ultrafast oscillator must be synchronized for
the TSA to operate. Here, timings associated with the switching of Pockel cell in the
CPA very critical. In order to ensure that only a single pulse enters the resonator
from the 82 MHz train, the input Pockel cell must be switched at the same time, with
respect to the mode locked pulse train. To achieve this, switching of the Pockel Cell
is synchronized with the RF signal generated by the mode-locker of the ultrafast
oscillator via a Synchronization and Delay Generator (SDG) unit. The Nd: YAG
laser system can also work as an independent unit when needed.
2.2.4 Chirped Pulse Amplifier (TSA-10) The energy of mode-locked single pulses produced by the ultrafast oscillator
(Tsunami) is too low (~ 10 nano Joules), and it has to be amplified to the milli Joules
level in order to obtain the high energy pulses required for intense laser field
experiments. Direct amplification of ultrashort pulses is not possible as it will
damage the amplifying medium itself (due to the high intensity of the 100 fs pulses),
and therefore, the technique of Chirped Pulse Amplification (CPA) is used for
amplification. In the CPA technique, the pulse is initially stretched in time by a large
factor (typically 10,000) to reduce the peak power, amplified, and then compressed
back to the original pulsewidth. Pulse stretching and compression are achieved by
the use of diffraction gratings.
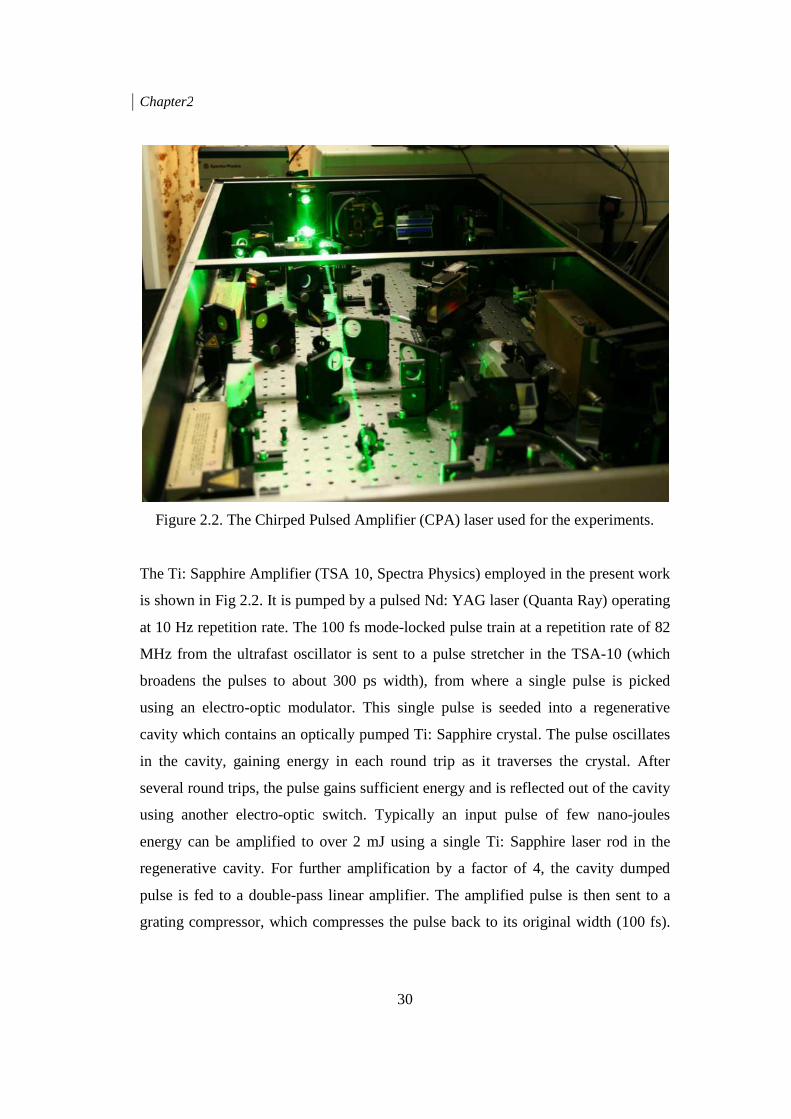
Chapter2
30
Figure 2.2. The Chirped Pulsed Amplifier (CPA) laser used for the experiments.
The Ti: Sapphire Amplifier (TSA 10, Spectra Physics) employed in the present work
is shown in Fig 2.2. It is pumped by a pulsed Nd: YAG laser (Quanta Ray) operating
at 10 Hz repetition rate. The 100 fs mode-locked pulse train at a repetition rate of 82
MHz from the ultrafast oscillator is sent to a pulse stretcher in the TSA-10 (which
broadens the pulses to about 300 ps width), from where a single pulse is picked
using an electro-optic modulator. This single pulse is seeded into a regenerative
cavity which contains an optically pumped Ti: Sapphire crystal. The pulse oscillates
in the cavity, gaining energy in each round trip as it traverses the crystal. After
several round trips, the pulse gains sufficient energy and is reflected out of the cavity
using another electro-optic switch. Typically an input pulse of few nano-joules
energy can be amplified to over 2 mJ using a single Ti: Sapphire laser rod in the
regenerative cavity. For further amplification by a factor of 4, the cavity dumped
pulse is fed to a double-pass linear amplifier. The amplified pulse is then sent to a
grating compressor, which compresses the pulse back to its original width (100 fs).
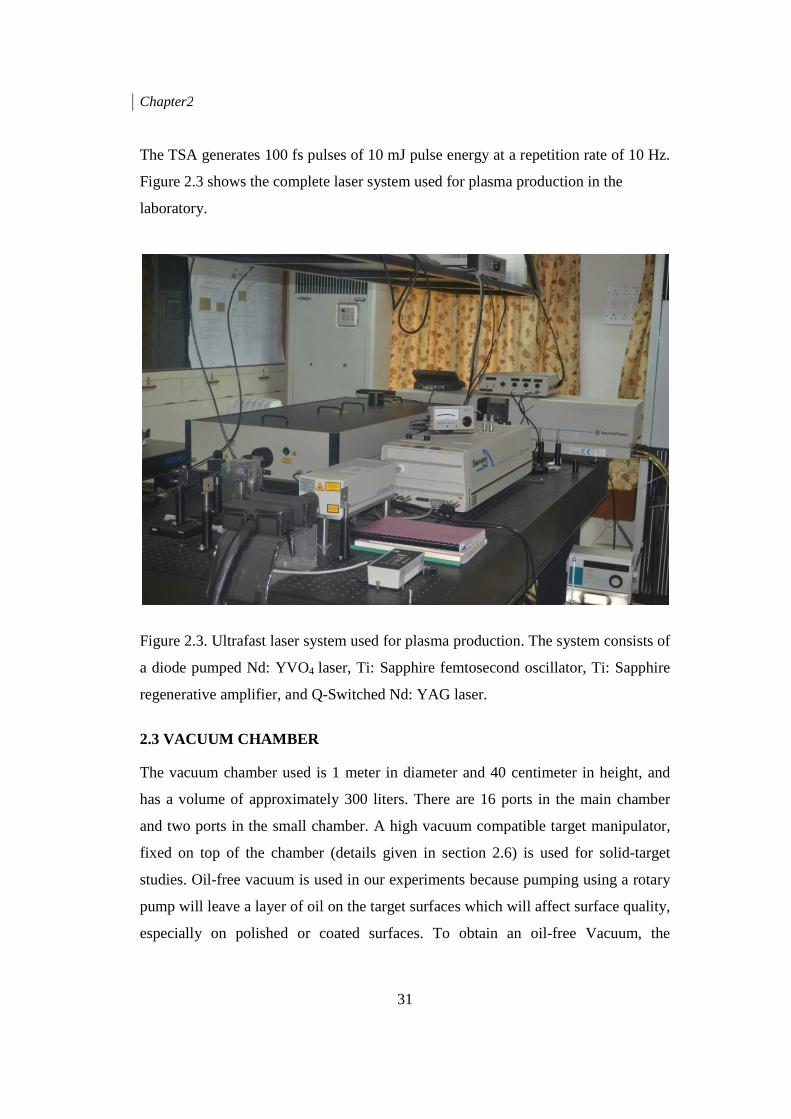
Chapter2
31
The TSA generates 100 fs pulses of 10 mJ pulse energy at a repetition rate of 10 Hz.
Figure 2.3 shows the complete laser system used for plasma production in the
laboratory.
Figure 2.3. Ultrafast laser system used for plasma production. The system consists of
a diode pumped Nd: YVO4 laser, Ti: Sapphire femtosecond oscillator, Ti: Sapphire
regenerative amplifier, and Q-Switched Nd: YAG laser.
2.3 VACUUM CHAMBER
The vacuum chamber used is 1 meter in diameter and 40 centimeter in height, and
has a volume of approximately 300 liters. There are 16 ports in the main chamber
and two ports in the small chamber. A high vacuum compatible target manipulator,
fixed on top of the chamber (details given in section 2.6) is used for solid-target
studies. Oil-free vacuum is used in our experiments because pumping using a rotary
pump will leave a layer of oil on the target surfaces which will affect surface quality,
especially on polished or coated surfaces. To obtain an oil-free Vacuum, the
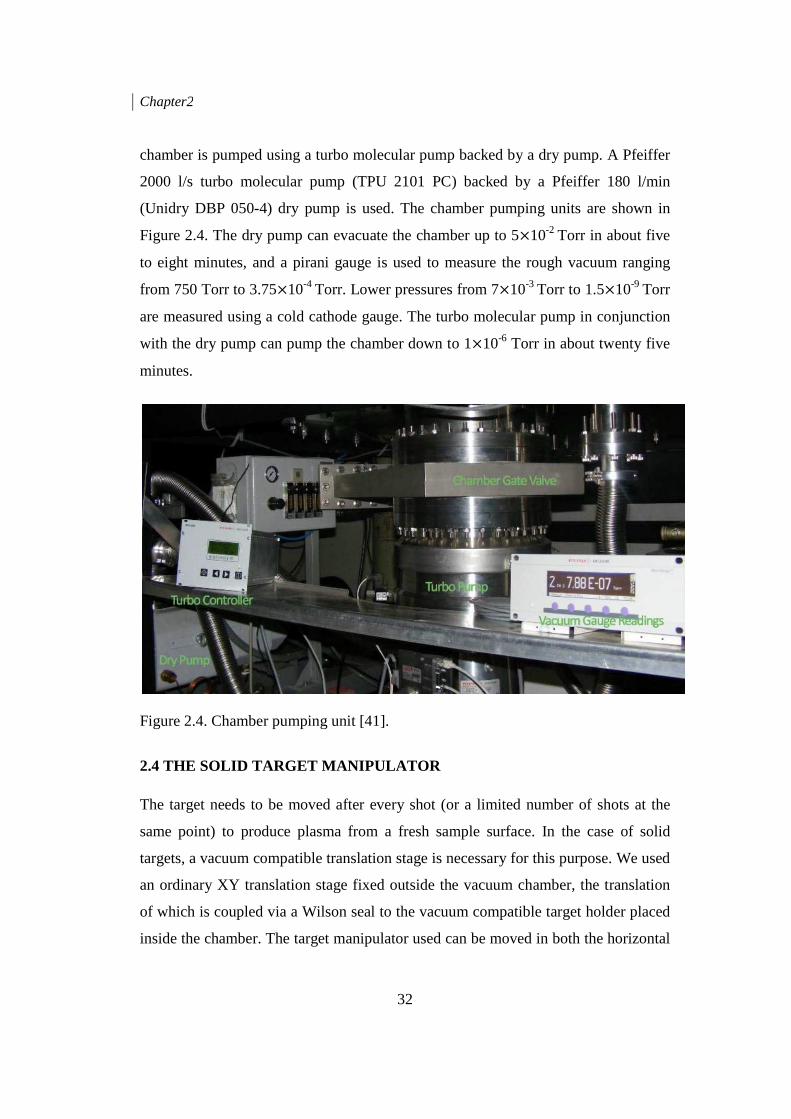
Chapter2
32
chamber is pumped using a turbo molecular pump backed by a dry pump. A Pfeiffer
2000 l/s turbo molecular pump (TPU 2101 PC) backed by a Pfeiffer 180 l/min
(Unidry DBP 050-4) dry pump is used. The chamber pumping units are shown in
Figure 2.4. The dry pump can evacuate the chamber up to 5×10⁻² Torr in about five
to eight minutes, and a pirani gauge is used to measure the rough vacuum ranging
from 750 Torr to 3.75×10⁻⁴ Torr. Lower pressures from 7×10⁻³ Torr to 1.5×10⁻⁹ Torr
are measured using a cold cathode gauge. The turbo molecular pump in conjunction
with the dry pump can pump the chamber down to 1×10⁻⁶ Torr in about twenty five
minutes.
Figure 2.4. Chamber pumping unit [41].
2.4 THE SOLID TARGET MANIPULATOR The target needs to be moved after every shot (or a limited number of shots at the
same point) to produce plasma from a fresh sample surface. In the case of solid
targets, a vacuum compatible translation stage is necessary for this purpose. We used
an ordinary XY translation stage fixed outside the vacuum chamber, the translation
of which is coupled via a Wilson seal to the vacuum compatible target holder placed
inside the chamber. The target manipulator used can be moved in both the horizontal
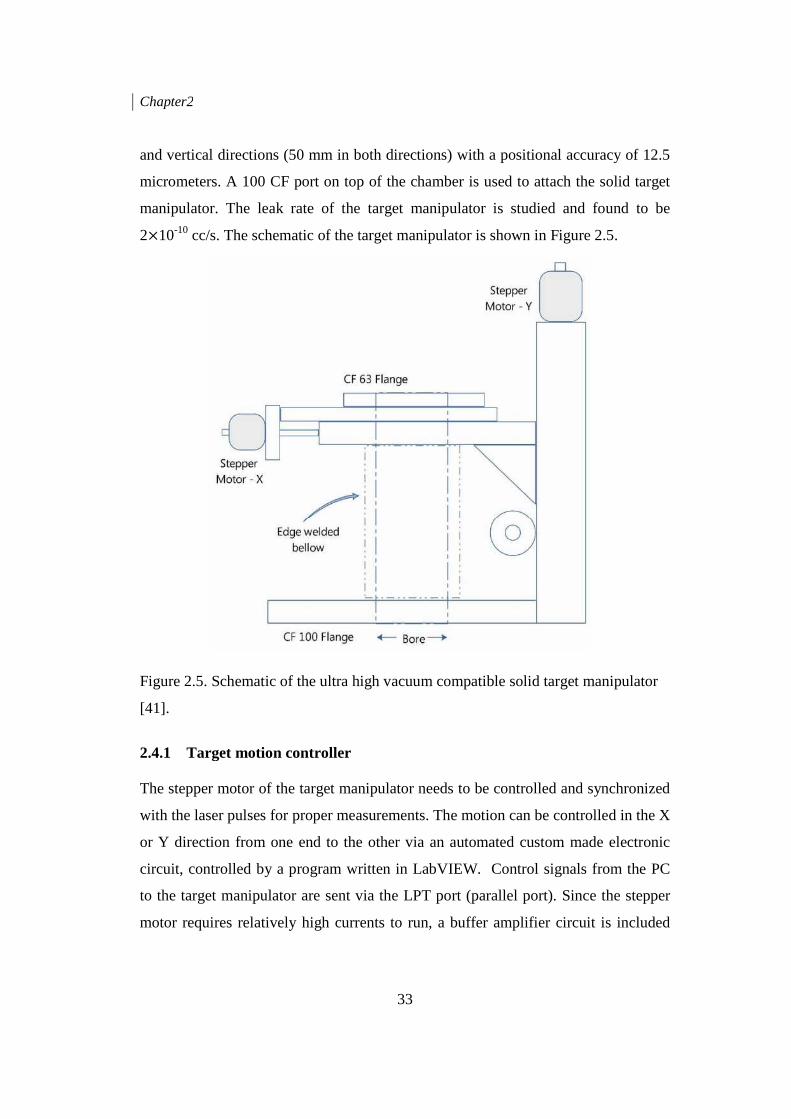
Chapter2
33
and vertical directions (50 mm in both directions) with a positional accuracy of 12.5
micrometers. A 100 CF port on top of the chamber is used to attach the solid target
manipulator. The leak rate of the target manipulator is studied and found to be
2×10⁻¹⁰ cc/s. The schematic of the target manipulator is shown in Figure 2.5.
Figure 2.5. Schematic of the ultra high vacuum compatible solid target manipulator
[41].
2.4.1 Target motion controller The stepper motor of the target manipulator needs to be controlled and synchronized
with the laser pulses for proper measurements. The motion can be controlled in the X
or Y direction from one end to the other via an automated custom made electronic
circuit, controlled by a program written in LabVIEW. Control signals from the PC
to the target manipulator are sent via the LPT port (parallel port). Since the stepper
motor requires relatively high currents to run, a buffer amplifier circuit is included
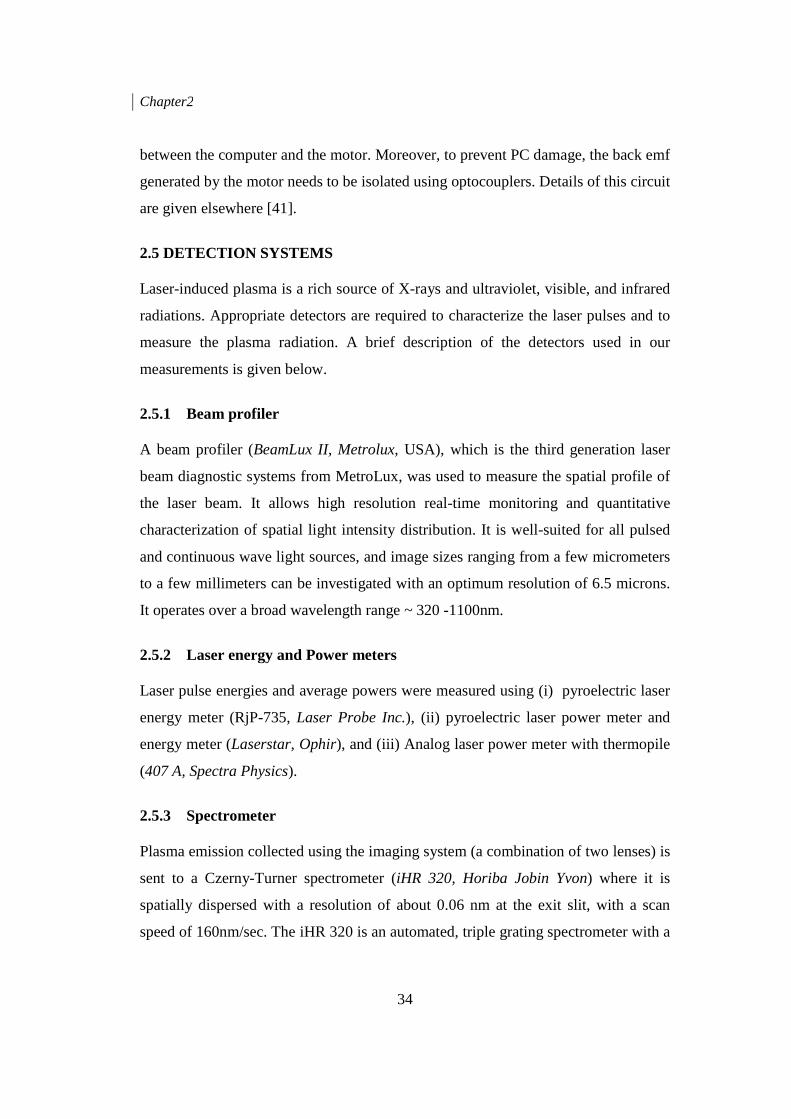
Chapter2
34
between the computer and the motor. Moreover, to prevent PC damage, the back emf
generated by the motor needs to be isolated using optocouplers. Details of this circuit
are given elsewhere [41].
2.5 DETECTION SYSTEMS Laser-induced plasma is a rich source of X-rays and ultraviolet, visible, and infrared
radiations. Appropriate detectors are required to characterize the laser pulses and to
measure the plasma radiation. A brief description of the detectors used in our
measurements is given below.
2.5.1 Beam profiler A beam profiler (BeamLux II, Metrolux, USA), which is the third generation laser
beam diagnostic systems from MetroLux, was used to measure the spatial profile of
the laser beam. It allows high resolution real-time monitoring and quantitative
characterization of spatial light intensity distribution. It is well-suited for all pulsed
and continuous wave light sources, and image sizes ranging from a few micrometers
to a few millimeters can be investigated with an optimum resolution of 6.5 microns.
It operates over a broad wavelength range ~ 320 -1100nm.
2.5.2 Laser energy and Power meters Laser pulse energies and average powers were measured using (i) pyroelectric laser
energy meter (RjP-735, Laser Probe Inc.), (ii) pyroelectric laser power meter and
energy meter (Laserstar, Ophir), and (iii) Analog laser power meter with thermopile
(407 A, Spectra Physics).
2.5.3 Spectrometer Plasma emission collected using the imaging system (a combination of two lenses) is
sent to a Czerny-Turner spectrometer (iHR 320, Horiba Jobin Yvon) where it is
spatially dispersed with a resolution of about 0.06 nm at the exit slit, with a scan
speed of 160nm/sec. The iHR 320 is an automated, triple grating spectrometer with a
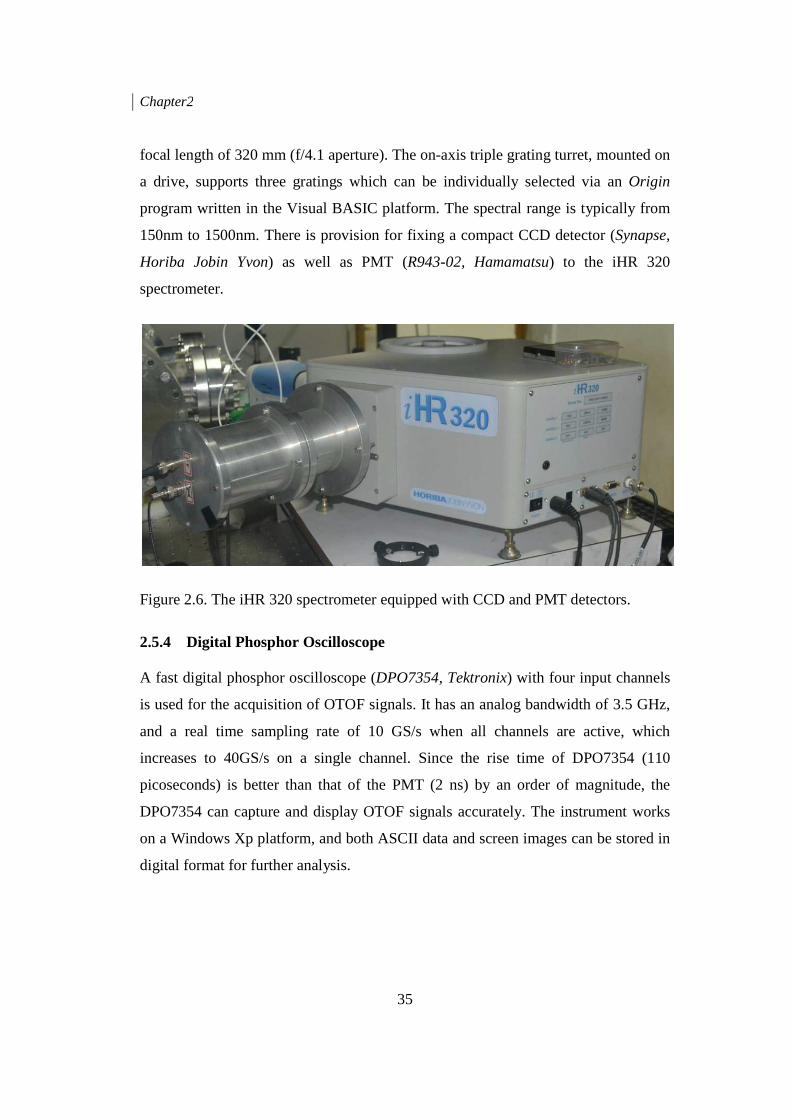
Chapter2
35
focal length of 320 mm (f/4.1 aperture). The on-axis triple grating turret, mounted on
a drive, supports three gratings which can be individually selected via an Origin
program written in the Visual BASIC platform. The spectral range is typically from
150nm to 1500nm. There is provision for fixing a compact CCD detector (Synapse,
Horiba Jobin Yvon) as well as PMT (R943-02, Hamamatsu) to the iHR 320
spectrometer.
Figure 2.6. The iHR 320 spectrometer equipped with CCD and PMT detectors.
2.5.4 Digital Phosphor Oscilloscope A fast digital phosphor oscilloscope (DPO7354, Tektronix) with four input channels
is used for the acquisition of OTOF signals. It has an analog bandwidth of 3.5 GHz,
and a real time sampling rate of 10 GS/s when all channels are active, which
increases to 40GS/s on a single channel. Since the rise time of DPO7354 (110
picoseconds) is better than that of the PMT (2 ns) by an order of magnitude, the
DPO7354 can capture and display OTOF signals accurately. The instrument works
on a Windows Xp platform, and both ASCII data and screen images can be stored in
digital format for further analysis.
Chapter2
36
2.5.5 Intensified charge coupled device The intensified charge coupled device (ICCD) is an excellent imaging device
capable of time gated data acquisition, commonly used for capturing images of LPP
expansion for various time delays. From ICCD images taken at regular time delays,
the nature of plume expansion can be directly investigated. The ICCD we used (4-
Picos, Stanford Research Systems Inc.) has an 18 mm image intensifier with S-20
photocathode, and can start acquiring images 40 ns after the trigger delay from the
trigger pulse. The minimum gate width is 200 picoseconds. The ICCD camera is
controlled using the application software 4-spec line and the communication is
performed via RS 232 serial interface.
2.6 CONCLUSION Brief descriptions of the instruments used for conducting the investigations reported
in this thesis are given in this chapter. A detailed discussion of the LPP and OTOF
experimental setups is given in the next chapter.

CHAPTER 3
EXPERIMENTAL TECHNIQUES FOR THE INVESTIGATION OF LASER PRODUCED PLASMA
Laser-produced plasma (LPP) is transient in nature, and the parameters which
unfold rapidly in time are crucially dependent on material properties and ambient
gas pressure, in addition to laser parameters such as fluence, pulse width,
wavelength, and beam spot size. Similar to other plasmas, key parameters like
temperature and number density should be estimated to characterize the plasma.
Plasma temperature can be estimated using techniques such as X-ray and visible
spectroscopy, and number density can be estimated using the methods of emission
spectroscopy, Langmuir probe, microwave and visible interferometry, and Thomson
scattering. This chapter discusses the techniques used for characterizing laser
produced plasmas, their pros and cons, and the other techniques used for the present
experimental work.
Chapter 3
38
3.1 INTRODUCTION After the invention of high power pulsed lasers, the study of intense laser-matter
interaction has been a major area of research undertaken by different labs around the
world. The advent of new technologies facilitated the production of sub-picosecond
laser pulses, which can be amplified using the chirped pulse amplification technique
to produce an intense source of monochromatic radiation suitable for producing
plasmas. The large intensities associated with these lasers create a highly excited
state of matter leading to nonlinear processes such as second and third harmonic
generation [42-48], multiphoton ionization and over the barrier ionization [49],
resulting in the formation of plasma. The plasma thus produced (Laser Produced
Plasma (LPP)) is a rich radiation source emitting in the Visible, UV, and X-ray
regions [7-8, 50]. Hence LPP is one of the currently relevant research areas in which
lot of research is going on, that finds applications in varied fields such as surface
cleaning [51], pulsed laser deposition [52-54], nanoparticle [11-14] and nanocluster
production [55], particle acceleration [56-59] etc. The ablation yield, material
removal, ionization and plasma plume expansion to the surroundings depend on
parameters such as laser fluence [12, 60-61], pulse width [62-68], wavelength [38-
40, 69-72], irradiation spot size [73] and material properties, along with the ambient
pressure [74-89].
In the case of LPP generated by nanosecond (ns) lasers, the generated plasma will
interact with the trailing part of the relatively long laser pulse and absorb energy
from it. On the other hand, for LPP generated by femtosecond (fs) lasers, the laser
pulse is too short to interact with the plasma since the electron-ion collision time and
heat conduction time are in the order of picoseconds [65, 90]. The entire energy
content of the pulse is deposited on the target resulting in efficient material ablation
[62] and plasma formation. Unlike ns excitation, fs excitation minimizes the
possibility of ejected particles interacting with the laser field preventing further
ionization, resulting in the formation fast ions, atoms, nanoparticles and nanoclusters
occurring at different time scales [12-14, 91-92]. This leads to a different emission
Chapter 3
39
dynamics for fs LPP compared to ns LPP. fs LPP is rich in excited neutrals at initial
times whereas ns LPP are dominated by ions. This can be explained by the different
ablation processes involved: while ns lasers tend to generate ions of lower charge
states and produce neutral species via recombination, fs lasers generate ions of
higher charge states emitting at much shorter wavelengths, followed by thermal
vaporization of the target, producing mostly neutral species. It has been
experimentally proven that the expansion is spherical for ns LPP both in vacuum and
at atmospheric pressure, while the expansion of fs LPP has a narrower angular
distribution. This narrower angular distribution is due to the strong self generated
magnetic field created during the early expansion stage of fs LPP, which pinches the
expanding plume and limits its expansion in a direction normal to the target [67].
Furthermore, higher plasma temperature and lower number density are characteristic
of plasma generated by larger laser pulse durations at higher pressures [89, 93].
Moreover, continuum emission also increases for larger pulse duration.
Interaction of LPP with the ambient gas leads to an expansion involving several
physical processes such as thermalization, attenuation, diffusion, electron-ion
recombination, and shock wave formation, which is a fairly complex phenomenon.
Plasma expands freely into vacuum or low background pressures, and the plume
dynamics is characterized by the stronger interpenetration of the ambient gas with
the plume, at higher ambient pressures. At still higher pressures, expansion dynamics
of the laser produced plasma is fully determined by the properties and nature of the
ambient gas. The increase in background pressures causes an increase in
fluorescence emission from all the species due to enhanced collisions of the
expansion front with the gas, and subsequent inter plume collisions. Shock wave
formation and slowing of the plume due to spatial confinement of the plasma happen
at higher pressures. The presence of ambient gas may lead to reactive scattering,
thermalization of the plume, enhanced condensation etc. leading to cluster and
nanoparticle formation. Thus the expansion and dynamics of the laser produced
plasma is governed by the properties of the plasma and the surrounding gas. For
Chapter 3
40
example, ICCD measurements performed in a ns Aluminum LPP have shown the
possibility of plume splitting at low pressures [94]. Plume expansion at lower
pressures can be accurately described by a Monte Carlo Simulation, but this model is
insufficient at moderate and high pressures [95-96]. At higher pressures a blast wave
model fits the experimental results well in the earlier stages of plasma expansion
[97-98] whereas a shock wave model predicts the plume length with reasonable
accuracy. A three dimensional combined model for plasma plume formation and its
expansion is available, which benefits from the advantages of both microscopic and
continuous descriptions [99]. The two available descriptions for ablation by
ultrashort pulses are the plasma-annealing model and the two-temperature model
[100-102]. Dynamics of the ablated species can be theoretically modeled using a
shock wave model at higher pressures [103], a blast wave model at moderate
pressures, and molecular dynamics simulations [104] at extremely low pressures.
Even though material removal efficiency and laser plasma dynamics leading to the
production of nanoparticles has been discussed in literature, a complete theoretical
understanding of the expansion process is yet to be achieved. However, it is shown
that at relatively lower laser fluences femtosecond laser produced plasmas consist of
two different components, viz. atomic species and nanoparticles, in the earlier (~ 200
ns to 500 ns) and later (~ 100 µs) stages of plasma expansion, respectively. Fast
atomic species can be observed once the fluence of the irradiating laser is increased
well beyond the ablation threshold. Similarly, nanoparticle production can be
maximized by optimizing the laser fluence. Furthermore, it is reported that ultrafast
ablation of high-Z materials can lead to higher nanoparticle yield when compared to
low Z materials [91]. The growth of nanoclusters from nanoparticles can be
explained using diffusion limited aggregation at lower pressures [55, 105].
It has been shown experimentally that fs LPP plumes consist of fast ions, neutral
atoms and nanoparticles, and that plume expansion depends on the ambient
conditions and initial parameters. The plume emits continuum during the initial
expansion stages due to the free-free and free-bound transitions, and acts as a black
Chapter 3
41
body radiator at later stages of expansion due to the formation of nanoparticles.
Compared to ns excitation, fs LPP plume has a relatively complex structure, even
though the processes leading to plume formation are simpler. Thus plasma
diagnostics is essential for tailoring plasma properties for various applications.
Different diagnostic techniques available for the characterization of LPP include
optical emission spectroscopy, laser-induced fluorescence, Langmuir probing, mass
spectrometry, photo-thermal beam deflection, Thomson scattering, interferometry
etc. [106]. Conventional techniques employed for the observation and analysis of
LPP include ion probe studies and time-resolved and time-gated emission
spectroscopy. Temporal evolution of the transient plasma can be recorded using fast
detectors such as photomultiplier tubes (PMT) and intensified charge coupled
devices (ICCD) [107]. These studies are essential for understanding and modeling
various processes in fundamental plasma physics and plasma hydrodynamics.
Optical Emission Spectroscopy (OES) is a nondestructive technique used for the
estimation of temperature and number density of LPP using radiative emission from
the plasma. The present chapter gives a detailed description of experimental
techniques employed for LPP diagnostics, such as the OES and Optical Time of
Flight (OTOF) methods.
3.2 OPTICAL EMISSION SPECTROSCOPY (OES) Spectroscopy is a branch of science which studies the interaction of electromagnetic
radiation with matter. Optical emission spectroscopy (OES) is a useful non-
destructive spectroscopic technique which can be used for the characterization of
LPP. Laser power, and the sensitivity and wavelength range of the spectrograph and
the detector, are important in OES. Because of its remarkable features, OES can be
used to study a wide range of materials like metals, alloys, biological samples,
pollutants, explosives etc.
The phenomenon of laser ablation plays a key role in the formation of LPP. If the
energy deposited on the target is much greater than then the latent heat of
Chapter 3
42
vaporization of all its constituents, they get completely vaporized and removed
causing ablation. The factors that affect ablation of the material mainly include the
laser pulse width, spatial and temporal fluctuations, power fluctuations, mechanical,
chemical and physical properties of the target, etc. In short the generation of LPP
consists of three steps, namely, laser-matter interaction, removal of material
followed by ablation, and finally plasma formation. Plasma will emit continuous as
well as characteristic (discrete) radiation. Since there is a delay of several
microseconds between continuum generation and characteristic radiation, the
detector should be gated in time to obtain discrete spectra, to get a conclusive idea
about the emitter. Detection and spectral measurement of the emission using a
spectrograph provides information on the elemental composition of the material
which has undergone ablation.
At lower irradiances (<108 W/cm2) and longer pulse durations (several µs)
differential absorption occurs and thermal processes are dominant. At higher
irradiances (≥108 W/cm2) and smaller pulse durations (nanoseconds) ablation takes
place. Short and energetic laser pulses deposit greater energy on the substrate and the
surface temperature rises above the vaporization temperature, inhibiting further
vaporization till a critical temperature is reached. More uniform target heating
leading to an explosive release of material with a composition close to the original
sample composition occurs here. When a laser pulse of intensity greater than the
breakdown threshold of the material is used, local heating leads to an intense
evaporation of the material, forming plasma. When the laser pulse falls on the
material, the initial part of the energy is utilized for the vaporization and ionization
of the substance whereas rest of the energy is absorbed by the vapor, causing
expansion in the plasma plume which emits continuum and atomic lines.
From the optical emission spectra, key parameters such as electron temperature and
number density of the plasma can be calculated. Temperature of the plasma is
calculated either by the ratio of line intensity method or via Boltzmann plot method
[20]. Electron temperatures (Te) in the current study are evaluated using intensity
Chapter 3
43
ratios of line emissions from similar species emitting two wavelengths which are
decaying to the same lower energy state. Assuming local thermodynamic
equilibrium (LTE) in the system, the temperature is estimated using the equation,
���� = ��������
���� exp �− �� − ������� � 3.1�
where λi, Ai, gi, Ii and Ei (i = 1,2) are the wavelength, transition probability, statistical
weight, line intensity, and energy of the excited state respectively. The electron
number density (Ne) was evaluated from Stark broadening of line emission at a
particular wavelength using the equation
∆��/� = 2� � ��10� ! + 3.5 � $ %�10� & �'× )1 − 3
4 �+,�-. � $ %�10� & Å 3.2�
where ∆��/� is the full width at half maximum (FWHM) of emission, � is the
electron impact parameter, ND is the number of particles in the Debye Sphere, and �
is the ion broadening parameter. In addition to Stark broadening, broadening
mechanisms such as Doppler broadening and Pressure broadening also will
contribute to line broadening in LPPs. Instrumental broadening is another factor
which can increase measured linewidths in OES. Doppler broadening arises due to
different velocity components in different regions of the plume. Typical FWHM of
Doppler width in LPP is always one or two orders of magnitude less than that of
Stark broadening. Pressure broadening depends on the ground state number density
and oscillator strength of the transition, and normally it can be neglected since it is
very small. Instrumental broadening can be minimized by reducing slit widths in the
spectrometer. For non-hydrogenic ions Stark broadening is dominated by electron

Chapter 3
44
impact, and therefore the ion correction factor is negligible. As a consequence the
Stark broadening equation reduces to
∆��/� = 2� � ��10� ! Å 3.3�
The theoretical value of � can be obtained from literature [108-109]. A Lorentzian
curve will fit to the emission profile for a given wavelength. Knowing the electron
impact parameter corresponding to the estimated temperature, Ne can be calculated.
Temperature calculations are performed by assuming the plasma to be in LTE.
Under a valid LTE, different temperatures of the plasma such as ion temperature,
electron temperature and neutral temperature can be considered to be approximately
equal. The validity of LTE can be checked using the McWhirter criterion [110] for
each case independently, which is given as
�� ≥ 1.6 × 10�'��2.3 ∆��-45,- 3.4�
Where ∆� is the energy difference between upper and lower energy levels in eV, and
Te is the electron temperature in eV. If the value of �� calculated using equation 3.3
is greater than that calculated using equation 3.4, then LTE approximation is valid.
In a transient system like the plasma, LTE is valid only when collision time between
particles is low compared to the time duration where significant changes occur in the
plasma.
3.3 OPTICAL TIME OF FLIGHT (OTOF) MEASUREMENTS Femtosecond and nanosecond LPP are different in the nature of their generation and
expansion. In ns LPP, ablated species in the plasma will interact with the trailing
edge of the irradiating laser pulse since material ablation happens in picoseconds.
The important processes involved in the generation of LPP are (1) laser–matter
Chapter 3
45
interaction, (2) laser- plasma interaction, (3) plasma plume-background interaction,
and (4) plasma expansion [111]. In fs LPP, laser-plasma interaction is absent as the
pulsewidth is very short and ablation happens only after the laser pulse ceases.
Plasma plume expanding freely in vacuum shows a free adiabatic expansion. The
ejected species will slow down with increase in ambient pressure and axial distance.
For sufficiently high pressures, when the ablated mass is small compared to the mass
of the background gas in motion, a shock wavefront is formed whose propagation is
given by
6 = $789:&� 3; <� 3; + 62 (3.5)
where z is the distance from the target, �2 is a constant proportional to the laser
energy density, and 62 is the distance moved by the species during a time of the
order of the average life time of excited states. If the mass of the species ejected is
higher than that of the background mass (i.e. at lower ambient pressure), the ejected
species slows down and this can be treated under a classical drag force model whose
expansion can be expressed as
6 = 6=>1 − exp −?<�@ + 62 3.6�
where ? is the slowing coefficient and 6= is the stopping distance of the plume. That
is, 6= = A8B , where C2 is the initial velocity of the ejected species.
Time and space resolved line emission spectroscopic information is an effective tool
to estimate the velocities of ions and neutrals moving in an expanding LPP. Line
emission dynamics can be recorded using a fast PMT attached to a spectrometer.
Recombination and ionization mechanisms present in expanding LPPs are studied in
Chapter 3
46
the present work. OTOF studies of ions and neutrals along the expansion direction
(i.e. normal to the target surface) for a large range of ambient pressures also are
done.
3.4 ICCD IMAGING Plume expansion dynamics of LPP can be investigated by acquiring single-shot
photographs of plume emission in the x-z plane using an intensified charge coupled
device (ICCD) operating in the time gated mode (2 ns and 5 ns temporal resolutions
for ns irradiation, and 10 ns for fs irradiation). From 2D imaging of a three
dimensionally expanding plasma, processes like plume splitting and instabilities
happening at different time scales during expansion can be recorded. Plume emission
is captured by the ICCD equipped with a 1360 × 1024 array with a 2:1
magnification. All images recorded are found to be fairly symmetric about the
surface normal. Measurements at various pressures for fs and ns irradiation allow
one to distinguish angular distributions of expanding plumes. Immediately after
plasma formation the plume intensity is high in the core, and it reduces as time
elapses due to thermal leak and reduced collisions. Experimental results are
discussed in detail in chapters 4 to 6.
3.5 EXPERIMENTAL A typical Laser induced breakdown spectroscopy (LIBS) system consists of a high
power pulsed laser, spectrometer, high sensitivity and time gated detector with fast
response time, and an interface with a computer that can rapidly process and
interpret the acquired data. Nd: YAG is the most commonly used laser for plasma
generation because its wavelengths are available in the NIR (1064nm), visible
(532nm), and UV (266nm) regions. Typical pulse durations are around 10
nanoseconds, and intensity at the focal point may exceed 1GW/cm2. Most commonly
used spectrometer is of the Czerny-Turner type, which will be either a
monochromator (scanning type) or a polychromator (non-scanning type).
Polychromators are usually used in LIBS as they allow simultaneous data acquisition
Chapter 3
47
in a broad wavelength range. The typical response of grating spectrometers (with
multiple gratings) is in the range of 170 nm (in deep UV region) to 1100 nm (in near
IR) region, which matches with the response range of CCD detectors. Hence all
elements whose emission falls in this wavelength range can be easily analyzed using
the LIBS technique. Another important part of instrumentation for LIBS is the delay
generator, which accurately gates the detector’s response. Gating helps to yield
spectra with best signal to background ratios.
We used two laser sources in our experiments. The first is a regeneratively amplified
ultrafast Ti: Sapphire laser (TSA-10, Spectra Physics) operating at 796 nm, pumped
by a Q-Switched Nd: YAG laser and seeded by a mode-locked Ti: Sapphire
oscillator (Tsunami, Spectra Physics). The second is a Q-Switched Nd: YAG laser
(Quanta Ray, Spectra Physics) operating at 1064 nm. Maximum pulse energy of the
former is 10 mJ with a pulsewidth of ~100 fs (which is monitored using an
autocorrelator (SSA-F, Positive Light)) and that of the latter is 150 mJ at 7 ns. The
lasers are set to run at 10 Hz for energy stability, but plasma measurements are taken
in the single-shot mode using a fast mechanical shutter placed in the beam path
which opens only when required. An electronic synchronization circuit is used to
drive the shutter so that single pulses can be selected from the 10 Hz pulse train at
will. Laser beam is focused on to the surface of high purity (>99.99%) 5 mm × 5
mm × 3 mm solid targets of zinc and nickel (ACI Alloys Inc.) to produce the
plasma. In order to avoid pitting of the target surface, the sample is moved by about
1 mm using a stepper motor driven X-Y translator after each laser pulse so that the
following laser pulse falls at a new point on the target surface. Plasma plume is
studied with the help of an imaging system which can be moved horizontally to
observe different axial positions of the plume, in order to get spatial information (see
Figure 3.2). Line emissions corresponding to different species in the plasma are
dispersed using a high resolution (~0.06 nm) spectrometer (Horiba Jobin Yvon, iHR
320) and is recorded using a CCD (synapse) attached to it. The spectral lines
recorded are identified with the help of a standard NIST atomic spectra database. In
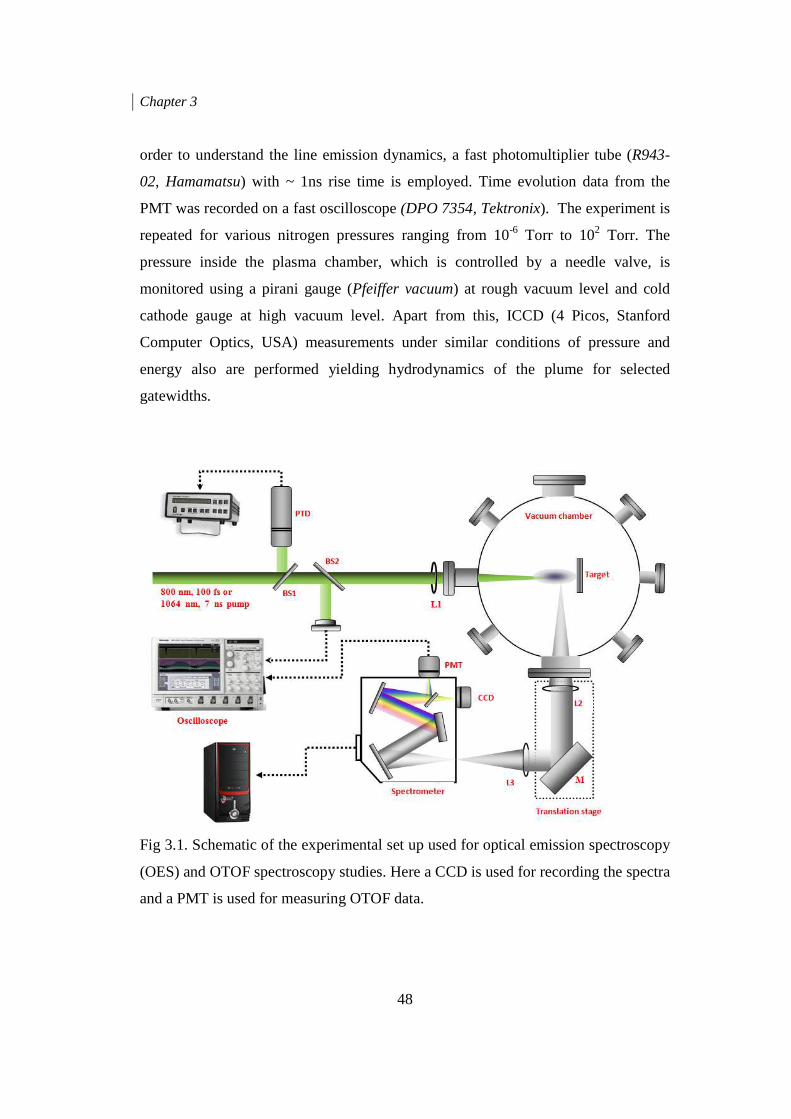
Chapter 3
48
order to understand the line emission dynamics, a fast photomultiplier tube (R943-
02, Hamamatsu) with ~ 1ns rise time is employed. Time evolution data from the
PMT was recorded on a fast oscilloscope (DPO 7354, Tektronix). The experiment is
repeated for various nitrogen pressures ranging from 10-6 Torr to 102 Torr. The
pressure inside the plasma chamber, which is controlled by a needle valve, is
monitored using a pirani gauge (Pfeiffer vacuum) at rough vacuum level and cold
cathode gauge at high vacuum level. Apart from this, ICCD (4 Picos, Stanford
Computer Optics, USA) measurements under similar conditions of pressure and
energy also are performed yielding hydrodynamics of the plume for selected
gatewidths.
Fig 3.1. Schematic of the experimental set up used for optical emission spectroscopy
(OES) and OTOF spectroscopy studies. Here a CCD is used for recording the spectra
and a PMT is used for measuring OTOF data.

Chapter 3
49
Figure 3.2: Geometry of the present LPP experiment. Focused laser pulses irradiate a
solid metal target to form an expanding plasma plume. Spectral measurements of the
plume are typically made at distances of 2 mm and 4 mm from the target surface.
Figure 3.3. A view of the actual experimental setup used for OES and OTOF studies.
Figure 3.1 shows the schematic of the experimental layout, and a view of the actual
experimental setup is shown in figure 3.3. The actual set up consists of the laser,
Chapter 3
50
vacuum chamber, target manipulator, a photo-thermal detector, oscilloscopes,
monochromator etc. These instruments are synchronized with one another using a
custom made electronic circuit; details of which are available in the Ph.D. thesis of
C. S. Suchand Sandeep [41].
3.6 CONCLUSION This chapter describes the necessity for doing optical emission spectroscopy and
optical time of flight measurements for characterizing spatially expanding laser
produced plasmas. Experimental details of optical emission spectroscopy and optical
time of flight, along with the double-pulse experiment requirements, are presented,
addressing the components used and their significance. The schematic and actual
experimental set up are explained and presented in detail. Details regarding the
synchronization and gating of the detectors are presented.

CHAPTER 4
INFLUENCE OF AMBIENT PRESSURE AND LASER PULSEWIDTH ON THE SPECTRAL AND TEMPORAL
FEATURES OF ALASER PRODUCED NICKEL PLASMA
Experimental characterization and comparison of the temporal features of
femtosecond and nanosecond laser produced plasmas generated from a solid Nickel
target, expanding into a nitrogen background, is presented in this chapter.
Dynamicsof the ions and fast and slow neutrals present in the laser produced nickel
plasma is studied by the optical time of flight technique,using emissions from neutral
Ni I species at 361.9 nm and ionized Ni II speciesat 428.5 nm,respectively. The
velocities of these species are estimated from the time of flight data. Furthermore,
the variation of temperature, number density and velocity of different species in the
plume with respect to variations in ambient pressure, for both nanosecond and
femtosecond irradiation, is also investigated.
Chapter 4
52
4.1INTRODUCTION Experimental characterization and comparison of the temporal features of ns and fs
LPPs generated from a solid nickel target, expanding into a nitrogen background, is
presented in this chapter. When the ambient pressure is varied from 10-6Torr to
102Torr, the plume intensity is found to increase rapidly as the pressure reaches 1
Torr. Electron temperatures (Te) calculated from optical emission spectroscopy is
found to be mostly pressure-independent for fs excitation, whereas an enhancement
is seen in the range of 10-4 to 10-3Torr for ns excitation. OTOF measurements of
emission from neutral Ni (Ni I) at 361.9 nm (3d9(2D) 4p � 3d9(2D) 4s transition)
reveals a single peak (the fast peak) in ultrafastexcitation and two peaks (fast and
slow peaks) in short-pulse excitation. The fast and slow peaks represent recombined
neutrals and un-ionized neutrals respectively. The dynamics of emission from
ionized Nickel (Ni II) also has been carried out using the 428.5 nm (3p6 3d6 (3P)
�3p63d9) transition. Velocities of neutrals and ions are determined from OTOF
measurements carried out at axial distances of 2 mm and 4 mm respectively from the
target surface. A detailed account of these studies is given below.
100 fs pulses at 800 nm from a regeneratively amplified Ti: sapphire laser (TSA-10,
Positive Light) with a maximum energy of ~ 10 mJ, and 7 ns pulses at 1064 nm
from a Q-Switched Nd: YAG laser (Quanta Ray, Spectra Physics) with a maximum
energy of ~ 150 mJ,were used for irradiating the target. In both cases the energies
were adjusted so that the laser fluence was the same (~16 Jcm-2,i.e. spot size is
200 µm and 560 µm for fs and ns excitations respectively) on the target surface,
which is well above the ablation threshold. A high purity (better than 99.99%) nickel
sample of dimensions 5cm×5cm×3mm(from ACI Alloys Inc., San Jose) was the
target. Optical emission spectra and temporal dynamics were measured by means of
a spectrometer(iHR320, Horiba JobinYvon) equipped with a CCD detector (Synapse,
Horiba JobinYvon) and PMT (R943-02, Hamamatsu).Plasma emission was collected
and focused onto the spectrometerusing two lenses and a mirror, which were fixed
on a high resolution translation stage which could be moved to record emission from
Chapter 4
53
any part of the plume (Figure 1). Emission lines in the recorded spectra (with a
resolution of 0.06 nm) were identified by comparingit with the standard NIST atomic
spectral database[112]. The optical time of flight (OTOF) signals from the neutral Ni
I line at 361.9 nm and ionic Ni II line at 428.5 nm were measured at various ambient
pressures using the PMT and recorded on a fast digital storage oscilloscope (DPO
7354, Tektronix).Imaging of the plasma plume was performed using a gated ICCD
(4-Picos, Stanford Research Systems), which revealed the temporal evolution of both
ultrafast (fs) and short-pulse (ns) LPP plumes so thattheir expansion into the
surrounding space could be characterized.
4.2 OPTICAL EMISSION SPECTROSCOPIC STUDIES Optical emission spectroscopy (OES) is a powerful non-destructive technique for the
estimation of plasma parameters such as electron temperature and number
density[38, 113-114].In the present work, OES is recorded for various pressures
from 1×10⁻⁶Torr to 1×10² Torr at two spatial points (2 mm and 4 mm distant from
the target surface, onthe plasma plume axis) for both ns and fs irradiations. Figures
4.1 and 4.3show the emission spectra measured for pressures ranging from
1×10²Torr to 5×10⁻²Torrfor ns and fs irradiation respectively,measured at 2 mm
distance from the target surface.Figures4.2 and 4.4 represent similar data for
pressures ranging from 1×10⁻²Torr to 5×10⁻⁶Torr. The measured variation of
emission intensities with respect to the laser pulsewidth and background pressure are
discussed below.
4.2.1 Effect of pulse width on the emission intensity Intensity of emission lines is found to depend on the pulsewidth of the laser used.
With lasers of sub-picoseconds pulse duration,enhanced emissions are seen from
shorter wavelengths due to the large intensity associated with fs laser pulses
compared to ns laser pulses.For instance, on fs irradiation, the emission intensity at
shorter wavelengths is almost double of that obtained at larger wavelengths,when the
pressure is increased from 5×10⁻⁶Torr to 1×10⁻² Torr (see figure 4.2). A further
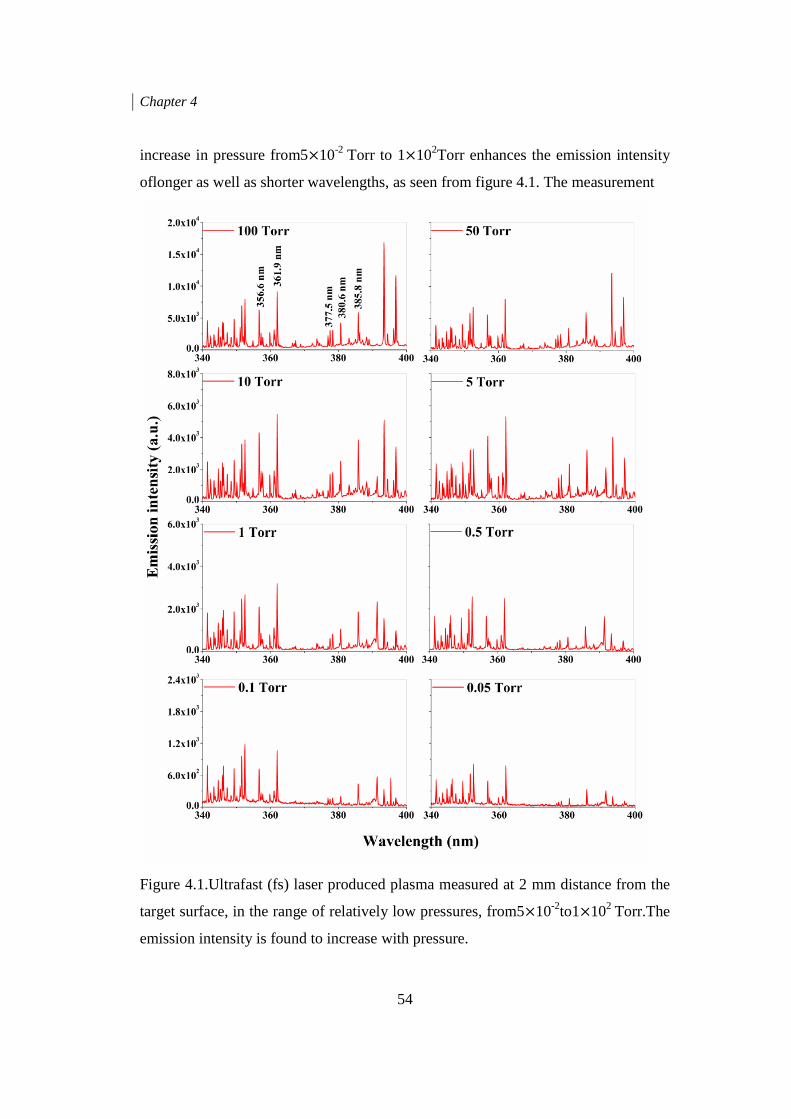
Chapter 4
54
increase in pressure from5×10-2 Torr to 1×10²Torr enhances the emission intensity
oflonger as well as shorter wavelengths, as seen from figure 4.1. The measurement
Figure 4.1.Ultrafast (fs) laser produced plasma measured at 2 mm distance from the
target surface, in the range of relatively low pressures, from5×10-2to1×102 Torr.The
emission intensity is found to increase with pressure.
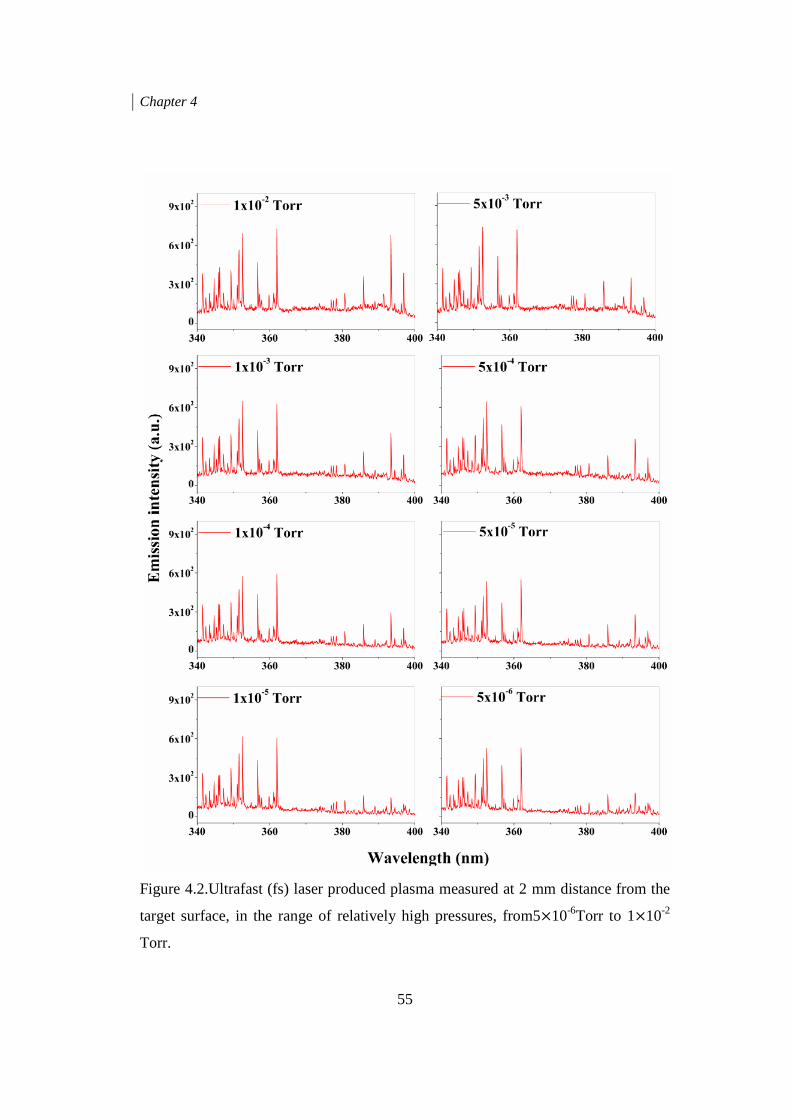
Chapter 4
55
Figure 4.2.Ultrafast (fs) laser produced plasma measured at 2 mm distance from the
target surface, in the range of relatively high pressures, from5×10-6Torr to 1×10⁻²
Torr.
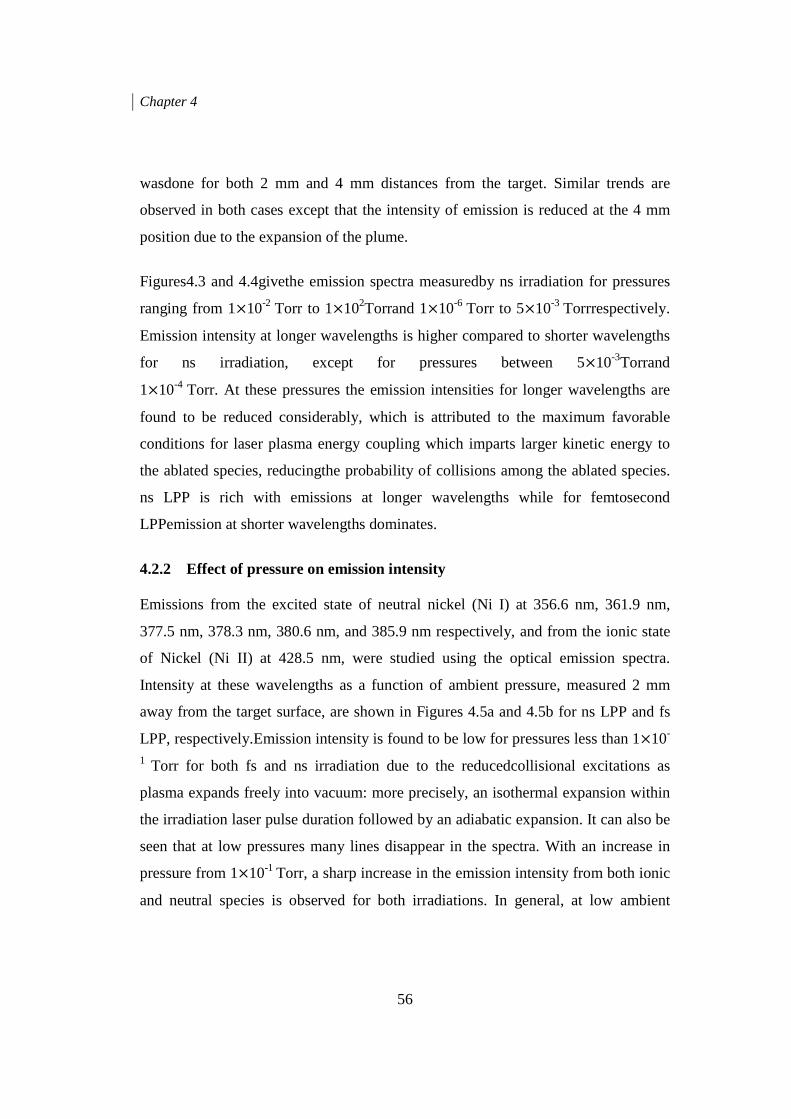
Chapter 4
56
wasdone for both 2 mm and 4 mm distances from the target. Similar trends are
observed in both cases except that the intensity of emission is reduced at the 4 mm
position due to the expansion of the plume.
Figures4.3 and 4.4givethe emission spectra measuredby ns irradiation for pressures
ranging from 1×10⁻² Torr to 1×10²Torrand 1×10⁻⁶ Torr to 5×10⁻³ Torrrespectively.
Emission intensity at longer wavelengths is higher compared to shorter wavelengths
for ns irradiation, except for pressures between 5×10⁻³Torrand
1×10⁻⁴ Torr. At these pressures the emission intensities for longer wavelengths are
found to be reduced considerably, which is attributed to the maximum favorable
conditions for laser plasma energy coupling which imparts larger kinetic energy to
the ablated species, reducingthe probability of collisions among the ablated species.
ns LPP is rich with emissions at longer wavelengths while for femtosecond
LPPemission at shorter wavelengths dominates.
4.2.2 Effect of pressure on emission intensity Emissions from the excited state of neutral nickel (Ni I) at 356.6 nm, 361.9 nm,
377.5 nm, 378.3 nm, 380.6 nm, and 385.9 nm respectively, and from the ionic state
of Nickel (Ni II) at 428.5 nm, were studied using the optical emission spectra.
Intensity at these wavelengths as a function of ambient pressure, measured 2 mm
away from the target surface, are shown in Figures 4.5a and 4.5b for ns LPP and fs
LPP, respectively.Emission intensity is found to be low for pressures less than 1×10-
1 Torr for both fs and ns irradiation due to the reducedcollisional excitations as
plasma expands freely into vacuum: more precisely, an isothermal expansion within
the irradiation laser pulse duration followed by an adiabatic expansion. It can also be
seen that at low pressures many lines disappear in the spectra. With an increase in
pressure from 1×10⁻¹ Torr, a sharp increase in the emission intensity from both ionic
and neutral species is observed for both irradiations. In general, at low ambient
Chapter 4
57
pressures the plume expands more, reducing the number density and collisions, and
therefore, the ionization rate. At high pressures the plume is smaller and the collision
Figure 4.3.Short-pulse (ns) laser produced plasma at 2 mm distance, forrelatively
high pressures ranging from1×10-2 to 1×10² Torr. The emission intensity is found to
increase with pressure.
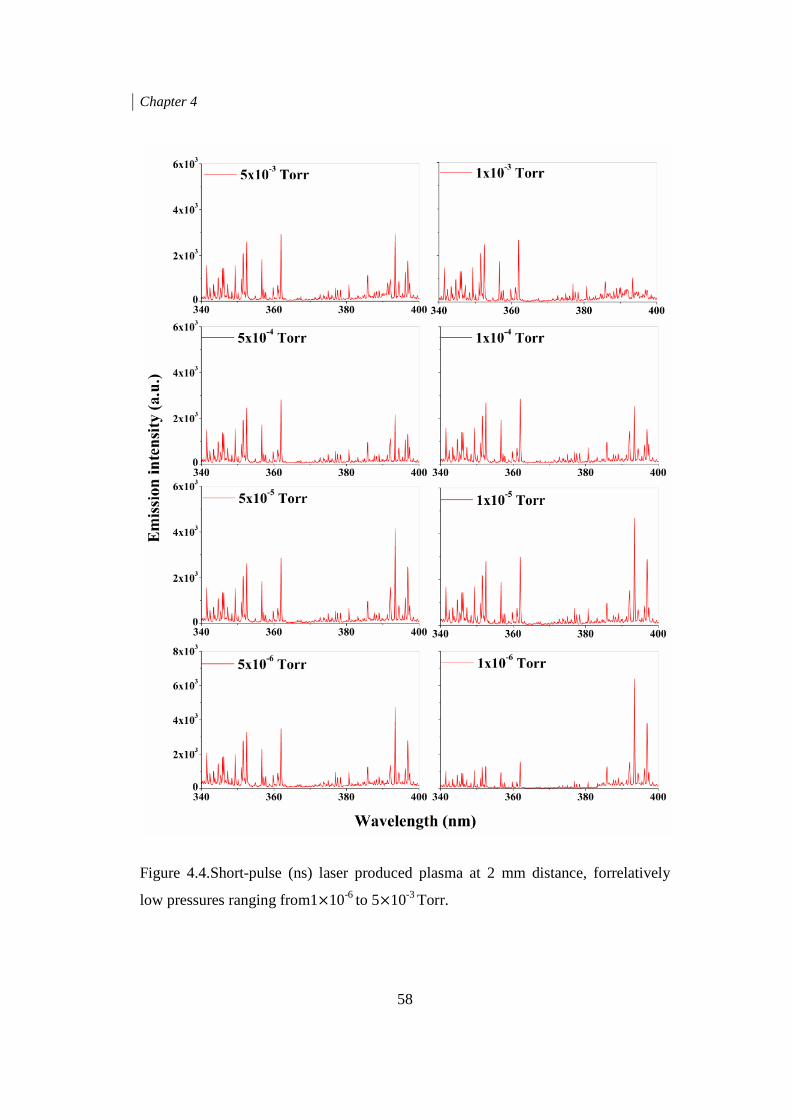
Chapter 4
58
Figure 4.4.Short-pulse (ns) laser produced plasma at 2 mm distance, forrelatively
low pressures ranging from1×10-6 to 5×10⁻³ Torr.
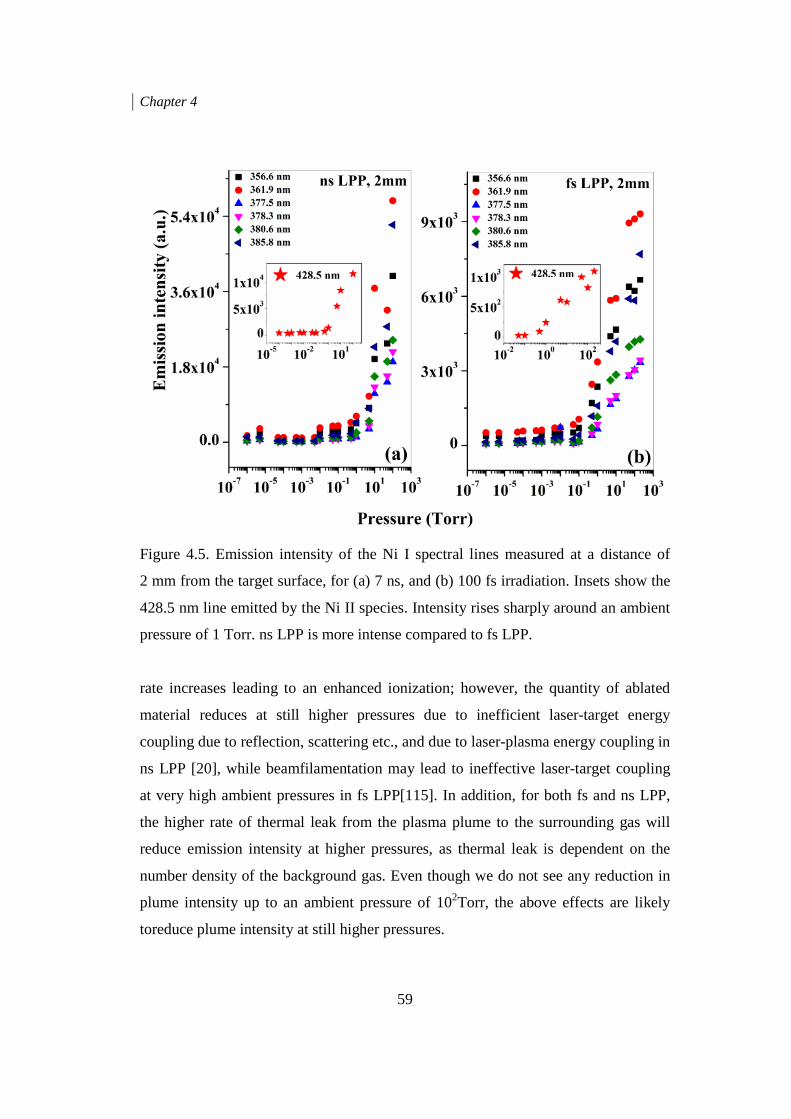
Chapter 4
59
Figure 4.5. Emission intensity of the Ni I spectral lines measured at a distance of
2 mm from the target surface, for (a) 7 ns, and (b) 100 fs irradiation. Insets show the
428.5 nm line emitted by the Ni II species. Intensity rises sharply around an ambient
pressure of 1 Torr. ns LPP is more intense compared to fs LPP.
rate increases leading to an enhanced ionization; however, the quantity of ablated
material reduces at still higher pressures due to inefficient laser-target energy
coupling due to reflection, scattering etc., and due to laser-plasma energy coupling in
ns LPP [20], while beamfilamentation may lead to ineffective laser-target coupling
at very high ambient pressures in fs LPP[115]. In addition, for both fs and ns LPP,
the higher rate of thermal leak from the plasma plume to the surrounding gas will
reduce emission intensity at higher pressures, as thermal leak is dependent on the
number density of the background gas. Even though we do not see any reduction in
plume intensity up to an ambient pressure of 102Torr, the above effects are likely
toreduce plume intensity at still higher pressures.
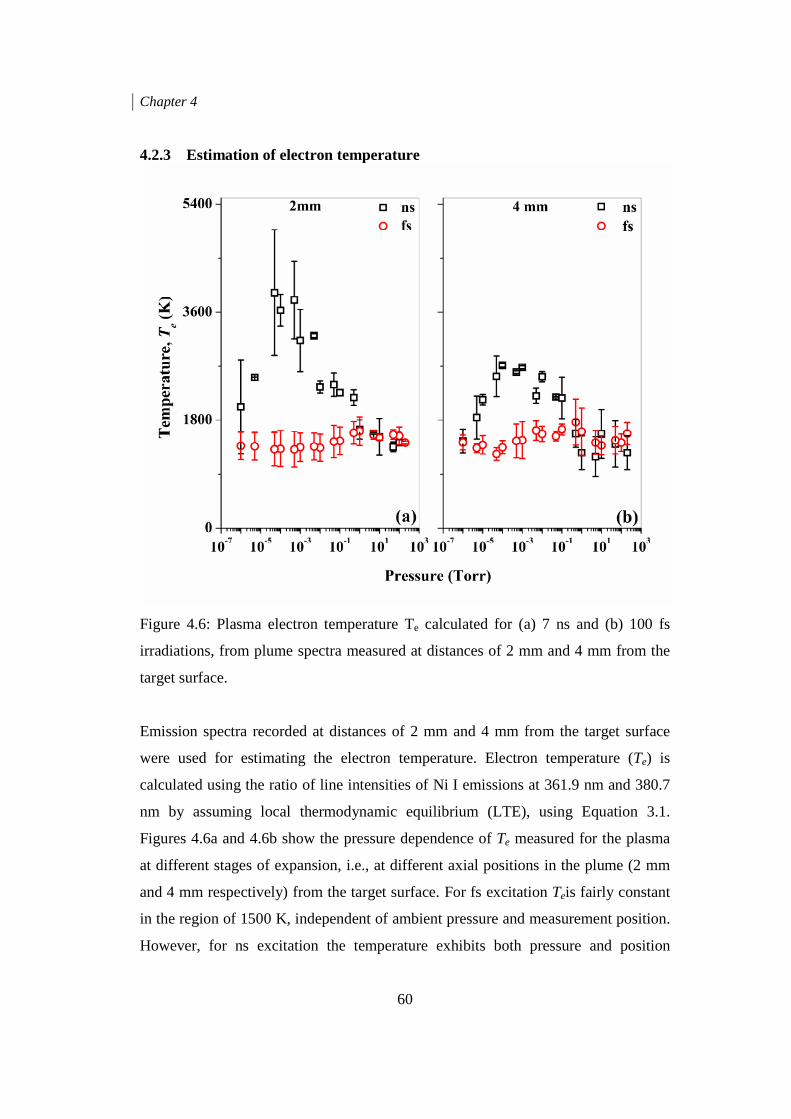
Chapter 4
60
4.2.3 Estimation of electron temperature
Figure 4.6: Plasma electron temperature Te calculated for (a) 7 ns and (b) 100 fs
irradiations, from plume spectra measured at distances of 2 mm and 4 mm from the
target surface.
Emission spectra recorded at distances of 2 mm and 4 mm from the target surface
were used for estimating the electron temperature. Electron temperature (Te) is
calculated using the ratio of line intensities of Ni I emissions at 361.9 nm and 380.7
nm by assuming local thermodynamic equilibrium (LTE), using Equation 3.1.
Figures 4.6a and 4.6b show the pressure dependence of Te measured for the plasma
at different stages of expansion, i.e., at different axial positions in the plume (2 mm
and 4 mm respectively) from the target surface. For fs excitation Teis fairly constant
in the region of 1500 K, independent of ambient pressure and measurement position.
However, for ns excitation the temperature exhibits both pressure and position
Chapter 4
61
dependence. For instance, Teincreases and reaches a maximum of 3900 K at 2 mm,
and 2700 K at 4 mm, in the pressure range of 1×10⁻⁴ to 1×10⁻³Torr. Tedecreases at
higher pressures. This maximization of Te happens due to the effective heating of the
plasma by the trailing edge of the ns laser pulse, which is a pressure dependent
process. Te is found to reduce as the plume expands, which is revealed by the
measurements taken at 4 mm distance. At the lowest and highest pressures studied
(10-6 and 102Torr respectively) Te is nearly the same for both fs and ns excitations.
4.3 OPTICAL TIME OF FLIGHT MEASUREMENTS In pulsed laser ablation, the energy absorbed from the laser pulse is utilized for
processes such as heat conduction, melting and vaporization of the material surface.
Target will be ablated if the light intensity is above the ablation threshold, and the
ablated species will interact with the surrounding gas[14, 75, 78]. The ablation
threshold, which is defined as the minimum power density required for vaporizing
the material, is given by
���� = ��
� �
∆��
� (4.1)
where� is the density of the material, Lv is the latent heat of vaporization, k is the
thermal diffusivity, and ∆t is the laser pulse width. Imin is calculated to be
8.69 × 10¹¹ W/cm2 for fs excitation and 3.89 × 10⁸ W/cm2 for ns excitation in the
present case, with the corresponding laser fluences being 8.69× 10⁻² J/cm2 and
2.72 J/cm2 respectively. However, since the applied fluence is higherat 16 J/cm2, and
electron-ion collisions and heat conduction occur in the order of picoseconds,
material ablation will happen rapidly by the leading edge of the laser pulse itself for
ns excitation. Ablation creates a high density region near the target called the
Knudsen layer, which shields the rest of the pulse from reaching the target surface.
Therefore the evaporated material will absorb energy from the trailing edge of the
laser pulse. On the other hand, for fs LPP, the whole energy content of the pulse is
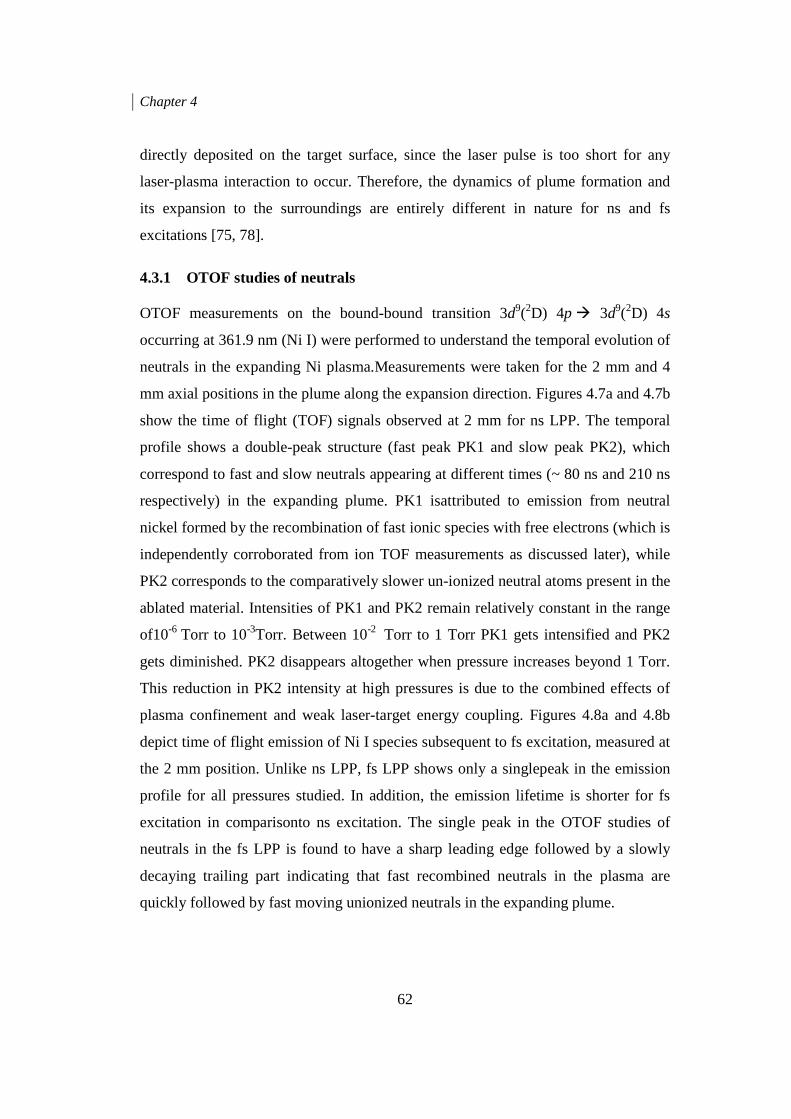
Chapter 4
62
directly deposited on the target surface, since the laser pulse is too short for any
laser-plasma interaction to occur. Therefore, the dynamics of plume formation and
its expansion to the surroundings are entirely different in nature for ns and fs
excitations [75, 78].
4.3.1 OTOF studies of neutrals OTOF measurements on the bound-bound transition 3d9(2D) 4p � 3d9(2D) 4s
occurring at 361.9 nm (Ni I) were performed to understand the temporal evolution of
neutrals in the expanding Ni plasma.Measurements were taken for the 2 mm and 4
mm axial positions in the plume along the expansion direction. Figures 4.7a and 4.7b
show the time of flight (TOF) signals observed at 2 mm for ns LPP. The temporal
profile shows a double-peak structure (fast peak PK1 and slow peak PK2), which
correspond to fast and slow neutrals appearing at different times (~ 80 ns and 210 ns
respectively) in the expanding plume. PK1 isattributed to emission from neutral
nickel formed by the recombination of fast ionic species with free electrons (which is
independently corroborated from ion TOF measurements as discussed later), while
PK2 corresponds to the comparatively slower un-ionized neutral atoms present in the
ablated material. Intensities of PK1 and PK2 remain relatively constant in the range
of10-6 Torr to 10-3Torr. Between 10-2 Torr to 1 Torr PK1 gets intensified and PK2
gets diminished. PK2 disappears altogether when pressure increases beyond 1 Torr.
This reduction in PK2 intensity at high pressures is due to the combined effects of
plasma confinement and weak laser-target energy coupling. Figures 4.8a and 4.8b
depict time of flight emission of Ni I species subsequent to fs excitation, measured at
the 2 mm position. Unlike ns LPP, fs LPP shows only a singlepeak in the emission
profile for all pressures studied. In addition, the emission lifetime is shorter for fs
excitation in comparisonto ns excitation. The single peak in the OTOF studies of
neutrals in the fs LPP is found to have a sharp leading edge followed by a slowly
decaying trailing part indicating that fast recombined neutrals in the plasma are
quickly followed by fast moving unionized neutrals in the expanding plume.
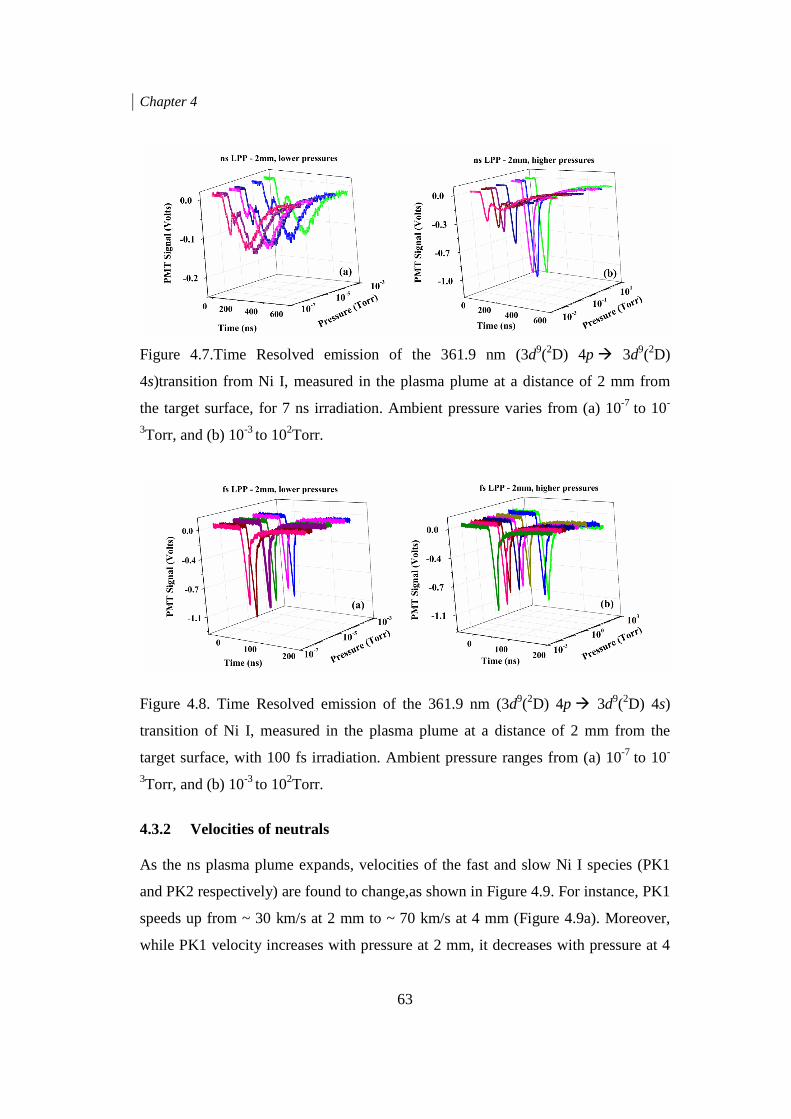
Chapter 4
63
Figure 4.7.Time Resolved emission of the 361.9 nm (3d9(2D) 4p � 3d9(2D)
4s)transition from Ni I, measured in the plasma plume at a distance of 2 mm from
the target surface, for 7 ns irradiation. Ambient pressure varies from (a) 10-7 to 10-
3Torr, and (b) 10-3 to 102Torr.
Figure 4.8. Time Resolved emission of the 361.9 nm (3d9(2D) 4p � 3d9(2D) 4s)
transition of Ni I, measured in the plasma plume at a distance of 2 mm from the
target surface, with 100 fs irradiation. Ambient pressure ranges from (a) 10-7 to 10-
3Torr, and (b) 10-3 to 102Torr.
4.3.2 Velocities of neutrals As the ns plasma plume expands, velocities of the fast and slow Ni I species (PK1
and PK2 respectively) are found to change,as shown in Figure 4.9. For instance, PK1
speeds up from ~ 30 km/s at 2 mm to ~ 70 km/s at 4 mm (Figure 4.9a). Moreover,
while PK1 velocity increases with pressure at 2 mm, it decreases with pressure at 4
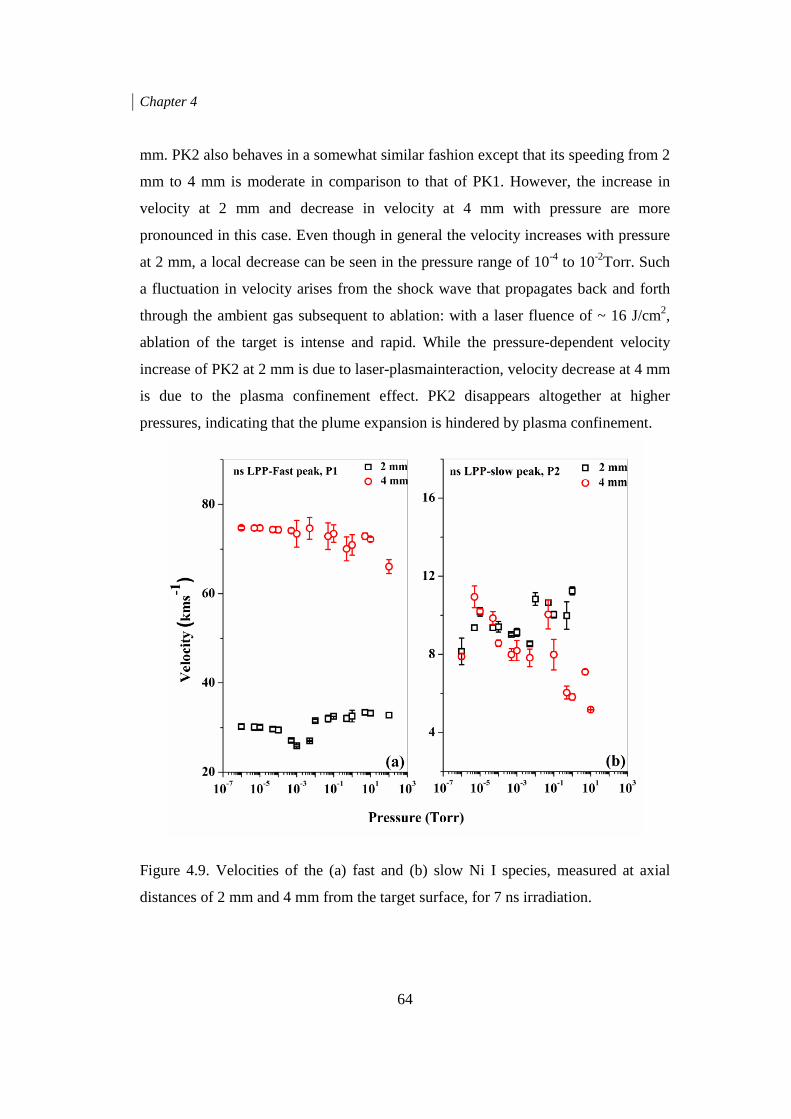
Chapter 4
64
mm. PK2 also behaves in a somewhat similar fashion except that its speeding from 2
mm to 4 mm is moderate in comparison to that of PK1. However, the increase in
velocity at 2 mm and decrease in velocity at 4 mm with pressure are more
pronounced in this case. Even though in general the velocity increases with pressure
at 2 mm, a local decrease can be seen in the pressure range of 10-4 to 10-2Torr. Such
a fluctuation in velocity arises from the shock wave that propagates back and forth
through the ambient gas subsequent to ablation: with a laser fluence of ~ 16 J/cm2,
ablation of the target is intense and rapid. While the pressure-dependent velocity
increase of PK2 at 2 mm is due to laser-plasmainteraction, velocity decrease at 4 mm
is due to the plasma confinement effect. PK2 disappears altogether at higher
pressures, indicating that the plume expansion is hindered by plasma confinement.
Figure 4.9. Velocities of the (a) fast and (b) slow Ni I species, measured at axial
distances of 2 mm and 4 mm from the target surface, for 7 ns irradiation.
Chapter 4
65
Figure 4.10. Velocities of the Ni I species measured at axial distances of 2 mm and 4
mm from the target surface, for 100 fs irradiation.
On the other hand, the velocities are found to be almost constant and independent of
the ambient pressure for fs LPP (Figure 4.10). Absolute velocities are higher
compared to the fast species in the ns LPP, but acceleration between the 2 mm and 4
mm positions is less than that seen for ns excitation. While the acceleration seen for
fs LPP is due to the pull experienced by ions from the fast electrons moving ahead of
them, accelerationobserved in ns LPP arises from laser-plasma interaction as well as
the Coulomb pull.
4.3.3 OTOF studies of ions Figures 4.11a and 4.11b show the TOF emission spectra of singly ionized Ni II ions.
Emission intensity is relatively lower compared to that of neutrals (see Figure 4.7
and 4.8). Ion emission is less prominent because ion density is reduced at high
pressures due to larger recombination rates, and at low pressures due to reduced
collisions. Therefore in the present experiments, emission from ionic species could
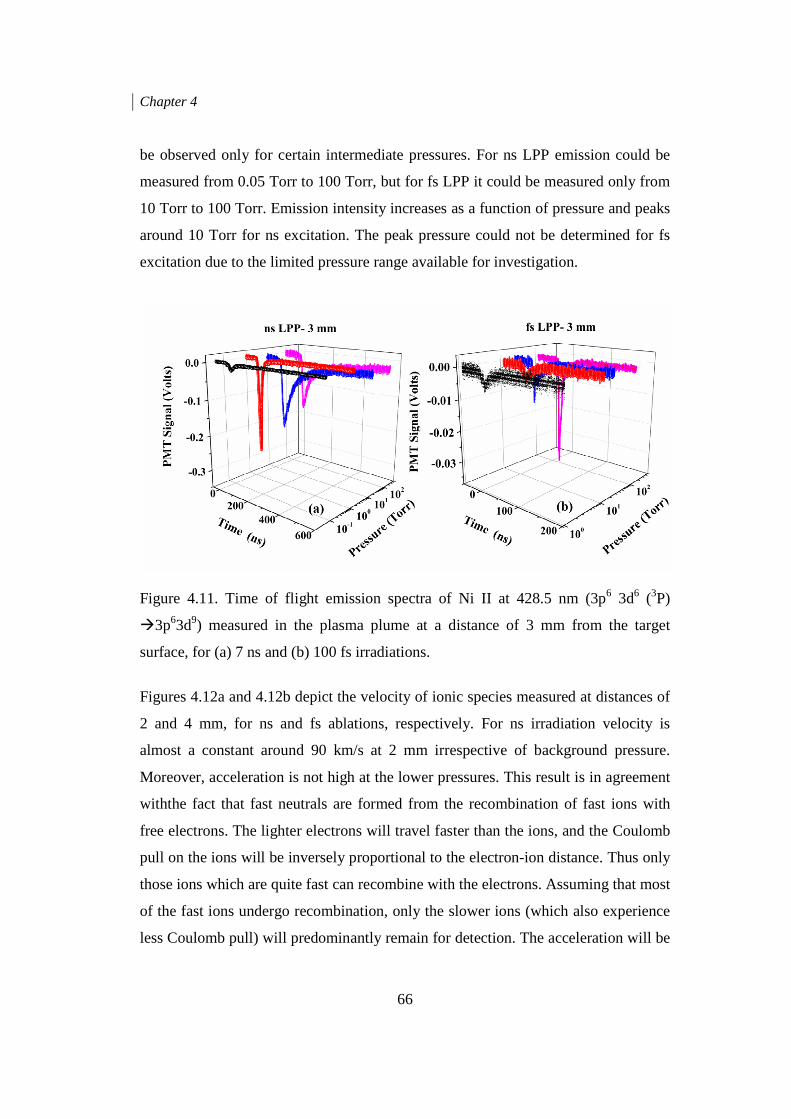
Chapter 4
66
be observed only for certain intermediate pressures. For ns LPP emission could be
measured from 0.05 Torr to 100 Torr, but for fs LPP it could be measured only from
10 Torr to 100 Torr. Emission intensity increases as a function of pressure and peaks
around 10 Torr for ns excitation. The peak pressure could not be determined for fs
excitation due to the limited pressure range available for investigation.
Figure 4.11. Time of flight emission spectra of Ni II at 428.5 nm (3p6 3d6 (3P)
�3p63d9) measured in the plasma plume at a distance of 3 mm from the target
surface, for (a) 7 ns and (b) 100 fs irradiations.
Figures 4.12a and 4.12b depict the velocity of ionic species measured at distances of
2 and 4 mm, for ns and fs ablations, respectively. For ns irradiation velocity is
almost a constant around 90 km/s at 2 mm irrespective of background pressure.
Moreover, acceleration is not high at the lower pressures. This result is in agreement
withthe fact that fast neutrals are formed from the recombination of fast ions with
free electrons. The lighter electrons will travel faster than the ions, and the Coulomb
pull on the ions will be inversely proportional to the electron-ion distance. Thus only
those ions which are quite fast can recombine with the electrons. Assuming that most
of the fast ions undergo recombination, only the slower ions (which also experience
less Coulomb pull) will predominantly remain for detection. The acceleration will be
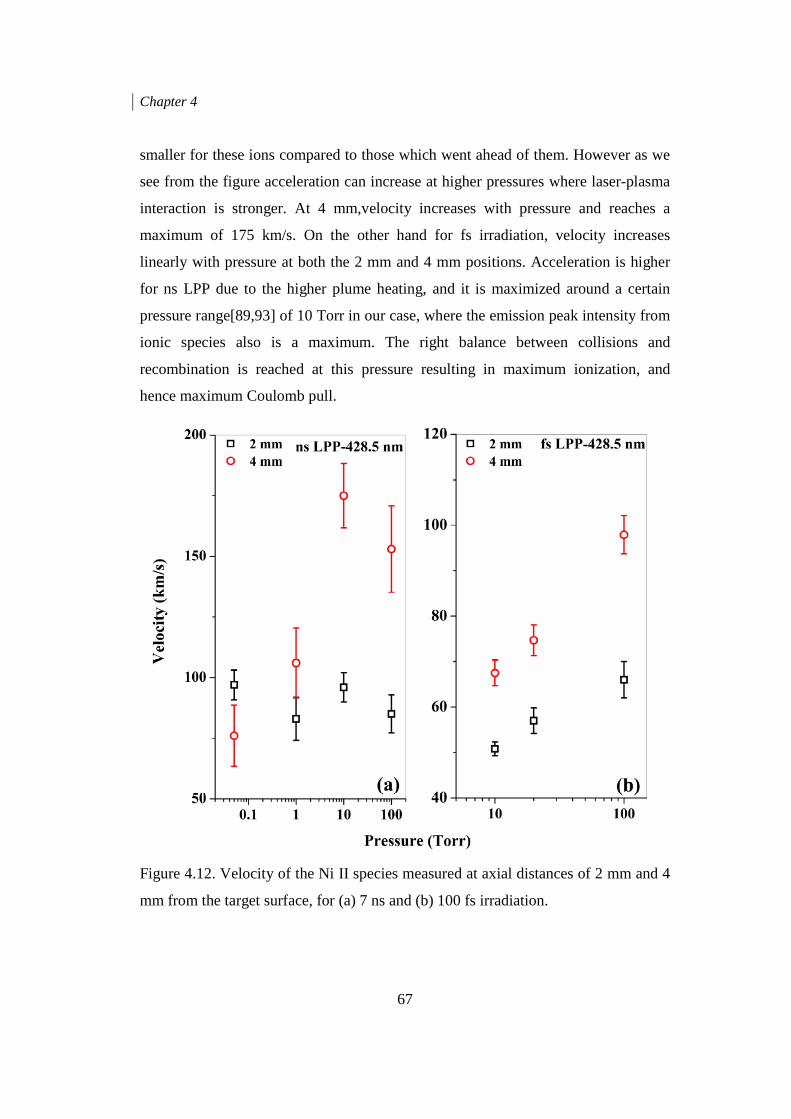
Chapter 4
67
smaller for these ions compared to those which went ahead of them. However as we
see from the figure acceleration can increase at higher pressures where laser-plasma
interaction is stronger. At 4 mm,velocity increases with pressure and reaches a
maximum of 175 km/s. On the other hand for fs irradiation, velocity increases
linearly with pressure at both the 2 mm and 4 mm positions. Acceleration is higher
for ns LPP due to the higher plume heating, and it is maximized around a certain
pressure range[89,93] of 10 Torr in our case, where the emission peak intensity from
ionic species also is a maximum. The right balance between collisions and
recombination is reached at this pressure resulting in maximum ionization, and
hence maximum Coulomb pull.
Figure 4.12. Velocity of the Ni II species measured at axial distances of 2 mm and 4
mm from the target surface, for (a) 7 ns and (b) 100 fs irradiation.
Chapter 4
68
Our detailed studies reveal that for the 2 mm position, arrival times of the fast
neutral species (33 ns to 70 ns) are similar to the arrival times of the ionized species
(23 ns to 40 ns), whereas the arrival of the slow species takes place between 180 ns
to 240 ns. This observation further affirms that the generation of fast atomic species
in the expanding plume is indeed due to the recombination of fast ions with
electrons.
4.4 EXPANSION OF THE PLASMA PLUME IN TIME Time gated imaging using an ICCD is an effective tool toinvestigate the temporal
evolution of the LPP plume. An ICCD records the two dimensional image of a three
dimensionally expanding plume,featuring the plume propagation dynamics and
structure. In general, for each image ICCD gain and gate width may be adjusted to
compensate for the reduction in intensity resulting from plasma expansion. Here, the
ICCD gain and gate width (5 ns for ns irradiation and 20 ns for fs irradiation) are
kept the same for all measurements, to compare the results across different
background pressures
Figure 4.13, 4.14 and 4.15 show the ICCD images of the femtosecond laser produced
nickel plasma expanding into nitrogen ambient at 100 Torr, 5 Torr, and 0.05 Torr
background pressures respectively, for various time delays after the laser pulse hits
the target surface. The gate width used is 20 ns. Plume intensity lasts until about
1400 ns, and the plume length remains almost the same at all times, for 100 Torr
pressure. The plume moves forward with a certain velocity in the initial stages of
expansion and stops around 250 ns time delay, and the plume intensity reduces due
to thermal decay at later stages of expansion. At 5 Torr the angular divergence of the
expanding plume is found to be less than that measured at 100 Torr. The sharp fast
edge seen in the TOF dynamics indicates that the velocity of expanding plume
increases at this pressure. The notable axial confinement of the plume is an
indication of the presence of giant self-generated magnetic field in the case of fs
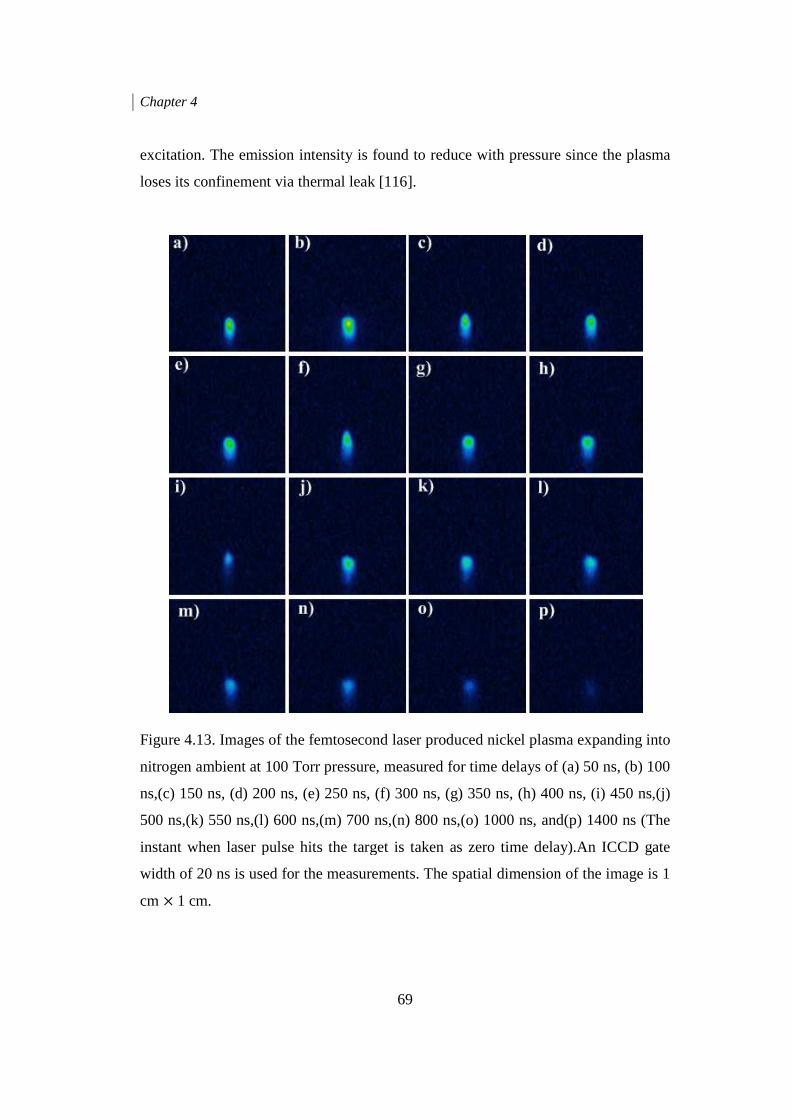
Chapter 4
excitation. The emission intensity is found to reduce with pressure
loses its confinement via thermal leak
Figure 4.13. Images of
nitrogen ambient at 100 Torr
ns,(c) 150 ns, (d) 200 ns
500 ns,(k) 550 ns,(l) 600 ns
instant when laser pulse
width of 20 ns is used for the measurements
cm × 1 cm.
69
excitation. The emission intensity is found to reduce with pressure
via thermal leak [116].
4.13. Images of the femtosecond laser produced nickel plasma expanding into
nitrogen ambient at 100 Torr pressure, measured for time delays of (
d) 200 ns, (e) 250 ns, (f) 300 ns, (g) 350 ns, (h) 400 ns
l) 600 ns,(m) 700 ns,(n) 800 ns,(o) 1000 ns, and(
instant when laser pulse hits the target is taken as zero time delay).An ICCD
is used for the measurements. The spatial dimension of the image is
excitation. The emission intensity is found to reduce with pressure since the plasma
femtosecond laser produced nickel plasma expanding into
time delays of (a) 50 ns, (b) 100
h) 400 ns, (i) 450 ns,(j)
, and(p) 1400 ns (The
hits the target is taken as zero time delay).An ICCD gate
. The spatial dimension of the image is 1
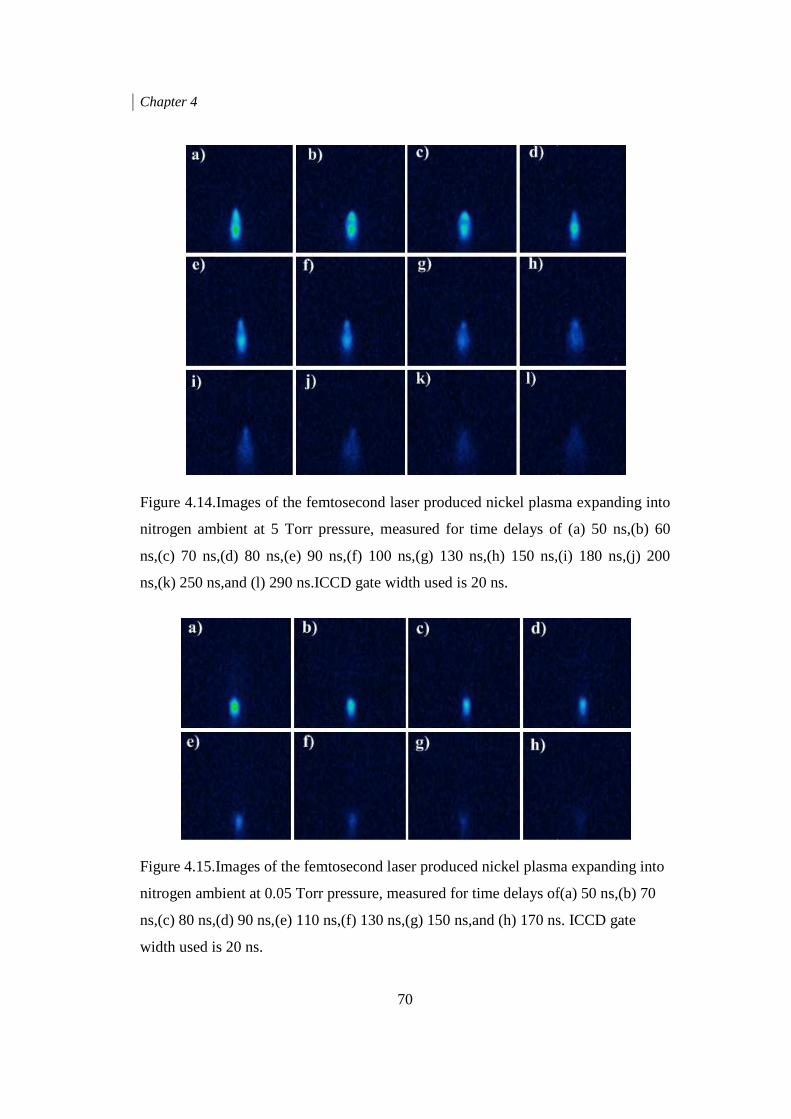
Chapter 4
Figure 4.14.Images of the femtosecond laser produced nickel plasma expanding into
nitrogen ambient at 5 Torr pressure, measured for time delays of (
ns,(c) 70 ns,(d) 80 ns
ns,(k) 250 ns,and (l) 290 ns
Figure 4.15.Images of the femtosecond laser produced nickel plasma expanding into
nitrogen ambient at 0.05 Torr pressure, measured for time delays of(
ns,(c) 80 ns,(d) 90 ns,(
width used is 20 ns.
70
Images of the femtosecond laser produced nickel plasma expanding into
nitrogen ambient at 5 Torr pressure, measured for time delays of (
d) 80 ns,(e) 90 ns,(f) 100 ns,(g) 130 ns,(h) 150 ns,(
l) 290 ns.ICCD gate width used is 20 ns.
Images of the femtosecond laser produced nickel plasma expanding into
nitrogen ambient at 0.05 Torr pressure, measured for time delays of(
,(e) 110 ns,(f) 130 ns,(g) 150 ns,and (h) 170 ns.
Images of the femtosecond laser produced nickel plasma expanding into
nitrogen ambient at 5 Torr pressure, measured for time delays of (a) 50 ns,(b) 60
,(i) 180 ns,(j) 200
Images of the femtosecond laser produced nickel plasma expanding into
nitrogen ambient at 0.05 Torr pressure, measured for time delays of(a) 50 ns,(b) 70
h) 170 ns. ICCD gate
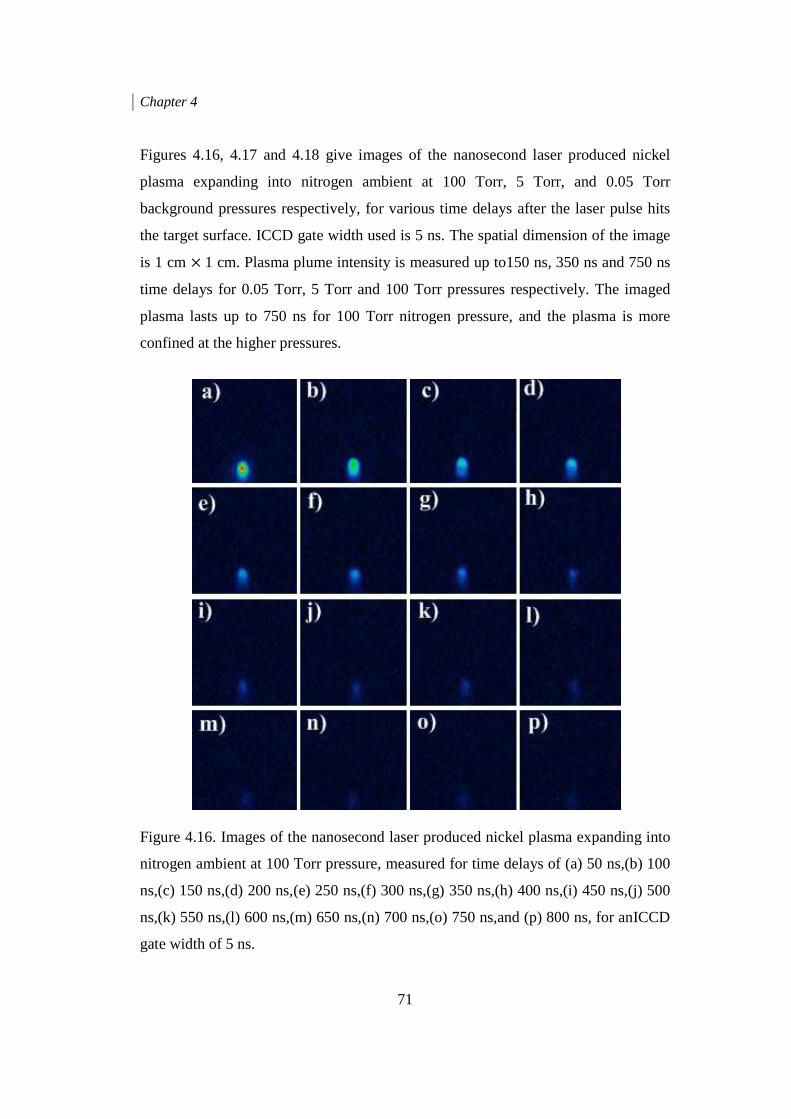
Chapter 4
Figures 4.16, 4.17 and 4.18 give images of the nanosecond laser produced nickel
plasma expanding into nitrogen ambient at 100 Torr, 5 Torr, and 0.05 Torr
background pressures respectively, for vari
the target surface. ICCD gate width used is 5
is 1 cm � 1 cm. Plasma plume intensity is measured
time delays for 0.05 Torr, 5 Torr and
plasma lasts up to 750 ns for 100 Torr nitrogen pressure,
confined at the higher pressures.
Figure 4.16. Images of
nitrogen ambient at 100 Torr pressure
ns,(c) 150 ns,(d) 200 ns
ns,(k) 550 ns,(l) 600 ns
gate width of 5 ns.
71
Figures 4.16, 4.17 and 4.18 give images of the nanosecond laser produced nickel
plasma expanding into nitrogen ambient at 100 Torr, 5 Torr, and 0.05 Torr
background pressures respectively, for various time delays after the laser pulse hits
ce. ICCD gate width used is 5 ns. The spatial dimension of the image
Plasma plume intensity is measured up to150 ns, 350 ns and
0.05 Torr, 5 Torr and 100 Torr pressures respectively
750 ns for 100 Torr nitrogen pressure, and the plasma is
higher pressures.
4.16. Images of the nanosecond laser produced nickel plasma expanding into
100 Torr pressure, measured for time delays of (
d) 200 ns,(e) 250 ns,(f) 300 ns,(g) 350 ns,(h) 400 ns
l) 600 ns,(m) 650 ns,(n) 700 ns,(o) 750 ns,and (p) 800 ns
Figures 4.16, 4.17 and 4.18 give images of the nanosecond laser produced nickel
plasma expanding into nitrogen ambient at 100 Torr, 5 Torr, and 0.05 Torr
ous time delays after the laser pulse hits
ns. The spatial dimension of the image
up to150 ns, 350 ns and 750 ns
pressures respectively. The imaged
the plasma is more
nanosecond laser produced nickel plasma expanding into
time delays of (a) 50 ns,(b) 100
h) 400 ns,(i) 450 ns,(j) 500
p) 800 ns, for anICCD
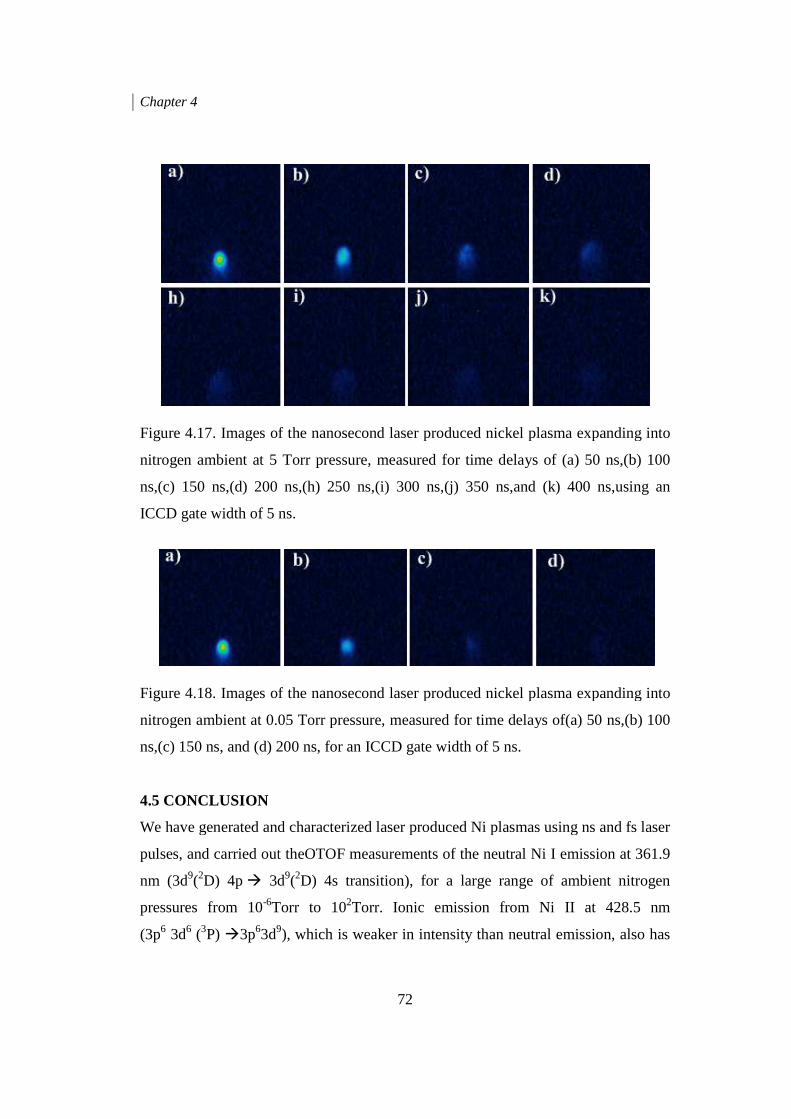
Chapter 4
Figure 4.17. Images of
nitrogen ambient at 5 Torr pressure
ns,(c) 150 ns,(d) 200 ns
ICCD gate width of 5 ns.
Figure 4.18. Images of
nitrogen ambient at 0.05 Torr pressure
ns,(c) 150 ns, and (d) 200 ns, for an ICCD gate wi
4.5 CONCLUSION
We have generated and characterized laser produced Ni plasmas using
pulses, and carried out
nm (3d9(2D) 4p � 3d
pressures from 10-6Torr to 10
(3p6 3d6 (3P) �3p63d9
72
4.17. Images of the nanosecond laser produced nickel plasma expanding into
nitrogen ambient at 5 Torr pressure, measured for time delays of (
d) 200 ns,(h) 250 ns,(i) 300 ns,(j) 350 ns,and (k) 400 ns
ns.
4.18. Images of the nanosecond laser produced nickel plasma expanding into
nitrogen ambient at 0.05 Torr pressure, measured for time delays of(
, and (d) 200 ns, for an ICCD gate width of 5 ns.
e have generated and characterized laser produced Ni plasmas using
pulses, and carried out theOTOF measurements of the neutral Ni I emission at 361.9
d9(2D) 4s transition), for a large range of ambient nitrogen
Torr to 102Torr. Ionic emission from Ni II at 428.5 nm 9), which is weaker in intensity than neutral emission, also has
nanosecond laser produced nickel plasma expanding into
time delays of (a) 50 ns,(b) 100
k) 400 ns,using an
nanosecond laser produced nickel plasma expanding into
time delays of(a) 50 ns,(b) 100
e have generated and characterized laser produced Ni plasmas using ns and fs laser
TOF measurements of the neutral Ni I emission at 361.9
e of ambient nitrogen
Torr. Ionic emission from Ni II at 428.5 nm
), which is weaker in intensity than neutral emission, also has
Chapter 4
73
been investigated. Emission and OTOF spectra have been taken from two axial
positions, viz. 2 mm and 4 mm away from the target surface, in the expanding
plasma plume. Plasma intensity increases with pressure for both ns and fs
excitations. While the electron temperature gets maximized around 10-4 to 10-3Torr
for ns excitation, it is relatively lower and rather independent of pressure for fs
excitation. A double-peak structure is observed in the OTOF spectrum of Ni I under
ns excitation where the fast peak corresponds to the neutrals and is formed by ion-
electron recombination, and the slow peak corresponds to the un-ionized neutrals
ablated from the target. On the other hand, only one peak (fast) is observed in the
OTOF spectrum of fs excitation. Measured velocities of the species are relatively
higher and independent of pressure for fs excitation, whereas shockwave effects are
evident for ns excitation. The measured velocities indicate that the fast species is
clearly accelerating in the plume on expansion, at least up to a distance of 4 mm
from the target. On the other hand the slow species gets decelerated, particularly at
higher pressures. These investigations provide new information on the pressure
dependent temporal behavior of Ni plasmas produced by ns and fs laser pulses,
which have potential use in applications such as pulsed laser deposition (PLD) and
laser-induced nanoparticle generation.
CHAPTER 5
INFLUENCE OF AMBIENT PRESSURE AND LASER PULSEWIDTH ON THE SPECTRAL AND TEMPORAL FEATURES OF A LASER PRODUCED ZINC PLASMA
A detailed study of femtosecond and nanosecond laser produced Zinc plasmas
conducted using optical emission spectroscopy and optical time of flight
techniques is presented in this chapter. Optical emission spectroscopy allows the
estimation of temperature and number density of the plasma, while optical time of
flight measurements throw light into the dynamics of ions and neutrals in the
plasma. Imaging done using an intensified charge coupled device helps observe
features of plasma expansion into the ambient medium with a high time
resolution.
Chapter 5
75
5.1 INTRODUCTION Laser produced plasma (LPP) is transient in nature, and plasma parameters will
change rapidly with time and space on expansion. Therefore studies of plasma
dynamics are essential to understand the fundamental plasma physics and plasma
chemistry relevant at different time scales. In this chapter, OES and OTOF
measurements of a laser produced Zinc (Zn) plasma, produced upon irradiating a
high purity Zn target (99.99%) using 100 fs (at 796 nm) and 7 ns (at 1064 nm) laser
pulses, under similar optical fluences of ~ 16 J/cm2, are presented. The excitation
wavelength can play a crucial role in the characteristics of the LPP at fluences just
above the threshold fluence, and we have used a larger laser fluence in the present
experiments to avoid the same. Moreover, measurements under larger fluences are
preferable for the study of the origin and nature of fast neutrals in the expanding
plume, since their presence has been generally reported at larger laser fluences.
Plasma parameters such as electron temperature and number density have been
calculated for a broad range of ambient pressures from 5×10⁻² Torr to 2 ×10² Torr
using the relative emission line intensity ratios and the Stark broadening mechanisms
respectively for both fs and ns irradiation and are compared. Moreover, an OTOF
measurement at 481 nm is performed to determine the dynamics of neutral Zn species
in the plume. Atomic emission is found to be prominent in the Zn plasma plume at
higher pressures. Spatial information is recorded by scanning the plasma plume along
its length, while plume imaging done at various time delays using an ICCD gives a
two dimensional view of the expanding LPP. A double-pulse experiment is also
performed using fs excitation, to understand the effect of a second pulse on the
emission dynamics of fs LPP.
5.2 OPTICAL EMISSION SPECTROSCOPY STUDIES OES of the LPP plume is useful for the estimation of important plasma parameters
such as electron temperature (Te) and electron number density (Ne). Other parameters
such as plasma frequency (ωp), inverse bremsstrahlung (αib) etc can be deduced from
the values of Te and Ne. Therefore, OES of LPP in the visible region has been
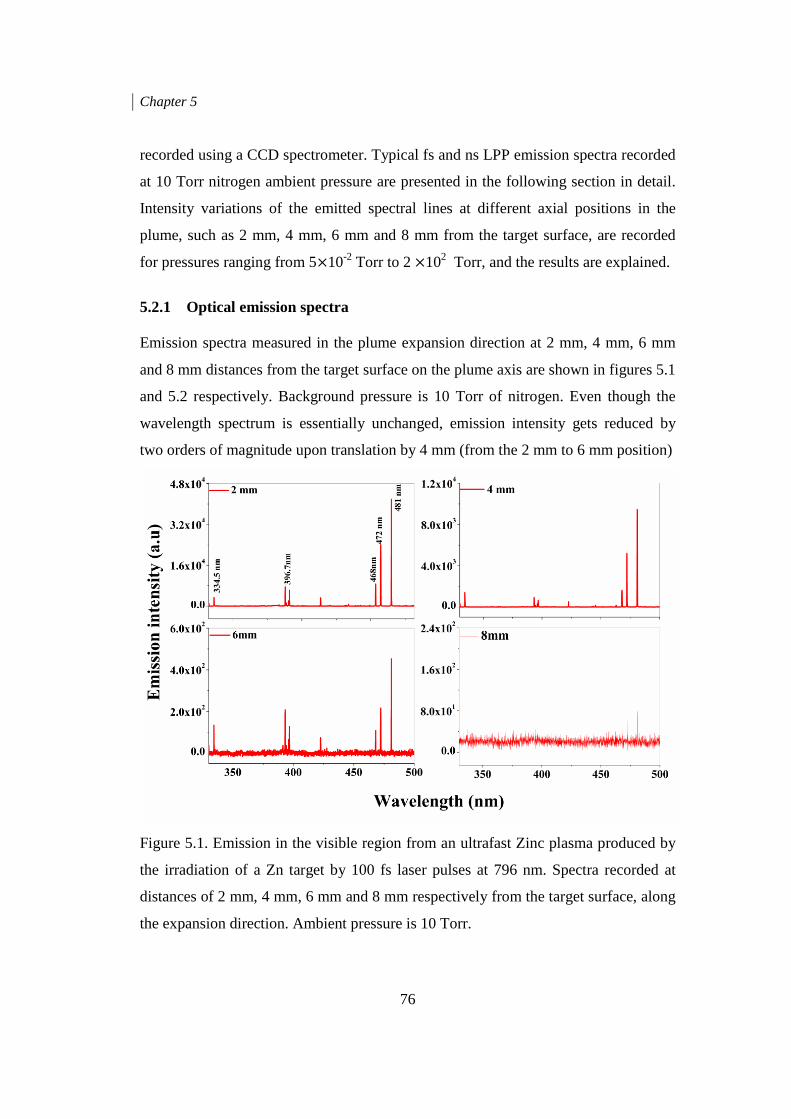
Chapter 5
76
recorded using a CCD spectrometer. Typical fs and ns LPP emission spectra recorded
at 10 Torr nitrogen ambient pressure are presented in the following section in detail.
Intensity variations of the emitted spectral lines at different axial positions in the
plume, such as 2 mm, 4 mm, 6 mm and 8 mm from the target surface, are recorded
for pressures ranging from 5×10⁻² Torr to 2 ×10² Torr, and the results are explained.
5.2.1 Optical emission spectra Emission spectra measured in the plume expansion direction at 2 mm, 4 mm, 6 mm
and 8 mm distances from the target surface on the plume axis are shown in figures 5.1
and 5.2 respectively. Background pressure is 10 Torr of nitrogen. Even though the
wavelength spectrum is essentially unchanged, emission intensity gets reduced by
two orders of magnitude upon translation by 4 mm (from the 2 mm to 6 mm position)
Figure 5.1. Emission in the visible region from an ultrafast Zinc plasma produced by
the irradiation of a Zn target by 100 fs laser pulses at 796 nm. Spectra recorded at
distances of 2 mm, 4 mm, 6 mm and 8 mm respectively from the target surface, along
the expansion direction. Ambient pressure is 10 Torr.
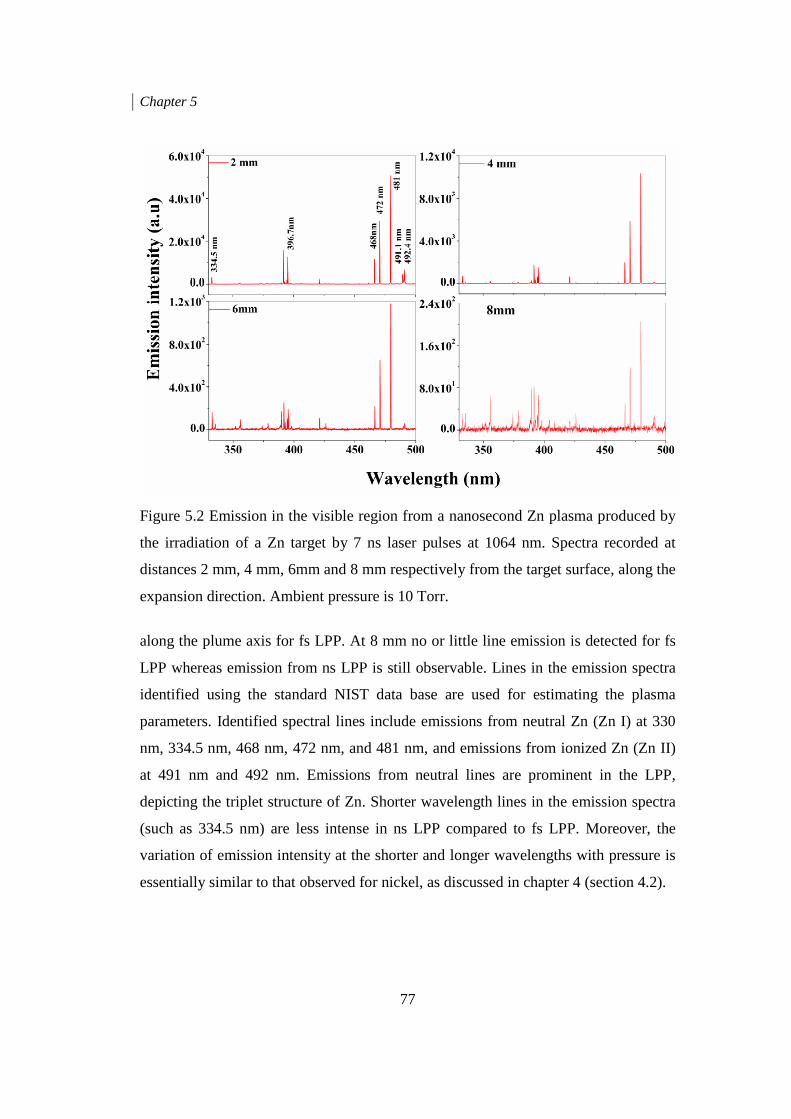
Chapter 5
77
Figure 5.2 Emission in the visible region from a nanosecond Zn plasma produced by
the irradiation of a Zn target by 7 ns laser pulses at 1064 nm. Spectra recorded at
distances 2 mm, 4 mm, 6mm and 8 mm respectively from the target surface, along the
expansion direction. Ambient pressure is 10 Torr.
along the plume axis for fs LPP. At 8 mm no or little line emission is detected for fs
LPP whereas emission from ns LPP is still observable. Lines in the emission spectra
identified using the standard NIST data base are used for estimating the plasma
parameters. Identified spectral lines include emissions from neutral Zn (Zn I) at 330
nm, 334.5 nm, 468 nm, 472 nm, and 481 nm, and emissions from ionized Zn (Zn II)
at 491 nm and 492 nm. Emissions from neutral lines are prominent in the LPP,
depicting the triplet structure of Zn. Shorter wavelength lines in the emission spectra
(such as 334.5 nm) are less intense in ns LPP compared to fs LPP. Moreover, the
variation of emission intensity at the shorter and longer wavelengths with pressure is
essentially similar to that observed for nickel, as discussed in chapter 4 (section 4.2).
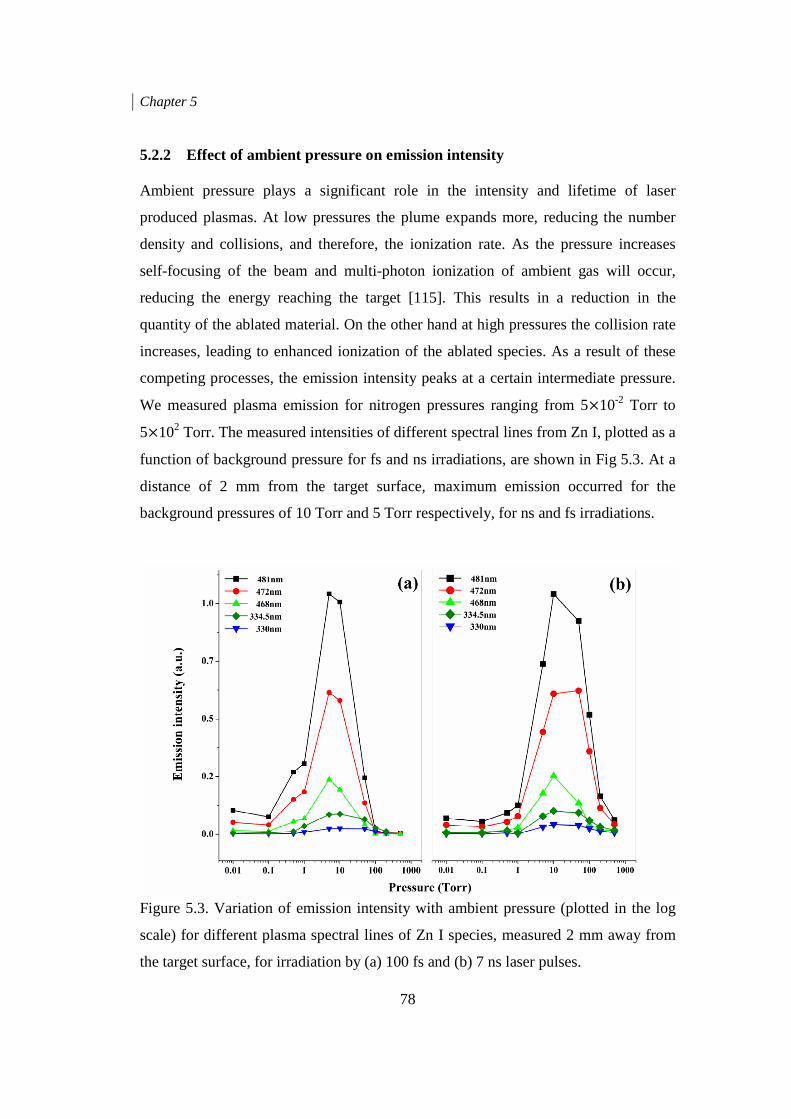
Chapter 5
78
5.2.2 Effect of ambient pressure on emission intensity Ambient pressure plays a significant role in the intensity and lifetime of laser
produced plasmas. At low pressures the plume expands more, reducing the number
density and collisions, and therefore, the ionization rate. As the pressure increases
self-focusing of the beam and multi-photon ionization of ambient gas will occur,
reducing the energy reaching the target [115]. This results in a reduction in the
quantity of the ablated material. On the other hand at high pressures the collision rate
increases, leading to enhanced ionization of the ablated species. As a result of these
competing processes, the emission intensity peaks at a certain intermediate pressure.
We measured plasma emission for nitrogen pressures ranging from 5×10⁻² Torr to
5×10² Torr. The measured intensities of different spectral lines from Zn I, plotted as a
function of background pressure for fs and ns irradiations, are shown in Fig 5.3. At a
distance of 2 mm from the target surface, maximum emission occurred for the
background pressures of 10 Torr and 5 Torr respectively, for ns and fs irradiations.
Figure 5.3. Variation of emission intensity with ambient pressure (plotted in the log
scale) for different plasma spectral lines of Zn I species, measured 2 mm away from
the target surface, for irradiation by (a) 100 fs and (b) 7 ns laser pulses.

Chapter 5
79
5.2.3 Dependence of emission intensity on laser pulsewidth Unlike ns laser pulses, fs laser pulses do not interact with the plasmas produced by
them, due to the fact that the electron-ion energy transfer time (tei) and the heat
conduction time (th) are of the order of ps, which is greater than the pulse duration of
the fs laser (tp) i.e. tei ~ th >> tp. Therefore, the entire energy content of the laser pulse
deposited on the target results in the generation of a large number of excited neutral
species, which intensifies the emission from Zn I in fs LPP at larger laser intensities,
as shown in Fig 5.1. However, ionization is found to be stronger in ns LPP compared
to fs LPP because of the interaction of the trailing part of the laser pulse with the
plasma produced by it, resulting in a large emission yield for Zn II. It is clear from
Figure 5.1a that line emissions at shorter wavelengths can be enhanced by fs
excitation, illustrating the pulsewidth dependence of emission intensity at shorter
wavelengths.
5.2.4 Estimation of temperature and number density Calculation of plasma parameters (electron temperature and number density) was
done by conventional methods as follows. Electron temperatures (��) were evaluated
using the line emission intensity ratios of Zn I emissions at 334.5 nm (4s4d 3D3 - 4s4p 3P2) and 481.0 nm (4s5s 3S1 - 4s4p 3P2) by assuming local thermodynamic equilibrium
(LTE), using equation (3.1).
The spectroscopic constants required for the calculation (Ai and gi) are taken from a
previous work [117], and the estimation of electron number density ���� was done
from Stark broadening of line emission at 481 nm (neglecting ion contribution to line
broadening) at each pressure, using equation 3.3 [108]. The theoretical value of �
was obtained from literature [118]. A Lorentzian fit to the emission profile at 481 nm,
measured 2 mm away from target surface at an ambient pressure of 10 Torr, is shown
in Figure 5.4. Calculated values of Te and �� for various ambient pressures, for
different distances in the plume from the target surface, are shown in Table I. The
validity of LTE was checked using the McWhirter criterion for each pressure using
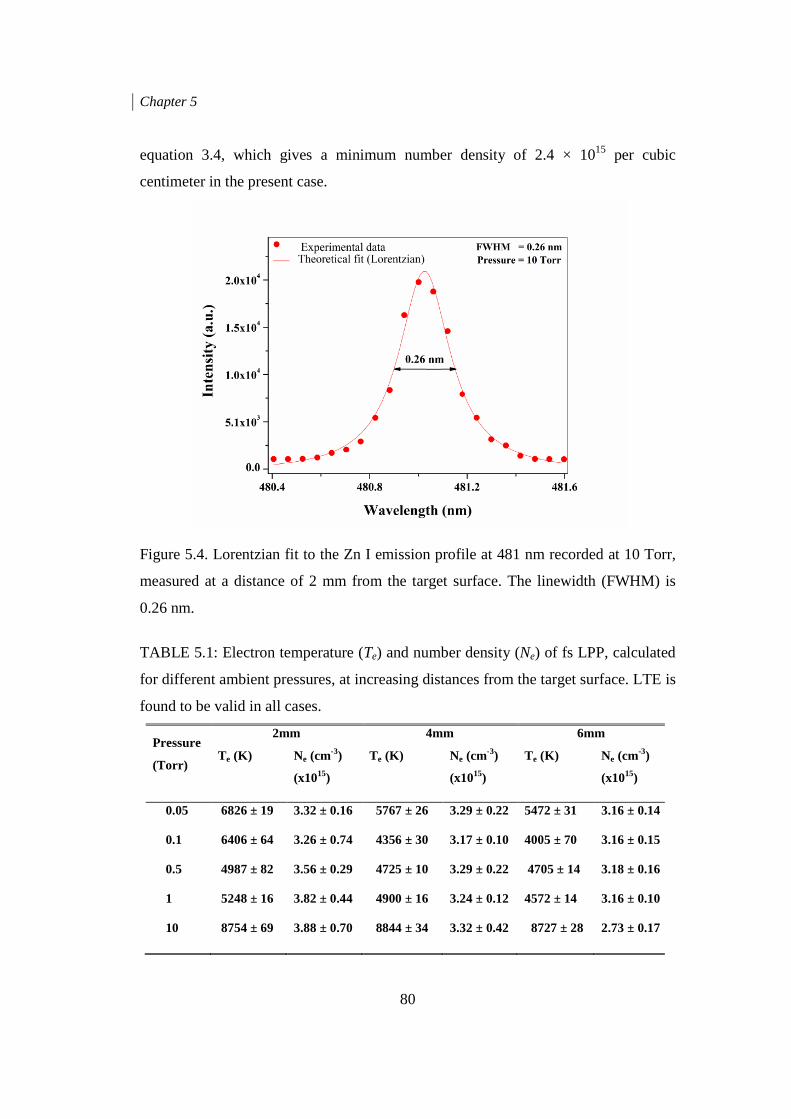
Chapter 5
80
equation 3.4, which gives a minimum number density of 2.4 × 10¹⁵ per cubic
centimeter in the present case.
Figure 5.4. Lorentzian fit to the Zn I emission profile at 481 nm recorded at 10 Torr,
measured at a distance of 2 mm from the target surface. The linewidth (FWHM) is
0.26 nm.
TABLE 5.1: Electron temperature (Te) and number density (Ne) of fs LPP, calculated
for different ambient pressures, at increasing distances from the target surface. LTE is
found to be valid in all cases.
Pressure
(Torr)
2mm 4mm 6mm
Te (K) Ne (cm-3)
(x1015)
Te (K) Ne (cm-3)
(x1015)
Te (K) Ne (cm-3)
(x1015)
0.05 6826 ± 19 3.32 ± 0.16 5767 ± 26 3.29 ± 0.22 5472 ± 31 3.16 ± 0.14
0.1 6406 ± 64 3.26 ± 0.74 4356 ± 30 3.17 ± 0.10 4005 ± 70 3.16 ± 0.15
0.5 4987 ± 82 3.56 ± 0.29 4725 ± 10 3.29 ± 0.22 4705 ± 14 3.18 ± 0.16
1 5248 ± 16 3.82 ± 0.44 4900 ± 16 3.24 ± 0.12 4572 ± 14 3.16 ± 0.10
10 8754 ± 69 3.88 ± 0.70 8844 ± 34 3.32 ± 0.42 8727 ± 28 2.73 ± 0.17
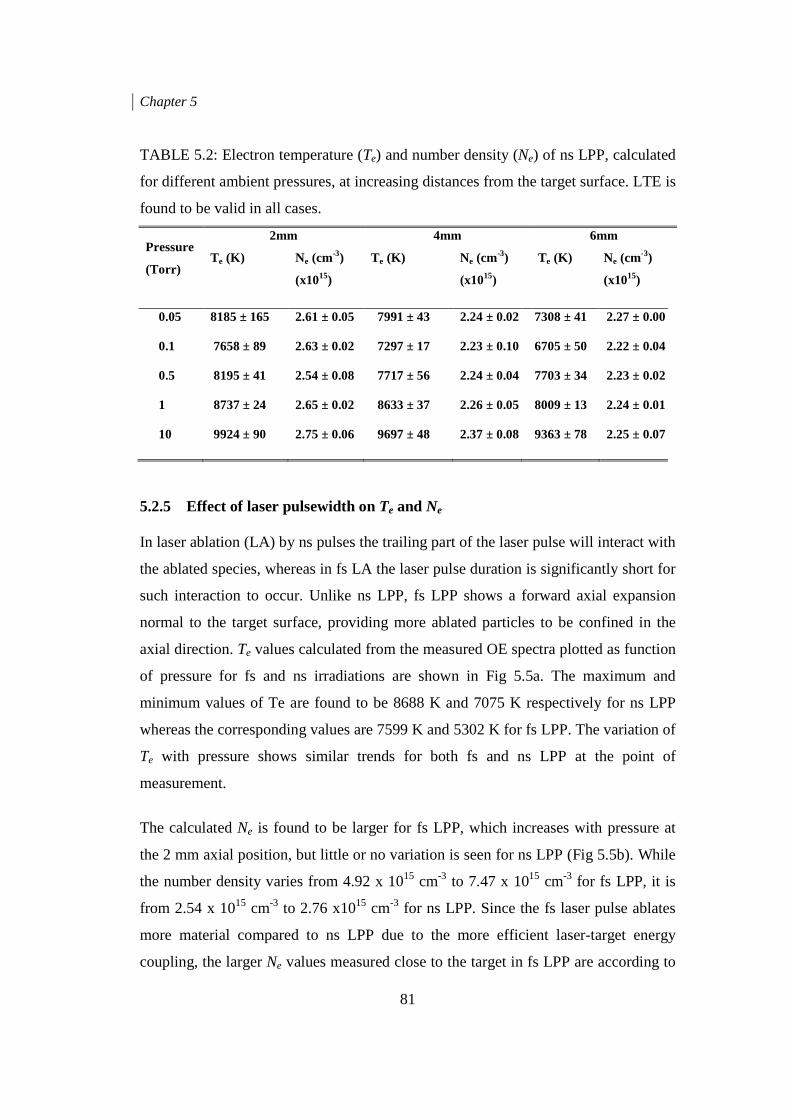
Chapter 5
81
TABLE 5.2: Electron temperature (Te) and number density (Ne) of ns LPP, calculated
for different ambient pressures, at increasing distances from the target surface. LTE is
found to be valid in all cases.
Pressure
(Torr)
2mm 4mm 6mm
Te (K) Ne (cm-3)
(x1015)
Te (K) Ne (cm-3)
(x1015)
Te (K) Ne (cm-3)
(x1015)
0.05 8185 ± 165 2.61 ± 0.05 7991 ± 43 2.24 ± 0.02 7308 ± 41 2.27 ± 0.00
0.1 7658 ± 89 2.63 ± 0.02 7297 ± 17 2.23 ± 0.10 6705 ± 50 2.22 ± 0.04
0.5 8195 ± 41 2.54 ± 0.08 7717 ± 56 2.24 ± 0.04 7703 ± 34 2.23 ± 0.02
1 8737 ± 24 2.65 ± 0.02 8633 ± 37 2.26 ± 0.05 8009 ± 13 2.24 ± 0.01
10 9924 ± 90 2.75 ± 0.06 9697 ± 48 2.37 ± 0.08 9363 ± 78 2.25 ± 0.07
5.2.5 Effect of laser pulsewidth on Te and Ne
In laser ablation (LA) by ns pulses the trailing part of the laser pulse will interact with
the ablated species, whereas in fs LA the laser pulse duration is significantly short for
such interaction to occur. Unlike ns LPP, fs LPP shows a forward axial expansion
normal to the target surface, providing more ablated particles to be confined in the
axial direction. Te values calculated from the measured OE spectra plotted as function
of pressure for fs and ns irradiations are shown in Fig 5.5a. The maximum and
minimum values of Te are found to be 8688 K and 7075 K respectively for ns LPP
whereas the corresponding values are 7599 K and 5302 K for fs LPP. The variation of
Te with pressure shows similar trends for both fs and ns LPP at the point of
measurement.
The calculated Ne is found to be larger for fs LPP, which increases with pressure at
the 2 mm axial position, but little or no variation is seen for ns LPP (Fig 5.5b). While
the number density varies from 4.92 x 1015 cm-3 to 7.47 x 1015 cm-3 for fs LPP, it is
from 2.54 x 1015 cm-3 to 2.76 x1015 cm-3 for ns LPP. Since the fs laser pulse ablates
more material compared to ns LPP due to the more efficient laser-target energy
coupling, the larger Ne values measured close to the target in fs LPP are according to
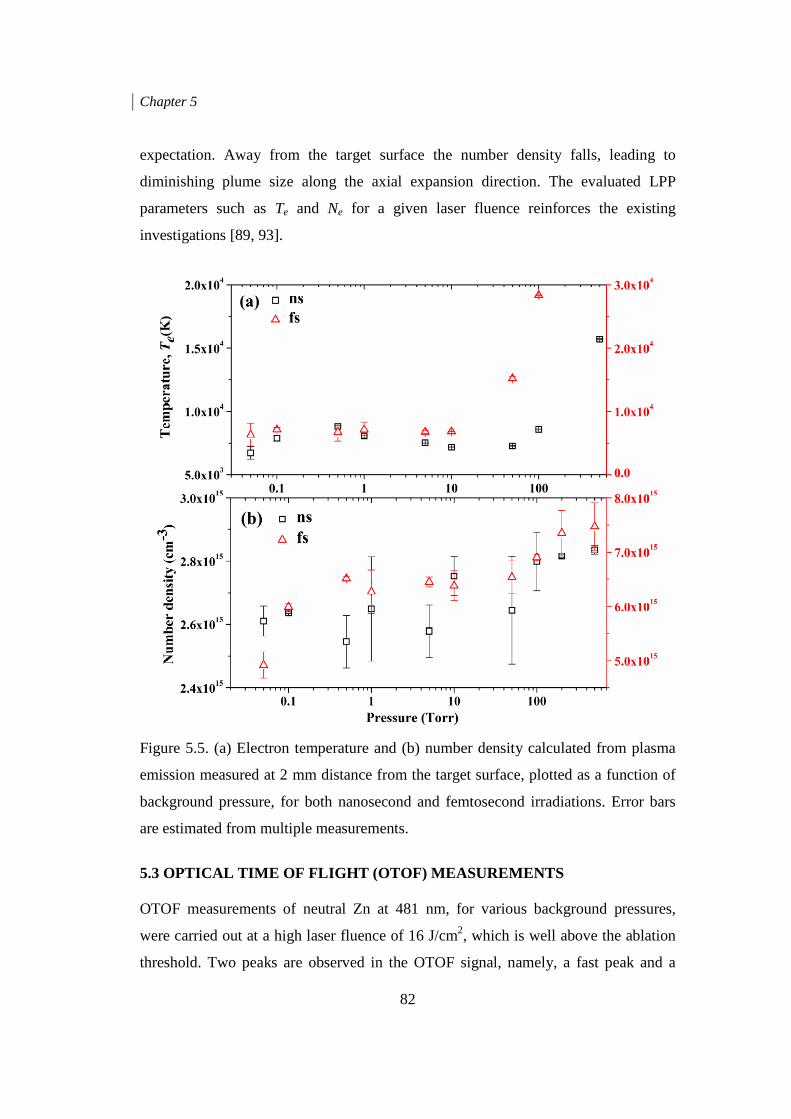
Chapter 5
82
expectation. Away from the target surface the number density falls, leading to
diminishing plume size along the axial expansion direction. The evaluated LPP
parameters such as Te and Ne for a given laser fluence reinforces the existing
investigations [89, 93].
Figure 5.5. (a) Electron temperature and (b) number density calculated from plasma
emission measured at 2 mm distance from the target surface, plotted as a function of
background pressure, for both nanosecond and femtosecond irradiations. Error bars
are estimated from multiple measurements.
5.3 OPTICAL TIME OF FLIGHT (OTOF) MEASUREMENTS OTOF measurements of neutral Zn at 481 nm, for various background pressures,
were carried out at a high laser fluence of 16 J/cm2, which is well above the ablation
threshold. Two peaks are observed in the OTOF signal, namely, a fast peak and a
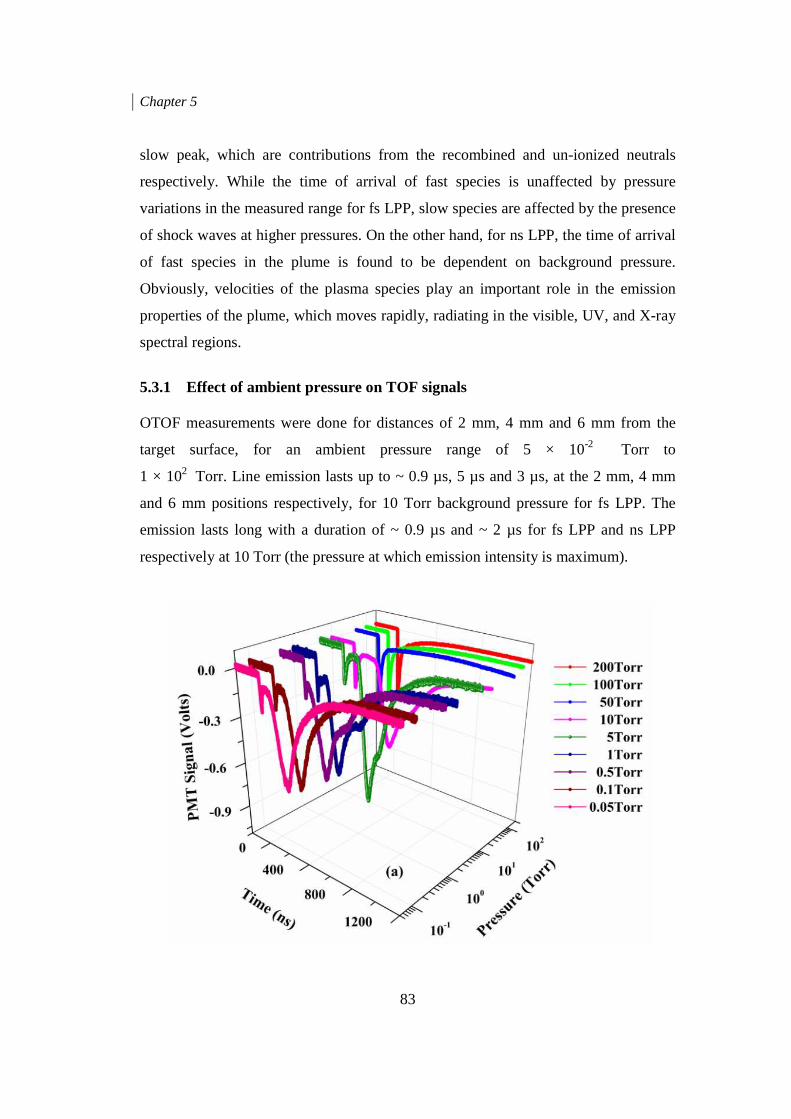
Chapter 5
83
slow peak, which are contributions from the recombined and un-ionized neutrals
respectively. While the time of arrival of fast species is unaffected by pressure
variations in the measured range for fs LPP, slow species are affected by the presence
of shock waves at higher pressures. On the other hand, for ns LPP, the time of arrival
of fast species in the plume is found to be dependent on background pressure.
Obviously, velocities of the plasma species play an important role in the emission
properties of the plume, which moves rapidly, radiating in the visible, UV, and X-ray
spectral regions.
5.3.1 Effect of ambient pressure on TOF signals OTOF measurements were done for distances of 2 mm, 4 mm and 6 mm from the
target surface, for an ambient pressure range of 5 × 10⁻² Torr to
1 × 10² Torr. Line emission lasts up to ~ 0.9 µs, 5 µs and 3 µs, at the 2 mm, 4 mm
and 6 mm positions respectively, for 10 Torr background pressure for fs LPP. The
emission lasts long with a duration of ~ 0.9 µs and ~ 2 µs for fs LPP and ns LPP
respectively at 10 Torr (the pressure at which emission intensity is maximum).

Chapter 5
84
Figure 5.6. Time of flight emission of the 481 nm (4s5s 3S1 → 4s4p 3P2) line of Zn I
at different ambient pressures, measured in the plasma plume at distances of (a) 2
mm, (b) 4 mm and (c) 6 mm, respectively, from the target surface, for fs irradiation.
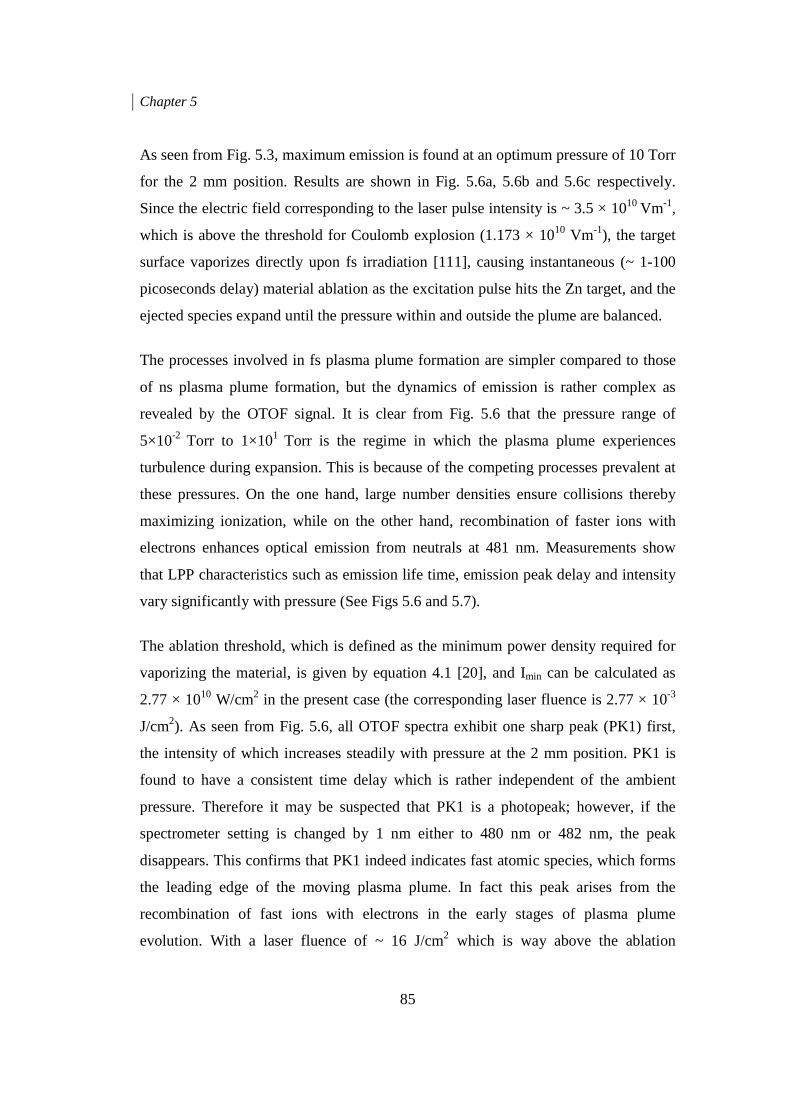
Chapter 5
85
As seen from Fig. 5.3, maximum emission is found at an optimum pressure of 10 Torr
for the 2 mm position. Results are shown in Fig. 5.6a, 5.6b and 5.6c respectively.
Since the electric field corresponding to the laser pulse intensity is ~ 3.5 × 10¹⁰ Vm-1,
which is above the threshold for Coulomb explosion (1.173 × 10¹⁰ Vm-1), the target
surface vaporizes directly upon fs irradiation [111], causing instantaneous (~ 1-100
picoseconds delay) material ablation as the excitation pulse hits the Zn target, and the
ejected species expand until the pressure within and outside the plume are balanced.
The processes involved in fs plasma plume formation are simpler compared to those
of ns plasma plume formation, but the dynamics of emission is rather complex as
revealed by the OTOF signal. It is clear from Fig. 5.6 that the pressure range of
5×10⁻² Torr to 1×101 Torr is the regime in which the plasma plume experiences
turbulence during expansion. This is because of the competing processes prevalent at
these pressures. On the one hand, large number densities ensure collisions thereby
maximizing ionization, while on the other hand, recombination of faster ions with
electrons enhances optical emission from neutrals at 481 nm. Measurements show
that LPP characteristics such as emission life time, emission peak delay and intensity
vary significantly with pressure (See Figs 5.6 and 5.7).
The ablation threshold, which is defined as the minimum power density required for
vaporizing the material, is given by equation 4.1 [20], and Imin can be calculated as
2.77 × 10¹⁰ W/cm2 in the present case (the corresponding laser fluence is 2.77 × 10⁻³
J/cm2). As seen from Fig. 5.6, all OTOF spectra exhibit one sharp peak (PK1) first,
the intensity of which increases steadily with pressure at the 2 mm position. PK1 is
found to have a consistent time delay which is rather independent of the ambient
pressure. Therefore it may be suspected that PK1 is a photopeak; however, if the
spectrometer setting is changed by 1 nm either to 480 nm or 482 nm, the peak
disappears. This confirms that PK1 indeed indicates fast atomic species, which forms
the leading edge of the moving plasma plume. In fact this peak arises from the
recombination of fast ions with electrons in the early stages of plasma plume
evolution. With a laser fluence of ~ 16 J/cm2 which is way above the ablation
Chapter 5
86
threshold, an efficient ablation of the target material happens rapidly, and a shock
wave propagates back and forth through the ambient gas [119], introducing a peak
shift at certain pressures in the OTOF. This also results in a small third peak, PK3,
which appears as a wing to PK2 at lower pressures as seen in Fig. 5.6. PK2 and PK3
disappear at higher pressures indicating that plume expansion is hindered due to the
plasma confinement effect.
As the ambient pressure increases from 0.05 Torr, the integrated line intensity at 481
nm in the TOF shows no or little change initially, but the intensity starts building up
after a certain pressure, and reaches a maximum at 5 Torr for fs LPP and 10 Torr for
ns LPP (Figs 5.6a and 5.7). A further increase in pressure reduces the emission
intensity. Although the emission lifetime is found to be larger for ns LPP, the
integrated emission intensity is more for fs LPP. The presence of shock waves play an
important role during LPP expansion, causing slow atomic species to split and move
with different average velocities within a range of pressures.
5.3.2 Effect of pulsewidth on TOF signals As mentioned before, in ns LPP material ablation occurs by the leading part of the
laser pulse and the energy content of the trailing part is absorbed by the ablated
species. Ionization followed by radiative recombination makes optical emission
feasible up to several microseconds after laser excitation. On the other hand in fs
excitation plasma formation happens only after the laser pulse is over, and the
absence of laser-plasma interaction results in optical emission of shorter timescales.
OTOF measurements are carried out on Zn I species by recording line evolution at
481nm (4s5s3S1→4s4p 3P2, Zn I) using a fast PMT coupled to the spectrometer for ns
irradiation. Measurements done at the 2 mm position is shown in figure 5.7. Intensity
variations in the emission of neutrals with time at various ambient pressures is
measured for ns as well as fs LPP. The PMT signal is relatively stronger for fs LPP,
and maximum signal is measured around 10 Torr for both fs and ns pulses. At low
pressures (i.e. for 0.05 Torr to 0.1 Torr) two different peaks are observed in the TOF,
namely, the fast peak (PK1) and the slow peak (PK2).
Chapter 5
87
5.3.3 Velocities of neutrals in the LPP When expanded adiabatically, the fast species within femtosecond plasma move with
an average speed ~100 kms-1 while slow species move at ~1-10 kms-1. Ions are
ejected normal to the target surface, and measurements show that at 10 Torr pressure,
they are accelerating with average velocities of 57 ± 2 kms-1, 109 ± 9 kms-1, and 154
± 12 kms-1, respectively, at the 2 mm, 4 mm, and 6 mm positions in the plume. This
acceleration is caused by the electron cloud which moves faster than the ion cloud in
the plasma: the electric field created by the electrons attract the ions so that they
follow, and some of these recombine with the electrons to form neutral atoms (a
detailed study is given in chapter 6). Velocities measured for different ambient
pressures are given in Fig. 5.8 for fs LPP. PK1 is followed by a stronger and broader
peak PK2, which, unlike PK1, becomes weaker at higher pressures, and disappears
altogether at the highest pressures studied. Similarly, the average velocity of the
relatively long-lived PK2 drops from 10 kms-1 to 2 kms-1 as the pressure is increased
from 0.05 Torr to 10 Torr. Adiabatic expansion of the plume consequent to intense fs
excitation results in a quick reduction of emission intensity away from the target
surface.
Figure 5.7. Line emission intensity from Zn I at 481 nm for different ambient
pressures, plotted as a function of time, for ns irradiation.
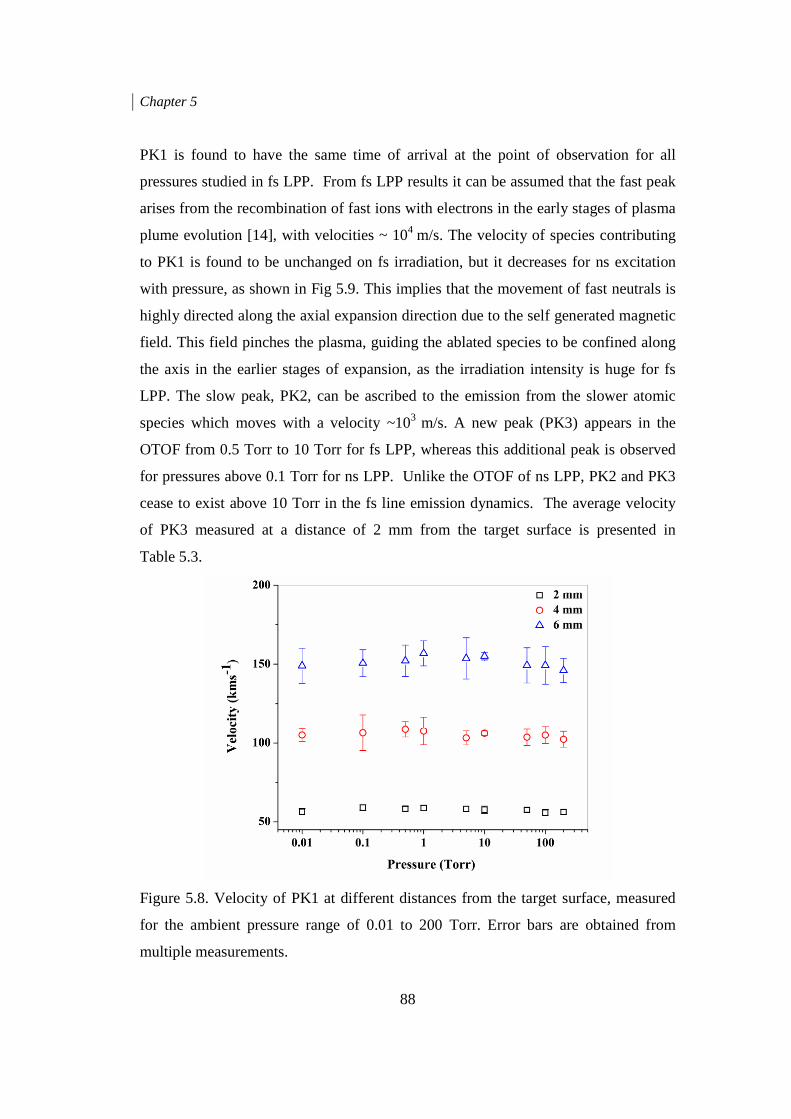
Chapter 5
88
PK1 is found to have the same time of arrival at the point of observation for all
pressures studied in fs LPP. From fs LPP results it can be assumed that the fast peak
arises from the recombination of fast ions with electrons in the early stages of plasma
plume evolution [14], with velocities ~ 104 m/s. The velocity of species contributing
to PK1 is found to be unchanged on fs irradiation, but it decreases for ns excitation
with pressure, as shown in Fig 5.9. This implies that the movement of fast neutrals is
highly directed along the axial expansion direction due to the self generated magnetic
field. This field pinches the plasma, guiding the ablated species to be confined along
the axis in the earlier stages of expansion, as the irradiation intensity is huge for fs
LPP. The slow peak, PK2, can be ascribed to the emission from the slower atomic
species which moves with a velocity ~103 m/s. A new peak (PK3) appears in the
OTOF from 0.5 Torr to 10 Torr for fs LPP, whereas this additional peak is observed
for pressures above 0.1 Torr for ns LPP. Unlike the OTOF of ns LPP, PK2 and PK3
cease to exist above 10 Torr in the fs line emission dynamics. The average velocity
of PK3 measured at a distance of 2 mm from the target surface is presented in
Table 5.3.
Figure 5.8. Velocity of PK1 at different distances from the target surface, measured
for the ambient pressure range of 0.01 to 200 Torr. Error bars are obtained from
multiple measurements.
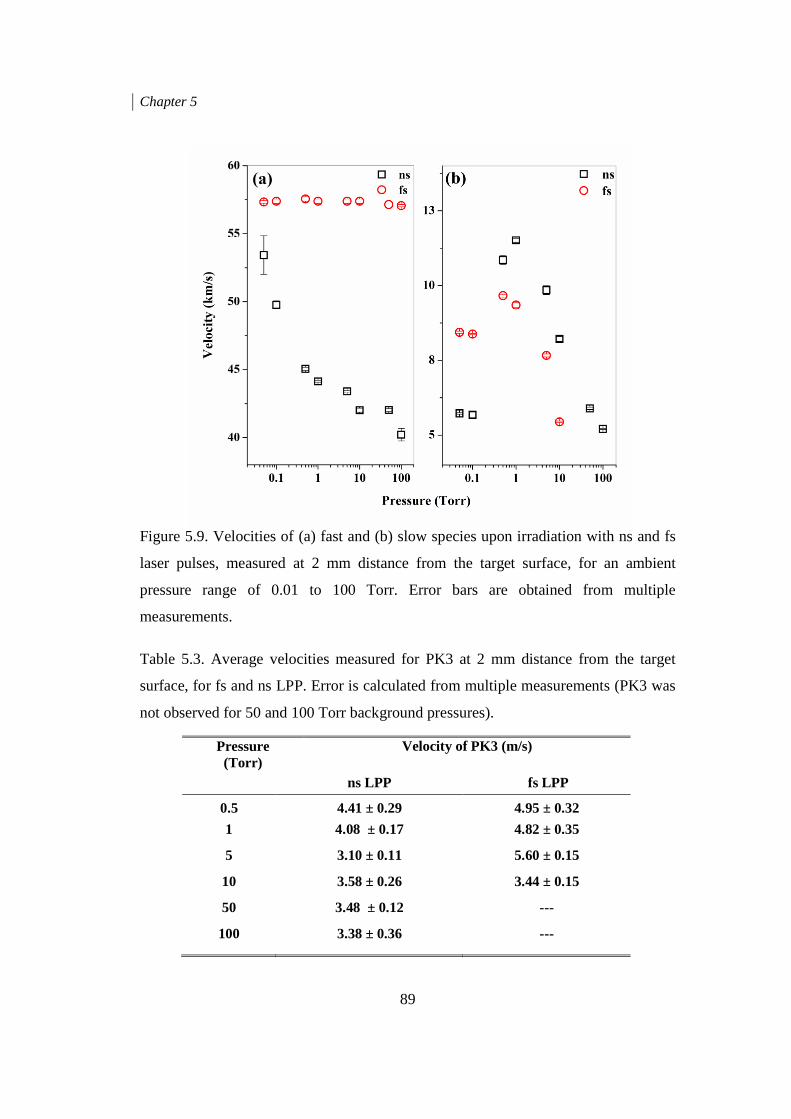
Chapter 5
89
Figure 5.9. Velocities of (a) fast and (b) slow species upon irradiation with ns and fs
laser pulses, measured at 2 mm distance from the target surface, for an ambient
pressure range of 0.01 to 100 Torr. Error bars are obtained from multiple
measurements.
Table 5.3. Average velocities measured for PK3 at 2 mm distance from the target
surface, for fs and ns LPP. Error is calculated from multiple measurements (PK3 was
not observed for 50 and 100 Torr background pressures).
Pressure (Torr)
Velocity of PK3 (m/s)
ns LPP fs LPP
0.5 4.41 ± 0.29 4.95 ± 0.32
1 4.08 ± 0.17 4.82 ± 0.35
5 3.10 ± 0.11 5.60 ± 0.15
10 3.58 ± 0.26 3.44 ± 0.15
50 3.48 ± 0.12 ---
100 3.38 ± 0.36 ---
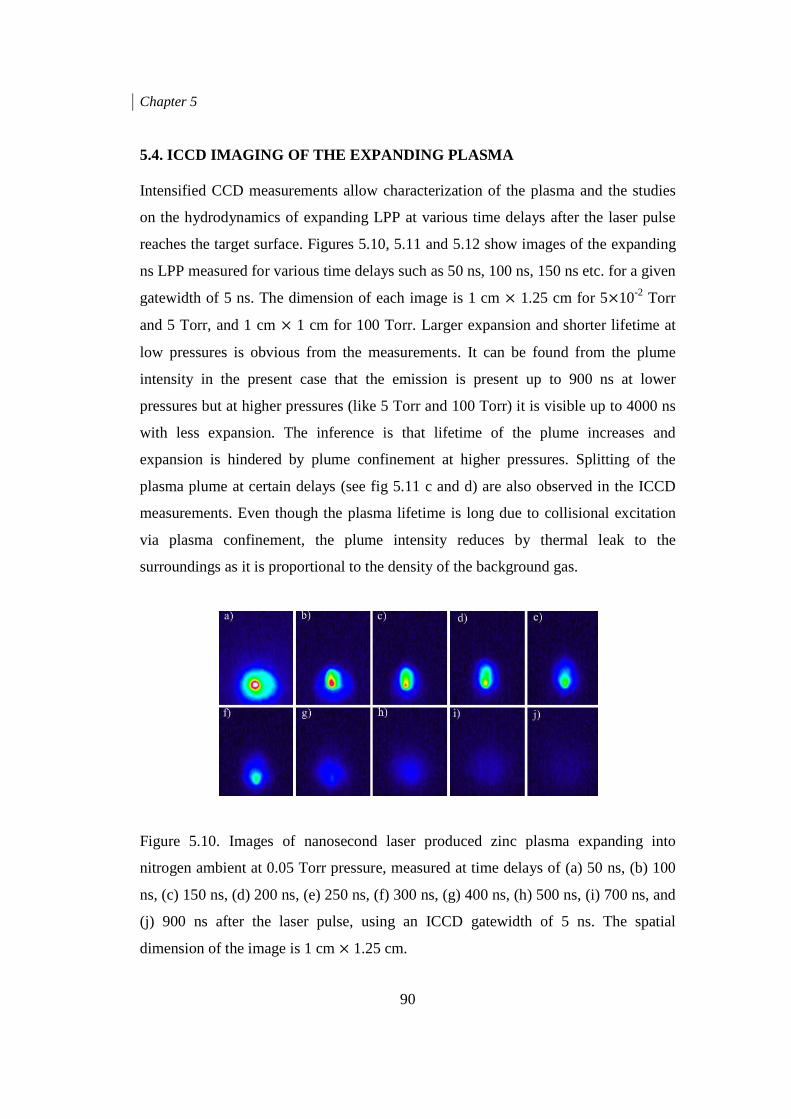
Chapter 5
90
5.4. ICCD IMAGING OF THE EXPANDING PLASMA Intensified CCD measurements allow characterization of the plasma and the studies
on the hydrodynamics of expanding LPP at various time delays after the laser pulse
reaches the target surface. Figures 5.10, 5.11 and 5.12 show images of the expanding
ns LPP measured for various time delays such as 50 ns, 100 ns, 150 ns etc. for a given
gatewidth of 5 ns. The dimension of each image is 1 cm × 1.25 cm for 5×10⁻² Torr
and 5 Torr, and 1 cm × 1 cm for 100 Torr. Larger expansion and shorter lifetime at
low pressures is obvious from the measurements. It can be found from the plume
intensity in the present case that the emission is present up to 900 ns at lower
pressures but at higher pressures (like 5 Torr and 100 Torr) it is visible up to 4000 ns
with less expansion. The inference is that lifetime of the plume increases and
expansion is hindered by plume confinement at higher pressures. Splitting of the
plasma plume at certain delays (see fig 5.11 c and d) are also observed in the ICCD
measurements. Even though the plasma lifetime is long due to collisional excitation
via plasma confinement, the plume intensity reduces by thermal leak to the
surroundings as it is proportional to the density of the background gas.
Figure 5.10. Images of nanosecond laser produced zinc plasma expanding into
nitrogen ambient at 0.05 Torr pressure, measured at time delays of (a) 50 ns, (b) 100
ns, (c) 150 ns, (d) 200 ns, (e) 250 ns, (f) 300 ns, (g) 400 ns, (h) 500 ns, (i) 700 ns, and
(j) 900 ns after the laser pulse, using an ICCD gatewidth of 5 ns. The spatial
dimension of the image is 1 cm × 1.25 cm.
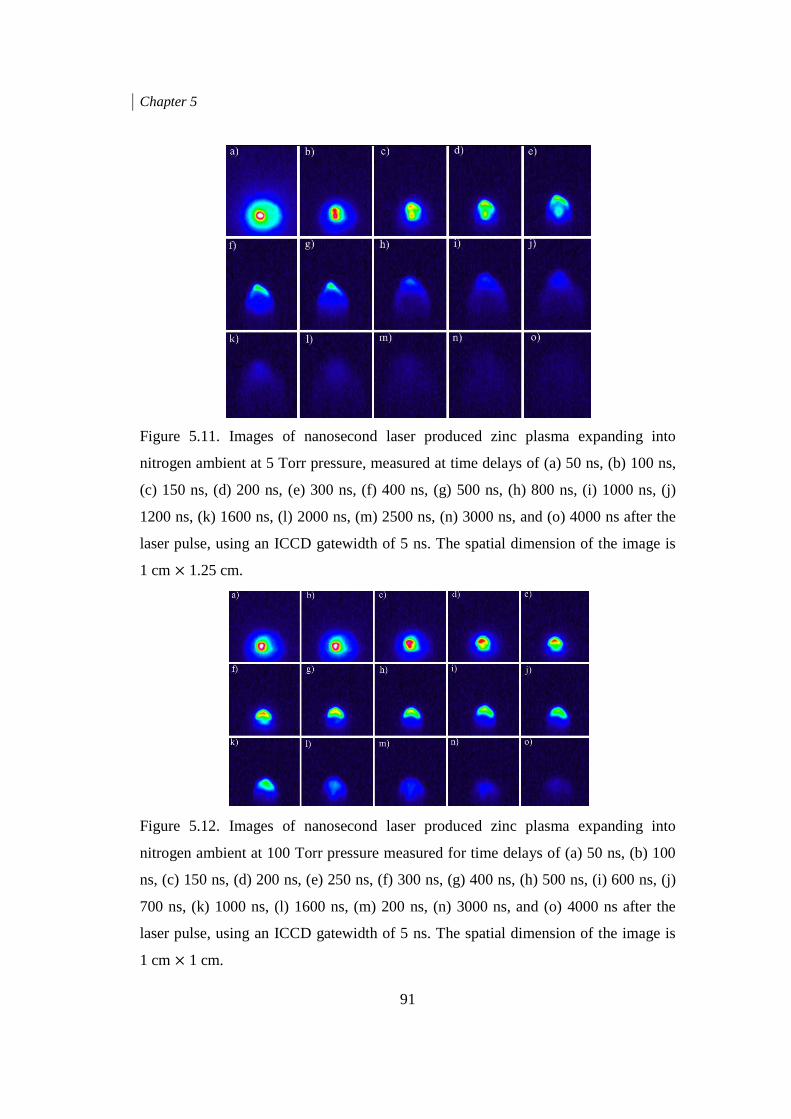
Chapter 5
91
Figure 5.11. Images of nanosecond laser produced zinc plasma expanding into
nitrogen ambient at 5 Torr pressure, measured at time delays of (a) 50 ns, (b) 100 ns,
(c) 150 ns, (d) 200 ns, (e) 300 ns, (f) 400 ns, (g) 500 ns, (h) 800 ns, (i) 1000 ns, (j)
1200 ns, (k) 1600 ns, (l) 2000 ns, (m) 2500 ns, (n) 3000 ns, and (o) 4000 ns after the
laser pulse, using an ICCD gatewidth of 5 ns. The spatial dimension of the image is
1 cm × 1.25 cm.
Figure 5.12. Images of nanosecond laser produced zinc plasma expanding into
nitrogen ambient at 100 Torr pressure measured for time delays of (a) 50 ns, (b) 100
ns, (c) 150 ns, (d) 200 ns, (e) 250 ns, (f) 300 ns, (g) 400 ns, (h) 500 ns, (i) 600 ns, (j)
700 ns, (k) 1000 ns, (l) 1600 ns, (m) 200 ns, (n) 3000 ns, and (o) 4000 ns after the
laser pulse, using an ICCD gatewidth of 5 ns. The spatial dimension of the image is
1 cm × 1 cm.
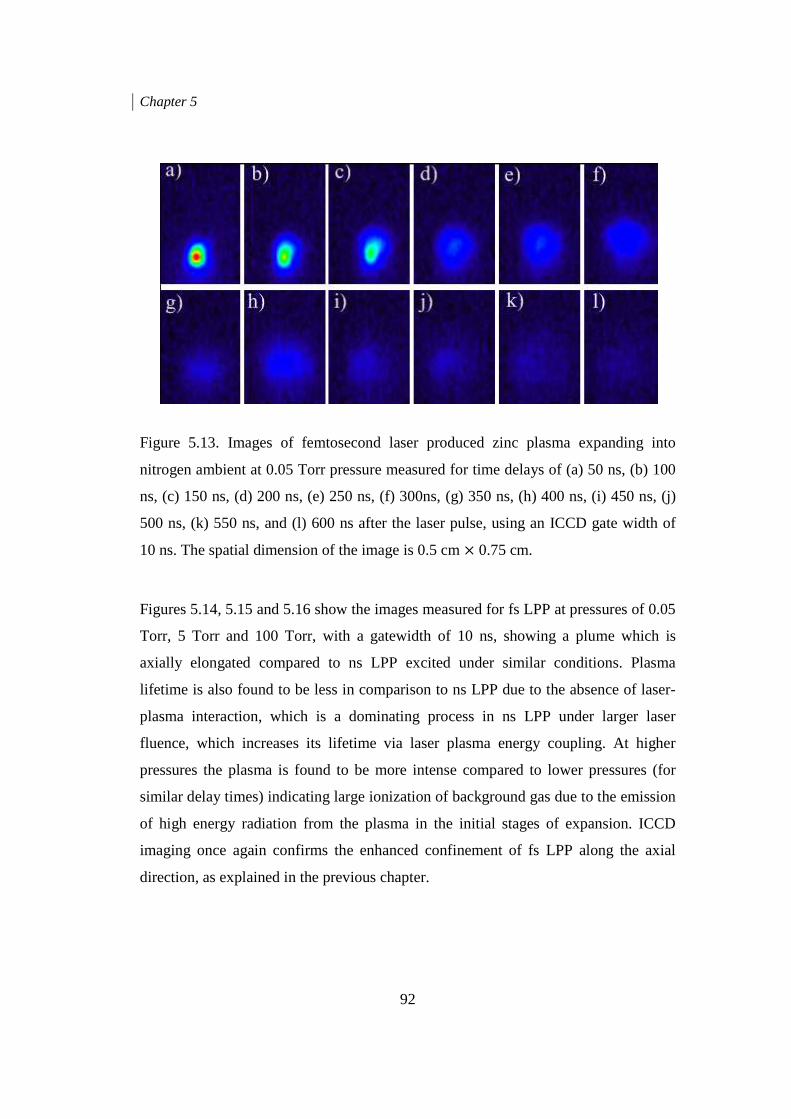
Chapter 5
92
Figure 5.13. Images of femtosecond laser produced zinc plasma expanding into
nitrogen ambient at 0.05 Torr pressure measured for time delays of (a) 50 ns, (b) 100
ns, (c) 150 ns, (d) 200 ns, (e) 250 ns, (f) 300ns, (g) 350 ns, (h) 400 ns, (i) 450 ns, (j)
500 ns, (k) 550 ns, and (l) 600 ns after the laser pulse, using an ICCD gate width of
10 ns. The spatial dimension of the image is 0.5 cm × 0.75 cm.
Figures 5.14, 5.15 and 5.16 show the images measured for fs LPP at pressures of 0.05
Torr, 5 Torr and 100 Torr, with a gatewidth of 10 ns, showing a plume which is
axially elongated compared to ns LPP excited under similar conditions. Plasma
lifetime is also found to be less in comparison to ns LPP due to the absence of laser-
plasma interaction, which is a dominating process in ns LPP under larger laser
fluence, which increases its lifetime via laser plasma energy coupling. At higher
pressures the plasma is found to be more intense compared to lower pressures (for
similar delay times) indicating large ionization of background gas due to the emission
of high energy radiation from the plasma in the initial stages of expansion. ICCD
imaging once again confirms the enhanced confinement of fs LPP along the axial
direction, as explained in the previous chapter.
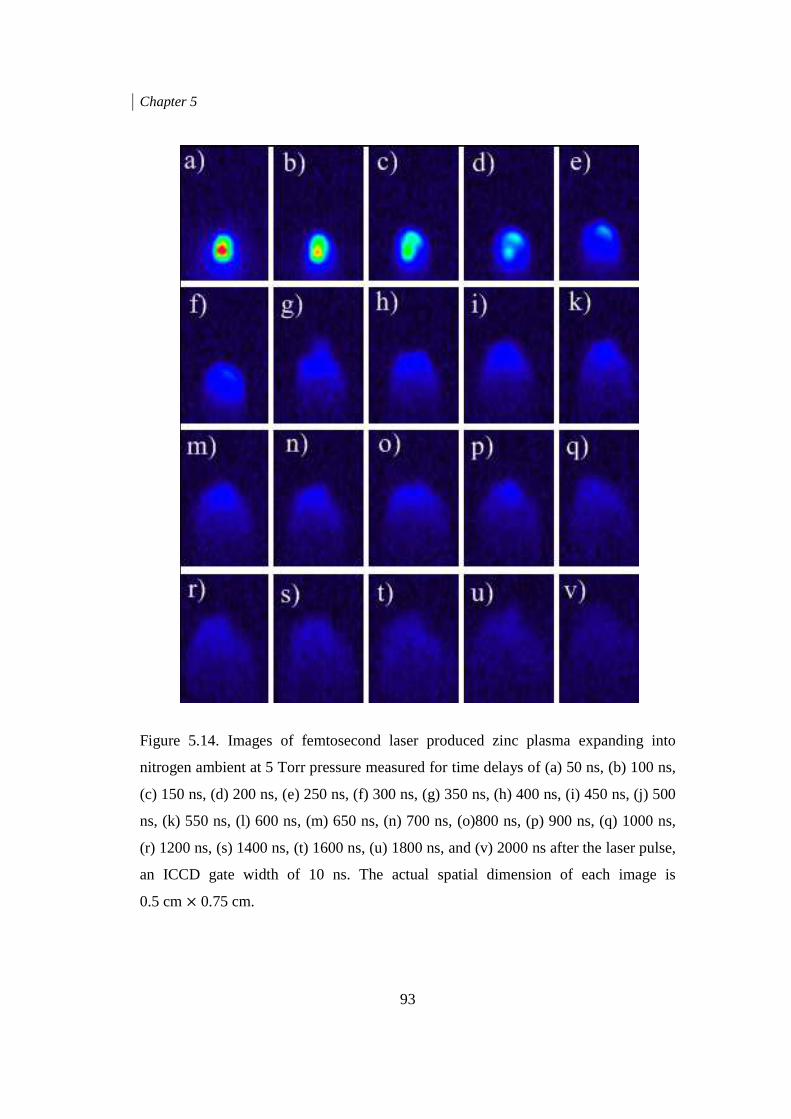
Chapter 5
93
Figure 5.14. Images of femtosecond laser produced zinc plasma expanding into
nitrogen ambient at 5 Torr pressure measured for time delays of (a) 50 ns, (b) 100 ns,
(c) 150 ns, (d) 200 ns, (e) 250 ns, (f) 300 ns, (g) 350 ns, (h) 400 ns, (i) 450 ns, (j) 500
ns, (k) 550 ns, (l) 600 ns, (m) 650 ns, (n) 700 ns, (o)800 ns, (p) 900 ns, (q) 1000 ns,
(r) 1200 ns, (s) 1400 ns, (t) 1600 ns, (u) 1800 ns, and (v) 2000 ns after the laser pulse,
an ICCD gate width of 10 ns. The actual spatial dimension of each image is
0.5 cm × 0.75 cm.

Chapter 5
Figure 5.15. Images of femtosecond laser produced
nitrogen ambient at 100 Torr pressure measured for
ns, (c) 150 ns, (d) 200 ns
and (j) 2000 ns after the laser pulse
dimension of the image is
5.5 DOUBLE PULSE
A double pulse (DP) experiment
plasma plume, which was generated 4 ns earlier by a 5 mJ laser pulse
in the fs irradiation scheme
(10 mJ) and the beam was divided into two using a 1:1 beam
beams was then sent through a delay stage, and attenuated to 2 mJ using a half
plate-polarizer cube combination. The TOF data
double pulse (DP) excitations for 5 Torr background, at 2 mm and 4 m
from the target surface respectively, are shown in Fig.
that the relative time of arrival of the fast component (PK1) is unaffected by double
pulse excitation: however, the slow species (PK2) is accelerated upon irra
the second pulse. DP excitation facilitates coupling of laser energy to t
plume in the fs excitation domain: energy is coupled to the fast atomic species with
the present delay time of 4 ns, leading to a reduction in its emission inte
94
Images of femtosecond laser produced zinc plasma expanding into
nitrogen ambient at 100 Torr pressure measured for time delays of (
d) 200 ns, (e) 300 ns, (f) 400 ns, (g) 500 ns, (h) 600 ns
after the laser pulse, an ICCD gate width of 10 ns.
dimension of the image is 0.5 cm × 0.75 cm.
DOUBLE PULSE ULTRAFAST EXCITATION
double pulse (DP) experiment [120-122] in which a 2 mJ pulse was fired into a
plasma plume, which was generated 4 ns earlier by a 5 mJ laser pulse
in the fs irradiation scheme. To generate these pulses the laser was run at full energy
(10 mJ) and the beam was divided into two using a 1:1 beam splitter. One of the
beams was then sent through a delay stage, and attenuated to 2 mJ using a half
polarizer cube combination. The TOF data measured for single pulse (SP) and
double pulse (DP) excitations for 5 Torr background, at 2 mm and 4 m
from the target surface respectively, are shown in Fig. 9. The TOF dynamics reveals
that the relative time of arrival of the fast component (PK1) is unaffected by double
however, the slow species (PK2) is accelerated upon irra
DP excitation facilitates coupling of laser energy to t
excitation domain: energy is coupled to the fast atomic species with
the present delay time of 4 ns, leading to a reduction in its emission inte
plasma expanding into
time delays of (a) 50 ns, (b) 100
h) 600 ns, (i) 1000 ns,
gate width of 10 ns. Actual spatial
pulse was fired into a
plasma plume, which was generated 4 ns earlier by a 5 mJ laser pulse, was carried out
. To generate these pulses the laser was run at full energy
splitter. One of the
beams was then sent through a delay stage, and attenuated to 2 mJ using a half-wave
for single pulse (SP) and
double pulse (DP) excitations for 5 Torr background, at 2 mm and 4 mm distances
. The TOF dynamics reveals
that the relative time of arrival of the fast component (PK1) is unaffected by double
however, the slow species (PK2) is accelerated upon irradiation with
DP excitation facilitates coupling of laser energy to the plasma
excitation domain: energy is coupled to the fast atomic species with
the present delay time of 4 ns, leading to a reduction in its emission intensity. In the

Chapter 5
95
DP configuration the TOF signal intensity of PK2 is found to be nearly doubled at the
4 mm position compared to SP excitation, while it is halved for PK1 at the 2 mm and
4 mm positions. The DP plume decays faster than the SP plume as well.
Figure 5.16. TOF spectra of 481 nm emission from Zn I at an ambient pressure of 5
Torr, measured using single pulse (SP) and double pulse (DP) excitations, at distances
of (a) 2 mm and (b) 4 mm from the target surface.
5.6 CONCLUSION In conclusion, we have generated fs and ns LPPs from a high quality solid zinc target
kept under broad ambient nitrogen pressures from 5×10⁻² Torr to 5×10² Torr, using
100 fs and 7 ns laser pulses of 800 nm and 1064 nm wavelengths respectively. With
larger laser fluence ~16 J/cm2, Zn I and Zn II lines are observed at a distance of 2 mm
from the target surface. The temperature and number density are calculated from
optical emission spectra and are plotted as a function of background pressure, and
analyzed. OTOF of the line at 481 nm shows a double-peak structure, ascribed to the
existence of fast and slow atomic species respectively in the LPP. Fast atomic species
Chapter 5
96
moves with an average velocity ~104 m/s whereas slow atomic species moves with a
lower velocity ~10-3 m/s. Interestingly, the average velocity of the fast atomic
component varies with pressure upon ns excitation whereas it remains unchanged for
fs excitation. ns LPP from solid Zn shows a longer plume lifetime. Emission from
neutral Zn is found to be more intense in both fs and ns LPPs depicting the
characteristic triplet structure of Zn. The optimized pressure for maximum emission
intensity and life time is found to be ~ 10 Torr, in the present measurements.
Furthermore, a double pulse excitation experiment is performed to understand the
effect of energy coupling by a delayed ultrafast laser pulse on the emission dynamics
of the plasma plume.
CHAPTER 6
ACCELERATION OF NEUTRALS IN LASER PRODUCED PLASMAS
This chapter gives a study of the phenomenon of acceleration of neutrals observed in
laser produced plasma from metal targets. Emission from neutrals has been
measured to larger axial distances compared to ions in expanding plasmas. The
measured times of arrival of ions and neutrals at larger laser fluences confirm the
generation of fast neutrals via the recombination of fast ions with electrons. It is also
observed that fast neutrals are absent at grater axial distances where emissions from
ions are not detected. The estimated peak velocities of fast neutrals and ions are
found to increase with an increase in the laser energy. Furthermore, an acceleration
of fast neutrals and ions is observed close to the target, which is attributed to the
space charge effect. Acceleration of fast neutrals is described in more detail.
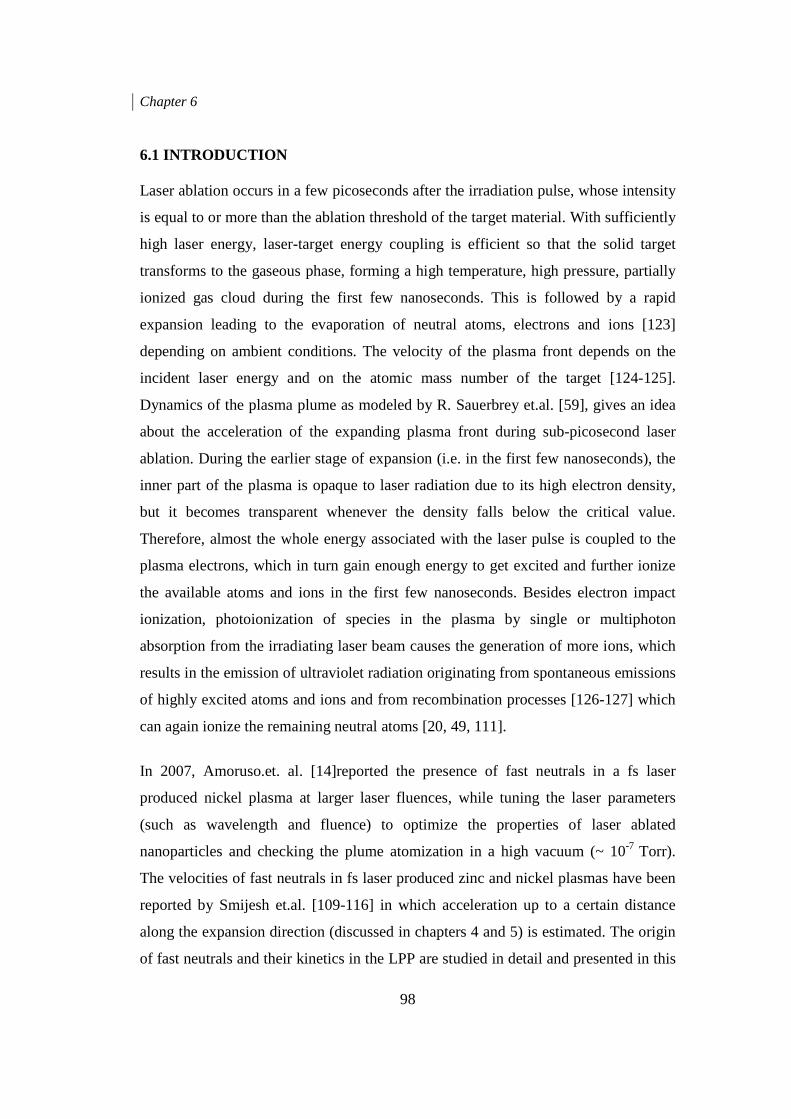
Chapter 6
98
6.1 INTRODUCTION Laser ablation occurs in a few picoseconds after the irradiation pulse, whose intensity
is equal to or more than the ablation threshold of the target material. With sufficiently
high laser energy, laser-target energy coupling is efficient so that the solid target
transforms to the gaseous phase, forming a high temperature, high pressure, partially
ionized gas cloud during the first few nanoseconds. This is followed by a rapid
expansion leading to the evaporation of neutral atoms, electrons and ions [123]
depending on ambient conditions. The velocity of the plasma front depends on the
incident laser energy and on the atomic mass number of the target [124-125].
Dynamics of the plasma plume as modeled by R. Sauerbrey et.al. [59], gives an idea
about the acceleration of the expanding plasma front during sub-picosecond laser
ablation. During the earlier stage of expansion (i.e. in the first few nanoseconds), the
inner part of the plasma is opaque to laser radiation due to its high electron density,
but it becomes transparent whenever the density falls below the critical value.
Therefore, almost the whole energy associated with the laser pulse is coupled to the
plasma electrons, which in turn gain enough energy to get excited and further ionize
the available atoms and ions in the first few nanoseconds. Besides electron impact
ionization, photoionization of species in the plasma by single or multiphoton
absorption from the irradiating laser beam causes the generation of more ions, which
results in the emission of ultraviolet radiation originating from spontaneous emissions
of highly excited atoms and ions and from recombination processes [126-127] which
can again ionize the remaining neutral atoms [20, 49, 111].
In 2007, Amoruso.et. al. [14]reported the presence of fast neutrals in a fs laser
produced nickel plasma at larger laser fluences, while tuning the laser parameters
(such as wavelength and fluence) to optimize the properties of laser ablated
nanoparticles and checking the plume atomization in a high vacuum (~ 10-7 Torr).
The velocities of fast neutrals in fs laser produced zinc and nickel plasmas have been
reported by Smijesh et.al. [109-116] in which acceleration up to a certain distance
along the expansion direction (discussed in chapters 4 and 5) is estimated. The origin
of fast neutrals and their kinetics in the LPP are studied in detail and presented in this
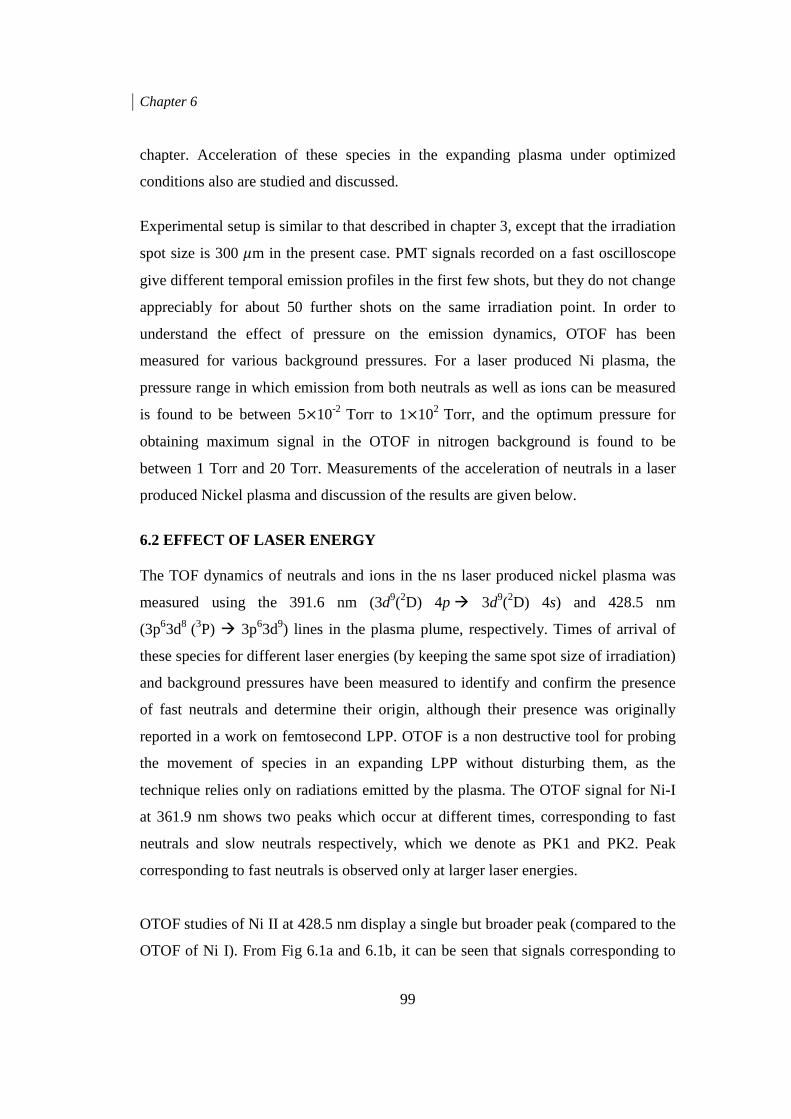
Chapter 6
99
chapter. Acceleration of these species in the expanding plasma under optimized
conditions also are studied and discussed.
Experimental setup is similar to that described in chapter 3, except that the irradiation
spot size is 300 �m in the present case. PMT signals recorded on a fast oscilloscope
give different temporal emission profiles in the first few shots, but they do not change
appreciably for about 50 further shots on the same irradiation point. In order to
understand the effect of pressure on the emission dynamics, OTOF has been
measured for various background pressures. For a laser produced Ni plasma, the
pressure range in which emission from both neutrals as well as ions can be measured
is found to be between 5×10⁻² Torr to 1×10² Torr, and the optimum pressure for
obtaining maximum signal in the OTOF in nitrogen background is found to be
between 1 Torr and 20 Torr. Measurements of the acceleration of neutrals in a laser
produced Nickel plasma and discussion of the results are given below.
6.2 EFFECT OF LASER ENERGY The TOF dynamics of neutrals and ions in the ns laser produced nickel plasma was
measured using the 391.6 nm (3d9(2D) 4p � 3d9(2D) 4s) and 428.5 nm
(3p63d8 (3P) � 3p63d9) lines in the plasma plume, respectively. Times of arrival of
these species for different laser energies (by keeping the same spot size of irradiation)
and background pressures have been measured to identify and confirm the presence
of fast neutrals and determine their origin, although their presence was originally
reported in a work on femtosecond LPP. OTOF is a non destructive tool for probing
the movement of species in an expanding LPP without disturbing them, as the
technique relies only on radiations emitted by the plasma. The OTOF signal for Ni-I
at 361.9 nm shows two peaks which occur at different times, corresponding to fast
neutrals and slow neutrals respectively, which we denote as PK1 and PK2. Peak
corresponding to fast neutrals is observed only at larger laser energies.
OTOF studies of Ni II at 428.5 nm display a single but broader peak (compared to the
OTOF of Ni I). From Fig 6.1a and 6.1b, it can be seen that signals corresponding to
Chapter 6
100
fast neutrals and ions are absent at relatively a lower irradiation energy of ~ 10 mJ,
indicating low ionization and recombination in the plume, whereas signals recorded
from slow neutrals confirm the presence of unionized neutrals at a lower laser energy.
With an increase in laser energy, signals from fast neutrals and ions appear at almost
similar times in comparison with the atomic species. From Fig 6.1a, it is found that
the velocity of fast neutrals increases and slow neutrals remain unaltered with
increase in laser energy. One interesting aspect to be noted here is that the time of
arrival of fast neutrals falls well within the time of arrival of ions, substantiating the
recombination mechanisms involved. In short, the fast atomic component is absent if
the number density of ions is low, which happens at lower irradiation energies.
Moreover the velocity of fast neutrals is found to increase with increase in irradiation
energy.
Figure 6.1. Time-resolved emission of the (a) 361.9 nm (3d9(2D) 4p � 3d9(2D)
4s)transition from Ni I and (b) 428.5 nm (3p63d8 (3P) 4s � 3p63d94s))transition from
Ni II, measured in the plasma plume at 2mm distance from the target surface, for 7 ns
irradiation. Ambient pressure is 5 Torr.
Chapter 6
101
Figure 6.2. ICCD images of an expanding Laser produced nickel plasma for the laser
energies (a) 10 mJ,(b) 20 mJ,(c) 30 mJ,(d) 40 mJ,(e) 50 mJ,(f) 60 mJ,(g) 70 mJ, and
(h) 80 mJ, measured using a gate delay of 5 ns. The measurement is done for a time
delay of 100 ns. Ambient pressure is 5 Torr.
Fig 6.2 shows ICCD images of LPP recorded at a time delay of 100 ns, with a gate
width of 5 ns, for energies ranging from 10 mJ to 80 mJ, measured at a pressure of 5
Torr. The presence of two peaks at larger laser energy (i.e., more than 10 mJ in the
present case) in an expanding LPP is once again confirmed by ICCD images. An
increase in the separation between the times of arrival of fast and slow species with
laser energy can also be observed in the ICCD images. LPP expands more at higher
irradiation energies: i.e., when the energy increases from 10 mJ to 80 mJ, the plasma
front reaches up to 9 mm from 3mm, when measured from the target surface. The
plume expansion velocity increases from 30 km/s to 90 km/s simultaneously.
In order to understand the effect of laser energy on the arrival of ions and fast peaks
in an expanding LPP, an experiment was performed by varying the laser energy,
while the irradiation spot size was kept a constant. Material ablation happens once the
irradiation intensity crosses the ablation threshold of the material, which can be
calculated using Equation 4.1. Imin is calculated to be 8.69 × 10¹¹ W/cm2 for fs
excitation and 3.89 × 10⁸ W/cm2 for ns excitation, with the corresponding laser
fluences being 8.69 × 10⁻² J/cm2 and 1.94 J/cm2 respectively. The measured variation
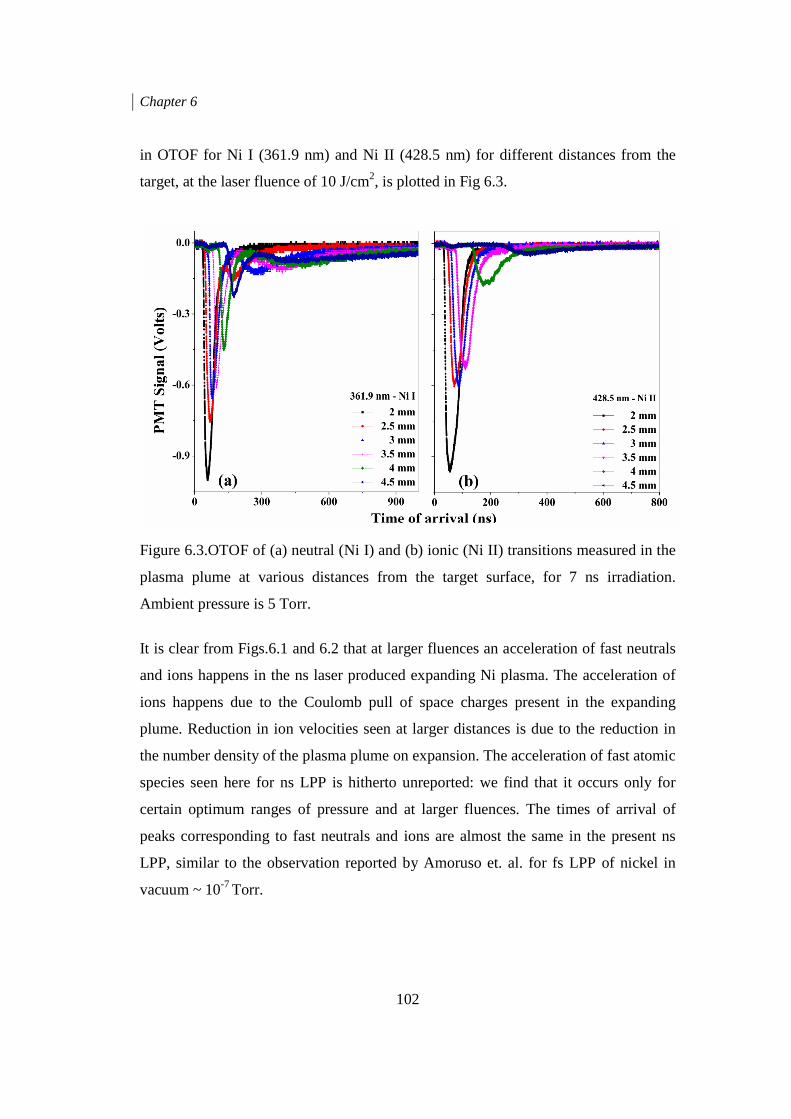
Chapter 6
102
in OTOF for Ni I (361.9 nm) and Ni II (428.5 nm) for different distances from the
target, at the laser fluence of 10 J/cm2, is plotted in Fig 6.3.
Figure 6.3.OTOF of (a) neutral (Ni I) and (b) ionic (Ni II) transitions measured in the
plasma plume at various distances from the target surface, for 7 ns irradiation.
Ambient pressure is 5 Torr.
It is clear from Figs.6.1 and 6.2 that at larger fluences an acceleration of fast neutrals
and ions happens in the ns laser produced expanding Ni plasma. The acceleration of
ions happens due to the Coulomb pull of space charges present in the expanding
plume. Reduction in ion velocities seen at larger distances is due to the reduction in
the number density of the plasma plume on expansion. The acceleration of fast atomic
species seen here for ns LPP is hitherto unreported: we find that it occurs only for
certain optimum ranges of pressure and at larger fluences. The times of arrival of
peaks corresponding to fast neutrals and ions are almost the same in the present ns
LPP, similar to the observation reported by Amoruso et. al. for fs LPP of nickel in
vacuum ~ 10-7 Torr.
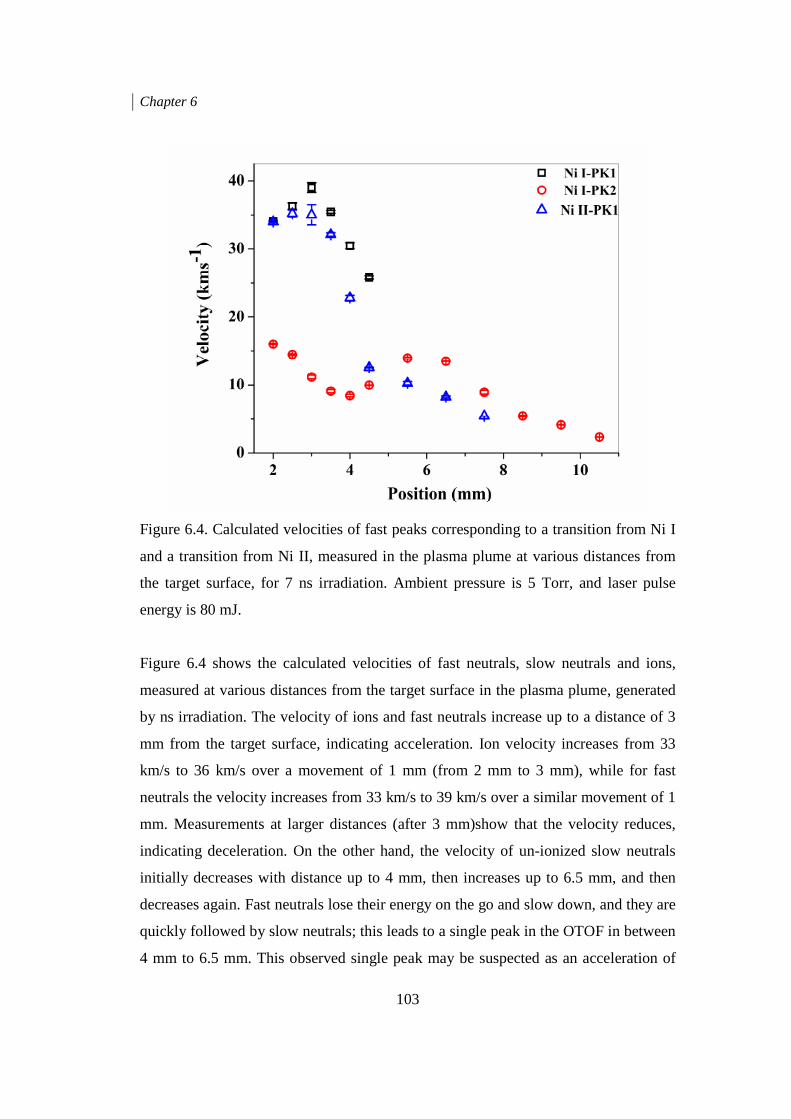
Chapter 6
103
Figure 6.4. Calculated velocities of fast peaks corresponding to a transition from Ni I
and a transition from Ni II, measured in the plasma plume at various distances from
the target surface, for 7 ns irradiation. Ambient pressure is 5 Torr, and laser pulse
energy is 80 mJ.
Figure 6.4 shows the calculated velocities of fast neutrals, slow neutrals and ions,
measured at various distances from the target surface in the plasma plume, generated
by ns irradiation. The velocity of ions and fast neutrals increase up to a distance of 3
mm from the target surface, indicating acceleration. Ion velocity increases from 33
km/s to 36 km/s over a movement of 1 mm (from 2 mm to 3 mm), while for fast
neutrals the velocity increases from 33 km/s to 39 km/s over a similar movement of 1
mm. Measurements at larger distances (after 3 mm)show that the velocity reduces,
indicating deceleration. On the other hand, the velocity of un-ionized slow neutrals
initially decreases with distance up to 4 mm, then increases up to 6.5 mm, and then
decreases again. Fast neutrals lose their energy on the go and slow down, and they are
quickly followed by slow neutrals; this leads to a single peak in the OTOF in between
4 mm to 6.5 mm. This observed single peak may be suspected as an acceleration of
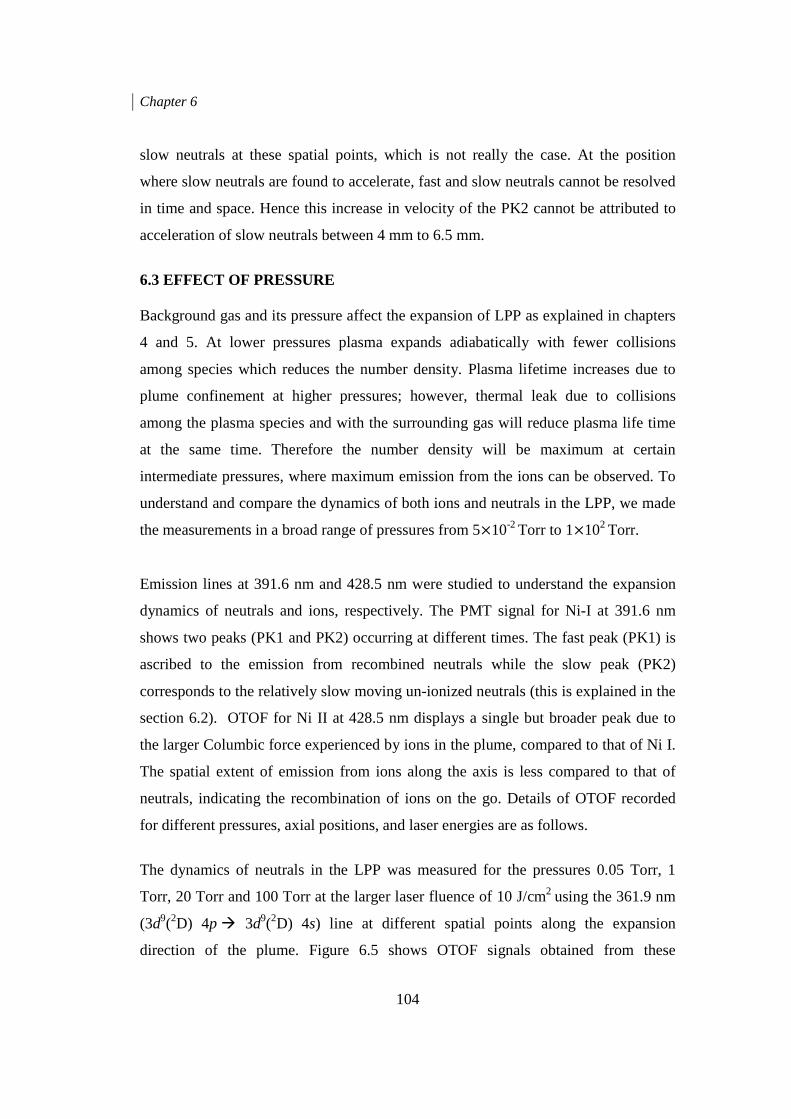
Chapter 6
104
slow neutrals at these spatial points, which is not really the case. At the position
where slow neutrals are found to accelerate, fast and slow neutrals cannot be resolved
in time and space. Hence this increase in velocity of the PK2 cannot be attributed to
acceleration of slow neutrals between 4 mm to 6.5 mm.
6.3 EFFECT OF PRESSURE Background gas and its pressure affect the expansion of LPP as explained in chapters
4 and 5. At lower pressures plasma expands adiabatically with fewer collisions
among species which reduces the number density. Plasma lifetime increases due to
plume confinement at higher pressures; however, thermal leak due to collisions
among the plasma species and with the surrounding gas will reduce plasma life time
at the same time. Therefore the number density will be maximum at certain
intermediate pressures, where maximum emission from the ions can be observed. To
understand and compare the dynamics of both ions and neutrals in the LPP, we made
the measurements in a broad range of pressures from 5×10⁻² Torr to 1×10² Torr.
Emission lines at 391.6 nm and 428.5 nm were studied to understand the expansion
dynamics of neutrals and ions, respectively. The PMT signal for Ni-I at 391.6 nm
shows two peaks (PK1 and PK2) occurring at different times. The fast peak (PK1) is
ascribed to the emission from recombined neutrals while the slow peak (PK2)
corresponds to the relatively slow moving un-ionized neutrals (this is explained in the
section 6.2). OTOF for Ni II at 428.5 nm displays a single but broader peak due to
the larger Columbic force experienced by ions in the plume, compared to that of Ni I.
The spatial extent of emission from ions along the axis is less compared to that of
neutrals, indicating the recombination of ions on the go. Details of OTOF recorded
for different pressures, axial positions, and laser energies are as follows.
The dynamics of neutrals in the LPP was measured for the pressures 0.05 Torr, 1
Torr, 20 Torr and 100 Torr at the larger laser fluence of 10 J/cm2 using the 361.9 nm
(3d9(2D) 4p � 3d9(2D) 4s) line at different spatial points along the expansion
direction of the plume. Figure 6.5 shows OTOF signals obtained from these
Chapter 6
105
measurements. The presence of fast and slow neutrals (PK1 and PK2) is observed
close to the target but only a single, broader peak is observed at larger distances. This
is because the kinetic energy of the fast species reduces as they travel, and they
become slow enough so that un-ionized neutrals catch up with them. Signals from
neutral species have maximum spatial extent at 1 Torr, compared to other pressures.
Figure 6.6 shows OTOF signals corresponding to the ions, which help substantiate the
concept of acceleration of neutrals via recombination.
Figure 6.5. Optical time of flight (OTOF) measurement of the 361.9 nm (3d9(2D)
4p � 3d9(2D) 4s) Ni I (neutral) transition at various axial positions in the plasma, for
0.05 Torr, 1 Torr, 20 Torr and 100 Torr ambient pressures. The arrival of fast and
slow neutrals can be seen distinctly at certain pressures and positions.
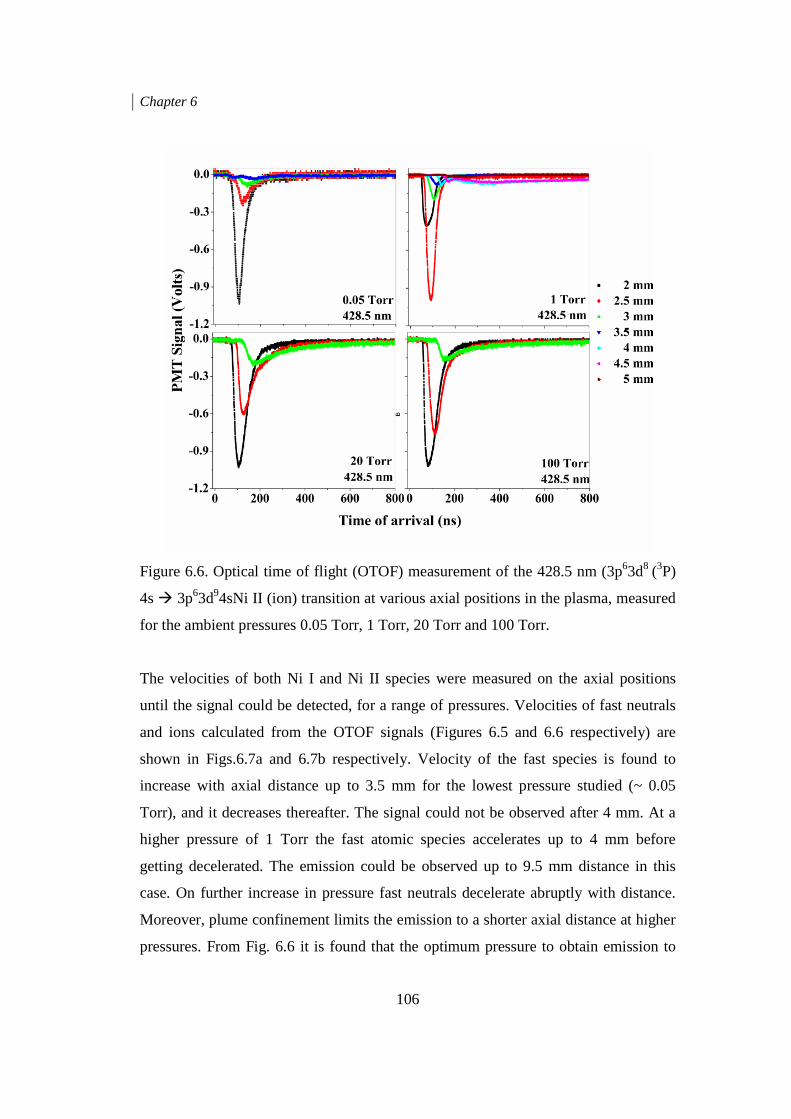
Chapter 6
106
Figure 6.6. Optical time of flight (OTOF) measurement of the 428.5 nm (3p63d8 (3P)
4s � 3p63d94sNi II (ion) transition at various axial positions in the plasma, measured
for the ambient pressures 0.05 Torr, 1 Torr, 20 Torr and 100 Torr.
The velocities of both Ni I and Ni II species were measured on the axial positions
until the signal could be detected, for a range of pressures. Velocities of fast neutrals
and ions calculated from the OTOF signals (Figures 6.5 and 6.6 respectively) are
shown in Figs.6.7a and 6.7b respectively. Velocity of the fast species is found to
increase with axial distance up to 3.5 mm for the lowest pressure studied (~ 0.05
Torr), and it decreases thereafter. The signal could not be observed after 4 mm. At a
higher pressure of 1 Torr the fast atomic species accelerates up to 4 mm before
getting decelerated. The emission could be observed up to 9.5 mm distance in this
case. On further increase in pressure fast neutrals decelerate abruptly with distance.
Moreover, plume confinement limits the emission to a shorter axial distance at higher
pressures. From Fig. 6.6 it is found that the optimum pressure to obtain emission to

Chapter 6
107
longer spatial extent from neutrals and ions along the length of the plume is 1 Torr.
Ions as well as fast neutrals accelerate to larger distances at this pressure. In short, at
5×10⁻² Torr the ions accelerate and fly away, and cannot be detected after 4.5 mm. At
1 Torr the ions accelerate from 2 mm to 4 mm along the plume axis, but get
decelerated at larger distances due to the reduced Coulomb pull, and the emission can
be detected up to 6.5 mm. At the highest pressures studied (20 Torr and 100 Torr) the
OTOF signal is very weak beyond an axial distance of 3.5 mm.
Figure 6.7. Velocities of the (a) fast Ni and (b) Ni II species, measured at various
axial distances from the target surface, for 7 ns irradiation. Ambient pressures vary
from 0.05 Torr to 100 Torr.
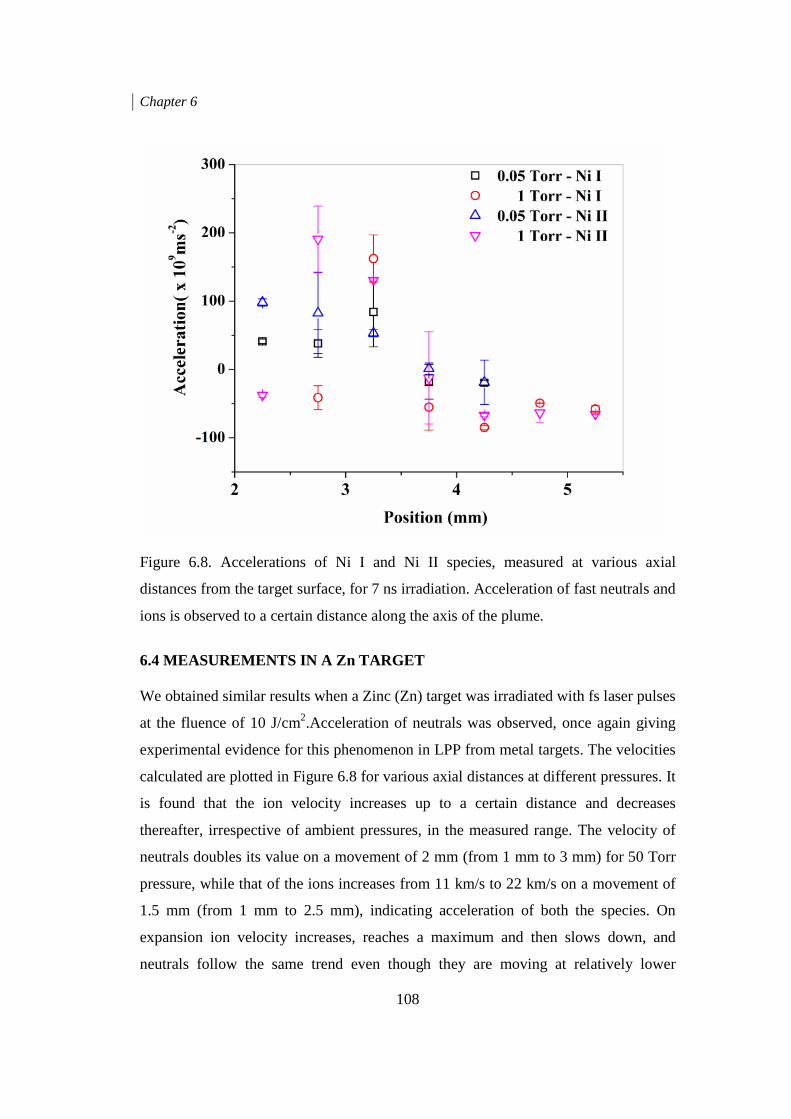
Chapter 6
108
Figure 6.8. Accelerations of Ni I and Ni II species, measured at various axial
distances from the target surface, for 7 ns irradiation. Acceleration of fast neutrals and
ions is observed to a certain distance along the axis of the plume.
6.4 MEASUREMENTS IN A Zn TARGET We obtained similar results when a Zinc (Zn) target was irradiated with fs laser pulses
at the fluence of 10 J/cm2.Acceleration of neutrals was observed, once again giving
experimental evidence for this phenomenon in LPP from metal targets. The velocities
calculated are plotted in Figure 6.8 for various axial distances at different pressures. It
is found that the ion velocity increases up to a certain distance and decreases
thereafter, irrespective of ambient pressures, in the measured range. The velocity of
neutrals doubles its value on a movement of 2 mm (from 1 mm to 3 mm) for 50 Torr
pressure, while that of the ions increases from 11 km/s to 22 km/s on a movement of
1.5 mm (from 1 mm to 2.5 mm), indicating acceleration of both the species. On
expansion ion velocity increases, reaches a maximum and then slows down, and
neutrals follow the same trend even though they are moving at relatively lower
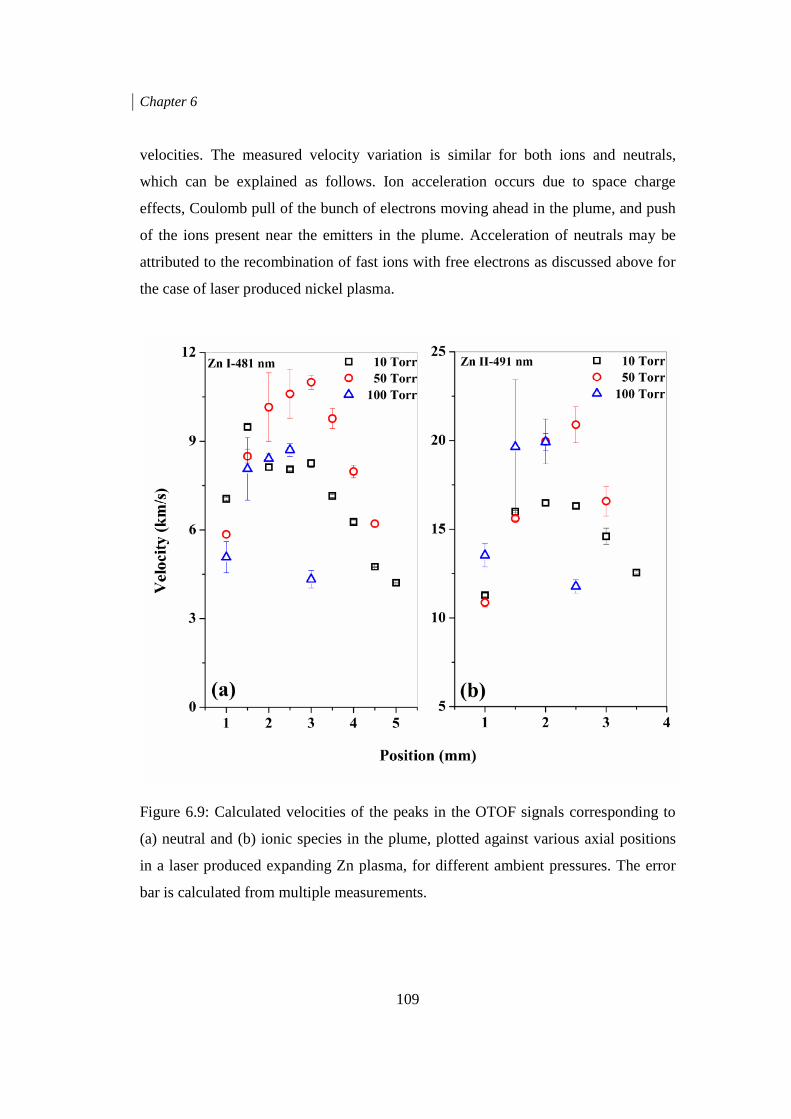
Chapter 6
109
velocities. The measured velocity variation is similar for both ions and neutrals,
which can be explained as follows. Ion acceleration occurs due to space charge
effects, Coulomb pull of the bunch of electrons moving ahead in the plume, and push
of the ions present near the emitters in the plume. Acceleration of neutrals may be
attributed to the recombination of fast ions with free electrons as discussed above for
the case of laser produced nickel plasma.
Figure 6.9: Calculated velocities of the peaks in the OTOF signals corresponding to
(a) neutral and (b) ionic species in the plume, plotted against various axial positions
in a laser produced expanding Zn plasma, for different ambient pressures. The error
bar is calculated from multiple measurements.
Chapter 6
110
6.5 CONCLUSION A detailed investigation of the acceleration of neutrals in laser produced plasmas,
observed in the LPP from solid metal targets, is given in this chapter. Studies of the
acceleration of fast neutrals in a nanosecond laser produced Ni plasma are given in
detail, along with similar observations made in a femtosecond laser produced Zn
plasma. These studies confirm that the acceleration of neutrals from the LPP of
metallic targets is indeed possible in the case of nanosecond laser excitation. Detailed
theoretical calculations should be able to provide more insights into the phenomenon
of neutral acceleration in nanosecond laser LPPs.
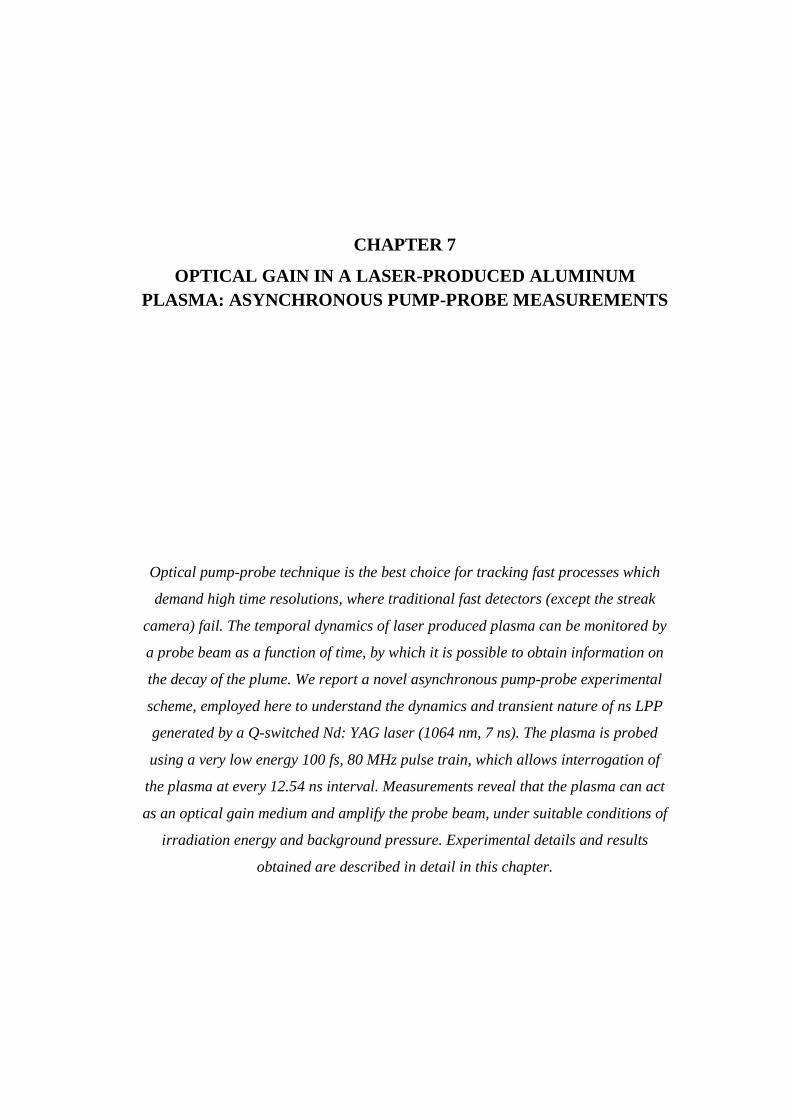
CHAPTER 7
OPTICAL GAIN IN A LASER-PRODUCED ALUMINUM PLASMA: ASYNCHRONOUS PUMP-PROBE MEASUREMENTS
Optical pump-probe technique is the best choice for tracking fast processes which
demand high time resolutions, where traditional fast detectors (except the streak
camera) fail. The temporal dynamics of laser produced plasma can be monitored by
a probe beam as a function of time, by which it is possible to obtain information on
the decay of the plume. We report a novel asynchronous pump-probe experimental
scheme, employed here to understand the dynamics and transient nature of ns LPP
generated by a Q-switched Nd: YAG laser (1064 nm, 7 ns). The plasma is probed
using a very low energy 100 fs, 80 MHz pulse train, which allows interrogation of
the plasma at every 12.54 ns interval. Measurements reveal that the plasma can act
as an optical gain medium and amplify the probe beam, under suitable conditions of
irradiation energy and background pressure. Experimental details and results
obtained are described in detail in this chapter.
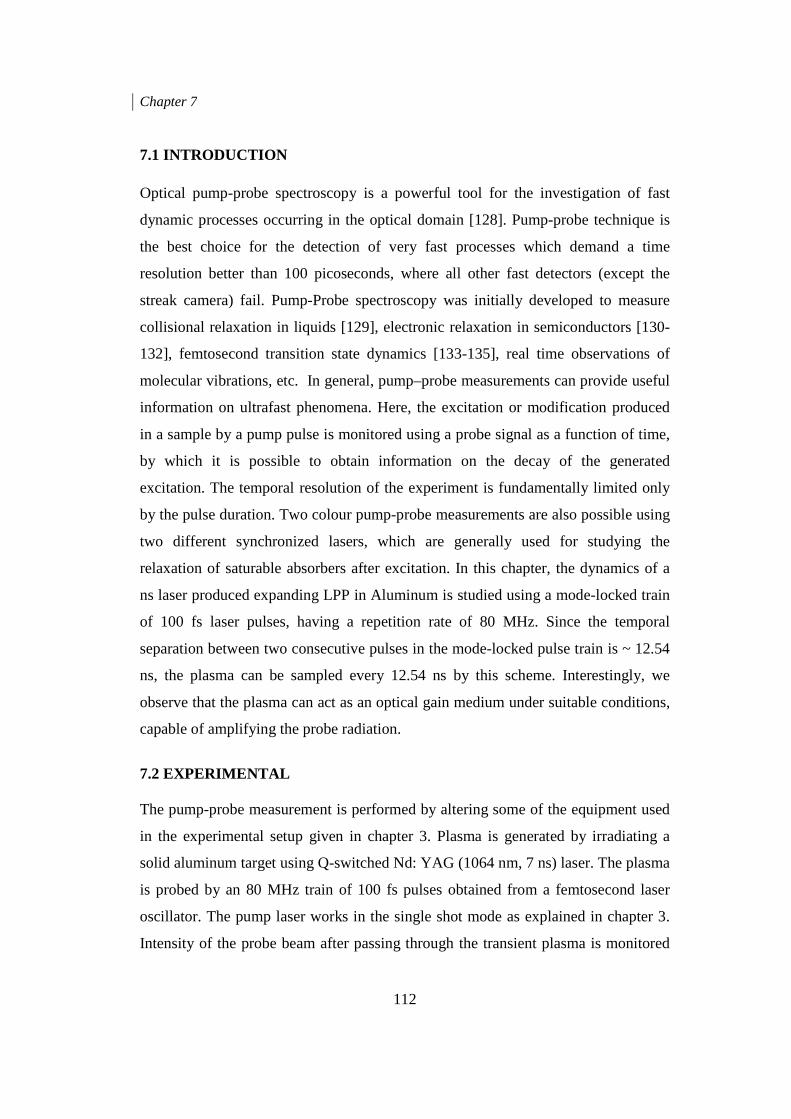
Chapter 7
112
7.1 INTRODUCTION Optical pump-probe spectroscopy is a powerful tool for the investigation of fast
dynamic processes occurring in the optical domain [128]. Pump-probe technique is
the best choice for the detection of very fast processes which demand a time
resolution better than 100 picoseconds, where all other fast detectors (except the
streak camera) fail. Pump-Probe spectroscopy was initially developed to measure
collisional relaxation in liquids [129], electronic relaxation in semiconductors [130-
132], femtosecond transition state dynamics [133-135], real time observations of
molecular vibrations, etc. In general, pump–probe measurements can provide useful
information on ultrafast phenomena. Here, the excitation or modification produced
in a sample by a pump pulse is monitored using a probe signal as a function of time,
by which it is possible to obtain information on the decay of the generated
excitation. The temporal resolution of the experiment is fundamentally limited only
by the pulse duration. Two colour pump-probe measurements are also possible using
two different synchronized lasers, which are generally used for studying the
relaxation of saturable absorbers after excitation. In this chapter, the dynamics of a
ns laser produced expanding LPP in Aluminum is studied using a mode-locked train
of 100 fs laser pulses, having a repetition rate of 80 MHz. Since the temporal
separation between two consecutive pulses in the mode-locked pulse train is ~ 12.54
ns, the plasma can be sampled every 12.54 ns by this scheme. Interestingly, we
observe that the plasma can act as an optical gain medium under suitable conditions,
capable of amplifying the probe radiation.
7.2 EXPERIMENTAL The pump-probe measurement is performed by altering some of the equipment used
in the experimental setup given in chapter 3. Plasma is generated by irradiating a
solid aluminum target using Q-switched Nd: YAG (1064 nm, 7 ns) laser. The plasma
is probed by an 80 MHz train of 100 fs pulses obtained from a femtosecond laser
oscillator. The pump laser works in the single shot mode as explained in chapter 3.
Intensity of the probe beam after passing through the transient plasma is monitored
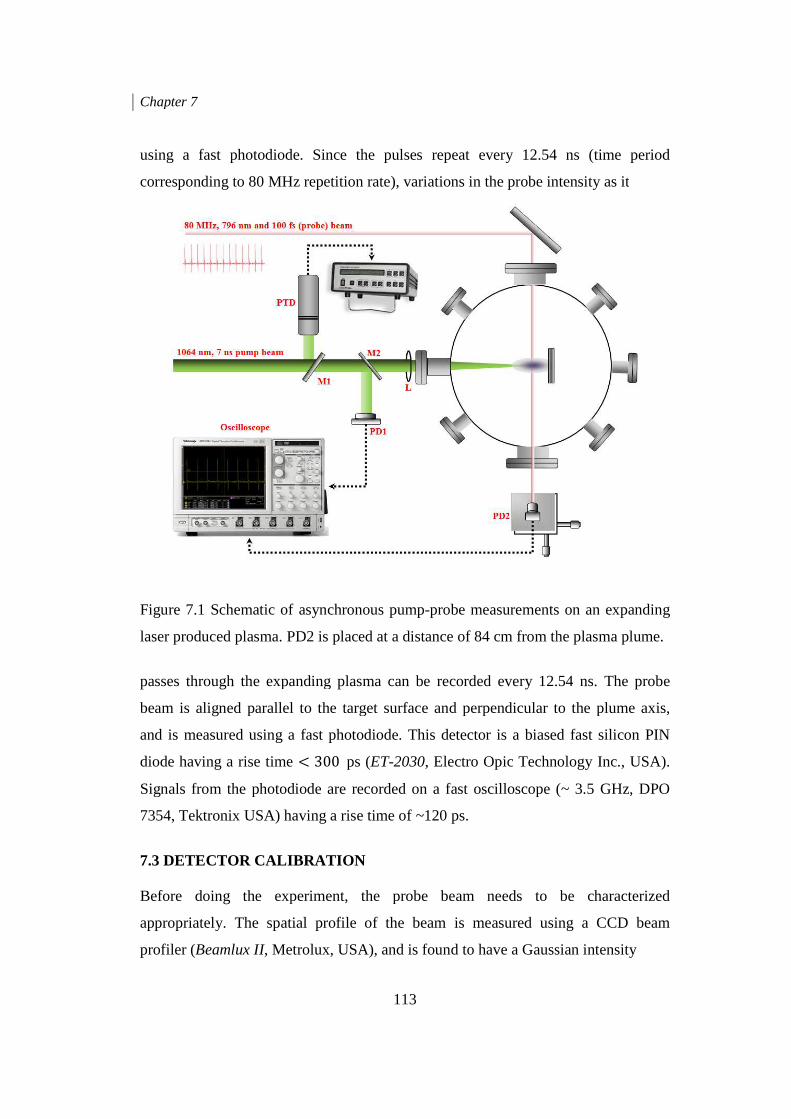
Chapter 7
using a fast photodiode.
corresponding to 80 MHz
Figure 7.1 Schematic
laser produced plasma.
passes through the expanding
beam is aligned parallel to the target surface and
and is measured using a fast photodiode.
diode having a rise time
Signals from the photodiode
7354, Tektronix USA)
7.3 DETECTOR CALIBRATION Before doing the experiment, the probe
appropriately. The spatial
profiler (Beamlux II, Metrolux, USA), and is found to have a Gaussian intensity
113
using a fast photodiode. Since the pulses repeat every 12.54
80 MHz repetition rate), variations in the probe intensity as it
Figure 7.1 Schematic of asynchronous pump-probe measurements on an expanding
laser produced plasma. PD2 is placed at a distance of 84 cm from the plasma plume.
expanding plasma can be recorded every 12.54
parallel to the target surface and perpendicular to the plume axis
using a fast photodiode. This detector is a biased fast silicon PIN
having a rise time � 300 ps (ET-2030, Electro Opic Technology Inc.
Signals from the photodiode are recorded on a fast oscilloscope (~ 3.5 GHz, DPO
7354, Tektronix USA) having a rise time of ~120 ps.
7.3 DETECTOR CALIBRATION
experiment, the probe beam needs to be characterized
The spatial profile of the beam is measured using
, Metrolux, USA), and is found to have a Gaussian intensity
ns (time period
probe intensity as it
measurements on an expanding
PD2 is placed at a distance of 84 cm from the plasma plume.
12.54 ns. The probe
perpendicular to the plume axis,
biased fast silicon PIN
ic Technology Inc., USA).
oscilloscope (~ 3.5 GHz, DPO
to be characterized
is measured using a CCD beam
, Metrolux, USA), and is found to have a Gaussian intensity
Chapter 7
Figure 7.2. Spatial profile
using a CCD beam profiler.
along the horizontal and
Figure 7.3. Probe laser
connected to fast oscilloscope. The measured FWHM is larger
and falltime of ~ 389.8 ps)
oscilloscope. The mean repetition rate
80 MHz (i.e., period is
114
2. Spatial profile of the Tsunami (100 fs, 80 MHz) laser
beam profiler. Insets (b and c) show the intensity distribution
horizontal and vertical directions respectively, on the beam cross section
laser pulses of 100 fs FWHM measured using a fast photodiode
fast oscilloscope. The measured FWHM is larger (risetime of ~187.4 ps
and falltime of ~ 389.8 ps) due to the finite response times of the photodiode and
he mean repetition rate is accurately measured, which is
period is ~ 12.54 ns).
laser pulses measured
intensity distribution measured
respectively, on the beam cross section.
using a fast photodiode
(risetime of ~187.4 ps
due to the finite response times of the photodiode and
is accurately measured, which is found to be
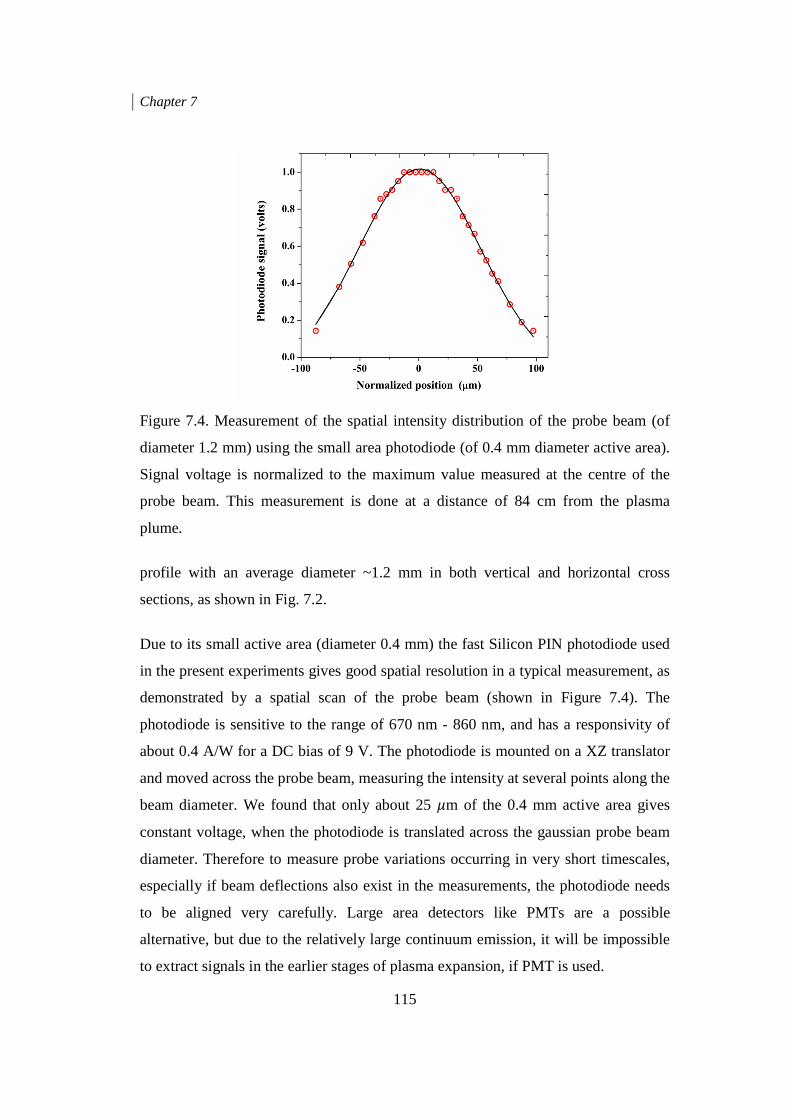
Chapter 7
115
Figure 7.4. Measurement of the spatial intensity distribution of the probe beam (of
diameter 1.2 mm) using the small area photodiode (of 0.4 mm diameter active area).
Signal voltage is normalized to the maximum value measured at the centre of the
probe beam. This measurement is done at a distance of 84 cm from the plasma
plume.
profile with an average diameter ~1.2 mm in both vertical and horizontal cross
sections, as shown in Fig. 7.2.
Due to its small active area (diameter 0.4 mm) the fast Silicon PIN photodiode used
in the present experiments gives good spatial resolution in a typical measurement, as
demonstrated by a spatial scan of the probe beam (shown in Figure 7.4). The
photodiode is sensitive to the range of 670 nm - 860 nm, and has a responsivity of
about 0.4 A/W for a DC bias of 9 V. The photodiode is mounted on a XZ translator
and moved across the probe beam, measuring the intensity at several points along the
beam diameter. We found that only about 25 �m of the 0.4 mm active area gives
constant voltage, when the photodiode is translated across the gaussian probe beam
diameter. Therefore to measure probe variations occurring in very short timescales,
especially if beam deflections also exist in the measurements, the photodiode needs
to be aligned very carefully. Large area detectors like PMTs are a possible
alternative, but due to the relatively large continuum emission, it will be impossible
to extract signals in the earlier stages of plasma expansion, if PMT is used.
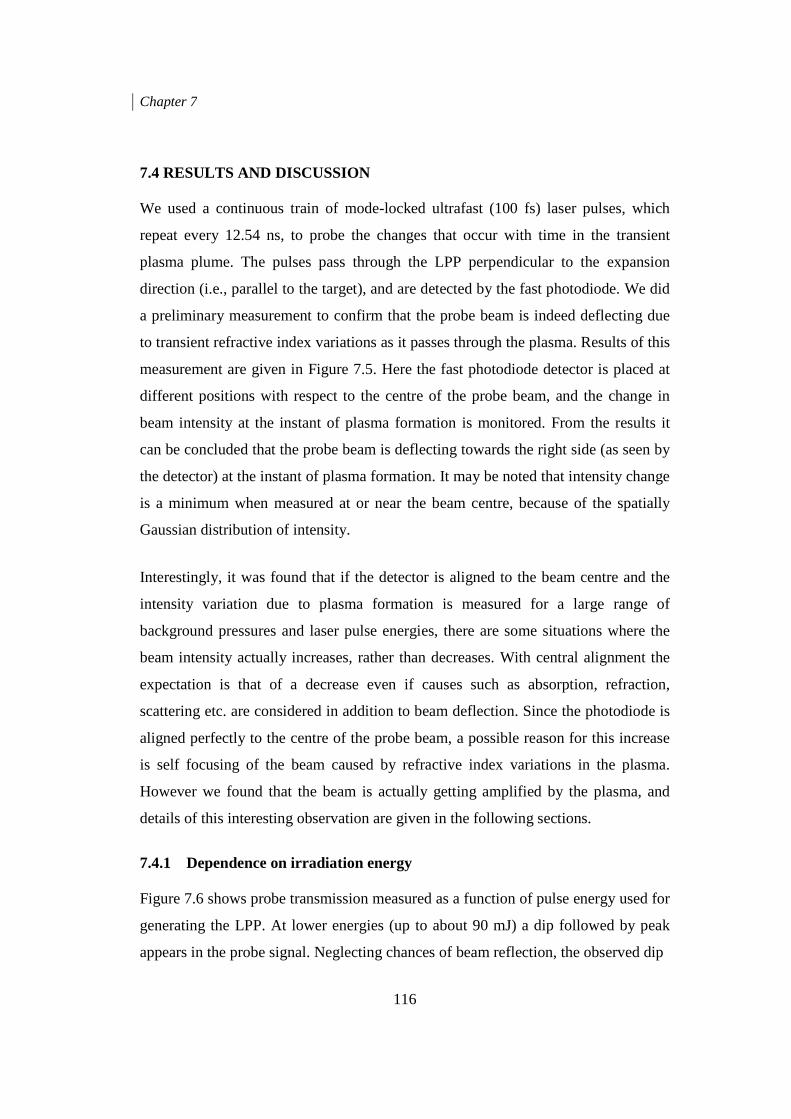
Chapter 7
116
7.4 RESULTS AND DISCUSSION We used a continuous train of mode-locked ultrafast (100 fs) laser pulses, which
repeat every 12.54 ns, to probe the changes that occur with time in the transient
plasma plume. The pulses pass through the LPP perpendicular to the expansion
direction (i.e., parallel to the target), and are detected by the fast photodiode. We did
a preliminary measurement to confirm that the probe beam is indeed deflecting due
to transient refractive index variations as it passes through the plasma. Results of this
measurement are given in Figure 7.5. Here the fast photodiode detector is placed at
different positions with respect to the centre of the probe beam, and the change in
beam intensity at the instant of plasma formation is monitored. From the results it
can be concluded that the probe beam is deflecting towards the right side (as seen by
the detector) at the instant of plasma formation. It may be noted that intensity change
is a minimum when measured at or near the beam centre, because of the spatially
Gaussian distribution of intensity.
Interestingly, it was found that if the detector is aligned to the beam centre and the
intensity variation due to plasma formation is measured for a large range of
background pressures and laser pulse energies, there are some situations where the
beam intensity actually increases, rather than decreases. With central alignment the
expectation is that of a decrease even if causes such as absorption, refraction,
scattering etc. are considered in addition to beam deflection. Since the photodiode is
aligned perfectly to the centre of the probe beam, a possible reason for this increase
is self focusing of the beam caused by refractive index variations in the plasma.
However we found that the beam is actually getting amplified by the plasma, and
details of this interesting observation are given in the following sections.
7.4.1 Dependence on irradiation energy Figure 7.6 shows probe transmission measured as a function of pulse energy used for
generating the LPP. At lower energies (up to about 90 mJ) a dip followed by peak
appears in the probe signal. Neglecting chances of beam reflection, the observed dip

Chapter 7
Figure 7.5. The probe beam (train of 100 fs pulses from the
Tsunami) measured using
diameter, at a distance of
pressure is 50 Torr and laser pulse
the centre of the probe beam are,
10 �m right, (e) 30 �m
that the probe beam is deflecting in the rightward direction (as seen by the detector)
at the instant of plasma formation.
in the probe beam in the initial stages of expansion could be either due to absorption
or scattering by the plasma species, if the number density is less than the critical
density ~ 1.72 � 1021
106 mJ, only the peak appears. In the time window of 200
formation, the amplitude of this peak exceeds the normal amplitude of the probe
beam ('normal amplitude' is the amplitude measured in the absence of the plasma).
This observation clearly indicates that the ultrafast laser pulses are getting amplified
by a single pass through the plasma. The use of plasma as a gain medium has been
discussed earlier in literature [136
117
The probe beam (train of 100 fs pulses from the ultrafast oscillator,
measured using a fast photodiode, at different positions along the beam
a distance of 84 cm from the centre of the plasma.
and laser pulse energy is ~120 mJ. Measurement positions from
the centre of the probe beam are, (a) 70 �m left, (b) 30 �m left, (c) 0
m right, and (f) 60 �m right. Observed intensity variations show
that the probe beam is deflecting in the rightward direction (as seen by the detector)
at the instant of plasma formation.
in the probe beam in the initial stages of expansion could be either due to absorption
or scattering by the plasma species, if the number density is less than the critical
cm-3 (for 796 nm). On further increase of irradiation energy t
106 mJ, only the peak appears. In the time window of 200 - 300 ns after plasma
formation, the amplitude of this peak exceeds the normal amplitude of the probe
beam ('normal amplitude' is the amplitude measured in the absence of the plasma).
ion clearly indicates that the ultrafast laser pulses are getting amplified
by a single pass through the plasma. The use of plasma as a gain medium has been
discussed earlier in literature [136-141], and the present results are a validation of
ultrafast oscillator,
at different positions along the beam
. LPP background
Measurement positions from
c) 0 �m (centre), (d)
Observed intensity variations show
that the probe beam is deflecting in the rightward direction (as seen by the detector)
in the probe beam in the initial stages of expansion could be either due to absorption
or scattering by the plasma species, if the number density is less than the critical
(for 796 nm). On further increase of irradiation energy to
300 ns after plasma
formation, the amplitude of this peak exceeds the normal amplitude of the probe
beam ('normal amplitude' is the amplitude measured in the absence of the plasma).
ion clearly indicates that the ultrafast laser pulses are getting amplified
by a single pass through the plasma. The use of plasma as a gain medium has been
141], and the present results are a validation of
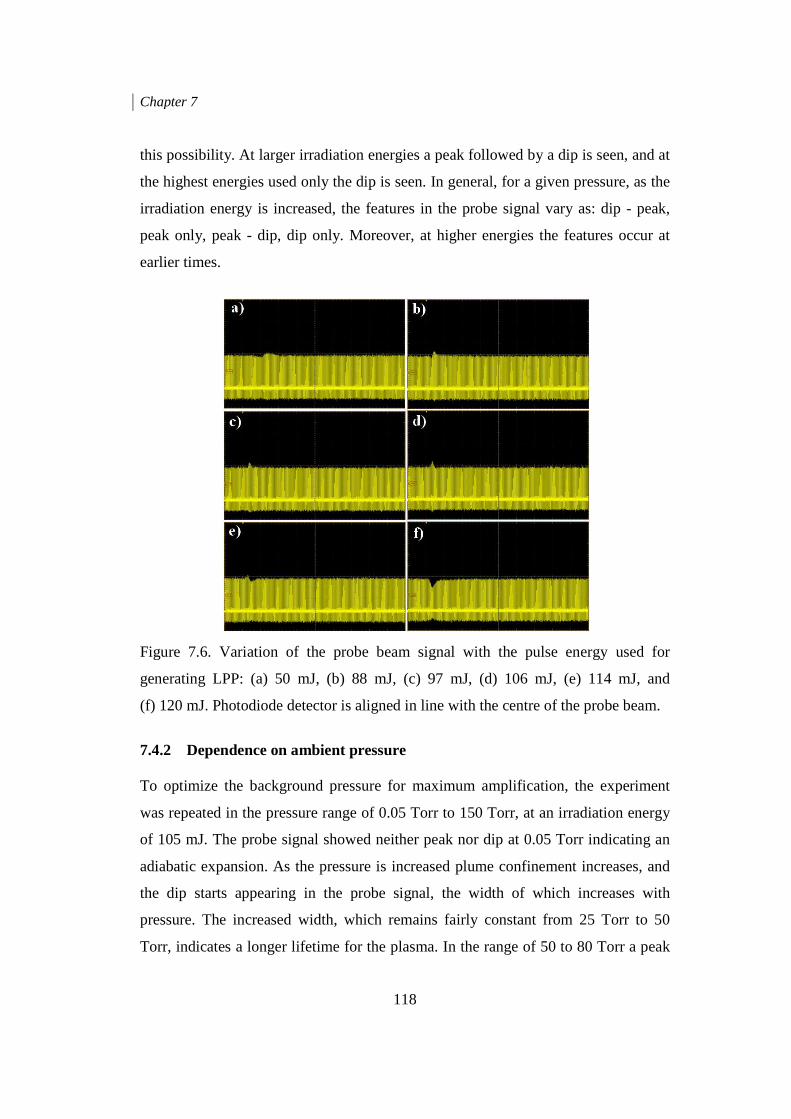
Chapter 7
this possibility. At larger irradiation energies a peak followed by a dip is seen, and at
the highest energies used only the dip is seen. In general, for a given pressure, as the
irradiation energy is increased, the features in the probe signal vary as: dip
peak only, peak - dip, dip only. Moreover, at higher energies the features occur at
earlier times.
Figure 7.6. Variation
generating LPP: (a) 50 mJ
(f) 120 mJ. Photodiode detector is aligned in line with the centre of the probe beam.
7.4.2 Dependence on To optimize the background
was repeated in the pressure
of 105 mJ. The probe signal
adiabatic expansion. As the
the dip starts appearing in the probe
pressure. The increased width, which remains fairly constant from 25 Torr to 50
Torr, indicates a longer lifetime for the plasma
118
lity. At larger irradiation energies a peak followed by a dip is seen, and at
the highest energies used only the dip is seen. In general, for a given pressure, as the
irradiation energy is increased, the features in the probe signal vary as: dip
dip, dip only. Moreover, at higher energies the features occur at
of the probe beam signal with the pulse energy used for
a) 50 mJ, (b) 88 mJ, (c) 97 mJ, (d) 106 mJ,
Photodiode detector is aligned in line with the centre of the probe beam.
on ambient pressure
background pressure for maximum amplification
pressure range of 0.05 Torr to 150 Torr, at an
he probe signal showed neither peak nor dip at 0.05 Torr indicating an
As the pressure is increased plume confinement increases
ing in the probe signal, the width of which
The increased width, which remains fairly constant from 25 Torr to 50
Torr, indicates a longer lifetime for the plasma. In the range of 50 to 80 Torr
lity. At larger irradiation energies a peak followed by a dip is seen, and at
the highest energies used only the dip is seen. In general, for a given pressure, as the
irradiation energy is increased, the features in the probe signal vary as: dip - peak,
dip, dip only. Moreover, at higher energies the features occur at
the pulse energy used for
(e) 114 mJ, and
Photodiode detector is aligned in line with the centre of the probe beam.
ion, the experiment
an irradiation energy
neither peak nor dip at 0.05 Torr indicating an
plume confinement increases, and
which increases with
The increased width, which remains fairly constant from 25 Torr to 50
In the range of 50 to 80 Torr a peak
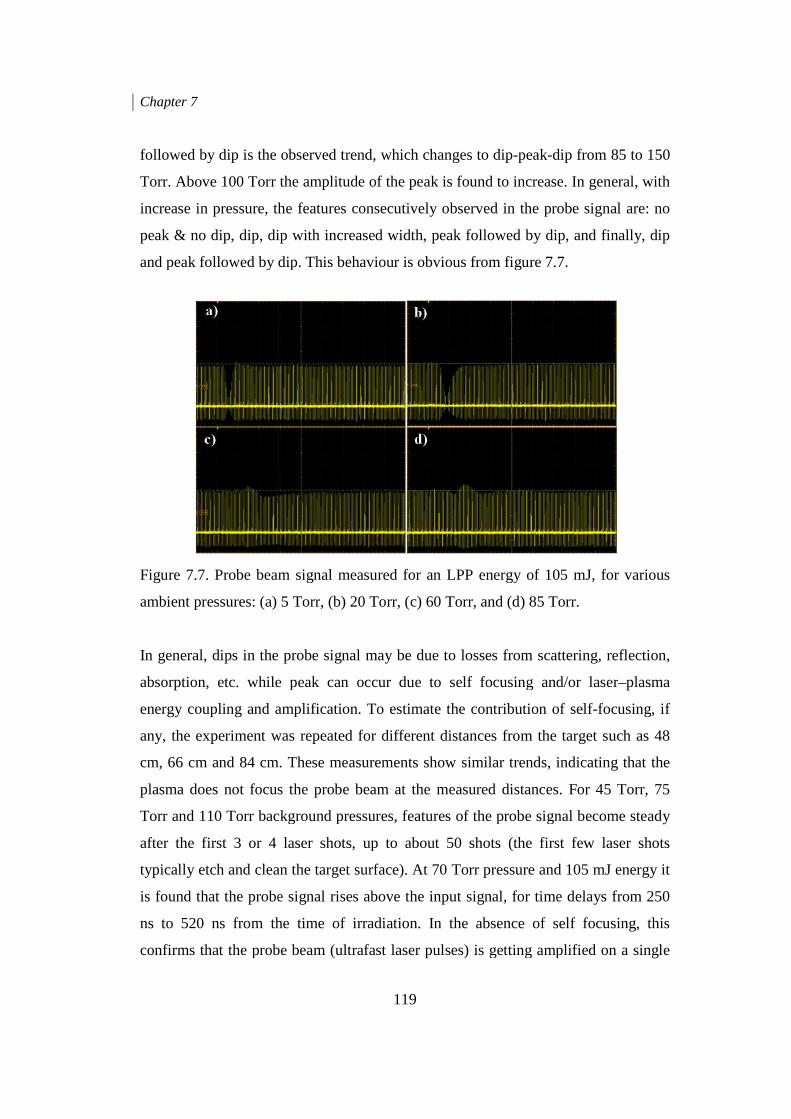
Chapter 7
followed by dip is the
Torr. Above 100 Torr the
increase in pressure, the features
peak & no dip, dip, dip with
and peak followed by dip
Figure 7.7. Probe beam signal measured for an LPP energy of 105 mJ,
ambient pressures: (a) 5 Torr
In general, dips in the
absorption, etc. while peak can occur due to
energy coupling and amplification
any, the experiment was
cm, 66 cm and 84 cm
plasma does not focus the
Torr and 110 Torr background pressures, features of the probe
after the first 3 or 4 laser shots, up to about 50 shots
typically etch and clean the
is found that the probe signal
ns to 520 ns from the time of irradiation
confirms that the probe beam
119
followed by dip is the observed trend, which changes to dip-peak-dip
Torr. Above 100 Torr the amplitude of the peak is found to increase
the features consecutively observed in the probe signal are: no
dip with increased width, peak followed by dip
peak followed by dip. This behaviour is obvious from figure 7.7
Probe beam signal measured for an LPP energy of 105 mJ,
a) 5 Torr, (b) 20 Torr, (c) 60 Torr, and (d) 85 Torr.
the probe signal may be due to losses from scattering, reflection,
while peak can occur due to self focusing and/or laser
amplification. To estimate the contribution of
was repeated for different distances from the target such as
cm, 66 cm and 84 cm. These measurements show similar trends, indicating that
not focus the probe beam at the measured distances.
Torr and 110 Torr background pressures, features of the probe signal
after the first 3 or 4 laser shots, up to about 50 shots (the first few
etch and clean the target surface). At 70 Torr pressure and 105 mJ
probe signal rises above the input signal, for time delays from 250
ns to 520 ns from the time of irradiation. In the absence of self focusing, this
probe beam (ultrafast laser pulses) is getting amplified
dip from 85 to 150
is found to increase. In general, with
observed in the probe signal are: no
peak followed by dip, and finally, dip
figure 7.7.
Probe beam signal measured for an LPP energy of 105 mJ, for various
d) 85 Torr.
scattering, reflection,
self focusing and/or laser–plasma
To estimate the contribution of self-focusing, if
distances from the target such as 48
indicating that the
distances. For 45 Torr, 75
signal become steady
first few laser shots
and 105 mJ energy it
, for time delays from 250
In the absence of self focusing, this
is getting amplified on a single
Chapter 7
120
pass through the plasma gain medium. For the same target location, increase in the
photodiode output voltage is found to be ~ 21% for the 5th to 15th shots, and ~ 15%
for the next 40 shots. Thus it is clear that under optimized conditions ultrafast laser
pulses can be amplified by a factor of 15% to 20% on a single pass through the
present ns Al LPP. The experiment was repeated 5 times, giving similar results. In
general, amplification occurs earlier in time with increase in pressure. Moreover,
maximum amplification occurs in the space of 2 mm to 4.5 mm from the target
surface, along the plume expansion direction.
7.5 CONCLUSION We have carried out a novel asynchronous pump-probe experiment to characterize
transient refractive index variations in a ns LPP generated in Aluminum, employing
a mode-locked pulse train of 80 MHz, 100 fs laser pulses as the probe. The
technique has a temporal resolution of 12.54 ns (inverse of the pulse repetition
frequency). Measurements reveal amplification of the probe pulses under optimal
LPP energy and pressure conditions, indicating that the plasma is acting as an
ultrafast photon gain medium. Detailed studies can reveal more information on the
nature of this amplification, which may have potential practical applications.

CHAPTER 8
CONCLUSION AND FUTURE SCOPE
An account of the major findings of the present study is given in this chapter. A brief
overview of the scope for future work in the direction of the current work is also
included.
Chapter 8
122
In a nutshell, the work reported in this thesis is on the generation and temporal
characterization of laser produced plasmas from metallic targets. Nanosecond (ns-
short-pulse) and femtosecond (fs-ultrafast pulse) Laser Produced Plasmas (LPP) were
generated using 7 ns and 100 fs laser pulses respectively, by irradiating Nickel and
Zinc targets. The studies show that the nature of the generated LPPs is different
between these irradiations, as mentioned in literature. A Q-Switched Nd:YAG laser,
emitting 1064 nm,7 ns pulses, and a regeneratively amplified Ti:Sapphire laser,
emitting 800 nm,100 fs pulses, were used to generate the ns and fs LPPs respectively.
Even though the system generates 10 Hz pulses, single pulses were selected from the
pulse train to facilitate single shot measurements, as described in Chapter 3. Proper
synchronization using required electronic circuits was done to synchronize the
instruments used in the experiment with the incident laser pulse, to make accurate
measurements. Once the plasma was formed it was analyzed by a CCD (to study the
optical emission spectra), PMT (to study the dynamics of the species) and an ICCD
(to image the plasma). Data acquisition was done through a PC installed with
appropriate softwares.
The plasma was found to be composed of neutrals, ions and electrons which are
referred to as plasma species in general. Optical Emission Spectroscopy (OES) was
carried out to identify the species in the generated plasma, by matching the observed
spectral lines with the NIST standard database. The identified lines were then
categorized and the lines with relatively higher probability were chosen and sent to
the PMT to investigate the dynamics (via Optical Time of Flight (OTOF
measurements)) of that particular species in the plasma. Furthermore, imaging using
ICCD was done which provided images of the expanding plasma at different delay
times, revealing interesting trends in the dynamics of the species in the expanding
plasma.
Nickel plasma produced using ns and fs irradiations were characterized using OES
and OTOF measurements and ICCD imaging. Emissions at 361nm (3d9(2D) 4p
3d9(2D) 4s transition) for the neutrals and 428.5nm (3p63d8(3P) 4s 3p63d9 4s) for ions
Chapter 8
123
were investigated for a large range of ambient nitrogen pressures varying from 10-6
Torr to 102 Torr. OES and OTOF measurements were done at two different spatial
points whereas imaging was done at different time delays at specific gatewidths to
observe the dynamics of the expanding plasma. Plasma intensity was found to
increase with pressure for both ns and fs excitations. While the electron temperature
is maximized around 10-4 Torr to 10-3 Torr for ns excitation, it was relatively lower
and rather independent of pressure for fs excitation. A double-peak structure was
observed in the OTOF spectrum of Ni I under ns excitation where the fast peak was
due to the neutrals formed by ion-electron recombination, and the slow peak was due
to the un-ionized neutrals ablated from the target. On the other hand, for fs excitation,
only one peak (fast) was observed in the OTOF spectrum. Measured velocities of the
species were found to be relatively higher and independent of pressure for fs
excitation, whereas shockwave effects were evident for ns excitation. The measured
velocities clearly indicate acceleration of fast species in the plume on expansion, at
least up to a distance of 4 mm from the target, whereas the slow species is found to
decelerate, particularly at higher pressures. These investigations provide new
information on the pressure dependent temporal behavior of Ni plasmas produced by
ns and fs laser pulses.
Similarly, plasma generated by fs and ns LPPs from a high quality solid zinc target
kept under broad ambient nitrogen pressures from 5 10-2 Torr to 5 102 Torr were
also studied. The Zn I (4s5s 3S1 - 4s4p 3P2) line was observed at a distance of 2 mm
from the target surface with a laser fluence of ~16 J/cm2. Temperature and number
density were calculated from the optical emission spectra and plotted as a function of
pressure. OTOF of the line at 481 nm showed a double-peak structure, ascribed to the
existence of fast and slow atomic species respectively in the LPP. Fast atomic species
was found to move with an average velocity of ~104 m/s whereas slow atomic species
was found to move with a velocity of ~103 m/s. Interestingly, the average velocity of
the fast atomic component was found to vary with pressure upon ns excitation,
whereas it remained unchanged for fs excitation. ns LPP from solid Zn showed a
longer plume lifetime. Emission from neutral Zn was found to be more intense in
Chapter 8
124
both fs and ns LPPs for similar fluences, depicting the characteristic triplet structure
of Zn. The optimum pressure for maximum emission intensity and lifetime was
experimentally found to be ~ 10 Torr. Furthermore, a double pulse excitation
measurement was performed to understand the effect of laser-plasma energy coupling
on the emission dynamics of the plasma plume.
Acceleration of neutrals was calculated for both ns and fs LPPs from the velocity
data. Data obtained from OTOF spectra are well supported by the ICCD images.
Occurrence of the phenomenon of acceleration of neutral species is verified and
confirmed by the experiments carried out in this work. Another important result
obtained is the amplification of the 796 nm probe beam by the plasma, which shows
that laser produced plasma is acting as an optical gain medium.
The results obtained from the present work lay a strong basis for the fundamental
study of laser produced plasmas from solid metal targets kept under a nitrogen
background, for both ns and fs laser irradiations. The obtained results will be useful to
understand the dynamics of various plasma species, nature of expansion, and various
phenomena associated with the plasma, which find potential applications in the fields
of pulsed laser deposition, nanoparticle generation, production of fourth generation
light sources, plasma based accelerators etc. Detailed studies with respect to various
ambient gases, various other targets etc. can be performed to get a better idea about
the fundamental physics of LPPs.
The observed acceleration of neutrals in the LPP of metal targets opens up new
possibilities for further research, which can lead to fundamental studies focusing on
plasma based accelerators for neutral species. The novel asynchronous pump-probe
experiment described in chapter 7 is essentially a new and effective technique for
probing highly transient plasmas with high temporal resolution. Possibilities of
optical gain and amplification in LPP, which is an important outcome of the
experiments performed, is a very promising result obtained from these investigations,
which may pave the way for potential applications in future.
125
REFERENCES
[1] D. H. Lowndes, D. B. Geohegan, A. A. Puretzky, D. P. Norton, and
C. M. Rouleau, Synthesis of novel thin-film materials by pulsed laser
deposition, Science, Vol. 273, No. 5277, August 1996, pp. 898-903.
[2] C. Thaury and F. Qu´er´e, High-order harmonic and attosecond pulse
generation on plasma mirrors: basic mechanisms, Journal of Physics B:
Atomic, Molecular and Optical Physics, Vol. 43, October 2010, pp. 21300-1-
33.
[3] R. A. Ganeev, High-order harmonic generation in a laser plasma: a review of
recent achievements, Journal of Physics B: Atomic, Molecular and Optical
Physics, Vol. 40, October 2007, pp. R213-R253.
[4] S. Varró and F. Ehlotzky, Higher harmonic generation at metal surfaces by
powerful femtosecond laser pulses, Physical Review A, Vol. 54, No. 4,
October 1996, pp 3245-3249.
[5] U. Teubner and P. Gibbon, High- order harmonics from laser-irradiated
plasma surfaces, Reviews of Modern Physics, Vol. 81, No.2, April 2009, pp
445-479.
[6] C. Chenais-Popovics, O. Rancu, P. Renaudin, and J. C. Gauthier, X-ray
spectroscopy of laser-produced hot dense plasmas, Physica Scripta, Vol. T65,
1996, pp-163-167.
[7] B. C. Fawcett, A. H. Gabriel, F. E. Irons, N. J. Peacock, P. A. H. Saunders,
Extreme ultra-violet spectra from laser-produced plasmas, Proceedings of the
Physical Society, Vol. 88, May 1966, pp 1051-1053.
[8] D. D. Burgess, B. C. Fawcett and N. J. Peacock, Vacuum ultra-violet emission
spectra from laser-produced plasmas, Proceedings of the Physical Society,
Vol. 92, July 1967, pp 805-816.
[9] J. D. Kmetec, Ultrafast Laser Generation of Hard X-Rays, IEEE Journal of
Quantum Electronics, Vol. 28, No. 10, October 1992, pp. 2382- 2387.
References
126
[10] M. Anand, C. P. Safvan, M. Krishnamurthy, Hard X-ray generation from
microdroplets in intense laser fields, Applied Physics B, Vol. 81, July 2005,
pp 469-477.
[11] S. Amoruso, G. Ausanio, R. Bruzzese, M. Vitiello, and X. Wang,
Femtosecond laser pulse irradiation of solid targets as a general route to
nanoparticle formation in a vacuum, Physical Reveiw B, Vol. 71, January
2005, pp. 033406-1-4.
[12] S. Amoruso, R. Bruzzese, X. Wang, N. N. Nedualkov, and P. A. Atanasov,
femtosecond laser ablation of nickel in vacuum, Journal of Physics D: Applied
Physics, Vol. 40, January 2007, pp 331-340.
[13] S. Amoruso, G. Ausanio, A. C. Barone, R. Bruzzese, C. Campana, X. Wang,
Nanoparticles size modifications during femtosecond laser ablation of nickel
in vacuum, Applied Surface Science, Vol. 254, July 2007, pp 1012-1016.
[14] S. Amoruso, R. Bruzzese, C. Pagano, X. Wang, Features of plasma plume
evolution and material removal efficiency during femtosecond laser ablation
of nickel in high vacuum, Applied Physics A, Vol. 89, August 2007, pp 1017-
1024.
[15] D. R. Nicholson, Introduction to Plasma Theory, © Wiley, New York, 1983.
[16] M. N. Rosenbluth and R. Z. Sagdeev, Handbook of plasma Physics, Volume
1: Basic Plasma Physics, © North-Holland Publishing Company, 1983.
[17] F. F. Chen, Introduction to plasma physics and controlled fusion © Plenum
Press New York, 1984.
[18] C. Uberoi, Introduction to unmagnetized plasmas, © PHI Pvt. Ltd. New Delhi
1988.
[19] http://farside.ph.utexas.edu/teaching/plasma/lectures/node9.html.
[20] D. A. Cremers and L. J. Radziemski, Handbook of laser induced breakdown
spectroscopy, © John Wiley & Sons Ltd, 2006.
[21] E. Woryna, P. Parys, J. Wołowski and W. Mróz, Corpuscular diagnostics and
processing methods applied in investigations of laser-produced plasma as a
source of highly ionized ions, Laser and Particle beams, Vol. 14, Issue 3,
September 1996, pp. 293-321.
References
127
[22] T.N. Hansen, J. Schou, J.G. Lunney, Langmuir probe study of plasma
expansion in pulsed laser ablation, Applied Physics A: Materials Science and
processing, Vol. 69 [Suppl.], December 1999, pp.S601–S604.
[23] R. L. Merlino, Understanding Langmuir probe current-voltage characteristics,
American Journal of Physics, Vol. 75, No. 12, December 2007, pp 1078-1083.
[24] D. E. T. F. Ashby and D. F. Jephcott, Measurement of plasma density using a
gas laser as an infrared interferometer, Applied Physics Letters, Volume 3,
No.1, July 1963, pp-13-16.
[25] L. C. Johnson and T. K. Chu, Measurements of electron density evolution and
beam self-focusing in a laser-produced plasma, Physical Review Letters, Vol.
32, No. 10, March 1974, pp. 517-520.
[26] R. Rajesh, B. Ramesh Kumar, S. K. Varshney, Manoj Kumar, Chhaya
Chavda, Aruna Thakkar, N. C. Patel, Ajai Kumar and ADITYA team,
PRAMANA- journal of physics, Vol. 55, No. 5&6, December 2000, pp 733-
740.
[27] I.M. Hutchinson. Principles of plasma diagnostics. © Cambridge University
Press, Cambridge, 1987.
[28] K. L. Lancaster, J. Pasley, J. S. Green, D. Batani, S. Baton, R. G. Evans, L.
Gizzi, R. Heathcote, C. Hernandez Gomez, M. Koenig, P. Koester, A.
Morace, I. Musgrave, P. A. Norreys, F. Perez, J. N. Waugh, and N. C.
Woolsey, Temperature profiles derived from transverse optical shadowgraphy
in ultraintense laser plasma interactions at 6×10²⁰ W cm−2, Physics of
Plasmas, Vol. 16, May 2009, pp-056707-1-5.
[29] W. I. Linlor, Some properties of plasma produced by laser giant pulse,
Physical Review Letters, Vol. 12, No. 14, 1964, pp 383-385.
[30] S. A. Ramsden, and P. Savie, A radiative detonation model for the
development of a laser-induced spark in air, Nature, Vol. 203, 1964, 1217-
1219.
[31] R. G Meyerand, Jr., and A. F. Haught, Optical-energy absorption and high
density plasma production, Physical Review Letters, Vol. 13, No. 1, 1964, pp
7-9.
References
128
[32] S. A. Ramsden, and W. E. R. Davies, Radiation scattered from the plasma
produced by a focused ruby laser beam, Physical Review Letters, Vol. 13, No.
7, 1964, pp 227-229.
[33] V. V. Korobkin and R. V. Serov, Investigations of the magnetic field of a
spark produced be focusing laser radiation, zHETFPis’ma, Vol. 4, No. 3,
1966, pp 103-106.
[34] S. S. Harilal, Riju C. Issac, C. V. Bindhu, V. P. N. Nampoori and C. P. G.
Vallabhan, Temporal and spatial evolution of C2 laser induced plasma from
graphite target, Journal of Applied Physics, Vol. 80, No. 6, July 1996, pp
3561-3565.
[35] S. S. Harilal , C. V. Bindhu , Riju C. Issac , V. P. N. Nampoori, and C. P. G.
Vallabhan, Electron density and temperature measurements in a laser
produced plasma, Journal of Applied Physics, Vol. 82, No. 5, May1997, pp
2140-2146.
[36] S. S. Harilal, Riju C. Issac, C. V. Bindhu, V.P.N. Nampoori and C. P. G.
Vallabhan, Emission characteristics and dynamics of C2 from laser produced
graphite plasma, Journal of Applied Physics, Vol. 81, No. 8, April 1997, pp
3637-3643.
[37] S. S. Harilal, Beau O’ Shay and M. S. Tillack, Spectroscopic characterization
of laser-induced tin plasma, Journal of Applied Physics, Vol. 98, July 2005,
pp 013306-1-7.
[38] S. S. Harilal, T. Sizyuk, A. Hassanein, D. Campos, P. Hough, and V. Sizyuk,
The effect of excitation wavelength on dynamics of laser-produced tin plasma,
Journal of Applied Physics, Vol. 109, March 2011, pp 063306-1-9.
[39] D. Campos, S. S. Harilal, and A. Hassanein, Laser wavelength effects on ionic
and atomic emission from tin plasma, Applied Physics Letters, Vol. 96, April
2010, 151501-1-3.
[40] S. S. Harilal, T. Sizyuk, A. Hassanein, D. Campos, P. Hough, and V. Sizyuk,
The effect of excitation wavelength on dynamics of laser-produced tin plasma,
Journal of Applied Physics, Vol. 109, March 2011, pp 063306-1-9.
[41] C. S. Suchand Sandeep, Investigations of Nonlinear Optical Effects and
Ultrafast laser induced plasma in Nano structured Media, March 2010
(http://dspace.rri.res.in/bitstream/2289/4315/1/SuchandSandeep_Thesis.pdf).
References
129
[42] Jeffrey L. Krause, Kenneth J. Schafer, and Kenneth C. Kulander, High-order
harmonic generation from atoms and ions in the high intensity regime,
Physical Review Letters, Vol. 68, No. 24, June 1992, pp. 3535–3538.
[43] J. J. Macklin, J. D. Kmetec, and C. L. Gordon, III , High-order harmonic
generation using intense femtosecond pulses, Physical Review Letters, Vol.
70, No.6, February 1993, pp. 766–769.
[44] B. M. Jovanović, Optimum conditions for second harmonics generation in a
magnetized plasma, ICPP & 25th Conference on Controlled Fusion and
Plasma Physics, Praha, ECA Vol. 22C, 29 June – 3 July 1998, pp 2415-2418.
[45] A. Giulietti, C. Beneduce, T. Ceccotti, D. Giulietti, L.A. Gizzi and R. Mildren,
Study of second harmonic emissions for characterization of laser–plasma X-
ray sources, Laser and Particle Beams, Volume 16, No. 2, June 1998, pp 397-
404.
[46] J. Parashar and A. K. Sharma, Second-harmonic generation by an obliquely
incident laser on a vacuum-plasma interface, Europhysics Letters, Vol. 41,
No.4, February 1998, pp 389-394.
[47] J. Parashar and H. D. Pandey, Second- Harmonic Generation of Laser
Radiation in a Plasma with a Density Ripple, IEEE Transactions on Plasma
Science, Vol. 20, No.6, December 1992, pp 996-999.
[48] T. Engers, W. Fendel, H. Schüler, H. Schulz and D. Von der Linde, Second-
harmonic generation in plasmas produced by femtosecond laser pulses,
Physical Review A, Vol. 43, No. 8, April 1991, pp 4564-4567.
[49] R. M. More, Laser interaction with atoms, solids and plasmas © Plenum
Press, New York and London, 1994.
[50] C. Chenais-Popovics, 0. Rancu, P. Renaudin and J. C. Gauthier, X-ray
spectroscopy of laser-produced hot dense plasmas, Physica Scripta. Vol. T 65,
November 1996, pp. 163-167.
[51] Y. F. Lu, M. Takai, S. Komuro, T. Shiokawa and Y. Aoyagi, Surface cleaning
of metals by pulsed laser irradiation in air, Applied Physics A: Solids and
Surfaces, Vol. 59 May 1994, pp. 281-288.
References
130
[52] A. V. Bulgakov and N. M. Bulgakova, Dynamics of laser-induced plume
expansion into an ambient gas during film deposition, Journal of Physics D:
Applied Physics, Vol. 28, May 1995, pp 1710-1718.
[53] X. Wang, S. Amoruso, M. Armenante, A. Boselli, R. Bruzzese, N. Spinelli, R.
Velotta, Pulsed laser ablation of borocarbide targets probed by time-of-flight
mass spectroscopy, Optics and Lasers in Engineering, Vol. 39, 2003, pp 179-
190.
[54] L. Torrisi, F Caridi, D. Margarone, and L. Giuffrida, Nickel Plasma Produced
by 532-nm and 1064-nm Pulsed Laser Ablation, Plasma Physics Reports, Vol.
34, No. 7, 2008, pp 547-554.
[55] S. J. Henley, J. D. Carey, S. R. P. Silva G. M. Fuge, M. N. R. Ashfold, D.
Anglos Dynamics of confined plumes during short and ultrashort pulsed laser
ablation of graphite, Physical. Review. B, Vol. 72, November 2005, pp.
205413-1-3.
[56] F. E.Irons, R. W. P. Mc Whirter and N. J. Peacock, The ion and velocity
structure in a laser produced plasma, Journal of Physics B: Atomic and
Molecular Physics, Vol. 5, October 1972, pp 1975-1987.
[57] R. Dinger, K. Rohr, and H. Weber, Ion distribution in laser produced plasma
on tantalum surfaces at low irradiances, Journal of Physics D: Applied
Physics, Vol. 13, 1980, pp 2301-2307.
[58] K. Nakajima, D. Fisher, T. Kawakubo, H. Nakanishi, A. Ogata, Y. Kato, Y.
Kitagawa, R. Kodama, K. Mima, H. Shiraga, K. Suzuki, K. Yamakawa, T.
Zhang, Y. Sakawa, T. Shoji, Y. Nishida, N. Yugami, M. Downer and T.
Tajima, Observation of Ultrahigh Gradient Electron Acceleration by a Self-
Modulated Intense Short Laser Pulse, Physical Review Letters, Vol. 74, No.
22, May 1995, pp 4428-4431.
[59] R. Sauerbrey, Acceleration in femtosecond laser produced plasmas, Physics of
Plasmas, Vol. 3, No. 12, December 1996, pp 4712-4716.
[60] S. Amoruso, G. Ausanio, M. Vitiello, X Wang, Infrared femtosecond laser
ablation of graphite in high vacuum probed by optical emission spectroscopy,
Applied Physics A: Material Science and Processing Vol. 81, January 2005,
pp. 981-986.
References
131
[61] F. Claeyssens, S. J. Henley, Michael and M. N. R. Ashfold, Comparison of the
ablation plumes arising from ArF laser ablation of graphite, silicon, copper
and aluminium in vacuum, Journal of Applied Physics, Vol 94, No 4, August
2003, pp. 2203-2211.
[62] X. Zeng, X. L. Mao, R. Greif, R. E. Russo, Experimental investigation of
ablation efficiency and plasma expansion during femtosecond and
nanosecond laser ablation of silicon, Applied Physics A, Vol. 80, 2005, pp
237-241
[63] S. Amoruso, G. Ausanio, A. C. Barone, R. Bruzzese, L. Gragnaniello, M.
Vitiello and X. Wang, Ultrashort laser ablation of solid matter in vacuum: a
comparison between the picoseconds and femtosecond regimes, Journal of
Physics B: Atomic, Molecular and Optical Physics, Vol. 38, September 2005,
pp L329-L338.
[64] L. A. Emmert, R. C. Chinni, D. A. Cremers, C. R. Jones, and W. Rudolph,
Comparative study of femtosecond and nanosecond laser induced breakdown
spectroscopy of depleted uranium, Applied Opticcs, Vol. 50, No. 3, January
2011, pp 313-317.
[65] B. Verhoff, S. S. Harilal, J. R. Freeman, P. K. Diwakar and A. Hassanein,
Dynamics of femto-and nanosecond laser ablation plumes investigated using
optical emission spectroscopy, Journal of Applied Physics, Vol. 112,
November 2012, pp 093303-1-9.
[66] X. Bai, Q. Ma, V. Motto-Ros, J. Yu, D. Sabourdy, L. Nguyen, and A. Jalocha,
Convoluted effect of laser fluence and pulse duration on the property of a
nanosecond laser-induced plasma expanding into an argon ambient gas at the
atmospheric pressure, Journal of Applied Physics, Vol. 113, January 2013, pp
013304-1-10.
[67] J. R. Freeman, S. S. Harilal, P. K. Diwakar, B.Verhoff, A. Hassanein,
Comparison of optical emission from nanosecond and femtosecond laser
produced plasma in atmosphere and vacuum conditions, Spectrochimica Acta
Part B, Vol. 87, May 2013, pp 43-50.
References
132
[68] M. E. Shaheen, J. E. Gagnon and B. J. Fryer, Laser ablation of iron: A
comparison between femtosecond and picoseconds laser pulses, Journal of
Applied Physics, Vol. 114, August 2013, pp 083110-1-8.
[69] S. Hafeez, N. M Shaikh and M.A Baig, Spectroscopic studies of Ca plasma
generated by the fundamental, second and third harmonics of an Nd:YAG
laser, Laser and Particle Beams Vol. 26, January 2008, pp. 41-50.
[70] D. Campos, S.S. Harilal and A. Hassanien, The effect of laser wavelength on
emission and particle dynamics of Sn plasma, Journal of Applied Physics,
Vol. 108, December 2010, pp. 113305-1-7.
[71] S. Amoruso, Modelling of laser produced plasma and time-of-flight
experiments in UV laser ablation of aluminium targets, Applied Surface
Science, Vol. 138-139, 1999, pp 292-298.
[72] A. E. Hussein, P. K. Diwakar, S. S. Harilal and A. Hassanein, The role of
laser wavelength on plasma generation and expansion of ablation plumes in
air, Journal of Applied Physics, Vol. 113, April 2013, pp 143305-1-10.
[73] S. S. Harilal, Influence of spot size on propagation dynamics of laser-
produced tin plasma, Journal of Applied Physics, Vol. 102, December 2007,
pp. 123306-1-6.
[74] J. E. Crow, P. L. Auer and J. E. Allen, The expansion of a plasma into a
vacuum, Journal of Plasma Physics, Vol. 14, Part 1, 1975, pp 65-76.
[75] A. Neogi, A. Mishra, and R. K. Thareja, Dynamics of laser produced carbon
plasma expanding in low pressure ambient atmosphere, Journal of Applied
Physics, Vol. 83, No. 5, March 1998, pp 2831-2834.
[76] E. G. Gamaly, A. V. Rode, and B. Luther-Davies, V. T. Tikhonchuk, Ablation
of solids by femtosecond lasers: Ablation mechanism and ablation threshold
for metals and dielectrics, Physics of Plasmas, Vol. 9, No. 3, March 2002, pp
949-957.
[77] H. Matsuta and K. Wagatsuma, Emission Characteristics of a Low –Pressure
Laser- Induced Plasma: Selective Excitation of Ionic Emission Lines of
Copper, Applied Spectroscopy, Vol. 56, No. 9, May 2002, pp 1165-1169.
[78] S. S. Harilal, C. V. Bindhu, M. S. Tilack, F. Najamabadi, and A. C. Gaeris,
Internal structure and expansion dynamics of laser ablation plumes into
References
133
ambient gases, Journal of Applied Physics, Vol. 93, No. 5, March 2003, pp
2380-2388.
[79] C. G. Parigger, J. O. Hornkohl, A. M. Keszler and L. Nemes, Measurement
and analysis of atomic and diatomic carbon spectra from laser ablation of
graphite, Applied Optics, Vol.42, No. 30, October 2003, pp 6192-6198.
[80] A. K. Sharma, R. K. Thareja, Plume dynamics of laser-produced aluminium
plasma in ambient nitrogen, Applied Surface Science, Vol. 243, 2005, pp 68-
75.
[81] J. S. Cowpe, R. D. Pilkington, J. S. Astin and A. E. Hill, The effect of ambient
pressure on laser-induced silicon plasma temperature, density and
morphology, Journal of Physics D: Applied Physics, Vol. 42, July 2009, pp
165202-1-8.
[82] H. C. Joshi, V. Prahlad, R. K. Singh, Ajai Kumar, Emission analysis of
expanding laser produced lithium plasma plume in presence of ambient gas,
Physics Letters A, Vol. 373, Issue 37, September 2009, pp 3350-3353.
[83] A. J. Effenberger, Jr. And J. R. Scott, Effect of Atmospheric Conditions on
LIBS Spectra, Sensors, Vol.10, April 2010, pp 4907-4925.
[84] T. Donnelly, J. G. Lunney, S. Amoruso, R. BRuzzese, X. Wang, and X. Ni,
Angular distributions of plume components in ultrafast laser ablation of metal
targets, Applied Physics A, Vol. 100, June 2010, pp 569-574.
[85] T. Donnelly, J. G. Lunney, S. Amoruso, R. BRuzzese, X. Wang, and X. Ni,
Dynamics of laser produced by ultrafast laser ablation of metals, Journal of
Applied Physics, Vol. 108, August 2010, pp 043309-1-13.
[86] N. Farid, S. Bashir and K. Mahmood, Effect of ambient gas conditions on
laser-induced copper plasma and surface morphology, Physica Scripta, Vol.
85, December 2011, pp 015702-1-7.
[87] P. E. Nica, M. Agop, S. Gurlui, C. Bejinariu, and C. Focsa, Characterization
of Aluminum Laser Produced Plasma by Target Current Measurements,
Japanese Journal of Applied Physics, Vol. 51, October 2012, pp 106102-1-10.
[88] K. F. Al- Shboul, S. S. Harilal and A. Hassanein, Emission features of
femtosecond laser ablated carbon plasma in ambient helium, Journal of
Applied Physics, Vol. 113, April 2013, pp 163305-1-9.
References
134
[89] N. Farid, S. S. Harilal, H. Ding, and A. Hassanein, Emission features and
expansion dynamics of nanosecond laser ablation plumes at different ambient
pressures, Journal of Applied Physics, Vol. 115, January 2014, pp 033107-1-
9.
[90] B Rethfeld,K. Sokolowski-tinten, D. Von der Linde and S. I. Anisimov,
Timescales in the response of materials to femtosecond laser excitation,
Applied Physics A: Material Science and Processing, Vol. 79, March 2004,
pp. 767–769.
[91] S. S. Harilal, N. Farid, A. Hassanein, and V. M. Kozhevin, Dynamics of
femtosecond laser produced tungsten nanoparticle plumes, Vol. 114, 2013, pp
203302-1-7.
[92] S. Amoruso, G. Ausanio, C. de. Lisio, V. Iannotti, M. Vitiello, X. Wang, L.
Lanotte, Synthesis of nickel nanoparticles and nanoparticles magnetic films by
femtosecond laser ablation in vacuum, Applied Surface Science, Vol. 247,
February 2005, pp 71-75.
[93] N. Farid, S. S. Harilal, H. Ding, and A. Hassanein, Dynamics of ultrafast laser
plasma expansion in the presence of an ambient, Applied Physics Letters, Vol.
103, November 2013, pp 191112-1-5.
[94] S. S. Harilal, C. V. Bindhu, M. S. Tilack, F. Najamabadi, and A. C. Gaeris,
Plume splitting and sharpening in laser-produced aluminium plasma, Journal
of Physics D: Applied Physics, Vol. 35, November 2002, pp 2935-2938.
[95] F. Garrelie, J. Aubreton and A. Catherinot, Monte Carlo simulation of the
laser-induced plasma plume expansion under vacuum: Comparison with
experiments, Journal of Applied Physics Vol. 83, No. 10, May 1998, pp.
5075-5082.
[96] S. R. Franklin, R. K Thereja, Monte Carlo simulation of laser ablated plasma
for thin film deposition, Applied Surface science, Vol. 177 January 2001, pp.
15-21.
[97] Ya. B. Zel’dovich and Yu. P. Raizer, Physics of Shock Waves and High
Temperature Hydrodynamic Phenomena, Academic, New York, 1966, Vol. 1,
pp. 94.

References
135
[98] M . A Liberman and A. L. Velikovich, Physics of Shock Waves in Gases and
Plasmas, Springer, Berlin, 1986.
[99] T. E. Itina, J.Hermann, P. Delaporte and M.Sentis, Laser-generated plasma
plume expansion: Combined continuous-microscopic modeling, Physical
Review E, Vol. 66, No. 6, December 2002, pp. 066406-1-12.
[100] L. Fornarini, R. Fantoni, F. Colao, A. Santagata, R. Teghil, A. Elhassan and
M. A. Harith, Theoretical modeling of laser ablation of quaternary bronze
alloys: Case studies comparing femtosecond and nanosecond LIBS
experimental, data Journal of Physical Chemistry A, Vol 113, No. 52,
September 2009, pp.14364-14374.
[101] J. F. Kielkopf, Spectroscopic study of laser-produced plasmas in hydrogen,
Physical Review E, Vol. 52, No.2, August 1995, pp 2013-2024.
[102] S. I. Anisimov, B. L. Kapeliovich and T. L. Perel’man, Electron emission
from metal surfaces exposed to ultrashort laser pulses, Soviet Physics-Journal
of Experimental and Theoretical Physics, Vol. 39, No. 2, August 1974, pp
375-377.
[103] A.J. McAlister and E.A. Stern, Plasma resonance absorption in thin metal
films Physical Review Vol. 132, No. 4, November 1963, pp. 1599-1602.
[104] Michael I. Zeifman, Barbara J. Garrison, and Leonid V. Zhigilei, Combined
molecular dynamics–direct simulation Monte Carlo computational study of
laser ablation plume evolution, Journal of Applied Physics, Vol. 92, No. 4,
August 2002, pp. 2181-2193.
[105] T. A. Witten and L. M. Sander, Diffusion-Limited Aggregation, a Kinetic
Critical Phenomenon, Physical Review Letters, Vol. 47, No. 19, November
1981, pp. 1400-1403.
[106] D. W. Hahn and N. Omenetto, Laser Induced Breakdown spectroscopy
(LIBS), Part I: Review of Basic diagnostics and plasma-particle interactions:
Still-challenging issues within the analytical plasma community, Applied
Spectroscopy, Vol. 64, No. 12, September 2010, pp. 335A-366A.
[107] M. Polek, S. S. Harilal, and A. Hassanein, Two-dimensional mapping of the
electron density in laser-produced plasmas, Applied Optics, Vol. 51, No. 4.
February 2012, pp 498-503.
References
136
[108] H. R. Griem, Principles of plasma spectroscopy © Springer- Verlag, Berlin,
Heidelberg, 2009.
[109] N. Smijesh and Reji Philip, Emission dynamic of an expanding ultrafast-laser
produced Zn plasma under different ambient pressures, Journal of Applied
Phyiscs, Vol. 114, September 2013, pp. 093301-1-5.
[110] R. W. P. McWhirter, Plasma Diagnostic Techniques, edited by R. H.
Huddlestone and S. L. Leonard (Academic Press, New York, 1965), Chap. 5
[111] C. Phipps, Laser Ablation and its Applications, Springer Science & Business
media LLC, 2007.
[112] http://physics.nist.gov/PhysRefData/ASD /lines_form.html.
[113] S. S. Harilal, Riju C. Issac, C. V. Bindhu, V. P. N. Nampoori and C. P. G.
Vallabhan, Optical emission studies of C2 species in laser-produced plasma
from carbon, Journal of Physics D: Applied Physics, Vol. 30, 1997, pp 1703-
1709.
[114] A. M. El Sherbini, A. A. Saad Al Amer, A. T. Hassan, T. M. El Sherbini,
Measurement of plasma electron temperature utilizing magnesium lines
appeared in laser produced Aluminum plasma in air, Optics and Photonics
Journal, Vol. 2, December 2012, pp 278-285.
[115] A. Couairon and A. Mysyrowics, Femtosecond filamentation in transparent
media, Physics. Reports, Vol. 441, February 2007, pp. 47-189.
[116] N. Smijesh, K. Chandrasekharan, Jagdish C Joshi and Reji Philip, Time of
flight emission spectroscopy of a laser produced expanding nickel plasma:
short-pulse and ultrafast excitations, Journal of Applied Phyiscs, Vol. 116,
July 2014, pp. 013301-1-7.
[117] N. M. Shaikh, B. Rashid, S. Hafeez, Y. Jamil, and M. A. Baig, Measurement
of electron density and temperature of a laser-induced zinc plasma, Journal of
Physics D: Applied Physics, Vol. 39 March 2006, pp. 1384–1391.
[118] M. S. Dimitrijevic and S. Sahal-Bréchot, Stark Broadening of Neutral Zinc
spectral lines Astronomy and Astrophysics Supplementary Series, Vol. 140,
No. 2, December 1999, pp. 193-196.

References
137
[119] D. Devaux, R. Fabbro, L. Tollier, and E. Bartnicki, Generation of shock
waves by laser-induced plasma in confined geometry, Journal of Applied
Physics, Vol. 74, No. 4, August 1993, pp 2268-2273.
[120] V. S. Burakov, A. F. Bokhonov, M. I. Nedel’ko, N. V. Tarasenko, Change in
the ionization state of a near-surface laser-produced aluminium plasma in
double-pulse ablation modes, Quantum Electronics, Vol. 33, No. 12, 2003, pp
1065-1071.
[121] S. S. Harilal, P. K. Diwakar, J. R. Freeman and A. Hassanein, Role of laser
pre-pulse wavelength and inter-pulse delay on signal enhancement in collinear
double-pulse laser-induced breakdown spectroscopy, Spectrochimica Acta
Part B, Vol. 87, May 2013, pp 65-73.
[122] S. S. Harilal, P. K. Diwakar and A. Hassanein, Electron-ion relaxation time
dependent signal enhancement in ultrafast double-pulse laser-induced
breakdown spectroscopy, Applied Physics Letters, Vol. 103, July 2013, pp
041102-1-4.
[123] T. Y. Chang and C. K. Birdsall, Laser-induced emission of electrons, ions,
and neutrals from ti and ti-d surfaces, Applied Physics Letters, Vol. 5, No. 9,
November 1964, pp. 171-172.
[124] P.A.H. Saunders, P. Avivi, W. Millar, Laser Produced Plasmas from solid
hydrogen targets, Physics Letters A, Vol. 24, No. 5, February 1967, pp. 290-
291.
[125] N. G. Basov, O. N. Krokhin, and G. V. Sklizkov Laser Application for the
Production and Diagnostics of Pulsed Plasma, Applied Optics, Vol. 6, No. 11,
1967, pp. 1814-1817.
[126] M. Mattioli, D. Véron, Electron-ion Recombination in laser produced plasma,
Plasma Physics, Vol.11, 1969, pp 684-686.
[127] G. J. Tallents, An experimental study of recombination in a laser-produced
plasma, Plasma Physics, Vol. 22, 1980, pp 709-718.
[128] Xin Zhao, Zheng Zheng, Lei Liu, Qi Wang, Haiwei Chen, and Jiansheng Liu,
Fast, long-scan-range pump-probe measurement based on asynchronous
sampling using a dual wavelength mode-locked fiber laser, Optics Express,
Vol. 20, No.23, November 2012, pp 25584-25589.
References
138
[129] F. Stienkemeier, F. Meier, A. Hägele, and H. O. Lutz, E. Schreiber, C. P.
Schulz, and I. V. Herte, Coherence and Relaxation in Potassium-Doped
Helium Droplets Studied by Femtosecond Pump-Probe Spectroscopy,
Physical Review Letters, Vol. 83, No. 12, September 1999, pp. 2320-2323.
[130] C. Manzoni, A. Gambetta, E. Menna, M. Meneghetti, G. Lanzani, and G.
Cerullo, Intersubband Exciton Relaxation Dynamics in Single-Walled Carbon
Nanotubes, Physical Review Letters, Vol. 94, No. 20, May 2005, pp. 207401-
1-4.
[131] W. J. H. Leyland, G. H. John, R. T. Harley, M. M. Glazov, E. L. Ivchenko, D.
A. Ritchie, I. Farrer, A. J. Shields, and M. Henini, Enhanced spin-relaxation
time due to electron-electron scattering in semiconductor quantum wells,
Physical Review B, Vol. 75, No. 16, April 2007, pp. 165309-1-8.
[132] V. I. Klimov, A. A. Mikhailovsky, D. W. McBranch, C. A. Leatherdale, and
M. G. Bawendi, Mechanisms for intraband energy relaxation in
semiconductor quantum dots: The role of electron-hole interactions, Physical
Review B, Vol. 61, No. 20,May 2000, pp. R13 349-R13 352
[133] M. Drescher, M. Hentschel, R. Kienberger, M. Uiberacker, V. Yakovlev, A.
Scrinzi, Th. Westerwalbesloh, U. Kleineberg,U. Heinzmann & F. Krausz,
Time-resolved atomic inner-shell spectroscopy, Nature, Vol. 419, October
2002, pp. 803-807.
[134] John B. Asbury, Randy J. Ellingson, Hirendra N. Ghosh, Suzanne Ferrere,
Arthur J. Nozik, and Tianquan Lian, Femtosecond IR Study of Excited-State
Relaxation and Electron-Injection Dynamics of Ru(dcbpy)2(NCS)2 in Solution
and on Nanocrystalline TiO2 and Al2O3 Thin Films, Journal of Physical
Chemistry B, Vol. 103, No. 16,February 1999, pp. 3110-3119.
[135] M. G. Bawendi, W. L. Wilson, L. Rothberg, P. J. Carroll, T. M. Jedju, M. L.
Steigerwald, and L. E. Brus, Electronic structure and photoexcited-carrier
dynamics in nanometer-size CdSe clusters, Physical Review Letters, Vol. 65,
No. 13, September 1990, pp. 1623-1626.
[136] L. Casperson and A. Yariv, Pulse Propagation in a High- Gain Medium,
Physical Review Letters, Vol. 26, No. 6, February 1971, pp 293-295.
References
139
[137] L. I. Gudzenko, L. A. Shelepin, and S. I. Yakovlenko, Amplification in
recombining plasmas (plasma lasers), Soviet Physics-Uspekhi, Vol. 17, No.6,
June 1975, pp 848-863.
[138] R. D. Milroy, C. E. Capjack, and C. R. James, Plasma laser pulse amplifier
using induced Raman or Brillouin processes, Physics of Plasmas, Vol. 22,
No.10, October 1979, pp 1922-1931.
[139] C. Chenais-Popovics, R. Corbett, C. J. Hooker, M. H. Key, G. P. Kiehn, C. L.
S. Lewis, G. J. Pert, C. Regan, S. J. Rose, S. Sadaat, R. Smith, T. Tomie, and
O. Willi, Laser Amplification at 18.2 nm in Recombining Plasma from a
Laser- Irradiated Carbon Fiber, Physical Review Letters, Vol. 59, No. 19,
November 1987, pp 2161-2164.
[140] A. A. Andreev, C. Riconda, and V. T. Tikhonchuk and S. Weber, Short light
pulse amplification and compression by stimulated Brillouin scattering in
plasmas in the strong coupling regime, Physics of Plasmas, Vol. 13, May
2006, pp 053110-1-5.
[141] A. V. Ponomarev, P. S. Strelkov, and A. G. Shkvarunets, Tunable Plasma
Relativistic Microwave Amplifier, Plasma Physics Reports, Vol. 26, No. 7,
2007, pp 592-597.

1
Smijesh N. Senior Research Fellow
Laser and Nonlinear Optics lab Department of Physics
National Institute of Technology Calicut Kerala, India
Phone: +91-9946326883/7829528635 Contact: [email protected]
ACADEMIC QUALIFICATIONS
• Submitted Ph. D. Thesis titled “Spectral and temporal characterization of nanosecond
and femtosecond laser produced plasma from metallic targets” to the National
Institute of Technology Calicut (http://nitc.ac.in), Kerala, India [Supervisors: Dr. K.
Chandrasekharan ([email protected]) and Dr. Reji Philip ([email protected])].
• M. Tech. in Electronics and Communication (Optoelectronics and Optical
Communication) in November 2009 from the University of Kerala,
Thiruvananthapuram, Kerala, India.
• M. Sc. (Physics) in 2006 from Mahatma Gandhi University Kottayam, Kerala, India.
RESEARCH INTERESTS
Intense light-matter interaction, Laser Produced Plasmas, Laser Induced Breakdown
Spectroscopy, Nonlinear Optics.
JOURNAL PUBLICATIONS
1. Time of flight emission spectroscopy of a laser produced expanding nickel plasma:
short-pulse and ultrafast excitations
N. Smijesh, K. Chandrasekharan, J. C. Joshi, R. Philip, J. Appl. Phys. 116, 013301 (2014)
2. Emission dynamics of an expanding ultrafast-laser produced Zn plasma under
different ambient pressures
N. Smijesh and R. Philip, J. Appl. Phys. 114, 093301 (2013)
3. Organic dye impregnated poly(vinyl alcohol) nanocomposite as an efficient optical
limiter: structure, morphology and photophysical properties
S. Sreeja, S. Sreedhanya, N. Smijesh, R. Philip, C. I. Muneera, J. Mater. Chem. C, 1,
3851(2013)
4. Size-dependent optical properties of Au nanorods
S.L Smitha, K.G. Gopchandran, N. Smijesh, R. Philip, Progress in Natural Science-
Material International 23(1), 36 (2013)
2
5. Nonlinear optical properties of composite napthalocyanine thin films with
nanocrystalline morphology
N. S. Panicker, N. Smijesh, R. Philip, C.S. Menon, Materials Letters 89, 188 (2012).
6. Electrochemical and Nonlinear Optical Studies of New DA Type pi-Conjugated
Polymers Carrying 3, 4-Benzyloxythiophene, Oxadiazole, and 3, 4-Alkoxythiophene
Systems
M. S. Sunitha, A. V. Adhikari, K. A. Vishnumurthy, N. Smijesh, R. Philip, Chemistry
Letters 41, 234 (2012).
7. Two-Photon Absorption and optical limiting in Tristhiourea Cadmium Sulphate
S. Dhanuskodi, T. C. Sabari Girisun, N. Smijesh, R. Philip, Chemical Physics Letters 486,
8083 (2010).
PUBLICATIONS IN CONFERENCE PROCEEDINGS
1. Short and ultrafast laser produced Aluminum plasma: A fluence dependent study
Pranitha Sankar, Jijil J. J. Nivas, N. Smijesh, Reji Philip (To appear in the conference
proceedings of 29th National Symposium on plasma science and Technology- Plasma
2014, India)
2. Expansion dynamics of laser produced Zn plasma: Short pulse and ultrafast excitation
N. Smijesh, Anitta R. Thomas, Kavya H. Rao and Reji Philip (To appear in the
conference proceedings of 29th National Symposium on plasma science and
Technology- Plasma 2014, India)
3. Optical Time of flight measurements of laser produced metal plasmas: Short pulse and
ultrafast excitations
N. Smijesh, K. Chandrasekharan, Reji Philip (To appear in the conference proceedings
of 24th Swadeshi Science Congress, National Seminar, Kerala, India)
4. Acceleration of neutrals in an expanding laser produced Zn plasma
N. Smijesh, Kavya H. Rao and Reji Philip (To appear in the conference proceedings of
the Theme meeting on ultrafast science (UFS)- 2014, DAE- BRNS, India)
5. Influence of laser pulse width on the emission dynamics of laser produced Zn plasma
in nitrogen ambient
N. Smijesh, K. Chandrasekharan, Reji Philip (Appeared in the conference proceedings
of National Laser Symposium- 22, DAE- BRNS, India)
6. Time-resolved spectroscopy of CI and CII line emissions from an ultrafast laser
produced solid graphite plasma
N. Smijesh, K. Chandrasekharan, R. Philip, AIP Conf. Proc.1620, 517 (2014))
7. Time-resolved studies of the 723 nm CII transition in a Q-switched Nd: YAG laser-
induced carbon plasma
N. Smijesh, K. Chandrasekharan, R. Philip (Accepted for publication in an IOP conference
proceedings- Material Science and Engineering)
3
8. Indigo carmine dye polymer nanocomposite films for optical limiting applications
S. Sreeja, S. Mayadevi, S. R. Suresh, P. G. L. Frobel, N. Smijesh, R. Philip, C. I. Muneera,
AIP Conf. Proc. 1391, 618 (2011).
9. Thermal diffusivity measurements of dental resin using photoacoustic effect
N. Smijesh, L. K. Joseph, A. Kurien, V. P. N. Nampoori, IEEE-ICIAS-2007
(DOI:10.1109/ICIAS.2007.4658397).
MANUSCRIPTS TO BE COMMUNICATED
1. Acceleration of neutrals in an expanding nanosecond laser produced nickel plasma
N. Smijesh, K. Chandrasekharan, R. Philip
2. Time of flight dynamics of neutrals in an expanding femtosecond laser produced zinc
plasma
N. Smijesh, Kavya H. Rao, R. Philip
3. Time-resolved emission spectroscopy of an expanding laser produced Al-Plasma: effect
of pulse width and ambient pressure
J. J. J. Nivas, Pranitha Sankar, N. Smijesh, R. Philip
4. Stark broadening of Zn I transitions in ultrafast laser produced Zinc plasma:
Recombination Effects
Kavya H. Rao, N. Smijesh, R. Philip
5 Influence of laser pulse width on the ablation of Zinc in nitrogen ambient
N. Smijesh, K. Chandrasekharan, R. Philip
6. Emission dynamics of ions and neutrals in an ultrafast laser produced expanding
Carbon plasma
N. Smijesh, K. Chandrasekharan, R. Philip
INVITED TALKS
1. “Spectroscopy and optical time of flight studies of laser produced metal plasmas: short
pulse and ultrafast excitations” at the Raman Research Instutute, Bangalore,
India – 560 080 on 10 September 2014.
PROJECTS UNDERGONE
1. M.Tech. Major project: “Investigation of Ultrafast laser induced plasma in
condensed matter” at the Raman Research Institute, Bangalore, India (December 2008–
December 2009). The femtosecond intense short laser pulse causes the ionization of the
matter and emits radiations like x-rays, UV and VUV etc. This experiment describes the
comparison of the amount of x-rays produced by water-soluble dyes and water upon
the irradiation with the femtosecond laser pulses.
4
2. M.Sc. Project: “Thermal diffusivity measurements of dental resin using
photoacoustic effect” at catholicate college Pathanamthitta, Kerala, India (Jan-May 2006).
The laser induced non-destructive photoacoustic technique has been employed to
measure the thermal diffusivity of dental resin. The thermal diffusivity value was
evaluated by knowing the transition frequency between the thermally thin to thermally
thick region from the log-log plot of photoacoustic amplitude versus chopping
frequency. Analysis of the data was carried out on the basis of the one-dimensional
model of Rosencwaig and Gersho.
ACADEMIC ACHIEVEMENTS
• Best poster award for the poster titled “Laser produced plasma emission studies in
solid targets” by N. Smijesh, M. Shafi Ollakkan, and R. Philip, in the Fifth SERB
(http://www.serb.gov.in) school on “Tokamaks & magnetized Plasma Fusion,” held
during 25 Feb to 15 Mar 2013 at the Institute for Plasma Research, Gandhinagar, India.
• Qualified GATE (Graduate Aptitude Test in Engineering) in 2007.
RESEARCH/ TEACHING EXPERIENCE
• Worked as a Project Assistant in the Ultrafast and Nonlinear Optics lab of the Light and
Matter Physics (LAMP) Group, Raman Research Institute (http://www.rri.res.in/),
Bangalore, India, from May 2010 to July 2011.
• Worked as a Guest Lecturer in the Post Graduate and Research Department of Physics,
Catholicate College (http://www.catholicatecollege.co.in/), Pathanamthitta, India,
from January 2007 to November 2007.
• Worked as a Post Graduate Teacher in Shalom Public School (ICSE syllabus)
Chenneerkara, Pathanamthitta, India.
PERSONAL DETAILS
Name : Smijesh N. Address : Kilithattil Veedu, Anakottoor (P O), Kottarakara, Kollam (Dist) Kerala, India- 691505. Date of Birth : 04th April 1984 Citizenship : Indian Language proficiency : English, Malayalam, Kannada, Tamil.
5
REFERENCES
Dr. K. Chandrasekharan Professor Department of Physics National institute of Technology Calicut Kerala-673 601, India E-mail: [email protected] Dr. Reji Philip Associate Professor and Coordinator Light and Matter Physics Raman Research Institute Bangalore-560 080, India E-mail: [email protected] Dr. S. S. Harilal Scientist Pacific Northwest National Laboratory Richland, WA 99352 Phone: 509.372.4926 Fax: 509.375.6497 [email protected]