smart intravenous infusion dosing system - mdpi
TRANSCRIPT
applied sciences
Article
Smart Intravenous Infusion Dosing System
Dragana Oros 1,* , Marko Pencic 1 , Jovan Šulc 1, Maja Cavic 1, Stevan Stankovski 1 , Gordana Ostojic 1
and Olivera Ivanov 2,3
�����������������
Citation: Oros, D.; Pencic, M.; Šulc,
J.; Cavic, M.; Stankovski, S.; Ostojic,
G.; Ivanov, O. Smart Intravenous
Infusion Dosing System. Appl. Sci.
2021, 11, 513. https://doi.org/
10.3390/app11020513
Received: 12 November 2020
Accepted: 11 December 2020
Published: 7 January 2021
Publisher’s Note: MDPI stays neu-
tral with regard to jurisdictional claims
in published maps and institutional
affiliations.
Copyright: © 2021 by the authors. Li-
censee MDPI, Basel, Switzerland. This
article is an open access article distributed
under the terms and conditions of the
Creative Commons Attribution (CC BY)
license (https://creativecommons.org/
licenses/by/4.0/).
1 Faculty of Technical Sciences, University of Novi Sad, Trg Dositeja Obradovica 6, 21000 Novi Sad, Serbia;[email protected] (M.P.); [email protected] (J.Š.); [email protected] (M.C.); [email protected] (S.S.);[email protected] (G.O.)
2 Faculty of Medicine, University of Novi Sad, Hajduk Veljkova 3, 21000 Novi Sad, Serbia;[email protected]
3 Oncology Institute of Vojvodina, Put Doktora Goldmana 4, 21204 Sremska Kamenica, Serbia* Correspondence: [email protected]
Abstract: Intravenous (IV) infusion therapy allows the infusion fluid to be inserted directly into thepatient’s vein. It is used to place medications directly into the bloodstream or for blood transfusions.The probability that a hospitalized patient will receive some kind of infusion therapy, intravenously,is 60–80%. The paper presents a smart IV infusion dosing system for detection, signaling, andmonitoring of liquid in an IV bottle at a remote location. It consists of (i) the sensing and computationlayer—a system for detection and signaling of fluid levels in the IV bottle and a system for regulationand closing of infusion flow, (ii) the communication layer—a wireless exchange of informationbetween the hardware part of the system and the client, and (iii) the user layer—monitoring andvisualization of IV therapy reception at a remote location in real time. All layers are modular,allowing upgrades of the entire system. The proposed system alerts medical staff to continuous andtimely changes of IV bottles, which can have positive effects on increasing the success of IV therapy,especially in oncology patients. The prescribed drip time of IV chemotherapy for the full effect ofcytostatics should be imperative.
Keywords: smart IV infusion dosing system; IV therapy; IV bottle; IV chemotherapy; nurse responsetime; Internet of Things (IoT); wireless intravenous system; remote infusion monitoring system
1. Introduction
Intravenous (IV) infusion therapy is a traditional medical procedure that is appliedin all branches of medicine and involves the insertion of fluid directly into a patient’svein using a needle/cannula. IV infusion therapy is especially used during operative andpostoperative procedures for the placement of drugs directly into the patient’s bloodstreamand for the transfusion of blood or some of its components. In addition, it is used inpatients with digestive system disorders; when treating dehydration; for the adjustment ofelectrolyte imbalances; in oncology patients; and, today, increasingly in the treatment ofpatients with coronavirus disease 2019 (COVID-19) [1]. Therefore, the probability that a hos-pitalized patient will receive some type of infusion therapy, intravenously, is 60–80% [2,3].
Although the use of IV infusion is mostly painless, in some cases the procedure isextremely painful, especially in oncology patients using cytostatics. While not all cyto-statics are equally aggressive, several months of intravenous cytostatic therapy leavesserious and permanent damage to the veins. In addition to changing color and darken-ing, these veins greatly reduce their tone, which is why they “withdraw”, and, conse-quently, become difficult to find during the next therapy session. After several cyclesof IV chemotherapy, at some point, there is no longer a vein on the patient’s hands thatcan withstand daily cytostatic therapy, which is a nightmare and a serious psycholog-ical problem for almost all oncology patients. For example, in patients with testicularcancer—seminoma- and non-seminoma-type—cisplatin/etoposide/bleomycin (PEB) and
Appl. Sci. 2021, 11, 513. https://dx.doi.org/10.3390/app11020513 https://www.mdpi.com/journal/applsci
Appl. Sci. 2021, 11, 513 2 of 26
cisplatin/etoposide/ifosfamide (PEI) protocols are used in treatment, respectively. Initialchemotherapy lasts four cycles—shorter/longer if necessary, with one cycle involving5 days of active IV therapy with cytostatics, 5 IV bottles per day, which is a total of 25 IVbottles during only one cycle. As a result, each subsequent cycle becomes more difficultfor patients, not only due to exhaustion but also because the veins are no longer able towithstand all-day chemotherapy. The veins become weak and porous over time and quicklybecome inflamed, which is why daily therapy, instead of a few hours, lasts significantlylonger. A solution for these and other problems would greatly encourage patients and thusincrease the success of IV chemotherapy, which is our goal.
The process of administering IV chemotherapy involves the continuous and timelychange of IV bottles which requires constant supervision and timely response of medicalstaff. However, in a situation when there is a large number of patients who receive differenttypes of chemotherapy intravenously, several IV bottles a day, the presence of a nurse foreach individual patient is practically impossible. It should be borne in mind that if the IVbottle is not replaced in time, the blood usually returns to the infusion tube, which resultsin a blocked cannula. There are two ways to solve this everyday problem. One is the useof a syringe and saline solution, which is extremely painful for the patient, and the other,if the first method does not help, is to replace the existing cannula with a new one, oftenthrough several attempts because the patient’s veins are already in an advanced stage oftrauma, manifested in bruising.
Because of all of the above, we want to pay special attention and invest a great deal ofeffort to overcome this problem. In this paper, we propose a modern IV infusion dosingsystem that will be able to detect and signal the liquid level in the IV bottle, as well as tomonitor and display the current state of IV infusion at a remote location such as the nurseroom. This would significantly improve the traditional approach to IV therapy and greatlyhelp both patients and medical staff, which is a real challenge for us. It should be notedthat continuous and timely change of IV bottles can have positive effects on increasing thesuccess of IV therapy, especially in oncology patients, where the drip times of IV bottlesare strictly prescribed for the full effect of the drug.
The paper is structured as follows. The first section stresses the motivation and goalof the research. The second section deals with a review of the literature, covering differentgroups of problems. The third section describes the problem in more detail from an onco-logical point of view. The fourth section shows a real example of the oncology departmenton the basis of which the response time of the medical staff is determined. The fifth sectionshows the configuration and working principle of the smart IV infusion dosing systemthat we propose. A summary of the results and discussions are presented in Section 6. Thefinal, seventh section contains the conclusion and directions of section research.
2. State of the Art
The development of a smart IV dosing system is a complex problem that includesdifferent elements such as detection of fluid level in the IV bottle, signaling/alarms, reg-ulation and closure of infusion flow, remote location IV therapy monitoring, patient’sdatabase, the efficiency of medical staff, and medical staff response time to alarms. Ourliterature search identified a significant number of papers focusing on solving each of theseindividual problems. Therefore, the state of the art section in this paper is divided into fivesubsections. Each subsection identifies the corresponding problem by describing the stateof the art and solving a specific problem.
2.1. Fluid Level Detection and Signaling Systems in IV Bottle/Bag
This subsection presents fluid level detection and signaling systems in an IV bottle/bagusing various sensors and alarms placed in the patient rooms and/or nurse room.
A system for measuring the weight of an IV bottle to detect the liquid level in it usinga load cell is shown in [4]. The microcontroller receives electrical signals and, on the basisof the defined parameters/response levels, activates the alarm/buzzer and displays a
Appl. Sci. 2021, 11, 513 3 of 26
warning on the liquid-crystal display (LCD). The system for detecting fluid level in theIV bag using infrared (IR) sensors is shown in [5]. The converter sends a signal to themicrocontroller that activates the voice module (sound recording), alerting the medicalstaff. The coupling of the load cell for measuring the weight of the IV bag (through fluidlevel detection in the bag), and the sensor for measuring the patient’s pulse, just before thecannula, is shown in [6]. If the bag empties or the patient’s pulse is outside the allowedvalues, then the microcontroller sends an alarm to the receiver at the nurse room via theZigbee module. To detect the change in force/weight of the IV bag, the researchers usedforce sensors by mapping technique, as shown in [7]. On the basis of the defined threshold—the minimum level of liquid in the IV bottle—the microcontroller wirelessly sends an alarmsignal to the nurse room. A sensor for detecting liquid in disposable plastic infusion orurine bags using a flexible capacitive sensor is shown in [8]. It consists of one or moreconductive plates that are placed on the outer side of the bag, and with the change of liquidlevel, the capacitance between the plates changes. The second approach is based on an IRsensor that sends a signal regarding the fluid level in the IV bag to the Arduino controllerand, if the minimum level is reached, the system generates a short message service (SMS)alarm to the medical staff [9]. An analysis of different systems for automated real-time IVinfusion monitoring using a load cell, IR LED sensors, IR sensors, and ultrasonic sensors,along with the necessary electronics and communication to alert medical staff, is presentedin [10]. An IV infusion monitoring system containing an IR sensor, an IV bag, a controller,a buzzer, and an LCD is shown in [11]. The IR sensor—transmitter and receiver—placednext to the IV bag sends a signal to the controller that, at the appropriate time, generatesan alarm in the form of an audible and visual signal—a buzzer and an LCD, respectively.The sensor system for monitoring IV infusion shown in [12] uses three electrodes, the firstof which is placed on the outlet of the IV bag (spike of drip chamber), the second in themiddle of the drip chamber, and the third on the outlet of the drip chamber. By decreasingthe fluid level in the IV bag and measuring the change in capacitance, the study generatedthe data on the remaining volume of the IV bag. A system for monitoring and controllingIV infusion using a photocell to detect and count liquid droplets through a drip chamber isshown in [13]. To display alarm states, the researchers formed a user interface with a screenattached to the IV stand. A prototype of a robotic IV infusion system is presented in [14].It features an autonomous stand with Mecanum wheels powered by direct current (DC)motors, ultrasonic sensors for the safe movement of the stand, a tracking system with acamera (TAG) for monitoring patient movement, force and flow sensors for detecting fluidlevels in the IV bag, and an IR LED sensor for detecting blood if returned to infusion viacannula, after which the valve closes automatically and alarms are sent to the medical staff.
The advantages of the described systems are continuous detection of IV bottle/bagfluid level [4–9,11–14], sound alarm in the patient’s room [4–6,8,9,11,13,14], LCD for textalarms in the patient’s room [4,6,9,11,13,14], alarm (sound, SMS or LCD) at the nurseroom [6,7,9,12], and additional sensors for fluid level detection or monitoring of the pa-tient’s condition [6,9,12,14].
The disadvantages of the described systems are that there is no alarm at the nurseroom [4,5,8,11,13,14]; it is not tested on IV bottle/bag [5–7,9,11]; the data are only in thecontroller, with no backup [4,5,8,9,11–14]; there is no monitoring application [4–9,11–14]and it has not been tested in hospitals [4–9,11–13].
2.2. Automated Systems for Regulating and Closing the Flow of IV Infusion
This subsection presents the papers dealing with various fluid level detection systemsin IV bottle/bag; however, the focus is on the systems for regulating or closing the infusionflow by using a shut-off valve, directional control valve, or pump.
A system for detecting and regulating the flow of an IV infusion using an opticalsensor and an electrically operated valve is presented in [15]. The sensor detects dropsthrough the drip chamber, while each drop activates a timer. After the droplet detectionstops or the time between the two-drop detection expires, the timer activates the solenoid
Appl. Sci. 2021, 11, 513 4 of 26
valve, which closes the fluid flow. A vision system for detecting and measuring the flow ofIV infusion, based on a color background in the form of a matrix, behind a drip chamber,and a digital/webcam to monitor the movement of the droplet, in front, is shown in [16].Upon the detection of a droplet in the matrix, the corresponding alarm is activated. The IVinfusion flow detection and control systems are presented in [17]. The sensor detects theweight of the IV bag and sends signals to the Arduino controller. When the bag is emptied,the controller closes the valve and the return of blood to the infusion is disabled. A methodof controlling IV infusion flow by using a sensor module to detect liquid droplets throughthe drip chamber is shown in [18]. On the basis of the number of drops, the microcontrollercalculates the liquid flow and the remaining time for emptying the IV bag, while theactuator regulates the liquid flow, if necessary. A clinical study confirming the efficacy andsafety of the use of IV infusion flow monitoring and control devices is presented in [19].
The advantages of the described systems are continuous detection of IV bottle/bagfluid level [15–19], alarm in the patient room or at the nurse room [17–19], flow controlvalve for infusion fluid [16], pump control [18], shut-off valve [15,17], patient monitoringsystem [18,19], and being tested in hospitals [17–19].
The disadvantages of the described systems are that there is no backflow solu-tion [18,19], that there is no alarm in the patient room or at the nurse room [15–18], the dataare only in the controller [15–19], there is no monitoring application [15–17,19], and that itwas not tested in hospitals [15,16].
2.3. Wireless Communication Systems
This subsection presents wireless communication between (i) the sensor for detectingthe fluid level in the IV bottle/bag and the controller that receives the data from the sensor,(ii) the controller that receives the data from the sensor and the user interface on thecomputer in the nurse room, and (iii) the controller that receives data from sensors and theuser interfaces on medical staff smartphones.
The Internet of Things (IoT) system for monitoring IV infusion using an ultrasoundand temperature sensor to detect fluid levels in the IV bag, as well as an IR sensor tocount liquid drops from the IV bag through the drip chamber, is shown in [20]. Thesensors send information to the microcontroller, which, via Global System for Mobilecommunications (GSM), sends SMS messages, i.e., alarms to medical staff. Monitoring ofinfusion fluid levels using a humidity sensor is shown in [21]. The humidity sensor, togetherwith sensors for detecting the patient’s temperature and pulse via a microcontroller andBluetooth connection, sends real-time data to medical staff mobile devices. The IoT infusionmonitoring system which comprises a temperature sensor for infusion flow detection,a microcontroller, and a Wireless-Fidelity (Wi-Fi) module is presented in [22]. Liquidlevel data is transmitted wirelessly from the microcontroller to the IoT cloud, the mobileapplication, and to the medical staff mobile phones. The use of a wireless flexible capacitivesensor to detect fluid levels in the IV bag by changing the capacitance when the fluidlevel in the bag decreases is shown in [23]. The sensor communicates wirelessly with amicrocontroller that produces an alarm at the appropriate time. A system which involvesan optical sensor with a lens for measuring the number of drops of liquid through the dripchamber is presented in [24]. The LED emits light of a predetermined light length and colorthrough different lenses. The electrical signal, which indicates the passage of the droplet, issent via Bluetooth communication to the microcontroller, and then to the medical staff. TheIoT system for monitoring IV infusion, based on the load sensor—detection of the liquidlevel of the IV bag by measuring its weight—and the IR sensor—counting liquid dripsthrough the drip chamber—is shown in [25]. When the IV bag is emptied, the controllerproduces an audible and visual alarm to the patient, and the data about this are collectedon a server that wirelessly forwards the information to the medical staff. The detectionof IV bag weight change using a load cell sensor is shown in [26]. If the IV bag empties,the microcontroller sends the data to the mobile application and medical staff mobilephones via Wi-Fi connection. An infusion monitoring system using artificial intelligence
Appl. Sci. 2021, 11, 513 5 of 26
is presented in [27]. It is based on an IR sensor for measuring the number of infusiondrops, and the system is designed to monitor the patient’s temperature, blood pressure,pulse, and respiration parameters. These data, along with infusion fluid flow data, aresent to a central processing unit (CPU) that forwards the data to the cloud. A system formonitoring IV infusion flow using two electrodes above and below the drip chamber, usedfor counting drops of liquid sends signals to the microcontroller, while the display showsthe remaining liquid level in the IV bag as a percentage, as is shown in [28]. In addition,data from the microcontroller are forwarded to the nurse room via a Bluetooth module. Theuse of weight sensors for monitoring the emptiness of the IV bag—measuring the weightof the IV liquid—is shown in [29]. When the fluid level is low, the processor activates analarm and sends the data to the server and personal digital assistants (PDAs) located inthe patient monitoring room. In addition, the authors suggest the use of a bar code orradio-frequency identification (RFID) to generate patient data, IV infusion, etc. A real-timeIV infusion monitoring system using a weight sensor to detect fluid levels in the IV bag isshown in [30]. The processor receives signals from the sensor and sends them to the cloudserver via a communication module that compares the current and initial liquid level in theIV bag, on the basis of which it generates the remaining time until the IV bag is emptied,and after discharging, the alarm is activated. A wireless patient–nurse communicationsystem is shown in [31]. When an alarm sounds, on the basis of the data collected fromhardware and RFID devices, the software connects the patient to the nurse via the voiceover internet protocol (VoIP). A system for monitoring a patient’s blood glucose level usinga sensor attached to the patient’s body that measures glucose levels and wirelessly sendsa signal to the doctor’s phone application and monitoring devices in the nurse room isshown in [32]. If the blood glucose level is outside the range, the alarm in the applicationis activated. The system for monitoring energy consumption on a test machine using asensor for measuring the change in current and a module for wireless communicationis shown in [33]. The data from the sensor are sent to the cloud server and interpretedto calculate the total operating time of the machine. A robotic system for monitoring apatient with lower limb paralysis using exoskeletons and a cloud server is shown in [34].The information from the sensor is sent to the cloud server where it is interpreted and, ifnecessary, the exoskeleton control is adjusted.
The advantages of the described systems are wireless communication between sensorand controller [20,23,24], wireless communication between controller and computer atnurse room [21–23,25–28], the use of IoT technologies [21,22,29,30], mobile application forIV therapy monitoring [21,22,25–27,29,30], personal computer (PC) monitoring applica-tion [28], continuous detection of IV bottle/bag fluid level [20–30], alarm at the patient or inthe nurse room [20–23,25,26,28–30], flow control valve or pump for infusion fluid [20,25,27],and monitoring system in patient’s room [20].
The disadvantages of the described systems are that there is no backflow solu-tion [21–24,26,28–30], there is no IV therapy monitoring application [20,23,24], there isno wireless between communication controller and control panel [20,24], there is no usageof IoT technology [20,23–28], and it has not been tested in hospitals [20–30].
2.4. Department Configuration, Room Layout, and Efficiency of Medical Staff
This subsection presents how the configuration of the department—rectangular, cen-tralized or hybrid—as well as the position of the patient rooms in relation to the medicalstaff room, affect the efficiency and response time of medical staff to alarms.
According to [35], if the rooms for medicaments and medical staff are positionedcentrally with regard to the patient rooms surrounding them, then the path to the farthestpatient is shorter and the efficiency of the medical staff is higher. The influence of thedepartment configuration, room layout, and the number of beds in the rooms on thewalking distance and the response time of the medical staff is shown in [36]. The medicalstaff walking distance in the rectangular configuration department is longer than in thecircular configuration. In addition, the efficiency of medical staff is affected by the existence
Appl. Sci. 2021, 11, 513 6 of 26
of a unified system for monitoring the patients’ conditions, the layout of rooms in thedepartment, the distribution of work tasks among nurses, as well as good cooperationand exchange of information between medical staff [37]. According to [38], the room formedical staff should be a modern and dynamic environment with new technologies wherea good exchange of information is imperative. Moreover, the centralization of the room formedical staff enables better communication between the staff, a shorter path to the patients,and thus a shorter response time to alarms. An analysis of nurses’ movements usingPedSim software in a total of eight departments with different room and bed layouts ispresented in [39]. The nurse response time is shorter by 15% in the centralized arrangementof patient rooms with regard to the nurse room. According to [40], hybrid room layout—acombination of rectangular and centralized room layout—reduces the maximum distanceand response time of medical staff by 60%. The impact of decentralized room layouton the communication between medical staff is presented in [41]. The medical staff wasstationed in front of the patient rooms, which implies a significantly shorter response time,but because of that, the communication between the medical staff was minimized. Theinfluence of the daycare center structure in nursing homes on the communication betweenstaff and patients is presented in [42]. Acoustics affect the quality of verbal communication,especially in patients who have speech difficulties as a result of a stroke or in patients withdementia for whom even a minimal noise level affects the ability to communicate. Ananalysis of the distance that medical staff should travel depending on the layout of therooms in the department is presented in [43]. Although it initially seemed different, thedistance that staff has to travel is actually not longer in departments with a larger numberof patient rooms when the layout of the rooms in the department is centralized. With astraight-line layout, as the number of patient rooms increases, the distance that staff needsto cover increases. According to [44], the use of the Pepid mobile application does notreduce the distance that nurses have to travel or the response times. However, medical staffhas increasing confidence in mobile applications intended for hospitals, which is significant.
2.5. Medical Staff Response Time to Alarms
The last subsection presents the response time of medical staff to alarms (for differentscenarios) in order to obtain feedback from patients on the response speed of medical staff,which greatly affects patient satisfaction.
An analysis of the response time of medical staff using a stopwatch and surveying atotal of 30 patients at the Indonesian National Hospital is presented in [45]. The responsetime of medical staff is within the legitimate values, with female patients being moresatisfied with the service (in terms of response time) than male patients. An analysis ofthe response time of medical staff in monitoring pulse oximetry in a total of 103 patientsis presented in [46]. When any of the oxygen parameters is outside the allowable values,a green light alarm is activated in front of the patient’s room. The medical staff on dutyhave 15 s to react to that alarm, otherwise a flashing green light in front of the patient’sroom and an audible alarm in the monitoring room are activated for another medicalworker to react. If the staff does not react even after 3 min and 15 s, an emergency alarm isactivated in the medical staff room—a louder alarm of stronger intensity and a flashinggreen and white light in front of the patient’s room. As many as 26% of missed initialalarms were recorded—40% of missed alarms generated after 2 min and 27% of missedalarms generated after 3 min. An analysis of the response time of medical staff to lightalarms in four nursing homes is presented in [47]. There were light signals in front of eachpatient’s room, where the red light indicates that the patient needs help in the bathroom,while the white light indicates the necessary help when moving in the room. Due tofrequent alarms, the response time was outside the defined standards, while in as manyas 50% of cases, the staff responded only after 5 min. According to [48], the medical staffdiminish the importance of light alarms, especially when the patient is not endangered,and therefore either do not respond to light alarms or react very slowly. An analysis ofalarm response time via video recordings of patients connected to ventilators in a children’s
Appl. Sci. 2021, 11, 513 7 of 26
hospital is presented in [49]. Each of the 36 nurses was assigned two or four patients,resulting in a total of 5070 on-call alarms. With the increase in the number of alarms thatdo not require an urgent response, the response time of nurses has increased significantly.A study which analyzed the response time of medical staff in the emergency departmentusing a questionnaire completed by the patients found that they considered the responsetime of the medical staff to be unsatisfactory [50]. An analysis of nurses’ response times topatient calls by canceling alarms is presented in [51]. In this experiment, after deactivationof the existing alarms in the department, each nurse was assigned one patient per day. Withfrequent changes of nurses and the exchange of key information about patients duringshort team meetings, the response time of nurses has decreased, but with the importanceof engagement and effort of nurses, which is impossible for a longer period and a largernumber of patients.
2.6. Summary
On the basis of the analysis of the literature review, we conclude that there is nocomprehensive research that represents a unique solution to the problem of detection,monitoring, and control of an automated system for IV infusion therapy, taking intoaccount the response time of medical staff. In addition, remote control, as an Industry 4.0technology, is particularly suitable for hospital systems because it allows medical staff toeasily and quickly, wirelessly, change system parameters in real time, manage the entireprocess, and access and download data about patients hosted on a cloud server, whichis our goal.
3. Problem Description
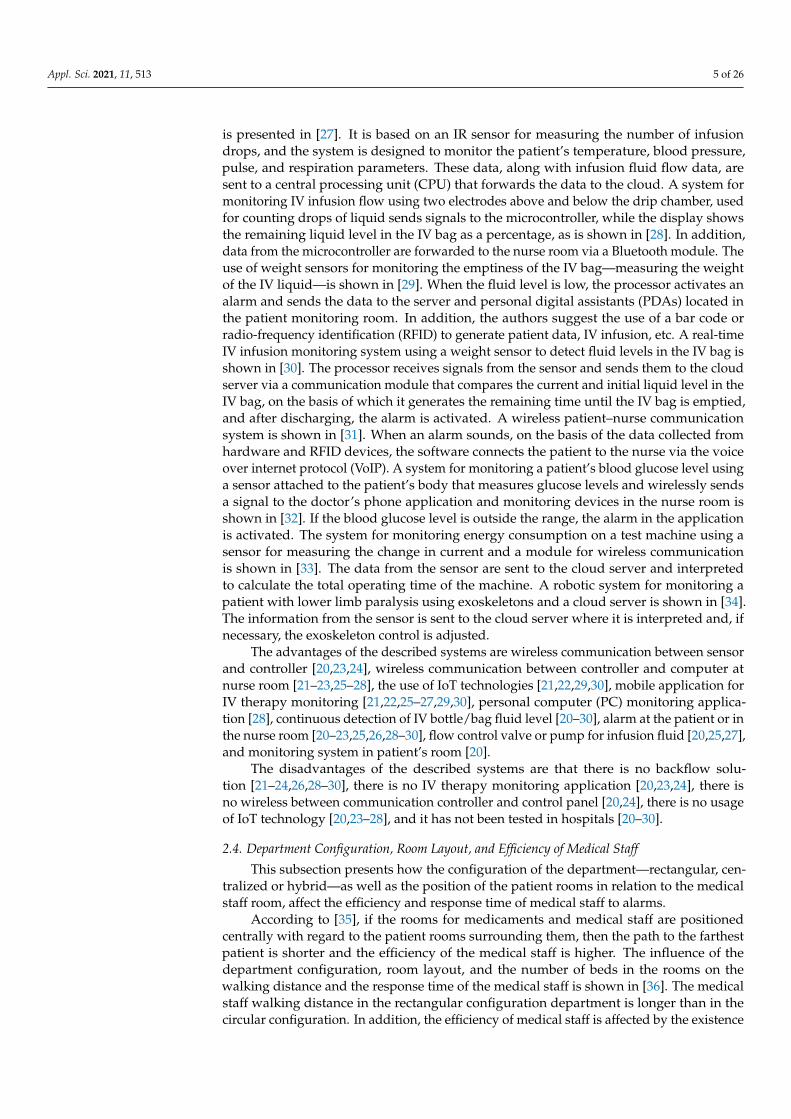
Non-automated IV infusion systems are most commonly found in hospitals aroundthe world. Figure 1 shows a traditional IV infusion therapy set consisting of four mainelements: a pole/stand (1) on which one or more IV bottles/bags (2) of appropriate contentare placed and an IV tubing set (5–8) for connection and transfer of fluid from the IVbottle/bag to the cannula (9), allowing fluid to be infused directly into the patient’s vein.The IV tubing set consists of a drip chamber (5) whose role is multiple, a piggyback port (6)for connecting an additional IV bottle/bag if necessary, IV tubing (7), and a roller clamp (8)for manual adjustment of the infusion flow. The drip chamber, at one end has spikes (3) forconnection to the IV bottle/bag by penetration, while on the opposite side it is connectedto the IV tubing. Moreover, laterally, there is an air valve (4) to prevent the appearanceof a vacuum. In addition, the drip chamber prevents the transfer of air into the patient’sbloodstream, which is extremely important, because otherwise an arterial gas embolismoccurs with dramatic consequences.
Figure 1. Traditional intravenous (IV) infusion therapy set: 1—pole/stand, 2—IV bottle/bag,3—spike, 4—air valve, 5—drip chamber, 6—piggyback port, 7—IV tubing, 8—roller clamp, and9—cannula.
Appl. Sci. 2021, 11, 513 8 of 26
According to [52], the most common reasons for receiving IV infusion are replacementof lost fluid and electrolytes; for chemotherapy, anesthesia, or drugs that the patient cannotreceive orally; for transfusion of blood or blood plasma during or after surgery as a resultof heavy bleeding; and for the intake of vitamins, minerals, and other trace elements.Numerous complications are possible, such as pulmonary edema that causes breathingproblems; the appearance of air plugs, which is manifested by shortness of breath, neckpain, and dizziness; and catheter embolism when part of the cannula breaks off and entersthe bloodstream. Moreover, local and systemic infections cause sepsis by penetrating thepatient’s bloodstream, leading to the presence of pyrogenic substances in the infusion as aresult of non-sterile preparation of the drug; rupture of veins and bleeding; artery puncture;phlebitis manifested by pain along the cannula; redness; locally elevated skin temperature;and extravasation of the drug that causes pain, tingling, and swelling along the vein.
Some IV therapies have a prescribed infusion time due to the full effect of the drug.However, the infusion rate directly depends on the pressure produced by the height of theliquid column in the IV bottle/bag, as well as on the position of the bottle/bag in relationto the cannula (see Figure 1, distance L). In addition, partial or complete closure of theIV tubing due to bending by moving the patient’s arm—e.g., the patient falls asleep—aswell as the deposition of various components of fluid in the vessel such as blood cells,can have negative effects on fluid flow. Nevertheless, the condition of the veins remainscrucial, especially in oncology patients. Therefore, the analysis of one of the most commonmalignant diseases of young men—testicular cancer—whose treatment requires severalmonths of IV infusion chemotherapy, is presented briefly.
3.1. Testicular Cancer
Although the COVID-19 virus is a burning problem in the world, with currentlyover 52 million cases and 1.29 million deaths [53], cardiovascular and malignant diseasesare still the leading causes of death worldwide, with close to 18 and 10 million deathsin 2017, respectively [54,55]. However, in malignant diseases, this number increasesdramatically [56–58]. In testicular cancers, which are the most common malignant disease inmen between 14–44 years of age [59,60], with a peak incidence at 30–34 years of age [61,62],a sudden increase in the number of patients half a century ago was recorded [63,64],which was equally influenced by hereditary factors and environmental conditions [59].Developed countries such as New Zealand [65], Norway [66], Canada [67], Denmark [68],Great Britain [69], Israel [70], Czech Republic [71], Australia [72], Croatia [73], the USA [74],France [62], Germany [75], and Switzerland [76], saw a significant increase in testicularcancer. According to [77,78], this type of cancer affects the populations of Europe andAustralia the most, and Asia and Africa the least. In addition, the highest incidence in theworld is in the Scandinavian countries [79]. It is also estimated that the number of peoplewith testicular cancer will increase in almost all European countries by 2035 [80]. However,in the case of timely diagnosis and beginning of treatment, the cure rate in Europeancountries is as high as 95–97% [81,82].
3.2. IV Chemotherapy
Testicular cancer most often arises from germ cells—seminoma- and non-seminoma-type. At diagnosis, approximately 70% of cases are detected in the first stage of thedisease when the cure rate is extremely high. The success of the treatment is also at-tributed to the fact that this type of cancer is very sensitive to IV chemotherapy andradiotherapy, which is why these treatment modalities are widely used in clinical prac-tice [83]. Platinum-based chemotherapy is most commonly used [84]. The combinationof cytostatics, cisplatin/etoposide/bleomycin, the so-called PEB protocol, is the standardin treatment after the initial surgical procedure for seminoma- and non-seminoma-typetumors. When there are poor prognostic parameters, 1–2 cycles of chemotherapy areapplied, while for metastatic disease, 3–4 cycles are used [85,86]. However, if the dis-
Appl. Sci. 2021, 11, 513 9 of 26
ease relapses or is refractory to the PEB protocol, then another combination of cytostatics,cisplatin/etoposide/ifosfamide, the so-called PEI protocol, is used.
The PEB protocol involves the intravenous administration of cisplatin and etoposidein the appropriate dose, from the first to the fifth day of the cycle, as well as the intravenousadministration of bleomycin in the form of an intravenous bolus on the 1st, 8th, and15th days of the cycle. The PEI cycle involves the intravenous administration of cisplatin,etoposide, and ifosfamide in the appropriate dose, from the first to the fifth day of thecycle [87]. In addition, before and after the IV infusion, the patients receive appropriatepremedication as an intravenous bolus using corticosteroids and antiemetics. One cycle ofchemotherapy lasts a total of 21 days, after which the therapy is repeated.
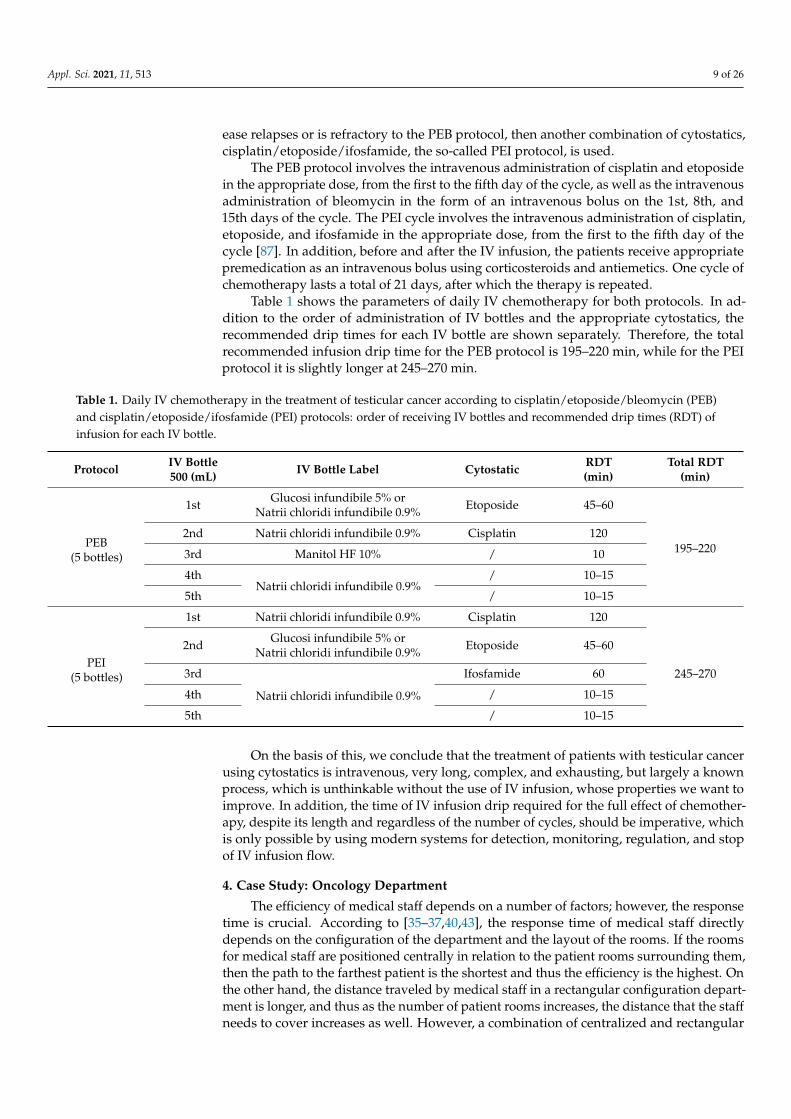
Table 1 shows the parameters of daily IV chemotherapy for both protocols. In ad-dition to the order of administration of IV bottles and the appropriate cytostatics, therecommended drip times for each IV bottle are shown separately. Therefore, the totalrecommended infusion drip time for the PEB protocol is 195–220 min, while for the PEIprotocol it is slightly longer at 245–270 min.
Table 1. Daily IV chemotherapy in the treatment of testicular cancer according to cisplatin/etoposide/bleomycin (PEB)and cisplatin/etoposide/ifosfamide (PEI) protocols: order of receiving IV bottles and recommended drip times (RDT) ofinfusion for each IV bottle.
Protocol IV Bottle500 (mL) IV Bottle Label Cytostatic RDT
(min)Total RDT
(min)
PEB(5 bottles)
1st Glucosi infundibile 5% orNatrii chloridi infundibile 0.9% Etoposide 45–60
195–2202nd Natrii chloridi infundibile 0.9% Cisplatin 120
3rd Manitol HF 10% / 10
4thNatrii chloridi infundibile 0.9%
/ 10–15
5th / 10–15
PEI(5 bottles)
1st Natrii chloridi infundibile 0.9% Cisplatin 120
245–270
2nd Glucosi infundibile 5% orNatrii chloridi infundibile 0.9% Etoposide 45–60
3rd
Natrii chloridi infundibile 0.9%
Ifosfamide 60
4th / 10–15
5th / 10–15
On the basis of this, we conclude that the treatment of patients with testicular cancerusing cytostatics is intravenous, very long, complex, and exhausting, but largely a knownprocess, which is unthinkable without the use of IV infusion, whose properties we want toimprove. In addition, the time of IV infusion drip required for the full effect of chemother-apy, despite its length and regardless of the number of cycles, should be imperative, whichis only possible by using modern systems for detection, monitoring, regulation, and stopof IV infusion flow.
4. Case Study: Oncology Department
The efficiency of medical staff depends on a number of factors; however, the responsetime is crucial. According to [35–37,40,43], the response time of medical staff directlydepends on the configuration of the department and the layout of the rooms. If the roomsfor medical staff are positioned centrally in relation to the patient rooms surrounding them,then the path to the farthest patient is the shortest and thus the efficiency is the highest. Onthe other hand, the distance traveled by medical staff in a rectangular configuration depart-ment is longer, and thus as the number of patient rooms increases, the distance that the staffneeds to cover increases as well. However, a combination of centralized and rectangular
Appl. Sci. 2021, 11, 513 10 of 26
configurations reduces the maximum distance and response time of medical staff by asmuch as 60%. In addition, the efficiency of medical staff is affected by the existence of aunique system for monitoring the condition of patients. The distribution of work tasks andgood cooperation and exchange of information between medical staff also has a positiveeffect on reducing the overall response time, which results in greater efficiency.
Bearing in mind that IV chemotherapy is inconceivable without the use of IV infusion,an analysis of the medical staff response time (depending on the staff’s gender and age), fora typical oncology department with rectangular configuration was performed. It should beemphasized that oncology patients, due to cytostatics, have a very low number of leuko-cytes, which causes a decline in the immune system, leaving the body unprotected frommany bacteria and viruses, which is why strict control at the entrance of the department iscrucial, especially today, due to the COVID-19 pandemic. Although it increases the medicalstaff response time, the rectangular configuration is of exceptional importance in oncologydepartments, which implies the use of modern systems for detection and monitoring of IVinfusion therapy at a remote location.
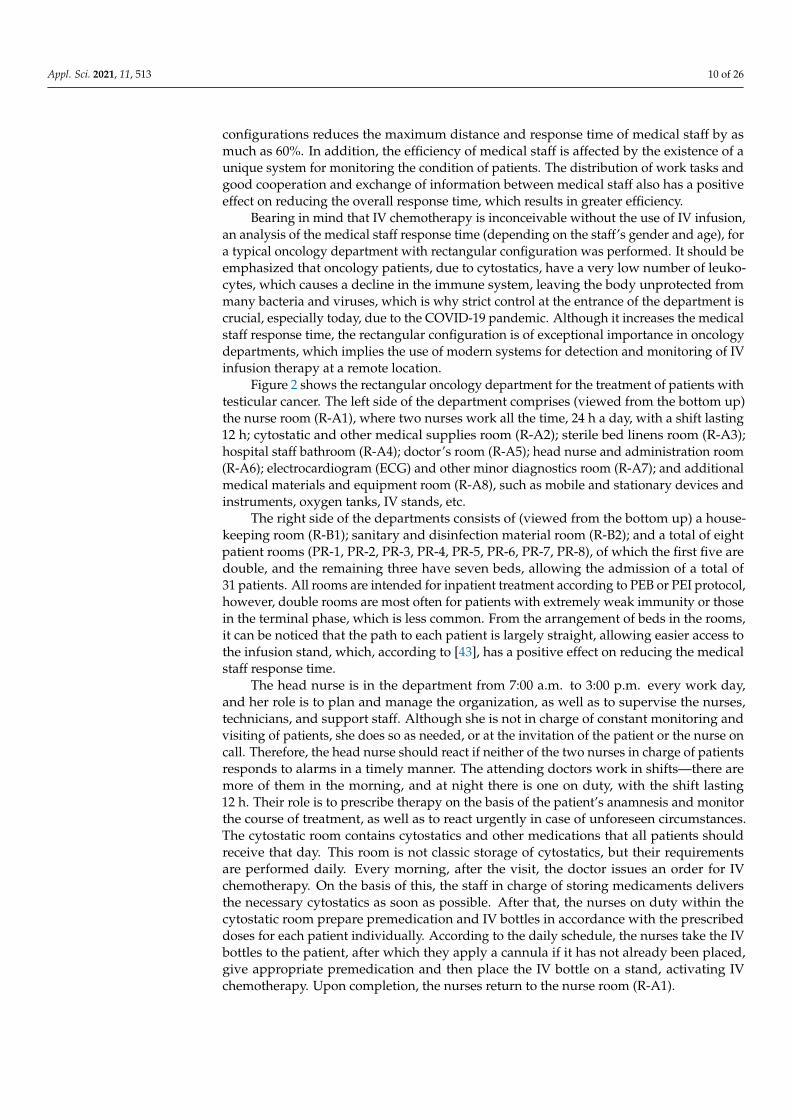
Figure 2 shows the rectangular oncology department for the treatment of patients withtesticular cancer. The left side of the department comprises (viewed from the bottom up)the nurse room (R-A1), where two nurses work all the time, 24 h a day, with a shift lasting12 h; cytostatic and other medical supplies room (R-A2); sterile bed linens room (R-A3);hospital staff bathroom (R-A4); doctor’s room (R-A5); head nurse and administration room(R-A6); electrocardiogram (ECG) and other minor diagnostics room (R-A7); and additionalmedical materials and equipment room (R-A8), such as mobile and stationary devices andinstruments, oxygen tanks, IV stands, etc.
The right side of the departments consists of (viewed from the bottom up) a house-keeping room (R-B1); sanitary and disinfection material room (R-B2); and a total of eightpatient rooms (PR-1, PR-2, PR-3, PR-4, PR-5, PR-6, PR-7, PR-8), of which the first five aredouble, and the remaining three have seven beds, allowing the admission of a total of31 patients. All rooms are intended for inpatient treatment according to PEB or PEI protocol,however, double rooms are most often for patients with extremely weak immunity or thosein the terminal phase, which is less common. From the arrangement of beds in the rooms,it can be noticed that the path to each patient is largely straight, allowing easier access tothe infusion stand, which, according to [43], has a positive effect on reducing the medicalstaff response time.
The head nurse is in the department from 7:00 a.m. to 3:00 p.m. every work day,and her role is to plan and manage the organization, as well as to supervise the nurses,technicians, and support staff. Although she is not in charge of constant monitoring andvisiting of patients, she does so as needed, or at the invitation of the patient or the nurse oncall. Therefore, the head nurse should react if neither of the two nurses in charge of patientsresponds to alarms in a timely manner. The attending doctors work in shifts—there aremore of them in the morning, and at night there is one on duty, with the shift lasting12 h. Their role is to prescribe therapy on the basis of the patient’s anamnesis and monitorthe course of treatment, as well as to react urgently in case of unforeseen circumstances.The cytostatic room contains cytostatics and other medications that all patients shouldreceive that day. This room is not classic storage of cytostatics, but their requirementsare performed daily. Every morning, after the visit, the doctor issues an order for IVchemotherapy. On the basis of this, the staff in charge of storing medicaments deliversthe necessary cytostatics as soon as possible. After that, the nurses on duty within thecytostatic room prepare premedication and IV bottles in accordance with the prescribeddoses for each patient individually. According to the daily schedule, the nurses take the IVbottles to the patient, after which they apply a cannula if it has not already been placed,give appropriate premedication and then place the IV bottle on a stand, activating IVchemotherapy. Upon completion, the nurses return to the nurse room (R-A1).
Appl. Sci. 2021, 11, 513 11 of 26
Figure 2. An example of an oncology department: room for nurses (R-A1), room for cytostaticspreparation and other medical supplies (R-A2), room for clean linen (R-A3), bathroom for hospitalstaff (R-A4), room for doctors (R-A5), room for head nurse (R-A6), room for ECG and other minordiagnostics (R-A7), room for medical equipment including mobile and stationary devices andinstruments (R-A8), room for housekeeping staff (R-B1), room with material for hospital cleaning anddisinfection (R-B2), rooms for patients with two beds each in which there are isolated or immobilepatients (PR-1, PR-2, PR-3, PR-4, PR-5), and rooms for patients with seven beds each in which thereare mobile patients (PR-6, PR-7, PR-8).
Experiment and Results
The average medical staff response time in the example of the oncology departmentfrom Figure 2 at full capacity when a total of 31 patients receive IV chemotherapy accordingto PEB or PEI protocol, was determined experimentally. Therefore, the total number of IV
Appl. Sci. 2021, 11, 513 12 of 26
bottles to be placed, turned on and off, was 165. In addition, the trajectory of the medicalstaff from the cytostatic room (R-A2) is shown in Figure 2 in the form of black arrows foreach individual patient. Thus, the distance from the cytostatic room to the farthest patient(P4 or P5) was calculated to be 53 m.
Within the experiment, a total of 50 healthy and adult subjects participated, of which40 (80%) were women (nurses) and 10 (20%) were men (medical technicians) in four agegroups: a total of 27 subjects (54%) were from 18 to 25 years old; a total of 8 subjects (16%)were from 25 to 30; a total of 8 subjects (16%) were from 35 to 45 and a total of 7 subjects(14%) were from 45 to 55 years old. All the subjects performed the task of crossing a straightpath with a total length of 53 m for two different scenarios—spontaneous and fast walking.Times were measured using a stopwatch.
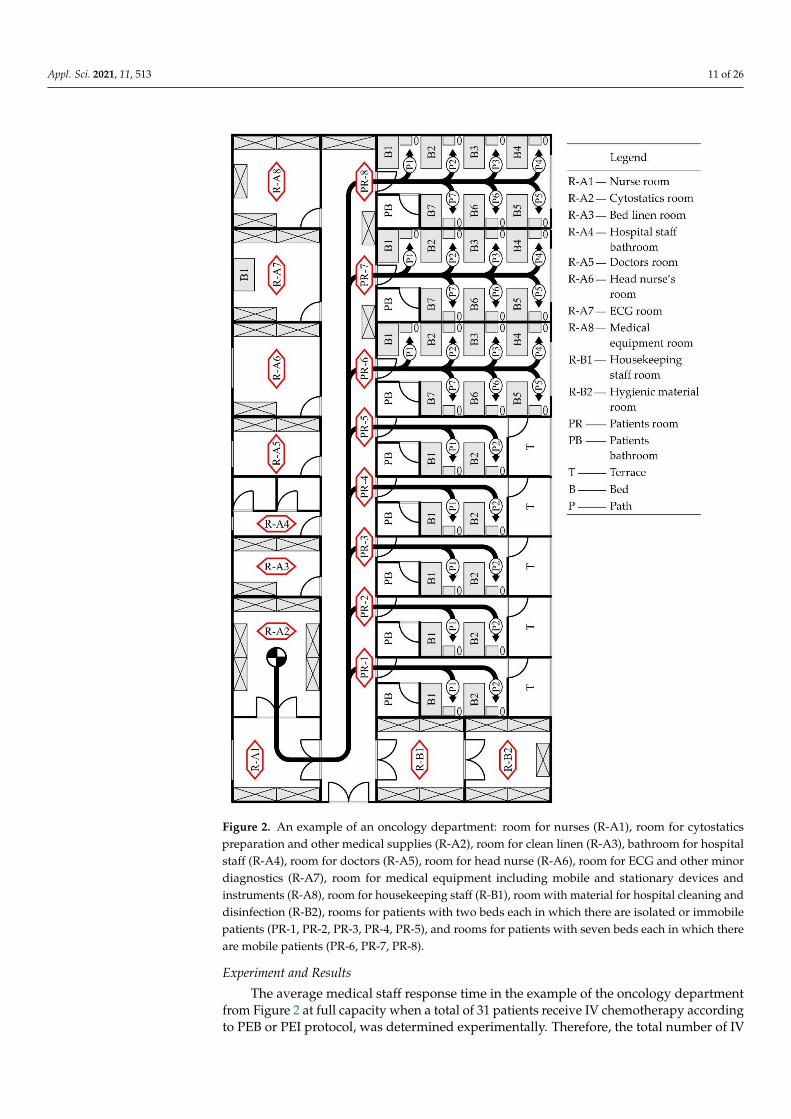
Table 2 shows the results of the experiment for the female, male, and total sample. Inaddition, for each age group, depending on the scenario, data for minimum, main, andmaximum walking times as well as standard deviation are given.
Table 2. Response time of medical staff depending on gender and age group.
Gender GroupAge
(Years) No. (%)
Spontaneous Walking Time(s)
Fast Walking Time(s)
min main max SD min main max SD
Female
I 18–25 21 (52.5) 28.28 30.24 33.89 1.60 21.69 24.45 27.50 1.45
II 25–35 7 (17.5) 24.05 29.76 32.25 2.68 22.55 25.90 31.46 2.60
III 35–45 6 (15.0) 27.19 31.70 34.06 2.57 22.66 25.47 27.39 1.80
IV 45–55 6 (15.0) 29.05 31.77 35.34 2.27 26.05 27.60 29.14 1.05
Total 40 (100) 24.05 30.61 35.34 2.22 21.69 25.33 31.46 2.04
Male
I 18–25 6 (60.0) 25.72 28.08 30.76 1.72 20.62 22.39 24.01 1.40
II 25–35 1 (10.0) 26.81 26.81 26.81 0 20.36 20.36 20.36 0
III 35–45 2 (20.0) 25.24 26.20 27.16 0.96 20.25 22.94 25.64 2.70
IV 45–55 1 (10.0) 31.84 31.84 31.84 0 24.79 24.79 24.79 0
Total 10 (100) 25.24 27.95 31.84 2.06 20.25 22.54 25.64 1.91
Female+
Male
I 18–25 27 (54.0) 25.72 29.76 33.89 1.86 20.62 23.99 27.50 1.67
II 25–35 8 (16.0) 24.05 29.39 32.25 2.69 20.36 25.21 31.46 3.05
III 35–45 8 (16.0) 25.24 30.33 34.06 3.30 20.25 24.84 27.39 2.33
IV 45–55 7 (14.0) 29.05 31.78 35.34 2.10 24.79 27.20 29.14 1.38
Total 50 (100) 24.05 30.08 35.34 2.43 20.25 24.77 31.46 2.31
The first part of the table refers to female subjects representing 80% of the total numberof subjects in the experiment. The first age group included a total of 21 subjects (52.5%), thesecond a total of 7 subjects (17.5%), while the third and fourth groups had a total of 6 subjects(15.0%) each. Therefore, the response time of female subjects during the spontaneous andfast walk was in the intervals of 24.05–35.34 s and 21.69–31.46 s, respectively. The shortestmain reaction time was recorded in the first group and the longest in the fourth group.In addition, the major times of all female subjects in the spontaneous and fast walk were30.61 ± 2.22 s and 25.33 ± 2.04 s, respectively.
The second part of the table refers to male subjects representing 20% of the totalnumber of subjects in the experiment. The first age group includes a total of 6 subjects(52.5%), the second and fourth a total of 1 subject each (10%), while the third group a totalof 2 subjects (20%). Therefore, the reaction times of male subjects during spontaneous andfast walking were in the range of 25.24–31.84 s and 20.25–25.64 s, respectively. The shortestmain reaction time was recorded in the second group, while the longest was in the fourth
Appl. Sci. 2021, 11, 513 13 of 26
group. In addition, the major times of all male subjects at spontaneous and fast walk were27.95 ± 2.06 s and 22.54 ± 1.91 s, respectively.
The third part of the table refers to all 50 subjects of both sexes. The first age groupincludes a total of 27 subjects (54%), the second and third a total of 8 subjects (16%) each,while the fourth group a total of 7 subjects (14%). Therefore, the reaction times of allsubjects during spontaneous and fast walking were in the intervals of 24.05–35.34 s and20.25–31.46 s, respectively. The shortest main reaction time was recorded in the first groupand the longest in the fourth group. In addition, the main times of all 50 subjects, both inspontaneous and fast walking, were 30.08 ± 2.43 s and 24.77 ± 2.31 s, respectively.
On the basis of the analysis of the results, we conclude that with increasing age, theresponse time increased in both sexes. In addition, the response time of male subjectswas approximately 10% shorter than that of female subjects. It should be noted that theresponse time also depended on the height and weight of the subject.
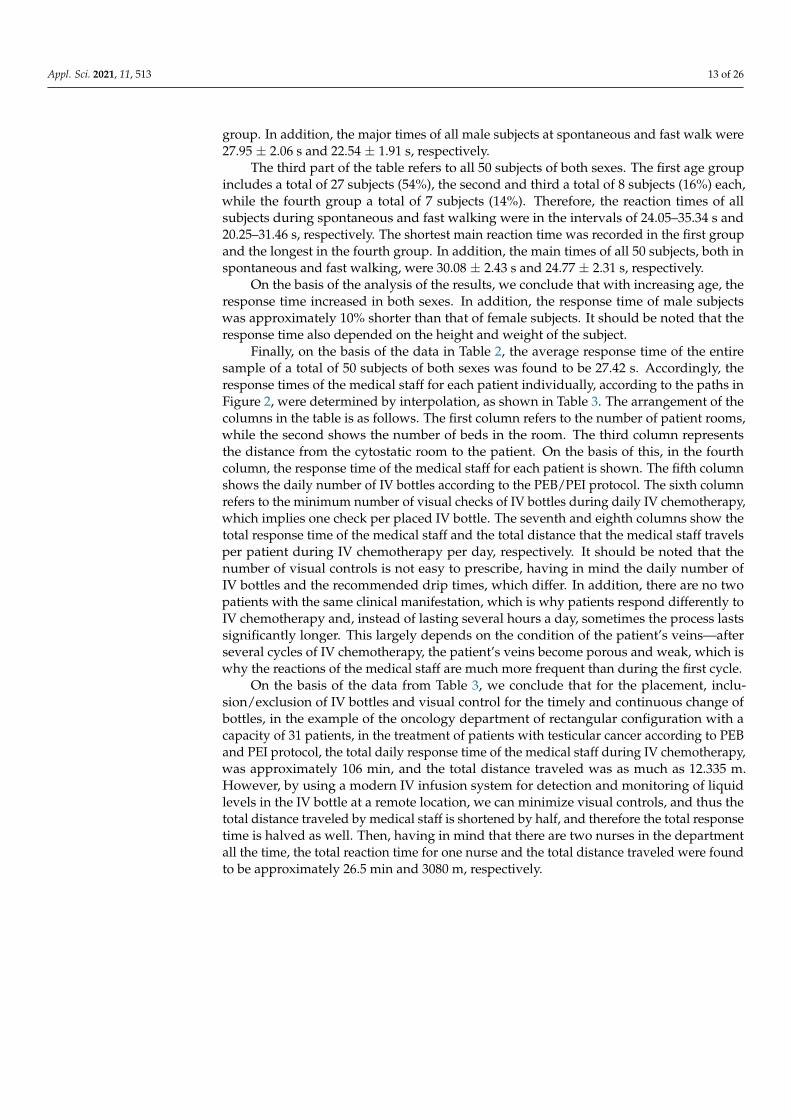
Finally, on the basis of the data in Table 2, the average response time of the entiresample of a total of 50 subjects of both sexes was found to be 27.42 s. Accordingly, theresponse times of the medical staff for each patient individually, according to the paths inFigure 2, were determined by interpolation, as shown in Table 3. The arrangement of thecolumns in the table is as follows. The first column refers to the number of patient rooms,while the second shows the number of beds in the room. The third column representsthe distance from the cytostatic room to the patient. On the basis of this, in the fourthcolumn, the response time of the medical staff for each patient is shown. The fifth columnshows the daily number of IV bottles according to the PEB/PEI protocol. The sixth columnrefers to the minimum number of visual checks of IV bottles during daily IV chemotherapy,which implies one check per placed IV bottle. The seventh and eighth columns show thetotal response time of the medical staff and the total distance that the medical staff travelsper patient during IV chemotherapy per day, respectively. It should be noted that thenumber of visual controls is not easy to prescribe, having in mind the daily number ofIV bottles and the recommended drip times, which differ. In addition, there are no twopatients with the same clinical manifestation, which is why patients respond differently toIV chemotherapy and, instead of lasting several hours a day, sometimes the process lastssignificantly longer. This largely depends on the condition of the patient’s veins—afterseveral cycles of IV chemotherapy, the patient’s veins become porous and weak, which iswhy the reactions of the medical staff are much more frequent than during the first cycle.
On the basis of the data from Table 3, we conclude that for the placement, inclu-sion/exclusion of IV bottles and visual control for the timely and continuous change ofbottles, in the example of the oncology department of rectangular configuration with acapacity of 31 patients, in the treatment of patients with testicular cancer according to PEBand PEI protocol, the total daily response time of the medical staff during IV chemotherapy,was approximately 106 min, and the total distance traveled was as much as 12.335 m.However, by using a modern IV infusion system for detection and monitoring of liquidlevels in the IV bottle at a remote location, we can minimize visual controls, and thus thetotal distance traveled by medical staff is shortened by half, and therefore the total responsetime is halved as well. Then, having in mind that there are two nurses in the departmentall the time, the total reaction time for one nurse and the total distance traveled were foundto be approximately 26.5 min and 3080 m, respectively.
Appl. Sci. 2021, 11, 513 14 of 26
Table 3. Nurse response time (NRT).
Room Patient Distance(m)
NRT(s)
IVBottles
VisualControl
TotalTime 1
(s)
Total Distance 2
(m)
PR-1P1 21 10.87 5 5 108.70 210
P2 23 11.90 5 5 119.00 230
PR-2P1 24.5 12.68 5 5 126.80 245
P2 26.5 13.71 5 5 137.10 265
PR-3P1 28 14.49 5 5 144.90 280
P2 30 15.52 5 5 155.20 300
PR-4P1 31.5 16.30 5 5 163.00 315
P2 33.5 17.33 5 5 173.30 335
PR-5P1 35 18.11 5 5 181.10 350
P2 37 19.14 5 5 191.40 370
PR-6
P1 36 18.63 5 5 186.30 360
P2 38 19.66 5 5 196.60 380
P3 40 20.70 5 5 207.00 400
P4 42 21.73 5 5 217.30 420
P5 42 21.73 5 5 217.30 420
P6 40 20.70 5 5 207.00 400
P7 38 19.66 5 5 196.60 380
PR-7
P1 41.5 21.47 5 5 214.70 415
P2 43.5 22.51 5 5 225.10 435
P3 45.5 23.54 5 5 235.40 455
P4 47.5 24.58 5 5 245.80 475
P5 47.5 24.58 5 5 245.80 475
P6 45.5 23.54 5 5 235.40 455
P7 43.5 22.51 5 5 225.10 435
PR-8
P1 47 24.32 5 5 243.20 470
P2 49 25.35 5 5 253.50 490
P3 51 26.39 5 5 263.90 510
P4 53 27.42 5 5 274.20 530
P5 53 27.42 5 5 274.20 530
P6 51 26.39 5 5 263.90 510
P7 49 25.35 5 5 253.50 490
Sum 3 31 1233.5 638.23 155 155 6382.30 123351 Total time is the product of NRT and the total number of connections/disconnections of IV bottlestogether with visual controls; 2 total distance is the product of the distance and the total number ofconnections/disconnections of IV bottles together with visual controls; 3 sum refers to columns onlyand represents statistics.
5. Smart IV Infusion Dosing System
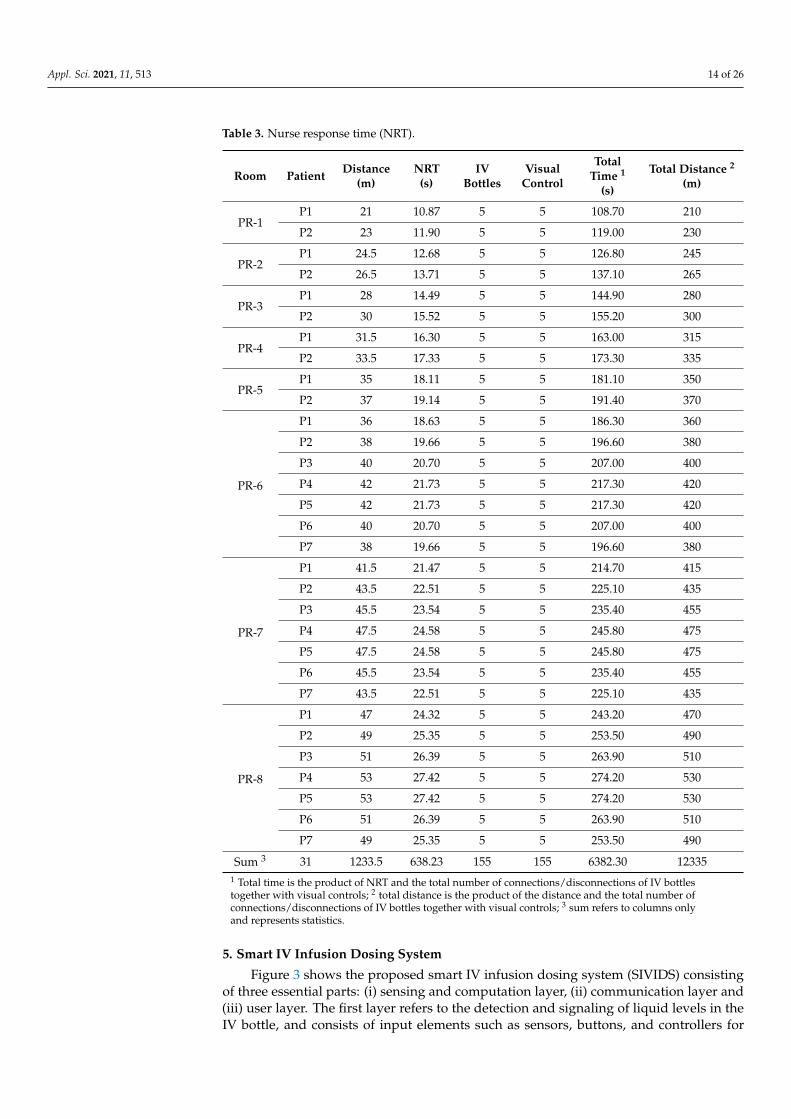
Figure 3 shows the proposed smart IV infusion dosing system (SIVIDS) consistingof three essential parts: (i) sensing and computation layer, (ii) communication layer and(iii) user layer. The first layer refers to the detection and signaling of liquid levels in theIV bottle, and consists of input elements such as sensors, buttons, and controllers for
Appl. Sci. 2021, 11, 513 15 of 26
signal interpretation, as well as output elements, such as an audible signal (buzzer), flowregulation valve, and a device for displaying the current state of the system (display). Thesecond layer refers to communication by enabling coupling between the first and thirdlayers using a wireless communication module on one side and a wireless router on theother. In addition, the communication layer allows internet access, and thus data from thedevices of the other two layers can be stored directly on the cloud server. The third andfinal layer allows the medical staff to monitor and visually display the infusion receptionin real time for each patient individually but also features a visual display of possiblealarms at the nurse room (R-A1) for monitoring. It should be noted that all layers are of themodular type, allowing, if necessary, the upgrade and improvement of the entire system,including the replacement or addition of components or the use of another computer ormobile application.
Figure 3. Smart IV infusion dosing system layers.
5.1. System Configuration
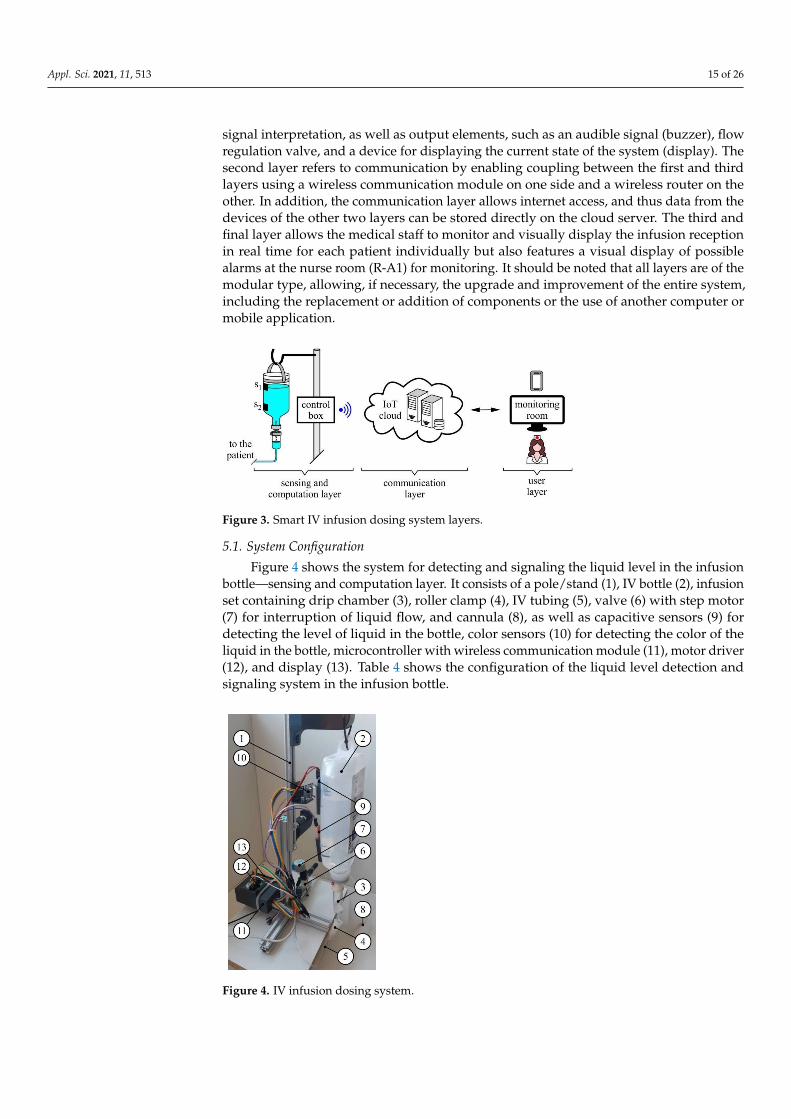
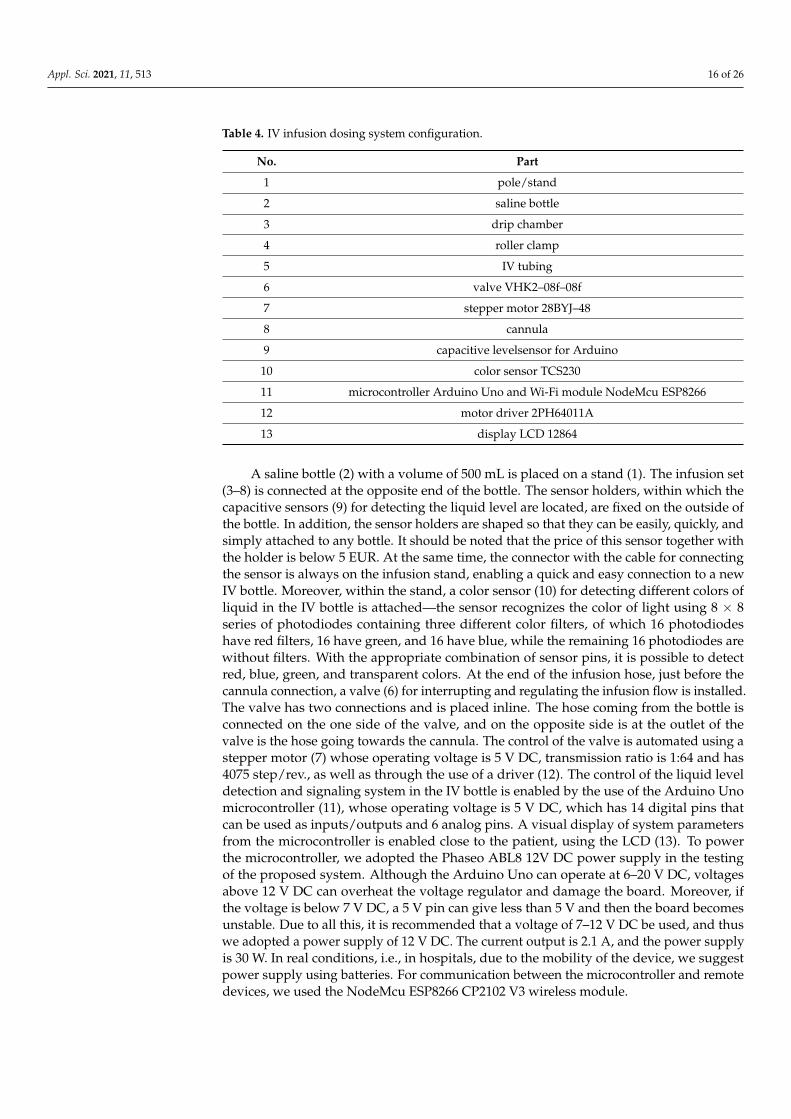
Figure 4 shows the system for detecting and signaling the liquid level in the infusionbottle—sensing and computation layer. It consists of a pole/stand (1), IV bottle (2), infusionset containing drip chamber (3), roller clamp (4), IV tubing (5), valve (6) with step motor(7) for interruption of liquid flow, and cannula (8), as well as capacitive sensors (9) fordetecting the level of liquid in the bottle, color sensors (10) for detecting the color of theliquid in the bottle, microcontroller with wireless communication module (11), motor driver(12), and display (13). Table 4 shows the configuration of the liquid level detection andsignaling system in the infusion bottle.
Figure 4. IV infusion dosing system.
Appl. Sci. 2021, 11, 513 16 of 26
Table 4. IV infusion dosing system configuration.
No. Part
1 pole/stand
2 saline bottle
3 drip chamber
4 roller clamp
5 IV tubing
6 valve VHK2–08f–08f
7 stepper motor 28BYJ–48
8 cannula
9 capacitive levelsensor for Arduino
10 color sensor TCS230
11 microcontroller Arduino Uno and Wi-Fi module NodeMcu ESP8266
12 motor driver 2PH64011A
13 display LCD 12864
A saline bottle (2) with a volume of 500 mL is placed on a stand (1). The infusion set(3–8) is connected at the opposite end of the bottle. The sensor holders, within which thecapacitive sensors (9) for detecting the liquid level are located, are fixed on the outside ofthe bottle. In addition, the sensor holders are shaped so that they can be easily, quickly, andsimply attached to any bottle. It should be noted that the price of this sensor together withthe holder is below 5 EUR. At the same time, the connector with the cable for connectingthe sensor is always on the infusion stand, enabling a quick and easy connection to a newIV bottle. Moreover, within the stand, a color sensor (10) for detecting different colors ofliquid in the IV bottle is attached—the sensor recognizes the color of light using 8 × 8series of photodiodes containing three different color filters, of which 16 photodiodeshave red filters, 16 have green, and 16 have blue, while the remaining 16 photodiodes arewithout filters. With the appropriate combination of sensor pins, it is possible to detectred, blue, green, and transparent colors. At the end of the infusion hose, just before thecannula connection, a valve (6) for interrupting and regulating the infusion flow is installed.The valve has two connections and is placed inline. The hose coming from the bottle isconnected on the one side of the valve, and on the opposite side is at the outlet of thevalve is the hose going towards the cannula. The control of the valve is automated using astepper motor (7) whose operating voltage is 5 V DC, transmission ratio is 1:64 and has4075 step/rev., as well as through the use of a driver (12). The control of the liquid leveldetection and signaling system in the IV bottle is enabled by the use of the Arduino Unomicrocontroller (11), whose operating voltage is 5 V DC, which has 14 digital pins thatcan be used as inputs/outputs and 6 analog pins. A visual display of system parametersfrom the microcontroller is enabled close to the patient, using the LCD (13). To powerthe microcontroller, we adopted the Phaseo ABL8 12V DC power supply in the testingof the proposed system. Although the Arduino Uno can operate at 6–20 V DC, voltagesabove 12 V DC can overheat the voltage regulator and damage the board. Moreover, ifthe voltage is below 7 V DC, a 5 V pin can give less than 5 V and then the board becomesunstable. Due to all this, it is recommended that a voltage of 7–12 V DC be used, and thuswe adopted a power supply of 12 V DC. The current output is 2.1 A, and the power supplyis 30 W. In real conditions, i.e., in hospitals, due to the mobility of the device, we suggestpower supply using batteries. For communication between the microcontroller and remotedevices, we used the NodeMcu ESP8266 CP2102 V3 wireless module.
Appl. Sci. 2021, 11, 513 17 of 26
5.2. Operating Principle
Two capacitive sensors (9) are attached to the saline bottle (2), one below the other,enabling the detection of liquid levels in the bottle. The upper sensor detects the MAXfluid level, while the lower detects the MIN 1 and MIN 2 levels. The height of the liquidcolumn in the bottle is 145 mm. Accordingly, the capacitive sensors are positioned to covera liquid column height of 140 mm, which is 5 mm less than the maximum. Thus, this 5 mmheight in the bottle cap zone is approximately 25 mL of saline, which drains from the bottleat maximum flow for approximately 30 s. This time was taken into account when formingthe alarm states. The sensors (9) for detecting the level of liquid in the bottle are connectedto the microcontroller (11), sending signals about the current level of liquid in the bottle allthe time. On the other hand, the color sensor (10) enables the detection of the color of thefluid in the IV bottle, indicating the type of fluid—saline, blood or plasma, or urine if thesystem is used to collect urine or drain the patient in postoperative days. On the basis ofthe type and volume of fluid contained in the IV bottle, the condition of the patient’s veins,and the flow of the selected cannula, the medical staff manually adjusts the infusion flowusing a roller clamp (4). All the above parameters directly affect the time the bottle empties,i.e., the time of occurrence of the alarm that gives the signal for the emptied IV bottle. Ifthe bottle is completely emptied and the medical staff does not respond to the alarm forany reason, then the stepper motor (7) is activated by closing the valve (6), and thus thereturn of blood through the cannula to the IV tubing is prevented, which is essential.
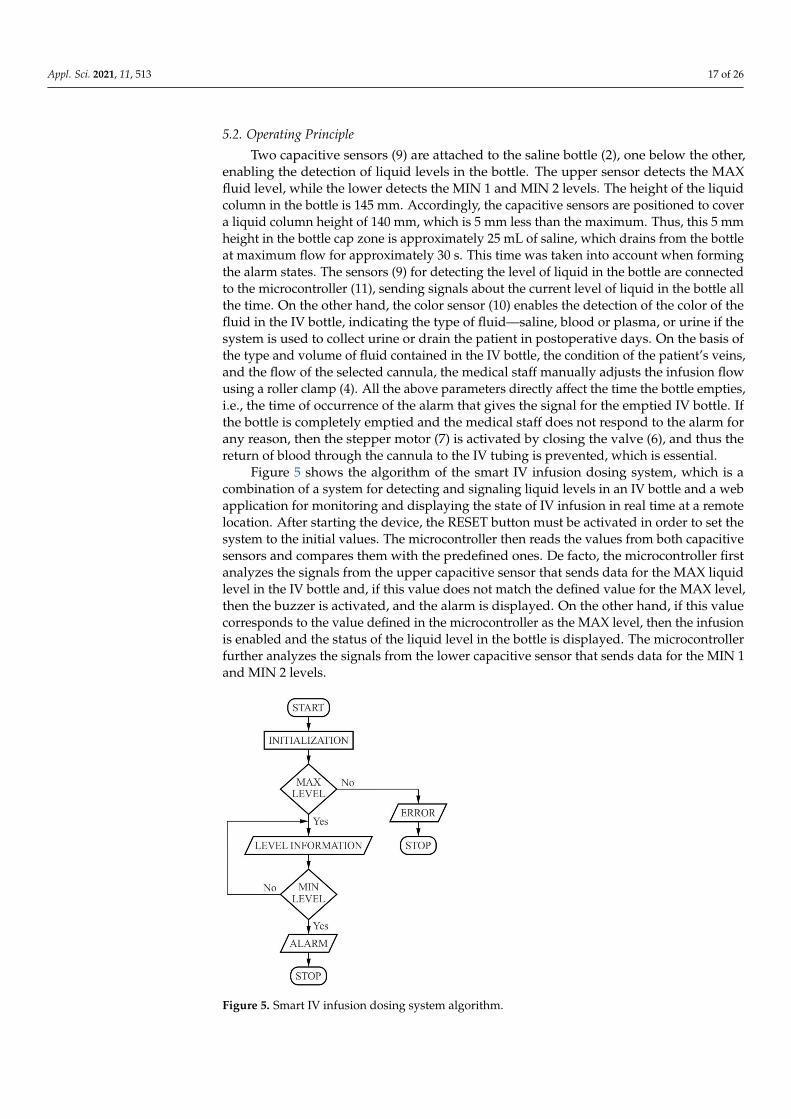
Figure 5 shows the algorithm of the smart IV infusion dosing system, which is acombination of a system for detecting and signaling liquid levels in an IV bottle and a webapplication for monitoring and displaying the state of IV infusion in real time at a remotelocation. After starting the device, the RESET button must be activated in order to set thesystem to the initial values. The microcontroller then reads the values from both capacitivesensors and compares them with the predefined ones. De facto, the microcontroller firstanalyzes the signals from the upper capacitive sensor that sends data for the MAX liquidlevel in the IV bottle and, if this value does not match the defined value for the MAX level,then the buzzer is activated, and the alarm is displayed. On the other hand, if this valuecorresponds to the value defined in the microcontroller as the MAX level, then the infusionis enabled and the status of the liquid level in the bottle is displayed. The microcontrollerfurther analyzes the signals from the lower capacitive sensor that sends data for the MIN 1and MIN 2 levels.
Figure 5. Smart IV infusion dosing system algorithm.
Appl. Sci. 2021, 11, 513 18 of 26
If this sensor detects the liquid level defined as MIN 1, the alarm is activated, butthe system continues to work. On the other hand, if the sensor detects the fluid leveldefined as MIN 2, then there is 5 mL of liquid left in the bottle. The microcontroller thenactivates a continuous buzzer alarm, showing the alarm condition on the display, and theinfusion flow to the patient automatically stops. Finally, it is necessary to replace the emptybottle with a new one, after which the procedure is repeated or the IV administration isterminated if the therapy is over.
5.3. Web Application
A web application for monitoring and displaying the state of IV infusion in real timeat a remote location, for PEB and PEI chemotherapy protocol was developed. It is usedto simulate the functioning of the automated system for detection and signaling of fluidlevels in IV bottle from Figure 4. All patients’ data are located in a centralized database onthe cloud server. Thanks to this, client devices (smart mobile phones, computers, tablets,etc.) can access the data by connecting to the server via hypertext transfer protocol (HTTP).However, if the communication between the cloud server and the client is interrupted forany reason, the data is not lost but is still on the server. In addition, it is not necessary toinstall the application on the client to access the data, but only to enter the internet protocol(IP) address in the browser.
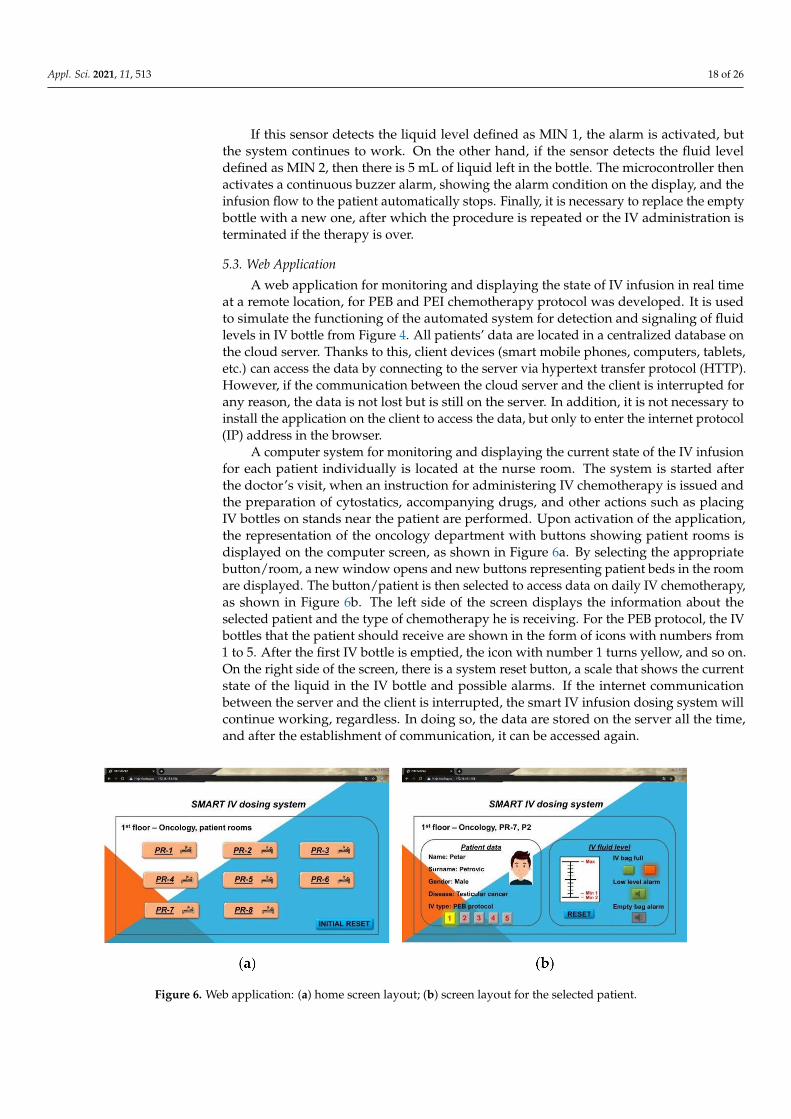
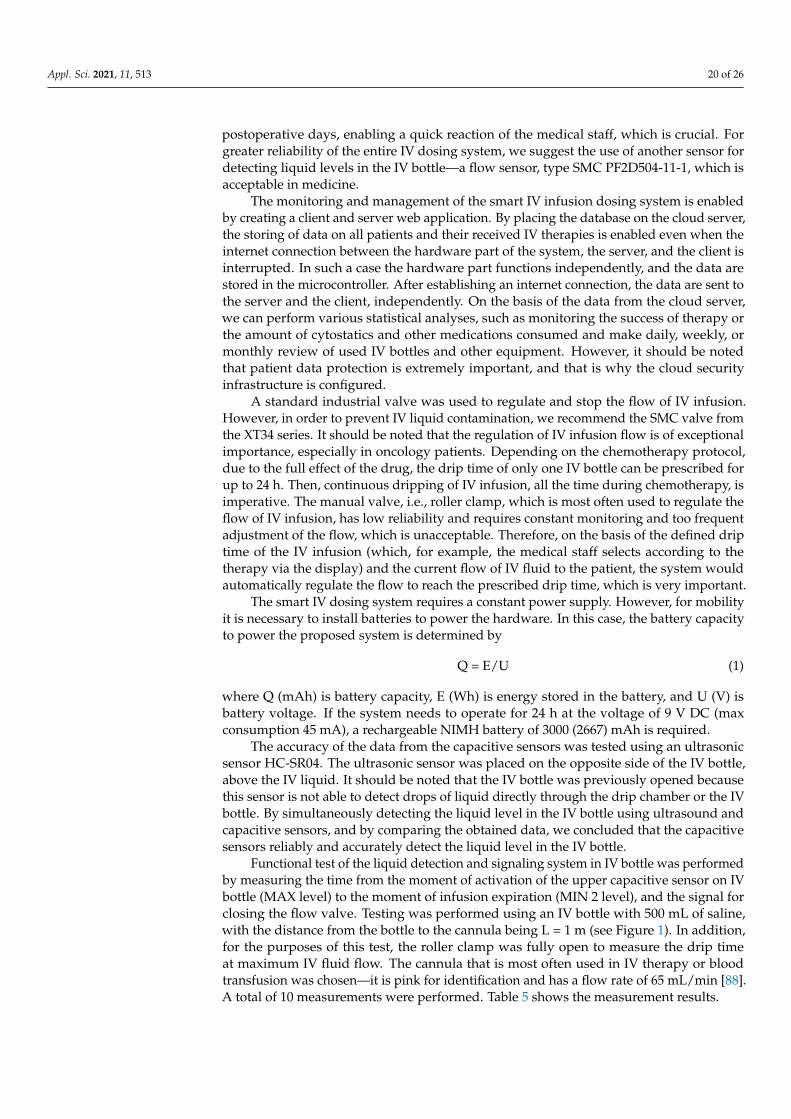
A computer system for monitoring and displaying the current state of the IV infusionfor each patient individually is located at the nurse room. The system is started afterthe doctor’s visit, when an instruction for administering IV chemotherapy is issued andthe preparation of cytostatics, accompanying drugs, and other actions such as placingIV bottles on stands near the patient are performed. Upon activation of the application,the representation of the oncology department with buttons showing patient rooms isdisplayed on the computer screen, as shown in Figure 6a. By selecting the appropriatebutton/room, a new window opens and new buttons representing patient beds in the roomare displayed. The button/patient is then selected to access data on daily IV chemotherapy,as shown in Figure 6b. The left side of the screen displays the information about theselected patient and the type of chemotherapy he is receiving. For the PEB protocol, the IVbottles that the patient should receive are shown in the form of icons with numbers from1 to 5. After the first IV bottle is emptied, the icon with number 1 turns yellow, and so on.On the right side of the screen, there is a system reset button, a scale that shows the currentstate of the liquid in the IV bottle and possible alarms. If the internet communicationbetween the server and the client is interrupted, the smart IV infusion dosing system willcontinue working, regardless. In doing so, the data are stored on the server all the time,and after the establishment of communication, it can be accessed again.
Figure 6. Web application: (a) home screen layout; (b) screen layout for the selected patient.
Appl. Sci. 2021, 11, 513 19 of 26
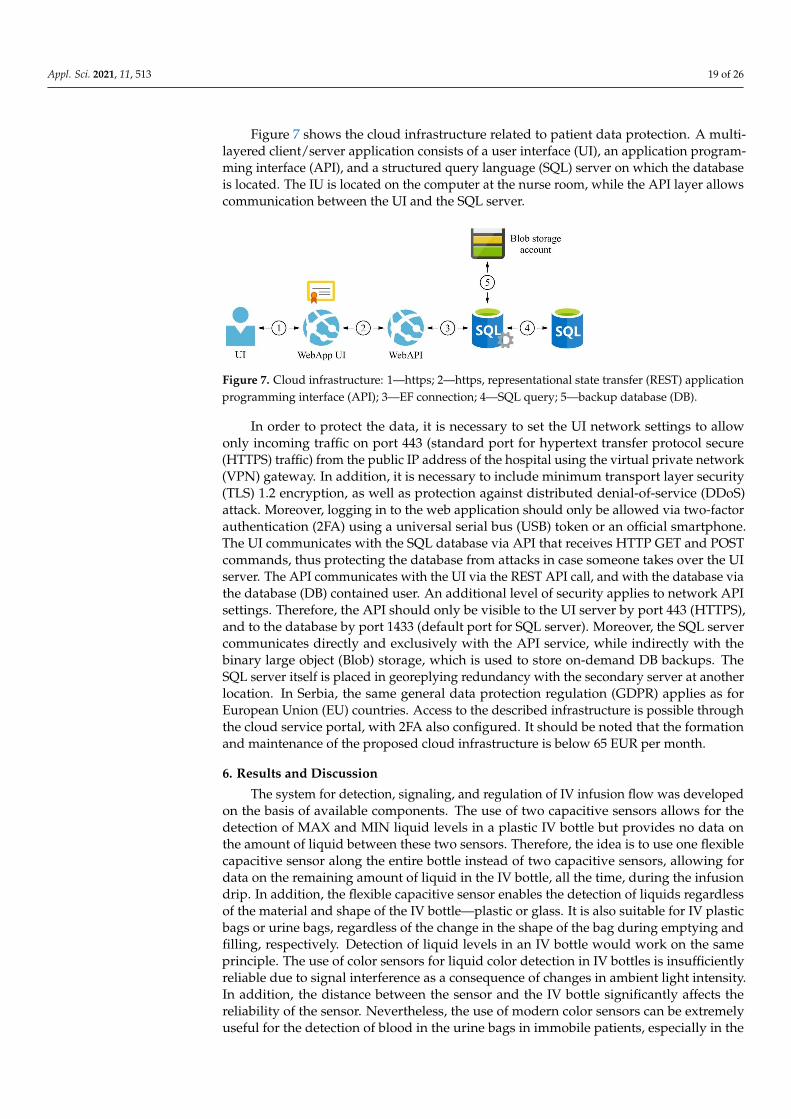
Figure 7 shows the cloud infrastructure related to patient data protection. A multi-layered client/server application consists of a user interface (UI), an application program-ming interface (API), and a structured query language (SQL) server on which the databaseis located. The IU is located on the computer at the nurse room, while the API layer allowscommunication between the UI and the SQL server.
Figure 7. Cloud infrastructure: 1—https; 2—https, representational state transfer (REST) applicationprogramming interface (API); 3—EF connection; 4—SQL query; 5—backup database (DB).
In order to protect the data, it is necessary to set the UI network settings to allowonly incoming traffic on port 443 (standard port for hypertext transfer protocol secure(HTTPS) traffic) from the public IP address of the hospital using the virtual private network(VPN) gateway. In addition, it is necessary to include minimum transport layer security(TLS) 1.2 encryption, as well as protection against distributed denial-of-service (DDoS)attack. Moreover, logging in to the web application should only be allowed via two-factorauthentication (2FA) using a universal serial bus (USB) token or an official smartphone.The UI communicates with the SQL database via API that receives HTTP GET and POSTcommands, thus protecting the database from attacks in case someone takes over the UIserver. The API communicates with the UI via the REST API call, and with the database viathe database (DB) contained user. An additional level of security applies to network APIsettings. Therefore, the API should only be visible to the UI server by port 443 (HTTPS),and to the database by port 1433 (default port for SQL server). Moreover, the SQL servercommunicates directly and exclusively with the API service, while indirectly with thebinary large object (Blob) storage, which is used to store on-demand DB backups. TheSQL server itself is placed in georeplying redundancy with the secondary server at anotherlocation. In Serbia, the same general data protection regulation (GDPR) applies as forEuropean Union (EU) countries. Access to the described infrastructure is possible throughthe cloud service portal, with 2FA also configured. It should be noted that the formationand maintenance of the proposed cloud infrastructure is below 65 EUR per month.
6. Results and Discussion
The system for detection, signaling, and regulation of IV infusion flow was developedon the basis of available components. The use of two capacitive sensors allows for thedetection of MAX and MIN liquid levels in a plastic IV bottle but provides no data onthe amount of liquid between these two sensors. Therefore, the idea is to use one flexiblecapacitive sensor along the entire bottle instead of two capacitive sensors, allowing fordata on the remaining amount of liquid in the IV bottle, all the time, during the infusiondrip. In addition, the flexible capacitive sensor enables the detection of liquids regardlessof the material and shape of the IV bottle—plastic or glass. It is also suitable for IV plasticbags or urine bags, regardless of the change in the shape of the bag during emptying andfilling, respectively. Detection of liquid levels in an IV bottle would work on the sameprinciple. The use of color sensors for liquid color detection in IV bottles is insufficientlyreliable due to signal interference as a consequence of changes in ambient light intensity.In addition, the distance between the sensor and the IV bottle significantly affects thereliability of the sensor. Nevertheless, the use of modern color sensors can be extremelyuseful for the detection of blood in the urine bags in immobile patients, especially in the
Appl. Sci. 2021, 11, 513 20 of 26
postoperative days, enabling a quick reaction of the medical staff, which is crucial. Forgreater reliability of the entire IV dosing system, we suggest the use of another sensor fordetecting liquid levels in the IV bottle—a flow sensor, type SMC PF2D504-11-1, which isacceptable in medicine.
The monitoring and management of the smart IV infusion dosing system is enabledby creating a client and server web application. By placing the database on the cloud server,the storing of data on all patients and their received IV therapies is enabled even when theinternet connection between the hardware part of the system, the server, and the client isinterrupted. In such a case the hardware part functions independently, and the data arestored in the microcontroller. After establishing an internet connection, the data are sent tothe server and the client, independently. On the basis of the data from the cloud server,we can perform various statistical analyses, such as monitoring the success of therapy orthe amount of cytostatics and other medications consumed and make daily, weekly, ormonthly review of used IV bottles and other equipment. However, it should be notedthat patient data protection is extremely important, and that is why the cloud securityinfrastructure is configured.
A standard industrial valve was used to regulate and stop the flow of IV infusion.However, in order to prevent IV liquid contamination, we recommend the SMC valve fromthe XT34 series. It should be noted that the regulation of IV infusion flow is of exceptionalimportance, especially in oncology patients. Depending on the chemotherapy protocol,due to the full effect of the drug, the drip time of only one IV bottle can be prescribed forup to 24 h. Then, continuous dripping of IV infusion, all the time during chemotherapy, isimperative. The manual valve, i.e., roller clamp, which is most often used to regulate theflow of IV infusion, has low reliability and requires constant monitoring and too frequentadjustment of the flow, which is unacceptable. Therefore, on the basis of the defined driptime of the IV infusion (which, for example, the medical staff selects according to thetherapy via the display) and the current flow of IV fluid to the patient, the system wouldautomatically regulate the flow to reach the prescribed drip time, which is very important.
The smart IV dosing system requires a constant power supply. However, for mobilityit is necessary to install batteries to power the hardware. In this case, the battery capacityto power the proposed system is determined by
Q = E/U (1)
where Q (mAh) is battery capacity, E (Wh) is energy stored in the battery, and U (V) isbattery voltage. If the system needs to operate for 24 h at the voltage of 9 V DC (maxconsumption 45 mA), a rechargeable NIMH battery of 3000 (2667) mAh is required.
The accuracy of the data from the capacitive sensors was tested using an ultrasonicsensor HC-SR04. The ultrasonic sensor was placed on the opposite side of the IV bottle,above the IV liquid. It should be noted that the IV bottle was previously opened becausethis sensor is not able to detect drops of liquid directly through the drip chamber or the IVbottle. By simultaneously detecting the liquid level in the IV bottle using ultrasound andcapacitive sensors, and by comparing the obtained data, we concluded that the capacitivesensors reliably and accurately detect the liquid level in the IV bottle.
Functional test of the liquid detection and signaling system in IV bottle was performedby measuring the time from the moment of activation of the upper capacitive sensor on IVbottle (MAX level) to the moment of infusion expiration (MIN 2 level), and the signal forclosing the flow valve. Testing was performed using an IV bottle with 500 mL of saline,with the distance from the bottle to the cannula being L = 1 m (see Figure 1). In addition,for the purposes of this test, the roller clamp was fully open to measure the drip timeat maximum IV fluid flow. The cannula that is most often used in IV therapy or bloodtransfusion was chosen—it is pink for identification and has a flow rate of 65 mL/min [88].A total of 10 measurements were performed. Table 5 shows the measurement results.
Appl. Sci. 2021, 11, 513 21 of 26
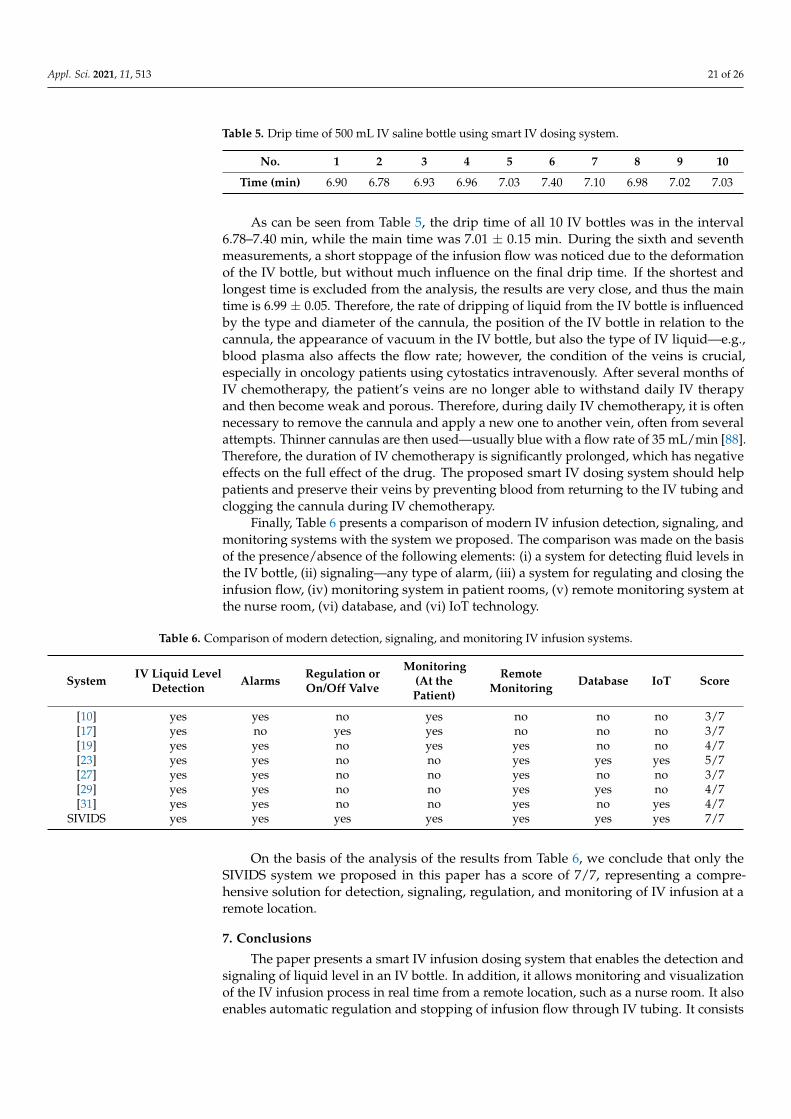
Table 5. Drip time of 500 mL IV saline bottle using smart IV dosing system.
No. 1 2 3 4 5 6 7 8 9 10
Time (min) 6.90 6.78 6.93 6.96 7.03 7.40 7.10 6.98 7.02 7.03
As can be seen from Table 5, the drip time of all 10 IV bottles was in the interval6.78–7.40 min, while the main time was 7.01 ± 0.15 min. During the sixth and seventhmeasurements, a short stoppage of the infusion flow was noticed due to the deformationof the IV bottle, but without much influence on the final drip time. If the shortest andlongest time is excluded from the analysis, the results are very close, and thus the maintime is 6.99 ± 0.05. Therefore, the rate of dripping of liquid from the IV bottle is influencedby the type and diameter of the cannula, the position of the IV bottle in relation to thecannula, the appearance of vacuum in the IV bottle, but also the type of IV liquid—e.g.,blood plasma also affects the flow rate; however, the condition of the veins is crucial,especially in oncology patients using cytostatics intravenously. After several months ofIV chemotherapy, the patient’s veins are no longer able to withstand daily IV therapyand then become weak and porous. Therefore, during daily IV chemotherapy, it is oftennecessary to remove the cannula and apply a new one to another vein, often from severalattempts. Thinner cannulas are then used—usually blue with a flow rate of 35 mL/min [88].Therefore, the duration of IV chemotherapy is significantly prolonged, which has negativeeffects on the full effect of the drug. The proposed smart IV dosing system should helppatients and preserve their veins by preventing blood from returning to the IV tubing andclogging the cannula during IV chemotherapy.
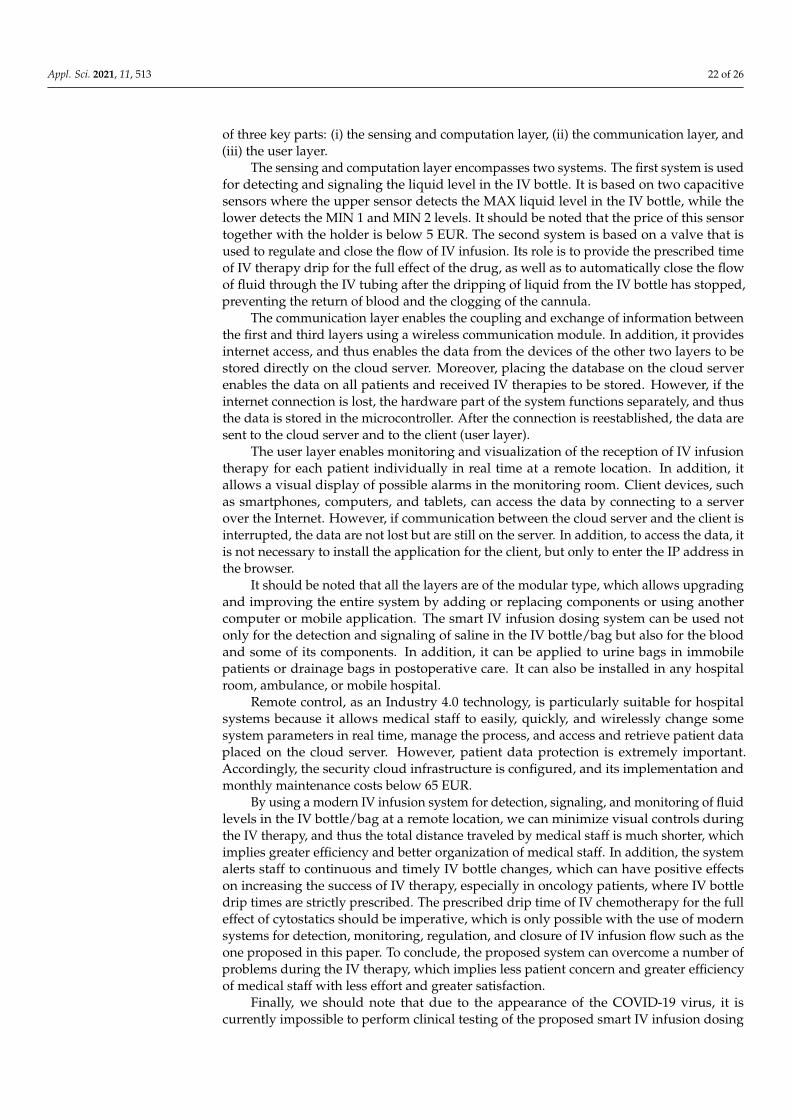
Finally, Table 6 presents a comparison of modern IV infusion detection, signaling, andmonitoring systems with the system we proposed. The comparison was made on the basisof the presence/absence of the following elements: (i) a system for detecting fluid levels inthe IV bottle, (ii) signaling—any type of alarm, (iii) a system for regulating and closing theinfusion flow, (iv) monitoring system in patient rooms, (v) remote monitoring system atthe nurse room, (vi) database, and (vi) IoT technology.
Table 6. Comparison of modern detection, signaling, and monitoring IV infusion systems.
System IV Liquid LevelDetection Alarms Regulation or
On/Off Valve
Monitoring(At thePatient)
RemoteMonitoring Database IoT Score
[10] yes yes no yes no no no 3/7[17] yes no yes yes no no no 3/7[19] yes yes no yes yes no no 4/7[23] yes yes no no yes yes yes 5/7[27] yes yes no no yes no no 3/7[29] yes yes no no yes yes no 4/7[31] yes yes no no yes no yes 4/7
SIVIDS yes yes yes yes yes yes yes 7/7
On the basis of the analysis of the results from Table 6, we conclude that only theSIVIDS system we proposed in this paper has a score of 7/7, representing a compre-hensive solution for detection, signaling, regulation, and monitoring of IV infusion at aremote location.
7. Conclusions
The paper presents a smart IV infusion dosing system that enables the detection andsignaling of liquid level in an IV bottle. In addition, it allows monitoring and visualizationof the IV infusion process in real time from a remote location, such as a nurse room. It alsoenables automatic regulation and stopping of infusion flow through IV tubing. It consists
Appl. Sci. 2021, 11, 513 22 of 26
of three key parts: (i) the sensing and computation layer, (ii) the communication layer, and(iii) the user layer.
The sensing and computation layer encompasses two systems. The first system is usedfor detecting and signaling the liquid level in the IV bottle. It is based on two capacitivesensors where the upper sensor detects the MAX liquid level in the IV bottle, while thelower detects the MIN 1 and MIN 2 levels. It should be noted that the price of this sensortogether with the holder is below 5 EUR. The second system is based on a valve that isused to regulate and close the flow of IV infusion. Its role is to provide the prescribed timeof IV therapy drip for the full effect of the drug, as well as to automatically close the flowof fluid through the IV tubing after the dripping of liquid from the IV bottle has stopped,preventing the return of blood and the clogging of the cannula.
The communication layer enables the coupling and exchange of information betweenthe first and third layers using a wireless communication module. In addition, it providesinternet access, and thus enables the data from the devices of the other two layers to bestored directly on the cloud server. Moreover, placing the database on the cloud serverenables the data on all patients and received IV therapies to be stored. However, if theinternet connection is lost, the hardware part of the system functions separately, and thusthe data is stored in the microcontroller. After the connection is reestablished, the data aresent to the cloud server and to the client (user layer).
The user layer enables monitoring and visualization of the reception of IV infusiontherapy for each patient individually in real time at a remote location. In addition, itallows a visual display of possible alarms in the monitoring room. Client devices, suchas smartphones, computers, and tablets, can access the data by connecting to a serverover the Internet. However, if communication between the cloud server and the client isinterrupted, the data are not lost but are still on the server. In addition, to access the data, itis not necessary to install the application for the client, but only to enter the IP address inthe browser.
It should be noted that all the layers are of the modular type, which allows upgradingand improving the entire system by adding or replacing components or using anothercomputer or mobile application. The smart IV infusion dosing system can be used notonly for the detection and signaling of saline in the IV bottle/bag but also for the bloodand some of its components. In addition, it can be applied to urine bags in immobilepatients or drainage bags in postoperative care. It can also be installed in any hospitalroom, ambulance, or mobile hospital.
Remote control, as an Industry 4.0 technology, is particularly suitable for hospitalsystems because it allows medical staff to easily, quickly, and wirelessly change somesystem parameters in real time, manage the process, and access and retrieve patient dataplaced on the cloud server. However, patient data protection is extremely important.Accordingly, the security cloud infrastructure is configured, and its implementation andmonthly maintenance costs below 65 EUR.
By using a modern IV infusion system for detection, signaling, and monitoring of fluidlevels in the IV bottle/bag at a remote location, we can minimize visual controls duringthe IV therapy, and thus the total distance traveled by medical staff is much shorter, whichimplies greater efficiency and better organization of medical staff. In addition, the systemalerts staff to continuous and timely IV bottle changes, which can have positive effectson increasing the success of IV therapy, especially in oncology patients, where IV bottledrip times are strictly prescribed. The prescribed drip time of IV chemotherapy for the fulleffect of cytostatics should be imperative, which is only possible with the use of modernsystems for detection, monitoring, regulation, and closure of IV infusion flow such as theone proposed in this paper. To conclude, the proposed system can overcome a number ofproblems during the IV therapy, which implies less patient concern and greater efficiencyof medical staff with less effort and greater satisfaction.
Finally, we should note that due to the appearance of the COVID-19 virus, it iscurrently impossible to perform clinical testing of the proposed smart IV infusion dosing
Appl. Sci. 2021, 11, 513 23 of 26
system, which will be done in the future in accordance with the legislation of the Republicof Serbia.
8. Patents
The smart intravenous infusion dosing system described in this paper is patent pending.
Author Contributions: Conceptualization, methodology, software, writing—original draft prepara-tion: D.O., M.P., and J.Š.; data curation, validation: M.C., G.O., and O.I.; supervision, writing—reviewand editing: S.S. All authors have read and agreed to the published version of the manuscript.
Funding: This research received no external funding.
Acknowledgments: This research has been supported by the Ministry of Education, Science andTechnological Development, Government of the Republic of Serbia, through the project “Innovativescientific and artistic research from the FTN activity domain”.
Conflicts of Interest: The authors declare no conflict of interest.
References1. Fraunhofer-Gesellschaft: Research News. Safe. IV Therapies in Developing Countries–Reducing Mortality with an Electronically
Controlled Infusion Set; Fraunhofer: Munich, Germany, 2020; pp. 1–4. Available online: https://www.fraunhofer.de/en/press/research-news/2020/september/reducing-mortality-with-an-electronically-controlled-infusion-set.html (accessed on12 November 2020).
2. Hindley, G. Infection control in peripheral cannulae. Nurs. Stand. 2004, 18, 37–40. [CrossRef]3. Millam, D.A. Managing complications of i.v. therapy (continuing education credit). Nursing 1988, 18, 34–43. [CrossRef]4. Ajibola, O.O.E.; Sunday, O.O.; Eyehorua, D.O. Development of automated intravenous blood infusion monitoring system using
load cell sensor. J. Appl. Sci. Environ. Manag. 2018, 22, 1557–1561. [CrossRef]5. Shelishiyah, R.; Suma, S.; Reji, J.R.M. A system to prevent blood backflow in intravenous infusions. In Proceedings of the 2nd
International Conference on Innovations in Information, Embedded and Communication Systems (ICIIECS), Coimbatore, India,19–20 March 2015; pp. 1–4. [CrossRef]
6. Bhavasaar, M.K.; Nithya, M.; Praveena, R.; Bhuvaneswari, N.S.; Kalaiselvi, T. Automated intravenous fluid monitoring andalerting system. In Proceedings of the IEEE Technological Innovations in ICT for Agriculture and Rural Development (TIAR),Chennai, India, 15–16 July 2016; pp. 77–80. [CrossRef]
7. Ramisha, R.K.; Shabana, N.; Tanmayee, P.; Loganathan, S.; Velmathi, G. Smart drip infusion monitoring system for instantalert-through nRF24L01. In Proceedings of the International Conference on Nextgen Electronic Technologies: Silicon to Software(ICNETS2), Chennai, India, 23–25 March 2017; pp. 452–455. [CrossRef]
8. Cohen, L.; Rose, R.A. Capacitance-Type Fluid Level Sensor for I.V., and Catheter Bags. U.S. Patent No. US5135485, 4 August 1992.9. Anand, M.; Pradeep, M.; Manoj, S.; Arockia Raj, L.M.; Thamaraikani, P. Intravenous drip monitoring system. Indo-Iran. J. Sci. Res.
2018, 2, 106–113. [CrossRef]10. Pratim, R.P.; Thapa, N. A systematic review on real-time automated measurement of IV fluid level: Status and challenges.
Measurement 2018, 129, 343–348. [CrossRef]11. Priyadharshini, R.; Mithuna, S.; Vasanth, K.U.; Kalpana, D.S.; Suthanthira, V.N. Automatic intravenous fluid level indication
system for hospitals. Int. J. Res. Appl. Sci. Eng. Technol. 2015, 3, 427–432.12. Ogawa, H.; Maki, H.; Tsukamoto, S.; Yonezawa, Y.; Amano, H.; Caldwell, W.M. A new drip infusion solution monitoring system
with a free-flow detection function. In Proceedings of the Annual International Conference of the IEEE Engineering in Medicineand Biology, Buenos Aires, Argentina, 31 August–4 September 2010; pp. 1214–1217. [CrossRef]
13. Makobore, P.N.; Mulerwa, M. An electronically controlled gravity feed infusion set for intravenous fluids. In Biomedical Engineeringfor Africa; Douglas, T.S., Ed.; University of Cape Town Libraries: Cape Town, South Africa, 2019; pp. 125–138. [CrossRef]
14. Sayed-Kassem, A.; Kozah, N.; Hajj-Moussa, G.; Harb, R.; Zaylaa, A.J. BMIVPOT, a fully automated version of the intravenouspole: Simulation, design, and evaluation. J. Healthc. Eng. 2020, 2020, 7963497. [CrossRef] [PubMed]
15. LeFevre, R.J.; Thomas, R.E. Electronically Controlled Intravenous Infusion Set. U.S. Patent No. US4038981, 2 August 1977.16. Cheng, T.-Y. Intravenous Drip Monitoring Method and Related Intravenous Drip Monitoring System. U.S. Patent
No. US2011/0144595A1, 16 June 2011.17. Moorthy, J.; Karunakaran, K.; Senthik, K.S.V. An automated locking system to prevent backflow of blood in an intravenous setup.
Glob. J. Res. Eng. 2020, 20, 27–34.18. Mulerwa, M.; Makobore, P.; Kagoda, H. Clinician engagement and training on an electronically controlled gravity feed infusion
set as a precursor for clinical studies. CMBES Proc. 2019, 42, 1–3.19. Makobore, P.N.; Mulerwa, M.; Kagoda, H.; Ocheng, M.; Niyitanga, P.; Wegoye, M.; Muhanguzi, D.; Rutakingirwa, M.; Meya, D.
Early feasibility study of an electronically controlled gravity feed infusion set for intravenous fluids in adults. CMBES Proc.2019, 42, 1–5.
Appl. Sci. 2021, 11, 513 24 of 26
20. Raghavendra, R.K.; Evangili, S.K. Design and development of IoT based intravenous infusion system. In Emerging Trends inElectrical, Communications, and Information Technologies: ICECIT 2018; Hitendra, S.T., Sankar, V., Shaik, R., Eds.; Springer: Singapore,2020; Volume 569, pp. 487–499. [CrossRef]
21. Joseph, S.; Francis, N.; John, A.; Farha, B.; Baby, A. Intravenous drip monitoring system for smart hospital using IoT. In Proceedingsof the 2nd International Conference on Intelligent Computing, Instrumentation and Control Technologies (ICICICT), Kannur,Kerala, India, 5–6 July 2019; pp. 835–839. [CrossRef]
22. Pratim, R.P.; Thapa, N.; Dash, D.; De, D. Novel implementation of IoT based non-invasive sensor system for real-time monitoringof intravenous fluid level for assistive e-healthcare. Circuit World 2019, 3, 109–123. [CrossRef]
23. Wei, Q.; Lee, J.H.; Seong, K.W.; Kim, M.N.; Cho, J.H. The design of a wireless flexible capacitive sensor detection system to detectliquid level in plastic bag intravenous drip sets. Biomed. Eng. Lett. 2011, 1, 247–253. [CrossRef]
24. Tseng, W.-H.; Juan, D.; Hsiao, W.-C.; Chan, C.-H.; Wang, K.-C.; Ma, H.-Y.; Lee, H.-Y. Optical design and study of a wireless IVdrip detection device. Microelectron. Reliab. 2019, 102, 113325. [CrossRef]
25. Feng, J.; Miao, X. Method for Determining the Empty State of an IV Bottle in an IV Infusion Monitoring Device. U.S. PatentNo. US9752913B2, 5 September 2017.
26. Binti, R.S.N.; Chin, K.L. The development of intravenous drip detector based on wireless application. In E-Proceedingsof the 4th International Conference on Research in TVET Studies (ICOR-TVET), Pamulang, Indonesia, 9 September 2019;Temerloh Community College Press: Mentakab, Pahang, 2019; pp. 188–193.
27. Dinesh, K.J.R.; Ganesh, B.C.; Soundari, D.V.; Priyadharsini, K.; Karthi, S.P. A novel system design for intravenous infusion systemmonitoring for betterment of health monitoring system using ML-AI. Int. J. Innov. Technol. Explor. Eng. 2020, 9, 2649–2655.[CrossRef]
28. Amano, H.; Ogawa, H.; Maki, H.; Tsukamoto, S.; Yonezawa, Y.; Caldwell, W.M. A remote drip infusion monitoring systememploying Bluetooth. In Proceedings of the Annual International Conference of the IEEE Engineering in Medicine and BiologySociety, San Diego, CA, USA, 28 August–1 September 2012; pp. 2029–2032. [CrossRef]
29. Feng, J.; Miao, X. IV Infusion Monitoring Device. U.S. Patent No. US2011/0205074A1, 25 August 2011.30. Yang, C.W. Intravenous Drip Real-Time Monitoring System and Method. U.S. Patent No. US2019/0365994A1, 5 December 2019.31. Unluturk, M.S.; Ozcanhan, M.H.; Dalkilic, G. Improving communication among nurses and patients. Comput. Meth. Prog. Bio.
2015, 120, 102–112. [CrossRef] [PubMed]32. Rghioui, A.; Lloret, J.; Parra, L.; Sendra, S.; Oumnad, A. Glucose data classification for diabetic patient monitoring. Appl. Sci.
2019, 9, 4459. [CrossRef]33. Jung, W.-K.; Park, Y.-C.; Lee, J.-W.; Suh, E.S. Remote sensing of sewing work levels using a power monitoring system. Appl. Sci.
2020, 10, 3104. [CrossRef]34. Lee, H.-W.; Lee, K.-O.; Kang, I.-A.; Kye, J.-E.; Park, Y.-Y. Design of a generic wearable-robot monitoring system (GWRMS) for
patients with lower limb paralysis. Appl. Sci. 2020, 10, 5566. [CrossRef]35. Yi, L.; Seo, H.-B. The effect of hospital unit layout on nurse walking behavior. HERD-Health Env. Res. 2012, 6, 66–82. [CrossRef]36. Shepley, M.M.; Davies, K. Nursing unit configuration and its relationship to noise and nurse walking behavior: An AIDS/HIV
unit case study. AIA Academy J. 2013, 6, 12–14.37. Chiang, Y. Design Dilemma: Nurses’ Stations; Cornell University: Ithaca, NY, USA, 2010; pp. 1–32. Available online: https:
//www.iwsp.human.cornell.edu/files/2013/09/Nurses-stations-qr3u4x.pdf (accessed on 12 November 2020).38. Adams, R. Nursing Unit Design: Staff Interaction and Communication Patterns; Cornell University: Ithaca, NY, USA, 2013;
pp. 1–30. Available online: https://www.iwsp.human.cornell.edu/files/2013/09/Nursing-Unit-Design-Staff-Interac-tion-Com-munication-patterns-u8f0lw.pdf (accessed on 12 November 2020).
39. Lee, J.; Lee, H.; Shepley, M.M. Exploring the spatial arrangement of patient rooms for minimum nurse travel in hospital nursingunits in Korea. Front. Archit. Res. 2020, 9, 711–725. [CrossRef]
40. Ullah, U.; Park, J.S. A comparative analysis of patient visibility, spatial configuration and nurse walking distance in Koreanintensive care units (ICUs)–focused on single corridor, pod and composite type units. J. Korea Inst. Health Archit. 2016, 22, 37–45.[CrossRef]
41. Real, K.; Bardach, S.H.; Bardach, D.R. The role of the built environment: How decentralized nurse stations shape communication,patient care processes, and patient outcomes. Health Commun. 2017, 32, 1557–1570. [CrossRef] [PubMed]
42. Devos, P.; Aletta, F.; Thomas, P.; Vander Mynsbrugge, T.; Petrovic, M.; Van de Velde, D.; De Vriendt, P.; Botteldooren, D.Application of a prediction model for ambient noise levels and acoustical capacity for living rooms in nursing homes hostingolder people with dementia. Appl. Sci. 2020, 10, 4205. [CrossRef]
43. Seo, H.-B.; Choi, Y.-S.; Zimring, C. Impact of hospital unit design for patient-centered care on nurses’ behavior. Environ. Behav.2011, 43, 443–468. [CrossRef]
44. Sedgwick, M.; Awosoga, O.; Grigg, L. A pilot study exploring the relationship between the use of mobile technologies, walkingdistance, and clinical decision making among rural hospital nurses. Health Inform. J. 2019, 25, 1163–1169. [CrossRef]
45. Mutiarasari, D.; Miranti, M.; Puspasari, K.D.I. Response times and patient satisfaction in emergency room at Anutapura GeneralHospital, city of Palu. J. Curr. Med. Res. Opin. 2019, 2, 152–157. [CrossRef]
Appl. Sci. 2021, 11, 513 25 of 26
46. Voepel-Lewis, T.; Parker, M.L.; Burke, C.N.; Hemberg, J.; Perlin, L.; Kai, S.; Ramachandran, S.K. Pulse oximetry desaturationalarms on a general postoperative adult unit: A prospective observational study of nurse response time. Int. J. Nurs. Stud.2013, 50, 1351–1358. [CrossRef]
47. Ali, H.; Li, H. Use of notification and communication technology (call light systems) in nursing homes: Observational study.J. Med. Internet Res. 2020, 22, e16252. [CrossRef]
48. Ali, H.; Cole, A.; Sienkiewicz, A.; Ho, T. Perspectives of nursing homes staff on the nature of residents-initiated call lights.SAGE Open Nurs. 2020, 6, 1–12. [CrossRef]
49. Bonafide, C.P.; Lin, R.; Zander, M.; Graham, C.S.; Paine, C.W.; Rock, W.; Rich, A.; Roberts, K.E.; Fortino, M.; Nadkarni, V.M.;et al. Association between exposure to nonactionable physiologic monitor alarms and response time in a children’s hospital.J. Hosp. Med. 2015, 10, 345–351. [CrossRef] [PubMed]
50. Martasari, Y.; Zakiyah, A.; Santoso, W. The differences of patient’s families perceptions with BPJS insurance and general aboutresponse time nurse’s based on triage in the emergency room. Int. J. Nurs. Midwifery Sci. 2020, 4, 22–28. [CrossRef]
51. Chapman, C.B. Improving communication among nurses, patients, and physicians. Am. J. Nurs. 2009, 109, 21–25. [CrossRef][PubMed]
52. Doyle, G.R.; McCutcheon, J.A. Intravenous therapy. In Clinical Procedures for Safer Patient Care; BCcampus: Victoria, BC, Canada,2015; pp. 463–542.
53. Worldometers. Available online: https://www.worldometers.info/coronavirus/ (accessed on 12 November 2020).54. Ritchie, H.; Roser, M. Causes of Death. Available online: https://ourworldindata.org/causes-of-death (accessed on
12 November 2020).55. GBD 2017 Causes of Death Collaborators. Global, regional, and national age-sex-specific mortality for 282 causes of death
in 195 countries and territories, 1980–2017: A systematic analysis for the Global Burden of Disease Study 2017. Lancet2018, 392, 1736–1788. [CrossRef]
56. Siegel, R.L.; Miller, K.D.; Jemal, A. Cancer statistics, 2018. CA Cancer J. Clin. 2018, 68, 7–30. [CrossRef]57. Siegel, R.L.; Miller, K.D.; Jemal, A. Cancer statistics, 2019. CA Cancer J. Clin. 2019, 69, 7–34. [CrossRef]58. Siegel, R.L.; Miller, K.D.; Jemal, A. Cancer statistics, 2020. CA Cancer J. Clin. 2020, 70, 7–30. [CrossRef]59. Cheng, L.; Albers, P.; Berney, D.M.; Feldman, D.R.; Daugaard, G.; Gilligan, T.; Looijenga, L.H.J. Testicular cancer.
Nat. Rev. Dis. Primers 2018, 4, 1–24. [CrossRef]60. De Toni, L.; Šabovic, I.; Cosci, I.; Ghezzi, M.; Foresta, C.; Garolla, A. Testicular cancer: Genes, environment, hormones.
Front. Endocrinol. 2019, 10, 408. [CrossRef]61. Baird, D.C.; Meyers, G.J.; Hu, J.S. Testicular cancer: Diagnosis and treatment. Am. Fam. Physician 2018, 97, 261–268.62. Kudjawu, Y.C.; de Maria, F.; Beltzer, N. Trends in rates of inpatients treated for testicular cancer in France, 2000–2014. Andrology
2018, 6, 798–804. [CrossRef] [PubMed]63. Huyghe, E.; Matsuda, T.; Thonneau, P. Increasing incidence of testicular cancer worldwide: A review. J. Urol. 2003, 170, 5–11.
[CrossRef] [PubMed]64. Garner, M.J.; Turner, M.C.; Ghadirian, P.; Krewski, D. Epidemiology of testicular cancer: An overview. Int. J. Cancer
2005, 116, 331–339. [CrossRef] [PubMed]65. Pearce, N.; Sheppard, R.A.; Howard, J.K.; Fraser, J.; Lilley, B.M. Time trends and occupational differences in cancer of the testis in
New Zealand. Cancer 1987, 59, 1677–1682. [CrossRef]66. Wanderås, E.H.; Tretli, S.; Fosså, S.D. Trends in incidence of testicular cancer in Norway 1955–1992. Eur. J. Cancer
1995, 31A, 2044–2048. [CrossRef]67. Weir, H.K.; Marrett, L.D.; Moravan, V. Trends in the incidence of testicular germ cell cancer in Ontario by histologic subgroup,
1964–1996. Can. Med. Assoc. J. 1999, 160, 201–205.68. Møller, H. Trends in incidence of testicular cancer and prostate cancer in Denmark. Hum. Reprod. 2001, 16, 1007–1011. [CrossRef]69. Toledano, M.B.; Jarup, L.; Best, N.; Wakefield, J.; Elliott, P. Spatial variation and temporal trends of testicular cancer in Great
Britain. Br. J. Cancer 2001, 84, 1482–1487. [CrossRef]70. Beri, A.; Matzkin, H.; Liphshitz, I.; Barchana, M. Epidemiological characteristics and trends of testicular cancer in Israel 1992–2002.
Harefuah 2007, 146, 515–519.71. Dusek, L.; Abrahamova, J.; Lakomy, R.; Vyzula, R.; Koptikova, J.; Pavlik, T.; Muzik, J.; Klimes, D. Multivariate analysis of risk
factors for testicular cancer: A hospital-based case-control study in the Czech Republic. Neoplasma 2008, 55, 356–368.72. Baade, P.; Carrière, P.; Fritschi, L. Trends in testicular germ cell cancer incidence in Australia. Cancer Causes Control
2008, 19, 1043–1049. [CrossRef] [PubMed]73. Sincic, N.; Kulis, T.; Znaor, A.; Bray, F. Time trends in testicular cancer in Croatia 1983–2007: Rapid increases in incidence,
no declines in mortality. Cancer Epidemiol. 2012, 36, 11–15. [CrossRef] [PubMed]74. Ghazarian, A.A.; Trabert, B.; Devesa, S.S.; McGlynn, K.A. Recent trends in the incidence of testicular germ cell tumors in the
United States. Andrology 2015, 3, 13–18. [CrossRef] [PubMed]75. Brandt, M.P.; Gust, K.M.; Bon, D.; Tsaur, I.; Thomas, C.; Neisius, A.; Haferkamp, A.; Herrmann, E.; Bartsch, G. Trend analysis and
regional tumor incidence in Germany for testicular cancer between 2003 and 2014. Andrology 2019, 7, 408–414. [CrossRef]76. Schaffar, R.; Pant, S.; Bouchardy, C.; Schubert, H.; Rapiti, E. Testicular cancer in Geneva, Switzerland, 1970–2012: Incidence trends,
survival and risk of second cancer. BMC Urol. 2019, 19, 64. [CrossRef]
Appl. Sci. 2021, 11, 513 26 of 26
77. Rosen, A.; Jayram, G.; Drazer, M.; Eggener, S.E. Global trends in testicular cancer incidence and mortality. Eur. Urol.2011, 60, 374–379. [CrossRef]
78. Kalan, F.K.H.; Mahdavifar, N.; Mohammadian-Hafshejani, A.; Salehiniya, H. Testicular cancer in the world: An epidemiologicalreview. WCRJ 2018, 5, e1180-1–e1180-5.
79. Gurney, J.K.; Florio, A.A.; Znaor, A.; Ferlay, J.; Laversanne, M.; Sarfati, D.; Bray, F.; McGlynn, K.A. International trends in theincidence of testicular cancer: Lessons from 35 years and 41 countries. Eur. Urol. 2019, 76, 615–623. [CrossRef] [PubMed]
80. Znaor, A.; Skakkebaek, N.E.; Rajpert-De Meyts, E.; Laversanne, M.; Kuliš, T.; Gurney, J.; Sarfati, D.; McGlynn, K.A.; Bray,F. Testicular cancer incidence predictions in Europe 2010-2035: A rising burden despite population ageing. Int. J. Cancer2020, 147, 820–828. [CrossRef]
81. Hanna, N.H.; Einhorn, L.H. Testicular cancer–discoveries and updates. N. Engl. J. Med. 2014, 371, 2005–2016. [CrossRef]82. Albers, P.; Albrecht, W.; Algaba, F.; Bokemeyer, C.; Cohn-Cedermark, G.; Fizazi, K.; Horwich, A.; Laguna, M.P.; Nicolai, N.;
Oldenburg, J. EAU guidelines on testicular cancer: 2015 update. Eur. Urol. 2015, 68, 1054–1068. [CrossRef] [PubMed]83. Albers, P.; Albrecht, W.; Algaba, F.; Bokemeyer, C.; Cohn-Cedermark, G.; Fizazi, K.; Horwich, A.; Laguna, M.P. EAU guidelines on
testicular cancer: 2011 update. Eur. Urol. 2011, 60, 304–319. [CrossRef] [PubMed]84. Travis, L.B.; Beard, C.; Allan, J.M.; Dahl, A.A.; Feldman, D.R.; Oldenburg, J.; Daugaard, G.; Kelly, J.L.; Dolan, M.E.; Hannigan,
R.; et al. Testicular cancer survivorship: Research strategies and recommendations. J. Natl. Cancer Inst. 2010, 102, 1114–1130.[CrossRef] [PubMed]
85. Krege, S. PEB beim hodentumor [PEB treatment of testicular cancer]. Aktuelle Urol. 2012, 43, 342–345. [CrossRef] [PubMed]86. Cullen, M.H.; Stenning, S.P.; Parkinson, M.C.; Fossa, S.D.; Kaye, S.B.; Horwich, A.H.; Harland, S.J.; Williams, M.V.; Jakes, R.
Short-course adjuvant chemotherapy in high-risk stage I nonseminomatous germ cell tumors of the testis: A Medical ResearchCouncil report. J. Clin. Oncol. 1996, 14, 1106–1113. [CrossRef] [PubMed]
87. Loehrer, P.J., Sr.; Lauer, R.; Roth, B.J.; Williams, S.D.; Kalasinski, L.A.; Einhorn, L.H. Salvage therapy in recurrent germ cell cancer:Ifosfamide and cisplatin plus either vinblastine or etoposide. Ann. Intern. Med. 1988, 109, 540–546. [CrossRef] [PubMed]
88. Braun, B. Healthcare Company. Available online: https://www.bbraun.com/content/dam/catalog/bbraun/bbraunProductCatalog/S/AEM2015/en-01/b9/patient-access-ininfusiontherapy.pdf (accessed on 12 November 2020).