single myelin fiber imaging in living rodents without labeling
TRANSCRIPT
Single myelin fiber imaging in livingrodents without labeling by deep opticalcoherence microscopy
Juliette Ben ArousJonas BindingJean-Francois LegerMariano CasadoPiotr TopilkoSylvain GiganA. Claude BoccaraLaurent Bourdieu
Downloaded From: https://www.spiedigitallibrary.org/journals/Journal-of-Biomedical-Optics on 26 Mar 2022Terms of Use: https://www.spiedigitallibrary.org/terms-of-use
Journal of Biomedical Optics 16(11), 116012 (November 2011)
Single myelin fiber imaging in living rodents withoutlabeling by deep optical coherence microscopy
Juliette Ben Arous,a,b,c,∗ Jonas Binding,a,b,c,d,e,f,∗ Jean-Francois Leger,a,b,c Mariano Casado,a,b,c Piotr Topilko,a,b,c
Sylvain Gigan,d A. Claude Boccara,d and Laurent Bourdieua,b,caEcole Normale Superieure, Institut de Biologie de l’ENS, IBENS 46 rue d’Ulm, Paris, 75005 FrancebInserm, U1024, Paris, 75005 FrancecCNRS, UMR 8197, Paris, 75005 FrancedInstitut Langevin, UMR7587 CNRS, ESPCI, 10 rue Vauquelin, Paris, 75005 FranceeMax Planck Institute for Medical Research, Jahnstraße 29, 69120 Heidelberg, GermanyfFondation Pierre-Gilles de Gennes pour la Recherche, 29 rue d’Ulm, Paris, 75005 France
Abstract. Myelin sheath disruption is responsible for multiple neuropathies in the central and peripheral nervoussystem. Myelin imaging has thus become an important diagnosis tool. However, in vivo imaging has been limited toeither low-resolution techniques unable to resolve individual fibers or to low-penetration imaging of single fibers,which cannot provide quantitative information about large volumes of tissue, as required for diagnostic purposes.Here, we perform myelin imaging without labeling and at micron-scale resolution with >300-μm penetrationdepth on living rodents. This was achieved with a prototype [termed deep optical coherence microscopy (deep-OCM)] of a high-numerical aperture infrared full-field optical coherence microscope, which includes aberrationcorrection for the compensation of refractive index mismatch and high-frame-rate interferometric measurements.We were able to measure the density of individual myelinated fibers in the rat cortex over a large volume ofgray matter. In the peripheral nervous system, deep-OCM allows, after minor surgery, in situ imaging of singlemyelinated fibers over a large fraction of the sciatic nerve. This allows quantitative comparison of normal andKrox20 mutant mice, in which myelination in the peripheral nervous system is impaired. This opens promisingperspectives for myelin chronic imaging in demyelinating diseases and for minimally invasive medical diagnosis.C©2011 Society of Photo-Optical Instrumentation Engineers (SPIE). [DOI: 10.1117/1.3650770]
Keywords: myelin; full-field optical coherence tomography; endogenous contrast; optical aberrations; live imaging.
Paper 11285R received Jun. 7, 2011; revised manuscript received Aug. 3, 2011; accepted for publication Sep. 20, 2011; publishedonline Oct. 31, 2011; corrected Nov. 4, 2011.
1 IntroductionThe myelin sheath is an essential component of the vertebratenervous system composed of glial membrane layers tightlywrapped around axonal fibers. Its high lipid content allowselectrical insulation of the axonal membrane and enables salta-tory conduction over long distances ensuring rapid, reliable, andenergetically efficient conduction of action potentials. Disrup-tion of the myelin sheath is involved in central nervous sys-tem pathologies, such as multiple sclerosis and leukodystro-phies, and peripheral nervous system (PNS) neuropathies, suchas Charcot-Marie-Tooth disease.1, 2
Quantitative myelin imaging is a necessary tool to followdemyelination or to evaluate eventual remyelinating treatments.Myelin in the white matter can be visualized in vitro and in vivowith magnetic resonance imaging, positron emission tomogra-phy, and near-infrared imaging with a (0.1–1)-mm resolution.3–6
This resolution is insufficient to detect single myelinated axons,thus preventing the study of demyelination in gray matter, wheremyelinated fibers are sparsely organized. However demyelinat-ing lesions in the gray matter are known to be an importanthallmark of pathologies such as multiple sclerosis.7
*These authors contributed equally to this work.
Address all correspondence to: Laurent Bourdieu, Ecole Normale Superieure,Institut de Biologie de l’ENS, IBENS 46 rue d’Ulm, Paris, F-75005 France. Tel:+33 144323734; Fax: +33 144323887; E-mail: [email protected].
Different approaches have been recently designed to over-come this limitation. Coherent anti-Stokes–Raman scatteringmicroscopy allows the visualization of single fibers without ex-ogenous labeling.8, 9 This technique has a penetration depth ofonly a few tens of micrometers and cannot provide quantitativeinformation on large volumes of nervous tissue. Third harmonicgeneration provides signals from myelin10 with an improvedpenetration but is still a costly and complicated technique, andits use for in vivo recording in the cortex has not yet been demon-strated. A noninvasive method allowing imaging of myelin withindividual fiber resolution is therefore still lacking.
Optical coherence tomography (OCT) is a simple yet pow-erful technique based on interference that allows noninvasiveimaging of biological samples and provides optical sectioningdeep into scattering tissues.11, 12 Full-field OCT (ff-OCT) is ahigh spatial resolution version of OCT, the only providing mi-cron resolution in three dimensions.13 OCT uses the backscat-tered light due to refractive index (n) variations in the sample asa source of endogenous contrast. The lipid-rich myelin sheathhas a high refractive index (up to n ∼ 1.455 ± 0.015 in thevisible14) and lies in an aqueous background (n ∼ 1.33 in thevisible15). Here we show that myelin produces a strong endoge-nous backscattering signal. To take advantage of this signal,we have designed a prototype of a high-numerical aperture in-frared ff-OCT microscope with automatic correction of defocus
1083-3668/2011/16(11)/116012/9/$25.00 C© 2011 SPIE
Journal of Biomedical Optics November 2011 � Vol. 16(11)116012-1
Downloaded From: https://www.spiedigitallibrary.org/journals/Journal-of-Biomedical-Optics on 26 Mar 2022Terms of Use: https://www.spiedigitallibrary.org/terms-of-use
Ben Arous et al.: Single myelin fiber imaging in living rodents without labeling...
aberration.16, 17 This prototype, designated as deep-OCM, allowshigh-resolution myelin imaging deep in tissue without staining.We present two applications of myelin imaging in large vol-umes of tissue with single fiber resolution: the myelination ofindividual fibers during development in the rat cortex and thecomparison of sciatic nerve structure in wild-type and mutantmice in which myelination in the PNS is impaired.
2 Materials and Methods2.1 AnimalsAll animal manipulation and surgical procedures were in accor-dance with the European Community guidelines on the care anduse of animals,18 French legislation,19 and the recommendationsof the CNRS. Male Wistar rats, female Swiss CNP-EGFP mice20
[cyclic nucleotide phosphodiesterase (CNP)], C57BL/6/DBA2wild-type, and Krox20− / − mice21, 22 were used in this study. Theage of the animals used in the different experiments is specifiedin the next paragraphs.
2.2 Slice PreparationFor in vivo fixation, animals were deeply anesthetized with ure-thane (1.5 g/kg) and perfused transcardially with cold phos-phate buffer solution (PBS) followed by 4% paraformaldehydein PBS solution. In the somato-sensory cortex of rats (P19 andP85) and CNP-EGFP mice (P120), 100 μm thick slices were cuttangentially to the flattened cortical surface. In the cerebellumof a P19 rat, 300-μm thick sagittal slices were cut. All sliceswere stored in PBS before imaging. For myelin immunofluo-rescence labeling, after bleaching (10% H2O2, 13.3% Dimethylsulfoxide, 53.3% methanol), cortical slices were incubated withrat monoclonal anti–myelin basic protein (MBP) antibodies(1:100, Millipore Bioscience Research, Billerica, MA) fol-lowed by goat anti-rat Cy3 secondary antibodies (1:500, JacksonImmuno Research, Newmarket, UK). All fluorescence imageswere acquired using a Leica SP2 confocal microscope (LeicaMicrosystems GmbH, Wetzlar, Germany) with a 10× objective.
2.3 Sciatic Nerve PreparationFor in vitro imaging, the sciatic nerves of two mice (wild-typeand Krox20− / − mutant, P14) were extracted and laid on glassslides in PBS for immediate imaging. The nerves were not heldby a coverslip to prevent them from being crushed. For in vivoimaging, a wild-type mouse (P60) was anesthetized with ke-tamine (100 mg/kg) and xylazine (10 mg/kg). A small incisionwas performed in the left hind limb and the sciatic nerve wasexposed. A plastic holder was slipped under the nerve to main-tain it and prevent movements. Imaging was performed in PBSwithout coverslip.
2.4 Surgical Procedure for In Vivo Cortex ImagingThree three-week old (P20-21; weight ∼80 g), three six-weekold (P45-46; weight ∼250 g), and two 12-week old (P86-87;weight ∼400 g) male Wistar rats were used for in vivo somato-sensory cortex imaging. Rats were anesthetized by urethaneinjection (1.5 g/kg). Supplementary doses of urethane were ap-plied when necessary. The body temperature of the animal washeld at 38 ◦C on a heating blanket during the whole experiment.Animals were maintained in a stereotaxic frame during the sur-
gical procedure. A craniotomy (∼3 mm diameter) centered onthe somato-sensory cortex was performed on the rat’s left hemi-sphere. In some cases, the dura mater was removed, as indicatedin the figure legends. The craniotomy was sealed with a cover-slip with 5 mm diameter that was glued onto the thinned skullto be in close contact with the brain, in order to prevent brainmovements during the imaging procedure. For ff-OCT imaging,the animal was maintained with a metal holder glued on its skullto ensure optical stability. At the end of the experiments, ratswere injected with a lethal dose of urethane.
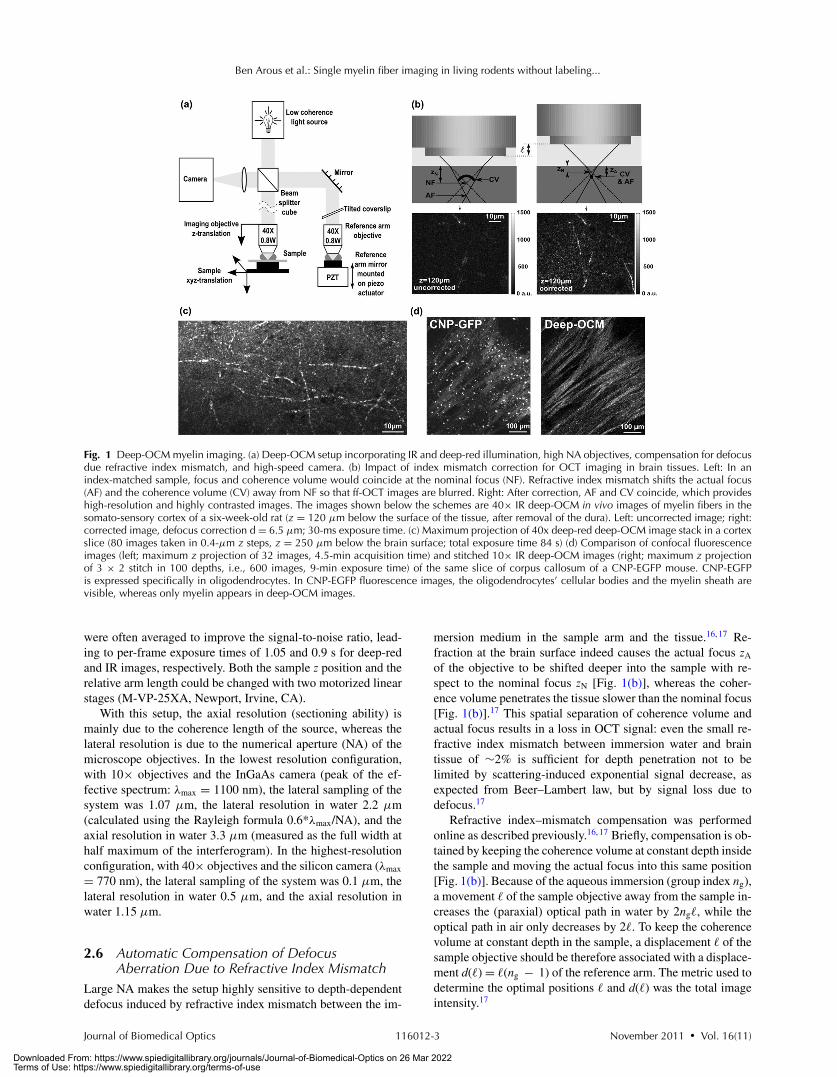
2.5 Deep Optical Coherence Microscopy SetupThe microscope [Fig. 1(a)] consists of a low spatial and temporalcoherence light source (250-W halogen lamp) with the standardKohler microscope illumination, a Linnik interferometer (i.e., aMichelson interferometer with an objective in each arm), a tubelens, and a camera. The water immersion objectives used wereeither Zeiss IR-Achroplan 40×/0.8 W (to maximize lateral res-olution) or Olympus UMPlanF 10×/0.3 W (for the observationof large fields of view). For dispersion correction, a coverslipidentical to the one used to cover the sample was placed in thereference arm. To avoid the backreflection from the coverslip onthe camera, the former was slightly tilted. A 50-cm doublet wasused as a tube lens to image the sample and the reference armmirror onto the camera.
Two different cameras were used: an infrared InGaAs cam-era (Xeva-1.7-320, Xenics Infrared Solutions, Leuven, Belgium)and a silicon camera (Pantera 1M60, Dalsa, Waterloo, Canada).Myelin fibers were detected with both sensors. Deep-OCM im-ages taken with the InGaAs camera are noted as “IR” in thetext (wavelength range 1000–1170 nm, measured at half thepeak height), whereas images from the silicon camera are de-scribed as deep-red (wavelength range 700–850 nm). Deep-redimaging maximized the lateral resolution, whereas IR imagingincreased further the depth penetration due to decreased scatter-ing at longer wavelengths.23 The InGaAs sensor chip had 320× 256 pixels (pixel size: 30 μm) and the silicon chip had 1024× 1024 pixels (pixel size: 12 μm).
Fast (∼30 Hz) image acquisition was performed in both casesto prevent motion artifacts and loss of contrast due to samplemotion. The InGaAs and silicon cameras were operated at 66and 57 Hz, respectively, triggered by a NI 6722 digital I/Oboard (National Instruments, Austin, Texas) controlled by thesoftware Light-CT (LLTech, Paris). A synchronized rectangular33 or 28.5 Hz signal drove the piezo linear stage actuator (PIP-753.11C, Physik Instrumente GmbH, Karlsruhe, Germany)onto which the reference arm mirror was mounted. The piezoac-tuator amplitude was adapted to produce a change in referencearm length of λ/2, so that the relative phase between both armsof the interferometer would change by π . Taking the differ-ence of subsequent camera images would therefore separatethe interference signal from the background light, implement-ing a two-step phase-stepping protocol. The software Light-CT(LLTech, Paris, France) running on a standard PC allowed real-time display of the infrared images at 33 Hz, while the higherpixel number of the silicon camera limited display speed to ∼15Hz. In vivo images were taken with the IR camera without anyaveraging to profit from the 30-ms exposure time. When imagingmechanically stable samples, such as tissue slices, 30 images
Journal of Biomedical Optics November 2011 � Vol. 16(11)116012-2
Downloaded From: https://www.spiedigitallibrary.org/journals/Journal-of-Biomedical-Optics on 26 Mar 2022Terms of Use: https://www.spiedigitallibrary.org/terms-of-use
Ben Arous et al.: Single myelin fiber imaging in living rodents without labeling...
Fig. 1 Deep-OCM myelin imaging. (a) Deep-OCM setup incorporating IR and deep-red illumination, high NA objectives, compensation for defocusdue refractive index mismatch, and high-speed camera. (b) Impact of index mismatch correction for OCT imaging in brain tissues. Left: In anindex-matched sample, focus and coherence volume would coincide at the nominal focus (NF). Refractive index mismatch shifts the actual focus(AF) and the coherence volume (CV) away from NF so that ff-OCT images are blurred. Right: After correction, AF and CV coincide, which provideshigh-resolution and highly contrasted images. The images shown below the schemes are 40× IR deep-OCM in vivo images of myelin fibers in thesomato-sensory cortex of a six-week-old rat (z = 120 μm below the surface of the tissue, after removal of the dura). Left: uncorrected image; right:corrected image, defocus correction d = 6.5 μm; 30-ms exposure time. (c) Maximum projection of 40x deep-red deep-OCM image stack in a cortexslice (80 images taken in 0.4-μm z steps, z = 250 μm below the brain surface; total exposure time 84 s) (d) Comparison of confocal fluorescenceimages (left; maximum z projection of 32 images, 4.5-min acquisition time) and stitched 10× IR deep-OCM images (right; maximum z projectionof 3 × 2 stitch in 100 depths, i.e., 600 images, 9-min exposure time) of the same slice of corpus callosum of a CNP-EGFP mouse. CNP-EGFPis expressed specifically in oligodendrocytes. In CNP-EGFP fluorescence images, the oligodendrocytes’ cellular bodies and the myelin sheath arevisible, whereas only myelin appears in deep-OCM images.
were often averaged to improve the signal-to-noise ratio, lead-ing to per-frame exposure times of 1.05 and 0.9 s for deep-redand IR images, respectively. Both the sample z position and therelative arm length could be changed with two motorized linearstages (M-VP-25XA, Newport, Irvine, CA).
With this setup, the axial resolution (sectioning ability) ismainly due to the coherence length of the source, whereas thelateral resolution is due to the numerical aperture (NA) of themicroscope objectives. In the lowest resolution configuration,with 10× objectives and the InGaAs camera (peak of the ef-fective spectrum: λmax = 1100 nm), the lateral sampling of thesystem was 1.07 μm, the lateral resolution in water 2.2 μm(calculated using the Rayleigh formula 0.6*λmax/NA), and theaxial resolution in water 3.3 μm (measured as the full width athalf maximum of the interferogram). In the highest-resolutionconfiguration, with 40× objectives and the silicon camera (λmax
= 770 nm), the lateral sampling of the system was 0.1 μm, thelateral resolution in water 0.5 μm, and the axial resolution inwater 1.15 μm.
2.6 Automatic Compensation of DefocusAberration Due to Refractive Index Mismatch
Large NA makes the setup highly sensitive to depth-dependentdefocus induced by refractive index mismatch between the im-
mersion medium in the sample arm and the tissue.16, 17 Re-fraction at the brain surface indeed causes the actual focus zA
of the objective to be shifted deeper into the sample with re-spect to the nominal focus zN [Fig. 1(b)], whereas the coher-ence volume penetrates the tissue slower than the nominal focus[Fig. 1(b)].17 This spatial separation of coherence volume andactual focus results in a loss in OCT signal: even the small re-fractive index mismatch between immersion water and braintissue of ∼2% is sufficient for depth penetration not to belimited by scattering-induced exponential signal decrease, asexpected from Beer–Lambert law, but by signal loss due todefocus.17
Refractive index–mismatch compensation was performedonline as described previously.16, 17 Briefly, compensation is ob-tained by keeping the coherence volume at constant depth insidethe sample and moving the actual focus into this same position[Fig. 1(b)]. Because of the aqueous immersion (group index ng),a movement � of the sample objective away from the sample in-creases the (paraxial) optical path in water by 2ng�, while theoptical path in air only decreases by 2�. To keep the coherencevolume at constant depth in the sample, a displacement � of thesample objective should be therefore associated with a displace-ment d(�) = �(ng − 1) of the reference arm. The metric used todetermine the optimal positions � and d(�) was the total imageintensity.17
Journal of Biomedical Optics November 2011 � Vol. 16(11)116012-3
Downloaded From: https://www.spiedigitallibrary.org/journals/Journal-of-Biomedical-Optics on 26 Mar 2022Terms of Use: https://www.spiedigitallibrary.org/terms-of-use
Ben Arous et al.: Single myelin fiber imaging in living rodents without labeling...
In the following, we systematically applied automated defo-cus compensation, increasing the penetration depth by typicallya factor of 2.5.17 In these conditions, deep-OCM provides mi-crometer resolution in the three dimensions and in the depth ofthe tissue.
2.7 StitchingFor images with a large field of view, a prototype of an ff-OCTmicroscope (LLTech, Paris, France) was used. It used a 640× 512 pixel InGaAs Xenics Xeva camera, Olympus UMPlanF10×/0.3W objectives, and a Marzhauser xy-translation stage(Marzhauser Wetzlar GmbH & Co. KG, Wetzlar, Germany).Stitching of individual images with 20% overlap was performedusing the ImageJ plugin “Stitch Image Collection” (StephanPreibisch, Max Planck Institute of Molecular Cell Biology andGenetics, Dresden, Germany).
2.8 QuantificationFor myelin quantification, vertical stacks of images were ac-quired in confocal immunofluorescence and in deep-OCM (bothin vitro and in vivo). The stacks had a total depth of 60–90 μmand were acquired either just below the brain surface (in vivo) orin the first tangential slice from the brain surface (in vitro). Thetotal length of myelin filaments per unitary surface was com-puted as follows. The length of myelin fibers contained withinthe depth of field in each independent frame was first measuredmanually using ImageJ. The average and standard error of themean of fiber length density per unitary surface was then calcu-lated for 23–37 frames chosen in at least four different stacksin each imaging condition. Images from stacks obtained in ratsof a given age were pooled together. Frame sizes were 120× 120 μm (immunofluorescence confocal), 105 × 105 μm (invitro 40× deep-red deep-OCM) and 79 × 63 μm (in vivo 40×IR deep-OCM). The volume density of fiber length was obtainedfrom the surface density by taking into account the thickness ofeach optical section (5.6 μm in confocal microscopy, 1.15 μmin in vitro deep-OCM, and 3.3 μm in in vivo deep-OCM).
Fiber diameters, lengths, and interfringe spacings were de-termined manually using the ImageJ Plot Profile tool. Fiberinclination A was calculated from the fibers’ apparent lengthL via tan(A) = L/lz, where lz is defined as the full widthof the interferogram measured at 10% of the maximum(lz = 2.3 μm for 40× deep-red deep-OCM). Statistical com-parisons were performed by standard Student’s t-tests.
3 Results3.1 In Vitro Imaging of Individual Myelinated FibersUsing deep-OCM, we were able to observe fibers in the rodentbrain tissue. They show up with very high endogenous contrastdue to backscattering of the incident light [Figs. 1(b) and 1(c)].Compensation of index-mismatch-induced defocus was manda-tory to observe the fibers with high contrast and resolution[Fig. 1(b)]. In 40× deep-red images of rat cortical slices[Fig. 1(c)], the observed diameter of the fibers was 0.6 ± 0.1 μmand was therefore at the diffraction limit (microscope lateralresolution: 0.56 μm), in good agreement with the diameter ofindividual myelinated fibers in the rat brain.24
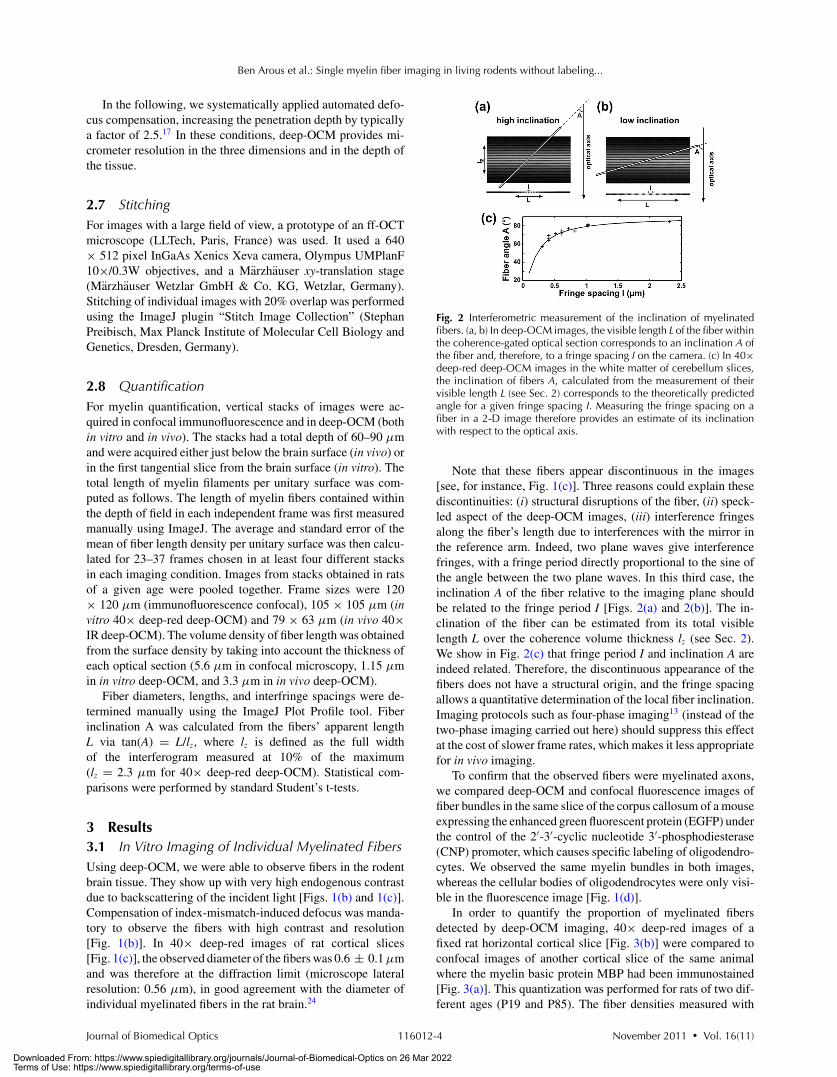
Fig. 2 Interferometric measurement of the inclination of myelinatedfibers. (a, b) In deep-OCM images, the visible length L of the fiber withinthe coherence-gated optical section corresponds to an inclination A ofthe fiber and, therefore, to a fringe spacing I on the camera. (c) In 40×deep-red deep-OCM images in the white matter of cerebellum slices,the inclination of fibers A, calculated from the measurement of theirvisible length L (see Sec. 2) corresponds to the theoretically predictedangle for a given fringe spacing I. Measuring the fringe spacing on afiber in a 2-D image therefore provides an estimate of its inclinationwith respect to the optical axis.
Note that these fibers appear discontinuous in the images[see, for instance, Fig. 1(c)]. Three reasons could explain thesediscontinuities: (i) structural disruptions of the fiber, (ii) speck-led aspect of the deep-OCM images, (iii) interference fringesalong the fiber’s length due to interferences with the mirror inthe reference arm. Indeed, two plane waves give interferencefringes, with a fringe period directly proportional to the sine ofthe angle between the two plane waves. In this third case, theinclination A of the fiber relative to the imaging plane shouldbe related to the fringe period I [Figs. 2(a) and 2(b)]. The in-clination of the fiber can be estimated from its total visiblelength L over the coherence volume thickness lz (see Sec. 2).We show in Fig. 2(c) that fringe period I and inclination A areindeed related. Therefore, the discontinuous appearance of thefibers does not have a structural origin, and the fringe spacingallows a quantitative determination of the local fiber inclination.Imaging protocols such as four-phase imaging13 (instead of thetwo-phase imaging carried out here) should suppress this effectat the cost of slower frame rates, which makes it less appropriatefor in vivo imaging.
To confirm that the observed fibers were myelinated axons,we compared deep-OCM and confocal fluorescence images offiber bundles in the same slice of the corpus callosum of a mouseexpressing the enhanced green fluorescent protein (EGFP) underthe control of the 2′-3′-cyclic nucleotide 3′-phosphodiesterase(CNP) promoter, which causes specific labeling of oligodendro-cytes. We observed the same myelin bundles in both images,whereas the cellular bodies of oligodendrocytes were only visi-ble in the fluorescence image [Fig. 1(d)].
In order to quantify the proportion of myelinated fibersdetected by deep-OCM imaging, 40× deep-red images of afixed rat horizontal cortical slice [Fig. 3(b)] were compared toconfocal images of another cortical slice of the same animalwhere the myelin basic protein MBP had been immunostained[Fig. 3(a)]. This quantization was performed for rats of two dif-ferent ages (P19 and P85). The fiber densities measured with
Journal of Biomedical Optics November 2011 � Vol. 16(11)116012-4
Downloaded From: https://www.spiedigitallibrary.org/journals/Journal-of-Biomedical-Optics on 26 Mar 2022Terms of Use: https://www.spiedigitallibrary.org/terms-of-use
Ben Arous et al.: Single myelin fiber imaging in living rodents without labeling...
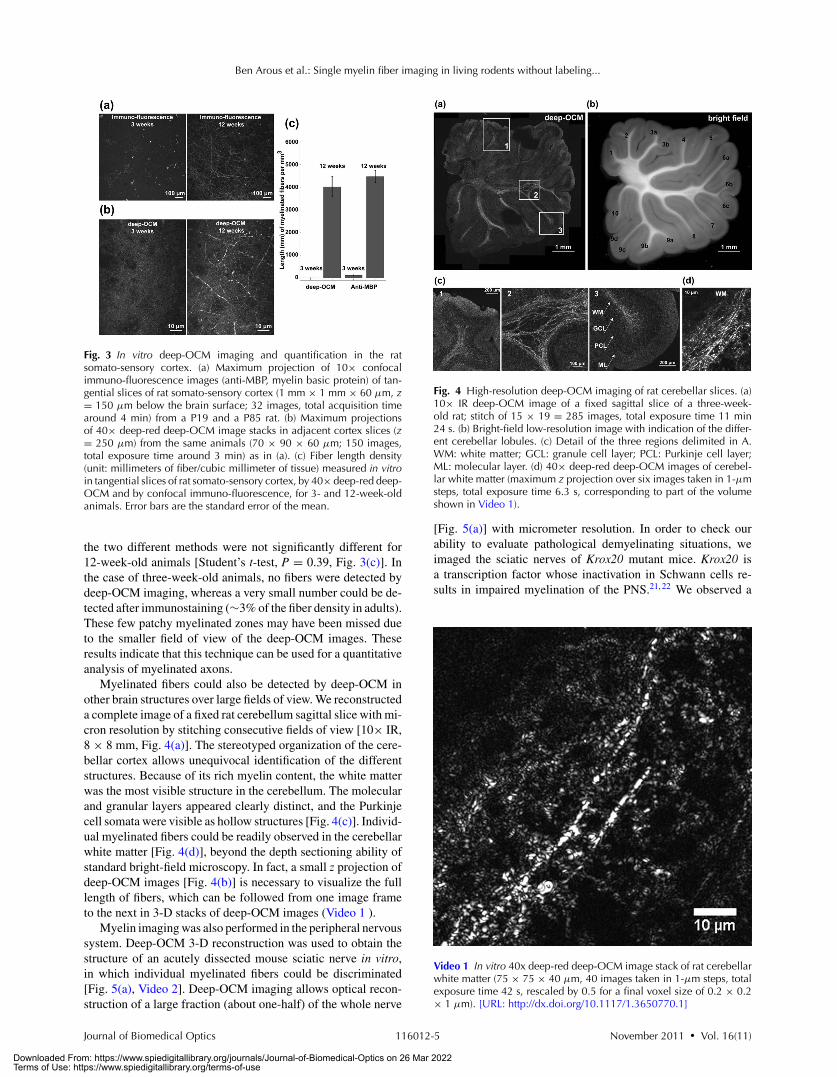
Fig. 3 In vitro deep-OCM imaging and quantification in the ratsomato-sensory cortex. (a) Maximum projection of 10× confocalimmuno-fluorescence images (anti-MBP, myelin basic protein) of tan-gential slices of rat somato-sensory cortex (1 mm × 1 mm × 60 μm, z= 150 μm below the brain surface; 32 images, total acquisition timearound 4 min) from a P19 and a P85 rat. (b) Maximum projectionsof 40× deep-red deep-OCM image stacks in adjacent cortex slices (z= 250 μm) from the same animals (70 × 90 × 60 μm; 150 images,total exposure time around 3 min) as in (a). (c) Fiber length density(unit: millimeters of fiber/cubic millimeter of tissue) measured in vitroin tangential slices of rat somato-sensory cortex, by 40× deep-red deep-OCM and by confocal immuno-fluorescence, for 3- and 12-week-oldanimals. Error bars are the standard error of the mean.
the two different methods were not significantly different for12-week-old animals [Student’s t-test, P = 0.39, Fig. 3(c)]. Inthe case of three-week-old animals, no fibers were detected bydeep-OCM imaging, whereas a very small number could be de-tected after immunostaining (∼3% of the fiber density in adults).These few patchy myelinated zones may have been missed dueto the smaller field of view of the deep-OCM images. Theseresults indicate that this technique can be used for a quantitativeanalysis of myelinated axons.
Myelinated fibers could also be detected by deep-OCM inother brain structures over large fields of view. We reconstructeda complete image of a fixed rat cerebellum sagittal slice with mi-cron resolution by stitching consecutive fields of view [10× IR,8 × 8 mm, Fig. 4(a)]. The stereotyped organization of the cere-bellar cortex allows unequivocal identification of the differentstructures. Because of its rich myelin content, the white matterwas the most visible structure in the cerebellum. The molecularand granular layers appeared clearly distinct, and the Purkinjecell somata were visible as hollow structures [Fig. 4(c)]. Individ-ual myelinated fibers could be readily observed in the cerebellarwhite matter [Fig. 4(d)], beyond the depth sectioning ability ofstandard bright-field microscopy. In fact, a small z projection ofdeep-OCM images [Fig. 4(b)] is necessary to visualize the fulllength of fibers, which can be followed from one image frameto the next in 3-D stacks of deep-OCM images (Video 1 ).
Myelin imaging was also performed in the peripheral nervoussystem. Deep-OCM 3-D reconstruction was used to obtain thestructure of an acutely dissected mouse sciatic nerve in vitro,in which individual myelinated fibers could be discriminated[Fig. 5(a), Video 2]. Deep-OCM imaging allows optical recon-struction of a large fraction (about one-half) of the whole nerve
Fig. 4 High-resolution deep-OCM imaging of rat cerebellar slices. (a)10× IR deep-OCM image of a fixed sagittal slice of a three-week-old rat; stitch of 15 × 19 = 285 images, total exposure time 11 min24 s. (b) Bright-field low-resolution image with indication of the differ-ent cerebellar lobules. (c) Detail of the three regions delimited in A.WM: white matter; GCL: granule cell layer; PCL: Purkinje cell layer;ML: molecular layer. (d) 40× deep-red deep-OCM images of cerebel-lar white matter (maximum z projection over six images taken in 1-μmsteps, total exposure time 6.3 s, corresponding to part of the volumeshown in Video 1).
[Fig. 5(a)] with micrometer resolution. In order to check ourability to evaluate pathological demyelinating situations, weimaged the sciatic nerves of Krox20 mutant mice. Krox20 isa transcription factor whose inactivation in Schwann cells re-sults in impaired myelination of the PNS.21, 22 We observed a
Video 1 In vitro 40x deep-red deep-OCM image stack of rat cerebellarwhite matter (75 × 75 × 40 μm, 40 images taken in 1-μm steps, totalexposure time 42 s, rescaled by 0.5 for a final voxel size of 0.2 × 0.2× 1 μm). [URL: http://dx.doi.org/10.1117/1.3650770.1]
Journal of Biomedical Optics November 2011 � Vol. 16(11)116012-5
Downloaded From: https://www.spiedigitallibrary.org/journals/Journal-of-Biomedical-Optics on 26 Mar 2022Terms of Use: https://www.spiedigitallibrary.org/terms-of-use
Ben Arous et al.: Single myelin fiber imaging in living rodents without labeling...
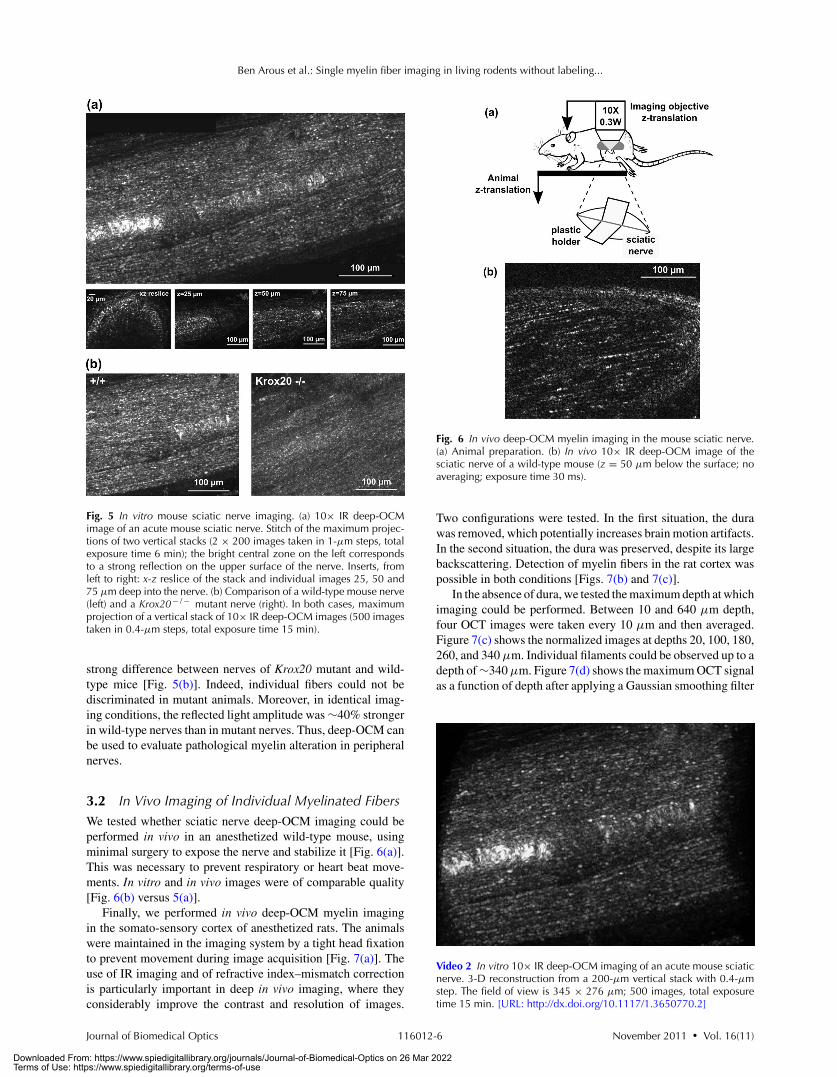
Fig. 5 In vitro mouse sciatic nerve imaging. (a) 10× IR deep-OCMimage of an acute mouse sciatic nerve. Stitch of the maximum projec-tions of two vertical stacks (2 × 200 images taken in 1-μm steps, totalexposure time 6 min); the bright central zone on the left correspondsto a strong reflection on the upper surface of the nerve. Inserts, fromleft to right: x-z reslice of the stack and individual images 25, 50 and75 μm deep into the nerve. (b) Comparison of a wild-type mouse nerve(left) and a Krox20− / − mutant nerve (right). In both cases, maximumprojection of a vertical stack of 10× IR deep-OCM images (500 imagestaken in 0.4-μm steps, total exposure time 15 min).
strong difference between nerves of Krox20 mutant and wild-type mice [Fig. 5(b)]. Indeed, individual fibers could not bediscriminated in mutant animals. Moreover, in identical imag-ing conditions, the reflected light amplitude was ∼40% strongerin wild-type nerves than in mutant nerves. Thus, deep-OCM canbe used to evaluate pathological myelin alteration in peripheralnerves.
3.2 In Vivo Imaging of Individual Myelinated FibersWe tested whether sciatic nerve deep-OCM imaging could beperformed in vivo in an anesthetized wild-type mouse, usingminimal surgery to expose the nerve and stabilize it [Fig. 6(a)].This was necessary to prevent respiratory or heart beat move-ments. In vitro and in vivo images were of comparable quality[Fig. 6(b) versus 5(a)].
Finally, we performed in vivo deep-OCM myelin imagingin the somato-sensory cortex of anesthetized rats. The animalswere maintained in the imaging system by a tight head fixationto prevent movement during image acquisition [Fig. 7(a)]. Theuse of IR imaging and of refractive index–mismatch correctionis particularly important in deep in vivo imaging, where theyconsiderably improve the contrast and resolution of images.
Fig. 6 In vivo deep-OCM myelin imaging in the mouse sciatic nerve.(a) Animal preparation. (b) In vivo 10× IR deep-OCM image of thesciatic nerve of a wild-type mouse (z = 50 μm below the surface; noaveraging; exposure time 30 ms).
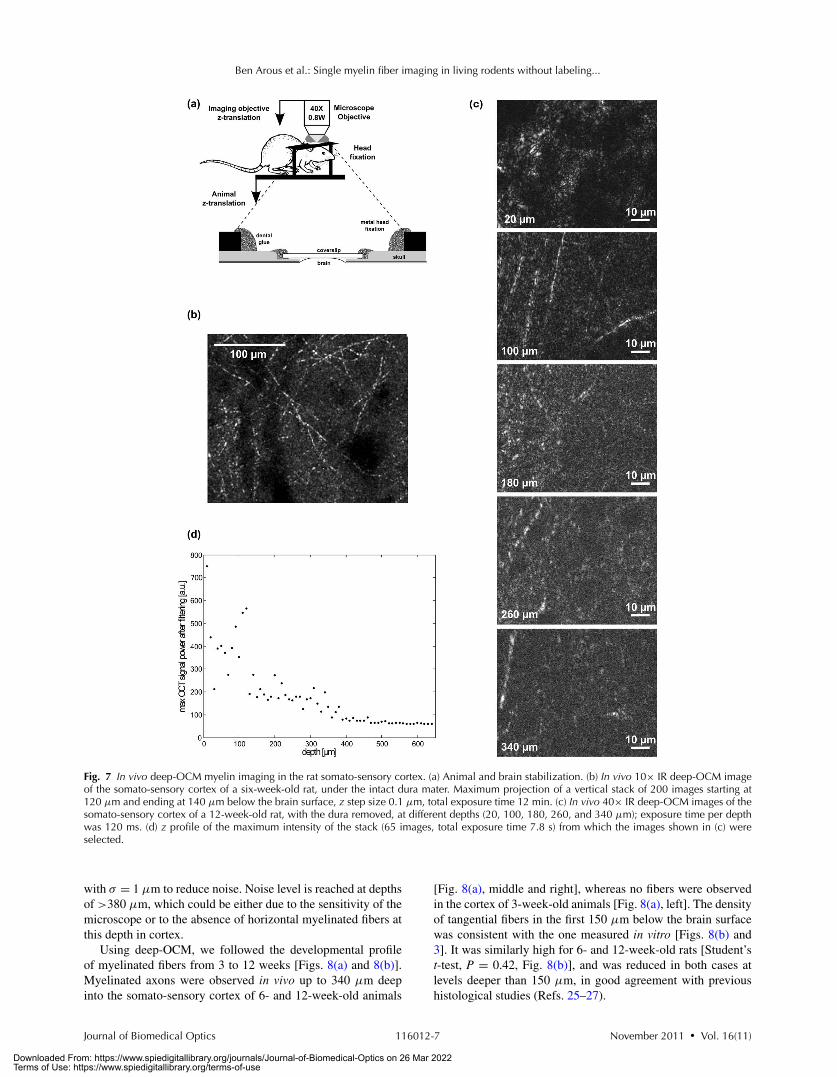
Two configurations were tested. In the first situation, the durawas removed, which potentially increases brain motion artifacts.In the second situation, the dura was preserved, despite its largebackscattering. Detection of myelin fibers in the rat cortex waspossible in both conditions [Figs. 7(b) and 7(c)].
In the absence of dura, we tested the maximum depth at whichimaging could be performed. Between 10 and 640 μm depth,four OCT images were taken every 10 μm and then averaged.Figure 7(c) shows the normalized images at depths 20, 100, 180,260, and 340 μm. Individual filaments could be observed up to adepth of ∼340 μm. Figure 7(d) shows the maximum OCT signalas a function of depth after applying a Gaussian smoothing filter
Video 2 In vitro 10× IR deep-OCM imaging of an acute mouse sciaticnerve. 3-D reconstruction from a 200-μm vertical stack with 0.4-μmstep. The field of view is 345 × 276 μm; 500 images, total exposuretime 15 min. [URL: http://dx.doi.org/10.1117/1.3650770.2]
Journal of Biomedical Optics November 2011 � Vol. 16(11)116012-6
Downloaded From: https://www.spiedigitallibrary.org/journals/Journal-of-Biomedical-Optics on 26 Mar 2022Terms of Use: https://www.spiedigitallibrary.org/terms-of-use
Ben Arous et al.: Single myelin fiber imaging in living rodents without labeling...
Fig. 7 In vivo deep-OCM myelin imaging in the rat somato-sensory cortex. (a) Animal and brain stabilization. (b) In vivo 10× IR deep-OCM imageof the somato-sensory cortex of a six-week-old rat, under the intact dura mater. Maximum projection of a vertical stack of 200 images starting at120 μm and ending at 140 μm below the brain surface, z step size 0.1 μm, total exposure time 12 min. (c) In vivo 40× IR deep-OCM images of thesomato-sensory cortex of a 12-week-old rat, with the dura removed, at different depths (20, 100, 180, 260, and 340 μm); exposure time per depthwas 120 ms. (d) z profile of the maximum intensity of the stack (65 images, total exposure time 7.8 s) from which the images shown in (c) wereselected.
with σ = 1 μm to reduce noise. Noise level is reached at depthsof >380 μm, which could be either due to the sensitivity of themicroscope or to the absence of horizontal myelinated fibers atthis depth in cortex.
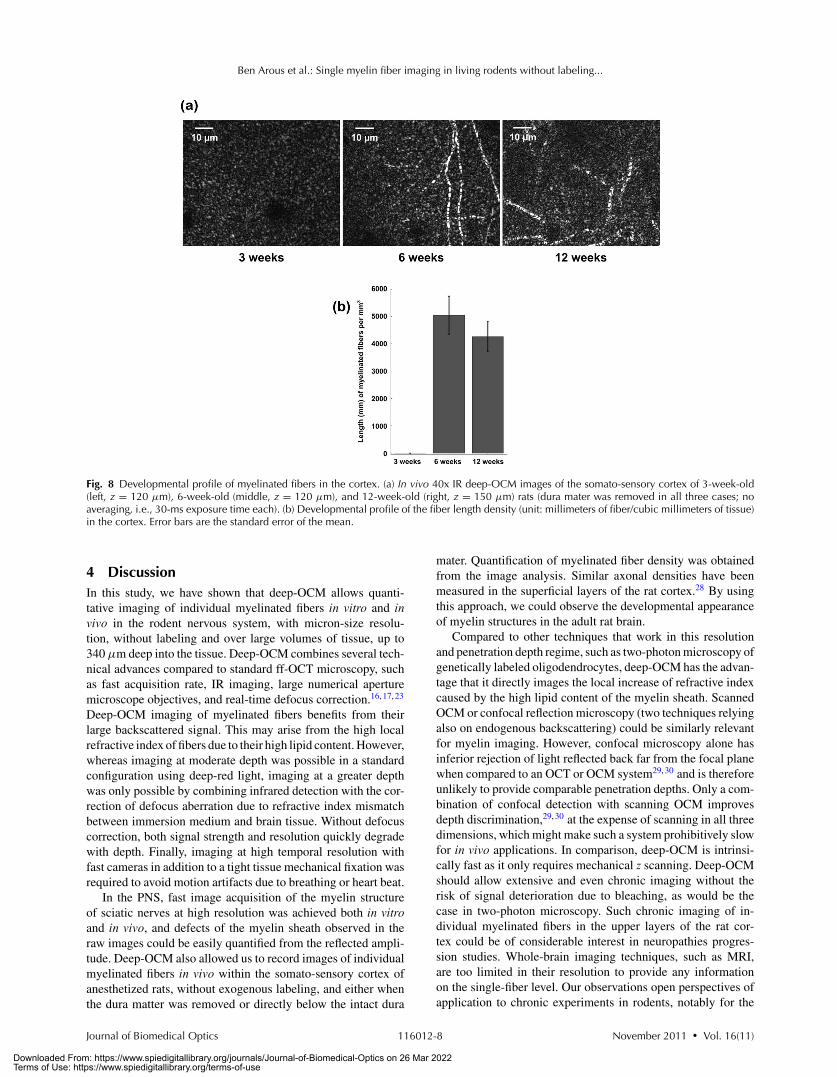
Using deep-OCM, we followed the developmental profileof myelinated fibers from 3 to 12 weeks [Figs. 8(a) and 8(b)].Myelinated axons were observed in vivo up to 340 μm deepinto the somato-sensory cortex of 6- and 12-week-old animals
[Fig. 8(a), middle and right], whereas no fibers were observedin the cortex of 3-week-old animals [Fig. 8(a), left]. The densityof tangential fibers in the first 150 μm below the brain surfacewas consistent with the one measured in vitro [Figs. 8(b) and3]. It was similarly high for 6- and 12-week-old rats [Student’st-test, P = 0.42, Fig. 8(b)], and was reduced in both cases atlevels deeper than 150 μm, in good agreement with previoushistological studies (Refs. 25–27).
Journal of Biomedical Optics November 2011 � Vol. 16(11)116012-7
Downloaded From: https://www.spiedigitallibrary.org/journals/Journal-of-Biomedical-Optics on 26 Mar 2022Terms of Use: https://www.spiedigitallibrary.org/terms-of-use
Ben Arous et al.: Single myelin fiber imaging in living rodents without labeling...
Fig. 8 Developmental profile of myelinated fibers in the cortex. (a) In vivo 40x IR deep-OCM images of the somato-sensory cortex of 3-week-old(left, z = 120 μm), 6-week-old (middle, z = 120 μm), and 12-week-old (right, z = 150 μm) rats (dura mater was removed in all three cases; noaveraging, i.e., 30-ms exposure time each). (b) Developmental profile of the fiber length density (unit: millimeters of fiber/cubic millimeters of tissue)in the cortex. Error bars are the standard error of the mean.
4 DiscussionIn this study, we have shown that deep-OCM allows quanti-tative imaging of individual myelinated fibers in vitro and invivo in the rodent nervous system, with micron-size resolu-tion, without labeling and over large volumes of tissue, up to340 μm deep into the tissue. Deep-OCM combines several tech-nical advances compared to standard ff-OCT microscopy, suchas fast acquisition rate, IR imaging, large numerical aperturemicroscope objectives, and real-time defocus correction.16, 17, 23
Deep-OCM imaging of myelinated fibers benefits from theirlarge backscattered signal. This may arise from the high localrefractive index of fibers due to their high lipid content. However,whereas imaging at moderate depth was possible in a standardconfiguration using deep-red light, imaging at a greater depthwas only possible by combining infrared detection with the cor-rection of defocus aberration due to refractive index mismatchbetween immersion medium and brain tissue. Without defocuscorrection, both signal strength and resolution quickly degradewith depth. Finally, imaging at high temporal resolution withfast cameras in addition to a tight tissue mechanical fixation wasrequired to avoid motion artifacts due to breathing or heart beat.
In the PNS, fast image acquisition of the myelin structureof sciatic nerves at high resolution was achieved both in vitroand in vivo, and defects of the myelin sheath observed in theraw images could be easily quantified from the reflected ampli-tude. Deep-OCM also allowed us to record images of individualmyelinated fibers in vivo within the somato-sensory cortex ofanesthetized rats, without exogenous labeling, and either whenthe dura matter was removed or directly below the intact dura
mater. Quantification of myelinated fiber density was obtainedfrom the image analysis. Similar axonal densities have beenmeasured in the superficial layers of the rat cortex.28 By usingthis approach, we could observe the developmental appearanceof myelin structures in the adult rat brain.
Compared to other techniques that work in this resolutionand penetration depth regime, such as two-photon microscopy ofgenetically labeled oligodendrocytes, deep-OCM has the advan-tage that it directly images the local increase of refractive indexcaused by the high lipid content of the myelin sheath. ScannedOCM or confocal reflection microscopy (two techniques relyingalso on endogenous backscattering) could be similarly relevantfor myelin imaging. However, confocal microscopy alone hasinferior rejection of light reflected back far from the focal planewhen compared to an OCT or OCM system29, 30 and is thereforeunlikely to provide comparable penetration depths. Only a com-bination of confocal detection with scanning OCM improvesdepth discrimination,29, 30 at the expense of scanning in all threedimensions, which might make such a system prohibitively slowfor in vivo applications. In comparison, deep-OCM is intrinsi-cally fast as it only requires mechanical z scanning. Deep-OCMshould allow extensive and even chronic imaging without therisk of signal deterioration due to bleaching, as would be thecase in two-photon microscopy. Such chronic imaging of in-dividual myelinated fibers in the upper layers of the rat cor-tex could be of considerable interest in neuropathies progres-sion studies. Whole-brain imaging techniques, such as MRI,are too limited in their resolution to provide any informationon the single-fiber level. Our observations open perspectives ofapplication to chronic experiments in rodents, notably for the
Journal of Biomedical Optics November 2011 � Vol. 16(11)116012-8
Downloaded From: https://www.spiedigitallibrary.org/journals/Journal-of-Biomedical-Optics on 26 Mar 2022Terms of Use: https://www.spiedigitallibrary.org/terms-of-use
Ben Arous et al.: Single myelin fiber imaging in living rodents without labeling...
longitudinal study of cortical demyelination and remyelination.To our knowledge, no other existing technique gives access tothis information.
The noninvasiveness, the speed, and the depth of penetrationof deep-OCM could make it a potentially interesting techniquefor human diagnostics. Because the access to the peripheralnervous system is quite simple and requires only minor surgery,this method may be used, in the future, in human patients withperipheral neuropathies. Deep-OCM-based myelin imaging ofthe sciatic nerve could replace nerve biopsy, which is a standardprocedure for diagnosing certain neuropathies. It could therebyhelp avoid neuropathic side effects associated with nervebiopsies. More studies will be necessary to demonstrate thatmyelinated fibers in the PNS of human patients are as readilyaccessible to deep-OCM imaging as shown for rats here, and thatmechanically stable recordings can be performed. Investiga-tions of the human central nervous system with single-fiberresolution will probably require further development to attaininteresting depth, for instance, using endoscopy.
In conclusion, deep-OCM makes a fine-scale analysis of themyelination processes possible, both in the cerebral cortex and inthe peripheral nervous system. Such analysis currently requirestime-consuming and invasive histological methods. Our tech-nique is relatively noninvasive, affordable, and fast, and providesreal-time imaging without complex off-line image treatment. Itopens promising possibilities for in vivo acute or chronic myelinimaging as well as for the diagnosis of myelin pathologies.
AcknowledgmentsWe thank Marie-Stephane Aigrot, Bruno Stankoff, andCatherine Lubetzki for their helpful comments and for trans-ferring the transgenic CNP-GFP mice. We also thank VittorioGallo for authorizing us to use the mice. We thank CharlesBrossollet (LLtech, Paris, France), Benjamin Mathieu, and Gas-pard Gerschenfeld for their help and Shawn Mikula for criticaldiscussions. This work was supported by ANR RIB Grants No.MICADO ANR-07-RIB-010-02 and No. ANR-07-RIB-010-04.J.B. was funded by a PhD fellowship from Fondation Pierre-Gilles de Gennes.
References1. S. S. Scherer and L. Wrabetz, “Molecular mechanisms of inherited
demyelinating neuropathies,” Glia 56(14), 1578–1589 (2008).2. N. Baumann and D. Pham-Dinh, “Biology of oligodendrocyte and
myelin in the mammalian central nervous system,” Physiol. Rev. 81(2),871–927 (2001).
3. C. Laule, I. M. Vavasour, S. H. Kolind, D. K. Li, T. L. Traboulsee, G. R.Moore, and A. L. MacKay, “Magnetic resonance imaging of myelin,”Neurotherapeutics 4(3), 460–484 (2007).
4. S. Mori and J. Zhang, “Principles of diffusion tensor imaging and itsapplications to basic neuroscience research,” Neuron 51(5), 527–539(2006).
5. B. Stankoff, Y. Wang, M. Bottlaender, M. S. Aigrot, F. Dolle, C. Wu, D.Feinstein, G. F. Huang, F. Semah, C. A. Mathis, W. Klunk, R. M. Gould,C. Lubetzki, and B. Zalc, “Imaging of CNS myelin by positron-emissiontomography,” Proc. Natl. Acad. Sci. U.S.A. 103(24), 9304–9309 (2006).
6. C. Wang, C. Wu, D. C. Popescu, J. Zhu, W. B. Macklin, R. H. Miller,and Y. Wang, “Longitudinal near-infrared imaging of myelination,” J.Neurosci. 31(7), 2382–2390 (2011).
7. J. J. Geurts, S. D. Roosendaal, M. Calabrese, O. Ciccarelli, F. Agosta,D. T. Chard, A. Gass, E. Huerga, B. Moraal, D. Pareto, M. A. Rocca, M.
P. Wattjes, T. A. Yousry, B. M. Uitdehaag, and F. Barkhof, “Consensusrecommendations for MS cortical lesion scoring using double inversionrecovery MRI,” Neurology 76(5), 418–424 (2011).
8. Y. Fu, T. B. Huff, H. W. Wang, H. Wang, and J. X. Cheng, “Ex vivoand in vivo imaging of myelin fibers in mouse brain by coherent anti-Stokes Raman scattering microscopy,” Opt. Express 16(24), 19396–19409 (2008).
9. J. Imitola, D. Cote, S. Rasmussen, X. S. Xie, Y. Liu, T. Chitnis, R. L.Sidman, C. P. Lin, and S. J. Khoury, “Multimodal coherent anti-StokesRaman scattering microscopy reveals microglia-associated myelin andaxonal dysfunction in multiple sclerosis-like lesions in mice,” J.Biomed. Opt. 16(2), 021109 (2011).
10. M. J. Farrar, F. W. Wise, J. R. Fetcho, and C. B. Schaffer, “In vivoimaging of myelin in the vertebrate central nervous system using thirdharmonic generation microscopy,” Biophys. J. 100, 1362–1371 (2011).
11. J. G. Fujimoto, “Optical coherence tomography for ultrahigh resolutionin vivo imaging,” Nat. Biotechnol. 21(11), 1361–1367 (2003).
12. J. G. Fujimoto, M. E. Brezinski, G. J. Tearney, S. A. Boppart, B. Bouma,M. R. Hee, J. F. Southern and E. A. Swanson, “Optical biopsy andimaging using optical coherence tomography,” Nat. Med. 1(9), 970–972 (1995).
13. L. Vabre, A. Dubois, and A. C. Boccara, “Thermal-light full-field opticalcoherence tomography,” Opt. Lett. 27(7), 530–532 (2002).
14. I. P. Antonov, A. V. Goroshkov, V. N. Kalyunov, I. V. Markhvida, A. S.Rubanov, and L. V. Tanin, “Measurement of the radial distribution of therefractive index of the Schwann’s sheath and the axon of a myelinatednerve fiber in vivo,” J. Appl. Spectrosc. 39(1), 822–824 (1983).
15. M. Daimon and A. Masumura, “Measurement of the refractive index ofdistilled water from the near-infrared region to the ultraviolet region,”Appl. Opt. 46(18), 3811–3820 (2007).
16. S. Labiau, G. David, S. Gigan, and A. C. Boccara, “Defocus test anddefocus correction in full-field optical coherence tomography,” Opt.Lett. 34(10), 1576–1578 (2009).
17. J. Binding, J. Ben Arous, J.-F. Leger, S. Gigan, C. Boccara. and L.Bourdieu, “Brain refractive index measured in vivo with high-NAdefocus-corrected full-field OCT and consequences on two-photon mi-croscopy,” Opt. Express 19(6), 4833–4847 (2011).
18. Directive 86/609/CEE, CE official journal L358 (December 18, 1986).19. Decret No. 97/748, 19 October, 1987, J. O. Republique francaise
(October 20, 1987).20. X. Yuan, R. Chittajallu, S. Belachew, S. Anderson, C. J. McBain, and V.
Gallo, “Expression of the green fluorescent protein in the oligodendro-cyte lineage: a transgenic mouse for developmental and physiologicalstudies,” J. Neurosci. Res. 70(4), 529–545 (2002).
21. P. Topilko, S. Schneider-Maunoury, G. Levi, A. Baron-Van Evercooren,A. B. Chennoufi, T. Seitanidou, C. Babinet, and P. Charnay, “Krox-20 controls myelination in the peripheral nervous system,” Nature371(6500), 796–799 (1994).
22. F. Coulpier, L. Decker, B. Funalot, J.-M. Vallat, F. Garcia-Bragado, P.Charnay, and P. Topilko, “CNS/PNS boundary transgression by centralglia in the absence of Schwann cells or Krox20/Egr2 function,” J.Neurosci. 30(17), 5958–5967 (2010).
23. D. Sacchet, J. Moreau, P. Georges, and A. Dubois, “Simultaneous dual-band ultra-high resolution full-field optical coherence tomography,”Opt. Express 16(24), 19434–19446 (2008).
24. G. Partadiredja, R. Miller, and D. E. Oorschot, “The number, size, andtype of axons in rat subcortical white matter on left and right sides: astereological, ultrastructural study,” J. Neurocytol. 32(9), 1165–1179(2003).
25. S. Mikula, I. Trotts, J. M. Stone, and E. G. Jones, “Internet-enabledhigh-resolution brain mapping and virtual microscopy,” NeuroImage35(1), 9–15 (2007).
26. I. Trotts, S. Mikula, and E. G. Jones, “Interactive visualization of mul-tiresolution image stacks in 3D,” NeuroImage 35(3), 1038–1043 (2007).
27. http://brainmaps.org/ajax-viewer.php?datid=148&sname=07.28. J. T. Eayrs and B. Goodhead, “Postnatal development of the cerebral
cortex in the rat,” J. Anat. 93(Pt 4), 385–402 (1959).29. J. A. Izatt, M. R. Hee, G. M. Owen, E. A. Swanson, and J. G. Fujimoto,
“Optical coherence microscopy in scattering media,” Opt. Lett. 19(8),590–592 (1994).
30. J. Mertz, Introduction to Optical Microscopy, Roberts, GreenwoodVillage, CO (2010).
Journal of Biomedical Optics November 2011 � Vol. 16(11)116012-9
Downloaded From: https://www.spiedigitallibrary.org/journals/Journal-of-Biomedical-Optics on 26 Mar 2022Terms of Use: https://www.spiedigitallibrary.org/terms-of-use