single-catalyst particle spectroscopy of alcohol-to-olefins conversions: comparison between sapo-34...
TRANSCRIPT

This article appeared in a journal published by Elsevier. The attachedcopy is furnished to the author for internal non-commercial researchand education use, including for instruction at the authors institution
and sharing with colleagues.
Other uses, including reproduction and distribution, or selling orlicensing copies, or posting to personal, institutional or third party
websites are prohibited.
In most cases authors are permitted to post their version of thearticle (e.g. in Word or Tex form) to their personal website orinstitutional repository. Authors requiring further information
regarding Elsevier’s archiving and manuscript policies areencouraged to visit:
http://www.elsevier.com/authorsrights
Author's personal copy
Catalysis Today 226 (2014) 14–24
Contents lists available at ScienceDirect
Catalysis Today
journa l homepage: www.e lsev ier .com/ locate /ca t tod
Single-catalyst particle spectroscopy of alcohol-to-olefinsconversions: Comparison between SAPO-34 and SSZ-13
Qingyun Qiana, Javier Ruiz-Martíneza,∗, Mohamed Mokhtarb, Abdullah M. Asirib,c,Shaeel A. Al-Thabaitib, Suliman N. Basahelb, Bert M. Weckhuysena,∗∗
a Inorganic Chemistry and Catalysis, Debye Institute for Nanomaterials Science, Faculty of Science, Utrecht University, Universiteitsweg 99,3584 CG Utrecht, The Netherlandsb Department of Chemistry, Faculty of Science, King Abdulaziz University, P.O. Box 80203, Jeddah 21589, Saudi Arabiac Center of Excellence for Advanced Materials Research, King Abdulaziz University, P.O. Box 80203, Jeddah 21589, Saudi Arabia
a r t i c l e i n f o
Article history:Received 5 July 2013Received in revised form16 September 2013Accepted 25 September 2013Available online 30 October 2013
Keywords:Alcohol-to-olefinsMicro-spectroscopyAcid strengthAcid site densityCoke formationChabazite
a b s t r a c t
The formation of distinct hydrocarbon pool (HCP) species on individual micron-sized SAPO-34 and SSZ-13crystals have been compared during methanol-to-olefins (MTO) and ethanol-to-olefins (ETO) conversionprocesses. In situ UV–vis micro-spectroscopy reveals the formation of 400 nm and 580 nm absorptionbands, which are ascribed to poly-alkylated benzene (PAB) carbocations, the most active HCP species andpoly aromatics (PA) the deactivating species, respectively. PAB formation within both catalysts is fittedwith first-order kinetics at low reaction temperatures and activation energies (Ea) can be calculated,while PA/PAB ratio is calculated to monitor the deactivation process for different reaction temperatures.The results show that for both activation and deactivation processes, methylation reactions are leading inMTO and are controlled by acid strength; while olefins condensation reactions are governing in ETO andare affected more by acid site density. Moreover, the distribution of HCP species is visualized by confocalfluorescence microscopy, which demonstrates that the acid site density plays an important role on thelocal catalytic performance. Finally, synchrotron-based IR micro-spectroscopy reveals different activityof the two catalysts as shown by the intensity and frequency of distinct characteristic bands.
© 2013 Elsevier B.V. All rights reserved.
1. Introduction
Light olefins, such as ethylene and propylene, have been widelyused as raw materials for the production of e.g. polymers [1,2].However, the current high price of crude oil as well as morestringent environmental legislation have spurred great interestsin developing new and improved catalytic technologies basedon alternative feedstocks, such as methane and biomass. Amongthese processes, the conversion of alcohols (e.g. methanol andethanol) to light olefins have received strong research attention[3,4]. Methanol can be produced from synthesis gas (CO + H2),which can be obtained from almost any gasifiable carbon source,such as natural gas, coal, biomass and agricultural waste [5]. Themethanol-to-olefins (MTO) process was discovered in 1976 andsignificantly improved by the discovery of the SAPO-34 materialby Union Carbide [1,6]. Furthermore, the ethanol-to-olefins (ETO)process has received recent attention owing to the interest in the
∗ Corresponding author. Tel.: +31 62 273 6379; fax: +31 30 251 1027.∗∗ Corresponding author. Tel.: +31 30 253 4328; fax: +31 30 251 1027.
E-mail addresses: [email protected] (J. Ruiz-Martínez),[email protected] (B.M. Weckhuysen).
full utilization in the production and use of bio-ethanol, which canbe obtained in large quantities from modern lignocellulosic biore-fineries [1,7].
MTO and ETO processes can be efficiently catalyzed by variousprotonated zeolites or zeotype materials, among which SAPO-34with large cavities (6.7 A × 10.9 A) interconnected through smallwindows (3.8 A × 3.8 A) is currently one of the archetypal industrialMTO catalysts, giving up to 80% total carbon yield of propylene andethylene [8]. Moreover, the CHA topology is one of the few whereboth the silicoaluminophosphate (SAPO-34) and aluminosilicate(SSZ-13) analogs are readily synthesized [9]. It has been reportedthat SSZ-13 displays higher acid strength than SAPO-34 [10]. Asa consequence, an enhanced production rate of olefins as well asaromatics retained in the catalyst pores was observed for SSZ-13,leading to a lower optimal temperature of operation [9].
Understanding the reaction mechanism and related deactiva-tion pathways during catalytic processes are important topics asthis knowledge can be further translated into designing new andimproved catalyst materials. In the case of MTO, there is a generalconsensus that the reaction follows the hydrocarbon pool (HCP)mechanism, in which methanol is subsequently added to an organicscaffold [11–14]. While when using ethanol as a feed over H-ZSM-5, an almost identical product distribution is found as for the MTO
0920-5861/$ – see front matter © 2013 Elsevier B.V. All rights reserved.http://dx.doi.org/10.1016/j.cattod.2013.09.056
Author's personal copy
Q. Qian et al. / Catalysis Today 226 (2014) 14–24 15
process. This suggests that ETO likely proceeds through similar HCPpathways [15]. Further investigations have shown that the trappedspecies within the zeolite channels after ETO are very similar thanthose found after MTO, although they contain a higher amount ofethyl-substituted molecules [16,17]. The formation of hydrocar-bon species and their activity critically rely on the combinationof reaction conditions, size of the cages/channels of the molecu-lar sieves as well as the acid site density and strength [5,14,18,19].However, active HCP species are often alkylated benzene moleculesand their protonic counterparts [1,2,18,20]. Furthermore, theseactive species in SAPO-34 readily convert into larger aromaticsthat eventually block the active sites and hinder the diffusion ofreactants as well as products [22,23]. Thus, the coke formation canaffect the catalyst performance as it provokes variations in activ-ity and selectivity. In the past decades, there have been intensivestudies investigating the nature of the coke species and their for-mation mechanism by using of a variety of analytical tools, such asIR, UV–vis, electron spin resonance (ESR), nuclear magnetic reso-nance (NMR), gravimetrical (TEOM & TGA) and X-ray photoelectronspectroscopy (XPS) [24–27]. Nevertheless, the number of methodsthat allows the investigation of the coke formation under realisticreaction conditions is limited and even further diminishes whennon-invasive methods or spatial resolution criteria are requested,which is crucial considering the dynamic nature of the catalystsystem.
Recently, our group has reported that in the case of SAPO-34, theactive aromatic species, alkylated benzene carbocations, follow dif-ferent formation pathways during MTO and ETO by using a set ofmicro-spectroscopy techniques [21]. In this work, we extend thismechanistic approach for the study of individual SSZ-13 crystals, analuminosilicate with CHA structure, stronger acid sites and in thisspecific case lower acid site density. We also include here an inves-tigation of the formation of bulkier poly aromatic species, which arebelieved to deactivate the material. These results will be comparedwith SAPO-34 ones and after that, the role of acid strength and acidsite density on the kinetics, location and nature of distinct hydro-carbon species during activation and deactivation in MTO and ETOprocesses will be assessed.
2. Experimental
2.1. Materials and experiments
The as-synthesized SAPO-34 and SSZ-13 materials under studyhave crystal sizes of 50 × 50 × 50 �m3 and 40 × 40 × 40 �m3,respectively. Their synthesis procedure has been reported else-where [28,29]. The Si/(Al + P) and Si/Al ratios are 0.204 and 17.7,which can be translated theoretically into two acid sites per cage forSAPO-34 crystals and two acid sites per three cages for SSZ-13 crys-tals. The crystals were placed on the heating stage of an in situ cell(Linkam FTIR 600) equipped with a temperature controller (LinkamTMS 93) where they were heated. During each measurement, thecalcined crystals were first heated to 673 K at a rate of 15 K min−1,then heated to 823 K with a rate of 5 K min−1, and held at thistemperature for 1 h under N2 atmosphere. Subsequently, the tem-perature was brought to the required reaction temperature at a rateof 15 K min−1 after which the N2 was flowing through methanol orethanol thereby acting as carrier gas.
2.2. N2 physisorption analysis
N2-physisorption isotherms were recorded using a Micromer-itics Tristar 3000 set-up operating at 77 K. Prior to physisorptionmeasurements, all samples were degassed for 12 h at 573 K in anitrogen flow. BET surface areas were determined using 10 points
between 0.06 and 0.25. Micropore volumes (cm3 g−1) were deter-mined by t-plot analysis for t between 3.3 and 5.4 A to ensureinclusion of all five minimum required pressure point.
2.3. Ammonia temperature programmed desorption
Acidity was investigated by temperature-programmed desorp-tion (TPD) of ammonia under He flow (25 ml min−1) using aMicromeritis Autochem II equipped with a TCD detector. 50 mg ofcatalyst was loaded and dried at 873 K for 1 h, then cooled down to373 K. After that, pulses of ammonia were introduced up to satu-ration of the catalyst material. The TPD was performed up to 873 Kwith a heating ramp of 5 K min−1.
2.4. In situ UV–vis micro-spectroscopy
The UV–vis micro-spectroscopy measurements were performedwith an Olympus BX41 upright microscope using a 50 × 0.5 NAhigh working-distance microscope objective lens. A 75 W tungstenlamp was used for illumination. In addition, the microscope has a50/50 double viewpoint tube, which accommodates a CCD videocamera (ColorView IIIu, Soft Imaging System GmbH) and an opticalfiber mount. A 200 �m core fiber connects the microscope to a CCDUV–vis spectrometer (AvaSpec-2048TEC, Avantes BV).
2.5. In situ confocal fluorescence microscopy
The confocal fluorescence microscopy studies were performedwith a Nikon Eclipse LV150 upright microscope with a 50 × 0.55 NAdry objective lens. The confocal fluorescence microscopy imageswere collected with the use of a Nikon-Eclipse C1 head connectedto the laser light sources (488 and 561 nm). The emission wasdetected with two photomultiplier tubes in the range 510–550and 575–635 nm for the two lasers, respectively (in order to avoidchannel overlap).
2.6. In situ synchrotron-based IR micro-spectroscopy
Synchrotron-based IR spectra were collected at beamline SMISlocated at the French National Synchrotron SOLEIL (Paris, France).A Thermo Nicolet NEXUS 70 spectrometer, coupled to a ContinuumXL microscope was used with the synchrotron light as the IR source.The microscope was equipped with a 15 × 0.5 NA Schwarzschildobjective, a motorized x and y mapping stage and an adjustablerectangular aperture. For typical MTO and ETO measurements, theSAPO-34 crystals were placed in the in situ cell (Linkam FTIR 600)and heated up to 723 K in dry air (heating rate 15 K min−1) for30 min to activate the molecular sieves. Subsequently, the in situcell was brought to reaction temperatures (15 K min−1), and thealcohols were fed into the cell with several pulses. Spectra werecollected during and after each pulse. For each measurement, thecrystals were placed on a CaF2 window located on the motorized (inx/y) mapping stage, recording the mid-IR (4000–1300 cm−1) spec-trum in transmission mode with a spectral resolution of 4 cm−1 and32 or 16 scans co-added. An aperture of IR beam 20 × 20 �m2 wasused to follow the MTO and ETO reactions in situ. Background mea-surements were performed with a spectral resolution of 4 cm−1 and64 scans per spectrum.
3. Results and discussion
3.1. Textural properties and acidity of the materials
Table 1 summarizes the textural properties of the two mate-rials under study, i.e., SAPO-34 and SSZ-13, as measured by N2

Author's personal copy
16 Q. Qian et al. / Catalysis Today 226 (2014) 14–24
Table 1Textural properties of the large SAPO-34 and SSZ-13 crystals under study.
Sample BET surfacearea (m2 g−1)
Micropore volume(cm3 g−1)
Mesopore volume(cm3 g−1)
SAPO-34 492 0.229 0.010SSZ-13 486 0.231 0.037
physisorption. The large SAPO-34 crystals are essentially micro-porous, which suggest that the crystals possess low defects contentand the porosity is coming mainly from the microporous structureof the silicoaluminophosphate. In the case of its zeolitic coun-terpart, SSZ-13, despite most of the porosity originates from themicroporous structure of the material, a certain amount of meso-porosity is observed, reflecting a less ideal and most likely moreaccessible material.
The ammonia TPD profiles of the large SAPO-34 and SSZ-13 crys-tals are presented in Fig. 1. The SSZ-13 and SAPO-34 materials showtwo distinct peaks at low and high temperatures. The ammoniadesorption peak at around 423 K is ascribed to weak acid sites dueto hydroxyl groups at the external surface of the material, there-fore they are not related to the active species inside the cages of themolecular sieves [30,31]. The ammonia desorption peak at highertemperature corresponds to sites with stronger acidity, most likelydue to Brønsted acid sites inside the cages. This peak is located ataround 623 K for SAPO-34 and at around 688 K for SSZ-13. Two mainconclusions can be drawn from the ammonia TPD results. First,the profiles clearly show that the SAPO-34 large crystals possessa higher amount of acid sites, and consequently a higher acid sitedensity. This observation is in line with the theoretical values of twoacid sites per cage for SAPO-34 and 0.66 acid sites per cage for SSZ-13. Second, the temperature difference between the second peak ofdesorption for SSZ-13 and SAPO-34 is indicative for a stronger acidsites in the former material, which is in line with literature data[10].
3.2. In situ UV–vis micro-spectroscopy
In order to fully compare the differences between SSZ-13 andSAPO-34, with respect to the activation and deactivation processes,in situ UV–vis micro-spectroscopy has been applied. During eachMTO or ETO experiment, the micron-sized SSZ-13 and SAPO-34crystals were heated to distinct reaction temperatures at whichthey were exposed to a flow of alcohol vapor. During the MTOand ETO reactions, pronounced color changes were observed over
Fig. 1. Ammonia temperature programmed desorption profiles for the large SSZ-13and SAPO-34 crystals under study.
SSZ-13 and SAPO-34 crystals, which are indicative for specificchemical transformation processes. Fig. 2a and c presents a selec-tion of optical micro-photographs of an individual SSZ-13 andSAPO-34 crystal taken throughout the MTO reaction at reactiontemperatures of 528 K and 563 K, respectively. Due to the differentreactivity of the two catalyst materials under study, they were eval-uated at different temperatures to allow a better comparison [9].For micron-sized SSZ-13 crystal, the color changes into yellow after410 s, and the crystal subsequently turns into orange, and displaysa brown color in the end. In contrast, when performing the sameMTO on SAPO-34, a strong yellow coloration is observed along theedges of the crystal, with the highest color intensity after ∼75 s on-stream. Subsequently, the crystal becomes more translucent, thefade rate being dependent on the reaction temperature [21,32].
To correlate the differences observed in the crystal colorationwith changing reactivity, the corresponding spectra were recordedduring each measurement, which were taken from a 2 �m spotin the central area of the crystals. As shown in Fig. 2b and d, themost prominent feature for both sets of UV–vis spectra is a strongabsorption band located at around 400 nm, which is responsiblefor the yellow coloration and assigned to highly methylated ben-zenium carbocations [32,33]. With time-on-stream, the intensityof this absorption band starts to decrease drastically for SAPO-34as shown in Fig. 2d, which is in line with the fading crystal color(Fig. 2c). Instead, in the case of SSZ-13, the intensity of the 400 nmabsorption band decreases only to a small extent with time-on-stream (Fig. 2b). Furthermore, for longer reaction time, a secondabsorption band appears at around 480 nm and later on a weak andbroad band rises at around 580 nm, which is particularly evident inthe case of the more acidic SSZ-13 material, as reported previously[5].
The ETO performances of the micron-sized SSZ-13 and SAPO-34crystals were also compared. Likewise, two different temperaturesfor the two catalyst materials are displayed, i.e., 461 K for SSZ-13and 509 K for SAPO-34. As shown in Fig. 2e, the SSZ-13 crystal grad-ually turns from yellow to light brown with time-on-stream, whilein the case of the SAPO-34 crystal, a faster coloration from yellowto dark orange was observed, as illustrated in Fig. 2g. Moreover, thecolors for both catalyst materials during the ETO process are ratherhomogeneously distributed throughout the whole crystal, whichis clearly different as compared to the MTO process. This observa-tion suggests that the formation of HCP species follows differentpathways during MTO and ETO, as shown in a recent work [21].The corresponding UV–vis spectra are depicted in Fig. 2f and h. Theabsorption band at around 400 nm steadily grows for both crys-tals, however, the absorption band is increasing faster in intensityfor SAPO-34. Moreover, an additional absorption band at around500 nm becomes more evidenced at a later stage of the ETO reactionin the case of SAPO-34.
The large variety of carbonaceous species, formed during theMTO and ETO processes conducted on both SSZ-13 and SAPO-34crystals, is clearly reflected in the complexity of the correspond-ing UV–vis spectra. For a reliable quantification of the intensitiesof the UV–vis absorption bands, we have developed and applied asystematic deconvolution procedure for both reactions over SSZ-13and SAPO-34 at different temperatures [5,21,32,34]. Table 2 sum-marizes the Gaussian function dataset to deconvolute the UV–visspectra obtained during MTO and ETO on SAPO-34 and SSZ-13. It isimportant to remark here that in all four cases under investigation,similar absorption band positions of the chosen Gaussian functionswere required, which suggests a similar nature of the HCP speciesformed within the cages of both SAPO-34 and SSZ-13 crystals. Thisfinding suggests that the nature of the HCP species is likely deter-mined by the pore structure of the material. Five Gaussian bands,located at approximately 400, 448, 505, 580 and 670 nm, are nec-essary to reconstruct the experimental UV–vis spectra, whereas

Author's personal copy
Q. Qian et al. / Catalysis Today 226 (2014) 14–24 17
Fig. 2. Optical micro-photographs and corresponding UV–vis spectra during the methanol-to-olefins (MTO) reaction conducted at 528 K over an individual 40 �m-sizedSSZ-13 crystal (a and b) and at 563 K over an individual 50 �m-sized SAPO-34 crystal (c and d) as a function of time-on-stream. The same for the ethanol-to-olefins (ETO)reaction conducted at 461 K over an individual 40 �m-sized SSZ-13 crystal (e and f) and at 509 K over an individual 50 �m-sized SAPO-34 crystal (g and h) as a function oftime-on-stream.
a wide absorption band with a maximum at 700 nm is used tocorrect for the increasing baseline during the MTO and ETO reac-tions. Although it is not straightforward to assign each Gaussianband to one particular type of HCP species, our latest progress fromboth experimental data and theoretical calculations provides use-ful insight into the chemistry behind the deconvolution procedure[5]. More specifically, the 400 nm absorption band can be assignedto �–�* transitions of poly-alkylated benzene (PAB) carbocations,
which are considered to be the most active species during MTOreaction [13,32,35,36]. Bands with higher wavelengths can be ratio-nalized in terms of an increased size of trapped alkylated aromaticcompounds [21,34]. Furthermore, with the aid of state-of-art time-dependent DFT calculations combined with molecular dynamics(MD), it is now possible to assign these UV–vis bands in moredetail [37]. Most of the single-ring aromatic cations contribute tothe 400 nm band and bicyclic species containing up to four methyl
Table 2Overview of the band positions and widths of the Gaussian functions used for the deconvolution of the in situ UV–vis absorption spectra for the methanol-to-olefins (MTO)and ethanol-to-olefins (ETO) processes over individual SAPO-34 and SSZ-13 crystals.
Position and width (between brackets) in nanometers of the Gaussian functions
MTO on SAPO-34 403 (31) 448 (42) 505 (46) 580 (50) 670 (65) 700 (800)ETO on SAPO-34 405 (33) 448 (46) 510 (55) 590 (60) 675 (62) 700 (800)MTO on SSZ-13 400 (31) 448 (45) 505 (48) 575 (60) 665 (65) 700 (800)ETO on SSZ-13 405 (33) 448 (46) 510 (50) 585 (60) 670 (65) 700 (800)

Author's personal copy
18 Q. Qian et al. / Catalysis Today 226 (2014) 14–24
Fig. 3. Absorbance intensity of the Gaussian bands at 400 nm and 580 nm as a function of time-on-stream for the methanol-to-olefins (MTO) reactions over individual40 �m-sized SSZ-13 crystals (a and b) and individual 50 �m-sized SAPO-34 crystals (c and d), for the ethanol-to-olefins (ETO) reactions over individual 40 �m-sized SSZ-13crystals (e and f) and individual 50 �m-sized SAPO-34 crystals (g and h) at different reaction temperatures.
Source: Fig. 3c and g were adapted from Ref. [21].
groups show broader absorption bands extending to 450 nm, whileheavier ones contribute to the absorption band around 505 nm.Additionally, the phenanthrenic species show high absorbance atlonger wavelengths, in particular around 560 nm. Moreover, thelargest ring system that can be accommodated in the cages ispyrene, which absorbs light at even longer wavelength. On theother hand, methylated naphthalenes only possess very limitedactivities toward olefins production and HCP species with a highernumber of aromatic rings are no longer active [5,38,39].
By applying the above mentioned deconvolution procedure tothe four sets of UV–vis absorption spectra obtained for the MTO andETO reaction over individual SAPO-34 or SSZ-13 crystals, it has beenpossible to determine the absorbance intensities of the Gaussiancurves at 400 and 580 nm at different reaction temperatures as a
function of time-on-stream. The main reason to limit our discussionto these two Gaussian functions is because these two absorptionbands are well resolved from each other and no band overlappingoccurred. In addition, the 400 nm band is indicative for the mostactive HCP species, while the 580 nm band is representative for PAspecies, the deactivating HCP species. In other words, by monitoringthe intensities of 400 nm and 580 nm bands we can directly assessthe contributions of specific markers for active and deactivatingspecies. The results of this spectroscopic approach are summarizedin Fig. 3.
In the case of the 400 nm absorption band during the MTOprocess, as illustrated in Fig. 3a and c, it is evident that in the lowtemperature region (i.e., below 600 K for SSZ-13 and below 617 Kfor SAPO-34), the two crystals behave very similarly. First, the
Author's personal copy
Q. Qian et al. / Catalysis Today 226 (2014) 14–24 19
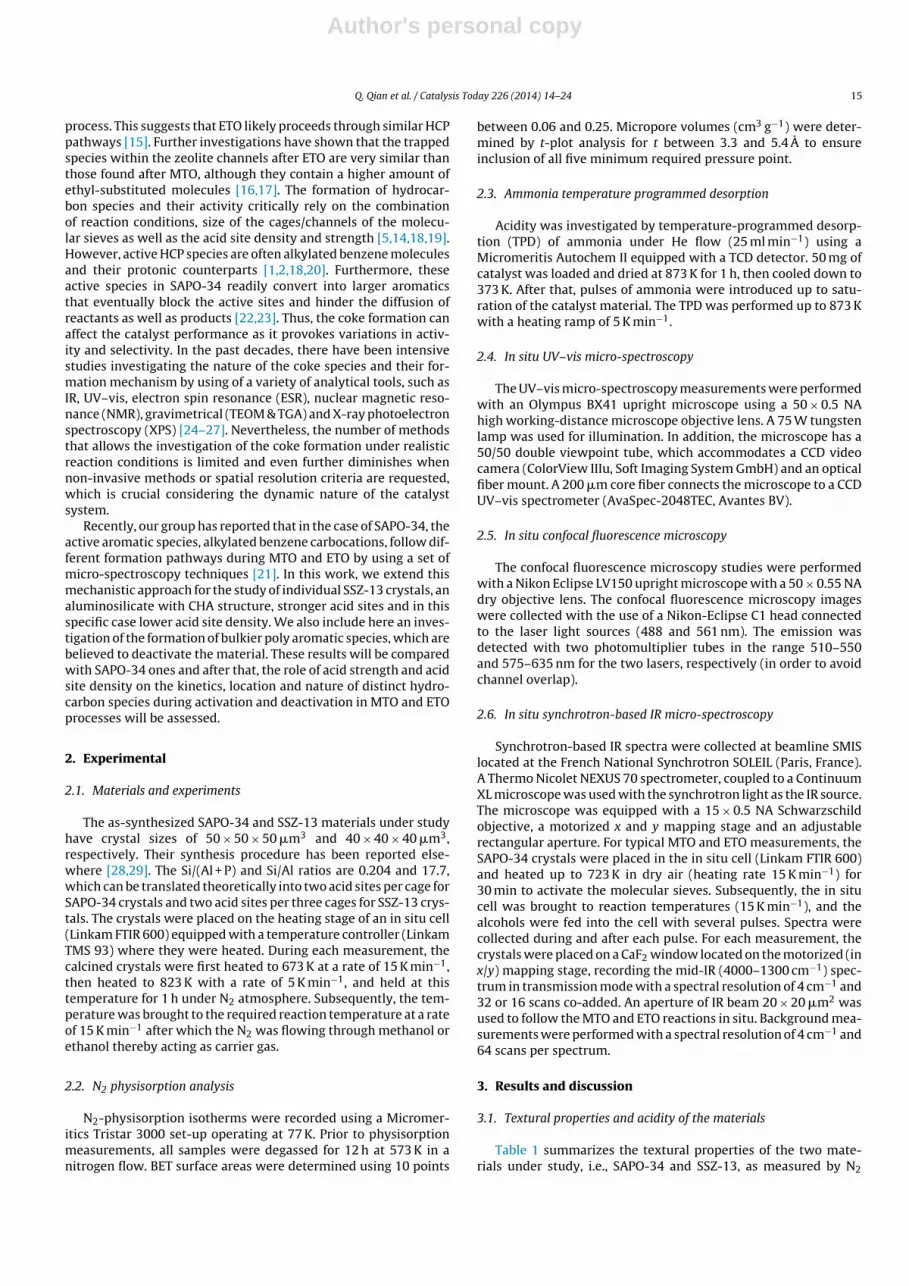
Fig. 4. Arrhenius plots of the fitted curves corresponding to the intensity profiles of the absorption band at around 400 nm obtained from the in situ UV–vis spectra measuredon individual 40 �m-sized SSZ-13 crystals and individual 50 �m-sized SAPO-34 crystals during (a) the methanol-to-olefins (MTO) and (b) ethanol-to-olefins (ETO) reactions.
Source: Data for MTO and ETO reactions on SAPO-34 crystal were taken from Ref. [21], data for MTO reactions on SSZ-13 crystal was taken from Ref. [5].
formation rate for the band of the active HCP species increases withincreasing temperature. Second, for all temperatures in this regionthe intensity of this absorption band decreases after reachinga maximum. The similarities suggest a similar PAB formationpath for the two crystals. In the case of the 580 nm absorptionband during the MTO process, as illustrated in Fig. 3b and d, cleartemperature differences exist when comparing the two crystals.More specifically, for SSZ-13 the intensity of this band is alreadyvery pronounced at the lowest reaction temperatures (i.e., 505 Kand 518 K) as shown in Fig. 3b. While for SAPO-34, the growthof the 580 nm absorption band is very slow when the reactiontemperature is below 553 K (Fig. 3d). Interestingly, the onset in theformation of the 580 nm absorption band corresponds with a dropof the 400 nm absorption band. This observation is more evidencedin the case of SSZ-13 with less acid site density (condensation ofadjacent HCP species is thus avoided [27]), which is an indicationthat deactivating PA species are most likely formed from theactive single-ring aromatics [1,2]. Furthermore, it was suggestedby theoretic modeling that the side-chain methylation might be adeactivating route leading to coke precursors rather than olefinsproduction [40]. Thus, the formation of PA species, as representedby the 580 nm absorption band, is likely based on methylationfollowed by condensation reactions of active PAB species.
In the case of the 400 nm absorption band during ETO over SSZ-13 and SAPO-34, as shown in Fig. 3e and g, it can be seen that fasterkinetics takes place with increasing temperature in the reactiontemperature window under study. Furthermore, the intensity ofthis absorption band slightly drops after reaching a maximum forSAPO-34, whilst for SSZ-13 a slow increase is observed. In the case ofthe 580 nm absorption band for ETO, the temperature dependencyfor the two crystals is the same, as the fact that a faster kineticsoccurs for both crystals. Nevertheless, the intensity of this absorp-tion band is much more pronounced for SAPO-34 as compared toSSZ-13, which might be due to its higher acid site density [41].
In order to analyze the data in more detail, time evolution pro-files of the 400 nm absorption band from the above mentioned foursets of experiments were fitted into a first-order reaction. The pro-cedure was reported in previous works [5,21]. More specifically, foreach band the evolution of the maximal absorbance as a function oftime was monitored at different temperatures. The rapidly increas-ing regions in the absorbance (A) versus time (t) curves (see Fig. 3a,c, e and g) that follow first-order kinetics were selected and fit-ted to the equation ln(Amax − A) = ln(Amax) − k·t. Thus we correctedfor an induction period at the beginning and for the occurrence ofsecondary reactions near the end of the process. For example, theregions between 0.2Amax and 0.5Amax for MTO over SAPO-34 andbetween 0.2Amax and 0.7Amax for ETO over SAPO-34 were used.Therefore, from this fitting procedure the rate constant k for eachreaction temperature (T) can be determined. Consequently, the
ln(k) as a function of 1/T is depicted in Fig. 4. The slope of theseArrhenius curves is denoted as the activation energy (Ea) of for-mation of the PAB carbocations responsible for the increase of the400 nm absorption band in the UV–vis spectra. Moreover, the timeinterval (�t) of the first-order reaction region is also used as a sec-ond method to determine the activation energy (Ea), as calculatedfrom the slope of the ln(1/�t) − 1/T plot.
In the Arrhenius plot, depicted in Fig. 4a and b, the activationenergy (Ea) for the formation of PAB carbocations can be obtainedfrom the slope of the curve. In the case of MTO reaction, the Ea
for the formation of the 400 nm band is 98 kJ mol−1 for SAPO-34 and 76 kJ mol−1 for SSZ-13, as shown in Fig. 4a. These valuesshow a strong correlation with the theoretical rates of methyla-tion reactions, indicating that the methylation reactions are ratedetermining steps for the formation of PAB carbonations in bothSAPO-34 and SSZ-13 crystals [5]. Furthermore, the Ea value is lowerfor SSZ-13, which is most probably due to its higher acid strengthas suggested both experimentally and theoretically [5,9]. Anotherevidence for acid strength governing the PAB formation is thatalthough SSZ-13 crystals possess a lower acid site density, it stillexhibits a much faster formation rate in all measured temperaturesas compared to SAPO-34 crystals.
In contrast, for ETO, the calculated Ea values for PAB forma-tion, represented by the 400 nm absorption band, are rather similarwhen comparing the SAPO-34 and SSZ-13 crystals, which are 57and 55 kJ mol−1, respectively. Those Ea values are comparable to theEa for the condensation of light olefins into aromatic species [21,42].Furthermore as reported previously, it demonstrates that indeedETO over SAPO-34 exhibits different mechanisms with respect tothe generation of PAB carbocations at low temperatures as com-pared to MTO [21]. Hence, one would expect that the same reactionroute holds for the ETO over SSZ-13 as compared to SAPO-34. Thecomparable Ea values for the SAPO-34 and SSZ-13 materials indi-cate that the acid strength does not play a major role with respectto the PAB formation for ETO. In other words, the acid strengthdoes not influence the condensation of light olefins into aromaticsto a large extent as this is the major route for the formation of PABcarbocations.
In order to monitor the deactivation of the crystals, the inten-sity ratios of the absorption bands at 580 nm and 400 nm band hasbeen analyzed. Fig. 5 displays these ratios calculated at the reactiontime when the 580 nm absorption band reaches a maximum. In thecase of MTO, it can be deduced from Fig. 5a that a volcano type ofcurve in the measured temperature region exists for both catalystmaterials. As PA species are most likely formed from methylationfollowed by condensation of PAB species as discussed above, thisobserved volcano type temperature-dependency can be rational-ized by an “alkylation-dealkylation” equilibrium of aromatics asreported previously in ZSM-5 catalyst [43]. However, a maximum

Author's personal copy
20 Q. Qian et al. / Catalysis Today 226 (2014) 14–24
Fig. 5. Absorbance intensity ratios between the Gaussian band at ∼580 nm and 400 nm as a function of reaction temperature taken (a) during the methanol-to-olefins reaction(MTO) and (b) during the ethanol-to-olefins (ETO) when the absorbance of the 580 nm band reaches a maximum.
of the intensity ratio occurs at 518 K and 576 K for SSZ-13 and SAPO-34, respectively. As the formation of different types of HCP speciesdirectly affect the performance of the catalyst materials, the shift ofthe observed temperature may strongly affect the operation tem-perature of the MTO reactions over SAPO-34 and SSZ-13 samples.This is in line with previous observations, where the optimum con-version capacity of SSZ-13 was shifted to lower temperature forabout 50 K due to its higher acid strength [9]. Therefore, it seemsvery reasonable to conclude that it is the different acid strengththat affects the methylation reactions, which induces a temperatureshift in the optimum formation of different types of HCP speciesincluding both PAB and PA carbocations. Hence, a temperature shiftin the optimum MTO performance can be obtained. Moreover, inthe case of SAPO-34, the decrease in the ratio above 576 K meansthat the retained hydrocarbons contain less PA, which is in goodagreement with previously reported results [9].
In the case of ETO, the ratio between the amount of PAspecies (deactivating species) and PAB carbocations (active species)increases with increasing reaction temperature for both catalystmaterials until reaching a maximum, as illustrated in Fig. 5b. This isdifferent from the volcano type of temperature-dependency behav-ior observed from MTO (Fig. 5a), which implies that there is no cleardirect connection between the formation of PA and PAB species. Inother words, “alkylation-dealkylation” equilibrium/reactions doesnot apply in the ETO process for formation of HCP species, at leastnot to a large extent. Instead, olefins condensation is more reason-able to contribute to the PA formation. Therefore, the higher ratiosas well as the faster formation of HCP species (both PA and PABmolecules) (evidenced by Figs. 3f, 4h and 4b) for SAPO-34 at all reac-tion temperatures can be well explained. The reason is that higheracid site density favors condensation reactions as reported previ-ously [27]. Thus, different from the case of MTO, the acid strength ofa porous material is not the major factor for governing PA formationduring ETO.
3.3. Confocal fluorescence microscopy
The spatiotemporal distribution of carbonaceous species withinindividual SSZ-13 crystals was monitored by confocal fluorescencemicroscopy as such species exhibit fluorescence in the visible lightregion. As a result, 2D and 3D maps of carbonaceous species can beconstructed with sub-micrometer resolution [44,45]. Furthermore,the optical properties of the carbon species can be related to theirmolecular dimensions, where the more conjugated and extendedcompounds absorb light at higher wavelengths [32,34]. This allowsus to discriminate between different coke species by exciting thesample with distinct laser lines. In this work, two different laserlines have been used; i.e., at 488 and 561 nm with the fluorescencedetection region set at 510–550 and 575–635 nm, respectively.
Fig. 6 depicts a series of confocal fluorescence microscopyimages in the middle plane of a single SSZ-13 and SAPO-34 crystalscollected during MTO at 600 K and ETO at 509 K. The images showthe combination of the light emitted upon excitation with the 488and 561 nm lasers and illustrate the location of the less and moreextended coke species (from green to red, respectively) [21]. It isimportant to note that this technique was used as an imaging tooland no quantitative information can be extracted from this study.This is due to the fact that the sensitivity of the fluorescence detec-tors for the two lasers might differ from each experiment becausethose settings were chosen for the best display of the fluorescencespecies. Therefore the evolution of the HCP species with respect tothe size and distribution can be followed within one crystal. ForMTO on SSZ-13 at 600 K, as shown in Fig. 6a, the formation of thefluorescent species is concentrated in the outer rim of the crystaland the light emitted goes from green to red with time-on-stream.This observation can be explained in terms of the formation of moreextended HCP species. This is similar to the previous findings forMTO on SAPO-34 crystal at 600 K (Fig. 6b), which demonstratesagain that HCP species formation follows the same pathway i.e.methylations for both catalyst materials, and the outer rim has ahigher concentration of methanol [21]. However, the active rim isthicker in the case of SSZ-13, which is likely due to its less acid sitedensity. Less acid site density leads to a lower density of formed HCPspecies, thus a better accessibility of the crystal can be obtained.Therefore, the size of active zone in a single crystal can be governedby the acid site density, further affecting the catalytic performanceof the material.
When performing ETO reaction at 509 K over SSZ-13 (Fig. 6c),the fluorescent signal was detected in the outer rim of the crystalat the beginning of the reaction, and it moves inwards with time-on-stream, where the intergrowth structure is clearly visible in asame fashion as for SAPO-34 (Fig. 6d). This proves again that thefluorescent species are formed from mobile olefins in both catalystmaterials [21]. After 15 min on-stream, the pattern for the SSZ-13crystal is less homogeneous than the one for the SAPO-34 crystal,which might be due to its lower acid site density and consequentlya lower reaction rate of olefins condensation. The confocal fluores-cence microscopy measurements illustrate that acid site densityinfluences the distribution and amount of formed HCP specieswithin single crystals.
3.4. In situ infrared micro-spectroscopy
In a final part of our combined micro-spectroscopy investiga-tion we aimed to gain more insight into chemical nature of the HCPspecies formed within individual SSZ-13 and SAPO-34 crystals dur-ing MTO and ETO. For this purpose, we have employed synchrotron-based IR micro-spectroscopy, which provides spectroscopic

Author's personal copy
Q. Qian et al. / Catalysis Today 226 (2014) 14–24 21
Fig. 6. Confocal fluorescence microscopy images during the methanol-to-olefins (MTO) reaction with time-on-stream at 600 K over (a) an individual 40 �m-sized SSZ-13crystal and (b) an individual 50 �m-sized SAPO-34 crystal (Figure adapted from Ref. [21]). Confocal fluorescence microscopy images during the ethanol-to-olefins (ETO)reaction with time-on-stream at 509 K over (c) an individual 40 �m-sized SSZ-13 crystal and (d) an individual 50 �m-sized SAPO-34 crystal (figure adapted from Ref. [21]).(e) Schematics of the crystal, the plane represents where the measurements have been performed. The colors shown in the figure represent the fluorescence originated fromtwo laser lines with an excitation of 488 nm (detection at 510–550 nm) and 561 nm (detection 565–635 nm).
fingerprints of the type and amount of aromatic and aliphatichydrocarbons formed, as well as of the hydroxyl groups interactingwith the encaged organic molecules at the single particle level [21].
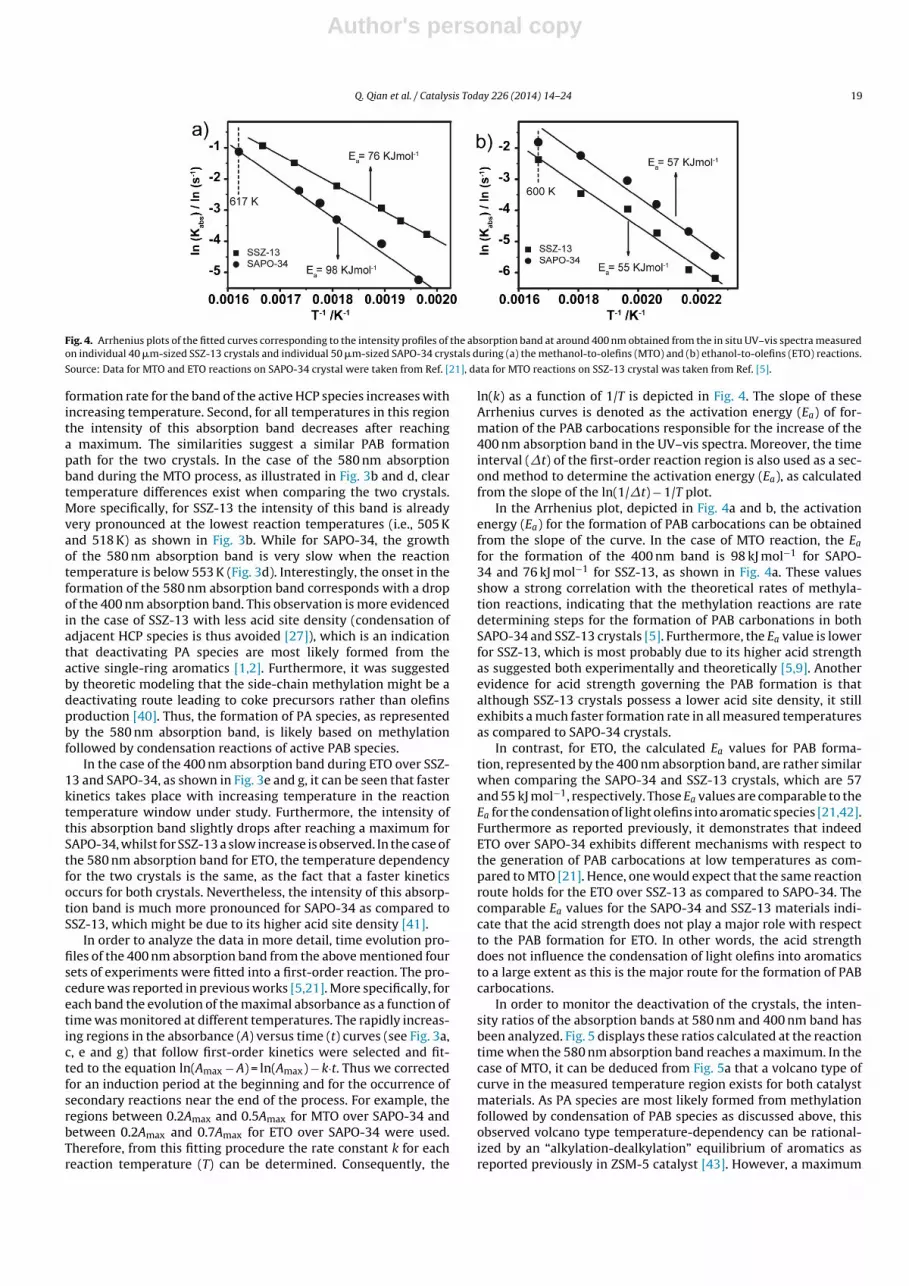
Fig. 7 compares the IR spectra obtained for an individual acti-vated SSZ-13 crystal before and after three pulses of methanol andethanol at 553 K, respectively. For sake of better comparison, the IRspectra taken before and after same reactions for SAPO-34 crystalare also included [21]. The IR spectra were taken from a spot sizeof 20 × 20 �m2 in the center of the crystal. One can now considerthree important regions in the measured IR spectra, i.e., the O H
stretching vibration region (>3500 cm−1), the C H stretching vibra-tion region (2800–3100 cm−1) and the C C stretching and C Hdeformation vibration region (1350–1650 cm−1) [21]. As can beconcluded from Fig. 7a, the SSZ-13 crystal has Brønsted acidity withtwo characteristic bands located at ∼3600 and 3575 cm−1, whilethe band at ∼3730 cm−1 is assigned to silanol groups. The sharpnessof the O H band at 3595 cm−1 for SAPO-34, shown in Fig. 7a’, andthe absence of other bands in the OH stretching vibration regionsuggest that silicon is homogeneously distributed [21]. Addition-ally, the higher intensity of the O H band at 3595 cm−1correlates
Author's personal copy
22 Q. Qian et al. / Catalysis Today 226 (2014) 14–24
Fig. 7. Synchrotron-based IR spectra of an individual 40 �m-sized SSZ-13 crystal (a)before alcohol-to-olefins (ATO) reaction, (b) after three pulses of methanol, and (c)after three pulses of ethanol at 553 K. Synchrotron-based IR spectra of an individual50 �m-sized SAPO-34 crystal (a′) before reaction, (b′) after three pulses of methanol,and (c′) after three pulses of ethanol at 553 K (Figures a′ , b′ , and c′ are adapted fromRef. [21]). The IR signal in the case of SSZ-13 is multiplied by a factor of 2.
with a higher acid site density as compared to SSZ-13, which is inline with the NH3-TPD results, discussed above. After performingthe ATO reactions, all IR bands in the O H region decrease, whichindicates a loss of the Brønsted acid sites in both catalyst materialsas well as in the silanol groups in the SSZ-13 crystal. The loss ofthose species is strongly attributed to the formation of protonatedHCP species as well as alkoxy groups. For the IR bands in the C Hstretching region, three bands centered at around 2955, 2925 and2870 cm−1 appear during ATO reactions on both SAPO-34 and SSZ-13. They are representative for the formation of alkyl groups onaromatic rings [16]. Furthermore, when comparing MTO and ETO,a much more pronounced C H stretching region is observed in theMTO reaction than in the ETO for both catalyst materials. Hence,one can conclude that there is a higher alkylation degree of theHCP species during MTO than during ETO on both crystals, which isdue to the different formation paths for MTO and ETO as reportedpreviously from our group [21].
If we compare the same ATO reaction on SSZ-13 and SAPO-34crystals, the differences are also clear. The intensity in the aliphaticC-H region is higher for the SAPO-34 than SSZ-13 crystals, whichsuggests that more alkylated HCP species are formed on SAPO-34most probably due to its higher acid site density. Moreover, in theC C vibration and C H deformation stretching region, for MTO(Fig. 7b and b′), the bands at ∼1460 cm−1 and 1380 cm−1 can befound in both catalyst materials, which are most likely due to theC C ring skeletal vibration of aromatics and bending vibration ofmethyl groups on benzenes, respectively [46,47]. This means thatthe active HCP species in both catalyst materials are methylatedbenzenes. However, an additional band in this region (∼1425 cm−1
for SSZ-13 and ∼1506 cm−1 band for SAPO-34) suggests the
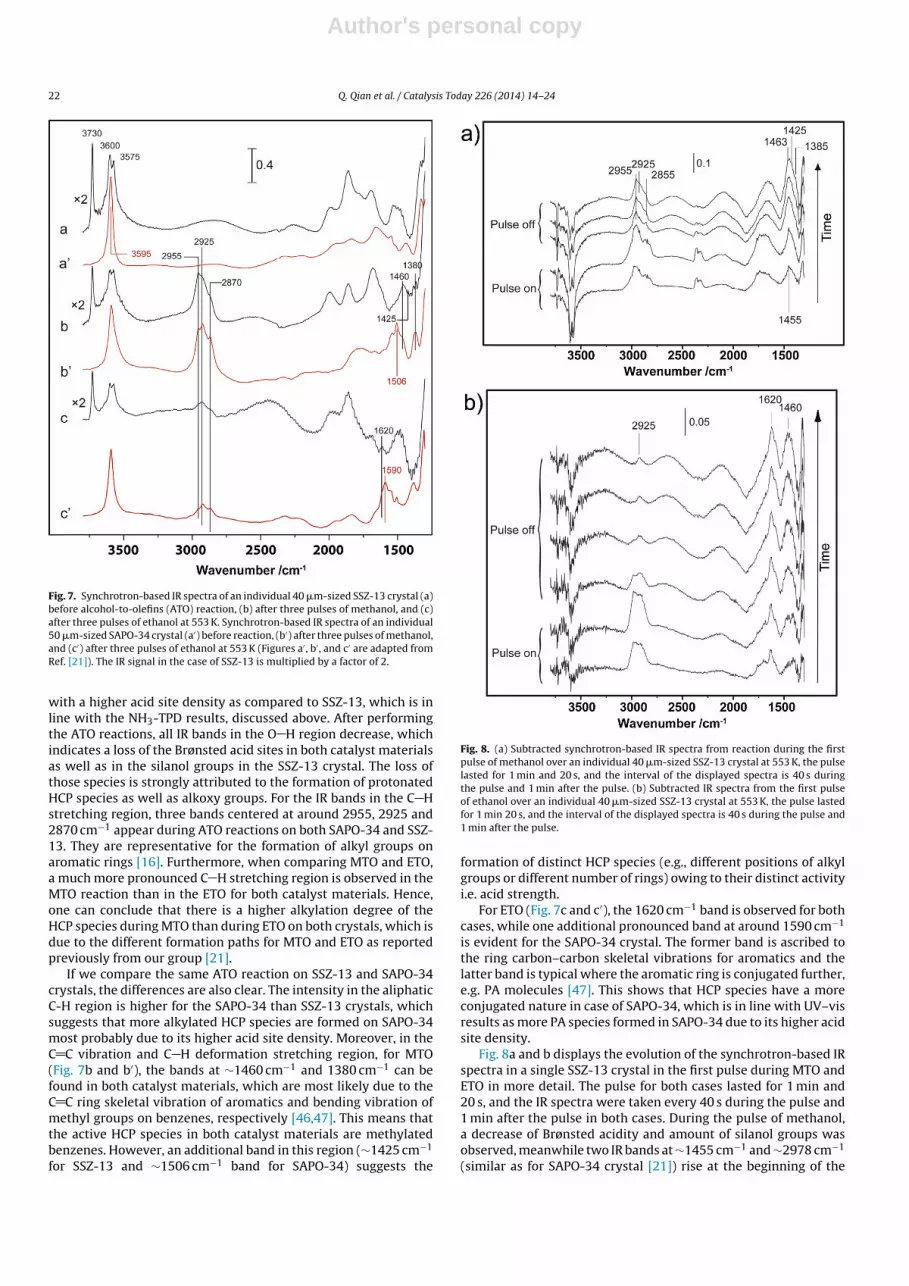
Fig. 8. (a) Subtracted synchrotron-based IR spectra from reaction during the firstpulse of methanol over an individual 40 �m-sized SSZ-13 crystal at 553 K, the pulselasted for 1 min and 20 s, and the interval of the displayed spectra is 40 s duringthe pulse and 1 min after the pulse. (b) Subtracted IR spectra from the first pulseof ethanol over an individual 40 �m-sized SSZ-13 crystal at 553 K, the pulse lastedfor 1 min 20 s, and the interval of the displayed spectra is 40 s during the pulse and1 min after the pulse.
formation of distinct HCP species (e.g., different positions of alkylgroups or different number of rings) owing to their distinct activityi.e. acid strength.
For ETO (Fig. 7c and c′), the 1620 cm−1 band is observed for bothcases, while one additional pronounced band at around 1590 cm−1
is evident for the SAPO-34 crystal. The former band is ascribed tothe ring carbon–carbon skeletal vibrations for aromatics and thelatter band is typical where the aromatic ring is conjugated further,e.g. PA molecules [47]. This shows that HCP species have a moreconjugated nature in case of SAPO-34, which is in line with UV–visresults as more PA species formed in SAPO-34 due to its higher acidsite density.
Fig. 8a and b displays the evolution of the synchrotron-based IRspectra in a single SSZ-13 crystal in the first pulse during MTO andETO in more detail. The pulse for both cases lasted for 1 min and20 s, and the IR spectra were taken every 40 s during the pulse and1 min after the pulse in both cases. During the pulse of methanol,a decrease of Brønsted acidity and amount of silanol groups wasobserved, meanwhile two IR bands at ∼1455 cm−1 and ∼2978 cm−1
(similar as for SAPO-34 crystal [21]) rise at the beginning of the

Author's personal copy
Q. Qian et al. / Catalysis Today 226 (2014) 14–24 23
MTO, indicating that the reaction is taking place. These two bandsare most likely due to the formation of methoxy groups (methyldeformation mode and stretching vibration mode), which con-tribute to the removal of the acid sites at the early stage of theMTO reaction [48,49]. When the pulse is off, the two bands dis-appear and the acid sites are partially recovered. Interestingly, theintensity of the silanol groups remains the same after switching offthe methanol flow, indicating that only methoxy species generatedfrom Brønsted acid sites are reactive. As a result of the depletion ofmethoxy species, several new bands are formed. Specifically, twobands located at ∼1463 and 1385 cm−1, are indicative for the for-mation of methylated benzenes as discussed above [46]. The IRband at ∼2925 cm−1 is assigned to the stretching vibration of theC H bond from alkyl groups on aromatics [46]. In addition, the1425 cm−1 band is likely originated from C H bending vibrationof methylated aromatic carbocations. It is reasonable to proposethat the new species i.e. methylbenzenes are HCP molecules gen-erated via methylation reactions, as evidenced from the previouslydescribed UV–vis results. These methylated benzene carbocationsare therefore responsible for the absorption at ∼400 nm in UV–visspectra as discussed in detail in our previous work [21].
In the case of synchrotron-based IR data for ETO, as illustrated inFig. 8b, a slight decrease is observedin the amount of both Brønstedacid sites and silanol groups when the pulse starts. Interestingly,the slow decrease in Brønsted acidity continues when the pulse isoff and suggests that the formation of the protonated HCP speciesin the ETO process is not related to surface species created exclu-sively at Brønsted acid sites. The same behavior was also observedfor SAPO-34 during ETO [21]. The lower decreasing rate of Brønstedacidity for SSZ-13, which corresponds with less HCP species forma-tion as shown in the UV–vis spectra, is due to its lower acid sitedensity. In addition, for the SSZ-13 crystal an absorption band ataround 1620 cm−1 appears at the beginning of the reaction, andcontinuously increases even in the absence of ethanol. This bandhas been assigned to �(C C) modes of a complex mixture of car-bonaceous, e.g. aromatic species [33,50,51], which is formed fromcondensation of olefins. At the end of the first pulse, bands at ∼2925and 1460 cm−1, similar to the ones from MTO yet with much lowerintensities, suggest the formation of alkylated aromatic species.
4. Conclusions
The catalytic performance of individual micron-sized SSZ-13and SAPO-34 crystals have been compared during methanol-to-olefins (MTO) and ethanol-to-olefins (ETO) reactions by acombination of three micro-spectroscopy techniques. More specif-ically, UV–vis micro-spectroscopy has been applied to follow theformation of two distinct HCP species (i.e., markers of an activeand a deactivating species) in a quantitative manner as a functionof reaction time and temperature. In addition, confocal fluores-cence microscopy has been used to unravel the spatiotemporaldistribution of formed HCP species within one crystal. Finally,synchrotron-based IR micro-spectroscopy provided insight into themolecular structure and amount of the HCP species as well as theinteractions of these molecules with the acid sites.
It was found that the SAPO-34 and SSZ-13 crystals are very sim-ilar MTO and ETO catalyst materials when comparing the natureof the formed HCP species as well as the formation pathways ofthese species. The formation of the most active HCP species, i.e.,poly-alkylated benzene (PAB) carbocations, as characterized by anabsorption band at around 400 nm band, was studied and fittedwith first-order kinetics. In the case of MTO, it was found thatthe methylation reactions are responsible for PAB formation inboth SAPO-34 and SSZ-13, whilst for ETO olefin condensation isgoverning the overall process. This is in agreement with the IR
micro-spectroscopy data as the HCP species formed during MTOhas a higher degree of alkylation than those observed during ETO.Moreover, the deactivating species, e.g. poly aromatic (PA) carbo-cations, as characterized by an absorption band at around 580 nm,was also studied in a quantitative way. It was found that the PAspecies are most likely formed at the expense of PAB species forboth crystals during MTO, more specifically from methylation fol-lowed by condensation of PAB carbocations; while this is not thecase for the ETO process as olefins condensation is more likely.Confocal fluorescence microscopy images show that the formedPA species are mainly located in the outer rim of the SAPO-34 andSSZ-13 crystals during the MTO process at 600 K, thus blocking thereactant molecules from diffusing into the inner part of the crystals.In contrast, the formation of the PA species during ETO involves thediffusion of reactants, e.g. mobile olefins, as the crystal intergrowthstructures are clearly seen for both SAPO-34 and SSZ-13.
Based on our characterization data we can conclude that SAPO-34 and SSZ-13 also show different reactivity during both MTO andETO. Furthermore, this difference comes from their distinct acidstrength as well as their acid site density. In the case of MTO, amuch lower Ea value with respect to the PAB formation for SSZ-13 than SAPO-34 indicates that acid strength plays an importantrole in this process. In addition, SSZ-13 deactivates faster in thelow temperature region (below 563 K), and it possesses the highestPA/PAB ratio at 518 K. In contrast, for SAPO-34, the temperature forthe highest PA/PAB ratio shifts to a higher temperature (576 K). Thistemperature shift can also be explained by the higher acid strengthof SSZ-13. Moreover, the confocal fluorescence microscopy imagesshow a larger active zone for SSZ-13 than SAPO-34. This can berationalized by its lower acid site density, which influence the num-ber and distribution of formed HCP species and furthermore mayhave impact on its catalytic performance.
In the case of ETO, comparable Ea values were found with respectto the formation of PAB for both crystals. This suggests that olefinscondensation, which is the major source to produce PAB carbo-cations, is not affected by acid strength. In addition, a faster PABformation was observed for all the measured temperatures forSAPO-34, which possesses a higher acid site density thus favor-ing condensation reactions. When comparing the PA content andPA/PAB ratio at temperatures lower than 600 K, an increasing trendwith increasing reaction temperatures was observed for both crys-tals. However, SAPO-34 contains more PA species than SSZ-13,although the acid strength of the former material is lower. This isevidenced by (a) the more pronounced 580 nm absorption band inthe UV–vis spectra and (b) an additional band at around 1590 cm−1
in the IR spectra. A plausible explanation could be the higher acidsite density of SAPO-34, which favors the condensation reactionsthat are likely the major route contributing to both PAB and PAformation.
Acknowledgements
This research work is funded by the Netherlands ResearchSchool Combination-Catalysis (NRSC-C) and the Deanship of Sci-entific Research (DSR) of King Abdulaziz University, Jeddah undergrant number (T-002-431). The authors gratefully acknowledgeDSR for technical and financial support. We also acknowledgeSOLEIL for access to the synchrotron radiation facilities under pro-posal number 20120471 and we would like to thank Dr. FrédéricJamme and Dr. Paul Dumas for their kind help and discussions. Dr.Jan Kornatowski (Max Planck Institute, Mulheim, Germany) and Dr.Einar A. Eilertsen (University of Oslo, Norway) are acknowledgedfor providing the SAPO-34 and SSZ-13 crystals, respectively. JavierRuiz-Martinez (Utrecht University, the Netherlands) also acknowl-edges CW-NWO for his VENI grant.
Author's personal copy
24 Q. Qian et al. / Catalysis Today 226 (2014) 14–24
References
[1] U. Olsbye, S. Svelle, M. Bjørgen, P. Beato, T.V.W. Janssens, F. Joensen, S. Bordiga,K.P. Lillerud, Angew. Chem. Int. Ed. 51 (2012) 5810–5831.
[2] K. Hemelsoet, J. Van der Mynsbrugge, K. De Wispelaere, M. Waroquier, V. VanSpeybroeck, ChemPhysChem 14 (2013) 1526–1545.
[3] M. Stöcker, Microporous Mesoporous Mater. 29 (1999) 3–48.[4] J. Rass-Hansen, H. Falsig, B. Jørgensen, C.H. Christensen, J. Chem. Technol.
Biotechnol. 82 (2007) 329–333.[5] V. Van Speybroeck, K. Hemelsoet, K. De Wispelaere, Q. Qian, J. Van der Myns-
brugge, B. De Sterck, B.M. Weckhuysen, M. Waroquier, ChemCatChem 5 (2013)173–184.
[6] C.D. Chang, A.J. Silvestri, J. Catal. 47 (1977) 249–259.[7] M. Stöcker, Angew. Chem. Int. Ed. 47 (2008) 9200–9211.[8] J.Q. Chen, A. Bozzano, B. Glover, T. Fuglerud, S. Kvisle, Catal. Today 106 (2005)
103–107.[9] F. Bleken, M. Bjørgen, L. Palumbo, S. Bordiga, S. Svelle, K.-P. Lillerud, U. Olsbye,
Top. Catal. 52 (2009) 218–228.[10] S. Bordiga, L. Regli, D. Cocina, C. Lamberti, M. Bjørgen, K.P. Lillerud, J. Phys. Chem.
B 109 (2005) 2779–2784.[11] I.M. Dahl, S. Kolboe, J. Catal. 149 (1994) 458–464.[12] I.M. Dahl, S. Kolboe, Catal. Lett. 20 (1993) 329–336.[13] M. Bjørgen, S. Svelle, F. Joensen, J. Nerlov, S. Kolboe, F. Bonino, L. Palumbo, S.
Bordiga, U. Olsbye, J. Catal. 249 (2007) 195–207.[14] M. Bjørgen, U. Olsbye, D. Petersen, S. Kolboe, J. Catal. 221 (2004) 1–10.[15] A.K. Talukdar, K.G. Bhattacharyya, S. Sivasanker, Appl. Catal. A: Gen. 148 (1997)
357–371.[16] F.F. Madeira, N.S. Gnep, P. Magnoux, S. Maury, N. Cadran, Appl. Catal. A: Gen.
367 (2009) 39–46.[17] R. Johansson, S. Hruby, J. Rass-Hansen, C. Christensen, Catal. Lett. 127 (2009)
1–6.[18] B. Arstad, S. Kolboe, J. Am. Chem. Soc. 123 (2001) 8137–8138.[19] S. Svelle, F. Joensen, J. Nerlov, U. Olsbye, K.-P. Lillerud, S. Kolboe, M. Bjørgen, J.
Am. Chem. Soc. 128 (2006) 14770–14771.[20] W. Song, J.F. Haw, J.B. Nicholas, C.S. Heneghan, J. Am. Chem. Soc. 122 (2000)
10726–10727.[21] Q. Qian, J. Ruiz-Martínez, M. Mokhtar, A.M. Asiri, S.A. Al-Thabaiti, S.N. Basa-
hel, H.E. van der Bij, J. Kornatowski, B.M. Weckhuysen, Chem. Eur. J. 19 (2013)11204–11215.
[22] J. Haw, D. Marcus, Top. Catal. 34 (2005) 41–48.[23] H. Fu, W. Song, J. Haw, Catal. Lett. 76 (2001) 89–94.[24] E.E. Wolf, F. Alfani, Catal. Rev. Sci. Eng. 24 (1982) 329–371.[25] S. Bhatia, J. Beltramini, D.D. Do, Catal. Rev. Sci. Eng. 31 (1989) 431–480.[26] M. Guisnet, P. Magnoux, Appl. Catal. A: Gen. 212 (2001) 83–96.[27] M. Guisnet, L. Costa, F.R. Ribeiro, J. Mol. Catal. A: Chem. 305 (2009) 69–83.
[28] L. Karwacki, E. Stavitski, M.H.F. Kox, J. Kornatowski, B.M. Weckhuysen, Angew.Chem. Int. Ed. 46 (2007) 7228–7231.
[29] E.A. Eilertsen, M.H. Nilsen, R. Wendelbo, U. Olsbye, K.P. Lillerud, Stud. Surf. Sci.Catal. 174 (2008) 265–268.
[30] S. Ashtekar, S.V.V. Chilukuri, D.K. Chakrabarty, J. Phys. Chem. 98 (1994)4878–4883.
[31] Q. Zhu, J.N. Kondo, T. Tatsumi, S. Inagaki, R. Ohnuma, Y. Kubota, Y. Shimodaira,H. Kobayashi, K. Domen, J. Phys. Chem. C 111 (2007) 5409–5415.
[32] D. Mores, E. Stavitski, M.H.F. Kox, J. Kornatowski, U. Olsbye, B.M. Weckhuysen,Chem. Eur. J. 14 (2008) 11320–11327.
[33] L. Palumbo, F. Bonino, P. Beato, M. Bjørgen, A. Zecchina, S. Bordiga, J. Phys. Chem.C 112 (2008) 9710–9716.
[34] D. Mores, J. Kornatowski, U. Olsbye, B.M. Weckhuysen, Chem. Eur. J. 17 (2011)2874–2884.
[35] D.M. McCann, D. Lesthaeghe, P.W. Kletnieks, D.R. Guenther, M.J. Hayman, V.Van Speybroeck, M. Waroquier, J.F. Haw, Angew. Chem. Int. Ed. 47 (2008)5179–5182.
[36] M. Bjørgen, F. Bonino, S. Kolboe, K.-P. Lillerud, A. Zecchina, S. Bordiga, J. Am.Chem. Soc. 125 (2003) 15863–15868.
[37] K. Hemelsoet, Q. Qian, T. De Meyer, K. De Wispelaere, B. De Sterck,B.M. Weckhuysen, M. Waroquier, V. Van Speybroeck, Chem. Eur. J. (2013),http://dx.doi.org/10.1002/chem.201301965.
[38] W. Song, H. Fu, J.F. Haw, J. Phys. Chem. B 105 (2001) 12839–12843.[39] D.M. Marcus, W. Song, L.L. Ng, J.F. Haw, Langmuir 18 (2002) 8386–8391.[40] D. Lesthaeghe, A. Horré, M. Waroquier, G.B. Marin, V. Van Speybroeck, Chem.
Eur. J. 15 (2009) 10803–10808.[41] I.M. Dahl, H. Mostad, D. Akporiaye, R. Wendelbo, Microporous Mesoporous
Mater. 29 (1999) 185–190.[42] A.G. Gayubo, A. Alonso, B. Valle, A.T. Aguayo, J. Bilbao, AIChE J. 58 (2012)
526–537.[43] H. Schulz, Catal. Today 154 (2010) 183–194.[44] J. Ruiz-Martínez, I.L.C. Buurmans, W.V. Knowles, D. van der Beek, J.A. Bergw-
erff, E.T.C. Vogt, B.M. Weckhuysen, Appl. Catal. A: Gen. 419–420 (2012) 84–94.
[45] I.L.C. Buurmans, J. Ruiz-Martínez, W.V. Knowles, D. van der Beek, J.A. Bergwerff,E.T.C. Vogt, B.M. Weckhuysen, Nat. Chem. 3 (2011) 862–867.
[46] J.W. Park, G. Seo, Appl. Catal. A: Gen. 356 (2009) 180–188.[47] G. Socrates, Infrared and Raman Characteristic Group Frequencies: Tables and
Charts, Third ed., John Wiley & Sons Ltd, Chichester, 2001.[48] H. Yamazaki, H. Shima, H. Imai, T. Yokoi, T. Tatsumi, J.N. Kondo, Angew. Chem.
Int. Ed. 50 (2011) 1853–1856.[49] T.R. Forester, R.F. Howe, J. Am. Chem. Soc. 109 (1987) 5076–5082.[50] M. Rozwadowski, M. Lezanska, J. Wloch, K. Erdmann, R. Golembiewski, J. Kor-
natowski, Chem. Mater. 13 (2001) 1609–1616.[51] H.G. Karge, W. Nießxen, H. Bludau, Appl. Catal. A: Gen. 146 (1996) 339–349.