simultaneous spectroscopic and photometric observations of binary asteroids
TRANSCRIPT

1
Simultaneous Spectroscopic and Photometric Observations of Binary Asteroids
D. Polishook1,2, N. Brosch2, D. Prialnik1 and S. Kaspi2
1Department of Geophysics and Planetary Sciences, Tel-Aviv University, Tel-Aviv
69978, Israel 2The Wise Observatory and the Raymond and Beverly Sackler School of Physics and
Astronomy, Tel-Aviv University, Tel-Aviv 69978, Israel. * Corresponding author: David Polishook, [email protected]
Abstract
We present results of visible wavelengths spectroscopic measurements (0.45 to
0.72 microns) of two binary asteroids, obtained with the 1-m telescope at the Wise
Observatory on January 2008. The asteroids (90) Antiope and (1509) Esclangona
were observed to search for spectroscopic variations correlated with their rotation
while presenting different regions of their surface to the viewer. Simultaneous
photometric observations were performed with the Wise Observatory's 0.46-m
telescope, to investigate the rotational phase behavior and possible eclipse events.
(90) Antiope displayed an eclipse event during our observations. We could not
measure any slope change of the spectroscopic albedo within the error range of 3%,
except for a steady decrease in the total light flux while the eclipse took place. We
conclude that the surface compositions of the two components do not differ
dramatically, implying a common origin and history.
(1509) Esclangona did not show an eclipse, but rather a unique lightcurve with
three peaks and a wide and flat minimum, repeating with a period of 3.2524 hours.
Careful measurements of the spectral albedo slopes reveal a color variation of 7 to 10
percent on the surface of (1509) Esclangona, which correlates with a specific region
in the photometric lightcurve. This result suggests that the different features on the
lightcurve are at least partially produced by color variations and could perhaps be
explained by the existence of an exposed fresh surface on (1509) Esclangona.

2
Introduction
Current models suggest that some binary asteroids are created from disrupted
bodies (Bottke et al. 2002; Walsh and Richardson 2006; Durda et al. 2004). Although
the disruption can occur due to different causes, such as too fast rotation over the
rubble pile barrier, tidal forces due to close encounters with planets (in the case of
NEAs) or a catastrophic collision, all scenarios end up with the exposure of fresh
surfaces. This younger area is less altered by space weathering effects, such as solar
wind, cosmic rays and micrometeorite bombardment that modify the optical
characteristic of the surface (Clark et al. 2002), thus these exposed fresh areas may
not present the dark and redder reflectance spectra as other asteroid surfaces do. This
is true if the asteroid's age as a binary is shorter than the timescale of space
weathering effects which is not obvious and is estimated between 5·104 to 108 years
(Chapman 2004).
Finding such areas, by detecting a change in the surface's colors, can help
determine the timescale of space weathering effects or pinpoint the time of disruption
of the progenitor asteroid. Observing fresh areas allows a glimpse to the asteroids'
interior and a possibility to compare it with exposed material on the surface. The
model of "satellite accretion" by Walsh et al. (2008) predicts that a single exposed
fresh area should not exist; rather, the primary should lose material from its equator
due to spin-up, thus a color change will be seen only for asteroids with inclined axial
orientation. Nonetheless, if there is a big difference in colors between the two
components of the binary, the disruption model could be questioned and other models
for binaries formation could be adopted, such as satellite capturing (Richardson and
Walsh 2006). To conclude, binary asteroids are good candidates to find color
variation and to link between different aspects of asteroids evolution such as
disruption and space weathering effects. In this work, we've searched for such color
variation on the surfaces of two binary asteroids by spectroscopic measurements.
Work method
The measurement of reflectance spectra is the most effective remote-sensing
technique to characterize the surface composition of many asteroids and is the key
method to classify asteroids (Bus and Binzel 2002). Rotationally resolved spectra are
also used to determine any variance in the asteroid's surface composition while it
spins around its axis (Gaffey 1997, Mothé-Diniz et al. 2000, Rivkin et al. 2006).

3
Recently, the young asteroid (832) Karin, formed ~5.75 Myr ago by a collisional
breakup (Nesvorný et al. 2002), was the issue of a dispute regarding spectral
variations on its surface (Sasaki et al. 2004, Chapman et al. 2007, Vernazza et al.
2007). The current consensus is that no such variations exist on (832) Karin.
Color variation between fresh and old surface start to appear on the slope of the
continuum spectra around 0.6 µm and increases with higher wavelength (see Fig. 5 at
Chapman 2004). Therefore, spectroscopic observations at the visible wavelength
range might show subtle color variations even though better results can be obtain by
observations at the near IR. The near IR holds more prominent differences in an
asteroid's spectrum, such as the depth of the absorption band in 1 µm (Clark et al.
2002).
Searching for spectral differences between the two components of a binary
asteroid, we confronted two problems: i) because our observing equipment (the 1-m
telescope) is not equipped with adaptive optics, the binary components cannot be
resolved, and ii) if color variations were found, we would not be able to specify the
rotation phase where the color change occurs and would not distinguish between
spectral variations and shape variations that appear in the lightcurves. Confronting the
first problem can be done when the binary's components eclipse each other especially
in the case of a total eclipse when only the reflectance spectrum of one component is
visible. Total and mutual eclipses are more likely to take place if the diameter ratio of
the binary is close to unity than in the case of a big asteroid with a small satellite, and
allows the independent measurement of both components. Photometric observations
provide an independent means of confirming the occurrence of an eclipse and yields
more rotation phase information, such as brightness changes due to rotation of the
elongated body. Therefore, to solve the second problem, we performed simultaneous
photometric observations using a second telescope while the asteroids were
spectroscopically monitored. Even though this observing technique is limited to
specific and therefore rare geometric conditions, it can be used with relatively small
telescopes lacking adaptive optics. Therefore, we encourage the community to
perform observations aimed at rotationally resolving the spectra of binary asteroid.
Observations, reduction, measurements and calibration
This paper focuses on simultaneous spectroscopic and photometric observations of
two asteroids, (90) Antiope and (1509) Esclangona, performed on January 11th to 14th,

4
2008. Some previous photometric observations were collected on January 7th and 8th.
The observational circumstances of these asteroids are summarized in Table I, which
lists the asteroid's designation, the observation date, the time span of the observation
during that night, the object's heliocentric distance (r), geocentric distance (∆), and
phase angle (α). In addition, the object's mean observed magnitude is listed, followed
by the number of obtained spectra for each night.
Spectroscopy
The observations were performed at the Wise Observatory (code: 097, E 34:45:47,
N 30:35:46). We used the observatory's 1-m Ritchey-Chrétien telescope equipped
with the Faint Object Spectrographic Camera (FOSC, see Kaspi et al. 1995) and a
cryogenically-cooled Princeton Instruments (PI) CCD for obtaining spectroscopic
measurements with a plate scale of ~1.75 arcsec per pixel. The FOSC contains two
sets of grisms: a 600 line per mm grism which gives a spectral dispersion of 3.17 Å
per pixel and a 300 line per mm grism with a spectral dispersion of 6.34 Å per pixel.
The effective wavelength range of both sets for the studied asteroids was 4500-7200
Å.
In order to keep the asteroids inside the slit, the spectrograph was rotated to align
the slit with the asteroid track on the sky. This setting causes the asteroid to travel
along the slit and no data is lost due to the asteroids' sky motion. To avoid light losses,
since the slit was not at the parallactic angle, a slit of 10'' width and 10.2' length was
used and the asteroids were observed at air masses below 1.6. The exposure time was
between 900 to 1200 seconds, and auto-guiding was used. The S/N ranged between
30 and 60, and the resulted flux scattering was between 3% to 5% of the flux value.
The images were reduced in the standard way using the IRAF software. Ten bias
frames were taken each night. Short exposures of the twilight sky and an internal
halogen lamp were used to flat-field the data. The twilight flats were used to calibrate
the spatial illumination pattern along the slit, while the internal lamp flats were used
to calibrate the pixel-to-pixel sensitivity variations of the CCD detector. For
wavelength calibration, we also regularly obtained He-Ar spectra. The extraction
width was 8-10 pixels and included all the light from the asteroid as it advanced along
the slit. The spectra were flux-calibrated using spectrophotometric standard stars
observed on January 13th and were corrected for extinction using the mean extinction
curve of the Wise Observatory. Cosmic rays were removed manually. To calibrate the
5
relative reflectance of each asteroid, spectra of the solar analog Hyades 64 (HD28099,
V=8.1 mag., G2V) were also obtained every night. This widely accepted solar analog
(Hardorp 1978) was observed in an air mass of 1.2 and was measured and calibrated
in an identical way to the asteroids. To retain the real ratio between the reflectance
spectra at different epochs, a reference spectrum was normalized to unity at 5500 Å
and all the other spectra were normalized by the same value. To verify the derived
spectra we compared them to the literature: (90) Antiope was measured by SMASS
(Bus and Binzel 2002), and (1509) Esclangona by ECAS (Zellner et al. 1985). The
matches are good and appear in Fig. 1.
Because our useful spectra range did not reach above 7200 Å, a match of a linear
fit to each reflectance spectra was sufficient to describe the reflectance slope and the
slope's error. The fit was done using a polynomial fitting with one degree (Press et al.
1989). The reflectance slopes were compared and differences were searched between
them.
Photometry
In parallel to the spectroscopic observations, photometric measurements were
performed with an 18'' Centurion telescope (hereafter C18) located in a separate
dome, 50 meters away from the 1-m telescope. This telescope is operated in a semi-
automated mode and requires minimal attention from the astronomer (see Brosch et
al. 2008 for the telescope's description). An SBIG ST-10XME CCD was used at the
f/2.8 prime focus. This CCD covers a field of view of 40.5'x27.3' with 2184x1472
pixels, each pixel subtending 1.1 arcsec, and is used in white light. The asteroids were
observed while crossing a single field per night, thus the same comparison stars were
used while calibrating the images.
The images were reduced in the standard way using bias and normalized flatfield
images. We used the IRAF phot task for the photometric measurements. The
photometric values were calibrated to a differential magnitude level using local
comparison stars (around ~300 stars per field) followed by absolute calibration using
Landolt standards (Landolt 1992). In addition, the asteroid magnitudes were corrected
for light travel time and were reduced to a 1 AU distance from the Sun and the Earth
to yield reduced R values (Bowell et al. 1989). Refer to Polishook and Brosch (2009)
for detailed description of the photometric procedures of observation, reduction and
calibration using the C18.

6
For a consistency check, we compared the photometric and the spectroscopic
measurements. The logarithm of the flux in the wavelength range 4500 to 7200 Å of
each spectrum was plotted on the photometric lightcurve at the time of mid-exposure
of the spectroscopic measurement, and the match between the two curves is evident in
Figures 2, 6 and 9.
Results and discussion
(90) Antiope
The binary nature of (90) Antiope, which is located in the outer main belt (a=3.16
AU), was discovered by Merline et al. (2000) using adaptive optics. Two
characteristics of this binary asteroid are unusual: i) its components rotate in a
synchronous motion of 16.505 hours; and ii) both components have similar diameters
(of 91 and 86 km; Descamps et al. 2007); these make (90) Antiope a good candidate
for testing our work method, even though it is not clear if fresh surface is exposed on
a binary of this size.
Descamps et al. (2007) performed an extensive campaign on (90) Antiope using
photometry and adaptive optics and succeeded to model the orbital parameters of the
components and to predict circumstances of mutual eclipses. The 171 km separation
between the components enabled them to calculate a density of 1.25±0.05 g/cm3 and
to derive the spherical shape of the asteroid's components. The model of the
components' orbits around the center of mass allowed Descamps et al. to identify
appearances of mutual eclipses on the lightcurve. Fig. 9 of Descamps et al. (2007)
demonstrates how a specific orbital position matches their measured lightcurve. The
unique deep V-shaped minima and shallow U-shaped maxima, which are typical of
eclipsing events of synchronous binaries (Polishook and Brosch 2008), are easily
seen.
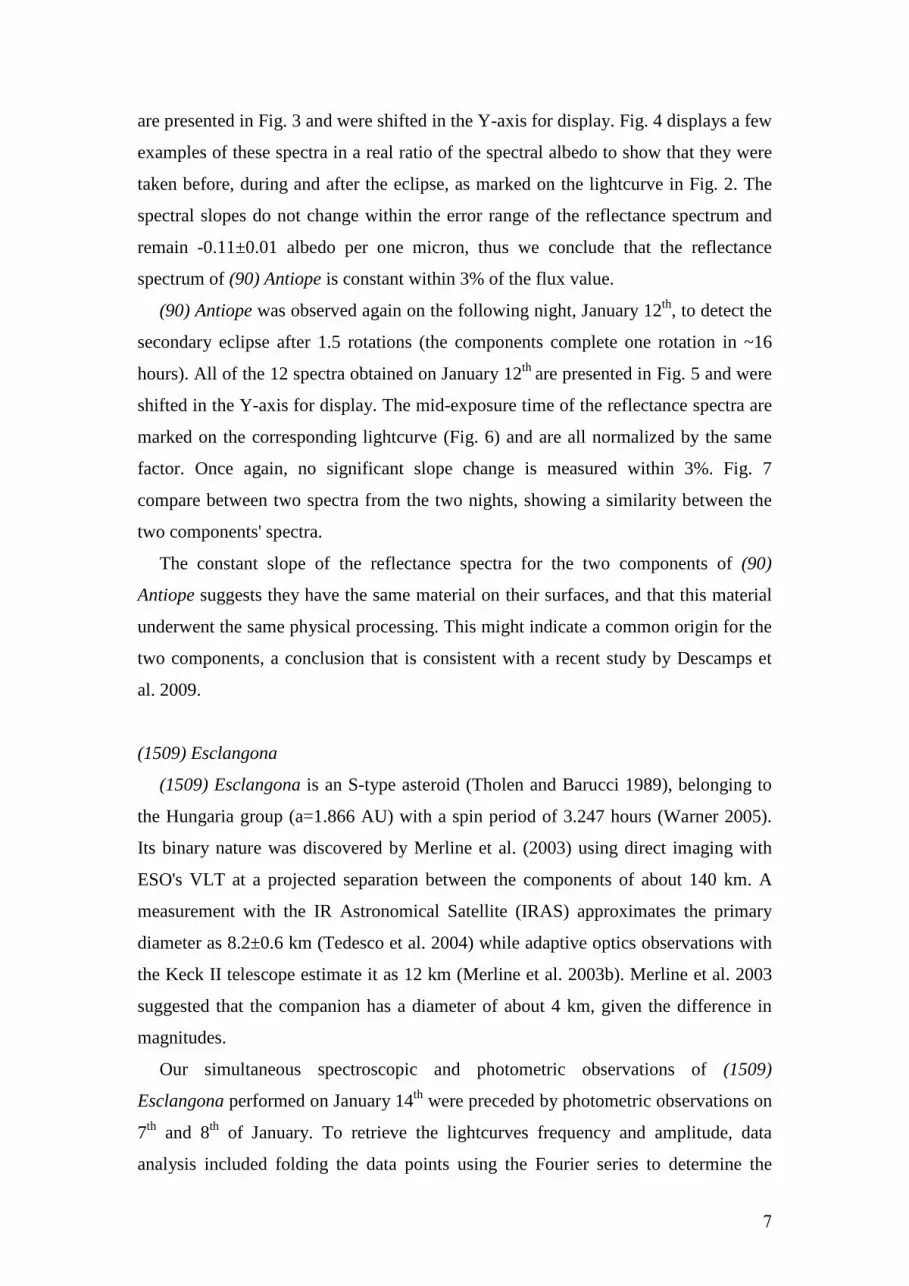
Our photometric measurements of (90) Antiope from January 11th yielded a
lightcurve (Fig. 2) similar in shape, frequency and amplitude to that of Fig. 10 in
Descamps et al. (2007). Since their lightcurve matches an almost total eclipse (see the
right panel of Fig. 10 in Descamps et al.), we conclude that our observations on
January 11th were also performed close to a full eclipse. This implies that only a
single component was spectroscopically measured at this epoch.
The derived spectra is flat as expected of a C-type asteroid, which is (90) Antiope's
classification (Bus and Binzel 2002). All of the 12 spectra obtained on January 11th
7
are presented in Fig. 3 and were shifted in the Y-axis for display. Fig. 4 displays a few
examples of these spectra in a real ratio of the spectral albedo to show that they were
taken before, during and after the eclipse, as marked on the lightcurve in Fig. 2. The
spectral slopes do not change within the error range of the reflectance spectrum and
remain -0.11±0.01 albedo per one micron, thus we conclude that the reflectance
spectrum of (90) Antiope is constant within 3% of the flux value.
(90) Antiope was observed again on the following night, January 12th, to detect the
secondary eclipse after 1.5 rotations (the components complete one rotation in ~16
hours). All of the 12 spectra obtained on January 12th are presented in Fig. 5 and were
shifted in the Y-axis for display. The mid-exposure time of the reflectance spectra are
marked on the corresponding lightcurve (Fig. 6) and are all normalized by the same
factor. Once again, no significant slope change is measured within 3%. Fig. 7
compare between two spectra from the two nights, showing a similarity between the
two components' spectra.
The constant slope of the reflectance spectra for the two components of (90)
Antiope suggests they have the same material on their surfaces, and that this material
underwent the same physical processing. This might indicate a common origin for the
two components, a conclusion that is consistent with a recent study by Descamps et
al. 2009.
(1509) Esclangona
(1509) Esclangona is an S-type asteroid (Tholen and Barucci 1989), belonging to
the Hungaria group (a=1.866 AU) with a spin period of 3.247 hours (Warner 2005).
Its binary nature was discovered by Merline et al. (2003) using direct imaging with
ESO's VLT at a projected separation between the components of about 140 km. A
measurement with the IR Astronomical Satellite (IRAS) approximates the primary
diameter as 8.2±0.6 km (Tedesco et al. 2004) while adaptive optics observations with
the Keck II telescope estimate it as 12 km (Merline et al. 2003b). Merline et al. 2003
suggested that the companion has a diameter of about 4 km, given the difference in
magnitudes.
Our simultaneous spectroscopic and photometric observations of (1509)
Esclangona performed on January 14th were preceded by photometric observations on
7th and 8th of January. To retrieve the lightcurves frequency and amplitude, data
analysis included folding the data points using the Fourier series to determine the

8
variability period (Harris and Lupishko 1989). The best match chosen by least squares
is 3.2524±0.0003 hours, about 20 seconds longer than measured by Warner (2005).
The folded lightcurve from the three nights (Fig. 8) of (1509) Esclangona presents
unique features without the usual symmetric two-peak pattern: it consists of two peaks
with amplitudes of 0.06 and 0.08 mag. followed by a wide and flat minimum (~25%
of the period) and a large amplitude peak of about 0.16 mag. Although these features
did not appear on the lightcurve published by Warner, we completely trust them as
real. We observed them at three different nights with an error of less than 0.01 mag
(compared to a spread of 0.05 mag on Warner's lightcurve). We also note that these
features might be visible in a specific viewing geometry, like in the case of an eclipse.
However, the deep minimum in the lightcurve is clearly not an eclipse event because
it repeats itself every 3.2524 hours; this is a very short time compared to the ~100
years it takes a satellite with a mean separation of 140 km to complete one orbit. If an
eclipse cannot explain the unique lightcurve, could changes in (1509) Esclangona's
colors explain it?
Fig. 9 presents the lightcurve of (1509) Esclangona from January 14th, with the
corresponding average values of the reflectance spectra drawn on it. The spectra are
normalized by the same factor, hence they are displayed in real ratio relative to each
other. As seen in Fig. 9, the average values of each spectrum fit the brightness
variation of the asteroid's lightcurve, verifying the measurements and calibration
processes that were done on the spectra. The reflectance spectra themselves are
presented in Fig. 10, shifted on the Y-axis for display.
The slope of the reflectance spectra of (1509) Esclangona is slightly changing. An
example is displayed in Fig. 11 that presents two reflectance spectra with different
slopes and which demonstrate the alteration in the asteroid's color. These two
reflectance spectra were superimposed in the blue side to clear the slope difference on
the red side. The slopes values (scaled to fit the Y axis for display) are plotted on the
lightcurve (Fig. 12) that shows a changing slope of the reflectance spectra as (1509)
Esclangona rotates. The decrease of the slope is between 7 to 10 percent of the mean
of the slopes values. To corroborate this, we note that the decrease and increase of the
slope are continuous and fit a specific phase of the lightcurve – the wide and flat
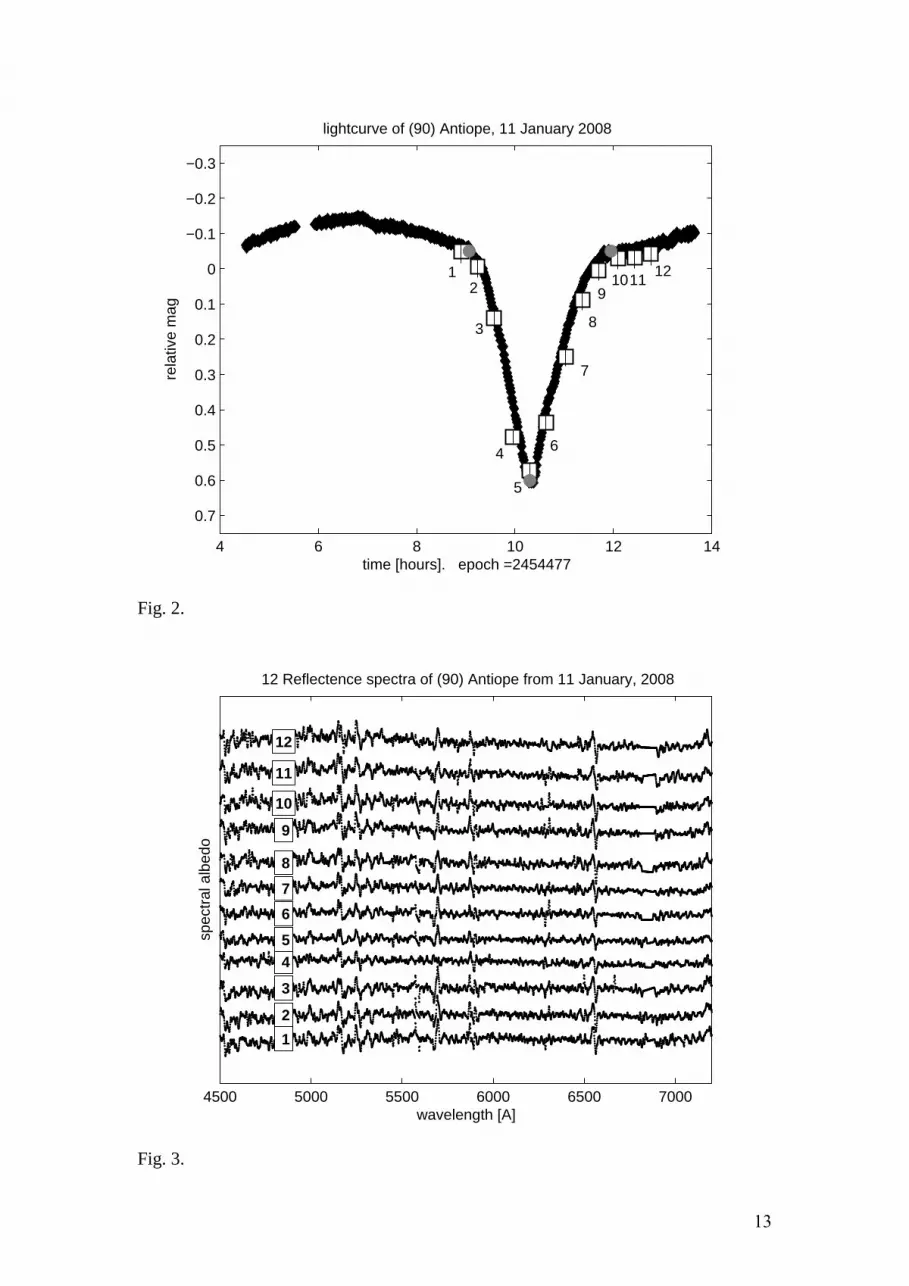
minimum. To reject the possibility of a slope change due to atmospheric effects we
plot (Fig. 13) the slope values against the air mass of each spectrum and show that it
is not correlated with the telescope elevation. To refute the possibility of thin clouds

9
changing the reflectance spectra, we plotted the photometric lightcurves of some
reference stars that were located in the same field of view of the C18. These
lightcurves (Fig. 14) were not calibrated, hence they reflect the atmospheric stability.
The brightness of the nearby stars remained constant while the slope of the reflectance
spectra changed (compare with Fig. 12), supporting the lack of clouds. However, we
should note that (1509) Esclangona was only spectroscopically measured during one
rotation and more spectroscopic data would be needed to confirm that the slope
change repeats itself periodically.
The correlation between a major feature on the photometric lightcurve and the
alteration of the spectral slope connects between shape and color. Different
configurations could explain this linkage and we point out some ideas: i) (1509)
Esclangona has a peanut-like shape which made it, in the specific observed geometry,
cast a shadow on itself, thus creating the unique patterns of the lightcurve. The bluer
area can be explained by a colored spot that was created by a big crater or by dust
scattered following an impact. However, this scenario does not consider the linkage
between these two phenomena and does not relate to the binary nature of (1509)
Esclangona. ii) One of the narrower sides of (1509) Esclangona's primary component
is flatter compared to the opposite narrow side of the asteroid which has a bullet
shape. This flat side, which corresponds to the wide minimum of the lightcurve, is
bluer than the rest of the surface, as the reflectance spectra measurements show. This
flat and blue side was recently exposed when the asteroid was disrupted to become a
binary, and therefore its surface was not yet altered by space weather effects as the
other parts of the asteroid. This idea can be examined by more photometric
measurements at different phase angles and apparitions that will reveal (1509)
Esclangona's model shape and axis orientation. iii) Due to the large separation
between the primary and the secondary of (1509) Esclangona (between 23 to 35 Rp,
Merline et al. 2003b), Durda et al. (2004) suggested that it is an Escaping Ejecta
Binary (EEB), meaning both components are fragments that escaped a catastrophic
collision on similar trajectories and they became bound. This suggests that (1509)
Esclangona has a collisional history that could explain the exposure of a fresh and
unweathered surface, and an asymmetric shape. Either way, more observations of
(1509) Esclangona are therefore needed in order to determine its true evolution
history.

10
Acknowledgements
David Polishook is grateful for an Ilan Ramon doctoral scholarship from the Israel
Space Agency (ISA) and the Ministry of Science, Sports and Culture. We thank the
Wise Observatory staff for their continuous support. The research was supported by
the Israeli Ministry of Science, Culture and Sport that created a National Knowledge
Center on NEOs and asteroids at the Tel-Aviv University.
References
Bowell E., Hapke B., Domingue D., Lumme K., Peltoniemi J. and Harris A.W. 1989. Application of Photometric Models to Asteroids. In Asteroids II (R.P. Binzel, T. Gehrels and M.S. Matthews, Eds.), pp. 524-556. Univ. of Arizona Press, Tucson.
Bottke W.F. Jr., Vokrouhlický D., Rubincam D.P. and Brož, M. 2002. The effect of Yarkovsky thermal forces on the dynamical evolution of asteroids and meteoroids. In Asteroids III (W.F. Bottke Jr. et al. eds.), pp. 395-408, Univ. of Arizona, Tucson.
Brosch N., Polishook D., Shporer A., Kaspi S., Berwald A. and Manulis I. 2008. The Centurion 18 telescope of the Wise Observatory. Astrophysics and Space Science 314: 163-176.
Bus S.J. and Binzel R.P. 2002. Phase II of the small Main Belt asteroid spectroscopic survey. A feature based taxonomy. Icarus 158:146-177.
Chapman C.R., Enke B., Merline W.J., Tamblyn P. Nesvorný D., Young E.F. and Olkin C. 2007. Young Asteroid 832 Karin shows no rotational spectral variations. Icarus 191:323-329.
Chapman C.R. 2004. Space weathering of asteroid surfaces. Annu. Rev. Earth Planet. Sci. 32:539-567.
Clark B.E., Hapke B., Pieters C. and Britt D. 2002. Asteroid Space Weathering and Regolith Evolution. In Asteroids III (W.F. Bottke Jr. et al. eds.), pp. 585-599, Univ. of Arizona, Tucson.
Descamps P., Marchis F., Michalowski T., Berthier J., Pollock J., Wiggins P., Birlan M., Colas F., Vachier F., Fauvaud S., Fauvaud M., Sareyan J.-P., Pilcher F. and Klinglesmith D.A. 2009. A giant crater on 90 Antiope? Accepted to Icarus.
Descamps P., Marchis F., Michalowski T., Vachier F., Colas F., Berthier J., Assafin M., Dunckel P.B., Polinska M., Pych W., Hestroffer D., Miller K.P.M., Vieira-Martins R., Birlan M., Teng-Chuen-Yu J.-P., Peyrot A., Payet B., Dorseuil J., Léonie Y., Dijoux T. 2007. Figure of the double Asteroid 90 Antiope from adaptive optics and lightcurve observations. Icarus 187:482–499.
Durda, D.D., Bottke, W.F., Enke, B.L., Merline, W.J., Asphaug, E., Richardson, D.C., Leinhardt, Z.M., 2004. The formation of asteroid satellites in large impacts: results from numerical simulations. Icarus, 170:243-257.
Gaffey, M.J. 1997. Surface lithologic heterogeneity of asteroid 4 Vesta. Icarus, 127:130-157.
Hardorp, J. 1978. The Sun among the Stars. I – A Search for Solar Spectral Analogs. Astron. Astrophys. 63:383–390.
Harris A. W. and Lupishko, D. F. 1989. Photometric lightcurve observations and reduction techniques. In Asteroids II (R. P. Binzel, T. Gehrels and M. S. Matthews, Eds.), pp. 39-53. Univ. of Arizona Press, Tucson.
Kaspi S., Ibbeton P.A., Mashal E. and Brosch N. 1995. Wise Obs. Tech. Rep. 6.

11
Landolt A. 1992. UBVRI Photometric Standard Stars in the Magnitude Range of 11.5 < V < 16.0 Around the Celestial Equator. The Astronomical Journal 104:340-371.
Merline W.J., Close L.M., Dumas C., Shelton J.C., Menard F., Chapman C.R. and Slater D.C. 2000. Discovery of companions to Asteroids 762 Pulcova and 90 Antiope by direct imaging, Bull. Am. Astron. Soc. 32:1017. Abstract 13.06.
Merline W.J., Close L.M., Tamblyn P.M., Menard F., Chapman C.R., Dumas C., Duvert G., Owen W.M., Slater D.C. and Sterzik M.F. 2003. S/2003 (1509) 1. IAUC 8075.
Merline W.J., Close L.M., Dumas C., Chapman C.R., Menard F., Tamblyn P.M., Durda, D.D., 2003b. Discovery of new asteroid binaries (121) Hermione and (1509) Esclangona. DPS #35:972.
Mothé-Diniz T., Lazzaro D., Carvano J.M. and Florczak M. 2000. Rotationally Resolved Spectra of Some S-type Asteroids. Icarus 148:494-507.
Nesvorný D., Bottke W.F., Dones L. and Levison H., 2002. The recent breakup of an asteroid in the main-belt region. Nature 417:720–722.
Polishook D. and Brosch, N. 2009. Photometry and Spin Rate Distribution of Small-Sized Main Belt Asteroids. Icarus 199:319-332.
Polishook D. and Brosch, N. 2008. Photometry of Aten asteroids - More than a handful of binaries. Icarus, 194:111-124.
Press W.H., Flannery B.P., Teukolsky, S.A. and Vetterling W.T. 1989. Numerical Recipes. Cambridge University Press.
Richardson D.C. and Walsh K.J. 2006. Binary Minor Planets. Annu. Rev. Earth Planet. Sci. 34:47-81.
Rivkin A.S., McFadden L.A., Binzel R.P. and Sykes M. 2006. Rotationally-resolved spectroscopy of Vesta I: 2–4 µm region. Icarus 180:464-472.
Sasaki T., Sasaki S., Watanabe J., Sekiguchi T., Yoshida F., Kawakita H., Fuse T., Takato N., Dermawan B. and Ito T., 2004. Mature and Fresh Surfaces on the Newborn Asteroid Karin. Astrophys. J. 615:L161–L164.
Tedesco E.F., Noah P.V., Price S.D. 2004. IRAS Minor Planet Survey. IRAS-A-FPA-3-RDR-IMPS-V6.0. NASA Planetary Data System.
Tholen D.J. and Barucci M.A. 1989. Asteroid Taxonomy. In Asteroids II (R.P. Binzel, T. Gehrels and M.S. Matthews, Eds.), pp. 298-315. Univ. of Arizona Press, Tucson.
Vernazza P., Rossi A., Birlan M., Fulchignoni M., Nedelcu A. and Dotto E. 2007. 832 Karin: Absence of rotational spectral variations. Icarus 191:330–336.
Walsh K.J. and Richardson D.C. 2006. Binary near-Earth asteroid formation: rubble pile model of tidal disruptions. Icarus, 180:201-216.
Walsh K.J., Richardson D.C. and Michel P. 2008. Rotational breakup as the origin of small binary asteroids, Nature 454:188-191.
Warner B.D. 2005. Asteroid Lightcurve Analysis at the Palmer Divide Observatory – Winter 2004-2005. Minor Planet Bul. 32:54-58.
Zellner B., Tholen D.J. and Tedesco E.F. 1985. The Eight-Color Asteroid Survey: Results for 589 Minor Planets. Icarus, 61:355-416.

12
Tables:
Table I: Observation circumstances: asteroid designation, observation date, nightly time span of the
specific observation, the object's heliocentric (r), and geocentric distances (∆), the phase angle (α), and
the average magnitude (mean reduced R). The number of obtained spectra appears at the last column.
Asteroid name Date Time span
[hours]
r
[AU]
∆
[AU]
α
[Deg]
Mean R
[Mag]
Number
of spectra
(90) Antiope Jan 11, 2008 9.1 3.6 2.6 2.5 13.3 12
Jan 12, 2008 7.2 3.6 2.6 2.8 13.3 12
(1509) Esclangona Jan 7, 2008 4.8 1.8 1.0 22.4 14.8 -
Jan 8, 2008 1.5 1.8 1.0 22.1 14.8 -
Jan 14, 2008 5.3 1.8 1.0 19.9 14.6 13
Figures:
3000 4000 5000 6000 7000 8000 9000 10000 11000
0.7
0.9
1.1
1.3
spec
tral
alb
edo
reflectence spectra of (90) Antiope
3000 4000 5000 6000 7000 8000 9000 10000 110000.3
0.5
0.7
0.9
1.1
1.3
1.5
spec
tral
alb
edo
reflectence spectra of (1509) Esclangona
wavelength [A]
This workECAS
This workSMASS
Fig. 1.
13
4 6 8 10 12 14
−0.3
−0.2
−0.1
0
0.1
0.2
0.3
0.4
0.5
0.6
0.7
lightcurve of (90) Antiope, 11 January 2008
time [hours]. epoch =2454477
rela
tive
mag
1 2
3
4
5
6
7
8
91011
12
Fig. 2.
4500 5000 5500 6000 6500 7000wavelength [A]
spec
tral
alb
edo
12 Reflectence spectra of (90) Antiope from 11 January, 2008
1
2
3
4 5
6
7
8
9
10
11
12
Fig. 3.

14
4500 5000 5500 6000 6500 70000.4
0.5
0.6
0.7
0.8
0.9
1
1.1
wavelength [A]
spec
tral
alb
edo
reflectence spectra of (90) Antiope at different epoch. T0=2454477
1, JD=0.371
5, JD=0.429
7, JD=0.460
6, JD=0.443
Fig. 4.
4500 5000 5500 6000 6500 7000
spec
tral
alb
edo
wavelength [A]
12 Reflectence spectra of (90) Antiope from 12 January, 2008
1
2
3
4
5
6
7
8
9
10
11
12
Fig. 5.

15
7 8 9 10 11 12 13 14
−0.4
−0.2
0
0.2
0.4
0.6
0.8
lightcurve of (90) Antiope, 12 January 2008
time [hours]. epoch =2454478
rela
tive
mag
1 2 3 4 5 6
7
8
9
10
11
12
Fig. 6.
4500 5000 5500 6000 6500 7000
spec
tral
alb
edo
wavelength [A]
Comparison between reflectence spectra of (90) Antiope from January 11 and 12, 2008
Jan 11Jan 12
Fig. 7.

16
0 0.2 0.4 0.6 0.8 1 1.2
12.88
12.9
12.92
12.94
12.96
12.98
13
13.02
13.04
13.06
13.08
synodic phase [epoch =2454473]. Period =3.2524 hours
abso
lute
mag
H(1
,0)
folded lightcurve of (1509) Esclangona
200801072008010820080114
Fig. 8.
9 10 11 12 13 14 15
−0.1
−0.08
−0.06
−0.04
−0.02
0
0.02
0.04
0.06
0.08
0.1
lightcurve of (1509) Esclangona, 14 January 2008
time [hours]. epoch = 2454480
rela
tive
mag
1
2
3
4
5
6
7 8
9
10
1112
13
Fig. 9.

17
4500 5000 5500 6000 6500 7000wavelength [A]
spec
tral
alb
edo
13 Reflectence spectra of (1509) Esclangona from 14 January, 2008
1
2
3
4
5
6 7 8 91011
1213
Fig. 10.
4500 5000 5500 6000 6500 70000.7
0.8
0.9
1
1.1
1.2
1.3
1.4
wavelength [A]
spec
tral
alb
edo
comparison between reflectence spectra of (1509) Esclangona and their slopes
4, JD=0.489
7, JD=0.524
Fig. 11.

18
0.9
1
1.1
1.2
1.3
1.4
1.5
1.6
1.7
1.8
1.9
Slo
pes
valu
es [a
lbed
o pe
r on
e m
icro
n]
9 10 11 12 13 14 15
−0.1
−0.08
−0.06
−0.04
−0.02
0
0.02
0.04
0.06
0.08
0.1
lightcurve of (1509) Esclangona, 14 January 2008
time [hours]. epoch = 2454480
rela
tive
mag
Fig. 12.
1.2 1.3 1.4 1.5 1.6 1.7
1.25
1.3
1.35
1.4
1.45
1.5
1.55
1.6
Air Mass
Slo
pes
valu
es [a
lbed
o pe
r on
e m
icro
n]
(1509) Esclangona: slopes of reflectence spectra vs. airmass. 14 January 2008
Fig. 13.
19
10 10.5 11 11.5 12 12.5 13 13.5 14 14.5
13.8
14
14.2
14.4
14.6
14.8
15
15.2
Time [hour]. epoch = 2454480
Mea
sure
d R
[mag
]Photometric mesurements of three reference stars (rectangular)
and the asteroid (1509) Esclangona (circles), Jan 14 2008
Fig. 14.
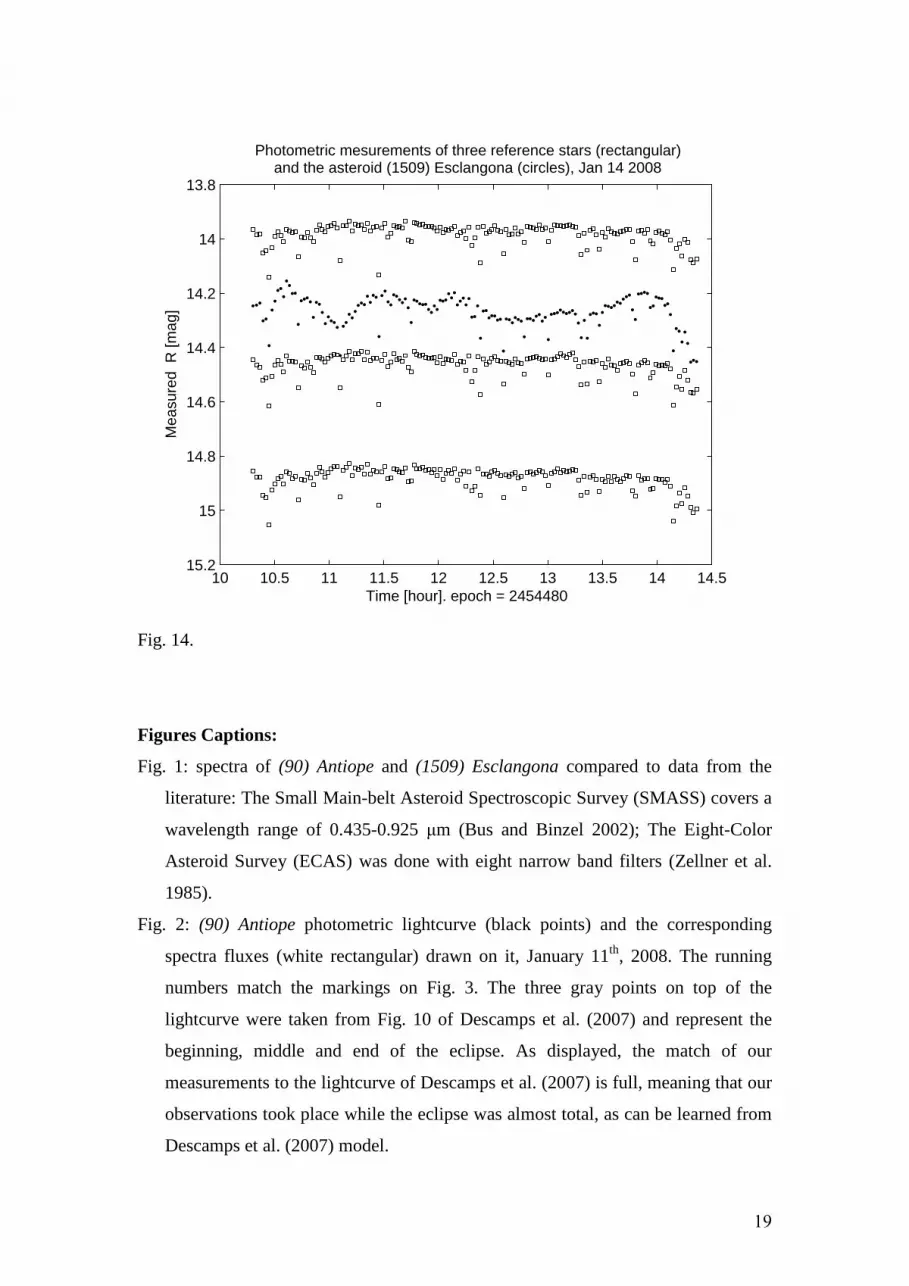
Figures Captions:
Fig. 1: spectra of (90) Antiope and (1509) Esclangona compared to data from the
literature: The Small Main-belt Asteroid Spectroscopic Survey (SMASS) covers a
wavelength range of 0.435-0.925 µm (Bus and Binzel 2002); The Eight-Color
Asteroid Survey (ECAS) was done with eight narrow band filters (Zellner et al.
1985).
Fig. 2: (90) Antiope photometric lightcurve (black points) and the corresponding
spectra fluxes (white rectangular) drawn on it, January 11th, 2008. The running
numbers match the markings on Fig. 3. The three gray points on top of the
lightcurve were taken from Fig. 10 of Descamps et al. (2007) and represent the
beginning, middle and end of the eclipse. As displayed, the match of our
measurements to the lightcurve of Descamps et al. (2007) is full, meaning that our
observations took place while the eclipse was almost total, as can be learned from
Descamps et al. (2007) model.

20
Fig. 3: The 12 spectra of (90) Antiope obtained on January 11th. The spectra were
shifted in the Y-axis for display. The running numbers match the markings on Fig.
2.
Fig. 4: Some spectra examples of (90) Antiope from January 11th while the eclipse
took place. The spectra are offset by the relative brightness of the signal during
the mutual event, thus they are displayed in real ratio. The running numbers match
the markings on Fig. 2.
Fig. 5: The 12 spectra of (90) Antiope obtained on January 12th. The spectra were
shifted in the Y-axis for display. The running numbers match the markings on Fig.
6.
Fig. 6: (90) Antiope photometric lightcurve (black points) and the corresponding
spectra fluxes (white rectangular) drawn on it, January 12th, 2008, while the
secondary eclipse took place. The running numbers match the markings on Fig. 5.
Fig. 7: Comparison between two spectra of (90) Antiope from the two nights, showing
a lack of differences between the two components' spectra.
Fig. 8: The lightcurve of (1509) Esclangona from three nights folded with a period of
3.2524 hours. The unusual features on the lightcurve repeat on different nights.
Fig. 9: (1509) Esclangona photometric lightcurve (black points) and the
corresponding spectra fluxes (white rectangular) drawn on it, January 14th, 2008.
The running numbers match the markings on Fig. 10.
Fig. 10: The 13 spectra of (1509) Esclangona obtained on January 14th. The spectra
were shifted in the Y-axis for display. The running numbers match the markings
on Fig. 9.
Fig. 11: Reflectance spectra (black line and dashed line) of (1509) Esclangona with
different slopes (grey lines) displaying alteration of the asteroid's color. The two
reflectance spectra were drawn on each other in the blue side to clear the slope
difference in the red side. The running numbers match the markings on Fig. 9.
Fig. 12: Lightcurve of (1509) Esclangona from January 14th (black points), with the
corresponding slopes of the reflectance spectra (white circles). The "slope curve"
was scaled to fit the Y axis for display. The change of the slope is continuous and
fits a specific location on the lightcurve – the wide and flat minimum, around 13
hours.
21
Fig. 13: The slopes of the reflectance spectra (in units of albedo per micron) against
the air mass of each spectrum of (1509) Esclangona. The non-linearity of the plot
shows that the slopes are not correlated with the telescope's elevation.
Fig. 14: The photometric lightcurves of three reference stars (empty rectangular)
located in the same field of view of the C18 as (1509) Esclangona (black points).
These lightcurves were not calibrated hence they reflect the atmospheric stability.
The brightness of the nearby stars remained steady while the slope of the
reflectance spectra changed (especially between 12 to 14 hours, compared to Fig.
12).