a five-year spectroscopic and photometric campaign on the prototypical Α cygni variable and a-type...
TRANSCRIPT

arX
iv:1
009.
5994
v1 [
astr
o-ph
.SR
] 2
9 Se
p 20
10
A Five-year Spectroscopic and Photometric
Campaign on the Prototypical α Cygni Variable
and A-type Supergiant Star Deneb
N. D. Richardson1, N. D. Morrison2, E. E. Kryukova2, S. J. Adelman3
ABSTRACT
Deneb is often considered the prototypical A–type supergiant, and isone of the visually most luminous stars in the Galaxy. A–type super-giants are potential extragalactic distance indicators, but the variabilityof these stars needs to be better characterized before this technique canbe considered reliable. We analyzed 339 high resolution echelle spectraof Deneb obtained over the five–year span of 1997 through 2001 as wellas 370 Stromgren photometric measurements obtained during the sametime frame. Our spectroscopic analysis included dynamical spectra of theHα profile, Hα equivalent widths, and radial velocities measured from SiII λλ 6347, 6371. Time-series analysis reveals no obvious cyclic behaviorthat proceeds through multiple observing seasons, although we found asuspected 40 day period in two, non-consecutive observing seasons. Somecorrelations are found between photometric and radial velocity data sets,and suggest radial pulsations at two epochs. No correlation is found be-tween the variability of the Hα profiles and that of the radial velocitiesor the photometry. Lucy (1976) found evidence that Deneb was a longperiod single–lined spectroscopic binary star, but our data set shows noevidence for radial velocity variations caused by a binary companion.
Subject headings: stars: supergiants — stars: early-type — stars: individual(Deneb) — stars: variables: other — stars: mass loss
1Center for High Angular Resolution As-tronomy, Department of Physics and As-
tronomy, Georgia State University, P. O.Box 4106, Atlanta, GA 30302-4106; richard-
1

1. Introduction
α Cygni variables are highly lumi-nous OBA stars that exhibit low am-plitude variations both in photometry(∆V . 0.15 mag; van Genderen etal. 1989) and velocity (e.g. Abt 1957).These variations are common for mas-sive stars and are observed in mosthot supergiants as well as the over-luminous supergiants such as luminousblue variables. The variations havebeen observed in some main sequencemassive stars, and the mechanism re-sponsible for the variations has eludedtheory and observers. Photometricand spectroscopic campaigns on mul-tiple stars that span the upper H-Rdiagram and exhibit these variationswill be crucial to understanding thesevariations and their source.
Deneb (α Cygni, HR 7924, HD197345) is an early–type A supergiant(spectral type A2Iae) and is the pro-totype for the α–Cygni type variablestars. With a great apparent bright-ness and because it can be observedfor most of the year at northern lat-itudes, Deneb can be easily studied
[email protected] Astrophysical Research Center,
Department of Physics and Astronomy, Uni-versity of Toledo, 2801 W. Bancroft, Toledo,OH 43606; [email protected],[email protected]
3Department of Physics, The Citadel, 171Moultrie Street, Charleston, SC 29409; [email protected]
spectroscopically with small or mod-erate aperture telescopes. Deneb hasbeen one of the most studied A–typesupergiants. Fath (1935) and Pad-dock (1935) made the first variabil-ity studies of this star, using pho-tometry and radial velocities, respec-tively. Abt (1957) observed 9 super-giants, including Deneb, and showedthat early and intermediate type su-pergiants exhibited oscillations of theiratmospheres. Lucy’s harmonic analy-sis of Deneb (1976) demonstrated thatmultiple oscillations were present inthe atmosphere of the star. He alsodiscovered what appeared to be a bi-nary period in the radial velocities ofDeneb. Parthasarathy and Lambert(1987) made 123 spectroscopic obser-vations of Deneb in the near-infraredbetween 1977 and 1982 at McDonaldObservatory. They found radial veloc-ity variations similar to those observedby Paddock and analyzed by Lucy andclaimed that the binary motion wasrecovered but presented no time-seriesanalysis.
The underlying cause of the bright-ness and velocity variations of theα Cygni variables has been recentlyanalyzed by a few authors. Saio etal. (2006) found that long-period os-cillations in HD 163899 could be un-derstood as g-mode pulsations thatare trapped in a convection zone po-sitioned above the H-burning shell ofthe star. An investigation of Deneb’svariability by Gautschy (2009) gave
2

evidence that Deneb also has a sub-photospheric convection zone drivingthe variability. Cantiello et al. (2009)showed how iron convection zonesabove the H-burning shell could bethe cause of the microturbulence andclumping in the base of the wind ofhot stars. The variability for the αCygni variables decreases in ampli-tude and time scale toward highereffective temperatures, and thereforethese processes are easier to observe inthe cooler A-type supergiants such asDeneb (e.g. Lefever et al. 2007).
Kaufer et al. (1996, 1997) examinedthe radial velocity variations and theHα profile variations of Deneb and fiveother supergiants. They found thatthe radial velocities were multiperiodicand showed different periods in dif-ferent observing seasons. They alsofound that the equivalent width of Hαexhibited multiperiodic variations andevanescent periodicities. In contrast,Morrison and Mulliss (1997) reportedfinding a much more active, and possi-bly cyclic, variability in the Hα profile.Often there are “absorption events” inwhich a secondary absorption compo-nent appears on the blue wing of theabsorption component of the Hα pro-file.
Literature on photometry of Denebis remarkably sparse, mostly due toits great apparent brightness (mV =1.25), combined with the fact thatthere are no comparison stars of simi-lar brightness in the vicinity of Deneb.
Adelman and Albayrak (1997) usedHIPPARCOS observations of Deneb,as well as other early A–type super-giants, to show that these objects aresmall or moderate amplitude variables(a few hundredths or a tenth of a mag-nitude in amplitude). The light curvewas not complete enough to state morethan there was a period on the orderof about 2 weeks, but there were mostlikely other effects to take into account.
It has long been known (e.g., Abtand Golson 1966) that the strengthof the Hα emission in hot supergiantsis correlated with the stellar luminos-ity. The potential of this fact for theuse of these optically luminous stars asextragalactic distance indicators wasgreatly advanced when Kudritzki et al.(1999a,b) developed the wind momen-tum - luminosity relationship (WLR).However, only four A–type supergiantswere in their sample, and the vari-ability of most of these objects wasneglected, with the exception of HD92207 (A0Ia) which showed little vari-ability in the momentum flow (Mv∞)(Kudritzki et al. 1999b). The variabil-ity of these objects needs to be investi-gated further in order to quantify thelikely error budget in the use of thisrelationship. With A–type supergiantsbeing among the brightest stars in theoptical, it is important to understandthis relationship between momentumflow, as derived from an Hα P Cygniprofile, and the luminosity.
The variability of the Hα profile is
3

an important diagnostic for hot super-giants in understanding the amount ofclumping in the wind of these stars. Ifvariations observed in Hα profiles werefound to be repeatable, they might beattributed to corotating interaction re-gions in the circumstellar matter (e.g.Cranmer & Owocki 1996), which wouldconstrain the rotation period of thestar.
In this paper, we present numerousspectroscopic and photometric obser-vations obtained during the calendaryears 1997 through 2001. Such a largedata set is important to understand-ing the complex observational varia-tions in Deneb and other hot super-giant stars, especially in the contextof the WLR. Further, variability stud-ies in stars such as this could revealthe underlying physical mechanismsthat cause the observed changes (e.g.Maeder 1980). For example, Gautschy(2009) demonstrated that some pulsa-tional modes would be consistent witha deep convection zone for α Cygnivariables.
2. Observations
339 high resolution (R = 26,000)red-yellow spectra of Deneb were ob-tained between 1997 March 20 and2001 December 21 with the Ritter Ob-servatory 1–meter telescope and fiber-fed echelle spectrograph. Details ofthe instrument are available in Morri-
son et al. (1997)1. For the most part,one spectrum was obtained per night,although multiple exposures were ob-tained on some nights. Exposure timesranged from 60 to 1200 seconds, withmost being about 300-400 seconds.The average signal-to-noise ratio wasaround 100 for the continuum nearHα. Portions of 9 orders of echelledata were recorded, and the ordersincluding the Hα profile and the SiII doublet at λλ 6347, 6371 are pre-sented here. They were reduced usingstandard techniques for echelle spec-troscopy via an IRAF2 script.
370 differential Stromgren photo-metric measurements were made withthe Four College Automated Photo-electric Telescope (FCAPT) during theconcurrent time period of 1997 Octo-ber 29 to 2001 July 2. Non-variablecheck (ch) and comparison (c) starswere used. Each observation consistedof a measurement of the dark count,followed by the sequence sky-ch-c-v-c-v-c-v-c-ch-sky. The light from Denebhad to be passed through a 5 mag-nitude neutral density filter in orderto avoid detector non-linearities. Thelight from the comparison and checkstars was not passed through the fil-ter. The estimated error in the dif-
1A full listing of observations of Deneb at RitterObservatory through 2006 is maintained online athttp://astro1.panet.utoledo.edu/≃wwwphys/ritter/archive/Alpha-Cyg.html
2IRAF is distributed by the National Optical Astron-omy Observatories, which are operated by the Associ-ation of Universities for Research in Astronomy, Inc.,under contract with the National Science Foundation.
4

ferential photometry is about 0.004magnitudes, as calculated from thestandard deviation of the differencebetween check and comparison stars.After HD 197036 had been used as thecomparison star for the first two years,with HD 198151 as the check star, itwas discovered that HD 197036 is asmall amplitude, long period variablestar. Thus, it was replaced with HD198151 for the remainder of these ob-servations, and a new check star, HD199311, was used. HD 197036 was notused for this analysis.
3. Analysis
Reductions beyond the observa-tory’s pipeline script included removalof telluric lines, application of the he-liocentric Doppler correction, and nor-malization to the continuum. Telluriclines were removed by means of theIRAF task telluric. The referencespectra were artificial templates cre-ated by mapping telluric lines in thespectra of rapidly rotating hot starstaken with the same instrumentation.Each telluric line in the template wasrepresented by a Gaussian of the ap-propriate equivalent width and fullwidth at half maximum, superimposedon a unit continuum.
When multiple exposures were takenin one night, the spectra were co-addedbefore normalization, as spectral vari-ability is not present on these timescales (e.g. Lucy 1976). From the con-
tinuum normalized spectra, dynamicalspectra were created for the Hα pro-file. When observations were not avail-able on consecutive days, the spectrawere linearly interpolated for the miss-ing observations, provided the gap wasless than 10 days. The net equivalentwidth of Hα was measured for eachof the continuum normalized spectra.The integration window was 22 A cen-tered on the laboratory wavelength ofHα, and the estimated errors in themeasurements are less than 5% basedon the techniques described by Chal-abaev and Maillard (1983).
Radial velocities were measured forthe Si II λλ 6347, 6371 doublet bymeans of a Gaussian fitted to each line.A weak Fe II line was found to beblended into the blue wing of Si II λ6371, and was also fitted when deter-mining the radial velocity of that line.When more than one observation wasavailable for a single night, the radialvelocity was measured for each obser-vation; the variations were never morethan 0.5 km s−1 over the course of anight. Observation series of stable gi-ant stars with this spectrograph andcamera generally yield standard devia-tions of a single measurement on theorder of 0.5 km s−1. Typically, theradial velocities of the two Si II linesagreed with each other to within 1 kms−1, but usually to within less than 0.5km s−1.
The differential magnitudes wereapproximately converted to standard
5

Stromgren uvby magnitudes, usingvalues for the comparison stars fromHauck and Mermilliod (1998). Thecolors u−b and b−y and the Stromgrenindices c1 and m1 were calculated. Be-cause no attempt was made to correctfor any color dependence that may ex-ist in the attenuation of the neutraldensity filter, and because multipleuvby standard stars were not used, thecolors we derived for Deneb are notprecisely on the standard system.
4. Results and Time-Series Anal-
ysis
4.1. Dynamical Spectra of Hα
Dynamical spectra were created foreach observing season in order to ex-plore the temporal behavior of the Hαprofile. Figure 1 shows the variationsof Deneb during calendar year 1997.Several strong absorption events oc-cur on the blue wing of the P Cygniprofile at intervals of approximately 40days. We define an absorption eventfor Deneb by the presence of a secondabsorption component in the blue wingof the principal absorption component.Usually this second absorption hada velocity blueshifted less than 100km s−1. The emission component re-mained fairly static, with the excep-tion of two periods of strengthening.The absorption events we observed donot show a progression to the terminalvelocity, as seen in discrete absorptioncomponents (DACs) of other hot, mas-
sive stars or in the high-velocity ab-sorption events described by Kaufer etal. (1996) in hotter supergiants suchas Rigel (B8 Ia). Aufdenberg et al.(2002) found that the terminal windspeed for Deneb is 225 km s−1. Neitherthis observing season nor subsequentobserving seasons show evidence thatthe Hα absorption reaches the termi-nal wind speed. The line probably hasa low optical depth at large distancesfrom the star, due to insufficient pop-ulation in the n = 2 level.
The cyclic-type behavior during the1997 observing season was not re-peated in the other observing seasons.The 1998 season (Figure 2) exhibitstwo absorption events, which are far-ther apart than the 40 day interval ofthe 1997 season. The emission fea-ture is nearly static for that year ofobservations. The 1999 season (Figure3) shows an exceptionally static Hαprofile for this star, with a possible be-ginning of an absorption event at theend of the observing season. One ab-sorption event is observed in 2000 (Fig-ure 4), but showed a more rapid onsetand disappearance than the other ob-served events in our data set. The2001 season (Figure 5) began with avery strong absorption event, and in-cluded one smaller event around HJD2452075-2452100. The time span ofSeptember and October of 2001 (HJD2452160-2452240) provided an inter-esting event that is discussed in Sec-tion 4.2.
6

4.2. The High-Velocity Absorp-
tion Event of 2001
The remarkable event of late 2001began with a quick onset of a strongemission component. The absorp-tion component reached a larger nega-tive velocity than had previously beenobserved by us or by Kaufer et al.(1996a,b, 1997). As the event sub-sided, we observed a quick and dra-matic fading of the P Cygni emission.Such a small level of emission had notpreviously been observed in Deneb.Figure 6 illustrates the details of thisevent in line plots.
The event also showed at least twoadditional absorption components atsome epochs, and a dynamical spec-trum created by subtracting the av-erage line profile of the time period(Figure 7) reveals that this was actu-ally two absorption events, spaced bythe same period of 40 days observedwith minor events in 1997. There isa sudden onset of a highly blueshifted(∼ −100 km s−1) absorption that in-creases in strength with time. About40 days after the onset of this event,we see a second high velocity ab-sorption event occur. As this secondevent reached its maximum absorptionstrength, we observed an onset of ab-sorption on the red wing of the pro-file. This event fits the definition ofa high-velocity absorption event, givenin Kaufer et al. (1996). These eventsare described as events, with a larger
blue velocity and deeper absorptionthan normally observed, a similar mor-phology throughout the time develop-ment of the event, and no evidence ofany spherical symmetry in the windat these epochs. The high velocity ab-sorption events are much more extremethan the “normal” absorption eventsdescribed in §4.1.
4.3. Hα equivalent widths
We measured the net equivalentwidths of all our Hα profiles (Table 1,available online). The errors in thesenet equivalent width measurements aretypically 1% of the measured value asdetermined using the methods of Chal-abaev & Maillard (1983). The Hα pro-file shows a P Cygni type profile, so thenet equivalent width does not providea simple measure of all the variability.Using the IRAF task splot, we mea-sured the equivalent width of the emis-sion component by trying to interpo-late linearly across the base of the com-ponent. Unfortunately, this method isprone to personal error. From multiplemeasures from the same spectrum, wederived a typical error for the equiva-lent width of the Hα emission compo-nent to be 5% of the measured value.We then subtracted the emission com-ponent from the net equivalent widthin order to obtain an absorption equiv-alent width.
We found that the net equivalentwidth had an average value of 1.318A with a standard deviation of 0.197
7

A. The overall estimated strength ofthe absorption component(s) variedby slightly more than a factor of two(Wλ,Hα,abs=2.172 A on HJD 2450999;Wλ,Hα,abs=1.067 A on HJD 2450669).The absorption component was 1.616A with a standard deviation of themean of 0.209 A.
4.4. Radial Velocities and Pho-
tometry
In order to derive the systemic ve-locity of Deneb, we computed an un-weighted average over all the obser-vations of the Si II 6347, 6371 dou-blet, assuming no wind contaminationof these lines. The result was -2.77km s−1, which is consistent with valuesderived from other studies (e.g. Lucy1976; Parthasarathy & Lambert 1987).The radial velocity had a range of val-ues of -10.8 to 9.1 km s−1, consistentwith the sum of the multiple pulsationmode amplitudes (10.44 km s−1) de-rived by Lucy (1976).
The differential uvby Stromgrenmeasurements (Table 2, available on-line) were averaged over all data toadopt the photometric parameters forDeneb given in Table 3. u, v, b, andy had a range of 0.09, 0.14, 0.41, and0.19 magnitudes respectively. The col-ors u − b and b − y had a range of0.075 and 0.081 magnitudes respec-tively. The Stromgren indices c1 andm1 were found to vary by 0.233 and0.141 magnitudes, respectively.
4.5. Time-Series Analysis and
the Binarity of Deneb
In order to verify the reliability ofvarious time-series analysis algorithms,their output was compared to that ob-tained by Lucy (1976) for the data col-lected by Paddock (1935). A Scargleperiodogram analysis (Scargle 1982) ofthe data from Paddock (1935) only re-produced one aspect of the analysis ofLucy (1976), the long term variabilitythat was suspected to be binary motionof Deneb.
The confirmation of the binary na-ture of this prototypical supergiantwould be useful for understanding thestar, as well as its early evolution (in-cluding mass transfer) and estimatingthe current mass. We used the Scar-gle periodogram and the CLEAN algo-rithm (Roberts et al. 1987) to searchour data set for the binary period, andfound that the power spectrum reacheda relative minimum in the period rangethat was suspected. As Lucy (1976)could not add other data to the dataof Paddock to better constrain the or-bit (Section III of his paper), and ourdata do not suggest any binary motion,the binary hypothesis for Deneb is notsupported.
A method that is more robust fordatasets containing multiple periodici-ties, the CLEAN algorithm was used tosearch for periodicities in the data sets.An analysis of the radial velocity datafrom Paddock (1935) produced similar
8

results to that of Lucy (1976). Theresults are shown in Figure 8, wherewe plot the frequencies and their rel-ative strengths found for each observ-ing season for net Hα equivalent width,Si II radial velocities, and Stromgreny. The time-series analysis was per-formed on the entire data set, but be-cause of the changing characteristicsof the star, no global properties werefound with a high probability of beingreal. If the same period were foundfor all three data sets, there would besome evidence for a photospheric-windconnection, but our analysis showed noevidence of this behavior. Similarly,if there were evidence for similar peri-ods in just the photometry and radialvelocities, that would provide informa-tion about pulsational behavior of thephotosphere of Deneb.
4.6. Radial Pulsations
Our analysis did find some periodsthat were the same for the radial ve-locities and for the photometry during1998 and 1999. The phased (to HJD2450000.0) data were fitted (minimumχ2) with a sine curve of the form
N = A× sin(2π(p− xc)) + c (1)
where N is the parameter we are fitting(radial velocity or magnitude), p is thearbitrary phase we are solving for, Ais the amplitude, xc is a phasing offset,and c is an offset for the systemic veloc-ity or magnitude. The period was notallowed to vary during these fits. The
parameters for our photometric and ra-dial velocity fits are given in Table 4 forthe two epochs of radial pulsations andthe variations are shown graphically inFigure 9. The offsets in phase betweenthe photometry maximum and radialvelocity maximum for the two periodswith the highest probability of radialpulsations (epochs with strong signalsthat match with both the photome-try and radial velocity data; the fall of1998 (P = 17.8d) and the fall of 1999(P = 13.4d)) are roughly 0.25P , whichstrongly supports the hypothesis thatDeneb was experiencing radial pulsa-tions at these epochs.
5. Discussion
We have searched for high-velocityabsorptions in a sample of B8Ia - A2Ia supergiants that have been moni-tored at Ritter Observatory since 1992.Our initial results, which are shown inTable 5, begin to constrain the rangeof effective temperatures in which su-pergiant stars exhibit high-velocity ab-sorption events. With the five yearsof data we have analyzed combinedwith the data presented in Kaufer etal. (1996), only one high velocity ab-sorption event has been observed inDeneb. These events are thus very rarefor this star. Other stars of similarproperties (ν Cep3 and 6 Cas) have
3 For ν Cep, there are numerous cases of en-hanced absorption in the blue wing with max-imum absorption around -100 km s−1 and
9

not shown any signs of high veloc-ity absorption in a long time series ofobservations. We can therefore con-clude that Deneb is at the lower endof the range of effective temperatureand luminosity (Teff ∼8500±200 K,log( L
L⊙) ∼5.2; Aufdenberg et al. 2002)
for which supergiants can exhibit highvelocity absorption events.
As discussed in Section 4.6, wefound evidence for radial pulsationsin the atmosphere of Deneb at twoepochs during our five year investiga-tion on this star. These pulsationswere present for a few cycles and thenvanished. Kaufer et al. (1997) didnot find radial pulsations for Deneb,although their data may have sug-gested such variability. Simultaneousphotometry of the star is necessaryfor finding the radial pulsations be-cause the atmosphere is also unstableto many non-radial modes simultane-ously. The light curves at the epochswhere we found radial pulsations havean amplitude such that they cannot beeasily explained with non-radial modes(see e.g. Unno et al. 1979 for a descrip-tion of non-radial oscillations).
edge velocity around -200 km s−1 as in theKaufer et al. (1996) definition, but the equiv-alent width involved is small. These veloci-ties are sometimes hard to estimate becauseof water line contamination and/or indistinctedges. From the Mg II profiles in the Verdugoet al. (1999) atlas, the terminal wind speed ofν Cep is lower than Deneb’s by about 35 kms−1, so events will be harder to distinguish forthat reason.
6. Conclusions and Future Work
Evidence was found for radial pul-sations at two epochs during this cam-paign. Radial pulsations are somewhatrare in the atmosphere of Deneb, wherethe atmosphere is does not usally dis-play these variations. With only twoshort epochs having radial pulsations,we find that Deneb displays radial pul-sations ≤20% of the time. While pho-tometry was difficult to obtain for sucha bright target, it is necessary to findsuch behavior. A complete look at allthe available data collected for this starwill potentially lead to a better un-derstanding of its interior. Gautschy(2009) has demonstrated that the vari-ability of Deneb may be indicative ofan underlying convective region for thisstar. Detailed analyses of the vari-ability of a larger population of super-giants could demonstrate if these in-termittent radial pulsations are normalfor the population.
A 40 day period was found with ab-sorption events in 1997 as well as inthe high velocity absorption event of2001. A similar period is reported byKaufer et al. (1996) for the 1991 ob-servations (Hα) of Deneb. Aufdenberget al. (2002) derived a stellar radius of180 R⊙ and v sin i =≈ 25 km s−1 forDeneb, which corresponds to a rota-tional period of 58 days. The v sin iwas used in the spectral line fittingof the star, and no error bars weregiven, but a small increase of ≈ 10
10

km s−1 to this parameter will yield arotational period of ≈ 40 days. Sim-ilarly, the radius of the star could bereduced by ≈ 30% to yield this pe-riod. With a poorly determined paral-lax (π = 2.31±0.32 mas; van Leeuwen2007), the interferometric radius deter-mined by Aufdenberg et al. (2002) can-not be used to constrain this param-eter. Therefore, we conclude that the40 day period is consistent with the ro-tation period of the star and these ob-servations may indicate occasional cou-pling between the photosphere and thewind.
During each observing season, thebehavior of the Hα profile was dif-ferent. Therefore, long-term moni-toring (over multiple seasons) is cru-cial to understanding the variabilitymechanisms of stars such as Deneb.With the extreme variability seen atthe time of the high velocity absorp-tion event in 2001, caution should beused on assigning mass-loss rates andother parameters to a single-epoch ob-servation for Deneb and similar stars.Further work will be needed for thewind-momentum luminosity relation-ship (Kudritzki et al. 1999a,b) withthe variability of these stars taken intoaccount.
There is a need for observing cam-paigns at high spectral resolution forstars in the temperature and luminos-ity regime of Deneb. The high ve-locity absorption event we observed in2001 is the only observed event for
Deneb. High-resolution spectroscopicmonitoring of Deneb at Ritter Obser-vatory spans nearly two decades (1993through present), and analysis of theentire data set is planned and will pro-vide additional insights into the fre-quency of occurrence of high-velocityabsorption events, of episodes of radialpulsation, and perhaps of other phe-nomena. Similar stars (in temperatureand luminosity) need monitoring to seeif Deneb is unique and where the tem-perature and luminosity boundary forhigh velocity absorption events is lo-cated.
We acknowledge the anonymous ref-eree for making suggestions that im-proved this paper. We are gratefulfor the Ritter Observing team whoperformed the spectroscopic observa-tions during the calendar years 1997through 2001, especially Karen Bjork-man, Anatoly Miroshnichenko, DavidKnauth, Chris Mulliss, Howard Rit-ter, Tracy Smith, Will Fischer, PatrickOuellette, John Wisniewski, and JoshThomas. The spectra were reducedby Chris Mulliss, David Knauth, andJohn Wisniewski by means of a scriptwritten by R. C. Dempsey, and latermodified by J. P. Aufdenberg. ChrisMulliss created the first dynamicalspectrum of Deneb from Ritter spec-tra, and began this project. Am-ber Ferguson analyzed radial veloc-ity standard stars which helped tounderstand the error associated with
11

our measurements; she was supportedby NSF-PREST. We would like tothank Observatory Technician RobertBurmeister for keeping the telescopein excellent working condition. Thisresearch has made use of the SIM-BAD database, operated at CDS,Strasbourg, France. Support for E.Kryukova on this project came fromthe NSF–REU program. Support forRitter Observatory during the time ofthe observations was provided by theFund for Astrophysical Research andthe American Astronomical SocietySmall Grants Program. Support forFCAPT during the time period camefrom NSF grant AST-0587381. Spe-cial thanks to Louis J. Boyd, GeorgeMcCook, and Robert J. Dukes, Jr. fortheir help in keeping the FCAPT ingood working order. We thank Dou-glas Gies (Georgia State University)for helpful discussions related to thepulsational behavior of Deneb and forsome software used in Figure 7.
Facilities: Ritter Observatory, FourCollege Automated Photoelectric Tele-scope
REFERENCES
Abt, H.A., 1957, ApJ, 126, 138
Abt, H.A., & Golson, J.C. 1966, ApJ,143, 306
Adelman, S.J. & Albayrak, B. 1997,IBVS 4541, 1
Aufdenberg, J.P. et al. 2002, ApJ, 570,344
Barlow, M. J. & Cohen, M. 1977, ApJ,213, 737
Cantiello, M. et al. 2009, A&A, 499,279
Chalabaev, A. & Maillard, J.P. 1983,A&A, 127, 279
Cranmer, S. & Owocki, S. 1996, ApJ,462, 469
Fath, E. 1935, Lick Obs. Bull., 17, 115
Gautschy, A. 2009, A&A, 498, 273
Hauck, B. & Mermilliod, M. 1998,A&AS, 129, 431
Kaufer, A. et al. 1996, A&A, 305, 887
Kaufer, A. et al. 1997, A&A, 320, 273
Kudritzki, R.P. et al. 1999a, A&A, 350,970
Kudritzki, R.P. et al. 1999b, in IAUColloquium, 169, 405
Lefever, K., Puls, J., Aerts, C. 2007,A&A, 463, 1093
Lucy, L. B. 1976, ApJ, 206, 499
Maeder, A. 1980, A&A, 90, 311
Markova, N., Prinja, R. K., Markov,H., Kolka, I., Morrison, N., Percy,J., Adelman, S. 2008, A&A, 487,211
12

Morrison, N.D. and C.L. Mulliss. 1997,BAAS, 191, 125.04
Morrison, N.D., Knauth, D. C.,Mulliss, C. L., and Lee, W. 1997,PASP, 109, 676
Paddock, G. 1935, Lick Obs. Bull., 17,99
Parthasarathy, M. and D. Lambert.1987, J. Astrophys. Astr., 8, 51
Roberts, D.H., J. Lehar, and J.W.Dreher. 1987, AJ, 93, 968
Saio, H., et al. 2006, ApJ, 650, 1111
Scargle, J.D. 1982, ApJ, 263, 835
van Genderen, A.M. et al. 1989,A&ASS 79, 263
van Leeuwen F. 2007, A&A 474, 653
Verdugo, E., Talavera, A., & Gomez deCastro, A.I. 1999, A&A, 346, 819
Unno, W., Osaki, Y., Ando, H., &Shibahashi, H. 1979, University ofTokyo Press, “Nonradial Oscilla-tions of Stars”
This 2-column preprint was prepared with theAAS LATEX macros v5.2.
13
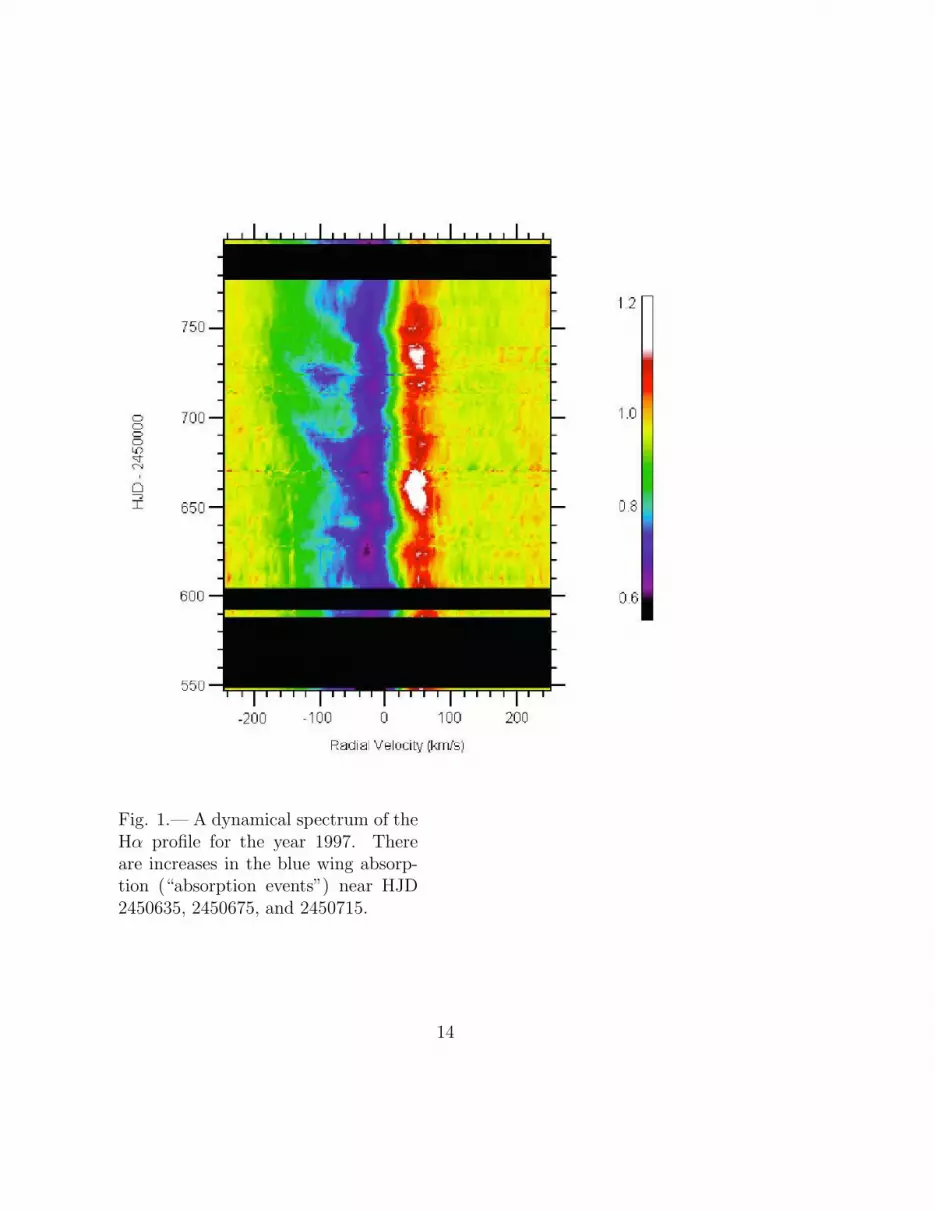
Fig. 1.— A dynamical spectrum of theHα profile for the year 1997. Thereare increases in the blue wing absorp-tion (“absorption events”) near HJD2450635, 2450675, and 2450715.
14

Fig. 2.— A dynamical spectrum of theHα profile for the year 1998.
15

Fig. 3.— A dynamical spectrum of theHα profile for the year 1999.
16

Fig. 4.— A dynamical spectrum of theHα profile for the year 2000.
17

Fig. 5.— A dynamical spectrum of theHα profile for the year 2001.
18

Fig. 6.— Line profiles of Hα ob-served during the major 2001 absorp-tion and emission event. Features tonote are the development of deep sec-ondary and tertiary absorption com-ponents, the increase in the Hα emis-sion and the near disappearence of theemission component beginning at HJD2452214.5. All spectra are normalizedto unity in the continuum and are plot-ted in the rest frame of Hα. The HJD- 2450000 is shown to the nearest inte-gral day in each plot.
19

Fig. 7.— A dynamical spectrum of theHα profile during the 2001 high ve-locity absorption event. The averageprofile for this time period, plotted inthe lower panel, has been subtracted.There is an onset of high velocity ab-sorption, followed by a second absorp-tion event ∼ 40 days later. The sec-ond portion of this event is followedby an onset of absorption on the redwing, causing the emission to appearthe weakest that we observed duringthe 5 years of data presented in thisstudy.
20

Fig. 8.— Plots of the frequencies de-rived in the CLEAN time series anal-ysis. The symbol size is proportionalto the relative strength of the derivedfrequency. The photometry producedsimilar results for all bandpasses, butonly the y filter is plotted.
21

Fig. 9.— Plots of suspected radial pul-sations seen in these data. On the topis the y band Stromgren photometry,and on the bottom are correspondingradial velocities. The periods are 17.8days for the fall of 1998, and 13.4 daysfor the fall of 1999. Standard errors areless than 0.005 magnitudes for y, andabout 1 km s−1 for the radial velocities.uvb magnitudes were also fitted, andthe parameters of these fits are givenin Table 4.
22

Table 1
Spectroscopic Measurements of the Hα profile and Si II doublet.This table can be found in its entirety online.
HJD Wλ Wλ Wλ Vr Vr σ(Vr)Hα, net emission absorption Si II 6347 Si II 6371(A) (A) (A) (km s−1) (km s−1) (km s−1)
2450546.91051251 1.46 -0.29 1.75 -5.18 -4.88 0.812450588.86303180 1.24 -0.21 1.45 -1.50 -1.91 0.852450590.84395394 1.26 -0.21 1.48 -1.75 -1.57 0.772450591.85544913 1.28 -0.18 1.46 -1.73 -1.59 0.762450604.79591576 1.21 -0.20 1.42 -5.35 -4.69 1.002450609.87109713 1.26 -0.20 1.46 -4.20 -4.19 0.752450614.84276841 1.37 -0.22 1.59 -4.43 -4.53 0.762450623.77241360 1.13 -0.27 1.40 -2.05 -1.91 0.762450626.77451461 1.29 -0.22 1.51 -3.54 -4.14 0.962450627.73838157 1.21 -0.24 1.44 -4.84 -4.68 0.772450628.78655021 1.24 -0.24 1.48 -4.03 -3.83 0.782450631.77347052 1.33 -0.15 1.49 -2.55 -2.67 0.762450632.84827024 1.31 -0.16 1.46 -2.75 -3.12 0.842450635.85337284 1.45 -0.15 1.60 -3.05 -3.52 0.892450640.80576980 1.29 -0.18 1.46 -4.39 -4.66 0.802450643.76409389 1.20 -0.17 1.38 -6.35 -5.55 1.102450645.78557716 1.26 -0.17 1.44 -4.51 -4.55 0.752450649.89552412 1.20 -0.20 1.40 -5.32 -5.76 0.872450654.69862821 1.12 -0.28 1.39 -7.64 -6.88 1.072450660.74224343 1.23 -0.31 1.55 -4.07 -4.08 0.752450661.78846059 1.09 -0.29 1.38 -5.58 -5.43 0.762450663.72390025 1.13 -0.31 1.43 -5.50 -5.53 0.752450665.74104598 1.15 -0.29 1.44 -3.30 -3.11 0.772450666.73503305 1.16 -0.25 1.41 -2.14 -2.49 0.832450668.73985444 1.13 -0.26 1.39 -1.02 -1.58 0.942450669.69969583 0.84 -0.23 1.07 -0.86 -1.27 0.852450670.69620772 1.33 -0.23 1.56 -2.31 -2.93 0.972450674.64682815 1.32 -0.22 1.55 -7.20 -6.88 0.82
23

Table 1—Continued
HJD Wλ Wλ Wλ Vr Vr σ(Vr)Hα, net emission absorption Si II 6347 Si II 6371(A) (A) (A) (km s−1) (km s−1) (km s−1)
2450684.61903913 1.24 -0.29 1.52 -4.31 -3.94 0.842450688.67315596 1.21 -0.21 1.41 -2.41 -2.60 0.772450689.70227578 1.22 -0.26 1.48 -2.58 -2.27 0.812450693.67658389 1.24 -0.23 1.47 -5.03 -4.10 1.192450695.72257290 1.20 -0.23 1.43 -5.77 -5.46 0.812450696.70105945 1.19 -0.15 1.33 -6.19 -5.45 1.052450704.69342104 1.15 -0.22 1.38 -1.93 -1.64 0.802450707.60930136 1.26 -0.20 1.46 -1.98 -1.96 0.752450709.72386113 1.22 -0.18 1.40 -3.41 -4.29 1.162450710.58845668 1.28 -0.18 1.46 -3.94 -3.76 0.772450712.61052209 1.26 -0.17 1.44 -4.31 -4.35 0.752450713.62311954 1.24 -0.23 1.47 -5.21 -4.18 1.272450715.60945511 1.26 -0.23 1.49 -4.15 -3.39 1.072450716.60215994 1.25 -0.22 1.47 -4.74 -3.66 1.312450717.57613373 1.26 -0.21 1.46 -4.43 -3.75 1.012450718.55766077 1.25 -0.20 1.45 -4.15 -3.72 0.862450719.57555580 1.22 -0.25 1.47 -4.06 -4.11 0.752450723.53224540 1.31 -0.28 1.58 -4.28 -4.50 0.782450724.50313663 1.35 -0.20 1.55 -4.60 -5.35 1.062450725.53217602 1.29 -0.22 1.51 -4.95 -5.29 0.822450727.59407425 1.27 -0.21 1.48 -5.04 -5.39 0.832450728.63555574 1.23 -0.20 1.42 -4.55 -4.93 0.842450729.52496529 1.15 -0.21 1.36 -4.67 -4.91 0.792450730.58291626 1.16 -0.21 1.37 -4.24 -4.15 0.762450731.64684010 1.09 -0.20 1.29 -3.84 -4.26 0.862450732.55339146 1.05 -0.21 1.26 -3.21 -3.22 0.752450736.53490734 1.08 -0.23 1.31 -2.14 -1.55 0.952450739.56125069 1.07 -0.21 1.27 -1.27 -1.70 0.86
24

Table 1—Continued
HJD Wλ Wλ Wλ Vr Vr σ(Vr)Hα, net emission absorption Si II 6347 Si II 6371(A) (A) (A) (km s−1) (km s−1) (km s−1)
2450740.58932877 1.11 -0.20 1.31 -2.70 -2.27 0.862450741.53111076 1.12 -0.22 1.34 -1.65 -1.19 0.882450742.50016212 1.13 -0.24 1.36 -1.41 -1.19 0.782450743.50555947 1.18 -0.19 1.37 -0.97 -1.14 0.772450750.55849728 1.05 -0.23 1.28 -2.02 -0.97 1.292450752.56531801 1.11 -0.23 1.34 -0.18 0.79 1.232450762.49980709 1.18 -0.17 1.35 -1.51 -2.54 1.272450765.51684137 1.32 -0.13 1.45 -1.39 -1.35 0.752450770.47501183 1.26 -0.12 1.39 -4.05 -4.24 0.772450777.49181747 1.28 -0.14 1.42 -2.38 -2.73 0.832450798.47763920 1.50 -0.12 1.62 -2.33 -2.26 0.752450799.48850632 1.53 -0.10 1.63 -2.86 -2.39 0.892450800.52262673 1.50 -0.13 1.63 -3.62 -3.31 0.812450950.88095748 1.23 -0.46 1.90 -1.45 -1.20 0.792450955.85326243 1.44 -0.50 1.86 -1.42 -1.49 0.752450972.84059198 1.36 -0.33 1.95 -1.80 -2.02 0.782450999.77149517 1.62 -0.46 2.17 -4.09 -4.24 0.762451000.73309465 1.71 -0.52 2.06 -4.88 -4.72 0.772451004.79542603 1.54 -0.46 1.90 -4.98 -4.69 0.802451006.80721263 1.44 -0.36 1.73 -3.62 -3.51 0.762451021.75284438 1.37 -0.43 1.96 -4.83 -4.75 0.752451027.69932164 1.52 -0.38 1.88 -3.74 -3.69 0.752451028.69395310 1.50 -0.51 1.86 -4.17 -4.08 0.762451038.67103865 1.35 -0.36 1.73 -0.84 -0.47 0.842451044.79884184 1.37 -0.52 1.88 -7.21 -7.41 0.782451045.76414008 1.36 -0.47 1.88 -6.93 -6.24 1.022451051.67669180 1.41 -0.50 1.93 -2.44 -2.37 0.752451052.74531801 1.43 -0.44 1.96 -2.27 -2.05 0.78
25

Table 1—Continued
HJD Wλ Wλ Wλ Vr Vr σ(Vr)Hα, net emission absorption Si II 6347 Si II 6371(A) (A) (A) (km s−1) (km s−1) (km s−1)
2451055.70155940 1.52 -0.48 2.00 -2.84 -2.84 0.752451057.67934585 1.52 -0.40 1.77 -4.38 -4.74 0.832451061.74683731 1.37 -0.37 1.76 -3.30 -2.73 0.942451062.70667893 1.39 -0.37 1.80 -2.94 -2.39 0.932451065.65878460 1.43 -0.41 1.84 -1.24 -0.97 0.802451066.63236443 1.43 -0.35 1.75 -3.71 -2.60 1.342451067.60498553 1.40 -0.42 1.78 -4.40 -3.89 0.912451068.71211093 1.36 -0.42 1.69 -5.04 -4.62 0.862451070.72930597 1.28 -0.33 1.66 -3.34 -2.85 0.902451075.53823459 1.33 -0.38 1.75 -2.91 -2.74 0.772451077.54643286 1.36 -0.36 1.68 -3.43 -2.99 0.872451079.57380094 1.32 -0.38 1.68 -4.92 -4.74 0.772451080.59926455 1.30 -0.46 1.75 -6.14 -5.66 0.892451083.61306955 1.29 -0.40 1.80 -5.77 -5.03 1.052451085.60670703 1.40 -0.45 1.83 -3.88 -3.48 0.852451088.57064794 1.38 -0.48 1.72 -5.33 -5.38 0.752451096.56685999 1.24 -0.48 1.70 -0.96 -0.59 0.842451097.55166005 1.22 -0.45 1.71 0.20 0.18 0.752451098.53583451 1.25 -0.38 1.68 0.56 0.62 0.752451102.52214259 1.30 -0.33 1.62 -6.81 -6.69 0.762451105.61378888 1.29 -0.38 1.67 -4.65 -4.35 0.812451106.58253566 1.29 -0.35 1.68 -4.06 -3.31 1.062451109.63728077 1.33 -0.35 1.68 -0.26 -0.25 0.752451110.50936285 1.33 -0.30 1.64 -0.11 0.56 1.012451111.50936280 1.34 -0.29 1.76 0.79 0.96 0.772451113.57118501 1.47 -0.29 1.80 -0.63 -0.57 0.752451115.51881552 1.51 -0.35 1.74 -3.71 -3.94 0.782451121.53755176 1.39 -0.46 1.50 -1.42 -1.28 0.76
26

Table 1—Continued
HJD Wλ Wλ Wλ Vr Vr σ(Vr)Hα, net emission absorption Si II 6347 Si II 6371(A) (A) (A) (km s−1) (km s−1) (km s−1)
2451135.58661100 1.03 -0.42 1.30 -5.14 -5.46 0.822451137.51457740 0.88 -0.43 1.36 -3.11 -2.82 0.802451141.54538907 0.93 -0.48 1.43 -3.23 -2.81 0.862451144.47399910 0.96 -0.48 1.48 -2.05 -2.16 0.762451145.46913573 1.00 -0.38 1.39 -2.07 -1.61 0.882451146.48616081 1.01 -0.39 1.59 -1.63 -1.49 0.762451149.50689755 1.19 -0.30 1.59 -2.69 -2.54 0.762451157.49058970 1.29 -0.24 1.63 -1.07 -1.13 0.752451159.50352561 1.39 -0.17 1.63 1.09 0.69 0.852451160.50281023 1.46 -0.22 1.72 -0.59 -1.38 1.092451162.53478797 1.50 -0.19 1.69 -3.70 -3.90 0.782451163.47022251 1.50 -0.43 1.89 -4.44 -4.72 0.802451336.80563403 1.46 -0.45 1.85 -3.66 -4.00 0.822451338.84190551 1.40 -0.50 1.65 -5.16 -4.83 0.822451344.80036071 1.15 -0.39 1.52 -3.58 -3.29 0.802451348.85423465 1.13 -0.52 1.75 -3.19 -3.08 0.762451350.84189368 1.23 -0.40 1.83 -0.93 -0.73 0.782451355.82954285 1.43 -0.42 1.69 -4.61 -4.32 0.802451364.80753528 1.27 -0.54 1.84 -1.04 -0.93 0.762451365.84349881 1.30 -0.53 1.78 0.71 1.14 0.862451366.81577188 1.26 -0.41 1.72 -0.36 1.53 2.032451367.81323986 1.32 -0.37 1.90 1.75 3.84 2.222451369.87641275 1.53 -0.41 1.89 1.83 1.70 0.762451370.83326650 1.48 -0.33 1.93 4.54 4.39 0.762451371.86956697 1.61 -0.24 1.93 0.75 0.30 0.872451376.84562954 1.70 -0.24 1.94 -2.38 -2.76 0.842451390.79296231 1.69 -0.19 1.74 -3.51 -3.85 0.822451392.81798543 1.56 -0.31 2.02 -8.57 -8.63 0.75
27

Table 1—Continued
HJD Wλ Wλ Wλ Vr Vr σ(Vr)Hα, net emission absorption Si II 6347 Si II 6371(A) (A) (A) (km s−1) (km s−1) (km s−1)
2451393.77638712 1.71 -0.42 1.60 -10.83 -10.12 1.032451399.79525191 1.18 -0.37 1.71 -5.80 -5.50 0.812451411.69902630 1.34 -0.43 1.67 -5.58 -4.93 0.992451419.73773457 1.24 -0.60 1.87 -6.22 -5.12 1.332451420.72246949 1.27 -0.36 1.53 -6.76 -5.23 1.702451421.64964821 1.17 -0.45 1.70 -5.87 -6.37 0.902451423.63147511 1.25 -0.52 1.78 -4.46 -4.50 0.752451424.65571363 1.27 -0.53 1.84 -4.99 -2.63 2.482451426.69744491 1.31 -0.44 1.73 -4.58 -4.45 0.762451435.62443607 1.29 -0.38 1.58 -4.82 -2.83 2.132451436.65566424 1.19 -0.43 1.60 -4.20 -4.28 0.752451437.67301701 1.17 -0.38 1.71 -3.85 -4.22 0.842451444.75422616 1.33 -0.28 1.58 -1.97 -1.58 0.852451445.67147021 1.30 -0.38 1.73 -2.80 -3.04 0.792451447.60288468 1.35 -0.42 1.65 -3.99 -3.54 0.872451457.69956882 1.24 -0.35 1.56 -3.94 -4.23 0.802451458.67892679 1.21 -0.36 1.58 -1.66 -2.71 1.292451459.67170132 1.22 -0.31 1.61 -5.60 -5.51 0.762451463.68991441 1.29 -0.32 1.79 0.23 0.61 0.842451466.66316974 1.46 -0.29 1.69 -3.91 -4.36 0.872451467.67782688 1.41 -0.25 1.73 -3.29 -2.77 0.912451471.61100990 1.48 -0.34 1.73 -8.61 -8.32 0.802451472.62301844 1.39 -0.40 1.81 -7.35 -7.63 0.802451473.53323194 1.41 -0.32 1.69 -5.85 -5.38 0.892451476.66490172 1.37 -0.46 1.88 -1.96 -1.88 0.752451478.61499964 1.42 -0.23 1.62 -2.69 -2.70 0.752451479.55320231 1.39 -0.46 1.64 -2.85 -3.32 0.892451487.60409752 1.18 -0.48 1.66 -3.22 -2.77 0.87
28

Table 1—Continued
HJD Wλ Wλ Wλ Vr Vr σ(Vr)Hα, net emission absorption Si II 6347 Si II 6371(A) (A) (A) (km s−1) (km s−1) (km s−1)
2451488.59862064 1.17 -0.43 1.66 -0.67 -0.51 0.772451489.49557849 1.23 -0.39 1.70 -1.34 -2.64 1.502451490.57043052 1.32 -0.35 1.74 1.13 1.44 0.812451491.58998624 1.39 -0.34 1.74 -0.94 -1.46 0.912451492.51301154 1.40 -0.35 1.88 -1.67 -1.93 0.792451497.55375277 1.53 -0.26 1.79 -3.21 -3.06 0.762451498.55827275 1.53 -0.31 1.79 -1.19 -1.07 0.762451499.56391749 1.48 -0.31 1.73 -3.36 -3.39 0.752451500.48317052 1.42 -0.33 1.67 -6.33 -6.11 0.782451501.58749059 1.35 -0.38 1.84 -5.81 -5.91 0.762451512.50205306 1.46 -0.50 1.96 -2.49 -2.54 0.752451520.44426611 1.46 -0.45 1.93 1.25 1.05 0.782451524.45578348 1.47 -0.29 1.79 0.18 0.10 0.752451766.65352529 1.50 -0.30 1.99 -0.50 -0.59 0.762451777.69434071 1.69 -0.42 2.06 -1.64 -1.62 0.752451790.67409622 1.65 -0.44 1.85 -4.23 -3.86 0.842451792.64695412 1.41 -0.47 1.73 -4.75 -4.71 0.752451794.65323420 1.26 -0.37 1.74 -3.57 -3.03 0.922451800.64645313 1.37 -0.30 1.94 0.77 0.32 0.872451801.66190175 1.64 -0.33 1.83 -0.99 -1.18 0.772451803.70268037 1.50 -0.27 1.90 -2.21 -2.58 0.842451804.69867070 1.62 -0.35 2.07 0.49 0.12 0.842451805.66527417 1.73 -0.28 1.81 -2.03 -2.08 0.752451806.60222468 1.53 -0.25 1.82 -1.56 -1.85 0.802451807.66589659 1.57 -0.24 1.89 -1.66 -1.41 0.792451809.61068368 1.66 -0.35 2.06 -0.42 -0.46 0.752451812.58110413 1.71 -0.37 1.81 -6.04 -6.30 0.792451814.64967713 1.44 -0.40 1.84 -6.64 -6.02 0.97
29

Table 1—Continued
HJD Wλ Wλ Wλ Vr Vr σ(Vr)Hα, net emission absorption Si II 6347 Si II 6371(A) (A) (A) (km s−1) (km s−1) (km s−1)
2451816.66153546 1.44 -0.50 1.65 -4.39 -3.72 1.012451817.70606781 1.15 -0.54 1.48 -1.74 -1.81 0.752451818.64572957 0.95 -0.38 1.69 9.14 8.26 1.162451819.56642114 1.31 -0.42 1.88 1.62 1.67 0.752451824.51645752 1.46 -0.43 1.68 -3.51 -3.64 0.762451825.49550015 1.26 -0.42 1.80 -4.03 -4.36 0.822451832.63255561 1.38 -0.29 1.55 -0.20 0.24 0.872451836.56151493 1.26 -0.31 1.88 -2.43 -1.63 1.102451837.56111674 1.56 -0.34 1.35 -1.34 -1.69 0.832451838.58314765 1.01 -0.28 1.37 -0.71 -1.07 0.832451839.49245117 1.09 -0.39 1.44 -1.88 -1.98 0.762451840.51696936 1.05 -0.20 1.77 -2.42 -3.43 1.262451845.50436195 1.56 -0.26 1.81 -5.35 -4.89 0.882451846.50508201 1.55 -0.34 1.46 -2.74 -2.37 0.842451847.64089982 1.12 -0.27 1.67 -3.02 -1.85 1.392451849.47802808 1.40 -0.28 1.81 -2.43 -1.64 1.092451853.47955711 1.53 -0.21 1.73 -0.11 -0.16 0.752451854.48402400 1.52 -0.32 1.84 -2.05 -2.00 0.752451864.47505721 1.53 -0.40 1.76 0.19 0.14 0.752451871.54475050 1.36 -0.31 1.64 -0.70 -0.56 0.762451873.50126078 1.33 -0.36 1.75 -2.86 -3.34 0.892451882.45217583 1.40 -0.22 1.61 -2.40 -1.89 0.912451901.47514821 1.38 -0.27 1.48 -1.65 -2.02 0.842451919.48566920 1.21 -0.18 1.87 -1.66 -1.55 0.762451994.89469939 1.69 -0.16 1.91 -2.82 -3.62 1.102451996.89223833 1.75 -0.14 1.86 2.06 1.85 0.782452001.97258815 1.71 -0.14 1.88 -1.79 -1.50 0.802452028.82093231 1.75 -0.14 1.54 -3.06 -2.88 0.77
30

Table 1—Continued
HJD Wλ Wλ Wλ Vr Vr σ(Vr)Hα, net emission absorption Si II 6347 Si II 6371(A) (A) (A) (km s−1) (km s−1) (km s−1)
2452029.80038531 1.40 -0.12 1.52 -6.37 -6.04 0.822452033.78390954 1.41 -0.20 1.61 -1.19 -0.82 0.842452038.74861894 1.34 -0.22 1.56 -0.55 -1.33 1.082452039.81000001 1.23 -0.11 1.34 -2.68 -2.92 0.792452069.86191237 1.55 -0.11 1.66 -3.95 -3.26 1.022452074.87611819 1.47 -0.06 1.53 -3.61 -3.87 0.792452079.73171166 1.70 -0.08 1.78 -2.61 -2.40 0.782452086.86035902 1.64 -0.06 1.69 -2.14 -2.33 0.772452090.78253705 1.64 -0.09 1.73 -0.38 -0.35 0.752452092.78033792 1.44 -0.06 1.50 0.51 0.47 0.752452095.77715713 1.64 -0.07 1.70 -1.46 -1.72 0.792452096.80859715 1.60 -0.06 1.66 -6.28 -6.60 0.822452101.71120681 1.66 -0.11 1.77 -4.96 -4.84 0.762452102.75962414 1.41 -0.12 1.53 0.00 0.71 1.032452104.84014659 1.34 -0.11 1.45 1.51 2.93 1.612452105.75722569 1.41 -0.12 1.53 -3.72 -3.94 0.782452115.71436255 1.19 -0.14 1.32 -0.58 -0.48 0.762452151.66575579 1.09 -0.16 1.25 -2.73 -2.69 0.752452154.77190308 1.12 -0.21 1.32 -3.12 -2.40 1.042452155.75065970 1.09 -0.19 1.28 -1.98 -1.75 0.782452157.66480292 1.04 -0.24 1.27 -3.81 -3.50 0.812452158.63577953 1.02 -0.24 1.26 -0.75 -0.32 0.862452159.60004226 1.09 -0.26 1.35 -3.21 -2.82 0.852452163.66854221 1.11 -0.36 1.47 -5.43 -4.88 0.932452164.64596066 1.04 -0.36 1.40 -6.06 -5.55 0.912452165.59930458 1.00 -0.38 1.38 -5.42 -5.01 0.852452167.65179817 0.97 -0.43 1.41 -3.87 -2.95 1.192452168.64343776 1.01 -0.41 1.42 -2.93 -2.33 0.96
31

Table 1—Continued
HJD Wλ Wλ Wλ Vr Vr σ(Vr)Hα, net emission absorption Si II 6347 Si II 6371(A) (A) (A) (km s−1) (km s−1) (km s−1)
2452169.54733498 1.05 -0.41 1.47 -2.43 -2.24 0.772452173.51536406 1.08 -0.38 1.47 -4.88 -4.71 0.772452180.52505513 0.96 -0.47 1.43 -1.10 -0.33 1.072452182.53683153 0.99 -0.50 1.49 -0.44 -0.12 0.822452183.55028786 1.01 -0.43 1.45 -6.20 -6.58 0.842452184.52438114 1.00 -0.46 1.46 -2.71 -2.17 0.922452185.57601779 0.97 -0.44 1.41 -3.36 -2.98 0.842452186.52787653 0.92 -0.50 1.42 -3.26 -2.94 0.822452190.51306572 0.85 -0.41 1.26 0.12 -0.13 0.792452192.50230576 0.93 -0.36 1.29 -0.88 -1.09 0.782452200.49032799 0.87 -0.36 1.23 -4.86 -4.65 0.782452202.51007565 0.75 -0.43 1.18 -3.96 -3.18 1.082452211.54627200 1.18 -0.21 1.39 1.94 1.19 1.062452212.53254794 1.28 -0.14 1.42 2.05 1.65 0.852452214.46641976 1.39 -0.11 1.50 2.06 1.35 1.032452216.49511221 1.44 -0.17 1.61 1.10 0.04 1.302452217.53935808 1.54 -0.05 1.59 -0.05 -1.15 1.332452218.46923395 1.47 -0.05 1.52 0.16 0.41 0.792452219.47158286 1.50 -0.03 1.53 0.09 0.05 0.752452220.54794420 1.48 -0.05 1.53 -0.36 -0.13 0.782452223.46755044 1.49 -0.05 1.54 -2.24 -1.95 0.802452224.50767394 1.46 -0.07 1.53 -2.59 -2.19 0.852452225.48495306 1.38 -0.07 1.46 -2.30 -2.47 0.772452227.49988936 1.28 -0.10 1.38 -1.97 -1.86 0.762452235.45532754 1.20 -0.14 1.35 0.40 0.75 0.832452253.46989869 1.37 -0.13 1.50 -3.33 -2.82 0.912452262.46741699 1.51 -0.10 1.61 1.70 2.14 0.872452264.49168601 1.53 -0.09 1.62 2.76 3.34 0.95
32

Table 1—Continued
HJD Wλ Wλ Wλ Vr Vr σ(Vr)Hα, net emission absorption Si II 6347 Si II 6371(A) (A) (A) (km s−1) (km s−1) (km s−1)
2452265.50806281 1.61 -0.07 1.69 4.11 4.31 0.78
33

Table 2
Stromgren Photometry of Deneb. This table can be found in itsentirety online.
HJD u v b y u− b b− y c1 m1
2450750.6404 2.229 1.347 1.172 1.171 1.057 0.001 0.707 0.1742450751.6399 2.222 1.336 1.164 1.158 1.058 0.006 0.714 0.1662450752.6566 2.215 1.332 1.158 1.153 1.057 0.005 0.709 0.1692450753.6364 2.210 1.322 1.155 1.141 1.055 0.014 0.721 0.1532450754.6564 2.197 1.314 1.142 1.142 1.055 0.000 0.711 0.1722450756.6545 2.174 1.299 1.124 1.121 1.050 0.003 0.700 0.1722450757.6456 2.178 1.295 1.122 1.119 1.056 0.003 0.710 0.1702450760.6463 2.181 1.312 1.134 1.128 1.047 0.006 0.691 0.1722450767.6317 2.186 1.305 1.133 1.128 1.053 0.005 0.709 0.1672450768.6054 2.182 1.297 1.123 1.124 1.059 -0.001 0.711 0.1752450769.6084 2.175 1.292 1.121 1.121 1.054 0.000 0.712 0.1712450771.6043 2.187 1.306 1.129 1.128 1.058 0.001 0.704 0.1762450772.5904 2.176 1.288 1.118 1.112 1.058 0.006 0.718 0.1642450781.5898 2.164 1.285 1.109 1.109 1.055 0.000 0.703 0.1762450782.5898 2.166 1.284 1.108 1.104 1.058 0.004 0.706 0.1722450792.5734 2.197 1.301 1.134 1.132 1.063 0.002 0.729 0.1652450793.5734 2.184 1.306 1.133 1.121 1.051 0.012 0.705 0.1612450919.9904 2.203 1.329 1.147 1.145 1.056 0.002 0.692 0.1802450920.9905 2.209 1.333 1.148 1.148 1.061 0.000 0.691 0.1852450921.9873 2.209 1.340 1.156 1.154 1.053 0.002 0.685 0.1822450922.9855 2.203 1.423 1.155 1.154 1.048 0.001 0.512 0.2672450926.9763 2.191 1.322 1.140 1.137 1.051 0.003 0.687 0.1792450928.9701 2.181 1.301 1.132 1.124 1.049 0.008 0.711 0.1612450931.9586 2.186 1.311 1.128 1.130 1.058 -0.002 0.692 0.1852450932.9547 2.182 1.315 1.137 1.134 1.045 0.003 0.689 0.1752450933.9526 2.192 1.318 1.139 1.134 1.053 0.005 0.695 0.1742450934.9499 2.195 1.328 1.147 1.139 1.048 0.008 0.686 0.1732450936.9446 2.196 1.322 1.141 1.141 1.055 0.000 0.693 0.1812450938.9448 2.195 1.317 1.139 1.139 1.056 0.000 0.700 0.1782450940.9372 2.226 1.338 1.163 1.156 1.063 0.007 0.713 0.168
34
Table 2—Continued
HJD u v b y u− b b− y c1 m1
2450942.9296 2.223 1.351 1.166 1.162 1.057 0.004 0.687 0.1812450943.9234 2.217 1.347 1.167 1.163 1.050 0.004 0.690 0.1762450944.9278 2.207 1.344 1.175 1.151 1.032 0.024 0.694 0.1452450946.9188 2.201 1.322 1.145 1.140 1.056 0.005 0.702 0.1722450948.9128 2.200 1.335 1.152 1.142 1.048 0.010 0.682 0.1732450949.9104 2.203 1.336 1.153 1.146 1.050 0.007 0.684 0.1762450951.9033 2.208 1.345 1.164 1.163 1.044 0.001 0.682 0.1802450957.8895 2.206 1.342 1.159 1.155 1.047 0.004 0.681 0.1792450959.8865 2.195 1.329 1.145 1.142 1.050 0.003 0.682 0.1812450960.8905 2.185 1.329 1.126 1.127 1.059 -0.001 0.653 0.2042450961.8762 2.180 1.320 1.138 1.132 1.042 0.006 0.678 0.1762450962.8976 2.179 1.309 1.133 1.126 1.046 0.007 0.694 0.1692450965.8725 2.199 1.317 1.135 1.135 1.064 0.000 0.700 0.1822450966.8626 2.201 1.315 1.141 1.140 1.060 0.001 0.712 0.1732450966.8776 2.210 1.314 1.138 1.140 1.072 -0.002 0.720 0.1782450968.8595 2.230 1.340 1.160 1.155 1.070 0.005 0.710 0.1752450968.8668 2.230 1.337 1.158 1.150 1.072 0.008 0.714 0.1712450969.8564 2.237 1.346 1.169 1.161 1.068 0.008 0.714 0.1692450969.9585 2.239 1.336 1.163 1.161 1.076 0.002 0.730 0.1712450970.8536 2.242 1.359 1.175 1.167 1.067 0.008 0.699 0.1762450970.8604 2.241 1.353 1.172 1.168 1.069 0.004 0.707 0.1772450972.8473 2.233 1.340 1.161 1.155 1.072 0.006 0.714 0.1732450972.8626 2.229 1.343 1.161 1.157 1.068 0.004 0.704 0.1782450973.8455 2.202 1.319 1.181 1.169 1.021 0.012 0.745 0.1262450974.8404 2.193 1.314 1.134 1.133 1.059 0.001 0.699 0.1792450977.8316 2.187 1.317 1.146 1.142 1.041 0.004 0.699 0.1672450977.8396 2.197 1.334 1.149 1.140 1.048 0.009 0.678 0.1762450977.8466 2.190 1.315 1.135 1.138 1.055 -0.003 0.695 0.1832450977.8545 2.201 1.327 1.146 1.142 1.055 0.004 0.693 0.1772450977.8612 2.192 1.326 1.143 1.142 1.049 0.001 0.683 0.182
35

Table 2—Continued
HJD u v b y u− b b− y c1 m1
2450977.8694 2.192 1.331 1.145 1.140 1.047 0.005 0.675 0.1812450977.8764 2.179 1.320 1.144 1.144 1.035 0.000 0.683 0.1762450977.8843 2.187 1.325 1.141 1.141 1.046 0.000 0.678 0.1842450977.8909 2.189 1.321 1.150 1.143 1.039 0.007 0.697 0.1642450977.8993 2.190 1.328 1.143 1.143 1.047 0.000 0.677 0.1852450977.9063 2.182 1.321 1.138 1.141 1.044 -0.003 0.678 0.1862450977.9140 2.183 1.327 1.147 1.140 1.036 0.007 0.676 0.1732450977.9204 2.192 1.322 1.140 1.142 1.052 -0.002 0.688 0.1842450977.9289 2.191 1.326 1.143 1.138 1.048 0.005 0.682 0.1782450977.9366 2.188 1.320 1.143 1.141 1.045 0.002 0.691 0.1752450977.9436 2.191 1.325 1.145 1.138 1.046 0.007 0.686 0.1732450977.9505 2.188 1.319 1.143 1.140 1.045 0.003 0.693 0.1732450978.8370 2.187 1.323 1.143 1.142 1.044 0.001 0.684 0.1792450978.8445 2.188 1.318 1.149 1.145 1.039 0.004 0.701 0.1652450978.8516 2.194 1.329 1.149 1.144 1.045 0.005 0.685 0.1752450978.8596 2.189 1.327 1.149 1.143 1.040 0.006 0.684 0.1722450978.8666 2.193 1.316 1.147 1.142 1.046 0.005 0.708 0.1642450978.8745 2.190 1.320 1.150 1.141 1.040 0.009 0.700 0.1612450978.8812 2.195 1.324 1.148 1.143 1.047 0.005 0.695 0.1712450978.8894 2.194 1.318 1.148 1.142 1.046 0.006 0.706 0.1642450978.8964 2.189 1.320 1.146 1.142 1.043 0.004 0.695 0.1702450978.9043 2.195 1.323 1.147 1.145 1.048 0.002 0.696 0.1742450978.9103 2.189 1.321 1.144 1.143 1.045 0.001 0.691 0.1762450978.9193 2.193 1.325 1.145 1.142 1.048 0.003 0.688 0.1772450978.9263 2.193 1.324 1.145 1.141 1.048 0.004 0.690 0.1752450978.9342 2.194 1.322 1.147 1.143 1.047 0.004 0.697 0.1712450978.9405 2.196 1.327 1.146 1.145 1.050 0.001 0.688 0.1802450978.9489 2.197 1.333 1.146 1.144 1.051 0.002 0.677 0.1852450978.9566 2.196 1.330 1.148 1.144 1.048 0.004 0.684 0.1782450979.8275 2.191 1.319 1.142 1.144 1.049 -0.002 0.695 0.179
36

Table 2—Continued
HJD u v b y u− b b− y c1 m1
2450979.8348 2.194 1.321 1.148 1.143 1.046 0.005 0.700 0.1682450979.8425 2.195 1.324 1.144 1.144 1.051 0.000 0.691 0.1802450979.8497 2.200 1.326 1.147 1.142 1.053 0.005 0.695 0.1742450979.8574 2.198 1.322 1.144 1.142 1.054 0.002 0.698 0.1762450979.8646 2.201 1.321 1.147 1.144 1.054 0.003 0.706 0.1712450979.8701 2.186 1.322 1.142 1.136 1.044 0.006 0.684 0.1742450979.8786 2.196 1.321 1.148 1.142 1.048 0.006 0.702 0.1672450979.8866 2.198 1.319 1.147 1.143 1.051 0.004 0.707 0.1682450979.8938 2.195 1.315 1.151 1.143 1.044 0.008 0.716 0.1562450979.9004 2.196 1.330 1.145 1.145 1.051 0.000 0.681 0.1852450979.9086 2.196 1.323 1.145 1.141 1.051 0.004 0.695 0.1742450979.9143 2.189 1.316 1.141 1.138 1.048 0.003 0.698 0.1722450979.9209 2.197 1.323 1.146 1.143 1.051 0.003 0.697 0.1742450979.9292 2.197 1.328 1.145 1.141 1.052 0.004 0.686 0.1792450979.9365 2.197 1.323 1.146 1.144 1.051 0.002 0.697 0.1752450979.9439 2.198 1.324 1.147 1.145 1.051 0.002 0.697 0.1752450980.8304 2.197 1.326 1.148 1.144 1.049 0.004 0.693 0.1742450980.8389 2.201 1.326 1.148 1.149 1.053 -0.001 0.697 0.1792450982.8244 2.212 1.330 1.155 1.146 1.057 0.009 0.707 0.1662450983.8176 2.205 1.339 1.154 1.139 1.051 0.015 0.681 0.1702450983.9336 2.214 1.339 1.157 1.152 1.057 0.005 0.693 0.1772450984.8142 2.204 1.346 1.157 1.156 1.047 0.001 0.669 0.1882450984.8205 2.210 1.347 1.159 1.157 1.051 0.002 0.675 0.1862450985.8176 2.206 1.345 1.161 1.154 1.045 0.007 0.677 0.1772450985.8255 2.210 1.349 1.167 1.160 1.043 0.007 0.679 0.1752450985.8328 2.208 1.353 1.163 1.157 1.045 0.006 0.665 0.1842450985.8405 2.212 1.355 1.164 1.156 1.048 0.008 0.666 0.1832450985.8476 2.217 1.348 1.160 1.163 1.057 -0.003 0.681 0.1912450985.8555 2.208 1.353 1.161 1.156 1.047 0.005 0.663 0.1872450985.8625 2.214 1.345 1.165 1.156 1.049 0.009 0.689 0.171
37

Table 2—Continued
HJD u v b y u− b b− y c1 m1
2450985.8703 2.213 1.349 1.165 1.157 1.048 0.008 0.680 0.1762450985.8776 2.209 1.350 1.161 1.156 1.048 0.005 0.670 0.1842450985.8852 2.210 1.346 1.158 1.154 1.052 0.004 0.676 0.1842450985.8925 2.214 1.347 1.163 1.155 1.051 0.008 0.683 0.1762450985.9003 2.204 1.340 1.164 1.154 1.040 0.010 0.688 0.1662450985.9075 2.209 1.352 1.157 1.155 1.052 0.002 0.662 0.1932450985.9149 2.212 1.349 1.162 1.154 1.050 0.008 0.676 0.1792450985.9224 2.215 1.343 1.160 1.154 1.055 0.006 0.689 0.1772450985.9296 2.211 1.343 1.163 1.157 1.048 0.006 0.688 0.1742450985.9375 2.215 1.354 1.160 1.160 1.055 0.000 0.667 0.1942450985.9448 2.209 1.343 1.161 1.159 1.048 0.002 0.684 0.1802450985.9524 2.212 1.343 1.160 1.157 1.052 0.003 0.686 0.1802450985.9596 2.212 1.343 1.165 1.156 1.047 0.009 0.691 0.1692450985.9673 2.211 1.348 1.161 1.154 1.050 0.007 0.676 0.1802450986.8146 2.205 1.341 1.159 1.165 1.046 -0.006 0.682 0.1882450986.8903 2.210 1.338 1.158 1.154 1.052 0.004 0.692 0.1762450987.8073 2.214 1.346 1.159 1.151 1.055 0.008 0.681 0.1792450988.8035 2.206 1.333 1.152 1.144 1.054 0.008 0.692 0.1732450988.8825 2.212 1.340 1.153 1.146 1.059 0.007 0.685 0.1802450989.8029 2.203 1.333 1.148 1.149 1.055 -0.001 0.685 0.1862450990.8066 2.199 1.349 1.153 1.146 1.046 0.007 0.654 0.1892450990.8864 2.206 1.339 1.153 1.145 1.053 0.008 0.681 0.1782450991.7985 2.201 1.343 1.156 1.143 1.045 0.013 0.671 0.1742450991.8876 2.207 1.343 1.154 1.147 1.053 0.007 0.675 0.1822450992.7955 2.193 1.344 1.161 1.155 1.032 0.006 0.666 0.1772450993.7905 2.207 1.346 1.157 1.154 1.050 0.003 0.672 0.1862450994.7875 2.194 1.340 1.150 1.149 1.044 0.001 0.664 0.1892450994.9665 2.202 1.333 1.155 1.148 1.047 0.007 0.691 0.1712450995.8553 2.199 1.325 1.146 1.145 1.053 0.001 0.695 0.1782450996.9302 2.195 1.316 1.149 1.140 1.046 0.009 0.712 0.158
38

Table 2—Continued
HJD u v b y u− b b− y c1 m1
2451081.6695 2.202 1.324 1.159 1.156 1.043 0.003 0.713 0.1622451082.6023 2.212 1.337 1.166 1.167 1.046 -0.001 0.704 0.1722451083.6003 2.211 1.340 1.165 1.164 1.046 0.001 0.696 0.1742451084.6002 2.211 1.334 1.162 1.158 1.049 0.004 0.705 0.1682451085.6203 2.211 1.337 1.163 1.156 1.048 0.007 0.700 0.1672451086.6404 2.214 1.325 1.159 1.160 1.055 -0.001 0.723 0.1672451087.6235 2.214 1.331 1.157 1.160 1.057 -0.003 0.709 0.1772451090.6225 2.213 1.334 1.167 1.165 1.046 0.002 0.712 0.1652451091.6253 2.212 1.338 1.164 1.163 1.048 0.001 0.700 0.1732451092.6186 2.208 1.346 1.170 1.168 1.038 0.002 0.686 0.1742451093.6176 2.217 1.347 1.169 1.165 1.048 0.004 0.692 0.1742451096.6155 2.194 1.332 1.161 1.157 1.033 0.004 0.691 0.1672451097.6146 2.185 1.321 1.154 1.151 1.031 0.003 0.697 0.1642451098.6035 2.183 1.319 1.146 1.143 1.037 0.003 0.691 0.1702451101.6001 2.206 1.323 1.154 1.146 1.052 0.008 0.714 0.1612451102.5998 2.217 1.336 1.163 1.165 1.054 -0.002 0.708 0.1752451103.5885 2.215 1.333 1.168 1.162 1.047 0.006 0.717 0.1592451104.5883 2.224 1.343 1.179 1.169 1.045 0.010 0.717 0.1542451105.5875 2.237 1.346 1.183 1.174 1.054 0.009 0.728 0.1542451105.6244 2.230 1.358 1.176 1.170 1.054 0.006 0.690 0.1762451113.5905 2.188 1.334 1.130 1.152 1.058 -0.022 0.650 0.2262451115.5894 2.194 1.320 1.149 1.147 1.045 0.002 0.703 0.1692451116.5905 2.199 1.338 1.158 1.152 1.041 0.006 0.681 0.1742451118.5911 2.201 1.331 1.159 1.157 1.042 0.002 0.698 0.1702451119.5885 2.210 1.348 1.166 1.162 1.044 0.004 0.680 0.1782451120.5902 2.213 1.340 1.168 1.166 1.045 0.002 0.701 0.1702451121.5694 2.224 1.351 1.176 1.172 1.048 0.004 0.698 0.1712451122.5690 2.225 1.354 1.176 1.174 1.049 0.002 0.693 0.1762451123.6403 2.218 1.346 1.175 1.174 1.043 0.001 0.701 0.1702451131.5902 2.195 1.314 1.150 1.148 1.045 0.002 0.717 0.162
39

Table 2—Continued
HJD u v b y u− b b− y c1 m1
2451132.5875 2.196 1.313 1.147 1.142 1.049 0.005 0.717 0.1612451133.5875 2.193 1.316 1.144 1.139 1.049 0.005 0.705 0.1672451136.5709 2.197 1.329 1.163 1.155 1.034 0.008 0.702 0.1582451290.9885 2.244 1.374 1.198 1.188 1.046 0.010 0.694 0.1662451295.9834 2.221 1.364 1.186 1.180 1.035 0.006 0.679 0.1722451298.9703 2.214 1.354 1.179 1.174 1.035 0.005 0.685 0.1702451299.9647 2.214 1.349 1.177 1.173 1.037 0.004 0.693 0.1682451300.9609 2.213 1.347 1.175 1.172 1.038 0.003 0.694 0.1692451302.9603 2.234 1.349 1.175 1.183 1.059 -0.008 0.711 0.1822451303.9644 2.242 1.354 1.182 1.182 1.060 0.000 0.716 0.1722451304.9593 2.231 1.346 1.174 1.172 1.057 0.002 0.713 0.1702451306.9786 2.225 1.335 1.168 1.169 1.057 -0.001 0.723 0.1682451308.9736 2.208 1.339 1.163 1.165 1.045 -0.002 0.693 0.1782451310.9669 2.196 1.324 1.149 1.150 1.047 -0.001 0.697 0.1762451312.9293 2.193 1.324 1.150 1.146 1.043 0.004 0.695 0.1702451313.9683 2.192 1.329 1.153 1.150 1.039 0.003 0.687 0.1732451314.9254 2.203 1.334 1.160 1.155 1.043 0.005 0.695 0.1692451315.9213 2.197 1.322 1.154 1.154 1.043 0.000 0.707 0.1682451317.9453 2.203 1.329 1.156 1.154 1.047 0.002 0.701 0.1712451318.9275 2.204 1.331 1.155 1.154 1.049 0.001 0.697 0.1752451319.9283 2.200 1.336 1.157 1.156 1.043 0.001 0.685 0.1782451320.9249 2.193 1.334 1.158 1.153 1.035 0.005 0.683 0.1712451321.9326 2.190 1.334 1.160 1.157 1.030 0.003 0.682 0.1712451322.9175 2.191 1.338 1.156 1.155 1.035 0.001 0.671 0.1812451323.9184 2.193 1.335 1.158 1.150 1.035 0.008 0.681 0.1692451324.9273 2.192 1.330 1.156 1.157 1.036 -0.001 0.688 0.1752451325.9233 2.196 1.337 1.159 1.162 1.037 -0.003 0.681 0.1812451326.9074 2.197 1.338 1.158 1.154 1.039 0.004 0.679 0.1762451447.7241 2.242 1.360 1.178 1.171 1.064 0.007 0.700 0.1752451448.7296 2.241 1.363 1.175 1.168 1.066 0.007 0.690 0.181
40

Table 2—Continued
HJD u v b y u− b b− y c1 m1
2451449.7205 2.231 1.356 1.174 1.168 1.057 0.006 0.693 0.1762451450.7197 2.227 1.347 1.170 1.164 1.057 0.006 0.703 0.1712451451.7045 2.219 1.344 1.154 1.154 1.065 0.000 0.685 0.1902451452.7455 2.194 1.329 1.144 1.144 1.050 0.000 0.680 0.1852451453.7328 2.185 1.317 1.138 1.136 1.047 0.002 0.689 0.1772451454.7100 2.177 1.310 1.131 1.130 1.046 0.001 0.688 0.1782451455.7241 2.180 1.314 1.134 1.130 1.046 0.004 0.686 0.1762451456.6853 2.187 1.330 1.144 1.138 1.043 0.006 0.671 0.1802451458.7142 2.218 1.342 1.159 1.154 1.059 0.005 0.693 0.1782451459.6947 2.224 1.350 1.168 1.163 1.056 0.005 0.692 0.1772451465.6754 2.167 1.304 1.125 1.120 1.042 0.005 0.684 0.1742451466.6700 2.169 1.303 1.121 1.121 1.048 0.000 0.684 0.1822451466.6785 2.169 1.303 1.120 1.119 1.049 0.001 0.683 0.1822451467.6596 2.169 1.299 1.115 1.116 1.054 -0.001 0.686 0.1852451467.6671 2.168 1.300 1.117 1.116 1.051 0.001 0.685 0.1822451470.6645 2.175 1.301 1.127 1.122 1.048 0.005 0.700 0.1692451470.6801 2.176 1.302 1.127 1.122 1.049 0.005 0.699 0.1702451471.6534 2.186 1.318 1.139 1.136 1.047 0.003 0.689 0.1762451471.6601 2.192 1.321 1.138 1.134 1.054 0.004 0.688 0.1792451472.6501 2.201 1.324 1.148 1.148 1.053 0.000 0.701 0.1762451472.6584 2.201 1.326 1.147 1.144 1.054 0.003 0.696 0.1762451473.6546 2.216 1.330 1.155 1.169 1.061 -0.014 0.711 0.1892451473.6601 2.218 1.331 1.157 1.170 1.061 -0.013 0.713 0.1872451474.6496 2.218 1.340 1.160 1.156 1.058 0.004 0.698 0.1762451474.6571 2.219 1.340 1.162 1.156 1.057 0.006 0.701 0.1722451475.6285 2.226 1.345 1.162 1.161 1.064 0.001 0.698 0.1822451475.6361 2.220 1.346 1.168 1.162 1.052 0.006 0.696 0.1722451477.6890 2.221 1.345 1.168 1.160 1.053 0.008 0.699 0.1692451477.6974 2.221 1.342 1.168 1.162 1.053 0.006 0.705 0.1682451478.6262 2.215 1.335 1.160 1.156 1.055 0.004 0.705 0.171
41

Table 2—Continued
HJD u v b y u− b b− y c1 m1
2451478.6670 2.217 1.341 1.160 1.156 1.057 0.004 0.695 0.1772451479.6305 2.206 1.330 1.155 1.149 1.051 0.006 0.701 0.1692451479.6656 2.210 1.335 1.151 1.154 1.059 -0.003 0.691 0.1872451480.6300 2.203 1.339 1.152 1.143 1.051 0.009 0.677 0.1782451480.6700 2.177 1.317 1.141 1.181 1.036 -0.040 0.684 0.2162451481.6254 2.197 1.325 1.142 1.138 1.055 0.004 0.689 0.1792451481.6664 2.195 1.319 1.146 1.135 1.049 0.011 0.703 0.1622451482.6301 2.190 1.323 1.144 1.141 1.046 0.003 0.688 0.1762451482.6700 2.195 1.328 1.140 1.132 1.055 0.008 0.679 0.1802451483.6185 2.187 1.323 1.146 1.141 1.041 0.005 0.687 0.1722451483.6595 2.188 1.326 1.145 1.142 1.043 0.003 0.681 0.1782451484.6565 2.196 1.333 1.150 1.145 1.046 0.005 0.680 0.1782451485.6060 2.211 1.337 1.162 1.157 1.049 0.005 0.699 0.1702451486.6090 2.216 1.350 1.167 1.161 1.049 0.006 0.683 0.1772451486.6435 2.213 1.352 1.169 1.162 1.044 0.007 0.678 0.1762451487.6077 2.219 1.355 1.171 1.168 1.048 0.003 0.680 0.1812451487.6486 2.217 1.355 1.172 1.166 1.045 0.006 0.679 0.1772451491.6033 2.240 1.354 1.173 1.170 1.067 0.003 0.705 0.1782451491.6371 2.239 1.355 1.172 1.167 1.067 0.005 0.701 0.1782451490.6306 2.239 1.359 1.173 1.170 1.066 0.003 0.694 0.1832451492.5950 2.230 1.352 1.167 1.165 1.063 0.002 0.693 0.1832451492.6351 2.232 1.353 1.172 1.161 1.060 0.011 0.698 0.1702451493.5753 2.219 1.353 1.167 1.164 1.052 0.003 0.680 0.1832451493.6274 2.225 1.349 1.164 1.161 1.061 0.003 0.691 0.1822451494.5721 2.209 1.344 1.160 1.155 1.049 0.005 0.681 0.1792451494.6242 2.208 1.344 1.161 1.154 1.047 0.007 0.681 0.1762451496.5732 2.204 1.331 1.140 1.142 1.064 -0.002 0.682 0.1932451497.5650 2.205 1.326 1.141 1.143 1.064 -0.002 0.694 0.1872451497.6161 2.197 1.326 1.141 1.140 1.056 0.001 0.686 0.1842451498.5655 2.208 1.331 1.145 1.104 1.063 0.041 0.691 0.145
42

Table 2—Continued
HJD u v b y u− b b− y c1 m1
2451500.5725 2.230 1.336 1.163 1.164 1.067 -0.001 0.721 0.1742451500.6043 2.226 1.341 1.166 1.164 1.060 0.002 0.710 0.1732451501.5722 2.243 1.352 1.170 1.168 1.073 0.002 0.709 0.1802451501.6023 2.235 1.356 1.168 1.170 1.067 -0.002 0.691 0.1902451502.6026 2.240 1.355 1.176 1.176 1.064 0.000 0.706 0.1792451503.5947 2.244 1.351 1.174 1.175 1.070 -0.001 0.716 0.1782451504.5942 2.232 1.344 1.162 1.162 1.070 0.000 0.706 0.1822451509.5782 2.204 1.329 1.151 1.150 1.053 0.001 0.697 0.1772451509.5857 2.205 1.332 1.155 1.148 1.050 0.007 0.696 0.1702451510.5704 2.207 1.329 1.150 1.146 1.057 0.004 0.699 0.1752451510.5857 2.207 1.330 1.150 1.147 1.057 0.003 0.697 0.1772451511.5856 2.221 1.339 1.152 1.153 1.069 -0.001 0.695 0.1882451514.5860 2.251 1.357 1.171 1.167 1.080 0.004 0.708 0.1822451656.9855 2.212 1.345 1.155 1.155 1.057 0.000 0.677 0.1902451657.9781 2.215 1.342 1.161 1.151 1.054 0.010 0.692 0.1712451658.9770 2.205 1.342 1.157 1.153 1.048 0.004 0.678 0.1812451659.9720 2.206 1.334 1.147 1.144 1.059 0.003 0.685 0.1842451660.9784 2.199 1.325 1.139 1.133 1.060 0.006 0.688 0.1802451661.9866 2.185 1.318 1.133 1.124 1.052 0.009 0.682 0.1762451663.9785 2.223 1.318 1.127 1.124 1.096 0.003 0.714 0.1882451664.9700 2.185 1.316 1.134 1.130 1.051 0.004 0.687 0.1782451665.9786 2.183 1.320 1.141 1.138 1.042 0.003 0.684 0.1762451666.9701 2.184 1.327 1.144 1.144 1.040 0.000 0.674 0.1832451667.9671 2.191 1.324 1.140 1.137 1.051 0.003 0.683 0.1812451668.9628 2.186 1.318 1.137 1.134 1.049 0.003 0.687 0.1782451669.9658 2.173 1.314 1.129 1.125 1.044 0.004 0.674 0.1812451670.9425 2.167 1.308 1.127 1.125 1.040 0.002 0.678 0.1792451671.9491 2.166 1.312 1.126 1.124 1.040 0.002 0.668 0.1842451672.9501 2.177 1.319 1.128 1.123 1.049 0.005 0.667 0.1862451673.9472 2.181 1.325 1.133 1.132 1.048 0.001 0.664 0.191
43

Table 2—Continued
HJD u v b y u− b b− y c1 m1
2451674.9462 2.192 1.345 1.149 1.145 1.043 0.004 0.651 0.1922451684.9161 2.181 1.318 1.140 1.138 1.041 0.002 0.685 0.1762451689.9027 2.202 1.329 1.149 1.143 1.053 0.006 0.693 0.1742451698.9054 2.169 1.328 1.137 1.139 1.032 -0.002 0.650 0.1932451699.8961 2.164 1.324 1.139 1.134 1.025 0.005 0.655 0.1802451700.9000 2.166 1.329 1.137 1.136 1.029 0.001 0.645 0.1912451704.8900 2.214 1.354 1.158 1.153 1.056 0.005 0.664 0.1912451705.8823 2.208 1.342 1.157 1.156 1.051 0.001 0.681 0.1842451706.8807 2.225 1.348 1.164 1.167 1.061 -0.003 0.693 0.1872451707.8820 2.231 1.360 1.168 1.168 1.063 0.000 0.679 0.1922451708.8798 2.232 1.354 1.171 1.166 1.061 0.005 0.695 0.1782451709.8760 2.231 1.360 1.174 1.171 1.057 0.003 0.685 0.1832451710.8847 2.235 1.359 1.187 1.171 1.048 0.016 0.704 0.1562451711.8690 2.231 1.353 1.167 1.164 1.064 0.003 0.692 0.1832451712.8621 2.218 1.348 1.161 1.155 1.057 0.006 0.683 0.1812451729.8198 2.169 1.304 1.122 1.130 1.047 -0.008 0.683 0.1902451809.6045 2.198 1.327 1.148 1.149 1.050 -0.001 0.692 0.1802451810.6860 2.197 1.330 1.145 1.148 1.052 -0.003 0.682 0.1882451815.6754 2.215 1.357 1.175 1.177 1.040 -0.002 0.676 0.1842451816.6651 2.220 1.360 1.183 1.176 1.037 0.007 0.683 0.1702451817.6596 2.224 1.373 1.185 1.185 1.039 0.000 0.663 0.1882451823.6563 2.191 1.318 1.141 1.147 1.050 -0.006 0.696 0.1832451823.6432 2.184 1.313 1.146 1.147 1.038 -0.001 0.704 0.1682451825.6436 2.192 1.321 1.146 1.148 1.046 -0.002 0.696 0.1772451830.6280 2.220 1.325 1.160 1.163 1.060 -0.003 0.730 0.1682451831.6222 2.212 1.332 1.159 1.164 1.053 -0.005 0.707 0.1782451833.6201 2.193 1.317 1.144 1.149 1.049 -0.005 0.703 0.1782451834.6195 2.190 1.317 1.141 1.144 1.049 -0.003 0.697 0.1792451842.6092 2.181 1.319 1.144 1.147 1.037 -0.003 0.687 0.1782451844.5860 2.185 1.316 1.149 1.144 1.036 0.005 0.702 0.162
44

Table 2—Continued
HJD u v b y u− b b− y c1 m1
2451847.6401 2.200 1.330 1.152 1.151 1.048 0.001 0.692 0.1772451849.5932 2.197 1.328 1.151 1.155 1.046 -0.004 0.692 0.1812451850.5907 2.193 1.323 1.153 1.151 1.040 0.002 0.700 0.1682451857.5724 2.187 1.311 1.146 1.149 1.041 -0.003 0.711 0.1682451861.5700 2.201 1.329 1.162 1.164 1.039 -0.002 0.705 0.1692451864.5691 2.192 1.328 1.153 1.153 1.039 0.000 0.689 0.1752451867.5690 2.169 1.309 1.144 1.146 1.025 -0.002 0.695 0.1672451869.5677 2.175 1.310 1.141 1.145 1.034 -0.004 0.696 0.1732451874.5741 2.174 1.310 1.138 1.143 1.036 -0.005 0.692 0.1772451875.5665 2.179 1.314 1.149 1.149 1.030 0.000 0.700 0.1652451877.5662 2.194 1.330 1.154 1.156 1.040 -0.002 0.688 0.1782452030.9561 2.163 1.314 1.137 1.138 1.026 -0.001 0.672 0.1782452031.9505 2.171 1.318 1.140 1.144 1.031 -0.004 0.675 0.1822452034.9587 2.196 1.332 1.152 1.154 1.044 -0.002 0.684 0.1822452035.9681 2.209 1.336 1.154 1.157 1.055 -0.003 0.691 0.1852452036.9480 2.237 1.344 1.160 1.163 1.077 -0.003 0.709 0.1872452037.9403 2.221 1.340 1.161 1.162 1.060 -0.001 0.702 0.1802452038.9407 2.213 1.344 1.157 1.158 1.056 -0.001 0.682 0.1882452039.9422 2.216 1.344 1.162 1.164 1.054 -0.002 0.690 0.1842452044.9106 2.221 1.343 1.159 1.164 1.062 -0.005 0.694 0.1892452045.9322 2.216 1.337 1.163 1.159 1.053 0.004 0.705 0.1702452046.9203 2.219 1.340 1.159 1.165 1.060 -0.006 0.698 0.1872452050.8982 2.208 1.330 1.145 1.147 1.063 -0.002 0.693 0.1872452051.9021 2.196 1.325 1.142 1.139 1.054 0.003 0.688 0.1802452052.9008 2.193 1.321 1.134 1.138 1.059 -0.004 0.685 0.1912452053.8872 2.184 1.320 1.136 1.134 1.048 0.002 0.680 0.1822452055.8843 2.180 1.315 1.123 1.130 1.057 -0.007 0.673 0.1992452058.8930 2.189 1.322 1.145 1.142 1.044 0.003 0.690 0.1742452061.8678 2.184 1.323 1.138 1.149 1.046 -0.011 0.676 0.1962452062.9052 2.191 1.310 1.138 1.142 1.053 -0.004 0.709 0.176
45

Table 2—Continued
HJD u v b y u− b b− y c1 m1
2452064.8663 2.192 1.311 1.136 1.139 1.056 -0.003 0.706 0.1782452073.8330 2.202 1.323 1.156 1.153 1.046 0.003 0.712 0.1642452074.8332 2.200 1.313 1.151 1.155 1.049 -0.004 0.725 0.1662452074.8305 2.193 1.318 1.149 1.149 1.044 0.000 0.706 0.1692452076.8383 2.167 1.307 1.119 1.123 1.048 -0.004 0.672 0.1922452084.8073 2.167 1.294 1.122 1.132 1.045 -0.010 0.701 0.1822452087.8001 2.185 1.303 1.135 1.138 1.050 -0.003 0.714 0.1712452088.7921 2.188 1.310 1.136 1.137 1.052 -0.001 0.704 0.175
Table 3
Stromgren Photometric Parameters derived from the data.
Filter Magnitude Amplitude ofor Color Variability
u 2.202 0.018v 1.331 0.016b 1.152 0.014y 1.149 0.014
u− b 1.050 0.009b− y 0.003 0.005c1 0.692 0.017m1 0.177 0.010
46

Table 4
Coefficients for the sine wave fits (through χ2 minimization) to theradial pulsations shown in Figure 9 as well as other variables we
fitted. The errors are the standard errors of the fit.
Season Type Period A xc c(days) (km s−1) or (mag) (phase) (km s−1) or (mag)
Fall 1998 u 17.8 −0.016± 0.002 0.39± 0.02 2.208± 0.001Fall 1998 v 17.8 −0.011± 0.002 0.42± 0.04 1.335± 0.002Fall 1998 b 17.8 −0.011± 0.002 0.38± 0.04 1.162± 0.002Fall 1998 y 17.8 −0.011± 0.002 0.42± 0.03 1.160± 0.001Fall 1998 Si II RV 17.8 2.27± 0.62 0.19± 0.03 −2.56± 0.43Fall 1999 u 13.4 −0.023± 0.002 0.38± 0.02 2.211± 0.002Fall 1999 v 13.4 −0.016± 0.002 0.39± 0.02 1.336± 0.001Fall 1999 b 13.4 −0.017± 0.002 0.39± 0.02 1.155± 0.001Fall 1999 y 13.4 −0.017± 0.002 0.39± 0.02 1.152± 0.001Fall 1999 Si II RV 13.4 1.21± 0.57 0.17± 0.08 −2.76± 0.42
47

Table 5
Hot supergiant stars observed at Ritter Observatory with the samespectroscopic instrumentation as the observations presented here.All stars with an absence of the absorption events have more than40 observations. Presented here are fundamental properties, thenumber of observations, and whether high velocity absorption
events have been seen in our data. Kaufer et al. (1996) also foundhigh velocity absorption in the late B-type supergiants HD 91619
and HD 96919, which both are hotter and more luminous than Deneband are inaccessible to the instrumentation used in this survey. νCep is nearly identical to Deneb, but has not exhibited any high
velocity absorption events.
Star MK Teff log(L/L⊙) Reference Number Years AbsorptionK (Stellar Parameters) of Spectra of Data Events?
Rigel B8 Ia 12500 5.56 Markova et al. (2008) 203 1996-2007 yesHR 8020 B8Iae 13000 5.08 Markova et al. (2008) 29 2000-2006 yesHR 1035 B9 Ia 9730 4.92 Verdugo et al. (1999) 108 1994-2007 yesHR 1040 A0 Ia 9600 4.76 Barlow & Cohen (1977) 187 1993-2007 yes9 Per A2 Ia 9000 4.99 Kudritzki et al. (1999a) 40 1993-2005 yesDeneb A2 Ia 8500 5.20 Aufdenberg et al. (2002) 781 1993-2007 yes, rareν Cep A2 Ia 8500 4.76 119 1994-2007 no, See Footnote 36 Cas A3 Ia 8400 5.13 Kudritzki et al. (1999) 69 1993-2007 no
48

49