simultaneous management of nitrogen and phosphorus
TRANSCRIPT
SIMULTANEOUS MANAGEMENT OF NITROGEN AND PHOSPHORUS
IN DEWATERED SLUDGE LIQUOR BY COMBINING ANAMMOX
PROCESS WITH STRUVITE CRYSTALLIZATION
by
Parssa Hassan
B.Sc. Engg. (Civil), Bangladesh University of Engineering and Technology,
Dhaka, Bangladesh, 2007
A THESIS SUBMITTED IN PARTIAL FULFILMENT OF THE
REQUIREMENTS FOR THE DEGREE OF
MASTER OF APPLIED SCIENCE
in
The Faculty of Graduate and Postdoctoral Studies
(Civil Engineering)
THE UNIVERSITY OF BRITISH COLUMBIA
(Vancouver)
September 2013
© Parssa Hassan, 2013
Abstract
A process combination of anaerobic ammonium oxidation (ANAMMOX), followed by struvite
crystallization, was examined for simultaneous removal of nutrients (nitrogen and phosphorus)
from dewatered sludge liquor or centrate. Phosphorus recovery as struvite can recover more than
90% P from centrate; however, the effluent after struvite crystallization still contains high
concentrations of ammonium nitrogen (NH4-N). ANAMMOX is a cost effective alternative
process for NH4-N removal and this process can remove 85% - 90% of NH4-N from centrate, but
leaves high concentration of phosphorus phosphate (PO4-P) in the treated effluent. Combining
ANAMMOX and struvite recovery can offer a sustainable solution for managing phosphorus and
nitrogen at wastewater treatment plants. The ANAMMOX process, followed by a struvite
crystallization process, was selected as the combination sequence for this first study. Synthetic
feed was prepared with different molar ratios of Mg: NH4-N: PO4-P to mimic centrate, partially
nitrified centrate and centrate treated by ANAMMOX process (ANAMMOX effluent). To
determine the molar ratio of Mg: NH4-N: PO4-P, centrate was obtained from Lulu Island
Wastewater Treatment Plant and partial nitrification, followed by ANNAMOX process, was
conducted on this batch of centrate. Jar tests were conducted to determine the struvite formation
potential from synthetic ANAMMOX effluent, as it has a very low N: P ratio. Pure struvite
formed successfully in the jar tests with P-removal efficiency up to 88%. The process
combination was upgraded to bench-scale, fluidized bed reactors for further investigation on the
nutrient recovery efficiencies and associated chemical costs. The process combination
successfully reduced NH4-N concentration to 70 mg/L from an initial value of 800 mg/L. The
concentration of PO4-P was reduced to 15 mg/L in the final treated effluent, from a starting value
of 119 mg/L. Overall, the combination resulted in phosphorus-phosphate (PO4-P) removal rate as
ii
iii
high as 87% and ammonium-nitrogen (NH4-N) as high as 92%. The mean particle size for
struvite from ANAMMOX effluent ranged between 90 - 160 μm, and was larger than struvite
particle formed from centrate. However, chemical costs associated with caustic and magnesium
consumption, were found to be higher for the process combination, compared to just struvite
formation using centrate.
Preface
This thesis is an original, unpublished, and independent work of the author, Parssa Hassan. The
experimental setup configurations used in this research, described in Chapter 2, were based on
previous designs developed by the Civil and Environmental Engineering Department, UBC, and
were modified by myself to best suit the outcomes of this research. All data presented in this
study were generated at the Environmental Laboratories, Civil Engineering Department, The
University of British Columbia, Vancouver (Point Grey Campus), Canada.
iv
Table of Contents
Abstract .................................................................................................................................... ii
Preface ..................................................................................................................................... iv
Table of Contents .................................................................................................................... v
List of Tables ........................................................................................................................... x
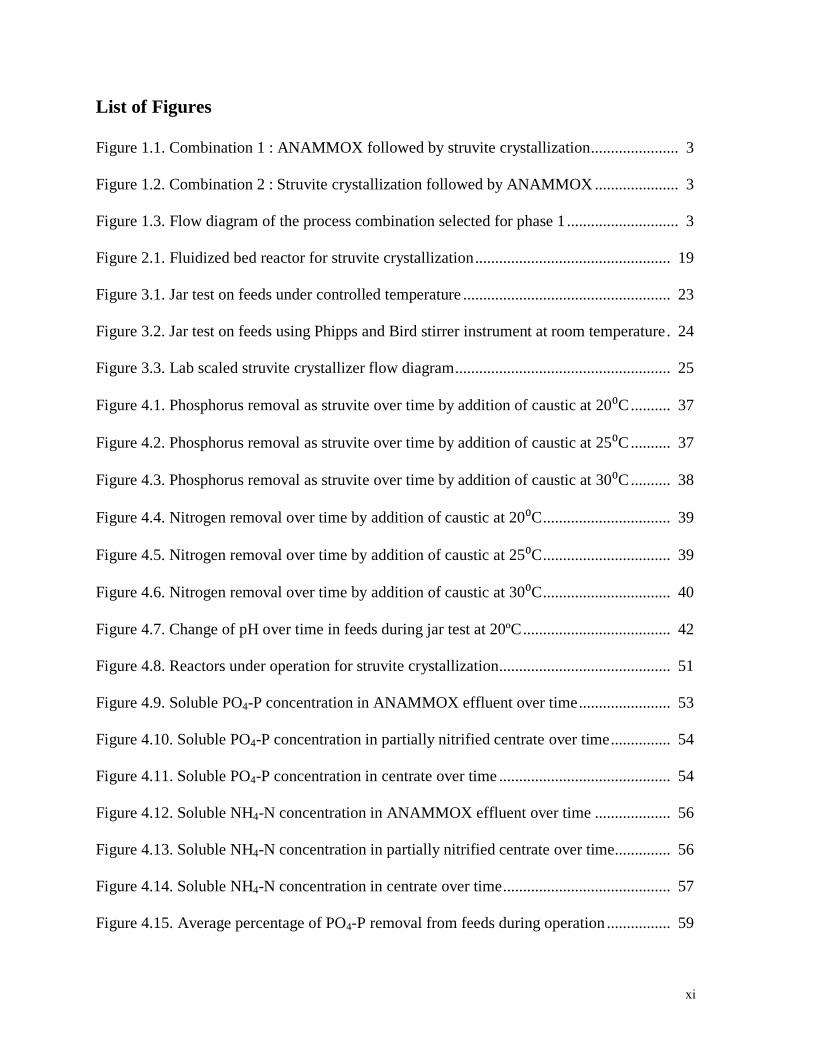
List of Figures ......................................................................................................................... xi
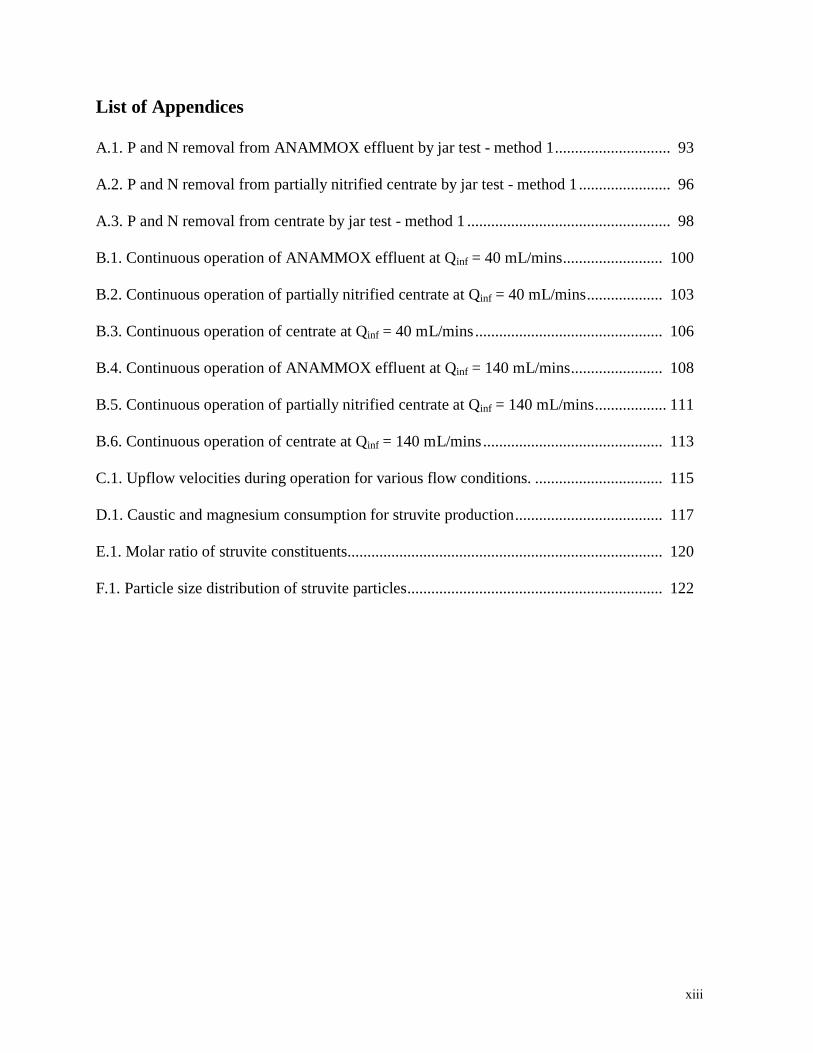
List of Appendices ................................................................................................................ xiii
List of Abbreviations ........................................................................................................... xiv
Acknowledgements .............................................................................................................. xvi
Dedication ............................................................................................................................ xvii
1. Introduction ....................................................................................................................... 1
1.1 Background ................................................................................................................. 1
1.2 Research Objectives .................................................................................................... 2
2. Literature Review .............................................................................................................. 5
2.1 Nutrient Removal and Recovery Methods .................................................................. 5
2.1.1 Nitrogen Recovery ................................................................................................ 5
2.1.1.1 Nitrification - Denitrification ........................................................................ 5
2.1.1.2 Anaerobic Amminium Oxidation (ANAMMOX) ......................................... 6
2.1.2 Phosphorus Recovery ........................................................................................... 6
2.1.2.1 Biological Processes ..................................................................................... 7
2.1.2.2 Chemical Processes ........................................................................................ 7
v
2.2 ANAMMOX Process and Benefits ............................................................................. 8
2.3 Struvite Recovery and Benefits ................................................................................. 10
2.4 Struvite Chemistry ..................................................................................................... 12
2.5 Factors Affecting Struvite Formation........................................................................ 12
2.5.1 pH ....................................................................................................................... 13
2.5.2 Supersaturation Ratio (SSR) ............................................................................... 14
2.5.3 Temperature ........................................................................................................ 14
2.5.4 Turbulence or Mixing Energy ............................................................................ 15
2.5.5 Ammonium to Phosphorus Molar Ratio ............................................................. 15
2.5.6 Magnesium to Phosphorus Molar Ratio ............................................................. 16
2.5.7 Presence of Foreign Ions .................................................................................... 16
2.6 Chemicals for Struvite Formation ............................................................................. 16
2.6.1 Caustic ................................................................................................................ 16
2.6.2 Magnesium ......................................................................................................... 17
2.7 Operating Cost for Struvite Production ..................................................................... 17
2.8 Fluidized Bed Reactors for Struvite Crystallization.................................................. 18
2.9 Struvite Morphology ................................................................................................. 19
3. Materials and Methods .................................................................................................... 21
3.1 Process Description ................................................................................................... 21
3.1.1 Part 1: Feed Characteristics Determination ........................................................ 21
3.1.2 Part 2: Struvite Formation Potential Tests .......................................................... 22
3.1.3 Part 3: Continuous Process with Fluidized Bed Reactors .................................. 24
3.2 Chemicals, Storage and Pumps ................................................................................. 26
vi
3.2.1 Influent Feed ....................................................................................................... 26
3.2.2 Magnesium (Mg) Feed ....................................................................................... 27
3.2.3 Caustic (NaOH) Feed ......................................................................................... 27
3.2.4 pH Controllers .................................................................................................... 27
3.3 Sample Collection and Preservation.......................................................................... 28
3.4 Analytical Methods ................................................................................................... 28
3.4.1 Magnesium ......................................................................................................... 28
3.4.2 Ortho-Phosphate (PO4-P) ................................................................................... 28
3.4.3 Ammonium (NH4-N) .......................................................................................... 29
3.4.4 Nitrite and Nitrite (NOx-N)................................................................................. 29
3.4.5 Calcium ............................................................................................................... 29
3.4.6 Caustic ................................................................................................................ 29
3.4.7 Alkalinity ............................................................................................................ 29
3.4.8 Filtration ............................................................................................................. 30
3.5 Struvite Collection, Drying, Analysis and Quality Determintaion ........................... 30
3.6 Particle Size Distribution .......................................................................................... 30
3.7 Terminology .............................................................................................................. 31
3.7.1 Removal Efficiency ............................................................................................ 31
3.7.2 Recylce Ratio ...................................................................................................... 31
3.7.3 Alkalinity ............................................................................................................ 31
4. Results and Discussions ................................................................................................... 32
4.1 Part 1: Determination of Soluble PO4-P in Feed after the ANAMMOX Process ..... 32
4.2 Part 2: Struvite Formation Potential in Feed after ANAMMOX Process ................. 34
vii
4.2.1 Jar Test Method 1: P and N Recovery at Variable Temperature ........................ 35
4.2.2 Jar Test Method 2: Influence of Alkalinity and NaOH Requirement ................. 43
4.2.3 Summary of Jar Test Method 1 and Method 2 ................................................... 49
4.3 Part 3: Continuous Operation with Bench-Scaled Fluidized Bed Reactors .............. 50
4.3.1 Operating Condition 1: Low Influent Flow Rate ................................................ 51
4.3.1.1 Phosphorus and Nitrogen Removal Recovery ............................................ 51
4.3.1.2 Phosphorus and Nitrogen Removal Efficiency ............................................ 58
4.3.2 Operating Condition 2: High Influent Flow Rate ............................................... 60
4.3.2.1 Phosphorus and Nitrogen Removal and Recovery ..................................... 60
4.3.2.2 Phosphorus and Nitrogen Removal Efficiency ............................................ 66
4.3.3 Chemical Costs ................................................................................................... 69
4.3.3.1 Caustic (NaOH) Consumption .................................................................... 69
4.3.3.2 Magnesium Consumption ............................................................................ 72
4.4 Struvite Purity ........................................................................................................... 73
4.5 Struvite Particle Size Distribution and Morphology .................................................. 74
5. Conclusions and Recommendations ............................................................................... 79
5.1 Conclusions ............................................................................................................... 79
5.2 Recommendation for Future Research ...................................................................... 81
References ............................................................................................................................. 83
Appendices ............................................................................................................................ 93
Appendix A ........................................................................................................................ 93
Appendix B ...................................................................................................................... 100
Appendix C ...................................................................................................................... 115
viii

ix
Appendix D ...................................................................................................................... 117
Appendix E ...................................................................................................................... 120
Appendix F....................................................................................................................... 122
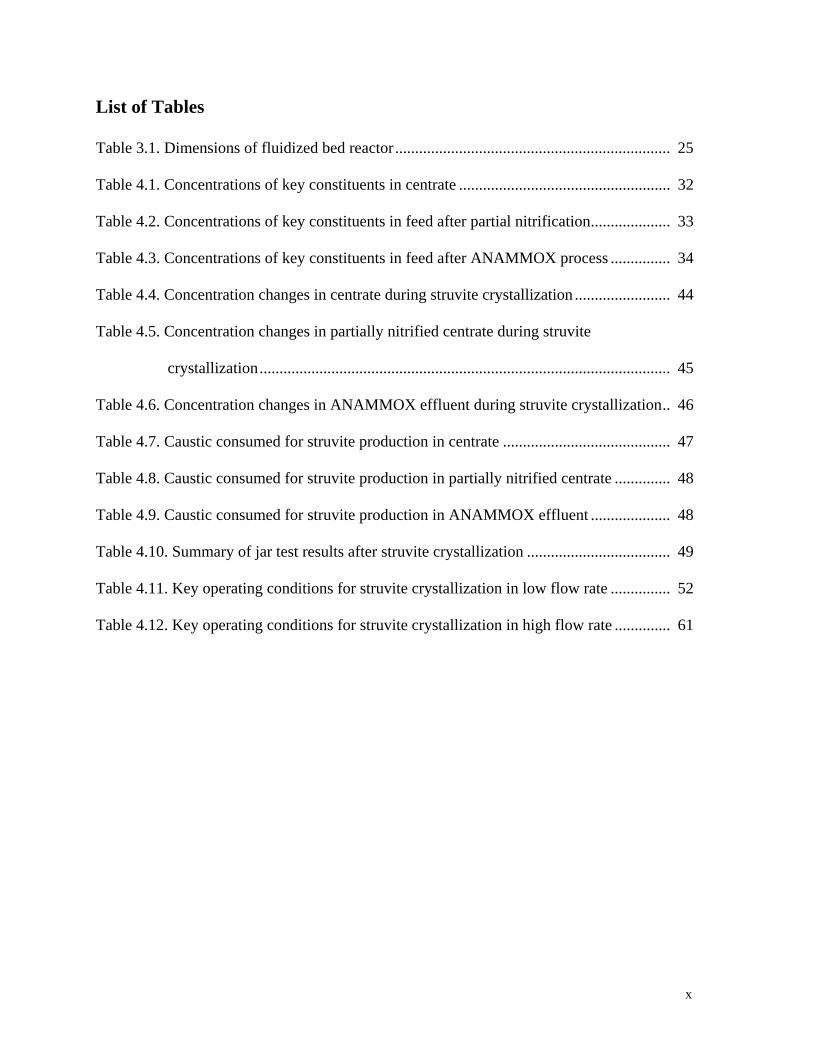
List of Tables
Table 3.1. Dimensions of fluidized bed reactor ..................................................................... 25
Table 4.1. Concentrations of key constituents in centrate ..................................................... 32
Table 4.2. Concentrations of key constituents in feed after partial nitrification .................... 33
Table 4.3. Concentrations of key constituents in feed after ANAMMOX process ............... 34
Table 4.4. Concentration changes in centrate during struvite crystallization ........................ 44
Table 4.5. Concentration changes in partially nitrified centrate during struvite
crystallization ....................................................................................................... 45
Table 4.6. Concentration changes in ANAMMOX effluent during struvite crystallization .. 46
Table 4.7. Caustic consumed for struvite production in centrate .......................................... 47
Table 4.8. Caustic consumed for struvite production in partially nitrified centrate .............. 48
Table 4.9. Caustic consumed for struvite production in ANAMMOX effluent .................... 48
Table 4.10. Summary of jar test results after struvite crystallization .................................... 49
Table 4.11. Key operating conditions for struvite crystallization in low flow rate ............... 52
Table 4.12. Key operating conditions for struvite crystallization in high flow rate .............. 61
x
xi
List of Figures
Figure 1.1. Combination 1 : ANAMMOX followed by struvite crystallization ...................... 3
Figure 1.2. Combination 2 : Struvite crystallization followed by ANAMMOX ..................... 3
Figure 1.3. Flow diagram of the process combination selected for phase 1 ............................ 3
Figure 2.1. Fluidized bed reactor for struvite crystallization ................................................. 19
Figure 3.1. Jar test on feeds under controlled temperature .................................................... 23
Figure 3.2. Jar test on feeds using Phipps and Bird stirrer instrument at room temperature . 24
Figure 3.3. Lab scaled struvite crystallizer flow diagram ...................................................... 25
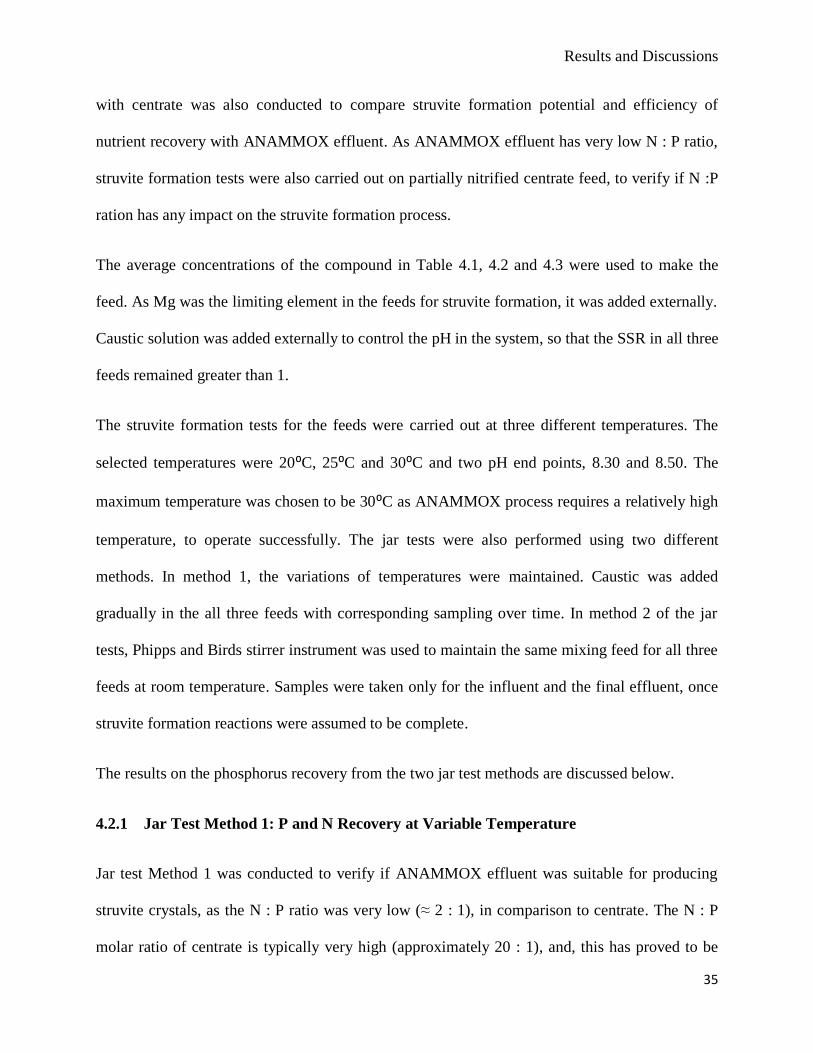
Figure 4.1. Phosphorus removal as struvite over time by addition of caustic at 20⁰C .......... 37
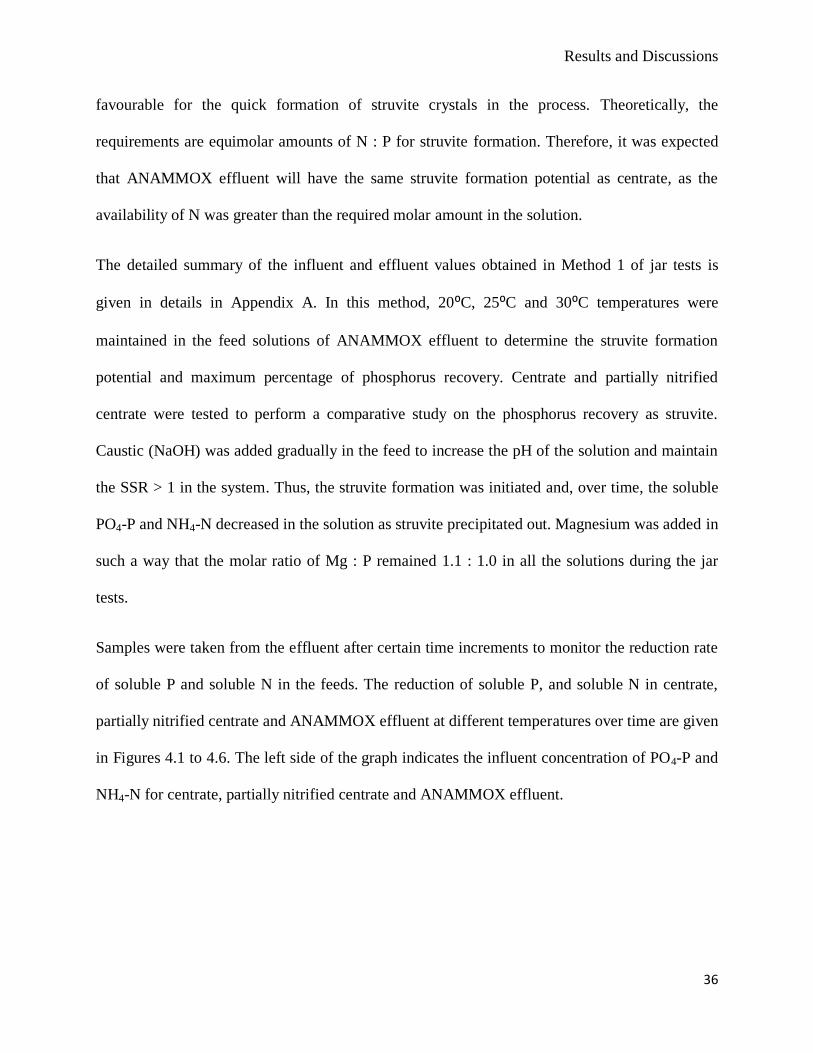
Figure 4.2. Phosphorus removal as struvite over time by addition of caustic at 25⁰C .......... 37
Figure 4.3. Phosphorus removal as struvite over time by addition of caustic at 30⁰C .......... 38
Figure 4.4. Nitrogen removal over time by addition of caustic at 20⁰C ................................ 39
Figure 4.5. Nitrogen removal over time by addition of caustic at 25⁰C ................................ 39
Figure 4.6. Nitrogen removal over time by addition of caustic at 30⁰C ................................ 40
Figure 4.7. Change of pH over time in feeds during jar test at 20ºC ..................................... 42
Figure 4.8. Reactors under operation for struvite crystallization........................................... 51
Figure 4.9. Soluble PO4-P concentration in ANAMMOX effluent over time ....................... 53
Figure 4.10. Soluble PO4-P concentration in partially nitrified centrate over time ............... 54
Figure 4.11. Soluble PO4-P concentration in centrate over time ........................................... 54
Figure 4.12. Soluble NH4-N concentration in ANAMMOX effluent over time ................... 56
Figure 4.13. Soluble NH4-N concentration in partially nitrified centrate over time .............. 56
Figure 4.14. Soluble NH4-N concentration in centrate over time .......................................... 57
Figure 4.15. Average percentage of PO4-P removal from feeds during operation ................ 59
xii
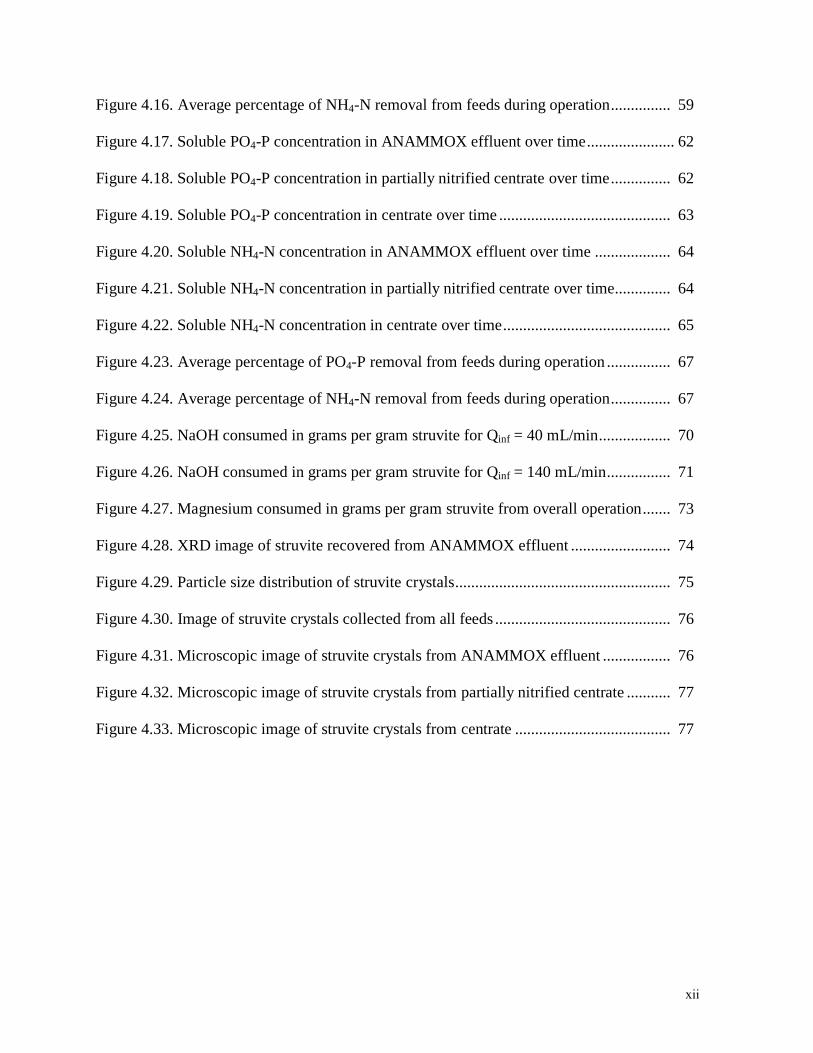
Figure 4.16. Average percentage of NH4-N removal from feeds during operation ............... 59
Figure 4.17. Soluble PO4-P concentration in ANAMMOX effluent over time ...................... 62
Figure 4.18. Soluble PO4-P concentration in partially nitrified centrate over time ............... 62
Figure 4.19. Soluble PO4-P concentration in centrate over time ........................................... 63
Figure 4.20. Soluble NH4-N concentration in ANAMMOX effluent over time ................... 64
Figure 4.21. Soluble NH4-N concentration in partially nitrified centrate over time .............. 64
Figure 4.22. Soluble NH4-N concentration in centrate over time .......................................... 65
Figure 4.23. Average percentage of PO4-P removal from feeds during operation ................ 67
Figure 4.24. Average percentage of NH4-N removal from feeds during operation ............... 67
Figure 4.25. NaOH consumed in grams per gram struvite for Qinf = 40 mL/min .................. 70
Figure 4.26. NaOH consumed in grams per gram struvite for Qinf = 140 mL/min ................ 71
Figure 4.27. Magnesium consumed in grams per gram struvite from overall operation ....... 73
Figure 4.28. XRD image of struvite recovered from ANAMMOX effluent ......................... 74
Figure 4.29. Particle size distribution of struvite crystals ...................................................... 75
Figure 4.30. Image of struvite crystals collected from all feeds ............................................ 76
Figure 4.31. Microscopic image of struvite crystals from ANAMMOX effluent ................. 76
Figure 4.32. Microscopic image of struvite crystals from partially nitrified centrate ........... 77
Figure 4.33. Microscopic image of struvite crystals from centrate ....................................... 77
xiii
List of Appendices
A.1. P and N removal from ANAMMOX effluent by jar test - method 1 ............................. 93
A.2. P and N removal from partially nitrified centrate by jar test - method 1 ....................... 96
A.3. P and N removal from centrate by jar test - method 1 ................................................... 98
B.1. Continuous operation of ANAMMOX effluent at Qinf = 40 mL/mins ......................... 100
B.2. Continuous operation of partially nitrified centrate at Qinf = 40 mL/mins ................... 103
B.3. Continuous operation of centrate at Qinf = 40 mL/mins ............................................... 106
B.4. Continuous operation of ANAMMOX effluent at Qinf = 140 mL/mins ....................... 108
B.5. Continuous operation of partially nitrified centrate at Qinf = 140 mL/mins .................. 111
B.6. Continuous operation of centrate at Qinf = 140 mL/mins ............................................. 113
C.1. Upflow velocities during operation for various flow conditions. ................................ 115
D.1. Caustic and magnesium consumption for struvite production ..................................... 117
E.1. Molar ratio of struvite constituents............................................................................... 120
F.1. Particle size distribution of struvite particles................................................................ 122
xiv
List of Abbreviations
AA Atomic Absorption
AAS Atomic Absorption Spectrophotometer
ANAMMOX Anaerobic Ammonium Oxidation
BC British Columbia
BNR Biological Nutrient Removal
ºC Degree Celsius
Calc. Calculated
EBPR Enhanced Biological Phosphorus Removal
Efl. Effluent
gm Grams
hrs Hours
HRT Hydraulic Retention Time
Inf. Influent
L Litre
LIWWTP Lulu Island Wastewater Treatment Plant
MAP Magnesium Ammonium Phosphate
Max. Maximum
Mg Magnesium
mg/L Milligram per Litre
Min. Minimum
Mins Minutes
mL/min Millilitre per Minute
mm Millimetre
N Nitrogen
NH4-N Ammonium-nitrogen
NOx Nitrites and Nitrates
NO2 Nitrites
NO3 Nitrates
N2O Nitrous Oxide
xv
P Phosphorus
PO4-P Phosphate-phosphorus
PAO Phosphate Accumulating Organism
PNC Partially Nitrified Centrate
Qinf Total Influent Flow Rate
QRR Recycle Flow Rate
RR Recycle Ratio
SSR Supersaturation Ratio
Theo. Theoretical
UBC University of British Columbia
WWPT Wastewater Treatment Plant
WWPTs Wastewater Treatment Plants
XRD X-ray Diffraction
μm Micro meter or microns

Acknowledgements
Firstly, I would like to express my deepest and heartfelt gratitude and appreciation to my
supervisor, Dr. Donald S. Mavinic for his continuous support, guidance and encouragement
throughout my time at UBC.
I would like to thank Dr. Babak Rezania for providing valuable suggestions for the development
of my thesis concept and for the fulfillment of my research work.
I would like also like to thank Mr. Harlan Kelly for having interest in my project, being involved
and providing in kind contributions.
Special thanks to Fred Koch, Sergey Lovanov for sharing their valuable knowledge and
experience.
I would like to thank Paula Parkinson and Tim Ma for their continuous support in the lab from
sample analysis to designing and building experimental setups. Special thanks to Bill Leung for
his contribution in building reactors for my project.
Thanks to NSERC, BCIC and Opus DaytonKnight for providing a grant for this project.
Finally, my appreciation goes to my fellow graduate colleagues, my friends and family for being
so supportive throughout my period of research.
xvi
Dedication
To my parents
xvii
Introduction
1. Introduction
1.1. Background
Nitrogen (N) and phosphorus (P) are fundamental elements for living organisms. However, the
presence of these nutrients in excess creates adverse effect in the environment. Wastewater is
significantly rich in these nutrients due to human activities. Therefore, nitrogen and phosphorus
should be removed from wastewater before discharge to water bodies, to prevent adverse effects
in the environment. Typically, in wastewater treatments plants (WWTPs), significant volumes of
sludge are produced during the wastewater treatment. The produced sludge is often further
processed for mass reduction in anaerobic digesters before the final reuse or disposal. During
sludge digestion, dewatered sludge liquor or centrate is released in the digester, which contains
very high amount of soluble ammonia and soluble phosphorus. The literature indicates that up to
90% of phosphate-phosphorus (PO4-P) is re-released from sludge into the sludge liquor (Mavinic
et al., 1998). The concentration of ammonium-nitrogen (NH4-N) ranges from 500 mg/L to 1500
mg/L in centrate. Hence, centrate is highly nutrient rich and should not be discharged of directly
to receiving water bodies. An extensive study conducted by Schindler (2006) in Ontario, Canada
proved that both phosphorus and nitrogen were equally responsible for causing eutrophication in
natural water bodies. Eutrophication causes excessive algae growth, which causes a toxic effect
in water bodies, killing fish and other living organism, and ultimately reduces the availability of
water resources. As a result, centrate has to be recycled back to WWTPs, combining it with raw
influent for the treatment process. This adds additional nutrient loading to the plant, which
affects process efficiencies and increases operating costs. It has been reported that in WWTPs,
15 – 20% of influent NH4-N concentration and 8% of influent PO4-P is contributed by centrate
(Fux et al., 2002; Wild et al. 1997). To reduce this additional nutrient loading in wastewater, the
1
Introduction
removal of the nutrients from centrate through interception becomes desirable (Forrest et al.,
2007).
Struvite crystallization and anaerobic ammonium oxidation (ANAMMOX) are two established
technologies now applied for removal of phosphorus and nitrogen from wastewater, respectively.
Phosphorus removal and recovery from wastewater in the form of struvite, a white crystalline
compound (MgNH4PO4.6H20), has successfully removed and recovered more than 90%
phosphorus from centrate (Adnan et al., 2003b; Fattah et al., 2008a; Fattah et al., 2008b).
Phosphorus recovery as struvite has gained interest since its composition makes it a potentially
beneficial product in the fertilizer industry. The fertilizer recovered as struvite also provides an
alternative source of phosphorus to mined mineral rock. Struvite recovery can reduce
maintenance costs in WWTPs by preventing undesirable struvite deposition in pipes, elbows,
valves, pumps, etc. However, the struvite recovery process leaves a significant amount of NH4-N
in the treated effluent, as struvite chemistry requires equimolar N to P molar ratios (the molar
ratio of N : P is around 20 : 1, in centrate).
Alternatively, the ANAMMOX process is a relatively cost effective microbial process that can
be effectively applied on centrate for removing the high nitrogen loading. This process can
successfully remove up to 90% of NH4-N from centrate (Fux et al., 2002), but, leaves a
significant amount of soluble phosphorus in the final effluent (Fux et al., 2006).
1.2. Research Objectives
The current technologies applied for nutrient removal from centrate only offer us a solution for
either phosphorus recovery or nitrogen removal. To effectively manage nutrient loadings at
treatment plants, a unified solution is highly required. The successful combination of
2
Introduction
ANAMMOX and struvite recovery could offer us a sustainable solution for managing
phosphorus and nitrogen simultaneously, at wastewater treatment plants.
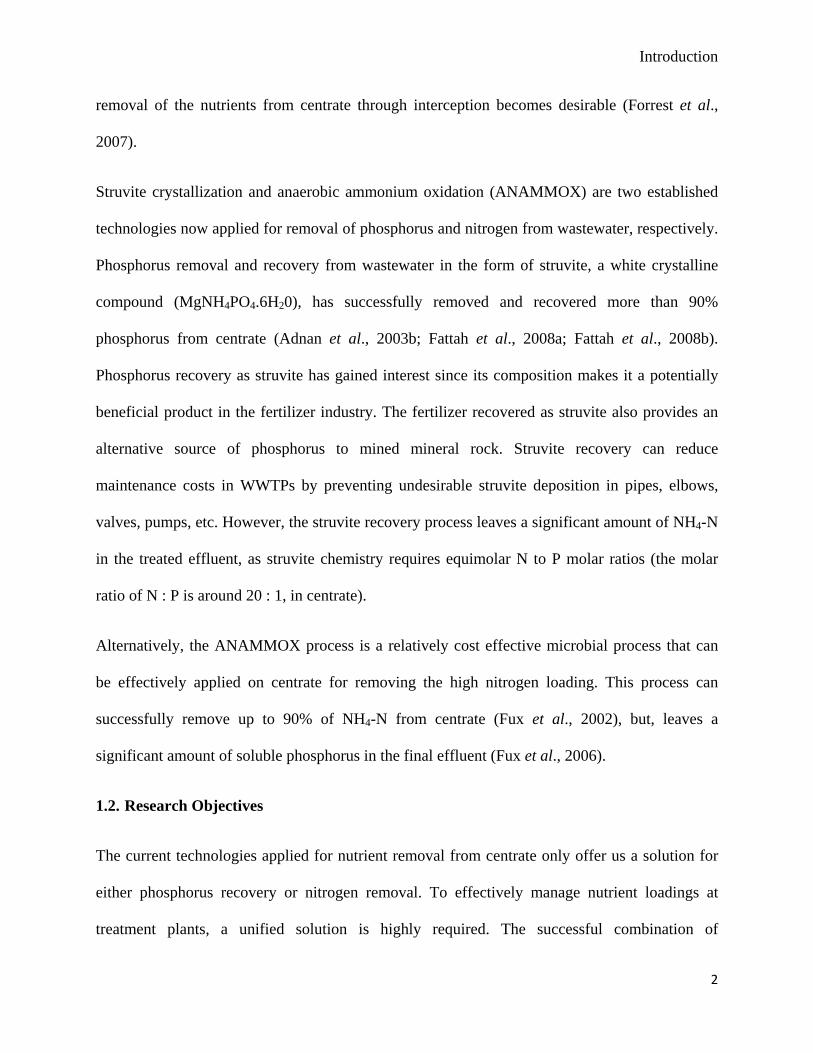
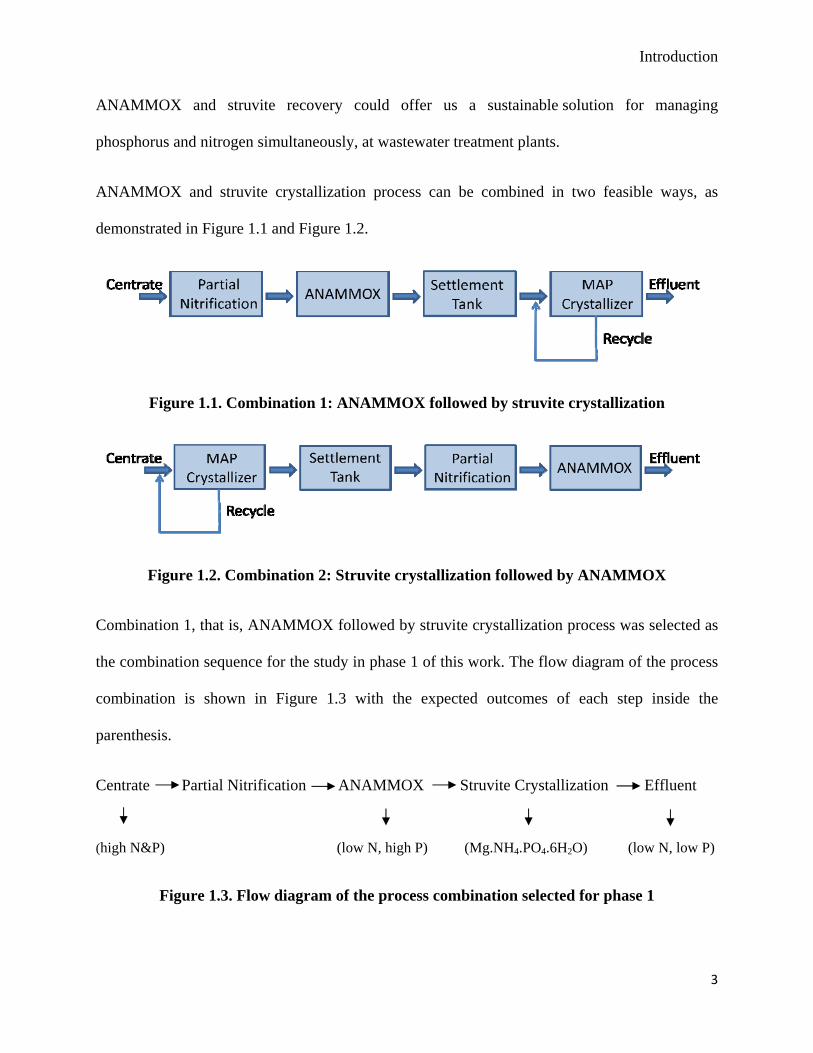
ANAMMOX and struvite crystallization process can be combined in two feasible ways, as
demonstrated in Figure 1.1 and Figure 1.2.
Figure 1.1. Combination 1: ANAMMOX followed by struvite crystallization
Figure 1.2. Combination 2: Struvite crystallization followed by ANAMMOX
Combination 1, that is, ANAMMOX followed by struvite crystallization process was selected as
the combination sequence for the study in phase 1 of this work. The flow diagram of the process
combination is shown in Figure 1.3 with the expected outcomes of each step inside the
parenthesis.
Centrate Partial Nitrification ANAMMOX Struvite Crystallization Effluent
(high N&P) (low N, high P) (Mg.NH4.PO4.6H2O) (low N, low P)
Figure 1.3. Flow diagram of the process combination selected for phase 1
3
Introduction
4
The objectives of this study were designed for the following outcomes:
• To find a solution for simultaneous nutrient (nitrogen and phosphorus) removal from
wastewater (dewatered sludge liquor or centrate).
• To investigate if struvite crystallization was possible for a low N : P molar ratio feed
(ANAMMOX effluent).
• To determine the maximum nitrogen and phosphorus removal efficiencies in the final
effluent resulting from the process combination.
• To compare the chemical costs associated with struvite production from ANAMMOX
effluent with struvite produced from centrate.
Literature Review
2. Literature Review
2.1 Nutrient Removal and Recovery Methods
2.1.1 Nitrogen Recovery
Nitrogen exists in the form of Ammonium-nitrogen (NH4-N), nitrite-nitrogen (NO2) and nitrate-
nitrogen (NO3) in wastewater. If wastewater effluent containing ammonia higher that regulatory
limits is discharged in water bodies like lakes, river etc., it causes eutrophication and creates
toxic environment for aquatic life (Robert and Russo, 1981). Therefore, the removal of ammonia
from wastewater is essential for the protection of many receiving waters. Two methods of
ammonia removal from wastewater are discussed in the following sections.
2.1.1.1 Nitrification-Denitrification
Biological nitrification-nitrafication-denitrification is the most widely used treatment process for
nitrogen removal from wastewater. The process removes nitrogen in two separate steps. The first
step is two phase biological nitrification and nitrification process, where ammonia is first
oxidized to nitrites, and, then to nitrates, under aerobic conditions (Sliekers et al., 2002). The
dissolved oxygen (D.O.) of the system needs to be maintained 2.0 mg/L or above for the healthy
growth of the nitrifying bacteria. This is also an alkalinity consuming step. The second step of
the process is biological denitrification, where the nitrates are converted to nitrogen gas under
anoxic conditions (Sliekers et al., 2002). The simplified reaction steps of nitrification,
nitrafication and denitrification are given in Equation 2.1 to 2.3 below (Metcalf and Eddy, 2003):
NH3 + CO2 + 1.5O2 + Ammonia Oxidizing Bacteria → NO2- + H2O + H+ (2.1)
NO2- + H2O + H+ + Nitrite Oxidizing Bacteria → NO3
- (2.2)
5
Literature Review
5CH3COOH + 8NO3- → 4N2 + 10CO2 + 6H2O + 8OH- (2.3)
The major drawback of the process is the addition of external carbon source in the denitrification
process. The denitrifying bacteria required electron donors for completing the denitrification
process and, thus, addition of extra carbon source makes the whole system expensive. Among
the carbon sources, methanol is relatively (currently) cheap and is most commonly used in the
denitrification process.
2.1.1.2 Anaerobic Ammonium Oxidation (ANAMMOX)
Anaerobic Ammonium Oxidation (ANAMMOX) is a novel microbial process for removing
nitrogen from wastewater (dewatered sludge liquor) (Strous et al., 1998). There is no
requirement for an external carbon source addition in this process (like conventional nitrification
denitrification). The operational cost savings can be up to 90%, by opting for the ANAMMOX
process over the conventional processes (Jetten et al., 2001). The conventional nitrification–
denitrification process is also unsuitable for dewatered sludge liquor of centrate as high amount
of CO2 is released. The advantages mentioned have made ANAMMOX process a novel nitrogen
removal technology for replacing traditional nitrification denitrification for wastewater
treatment. Further, since only half of the ammonia to be treated is oxidized to nitrite, nitrous
oxide production is anticipated to be half than that produced in the traditional nitrification-
denitrification process. Details on ANAMMOX process are discussed in Section 2.2.
2.1.2 Phosphorus Recovery
Phosphorus (P) is one of key element required for all living organisms for growth and biological
productivity. However, excess amount of phosphorus is one of the major elements contributing
to eutrophication in water bodies. The major source of P is from phosphates commonly used in
6
Literature Review
pesticides, detergents and fertilizers, generally washed out with wastewater. Thus, severe
regulations have been imposed on the discharge limits of P concentrations in wastewater. The
most common processes of P removal are by phosphorus fixation in activated sludge, either by
biological or by chemical methods. These methods are discussed in the following sections.
2.1.2.1 Biological Processes
Biological (BNR, EBPR) process removes phosphorus by using phosphorus accumulating
organisms (PAOs). These organisms use their own metabolism to accumulate phosphorus
(phosphates) as polyphosphates under certain conditions. An overall 80 – 90% of phosphorus
removal has been reported to be achieved by this method. Biological processes have the
advantages of avoiding chemical usage and prevention of chemical sludge production. However,
the process requires complex plant design and operating conditions (Morse et al., 1998). Detailed
literature and reviews on biological P removal processes can be found in Bowker and Stensel
(1990).
2.1.2.2 Chemical Processes
Chemical precipitation using various metal salts, are one of the most common techniques applied
for P removal processes. Metal salts include aluminum and iron precipitation, calcium phosphate
precipitation, struvite precipitation, membrane/ion exchange with precipitation etc. Phosphorus
recovery (as calcium phosphate) has been described to be very promising as the recovered forms
were close to that of mined phosphorus and use in the P-industry (Driver et al., 1999).
Precipitation of P as magnesium ammonium phosphate, commonly known as struvite, has gained
popularity as a process of P recovery (Doyle et al., 2003). The composition of struvite (N, P and
Mg) makes it a potentially useful product that can be directly used as fertilizer (Booker et al.,
7
Literature Review
1999). This method has already reduced the demand of mined phosphorus in the P-industry, by
giving an alternative solution. Detailed discussion on struvite chemistry and recovery is provided
in Section 2.3 to Section 2.9.
2.2 ANAMMOX Process and Benefits
The first recognition of the ANAMMOX process started in the 1970’s when Broda (1977)
predicted that micro-organisms oxidized ammonia to nitrite and nitrate, based on
thermodynamics calculations. After numerous studies conducted by several researchers, in 1999,
Strous et al. described ANAMMOX process bacteria for the first time, by illustrating the
removal of ammonia and nitrite and into nitrogen gas under anaerobic conditions, by bacteria
cells.
Strous et al. (1998) estimated that ANAMMOX stoichiometry requires 1 mole ammonia to 1.32
moles nitrite and converts into 1.02 mole nitrogen gas and 0.26 mole nitrate for the process to
complete. The resultant ANAMMOX process reaction is given as Equation 2.4.
NH4+ + 1.32 NO2
- + 0.066 HCO3- + 0.13 H+
→ 1.02 N2 + 0.26 NO3
- + CO2 + 0.066CH2O0.5N0.15
+ 2.03 H2O (2.4)
In most types of wastewater, nitrite is not available in a molar ratio of 1.32 for 1 mole of
ammonium. Therefore, an external source of nitrite is required for completion of the
ANAMMOX process (Zhang et al., 2008). This can be achieved by combining other
accompanying processes, like partial nitrification, for generating nitrites and fulfilling the
requirements of additional nitrites.
8
Literature Review
In nitrification, ammonia is oxidized by aerobic ammonium oxidizing bacteria under aerobic
conditions. In this step, ammonia is partially oxidized to nitrite by nitrifying organisms, thus
producing an effluent which contains a mixture of ammonia and nitrite. The simplified partial
nitrification reaction is given below at Equation 2.5 and Equation 2.6:
NH4+ + 1.5 O2 → NO2
- + 2H+ + H2O (2.5)
NH4+ + HCO3
- + 0.75 O2 → 0.5 NH4+ + 0.5 NO2
- + CO2 + 1.5 H2O (2.6)
Partial nitrification by ammonium oxidation to form nitrites (up to 53%) was achieved in a lab
scaled continuous stirred tank (CSTR) using dewatered sludge liquor (centrate), by van Dongen
et al. (2001). Similarly, partial nitrification of up to 58% was achieved in a pilot scale CSTR
reactor by Fux et al. (2002). Partial nitrification required a temperature of around 30ºC to
achieve successful conversion of ammonium to nitrites in the studies mentioned.
The effluent produced after partial nitrification is processed in the second step, the ANAMMOX
reactor, where ammonium works as the electron donor for denitrification and nitrite serves as the
electron acceptor. The formed nitrite and the remaining ammonium in the effluent is converted to
nitrogen gas in the ANAMMOX reactor and complete nitrogen removal process from
wastewater. This step is anoxic; the presence of oxygen causes inhibition of the anaerobic
ammonium conversion (Strous et al., 1997). A complete ANAMMOX process has achieved
stable nitrogen removal of more than 90% from wastewater in many studies (Third et al., 2001;
van Kempen et al., 2001).
There are major advantages of using an ANAMMOX process over a conventional nitrification- -
denitrification process. The ANAMMOX process requires less oxygen during the partial
nitrification step. There is no requirement of adding organic carbon in the second denitrification
9
Literature Review
step. The autotrophic bacteria consumes dissolved carbon dioxide as the source of carbon, thus
no carbon dioxide gas is released in this process, and reduces the potential for production of
nitrous oxide (N2O) by half, making it friendlier to the environment.
However, the ANAMMOX process also carries some important disadvantages. The major
drawback of the system is the slow growth ANAMMOX bacteria. It has been suggested that the
doubling time for these bacteria are between 9 to 14 days, they are very hard to grow (especially
in vitro), and, they tend to wash out from continuously operated reactors (Waki et al., 2013; Gao
et al., 2012; Yapsakli, 2010; Strous et al., 1998). The success rate of the process is dependent on
balanced reactor conditions. The nitrite in the ammonium/nitrite ratio should be available at 50%
for the good development of the process (Galí et al., 2007; van de Graaf et al., 1995). Nitrous
oxide (N2O), a green house gas, can also be produced in by ammonium oxidizing bacteria and
nitrite oxidizing bacteria in the process (Lipschultz et al., 1981; Freitag & Bock, 1990). Studies
show that N2O emission of the nitrogen load to the reactor was 2.3% from full scale two-stage
ANAMMOX reactor (Kampschreur et al., 2008), 1.2% from full scale single-stage reactor
(Kampschreur et al., 2009a), and, 0.1% from lab-scaled single stage ANAMMOX reactor
(Sliekers et al., 2002). Even though N2O emission is monitored in ANAMMOX process, the
percentages are still lower than conventional nitrification - denitrification process. Nitrous oxide
(N2O) emission from various WWTPs can be found in details in Kampschreur et al. (2009b).
2.3 Struvite Recovery and Benefits
Struvite (magnesium ammonium phosphate, MAP) scale deposition occurs spontaneously in
wastewater treatments plants under favourable conditions. When the appropriate ions are present,
the problem associated with struvite (or other mineral) scaling is nothing new at treatment plants.
10
Literature Review
In 1937 struvite scaling was noticed for the first time in a multiple stage sludge digestion system
(Rawn et al., 1939). The deposition causes a severe nuisance by affecting treatment process
efficiencies in plants and causing maintenance issues. Therefore, struvite depositions are of
significant concern in wastewater treatment plants (WWTPs) (Doyle et al., 2003). The causes of
struvite deposition have been widely investigated. Various techniques have been applied for
struvite deposition control, such as prevention by chemical dosing with iron salts (Mamais et al.,
1994), dilution of struvite crystals with water effluent (Borgerding, 1972), chemical inhibitors
addition (Doyle et al., 2003; Snoeyink and Jenkins, 1980) etc. Recovering phosphorus from
wastewater can prevent scaling problems in WWTPs, saving huge maintenance costs and
reduces pollution caused by excessive discharge of nutrients (P and N) in the effluent.
Phosphorus recovery, in the form of struvite, gained a lot of interest in the past decade as it offers
economical and environmental benefits with its fertilizer qualities in agriculture sector (Doyle et
al., 2003; Owen et al., 2009). The low solubility property of struvite allows prolonged release of
nutrients in the fertilizer during the agriculture season, making fertilizer application less frequent,
without the danger of burning crop roots (Bridger et al., 1961; Gatterell et al., 2000; Ries et al.,
1969). Struvite recovery also provides a sustainable alternative solution to mined phosphorus in
the fertilizer industry (Jaffer et al., 2002; Berg, 1982). A study by Sterling and Ashley, (2003)
indicated that slow release fertilizers, like struvite, can be added to increase the level of nutrients
in nutrient deficit streams, to increase salmonid production and fish fertility, and, will last up to
four months, in situ.
Heavy metal contamination is present in fertilizers produced from phosphate rock as degradation
in phosphate rock increases metal contamination in it (von Horn and Sartorius, 2009). Struvite
recovery as fertilizer eliminates the possibility of such heavy metal contamination, which is a
11
Literature Review
major advantage (Fattah et al., 2008b). Struvite recovery also reduces the amount of sludge
produced during wastewater treatment. Sludge mass reduction up to 49% was reported by
implementing struvite recovery, instead of phosphorus accumulation in biosolids (Woods et al.,
1999).
2.4 Struvite Chemistry
Struvite (Mg.NH4.PO4.6H20) is an orthophosphate containing equimolar concentrations of
magnesium, ammonium and phosphate, bound by six moles of water. The most general equation
used to describe struvite formation is given below at Equation 2.7 (where n = 0, 1, or 2).
Mg+2 + NH4+ + HnPO4
3-n + 6H20 ↔ Mg.NH4.PO4.6H20 + nH+ (2.7)
The struvite crystallization occurs in two stages: nucleation (crystal birth) and crystal growth
(Jones, 2002). The reaction between magnesium, ammonium and phosphate ions releases
hydrogen ions in the solution. Therefore, a drop in the pH value is monitored when struvite
crystals spontaneously precipitate out of solution. Precipitation of struvite is always evident at
WWTPs in areas with high turbulence (pumps, elbows, propellers, valves) and areas with high
phosphate, high magnesium, and high pH, like digested sludge liquor pipelines.
The prediction and formation chemistry is complex and dynamic and depends on many factors,
which are discussed in Section 2.5.
2.5 Factors Affecting Struvite Formation
Struvite nucleation and growth is complex and depends on many combinations of factors. The
key factors will be discussed in the following section.
12
Literature Review
2.5.1 pH
The hydrogen ion concentration (measured by pH) is one the most important factors that
influence struvite crystallization process, as it is linked to the concepts of saturation and
solubility. A low hydrogen ion concentration (high pH) causes increases the rate of struvite
crystallisation and a higher concentration (lower pH value) increases solubility. Struvite scaling
in WWTPs occurs mostly due to reduced hydrogen ion concentration coincident with a pH
increase, caused by CO2 stripping (HCO3- → CO2 + OH-) in wastewater (Neethling and Benisch,
2004). A specific range of pH has been found to be suitable for optimum struvite precipitation
(Booker et al., 1999; Stratful et al., 2001). Experiments conducted by Booker et al., (1999) by
analyzing molar removal of NH4+, PO4
-3 and Mg2+demonstrated maximum struvite precipitation
at a pH range of 8.8 and 9.4. Stratful et al., (2001) recommended operation at a pH value > 8.5
for effective struvite removal.
However, conditions where pH > 9 shows inhibition to struvite formation, as ammonium ion
(NH4+) is transferred in gaseous free ammonia (NH3). Thus, ionic nitrogen concentration is
reduced affecting the required molar ratio (Mg : N : P = 1 : 1 : 1) for struvite formation (Booker
et al., 1999; Buchanan et al., 1994).
The optimum range of operational pH for maximum phosphorus recovery is highly variable with
the characteristics of wastewater (Stratful et al., 2001). In most literature, the recommended
operational pH range to achieve more than 80% phosphorus recovery is suggested to be between
8.0 and 9.0 (Münch and Barr, 2001; Jaffer et al., 2002). However, other literature has
demonstrated more than 90% phosphorus recovery for a pH ranging from 7.3 to 7.5 (Adnan et
al., 2003a; Fattah, 2004; Fattah et al., 2008b).
13
Literature Review
2.5.2 Supersaturation Ratio (SSR)
Supersaturation ratio (SSR) of a solution indicates it’s potential to form struvite. The pH value
controls the SSR ratio of the solution. When SSR > 1, the solution is supersaturated and struvite
precipitation occurs. When SSR < 1, the solution remains under saturated and thus struvite
precipitation is not possible. SSR = 1 indicates the solution to be at equilibrium state. The SSR of
a system needs to be maintained between 1 and 5 to achieve the highest amount of phosphorus
recovery as struvite. SSR can be calculated from Equation 2.8.
SSR = Ps/Ps-eq (2.8)
Ps = Conditional solubility product of struvite in a solution
Ps-eq = Ps under equilibrium condition
To maintain a constant SSR > 1 in solution, pH value needs to be consistently maintained in the
optimum range (section 2.5.1). Struvite growth rate also depends on the supersaturation level of
centrate. Doyle et al. (2002) demonstrated that at a constant SSR value, struvite growth rate
reached up to seven times the initial value, after 40 hours precipitation.
2.5.3 Temperature
Temperature has a lower impact on the chemistry of struvite formation compared to pH and SSR
value. The solubility and struvite crystal morphology is mainly affected due to temperature
variation (Durrant et al., 1999). Temperature affects the struvite solubility product, which is
linked to the supersaturation state of the solution where a crystal grows. Aage et al. (1997)
demonstrated that struvite solubility increased as temperature changed from 10ºC to 50ºC, and
Burns and Finlayson (1982) demonstrated a similar trend when the temperature increased from
14
Literature Review
25ºC to 45ºC. This explains why a temperature between 25ºC to 35ºC is considered to be the best
conditions for struvite formation. Lower temperatures also favour phosphorus recovery more
efficiently (Adnan et al., 2004). Studies conducted by Boistelle et al. (1983) and Babić-Ivanĉić et
al. (2002) demonstrated that for identical feed concentrations, struvite crystals formed at 37ºC
were thick and square, compared to the crystals formed at 25ºC, which were rectangular and
prismatic.
2.5.4 Turbulence or Mixing Energy
Turbulence or mixing energy also influences struvite formation. In WWTPs, high turbulence
areas liberate CO2 from wastewater, reducing acidity causing increase in pH value and
subsequent precipitation of struvite. In struvite crystallizers, turbulence is also required during
operation for allowing particles to collide with each other, resulting in struvite formation.
Struvite particle shapes depend on the shear gradient or the amount of turbulence in the reactor.
Studies show that high turbulence creates compact crystals and low turbulence creates elongated
crystals (Ohlinger et al., 1999). However, too much turbulence affects crystal size as nucleation
is accelerated but crystal growth is limited, which eventually causes crystal breakage (Durrant et
al., 1999).
2.5.5 Ammonium to Phosphorus Molar Ratio
Wastewater like dewatered sludge liquor or centrate, generally carries a higher molar ammonium
concentration than phosphorus. Studies showed that phosphorus removal as struvite was sharper
with the increase in ammonium concentration (Münch and Barr, 2001). Higher ammonium
concentration forms relatively pure struvite (Stratful et al., 2001).
15
Literature Review
2.5.6 Magnesium to Phosphorus Molar Ratio
The molar ratio of Mg : P influences the amount of phosphorus recovered as struvite during
crystallization process. Studies indicated that a molar ratio of 1.05 : 1.00 for Mg : P was required
to achieve 95% P recovery from centrate (Jaffer et al., 2002; Fujimoto et al., 1991) . Other
studies indicated that a higher molar ratio of 1.30 : 1.00 was required to guarantee high P
recovery as struvite (Shimamura et al., 2003; Münch and Barr, 2001). However, the presence of
excessive Mg during operation decreases struvite purity by transforming into newberyite
(MgHPO4.3H2O) (Babić-Ivanĉić et al., 2002; Demeestere et al., 2001).
2.5.7 Presence of Foreign Ions
Impurities in solution can inhibit struvite crystal growth rate by blocking sites where crystal
could be produced (Jones, 2002). The presence of relatively high levels of calcium in sludge
liquor interacts with phosphate and forms calcium phosphate (Le Corre et al., 2005).
2.6 Chemicals for Struvite Formation
2.6.1 Caustic
Struvite formation in wastewater is highly dependent on the balance of alkalinity and acidity
measured as pH of the system. In wastewater treatment plants, unintentional struvite
precipitation occurs inside pipes whenever the pH is high. This is because pH helps to preserve
the supersaturation ratio of the solution. Therefore, for intentional phosphorus recovery as
struvite, the pH of the system has to be maintained within a certain range to ensure the SSR is
greater than 1. The most common chemical use to control and maintain the pH is by adding
caustic (NaOH) externally (Fattah et al., 2008a; Jaffer et al., 2002; Münch and Barr, 2001;
Ohlinger et al., 1999). Another alternative of raising the pH instead of using NaOH solution is by
16
Literature Review
stripping CO2 from wastewater (Jordaan et al., 2013; Zhang, 2006). This method avoids the use
of chemicals and saves cost for struvite production. The recommended value of pH value in a
system is between 7.5 and 9.0 for the best phosphorus recovery as struvite (Fattah et al., 2008a;
Fattah et al., 2008b; Jaffer et al., 2002; Celen and Türker, 2001).
2.6.2 Magnesium
Theoretically, equimolar amount phosphate, ammonium and magnesium are required to form
struvite. In most wastewater, the limiting factor for struvite formation is the inadequate amount
of magnesium in the system. As a result, magnesium needs to be added externally to the system
to initiate struvite formation and phosphorus recovery. Two common sources used for external
magnesium addition are magnesium hydroxide {Mg(OH)2} and magnesium chloride (MgCl2).
Mg(OH)2 is the cheaper chemical of the two and it also helps to raise the pH in the system.
However, as it functions as a base, it becomes hard to control the external caustic dose during
operation and the pH is a desired range (Jaffer et al., 2002; Münch and Barr 2001). For these
reasons, MgCl2 is preferred mostly as the external source. This chemical is easy to transport and
dissociates in water faster than Mg(OH)2 (Jaffer et al., 2002).
Although theory suggests a molar ratio of Mg : P to be 1 : 1, in practice excess amount of
magnesium is required in the system to achieve higher phosphorus recovery. Suggested molar
ratio ranges between 1.3 and 2.0 (Fattah et al., 2008b; Adnan et al., 2003a; Jaffer et al., 2002;
Münch and Barr, 2001).
2.7 Operating Cost for Struvite Production
The production cost of struvite is mainly dependant on the cost of chemicals and the energy
required to pump the feed in the reactors. Studies shows cost associated with energy
17
Literature Review
consumption were insignificant when compared to the cost of chemicals (Jaffer et al., 2002). The
two main chemicals used for the struvite crystallization process are a magnesium source
(generally MgCl2) and caustic (NaOH) to maintain the desired pH inside the reactor. Caustic
addition alone caused 97% of the total chemical cost in this process (Jaffer et al., 2002). Caustic
usage can be reduced by choosing air/CO2 stripping method to increase the pH in the system
(Zhang, 2006; Battistoni et al., 2001).
2.8 Fluidized Bed Reactors for Struvite Crystallization
Fluidized bed reactors are the most common process used for struvite crystallization from
wastewater. In this process, the particles responsible for struvite formation participate
spontaneously inside the reactor. Once the molar ratio of Mg:N:P reaches 1:1:1, struvite
nucleation starts. Struvite growth occurs over time either by seeding materials (sand or struvite)
or by interaction between by the smaller struvite particles. The particles are kept into continuous
motion either by controlling the solution flow rate (Fattah et al., 2012; Fattah et al., 2008a;
Fattah et al., 2008b; Adnan et al., 2003a) or by up-flow circulation of air (Suzuki et al., 2002).
In fluidized bed reactors, the feed is typically centrate and anaerobically digested sludge liquors
and it enters from the bottom of the reactor in the reacting zone. NaOH solution is more
commonly used to adjust the pH of the solution (Fattah et al., 2012; Fattah et al., 2008a; Fattah
et al., 2008b; Adnan et al., 2003a). The flow velocity of wastewater is greater in the bottom
column sections and decreases gradually to the upper sections, allowing treated effluent
discharge from the reactor top (outflow). The struvite particles remain fluidized and grow inside
the column section. The pilot-scale, fluidized reactor used for struvite crystallization and P
recovery from centrate at Lulu Island Wastewater Treatment Plant (LIWWTP) in Richmond,
18
Literature Review
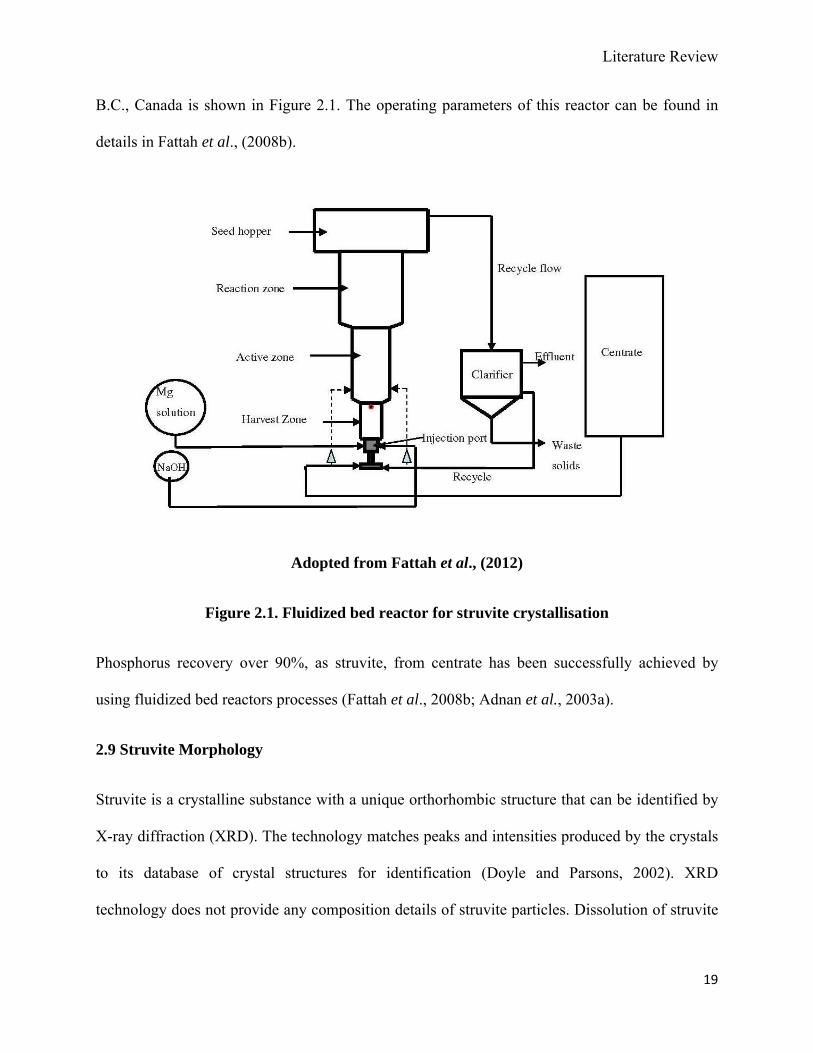
B.C., Canada is shown in Figure 2.1. The operating parameters of this reactor can be found in
details in Fattah et al., (2008b).
Adopted from Fattah et al., (2012)
Figure 2.1. Fluidized bed reactor for struvite crystallisation
Phosphorus recovery over 90%, as struvite, from centrate has been successfully achieved by
using fluidized bed reactors processes (Fattah et al., 2008b; Adnan et al., 2003a).
2.9 Struvite Morphology
Struvite is a crystalline substance with a unique orthorhombic structure that can be identified by
X-ray diffraction (XRD). The technology matches peaks and intensities produced by the crystals
to its database of crystal structures for identification (Doyle and Parsons, 2002). XRD
technology does not provide any composition details of struvite particles. Dissolution of struvite
19
Literature Review
20
particles in acidic solution is commonly practiced for measuring the ionic constituents of crystal
binding elements.
Studies on struvite pellet sizes indicated that the Mg : P molar ratio and Mg concentration has
strong influence on crystal size (Fattah et al., 2008b; Le Corre et al., 2007). A study conducted
by Hirasawa et al. (1997) demonstrated that large crystals were produced by crystal
agglomeration, when Mg : P molar ratio was 2. By increasing the molar ratio to 4, the crystals
shape became needle like crystals. However, Le Corre et al. (2007) indicated in their study that
no correlation existed between struvite particle size and magnesium dosage. Their study also
indicated that pH was the most influential parameter that controlled struvite quality (like
morphology, purity), struvite quantity and nutrient removal.
Materials and Methods
3. Materials and Methods
3.1 Process Description
The study was divided into three processes for the determination of simultaneous nutrient
removal from wastewater by combining ANAMMOX treatment process with struvite
crystallization. The first step of the process was conducted to verify if the ANAMMOX effluent
contained significant soluble phosphorus and to confirm the molar of N : P (1 : 1) for struvite
production. The second step of the process was conducted to establish struvite formation
potential using ANAMMOX effluent, which has very low N : P molar ratio. The third step of the
process combination (using bench scaled fluidized bed reactors), was operated to quantify
nitrogen and phosphorus removal and recovery efficiencies.
3.1.1 Part 1: Feed Characteristics Determination
Centrate obtained from Lulu Island Wastewater treatment plant was partially nitrified and then
characterised for the ANAMMOX process to determine the effluent characteristics. Nitrifying
sludge seed of 150 mL was added in a jar and centrate was pumped at 0.5 mL/min flow rate into
the jar. The DO was maintained between 2 mg/L to 4mg/L and a magnetic stir bar was used to
keep the centrate and the sludge seeds well mixed. The process temperature was maintained at
30ºC. Influent pumping was stopped when the total feed volume reached 1000 mL. The process
indicated that partial nitrification on centrate was complete when the feed solution reached a pH
value of 6. The changes of constituents in centrate by partial nitrification were measured to
prepare synthetic partially nitrified centrate. Literature values from Kosari (2011) for effluent
constituents after ANAMMOX were used to prepare synthetic ANAMMOX effluent feed.
21
Materials and Methods
Detailed process description for partial nitrification and ANAMMOX process is given in Kosari,
(2011).
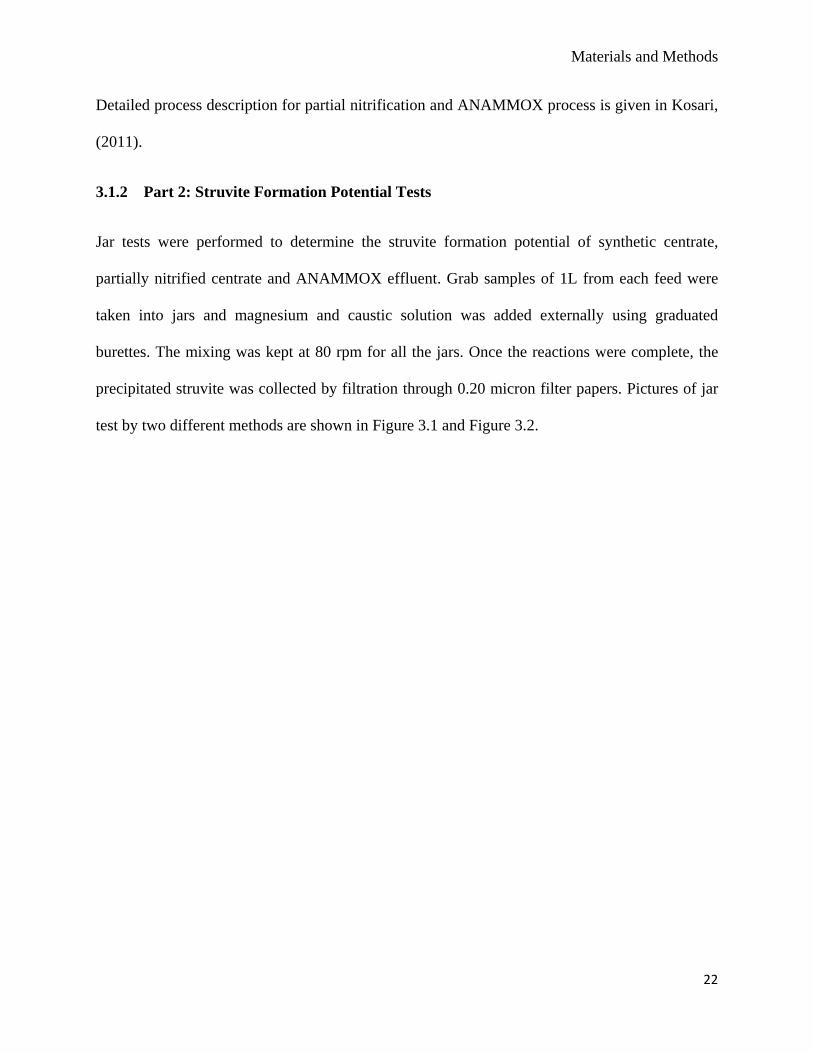
3.1.2 Part 2: Struvite Formation Potential Tests
Jar tests were performed to determine the struvite formation potential of synthetic centrate,
partially nitrified centrate and ANAMMOX effluent. Grab samples of 1L from each feed were
taken into jars and magnesium and caustic solution was added externally using graduated
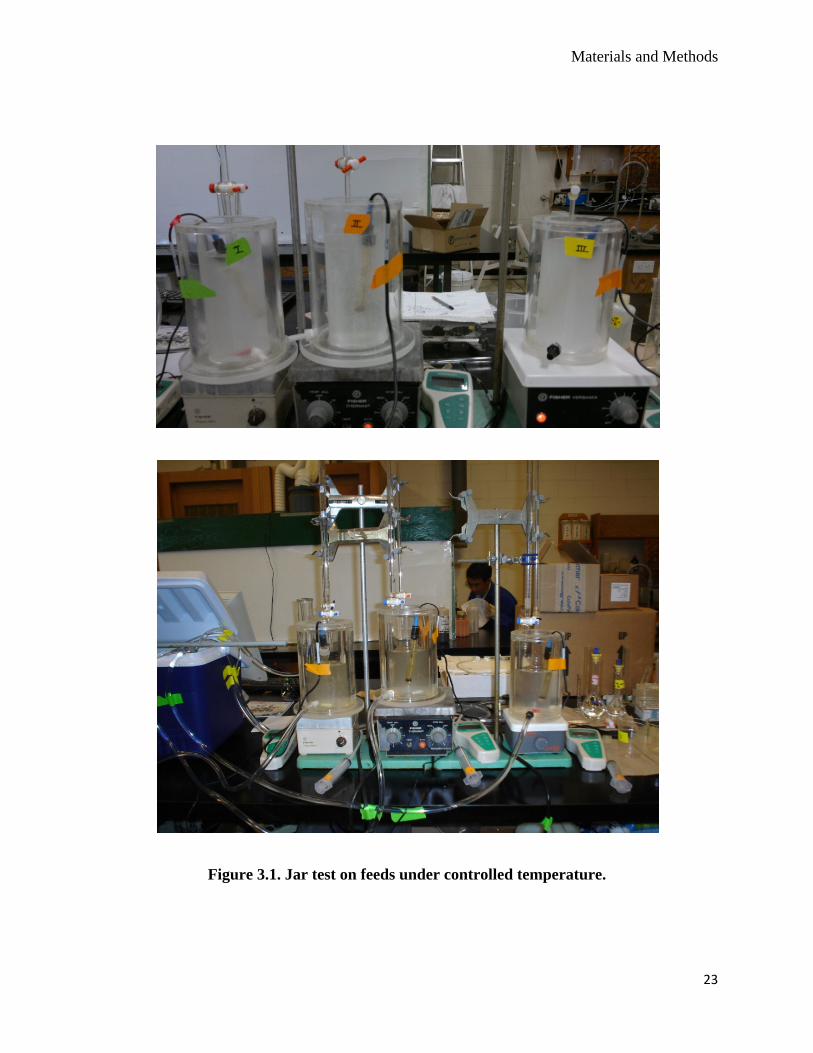
burettes. The mixing was kept at 80 rpm for all the jars. Once the reactions were complete, the
precipitated struvite was collected by filtration through 0.20 micron filter papers. Pictures of jar
test by two different methods are shown in Figure 3.1 and Figure 3.2.
22
Materials and Methods
Figure 3.1. Jar test on feeds under controlled temperature.
23
Materials and Methods
Figure 3.2. Jar test of feeds using Phipps and Bird stirrer instrument at room temperature
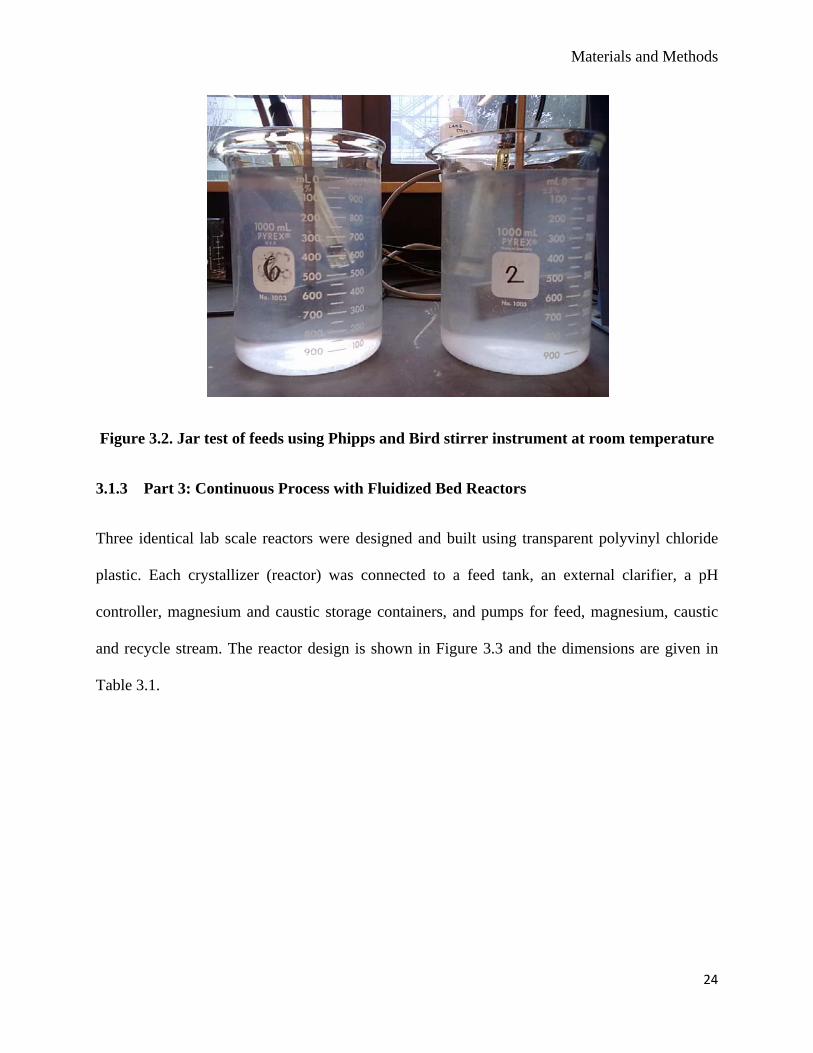
3.1.3 Part 3: Continuous Process with Fluidized Bed Reactors
Three identical lab scale reactors were designed and built using transparent polyvinyl chloride
plastic. Each crystallizer (reactor) was connected to a feed tank, an external clarifier, a pH
controller, magnesium and caustic storage containers, and pumps for feed, magnesium, caustic
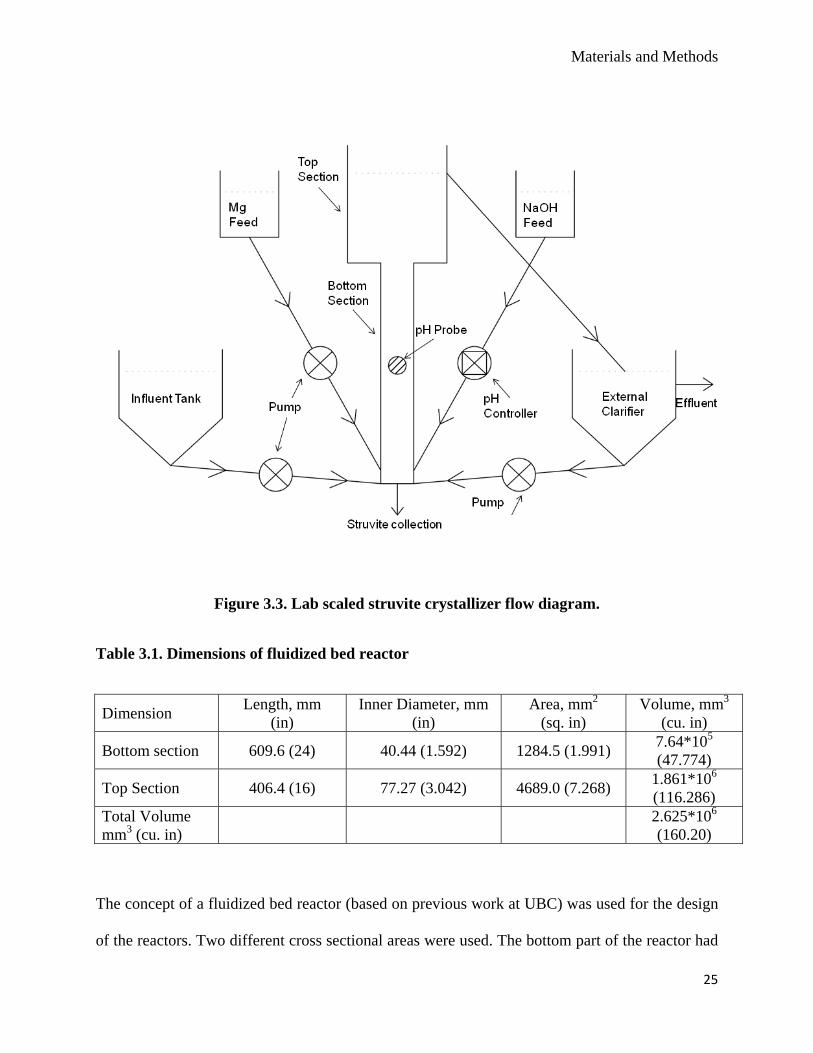
and recycle stream. The reactor design is shown in Figure 3.3 and the dimensions are given in
Table 3.1.
24
Materials and Methods
Figure 3.3. Lab scaled struvite crystallizer flow diagram.
Table 3.1. Dimensions of fluidized bed reactor
Dimension Length, mm (in)
Inner Diameter, mm (in)
Area, mm2 (sq. in)
Volume, mm3 (cu. in)
Bottom section 609.6 (24) 40.44 (1.592) 1284.5 (1.991) 7.64*105 (47.774)
Top Section 406.4 (16) 77.27 (3.042) 4689.0 (7.268) 1.861*106 (116.286)
Total Volume mm3 (cu. in)
2.625*106 (160.20)
The concept of a fluidized bed reactor (based on previous work at UBC) was used for the design
of the reactors. Two different cross sectional areas were used. The bottom part of the reactor had
25
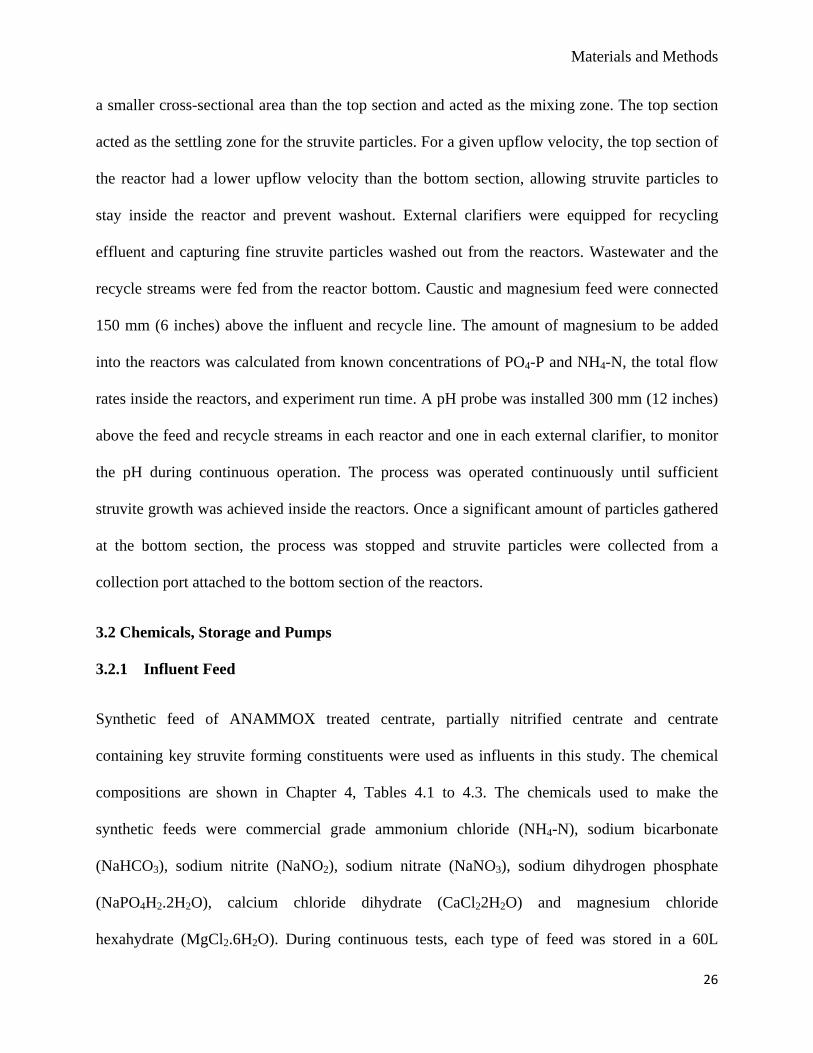
Materials and Methods
a smaller cross-sectional area than the top section and acted as the mixing zone. The top section
acted as the settling zone for the struvite particles. For a given upflow velocity, the top section of
the reactor had a lower upflow velocity than the bottom section, allowing struvite particles to
stay inside the reactor and prevent washout. External clarifiers were equipped for recycling
effluent and capturing fine struvite particles washed out from the reactors. Wastewater and the
recycle streams were fed from the reactor bottom. Caustic and magnesium feed were connected
150 mm (6 inches) above the influent and recycle line. The amount of magnesium to be added
into the reactors was calculated from known concentrations of PO4-P and NH4-N, the total flow
rates inside the reactors, and experiment run time. A pH probe was installed 300 mm (12 inches)
above the feed and recycle streams in each reactor and one in each external clarifier, to monitor
the pH during continuous operation. The process was operated continuously until sufficient
struvite growth was achieved inside the reactors. Once a significant amount of particles gathered
at the bottom section, the process was stopped and struvite particles were collected from a
collection port attached to the bottom section of the reactors.
3.2 Chemicals, Storage and Pumps
3.2.1 Influent Feed
Synthetic feed of ANAMMOX treated centrate, partially nitrified centrate and centrate
containing key struvite forming constituents were used as influents in this study. The chemical
compositions are shown in Chapter 4, Tables 4.1 to 4.3. The chemicals used to make the
synthetic feeds were commercial grade ammonium chloride (NH4-N), sodium bicarbonate
(NaHCO3), sodium nitrite (NaNO2), sodium nitrate (NaNO3), sodium dihydrogen phosphate
(NaPO4H2.2H2O), calcium chloride dihydrate (CaCl22H2O) and magnesium chloride
hexahydrate (MgCl2.6H2O). During continuous tests, each type of feed was stored in a 60L
26
Materials and Methods
capacity holding tank and was pumped inside the reactors by 1-100 rpm MasterflexTM
laboratory-scaled pumps. MasterflexTM laboratory-scaled 6-600 rpm pump was used for
recycling effluent back in the reactor.
3.2.2 Magnesium (Mg) Feed
Magnesium feed was made using commercial grade magnesium chloride hexahydrate pellets
(MgCl2.6H2O). The solution was stored in a 2L graduated cylinder and pumped into the reactors
using Zellweger Analytics Inc.’s reagent pump. The Mg solution was made in such a way that
the molar ratio of Mg : PO4-P was always 1.1 inside the reactors during the whole operation.
3.2.3 Caustic (NaOH) Feed
Commercial grade sodium hydroxide or caustic (NaOH) was used to prepare a base solution for
the study. The pellets were dissolved in distilled water to the desired normality and pumped into
the reactors using pH controllers.
3.2.4 pH Controllers
The caustic solution pump was connected to pH controllers by Eutech Instruments (Model: alpha
pH-800) and by the Environmental Laboratory, University of British Columbia to keep the pH
inside the reactors under a certain range by controlling the amount of caustic pumped in the
reactors. The pH inside the reactors and external clarifiers were monitored continuously with
Oakton gel filled, epoxy body pH probes connected to the pH controllers and Oakton pH meters.
The pH probes were calibrated by using standard buffer solution of pH 4, pH 7 and pH 10.
27
Materials and Methods
3.3 Sample Collection and Preservation
Grab samples of influent and effluent were collected during each experiment. Magnesium and
caustic samples were collected for the storages jars before and after each experiment were
performed. The pH of feed inside the reactors were monitored and controlled by an inbuilt pH
probe connected to a pH controller. The sample pH and temperature were measured using
Oakton gel filled, epoxy body pH probes connected to Oakton pH meters.
3.4 Analytical Methods
3.4.1 Magnesium
Analysis of magnesium was performed by flame atomic absorption spectrophotometry using a
Varian Inc. SpectrAA220 Fast Sequential Atomic Absorption Spectrophotometer (AAS).
With real wastewater where soluble organics are present in the samples, 1mL of concentrated
nitric acid was added to 10mL of sample and digested. This prevented the organics from
interfering during analysis. Samples collected for magnesium test were first preserved in plastic
containers using few drops of concentrated nitric acid (HNO3). To prevent interference by
carbonate ion in AAS, 2 mL of 100,000 mg/L lanthanum solution was added to each 100 mL of
magnesium sample before testing in the AAS. Samples were diluted when necessary.
3.4.2 Ortho-Phosphate (PO4-P)
Analysis for ortho-phosphate samples were performed by using flow injection analysis on Lachat
QuickChem 8000 instrument. Samples were diluted before testing when necessary.
28
Materials and Methods
3.4.3 Ammonium (NH4-N)
Analysis for ammonia samples were performed by using flow injection analysis on Lachat
QuickChem 8000 instrument. Dilution of samples was performed before testing.
3.4.4 Nitrite and Nitrate (NOx-N)
Analyses for nitrite and nitrate samples were performed by using flow injection analysis on
Lachat QuickChem 8000 instrument.
3.4.5 Calcium
Analysis of calcium was performed to check the composition of struvite precipitates. The tests
were performed by atomic absorption spectrophotometry using the AAS.
3.4.6 Caustic
Caustic (NaOH) solutions were dissolved in distilled water to make caustic solutions. Caustic
samples were collected during each run of experiment and sodium ion in the solution was
analyzed. Measured sodium ion concentration gave the molar strength of the caustic solution
used in the experiment. The volume of caustic used in the experiment by each reactor during
each run was recorded. The mass of caustic was calculated then from the consumed volume and
caustic concentration.
3.4.7 Alkalinity
Alkalinity of the influent and effluent was measured during the study. A pH probe was used to
measure the alkalinity. Sulfuric acid (0.2N or 0.02N) was added to the influent and effluents
samples till pH of the sample reached 4.5. Alkalinity calculations are provided in Section 3.7.
29
Materials and Methods
3.4.8 Filtration
All samples were filtered before analysing using cellulose nitrate membranes (filter papers)
having a nominal pore size of 0.20 microns. These removed all the suspended particles from the
samples giving more accuracy in obtained results.
3.5 Struvite Collection, Drying, Analysis and Quality Determination
Struvite precipitates were collected for each reactor after completion of an experimental run. The
collected particles were first filtered using nylon membranes with nominal pore size of 0.20
microns. The collected precipitates in the filter paper were first washed with distilled water, and
then washed with reagent alcohol, to evaporate the water trapped in the precipitates quickly,
thus, reducing the crystal drying time.
The dried struvite crystals were then analysed for magnesium, ortho-phosphate, ammonium and
calcium. For analysing these constituents, 0.25 gm of precipitate was first dissolved in 50mL of
5% nitrite acid. Once dissolved, the sample was filtered by 0.20 µm cellulose membrane and
diluted 50 times. The molar ratio of each constituent present in the precipitate gave the purity of
the crystals formed during the experiments. The molar ratio of water in struvite was determined
by oven drying a measured amount of struvite for 24 hours and then re-measuring the remaining
weight. Struvite particles were also analysed in XRD to check the purity of the substance.
3.6 Particle Size Distribution
Particle size distribution of struvite particles was obtained using a Malvern Mastersizer 2000
particle size analyzer model Hydro 2000S. A particle size distribution image was captured by
B3-Series Motic Microscope.
30
Materials and Methods
31
3.7 Terminology
3.7.1 Removal Efficiency
X-removal efficiency (%) = (Xinfluent – Xeffluent)*100/Xinfluent
Xinfluent = Concentration of X of influent at reactor inlet in mg/L.
Xeffluent = Concentration of X of effluent collected from external clarifier in mg/L.
3.7.2 Recycle Ratio
Recycle Ratio (RR) = QRR / Qinf
QRR = Recycle flow rate; Qinf = Total influent flow rate.
3.7.3 Alkalinity
Alkalinity, mg/L CaCO3 = (A x N x 50000) / (mL of sample)
Where, A = mL standard acid used to reach pH 4.5; N = normality of standard.
Results and Discussions
32
4. Results and Discussions
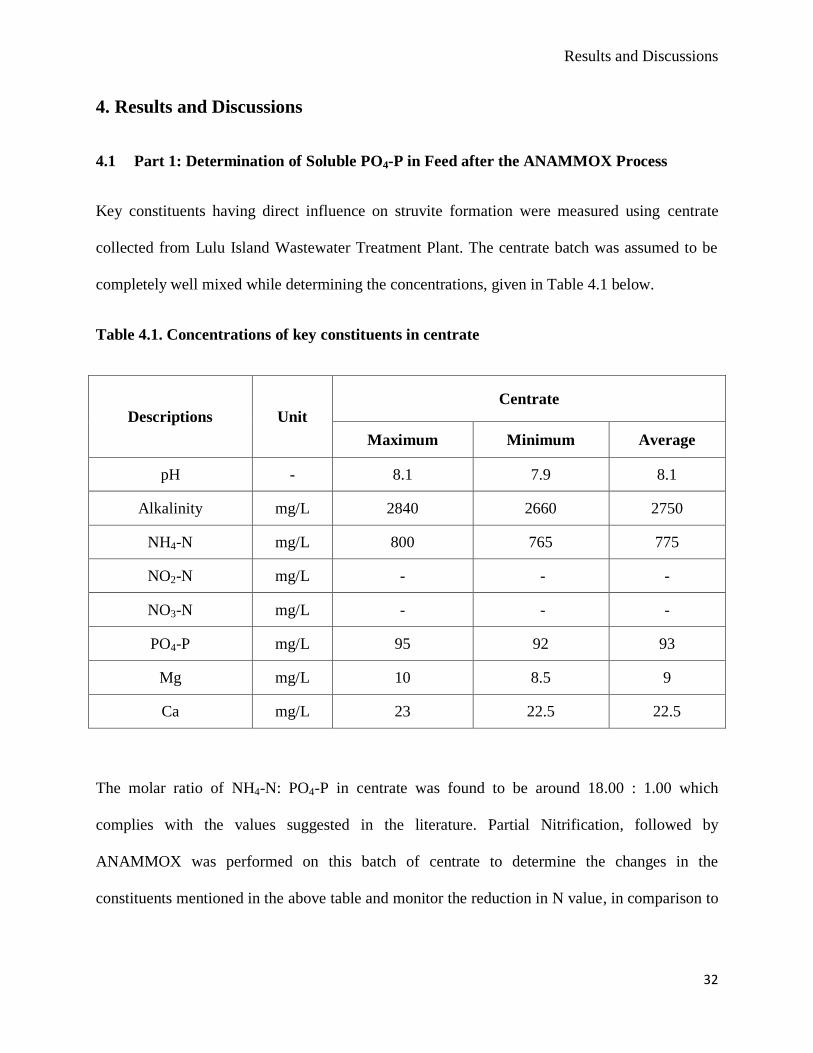
4.1 Part 1: Determination of Soluble PO4-P in Feed after the ANAMMOX Process
Key constituents having direct influence on struvite formation were measured using centrate
collected from Lulu Island Wastewater Treatment Plant. The centrate batch was assumed to be
completely well mixed while determining the concentrations, given in Table 4.1 below.
Table 4.1. Concentrations of key constituents in centrate
Descriptions Unit
Centrate
Maximum Minimum Average
pH - 8.1 7.9 8.1
Alkalinity mg/L 2840 2660 2750
NH4-N mg/L 800 765 775
NO2-N mg/L - - -
NO3-N mg/L - - -
PO4-P mg/L 95 92 93
Mg mg/L 10 8.5 9
Ca mg/L 23 22.5 22.5
The molar ratio of NH4-N: PO4-P in centrate was found to be around 18.00 : 1.00 which
complies with the values suggested in the literature. Partial Nitrification, followed by
ANAMMOX was performed on this batch of centrate to determine the changes in the
constituents mentioned in the above table and monitor the reduction in N value, in comparison to
Results and Discussions
33
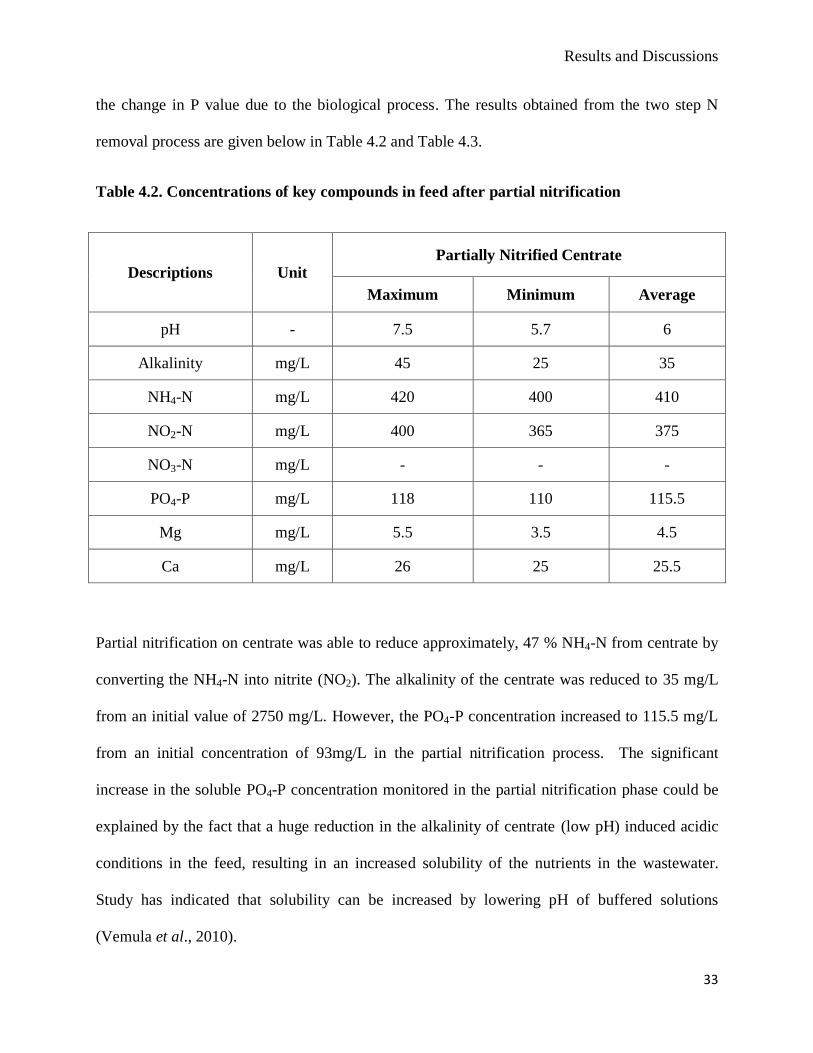
the change in P value due to the biological process. The results obtained from the two step N
removal process are given below in Table 4.2 and Table 4.3.
Table 4.2. Concentrations of key compounds in feed after partial nitrification
Descriptions Unit Partially Nitrified Centrate
Maximum Minimum Average
pH - 7.5 5.7 6
Alkalinity mg/L 45 25 35
NH4-N mg/L 420 400 410
NO2-N mg/L 400 365 375
NO3-N mg/L - - -
PO4-P mg/L 118 110 115.5
Mg mg/L 5.5 3.5 4.5
Ca mg/L 26 25 25.5
Partial nitrification on centrate was able to reduce approximately, 47 % NH4-N from centrate by
converting the NH4-N into nitrite (NO2). The alkalinity of the centrate was reduced to 35 mg/L
from an initial value of 2750 mg/L. However, the PO4-P concentration increased to 115.5 mg/L
from an initial concentration of 93mg/L in the partial nitrification process. The significant
increase in the soluble PO4-P concentration monitored in the partial nitrification phase could be
explained by the fact that a huge reduction in the alkalinity of centrate (low pH) induced acidic
conditions in the feed, resulting in an increased solubility of the nutrients in the wastewater.
Study has indicated that solubility can be increased by lowering pH of buffered solutions
(Vemula et al., 2010).
Results and Discussions
34
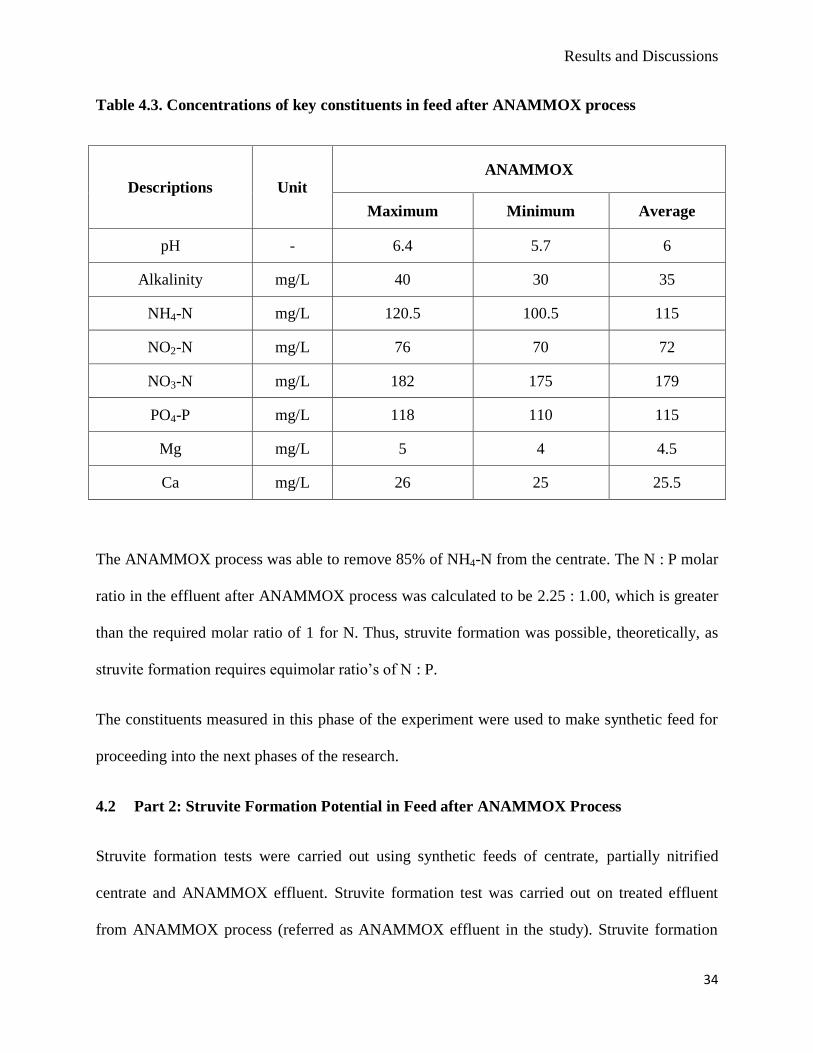
Table 4.3. Concentrations of key constituents in feed after ANAMMOX process
Descriptions Unit
ANAMMOX
Maximum Minimum Average
pH - 6.4 5.7 6
Alkalinity mg/L 40 30 35
NH4-N mg/L 120.5 100.5 115
NO2-N mg/L 76 70 72
NO3-N mg/L 182 175 179
PO4-P mg/L 118 110 115
Mg mg/L 5 4 4.5
Ca mg/L 26 25 25.5
The ANAMMOX process was able to remove 85% of NH4-N from the centrate. The N : P molar
ratio in the effluent after ANAMMOX process was calculated to be 2.25 : 1.00, which is greater
than the required molar ratio of 1 for N. Thus, struvite formation was possible, theoretically, as
struvite formation requires equimolar ratio’s of N : P.
The constituents measured in this phase of the experiment were used to make synthetic feed for
proceeding into the next phases of the research.
4.2 Part 2: Struvite Formation Potential in Feed after ANAMMOX Process
Struvite formation tests were carried out using synthetic feeds of centrate, partially nitrified
centrate and ANAMMOX effluent. Struvite formation test was carried out on treated effluent
from ANAMMOX process (referred as ANAMMOX effluent in the study). Struvite formation
Results and Discussions
35
with centrate was also conducted to compare struvite formation potential and efficiency of
nutrient recovery with ANAMMOX effluent. As ANAMMOX effluent has very low N : P ratio,
struvite formation tests were also carried out on partially nitrified centrate feed, to verify if N :P
ration has any impact on the struvite formation process.
The average concentrations of the compound in Table 4.1, 4.2 and 4.3 were used to make the
feed. As Mg was the limiting element in the feeds for struvite formation, it was added externally.
Caustic solution was added externally to control the pH in the system, so that the SSR in all three
feeds remained greater than 1.
The struvite formation tests for the feeds were carried out at three different temperatures. The
selected temperatures were 20⁰C, 25⁰C and 30⁰C and two pH end points, 8.30 and 8.50. The
maximum temperature was chosen to be 30⁰C as ANAMMOX process requires a relatively high
temperature, to operate successfully. The jar tests were also performed using two different
methods. In method 1, the variations of temperatures were maintained. Caustic was added
gradually in the all three feeds with corresponding sampling over time. In method 2 of the jar
tests, Phipps and Birds stirrer instrument was used to maintain the same mixing feed for all three
feeds at room temperature. Samples were taken only for the influent and the final effluent, once
struvite formation reactions were assumed to be complete.
The results on the phosphorus recovery from the two jar test methods are discussed below.
4.2.1 Jar Test Method 1: P and N Recovery at Variable Temperature
Jar test Method 1 was conducted to verify if ANAMMOX effluent was suitable for producing
struvite crystals, as the N : P ratio was very low (≈ 2 : 1), in comparison to centrate. The N : P
molar ratio of centrate is typically very high (approximately 20 : 1), and, this has proved to be
Results and Discussions
36
favourable for the quick formation of struvite crystals in the process. Theoretically, the
requirements are equimolar amounts of N : P for struvite formation. Therefore, it was expected
that ANAMMOX effluent will have the same struvite formation potential as centrate, as the
availability of N was greater than the required molar amount in the solution.
The detailed summary of the influent and effluent values obtained in Method 1 of jar tests is
given in details in Appendix A. In this method, 20⁰C, 25⁰C and 30⁰C temperatures were
maintained in the feed solutions of ANAMMOX effluent to determine the struvite formation
potential and maximum percentage of phosphorus recovery. Centrate and partially nitrified
centrate were tested to perform a comparative study on the phosphorus recovery as struvite.
Caustic (NaOH) was added gradually in the feed to increase the pH of the solution and maintain
the SSR > 1 in the system. Thus, the struvite formation was initiated and, over time, the soluble
PO4-P and NH4-N decreased in the solution as struvite precipitated out. Magnesium was added in
such a way that the molar ratio of Mg : P remained 1.1 : 1.0 in all the solutions during the jar
tests.
Samples were taken from the effluent after certain time increments to monitor the reduction rate
of soluble P and soluble N in the feeds. The reduction of soluble P, and soluble N in centrate,
partially nitrified centrate and ANAMMOX effluent at different temperatures over time are given
in Figures 4.1 to 4.6. The left side of the graph indicates the influent concentration of PO4-P and
NH4-N for centrate, partially nitrified centrate and ANAMMOX effluent.
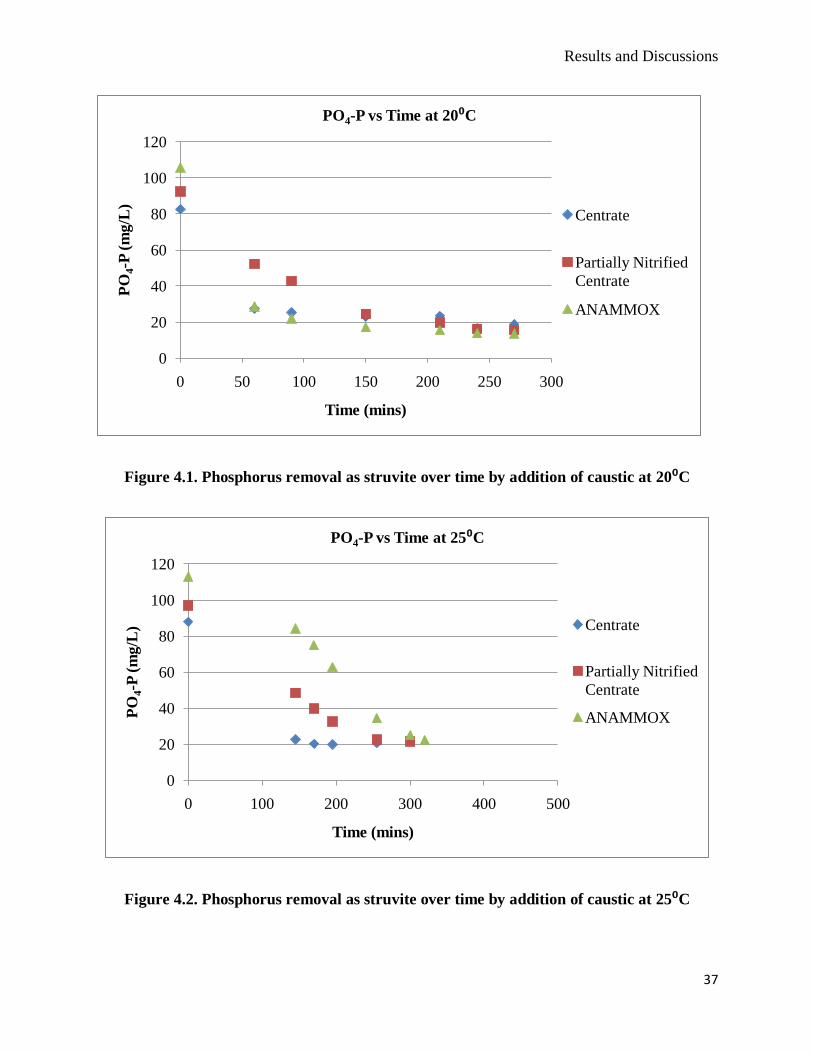
Results and Discussions
37
Figure 4.1. Phosphorus removal as struvite over time by addition of caustic at 20⁰C
Figure 4.2. Phosphorus removal as struvite over time by addition of caustic at 25⁰C
0
20
40
60
80
100
120
0 50 100 150 200 250 300
PO
4-P
(m
g/L
)
Time (mins)
PO4-P vs Time at 20⁰C
Centrate
Partially Nitrified
Centrate
ANAMMOX
0
20
40
60
80
100
120
0 100 200 300 400 500
PO
4-P
(m
g/L
)
Time (mins)
PO4-P vs Time at 25⁰C
Centrate
Partially Nitrified
Centrate
ANAMMOX
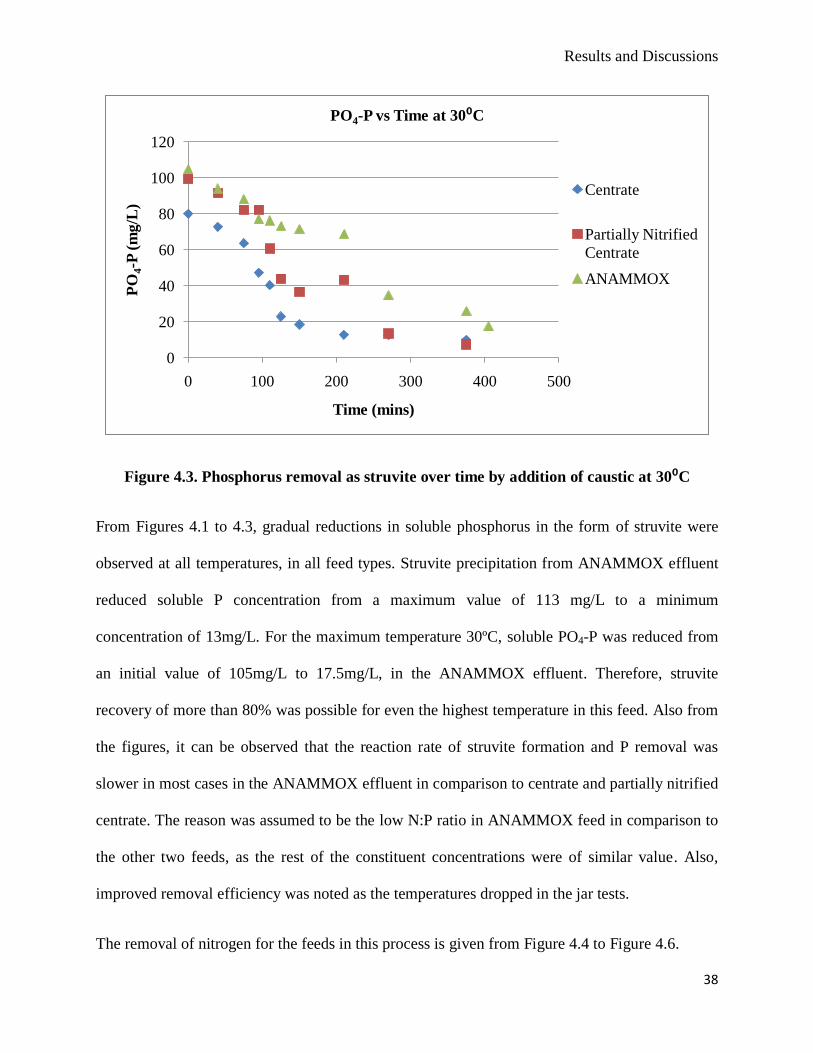
Results and Discussions
38
Figure 4.3. Phosphorus removal as struvite over time by addition of caustic at 30⁰C
From Figures 4.1 to 4.3, gradual reductions in soluble phosphorus in the form of struvite were
observed at all temperatures, in all feed types. Struvite precipitation from ANAMMOX effluent
reduced soluble P concentration from a maximum value of 113 mg/L to a minimum
concentration of 13mg/L. For the maximum temperature 30ºC, soluble PO4-P was reduced from
an initial value of 105mg/L to 17.5mg/L, in the ANAMMOX effluent. Therefore, struvite
recovery of more than 80% was possible for even the highest temperature in this feed. Also from
the figures, it can be observed that the reaction rate of struvite formation and P removal was
slower in most cases in the ANAMMOX effluent in comparison to centrate and partially nitrified
centrate. The reason was assumed to be the low N:P ratio in ANAMMOX feed in comparison to
the other two feeds, as the rest of the constituent concentrations were of similar value. Also,
improved removal efficiency was noted as the temperatures dropped in the jar tests.
The removal of nitrogen for the feeds in this process is given from Figure 4.4 to Figure 4.6.
0
20
40
60
80
100
120
0 100 200 300 400 500
PO
4-P
(m
g/L
)
Time (mins)
PO4-P vs Time at 30⁰C
Centrate
Partially Nitrified
Centrate
ANAMMOX
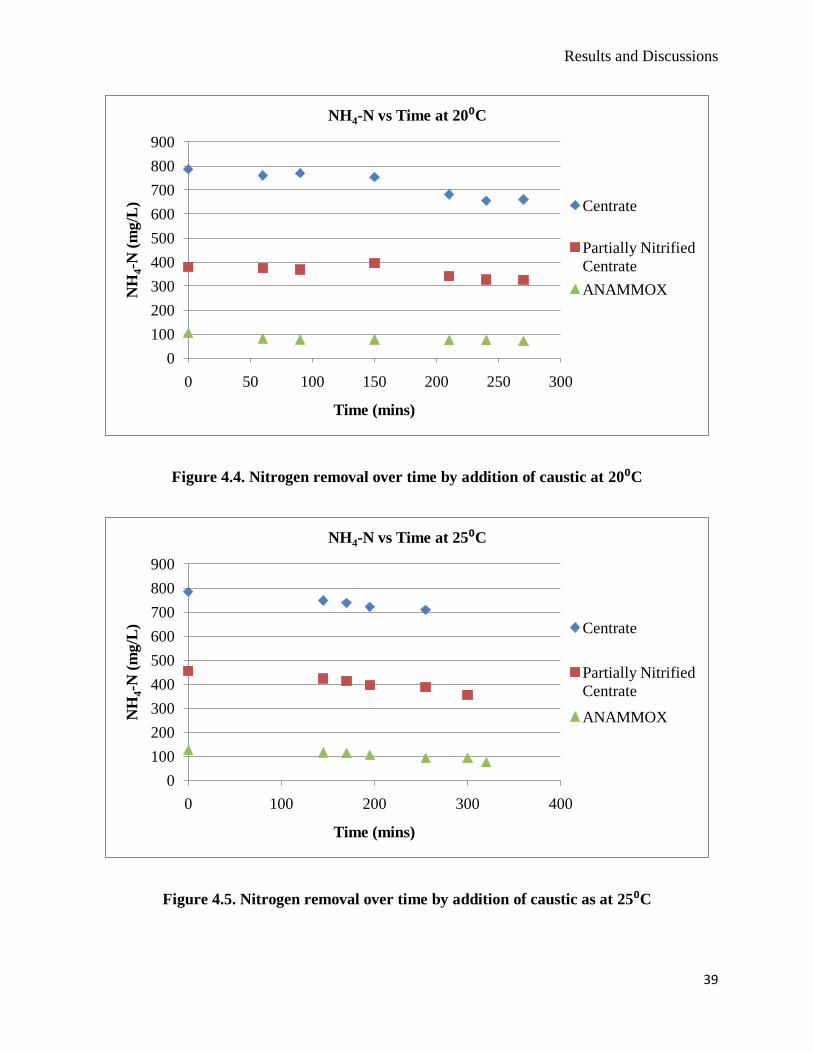
Results and Discussions
39
Figure 4.4. Nitrogen removal over time by addition of caustic at 20⁰C
Figure 4.5. Nitrogen removal over time by addition of caustic as at 25⁰C
0
100
200
300
400
500
600
700
800
900
0 50 100 150 200 250 300
NH
4-N
(m
g/L
)
Time (mins)
NH4-N vs Time at 20⁰C
Centrate
Partially Nitrified
Centrate
ANAMMOX
0
100
200
300
400
500
600
700
800
900
0 100 200 300 400
NH
4-N
(m
g/L
)
Time (mins)
NH4-N vs Time at 25⁰C
Centrate
Partially Nitrified
Centrate
ANAMMOX
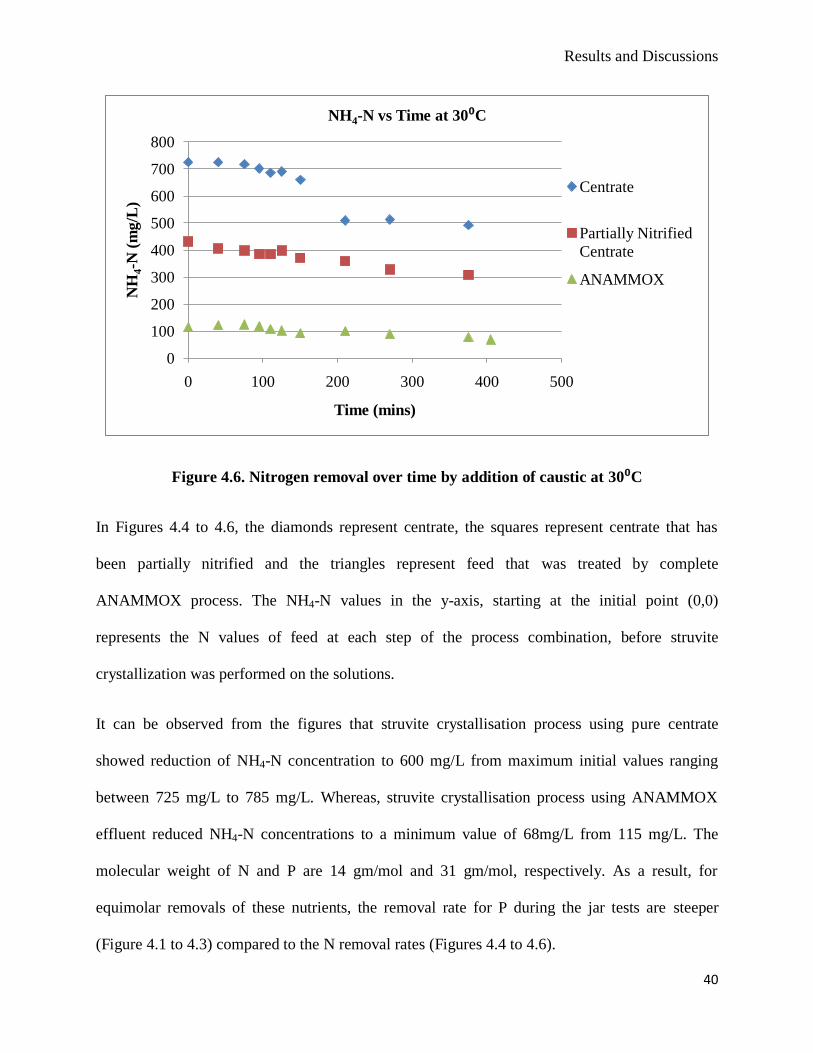
Results and Discussions
40
Figure 4.6. Nitrogen removal over time by addition of caustic at 30⁰C
In Figures 4.4 to 4.6, the diamonds represent centrate, the squares represent centrate that has
been partially nitrified and the triangles represent feed that was treated by complete
ANAMMOX process. The NH4-N values in the y-axis, starting at the initial point (0,0)
represents the N values of feed at each step of the process combination, before struvite
crystallization was performed on the solutions.
It can be observed from the figures that struvite crystallisation process using pure centrate
showed reduction of NH4-N concentration to 600 mg/L from maximum initial values ranging
between 725 mg/L to 785 mg/L. Whereas, struvite crystallisation process using ANAMMOX
effluent reduced NH4-N concentrations to a minimum value of 68mg/L from 115 mg/L. The
molecular weight of N and P are 14 gm/mol and 31 gm/mol, respectively. As a result, for
equimolar removals of these nutrients, the removal rate for P during the jar tests are steeper
(Figure 4.1 to 4.3) compared to the N removal rates (Figures 4.4 to 4.6).
0
100
200
300
400
500
600
700
800
0 100 200 300 400 500
NH
4-N
(m
g/L
)
Time (mins)
NH4-N vs Time at 30⁰C
Centrate
Partially Nitrified
Centrate
ANAMMOX
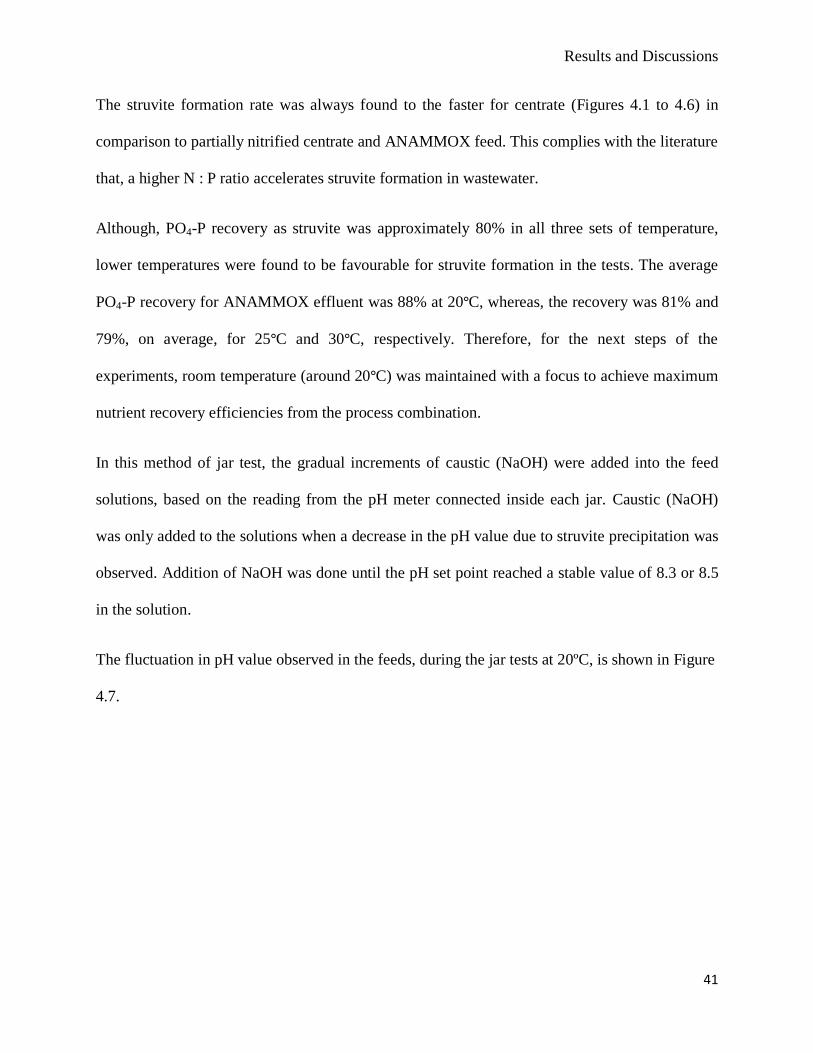
Results and Discussions
41
The struvite formation rate was always found to the faster for centrate (Figures 4.1 to 4.6) in
comparison to partially nitrified centrate and ANAMMOX feed. This complies with the literature
that, a higher N : P ratio accelerates struvite formation in wastewater.
Although, PO4-P recovery as struvite was approximately 80% in all three sets of temperature,
lower temperatures were found to be favourable for struvite formation in the tests. The average
PO4-P recovery for ANAMMOX effluent was 88% at 20ºC, whereas, the recovery was 81% and
79%, on average, for 25ºC and 30ºC, respectively. Therefore, for the next steps of the
experiments, room temperature (around 20ºC) was maintained with a focus to achieve maximum
nutrient recovery efficiencies from the process combination.
In this method of jar test, the gradual increments of caustic (NaOH) were added into the feed
solutions, based on the reading from the pH meter connected inside each jar. Caustic (NaOH)
was only added to the solutions when a decrease in the pH value due to struvite precipitation was
observed. Addition of NaOH was done until the pH set point reached a stable value of 8.3 or 8.5
in the solution.
The fluctuation in pH value observed in the feeds, during the jar tests at 20ºC, is shown in Figure
4.7.
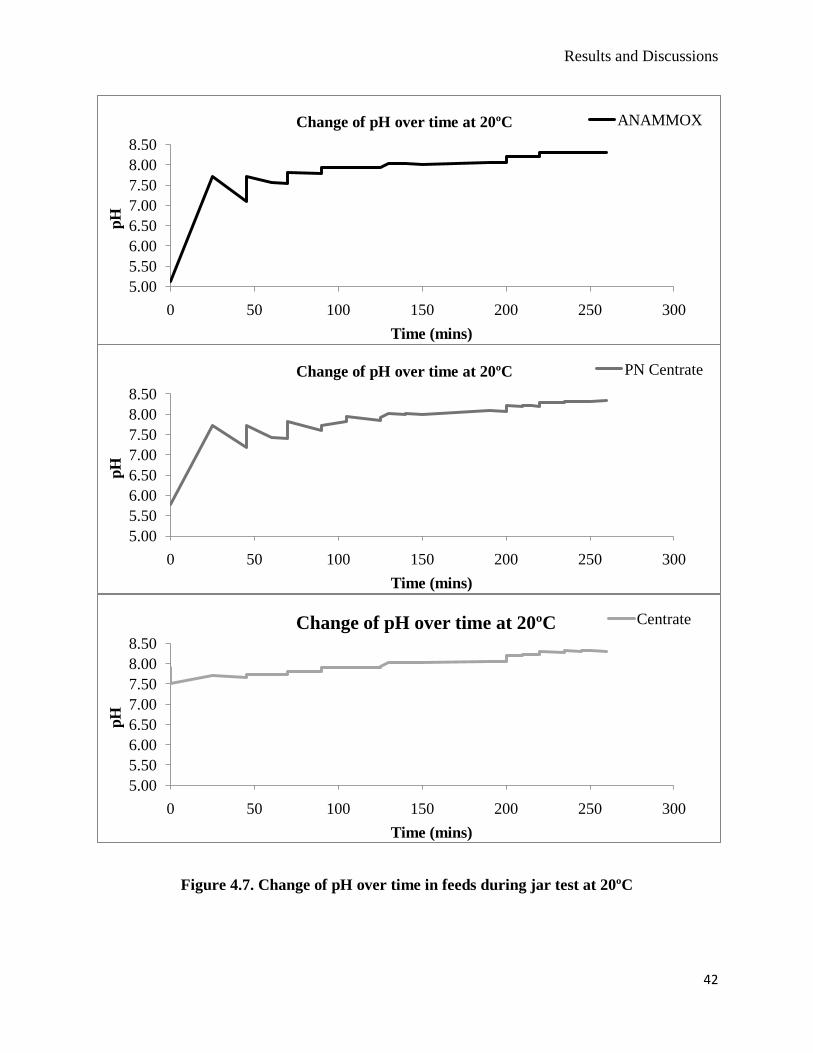
Results and Discussions
42
Figure 4.7. Change of pH over time in feeds during jar test at 20ºC
5.00
5.50
6.00
6.50
7.00
7.50
8.00
8.50
0 50 100 150 200 250 300
pH
Time (mins)
Change of pH over time at 20ºC ANAMMOX
5.00
5.50
6.00
6.50
7.00
7.50
8.00
8.50
0 50 100 150 200 250 300
pH
Time (mins)
Change of pH over time at 20ºC PN Centrate
5.00
5.50
6.00
6.50
7.00
7.50
8.00
8.50
0 50 100 150 200 250 300
pH
Time (mins)
Change of pH over time at 20ºC Centrate
Results and Discussions
43
From Figure 4.7, it can be observed that the fluctuation in pH for ANAMMOX and partially
nitrified feed was significant, compared to centrate. The phenomena observed could be explained
by the soluble alkalinity of the solutions. From Tables 4.1 to 4.3, it can be seen that centrate has
a very high soluble alkalinity in the system, which acts as a buffer; whereas, ANAMMOX and
partially nitrified feed has a very low soluble alkalinity. For centrate, it took a significant amount
of caustic addition to raise the pH initially for initializing struvite precipitation. However, the
system was able to maintain the high pH for a prolonged period of time and precipitate out a
majority of the soluble phosphorus as struvite. These conditions allowed the reaction rate to be
faster in comparison to ANAMMOX and partially nitrified feed, as observed in Figures 4.1 to
4.3. For ANAMMOX and partially nitrified feed, less caustic solution was required to increase
the solution’s pH, but the addition was more frequent to maintain SSR>1 for struvite
precipitation.
Therefore, to determine if alkalinity had any influence on struvite formation in centrate, and, to
have an estimate on the amount of chemical grade caustic requirement for struvite formation,
method 2 jar tests were performed.
4.2.2 Jar Test Method 2: Influence of Alkalinity and NaOH Requirement
Jar test method 2 was conducted to determine if alkalinity had any influence on struvite
formation in centrate feed. The tests were conducted by sampling effluent samples only after
complete struvite crystallization in the feed. This eliminated errors that resulted due to multiple
effluent samplings from feed volume in jar test method 1. This method also provided an estimate
on the amount of chemical grade caustic required for struvite formation. The mass balance
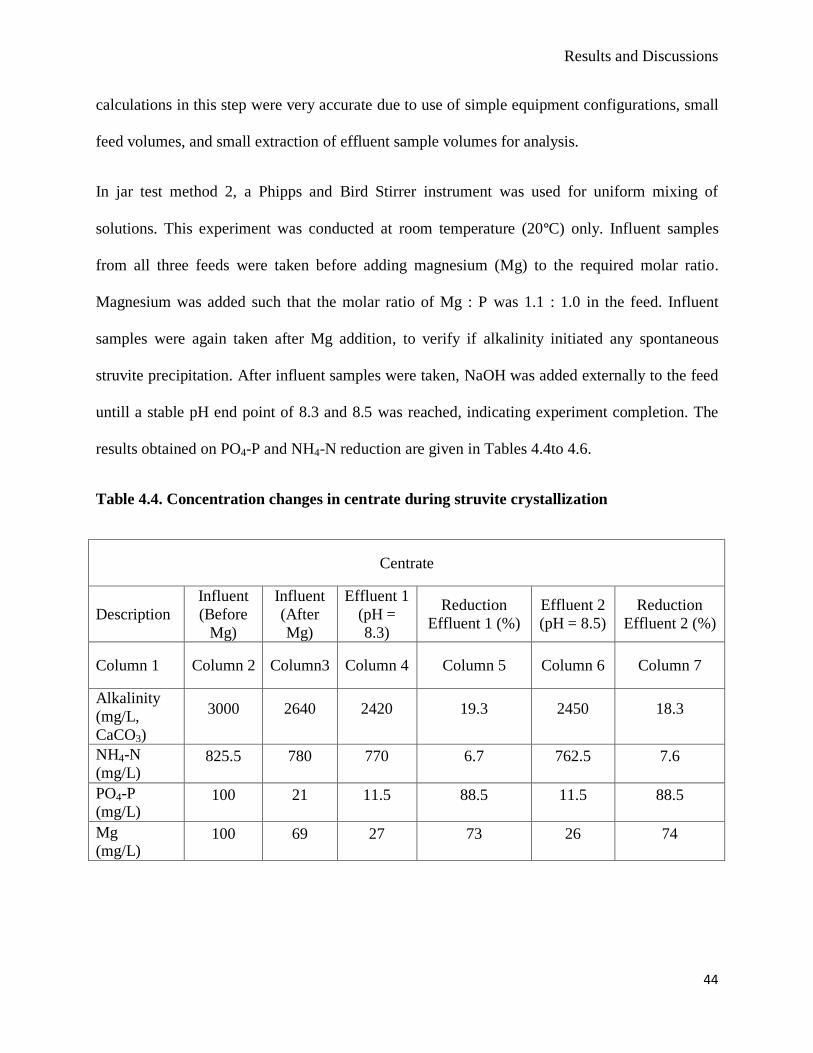
Results and Discussions
44
calculations in this step were very accurate due to use of simple equipment configurations, small
feed volumes, and small extraction of effluent sample volumes for analysis.
In jar test method 2, a Phipps and Bird Stirrer instrument was used for uniform mixing of
solutions. This experiment was conducted at room temperature (20ºC) only. Influent samples
from all three feeds were taken before adding magnesium (Mg) to the required molar ratio.
Magnesium was added such that the molar ratio of Mg : P was 1.1 : 1.0 in the feed. Influent
samples were again taken after Mg addition, to verify if alkalinity initiated any spontaneous
struvite precipitation. After influent samples were taken, NaOH was added externally to the feed
untill a stable pH end point of 8.3 and 8.5 was reached, indicating experiment completion. The
results obtained on PO4-P and NH4-N reduction are given in Tables 4.4to 4.6.
Table 4.4. Concentration changes in centrate during struvite crystallization
Centrate
Description
Influent
(Before
Mg)
Influent
(After
Mg)
Effluent 1
(pH =
8.3)
Reduction
Effluent 1 (%)
Effluent 2
(pH = 8.5)
Reduction
Effluent 2 (%)
Column 1 Column 2 Column3 Column 4 Column 5 Column 6 Column 7
Alkalinity
(mg/L,
CaCO3)
3000 2640 2420 19.3 2450 18.3
NH4-N
(mg/L) 825.5 780 770 6.7 762.5 7.6
PO4-P
(mg/L) 100 21 11.5 88.5 11.5 88.5
Mg
(mg/L) 100 69 27 73 26 74
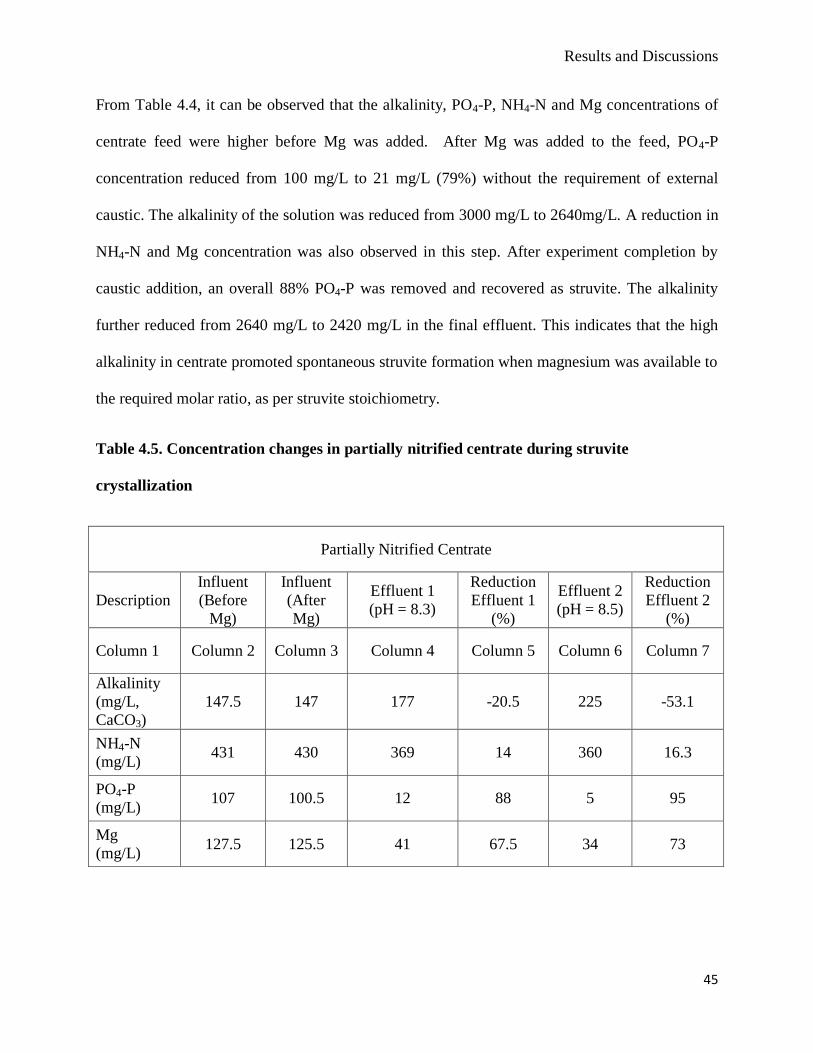
Results and Discussions
45
From Table 4.4, it can be observed that the alkalinity, PO4-P, NH4-N and Mg concentrations of
centrate feed were higher before Mg was added. After Mg was added to the feed, PO4-P
concentration reduced from 100 mg/L to 21 mg/L (79%) without the requirement of external
caustic. The alkalinity of the solution was reduced from 3000 mg/L to 2640mg/L. A reduction in
NH4-N and Mg concentration was also observed in this step. After experiment completion by
caustic addition, an overall 88% PO4-P was removed and recovered as struvite. The alkalinity
further reduced from 2640 mg/L to 2420 mg/L in the final effluent. This indicates that the high
alkalinity in centrate promoted spontaneous struvite formation when magnesium was available to
the required molar ratio, as per struvite stoichiometry.
Table 4.5. Concentration changes in partially nitrified centrate during struvite
crystallization
Partially Nitrified Centrate
Description
Influent
(Before
Mg)
Influent
(After
Mg)
Effluent 1
(pH = 8.3)
Reduction
Effluent 1
(%)
Effluent 2
(pH = 8.5)
Reduction
Effluent 2
(%)
Column 1 Column 2 Column 3 Column 4 Column 5 Column 6 Column 7
Alkalinity
(mg/L,
CaCO3)
147.5 147 177 -20.5 225 -53.1
NH4-N
(mg/L) 431 430 369 14 360 16.3
PO4-P
(mg/L) 107 100.5 12 88 5 95
Mg
(mg/L) 127.5 125.5 41 67.5 34 73

Results and Discussions
46
The NH4-N concentration reduced to 431 mg/L after partial nitrification on centrate from an
initial concentration of 825.5 mg/L, which is indicated in column 2 in Table 4.5. Struvite
crystallization was performed on partially nitrified centrate, and, the reduced concentrations of
the nutrients are given in the columns 4 and 7 in Table 4.5.
Table 4.6. Concentration changes in ANAMMOX effluent during struvite crystallisation
ANAMMOX Effluent
Description
Influent
(Before
Mg)
Influent
(After
Mg)
Effluent 1
(pH = 8.3)
Reduction
Effluent 1
(%)
Effluent 2
(pH = 8.5)
Reduction
Effluent 2
(%)
Column 1 Column 2 Column3 Column 4 Column 5 Column 6 Column 7
Alkalinity
(mg/L,
CaCO3)
76 76 165 -117.1 97 -27.6
NH4-N
(mg/L) 138 137.5 113.5 17.5 94.3 31.5
PO4-P
(mg/L) 125.5 124.5 55.5 55.5 24 80.8
Mg
(mg/L) 136.5 136.5 90 34 52.5 61.5
The NH4-N concentration reduced to 138 mg/L from an initial concentration of 825.5 mg/L, after
complete ANAMMOX process was performed on centrate, which is indicated in column 2 in
Table 4.6. Struvite crystallization was performed on ANAMMOX treated effluent, and, the
reduced concentrations of the nutrients are given in the columns 4 and 7 in Table 4.6.
From Table 4.5 and Table 4.6, it was observed that the low soluble alkalinity did not have any
influence on soluble PO4-P, NH4-N and Mg concentrations, after adding Mg in the feeds.
Struvite formation only initiated when NaOH solution was added to the feed, to raise the pH.
After NaOH addition, PO4-P concentration was reduced by a maximum of 94% and 80% in
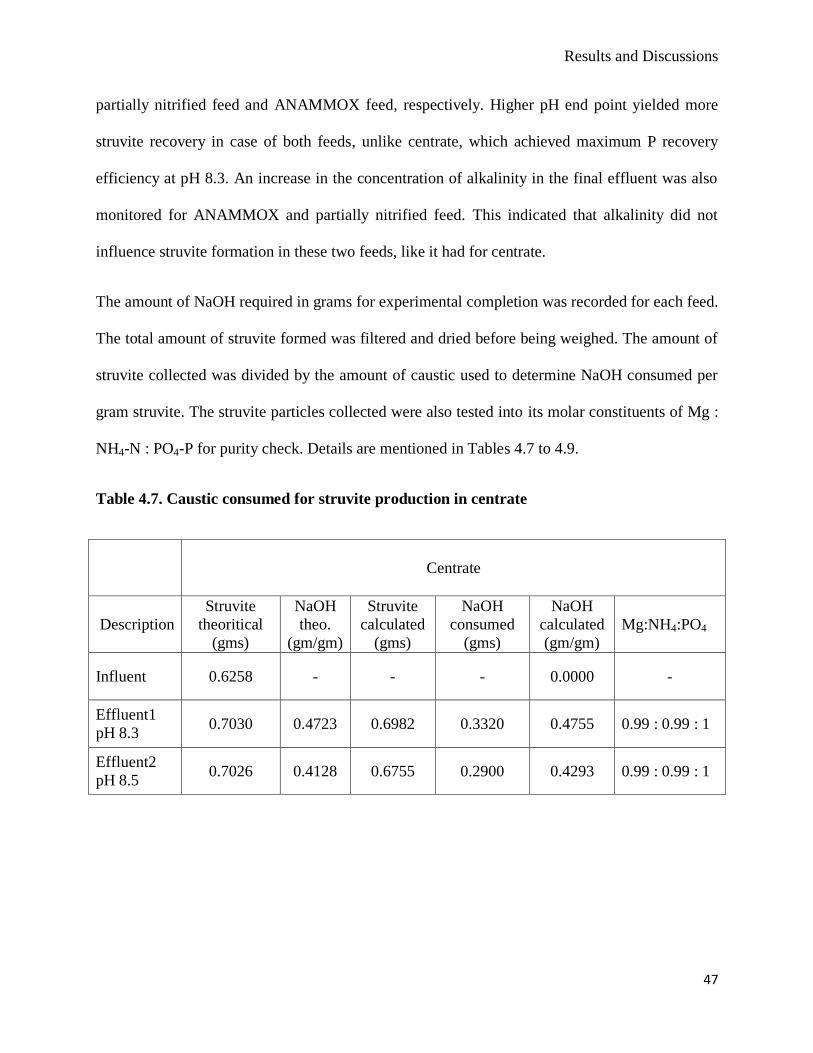
Results and Discussions
47
partially nitrified feed and ANAMMOX feed, respectively. Higher pH end point yielded more
struvite recovery in case of both feeds, unlike centrate, which achieved maximum P recovery
efficiency at pH 8.3. An increase in the concentration of alkalinity in the final effluent was also
monitored for ANAMMOX and partially nitrified feed. This indicated that alkalinity did not
influence struvite formation in these two feeds, like it had for centrate.
The amount of NaOH required in grams for experimental completion was recorded for each feed.
The total amount of struvite formed was filtered and dried before being weighed. The amount of
struvite collected was divided by the amount of caustic used to determine NaOH consumed per
gram struvite. The struvite particles collected were also tested into its molar constituents of Mg :
NH4-N : PO4-P for purity check. Details are mentioned in Tables 4.7 to 4.9.
Table 4.7. Caustic consumed for struvite production in centrate
Centrate
Description
Struvite
theoritical
(gms)
NaOH
theo.
(gm/gm)
Struvite
calculated
(gms)
NaOH
consumed
(gms)
NaOH
calculated
(gm/gm)
Mg:NH4:PO4
Influent 0.6258 - - - 0.0000 -
Effluent1
pH 8.3 0.7030 0.4723 0.6982 0.3320 0.4755 0.99 : 0.99 : 1
Effluent2
pH 8.5 0.7026 0.4128 0.6755 0.2900 0.4293 0.99 : 0.99 : 1
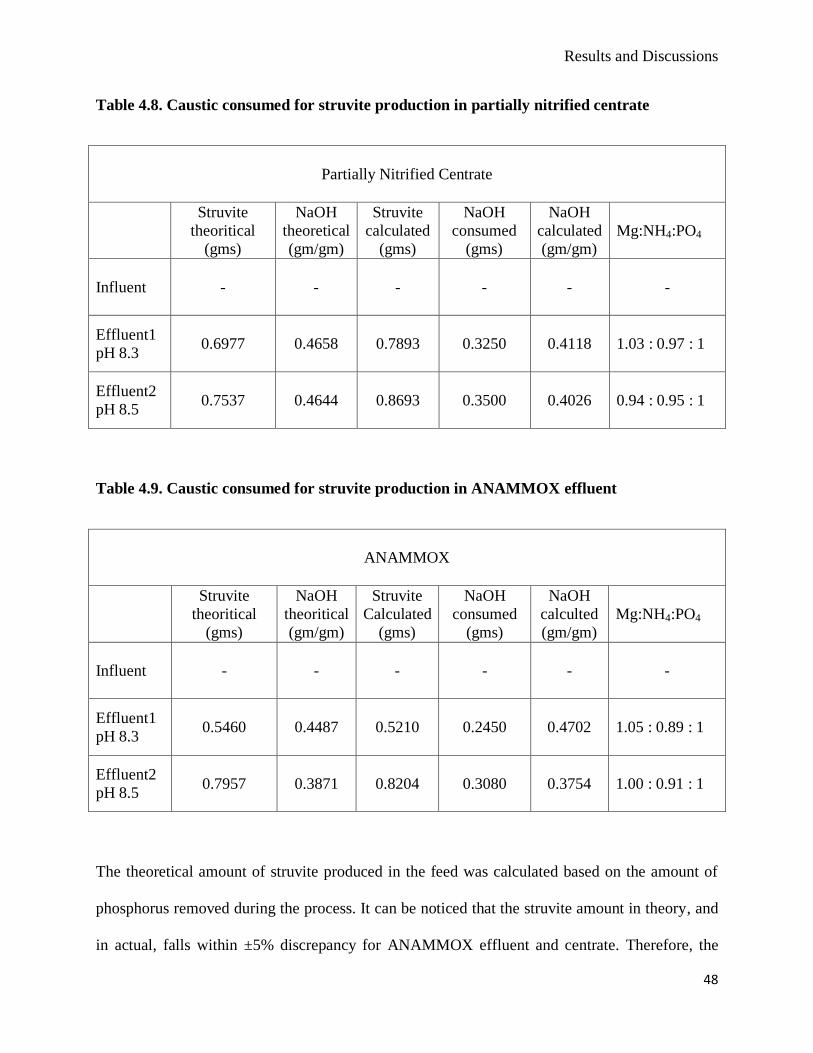
Results and Discussions
48
Table 4.8. Caustic consumed for struvite production in partially nitrified centrate
Partially Nitrified Centrate
Struvite
theoritical
(gms)
NaOH
theoretical
(gm/gm)
Struvite
calculated
(gms)
NaOH
consumed
(gms)
NaOH
calculated
(gm/gm)
Mg:NH4:PO4
Influent - - - - - -
Effluent1
pH 8.3 0.6977 0.4658 0.7893 0.3250 0.4118 1.03 : 0.97 : 1
Effluent2
pH 8.5 0.7537 0.4644 0.8693 0.3500 0.4026 0.94 : 0.95 : 1
Table 4.9. Caustic consumed for struvite production in ANAMMOX effluent
ANAMMOX
Struvite
theoritical
(gms)
NaOH
theoritical
(gm/gm)
Struvite
Calculated
(gms)
NaOH
consumed
(gms)
NaOH
calculted
(gm/gm)
Mg:NH4:PO4
Influent - - - - - -
Effluent1
pH 8.3 0.5460 0.4487 0.5210 0.2450 0.4702 1.05 : 0.89 : 1
Effluent2
pH 8.5 0.7957 0.3871 0.8204 0.3080 0.3754 1.00 : 0.91 : 1
The theoretical amount of struvite produced in the feed was calculated based on the amount of
phosphorus removed during the process. It can be noticed that the struvite amount in theory, and
in actual, falls within ±5% discrepancy for ANAMMOX effluent and centrate. Therefore, the
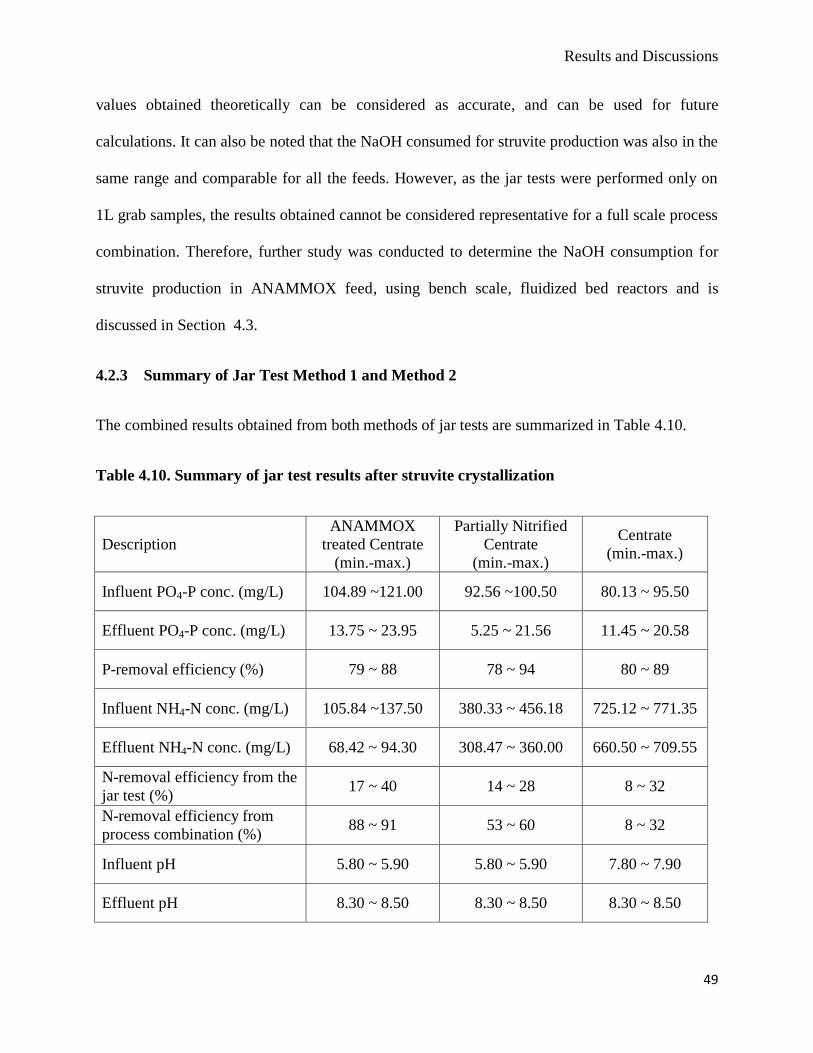
Results and Discussions
49
values obtained theoretically can be considered as accurate, and can be used for future
calculations. It can also be noted that the NaOH consumed for struvite production was also in the
same range and comparable for all the feeds. However, as the jar tests were performed only on
1L grab samples, the results obtained cannot be considered representative for a full scale process
combination. Therefore, further study was conducted to determine the NaOH consumption for
struvite production in ANAMMOX feed, using bench scale, fluidized bed reactors and is
discussed in Section 4.3.
4.2.3 Summary of Jar Test Method 1 and Method 2
The combined results obtained from both methods of jar tests are summarized in Table 4.10.
Table 4.10. Summary of jar test results after struvite crystallization
Description
ANAMMOX
treated Centrate
(min.-max.)
Partially Nitrified
Centrate
(min.-max.)
Centrate
(min.-max.)
Influent PO4-P conc. (mg/L) 104.89 ~121.00 92.56 ~100.50 80.13 ~ 95.50
Effluent PO4-P conc. (mg/L) 13.75 ~ 23.95 5.25 ~ 21.56 11.45 ~ 20.58
P-removal efficiency (%) 79 ~ 88 78 ~ 94 80 ~ 89
Influent NH4-N conc. (mg/L) 105.84 ~137.50 380.33 ~ 456.18 725.12 ~ 771.35
Effluent NH4-N conc. (mg/L) 68.42 ~ 94.30 308.47 ~ 360.00 660.50 ~ 709.55
N-removal efficiency from the
jar test (%) 17 ~ 40 14 ~ 28 8 ~ 32
N-removal efficiency from
process combination (%) 88 ~ 91 53 ~ 60 8 ~ 32
Influent pH 5.80 ~ 5.90 5.80 ~ 5.90 7.80 ~ 7.90
Effluent pH 8.30 ~ 8.50 8.30 ~ 8.50 8.30 ~ 8.50
Results and Discussions
50
In the jar tests, it was possible to recover PO4-P (as struvite) as high as 88% from ANAMMOX
effluent. In comparison, up to 88% PO4-P was recovered as struvite from centrate feed, in this
study. Partially nitrified centrate had the highest PO4-P removal of 94% in the jar tests. Overall,
the process combination of ANAMMOX, followed by struvite crystallization, was able to reduce
in excess of 85% PO4-P and 85% NH4-N from centrate in the final effluent. Lower temperatures
were also found to be favourable for nutrient recovery as struvite. Also, higher pH resulted in
higher struvite formation, thus, higher P and N recovery from ANAMMOX effluent.
4.3 Part 3: Continuous Operation with Bench-Scaled Fluidized Bed Reactors
In treatment plants, the process combination of ANAMMOX followed by struvite crystallization
will be operating continuously in reactors if applied to pilot or full scale. The jar tests provided a
positive indication that the processes could be combined successfully for simultaneous nutrient
recovery. However, the results were not representative to real treatment plant process conditions.
Therefore, a bench scale continuous operation using fluidized bed reactors were opted for the
next step of the study, so that the results obtained in this step can be considered representative to
pilot or full scale treatment plants. This study was conducted to determine the nutrient removal
efficiencies resulting from the process combination under continuous reactor operation for a
significant period.
Synthetic feeds of centrate, partially nitrified centrate and ANAMMOX treated centrate were
prepared and were fed into three identical reactors, under the similar conditions for process
operation. Magnesium (Mg) feed and caustic (NaOH) feed were added externally to balance the
stoichiometry inside the reactors and to keep the pH under control to maintain SSR greater than
unity respectively. Influent samples and effluent samples were taken at random times, to check
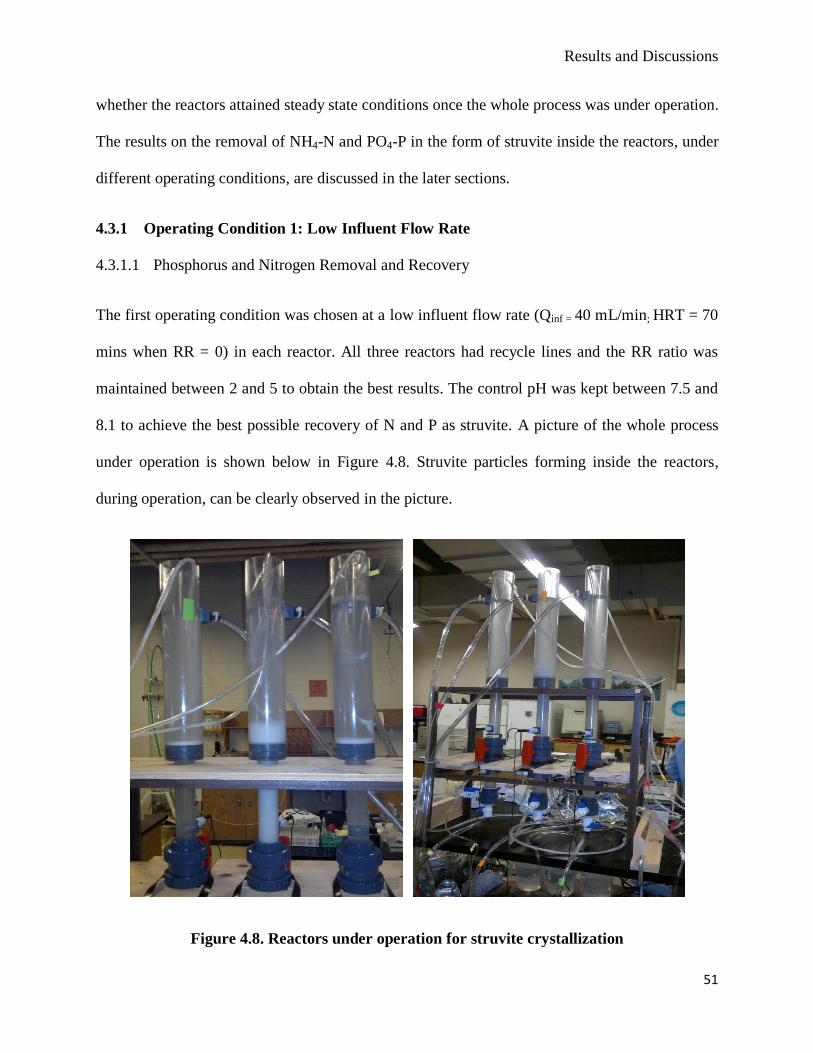
Results and Discussions
51
whether the reactors attained steady state conditions once the whole process was under operation.
The results on the removal of NH4-N and PO4-P in the form of struvite inside the reactors, under
different operating conditions, are discussed in the later sections.
4.3.1 Operating Condition 1: Low Influent Flow Rate
4.3.1.1 Phosphorus and Nitrogen Removal and Recovery
The first operating condition was chosen at a low influent flow rate (Qinf = 40 mL/min; HRT = 70
mins when RR = 0) in each reactor. All three reactors had recycle lines and the RR ratio was
maintained between 2 and 5 to obtain the best results. The control pH was kept between 7.5 and
8.1 to achieve the best possible recovery of N and P as struvite. A picture of the whole process
under operation is shown below in Figure 4.8. Struvite particles forming inside the reactors,
during operation, can be clearly observed in the picture.
Figure 4.8. Reactors under operation for struvite crystallization
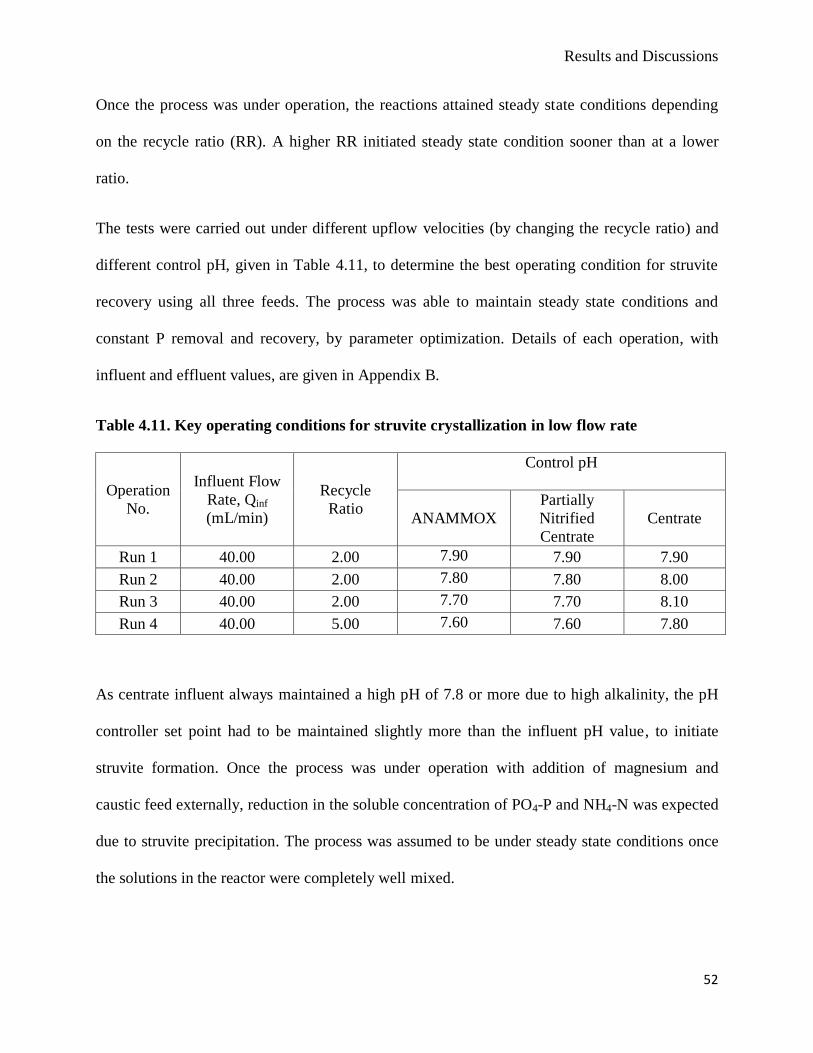
Results and Discussions
52
Once the process was under operation, the reactions attained steady state conditions depending
on the recycle ratio (RR). A higher RR initiated steady state condition sooner than at a lower
ratio.
The tests were carried out under different upflow velocities (by changing the recycle ratio) and
different control pH, given in Table 4.11, to determine the best operating condition for struvite
recovery using all three feeds. The process was able to maintain steady state conditions and
constant P removal and recovery, by parameter optimization. Details of each operation, with
influent and effluent values, are given in Appendix B.
Table 4.11. Key operating conditions for struvite crystallization in low flow rate
Operation
No.
Influent Flow
Rate, Qinf
(mL/min)
Recycle
Ratio
Control pH
ANAMMOX
Partially
Nitrified
Centrate
Centrate
Run 1 40.00 2.00 7.90 7.90 7.90
Run 2 40.00 2.00 7.80 7.80 8.00
Run 3 40.00 2.00 7.70 7.70 8.10
Run 4 40.00 5.00 7.60 7.60 7.80
As centrate influent always maintained a high pH of 7.8 or more due to high alkalinity, the pH
controller set point had to be maintained slightly more than the influent pH value, to initiate
struvite formation. Once the process was under operation with addition of magnesium and
caustic feed externally, reduction in the soluble concentration of PO4-P and NH4-N was expected
due to struvite precipitation. The process was assumed to be under steady state conditions once
the solutions in the reactor were completely well mixed.
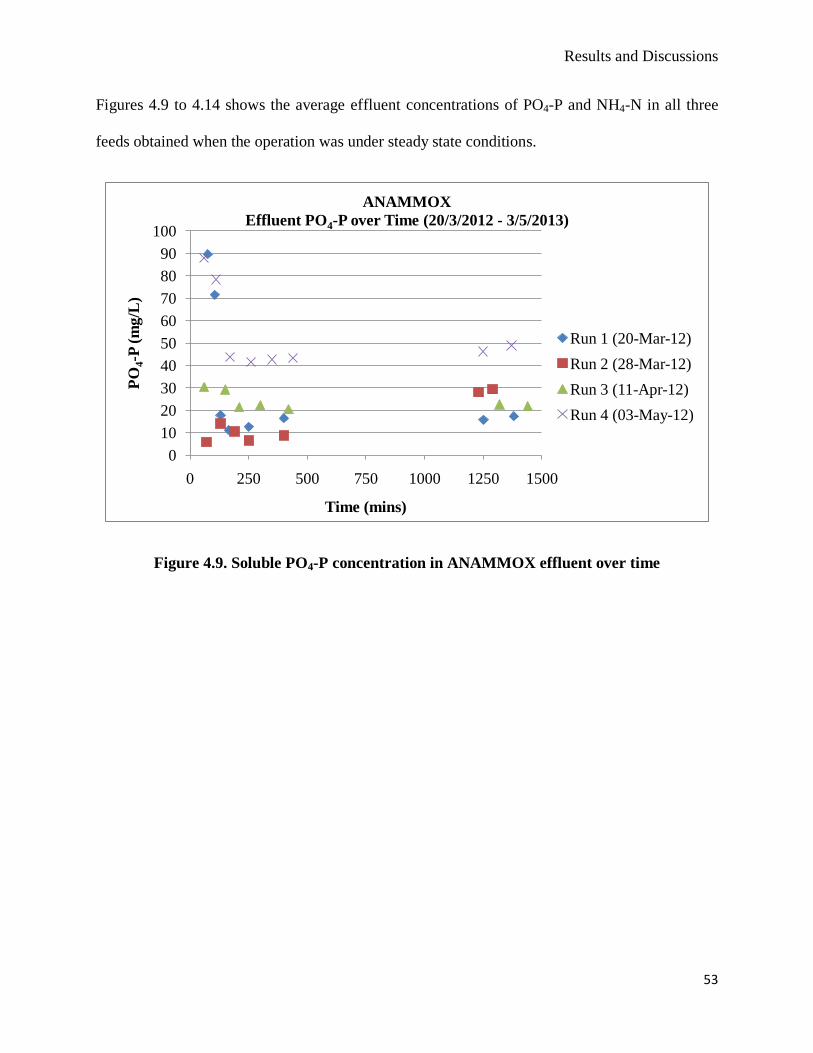
Results and Discussions
53
Figures 4.9 to 4.14 shows the average effluent concentrations of PO4-P and NH4-N in all three
feeds obtained when the operation was under steady state conditions.
Figure 4.9. Soluble PO4-P concentration in ANAMMOX effluent over time
0
10
20
30
40
50
60
70
80
90
100
0 250 500 750 1000 1250 1500
PO
4-P
(m
g/L
)
Time (mins)
ANAMMOX
Effluent PO4-P over Time (20/3/2012 - 3/5/2013)
Run 1 (20-Mar-12)
Run 2 (28-Mar-12)
Run 3 (11-Apr-12)
Run 4 (03-May-12)
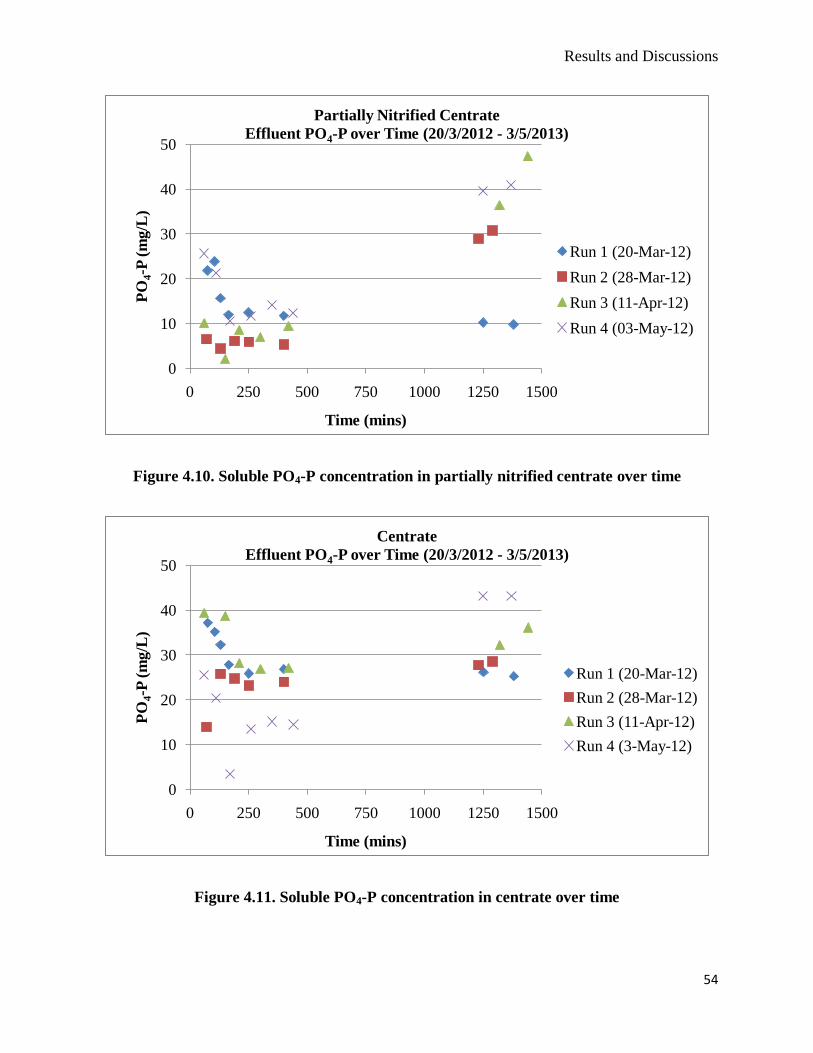
Results and Discussions
54
Figure 4.10. Soluble PO4-P concentration in partially nitrified centrate over time
Figure 4.11. Soluble PO4-P concentration in centrate over time
0
10
20
30
40
50
0 250 500 750 1000 1250 1500
PO
4-P
(m
g/L
)
Time (mins)
Partially Nitrified Centrate
Effluent PO4-P over Time (20/3/2012 - 3/5/2013)
Run 1 (20-Mar-12)
Run 2 (28-Mar-12)
Run 3 (11-Apr-12)
Run 4 (03-May-12)
0
10
20
30
40
50
0 250 500 750 1000 1250 1500
PO
4-P
(m
g/L
)
Time (mins)
Centrate
Effluent PO4-P over Time (20/3/2012 - 3/5/2013)
Run 1 (20-Mar-12)
Run 2 (28-Mar-12)
Run 3 (11-Apr-12)
Run 4 (3-May-12)
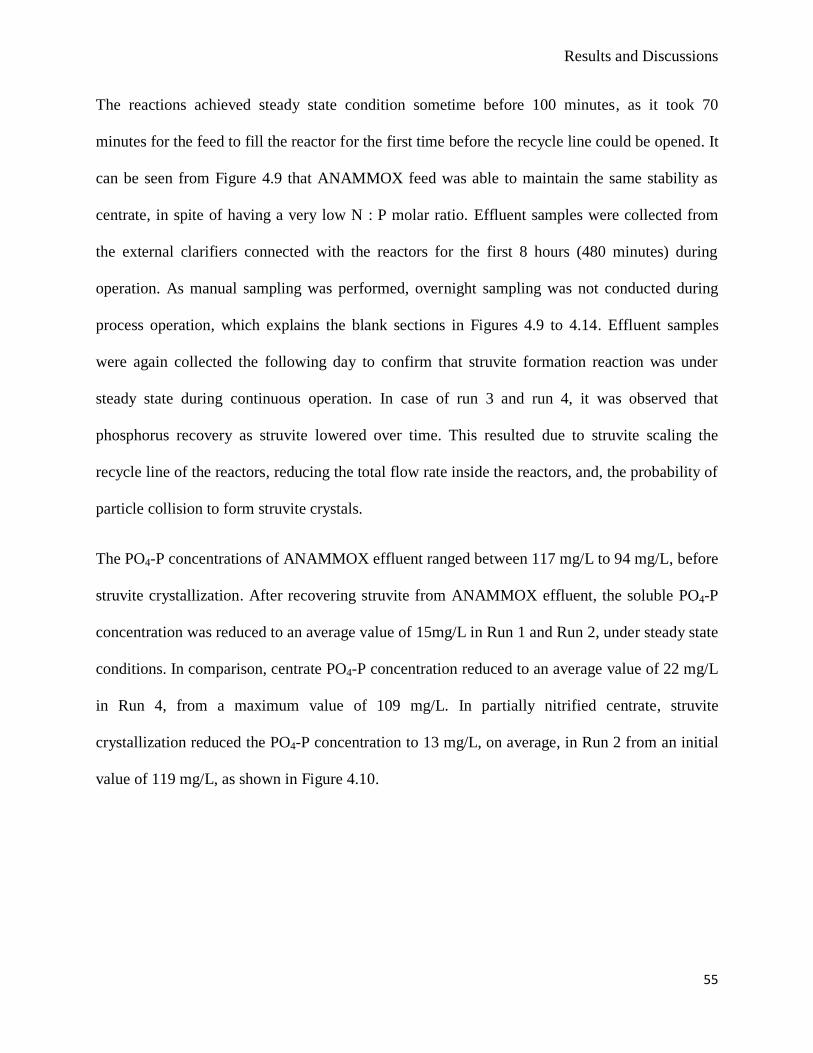
Results and Discussions
55
The reactions achieved steady state condition sometime before 100 minutes, as it took 70
minutes for the feed to fill the reactor for the first time before the recycle line could be opened. It
can be seen from Figure 4.9 that ANAMMOX feed was able to maintain the same stability as
centrate, in spite of having a very low N : P molar ratio. Effluent samples were collected from
the external clarifiers connected with the reactors for the first 8 hours (480 minutes) during
operation. As manual sampling was performed, overnight sampling was not conducted during
process operation, which explains the blank sections in Figures 4.9 to 4.14. Effluent samples
were again collected the following day to confirm that struvite formation reaction was under
steady state during continuous operation. In case of run 3 and run 4, it was observed that
phosphorus recovery as struvite lowered over time. This resulted due to struvite scaling the
recycle line of the reactors, reducing the total flow rate inside the reactors, and, the probability of
particle collision to form struvite crystals.
The PO4-P concentrations of ANAMMOX effluent ranged between 117 mg/L to 94 mg/L, before
struvite crystallization. After recovering struvite from ANAMMOX effluent, the soluble PO4-P
concentration was reduced to an average value of 15mg/L in Run 1 and Run 2, under steady state
conditions. In comparison, centrate PO4-P concentration reduced to an average value of 22 mg/L
in Run 4, from a maximum value of 109 mg/L. In partially nitrified centrate, struvite
crystallization reduced the PO4-P concentration to 13 mg/L, on average, in Run 2 from an initial
value of 119 mg/L, as shown in Figure 4.10.
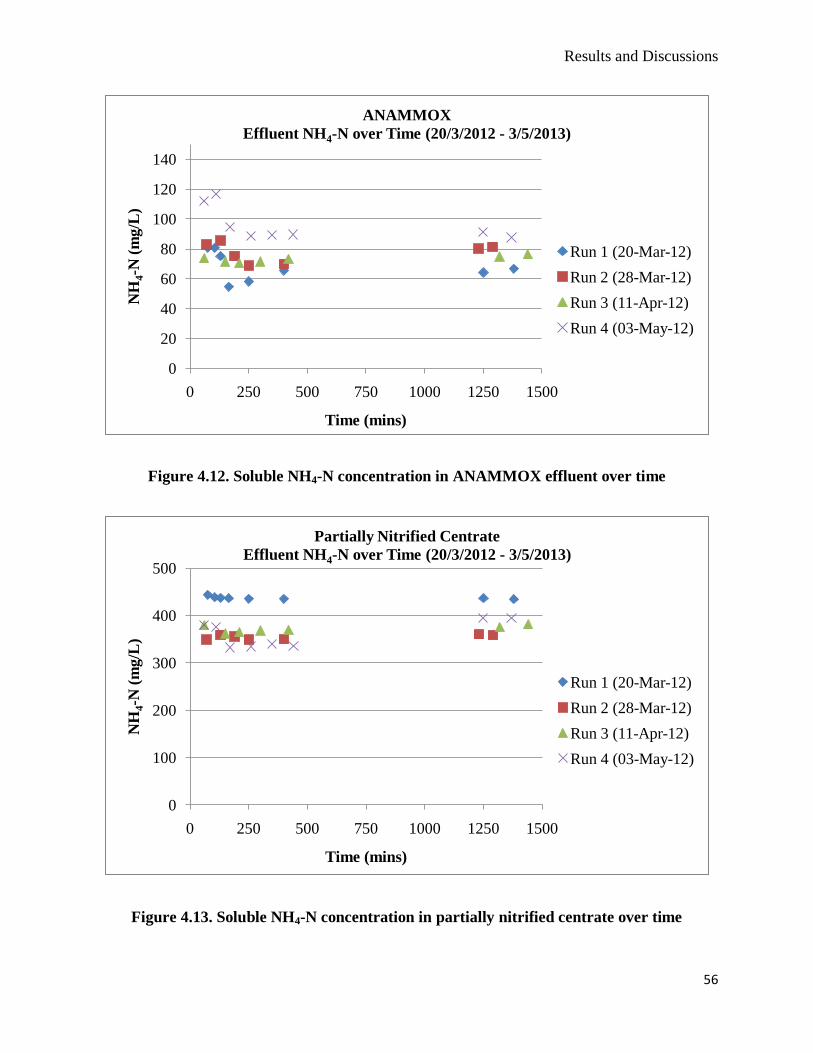
Results and Discussions
56
Figure 4.12. Soluble NH4-N concentration in ANAMMOX effluent over time
Figure 4.13. Soluble NH4-N concentration in partially nitrified centrate over time
0
20
40
60
80
100
120
140
0 250 500 750 1000 1250 1500
NH
4-N
(m
g/L
)
Time (mins)
ANAMMOX
Effluent NH4-N over Time (20/3/2012 - 3/5/2013)
Run 1 (20-Mar-12)
Run 2 (28-Mar-12)
Run 3 (11-Apr-12)
Run 4 (03-May-12)
0
100
200
300
400
500
0 250 500 750 1000 1250 1500
NH
4-N
(m
g/L
)
Time (mins)
Partially Nitrified Centrate
Effluent NH4-N over Time (20/3/2012 - 3/5/2013)
Run 1 (20-Mar-12)
Run 2 (28-Mar-12)
Run 3 (11-Apr-12)
Run 4 (03-May-12)
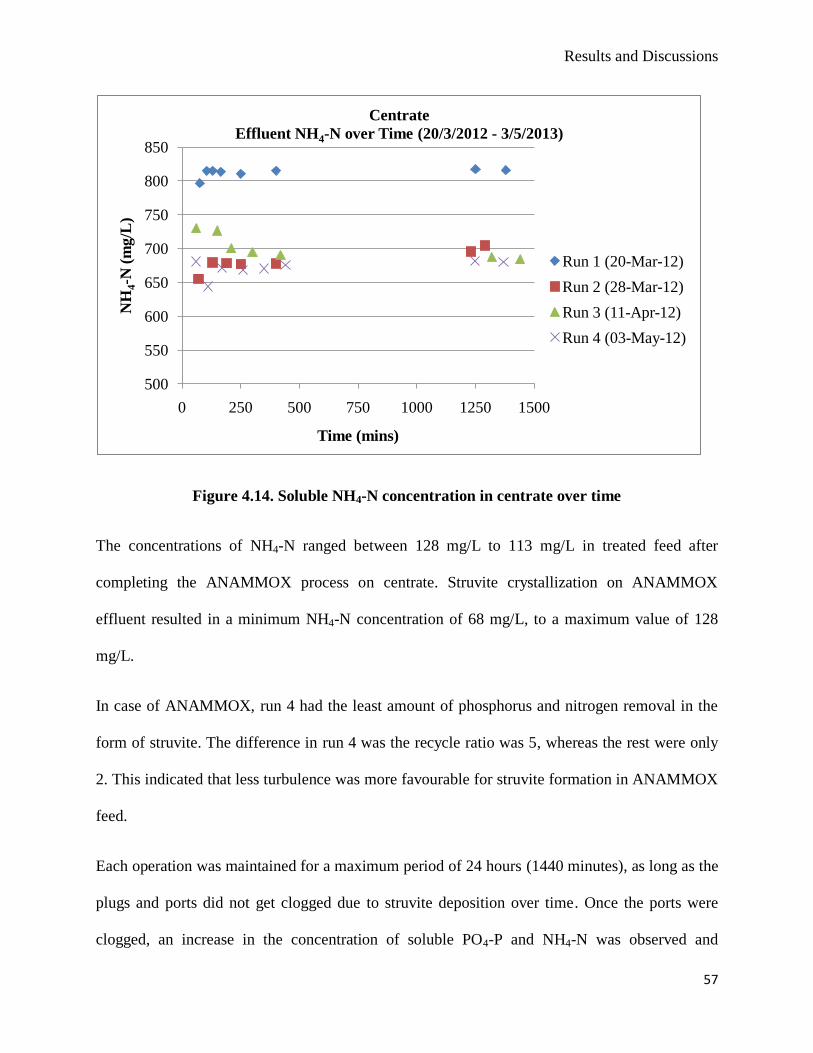
Results and Discussions
57
Figure 4.14. Soluble NH4-N concentration in centrate over time
The concentrations of NH4-N ranged between 128 mg/L to 113 mg/L in treated feed after
completing the ANAMMOX process on centrate. Struvite crystallization on ANAMMOX
effluent resulted in a minimum NH4-N concentration of 68 mg/L, to a maximum value of 128
mg/L.
In case of ANAMMOX, run 4 had the least amount of phosphorus and nitrogen removal in the
form of struvite. The difference in run 4 was the recycle ratio was 5, whereas the rest were only
2. This indicated that less turbulence was more favourable for struvite formation in ANAMMOX
feed.
Each operation was maintained for a maximum period of 24 hours (1440 minutes), as long as the
plugs and ports did not get clogged due to struvite deposition over time. Once the ports were
clogged, an increase in the concentration of soluble PO4-P and NH4-N was observed and
500
550
600
650
700
750
800
850
0 250 500 750 1000 1250 1500
NH
4-N
(m
g/L
)
Time (mins)
Centrate
Effluent NH4-N over Time (20/3/2012 - 3/5/2013)
Run 1 (20-Mar-12)
Run 2 (28-Mar-12)
Run 3 (11-Apr-12)
Run 4 (03-May-12)
Results and Discussions
58
operation had to be stopped for maintenance purposes. The sharp increase in soluble PO4-P and
NH4-N concentration was monitored in the effluent samples taken after 22 hours (1320 minutes)
of operation and can be observed in Figures 4.9 to 4.14. Increasing the recycle ratio resulted in
more plugging inside the reactors and consequently lowering the mixing turbulence in the
reactors. A difference in pH value to ± 0.5 was also monitored between the effluent samples and
the reactor solution. Therefore, to increase the mixing energy of the solution for the same pH
value between the reactor feed and the effluent, and, to prevent particle deposition into the ports
of the reactors, the influent flow rate was increased to 140 mL/min; this is discussed later in
Section 4.3.2.
4.3.1.2 Phosphorus and Nitrogen Removal Efficiency
For operating condition Qinf = 40 mL/min, the overall process performance, using ANAMMOX
effluent as the feed for struvite crystallization in comparison with partially nitrified centrate, and
centrate is given in Figure 4.15 and Figure 4.16. Each group of values represented in the figures
are the average P and N removal percentage, when the feeds were operated under conditions
mentioned in Table 4.11. For ANAMMOX treated centrate, the best values where found under
certain operating conditions which were not the best case for centrate and/or partially nitrified
centrate. However, partially nitrified centrate maintained an overall steady and high P and N
recovery efficiency as struvite, under all operating conditions.
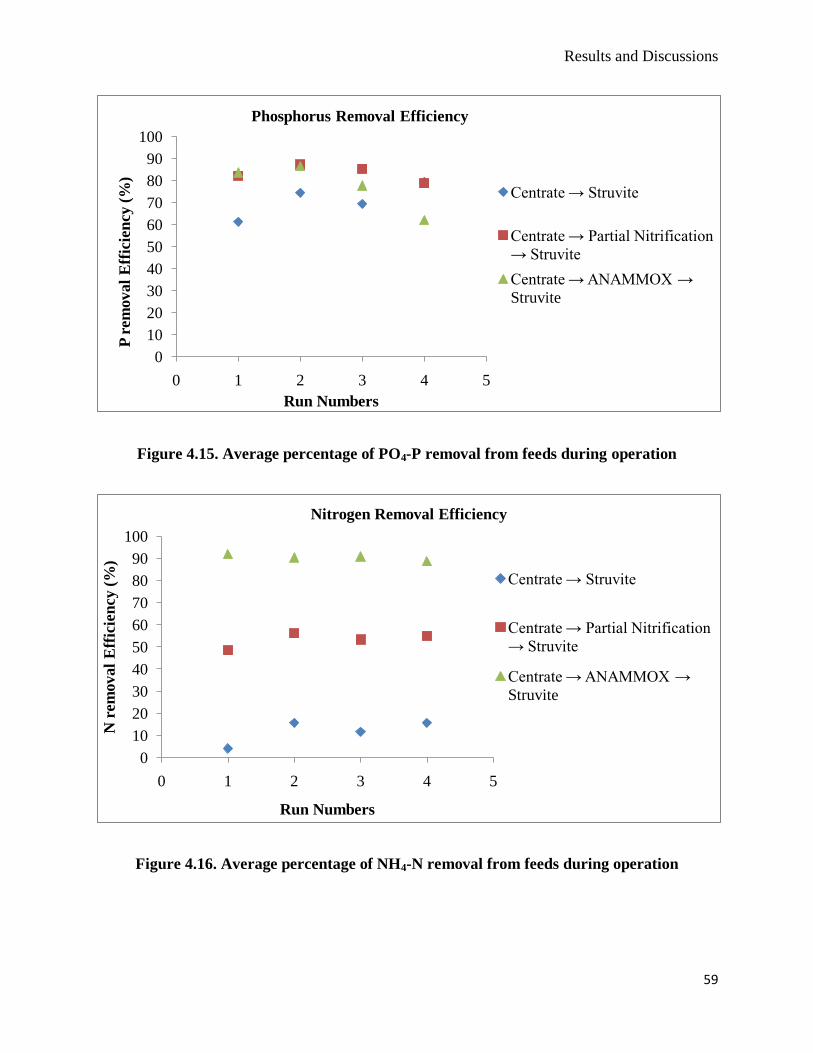
Results and Discussions
59
Figure 4.15. Average percentage of PO4-P removal from feeds during operation
Figure 4.16. Average percentage of NH4-N removal from feeds during operation
0
10
20
30
40
50
60
70
80
90
100
0 1 2 3 4 5
P r
em
oval
Eff
icie
ncy
(%
)
Run Numbers
Phosphorus Removal Efficiency
Centrate → Struvite
Centrate → Partial Nitrification
→ Struvite
Centrate → ANAMMOX →
Struvite
0
10
20
30
40
50
60
70
80
90
100
0 1 2 3 4 5
N r
em
oval
Eff
icie
ncy
(%
)
Run Numbers
Nitrogen Removal Efficiency
Centrate → Struvite
Centrate → Partial Nitrification
→ Struvite
Centrate → ANAMMOX →
Struvite
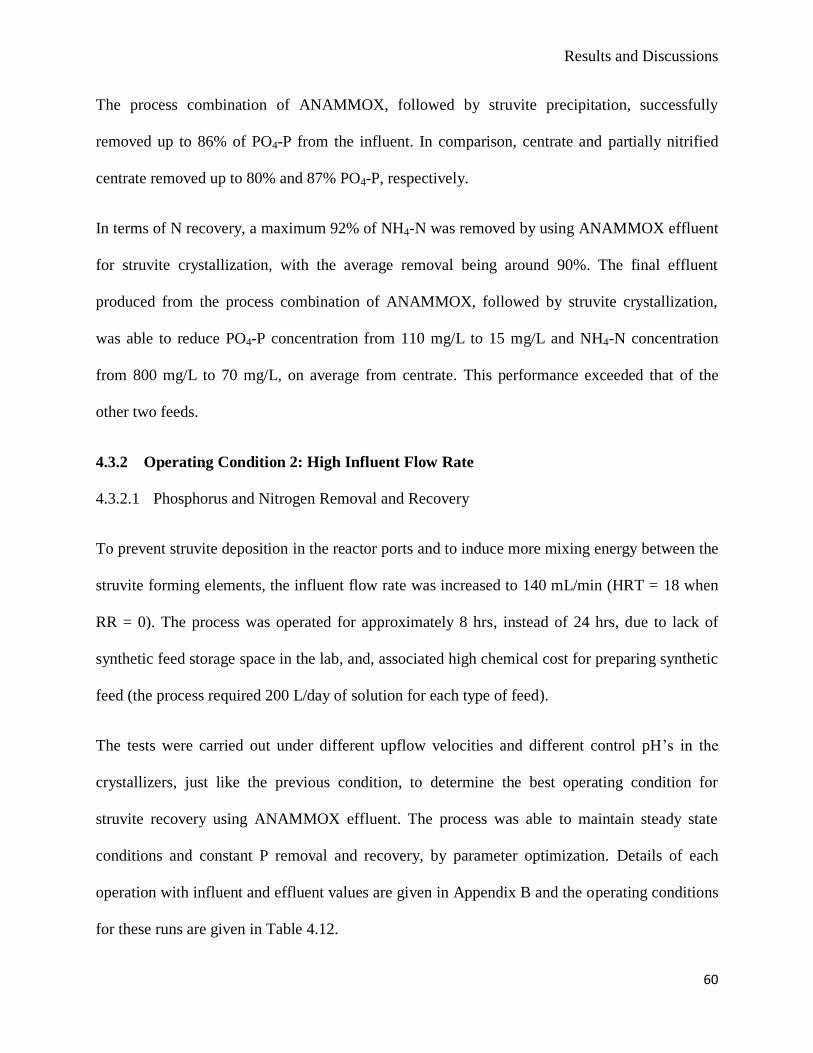
Results and Discussions
60
The process combination of ANAMMOX, followed by struvite precipitation, successfully
removed up to 86% of PO4-P from the influent. In comparison, centrate and partially nitrified
centrate removed up to 80% and 87% PO4-P, respectively.
In terms of N recovery, a maximum 92% of NH4-N was removed by using ANAMMOX effluent
for struvite crystallization, with the average removal being around 90%. The final effluent
produced from the process combination of ANAMMOX, followed by struvite crystallization,
was able to reduce PO4-P concentration from 110 mg/L to 15 mg/L and NH4-N concentration
from 800 mg/L to 70 mg/L, on average from centrate. This performance exceeded that of the
other two feeds.
4.3.2 Operating Condition 2: High Influent Flow Rate
4.3.2.1 Phosphorus and Nitrogen Removal and Recovery
To prevent struvite deposition in the reactor ports and to induce more mixing energy between the
struvite forming elements, the influent flow rate was increased to 140 mL/min (HRT = 18 when
RR = 0). The process was operated for approximately 8 hrs, instead of 24 hrs, due to lack of
synthetic feed storage space in the lab, and, associated high chemical cost for preparing synthetic
feed (the process required 200 L/day of solution for each type of feed).
The tests were carried out under different upflow velocities and different control pH’s in the
crystallizers, just like the previous condition, to determine the best operating condition for
struvite recovery using ANAMMOX effluent. The process was able to maintain steady state
conditions and constant P removal and recovery, by parameter optimization. Details of each
operation with influent and effluent values are given in Appendix B and the operating conditions
for these runs are given in Table 4.12.
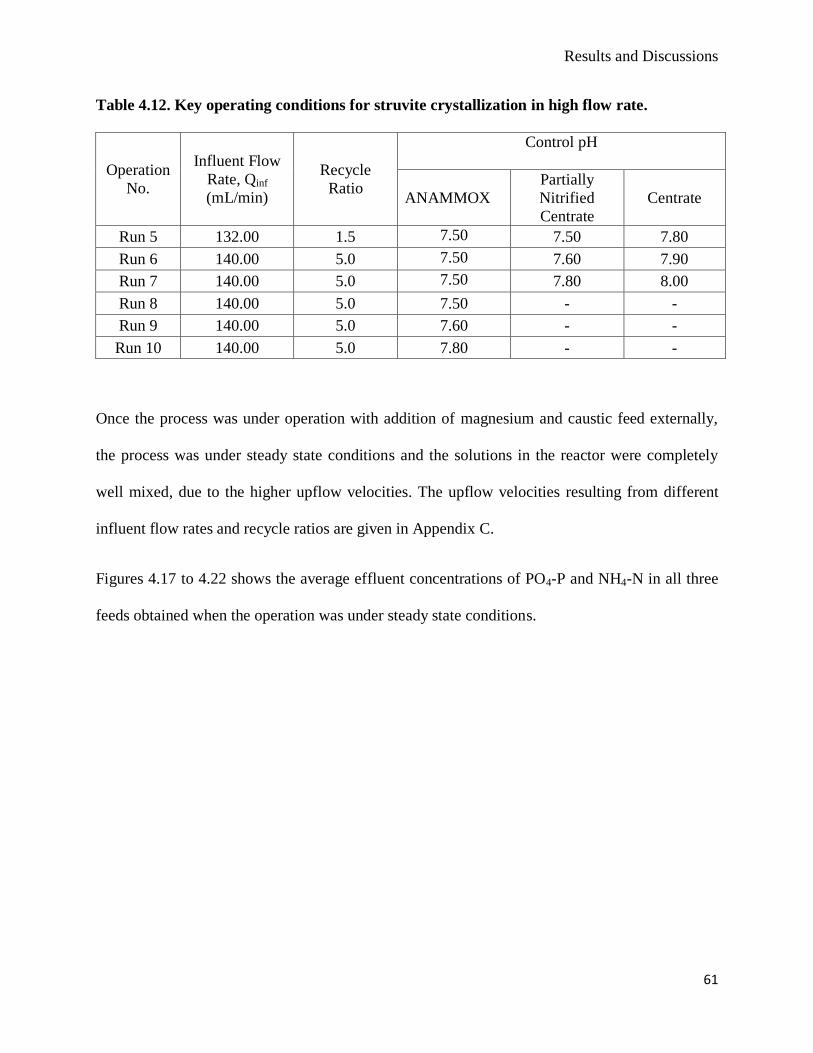
Results and Discussions
61
Table 4.12. Key operating conditions for struvite crystallization in high flow rate.
Operation
No.
Influent Flow
Rate, Qinf
(mL/min)
Recycle
Ratio
Control pH
ANAMMOX
Partially
Nitrified
Centrate
Centrate
Run 5 132.00 1.5 7.50 7.50 7.80
Run 6 140.00 5.0 7.50 7.60 7.90
Run 7 140.00 5.0 7.50 7.80 8.00
Run 8 140.00 5.0 7.50 - -
Run 9 140.00 5.0 7.60 - -
Run 10 140.00 5.0 7.80 - -
Once the process was under operation with addition of magnesium and caustic feed externally,
the process was under steady state conditions and the solutions in the reactor were completely
well mixed, due to the higher upflow velocities. The upflow velocities resulting from different
influent flow rates and recycle ratios are given in Appendix C.
Figures 4.17 to 4.22 shows the average effluent concentrations of PO4-P and NH4-N in all three
feeds obtained when the operation was under steady state conditions.
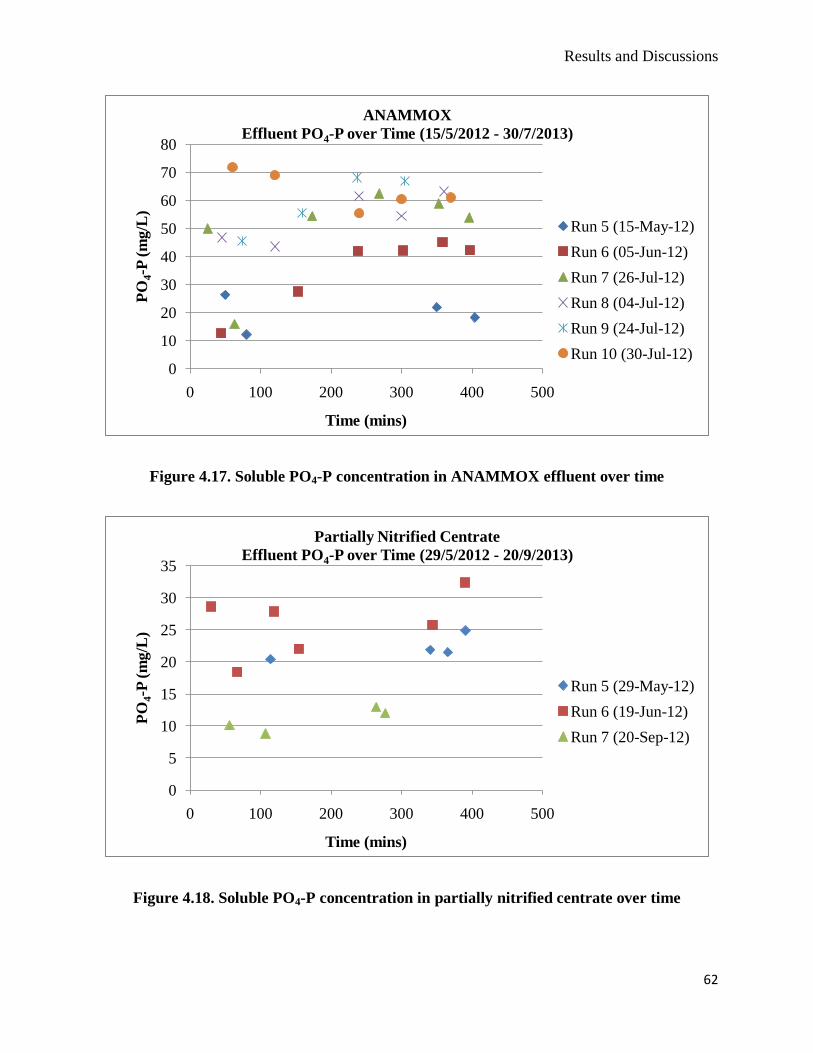
Results and Discussions
62
Figure 4.17. Soluble PO4-P concentration in ANAMMOX effluent over time
Figure 4.18. Soluble PO4-P concentration in partially nitrified centrate over time
0
10
20
30
40
50
60
70
80
0 100 200 300 400 500
PO
4-P
(m
g/L
)
Time (mins)
ANAMMOX
Effluent PO4-P over Time (15/5/2012 - 30/7/2013)
Run 5 (15-May-12)
Run 6 (05-Jun-12)
Run 7 (26-Jul-12)
Run 8 (04-Jul-12)
Run 9 (24-Jul-12)
Run 10 (30-Jul-12)
0
5
10
15
20
25
30
35
0 100 200 300 400 500
PO
4-P
(m
g/L
)
Time (mins)
Partially Nitrified Centrate
Effluent PO4-P over Time (29/5/2012 - 20/9/2013)
Run 5 (29-May-12)
Run 6 (19-Jun-12)
Run 7 (20-Sep-12)
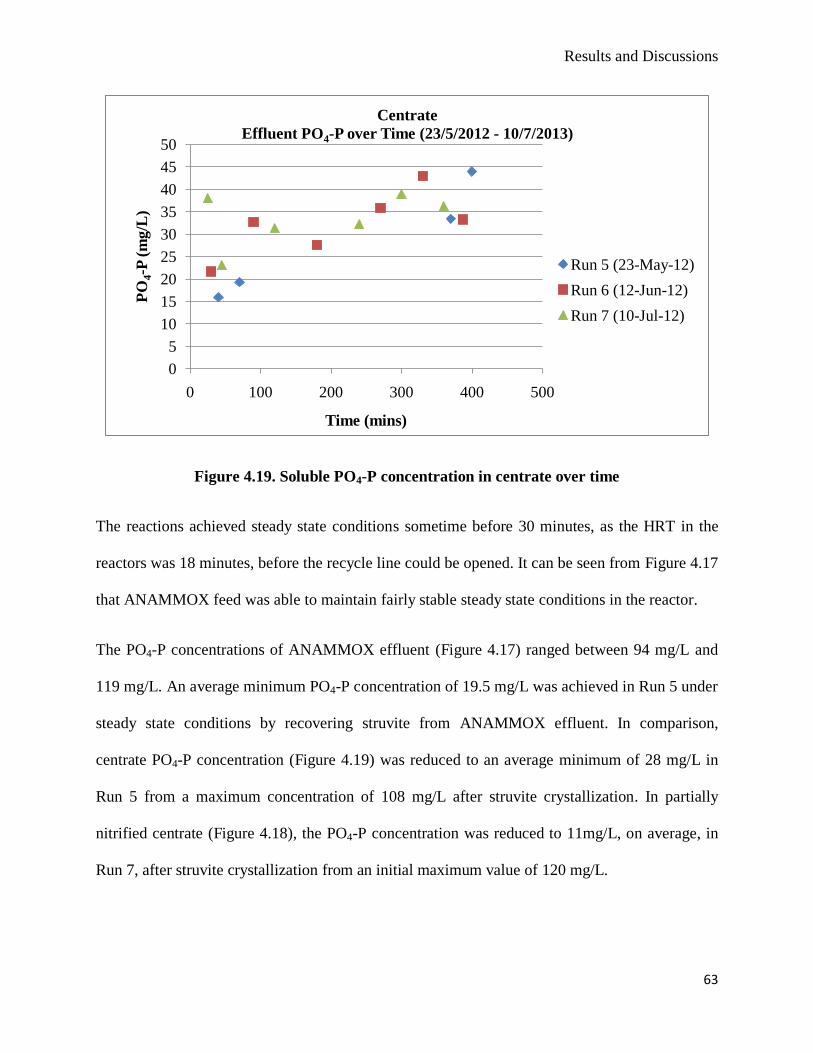
Results and Discussions
63
Figure 4.19. Soluble PO4-P concentration in centrate over time
The reactions achieved steady state conditions sometime before 30 minutes, as the HRT in the
reactors was 18 minutes, before the recycle line could be opened. It can be seen from Figure 4.17
that ANAMMOX feed was able to maintain fairly stable steady state conditions in the reactor.
The PO4-P concentrations of ANAMMOX effluent (Figure 4.17) ranged between 94 mg/L and
119 mg/L. An average minimum PO4-P concentration of 19.5 mg/L was achieved in Run 5 under
steady state conditions by recovering struvite from ANAMMOX effluent. In comparison,
centrate PO4-P concentration (Figure 4.19) was reduced to an average minimum of 28 mg/L in
Run 5 from a maximum concentration of 108 mg/L after struvite crystallization. In partially
nitrified centrate (Figure 4.18), the PO4-P concentration was reduced to 11mg/L, on average, in
Run 7, after struvite crystallization from an initial maximum value of 120 mg/L.
0
5
10
15
20
25
30
35
40
45
50
0 100 200 300 400 500
PO
4-P
(m
g/L
)
Time (mins)
Centrate
Effluent PO4-P over Time (23/5/2012 - 10/7/2013)
Run 5 (23-May-12)
Run 6 (12-Jun-12)
Run 7 (10-Jul-12)
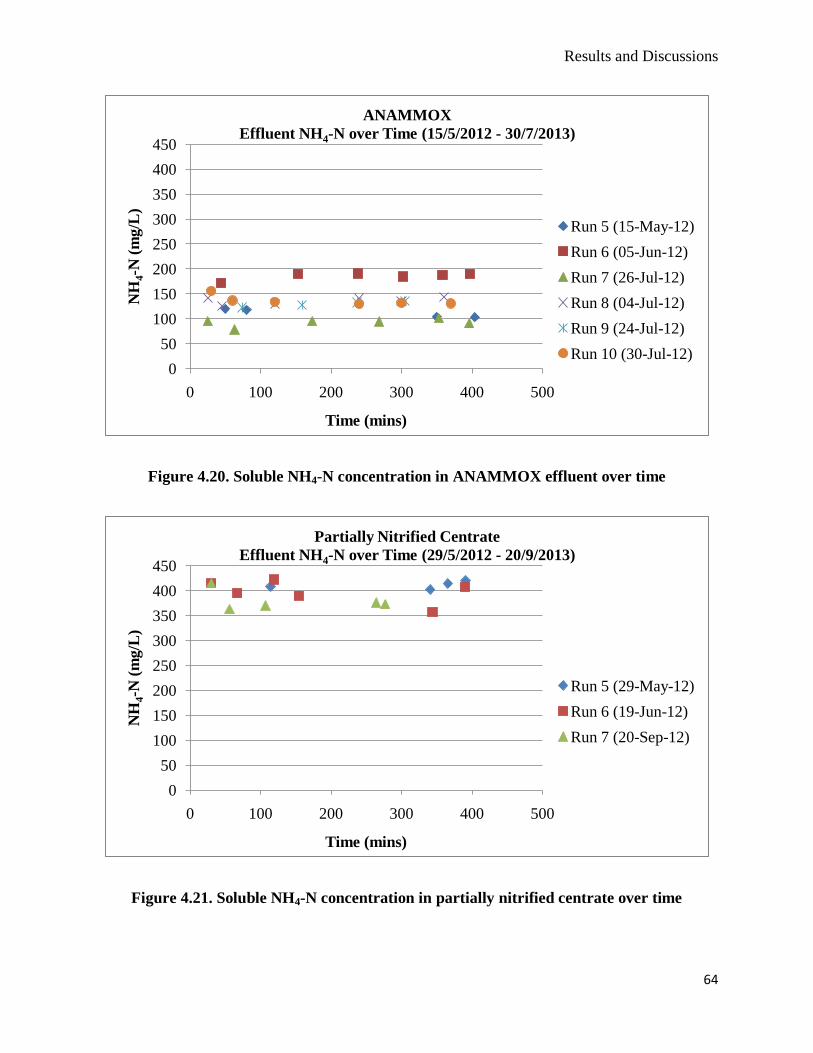
Results and Discussions
64
Figure 4.20. Soluble NH4-N concentration in ANAMMOX effluent over time
Figure 4.21. Soluble NH4-N concentration in partially nitrified centrate over time
0
50
100
150
200
250
300
350
400
450
0 100 200 300 400 500
NH
4-N
(m
g/L
)
Time (mins)
ANAMMOX
Effluent NH4-N over Time (15/5/2012 - 30/7/2013)
Run 5 (15-May-12)
Run 6 (05-Jun-12)
Run 7 (26-Jul-12)
Run 8 (04-Jul-12)
Run 9 (24-Jul-12)
Run 10 (30-Jul-12)
0
50
100
150
200
250
300
350
400
450
0 100 200 300 400 500
NH
4-N
(m
g/L
)
Time (mins)
Partially Nitrified Centrate
Effluent NH4-N over Time (29/5/2012 - 20/9/2013)
Run 5 (29-May-12)
Run 6 (19-Jun-12)
Run 7 (20-Sep-12)
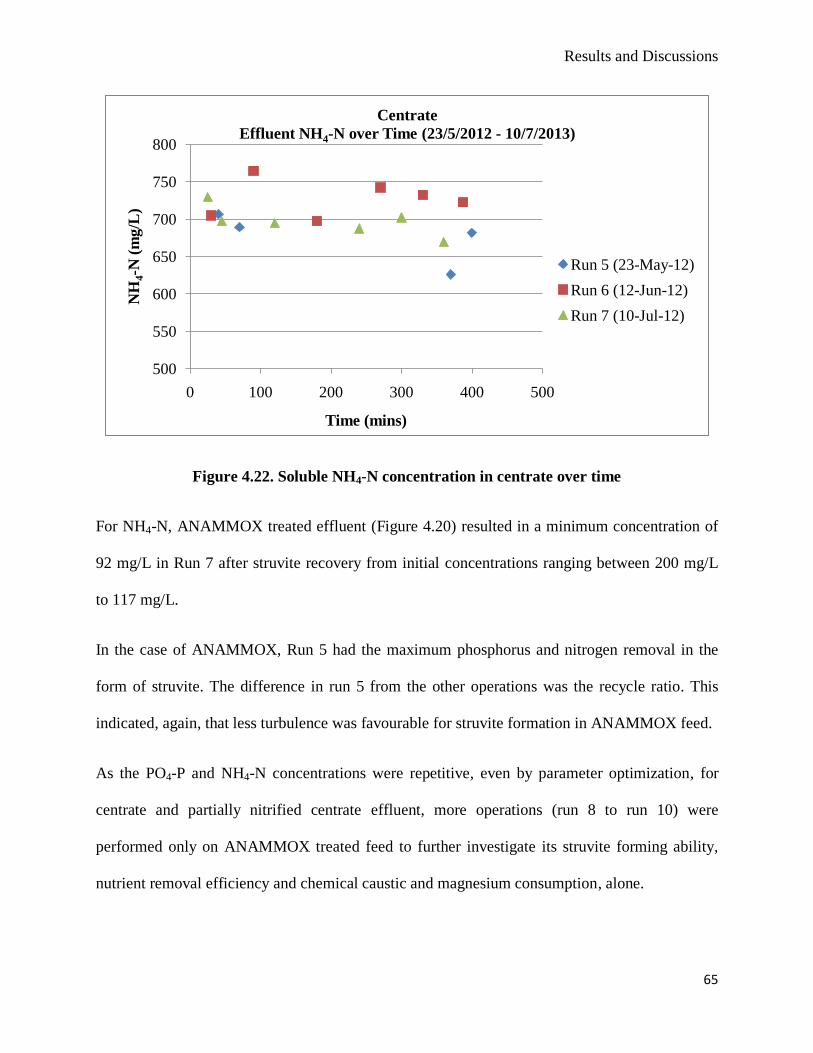
Results and Discussions
65
Figure 4.22. Soluble NH4-N concentration in centrate over time
For NH4-N, ANAMMOX treated effluent (Figure 4.20) resulted in a minimum concentration of
92 mg/L in Run 7 after struvite recovery from initial concentrations ranging between 200 mg/L
to 117 mg/L.
In the case of ANAMMOX, Run 5 had the maximum phosphorus and nitrogen removal in the
form of struvite. The difference in run 5 from the other operations was the recycle ratio. This
indicated, again, that less turbulence was favourable for struvite formation in ANAMMOX feed.
As the PO4-P and NH4-N concentrations were repetitive, even by parameter optimization, for
centrate and partially nitrified centrate effluent, more operations (run 8 to run 10) were
performed only on ANAMMOX treated feed to further investigate its struvite forming ability,
nutrient removal efficiency and chemical caustic and magnesium consumption, alone.
500
550
600
650
700
750
800
0 100 200 300 400 500
NH
4-N
(m
g/L
)
Time (mins)
Centrate
Effluent NH4-N over Time (23/5/2012 - 10/7/2013)
Run 5 (23-May-12)
Run 6 (12-Jun-12)
Run 7 (10-Jul-12)
Results and Discussions
66
4.3.2.2 Phosphorus and Nitrogen Removal Efficiency
For operating condition Qinf = 140 mL/min, the overall process performance, using ANAMMOX
effluent as the feed for struvite crystallization in comparison to partially nitrified centrate, and
centrate, is shown in Figure 4.23 and Figure 4.24. For efficiency calculation of ANAMMOX
feed for Runs 8 to 10, the average influent and effluent concentration of PO4-P and NH4-N in
centrate and partially nitrified centrate obtained in Run 7 was used. Thus, the P and N removal
efficiency indicated in Figure 4.23 and Figure 4.24, for Runs 8 to 10 for centrate and partially
nitrified centrate feed, are the results obtained from Run 7.
Each group of values represented in the graph are the average P and N removal percentage when
the feeds were operated under conditions mentioned in Table 4.12. However, partially nitrified
centrate maintained an overall steady and high P and N recovery efficiency as struvite, in this
case as well, under all operating conditions.
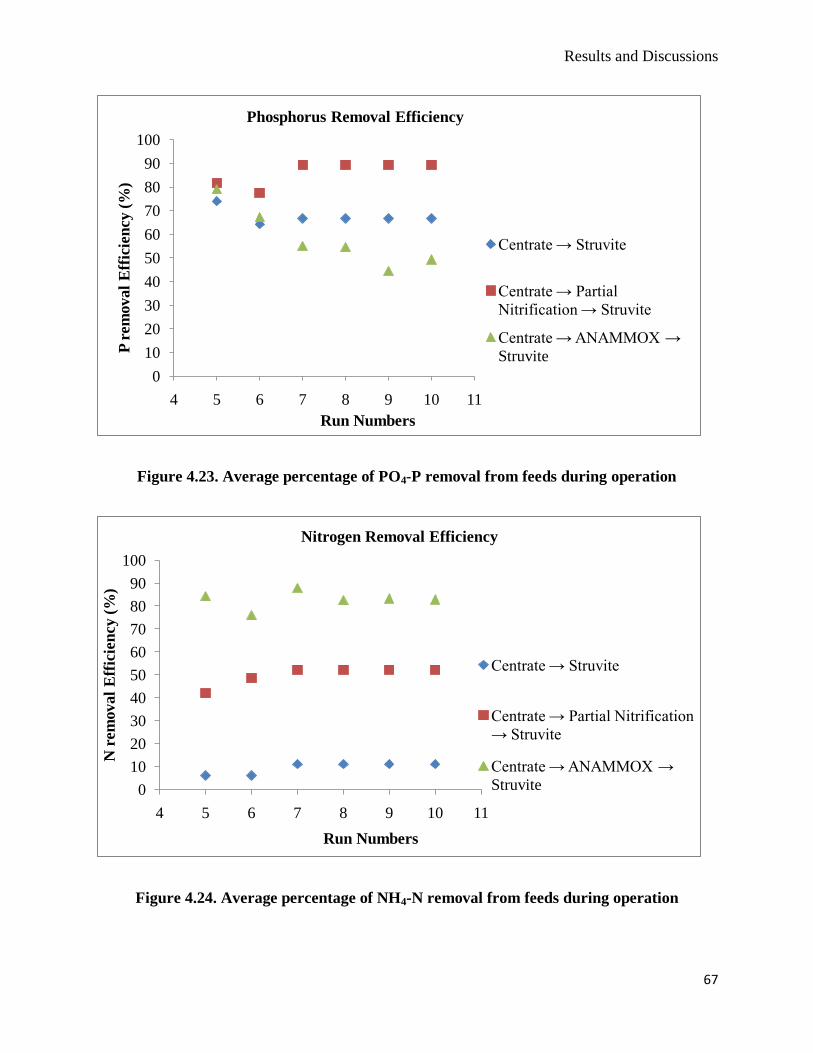
Results and Discussions
67
Figure 4.23. Average percentage of PO4-P removal from feeds during operation
Figure 4.24. Average percentage of NH4-N removal from feeds during operation
0
10
20
30
40
50
60
70
80
90
100
4 5 6 7 8 9 10 11
P r
em
oval
Eff
icie
ncy
(%
)
Run Numbers
Phosphorus Removal Efficiency
Centrate → Struvite
Centrate → Partial
Nitrification → Struvite
Centrate → ANAMMOX →
Struvite
0
10
20
30
40
50
60
70
80
90
100
4 5 6 7 8 9 10 11
N r
em
oval
Eff
icie
ncy
(%
)
Run Numbers
Nitrogen Removal Efficiency
Centrate → Struvite
Centrate → Partial Nitrification
→ Struvite
Centrate → ANAMMOX →
Struvite
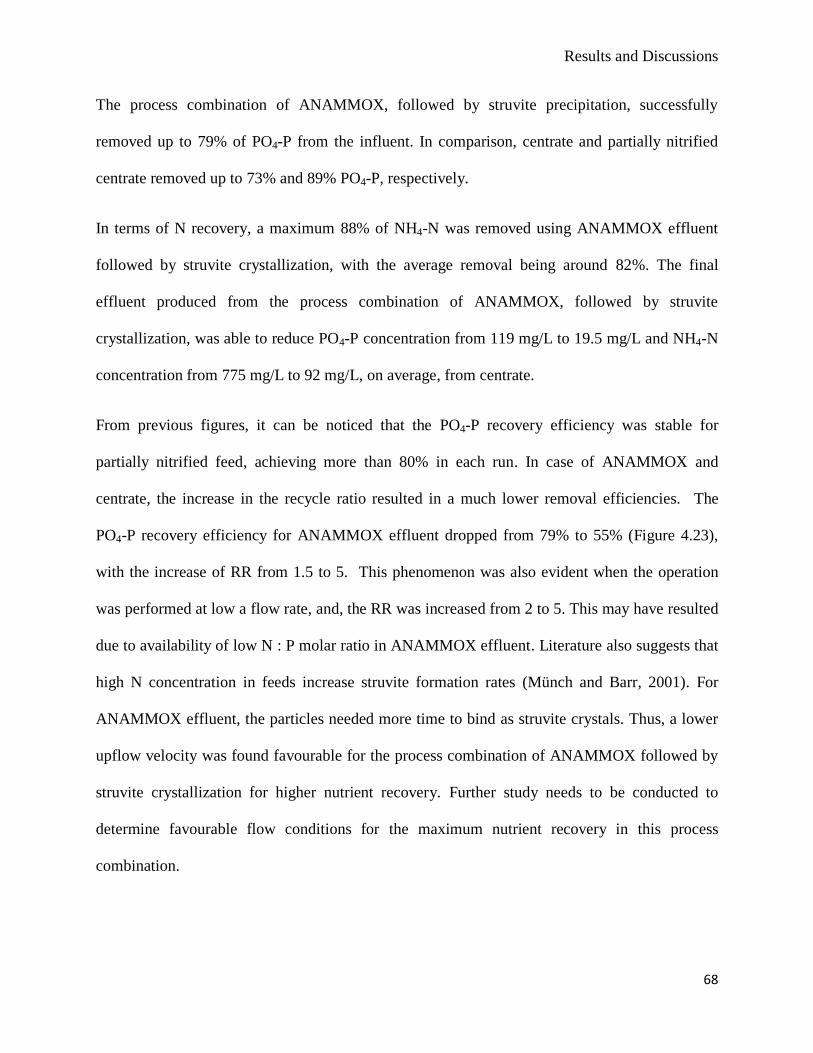
Results and Discussions
68
The process combination of ANAMMOX, followed by struvite precipitation, successfully
removed up to 79% of PO4-P from the influent. In comparison, centrate and partially nitrified
centrate removed up to 73% and 89% PO4-P, respectively.
In terms of N recovery, a maximum 88% of NH4-N was removed using ANAMMOX effluent
followed by struvite crystallization, with the average removal being around 82%. The final
effluent produced from the process combination of ANAMMOX, followed by struvite
crystallization, was able to reduce PO4-P concentration from 119 mg/L to 19.5 mg/L and NH4-N
concentration from 775 mg/L to 92 mg/L, on average, from centrate.
From previous figures, it can be noticed that the PO4-P recovery efficiency was stable for
partially nitrified feed, achieving more than 80% in each run. In case of ANAMMOX and
centrate, the increase in the recycle ratio resulted in a much lower removal efficiencies. The
PO4-P recovery efficiency for ANAMMOX effluent dropped from 79% to 55% (Figure 4.23),
with the increase of RR from 1.5 to 5. This phenomenon was also evident when the operation
was performed at low a flow rate, and, the RR was increased from 2 to 5. This may have resulted
due to availability of low N : P molar ratio in ANAMMOX effluent. Literature also suggests that
high N concentration in feeds increase struvite formation rates (Münch and Barr, 2001). For
ANAMMOX effluent, the particles needed more time to bind as struvite crystals. Thus, a lower
upflow velocity was found favourable for the process combination of ANAMMOX followed by
struvite crystallization for higher nutrient recovery. Further study needs to be conducted to
determine favourable flow conditions for the maximum nutrient recovery in this process
combination.
Results and Discussions
69
4.3.3 Chemical Costs
After the completion of each operation, the struvite collected from all the reactors was filtered,
dried and weighed. The theoretical weight of struvite produced in the reactors was also
calculated by using the mass of average PO4-P removed during operation. The calculations are
given in details in Appendix D. It was observed that there was a significant difference between
the measured and theoretical struvite weights for both high flow rate and low flow rate during
operation. The differences in the theoretical and actual values were assumed to be for the
following reasons;
During low flow rate, a significant amount of struvite scaling on the reactor walls and
struvite clogging in effluent/recycle ports and pipes were observed. These made the mass of
struvite collected after process completion less than the actual mass formed in the operation.
For high flow rates, struvite scaling on reactor walls evident. There was less clogging in
the ports, but, high flow rate with a high recycle ratio, caused much of particle wash out at the
starting hours of the process. Thus, the mass of struvite collected after the process was less than
the mass actually formed in the operation.
Therefore, the theoretical struvite mass was used for the calculation of chemical cost associated
with caustic and magnesium.
4.3.3.1 Caustic (NaOH) Consumption
Caustic is one of the two major chemical expenses for struvite production. As the continuous
process combinations were bench scaled, the consumption was calculated in as a smaller mass
value, which are grams required per gram struvite being produced.
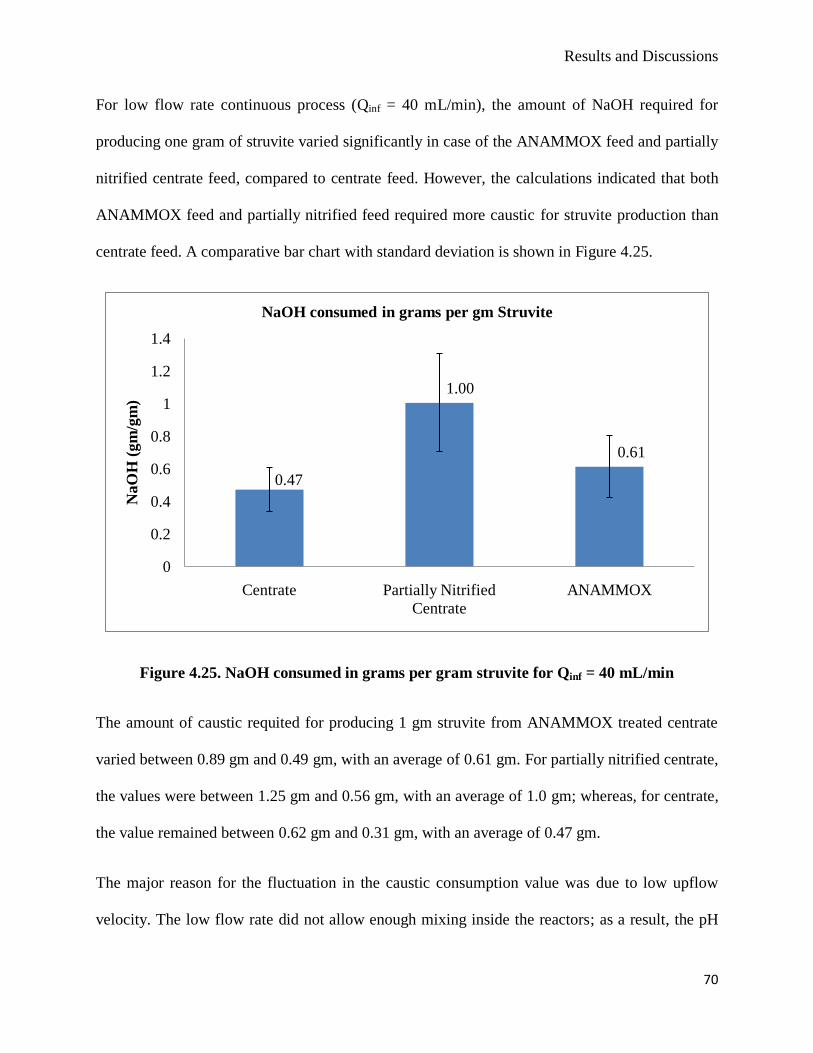
Results and Discussions
70
For low flow rate continuous process (Qinf = 40 mL/min), the amount of NaOH required for
producing one gram of struvite varied significantly in case of the ANAMMOX feed and partially
nitrified centrate feed, compared to centrate feed. However, the calculations indicated that both
ANAMMOX feed and partially nitrified feed required more caustic for struvite production than
centrate feed. A comparative bar chart with standard deviation is shown in Figure 4.25.
Figure 4.25. NaOH consumed in grams per gram struvite for Qinf = 40 mL/min
The amount of caustic requited for producing 1 gm struvite from ANAMMOX treated centrate
varied between 0.89 gm and 0.49 gm, with an average of 0.61 gm. For partially nitrified centrate,
the values were between 1.25 gm and 0.56 gm, with an average of 1.0 gm; whereas, for centrate,
the value remained between 0.62 gm and 0.31 gm, with an average of 0.47 gm.
The major reason for the fluctuation in the caustic consumption value was due to low upflow
velocity. The low flow rate did not allow enough mixing inside the reactors; as a result, the pH
0.47
1.00
0.61
0
0.2
0.4
0.6
0.8
1
1.2
1.4
Centrate Partially Nitrified
Centrate
ANAMMOX
NaO
H (
gm
/gm
)
NaOH consumed in grams per gm Struvite
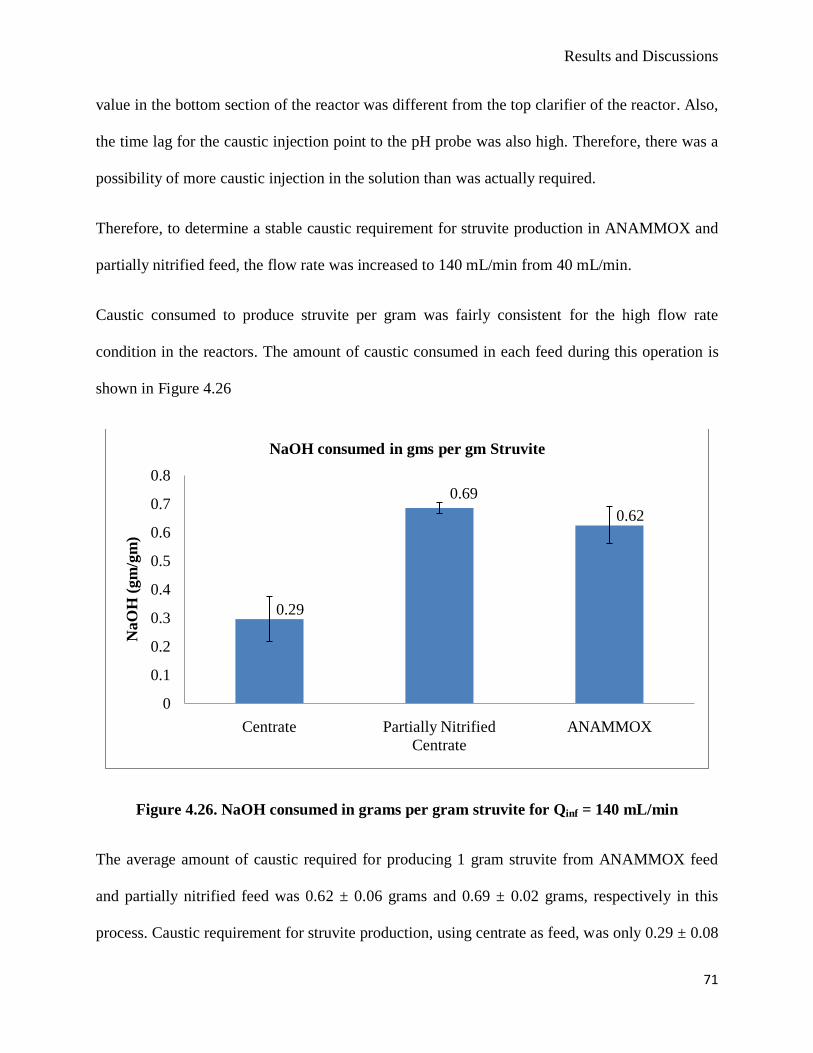
Results and Discussions
71
value in the bottom section of the reactor was different from the top clarifier of the reactor. Also,
the time lag for the caustic injection point to the pH probe was also high. Therefore, there was a
possibility of more caustic injection in the solution than was actually required.
Therefore, to determine a stable caustic requirement for struvite production in ANAMMOX and
partially nitrified feed, the flow rate was increased to 140 mL/min from 40 mL/min.
Caustic consumed to produce struvite per gram was fairly consistent for the high flow rate
condition in the reactors. The amount of caustic consumed in each feed during this operation is
shown in Figure 4.26
Figure 4.26. NaOH consumed in grams per gram struvite for Qinf = 140 mL/min
The average amount of caustic required for producing 1 gram struvite from ANAMMOX feed
and partially nitrified feed was 0.62 ± 0.06 grams and 0.69 ± 0.02 grams, respectively in this
process. Caustic requirement for struvite production, using centrate as feed, was only 0.29 ± 0.08
0.29
0.69
0.62
0
0.1
0.2
0.3
0.4
0.5
0.6
0.7
0.8
Centrate Partially Nitrified
Centrate
ANAMMOX
NaO
H (
gm
/gm
)
NaOH consumed in gms per gm Struvite
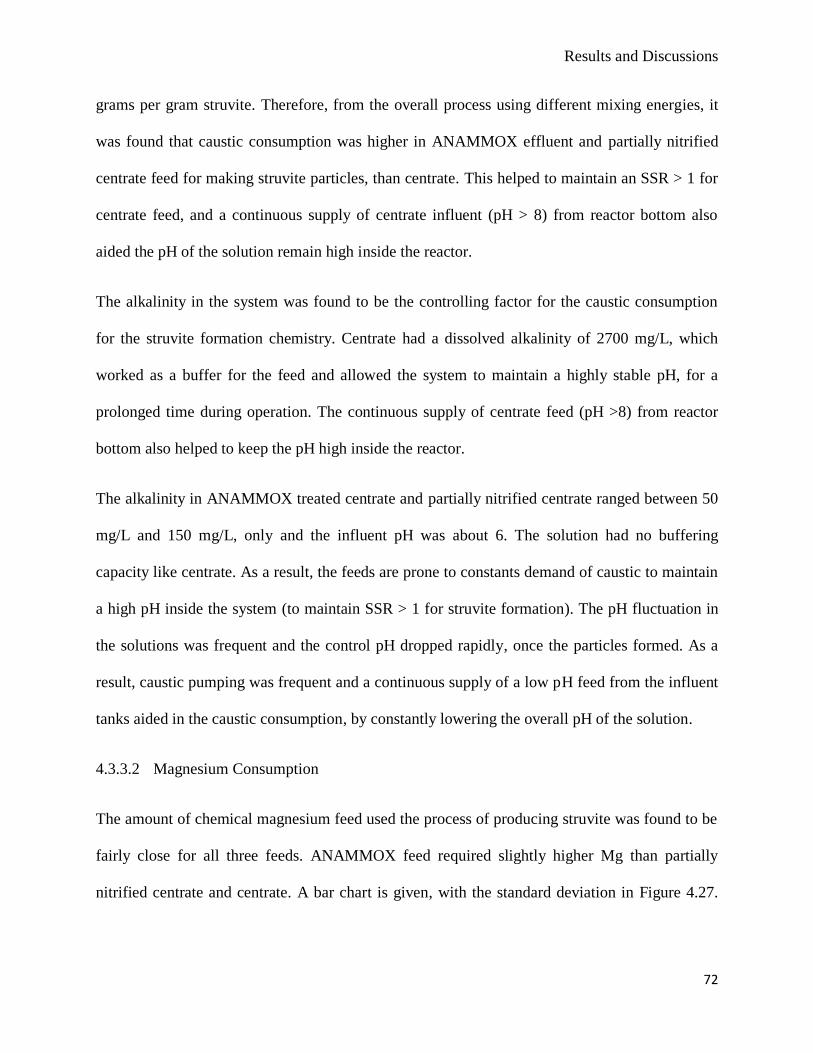
Results and Discussions
72
grams per gram struvite. Therefore, from the overall process using different mixing energies, it
was found that caustic consumption was higher in ANAMMOX effluent and partially nitrified
centrate feed for making struvite particles, than centrate. This helped to maintain an SSR > 1 for
centrate feed, and a continuous supply of centrate influent (pH > 8) from reactor bottom also
aided the pH of the solution remain high inside the reactor.
The alkalinity in the system was found to be the controlling factor for the caustic consumption
for the struvite formation chemistry. Centrate had a dissolved alkalinity of 2700 mg/L, which
worked as a buffer for the feed and allowed the system to maintain a highly stable pH, for a
prolonged time during operation. The continuous supply of centrate feed (pH >8) from reactor
bottom also helped to keep the pH high inside the reactor.
The alkalinity in ANAMMOX treated centrate and partially nitrified centrate ranged between 50
mg/L and 150 mg/L, only and the influent pH was about 6. The solution had no buffering
capacity like centrate. As a result, the feeds are prone to constants demand of caustic to maintain
a high pH inside the system (to maintain SSR > 1 for struvite formation). The pH fluctuation in
the solutions was frequent and the control pH dropped rapidly, once the particles formed. As a
result, caustic pumping was frequent and a continuous supply of a low pH feed from the influent
tanks aided in the caustic consumption, by constantly lowering the overall pH of the solution.
4.3.3.2 Magnesium Consumption
The amount of chemical magnesium feed used the process of producing struvite was found to be
fairly close for all three feeds. ANAMMOX feed required slightly higher Mg than partially
nitrified centrate and centrate. A bar chart is given, with the standard deviation in Figure 4.27.
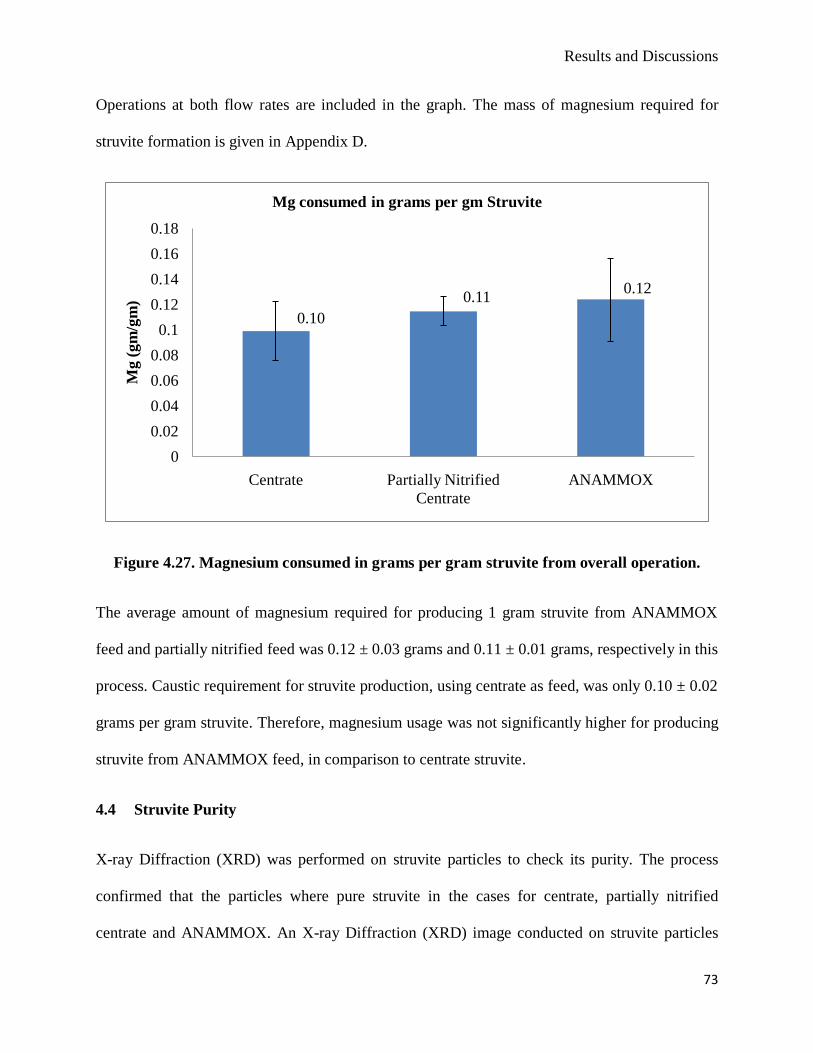
Results and Discussions
73
Operations at both flow rates are included in the graph. The mass of magnesium required for
struvite formation is given in Appendix D.
Figure 4.27. Magnesium consumed in grams per gram struvite from overall operation.
The average amount of magnesium required for producing 1 gram struvite from ANAMMOX
feed and partially nitrified feed was 0.12 ± 0.03 grams and 0.11 ± 0.01 grams, respectively in this
process. Caustic requirement for struvite production, using centrate as feed, was only 0.10 ± 0.02
grams per gram struvite. Therefore, magnesium usage was not significantly higher for producing
struvite from ANAMMOX feed, in comparison to centrate struvite.
4.4 Struvite Purity
X-ray Diffraction (XRD) was performed on struvite particles to check its purity. The process
confirmed that the particles where pure struvite in the cases for centrate, partially nitrified
centrate and ANAMMOX. An X-ray Diffraction (XRD) image conducted on struvite particles
0.10
0.110.12
0
0.02
0.04
0.06
0.08
0.1
0.12
0.14
0.16
0.18
Centrate Partially Nitrified
Centrate
ANAMMOX
Mg (
gm
/gm
)
Mg consumed in grams per gm Struvite
Results and Discussions
74
from ANAMMOX effluent in given in Figure 4.28. The image illustrates the peaks and
intensities of the particles being matched with the peaks and intensities of struvite particles in the
XRD database.
Figure 4.28. XRD image of struvite recovered from ANAMMOX effluent
The struvite particle collected from each run for each feed type was dried and weighted. A
certain amount was taken from each type of feed, solubilised in acid and tested for Mg : NH4-N :
PO4-P molar ratio. Pure struvite contains equimolar Mg : NH4-N : PO4-P and 6 moles of water.
The actual molar ratios of the crystals are available in Appendix E.
4.5 Struvite Particle Size Distribution and Morphology
A particle size distribution showed that ANAMMOX effluent and partially nitrified centrate feed
produced overall larger particles than centrate. A particle size distribution graph is shown below
in Figure 4.29. The actual particle size distribution values are given in Appendix F.
2-Theta - Scale
Lin
(C
ps)
Diffraction of particles in experiment
Peaks of the struvite pattern
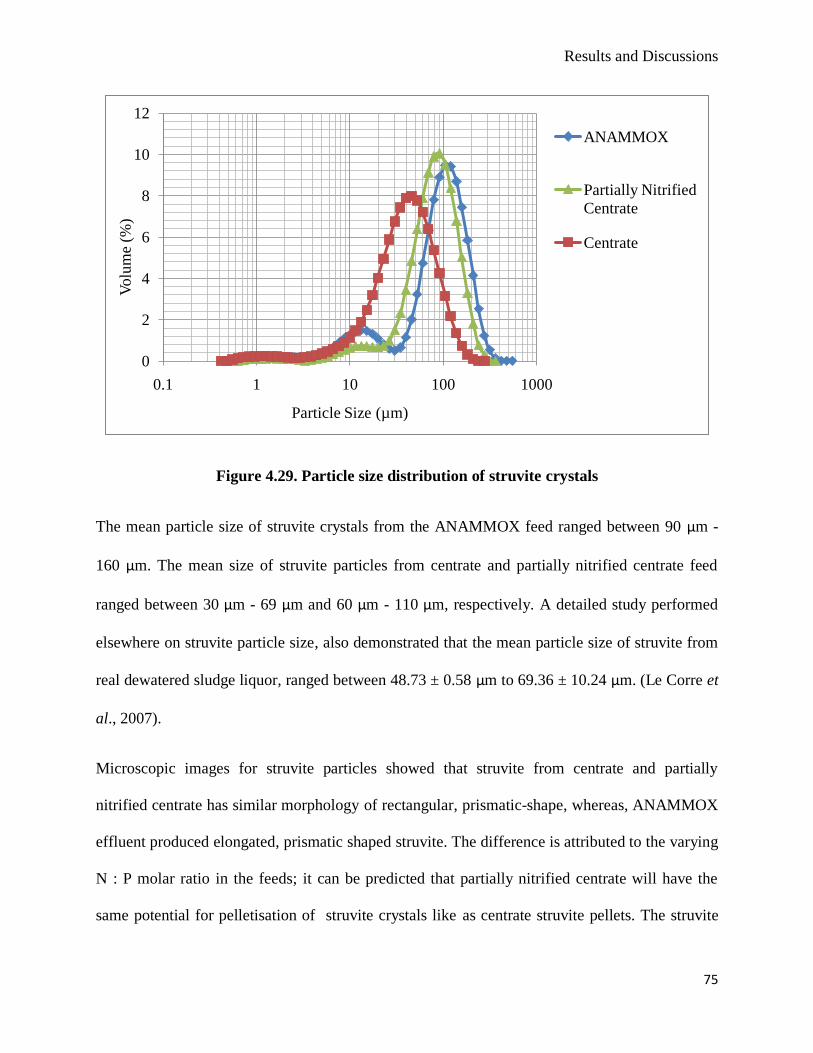
Results and Discussions
75
Figure 4.29. Particle size distribution of struvite crystals
The mean particle size of struvite crystals from the ANAMMOX feed ranged between 90 μm -
160 μm. The mean size of struvite particles from centrate and partially nitrified centrate feed
ranged between 30 μm - 69 μm and 60 μm - 110 μm, respectively. A detailed study performed
elsewhere on struvite particle size, also demonstrated that the mean particle size of struvite from
real dewatered sludge liquor, ranged between 48.73 ± 0.58 μm to 69.36 ± 10.24 μm. (Le Corre et
al., 2007).
Microscopic images for struvite particles showed that struvite from centrate and partially
nitrified centrate has similar morphology of rectangular, prismatic-shape, whereas, ANAMMOX
effluent produced elongated, prismatic shaped struvite. The difference is attributed to the varying
N : P molar ratio in the feeds; it can be predicted that partially nitrified centrate will have the
same potential for pelletisation of struvite crystals like as centrate struvite pellets. The struvite
0
2
4
6
8
10
12
0.1 1 10 100 1000
Volu
me
(%)
Particle Size (µm)
ANAMMOX
Partially Nitrified
Centrate
Centrate
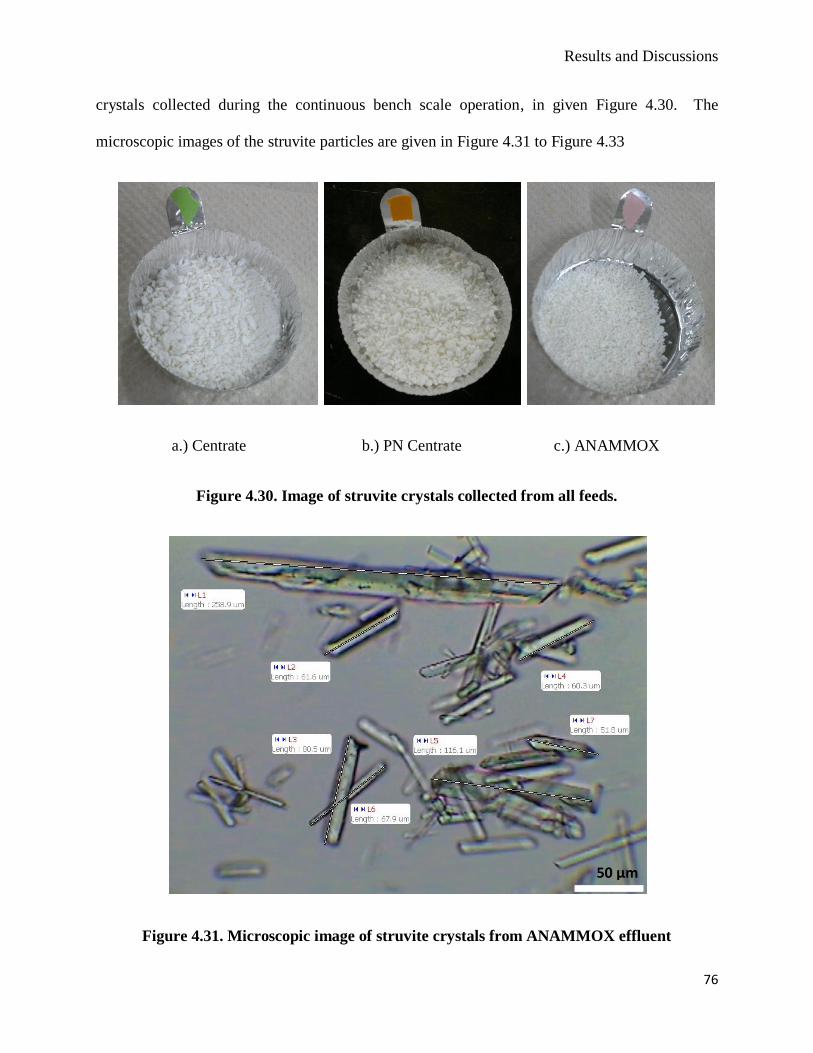
Results and Discussions
76
crystals collected during the continuous bench scale operation, in given Figure 4.30. The
microscopic images of the struvite particles are given in Figure 4.31 to Figure 4.33
a.) Centrate b.) PN Centrate c.) ANAMMOX
Figure 4.30. Image of struvite crystals collected from all feeds.
Figure 4.31. Microscopic image of struvite crystals from ANAMMOX effluent
50 µm
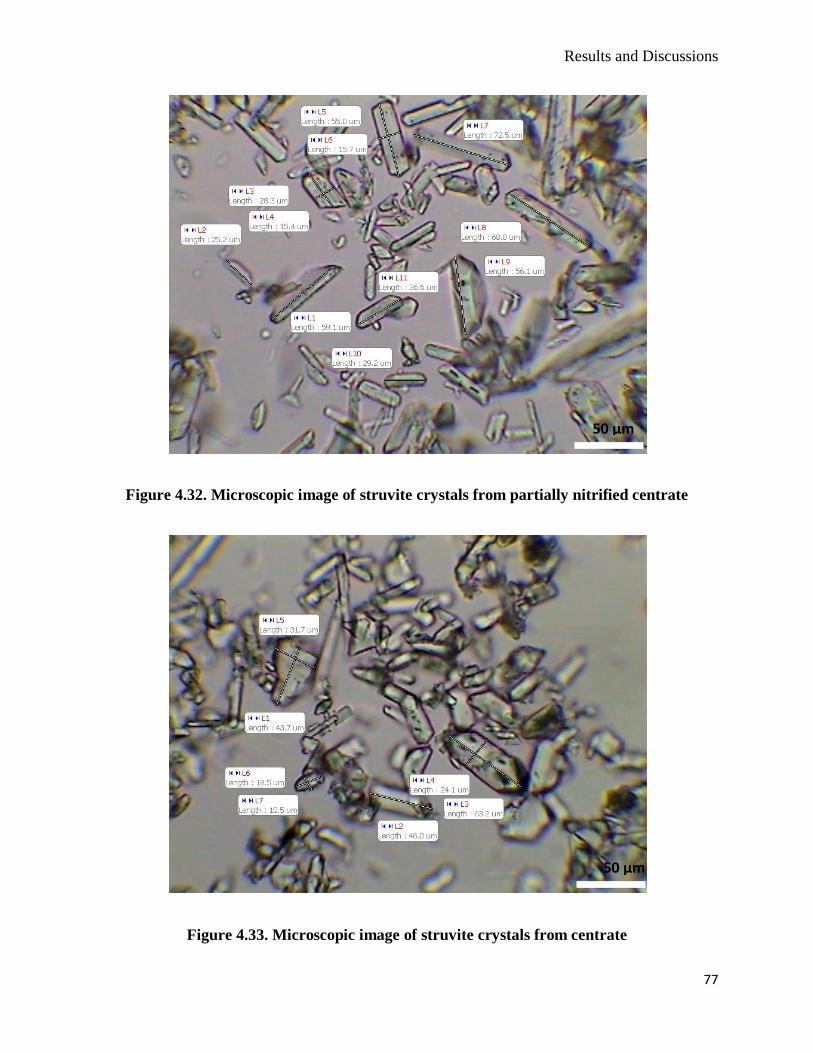
Results and Discussions
77
Figure 4.32. Microscopic image of struvite crystals from partially nitrified centrate
Figure 4.33. Microscopic image of struvite crystals from centrate
50 µm
50 µm

Results and Discussions
78
ANAMMOX effluent struvite particles were, overall, larger in size and had more surface area.
This might be beneficial in adhering more particles and aiding in agglomeration to form pellets.
Further study is required to examine the pellet forming potential of struvite particles formed from
the process combination of ANAMMOX, followed by struvite crystallization.
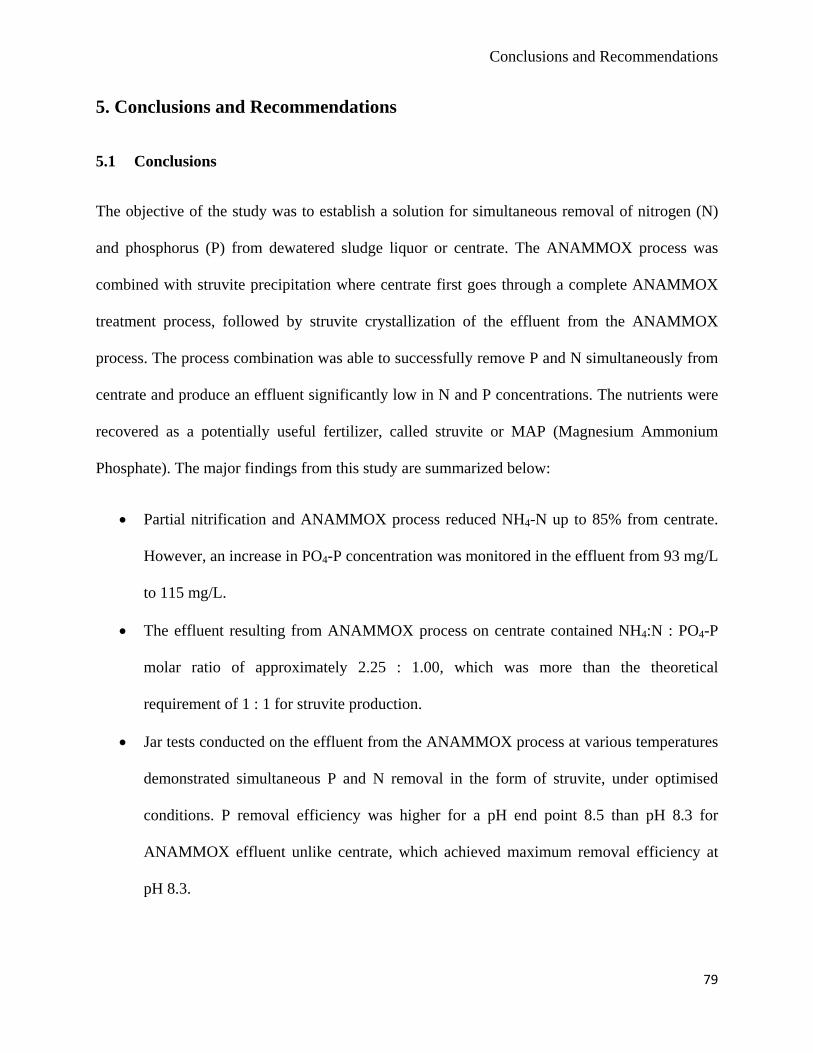
Conclusions and Recommendations
5. Conclusions and Recommendations
5.1 Conclusions
The objective of the study was to establish a solution for simultaneous removal of nitrogen (N)
and phosphorus (P) from dewatered sludge liquor or centrate. The ANAMMOX process was
combined with struvite precipitation where centrate first goes through a complete ANAMMOX
treatment process, followed by struvite crystallization of the effluent from the ANAMMOX
process. The process combination was able to successfully remove P and N simultaneously from
centrate and produce an effluent significantly low in N and P concentrations. The nutrients were
recovered as a potentially useful fertilizer, called struvite or MAP (Magnesium Ammonium
Phosphate). The major findings from this study are summarized below:
• Partial nitrification and ANAMMOX process reduced NH4-N up to 85% from centrate.
However, an increase in PO4-P concentration was monitored in the effluent from 93 mg/L
to 115 mg/L.
• The effluent resulting from ANAMMOX process on centrate contained NH4:N : PO4-P
molar ratio of approximately 2.25 : 1.00, which was more than the theoretical
requirement of 1 : 1 for struvite production.
• Jar tests conducted on the effluent from the ANAMMOX process at various temperatures
demonstrated simultaneous P and N removal in the form of struvite, under optimised
conditions. P removal efficiency was higher for a pH end point 8.5 than pH 8.3 for
ANAMMOX effluent unlike centrate, which achieved maximum removal efficiency at
pH 8.3.
79
Conclusions and Recommendations
• Jar tests also illustrated that high alkalinity promoted spontaneous struvite formation in
centrate, when magnesium was available at stoichiometric requirements, without addition
of base solution.
• The process combination of ANAMMOX, followed by struvite crystallization in the jar
tests, was able to reduce PO4-P from a maximum 120 mg/L to a minimum 14 mg/L, in
the final effluent. The NH4-N concentration was reduced to a minimum of 68 mg/L from
770 mg/L, in the final effluent. Overall, the process combination achieved 91% NH4-N
and 88% PO4-P, from centrate.
• A continuous process using bench scaled fluidized bed reactors were operated at two sets
of influent flow rates, of 40 mL/min and 140 mL/min. The recycle ratio and control pH
was varied to different values for determining the best P and N removal efficiency in the
process combination. The continuous process was able to reduce PO4-P from a maximum
119 mg/L to a minimum 15 mg/L, in the final effluent. The NH4-N concentration was
reduced to a minimum of 70 mg/L from 800 mg/L, in the final effluent. The low influent
flow rate of 40 mL/min, with a recycle ratio of 2.0, was found as the best conditions for
struvite formation from the process combination.
• The process combination in the continuous process achieved PO4-P and NH4-N removal
and recovery up to 87% and 92%, respectively, in the final effluent. The final effluent
resulted in a very low PO4-P and NH4-N concentration and a unified solution for nutrient
recovery was obtained.
• Caustic consumption was higher for producing struvite from the process combination,
compared to struvite produced directly from centrate. ANAMMOX and partially nitrified
feed required 0.62 ± 0.06 and 0.69 ± 0.02 grams of commercial grade NaOH,
80
Conclusions and Recommendations
respectively, to produce 1 gram pure struvite. Caustic (NaOH) requirement for struvite
production, using centrate as feed, was less at 0.29 ± 0.08 gram per gram struvite.
• Magnesium consumption was also higher in the process combination compared to
struvite produced only from centrate. ANAMMOX and partially nitrified feed required
approximately 0.12 ± 0.03 grams and 0.11 ± 0.01 grams of Mg, respectively, to produce
1 gram pure struvite. Magnesium (Mg) requirement for struvite production, using
centrate as feed, was less at 0.10 ± 0.02 gram per gram struvite.
• ANAMMOX effluent produced pure struvite particles with a larger mean particle size,
compared to struvite particles produced from centrate. The mean particle size of struvite
crystals from the ANAMMOX feed ranged between 90 - 160 μm. The mean size of
struvite particles from centrate and partially nitrified centrate feed ranged between 40 - 69
μm and 60 - 120 μm, respectively.
5.2 Recommendation for Future Research
Based on the study conducted on the process combination of ANAMMOX, followed by struvite
crystallization, for simultaneous removal and recovery of nutrients from synthetic feed, the
author makes the following recommendations for further study.
• The study on process combination of ANAMMOX followed by struvite crystallization
was conducted using synthetic feed of centrate, partially nitrified centrate and
ANAMMOX effluent. Synthetic feed gives the flexibility to understand a process in
depth, as it contains only the key constituents that influence the process. However, the
influence of different parameters present in real wastewater is not considered in this
study, which may have a significant role in the process combination. Therefore, the study
81
Conclusions and Recommendations
82
should be conducted using real wastewater (side streams), to verify the results obtained
from synthetic wastewater.
• The continuous process was conducted on bench scaled fluidized reactors. The scale
should be upgraded to pilot scale, so that it can be comparable to full scale wastewater
treatment plants. Also, the pelletisation property of struvite crystals from ANAMMOX
effluent should be studied.
• The chemical costs associated with struvite production from the process combination of
ANAMMOX and struvite crystallization was higher than struvite produced directly from
centrate. This will increase the overall process cost associated with struvite production.
Further study is underway to see the scope of minimizing caustic usage for struvite
production, using real wastewater. Stripping of CO2 from the feed could alleviate the
need for additional caustic, hence reduce the chemical costs. Pelletisation of struvite
particles using real ANAMMOX effluent is recommended and underway.
• Similarly, research on reversing these two processes, that is struvite crystallisation
followed by ANAMMOX treatment process, is recommended and underway.
References
83
References
Aage, H. K., Anderson, B.L., Blom, A., and Jensen, I. (1997). The solubility of struvite.
Journal of Radio Analytical and Nuclear Chemistry, 223(1-2), 213-215.
Adnan, A., Dastur, M., Mavinic, D. S., and Koch, F. A. (2004). Preliminary investigation into
factors affecting controlled struvite crystallization at the bench scale. Journal of
Environmental Engineering and Science, 3(3), 195-202.
Adnan, A., Mavinic, D. S., and Koch, F. A. (2003a). Pilot-scale study of phosphorus recovery
through struvite crystallization-II: Applying in-reactor supersaturation ratio as a process
control parameter. Journal of Environmental Engineering and Science, 2(6), 473-483.
Adnan, A., Mavinic, D. S., and Koch, F. A. (2003b). Pilot-scale study of phosphorus recovery
through struvite crystallization – examining the process feasibility. Journal of
Environmental Engineering and Science, 2(5), 315-324.
Babić-Ivanĉić, V., Kontrec, J., Kralj, D., and Breĉević, L. (2002). Precipitation diagrams of
struvite dissolution kinetics of different struvite morphologies Precipitation diagrams of
struvite dissolution kinetics of different struvite morphologies. Croatica Chemica Acta, 75,
89-106.
Battistoni, P., De Angelis, A., Pavan, P., Prisciandaro, M., and Cecchi, F. (2001). Phosphorus
removal from a real anaerobic supernatant by struvite crystallization. Water Research,
35(9), 2167-2178.
Berg, E. (1982). Handbook for Sampling and Sample Preservation for Water and Wastewater.
U.S. Environmental Protection Agency, Washington, D.C., EPA/600/4-82/029 (NTIS
PB83124503).
References
84
Boistelle, R., Abbona, F., and Lundager Madsen, H. E. (1983). On the transformation of
struvite into newberyite in aqueous systems. Physics and Chemistry of Mineral, 9(5), 216-
222.
Booker, N. A., Priestley, A. J. and Fraser, I. H. (1999). Struvite formation in wastewater
treatment plants: Opportunities for nutrient recovery. Environmental Technology, 20(7),
777-782.
Borgerding, J. (1972). Phosphate deposits in digestion systems. Journal of the Water Pollution
Control Federation, 44(5), 813-819.
Bowker, R. P. G., and Stensel, H. D. (1990). Phosphorus removal from wastewater. New
Jersey, US: Noyes Data Corporation.
Bridger, G. L., Salutsky, M. L., and Starosika, R. (1961). Metal ammonium phosphates as
fertilizers. 140th Meeting of the American Chemical Society, Chicago, Illinois, 1-19.
Broda, E. (1977). Two kinds of lithotrophs missing in nature. Journal of Basic Microbiology,
17(6), 491-493.
Buchanan, J. R., Mote, C. R. and Robinson, R. B. (1994). Thermodynamics of struvite
formations. Transactions of the ASEA, 37(2), 617-621.
Burns, J. R., and Finlayson, B. (1982). Solubility product of magnesium ammonium phosphate
hexahydrate at various temperatures. The Journal of Urology, 128(2), 426–428.
Celen, I., and Türker, M. (2001). Recovery of ammonia as struvite from anaerobic digester
effluents. Environmental Technology, 22(11), 1263-1272.
Demeestere, K., Smet, E., van Langenhove, H., and Galbacs, Z. (2001). Optimalisation of
magnesium ammonium phosphate precipitation and its applicability to the removal of
ammonium. Environmental Technology, 22(12), 1419-1428.
References
85
Doyle, J. D. and Parsons, S. A. (2002). Struvite formation, control and recovery. Water
Research, 36(16), 3925-3940.
Doyle, J. D., Oldring, K., Churchley, J., Price, C., and Parsons, S. A. (2003). Chemical control
of struvite precipitation. Journal of Environmental Engineering. 129(5), 419-426.
Driver, J., Lijmbach, D. and Steen, I. (1999). Why recover phosphorus for recycling, and how?
Environmental Technology, 20(7), 651-662.
Durrant, A. E., Scrimshaw, M. D., Stratful, I. and Lester, J. N. (1999). Review of the feasibility
of recovering phosphate from wastewater for use as a raw material by the phosphate
industry. Environmental Technology, 20(7), 749-758.
Fattah, K. P., Mavinic, D. S., Koch, F. A. and Jacob, C. (2008b). Determining the feasibility of
phosphorus recovery as struvite from filter press centrate in a secondary wastewater
treatment plant. Journal of Environmental Science and Health Part A-Toxic/hazardous
Substances and Environmental Engineering, 43(7), 756-764.
Fattah, K. P., Mavinic, D. S., and Koch, F. A. (2012). Influence of process parameters on the
characteristics of struvite pellets. Journal of Environmental Engineering, 138(12), 1200-
1209.
Fattah, K. P., Zhang, Y., Mavinic, D. S. and Koch, F. A. (2008a). Application of carbon
dioxide stripping for struvite crystallization - I: Development of a carbon dioxide stripper
model to predict CO2 removal and pH changes. Journal of Environmental Engineering and
Science, 7(4), 345-356.
Fattah, K. P. (2004). Pilot scale struvite recovery potential from centrate at Lulu Island
Wastewater Treatment Plant. M.A.Sc. Thesis, Department of Civil Engineering, University
of British Columbia, Vancouver, BC, Canada.
References
86
Forrest, A. L., Fattah, K. P., Mavinic, D. S. and Koch, F. A. (2007). Application of artificial
neural networks to effluent phosphate prediction in struvite recovery. Journal of
Environmental Engineering and Science, 6(6), 713-725.
Freitag, A. & Bock, E. (1990) Energy conservation in nitrobacter. FEMS Microbiology Letters
66(1–3), 157–162.
Fujimoto, N., Mizuochi, T., and Togami, Y. (1991). Phosphorus Fixation in the Sludge
Treatment System of a Biological Phosphorus Removal Process. Water Science and
Technology, 23(4-6), 635-640.
Fux, C., Boehler, M., Huber, P., Brunner, I., and Siegrist, H. (2002). Biological treatment of
ammonium-rich wastewater by partial nitritation and subsequent anaerobic ammonium
oxidation (anammox) in a pilot plant. Journal of Biotechnology, 99(3), 295-306.
Fux, C., Velten, S,. Carozzi, V., Solley, D., and Keller, J. (2006) Efficient and stable nitritation
and denitritation of ammonium-rich sludge dewatering liquor using an SBR with
continuous loading. Water Research. 40(14), 2765-2775.
Galí, A., Dosta, J., van Loosdrecht, M. C. M., and Mata-Alvarez, J. (2007). Two ways to
achieve an anammox influent from real reject water treatment at lab-scale: Partial SBR
nitrification and SHARON process. Process Biochemistry, 42(4), 715-720.
Gao, Y.; Liu, Z.; Liu, F.; Furukawa, K. (2012). Mechanical shear contributes to granule
formation resulting in quick start-up and stability of a hybrid ANAMMOX reactor.
Biodegradation, 23(3), 363-372.
Gaterell, M. R., Gay, R., Wilson, R., Gochin, R.J., and Lester, J.N. (2000). An economic and
environmental evaluation of the opportunities for substituting phosphorus recovered from
References
87
wastewater treatment works in existing UK fertilizer markets. Environmental Technology,
21(9), 1067-1084.
Hirasawa, I., Nakagawa, H., Yosikawa, O., and Itoh, M. (1997). Phosphate Recovery by
Reactive Crystallization of Magnesium Ammonium Phosphate: Application to Wastewater.
Separation and Purification by Crystallization, 667(22), 267-276.
Jaffer, Y., Clark, T. A., Pearce, P., and Parsons, S. A. (2002). Potential phosphorus recovery by
struvite formation. Water Research, 36(7), 1834-1842.
Jetten, M. S. M, Wagner, M., Fuerst, J., van Loosdrecht, M., Kuenen, G., and Marc, S. (2001).
Microbiology and application of the anaerobic ammonium oxidation (“ANAMMOX”)
process. Environmental Biotechnology, 12(3), 283-288.
Jones, A. G. (2002). Crystallization process system. Butterworth- Heinemann, Oxford, OX2
8DP, U.K.
Jordaan, M. E., Rezania, B., and Ҫiҫek, N. (2013). Investigation of chemical-free nutrient
removal and recovery from CO2-rich wastewater. Water Science and Technology, 67(10),
2195-2201.
Kampschreur, M. J., Poldermans R., Kleerebezem R., van der Star, W. R., Haarhuis, R., Abma,
W. R., Jetten, M. S., and van Loosdrecht, M. C. (2009a). Emission of nitrous oxide and
nitric oxide from a full-scale single-stage nitritation-anammox reactor. Water Science and
Technology, 60(12), 3211-3217.
Kampschreur, M. J., Temmink, H., Kleerebezem, R., Jetten, M. S. M., and van Loosdrecht, M.
C. M. (2009b). Nitrous oxide emission during wastewater treatment. Water Research,
43(17), 4093-4193.
References
88
Kampschreur, M. J., van der Star, W. R., Wielders, H., Mulder, J., Jetten, M. S. M., and van
Loosdrecht, M. C. (2008). Dynamics of nitric oxide and nitrous oxide emission during full-
scale reject water treatment. Water Research, 42(3), 812-826.
Kosari, F. (2011). Nitrogen removal from wastewater through partial nitrification /
ANAMMOX process. M.A.Sc. Thesis, Department of Civil Engineering, University of
British Columbia, Vancouver, BC, Canada.
Le Corre, K. S., Valsami-Jones, E., Hobbs, P., and Parsons, S. A. (2007). Impact of reactor
operation on success of struvite precipitation from synthetic liquors. Environmental
Technology, 28(11), 1245-1256.
Le Corre, K. S., Valsami-Jones, E., Hobbs, P., and Parsons, S. A. (2005). Impact of calcium on
struvite crystal size, shape and purity. Journal of Crystal Growth, 283(3-4), 514-522.
Lipschultz, F., Zafiriou, O. C., Wofsy, S. C., McElroy, M. B., Valois, F. W., and Watson, S. W.
(1981). Production of nitric oxide and nitrous oxide by soil nitrifying bacteria. Nature
294(5842), 641–643.
Mamais, D., Pitt, P. A., Cheng, Y. W., Loiacono, J., and Jenkins, D. (1994). Determination of
ferric-chloride dose to control struvite precipitation in anaerobic sludge digesters. Water
Environment Research, 66(7), 912-918.
Mavinic, D. S., Koch, F. A., Hall, E. R., Abraham, K. and Niedbala, D. (1998). Anaerobic co-
digestion of combined sludges from a BNR wastewater treatment plant. Environmental
Technology, 19(1), 35-44.
Metcalf and Eddy (2003). Wastewater Engineering: Treatment and Reuse. McGraw-Hill, New
York, USA.
References
89
Morse G. K., Brett S. W., Guy J. A. and Lester J.N. (1998). Review: Phosphorus removal and
recovery technologies. The Science of the Total Environment, 212(1), 69-81
Munch, E. V. and Barr, K. (2001). Controlled struvite crystallisation for removing phosphorus
from anaerobic digester sidestreams. Water Research, 35(1), 151-159.
Neethling, J. B., and Benisch, M. (2004). Struvite control through process and facility design
as well as operation strategy. Water Science and Technology, 49(2), 191-199.
Ohlinger, K. N., Young, T. M. and Schroeder, E. D. (1999). Kinetics effects on preferential
struvite accumulation in wastewater. Journal of Environmental Engineering, 125(8), 730-
737.
Owen, J., Stoven, H., Kowalski, J. and Phillips, K. (2009). Assessment of struvite containing
controlled release fertilizer as a source of phosphorus for containerized ornamental crops.
Hortiscience, 44(4), 1131-1132.
Rawn, A. M., Perry Banta, A., and Pomeroy, R. (1939). Multiple-stage sewage sludge
digestion. American Society of Civil Engineers, 104(1), 93-119.
Ries, K. M., Dunseth, M. G., Salutsky, M. L., and Shapiro, J. J. (1969). Ultimate disposal of
phosphate from wastewater by recovery as a fertilizer. Final report prepared for the Interior
Federal Water Pollution Control Administration, USA.
Robert V. T. and Russo, R. C. (1981). Ammonia Toxicity to Fishes. Effect of pH on the
toxicity of the un-ionized ammonia species. American Chemical Society, 15(7), 837-840.
Schindler, D. W. (2006). Recent advances in the understanding and management of
eutrophication. Limnology and Oceanography, 51(1), 356-363.
References
90
Shimamura, K; Tanaka, T; Miura, Y; Ishikawa, H. (2003) Development of a high efficiency
phosphorus recovery method using a fluidized-bed crystallized phosphorus removal
system. Water Science and Technology, 49(1), 163-170.
Sliekers, A. O., Derwort, N., Gomez, J. L. C., Strous, M., Kuenen, J. G., and Jetten, M. S. M.
(2002). Completely autotrophic nitrogen removal over nitrite in one single reactor. Water
Research, 36(10), 2475-2482.
Snoeyink, V. L., and Jenkins, D. (1980). Water chemistry. New York: John Wiley and Sons.
Sterling, M. S. and Ashley, K. I. (2003). Evaluations of a slow-release fertilizer for
rehabilitating oligotrophic streams. American Fisheries Society Symposium, 34, 237-243.
Stratful I., Scrimshaw, M. D. and Lester J. N. (2001). Conditions influencing the precipitation
of magnesium ammonium phosphate. Water Research, 35(17), 4191-4199.
Strous, M., Heijnen, J. J., Kuenen, J. G., and Jetten, M. S. M. (1998). The sequencing batch
reactor as a powerful tool for the study of slowly growing anaerobic ammonium-oxidizing
microoganisms. Applied Microbiology Biotechnology, 50(5), 589-596.
Strous, M., Kuenen, J. G., and Jetten, M. S. M. (1999). Key Physiology of Anaerobic
Ammonium Oxidation. Applied and Environmental Microbiology, 65(7), 3248-3250.
Strous, M., van Gerven, E., Kuenen, J. G., and Jetten, M. S. M. (1997). Effects of Aerobic and
Microaerobic Conditions on Anaerobic Ammonium-Oxidizing (ANAMMOX) Sludge.
Applied and Environmental Microbiology, 63(6), 2446–2448.
Suzuki, K., Tanaka, Y., Osada, T., and Waki, M. (2002). Removal of phosphate, magnesium
and calcium from swine wastewater through crystallization enhanced by aeration. Water
Research, 36(12), 2991-2998.
References
91
Third, K. (2001). The CANON System (Completely Autotrophic Nitrogen-removal Over
Nitrite) under Ammonium Limitation: Interaction and Competition between Three Groups
of Bacteria. Systematic and Applied Microbiology, 24(4), 588-596.
van de Graaf, A. A., Mulder, A., de Bruijn, P., Jetten, M. S., Robertson, L. A., and Kuenen, J.
G. (1995). Anaerobic oxidation of ammonium is a biologically mediated process. Applied
and Environmental Microbiology, 61(4), 1246-1251.
van Dongen, U., Jetten, M. S. M., and van Loosdrecht, M. C. M. (2001). SHARON-
ANAMMOX process for treatment of ammonium rich. Water Science and Technology,
44(1), 153-160.
van Kempen, R., Mulder, J. W., Uijterlinde, C. A., and, Loosdrecht, M. C. M. (2001).
Overview: full scale experience of the SHARON process for treatment of rejection water
of digested sludge dewatering. Water Science and Technology, 44(1), 145–152.
Vemula, V., Lagishetty, V., and Lingal, S. (2010). Solubility Enhancement Techniques.
International Journal of Pharmaceutical Sciences Review and Research, 5(1), 41-51.
von Horn, J. and Sartorius, C. (2009). Impact of supply and demand on the price development
of phosphate (fertilizer). International conference on nutrient recovery from wastewater
streams. Vancouver, BC, Canada. IWA publishing, UK.
Waki, M., Yasuda T., Fukumoto, Y., Kuroda, K., and Suzuki K. (2013). Effect of electron
donors on anammox coupling with nitrate reduction for removing nitrogen from nitrate and
ammonium. Bioresource Technology, 130, 592-598.
Wild, D., Kisliakova, A., and Siegrist, H. (1997). Prediction of recycle phosphorus loads from
anaerobic digestion. Water Research, 31(9), 2300-2308.
References
92
Woods, N. C., Sock, S. M., and Daigger, G. T. (1999). Phosphorus recovery technology
modelling and feasibility evaluation for municipal wastewater treatment plants.
Environmental Technology, 20(7), 743-748.
Yapsakli, K. (2010). Co-occurrence of nitrogen-converting organisms in full-scale treatment
plants. Journal of Environmental Science Health Part A, 45(9), 1060-1070.
Zhang, L., Zheng, P., Tang, C. J., and Ren-cun, J. (2008). Anaerobic ammonium oxidation for
treatment of ammonium-rich wastewaters. Journal of Zhejiang University SCIENCE B,
9(5), 416-426.
Zhang, Y. (2006). Struvite crystallisation from digestor supernatant – Reducing caustic
chemical addition by CO2 stripping. M.A.Sc. Thesis, Department of Civil Engineering,
The University of British Columbia, Vancouver, B.C., Canada.
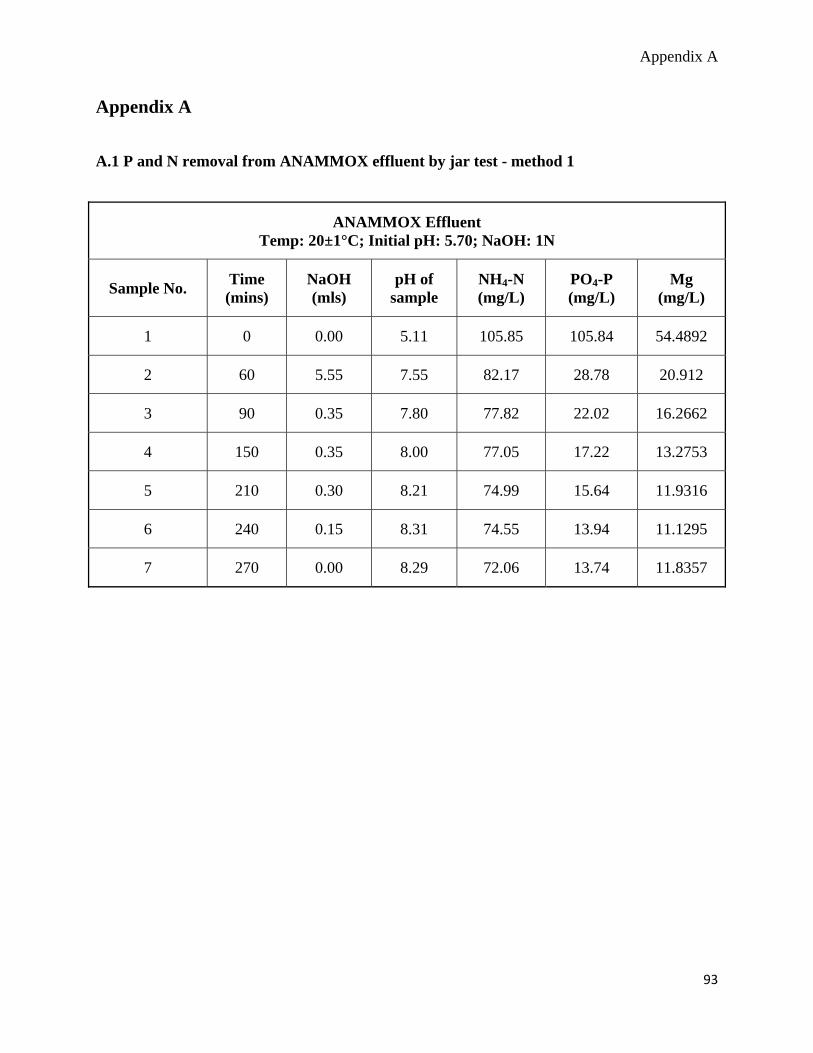
Appendix A
Appendix A
A.1 P and N removal from ANAMMOX effluent by jar test - method 1
ANAMMOX Effluent Temp: 20±1°C; Initial pH: 5.70; NaOH: 1N
Sample No. Time (mins)
NaOH (mls)
pH of sample
NH4-N (mg/L)
PO4-P (mg/L)
Mg (mg/L)
1 0 0.00 5.11 105.85 105.84 54.4892
2 60 5.55 7.55 82.17 28.78 20.912
3 90 0.35 7.80 77.82 22.02 16.2662
4 150 0.35 8.00 77.05 17.22 13.2753
5 210 0.30 8.21 74.99 15.64 11.9316
6 240 0.15 8.31 74.55 13.94 11.1295
7 270 0.00 8.29 72.06 13.74 11.8357
93
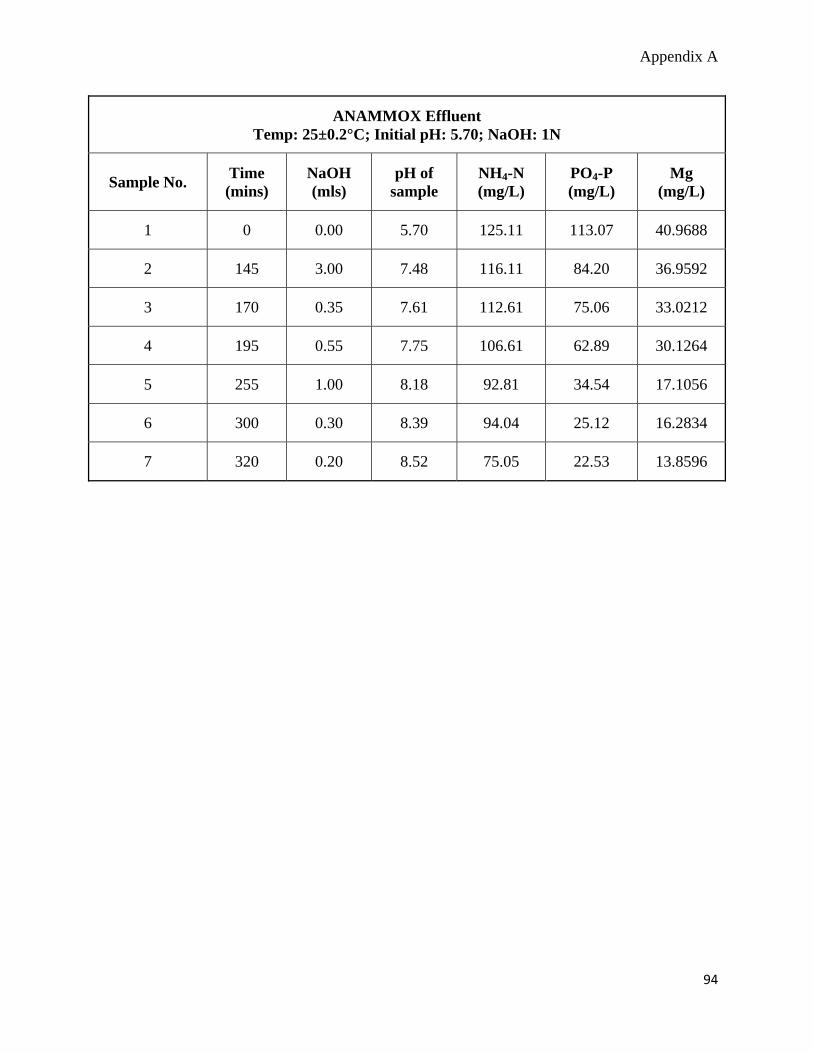
Appendix A
ANAMMOX Effluent Temp: 25±0.2°C; Initial pH: 5.70; NaOH: 1N
Sample No. Time (mins)
NaOH (mls)
pH of sample
NH4-N (mg/L)
PO4-P (mg/L)
Mg (mg/L)
1 0 0.00 5.70 125.11 113.07 40.9688
2 145 3.00 7.48 116.11 84.20 36.9592
3 170 0.35 7.61 112.61 75.06 33.0212
4 195 0.55 7.75 106.61 62.89 30.1264
5 255 1.00 8.18 92.81 34.54 17.1056
6 300 0.30 8.39 94.04 25.12 16.2834
7 320 0.20 8.52 75.05 22.53 13.8596
94
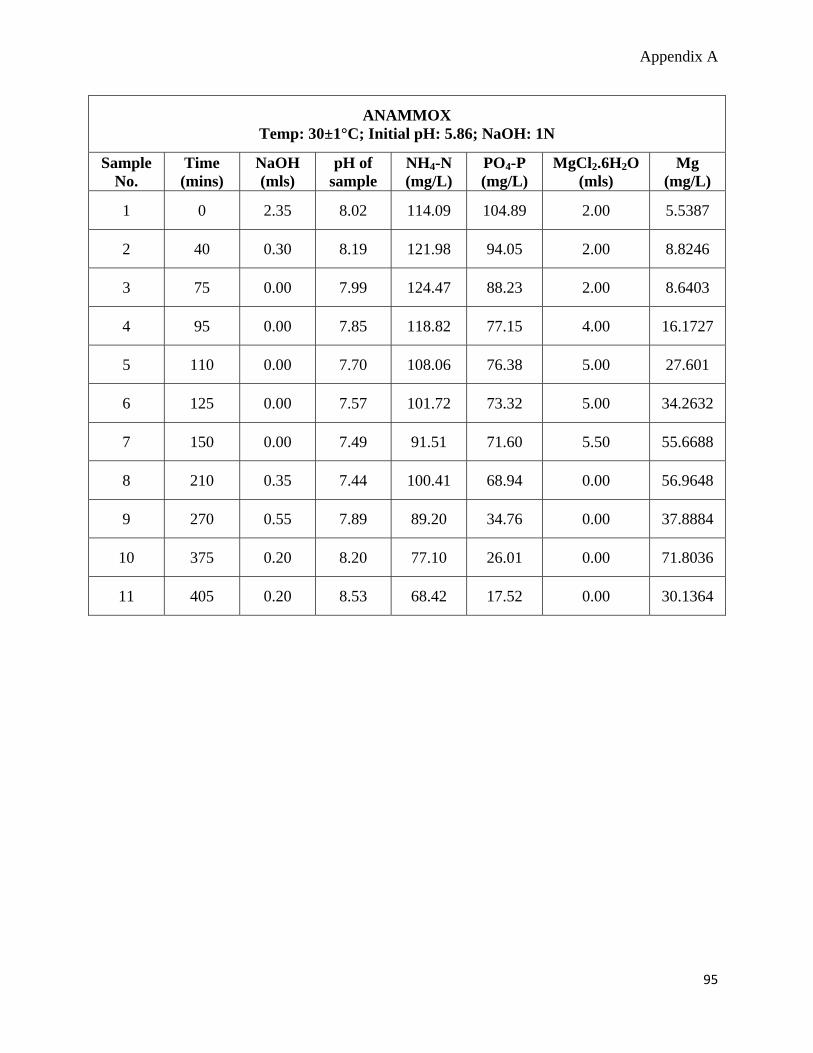
Appendix A
ANAMMOX Temp: 30±1°C; Initial pH: 5.86; NaOH: 1N
Sample No.
Time (mins)
NaOH (mls)
pH of sample
NH4-N (mg/L)
PO4-P (mg/L)
MgCl2.6H2O (mls)
Mg (mg/L)
1 0 2.35 8.02 114.09 104.89 2.00 5.5387
2 40 0.30 8.19 121.98 94.05 2.00 8.8246
3 75 0.00 7.99 124.47 88.23 2.00 8.6403
4 95 0.00 7.85 118.82 77.15 4.00 16.1727
5 110 0.00 7.70 108.06 76.38 5.00 27.601
6 125 0.00 7.57 101.72 73.32 5.00 34.2632
7 150 0.00 7.49 91.51 71.60 5.50 55.6688
8 210 0.35 7.44 100.41 68.94 0.00 56.9648
9 270 0.55 7.89 89.20 34.76 0.00 37.8884
10 375 0.20 8.20 77.10 26.01 0.00 71.8036
11 405 0.20 8.53 68.42 17.52 0.00 30.1364
95
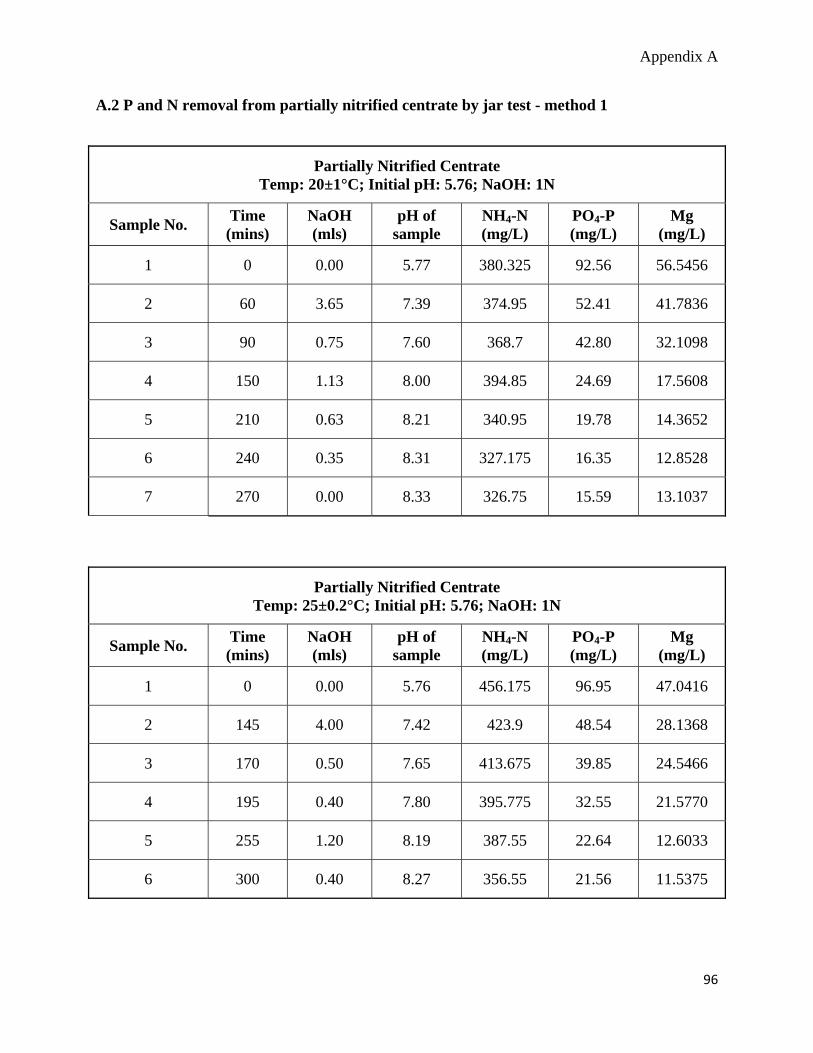
Appendix A
A.2 P and N removal from partially nitrified centrate by jar test - method 1
Partially Nitrified Centrate Temp: 20±1°C; Initial pH: 5.76; NaOH: 1N
Sample No. Time (mins)
NaOH (mls)
pH of sample
NH4-N (mg/L)
PO4-P (mg/L)
Mg (mg/L)
1 0 0.00 5.77 380.325 92.56 56.5456
2 60 3.65 7.39 374.95 52.41 41.7836
3 90 0.75 7.60 368.7 42.80 32.1098
4 150 1.13 8.00 394.85 24.69 17.5608
5 210 0.63 8.21 340.95 19.78 14.3652
6 240 0.35 8.31 327.175 16.35 12.8528
7 270 0.00 8.33 326.75 15.59 13.1037
Partially Nitrified Centrate Temp: 25±0.2°C; Initial pH: 5.76; NaOH: 1N
Sample No. Time (mins)
NaOH (mls)
pH of sample
NH4-N (mg/L)
PO4-P (mg/L)
Mg (mg/L)
1 0 0.00 5.76 456.175 96.95 47.0416
2 145 4.00 7.42 423.9 48.54 28.1368
3 170 0.50 7.65 413.675 39.85 24.5466
4 195 0.40 7.80 395.775 32.55 21.5770
5 255 1.20 8.19 387.55 22.64 12.6033
6 300 0.40 8.27 356.55 21.56 11.5375
96
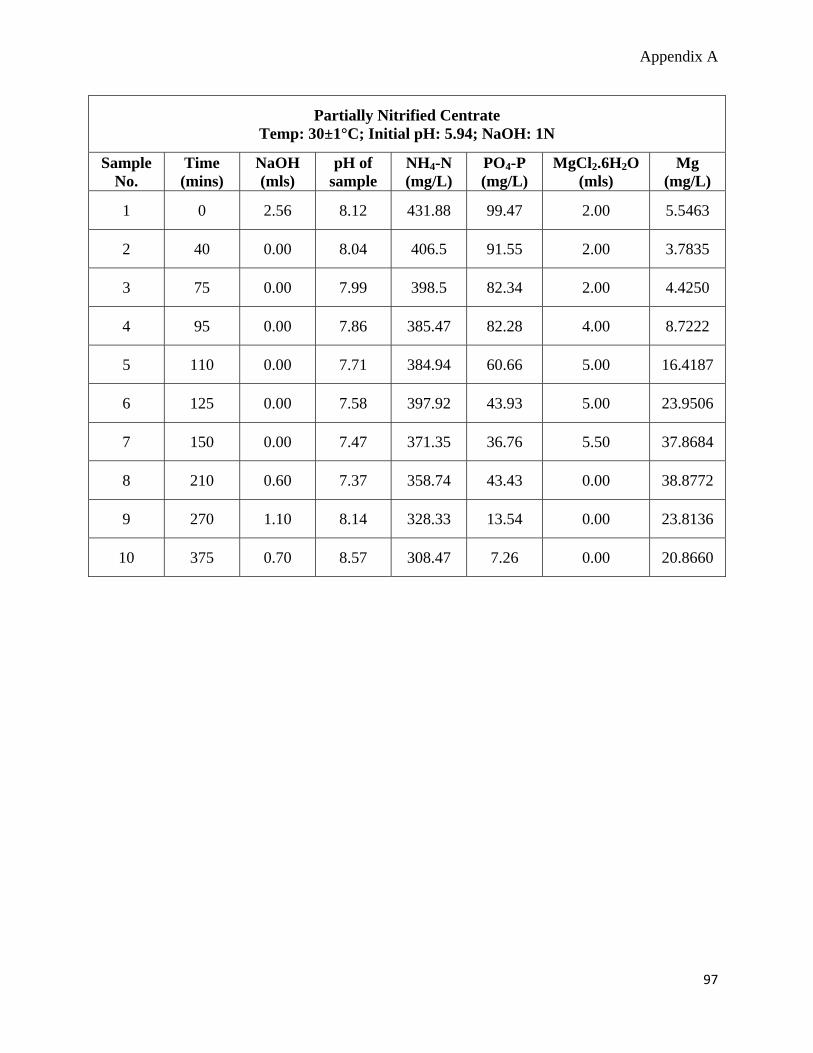
Appendix A
Partially Nitrified Centrate Temp: 30±1°C; Initial pH: 5.94; NaOH: 1N
Sample No.
Time (mins)
NaOH (mls)
pH of sample
NH4-N (mg/L)
PO4-P (mg/L)
MgCl2.6H2O (mls)
Mg (mg/L)
1 0 2.56 8.12 431.88 99.47 2.00 5.5463
2 40 0.00 8.04 406.5 91.55 2.00 3.7835
3 75 0.00 7.99 398.5 82.34 2.00 4.4250
4 95 0.00 7.86 385.47 82.28 4.00 8.7222
5 110 0.00 7.71 384.94 60.66 5.00 16.4187
6 125 0.00 7.58 397.92 43.93 5.00 23.9506
7 150 0.00 7.47 371.35 36.76 5.50 37.8684
8 210 0.60 7.37 358.74 43.43 0.00 38.8772
9 270 1.10 8.14 328.33 13.54 0.00 23.8136
10 375 0.70 8.57 308.47 7.26 0.00 20.8660
97
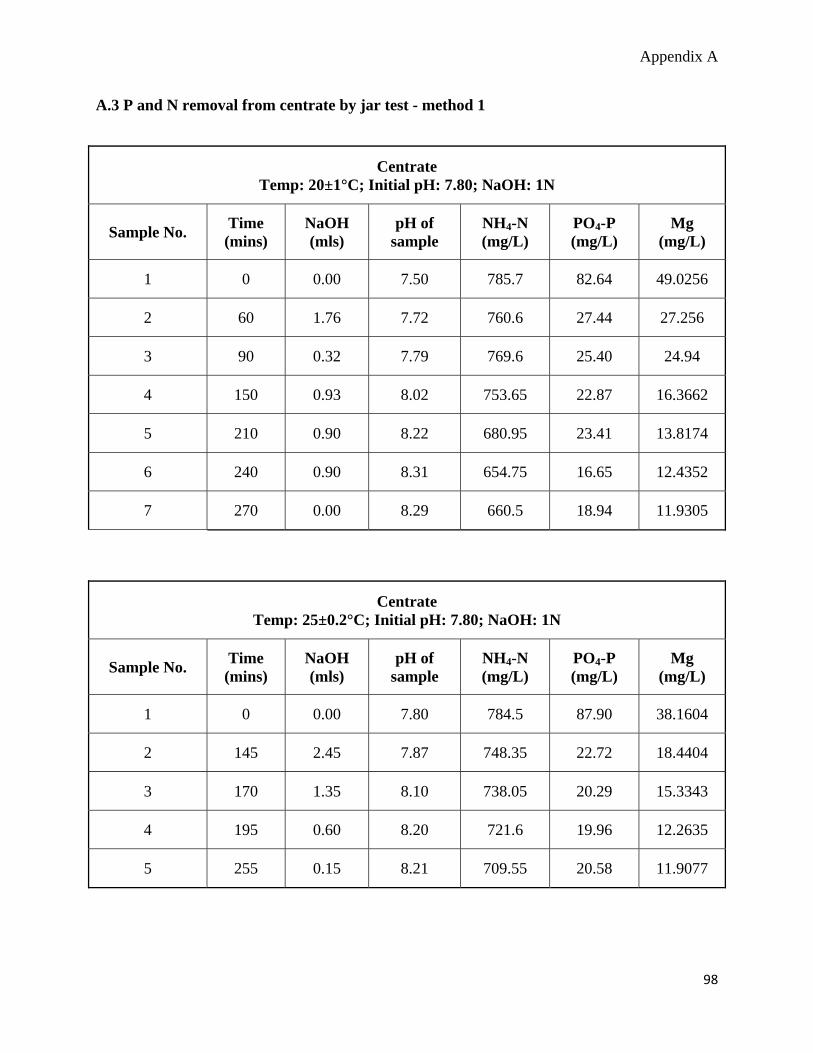
Appendix A
A.3 P and N removal from centrate by jar test - method 1
Centrate Temp: 20±1°C; Initial pH: 7.80; NaOH: 1N
Sample No. Time (mins)
NaOH (mls)
pH of sample
NH4-N (mg/L)
PO4-P (mg/L)
Mg (mg/L)
1 0 0.00 7.50 785.7 82.64 49.0256
2 60 1.76 7.72 760.6 27.44 27.256
3 90 0.32 7.79 769.6 25.40 24.94
4 150 0.93 8.02 753.65 22.87 16.3662
5 210 0.90 8.22 680.95 23.41 13.8174
6 240 0.90 8.31 654.75 16.65 12.4352
7 270 0.00 8.29 660.5 18.94 11.9305
Centrate Temp: 25±0.2°C; Initial pH: 7.80; NaOH: 1N
Sample No. Time (mins)
NaOH (mls)
pH of sample
NH4-N (mg/L)
PO4-P (mg/L)
Mg (mg/L)
1 0 0.00 7.80 784.5 87.90 38.1604
2 145 2.45 7.87 748.35 22.72 18.4404
3 170 1.35 8.10 738.05 20.29 15.3343
4 195 0.60 8.20 721.6 19.96 12.2635
5 255 0.15 8.21 709.55 20.58 11.9077
98
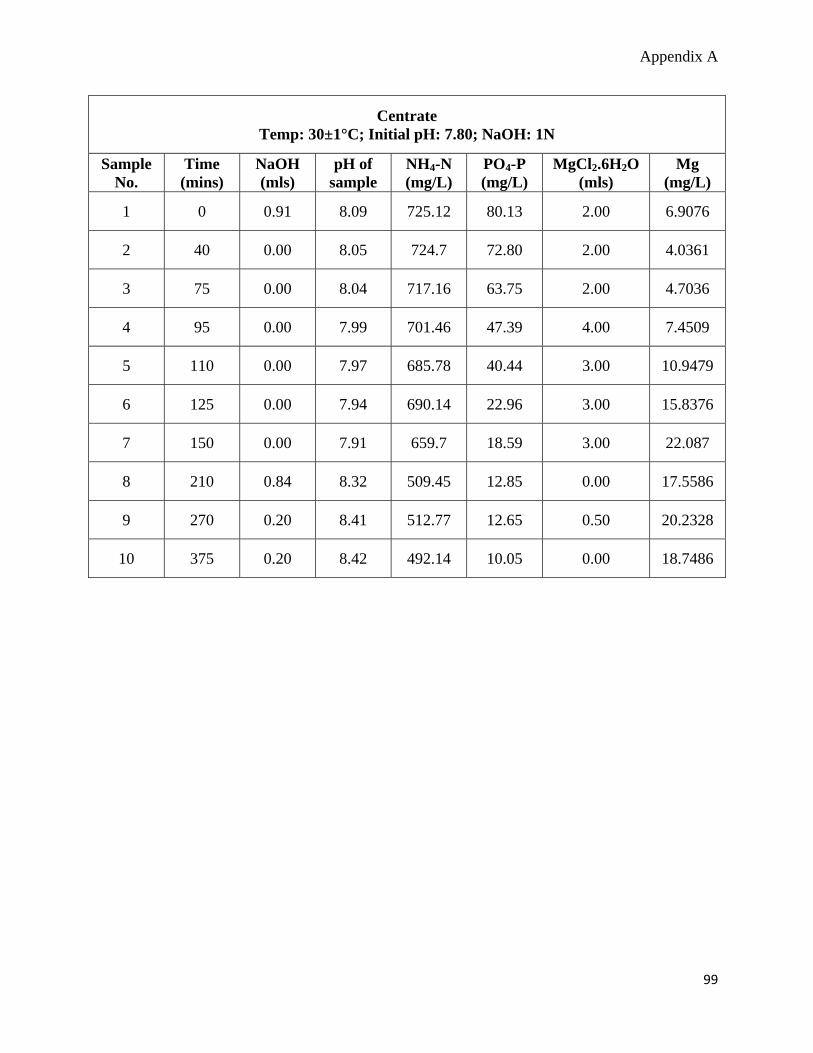
Appendix A
99
Centrate Temp: 30±1°C; Initial pH: 7.80; NaOH: 1N
Sample No.
Time (mins)
NaOH (mls)
pH of sample
NH4-N (mg/L)
PO4-P (mg/L)
MgCl2.6H2O (mls)
Mg (mg/L)
1 0 0.91 8.09 725.12 80.13 2.00 6.9076
2 40 0.00 8.05 724.7 72.80 2.00 4.0361
3 75 0.00 8.04 717.16 63.75 2.00 4.7036
4 95 0.00 7.99 701.46 47.39 4.00 7.4509
5 110 0.00 7.97 685.78 40.44 3.00 10.9479
6 125 0.00 7.94 690.14 22.96 3.00 15.8376
7 150 0.00 7.91 659.7 18.59 3.00 22.087
8 210 0.84 8.32 509.45 12.85 0.00 17.5586
9 270 0.20 8.41 512.77 12.65 0.50 20.2328
10 375 0.20 8.42 492.14 10.05 0.00 18.7486
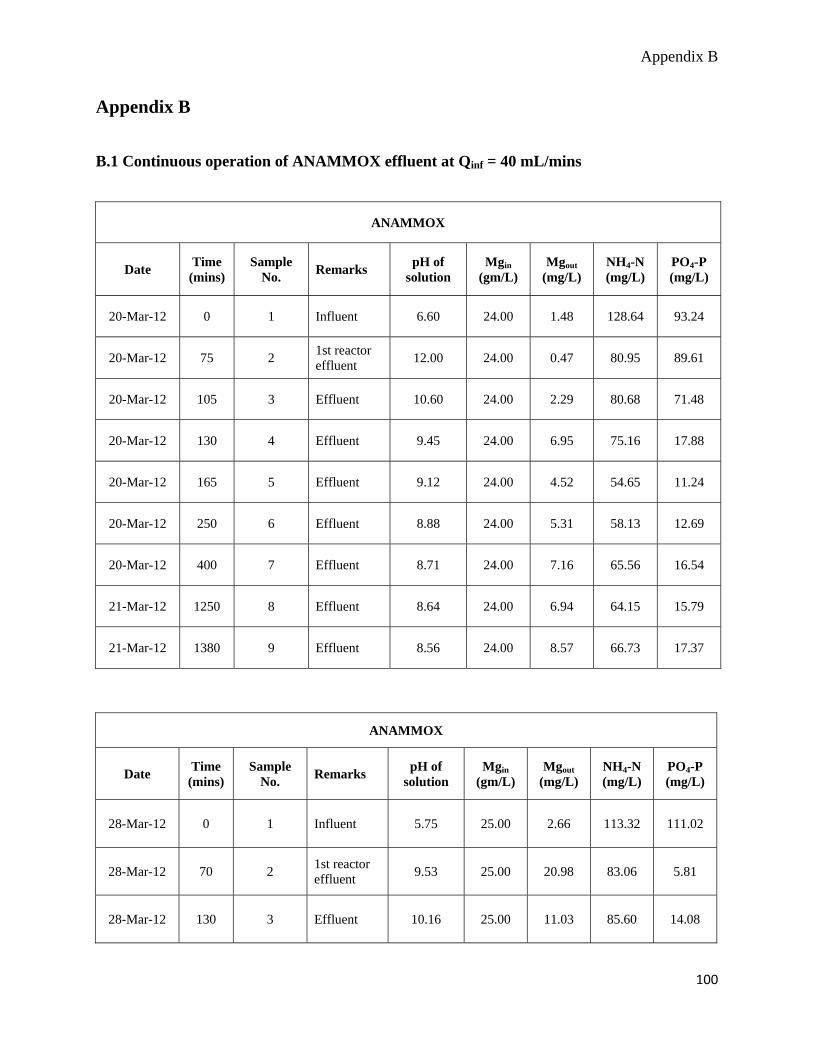
Appendix B
Appendix B
B.1 Continuous operation of ANAMMOX effluent at Qinf = 40 mL/mins
ANAMMOX
Date Time (mins)
Sample No. Remarks pH of
solution Mgin
(gm/L) Mgout
(mg/L) NH4-N (mg/L)
PO4-P (mg/L)
20-Mar-12 0 1 Influent 6.60 24.00 1.48 128.64 93.24
20-Mar-12 75 2 1st reactor effluent 12.00 24.00 0.47 80.95 89.61
20-Mar-12 105 3 Effluent 10.60 24.00 2.29 80.68 71.48
20-Mar-12 130 4 Effluent 9.45 24.00 6.95 75.16 17.88
20-Mar-12 165 5 Effluent 9.12 24.00 4.52 54.65 11.24
20-Mar-12 250 6 Effluent 8.88 24.00 5.31 58.13 12.69
20-Mar-12 400 7 Effluent 8.71 24.00 7.16 65.56 16.54
21-Mar-12 1250 8 Effluent 8.64 24.00 6.94 64.15 15.79
21-Mar-12 1380 9 Effluent 8.56 24.00 8.57 66.73 17.37
ANAMMOX
Date Time (mins)
Sample No. Remarks pH of
solution Mgin
(gm/L) Mgout
(mg/L) NH4-N (mg/L)
PO4-P (mg/L)
28-Mar-12 0 1 Influent 5.75 25.00 2.66 113.32 111.02
28-Mar-12 70 2 1st reactor effluent 9.53 25.00 20.98 83.06 5.81
28-Mar-12 130 3 Effluent 10.16 25.00 11.03 85.60 14.08
100
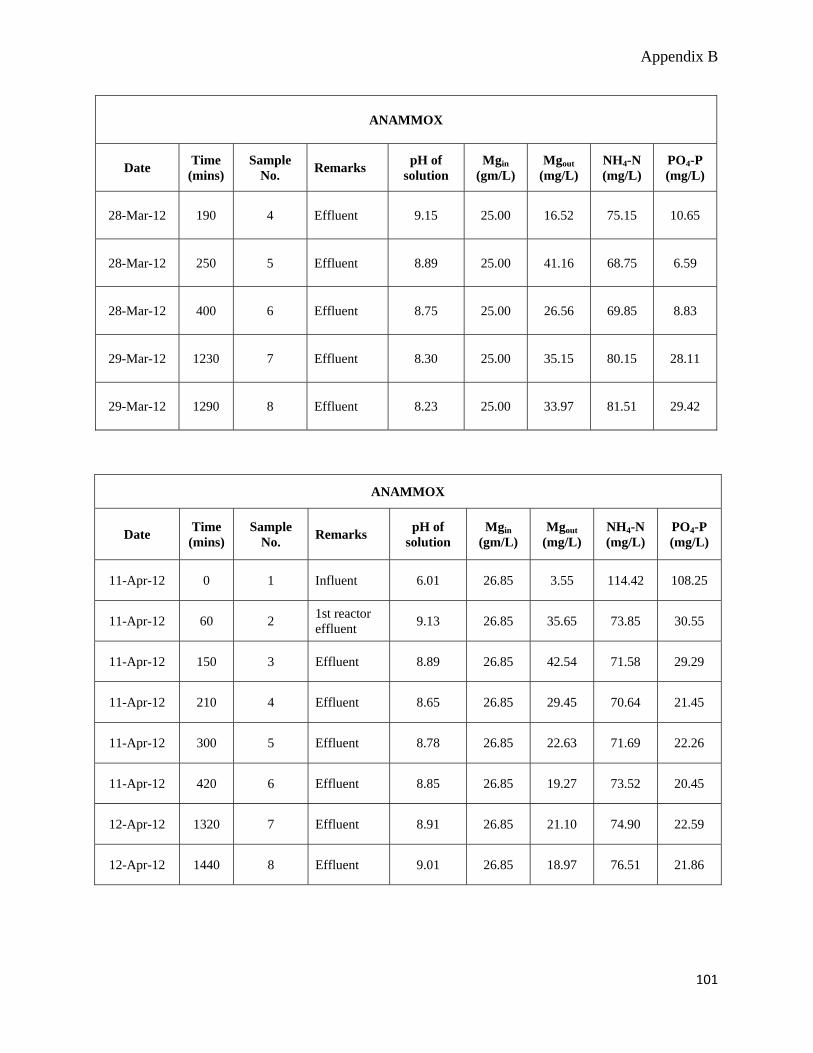
Appendix B
ANAMMOX
Date Time (mins)
Sample No. Remarks pH of
solution Mgin
(gm/L) Mgout
(mg/L) NH4-N (mg/L)
PO4-P (mg/L)
28-Mar-12 190 4 Effluent 9.15 25.00 16.52 75.15 10.65
28-Mar-12 250 5 Effluent 8.89 25.00 41.16 68.75 6.59
28-Mar-12 400 6 Effluent 8.75 25.00 26.56 69.85 8.83
29-Mar-12 1230 7 Effluent 8.30 25.00 35.15 80.15 28.11
29-Mar-12 1290 8 Effluent 8.23 25.00 33.97 81.51 29.42
ANAMMOX
Date Time (mins)
Sample No. Remarks pH of
solution Mgin
(gm/L) Mgout
(mg/L) NH4-N (mg/L)
PO4-P (mg/L)
11-Apr-12 0 1 Influent 6.01 26.85 3.55 114.42 108.25
11-Apr-12 60 2 1st reactor effluent 9.13 26.85 35.65 73.85 30.55
11-Apr-12 150 3 Effluent 8.89 26.85 42.54 71.58 29.29
11-Apr-12 210 4 Effluent 8.65 26.85 29.45 70.64 21.45
11-Apr-12 300 5 Effluent 8.78 26.85 22.63 71.69 22.26
11-Apr-12 420 6 Effluent 8.85 26.85 19.27 73.52 20.45
12-Apr-12 1320 7 Effluent 8.91 26.85 21.10 74.90 22.59
12-Apr-12 1440 8 Effluent 9.01 26.85 18.97 76.51 21.86
101
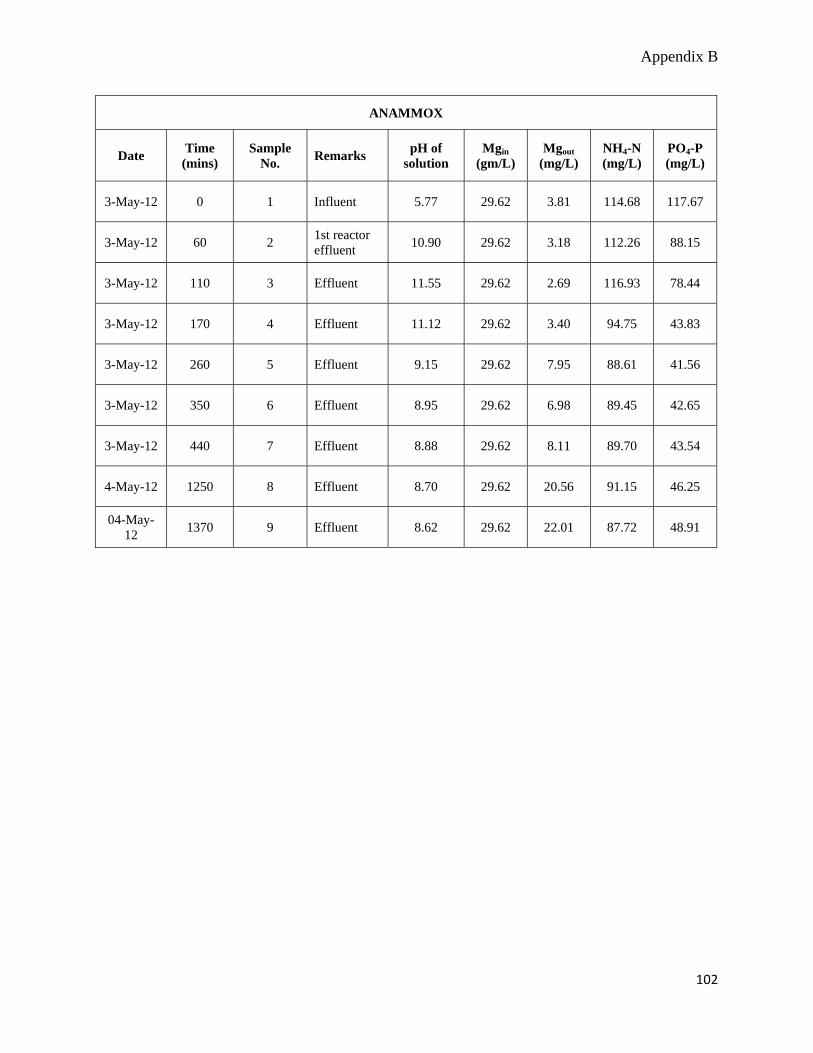
Appendix B
ANAMMOX
Date Time (mins)
Sample No. Remarks pH of
solution Mgin
(gm/L) Mgout
(mg/L) NH4-N (mg/L)
PO4-P (mg/L)
3-May-12 0 1 Influent 5.77 29.62 3.81 114.68 117.67
3-May-12 60 2 1st reactor effluent 10.90 29.62 3.18 112.26 88.15
3-May-12 110 3 Effluent 11.55 29.62 2.69 116.93 78.44
3-May-12 170 4 Effluent 11.12 29.62 3.40 94.75 43.83
3-May-12 260 5 Effluent 9.15 29.62 7.95 88.61 41.56
3-May-12 350 6 Effluent 8.95 29.62 6.98 89.45 42.65
3-May-12 440 7 Effluent 8.88 29.62 8.11 89.70 43.54
4-May-12 1250 8 Effluent 8.70 29.62 20.56 91.15 46.25
04-May-12 1370 9 Effluent 8.62 29.62 22.01 87.72 48.91
102
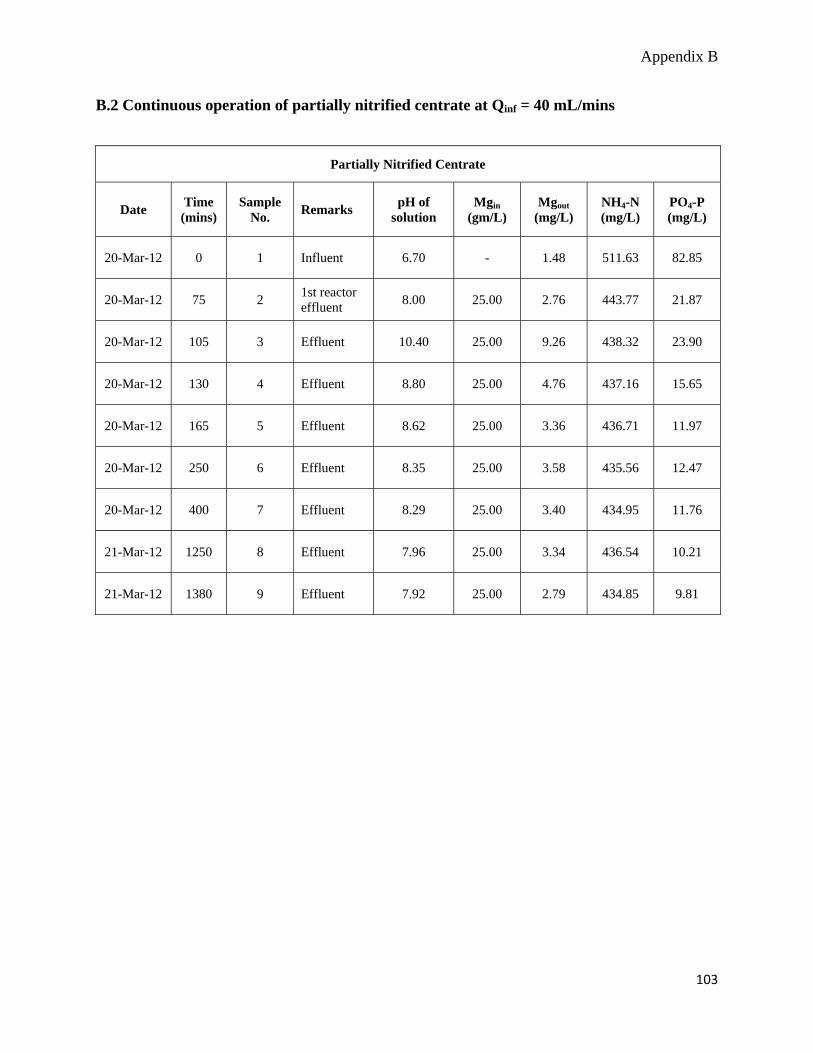
Appendix B
B.2 Continuous operation of partially nitrified centrate at Qinf = 40 mL/mins
Partially Nitrified Centrate
Date Time (mins)
Sample No. Remarks pH of
solution Mgin
(gm/L) Mgout
(mg/L) NH4-N (mg/L)
PO4-P (mg/L)
20-Mar-12 0 1 Influent 6.70 - 1.48 511.63 82.85
20-Mar-12 75 2 1st reactor effluent 8.00 25.00 2.76 443.77 21.87
20-Mar-12 105 3 Effluent 10.40 25.00 9.26 438.32 23.90
20-Mar-12 130 4 Effluent 8.80 25.00 4.76 437.16 15.65
20-Mar-12 165 5 Effluent 8.62 25.00 3.36 436.71 11.97
20-Mar-12 250 6 Effluent 8.35 25.00 3.58 435.56 12.47
20-Mar-12 400 7 Effluent 8.29 25.00 3.40 434.95 11.76
21-Mar-12 1250 8 Effluent 7.96 25.00 3.34 436.54 10.21
21-Mar-12 1380 9 Effluent 7.92 25.00 2.79 434.85 9.81
103
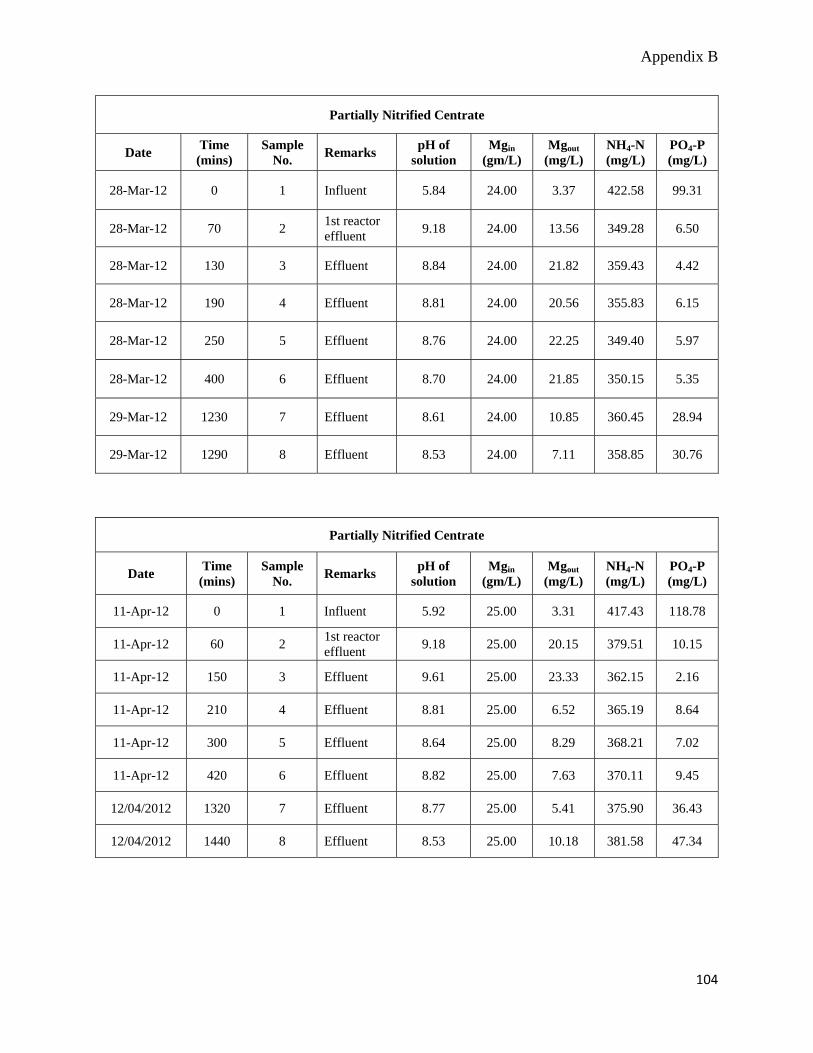
Appendix B
Partially Nitrified Centrate
Date Time (mins)
Sample No. Remarks pH of
solution Mgin
(gm/L) Mgout
(mg/L) NH4-N (mg/L)
PO4-P (mg/L)
28-Mar-12 0 1 Influent 5.84 24.00 3.37 422.58 99.31
28-Mar-12 70 2 1st reactor effluent 9.18 24.00 13.56 349.28 6.50
28-Mar-12 130 3 Effluent 8.84 24.00 21.82 359.43 4.42
28-Mar-12 190 4 Effluent 8.81 24.00 20.56 355.83 6.15
28-Mar-12 250 5 Effluent 8.76 24.00 22.25 349.40 5.97
28-Mar-12 400 6 Effluent 8.70 24.00 21.85 350.15 5.35
29-Mar-12 1230 7 Effluent 8.61 24.00 10.85 360.45 28.94
29-Mar-12 1290 8 Effluent 8.53 24.00 7.11 358.85 30.76
Partially Nitrified Centrate
Date Time (mins)
Sample No. Remarks pH of
solution Mgin
(gm/L) Mgout
(mg/L) NH4-N (mg/L)
PO4-P (mg/L)
11-Apr-12 0 1 Influent 5.92 25.00 3.31 417.43 118.78
11-Apr-12 60 2 1st reactor effluent 9.18 25.00 20.15 379.51 10.15
11-Apr-12 150 3 Effluent 9.61 25.00 23.33 362.15 2.16
11-Apr-12 210 4 Effluent 8.81 25.00 6.52 365.19 8.64
11-Apr-12 300 5 Effluent 8.64 25.00 8.29 368.21 7.02
11-Apr-12 420 6 Effluent 8.82 25.00 7.63 370.11 9.45
12/04/2012 1320 7 Effluent 8.77 25.00 5.41 375.90 36.43
12/04/2012 1440 8 Effluent 8.53 25.00 10.18 381.58 47.34
104
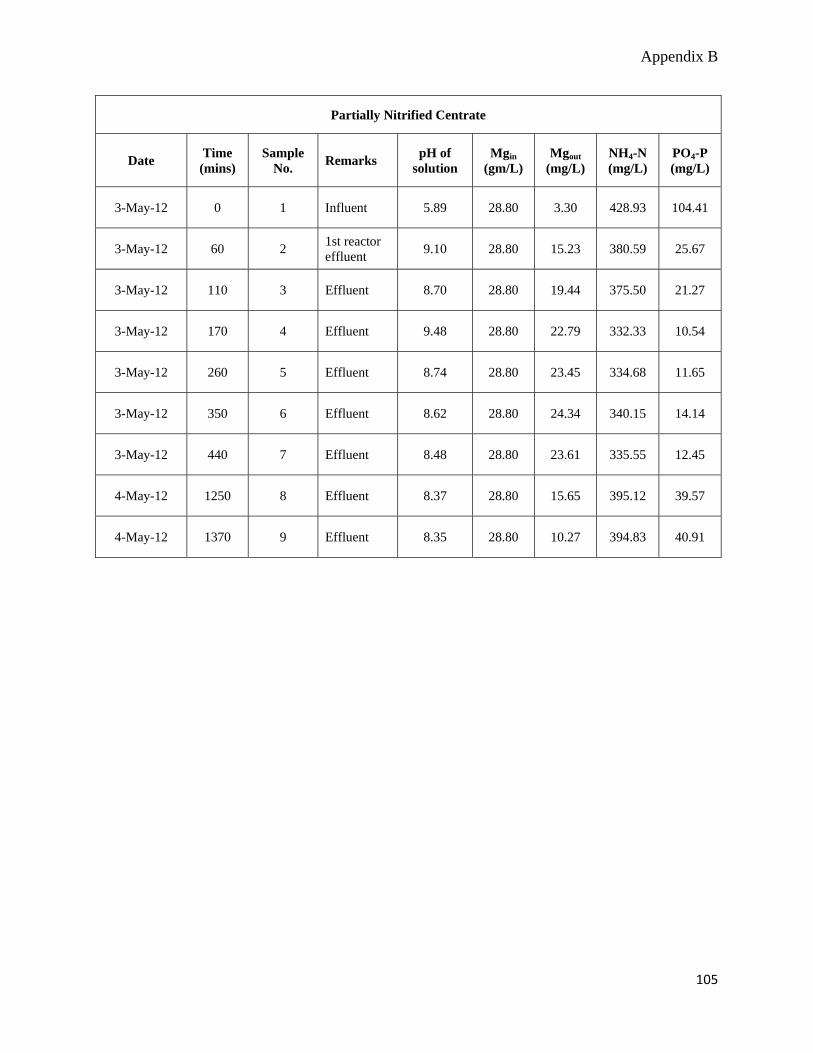
Appendix B
Partially Nitrified Centrate
Date Time (mins)
Sample No. Remarks pH of
solution Mgin
(gm/L) Mgout
(mg/L) NH4-N (mg/L)
PO4-P (mg/L)
3-May-12 0 1 Influent 5.89 28.80 3.30 428.93 104.41
3-May-12 60 2 1st reactor effluent 9.10 28.80 15.23 380.59 25.67
3-May-12 110 3 Effluent 8.70 28.80 19.44 375.50 21.27
3-May-12 170 4 Effluent 9.48 28.80 22.79 332.33 10.54
3-May-12 260 5 Effluent 8.74 28.80 23.45 334.68 11.65
3-May-12 350 6 Effluent 8.62 28.80 24.34 340.15 14.14
3-May-12 440 7 Effluent 8.48 28.80 23.61 335.55 12.45
4-May-12 1250 8 Effluent 8.37 28.80 15.65 395.12 39.57
4-May-12 1370 9 Effluent 8.35 28.80 10.27 394.83 40.91
105
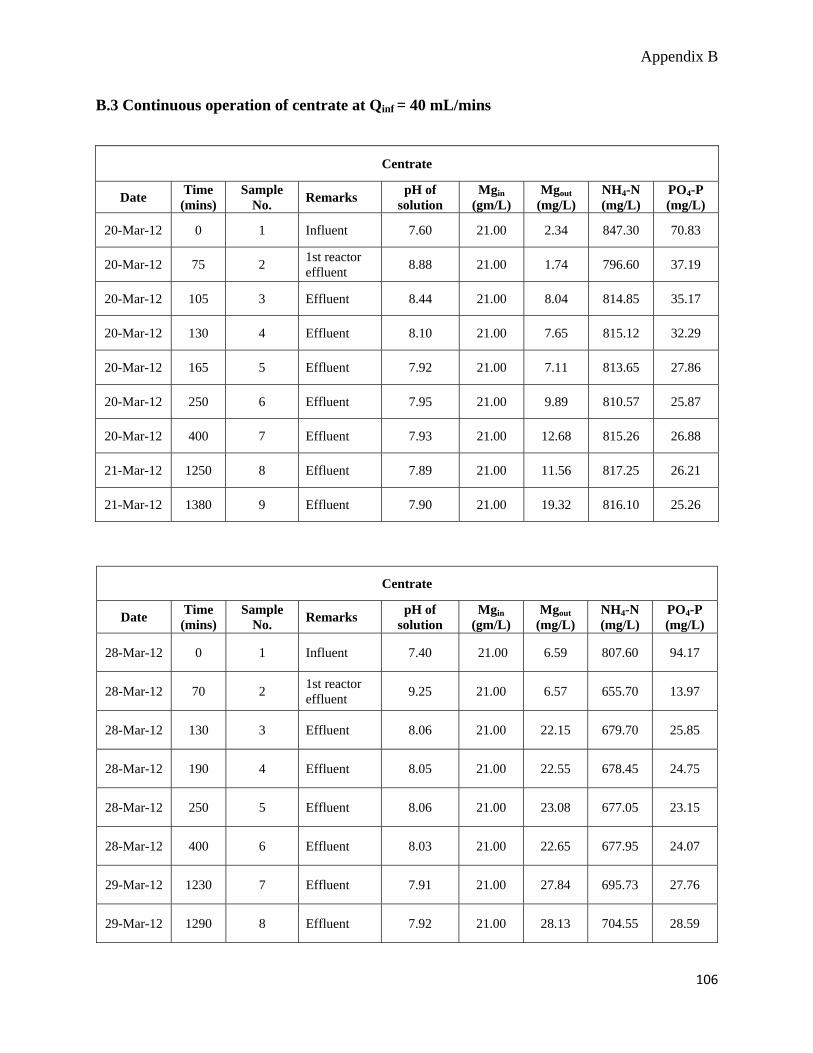
Appendix B
B.3 Continuous operation of centrate at Qinf = 40 mL/mins
Centrate
Date Time (mins)
Sample No. Remarks pH of
solution Mgin
(gm/L) Mgout
(mg/L) NH4-N (mg/L)
PO4-P (mg/L)
20-Mar-12 0 1 Influent 7.60 21.00 2.34 847.30 70.83
20-Mar-12 75 2 1st reactor effluent 8.88 21.00 1.74 796.60 37.19
20-Mar-12 105 3 Effluent 8.44 21.00 8.04 814.85 35.17
20-Mar-12 130 4 Effluent 8.10 21.00 7.65 815.12 32.29
20-Mar-12 165 5 Effluent 7.92 21.00 7.11 813.65 27.86
20-Mar-12 250 6 Effluent 7.95 21.00 9.89 810.57 25.87
20-Mar-12 400 7 Effluent 7.93 21.00 12.68 815.26 26.88
21-Mar-12 1250 8 Effluent 7.89 21.00 11.56 817.25 26.21
21-Mar-12 1380 9 Effluent 7.90 21.00 19.32 816.10 25.26
Centrate
Date Time (mins)
Sample No. Remarks pH of
solution Mgin
(gm/L) Mgout
(mg/L) NH4-N (mg/L)
PO4-P (mg/L)
28-Mar-12 0 1 Influent 7.40 21.00 6.59 807.60 94.17
28-Mar-12 70 2 1st reactor effluent 9.25 21.00 6.57 655.70 13.97
28-Mar-12 130 3 Effluent 8.06 21.00 22.15 679.70 25.85
28-Mar-12 190 4 Effluent 8.05 21.00 22.55 678.45 24.75
28-Mar-12 250 5 Effluent 8.06 21.00 23.08 677.05 23.15
28-Mar-12 400 6 Effluent 8.03 21.00 22.65 677.95 24.07
29-Mar-12 1230 7 Effluent 7.91 21.00 27.84 695.73 27.76
29-Mar-12 1290 8 Effluent 7.92 21.00 28.13 704.55 28.59
106
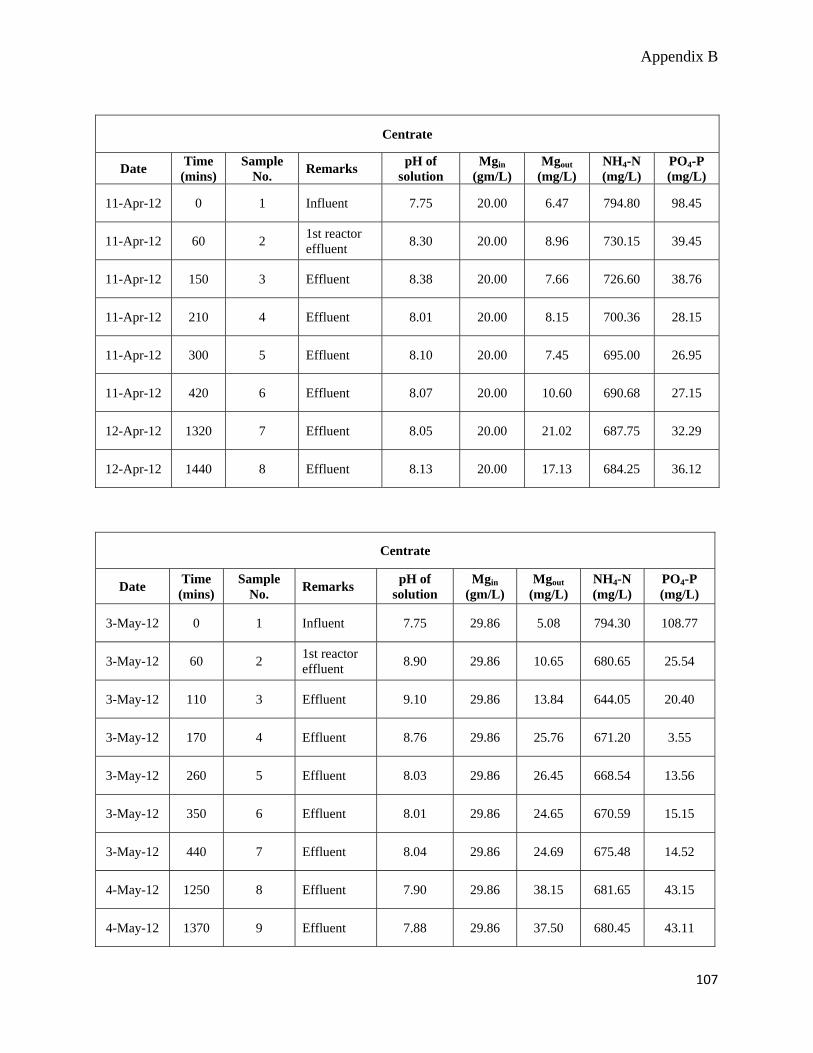
Appendix B
Centrate
Date Time (mins)
Sample No. Remarks pH of
solution Mgin
(gm/L) Mgout
(mg/L) NH4-N (mg/L)
PO4-P (mg/L)
11-Apr-12 0 1 Influent 7.75 20.00 6.47 794.80 98.45
11-Apr-12 60 2 1st reactor effluent 8.30 20.00 8.96 730.15 39.45
11-Apr-12 150 3 Effluent 8.38 20.00 7.66 726.60 38.76
11-Apr-12 210 4 Effluent 8.01 20.00 8.15 700.36 28.15
11-Apr-12 300 5 Effluent 8.10 20.00 7.45 695.00 26.95
11-Apr-12 420 6 Effluent 8.07 20.00 10.60 690.68 27.15
12-Apr-12 1320 7 Effluent 8.05 20.00 21.02 687.75 32.29
12-Apr-12 1440 8 Effluent 8.13 20.00 17.13 684.25 36.12
Centrate
Date Time (mins)
Sample No. Remarks pH of
solution Mgin
(gm/L) Mgout
(mg/L) NH4-N (mg/L)
PO4-P (mg/L)
3-May-12 0 1 Influent 7.75 29.86 5.08 794.30 108.77
3-May-12 60 2 1st reactor effluent 8.90 29.86 10.65 680.65 25.54
3-May-12 110 3 Effluent 9.10 29.86 13.84 644.05 20.40
3-May-12 170 4 Effluent 8.76 29.86 25.76 671.20 3.55
3-May-12 260 5 Effluent 8.03 29.86 26.45 668.54 13.56
3-May-12 350 6 Effluent 8.01 29.86 24.65 670.59 15.15
3-May-12 440 7 Effluent 8.04 29.86 24.69 675.48 14.52
4-May-12 1250 8 Effluent 7.90 29.86 38.15 681.65 43.15
4-May-12 1370 9 Effluent 7.88 29.86 37.50 680.45 43.11
107
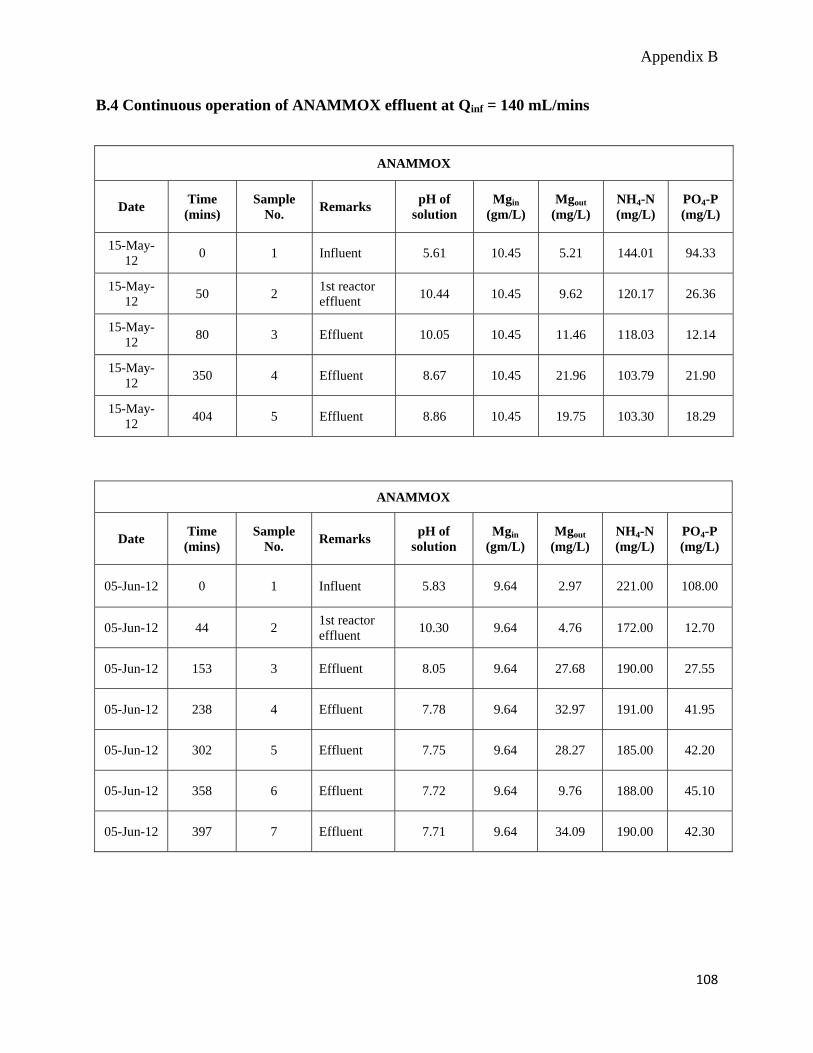
Appendix B
B.4 Continuous operation of ANAMMOX effluent at Qinf = 140 mL/mins
ANAMMOX
Date Time (mins)
Sample No. Remarks pH of
solution Mgin
(gm/L) Mgout
(mg/L) NH4-N (mg/L)
PO4-P (mg/L)
15-May-12 0 1 Influent 5.61 10.45 5.21 144.01 94.33
15-May-12 50 2 1st reactor
effluent 10.44 10.45 9.62 120.17 26.36
15-May-12 80 3 Effluent 10.05 10.45 11.46 118.03 12.14
15-May-12 350 4 Effluent 8.67 10.45 21.96 103.79 21.90
15-May-12 404 5 Effluent 8.86 10.45 19.75 103.30 18.29
ANAMMOX
Date Time (mins)
Sample No. Remarks pH of
solution Mgin
(gm/L) Mgout
(mg/L) NH4-N (mg/L)
PO4-P (mg/L)
05-Jun-12 0 1 Influent 5.83 9.64 2.97 221.00 108.00
05-Jun-12 44 2 1st reactor effluent 10.30 9.64 4.76 172.00 12.70
05-Jun-12 153 3 Effluent 8.05 9.64 27.68 190.00 27.55
05-Jun-12 238 4 Effluent 7.78 9.64 32.97 191.00 41.95
05-Jun-12 302 5 Effluent 7.75 9.64 28.27 185.00 42.20
05-Jun-12 358 6 Effluent 7.72 9.64 9.76 188.00 45.10
05-Jun-12 397 7 Effluent 7.71 9.64 34.09 190.00 42.30
108
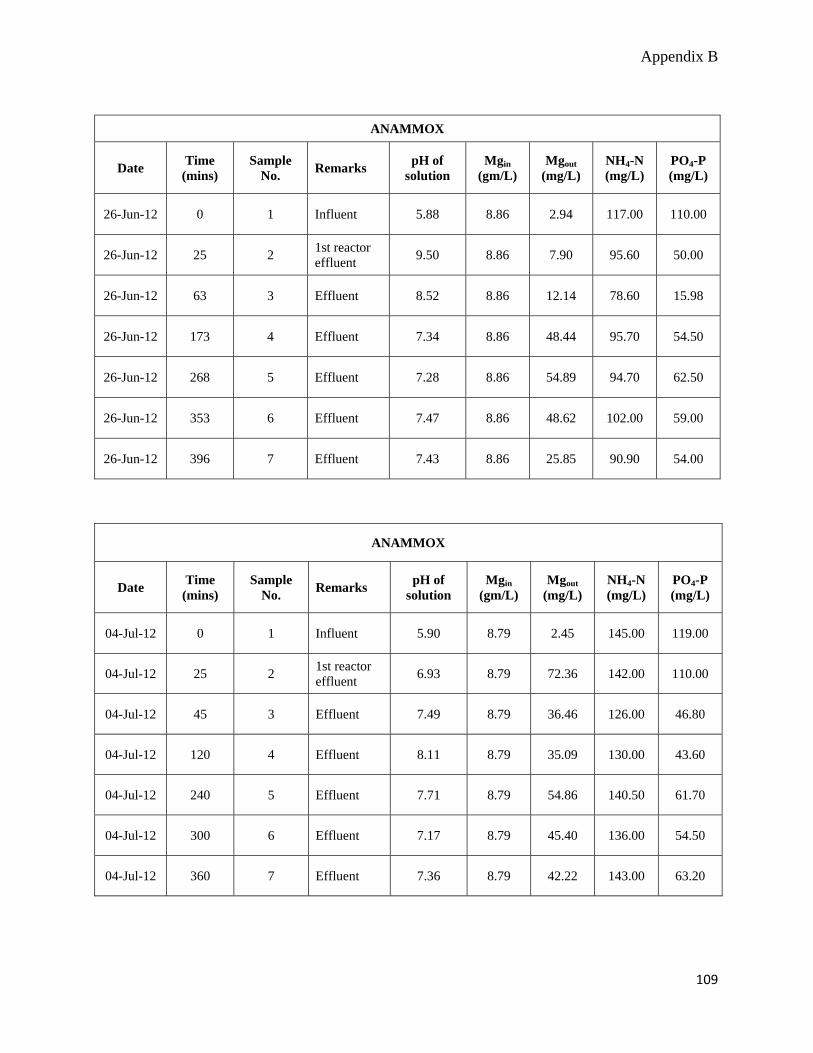
Appendix B
ANAMMOX
Date Time (mins)
Sample No. Remarks pH of
solution Mgin
(gm/L) Mgout
(mg/L) NH4-N (mg/L)
PO4-P (mg/L)
26-Jun-12 0 1 Influent 5.88 8.86 2.94 117.00 110.00
26-Jun-12 25 2 1st reactor effluent 9.50 8.86 7.90 95.60 50.00
26-Jun-12 63 3 Effluent 8.52 8.86 12.14 78.60 15.98
26-Jun-12 173 4 Effluent 7.34 8.86 48.44 95.70 54.50
26-Jun-12 268 5 Effluent 7.28 8.86 54.89 94.70 62.50
26-Jun-12 353 6 Effluent 7.47 8.86 48.62 102.00 59.00
26-Jun-12 396 7 Effluent 7.43 8.86 25.85 90.90 54.00
ANAMMOX
Date Time (mins)
Sample No. Remarks pH of
solution Mgin
(gm/L) Mgout
(mg/L) NH4-N (mg/L)
PO4-P (mg/L)
04-Jul-12 0 1 Influent 5.90 8.79 2.45 145.00 119.00
04-Jul-12 25 2 1st reactor effluent 6.93 8.79 72.36 142.00 110.00
04-Jul-12 45 3 Effluent 7.49 8.79 36.46 126.00 46.80
04-Jul-12 120 4 Effluent 8.11 8.79 35.09 130.00 43.60
04-Jul-12 240 5 Effluent 7.71 8.79 54.86 140.50 61.70
04-Jul-12 300 6 Effluent 7.17 8.79 45.40 136.00 54.50
04-Jul-12 360 7 Effluent 7.36 8.79 42.22 143.00 63.20
109
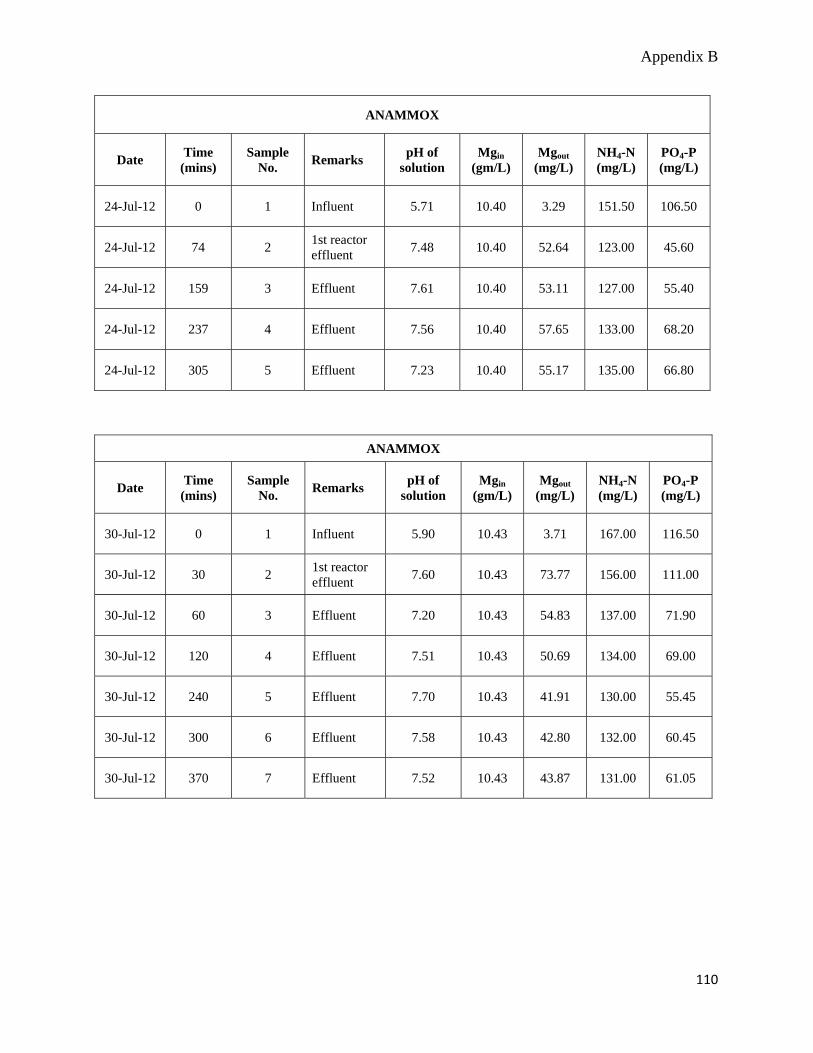
Appendix B
ANAMMOX
Date Time (mins)
Sample No. Remarks pH of
solution Mgin
(gm/L) Mgout
(mg/L) NH4-N (mg/L)
PO4-P (mg/L)
24-Jul-12 0 1 Influent 5.71 10.40 3.29 151.50 106.50
24-Jul-12 74 2 1st reactor effluent 7.48 10.40 52.64 123.00 45.60
24-Jul-12 159 3 Effluent 7.61 10.40 53.11 127.00 55.40
24-Jul-12 237 4 Effluent 7.56 10.40 57.65 133.00 68.20
24-Jul-12 305 5 Effluent 7.23 10.40 55.17 135.00 66.80
ANAMMOX
Date Time (mins)
Sample No. Remarks pH of
solution Mgin
(gm/L) Mgout
(mg/L) NH4-N (mg/L)
PO4-P (mg/L)
30-Jul-12 0 1 Influent 5.90 10.43 3.71 167.00 116.50
30-Jul-12 30 2 1st reactor effluent 7.60 10.43 73.77 156.00 111.00
30-Jul-12 60 3 Effluent 7.20 10.43 54.83 137.00 71.90
30-Jul-12 120 4 Effluent 7.51 10.43 50.69 134.00 69.00
30-Jul-12 240 5 Effluent 7.70 10.43 41.91 130.00 55.45
30-Jul-12 300 6 Effluent 7.58 10.43 42.80 132.00 60.45
30-Jul-12 370 7 Effluent 7.52 10.43 43.87 131.00 61.05
110
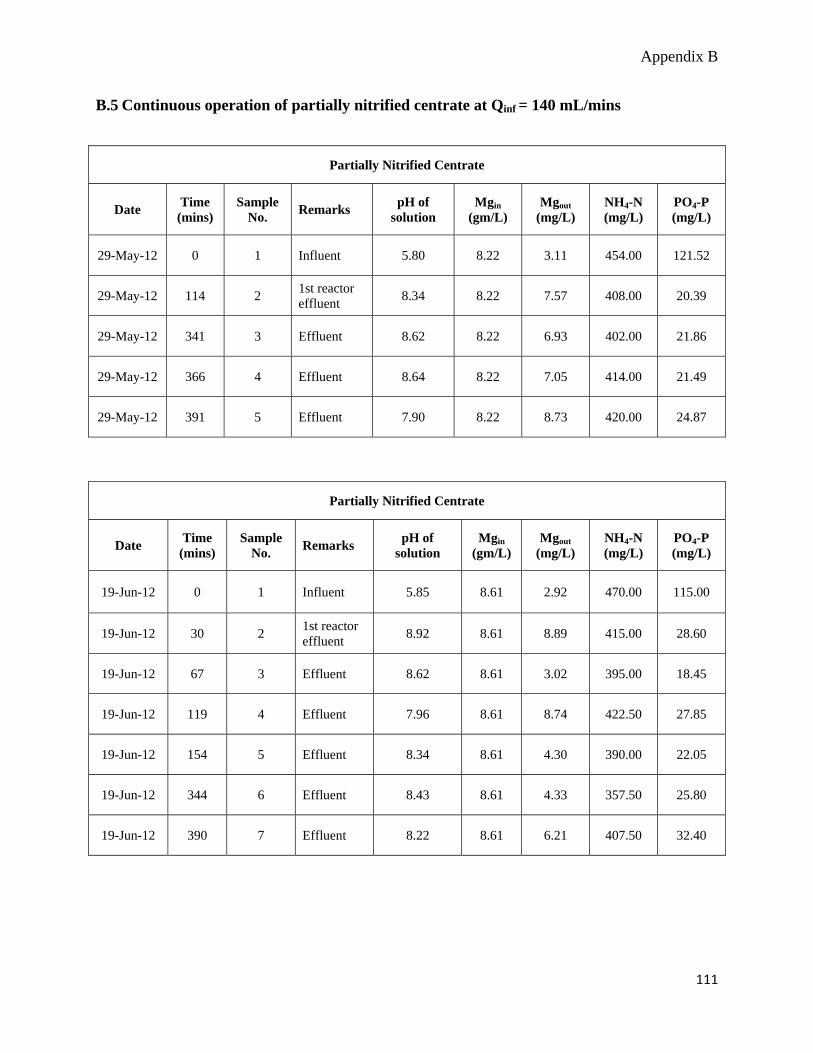
Appendix B
B.5 Continuous operation of partially nitrified centrate at Qinf = 140 mL/mins
Partially Nitrified Centrate
Date Time (mins)
Sample No. Remarks pH of
solution Mgin
(gm/L) Mgout
(mg/L) NH4-N (mg/L)
PO4-P (mg/L)
29-May-12 0 1 Influent 5.80 8.22 3.11 454.00 121.52
29-May-12 114 2 1st reactor effluent 8.34 8.22 7.57 408.00 20.39
29-May-12 341 3 Effluent 8.62 8.22 6.93 402.00 21.86
29-May-12 366 4 Effluent 8.64 8.22 7.05 414.00 21.49
29-May-12 391 5 Effluent 7.90 8.22 8.73 420.00 24.87
Partially Nitrified Centrate
Date Time (mins)
Sample No. Remarks pH of
solution Mgin
(gm/L) Mgout
(mg/L) NH4-N (mg/L)
PO4-P (mg/L)
19-Jun-12 0 1 Influent 5.85 8.61 2.92 470.00 115.00
19-Jun-12 30 2 1st reactor effluent 8.92 8.61 8.89 415.00 28.60
19-Jun-12 67 3 Effluent 8.62 8.61 3.02 395.00 18.45
19-Jun-12 119 4 Effluent 7.96 8.61 8.74 422.50 27.85
19-Jun-12 154 5 Effluent 8.34 8.61 4.30 390.00 22.05
19-Jun-12 344 6 Effluent 8.43 8.61 4.33 357.50 25.80
19-Jun-12 390 7 Effluent 8.22 8.61 6.21 407.50 32.40
111
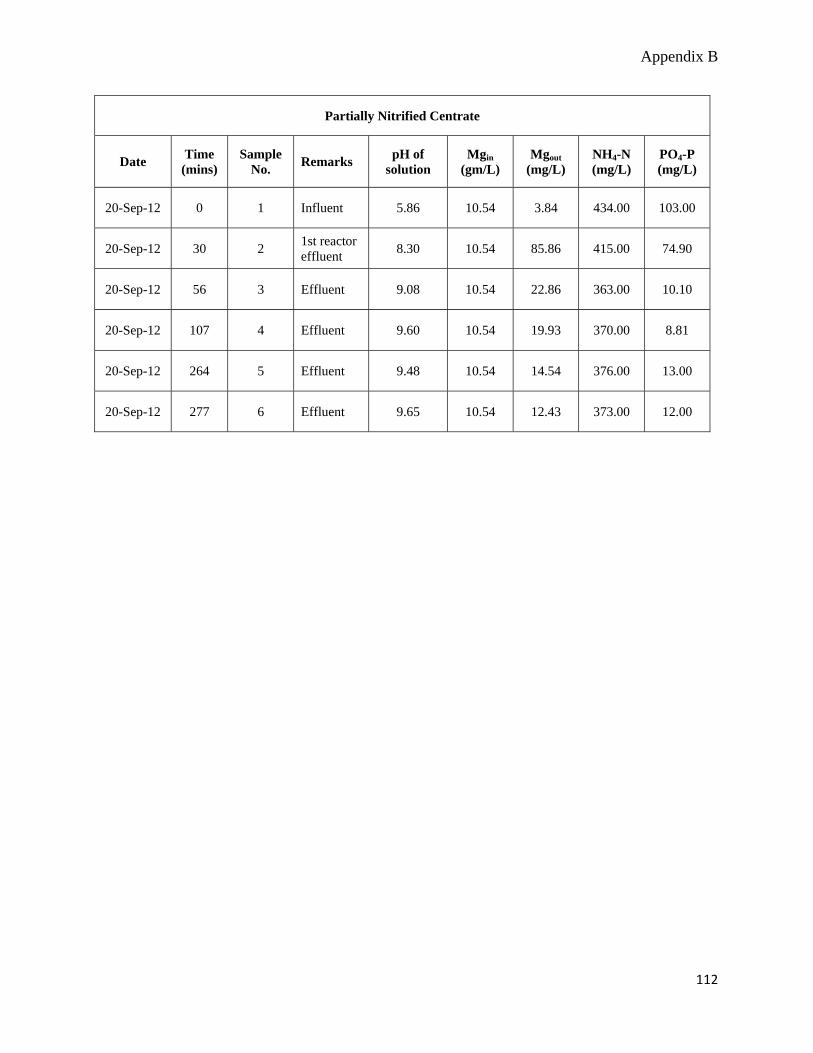
Appendix B
Partially Nitrified Centrate
Date Time (mins)
Sample No. Remarks pH of
solution Mgin
(gm/L) Mgout
(mg/L) NH4-N (mg/L)
PO4-P (mg/L)
20-Sep-12 0 1 Influent 5.86 10.54 3.84 434.00 103.00
20-Sep-12 30 2 1st reactor effluent 8.30 10.54 85.86 415.00 74.90
20-Sep-12 56 3 Effluent 9.08 10.54 22.86 363.00 10.10
20-Sep-12 107 4 Effluent 9.60 10.54 19.93 370.00 8.81
20-Sep-12 264 5 Effluent 9.48 10.54 14.54 376.00 13.00
20-Sep-12 277 6 Effluent 9.65 10.54 12.43 373.00 12.00
112
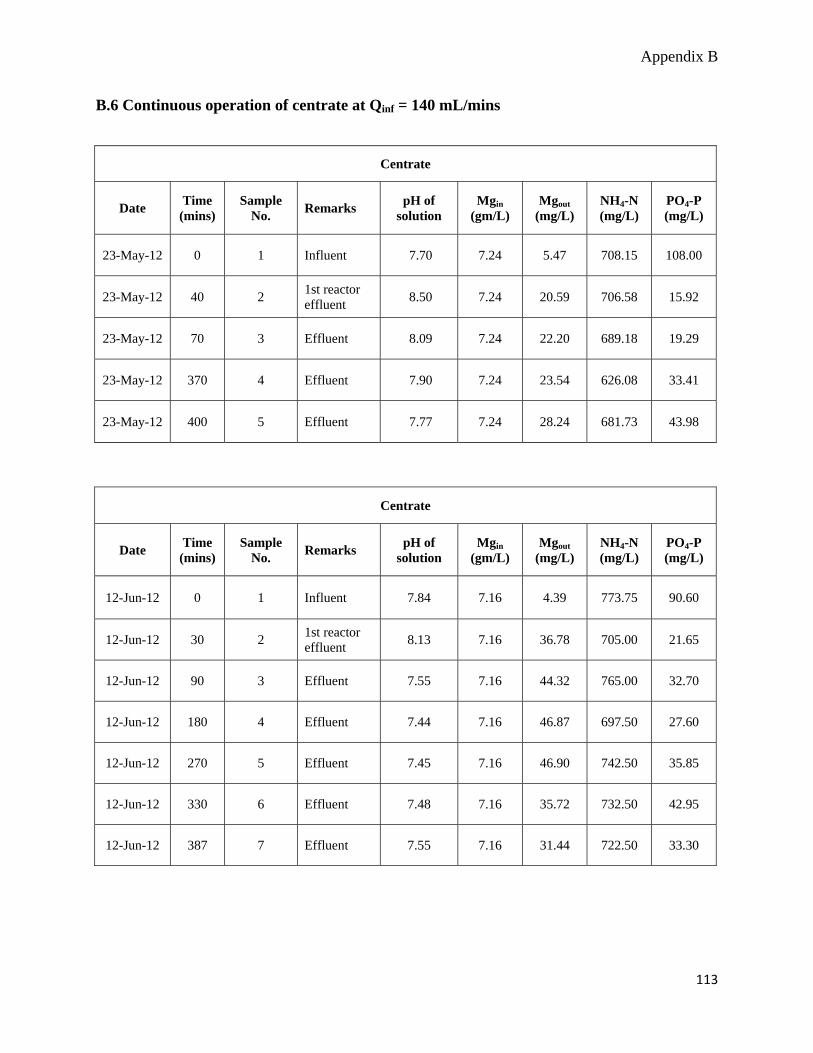
Appendix B
B.6 Continuous operation of centrate at Qinf = 140 mL/mins
Centrate
Date Time (mins)
Sample No. Remarks pH of
solution Mgin
(gm/L) Mgout
(mg/L) NH4-N (mg/L)
PO4-P (mg/L)
23-May-12 0 1 Influent 7.70 7.24 5.47 708.15 108.00
23-May-12 40 2 1st reactor effluent 8.50 7.24 20.59 706.58 15.92
23-May-12 70 3 Effluent 8.09 7.24 22.20 689.18 19.29
23-May-12 370 4 Effluent 7.90 7.24 23.54 626.08 33.41
23-May-12 400 5 Effluent 7.77 7.24 28.24 681.73 43.98
Centrate
Date Time (mins)
Sample No. Remarks pH of
solution Mgin
(gm/L) Mgout
(mg/L) NH4-N (mg/L)
PO4-P (mg/L)
12-Jun-12 0 1 Influent 7.84 7.16 4.39 773.75 90.60
12-Jun-12 30 2 1st reactor effluent 8.13 7.16 36.78 705.00 21.65
12-Jun-12 90 3 Effluent 7.55 7.16 44.32 765.00 32.70
12-Jun-12 180 4 Effluent 7.44 7.16 46.87 697.50 27.60
12-Jun-12 270 5 Effluent 7.45 7.16 46.90 742.50 35.85
12-Jun-12 330 6 Effluent 7.48 7.16 35.72 732.50 42.95
12-Jun-12 387 7 Effluent 7.55 7.16 31.44 722.50 33.30
113
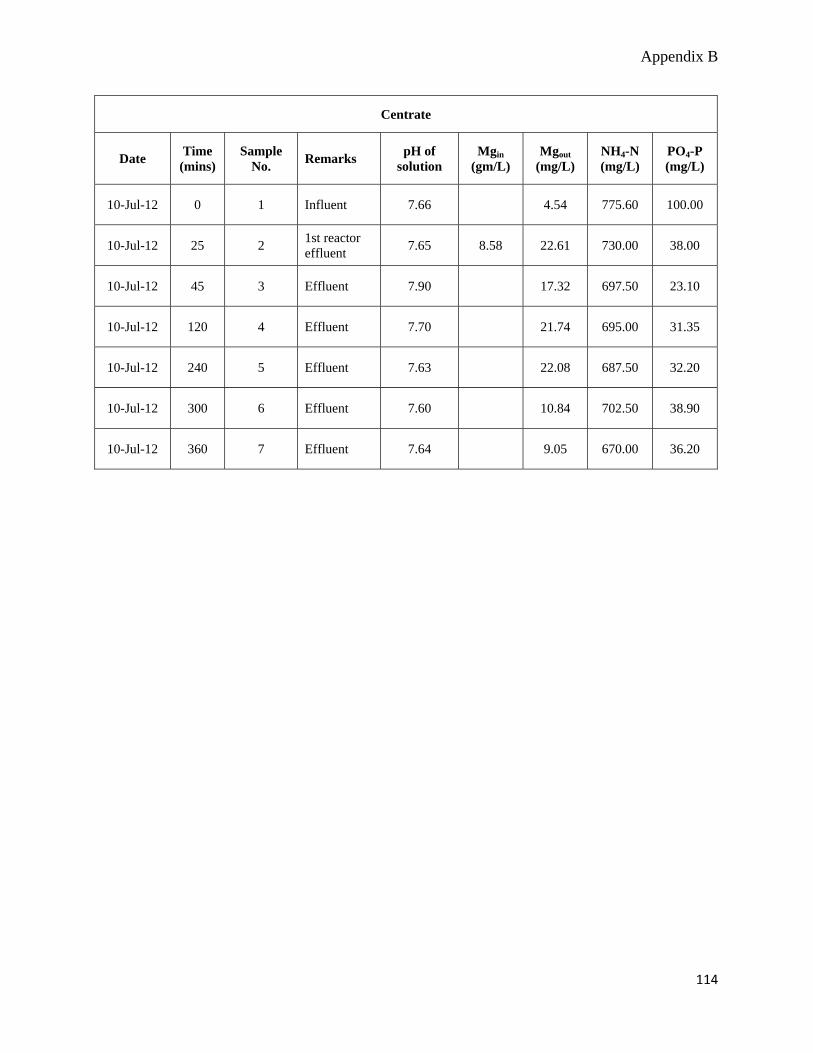
Appendix B
114
Centrate
Date Time (mins)
Sample No. Remarks pH of
solution Mgin
(gm/L) Mgout
(mg/L) NH4-N (mg/L)
PO4-P (mg/L)
10-Jul-12 0 1 Influent 7.66 4.54 775.60 100.00
10-Jul-12 25 2 1st reactor effluent 7.65 8.58 22.61 730.00 38.00
10-Jul-12 45 3 Effluent 7.90 17.32 697.50 23.10
10-Jul-12 120 4 Effluent 7.70 21.74 695.00 31.35
10-Jul-12 240 5 Effluent 7.63 22.08 687.50 32.20
10-Jul-12 300 6 Effluent 7.60 10.84 702.50 38.90
10-Jul-12 360 7 Effluent 7.64 9.05 670.00 36.20
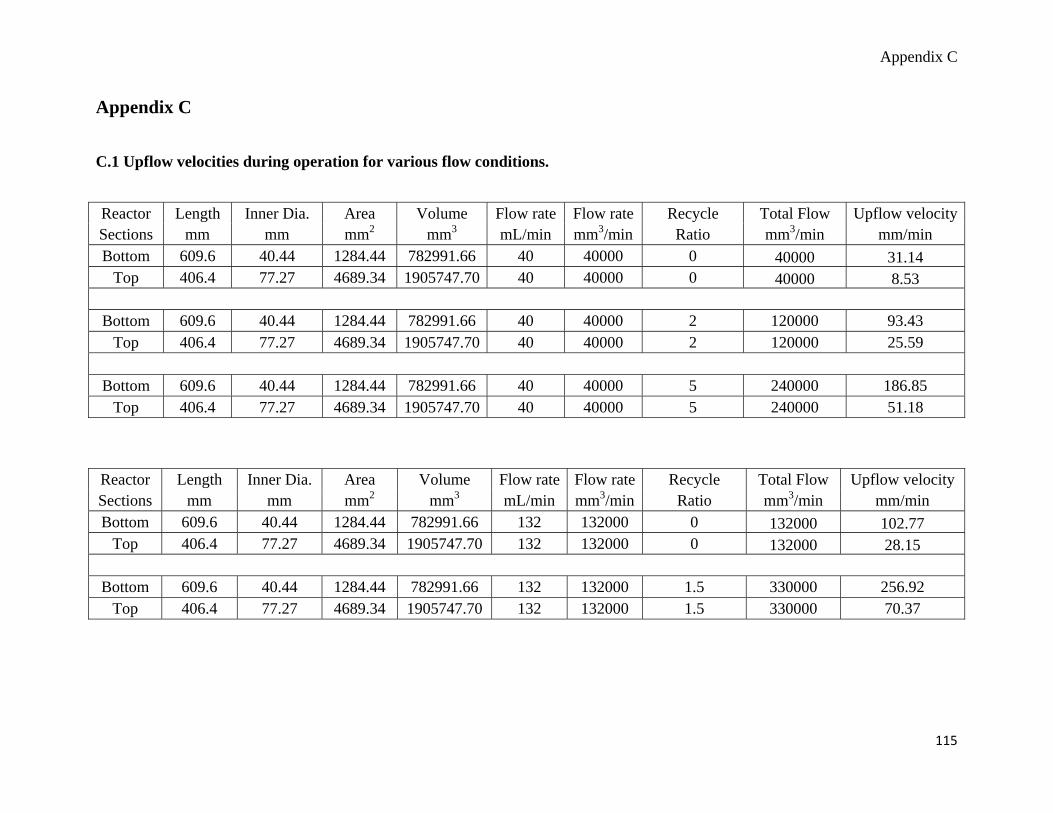
Appendix C
Appendix C
C.1 Upflow velocities during operation for various flow conditions.
Reactor Length Inner Dia. Area Volume Flow rate Flow rate Recycle Total Flow Upflow velocitySections mm mm mm2 mm3 mL/min mm3/min Ratio mm3/min mm/min Bottom 609.6 40.44 1284.44 782991.66 40 40000 0 40000 31.14
Top 406.4 77.27 4689.34 1905747.70 40 40000 0 40000 8.53
Bottom 609.6 40.44 1284.44 782991.66 40 40000 2 120000 93.43 Top 406.4 77.27 4689.34 1905747.70 40 40000 2 120000 25.59
Bottom 609.6 40.44 1284.44 782991.66 40 40000 5 240000 186.85
Top 406.4 77.27 4689.34 1905747.70 40 40000 5 240000 51.18
Reactor Length Inner Dia. Area Volume Flow rate Flow rate Recycle Total Flow Upflow velocity Sections mm mm mm2 mm3 mL/min mm3/min Ratio mm3/min mm/min Bottom 609.6 40.44 1284.44 782991.66 132 132000 0 132000 102.77
Top 406.4 77.27 4689.34 1905747.70 132 132000 0 132000 28.15
Bottom 609.6 40.44 1284.44 782991.66 132 132000 1.5 330000 256.92 Top 406.4 77.27 4689.34 1905747.70 132 132000 1.5 330000 70.37
115
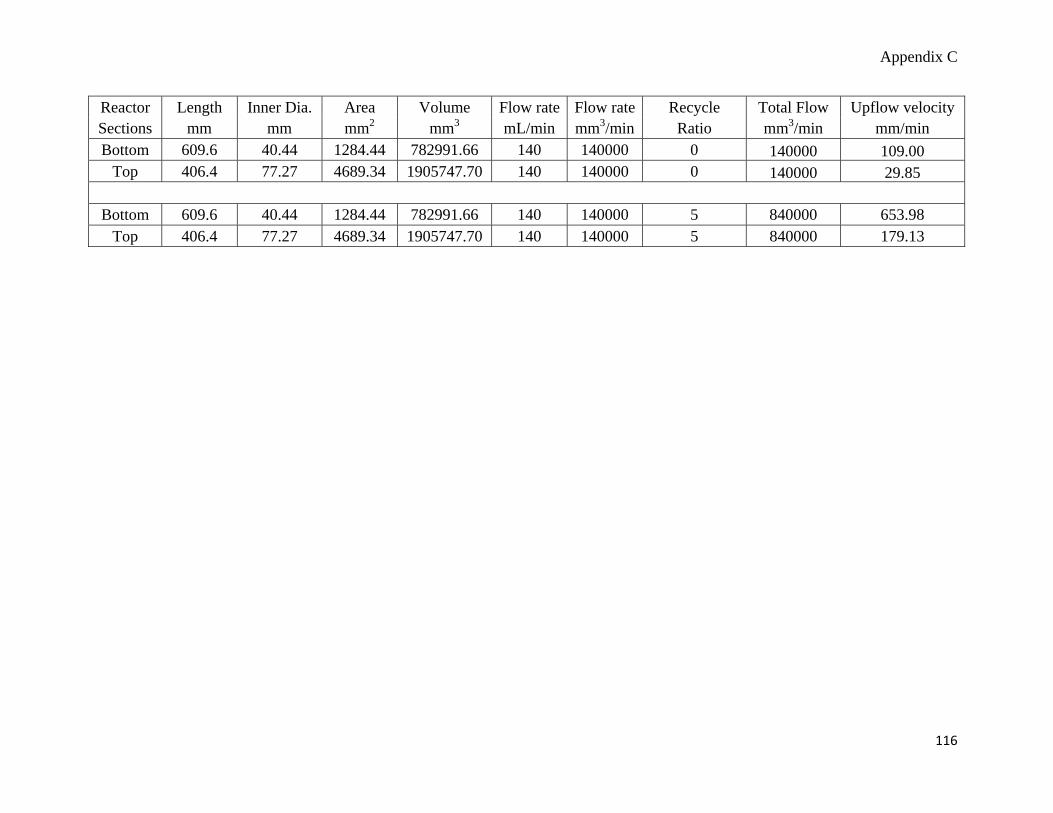
Appendix C
116
Reactor Length Inner Dia. Area Volume Flow rate Flow rate Recycle Total Flow Upflow velocity Sections mm mm mm2 mm3 mL/min mm3/min Ratio mm3/min mm/min Bottom 609.6 40.44 1284.44 782991.66 140 140000 0 140000 109.00
Top 406.4 77.27 4689.34 1905747.70 140 140000 0 140000 29.85 Bottom 609.6 40.44 1284.44 782991.66 140 140000 5 840000 653.98
Top 406.4 77.27 4689.34 1905747.70 140 140000 5 840000 179.13
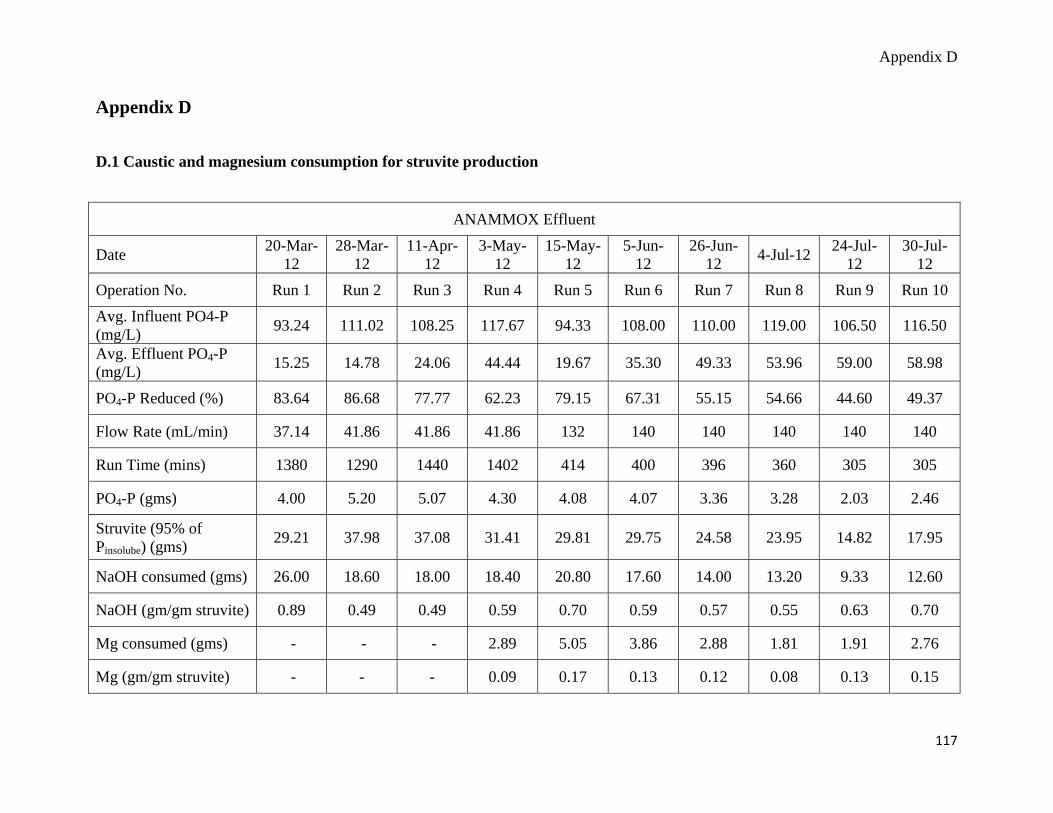
Appendix D
Appendix D
D.1 Caustic and magnesium consumption for struvite production
ANAMMOX Effluent
Date 20-Mar-12
28-Mar-12
11-Apr-12
3-May-12
15-May-12
5-Jun-12
26-Jun-12 4-Jul-12 24-Jul-
12 30-Jul-
12 Operation No. Run 1 Run 2 Run 3 Run 4 Run 5 Run 6 Run 7 Run 8 Run 9 Run 10 Avg. Influent PO4-P (mg/L) 93.24 111.02 108.25 117.67 94.33 108.00 110.00 119.00 106.50 116.50
Avg. Effluent PO4-P (mg/L) 15.25 14.78 24.06 44.44 19.67 35.30 49.33 53.96 59.00 58.98
PO4-P Reduced (%) 83.64 86.68 77.77 62.23 79.15 67.31 55.15 54.66 44.60 49.37
Flow Rate (mL/min) 37.14 41.86 41.86 41.86 132 140 140 140 140 140
Run Time (mins) 1380 1290 1440 1402 414 400 396 360 305 305
PO4-P (gms) 4.00 5.20 5.07 4.30 4.08 4.07 3.36 3.28 2.03 2.46
Struvite (95% of Pinsolube) (gms) 29.21 37.98 37.08 31.41 29.81 29.75 24.58 23.95 14.82 17.95
NaOH consumed (gms) 26.00 18.60 18.00 18.40 20.80 17.60 14.00 13.20 9.33 12.60
NaOH (gm/gm struvite) 0.89 0.49 0.49 0.59 0.70 0.59 0.57 0.55 0.63 0.70
Mg consumed (gms) - - - 2.89 5.05 3.86 2.88 1.81 1.91 2.76
Mg (gm/gm struvite) - - - 0.09 0.17 0.13 0.12 0.08 0.13 0.15
117
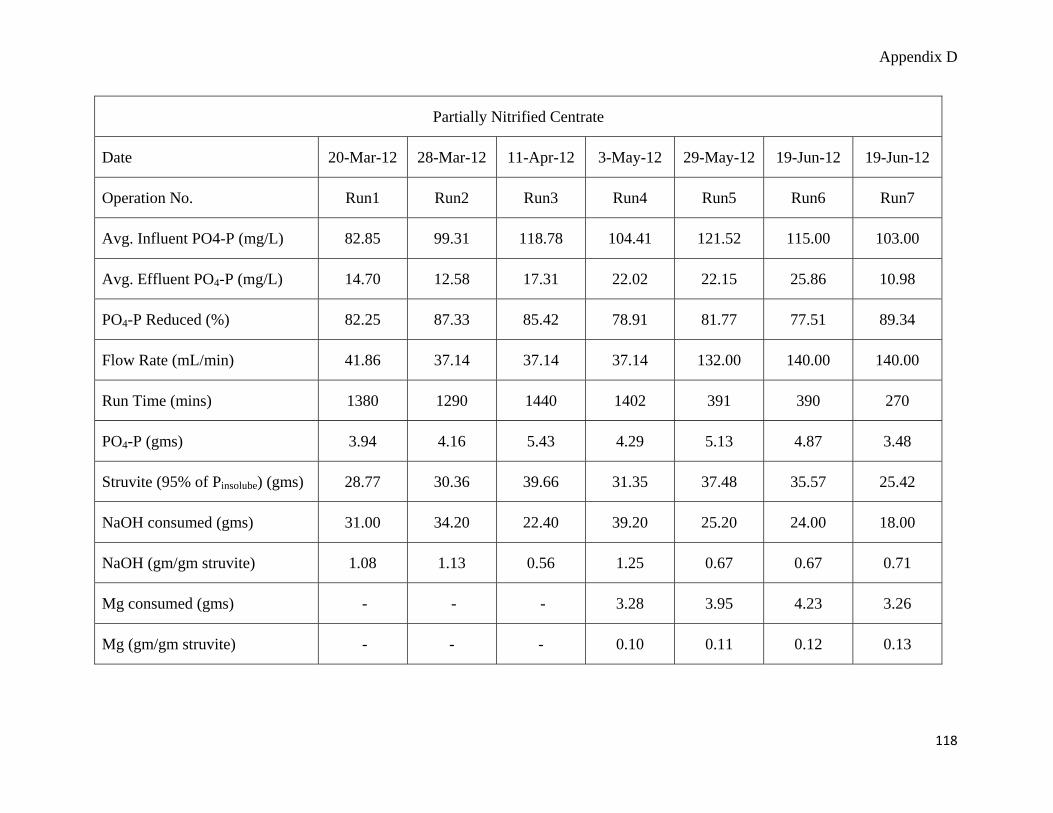
Appendix D
Partially Nitrified Centrate
Date 20-Mar-12 28-Mar-12 11-Apr-12 3-May-12 29-May-12 19-Jun-12 19-Jun-12
Operation No. Run1 Run2 Run3 Run4 Run5 Run6 Run7
Avg. Influent PO4-P (mg/L) 82.85 99.31 118.78 104.41 121.52 115.00 103.00
Avg. Effluent PO4-P (mg/L) 14.70 12.58 17.31 22.02 22.15 25.86 10.98
PO4-P Reduced (%) 82.25 87.33 85.42 78.91 81.77 77.51 89.34
Flow Rate (mL/min) 41.86 37.14 37.14 37.14 132.00 140.00 140.00
Run Time (mins) 1380 1290 1440 1402 391 390 270
PO4-P (gms) 3.94 4.16 5.43 4.29 5.13 4.87 3.48
Struvite (95% of Pinsolube) (gms) 28.77 30.36 39.66 31.35 37.48 35.57 25.42
NaOH consumed (gms) 31.00 34.20 22.40 39.20 25.20 24.00 18.00
NaOH (gm/gm struvite) 1.08 1.13 0.56 1.25 0.67 0.67 0.71
Mg consumed (gms) - - - 3.28 3.95 4.23 3.26
Mg (gm/gm struvite) - - - 0.10 0.11 0.12 0.13
118
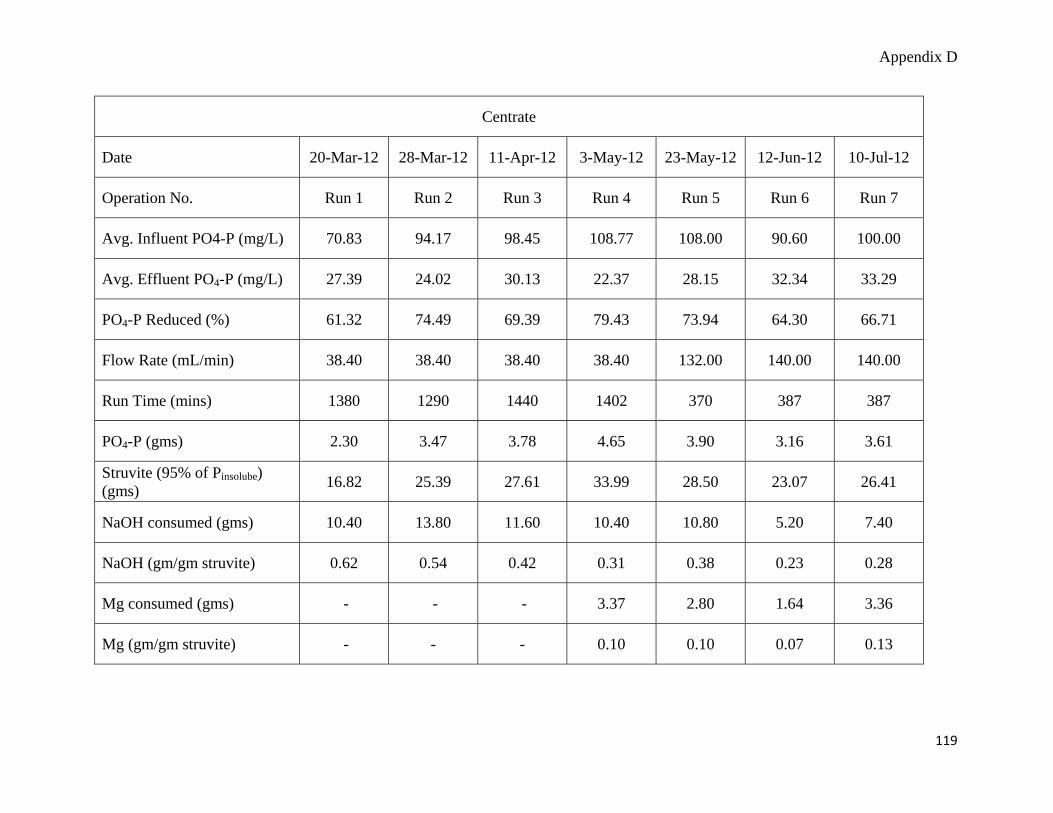
Appendix D
119
Centrate
Date 20-Mar-12 28-Mar-12 11-Apr-12 3-May-12 23-May-12 12-Jun-12 10-Jul-12
Operation No. Run 1 Run 2 Run 3 Run 4 Run 5 Run 6 Run 7
Avg. Influent PO4-P (mg/L) 70.83 94.17 98.45 108.77 108.00 90.60 100.00
Avg. Effluent PO4-P (mg/L) 27.39 24.02 30.13 22.37 28.15 32.34 33.29
PO4-P Reduced (%) 61.32 74.49 69.39 79.43 73.94 64.30 66.71
Flow Rate (mL/min) 38.40 38.40 38.40 38.40 132.00 140.00 140.00
Run Time (mins) 1380 1290 1440 1402 370 387 387
PO4-P (gms) 2.30 3.47 3.78 4.65 3.90 3.16 3.61
Struvite (95% of Pinsolube) (gms) 16.82 25.39 27.61 33.99 28.50 23.07 26.41
NaOH consumed (gms) 10.40 13.80 11.60 10.40 10.80 5.20 7.40
NaOH (gm/gm struvite) 0.62 0.54 0.42 0.31 0.38 0.23 0.28
Mg consumed (gms) - - - 3.37 2.80 1.64 3.36
Mg (gm/gm struvite) - - - 0.10 0.10 0.07 0.13
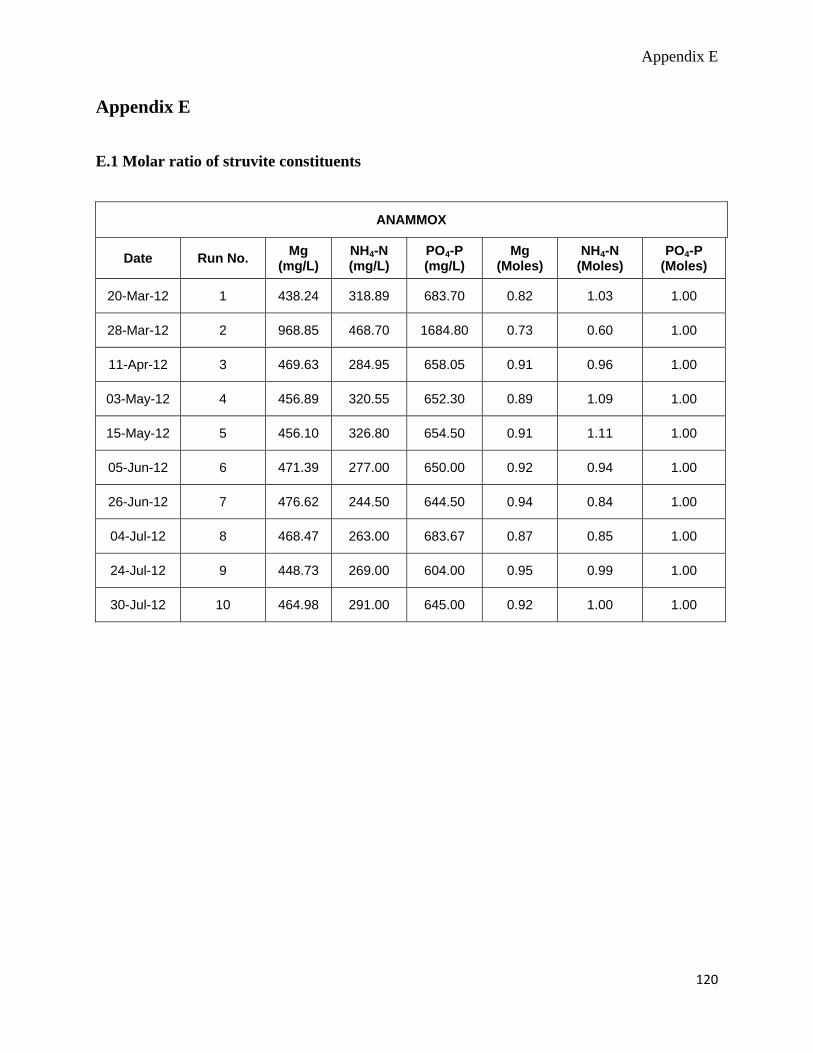
Appendix E
Appendix E
E.1 Molar ratio of struvite constituents
ANAMMOX
Date Run No. Mg (mg/L)
NH4-N (mg/L)
PO4-P (mg/L)
Mg (Moles)
NH4-N (Moles)
PO4-P (Moles)
20-Mar-12 1 438.24 318.89 683.70 0.82 1.03 1.00
28-Mar-12 2 968.85 468.70 1684.80 0.73 0.60 1.00
11-Apr-12 3 469.63 284.95 658.05 0.91 0.96 1.00
03-May-12 4 456.89 320.55 652.30 0.89 1.09 1.00
15-May-12 5 456.10 326.80 654.50 0.91 1.11 1.00
05-Jun-12 6 471.39 277.00 650.00 0.92 0.94 1.00
26-Jun-12 7 476.62 244.50 644.50 0.94 0.84 1.00
04-Jul-12 8 468.47 263.00 683.67 0.87 0.85 1.00
24-Jul-12 9 448.73 269.00 604.00 0.95 0.99 1.00
30-Jul-12 10 464.98 291.00 645.00 0.92 1.00 1.00
120
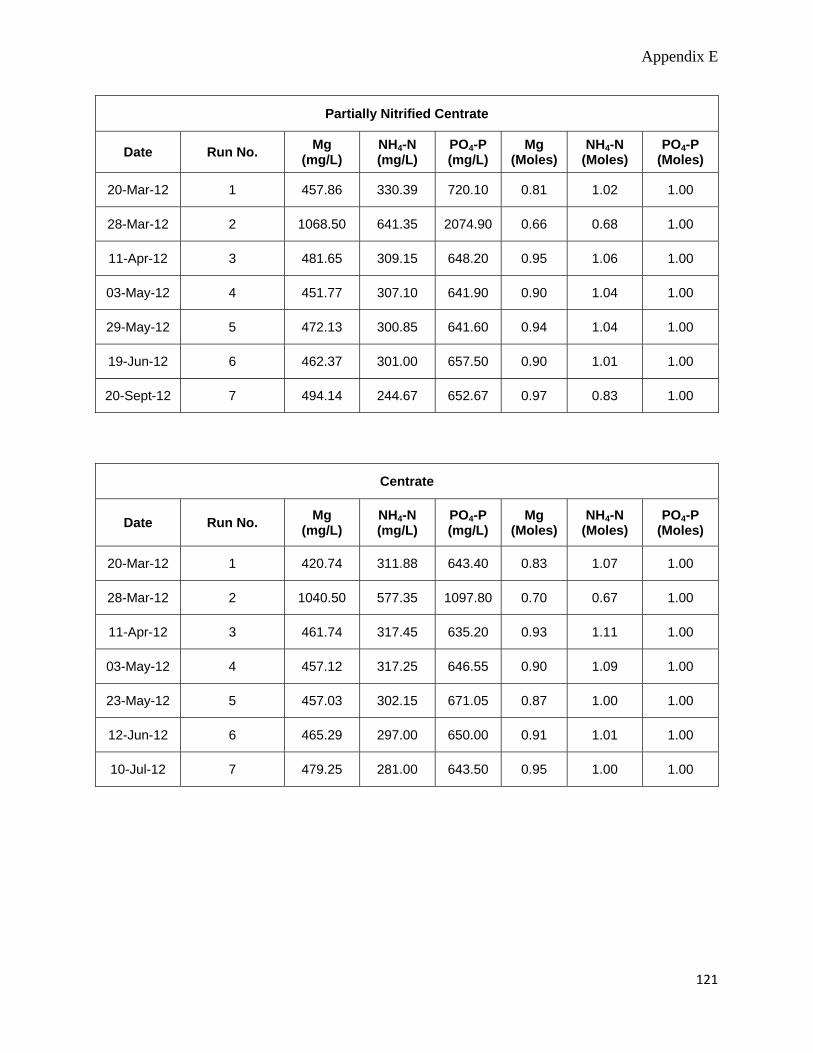
Appendix E
121
Partially Nitrified Centrate
Date Run No. Mg (mg/L)
NH4-N (mg/L)
PO4-P (mg/L)
Mg (Moles)
NH4-N (Moles)
PO4-P (Moles)
20-Mar-12 1 457.86 330.39 720.10 0.81 1.02 1.00
28-Mar-12 2 1068.50 641.35 2074.90 0.66 0.68 1.00
11-Apr-12 3 481.65 309.15 648.20 0.95 1.06 1.00
03-May-12 4 451.77 307.10 641.90 0.90 1.04 1.00
29-May-12 5 472.13 300.85 641.60 0.94 1.04 1.00
19-Jun-12 6 462.37 301.00 657.50 0.90 1.01 1.00
20-Sept-12 7 494.14 244.67 652.67 0.97 0.83 1.00
Centrate
Date Run No. Mg (mg/L)
NH4-N (mg/L)
PO4-P (mg/L)
Mg (Moles)
NH4-N (Moles)
PO4-P (Moles)
20-Mar-12 1 420.74 311.88 643.40 0.83 1.07 1.00
28-Mar-12 2 1040.50 577.35 1097.80 0.70 0.67 1.00
11-Apr-12 3 461.74 317.45 635.20 0.93 1.11 1.00
03-May-12 4 457.12 317.25 646.55 0.90 1.09 1.00
23-May-12 5 457.03 302.15 671.05 0.87 1.00 1.00
12-Jun-12 6 465.29 297.00 650.00 0.91 1.01 1.00
10-Jul-12 7 479.25 281.00 643.50 0.95 1.00 1.00
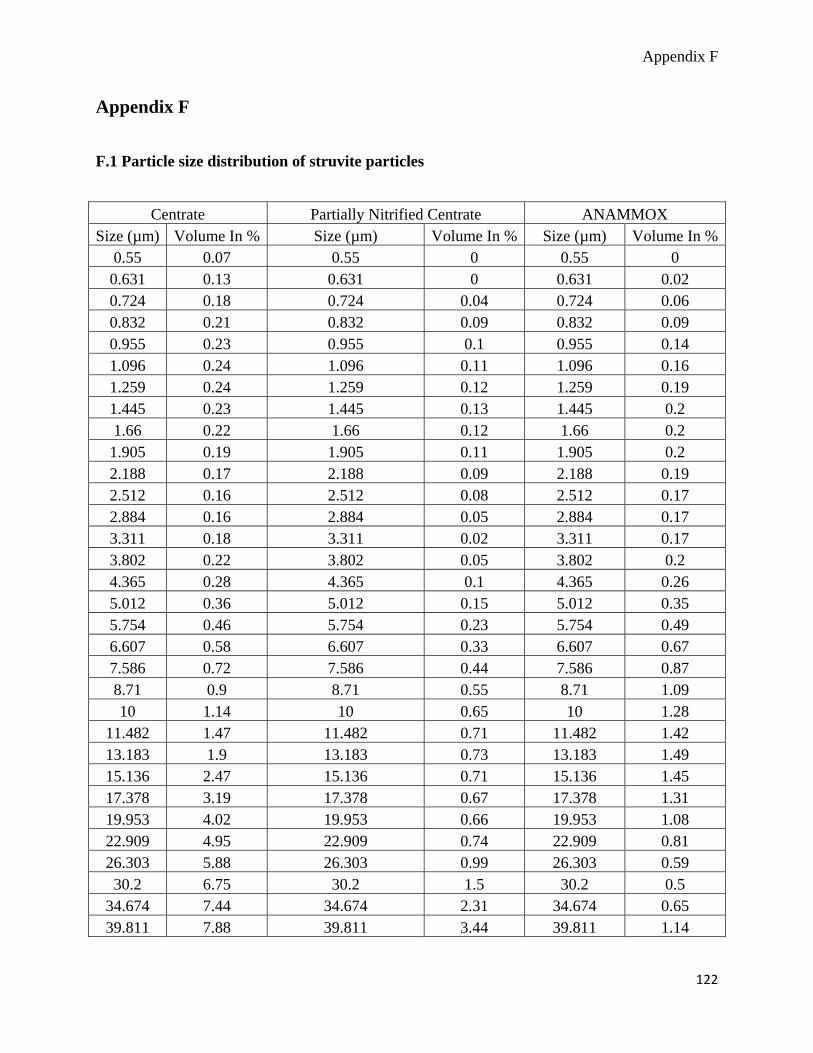
Appendix F
Appendix F
F.1 Particle size distribution of struvite particles
Centrate Partially Nitrified Centrate ANAMMOX Size (µm) Volume In % Size (µm) Volume In % Size (µm) Volume In %
0.55 0.07 0.55 0 0.55 0 0.631 0.13 0.631 0 0.631 0.02 0.724 0.18 0.724 0.04 0.724 0.06 0.832 0.21 0.832 0.09 0.832 0.09 0.955 0.23 0.955 0.1 0.955 0.14 1.096 0.24 1.096 0.11 1.096 0.16 1.259 0.24 1.259 0.12 1.259 0.19 1.445 0.23 1.445 0.13 1.445 0.2 1.66 0.22 1.66 0.12 1.66 0.2 1.905 0.19 1.905 0.11 1.905 0.2 2.188 0.17 2.188 0.09 2.188 0.19 2.512 0.16 2.512 0.08 2.512 0.17 2.884 0.16 2.884 0.05 2.884 0.17 3.311 0.18 3.311 0.02 3.311 0.17 3.802 0.22 3.802 0.05 3.802 0.2 4.365 0.28 4.365 0.1 4.365 0.26 5.012 0.36 5.012 0.15 5.012 0.35 5.754 0.46 5.754 0.23 5.754 0.49 6.607 0.58 6.607 0.33 6.607 0.67 7.586 0.72 7.586 0.44 7.586 0.87 8.71 0.9 8.71 0.55 8.71 1.09 10 1.14 10 0.65 10 1.28
11.482 1.47 11.482 0.71 11.482 1.42 13.183 1.9 13.183 0.73 13.183 1.49 15.136 2.47 15.136 0.71 15.136 1.45 17.378 3.19 17.378 0.67 17.378 1.31 19.953 4.02 19.953 0.66 19.953 1.08 22.909 4.95 22.909 0.74 22.909 0.81 26.303 5.88 26.303 0.99 26.303 0.59 30.2 6.75 30.2 1.5 30.2 0.5
34.674 7.44 34.674 2.31 34.674 0.65 39.811 7.88 39.811 3.44 39.811 1.14
122
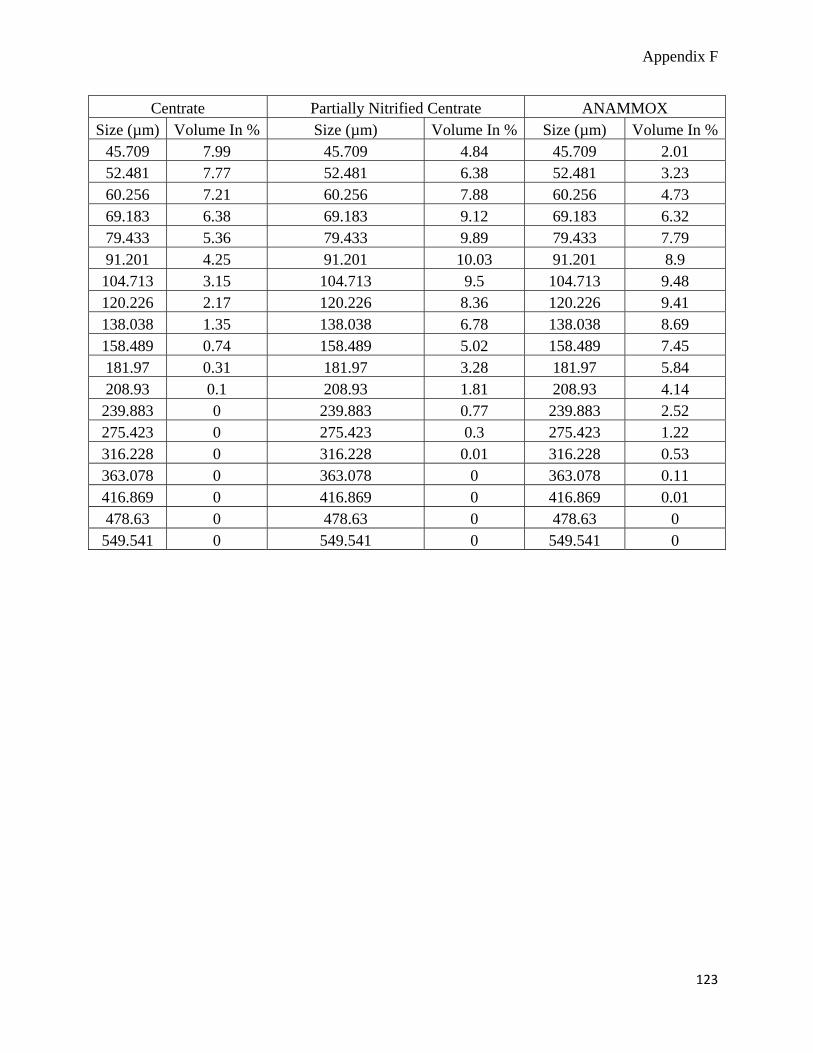
Appendix F
123
Centrate Partially Nitrified Centrate ANAMMOX Size (µm) Volume In % Size (µm) Volume In % Size (µm) Volume In %
45.709 7.99 45.709 4.84 45.709 2.01 52.481 7.77 52.481 6.38 52.481 3.23 60.256 7.21 60.256 7.88 60.256 4.73 69.183 6.38 69.183 9.12 69.183 6.32 79.433 5.36 79.433 9.89 79.433 7.79 91.201 4.25 91.201 10.03 91.201 8.9 104.713 3.15 104.713 9.5 104.713 9.48 120.226 2.17 120.226 8.36 120.226 9.41 138.038 1.35 138.038 6.78 138.038 8.69 158.489 0.74 158.489 5.02 158.489 7.45 181.97 0.31 181.97 3.28 181.97 5.84 208.93 0.1 208.93 1.81 208.93 4.14 239.883 0 239.883 0.77 239.883 2.52 275.423 0 275.423 0.3 275.423 1.22 316.228 0 316.228 0.01 316.228 0.53 363.078 0 363.078 0 363.078 0.11 416.869 0 416.869 0 416.869 0.01 478.63 0 478.63 0 478.63 0 549.541 0 549.541 0 549.541 0