simple-sequence repeat markers used in merging linkage maps of melon ( cucumis melo l
TRANSCRIPT
ORIGINAL PAPER
M. J. Gonzalo Æ M. Oliver Æ J. Garcia-Mas Æ A. Monfort
R. Dolcet-Sanjuan Æ N. Katzir Æ P. Arus Æ A. J. Monforte
Simple-sequence repeat markers used in merging linkage mapsof melon (Cucumis melo L.)
Received: 5 July 2004 / Accepted: 4 September 2004 / Published online: 8 February 2005� Springer-Verlag 2005
Abstract A set of 118 simple sequence repeat (SSR)markers has been developed in melon from two differentsources: genomic libraries (gSSR) and expressed se-quence-tag (EST) databases (EST-SSR). Forty-ninepercent of the markers showed polymorphism betweenthe ‘Piel de Sapo’ (PS) and PI161375 melon genotypesused as parents for the mapping populations. Similarpolymorphism levels were found in gSSR (51.2%) andEST-SSR (45.5%). Two populations, F2 and a set ofdouble haploid lines (DHLs), developed from the sameparent genotypes were used for map construction.Twenty-three SSRs and 79 restriction fragment lengthpolymorphisms (RFLPs), evenly distributed through themelon genome, were used to anchor the maps of bothpopulations. Ten cucumber SSRs, 41 gSSRs, 16 EST-SSR, three single nucleotide polymorphism (SNP)markers, and the Nsv locus were added in the DHLpopulation. The maps developed in the F2 and DHLpopulations were co-linear, with similar lengths, except inlinkage groups G1, G9, and G10. There was segregationdistortion in a higher proportion of markers in the DHLpopulation compared with the F2, probably caused by
selection during the construction of DHLs through invitro culture. After map merging, a composite geneticmap was obtained including 327 transferable markers:226 RFLPs, 97 SSRs, three SNPs, and theNsv locus. Themap length is 1,021 cM, distributed in 12 linkage groups,and map density is 3.11 cM/marker. SSR markers alonecover nearly 80% of the map length. This map is pro-posed as a basis for a frameworkmelonmap to bemergedwith other maps and as an anchor point for map com-parison between species of the Cucurbitaceae family.
Introduction
Melon (Cucumis melo L.) is a crop of the Cucurbitaceaefamily, grown in temperate and tropical regions world-wide. Fruits of C. melo exhibit a wide range of mor-phological variation, including fruits from a few gramsto several kilograms, climacteric to non-climacteric,oblong to very elongated shapes or high to low fleshsugar content (Kirkbride 1993; Stepansky et al. 1999;Liu et al. 2004; Monforte et al. 2004a). High geneticdiversity has been shown in studies using molecularmarkers (Stepansky et al. 1999; Mliki et al. 2001; Akashiet al. 2002; Monforte et al. 2003).
Even though 162 major genes controlling differentaspects of melon biology have been described (Pitrat2002), most of them have not been mapped. The geneticinheritance of most important agronomic traits is largelyunknown due, at least in part, to the fact that fulllinkage maps have not been available until recently(Oliver et al. 2001; Perin et al. 2002a). With the availablemaps, quantitative trait loci (QTL) involved in fruitquality traits were detected in three different crosses ofEuropean cultivars and exotic Asian accessions (Perinet al. 2002b; Monforte et al. 2004b), providing the firstresults of the genetic control of important fruit qualities.However, the use of linkage maps in melon breedingprograms is still very limited. The map from Perin et al.
Electronic Supplementary Material Supplementary material isavailable for this article at http://dx.doi.org/10.1007/s00122-004-1814-6
Communicated by I. Paran
M. J. Gonzalo Æ M. Oliver Æ J. Garcia-Mas Æ A. MonfortR. Dolcet-Sanjuan Æ P. Arus Æ A. J. Monforte (&)Laboratori CSIC-IRTA Genetica Molecular Vegetal,Carretera Cabrils s/n, 08348 Cabrils (Barcelona), SpainE-mail: [email protected].: +34-93-7507511Fax: +34-93-7533954
N. KatzirDepartment of Genetics and Vegetable Crops,Agricultural Research Organization,Newe Ya’ar Research Center,P.O. Box 1021, Ramat Yishay, 30-095, Israel
Present address: M. OliverSyngenta Seeds S.A.S, 12 Chemin de l’Hobit,B.P.27, 31790 Saint Sauveur, France
Theor Appl Genet (2005) 110: 802–811DOI 10.1007/s00122-004-1814-6
(2002a) consists mainly of amplified fragment lengthpolymorphism (AFLP) and intersimple sequence repeat(ISSR) markers. These markers are dominant and can-not be transferred readily to other populations. The mapfrom Oliver et al. (2001) contains a large number ofcodominant transferable markers, mainly restrictionfragment length polymorphisms (RFLPs). These mark-ers have not been widely adopted by the melon researchcommunity, because the laborious RFLP procedures arenot available to all laboratories.
Microsatellite or simple sequence repeat (SSR)markers are preferable, because they are easy to imple-ment and amenable for high-throughput in most labo-ratories. SSR markers are highly polymorphic,codominant, and readily transferable among mappingpopulations.
A set of SSR markers (Katzir et al. 1996; Danin-Poleg et al. 2001; Chiba et al. 2003; Ritschel et al. 2004),produced sufficient polymorphism within melon germ-plasm, and is useful in map construction (Danin-Poleget al. 2001; Monforte et al. 2003). A subset of these SSRshas been included in some melon maps (Danin-Poleget al. 2000, 2002; Oliver et al. 2001; Perin et al. 2002a;Silberstein et al. 2003; Ritschel et al. 2004). Unfortu-nately, these SSRs cover only part of the melon genomeand are not sufficient in bridging between melon maps(Danin-Poleg et al. 2000; Ritschel et al. 2004).
Genome mapping is a continuous process. However,most populations used for melon genome mapping aretransient F2 (Braudracco-Arnas and Pitrat 1996; Oliveret al. 2001; Daning-Poleg et al. 2002; Silberstein et al.2003), not suitable for long-term mapping projects.Recombinant inbred lines [(RILs) Perin et al. 2002a] anddouble haploid lines (DHLs) can be propagated by seedand are suitable for such objectives.
In the this study, a new set of SSR markers has beendeveloped to build a framework genetic based mainly inSSRs. Thirteen cucumber SSRs (Fazio et al. 2002), 59melon SSRs, and three single nucleotide polymorphism(SNP) markers were added to the melon genetic map bymerging F2-based (Oliver et al. 2001) and a newlydeveloped DHL-based maps. The extended genetic mapis proposed as a bridge with other melon genetic maps tofurther develop a reference map containing highlypolymorphic and transferable markers.
Material and methods
Plant material and DNA extraction
Two mapping populations (F2 and DHL) were obtainedfrom the cross between the Korean accession PI 161375and a ‘Piel de sapo’ (PS) inbred line from Semillas FitoS.A., Spain. The 93 F2 individuals were obtained andmaintained in vitro, as described by Oliver et al. (2001).Seventy-seven DHLs were developed by in situ-inducedparthenogenesis through pollination with Co60 gamma-irradiated pollen, in vitro rescue of parthenogenic em-
bryos, in vitro chromosome-doubling by colchicinetreatment, and self-pollination of acclimated plants(Gonzalo 2003), adapting a protocol previously devel-oped for Dianthus caryophyllus (Dolcet-Sanjuan et al.2001). Total DNA was extracted from young leaves ofDHL plants, as described by Doyle and Doyle (1990),with minor modifications (Oliver et al. 2001).
RFLPs
RFLPs were obtained as described by Oliver et al.(2001). The prefix of the RFLP indicates the origin ofthe clones: MG, melon genomic DNA; MC and CM,melon cDNA (Oliver et al. 2001; Baudracco-Arnas andPitrat 1996); and AEST, Arabidopsis cDNA (Patersonet al. 1996).
SSR markers
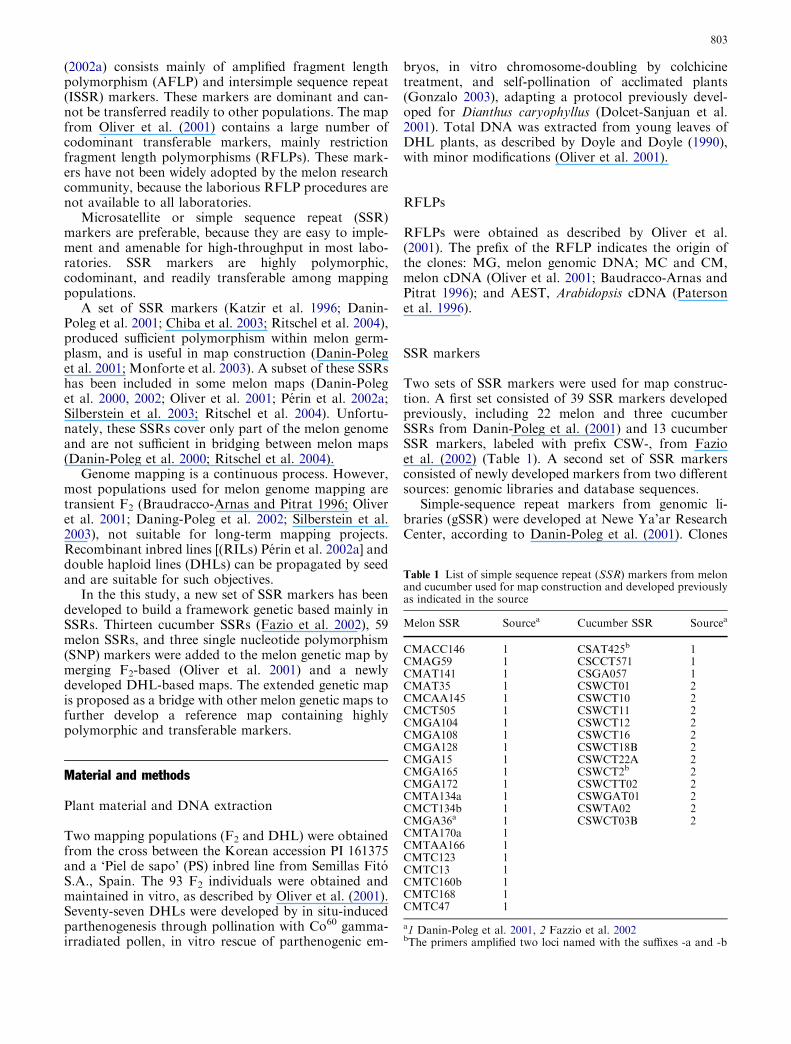
Two sets of SSR markers were used for map construc-tion. A first set consisted of 39 SSR markers developedpreviously, including 22 melon and three cucumberSSRs from Danin-Poleg et al. (2001) and 13 cucumberSSR markers, labeled with prefix CSW-, from Fazioet al. (2002) (Table 1). A second set of SSR markersconsisted of newly developed markers from two differentsources: genomic libraries and database sequences.
Simple-sequence repeat markers from genomic li-braries (gSSR) were developed at Newe Ya’ar ResearchCenter, according to Danin-Poleg et al. (2001). Clones
Table 1 List of simple sequence repeat (SSR) markers from melonand cucumber used for map construction and developed previouslyas indicated in the source
Melon SSR Sourcea Cucumber SSR Sourcea
CMACC146 1 CSAT425b 1CMAG59 1 CSCCT571 1CMAT141 1 CSGA057 1CMAT35 1 CSWCT01 2CMCAA145 1 CSWCT10 2CMCT505 1 CSWCT11 2CMGA104 1 CSWCT12 2CMGA108 1 CSWCT16 2CMGA128 1 CSWCT18B 2CMGA15 1 CSWCT22A 2CMGA165 1 CSWCT2b 2CMGA172 1 CSWCTT02 2CMTA134a 1 CSWGAT01 2CMCT134b 1 CSWTA02 2CMGA36a 1 CSWCT03B 2CMTA170a 1CMTAA166 1CMTC123 1CMTC13 1CMTC160b 1CMTC168 1CMTC47 1
a1 Danin-Poleg et al. 2001, 2 Fazzio et al. 2002bThe primers amplified two loci named with the suffixes -a and -b
803
containing SSR motifs from small-insert genomic li-braries were selected by hybridizing filters containingtheir DNA, with the primer (CT)10 end-labeled with[c�32P]-ATP (Katzir et al. 1996; Danin-Poleg et al.2001). Positive clones were selected for DNA sequenc-ing. These SSRs were labeled with the prefixes CMTCN-, CMCTN-, CMGAN-, CMAGN-, CMATN-, andCMTAAN-. SSR markers from expressed sequence-tagdatabase sequences (EST-SSR) were obtained from theGenBank database and EST sequences developed byIRTA analyzed using the SPUTNIK software (http://espressosoftware.com/pages/sputnik.jsp). Only micro-satellites with dinucleotide repeats longer than 10 or theequivalent length in nucleotides with tri-, tetra-, orpentanucleotide motifs were considered for primer de-sign using Primer 3 (Rozen and Skaletsky 2000). EST-SSRs were labeled with the prefix TJ-. The SSRsCMCTN-86, CMATN-89, CMCAN-90, and CMATN-101 were also obtained from public EST databases atNewe Ya’ar Research Center.
Temperature-gradient PCR in a PTC-200 Thermo-clycer (MJ Research, Waltham, Mass., USA) was per-formed to obtain the optimum annealing temperature foreach primer pair. PCR reactions were performed in a finalvolume of 15 ll with 1· Taq buffer [20 mM (NH4)SO4, 75mM Tris-HCl (pH 8.8), 0.01% (v/v) Tween 20], 2 mMMgCl2, 166 lM dNTPs, 0.6 lM each primer, 1 U TaqDNA polymerase (PE Applied Biosystems), and 60 ngDNA. The cycling conditions were as follows: an initialcycle at 94�C for 1min, followed by 35 cycles at 94�C, 30 s,40–60�C, 30 s and 72�C, 1min, and a final cycle at 72�C for5 min. Amplification products were visualized with UVlight after electrophoresis in 2%agarose gels with 1·TBE(0.9MTris-borate, 0.002MEDTA, pH 8.0), stained withethidium bromide.
Tests of SSR polymorphism between PS and PI161375 and genotyping of the polymorphic SSR markerswere performed by standard polyacrylamide gel elec-trophoresis separation of [33P]-labeled amplificationfragments or by analysis of IRD-800-labeled ampliconsin a LI-COR IR2 (LI-COR, Nebraska, USA) automaticsequencer. PCR reactions with radioactive labeling wereas described above, except that the final dCTP concen-tration was 2 lM, and 0.1 ll [a�33P]dCTP (3,000 Ci/mmol) was also added to the reaction. Cycling condi-tions were also as above. Labeled fragments were sepa-rated in 6% denaturing polyacrylamide gels in 1· TBEbuffer and 7.5 M urea at 60 W. Gels were dried andexposed to X-ray films. For LI-COR analysis, micro-satellites were amplified as above, except that 2 pmol ofeach primer (one labeled with IRD-800) was used. Fivemicroliters of loading buffer (95% formamide, 20 mMEDTA, 0,05% bromophenol blue, 0.05% xylene cyanol)were added to the PCR mix, samples were denatured at100�C for 5 min, and 0.8 ll was loaded onto a LI-CORIR2 sequencer using 25-cm plates with 6% acrylamide in1· TBE and 7.5 M urea. Electrophoresis was performedat 1500 V, 35 mA, and 31 W at 50�C until the PCRproducts were visible. The molecular weight of each
microsatellite band was estimated by comparing itsmigration with the IRD-labeled STR molecular sizemarker (LI-COR). Polymorphic SSR markers were usedto genotype the DHL population as described above.
SNPs
SNPs for the ESTs EST5.5, EST1.41 and EST1.11 weredetected in the DHL population with cleaved-amplifiedpolymorphic sequence assays or with the ABI PrismSNaPshot ddNTP Primer extension kit (Applied Bio-systems, Foster City, Calif., USA), as described byMorales et al. (2004).
Linkage analysis and map construction
Segregation distortion at each marker locus was testedagainst the expected ratios (1:2:1 for F2 and 1:1 forDHL) using a chi-square test with JoinMap, version 3.0(van Ooijen and Voorrips 2001). Distortion was declaredsignificant at P<0.005. Loci with a distortion betweenP<0.05 and P>0.005 and linked to a loci with signifi-cant segregation distortion at P<0.005 were used todefine the confidence interval of the position of the pu-tative locus causing the distortion.
Linkage maps were constructed independently ineach population with MAPMAKER, version 3.0(Lander et al. 1987). Markers were associated with thegroup command with LOD>3.0. Markers within groupswere ordered using the order command with LOD>3.0and were considered as the framework for each linkagegroup. Markers that could not be resolved were locatedusing a LOD>2.0. Distances were calculated with theKosambi function (Kosambi 1944). The remainingmarkers were then located with the try command.
F2 and DHL maps were compared based on thepositions of common markers. A framework markerorder was set, taking into account those marker groupsthat maintained the same order in the two populations,using a LOD>2 in each individual map. Total maplength was compared by a paired t-test using the longestdistance between common markers within each linkagegroup. Heterogeneity tests of recombination rates withinlinkage groups were performed with JoinMap and weredeclared statistically significant at P<0.005. The com-posite map was obtained after merging the individualmaps using the framework marker order as fixed orderwith JoinMap. Maps were drawn with MapChart, ver-sion 2.1 (Voorrips 2002).
Results
Development of SSR markers and polymorphism
Eighty-five primer pairs flanking SSR motifs were de-signed from positive genomic clones after screening
804
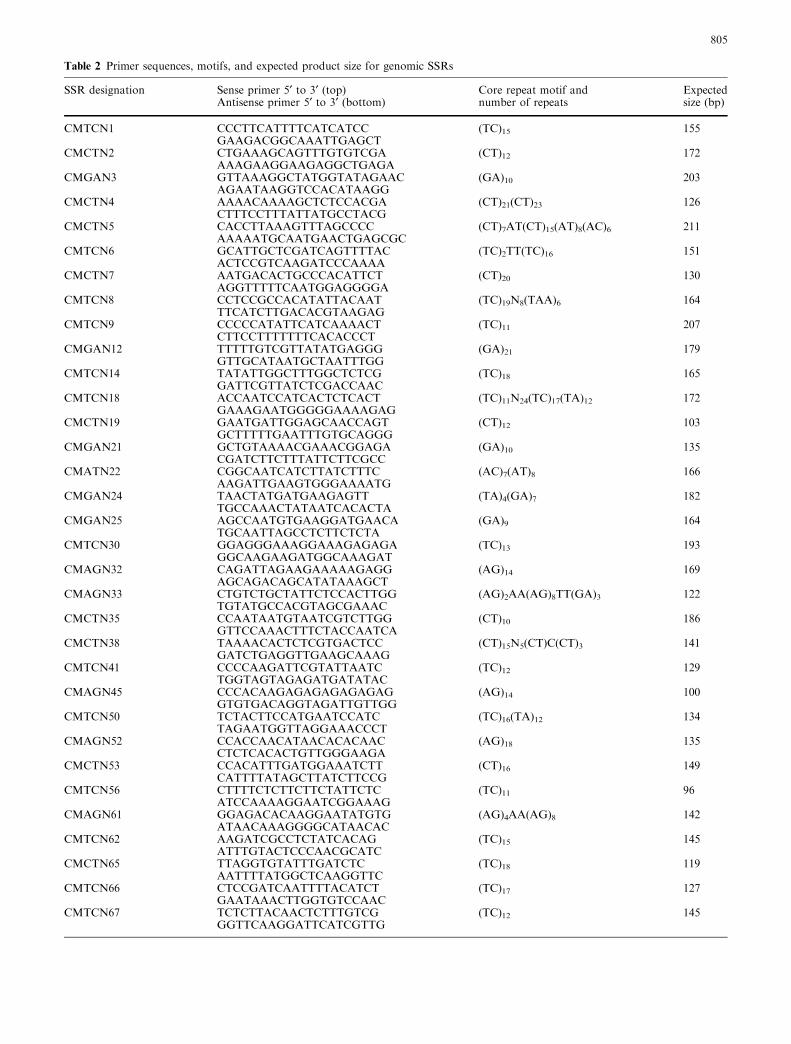
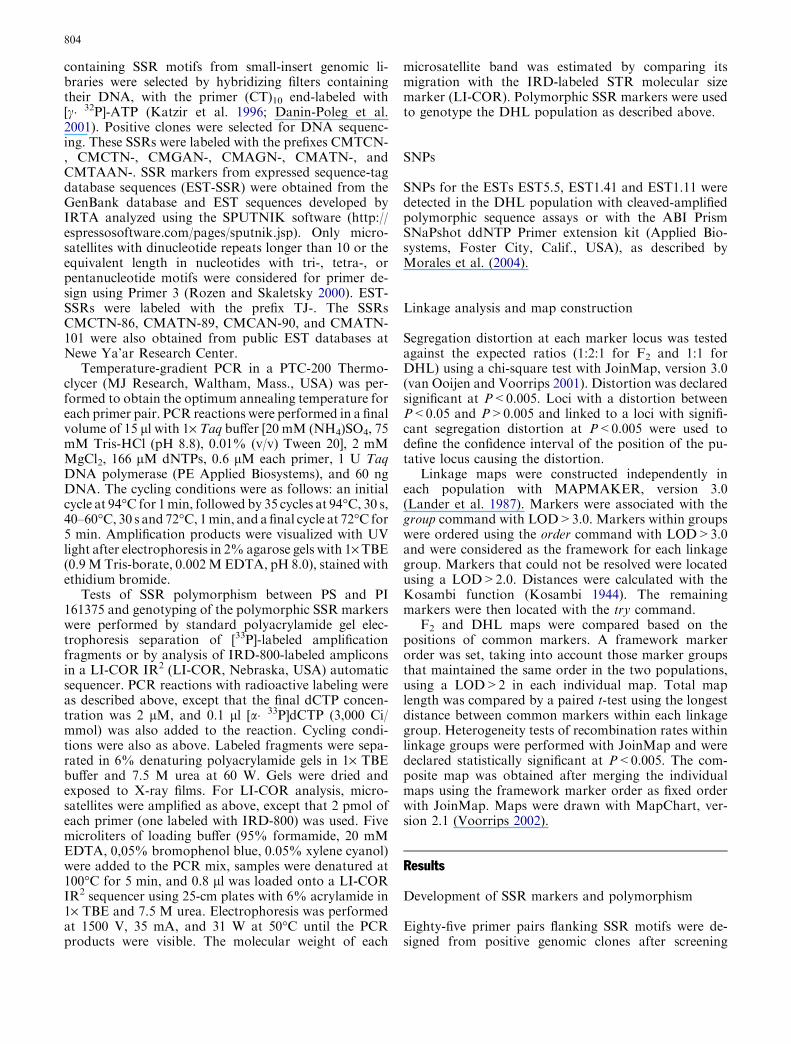
Table 2 Primer sequences, motifs, and expected product size for genomic SSRs
SSR designation Sense primer 5¢ to 3¢ (top)Antisense primer 5¢ to 3¢ (bottom)
Core repeat motif andnumber of repeats
Expectedsize (bp)
CMTCN1 CCCTTCATTTTCATCATCC (TC)15 155GAAGACGGCAAATTGAGCT
CMCTN2 CTGAAAGCAGTTTGTGTCGA (CT)12 172AAAGAAGGAAGAGGCTGAGA
CMGAN3 GTTAAAGGCTATGGTATAGAAC (GA)10 203AGAATAAGGTCCACATAAGG
CMCTN4 AAAACAAAAGCTCTCCACGA (CT)21(CT)23 126CTTTCCTTTATTATGCCTACG
CMCTN5 CACCTTAAAGTTTAGCCCC (CT)7AT(CT)15(AT)8(AC)6 211AAAAATGCAATGAACTGAGCGC
CMTCN6 GCATTGCTCGATCAGTTTTAC (TC)2TT(TC)16 151ACTCCGTCAAGATCCCAAAA
CMCTN7 AATGACACTGCCCACATTCT (CT)20 130AGGTTTTTCAATGGAGGGGA
CMTCN8 CCTCCGCCACATATTACAAT (TC)19N8(TAA)6 164TTCATCTTGACACGTAAGAG
CMTCN9 CCCCCATATTCATCAAAACT (TC)11 207CTTCCTTTTTTTCACACCCT
CMGAN12 TTTTTGTCGTTATATGAGGG (GA)21 179GTTGCATAATGCTAATTTGG
CMTCN14 TATATTGGCTTTGGCTCTCG (TC)18 165GATTCGTTATCTCGACCAAC
CMTCN18 ACCAATCCATCACTCTCACT (TC)11N24(TC)17(TA)12 172GAAAGAATGGGGGAAAAGAG
CMCTN19 GAATGATTGGAGCAACCAGT (CT)12 103GCTTTTTGAATTTGTGCAGGG
CMGAN21 GCTGTAAAACGAAACGGAGA (GA)10 135CGATCTTCTTTATTCTTCGCC
CMATN22 CGGCAATCATCTTATCTTTC (AC)7(AT)8 166AAGATTGAAGTGGGAAAATG
CMGAN24 TAACTATGATGAAGAGTT (TA)4(GA)7 182TGCCAAACTATAATCACACTA
CMGAN25 AGCCAATGTGAAGGATGAACA (GA)9 164TGCAATTAGCCTCTTCTCTA
CMTCN30 GGAGGGAAAGGAAAGAGAGA (TC)13 193GGCAAGAAGATGGCAAAGAT
CMAGN32 CAGATTAGAAGAAAAAGAGG (AG)14 169AGCAGACAGCATATAAAGCT
CMAGN33 CTGTCTGCTATTCTCCACTTGG (AG)2AA(AG)8TT(GA)3 122TGTATGCCACGTAGCGAAAC
CMCTN35 CCAATAATGTAATCGTCTTGG (CT)10 186GTTCCAAACTTTCTACCAATCA
CMCTN38 TAAAACACTCTCGTGACTCC (CT)15N5(CT)C(CT)3 141GATCTGAGGTTGAAGCAAAG
CMTCN41 CCCCAAGATTCGTATTAATC (TC)12 129TGGTAGTAGAGATGATATAC
CMAGN45 CCCACAAGAGAGAGAGAGAG (AG)14 100GTGTGACAGGTAGATTGTTGG
CMTCN50 TCTACTTCCATGAATCCATC (TC)16(TA)12 134TAGAATGGTTAGGAAACCCT
CMAGN52 CCACCAACATAACACACAAC (AG)18 135CTCTCACACTGTTGGGAAGA
CMCTN53 CCACATTTGATGGAAATCTT (CT)16 149CATTTTATAGCTTATCTTCCG
CMTCN56 CTTTTCTCTTCTTCTATTCTC (TC)11 96ATCCAAAAGGAATCGGAAAG
CMAGN61 GGAGACACAAGGAATATGTG (AG)4AA(AG)8 142ATAACAAAGGGGCATAACAC
CMTCN62 AAGATCGCCTCTATCACAG (TC)15 145ATTTGTACTCCCAACGCATC
CMCTN65 TTAGGTGTATTTGATCTC (TC)18 119AATTTTATGGCTCAAGGTTC
CMTCN66 CTCCGATCAATTTTACATCT (TC)17 127GAATAAACTTGGTGTCCAAC
CMTCN67 TCTCTTACAACTCTTTGTCG (TC)12 145GGTTCAAGGATTCATCGTTG
805
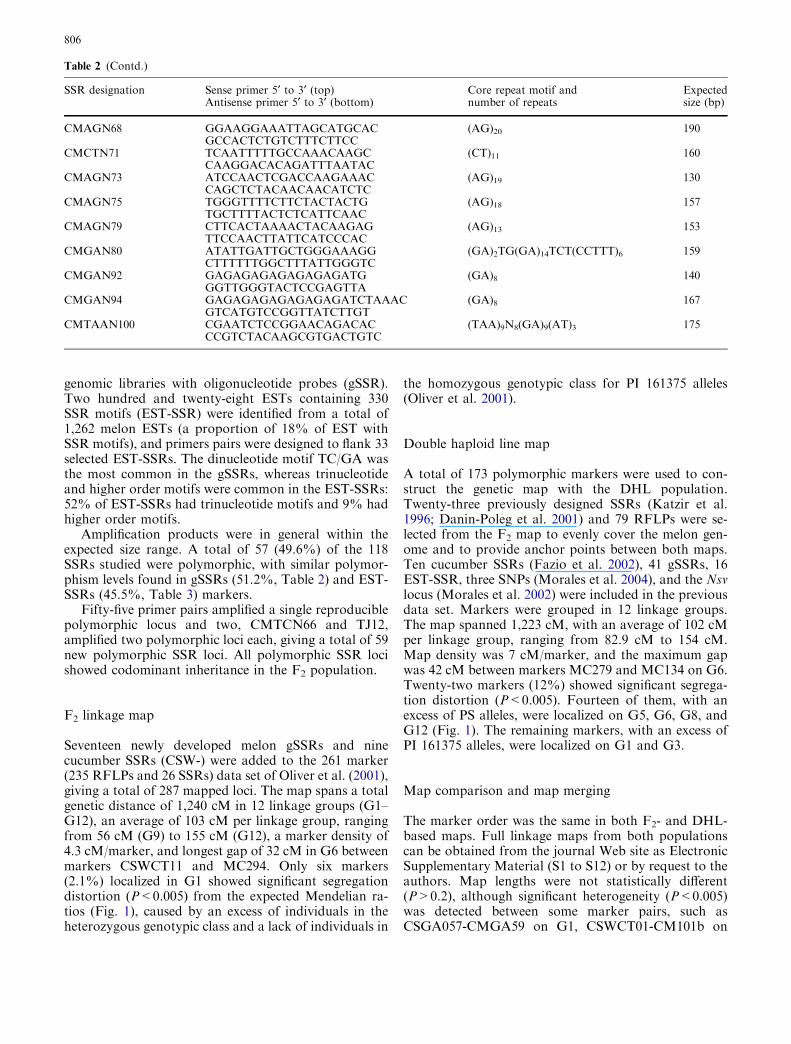
genomic libraries with oligonucleotide probes (gSSR).Two hundred and twenty-eight ESTs containing 330SSR motifs (EST-SSR) were identified from a total of1,262 melon ESTs (a proportion of 18% of EST withSSR motifs), and primers pairs were designed to flank 33selected EST-SSRs. The dinucleotide motif TC/GA wasthe most common in the gSSRs, whereas trinucleotideand higher order motifs were common in the EST-SSRs:52% of EST-SSRs had trinucleotide motifs and 9% hadhigher order motifs.
Amplification products were in general within theexpected size range. A total of 57 (49.6%) of the 118SSRs studied were polymorphic, with similar polymor-phism levels found in gSSRs (51.2%, Table 2) and EST-SSRs (45.5%, Table 3) markers.
Fifty-five primer pairs amplified a single reproduciblepolymorphic locus and two, CMTCN66 and TJ12,amplified two polymorphic loci each, giving a total of 59new polymorphic SSR loci. All polymorphic SSR locishowed codominant inheritance in the F2 population.
F2 linkage map
Seventeen newly developed melon gSSRs and ninecucumber SSRs (CSW-) were added to the 261 marker(235 RFLPs and 26 SSRs) data set of Oliver et al. (2001),giving a total of 287 mapped loci. The map spans a totalgenetic distance of 1,240 cM in 12 linkage groups (G1–G12), an average of 103 cM per linkage group, rangingfrom 56 cM (G9) to 155 cM (G12), a marker density of4.3 cM/marker, and longest gap of 32 cM in G6 betweenmarkers CSWCT11 and MC294. Only six markers(2.1%) localized in G1 showed significant segregationdistortion (P<0.005) from the expected Mendelian ra-tios (Fig. 1), caused by an excess of individuals in theheterozygous genotypic class and a lack of individuals in
the homozygous genotypic class for PI 161375 alleles(Oliver et al. 2001).
Double haploid line map
A total of 173 polymorphic markers were used to con-struct the genetic map with the DHL population.Twenty-three previously designed SSRs (Katzir et al.1996; Danin-Poleg et al. 2001) and 79 RFLPs were se-lected from the F2 map to evenly cover the melon gen-ome and to provide anchor points between both maps.Ten cucumber SSRs (Fazio et al. 2002), 41 gSSRs, 16EST-SSR, three SNPs (Morales et al. 2004), and the Nsvlocus (Morales et al. 2002) were included in the previousdata set. Markers were grouped in 12 linkage groups.The map spanned 1,223 cM, with an average of 102 cMper linkage group, ranging from 82.9 cM to 154 cM.Map density was 7 cM/marker, and the maximum gapwas 42 cM between markers MC279 and MC134 on G6.Twenty-two markers (12%) showed significant segrega-tion distortion (P<0.005). Fourteen of them, with anexcess of PS alleles, were localized on G5, G6, G8, andG12 (Fig. 1). The remaining markers, with an excess ofPI 161375 alleles, were localized on G1 and G3.
Map comparison and map merging
The marker order was the same in both F2- and DHL-based maps. Full linkage maps from both populationscan be obtained from the journal Web site as ElectronicSupplementary Material (S1 to S12) or by request to theauthors. Map lengths were not statistically different(P>0.2), although significant heterogeneity (P<0.005)was detected between some marker pairs, such asCSGA057-CMGA59 on G1, CSWCT01-CM101b on
Table 2 (Contd.)
SSR designation Sense primer 5¢ to 3¢ (top)Antisense primer 5¢ to 3¢ (bottom)
Core repeat motif andnumber of repeats
Expectedsize (bp)
CMAGN68 GGAAGGAAATTAGCATGCAC (AG)20 190GCCACTCTGTCTTTCTTCC
CMCTN71 TCAATTTTTGCCAAACAAGC (CT)11 160CAAGGACACAGATTTAATAC
CMAGN73 ATCCAACTCGACCAAGAAAC (AG)19 130CAGCTCTACAACAACATCTC
CMAGN75 TGGGTTTTCTTCTACTACTG (AG)18 157TGCTTTTACTCTCATTCAAC
CMAGN79 CTTCACTAAAACTACAAGAG (AG)13 153TTCCAACTTATTCATCCCAC
CMGAN80 ATATTGATTGCTGGGAAAGG (GA)2TG(GA)14TCT(CCTTT)6 159CTTTTTTGGCTTTATTGGGTC
CMGAN92 GAGAGAGAGAGAGAGATG (GA)8 140GGTTGGGTACTCCGAGTTA
CMGAN94 GAGAGAGAGAGAGAGATCTAAAC (GA)8 167GTCATGTCCGGTTATCTTGT
CMTAAN100 CGAATCTCCGGAACAGACAC (TAA)9N8(GA)9(AT)3 175CCGTCTACAAGCGTGACTGTC
806
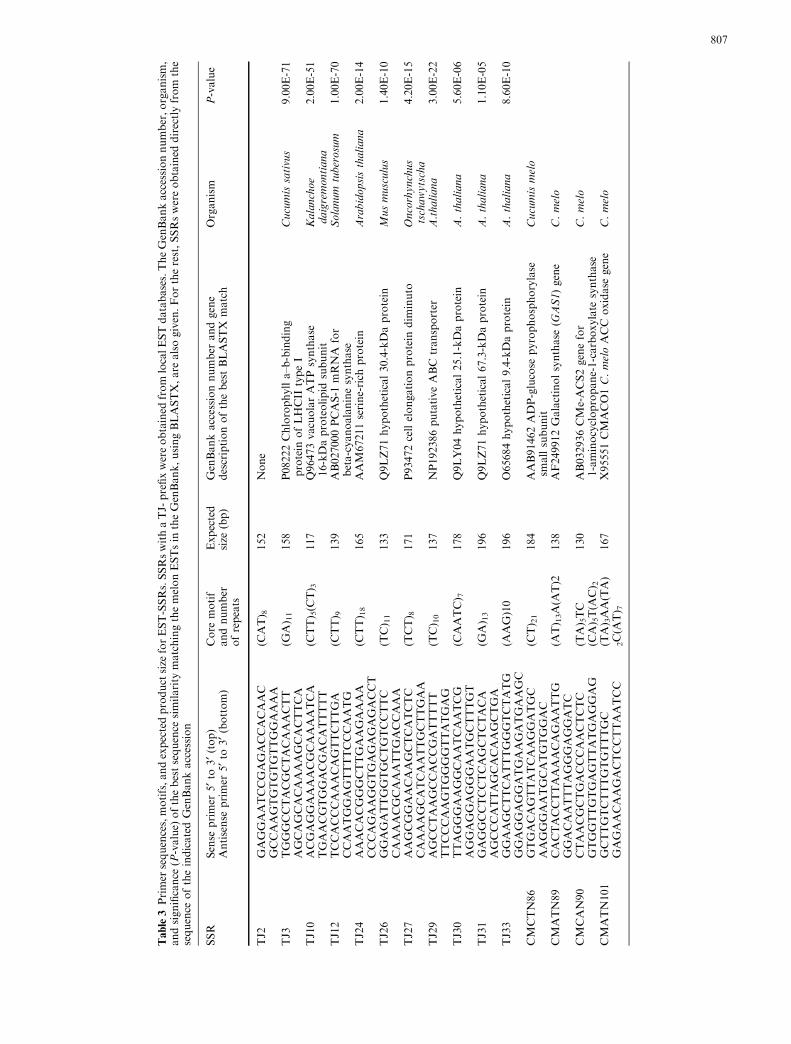
Table3Primer
sequences,motifs,andexpectedproduct
size
forEST-SSRs.SSRswithaTJ-
prefixwereobtained
from
localESTdatabases.TheGenBankaccessionnumber,organism,
andsignificance
(P-value)
ofthebestsequence
similarity
matchingthemelonESTsin
theGenBank,usingBLASTX,are
alsogiven.Fortherest,SSRswereobtained
directlyfrom
the
sequence
oftheindicatedGenBankaccession
SSR
Sense
primer
5¢to3
¢(top)
Antisense
primer
5¢to3¢(bottom)
Core
motif
andnumber
ofrepeats
Expected
size
(bp)
GenBankaccessionnumber
andgene
descriptionofthebestBLASTX
match
Organism
P-value
TJ2
GAGGAATCCGAGACCACAAC
(CAT) 8
152
None
GCCAAGTGTGTGTTGGAAAA
TJ3
TGGGCCTACGCTACAAACTT
(GA) 11
158
P08222Chlorophylla–b-binding
protein
ofLHCII
typeI
Cucumissativus
9.00E-71
AGCAGCACAAAAGCACTTCA
TJ10
ACGAGGAAAACGCAAAATCA
(CTT) 5(C
T) 3
117
Q96473vacuolarATPsynthase
16-kDaproteolipid
subunit
Kalanchoe
daigremontiana
2.00E-51
TGAACGTGGACGACATTTTT
TJ12
TCCACCCAAACAGTTCTTGA
(CTT) 9
139
AB027000PCAS-1
mRNA
for
beta-cyanoalaninesynthase
Solanum
tuberosum
1.00E-70
CCAATGGAGTTTTCCCAATG
TJ24
AAACACGGGCTTGAAGAAAA
(CTT) 18
165
AAM67211serine-rich
protein
Arabidopsisthaliana
2.00E-14
CCCAGAAGGTGAGAGAGACCT
TJ26
GGAGATTGGTGCTGTCCTTC
(TC) 11
133
Q9LZ71hypothetical30.4-kDaprotein
Musmusculus
1.40E-10
CAAAACGCAAATTGACCAAA
TJ27
AAGCGGAACAAGCTCATCTC
(TCT) 8
171
P93472cellelongationprotein
dim
inuto
Oncorhynchus
tschawytscha
4.20E-15
CAAAAGCATCAATTGCTTGAA
TJ29
AGCCTAAGCCACCGATTTTT
(TC) 10
137
NP192386putativeABC
transporter
A.thaliana
3.00E-22
TTCCCAAGTGGGGTTATGAG
TJ30
TTAGGGAAGGCAATCAATCG
(CAATC) 7
178
Q9LY04hypothetical25.1-kDaprotein
A.thaliana
5.60E-06
AGGAGGAGGGAATGCTTTGT
TJ31
GAGGCCTCCTCAGCTCTACA
(GA) 13
196
Q9LZ71hypothetical67.3-kDaprotein
A.thaliana
1.10E-05
AGCCCATTAGCACAAGCTGA
TJ33
GGAAGCTTCATTTGGGTCTATG
(AAG)10
196
O65684hypothetical9.4-kDaprotein
A.thaliana
8.60E-10
GGAGGAGGATGAAGATGAAGC
CMCTN86
GTGACAGTTATCAAGGATGC
(CT) 21
184
AAB91462ADP-glucose
pyrophosphorylase
smallsubunit
Cucumismelo
AAGGGAATGCATGTGGAC
CMATN89
CACTACCTTAAAACAGAATTG
(AT) 13A(A
T)2
138
AF249912Galactinolsynthase
(GAS1)gene
C.melo
GGACAATTTAGGGAGGATC
CMCAN90
CTAACGCTGACCCAACTCTC
(TA) 5TC
130
AB032936CMe-ACS2genefor
1-aminocyclopropane-1-carboxylate
synthase
C.melo
GTGGTTGTGAGTTATGAGGAG
(CA) 5T(A
C) 2
CMATN101
GCTTGTCTTTGTGTTTGC
(TA) 3AA(TA)
167
X95551CMACO1C.meloACC
oxidase
gene
C.melo
GAGAACAAGACTCCTTAATCC
2C(A
T) 7
807
G9, and CM47-MC219 on G10, with higher re-combination rates in the DHL population in all cases.
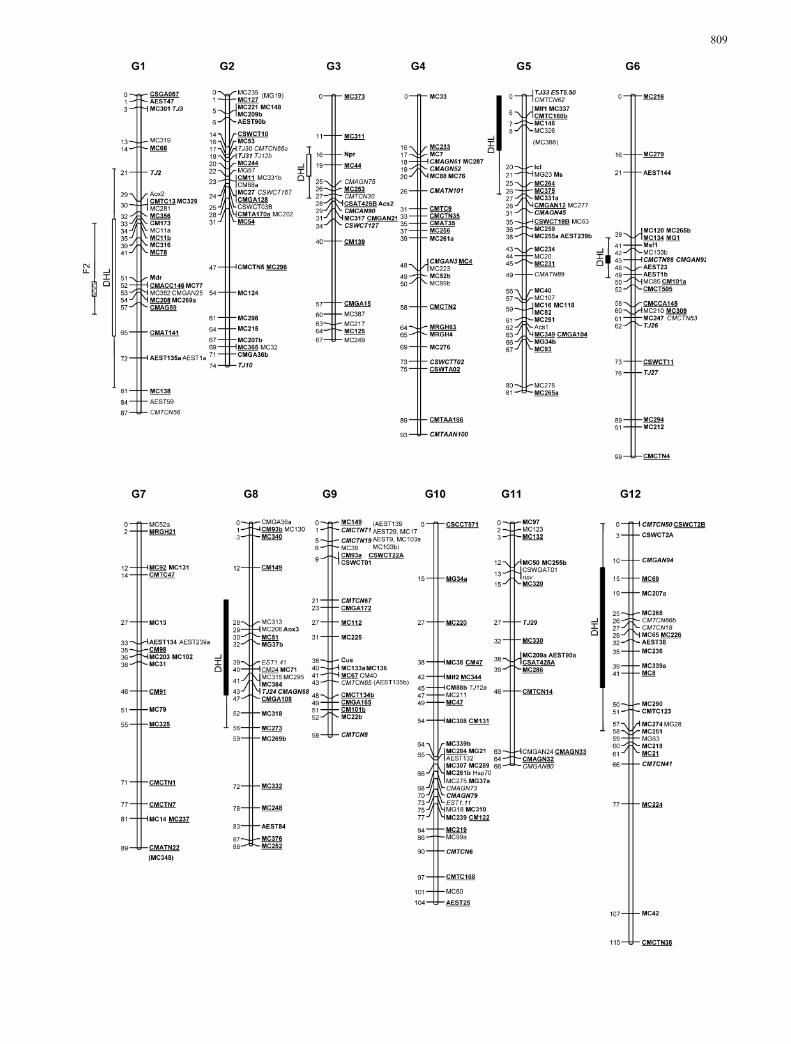
After map merging, a composite genetic map wasobtained including 327 markers: 226 RFLPs, 97 SSRs,three SNPs, and the Nsv locus (Fig. 1). The position ofnine RFLPs could not be resolved after map merging.Map length was 1,021 cM, slightly smaller than the F2
and DHL maps. Comparison between individual andmerged maps can be obtained as Electronic Supple-mentary Material or by request to the authors. Mapdensity was 3.11 cM/marker, with a maximum gap of 30cM on G12 between markers MC42 and MC224.
Both gSSRs and EST-SSRs were evenly distributedthroughout the melon genome, with an average of 8SSRs per LG, ranging from 4 (G7) to 12 (G2 and G4).The new SSRs contributed to reducing the gap lengthbetween codominant markers, e.g., TJ2 on G1 and alsoexpanded some linkage groups, such as CMTCN56 onG1. Assuming that each SSR marker has a window of 10cM on each side of its position, the set of SSRs used inthe current map covers 795 cM, 78% of the length of thecomposite map.
Discussion
SSR characterization
The polymorphism for SSR markers between the parentgenotypes of the mapping populations was high (49%)regardless of their origin, confirming that both genomiclibraries and EST sequences provide useful SSR markersand that the PS · PI 161375 cross is a highly polymor-phic one. The isolation of SSR sequences from genomiclibraries is tedious and labor intensive. EST sequences inpublic databases are useful source for searching for SSRsequences. EST-SSRs are associated with transcribedgenes that can be used as candidate genes.
A large number of melon ESTs (18%) in this studycontained SSR sequences. This proportion of ESTscontaining SSRs is high in comparison with these foundin other crop species, including rice (1.6%, Temnykhet al. 2000), grape (2.5%, Scott et al. 2000), and barley(7.5%, Thiel et al. 2003). However, only 16 EST-SSR(1.27%) of the ESTs surveyed could be mapped in thepopulation, implying that tens of thousands of ESTsshould be screened to obtain a map with several hundredEST-SSRs.
Most of the gSSRs had CT/GA repeats, confirmingthe high efficiency of screening with CT/GA probes toisolate SSRs in melon (Danin-Poleg et al. 2001). Tri-meric SSRs (CAT, CTT, TCT, AAG) were commonamong EST-SSRs, as found in other plant species(Temnykh et al. 2000; Chin 1996; Thiel et al. 2003). Thisdifference may be due to the suppression of non-trimericSSRs that could cause frameshift mutations in codingregions (Metzgar et al. 2000). EST-SSR markers showedsimilar levels of polymorphism to gSSRs among theparent genotypes (45% vs 51% respectively), although it
is well documented that EST-SSRs are less polymorphicthan gSSRs (Cho et al. 2000; Thiel et al. 2003; Eujaylet al. 2002). Cho et al. (2000) found that G/C-richpolytrinucleotides had the lowest values of genetic var-iability, suggesting a different variability potentialdepending on the trinucleotide motif. Differences in thetrinucleotide motif may explain the higher polymor-phism observed in this set of melon EST-SSR markers,as the trimeric EST-SSRs isolated in melon were rich inA/T (CAT, CTT, TCT, AAG motifs), whereas in theprevious reports, the majority of trimeric EST-SSRswere rich in G/C (CGC, AGG, and ACG motifs).
Melon map
Markers evenly distributed in the F2 map (Oliver et al.2001) were used to transfer a basic map framework tothe DHL population. The maps developed in the F2 andDHL populations were co-linear. Map lengths were alsovery similar except in three regions on G1, G9, and G10.The two populations were generated from the samehybrid, although the DHL map reflected only recombi-nation events in the female gamete. Differences inrecombination rates between female and male gametes(Plomion and O’Malley 1996; Wang et al. 1995), sam-pling errors, or selection during the in vitro processesmay be the reasons for the recombination differencesbetween the two maps in some genomic regions.
A higher proportion of markers in the DHL popu-lation showed segregation distortion compared with theF2, as it has been extensively reported in other species(Mannien 2000; Chani et al. 2002; Guzy-Wrobelska andSzarejko 2003). Some of this distortion may be causedby selection during the steps needed to construct DHLsthrough in vitro culture (Dufour et al. 2001). Markerswith distortion only in the DHL population are candi-dates to be linked to genes selected during DHL con-struction.
The differences in segregation distortion and localrecombination rates between populations did not pro-duce any significant difference between the maps. These
Fig. 1 Composite linkage map of melon (Cucumis melo L.) aftermerging the F2 and double haploid line (DHL) maps. Linkagegroups are represented by vertical double lines and labeled G1–G12.Loci are listed to the right, and recombination distances (incentiMorgans) to the left, of each linkage group. Loci in boldfacedefine the framework of each linkage group. Underlined loci werescored in both populations; those in italics were scored only in theDHL population and the remainder only in the F2 population. Lociin brackets could not be mapped after map merging; these markersare in their most likely map positions, according to those calculatedwith the individual populations. Boxes on the left of the linkagegroups indicate regions with distorted segregation (P<0.005) in thepopulation indicated. Solid boxes indicate excess of ‘Piel de Sapo’alleles, white boxes excess of PI 161375 alleles, and dashed boxesexcess of heterozygous genotypic class and lack of PI 161375homozygous. The confidence interval of the position of the putativelocus involved in the distorted segregation is shown with bars,including markers with distortion at P<0.05
c
808
809
results confirm the validity of the previous map (Oliveret al. 2001) and the suitability of the DHL population asthe base population to saturate the melon genetic map.
A map was constructed exclusively with RFLP, SSR,and SNP markers that are typically co-dominant, andhighly or moderately transferable after merging F2- andDHL-based maps. The merged map was slightly shorterthan individual maps (1,021 cM for the merged map vs1,240 cM for the F2 map and 1,223 cM for the DHLmap). Individual maps were built with MAPMAKER,whereas JoinMap was used to build the composite map.MAPMAKER usually produces larger linkage groupsthan JoinMap, even when using the same data set andthe same settings (Liebhard et al. 2003). These differ-ences may be explained by differences in the algorithmsused by these softwares. JoinMap uses map distances tobuild the map and calculate the chi-square for thegoodness of fit of the constructed map, whereas MAP-MAKER uses recombinant frequencies for adjacentintervals, assuming no interference, to calculated likeli-hoods to search the best order and then recombinationfrequencies are translated into mapping distances (Stam1993). Therefore, when the Kosambi mapping functionis used, some degree of discrepancy may occur whenusing these softwares. Nevertheless, the discrepancyobserved in this study was minor and we think that itwas not relevant. Thus, 59 newly developed melon SSRs,13 previously developed cucumber SSRs, and threeSNPs were added to the original melon map, filling somegaps and increasing the map density. SSRs wereapparently distributed randomly throughout the melongenome as has been observed in other plant species suchas rice (Temnykh et al. 2000) or Prunus (Aranzana et al.2003). The association of SSR sequences with centro-meric regions, observed in species such as tomato (Bryanet al. 1997; Areshchenkova and Ganal 1999), was notobserved.
Most previous melon maps have been constructedwith a large proportion of dominant anonymousmarkers (Wang et al. 1997; Perin et al. 2002a; Silbersteinet al. 2003), making full map comparisons and mapmerging not possible. The set of co-dominant molecularmarkers used here covers the whole melon genome.Interestingly, SSR markers alone cover nearly 80% ofthe map. A selected sample of these SSRs can be used asbridges with other published maps to build a melonconsensus maps.
Framework maps based on SSRs and RFLPs couldbe used for genetic analysis in other melon populations,allowing the comparison of the positions of major genesand QTLs what will help to improve our knowledgeabout the genetic control of important fruit qualitytraits. Finally, given that some of these SSRs are alsotransferable to cucumber (Danin-Poleg et al. 2000),Cucurbita pepo (Paris et al. 2003) and other Cucumisspecies (Garcia-Mas et al. 2004), they could also be usedas anchor points for map comparison between species ofthe Cucurbitaceae family.
Acknowledgements The authors thank V. Alfaro and N. Galofre fortechnical assistance. This work was funded in part by grants forprojects AGL2000-0360 and AGL2003-09175-C02-01 from TheSpanish Ministry of Science and Technology and by the SemillasFito-Institut de Recerca i Tecnologia Agroalimentaries (IRTA)joint programme. A.J.M. was supported by a contract from Insti-tuto Nacional de Investigaciones Agrarias (INIA). M.J.G. wassupported by a fellowship from Institut de Recerca I TecnologiaAgroalimentaries (IRTA). The experiments presented here complywith current Spanish law.
References
Akashi Y, Fukunda N, Wako T, Masuda M, Kato K (2002) Ge-netic variation and phylogenetic relationships in East and SouthAsian melons, Cucumis melo L., based on the analysis of fiveisozymes. Euphytica 125:385–396
Aranzana MJ, Pineda A, Cosson P, Dirlewanger E, Ascasibar J,Cipriani G, Ryder CD, Testolin R, Abbott A, King GJ, IezzoniAF, Arus P (2003) A set of simple-sequence repeat (SSR)markers covering the Prunus genome. Theor Appl Genet106:819–825
Areshchenkova T, Ganal MW (1999) Long tomato microsatellitesare predominantly associated with centromeric regions. Gen-ome 42:536–544
Baudracco-Arnas S, Pitrat M (1996) A genetic map of melon(Cucumis melo L.) with RFLP, RAPD, isozyme, disease resis-tance and morphological markers. Theor Appl Genet 93:57–64
Bryan GJ, Collins AJ, Stephenson P, Orry A, Smith JB, Gale MD(1997) Isolation and characterisation of microsatellites fromhexaploid bread wheat. Theor Appl Genet 94:557–563
Chani E, Ashkenazi V, Hillel J, Veilleux E (2002) Microsatellitemarker analysis of an anther-derived potato family: skewedsegregation and gene-centromere mapping. Genome 45:236–242
Chiba N, Suwabe K, Nunome T, Hirai M (2003) Development ofmicrosatellite markers in melon (Cucumis melo L.) and theirapplication to major cucurbit crops. Breed Sci 53:21–27
Chin ECL (1996) Maize simple repetitive DNA sequences: abun-dance and allele variation. Genome 39:866–873
Cho YG, Ishii T, Temnykh S, Chen X, Lipovich L, McCouch SR,Parl WD, Ayres N, Cartinhour S (2000) Diversity of micro-satellites derived from genomic libraries and GenBank se-quences in rice (Oryza sativa L.). Theor Appl Genet 100:713–722
Danin-Poleg Y, Reis N, Baudracco-Arnas S, Pitrat M, Staub JE,Oliver M, Arus P, de Vicente CM, Katzir N (2000) Simplesequence repeats in Cucumis mapping and map merging. Gen-ome 43:963–974
Danin-Poleg Y, Reis N, Tzuri G, Katzir N (2001) Developmentand characterisation of microsatellite markers in Cucumis.Theor Appl Genet 102:61–72
Danin-Poleg Y, Tadmor Y, Tzuri G, Reis N, Hirschberg J, KatzirN (2002) Construction of a genetic map of melon with molec-ular markers and horticultural traits, and localization of genesassociated with ZYMV resistance. Euphytica 125:373–384
Dolcet-Sanjuan R, Claveria E, Llaurado M, Ortigosa A, Arus P(2001) Carnation (Dianthus caryophyllus L.) dihaploid linesresistant to Fusarium oxysporum f. sp. Dianthi. Acta Hortic560:141–144
Doyle JJ, Doyle JL (1990) Isolation of plant DNA from fresh tis-sue. Focus 12:13–15
Dufour P, Johnsson C, Antoine-Michard S, Cheng R, MurigneuxA, Beckert M (2001) Segregation distortion at marker loci:variation during microspore embryogenesis in maize. TheorAppl Genet 102:993–1001
Eujayl I, Sorrells ME, Baum M, Wolters P, Powell W (2002) Iso-lation of EST-derived microsatellite markers for genotyping theA and B genomes of wheat Theor Appl Genet 104:399–407
810
Fazio G, Staub JE, Chung SM (2002) Development and charac-terization of PCR markers in cucumber (Cucumis sativus L.).J Am Soc Hortic Sci 127:545–557
Garcia-Mas J, Monforte AJ, Arus P (2004) Phylogenetic relation-ships among Cucumis species based on the ribosomal internaltranscribed spacer sequence and microsatellite markers. PlantSyst Evol 248:191–204
Gonzalo MJ (2003) Generacion, caracterizacion molecular y eval-uacion morfologica de una poblacion de lıneas dihaploides enmelon (Cucumis melo L.). PhD Dissertation, Universiad deLleida
Guzy-Wrobelska J, Szarejko I (2003) Molecular and agronomicevaluation of wheat doubled haploid lines obtained throughmaize pollination and anther culture methods. Plant Breed122:305–313
Katzir N, Danin-Poleg Y, Tzuri G, Karchi A, Lavi U, Cregan PB(1996) Length polymorphisms and homologies of microsatel-lites in several Cucurbitaceae species. Theor Appl Genet93:1282–1290
Kirkbride JH (1993) Biosystematic monograph of the genus Cuc-umis (Cucurbitaceae). Parkway, Boone
Kosambi DD (1944) The estimation of map distances fromrecombination values. Ann Eugen 12:172–175
Lander ES, Green P, Abrahamson J, Barlow A, Daley M, LincolnS, Newburg L (1987) MAPMAKER: An interactive computerpackage for constructing primary genetic linkage maps ofexperimental and natural populations. Genomics 1:174–181
Liebhard R, Koller B, Gianfranceschi L, Gessler C (2003) Creatinga saturated reference map for the apple (Malus · domesticaBorkh.) genome. Theor Appl Genet 106:1497–1508
Liu L, Kakihara F, Kato M (2004) Characterization of six varietiesof Cucumis melo L. based on morphological and physiologicalcharacters, including shelf-life of fruit. Euphytica 135:305–313
Manninen OM (2000). Associations between anther-culture re-sponse and molecular markers on chromosomes 2H, 3H and 4Hof barley (Hordeum vulgare L.). Theor Appl Genet 100:57–62
Metzgar D, Bytof J, Wills C (2000) Selection against frameshiftmutations limits microsatellite expansion in coding DNA.Genome Res 10:72–80
Mliki A, Staub JE, Zhangyong S, Ghorbel A (2001) Geneticdiversity in melon (Cucumis melo L.): an evaluation of Africangermplasm. Genet Res Crop Evol 48:587–597
Monforte AJ, Garcia-Mas J, Arus P (2003) Genetic variability inmelonbased onmicrosatellite variation. PlantBreed 122:153–157
Monforte AJ, Eduardo I, Abad S, Arus P (2004a) Inheritancemode of fruit traits in melon. Heterosis for fruit shape and itscorrelation with genetic distance. Euphytica (in press)
Monforte AJ, Oliver M, Gonzalo MJ, Alvarez JM, Dolcet-SanjuanR, Arus P (2004b) Identification of quantitative trait loci in-volved in fruit quality traits in melon. Theor Appl Genet108:750–758
Morales M, Luıs-Arteaga M, Marıa Alvarez J, Dolcet-Sanjuan R,Monfort A, Arus P, Garcia-Mas J (2002) Marker saturation ofthe region flanking the gene NSV conferring resistance to themelon necrotic spot carmovirus (MNSV) in melon. J Am SocHortic Sci 127:540–544
Morales M, Roig E, Monforte AJ, Arus P, Garcia-Mas J (2004)Single-nucleotide polymorphisms detected in expressed se-quence tags of melon (Cucumis melo L.). Genome 47:352–360
Oliver M, Garcia-Mas J, Cardus M, Pueyo N, Lopez-Sese AI,Arroyo M, Gomez-Paniagua H, Arus P, De Vicente MC (2001)Construction of a reference linkage map for melon. Genome44:836–845
Ooijen JW van, Voorrips RE (2001) JoinMap 3.0, software for thecalculation of genetic linkage maps. Plant Research Interna-tional, Wageningen
Paris HS, Yonash N, Portnoy V, Mozes-Daube N, Tzuri G, KatzirN (2003) Assessment of genetic relationships in Cucurbita pepo(Cucurbitaceae) using DNA markers. Theor Appl Genet106:971–978
Paterson AH, Lan TH, Reischmann KP, Chang C, Lin SC, BurowMD, Kowalski SP, Katsar CS, DelMonte TA, Feldmann KA,Schertz KF, Wendel JF (1996) Toward a unified genetic map ofhigher plants, transcending the monocot–dicot divergence. NatGenet 14:380–382
Perin C, Hagen LS, de Conto V, Katzir N, Danin-Poleg Y, PortnoyV, Baudracco-Arnas S, Chadoeuf J, Dogimont C, Pitrat M(2002a) A reference map for Cucumis melo based on two re-combinant inbred line populations. Theor Appl Genet104:1017–1034
Perin C, Hagen LS, Giovinazzo N, Besombes, D, Dogimont C,Pitrat M (2002b) Genetic control of fruit shape acts prior toanthesis in melon (Cucumis melo L.). Mol Gen Genomics266:933–941
Pitrat M (2002) 2002 melon gene list. http://www.umre-search.umd.edu/CGC/genes.htm
Plomion C, O’Malley DM (1996) Recombination rate differencesfor pollen parents and seed parents in Pinus pinaster. Heredity77:341–350
Ritschel PS, Lins TCL, Tristan RL, Buso GSC, Buso JA, FerreiraME (2004) Development of microsatellite markers from anenriched genomic library for genetic analysis of melon (Cucumismelo L.). BMC Plant Biol 4:9
Rozen A, Skaletsky HJ (2000) Primer3 on the WWW for generalusers and for biologist programmers. In: Krawetz S, Misener S(eds) Bioinformatics methods and protocols: methods inmolecular biology. Humana, Totowa, pp 365–386
Scott KD, Eggler P, Seaton G, Rossetto M, Ablett EM, Lee LS,Henry RJ (2000) Analysis of SSRs derived from grape ESTs.Theor Appl Genet 100:723–726
Silberstein L, Kovalski I, Brotman Y, Perin C, Dogimont C, PitratM, Klingler J, Thompson G, Portnoy V, Katzir N, Perl-TrevesR (2003) Linkage map of Cucumis melo including phenotypictraits and sequence-characterized genes. Genome 46:761–773
Stam P (1993) Construction of integrated genetic linkage maps bymeans of a new computer package: JoinMap. Plant J 3:739–744
Stepansky A, Kovalski I, Perl-Treves R (1999) Intraspecific clas-sification of melons (Cucumis melo L.) in view of their pheno-typic and molecular variation. Plant Syst Evol 217:313–332
Temnykh S, Park WD, Ayres N, Cartinhour S, Hauck N, LipovichL, Cho YG, Ishii T, McCouch SR (2000) Mapping and genomeorganization of microsatellite sequences in rice (Oryza sativaL.). Theor Appl Genet 100:697–712
Thiel T, Michalek W, Varshney RK, Graner A (2003) ExploitingEST databases for the development and characterization ofgene-derived SSR markers in barley (Hordeum vulgare L.).Theor Appl Genet 106:411–422
Voorrips RE (2002) MapChart: software for the graphical pre-sentation of linkage maps and QTLs. J Hered 93:77–78
Wang G, Hyne V, Chao S, Henry Y, Buyser J, Gale MD, SnapeJW (1995) A comparison of male and female recombinationfrequency in wheat using RFLP maps of homoeologous group 6and 7 chromosomes. Theor Appl Genet 91:744–746
Wang YH, Thomas CE, Dean RA (1997) A genetic map of melon(Cucumis melo L.) based on amplified fragment length poly-morphism (AFLP) markers. Theor Appl Genet 95:791–798
811