signatures of vegetational functional diversity in river basins
TRANSCRIPT

Signatures of vegetational functional diversity in river basins
Rachata Muneepeerakul,1 Andrea Rinaldo,2 Simon A. Levin,3
and Ignacio Rodriguez-Iturbe1
Received 3 May 2007; revised 20 October 2007; accepted 5 November 2007; published 25 January 2008.
[1] Using radiative reflectance as the discriminatory functional trait, we find scale-freesignatures of local functional diversity density of vegetation in river basins, implying ahigh likelihood of locations with very high diversity relative to the overall diversity of theriparian systems (i.e., riparian diversity hot spots). The spatial series of average localfunctional diversity exhibits correlation structures that indicate long-range communicationof diversity information along river networks. The riparian area of a randomly selectedstreamlink is found to be exponentially distributed. Our findings suggest that landscapestructure and dispersal directionality play crucial roles in determining biodiversitypatterns, and thus should be addressed in comprehensive biodiversity theories andfieldwork and conservation campaigns. Finally, the connection between the spectral-group-based functional diversity signatures and those associated with the actual speciesrichness is yet to be verified and quantified; such connection will significantly enhance theimportance of the already meaningful signatures reported here.
Citation: Muneepeerakul, R., A. Rinaldo, S. A. Levin, and I. Rodriguez-Iturbe (2008), Signatures of vegetational functional diversity
in river basins, Water Resour. Res., 44, W01431, doi:10.1029/2007WR006153.
1. Introduction
[2] Riparian systems are a crucial component of ecosys-tems in their respective river basins. The riparian systems,along with their inhabitant, riparian vegetation, providenumerous important ecological functions and services[Lowrance et al., 1984; Peterjohn and Correll, 1984;Gregory et al., 1991;Malanson, 1993; Horne and Goldman,1994; Naiman and Decamps, 1997; McClain et al., 2003].Different species of riparian vegetation differ in the func-tions and services they provide and in their response tovarious kinds of disturbance. As such, understanding thebiodiversity patterns of riparian vegetation is critical forproperly managing the valuable resources associated withthe riparian systems. However, while traditional biodiversitytheories [e.g., MacArthur and Wilson, 1967; Tilman, 1994;Loreau, 2000; Hubbell, 2001] deals almost exclusively withmean-field systems and two-dimensional landscape, riparianvegetation diversity exists in a different landscape, one that ischaracterized by network structure and dispersal directionalityand that has only relatively recently been given its dueattention [Honnay et al., 2001; Fagan, 2002; Levine, 2003;Grant et al., 2007;Muneepeerakul et al., 2007a, 2007c]. Thus,in river basins, hydrology interplays with geomorphology todetermine the ecological diversity patterns.[3] In this paper, we address such issue by investigating
the riparian vegetation functional diversity. Function di-
versity (FD)—which is different from, but related to,taxonomic diversity, i.e., species richness (SR)—is crucialto ecosystems and the services they provide to humans[Tilman et al., 1997; Hulot et al., 2000; Petchey andGaston, 2002]. Here, we study FD patterns of vegetationin riparian systems, using the radiative reflectance as thediscriminatory functional trait. Apart from the practicalsignificance associated with the important roles played bythe riparian systems, such study contributes to theoreticaladvances of a general theory of biodiversity because ripariansystems are geometrically, topologically, and dynamicallydifferent from the two-dimensional (2D), isotropic land-scapes commonly studied in biodiversity (be it FD or SR)literature [MacArthur and Wilson, 1967; Hubbell, 2001;Tilman, 1994; Kinzig et al., 2002]. Thus, the findingsreported here contribute to both practical understanding ofriparian systems, which is useful for large-scale resourcesmanagement, and theoretical development of a more com-prehensive biodiversity theory that takes into account land-scape structure and dispersal directionality.[4] This paper is organized as follows. Section 2 describes
the method used to extract FD information from remotesensing data. Section 3 reports and discusses the signaturesof vegetation functional diversity found in our analysis. Weconclude in section 4.
2. Method
[5] One of the major obstacles in biodiversity studies ingeneral, let alone in riparian systems, is the difficulty inobtaining reliable empirical data of large spatial extent. Tocircumvent this obstacle, there have been attempts to inferbiodiversity from remote sensing data [Gould, 2000;Nagendra,2001; Held et al., 2003; Cingolani et al., 2004; Zhang et al.,2006; Foody and Cutler, 2006; Marani et al., 2006], forexample, via establishing a relationship between SR and
1Department of Civil and Environmental Engineering, PrincetonUniversity, Princeton, New Jersey, USA.
2Dipartimento di Ingegneria Idraulica, Marittima, Ambientale eGeotecnica (IMAGE) and International Centre for Hydrology ‘‘DinoTonini,’’ Universita di Padova, Padova, Italy.
3Department of Ecology and Evolutionary Biology, Princeton University,Princeton, New Jersey, USA.
Copyright 2008 by the American Geophysical Union.0043-1397/08/2007WR006153
W01431
WATER RESOURCES RESEARCH, VOL. 44, W01431, doi:10.1029/2007WR006153, 2008
1 of 7

such surrogates as the standard deviation of the normalizeddifference vegetation index (NDVI). Oftentimes in thisapproach, there is trade-off between the spatial resolutionof the data and the extent it covers. However, with the recentlarge-scale exploitation of commercial satellites and en-hanced remote sensing technologies [Turner et al., 2003],very high resolution data of large areas have becomeavailable and potentially allow for new approaches ofbiodiversity inference [e.g., Zhang et al., 2006]. In thispaper, we focus on the signatures of FD, namely the diversityof spectral groups (SGs), i.e., functional groups classified bytheir radiative reflectance data (see below). The radiativereflectance is a functional trait that is closely tied to theamount of solar energy plants absorb, which is in turn relatedto the leaf area index (LAI) and which drives many keyvegetation processes, e.g., reproduction and productivity[Schlesinger, 1997; Aber and Melillo, 2001; Turner et al.,2003; Fensholt et al., 2004].[6] Here, we analyze the remote sensing data of Sand
Creek, Oklahoma, (approximate location: 36� 300N, 99�060W) taken by the QuickBird satellite on July 18, 2006under excellent atmospheric conditions, i.e., zero cloudcover (Figure 1). The reflectance data from 4 bands—red,green, blue, and infrared—were collected in 11 bits (whose
range of value is 0 to 2047). Its spatial resolution is 2.4 m.Sand Creek was selected primarily because it is located inareas with semi-arid climate, in which riparian zones can beeasily distinguished. It is clear from the QuickBird imagethat during the summer vegetation is relatively lush nearstreams—associated with the dark color—and quite dry inupland areas, due to more water supply in the former.Riparian zones can be defined in many ways, e.g., hydro-logically, geomorphologically, topographically, and biolog-ically. In the present case, it is natural and practical to defineriparian zones as those areas that can support trees duringthe summer.[7] We consider the diversity of specific kinds of func-
tional groups, namely, spectral groups (SGs). We assumethat a 2.4 � 2.4-m pixel contains only one spectral group(SG). A pixel is considered as part of the riparian systems if:(1) it has NDVI � 0.3; and (2) it is located within 60 mfrom the streams delineated by TauDEM. The first criterionensures that we consider only pixels containing trees, whichare used to define riparian systems in this work, not drygrass, bare soils, or water bodies. The second one ensuresthat we do not include trees located in upland areas. Thecriteria result in the extracted riparian zones shown inFigure 2.
Figure 1. QuickBird image of Sand Creek, Oklahoma.
2 of 7
W01431 MUNEEPEERAKUL ET AL.: FUNCTIONAL DIVERSITY IN RIVER BASINS W01431
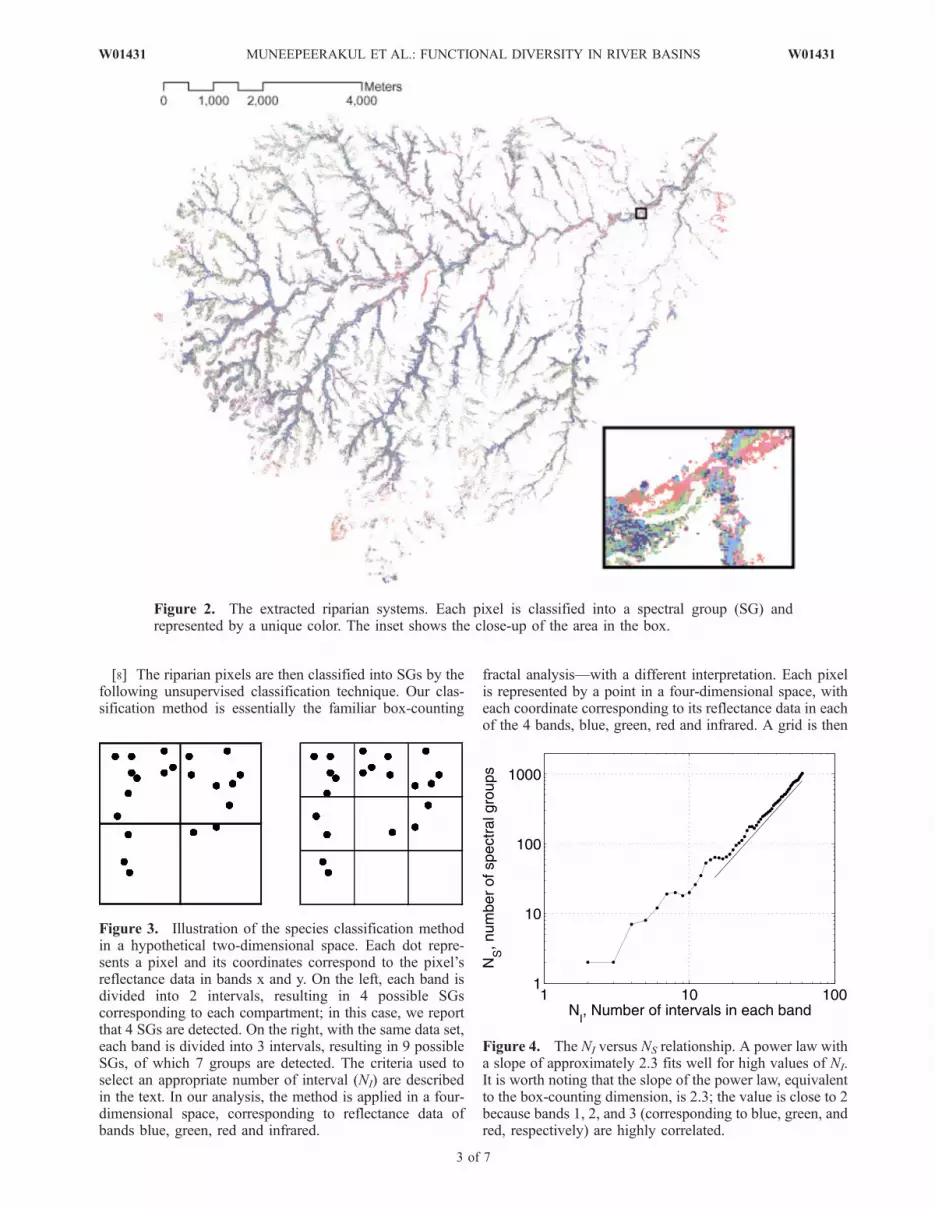
[8] The riparian pixels are then classified into SGs by thefollowing unsupervised classification technique. Our clas-sification method is essentially the familiar box-counting
fractal analysis—with a different interpretation. Each pixelis represented by a point in a four-dimensional space, witheach coordinate corresponding to its reflectance data in eachof the 4 bands, blue, green, red and infrared. A grid is then
Figure 2. The extracted riparian systems. Each pixel is classified into a spectral group (SG) andrepresented by a unique color. The inset shows the close-up of the area in the box.
Figure 3. Illustration of the species classification methodin a hypothetical two-dimensional space. Each dot repre-sents a pixel and its coordinates correspond to the pixel’sreflectance data in bands x and y. On the left, each band isdivided into 2 intervals, resulting in 4 possible SGscorresponding to each compartment; in this case, we reportthat 4 SGs are detected. On the right, with the same data set,each band is divided into 3 intervals, resulting in 9 possibleSGs, of which 7 groups are detected. The criteria used toselect an appropriate number of interval (NI) are describedin the text. In our analysis, the method is applied in a four-dimensional space, corresponding to reflectance data ofbands blue, green, red and infrared.
Figure 4. The NI versus NS relationship. A power law witha slope of approximately 2.3 fits well for high values of NI.It is worth noting that the slope of the power law, equivalentto the box-counting dimension, is 2.3; the value is close to 2because bands 1, 2, and 3 (corresponding to blue, green, andred, respectively) are highly correlated.
W01431 MUNEEPEERAKUL ET AL.: FUNCTIONAL DIVERSITY IN RIVER BASINS
3 of 7
W01431
imposed onto this four-dimensional space by dividing eachband into the same number of equal intervals, NI. Eachblock in the grid corresponds to a SG. Figure 3 illustratesthe procedures. The relationship between NI and the numberof SGs detected, NS, is shown in Figure 4.[9] We consider three criteria to determine appropriate
values of NI. First, for functional diversity (FD) patterns oftrees to be discernible at all, a reasonably high number ofSGs is required. Second, while the overall trend of the NI
versus NS relationship is that NS tends to increase as NI
increases (i.e., finer division), this is not the case for everyincrement in NI. Applying the method to hypothetical data,we find that for some increments in NI, NS decreases, andthat the divisions associated with these locally low values ofNS usually yield better grouping structure; this is shown inFigure 5. Third, for NI greater than approximately 30, therelationship closely follows a power law with a smallvariance and little fluctuation. Thus, in the power lawregime, an increment of NI will produce a predictable,almost deterministic change in NS, implying that no infor-mation on NS is being gained by using a finer-resolutiondivision. Based on these three criteria, we use NI values of
9, 17 and 28 intervals for the analysis, which result in 18, 61and 167 SGs, respectively. We then compare the results tostudy their sensitivity to changes in NI.
3. Results and Analysis
3.1. Exponentially Distributed Riparian Areas
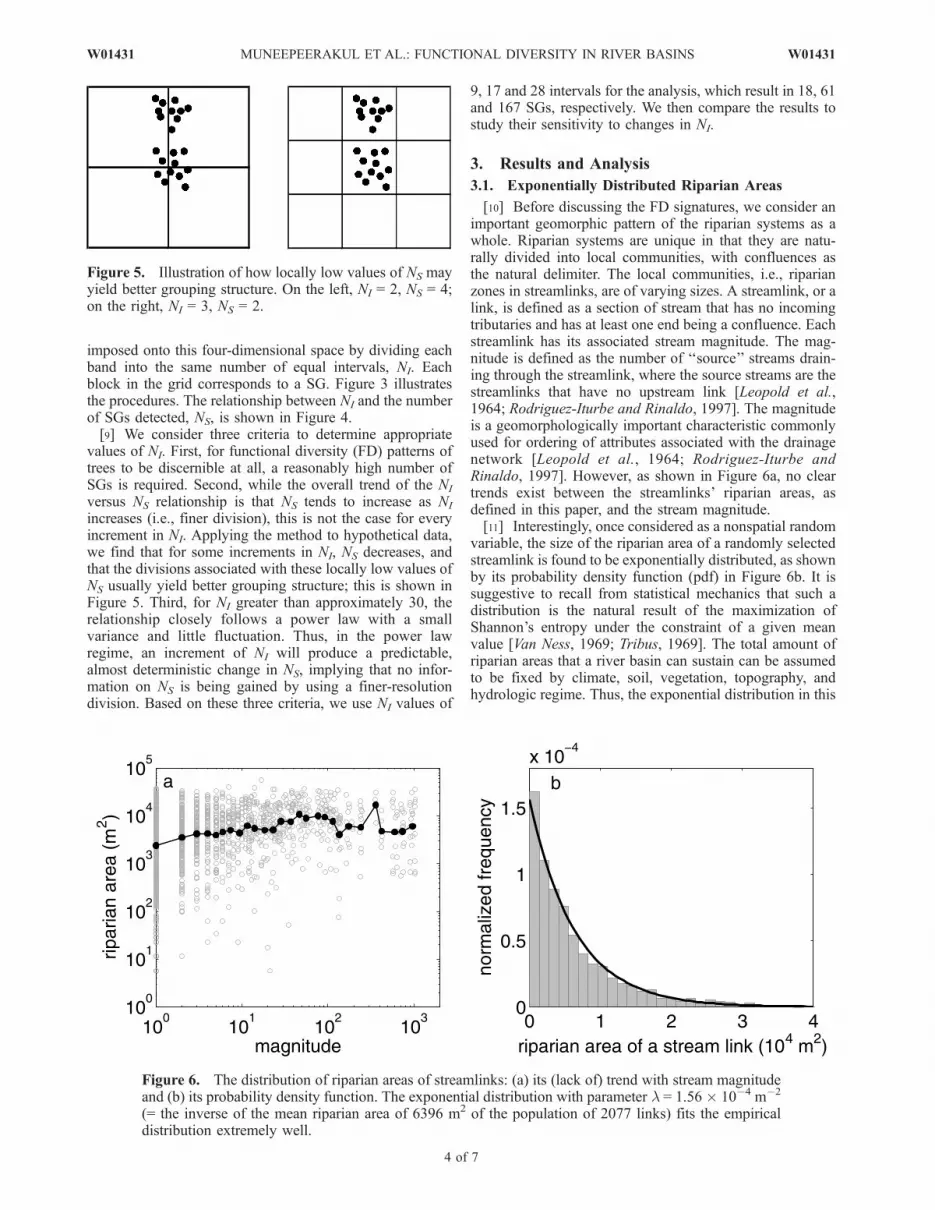
[10] Before discussing the FD signatures, we consider animportant geomorphic pattern of the riparian systems as awhole. Riparian systems are unique in that they are natu-rally divided into local communities, with confluences asthe natural delimiter. The local communities, i.e., riparianzones in streamlinks, are of varying sizes. A streamlink, or alink, is defined as a section of stream that has no incomingtributaries and has at least one end being a confluence. Eachstreamlink has its associated stream magnitude. The mag-nitude is defined as the number of ‘‘source’’ streams drain-ing through the streamlink, where the source streams are thestreamlinks that have no upstream link [Leopold et al.,1964; Rodriguez-Iturbe and Rinaldo, 1997]. The magnitudeis a geomorphologically important characteristic commonlyused for ordering of attributes associated with the drainagenetwork [Leopold et al., 1964; Rodriguez-Iturbe andRinaldo, 1997]. However, as shown in Figure 6a, no cleartrends exist between the streamlinks’ riparian areas, asdefined in this paper, and the stream magnitude.[11] Interestingly, once considered as a nonspatial random
variable, the size of the riparian area of a randomly selectedstreamlink is found to be exponentially distributed, as shownby its probability density function (pdf) in Figure 6b. It issuggestive to recall from statistical mechanics that such adistribution is the natural result of the maximization ofShannon’s entropy under the constraint of a given meanvalue [Van Ness, 1969; Tribus, 1969]. The total amount ofriparian areas that a river basin can sustain can be assumedto be fixed by climate, soil, vegetation, topography, andhydrologic regime. Thus, the exponential distribution in this
Figure 5. Illustration of how locally low values of NS mayyield better grouping structure. On the left, NI = 2, NS = 4;on the right, NI = 3, NS = 2.
Figure 6. The distribution of riparian areas of streamlinks: (a) its (lack of) trend with stream magnitudeand (b) its probability density function. The exponential distribution with parameter l = 1.56 � 10�4 m�2
(= the inverse of the mean riparian area of 6396 m2 of the population of 2077 links) fits the empiricaldistribution extremely well.
4 of 7
W01431 MUNEEPEERAKUL ET AL.: FUNCTIONAL DIVERSITY IN RIVER BASINS W01431

case suggests the possibility that riparian communities alonga drainage network organize themselves into a configurationthat maximizes entropy, leading to high flexibility andresilience in a naturally uncertain environment; furtherinvestigation is certainly needed to verify this hypothesis.This geomorphic pattern controls the FD signatures, andpotentially, other processes such as foraging patterns ofanimals in the system.
3.2. Power Law a Diversity: More Likely BiodiversityHot Spots
[12] The first striking FD signature detected in the anal-ysis is the power law character of a diversity (Figure 7).Here, a diversity is defined as the number of SGs detectedin a streamlink normalized by the link’s riparian area; onemay thus call it local FD density. Note that although thenumber of SGs depends on how finely the reflectance dataare classified, Figure 7 shows that the power law characteris exhibited in all cases. The power law distributions show anontrivial scaling exponent through approximately twoorders of magnitude. An important implication of the powerlaw character is that in river basins, FD hot spots, i.e., localcommunities with much higher a diversity than most othercommunities in the same riparian system, are highly likelyto occur.
3.3. Rank-Abundance Curves
[13] Another important diversity signature is the relativeabundance pattern; the rank-abundance curves of SGs inSand Creek in Figure 8 illustrate such pattern. The rank-abundance curves are either relatively straight or slightlyconcave toward the bottom of the figure. The relativelystraight rank-abundance curves may be indicative of thestochasticity of interspecific dynamics because a number ofbiodiversity (SR) models, which do not exhibit straight-linerank-abundance curves in their deterministic form, do sowhen stochasticity in interspecific dynamics is allowed[Purves and Pacala, 2005]. It is also important to recognizethat, although the straight-line character is predicted by the
neutral model [Hubbell, 2001], it does not imply neutralprocess [Purves and Pacala, 2005]. Furthermore, it hasbeen shown that dispersal directionality causes concavity ofthe rank-abundance curves [Muneepeerakul et al., 2007c]. Itis remarkable that these observed FD signatures bearsignificant resemblance to their SR counterparts derivedfrom theoretical models.[14] From the modeling perspective, the shape of rank-
abundance curves and the power law character of a diver-sity constitute a stringent set of requirements that appropri-ate models of biodiversity in river basins are to meet. Forexample, consider a simple model in which the speciescomposition in streamlinks—whose riparian areas are ex-ponentially distributed—are drawn from a species poolconsisting of a fixed number of species, each with equalprobability of being drawn and with infinite supply; that is,the pool never runs out of any species. This simple model iscapable of producing the power law a diversity distributionwhen the number of species in the pool is low, in which casethe distribution of a diversity is dominated by features ofthe exponential distribution controlling the space availablefor the species coexistence. The power law character is,however, quickly lost as the number of species increases.Furthermore, the rank-abundance curves associated withthis model are essentially horizontal lines, meaning thatevery species is equally abundant, a pattern far from theobserved one.
3.4. Spatial Series of a Diversity
[15] The spatial structure of a diversity and its connec-tion to the river network may be analyzed through thespatial series of the average a diversity of all the stream-links located at the same distance from the basin outlet—ina similar fashion to the width function, which represents therelative proportion of drainage area at a distance from theoutlet and thus embeds the key features of travel timedistributions [Leopold et al., 1964; Rodriguez-Iturbe and
Figure 7. The exceedance probability plots of a diversity:the solid line represents the classification that results in18 SGs; the dashed line 61 SGs; and the dotted line 167 SGs.The straight-line character implies power laws.
Figure 8. The rank-abundance curves of spectral groups(SGs): the solid line represents the classification that results in18 SGs; the dashed line 61 SGs; and the dotted line 167 SGs.The relatively straight line character indicates the possibleeffects of stochasticity in interspecific dynamics, notnecessarily the neutral process [Purves and Pacala, 2005].
W01431 MUNEEPEERAKUL ET AL.: FUNCTIONAL DIVERSITY IN RIVER BASINS
5 of 7
W01431

Rinaldo, 1997]. The resulting spatial series is shown inFigure 9a. The distance is measured in unit of ‘‘step’’, wherea step occurs when one or more streamlinks becomeincluded in, or excluded from, the averaging. The seriessuggests that a diversity is higher and more fluctuating inthe downstream links of the river basin. Further analysesshow that the series exhibits long-range autocorrelation(Figure 9b) and a power law power spectrum, S(f) � f�1.3
(Figure 9c). These characteristics suggest long-range com-munication of diversity information (likely via such pro-cesses as long-distance dispersal) and possible criticality[Pascual and Guichard, 2005] of riparian systems in riverbasins.
4. Conclusions and Discussion
[16] The signatures reported here have significant impli-cations for both theoretical and empirical studies of vege-tation diversity. The exponential distribution of riparianareas calls for a theoretical explanation regarding themechanisms behind and the benefits/drawbacks associatedwith this configuration. The enhanced likelihood of FD hotspots, suggested by the power law a diversity distribution,needs to be taken into account in the management andconservation of the riparian systems, which in turn areclosely tied to other important resources. The power lawcharacter of a diversity and the shape of the rank-abun-dance curves also serve as a cross-check for theoreticalbiodiversity models implemented in river networks. Theconsequences of long-range communication of biodiversityinformation are less clear; theoretical and empirical studiesare needed to conclusively determine its impact on theresilience of riparian systems to natural and anthropogenicdisturbances. Importantly, given the common characteristicsshared by river basins of various sizes under variousclimates [Rodriguez-Iturbe and Rinaldo, 1997], we expectthese signatures to hold in general across various riparian
systems; similar analysis on different river basins is ofcourse needed to confirm this hypothesis.[17] While the signatures of spectral-group-based func-
tional diversity are inherently meaningful, their implicationswould be even greater if the connection to actual speciesrichness was verified and quantified. This must be done viaintensive fieldwork in riparian zones. Once such connectionis established, we would then acquire an effective way toretrieve biodiversity information over large areas for futureresearch with minimal fieldwork. Finally, the method andanalysis employed here may be extended to other riverbasins located in nonarid regions, whose riparian zones maynot be easily distinguishable. One possible approach is todelineate riparian zones based on results of theoreticalmodels that take into account biology of the riparianvegetation and hydrology and geomorphology of the riverbasins [see Camporeale and Ridolfi, 2006; Muneepeerakulet al., 2007b]; this is the approach that we are currentlyinvestigating. Other approaches are entirely possible andcertainly warrant future research.
[18] Acknowledgments. We gratefully acknowledge the support ofthe James S. McDonnell Foundation through grant for Studying ComplexSystems (220020138). We also thank Joshua S. Weitz for useful comments.
ReferencesAber, J. D., and J. M. Melillo (2001), Terrestrial Ecosystems, 2nd ed.,Academic, San Diego, Calif.
Camporeale, C., and L. Ridolfi (2006), Riparian vegetation distributioninduced by river flow variability: A stochastic approach, Water Resour.Res., 42, W10415, doi:10.1029/2006WR004933.
Cingolani, A. M., D. Renison, M. R. Zak, and M. R. Cabido (2004),Mapping vegetation in a heterogeneous mountain rangeland using Land-sat data: an alternative method to define and classify land-cover units,Remote Sens. Environ., 92(1), 84–97, doi:10.1016/j.rse.2004.05.008.
Fagan, W. F. (2002), Connectivity, fragmentation, and extinction risk indendritric metapopulations, Ecology, 83(12), 3243–3249.
Fensholt, R., I. Sandholt, and M. S. Rasmussen (2004), Evaluation ofMODIS LAI, fAPAR and the relation between fAPAR and NDVI in asemi-arid environment using in situ measurements, Remote Sens. Envir-on., 91, 490–507.
Foody, G. M., and M. E. Cutler (2006), Mapping the species richness andcomposition of tropical forests from remotely sensed data with neuralnetworks, Ecol. Modell., 195, 37–42.
Gould, W. (2000), Remote sensing of vegetation, plant species richness andregional biodiversity hot spots, Ecol. Appl., 10(6), 1861–1870.
Grant, E. H. C., W. H. Lowe, andW. F. Fagan (2007), Living in the branches:population dynamics and ecological processes in dendritic networks, Ecol.Lett., 10, 165–175.
Gregory, S. V., F. J. Swanson, W. A. McKee, and K. W. Cummins (1991),An ecosystem perspective of riparian zones, Bioscience, 41(8), 540–551.
Held, A., C. Ticehurst, L. Lymburner, and N. Williams (2003), High reso-lution mapping of tropical mangrove ecosystems using hyperspectral andradar remote sensing, Int. J. Remote Sens., 24(13), 2739–2759.
Honnay, O., W. Verhaeghe, and M. Hermy (2001), Plant community as-sembly along dendritic networks of small forest streams, Ecology, 82(6),1691–1702.
Horne, A. J., and C. R. Goldman (1994), Limnology, 2nd ed., McGraw-Hill,New York.
Hubbell, S. P. (2001), The Unified Neutral Theory of Biodiversity andBiogeography, Princeton Univ. Press, Princeton, N. J.
Hulot, F. D., G. Lacroix, F. Lescher-Moutoue, and M. Loreau (2000),Functional diversity governs ecosystem response to nutrient enrichment,Nature, 405, 340–344.
Kinzig, A. P., S. W. Pacala, and D. Tilman (Eds.) (2002), The FunctionalConsequences of Biodiversity, Princeton Univ. Press, Princeton, N. J.
Leopold, L. B., M. G. Wolman, and J. P. Miller (1964), Fluvial Processes inGeomorphology, W. H. Freeman, New York.
Levine, J. M. (2003), A patch modeling approach to the community-levelconsequences of directional dispersal, Ecology, 84(5), 1215–1224.
0
Figure 9. The spatial series analysis of average a diversityfor the case of 61 SGs: (a) the spatial series of streamlinksat a given distance from the outlet, (b) its correlogram, and(c) its power spectrum.
6 of 7
W01431 MUNEEPEERAKUL ET AL.: FUNCTIONAL DIVERSITY IN RIVER BASINS W01431

Loreau, M. (2000), Are communities saturated?: On the relationshipbetween a, b and g diversity, Ecol. Lett., 3, 73–76.
Lowrance, R., R. Todd, J. Fail, Jr., O. Hendrickson, Jr., R. Leonard, andL. Asmussen (1984), Riparian forests as nutrient filters in agriculturalwatersheds, BioScience, 34(6), 374–377.
MacArthur, R. H., and E. O. Wilson (1967), The Theory of Island Biogeo-graphy, Princeton Univ. Press, Princeton, N. J.
Malanson, G. P. (1993), Riparian Landscapes, Cambridge Univ. Press,New York.
Marani, M., T. Zillio, E. Belluco, S. Silvestri, and A. Maritan (2006), Non-neutral vegetation dynamics, PLoS ONE, 1(1), e78.
McClain, M. E., et al. (2003), Biogeochemical hot spots and hot momentsat the interface of terrestrial and aquatic ecosystems, Ecosystems, 6,301–312, doi:10.1007/s10021-003-0161-9.
Muneepeerakul, R., S. A. Levin, A. Rinaldo, and I. Rodriguez-Iturbe(2007a), On biodiversity in river networks: A trade-off metapopulationmodel and comparative analysis, Water Resour. Res., 43, W07426,doi:10.1029/2006WR005857.
Muneepeerakul, R., A. Rinaldo, and I. Rodriguez-Iturbe (2007b), Effects ofriver flow scaling properties on riparian width and vegetation biomass,Water Resour. Res., 43, W12406, doi:10.1029/2007WR006100.
Muneepeerakul, R., J. S. Weitz, S. A. Levin, A. Rinaldo, and I. Rodriguez-Iturbe (2007c), A neutral metapopulation model of biodiversity in rivernetworks, J. Theor. Biol., 245(2), 351–363, doi:10.1016/j.jtbi.2006.10.005.
Nagendra, H. (2001), Using remote sensing to assess biodiversity, Int. J.Remote Sens., 22(12), 2377–2400.
Naiman, R. J., and H. Decamps (1997), The ecology of interfaces: Riparianzones, Ann. Rev. Ecol. Syst., 28, 621–658.
Pascual, M., and F. Guichard (2005), Criticality and disturbance in spatialecological systems, Trends Ecol. Evol., 20(2), 88–95.
Petchey, O. L., and K. J. Gaston (2002), Function diversity (fd), speciesrichness and community composition, Ecol. Lett., 5, 402–411.
Peterjohn, W. T., and D. L. Correll (1984), Nutrient dynamics in an agri-cultural watershed: Observations on the role of a riparian forest, Ecology,65(5), 1466–1475.
Purves, D. W., and S. W. Pacala (2005), Ecological drift in niche-structuredcommunities: Neutral pattern does not imply neutral process, in BioticInteractions in the Tropics, edited byD.Burslem,M. Pinard, and S. Hartley,pp. 107–138, Cambridge Univ. Press, New York.
Rodriguez-Iturbe, I., and A. Rinaldo (1997), Fractal River Basins: Chanceand Self-Organization, Cambridge Univ. Press, New York.
Schlesinger, W. H. (1997), Biogeochemistry: An Analysis of GlobalChange, 2nd ed., Academic, San Diego, Calif.
Tilman, D. (1994), Competition and biodiversity in spatially structuredhabitats, Ecology, 75(1), 2–16.
Tilman, D., J. Knops, D. Wedin, P. Reich, M. Ritchie, and E. Siemann(1997), The influence of functional diversity and composition on ecosys-tem processes, Science, 277, 1300–1302.
Tribus,M. (1969),Rational Descriptions, Decisions andDesigns, Pergamon,New York.
Turner, W., S. Spector, N. Gardiner, M. Fladeland, E. Sterling, andM. Steininger (2003), Remote sensing for biodiversity science andconservation, Trends Ecol. Evol., 18(6), 306–314.
Van Ness, H. C. (1969), Understanding Thermodynamics, Dover, Mineola,N. Y.
Zhang, J., B. Rivard, A. Sanchez-Azofeifa, and K. Castro-Esau (2006),Intra- and inter-class spectral variability of tropical tree species at LaSelva, Costa Rica: Implications for species identification using HYDICEimagery, Remote Sens. Environ., 105(2), 129 – 141, doi:10.1016/j.rse.2006.06.010.
����������������������������S. A. Levin, Department of Ecology and Evolutionary Biology, Eno
Hall, Princeton University, Princeton, NJ 08544, USA.R. Muneepeerakul and I. Rodriguez-Iturbe, Department of Civil and
Environmental Engineering, Princeton University, Engineering Quad,Princeton, NJ 08544, USA. ([email protected])
A. Rinaldo, Dipartimento di Ingegneria Idraulica, Marittima, Ambientalee Geotecnica (IMAGE) and International Centre for Hydrology ‘‘DinoTonini,’’ Universita di Padova, via Loredan 20, I-35131 Padova, Italy.
W01431 MUNEEPEERAKUL ET AL.: FUNCTIONAL DIVERSITY IN RIVER BASINS
7 of 7
W01431