siconsem_2021.pdf - uum press - universiti utara malaysia
TRANSCRIPT


Organised by
UUM PRESSUNIVERSITI UTARA MALAYSIA
http://uumpress.uum.edu.my/siconsem/ http://www.uumpress.uum.edu.my
PENERBIT UNIVERSITI UTARA MALAYSIASintok • 2021
e-ISBN 978-967-2486-85-5
PublisherUUM PressUniversiti Utara Malaysia06010 UUM Sintok, KedahMalaysiaPhone: +604—9284797 Fax: +604-9284792URL: http://[email protected]
© 2021 UUM Press. All Rights reserved.
This work is subject to copyright. All right are reserved. Whether the whole or part of the material is concerned, specifically, the right of translating, reprinting, reuse of illustrations, recitation, broadcasting, reproduction on papers, electronics or any other way, and storage in data banks without either the prior written permission of the Publisher, or authorization through payment of the appropriate fees as charged by the Publisher. Due care has been taken to ensure that the information provided in this proceeding is correct. However, the publisher bears no responsibility for any damage resulting from any inadvertent omission or inaccuracy of the content in the proceedings. This proceeding is published in electronic format.
Perpustakaan Negara Malaysia Cataloguing-in-Publication DataTitle
4th Sintok International Conference on Social Science and Management
EditorsNor Arpizah AtanNor Aziani JamilZurina Yahya
Graphic and LayoutZuraizee Zulkifli
TypesetterNoor Dalilah Mohd Yunos Rosida Abdul Razak Siti Asmahani Aziz
Published by UUM Press
5
4TH SINTO
K INTERN
ATION
AL CON
FERENCE O
N SO
CIAL SCIENCE AN
D M
ANAG
EMEN
T
MESSAGE FROM DEPUTY VICE-CHANCELLOR PERFORMING DUTIES OF VICE-CHANCELLOR
6
MESSAGE FORM THE CONFERENCE DIRECTOR 7
SICONSEM THEMES 8
LIST OF ARTICLES 9 - 11
ARTICLES 14 - 422
ORGANIZING COMMITTEE 424
ACKNOWLEDGMENT 425
CONTENTS
6
MESSAGEFROM DEPUTY VICE-CHANCELLOR PERFORMING DUTIES OF VICE- CHANCELLOR
Assalamualaikum Warahmatullahi Wabarakatuh
In the name of Allah, the most Gracious and the most Merciful, Universiti Utara Malaysia (UUM) is proud to host the 4th Sintok International Conference on Social Science and Management (SICONSEM) 2021 organized by UUM Press.
When reports emerged from China of a novel coronavirus at the end of 2019, healthcare leaders, researchers, scientists and medical experts around the world immediately began working to find effective and safe vaccines and treatments. The global spread of COVID-19 has meant that our normal life and campus life totally changed. Teaching methods through classroom teaching, laboratory research and research activities are really affected owing to SOP mandate and to keep everyone safe.
The aim of SICONSEM 2021 is to address the issues related to research in the field of Social Science. I believe this is a truly a unique platform for researchers, academic and Postgraduate Students to contribute and share their current research finding on pandemic theme.
This conference will also work as a platform for producing high-impact papers and promoting UUM Journals to be internationally competitive. On behalf of the management of UUM, I welcome all conference delegates and wish you all a fruitful discourse throughout SICONSEM 2021. I wish to congratulate UUM Press and all the Editors-in Chief and Editorial board member UUM journals for organizing this conference.
PROFESSOR DR. HAIM HILMAN ABDULLAH Deputy Vice-Chancellor Performing Duties of Vice- Chancellor

7
4TH SINTO
K INTERN
ATION
AL CON
FERENCE O
N SO
CIAL SCIENCE AN
D M
ANAG
EMEN
T
MESSAGEFROM THECONFERENCE DIRECTOR
Assalamualaikum Warahmatullahi Wabarakatuh
It is my privilege, on behalf of the SICONSEM 2021 organizing committee, to welcome you to the conference.
The Sintok International Conference on Social Science and Management (SICONSEM) 2021, is the fourth conference in the series.
As the pandemic swept across the globe, it has forced us to rethink the way we work and deliver. For the first time ever, SICONSEM is being held in the virtual mode.
While we are still confronted with the COVID 19 pandemic, we are proud to bring SICONSEM as a platform for academia, researchers and student to virtually gather and share current issues, challenges and potentials related to the pandemic in Social Science. It brings together about 80 registered presenters for the parallel session, converging at the conference in 10 tracks, namely Learning and Instructions in the New Normal; Legal and Ethical Challenges and Way Forward in the Era of Pandemic; Examining New Realities, Trends and Strategies in the Changing World; Sustainable Growth in the Midst of Uncertainties; Sustainability and Performance: Navigating Business in Dynamic Environment; Striving through Disaster (Pandemic) for Sustainable Livelihood; Entrepreneurism & Business Growth; Digitization of Government in Coping the Challenges of Pandemic Landscape; Examining Language Realities, Language Context and Industrial Context 5.0 and Current Issues in Event, Tourism and Hospitality Studies.
Selected articles will be published in the UUM journals after going through the process of evaluation and improvement. Thank you to the presenters and participants of SICONSEM 2021. I wish the conference a grand success.
PROF. DR. RAM AL JAFFRI SAADConference Director

8
SICONSEMTHEMES Learning and Instructions in the New Normal
Legal and Ethical Challenges and Way Forward in the Era of Pandemic
Managing New Dimension of Global Economic and Business for Gaining the Edge
Examining New Realities, Trends and Strategies in the Changing World
Sustainable Growth in the Midst of Uncertainties
Sustainability and Performance: Navigating Business in Dynamic Environment
Striving through Disaster (Pandemic) for Sustainable Livelihood
Entrepreneurism & Business Growth
Digitization of Government in Coping the Challenges of Pandemic Landscape
Current Issues in Event, Tourism and Hospitality Studies
Examining Language Realities, Language Contexts and Industrial 5.0
9
4TH SINTO
K INTERN
ATION
AL CON
FERENCE O
N SO
CIAL SCIENCE AN
D M
ANAG
EMEN
T
LIST OF ARTICLES1. Implementation of heutagogy management in remote areas for student
learning during the covid 19 pandemic Alex Winarno, Ahmad Kultur Hia, Nurdelima Waruwu & Deni Hermana
2. Optimizing online learning process in the new normal Iffah Budiningsih, Imelda Pujiharti & Siti Rapingah
3. School improvement specialist coach plus (SISC+) from perspectives of assessment competencies Noel Jimbai Balang
4. Artificialintelligenceinacademicwritingteaching Marina Georgievna, Petrova & Natalia Fedorovna, Mikheeva
5. Online learning readiness and its relationship with student perceived stress during covid-19 pandemic Noraini Omar, Salmi Lilek, Lee Hou Yew & Teng Kie Yin
6. The level of language anxiety among students studying arabic language as a foreign language: A sample from Universiti Teknologi Mara Muhammad Syaffiq Mohammed Raffi & Nadhirah Ishak
7. Understanding the key features of ufuture as an open and distance learning platform for Universiti Teknologi Mara Nawal Abdul Razak, Zazaleena Zakariah, Juhaida Ismail & Rozeleenda Abdul Rahman
8. Myself-reflexivejourneyfromcontacttoremoteteachingandlearning:Insights and experiences Logamurthie Athiemoolam
9. Evaluating students’ engagement in distance learning program blended learningactivities:Acasestudyinelementarystatisticssubject Nur Asy-Syura, Saadi Ahmad Kamaruddin, Fazillah Mohmad Kamal & Norhayati Yusof
10. A comparative analysis of management systems in Nigerian and Ukrainian universities Anu K. Toriola & Salami A. Lateef, Oyewola & S. Adegboyega
11. The perception, behaviours and acceptance of covid-19 vaccine among Malay senior citizens: A qualitative study Ismail Sualman & Suffian Hadi Ayub
12. Fostering new teaching strategies of teaching English as a foreign language in online classrooms for undergraduates during the pandemic Ayad Hammad Ali & Hanaa Abass Suleiman
13. Analyzing criteria used in developing descriptive essay marking rubrics focussing on vocabulary use Mariann Edwina a/p Mariadass, Mohd Hasrul Kamarulzaman & Belinda Marie Balraj
14. Equity crowdfunding industry and its’ regulation in Malaysia and Indonesia: Prospects and challenges during the covid-19 pandemic Asmah Laili Hj. Yeon & Putri, U.T
10
15. Copyright infringement and protection of short video in China Zhang Chunyu & Zinatul Ashiqin Zainol
16. Failure of wages in employment contracts: Legal and employment relationship perspectives Nazruzila Razniza Mohd Nadzri, Rohaida Nordin, Dihlvinder Kaur Mohkam Singh, Kalaveny Kanagasingam & Mary Mathews K.A. Mathew
17. Consumer protection for halal false description in e-commerce Nurul Najla’ Athirah Muhamad Nazari, Elistina Abu Bakar & Afida Mastura Muhammad Arif
18. The impact of covid-19 on systemic risk towards companies: Malaysian comparate law and corporate governance perspectives Yang Chik Adam
19. Legal issues on right to operate franchise business in Malaysia: Challenges and way forward in the pandemic era Hua Siong Wong
20. Regulatingsocialmediainfluencermarketinginthecovid-19erainMalaysia Junaidah Zeno
21. Stateeffortsinordertofulfilltherighttohealthinthemidstofthecovid-19 pandemic Rosalia Dika Agustanti, Shafira Fatahaya & Rissa Asmitha Wardoyo
22. National policy versus competition policy: Impact of SOE, GLCS and GLICS monopolistic practice on the national economy Angayar Kanni Ramaiah & Safinaz Mohd. Hussein
23. The effect of dynamic and organizational capabilities on integrated supply chain performance in Malaysian wood-based industry: A future direction Rainah Yusof, Nazura Mohamed Sayuti, Siti Norida Wahab & Arifff Azly Muhamed
24. The impact of relationship marketing on channel performance of MLM sales leaders in Malaysia: Soft skills training program as a moderator Loo Yew Liang, Mohd Sobri Don & Nik Ab. Halim Nik Abdullah
25. Strategic planning of reverse logistics system among omnichannel companies: A qualitative study Yee Jing Foo & Emy E A-Jalil
26. Enhancing employee well-being from knowledge management perspectives among academicians Siti Murni Mat Khairi, Norzanah Mat Nor & Herwina Rosnan
27. Fiscal and monetary policies in Malaysia, Singapore, and Indonesia during the covid-19 crisis Roziana Baharin & Noorhalizam Mohamed Noor
28. Intended use of IPO proceeds and survival of public listed companies in Malaysia Siti Sarah Alyasa-Gan & Norliza Che-Yahya
29. Risk management practices in Malaysian public listed company: A concept paper Saifulrizan Norizan, Fazlida Mohd Razali, Nadiah Abd Hamid & Dayangku Ruhayah Awang Bolhan
11
4TH SINTO
K INTERN
ATION
AL CON
FERENCE O
N SO
CIAL SCIENCE AN
D M
ANAG
EMEN
T
30. The impact of income and educational level on happiness Badariah Haji Din, Muzafar Shah Habibullah & Ratneswary Rasiah
31. Impactofemployee’scareerexpectationandworkrecognitiononjobsatisfaction among working adult in Malaysia Poon Yih Kiat & Lee Huah
32. Mitigating climate change: Evidence from companies participating in mycarbon program Jamaliah Abdul Majid, Noriah Che Adam, Nor Atikah Shafai, & Saidatul Nurul Hidayah Jannatun Naim
33. A preliminary study on understanding the consumptions of therapeutic essential oils during covid-19 pandemic among adults using ANN Saadi Ahmad Kamaruddin, Abdul Malek Yaakob, Nor Anis Nadhirah Md Nasir & Siti Fatimah Abdul Rahman
34. Pandemic:LinkingthebigfiveandemployeeperformancewithintheSMES context in Malaysia Nur Lailatul Husna Mohammad Yusof, Abdul Halim Abdul Majid & Siti Norasyikin Abdul Hamid
35. Redefiningsuccessofmanagementgraduatesthroughemploymentquality:Impactofperceivedemployabilityandfocusedjobsearch Ruchika Gupta & Amirul Hasan Ansari
36. Importance-performance analysis on Malaysian shopping mall facilities William Eng Yong Keong
37. Perceived organizational support as a moderator in the association between work-life balance and employee retention Abdul Rahim Zumrah, Mohd Azmir Mohd Nizah & Nurhamidah Jalil
38. Effect of experiential and symbolic value on luxury cosmetic brand loyalty: Themediatingroleofbrandidentification Siti Nor Bayaah Ahmad & Azizah Omar
39. NATO Eastward expansion and offensive realism perspective: An analysis Mohd. Noor Mat Yazid

12

ARTICLES
14
SICONSEM2021: 006-002
IMPLEMENTATION OF MANAGING HEUTAGOGY IN REMOTE AREA FOR STUDENT LEARNING IN PANDEMIC COVID-19
1Alex Winarno, 2Ahmad Kultur Hia, 3Nur Delima Waruwu & 4Deni Hermana1Department of Business Administration, Universitas Telkom, Bandung, Indonesia
2Department of Management, STIE Pertiwi, Bekasi, Indonesia3Department of Education Management, UIN Syarif Hidayatullah, Jakarta, Indonesia
4Department of Business Administration, STIE Bagasasi, Bandung, Indonesia.
Corresponding authors: [email protected]; [email protected]; [email protected]; [email protected]
ABSTRACT
Changes in interactions in learning due to the COVID-19 pandemic have become imperative. The role of technology is very helpful for teachers to organize the learning process to remain optimal. But the various obstacles faced cause teachers to have difficulty managing limitations both related to technology and how to encourage students to learn independently. The aim of the research is to implement heutagogy management in remote areas for student learning. The research method uses a mix method through pseudo-experiments and surveys of 75 teachers and high school students in Banten Province, Indonesia who apply heutagogy management in learning. Data analysis uses different tests and constructive analysis. Implementation of heutagogy management developed and adapted to the needs for student learning in some remote areas with teachers is considered quite effective. The application of the principles and dimensions of self-directed learning in heutagogy management as the key to the success of heutagogy learning. The limitations of technology infrastructure can be anticipated with a learning model with direct visits and instructionals. Optimization of information system functions in the self-directed learning process is followed by teacher readiness to understand the importance of learning how to learn to manage information technology-based learning as a force in heutagogy management governance. Students and teachers learn together independently with the same goal of understanding the meaning of learning. The limitations of teachers in understanding technology become obstacles that need to be solved together through ICT literacy education and training.
Keywords: Managing heutagogy, remote area, self-directed learning, student, teacher
INTRODUCTION
In general, Nicola et al. (2020), Phillipson et al. (2020) explained that COVID-19 has affected various sectors both primary, secondary and tertiary such as education. The COVID-19 pandemic has prompted changes to the learning management system. Optimization of technology functions into the learning process becomes the main choice so that learning goals can be realized. But these efforts require support in the form of an understanding of learning management models based on technology. One learning system suitable for situations such as pandemics is heutagogy. Hia (2018) presented heutagogy as a virtual collaboration to expand access to shared knowledge and innovation. The convergence of technologies can facilitate increased activity of learning activities through technology. Hase and Kenyon (2001) proposed, heutagogy as a concept of self-learning. Heutagogy is a holistic framework for creating self-determined learners in the 21st century. Jones et al. (2014), Msila and Setlhako (2012), Blaschke and Hase (2016) explained heutagogy further expanding the role of human agency in the learning process.
Heutagogy is more widely applied in adult learning. During the COVID-19 Pandemic, the challenge to the concept of heutagogy to solve learning was higher. This can be seen
01

15
4TH SINTO
K INTERN
ATION
AL CON
FERENCE O
N SO
CIAL SCIENCE AN
D M
ANAG
EMEN
T
from the demands of changes in the learning process of students to be more independent by integrating information technology. Restrictions on interaction allow heutagogy with the concept of self-directed learning to gain space to empirically prove the concept and its function to learn to understand learning. Firat (2016) suggests that self-directed learning is based on self-study from independent individuals of time and place. Learners are expected to benefit from the available environment, equipment, and resources under the control of learners.
Although heutagogy management can theoretically direct the learning process and become a concept framework for teachers to manage learning, heutagogy management practices are still very limited. The learning process that tends to adopt the lecture model in formal schools also inhibits the integration of heutagogy into the student learning system. Skills are needed to manage learning principles and self-directed learning concepts as prerequisites for the integration of information-based learning into formal learning structures. In addition, conceptually heutagogy is rarely discussed, especially in the process of organizing formal education. Heutagogy for high school students requires further proof considering heutagogy was developed based on the concept of self-directed learning for adults (Hase & Kenyon, 2001).
On the other hand, the limitations of teachers in using technology and understanding the importance of learning to integrate technology into the learning structure becomes a problem in itself. Therefore, the purpose of discussion on the implementation of heutagogy management into the implementation of formal learning as: (a) efforts to help the development of theory and explain problems that occur in independent learning of a specific nature such as technology; and (b) improve understanding of the concept of heutagogy, heutagogy management, and its implementation in formal learning to facilitate the efforts of teachers and educational institutions to reduce the impact of disasters. COVID-19 pandemic on learning and understanding the meaning of learning. The aim of the study was to analyze the implementation of managing heutagogy in remote area for student learning in Pandemic COVID-19
METHODS
In this study used mix method research design is pseudo-experiments and surveys. The strategy used is a sequential explanatorical strategy. Data collection techniques through deep interviews and observations, as well as disseminating questionnaires on heutagogy management governance to 75 teachers and high school students who participated in the study.
Data analysis uses quantitative descriptive test procedures, the first different test focuses on: (a) Principles in design in self-direted learning are learners who determine the direction (user directed), variarty, learning analytic, motivation and sharing knowledge; (b) The dimensions of self-directed learning as stated by Firat et al. (2016) are motivation (willingness to learn), cognitive self control and self direction to explain how the teacher and students understand the meaning of learning to learn. The second different test analysis is: implementation of heutagogy learning in accordance with the concepts put forward (Blaschke & Hase, 2016; Hia, 2018). Measurement of the effectiveness of heutagogy management implementation is not only based on output but from the aspect of the process as well as the understanding of teachers and students about learning how to learn with a learning architecture that integrates information technology in remote areas.
Qualitative analysis according to research instruments such as field records, documentation, interview results, serves limited as a supporter of the main instrument (researcher). Qualitative data analysis procedures are data reduction, data display, data validation, conclusion and verification, namely efforts by looking for important things related to heutagogy management. The process of data analysis used for qualitative data is a spiral data technique that is a data analysis technique as described by Cresswell (2007) with

16
stages as described by Ary et al. (2009) that after the data is collected, then the data is organized according to research variables then the data is reflected with the results of quantitative analysis. The output of the interpretation of data analysis is in the form of a thorough explanation of the research problems from the survey and confirmed from the results of qualitative analysis.
LITERATURE REVIEW
Heutagogy is a term coined by Stewart Hase of Southern Cross University and Chris Kenyon in Australia (Hase & Kenyon, 2001). Heutagogy refers to the self-determined study of learning. This concept expands and reinterprets ‘andragogy’ (a teaching strategy developed for adult learners – a concept that is strongly united by heutagogy and which can be misunderstood). Heutagogy integrates resources for learning resources especially technological and information developments. Informal or even non-formal learning environments can be inspiring, innovative and engaging to students. The learning environment helps motivate learning and prospective participants to be used as a source of learning.
Heutagogy is a holistic framework for creating self-learners based on the concept of self-directed learning. Msila and Setlhako (2012) say, heutagogy as the idea of learning how to learn. Furthermore, Firat et al. (2016) presented principles in the design of self-direted learning, namely learners who determine the direction (user directed), variarty, learning analytic, motivation and knowledge sharing. Focus on managing learning changes so that participants learn to understand learning by integrating technology into learning. Karakas and Manisaligil (2012) describe the self-sustaining landscape in the digital age of virtual collaboration to expand access to knowledge and innovation together. Technological convergence facilitates the increase of learning activities with technology. Global connectivity connects to the internet which provides access to the rest of the world. Online communities are meaningful and involved inproblem-oriented bag activities. Digital creativity builds creative abilities and strengths and emphasizes participants’ awareness of the meaning of learning how to learn.
Heutagogy integrates resources for learning resources especially technological and informationdevelopments. Therefore, governance is needed as an art and science. Heutagogy management is a planning, implementation to evaluation of how-to learning process based on understanding the importance of learning to learn independently (Hia, 2018). Heutagogy management describes changes to the learning architecture (Little & Knihova, 2014). Learning architecture and learning design need to be improved according to its function and equipped with a variety of new tools, strategies and learning delivery platforms so that learning becomes interesting, even addictive for learners.
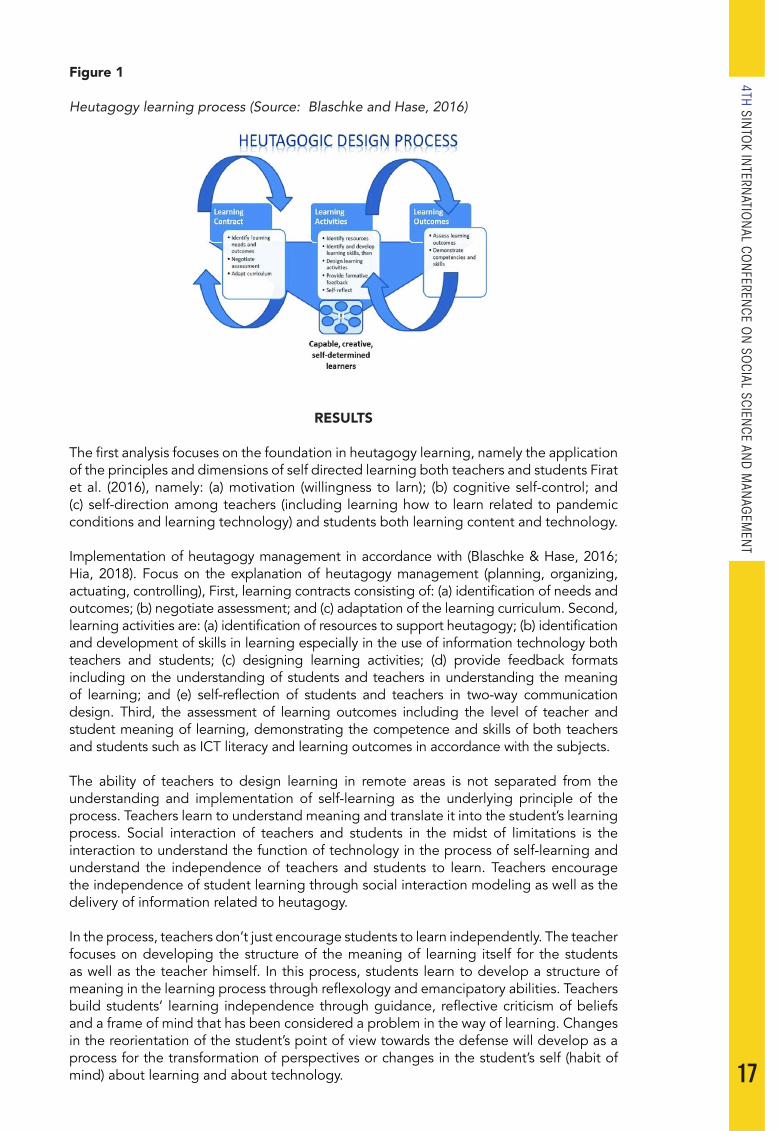
Blaschke and Hase (2016) describe the learning process in heutagogy as shown in Figure 1 as follows.
17
4TH SINTO
K INTERN
ATION
AL CON
FERENCE O
N SO
CIAL SCIENCE AN
D M
ANAG
EMEN
T
Figure 1
Heutagogy learning process (Source: Blaschke and Hase, 2016)
RESULTS
The first analysis focuses on the foundation in heutagogy learning, namely the application of the principles and dimensions of self directed learning both teachers and students Firat et al. (2016), namely: (a) motivation (willingness to larn); (b) cognitive self-control; and (c) self-direction among teachers (including learning how to learn related to pandemic conditions and learning technology) and students both learning content and technology.
Implementation of heutagogy management in accordance with (Blaschke & Hase, 2016; Hia, 2018). Focus on the explanation of heutagogy management (planning, organizing, actuating, controlling), First, learning contracts consisting of: (a) identification of needs and outcomes; (b) negotiate assessment; and (c) adaptation of the learning curriculum. Second, learning activities are: (a) identification of resources to support heutagogy; (b) identification and development of skills in learning especially in the use of information technology both teachers and students; (c) designing learning activities; (d) provide feedback formats including on the understanding of students and teachers in understanding the meaning of learning; and (e) self-reflection of students and teachers in two-way communication design. Third, the assessment of learning outcomes including the level of teacher and student meaning of learning, demonstrating the competence and skills of both teachers and students such as ICT literacy and learning outcomes in accordance with the subjects.
The ability of teachers to design learning in remote areas is not separated from the understanding and implementation of self-learning as the underlying principle of the process. Teachers learn to understand meaning and translate it into the student’s learning process. Social interaction of teachers and students in the midst of limitations is the interaction to understand the function of technology in the process of self-learning and understand the independence of teachers and students to learn. Teachers encourage the independence of student learning through social interaction modeling as well as the delivery of information related to heutagogy.
In the process, teachers don’t just encourage students to learn independently. The teacher focuses on developing the structure of the meaning of learning itself for the students as well as the teacher himself. In this process, students learn to develop a structure of meaning in the learning process through reflexology and emancipatory abilities. Teachers build students’ learning independence through guidance, reflective criticism of beliefs and a frame of mind that has been considered a problem in the way of learning. Changes in the reorientation of the student’s point of view towards the defense will develop as a process for the transformation of perspectives or changes in the student’s self (habit of mind) about learning and about technology.
18
Heutagogy as a learning design to encourage understanding and practice how learning for adults can be applied to adolescent learning participants. The principles of self-learning are applied while still placing teachers as facilitators for students. The change and acceleration of digitalization and pandemic situations “force” teachers to encourage learning and application of heutagogy learning to students.
Changes in learning architecture in line with the demands of the impact of the COVID-19 pandemic are urgent to be done. Learning architecture and learning design for students need to be adjusted, developed in line with the characteristics of the students, introducing information technology including the learning platform independently. The process of self-learning becomes very interesting and even addictive, for learners by still placing the teacher as a companion. Teachers ensure the development of different education that is consistent with educational goals in the midst of demands and limitations. The teacher integrates theoretical aspects and contemporary practice-based approaches pedagogy-andragogy-heutagogy proportionally. Another important aspect that emphasized is that teachers continue to create a framework for developing independent learning and integrating learning with independent learning designs to encourage students’ understanding of sustainable learning.
CONSLUSION
The lack of kapabilits for self-study has an impact on the ability to design heutagogy in remote areas for student learning. The self-learning model is one implementation of the heutagogy approach. The interaction of learning participants and facilitators is social interaction. The participants learned to imitate and bring up behaviors that are in accordance with the imitated model, namely the characteristics of teachers who are highly ICT literacy capable and able to develop personalities independently. Students learn to take a more active role with guidance from facilitators to improve ICT literacy independently, controlling the learning process. Students are given the motivation and commitment to find answers to the fundamental question of how to optimize information to develop self-personality.
The availability of information technology moderates the influence of self-directed capability learning on heutagogy design. An important element affecting learning is the role of teachers who consider the affordability and level of participants’ abilities in ICT for self-development, time frame agreement, methodology, frequency of progress reviews and final assessments. Another important element is flexibility in learning with limitations and consideration of learning goals. Assessment at the end of the learning period is an important aspect in the design of self-directed learning. The effectiveness of activities is measured from whether the objectives of managing heutagogy implementation in remote area for student learning can be achieved through the application of andragogy learning principles to the implementation of heutagogy approaches.
The theoretical implication is that it focuses on explanations from the perspective of capability theory based on a view of the nature of the attributes possessed to design heutagogy. The implications of praktis are learning model that integrates pedagogy, andragogy, heutagogy approaches functionally. The practical use of all three approaches is tailored to the purpose of the activity and is associated with the characteristics of the learner.
ACKNOWLEDGEMENT
Competing interestThe authors have declared the no competing interests exist
Author’s contributionsAll the authors contributed equally to this work
19
4TH SINTO
K INTERN
ATION
AL CON
FERENCE O
N SO
CIAL SCIENCE AN
D M
ANAG
EMEN
T
Ethical consederationsEthical clearance was obtained from the univesity research institution.
Funding informationThis research received no specific grant from any funding agency in the public, commercial or not-for-profit sectors.
Availability dataThe data that support the findings of this study are available from the author upon reasonable request.
DisclaimerThe views and opinions expressed in the article are those of the authors and do not represent the views of any affiliated institution.
RERERENCES
Ary, D., Jacobs, L. C., Sorensen, C., & Razavieh, A. (2010). Introduction to Research in Education. Thompson Wadsworth.
Blaschke, L. M., & Hase, S. (2016). The future of ubiquitous learning. Springer.Creswell, J. W. (2007). Qualitative inquiry and research design: Choosing among five
approaches (2nd ed.). Sage Publications.Firat, M., Sakar, A., & Kabakci, I. (2016). Web interface design principles for adults’ self-
directed learning. Turkish Online Journal of Distance Education, 17, 17–21. https://doi.org/10.17718/tojde.47086
Hase, S., & Kenyon, C. (2001). Moving from andragogy to heutagogy: implications for VET. Proceedings of Research to Reality: Putting VET Research to Work: Australian Vocational Education and Training Research Association (AVETRA), Adelaide, SA, 28-30 March, AVETRA, Crows Nest, NSW. http://www.avetra.org.au/Conference_Archives/2001/ proceedings.shtml
Hia, A. K. (2018). Model pendidikan dan pelatihan berbasis manajemen heutagogy dalam peningkatan perilaku kewirausahaan yang sustainabel (studi pada para pegawai PT Bank Rakyat Indonesia (Persero) Tbk (Unpublished dissertation). UPI.
Jones, C., Matlay, H., Penaluna, K., & Penaluna, A. (2014). Claiming the future of enterprise education. Education + Training, 56(8/9), 764–775. https://doi.org/10.1108/ET-06-2014-0065
Karakas, F., & Manisaligil, A. (2012). Reorienting self-directed learning for the creative digital era. European Journal of Training and Development, 36(7), 712–731. https://doi.org/10.1108/03090591211255557
Little, B., & Knihova, L. (2014). Modern trends in learning architecture. Industrial and Commercial Training, 46(1), 34–38. https://doi.org/10.1108/ICT-07-2013-0046
Msila, V., & Setlhako, M. (2012). Teaching (still) matters: Experiences on developing a Heutagogical online module at UNISA. Procedia - Social and Behavioral Sciences, 69, 136–142. https://doi.org/10.1016/j.sbspro.2012.11.392
Nicola, M., Alsafi, Z., Sohrabi, C., Kerwan, A., Al-Jabir, A., Iosifidis, C., Agha, M., & Agha, R. (2020). The socio-economic implications of the coronavirus pandemic (COVID-19): A review. International Journal of Surgery, 78, 185–193. https://doi.org/https://doi.org/10.1016/j.ijsu.2020.04.018
Phillipson, J., Gorton, M., Turner, R., Shucksmith, M., Aitken-McDermott, K., Areal, F., Cowie, P., Hubbard, C., Maioli, S., McAreavey, R., Souza-Monteiro, D., Newbery, R., Panzone, L., Rowe, F., & Shortall, S. (2020). The COVID-19 pandemic and its implications for rural economies. In Sustainability, 12(10). https://doi.org/10.3390/su12103973
20
SICONSEM2021: 007-001
OPTIMIZING OF ONLINE LEARNING PROCESS IN THE NEW NORMAL
1Iffah Budiningsih, 2Imelda Pujiharti & 3Siti Rapingah1,2,3Universitas Islam As-Syafi”iyah, Jakarta, Indonesia
Corresponding authors: [email protected]; [email protected];[email protected]
ABSTRACT
The purpose of the present evaluative research of online learning processes, in general, is to determine the effectiveness of factors that affect the implementation of online learning processes. The research method used is quantitative through surveys, with a sample of 248 regular students of The Islamic University of As-Syafiiyah (UIA) Jakarta, Indonesia, from the total number of populations about 4000 people. Analyze data using descriptive analysis (mean &%). The results of the study showed: a) the average assessment score of UIA student respondents on the online learning process during Covid 19 pandemic in Th 2020 = 2.44– 3.13 (scale 1-4) or show the quality between less until enough; b) almost all factors that affect the optimal learning process are below the standards that should be; c) the transition of the learning system from face-to-face (classroom) to digital systems takes time in the process of adoption and adaptation, so that in the learning process in 2020 many experience irregularities, also technical barriers related to internet connection which has implications on the optimal implementation of the learning process; d) in the new normal era recommended to professional development of lecturers to integrate pedagogic skills involving EQ lecturers as educators with various applications of learning technology; lecturers should more shift the pedagogic learning process centered on lecturers into pedagogic centered on students; using blended learning, and the use of Hyper-content module.
Keywords: evaluation, face-to-face (classroom), online learning processes.
INTRODUCTION
The act of learning, at its essence, is an activity that takes place either consciously or unconsciously to generate a change of knowledge, skills, and values. It is an integral part of human life; the absence of learning hampers people from carrying out a wide range of activities and adjusting themselves with the ever-changing dynamics and progresses in science, technology, humanities, and arts, as well as in other aspects. That said, learning is seen as a lifelong activity for a human being to cope with the ever-growing demands of life from one’s birth to the end of life. A learning process is said to be efficient and effective if it comprises not only the transfer of knowledge, skills, attitude, and values, but also the transformation process of such aspects. In this regard, learning instigates forward progress in terms of the capacity or behavior of an individual. The achievement of the transformation process towards the penultimate goals of learning, i.e., capacity development and progress of behavior, relies heavily on the optimal support from the factors of the learning process. Some might proceed through a certain set of learning processes but generate less optimal results in terms of capacity development and change of behavior. In such a context, the problem is influenced by several internal and external factors. The internal factors comprise learning interest, motivation, personal problems, and the like, while the external factors consist of educators, learning conditions, curriculum, learning environment, and learning facilities (internet, other sources, etc.).
To prevent the spread of the COVID 19 virus amid the pandemic, the implementation of learning in all levels of education relies on an online learning method that employs electronic learning media such as the internet. At present, the online learning method
02
21
4TH SINTO
K INTERN
ATION
AL CON
FERENCE O
N SO
CIAL SCIENCE AN
D M
ANAG
EMEN
T
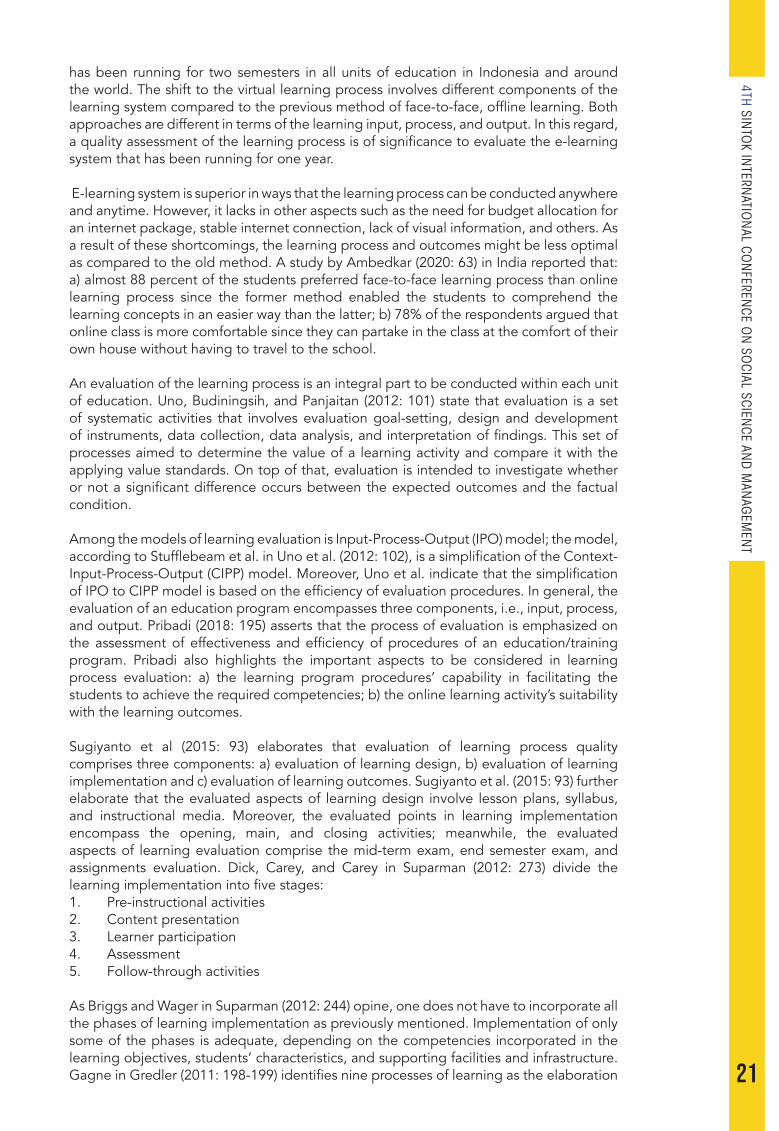
has been running for two semesters in all units of education in Indonesia and around the world. The shift to the virtual learning process involves different components of the learning system compared to the previous method of face-to-face, offline learning. Both approaches are different in terms of the learning input, process, and output. In this regard, a quality assessment of the learning process is of significance to evaluate the e-learning system that has been running for one year.
E-learning system is superior in ways that the learning process can be conducted anywhere and anytime. However, it lacks in other aspects such as the need for budget allocation for an internet package, stable internet connection, lack of visual information, and others. As a result of these shortcomings, the learning process and outcomes might be less optimal as compared to the old method. A study by Ambedkar (2020: 63) in India reported that: a) almost 88 percent of the students preferred face-to-face learning process than online learning process since the former method enabled the students to comprehend the learning concepts in an easier way than the latter; b) 78% of the respondents argued that online class is more comfortable since they can partake in the class at the comfort of their own house without having to travel to the school.
An evaluation of the learning process is an integral part to be conducted within each unit of education. Uno, Budiningsih, and Panjaitan (2012: 101) state that evaluation is a set of systematic activities that involves evaluation goal-setting, design and development of instruments, data collection, data analysis, and interpretation of findings. This set of processes aimed to determine the value of a learning activity and compare it with the applying value standards. On top of that, evaluation is intended to investigate whether or not a significant difference occurs between the expected outcomes and the factual condition.
Among the models of learning evaluation is Input-Process-Output (IPO) model; the model, according to Stufflebeam et al. in Uno et al. (2012: 102), is a simplification of the Context-Input-Process-Output (CIPP) model. Moreover, Uno et al. indicate that the simplification of IPO to CIPP model is based on the efficiency of evaluation procedures. In general, the evaluation of an education program encompasses three components, i.e., input, process, and output. Pribadi (2018: 195) asserts that the process of evaluation is emphasized on the assessment of effectiveness and efficiency of procedures of an education/training program. Pribadi also highlights the important aspects to be considered in learning process evaluation: a) the learning program procedures’ capability in facilitating the students to achieve the required competencies; b) the online learning activity’s suitability with the learning outcomes.
Sugiyanto et al (2015: 93) elaborates that evaluation of learning process quality comprises three components: a) evaluation of learning design, b) evaluation of learning implementation and c) evaluation of learning outcomes. Sugiyanto et al. (2015: 93) further elaborate that the evaluated aspects of learning design involve lesson plans, syllabus, and instructional media. Moreover, the evaluated points in learning implementation encompass the opening, main, and closing activities; meanwhile, the evaluated aspects of learning evaluation comprise the mid-term exam, end semester exam, and assignments evaluation. Dick, Carey, and Carey in Suparman (2012: 273) divide the learning implementation into five stages:1. Pre-instructional activities2. Content presentation3. Learner participation4. Assessment5. Follow-through activities
As Briggs and Wager in Suparman (2012: 244) opine, one does not have to incorporate all the phases of learning implementation as previously mentioned. Implementation of only some of the phases is adequate, depending on the competencies incorporated in the learning objectives, students’ characteristics, and supporting facilities and infrastructure. Gagne in Gredler (2011: 198-199) identifies nine processes of learning as the elaboration

22
of five phases pointed out by Dick et al previously. The processes comprise:1. Directing the attention2. Delivering the learning objectives3. Reminding relevant information/knowledge4. Giving stimulus5. Delivering learning guidelines6. Highlighting performance7. Reinforcing8. Assessing students’ performance9. Highlighting performance by giving new examples
According to Stockley in Pribadi (2017: 198), e-learning is a learning facility that incorporates the internet, CD-ROM, and other tools to deliver the learning contents. Pribadi (2017: 202) also explains that the benefits of e-learning approach implementation:1. Promoting fun atmospheres in learning2. Enabling the learning process to be efficient3. Opening the possibilities to gain information and knowledge from wide ranges of
sources globally4. Creating a dynamic learning interaction5. Cultivating the students’ creativity in utilizing the information/knowledge
Regarding the advantages of e-learning, as mentioned above, it is expected that the e-learning system generates better results than face-to-face. On top of that, Pribadi (2017: 204-205) points out the shortcomings of the e-learning approach. The issues are: 1) the students and teachers are required to master basic computer skills; 2) the learning participants are also required to be able to identify and solve any error problems regarding computers and networks. These hindrances might impact the optimization of the e-learning process.
Based on the notions above, the study concludes that evaluation of learning process quality is a systematic set of activities that evaluate: a) learning design, b) learning implementation, and c) learning outcomes; and these activities employ sub-indicators of the lesson plan, delivery of learning contents and student activities, and implementation of mid-term examination, end-semester examination, and assignments given to the students.
The present work seeks to explore the data analysis results of an evaluation study on the process of e-learning in Universitas Islam As Syafi’iyah Jakarta during the COVID 19 pandemic, 2020. The objectives of the study are: 1. To identify the effectiveness of online learning activities by following the learning
objectives as reflected in the learning design.2. To identify whether or not the online learning procedures can facilitate the students
in achieving the fun learning process.3. To investigate the factors contributing to the online learning process.4. To formulate a recommendation for the management board of Universitas Islam As
Syafi’iyah in upgrading and optimizing the learning process.
RESEARCH METHOD
The quantitative survey study was conducted in Universitas Islam As Syafi’iyah Jakarta, Indonesia. The accessible population in this research comprises 4000 regular students of Universitas Islam As-Syafi’iyah (UIA); from the population, the study collected 248 samples by simple random sampling. All data were obtained by a Google-form questionnaire with a Likert scale; the data were further analyzed descriptively by employing central tendency measurement: mean & % by Excel and SPSS version 25 for Windows software.
Validity and reliability tests were conducted before the distribution of the research questionnaire. The instrument validity test employed the r-coefficient Product Moment

23
4TH SINTO
K INTERN
ATION
AL CON
FERENCE O
N SO
CIAL SCIENCE AN
D M
ANAG
EMEN
T
formula (the instrument is considered as valid if r-count ≥ 0.361 with while the reliability test employed the r-coefficient Alpha Cronbach formula (the instrument is considered as reliable if r-count ≥ 0.6). The results are displayed in the following table:
Table 1
Validity Test Results of Instrument of Evaluation of Online Learning Process Quality of Universitas Islam As-Syafi’iyah, 2020
Item r-table(Product Moment)
r-count(Product Moment) Description
Item 1 0.36 0.696 Valid
Item 2 0.36 0.742 Valid
Item 3 0.36 0.678 Valid
Item 4 0.36 0.637 Valid
Item 5 0.36 0.448 Valid
Item 6 0.36 0.540 Valid
Item 7 0.36 0.447 Valid
Item 8 0.36 0.769 Valid
Item 9 0.36 0.553 Valid
Item 10 0.36 0.542 Valid
The statistical reliability of all instrument items
0.788 Reliable
Moreover, the indicators of variable and instrument items of online learning process evaluation are presented in the following Table 2.
Table 2
Variable & Indicator of Research
Variable Indicator Question Items
Learning Process
• Learning Design 1. Learning Design Clarity
2. Learning Design Implementation
• Learning Implementation
3. Content Absorption
4. Duration of discussion/question session per meeting (online or offline)
5. Benefits of assignments from the lecturer
6. Lots of updated learning material
7. Punctuality of learning process
8. Learning process’ ability to arouse students’ learning motivation
•Learning Evaluation 9. Assignments/Mid-term exam/End semester exam is thoroughly assessed.
10. Academic clarity of learning results assessment
RESULTS
As based on the descriptive analysis results, the study generates the values of mean, median, mode, standard error of the mean, standard deviation, variance, range, minimum
24
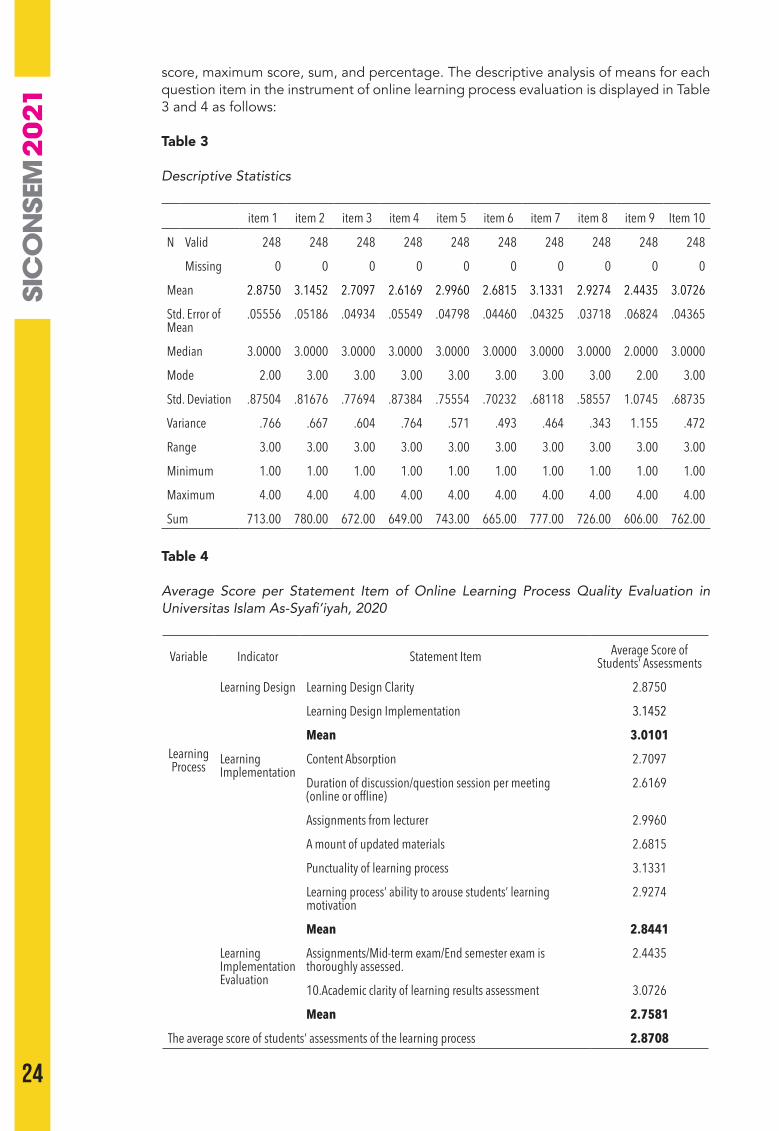
score, maximum score, sum, and percentage. The descriptive analysis of means for each question item in the instrument of online learning process evaluation is displayed in Table 3 and 4 as follows:
Table 3
Descriptive Statistics
item 1 item 2 item 3 item 4 item 5 item 6 item 7 item 8 item 9 Item 10
N Valid 248 248 248 248 248 248 248 248 248 248
Missing 0 0 0 0 0 0 0 0 0 0
Mean 2.8750 3.1452 2.7097 2.6169 2.9960 2.6815 3.1331 2.9274 2.4435 3.0726
Std. Error of Mean
.05556 .05186 .04934 .05549 .04798 .04460 .04325 .03718 .06824 .04365
Median 3.0000 3.0000 3.0000 3.0000 3.0000 3.0000 3.0000 3.0000 2.0000 3.0000
Mode 2.00 3.00 3.00 3.00 3.00 3.00 3.00 3.00 2.00 3.00
Std. Deviation .87504 .81676 .77694 .87384 .75554 .70232 .68118 .58557 1.0745 .68735
Variance .766 .667 .604 .764 .571 .493 .464 .343 1.155 .472
Range 3.00 3.00 3.00 3.00 3.00 3.00 3.00 3.00 3.00 3.00
Minimum 1.00 1.00 1.00 1.00 1.00 1.00 1.00 1.00 1.00 1.00
Maximum 4.00 4.00 4.00 4.00 4.00 4.00 4.00 4.00 4.00 4.00
Sum 713.00 780.00 672.00 649.00 743.00 665.00 777.00 726.00 606.00 762.00
Table 4
Average Score per Statement Item of Online Learning Process Quality Evaluation in Universitas Islam As-Syafi’iyah, 2020
Variable Indicator Statement Item Average Score of Students’ Assessments
Learning Process
Learning Design Learning Design Clarity 2.8750
Learning Design Implementation 3.1452
Mean 3.0101
Learning Implementation
Content Absorption 2.7097
Duration of discussion/question session per meeting (online or offline)
2.6169
Assignments from lecturer 2.9960
A mount of updated materials 2.6815
Punctuality of learning process 3.1331
Learning process’ ability to arouse students’ learning motivation
2.9274
Mean 2.8441
Learning Implementation Evaluation
Assignments/Mid-term exam/End semester exam is thoroughly assessed.
2.4435
10.Academic clarity of learning results assessment 3.0726
Mean 2.7581
The average score of students’ assessments of the learning process 2.8708
25
4TH SINTO
K INTERN
ATION
AL CON
FERENCE O
N SO
CIAL SCIENCE AN
D M
ANAG
EMEN
T
Description: Assessment score interpretation 1 = Very less2 = Less3 = Moderate4 = Good
As based on the table above, the respondents’ score of the learning process quality arrives at 2.8708 (below 3.0), or the “less” category (see Table 4). The number signifies that the learning process must be improved. The problems in the aspect are to be identified and solved to optimize the improvement of learning process quality. Moreover, based on the average score of respondents’ assessments, only three items arrived at 3.0 or the “moderate” category. The items are:1. The learning design implementation, with an average score of 3.1452;2. Punctuality of learning process, with an average score of 3.1331;3. Academic clarity of learning results assessment, with an average score of 3.0726
The rest seven items arrived below 3.0 or in the “less” category. The items are:1. Learning design clarity, with an average score of 2.8750;2. Content absorption, with an average score of 2.7097;3. Duration of discussion/question session per meeting (online or offline), with an
average score of 2.6169;4. Assignments from a lecturer, with an average score of 2.9960;5. A mount of updated learning material, with an average score of 2.6815;6. Learning process’ ability to arouse students’ learning motivation, with a score of
2.9274; and7. Proper assessment of assignments/mid-term exam/end semester exam, with an
average score of 2.4435.
of the items that yielded scores below 3.0, the item with the lowest score was a proper assessment of assignments/mid-term exam/end semester exam, scored at 2.4435. This indicates that the item requires serious concerns.
DISCUSSION
The descriptive analysis on the evaluation of online learning in the research site generates an average score of 2.8708; the number indicates that almost all question items given to the students must be improved. All units of the education system in Indonesia and the global context are obliged to shift the approach from face-to-face to online learning. The at-home online learning approach, all of a sudden, has brought significant changes in the approach and role of the teachers, students, and parents. The teachers are required to perform as the designer and facilitator of online learning. The sudden disappearance of the conventional learning approach is an inevitable condition during the pandemic. This in turn drains the lecturers’ physical and emotional state in monitoring the effectiveness of the learning process virtually. Such a process is not easy at all. Smaldino et al. (2011: 208) elaborate that a lecturer must ensure the availability of access to the resources of online learning such as PC/laptop, internet connection, Android, internet package, and other tools to optimize the learning process. Further, Lie (2020) asserts that psychologically, the students as social beings require physical interaction with their peers during the learning process. If such a condition is not facilitated, as the condition during the pandemic, the students might see that the learning process is less optimal and give a score of 2.0 to 3.0 (or “poor” to “moderate” category).
Another point worth noticing is that the lecturers lack technological literacy in terms of operating online learning platforms, such as Google Meet, Google Classroom, Zoom, and other types of online meeting software as the alternative to the face-to-face learning approach. The transition from regular face-to-face meetings to online learning urges lecturers to prepare themselves to adapt to new learning technology. This has led to
26
the disruption in the learning process during the whole year of 2020; on top of that, it implicates the students’ evaluation of “poor” to “moderate” on the aspect of learning process quality. Prensky in Smaldino (2011: 434) points out several variations of the adaptation process of technology: 1. Trying new things 2. Carrying out old things in pre-existing methods 3. Carrying out old things in new methods 4. Carrying out new things in new methods
As the implication to the aforementioned concerns, the disruption in the learning process in 2020 is seen as an inevitable event that leads to the decrease in students’ learning motivation. A study by Ambedkar in India (2020:64) reported several issues that hindered the online learning process, i.e., a) bad internet connectivity (88%); b) audio problems (67%); c) absence of internet connectivity; d) poor interaction between students and teacher (53%); e) problems in uploading the assignments due to bad connection (40%); f) online learning approach’s compatibility only for theoretical explanation, not for practice-based learning (96%).
Moreover, Rachman (2020) argues that in an abnormal setting of a pandemic, a lecturer is demanded to bear extra roles to: a. Ensure the achievement of learning objectives, academically and non-academicallyb. Ensure the students’ physical and psychological safetyc. Reinforcing the students of the importance of compliance to the health protocolsd. Providing emotional support for the students during online learninge. Communicating and cooperating with the students to establish trust and optimize
the learning process
These roles are considered as indicators of teachers/lecturers’ adaptability to the transition from face-to-face to an online approach. The ability to adapt oneself is among the most significant components in the emotional quotient (EQ). In this regard, Budiningsih et al. (2020:34) opine that a sense of emotional bond is missing during online learning, as the lecturers and the students cannot meet and interact with each other. This sense is irreplaceable in virtual communication. On top of that, Corcorana & Tormeyb (2010:2455) elaborate that teaching is regarded as the teachers’ emotional practices, particularly in correlation with the issues of sustainable global development that require the students’ emphatic ability as their central point of capacity to be engaged in the issues. Therefore, the success of the learning process is reliant on the teachers’ emotional quotient (EQ).
In the new normal era, the implementation of the blended learning model that integrates face-to-face and online learning is expected to increase. Moreover, the use of Hyper-content modules enriched with QR codes of various audiovisual media is seen as the alternative to the issues in learning as previously mentioned. Regarding this, Lie (2020) indicates the need for continuous professional development for lecturers. This includes not only the training to operate various technology-based learning applications but also the integration of pedagogic skills that involve lecturers’ EQ within the learning process. That said, a shift from a teacher-centered to a student-centered learning process is of paramount significance.
CONCLUSION
The conclusions of this study are a) the average of respondents’ evaluation on the online learning process in this research at “less” to “moderate” category; b) the items that fall under the “moderate” category are: learning design implementation; punctuality of learning process; academic clarity of learning results assessment; c) moreover, the item that yields the lowest score is the proper assessment of assignment/examination; d) the transition from regular face-to-face meeting to the online learning demands lecturers to prepare themselves to adapt to new learning technology. This has led to the disruption in the learning process during the whole year of 2020; on top of that, it implicates

27
4TH SINTO
K INTERN
ATION
AL CON
FERENCE O
N SO
CIAL SCIENCE AN
D M
ANAG
EMEN
T
towards the students’ evaluation of “poor” to “moderate” on the aspect of learning process quality; e) the study proposes several recommendations to be undertaken: a) a professional development for lecturers that integrates the pedagogic skills and emotional quotient within the learning process; b) a shift from teacher-centered to the student-centered learning process; c) the implementation of the blended learning and Hyper-content modules.
LIMITATIONS AND FUTURE STUDIES
These Research respondents are students from a private college in Indonesia, it may be necessary to conduct further research using the same questionnaire but the respondents are from students of State Universities or from college students from other countries who differ in respondent characteristics.
REFERENCES
Ambedkar. (2020). Student survey regarding on-lime classes during and post Covid-19 Period. Iconic Research and Engineering Journals, 4(1), 62-66. https://www.academia.edu/s/6b54798563#comment_803477.
Budiningsih, I., Soehari, T. D. & Casriyanti. (2020). The strengthening of teachers’ eq in facing various changes in the educational environment. Global Journal of Human-Social Science (GJHSS), 21(5), 33-34. https://globaljournals.org/GJHSS_Volume21/E-Journal_GJHSS_(G)_Vol_21_ Issue_ 5.pdf.
Corcorana R., & Tormeyb R. (2010). Teacher education, emotional competencies, and development education. Procedia Social and Behavioral Sciences, 2, 2448–2457. https:// doi.org/10.1016/j.sbspro.2010.03.352
Gredler, M. E. (2011). Learning and instruction, theory and application. Edisi Bahasa Indonesia. Kencana, Prenada Media Grup.
Jaya, H. E., Situmorang, R., & Muslim. Suyitno. (2020). Development of a printed hypercontent mudule for leadsership subjects. Akademika Jurnal MTP-UIA, 9(2), 1-16. https:// doi.org/10.34005/akademika.v9i02.1009.
Lie, A. (2020). The new normal in education. The Jakarta Post. https://www. thejakartapost.com/academia/2020/06/20/the-new-normal-in-education.html.
Prawiradilga, D. S., Widyaningrum, R. & Ariani, D. (2017). Prinsp-prinsp dasar pengembangan modul berpendekatan Hyperconten. Indonesian Journal of Currikulum and Ecucational Technology Studies, 5(2), 57-65. http://doi.org/10.15294/ijcets. V3i1.8675.
Pribadi, R.B. (2017). Media & teknologi dalam pembelajaran. Kencana. Prenada Media Grup.
Pribadi, R B. (2018). 21 Konsep esensial dalam teknologi pendidikan. Dian Rakyat.Rachman A. (2020). Ini peran dan tuntutan kompetensi guru di masa pandemi, ed: Albertus
Adit. Kompas.com. https://www.kompas.com/edu/read/2020/10/08/113530671/ini-peran-dan-tuntutan-kompetensi-guru-di-masa-pandemi?page= all.
Smaldino, S. E., Lowther D.L., & Russell J.D. (2011). Instructional techhnology & media for learning. Edisi Bahasa Indonesia.Kencana, Prenada Media Grup.
Sugiyanto, Kartowagiran, B., & Jailani. (2015). Pengembangan model evaluasi kualitas proses pembelajaran daring Matematika di SMP berdasarkan kurikulum 2013. Jurnal Penelitian dan Evaluasi Pendidikan. 19(1), 82-95. http://journal.uny.ac.id/index.php/jpep
Suparman, M. Atwi. (2012). Modern instructional design. Jakarta: Erlangga.Universitas Islam As-Syafi’iyah (UIA) Jakarta. (2019). Panduan penyusunan kurikulum
KKNI. UIA Jakarta.Uno, H. B, Budiningsih, I., & Panjaitan K. (2012). Model pembelajaran. BMT Nurul
Janah.
28
SICONSEM2021: 009-075
SCHOOL IMPROVEMENT SPECIALIST COACH PLUS (SISC+) FROM THE PERSPECTIVES OF ASSESSMENT COMPETENCIES
1Noel Jimbai Balang, 2Zamri Mahamod & 3Nor Aishah Buang Faculty of Education, University Kebangsaan Malaysia, Malaysia
Corresponding authors: [email protected]; [email protected];[email protected]
ABSTRACT
In many education systems around the world, instructional coaching programs are developed to support teachers in needs ranging from curriculum and pedagogical to the assessment practice. School Improvement Specialist Coach Plus (SISC+) program in Malaysia has been in place since 2013 and offers support to teachers through their coaches, a member of professional education teams in all districts in Malaysia. According to the District Transformation Programmed 3.0 (DTP 3.0), the roles of the SISC+ is underpinned by knowledge and skills in assessment aspects. Therefore, this study aimed to identify the level of competencies of SISC+ in assessment aspects. Data were collected through a set of questionnaires distributed to 118 SISC+ nationwide and analyzed using SPSS version 23. Descriptive statistics involving frequency, mean score, standard deviation and percentage were used in the study. The findings showed that SISC+ competency level in assessment knowledge is at a high level with a mean score of 4.30, sd=0.582. The findings of this study indicate that SISC+ is competent and knowledgeable in the assessment aspects of the subject being taught. The findings of this study provide insight into the ability of SISC+ in coaching teachers in school and in their practice of quality teaching and learning. Moreover, the school and social environment played a crucial role in the way teachers interacted and defined their challenges. It is thus recognized that the instructional coaching program needs to be adequately understood and acknowledged by schools and the education authorities in order for it to reach its aims of supporting teachers. Physical spaces and opportunities for collaboration can enhance what the coaches are trying to achieve. Originality and value of this research is the first of its kind in Malaysia as it explores the competencies and experiences of coaches who are actively participating in the instructional coaching programmed for teachers. Therefore, the authority needs to provide support and cooperation to ensure SISC+ continues to be competent in providing quality coaching to teachers.
Keywords: Instructional coaching, coaching and mentoring, assessment, School Improvement Specialist Coaches Plus (SISC+), teaching and learning.
INTRODUCTION
The knowledge and coaching skills among School Improvement Specialist Coaches Plus Officers (SISC+) is the magic of educational transformation of the new millennium (Rafisah Osman & Haslina Ismail, 2017). In transforming teaching and learning SISC+ are required to diversify their coaching approach when mentoring (Mohd Hilmi & Jamil Ahmad, 2017; Rozita Radhiah et al., 2016). In this context, SISC+ needs to master a variety of effective coaching approaches in order to attract teachers to add new knowledge in line with SISC+’s role as teachers coaches (Sarabiah & Zamri, 2016; Siti Fatimah & Ab.Halim, 2010). Among the challenges faced by SISC+ is determining a coaching approach that is considered a catalyst to teacher quality (Jim Knight, 2019; Joyce & Showers, 2018). The field of instructional coaching is considered a catalyst to a quality of teaching and learning process (Sarabiah & Zamri, 2016; Noel Jimbai & Zamri, 2017). The SISC+ position introduced in 2012 has greatly helped teachers increase teaching capacity in the
03

29
4TH SINTO
K INTERN
ATION
AL CON
FERENCE O
N SO
CIAL SCIENCE AN
D M
ANAG
EMEN
T
classroom. In this context, SISC+ plays a role in assisting teachers in the development of professionalism to improve the quality of teaching (Jim Knight, 2019; Elena, 2016). SISC+ are advised to master assessment skills in achieving a quality of teaching process. Based on the increasingly complex role changes, SISC+ needs to ensure that the coaching approach offered is in line with the educational needs of the 21st century.
PROBLEM STATEMENT
The educational transformation in Malaysia involves a variety of planned educational programs such as the SISC+ program, School Improvement Partners (SIP+), Enhancement Programmed for Malay and English Language (MBMMBI), Student Integration Plan for Unity (RIMUP), 1 Student 1 Sports, i-Think Program and the Transformation School (TS 25). However, the extent to which an officer’s competence cannot be determined without knowing the level of competence practiced while implementing and providing guidance. According to Kirkpatrick and Kirkpatrick (2006: 3), Owoc et al. (2009), Mathieu and Tannenbaum (1992) and Cascio (1989), each organization needs to carry out a competency survey to identify the competencies of employees of a program. Each program needs to be reviewed and evaluated to identify strengths and weaknesses for improvement or to determine whether the program’s objectives are being met or not.
One of the programs that has not been reviewed is SISC + competency related programs. Since its introduction in 2012 to date based on a document review at the School Management Division’s Documentation Reference Center, KPM found that no records were found regarding the competencies and practices of coaching for the SISC + program even though the School Management Division (BPSH) annually appoints the new SISC + (Abdul Hamid, 2013). The absence of continuous and systematic aspects of competency assessment of a program is expected to impact the overall program (McKeachie, 2006). Among the consequences of the SISC + program being implemented are unknown aspects of SISC + competency and the ongoing training requirements (CPD) needed to make the program successful (Levine 2005; Young, Peterson & Short 2002).
The unsupervised SISC + program may also lead to poor quality of teaching and may result in SISC + not being able to guide teachers in improving performance towards excellence (Kotirde & Jailani 2015; Box 2006) in Hursen and Check (2011). In fact, the presence of SISC + at the school for guidance only interrupts the day-to-day routine of the teacher and does not make any impact as SISC + itself is less competent and less proficient in curriculum, pedagogy and assessment (Hamid, 2014; Detective & Karakus, 2013) and less confident (Mohd Idrus, 2012). In addition, if the SISC + fails to identify the teaching problem then the guidance provided will certainly conflict with the information of the subject trainer or supervisor from the District Education Office and the State Education Department (NRD). This causes confusion among teachers. If this is the case, then SISC + will not be able to play the role of quality teacher guidance (Details & Competitive 2011). In this context, SISC + should be competent in all aspects of their work especially in the areas of curriculum, pedagogy and assessment (Noel Jimbai & Zamri; Nur Syamila & Siti Mistima 2017). It is feared that this poor SISC + could contribute to the perception and perception negative teachers (Sarabiah & Zamri 2016; Noel Jimbai & Zamri 2017). Among the objectives of the SISC+ program is the responsibility of providing teachers with guidance in curriculum, pedagogy, and assessment in order to produce high-quality teachers who can apply their knowledge in classroom teaching (District Transformation Program Management Guide, KPM 2017). This means that ideally the SISC + competency level and coaching practice need to surpass the quality of the teachers they teach (Daily School Management Division 2014). However, BPSH states that there is a SISC + that performs poorly in mentoring because it is not proficient in curriculum, pedagogy and assessment (BPSH). There are also some SISC + mentors who are less competent to guide so it is difficult to get an accurate picture of an aspect that teachers need to develop based on the Teacher Development Plan form (KPM 2017). A review of the literature conducted by the researchers found that studies on the SISC + program are still
30
lacking. Most researchers focus only on teachers’ perceptions of SISC + such as the study conducted by Rozita Radhiah et al (2015), Sarabiah and Zamri (2016), Noel Jimbai and Zamri (2017), Nur Syamila and Siti (2017), Mohd Hilmi and Jamil (2017), and Wong and Elzira (2018). Studies done by Kaur & Bitty (2017) and Ali et al (2018) focus only on the role of SISC + in the context of providing guidance and mentoring to mentoring teachers. The study of Radzuwan et al (2016) and Zakaria et al (2014) conducted in a case study only examined the effectiveness of SISC + guidance and function in Kluang, Johor and Tuaran, Sabah. The findings of this study certainly do not provide a comprehensive overview of SISC + coaching competencies and best practices.
ObjectivesOnly one objective and one research question to develop in this research, which is.i. To identify SISC+ competency in the aspects of assessment knowledge.
Research Questionsii. What is the SISC+ competency in the aspect of assessment knowledge?
METHODS
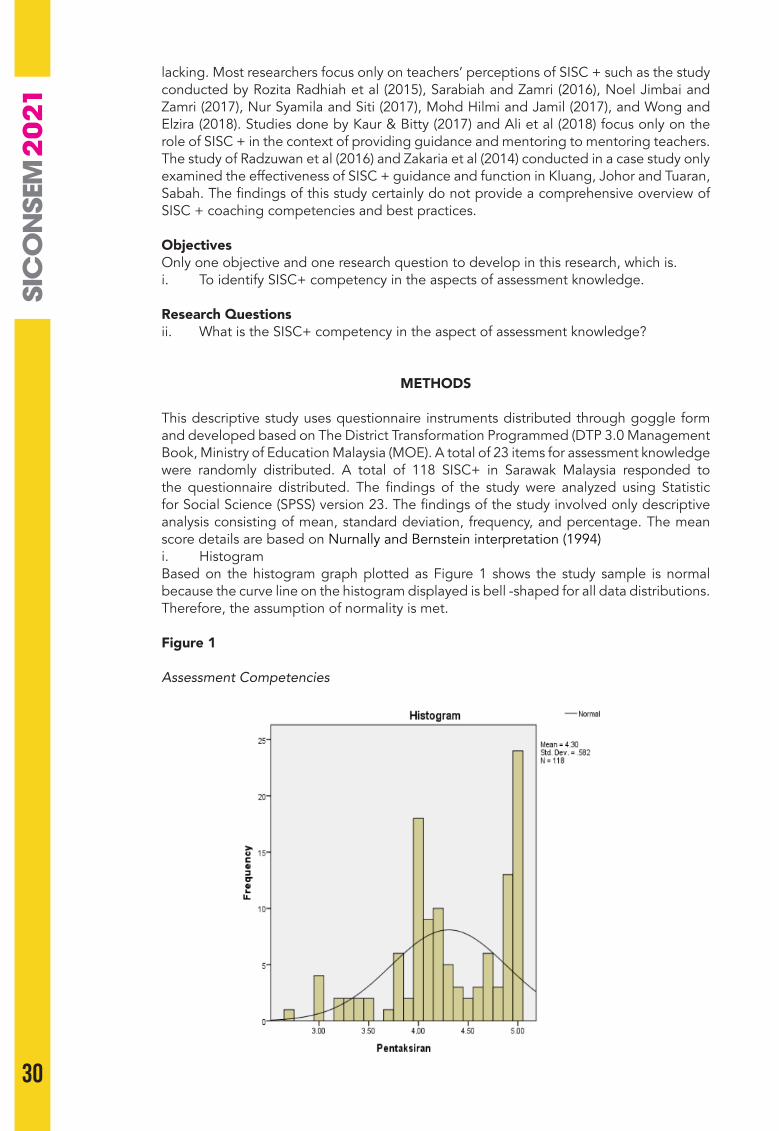
This descriptive study uses questionnaire instruments distributed through goggle form and developed based on The District Transformation Programmed (DTP 3.0 Management Book, Ministry of Education Malaysia (MOE). A total of 23 items for assessment knowledge were randomly distributed. A total of 118 SISC+ in Sarawak Malaysia responded to the questionnaire distributed. The findings of the study were analyzed using Statistic for Social Science (SPSS) version 23. The findings of the study involved only descriptive analysis consisting of mean, standard deviation, frequency, and percentage. The mean score details are based on Nurnally and Bernstein interpretation (1994)i. HistogramBased on the histogram graph plotted as Figure 1 shows the study sample is normal because the curve line on the histogram displayed is bell -shaped for all data distributions. Therefore, the assumption of normality is met.
Figure 1
Assessment Competencies

31
4TH SINTO
K INTERN
ATION
AL CON
FERENCE O
N SO
CIAL SCIENCE AN
D M
ANAG
EMEN
T
ii. Boxplotiii. Figure 2 show the Boxplot for SISC+ competencies in assessment aspect. These
figures found a line located in the center of the box indicating that the scattered data were normal.
Figure 2
Boxplot of SISC+ Competency in Assessment
LITERATURE REVIEW Instructional Coaching
Research on effective professional development (e.g., Garret, Porter, Desimone, Birman, & Yoon 2001) has established the importance of using sustained, collaborative, school-based approaches. Coaching (e.g., Joyce & Showers, 1995; Sailors & Shanklin, 2010), and instructional coaching as a particular type of coaching (Knight, 2009b), has emerged as an example of quality professional development. By definition, coaching provides teachers with individualized, continuous, and extended support from a more knowledgeable other. The collaborative coaching conversations promote growth by inviting ongoing cycles of reflection and action—or praxis (Freire, 1994)— about how to effectively implement new practices in the classroom (e.g., Knight, 2009a). Cornett’s and Knight’s (2009) review of research showed coaching positively improves (a) teachers’ attitudes, (b) skill transfer, (c) feelings of efficacy, and (d) student achievement. Literacy and mathematics coaching research is becoming more rigorous, moving beyond self-report data (e.g., Biancarosa, Bryk, & Dexter, 2010; Neuman & Wright, 2010; Vanderburg & Stephens, 2010). Sailors and Shanklin (2010, p. 5) assert, “While coaching may be new, it is no longer unproven.” Nevertheless, coaching practices vary widely. Many questions remain about what coaching content, for what duration and intensity are the most effective for which teachers, in what setting, or for what purposes. The answers to such questions are pressing given today’s politics around high-stakes accountability (Ravitch, 2010).
Instructional coaching focuses on improving classroom instruction. Instructional coaches (e.g., a peer, seasoned teacher, district leader, or external consultant) possess instructional expertise that they bring to bear in their work with teachers. Knight (2009b), for example, views instructional coaching as a partnership defined by equality, choice, empowerment and respect, authentic dialogue, reflection, praxis, and reciprocity. The coach–teacher dialogue is negotiated, evolving, and partnership specific, based in equity and shared expertise. Knight (2009b) asserts instructional coaching generally focuses on four elements: classroom management, content, instruction, or ongoing assessment.
32
SISC+
The position of School Improvement Specialist Coaches Plus (SISC+) was introduced by KPM in 2011. Originally, this position was only given to outstanding teachers who have been given training in the form of master coaches by the Teacher Education Division (BPG) and JPN. The teachers who receive this training are then assigned to carry out the supervision and development of teachers especially schools that are in bands 5, 6 and 7. (MOE) In a year they must go to the monitored school at least three times a year. Monitoring is done to ensure that the intervention and rehabilitation aspects made have a positive impact on teacher development and school achievement. The SISC+ then designed various intervention programs together with school administrators and subject committees, especially committees whose performance in public examinations was not encouraging (MOE)
The SISC+ posts were held in stages with two pilot states, namely Sabah and Kedah in 2011. As a result of the success and effectiveness of the SISC+ program which started in these two pilot states, the SISC+ posts began to be offered nationwide in 2013. Selected teachers for this position will be placed full time in PPD, however they are not directly involved in management in PPD. SISC+ will hold teacher guidance visits from Monday to Thursday while on Friday it will be used to report to the PPD. Currently, the SISC+ position involves in four major area, which is Language, Science and Mathematics, Social Science and Technique Vocational and Technical (TVET).
Role of the Coach.
Polly et al. (2013), found that instructional coaches can stimulate changes in the instructional practices of teachers if they have a clear understanding of their role and responsibilities, knowledge of instructional practices, mastery of coaching techniques, and an understanding of the adult learner. A coach helps teachers increase their content knowledge, build on their strengths, and improve instructional practices (Polly et al., 2013). An instructional coach takes on several roles. Roles are inclusive of mentor, data coach, content expert, and professional learning facilitator (Chien, 2013; Polly et al., 2013; Collegial Coaching Toolkit, 2007). Therefore, instructional coaches need to receive essential PD to support understanding of the varied roles they play in teachers’ instructional practice.
FINDINGS
This descriptive study uses questionnaire instruments distributed through goggle form and developed based on The District Transformation Programmed (DTP 3.0 Management Book, Ministry of Education Malaysia (MOE). A total of 23 items for assessment knowledge were randomly distributed. A total of 118 SISC+ in Sarawak Malaysia responded to the questionnaire distributed. The findings of the study were analyzed using Statistic for Social Science (SPSS) version 23. The findings of the study involved only descriptive analysis consisting of mean, standard deviation, frequency, and percentage. The mean score details are based on Nurnally and Bernstein interpretation (1994).
RESULTS
The findings show that SISC + competency level in the assessment is high. It is good that SISC+ can maintain the momentum of excellence in providing quality guidance to teachers. Overall, this reinforces the findings of Rozita et al (2016), Sarabiah and Zamri (2017), and Noel Jimbai and Zamri (2019) that SISC + needs strong curriculum and pedagogical skills in order for teachers to have high confidence in SISC +’s ability to provide guidance. For the purpose of strengthening SISC + professionals, the findings of Mohd Hilmi and Jamil (2017) study support that the quality of mentoring is one level or the ability of SISC + to provide guidance through quality coaching practice. It is appropriate

33
4TH SINTO
K INTERN
ATION
AL CON
FERENCE O
N SO
CIAL SCIENCE AN
D M
ANAG
EMEN
T
and appropriate that the KPM establish this position with a focus on providing guidance in curriculum, pedagogy and assessment (DTP 3.0) Through effective coaching practices as well as schools under band 5 can be assisted and teachers will be given guidance in terms of concepts, ideas, methods, techniques, teaching strategies of the 21st century. Implications from the study also found that SISC + pedagogical knowledge was at a high level. This has implications for the planning and implementation of the SISC + Program. The findings of this study are in line with Mohd Hilmi & Jamil’s 2017 study which stated that SISC + needs to focus on the suitability of guidance, timeframe, location of guidance and facilities in the guidance field. Wong and Elzira (2017), stated that the appropriateness of a mentoring session is very important during the mentoring session. According to Rozita et al (2016) the factors of teachers and schools are the catalyst for school effectiveness and student achievement. According to Liddicoat (2018) SISC + professionals are not only referring to the professional attitude of the educational institution, but are comprehensive. Being a quality SISC + integrates three important elements namely curriculum knowledge, pedagogy and assessment making a SISC + person more credible and respected by a mentor. For effective guidance, SISC + needs to use the right skills to make the knowledge transition smoothly. Applying values in coaching practice is also important for SISC+ to be a good example for teachers (Burchinal et al, 2012; Pianta et al., 2010) As compelling as these recommendations may seem, there is little empirical evidence that having instructional coaches in schools leads to growth in students achievement. Some of the reasons for this are that use of SISC+ for TnL improvement and professional development is a fairly new phenomenon, there is little uniformity in the role of SISC+ from site to site, there is a lack of data linking coaching directly to changes in teacher practice and student achievement, and there is limited documentation of what actually occurs during coaching interactions (Peterson et al., 2018). Meanwhile Duessen, et al. (2018) found that the role of instructional coaches looked very different from school to school and covered a variety of responsibilities other than coaching. Clearly, instructional coaching played by the SISC+ accounted for only a fraction of time during coaches work weeks. When instructional coaches do work with teachers in a coaching capacity, there is little documentation of what they do, how the coaching of teachers stimulates student’s growth and achievement (Knight, 2017; Sweeney, 2018) As a recommendation, in order to make SISC+ more effective they need to provide a variety of courses and workshops to strengthen their personalities in terms of communication, quality of knowledge, mastering coaching methodology, mastering current curriculum and pedagogical skills, self-directed professional learning, learning interest and having questioning skills. Further studies on the role and effectiveness of SISC + guidance should be reviewed to enrich the richness of coaching in Malaysia. The contribution of this study as a whole can be a catalyst for educators, educators in the field of education, schools, the Ministry of Education, parents and the community as a whole to stay informed and seek ideas and solutions for better practice. (Decimon & Pak 2016; Clements et al., 2011; Roschelle et al., 2010; Greenleaf, 2011; Heller, 2010). When SISC+ competent with key elements such as content standards, curriculum, and daily lessons it is more likely to be well implemented. Such alignment provides teachers with clearer directions, rather than leaving it up to the teacher to integrate new ideas and strategies into their teaching. For example, the success of SISC+ efforts have been linked to the effectiveness with the curriculum that teachers were using (Fishman, Max, Best, & Tal, 2003; Phelan et al., 2011; Roschelle 2018) as well as the standards and content that teachers were teaching.
CONCLUSION
We have discussed how SISC+ via instructional coaching is consistent with research-based ideas of effective professional development, specifically with its fulfillment of five key features of competencies- content focus, active learning, duration, collective participation,

34
and coherence. We also addressed the potential for inconsistencies and why they should be mitigated. The reader should not be surprised to discover the power and benefits of instructional coaching implemented by SISC+. More empirical investigations need to be conducted, however, to firmly establish coaching as a valuable professional development opportunity for teachers to improve their teaching and learning.
REFERENCES Ahmad, S.M., Radzuwan, A.R., Kamariah,Y.,& Safawati, B.Z.(2016). Exploring the school
improvement specialist coaches’experience in caoching english language teachers. International Arab World English Journal (AWEJ), 7, 243-255.
Allen,J.P., Pianta, R.C., Gregory.A., Mikami,A.Y.,& Lun,J.(2011). An interaction-based approach to enhancing secondary School’s instruction and student achievement. Science, 333, 1034-1037.
Aniza Ahmad & Zamri Mahamod (2015). Tahap kemahiran guru bahasa melayu sekolah menengah dalam melaksanakan pentaksiran berasaskan sekolah berdasarkan jantina, opsyen dan tempat mengajar. Jurnal Pendidikan Bahasa Melayu, 1 (Mei) Universiti Kebangsaan Malaysia.
Annenberg Institute for School Reform, (2009). Instructional coaching, professional development strategies that improve instruction. fhttp://www.annenberginstitute.org/pdf/ Instructinallcoaching.pdf.
Beth B,Chyran,G, (2009). Coaching for instructional improvement: Theme in research and practice. A Journal For Research, Leadership, And Practice, 2(1). http://www.k12leadership.org/sites/default/files/kappan-article.pdf
Bhavani a/p Somasundram & Zamri Mahamod, (2016). Prosiding Seminar Pascasiswazah Pendidikan Kesusasteraan Melayu Kali Kelima. Fakulti Pendidikan, Universiti Kebangsaan Malaysia.
Bitty, A. & Vincent, P. (2017). The relationship between professional learning community and lesson study: A case study in low performing schools in Sabah, Malaysia. Sains Humanika, 9(1-3), 63-70. http://www.sainshumanika.utm.my/index.php/sainshumanika/article/view/1144.
Borman, J., Fieger’s. (2006). Instructional coaching: Key themes from literature. http://www.brown.edu/academics/education-alliance/sites/brown.edu.academic.education-alliance/files/publication/TL-Coaching- Lit-review.pdf.
Bradley, W. (2017). High impact instruction. Prentice Hall.Creswell, J. W. (2005). Research design: Qualitative, quantitative and mixed methods
approaches (2nd ed.). Sage.Creswell, J. W. (2008). Educational research: Planning, conducting, and evaluating
quantitative and qualitative research. Prentice Hall.Desimone, L., & Pak,K., (2016). Instructional coaching as high-quality professional
development. The college of education and human ecology. The Ohio State University.Deussen, T., Coskie, T., Robinson, L., & Autio,E., (2018).“Coach”can mean many things:
Five categories of literacy coaches in Reading First (Issues & Answers Report, REL 2007-No 005). Washington,DC: Department of Education, Institute of Education Sciences, National Center for Education Evaluation and Regional Assistance Northwest. http://ies.ed/gov/ncee/edlabs/regions/northwest/pdf/REL_2007005.pdf
Garis Panduan Praktikum. (2005). Latihan perguruan praperkhidmatan mode latihan perguruan berasaskan sekolah. Bahagian Pendidikan Guru Kementerian Pelajaran Malaysia.
Holland. M. & Adam, M. (2012). Teachers for professional growth: Creating a culture of motivation and learning. Corwin Press.
Jack Canfield & Chee. (2013). Coaching and mentoring: A handbook for coaches. Columbia University Press.
Jake, C, & Knight, J. (2008). Research on coaching. http://www.instructionalcoach.org/images/download/research-pubs/corntt-knight- 2008.pdf.
joyce & shower. (2010). Instruction supervision: a behavior system. Allyn and Bacon.Kementerian Pendidikan Malaysia, (2013), Bidang keberhasilan utama negara (NKRA).
http://www.sumberpemandu.gov.my.Kementerian Pendidikan Malaysia. (2013). Pelan pembangunan pendidikan Malaysia
35
4TH SINTO
K INTERN
ATION
AL CON
FERENCE O
N SO
CIAL SCIENCE AN
D M
ANAG
EMEN
T
2013-2015: Pendidikan prasekolah hingga lepas menengah.Kementerian Pengajian Tinggi Malaysia, & Kementerian Pelajaran Malaysia, (2005).
Penilaian latihan mengajar dalam program pendidikan guru di Malaysia. Knight, J, & Jake, C. (2007). Paper: Studying the impact of instructional coaching.
http://www.instructionalcoach.org/research/tools/paper-studying-the-impact-of-instructional-coaching
Knight, J. (2019). Instructional coaching for implementing visible learning: A model for translating research into practice. Corwin.
Margerat, R. (2009). Principals and teachers perceptions of teacher supervision, University of Nevada, Las Vegas. https://www.digitalscholarship.univ.edu/cgi/viewcontent.cgi?article=1056&context= thesesdissertation.
Mohd Hilmi Anwa & Jamil Ahmad. (2017). Persepsi guru terhadap program pembimbing pakar peningkatan sekolah (SISC+). Seminar on Transdisciplinary Eduaction (STEd2017). https://sted2017.files.wordpress.com/2016/12/1-24-mohd-hilmi-anwa-jamil-ahmad.pdf
Nieto, R. J., & Rirt.h (2014). Clinical supervision. Houghton Mifflin. Noel Jimbai (2017). School improvement specialist coach (SISC+): Suatu analisis
argumentatif. Jurnal Pendidikan IPGKTAR, 48-71.Noel Jimbai, & Zamri, M. (2017). Penerimaan guru-guru bahasa melayu terhadap
bimbingan dan pementoran SISC+. Seminar Penyelidikan Pendidikan 2017. Nor Asimah Zakaria, (2010). Keberkesanan bimbingan guru pembimbing terhadap
latihan mengajar guru pelatih UPSI. Proceeding of the 4th International Conference on Teacher Education.
Ong Sze Chong & Zamri Mahamod. (2016). Ciri pengajaran dan pembelajaran guru cemerlang bahasa Melayu Sekolah Menengah di Negeri Sarawak. Prosiding Seminar Pascasiswazah Pendidikan Kesusasteraan Melayu Kali Kelima. Fakulti Pendidikan, Universiti Kebangsaan Malaysia.
Peter, S. D., Taylor, M. B., Burnham, B., & Shock, R. (2018). Reflective coaching conversations: A missing piece. Longman.
Pusat Pengajian Ilmu Pendidikan, Universiti Sains Malaysia: Jawatankuasa Penyelarasan Pendidikan Guru (JPPG) Malaysia.
Richard, L. (2016). Coaching and mentoring. Harvard Business School Press. Rozita Radhiah Said, Abdul Rasid Jamian & Azhar Md. Sabil. (2016). Pengetahuan dan
kefahaman skop pengajaran dan pembelajaran bahasa melayu dalam kalangan jurulatih pakar pembangunan sekolah (SISC+). International Journal of Education and Training (InJET), 2(2), 1-9. http://www.injet.upm.edu.my
Rozita Radhiah Said, Mohammad Brahim & Azhar Md. Sabil. (2016). Bimbingan dan pementoran berfokus oleh SISC+ Bahasa Melayu: Impak terhadap kualiti pengajaran guru bahasa melayu di sekolah-sekolah menengah daerah samarahan, sarawak. Jurnal Pendidikan Malaysia, 41(2), 131-139. http://ejournals.ukm.my/jpend/article/view/16017.
Rusni Mohamad Zain. (2013). Pengurusan Penyeliaan dalam suasana sekolah: Isu dan strategi. Jurnal Kementerian Pendidikan. 2(4).
Saemah Rahman & Zamri Mahamod. (2016). Kreativiti dalam pengajaran dan pembelajaran. Universiti Kebangsaan Malaysia.
Sarabiah Jusoh & Zamri Mahamod. (2016). Tanggapan, amalan dan keberkesanan bimbingan pegawai SISC+ dari perspektif guru bahasa Melayu. prosiding seminar pascasiswazah pendidikan kesusasteraan melayu kali kelima. Fakulti Pendidikan, Universiti Kebangsaan Malaysia.
Shamsudin Mohamad & Kamarul Azmi Jasmi, (2011). Penyeliaan dalam pengajaran dan pembelajaran. Universiti Teknologi Malaysia.
Shaun, A. & Harbour, M. (2009). The coaching toolkit. Sage Publication. Syed Ismail Syed Mustapa. (2010). Amalan bimbingan pengajaran pensyarah dan guru
pembimbing dalam program mentoring praktikum serta impaknya terhadap kualiti guru pelatih. https://www.ukm.my/jurfpend/jurnal38/7SYEDISMAILSYEDMUSTAPA.pdf.
Thomas, N. (2015). Handbook for effective supervision of instruction (3rd ed.). 2-3. Prentice- Hall.
Tshabalala, T. (2013). Teachers perception towards classroom instructional supervision:

36
A case study of nkayi district in Zimbabwe. https://www.ijsse.com/sites/default/files/issues/2013/v4il/paper/Paper-3.pdf
Wan Norhasma & Nurahimah Mohd Yusoff, (2019). SKPMg2 (Standard 4) as tools to upgrade teachers teaching quality. Journal of Educational Research and Indigenous Studies. 1(1). http://www.jerisjournal.com
Ware & Kitsanis, E. D. (2015). Supervising instruction: Differentiating for teacher success. Christopher Gordon.
Yunos Salleh. (2011). Hubungan kualiti penyeliaan pengajaran dan pembelajaran dengan komitmen dan efikasi guru. Universiti Kebangsaan Malaysia.
Zamri Mahamod, Ruslin Emir & Mohamed Amin Embi. (2015). Kepelbagaian pelajar dan perbezaan pembelajaran. Dewan Bahasa dan Pustaka, Kuala Lumpur.
Zubaidah Bibi, Hamidah Yamat & Wahiza Wahi, (2019). School improvement specialist coaches plus (SISC+) teacher coaching in Malaysia: Examining the studies. International Journal of Contemporary Applied Research, 6. http://www.ijcar.net.pdf
37
4TH SINTO
K INTERN
ATION
AL CON
FERENCE O
N SO
CIAL SCIENCE AN
D M
ANAG
EMEN
T
SICONSEM202: 104-072
ARTIFICIAL INTELLIGENCE IN ACADEMIC WRITING TEACHING
*1Marina Georgievna, Petrova & 2Natalia Fedorovna, Mikheeva Institute of Foreign Languages, Peoples’ Friendship University of Russia
Corresponding authors: [email protected], [email protected]
ABSTRACT
Purpose – The article aimed the scientific and theoretical justification, development, and testing a method for teaching graduate students academic writing using the author’s model of chatbots, which involve training a self-learning AI software for teaching a foreign language.
Methodology – To create a methodology for teaching academic writing using chatbots, we selected, reviewed, and interpreted didactic and methodological principles of teaching. During experimental training, the following research methods were used: study and analysis of theoretical studies on AI using in education, FLT methods, IT, cognitive science; study and generalization of the experience in teaching a foreign language in Russia and abroad using AI; interviews and surveys of teachers and PhD students according to the developed method using chatbots; conducting an experimental learning and the final test; presentation and verification of the developed model’s effectiveness by processing the obtained data; the technology of the SWOT-model for the development of the teaching method strategy. Findings – The article described the actions’ algorithm of two educational chatbots, which were created for Ph.D. students by a group of experts. The chatbot Professor_EDU helps Ph.D. students learn to use academic English for particular purposes. It helps to improve grammar and expand professional vocabulary. MG_Bot helps to resolve technical issues. Each of chatbots has individual personality traits, reacts emotionally under the situation using aphorisms in Latin.
Significance – The findings of the study showed that interacting with PhD students chatbots can quickly adapt to the specifics of Academic English and assist to practice professional skills of the 21st century.
Keywords: Academic writing (AW), artificial intelligence (AI), educational chatbots, foreign language teaching (FLT), multiprofile TV studio.
INTRODUCTION
The first paragraph text begins with no indent. The first paragraph text begins with no indent. In the context of the fourth industrial revolution development, in the process of modernizing Russian higher education, the use of AI technologies in Academic Writing (AW) teaching is one of the essential elements of the educational process. Technology is opening up many new possibilities for language learning, and Artificial intelligence has an enormous potential (Fryer & Carpenter, 2006). AI technologies, known as ‘new electricity,’ are used in all the fields: eCommerce, FinTech, medicine, electric power, automotive industries. Education technology is no exception. Learning process digitalization is not limited to technical support; it starts to pretend to the linguodidactic level of the teaching. Virtual interaction expands the base of informative communication, makes the language immersion and language culture more interesting. Thanks to the unified information intellectual, educational environment, interested persons in obtaining knowledge already interact virtually, stimulating the development of electronic, distance, and mobile education (Chernyshkova, 2018). Digital technology adoption into the learning process
04
38
helps teachers and students to reach the best results in acquiring knowledge. Now Natural Language Processing (NLP), Machine Learning (ML), deep neural networks allow using the tablet or mobile for communication with the program. There is no doubt AI will significantly change the language learning process in the future with the use of chatbots.
According to Oxford Dictionaries, a chatbot is “a computer program that can hold a conversation with a person, usually over the Internet” (Oxford dictionary, 2020). A virtual assistant is a program that imitates human speech. With the Chatbot, students can chat in English every day at any time convenient for them, and it will not judge them for mistakes as strictly as a teacher. Students’ assistant in learning English is always and everywhere with them.
Chatbots have come a long way from useless dummies to intelligent assistants that can trick you into thinking you are communicating with a real person. With chatbots getting smarter, people have started using them in learning foreign languages. They engage in a dialog with an AI bot and learn through the process of communication. Chatbots provide customized answers in response to your messages and can even grade your performance or give tips on what you need to improve (Intellias Intelligent Software Engineering, 2019). Because of a comparative analysis of computer language programs, nine educational chatbots’ advantages and disadvantages were identified.
ALICE, one of the oldest chatbots, specially designed as an assistant to English learners, can choose various characters for communication. Besides, it gives quick answers with a bit of humor. Moreover, it has the ability to learn and refine the dialogue.
Quite a friendly chatbot MITSUKI is easy to speak Japanese because it clarifies, understands abbreviation, has logical dialogues, its language of communication is very similar to humans. This version uses flash and without it.
SPLOTCHY, a fun chatbot, was created for the purpose of having fun. It has got funny answers, a high speed of responses, and it uses slang.
CLEVERBOT, created by the British, has got its application and the ability to connect the chat to the Facebook messenger and talk through a microphone. Its answers are realistic and with a sense of humor.
EXISTOR presents a site that specializes in creating bots and offers the opportunity to create your own. With a convenient and modern interface, the bot has several characters and a set of emotions.
A modern chatbot, ELBOT, which is quite interesting to communicate with, has fun answers and animation, long sentences, logical dialogues, and an app for android and ios.
The bot iGod, simulating communication on behalf of God, has cheerful messages and quite logical dialogues.
MONDLY is a language-learning program that has two versions for the browser and a mobile app. The users can get several answers voiced by a male or female voice; it helps to learn the correct pronunciation. Users can choose the answer, say their own, type it in the dialog box. The chatbot can clarify the answers in American or British English.
ANDY, an app designed specifically for speaking practice in English, suggests linguistic games, learning grammar rules from “beginner” to “advanced,” lexical resource upbuilding, explanation of mistakes and new words, examples of new lexical units using, grammar tests.
For creating new chatbots, assistants in Academic Writing, the main attention was paid to the disadvantages of the existing bots. These are: outdated and boring interface that
39
4TH SINTO
K INTERN
ATION
AL CON
FERENCE O
N SO
CIAL SCIENCE AN
D M
ANAG
EMEN
T
works via the flash player, payment of the characters for communication, no contact via mic, technical problems with sound, repeating answers, strange and illogical answers from troll users, the algorithm of interaction between user and support chatbot (teacher).
As we see, chatbots based on dialogue management and developed with AI, TTS technology, and computer animation can engage the learner in computer-simulated human-human conversations (Sha, 2009). It is possible when chatbot meets the requirements of the language program.
It is no secret that at the third stage of higher education, post-graduate students should publish their research results in scientific journals indexed in Web of Science or Scopus. English-language publications have become a quantitative and qualitative indicator of scientific research (Alenkina, 2018; Jamali, & Krish, 2021). Postgraduate students must think methodically and innovatively, including the ability to competently and reasonably express their ideas in English (Popova & Biricheva, 2017). Many questions arise. How to write a scientific article using academic English? How to choose a scientific journal according to your strategy? How to write a cover letter to the scientific journal? Where can a post-graduate student find a dictionary with professional terms?
As a result of an in-depth analysis of existing language chatbots, the author’s model of virtual assistants for PhD. students was developed. The Institute of Foreign Languages (RUDN University) began to use neural network capabilities and AI in AW teaching post-graduate students. AI is integrated into the learning process. Thanks to using it, the needs of each PhD. student can be taken into consideration. Therefore, educators collect data about learners, their abilities, interests, projects, problems, and scientific researches. The specialists consider this data when creating chatbots.
METHODS
The research focuses on higher education students’ attitudes towards chatbots using in Academic Writing. The purpose of the study is the scientific and theoretical justification, development, and testing of methods for teaching graduate students in academic writing using chatbots. To achieve the educational goal is advisable to rely on the following methodological approaches: personality-activity, cognitive, and competence. To create a methodology for AW teaching using chatbots, we selected, reviewed, and interpreted didactic and methodological principles of teaching.
The personal-activity approach allowed for the use of chatbots in teaching academic writing to use a unique organization of educational activity, which involves the interconnection of personal and activity components. It means the formation of academic skills in the process of fulfilling the practical tasks that it faces. From the position of the activity approach, the structure and specifics of the chatbots’ operating procedures are analyzed.
The cognitive approach made it possible to justify the chatbots inclusion in the content of the developed methodology. This approach determined the need to take cognitive processes among post-graduate students, which resulted in the formation of a “concept of multilevel discourse, their mental clot, maximally curtailed deep semantic structure” (Krasnykh, 2003).
During experimental training, the following research methods were used:• Theoretical: study and analysis of theoretical studies on AI using in education,
methods of teaching foreign languages, information technology, cognitive science; analysis of curricula of the Federal State Educational Standard of Higher Professional Education;
• empirical: study and generalization of the experience in teaching a foreign language in Russia and abroad using AI; interviews and surveys of teachers; interviews and surveys of post-graduate students according to the developed method using
40
chatbots; conducting an experimental learning and the final test;• statistical: presentation and verification of the developed model’s effectiveness by
processing the obtained data;• the technology of the SWOT-model for the development of the teaching method
strategy.
Two hundred young respondents took part in computer-assisted web interviewing about writing the research paper. These were Ph.D. students from 4 Russian higher education institutions: Peoples’ Friendship University of Russia, Lomonosov Moscow State University, Moscow State Linguistic University, North-Eastern Federal University. The survey showed that only 14 percent of Ph.D. students could write researches in academic English and publish them in international scientific journals.
One of the most common methods for evaluating the complexity of internal and external factors affecting the development of a company is the SWOT analysis.
For a more detailed analysis of the use of chatbot in the methodology of teaching a foreign language, we present a SWOT analysis in four categories: strengths, weaknesses, opportunities, and threats.Strengths: • helps the teacher to improve the effectiveness of the educational process; • contributes to the modernization of the educational process, the intensification of
independent work of graduate students and increase their cognitive activity; • allows the teachers to implement a personal-activity and differentiated approach to
learning; • develops students’ motivation; • helps to create real situations of communication, remove psychological barriers,
and increase interest in the subject.
The advantage of using AI technologies is the transfer of the center of gravity from verbal teaching methods to the methods of search and creative activity of the teacher and the student. Consequently, the role of the teacher in the educational process is also changing. Disadvantages: • Chatbot creating with AI elements requires significant financial expenses. A teacher
can fill a chatbot with language content, but only developers can complete a component technical specification.
• University teachers are not always able to solve the problem of leveling the foreign language training of students and bringing it to the level necessary to write a paper in the top-rated journal. Teachers of a foreign language have to direct their efforts to optimize the learning process, finding new ways to organize their professional activities, and using the most effective teaching methods and techniques.
Opportunities: • helps to change the educational process, giving it a problem-searching orientation; • allows you to move from reproductive forms of an educational activity to
independent, creative types of work; • shifts emphasis to the formation of students’ communicative culture and the
development of skills to work with various kinds of information and its sources; • gives the teacher great opportunities to control and adjust the educational process; • it makes it possible to organize a new educational environment, which, on the one
hand, is provided with previously inaccessible materials and authentic texts, and on the other - helps to establish a fruitful interaction of all subjects of the educational process.
Threats: • Misunderstanding of sarcasm. The chatbot can’t read through the lines. Scientists
are working tirelessly to improve artificial intelligence, trying to humanize computer programs, but at the moment, their capabilities regarding this aspect leave much to be desired.

41
4TH SINTO
K INTERN
ATION
AL CON
FERENCE O
N SO
CIAL SCIENCE AN
D M
ANAG
EMEN
T
• Bad improvisation. The chatbot works well as long as the conversation does not go beyond the programmed algorithm. However, the expert group cannot predict the number of possible scenarios. The chatbot learns both good and bad from users, so the teacher needs to keep track of the conversations all the time.
Despite the real disadvantages, chatbots have some undeniable advantages over traditional forms of building the educational process: communication orientation, visualization of educational information, the ability to store a large amount of data, automation of verification processes, easy access to resources, the ability to change and replenish the content continually.
RESULTS
The first paragraph text begins with no indent. Chatbot operating procedures. Thus, for the telegram messenger, it was decided to develop and implement two chatbots in the educational process that accompany post-graduate students when writing a scientific article in English.
Because of the work of an expert group consisting of two developers, two teachers, and six graduate students, chatbot #1 has the following functions: • informing Ph.D. students about the requirements for writing a scientific article in
English in a peer-reviewed high-rating journal;• familiarity with professional terminology for the following areas: “Education
and pedagogical Sciences,” “Linguistics and literature studies,” “Psychological Sciences»;
• training in professional terms using;• practice in writing a “Cover letter” to the editor of a scientific journal.
We used the technologies of fundamental natural language processing (NLP) for Chatbot No.1. These are: • segmentation (splitting into sentences)• lemmatization • highlight keywords and named entities
Besides, the specialists developed technologies for creating regular grammars such as “input pattern - reaction pattern” (AIML):• regular expressions• variables/arrays for remembering the context• conditions, loops, recursions, etc.
For bot No.2, the expert group used machine learning technologies, first of all, deep neural networks. As a result of the in-depth analysis of existing chatbots and brainstorming sessions, an expert group of teachers and Ph.D. students (20 members) created a system for classifying intentions using a basic NLP and a neural network based on a normalized exponential function. Natural language is a natural and intuitive way of communicating information because we use it as well for human-human teaching [Winter & et al, 2019].
Demonstration of chatbots’ prototype provides • reception of requests from the user; • integration with existing billing systems; • providing graduate students with universal access to information – from any
personal computer or mobile device (smartphone) connected to the Internet; • putting the System into operation.
The structure of the chatbot named Professor_EDU (Figure 1) includes five subsystems: “Cover letter,” “Glossary,” “Choice of a Journal,” “Assessment and testing,” “Contact the teacher.” teacher.”
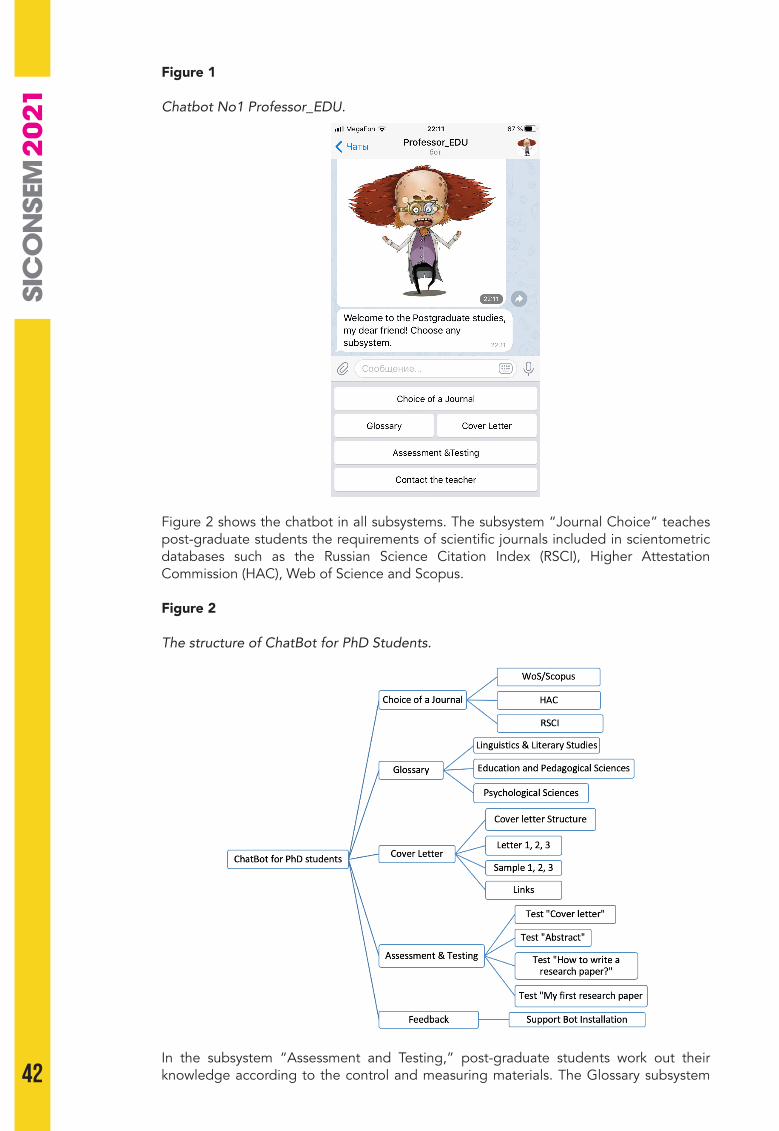
42
Figure 1
Chatbot No1 Professor_EDU.
Figure 2 shows the chatbot in all subsystems. The subsystem “Journal Choice” teaches post-graduate students the requirements of scientific journals included in scientometric databases such as the Russian Science Citation Index (RSCI), Higher Attestation Commission (HAC), Web of Science and Scopus.
Figure 2
The structure of ChatBot for PhD Students.
In the subsystem “Assessment and Testing,” post-graduate students work out their knowledge according to the control and measuring materials. The Glossary subsystem

43
4TH SINTO
K INTERN
ATION
AL CON
FERENCE O
N SO
CIAL SCIENCE AN
D M
ANAG
EMEN
T
includes professional terms in English in three areas of post-graduate studies at the Institute of Foreign Languages of the RUDN University: Linguistics and Literary Studies, Education and Pedagogical Sciences, and Psychological Sciences. Each glossary includes more than a thousand lexical units. It is worth mentioning that all the Ph.D. students from the Institute of foreign languages (RUDN University) took part in the Glossaries making. In the subsystem “Cover Letter», chatbot provides to the Ph.D. students the following headings: Cover Letter Template for Journal Submissions; Letters 1-3; Samples 1-3; Links. In the Subsystem “Assessment & Testing,” Ph.D. students can test their knowledge using tests: “Cover letter,” “Abstract,” “How to write a research paper?”, “My first research paper” (Figure 3). At the end of the test, chatbot #1 directs the Ph.D. student to the support chatbot. MG-Bot checks the test, shows the rating, and writes recommendations to the student. the student.
Figure 3
Subsystem “Assessment & Testing”.
(a) (b)
The chatbot Professor_EDU helps Ph.D. students learn to use academic English for particular purposes. It helps to improve grammar and skills in research paper writing and expand professional vocabulary. The chatbot of Support, MG_Bot, helps to resolve technical issues, cooperates with each Ph.D. student personalized 24/7. Each of chatbots has individual personality traits, reacts emotionally under the situation using aphorisms in Latin.
TV content for Chatbot No2. A teacher uses AI technology because “it can offer tools that simulate real-life work situations while allowing students to acquire and practice essential 21st-century professional skills”. That is why we decided to create a multifunctional TV studio for students. They create content for chatbot No2 (Figure 4).
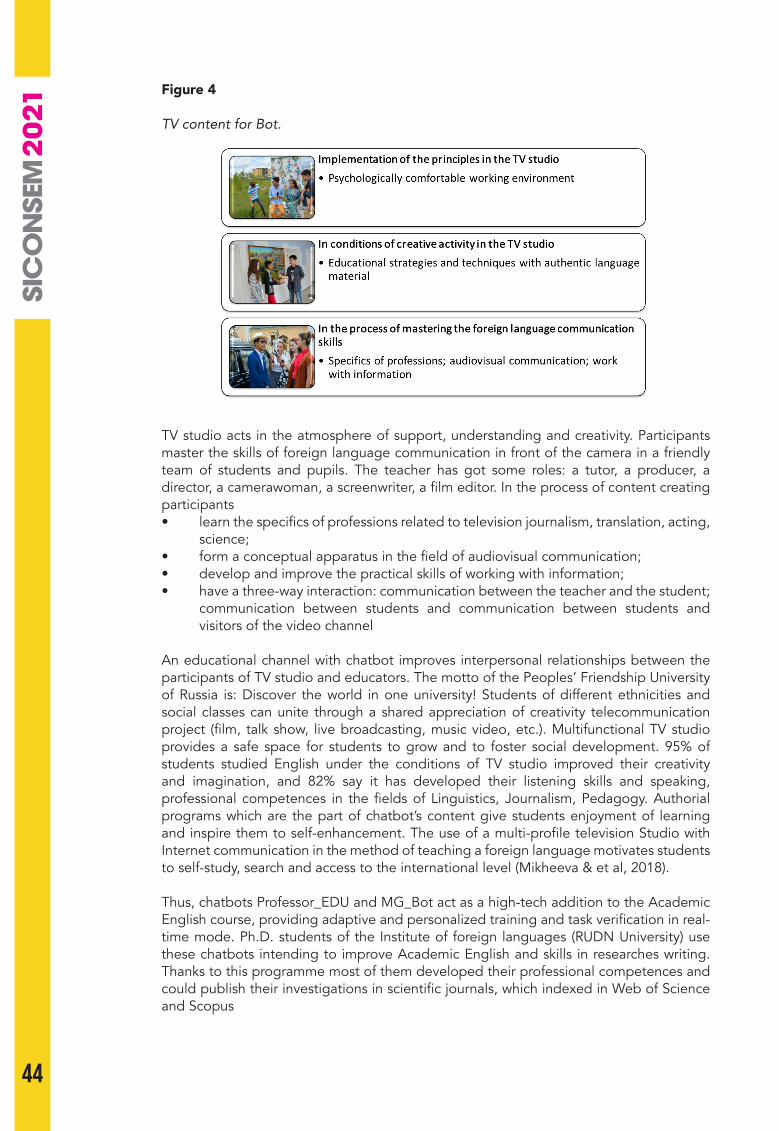
44
Figure 4
TV content for Bot.
TV studio acts in the atmosphere of support, understanding and creativity. Participants master the skills of foreign language communication in front of the camera in a friendly team of students and pupils. The teacher has got some roles: a tutor, a producer, a director, a camerawoman, a screenwriter, a film editor. In the process of content creating participants• learn the specifics of professions related to television journalism, translation, acting,
science;• form a conceptual apparatus in the field of audiovisual communication; • develop and improve the practical skills of working with information;• have a three-way interaction: communication between the teacher and the student;
communication between students and communication between students and visitors of the video channel
An educational channel with chatbot improves interpersonal relationships between the participants of TV studio and educators. The motto of the Peoples’ Friendship University of Russia is: Discover the world in one university! Students of different ethnicities and social classes can unite through a shared appreciation of creativity telecommunication project (film, talk show, live broadcasting, music video, etc.). Multifunctional TV studio provides a safe space for students to grow and to foster social development. 95% of students studied English under the conditions of TV studio improved their creativity and imagination, and 82% say it has developed their listening skills and speaking, professional competences in the fields of Linguistics, Journalism, Pedagogy. Authorial programs which are the part of chatbot’s content give students enjoyment of learning and inspire them to self-enhancement. The use of a multi-profile television Studio with Internet communication in the method of teaching a foreign language motivates students to self-study, search and access to the international level (Mikheeva & et al, 2018).
Thus, chatbots Professor_EDU and MG_Bot act as a high-tech addition to the Academic English course, providing adaptive and personalized training and task verification in real-time mode. Ph.D. students of the Institute of foreign languages (RUDN University) use these chatbots intending to improve Academic English and skills in researches writing. Thanks to this programme most of them developed their professional competences and could publish their investigations in scientific journals, which indexed in Web of Science and Scopus

45
4TH SINTO
K INTERN
ATION
AL CON
FERENCE O
N SO
CIAL SCIENCE AN
D M
ANAG
EMEN
T
CONCLUSION
Being a budding field of applied linguistics, AI technology allows students to acquire and practice the necessary professional skills of the 21st century. It is a field that desperately needs language teachers to get involved if chatbots are to become the invaluable tool they have the potential to be (Fryer & Carpenter, 2006). AI implementation in online English language learning has already proved its effectiveness. Convenience and flexibility in the use of digital technologies draw the teachers in the capability of the language immersion. Digital technologies change the education pattern; AI adapts and personalizes the learning process. The teacher can reach it in the traditional lesson very seldom. The system of the student’s progress digital assessment by AI allows the teacher to correct the teaching course with dispatch.
Moreover, AI allows estimating the students’ knowledge level and selecting an appropriate teaching format initially. The teaching process with the use of AI is more exciting and productive. Instead of dull writing words and phrases, the students learn in an interactive format. Teaching with AI supposes a continual change of pace. It does not give to distract attention to the lesson and helps to focus on the teaching. The algorithm considers many factors: basic knowledge level, previous experience, the quality of information perception, the level of course content acquiring. This algorithm allows adopting the content for the concrete student. According to these statistics, the teaching format is selected. The student will be able to resolve creative tasks and a typical program.
AI in the English teaching process allows you fully or partially automating and making full-fledged analytics of all the processes – from selecting a teacher to a specific task, checking homework, as well as training. If the student cannot complete correctly at the first try, the exercises are automatically given for repetition and task revision. Thanks to AI introduction, a clear structure is observed in the classes. There is also the ability to track student’s progress at all levels. Not only the student himself/herself, but the teacher and the student’s curator can view statistics and help the student achieve better results. For example, the students develop vocabulary and grammar skills using practical, interactive tasks: vocabulary: collect a word in pieces, write the correct option, or choose the option you want. In contrast, all words are accompanied by a picture, voice acting, and translation.
Working with AI is also very useful for educating teachers because you can track why the program changes the curriculum, what factors take into account, and what progress the student has as a result. Or, for example, the selection of participants for teamwork. If the teacher can succumb to some emotional influence - we are all humans - and as a result, neglect to something, underestimate or overestimate the level of knowledge and capabilities of participants. Then AI will do it impartially and following the knowledge level of participants, their abilities, and interests.
However, it is impossible to robotize the educational process entirely for several reasons. The point is that in the educational process, the teacher plays not only the role of an information carrier but also a mentor, to whom students always have a sense of responsibility. And it’s more accessible for a person to work out the correct reactions to different life situations than a machine that will choose the right action not intuitively, but by analyzing thousands of possible options. It is a scientific paradox: We strive to make a machine out of a man, and a man out of a machine.
Therefore, people should consider AI as a useful assistant to the teacher, who does high-quality analytics and personification of the educational process. Secondly, we must not forget that AI is well-trained, but it can learn both good and bad, so it is necessary to limit the scope of its influence on students strictly. Moreover, if you do not control the educational process, the question arises of who will be responsible for the mistakes of AI, which can harm not only the assimilation of the curriculum but the purely human qualities of the student. Finally, the teacher forms the personality, attitude to any things and events, and has a significant influence on our worldview.

46
The practice showed that the Chatbots for Ph.D. students can facilitate the delivery of multi-modal content as well as offering the potential to register user interaction, provide feedback and track progress. Thus, becoming a part of the ecosystem of foreign language learning, the chatbot as a product of artificial intelligence: • helps track individual progress of each student; creates an “innovative individual
trajectory of a foreign language teacher” (Karsenti & Kozarenko, 2019); • adapts the educational process to the individual learning speed of the student and
offers tasks of increasing complexity; • makes the learning process more efficient; increases engagement through
gamification (Artificial Intelligence in Education: Seven Applications, 2020); • contributes to the development of professional competencies.
The use of chatbots in foreign language teaching methods contributes to the creation of an educational environment that meets modern requirements for graduates of specialized universities. The ability to navigate in the modern information flow and work with new technologies during training contributes to the rapid adaptation of the employee to professional activities in the future.
It should be emphasized that the chatbots implementing into the educational process does not exclude traditional teaching methods, but is harmoniously combined with them at all stages of training: familiarization, training, application, control.
The use of AI technologies allows us to modernize and differentiate the learning process taking into account the individual characteristics of each student, thereby increasing its effectiveness, as well as encouraging students to further independent study of a foreign language. The use of information educational technologies has long been not a tribute to fashion. Still, a necessity aimed not only at training a professional researcher and developing information competence but also at developing universal and general professional competencies (Byyanova & et al, 2017).
ACKNOWLEDGEMENT
This paper has been supported by the RUDN University Strategic Academic Leadership Program.
REFERENCES
Alenkina, T.B. (2018). Academic writing and its development in Russia: Genre approach. Higher Education in Russia, 27(5), 110-113.
Artificial Intelligence in Education: Seven applications. Retrieved March 15, 2020, from URL: https://the-accel.ru/iskusstvennyiy-intellekt-v-obrazovanii-sem-variantov-primeneniya/.
Buyanova, G. V., Kinderknecht, A. S., Popova, T. V., & Peunova, E. V. (2017). FLT in postgraduate studies of a non-linguistic university: relevant issues. Perm: IPC PROKROST.
Chernyshkova, N. V. (2018). SMART technologies in teaching a foreign language. Philological Sciences. Questions of theory and practice, 2(80). 211-214.
Fryer, L., & Carpenter, R. (2006). Bots as language learning tools. Language, Learning and Technology, 10(3), 8-14. https://doi.org/10125/44068
Intellias Intelligent Software Engineering. https://www.intellias.com/how-ai-helps-crack-a-new-language/.
Jamali, M., & Krish, P. (2021). Fostering 21st century skills using an online discussion forum in an English for specific purposes. Malaysian Journal of Learning and Instruction, 18(1), 219-240. https://doi.org/10.32890/mjli2021.18.1.9
Karsenti, T.,& Kozarenko, O. (2019). New technological trends and innovative foreign language teaching: what are the most effective learning strategies? XLinguae, 12(1), 128-144. https://doi.org/10.18355/XL.2019.12.01XL.10
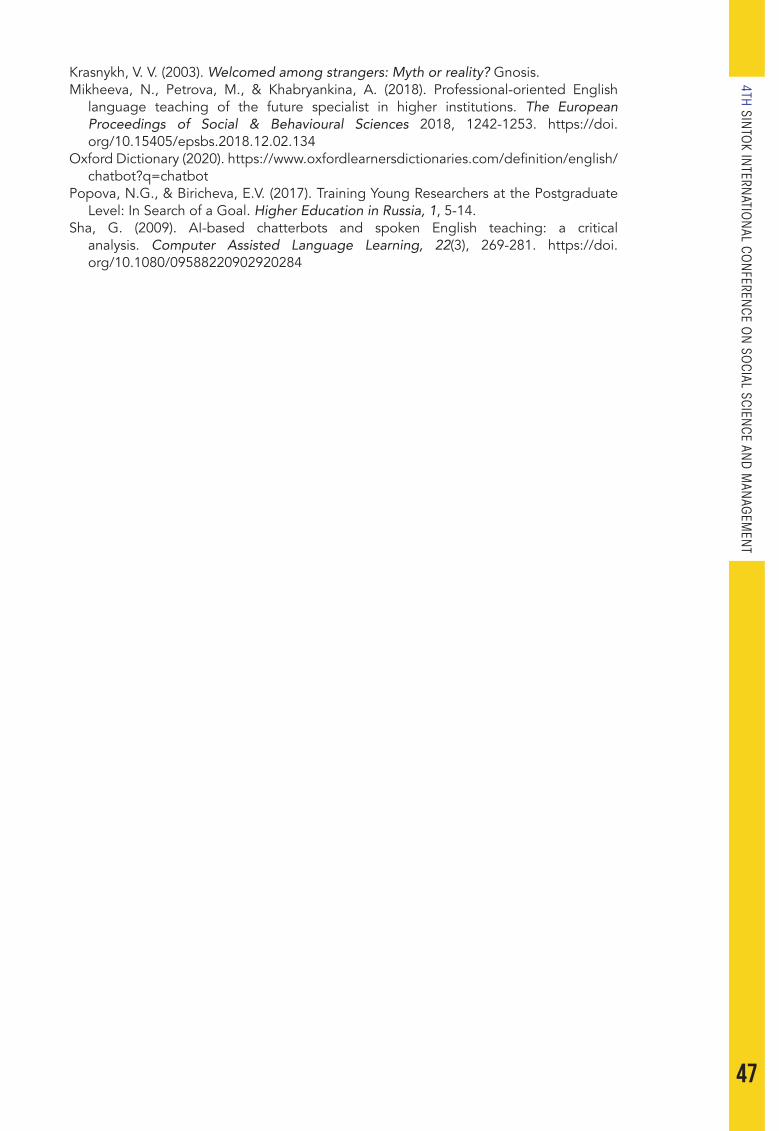
47
4TH SINTO
K INTERN
ATION
AL CON
FERENCE O
N SO
CIAL SCIENCE AN
D M
ANAG
EMEN
T
Krasnykh, V. V. (2003). Welcomed among strangers: Myth or reality? Gnosis.Mikheeva, N., Petrova, M., & Khabryankina, A. (2018). Professional-oriented English
language teaching of the future specialist in higher institutions. The European Proceedings of Social & Behavioural Sciences 2018, 1242-1253. https://doi.org/10.15405/epsbs.2018.12.02.134
Oxford Dictionary (2020). https://www.oxfordlearnersdictionaries.com/definition/english/chatbot?q=chatbot
Popova, N.G., & Biricheva, E.V. (2017). Training Young Researchers at the Postgraduate Level: In Search of a Goal. Higher Education in Russia, 1, 5-14.
Sha, G. (2009). AI-based chatterbots and spoken English teaching: a critical analysis. Computer Assisted Language Learning, 22(3), 269-281. https://doi.org/10.1080/09588220902920284
48
SICONSEM2021: 037-045
ONLINE LEARNING READINESS AND ITS RELATIONSHIP TO STUDENT PERCEIVED STRESS DURING COVID-19 PANDEMIC
1Noraini Omar, 2Salmi Lilek, 3Lee Hou Yew & 4Teng Kie YinJabatan Kecemerlangan Akademik,
Institut Pendidikan Kampus Tun Abdul Razak, Malaysia
Corresponding authors: [email protected]; [email protected]; [email protected]; [email protected]
ABSTRACT
Amidst the rapidly evolving global health crisis of COVID-19, the education institutions all around the world have to make the switch, moving from face-to-face to online learning. According to literature search, learning process without learning readiness will be less effective and it might lead to stressful feelings and thoughts among the students. Therefore, this paper sets out to examine the students’ online learning readiness and perceived stress as well as the relationship between both variables. In this quantitative study, a set of questionnaire in Google Forms which was made up of respondents’ demography, Online Learning Readiness Scale and Perceived Stress Scale was shared via WhatsApp to all the relevant students. Data collected from 701 students indicated that the level of online learning readiness is at very high level (µ = 4.14; σ = .522) whereas students’ perceived stress level is at moderate level (µ = 1.99; σ = .518). The relationship between online learning readiness and student perceived stress was examined using correlation analysis and the multiple stepwise regression analysis. According to correlation results, online learning readiness (r = - .435) related negatively to student perceived stress. The results of stepwise regression analysis showed that student perceived stress was predicted negatively by motivation for learning (β = - .292) and learner control (β = - .197). In addition, stepwise regression analysis showed that online learning readiness accounted for 20.2% of the variance in student perceived stress. Some implications and recommendations have been put forward at the end of this study.
Keywords: Online learning, readiness, perceived stress, COVID-19, multiple regression.
INTRODUCTION
The global outbreak of the COVID-19 pandemic has resulted the closure of educational institutions such as schools, colleges and universities. Pokhrel and Chhetri (2021) reported that it is estimated nearly 1.6 billion students in more than 200 countries are affected and impacted more than 94% of the world’s student population. The education system across the world has being challenged and shifted from traditional face to face learning to online learning (Vijayan, 2021). Online learning serves as a panacea in the time of COVID-19 crisis (Dhawan, 2020). It was a critical global incident which students had no other option but to accept and adapt themselves with the change of their classrooms into online learning spaces.
Many researches depicted online learning provides students with a variety of benefits (Akkoyunlu, 2006; Alqahtani, 2011; Chang & Smith, 2008). However, learning process without learning readiness will be less effective. The readiness of online learning will positively impact the students’ academic performance (Engin, 2017). Accoding to Hung et al. (2010), there are five crucial dimensions of online learning readiness. For instance, self-directed learning, motivation for learning, computer/Internet self-efficacy, online communication self-efficacy and learner control. In order to cope with online learning, students need technical equipment, relevant skills on digital tools for interacting virtually with their lecturers and peers. Students might perceive this exceptional situation as
05

49
4TH SINTO
K INTERN
ATION
AL CON
FERENCE O
N SO
CIAL SCIENCE AN
D M
ANAG
EMEN
T
burdensome which might lead to stressful feelings and thoughts among them.
This study therefore sought to examine the students’ online learning readiness and their perceived stress as well as the relationship between both variables. The following research questions were posed to guide the study: 1. What are the levels of online learning readiness and perceived stress among students
of Institut Pendidikan Guru Kampus Tun Abdul Razak (IPGKTAR)?2. What is the relationship between online learning readiness and perceived stress among
students of IPGKTAR?3. Which factor(s) predict more of online learning readiness towards perceived stress
among students of IPGKTAR?
METHODS
Participants
A total of 701 students from IPGKTAR took part in this study. The respondents were consisting of 520 (74.2%) females and 181 (25.8%) males. They were enrolled in various programme: Program Persediaan Ijazah Sarjana Muda Perguruan (4, .6%); Program Ijazah Sarjana Muda Perguruan (515, 73.5%); Program Diploma Pascasiswazah Pendidikan (173, 24.7%) and Program Diploma Perguruan Malaysia (9, 1.3%).
Measures
Online Learning Readiness Scale (OLRS) was developed by Hung et al. (2010) and consisting of 18 items. The students were asked to describe themselves in reference to a 5-point Likert-type scale, with anchors ranging from 1 (strongly disagree) to 5 (strongly agree). The OLRS has five dimensions: computer/Internet self-efficacy, self-directed learning, learner control, motivation for learning and online communication self-efficacy. Pilot test has been carried out. Reliability coefficients for all the dimensions were .82, .83, .68, .85 and .71 for five dimensions, respectively.
Perceived Stress Scale (PSS) was developed by Sheldon (1983). The scale comprised of 10 items and each item ranges from 0 (never) to 4 (very often). Yield total scores from 0 to 40 where a higher score indicates a higher perceived stress level. The Cronbach alpha coefficient obtained from pilot test was .80. PSS scores were obtained by reversing responses (e.g., 0 = 4, 1 = 3, 2 = 2, 3 = 1 & 4 = 0) to the four positively stated items (items 4, 5, 7 and 8) and then summing across all scale items.
Procedures
Data collection took a respondent approximately 30 minutes to complete the data set. Respondents voluntarily participated and were free to fill out questionnaires in Google Forms via link provided at their convenient time and place as well as based on their own affects and ideas. In this study, the analysis of the data was carried out by Pearson correlation and multiple stepwise regression method analysis. The analysis were applied via SPSS 24 for windows.
LITERATURE REVIEW
Online Learning Readiness
Online learning is defined as a mode of learning which both instructors and learners are engaged with each others through the utilisation of Internet and digital technology (Al-Busaidi, 2013; Nor Aniza & Chua, 2015). Online learning can be conducted in both synchronous and asynchronous mode which means with the application of electronic devices along with or without internet connection (Fahmeeda & Ming, 2015). Learners
50
readiness is indeed an important issue in online learning settings. Hung et al. (2010) believed that computer/Internet self-efficacy, self-directed learning, learner control, motivation for learning and online communication self-efficacy are adequate to reflect overall online learner readiness at a more general level. They found that the highest readiness in the dimension of computer/Internet self-efficacy, followed by motivation for learning and online communication self-efficacy and the lowest readiness in the dimensions of learner control and self-directed learning among their sample of college students.
There were quite a number of researches have being carried out locally in Malaysia which focused on the students’ readiness towards online learning. According to Kamaruzaman et al. (2021), undergraduate students were ready towards the use of online learning in term of their motivation, facilities and technology capabilities. The level of readiness of online learning among students from Kolej Komuniti Beufort Sabah (KKBS) is at a high level (Siti Norazian Miskam et al., 2020). Besides, Zulaikha Khairuddin et al. (2020) revealed that majority of the students were unsure to have adequate technology and acceptance to learn online. However, they were ready with the technology skills, self-confidence to practise self-directed learning and to be equipped for online learning. Meanwhile, another study by Chung et al. (2020) reported that the readiness of students to participate in online learning was at the moderate level due to lacking of learners control, self-directed learning and online communication efficacy among them.
Stress and Personal Factors in Online Learning
COVID-19 has turned our worlds upside down especially in causing the disorienting issues in online learning. Students were ushered out of schools and forced to resume with teachers and classmates through computers, cellphones and some other devices. Online learning has been found to be related to psychological impact such as stress and anxiety (Ana Nurdini Sharin, 2021). The frequency and performance of tests, large curricula, parental pressure, loneliness, concern for the future, financial and social issues are the causes of stress (Al Ateeq et al., 2020).
Students are also found a decline in wellbeing, lack of motivation, trouble concentrating on their studies and Internet access issues with regards to difficulties faced (Azlan et al., 2020). Malik and Javed (2021) reported that, students in general have experienced a moderate to higher stress during the online teaching and learning induced by the pandemic. The students’ mental health was significantly affected by the support they perceived from their family and the institution.
Another study by Al-Kumaim et al. (2021) revealed that 67% of students declared feeling stress during the COVID-19 pandemic, while about 28% declared no feeling of stress. There were five major sources of stress expressed by the students. For instance, pressure from having too many online tasks, limited and weak internet connection, unfamiliarity with the study environment and “new normal” study practices in their home,inadequate resources relevant to subjects they are learning and worried they may become victims of COVID-19. Majority of the students declared they had the ability to manage and control their stress as well.
Self-regulation is a construct that has been researched for decades, and more recently has become an important component of successful online teaching and learning (Barnard et al., 2009). In addition, some other research emphasised that students need to be motivated to acquire and use self-regulation to allocate sufficient cognitive resources to accomplish learning tasks (Chiu et al., 2020). Students who regulate their learning are thus able to coordinate and manage reasonable task-related goals, take responsibility for their learning and maintain self-motivation (Heikkilä, & Lonka, 2006). Many recent studies have found that self-regulation has strong links and positive effects on students’ self-help, motivation, and wellbeing (Saroughi, & Kitsantas, 2021)

51
4TH SINTO
K INTERN
ATION
AL CON
FERENCE O
N SO
CIAL SCIENCE AN
D M
ANAG
EMEN
T
RESULTS
Interpretative Scales for the Study Variables
For the purpose of interpretation in descriptive analysis, each of the study variables was appropriately assigned an interpretative scale as according to the Mathematical formula recommended by Gravetter and Wallnau (2000). In order to standardise the interpretation for descriptive analysis on the overall level of the variables, researchers have set five value labels or divisions for each of them. For instance, very low, low, moderate, high and very high levels.
Table 1
Interpretative Scale for Online Learning Readiness Scale (OLRS)
Value Value Level
1.00 – 1.80 Very low
1.81 – 2.60 Low
2.61 – 3.40 Moderate
3.41 – 4.20 High
4.21 – 5.00 Very high
Table 2
Interpretative Scale for Perceived Stress Scale (PSS)
Value Value Level
0.00 – 0.80 Very low
0.81 – 1.60 Low
1.61 – 2.40 Moderate
2.41 – 3.20 High
3.21 – 4.00 Very high
Level of Online Learning Readiness and Student Perceived Stress
Means, standard deviations, inter-correlation for both the variables and the level of online learning readiness and student perceived stress are presented in Table 3.
Table 3
Descriptive Statistics of the Variables
Variables 1 2 3 4 5 6 7 µ σ Level
1 Student Perceived Stress - 1.99 .52 Moderate
2 Online Learning Readiness -.44** - 4.14 .52 High
3 Computer/Internet self-efficacy -.27** .76** - 4.33 .57 Very high
4 Self-directed Learning -.40** .88** .58** - 4.14 .58 High
(Continued)
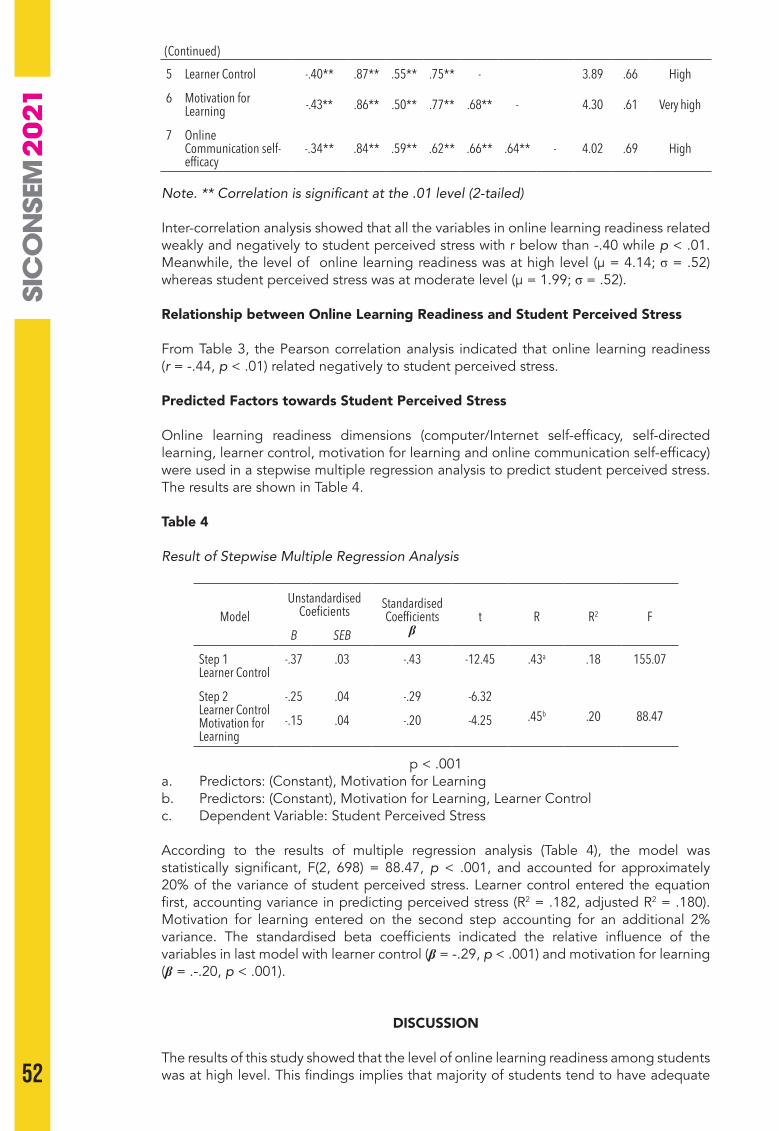
52
5 Learner Control -.40** .87** .55** .75** - 3.89 .66 High
6 Motivation for Learning -.43** .86** .50** .77** .68** - 4.30 .61 Very high
7 Online Communication self-efficacy
-.34** .84** .59** .62** .66** .64** - 4.02 .69 High
Note. ** Correlation is significant at the .01 level (2-tailed)
Inter-correlation analysis showed that all the variables in online learning readiness related weakly and negatively to student perceived stress with r below than -.40 while p < .01. Meanwhile, the level of online learning readiness was at high level (µ = 4.14; σ = .52) whereas student perceived stress was at moderate level (µ = 1.99; σ = .52).
Relationship between Online Learning Readiness and Student Perceived Stress
From Table 3, the Pearson correlation analysis indicated that online learning readiness (r = -.44, p < .01) related negatively to student perceived stress.
Predicted Factors towards Student Perceived Stress
Online learning readiness dimensions (computer/Internet self-efficacy, self-directed learning, learner control, motivation for learning and online communication self-efficacy) were used in a stepwise multiple regression analysis to predict student perceived stress. The results are shown in Table 4.
Table 4
Result of Stepwise Multiple Regression Analysis
ModelUnstandardised
Coeficients Standardised Coefficients
βt R R2 F
B SEB
Step 1Learner Control
-.37 .03 -.43 -12.45 .43a .18 155.07
Step 2Learner ControlMotivation for Learning
-.25 .04 -.29 -6.32.45b .20 88.47-.15 .04 -.20 -4.25
p < .001a. Predictors: (Constant), Motivation for Learningb. Predictors: (Constant), Motivation for Learning, Learner Controlc. Dependent Variable: Student Perceived Stress
According to the results of multiple regression analysis (Table 4), the model was statistically significant, F(2, 698) = 88.47, p < .001, and accounted for approximately 20% of the variance of student perceived stress. Learner control entered the equation first, accounting variance in predicting perceived stress (R2 = .182, adjusted R2 = .180). Motivation for learning entered on the second step accounting for an additional 2% variance. The standardised beta coefficients indicated the relative influence of the variables in last model with learner control (β = -.29, p < .001) and motivation for learning (β = .-.20, p < .001).
DISCUSSION
The results of this study showed that the level of online learning readiness among students was at high level. This findings implies that majority of students tend to have adequate
(Continued)
53
4TH SINTO
K INTERN
ATION
AL CON
FERENCE O
N SO
CIAL SCIENCE AN
D M
ANAG
EMEN
T
readiness which covers all of the dimensions, namely, computer/Internet self-efficacy, self-directed learning, learner control, motivation for learning and online communication self-efficacy. This results is consistent with several local studies that have been carried out earlier (Kamaruzaman et. al, 2021; Siti Norazian Miskam et al., 2020). Since the students were ready for online learning, educators have to put in more effort in employing or adapting more creative teaching techniques and assessments of learning to help to further increase the level of sustainable and healthy online learning among the students.
In addition, the level of students’ perceived stress is found at moderate level in current study. This findings is congruent with Malik and Javed (2021) that majority of the students reported having experienced moderate level of stress through e-learning during COVID-19. The students required proper supports in order to keep them healthy in both mentally and physically. The institutions should reflect the online courses content and design from time to time to ensure that students are always being supported and not over stressed with academic workload. Apart from that, Ana Nurdini Sharin (2021) proposed to have proper online advisers and phychological advice for the students’ mental well-being.
Motivation for learning and learner control in the context of online learning were found predicted the students’ perceived stress in current studies. Chiu et al. (2021) believed that emotional engagement performed through well-designed online learning helps to increase students’ motivation to learn while reducing stress.
Another generally recognised key factor in online learning readiness is students’ self-management of learning or self-directed learning. Online learners who are more self-directed in making decisions regarding their learning tend to be more successful in online learning in higher education (Chiu et al., 2021). In dealing with those who are low in learner control, teachers should create an interesting learning community through group discussions, experience sharing, instant feedback to keep them interested and involved actively in the virtual class activities (Hung, et al. 2010).
Based on the results obtained in the present study, it is suggested for other researchers to conduct a study using qualitative research method to have better understanding of students’ readiness to undergo online learning. This is where researchers can have more in-depth data to be analysed to cater to students’ needs and be current in the technology in education. Thus, future studies can support the data from current study qualitatively. Besides, there are various dimensions for assessing online learning readiness. For instance, psychological, sociological, environmental, human resources, financial, technological skills, equipment and content readiness (Chapnick, 2000); student’s preparedness, teacher’s preparedness, IT infrastructure, management support, school culture and face-to-face (So & Swatman, 2006). Researchers may look into other dimensions in future in order to gain more thorough understanding on student online learning readiness.
CONCLUSION
Online learning was widely practiced due to the closure of the education institutions during the outbreak of COVID-19 pandemic. With this sudden shift away from classroom, both the students’ online learning readiness and perceived stress were widely studied. In order to fill up the research and practice gaps, current study has related both the variables in gaining more useful insights to the relevant stakeholders.
ACKNOWLEDGMENTS
This work was supported in part by grant from the Institut Pendidikan Guru Malaysia (IPGM), Dana Inisiatif Aktiviti Kesarjanaan 2021 (DIAK IPG 2021) with the grant reference: KPM.600-17/5/1 (2) where the first author as the chief researcher.
54
REFERENCES
Akkoyunlu, B., & Soylu, M. Y. (2006). A study on students’ views on blended learning environment. Turkish Online Journal of Distance Education, 7(3), 43-56.
Al Ateeq, D. A., Aljhani, S., & AlEesa, D. (2020). Perceived stress among students in virtual classrooms during the Covid-19 outbreak in KSA. Journal of Taibah University Medical Sciences, 15(5), 398-403. https://doi.org/10.1016/j.jtumed.2020.07.004
Al-Busaidi, K. A. (2013). An empirical investigation linking learners’ adoption of blended learning to their intention of full e-learning. Journal Behaviour & Information Technology, 32(11), 1168-1176. https://doi.org/10.1080/0144929X.2013.774047
Al-Kumaim, N. H., Alhazmi, A. K., Mohammed, F., Gazem, N. A., Shabbir, M. S., & Fazea, Y. (2021). Exploring the impact of the covid-19 pandemic on university students’ learning life: An integrated conceptual motivational model for sustainable and healthy online learning. Sustainability, 13, 2546. https://doi.org/10.3390/su13052546
Alqahtani, A. A. (2010). The effectiveness of using e-learning, blended learning and traditional learning on students. Achievement and attitudes in a course on Islamic culture: An experimental study (Unpublished doctoral thesis). Durham University, England.
Ana Nurdini Sharin. (2021). E-learning during covid-19: A review of literature. Malaysian Journal of Media Studies, 23(1), 15-28.
Azlan, C. A. et al. (2020). Teaching and learning of postgraduate medical physics using internet-based e-learning during the covid-19 pandemic: A case study from Malaysia. Physica Medica, 80, 10-16. https://doi.org/10.1016/j.ejmp.2020.10.002
Barnard, L., Lan, W. Y., To, Y. M., Paton, V. O., & Lai, S.L. (2009). Measuring self-regulation in online and blended learning environments. The Internet and Higher Education, 12, 1–6.
Chang, S. H., & Smith, R. A. (2008). Effectiveness of personal interaction in a learner centered paradigm distance education class based on student satisfaction. Journal of Research on Technology in Education, 40(4), 407-426. https://doi.org/10.1080/15391523.2008.10782514
Chapnick, S. (2000). Are you ready for e-Learning? http://blog.uny.ac.id/nurhadi/files/2010/08/are_you_ready_ for_elearning.pdf
Chung, E., Subramaniam, G., & Dass, L. C. (2020). Online learning readiness among university students in Malaysia amidst Covid-19. Asian Journal of University Education, 16 (2), 46- 58. https://doi.org/10.24191/ajue.v16i2.10294
Chiu, T. K., Jong, M. S. Y., & Mok, I. A. (2020). Does learner expertise matter when designing emotional multimedia for learners of primary school mathematics? Educ. Technol. Res. Dev., 68, 2305–2320.
Dhawan, S. (2020). Online Learning: A panacea in the time of COVID-19. Journal of Educational Technology Systems, 2020, 49(1), 5–22. https://doi.org/10.1177/0047239520934018
Engin, M. (2017). Analysis of students’ online learning readiness based on their emotional intelligence level. Universal Journal of Educational Research, 5(12A), 32-40.
Fahmeeda, A. A., & Ming, L. C. (2015). Review of e-learning practice at the tertiary education level in Malaysia. Indian Journal of Pharmaceutical Education and Research, 49(4), 248-257.
Gravatter, F. J. & Wallnau, L. B. (2000). Statistics for the Behavioural Sciences (5th ed.). Wadsworth – Thomsom Learning.
Heikkilä, A. & Lonka, K. (2006). Studying in higher education: Students’ approaches to learning, self-regulation, and cognitive strategies. Stud. High. Educ., 31, 99–117.
Kamaruzaman, F. M., Sulaiman, N. A., & Shaid, N. A. N. (2021). A study on perception of students’ readiness towards online learning during covid-19 pandemic. International Journal of Academic Research in Business and Social Sciences, 11(7), 1536–1548. http://dx.doi.org/10.6007/IJARBSS/v11-i7/10488
Malik, M. & Javed, S. (2021). Perceived stress among university students in Oman during COVID-19-induced elearning. Middle East Current Psychiatry, 28(49), 1-8. https://doi.org/10.1186/s43045-021-00131-7
Nor Aniza, A., & Chua, L. N. (2015). Technology and higher education: Using an e-learning tutorial as a pedagogy for innovation and flexible learning. Malaysian Journal of
55
4TH SINTO
K INTERN
ATION
AL CON
FERENCE O
N SO
CIAL SCIENCE AN
D M
ANAG
EMEN
T
Distance Education, 17(1), 21-31.Pokhrel, S. & Chhetri, R. (2021). A literature review on impact of covid-19 pandemic on
teaching and learning. Higher Education for the Future 8(1), 133–141. https:// doi.org/10.1177/2347631120983481
Pozo, J-I., Pérez Echeverría, M-P., Cabellos, B., & Sánchez, D. L. (2021). Teaching and learning in times of covid-19: Uses of digital technologies during school lockdowns. Frontier in Psychology. 12:656776, 1-13. https://www.frontiersin.org/articles/10.3389/fpsyg.2021.656776/full
Saroughi, M. & Kitsantas, A. (2021). Examining relationships among contextual, motivational and wellbeing variables of immigrant language-minority college students. Altern. High. Educ., 46, 1–19.
Siti Norazian Miskam, Liaw, Y. H., & Zulfadhli Osman. (2020). Tahap kesediaan pembelajaran atas talian pelajar Kolej Komuniti Beufort (KKBS). Proceedings of 4th National Research and Innovation Conference, 293-298.
So, T., & Swatman, P. M. C. (2006). E-Learning readiness of Hong Kong teachers in Hong Kong IT in education conference. Citeseer. http://citeseerx.ist.psu.edu/viewdoc/download?doi¼10.1.1.65.8121&rep¼rep1&type¼pdf
Sundarasen, S., Chinna, K., Kamaludin, K., Nurunnabi,M., Mohammad Baloch, G., Khoshaim, H. B., Hossain, S. F. A., & Sukayt, A. (2020). Psychological impact of covid-19 and lockdown among university students in Malaysia: Implications and policy recommendations. International Journal of Environmental Research and Public Health, 17(6206), 1-13. https://doi.org/10.3390/ijerph17176206
Vijayan, R. (2021). Teaching and learning during the covid-19 pandemic: A topic modeling study. Education Sciences, 2021, 11, 347: 1-15. 7. https://doi.org/10.3390/educsci11070347
Zulaikha Khairuddin, Nik Nur Athirah Nik Mohd Arif, & Zurina Khairuddin (2020). Students’ readiness on online distance learning (ODL). Universal Journal of Educational Research, 8(12), 7141 - 7150. https://doi.org/10.13189/ujer.2020.081281
56
SICONSEM2021: 049-028
THE LEVEL OF LANGUAGE ANXIETY AMONG STUDENTS STUDYING ARABIC LANGUAGE AS A FOREIGN LANGUAGE:
A SAMPLE FROM UNIVERSITI TEKNOLOGI MARA
1Muhammad Syaffiq Mohammed Raffi & 2Nadhirah Ishak 1,2Kulliyyah of Islamic Revealed Knowledge and Human Sciences, International Islamic
University Malaysia, Malaysia
Corresponding authors: [email protected]; [email protected]
ABSTRACT
This research aims to study the level of language anxiety among Arabic as a Foreign Language students at Universiti Teknologi Mara (UiTM) which focus on the following variables: the level of anxiety for the overall students, the differences of anxiety level between students with academic background in learning Arabic Language and students without any prior experience in learning Arabic Language as well as level of anxiety based on faculties. The study sample consists of 149 students, 73 from the Faculty of Business and Management, 38 students from the Faculty of Health Sciences and 38 students from the Faculty of Accountancy. A questionnaire on language anxiety phenomenon which is Modified Foreign Language Classroom Anxiety Scale (MFLCAS) was distributed among them and it was later analysed using SPSS IBM Statistics. The results revealed that the level of language anxiety for overall students is moderate. Added to that, the students without any academic background in learning Arabic Language have higher level of language anxiety compared to students who have academic background in learning Arabic Language. Lastly, the students from the Faculty of Accountancy have the highest level of language anxiety compared to the students from the Faculty of Business and Management and students from the Faculty of Health Sciences.
Keywords: Arabic as a foreign language, language anxiety, Universiti Teknologi Mara.
INTRODUCTION
The discussion on linguistic anxiety has grown over time with a view of its importance in the field of psycholinguistics and the field of language teaching. Linguistic anxiety is considered as one of the obstacles in learning foreign languages that the students must overcome. Anxiety can be defined literally as agitation and it does not settle in one place. In the Oxford dictionary, anxiety is defined as a disturbing feeling in the mind that arises from fear and uncertainty about the future. As for the terminological term, anxiety means fear and turmoil, and some of them leads to terrible pain, sadness and panic. The main concern of this study is to discover the linguistic anxiety among students. There are many definitions of linguistic anxiety that the scholars focused on, including the definition by Elaine K. Horwitz et al. (1986) who defined anxiety as a complex type of perceptions, beliefs, feelings and behaviors associated with language learning in foreign language classes. Young added that linguistic anxiety is a type of anxiety that is related mainly to the contexts of learning a language other than the mother tongue. McEntry sees linguistic anxiety as the students’ fear or apprehension about what might happen when learning a foreign language. It is also a state of tension and turmoil caused by fear of something unknown as students start to learn the language, surrounded by mixed feelings dominated with fear of the new environment and the result of learning process.
06
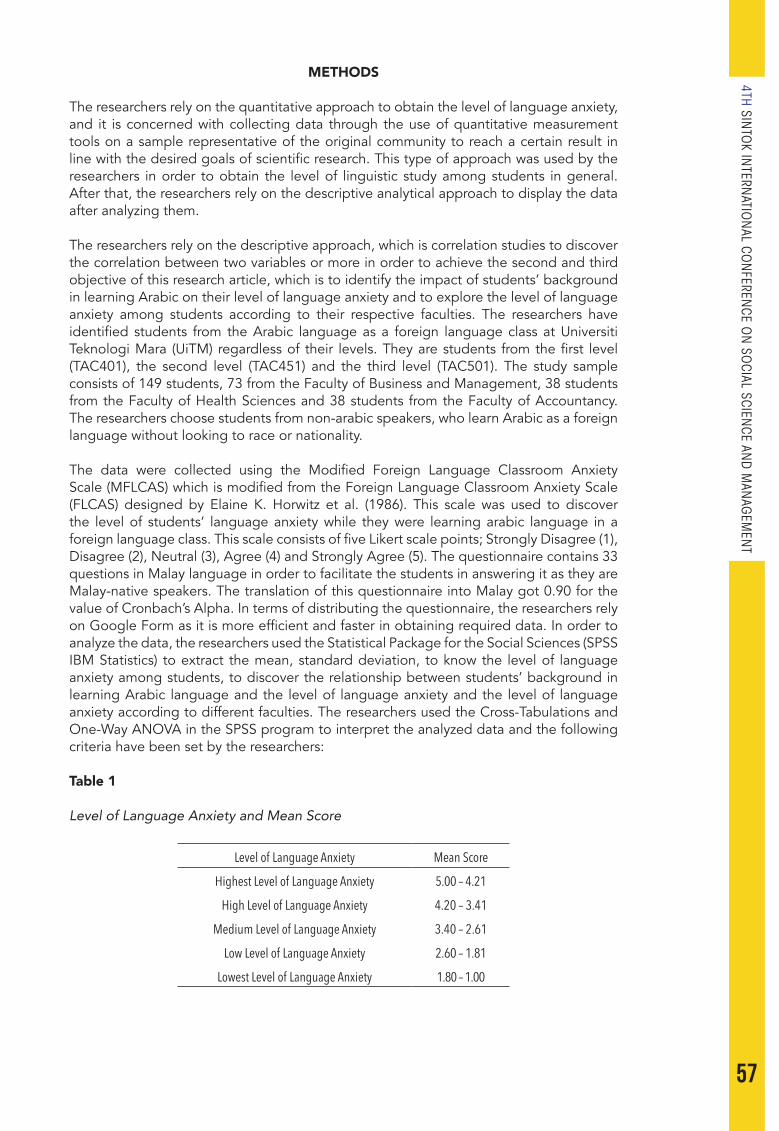
57
4TH SINTO
K INTERN
ATION
AL CON
FERENCE O
N SO
CIAL SCIENCE AN
D M
ANAG
EMEN
T
METHODS
The researchers rely on the quantitative approach to obtain the level of language anxiety, and it is concerned with collecting data through the use of quantitative measurement tools on a sample representative of the original community to reach a certain result in line with the desired goals of scientific research. This type of approach was used by the researchers in order to obtain the level of linguistic study among students in general. After that, the researchers rely on the descriptive analytical approach to display the data after analyzing them.
The researchers rely on the descriptive approach, which is correlation studies to discover the correlation between two variables or more in order to achieve the second and third objective of this research article, which is to identify the impact of students’ background in learning Arabic on their level of language anxiety and to explore the level of language anxiety among students according to their respective faculties. The researchers have identified students from the Arabic language as a foreign language class at Universiti Teknologi Mara (UiTM) regardless of their levels. They are students from the first level (TAC401), the second level (TAC451) and the third level (TAC501). The study sample consists of 149 students, 73 from the Faculty of Business and Management, 38 students from the Faculty of Health Sciences and 38 students from the Faculty of Accountancy. The researchers choose students from non-arabic speakers, who learn Arabic as a foreign language without looking to race or nationality.
The data were collected using the Modified Foreign Language Classroom Anxiety Scale (MFLCAS) which is modified from the Foreign Language Classroom Anxiety Scale (FLCAS) designed by Elaine K. Horwitz et al. (1986). This scale was used to discover the level of students’ language anxiety while they were learning arabic language in a foreign language class. This scale consists of five Likert scale points; Strongly Disagree (1), Disagree (2), Neutral (3), Agree (4) and Strongly Agree (5). The questionnaire contains 33 questions in Malay language in order to facilitate the students in answering it as they are Malay-native speakers. The translation of this questionnaire into Malay got 0.90 for the value of Cronbach’s Alpha. In terms of distributing the questionnaire, the researchers rely on Google Form as it is more efficient and faster in obtaining required data. In order to analyze the data, the researchers used the Statistical Package for the Social Sciences (SPSS IBM Statistics) to extract the mean, standard deviation, to know the level of language anxiety among students, to discover the relationship between students’ background in learning Arabic language and the level of language anxiety and the level of language anxiety according to different faculties. The researchers used the Cross-Tabulations and One-Way ANOVA in the SPSS program to interpret the analyzed data and the following criteria have been set by the researchers:
Table 1
Level of Language Anxiety and Mean Score
Level of Language Anxiety Mean Score
Highest Level of Language Anxiety 5.00 – 4.21
High Level of Language Anxiety 4.20 – 3.41
Medium Level of Language Anxiety 3.40 – 2.61
Low Level of Language Anxiety 2.60 – 1.81
Lowest Level of Language Anxiety 1.80 – 1.00

58
LITERATURE REVIEW
Anxiety can be divided into three categories, namely: trait anxiety, which is a person’s tendency to nervous tension and feeling anxious regardless of the surrounding circumstances, and it can be noticed through facial expression of students, yet uprooting this kind of category is not easy because it is associated with a complex psychological factors. The second one is situational anxiety, which is provoked by a specific situation or circumstances such as public speaking or participation in class. Linguistic anxiety is discussed under this type. The third one is state anxiety, a temporary emotional state which consists of fear, nervousness and a psychological effect in terms of an increase in heart rate or breathing. There are three components of linguistic anxiety which are: communication apprehension, which is the shyness that is caused by fear and anxiety in communicating with others and the difficulty of speaking in public and groups.
Elaine K. Horwitz et al. (1986) stated that communication anxiety is not only the difficulty in communicating, but it includes the difficulty in absorbing messages or information from others. This means that a person with communication anxiety has difficulty in absorbing and understanding others while at the same time causing other people to have difficulties to understand them. The second component is the fear of negative evaluation that is due to lack of self-confidence. A person with this type of anxiety overthinks what others think of him until he feels fear and anxiety. Meanwhile, the third component is the test anxiety which is an anxiety that causes a person to feel afraid to face examinations, tests or assignments that will evaluate his performance.
RESULTS
The results will be classified into three sections according to the research questions. Firstly, what is the level of language anxiety among students of Arabic as foreign language class at Universiti Teknologi Mara? Secondly, is the students’ background in terms of Arabic language learning affects the level of language anxiety? Thirdly, what is the level of language anxiety of students from the Faculty of Business and Management, the Faculty of Health Sciences and the Faculty of Accountancy?
The Level of Language Anxiety among Students of Arabic as Foreign Language Class
In order to reach an answer to this question, the mean and standard deviation were collected to find out the level of language anxiety. The results obtained from Table 2 indicates that the level of language anxiety among students in the Arabic as foreign language class was moderate among 149 students from the Faculty of Business and Management, the Faculty of Health Sciences and the Faculty of Accountancy.
Table 2
Descriptive Statistics & Language Anxiety Level
N Min Max Mean Std. Deviation
Language Anxiety Level
MeanValid N (listwise)
149149 1.36 4.91 2.95 0.82 Moderate
The Difference between the Level of Language Anxiety among Students with a Background in Learning Arabic and Students without a Background in Learning Arabic.
The number of students with a background in learning Arabic is 112 (75%), and the number of students without a background in learning Arabic is 37 (25%), and the following pie chart indicates these data:
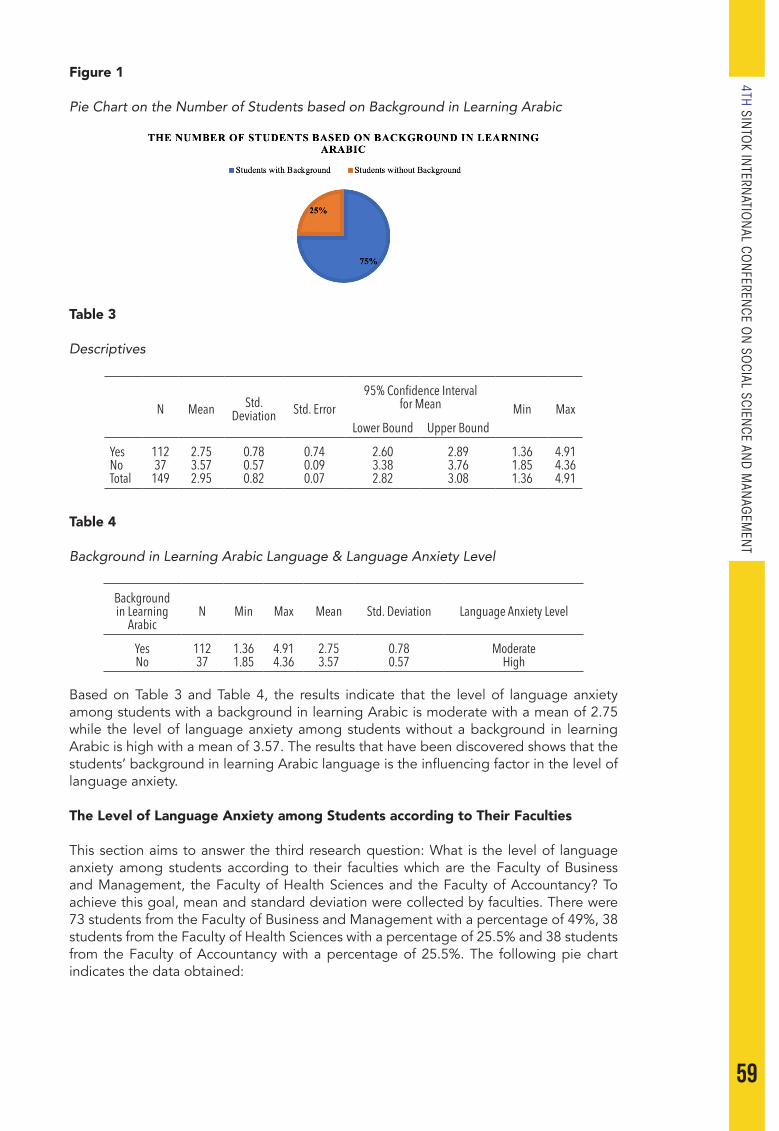
59
4TH SINTO
K INTERN
ATION
AL CON
FERENCE O
N SO
CIAL SCIENCE AN
D M
ANAG
EMEN
T
Figure 1
Pie Chart on the Number of Students based on Background in Learning Arabic
Table 3
Descriptives
N Mean Std. Deviation Std. Error
95% Confidence Intervalfor Mean Min Max
Lower Bound Upper Bound
YesNoTotal
11237
149
2.753.572.95
0.780.570.82
0.740.090.07
2.603.382.82
2.893.763.08
1.361.851.36
4.914.364.91
Table 4
Background in Learning Arabic Language & Language Anxiety Level
Background in Learning
ArabicN Min Max Mean Std. Deviation Language Anxiety Level
YesNo
11237
1.361.85
4.914.36
2.753.57
0.780.57
ModerateHigh
Based on Table 3 and Table 4, the results indicate that the level of language anxiety among students with a background in learning Arabic is moderate with a mean of 2.75 while the level of language anxiety among students without a background in learning Arabic is high with a mean of 3.57. The results that have been discovered shows that the students’ background in learning Arabic language is the influencing factor in the level of language anxiety.
The Level of Language Anxiety among Students according to Their Faculties
This section aims to answer the third research question: What is the level of language anxiety among students according to their faculties which are the Faculty of Business and Management, the Faculty of Health Sciences and the Faculty of Accountancy? To achieve this goal, mean and standard deviation were collected by faculties. There were 73 students from the Faculty of Business and Management with a percentage of 49%, 38 students from the Faculty of Health Sciences with a percentage of 25.5% and 38 students from the Faculty of Accountancy with a percentage of 25.5%. The following pie chart indicates the data obtained:
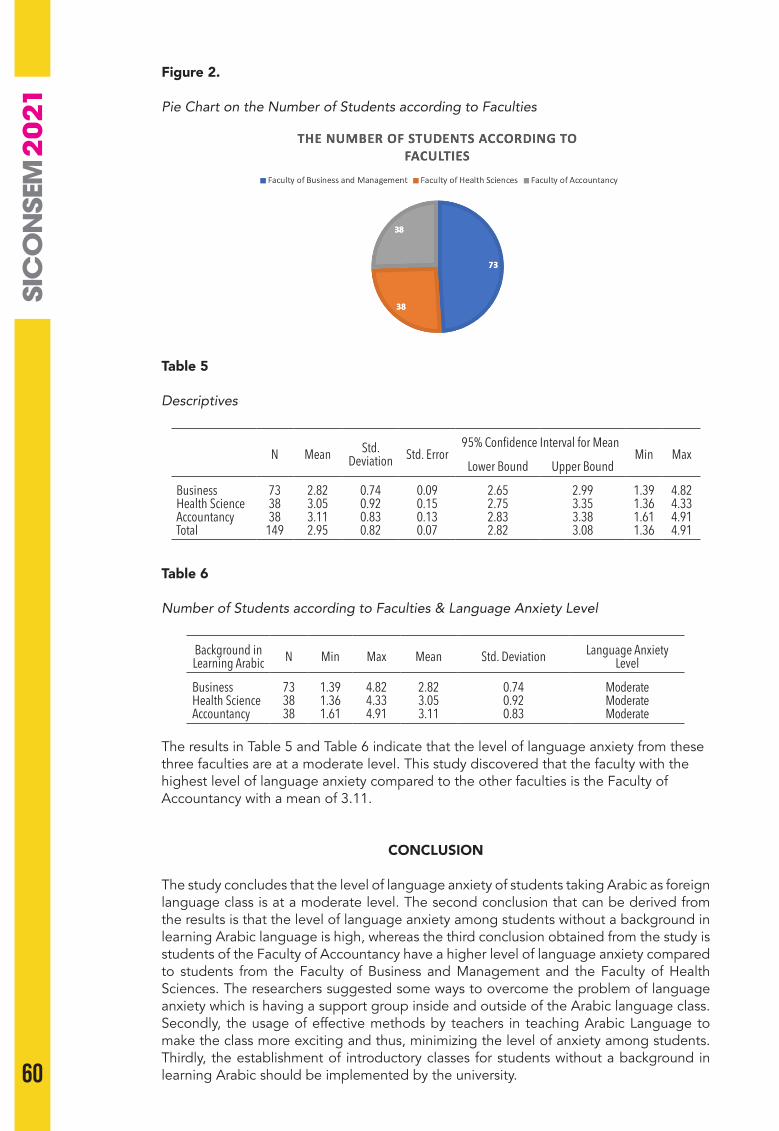
60
Figure 2.
Pie Chart on the Number of Students according to Faculties
Table 5
Descriptives
N Mean Std. Deviation Std. Error
95% Confidence Interval for MeanMin Max
Lower Bound Upper Bound
BusinessHealth ScienceAccountancyTotal
733838
149
2.823.053.112.95
0.740.920.830.82
0.090.150.130.07
2.652.752.832.82
2.993.353.383.08
1.391.361.611.36
4.824.334.914.91
Table 6
Number of Students according to Faculties & Language Anxiety Level
Background in Learning Arabic N Min Max Mean Std. Deviation Language Anxiety
Level
BusinessHealth ScienceAccountancy
733838
1.391.361.61
4.824.334.91
2.823.053.11
0.740.920.83
ModerateModerateModerate
The results in Table 5 and Table 6 indicate that the level of language anxiety from these three faculties are at a moderate level. This study discovered that the faculty with the highest level of language anxiety compared to the other faculties is the Faculty of Accountancy with a mean of 3.11.
CONCLUSION
The study concludes that the level of language anxiety of students taking Arabic as foreign language class is at a moderate level. The second conclusion that can be derived from the results is that the level of language anxiety among students without a background in learning Arabic language is high, whereas the third conclusion obtained from the study is students of the Faculty of Accountancy have a higher level of language anxiety compared to students from the Faculty of Business and Management and the Faculty of Health Sciences. The researchers suggested some ways to overcome the problem of language anxiety which is having a support group inside and outside of the Arabic language class. Secondly, the usage of effective methods by teachers in teaching Arabic Language to make the class more exciting and thus, minimizing the level of anxiety among students. Thirdly, the establishment of introductory classes for students without a background in learning Arabic should be implemented by the university.
61
4TH SINTO
K INTERN
ATION
AL CON
FERENCE O
N SO
CIAL SCIENCE AN
D M
ANAG
EMEN
T
REFERENCES
Amiri, M. (2015). The relationship between English learning anxiety and the students’ achievement on examinations. Journal of Language Teaching and Research, 6(4).
Elaine K. H., Michael B. H., & Joann, C. (1986). Foreign language classroom anxiety. The Modern Language Journal, 70(2).
Elaldı, S. (2016). Foreign language anxiety of students studying english language and literature: A Sample from Turkey. Educational Research and Reviews, 11(6).
Kamaruddin, S. (2015). Language anxiety among university students: Causal factors and coping strategies (Unpublished master’s thesis).. Universiti Teknologi MARA.
Kothari, C. R. (2004). Research methodology: Methods and techniques (2nd ed.). New Age International.
Loyarte, L. T. (2014). Foreign language anxiety: Students’ perspectives and pedagogical implications (Unpublished doctoral dissertation). Universidad del Pais Vasco.
Masoomeh Salehi, Fahimeh Marefat. (2014). The effects of foreign language anxiety and test anxiety on foreign language test performance, theory and practice in language studies, 4(5). Academy Publisher.
Masoud, H. (2011). Language stress and anxiety among the english language learners, 30.
Mohtasham, L., & Farnia, M. (2017). English speaking anxiety: A study of the effect of gender on iranian efl university students. International Journal of Research in English Education. 2(4).
Rosnah Sham, Nazri Latif. (2018). The reliability of foreign language anxiety scale in malay version based on cronbach’s alpha, language literacy, 2(1), Universiti Sultan Zainal Abidin.
Songyut, A. (2016). Speaking anxiety in english conversation classrooms among thai students. Malaysian Journal of Learning and Instruction, 13(1).
Subekti, A (2018) An exploration of learners’ foreign language anxiety in the indonesian university context: Learners’ and teachers’ voices. TEFLIN Journal, 29(2).
Tsiplakides, I. (2009). Helping students overcome foreign language speaking anxiety in the english classroom: Theoretical issues and practical recommendations, International Education Studies, 2(4).

62
SICONSEM2021: 085-048
UNDERSTANDING KEY FEATURES OF UFUTURE AS OPEN AND DISTANCE LEARNING PLATFORM FOR UNIVERSITI TEKNOLOGI MARA
1Nawal Abdul Razak, 2Zazaleena Zakariah, 3Juhaida Ismail &4Rozeleenda Abdul Rahman
1,2Centre of Foundation Studies, Universiti Teknologi MARA, Selangor, Malaysia3,4Faculty of Computer & Mathematical Sciences, Universiti Teknologi MARA
Pahang, Malaysia
Corresponding authors: [email protected]; [email protected]; [email protected]; [email protected]
ABSTRACT
Open and distance learning (ODL) is one of the most rapidly growing fields of education today and has extensive impact on all education delivery systems. This adoption of technology has enriched the popularity for online learning in educational industries as it offers flexibility and accessibility. Responding to latest trend, Universiti Teknologi MARA (UiTM) has developed an ODL platform named UFUTURE. UFUTURE is a platform for delivering learning content online to any person who wants to take a course, with no limit on attendance. UFUTURE integrates full time and part time students, Massive Open Online Courses (MOOCs) and upcoming UiTM teaching and learning processes. As a new platform, UFUTURE has received tremendous positive feedbacks from its target users. In this paper, we discuss an overview of UFUTURE and understanding on key features of UFUTURE as ODL platform for UiTM. All features and its functions have been prudently observed and discussed based on thorough overview through structured web observation. Findings confirm that seven key features of UFUTURE play a key role in serving as ODL platform for UiTM. These key features are very crucial in ensuring the deliverables of UFUTURE as an ODL platform especially as this platform cater for teaching and learning process throughout the semester for hundred thousand of users. In a wider view, findings and discussion in this study can be used as guidelines in the process of improving the services of UFUTURE and as references for other institutes that are in the process of developing an ODL platform.
Keywords: ODL, e-learning, ufuture, UiTM, distance learning.
INTRODUCTION
Commercialization of Internet in education has prompt a new method of teaching which is known as electronic learning (e-learning) over the last decade. It is one of technology that is widely used nowadays especially in higher learning institutions (Juhaida et al, 2019; Nayak et al., 2020; Kant, 2020). E-learning goes beyond digital technologies. Progressively, the technologies are becoming more integrated as an invisible and ubiquitous part of a global education system (Nursyahidah et al., 2012; Zazaleena et al., 2012; Nor Zalina et al., 2012; Juhaida et al., 2019). Due to its massive growth, e-learning has expanded its capability and be known as open and distance learning (ODL).
ODL is one of the most rapidly growing fields of education today and has extensive impact on all education delivery systems (Bates, 1995; Bosch, 1997; Bradley & Yates, 2000; Nayak et al., 2020; Kant, 2020). ODL is a system of education wherein lecturers and students need not to be present either at same place or same time; but is flexible in regard to modalities and timing of teaching and learning. This adoption of technology has enriched the popularity for online learning in educational industries as it offers limitless potential in terms of flexibility and accessibility. Moreover, ODL lecturers also found the usage the technology can improve the interaction as well as collaboration among students (Saima, et al., 2012).
07
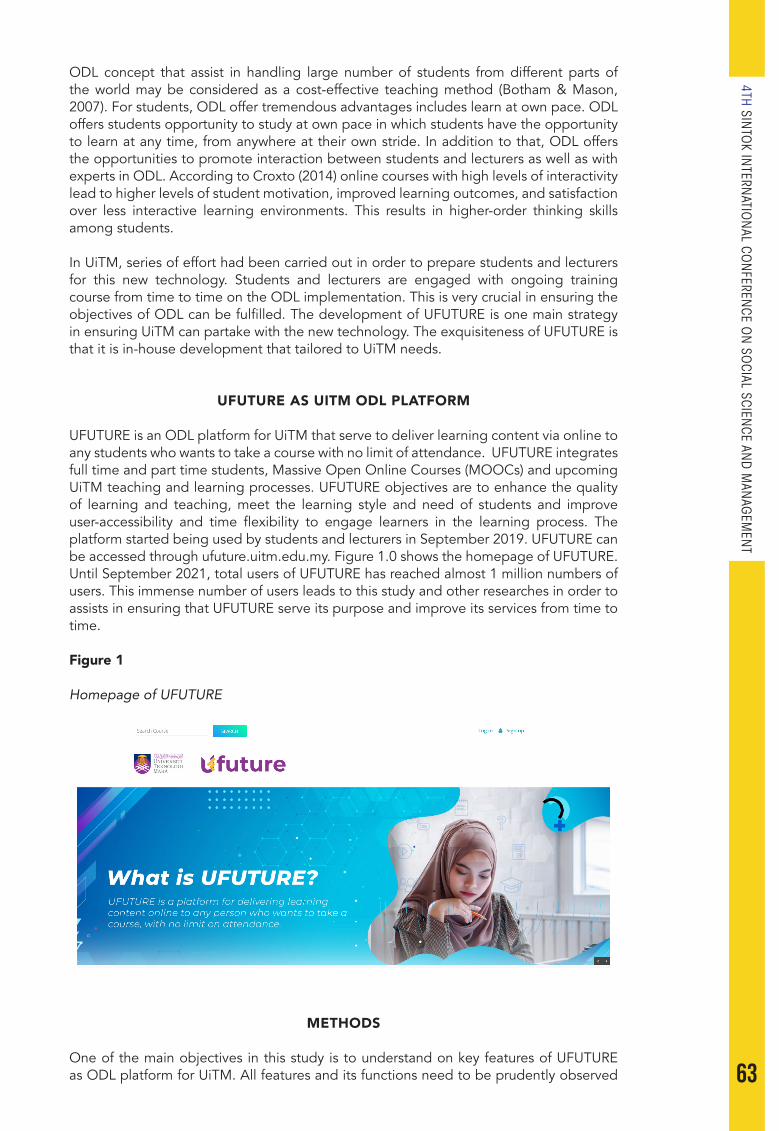
63
4TH SINTO
K INTERN
ATION
AL CON
FERENCE O
N SO
CIAL SCIENCE AN
D M
ANAG
EMEN
T
ODL concept that assist in handling large number of students from different parts of the world may be considered as a cost-effective teaching method (Botham & Mason, 2007). For students, ODL offer tremendous advantages includes learn at own pace. ODL offers students opportunity to study at own pace in which students have the opportunity to learn at any time, from anywhere at their own stride. In addition to that, ODL offers the opportunities to promote interaction between students and lecturers as well as with experts in ODL. According to Croxto (2014) online courses with high levels of interactivity lead to higher levels of student motivation, improved learning outcomes, and satisfaction over less interactive learning environments. This results in higher-order thinking skills among students.
In UiTM, series of effort had been carried out in order to prepare students and lecturers for this new technology. Students and lecturers are engaged with ongoing training course from time to time on the ODL implementation. This is very crucial in ensuring the objectives of ODL can be fulfilled. The development of UFUTURE is one main strategy in ensuring UiTM can partake with the new technology. The exquisiteness of UFUTURE is that it is in-house development that tailored to UiTM needs.
UFUTURE AS UITM ODL PLATFORM
UFUTURE is an ODL platform for UiTM that serve to deliver learning content via online to any students who wants to take a course with no limit of attendance. UFUTURE integrates full time and part time students, Massive Open Online Courses (MOOCs) and upcoming UiTM teaching and learning processes. UFUTURE objectives are to enhance the quality of learning and teaching, meet the learning style and need of students and improve user-accessibility and time flexibility to engage learners in the learning process. The platform started being used by students and lecturers in September 2019. UFUTURE can be accessed through ufuture.uitm.edu.my. Figure 1.0 shows the homepage of UFUTURE. Until September 2021, total users of UFUTURE has reached almost 1 million numbers of users. This immense number of users leads to this study and other researches in order to assists in ensuring that UFUTURE serve its purpose and improve its services from time to time.
Figure 1
Homepage of UFUTURE
METHODS
One of the main objectives in this study is to understand on key features of UFUTURE as ODL platform for UiTM. All features and its functions need to be prudently observed
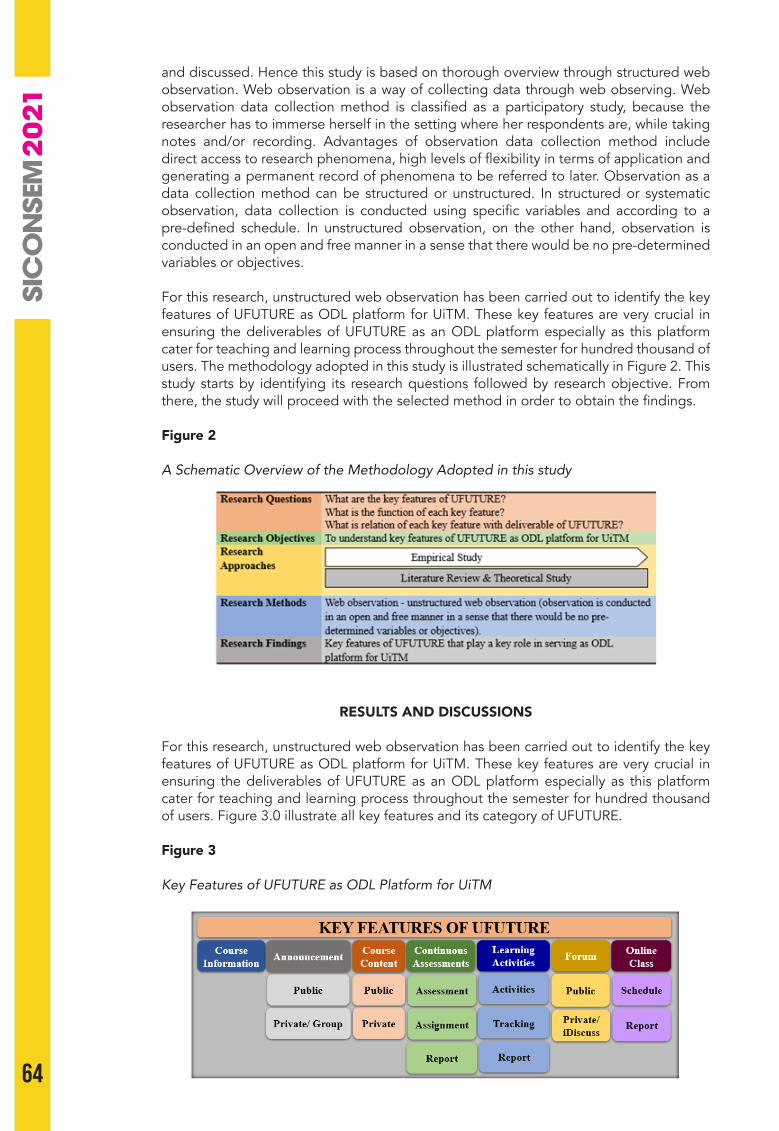
64
and discussed. Hence this study is based on thorough overview through structured web observation. Web observation is a way of collecting data through web observing. Web observation data collection method is classified as a participatory study, because the researcher has to immerse herself in the setting where her respondents are, while taking notes and/or recording. Advantages of observation data collection method include direct access to research phenomena, high levels of flexibility in terms of application and generating a permanent record of phenomena to be referred to later. Observation as a data collection method can be structured or unstructured. In structured or systematic observation, data collection is conducted using specific variables and according to a pre-defined schedule. In unstructured observation, on the other hand, observation is conducted in an open and free manner in a sense that there would be no pre-determined variables or objectives.
For this research, unstructured web observation has been carried out to identify the key features of UFUTURE as ODL platform for UiTM. These key features are very crucial in ensuring the deliverables of UFUTURE as an ODL platform especially as this platform cater for teaching and learning process throughout the semester for hundred thousand of users. The methodology adopted in this study is illustrated schematically in Figure 2. This study starts by identifying its research questions followed by research objective. From there, the study will proceed with the selected method in order to obtain the findings.
Figure 2
A Schematic Overview of the Methodology Adopted in this study
RESULTS AND DISCUSSIONS
For this research, unstructured web observation has been carried out to identify the key features of UFUTURE as ODL platform for UiTM. These key features are very crucial in ensuring the deliverables of UFUTURE as an ODL platform especially as this platform cater for teaching and learning process throughout the semester for hundred thousand of users. Figure 3.0 illustrate all key features and its category of UFUTURE.
Figure 3
Key Features of UFUTURE as ODL Platform for UiTM

65
4TH SINTO
K INTERN
ATION
AL CON
FERENCE O
N SO
CIAL SCIENCE AN
D M
ANAG
EMEN
T
Course Information
This key feature consists of course information that uploaded and completed by Resource Person (RP). It contains course summary, course description, course learning outcomes, number of lecturers that teach that course, number of students that enroll in that course and MOOC information. Figure 4 shows the example of course information page.
Figure 4
Example of Course Information Page
Announcement
This key feature is divided into two types which are:• Public announcement is announcement that can be seen by all students and
lecturers enrolled in that course.• Private announcement is announcement that can be seen only by students and
lecturers enrolled in that particular group. Figure 5 shows the example of an announcement page.
Figure 5
Example of an Announcement Page
Course Content
This key feature is divided into two types. Course content consists of lecturers’ folder or any other folder that related to that course.• Public course content is content that be seen by all students and lecturers enrolled
in that course.• Private course content is content that is set for particular user by adding password
authentications. Lecturers can set their folder as private folder by adding password authentications and be shared only for the selected users (own use, students, lecturers or MOOC users). Figure 6 shows the example of course content page.

66
Figure 6
Example of Course Content Page
Continuous Assessments
This key feature is divided into three types which are:• Assessment allows creation of assessment questions such as quiz, test, etc. by
providing six types of questions pattern (fill in the blanks, multiple choice standard, multiple choice multiple response, short essay, true false standard and true false multiple response. Questions in assessment can be shared among instructors. Assessment can be set for particular date and time. In assessment, marks can be auto calculated and display for multiple choice and true and false type. For short essay, marks will be counted once marks be inserted by lecturers (total marks will be recalculated). In assessment it allows group marking for classes that have more than one lecturer or for courses that need group marking. Figure 7 shows example of an assessment taken by students and marked by lecturer.
Figure 7
Example of Assessment Page
• Assignment allows creation of assignment with multiple or singular question. Assignment can be set for particular date and time. Marks and feedback can be viewed by students. Assignments allow group assignment to be conducted. Students will receive common feedback and grade among group members. Rubric, schema, score and feedback can be viewed by students. Figure 8 shows example of an assignment completed by students and marked by lecturer.
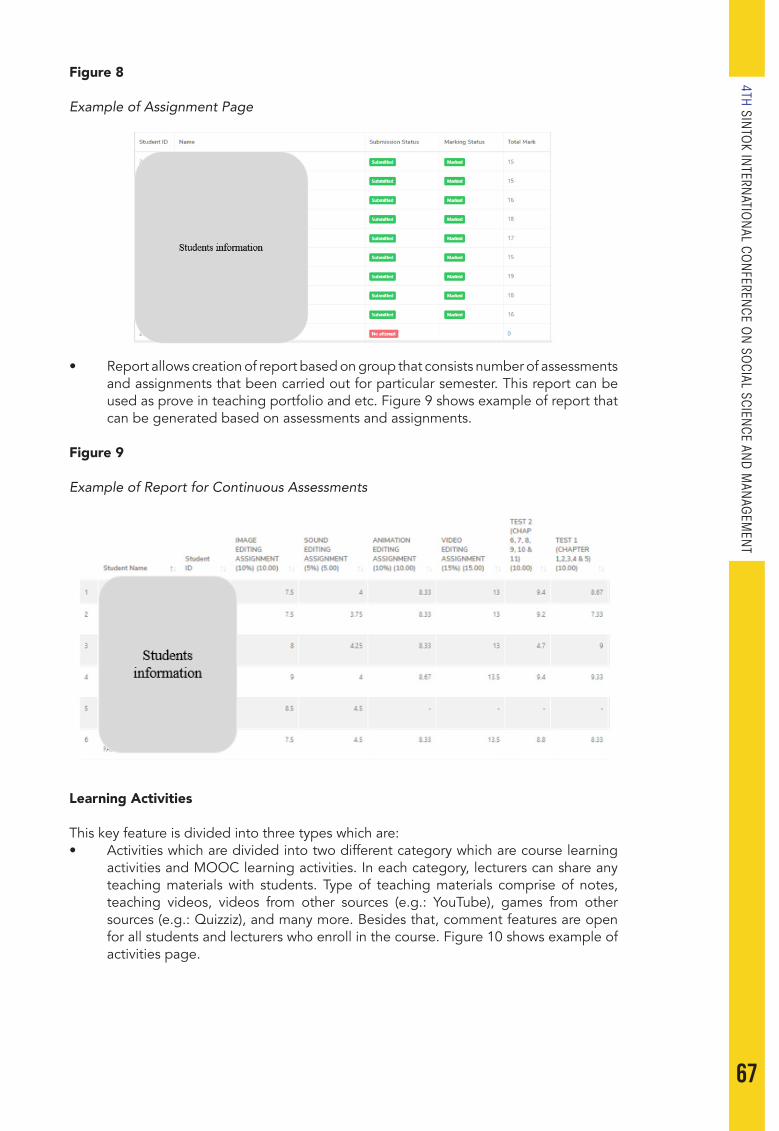
67
4TH SINTO
K INTERN
ATION
AL CON
FERENCE O
N SO
CIAL SCIENCE AN
D M
ANAG
EMEN
T
Figure 8
Example of Assignment Page
• Report allows creation of report based on group that consists number of assessments and assignments that been carried out for particular semester. This report can be used as prove in teaching portfolio and etc. Figure 9 shows example of report that can be generated based on assessments and assignments.
Figure 9
Example of Report for Continuous Assessments
Learning Activities
This key feature is divided into three types which are:• Activities which are divided into two different category which are course learning
activities and MOOC learning activities. In each category, lecturers can share any teaching materials with students. Type of teaching materials comprise of notes, teaching videos, videos from other sources (e.g.: YouTube), games from other sources (e.g.: Quizziz), and many more. Besides that, comment features are open for all students and lecturers who enroll in the course. Figure 10 shows example of activities page.
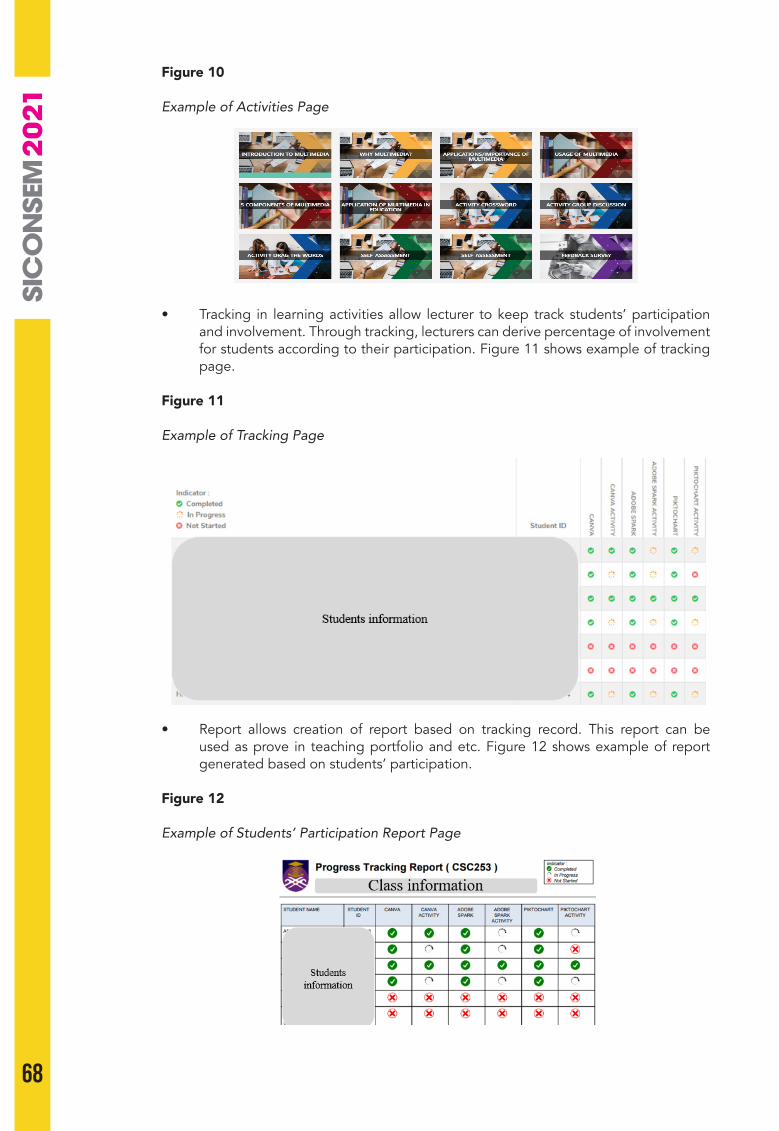
68
Figure 10
Example of Activities Page
• Tracking in learning activities allow lecturer to keep track students’ participation and involvement. Through tracking, lecturers can derive percentage of involvement for students according to their participation. Figure 11 shows example of tracking page.
Figure 11
Example of Tracking Page
• Report allows creation of report based on tracking record. This report can be used as prove in teaching portfolio and etc. Figure 12 shows example of report generated based on students’ participation.
Figure 12
Example of Students’ Participation Report Page
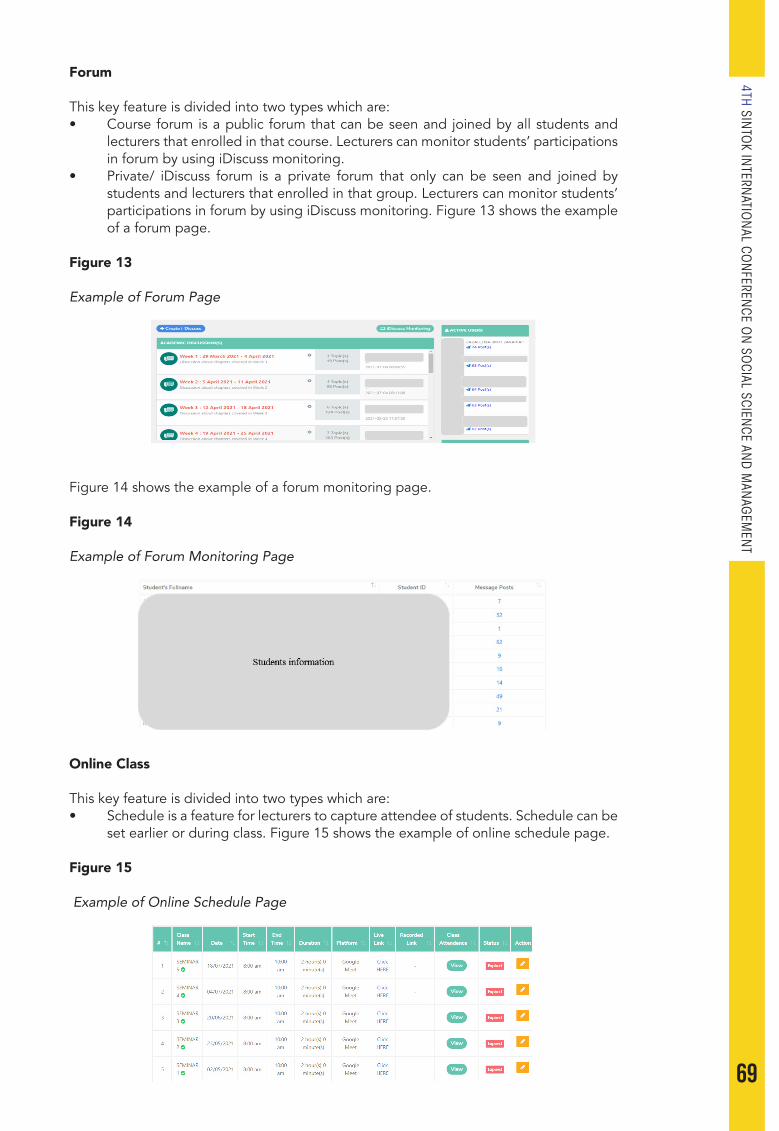
69
4TH SINTO
K INTERN
ATION
AL CON
FERENCE O
N SO
CIAL SCIENCE AN
D M
ANAG
EMEN
T
Forum
This key feature is divided into two types which are:• Course forum is a public forum that can be seen and joined by all students and
lecturers that enrolled in that course. Lecturers can monitor students’ participations in forum by using iDiscuss monitoring.
• Private/ iDiscuss forum is a private forum that only can be seen and joined by students and lecturers that enrolled in that group. Lecturers can monitor students’ participations in forum by using iDiscuss monitoring. Figure 13 shows the example of a forum page.
Figure 13
Example of Forum Page
Figure 14 shows the example of a forum monitoring page.
Figure 14
Example of Forum Monitoring Page
Online Class
This key feature is divided into two types which are:• Schedule is a feature for lecturers to capture attendee of students. Schedule can be
set earlier or during class. Figure 15 shows the example of online schedule page.
Figure 15
Example of Online Schedule Page
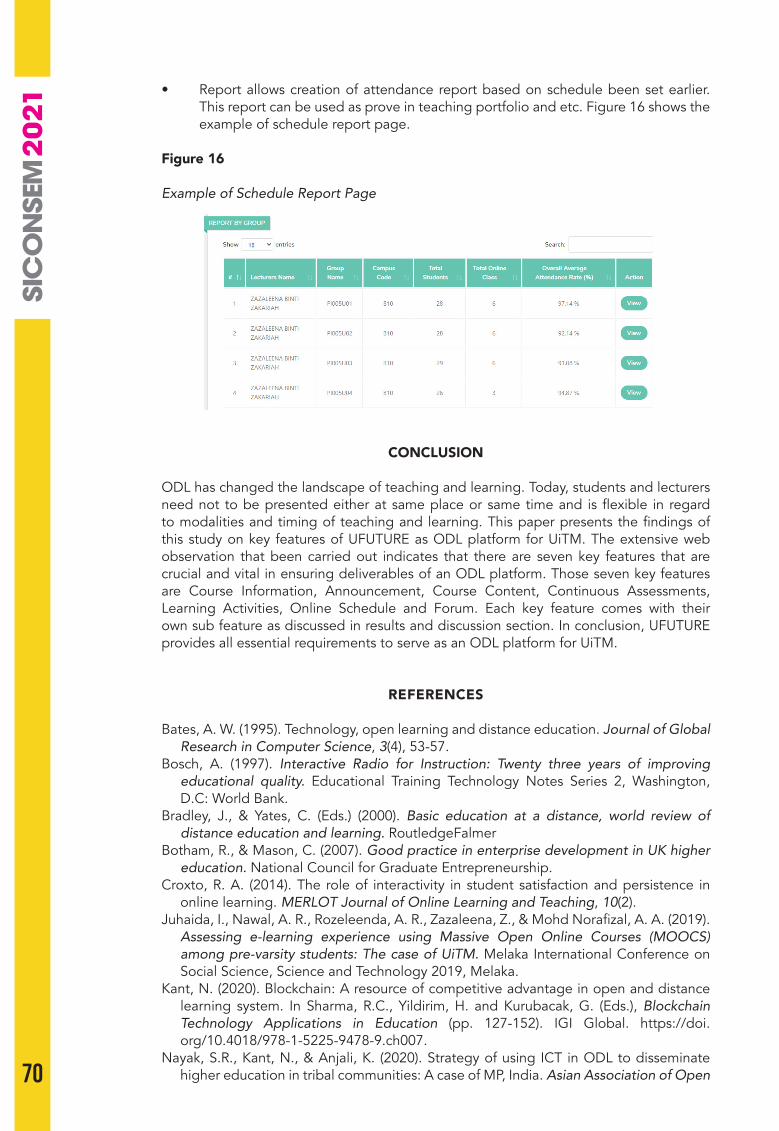
70
• Report allows creation of attendance report based on schedule been set earlier. This report can be used as prove in teaching portfolio and etc. Figure 16 shows the example of schedule report page.
Figure 16
Example of Schedule Report Page
CONCLUSION
ODL has changed the landscape of teaching and learning. Today, students and lecturers need not to be presented either at same place or same time and is flexible in regard to modalities and timing of teaching and learning. This paper presents the findings of this study on key features of UFUTURE as ODL platform for UiTM. The extensive web observation that been carried out indicates that there are seven key features that are crucial and vital in ensuring deliverables of an ODL platform. Those seven key features are Course Information, Announcement, Course Content, Continuous Assessments, Learning Activities, Online Schedule and Forum. Each key feature comes with their own sub feature as discussed in results and discussion section. In conclusion, UFUTURE provides all essential requirements to serve as an ODL platform for UiTM.
REFERENCES
Bates, A. W. (1995). Technology, open learning and distance education. Journal of Global Research in Computer Science, 3(4), 53-57.
Bosch, A. (1997). Interactive Radio for Instruction: Twenty three years of improving educational quality. Educational Training Technology Notes Series 2, Washington, D.C: World Bank.
Bradley, J., & Yates, C. (Eds.) (2000). Basic education at a distance, world review of distance education and learning. RoutledgeFalmer
Botham, R., & Mason, C. (2007). Good practice in enterprise development in UK higher education. National Council for Graduate Entrepreneurship.
Croxto, R. A. (2014). The role of interactivity in student satisfaction and persistence in online learning. MERLOT Journal of Online Learning and Teaching, 10(2).
Juhaida, I., Nawal, A. R., Rozeleenda, A. R., Zazaleena, Z., & Mohd Norafizal, A. A. (2019). Assessing e-learning experience using Massive Open Online Courses (MOOCS) among pre-varsity students: The case of UiTM. Melaka International Conference on Social Science, Science and Technology 2019, Melaka.
Kant, N. (2020). Blockchain: A resource of competitive advantage in open and distance learning system. In Sharma, R.C., Yildirim, H. and Kurubacak, G. (Eds.), Blockchain Technology Applications in Education (pp. 127-152). IGI Global. https://doi.org/10.4018/978-1-5225-9478-9.ch007.
Nayak, S.R., Kant, N., & Anjali, K. (2020). Strategy of using ICT in ODL to disseminate higher education in tribal communities: A case of MP, India. Asian Association of Open

71
4TH SINTO
K INTERN
ATION
AL CON
FERENCE O
N SO
CIAL SCIENCE AN
D M
ANAG
EMEN
T
Universities Journal, 15(2), 189-206. https://doi.org/10.1108/AAOUJ-05-2020-0029Nor Zalina, I., Mohd Rizal, R., Zazaleena, Z., Nursyahidah, A., & Mohd Norafizal, A.A.
(2012). E-learning continuance intention among higher learning institution students’ in Malaysia. Procedia - Social and Behavioral Sciences, 67, 409-415. https://doi.org/10.1016/j.sbspro.2012.11.345.
Nursyahidah, A., Zazaleena, Z., Nor Zalina, I. & Mohd Norafizal, A.A. (2012). E-learning successful elements for higher learning institution in Malaysia. Procedia - Social and Behavioral Sciences, 67, 484-489. https://doi.org/10.1016/j.sbspro.2012.11.353.
Saima, G., Joyshree, N., Shalabh, A. & Asoke, N. (2012). Open and Distance Learning (ODL) education system: Past, present and future – A systematic study of an alternative education system. Journal of Global Research in Computer Science, 3(4), 53-57.
Zazaleena, Z., Nursyahidah, A., Mohd Norafizal, A.A, & Nor Zalina, I. (2012). E-learning awareness in a higher learning institution in Malaysia. Procedia - Social and Behavioral Sciences, 67, 621-625. https://doi.org/10.1016/j.sbspro.2012.11.368.
72
SICONSEM2021: 042-017
MY SELF-REFLEXIVE JOURNEY FROM CONTACT TO REMOTE TEACHING AND LEARNING: INSIGHTS AND EXPERIENCES
Logamurthie AthiemoolamFaculty of Education, Nelson Mandela University, South Africa
Corresponding author: [email protected]
ABSTRACT
The onset of the Covid-19 pandemic resulted in the imposition of lockdowns which led to higher education institutions being closed indefinitely and a transition to virtual teaching and learning. Since most lecturers were not familiar with this mode of lecture presentations, they were either left disillusioned and frustrated or embraced the possibilities that virtual teaching and learning had to offer. It is with this background in mind that this paper provides insights into my own personal journey as a lecturer who was forced to transition from face-to-face to remote teaching and learning. In engaging with my self-reflexive journey, I provide accounts of my initial frustrations and concerns and how I managed to move beyond my fear to embrace remote teaching and learning during periods of prolonged uncertainty. The paper sheds light on my impetus for change, how I was forced to move out of my comfort zone to embrace change, how my understanding of remote teaching and learning was enhanced through the application of various learning platforms and what I have learnt from these experiences. In reflecting on my experiences of virtual teaching and learning I have come to realise that change is inevitable and that if I hope to adapt to change synonymous with increased technological advances in education and the 4IR I will need to embrace change and not fight against it.
Keywords: Covid-19, remote teaching, virtual learning, learning and teaching, self-reflexive learning.
INTRODUCTION
The rapid spread of the coronavirus globally in 2020 necessitated the implementation of various measures by countries to curb its proliferation, both from within the borders of the respective countries and internationally. The onset of this virus prompted the President of South Africa, President Cyril Ramaphosa, to declare a national lockdown with effect from midnight on the 26th of March 2020 (DHET, 2020). This unexpected announcement led to the closure of all higher education institutions, which placed the onus on South African universities to decide on the measures that they would implement to conclude the 2020 academic year successfully. In deliberating on the various options, however, they realised that the only way in which universities could continue to function, was to transition from face-to-face to remote or online teaching and learning (Ngubane et al., 2020). This, however, posed many challenges since neither lecturers nor students were adequately prepared for remote teaching and learning, and furthermore many students did not have access to digital devices or data to access learning material for the realisation of effective teaching and learning (Tamrat & Teferra, 2020).
In my role as a lecturer at a higher education institution, I was confronted with similar challenges, since I did not have the requisite skills for online teaching and learning, neither did I embrace such an approach to pedagogy. However, since there was no other alternative, I came to the realisation that I could either adapt to the changed circumstances or continue to hope that face-to-face classes would resume. Unfortunately, the latter did not materialise, and online classes continued from the onset of the lockdown in March 2020 until presently in September 2021.
08
73
4TH SINTO
K INTERN
ATION
AL CON
FERENCE O
N SO
CIAL SCIENCE AN
D M
ANAG
EMEN
T
It is with this background in mind that this article provides an overview of my personal journey from initially being negative towards online teaching and learning to embracing it and learning how to navigate across the various digital platforms to engage students meaningfully in connected learning through the adoption of a humanising pedagogy (Freire, 1970). Although it was uplifting for me to gain new skills, I also became patently aware of the many challenges that my students experienced as they struggled to adapt to online teaching given the connectivity and data challenges (Van Deursen & Van Dijk, 2019). In this reflection based on my experiences from face-to-face teaching to online teaching and learning I will provide insights into how I felt initially and what happened, will explain and analyse what happened based on theory and how, what I have learned could be applied to my future deliberations. This approach to my personal reflection is explained within the context of Rolfe et al. (2010) reflective model which serves to provide the research framework for my self-study.
THE SELF-REFLECTION PROCESS
The advantages of self-reflection for one’s practice are manifold, but one of the most significant advantages is that it enables one to become more aware of one’s strengths and limitations and to reflect on how one’s practice could be developed for enhanced learning. While White (2004) regards reflection as one of the most important characteristics of successful teachers, Robins et al. (2003) contend that besides being empowering it enables a teacher to make informed judgements and professional decisions.According to Dewey (1933) reflective practice can be described as a cognitive process which focuses on active, conscious, and deliberate thinking for the purposes of problem-solving. This was expanded on by Schon (1991) who proposed two levels of reflection namely reflection- in- action and reflection-on-action. Whilst the former allows for continual interpretation, investigation, and reflective conversations with oneself about the problem, the latter focuses on reflection after the event or experience of teaching and learning (Sellars, 2017). In the context of my self-reflection based on my transition from face-to-face to remote learning the focus will be on reflection-on-action.
There are various models of self-reflective practice including those designed by Gibbs (1988), Mcniff and Whitehead (2005), Rolfe et al (2010) and Kolb (2014), among others. The model that will undergird my experiences as a lecturer who had to transition from face-to-face lecturing to online teaching and learning is Rolfe et al’s (2010) model of self-reflective practice. The three stages of this model require that one consider what happened, the implications of the occurrence and the consequences for future conduct. These stages are explained with reference to a focus on three guiding questions namely What? So What? and Now What? which represent the three phases of the learning experience (Rolfe et al., 2010).
In responding to the three questions I will first provide a description of what happened when I was required to change my pedagogy from face-to-face teaching to online teaching to respond to the ‘what?’ question. Thereafter I will explain what the experience and situation meant with reference to literature to support my views in response to the ‘so what?’ question, and I will finally provide an overview of how this experience has enabled me to develop my practice and motivated me to learn from my initial concerns by responding to the ‘now what?’ question. The elucidation of the self-reflective process, based on my transition from face-to-face lecturing to remote teaching and learning, will be structured according to the three questions as per Rolfe et al’s (2010) model.
REFLECTING ON MY EXPERIENCES
What Led to My Paradigm Shift?
When our university closed in March after the president announced the country wide lockdown, I was at a loss as to how I would proceed with my classes in my role as a lecturer
74
at a higher education institution, given that I was inadequately prepared to present online or virtual lessons. Furthermore, in the past I was negatively predisposed to the university’s digital platform moodle and was consequently ill-equipped to present classes virtually. My philosophy of teaching is based on the tenets of a humanising pedagogy (Freire, 1970) which I believed was only possible via face-to-face contact and not virtually via digital platforms, as I could not imagine how lecturers and students could be connected in this way for effective problem-based learning (Liu & Long, 2014).
However, when face-to-face contact was no longer possible, I had to reconsider my attitude towards online teaching and learning and to critically reflect on how to transition from face-to-face lecturing to online teaching and learning. I realised that this required a major paradigm shift which entailed coming to terms with my negative attitude towards digital teaching and learning, and reflecting on how I could move from where I was with my limited knowledge of e-learning to where I needed to be (Park, 2010).
So What Did This Imply For My Practice?
While we were awaiting directives from our university on the way forward and how to proceed with our lecturing programme, I spent time reading books such as the Power of Positive Thinking by Vincent Peale (1953), The Gift by Edith Eger (2020) focusing on life’s lessons during stressful periods, The Alchemist by Paulo Coelho (1992) on how to follow one’s dreams, and Who moved my Cheese by Spencer Johnson (1998) on the importance of adapting to change during periods of change. Reading these books was therapeutic as they enabled me to reflect more critically on the road that I would need travel to embrace the change from face-to-face to online teaching and learning. It was especially after reading Johnson’s book (1998) that I realised that I could either behave like Haw and be proactive by adapting to change and embracing it, or be complacent like Hem and wait for the situation to return to how it originally was. After reflection and introspection, I realised that if I adopted a more positive attitude and made a concerted effort to adapt to the changed scenario, there was the potential that this could contribute to my own personal and professional development (Van den Heuvel, 2020).
Johnson’s (1998) focus on a process of meaning-making to adapt to change also enabled me to integrate the challenging situation into a framework of personal meaning, using value-based reflection. According to Park (2010) ‘meaning-making’ focuses on the ability to constructively reflect and process challenging events, which results in a sense of meaningfulness. Since the process of meaning-making includes being able to link the change to personal goals and values it goes beyond understanding the content of change (Van den Heuvel, 2020). My engagement in the process of meaning-making contributed to my ability to accept change and to reflect on the skills that I would need to develop to adapt to online teaching and learning. This openness to change arising from the meaning-making process enabled me to focus on the new demands placed on me during the change process and to gradually disengage from my old approach to teaching and learning, and to learn to adapt to the changed scenario (van Dam, 2011).
After realising that change was inevitable, and that I had to empower myself with skills if I hoped to present lectures virtually, I attended workshops on how to use moodle, watched videos on various approaches to e-learning and read widely on research conducted in the field of online teaching and learning (Goh et al., 2017). This initial engagement with the field provided me with limited insights into the various options that I could explore for enhanced online teaching and learning and what the process entailed. I realised however that this was the beginning of a journey of discovery that could stretch over a long period of time (Van den Heuvel, 2020). Another challenge that I was confronted with, however, was how to present my lectures in a humanising way given that my philosophy of teaching is based on a humanising pedagogy as espoused by Freire (1970). The components of Freirean (1970) thinking that included problem-based learning, dialogical engagement, and praxis were key features of my lectures.

75
4TH SINTO
K INTERN
ATION
AL CON
FERENCE O
N SO
CIAL SCIENCE AN
D M
ANAG
EMEN
T
Initially when we were given a directive from the university management to commence lectures remotely, I felt constrained since I had not acquired the requisite skills in using digital platforms such as Teams and Zoom for online teaching and learning. Consequently, I decided to write up my lectures in a conversational style by incorporating reflective questions and e-mailing them to students. In reflecting on the initial strategy adopted, however, I felt that besides being time consuming to prepare, these lectures tended to disengage the students from learning as they did not appear to read the lectures, and neither did they take the time to respond to the reflective questions based on them. Furthermore, some students felt that these written lectures were disempowering as they were overwhelmed with extensive reading material with virtually no opportunities for connecting via digital platforms such as Teams and Zoom. It was clear that this initial approach to engaging students in some form of learning was disempowering and was furthermore not aligned to my philosophy of teaching as there were virtually no opportunities for dialogical engagement (Freire, 1984). According to Bartolomé (1994) the achievement of humanising teaching experiences for students is dependent on the establishment of a synergy between a teacher’s philosophical orientation and his/her instructional methods. Based on my practice I realised that there was a mismatch between my philosophy of teaching and the instructional methods adopted.
In reflecting on my practice, I resolved to approach a colleague, who was well versed in Teams, to mentor me on how to engage my students virtually by using this digital platform. My colleague guided me through the practices and procedures and under his guidance I was able to acquire new skills and gained the confidence in how to use Teams effectively for enhanced teaching and learning. This process of reflecting on my action for improved learning is what Freire describes as “reflection and action upon the world in order to transform it” (1970, p. 145). According to Freire (1984) it is in the intersection of reflection and action where people become more fully human, power is shared by students and educators and the continuous process of re-humanisation occurs (Bartolomé, 1994; Huerta, 2011). Bartolomé (1994) further asserts that teachers should abandon uncritical approaches to teaching and learning in favour of reflection and action. This allows educators to “recreate and reinvent teaching methods and materials by always taking into consideration the sociocultural realities that can either limit or expand the possibilities to humanize education” (Bartolome, 1994, p.177).
As my skills in the application of the Teams digital platform were enhanced, I engaged students more interactively and at times was able to discuss issues that affected them individually since many of them felt constrained during the experience. This led to the process of dialogical engagement which was missing from my initial engagement with them, and which, according to Freire (1984) contributes to the enhancement of individual and collective critical consciousness. Dialogue for the development of critical consciousness focuses on one’s lived experiences, the social and political conditions that lead to inequity and oppression, and stimulates action aimed at interrupting and disrupting oppression (Souto-Manning, 2006). I discovered that dialogical engagement was possible via the Teams platform, since students could respond directly to my questions and to also pose their own questions, albeit virtually (Goh et al., 2017).
During my face-to-face contact lessons with my students prior to the lockdown, I used problem-based learning extensively to enable my students to engage critically with issues of concern through interactive meaning-making. Although I was initially sceptical about the extent to which this could be implemented virtually, my engagement with digital platforms such as Teams, Zoom, Moodle and E-mail correspondence motivated me to explore how connectivism could promote problem-based learning. According to Siemens and Downes (2009), in the process of learning connections are created by crossing boundaries between human and non-human nodes through the establishment of an interconnected network. Since the connectivist learning process views students as active participants and not passive recipients, they are able to access, share, critically engage with and use information for learning (Siemens, 2005). I thus discovered that through my engagement with connectivism problem- based learning could be interactively implemented by providing students with skills that could enable them to search across

76
the various nodes for information to substantiate viewpoints. This aligns to Freire’s (1970) critical pedagogy that posits that teachers need to create ample opportunities for learners to be active participants in the learning process and not passive recipients of learning. Since the content is only one of the nodes in the learning process, Siemens (2006) points out that it is imperative that teachers create online teaching and learning opportunities for learners that focus on the development of critical thinking skills so that the learners are not side-lined by the content at the expense of critical engagement with the content. According to Siemens (2006) since learners are autonomous nodes in the system, they have different aims and consequently respond differently in terms of their engagement with the content. Hence the focus should be on the diversity of their interpretation rather than on similarities. The implementation of problem-posing education in this way encouraged students to connect their everyday lives to global issues, think critically about actions that they could take to effect change, and identify connections between self and society (Bigelow & Peterson, 2002; Schugurensky, 2011). I discovered that the process of connectivism across teaching and learning nodes stimulated critical inquiry and creative transformation as students were actively involved in interrogating issues of concern from multiple perspectives (Bahruth, 2000; Schugurensky, 2011).
To ensure that learners engaged critically with the various nodes, I focused on providing them with unstable, controversial, unsolved, and real-life problems to involve them actively in the learning process (Al Dahdouh et.al, 2015). Consequently, at times learners felt uncertain about what needed to be done and how they needed to engage with the tasks, which as highlighted by Al Dahdouh et. al (2015, p.16) “forced them to search for answers, to ask help, to seek for patterns and, in other words, to form connections, in an attempt to solve the problem ahead”. Hence in my role as the lecturer connected to a very good network in the field such as other researchers, books, journals, websites, databases, mobile applications and others, I was able to support my students to plant themselves in the network, to be connected to its nodes and to be a part of it (Al Dahdouh et al., 2015, p.16).
According to Downes (2010) connectivist learning involves dialogical engagement for the social construction of knowledge which implies that learning is not only about knowledge consumption but knowledge construction. During the dialogical engagement process connectivists provide students with skills to connect with other people in other contexts by using search engines, social media and other means (Anderson, 2016). Hence in consideration of the tenets of connectivism it was logical that my assessment focused on students’ engagement with the connections between subject fields, ideas and concepts (Siemens & Downes, 2009) and not on disconnected learning. The outcome of this approach to assessment was that students found the assessment tasks engaging, meaningful and enjoyable and not disempowering (Black & William, 2009). An important lesson, however, that I learnt from my engagement with connectivism is that its success is dependent on lecturers’ awareness of the possibilities of internet access and other technological resources for effective learning so that each individual student may gather and share information irrespective of challenges faced (Bell, 2011).
During my face-to-face contact lectures with my students prior to the lockdown, I always made a concerted attempt to inquire about their well-being and espoused an open-door policy, which entailed that students were welcome to discuss issues of an academic or personal level with me. These meetings with students ensured that they were motivated, remained positive and felt appreciated. In this way as highlighted by Huerta (2011) and Salazar (2008) my approach to a humanising pedagogy focused on building trusting and caring relationships with my students since I was prepared to listen to their interests, needs, and concerns; model kindness, patience, and respect; tend to their general well-being, including their emotional, social, and academic needs; and create a support network for them (Fránquiz & Salazar, 2004; Rodriguez, 2008).
After the lockdown, however, I wondered how I would be able to ensure that our rich interpersonal relationships could be maintained, as this did not appear possible via e-learning platforms. I tried to overcome this challenge by e-mailing my students regularly

77
4TH SINTO
K INTERN
ATION
AL CON
FERENCE O
N SO
CIAL SCIENCE AN
D M
ANAG
EMEN
T
to inquire about their well-being and invited them to share their challenges and concerns with me via e-mail. This seemed to work well as highlighted by the following e-mails from students in which they explain what the emotional support that I provided meant to them:
Student 1 expressed her appreciation as follows:You have been such a stable source of strength and support to us during this difficult time! You also shared such kind words with me before I faced my surgery and I would like to thank you for going above and beyond as a lecturer. It does not go unnoticed and it does not go unappreciated.
This was further articulated by Student 2 as follows:I would like to express my gratitude to you for being so understanding and supportive towards me during this trying time. I have dawned upon the realization that lecturers like you are extremely rare. You demonstrate all the great qualities of an excellent lecturer who is such an inspiration to not just me but all your students. Your efforts most definitely do not go unnoticed by those who are fortunate enough to have you as their guide and friend.
The students’ views of the support that they received during a difficult period in their lives demonstrates that my humanising approach to teaching could still be realised via e-mail correspondence. Through my personal connectedness with my students I was able to embed my understanding of the humanising pedagogy in building relationships with my students, which according to Huerta & Brittain (2010, p. 385–386), “respects the human, inter-personal side of teaching, and emphasizes the richness of the teacher-student relationships”. Furthermore, it aligns to caring literature in education and is inclusive of respect, trust, mutual understanding, active listening, mentoring, compassion, and interest in students’ overall well-being (Gay, 2010; Bartolomé, 1994; Cammarota & Romero, 2006).
Now What Have I learnt from this Experience?
Now that I have gained new skills in e-learning, I will continue to enhance my knowledge of digital platforms and explore other ways of ensuring that my classes are more learner centred (Goh et.al, 2017). This is an area that I still need to work on as the online classes, unlike face-to- face classes still tend to be more teacher centred with a degree of questioning. I am still growing in my understanding of how to ensure that students’ voices become more prominent in my e-learning classes. The paradigm shift from face-to-face lecturing to online teaching and learning has contributed significantly to my personal, academic and professional development, since I am now more open to embracing change and exploring how the principles of the humanising pedagogy, as espoused by Freire (1970) and others, could be realised within the context of virtual teaching and learning (Park, 2010). I have learnt that innovative learning platforms such as Microsoft Teams, Zoom and Moodle, as highlighted by Chinyamurindi (2020), create opportunities for interaction and communication albeit in a virtual space and that effective teaching and learning can take place across the various nodes of learning. Some of the features that align to Freire’s (1970) humanising pedagogy relate to the sharing of ideas and dialogical engagement via oral communication, typing messages onscreen, the sharing of power point presentations and trying to solve problems by searching the internet for information (Chinyamurindi, 2020; Darby, 2020). Hence as pointed out by Ngubane et al, (2020) e-learning tools create multiple opportunities for enhanced learning.
Perhaps the fact that I was thrown into the deep end and that I had to learn to sink or swim contributed to my transformative approach to teaching and learning via digital platforms. I realised that embracing a pedagogy of discomfort that was very demotivating at the onset, enabled me to move out of my limited vision of teaching and learning to embrace new ways of pedagogy in times when the pedagogies that we are so married to, cannot be practiced in the same way that we are used to (van Dam, 2020). Perhaps the lockdown forced me to move out of my comfort zone and to think more deeply about how I embrace change during periods of uncertainty and how I move from
78
where I am to where I want to be . This is part of the learning process that contributed significantly to how I view the world and how I perceive teaching and learning to be (De Heuvel, 2020).
CONCLUSION
Although I realise that remote learning has its positive features, we need to still incorporate a measure of face-to-face teaching when this becomes possible post-Covid-19. In this sense in the foreseeable future when the situation reverts to some semblance of normality, whatever that is meant to be, we need to explore the possibilities of the implementation of a hybrid model, as I now believe that there is a significant place for online teaching and learning in the era of the 4th Industrial Revolution which we are traversing presently (Andersen, 2016; Bates, 2018).
We are living in exciting times since technology is moving us out of limited conceptualisations of how we perceive the world to be, to the endless opportunities of space travel beyond this singular world that we call our home. Embracing change enables one to reflect philosophically on the transient nature of the world and our transient existence on earth. It enables us to become more aligned to our inner spiritual self as we come to terms with who we are, why we are here and what we intend accomplishing during our sojourn on earth. Adapting to technological changes during changing times and to embracing e-learning in a spirit of openness affords one opportunities to tap into one’s creativity and to ensuring that teaching and learning focuses on the development of students’ critical and creative skills for enhanced learning.
REFERENCES
Al Dahdouh, A.A.,Osório, A.J. & Caires, S. (2015). Understanding knowledge network, learning and Connectivism. International Journal of Instructional Technology and Distance Learning, 12 (10), 3-21.
Anderson, T. (2016). Theories for learning with emerging technologies. Emerging Technologies in Distance Education, 7(1), 17-23.
Bahruth, R. E. (2000). Changes and challenges in teaching the word and the world for the benefit of all humanity. In Katchen, J.E and Yiu-Nam, L. (Eds), Selected papers from the ninth international symposium on English teaching (pp. 1–9). Crane Publishing.
Bartolomé, L. (1994). Beyond the methods fetish: Toward a humanizing pedagogy. Harvard Educational Review, 64, 173–195.
Bates, A. (2018). Teaching in a digital age: Quidelines for designing teaching and learning for a digital age. Tony Bates Associates.
Bell, F. (2011). Connectivism: Its place in theory-informed research and innovation in technology-enabled learning. International Review of Research in Open and Distance Learning, 12(3), 98-118.
Bigelow, B., & Peterson, B. eds. (2002). Rethinking globalization: Teaching for justice in an unjust world. Milwaukee, WI: Rethinking Schools Press.
Black, P., & William, D. (2009). Developing the theory of formative assessment. Educational assessment evaluation and accountability. Journal of Personnel Evaluation of Education, 21(1), 5-31
Cammarota, J., & Romero, A. (2006). A critically compassionate intellectualism for Latina/o students: Raising voices above the silencing in our schools. Multicultural Education, 14(2), 16–23.
Chinyamurindi.W.T. (2020). Learning in the time of Covid-19. In Mail and Guardian. https://mg.co.za/article/2020-03-17-learning-in-the-time-of-covid-19/
Coelho, P. (2012). The alchemist. Harper Collins Publishers. Darby,F. (2020). 5 Low-tech, time-saving ways to teach online during Covid-19. In the
Chronicle of Higher Education. https://www.chronicle.com/article/5-low-tech-time-saving-ways-to-teach-online-during-covid-19/
Dewey, J. (1933). How We Think: A restatement of the relation of reflective thinking to

79
4TH SINTO
K INTERN
ATION
AL CON
FERENCE O
N SO
CIAL SCIENCE AN
D M
ANAG
EMEN
T
the educative process. DC Heath.DHET. (2020). Measures to deal with the Coronavirus COVID-19 in the post school
education and training sector. https://www.gov.za/speeches/minister-higher-education-science-and-innovation-statement-measures-deal-covid-19-threat
Downes, S. (2010). New technology supporting informal learning. Journal of Emerging Technology in Web Intelligence, 2(1), 27-33.
Eger, E. (2020). The gift: 12 lessons to save your life. Penguin Random House. Fránquiz, M., & Salazar, M. (2004). The transformative potential of humanizing pedagogy:
Addressing the diverse needs of Chicano/Mexicano students. High School Journal, 87(4), 36–53.
Freire, P. (1970). Pedagogy of the oppressed. Continuum. Freire, P. (1984). Pedagogy of the oppressed. Continuum.Gay, G. (2010). Culturally responsive teaching: Theory, research, and practice (2nd ed.).
Teachers College Press. Gibbs, G. (1988). Learning by doing: a guide to teaching and learning methods. FEU. Goh, C., Leong, C., Kasmin, K., Hii, P., & Owee, T. (2019). Students’ experiences, learning
outcomes and satisfaction in e-Learning. Journal of e-Learning and Knowledge Society, 13(2). https://www.learntechlib.org/p/188116/.
Huerta, T. M. (2011). Humanizing pedagogy: Beliefs and practices on the teaching of Latino children. Bilingual Research Journal, 34(1), 38–57.
Huerta, T. M. and Brittain, C. M. (2010). Effective practices that matter for Latino children. In Murillo, E. G., Villenas, S. A., Galvan, R. Trinidad, Munoz, J. Sanchez, Martinez, C., Machado-Casas, M. eds. Handbook of Latinos and education: Theory, research, and practice (pp. 382–399). Routledge.
Johnson, S. (1998). Who moved my cheese? Penguin Random House. Kolb, D.A. (2014). Experiential learning: experience as the source of learning and
development. Pearson FT Press.Liu, C., & Long, F. (2014). The discussion of traditional teaching and multimedia teaching
approach in college English teaching. Paper presented at the 2014 International Conference on Management, Education and Social Science (ICMESS 2014).
Mcniff, J., & Whitehead, J. (2005). Action research for teachers: A practical guide. David Fulham.
Ngubane, N., Blose, S., Mthembu., P and Hlongwa, T. (2020). Transitioning from face-to-face remote teaching in the context of Covid-19 pandemic: Reflections of South African emerging academics. In Ndimande-Hlongwa, N, Ramratan, L, Mkhize N and Smit, J.A. Technology-based Teaching and Learning in Higher education during the time of Covid-19. (pp.71-90). CSSALL Publishers.
Nikoubakht, A., & Kiamanesh, A. (2019). The comparison of the effectiveness of computer-based education and traditional education on the numerical memory in students with mathematics disorder. Journal of Psychological Sciences, 18(73), 55–65.
Park, C. (2010). Making sense of the meaning literature: An integrative review of meaning making and its effects on adjustment to stressful life events. Psychological Bulletin, 136, 257–301. http://doi.org/10.1037/a0018301
Peale, N.V. (1953). The power of positive thinking. Ebury Publishing.Robins, A., Ashbake, V., Enriquez, J. and Morgan, J. (2003). Learning to reflect: Professional
practice for professionals and paraprofessionals. International Journal of Learning, 10, 2555-65.
Rodriguez, A. (2008). Toward a transformative teaching practice: Criticality, pedagogy, and praxis. International Journal of Learning, 15, 345–352.
Rolfe, G., Jasper, M., & Freshwater, D. (2010). Critical reflection in practice: generating knowledge for care (2nd ed.). Palgrave Macmillan.
Salazar, M. (2008). English or nothing: The impact of rigid language policies on the inclusion of humanizing practices in a high school ESL program. Equity & Excellence in Education, 41, 341–356.
Salazar, M. (2013). A humanizing pedagogy: Reinventing the principles and practices of education as a journey toward liberation. Review of Research in Education, 37, 121-148.
Schon, D. (1991).The reflective practitioner: How professionals think and act. AveburySchugurensky, D. (2011). Paulo Freire. Continuum.

80
Schon, D. (1991). The reflective practitioner: How professionals think and act. AveburySiemens, G. (2005). Connectivism: A learning theory for the digital age. https://jotamac.
typepad.com/jotamacs_weblog/files/Connectivism.pdf Siemens, G. (2006). Connectivism: Learning theory or pastime of the self-amused.
Learning Technologies Centre.Siemens, G., & Downes, S. (2009). Connectivism and connected knowledge. International
Journal of Instructional Technology for Distance Learning, 2(1), 3-10.Souto-Manning, M. (2006). A critical look at bilingualism discourse in public schools:
Auto/ethnographic reflections of a vulnerable observer. Bilingual Research Journal, 29, 439–458.
Tamrat, W., & Teferra, D. (2020). Covid-19 poses a serious threat to Higher Education. https://www.universityworldnews.com/post.php?story=20200409103755715
Van Dam, K. (2013). Employee adaptability to change at work: A multidimensional, resource-based framework. In Oreg, S., Michel, A. and By, R.T. The psychology of organisational change: Viewing change from the employees’ perspective (pp. 123-142). Cambridge University Press. https://doi.org/10.1017/CBO9781139096690.009
Van den Heuvel, M., Demerouti, E., Bakker, A.B., Hetland, J., & Schaufelli, W.B. (2020). How employees adapt to organisational change? The role of meaning-making and work engagement. The Spanish Journal of Psychology, 23. https://doi.org/10.1017/SJP.2020.55
Van Deursen, A.J, & van Dijk, J.A. (2019). The first-level digital divide shifts from inequalities in physical access to inequalities in material access. New Media and Society, 21(2), 354–375. https://doi.org/10.1177/1461444818797082
White, D. (2004). Reflective practice: wishful thinking or a practical leadership tool? Practising Administrator, 26(3), 41-4.

81
4TH SINTO
K INTERN
ATION
AL CON
FERENCE O
N SO
CIAL SCIENCE AN
D M
ANAG
EMEN
T
SICONSEM2021: 100-062
EVALUATING STUDENTS’ ENGAGEMENT IN DISTANCE LEARNING PROGRAM BLENDED LEARNING ACTIVITIES:
A CASE STUDY IN ELEMENTARY STATISTICS SUBJECT
1Nur Asy-syura, 2Saadi Ahmad Kamaruddin, 3Fazillah Mohmad Kamal& 4Norhayati Yusof
1,2,3,4School of Quantitative Sciences, Universiti Utara Malaysia2Centre of Testing, Measurement and Appraisal, Universiti Utara Malaysia
2Institute of Strategic Industrial Decision Modelling, Universiti Utara Malaysia
Corresponding authors: [email protected]; [email protected]; [email protected]
ABSTRACT
Face-to-face training has becoming less prevalent as the COVID-19 epidemic has risen in intensity and expanded internationally. Virtual teaching and learning will most likely be employed in the future learning environment. It is still feasible to teach and study from home, thanks to technology developments. Blended learning, on the other hand, is always evolving. Students’ grasp of statistics must be examined from several viewpoints in this course. As a consequence, in this study, we presented real-world applications in students’ statistics class activities at the tertiary level. This research was carried out on an undergraduate statistic course named Elementary Statistics (SQQS1013) at Universiti Utara Malaysia (UUM). The major focus is on the Professional and Continuing Education (PACE) distance education programme (PJJ), focusing on those who enrolled in elementary statistics during semester JA211. Students were given a questionnaire at the end of the semester to evaluate the success of the implementation. The target groups were SQQS1013 students (N=63) from the two campuses: Sintok (n=13) and Kuala Lumpur (n=50) enrolled in the April 2021 semester JA211. It is intended that this research would allow teachers to further analyze the blended learning technique in terms of student involvement and knowledge appreciation for statistics courses. Also, this research is anticipated to assist elementary statistics educators in remote learning programs in improving their class activity techniques to have a long-lasting effect and meaningful experience in the lives of students. Overall, the proposed research aims to continuously enhance our service delivery to students as stakeholders.
Keywords: Student engagement, undergraduate, elementary statistics, blended learning, distance learning programme.
INTRODUCTION
Blended learning is an educational pattern in which students study using electronic and online media in addition to conventional face-to-face instruction. Blended learning is more difficult to describe than one might imagine, with widely differing views on the issue. To connect with students online, most instructors in blended classrooms, for example, utilise a sort of of course management system. Since the inception of blended learning over two decades ago, researchers, instructional designers, and instructors have been seeking for successful blended learning techniques. The broad definition of blended learning, which is a pedagogically deliberate mix of online and face-to-face (Graham 2006), allows for a variety of designs that best suit and the micro classroom circumstances seen in diverse higher education institutions across the world.
Even if all lecturers used the same platform, they may use it in various ways in their classes. Lecturers can augment classroom education with conventional online media or
09
82
alternate between online and classroom instruction, according to Institute research. One of the most current or at least well-covered hybrid teaching approaches is the “online driver” approach, often known as “flittering.”
Many academicians are abandoning traditional teaching approaches in search of innovative ways to increase student performance. Traditional teaching is best explained by face-to-face learning, in which the instructor stands in front of the class and educates their students. The times, however, change as pupils do. Blended learning is a great teaching method that has emerged. This innovative teaching technique is becoming increasingly popular (Fleck, 2012; Güzer & Caner, 2013; Nazarenko, 2015). Blended learning is seen as a combination of face-to-face and online learning; nevertheless, blended learning may be categorised in a variety of ways.
Blended learning has been demonstrated to greatly increase students’ academic understanding (Lozano-Lozano et al., 2020; Fazal & Bryant, 2019; Camahalan & Ruley, 2014; Kazu & Demirkol, 2014; Chang et al., 2014). In research that looked at the influence of blended learning on high school students’ writing, it was revealed that after participating in blended learning training, most students were more adept with writing ideas than students who received conventional forms of instruction (Camahalan & Ruley, 2014). As a result, some colleges have begun to provide students with blended learning possibilities. Blended learning, on the other hand, is not a one-size-fits-all approach. The Christensen Institute offers four blended learning methods. There are four types of blended learning models (Acree et al., 2017).
There hasn’t been much study conducted on the most successful forms of blended learning activities for tertiary level of statistics course. The majority of students, particularly those in social arts programmes, found that this subject is one of the most critical subjects. The problem is exacerbated by the global pandemic situation, in which virtual teaching and learning activities have become the new standards. Keeping students motivated and interested in statistics is a big issue for statistics teachers. Most significantly, the major objective of all lecturers is to make this topic have an influence on the lives of students, especially those who will work for businesses or pursue postgraduate studies in the future.
The study findings are presented in five sections in this publication. The first section of the study provides the research’s introduction and background material. Section 2 goes over the literature that is pertinent to this study. Section 3 discusses the research methods in depth. The study findings and discussions are also included in Section 4. Finally, Section 5 concludes the complete study effort.
METHODOLOGY
This research investigates students’ performance in blended learning activities in distance learning programmes at UUM’s Sintok and Kuala Lumpur campuses. The demographic of the study is N=63 male and female elementary statistics students (SQQS 1013) for the semester April session 2021/2022. The respondents were chosen via purposive sampling that is a non-probability sampling in which researchers use their professional judgement to pick individuals of the public to participate in surveys. Purposive sampling is a sample approach in which elements are drawn from the total population based on the goal of the research. The primary goal of purposeful sampling is to choose those components that are meant to fulfil the study objective.
To begin, we create a questionnaire to collect data. The questionnaire items adapted from previous study (Noraini, 2017) to collect data for the elementary statistics topic from 63 students (2 groups) at both the Sintok and Kuala Lumpur campuses, who are slated to employ blended learning in the April 2021/2022 session. The questionnaire options are four conventional Likert scales (1 = strongly disagree to 7 = strongly agree) with the exception of the most successful remote learning techniques (6 online learning formats) and questions regarding the pleasurable distance learning experience. There were 20

83
4TH SINTO
K INTERN
ATION
AL CON
FERENCE O
N SO
CIAL SCIENCE AN
D M
ANAG
EMEN
T
questions in all, separated into four sections: (a) general student gender information, study year, and final result information, (b) performance factors, (c) student interactions, and (d) effectiveness model based on student performance and student interactions.
To estimate a significant component and establish a trend, we utilised multiple linear regression to estimate the value of a variable based on the values of two or more other variables. The variable we wish to forecast is known as the dependent variable. Independent variables are variables that we utilise to estimate the value of the dependent variable. We apply this technique for aim 3, which is to create a model based on determinants of students’ success in Elementary Statistics online blended learning activities among distance learning programme students.
The dataset was submitted to multiple linear regression and artificial neural network analysis (Butvil et al., 2021). (Rivas et al., 2021).
Figure 1
Conceptual Framework
Figure 1 shows the conceptual framework of this research. For the existing factors, we have race, tools, age, number of children, gender, marital status, campus and benefit of blended learning. Meanwhile, for the research gap, we have interaction student-student and interaction student-instructor (Noraini, 2017).
RESULTS
To comprehend the study participants’ perspectives, the reliability of the questionnaire or instrument used for data collecting is appropriately employed. In order to offer useful information that is important for societal progress, the questionnaire utilised must be trustworthy. The dependability of a questionnaire is assessed by assessing whether or not it delivers reliable information. If the same questionnaire is utilised efficiently to gather information from different sources, and whether it delivers trustworthy data. To assist, reliability statistics utilising the Statistical programme for social sciences (SPSS) are utilised. Cronbach The Alpha it identified for 49 of the questions was 97.4 percent, suggesting that the material is trustworthy. A value more than 50% is deemed appropriate, and the value in this case is 97.4 percent.
The variable involved in this research. The regression analysis aids in the comprehension of the link between interaction students-instructor, engagement, interaction student-student, blended learning variables, blended learning advantages, and tools.
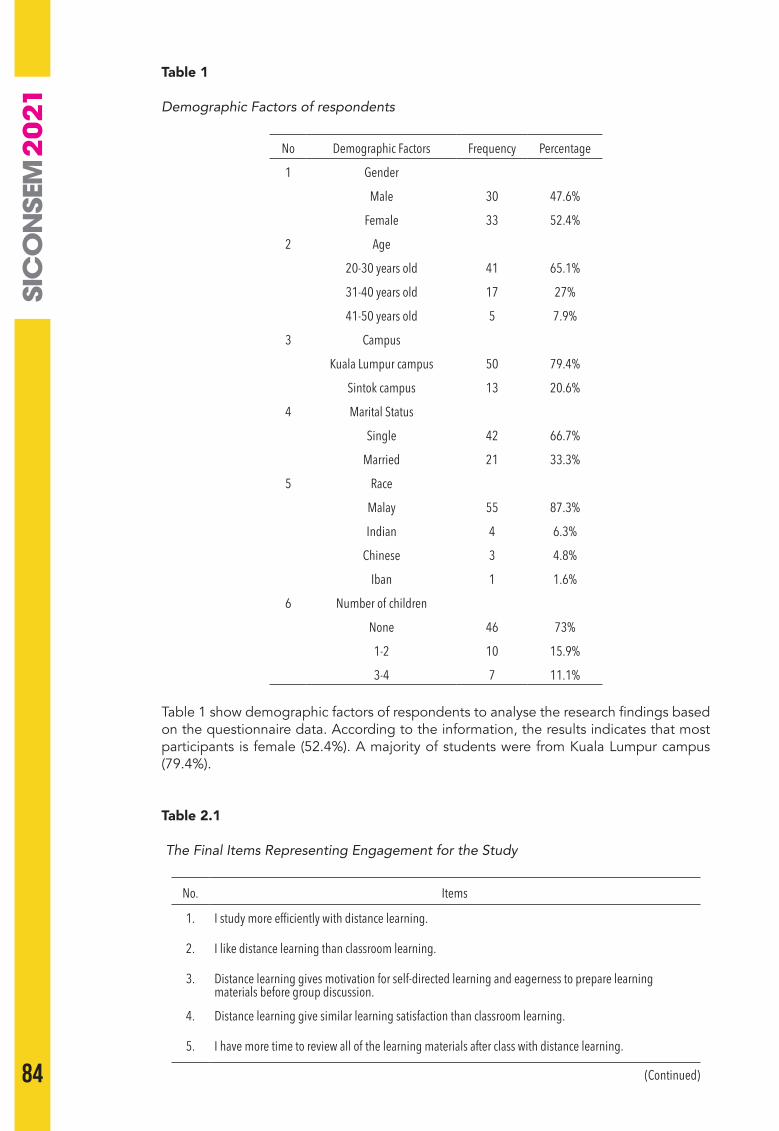
84
Table 1
Demographic Factors of respondents
No Demographic Factors Frequency Percentage
1 Gender
Male 30 47.6%
Female 33 52.4%
2 Age
20-30 years old 41 65.1%
31-40 years old 17 27%
41-50 years old 5 7.9%
3 Campus
Kuala Lumpur campus 50 79.4%
Sintok campus 13 20.6%
4 Marital Status
Single 42 66.7%
Married 21 33.3%
5 Race
Malay 55 87.3%
Indian 4 6.3%
Chinese 3 4.8%
Iban 1 1.6%
6 Number of children
None 46 73%
1-2 10 15.9%
3-4 7 11.1%
Table 1 show demographic factors of respondents to analyse the research findings based on the questionnaire data. According to the information, the results indicates that most participants is female (52.4%). A majority of students were from Kuala Lumpur campus (79.4%).
Table 2.1
The Final Items Representing Engagement for the Study
No. Items
1. I study more efficiently with distance learning.
2. I like distance learning than classroom learning.
3. Distance learning gives motivation for self-directed learning and eagerness to prepare learning materials before group discussion.
4. Distance learning give similar learning satisfaction than classroom learning.
5. I have more time to review all of the learning materials after class with distance learning.
(Continued)
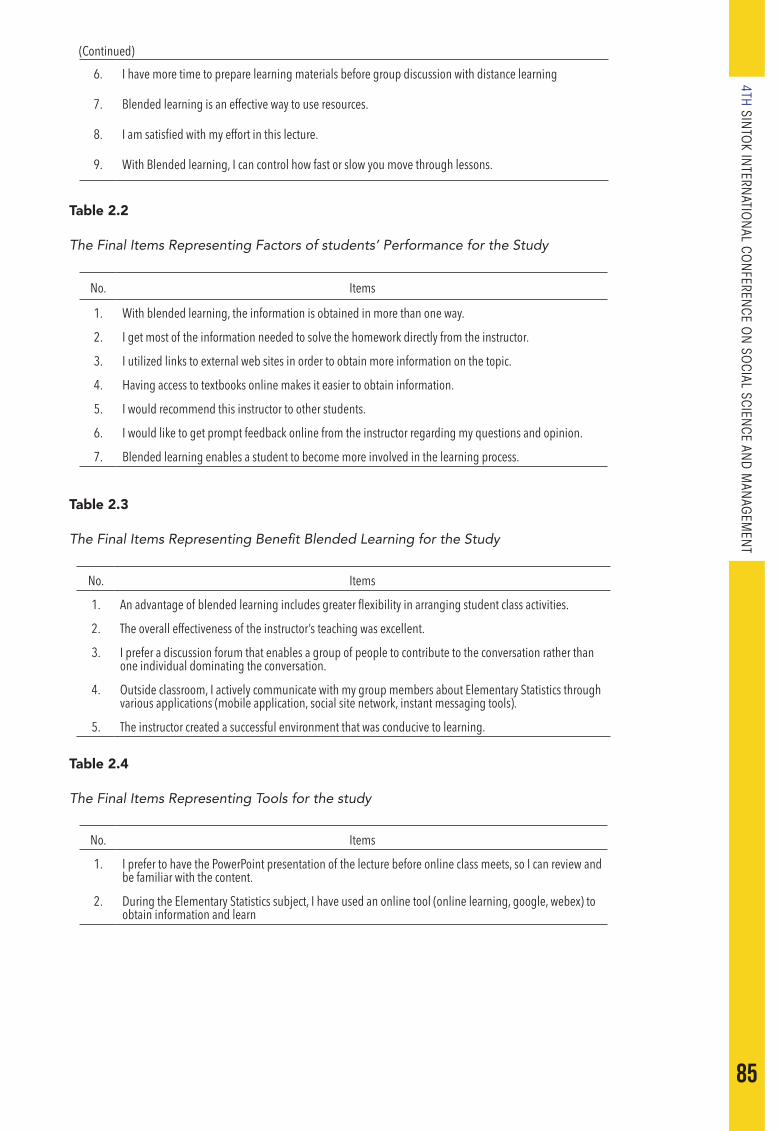
85
4TH SINTO
K INTERN
ATION
AL CON
FERENCE O
N SO
CIAL SCIENCE AN
D M
ANAG
EMEN
T
6. I have more time to prepare learning materials before group discussion with distance learning
7. Blended learning is an effective way to use resources.
8. I am satisfied with my effort in this lecture.
9. With Blended learning, I can control how fast or slow you move through lessons.
Table 2.2
The Final Items Representing Factors of students’ Performance for the Study
No. Items
1. With blended learning, the information is obtained in more than one way.
2. I get most of the information needed to solve the homework directly from the instructor.
3. I utilized links to external web sites in order to obtain more information on the topic.
4. Having access to textbooks online makes it easier to obtain information.
5. I would recommend this instructor to other students.
6. I would like to get prompt feedback online from the instructor regarding my questions and opinion.
7. Blended learning enables a student to become more involved in the learning process.
Table 2.3
The Final Items Representing Benefit Blended Learning for the Study
No. Items
1. An advantage of blended learning includes greater flexibility in arranging student class activities.
2. The overall effectiveness of the instructor’s teaching was excellent.
3. I prefer a discussion forum that enables a group of people to contribute to the conversation rather than one individual dominating the conversation.
4. Outside classroom, I actively communicate with my group members about Elementary Statistics through various applications (mobile application, social site network, instant messaging tools).
5. The instructor created a successful environment that was conducive to learning.
Table 2.4
The Final Items Representing Tools for the study
No. Items
1. I prefer to have the PowerPoint presentation of the lecture before online class meets, so I can review and be familiar with the content.
2. During the Elementary Statistics subject, I have used an online tool (online learning, google, webex) to obtain information and learn
(Continued)

86
Table 2.5
Dimensions of Students Interaction for this Study
Dimension No. Items
Interaction Students-Instructor
1 The instructor replied my questions in a timely fashion.
2 I received enough feedback from my instructor to complete my assignments when I needed it.
3 Elementary Statistic assignments led to interactions with my classmates.
4 Online materials helped me to relate my personal experience to new concepts or new knowledge.
5 I replied to messages from the instructor through various application (mobile application, social site network, instant messaging tools, etc.)
6 I asked the instructor my questions related to Elementary Statistic contents through various application (mobile application, social site network, instant messaging tools, etc.)
7 I had numerous interactions with the instructor during Elementary Statistic class.
8 Watch the instructor demonstrate how to solve problems.
9 It was easy for me to access the online materials.
10 Online materials stimulated my interest for this subject
11 I communicated with my classmates about Elementary Statistic subject contents through various application (mobile application, social site network, instant messaging tools, etc.)
12 I shared my thoughts or idea about the lecture and its application with other students during Elementary Statistic class.
13 Beside Elementary Statistic module, online materials helped me to understand the Elementary Statistic content better.
Interaction Student-Student
1 I comment on other friend’s thoughts and ideas in Elementary Statistic class.
2 I got lots of feedback related to Elementary Statistic subject from my classmates.
3 Overall, I had numerous interactions related Elementary Statistic class content with fellow students.
4 I answered questions of my classmates about Elementary Statistic subject through various application (mobile application, social site network, instant messaging tools, etc.)
5 Because of Elementary Statistics class, I start to get to know other students in who enrolled this subject from other classes.
6 Because of Elementary Statistics class, I start to get to know other students in who enrolled this subject from other faculties.
Table 2.1 is representing the final items of engagement for this study. The finalized items for factors of students’ performance are presented in the Table 2.2. The finalized items for benefit blended learning are presented in the Table 2.3. Table 2.4 is representing the final items of tools for this study. The final dimensions and items in student interactions are as presented in the Table 2.5.
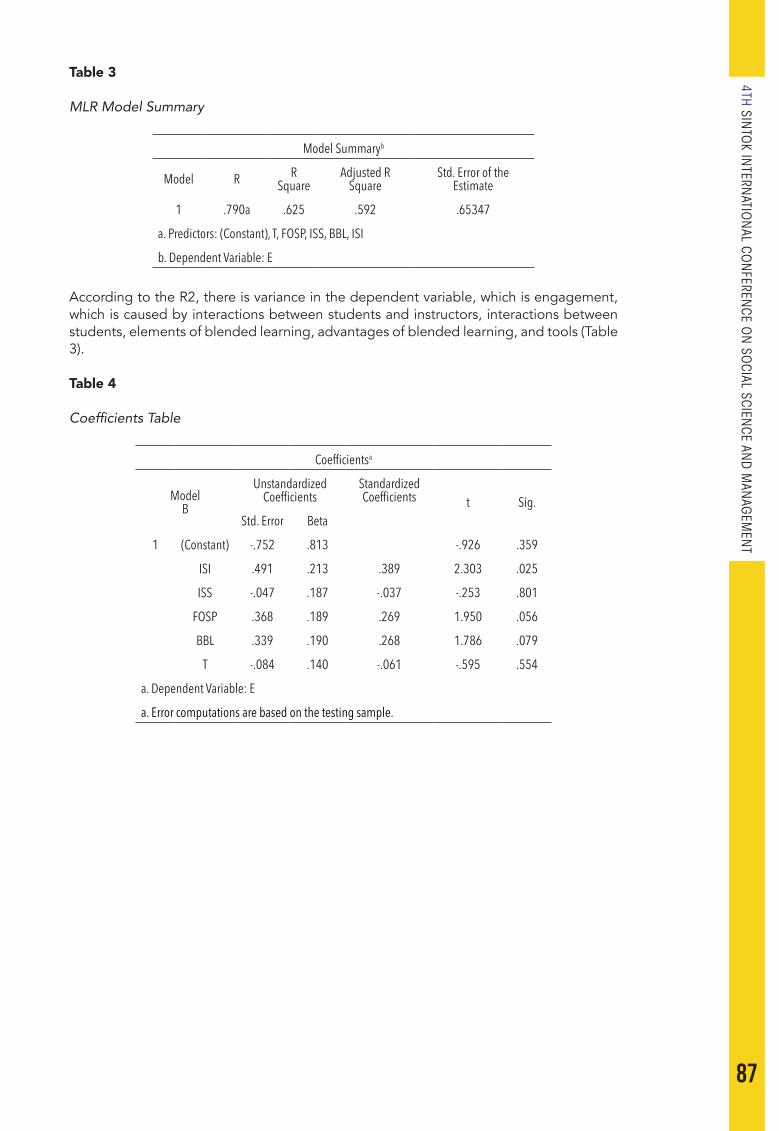
87
4TH SINTO
K INTERN
ATION
AL CON
FERENCE O
N SO
CIAL SCIENCE AN
D M
ANAG
EMEN
T
Table 3
MLR Model Summary
Model Summaryb
Model R R Square
Adjusted R Square
Std. Error of the Estimate
1 .790a .625 .592 .65347
a. Predictors: (Constant), T, FOSP, ISS, BBL, ISI
b. Dependent Variable: E
According to the R2, there is variance in the dependent variable, which is engagement, which is caused by interactions between students and instructors, interactions between students, elements of blended learning, advantages of blended learning, and tools (Table 3).
Table 4
Coefficients Table
Coefficientsa
ModelB
Unstandardized Coefficients
Standardized Coefficients t Sig.
Std. Error Beta
1 (Constant) -.752 .813 -.926 .359
ISI .491 .213 .389 2.303 .025
ISS -.047 .187 -.037 -.253 .801
FOSP .368 .189 .269 1.950 .056
BBL .339 .190 .268 1.786 .079
T -.084 .140 -.061 -.595 .554
a. Dependent Variable: E
a. Error computations are based on the testing sample.

88
Table 5
Parameter Estimates
PredictorHidden Layer 1
H(1:1)
Predicted
Output Layer
EInput Layer (Bias) .059
ISI -.607
ISS -.221FOSP -.368BBL -.262
T -.241Gender .393
Age -.264Campus -.159
MaritalStatus .283Race -.676A1 -.287
Hidden Layer 1 (Bias) -.251
H(1:1) -.849
Table 4 show the coefficients table represents the regression line that will be created based on the data that has been analysed. The significant values for student-instructor interaction, blended learning variables, and blended learning benefits are all less than 0.05, and when the p is less than 0.05, the null hypothesis is rejected, and the alternative hypothesis is accepted. According to the statistics, the contact between students and instructors, blended learning variables, and blended learning advantages all have a substantial influence on engagement. The interaction students-instructor has a greater value of 0.49, while the variables blended learning 0.37 and benefit blended learning 0.34 have a lesser influence, according to the data in the table. Meanwhile, Table 5 show parameter estimates.
Table 6
Independent Variable Importance
Importance Normalized Importance
ISI .192 91.2%
ISS .069 33.1%
FOSP .108 51.7%
BBL .090 42.7%
T .085 40.5%
Gender .060 28.7%
Age .057 27.0%
Campus .026 12.5%
Marital Status .043 20.6%
Race .210 100.0%
Number of Children .059 28.2%
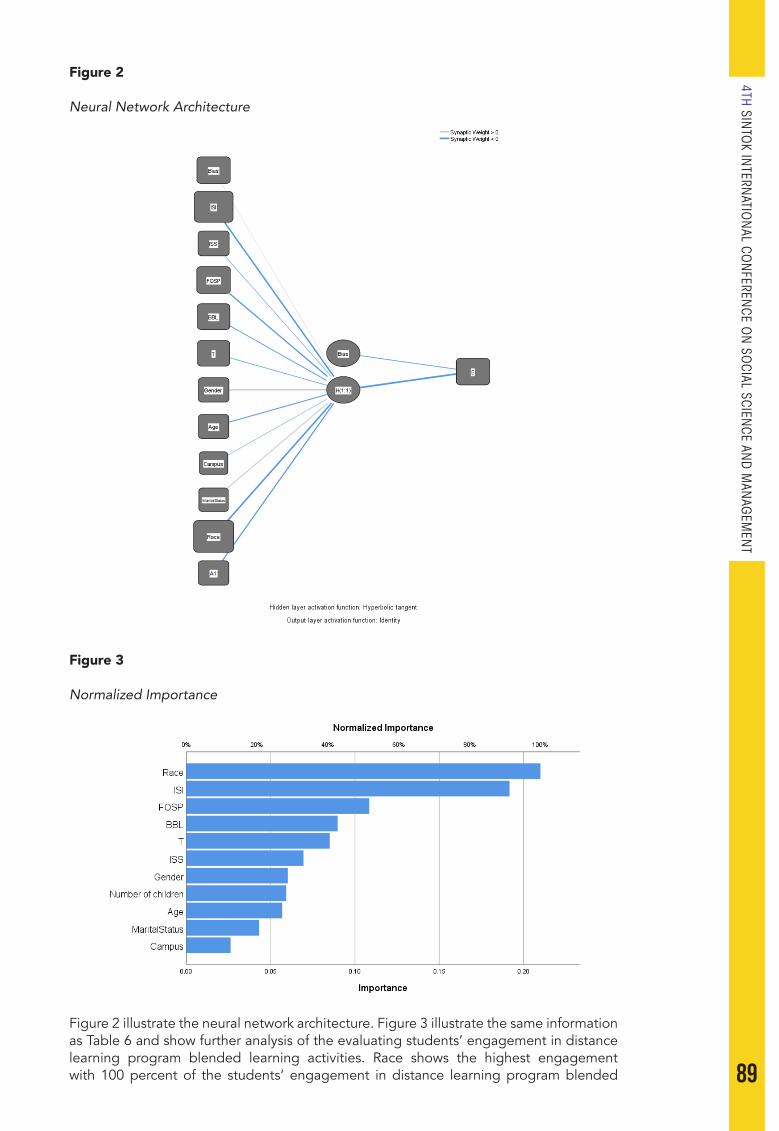
89
4TH SINTO
K INTERN
ATION
AL CON
FERENCE O
N SO
CIAL SCIENCE AN
D M
ANAG
EMEN
T
Figure 2
Neural Network Architecture
Figure 3
Normalized Importance
Figure 2 illustrate the neural network architecture. Figure 3 illustrate the same information as Table 6 and show further analysis of the evaluating students’ engagement in distance learning program blended learning activities. Race shows the highest engagement with 100 percent of the students’ engagement in distance learning program blended
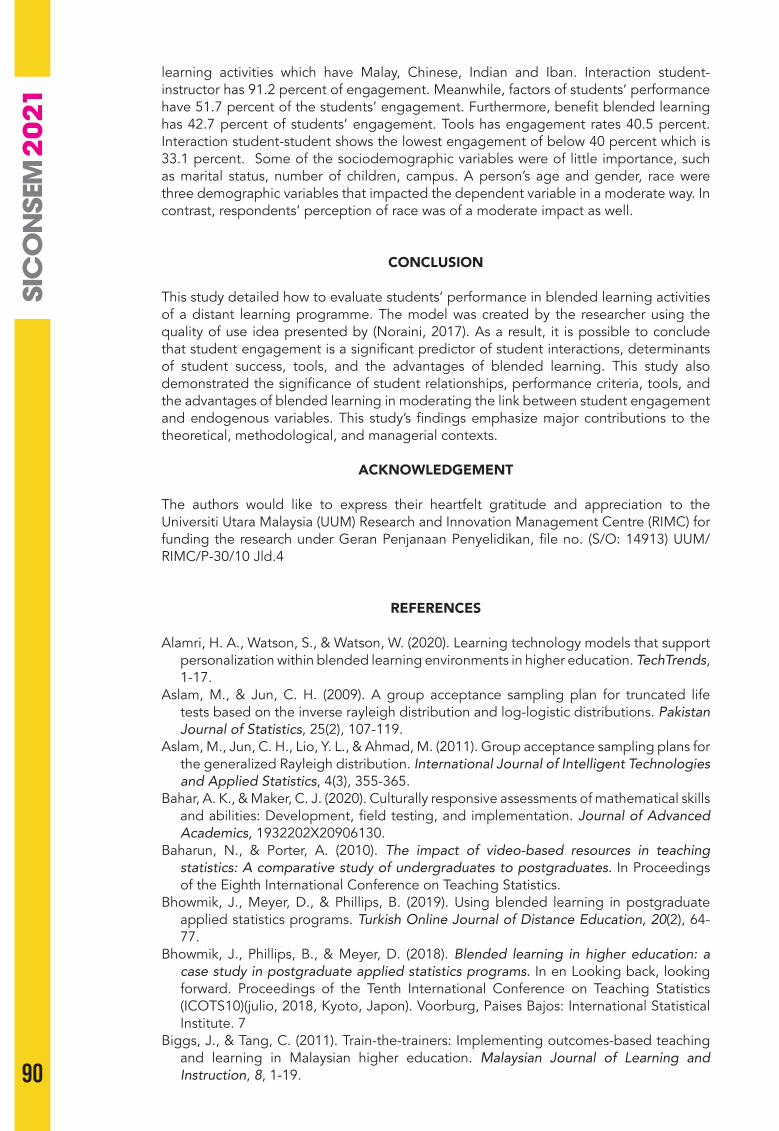
90
learning activities which have Malay, Chinese, Indian and Iban. Interaction student-instructor has 91.2 percent of engagement. Meanwhile, factors of students’ performance have 51.7 percent of the students’ engagement. Furthermore, benefit blended learning has 42.7 percent of students’ engagement. Tools has engagement rates 40.5 percent. Interaction student-student shows the lowest engagement of below 40 percent which is 33.1 percent. Some of the sociodemographic variables were of little importance, such as marital status, number of children, campus. A person’s age and gender, race were three demographic variables that impacted the dependent variable in a moderate way. In contrast, respondents’ perception of race was of a moderate impact as well.
CONCLUSION
This study detailed how to evaluate students’ performance in blended learning activities of a distant learning programme. The model was created by the researcher using the quality of use idea presented by (Noraini, 2017). As a result, it is possible to conclude that student engagement is a significant predictor of student interactions, determinants of student success, tools, and the advantages of blended learning. This study also demonstrated the significance of student relationships, performance criteria, tools, and the advantages of blended learning in moderating the link between student engagement and endogenous variables. This study’s findings emphasize major contributions to the theoretical, methodological, and managerial contexts.
ACKNOWLEDGEMENT
The authors would like to express their heartfelt gratitude and appreciation to the Universiti Utara Malaysia (UUM) Research and Innovation Management Centre (RIMC) for funding the research under Geran Penjanaan Penyelidikan, file no. (S/O: 14913) UUM/RIMC/P-30/10 Jld.4
REFERENCES
Alamri, H. A., Watson, S., & Watson, W. (2020). Learning technology models that support personalization within blended learning environments in higher education. TechTrends, 1-17.
Aslam, M., & Jun, C. H. (2009). A group acceptance sampling plan for truncated life tests based on the inverse rayleigh distribution and log-logistic distributions. Pakistan Journal of Statistics, 25(2), 107-119.
Aslam, M., Jun, C. H., Lio, Y. L., & Ahmad, M. (2011). Group acceptance sampling plans for the generalized Rayleigh distribution. International Journal of Intelligent Technologies and Applied Statistics, 4(3), 355-365.
Bahar, A. K., & Maker, C. J. (2020). Culturally responsive assessments of mathematical skills and abilities: Development, field testing, and implementation. Journal of Advanced Academics, 1932202X20906130.
Baharun, N., & Porter, A. (2010). The impact of video-based resources in teaching statistics: A comparative study of undergraduates to postgraduates. In Proceedings of the Eighth International Conference on Teaching Statistics.
Bhowmik, J., Meyer, D., & Phillips, B. (2019). Using blended learning in postgraduate applied statistics programs. Turkish Online Journal of Distance Education, 20(2), 64-77.
Bhowmik, J., Phillips, B., & Meyer, D. (2018). Blended learning in higher education: a case study in postgraduate applied statistics programs. In en Looking back, looking forward. Proceedings of the Tenth International Conference on Teaching Statistics (ICOTS10)(julio, 2018, Kyoto, Japon). Voorburg, Paises Bajos: International Statistical Institute. 7
Biggs, J., & Tang, C. (2011). Train-the-trainers: Implementing outcomes-based teaching and learning in Malaysian higher education. Malaysian Journal of Learning and Instruction, 8, 1-19.

91
4TH SINTO
K INTERN
ATION
AL CON
FERENCE O
N SO
CIAL SCIENCE AN
D M
ANAG
EMEN
T
Bruggeman, B., Tondeur, J., Struyven, K., Pynoo, B., Garone, A., & Vanslambrouck, S. (2020). Experts speaking: Crucial teacher attributes for implementing blended learning in higher education. The Internet and Higher Education, 100772.
Butvilė, J., Butvilas, T., & Arslan, H. (2021). Adults participation in non-formal education: The statistical regression model. An Interdisciplinary Approach to the Management of Organizations, 23.
Dodge, H. F. (1955). Chain sampling inspection plan. Industry Quality Control, 11(4), 10-13.
Epstein, B. (1954).Truncated life tests in the exponential case. The Annals of Mathematical Statistics, 25(3), 555-564.
Farouk, M., Aziz, N. & Zain, Z. (2019). The new two-sided group chain sampling plan for pareto distribution of the 2nd kind. International Journal of Innovative Technology and Exploring Engineering (IJITEE), 8(5S).
Hook, S. (2020). Education for modern man. WIPF and Stock Publishers. Kilpatrick, J. (2020). History of research in statistics education. Encyclopedia of Statistics Education, 349-354.
Montgomery, D.C. (2009). Introduction to Statistical Quality Control. John Wiley & Sons.Mughal, A.R., Zain, Z. & Aziz, N. (2015). New two-sided complete group chain sampling
plan for Pareto distribution of the 2nd kind. International Journal of Applied Engineering Research, 10(12), 31855 – 318860.
Mughal, A.R., Zain, Z. & Aziz, N. (2015). Time truncated group chain sampling strategy for pareto distribution of the 2nd kind. Research Journal of Applied Sciences, Engineering and Technology, 10(4), 471-474.
Mughal, A.R. (2018). A family of group chain acceptance sampling plans based on truncated life test. PhD thesis, Universiti Utara Malaysia,
Nieminen, J. H., & Valtteri Pesonen, H. (2020). Taking universal design back to its roots: Perspectives on accessibility and identity in undergraduate Statistics. Education Sciences, 10(1), 12.
Noraini, N. (2017). Student engagement, student interactions and’quality of use’in blended learning using flipped classroom (Unpublished doctoral dissertation). Universiti Utara Malaysia
Oxford Group, (2013). Blended learning-current use, challenges and best practices. http://www.kineo.com/m/0/ blended-learning-report-202013.pdf.
Patterson, C. L., Parrott, A., & Belnap, J. (2020). Strategies for assessing mathematical knowledge for teaching in statistics content courses. The Statistics Enthusiast, 17(2), 807-842.
Ramaswamy, A. R. S., & Sutharani, R. (2013). Designing double acceptance sampling plans based on truncated life tests inRayleigh distribution using minimum angle method. American Journal of Mathematics and Statistics, 3(4), 227-236.
Ramaswamy, A.R.S. & Jayasri, S. (2014). Time truncated chain sampling plans for generalized Rayleigh distributions. International Referred Journal of Engineering and Science, 3(2), 49-53.
Ramaswamy, A.R.S. & Jayasri, S. (2014). Time truncated chain sampling plans for inverse Rayleigh distributions. International Journal of Engineering and Inventions, 3(6), 41- 45.
Ramaswamy, A.R.S. & Jayasri, S. (2015). Time truncated chain sampling plan for Weibull distributions. International Journal of Engineering Research and General Science, 3(2).
Rivas, A., Gonzalez-Briones, A., Hernandez, G., Prieto, J., & Chamoso, P. (2021). Artificial neural network analysis of the academic performance of students in virtual learning environments. Neurocomputing, 423, 713-720.
Tan, Vincent (2020). COVID-19: Malaysia extends movement control order for third time until May 12. https://www.channelnewsasia.com/news/asia/covid-19-malaysia-extendsmovement-control-order-may-12-12670228
Teh, M.A.P., Aziz, N. & Zain, Z. (2016). Group chain sampling plans on truncated life test for log-logistic distributions. International Journal of Applied Engineering Research, 11(16), 8971-8974.
Teh, M.A.P., Aziz, N. & Zain, Z. (2016). Group chain sampling plans on truncated life test for inverse Rayleigh distributions. Research Journal of Applied Sciences, 11(11), 1432-1435.

92
Teh, M.A.P., Aziz, N. & Zain, Z. (2019). Constructing group chain acceptance sampling plans (gchsp) for gamma distributions. International Journal of Innovative Technology and Exploring Engineering (IJITEE), 8(5S).
Teh, M.A.P., Aziz, N. & Zain, Z. (2018). Group chain sampling plans based on truncated life test for exponential distributions. International Journal of Pure and Applied Mathematics, 119(3), 491-500.
Teh, M.A.P., Aziz, N. & Zain, Z. (2016). Time truncated group chain sampling plans for Rayleigh distributions. Global Journal of Pure and Applied Mathematics, 12(4), 3693-3699.
Tuomainen, S. (2017). Role of reflection in blended learning language courses in higher education. In European Conference on e-Learning Academic Conferences International Limited, 520-526.
Varga, P., Peto, J., Franko, A., Balla, D., Haja, D., Janky, F., Soos, G., Ficzere, D., Maliosz, M. & Toka, L. (2020). 5G support for industrial iot applications–challenges, solutions, and research gaps. Sensors, 20(3), 828.
Varthis, S., & Anderson, O. R. (2016). Students’ perceptions of a blended learning experience in dental education. European Journal of Dental Education, 22(1), e35–e41.
93
4TH SINTO
K INTERN
ATION
AL CON
FERENCE O
N SO
CIAL SCIENCE AN
D M
ANAG
EMEN
T
SICONSEM2021: 030-019
A COMPARATIVE ANALYSIS OF MANAGEMENT SYSTEMS IN NIGERIAN AND UKRAINIAN UNIVERSITIES
1Anu K. Toriola, 2Salami A. Lateef, 3Oyewola, S. Adegboyega & 4Modesta A. Chiyenre
1Faculty of Management and Social Science, Hallmark University, Ijebu-itele,Ogun State, Nigeria
2,3,4Federal University of Agriculture, Abeokuta, Nigeria
Corresponding author: [email protected]
ABSTRACT
This study compared the management systems in Ukrainian and Nigerian universities. The study specifically assessed core similarities of both universities, and investigated areas in which the two universities differed. The main purpose of this study was to introduce the management structure of university education in both countries. The study was based on comparative analysis with data and information collected from journal articles, conference proceedings, other online literature and data provided by UNESCO and educational agencies of both countries. Based on the results of the empirical analysis, several areas of similarities and differences in the university management system of the two countries were established while acknowledging that the higher educational system in Ukraine is more advanced in number, output and quality than the university education system in Nigeria. One key finding is the fact that other higher educational institutions apart from universities in the Ukrainian higher educational system, are by law permitted to run both bachelor and master’s degree awarding programmes, whereas in Nigeria, only universities are permitted to run bachelor and master’s degree awarding programmes; although polytechnics and colleges of education can run bachelor programmes, they are usually in affiliation with universities.
Keywords: Comparative analysis, management systems, Nigeria, Ukraine, university.
INTRODUCTION
In the world over, education is being recognised as a tool of disseminating and inculcating the norms, values, ideas, knowledge and discovery of a society or the world at large to the people especially the younger generation without which a landmark mark progress may be unrealisable (Luzik, Khomenko-Semenova, Kokareva & Hurska, n.d). The growth in intellectual capital through education, enable expansion in productivity and investment in human capital needed for national economic growth and development. Given this realisation countries all over the world invest both financial and other resources heavily in the provision of quality education (Tawari & Koko, 1996). Meanwhile, educational system across the world is divided into different sub-components, with main grouping being primary, secondary and tertiary levels of education. In many countries, the tertiary education is further divided into universities, colleges and or polytechnic education with the university being the highest level of education. Within this grouping, university education serve as the core and prime-mover of other levels of education, materials and all tangible and intangible input for economic growth and development by their very nature of being the host of every research and knowledge factories for producing high quality manpower (Tawari & Koko, 1996).
The performance and quality of the university system is dependents on the level of effectiveness and efficiently of the university management system (Daramola & Amos, 2016). Consequently, many countries are doing everything to boost the levels of their higher education systems in order to attract people just to study in their countries (Oksana,
10
94
2014). To realise this goal, every nation of the world now pursue global acceptability and competiveness of its university education through the administration and management of the university system (Ibijola, 2015). The administration of higher educational institutions refers to the means by which higher educational institutions are operated, organized and managed. Likewise, management is the ability to cope with complexity, to devise structures and systems that produce order and harmony (Ogbogu, 2013).
Although, universities are essentially the ‘same’ in general terms but they vary in detailed traditions which are dictated by peculiarities such as nature of ownership, focus of training and funding (Daft & Marcic, 2006). The objective of making the university system of a nation globally acceptable and competitive to facilitate educational exchange and collaboration between among countries demand holistic appraisal of the top-performing university in the world and comparing this system with the nation university education to address the grey arrears (McCormick, 2008). In this regard, the classical criteria of world Class University has been frequently used in the literature evaluate the teaching and research potential with the addition of social, business, and other innovative dimensions of University activities (Montesinos, Carot, Martinez, & Mora, 2008). Likewise, Anderson and Johnson (1998) identified the parameters that indicate freedom in the management of a university institution as consisting of staff appointments, staff promotions and status of academic and non-academic staff, student admissions, student progress and discipline, curriculum and teaching methods, examinations, curriculum content and textbooks, academic degree standards, Academic quality and accreditation, postgraduate teaching, priorities and freedom to publish, governing councils, academic boards and senate and student associations, administration, funding of institutions, operating grants, budgeting, financial aid and accountability.
In Nigeria, there has not been any noticeable attempt empirically to compare the Nigeria university education system with the university system in the rest of the world. Even in the Ukraine apart from the study conducted by Oksana (2014) that compares the higher education systems between China and Ukraine, there is no other known study to the best of the authors’ knowledge that compare the university system in Ukraine with other countries in the world. With this gap in the literature it is clear that most of the reform and policies introduce by the government from time to time to improve university education in Nigeria does not have sound empirical basis and were not based on what is obtainable in global university education market. Little wonder why the challenges facing the system persist and even worsen in the Nigeria case. Against this background this study was motivated to compare management systems in Ukrainian and Nigerian universities. The study specifically:a) explore the structure and administration of university system in Ukraine and Nigeria;b) examine the process and approach of studying in Ukraine and Nigeria;c) investigate the rules of admission in Ukraine and Nigeria;d) investigate the structure of teaching and Educational Staff Ukraine and Nigeria
The study will provide a better understanding of university system in the two countries and recommendations to improve the higher education systems of the two countries. The study will points out the possibility establishing exchange programme between universities in Nigeria and Universities in Ukraine and collaboration among the two countries. It also points out the possibility of receiving higher education in China and Ukraine
LITERATURE REVIEW
Empirical Studies
Against the existing literature, limited studies abound comparing the university system of one country with another. Among the limited available literature Oksana (2014) compares the higher education systems between China and Ukraine by comparing Shanxi Normal University in China and Luhansk Taras Shevchenko National Pedagogical University in Ukraine by paying special attention to the structures, facilities, rules of admission, the

95
4TH SINTO
K INTERN
ATION
AL CON
FERENCE O
N SO
CIAL SCIENCE AN
D M
ANAG
EMEN
T
organization of studying process and some approaches, and levels of acknowledgements by governments between the two. The study concludes that higher education is a very important topic in both China and Ukraine. The study also identified the possibility of receiving higher education in China and Ukraine. In another study, Ezenyilimba (2015) study the problems perverting management education in Nigeria in the area of the inadequacies in educational policies, curricula, facilities, balance between education levels, states, ethnicity, sexes, arts and sciences, quantity and quality of education, occupations, and professions using multiple linear regressions based on data collected from about 132 management graduates through oral interviews and observations. It was found that an all encompassing Systems-Innovative Management Education Model premised in self-employment, self-reliance, entrepreneurial, technical, vocational and problem-based learning skills is the ultimate.
In a similar vein, Kurbatov (2014) analyze the Soviet policy on access to higher education during the last four decades of existence of the USSR, with a particular focus on the Ukrainian case. It was found that the number of students, which increased four point four times between 1950 and 1990, was less significant per 100,000 people as such access to university education continued to be rather restrictive in social terms which accountable for the slow development of Soviet Ukraine in scientific and technological areas. The study conducted by Arikewuyo and Ilusanya (2010) examined the level of autonomy in one of Nigeria’s third-generation universities revealed that government intervention is considered reasonable. Specifically, the study discovered that government never exerts any influence on teaching and curriculum including the appointment of staff. However, from time to time, government exerts its influence on the control of governing councils and quality control of academic standards, number of students to be admitted and the level of fees to be charged by the universities.
In the same vein, the study conducted by Lunyachek (2011) study the processes of education system development in Ukraine in times of economic and political crisis to understand the situation existing in all branches of education: secondary, vocational and higher education. The study found reasonability of the implementation of the external independent evaluation of higher educational institutions` graduates and indentified the necessity for the principal reformation of the vocational education system. The study of Arikewuyo (2014) on the relationship between staff unions and the management of Nigerian universities at both government and institutional levels observed that unions within the system have often based their demands on adequate funding of the system, university autonomy and academic freedom, as well as salary and conditions of service. It also notes that high handedness, arbitrariness and corruption, on the part of university administration, are some of the causes of agitation in the system.
Country Profile: Ukraine and Nigeria
Nigeria is a West African nation with a geographical area covering 923,768km2. The country bordered Niger Republic to the North, Chad and Cameroon to the East, Benin to the West and Atlantic Ocean to the South Nigeria was under the British colonial rule until 1960 when the country gained her independence. The country was a federal state made up of three regions- Northern, Eastern, and Western region, which were later dissolved in 1963 into 36 states bounded together by a federal capital territory (Lembani, 2019). The country with a population estimated at 198, 000, 000 (NPCN, 2018) is the most populous country in Africa and its population is by youth which makes over 54% of the entire people in the country (Lembani, 2019). Although, the country has over 500 languages with differs traditions and customs, English remains the official language while English Pidgin is used across the state as an unofficial medium of communication (Lembani, 2019). The religion affiliation of the people is dominated by Muslim, followed by Christian and traditional worshippers. Nigeria’s GDP per capita stood at $2, 134.1 while the GDP growth rate is 2.6% as at December 2019 In Nigeria, the federal universities are the oldest institutions and since the establishment of university of Ibadan in 1948 in Oyo State, the number of universities has been doubling

96
every five years (Adesola, 1991). The number of universities in 1962 was four, then it increase to 12 in 1977 and 20 in 1983. The number of public and private universities in Nigeria as at December 2018 is total 162 licensed and approved by the federal government through the NUC comprising of 40 federal universities, 47 state universities and 75 private universities (Lembani, 2019). Given the number of universities compare to the population of 198, 000, 000 people in the country, it is clear that the population of people has outgrown the number of universities in the country (Okoroma, 2008). The inadequate number of universities in the country in addition to high demand for university education created admission problem into the available universities and maintenance of quality and sound university education. To address these challenges, the government establish the Joint Admission and Matriculation Board (JAMB) in 1978 to handle all admission matters with respect to universities including other institutions (Okoroma, 2008). The challenges have also raised the number of transnational students seeking admission abroad in the country. The country has the most transnational students in Africa, with approximately 71,351 students pursuing studies in more than 70 countries. The top six destinations for Nigerian students include the United Kingdom (17,973), Ghana (13,919), United States (9,786), Malaysia (4,943), Ukraine (3,328) and Canada (3,257), and more recently South Africa (Lembani, 2019). During the 71 year period since the establishment of the first university, funding of public universities has averaged between 1.1% and 8.8% of the total government expenditure ( Lembani, 2019).
Ukraine is a former Soviet republic which gained her independence in 1991. The country is located in Eastern Europe and stretches between Russia and Poland from East and west. Ukraine Bordered Belarus in the north and Black sea in the South with a geographical area covering 603, 628km2. Since her independence in 1991 Ukraine has undergone a transition period from a planned to market economy (UNESCO-CEPES, 2006). The population of people in Ukraine is 42, 759, 661, the number which has been decreasing since 1991 due to the declining fertility rates and a large migration of Ukrainians to the West during the 90s (UNESCO-CEPES, 2006) (OECD, 2017). Although, Ukrainian as the largest ethnic group, as such the state language is Ukrainian while the Constitution of Ukraine guarantees free development of national and ethnic minorities’ languages. The religion affiliation of the people is dominated by Orthodox Christians followed by Greco-Catholics, Rome-Catholics, Protestants, Muslims, 0.5% other confessions including atheists (European Union, 2017). Ukraine’s GDP per capita stood at $3, 659.0 while the GDP growth rate is 1.5% as at December 2019.
Ukraine has a well-developed university educational system. According to tertiary education enrolment rate in Ukraine is the 8th in the world and General Global Competitiveness Index ranks the country as 89th country in the world (Kurbatov, 2012). In 1991 when the country gained her independence, the number of students in Ukrainian higher educational institutions increased 2.5 times. In 2010 543.7 thousands of people graduated from higher educational institutions and this is four times more, than in 1991 (Kurbatov, 2012). As at February 2011, the country has 854 higher educational institutions of the 1-4 level of accreditation, with more than 2,491,000 students (State Statistic Service of Ukraine, 2011). Ukraine has over 800 higher institution of leaning including 144 private HEIs functioning under national legislation on higher education (European Union, 2017). Ukraine’s expenditure on education is around 6% of the GDP (CEDOS, 2015).
University Ranking: Ukraine and Nigeria
Nigerian Universities have remained consistently very low in global universities ranking for many years. In the list of 1000 world leading universities, no Nigerian based university is ever recognised according to The Webometrics World Ranking of Universities. Even in the list of 100 leading universities in Africa, no Nigeria University has ever made the first 40 since the 1970 (Adewale, 2011). In 2005, Nigeria’s best university, the University of Ibadan was ranked 59th in Africa and 6,320th in the world by the World universities Ranking project (Okoroma, 2008). The country, literacy rate according to UNESCO is 60.0 in 2015
97
4TH SINTO
K INTERN
ATION
AL CON
FERENCE O
N SO
CIAL SCIENCE AN
D M
ANAG
EMEN
T
One Ukrainian University was ranked 321 among the 12,000 world universities in the ranking of Web of World Universities in July 2012 with only 137 Ukrainian universities in the ranking in July 2011 (Ranking Web of Universities, 2012). In 2011 two Ukrainian universities appear under the number 601 (QS world university rankings, 2011). According to tertiary education enrolment rate Ukraine become this 7th country in the world. According to Human Development Index in 2010 Ukraine was 69th country in the world (United Nations Development Programme, 2010). In Ukraine, the level of literacy rate in the country according to UNESCO is 99.98 in 2015.
UNIVERSITY STRUCTURE AND ADMINISTRATION IN UKRAINE AND NIGERIA
University Structure and Compositions in Ukraine and Nigeria
In the Nigeria tertiary education system, there four major degree awarding institutions comprising of Universities, Polytechnics, Institutions of technology, Colleges of Education, that form part of or affiliated to, universities and polytechnic colleges and professional, specialized institution. They can further categorized as state or federal universities and as first, second or third generation universities (Hartnett 2001). In the country, there are three levels of university education, At the first level, Bachelors’ degree are offered after a minimum of three years and a minimum of six year especially for a degree in medicine. The university second level stage offers a Master’s certification following a minimum of year academic calendar of post-Bachelor study. At the third level, Doctorate degree is offer after three to four years Master’s study. Meanwhile, to secure admission into the first level university education, one has to pass the competitive University Matriculation Examination (Akintoye, 2008). In addition to this, the candidate must have secure a minimum of five O-level credit in five subjects including English and Mathematics in the senior secondary school examination to be eligible for any course of study in the university. On governance, government often exerts its influence on the membership of governing councils and also, from time to time, exerts its control on these councils. Governing councils are often constituted, dissolved and re-constituted at the prerogative of the visitors to the universities (i.e. the President in the case of federal universities and Governors in the case of state universities). And on the membership of the councils, the majority of the members are usually government appointees (Arikewuyo & Ilusanya, 2010)
In Ukraine, there are 4 types of Higher Education Institutions (HEIs) in Ukraine (Article 28 of the Law on Higher Education): Universities which is multisectorial (lassical and technical) or sectoral (technological, pedagogical, physical education and sport, humanities, theological, medical, economic, legal, pharmaceutical, agricultural, artistic, cultural, etc.) that carries out educational activities for various degrees in higher education including PhD; Academies are sectorial higher educational institutions carrying out activity related to the provision of higher education at the first and second levels\cycles in one or several fields of knowledge; Institutes are also sectoral based on the Academies model that can provide only first and second levels\cycles degree in one or several fields of knowledge; and Colleges which are also sectoral entitled to organize and conduct only short and first-cycle study programmes i.e Junior Bachelor and/or Bachelor degrees (European Commission, 2017).
Meanwhile, there are four levels of education in the country: the first cycle, second cycle third circle and scientific level education. The initial level of education (Ukr. Pochatkovyi) is the Short cycle. The first cycle studies offered a bachelor degree (Ukr. Pershyi) with a specific profile of an academic or professional training programme which is offered at all types of higher education institutions in Ukraine. A condition for entering a first-cycle study programme is the completion of 11-year compulsory secondary (incl. primary and secondary) school and obtains full general secondary education certificate (European Union, 2017). In the country, master studies (Ukr. Drugyi) can be organised by universities, academies and institutes excluding colleges. The duration of studies at this level is either one and a half or two years (90 or 120 ECTS). In order to enrol at a Master programme, students must have completed a Bachelor programme. To complete a Master study
98
programme, the student has to write and defend a Master thesis at the end of his/her studies. The length of integrated studies in the fields of Veterinary Medicine and Health (studies of Medicine, Pharmacy) at Master level is either five or six years (300 or 360 ECTS). Master degrees correspond to the 7th qualification level of the National Qualifications Frameworks of Ukraine (European Union, 2017).
The third cycle is for Doctoral degree. Doctoral studies (PhD) are organized at universities and last four years. To enrol for a doctoral degree (Ukr. Tretiy), the student must have completed a Master course. PhD programmes involve an educational component (30-60 ECTS), extensive scientific research activities and the publication of papers in scientific journals. A PhD thesis is the final part of the doctoral study programme. The preparation, procedure and conditions for the defence of the PhD thesis are defined by the general act of each particular higher education institution in line with the regulations of the Ministry of Education and Science. The institution where the PhD thesis is defended has the obligation to make the thesis and the abstract (synopsis) available to the public on its web site, alongside a printed version of the work, which needs to be available in the institution’s library, at least 10 days prior to the defence of the thesis ((European Union, 2017). Scientific level of higher education responds to the 9th qualification level of the NQF. The duration of those scientific (postdoctoral) programmes is 2 years defined by a regulation of the cabinet of Ministries of Ukraine. Scientific programme leads to the higher education degree “Doctor of Science”, which is the second scientific degree (European Union, 2017).
Control and Administration of University Education in Ukraine and Nigeria
Universities in Nigeria are usually founded by acts of parliament in the civilian era and by decrees and edicts under the military regimes. This acts and laws of each university dictates the function of the various organs of the university administration, such as Governing Council, Senate, Faculty, Department, Unit and so on (Arikewuyo & Ilusanya, 2010). From 1948 when the first university was founded to 1979, university was under the exclusive list right of the government which allows only the federal government to establish, fund and manage university education in the country. After the constitution was amended in 1979, university education was now put on the concurrent list of the government which allows both the federal, state and private individuals to establish and own its own university named after them since it became clear that the funding of university may be difficult for the federal government alone (Ajadi, 2010).
In Nigeria university whether private or public are run through committee system which are either responsible to the council or the senate (Mgbekem, 2004). The governing council are the custodian of the university assets and its application while the Senate oversees the academic programmes and development of the University. The everyday management of the university and policy implementation are the role of the vice chancellor and other principal officers (Daramola, and Amos, 2016). According to Arikewuyo (2014), university administration revolves around the Vice-Chancellor who is both the academic and administrative head of the institution. He is supported by one or sometimes two deputy Vice-Chancellors and a number of senior academic staff such as Provosts or Deans of Colleges, Faculties or Schools and Heads of Departments (Erero, 1996). In addition to this, the Registrar, the Bursar, the Librarian as well as an array of other administrative staff assist the Vice-Chancellor in managing the affairs of the University. The academic affairs of the institution are managed by the University Senate which possesses full responsibility for the responsibility (Ogbogu, 2013). The governing board or council is appointed by the government and have some internal representatives of the institution as elected member or members. These councils generally govern the affairs of the institution on behalf of the government (Afolayan, 2015).
The current membership governing councils of universities, as contained in the military government Decree of 1st January 1993, which amended the Acts of Nigerian Universities, and even in the autonomy bill of 2003 consist of: the Pro-Chancellor; the Vice-Chancellor; the Deputy Vice-Chancellor (Deputy Vice-Chancellors in the 2003 bill); one person from the Federal Ministry responsible for Education; four persons representing a variety of
99
4TH SINTO
K INTERN
ATION
AL CON
FERENCE O
N SO
CIAL SCIENCE AN
D M
ANAG
EMEN
T
interests and broadly representative of the whole Federation to be appointed by the National Council of Ministers; four persons appointed by the Senate from among its members; two persons appointed by Congregation from among its members; and one person appointed by Convocation from among its members.” Thus, the membership of Councils is tilted in favour of internal members. The external members are 6 in number representing various interests who are government appointees with no input by the universities to their appointments. One of the external members is appointed by government as the Pro-Chancellor and Chairman of Council. At the external level, the university system is the control by the federal government through the National Universities Commission (NUC), a body charged with the coordination of university management in the country (Oraka, Ogbodo and Ezejiofor, 2017)
The main responsibility of NUC is to ensure the orderly development of university education in Nigeria, to maintain its high standard and to ensure its adequate funding by handling the process of accreditation of courses, approval of courses and programmes, maintenance of minimum academic standards, monitoring of universities, giving guidelines for setting up of universities, monitoring of private universities, prevention of the establishment of illegal campus and appropriate sanctions. The National University Commission (NUC) created in 1962 and reconstituted as a statutory body in 1974 is an autonomous agency under the Federal Ministry of Education (FME) (Uvah, 2005). NUC has evolved a robust scheme of international standards for the accreditation of programmes in the system. For the accreditation exercise, NUC developed the basic minimum academic standard (BMAS) for every undergraduate programme in the university system. The BMAS forms the basis of accreditation of programmes in the national university system (NUS). The result of programme-based accreditation exercise is in terms of a programme being found to be worthy of “full accreditation” or “Interim Accreditation” or the worst case, “Denied Accreditation”. The commitment of the university administration is towards ensuring that all programmes attract full accreditation or, where the deficiencies cannot be fully taken care of, an interim accreditation.
The preference for universities among the people led to the creation of the Joint Admissions and Matriculation Board (JAMB) by Act (No. 2 of 1978) of the Federal Military Government (Joint Admissions and Matriculation Board, 2004). The main aim was to place suitably qualified candidates into the existing tertiary institutions after taking into account the vacancies available in each tertiary institution. Placement was to be done on the basis of merit, catchment area, and with a special focus on females and the Educational Less Advantaged States (Abiodun-Oyebanji, 2011). The Joint Admissions and Matriculation Board (JAMB) place the suitably qualified candidates in different universities through the direct entry based on the Senior Secondary Certificate Examination (SSCE) or through the Unified Tertiary Matriculation Examinations (UTME). The minimum criteria for the UTME candidate is the SSCE with a minimum of five credits (including English and Mathematics) acquired at a maximum of two sittings or its equivalent such as Advanced Level Certificates (Iruonagbe et al., 2015).
In Ukraine, the government adopted a set of laws that provided a legal support for the higher education system. In 1996, the constitution that was enacted had the greatest steering power which helped to control the decision-making process of the state. It ensures equal access to education and rights to obtain free higher education (Verkhovna Rada, 1996). In the same year, Ukraine adopted ‘Law of Ukraine on Education’ and in 2002 adopted ‘Law on Higher Education.’ These laws built a legal foundation for the higher education in Ukraine and defined “the main directions of Ukrainian state policy for higher education” (Stepko, 2006). Since the establishment of the Soviet Union in 1922 and up to its collapse in 1991, Soviet Ukraine was part of the USSR (Kurbatov, 2014). The Soviet system of higher education inherited some of the essential features of its predecessor, the academic system of the Russian Empire. Meanwhile, the Russian and, later, the Soviet model of a university followed the French university model (Kurbatov, 2014).
The key responsibility of managing higher education in Soviet Ukraine was played by the Ministry of Higher Education of the Ukrainian Soviet Republic founded at the beginning
100
of 1955. The ministry controlled the teaching, methodological and scientific activities of 58 higher education institutions out of 134, which were located in Ukraine (Serhiychuk, 2002). The ministry was later in 1959 reorganised as the Ministry of Higher and Special Secondary Education of the UkrSSR, and operated as a central-republican institution of state management, which exerted control over teaching, upbringing, scientific and research activities of higher and special secondary education institution. However, the main activities including training and distribution of graduates of higher education institutions were under the control of the Central Committee of the Communist Party of the USSR and the officials in Moscow (Kurbatov, 2014).
The higher education in Ukraine is structured hierarchically or top-down where the Ministry of Education and Science (MESU) embodies the top. The MESU controls the licensing, accreditation, admissions process, issue of diplomas, and funding of the universities. In 2014 the Higher Education Law that was enacted although granted autonomy to institutions of higher education is merely a formality as during the time of emergency, universities expected clear directions and orders from the Ministry regarding their displacement, and most importantly they expected immediate legislative, social and financial support (Furiv, 2018). The establishment and operation of both public and private educational institutions are monitored by the Ministry of Education and Science and the competent local authorities as well as the State Inspection for Educational Institutions. The Ministry of Education and Science issues a formal decision when the compliance with the conditions for the establishment of a public or private institution are met and validated by the expert commission, after which the institution is recorded in the register of institutions.
The National Qualifications Framework of Ukraine (NQF) document was adopted by the Cabinet of Ministers of Ukraine on 23 Novembers 2011. NQF qualification’s levels define the integral and general basic competences (learning outcomes) such as knowledge, skills, communication, autonomy and accountability. The standards of higher education and educational programmes within the higher education system define the competencies and learning outcomes in reference to the levels and fields of education covered by the programmes. The National Qualifications Framework in Ukraine includes 10 levels- levels 1-8 are in line with the EQF for LLL whereas levels 0 and 9 are additional levels in line with national traditions.
The Law on Higher Education establishes correspondence between higher education levels and the qualifications levels of the National Qualifications Framework. The objective of establishing NQFU was to design identification, recognition, planning, and development of qualifications. The State Inspection for Educational Institutions is a body established by the Government with the aim of monitoring, ensuring the quality of educational activities and development of the educational institutions in the area of preschool, primary, secondary, vocational and higher education while the National Agency for Quality Assurance in Higher Education is responsible for ensuring the development, promotion and improvement of the quality of higher education. According to the Law on Higher Education the National Agency should be established by the Government for evaluating higher education and providing recommendations for the development of a Quality Assurance System (QA) in higher education (European Union, 2017). Nevertheless, higher education institutions are autonomous in the creation and content of their respective educational curricula. However, there are some general rules regarding the curricula prescribed by the Ministry of Education and Sciences and the National Agency for Quality Assurance in Higher Education. Some elements of the study programmes are broadly defined by the Law on Higher Education and the national regulations (e.g. the higher education standards, the regulation on academic mobility, the percentage of elective subjects). Unlike public universities that are fully dependent on government subsidies, private universities have the flexibility to embrace change and have a better business model to cope with the ever-increasing demand for HE education (Lembani, 2019).
101
4TH SINTO
K INTERN
ATION
AL CON
FERENCE O
N SO
CIAL SCIENCE AN
D M
ANAG
EMEN
T
Enrolments in Ukraine and Nigeria
In Nigeria, the federal universities are the oldest institutions and since the establishment of university of Ibadan in 1948 in Oyo State, the number of universities has been doubling every five years (Adesola, 1991). The number of universities in 1962 was four, then it increase to 12 in 1977 and 20 in 1983. The number of public and private universities in Nigeria as at December 2018 is total 162 licensed and approved by the federal government through the NUC comprising of 40 federal universities, 47 state universities and 75 private universities (Lembani, 2019). Student enrolment in the country has continue to rise from 325,299 in 1999/2000 academic session to 433, 821 in 2000/2001 academic session then to 1, 961,000 in 2018/2019. Given the number of universities compare to the population of 198, 000, 000 people in the country, it is clear that the population of people has outgrown the number of universities in the country (Okoroma, 2008).
Ukraine has a welldeveloped university educational system (Kurbatov, 2012). In 1991 when the country gained her independence, the number of students in Ukrainian higher educational institutions increased 2.5 times. In 2010 543.7 thousands people graduated from higher educational institutions and this is four times more, than in 1991 (Kurbatov, 2012). As at February 2011, the country has 854 higher educational institutions of the 1-4 level of accreditation, with more than 2,491,000 students (State Statistic Service of Ukraine, 2011). There are 144 private HEIs functioning under national legislation on higher education (European Union, 2017). Ukraine’s expenditure on education is around 6% of the GDP (CEDOS, 2015).
The Process and Approach of Studying in Ukraine and Nigeria
In Nigeria there full time and part-time studies. The full time students have their classes the whole day but the part-time students which comprises of distance learning student who have their lecture on weekends, long-vacation who have their lecture during the holidays in secondary and primary schools, and online distance learning student also have their lecture after working hours or days according to their time table. Student have only day-schedule study period and there are no night classes.
In Ukraine, there are full time and part-time students. The full-time students have classes the whole day while the part-time students including extra-mural students go to work and have classes according to the time-table. Student can choose between a day-schedule or evening study period. Meanwhile, the part-time students study for longer period than full-time students.
In Nigeria, lectures begin at 8:00 in the morning and end 18.00 pm in the evening for the full-time students during the week and the part-time student during the weekend or secondary and primary school holidays as the case may be. In the hostel based universities student can be in lecture room till night before the doors are closed.
In Ukraine the lessons begin at 8.30 in the morning and end at 14.00pm in the evening for students that have a day-schedule study period or from 14:00 in the evening till 19.00 in the night for students that have an evening period. Students can be at university till 20.00 in the night and then the doors are closed. After getting back home, students may continue studying.
In Nigeria university system, there are 2 semester with two vocational holidays (harmattan and rain). The students have classes only five days in a week and at the end of each semester there is only one examination
In Ukraine, there are 2 terms with 2 vocational holidays (winter and summer). The students have classes five days and sometimes six days in a week and at the end of each term there are several examinations (Oksana, 2014).
102
In Nigeria, because the university system was modelled after the British university system, the teaching language is mainly English. Another language that is seldom used especially in the one-year national youth service camp after graduation from a Bachelor degree programme in the Pidgin English. In Ukraine there was a tendency to use Russian as the main language of instruction since the educational system was inherited from Russia (Myronchuk and Igoshkin, 2002) as such the teaching languages are Ukrainian and Russian (Oksana, 2014). Although there also higher educational institution which offers admission to international students that uses English language in teaching
In Nigeria the success of students is evaluated on a continuous basis using a ratio of points obtained from continuous assessment (CA) covering class attendance and middle of the semester examination score and those earned from the exam as determined by the National University Commission (NUC) as an organ of the government. The students assessment scale as defined by NUC in their basic minimum academic standard (BMAS) for every undergraduate programme in the university system is expressed from grades 0 (failed) to 5 (excellent) or from 39 points minimum (failed) to 70 points maximum (excellent). Higher educational institutions are not allowed to establish other, non-numerical grading systems. Students are expected to reach a certain level in every subject. The lecturers are responsible for preparing the score sheet of the course allocated to them by the department while the course adviser for a particular level in the Bachelor degree programme cycle are expected to collate the score sheet of each course that was taken by each of the student and aggregate such from the first year to the end of the programme for student under them. The student can check their score for each course and their grade point average for each semester form the course adviser or from their portal on the school website. The student documents include student identity card, library card and health centre card and are also expected to use writing and study materials.
In Ukraine the success of students is evaluated on a continuous basis using a ratio of points obtained through the pre-examination obligations in terms of participation in class and attendance and those earned from the exam as determined in the study programme. The students assessment scale as defined by the higher educational institutions is expressed from grades 1 (failed) to 5 (excellent) or from 30 points minimum (failed) to 100 points maximum (excellent). Higher educational institutions may also establish other, non-numerical grading systems by relating the ratio of such marks to the one expressed through grades from 1 to 5. Students are expected to reach a certain level in every subject. The teachers are responsible for filling of the test books and the sheets. The Test books are student’ books, where teachers write marks of passing exams, subjects, hours, their names and signs and students are expected to keep these books until graduation as the marks from the test books will be in supplements of future diplomas. When a student scores below certain mark, he will not take the examinations. It is like passing automatically (Oksana, 2014). Other student documents are reading card, student card and dormitory card
Curriculum and Teaching Methods
In Nigeria, before the university is virtually free of government influence in the area of curriculum and teaching, as it is allowed to adopt its own curriculum and conduct its own examination but in recent time the BMAS imposed by the NUC is now the benchmark used by all universities in developing their curriculum and teaching. Also, government, from time to time, exerts some influence on the introduction of new teaching fields. It is not uncommon in Nigeria for the National Universities Commission (NUC) to advise universities to incorporate certain aspects of knowledge into the curriculum. Similarly, the general studies programme has been streamlined throughout the entire system, unlike before, when each university was doing it in its own way (Arikewuyo & Ilusanya, 2010)
In Ukraine, there are no specific rules for the first cycle studies regarding the teaching methods. The higher education teachers have to organize their lectures in line with the curriculum but the teaching methods are not prescribed as such the teachers are free to choose their own teaching methods in line with academic freedom. Teaching materials
103
4TH SINTO
K INTERN
ATION
AL CON
FERENCE O
N SO
CIAL SCIENCE AN
D M
ANAG
EMEN
T
such as books and audio-visual materials are commonly used in the teaching process and usually are provided to students free of charge. Students can move on to the next year of studies once they have completed their obligations in terms of obtaining the sufficient number of ECTS. It depends on the rules of the HEIs. The list of obligatory and optional courses is prescribed in the study programme. The student can pass a particular exam at any time from the moment the lectures related to it are finished, up to the start of the next year lectures. HEIs determine the conditions for students to retake exams, including the number of attempts to pass them (European Union, 2017).
Certification and Classes of Degree
In Nigeria, there are three levels of university education, At the first level, Bachelors’s degree are offered after a minimum of three years and a minimum of six year especially for a degree in medicine. The university second level stage offers a Master’s certification following a minimum of year academic calendar of post-Bachelor study. At the third level, Doctorate degree is offer after three to four years Master’s study. Meanwhile, to secure admission into the first level university education, one has to pass the competitive University Matriculation Examination (Akintoye, 2008). In addition to this, the candidate must have secure a minimum of five O-level credit in five subjects including English and Mathematics in the senior secondary school examination to be eligible for any course of study in the university. Another degree in Nigeria in between a Master’s and a Doctor’s degree is M.Phil for candidates who have a cumulative grade point average less than 4 point on a 5-point scale or 3 point on a 4-point scale. There is also post graduate diploma for candidates with third class or a pass Bachelor degree. The classes of degree in the country at the undergraduate level are First class for students with cumulative grade point average of 4.5 above on a 5-point scale, second class upper division for candidates that obtain between 3.5 and 4.49, second class lower division for candidate that secure between 2.4 and 3.49 point, third class division for candidates that obtain between 1.5 and 2.39 and a pass degree when the point is less than 1.5.
In Ukraine there are the first cycle, second cycle third circle and scientific level education. The initial level of education is for junior specialist certification (Ukr. Pochatkovyi) is the Short cycle. The first cycle studies offered a bachelor degree (Ukr. Pershyi) with a specific profile of an academic or professional training programme which is offered at all types of higher education institutions in Ukraine. A condition for entering a first-cycle study programme is the completion of 11-year compulsory secondary (incl. primary and secondary) school and obtains full general secondary education certificate (European Union, 2017). In the country, master studies (Ukr. Drugyi) can be organised by universities, academies and institutes excluding colleges. The duration of studies at this level is either one and a half or two years (90 or 120 ECTS). In order to enrol at a Master programme, students must have completed a Bachelor programme. To complete a Master study programme, the student has to write and defend a Master thesis at the end of his/her studies. The length of integrated studies in the fields of Veterinary Medicine and Health (studies of Medicine, Pharmacy) at Master level is either five or six years (300 or 360 ECTS). Master degrees correspond to the 7th qualification level of the National Qualifications Frameworks of Ukraine (European Union, 2017). The third cycle is for Doctoral degree. Doctoral studies (PhD) are organized at universities and last four years. To enrol in a doctoral degree (Ukr. Tretiy), the student must have completed a Master course. PhD programmes involve an educational component (30-60 ECTS), extensive scientific research activities and the publication of papers in scientific journals (European Union, 2017).
Scientific level of higher education responds to the 9th qualification level of the NQF. The duration of those scientific (postdoctoral) programmes is 2 years defined by a regulation of the cabinet of Ministries of Ukraine. Scientific programme leads to the higher education degree “Doctor of Science”, which is the second scientific degree (European Union, 2017). Another degree in Ukraine is “Candidate of Science” which is between a Master’s and a Doctor’s degree (Oksana, 2014). The students assessment scale as defined by the higher educational institutions is expressed from grades 1 (failed) to 5 (excellent) or from 30 points minimum (failed) to 100 points maximum (excellent). Higher educational
104
institutions may also establish other, non-numerical grading systems by relating the ratio of such marks to the one expressed through grades from 1 to 5. Students are expected to reach a certain level in every subject. The teachers are responsible for filling of the test books and the sheets. The Test books are student’ books, where teachers write marks of passing exams, subjects, hours, their names and signs and students are expected to keep these books until graduation as the marks from the test books will be in supplements of future diplomas. When a student scores below certain mark, he will not take the examinations. It is like passing automatically (Oksana, 2014). Other student documents are reading card, student card and dormitory card.
Duration of programmes
The duration of undergraduate studies in Nigerian universities is determined by the programme of study. For social sciences/humanities related courses the duration of study is four years, for engineering/technology related courses the duration is five years and law courses have five years duration, each with two semesters per one academic year calendar (UNESCO, 2012).
In Ukraine, Bachelor studies are organised at universities, academies, institutes and colleges, and can last either three or four years (180 or 240 ECTS) and after completion of this level of studies, the student receives a bachelor degree which corresponds to 6th qualification level of National Qualifications Framework of Ukraine.
Rules of Admission in Ukraine and Nigeria
In the area of student admission, government, from time to time, intervenes when it comes to procedures for admission and the quota for minority groups. The federal executive council on September 22, 2000 approved admission criteria of universities as follows: merit 45%, catchment area 35% and educationally disadvantaged states or minority groups 20% (Arikewuyo & Ilusanya, 2010). Merit in admission is determined by the scores in the University Matriculation Examination (UME) conducted by the Joint Admission and Matriculation Board (JAMB), Secondary school certificate examination (Okoroma, 2008). Each university also conduct post UME test in their selection of students for admission after securing a pass mark in the UME in order to reduce the enrolment figure to a manageable.
The post UME benchmark use for admission for the sciences ranges from one lecturer to between 15 and 30 students in the class and for the arts, 20 to 40 students per lecturer. Also, one senior administrative staff to 12 teachers, one senior technician staffs to 4 technical teachers are required for science based discipline. In addition to 1 (one) technical staff to every 20 teachers (arts based discipline) (Adewale, 2011). In Nigeria there were two categories of tutoring for the entrance examination: post graduate diploma programme where the score of the student after receiving lecture for a period of two years determine their admission into the second year of the bachelor degree programme with a better chances of being admitted since the management influence the process and post graduate degree programme where the student study for one year and after a qualifying exam successful candidates are admitted to the first year of the programme but the student have limited chances for admission compare to the diploma programme.
In Ukraine, access to higher education in Soviet time something prestigious and desirable as such candidates faced serious competition before enrolling at a higher education institution (Kurbatov, 2014). The rules of admission applicable throughout Soviet union are published annually to ensure a common ground in the admission process. The rule of admission determined the procedures for entrance examinations, the term of admission in connection with certain field and form of education (full time, evening or extral-mural). Privileges is given for certain categories of applicants, special requirements in the cases of a number of specialities (medical studies, for instance), and the necessary forms to be filled (Savelyev et al., 1990). Most institutions organize admission campaign in June and July usually. The ranking of the candidates depends on both the results of the Independent External Evaluation and the success in the previous level of education.
105
4TH SINTO
K INTERN
ATION
AL CON
FERENCE O
N SO
CIAL SCIENCE AN
D M
ANAG
EMEN
T
The number of admissions is individually determined by each higher education institution, but such a number may not exceed the one specified in the license. For the public higher education institutions the government defines the number of students to be enrolled in the first year of the study programmes and financed from the State budget (European Commission, 2017). All citizens of the Soviet Union who have completed secondary education have the right to apply for admission to higher education institutions. There were two practices of tutoring for the entrance examination: tutoring ‘with guarantee’ of admission is provided by the faculty of higher education institutions, who could influence the admission process, and was much more expensive while tutoring ‘without guarantee’ is usually provided by secondary school teachers and was some form of additional training without the ‘flavor of corruption’. Persons who worked at higher education institutions and who were connected in some way to the candidate’s family (relatives, friends, neighbors, etc.) played an important role during the admission process. This type of favor was called blat, and represented a widespread and popular phenomenon in Soviet Ukraine (Kurbatov, 2014). In Ukraine Higher education system the list of study and programme as approved by the Decree of the Cabinets of Ministers in April 2015 are 27 fields of study and 114 progrmme subject areas (European Union, 2017).
Structure of Teaching and Educational Staff in Ukraine and Nigeria
In Nigeria the initial education, conditions of service and professional development of academic staff is regulated by the national university commission. Generally, a PhD is required for those applying for academic staff positions, although persons with masters degree are encourage to apply as assistant lecture while student who finished bachelor degree of the university with a first class degree are consider for the position of graduate assistant lecturer. Research work and the publication of scientific papers are highly valued for students aiming to academic career.
In Ukraine the initial education, conditions of service and professional development of academic staff is regulated by the Law on Higher Education and, more specifically, by the higher education institution statutes and rules. Generally, a PhD or Doctor of Sciences degree (Doctor of Sciences degree corresponds to 9th qualification level of the National Qualifications Frameworks of Ukraine) is required for those applying for academic staff positions, although persons with lower degree levels may apply for some positions. Research work and the publication of scientific papers are highly valued for students aiming to academic career (European Union, 2017).
In Nigeria, academic staff of the university is the lecturers who also double as the researcher. There are several cadres within the university lecturing profession comprising of graduate assistant, assistant lecturer, lecturer II, lecturer I, senior lecturer, associate professor or reader and professor. The National university commission acting on behalf of the federal government determine the national salary scale for the academic and non-academic staff of the university through its salary structure (CONUASS) implemented in 2010. Aapproximate earnings of professor is between N4,508,349 and N6, 020,163 per annum, Reader earns between N3,091,221 and N4, 455,506 per annum, Senior lecture earns between N3, 091,505 and N4, 445,506 per annum, Lecturer earn as much as N2, 079,996 per annum and a Lecturer II earn up to N1, 979, 640 per annum.
In Ukraine, academic staff in higher education institutions includes university teachers and researchers. There are several levels of titles within the university teachers’ profession comprising of assistant lecturer, lecturer; associate professor; professor (European Commission, 2017). In Ukraine, the Cabinet of Ministers of Ukraine determines the salary levels in line with a national rate scale and establishes norms for the salary of academic staff in the framework of the Law on Higher Education. The Law on Higher Education adds top-up (additional payment to basic salary) for employees with academic titles and degrees: PhD: +15% of basic salary; Doctor of Science: +20% of basic salary; Associate professor: +25% of basic salary; Professor: +33% of the basic salary. Higher education institutions can propose higher salaries to academic staff funded from the Institution’s own revenues
106
DISCUSSION AND CONCLUSION
This study comparatively analyse the management systems in Ukrainian and Nigerian universities. The study specifically, assess the historical development of university system; explore the structure and administration of university system; examine the process and approach of studying; investigate the rules of admission; assess the level of infrastructure and facilities; and investigate the structure of teaching and educational staff in Ukraine and Nigeria. The investigation is imperative because the objective of making the university system of a nation globally acceptable and competitive to facilitate educational exchange and collaboration between among countries demand holistic appraisal of the top-performing university in the world and comparing this system with the nation university education to address the grey arrears. Moreover, there has not been any empirically that studies that compare the Nigeria university education system with the university system of other countries in the rest of the world. Even in Ukraine, apart from the study conducted by Oksana (2014) that compares the higher education systems between China and Ukraine, there is no other known study to the best of the authors’ knowledge that compare the university system in Ukraine with other countries in the world. This study is motivated to help us have a better understanding of each other’s educational process and improve the higher education.
It was evident from the study that the university management systems in both Ukraine and Nigeria have similar dimensions and several aspect divergences. Among the several similar features in the university management systems management include: their university system operated in resemblance of their predecessors that is the university system of their colonial master, both country attached high premium to university education, enrolment rate number of universities and admission seekers has been on the increase since the inception of university education in both countries, both countries have public and private owned universities with the more number of public owned universities, funding of public owned university in both countries is the responsibility of the state financed from the state budget while that of private owned institution is the responsibility of the owner financed from the state budget.
Furthermore, both countries have four major degree awarding institutions though their scope and operation differs from the two countries, the first level of higher education in both countries offer Bachelor degree certification, second level offer master degree certification while the third level offer Doctor of philosophy PhD certification, the condition for entering the first level of higher education in both countries is based on the completion of both primary and secondary school education, the condition to enrol for a Mater degree is the completion of Bachelor degree in both countries while the condition of entering a doctorate degree programme is the successful completion of the Masters programme and thesis defence, in both countries a PhD thesis is the final part of the doctoral study programme in addition to extensive research and publication, government exert influence on the university system but the control is limited to certain arrears in both countries, establishment of any university in both countries is backed up by law which dictates the function of the various organs of the university administration, in both countries government established agencies or ministry to oversee the affairs of higher education system, there full time and part-time studies in both countries, in both countries there are 2 semester with two vocational holidays in one year academic calendar, in both countries the success of students is evaluated on a continuous basis and a PhD is required for those applying for academic staff positions, although persons with lower degree may apply for some positions in both countries.
Among the several areas of departure in the two universities system includes: the population of people in Nigeria is well above that of Ukraine but the size of Ukraine GDP is more than that of Nigeria, the university system operated in Nigeria is in resemblance of the British university system while the Ukraine university system follows after the Russia and the French model its predecessors, while Nigeria gained her independence as far back as 1960, Ukraine gained her independence from the Soviet union lately in 1991, English is the official language in Nigeria while Ukrainian is the official language Ukraine,
107
4TH SINTO
K INTERN
ATION
AL CON
FERENCE O
N SO
CIAL SCIENCE AN
D M
ANAG
EMEN
T
in Nigeria university, the language use is English while both Russian and Ukrainian are used in the university system of Ukraine, the oldest university in Nigeria is the university of Ibadan founded in 1948 while the oldest university in the territory of the contemporary Ukraine was Lviv University established in 1661. Although both countries have public and private owned universities with more number of public owned universities, public university in Nigeria is grouped into state and federal government owned institutions. As at 2018 there are over 800 higher degree awarding institutions while there are only 170 universities in Nigeria, the global ranking of world university has consistently rank university education very low without any university making it to the list of first 1000 university in Nigeria while Ukraine is ranked 321 among the 12,000 world universities. Though both countries have four major degree awarding institutions a peculiar feature in the Ukraine higher educational system is that the two other type educational institutions aside the university (i.e Academies, Institutes) are also permitted by law to offer Bachelor’s and Master’s degree, even the Colleges are permitted to offer Bachelor’s degree which is a complete departure from the tertiary education model in Nigeria where other tertiary education institutions (i.e Polytechnics, Colleges and Monotechnics) offer degree below Bachelor degree and are not allowed to provide Bachelor and masters awarding degree except in affiliation with a university.
The study established several areas of similarities and differences in the university management system in the two countries while acknowledging that the higher educational system in Ukraine is advance in the number, output and quality of university education well above the university education system in Nigeria. One salient feature in the Ukraine higher educational system is that apart from the university other higher educational institutions in Ukraine are by law permitted to run both bachelor and masters degree awarding programmes while in Nigeria it is only the university that is permitted to run bachelor and masters degree awarding programmes though polytechnic and colleges of education can run bachelor programme but it must be in affiliation with a university institution.
REFERENCES
Abiodun-Oyebanji, O. (2011). Towards effective management of private university education in Nigeria. Journal of Emerging Trends in Educational Research and Policy Studies, 2(6), 526-530
Adewale, T. M. (2011). Determinants of carrying capacity of academic programmes in federal Universities in Nigeria (Unpublished doctoral dissertation). University of Ibada.
Afolayan, F. O. (2015). Funding higher education in Nigeria, Journal of Research & Method in Education. 5(1), 63-68. https://doi.org/10.9790/7388-05116368
Ajadi, T.O. (2010). Private universities in Nigeria-the challenges ahead, American Journal of Scientific Research Issue, 7(2010), 15-24
Arikewuyo, M. O. & Ilusanya, G. (2010). University autonomy in a third-generation university in Nigeria. Tertiary Education and Management, 16(2), 81-98. https://doi.org/ 10.1080/13583881003756468
Arikewuyo, M. O. (2014). University management and staff unions in Nigeria: Issues and challenges. SA-eDUC Journal, 3(1), 15-22.
Baridam, D. M., & Don-Baridam, L. (2020). University administration and the challenges of brain drain in Nigeria. Journal of Business and Management, 22(4), 57-65. https://doi.org/10.9790/487X-2204015765
Daramola, A. G., & Amos, T. T. (2016). Management and leadership in Nigerian universities. FUTA Journal of Management and Technology Management and Leadership in Universities Maiden Edition, 1(1), 1-16.
European Union, (2017). Overview of the higher education system. http://eacea.ec.europa.eu/education/eurydice/index_en.php
Ezenyilimba, E. (2015). The challenges of tertiary management education and strategic learning panacea in Nigeria, International Journal of Academic Research in Business and Social Sciences, 5(6). https://doi.org/10.6007/IJARBSS/v5-i6/1650
Furiv, U. (2018). Ukrainian higher education during armed conflict. Perspectives of crisis
108
management. University of Tampere, Faculty of Management, Higher Education Group (HEG)
Ibijola, E. Y. (2015). Regulatory roles of the National Universities Commission and the quality of Nigerian university education. International Journal of Education and Practice, 3(2), 104-114. https://doi.org/10.18488/journal.61/2015.3.2/61.2.104.113
Kurbatov, S. (2011). University rankings as tool for reformation of university education in Ukraine. Proceedings of ICERI2011 Conference.
Kurbatov, S. (2014). Before massification: Access to university education in Ukraine in 1950s-1980s. International Review of Social Research, 4(2), 75-86.
Lembani, R.L. (2019). Country report on Nigeria university education. University of South Africa, National Research Foundation, international Distance Education and African Students.
Lunyachek, V. (2011). Problems of the education system development of Ukraine in times of crisis, Public Policy and Administration, 10(1), 67-78.
Luzik, E., Khomenko-Semenova, L., Kokareva, A. & Hurska, O. (ed.). University education innovative models in Ukraine: Foreign experience, UDK 378.091:005.591
Ogbogu, C. O. (2013). Policy Issues in the Administration of Higher Education in Nigeria, World Journal of Education, 3(1), 32-38. https://doi.org/10.5430/wje.v3n1p32
Okoroma, N. S. (2008). Admission policies and the quality of university education in Nigeria. Educational Research Quarterly, 31(3), 1-12.
Oksana, S. (2014). A comparison of higher education system between China and Ukraine (Porównanie systemu szkolnictwa wyższego w Chinachina Ukrainie). Kultura – Społeczeństwo – Edukacja nr, 2(6), 9-22.
Oraka, A. O., Ogbodo, C. Y. & Ezejiofor, R. A. (2017). Effect of tertiary education tax fund (Tatfund) in management of Nigerian tertiary institutions. Not Peer-Reviewed
Tawari, S. A., & Koko, M. (1996). Student enrolment and educational expenditure in university education: An examination of trends in Nigeria (1980-1990). International Journal of Educational Development, 16(1), 79-87.
109
4TH SINTO
K INTERN
ATION
AL CON
FERENCE O
N SO
CIAL SCIENCE AN
D M
ANAG
EMEN
T
SICONSEM2021: 027-012
THE PERCEPTION, BEHAVIOURS AND ACCEPTANCE OF COVID-19 VACCINEAMONG MALAY SENIOR CITIZENS: A QUALITATIVE STUDY
1Ismail Sualman & 2Suffian Hadi Ayub1&2Universiti Teknologi Mara, Shah Alam, Malaysia
Corresponding author: [email protected]
ABSTRACT
Despite concerted efforts taken since the launched of immunization campaign for Malaysians, the country still wary of individuals who consistently disputing the validity and legality of the vaccine. Further to that, there are also Malaysia citizens who do not believe in the effectiveness of the vaccine which lead to refusal in receiving it voluntarily. The study aimed to (i) to explore the understanding of the Malay senior citizens on health communication campaigns related to the COVID-19 vaccination programmes, (ii) to review the sources of information used by the senior citizens in obtaining information related to the vaccine and COVID-19, and (iii) to explore the behaviours of the senior citizens and their acceptance of the COVID-19 vaccine. The study involved eight Malay senior citizens within the range age group of 55-65 years. In order to seek diverse insights on the information seeking behaviour and the preferred sources, the study focused on the influence of cultural, religious diversity and the implementation of health communication campaigns by the government on the effectiveness of the COVID-19 vaccine. Further, the study also explored the level of understanding and perception on the effectiveness of COVID-19 vaccine among senior citizens. Qualitative methodology was applied using focus group discussion in the data collection, and NVIVO software was used for analysis. The study found hesitancy on the vaccine resulting from the unsure sources of information. Senior citizens from Malay community were very concerned on receiving the vaccine. Additionally, the result indicated that the national immunisation campaign is less effective especially to those who resides in rural areas. The majority of the participants obtained information sources related to vaccines and covid-19 through social media compared to mainstream media. Inasmuch the overseas media provided more authentic information than the local media, it was equally significant that the informants also found the information by the National Security Council (MKN) and the Ministry of Health Malaysia (MOH) to be authentic and were always referred to.
Keywords: Health communication, vaccine, senior citizens, rural areas.
INTRODUCTION
A vaccine is produced from part or all of the structure of a virus or bacteria that has been turned off or weakened, or from a subunit protein in a virus. Antigens in vaccines serve to stimulate the immune system of infection (immunity system) of the body forming immunity against specific disease infections. According to Kementerian Kesihatan Malaysia (the Ministry of Health Malaysia 2021), vaccines help the immune system by training these antibodies to identify certain germs so that the immune system is adequately prepared when the real germs strike into human body. Vaccines are prescribed to help stimulate the body’s natural endurance system in reducing the risk of developing germs/ virus infections where it generally categorized into a number of types such as viral vector vaccine, inactivated virus vaccine, nucleic acid, live-attenuated virus vaccine, protein subunit vaccine, and toxoid vaccine. A vaccination is a simple procedure where it is safe and highly effective way to protect individuals from infectious diseases. In fact, it makes the immune system stronger and do not cause infection because it contain disinfectants/ viruses that are turned off or weakened.
11

110
A survey on social media sentiment on COVID-19 vaccines by the Health Education division (FMB) of MOH found that out of 67% of respondents who received COVID-19 Vaccine in 95.7% felt safe to use vaccine and a positive 89.6% further believed that vaccines are effective in preventing infection. Meanwhile, 67.4% of the respondents confident that the substance in the vaccine. The study also reported that total of 83.3% agreed to take the vaccine and to that extent, 61.8% agreed to take the vaccine even if they have to pay for cost of the vaccine (Kementerian Kesihatan Malaysia, 2021). The findings of the study illustrated the confidence that Malaysians have on the vaccination programmes which could be positively attributed to the success of consistent awareness campaign on the importance of vaccines to society in combatting the COVID-19 pandemic.
Hitherto to acceptance rate of vaccine in Malaysia has shown tremendous progress that it is one of the leading countries in the world compared to the global vaccine acceptance rate in general. This augur well when correspond with the theory of diffusion of innovation (Rogers, 1976) which stipulates five types of categories of recipients pertaining to innovation encompassing the ‘innovators, early adopters, early majority, late majority and laggards’. Therefore, when dealing with the inception of innovation and product as important as vaccine, it is empirical that the government and its ministries educate its citizen using consistent health communication campaign. The mapping of the campaign should allow in the formulation of effective communication strategy that map the plan to address the acceptance and rejection of vaccine among people. This awareness campaign should cognitively create a profound apprehension to the receiver of the message that it create a ripple effect to allow for the entire community understanding of the importance of vaccine.
In relation to that, the formulation of constructive communication strategy must also provide sufficient information on vaccines in order to effectively maintain the perception on its acceptance that pave the way for behavioural changes among the anti-vaccines and those who are not convinced. This augur with the significance of seeking the relevant and correct information pertaining to vaccine that is highly relevant in today’s pandemic situation especially when it is abundant and readily available on social media. Sorensen, et al., (2012) added this is where the health literacy components contribute to both sender (health communication campaign) and the receiver (individuals) inasmuch the involvement of the process beginning from the searching of information, understanding the information, evaluating and finally exercising the said health information.
Problem Statement
The role of health communication in determining an individual’s health status is largely determined by the individual’s physical activity behaviour, diet and lifestyle. Since most diseases stem from human lifestyle practices, then health communication has a big role to convey a variety of information so that individuals can practice a healthy lifestyle and in turn have a good level of health (Lapinski MK, Rimal, 2005). According to Rimal (2003) the first step of health care and disease prevention is through the input of information that will trigger knowledge to bring about changes in attitudes and lifestyles of individuals. Meanwhile a study by Parrot (2004) found that health communication has an important role to assist in the process of information transfer from health authorities to the general public.
Although health communication campaigns have conveyed much information about the importance of health care, the expected changes in health behaviors are too small (Witte , 2009; Snyder et al., 2004). Not all information conveyed by health communication campaigns is accepted by the public and used to change health practices. A study by (Su., 2020) related to “A race for a better understanding of COVID-19 vaccine non-adopters” has underscored the need for a deeper understanding of the subtle differences between vaccine users. Because the availability of a vaccine does not translate into its de facto use; a phenomenon that may be more pronounced in “Operation Warp Speed”- it is thereby important for public health professionals to fully understand their “customers” (i.e., end users of COVID-19 Vaccine) to ensure satisfactory vaccination rates and to protect society

111
4TH SINTO
K INTERN
ATION
AL CON
FERENCE O
N SO
CIAL SCIENCE AN
D M
ANAG
EMEN
T
at large. “Operation Warp Speed” refers specifically to the American COVID-19 vaccine program, i.e. speed has been the focus (Foo et al, 2020) for most programs since the COVID-19 vaccine was first approved.
Although Malaysia has launched an immunization campaign for Malaysians, there are still some who try to dispute the validity and legality of the vaccine (Ismail Sualman, 2021). In addition, there are also Malaysians who do not believe in the effectiveness of the vaccine and are afraid to take it voluntarily. The information channeled to them is disputed for its authenticity and is said to have been manipulated by the source by the local media (Ismail Sualman & Salmi Othman, 2021). In addition, MOH also issued a warning that any party who does not agree with the COVID-19 vaccine injection not to run a campaign to reject the injection.
While the country is almost certain to be fulfilling the mission of 90% vaccine acceptance for the second dose to curb the spread of the pandemic, these ‘voices’ seem to dispute the government’s actions even though it is seen as the best step in this challenging global situation. Among the reasons frequently thrown and repeated by anti-vaccination groups especially on social media sites are substances used when vaccine production is taken from illegal elements for Muslims such as pig DNA, WHO malicious conspiracy to reduce and control the world population, as well as Bill Gates’ billionaire plan to succeed ‘Pandemic’ (Ismail Sualman, 2020).
The heavy claims made by this group create uneasiness and weary the public, especially Muslims since Islam forbids its ummah from using illegal substances. Studies have also indicated that there are still many civilians, especially the Muslims in Malaysia are still unaware of the existence of the Fiqh Islami method specifically related to the issue of purification of substances in vaccines known as Istihalah and Istihlak. In fact, a study by . The study found that the majority of participants obtained information sources related to vaccines and Covid-19 through social media compared to the major mass media such as television, radio or newspapers. Malaysian women are very concerned about their families and decision to receive the Covid-19 vaccine can pose a dilemma to them (Ismail Sualman & Salmi Othman, 2021).
On the reasons for people receiving vaccines were primarily due to increase protection with the belief that prevention is better than cure. This finding signalled that the health communication campaign on vaccination by the government has actually create awareness and educate the people. Among other vital findings of the survey also indicated that the people would like to reduce complication from the COVID-19, assisting the country in achieving her immunity, to return to old norm, protecting the high-risk group such as the elderly, decree by the religious authority on the obligation to vaccine, social responsibility, most importantly the people are able to make uniform decision due to the availability of the information on media about vaccination.
Objectives of the Study
The objectives of the study are toi. exploring Malay senior citizen’s understanding of covid-19 vaccine-related health
communication campaignsii. review the sources of information used by Malay senior citizen to obtain information
related to the covid-19 vaccineiii. identify Malay senior citizen’ acceptance of the covid-19 vaccine
METHODOLOGY
This study employs the selection of samples by purposeful sampling and is assisted by criterion-based selection, as well as implementing it by theoretical sampling. In this study, the sample was chosen deliberately because it has characteristics that can allow researchers to obtain a lot of information, detail and in-depth understanding of the problems and
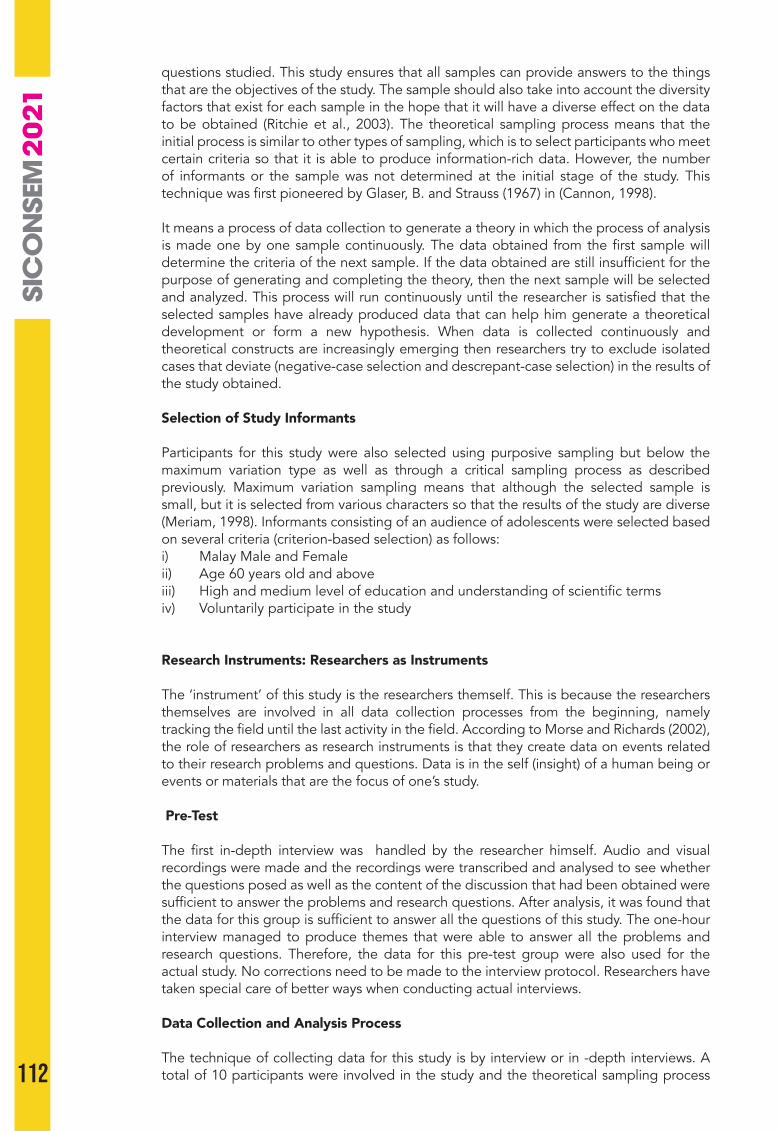
112
questions studied. This study ensures that all samples can provide answers to the things that are the objectives of the study. The sample should also take into account the diversity factors that exist for each sample in the hope that it will have a diverse effect on the data to be obtained (Ritchie et al., 2003). The theoretical sampling process means that the initial process is similar to other types of sampling, which is to select participants who meet certain criteria so that it is able to produce information-rich data. However, the number of informants or the sample was not determined at the initial stage of the study. This technique was first pioneered by Glaser, B. and Strauss (1967) in (Cannon, 1998).
It means a process of data collection to generate a theory in which the process of analysis is made one by one sample continuously. The data obtained from the first sample will determine the criteria of the next sample. If the data obtained are still insufficient for the purpose of generating and completing the theory, then the next sample will be selected and analyzed. This process will run continuously until the researcher is satisfied that the selected samples have already produced data that can help him generate a theoretical development or form a new hypothesis. When data is collected continuously and theoretical constructs are increasingly emerging then researchers try to exclude isolated cases that deviate (negative-case selection and descrepant-case selection) in the results of the study obtained.
Selection of Study Informants
Participants for this study were also selected using purposive sampling but below the maximum variation type as well as through a critical sampling process as described previously. Maximum variation sampling means that although the selected sample is small, but it is selected from various characters so that the results of the study are diverse (Meriam, 1998). Informants consisting of an audience of adolescents were selected based on several criteria (criterion-based selection) as follows:i) Malay Male and Female ii) Age 60 years old and aboveiii) High and medium level of education and understanding of scientific termsiv) Voluntarily participate in the study
Research Instruments: Researchers as Instruments
The ‘instrument’ of this study is the researchers themself. This is because the researchers themselves are involved in all data collection processes from the beginning, namely tracking the field until the last activity in the field. According to Morse and Richards (2002), the role of researchers as research instruments is that they create data on events related to their research problems and questions. Data is in the self (insight) of a human being or events or materials that are the focus of one’s study.
Pre-Test
The first in-depth interview was handled by the researcher himself. Audio and visual recordings were made and the recordings were transcribed and analysed to see whether the questions posed as well as the content of the discussion that had been obtained were sufficient to answer the problems and research questions. After analysis, it was found that the data for this group is sufficient to answer all the questions of this study. The one-hour interview managed to produce themes that were able to answer all the problems and research questions. Therefore, the data for this pre-test group were also used for the actual study. No corrections need to be made to the interview protocol. Researchers have taken special care of better ways when conducting actual interviews.
Data Collection and Analysis Process
The technique of collecting data for this study is by interview or in -depth interviews. A total of 10 participants were involved in the study and the theoretical sampling process
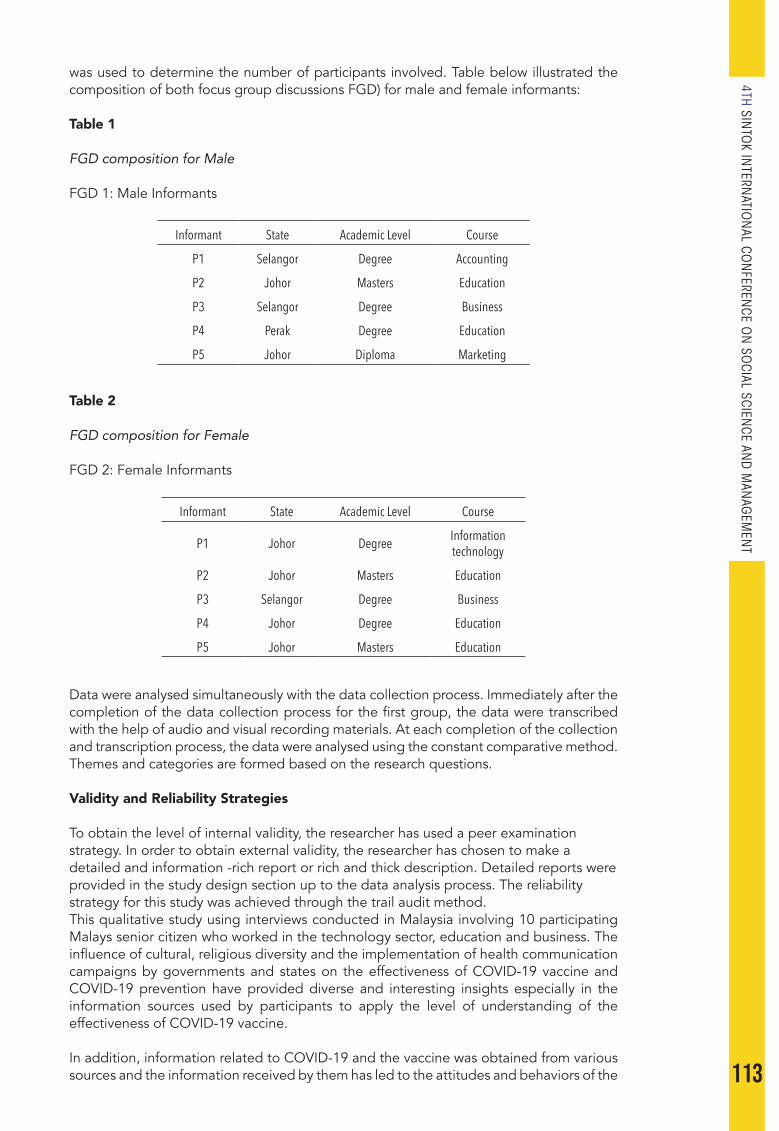
113
4TH SINTO
K INTERN
ATION
AL CON
FERENCE O
N SO
CIAL SCIENCE AN
D M
ANAG
EMEN
T
was used to determine the number of participants involved. Table below illustrated the composition of both focus group discussions FGD) for male and female informants:
Table 1
FGD composition for Male
FGD 1: Male Informants
Informant State Academic Level Course
P1 Selangor Degree Accounting
P2 Johor Masters Education
P3 Selangor Degree Business
P4 Perak Degree Education
P5 Johor Diploma Marketing
Table 2
FGD composition for Female
FGD 2: Female Informants
Informant State Academic Level Course
P1 Johor Degree Information technology
P2 Johor Masters Education
P3 Selangor Degree Business
P4 Johor Degree Education
P5 Johor Masters Education
Data were analysed simultaneously with the data collection process. Immediately after the completion of the data collection process for the first group, the data were transcribed with the help of audio and visual recording materials. At each completion of the collection and transcription process, the data were analysed using the constant comparative method. Themes and categories are formed based on the research questions.
Validity and Reliability Strategies
To obtain the level of internal validity, the researcher has used a peer examination strategy. In order to obtain external validity, the researcher has chosen to make a detailed and information -rich report or rich and thick description. Detailed reports were provided in the study design section up to the data analysis process. The reliability strategy for this study was achieved through the trail audit method.This qualitative study using interviews conducted in Malaysia involving 10 participating Malays senior citizen who worked in the technology sector, education and business. The influence of cultural, religious diversity and the implementation of health communication campaigns by governments and states on the effectiveness of COVID-19 vaccine and COVID-19 prevention have provided diverse and interesting insights especially in the information sources used by participants to apply the level of understanding of the effectiveness of COVID-19 vaccine.
In addition, information related to COVID-19 and the vaccine was obtained from various sources and the information received by them has led to the attitudes and behaviors of the
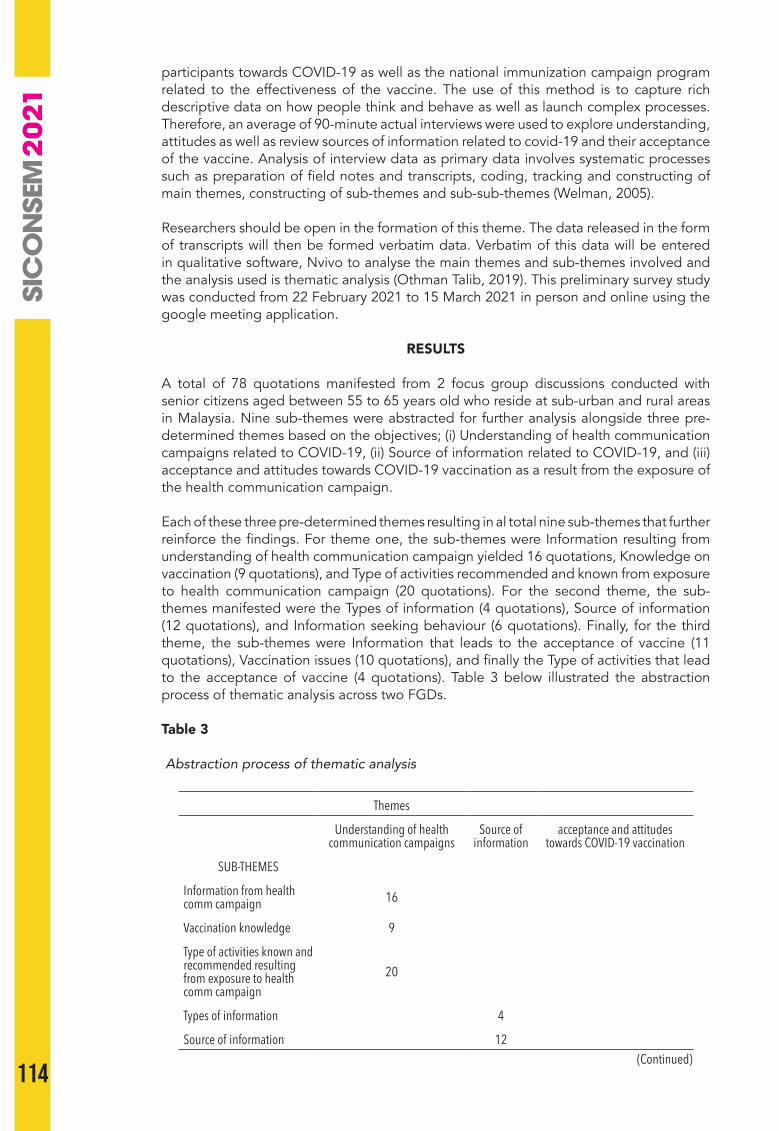
114
participants towards COVID-19 as well as the national immunization campaign program related to the effectiveness of the vaccine. The use of this method is to capture rich descriptive data on how people think and behave as well as launch complex processes. Therefore, an average of 90-minute actual interviews were used to explore understanding, attitudes as well as review sources of information related to covid-19 and their acceptance of the vaccine. Analysis of interview data as primary data involves systematic processes such as preparation of field notes and transcripts, coding, tracking and constructing of main themes, constructing of sub-themes and sub-sub-themes (Welman, 2005).
Researchers should be open in the formation of this theme. The data released in the form of transcripts will then be formed verbatim data. Verbatim of this data will be entered in qualitative software, Nvivo to analyse the main themes and sub-themes involved and the analysis used is thematic analysis (Othman Talib, 2019). This preliminary survey study was conducted from 22 February 2021 to 15 March 2021 in person and online using the google meeting application.
RESULTS
A total of 78 quotations manifested from 2 focus group discussions conducted with senior citizens aged between 55 to 65 years old who reside at sub-urban and rural areas in Malaysia. Nine sub-themes were abstracted for further analysis alongside three pre-determined themes based on the objectives; (i) Understanding of health communication campaigns related to COVID-19, (ii) Source of information related to COVID-19, and (iii) acceptance and attitudes towards COVID-19 vaccination as a result from the exposure of the health communication campaign.
Each of these three pre-determined themes resulting in al total nine sub-themes that further reinforce the findings. For theme one, the sub-themes were Information resulting from understanding of health communication campaign yielded 16 quotations, Knowledge on vaccination (9 quotations), and Type of activities recommended and known from exposure to health communication campaign (20 quotations). For the second theme, the sub-themes manifested were the Types of information (4 quotations), Source of information (12 quotations), and Information seeking behaviour (6 quotations). Finally, for the third theme, the sub-themes were Information that leads to the acceptance of vaccine (11 quotations), Vaccination issues (10 quotations), and finally the Type of activities that lead to the acceptance of vaccine (4 quotations). Table 3 below illustrated the abstraction process of thematic analysis across two FGDs.
Table 3
Abstraction process of thematic analysis
Themes
Understanding of health communication campaigns
Source of information
acceptance and attitudes towards COVID-19 vaccination
SUB-THEMES
Information from health comm campaign 16
Vaccination knowledge 9
Type of activities known and recommended resulting from exposure to health comm campaign
20
Types of information 4
Source of information 12(Continued)
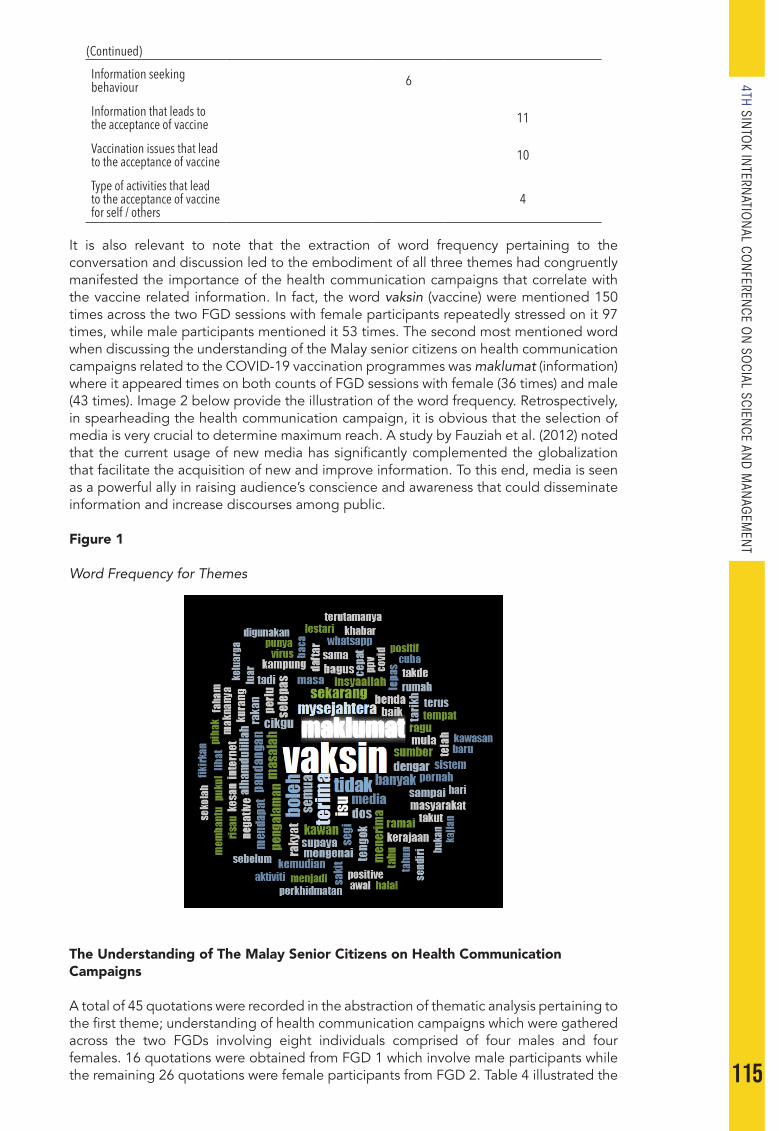
115
4TH SINTO
K INTERN
ATION
AL CON
FERENCE O
N SO
CIAL SCIENCE AN
D M
ANAG
EMEN
T
Information seeking behaviour 6
Information that leads to the acceptance of vaccine 11
Vaccination issues that lead to the acceptance of vaccine 10
Type of activities that lead to the acceptance of vaccine for self / others
4
It is also relevant to note that the extraction of word frequency pertaining to the conversation and discussion led to the embodiment of all three themes had congruently manifested the importance of the health communication campaigns that correlate with the vaccine related information. In fact, the word vaksin (vaccine) were mentioned 150 times across the two FGD sessions with female participants repeatedly stressed on it 97 times, while male participants mentioned it 53 times. The second most mentioned word when discussing the understanding of the Malay senior citizens on health communication campaigns related to the COVID-19 vaccination programmes was maklumat (information) where it appeared times on both counts of FGD sessions with female (36 times) and male (43 times). Image 2 below provide the illustration of the word frequency. Retrospectively, in spearheading the health communication campaign, it is obvious that the selection of media is very crucial to determine maximum reach. A study by Fauziah et al. (2012) noted that the current usage of new media has significantly complemented the globalization that facilitate the acquisition of new and improve information. To this end, media is seen as a powerful ally in raising audience’s conscience and awareness that could disseminate information and increase discourses among public.
Figure 1
Word Frequency for Themes
The Understanding of The Malay Senior Citizens on Health Communication Campaigns
A total of 45 quotations were recorded in the abstraction of thematic analysis pertaining to the first theme; understanding of health communication campaigns which were gathered across the two FGDs involving eight individuals comprised of four males and four females. 16 quotations were obtained from FGD 1 which involve male participants while the remaining 26 quotations were female participants from FGD 2. Table 4 illustrated the
(Continued)
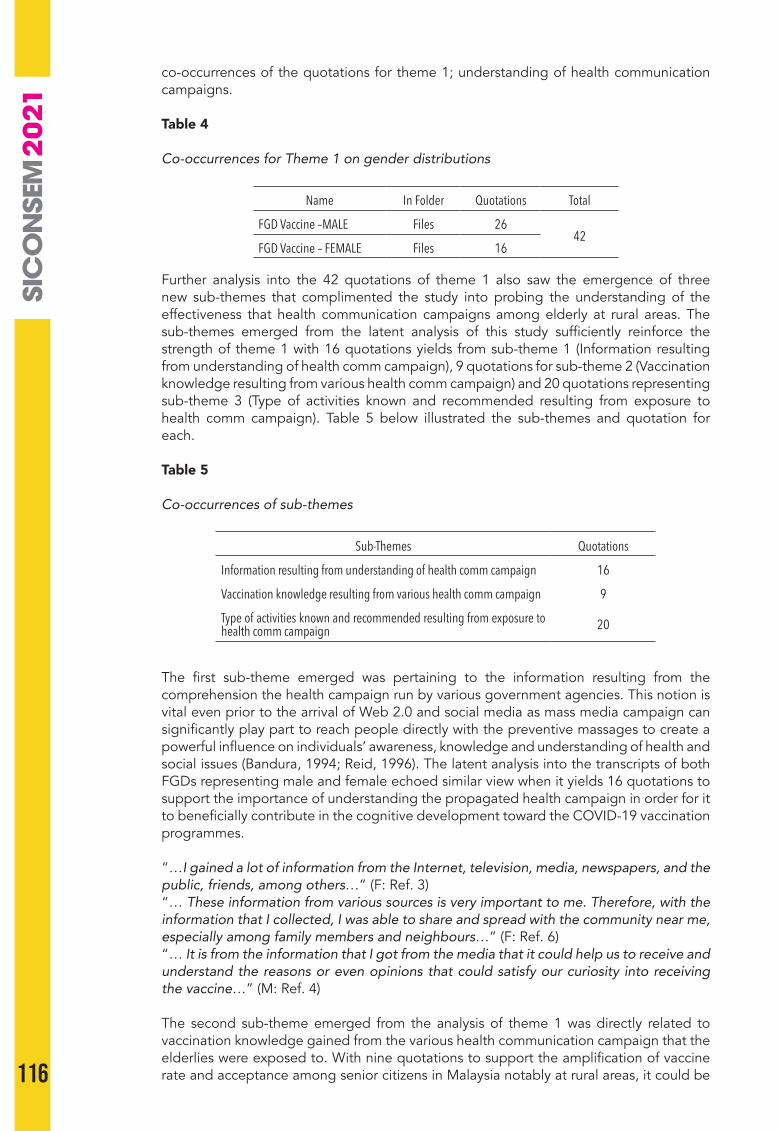
116
co-occurrences of the quotations for theme 1; understanding of health communication campaigns.
Table 4
Co-occurrences for Theme 1 on gender distributions
Name In Folder Quotations Total
FGD Vaccine –MALE Files 2642
FGD Vaccine – FEMALE Files 16
Further analysis into the 42 quotations of theme 1 also saw the emergence of three new sub-themes that complimented the study into probing the understanding of the effectiveness that health communication campaigns among elderly at rural areas. The sub-themes emerged from the latent analysis of this study sufficiently reinforce the strength of theme 1 with 16 quotations yields from sub-theme 1 (Information resulting from understanding of health comm campaign), 9 quotations for sub-theme 2 (Vaccination knowledge resulting from various health comm campaign) and 20 quotations representing sub-theme 3 (Type of activities known and recommended resulting from exposure to health comm campaign). Table 5 below illustrated the sub-themes and quotation for each.
Table 5
Co-occurrences of sub-themes
Sub-Themes Quotations
Information resulting from understanding of health comm campaign 16
Vaccination knowledge resulting from various health comm campaign 9
Type of activities known and recommended resulting from exposure to health comm campaign 20
The first sub-theme emerged was pertaining to the information resulting from the comprehension the health campaign run by various government agencies. This notion is vital even prior to the arrival of Web 2.0 and social media as mass media campaign can significantly play part to reach people directly with the preventive massages to create a powerful influence on individuals’ awareness, knowledge and understanding of health and social issues (Bandura, 1994; Reid, 1996). The latent analysis into the transcripts of both FGDs representing male and female echoed similar view when it yields 16 quotations to support the importance of understanding the propagated health campaign in order for it to beneficially contribute in the cognitive development toward the COVID-19 vaccination programmes.
“…I gained a lot of information from the Internet, television, media, newspapers, and the public, friends, among others…” (F: Ref. 3)“… These information from various sources is very important to me. Therefore, with the information that I collected, I was able to share and spread with the community near me, especially among family members and neighbours…” (F: Ref. 6)“… It is from the information that I got from the media that it could help us to receive and understand the reasons or even opinions that could satisfy our curiosity into receiving the vaccine…” (M: Ref. 4) The second sub-theme emerged from the analysis of theme 1 was directly related to vaccination knowledge gained from the various health communication campaign that the elderlies were exposed to. With nine quotations to support the amplification of vaccine rate and acceptance among senior citizens in Malaysia notably at rural areas, it could be
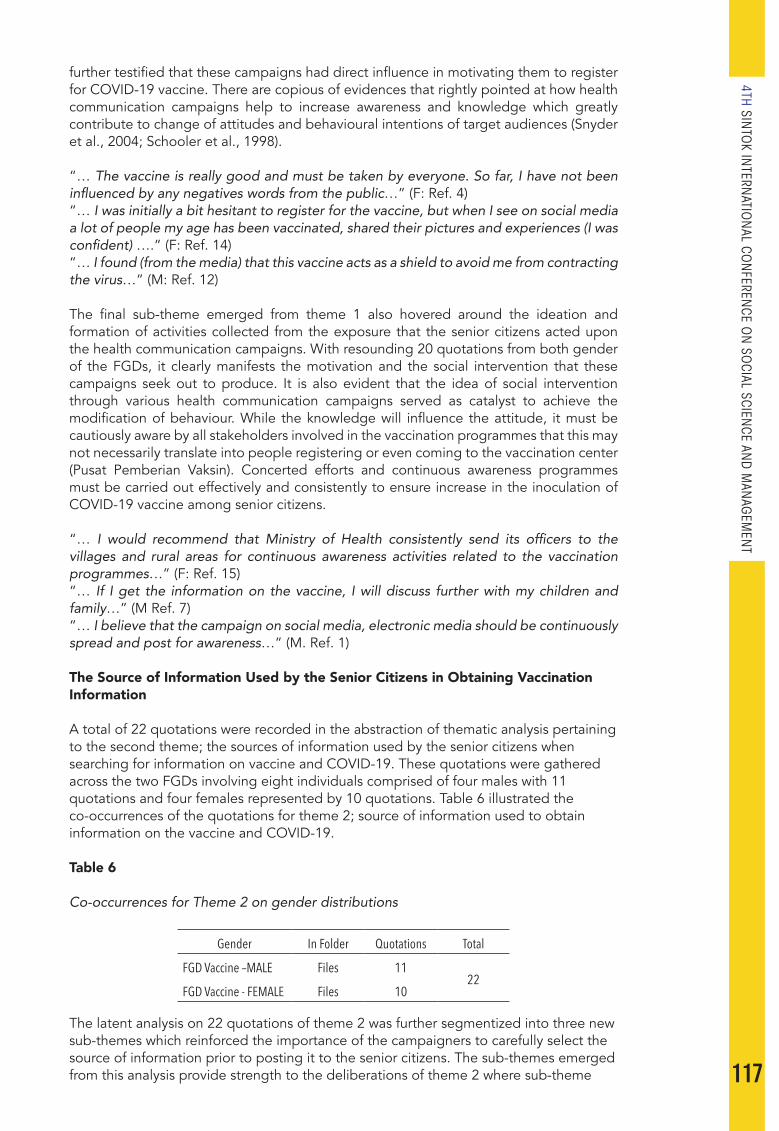
117
4TH SINTO
K INTERN
ATION
AL CON
FERENCE O
N SO
CIAL SCIENCE AN
D M
ANAG
EMEN
T
further testified that these campaigns had direct influence in motivating them to register for COVID-19 vaccine. There are copious of evidences that rightly pointed at how health communication campaigns help to increase awareness and knowledge which greatly contribute to change of attitudes and behavioural intentions of target audiences (Snyder et al., 2004; Schooler et al., 1998).
“… The vaccine is really good and must be taken by everyone. So far, I have not been influenced by any negatives words from the public…” (F: Ref. 4)“… I was initially a bit hesitant to register for the vaccine, but when I see on social media a lot of people my age has been vaccinated, shared their pictures and experiences (I was confident) ….” (F: Ref. 14)“… I found (from the media) that this vaccine acts as a shield to avoid me from contracting the virus…” (M: Ref. 12) The final sub-theme emerged from theme 1 also hovered around the ideation and formation of activities collected from the exposure that the senior citizens acted upon the health communication campaigns. With resounding 20 quotations from both gender of the FGDs, it clearly manifests the motivation and the social intervention that these campaigns seek out to produce. It is also evident that the idea of social intervention through various health communication campaigns served as catalyst to achieve the modification of behaviour. While the knowledge will influence the attitude, it must be cautiously aware by all stakeholders involved in the vaccination programmes that this may not necessarily translate into people registering or even coming to the vaccination center (Pusat Pemberian Vaksin). Concerted efforts and continuous awareness programmes must be carried out effectively and consistently to ensure increase in the inoculation of COVID-19 vaccine among senior citizens.
“… I would recommend that Ministry of Health consistently send its officers to the villages and rural areas for continuous awareness activities related to the vaccination programmes…” (F: Ref. 15)“… If I get the information on the vaccine, I will discuss further with my children and family…” (M Ref. 7)“… I believe that the campaign on social media, electronic media should be continuously spread and post for awareness…” (M. Ref. 1)
The Source of Information Used by the Senior Citizens in Obtaining Vaccination Information A total of 22 quotations were recorded in the abstraction of thematic analysis pertaining to the second theme; the sources of information used by the senior citizens when searching for information on vaccine and COVID-19. These quotations were gathered across the two FGDs involving eight individuals comprised of four males with 11 quotations and four females represented by 10 quotations. Table 6 illustrated the co-occurrences of the quotations for theme 2; source of information used to obtain information on the vaccine and COVID-19.
Table 6
Co-occurrences for Theme 2 on gender distributions
Gender In Folder Quotations Total
FGD Vaccine –MALE Files 1122
FGD Vaccine - FEMALE Files 10
The latent analysis on 22 quotations of theme 2 was further segmentized into three new sub-themes which reinforced the importance of the campaigners to carefully select the source of information prior to posting it to the senior citizens. The sub-themes emerged from this analysis provide strength to the deliberations of theme 2 where sub-theme

118
1 (Types of information) was represented by four quotations, sub-theme 2 (Source of information) with 12 quotations and finally sub-theme 3 (Information seeking behaviour) with six quotations. Table 7 below illustrated the sub-themes and quotation for each.
Table 7
Co-occurrences of Sub-themes
Sub-Themes Quotations
Types of information – vaccine, health, PPV 4
Source of information – social media, electronic media, print media, official media, word of mouth 12
Information seeking behaviour 6
The first sub-theme was directly related to the types of information seek by the senior citizens concerning vaccine and COVID-19 related issues. A survey by the Office of Disease Prevention and Health Promotion (2020) found that inasmuch health communication field and its campaign strategies are concerned, consumers and users always view health information seeking as part of simultaneous interaction that require assertiveness to ensure its influence in educating the public. This argument has effectively established throughout the FGDs held where both genders agreed that issues and information on vaccine and COVID-19 must be tackled immediately to avoid misinformation as well as misinterpretation by stakeholders.
“… I found the information from mass media, where at the beginning they were all very curious about the halal status of the vaccine…” (F: Ref. 6)“… There are also people (who read the information) said that when they have received complete dosages of the vaccine… so, if we meet people with COVID-19 symptoms (we know it will be a lot safer) …” (F: Ref. 7)“… If the issues originated from the newspaper, I believed the government would still take it positively but when it comes from whatsapp group… yes, a lot of it came out very negative (about vaccine and COVID-19) …” (M: Ref. 7)“… After that, there could be issues (or misunderstandings) regarding what has been informed and posted, and of course, the ministry would then go places (to give briefing and information… here, there are three places such as Bandar Penawar and Bandar Tenggara…” (M: Ref. 9)
With source of information recognized as the second sub-theme emerged from the analysis of theme 2, it directly implied that type and source of information are extremely vital to the formation of effective health communication campaigns. An astounding 12 quotations detailed out the origin of the information that the senior citizens from rural areas obtained the information on vaccine and COVID-19. This unswervingly indicate that the demographic group in the study is very conscious and highly aware of their surroundings that they seek information rather than waiting for family members to feed them with one. A study by Cotten and Gupta (2004) observed that health information seeking is one of activities that involve the searching and receiving information in order to reduce health uncertainties and boost self-esteem in health context. To this, Niederdeppe et al. (2007) in their study further inferred that the aim of health information seeking is dedicated to satisfactorily obtain relevant information related to individual’s health.
“… information was obtained from various sources, such as the Internet and mass media… from there, I found there are abundant of information. I also got the information from official sources since (I know) the news are regulated, and often this type of information could be obtained from various ministries…” (F: Ref. 2)“… I got the information on vaccine mostly from the Internet, news channels on the television… and if I’m not mistaken, there are also reports from the MKN… then of course from my friends, neighbours…” (F: Ref. 3)
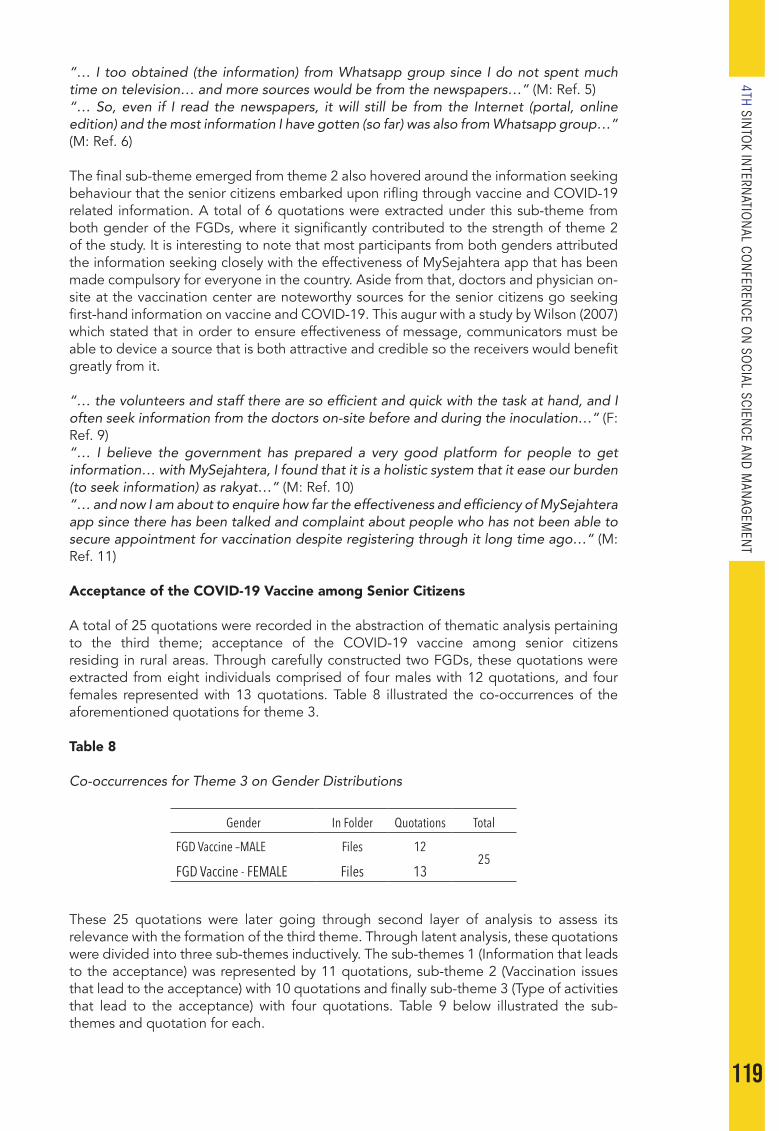
119
4TH SINTO
K INTERN
ATION
AL CON
FERENCE O
N SO
CIAL SCIENCE AN
D M
ANAG
EMEN
T
“… I too obtained (the information) from Whatsapp group since I do not spent much time on television… and more sources would be from the newspapers…” (M: Ref. 5)“… So, even if I read the newspapers, it will still be from the Internet (portal, online edition) and the most information I have gotten (so far) was also from Whatsapp group…” (M: Ref. 6)
The final sub-theme emerged from theme 2 also hovered around the information seeking behaviour that the senior citizens embarked upon rifling through vaccine and COVID-19 related information. A total of 6 quotations were extracted under this sub-theme from both gender of the FGDs, where it significantly contributed to the strength of theme 2 of the study. It is interesting to note that most participants from both genders attributed the information seeking closely with the effectiveness of MySejahtera app that has been made compulsory for everyone in the country. Aside from that, doctors and physician on-site at the vaccination center are noteworthy sources for the senior citizens go seeking first-hand information on vaccine and COVID-19. This augur with a study by Wilson (2007) which stated that in order to ensure effectiveness of message, communicators must be able to device a source that is both attractive and credible so the receivers would benefit greatly from it.
“… the volunteers and staff there are so efficient and quick with the task at hand, and I often seek information from the doctors on-site before and during the inoculation…” (F: Ref. 9)“… I believe the government has prepared a very good platform for people to get information… with MySejahtera, I found that it is a holistic system that it ease our burden (to seek information) as rakyat…” (M: Ref. 10)“… and now I am about to enquire how far the effectiveness and efficiency of MySejahtera app since there has been talked and complaint about people who has not been able to secure appointment for vaccination despite registering through it long time ago…” (M: Ref. 11)
Acceptance of the COVID-19 Vaccine among Senior Citizens
A total of 25 quotations were recorded in the abstraction of thematic analysis pertaining to the third theme; acceptance of the COVID-19 vaccine among senior citizens residing in rural areas. Through carefully constructed two FGDs, these quotations were extracted from eight individuals comprised of four males with 12 quotations, and four females represented with 13 quotations. Table 8 illustrated the co-occurrences of the aforementioned quotations for theme 3.
Table 8
Co-occurrences for Theme 3 on Gender Distributions
Gender In Folder Quotations Total
FGD Vaccine –MALE Files 1225
FGD Vaccine - FEMALE Files 13
These 25 quotations were later going through second layer of analysis to assess its relevance with the formation of the third theme. Through latent analysis, these quotations were divided into three sub-themes inductively. The sub-themes 1 (Information that leads to the acceptance) was represented by 11 quotations, sub-theme 2 (Vaccination issues that lead to the acceptance) with 10 quotations and finally sub-theme 3 (Type of activities that lead to the acceptance) with four quotations. Table 9 below illustrated the sub-themes and quotation for each.
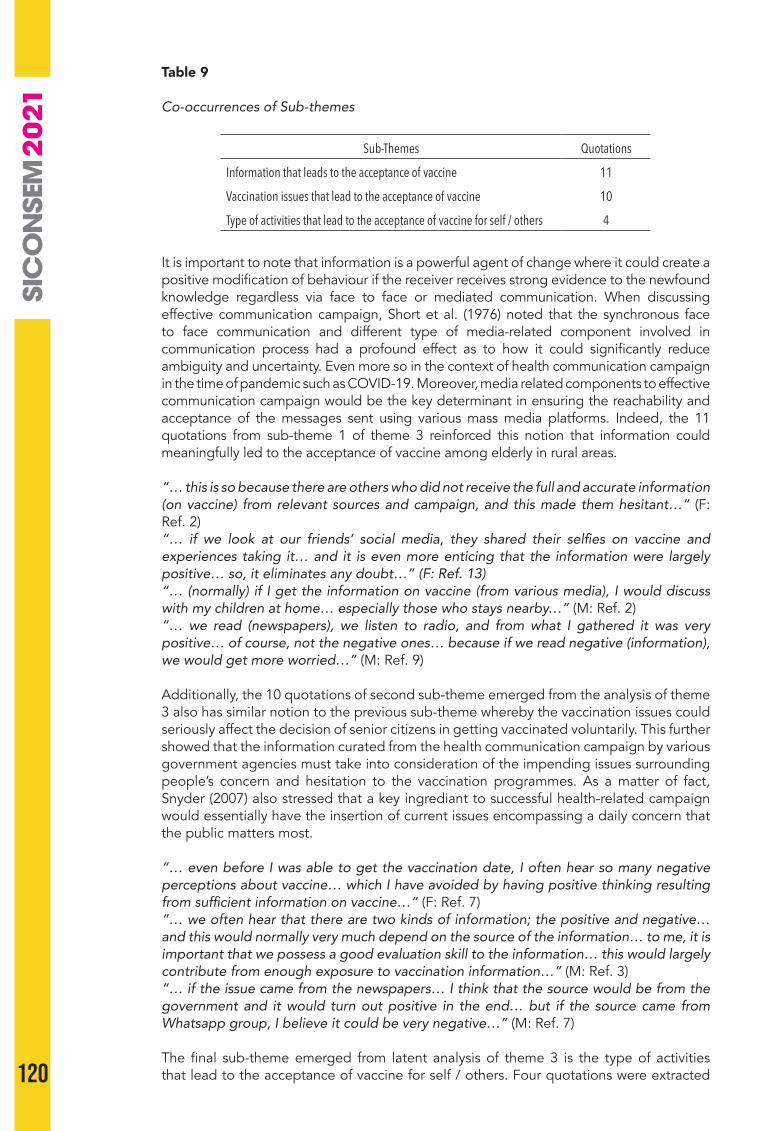
120
Table 9
Co-occurrences of Sub-themes
Sub-Themes Quotations
Information that leads to the acceptance of vaccine 11
Vaccination issues that lead to the acceptance of vaccine 10
Type of activities that lead to the acceptance of vaccine for self / others 4
It is important to note that information is a powerful agent of change where it could create a positive modification of behaviour if the receiver receives strong evidence to the newfound knowledge regardless via face to face or mediated communication. When discussing effective communication campaign, Short et al. (1976) noted that the synchronous face to face communication and different type of media-related component involved in communication process had a profound effect as to how it could significantly reduce ambiguity and uncertainty. Even more so in the context of health communication campaign in the time of pandemic such as COVID-19. Moreover, media related components to effective communication campaign would be the key determinant in ensuring the reachability and acceptance of the messages sent using various mass media platforms. Indeed, the 11 quotations from sub-theme 1 of theme 3 reinforced this notion that information could meaningfully led to the acceptance of vaccine among elderly in rural areas.
“… this is so because there are others who did not receive the full and accurate information (on vaccine) from relevant sources and campaign, and this made them hesitant…” (F: Ref. 2) “… if we look at our friends’ social media, they shared their selfies on vaccine and experiences taking it… and it is even more enticing that the information were largely positive… so, it eliminates any doubt…” (F: Ref. 13)“… (normally) if I get the information on vaccine (from various media), I would discuss with my children at home… especially those who stays nearby…” (M: Ref. 2)“… we read (newspapers), we listen to radio, and from what I gathered it was very positive… of course, not the negative ones… because if we read negative (information), we would get more worried…” (M: Ref. 9)
Additionally, the 10 quotations of second sub-theme emerged from the analysis of theme 3 also has similar notion to the previous sub-theme whereby the vaccination issues could seriously affect the decision of senior citizens in getting vaccinated voluntarily. This further showed that the information curated from the health communication campaign by various government agencies must take into consideration of the impending issues surrounding people’s concern and hesitation to the vaccination programmes. As a matter of fact, Snyder (2007) also stressed that a key ingrediant to successful health-related campaign would essentially have the insertion of current issues encompassing a daily concern that the public matters most.
“… even before I was able to get the vaccination date, I often hear so many negative perceptions about vaccine… which I have avoided by having positive thinking resulting from sufficient information on vaccine…” (F: Ref. 7)“… we often hear that there are two kinds of information; the positive and negative… and this would normally very much depend on the source of the information… to me, it is important that we possess a good evaluation skill to the information… this would largely contribute from enough exposure to vaccination information…” (M: Ref. 3)“… if the issue came from the newspapers… I think that the source would be from the government and it would turn out positive in the end… but if the source came from Whatsapp group, I believe it could be very negative…” (M: Ref. 7) The final sub-theme emerged from latent analysis of theme 3 is the type of activities that lead to the acceptance of vaccine for self / others. Four quotations were extracted
121
4TH SINTO
K INTERN
ATION
AL CON
FERENCE O
N SO
CIAL SCIENCE AN
D M
ANAG
EMEN
T
from the FGDs transcripts of both male and female senior citizens living in rural areas. The extraction of data on this sub-theme primarily observed the consequential and reciprocal activities upon receiving enough exposure on vaccine as well as the narrative of the shared experienced. Carleen (2009) highlighted that information sharing would evidently enabled the user generated content to be more conversational on social media platforms, where a more concerted approach in users’ controlled and exchange of health related information could be realised in making a more informed decision. This means that the additional information and knowledge sharing from basic narrative of words of mouth to social media platform could contribute to wealth of information.
“…I would normally spread (the positive) information as much as I could especially to those closer to me (such as my family) …” (F: Ref. 2)“… after receiving 2 doses, I would share my experiences with my neighbours who are yet to be vaccinated as well as those who incline to get the vaccination…” (F: Ref. 11)“… they would see and read my experiences (from Whatsapp group, social media) … that this would make them more confident to get vaccinated…” (F: Ref. 12)
CONCLUSION
Health literacy and effective communication eco-system prudently noted that knowledge, attitude, and practice would determine strategic campaign planning. This is so because it serves as key factor that inform and influence individuals as social intervention to enhance their health by action as a result to exposure of health message. At societal level, this will pave ways for adaptive social mechanism to holistically create an enable environment for government to implement the policy, legislation, economics, and technology plan that enhance community’s health behaviour during and post COVID-19 pandemic.
The concerted effort in healthy lifestyle campaign must also involve other stakeholders in the time of COVID-19 to ensure the social capital could be mutually and beneficially shared. Topped with good governance, it would be essentially rewarding when dealing with senior citizens which pose equivocal health situations pertaining to their knowledge and attitudes towards vaccination programmes and COVID-19. In responding to this complex situation, the role that different stakeholder could play is no longer secondary when dealing with COVID-19 pandemic. It is also obvious that the proliferation of communication technology is highly relevant in today’s context that it massively contributes in the increased interest on health-related information.
Cautiously, the information seeking behaviour that contributed to the increased search on social media platforms among elderly must also monitored to ensure authenticity and combat the misinformation. It is therefore evident in the that web 2.0 and social media platforms specifically is highly relevant in today’s digital society regardless of demographic groups where social engagement transcend basic communication. This in its essence would further challenge the governments to facilitate and equip the nations with in relevant infrastructures and facilities that could help to mobilise and increase the effort in running health communication campaigns on-site or on social media platforms.
The effectiveness of vaccine immunisation campaigns needs to be analysed in stages and divided into several phases of evaluation. Based on the findings of the study, the participants’ understanding of Covid-19 was at a good level as the statements showed that the participants understood the effects of Covid-19 and the vaccine on themselves, their families and the local community.
Therefore, the findings of this study should be taken into account by those responsible to identify the target groups more clearly in order to channel information and conduct health campaigns. The registration rate for vaccination is not very encouraging at the moment, due to the ‘wait and see’ attitude among the people of this country. Therefore, continuous and systematic campaign efforts using “social marketing” should be a priority. A social marketing approach that covers products, promotions, venues, and prices can ensure that health campaigns are more comprehensive and effective.
122
The approach of registering through MySejahtera is also not enough. It is suggested that there should be a more comprehensive interpersonal approach. This is due to the digital divide whereby some places do not get internet coverage especially in rural and inland areas. The study also suggests that campaigns targeting women be created because of the uniqueness of women who are at risk if they do not know the effects of vaccines on them specifically.
Messages and promotions as well as special clinics can be created to provide information as well as having specific vaccination segments for senior citizen. Future studies can be expanded in scope by focusing on participants who are in the B40 group and have low levels of education to gain understanding of vaccine reception in that group. Besides that, entertainment education initiatives by using PCI Media, BBC Media Action, and Sesame Workshop can be examples of initiatives to be adopted and modified towards greater immunisation campaign among seniour citizen in Malaysia. Overall, this study found that the need for information on diseases and vaccines is very important for receptive decisions among seniour citizen. Although this is a qualitative study, the findings of this study highlight the real problems faced by senior citizen regarding the Covid-19 vaccine.
REFERENCES
Bandura, A. (1994). Social cognitive theory of mass communication. In J. Bryant, and D. Zillmann (Eds.), Media Effects: Advances in Theory and Research. Lawrence Erlbaum Associates.
Brashers D. E. (2001). Communication and uncertainty management. J Commun. 51,477–97. https://doi.org/10.1111/j.1460-2466.2001.tb02892.x.
Carey J. W. (1989). Communication as culture: essays on media and society. Unwin Hyman.Carleen, H. (2009). Take two aspirin and tweet me in the morning: how Twitter, Facebook,
and other social media are reshaping health care. Health Aff (Millwood), 28(2), 361–8. https://doi.org/10.1377/hlthaff.28.2.361.28/2/361.
Cho, H., & Salmon C. T. Unintended effects of health communication campaigns. J Comm, 57, 293-317.
Cotten, S., & Gupta, S. (2004). Characteristics of online and offline health information seekers and factors that discriminate between them. Social Science and Medicine, 59, 1795-1806.
Fauziah, A., Chang, P., Normah, M., Faridah, I., Wan Amizah, W., & Dafrizal, S. (2012). Information propagation and the forces of social media in Malaysia. Journal of Asian Social Sciences, 71-76.
Lee-Peng F., Mui-Yin C., Kim-Leng T. & Kit-Teng P. (2021) The impact of COVID-19 on tourism industry in Malaysia. Current Issues in Tourism, 24(19), 2735-2739, https://doi.org/10.1080/13683500.2020.1777951
Hayes, H. (2020). Social media and inspiring physical activity during COVID-19 and beyond. Managing Sport and Leisure, 1-8.
Ismail Sualman & Salmi Othman. (2021). Understanding and acceptance of COVID-19 vaccine among young women: A qualitative study. Journal of Media and Information Warfare 14(1), 93-106.
Ismail Sualman. (2021). Kesan COVID-19 terhadap soio-ekonomi di Negeri Selangor. Laporan Kajian Universiti Teknologi MARA.
Ismail Sualman. (2021). Kempen imunisasi tingkat keyakinan perangi pandemik. Berita Harian Online. https://www.bharian.com.my/rencana/komentar/2021/02/787413/kempen-imunisasi-tingkat-keyakin an-perangi-pandemik.
Kementerian Kesihatan Malaysia. (2021). Situasi Terkini Covid-19 di Malaysia. http://covid-19.moh.gov.my/terkini
Lapinski, M. K. & Rima,l R. N. (2005). An explication of social norms. Commun Theory, 15, 127–47. https://doi.org/10.1111/j.1468-2885.2005.tb00329.x.
Meriam, S. (1998). Qualitative research and case study application in education. Jossey-Bass Publishers.
Mitchell, M. M., Brown, K. M., Morris-Villagran, M., Villagran, P. D. (2001). The effects of anger, sadness and happiness on persuasive message processing: A test of

123
4TH SINTO
K INTERN
ATION
AL CON
FERENCE O
N SO
CIAL SCIENCE AN
D M
ANAG
EMEN
T
the negative state relief model. Commun Monogr. 68, 347–59. https://doi.org/10.1080/03637750128070.
Moges, Z., & Amberbir, A. (2011). Factors associated with readiness to VCT service utilization among pregnant women attending antenatal clinics in Northwestern Ethiopia: A health belief model approach. Ethiopian Journal of Health Sciences, 21(Suppl), 107–115.
Morse, J. M., & Richards, L. (2002). Readme first for a user’s guide to qualitative methods. Sage Publications.
Mullard, A. (2020). Covid-19 vaccine development pipeline gears up. Lancet, 395(10239), 1751–1752. https://doi.org/10.1016/S0140-6736(20)31252-6
Othman Talib. (2019). Analisis data kualitatif dengan Atlas Ti. UPM Press. Parrott, R. (2004). Emphasizing “communication” in health communication. J Commun.,
54, 751–87. https://doi.org/10.1111/j.1460-2466.2004.tb02653.x.Pasick, R. J., & Wallack, L. (1990). Mass media in health promotion: A compilation of
expert opinion. International Quarterly of Community Health Education, 9(2), 89–110. https://doi.org/10.2190/fv2t-qgu8-pm93-kc81
Reid, D. (1996). How effective is health education via mass communications? Health Education Journal, Vol. 55, No. 3, pp. 332–44.
Rimal, R. N., & Real, K. (2005). How behaviors are influenced by perceived norms: A test of the theory of normative social behavior. Communication Research, 32(3), 389-414. https://doi.org 10.1177/0093650205275385
Rimal, R. N., & Real, K. (2003). Perceived risk and efficacy beliefs as motivators of change: Use of the risk perception attitude (RPA) framework to understand health behaviors. Human Communication Research. 29(3), 370–99.
Rogers, E. M. (1976). Communication and development: The passing of the dominant paradigm. In E. M. Rogers (ed.), Communication and development: Critical perspectives. (pp. 121–148). Sage,
Schooler, C., Chaffee, S., Flora, J., and Roser, C. (1998). Health campaign channels: Tradeoffs among reach, specificity, and impact. Hum Human Communication Research, 24(3), 410–32.
Short, J., Williams, E., & Christie, B. (1976). The social psychology of telecommunications. John Wiley and Sons.
Snyder, L. (2007). Health communication campaigns and their impact on behaviour. Journal of Nutrition Education and Behaviour, 39,S32-40.
Snyder, L., Hamilton, M., Mitchell, E., Kiwanuka-Tondo , J., Fleming-Milici, F., & Proctor, D. (2004). A meta-analysis of the effect of mediated health communication campaigns on behavior change in the U.S. J. Health Commun, 9(1S), S71–S96.
Sorensen, K., Van-Den-Broucke, S., Brand, H., Fullam, J., Doyle, G., Pelikan, J., & Slonszka, Z. (2012). Health literacy and public health: A systematic review and integration of definitions and models. BMC Public Health, (1) 80. (DOS 1995a).
Su. (2020). Chinese mental health burden during the COVID-19 pandemic Y Huang, N Zhao - Asian Journal of Psychiatry, ncbi.nlm.nih.gov
Witte K. (1994). Fear control and danger control: A test of the extended parallel process model (EPPM). Commun Monogr. 61, 113–34.
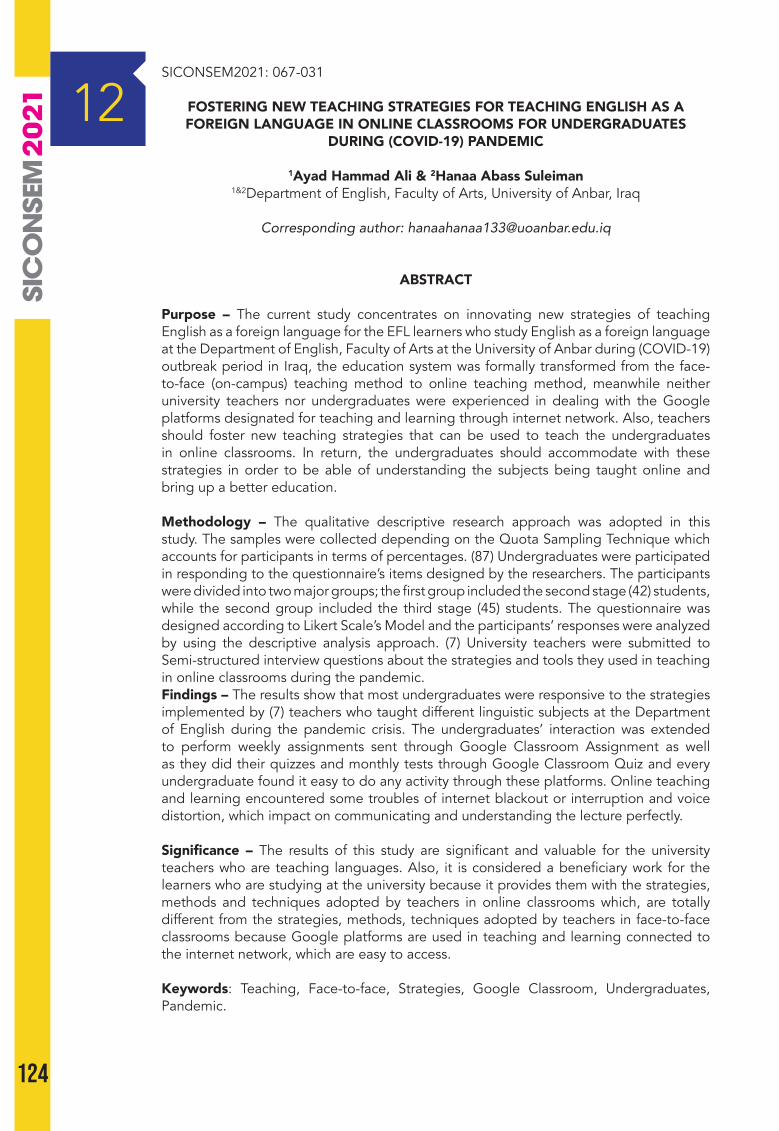
124
SICONSEM2021: 067-031
FOSTERING NEW TEACHING STRATEGIES FOR TEACHING ENGLISH AS A FOREIGN LANGUAGE IN ONLINE CLASSROOMS FOR UNDERGRADUATES
DURING (COVID-19) PANDEMIC
1Ayad Hammad Ali & 2Hanaa Abass Suleiman1&2Department of English, Faculty of Arts, University of Anbar, Iraq
Corresponding author: [email protected]
ABSTRACT
Purpose – The current study concentrates on innovating new strategies of teaching English as a foreign language for the EFL learners who study English as a foreign language at the Department of English, Faculty of Arts at the University of Anbar during (COVID-19) outbreak period in Iraq, the education system was formally transformed from the face-to-face (on-campus) teaching method to online teaching method, meanwhile neither university teachers nor undergraduates were experienced in dealing with the Google platforms designated for teaching and learning through internet network. Also, teachers should foster new teaching strategies that can be used to teach the undergraduates in online classrooms. In return, the undergraduates should accommodate with these strategies in order to be able of understanding the subjects being taught online and bring up a better education.
Methodology – The qualitative descriptive research approach was adopted in this study. The samples were collected depending on the Quota Sampling Technique which accounts for participants in terms of percentages. (87) Undergraduates were participated in responding to the questionnaire’s items designed by the researchers. The participants were divided into two major groups; the first group included the second stage (42) students, while the second group included the third stage (45) students. The questionnaire was designed according to Likert Scale’s Model and the participants’ responses were analyzed by using the descriptive analysis approach. (7) University teachers were submitted to Semi-structured interview questions about the strategies and tools they used in teaching in online classrooms during the pandemic.Findings – The results show that most undergraduates were responsive to the strategies implemented by (7) teachers who taught different linguistic subjects at the Department of English during the pandemic crisis. The undergraduates’ interaction was extended to perform weekly assignments sent through Google Classroom Assignment as well as they did their quizzes and monthly tests through Google Classroom Quiz and every undergraduate found it easy to do any activity through these platforms. Online teaching and learning encountered some troubles of internet blackout or interruption and voice distortion, which impact on communicating and understanding the lecture perfectly.
Significance – The results of this study are significant and valuable for the university teachers who are teaching languages. Also, it is considered a beneficiary work for the learners who are studying at the university because it provides them with the strategies, methods and techniques adopted by teachers in online classrooms which, are totally different from the strategies, methods, techniques adopted by teachers in face-to-face classrooms because Google platforms are used in teaching and learning connected to the internet network, which are easy to access.
Keywords: Teaching, Face-to-face, Strategies, Google Classroom, Undergraduates, Pandemic.
12
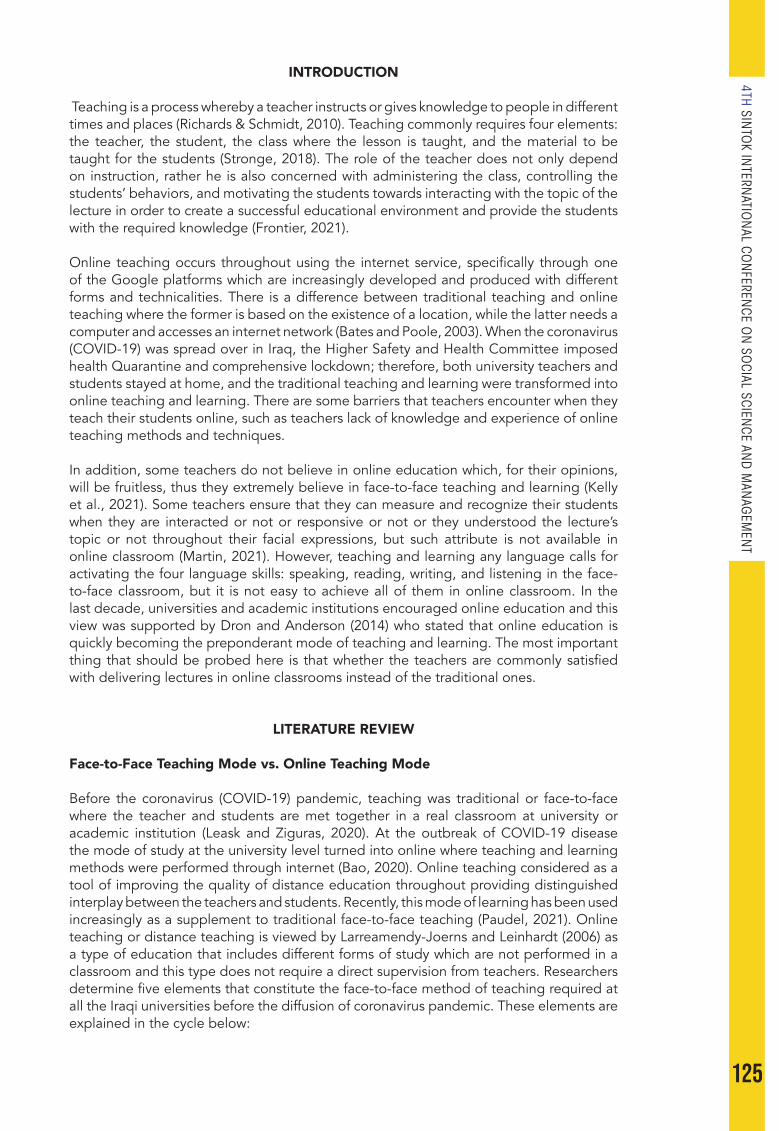
125
4TH SINTO
K INTERN
ATION
AL CON
FERENCE O
N SO
CIAL SCIENCE AN
D M
ANAG
EMEN
T
INTRODUCTION
Teaching is a process whereby a teacher instructs or gives knowledge to people in different times and places (Richards & Schmidt, 2010). Teaching commonly requires four elements: the teacher, the student, the class where the lesson is taught, and the material to be taught for the students (Stronge, 2018). The role of the teacher does not only depend on instruction, rather he is also concerned with administering the class, controlling the students’ behaviors, and motivating the students towards interacting with the topic of the lecture in order to create a successful educational environment and provide the students with the required knowledge (Frontier, 2021).
Online teaching occurs throughout using the internet service, specifically through one of the Google platforms which are increasingly developed and produced with different forms and technicalities. There is a difference between traditional teaching and online teaching where the former is based on the existence of a location, while the latter needs a computer and accesses an internet network (Bates and Poole, 2003). When the coronavirus (COVID-19) was spread over in Iraq, the Higher Safety and Health Committee imposed health Quarantine and comprehensive lockdown; therefore, both university teachers and students stayed at home, and the traditional teaching and learning were transformed into online teaching and learning. There are some barriers that teachers encounter when they teach their students online, such as teachers lack of knowledge and experience of online teaching methods and techniques.
In addition, some teachers do not believe in online education which, for their opinions, will be fruitless, thus they extremely believe in face-to-face teaching and learning (Kelly et al., 2021). Some teachers ensure that they can measure and recognize their students when they are interacted or not or responsive or not or they understood the lecture’s topic or not throughout their facial expressions, but such attribute is not available in online classroom (Martin, 2021). However, teaching and learning any language calls for activating the four language skills: speaking, reading, writing, and listening in the face-to-face classroom, but it is not easy to achieve all of them in online classroom. In the last decade, universities and academic institutions encouraged online education and this view was supported by Dron and Anderson (2014) who stated that online education is quickly becoming the preponderant mode of teaching and learning. The most important thing that should be probed here is that whether the teachers are commonly satisfied with delivering lectures in online classrooms instead of the traditional ones.
LITERATURE REVIEW
Face-to-Face Teaching Mode vs. Online Teaching Mode
Before the coronavirus (COVID-19) pandemic, teaching was traditional or face-to-face where the teacher and students are met together in a real classroom at university or academic institution (Leask and Ziguras, 2020). At the outbreak of COVID-19 disease the mode of study at the university level turned into online where teaching and learning methods were performed through internet (Bao, 2020). Online teaching considered as a tool of improving the quality of distance education throughout providing distinguished interplay between the teachers and students. Recently, this mode of learning has been used increasingly as a supplement to traditional face-to-face teaching (Paudel, 2021). Online teaching or distance teaching is viewed by Larreamendy-Joerns and Leinhardt (2006) as a type of education that includes different forms of study which are not performed in a classroom and this type does not require a direct supervision from teachers. Researchers determine five elements that constitute the face-to-face method of teaching required at all the Iraqi universities before the diffusion of coronavirus pandemic. These elements are explained in the cycle below:
126
Figure 1
Elements of Face-to-face Teaching Mode
Teacher
Students
Place (Fixed)Subject
Whiteboard
The controversial elements in this cycle of elements are the whiteboard; the medium of writing the subject matter, and the place which must be in university campus in specified classes, but these two elements will be different in the online teaching.
On the other hand, online learning which is also called distance learning, or web-based learning or computer-assisted learning or online instruction is neatly defined by Khan (1997) as “as an innovative approach for delivering instruction to remote learners by using the internet as the medium of communication”. For Cole (2000) online learning provides the learners with free time and space as this attribute is granted to the teacher who teaches certain materials. This ensures that both teaching and learning have more time and more space in the sense that the teacher can deliver his lectures to his students from his own room at his home or any quite place. Similarly, the learner can attend the teacher’s lecture from any comfortable place. Womble (2008) ensures that online learning motivates the learners’ skills and cognitive functioning. One of the positive aspects of online learning is that it offers to the learners the flexibility of accessing the lectures at any time and any place whether through a smartphone or computer (Smith et al., 2005).
The importance of online teaching as a pedagogical trend in education is obvious in the amounts of studies and practical researches that have been done before and during coronavirus (Covid-19) pandemic (Stephenson, 2001). As its significance grows specifically with the existence of several online Google platforms (Dawley, 2007). Due to the global lockdown which was imposed by COVID-19 pandemic, there was a transition from face-to-face teaching to online teaching, this rapid and unprecedented switching obliged university teachers to adopt technologies of teaching connected with internet where most of them lack knowledge about them or they do not know how to use them (Dhawan, 2020). In Iraq, neither university teachers nor undergraduates are aware of using technology-based teaching and learning at the beginning of the pandemic. To draw a comparison between face-to-face teaching and online teaching, one can find some differences between them and challenges that both teachers and students encounter (Kim, 2020). Face-to-face teaching is effective for the teacher because he can activate the language skills in order to examine the students’ performance and interaction (Stern, 2004) whereas in online teaching the teacher focuses on delivering the lecture without occurring any interruptions or disconnection, so he cannot activate the language skills of the students. First and, perhaps most importantly, classroom instruction is extremely dynamic. Traditional classroom teaching provides real-time face-to-face instruction and sparks innovative questions. It also allows for immediate teacher response and more flexible content delivery. Online instruction dampens the learning process because students must

127
4TH SINTO
K INTERN
ATION
AL CON
FERENCE O
N SO
CIAL SCIENCE AN
D M
ANAG
EMEN
T
limit their questions to save time, then grant the teacher and fellow classmates time to respond (Salcedo, 2010). However, online teaching provided a good opportunity to the teachers in order to train on adopting the online teaching and to keep acquainted with the tools and techniques used in teaching groups of students in remote places.
Teaching and Learning Methods before and during (COVID-19) Pandemic Crisis
Both teaching and learning were performed in the traditional methods at universities and schools before the pandemic outbreak. This means that the teaching method required certain elements: teacher, learners, topics to be taught, actual or physical classroom, Whiteboard or rarely using Data show Projector or Projector Screen. Online teaching has rapidly become more circulated than ever as compared to face-to-face teaching mode due to development of computer-aided technology (Orfan et al., 2021). Due to the international lockdown of universities, there is a need for online teaching and learning as quick alternatives to the face-to-face teaching and learning modes, and certainly teachers around the world have experienced challenges and opportunities at the same time during (COVID-19) pandemic (König et al., 2020). Teaching, according to Ayeni (2011), is a continual activity involving the application of appropriate approaches to bring about desired changes in learners. Aminuddin (2021) in his study concluded that online teaching during the (COVID-19) pandemic created a great chance to the teachers and learners to get acquainted with using different platforms that offer mutual communication. Furthermore, Ganyaupfu (2013) asserted that teaching approaches are effective only if they are tailored to the needs of the students, as each student interprets and answers to questions differently. She focused on two basic methods for teaching which are: teacher – centered method and student –centered method. For the first method, Students just obtain knowledge from the teacher in this manner, without increasing their level of engagement with the subject being taught. The strategy is the least practical, being more theoretical and memorizing (Popa et al., 2020). While for the second method, many researchers now use more flexible student-centered strategies to increase active learning, thanks to the introduction of the notion of discovery learning. Most teachers currently use a student-centered approach to encourage students’ curiosity, analytical investigation, critical thinking, and skill development (Huang et al., 2020).
Ghulam (2019) confirms that teaching methods are a vehicle hired in the teaching process which can help learners and teachers in achieving a vital goal and accomplishing a common task of teaching. Vikoo (2003) states that discussion is usually at a higher cognitive level and it develops critical thinking. Student’s participation is necessary for a successful classroom discussion. It is a student centered teaching technique but requires careful planning by the teacher to guide discussion. Successful discussions are guided by specific teaching goals. Dorgu (2015) states that there are many methods of teaching that the teacher can use in teaching the material. They are 1. Discussion method, 2. Questioning method 3. Role Playing Method 4. Stimulation Method 5. Demonstration Method 6. Inquiry/Discovery Method. However, lecturing is not an easy task which is considered to be one key time-tested and pivotal teaching method that remains the most frequently used method of instruction in higher education throughout the world (Svinicki & McKeachie, 2011).
Online learning is a type of remote education that primarily consists of internet-based education in which courses are delivered synchronously (Singh and Thurman, 2019). Actually, teachers in a physical classroom interact with students in real time, but instructors in an online mode can deliver real-time lectures using learning management systems (LMS) such as Edmodo or Zoom or Google Meet platforms or record lectures for students to watch later. Purely online courses are only available online, whereas blended learning blends between traditional face-to-face classes with online learning class (Nguyen, 2015). Gros and García-Peñalvo (2016) affirm that e-learning has become an excessively important mode of learning and teaching in the last decades and has been recognized as a productive and influential method of learning. The quick increasing number of internet users of mobiles and their applications, and Google platforms around the world has enhanced the proliferation of online learning in universities and high schools. Researchers

128
proposed five elements that frame the cornerstone of the online teaching during the coronavirus pandemic. These elements are shown in the cycle below:
Figure 2
Elements of Online Teaching Method
Teacher
Students
InternetFrom
anywhereSubject
PlatformsGoogle Meet
Having a glimpse at the above cycle, one can see that there is a difference between cycle (1) of face-to-face teaching method and cycle (2) of online teaching method specifically in two elements. The first is that the online method requires internet service and a smartphone or laptop connected with the internet network that lets the teachers and students join the online classrooms from any place. The second is that there is no whiteboard or blackboard instead there is a platform (Google Hangout Meet), which is the tool of contact between the teacher and his students. The material of the lecture is already prepared on Power Point Slides, whereas in the face-to-face method, the teacher uses the Whiteboard to write on it the material by color markers.
Before the pandemic, most courses had previously done a number of face-to-face lectures and exams. Due to the global lockdown, the universities were forced to the online learning in order to achieve the lessons and hours required for each semester (Chisadza et al, 2021). It became easy to verify the changes in students’ performance because of the forced transformation from face-to-face to online learning. Classes used to be held on campus prior to lockdown (Darius et al., 2021). These actual classes were shifted to online platforms, Blackboard Collaborate, which could be accessible by all registered students on the university intranet during the lockdown. Students will, however, incur significant internet bandwidth fees as a result of these live online courses (Sadeghi, 2019). Students were unable to attend the live online lectures due to poor internet connections or high internet data costs. Several options were made available for students who wanted to access course content via a variety of means. These included prerecorded narrated slides, PowerPoint slides and standard PDF lecture slides (Rapanta et al., 2020).
Google Platforms Used in Teaching and Learning in Local Lockdown
The universal shift from face-to-face teaching and learning modes due to the outbreak of coronavirus committed both university teachers and learners to foster online classrooms which are technologies connected with the network. Academic teaching staff trained in workshops and training sessions on how to use technologies for teaching their lessons online (Treacy, 2021). During the pandemic, teachers are engaged in teaching and learning at home, but many have not had adequate preparation for this. Education authorities need to help teachers prepare the required facilities for delivering lessons and monitoring learning remotely (Miao et al., 2020).
129
4TH SINTO
K INTERN
ATION
AL CON
FERENCE O
N SO
CIAL SCIENCE AN
D M
ANAG
EMEN
T
The Google Classroom adaptation has benefits for online learning and teaching during the covid-19 pandemic. In fact, Google Classroom proved to be effective for teachers and learners, which is regarded a good alternative for the classroom Whiteboard in university campus (Okmawati, 2020). This platform allows collaboration between teachers and their students in online classes. Furthermore, Google Classroom also helps students and teachers organize and make assignments by using the virtual attributes that are found in the Google Classroom application. Teachers also use Google Meet to communicate with the students to deliver lectures or hold seminars and it is considered the most influential medium of online teaching and learning. Commonly, online teaching and learning modes were performed by using different creative software and mobile applications including Google Classroom, Google Meet, Zoom, Telegram or WhatsApp (Wangdi et al., 2021). Google Meet is explained by Dash et al. (2021) as a significant video conferencing platform which has two major features as being easily accessible and affordable. Technically, it is very secure and the teacher or creator is the only controller who can accept more than 25 students or visitors. As this platform has another attribute is that it can be used on Android (Mobile device) or Chrome (on laptop or desktop computer).
Since the local lockdown in Iraq due to the proliferation of coronavirus in, the Iraqi Ministry of Higher Education and Scientific Research (MOHESR) (The Electronic Teaching Committee) directed all the public and private universities to teach the students in online methods by using the Google Classroom and Google Meet platforms. The Google Meet is considered as a face-to-face medium of delivering the lectures, while the Google Classrooms are created by the teachers in order to make the students send their assignments and through which the teacher submits the students to quizzes or monthly tests or any other scientific activities. Petrie (2020) states that online classroom platforms including Google Classroom and Google Hangout Meet are increasingly used by teachers and learners during the world lockdown. However, Google offered online platforms for teachers and learners during the pandemic which are highly effective and easy to use. Bui et al. (2020) assure that Google contains online platforms which are useful in the educational process as they are easily accessible at any time and from everywhere. In addition, they are free of charge. However, Cuellar (2002) indicate that Online learning platforms provide the learners with all they want as they enhance the quality of learning for many learners because they are assisted with modem technology linked with internet.
METHODOLOGY
Participants
The research samples used in this paper were two experimental groups; the first group represents the Second stage and second group represents the Third stage who are studying English as a foreign language in the Department of English, Faculty of Arts, at University of Anbar. The total number of the students who participated in the questionnaire was (n= 87) participants including males and females, but distributed into two separate groups; the first group includes the Second Stage who were (n= 42) students, while the second group, which represents the Third Stage, comprises (n= 45) students. The test was done at the end of the second course of the academic year (2020-2021). The test of the first group was done in Sept 2, 2021 at (10:00 pm), while the second group was tested in Sept 3, 2021 at (10:00 pm). Both groups were given only one hour, which is the period of doing the test.
Instruments
The researchers adopted two instruments that were used in teaching the subjects and doing the questionnaire virtually. The Google Meet Platform was used to teach the subject matter and prepare the students for responding to the questionnaire test items, while the Google Classroom Platform was used to administer the test. Doing tests is one of its efficacious attributes, and the other attribute is to offer the tester a full automatic

130
statistical analysis of outputs he gets from his testees during answering the test directly; to get frequency numbers and their rates. This attribute was exploited by the researchers to design the test and assign it to the students in each classroom, hence, each student receives a notification of the questionnaire items, and in return, he responds to the items, then he sends back his response to the researchers electronically. However, the Google Classroom of the second group (Second Stage), in which the test was done, has the class code (j5dbevc), whereas the Google Classroom of the second group (Third Stage), in which the test was done, bears the class code (rv5ns3w). The questionnaire was assigned to each student (Assign Notification) who already joined the class designated for teaching subjects. The questionnaire link was sent to the 2nd stage students through Google Classroom is (https://forms.gle/Jc3m5Urog5AsP2i79), while the questionnaire link was sent to the 3rd stage students through Google Classroom is (https://forms.gle/wvSBEcDQyRMHrUgW7). The five-point Likert scales were used in order to have statistical outputs. It’s worth mentioning that online Google Classroom is characterized by manifesting the results in statistical numbers and percentages through histograms or segmented cycles through automatic calculating grader. As a result, after accomplishing the reception of the responses in the limited time, the researchers go to the response page to take the participants’ responses in terms of numbers and percentages available on segmented cycles visibly and place them into tables to analyze them statistically and discuss the results.
Data Analysis
Undergraduates’ Assessment of Teaching Strategies and Tools Adopted in Online Classroom at the Second StageThis section is concerned with analyzing the undergraduates’ assessment of the strategies and tools used by teachers when teaching their subject matters in online classrooms in order to measure the students’ interaction and response. This, in return, shows how effective or ineffective these strategies and instruments adopted by teachers. Likert five scales were typically used in the process of analysis.
Undergraduates’ Satisfaction with Teaching Strategies and ToolsTable (1) below is an evaluation in terms of numbers and percentage of the students’ reaction and attitude towards the strategies and tools employed by the teachers to teach their students different subjects in online classrooms. Scale (1) represents Strongly Agree, Scale (2) is Agree, Scale (3) is Undecided, Scale (4) is Disagree, while Scale (5) is Strongly Disagree. The numbers and percentages were collected from the segmented cycles in the online Google Form Grader.
Table 1
Adoptability of Teaching Strategies and Tools
Statement (1) Scale 1 Scale 2 Scale 3 Scale 4 Scale 5
Teachers adopt different methods (strategies) of teaching the subject matter in online classrooms.
Freq
Perc
Freq
Perc
Freq
Perc
Freq
Perc
Freq
Perc
5 11.9 29 69.1 4 9.5 3 7.1 1 2.4
Statement (2) Scale 1 Scale 2 Scale 3 Scale 4 Scale 5
Teachers use virtual platforms as a medium for teaching and learning like Google Meet and Google Classroom in online classrooms.
Freq
Perc
Freq
Perc
Freq
Perc
Freq
Perc
Freq
Perc
12 28.6 19 45.2 7 16.7 3 7.1 1 2.4
Statement (3) Scale 1 Scale 2 Scale 3 Scale 4 Scale 5
(Continued)
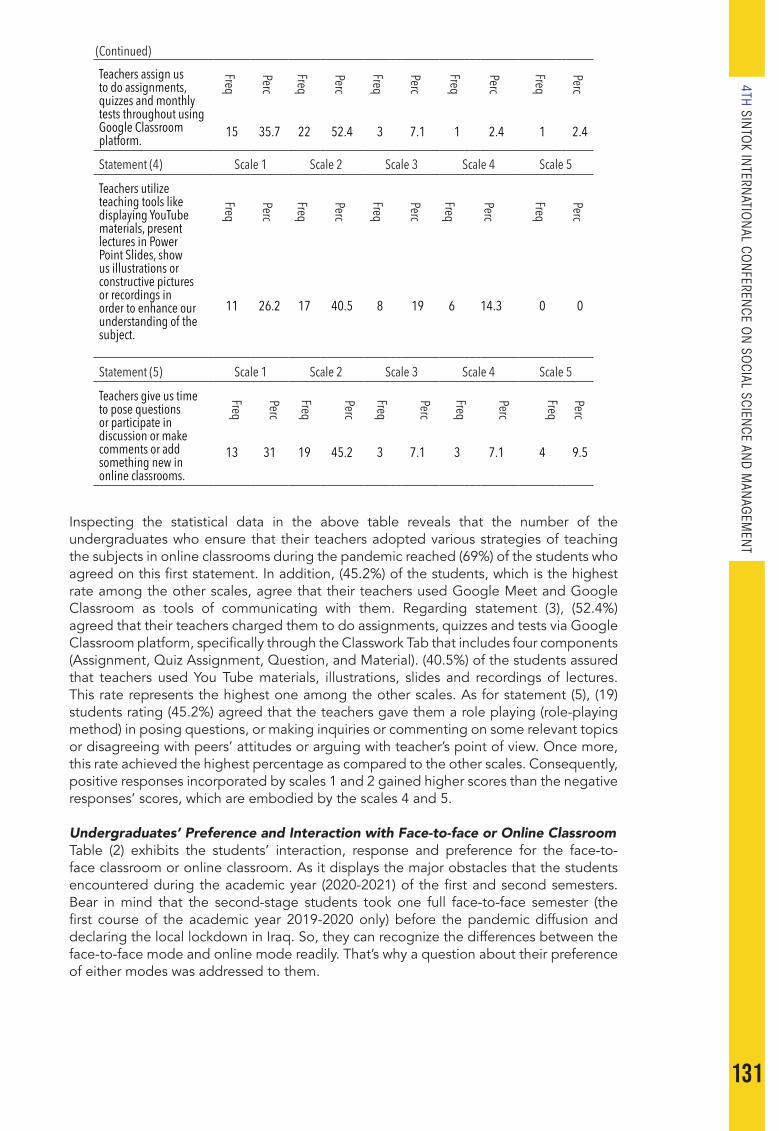
131
4TH SINTO
K INTERN
ATION
AL CON
FERENCE O
N SO
CIAL SCIENCE AN
D M
ANAG
EMEN
T
Teachers assign us to do assignments, quizzes and monthly tests throughout using Google Classroom platform.
Freq
Perc
Freq
Perc
Freq
Perc
Freq
Perc
Freq
Perc
15 35.7 22 52.4 3 7.1 1 2.4 1 2.4
Statement (4) Scale 1 Scale 2 Scale 3 Scale 4 Scale 5
Teachers utilize teaching tools like displaying YouTube materials, present lectures in Power Point Slides, show us illustrations or constructive pictures or recordings in order to enhance our understanding of the subject.
Freq
Perc
Freq
Perc
Freq
Perc
Freq
Perc
Freq
Perc
11 26.2 17 40.5 8 19 6 14.3 0 0
Statement (5) Scale 1 Scale 2 Scale 3 Scale 4 Scale 5
Teachers give us time to pose questions or participate in discussion or make comments or add something new in online classrooms.
Freq
Perc
Freq
Perc
Freq
Perc
Freq
Perc
Freq
Perc
13 31 19 45.2 3 7.1 3 7.1 4 9.5
Inspecting the statistical data in the above table reveals that the number of the undergraduates who ensure that their teachers adopted various strategies of teaching the subjects in online classrooms during the pandemic reached (69%) of the students who agreed on this first statement. In addition, (45.2%) of the students, which is the highest rate among the other scales, agree that their teachers used Google Meet and Google Classroom as tools of communicating with them. Regarding statement (3), (52.4%) agreed that their teachers charged them to do assignments, quizzes and tests via Google Classroom platform, specifically through the Classwork Tab that includes four components (Assignment, Quiz Assignment, Question, and Material). (40.5%) of the students assured that teachers used You Tube materials, illustrations, slides and recordings of lectures. This rate represents the highest one among the other scales. As for statement (5), (19) students rating (45.2%) agreed that the teachers gave them a role playing (role-playing method) in posing questions, or making inquiries or commenting on some relevant topics or disagreeing with peers’ attitudes or arguing with teacher’s point of view. Once more, this rate achieved the highest percentage as compared to the other scales. Consequently, positive responses incorporated by scales 1 and 2 gained higher scores than the negative responses’ scores, which are embodied by the scales 4 and 5.
Undergraduates’ Preference and Interaction with Face-to-face or Online Classroom Table (2) exhibits the students’ interaction, response and preference for the face-to-face classroom or online classroom. As it displays the major obstacles that the students encountered during the academic year (2020-2021) of the first and second semesters. Bear in mind that the second-stage students took one full face-to-face semester (the first course of the academic year 2019-2020 only) before the pandemic diffusion and declaring the local lockdown in Iraq. So, they can recognize the differences between the face-to-face mode and online mode readily. That’s why a question about their preference of either modes was addressed to them.
(Continued)
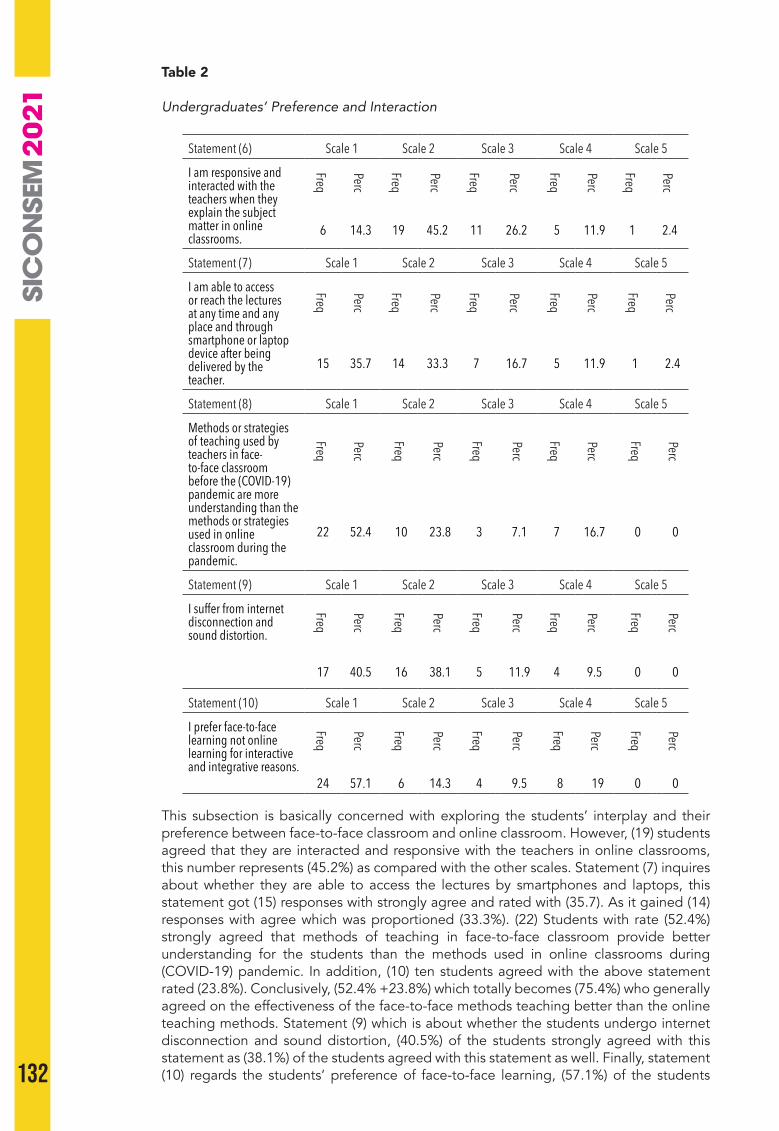
132
Table 2
Undergraduates’ Preference and Interaction
Statement (6) Scale 1 Scale 2 Scale 3 Scale 4 Scale 5
I am responsive and interacted with the teachers when they explain the subject matter in online classrooms.
Freq
Perc
Freq
Perc
Freq
Perc
Freq
Perc
Freq
Perc
6 14.3 19 45.2 11 26.2 5 11.9 1 2.4
Statement (7) Scale 1 Scale 2 Scale 3 Scale 4 Scale 5
I am able to access or reach the lectures at any time and any place and through smartphone or laptop device after being delivered by the teacher.
Freq
Perc
Freq
Perc
Freq
Perc
Freq
Perc
Freq
Perc
15 35.7 14 33.3 7 16.7 5 11.9 1 2.4
Statement (8) Scale 1 Scale 2 Scale 3 Scale 4 Scale 5
Methods or strategies of teaching used by teachers in face-to-face classroom before the (COVID-19) pandemic are more understanding than the methods or strategies used in online classroom during the pandemic.
Freq
Perc
Freq
Perc
Freq
Perc
Freq
Perc
Freq
Perc
22 52.4 10 23.8 3 7.1 7 16.7 0 0
Statement (9) Scale 1 Scale 2 Scale 3 Scale 4 Scale 5
I suffer from internet disconnection and sound distortion.
Freq
Perc
Freq
Perc
Freq
Perc
Freq
Perc
Freq
Perc
17 40.5 16 38.1 5 11.9 4 9.5 0 0
Statement (10) Scale 1 Scale 2 Scale 3 Scale 4 Scale 5
I prefer face-to-face learning not online learning for interactive and integrative reasons.
Freq
Perc
Freq
Perc
Freq
Perc
Freq
Perc
Freq
Perc
24 57.1 6 14.3 4 9.5 8 19 0 0
This subsection is basically concerned with exploring the students’ interplay and their preference between face-to-face classroom and online classroom. However, (19) students agreed that they are interacted and responsive with the teachers in online classrooms, this number represents (45.2%) as compared with the other scales. Statement (7) inquires about whether they are able to access the lectures by smartphones and laptops, this statement got (15) responses with strongly agree and rated with (35.7). As it gained (14) responses with agree which was proportioned (33.3%). (22) Students with rate (52.4%) strongly agreed that methods of teaching in face-to-face classroom provide better understanding for the students than the methods used in online classrooms during (COVID-19) pandemic. In addition, (10) ten students agreed with the above statement rated (23.8%). Conclusively, (52.4% +23.8%) which totally becomes (75.4%) who generally agreed on the effectiveness of the face-to-face methods teaching better than the online teaching methods. Statement (9) which is about whether the students undergo internet disconnection and sound distortion, (40.5%) of the students strongly agreed with this statement as (38.1%) of the students agreed with this statement as well. Finally, statement (10) regards the students’ preference of face-to-face learning, (57.1%) of the students
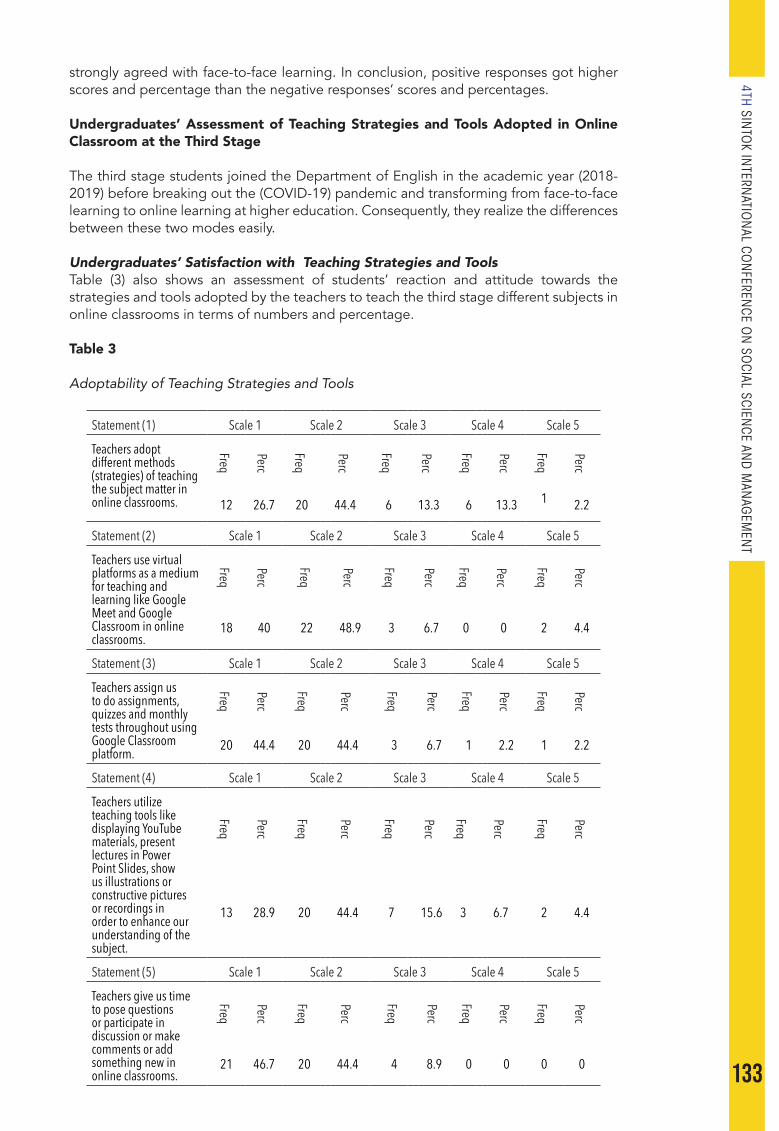
133
4TH SINTO
K INTERN
ATION
AL CON
FERENCE O
N SO
CIAL SCIENCE AN
D M
ANAG
EMEN
T
strongly agreed with face-to-face learning. In conclusion, positive responses got higher scores and percentage than the negative responses’ scores and percentages.
Undergraduates’ Assessment of Teaching Strategies and Tools Adopted in Online Classroom at the Third Stage
The third stage students joined the Department of English in the academic year (2018-2019) before breaking out the (COVID-19) pandemic and transforming from face-to-face learning to online learning at higher education. Consequently, they realize the differences between these two modes easily.
Undergraduates’ Satisfaction with Teaching Strategies and ToolsTable (3) also shows an assessment of students’ reaction and attitude towards the strategies and tools adopted by the teachers to teach the third stage different subjects in online classrooms in terms of numbers and percentage.
Table 3
Adoptability of Teaching Strategies and Tools
Statement (1) Scale 1 Scale 2 Scale 3 Scale 4 Scale 5
Teachers adopt different methods (strategies) of teaching the subject matter in online classrooms.
Freq
Perc
Freq
Perc
Freq
Perc
Freq
Perc
Freq
Perc
12 26.7 20 44.4 6 13.3 6 13.3 1 2.2
Statement (2) Scale 1 Scale 2 Scale 3 Scale 4 Scale 5
Teachers use virtual platforms as a medium for teaching and learning like Google Meet and Google Classroom in online classrooms.
Freq
Perc
Freq
Perc
Freq
Perc
Freq
Perc
Freq
Perc
18 40 22 48.9 3 6.7 0 0 2 4.4
Statement (3) Scale 1 Scale 2 Scale 3 Scale 4 Scale 5
Teachers assign us to do assignments, quizzes and monthly tests throughout using Google Classroom platform.
Freq
Perc
Freq
Perc
Freq
Perc
Freq
Perc
Freq
Perc
20 44.4 20 44.4 3 6.7 1 2.2 1 2.2
Statement (4) Scale 1 Scale 2 Scale 3 Scale 4 Scale 5
Teachers utilize teaching tools like displaying YouTube materials, present lectures in Power Point Slides, show us illustrations or constructive pictures or recordings in order to enhance our understanding of the subject.
Freq
Perc
Freq
Perc
Freq
Perc
Freq
Perc
Freq
Perc
13 28.9 20 44.4 7 15.6 3 6.7 2 4.4
Statement (5) Scale 1 Scale 2 Scale 3 Scale 4 Scale 5
Teachers give us time to pose questions or participate in discussion or make comments or add something new in online classrooms.
Freq
Perc
Freq
Perc
Freq
Perc
Freq
Perc
Freq
Perc
21 46.7 20 44.4 4 8.9 0 0 0 0

134
Third-year students affirmed that their teachers adopted different strategies in teaching them subjects in online classrooms in the sense that (44.4%) of the students chose scale (1 Agree) in their response to the questionnaire, whereas (26.7%) strongly agreed with statement (1). On the other hand, (13.3%) disagree with this statement, and (2.2%) strongly disagreed with statement. As concerns statement (2) using Google platforms, (48.9%) agreed that the teachers used such platforms, and (40%) strongly agreed that the teachers used such platforms as a medium of teaching and learning. Two students who rated (4.4%) strongly disagreed with this statement, but nobody disagreed with this statement. This statement is evidently proved by Martín-Blas and Serrano-Fernández (2009) who maintained that by using online platforms, teachers are able to upload files or provide their students with information and resources to which they had not been able to access during face-to-face classes.
In return, the students can share information, state their difficulties and receive feedback. Statement (3) has got the highest agreement where (44.4%) strongly agreed that teachers charge their students to do assignments and tests by Google Classroom, similarly (44.4%) agreed with this statement too. Those who strongly disagreed and disagreed formed (2.2%) only. The highest rate that statement (4) has acquired is (44.4%), and (28.9%) agreed with this statement too, but (15.6%) were undecided about this statement and (3%) disagreed with the content of statement (4). More interestingly, statement (5) gained the highest percentage of both scale (1) and scale (2) in the sense scale (1) rated with (46.7%) strongly agreed, and (44.4%) of the students agreed that their teachers give them time to pose questions or inquiry or comment or discuss. So, the mean average when counting scales 1 and 2 altogether, it becomes (90.1%) of the positive response of statement 5. Thus, Arkorful and Abaidoo (2014) assert that online learning stimulates students to interact with their peers or teachers to discuss and exchange attitudes and themes with each other. Eventually, both scales 1 and 2, the positive responses, raised higher scores than the negative scales 4 and 5.
Undergraduates’ Preference and Interaction with Face-to-face or Online Classroom Responses of the third stage students measure the interaction with online classrooms and their preference of which mode of learning they like. This section is essentially designated to investigate the students’ reaction to online classrooms of the academic year (2020-2021) during spreading up coronavirus (COVID-19) disease.
Table 4
Undergraduates’ Preference and Interaction
Statement (6) Scale 1 Scale 2 Scale 3 Scale 4 Scale 5
I am responsive and interacted with the teachers when they explain the subject matter in online classrooms.
Freq
Perc
Freq
Perc
Freq
Perc
Freq
Perc
Freq
Perc
16 35.6 19 42.2 6 13.3 1 2.2 3 6.7
Statement (7) Scale 1 Scale 2 Scale 3 Scale 4 Scale 5
I am able to access or reach the lectures at any time and any place and through smartphone or laptop device after being delivered by the teacher.
Freq
Perc
Freq
Perc
Freq
Perc
Freq
Perc
Freq
Perc
16 35.6 15 33.3 8 17.8 4 8.9 2 4.4
Statement (8) Scale 1 Scale 2 Scale 3 Scale 4 Scale 5
(Continued)
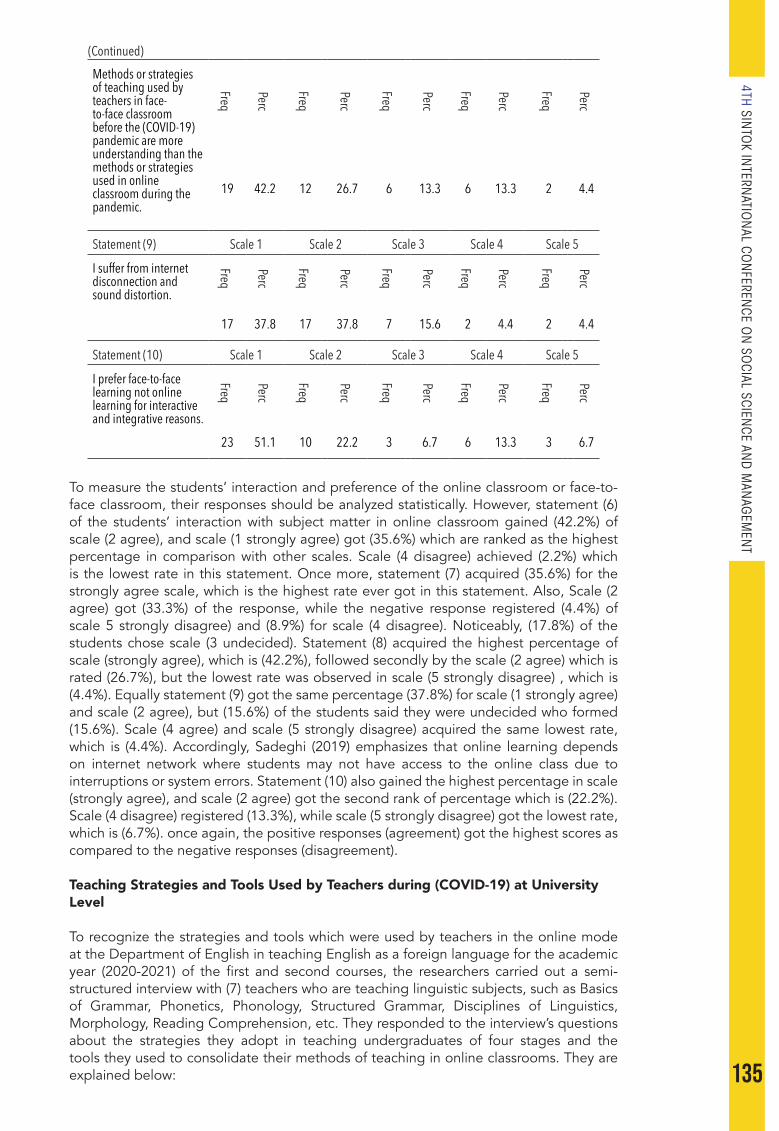
135
4TH SINTO
K INTERN
ATION
AL CON
FERENCE O
N SO
CIAL SCIENCE AN
D M
ANAG
EMEN
T
Methods or strategies of teaching used by teachers in face-to-face classroom before the (COVID-19) pandemic are more understanding than the methods or strategies used in online classroom during the pandemic.
Freq
Perc
Freq
Perc
Freq
Perc
Freq
Perc
Freq
Perc19 42.2 12 26.7 6 13.3 6 13.3 2 4.4
Statement (9) Scale 1 Scale 2 Scale 3 Scale 4 Scale 5
I suffer from internet disconnection and sound distortion.
Freq
Perc
Freq
Perc
Freq
Perc
Freq
Perc
Freq
Perc
17 37.8 17 37.8 7 15.6 2 4.4 2 4.4
Statement (10) Scale 1 Scale 2 Scale 3 Scale 4 Scale 5
I prefer face-to-face learning not online learning for interactive and integrative reasons.
Freq
Perc
Freq
Perc
Freq
Perc
Freq
Perc
Freq
Perc
23 51.1 10 22.2 3 6.7 6 13.3 3 6.7
To measure the students’ interaction and preference of the online classroom or face-to-face classroom, their responses should be analyzed statistically. However, statement (6) of the students’ interaction with subject matter in online classroom gained (42.2%) of scale (2 agree), and scale (1 strongly agree) got (35.6%) which are ranked as the highest percentage in comparison with other scales. Scale (4 disagree) achieved (2.2%) which is the lowest rate in this statement. Once more, statement (7) acquired (35.6%) for the strongly agree scale, which is the highest rate ever got in this statement. Also, Scale (2 agree) got (33.3%) of the response, while the negative response registered (4.4%) of scale 5 strongly disagree) and (8.9%) for scale (4 disagree). Noticeably, (17.8%) of the students chose scale (3 undecided). Statement (8) acquired the highest percentage of scale (strongly agree), which is (42.2%), followed secondly by the scale (2 agree) which is rated (26.7%), but the lowest rate was observed in scale (5 strongly disagree) , which is (4.4%). Equally statement (9) got the same percentage (37.8%) for scale (1 strongly agree) and scale (2 agree), but (15.6%) of the students said they were undecided who formed (15.6%). Scale (4 agree) and scale (5 strongly disagree) acquired the same lowest rate, which is (4.4%). Accordingly, Sadeghi (2019) emphasizes that online learning depends on internet network where students may not have access to the online class due to interruptions or system errors. Statement (10) also gained the highest percentage in scale (strongly agree), and scale (2 agree) got the second rank of percentage which is (22.2%). Scale (4 disagree) registered (13.3%), while scale (5 strongly disagree) got the lowest rate, which is (6.7%). once again, the positive responses (agreement) got the highest scores as compared to the negative responses (disagreement).
Teaching Strategies and Tools Used by Teachers during (COVID-19) at University Level
To recognize the strategies and tools which were used by teachers in the online mode at the Department of English in teaching English as a foreign language for the academic year (2020-2021) of the first and second courses, the researchers carried out a semi-structured interview with (7) teachers who are teaching linguistic subjects, such as Basics of Grammar, Phonetics, Phonology, Structured Grammar, Disciplines of Linguistics, Morphology, Reading Comprehension, etc. They responded to the interview’s questions about the strategies they adopt in teaching undergraduates of four stages and the tools they used to consolidate their methods of teaching in online classrooms. They are explained below:
(Continued)
136
1. Teachers always prepare the subject matter prior to the time of the lecture. The lecture is made by using Power Point Slides that contain all the details of the lecture. A few of them make it on Word Format.
2. Teachers use the Google Meet platform exclusively as a tool of delivering the lecture and communicating with their students. The teacher controls the virtual classroom through some devices that make him the classroom manager.
3. Teachers receive from some students questions about certain topics mentioned in the lecture, inquiries about the meaning of odd or unfamiliar expressions or terms, comments, and short discussions, and in returns, he responds to these inquiries and gives feedback.
4. All teachers created online Google classrooms and invited their students to join them. These Google classrooms are used to send the lectures to the students after delivering the lecture on Google Meet Screen. Also, the teachers post links of You Tube, recordings. Each lecture is posted on the Google Classroom Stream mostly with either Power Point slides or PDF formats.
5. The Google Classroom is also used by teachers to do quizzes and monthly tests. As the teachers use this tool to charge their students to do some assignments, such as doing exercises, the teachers receive their responses and place marks in the Return Mark Icon.
6. Some teachers use the Pre-recoding Lecture Method (as part of PLM), which means he records the lecture before its due date one day or two days earlier or more, then he displays it to the students in its due time as he posts it on the Google Classroom Stream or sends it to the Lecture Bank on the university website where everyone is able to access it or download it easily.
7. During presenting the lecture on Google Meet Screen, teachers usually use illustrations including images, diagrams and tables where it is required. In addition, they play audios that explain certain complicated phenomena or expressions. However, audiovisual aids and illustrations are commonly used in online classrooms where teachers said in the face-to-face classroom before the pandemic we did not use such aids and illustrations.
Teachers accordingly considered the Google Meet Screen in online classroom as a whiteboard used in face-to-face classroom in the sense that some teachers ensured that thy use the Word Format to write additional examples or explain certain terms. On the other hand, the Google Classroom is used as a medium for receiving the assignments, doing quizzes and tests, and giving feedback by the teachers. Teachers adopted certain strategies in teaching their students including open discussion of the subject matter, free questioning and inquiring about certain topics, student-stimulation method was activated by most teachers throughout praising the students and granting extra marks for participants. Demonstrating method was used to demonstrate terms or phenomena via using illustrations including images, diagrams, charts or tables. However, Odit-Dookhan (2018) affirms that online teaching and learning promote the process of education and online learning offers collaboration and quick contact with the students. As it is flexible and easy to access.
RESULTS AND DISCUSSION
To get a full insight of both groups (second and third stages) of the frequency numbers of each statement based on the five scales, there should be total numbers and rates by aggregating the numbers of the second stage with the numbers of the third stage collectively in order to gain the total percentages (mean averages). Accordingly, table (5) presents the total numbers of the participants of both second and third stages of the five scales. The percentage was calculated through a mathematical equation that results in the total percentage of each scale. It rests upon the variables of the 2nd stage rate + 3rd stage rate of each scale of each statement, which is mathematically symbolized (X + Y. Z (100) 87%= T). The outcome, which is indicated in yellow color, represents the mean percentage average of each scale in each of the ten statements. For example, scale 1 of statement 1 of the second stage’s number (5) + scale 1 of statement 1 of the third stage’s

137
4TH SINTO
K INTERN
ATION
AL CON
FERENCE O
N SO
CIAL SCIENCE AN
D M
ANAG
EMEN
T
number (12), thus X (5) + Y (12) . (100) 87% = T (19.54%). Thus, this mathematical equation (procedure) is carried out to all variables of each statement. Knowing that this equation is carried out by using a portable electronic calculator to avoid any mistakes and to attain the total average.
Table 5 Overall Statistical Analysis of the Statements
Statement No.
Scale 1Total Numbers &
Percentage
Scale 2Total Numbers &
Percentage
Scale 3Total Numbers &
Percentage
Scale 4Total Numbers &
Percentage
Scale 5Total Numbers &
Percentage
1 N=17 19.54% N=49 56.32% N=10 11.49% N=9 10.34% N=2 2.29%
2 N=30 34.48% N=41 47.12% N=10 11.49% N=3 3.44% N=3 3.44%
3 N=35 40.22% N=42 48.27% N=6 6.89% N=2 2.29% N=2 2.29%
4 N=24 27.58% N=37 42.52% N=15 17.24% N=9 10.34% N=2 2.29%
5 N=34 39% N=39 44.82% N=7 8% N=3 3.44% N=4 4.59%
6 N=22 25.28% N=38 43.67% N=17 19.54% N=6 6.89% N=4 4.59%
7 N=31 35.63% N=29 33.33% N=15 17.24% N=9 10.34% N=3 3.44%
8 N=41 47.12% N=22 25.28% N=9 10.34% N=13 14.94% N=2 2.29%
9 N=34 39% N=33 37.93% N=12 13.79% N=6 6.89% N=2 2.29%
10 N=47 54% N=16 18.39% N=17 19.54% N=14 16% N=3 3.44%
(.) is a mathematical symbol of multiplication.(T) is total average.
The statistical survey and analysis of the undergraduates’ responses indicate that higher number of the undergraduates agree or strongly agree on the items of the ten statements, for example, if someone counts the agreement responses (strongly agree and agree) together, he will find out that they form higher rates. Consequently, statement one gets (19.54%) for the scale 1 (strongly agree) with the rate of (56.32%) for the scale 2 (agree), it totally gets the rate (M average 75.86%). This mean average actually proves that there are many students who agreed that teachers adopted different strategies or methods and tools when they taught them subjects in online classrooms for two courses in the academic year (2020-2021). On the other hand, if someone counts the disagreement responses (scale 4 disagree and scale 5 strongly disagree) altogether, he will find out that they have lower rates. Thus, scale 4 (disagree) has the rate (10.34%) + scale 5 (strongly disagree) has the rate (2.29%), both give the mean average (12.63%). Such lower percentage confirms the validity of the statements presumed by the researchers. Statement (2) got (47.12%) on agreement, and strongly agreement scale 1 gained (34.48%), which totally becomes (M 81.6%), which is conspicuously a clear indicator of the great agreement on this statement. The mean average of statement (3) reaches (88.49%) if scales 1 and 2 are counted together, which proves that teachers charge their students to do assignments and tests via Google Classrooms. Statement (4), which is about whether the teachers use illustrative aides and videos, gained collectively (70.1%), which is a good rate. Statement (5) also got a very good average of agreement, which is collectively reached (83.82%).
Statement (6) regards the students’ interaction and response which got all together the mean average (68.95%), while the mean average of the disagreement (scales 4 and 5) on this statement amounted to (11.39%), which is a lower average. Statement (7) of the accessibility of the lectures through phones or computers acquired the average (68.96), and the disagreement average reached (13.78%), which is a lower average too. Statement (8) got an agreement with the average (72.4%), and this ensures, nonetheless, the eligibility of the face-to-face learning teaching methods used before the pandemic outbreak. Students’ responses to statement (9) marked by their agreement on the content of this statement that they suffer from internet disconnection, which got the average

138
(76.93%). So, the internet disconnection or outage is a major problem for the students who are learning electronically. Collectively (72.39%) of the students agreed (scales 1 and 2) on their preference to face-to-face learning due to certain causes. The outcome of this statement goes in line with the statement of Coman et al. (2020) who in their study conclude that the most appropriate teaching-learning process is to foster the face-to-face mode as they ensure that students state that online learning platforms should be used as a complementary tool in order to facilitate the process of education.
CONCLUSION
The research findings that teachers have fostered new strategies and tools in teaching the students different subjects during the diffusion of coronavirus disease. According to some teachers’ attitudes that transformation from face-to-face mode of teaching and learning to the online mode of teaching and learning due to the public lockdown paved the way to the university teachers to explore how to use Google platforms and communicate with the students and academicians or researchers across the world throughout holding scientific symposia, workshops, webinars or conferences, which were impossible to use before the pandemic. However, the pandemic is a global crisis yet it paved the way for the teachers and students to know and use different platforms connected with the internet and based on modern technology. But one of the major problems that both teachers and students encounter in online classrooms is the internet disconnection or sound distortion in the sense that (76.93%) of the students confirmed their suffering from this problem. In fact, it has been proved that teachers used different teaching tools in the teaching process like displaying You Tubes or videos having relevant information to syllabus items or presenting the lectures on Power Point slides or using some illustrations or constructive pictures or record the lectures and send it to the students via Google Classrooms where the students joined them through their academic emails. This fact has been proved by (70.1%) of the students of both 2nd and 3rd stages. As a mean average of (68.95%) assured that they were responsive and interactive with the teacher’s lecture in online classroom. According to the semi-structured interview made with the teachers at the Department of English, they used two platforms to teach the students and contact with them virtually; the Google Classroom and Google Hangout Meet given that the latter is used as a tool of presenting the lecture through its screen, which is considered as an alternative to the Whiteboard in the face-to-face classroom before the pandemic. On the other hand, (72.39%) of the students prefer the face-to-face learning method because they can see the facial expressions and movements of his lips when explaining a certain topic which gives them some clues about the topic and helps them better understand the topic being explicated. As there is much room for the students to discuss or inquiry. It has been concluded that online teaching or learning mode has advantages and disadvantages at the same time. Undergoing internet interruption or outrage and sound distortion are the major disadvantages, in addition to the absence of the physical actions and bodily gestures practiced by the teacher and students through the lecture. On the other side, online teaching or learning mode is easy to access as the teachers and students no longer need to go for miles to remote places to reach their university. Also, online mode provides the teachers and learners with platforms that let them attend or participate in international and local conferences or workshops or webinars.
ACKNOWLEDGMENT
The authors profoundly acknowledge the support made by the teaching-staff members of the Department of English and undergraduates for their full cooperation in achieving this paper.
139
4TH SINTO
K INTERN
ATION
AL CON
FERENCE O
N SO
CIAL SCIENCE AN
D M
ANAG
EMEN
T
REFERENCES
Aminuddin Hashemi (2021). Online teaching experiences in higher education institutions of Afghanistan during the COVID-19 outbreak: Challenges and opportunities. Cogent Arts & Humanities, 8(1), 1947008. https://doi.org/10.1080/23311983.2021.1947008
Arkorful, V., & Abaidoo, N. (2014). The role of e-learning, the advantages and disadvantages of its adoption in higher education. International Journal of Education and Research, 2, 397-410.
Ayeni, A. J. (2011). Teachers professional development and quality assurance in Nigerian secondary schools. World Journal of Education, 1(2). https://doi.org/10.5430/wje.v1n2p143
Bao, W. (2020). COVID-19 and online teaching in higher education: A case study of Peking University. Human Behavior and Emerging Technologies Journal. 2, 113–115. https://doi.org/10.1002/hbe2.191
Bates, A. W., & Poole, G. (2003). Effective teaching with technology in higher education. Jossey-Bass.
Bui, T.-H., Luong, D.-H., Nguyen, X.-A., Nguyen, H.-L., & Ngo, T.-T. (2020). Impact of female students’ perceptions on behavioral intention to use video conferencing tools in COVID 19: Data of Vietnam. Data Brief, 32, 106142. https://doi.org/10.1016/j.dib.2020.106142.
Carolyn, C., Clance, M., Mthembu, T., Nicholls, N., & Yitbarek, E. (2021). Online and face-to-face learning: Evidence from students’ performance during the Covid-19 pandemic. African Development Review, African Development Bank, 33(S1), 114-125, https://doi.org/10.1111/1467-8268.12520
Cole, R. A. (2000). Issues in web-based pedagogy: A critical primer. Greenwood Press. Coman, C., Laurențiu, G. Ț., Meseșan-Schmitz, L., Stanciu, C. & Maria C. B. (2020). Online
teaching and learning in higher education during the coronavirus pandemic: Students’ perspective. Sustainability, 12(24), 10367. https://doi.org/10.3390/su122410367
Cuellar, N. (2002). Tips to increase success for teaching online: Communication. CIN Plus, 5(1), 3–6.
Darius, P.S.H., Gundabattini, E., & Solomon, D.G. (2021). A survey on the effectiveness of online teaching–learning methods for university and college students. Journal of The Institution of Engineers (India): Series B. https://doi.org/10.1007/s40031-021-00581-x
Dash, S., Samadder, S., Srivastava, A., Meena, R., & Ranjan, P. (2021). Review of online teaching platforms in the current period of covid-19 pandemic. The Indian Journal of Surgery, 1–6. https://doi.org/10.1007/s12262-021-02962-4
Dhawan, S. (2020). Online learning: A panacea in the time of COVID-19 crisis. Journal of Educational Technology, 49(1), 5–22. https://doi.org/10.1177/ 0047239520934018
Dawley, L. (2007). The tools for successful online teaching. British Journal of Educational Technology (BJET), 38(5), 943-955. https://doi.org/10.1111/j.1467-8535.2007.00749_8.x
Dorgu, T. (2015). Different teaching methods: A panacea for effective curriculum implementation in the classroom. International Journal of Secondary Education. Special Issue: Teaching Methods and Learning Styles in Education. 3(6-1), 77-87. https://doi.org/10.11648/j.ijsedu.s.2015030601.13
Dron, J., & Anderson, T. (2014). Teaching crowds: Learning and social media. Athabasca University Press.
Frontier, T. (2021). Teaching with clarity: How to prioritize and do less so students understand more. ASCD.
Ganyaupfu, M. E. (2013). Teaching methods and students’ academic performance. International Journal of Humanities and Social Science Invention, 2(9).
Ghulam, M. (2019). Innovative teaching methods in higher education in Pakistani universities: An advanced training program for university teachers at ARID University, Punjab Pakistan. Südasien-Chronik - South Asia Chronicle 9/2019, S. 363-377.
Gros, B., & García-Peñalvo, F. J. (2016). Future trends in the design strategies and technological affordances of e-learning. In M. Spector, B. B. Lockee, & M. D. Childress (Eds.), Learning, design, and technology. An international compendium of theory, research, practice, and policy (pp. 1-23). Springer International Publishing. https://doi.org/10.1007/978-3-319-17727-4_67-1

140
Huang, R., Tlili, A., Yang, J., Chang, T.-W., Wang, H., Zhuang, R., & Liu, D. (2020). Handbook on facilitating flexible learning during educational disruption: The Chinese experience in maintaining undisrupted learning in COVID-19 outbreak. Smart Learning Institute of Beijing Normal University: Beijing, China.
Kelly, K., Zakrajsek Todd., & Brock Michelle (2021). Advancing online teaching: Creating equity-based digital learning environments. Stylus Publishing LLC.
Khan, B. (1997). Web-based instruction: What is it and why is it? In B. H. Khan (Ed.), Web-based instruction (pp. 5–18). Educational Technology Publications.
Kim, J. (2020). Learning and teaching online during covid-19: Experiences of student teachers in an early childhood education practicum. International Journal of Early Childhood, 52(2), 145–158. https://doi.org/10. 1007/s13158-020-00272-6
König, J., Jäger-biela, D. J., & Glutsch, N. (2020). Adapting to online teaching during COVID-19 school closure: teacher education and teacher competence effects among early career teachers in Germany. European Journal of Teacher Education, 43(4), 608–622. https://doi.org/10.1080/02619768.2020
Larreamendy-Joerns, J., & Leinhardt, G. (2006). Going the distance with online education. Review of Educational Research, 76(4), 567-605.
Leask, B., & Ziguras, C. (2020). The impact of Covid-19 on Australian Higher Education. International Higher Education, 102, 36–37.
Martín-Blas, T., & Serrano-Fernández, A. (2009). The role of new technologies in the learning process: Moodle as a teaching tool in Physics. Computer & Education, 52(1), 35–44. https://doi.org/10.1016/j.compedu.2008.06.005
Martin, A. M. (2021). Instructor qualities and student success in higher education online courses. Journal of Digital Learning in Teacher Education, 37(1), 65–80.
Miao F., Huang R., Liu D., & Zhuang R. (2020). Ensuring Effective distance learning during COVID-19 disruption: Guidance for teachers. United Nations Educational, Scientific and Cultural Organization.
Nguyen, T. (2015). The effectiveness of online learning: Beyond no significant difference and future horizons. MERLOT Journal of Online Teaching and Learning, 11(2).
Odit-Dookhan, K. (2018). Attitude towards e-learning: The case of Mauritian students in public teis. PEOPLE: International Journal of Social Sciences, 4(3), 628-643. https://doi.org/10.20319/pijss.2018.43.628643
Okmawati, Mike. (2020). The use of google classroom during pandemic. Journal of English Language Teaching, 9(2). https://doi.org/10.24036/jelt.v9i2.109293
Orfan, S. N., Noori, A. Q., Hashemi, A., & Akramy, S. A. (2021). Afghan EFL instructors’ use of teaching methods. International Journal of English Language Studies (IJELS), 3(5), 31–38. https://doi.org/10.32996/ijels
Paudel, P. (2021). Online education: Benefits, challenges and strategies during and after COVID-19 in higher education. International Journal on Studies in Education. 3, 70–85.
Petrie, C. (2020). Spotlight: Quality education for all during COVID-19 crisis (hundrED Research Report #01). United Nations. https://hundred.org/en/collections/quality-education-for-all-during-coronavirus
Popa, D., Repanovici, A., Lupu, D., Norel, M., &Coman, C. (2020). Using mixed methods to understand teaching and learning in Covid-19 Times. Sustainability, 12, 8726. https://doi.org/10.3390/su12208726
Rapanta, C., Botturi, L., Goodyear, P., Guàrdia, L., & Koole, M. (2020). Online university teaching during and after the Covid-19 crisis: Refocusing teacher presence and learning activity. Postdigital Science and Education, 2, 923–945.
Richards, J., & Schmidt, R. (2010). Longman dictionary of language teaching and applied linguistics. Longman.
Sadeghi, M. (2019). A shift from classroom to distance learning: Advantages and limitations. International Journal Research in English Education, 4(1). http://ijreeonline.com/article-1-132-en.html
Salcedo, C. S. (2010). Comparative analysis of learning outcomes in face-to-face foreign language classes vs. language lab and online. Journal of College Teaching & Learning (TLC), 7(2). DOI https://doi.org/10.19030/tlc.v7i2.88
Singh, V., & Thurman, A. (2019). How many ways can we define online learning? A systematic literature review of definitions of online learning (1988-2018). American

141
4TH SINTO
K INTERN
ATION
AL CON
FERENCE O
N SO
CIAL SCIENCE AN
D M
ANAG
EMEN
T
Journal of Distance Education, 33(4). 289- 306. https://doi.org/10.1080/08923647.2019.1663082.
Smith, P., Coldwell, J., Smith, S. N., & Murphy, K. (2005) Learning through computer-mediated communication: a comparison of Australian and Chinese heritage students. Innovations in Education and Teaching International, 42(2), 123–134.
Stephenson, J. (2001). Teaching and learning online: Pedagogies for new technologies. Routledge.
Stern, B. S. (2004). A comparison of online and face-to-face instruction in an undergraduate foundations of American education course. Contemp. Issues Technol. Teach. Educ. J. 4, 196–213.
Stronge, J. (2018). Qualities of effective teachers (3rd ed.). ASCD.
Svinicki, M., & McKeachie, W. J. (2011). Teaching tips: Strategies, research, and theory for college and university teachers (13th ed.). Wadsworth.
Treacy, B. (2021). Developing strategies for online teaching and learning, professional education. https://www.gse. harvard.edu/ppe/program/developing-strategies-online-teaching-and-learning
Vikoo, B. (2003). Learning theories and instructional process. Springfield Publishers.Wangdi, N., Dema, Y., & Chogyel, N. (2021). Online learning amid Covid-19 pandemic:
Perspectives of Bhutanese students. International Journal of Didactical Studies, 2(1), 101456. https://doi.org/10.33902/IJODS.2021167818
Womble, J. (2008). E-learning: The relationship among learner satisfaction, self-efficacy, and usefulness. The Business Review, 10(1), 182-188.

142
APPENDIX
Screenshots of Second and Third Stages’ Responses
Samples of Responses (2nd Stage)
Samples of Responses (3rd Stage)
143
4TH SINTO
K INTERN
ATION
AL CON
FERENCE O
N SO
CIAL SCIENCE AN
D M
ANAG
EMEN
T
SICONSEM2021: 079-043
ANALYZING CRITERIA USED IN DEVELOPING DESCRIPTIVE ESSAY MARKING RUBRICS FOCUSSING ON VOCABULARY USE
1Mariann Edwina a/p Mariadass, 2Mohd Hasrul bin Kamarulzaman & 3Belinda Marie Balraj
1,2&3Language Center, Universiti Pertahanan Nasional Malaysia
Corresponding author: [email protected], [email protected],[email protected]
ABSTRACT
Many have considered descriptive writing as an excellent strategy for vocabulary learning and application, simultaneously testing students’ language competence. Teachers find that the duration needed to teach students write descriptively is longer and complex because there isn’t many credible rubric or guidelines to help them teach the important components of descriptive writing. Teachers extensively employ the common 5 paragraph writing style for all types of essay that they teach their student, nevertheless this study found that to write descriptive essay, students need to focus on vocabulary use to be able to describe scenes, characters, plots or settings accurately. As such, the primary aim of this study is to investigate how teachers can prepare their teaching lessons, as well as teach students descriptive writing through a specific descriptive writing rubric, that is aligned with vocabulary competence. A total of 20 prominent descriptive writing rubrics together with its clear descriptions were gathered and analysed in this study. The analysis of the 20 rubrics were done by employing a systematic literature review. The most frequent components that were used as an assessment criteria were listed down and integrated into an exclusive descriptive writing rubric. In this study, it was found that these rubrics that were studied had their preeminence but needed improvements. The findings of this study showed that the components used to assess students descriptive writing should be focusing on description, word choice and vocabulary competence as it helps students prepare and write better descriptively. The findings also indicate that with a specific descriptive writing rubric, teachers will be able to know what should be taught in descriptive writing lessons, while being able to distinguish them from other types of writing. This exclusive rubric would also necessitate students to constantly learn new vocabulary, if they intend to be better writers.
Keywords: Descriptive writing, vocabulary learning.
INTRODUCTION
Writing has always been a major component in language learning. Shanahan (2015) cited three types of writing that include argumentative writing, informational/explanatory writing, and narrative writing. In Shanahan’s (2015) study, Appendix A referred to the Common Core State Standards that defines argumentative writing as the development of rational arguments constructed in defence of the writer’s position or claim in a given text, usually with evidence. The expository structure of informational or explanatory writing aims to enhance the reader’s knowledge in a certain subject or aid readers in the comprehension of a certain process, procedure, or concept. A narrative writing style can be employed in a wide range of tasks, such as for information, instructional, persuasive, or entertainment purposes. The Common Core State Standards covered the rudimentary types of writing styles. However, there are different methods of grouping to classify writing styles. For example, Melly (2006) stated that writing styles can be divided into five types; expository writing, where the writing serves to explain or inform; descriptive writing,
13

144
where the writing offers to show or describe; persuasive writing, where one argues either for or against an issue; creative writing, which is vague term, but it includes fiction, poetry, drama, screenwriting and autobiographies; and narrative writing, which merely conveys a story. It is clear that the writing styles mentioned in this grouping have the tendency to overlap, for example, a narrative writing may convey a story that may also be a form of creative writing. This has been broadly explained by McVey (2008), who is a proponent of the notion that “all writing is creative writing” (pg 289).
LITERATURE REVIEW
Rivers (2018) claimed that writing is complicated because it involves nuance segments of language use which are from words, sentence, grammar, to channelling those segments into written forms. Therefore, it can be postulated that for one to produce qualified written work in a specific language, one must develop the cognitive abilities to distinguish certain segments of that language. It is easy to understand the reason Rivers (2018) acknowledged that writing in a language is complicated as it was further explained in his study that a writer should be able to recognise word use and sentence structure to be able to write well. As such, one can infer that the writing process can be divided into the exploration of ideas and the transformation or conversion of these ideas into readable texts. In the transformation of ideas into readable texts, there is a silent requirement of having the cognitive ability to utilize the nuanced segments of language and channel them into the written form.
In the teaching of writing skills, there are some objectives and markers that are expected to be achieved. It was stated by the National Education Department, BSNP (2006) that the objective of teaching and learning of writing skills in Junior High School is to obtain a functional level of comprehension, whereby students can adequately communicate in verbal and written form to perform their daily activities. Moreover, upon achieving this functional level, students are able to create monologues, short functional texts and essays in the procedure, descriptive, recount, narrative, and report forms. According to the National Education Department, BSNP (2006), another marker to reach the functional level is achieving a comfortable level of linguistic competence by using correct grammar and adequate vocabulary. There are several approaches to achieve these objectives. According to Brookhart (2018), there are two approaches in teaching writing. These approaches include either focusing on the product of the writing process or focusing on the writing process itself. Brookhart (2018) stated that those who advocate a process approach in writing concentrate on the writing process. However, teachers should pay attention to the various stages of any piece throughout the writing process.
These writing approaches, including the process approach, are applied to achieve the objectives set. Essentially, they are enabling students to understand the materials and helping them to express their ideas in a manner that is grammatically sound in the English language. Additionally, Suastra and Menggo (2020) stated that a process approach in writing examines the act of composing from a different perspective, focusing as much on itself. The researchers clarified that the process approach also focuses on the procedural steps involving the drafting and redrafting a piece of work. In the process approach, the types of activities transfer from being language-focused to learner-centered, in which students have more freedom on what and how they write (Richards, 2002). However, the existing literature on the process approach does not only comprise of positive remarks and high praise. Sumekto and Setyawati (2018) claimed that the process-centered approach is insufficient in preparing university-bound students to function at the level required of them. For instance, Law students are usually required to write in an argumentative style for their assignments so that it would actually enable them to use the knowledge of process writing learnt, to convey better arguments. Naturally, these students would become proficient users in the language as they can achieve the objective of their courses, at the same time stimulate thinking abilities needed for their level.
145
4TH SINTO
K INTERN
ATION
AL CON
FERENCE O
N SO
CIAL SCIENCE AN
D M
ANAG
EMEN
T
Most importantly, it was also studied that in the process approach, the writing process is prioritised as much as the product itself. Pourdana and Asghari (2021) listed premeditated process writing activities such as writing poetry and utilizing the computer, which were executed in the classroom to enhance the motivations of both the learner and the teacher. The activities listed can be slightly modified for the use of learning other languages as effectively and at different levels of instruction. Thus, one can reasonably concur with the supposition that the process approach can be developed through regular writing practices using effective activities that provide better input, which in turn improves the students’ writing skills.
METHODOLOGY
In this qualitative study, 20 set of prominent rubrics related to descriptive writing were gathered and analysed using the summative content analysis method. Theses rubrics were obtained from the global rubric bank that stores all rubrics used by English language teachers. These rubrics were carefully checked for ‘suitability’ and selected to be used in this study. A process known as the systematic literature review (SLR) was done to categorise the rubrics. According to Dewey and Drahota (2016) a SLR allows researchers to “identify, select and critically appraise literature in order to answer research questions”. It involves clear methods to 1) perform a comprehensive literature search, 2) write a critical judgement of the individual studies gathered, and 3) integrate the valid studies using appropriate statistical techniques. As explained by Vlachopoulos and Makri (2017) in their study, the SLR in this study was done using the steps below:1. Formulate a research question2. Develop protocol3. Conduct literature search4. Select studies based on study quality5. Extract data and analyze, summarize and synthesize relevant studies6. Interpret results
Using these six steps, 20 rubrics were selected and analyzed. The assessment criteria that were included in the rubrics were list down in a table. The more criteria that appeared from other studies, the more columns were created in the table below to see if the criteria appear in the other rubrics. Ticks were inserted into the table to be statistical calculated later.
Table 1 below presents the analysis of 20 rubrics that were studied to construct a descriptive paragraph marking rubric that focuses on vocabulary use. The table shows the criteria that were used in each of the rubrics listed below and the most frequently used relevant criteria has been included in the descriptive paragraph marking rubric. The most recurring components that were used as an assessment criteria were listed down and integrated into an exclusive descriptive writing rubric. In this study, it was found that these rubrics that were studied had their dominance but needed improvements. These rubrics featured non-descriptive components as its assessment criteria such as main topic, thesis statement, topic sentences, supporting details, evidence and creativity. This is certainly not wrong, however these rubrics portray very less importance to description and variety of vocabulary use, which is actually needed for descriptive writing.

146
Table 1
Analysis of Criteria Used in Descriptive Essay Marking Rubrics
Descriptive Writing Rubric
Criteria/Items
Content (Ideas/ style)
Task fulfillment/ achievem
ent
Language & Gramm
ar
Mechanics / Conventions (capitalization,
spelling & punctuation)
Main Topic/ Thesis statem
ent/ topic sentences/ supporting details
Vocabulary (Word choice/ lexical item
s – verbs/ nouns/ adverb/ adjectives)
Creative Presentation/ Creativity/ Interesting
Descriptive language (metaphors/ sim
iles/ collocations)
Overall organization (structure/ transition/ coherence/ cohesion/ logical/clarity)
Sentence fluency (simple, com
pound, com
plex)
Format
1 (IELTS Task 1) ✘ ✔ ✔ ✔ ✘ ✔ ✘ ✘ ✔ ✔ ✘
2 (IELTS Task 2) ✘ ✔ ✔ ✔ ✘ ✔ ✘ ✘ ✔ ✘ ✘
3 (TOEFL – Independent Writing)
✘ ✔ ✔ ✘ ✘ ✔ ✘ ✔ ✔ ✘ ✘
4 (TOEFL – Integrated Writing)
✔ ✔ ✔ ✘ ✘ ✘ ✘ ✘ ✘ ✘ ✘
5 (R1*) ✔ ✔ ✔ ✔ ✔ ✘ ✔ ✘ ✔ ✔ ✘
6 (R2) ✘ ✘ ✘ ✔ ✘ ✔ ✘ ✘ ✘ ✔ ✘
7 (R3) ✔ ✘ ✘ ✔ ✘ ✔ ✔ ✔ ✔ ✔✔
8 (R4) ✘ ✘ ✘ ✔ ✔ ✘ ✔ ✘ ✔ ✔ ✘
9 (R5) ✔ ✘ ✘ ✘ ✔ ✘ ✔ ✘ ✔ ✘ ✘
10 (R6) ✔ ✘ ✔ ✔ ✔ ✘ ✘ ✘ ✔ ✔ ✘
11 (R7) ✘ ✘ ✔ ✔ ✔ ✔ ✔ ✘ ✔ ✔ ✘
12 (R8) ✘ ✘ ✔ ✔ ✔ ✔ ✘ ✘ ✔ ✔✘
13 (R9) ✘ ✘ ✔ ✔ ✘ ✘ ✔ ✘ ✘ ✔ ✘
14 (R10) ✔ ✘ ✔ ✔ ✔ ✔ ✔ ✘ ✘ ✔ ✘
15 (R11) ✘ ✘ ✔ ✔ ✔ ✘ ✔ ✘ ✔ ✔ ✘
16 (R12) ✘ ✘ ✔ ✔ ✔ ✔ ✔ ✘ ✔ ✔ ✔
17 (R13) ✘ ✘ ✔ ✔ ✘ ✔ ✔ ✔ ✘ ✔ ✘
18 (R14) ✔ ✘ ✔ ✔ ✘ ✔ ✔ ✔ ✔ ✘ ✘
19 (R15) ✘ ✘ ✔ ✔ ✔ ✔ ✔ ✘ ✔ ✘ ✘
20 (R16) ✔ ✔ ✔ ✔ ✔ ✔ ✘ ✘ ✔ ✔ ✘
R- Rubric*

147
4TH SINTO
K INTERN
ATION
AL CON
FERENCE O
N SO
CIAL SCIENCE AN
D M
ANAG
EMEN
T
FINDINGS AND DISCUSSIONS
Table 2
Descriptive Paragraph Marking Rubrics (Vocabulary Focused)
Criteria/ItemsReoccurrences in 20 Descriptive Writing
Rubric
Content (Ideas/ style) 8
Task fulfillment/ achievement 6
Language & Grammar 16
Mechanics / Conventions (capitalization, spelling & punctuation) 17
Main Topic/Thesis statement/topic sentences/supporting details 11
Vocabulary (Word choice/lexical items – verbs/nouns/adverb/adjectives) 13
Creative Presentation/ Creativity/ Interesting/ 12
Metaphors/similes/collocations 4
Overall organization (structure/transition/ coherence/cohesion/logical/clarity) 15
Sentence fluency (simple, compound, complex) 14
Format 2
As seen in Table 2, there are a few important criteria that are commonly used in a descriptive essay marking rubric. The criteria in the rubrics were categorised into 11 sections. Certain criteria with the same functions or description were labelled with different names, thus the researcher categorised these criteria in one suitable section. This includes content (ideas/ style), task fulfilment, language & grammar, mechanics (capitalization, spelling & punctuation), main topic/thesis statement/topic sentences/supporting details, vocabulary/word choice, creativity, descriptive language (metaphors/similes/collocations), organization, sentence fluency and format. The analysis on Table 2 shows the most frequent criteria that were used in international rubrics such as TOEFL, IELTS and other prominent ones in the rubrics’ bank. The analysis shows that not much focus needs to be given to the format of descriptive writing. This is because descriptive writing does not involve any format that is commonly seen in letter writing and report writing. The analysis highly indicated that language, grammar, mechanics, creativity, sentence fluency and organization are the most common criteria in the descriptive essay writing rubric. However, there was also an indication that vocabulary usage that includes word choice such as verbs/ nouns/ adverb and adjectives, and descriptive language that includes metaphors/ similes and collocations were also used to assess descriptive writing.
Based on the findings that were gathered in this study, the following descriptive writing rubric template was developed. As seen in Table 3, this template can be used by teachers and lecturers to insert criteria descriptors that suit their students level of study.

148
Table 3
A Descriptive Writing Rubric Template
Descriptive Writing Rubric Template
CRITERIA 1(C1)
SCORE
9-10(Excellent)
7-8(Good)
5-6(Average)
3-4(Weak)
1-2(Poor)
Content/ Task Fulfilment
CRITERIA 2(C2)
9-10(Excellent)
7-8(Good)
5-6(Average)
3-4(Weak)
1-2(Poor)
Language & Mechanics
CRITERIA 3(C3)
9-10(Excellent)
7-8(Good)
5-6(Average)
3-4(Weak)
1-2(Poor)
Vocabulary/ Word Choice
CRITERIA 4(C4)
9-10(Excellent)
7-8(Good)
5-6(Average)
3-4(Weak)
1-2(Poor)
Organization
After thorough analysis, a descriptive writing rubric template was created to be used to assess the descriptive writing by teachers. This particular descriptive writing rubric template allows teachers to easily comprehend the criteria that would be looked at during marking. The descriptive writing rubric template was improved several times to prevent any type of confusion and discrepancy while marking took place.
The descriptive writing rubric template is brief and comprehensive compared to other marking rubrics that focused too much on the content or mechanics of writing alone. This template was constructed after the researcher studied and considered several reliable and widely used descriptive essay marking rubrics, thus making this marking rubric highly consistent and valid. It was precisely constructed for the use of marking descriptive essays which focused mainly on vocabulary and word choice. There were four criteria that were assessed in the students’ paragraph writing task. First was Criteria 1 (C1) which focused on content/ task fulfillment. The second criteria (C2) looked at the use of language and mechanics of writing. It concentrated on grammar use, spelling, capitalization and punctuation. Criteria 3 (C3) is an extremely unique feature that was inserted in this marking rubric. The researcher realized that there was a great need for students to use a good amount of descriptive words to write descriptively. As this study focused on vocabulary use through students’ descriptive writings, the marking rubric was created to assess vocabulary use, which was not seen in other descriptive writing rubric. It was observed that most descriptive essay marking rubrics did not focus extensively on the use of vocabulary, making them not different from the common 6 trait or 5 paragraph essay marking rubric. Finally, Criteria 4 (C4) looked at the organization of the paragraph. It focused on sentence construction, coherence, flow of ideas and also the length of the paragraph. The suggested total marks for each essay was 40, where 10 marks were allocated for each criteria. The score range was categorized as Excellent (9-10 marks), Good (7-8 marks), Average (5-6 marks), Weak (3-4 marks) and Poor (1-2 marks).

149
4TH SINTO
K INTERN
ATION
AL CON
FERENCE O
N SO
CIAL SCIENCE AN
D M
ANAG
EMEN
T
CONCLUSION
Many have considered descriptive writing as an excellent strategy for vocabulary learning and application, simultaneously testing students’ language competence. Teachers find that the duration needed to teach students write descriptively is longer and complex because there isn’t many credible rubric or guidelines to help them teach the important components of descriptive writing. Teachers extensively employ the common 5 paragraph writing style for all types of essay that they teach their student, nevertheless this study found that to write descriptive essay, students need to focus on vocabulary use to be able to describe scenes, characters, plots or settings accurately. This means that teachers need to educate their students to focus and use an extensive amount of vocabulary, particularly adverbs and adjectives in their descriptive writing, compared to other types of writing such as expository, persuasive, and narrative. As such, the primary aim of this study is to investigate how teachers can prepare their teaching lessons, as well as teach students descriptive writing through a specific descriptive writing rubric, that is aligned with vocabulary competence.
This rubric is essential as it outlines the components that need to be taught in descriptive writing lessons. A total of 20 prominent descriptive writing rubrics together with its clear descriptions were gathered and analysed in this study. The most reoccurring components that were used as an assessment criteria were listed down and integrated into an exclusive descriptive writing rubric. In this study, it was found that these rubrics that were studied had their dominance but needed improvements. These improvements on components that should be assessed include placing emphasis on strength of description, summative vocabulary use, word choice and a few more. On the other hand, these rubrics featured non-descriptive components as its assessment criteria such as main topic, thesis statement, topic sentences, supporting details, evidence and creativity. This is definitely not wrong, however these rubrics portray very less importance to description and a variety of vocabulary use, which is actually needed for descriptive writing.
The analysis of the 20 rubrics were done by employing a systematic literature review. The findings showed that the components used to assess students descriptive writing should be focusing on description, word choice and vocabulary competence as it helps students prepare and write better descriptively. The findings also indicate that with a specific descriptive writing rubric, teachers will also be able to know what should be taught in descriptive writing lessons, while being able to distinguish them from other types of writing. This exclusive rubric would also necessitate students to constantly learn new vocabulary, if they intend to be better writers.
REFERENCES
Brookhart, S. M. (2018). Appropriate criteria: key to effective rubrics. In Frontiers in Education (Vol. 3, p. 22). Frontiers.
Cheng, M. W., & Chan, C. K. (2019). An experimental test: Using rubrics for reflective writing to develop reflection. Studies in Educational Evaluation, 61, 176-182.
Dewey, A., & Drahota, A. (2016). Introduction to systematic reviews: Online learning module Cochrane Training.
McVey, D. (2008). Why all writing is creative writing. Creativity or Conformity Conference, 45(3), 289–294.
Melly. (2006). All kinds of Writing (Writing description or Deskriptive Writing). Blackwell Publishing.
National Education Department, BSNP. (2006). PPK and SMK Standard of Subject Content. Purkur
Pourdana, N., & Asghari, S. (2021). Different dimensions of teacher and peer assessment of EFL learners’ writing: Descriptive and narrative genres in focus. Language Testing in Asia, 11(1), 1-22.
Richards, J. C. (2002). 30 Years of TEFL / TESL: A Personal Reflection, 1–30.Rivers, W. M. (2018). Teaching foreign-language skills. University of Chicago Press.

150
Shanahan, T. (2015). Common core state standards: A new role for writing. The Elementary School Journal, 115(4), 464-479.
Suastra, I., & Menggo, S. (2020). Empowering Students’ Writing Skill through Performance assessment. International Journal of Language Education, 4(3), 432-441.
Sumekto, D. R., & Setyawati, H. (2018). Students’ descriptive writing performance: The analytic scoring assessment usage.
Vlachopoulos, D., & Makri, A. (2017). The effect of games and simulations on higher education: a systematic literature review. International Journal of Educational Technology in Higher Education, 14(1), 1-33.

151
4TH SINTO
K INTERN
ATION
AL CON
FERENCE O
N SO
CIAL SCIENCE AN
D M
ANAG
EMEN
T
SICONSEM2021: 117-076
EQUITY CROWDFUNDING INDUSTRY AND ITS’ REGULATION IN MALAYSIA AND INDONESIA: PROSPECTS AND CHALLENGES DURING THE COVID-19 PANDEMIC
1Asmah Laili Yeon & 2Putri, U.T1School of Law, Universiti Utara Malaysia, Malaysia
2Faculty of Law, Universitas Ahmad Dahlan, Indonesia
Corresponding author: [email protected]
ABSTRACT
The aim of the paper is to discuss about equity crowdfunding industry and its’ regulation in Malaysia and Indonesia in terms of its’ prospects and challenges during the covid 19 pandemic. Therefore, it is meaningful to describe the nature of ECF in both countries and the role of its’ regulation and whether the pandemic is a blessing to the ECF industry or it makes it rearward. This paper is based on a doctrinal research which adopted the conventional legal method. Hence, to achieve its objectives two techniques were used i.e. critical and analytical approaches. The findings show that in Malaysia, In Malaysia, the ECF statistics as of 31 December 2019 shows the distribution by fundraising amount RM500,000 and below is 50%, >RM500,000 and up to RM1.5 million is 27% and >RM1.5 million and up to RM3 million is 23%. It consists of 80 successful campaigns, RM73.74 million amount were raised and involved 77 successful issuers (Securities Commission Malaysia, 2020). It shows that the ECF businesses becomes one of the new sources of investment in Malaysia. In order to regulate the ECF, the SC has introduced new rules in ECF platform registration and provision of good governance for ECF platform operators through Section 377 of Capital Market Services Act 2007 (CMSA) read together with CMSA Subdivision 4, Division 2, Part II and the publication of Guidelines on Recognized Market (GRM 2020) (Item 1.01 GRM). Section 15 (g) of Securities Commission Act 1993 (SCA 1993) clarifies that the function of these regulations is to regulate the ECF’s activities and protect the interests of the parties involved, especially investors. ECF platform operators need to satisfy the criteria in the GRM before Securities Commission can issue ECF licenses (Item 2.01 GRM). Since the launch of ECF regulation, Liz (2015) reported that countless efforts have been done by Securities Commission together with registered ECF platform to educate people and entrepreneurs on the company’s alternative financing. In Indonesia, Financial Services Authority substituted the FSA Regulation concerning Equity Crowdfunding to the FSA Regulation Number 57/POJK.04/2020 concerning Securities Crowdfunding (hereinafter as referred to as SCF). The main purpose of the regulation is to extend the scope of the crowdfunding, from limited only to offering the “shares” to offering the “securities” in the broader sense, which include debt-based securities and Sukuk. Besides, the main target of SCF FSA Regulation is broader. To conclude, in comparison to both countries Malaysia and Indonesia, the law of ECF is different in terms of the governance, process and procedure, types of investors etc.
Keywords: Equity crowdfunding, platform operator, digital business.
INTRODUCTION
On Thursday, 30 January 2020, the World Health Organization Director-General made a final decision on the determination of a Public Health Emergency of International Concern (PHEIC) of the outbreak of 2019 novel Coronavirus (2019-nCoV) (WHO, 2020c), which is now known as the COVID-19 pandemic. Since the report of the Chinese authorities’ determination that the outbreak is caused by a novel coronavirus on 9 January 2020, the first recorded case outside the People’s Republic of China is reported in Thailand on 13 January 2020 (WHO, 2020b), the COVID-19 had spread around the world including in Malaysia and Indonesia.
14

152
On 25 January 2020, the new SARS-CoV-2 virus that causes the disease COVID-19 first arrived on the shores of Malaysia. A month later, case numbers rose to 22 positive cases in February. Case numbers had ballooned 20 times to 428 cases by mid-March. In response, on 18 March 2020, Malaysian authorities released a two-week Movement Control Order (MCO). Businesses and facilities that were considered non-essential were closed. Interstate travel was heavily limited. Public sports, religious programmes and events have been postponed. After a year, the situation of pandemic in Malaysia in 2021 continuously increase in number. As of 27 February 2021, the total active cases of covid-19 in Malaysia are 27,028 and total confirmed cases are 293,315. The statistic shows that total recovered cases 270,166 (90.56%) and total death 1,121 (0.38%) (National CPRC Ministry of Health, 2021).
In Indonesia, on 2 March 2020, the Indonesian President announced the first two confirmed COVID-19 cases in Indonesia (WHO, 2020a). Indonesia’s situation then led to the spread of COVID-19 in all 34 provinces on 10 April 2020, with 3.512 positive cases (Mukaromah & Ratriani, 2020). Until 6 March 2021, COVID-19 cases in Indonesia reached 1.373.836 confirmed cases, with 147.172 in care, 1.189.510 cured, and 37.154 deaths (KawalCovid19, 2021; Komite Penanganan Covid-19 dan Pemulihan Ekonomi Nasional, 2021; Mashabi, 2021).
In response to the Pandemic, Indonesian authorities issued Presidential Regulation Number 21 Year 2020 concerning the Large-Scale Social Restriction in order to the Acceleration of Handling Corona Virus Disease 2019 (COVID-19). The regulation has then influenced some sectors, including economy. Yamali & Putri, (2020) asserted that COVID-19 impact to the economic sector includes inflation and the losses in the tourism sector which caused a decrease in occupancy. In Klaten and Wonogiri: Klepu Market, Kalikotes Market, and Wonogiri City Market had suffered an economic and social loss due to the COVID-19 pandemic. As the local government implemented a large-scale social restriction policy, the traders suffered a 50% loss due to the decrease of customers in the markets (Azimah et al., 2020).
It is clear that this pandemic would have an intensely negative effect on both countries Malaysia and Indonesia in the context of macro economy and the economic well-being of the citizen. The key sources of economic damage in Malaysia and Indonesia are twofold: the first is the spillover effect from the coronavirus’s effects abroad, and the second is caused domestically as a result of the recently imposed movement control measures. The overview of global recession can be seen from figure 1 below.
Figure 1
Overview of World Recession

153
4TH SINTO
K INTERN
ATION
AL CON
FERENCE O
N SO
CIAL SCIENCE AN
D M
ANAG
EMEN
T
The focus of this paper is to discuss about equity crowdfunding (ECF) industry and its’ regulation in Malaysia and Indonesia in terms of its’ prospects and challenges during the covid-19 pandemic. Therefore, it is meaningful to describe the nature of ECF in both countries and the role of its’ regulation and whether the pandemic is a blessing to the ECF industry or it makes it rearward.
ECF is an act in which individuals invest in a start-up company that is exempt from the stock market list. If the result goes well, the shareholder will be given partial control of the business and able to earn profits. Back in those days, only rich people and businessmen were willing to invest in start-ups. In democratising the investment procedure, the ECF platform has helped. It opened a gate to a number of investors directly, leading to a ‘crowd’ and thus ECF. The crowdfunding framework offers an interesting new environment in which to re-examine an old question in view of the pronounced benefits and extreme risks of ECF along with the shifting regulatory landscape around the world: is the competitive model of law development one that gives rise to a race to the top or a race to the bottom?
In Malaysia, the ECF is an alternative fundraising site controlled by Malaysia’s Securities Commission (SC). There are currently ten registered equity crowdfunding such as Leet Capital, Ata Plus, Pitchin, Ethis Ventures, Fundnel and others. The top Malaysian companies involve in equity crowdfunding (ECF) are ATA PLUS Sdn Bhd, Netrove Ventures Group, and Alix Global Sdn Bhd. In Malaysia, the ECF statistics as of 31 December 2019 shows the distribution by fundraising amount RM500,000 and below is 50%, >RM500,000 and up to RM1.5 million is 27% and >RM1.5 million and up to RM3 million is 23%. It consists of 80 successful campaigns, RM73.74 million amount were raised and involved 77 successful issuers (Securities Commission Malaysia, 2020). It shows that the ECF businesses becomes one of the new sources of investment in Malaysia.
In order to regulate the ECF, the SC has introduced new rules in ECF platform registration and provision of good governance for ECF platform operators through Section 377 of Capital Market Services Act 2007 (CMSA) read together with CMSA Subdivision 4, Division 2, Part II and the publication of Guidelines on Recognized Market (GRM 2020) (Item 1.01 GRM). Section 15 (g) of Securities Commission Act 1993 (SCA 1993) clarifies that the function of these regulations is to regulate the ECF’s activities and protect the interests of the parties involved, especially investors. ECF platform operators need to satisfy the criteria in the GRM before Securities Commission can issue ECF licenses (Item 2.01 GRM). Since the launch of ECF regulation, Liz (2015) reported that countless efforts have been done by Securities Commission together with registered ECF platform to educate people and entrepreneurs on the company’s alternative financing.
In the case of Indonesia, in the year 2018 before pandemic, the Indonesian authorities through Financial Services Authority (hereinafter as referred to as FSA) issued FSA Regulation Number 37/POJK.04/2018 concerning ECF. The regulation aimed to provide an alternative funding towards society by ECF method. ECF focusing on collecting funds from society as investors by offering the shares of a company. Under the ECF FSA Regulation, the company shall be in the form of Limited Liability Company (hereinafter as referred as LLC).
During the COVID-19 pandemic, on 11 December 2020, FSA substituted the FSA Regulation concerning Equity Crowdfunding to the FSA Regulation Number 57/POJK.04/2020 concerning Securities Crowdfunding (hereinafter as referred to as SCF). The main purpose of the regulation is to extend the scope of the crowdfunding, from limited only to offering the “shares” to offering the “securities” in the broader sense, which include debt-based securities and Sukuk. Besides, the main target of SCF FSA Regulation is broader. Previously the issuer company shall be in the form of a limited liability company and may offer the “share”, under the new SCF 2020 FSA Regulation, issuer company shall be a business entity which is not limited to LLC only.
154
The SCF mechanism is provided by an operator. An operator is an Indonesian legal entity who provides, manages and operates the crowdfunding. As of now, there are three SCF operators (which previously ECF platform) in Indonesia: Santara, Bizhare, and CrowdDana. Prior to the issuance of the SCF FSA Regulation, the signature of the services agreement between the Indonesian Central Securities Depository has been officially circularly executed in the middle of the COVID-19 pandemic, with Santara on 6 March 2020, Bizhare on 27 March 2020, and CrowdDana on 19 August 2020. (Indonesian Central Securities Depository, 2020, 2021).
On 4 January 2021, Indonesian authorities officially launched the SCF as expected to be technology-based alternative funding for societies especially the Small and Medium Enterprises [SMEs]. There are 23 candidates of operator. Indonesian government urges investors as well as young generation to contribute in SCF (Intan & Rahmawati, 2021). As the implementation of physical distancing policy, there’s a limited movement space. The money which usually spent for ‘moving’ activities such as spending for consumption could be transferred to electronic securities trading.
LITERATURE REVIEW
Globally, the impact of covid-19 to economy, education, social affairs and other sectors is overwhelming for example the closure of schools, universities and many small businesses particularly in the restaurant, retail and entertainment sectors. It has likewise exposed some governments’ inability — or leader’s unwillingness — to provide income and economic stimulus support to the growing number of unemployed, precarious small businesses and hard-hit economic sectors. And where support has emerged, for example in the case of South Africa, the inadequateness of one-time emergency income replacement funds has only served to heighten awareness of the longer-term implications of income insecurity and inequality, chronic unemployment and systemic inequality (Dawson and Fouksman, 2020). Even before the virus hit South Africa hard the unemployment rate in the country was a staggering 29 percent (Bronkhorst, 2020). Estimates following the closure of vast parts of the economy now forecast the unemployment rate as high as 50 percent (Charles, 2020). By comparison, at the end of April 2020 30 million Americans had filed for unemployment, raising the unemployment rate from 4 to 15 percent. The numbers were similar in Canada, with 13 percent unemployment, 9 percent in the U.K., 8.4 percent in Italy, and 5.8 percent in Germany (Kretchmer, 2020).
During financial crises, GoFundMe in United States has witnessed a dramatic rise in appeals for financial help during the outbreak of the COVID-19 pandemic. Soon after the World Health Organization (2020) declared a global pandemic 35,000 new COVID-related crowdfunding campaigns were launched on GoFundMe. This rapid expansion represents an approximately 60 percent jump in campaigns hosted by the platform in mid-March 2020, appeals that must compete for attention among a sea of upsetting personal stories of financial need. As a result, the entrepreneurial spirit of GoFundMe has exacerbated as COVID-19 plunges more people attention, with widespread calls for help necessarily being supplemented with what amounts to small-scale marketing campaigns.
There are strongly pronounced potential benefits linked to equity crowdfunding. Entrepreneurs may access the money they need to make it easier for their company to exist, which would not have been available from other outlets, such as banks, angel investors, or venture capital. Indeed, several enterprises could not have worked if they hadn’t been able to raise funds by crowdfunding. In total, there were 39 equity crowdfunding platforms from all styles of crowdfunding models worldwide, representing 7.3 percent of the 452 platforms, and there was a total of US$ 88 million raised from equity crowdfunding in 2011 and a total of US$ 1441 million raised from all platforms and all crowdfunding models (Ahlers et al., 2012; Crowdfunding Industry Report 2012).
In selected OECD countries around the world, such as Australia, the United Kingdom, Ireland, France, the Netherlands, and Switzerland, entrepreneurs can raise capital by
155
4TH SINTO
K INTERN
ATION
AL CON
FERENCE O
N SO
CIAL SCIENCE AN
D M
ANAG
EMEN
T
selling equity stakes in their companies via crowdfunding or by making open calls to investors through Internet portals. Donations, rewards-based, and lending are other examples of crowdfunding sites (for a description, see Agrawal, Catalini, & Goldfarb 2011; Ahlers et al., 2012; Belleflamme, Lambert & Schwienbacher, 2010, 2013; Bradford, 2012; Burtch, Ghose, & Wattal, 2012; Griffin, 2012; Mollick, 2012; Schwienbacher & Larralde, 2013).The Ontario Securities Commission is currently considering legislation in Canada to allow crowdfunding, primarily in response to pressure from entrepreneurs and other stakeholders on demand. The belief that a country’s legal system’s adaptability promotes access to finance is backed by empirical evidence (e.g., Beck, Demirgüç-Kunt, & Levine, 2005; Cumming &Johan, 2008). It is uncertain, however, whether securities laws should be adaptable to demand pressures to allow crowdfunding.
ECF-related potential threats are also quite pronounced. For example, through crowdfunding, an entrepreneur can squander the proceeds or raise equity capital and then issue more shares to himself/herself, diluting the equity stake held by the investors in the crowd. Entrepreneurs should simply pay themselves more and not invest the money raised in suitable projects. However, as discussed below, it is possible to minimise such risks by conditions put on entrepreneurs, websites, and investors.
RESEARCH METHODOLOGY
Research Design: This study is a doctrinal research which adopted the conventional legal method. In particular, traditional or conventional legal methods can be divided into four, namely the philosophical; historical; comparative; and critical and analytical method. In order to achieve its objectives, two techniques were used i.e. critical and analytical method. The technique of interpretation of statutes which consists of the literal rule, golden rule, mischief rule and purposive approach is employed. Here, the provisions relating to crowdfunding legislations were analyzed. Secondly, the doctrine of judicial precedent is also has been applied to analyze cases that are related to crowdfunding. Additionally, a comparative legal method has been used as this research involves comparative legal analysis of Malaysia and Indonesia.
Research Scope: The legal documents referred to for this research in the context of Malaysia, are the CMSA 2007, Securities Commission’s Guidelines on Regulation of Markets, the Companies Act 2016 and other relevant laws. As for Indonesia, the primary legal sources are among others, Indonesian Civil Code, Law Number 19 of 2016 concerning Amendments to Law Number 11 of 2008 concerning Information and Electronic Transactions, Law Number 21 of 2011 concerning the Financial Services Authority, Law Number 9 of 1961 concerning Fund Raising, Law Number 8 of 1995 concerning Capital Market, Law Number 40 of 2007 concerning Limited Liability Company and Law Number 20 of 2008 concerning Micro, Small, and Medium Enterprises.
Types of data: The source of data are primary data and secondary data. The primary data for this study are the statutes, regulations, rules, guidelines and cases relating to crowdfunding. Secondary data of this study comprises of books, legal documents, and articles from journals and online resources. Data has been collected from Sultanah Bahiyah Library, Universiti Utara Malaysia and Ahmad Dahlan University Library and also from other online database.
Data Analysis: Generally, the primary and secondary data will be analysed using content analysis. Specifically, the provisions relating to ECF under the Malaysian Capital Markets Act 2007, Securities Commission’s Guidelines on Regulation of Markets, the Companies Act 2016 and other relevant laws. As for Indonesia, the primary legal sources is the main or binding legal substance, among others are Indonesian Civil Code, Law Number 19 of 2016 concerning Amendments to Law Number 11 of 2008 concerning Information and Electronic Transactions, Law Number 21 of 2011 concerning the Financial Services Authority, Law Number 9 of 1961 concerning Fund Raising, Law Number 8 of 1995

156
concerning Capital Market, Law Number 40 of 2007 concerning Limited Liability Company and Law Number 20 of 2008 concerning Micro, Small, and Medium Enterprises. Other relevant laws will be analysed by using interpretation of statutes techniques. While, court cases that relate to ECF is analysed by using the doctrine of judicial precedent. The descriptive analysis is carried out with the purpose of stating the rules and principles of the law regarding ECF. As for analytical analysis is to investigate deeply, and evaluate every aspect of the factual data in the study.
FINDINGS
Law and Regulation of ECF in Malaysia and Indonesia
MalaysiaThe substantive law governing ECF business in Malaysia are the CMSA 2007, GRM 2020 and the Companies Act 2016. In regards to the legal protection for participants (issuers, ECF operators and investors) of ECF in Malaysia are stipulated under various statutes and guideline i.e. the CMSA 2007, Companies Act 2016, SCA 1993 and GRM 2020.
The new rules in governing ECF pertaining to platform registration has been introduced by Malaysia SC as stipulated in section 377 of the CMSA 2007. Under this section, the SC has been entrusted a power to issue guidelines and practice notes which are related to ECF i.e. the GRM 2020. The same goes to the provision of good governance. Such section 377 to be read together with Subdivision 4, Division 2, Part II of CMSA 2007 and the publication of GRM 2020 (Item 1.01 GRM). Section 377 of CMSA 2007 stipulates the SC can revoke, vary, revise or amend the whole or any part of any, guidelines and practice notes issued. Any person contravenes or fails to give effect to any guideline or practice note issued, the SC can take any one or more of the actions set out in section 354, 355 (only for derivatives exchange and clearing house) or 356 of the CMSA 2007 as it thinks fit.
Under Chapter 13 of the GRM 2020, there are three entities involved in the ECF business i.e. (i) ECF operator means an Recognized Market Operator (RMO) who operates an ECF platform where it is registered by the SC; (ii) issuer means a person who is hosted on an ECF platform to offer its shares on the ECF platform; and lastly the investors is a person who invest in any issuer hosted on the ECF platform, subject to the following limits –(a) Sophisticated investors: no restrictions on investment amount; (b) Angel investors: a maximum of RM500,000 within a 12-month period; and (c) Retail investors: a maximum of RM5,000 per issuer with a total amount of not more than RM50,000 within a 12-month period.
In ensuring the RMO fulfil its responsibility, the GRM 2020 states all ECF operator must be locally incorporated. In addition to the obligations specified in chapter 6 of the GRM 2020, an ECF operator must– (a) carry out a due diligence exercise on prospective issuers planning to use its platform; (b) ensure the issuer’s disclosure document lodged with the ECF operator is verified for accuracy and made accessible to investors through the ECF platform; (c) inform investors of any material adverse change to the issuer’s proposal as set out under paragraph 13.09; (d) ensure that the fundraising limits imposed on the issuer are not breached; and (e) ensure that the investment limits imposed on the investor are not breached.
There is a limit to funds raised from ECF platform where an issuer may only raise, collectively, a maximum amount of RM10 million through ECF platforms in its lifetime, excluding the issuer’s own capital contribution or any funding obtained through a private placement exercise (para 13.19).
157
4TH SINTO
K INTERN
ATION
AL CON
FERENCE O
N SO
CIAL SCIENCE AN
D M
ANAG
EMEN
T
Indonesia
Indonesia’s first recognition of the equity crowdfunding industry was on 31 December 2018 as the Financial Services Authority (FSA) issued Regulation No. 37/POJK.04/2018 concerning the Crowdfunding Services through Information Technology-Based of Share Offerings as known as Equity Crowdfunding. Two years later, the Equity Crowdfunding 2018 Regulation was substituted by the FSA Regulation No. 57/POJK.04/2020 concerning Securities Offering through Information Technology-Based of Crowdfunding Services as known as Securities Crowdfunding on 10 December 2020 and came into force on 11 December 2020. The newly recent regulation aims to expand the object offered in the crowdfunding services, from previously limited to “share” (equity-based securities) to “securities,” which cover not only equity-based securities but also debt-based securities and Sukuk. Therefore, FSA Regulation No. 57/POJK.04/2020 uses the term “securities crowdfunding” rather than “equity crowdfunding.”
In the consideration point of both FSA Regulation No. 37/POJK.04/2018 concerning Equity Crowdfunding and FSA Regulation No. 57/POJK.04/2020 concerning Securities Crowdfunding, they put bases on Act No. 8 of 1995 concerning the Capital Market and Act No. 21 the Year 2011 concerning the Financial Services Authority [FSA]. Basically, both the Capital Market Act and the FSA Act Law do not clearly regulate ECF or SCF. Under Indonesian Law Number 11 Year 2012 concerning the Legal Drafting, the hierarchy of legal source in Indonesia is: (i) 1945 Constitution; (ii) Decision of People’s Consultative Assembly; (iii) Law/Government Regulation Constituting the Law; (iv) Government Regulation; (v) Presidential Regulation; (vi) Provincial Regulation; and (vii) Regency Regulation. Other regulation issued by an institution which is established based on the regulation shall be recognized and have a legal binding power as long as the higher regulation order so. Under the FSA Act, FSA is an authority who has regulatory and supervisory duties towards financial services in the capital market sector. Based on that legal basis, FSA tried to issue FSA Regulation considering the equity crowdfunding which further changed to securities crowdfunding.
Article 2 section (1) FSA Regulation concerning SCF states that, “crowdfunding services are financial services activities in the capital market sector.” In its section (2) mentions that a party carrying out crowdfunding activities is considered a party carrying out financial services activities in the capital market sector. Meanwhile, Article 1 Number 13 of the Capital Market Act states that “capital market” is an activity related to: (1) Public Offering and Securities trading, (2) Public Companies related to the securities it issues, and (3) institutions and professions related to Securities. Furthermore, public offering, in article 1 point 15 of the Capital Market Act, is defined as the activity of offering securities by an Issuer to sell securities to the public based on the procedures stipulated in the Capital Market Act and its implementing regulations. Article 3 of the SCF FSA Regulation states that an offering of securities by an issuer through securities crowdfunding is not a public offering as referred to in the law concerning the capital market if:a. securities offerings are made through an operator that has obtained a license from the FSA;b. securities offering is conducted for a maximum period of 12 (twelve) months; andc. the total fund raised is a maximum of IDR 10,000,000,000 (ten billion rupiah).Based on the regulations in the Capital Market Act, the FSA Act and the FSA Regulation of SCF, there are regulatory inconsistencies. In one side, article 2 of SCF FSA Regulation considers crowdfunding services as financial activities in the capital market sectors, while it is not a public offering activity as referred in the Capital Market Act under several circumstances. However, both ECF and SCF FSA Regulation were a better solution to provide legal basis of ECF and/or SCF industry in Indonesia rather than no legal basis.
As previously been discussed, FSA Regulation No. 37/POJK.04/2018 concerning Equity Crowdfunding (ECF) has been substituted with FSA Regulation No. 57/POJK.04/2020 concerning Securities Crowdfunding (SCF). The alteration of ECF regulation to SCF regulation does not necessarily eliminate ECF activities. The new SCF Regulation aims to expand the scope and subject matter of the crowdfunding service. In particular, the
158
previous 2018 ECF Regulation covers only share-offering activity through crowdfunding services, while the 2020 SCF Regulation covers not only share-offering but also equity-based securities in a wider sense than share, debt-based securities, and Sukuk. Article 28 section (1) letter (a) of FSA Regulation NO. 57/POJK.04/2020 concerning SCF states that equity-based securities shall be one of the securities offered through the crowdfunding services platform (Peraturan Otoritas Jasa Keuangan Nomor 57/POJK.04/2020 tentang Penawaran Efek Melalui Layanan Urun Dana Berbasis Teknologi Informasi, 2020).
In the previous 2018 ECF FSA Regulation, ECF is defined as a crowdfunding service through information technology-based of share offerings. Later, the 2020 SCF FSA Regulation uses the term “securities-offering” rather than “share-offering.” Securities shall mean commercial paper such as debt instruments, commercial securities, shares, bonds, evidence of debt, collective investment units, futures contracts for securities, and securities derivatives (POJK No. 57/POJK.04/2020, Art. 1). The existence of “shares” in the definition of securities affirms that the new regulation does not eradicate ECF. Under the 2020 SCF FSA Regulation, it is logical to conclude that ECF is part of SCF.
Based on the previous 2018 ECF FSA Regulation, there are three main actors in the ECF activity: (1) the Operator; (2) the Issuer; (3) the Investor. Those actors remained the same in the 2020 SCF FSA Regulation. However, there are several amendments to the parties’ requirements as the main purpose of the 2020 SCF FSA Regulation is to expand the parties’ scope in crowdfunding activities.
An operator shall mean an Indonesian legal entity that provides, manages, and operates the crowdfunding services (FSA Regulation No. 57/POJK.04/2020, Art. 1 (5)). By “Indonesian,” it means its legal entity’s status must be established in and within Indonesian regulation. By “legal entity,” means the Operator must be established to be either as Limited Liability Company (LLC) or Cooperation (FSA Regulation No. 57/POJK.04/2020, Art. 8). Suppose the Operator chooses to be in LLC form. In that case, the company may be established and owned by an Indonesian citizen or Indonesian legal entity. Other than that, foreign citizen or foreign legal entity may become the shareholder or the owner of the Operator company with a maximum of 49% of shares (FSA Regulation No. 57/POJK.04/2020, Art. 9). The LLC Operator shall have minimum IDR 2.500.000.000, - of paid-up capital at the time of filing the request of permission.
The new 2020 SCF FSA Regulation covers the new form of an operator, which is co-operation. Under its article 10, the cooperation is limited to those who conduct business on services. Further, the Cooperation operator shall have minimum 2.500.000.000, - self-owned capital at the time of filing the request of permission. Within Indonesian company law, cooperation legal entity is regulated in the Act No. 25 of 1992 concerning the Cooperation. Highlighting on article 41 of Cooperation Act, self-owned capital (of the cooperation) consists of principal savings, mandatory savings, reserved fund and grant. The explanation of article 11 2020 SCF FSA Regulation also mentioned and refer to the article 41 of 1992 Cooperation Act. Under the 2020 SCF FSA Regulation, issuers shall be an Indonesian business entity both the legal entity one or the non-legal entity one. Alike to the prior 2018 ECF FSA Regulation, the issuer shall be in the form of limited liability company, who is able to only issue and offer the “share”. However, in the new SCF regime, there is no clear regulation on whether foreign ownership of the issuers business entity could be regarded as issuer within the 2020 SCF FSA Regulation. The regulation only says that the issuer shall be Indonesian business entity, and the issuer may be in any legal or non-legal form. By “legal entity” means in the form of limited liability company or cooperation and by “non-legal entity” means Commanditaire Vennootschap (CV), firm, or partnership, both can be the issuers of the securities and participate in the securities crowdfunding. Even more, as not has been regulated clearly, it shall be possible for a sole proprietorship to be an issuer.
Speaking of the issuers’ business entity, it might also cover the newly recognized one-man company form under the Indonesian Law Number 11 Year 2020 concerning Job Creation Law, which substituted some regulations including the Law Number 40 Year 2007
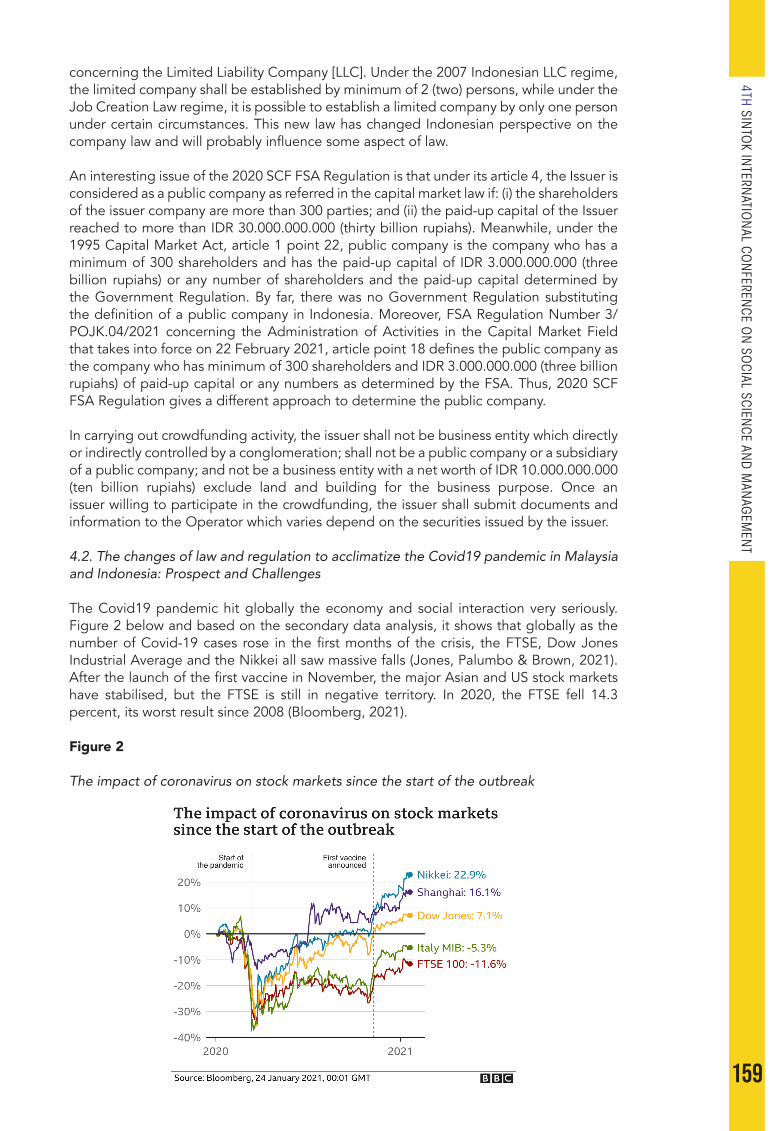
159
4TH SINTO
K INTERN
ATION
AL CON
FERENCE O
N SO
CIAL SCIENCE AN
D M
ANAG
EMEN
T
concerning the Limited Liability Company [LLC]. Under the 2007 Indonesian LLC regime, the limited company shall be established by minimum of 2 (two) persons, while under the Job Creation Law regime, it is possible to establish a limited company by only one person under certain circumstances. This new law has changed Indonesian perspective on the company law and will probably influence some aspect of law.
An interesting issue of the 2020 SCF FSA Regulation is that under its article 4, the Issuer is considered as a public company as referred in the capital market law if: (i) the shareholders of the issuer company are more than 300 parties; and (ii) the paid-up capital of the Issuer reached to more than IDR 30.000.000.000 (thirty billion rupiahs). Meanwhile, under the 1995 Capital Market Act, article 1 point 22, public company is the company who has a minimum of 300 shareholders and has the paid-up capital of IDR 3.000.000.000 (three billion rupiahs) or any number of shareholders and the paid-up capital determined by the Government Regulation. By far, there was no Government Regulation substituting the definition of a public company in Indonesia. Moreover, FSA Regulation Number 3/POJK.04/2021 concerning the Administration of Activities in the Capital Market Field that takes into force on 22 February 2021, article point 18 defines the public company as the company who has minimum of 300 shareholders and IDR 3.000.000.000 (three billion rupiahs) of paid-up capital or any numbers as determined by the FSA. Thus, 2020 SCF FSA Regulation gives a different approach to determine the public company.
In carrying out crowdfunding activity, the issuer shall not be business entity which directly or indirectly controlled by a conglomeration; shall not be a public company or a subsidiary of a public company; and not be a business entity with a net worth of IDR 10.000.000.000 (ten billion rupiahs) exclude land and building for the business purpose. Once an issuer willing to participate in the crowdfunding, the issuer shall submit documents and information to the Operator which varies depend on the securities issued by the issuer.
4.2. The changes of law and regulation to acclimatize the Covid19 pandemic in Malaysia and Indonesia: Prospect and Challenges
The Covid19 pandemic hit globally the economy and social interaction very seriously. Figure 2 below and based on the secondary data analysis, it shows that globally as the number of Covid-19 cases rose in the first months of the crisis, the FTSE, Dow Jones Industrial Average and the Nikkei all saw massive falls (Jones, Palumbo & Brown, 2021). After the launch of the first vaccine in November, the major Asian and US stock markets have stabilised, but the FTSE is still in negative territory. In 2020, the FTSE fell 14.3 percent, its worst result since 2008 (Bloomberg, 2021).
Figure 2
The impact of coronavirus on stock markets since the start of the outbreak
160
Similarly, in ASEAN, the uncertainties brought about by the pandemic also triggered a swift outflow of capital, causing a dive in the markets and a rapid depreciation of the exchange rates across the region. Around a fourth of the stock market values in Indonesia, Philippines, Thailand, and Viet Nam were wiped out. The largest drop was in Viet Nam, where the index fell by 29.3% from 936.6 at the end of January to 662.5 by the end of March. In comparison, the downswing was relatively contained in Malaysia, where the descent was limited to 11.8% (from 1513.1 in end January to 1350.9 in end March). Moreover, key currencies in the region, specifically the Thai Baht, Indonesian Rupiah, and Singapore Dollar, considerably depreciated. The largest depreciation was seen in the Indonesian Rupiah (IDR), which went from IDR13,662 per USD in end January to IDR 16,367 in end March, a 19.8% increase (ASEAN Policy Brief, 2020).
In Malaysia, in view of the new norms, digital economy plays a significance role. It refers to activities and transactions driven by the public and private sectors as well as the citizens to produce, adopt and innovate digital technologies and services in relation to socio-economic functions for enhanced wealth creation, productivity and quality of life (MDEC, 2021). The Malaysia Digital Economy Corporation (MDEC), a government agency has been aggressively pushing for small businesses and startups to take up alternative funding such as peer to peer including equity crowdfunding campaigns to raise funds. The local fintech industry is now home to alternative market-based financing platforms such as Equity Crowdfunding (ECF) and Peer-to-Peer financing (P2P) as well as a diverse range of fintech players including digital investment managers, digital asset exchanges and property crowdfunding operator. There are currently 21 ECF and P2P platforms registered with the SC, which have collectively raised RM587 million for more than 1600 MSMEs. According to Datuk Syed Zaid Albar, Chairman of the SC, these platforms continue to serve a number of MSME sectors including high tech, education, retail, F&B and consumer product; and have attracted many new investors especially young investors aged 35 and below (Securities Commission, 2019). The government of Malaysia has, under Budget 2020, allocated RM50 million to the Malaysia Co-Investment Fund (MyCIF) to help finance start-ups and SMEs by co-investing on a one-to-four basis in campaigns listed on ECF and P2P platforms. A further RM10 million has been allocated to MyCIF under Budget 2020 specifically for social enterprises to raise funds via P2P financing platforms.
Consequently, in response to the pandemic, in April 2020, the SC of Malaysia further increased the fundraising of ECF limit to RM10 million from the initial RM5 million limit. This is to allow ECF and peer-to-peer financing (P2P) schemes to operationalise secondary trading with immediate effect due to micro, small and medium enterprises interest to tap into alternative fund raising channels. Further, the Malaysia Co-Investment Fund, which is administered by the SC, has also increased its funding matching ratio from 1:4 to 1:2 for eligible ECF and P2P campaigns to provide additional liquidity into the alternative fundraising space. Looking at the high demand, the industry has to seize the opportunity to accelerate their digitalization transformations and offer more online products and services to investors, as the regulator observed a significant increase of new online trading accounts opening in recent months (SC, 2020). On 6 November 2020, the Minister of Finance of Malaysia presented Budget 2021 themed as “stand united, we shall prevail”. Tax incentive for investment in equity crowdfunding. It is proposed that individual investors be given an income tax exemption on aggregate income equivalent to 50% of the investment amount made through equity crowdfunding platform approved by the Security Commission Malaysia (SC). The eligible amount for this tax exemption is limited to RM50,000 for each year of assessment and deductible amount is capped at 10% of the aggregate income for that year of assessment with other conditions to be fulfilled. This exemption is applicable to investment made from 1 January 2021 to 31 December 2023 (Ministry of Finance, 2020).
Recently, there are amendments, effected through changes made to Schedules 6 and 7 of the CMSA 2007, have widened the categories of sophisticated investors, to include among others, individuals with investments of RM1 million in capital market products,
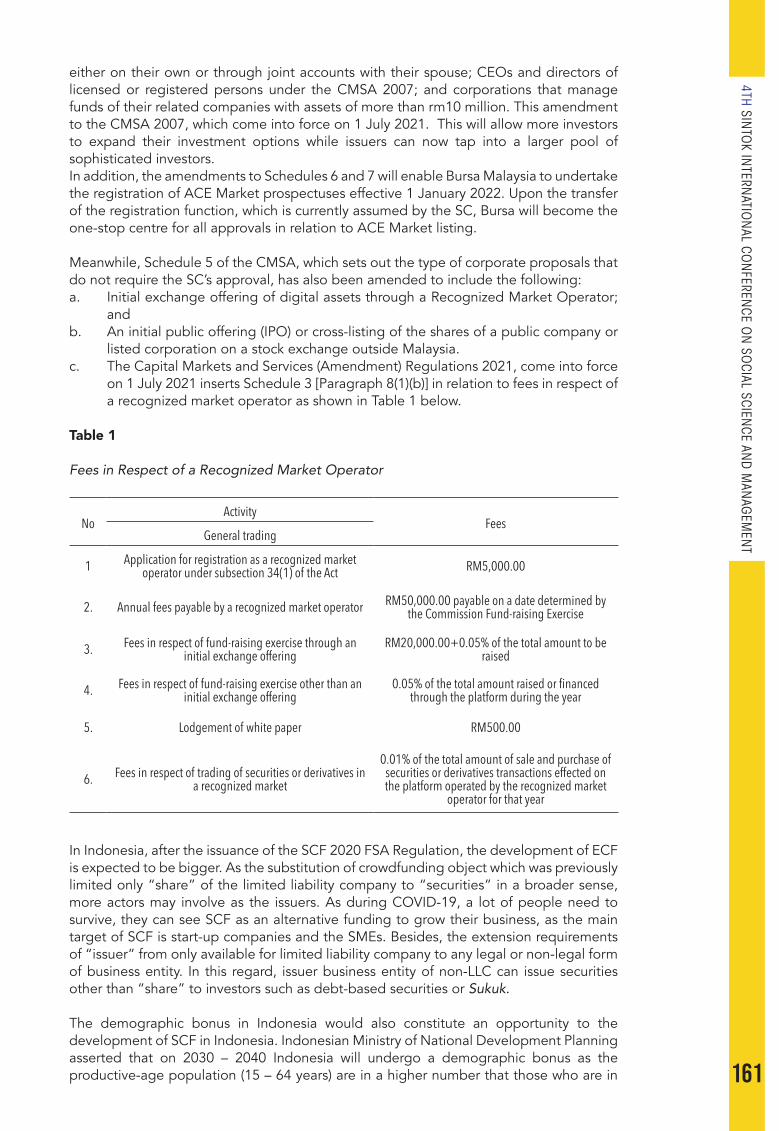
161
4TH SINTO
K INTERN
ATION
AL CON
FERENCE O
N SO
CIAL SCIENCE AN
D M
ANAG
EMEN
T
either on their own or through joint accounts with their spouse; CEOs and directors of licensed or registered persons under the CMSA 2007; and corporations that manage funds of their related companies with assets of more than rm10 million. This amendment to the CMSA 2007, which come into force on 1 July 2021. This will allow more investors to expand their investment options while issuers can now tap into a larger pool of sophisticated investors.In addition, the amendments to Schedules 6 and 7 will enable Bursa Malaysia to undertake the registration of ACE Market prospectuses effective 1 January 2022. Upon the transfer of the registration function, which is currently assumed by the SC, Bursa will become the one-stop centre for all approvals in relation to ACE Market listing. Meanwhile, Schedule 5 of the CMSA, which sets out the type of corporate proposals that do not require the SC’s approval, has also been amended to include the following:a. Initial exchange offering of digital assets through a Recognized Market Operator;
andb. An initial public offering (IPO) or cross-listing of the shares of a public company or
listed corporation on a stock exchange outside Malaysia.c. The Capital Markets and Services (Amendment) Regulations 2021, come into force
on 1 July 2021 inserts Schedule 3 [Paragraph 8(1)(b)] in relation to fees in respect of a recognized market operator as shown in Table 1 below.
Table 1
Fees in Respect of a Recognized Market Operator
NoActivity
FeesGeneral trading
1 Application for registration as a recognized market operator under subsection 34(1) of the Act RM5,000.00
2. Annual fees payable by a recognized market operator RM50,000.00 payable on a date determined by the Commission Fund-raising Exercise
3. Fees in respect of fund-raising exercise through an initial exchange offering
RM20,000.00+0.05% of the total amount to be raised
4. Fees in respect of fund-raising exercise other than an initial exchange offering
0.05% of the total amount raised or financed through the platform during the year
5. Lodgement of white paper RM500.00
6. Fees in respect of trading of securities or derivatives in a recognized market
0.01% of the total amount of sale and purchase of securities or derivatives transactions effected on the platform operated by the recognized market
operator for that year
In Indonesia, after the issuance of the SCF 2020 FSA Regulation, the development of ECF is expected to be bigger. As the substitution of crowdfunding object which was previously limited only “share” of the limited liability company to “securities” in a broader sense, more actors may involve as the issuers. As during COVID-19, a lot of people need to survive, they can see SCF as an alternative funding to grow their business, as the main target of SCF is start-up companies and the SMEs. Besides, the extension requirements of “issuer” from only available for limited liability company to any legal or non-legal form of business entity. In this regard, issuer business entity of non-LLC can issue securities other than “share” to investors such as debt-based securities or Sukuk.
The demographic bonus in Indonesia would also constitute an opportunity to the development of SCF in Indonesia. Indonesian Ministry of National Development Planning asserted that on 2030 – 2040 Indonesia will undergo a demographic bonus as the productive-age population (15 – 64 years) are in a higher number that those who are in

162
the non-productive age. Even though on the other side, this condition gives another challenges to Indonesian as related to the skills and educations of the labor in Indonesia (Afandi, 2017). The more skilled and educated the productive population are, the more developed Indonesia would be, including the development of ECF as one alternative financial service in Indonesia.
Other than that, the rapid development of technology and innovation which lead to the rapid growth of financial technology will also create a prospect and challenge to ECF in Indonesia. In one side, during COVID-19 Pandemic, the use of technology becomes massive. Most students, young generation, older generation shall be in touch to technology. Slowly, the society will get to know the new development of internet features, social media, blockchain, and financial services, including SCF. Not only that they can act as investors but also, they can participate as issuers company. On the other side, responding the swift improvement of technology is uneasy for the government. As a civil law country that shall have a written legal basis for certain activity, the regulation is somehow at the rear of the development of business and technology. Furthermore, the lack of cyberlaw, data protection and privacy law make a big challenge for Indonesia to face the criminal action and legal violation of right to privacy. Besides that, business risks might also constitute a challenge. The most important aspect of financial services is a trust from society. Somehow, business risks play a big role in determining the trust of society. The risk of default, loss, fiduciary duty, non-performing loan, liquidity, cyber-attack are some business risks examples that may influence society’s trust to crowdfunding services.
RECOMMENDATION AND CONCLUSION
ECF Industry in Indonesia grew after the issuance of FSA Regulation Number 37/POJK.04/2018 concerning Equity Crowdfunding. The industry is expected to grow bigger after the substitution of ECF FSA Regulation to the FSA Regulation Number 57/POJK.04/2020 concerning Securities Crowdfunding. The new 2020 SCF FSA Regulation covers the business entity of other than limited liability company to participate in the SCF as the issuer. Furthermore, the new regulation covers securities other than “share/stock” of a limited liability company. It shall be a basis for a future-prospects to the growth of SCF and supporting the SMEs in Indonesia. The demographic bonus in Indonesia, the spread of SMEs and start-up companies, and the massive use of technology might also be the opportunities to execute SCF activities in Indonesia.
On the other side, inconsistent regulation might constitute a challenge to the implementation of the rules. Even though, the lex superior derogat legi inferior principle may take place to settle down the problem, certain and consistent regulation constitute a better regulatory basis. Rapid development of technology and innovation, the lack of data protection legal basis in Indonesia, and business risk in the implementation of SCF, especially for the debt-based securities and Sukuk would constitute challenges to the implementation of ECF or SCF in Indonesia. In this regard, the government may consider for the amendment of capital market act and consider to the issuance of data protection act.
In the case of Malaysia, the findings of the study denote that breach of any provision in the GRM 2020 which related to ECF will amount to several actions as prescribed in section 354 and 356 of the CMSA 2007. These two sections is under the Administrative and Civil Actions Part XI. In the GRM 2020 there is no provisions which describe the offences of cybercrimes despite the ECF trading are using internet platform. Although, there are provisions in the CMSA 2007, Part V concerning market misconduct and prohibited conduct but these provisions are applicable to the approved markets where the business entities are public companies. Whether the recognized markets such as ECF markets where only locally incorporated private companies and limited liability partnerships (excluding exempt private companies) are allowed to be hosted on the ECF platform, are covered by Part V is something to be studied in the future.In conclusion, the crisis has given a significant boost to digitalisation in general and
163
4TH SINTO
K INTERN
ATION
AL CON
FERENCE O
N SO
CIAL SCIENCE AN
D M
ANAG
EMEN
T
digital business models in particular. Flexible companies, which can quickly switch to new markets and products, gain an advantage over specialised high-volume manufacturers when there is a need to react to exogenous shocks like a pandemic. The economic benefits that conventionally mandated the pursuit for economies of scale and a shift to low-wage countries are now being reconsidered. Therefore, in response to the changes in business world, the existence of law governing ECF in both countries is seen as a proactive agenda by both governments. However, based on the above discussion, the law is different between the two jurisdiction in terms of the governance, process and procedure, types of investors, issuers, penalty and compensation.
ACKNOWLEDGEMENT
The authors would like to express their gratitude to the Universiti Utara Malaysia and Universitas Ahmad Dahlan Indonesia for awarding the Research Matching Grant 2020-2021.
REFERENCES
Agrawal, A., Catalini, C., & Goldfarb, A. (2011). The geography of crowdfunding. http://ssrn.com/abstract = 1692661.
Ahlers, G. K. C., Cumming, D. J., Guenther, C., & Schweitzer, D. (2012). Signaling in equity crowdfunding. http://ssrn.com/abstract = 2161587.
ASEAN Policy Brief (2020). Economic impact of Covid-19 Outbreak on ASEAN. https://asean.org/storage/2020/04/ASEAN-Policy-Brief-April-2020_FINA.L.pdf
Bebchuk, L. A. (1992). Federalism and the corporation: The desirable limits on state competition in corporate law. Harvard Law Review, 105, 1435–1510.
Beck, T., Demirgüç-Kunt, A., & Levine, R. (2005). Law and firm’s access to finance. American Law and Economics Review, 7, 211–252.
Belleflamme, P., Lambert, T. & A. Schwienbacher. (2010). Crowdfunding: An industrial organization. [Working Paper] Louvain School of Management, Universite catholique de Louvain.
Belleflamme, P., Lambert, T. & Schwienbacher, A. (2013). Individual crowdfunding practices. Venture Capital: An International Journal of Entrepreneurial Finance.
Bronkhorst, Q. (2020, February 11). South Africa’s unemployment rate unchanged at 29.1%. BusinessTech. from https://businesstech.co.za/news/government/372994/south-africas-unemployment-rate-unchanged-at-29-1/
Bradford, S. C. (2012). Crowdfunding and the federal securities laws. Columbia Business Law Review, 1, 3–148.
Burtch, G., Ghose, A. & Wattal, S. (2012). An empirical examination of the antecedents and consequences of investment patterns in crowd-funded markets. Information Systems Research, forthcoming.
Cary, W. (1974). Federalism and corporate law: Reflections upon Delaware. Yale Law Journal, 83, 663–705.
Cheng, C. (2020). COVID-19 in Malaysia: Economic impacts & fiscal responses. ISIS Malaysia. Retrieved February 27, 2021 from https://www.isis.org.my/2020/03/26/covid-19-in-malaysia-economic-impacts-fiscal-responses/
Crowdfunding Industry Report. (2012). Crowdfunding industry report: Market Trends, Composition and Crowdfunding Platforms. Crowdsourcing.org.
Cumming, D. J,. & Johan, S. A. (2013). Demand driven securities regulation: Evidence from crowdfunding. Venture Capital: An International Journal of Entrepreneurial Finance, 15, 361-379. http://dx.doi.org/10.2139/ssrn.2296453
Cumming, D. J., & MacIntosh, J. (2000). The role of interjurisdictional competition in shaping Canadian corporate law. International Review of Law and Economics, 20(2), 141–186.
Cumming, D. J., & MacIntosh, J. (2000). The rationales underlying reincorporation and implications for Canadian Corporations. International Review of Law and Economics, 22(3), 277–330.
164
Cumming, D. J., & Johan, S. A. (2008). Global market surveillance. American Law and Economics Review, 10, 454–506.
Daines, R. M., & Klausner, M. (2001). Do IPO charters maximize firm value? Antitakeover protection in IPOs. Journal of Law, Economics, and Organization, 17, 83–120.
Daines, R. M. (2001). Does Delaware law improve firm value? Journal of Financial Economics, 62, 525–558.
Daines, R. (2002). The incorporation choices of IPO firms. New York University Law Review, 77, 1559–1611.
Griffin, Z. J. (2012). Crowdfunding: Fleecing the American Masses. Case Western Reserve Journal of Law, Technology & the Internet, forthcoming.
Hannah, J. D., & Fouksman, E. (2020). Why South Africa needs to ensure income security beyond the pandemic. The Conversation. Retrieved October 15, 2020 from https://theconversation.com/why-south-africa-needs-to-ensure-income-security-beyond-the-pandemic-137551,
Harry, K. (2020, May 13). How coronavirus has hit employment in G7 economies. World Economic Forum. https://www.weforum.org/agenda/2020/05/coronavirus-unemployment-jobs-work-impact-g7-pandemic/
Heminway, J. M., & Hoffman, S. R. (2011). Proceed at your peril: Crowdfunding and the Securities Act of 1933. Tennessee Law Review, 78, 879. https://www.bbc.com/news/business-51706225
Izwan & Partners. (2021). Equity crowdfunding: Legal tips for Malaysia companies. https://www.izwanpartners.com/equity-crowdfunding-legal-tips-startups/
Jones, L, Palumbo, D., & Brown, D. (2021). Coronavirus: How the pandemic has changed the world economy. BBC News.
Leland, H. E., & Pyle, D. H. (1977). Informational asymmetries, financial structure, and financial intermediation. Journal of Finance, 32, 371–387.
Charles, M. (2020). South Africa’s unemployment rate expected to reach 50%, IOL (27 May). https://www.iol.co.za/capeargus/news/south-africas-unemployment-rate-expected-to-reach-50-48565641
MDEC (2021). We lead Malaysia’s digital economy. https:// mdec.my.Ministry of Finance, (2020). Malaysian Budget 2021 Tax Highlights. https://pkfmalaysia.
com/media/pqnnapyn/pkf-budget-2021.pdfMollick, E. R. (2012). The dynamics of crowdfunding: Determinants of success and failure.
http://ssrn.com/abstract = 2088298. Myers, S., & Majluf, N. (1984). Corporate financing and investment decisions when firms
have information that investors do not have. Journal of Financial Economics, 13, 187–221.
Nahata, R., Hazarika, S., & Tandon, K. (2012). Success in global venture capital investing: Do institutional and cultural differences matter? Journal of Financial and Quantitative Analysis.
Nahata, R. (2008). Venture capital reputation and investment performance. Journal of Financial Economics 90, 127–151.
Ritter, J. R. (1987). The costs of going public. Journal of Financial Economics, 19, 269–281.
Roe, M. J. (2003). Delaware’s competition. Harvard Law Review, 117, 588–646. Romano, R. (1985). Law as a product: Some pieces of the incorporation puzzle. Journal of
Law, Economics, and Organization, 1, 225–283. Romano, R. (1987). The state competition debate in corporate law. Cardozo Law Review,
8, 709–757. Romano, R. (1993). The Genius of American Corporate Law. The AEI Press. Schwienbacher, A., & Larralde, B. (2013). Crowdfunding of small entrepreneurial ventures.
In D. J. Cumming (Eds.), Oxford handbook of entrepreneurial finance (pp. 369–391). Oxford University Press.
Schwienbacher, A. (2008). Innovation and venture capital exits. Economic Journal, 118(533): 1888–1916.
Securities Commission. (2019). Securities commission Malaysia’s annual Fintech conference returns for the sixth year. https://www.sc.com.my/resources/media/media-release/securities-commission-malaysias-annual-fintech-conference-returns-for-the-sixth-year.
165
4TH SINTO
K INTERN
ATION
AL CON
FERENCE O
N SO
CIAL SCIENCE AN
D M
ANAG
EMEN
T
Securities Commission. (2020). SC lifts equity crowdfunding fundraising limit. https://www.theedgemarkets.com/article/sc-lifts-equity-crowdfunding-fundraising-limit.
US Securities Securities Commission. (2020). SEC provides temporary, conditional relief to allow small businesses to pursue expedited crowdfunding offerings. Retrieved April 1, 2021 from https://www.sec.gov/news/press-release/2020-101
World Health Organization. (2020, April 27). Archived: WHO timeline — COVID-19. Retrieved May 27, 2020 from https://www.who.int/news-room/detail/27-04-2020-who-timeline---covid-19.
166
SICONSEM2021 080_046
COPYRIGHT INFRINGEMENT AND PROTECTION OF SHORT VIDEO IN CHINA
1Zhangchunyu & 2Zinatul Ashiqin Zainol1&2Universiti Kebangsaan Malaysia
Corresponding author: [email protected]; [email protected]
ABSTRACT
With the development of network technology and the rapid development of social media, users have more and more demand for the interactive and real-time content of social media. Short videos with short duration but rich content have largely met the needs of users. However, with the rapid increase in the number of social users and the rapid development of the short video industry, related legal issues have arisen, in particular, copyright infringement cases have become hot issues. Among that, the most famous case in China is “Tik Tok short video” appeals to “Huo Pai short video”. This case triggered a short video copyright debate. This case is of milestone significance. The court for the first time identified an original short video composition. works. The short video industry is developing rapidly and the scale of the industry is huge. It is precisely because the short video industry is developing very fast that China is still in a period of groping about how to protect copyright relate to short video, a rapidly developing emerging product. The copyright protection of short videos is not only a hot issue discussed in the theoretical circle, but also a focus issue in judicial practice. Therefore, based on this kind of social hotspot phenomenon, this paper discusses the copyright infringement and protection of short videos. This paper provides suggestions for the improvement of short video copyright protection system in China and promotes the healthy development of the short video industry.
Keywords: Short video, copyright infringement, copyright protection,
INTRODUCTION
With the development of information technology and the advent of the 5G era, the social platforms and media that netizens are exposed to are far from being able to meet their own social needs, so short mobile videos as a new form of self-media began to explode. Short video breaks the existing social model to a certain extent. Whether it is government agencies, enterprises or ordinary netizens, all users can apply for an account on the short video platform such as (give examples here) to establish an exclusive social model. While the rapid development of short videos is gaining benefits, various infringement issues continue to occur in the short video industry, among which short video copyright disputes are the most common.
In China, according to the China Internet Statistics Report, as of June 2021, the number of online video users in China has reached 944 million, an increase of 17.07 million from December 2020, accounting for 93.4% of the total Internet users (CNNIC, 2021). Among them, the number of short video users is 888 million, an increase of 144 million from December 2020, accounting for 87.8% of the total netizens (CNNIC, 2021). In 2021, short video applications are also booming in overseas markets, harvesting a large number of loyal fans abroad. These data are sufficient to see that the number of short video users is huge. According to the Chinese National Copyright Administration, a total of 570,000 works were suspected of infringing on 15 short video platforms including Douyin, Watermelon, and Kuaishou video were finally deleted in the special action of Jianwang in 2018 (NCAC, 2019). In 2017, Kaishou appealed the copyright infringement case of the short video of Budao and PPAP. In 2018, Douyin sued Baidu for 13-second short video claim 1.05 million copyright infringement case aroused great attention and
15
167
4TH SINTO
K INTERN
ATION
AL CON
FERENCE O
N SO
CIAL SCIENCE AN
D M
ANAG
EMEN
T
in-depth research in copyright academic circles (Liao, 2021). Thus, in the era of rapid development of new media in China, short video platforms have become a field where copyright infringements frequently occur. The copyright protection issues related to short videos need to be resolved urgently. Whether it is necessary to protect short videos, the judgment of short video infringement, and how short video creators’ works are protected, are all key to short video infringement and protection.
LITERATURE REVIEW
At present, neither academia nor the short video industry have reached a consensus on the definition of short video. In 2017, CBN Commercial Data Center in the Big Data Insights of Short Video Industry defined short videos as the video format within 15 minutes that can be published and shared on the corresponding social media platforms with the help of the fast shooting and beautifying and editing functions of the smart terminal (Bennerhad, 2020). It can satisfy the user’s expression and sharing needs to the greatest extent. In China’s Short Video Industry Report published by iResearch, short video is defined as an online video with a playback time of less than five minutes, which has the characteristics of strong social attributes, low creation threshold, viewing time and convenient scenes (iResearch, 2018). In academia, Zhu et al. (2020) believe that short videos are new video formats that are mainly filmed, scored, and edited on smart mobile terminals, and can be uploaded, interacted, and shared on social platforms in real time (Zhu et al., 2020). The duration is significantly shorter than that of traditional videos. video. Ziyi (2020) points out that short video refers to a new form of video that is short in duration and diverse in content. It relies on smart mobile terminals for creation and playback, and is mostly shared and disseminated in real time through social media platforms. In addition, Shi & Chung (2019) states that short videos are videos that are generally less than 5 minutes long that are shot, edited, and uploaded to the Internet using smart terminals and digital technology. Judging from the definition of short video in the short video industry and academia, the definition of short video is different in understanding and thinking. Therefore, the definition of short video has not yet formed a consistent view. One of the fundamental reasons for this situation may be that the research time is relatively short, and with the passage of time and the deepening of research, the definition of short video will eventually form an accepted view.
There is also no consensus on the classification of short video categories. In the academic field, short video types are divided into four categories based on the characteristics of short video production and the main content of the content, namely short documentary type, Internet celebrity IP type, creative editing type, and hand-sharing type. Some people divide short videos into different ways of content generation: UGC, PGC and PUGC (Xu, 2017).
Regarding the responsibility and avoidance of online service platforms in short video copyright infringements. This issue is a focus of attention in the field of copyright infringement. Meng (2019) has conducted a detailed analysis of this issue and provided specific measures for the exemption of liability for network service platforms (Meng, 2019). She proposed that in response to the current short video copyright disputes, network service platforms should increase their duty of care. In the face of the frequent occurrence of short video copyright infringement problems, the protection of short video copyright has become urgently important, and scholars on its protection measures have also put forward their own views from various aspects. For example, Guo (2016) analyzes the duty of care of short video content producers, short video comprehensive platforms, and short video sharing and promotion platforms from the perspective of duty of care. Li (2017) put forward protection suggestions from the perspective of protecting short videos themselves and improving the duty of care of third-party integrated platforms. Sun (2019) put forward perfect ideas from the short video platform specification and short video related legal protection. It is also believed that short videos are divided into two types: short videos with originality and those without originality, and different types of protection are provided for different types. For this point of view, Xu (2019) has also

168
expressed a consistent point of view in “Exploring the Path to Short Video Copyright Protection” (Xu, 2019).
In summary, scholars have not yet reached a common understanding of the definition and classification of short videos. For copyright infringement disputes, scholars believe that there are mainly direct infringements and indirect infringements. The specific application of the infringement liability and corresponding liability of the network platform, and the specific application of the first-level safe haven principle is still under discussion in the academic circles. Regarding the protection of short video copyright, most scholars have also put forward corresponding suggestions from the perspective of legislation and judicial practice, but they have not yet formed a system.
On the other hand, research on short videos in other countries mainly focuses on the commercial value of short videos. In the field of short video protection, it mainly involves the issue of whether short videos are works, short video-related copyright disputes, and the protection of short video copyrights. Understanding of the originality of the work. Copyright laws in the world can be divided into copyright system and author’s right system. The originality in modern British copyright includes independent completion and the author’s creative investment (Sterling, ). The originality of creation in the US copyright system is relatively low, and it emphasizes that the work must have a small amount of creativity (Paul, 1999). In countries with the authorship system, Goldstein (1999) points out that France emphasizes that originality stems from the author’s creative choice and responsibility (Sterling,. After experiencing “creative height” and “small copper coin theory”, Germany has made stricter judgments on originality and promulgated identification standards. Specifically, they borrowed from the “The Idea-Expression Dichotomy.” Chen, 2008).
To sum up, it can be seen that the research on short video copyright protection in other countries is still in the exploratory stage, but the research results of other countries have great reference significance for the issue of originality determination.
METHODOLOGY
This research mainly uses qualitative research methods. Libraries, CNKI, China Judgment Documents Network and various related Internet resources, consulted and collected a large number of related materials (including documents, periodicals, books, etc.) are fully utilized, and are analyzed by researcher to obtain a large amount of useful second-hand data. This research makes use of the relevant theories, viewpoints and methods of Internet copyright, and quotes scholars’ research results to supplement and improve this research to ensure research more rigorous and persuasive.
Short Video Overview
Definition of Short Video
With the advent of the information age, the pace of society is accelerating, and people’s lives are getting faster and faster. Under this social background, short videos cater to the leisure and entertainment needs of contemporary people with its own convenience and immediacy. As a result, the rapid development, the current very popular Douyin, Kuaishou, etc. have become the primary choice for contemporary people to relax and entertain. According to the definition of Baidu Encyclopedia, short video refers to high-frequency video content that is played on various new media platforms and suitable for viewing in mobile and short-term leisure states, ranging from a few seconds to a few minutes. The content incorporates themes such as skill sharing, funny humor, fashion trends, social hot spots, street interviews, charity education, advertising creativity, and commercial customization. Because the content is short, it can be a separate film or a series of columns.
169
4TH SINTO
K INTERN
ATION
AL CON
FERENCE O
N SO
CIAL SCIENCE AN
D M
ANAG
EMEN
T
Classification of Short Videos
According to the different creators of short videos, it can be divided into the following three categories: UGC, PGC and PUGC (Sun, 2019). UGC refers to user-generated content. The “user” here refers to ordinary users on the network. Short videos shot by them and uploaded to platforms such as Kuaishou and Douyin fall into this category. PUGC refers to the content generated by professional users. Most of the “professional users” here have a certain degree of influence or expertise in a certain field, and have formed their own style system. They contract with the platform to use short videos as their business, and they will regularly The updated short videos fall into this category. PGC refers to the content generated by a professional organization, which is usually shot by a professional production team. The content is well-produced and has a certain brand effect.
The Originality Analysis of Short Video Copyright
Originality is a necessary condition for short videos to obtain copyright protection, and short videos that obtain copyright protection must have originality (Eskicioglu et al.,2003). Originality cannot exist alone. It must be presented on a certain carrier. Thought is the abstract carrier of originality, and expression is the concrete carrier of originality. Both thoughts and expressions need to be perceived by the outside world through works. Therefore, this research cannot talk about the identification of originality without the short video itself. According to the dichotomy of thought and expression, it can be divided into two sets: one is a set that is not protected by copyright law-thought, the originality of the thought level contained in short videos is in this set; the other is protected by copyright law-expression, the originality of the expression level contained in the short video is in this collection. It can be seen that the identification of the originality of the short video discussed in this research is the identification of the originality of its expression level. However, thought and expression are not completely separated. For the division of ideas and expressions in short videos, the three-step test method of “abstraction-filter-comparison” in the determination of copyright infringement in Chinese judicial practice can be used.
This is similar to the Abstractions Test method established by Judge Hand. In the case of Nichols v. Universal Pictures, namely, United States Court of Appeals for the case on copyright infringement by non-literal copying of a dramatic work, Judge Learned Hand thinks that the protection of literature is not limited to accurate texts (Michael, 2019). Since it is impossible to draw a clear boundary between ideas and works, Judge Hand proposed Abstractions Test. It excludes content that belongs to the category of ideas, basic materials, and the public domain. In the case of Kuaishou v. Huaduo (Xia, 2018), the court’s determination of whether the short video involved in the case was original was also based on the originality of its expression. A distinction is made between contents such as plans and basic materials or public domain information with a high degree of universality. When judging the originality of short videos, the short duration and small creative space negate the common reasons for the originality of short videos. Duration is one of the important characteristics of short videos, which compresses the creative space to a certain extent and limits the content of expression, but this does not mean that the expression of short videos is the only product of the ideological category due to this reason. On the contrary, although the duration of a short video is relatively short, it can form a variety of expressions within a limited time by combining, designing, and arranging various elements such as copywriting, soundtrack, scenes, and special effects. Therefore, the length of time is not necessarily related to the determination of originality.
Through the above analysis, it is not difficult to see that in judicial practice, the grasp of originality is relatively flexible. This is because legislation only stipulates originality but does not specify the criteria for determining originality in China. Therefore, in judicial practice, judges are more sensitive to originality. The determination of originality has greater discretion. Therefore, it is not advisable to adopt a “one size fits all” model to determine the originality of short videos. Comprehensive judgments should be made in the case of specific types of short videos. Generally speaking, short video can constitute
170
a specific expression with originality, and its originality is reflected in: first, short video creators independently create and complete short videos; second, short video creators’ pictures, dialogues, subtitles, and soundtracks of short videos, special effects and other personalized selection, combination and processing of one or more elements.
Characteristics and Types of Short Video Copyright Infringement
Characteristics of Short Video Infringement
At present, the short video industry is developing rapidly. In the current network environment, there is no unified administrator for short videos, and there are no management rules specifically applied to all short videos. Short video users and short video platforms have relatively greater freedom of behavior. At the same time, a series of infringements have occurred, and they all have these characteristics.
(1) Difficulty to determine the subject of the infringement
The characteristics of convenient network transmission, easy copying, and low cost greatly weaken the exclusivity of short video copyrights. It is difficult for copyright owners to control the large number of violations of their rights in the network environment. The subject of short video copyright infringement may be short video users, short video platforms, or short video users and short video platforms that constitute a joint infringement. Short video users’ infringement behaviors in the network environment are scattered and large in number. The nicknames used by short video users are often not real names, and it is difficult to determine their true identity, resulting in high costs for copyright owners to defend their rights. In practice, infringements of short video users are filed There are very few lawsuits.
(2) The nature of infringement is hard to define
Whether it constitutes an infringement and what kind of rights are infringed are often the focus issues in the trial of short video copyright disputes. Whether the short video involved can constitute a work in the sense of copyright law has also become a key issue. The definition of works1 in Copyright Law in China does not include short video works, and the current judicial practice is to identify short videos that meet the originality standards as electronic works, and the determination of originality depends on the discretion of the judge, which means that there may be different judgments in the same case. Short video copyright infringement is closely related to information network technology. In short video copyright infringement disputes, the determination of infringement must not only be based on traditional copyright infringement theory, but also combine the characteristics of information network technology.
(3) It is difficult to obtain evidence for infringement
The dissemination speed of short video works is fast and the dissemination range is wide. Therefore, while technology brings convenience, it also creates convenient conditions for the occurrence of infringements. It is no exaggeration to say that the infringement of the copyright of short videos can be completed in just a few seconds. The digitization and informatization of short video works determine the concealment of short video copyright infringement. Compared with traditional copyright infringement, short video copyright infringement comes and goes invisible, and it is difficult to collect evidence. Difficulty in obtaining evidence for infringements increases the difficulty of rights holders’ rights protection, and it is difficult to effectively curb infringements in a timely and effective manner. The current effective method is to register short video works with DCI. The monitoring and evidence collection function in the DCI system can better fix and collect evidence.

171
4TH SINTO
K INTERN
ATION
AL CON
FERENCE O
N SO
CIAL SCIENCE AN
D M
ANAG
EMEN
T
Types of Copyright Infringement of Short Videos
With the rapid development of the short video industry, many high-quality short videos are well known, but a large number of copyright disputes inevitably arise. Judging from the large number of copyright disputes in current practice, short video copyright infringement manifestations are endless, showing diversified characteristics, which can be roughly summarized into two categories: short video infringement and short video is infringed.
(1) Short video infringement
The short video infringement discussed in this study mainly refers to the short video infringement of the copyright that others legally enjoy in the process of production and dissemination. The current short video infringement mainly includes the following forms:The first is to split the long videos such as theater movies, hit shows, variety shows, and sports events into several short videos for dissemination without permission, that is, “long and short videos”. At present, there are some short video users and short video platforms that specialize in this kind of “long-term dismantling and short-term” business for profit. Pay-to-play programs are often the hardest hit area for such infringements. This will undoubtedly lead to a decrease in the number of clicks on video sites that spend huge amounts of money to purchase copyright, The income is damaged, and even the normal copyright transaction order is disrupted. The second is to use other people’s music and text works in short videos without permission. For example, the Bigger Institute used the music work “Walking on The Sidewalk” as its short video soundtrack without authorization (Leps, 2019), which was found by the court to constitute infringement. In practice, such infringements are not rare. In particular, the infringement of the copyright of music works is the most common. This is mainly due to the lack of copyright awareness of most short video creators and direct use of copyrighted works for others.
(2) Short video is infringed
The phenomenon of short videos being infringed is very common, especially short videos produced by well-known video bloggers on the Internet are infringed higher. At present, short videos are infringed mainly in the following forms:The first is to move short videos of others without permission. Short videos are actually very easy to transport, which can be described as “micro-processing piracy”. The usual method is to copy and paste the link of the short video into the handling software and then download the short video directly. The handling software can also remove the watermark and modify the MD5 value, and pass it later. Operations such as modifying the parameters, the number of video frames, adding and deleting titles and endings complete the short video. This seems to be the creation of a new short video, which is essentially a plagiarism from the original short video. The second is to compile or adapt others’ short videos without permission. People are no stranger to this form of infringement of splitting a long video into several short videos, and the copyright owner of a long video is often a film and television company with a professional rights protection team that can take timely measures to stop the infringement of its copyright. However, there is another form of infringement that integrates and edits several short videos or short video clips to grow videos. Basically, a large number of unauthorized short video collections can be searched on various short video platforms. This form of infringement can be seen. Not in the minority, it should be taken seriously. Moreover, driven by the interests of winning in the field of short videos, some people use malicious editing of other short videos to gain attention, thereby increasing the number of clicks and making huge profits. Malicious editing involves not only the infringement of the copyrights legally enjoyed by the short video creators, but also the infringement of the portrait rights and reputation rights of the short video creators. Since the copyright owners of short videos are often single-handed individuals, it is difficult and costly to protect the rights, which has caused many short video copyright owners to directly give up their rights protection, resulting in more unscrupulous infringements.
172
The improvement of short video copyright infringement identification and protection system
Elements of Short Video Infringement Determination
Regarding the constituent elements of general infringements, the laws of various countries are not consistent. France advocates three elements, and German civil law advocates four elements. The Chinese legal profession is more inclined to four elements (Loren et al., 2019). The illegal act of short video copyright infringement mainly refers to the loss of the short video copyright owner caused by the illegal act of the infringer. This loss can be the infringement of legal rights or the loss of profit. First of all, this kind of infringement must be copyrighted short videos. Short videos that do not constitute works are not the object of copyright protection in the copyright law, so they are not the constituent elements of the short video copyright infringement discussed here; secondly, the illegality of this kind of infringement must be outside the defense of copyright infringement, that is, it does not belong to the fair use of copyright, statutory license, invalidation of copyright, and expiration of litigation. Finally, this kind of infringement must be objective, that is, this kind of infringement is a real occurrence. For the infringed object, the short video has been objectively “changed”, and this change is a change in form or content.
In terms of damage facts of short video copyright infringement, the damage fact has the characteristics of objectivity and certainty. First of all, the objectivity of damage means that the damage is a fact that has occurred, and the actions of the infringer have caused objective damage to the short video of the short video copyright owner, irreversible damage or hindering the short video copyright owner’s rights. Exercising, that is, although it has not caused concrete and visible loss of property, such damage can be truly foreseen. Secondly, the certainty of the loss facts does not mean that the infringer infringes the short video copyright owner’s short video to form a definite and visible loss of property. It means that the occurrence of such infringement will inevitably bring about the short video copyright. Inappropriate reduction of interests or rights, only short video infringement damage is confirmed, and short video copyright can be remedied for infringement liability.
As for the causal relationship between short video copyright infringement and the fact of damage, the determination of this causal relationship is objective, that is, this logical relationship exists objectively and is not a subjective conjecture, that is, the fact that the infringement of short video copyright infringes the short video copyright owner’s rights and interests.
Regarding the subjective fault of the short video copyright infringers, subjective fault refers to the subjective psychological state of short video copyright infringers when they infringe on short video copyright. There are two main types of subjective faults: intentional and negligent. Intentional, that is, the short video infringers are active and are subjectively aware of the illegality and impropriety of their actions. As for whether the perpetrators are aware of or anticipate themselves the act of causing losses to the copyright owner of the short video shall not be considered. Negligence, that is, short video copyright infringers are not actively pursuing the psychological state of infringing short video copyrights, but it cannot be considered that negligence means that the perpetrator is subjectively passive. This kind of negligence means that the perpetrator infringes the short video copyright Subjectively, he did not realize the illegality and impropriety of his behavior. Most of his behaviors were subjectively “joking”. This kind of subjective negligence mostly occurs among ordinary Internet users. The reason is that the awareness of copyright protection is weak.

173
4TH SINTO
K INTERN
ATION
AL CON
FERENCE O
N SO
CIAL SCIENCE AN
D M
ANAG
EMEN
T
Suggestions for Improving Short Video Copyright Protection System
(1) Good at using technical means
In this era of rapid development of the Internet, a large number of short videos are created every day. In the face of a large number of short video works, it is difficult to effectively reduce the infringement in the traditional copyright protection method that only relies on the short video rights holder’s after-relief. After short videos are created, they are usually disseminated to the public through short video platforms, and high-quality short video works are also one of the core competition manifestations of short video platforms. Short video platforms should play a more active role in the protection of short video copyrights. Short videos are participants in the advancement of network technology, and their creation and dissemination are inseparable from technical support, and the copyright of short video should also receive more complete technical support.
China can learn from the pre-review mechanism of YouTube in the United States. The YouTube platform has built a Content ID system (YouTube Help, 2021). The Content ID system has a huge video data comparison library. After the actor uploads his video to the YouTube platform, the platform will match the uploaded video with the existing video audio and video in the database. If the match is successful, it proves that the upload is successful. The video may have copyright infringement, and the platform will automatically generate a notice to feed back the situation to the right holder. Regarding the post-incident punishment mechanism, copyright warnings are the main punishment method on the YouTube platform. If a YouTube user receives a copyright alert, the platform will prohibit them from uploading videos, posting posts, etc. within a certain period of time; if a YouTube user receives three copyright alerts in total, all videos in the user’s channel will be deleted by the platform, even the user’s The channel will also be permanently removed and no new channels can be created.
China has also accumulated a certain amount of Chinese experience in pre-audit technology. Keyword filtering technology is currently a relatively mature text content review technology. It sets the words that may have the risk of violation as characteristic keywords and establishes a keyword database, and uses the keywords in the database to match the content uploaded by users, and can initially screen out the content with the risk of violation. In the field of video content review, it can generally be split into two parts: image and audio for review. The image part adopts key frame technology to review frame by frame, and accurately captures the hidden violation pictures; the audio part adopts voice recognition technology, which can identify both the illegal vocabulary and the illegal sound. The technology involved in the above content compliance review can also be applied to the copyright infringement review, which can be achieved only by optimizing the program algorithm in the technical means. Regarding the punishment afterwards mechanism, China’s Regulation on Administration of Online Short Video Platforms2 requires all online short video platforms to establish and share the “illegal uploading account list”, and at the same time, users on the blacklist will be banned for one year, three years, and permanent according to the severity of the plot.
In summary, in terms of the pre-review mechanism, short video platforms can use existing technology for standardized operations. First, the platform can use keyword search technology to preliminarily filter out short videos that contain infringing keywords. Secondly, the platform can also use voice recognition technology to filter short videos again by comparing audio, voice recognition, etc., to screen out the unauthorized use of short music videos that are copyrighted by others. Regarding the mechanism of follow-up and punishment after the event, the short video platform can also establish rules and regulations. On the one hand, short video platforms can establish a sound blacklist system, increase penalties for short video publishers who have repeatedly infringed, and blacklist platform users who have published infringing short videos multiple times, and prohibit them from publishing short videos within a certain period of time. Video, if the circumstances are serious, take permanent banning measures. On the other hand, the short video platform should also establish a sound complaint and feedback mechanism.
174
The short video platform should provide users with convenient and effective complaint channels, and provide timely feedback on user complaints.
(2) Establish a comprehensive protection system
China is currently still in the exploratory period for copyright protection of short videos, which is working hard to find an effective protection plan. This is a gradual process. The copyright protection of short videos requires the joint efforts of judicial organs, administrative agencies, and industry associations, etc. The purpose is to build a long-term comprehensive protection system for copyrights of short videos. First of all, the guiding role of judicial trials is needed. Judicial protection is an important means to protect the copyright of short videos, and the judgments made by the courts in individual cases have an important guiding role in the protection of copyrights of short videos. Judging from the current judicial practice, Chinese courts have recognized in several typical cases that original short video works can be protected as electronic works, which is of great significance to the copyright protection of short videos. Facing the increasing number of short video copyright dispute cases in practice, the court should actively respond. For new forms of works such as short video, it should start from the original intention of the Chinese “Copyright Law” to protect the creation and dissemination of excellent works. A short video whose originality meets the requirements of a work shall be identified as a work and shall be protected by law. At the same time, the online trial model adopted by the court in the “the Tik Tok v. Huopai case”, the iconic short video infringement case, is also of reference significance. The online trial mode simplifies the trial process. The parties do not need to go to court to participate in the lawsuit, and the simultaneous trial can be realized through remote connection, which greatly reduces the litigation cost of short video rights holders. In the future, in short video copyright dispute litigation, the court can innovate the trial mode to realize the online mode from case acceptance, litigation payment, evidence exchange, court hearing, and document service to create convenient conditions for short video copyright owners to protect their rights.
Second, the supervisory role of administrative law enforcement should be brought into play. Different from the judicial protection of short videos that focuses on post-event relief, the administrative protection of short videos can be proactive and effectively crack down on short video copyright infringements. In recent years, China’s multi-sectoral “net-net” action has achieved remarkable results, effectively controlling the bad trends in the short video industry. Administrative supervision measures are mainly through increasing the enforcement of short video platform enterprises, and imposing administrative penalties and rectification within a time limit for short video platforms that have a large number of copyright infringements. The administrative law enforcement department and the short video platform not only have a relationship between supervision and being supervised, but also a cooperative relationship should be established to jointly build a short video copyright protection platform to jointly combat infringements. The back-end database of the short video platform can be shared with the administrative law enforcement department, which is convenient for the administrative law enforcement department to monitor in real time and deter copyright infringement in a timely manner. At the same time, the administrative law enforcement department can establish a special short video copyright protection service platform to increase administrative penalties for serious violations of short video copyright infringements reported and complained by right holders.
Finally, it also requires the self-discipline of the industry platform. Judicial protection and administrative protection will inevitably be inaccessible, which requires the self-discipline and self-regulation of the short video industry and platforms. At present, in order to regulate the chaos in the short video industry, the Network Audiovisual Program Service Association has successively issued industry specifications for network short-sighted platform management and network short video content review. These two industry specifications have played a role as a model guide. In addition, in response to the widespread lack of copyright awareness among short video creators, the platform can also formulate short video copyright guidelines for short video creators. The short
175
4TH SINTO
K INTERN
ATION
AL CON
FERENCE O
N SO
CIAL SCIENCE AN
D M
ANAG
EMEN
T
video copyright guide can introduce the copyright issues that short video creators may encounter in the process of creation and dissemination, including the copyright issues that may be involved in the use of materials in the creation of short videos, and how to remedy the copyright infringement of short videos. At the same time, various short video platforms should establish cooperation and communication mechanisms to jointly prevent and control short video copyright infringements, and effectively prevent repeated infringements on multiple platforms of the same subject.
CONCLUSION
In the era of rapid development of science and technology and the Internet, the products of the era will be bred, and new things have the characteristics of the era. When there is a contradiction between the emergence of new things and the stability of the law, various participants are required to reconcile them in a variety of ways. The emergence and rapid development of short videos and their related copyright infringement disputes are the manifestation of the contradiction between legal stability and the social changes brought about by the rapid development of science and technology. In resolving these disputes, it is necessary to clarify whether short videos, as a new product of the era, should be regulated by copyright law, whether all short videos will become the object of copyright protection, and what are the disadvantages of copyright in protecting short video works. Where to perfect, how to improve laws and regulations, these problems all arise in legal practice. After analyzing and discussing the above-mentioned problems, this research proposes corresponding solutions for specific problems. Clarifying the legal attributes of short videos as works is a key factor for short video protection. In order to avoid legal disputes during the dissemination of short videos, this research suggests that some measures can be adopted, such as reasonable application of technical protection measures. In the process, it is still necessary to pay attention to not to excessively use technical protection measures in order to protect the interests of short video copyright owners, and ultimately tilt the balance of interests. The further improvement of laws and regulations and the application of other measures such as technical measures will definitely improve the current poor protection of short video copyrights.
ENDNOTES
1 Article 2 (Regulation) The term “works” as referred to in the Copyright Law means intellectual creations with originality in the literary, artistic or scientific domain, insofar as they can be reproduced in a tangible form. Taken from Emeritus D. E. Long. (2019). Copyright Law in China: Challenges, Opportunities and Future Developments. https://www.uspto.gov/sites/default/files/documents/CRS-Durham-Long-Copyright-Law-China.pdf
2 China Law Translate. (2019). Norms for the Administration of Online Short Video Platforms and Detailed Implementation Rules for Online Short Video Content Review Standards. https://www.chinalawtranslate.com/en/norms-for-the-administration-of-online-short-video-platforms-and-detailed-implementation-rules-for-online-short-video-content-review-standards/
REFERENCES
Bennehard, M. (2020). The short video market in China: Embodying the fast pace of modern lifestyle. https://daxueconsulting.com/short-video-market-china/
Chen, W. (2008). On the originality of copyright law. (Unpublished master’s thesis). Southwest University of Political Science and Law.
China Law Translate. (2019). Norms for the administration of online short video platforms and detailed implementation rules for online short video content review standards. https://www.chinalawtranslate.com/en/norms-for-the-administration-of-online-short-
176
video-platforms-and-detailed-implementation-rules-for-online-short-video-content-review-standards/
CNNIC. (2021). The 47th Statistical Report on China’s Internet Development. https://www.cnnic.com.cn/IDR/ReportDownloads/202104/P020210420557302172744.pdf
Council Foreign Relations. Media Censorship in China. https://www.cfr.org/backgrounder/media-censorship-china
Eskicioglu, A. M., Town, J., & Delp, E. J. (2003). Security of digital entertainment content from creation to consumption. Signal Processing: Image Communication, 18(4), 237-262.
Guo R. (2016). Short video content copyright protection from the perspective of duty of care. Electronic Intellectual Property, 000(010), 88-96.
iResearch. (2018). 2017 China’s short video industry report. http://www.iresearchchina.com/content/details8_40413.html
Leps. (2019). Short video MCN music infringement follow-up: VFine calls bigger institute defamation. https://www.rayradar.com/2019/09/16/short-video-mcn-music-infringement-follow-up-vfine-calls-bigger-institute-defamation/
Li Jiying. (2017). Research on the protection of short video copyright in my country. Legal Expo, 000(014), 216.
Liao, Rita. (2021). TikTok’s China twin Douyin has 550 million search users, takes on Baidu. https://techcrunch.com/2021/02/17/short-video-search-douyin-tiktok/
Loren, Lydia Pallas & Reese, Anthony. (2019). Proving infringement: burdens of proof in copyright infringement litigation. https://law.lclark.edu/live/files/28482-lcb232article5lorenpdf
Meng L. (2019). Research on short video software copyright infringement. Legal System and Society, (03), 60-61.
Michael R. (2019). Abstraction, filtration, and comparison in patent law. JL & Innovation, 1, 37.
NCAC. (2019). Briefing on “Jianwang 2018” campaign achievements held by the NCAC. http://en.ncac.gov.cn/copyright/contents/10361/394461.shtml
Paul G. (1999). Copyright trademark and related state doctrines 601(New York foundation Press).
Shi, Y., & Chung, J. H. (2019). A study on video content application based on mobile device platform in China. Journal of Digital Convergence, 17(10), 433-438.
Sterling Jal, World Copyright Law, London sweet& maxwell, 255-262.Sun Shan. (2019). The originality of short videos and the path of copyright protection.
Intellectual Property, 4, 44-49.Sun H.. (2019). Short video copyright disputes and ideas for perfecting the protection
system. Young Journalist, 648(28), 72-74. Xia, Y. (2018). China: The latest case law development on short video copyright
infringement. HG.org.Xu Jing. (2017). Research on short video copyright issues (Unpublished doctoral
dissertation). Zhejiang University).Xu C. (2019). Short video copyright protection path exploration. News Research Guide,
010(011), 80-80. YouTube Help. (2021). How content id works. https://support.google.com/youtube/
answer/2797370?hl=enZiyi, M. E. N. (2020, December). SWOT analysis of the business model of short video
platform: Take Tik Tok as an example. In 2020 Management Science Informatization and Economic Innovation Development Conference (MSIEID) (pp. 38-42). IEEE.
Zhu, C., Xu, X., Zhang, W., Chen, J., & Evans, R. (2020). How health communication via Tik Tok makes a difference: a content analysis of Tik Tok accounts run by Chinese Provincial Health Committees. International Journal of Environmental Research and Public Health, 17(1), 192.

177
4TH SINTO
K INTERN
ATION
AL CON
FERENCE O
N SO
CIAL SCIENCE AN
D M
ANAG
EMEN
T
SICONSEM-026
LESSONS FROM COVID-19 PANDEMIC ON THE FAILURE OF WAGES IN EMPLOYMENT CONTRACTS
1Nazruzila Razniza Mohd Nadzri, 2Rohaida Nordin, 3Dihlvinder Kaur Mohkam Singh, 4Kalaveny Kanagasingam & 5Mary Mathews K.A. Mathew
1,3,4, 5Faculty of Business, Communications and Law, INTI International University2Faculty of Law, Universiti Kebangsaan Malaysia
Corresponding author: [email protected]
ABSTRACT
While many businesses have been struggling to survive, on the other side, the employees have been puzzling whether they will get their pay by end of each month during the enforcement of several movement restrictions imposed by the state. Non-operation of business activities due to the enforcement of law affects both parties in employment contracts. One of the most peculiar issues is the entitlement of employees to secure their full wages while they can’t perform their work at all or partially perform the assigned tasks from home. Therefore, the paper is to explore the issue by examining the legal position of ‘wages’ in employment contracts as a contract of employment is generally built on the exchange of labour for wages. Apart from, the reference to the relevant labour statutory provisions and case laws within Malaysian and foreign jurisdictions in particular United Kingdom and Australia, the issue is evaluated through the theory of employment relationship. The paper generally has found that the national labour law is inadequate to deal effectively with the issue.
Keywords: Employment law, employment relationship, employment contract, wages.
INTRODUCTION
Since the first movement restriction order that was enforced on 18th March 2020, one of the popular issues that have been emerged regarding the employment contract is the legal status of payment of wages. The issue ensued because most of the economic sectors were closed due to the imposition of the movement restriction orders and businesses have to stop operations temporarily. Even though when this paper was written, most of the restrictions have been lifted but many businesses have been affected on various scales. Some businesses were permanently ceased operations. For example in the retailing sector, Chan (2021) reported 30% of shops in malls have folded due to the financial challenge of the past 16 months amid the Covid-19 pandemic and left 300,000 people losing their jobs. Some businesses might have gone through several cost-cutting measures to stay afloat including reduction of employees’ pay and holding employees’ pay temporarily (Kuriakose & Tran, 2021).
Additionally, the Department of Statistics Malaysia (DOSM) (2020) found 76.6% of the business entities considered a salary payment to their employees was the main challenge for them during the Movement Control Order 1.0 (MCO 1.0). Hence, viewing the issue of wages as one of the crucial issues for most businesses and workers during the crisis, the writer sought clarification on the legal position of pay in an employment relationship within the purview of the employment legal framework. Besides that, the paper tested the theoretical perspective in evaluating the same issue by applying the relational contract theory. Finally, the paper is to address the lessons learned and the overhaul of the employment legal system which the pandemic Covid-19 has revealed to be necessary.
16
178
METHODOLOGY
This study is typical legal research and adopted a qualitative approach. The relevant legal provisions mainly in the form of statutory provisions and case laws in the employment law framework were relied on to study the issue at hand. Besides that, reference to the legal authorities grounded in the Australian and English employment legal framework was carried out in pursuing the findings that the Malaysian employment law is lack resilience and was heavily relied on the common law in addressing the issue of payment of wages during the pandemic Covid-19 and the enforcement of the restrictions orders imposed by the government. This paper is exploratory in nature and the study on the practice and legal provisions from the foreign jurisdictions to find good practices in general only without the support of comprehensive empirical data. Future research may need to be conducted to pursue concrete justifications for the proposed findings.
This paper is divided into three parts. Firstly, it presents the correlation of the contract of employment and the employment relationship that is widely accepted as fundamental parts of the employment law in Malaysia. The author evaluated and proposed that the relational contract theory be part of it. Secondly, the existing legislative provisions and case laws were analysed to find the position of wages in the employment relationship or the employment contract. At this stage, some issues associated with wages have been emerged for the past 16 months since the MCO 1.0 including non-payment of wages, reduction of wages and forced leave with or without pay attracted debates among scholars and legal practitioners and worth research. The legal provisions and policies from Australia and United Kingdom (UK) labour law in addressing the same issues were outlined to ensue on good practices which can be learned to improve the existing Malaysian labour law framework albeit in general views. This analysis is incorporated into the third part of the paper.
CONTRACT OF EMPLOYMENT, EMPLOYMENT RELATIONSHIP AND RELATIONAL CONTRACT THEORY
For most countries that adopted English law as the foundation for their employment law framework, the legal conceptualisation of the employment relationship revolves around the central concept of the contract of employment (Adams, 2021). Kahn-Freud described this concept as the cornerstone of the modern labour law system (Adams, 2021). Countouris (2007) reported that the concept developed in Europe between the 18th and 19th century and due to two principal factors, for instance, the industrial revolution and the growth of liberal ideas. The same concept was fully forced in the United Kingdom slightly later and was observed on account of the enactments of social legislations. The contractual basis of an employment relationship functions to enhance the freedom and dignity of the employee and on the other side of the coin to provide businesses with an efficient organizational legal tool (Razzolini, 2010). A contract of employment is a mutual agreement between two parties in exchange for work and wages (Collins, 2019). It is equally similar to a contract of hiring goods but the subject matter hired is service. Therefore, to form an enforceable employment agreement it must satisfy all the principles of formation of contract that an agreement between two parties which provide each other with consideration. The consideration is the employer’s promise to pay wages in return for work done and agreement to be controlled and ordered by his employer. Any breach of contractual terms enables the aggrieved party to claim remedies in the forms of compensation (Brodie, 2005). Priscilla et al. (2019) regarded viewing an employment relationship according to employment contract as based on the classical contract law approach. Some employment law scholars found this approach is incompatible considering some distinctive features embedded in employment contracts compared to normal commercial contracts particularly the reality that the contract of employment is not a one-off relationship and the contractual parties are regarded have unequal bargaining power (Priscilla et al, 2019). One of the alternative theories offered to substantiate the classical theory is the relational theory. The relational theory had been tested in justifying the rights of employees for minimum wage and other incentives (Fahn,
179
4TH SINTO
K INTERN
ATION
AL CON
FERENCE O
N SO
CIAL SCIENCE AN
D M
ANAG
EMEN
T
2017).
Bird (2005) relied heavily on Ian Macneil1 in defining relational contract theory who suggests that agreements are not always discrete occasions whereby parties exchange only value but the contractors’ relationship goes deeper. They develop a connection between one another that implies planning, trust and solidarity that is far beyond the terms expressed in the document. This may arise through the interpersonal relationship between the parties. Bird (2005) further holds that most of the characteristics of a relational contract are well suited to an employment contract for instance the relationship of exchange continues over a significant period and is not a one-deal, contain significant open terms and reserve discretion for the parties largely because of a long-term relationship between the parties, contractual parties expect future cooperative behaviour and facilitate that arrangement through agreed-upon governance mechanisms, benefits and burdens are shared not divided.
Priscilla (2019) echoed Bird and identified the aspects that the classical contract approach being regarded as incompatible to be adopted into an employment contract. Firstly, the strict contract theory does not cater to changes even though in common many changes may happen during the existence of the relationship. In the employment relations that form long term contracts, there may be many changes in situations and circumstances that may not be described and anticipated at the beginning of drafting of the contract. If reference is only pursued to the expressed terms of employment it would cause unfairness.
Besides that, according to Brodie (2011), the rule of consideration is fictional where the variation of the employment contract is concerned in contrast to a relational contract that facilitates variation. This position is confirmed by the court’s decision in the case of Lee v GEC [1993] IRLR 383, 389 when the court accepted the plaintiff’s proposition that the employee gives consideration by continuing to work in return for the improved terms and without seeking a larger or more significant improvement. It is unnecessary to issue new contracts whenever adjustments are put into effect.
The Malaysian employment legal framework embraces the principle of employment contract into the employment relationship through its legislative provisions and judicial deliberation (Vanitha, 2012). The fundamental employment protection statutes notably the Employment Act 1955 (Act 265) (section 2 (1)) and the Industrial Relations Act 1967 (Act 177) (section 2) define the employment relationship as being a ‘contract of service’ and ‘contract of employment’ respectively (Vanitha, 2012). Since there is no comprehensive statutory definition of both terms, the judiciary has been applying the common law principles in determining a relationship that possibly falls within the purview of the terms. Priscilla (2019) asserts that in Malaysia, the present employment contracts are based on classical contract law regardless that the approach is arguably inadequate. However, she observed that the employment relationship is said to be transforming from the strict contractual approach to one stress on partnership and collaboration. The author, therefore, points out the potential of considering the relational contract theory in dealing with the issue of failure of wages during any crisis Covid-19 pandemic alike particularly because the relational theory does not give strict emphasis upon exchange and is relatively practical to address changes while the employment relations was going concerned. During the crisis, trust and mutual understanding between the parties in the relationship are highly demanded and regarded much more important than rigidly observe the law of contract. Both contractual parties were encountering their challenges and seeking each other high level of cooperation and understanding to deal with the issues effectively.
‘WAGES FOR WORK DONE’ INTERPRETATION
Statutory definitions of the contract of service or contract of employment do not expressly identify wages as a consideration in return for employment. Section 2 (1) of the Employment Act 1955 defines a contract of service as ‘any agreement, whether oral or in
180
writing and whether express or implied, whereby one person agrees to employ another as an employee and that other agrees to serve his employer as an employee and includes an apprenticeship contract’. The Industrial Relations Act 1967 outlines a similar definition for the ‘contract of employment’. Nevertheless, the term ‘wages’ is defined with explicit reference to the contract of service. Section 2 (1) of the Employment Act 1955 ‘wages’ means ‘basic wages and all other payments in cash payable to an employee for work done in respect of his contract of service…’. Altaf and Ahmad Kamal (2006) reinstate this statutory provision by expressing that wages are a pledge of payment of monetary remuneration by an employer for labour or services according to the contract or on an hourly, daily or piece work basis and often including bonuses, commissions and the amounts paid by the employer for insurance, pensions, hospitalization and other benefits. However, in contrast, according to the statute, the definition of wages is narrowly defined as basic wages and exclude pensions, allowance, bonus or other benefits (section 2 (1) of the Employment Act 1955). It is understandable, the definition was designed as such to determine the calculation of overtime pay.
In the meantime, the term ‘wages’ for ‘work done’ in section 2 (1) of the Employment Act 1955 confers the central point in addressing the issue outlined in this paper. According to Mark (2020) this statutory provision was understood that the obligation to pay salary is not dependent on work being provided by the employer or work being done by the employee unless there is a specific clause in the contract of service which provides so. Mark (2020) backed his opinion in reference to a few case laws. In the case of Viking Askim Sdn Bhd v National Union of Employees in Companies Manufacturing Rubber Products [1991] 3 CLJ (Rep) 156. Edgar Joseph Jr Justice decided that as the terms and conditions of employment are governed by the collective agreement and no specific clause allows the company to reduce the wages of monthly paid employees on the ground that there is no work available as a result of a fall in orders, such clause were legally binding the parties. Therefore, the employees were entitled to fully receive their salaries disregard the employer shuts down production which accords no work is done at all. The court rejected the employer’s attempt to rely on Regulation 5 of the Employment (Termination and Lay-Off Benefits) Regulations 1980 (Revised 1983) (PU(A) 338/1983)2 and held that the protection offered by the provision is not applicable to the monthly paid employees. Their wages are not dependent upon their employers providing work.
Furthermore, in the case of Lee Fatt Seng v Harper Gilfillan Sdn Bhd [1988] 1 CLJ (Rep) 156 the Supreme Court outlined a few significant rules regarding the interpretation of ‘wages for work done’ in the definition of ‘wages’ specified in the Employment Act 1955. Firstly, it is used so as to stress on the requirement that the remuneration must be for work done in respect the contract of service of the employee concerned, so that any payment made to him by the employer ex gratia, not for work done or to be done, and not in connection with the contract of service, is not part of the wages. Additionally, Wan Hamzah Supreme Court Judge reiterated that the concept ‘wages for work done’ is not expressly used with reference to any particular time or period. He stated that “there is no indication anywhere that they are intended to be used with reference to any particular time or period. Therefore in my opinion, it is not correct to say that wages are only in respect of days on which is actually done. The wages or salary is of the same amount irrespective of whether there are the same number or working days in January as in any other month. In other words, the number of working days in the month is not relevant” (Lee Fatt Seng v Harper Gilfillan Sdn Bhd [1988] 1 CLJ (Rep) 156).
Regarding the question of whether employer is lawful to ask its employee to go on paid annual leave or no pay leave during duration of suspension of production, the Industrial Court in the case of Dunlop Malaysian Industries Berhad v Dunlop Malaysia Industries Employees Union [1982] 1 ILR 161 viewed this approach as against the law. The Industrial Court ruled on the similar issue in the case of Kesatuan Pekerja-pekerja Continental Typre PJ Malaysia Sdn Bhd v Continental Tyre PJ Malaysia Sdn Bhd [2015] 3 ILR 462 held that since there had not been any provision in the collective agreement which empowered the employer to compel its workmen to take annual leave during the plant shutdown, the employer had no right to do so.
181
4TH SINTO
K INTERN
ATION
AL CON
FERENCE O
N SO
CIAL SCIENCE AN
D M
ANAG
EMEN
T
Therefore, it can be summed up that employers while considering any measures to mitigate the impact of the pandemic Covid-19 that will have adverse effects to their employees must always observe strictly the terms and conditions of employment. To enforce non-payment of wages, reduction of wages or any force to take annual leave either paid or unpaid that are against the contractual terms must firstly seek consent from their employees and cannot be done unilaterally.
LEGAL PROVISIONS AND PRACTICES OF FOREIGN JURSIDICTIONS
Adams (2021) presented the common law principles regulating the question whether wages are payable in return for finished work, services actually rendered over a period of time or readiness to work. In the event, the contract specifies that wages are to be paid on a piece-work basis, obviously the right to wages depend on the relevant work being finished. Therefore, if an employee was hired on hourly-paid work, he had to complete each hour of work in order to be paid wages (Devonald v Rosser & Sons [1906] 2 KB 728). The principle of ‘the consideration for work is wages and the consideration for wages is work’ is applied strictly in this circumstance. In contrast, salaried employees were regarded as receiving payment in return for a more general commitment of loyalty and faithful service over time. Hence, merely being ready and willing to work sufficed for them to claim payment. These rules are consistent to the approach taken by the courts in Malaysia.
In addition, Adams (2021) commented the principle of ‘wage-work bargain’ in the context of the implementation of the Coronavirus Job Retention Scheme (CJRS). The CJRS is one of the supports offered by the UK government to businesses in mitigating their losses due to the pandemic Covid-19. It took effect since March 2020 and has ended on 30 September 2021 (HM Revenue & Custom, 2021). The scheme among others entitled employers to put their employees on temporary leave (furlough) and in the meantime, the employers concerned are eligible for a government grant that covers 80% of their wages up to a maximum of £2500 a month. Even though the CJRS is viewed as against the labour law principle of ‘wage-work bargain’ but Adams (2021) viewed that the concept of furlough does not mean a complete termination of the wage-work bargain. It is reasonable to treat the work side of the wage-work bargain is held back but the contract and the obligation to pay wages continues. For the employees subject to furlough, all the common law implied duties will continue to apply except not in full force. The CJRS should not be seen equally similar to the subsidy scheme3 offered by the Malaysian government. The CJRS obliged employers to instruct their employers to fully stop work and placed on leave on hourly basis or daily basis. The employers will only be eligible to claim the scheme based on the actual leaves taken by their employees. Meanwhile, the Malaysian subsidy wage scheme gives rights to employer to claim RM600 for each of their hired employees to support the payment of the employees’ wages and the eligibility is for six (6) months only (Perkeso, 2020). In summary, the national subsidy wage scheme is viewed as a one-off financial support to businesses and its objective to retain people in employment is arguably less effective compared to the CJRS that offers a longer-term support and based on actual furlough duration. In the meantime, the national subsidy wage scheme does not directly arise to failure of the work-wage bargain since the employers were not required to ask their employees to take leave or stop work to be eligible for the scheme.
The Australian employment statute can be viewed has been equipped with specific provisions to deal with the issue of failure of wages due to pandemic Covid-19. Part 3-5 of the Fair Work Act 2009 (FWA 2009) allows national system employers to stand down workers without pay whenever they cannot usefully be employed because of industrial action, a breakdown of machinery, or any ‘stoppage of work for any cause for which the employer cannot reasonably be held responsible (section 524 of the FWA 2009). According to Stewart (2021), since the inception of the Covid-19 and its related restrictions in March 2020, many employer invoked the Part 3-5 FWA 2009 provisions and their employees were stood down without pay although some were benefit from the JobKeeper wage subsidy that operated for the first 12 months of the pandemic.
182
Nevertheless, Stewart (2021) claimed that in a few instances, the validity of such stand downs has been challenged and there were many issues left unanswered including as how long the employers can invoke Part 3-5 of the FWA 2009 to stand down their employees.
CONCLUSION
Largely, the Malaysian labour system is found has to resort to the common law principles in dealing with the issue of failure of wages proving that the existing labour law framework does not offer adequate support to deal with the same. Therefore, the legislative interference is considered reasonable to deal with the Covid-19 alike crisis in the future. Additionally, since the employment contract has been presented above as having distinct attributes than other commercial contracts, the approach in designing the legislative framework especially to address the issue of failure of wages may need to apply a more flexible approach as offered by the relational contract theory.
The covid-19 pandemic has proved that a lot to learn notably in preparing a more resilient national labour law system. It is undeniably both UK and Australia employment legal framework and practices offered a better way in dealing with a crisis. UK outlined the CJRS that is a more sustainable mechanism while meeting the same objective as the national subsidy wage system. In opposite, Australia provided clearer legal provisions regarding the failure of the wage-work principle.
ENDNOTES
1 A John Henry Wigmore Professor of Law at Northwestern University has been
actively publishing on relational theory for decades.
2 It provides the situations an employee is considered being laid off by his employer for instance if he depends on jobs provided by his employer to receive remuneration; the employer does not provide such work for him on at least a total of twelve normal working days within any period of four consecutive weeks; and the employee is not entitled to any remuneration under the contract for the period or periods (within such period of four consecutive weeks) in which he is not provided with work.
3 Subsidy wage scheme is a form of financial support to businesses where the government paid the employers for each of their employees who monthly salary of RM4000 and below. The scheme was announced by the government on 27 March 2020 as part of PRIHATIN Package.
REFERENCES
Adams, Z. et al. (2021). Deakins and Morris’s Labour Law. London: Bloomsbury Publishing. Altaf, A.A. & Ahmad Kamal, N. (2006). Employment law in Malaysia. International Law
Book Services.Bird, R.C. (2005). Employment as a relational contract. U. PA. Journal of Labour and
Employment Law, 8(1), 149-217.Brodie, D. (2011). How relational is the employment contract? Industrial Law Journal,
40(3), 232-253.Brodie, D. (2005). The employment contract: Legal principles, drafting, and interpretation.
Oxford University Press.Chan, D. (2021, June 22). 30 PCT of shops at malls have closed; 300,000 workers
lost jobs over past 16 months. New Straits Times. https://www.nst.com.my/news/nation/2021/06/701290/30-pct-shops-malls-have-closed-300000-workers-lost-jobs-over-past-16
Collins, H. et al. (2019). Labour law(2nd ed.). Cambridge University Press.
183
4TH SINTO
K INTERN
ATION
AL CON
FERENCE O
N SO
CIAL SCIENCE AN
D M
ANAG
EMEN
T
Countouris, N. (2007). The changing law of the employment relationship: Comparative Analyses in the European Context, England: Ashgate.
Department of Statistics of Malaysia (2020). Summary of findings: Special survey effects of Covid-19 on economy and companies/business firms (Round 1). https://www.dosm.gov.my/v1/uploads/files/covid-19/Infographic.pdf
Fahn, M. (2017). Minimum wages and relational contracts. The Journal of Law, Economics, and Organization, 33(2), 301-331.
HM Revenue & Customs. (2021). Guidance check if you can claim for your employees’ wages through the coronavirus job retention scheme. https://www.gov.uk/guidance/claim-for-wage-costs-through-the-coronavirus-job-retention-scheme#who-can-claim
Kuriakose, S. & Tran, T. (2021). Impacts of Covid-19 on firms in Malaysia: Results from the 1st round of Covid-19 business pulse survey. World Bank Group. https://openknowledge.worldbank.org/bitstream/handle/10986/34965/Impacts-of-COVID-19-on-Firms-in-Malaysia-Results-from-the-First-Round-of-COVID-19-Business-Pulse-Survey.pdf?sequence=1&isAllowed=y
Mark, J. (2020). Payment of ‘wages for work done’: A tale of two approaches. Legal Network Series. 1, lxxvi.
Perkeso. (2020). Soalan-soalan lazim (FAQ) program subsidi upah 2.0 sistem insurans pekerjaan. Perkeso.https://www.perkeso.gov.my/images/penjana/psu/25092020_FAQ_PSU_2.0_BM.pdf.
Priscilla, S. D. et al. (2019). Employment relationship in Malaysia: A classical contract or contractual hybrid? Industrial Law Journal, Article, 3, iii.
Razzolini, O. (2010). The need to go beyond the contract: “Economic” and Bureaucratic” dependence in personal work relations. Comparative Labor Law & Policy Journal Comparative Labor Law & Policy Journal, 31, 267-301.
Stewart, A. (2021). Stewart’s guide to employment law (7th ed.). The Federation Press.Vanitha, S.K. (2012). Employment law and theory: A Malaysian focus with a comparative
perspective. CLJ Publication.
184
SICONSEM 2021:082
CONSUMER PROTECTION AGAINST FALSE HALAL DESCRIPTION IN E-COMMERCE
1NurulNajla’AthirahMuhamadNazari2Elistina Abu Bakar &
3AfidaMasturaMuhammadArif1,2Halal Products Research Institute, Universiti Putra Malaysia, Malaysia
2,3Department of Resource Management & Consumer StudiesFaculty of Human Ecology, Universiti Putra Malaysia, Malaysia
Corresponding author: [email protected]
ABSTRACT
The rapid growth of e-commerce during the COVID-19 pandemic has caused an increase in halal issues such as deceptive conduct, misleading representation and false description. These problems have become more prevalent with the availability of various online platform providers that are becoming increasingly popular such as Lazada, Shopee and Mudah. The products either halal or vice versa, are easily marketed through these online platforms. This study analysed the extent to which the law, specifically the Consumer Protection Act 1999 and its subsidiary regulation can provide comprehensive protection to consumers especially with regard to halal issues. Analysis was also conducted by making comparisons with the consumer protection law of other countries such as Australia, India and the United Kingdom. Some recommendations are put forward to amend the Consumer Protection Act 1999 so that better protection is available to Muslim consumers in acquiring halal products when they shop online.
Keywords: E-commerce, halal issues, online transactions, Consumer Protection Act 1999.
17

185
4TH SINTO
K INTERN
ATION
AL CON
FERENCE O
N SO
CIAL SCIENCE AN
D M
ANAG
EMEN
T
SICONSEM 2021: 113
THE IMPACT OF COVID-19 ON SYSTEMIC RISK TOWARDS COMPANIES: MALAYSIAN COMPARATE LAW AND CORPORATE GOVERNANCE PERSPECTIVES
Yang Chik Adam Faculty of Law, Multimedia University, Melaka Campus, Malaysia
ABSTRACT
Business transactions and commercial activities are the core life line for the global economy. The onset of the Covid-19 pandemic in December 2019 which can be regarded as the unprecedented event has affected all business and commercial activities to adopt the ‘new normal’ of conducting business globally. In adopting this ‘new normal’ of conducting businesses for companies it has structurally affects its operations. In certain situation it would have resulted in the systemic risk condition. The term systemic risk has no specific definition, in a less formal situation it can be illustrated as the propensity of the system “to transmit a localized adverse economic shock throughout the financial system, amplifying it in the process”. “The nature of systemic risk is that it builds over time, it is interactive and synergistic and once in play, is difficult to control. “Systemic risk drivers tend to be cumulative and or interdependent, resulting in far-reaching impacts, shocks or even system-wide failure.” This will affect the roles of shareholder or stakeholders in which will affect the fiduciary duties of the board of directors. Thus, the spiral effect of it in respect to corporate governance on the management of the company. The outcome of this paper is to provide solution(s) to corporate regulators and board of directors to adopt the systemic risk mechanism in order for board of directors of company to navigate in situation(s) of unprecedented event. The qualitative approach will be adopted in this paper. The limitation is anticipated that difficulties in meeting the respondents. The novelty of this paper will provide the systemic risk framework for board of directors and corporate regulators adopt in the “new normal’ of doing business.
Keywords: Corporate law, systemic risk, board of directors, corporate governance.
18
186
SICONSEM 2021: 021-025
LEGAL ISSUES OF RIGHT TO OPERATE FRANCHISE BUSINESS IN MALAYSIA: CHALLENGES AND WAY FORWARD IN THE ERA OF PANDEMIC
1Wong Hua Siong
1School of Law, College of Law, Government and International Studies Universiti Utara Malaysia, Malaysia
1Corresponding author: [email protected]
ABSTRACT
The Franchise Act 1998 has been in force for over 20 years in Malaysia but there were only two amendments made during its enforcement period, namely in 2012 and 2020. However, the Franchise Act 1998 has still a room for improvement in terms of its laws and practices in the franchise industry, particularly in terms of the right to operate franchise business. The Corona Virus Disease 2019 (‘COVID-19’) pandemic is affecting the global business activities drastically and essentially impact on the retail and administration organizations including but not limited to the franchise section. The objective of this study is to discuss the right to operate business and franchise in Malaysia to protect the interests of both the franchisor and the franchisee including the challenges facing by them particularly in this era of pandemic. The immediate impacts on the both franchisor and franchisee are on generating job opportunities which will reduce the unemployment rate, income and the achievement of social goals in the market. This research will base on the library study from various primary and secondary data sources, such as cases, legislation, articles and etc. In view that the franchisee duplicates the franchisor’s business system, the franchisor must grant the franchisee the right to operate business including the use of its intellectual property. The right to operate and to control franchise business must be included in an agreement to protect the interests of both parties contracted. It is suggested that a good business strategy planning must be developed by the franchisors in order to maintain the confidence of the franchise network.
Keywords: Challenges, COVID-19, franchise sector, legal impact, Malaysia.
INTRODUCTION
The onset of the corona virus disease 2019 (COVID-19) pandemic brought about an unprecedented disruption to our lives and economy. Nevertheless, the human spirit rose to the challenge to overcome the dilemma. The World Health Organization (WHO) has also officially announced the acute respiratory infections caused by COVID-19 as a global pandemic with long-term risk on 11th March 2020. On 18th March 2020, Movement Control Order (‘MCO’) has been imposed by the government of Malaysia in order to overcome the impact of COVID-19 to the country. However, implementation of MCO has also resulted most of the business activities has to temporary shutdown including both franchisors and franchisees had to close the doors of their stores during the MCO period. Although currently the business is allowed to operate under strict standards of procedure (SOP), but the impact of COVID-19 on the global economy as well as on the franchise industry is massively terrible. Franchising has been used as an efficient tool in economic development and broader global integration, so it plays an extremely important role for the global economy development with positive effects include output and job opportunity, increasing the tax collection, modernizing the economy, adjusting the balance of payments, developing small and medium enterprises, etc. However, the coronavirus pandemic crisis has impacted the franchise industry in unprecedented ways and raises some earnest questions that need to be answered by all businesses in this industry. How franchisors and franchisees are able to cope with this crisis? Furthermore, in fact, bad times for the economy mean good times for dispute resolution practitioners.
19
187
4TH SINTO
K INTERN
ATION
AL CON
FERENCE O
N SO
CIAL SCIENCE AN
D M
ANAG
EMEN
T
Under current circumstances, will litigation or arbitration be the appropriate method to be chosen by franchise parties if a dispute arises? Thus, this paper will look into the discussion of legal impact of the COVID-19 on the franchise sector from a Malaysian legal perspective.
METHODS
The aim of this paper is to identify and demonstrate the effect of the corona virus pandemic on franchising activity and development. To do this, the article first uses the data collection method, then analyses it to prove its point.
This study will combine qualitative and semi-quantitative in nature. Being so, research methodologies of library research and critical analysis will be used in analyzing relevant materials, data and information. This study will collect relevant materials, data and information on COVID-19 and franchise matters. The approach to be applied involves a content analysis of existing laws, regulations and guidelines on the legal protection of franchise business during COVID-19 pandemic.
A. Data CollectionData collection techniques would be divided into several stages. A structure work will be held to get the overview of the study in the early stage, which includes data observation. An extensive review of the literature will also be conducted. The researchers will study on the position of franchise business during COVID-19 in Malaysia from various perspective, including legal point of view. From the literature review, the lacuna of the legal protection on franchise business will be identified.
B. Types of dataThis study will use primary data and secondary data. The primary data for this study are the statutes, regulations, rules and guidelines relating to COVID-19 and franchise. Secondary data of this study comprises of books, legal documents, and articles from journals and online resources.
C. Methods of data collectionMethods of data collection for this study can be divided into two namely; library research and also field work. For library research, data will be collected from law library of International Islamic University Malaysia, Universiti Kebangsaan Malaysia and Universiti Malaya. For field work where applicable, interview will be conducted with the relevant respondents, namely the franchisors and franchisees to support the data collection from the library research.
D. Data AnalysisGenerally, the primary legal data and secondary data will be analysed using content analysis. Specifically, policies and guidelines concerning COVID-19 and franchise will be analysed. In addition, the data collected through questions for interview will also be analysed according to support the legal data and secondary data.
E. Development of InstrumentsQuestions for interview will be developed from the provisions of the statutes, rules and guidelines and also from past literatures relating to COVID-19 and franchise business in Malaysia specifically and in the world generally.
LITERATURE REVIEW
According to Williams et al. (2017), crisis means “process of weakening or degeneration that can culminate in a disruption event to the actor’s (i.e., individual, organization, and/or community) normal functioning.” From this perspective, both outbreaks and epidemics could already be considered local even worldwide crises. The direct impact for this
188
COVID-19 crisis is on generating income, the issue of employment, and the achievement of social goals are most noticeable in emerging and developing markets (Alon, Welsh, & Falbe, 2010; Elango, 2019; Naatu & Alon, 2019). Each countries around the World are facing challenging to save the livelihood and interest of the people while at the same time the Government is also struggling to mitigate the economic impact of the COVID-19. (Anderson, Heesterbeek, Klinkenberg, & Hollingsworth, 2020; Rodriguez-Morales et al., 2020; Surico & Galeotti, 2020). Franchising as a commercial and social model has several economic and social effects due to this COVID-19, such as job creation, economic modernization, and the development of entrepreneurship (Alon, 2004; Naatu & Alon, 2019). Kuckertz et al. (2020) suggest that the dynamic character of startups prepares them for a better confrontation of crises when facing other economic actors. In turn, operating through franchised units could restrict the dynamism observed in this type of business.
According to the World Franchise Council’s 2017 survey on the economic impact of franchising worldwide, India, Taiwan, and Brazil ranked among the top five countries worldwide in the number of franchise brands. According to Mrs. Hsien Naidu from Astreem Consulting Pte Ltd (2020), the World has becoming more scrappy in this digitisation era. With the increase and ease of conducting any business through e-commerce as well as staying connected through online meetings via many online platforms, there is no more issue of barriers of entry for international competition and business. If there is anyone who can add enormous value to a stressed franchisee at this time, it is their franchisor. What can franchisor do from a strategy perspective is to control the franchisor’s revenue sources, managing the quality control, accelerated innovation and ensure the business continuity planning.
According to YB Dato’ Rosol bin Wahid (2020), the Deputy Minister of Domestic Trade and Consumers Affairs of Malaysia, the Ministry of Domestic Trade and Consumer Affairs (KPDNHEP) is currently get ready with several initiatives to stimulate retail activities including franchise businesses affected by the COVID-19 pandemic.
RESULTS
COVID-19 have brought both positive and negative impacts to the franchise business in Malaysia.
Negative Impact
The relationship between franchisors and franchisees is an interdependence where franchisors supply brand, training, systems, supply chain, and franchisees supply capital, time, and work effort. The COVID-19 pandemic significantly affected the franchise community and caused great economic instability to the global. Franchisees face a shortage of cash flows due to a drop-in customer sales and franchisors face a shortage of cash flows due to reduced royalties. These are some brands in global that were impacted by the coronavirus pandemic as following: On June 10, the Starbucks coffee chain announced that it would close about 400 stores in the U.S., and up to 200 stores in Canada in the next 18 months. In the second-quarter earnings report of 2020, Dunkin’ plans to permanently close 800 donut and coffee stores that located in the U.S. by the end of 2020. According to this report, Global systemwide sales decline of 20.8 percent in the second quarter. Compared to the prior-year period, revenues for the second quarter decreased $72.0 million (20.0%).1
On July 28, McDonald’s announced in earnings call that it planned to close around 200 restaurants by the end of 2020 permanently.2 On August 17, NPC International, the largest franchisee of Pizza Hut that make up 20 percent of all U.S. Pizza Hut restaurants, announced that it would close up to 300 Pizza Hut locations and sell the rest Pizza Hut business.3
In South Africa, the franchise industry contributes approximately 13.9 percent towards the country’s gross domestic product. The widespread disruption seriously impacts on

189
4TH SINTO
K INTERN
ATION
AL CON
FERENCE O
N SO
CIAL SCIENCE AN
D M
ANAG
EMEN
T
the small, medium, and micro-sized enterprises, that would have been forced to close temporarily, will affect thousands of lives in South Africa.4
If we look at Malaysia, the major negative impact to the franchise business would be the legal issues including Franchise Agreement, Business continuity plans (BCP), franchise system, standard procedure of operation (SOP) for arrangement of training and support.
The franchisors need to explore on the best ways or alternative options to cope with the issues. It includes working together closely with the franchisee and consider on providing enhanced support and guidance without additional fee. Ongoing engagement and communication will lead to long term inter-dependent relationship between the franchisor and the franchisees.
Positive Impact
As the COVID-19 pandemic continues to challenge businesses worldwide, some franchise business model, in contrast, have been able to do exceptionally well in this context. These business models are the businesses which are adaptable to this new environment by conducting their businesses through online and widely embrace contactless delivery services and cashless payment methods. Many franchises, either small businesses or large corporations are finding ways to keep customers coming back for more. For example, Uniqlo or Padini in Malaysia had leveraged their digital presence at the times of pandemic by offering online shopping platform through its shopping apps and its in-store payment method and to provide door to door delivery services for the purchased item.5 As a result, the consumers will still able to purchase their favorite brands and stores online without stepping out from their house’s door and exposed themselves to the coronavirus. Here are some of the franchises that have been successful in the pandemic. Domino’s Pizza, Inc., the largest multinational pizza company, estimated that about 900 international restaurants are currently temporarily closed. However, the Domino’s system has responded rapidly to the COVID-19 environment, and the main change is the transition to 100 percent contactless delivery. The chain’s sales at same stores in the United States rose 16 percent in the latest quarter.6 In Q2, Domino’s borrowed the remaining $158 million available under its outstanding variable funding notes. It’s repaid $100 million of the borrowings and is currently generating positive operating cash flow. Domino’s has nearly $250 million in cash and $102 million of available borrowings.7
The Options for Franchise Parties to Combat the Covid-19 Pandemic
To relieve the burden on franchisees during this unprecedented global pandemic, franchisors should consider some of the measures listed below to support franchisees to continue trading when the lockdown is loosened.
A mutual cooperation between franchisor and franchisees have to be arrived at in order to cushion the impact of the COVID-19 on the franchise businesses which are at the brink of collapse such as royalties payment deferral or royalties waiver for a reasonable period to be granted by the franchisor. In some cases, the Franchise Agreement may include provisions which requires the franchisee to pay a minimum royalty amount monthly to the franchisor, regardless of the Franchisee’s actual revenue. However, in the current situation, if the franchisor insists on collecting the minimum royalty, leaving the franchisee with no breathing space, it could cause the business of the franchisee to collapse completely.
Renting: The franchisors may agree to temporarily reduce or suspend the rent to relieve the franchisee’s financial pressure if the franchisors directly lease the premises to their franchisees. Bin other cases, the franchisors could assist the franchisees in negotiating with their landlords.
Supply chain problems: Currently, most businesses around the world are experiencing significant disruption in their supply chain system especially the flow of product and the inventory and product continuity are adversely impacted by the implementation of
190
government restrictions. Franchisor shall have adopt and relies on a large global supply chain instead of single supply. Therefore, in the event of the shortages arise, Franchisor is able to reallocate the supply from other supply source. Further, the parties should then review their Franchise Agreement to find possible ways to suspend certain obligations and terms in the Franchise Agreement and to consider the possibility and risks of contractual breaches.
More often than not, the “force majeure” clause has now attracting more focus by many franchise arrangements locally or internationally. The franchise parties could use the appropriate force majeure provisions to allow themselves to cancel existing orders from one supplier and find goods at another supplier.
Inside the franchise system: the franchisors should provide guidance with employee issues, re-evaluate their product offerings, and change distribution channels to contactless delivery.
Legal Uncertainty
There has been legal uncertainties in regards of the “rental” comes to light at the beginning of the COVID-19 crisis. As early as March 2020, plenty of doubts have rolled out by the Franchisor as to whether they could, in view of the unprecedented drop in turnover as a result of the comprehensive government protective measures, to grant rental reductions accordingly or even withhold rent payments altogether. The expectation was that this would be possible because the pandemic was not franchisors’ fault. However, the fact that landlords are also not to blame for the crisis and its severe economic impact was often overlooked.
The legal position in this regard is in the state of flux as there is no precedent regarding the global pandemic. The legal affairs committee of the German Franchise Association debated the topic when writing its guide “Franchise law in the coronavirus crisis”. Do public operating bans – such as restaurants, hairdressing salons and gyms – constitute a defect of the rented property, resulting in the elimination of the obligation to pay rent? Or is it a case of impossibility because the rented property can no longer be used for its rental purpose? And what about the right to a contractual adjustment following contract frustration due to force majeure? In the case of Sneakerboy Retail Pty Ltd t/as Sneakerboy v Georges Properties Pty Ltd,.8 Sneaker boy a luxury footwear retailer in Australia Sneakerboy who had experienced a sudden decline in revenue has been evicted from rented premise due to its decision to relocate due to impact of Covid-19. With the COVID-19 Legislation Amendment (Emergency Measures) Act 2020 (NSW) came into force, the Lessors would be precluded from taking action against Sneakerboy for any closure of the retail shop due to the COVID-19 pandemic. The lessors would be prohibited from terminating the Lease, provided Sneakerboy complied with any revised terms determined by the application of the Code and the COVID-19 Regulation. The court ruled that Sneakerboy is entitled to equitable relief against forfeiture of lease upon finding that Sneakerboy’s relocation to its warehouse was not intended to abandon the lease, but for security purposes and to focus on online selling to save revenue.
Rent Payments
In addition to personnel costs, rent payments represent the largest share of costs for franchise systems. Franchisees are either tenants themselves or, in most cases, sub-lessees of their franchisor, which rents the site. During the COVID-19 crisis, one of the most challenging tasks for franchisors has been defending their franchisees’ interests against landlords in order to obtain pandemic-related reductions or at least deferrals of rent. Over the past few months, there has been little conflict within franchise systems, and franchisees seem to have a high level of trust in and cooperation with their franchisors with respect to negotiations with landlords.
191
4TH SINTO
K INTERN
ATION
AL CON
FERENCE O
N SO
CIAL SCIENCE AN
D M
ANAG
EMEN
T
Does the Malaysia Covid-19 Act Help?
Many businesses had only just begun to find their way through the legal fog when the legislature adopted the COVID-19 Mitigation Act on 27 March 2020. In the case of continuing obligations entered into before 8 March 2020, this gives micro-enterprises and others the right to defer payments if, as a result of the pandemic, they cannot make payments without jeopardising the economic foundations of their business. However, franchisees cannot benefit from this rule, as it expressly does not apply to leases. For leases, the COVID-19 Mitigation Act in German provides only for a ban on termination (applicable until 30 June 2022), under which landlords are prohibited from terminating a lease on account of rent arrears from April, May and June 2020. Many misunderstood the hastily drafted provision as a statutory deferral of rent. In reality, as is clear in the explanatory memorandum, the obligation to pay rent remains in principle.
During the pandemic, one of the key burdens for businesses is fulfilling their contractual obligations, whether it is for monetary payment or for the supply of goods and services. So, it is important for COVID-19 laws to mitigate, suspend or relieve certain contractual parties from having to fulfil their contractual obligations if their ability to do so has been significantly affected by COVID-19. Similar to the Temporary Measures Act of Singapore, the COVID-19 Act 2020 of Malaysia also specifies the types of contracts which would be subject to a moratorium. This is in contrast with the contractual moratorium under the Mitigation Act in Germany which has a relatively general scope.
The list of contracts subject to the moratorium against enforcement actions pursuant to the COVID-19 Act 2020 of Malaysia, which is similar to the Scheduled Contracts in Singapore, are as follows: 1. Construction related contract;2. Performance bond granted pursuant to a construction contract or supply contract;3. Professional services contract;4. Lease or tenancy of non-residential immovable property;5. Event related goods and services contract;6. Contract by a tourism enterprise and for the promotion of tourism in Malaysia;7. Religious pilgrimage-related contract;8. Contracts related to hire-purchase transaction; and9. Credit sales contracts.
As a result, negotiations with landlords imply that the law has made it more difficult to achieve rent reductions or deferrals. Thus, many landlords, particularly on receiving legal advice, have insisted that the legislature affirmed their right to continue to demand rent in full by not interfering with the obligation to pay rent and merely limiting their right to terminate a lease because of arrears. The legislature has thus left it up to the parties to a lease to find an appropriate solution. This was arguably the correct approach, as the results so far have been largely satisfactory (eg, partial rent waivers and far-reaching deferrals for the particularly demanding months of April, May and June 2020). However, it is difficult to predict what the situation will be in the future. McDonald’s temporary closed their dine-in restaurants on mid-March when movement control order begun and their service were restricted to takeaways only.9 Despite the partially relaxation of the movement control order which is known as conditional movement control order effective from May 4 which allows restaurants to accept dine-in, McDonald’s refuse to provide dine-in in all their restaurants citing safety as their main priority and continue to offer takeaways until further notice.
In Subang Jaya, bubble tea is one of the food industries that were worst hit by COVID-19 pandemic. According to the observation by Malay Mail, reporter discovered that in SS15 area which is well known for bubble tea hence unofficially named “Bubble Tea Street” or “Boba Street”, 15 out of 20 bubble tea shops in that area were permanently closed.

192
CONCLUSION
the impact of the covid-19 epidemic on the economy in general and franchising in particular is enormous and terrible. even though the businesses are reopening, the franchise will never be the same after covid-19. even when the short-term effects end, the long-term economic impact will ripple for years. some brands go bankrupt, some are severely affected and closed many of their franchisees as a result, but on the contrary, there are some franchises thrive regardless to the covid-19 pandemic is continuing to spread worldwide. and the main reason here is the cooperation between franchisor and franchisee.
in this pandemic context, the option for franchisors and franchisees is mutually cooperating to fight disease. an example would be a franchisees taking franchisors’ concessions to postpone or reduce royalty payments; the franchisors, in turn, support their franchisees in renting royalty premises, seek to resolve supply chain issues due to governmental restrictions, provide guidance with employee issues, re-evaluate their product offerings, and change distribution channels to contactless delivery, etc. the franchise may have never seen covid-19 pandemic before, but it has seen very bad days, such as the 2008 financial crisis, but the franchise industry as well as the economy has always been able to overcome. Franchise is born of innovation and survive through resilience.
However, if a dispute between franchisors and franchisees occurs, both parties can consider to choose either litigation or arbitration. Many courts in a number of countries have given instructions for using digital tools in the trial, but in many countries, this idea is still quite unrealistic. Moreover, compared to the arbitrators who are familiar with videoconference, the judges are only familiar with in-person traditional court proceedings. Arbitration itself is an alternative dispute resolution that has a flexible and consensus process, so it has a remarkable ability to react quickly to challenges in current circumstances. Indeed, the international arbitration community, led by large arbitration institutions, worked together to seek to maintain timely and effective access to justice in a very short time. Regard to the choice of dispute resolution mechanisms, court closures and delays as currently uncertain, franchise parties may look for comfort and effectiveness during the arbitration process.
REFERENCES
Alon, I. (2004). Global franchising and development in emerging and transitioning markets. Journal of Macromarketing, 24(2), 156–167.
Alon, I., Welsh, D. H. B., & Falbe, C. M. (2010). Franchising in emerging markets. In I. Alon (Ed.), Franchising globally: Innovation, learning and imitation (pp. 11–35). Palgrave Macmillan.
Anderson, R. M., Heesterbeek, H., Klinkenberg, D., & Hollingsworth, T. D. (2020). How will country-based mitigation measures influence the course of the covid-19 epidemic? The Lancet, 395(10228), 931–934.
Daim, Nuradzimmah. (2020, 17 March). Restaurants, fast food outlets prepare for restricted movement order. New Straits Times
Dunkin Brands. (2020). [Online]. https://investor.dunkinbrands.com/news-releases/news-release-details/dunkin-brands-reports-second-quarter-2020-results.
Dunkin’ Brands. (2020). [Online]. https://investor.dunkinbrands.com/news-releases/news-release-details/dunkin-brands-reports-second-quarter-2020-results. [Accessed 10 September 2020].
Elango, B. (2019). A bibliometric analysis of franchising research (1988–2017). The Journal of Entrepreneurship, 28(2), 223–249.
Klein, D. (2020). Domino’s is thriving during uncertain times.Kuckertz, A.; Brandle, L.; Gaudig, A.; Hinderer, S.; Reyes, C. A. M.; Prochotta, A.;
Steinbrink, K.; Berger, E. S.C. (2020). Startups in times of crisis–A rapid response to the COVID-19 pandemic. Journal of Business Venturing Insights, 13, e00169, https://doi.org/10.1016/j.jbvi.2020.e00169

193
4TH SINTO
K INTERN
ATION
AL CON
FERENCE O
N SO
CIAL SCIENCE AN
D M
ANAG
EMEN
T
Ludwig, S. (2020). 8 franchises that are thriving during the pandemic. U.S Chamber of Commerce.
Naatu, F., & Alon, I. (2019). Social franchising: A bibliometric and theoretical review. Journal of Promotion Management, 25(5), 738–764
NSWSC 1141. (2020). Protulis, A. (24 April 2020). The impact of covid 19 on the franchise industry. [Online].
https://www.lexisnexis.co.za/news-and-insights/covid-19-resource-centre/practice-areas/commercial-law/the-impact-of-covid-19-on-the-franchise-industry.
Retail.com. (2020). The Economic Time. [Online]. https://retail.economictimes.indiatimes.com/news/apparel-fashion/apparel/hm-in-talks-with-tens-of-thousands-of-staff-to-cut-working-hours-due-to-pandemic/74949167.
Rodriguez-Morales, A. J., Gallego, V., Escalera-Antezana, J. P., Méndez, C. A., Zambrano, L. I., Franco-Paredes, C., … Cimerman, S. (2020). COVID-19 in Latin America: The implications of the first confirmed case in Brazil. Travel Medicine and Infectious Disease, 101613 [published online ahead of print], https://doi.org/10.1016/j.tmaid.2020.101613
Surico, P., & Galeotti, A. (2020, March). The economics of a pandemic: The case of COVID-19. Presented at the International Council for Small Business, London Business School. https://icsb.org/theeconomicsofapandemic/
Syahirah Mokhtazar. (2020, 1 April). How covid-19 is reshaping local retail. [Online]. https://www.nst.com.my/lifestyle/flair/2020/04/580093/how-covid-19-reshaping-local-retail
USA Today. (2020). [Online]. https://www.usatoday.com/story/money/food/2020/07/28/mcdonalds-earnings-2020-coronavirus-impact-restaurant-closings/5527617002/. [Accessed 10 September 2020].
Williams, T. A.; Grauber, D. A.; Sutcliffe, K. M.; Shepherd, D. A.; Zhao, E. Y. (2017). Organizational response to adversity: Fusing crisis management and resilience research streams. Academy of Management Annals, 11(2), pp.733-769, https://doi.org/10.5465/annals.2015.0134

194
SICONSEM2021: 089-049
REGULATING SOCIAL MEDIA INFLUENCERS MARKETING IN THE AGE OF COVID-19 IN MALAYSIA
Junaidah ZenoUniversiti Malaysia Sabah (UMS), Malaysia
Corresponding author: [email protected]
ABSTRACT
The emergence of social media has profoundly altered how marketing information is utilised to promote products and create consumer demands. Modern marketing relies on ‘social media influencers’ (SMIs), a relatively new social media trend whereby individuals with significant followers endorse a particular product or service to increase online engagement. SMIs established themselves as trusted figures in the online community by portraying themselves as approachable, authentic, and engaging. Businesses recognised SMIs as a novel means for promoting their products and diversifying their marketing strategy in response to the apparent increase in online shopping due to COVID-19 and increased traffic of social networks and video-sharing platforms such as Facebook, Instagram, YouTube and TikTok. While the analysis of SMIs marketing is still at an infancy stage in Malaysia, it raises several new legal and ethical issues that must be addressed. For instance, how should the advertising practices of SMIs be regulated, should SMIs be treated as professionals or as consumers, are influencers marketing a new type of job and do they fall under the purview of the regulatory framework for consumer protection. This article contends that SMIs marketing is not adequately regulated in Malaysia and aims to analyse the legality of SMIs marketing under the Consumer Protection Act 1999 (CPA) and Trade Descriptions Act 2011 (TDA). To validate the hypothesis, this paper adopted doctrinal and comparative methodologies, analysing statutes, decided cases and journal articles whilst examining the approaches in the United Kingdom (UK) against SMIs marketing. The findings are intended to provide insights for legislative and non-legislative reforms in Malaysia to evolve with the rise of technology and emerging trends.
Keywords: Consumer law, marketing, social media influencers.
INTRODUCTION
SMIs refers to individuals who have the ability to influence the opinion or belief of others whilst conveying information about a product in more effective ways. Lou and Yuan (2019, p. 59) define SMIs as a content creator who has established a reputation in a specific field and acquired a substantial number of followers. They are of marketing value to brands for consistently producing valuable content via social media. Modern influencer marketing is a digital version of ‘word-of-mouth’ (WoM) advertising, a well-known effective marketing method that relies on the endorsement of information by trusted individuals within small communities or networks established on mutual trust and repeated interactions. Individuals that provide WoM generally have reputational incentives to continue providing accurate information. Electronic WoM has begun to serve similar functions with the advancement of the Internet, transforming online communities into spaces of trust (Goanta & Ranchordás, 2020, p. 4).
The most common types of SMIs are public figures such as celebrities, models and athletes. However, influencers can also be ordinary people without prior training, such as vloggers and ‘instafamous’ personalities (also known as ‘micro-celebrities) who bought or has experience with the product. They are typically more active online than the average individual and gained large followers on social media by enthusiastically sharing self-generated content on topics like skin care, fitness, food, lifestyle travel and fashion (Lou
20
195
4TH SINTO
K INTERN
ATION
AL CON
FERENCE O
N SO
CIAL SCIENCE AN
D M
ANAG
EMEN
T
& Yuan, 2019, p. 58; Schouten et al., 2020, p. 259). Digital influencers have become much more effective for marketing than sellers’ self-promotion (Riefa & Clausen, 2019, p. 64). In response to the increased traffic on YouTube videos and Instagram profiles, businesses have begun to leverage SMIs into their marketing strategies (Goanta & Ranchordás, 2020, p. 5; Lou & Yuan, 2019, p. 58). Other social networks and video-sharing platforms such as Facebook and TikTok as well as the apparent increase in online shopping following COVID-19, also contributed to the growing number of SMIs marketing.
While Malaysia has eased the recent nationwide lockdown that began on 1st June 2021, online transactions are expected to increase despite the reopening of more conventional stores. The most likely causes are the inconvenience of shopping at brick-and-mortar shops whilst adhering to strict Standard Operating Procedures and queuing or waiting outside the conventional outlets, which is time-consuming and increases the risk of exposure to COVID-19. Additionally, the restriction imposed on those not vaccinated from entering certain business premises may also be the cause. As the world adapted to coexisting with COVID-19, SMIs have grown in popularity and became important avenues for marketing (Archer et al., 2021, p. 108). With millions of internet users browsing social media platforms daily for entertainment, inspiration, and product recommendations, it is unsurprising that marketers are leveraging the power of social media’s most recognisable faces for advertising (Statista Research Department, 27.09.2021). In Malaysia alone, nearly 59% of respondents have purchased a product amid the pandemic because it was endorsed by SMIs (Müller, 07.09.2021b).
SMIs marketing lowers the cost of reaching a targeted audience while still allowing for the delivery of multiple benefits about a product via their postings. SMIs also established themselves as trusted figures in the online community by portraying themselves as approachable, authentic, and engaging. Similarly, consumers view SMIs as more reliable, well-connected, and less influenced by brands. Consumers also benefit from lower prices and better services resulting from businesses harnessing SMIs to promote products as market competition increases. However, despite its growing popularity, research on SMIs is relatively limited (Martínez-López et al., 2020, p. 579). Legally speaking, if SMIs fall outside the remit of consumer law, it will constitute a barrier to consumer empowerment through high-quality information. SMIs marketing is likewise questionable, especially if they received incentives in exchange for their endorsements. As such, this article focuses on the legality of SMIs marketing and the importance of holdings SMIs legally accountable for their endorsements.
SMIs marketing creates new risks that have yet to be fully understood or regulated in Malaysia. As such, this paper aims to:i. analyse whether SMIs marketing in Malaysia falls under the purview of the CPA and
TDA; andii. identify how the CPA and TDA may be adjusted to effectively respond to SMIs
marketing in Malaysia.
This article argues that the CPA and TDA do not adequately regulate SMIs marketing and lag in addressing the resultant legal issues amid development in digital commerce. The legal liabilities of SMIs for endorsing a product or brand, in particular, remains unsettled. Therefore, to validate these hypotheses, this article is predicated upon the following research questions:i. to what extent do the CPA and TDA regulate SMIs marketing in Malaysia?; and ii. how might a reference to the legal and non-regulatory approaches at English law
provide insights for governing SMIs marketing in Malaysia?
METHODS
This article adopted a doctrinal approach in analysing the legitimacy of SMIs marketing under the CPA and TDA. Doctrinal research is the process of identifying, analysing and synthesising the content of the law. It critically examines the key features of the legislation
196
and case law whilst summarises the relevant elements to establish an arguably correct and complete statement of the law on the issue in question (Watkins & Burton, 2018, p. 13). Doctrinal research is also known as library-based research, and it is the most common methodology used by legal researchers (Singhal & Malik, 2012). While conducting a doctrinal analysis, researchers will locate and analyse the primary sources of law, which include but are not limited to statutes, case law, rules and regulations. Additionally, doctrinal research does not merely describe the law (Hutchinson & Duncan, 2012), but it also examines secondary sources such as scholarly writings to assist in understanding the primary sources.
This article also used a comparative approach, examining how the English legal framework addresses issues of SMIs marketing. Comparisons with English law provides new insights and pragmatic suggestions for legal reforms and non-regulatory approaches in dealing with SMIs marketing. Furthermore, ‘borrowing’ legal rules and approaches that have already been successfully ‘tested’ abroad via legal transplants can be a more cost-effective alternative. Instead of guessing possible solutions and risking fewer effective approaches, Malaysia may consider the enormous wealth of legal experience from a more advanced country like the UK. Specifically, appropriate transplantation of English law approaches may lower the costs of enacting new laws or switching from one set of rules to another. The Malaysian legal system is also primarily based on the English common law due to the long period of colonisation by the British empire. Although Malaysia attained independence a long while ago, English law retains influence and remains permitted in Malaysia to a limited extent (Civil Law Act 1956, sections 3, 5; Lee Kee Chong v Empat Nombor Ekor (N.S.) Sdn.Bhd [1976] 2 MLJ 93), whilst some English statutes have been modified to suit the local circumstances. For instance, the Sale of Goods Act 1957 is a modified version of the Sale of Goods Act 1893 in the UK.
LITERATURE REVIEW
Social media enables a wide range of marketing collaborations between brands and SMIs (Goanta & Ranchordás, 2020, p. 10). It might be through affiliate marketing where the SMIs posted content with a discount code and earned commissions on sales or clicks generated via their customised URLs. Depending on the nature of the industry, the SMIs may also promote the brand’s goods or services via a post, review, shoutout, or a story on their social media in exchange for free products or services. Either party can initiate this commercial engagement. For example, a skincare company may invite a SMI to collaborate in raising awareness of the brands, demonstrate how to use the skincare, and provide practical advice on the benefits of the products to their followers. Likewise, SMIs may approach hotels, for instance, to get complimentary stays in exchange for promoting the hotel in a way that benefits their business. These collaborations might be formalised through a formal contract or by informal negotiations.
Additionally, SMIs can enter into endorsement deals with a certain brand and received commissions for advertising as agreed. They serve as the brand ambassador and are bound by exclusivity clauses that prevent them from endorsing competing brands products. Breach of these terms will result in legal consequences. The SMIs may also form partnerships with the company whilst becoming a producer of goods or services themselves. In particular, the SMIs develop their own product, which the established company then launches. It is also possible for both parties to co-create the product. However, it is unclear if the SMI is acting in the capacity of the chief executive officer, advertisers, or an independent party in this case. It also raises ethical issues relating to conflict of interests, i.e., whether the SMIs will ever criticise the product in their endorsements.
The standard of good business practice amongst digital influencers remains unsettled to date (Riefa & Clausen, 2019, p. 67). Despite its increasing prominence, the relevance of SMIs to promote brands is vastly underestimated. While legal analysis of SMIs is still in its infancy, there is always space for improvement (Goanta & Ranchordás, 2020, p. 4). As

197
4TH SINTO
K INTERN
ATION
AL CON
FERENCE O
N SO
CIAL SCIENCE AN
D M
ANAG
EMEN
T
SMIs marketing has grown in popularity, many influencers are likely to compete for steady followers through unethical practices, as is the case nowadays (Goanta & Ranchordás, 2020, p. 14). Besides, SMIs marketing can impair consumers’ freedom to make informed choices, causes unfair competition and lead to a loss of trust, all of which are essential key to the continued success of digital commerce (Riefa & Clausen, 2019, p. 65). Marketing via social platforms likewise merits proper legal attention following the progressive migration of visual content and advertising (e.g., television, newspapers, magazines) towards social media.
The Legality of SMIs Marketing
Celebrities and the general public alike are advertising on social media as the new norm for digital marketing. Thousands of smaller-scale content creators are active on platforms such as YouTube, Instagram, TikTok and Snapchat. These SMIs monetise their content and profit financially through interaction with their viewers (Goanta & Wildhaber, 2020, p. 210). Although SMIs marketing is not prohibited by law, it has raised several legal issues. SMIs shared moments of their daily lives and offered advice in various areas (fitness, beauty, food) whilst endorsing consumer goods and services. Frequently, these SMIs fail to adequately disclose their commercial ties with the companies behind their advertisements (Goanta & Ranchordás, 2020, p. 1). Harnessing SMIs has nurtured an emerging grey, non-regulated market, i.e., the monetisation of SMIs on social media. While utilising SMIs has benefits such as aspirational careers, it also exposes consumers, especially the vulnerable like minors, to exploitation. Consumers also respond positively to reviews by their favourite influencers despite issues such as products safety or hidden costs. Furthermore, the absence of market entry barriers and lack of regulation on SMIs marketing leaves both the SMIs and consumers vulnerable to manipulation (Goanta & Wildhaber, 2020, p. 211).
SMIs marketing is often linked with deceptive behaviour (e.g., hiding paid endorsement) and misleading expertise (e.g., promoting harmful products) (Goanta & Wildhaber, 2020, pp. 210,211). Marketing via SMIs can also be challenging when it clashes with the legal duty to provide information (Ducato, 2020, p. 237). This is particularly true when there is no clear indication of whether SMIs fall under the remit of the existing laws leaving their status, rights and responsibilities legally uncertain. For instance, it has to be decided whether SMIs play an active role in deceiving consumers and thus are lawfully liable for misleading and false representation. SMIs may also be involved in advertising counterfeit products or fraudulent businesses through their social media, thus raising questions of how to penalise SMIs and measure their level of responsibility. Essentially, legal ramifications must exist to ensure that SMIs do not profit from defrauding consumers.
SMIs marketing is questionable and may be biased especially if they received incentives in exchange for their endorsements. It is not an issue if SMIs are being paid for their professional recommendations or sharing feedback, but it may affect the credibility of their endorsements in terms of quality and authenticity. If the endorsements are circulated around the social environment, e.g., via Facebook, potential buyers might assume that it is just an exchange of information between consumers without being aware that their social interactions are being exploited for marketing purposes. Some SMIs endorsed goods and services on their social platform in exchange for complimentary products or discounted items for their followers. As the endorsements were part of the SMIs regular content, consumers would find it difficult to determine their authenticity. Self-defence mechanisms that typically assist consumers in critically evaluating advertisements are likely to be weakened if sponsored endorsements are absorbed and diluted in SMIs regular posts. Consequently, consumers may be misled an advertisement for an endorsement stemming from the concealment of information related to the commercial nature of the posts (Ducato, 2020, p. 233; Pflücke, 2020, p. 299).
Some SMIs reviewed products because it was a ‘gift’ or because they bought it from sellers they knew personally. Despite the fact that they have rarely or never used the product, the SMIs are likely to claim that they have had positive outcomes from the

198
product. Consumers, on the other hand, still perceive the endorsements as less biased because it was from the SMIs’ actual experiences, which makes it more trustworthy than those provided by sellers (DiMatteo, 2016; Filieri et al., 2015). In fact, some consumers read and trust SMIs’ reviews in the same way that they trust personal recommendations (BrightLocal). In Malaysia, for instance, nearly 47% of respondents were convinced by the endorsements made by influencers when making purchases (Müller, 07.09.2021a) as shown below:
Table 1
Reasons for Purchasing Products That were Endorsed by Influencers in Malaysia as of October 2020
RESULTS
Marketing is a vital part of ensuring the continuity and success of a business. However, competition has shifted to marketing images rather than price and quality, leading to market failures (Howells et al., 2018, p. 7). The increased use of digital influencers to promote brands and products has posed a challenge to consumer protection laws (Riefa & Clausen, 2019, p. 64) in any region, including Malaysia. This part, therefore, analyses the adequacy of the CPA and TDA in regulating SMIs marketing in Malaysia.
The Consumer Protection Act 1999
The CPA comprises 14 parts with 150 sections dealing with various consumer-related issues. It aims to provide comprehensive protection and redress to consumers regarding goods and services offered or supplied through offline and online transactions (section 2(1)). The CPA prohibits any person from engaging in misleading conduct related to the manufacturing process (for goods), nature, characteristics, suitability for a purpose and the availability of the goods or services (section 9). The CPA also prohibits any person from giving false or misleading representation, which among others, relates to the key features of the goods or services (e.g., type, quality and quantity), its previous history and place of origin (section 10). The CPA does not specify the standard or test used to assess whether these prohibitions have been committed. However, one is considered to engage in ‘false’, ‘misleading’ and ‘deceptive’ conduct or representation if such practices are capable of leading a consumer into error (section 8(a)). The CPA does not explicitly refer to a ‘seller’ as the person that would be liable for false, misleading and deceptive
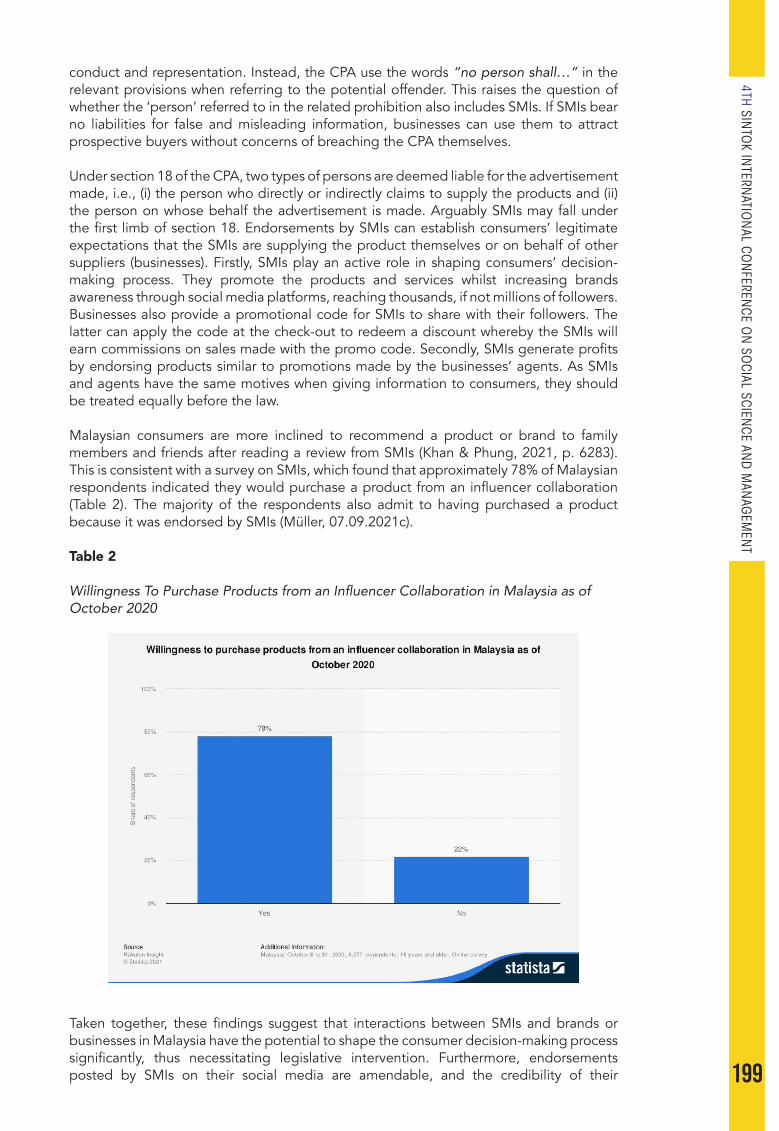
199
4TH SINTO
K INTERN
ATION
AL CON
FERENCE O
N SO
CIAL SCIENCE AN
D M
ANAG
EMEN
T
conduct and representation. Instead, the CPA use the words “no person shall…” in the relevant provisions when referring to the potential offender. This raises the question of whether the ‘person’ referred to in the related prohibition also includes SMIs. If SMIs bear no liabilities for false and misleading information, businesses can use them to attract prospective buyers without concerns of breaching the CPA themselves.
Under section 18 of the CPA, two types of persons are deemed liable for the advertisement made, i.e., (i) the person who directly or indirectly claims to supply the products and (ii) the person on whose behalf the advertisement is made. Arguably SMIs may fall under the first limb of section 18. Endorsements by SMIs can establish consumers’ legitimate expectations that the SMIs are supplying the product themselves or on behalf of other suppliers (businesses). Firstly, SMIs play an active role in shaping consumers’ decision-making process. They promote the products and services whilst increasing brands awareness through social media platforms, reaching thousands, if not millions of followers. Businesses also provide a promotional code for SMIs to share with their followers. The latter can apply the code at the check-out to redeem a discount whereby the SMIs will earn commissions on sales made with the promo code. Secondly, SMIs generate profits by endorsing products similar to promotions made by the businesses’ agents. As SMIs and agents have the same motives when giving information to consumers, they should be treated equally before the law.
Malaysian consumers are more inclined to recommend a product or brand to family members and friends after reading a review from SMIs (Khan & Phung, 2021, p. 6283). This is consistent with a survey on SMIs, which found that approximately 78% of Malaysian respondents indicated they would purchase a product from an influencer collaboration (Table 2). The majority of the respondents also admit to having purchased a product because it was endorsed by SMIs (Müller, 07.09.2021c).
Table 2
Willingness To Purchase Products from an Influencer Collaboration in Malaysia as of October 2020
Taken together, these findings suggest that interactions between SMIs and brands or businesses in Malaysia have the potential to shape the consumer decision-making process significantly, thus necessitating legislative intervention. Furthermore, endorsements posted by SMIs on their social media are amendable, and the credibility of their
200
endorsements is questionable. Therefore, if SMIs marketing is not recognised to fall within the purview of the CPA or TDA, it is the consumers that would suffer the most from the invisible marketing tactics.
The Trade Descriptions Act 2011
The TDA was introduced to promote ethical trade practices. The TDA resembles the CPA in many ways. Firstly, both legislations prohibit false and misleading statements about goods and services (TDA, section 18; CPA, sections 10, 18). Secondly, the aspects considered in assessing false and misleading representations of goods and services are practically the same (TDA, sections 6,7,16 (1); CPA, section 10). Thirdly, both legislations use similar tests for determining false or misleading offences, namely, whether the conduct or statement is capable of leading any consumers into error (TDA, section 13; CPA, section 8). Lastly, the TDA closely followed the CPA concerning the person deemed liable for making an advertisement (section 19 of the TDA is in pari materia with section 18 of the CPA). Therefore, previous arguments justifying the relevance of SMIs marketing fall within the purview of the CPA may likewise apply to the TDA.
Comparative Observations
The key legislation governing consumer law in the UK are the Consumer Rights Act 2015, Consumer Contracts (Information, Cancellation and Additional Charges) Regulations 2013, and the Consumer Protection from Unfair Trading Regulations 2008 (CPUTRs). Enforcement of these Acts are carried out by public agencies such as the Competition and Markets Authority (CMA) and the local authority Trading Standards Services. The CMA also plays a vital role in educating consumers and businesses on consumer protection laws and regulations. Educating consumers of their rights is, however, challenging as many consumers are not interested in this information until they experience the unfair practices themselves (Tokeley, 2018, p. 439). Apart from providing guidance on newly implemented laws, the CMA also conducted market studies and investigations to understand the operation of the market for better regulation. The CMA’s guidance and findings aid businesses and their advisors in understanding and complying with the law. Information and advice from the CMA also help consumers and their advisers to identify any breaches of the law (Wilhelmsson & Willett, 2018, p. 164). In furtherance of their roles as the UK’s primary competition and consumer authority, the CMA also collaborated with the Advertising Standards Authority (ASA). The sharing of expertise between these two authorities lead to more effective and consistent enforcement actions in the UK against false and misleading information in advertising.
The CMA has taken several initiatives to regulate SMIs marketing with a focus on increasing transparency. Additionally, the CMA regularly investigates compliance with consumer protection laws. For example, they have investigated influencers who did not adequately disclose whether they were paid or rewarded when endorsing a product. The investigation includes gathering information from celebrities and social media influencers about their posts and the nature of the business agreements with the brands they promote (Competition & Markets Authority, 16.08.2018). The CMA argues that if influencers were incentivised to promote, review or talk about a product, the resulting posts become subject to consumer protection law. Sellers who have control over the contents of the post will also become subject to the UK advertising Code. Consumers tend to trust products recommended by someone they admire. Therefore, failure to properly label posts may lead consumers to believe that an endorsement represents the influencers’ personal views. Conversely, this is unlikely to happen if influencers clearly state that the endorsement was a paid partnership with a particular brand (Competition & Markets Authority, 16.08.2018).
The CMA had published two successive sets of guidelines targeted at influencers. In September 2018, the ‘Advertising Guidelines’ were released in collaboration with the ASA and the Committee of Advertising Practice (CAP) (ASA, 28.09.2018a, 28.09.2018b). The Advertising Guidelines help all parties involved in influencer marketing to follow
201
4TH SINTO
K INTERN
ATION
AL CON
FERENCE O
N SO
CIAL SCIENCE AN
D M
ANAG
EMEN
T
the specified rules. It requires brands and influencers to disclose their commercial relationship to avoid the risk of action from the ASA. The second set of guidelines, namely, the ‘Transparency Guidelines’ were published in January 2019 (Competition & Markets Authority, 23.01.2019). It focuses on transparency with social media followers and provides further guidance on how influencers who received incentives should disclose their posts. Both guidelines do not have a force of law. However, they provide useful advice on how the existing consumer protection laws in the UK (e.g., the CPUTRs) and industry rules apply to influencers marketing. If influencers violate the consumer protection laws and industry rules, they will face enforcement action from the CMA (which has both civil and criminal enforcement powers) or be compelled by the ASA to amend or withdraw the relevant contents.
Proposed Reforms
The paradox of today’s digital world makes it challenging to assess the authenticity of information disseminated in cyberspace. Social and commercial posts are now inseparable, making it difficult to tell whether SMIs are honest when reviewing a particular product. The CPA and TDA defined false, misleading and deceptive conduct and representation as those that lead a consumer into error (section 8 (a)). Even if SMIs do not satisfy the conditions set forth in the CPA and TDA regarding liability for advertisement, their endorsements can nonetheless lead a consumer into error. As such, this article argues that the CPA and TDA should explicitly extend its applications to SMIs marketing to provide optimum protection to Malaysian consumers. Imposing the same advertisement liability to SMIs also serves as a reminder to be extra vigilant while endorsing a product so that they do not lead a consumer into error. Besides, extending the scope of the CPA and TDA to administer SMIs marketing is preferable because it is less costly than introducing a new law for that purpose.
The CPA and TDA may also require influencers to transparently disclose any commercial relationship they have with the brand they promote and incentives received in exchange for their endorsements. If consumers know that the influencer is being paid to promote or talk about the product, it can reduce the persuasive power of the endorsements (Quirk & Rothchild, 2018, p. 313). To illustrate, using editorial content in media to promote a product without making it clear that the content is sponsored or that the seller has paid for the promotion is considered unfair practices under the English law (CPUTRs 2008, Sch 1, no 11). Influencers must disclose their commercial relationship with the brand and be transparent about whether the brand paid the content of their post. For example, influencers must tag the brand sponsoring them by placing “this post is sponsored by or paid partnership with…” or other sentences with similar effect. It must be placed close to their post to remind consumers of the nature of the information. If the influencer uses disclosure hashtags, it must be prominent and easy to understand (e.g., #sponsored and not #ad).
The CPA and TDA may additionally provide guidelines on SMIs marketing to ensure that their activities are consistent with the respective laws. As in the UK, for instance, apart from conducted investigations into the transparency of endorsements issued by SMIs, the CMA had published the Advertising Guidelines and the Transparency Guidelines targeted at influencers. These guidelines require brands and influencers to disclose their commercial relationship to avoid the risk of action from the ASA. Lawmakers and consumers’ enforcement authorities in Malaysia, such as the Ministry of Domestic Trade and Consumer Affairs, may follow suit to safeguard Malaysian consumers from being manipulated by invisible marketing tactics. However, the enforcement authorities may find it challenging to supervise SMIs. There are probably thousands, if not millions, of SMIs in Malaysia, making it virtually impossible to monitor each influencer individually. In this regard, raising awareness of consumer law may complement the legislative and non-legislative initiatives.

202
CONCLUSION
This article discussed the legality of SMIs marketing under the CPA and TDA. SMIs play a vital role in shaping consumers purchase decisions and thus warrant legal attention. While both the CPA and TDA are silent on SMIs marketing, this article argues that SMIs should be equally accountable to the relevant brands for their endorsements. Otherwise, brands will use SMIs as a stepping stone to influence consumers into buying their products without worrying about the liability for false and misleading advertisements under the CPA and TDA. It is also futile for the CPA and TDA to ban false and misleading conducts and representations if businesses can utilise SMIs as conduits to shape the legitimate expectations of consumers in regards to their products. Essentially, SMIs should be legally liable for their endorsements or advertisements to empower Malaysian consumers to make informed decisions in an ever-changing digital marketplace.
This research, however, focuses solely on the CPA and TDA. Future research may discuss other legislation and guidelines such as the Communications and Multimedia Act 1998, the Malaysian Code of Advertising Practice and the Advertising Committee established under the CPA. Additionally, the subject matter of future research can be broadened to include the platform that serves as the ‘gatekeeper’ and ‘intermediary’ for SMIs to endorse products as well as the legal liabilities of minor influencers. The doctrinal and comparative research herein can also be a starting point for empirical research by legal scholars, courts, legislators and others interested in SMIs marketing. Empirical research may provide valuable insights into understanding consumers’ behaviour and the necessity for legal intervention. This may entail determining if consumers value disclosure of the commercial relationship between SMIs and brands prior to making purchase decisions.
REFERENCES
Archer, C., Wolf, K., & Nalloor, J. (2021). Capitalising on chaos–exploring the impact and future of social media influencer engagement during the early stages of a global pandemic. Media International Australia, 178(1), 106-113.
ASA. (28.09.2018a). Influencer’s Guide. https://www.asa.org.uk/resource/influencers-guide.html
ASA. (28.09.2018b). New guidance launched for social influencers. https://www.asa.org.uk/news/new-guidance-launched-for-social-influencers.html
BrightLocal. Local Consumer Review Survey 2017. https://www.brightlocal.com/learn/local-consumer-review-survey/
Competition & Markets Authority. (16.08.2018). Celebrities and social media stars investigated for not labelling posts. Gov.UK. https://www.gov.uk/government/news/celebrities-and-social-media-stars-investigated-for-not-labelling-posts
Competition & Markets Authority. (23.01.2019). Guidance: Social media endorsements: Being transparent with your followers. https://www.gov.uk/government/publications/social-media-endorsements-guide-for-influencers/social-media-endorsements-being-transparent-with-your-followers
DiMatteo, L. A. (2016). Regulation of share economy: A consistently changing environment. In R. Schulze & D. Staudenmayer (Eds.), Digital revolution: Challenges for contract law in practice. Hart Publishing.
Ducato, R. (2020). One hashtag to rule them all? Mandated disclosures and design duties in influencer marketing practices. In C. Goanta & S. Ranchordás (Eds.), The regulation of social media influencers. Elgar.
Filieri, R., Alguezaui, S., & McLeay, F. (2015). Why do travelers trust TripAdvisor? Antecedents of trust towards consumer-generated media and its influence on recommendation adoption and word of mouth. Tourism Management, 51, 174-185.
Goanta, C., & Ranchordás, S. (2020). The regulation of social media influencers: an introduction. In C. Goanta & S. Ranchordás (Eds.), The Regulation of social media influencers. Edward Elgar Publishing.
Goanta, C., & Wildhaber, I. (2020). Controlling influencer content through contracts: a qualitative empirical study on the Swiss influencer market. In C. Goanta & S.
203
4TH SINTO
K INTERN
ATION
AL CON
FERENCE O
N SO
CIAL SCIENCE AN
D M
ANAG
EMEN
T
Ranchordás (Eds.), The regulation of social media influencers. Elgar. Howells, G., Ramsay, I., & Wilhelmsson, T. (2018). Consumer law in its international
dimension. In G. Howells, I. Ramsay, & T. Wilhelmsson (Eds.), Handbook of research on international consumer law. Elgar.
Hutchinson, T., & Duncan, N. (2012). Defining and Describing what we do: Doctrinal legal research. Deakin Law Review, 17, 83.
Khan, F. R., & Phung, S. P. (2021). Social media influencers and its impacts on consumer behavior: Malaysia. Annals of the Romanian Society for Cell Biology, 25(4), 6276-6285.
Lou, C., & Yuan, S. (2019). Influencer marketing: How message value and credibility affect consumer trust of branded content on social media. Journal of Interactive Advertising, 19(1), 58-73.
Martínez-López, F. J., Anaya-Sánchez, R., Fernández Giordano, M., & Lopez-Lopez, D. (2020). Behind influencer marketing: Key marketing decisions and their effects on followers’ responses. Journal of Marketing Management, 36(7-8), 579-607.
Müller, J. (07.09.2021a). Reasons for purchasing products that were endorsed by influencers in Malaysia as of October 2020. Statista. https://www-statista-com.ezproxy.ums.edu.my/statistics/1201903/malaysia-reasons-for-buying-products-endorsed-by-an-influencers/
Müller, J. (07.09.2021b). Share of people who have purchased an item or product because it was endorsed by an influencer in Malaysia as of October 2020. statista. https://www-statista-com.ezproxy.ums.edu.my/statistics/1201834/malaysia-influencer-impact-on-buyer-behavior/
Müller, J. (07.09.2021c). Willingness to buy influencer collaboration products Malaysia 2020. statista. https://www-statista-com.ezproxy.ums.edu.my/statistics/1202150/malaysia-willingness-to-buy-influencer-collaboration-products/#statisticContainer
Pflücke, F. (2020). Making influencers honest: the role of social media platforms in regulating disclosures. In C. Goanta & S. Ranchordás (Eds.), The regulation of social media influencers. Edward Elgar Publishing.
Quirk, P., & Rothchild, J. A. (2018). Consumer protection and the internet. In G. Howells, I. Ramsay, & T. Wilhelmsson (Eds.), Handbook of research on international consumer law (2nd ed.). Elgar.
Riefa, C., & Clausen, L. (2019). Towards fairness in digital influencers’ marketing practices. Journal of European Consumer and Market Law, 8(2), 64-74.
Schouten, A. P., Janssen, L., & Verspaget, M. (2020). Celebrity vs. influencer endorsements in advertising: The role of identification, credibility, and product-endorser fit. International Journal of Advertising, 39(2), 258-281.
Singhal, A. K., & Malik, I. (2012). Doctrinal and socio-legal methods of research: Merits and demerits. Educational Research Journal, 2(7, July), 252-256.
Statista Research Department. (27.09.2021). Influencer marketing worldwide - Statistics & facts. Statista Research Department. https://www.statista.com/topics/2496/influence-marketing/
Tokeley, K. (2018). Access to justice. In G. Howells, I. Ramsay, & T. Wilhelmsson (Eds.), Handbook of research on international consumer law. Elgar.
Watkins, D., & Burton, M. (2018). Research methods in law (2nd ed.). Routledge. Wilhelmsson, T., & Willett, C. (2018). Unfair terms and standard form contracts. In G.
Howells, I. Ramsay, & T. Wilhelmsson (Eds.), Handbook of research on international consumer law. Elgar.
204
SICONSEM2021: 103-067
STATE EFFORTS IN ORDER TO FULFILL THE RIGHT TO HEALTH IN THE MIDST OF THE COVID-19 PANDEMIC
1Rosalia Dika Agustanti, 2Shafira Fatahaya & 3Rissa Asmitha Wardoyo1,2,3Faculty of Law, Jakarta Veterans National Development University
Corresponding author: [email protected]
ABSTRACT
This study examined the right to health pursued by the country in the midst of the Covid-19 pandemic because it is the right of every citizen to fulfill his health rights. Each country has a responsibility to take appropriate action in dealing with the pandemic that has severely estabilized many countries in the world. It should be a question about the efforts of the state to be associated with the appropriate or not, health rights based on the rule of law of the country. The research methods used include normative juridical with a compatriotic approach, a statutory approach and a conceptual approach derived from the study of literature. The results showed that the country in overcoming Covid-19 used the principle of social distancing, namely physical restriction of humans so that activities that were generally conducted face to face have changed to online media. Even some countries have made lockdown, a policy. The state also sought to fulfill the health rights of its citizens by improving health facilities and administering vaccines. However, some efforts which have been conducted, in fact could not fully solve the pandemic fast enough. These are not caused by rudimentary policy factors or even public factors that have yet to be aware of the dangers of the pandemic. Therefore, the fulfillment of the right to health has not been fully achieved as some efforts require time for adjustment. From that adjustment, a new policy is expected to be formed which will be able to fulfill the health rights of every citizen.
Keywords: Law, human rights, health, citizen.
INTRODUCTION
Every country in the world certainly has a responsibility in terms of providing protection and fulfilling the human rights of citizens including health rights. Human rights must be given fairly in order to prosper the people without discrimination. With the health insurance provided by the Government, then if there are problems in the country such as the spread of viruses such as Covid-19, it can be resolved with the guarantee. Looking at its history, Covid-19 is an infectious disease and began to develop in 2019 which then became a major problem almost all over the world. The virus originally originated in Wuhan, China. The cause is said to come from one of the wild animals, bat. The impact of this virus is very dangerous because it not only causes respiratory tract disorders but can also cause death for those infected with this virus (Juaningsih et al., 2020). The Covid-19 virus is the result of an old virus that mutated to form a new genetic makeup which means that it is the same type but only changes identity. The virus is named SARS-Cov-2 because it is genetically linked to the virus that causes SARS and MERS (Nurhalimah, 2020). It doesn’t take long, the virus quickly spreads and infects many people.
It is undeniable that this virus puts the world in an excruciating and chaoticstate. The extent of the extent of the outbreak scale and the large number of infected world populations succeeded in making the WHO Director-General on January 30, 2020 in Geneva declare the current situation as Public Health Emergency Of International Concern (PHEIC) (Hairi, 2020). Where the number of corona cases reached more than 238 million with a total death of almost 5 million (Worldometer, 2021). This indicates that the covid-19 virus is indeed very dangerous. Problems in various aspects of state life arise due to this virus,
21

205
4TH SINTO
K INTERN
ATION
AL CON
FERENCE O
N SO
CIAL SCIENCE AN
D M
ANAG
EMEN
T
one of which is the economy that has declined. However, no less important is the health of the citizens of each country. Handling COVID-19 and its impact certainly requires a very large capacity of resources in the provision of all health care facilities and systems, as well as medical personnel to be able to serve citizens infected with the covid-19 virus (Nurhadi, 2020). It must be an urgency to be fulfilled by the state. Various policies and rules are made by the state in order to overcome and break the chain of spread of the virus.
Each country has a fairly different effort but has the same goal of suppressing positive Covid-19 numbers. Among them, the Indonesian state implements Scale Social Restrictions (in Indonesian called PSBB) and the Enactment of Restrictions on Community Activities (in Indonesian called PPKM). Malaysia enacted the Movement Control Order (MCO) as a pandemic curve alignment strategy (Salim et al., 2020). Singapore as a preventive measure has an extensive pandemic mitigation system and named Disease Outbreak Response System Condition (Salim et al., 2020)(DORSCON) (Goh, 2020) as well as carrying out Home Quarantine and tracking in public places that are frequented. The state of India and vietnam imposed a similar policy of conducting a nationallockdown. And tahiland state implemented social distancing as well as establishing a National Emergency, such as restrictions on the sale of alcoholic beverages and the cancellation of the Songkran festival to prevent mass gatherings, and the provision of economic stimulus packages.
In the perspective of international law, the World Health Organization WHO) is the main mandate holder, especially regarding global public health (Nadilla, 2020). Everyone has the potential to be exposed to Covid-19. Each country is obliged to fulfill the right to the health of citizens, especially in the current Covid-19 pandemic. In its fulfillment vaccination as a health right of citizens that should not be ruled out. But in fact, there are countries that are still hampered in disseminating vaccinations. Vaccines are antigenic substances used for immunity to a disease (Rahmi Ayunda, Velany Kosasih, 2021). Indonesia, Malaysia, Singapore, India, Vietnam and Thailand are currently working to ensure that vaccinations for their citizens are quickly delivered and strive to fulfill their health rights as the responsibility of each country.(Nadilla, 2020)(Rahmi Ayunda, Velany Kosasih, 2021).
This study examines the right to health pursued by the country in the midst of the Covid-19 pandemic because it is the right of every citizen to fulfill his health rights. Countries have a responsibility to take appropriate action in dealing with pandemics that have severely destabilized all countries in the world. It should be a question about the efforts of the state to be associated with the appropriate or not health rights based on the rule of law of the country. This research is important to be an example of learning for the government in overcoming Covid-19 cases. With the perbandingn six countries this can be a benchmark of the success of the government to deal with Covid-19. Based on this background, researchers limited this study first, how the government’s efforts in tackling Covid-19 cases and second, whether the government has fulfilled the right to the health of citizens during the Covid-19 pandemic.
METHODS
The research method used is juridis normative by using a comparative approach, a legal approach, and a conceptual approach. Comparative approach is research on legal comparison both regarding the comparison of legal systems between countries and comparison of legal products and legal character between times in one country (Nasution, 2008) this approach is carried out to compare domestic and foreign regulations. The legal approach is carried out by reviewing all laws and regulations related to legal issues that are being handled (Marzuki, 2019). Subsequently the conceptual approach moved from the views and doctrines that developed in the legal sciences. This research is supported by secondary data consisting of primary legal materials, secondary legal materials and tertiary legal materials. Where primary legal material is obtained from sharing existing laws and regulations in each country and secondary legal materials obtained from books, journals and scientific articles from various countries that want to be studied in this study.

206
Furthermore, the author uses secondary legal materials in the form of journals, books related to the right to the health of citizens, government responsibilities and so on. As well as tertiary legal materials in the form of the internet. This data analysis technique is carried out qualitatively based on the legal norms in the laws and regulations that are analyzed and spelled out in accordance with the problems used as anapproachin research (Ali, 2019). This study uses the theory of accountability related to the issues raised, namely state accountability to citizens regarding health so that every citizen gets the right to health as a matter of life so that the community is prosperous and protected and the principle used is the principle of equality before the law, meaning thatresearchers will review that every citizen has the right to be respected. the same to be fulfilled for health, especially for those infected with the covid-19 virus.
LITERATURE REVIEW
In the research conducted by Siti Nurhalimah, Indonesia as a country is responsible for fulfilling people’s right to health as stipulated in Article 28H paragraph (1) of the 1945 Constitution of the Republic of Indonesia, the following norms: “... Everyone has the right to live a prosperous life born and inward, residing, and getting a good and healthy living environment and entitled to health services...” As an attribute of the provisions of Article 4 of Law No. 36 of 2009 on Health states that “Everyone is entitled to health” which broadly outlines the rule of law has mandated that as many people are entitled to protection of their health, and the state is responsible for regulating the fulfillment of the right to healthy living for its population including for the poor and unable (Nurhalimah, 2020). Health is no longer only associated with the fate of the person but the right to health is a legal right that hasbeen guaranteed, protected, respected and must be fulfilled by the state (Hidayat, 2016). The need for various policies such as the provision of health insurance systems, provision of health infrastructure, optimization of human resources as medical personnel is a way to meet the health degrees of every citizen. Being the same when there is a pandemic, the responsibility of the state to maintain public health becomes more and more extra and do not forget to keep media personnel as the vanguard. All forms of legal policies that are set must be for the benefit of the community, especially in the field of health. The government must be very careful to take action in the midst of pandami covid so as not to harm the community by paying attention to the principle of legal certainty. There needs to be attention to medical personnel who are struggling to treat thousands of patients infected with the corona virus.
Furthermore, research conducted by Nisa Khoerunisa and Faisal Fadilla Noorikhsan with the title Comparison of Governance of Handling the Covid 19 Pandemic in Indonesia and India concluded thatthe psbb policy was chosen by Indonesia whose journey experienced duration adjustments for various regions. Violations that occur due to low awareness of citizens are still often found. Although successfully suppressing the rate of spread of Covid, psbb is not effective enough. In India, similar challenges are experienced, with both having the second largest population in the world. Lockdown was chosen by the Indian government to track infected people among the 1.3 billion population, this is done to look for symptoms for 14 days and one week later is reserved to observe the situation of infection, death and recovery rate (Paital, B., Das, K., & Parida, 2020). Although able to reduce the rate of Covid-19 numbers temporarily, the sudden implementation of lockdown and lack of preparation has caused a humanitarian crisis so that the right to health will also be difficult to achieve. Such as violently impacting the poor in India or discrimination. Strong leadership in crisis situations is needed to provide clear crisis management direction and foster public confidence in the system that is needed to get through the crisis. Indonesia’s experience at the beginning of the Covid-19 outbreak illustrates that one of the heaviest burdens is the politicization of pandemics, the failure of synergy and coordination between elements in response to the threat of pandemics will result in a deep humanitarian crisis (Khoerunisa & Noorikhsan, 2021).
So, what distinguishes the previous research from this study is that researchers will examine more deeply related to the efforts of the government in various countries, especially
207
4TH SINTO
K INTERN
ATION
AL CON
FERENCE O
N SO
CIAL SCIENCE AN
D M
ANAG
EMEN
T
Indonesia, Singapore, Malaysia, Vietnam, Thailand and India in overcoming the Covid-19 virus. So that later there will be a comparison related to the efforts made by the state with the aim to fulfill the health rights of each citizen. Researchers will discuss further about what policies, efforts or implementations have been done by the state and whether these efforts have ensured health rights are associated with obstacles that occur in the implementation of efforts to overcome the covid-19 virus. Each country has its own way in trying to overcome this virus, especially in fulfilling the right to the health of its citizens. So that the ways that are considered effective enough can be used as an example for other countries to reduce the number of Covid-19 cases are also included in the fulfillment of the right to health of their citizens.
RESULTS
Efforts Made by the State in Handling Covid-19 Cases
The Covid-19 pandemic has markedly disrupted activities, especially in the economic field, which has a major impact on economies around the world (Juliani, 2020). Making every country must be able to take decisive and appropriate steps in dealing with Covid-19 cases in order to protect their citizens. A number of countries have even taken lockdown policies (Wang et al., 2020) to prevent the spread of Covid-19 or what can be called the corona virus. Where the lockdown is done to be able to limit the space of community movement despite the many impacts arising from this enactment (Jovita & Yazid, 2020). The government in this case has also applied the principle of social distancing to its people that not only makes people move away physically but also socially (Firdaus & Pakpahan, 2020),although there are countries that do not apply it. Article 25 of the Universal Declaration of Human Rights “Everyone is entitled to a standard of living that ensures the health and well-being of himself and his family. “So that every country regulates what every human right to his health should be respected, protected and fulfilled by everyone without exception (Nugraha & Danyathi, 2019). Thus the state has a responsibility to the health of every citizen. Where the principle of health law becomes the basis of a state accountability to ensure the health of every citizen and there are four principles that are universal, including the principle of personality, the principle of communion, the principle of equality before the law and the principle of authority that shows that the law of authority gives binding decisions to its parties (Suduthukum, 2018). The policies implemented by each country in terms of restrictions on wiggle room are certainly different and coupled with other policies that are considered supportive. In some examples of countries and efforts made in dealing with Covid-19 cases, among others:
Indonesia
Indonesia imposed Large-Scale Social Restrictions (PSBB) in order to suppress the growth of this virus (Permatasari, 2021). Where PSBB in this case is considered effective to be able to prevent the spread of Covid-19 which is then confirmed in Government Regulation No. 21 of 2020 on Large-Scale Social Restrictions in order to Accelerate the Handling of Corona Virus Disease 2019 (COVID-19). This has also been considered by the Minister of Health with consideration of the magnitude of the number of fatalities caused by the threat of the virus. (Hasrul, 2020). The government also implemented several strategies that are considered to be able to suppress the path of spread of the virus and have been published with the establishment of Social Distancing procedures, limiting community activities not to work directly in the office or Work from Home (WFH) (Hasibuan & Ashari, 2020). The implementation of PSBB in the end did not make the corona virus disappear and existing cases continued to grow so that in the end the Government issued a new policy by implementing restrictions on community activities (PPKM) (Mahardika & Saputra, 2021). Restrictions on the entry and exit of individuals to an area that has been declared the source of the outbreak, including regulating the existence of orders to conduct isolation, quarantine of territories, vaccinations, or even the application of restrictions on activities have been regulated all in Law No. 6 of 2018 on Health Quarantine (Gelora
208
Mahardika, 2020). Indonesia is in the stage of implementing vaccinations stipulated in the Presidential Regulation (Rahman, 2021). However, the vaccine was not completely able to stop the spread of this virus proven as of September 18, 2021 there were 4,188,529 cases with a total of 140,323 deaths (Worldometer, 2021).
Malaysia
The COVID-19 pandemic has left the Malaysian government in this regard having to take pragmatic measures to prevent the spread of the virus, tracking and mandatory quarantine within two weeks. Therefore, the Malaysian government has also announced the enactment of the Movement Control Order (MCO) as a pandemic curve alignment strategy (Salim et al., 2020). Malaysian authorities’ health strategy is not only isolation or quarantine for people infected with virus but also in people with mild diseases to stay at home so that health care facilities are not full and not a source of spread of the virus (Shakeel et al., 2020). Traffic and industrial emissions in this case also became significantly reduced, this is because almost all industrial and commercial activities are strictly prohibited during the first phase of the MCO (Ismail et al., 2020). Stimulus packages from the government such as special allowances, cash assistance, and loan repayment delays will help ease the financial burden of people in Malaysia (Kaur, 2020). The Ministry of Health in Malaysia has also sought to provide education about Covid-19 to the public both through interviews and talk shows in various media, as well as through official websites, Facebook, Twitter, and Telegram. Warnings not to travel to banned countries have also been issued, which was originally just Wuhan City in Hubei Province as a whole now covering more countries. These efforts were successful in reducing the number of COVID-19 infection infections (Ahmad et al., 2020). The latest data on September 18, 2021, the total corona cases in Malaysia reached 2,082,876 cases with a death rate of 23,067 cases (Worldometer, 2021).
Singapore
This country is one of the countries that have the largest confirmed cases in the region and is the country with the largest spike in cases (Hariyadi, 2020). The Singapore government in this case is quite responsive in its readiness to handle Covid-19 cases (Winanti & Mas’udi, 2020) by pursuing strategies in three forms, namely implementing social distancing strategies in order to minimize the spread of the outbreak, setting up medical posts in each dormitory to deal with the health problems of migrant workers to be immediately followed up and implementing an aggressive testing regime (Ministry of Foreign) Affairs (MOFA) Singapore, 2020). The Singapore Government’s efforts were to establish an inter-ministerial committee on January 22, the day before the first case was reported (Goh, 2020). The country has an extensive pandemic mitigation system called the Disease Outbreak Response System Condition (DORSCON). Preventive measures are used by the government in order to reduce the spread of COVID-19 in Singapore so as not to be high. However, in September 2021 the spread of this virus increased rapidly where the number of coronavirus infected in Singapore reached 76,792 cases as of September 18, 2021 with a total of 60 cases of death (Worldometer, 2021). This makes the country must try to further tighten the applicable health protocols, namely implementing Home Quarantine and tracking public places that are frequented (Ministry of Health (MOH) Singapore, 2021).
India
The Government of India in this case made efforts to overcome this virus by conducting a national lockdown (lockdown) for almost 2 (two) months until May 17, 2020, while continuing to cooperate on service centers that are important to the community (Iqbal & Dar, 2020). India also controls public transportation and provides specialized medical support to populations affected by the Covid-19 virus (Tiwari et al., 2020). The Government of India uses its power in the framework of quarantine law enforcement which is considered the right step to protect public health there (Nomani et al., 2020). India uniquely places COVID-19 as a disaster and catastrophe arising from nature or man-made by using the
209
4TH SINTO
K INTERN
ATION
AL CON
FERENCE O
N SO
CIAL SCIENCE AN
D M
ANAG
EMEN
T
provisions in the 2005 Law on Disaster Management. This COVID-19 prevention strategy has basically been adapted to ipso facto for disaster management measures to serve as a justification for the implementation of the national lockdown (Nomani & Tahreem, 2020). Unexpectedly it turns out that India became the second country to have the highest number of cases infected with the Covid-19 virus with a total of 33,437,535 and a death rate of 444,713 cases as of September 18, 2021 (Worldometer, 2021). Efforts that have been explained earlier in fact cannot withstand the flow of the spread of this dangerous virus, the government is overwhelmed because the number of positive cases and deaths continues to grow every day plus people who are not willing to cooperate in handling this case. India has been the worst affected country in the world due to a failure to pay attention to restrictions on the movement and social interaction of its people (Haridwar & Ahmedabad, 2021).
Vietnam
Vietnam is categorized as successful in overcoming the spread of COVID-19 in the country because it was able to record zero deaths due to COVID-19 at the beginning of the spread of this coronavirus. (Rizal, 2020) Whereas this country is at high risk of getting transmission of the virus, especially the population is quite large, which is approximately 96 million people (Charin & Afriandi, 2021). However, based on research from the Lowy Institute, Vietnam managed to be ranked 2nd as the country with the best Covid-19 response in the world from 100 countries. Vietnam is a country that applies lockdown firmly and is supported by its law-abiding people (Susilowati & Hakiem, 2020). Vietnam was brave and responsive in the face of the Covid-19 pandemic before other countries made rules related to the pandemic, including banning large activities that used to involve the majority of the community (Verdiana, 2020). The country is willing to snaking assistance of 1.1 billion US dollars (DW, 2020). Vietnamese citizens are willing to accept the government’s policy by bearing short-term pain because they consider the government is legitimate and competent in terms of overcoming the spread of the Covid-19 virus. As of September 18, it can be known that the number of cases infected with the Covid-19 virus in Vietnam as many as 677,023 cases with a death rate of 16,857 cases, this number can still be said to be low compared to other countries that reach millions (Worldometer, 2021).
Thailand
To date, the number of cases infected with the Covid-19 virus reached 1,462,901 cases with the death rate reaching 15,246 cases as of September 18, 2021 (Worldometer, 2021). Thailand’s central government is making various efforts to tackle the Covid-19 virus by imposing several rules and policies. COVID-19 is listed in Thailand as one of the health-guaranteed diseases for everyone infected. The government also implemented social distancing by stopping all teaching and face-to-face lecture activities which were then replaced with an online classroom system and this was certainly done by every country. In addition, establishing a National Emergency Status, such as restrictions on the sale of alcoholic beverages and the cancellation of Songkran festivals to prevent mass gatherings, and the provision of economic stimulus packages (Mulyasari, 2020) as well as quarantine groups or people affected by disease (Studdert & Hall, 2020). In addition, it is not allowed to enter or exit premises and vehicles close markets, community spaces, entertainment venues or schools. Conduct surveillance and prevention measures for international infectious diseases and establish an international infectious disease control checkpoint.
Factors that encourage people to obey what policies have been made by their government either in the form of law or appeals even if there is a concern in the self that is considered a bad condition and the need for awareness to be able to deal with the threats that arise within the country itself. Obedience to the law will arise if indeed the people have thoughts to obey their government (Sefriani, 2011). Efforts to counter the Covid-19 virus have been swiftly handled by every country to be able to protect the country and its people, so strong cooperation is needed in terms of solving the problem of this virus.
210
No country expects the arrival of the Covid-19 virus. The importance of being free from this virus is to consider the importance of this disease and have a strong effort to be free from this outbreak like the government in every country that is earnest to exert all means including especially in the health system to create a strong and immune society to the Covid-19 virus (Bainus &Junita, 2020). All things need to be considered by the government including the fulfillment of the health rights of every citizen who is the human right of every individual.
The Right to Health of Every Citizen in the Time of Covid-19
Everyone has the potential to be exposed to Covid-19 but there are several groups that are at high risk for exposure to Covid-19 (Siagian, 2020). The right to the health of citizens is guaranteed by every Country but not all countries are perfect in fulfilling the right to health, especially in the current Covid-19 pandemic, certainly cannot be separated from the obstacles as described earlier. Similarly, the handling carried out by some countries that cannot be equalized is good because it is motivated by the number of citizens, the area of the country, the system of government and so on. The following is done by several countries such as Indonesia, Malaysia, Singapore, India, Vietnam and Thailand in handling the Covid-19 pandemic.
Indonesia
The State in the face of the Covid-19 case has a responsibility to the people as described in the fourth paragraph of the Opening of the Constitution of the Republic of Indonesia in 1945, namely protecting the entire Indonesian nation and all Indonesian blood, advancing the general welfare, educating the life of the nation and participating in implementing world order based on independence, lasting peace and social justice (Disantara, 2020). Covid-19 is a particular threat to health. The right to continued life is included in the rights of everyone. Article 9 Paragraph (1) of Law No. 39 of 1999 on Human Rights (Human Rights Law) states that “Everyone has the right to live, maintain life and improve his standard of living”, Article 9 Paragraph (2) “Everyone has the right to live peacefully, safely, peacefully, happily, prosperously, born and inward” and Article 9 Paragraph (3) “Everyone is entitled to a good and healthy living environment”(Law No. 39 of 1999 on humanrights). The government is responsible for the health of every citizen, as stated in Article 28H Paragraph (1) of the 1945 Constitution (Constitution of 1945). Guarantee of the right of health which is also contained in Article 4 of Law No. 23 of 1992 on health (Law No. 23 of 1992 on Health). This means that the government is responsible for the health of every citizen and bears everything and bears all the consequences (Saija &Lumintang, 2021).
In practice to fulfill the health rights of the government is quite overwhelmed. Various hospitals experience many obstacles such as lack of access to information, lack of medical personnel, lack of facilities and infrastructure supporting health services, and the lack of special procedures for the examination of Covid-19 patients (Alfina Rusliana, Anita Trisiana, 2021). The low capacity of hospitals and the lack of health workers cause many lives cannot be helped. In addition, the lack of health facilities and medical devices such as mattresses in the Hospital ICU is not in accordance with existing capacity, causing many patients to be exposed outside the hospital room with makeshift tools even medical devices are often lacking. There has been an increase in deaths due to Covid-19 on July 27, 2021 as many as 2,069 cases/day (Worldometer, 2021). Based on reported data about Covid-19, the government continues to try to suppress the spread of Covid-19. Government accountability can be seen starting from social assistance both cash and non-cash, this can not only guarantee the economy but also health for its citizens. Presidential Regulation of the Republic of Indonesia No. 14 of 2021 on Changes to Presidential Regulation No. 99 of 2020 on Vaccine Procurement and Implementation of Vaccination in order to Combat Coronavirus Disease Pandemic 2019 (COVID 19) Article 15B explains that “In the event of a case of post-vaccination follow-up incidents affected by Covid-19 Vaccine products based on the results of causality studies as referred to in article 15A Paragraph 3 and such cases cause defects/ died, compensated by the
211
4TH SINTO
K INTERN
ATION
AL CON
FERENCE O
N SO
CIAL SCIENCE AN
D M
ANAG
EMEN
T
government” (Presidential Regulation No. 99 of 2020 concerning Vaccine Procurement and Implementation of Vaccinations in order to Combat coronavirus pandemic Desease 2019 (Covid-19). The Indonesian government has tried to guarantee the right to health for its citizens but it can be said to be not optimal because there are still many evaluations that need to be done properly. Inadequate health workers and health facilities cause the lives of patients to be endangered. This means that the right to health of one of the citizens is not properly fulfilled.
Malaysia
There has been an increase in deaths from Covid-19 on September 11, 2021 as many as 592 cases / day in Malaysia (Worldometer, 2021). Malaysia is currently trying to stabilize the economy along with reducing the number of cases of Covid-19 transmission, similar to the Indonesian government that seeks to do so. Reducing the number of cases of transmission with vaccination as a form of right to the health of citizens, through vaccines is one of the steps of the Malaysian government in fulfilling the right to the health of its citizens. Vaccines are antigenic substances used for immunity to a disease (Rahmi Ayunda, Velany Kosasih, 2021). The distribution of vaccines in Malaysia is considered to be quite high, namely 75% of the population has been vaccinated at full dose (Yuliawati, 2021). The handling of the Covid-19 pandemic by fulfilling the right to the health of Malaysian citizens is quite good throughout 2020 but the negligence that makes positive cases of Covid-19 soared many times until the strike by doctors. So it is necessary to evaluate with careful action so as not to repeat similar failures in health aspects of course health will be related to other aspects such as the economy, etc.
Singapore
The right to health depends heavily on the policies that the Singapore government takes, one of the facilities provided through health literacy which is promoted throughout society by using social and traditional media platforms with consistent and evidence-based information (Wang &Teo, 2021). In June 2021, the Singapore government announced that it would plan to co-exist with Covid-19. In August some restrictions were relaxed so as to allow people to move more freely in public. However, because the restrictions have an impact on the rise in the positive number of Covid-19, deaths increased on August 27, 2021 as many as 3 cases/day (Worldometer, 2021). But, Singapore’s success in getting its people to follow the prevailing policies sets an example for countries to take the next step in dealing with the Covid-19 pandemic. By learning from the past that had been affected by the MERS and SARS viruses, so that the current handling of Covid-19 is done quickly to respond to health disasters efficiently through mitigation systems, good health services, and use data and cases wisely. Vaccinations given to the community are fast because the average positive has been vaccinated.
India
Lockdown is the chosen step to track down anyone who is infected and will see symptoms for 14 days and the next week is used to observe the positive situation of Covid-19, death and recovery (Khoerunisa & Noorikhsan, 2021). But the strategic move by the Indian government did not last long. The lockdown in addition to causing social impact, also had an impact on the rotation of the economic wheels so that India began to loosen the Lockdown policy. In the current Covid-19 pandemic did not dampen the intention of the Indian people to create an annual festival called Kumbh Mela where thousands of people gathered to celebrate religious events in April. This illustrates the poor management of Covid-19 in India (Sorongan, 2021). Coupled with the circulation of fake vaccines, approximately 2,500 people have received fake vaccines containing salt water (Cahyani, 2021). This has the potential for people’s trust in the government to fade. Handling Covid-19 cannot be underestimated, the handler must be done seriously and wisely so that positive numbers do not bounce back. Currently the Indian government in fulfilling the right to health of its citizens is increasing vaccinations. The government also conducts tests in major cities using PCR and tests in the countryside using this self-antigen so that
212
the government can detect anyone who is infected. The Indian government looks less assertive in taking such steps as not learning from previous experience. In addition, the difficult society to regulate hampers the government’s performance in dealing with the virus. This has an impact on the rights of every person who are not fulfilled, especially health rights. The lack of medical infrastructure means that patients must be willing to be placed in mosques as Covid-19 treatment facilities. Of course, the lack of medical infrastructure facilities can threaten a person’s life, so this is where the role of government is needed.
Vietnam
In Vietnam victims recovered 423,551 cases/ as of September 18, victims died 16,857 cases/ September 18 (Worldometer, 2021). This means that more have recovered than have lost their lives due to Covid-19. The highest death rate occurred on September 1, 2021 as many as 803 cases/day. The Vietnamese government to restore normal conditions for its public health made a health communication (Bui et al., 2021). Vietnam experienced a surge in September 2021 so that it is currently implementing strict restrictions, the government’s efforts to fulfill the right to health for its citizens through vaccinations that are currently being accelerated.
Vietnam is included in the category of countries that successfully faced the Covid-19 pandemic. The assessment of the government in taking steps is quite good and can be used as an example of other countries. The current condition is the same as other countries that feel the positive Covid-19. In fulfilling the health of the people of Vietnam focused on vaccinations that are currently being pursued quickly accompanied by the use of digital health media.
Thailand
Thailand is experiencing a positive surge in Covid-19 in 2021. The government also does not provide timely vaccinations to the public. In recent months there has been an increase in prison clusters, where the virus was brought by several Covid-19 positive activist figures into prison (BBCNews, 2021). The highest death cases occurred on August 18, 2021 as many as 312 cases/day (Worldometer, 2021). Policies in dealing with the Covid-19 pandemic that the government chooses with various efforts in fulfilling people’s rights are considered quite good. But not necessarily in the handling of smoothly, sometime recently the government is not okay because of the surge in positive numbers and high deaths. In addition, the slowness of the government to give vaccinations as one of the rights to health of Thai people makes the public judge badly on the government’s performance. Vaccines are one of the rights to public health that must be fulfilled by the state.
CONCLUSION
Covid-19 is a new disease that was first designated by the World Health Organization (WHO) in 2020 as a pandemic. With relatively rapid transmission and mortality rates that cannot be ignored and the absence of definitive therapy makes this disease must be wary, because Covid-19 not only affects health aspects but also various other aspects. Various efforts are made by various countries to reduce the number of Covid-19 that is not yet known the origin of the virus. The work imposed by various countries has the same goal but the success rate is different depending on how the government’s policies and people’s enthusiasm to fight Covid-19. One country that can be used as an example is Vietnam, through massive tracking Vietnam managed to suppress the positive number of Covid-19 and impose a lockdown firmly and supported by its law-abiding people. In fulfilling the right to public health Vietnam is focused on vaccination which is currently being pursued quickly accompanied by the use of digital health media.
The right to the health of citizens is guaranteed by every Country but not all countries are perfect in fulfilling the right to health, especially in the current Covid-19 pandemic,
213
4TH SINTO
K INTERN
ATION
AL CON
FERENCE O
N SO
CIAL SCIENCE AN
D M
ANAG
EMEN
T
certainly can not be separated from the obstacles as described above. Indonesia, Malaysia, Singapore, India, Vietnam and Thailand are currently working to ensure that vaccinations for their citizens are quickly delivered and strive to fulfill health rights as the responsibility of each country. The advice is to cooperate in dealing with pandemics between countries in addition to also conducting education so that it can reduce the number of Covid-19 so that the right to the health of citizens can be fulfilled properly.
ACKNOWLEDGEMENT
Our thanks go to the Rector of the Jakarta Veteran National Development University (Dr. Erna Hernawati, Ak, CPMA, CA), Mr. Dean of the Faculty of Law of the National Development University of Veterans Jakarta (Dr. Abdul Halim, M. Ag), and Mr. Prof. Dr. Bambang Waluyo, SH, MH who has devoted his knowledge and direction and Beloved Family so that this writing can be composed.
REFERENCES
Ahmad, N. A., Lin, C. Z., Abd Rahman, S., bin Ghazali, M. H., Nadzari, E. E., Zakiman, Z., Redzuan, S., Md Taib, S., Kassim, M. S. A., & Wan Mohamed Noor, W. N. (2020). First local transmission cluster of covid-19 in Malaysia: Public health response. International Journal of Travel Medicine and Global Health, 8(3), 124–130. https://doi.org/10.34172/ijtmgh.2020.21
Alfina Rusliana, Anita Trisiana, A. R. D. K. (2021). Pemenuhan hak asasi pada saat pandemi covid. Jurnal Global Citizen, 10(1), 37. https://doi.org/http://dx.doi.org/10.33061/jgz.v10i1.4688
Ali, Z. (2019). Metode penilitian hukum. Sinar Grafika.Bainus, A., & Junita, B. R. (2020). Pandemi penyakit menular (Covid-19) hubungan
internasional. Journal of International Studies, 4(2), 111–123. https://doi.org/http://dx.doi.org/10.24198/intermestic.v4n2.1.
BBCNews. (2021). Covid-19 di Thailand: Angka kasus naik tajam, sebagian besar dari klaster penjara, di satu lapas 61% penghuninya terkena virus corona. Bbc.Com.
Bui, L. V., Ha, S. T., Nguyen, H. N., Nguyen, T. T., Nguyen, T. P., Tran, K., Tran, T. Van, Nguyen, T. H., Tran, T. H., Pham, N. D., & Bui, H. M. (2021). The contribution of digital health in the response to Covid-19 in Vietnam. Frontiers in Public Health, 9(August), 1–6. https://doi.org/10.3389/fpubh.2021.672732
Cahyani, D. R. (2021). Ribuan orang di India disuntik vaksin corona palsu, isinya air dan garam. Dunia.Tempo.Co.
Charin, R. O. P. C., & Afriandi, F. (2021). Vietnam dan Indonesia di awal pandemi covid (Ditinjau dari sistem politik-pemerintahan). Pro Patria, 4(2), 184–203. https://doi.org/https://doi.org/10.47080/propatria.v4i2.1295
Disantara, F. P. (2020). Tanggung jawab negara dalam masa pandemi covid-19. JCH (Jurnal Cendekia Hukum), 6(1), 48. https://doi.org/10.33760/jch.v6i1.262
DW. (2020). Cara Vietnam menangkan “Perang” lawan virus corona. Tempo. https://www.tempo.co/dw/2221/cara-vietnam-menangkan-perang-lawan-virus-corona
Firdaus, A., & Pakpahan, R. H. (2020). Kebijakan hukum pidana sebagai upaya penanggulangan kedaruratan covid-19. Majalah Hukum Nasional, 50(2), 201–219. https://doi.org/10.33331/mhn.v50i2.61
Gelora Mahardika, A. (2020). Problematika yuridis peraturan pemerintah nomor 21 tahun 2020 dalam perspektif ilmu perundang-undangan. Al-Daulah:Jurnal Hukum dan Perundang-Undangan Islam, 10(46), 94–113. https://doi.org/https://doi.org/10.15642/ad.2020.10.1.93-113
Goh, T. (2020). Wuhan virus: MOH sets up multi-ministry task force, advises against non-essential trips to Wuhan. The Straits Times. https://www.todayonline.com/singapore/covid-19-%0Awuhan-coronavirus-outbreak-government-put-fund-online-site- public-support-healthcare-workers
Hairi, P. J. (2020). Implikasi hukum pembatasan sosial berskala besar terkait pencegahan covid-19. Info Singkat Bidang Hukum, 12(April), 1–6.
214
Haridwar, & Ahmedabad. (2021). Umat Hindu berkumpul di Sungai Gangga, India catat rekor kasus covid. Antara News. https://www.antaranews.com/berita/2100634/umat-hindu-berkumpul-di-sungai-gangga-india-catat-rekor-kasus-covid
Hariyadi, R. P. (2020). Singapura dan Asean: Analisis relasi negara dan institusi kawasan di tengah pandemi covid-19. Jurnal Dinamika Global, 5(02), 299–318. https://doi.org/10.36859/jdg.v5i02.219
Hasibuan, R. P. P. M., & Ashari, A. (2020). Optimasi peran negara menghadapi pandemi corona virus disease 2019 dalam perspektif hukum tata negara darurat. SALAM: Jurnal Sosial dan Budaya Syar-I, 7(7). https://doi.org/10.15408/sjsbs.v7i7.15379
Hasrul, M. (2020). Aspek hukum pemberlakuan pembatasan sosial berskala besar (PSBB) dalam rangka penanganan corona virus disease 2019 (Covid-19). Jurnal Legislatif, 3(2), 385–398.
Hidayat, R. (2016). Hak atas derajat pelayanan kesehatan yang optimal. Syariah Jurnal Hukum Dan Pemikiran, 16(2), 129. https://doi.org/http://dx.doi.org/10.18592/sy.v16i2.1035
Iqbal, N., & Dar, K. A. (2020). Coronavirus disease (COVID-19) Pandemic: Furnishing experiences from India. Psychological Trauma: Theory, Research, Practice, and Policy, 12(S1), S33–S34. https://doi.org/10.1037/tra0000770
Ismail, M. H., Ghazi, T. I. M., Hamzah, M. H., Manaf, L. A., Tahir, R. M., Nasir, A. M., & Omar, A. E. (2020). Impact of movement control order (MCO) due to coronavirus disease (covid-19) on food waste generation: A case study in Klang Valley, Malaysia. Sustainability (Switzerland), 12(21), 1–17. https://doi.org/10.3390/su12218848
Jovita, L. D., & Yazid, S. (2020). Dampak pandemi terhadap mobilitas manusia di Asia Tenggara. Jurnal Ilmiah Hubungan Internasional, Edisi Khusus, 75–83. https://doi.org/10.26593/jihi.v0i0.3862.75-83
Juaningsih, I. N., Consuello, Y., Tarmidzi, A., & NurIrfan, D. (2020). Optimalisasi kebijakan pemerintah dalam penanganan Covid-19 terhadap Masyarakat Indonesia. SALAM: Jurnal Sosial dan Budaya Syar-I, 7(6), 509–518. https://doi.org/10.15408/sjsbs.v7i6.15363
Juliani, H. (2020). Analisis yuridis kebijakan keuangan negara dalam penanganan pandemi covid-19 melalui peraturan pemerintah pengganti undang-undang nomor 1 Tahun 2020. Administrative Law and Governance Journal, 3(2), 329–348. https://doi.org/10.14710/alj.v3i2.329-348
Kaur, S. (2020). The coronavirus pandemic in Malaysia: A commentary. Psychological Trauma: Theory, Research, Practice, and Policy, 12(5), 482–484. https://doi.org/10.1037/tra0000897
Khoerunisa, N., & Noorikhsan, F. F. (2021). Perbandingan tata kelola penanganan pandemi covid 19 di Indonesia dan India. Journal of Political Issues, 2(2), 92. https://doi.org/10.33019/jpi.v2i2.36
Mahardika, A. G., & Saputra, R. (2021). Kedudukan hukum pemberlakuan pembatasan kegiatan masyarakat dalam sistem ketatanegaraan Indonesia. Legacy Jurnal Hukum Dan Perundang-Undangan, 1(1), 1–23.
Marzuki, P. M. (2019). Penelitian hukum (Revisi). Prenada Media Group.Ministry of Foreign Affairs (MOFA) Singapore. (2020). Confirmed imported case of novel
coronavirus infection in Singapore: Multi-ministry taskforce ramps up precautionary measures [Press release]. 23 Januari 2020. https://www.mfa.gov.sg/Newsroom/Announcements-and- Highlights/2020/01/23012020
Ministry of Health (MOH) Singapure. (2021). Press releases: Updating our healthcare protocols for a more covid-19 resilient nation. A Singapore Government Agency Website. https://www.moh.gov.sg/news-highlights/details/updating-our-healthcare-protocols-for-a-more-covid-19-resilient-nation
Mulyasari, P. N. (2020). Thailand pada masa pandemi covid-19 : Catatan singkat (Edisi Covid-19, Bagian 5). Lembaga Ilmu Pengetahuan Indonesia (LIPI). http://lipi.go.id/publikasi/thailand-pada-masa-pandemi-covid-19--catatan-singkat-edisi-covid-19-bagian-5-/37618
Nadilla, S. (2020). Krisis covid-19 : Perspektif hukum internasional terhadap pandemi. Majalah Hukum Nasional, 50(2). https://doi.org/10.33331/mhn
Nasution, J. (2008). Metode Penelitian Ilmu Hukum. Mandar Maju.Nomani, M. Z. M., Rauf, M., Ahmed, Z., Faiyaz, T., Khan, S. A., & Tahreem, M. (2020).
215
4TH SINTO
K INTERN
ATION
AL CON
FERENCE O
N SO
CIAL SCIENCE AN
D M
ANAG
EMEN
T
Quarantine law enforcement & corona virus (covid-19) pandemic in India. Journal of Xidian University, 14(4), 536–542. https://doi.org/10.37896/jxu14.4/068
Nomani, M. Z. M., & Tahreem, M. (2020). Constitutionality and legality of corona virus (covid-19) in India: Limits of sanction and extent of liberation. International Journal on Emerging Technologies, 11(3), 14–18.
Nugraha, I. G. A. B. C. K., & Danyathi, A. P. L. (2019). Hak atas kesehatan bagi warga negara miskin di Singapura dalam perspektif hukum hak asasi manusia internasional. Acadamia.Edu, 4.
Nurhadi, N. (2020). Tata kelola penanganan covid-19 di indonesia. Gadjah Mada University Press, 19(10), 1–372.
Nurhalimah, S. (2020). Covid-19 dan hak masyarakat atas kesehatan. SALAM: Jurnal Sosial Dan Budaya Syar-I, 7(6), 543–554. https://doi.org/10.15408/sjsbs.v7i6.15324
Paital, B., Das, K., & Parida, S. K. (2020). Investigating the dynamics of COVID-19 pandemic in India under lockdown. ScienceDirect.
Peraturan Presiden Republik Indonesia Nomor 14 tahun 2021 tentang Perubahan atas Peraturan Presiden Nomor 99 Tahun 2020 tentang Pengadaan Vaksin dan Pelaksanaan Vaksinasi dalam Rangka Penanggulangan Pandemi Corona Virus Desease 2019 (Covid-19), (2021).
Permatasari, D. (2021). Kebijakan Covid-19 dari PSBB hingga PPKM Empat Level. Kompas Pedia. https://kompaspedia.kompas.id/baca/infografik/kronologi/kebijakan-covid-19-dari-psbb-hingga-ppkm-empat-level
Rahman, Y. A. (2021). Vaksinasi massal covid-19 sebagai Sebuah upaya masyarakat dalam melaksanakan kepatuhan hukum (Obedience Law). Khazanah Hukum, 3(2), 80–86. https://doi.org/10.15575/kh.v3i2.11520
Rahmi Ayunda, Velany Kosasih, H. S. D. (2021). Perlindungan hukum bagi masyarakat terhadap efek samping pasca pelaksanaan vaksinasi covid-19 di Indonesia. Nusantara: Jurnal Ilmu Pengetahuan Sosial, 8(3), 194–206. https://doi.org/http://dx.doi.org/10.31604/jips.v8i3.2021.194-206
Rizal, J. G. (2020). Nol korban meninggal, bagaimana Vietnam berhasil menangani. Kompas. https://www.kompas.com/tren/read/ 2020/05/15/131208465/nol-korban- meninggal-bagaimana-vietnam- berhasil-menangani-pandemi- corona?page=all.%0A
Saija, V. J. E., & Lumintang, J. A. N. (2021). Perlindungan hak asasi pasien hemodialisis di masa pandemi covid-19. UKM Lex Scientia, 7(1), 387. https://doi.org/https://doi.org/10.15294/snhunnes.v7i1.715
Salim, N., Chan, W. H., Mansor, S., Bazin, N. E. N., Amaran, S., Faudzi, A. A. M., Zainal, A., Huspi, S. H., Hooi, E. K. J., & Shithil, S. M. (2020). COVID-19 epidemic in Malaysia: Impact of lockdown on infection dynamics. MedRxiv, 1–27. https://doi.org/https://doi.org/10.1101/2020.04.08.20057463
Sefriani. (2011). Ketaatan masyarakat internasional terhadap hukum internasional dalam perspekti filsafat hukum. Jurnal Fakultas Hukum UII, 18(3), 405–427.
Shakeel, S., Ahmed Hassali, M. A., & Abbas Naqvi, A. (2020). Health and economic impact of covid-19: mapping the consequences of a pandemic in Malaysia. Malaysian Journal of Medical Sciences, 27(2), 159–164. https://doi.org/10.21315/mjms2020.27.2.16
Siagian, T. H. (2020). Corona dengan discourse network analysis. Jurnal Kebijakan Kesehatan Indonesia, 09(02), 98–106. https://doi.org/https://doi.org/10.22146/jkki.55475
Sorongan, T. P. (2021). India siaga tsunami covid baru, kasus mumbai naik gegara ini. Cnbcindonesi.
Studdert, D. M., & Hall, M. A. (2020). Disease control, civil liberties, and mass testing-calibrating restrictions during the covid-19 pandemic. Perspective: New England Journal of Medicine, 383, 102–104. https://doi.org/10.1056/NEJMp2007637
Suduthukum. (2018). Asas-asas hukum kesehatan. Suduthukum.Com.Susilowati, I., & Hakiem, F. N. (2020). Optimalisasi peran perempuan sebagai strategi
alternatif kebijakan publik dalam menekan penyebaran pandemi covid-19. SALAM: Jurnal Sosial Dan Budaya Syar-I, 7(8), 723–736. https://doi.org/10.15408/sjsbs.v7i8.16551
Tiwari, S., Kumar, S., & Guleria, K. (2020). Outbreak trends of coronavirus disease-2019 in India: A prediction. Disaster Medicine and Public Health Preparedness, 14(5), e33–e38. https://doi.org/10.1017/dmp.2020.115
216
Undang-Undang Dasar Negara Republik Indonesia Tahun 1945, (1945).Undang-Undang No. 39 Tahun 19N99 Tentang Hak Asasi Manusia, Pub. L. No. 39 Tahun
1999 (1999).Undang-Undang Republik Indonesia Nomor 23 Tahun 1992 Tentang Kesehatan, Menteri/
Sekretaris Negara Republik Indonesia (1992).Verdiana, B. M. T. (2020). Nol kematian, ternyata begini cara vietnam tangani virus corona
covid-19. Liputan 6. https://m.liputan6.com/global/read/4259317/nol-kematian-ternyata-begini-cara-vietnam-tangani-virus- corona-covid-19
Wang, K., Ding, L., Yan, Y., Dai, C., Qu, M., Jiayi, D., & Hao, X. (2020). Modelling the initial epidemic trends of COVID-19 in Italy, Spain, Germany, and France. PLoS ONE, 15(11), 1–14. https://doi.org/10.1371/journal.pone.0241743
Wang, S. S. Y., & Teo, W. Z. Y. (2021). Equitable and holistic public health measures during the singaporean covid-19 pandemic. Annals of Global Health, 87(1), 1–8. https://doi.org/10.5334/aogh.3244
Winanti, P. S., & Mas’udi, W. (2020). Menyelamatkan kelompok rentan: Kebijakan inklusif penanganan dampak covid-19 (Policy Brief (Ed.); 5th ed.). Fisipol UGM.
Worldometer. (n.d.). Coronavirus cases. 2021. https://www.worldometers.info/coronavirus/
Yuliawati. (2021). Malaysia & Vietnam siap longgarkan aktivitas saat covid-19 melonjak. Katadata.Co.Id.

217
4TH SINTO
K INTERN
ATION
AL CON
FERENCE O
N SO
CIAL SCIENCE AN
D M
ANAG
EMEN
T
SICONSEM 2021: 078
NATIONAL POLICY VERSUS COMPETITION POLICY: IMPACT OF SOE, GLCS AND GLICS MONOPOLISTIC PRACTICE ON THE NATIONAL ECONOMY
1Angayar Kanni Ramaiah & 2Safinaz Mohd. Hussein1 Faculty of Law, Universiti Teknologi Mara, Cawangan Pulau Pinang, Malaysia
2 Faculty of Law, Universiti Kebangsaan Malaysia
Corresponding author: [email protected]
ABSTRACT
A competitive market is vital for a viable economy, otherwise, the state will collapse. Therefore, Competition Law (CL) with the sensible policy may liberate and regulate activity that impairs market competition that encourages innovation, entrepreneurship, and trade investment. Malaysia economic system is represented by a mixed degree of ‘free market’ and ‘command’ market system. Comprised of ‘private’ enterprises and ‘Government-Linked Companies’ (GLCs) or ‘State-Owned Enterprises’ (SOE). Government-linked-corporatisation was created to complement, national political-social-economic roadmap to bring prosperity and industrialisation into the country. However, their extended and broad presence in the private sector is feared to inherently challenge the long-term development of the Malaysian economy and trade investment. Furthermore, lately, the SOE and GLCs usage of public money, unfair business competition and consequential monopolistic behaviour on local private enterprises were censured. Rule of law requires all government action not just be authorised by law but that law itself must be clear and certain, transparent, and justifiable. Therefore, this paper reviews the CLC and SOE consequential impact on market efficiency and consumer welfare on how to prevent the government intervention from the facet of opportunism or self-interest and expounds on what doctrine be applied to find the delicate balance between the Competition Law and Policy goals to legitimise the government intervention. The paper examines the impact of the government-linked corporate structure from the effect-based approach to encounter the state interest doctrine to articulate sensible state policy exclusion theory for the Competition Act 2010 in Malaysia.
Keywords: State-Owned Enterprise (SOE); Government-Link Corporations (GLC); anti-competitive and political economy.
22
218
SICONSEM 2021: 066-030
THE EFFECT OF DYNAMIC AND ORGANIZATIONAL CAPABILITIES ON INTEGRATED SUPPLY CHAIN PERFORMANCE IN MALAYSIAN
WOOD-BASED INDUSTRY: A FUTURE DIRECTIONS
1Rainah Yusof, 2Nazura Mohamed Sayuti, 3Siti Norida Wahab & 4Arifff Azly Muhamed1,2,3,4Faculty of Business and Management, Universiti Teknologi Mara, Malaysia
Corresponding author: [email protected]; [email protected];[email protected]@uitm.edu.my
ABSTRACT
The concept of supply chain management (SCM) has emerged in the early of 1980s and been widely accepted among practitioners and academicians especially in the service and production segments. This is due to its efficient and cost-effective in enhancing the business performance. The Malaysian wood-based industry is one of the major contributors to the Malaysian economy and has foreseen opportunity gain in this industry, the government has shifted it trends from upstream activities to downstream activities. Due to these drastic changes, has impacted the upstream activities, shortfall in raw materials whereas in downstream activities, manufacturers unable to meet the demands sustaining their performance. This study aims to examine and identifying the dynamic and organizational capabilities influencing integrated supply chain practices in the Malaysia wood-based industry. This study also intends to understand the impact of integrated supply chain practices on the performances, operational performance and financial performance. The result will be conceptualized using literature review accordance to resource-based view (RBV) and dynamic capability view (DCV) models. This concept paper provides insights into vital factors, organizational capabilities and dynamic capabilities that influence integrated supply chain practices that impacted on the supply chain operational performance (SCOP) and supply chain financial performance (SCFP) in the Malaysian wood-based industry. The groundwork for future research projects expected to give invaluable impact on the Malaysian wood-based industry by improving the performance of the wood-based manufacturer.
Keywords: Supply chain, wood-based industry, performance, operational capabilities, dynamic capabilities.
INTRODUCTION
In the 1970s, Malaysia’s wood-based industry emerged as the most important socioeconomic sector, as the country transitioned from an agricultural to a manufacturing-based economy (Ratnasingam et. al, 2015). The government has played an important role in the industrial transformation process by enacting a series of Industrial Master Plans (IMPs) and offering incentives. The emphasis was on moving away from primary processed wood-based products and towards value-added wood-based products (Ziaie et al. 2012). As total exports of value-added products in furniture, moulding, and builders’ joinery and carpentry (BJC) began to rise, the transformation and restructuring of the wood-based industry was a success (Ratnasingam et. al, 2019). Malaysia has thus established itself as a major player in the worldwide market for tropical wood and wood products. Malaysia’s wood-based industry has been one of the primary financial drivers to the country’s economic growth for the past 20 years.
23

219
4TH SINTO
K INTERN
ATION
AL CON
FERENCE O
N SO
CIAL SCIENCE AN
D M
ANAG
EMEN
T
Figure 1Malaysia: Export of Timber by Major Products, 2020
Source: Malaysian Timber Industry Board (MTIB)
Figure 2 Malaysia: Export of Timber and Timber Products, 2010 – 2020
Source: Malaysian Timber Industry Board (MTIB)
Currently, the total export value of wood-based products in year 2020 is RM22.02 billion, which generated 60% from producing value-added products (MTIB, 2021) as illustrated in Figure 1 and Figure 2. The rate of growth of the wood-based sector has slowed, and its contribution to the country’s economy has dropped in contrast to other manufacturing sectors (MITI, 2014). From the data as illustrated in Figure 2, the value of exports in the wood-based industry has been constant since 2015. This is due to the uncertainty of the global geopolitical scenario such as trade war between China and US, US economic sanctions to Iran and Brexit, shortage of raw materials supplies, labour intensive and lack of innovation and technology (News Straits Times, 2019).
The Malaysian government is well aware of the problem and has taken corrective action. For example, implementing Sustainable Forest Management (SFM) practices to balance development and conservation in sustaining raw materials supply (Noraida et al., 2017), and developing a number of strategic thrusts and policy direction in addressing challenges to ensure the Malaysian wood-based industry remains sustainable and competitive (Ahmad, 2003). Despite this, the issue has not been totally remedied.
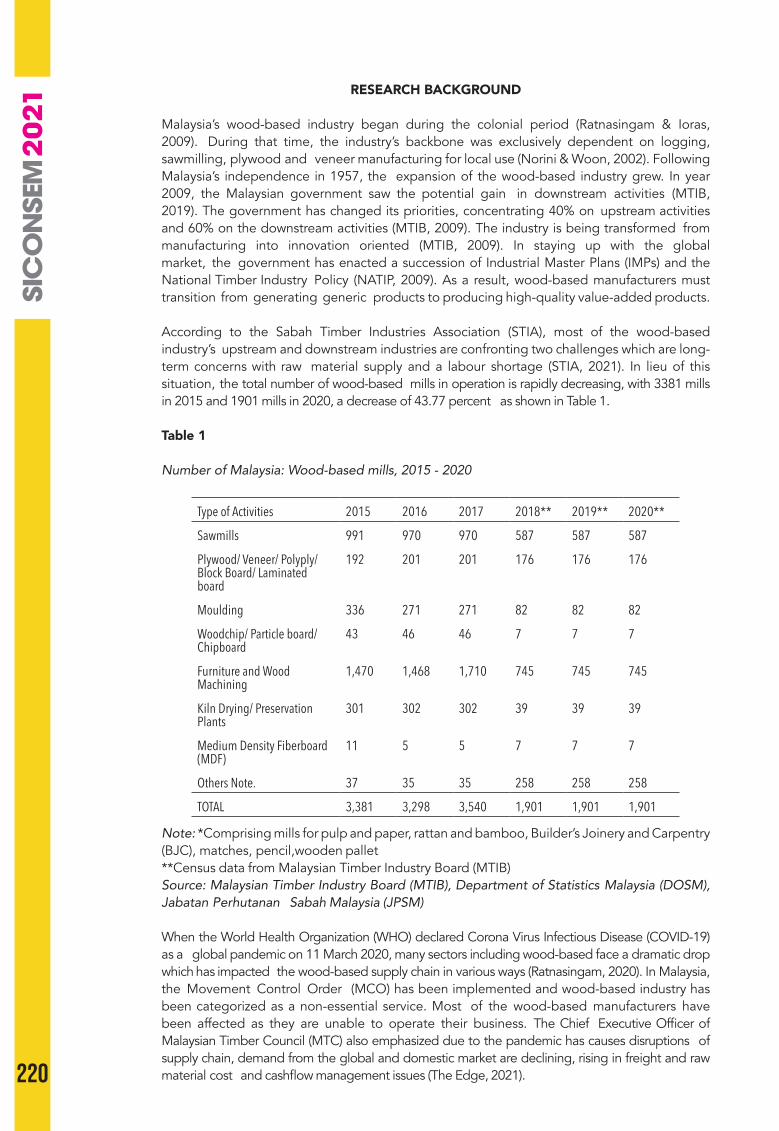
220
RESEARCH BACKGROUND
Malaysia’s wood-based industry began during the colonial period (Ratnasingam & Ioras, 2009). During that time, the industry’s backbone was exclusively dependent on logging, sawmilling, plywood and veneer manufacturing for local use (Norini & Woon, 2002). Following Malaysia’s independence in 1957, the expansion of the wood-based industry grew. In year 2009, the Malaysian government saw the potential gain in downstream activities (MTIB, 2019). The government has changed its priorities, concentrating 40% on upstream activities and 60% on the downstream activities (MTIB, 2009). The industry is being transformed from manufacturing into innovation oriented (MTIB, 2009). In staying up with the global market, the government has enacted a succession of Industrial Master Plans (IMPs) and the National Timber Industry Policy (NATIP, 2009). As a result, wood-based manufacturers must transition from generating generic products to producing high-quality value-added products.
According to the Sabah Timber Industries Association (STIA), most of the wood-based industry’s upstream and downstream industries are confronting two challenges which are long-term concerns with raw material supply and a labour shortage (STIA, 2021). In lieu of this situation, the total number of wood-based mills in operation is rapidly decreasing, with 3381 mills in 2015 and 1901 mills in 2020, a decrease of 43.77 percent as shown in Table 1.
Table 1
Number of Malaysia: Wood-based mills, 2015 - 2020
Type of Activities 2015 2016 2017 2018** 2019** 2020**
Sawmills 991 970 970 587 587 587
Plywood/ Veneer/ Polyply/ Block Board/ Laminated board
192 201 201 176 176 176
Moulding 336 271 271 82 82 82
Woodchip/ Particle board/ Chipboard
43 46 46 7 7 7
Furniture and Wood Machining
1,470 1,468 1,710 745 745 745
Kiln Drying/ Preservation Plants
301 302 302 39 39 39
Medium Density Fiberboard (MDF)
11 5 5 7 7 7
Others Note. 37 35 35 258 258 258
TOTAL 3,381 3,298 3,540 1,901 1,901 1,901
Note: *Comprising mills for pulp and paper, rattan and bamboo, Builder’s Joinery and Carpentry (BJC), matches, pencil,wooden pallet**Census data from Malaysian Timber Industry Board (MTIB)Source: Malaysian Timber Industry Board (MTIB), Department of Statistics Malaysia (DOSM), Jabatan Perhutanan Sabah Malaysia (JPSM)
When the World Health Organization (WHO) declared Corona Virus Infectious Disease (COVID-19) as a global pandemic on 11 March 2020, many sectors including wood-based face a dramatic drop which has impacted the wood-based supply chain in various ways (Ratnasingam, 2020). In Malaysia, the Movement Control Order (MCO) has been implemented and wood-based industry has been categorized as a non-essential service. Most of the wood-based manufacturers have been affected as they are unable to operate their business. The Chief Executive Officer of Malaysian Timber Council (MTC) also emphasized due to the pandemic has causes disruptions of supply chain, demand from the global and domestic market are declining, rising in freight and raw material cost and cashflow management issues (The Edge, 2021).
221
4TH SINTO
K INTERN
ATION
AL CON
FERENCE O
N SO
CIAL SCIENCE AN
D M
ANAG
EMEN
T
In the MTC’s inaugural Malaysian Timber Conference: Towards A Better Tomorrow on 18th
October 2018, Minister of Primary Industries (MPI) currently known as Ministry Plantation Industries and Commodities (MPIC) emphasized the need to maintain Malaysia position in the global market and the need to face up challenges by employing innovative, sustainable and market-driven solutions. Therefore, wood- based manufacturers are required to identify and overcome its own pitfall in order to maintain and improve their business in the market. Malaysia Timber Council (MTC) Chairman also highlighted the needs for the Malaysian wood-based manufacturer to understand their own product lifecycle as it helps to maximize profit and emphasized on diversifying products must be accordance with current market trends. Therefore, it is important for the wood-based manufacturer to understand the basic concept of supply chain management (SCM) as different organizations have different connotation on the implementation of SCM (Didonet & Diaz, 2012; Lambert & Enz, 2017).
SCM was first introduced sin the early 1980s and has since gained widespread acceptance among practitioners and academics, particularly in the service and production sectors (Pakurár et al., 2019). A supply chain is a network between an organization and its suppliers for the purpose of producing and distributing a certain product to the end user (Flynn et al., 2010). Different activities, people, entities, information, and resources are all part of this network. The supply chain also depicts the flow of a product or service from its initial state to its final destination; the customer (Lu Dawei, 2011). The advantage of having a SCM is that it reduces costs and allows organization to remain competitive in the marketplace (Didonet & Diaz, 2012). SCM also aids in the improvement of the production cycle (Lambert & Enz, 2017). The needs to understand product cycle and the type of supply chain practices is vital as it determines the performance of the organization. However, internal integration in organization should not be overlooked because it is the foundation for both dimensions (Pakurár et al., 2019). Internal organizational constraints are the most significant element limiting any good supply chain practices. (Ralston, 2014). The ability of organization to strategize in fully utilizing resources efficiently to create competitive advantage is critical to its success. (Yu & Ramanathan, 2016; Barrales-Molina et al., 2015; Krasnikov & Jayachandran, 2008). Manufacturers must be able to create, access and exploiting new resources that were develop on its capabilities platform that are inimitable (Yu & Ramanathan, 2016) and the needs to revise their routines activities (Makhloufi, Mohammed, et al., 2017) to survive and staying up in the global market. Hence, it is recommended that wood-based manufacturers generate new value in business models, customer experiences, and internal capabilities that will allow them to continue operating.
Supply management has been identified as one of the key functions of every organization, whether it is focused on production or service. According to Kopczak & Johnson (2003), there are many different perspectives on supply chain management, some of which are highly detailed and focus on operations, while others focus on information management. Several studies have looked into how supply chain management has evolved from simply purchasing or procurement to incorporating other tasks such as logistics and transportation, as well as information management (Burt et al. 2003; Monczka et al. 2002; Ayres 2001; Fredendall & Hill 2001; Ross 1998). These authors have also highlighted that supply management is crucial for organizations’ strategic planning functions including logistics and transportation and information management. Burt et al. (2003) suggested that a future focus should be on continuous improvement, becauseit is becoming acknowledged as one of the fundamental responsibilities of corporate relevance, in their examination of the expanding importance of supply chain management.
Most research conducted in the Malaysia wood-based industry primarily focused on illegal logging (Mohd Noor et al., 2018), sustainable forest management practices (Noraida et al., 2017; Islam & Siwar, 2010; Rahim et al., 2012), trade barriers (Aini et al., 2012), timber certification (Islam & Siwar, 2010), Malaysian research and development grant scheme (Ahmad, 2003), rubberwood sawmilling (Ramasamy et al., 2015; Ratnasingam & Scholz, 2012; Ratnasingam et al., 2016), furniture industry (Khan et al., 2018; Makhloufi, Esmail, et al., 2017) and small-medium enterprise in furniture industry (Ratnasingam et al., 2020). Study on the capabilities and integrated supply chain in the Malaysia wood-based industry has

222
yet to be done. Therefore, it is critical to have further research on the capabilities and integrated supply chain practices in the Malaysia wood-based industry.
RESEARCH MODEL
Capabilities are perceived as a tool in supporting its operations by developing new products and process by remodifying current activities to meet customers and competitive advantage (Makhloufi, Mohammed, et al., 2017; Ofori-Amanfo, 2014) and most organizations rely on their capabilities to offer better performance and competitive value (Novack & Simco, 1991). Thus, most literature emphasized by having strong capabilities, have a substantial effect on the bottom-line (Bernardes & Zaidisin, 2008; Chen & Paulraj, 2004) which believed to be substantial in the manufacturing sector (Ofori-Amanfo, 2014).
Resource-Based View (RBV)
The resource-based view (RBV) is known as the most prominent and cited theories in the history of management theorizing (Kraaijenbrik et. al, 2010). Bain (1968) and Porter (1979, 1980, 1985) were among the early proponents of the RBV as a complement to the industrial organization approach. The industrial organization approach, with its emphasis on the structure–conduct–performance paradigm, places the drivers of firm performance outside of the firm, in the structure of the industry. The RBV, which is opposed to this viewpoint, seeks for internal sources of sustainable competitive advantage and aims to explain why companies in the same industry might perform differently. As a result, the RBV supplemented rather than replaced the industrial organization view (Barney, 2002; Mahoney & Pandian, 1992; Peteraf & Barney, 2003). The RBV theory suggests that each organization has a specific set of resources and capabilities, and in return some capabilities have high impact on financial performance than the others (Ogunkoya et al., 2014, Kaleka, 2002). Organization’s resources here include assets, organizational process, firm attributes, information or knowledge that can be used as strategy in enhancing competitive advantage (Madhani, 2014).
Performance variance between organization depends on its inimitable inputs and capabilities and the RBV analyze and explain on how the organization achieve sustainable competitive advantage (Madhani, 2014). Madhani (2014) further emphasize that the RBV helps the managers to understand better in acknowledging them resources that can be enhance the organization performance. Numerous studies have employed RBV and found a significant relationship between organization performance and organizational capabilities (Nath et al., 2010; Yu & Ramanathan, 2016).
Organizational Capabilities
Organizational capabilities is the ability of a firm to perform a coordinated task, utilizing organizational resources, for achieving a particular result (Peng et al., 2008; Yu & Ramanathan, 2016). In the state of success, organization are depending on how quickly, efficiently and effectively it is adapting to the volatile business environment (Anan & Kodali, 2010; Jasti & Kodali, 2015). In doing so, the organization must be able to create, access and exploiting new resources that were develop on its capabilities platform that are inimitable and being competitive advantage (Yu & Ramanathan, 2016).Organizational capabilities symbolize the inner strength of an organization in adapting the market change to give high impact towards customer satisfaction. Therefore, organizational capabilities can be referred as the ability of an organization achieving it goals by searching and adapting the right way which include organizational knowledge, organizational skills and organizational affect (Wang & Zeng, 2017).
Dynamic Capability Views
DCV is develop on the RBV to achieve sustainable competitive advantage (Eisenhardt & Martin, 2000). Dynamic capability is “the firm ability to integrate, build and reconfigure internal and external competences to address rapidly changing environment” (Teece et al., 1997). According to DCV, operation capability is regarded as an important dynamic capability of an organization operating in dynamic environment (Helfat & Winter, 2011). The implementation

223
4TH SINTO
K INTERN
ATION
AL CON
FERENCE O
N SO
CIAL SCIENCE AN
D M
ANAG
EMEN
T
of the DCV in strategizing decision making in supply chain management is highly acceptable (Helfat & Peteraf, 2003) as it helps to highlight the most critical capabilities management needs to sustain for competitive advantage (Barrales-Molina et al., 2013). As the DCV able to enhance better understanding on the benefits of organization capability in return, able to strengthen the operation systems to survive in a highly dynamic environment. Therefore, organization need to have strategic decision making, flexible facilities and the ability to utilize resources and capabilities by producing new output (Eisenhardt & Martin, 2000).
Dynamic Capabilities
Dynamic capabilities is defined as organization ability “to sense and then seize new opportunities, and to reconfigure and protect knowledge assets, competencies and complementary assets with the aim of achieving a sustained competitive advantage” (Teece et al., 1997; Zahra et al., 2006).
Dynamic capabilities are used to extend or remodify their current resources different ways such as altering operational daily routines (Helfat and Winter, 2011) which help organization to redeploy and reconfigure their resource base to meet evolving customer demands and competitor strategies (Zahra & George, 2002). As a result, dynamic capabilities lead to differences in the performance of organization, even if organization are similar in terms of resources and capabilities (Easterby-Smith et al., 2009). Examples of dynamic capabilities are strategic decision-making, product development and management of alliances (Eisenhardt & Martin, 2000). These examples highlight the main factors of dynamic capabilities in a strategically managed supply system as such capabilities helps the organization to be able to create added value to the current capabilities and exploiting new resources (Agbim et al., 2014) which lead the organization to be competitive advantage (Ogunkoya et al., 2014).
Performance Management
Performance measurement is defined as “the process of quantifying tshe efficiency and effectiveness of an action” (Neely et al., 2005). The description of performance measurement as the “information system which is at the heart of the performance management process and it is of critical importance to the effective and efficient functioning of the performance management system” (Inan & Bititci, 2015). Measuring the performance of an organization is necessary to determine the level of efficiency and effectiveness. It also helps to identify any rooms for improvements to cope with the volatile business environment. There is various method in measuring performance in return there are various definition of performance measurement were developed (Franco-Santos et al., 2007).
Supply chain performance is a combined performance from every network or relationship that linked together in a chain. The supply chain networks are developed with same goal that has mutual benefits (Chen& Paulraj, 2004). These relationships are based on the theory of strategic management in which emphasized on the collaborative advantage also known as the competitive advantage (Moss et al., 2006). The relationship trait is the key in determining the overall performance of supply chain. If one of the networks or relationships occurred problem, it will slow down the operation and affected the entire chain.
Supply Chain Operational Performance
In getting a better picture of effective business performance, the operational performance should be included (Sayuti, 2014). Financial performance measures imitate the valuation of an organization by the external factors of the organization whereas operational measures indicate the operation efficiency and effectiveness. The non-financial measures and the financial measures are intertwined (Bourne et al., 2005; Medori & Steeple, 2000). Benefit of implementing non-financial measures, they are measurable, accurate and align with the organization objectives (Kotane & Merlino, 2011). The non-financial measures evolved according to the market trend and thus tend to be supple (Medori & Steeple, 2000; Pun & White, 2005). The measure indicators that are used in operational performance are quality, time, cost and flexibility (Prajogo & Olhager, 2012).

224
Supply Chain Financial Performance
In determining the success of an organization it is based on its financial performance (Nath et al., 2010; Wahyuni, 2010). It is vital to determine the costs that are involve in the supply chain process. There are two type of costs which are direct cost and coordination cost (Christopher & Gattorna, 2005). Direct cost here defined as the cost involve ensuring the operations run accordingly. Manufacturing expenses, inventory costs, transportation costs, labour costs, and product availability are examples of direct costs. The coordination cost is the extra cost that happens when there is a misinterpretation. For example, incorrect forecasting of client demand and a lack of information result in massive inefficiency (Chopra & Meindl, 2013).
Proposed Research Framework
Figure 3
The Proposed Research Framework
RESEARCH HYPOTHESES
Based on the study topic, the following hypotheses are established and justified regarding the organizational capabilities and dynamic capabilities influencing integrated supply chain practices thus impact the performances in the Malaysia wood-based industry.
The first hypothesis proposes the organizational knowledge will influence the integrated supply chain practices (ISC). In the current agile environment, the organization required to be more knowledgeable by able to develop rational decision making and cater emotions among its members in the organization to survive and to excel its performance by aligning its products and services according to the customer’s need and demand. There is quite a number of organization has implemented various theories and developed new philosophies in order to enhance their performance and the improvement that been practice, integrated supply chain practices has been steadily accelerated (Agus, 2015). This has been supported by other researchers emphasized that ISC are highly important in improving overall business performance (Chin et al., 2013; Didonet & Díaz, 2012; Ibrahim & Hamid, 2012; Ronoh & Koech, 2014).
225
4TH SINTO
K INTERN
ATION
AL CON
FERENCE O
N SO
CIAL SCIENCE AN
D M
ANAG
EMEN
T
H1(a): Organizational knowledge has significant effect on integrated supply chain practices
The second hypothesis proposes the organizational skill plays an important role which influence the integrated supply chain practices by ensuring the effectiveness and efficiency in the organization which include clear objectives and organizational goals (Kotter, 1995), encouraging positive attitude (Hon et al., 2014; Pardo Del Val & Martínez Fuentes, 2003) and decomposing the change-related works, obtaining the required knowledge for change (Nasiri et al., 2013). In coping in the agile market, without organizational skill, adapting in the organization is impossible.
H1(b): Organizational skills have significant effect on integrated supply chain practices
The third hypothesis proposes the organizational affect influence the integrated supply chain practices. In facing volatile in the market, there is a need for the organization to focus on delivering performance to its customers which may lead into two types of affective situation which are positive emotions that encourage members in the organization to move forward in achieving organizational goals and negative emotions that discourage members to move forward (Wang & Zeng, 2017). Methods and delegating tasks or workloads adequately by improving knowledge and skills can encourage members in moving forward (Campbell et al., 2013) as well as clearer view and benefit gains could encourage action to be taken by the members in improving organization’s value and performance (Kalinainen, 2013).
H1(c): Organizational affects have significant effect on integrated supply chain practices
The fourth hypothesis proposes that the organization’s product development have impact on integrated supply chain practices. Organization ultimate success are dependent on its ability to strategize and fully utilize the resources efficiently by remodifying existing capabilities by creating new capabilities to be competitive advantage (Krasnikov & Jayachandran, 2008; Yu & Ramanathan, 2016). Thus, allowing the organization to produce new products with a new process with the ability in responding to the market volatile environment (Eisenhardt & Martin, 2000) is vital elements as it affecting the level of customer satisfaction (Ofori-amanfo, 2014). Nowadays, organization do not only compete with price but also products with added- value thus resulting high profits and value advantages (Agus, 2015). Organization that produce low quality products leads to operation and production delays in which requires additional time in providing correction that will affect the performance (Ofori-amanfo, 2014).
H2(a): Product development has significant effect on integrated supply chain practices
The fifth hypothesis proposes the strategic decision making have impact on integrated supply chain practices. The goal of a supply chain manager must be able to meet the customer demands, the supply chain distribution with the limited resources thus achieving customer’s expectation at the very minimal cost in the volatile market (Ibrahim & Hamid, 2012). In return, it will be beneficial for the organization success.
H2(b): Strategic decision making has significant effect on integrated supply chain practices
The sixth hypothesis proposes the organization’s alliance management have impact on integrated supply chain practices to meet the customer’s satisfaction accordingly. A strategic alliance management emphasizes direct, long-term relationship by complementing each other in problem solving thus gain mutual benefits (Zhao & Lee, 2009). The aim of this alliances are to promote shared benefits such as technology, products and market among the partners throughout the supply chain (Lambert and Cooper, 2000) and improving time and effort management (Kroes & Ghosh, 2010). An effective alliance management can be a critical impact on the integrated supply chain practices (Karimi & Rafiee, 2014) as it influence the supply chain performances (Ibrahim & Hamid, 2012).
H2(c): Alliance management has significant effect on integrated supply chain practices
226
The seventh hypothesis examines the impact of integrated supply chain practices on organization operation performance. Integrated supply chain practices provides great impact on the business performance (Ofori-Amanfo, 2014). Integrated supply chain practices implemented to give direct impact on the operation performance through projection, flexibility and time (Larsson et al., 2016; Sayuti, 2013; Selldin & Olhager, 2007).
H3: Integrated supply chain practices have positive impact on supply chain operational performance
The eight hypothesis examines the impact of integrated supply chain practices on the organization financial performance. Financial performance is reflected based on the outcome of the organization. Implementing integrated supply chain it is expected to improve the organization sales growth, profitability as well as earning per share (Ivanov, 2018; Wahdan & Emam, 2017; Yap & Tan, 2012).
H4: Integrated supply chain practices have positive impact on supply chain financial performance
The nineth hypothesis focuses on the relationship of supply chain operational performance and supply chain financial performance of the organization. Previous studies stated that financial and operational performance are the ultimate source in determining the success of an organization. By improving supply chain operational performance, supply chain financial performance will gain profit (Bagher, 2018; Moura et al., 2011; Shahril et al., 2017).
H5: Supply chain operational performance has significant positive relationship on supply chain financial performance.
RESEARCH METHODOLOGY AND EXPECTED CONTRIBUTION
The purpose of this study is to identify the organizational capabilities and dynamic capabilities influencing integrated supply chain practices thus impact the performances in the Malaysia wood-based industry. This study is a quantitative research and structured questionnaire is used in collecting data from the targeted population, wood-based manufacturers located in Peninsular Malaysia registered under Malaysian Timber Industry Board (MTIB). To ensure equal chance to be selected assample, this study uses probability disproportionate stratified random sampling methods. The characters are according to the wood-based activities such as furniture, builders’ carpentry and joinery (BJC), sawn timber, medium density fiberboard (MDF) and panel products include plywood, veneer and laminated board. This study applies the Partial Least Square Structural Equation Modelling (PLS-SEM) because it permits the assessment of relationship between the observed and unobserved variables. It allows to understand the pattern by which each indicator loads on a particular latent variable. This method is considered ideal for the form of investigation performed as it enables to answer question involving multiple regression analysis of construct within a single calculated dependent variable and measured the independent variables (Hair et. al, 2017).
The questionnaire was develop based on the hypotheses as well previous research that been adapted as guideline. The questions designed were structured as concisely to avoid confusion nor ambiguity. Therefore, instructions and explanation were included to make better understanding for the respondents. The questionnaire consists of six sections. Section A focused on organization supply practices. Section sB focused on organizational capabilities which include organizational knowledge, organizational skills and organizational affect. Section C focused on the dynamic capabilities which include product development, strategic decision making and alliance management.
Section D focused on performance management. Section E focused on the organization information. Lastly, Section F focused on the demographic profile of the respondent. Pilot study was conducted in order to assess the effectiveness and reliability of the questionnaire (Sekaran and Bougie, 2016). The questionnaire was distributed to ten (10) high position personnel in the Malaysian Timber Industry
227
4TH SINTO
K INTERN
ATION
AL CON
FERENCE O
N SO
CIAL SCIENCE AN
D M
ANAG
EMEN
T
Board (MTIB) and five (5) manufacturers in the Malaysian wood-based industry. The questionnaire has been revised according to the comments and suggestion given. All data that been collected analyzed through statistical analysis using SMARTPLS software.
Descriptive statistics make use of the data to describe the population and the study’s constructs. The central tendency and dispersion were assessed using mean and standard deviation measurements. The features of the respondents were assessed using frequency tables. The data was then assessed for normality using skewness and kurtosis measures. To test the hypotheses that theoretical relationships exist between the observed indicator variables and their underlying latent constructs, internal consistency (reliability), convergent validity (loading and average variance extracted), and discriminant validity for reflective indicators as well as convergent validity (concurrent validity using redundancy analysis), indicator collinearity and significance weight for composite formative indicators (Hair et. al, 2017).
This study is expected to make a significant impact and examines the relationships between operational capabilities, dynamic capabilities that influence integrated supply chain practices impacting the financial and non-financial performance on the manufacturers of Malaysian wood-based industry. The findings of this study may highlight the important keys that will help the manufactures to enhance their operations and production segments. The outcome of this study is also expected to provide contribution to the existing theory by increasing the knowledge and understanding that helps to facilitate other future study.
REFERENCES
Agbim, K. C., & Oriarewo, Godday Orziemgbe, Zever, T. A. (2014). Impact of business environmental scanning behaviour on the entrepreneurial performance of micropreneurs: A conceptual framework. European Journal of Business and Management, http://www.Iiste.org ISSN.
Agus, A. (2015). Supply chain management: The influence of SCM on production performance and product quality. Journal of Economics, Business and Management, 3(11), 1046–1053. https://doi.org/10.7763/joebm.2015.v3.332
Ahmad A.H. (2003). Th participation of the wood based sector in the Malaysian research and development grant scheme. UPM Press, Serdang.
Anand, G., & Kodali, R. (2010). Analysis of lean manufacturing frameworks. Journal of Advanced Manufacturing Systems, 09(01), 1–30. https://doi.org/10.1142/s0219686710001776
Bagher, A. N. (2018). The effect of supply chain capabilities on performance of food companies. 2(4).
Barrales-Molina, V., Bustinza, Ó. F., & Gutiérrez-Gutiérrez, L. J. (2013). Explaining the causes and effects of dynamic capabilities generation: A multiple-indicator multiple-cause modelling approach. British Journal of Management. https://doi.org/10.1111/j.1467-8551.2012.00829.x
Bourne, M., Kennerley, M., Franco-Santos, M., Kagaari, J., Munene, J. C., Ntayi, J. M., & Kagaari, J. R. K. (2005). Journal of Manufacturing Technology Management Managing through measures: a study of impact on performance”Performance management practices and managed performance: the moderating influence of organisational culture and climate in public universities in. Journal of Manufacturing Technology Management International Journal of Educational Management Iss Measuring Business Excellence Iss, 16(2), 373–395. https://doi.org/10.1108/17410380510594480
Campbell, W. M., Ratcliffe, M., & Moore, P. (2013). An exploration of the impact of organizational culture on the adoption of green IT. Proceedings - 2013 IEEE International Conference on Green Computing and Communications and IEEE Internet of Things and IEEE Cyber, Physical and Social Computing, Gree GreenCom-IThings-CPSCom 2013. https://doi.org/10.1109/GreenCom-iThings-CPSCom.2013.44
Chen, I. J., & Paulraj, A. (2004). Towards a theory of supply chain management: The constructs and measurements. Journal of Operations Management, 22(2), 119–150 https://doi.org/10.1016/ j.jom.2003.12.007
Chin, T. A., Hamid, A. B. A., Rasli, A., & Baharun, R. (2013). Adoption of supply chain
228
management in SMEs. Procedia - Social and Behavioral Sciences, 65(ICIBSoS), 614–619. https://doi.org/10.1016/ j.sbspro.2012.11.173
Chopra, S., & Meindl, P. (2013). Supply chain management. strategy, planning & amp; operation. In Das Summa Summarum des Management. https://doi.org/10.1007/978-3-8349-9320-5_22
Christopher, M., & Gattorna, J. (2005). Supply chain cost management and value-based pricing. Industrial Marketing Management. https://doi.org/10.1016/j.indmarman.2004.07.016
Didonet, S. R., & Diaz, G. (2012). Supply chain management practices as a support to innovation in SMEs. Journal of Technology Management and Innovation, 7(3), 91–109.http://www.scopus.com/inward/record.url?eid=2-s2.0-84868119928&partnerID=40&md5=34cbbd 32fa2d9928d10e9cdc4aec0320
Didonet, S. R., & Díaz, G. (2012). Supply chain management practices as a support to innovation in SMEs. 7(3), 91–109.
Easterby-Smith, M., Lyles, M. A., & Peteraf, M. A. (2009). Dynamic capabilities: Current debates and future directions. British Journal of Management. https://doi.org/10.1111/j.1467-8551.2008.00609.x
Eisenhardt, K. M., & Martin, J. A. (2000). Dynamic capabilities what are they. Strategic Management Journal. 1105–1121. https://doi.org/10.1002/1097-0266(200010/11)21:10/11
Flynn, B. B., Huo, B., & Zhao, X. (2010). The impact of supply chain integration on performance: A contingency and configuration approach. Journal of Operations Management, 28(1), 58–71. https://doi.org/10.1016/j.jom.2009.06.001
Franco-Santos, M., Kennerley, M., Micheli, P., Martinez, V., Mason, S., Marr, B., Gray, D., & Neely, A. (2007). Towards a definition of a business performance measurement system. International Journal of Operations and Production Management, 27(8), 784–801.https://doi.org/10.1108/01443570710763778
Hair, J., Hollingsworth, C. L., Rondolph, A. B., Chong, A. (2017). An updated and expanded assessment of PLS-SEM in information system research. Industrial Management & Data Systems, 117(3), 442-458.
Helfat, C. E., & Peteraf, M. A. (2003). The dynamic resource-based view: Capability lifecycles. Strategic Management Journal, 24(10 SPEC ISS.), 997–1010. https://doi.org/10.1002/smj.332
Helfat, C. E., & Winter, S. (2011). Untangling dynamic and operational capabilities: Strategy for the (N)ever-Changing World. Strategic Management Journal, 32(August), 1243–1250.https://doi.org/10.1002/smj
Hon, A. H. Y., Bloom, M., & Crant, J. M. (2014). Overcoming resistance to change and enhancing creative performance. Journal of Management. https://doi.org/10.1177/0149206311415418
Ibrahim, S. B., & Hamid, A. A. (2012). Supply chain management practices and supply chain performance effectiveness. International Journal of Science and Research, 3(8), 2319–7064.
Inan, G. G., & Bititci, U. S. (2015). Understanding organizational capabilities and dynamic capabilities in the context of micro enterprises: A research agenda. Procedia - Social and Behavioral Sciences, 210, 310–319. https://doi.org/10.1016/j.sbspro.2015.11.371
Islam, R., & Siwar, C. (2010). Trade and environemnt in the forestry sect-towards sustainable forest management.pdf (p. 1–17).
Ivanov, D. (2018). Supply chain risk management: Bullwhip effect and ripple effect. International Series in Operations Research and Management Science, 265, 19–44. https://doi.org/10.1007/978-3-319- 69305-7_2
Jasti, N. V. K., & Kodali, R. (2015). A critical review of lean supply chain management frameworks: Proposed framework. Production Planning and Control, 26(13), 1051–1068. https://doi.org/10.1080/09537287.2015.1004563
Kaleka, A. (2002). Resources and capabilities driving competitive advantage in export markets: Guidelines for industrial exporters. Ind. Mark. Manag., 31, 273–283.
Kalinainen, J. (2013). A study about delivery reliability in large machine or structure delivery projects. 61.
Karimi, E., & Rafiee, M. (2014). Analyzing the impact of supply chain management practices on organizational performance through competitive priorities (Case Study: Iran Pumps Company). International Journal of Academic Research in Accounting, Finance and Management Sciences, 4(1), 1–15. https://doi.org/10.6007/ijarafms/v4-i1/503
Kaur, V., & Mehta, V. (2017a). Dynamic Capabilities for Competitive Advantage: A Comparative
229
4TH SINTO
K INTERN
ATION
AL CON
FERENCE O
N SO
CIAL SCIENCE AN
D M
ANAG
EMEN
T
Study of IT Multinationals in India. https://doi.org/10.1177/0971890717701781Khan, F., Tun, U., Onn, H., & Wadood, F. (2018). The Importance of SMEs and Furniture
Manufacturing SMEs in Malaysia. A Review of Literature. January.Kor, Y. Y., & Mahoney, J. T. (2004). Edith Penrose’s (1959) Contributions to the resource-
based view of strategic management. Journal of Management Studies. https://doi.org/10.1111/j.1467- 6486.2004.00427.x
Kor, Y. Y., Mahoney, J. T., Siemsen, E., & Tan, D. (2016). Penrose’s the theory of the growth of the firm: An exemplar of engaged scholarship. Production and Operations Management, 25(10), 1727–1744. https://doi.org/10.1111/poms.12572
Kotane, I., & Merlino, I. K. (2011). Non-financial indicators for evaluation of business activity non-financial indicators for evaluation of business activity. Inta Kotane, Irina Kuzmina-Merlino. European Integration Studies, 5(5), 213–219. https://doi.org/10.5755/j01.eis.0.5.1099
Krasnikov, A., & Jayachandran, S. (2008). The relative impact of marketing, operations capabilities on firm. Journal of Marketing, 72(July), 1–11. https://doi.org/10.1509/jmkg.72.4.1
Kroes, J. R., & Ghosh, S. (2010). Outsourcing congruence with competitive priorities: Impact on supply chain and firm performance. Journal of Operations Management, 28(2), 124–143. https://doi.org/10.1016/j.jom.2009.09.004
Lambert, D. M., & Cooper, M. C. (2000). Issues in supply chain management. Industrial Marketing Management, 29(1), 65–83. https://doi.org/10.1016/S0019-8501(99)00113-3
Lambert, D. M., & Enz, M. G. (2017). Issues in supply chain management: progress and potential. Industrial Marketing Management, 62, 1–16. https://doi.org/10.1016/j.indmarman.2016.12.002
Larsson, M., Stendahl, M., & Roos, A. (2016). Supply chain management in the Swedish wood products industry – A need analysis. Scandinavian Journal of Forest Research, 31(8), 777–787. https://doi.org/10.1080/02827581.2016.1170874
Lu Dawei.(2011). Fundamentals of supply chain management. https://books.google.ro/books?id=NveABxm-uXMC&printsec=frontcover&hl=rp&source=gbs_ge_summary_r&cad=0#v=onepage&q&f=false
Madhani, P. M. (2014). Resource based view (RBV) of competitive advantage: an overview. Open Journal System, March 2010, 3–22. https://doi.org/10.3386/w19846
Makhloufi, L., Mohammed, H., & Abu, E.. (2017). The effect of core competence on the sustainable competitive advantage of Malaysian SMES furniture industry. Journal of Humanities, Language, Culture and Business, 1(3),90–99. http://www.icohlcb.com/images/Articles/vol_1_No.3/Paper-049-.pdf
Medori, D., & Steeple, D. (2000). A framework for auditing and enhancing performance measurement systems. International Journal of Operations and Production Management, 20(5), 520–533. https://doi.org/10.1108/01443570010318896
Mohd Noor, M. N. H., Kadir, R., & Muhammad, S. (2018). Suppressing illegal logging in Peninsular Malaysia, 73–78.
Moss, R., Richard, K., Corn, I., Kanter, R. M., & Corn, R. I. (2006). A business difference? Contextual Factors Affecting Cross-cultural Relationship Success. 4–25.
Moura, A. L. de C., Brito, L. A. L., Di Serio, L. C., & Martins, G. S. (2011). Operational practices and financial performance: An empirical analysis of Brazilian manufacturing companies. BAR - Brazilian Administration Review, 8(4), 395–411.http://www.scielo.br/scielo.php?script=sci_arttext&pid=s1807- 76922011000400004&lng=en&nrm=iso&tlng=en
MITI (2014). Performance of Malaysian Resource-Based Manufacturing Industries. Ministry of International Trade and Industry, Putrajaya, Malaysia.
MTIB (2019). Annual Report 2018. Malaysian Timber Industry Board, Kuala Lumpur, Malaysia MTIB (2020). Annual Report 2019. Malaysian Timber Industry Board, Kuala Lumpur, Malaysia. MTIB (2021). Annual Report 2020. Malaysian Timber Industry Board, Kuala Lumpur, Malaysia.
Nasiri, S., Ansari, F., & Fathi, M. (2013). Dynamics of knowledge assets and change management perspectives. IEEE International Conference on Electro Information Technology. https://doi.org/10.1109/EIT.2013.6632704
Nath, P., Nachiappan, S., & Ramanathan, R. (2010). The impact of marketing capability, operations capability and diversification strategy on performance: A resource-based view. Industrial Marketing Management, 39(2), 317–329. https://doi.org/10.1016/j.indmarman.2008.09.001
230
NATIP. (2009). National Timber Industry Policy 2009-2020. Ministry of Plantation Industries and Commodities, Malaysia.
Neely, A., Gregory, M., & Platts, K. (2005). Performance measurement system design: A literature review and research agenda. International Journal of Operations and Production Management, 25(12), 1228– 1263. https://doi.org/10.1108/01443570510633639
Noraida, A., Abdul-Rahim, A., & Mohd-Shahwahid, H. (2017). The impact of sustainable forest management (SFM) practices on primary timber-based production in Peninsular Malaysia. Jurnal Ekonomi Malaysia, 51(2), 159–172. https://doi.org/10.17576/JEM-2017-5001-12
Ofori-Amanfo, J. (2014). Supply management capabilities and operations performance of UK Manufacturing Small and Medium Sized Enterprises (SMEs). Intellectual Property Statement. 286–294.
Ogunkoya, A. O., Hassan, A. B., & Shobayo, B. P. (2014). Dynamic capabilities and competitive advantage: An analysis of the Nigerian banking sector. Journal of Accounting & Management, 4(2), 29–36. http://search.ebscohost.com/login.aspx?direct=true&db=bth&AN=100666753&lang=ja&site=ehost- live
Pakurár, M., Haddad, H., Nagy, J., Popp, J., & Oláh, J. (2019a). The impact of supply chain integration and internal control on financial performance in the Jordanian Banking Sector. Sustainability (Switzerland), 11(5). https://doi.org/10.3390/su11051248
Pardo Del Val, M., & Martínez Fuentes, C. (2003). Resistance to change: A literature review and empirical study. In Management Decision. https://doi.org/10.1108/00251740310457597
Parkinson, B., & Manstead, A. S. R. (2015). current emotion research in social psychology: Thinking about emotions and other people. Emotion Review. https://doi.org/10.1177/1754073915590624
Peng, D. X., Schroeder, R. G., & Shah, R. (2008). Linking routines to operations capabilities: A new perspective. Journal of Operations Management, 26(6), 730–748.https://doi.org/10.1016/j.jom.2007.11.001
Prajogo, D., & Olhager, J. (2012). Supply chain integration and performance: The effects of long-term relationships, information technology and sharing, and logistics integration. International Journal of Production Economics, 135(1), 514–522. https://doi.org/10.1016/j.ijpe.2011.09.001
Pun, K. F., & White, A. S. (2005). A performance measurement paradigm for integrating strategy formulation: A review of systems and frameworks. International Journal of Management Reviews, 7(1), 49–71. https://doi.org/10.1111/j.1468-2370.2005.00106.x
Ralston, P. M. (2014). Supply chain collaboration: A literature review and empirical analysis to investigate uncertainty and collaborative benefits in regards to their practical impact on collaboration and performance.
Ramasamy, G., Ratnasingam, J., Bakar, E. S., Halis, R., & Muttiah, N. (2015). Assessment of environmental emissions from sawmilling activity in Malaysia. BioResources. https://doi.org/10.15376/biores.10.4.6643-6662
Ramon-Jeronimo, J. M., Florez-Lopez, R., & Araujo-Pinzon, P. (2019). Resource-Based View and SMEs Performance Exporting through Foreign Intermediaries: The mediating effect of management controls. Sustainability, 11(12), 3241. MDPI AG. http://dx.doi.org/10.3390/su11123241
Ratnasingam, J. (2020). How are Small and Medium Enterprises in Malaysia’s Early evidences from a Survey and Recommendations. Bio Resources, 15(3), 5951–5964.
Ratnasingam, J., Ab Latib, H., Yi, L. Y., Liat, L. C., & Khoo, A. (2019). Extent of automation and the readiness for industry 4.0 among Malaysian furniture manufacturers, Bio Resources, 14(3), 7095-7110. http://doi.org/10.15376/biores.14.3.7095-7110
Ratnasingam, J. (2019). Innovation in the Malaysian furniture industry: Drivers and challenges. Bio Resources, 13(3), 5254–5270. https://doi.org/10.15376/biores.13.3.5254-5270
Ratnasingam, J., Chin, K. A., Latib, H. A., Subramaniam, H., and Khoo, A. (2018). Innovation in the Malaysian furniture industry: Drivers and challenges,” BioResources 13(3), 5254-5270. http://doi.org/10.15376/biores.13.3.5254-5270
Ratnasingam, J., Ark, C. K., Mohamed, S., Liat, L. C., Ramasamy, G., and Senin, A. L. (2017). “An analysis of labor and capital productivity in the Malaysian timber sector,” BioResources 12(1), 1430-1446. http://doi.org/10.15376/biores.12.1.1430-1446
Ratnasingam, J. (2015). The Malaysian furniture industry: Unravelling its challenges to
231
4TH SINTO
K INTERN
ATION
AL CON
FERENCE O
N SO
CIAL SCIENCE AN
D M
ANAG
EMEN
T
growth and innovation. UPM Press, Serdang, Selangor.Ratnasingam, J., and Ioras, F. (2009). Foreign direct investment (FDI) added value and
environmental- friendly practices in furniture manufacturing: the case of Malaysia and Vietnam. International Forestry Review, 11(4),464-474. http://doi.org/10.1505/ifor.11.4.464
Reinhardt, N. (2000). Back to basics in Malaysia and Thailand: The role of resource-based exports in their export-led growth. World Development 28(1),57-77. https://doi.org/10.1016/S0305-750X(99)00111-4
Ronoh, R., & Koech, W. K. (2014). Components of supply chain management in the manufacturing sector components of supply chain management in the manufacturing sector. November. https://doi.org/10.21275/ART20162219
Sayuti, N. M. (2013). Antecedents of supply chain relationships between MNCS and SMES in agile environment. Philosophy from the Royal Melbourne Institute of Technology.
Sekaran, U., & Bougie, R. (2016). Research method for business textbook: A skill building approach. In John Wiley & Sons.
Selldin, E., & Olhager, J. (2007). Linking products with supply chains: Testing Fisher’s model. Supply Chain Management, 12(1), 42–51. https://doi.org/10.1108/13598540710724392
Teece, D. J., Pisano, G., & Shuen, A. (1997). Dynamic Capabilities and Strategic Management. Strategic Management Journal, 18, 509–533. https://doi.org/10.1002/(SICI)1097- 0266(199708)18:7<509::AID-SMJ882>3.0.CO;2-Z
Wahdan, M. A., & Emam, M. A. (2017). the impact of supply chain management on financial performance and responsibility accounting agribusiness case from Egypt. Accounting and Finance Research, 6(2), 136. https://doi.org/10.5430/afr.v6n2p136
Wahyuni, D. (2010). The importance of supply chain management in competitive business: A case study in Wooworths. Manajemen Usahawan Indonesia, 1, 32–39. http://ssrn.com/abstract=1739399
Wang, X., & Zeng, Y. (2017). Organizational capability model: toward improving organizational performance. Journal of Integrated Design and Process Science, 21(1), 5–24. https://doi.org/10.3233/jid-2017-0005
Yap, L. L., Tan, C. T. (2012). The effect of service supply chain management practices on the public healthcare organizational performance. International Journal of Business and Social Science, 3(16), 216–224.
Yu, W., & Ramanathan, R. (2016). Environmental management practices and environmental performance the roles of operations and marketing capabilities. Industrial Management and Data Systems, 116(6), 1201-1222. https://doi.org/10.1108/IMDS-09-2015-0380
Zahra, S. A., & George, G. (2002). Absorptive capacity: A review, reconceptualization, and extension. The Academy of Management Review. https://doi.org/10.2307/4134351
Zahra, S. A., Sapienza, H. J., & Davidsson, P. (2006). Entrepreneurship and dynamic capabilities: A review, model and research agenda. Journal of Management Studies, 43(4), 917–955. https://doi.org/10.1111/j.1467-6486.2006.00616.x
Zhao, X., & Lee, T. sheng. (2009). Developments and emerging research opportunities in operations strategy and supply chain management. International Journal of Production Economics, 120(1), 1–4. https://doi.org/10.1016/j.ijpe.2008.12.010
Ziaie, M., Mohamed, S., Ratnasingam, J., Ghani, A.N.A. and Salleh, R. (2012). Unsteadiness of the resource- based competitive advantage in the absence competitive strategy: Lessons from the Malaysian wooden furniture industry. Journal of Applied Sciences, 12(2), 113-124.
232
SICONSEM 2021: 097-056
THE IMPACT OF RELATIONSHIP MARKETING ON CHANNEL PERFORMANCE OF MLM SALES LEADERS IN MALAYSIA: SOFT
SKILLS TRAINING PROGRAM AS A MODERATOR
1Loo Yew Liang, 2Mohd Sobri Don & 3Nik Ab Halim Nik Abdullah1,2&3School of International Studies, Universiti Utara Malaysia
Corresponding author: [email protected]; [email protected];[email protected]
ABSTRACT
Multi-Level Marketing (MLM) business revolves largely around people due to its business concept connecting large group of downlines’ network business activities. In MLM business industry, people costs are much higher than capital costs. Such people-based businesses required the influence of relationship marketing which refers to the initiative of showing trust and commitment among each other to ensure long-term cooperation between MLM sales leaders and their downlines. This study tends to understand the consequences on the practice of relationship marketing among MLM sales leaders towards channel performance. The achievement of channel performance depends on the loyalty and retention between MLM sales leaders and downlines. Soft skills training program as a moderator to examine the intensity between relationship marketing and channel performance to display the effects as proposed in this study. In this research, cluster sampling was adapted in selecting 64 Multi-Level Marketing Organizations (MLMO) as the study sample based on the registered list of Direct Selling Association of Malaysia (DSAM). There were 320 sets of questionnaires sent out to the targeted downlines through the mailing method for the data collection. Statistical Package for the Social Sciences (SPSS) was utilized as the statistical tool to analyze the final inputs and measure the significance of the relationship and revealed the importance of relationship marketing on channel performance of MLM sales leaders in Malaysia.
Keywords: Relationship marketing, channel performance, trust, commitment, soft skills training program
INTRODUCTION
The ultimate goal of MLM business is to achieve financial freedom. Continuous and successful recruitment of downlines will effectively generate higher level income to MLM sales leaders. Specifically, the recruits must be actively running MLM businesses and at the same time they also need expanding their own distribution networks through intensive recruitment. Failing which can cause MLM sales leaders difficulties to improve or sustain channel performance. MLM sales leaders could be recognized as an essential success factor in MLM business, mainly due to their persuasiveness in conveying the message along the way when they are recruiting downlines through advertisements or face-to-face conferences. Sales leaders need to guide their downlines effectively by creating more new businesses. This scenario is not only seen in MLM industry, but top management from worldwide companies have been focusing on the development of sales team by enhancing their individual capabilities through the efforts of sales leaders (Piercy, Cravens, & Lane, 2007).
The essence of relationship marketing is the establishment of long-term relationships through loyalty and retention (Shirazi & Som, 2013) between sales leaders and downlines
24
233
4TH SINTO
K INTERN
ATION
AL CON
FERENCE O
N SO
CIAL SCIENCE AN
D M
ANAG
EMEN
T
(Grönroos, 2004). The salespersons’ perceptions of their sales manager’s trust and commitment will influence their acceptance of organizational objectives. In this context, trust is viewed as a confidence in the perceptions of an individual’s capabilities and intentions (Schetzsle & Delpechitre, 2013) meanwhile commitment as is viewed as salesperson’s desire to continue with the relationship (Morgan & Hunt, 1994). Hence, the theory of trust-commitment is crucial to leaders to strive for self-improvement and better individual performance. Past studies revealed that the extent of supervisory support (up-line support) gave impacts on downlines’ overall performance (Babin & Boles’s, 1996; Wotruba & Rochford, 1995). These studies also revealed that the guidance from up-lines and supervisors was potentially influencing the performance among downlines to achieve greater performance for MLMO. In addition, the success of organizational change could be affected based on the degree of supervisory support (Weber & Weber, 2001). Nevertheless, a study by Filzah, Cheng and Jasmani (2012) showed negative relationship between up-line support and sales performance. Based on their study, up-line support does not really refer to sales leaders’ support, rather, it refers to the downlines for whose ranking is slightly higher but not at the top position. Hence, the result showed that sales performance was not optimistic even up-line support given to the downlines. In this regard, such circumstance enables this research to further explore the support given by MLM sales leaders (top-ranked) to downlines in leading them to higher performance, simultaneously increase profitability of MLMO in the context of channel performance.
Many studies generally focused on salespeople’s performance (Salciuviene, Reardon, & Auruskeviciene, 2011) and only little previous research that scrutinized the downlines’ performance in MLMO (Msweli-Mbanga, 2001). In addition, the role and performance among MLM sales leaders has received limited attention from scholars, especially in MLM industry of Malaysia. In this regard, this study examines the impact of relationship marketing on channel performance among MLM sales leaders.
LITERATURE REVIEW
MLM Sales Leaders - ‘Heart and Soul’ of MLMO
The role of MLM sales leader is to influence people whereby influencing can affect someone to think and subsequently to take an action in the expected direction. Competency of influencing others is very crucial in the leadership field due to those people who take the leads probably might not to be called as leader if he or she is unable to persuade people of concepts and ideas. MLM sales leaders must understand that persuasion as a core construct of influence and such skill enables oneself to influence others to accomplish the tasks easily and effectively. There is hard to get the best definition of leadership, but basically most of scholars treated leaders have competence to mentor, motivate inspire, serve, direct, and guide others. Leaders have persuasion power which can influence others individually or community to meet the objectives.
MLM sales leaders are not only offering products or services, but also encouraged promoting a vision through the purpose of product or service is able to make people feel as a result of ownership. For instance, the downlines might feel proud once they fulfilled consumers’ demands and expectation by improving their health condition through the food supplements consumption delivered in MLM businesses transaction. They are bringing the prospects by helping people to foresee something valuable and different in their future life. It also can be said that MLM sales leaders are able to visualize something beneficial in current position or in future. Furthermore, leaders are fundamentally accountable to the articulation of the goals, mission, and vision that strikes a common bond with the people they lead, builds solidarity, and inspires their followers (Kouzes & Posner, 2012). The task of MLM sales leaders is to promote the products and services to consumers (potential leads) and will simultaneously recruit them as downlines to join their sales force for achieving the targets collectively and successfully under cooperative work.
234
The support of sales leaders is critical in MLM industry because of downlines practically will deal directly with their sales leaders and not the management for most of the times, particularly for moral support, motivation, training, development, and mentoring purposes (Filzah, Cheng, & Jasmani, 2012). MLM sales leaders’ support is defined as “the degree to which downlines perceive that their sales leaders offer support, encouragement, and concern on them” preferably on a continuous basic (Burke, Hurley, & Borucki, 1992). MLMO always encourage sales leaders to assist their downlines to succeed through their own efforts and willing to make a sacrifice for long-term good (Biggart, 1990). At the same time, MLM sales leaders have tendency to cultivate the cooperative social bonds among recruits by facilitating frequent and regular contact with each other (Sparks and Shenck, 2006).
In MLM business world, MLM sales leaders are the key persons to lead the sales force to generate more good sales results and their sustainable performance is essential to lead MLMO to better achievement in the matter of profitability and sales growth. Conversely, higher rate of turnover among MLM sales leaders will cause the motivation level goes down and the absence of effective leadership will potentially destroy the momentum of downlines. Therefore, MLM sales leaders play an important role to build rapports with their leading downlines. MLM sales leaders are expected to help improving their downlines’ performance (Sparks & Schenk, 2006; Wotruba & Rochford, 1995) according to their high-level interaction throughout their sales career in the industry. Theoretically and practically, MLM sales leaders are ranked on the top of MLMO compensation plan structure.
Relationship Marketing
Building rapport or relationship with customers is nothing new. Relationship marketing is and ‘old new’ idea, but with a new focus (Berry, 1995). Berry (1983) from a services perspective stated that relationship marketing is attracting, maintaining, and multi-service organizations enhancing customer relationship. Jackson (1985) from an industrial marketing perspective defined marketing concentrated towards strong, lasting relationships with individual accounts. Grönroos (1995) from a network perspective emphasized that marketing is to identify and establish, maintain and enhance relationships with customers and other stakeholders, at a profit so that the objectives of the partners’ interest are met, and this is achieved by a mutual exchange and fulfillment of promises. From this perspective, leadership is centered in the communication between leaders and followers rather than on the unique quality of the leader. Thought of as relationship, leadership becomes a process of collaboration that occurs between leaders and followers (Rost, 1991).
Relationship marketing benefits the customers as well as the firm (Berry, 1995). The focus of relationship marketing is elaborating on long term relationships and improving corporate performance through customer loyalty and customer retention (Shirazi & Som, 2013). In MLM business context, MLM sales leaders imperatively need to concentrate on relationship marketing approach through building rapport with downlines to meet their specifications and in addition to the risk-reducing benefits of having a relationship with downlines meanwhile customers also can reap social benefits (Berry, 1995). Relationship marketing strategies is highly recommended to be adapted into the relationship with customers than transactional activities due to its effectiveness to migrate it to a higher performing relationship state or prevent it from moving to a lower performing state (Zhang et al., 2016). MLM sales leaders are recognizing long term values of sales force relationship to foster downlines’ loyalty via progressive interaction and effective communication.
Trust-Commitment Theory
The existence of trust and commitment could be a key of the success in relationship marketing strategies (Morgan & Hunt, 1994; Palmatier et al., 2006). The commitment-trust theory of relationship marketing indicates that two fundamental factors which are trust and

235
4TH SINTO
K INTERN
ATION
AL CON
FERENCE O
N SO
CIAL SCIENCE AN
D M
ANAG
EMEN
T
commitment must exist for a relationship to be successful. Trust is defined in various ways in the marketing literature; trust could be confidence in the exchange partner’s reliability and integrity which potentially to overcome the insecurity (Lewicki et al., 1983; Morgan & Hunt, 1994). Trust also is seen as an important driver to both relationship and relationship enhancement that would appear to reduce risk perception more effectively than anything else. Subsequently, it is formed as a fundamental relationship model building block (Wilson, 1995). From another perspective, trust may also be a psychological outcome of a trusting relationship (Swaminathan & Reddy, 2000) and/or associated with outstanding performance.
Wilson (1995) mentioned that commitment is widely viewed as one of the defining variables of relationship marketing in buyer-seller relationship studies. Extending this commitment theory into the relationship between MLM sales leaders and downlines, once MLM sales leaders are committed, and vice versa, they feel value in the relationship and look forward to working together for long term basic (Schetzsle & Delpechitre, 2012). As with trust, commitment may also could be treated as a potential ‘psychological outcome’ of a strong relationship (Swaminathan & Reddy, 2000). Commitment implies the importance of the relationship to the parties and their desire to continue it (Beck & Wilson, 2000) and both parties will be loyal, reliable, and show stability in the relationship with one another (Bejou & Palmer, 1998). Practically, trust and commitment hardly to be separated in the relationship marketing debate due to both are invariably associated with the prerequisite that the relationship is of significantly high importance to one or both parties that it warrants maximum efforts at maintaining it (Morgan & Hunt, 1994). In this scenario, the committed party such as MLM sales leaders believes that the relationship with their downlines is worth working at to ensure that is endures indefinitely.
Channel Performance
Performance is seen as continuous and flexible process involves management level people to work closely to achieve the required results (Armstrong, 2006). Performance is the final result produced from activities involving strategic management process which it has ability to improve organization’s performance (Thomas & Hunger, 2010). To achieve the organizational performance, human resources are the primary factors to effectively and efficiently realize the objectives. Indeed, effectiveness and efficiency among employees are required to contribute for organizational performance. Management teams will be more focused in this situation because of they need leading the organizations to higher levels performance. In MLMO context, MLM sales leaders have more responsibilities than management team to enhance the organizational performance via their prominence in guiding, developing, and recruiting downlines as primary resources towards achieving financial freedom. Once the MLM sales leaders performed well and they will eventually meet their expectation and job satisfaction in terms of remuneration, benefits, promotion, work condition, supervision, organizational practices, and relationship with co-workers (Misener et al., 1996).
From another point of view, performance is an evaluation of the salespersons’ job activities and accomplishments relative to the organization’s objectives. In MLM business practice, MLM sales leaders and downlines typically view performance both in terms of product sales and new recruits. Therefore, performance basically is measured by the monthly sales achievement in total amounts meanwhile they need to expand their network businesses through continuous recruitment since their bonuses or commissions will be paid by monthly basic. Both sales and recruits per year were used to measure performance (Sparks & Schenk, 2006) similarly for evaluating the performance of MLM sales leaders. MLM sales leaders will be practically recognized with achieving sales target and continuous recruitment instead of focusing on selling activities. MLM sales leaders will be required to report their evaluation of the performance of downlines that under their supervision with respect in achieving annual sales target. Meanwhile, recruits per year in this context of study represents a result generated from broader network of downlines. As such, in this study, performance of MLM sales leaders is measured by channel performance. To be more specifically, channel performance (economic benefit) refers to the extent to which
236
relationship between the downlines and uplines is productive (good personal sales), profitable (good one’s network sales), and rewarding (resulting in a broader network of downlines) (Skarmeas et al., 2002; Msweli-Mbanga, 2001, Bucklin & Sengupta, 1993). There is a limited attention received for the study of channel performance in network marketing field (Salciuviene, Reardon, & Auruskeviciene, 2011) and this study to carry out the channel performance as important outcome in the context of MLM industry in Malaysia.
Soft Skills Training Program as a Moderator
The human factor is an important resource in modern business organizations, and it is treated as one of the activities that raise employees’ skills and abilities. Most of the modern business organizations spent part of money on training of workers to particularly increase their jobs effectively and efficiently. It was also considered as an investment of employees in the organizations.. A valuable MLM sales leader’s power consists of experiences, knowledge, competency, capabilities, and so forth. Hence, value-added resources will create the rareness in MLMO to gain the continuous organizational competitive advantage. Delgado (2000) in his study concluded that the higher level of success among downlines is derived from the higher quality of training program. If the training program was effective to build up downlines to be successful in MLM business, then it is logical for MLMO to organize a training program to train up a sales leader to achieve higher levels performance in future. Basically, training is a continual process and structured intentionally to recruit a person with skills, good abilities, and knowledge meanwhile it could provide individuals the experience and make them to feel more confident (Khanfar, 2014).
Downlines who joined the MLMO are normally not well-trained under the conventional human resource policies. MLM sales leaders must master themselves with the selling and recruiting skills and they are expected to undergo the training program as well (Anderson, 1995 & Clements, 1997). MLMO have the obligation to develop and train their sales leaders with their own training programs to achieve higher levels performance and to continuously provide the best learning environment to them. MLMO normally will consider contracting the services of professional firms specializing in sales training and interpersonal skills, otherwise hiring trainers or instructors who own their profession to impart their knowledge to MLM sales leaders (Delgado, 2000). Soft skills ranked highest than GPA (Grade Point Average) and work experiences among recruiter preferences in a survey done at a regional university career (Jones et al., 2016). It also reveals that soft skills could be develop through program as their competitive advantage. Moreover, soft skills are importantly applied for today’s workplace depends on the problem solving, critical thinking, communication, creativity, and industry to take care of the employees’ welfare in various jobs (Ellen, 2011).
Based on the MLM business model, sales force is very crucial in MLM business channel and they must be well-prepared with knowledge and soft skills especially for the sales management functions of hiring and educating their recruits (Ballard, 2006). To create and sustain the effective sales force, it depends on the ability of MLM sales leaders in recruiting downlines continuously which able to yield enormous sales volume and it helps to enhance the MLMO performance; and it is also simultaneously transforming their downlines to higher ranking based on the compensation plan structure. Practically, MLM sales leaders allow the downlines enjoying more compensation and satisfaction due to their excellent sales achievement; and this will significantly reduce the turnover among them to leave the job. In short, if the MLM sales leaders are not born or easily to be captured, then they need to be nurtured through professional soft skills training program to ensure them reaching on that position.
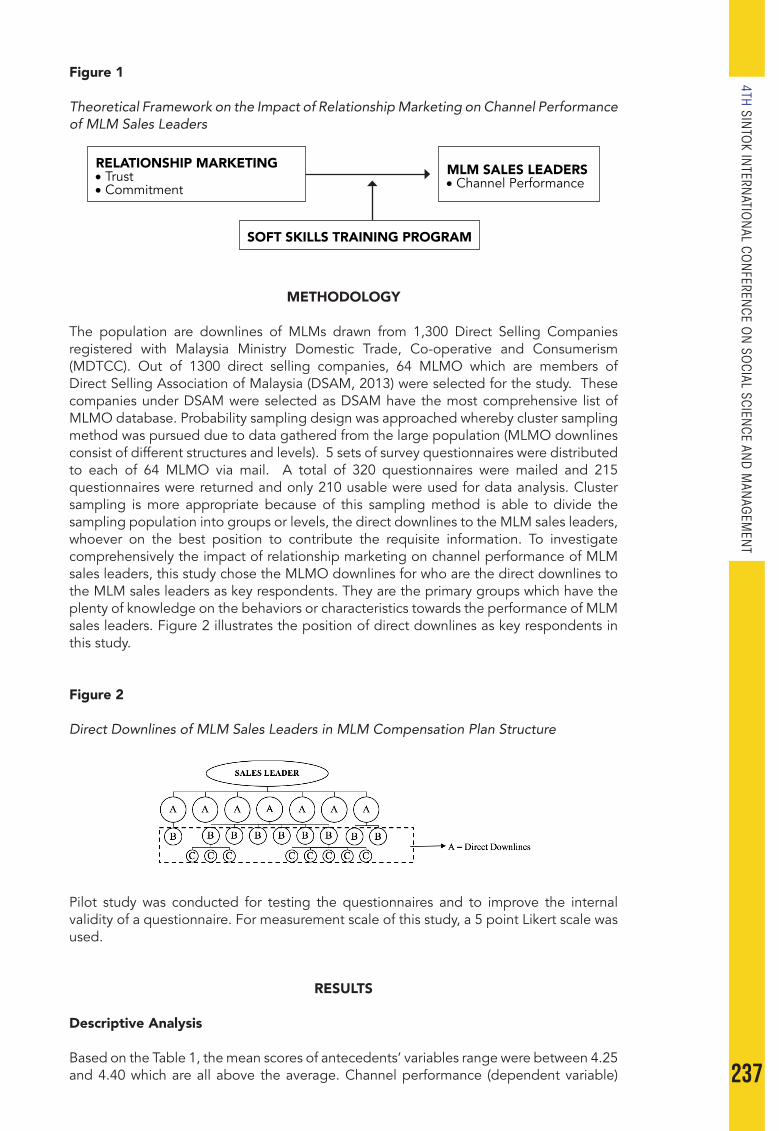
237
4TH SINTO
K INTERN
ATION
AL CON
FERENCE O
N SO
CIAL SCIENCE AN
D M
ANAG
EMEN
T
Figure 1
Theoretical Framework on the Impact of Relationship Marketing on Channel Performance of MLM Sales Leaders
METHODOLOGY
The population are downlines of MLMs drawn from 1,300 Direct Selling Companies registered with Malaysia Ministry Domestic Trade, Co-operative and Consumerism (MDTCC). Out of 1300 direct selling companies, 64 MLMO which are members of Direct Selling Association of Malaysia (DSAM, 2013) were selected for the study. These companies under DSAM were selected as DSAM have the most comprehensive list of MLMO database. Probability sampling design was approached whereby cluster sampling method was pursued due to data gathered from the large population (MLMO downlines consist of different structures and levels). 5 sets of survey questionnaires were distributed to each of 64 MLMO via mail. A total of 320 questionnaires were mailed and 215 questionnaires were returned and only 210 usable were used for data analysis. Cluster sampling is more appropriate because of this sampling method is able to divide the sampling population into groups or levels, the direct downlines to the MLM sales leaders, whoever on the best position to contribute the requisite information. To investigate comprehensively the impact of relationship marketing on channel performance of MLM sales leaders, this study chose the MLMO downlines for who are the direct downlines to the MLM sales leaders as key respondents. They are the primary groups which have the plenty of knowledge on the behaviors or characteristics towards the performance of MLM sales leaders. Figure 2 illustrates the position of direct downlines as key respondents in this study.
Figure 2
Direct Downlines of MLM Sales Leaders in MLM Compensation Plan Structure
Pilot study was conducted for testing the questionnaires and to improve the internal validity of a questionnaire. For measurement scale of this study, a 5 point Likert scale was used.
RESULTS
Descriptive Analysis
Based on the Table 1, the mean scores of antecedents’ variables range were between 4.25 and 4.40 which are all above the average. Channel performance (dependent variable)
RELATIONSHIP MARKETING•Trust•Commitment
MLM SALES LEADERS•Channel Performance
SOFT SKILLS TRAINING PROGRAM
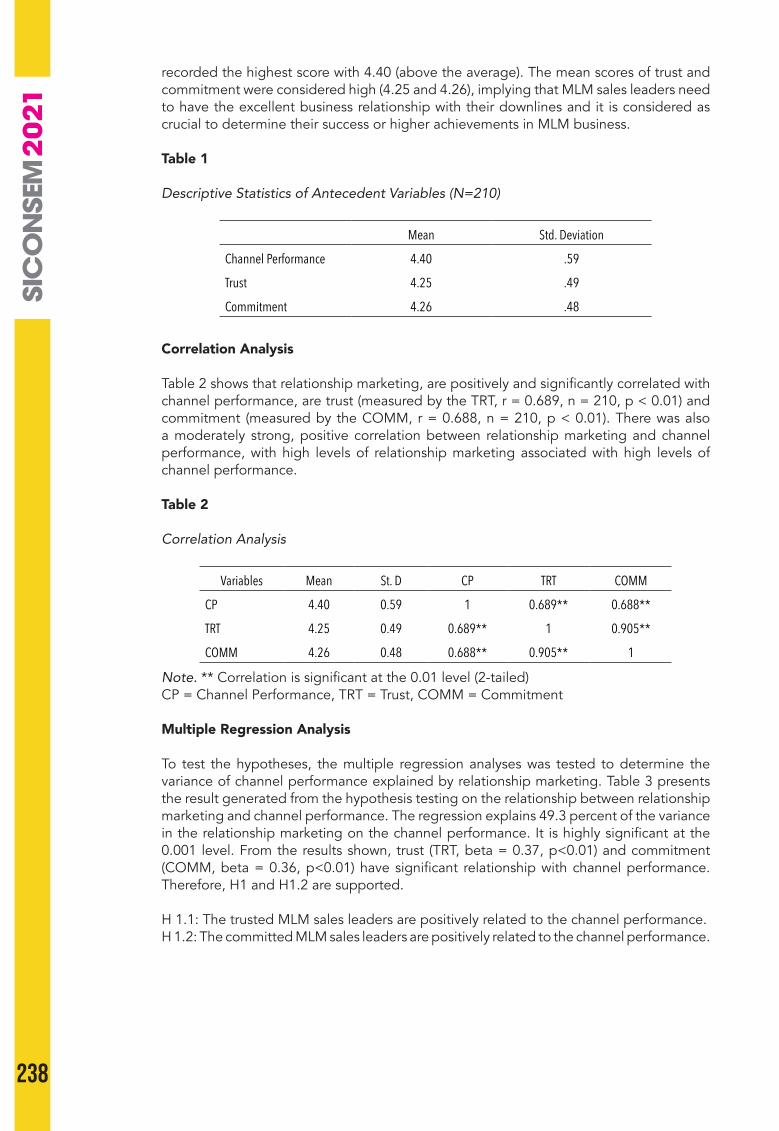
238
recorded the highest score with 4.40 (above the average). The mean scores of trust and commitment were considered high (4.25 and 4.26), implying that MLM sales leaders need to have the excellent business relationship with their downlines and it is considered as crucial to determine their success or higher achievements in MLM business.
Table 1
Descriptive Statistics of Antecedent Variables (N=210)
Mean Std. Deviation
Channel Performance 4.40 .59
Trust 4.25 .49
Commitment 4.26 .48
Correlation Analysis
Table 2 shows that relationship marketing, are positively and significantly correlated with channel performance, are trust (measured by the TRT, r = 0.689, n = 210, p < 0.01) and commitment (measured by the COMM, r = 0.688, n = 210, p < 0.01). There was also a moderately strong, positive correlation between relationship marketing and channel performance, with high levels of relationship marketing associated with high levels of channel performance.
Table 2
Correlation Analysis
Variables Mean St. D CP TRT COMM
CP 4.40 0.59 1 0.689** 0.688**
TRT 4.25 0.49 0.689** 1 0.905**
COMM 4.26 0.48 0.688** 0.905** 1
Note. ** Correlation is significant at the 0.01 level (2-tailed)CP = Channel Performance, TRT = Trust, COMM = Commitment Multiple Regression Analysis
To test the hypotheses, the multiple regression analyses was tested to determine the variance of channel performance explained by relationship marketing. Table 3 presents the result generated from the hypothesis testing on the relationship between relationship marketing and channel performance. The regression explains 49.3 percent of the variance in the relationship marketing on the channel performance. It is highly significant at the 0.001 level. From the results shown, trust (TRT, beta = 0.37, p<0.01) and commitment (COMM, beta = 0.36, p<0.01) have significant relationship with channel performance. Therefore, H1 and H1.2 are supported.
H 1.1: The trusted MLM sales leaders are positively related to the channel performance.H 1.2: The committed MLM sales leaders are positively related to the channel performance.
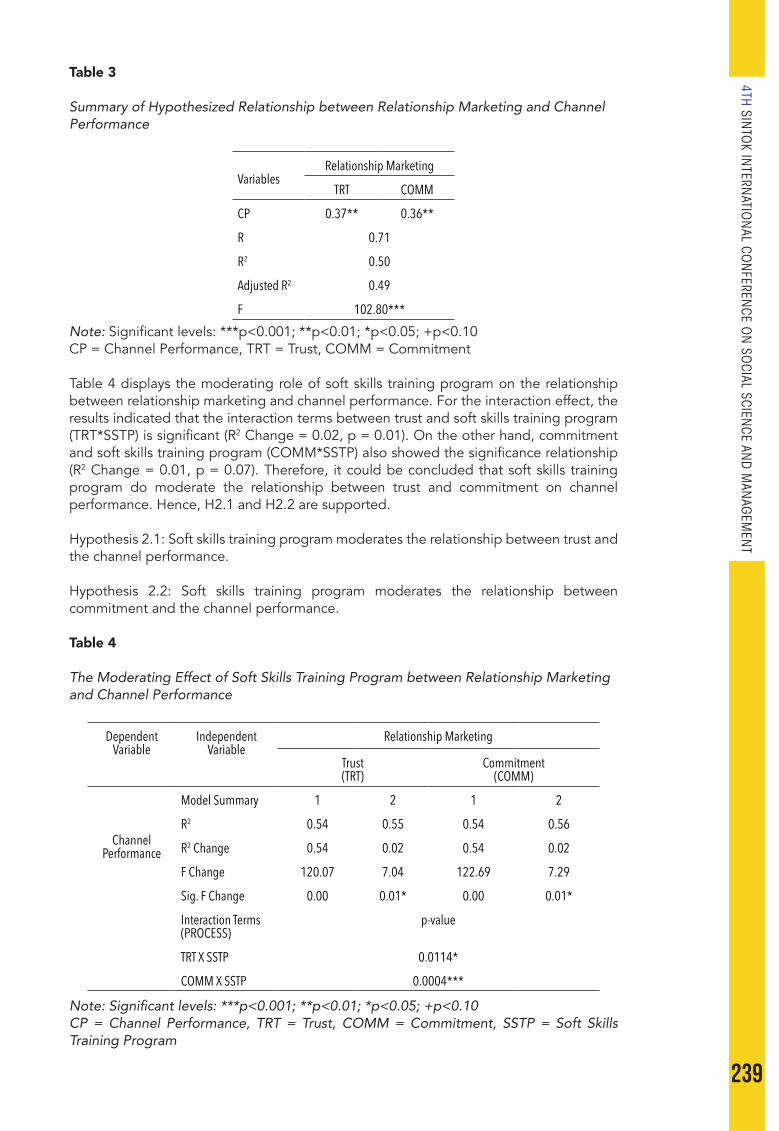
239
4TH SINTO
K INTERN
ATION
AL CON
FERENCE O
N SO
CIAL SCIENCE AN
D M
ANAG
EMEN
T
Table 3
Summary of Hypothesized Relationship between Relationship Marketing and Channel Performance
VariablesRelationship Marketing
TRT COMM
CP 0.37** 0.36**
R 0.71
R2 0.50
Adjusted R2 0.49
F 102.80***Note: Significant levels: ***p<0.001; **p<0.01; *p<0.05; +p<0.10CP = Channel Performance, TRT = Trust, COMM = Commitment
Table 4 displays the moderating role of soft skills training program on the relationship between relationship marketing and channel performance. For the interaction effect, the results indicated that the interaction terms between trust and soft skills training program (TRT*SSTP) is significant (R2 Change = 0.02, p = 0.01). On the other hand, commitment and soft skills training program (COMM*SSTP) also showed the significance relationship (R2 Change = 0.01, p = 0.07). Therefore, it could be concluded that soft skills training program do moderate the relationship between trust and commitment on channel performance. Hence, H2.1 and H2.2 are supported.
Hypothesis 2.1: Soft skills training program moderates the relationship between trust and the channel performance.
Hypothesis 2.2: Soft skills training program moderates the relationship between commitment and the channel performance.
Table 4
The Moderating Effect of Soft Skills Training Program between Relationship Marketing and Channel Performance
DependentVariable
IndependentVariable
Relationship Marketing
Trust(TRT)
Commitment(COMM)
ChannelPerformance
Model Summary 1 2 1 2
R2 0.54 0.55 0.54 0.56
R2 Change 0.54 0.02 0.54 0.02
F Change 120.07 7.04 122.69 7.29
Sig. F Change 0.00 0.01* 0.00 0.01*
Interaction Terms(PROCESS)
p-value
TRT X SSTP 0.0114*
COMM X SSTP 0.0004***
Note: Significant levels: ***p<0.001; **p<0.01; *p<0.05; +p<0.10CP = Channel Performance, TRT = Trust, COMM = Commitment, SSTP = Soft Skills Training Program
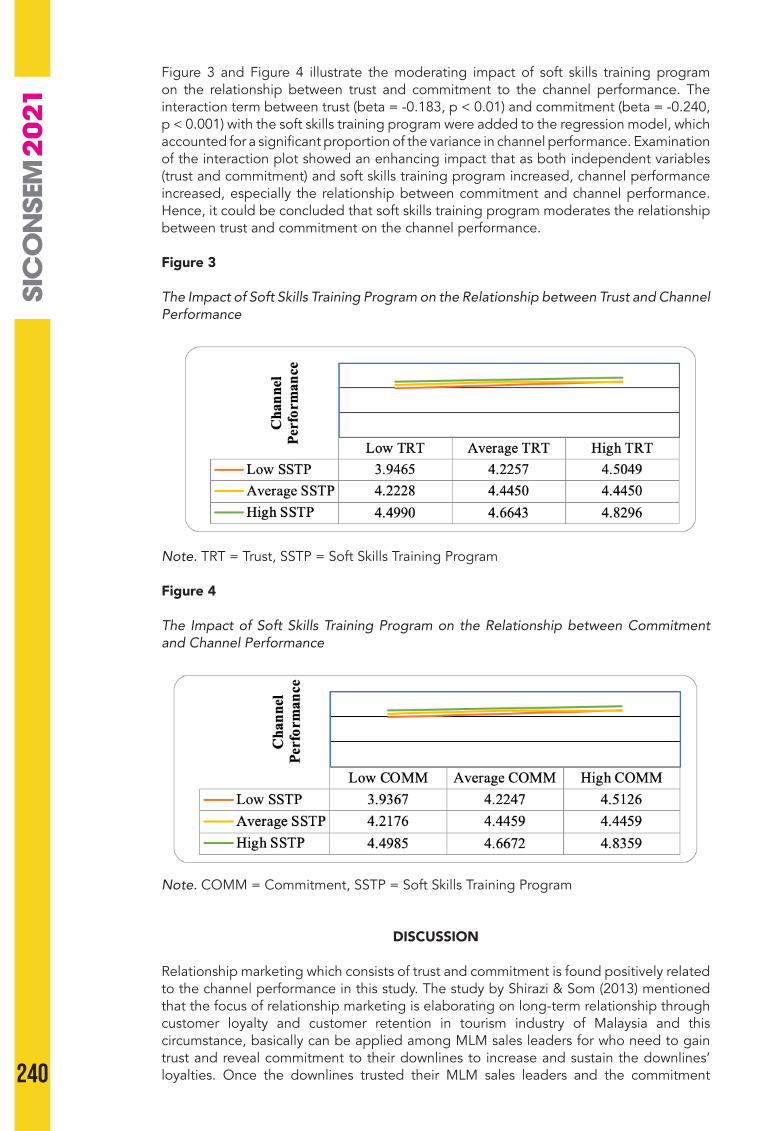
240
Figure 3 and Figure 4 illustrate the moderating impact of soft skills training program on the relationship between trust and commitment to the channel performance. The interaction term between trust (beta = -0.183, p < 0.01) and commitment (beta = -0.240, p < 0.001) with the soft skills training program were added to the regression model, which accounted for a significant proportion of the variance in channel performance. Examination of the interaction plot showed an enhancing impact that as both independent variables (trust and commitment) and soft skills training program increased, channel performance increased, especially the relationship between commitment and channel performance. Hence, it could be concluded that soft skills training program moderates the relationship between trust and commitment on the channel performance.
Figure 3
The Impact of Soft Skills Training Program on the Relationship between Trust and Channel Performance
Note. TRT = Trust, SSTP = Soft Skills Training Program
Figure 4
The Impact of Soft Skills Training Program on the Relationship between Commitment and Channel Performance
Note. COMM = Commitment, SSTP = Soft Skills Training Program
DISCUSSION
Relationship marketing which consists of trust and commitment is found positively related to the channel performance in this study. The study by Shirazi & Som (2013) mentioned that the focus of relationship marketing is elaborating on long-term relationship through customer loyalty and customer retention in tourism industry of Malaysia and this circumstance, basically can be applied among MLM sales leaders for who need to gain trust and reveal commitment to their downlines to increase and sustain the downlines’ loyalties. Once the downlines trusted their MLM sales leaders and the commitment
241
4TH SINTO
K INTERN
ATION
AL CON
FERENCE O
N SO
CIAL SCIENCE AN
D M
ANAG
EMEN
T
showed to each other, they are potentially to achieve the channel performance. This is further supported by a study from Schetzsle and Delpechitre (2013) that focused on the salesperson’s trust and commitment to the relationship with sales manager. The research found that the salesperson’s trust and commitment have significant positive relationship to sales manager’s personal characteristics. This means that sales manager is a key person to communicate organizational objectives and goals to the salespersons who will have the responsibility of implementing necessary strategies and actions to achieve those specific objectives and goals. Such situation reflects to the MLM sales leaders have specific roles to lead their downlines effectively to be successful in MLM business meanwhile they able to expand their business networks in recruitment activities to increase the channel performance. More importantly, marketing practitioners and scholars found that marketing mix is no more leading in the complex interaction and information exchange processes; there are indications that relationship marketing is considered as a fundamental aspect of relationship development (Andersen, 2001). Trust and commitment were strongly built into the relationship between MLM sales leaders and the downlines and it could potentially sustain the business relationship for long-term basic. Soft skills training program moderates the impact of trust and commitment on the channel performance. For organizational success, the focus needs to move from simple knowledge acquisition to attitude and behaviour change whereby the employees able to utilize the training program they received and apply it into their daily job. For this to occur, an effective training program with increased soft skills training individually will lead to increased work performance and company’s objectives achievement (Ibrahim, Boerhannoeddin, & Bakare, 2017). Employers worried the dearth of soft skills than hard skills (technical skills) whereby nearly half (44 percent) of the interviewed executives believe that American Workforce are required the practice of soft skills to be successful in business world (Slade, 2014). There are instances in which employees have strong hard skills but fail to survive because they did not focus on soft skills’ implementation that enable them to build rapport with superiors, peers, and subordinates in the workplace (Rao, 2012). Soft skills are essentially needed in this present world where complexity and uncertainty have become the hallmarks of businesses; and it ensures professional success and enhance employee productivity and performance. Soft skills training program as a moderator in this study proved that it could affect the relationship between relationship marketing (trust and commitment) and channel performance in positive way.
CONCLUSION
The findings clearly reveal the important of MLM sales leaders as key persons with promoting relationship marketing to achieve channel performance. The results revealed the essence of relationship marketing, which are paramount to MLM sales leaders to bring forward the MLM business to higher stage of performance. MLM business is a people-based network business, so the primary challenges will focus on personal leadership skills for who takes the lead on driving the large group of downlines to be financial freedom. Soft skills training program also gave impacts on the relationship between relationship marketing and channel performance. The results are expected, and this is also another research gap which it is very useful to provide a stimulus to other researchers to investigate about the nature of learning MLM businesses in Malaysia. This study’s results emphasize that MLM sales leaders are treated as important source and critical edge for the measurement of channel performance. However, MLM sales leaders could go through the structured soft skills training program to increase their knowledge and business skills in upgrading the channel performance.
REFERENCES
Anderson, C. J. (1995). The dynamics of public support for coalition governments. Comparative Political Studies, 28(3), 350-383.
Armstrong, M. (2006). A Handbook of human resource management practice (10th ed.). London: Kogan Page Publishing.

242
Babin, B. J. & Boles, J. S. (1996). The effect of perceived co-worker involvement and supervisor support on service provider role stress, performance and job satisfaction. Journal of Retailing, 72(1), 75.
Ballard, J. A. (2006). Book review: the future of leadership development. Academy of Management Learning and Education, 5(4), 526-528.
Beck, K. & Wilson, C. (2000). Development of affective organizational commitment: a cross-sequential examination of change with tenure. Journal of Vocational Behaviour, 56(1), 114-136.
Bejou, D. & Palmer, A. (1998). Service failure and loyalty: an exploratory empirical study of airlines customers. Journal of Services Marketing, 12(1), 7-22.
Berry, L. L. (1995). Relationship marketing of services - growing interest, emerging perspectives. Journal of the Academy of Marketing Science, 23(4), 236-245.
Biggart, N. W. (1990). Charismatic capitalism: direct selling organizations in America. Chicago: University of Chicago Press.
Burke, M., Hurley, A. E, & Borucki, C. (1992). Reconceptualising psychological climate in a retail service environment: a multi-stakeholder perspective. Journal of Applied Psychology, 77(5), 717-729.
Cavana, R. Y., Delahaye, B. L., & Sekaran, U. (2000). Applied business research: qualitative and quantitative methods. New York: John Wiley and Sons, Inc.
Clements, M. P. (1997). Evaluating the rationality of fixed-event forecasts. Journal of Forecasting, 16(1), 225-239.
Delgado, H. (2000, February). The impact of the recruiting and training practices on the satisfaction and success in the network marketing distribution channel. Retrieved December 17, 2012, from https://search.proquest.com/doc view/304655634
Direct Sales Association of Malaysia (2012). Retrieved March 22, 2012, from www.dsam.org.my
Ellen, R. (2011). Soft Skills: A case for higher education and workplace training. Professional and Management Development Training, 65(11), 16-16.
Filzah, M. I., Cheng, W. H., & Jasmani, M. Y. (2012). The influence of up line support on change success in Malaysian health care products direct selling industry. International Journal of Business and Management Science, 5(1), 51-64.
Grönroos, C. (2004). High-performing sales teams. American Salesman, 57(2), 13-18.Grönroos, C. (2004). The relationship marketing process: communication, interaction,
dialogue, value. Journal of Business & Industrial Marketing, 19(2), 99-113.Ibrahim, R., Boerhannoeddin, A., & Bakare, K. (2017). The effect of soft skills and
training methodology on employee performance. European Journal of Training and Development, 41(4), 388-406.
Jackson, B. B. (1985). Winning and keeping industrial customers. Lexington, KY: Lexington.Jones, M., Baldi, C., Phillips, C., & Waikar, A. (2016). The hard truth about soft skills: what
recruiters look for in business graduates. College Student Journal, 50(3), 422-428.Khanfar, S. M. (2014). Training and its important in the efficiency of employees’ performance
in five-star hotels in Jordan. Journal of Business Studies Quarterly, 6(2), 137-158.Kouzes, J. M. & Posner, B. Z. (2012). The leadership challenge. San Francisco: Jossey-
Bass.MDTCC (2010, February). Retrieved February 13, 2012, from www.kpdnkk.gov.my/index.
phpMintzberg, H. (1994). Rounding out the manager’s job. MIT Sloan Management Review,
37(1), 11-25.Misener, T. R., Haddock, K. S., Gleaton, J. U, & Ajamieh, A. R. A. (1996). Toward an
international measure of job satisfaction. Nursing Research, 45, 87-91.Morgan, R. M. & Hunt, S. D. (1994). The commitment-trust theory of relationship marketing.
The Journal of Marketing, 58(3), 20-38.Msweli-Mbanga, P. (2001). Modelling distributor performance in network marketing
organizations. South Africa Journal of Business Management, 32(3), 33-40.Muir, C. (2004). Learning soft skills at work. Business Communication Quarterly, 67(1),
95-101.Nayak, G. (2014). The effects of a skills training program on the group discussion skills of
engineering students. The IUP Journal of Soft Skills, 8(3), 66-70.Palmatier, R. W., Dant, R. P., Grewal, D., & Evans, K. R. (2006). Factors influencing the
243
4TH SINTO
K INTERN
ATION
AL CON
FERENCE O
N SO
CIAL SCIENCE AN
D M
ANAG
EMEN
T
effectiveness of relationship marketing: a meta-analysis. Journal of Marketing, 70(4), 136-153.
Piercy, N. F., Cravens, D. W., & Lane, N. (2007). Enhancing salespeople’s effectiveness. Marketing Management, 18-25.
Rao, M. S. (2012). Myths and truths about soft skills. Talent Development, 66(5), 48-51.Replace Managing with the Coaching Effect (2019, April). Retrieved from June 15, 2019,
from http://www.destinationcrm.com.Rost, J. C. (1991). Leadership for twenty-first century. New York: Praeger.Salciuviene, L., Reardon, J., & Auruskeviciene, V. (2011). Antecedents of performance of
multi-level channels in transitional economies. Baltic Journal of Management, 6(1), 89-104.
Shirazi, F. M. & Som, A. P. M. (2013). Relationship marketing and destination loyalty: evidence from Penang, Malaysia. International Journal of Management and Marketing Research, 6(1), 95-106.
Skarmeas, D., Katsikea, C., & Schlegelmilch, B. (2002). Drivers of commitment and its impact on performance in cross-cultural buyer-seller relationship: the importer’s perspective. International Journal of Business Studies, 33(4), 753-783.
Slade, A. (2014). Mind the soft skills gap. Talent Development, 68(4), 20-20.Slade, A. (2014, April). Mind the soft skills gap. Talent Development Magazine,
Vol. 68, No. 4, Retrieved from June 18, 2014, from https://www.questia.com/magazine/1G1-366805399/mind-the-soft-skills-gap
Sparks, J. R. & Schenk, J. A. (2006). Socialization communication, organizational citizenship behaviours, and sales in a multilevel marketing organization. Journal of Personal Selling and Sales Management, 26(2), 161-180.
Swaminathan, V. & Reddy, S. K. (2000). Affinity partnering: conceptualization and issues in handbook of relationship marketing, eds. Jagdish N. Sheth and Atul Parvatiyar. Thousand Oaks. CA: Sage Publications, pp. 381-405
Wotruba, T. R. & Rochford, L. (1995). The impact of new product introduction on sales management strategy. Journal of Personal Selling and Sales Management, 5(1), 35-51.
Zhang, J. Z., Watson IV, G. F., Palmatier, R. W., & Dant, R. P. (2016). Dynamic relationship marketing. Journal of Marketing, 80(5), 53-75.

244
SICONSEM 2021: 034-016
STRATEGIC PLANNING OF REVERSE LOGISTICS SYSTEM AMONG OMNICHANNEL COMPANIES: A QUALITATIVE STUDY
1Yee Jing Foo & 2Emy E A-Jalil1&2School of Technology Management and Logistics, UUM College of Business, Universiti Utara Malaysia
2Technology Supply Chain Excellence Institute
Corresponding author: [email protected]; [email protected]
ABSTRACT
In an omnichannel context, reverse logistics systems are hazy and difficult to manage. Improper reverse logistics management can lead to consumer unhappiness and increased costs for omnichannel companies. Therefore, the understanding of reverse logistics in omnichannel environment is important to improve the management of reverse flow. This paper aims to explore the factors in reverse logistics system that would improve omnichannel firm performance. The semi-structured interviews were arranged and useful to obtain comprehensive understanding about reverse logistics system among companies in the omnichannel environment. Thematic content analysis was conducted to analysis the interview. The thematic analysis has provided a thorough understanding of reverse logistics in omnichannel companies, as well as their role in improving firm performance. Overall, there are nine major themes identified which was top management support, formalization, flexibility, information system, collaboration, supplier, customer, regulator, and competitor. The themes identified from omnichannel companies can be categorized into two categories which were firm and task environment factors. Omnichannel companies were reported a positive attitude in these reverse logistics factors to support the improved firm performance. The themes discussed because were thought to help in managing reverse logistics system and thus ensure the company’s success. The findings of this study also providing a robust structural for understanding in omnichannel reverse logistics system. In conclusion, managers and related practitioners could manipulate the reverse logistics systems to improve firm performance. At the same time, the outcome would provide more comprehensive understanding in the strategic criteria of reverse logistics management.
Keywords: Omnichannel, reverse logistics, firm performance.
INTRODUCTION
In order to survive through COVID-19 pandemic, companies need to adopt omnichannel strategy (Leu & Masri, 2021) some of them lay off workers or choose to close down. According to the statistics, e-commerce experiences a four-fold growth in sales during the pandemic period. There is an urgency for firms to digitalize their businesses to respond to the change in the landscape of purchasing patterns of consumers. The purpose of this study is to understand the success of a few popular apparel brands in digital businesses. This is a qualitative research, and secondary data is collected for the analysis. The findings reveal that all of them engage in omni-channel methods in digitizing their businesses while utilizing other forms of technologies in their product and operational management. All selected firms agree with the importance of digital business, and omni-channel retailing is their choice. In these unprecedented times, the sustainable success of the apparel firms in digital businesses requires a flexible and innovative approach and a commitment to achieving operational excellence. Continuous renewal and digital transformation are needed so that these companies have the capabilities to adapt to changes and reap the benefits of a satisfactory organizational performance. Accordingly, traditional
25
245
4TH SINTO
K INTERN
ATION
AL CON
FERENCE O
N SO
CIAL SCIENCE AN
D M
ANAG
EMEN
T
retailers have gained entry into the digital channels while at the same time, e-commerce retailers have started operating new brick and mortar stores (Hübner et al., 2016; Rai et al., 2019) while consumers use multiple offline and online channels throughout their shopping journeys. In these shopping journeys, consumers can travel for researching, testing, receiving and returning activities related to a purchase, next to the purchasing itself. It is unclear how such omnichannel consumer behaviour materialises in practice. This information is important for practitioners from retail as well as for society, not in the least because of the environmental impact that shopping trips generate. Existing environmental assessments of retail-related transport and logistics do not account for consumers’ omnichannel shopping and travel behaviour. To fill this gap in research, we set up a case-study collaboration with an omnichannel footwear retailer in Belgium. We collected data on logistics and consumer flows and analysed this data to determine the CO2 footprint. Our research results in six profiles, of which \”the online shopper\” that shops online and receives its purchase at home or at a collection point generates the lowest impact. However, when online shoppers travel to stores prior to their e-purchase and become \”showroomers\”, the external CO2 costs double compared to \”traditional shoppers\” that carry out all shopping activities in-store and are more than eight times higher compared to \”online shoppers\”. Although the case-study context should be taken into account (e.g., in terms of product type, retailer type and geography. Small and medium enterprises (SME) have been encouraged by the government to participate in the omnichannel business environment but they may be facing obstacles as the trend may be still unfamiliar to them (Kaur et al., 2019; Mahusni & Abdul Ghafar, 2018). In an effort to increase their competitive edge, omnichannel companies need to adopt strategies that facilitate smooth and efficient reverse logistics processes as the growing amount of attention from customers on after-sales services such as returns, complaints and warranty (Choudhary et al., 2011; De Brito, 2004). Appropriate reverse logistics strategies can help companies improve their business performance. However, improper reverse logistics activities may worsen existing performance causing reduction in sales and boycott by the public (Abdullah & Yaakub, 2015). Despite the growing awareness of reverse logistics, many omnichannel companies are not prepared to meet the challenges involved in handling returns. The significant increase in the returned products often exceeds the abilities of the company to effectively manage the reverse flow of rejected products originating from the market (Genchev et al., 2011). As the reverse logistics management is not always well understood in many companies, there is a need for studies to be done by researchers to further investigate it.
LITERATURE REVIEW
Omnichannel companies refer to the entities that manage different types of channel (digital and physical) in various stages of the return process. Some examples of omnichannel companies that are often discussed include manufacturers, digital retailers, physical retailers, and logistics service providers (Saghiri et al., 2017). The reverse logistics system is important in return processes because it gives omnichannel companies an advantage from the aspects of customer satisfaction and cost optimization. Hübner et al., (2016)however, leads to multiple challenges. The questions arise for example, from where online orders should be fulfilled, how delivery and return processes can be organized, and which context-specific OC distribution systems exist. Answering these questions retail research and practice require an overall view of the distribution concepts for direct-to-customer and store deliveries in OC retailing, including the associated return processes. This overall picture is still missing in the literature. We conducted an exploratory study to close this observable gap in the literature. This exploratory study is based on semi-structured interviews with major OC retailers in German-speaking countries and was complemented by market data research and discussions with further experts in the field of OC retailing. Based on the results of the study, the forward distribution system in OC retailing is characterized by the sources (supplier DCs, retailer DCs, stores had conducted exploratory research on the distribution systems in omnichannel. A distribution system is characterized by its sources and destination of delivery. The following framework
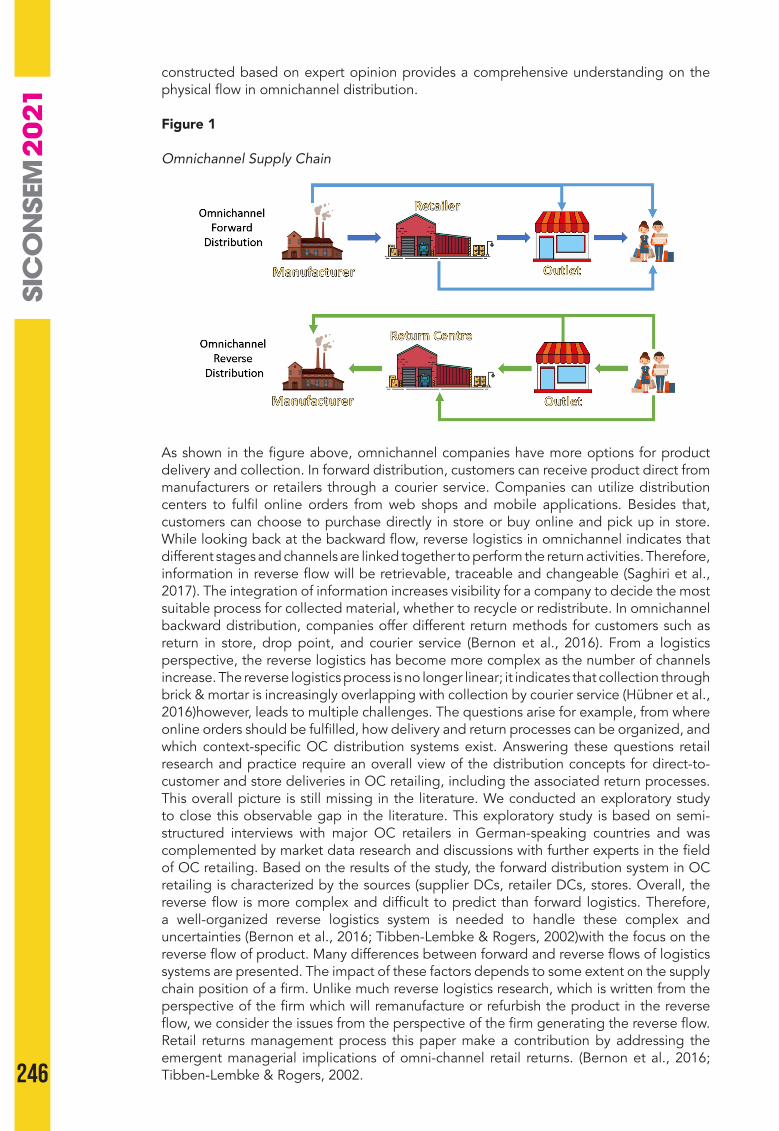
246
constructed based on expert opinion provides a comprehensive understanding on the physical flow in omnichannel distribution.
Figure 1
Omnichannel Supply Chain
As shown in the figure above, omnichannel companies have more options for product delivery and collection. In forward distribution, customers can receive product direct from manufacturers or retailers through a courier service. Companies can utilize distribution centers to fulfil online orders from web shops and mobile applications. Besides that, customers can choose to purchase directly in store or buy online and pick up in store. While looking back at the backward flow, reverse logistics in omnichannel indicates that different stages and channels are linked together to perform the return activities. Therefore, information in reverse flow will be retrievable, traceable and changeable (Saghiri et al., 2017). The integration of information increases visibility for a company to decide the most suitable process for collected material, whether to recycle or redistribute. In omnichannel backward distribution, companies offer different return methods for customers such as return in store, drop point, and courier service (Bernon et al., 2016). From a logistics perspective, the reverse logistics has become more complex as the number of channels increase. The reverse logistics process is no longer linear; it indicates that collection through brick & mortar is increasingly overlapping with collection by courier service (Hübner et al., 2016)however, leads to multiple challenges. The questions arise for example, from where online orders should be fulfilled, how delivery and return processes can be organized, and which context-specific OC distribution systems exist. Answering these questions retail research and practice require an overall view of the distribution concepts for direct-to-customer and store deliveries in OC retailing, including the associated return processes. This overall picture is still missing in the literature. We conducted an exploratory study to close this observable gap in the literature. This exploratory study is based on semi-structured interviews with major OC retailers in German-speaking countries and was complemented by market data research and discussions with further experts in the field of OC retailing. Based on the results of the study, the forward distribution system in OC retailing is characterized by the sources (supplier DCs, retailer DCs, stores. Overall, the reverse flow is more complex and difficult to predict than forward logistics. Therefore, a well-organized reverse logistics system is needed to handle these complex and uncertainties (Bernon et al., 2016; Tibben-Lembke & Rogers, 2002)with the focus on the reverse flow of product. Many differences between forward and reverse flows of logistics systems are presented. The impact of these factors depends to some extent on the supply chain position of a firm. Unlike much reverse logistics research, which is written from the perspective of the firm which will remanufacture or refurbish the product in the reverse flow, we consider the issues from the perspective of the firm generating the reverse flow. Retail returns management process this paper make a contribution by addressing the emergent managerial implications of omni-channel retail returns. (Bernon et al., 2016; Tibben-Lembke & Rogers, 2002.

247
4TH SINTO
K INTERN
ATION
AL CON
FERENCE O
N SO
CIAL SCIENCE AN
D M
ANAG
EMEN
T
An effective reverse logistics system should have top management support, information system, collaboration, flexibility, and formalization (Bai & Sarkis, 2013; García-Sánchez et al., 2018; Genchev et al., 2011; Ho et al., 2012; Morgan et al., 2016). Managers who are conscious of the complexity and uncertainty in reverse logistics activities positive attitude toward reverse logistics management are very important for the effectiveness of reverse logistics systems which could reduce cost (García-Sánchez et al., 2018). Moreover, the firm can properly manage the reverse logistics activities according to the expectations of stakeholders by having formalization and standardization procedures (Huscroft, 2010). For example, formalized procedures in firm factors can be established to identify the best reprocessing method for returned products whether the products should be resold, reuses, repaired, refurbished, remanufactured, retrieved or recycled. Besides that, companies that are equipped with operational flexibility could ensure the smooth movement of reverse logistics activities such as gatekeeping, collection, sortation, and disposition (Tombido et al., 2018). Flexibility provides a company the ability to react to unexpected incidents and figure out innovative solutions (Bai & Sarkis, 2013). Achieving flexibility require the cooperation of multiple managerial levels within and across organizations. Furthermore, companies need to utilize information systems in reverse logistics operations to handle the complexity and increase the speed of process flow (García-Sánchez et al., 2018). For example, a company can plan a reverse logistics operation based on prediction of the type and volume of returns by historical database. Collaboration was defined by Mai et al. (2012)the research on its antecedents is still far from comprehensive. The current study utilizes data collected from China to empirically test a conceptual model that is developed based on the resource based view of the firm. It is proposed that returns management orientation, internal collaboration, and information support are important predictors of reverse logistics performance. The structural equation modeling analysis supports these proposed relationships. Furthermore, the current study also confirms the positive relationship between a firm’s reverse logistics performance and market performance.”,”author”:[{“dropping-particle”:””,”family”:”Mai”,”given”:”Enping (Shirley as a synergistically shared process within a firm where two or more departments display mutual understanding and a shared vision as well as closely work together to achieve collective goals. As mentioned earlier, handling of reverse logistics activities is complex and uncertain. A research by Hernández et al. (2011) emphasized the importance of information sharing to handle the complexity of planning in reverse flow such as collection channels.
Based on previous studies, reverse logistics system of omnichannel companies also should conform to the external influences such as supplier, customer, regulator and competitor (Abdullah & Yaakub, 2015; Carter & Ellram, 1998; Huang et al., 2016; Mills, 2007; Ye et al., 2013). This study aims to explore the relationships among institutional pressures, commitment of resources and returns management. Returns management is regarded as a part of supply chain management. However, the research in returns management has received much less attention. To bridge the gap, this study concerns key concepts from two important schools of thought, i.e. institutional theory and the resource-based view, to build up the research model. Design/methodology/approach: Retailers and maintenance providers in the 3C industry (computers, communication and consumer electronics. Companies that coordinate and integrate with suppliers in the implementation of reverse logistics whether intra- and inter-organization processes can improve performance through better partner relationships (Vlachos, 2016). Companies that integrate with suppliers could reduce the bullwhip effect that leads to improper planning and inefficient resource allocation. Moreover, the company that has the ability to recognize and react to the demands of customers is better able to survive in the competitive market (Vlachos, 2016). Moreover, Ye et al. (2013) also indicated that paying attention to the customer has always been an important criteria of business. However, some studies have mentioned that the regulator is the greatest impact among task environment factors in the company reverse logistics practices (Carter & Ellram, 1998). The regulator can control as well as formulate laws and regulations to influence an organization’s policies and strategies (Huang & Yang, 2014; Lau & Wang, 2009). In a social network, a company may imitate the practice of other network members unconsciously (Ye et al., 2013). A company will imitate another that they perceive as the winner in their industry. Companies may copy reverse
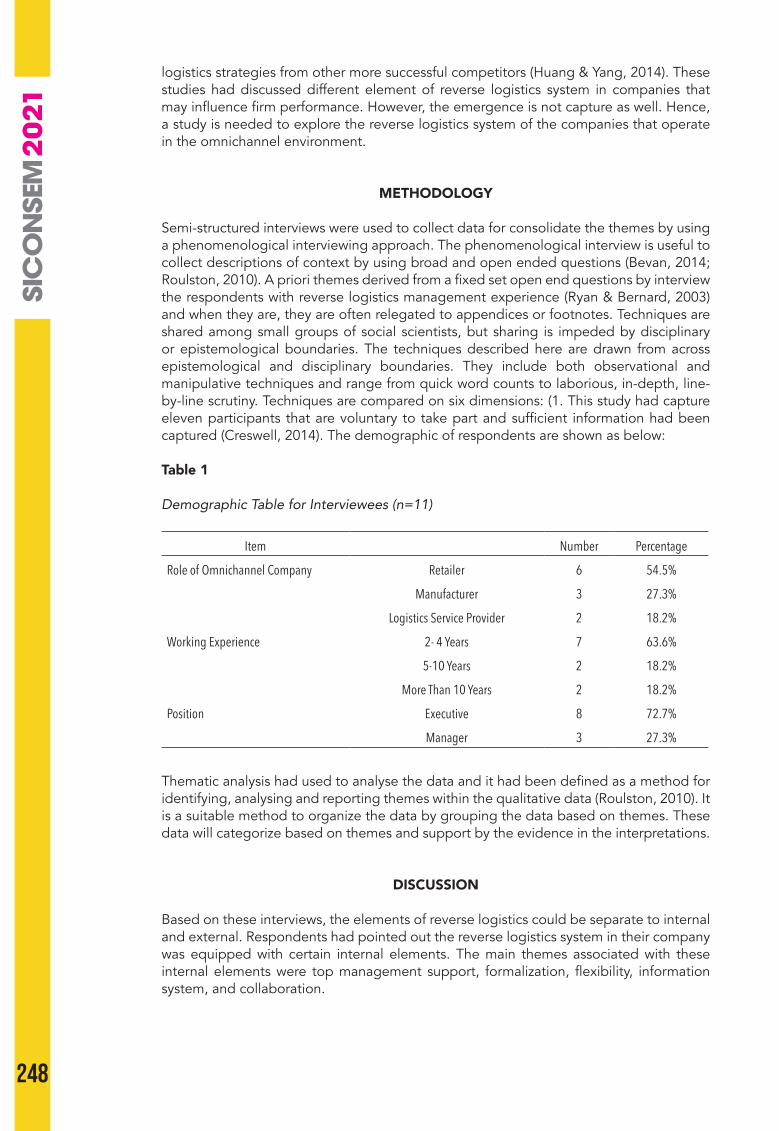
248
logistics strategies from other more successful competitors (Huang & Yang, 2014). These studies had discussed different element of reverse logistics system in companies that may influence firm performance. However, the emergence is not capture as well. Hence, a study is needed to explore the reverse logistics system of the companies that operate in the omnichannel environment.
METHODOLOGY
Semi-structured interviews were used to collect data for consolidate the themes by using a phenomenological interviewing approach. The phenomenological interview is useful to collect descriptions of context by using broad and open ended questions (Bevan, 2014; Roulston, 2010). A priori themes derived from a fixed set open end questions by interview the respondents with reverse logistics management experience (Ryan & Bernard, 2003)and when they are, they are often relegated to appendices or footnotes. Techniques are shared among small groups of social scientists, but sharing is impeded by disciplinary or epistemological boundaries. The techniques described here are drawn from across epistemological and disciplinary boundaries. They include both observational and manipulative techniques and range from quick word counts to laborious, in-depth, line-by-line scrutiny. Techniques are compared on six dimensions: (1. This study had capture eleven participants that are voluntary to take part and sufficient information had been captured (Creswell, 2014). The demographic of respondents are shown as below:
Table 1
Demographic Table for Interviewees (n=11)
Item Number Percentage
Role of Omnichannel Company Retailer 6 54.5%
Manufacturer 3 27.3%
Logistics Service Provider 2 18.2%
Working Experience 2- 4 Years 7 63.6%
5-10 Years 2 18.2%
More Than 10 Years 2 18.2%
Position Executive 8 72.7%
Manager 3 27.3%
Thematic analysis had used to analyse the data and it had been defined as a method for identifying, analysing and reporting themes within the qualitative data (Roulston, 2010). It is a suitable method to organize the data by grouping the data based on themes. These data will categorize based on themes and support by the evidence in the interpretations.
DISCUSSION
Based on these interviews, the elements of reverse logistics could be separate to internal and external. Respondents had pointed out the reverse logistics system in their company was equipped with certain internal elements. The main themes associated with these internal elements were top management support, formalization, flexibility, information system, and collaboration.
249
4TH SINTO
K INTERN
ATION
AL CON
FERENCE O
N SO
CIAL SCIENCE AN
D M
ANAG
EMEN
T
Top Management Support
8 of 11 interviewees had mentioned top management in their reverse logistics system. Most of the interviewees highlighted the role of top management as a decision-maker to solve the problem or error in reverse logistics systems. One interviewee stated:I09: There is a daily report auto generated and sent to manager … normally they need to have group discussion as well provide preventive and corrective action.
This had shown that top management is dedicated to minimizing errors in the reverse logistics system to ensure the functionality of the reverse logistics process. At the same time, some of the top management will participate in the reverse logistics process to minimize the cost as one of the interviewee stated:
I05: We need the approval from top management before we scrap the seal because it incurred cost … sometime they will give some suggestion to the technical persons in the factory. So, they can do some improvement on the products to reduce the problem.
Besides that, retailing and manufacturing companies are collecting feedback for returned products. Some of the interviewees had pointed up that top management will evaluate the reason for returns. After that, they will be planning for improvement according to the feedback of customers. One interview gave examples by stated:
I04: manager and top management will oversee the return reason and provide advice to the people in charge to be careful in future order.
In order to increase firm performance, the role of top management in reverse logistics systems has been annotated by interviewees to ensure the processes are effective and efficient.
Formalization
9 of 11 interviewees had frequently highlight elements that related to formalization. For instance, their company having standard operation procedures (SOP) in their reverse logistics process. All the related personnel need to follow the SOP guideline in the returns process. Interviewees had mentioned that SOP is important when they handle a lot of customers in which the SOP can simplify the return processes.
I01: We do have our SOP for collection process. In the good return process, our sales executives and drivers are required to check on the spot to make sure the products are still in good condition. Then, only we can proceed to the next step which issues the CN to our customer. Due to the big amount of customers, that why the SOP is very important. It became a guideline for our return process which make it faster and improve customer satisfaction.
Besides that, interviewees had mentioned return policy in their reverse logistics system. All the terms and conditions of returns are referring to the return policy such as a valid period, type of product, and return options. In the interview, interviewees show that the return policy may publish in different places such as online website stores and invoices. This published return policy can be read by customers in the early or end of the purchase journey.
I01: In our company, we do accept the good return based on the return policy... As long as not more than a week or 7 days, we will accept good return provide in good condition and original packaging.
It means that all the company should have their own return policy and they should be listed down all the term and conditions clearly in the policy. Some of the interviewees also mentioned that they need to achieve some of the goals in their reverse logistics processes based on the standard operation procedure. The existence of process goals is to ensure
250
the reverse logistics system can function effectively in order to improve customer service and customer satisfaction.
I11: There are standard operation procedure for us to follow. These can make sure our performance can meet the standard such as reply to the customer request within 3 days.
These descriptions had shown that the formalization element exists in the omnichannel companies. When omnichannel companies practice the formalization element in the reverse logistics system, it could help the companies to improve firm performance in particular customer relationship.
Flexibility
Flexibility is also frequently mentioned by most of the interviewees (90.1%) in the reverse logistics process. In case, an interviewee had direct mentioned that the company should equip the reverse logistics system with flexibility.
I10: The return process also related to flexibility of our company. If the return process is easy and fast, these mean our company are very flexible to our customer request. These can help company to build a good image among customers.
In particular, other interviewees also mentioned more elements that had related to the flexibility in return process such as schedule, channel, and product. In order to provide convenience to the customers, some of the companies offer flexible channels for customers to return unwanted products. Customers can choose to either return through physical stores or pick up.
I06: Customers can do their return process in any of our retail stores nationwide in Malaysia. So, customers can bring their returned items to our counter and our staffs will verify for the products... Otherwise, Amway will arrange for service technician or delivery team for collect parcel from customers.
Customers can return their products in retail stores or pick up by courier that offered by these omnichannel companies. Besides that, omnichannel companies also had offered different channels for customer to initiate returns such as website store, e-commerce platform, email, social media and even retail outlet.
I10: They will contact us by clicking the return function in the market place so the third party platform will trigger us about the return case. If the customer purchases the product from own website, they can contact us directly by clicking the message button in our online store to connect to us. Besides that, they also can email us or contact us through social media such as Facebook and tell us their issues. Customer can return the goods to the nearest retail outlet and then our salesperson will assist to ship back the item.
Another perspective of flexible would be the returns request that raise by customers. Omnichannel companies are willing to handle different kind of return reasons.
I10: We accept all kind of returns. For example, broken product due to courier service provider miss handling and packaging problem are allowing to return. Let say if our customer wants to change the size and colour of the product and they can request for return too.In order to resolve different kind of return requests, they have flexibility from return policy that would answer to the customer requests. Different products would have different types of return policy based on the product characteristics.
I11: We accept different kind of returns based on return policy as mentioned in the information of products. We got different kind of return policy which have different return availability... However, some products are completely not allowed for return especially those perishable products such as food.
251
4TH SINTO
K INTERN
ATION
AL CON
FERENCE O
N SO
CIAL SCIENCE AN
D M
ANAG
EMEN
T
From the aspect of a collection in the return process, companies are offering a pick-up schedule based on customer preferences. Customers are entitled to choose their preferred time for the carrier to come over and collect unwanted goods.
I06: The collection for customer schedule is based on customer preferences... we also communicate with our third party because we are assigning our forwarder or our technician to meet up with customer. Another example would be the interviewee’s company would offer solutions to the vendor that has obstacles in picking up return products.
I03: Our client personal incharge will arrange for transporter (to pick up returned products). In case, they cannot find transporter and they have urgent order. They will request we use our own transporter. Then, we will check with our driver (for the availability).
Generally, omnichannel companies that equip reverse logistics systems with flexibility could ensure customer satisfaction and maintain a good customer relationship.
Information System
For the theme information system, there are many kinds of information systems that had been mentioned by interviewees directly such as Oracle EDS and Korean ERP system.
I06: We do have the information system to do tracking for all this kind of process and we are using AS1. Previously, we are using AS400 system and now we had switch to another new system which is called oracle EDS.
I07: We do have a standard system that have record the return information which is Korean ERP system.
Interviewees had described the function of the information system in the reverse logistics process. Mostly, interviewees had mentioned their company is using an information system to record the reverse logistics process either the order is in the process of return or had been returned. I02: After all this checking is completed, we will upload the details to our system based on the collection and customers will need to acknowledge that the returned goods have been received in our warehouse.
By using the data stored inside the information system, omnichannel companies could use the data to identify the root cause of returns. if the omnichannel companies could study the returns reason apparently, they could resolve the problem which could improve their firm performance. Some omnichannel companies can track the status of returned goods by using the information system. The tracking function can ensure the status would be kept updated to the customer.
I06: After that, they will key in those information into the system based on the document. So, we are using both document and system for tracking for purpose.
Besides that, the information system of some companies also plays a role as a communication tool as described by interviewees. Omnichannel companies using the information system to communicate with customer regarding any details for the returns. The interviewee also had giving on the details about the input and output of the information system to provide appropriate information.
I03: The company had using our warehouse management system to retrieve the order from our clients. Some of the session for my company using it to retrieve the order from my clients. First, receive the email from client about the new order. Then, upload the excel file into our warehouse management system to print out the order.
252
Furthermore, one interviewee also highlighted the function of information system as a communication platform between vendors and end users. They can discuss the returns process through the information system for further actions.
I11: We have our own order management system to manage all the order which including those return orders. First, the platform had been using to communicate between our company, sellers and customers. The information system enables communication inside the firm in which the in-charge person performs their task according to the instruction. When the task had completed, the status will update in the system. Next, the returned goods will transfer to the related department or personnel.
I02: information system mainly for record each job including deliver and return. Customer service will be key in the job inside the system and other team will be take action based on the system.
The information system also plays a role as reminder which avoid further delay of customer return requests. The function of reminder could ensure the return process is effective and efficiency.
I10: For the backend platform of our market places and online store, customer click the return function and notification will send to us which will be directly record in the system ... Information system also will trigger us to respond to our customers soon as possible. For example, we didn’t respond to our customer and the system will generate a pop out message which remind us.
Overall, interviewees had highlight different role of information system in the implementation of reverse logistics system.
Collaboration
10 of 11 interviewees had highlighted that different teams or departments are involved in the return process. They need to work together to ensure the reverse logistics system smoothly. The different team had their task in the return process but they need to collaborate to complete the task. They coordinate with other different teams to ensure effectiveness of the reverse logistics system. For instance, the collaboration between the customer service and logistics department had been frequently highlighted by interviewees. Mostly, the logistics department would responsible for the collection process.
I1: That will 3 parties will be involve in the good return process... Customer will request a good return through the phone call or email with our sales executive. The second party is from our company sites whether is driver or sales executive (logistics). They will go and collect the returned goods from our customer. Our sales executives need to check on the returned goods on the quantity and quality. The third party also is from our company sites which is the customer care (customer service). They will issue a credit note (CN) to our customer after we make sure the returned good is acceptable and staging in our warehouse.
Besides that, some omnichannel companies also organize a department that purposely handle those returned products. The department also need to work together with other departments in the return process.
I10: we will pass the returned good to our rework department before we pass back the returned good to our warehouse. So, the rework department will check and verify whether the goods need to be rework or is it okay to return back to warehouse or either the good must be dispose.
253
4TH SINTO
K INTERN
ATION
AL CON
FERENCE O
N SO
CIAL SCIENCE AN
D M
ANAG
EMEN
T
Besides that, interviewees also stated the importance of information sharing between different department in the reverse logistics process. They had mentioned that the customer service team need to provide the correct information to the logistics department to ensure that they had collected the correct returned unit at the correct time in the correct place from the correct person.
I7: We have few departments in the office and the communication with the customers is only one person. So, the single person that communicate with customers will collaborate with other departments such as department that in charge for repair. The person will be knowing all the information for the return process and maintain contact with the customers.
The information that sharing among different departments also helping the employees to perform their task. For example, certain department judging the destination of returned products based on the information from other departments.
I6: Our customer service is in charging for information collection on the returned goods. However, the decision on whether for accept the returned goods still will depend on the PRS team. They are the one who are make decision whether to accept the return or not.
Some of the interviewees also giving details on the communication method whether verbally or electronically between different departments in the return process.
I10: The process is in hierarchy order which mean each departments have their task and finishing the task to pass to next department. We normally transfer the message verbally and form will be fill out with details and pass to next department.
So, the themes of collaboration between different departments in the return process can be observed through the interviews with different omnichannel company experts. Besides that, the influences of task environment elements also had shown in the interview with the employees from omnichannel firms. They had explained the role of these external elements in the reverse logistics system. The common themes that grouping in the task environment factors are supplier, customer, regulator, and competitor. In particular, all interviewees had mentioned the existence of a reverse logistics system to comfort with customer requirements.
Supplier
The role of suppliers also had been mentioned by the interviewees in the reverse logistics system. 10 of 11 interviewees had agreed that the reverse logistics system is interrelated with the supplier of their company. For instance, they had highlighted that the reverse logistics system had been always linked with suppliers.
I1: we will follow the supplier return policy. We will return the goods to our suppliers. We will make sure the returned goods in good packaging. After that, we will inform our supplier and they will come along with their lorry. Count down will be done before return to the suppliers. They will issue a GRN for us and then as soon as those returned goods arrived at supplier warehouse. After that, they will provide us a CN.
One of the interviewee had mentioned that good relationship with supplier is important in a good reverse logistics management. The relationship could be enhancing through a communication between omnichannel companies with their supplier.
I1: It is important to maintain a good relationship with our supplier in a good return management. It can help to maintain a two-way communication between supplier with our company.
Their company shares the feedback of end-users with the supplier to improve their products. Companies that integrate with suppliers could ensure the demand of customers
254
can arrive at the supplier which can ensure proper planning of supplier production. Some of the omnichannel companies will send back the returned products to the supplier to find the root cause of returns.
I7: they (supplier) will also need to know issue of the products so they need us to send back to the headquarter. Basically, they (supplier) just want to check what is the issues behind to ensure the quality problem.
Another choice would be the omnichannel companies will diagnose the reason of returns and discuss together with supplier for a comprehensive solution.
I10: When the customer returns the good to us, these mean we can understand their satisfaction and any weakness that we need to be improve. For example, bottle of shampoo broken during the delivery process return by customer... If the return cases related to quality issues, we will highlight and notified the supplier to make sure them have improvement and solution for these.
Besides that, most of the omnichannel companies have made a contract with their supplier in the responsibility of handling returned goods. Some of the suppliers will handle the returned goods by themselves while some of the companies need to handle the returned goods on their own. By following the agreement on the contract, the employees in the company could follow the return procedure that had been agreed upon by both parties. So, both parties can seek benefit maximization by aligning the return process in the related functional department.
I6: We have different agreement with different suppliers. Some of the suppliers accept good return and they willing to bear for the cost that incurred for repair or dispose by themselves. Some of them are not. So, it is depending on the agreement that had been signed between Amway and our suppliers.
Hence, the theme of supplier has emerged in the reverse logistics system of omnichannel companies.
Customer
From the interviews, the themes of customer can be observed from all the interviewees. They had frequently mentioned customers as the main priority in the reverse logistics system. They emphasized that the effective reverse logistics process would improve customer service. So, they need to ensure the return process to be responsive and agility to boost the confidence of customers. For instance, omnichannel companies need to process returns effectively for refund or replacement.
I02: For the collection step, we aim to done the collection within 1 days. The next day, we must had been deliver to our customers as long as there are not trouble. If not, we may face complaint from our customer due to our inefficient … We need to make sure our return process is efficient and effective that only our customer will be satisfying with our service.
By using the effective reverse logistics system, omnichannel companies also hope to increase customer loyalty thus boosting the sales opportunity.
I01: Having these good return management system, we may provide the best and good customer service to our local customer. When our local customers are satisfied with our customer service, then they will become more loyal to our company. Our company performance also will be keep going up by boosting the sales.
Omnichannel companies also aim to maintain a good relationship with customers by using a good reverse logistics system.
255
4TH SINTO
K INTERN
ATION
AL CON
FERENCE O
N SO
CIAL SCIENCE AN
D M
ANAG
EMEN
T
I07: Most of the return management is depending on how we want keep the good relationship with our customers … What we looking and priority would be maintain and improve the good relationship with our customers.
Besides that, some omnichannel companies are offering liberal return policy to customers which allowing for return without reason. The liberal return policy would stimulate the sales volume which customers are more willing to purchase from the company. Moreover, omnichannel companies are offering other types of customer-driven return policy such as a full refund policy or free return cost (Janakiraman et al., 2016). I04: return policy is very important. If company could have a good return policy, company could build a good relationship with customers. For example, our company respond to those manufacturing deflects products. We need to proceed it as soon as possible and customer will satisfy and having a good impression on our company.
Interviewees also argued that returns are unavoidable and all the companies are providing a certain warranty period for customers to return those defect products or unwanted goods. In particular, one of the omnichannel companies providing a nearly unlimited timeframe of the warranty period as long as the product expiry date is more than six months. Customers will be satisfied and confident with the quality assurance that provides by omnichannel companies.
I06: Customers can bring their returned items to our counter and our staffs will verify for the products to make sure that the products meet the two requirements as mentioned which is the consumption cannot be more than 80% and expiry date must more than six months... return policy in Amway is help to grow the new market, new buyer and new user which is very benefit to the company.
Furthermore, interviewees also had stated that their company design the return process which convenient for customers. For example, customers can choose the returns method which is more convenient and easier such as return in-store or pick up by courier. The convenience of reverse logistics systems would be enhancing customer satisfaction.
I11: After the return request had been approved, there will be return option for customer to choose. Customer can either choose courier pick up or drop off at courier office. Besides that, customers also can choose drop off at preferred location which is convenience to them.
The element of environmental friendly also emerged in the reverse logistics system as one of the interviewees mentioned their company not providing the return policy and return procedure in hardcopy while their customers can search through their library system. The interviewee had mentioned these steps could enhance the objective of eco-friendly in their company. Numerous researchers had mentioned that companies implement eco-friendly strategy that pressuring by customers (Huang et al., 2015)communication, and consumer (3C.
I09: In order for environmentally friendly, we are providing online manual which is easier for customers to download it from our online channels.The objective of these omnichannel companies is to match with the customers that concern about environmental protection. By practicing eco-friendly objective, omnichannel companies could enhance their reputation as an eco-friendly company. Hence, rich descriptions provided by interviewees had given a focal point on the themes of customer.
Regulator
7 of 11 interviewees argued that the regulator plays a role in the reverse logistics system of their companies. They recognize the requirement of regulators when planning for the reverse logistics process. In the return process that needs to be cross-border which deliver to other countries, they aware of the difference of declaration in the custom for returned
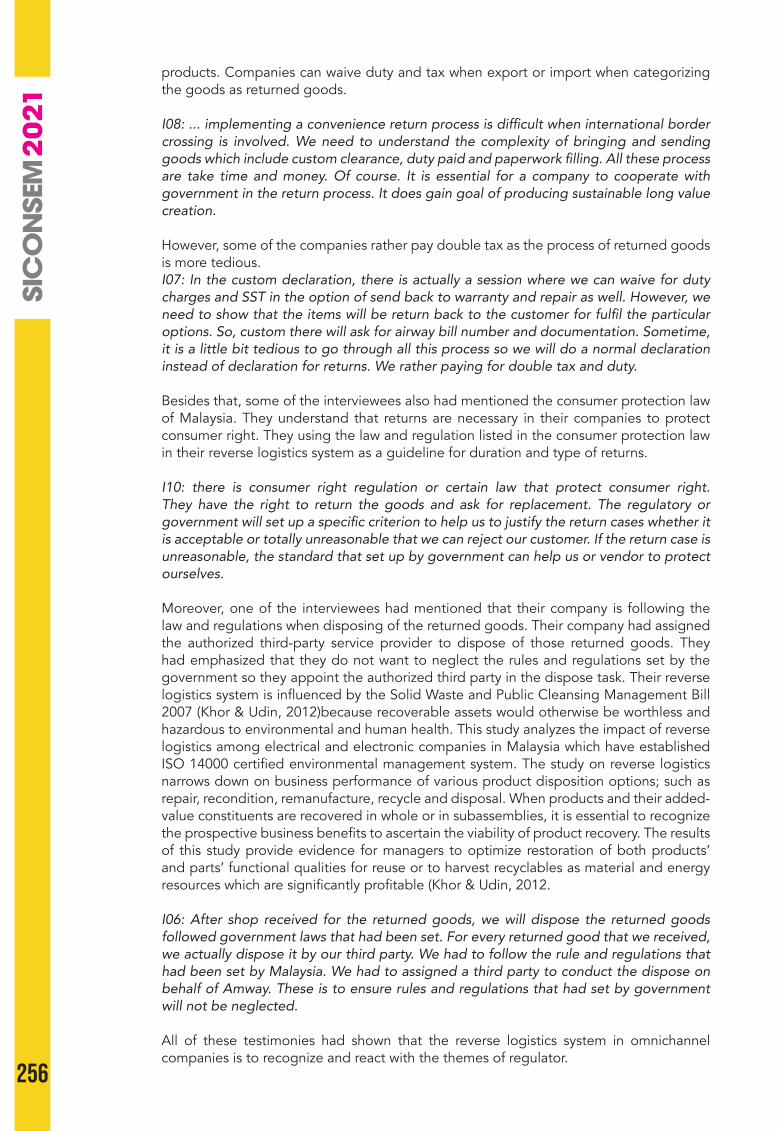
256
products. Companies can waive duty and tax when export or import when categorizing the goods as returned goods.
I08: ... implementing a convenience return process is difficult when international border crossing is involved. We need to understand the complexity of bringing and sending goods which include custom clearance, duty paid and paperwork filling. All these process are take time and money. Of course. It is essential for a company to cooperate with government in the return process. It does gain goal of producing sustainable long value creation. However, some of the companies rather pay double tax as the process of returned goods is more tedious. I07: In the custom declaration, there is actually a session where we can waive for duty charges and SST in the option of send back to warranty and repair as well. However, we need to show that the items will be return back to the customer for fulfil the particular options. So, custom there will ask for airway bill number and documentation. Sometime, it is a little bit tedious to go through all this process so we will do a normal declaration instead of declaration for returns. We rather paying for double tax and duty.
Besides that, some of the interviewees also had mentioned the consumer protection law of Malaysia. They understand that returns are necessary in their companies to protect consumer right. They using the law and regulation listed in the consumer protection law in their reverse logistics system as a guideline for duration and type of returns.
I10: there is consumer right regulation or certain law that protect consumer right. They have the right to return the goods and ask for replacement. The regulatory or government will set up a specific criterion to help us to justify the return cases whether it is acceptable or totally unreasonable that we can reject our customer. If the return case is unreasonable, the standard that set up by government can help us or vendor to protect ourselves.
Moreover, one of the interviewees had mentioned that their company is following the law and regulations when disposing of the returned goods. Their company had assigned the authorized third-party service provider to dispose of those returned goods. They had emphasized that they do not want to neglect the rules and regulations set by the government so they appoint the authorized third party in the dispose task. Their reverse logistics system is influenced by the Solid Waste and Public Cleansing Management Bill 2007 (Khor & Udin, 2012)because recoverable assets would otherwise be worthless and hazardous to environmental and human health. This study analyzes the impact of reverse logistics among electrical and electronic companies in Malaysia which have established ISO 14000 certified environmental management system. The study on reverse logistics narrows down on business performance of various product disposition options; such as repair, recondition, remanufacture, recycle and disposal. When products and their added-value constituents are recovered in whole or in subassemblies, it is essential to recognize the prospective business benefits to ascertain the viability of product recovery. The results of this study provide evidence for managers to optimize restoration of both products’ and parts’ functional qualities for reuse or to harvest recyclables as material and energy resources which are significantly profitable (Khor & Udin, 2012.
I06: After shop received for the returned goods, we will dispose the returned goods followed government laws that had been set. For every returned good that we received, we actually dispose it by our third party. We had to follow the rule and regulations that had been set by Malaysia. We had to assigned a third party to conduct the dispose on behalf of Amway. These is to ensure rules and regulations that had set by government will not be neglected.
All of these testimonies had shown that the reverse logistics system in omnichannel companies is to recognize and react with the themes of regulator.
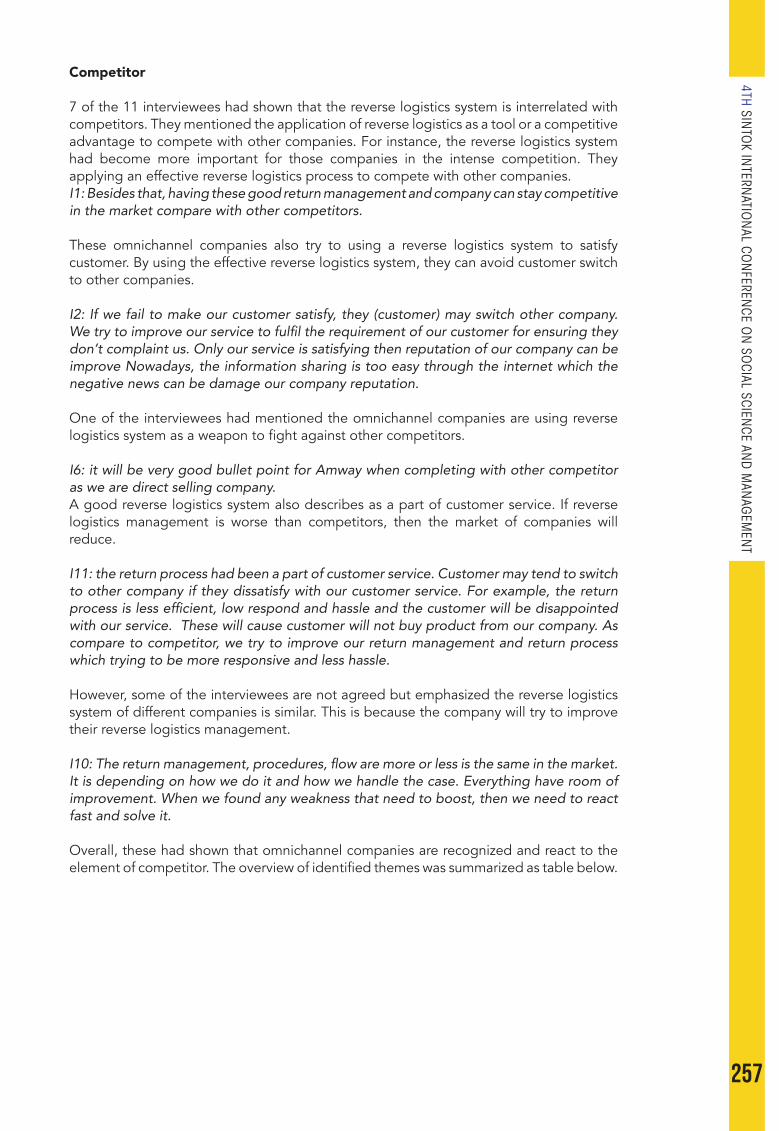
257
4TH SINTO
K INTERN
ATION
AL CON
FERENCE O
N SO
CIAL SCIENCE AN
D M
ANAG
EMEN
T
Competitor
7 of the 11 interviewees had shown that the reverse logistics system is interrelated with competitors. They mentioned the application of reverse logistics as a tool or a competitive advantage to compete with other companies. For instance, the reverse logistics system had become more important for those companies in the intense competition. They applying an effective reverse logistics process to compete with other companies.I1: Besides that, having these good return management and company can stay competitive in the market compare with other competitors.
These omnichannel companies also try to using a reverse logistics system to satisfy customer. By using the effective reverse logistics system, they can avoid customer switch to other companies.
I2: If we fail to make our customer satisfy, they (customer) may switch other company. We try to improve our service to fulfil the requirement of our customer for ensuring they don’t complaint us. Only our service is satisfying then reputation of our company can be improve Nowadays, the information sharing is too easy through the internet which the negative news can be damage our company reputation.
One of the interviewees had mentioned the omnichannel companies are using reverse logistics system as a weapon to fight against other competitors.
I6: it will be very good bullet point for Amway when completing with other competitor as we are direct selling company.A good reverse logistics system also describes as a part of customer service. If reverse logistics management is worse than competitors, then the market of companies will reduce.
I11: the return process had been a part of customer service. Customer may tend to switch to other company if they dissatisfy with our customer service. For example, the return process is less efficient, low respond and hassle and the customer will be disappointed with our service. These will cause customer will not buy product from our company. As compare to competitor, we try to improve our return management and return process which trying to be more responsive and less hassle.
However, some of the interviewees are not agreed but emphasized the reverse logistics system of different companies is similar. This is because the company will try to improve their reverse logistics management.
I10: The return management, procedures, flow are more or less is the same in the market. It is depending on how we do it and how we handle the case. Everything have room of improvement. When we found any weakness that need to boost, then we need to react fast and solve it.
Overall, these had shown that omnichannel companies are recognized and react to the element of competitor. The overview of identified themes was summarized as table below.
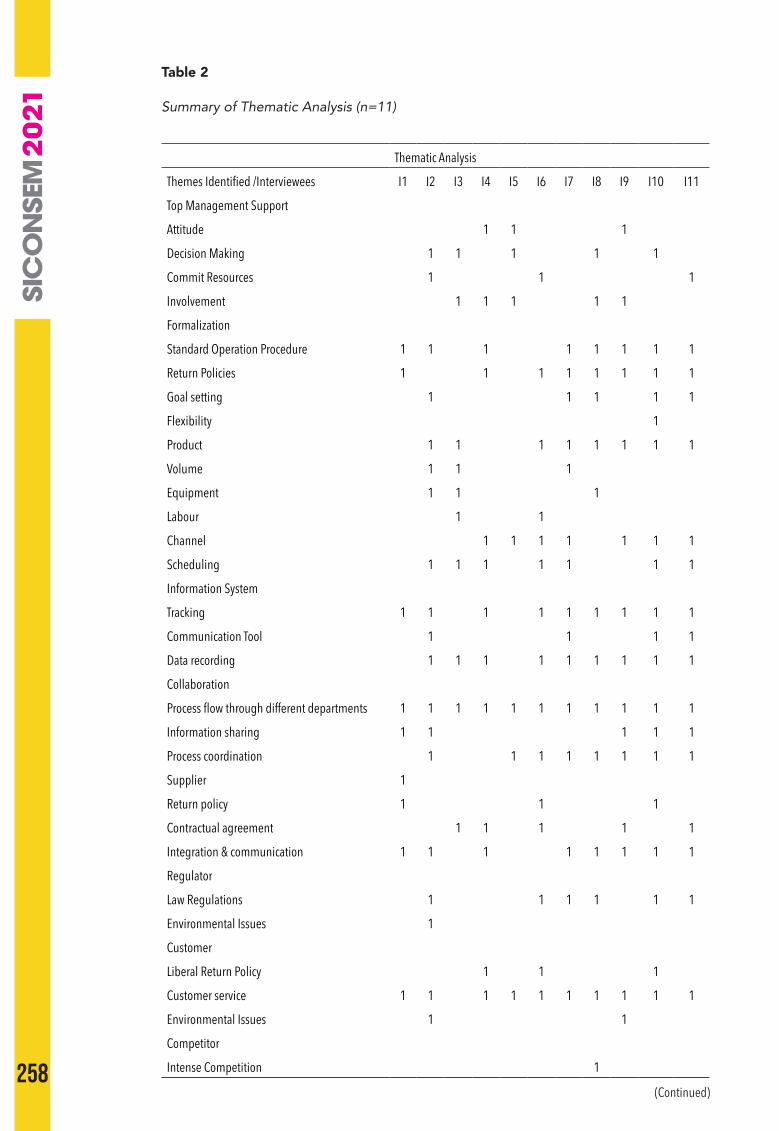
258
Table 2
Summary of Thematic Analysis (n=11)
Thematic Analysis
Themes Identified /Interviewees I1 I2 I3 I4 I5 I6 I7 I8 I9 I10 I11
Top Management Support
Attitude 1 1 1
Decision Making 1 1 1 1 1
Commit Resources 1 1 1
Involvement 1 1 1 1 1
Formalization
Standard Operation Procedure 1 1 1 1 1 1 1 1
Return Policies 1 1 1 1 1 1 1 1
Goal setting 1 1 1 1 1
Flexibility 1
Product 1 1 1 1 1 1 1 1
Volume 1 1 1
Equipment 1 1 1
Labour 1 1
Channel 1 1 1 1 1 1 1
Scheduling 1 1 1 1 1 1 1
Information System
Tracking 1 1 1 1 1 1 1 1 1
Communication Tool 1 1 1 1
Data recording 1 1 1 1 1 1 1 1 1
Collaboration
Process flow through different departments 1 1 1 1 1 1 1 1 1 1 1
Information sharing 1 1 1 1 1
Process coordination 1 1 1 1 1 1 1 1
Supplier 1
Return policy 1 1 1
Contractual agreement 1 1 1 1 1
Integration & communication 1 1 1 1 1 1 1 1
Regulator
Law Regulations 1 1 1 1 1 1
Environmental Issues 1
Customer
Liberal Return Policy 1 1 1
Customer service 1 1 1 1 1 1 1 1 1 1
Environmental Issues 1 1
Competitor
Intense Competition 1
(Continued)
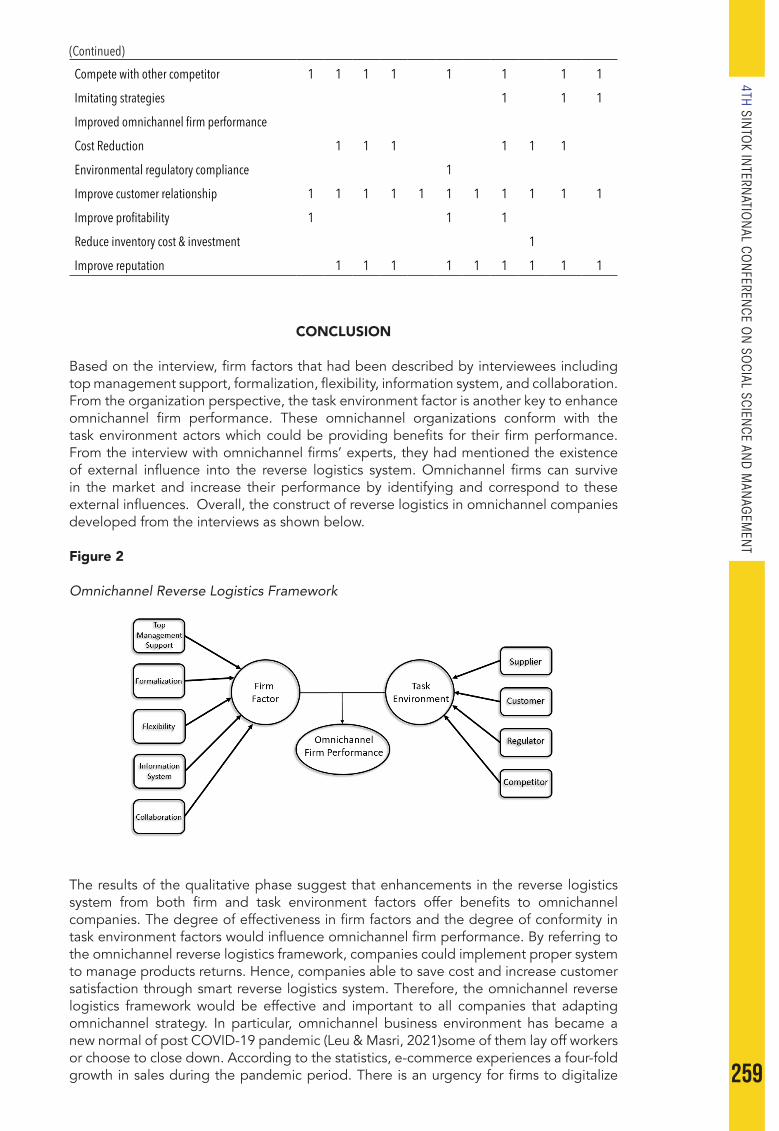
259
4TH SINTO
K INTERN
ATION
AL CON
FERENCE O
N SO
CIAL SCIENCE AN
D M
ANAG
EMEN
T
Compete with other competitor 1 1 1 1 1 1 1 1
Imitating strategies 1 1 1
Improved omnichannel firm performance
Cost Reduction 1 1 1 1 1 1
Environmental regulatory compliance 1
Improve customer relationship 1 1 1 1 1 1 1 1 1 1 1
Improve profitability 1 1 1
Reduce inventory cost & investment 1
Improve reputation 1 1 1 1 1 1 1 1 1
CONCLUSION
Based on the interview, firm factors that had been described by interviewees including top management support, formalization, flexibility, information system, and collaboration. From the organization perspective, the task environment factor is another key to enhance omnichannel firm performance. These omnichannel organizations conform with the task environment actors which could be providing benefits for their firm performance. From the interview with omnichannel firms’ experts, they had mentioned the existence of external influence into the reverse logistics system. Omnichannel firms can survive in the market and increase their performance by identifying and correspond to these external influences. Overall, the construct of reverse logistics in omnichannel companies developed from the interviews as shown below.
Figure 2
Omnichannel Reverse Logistics Framework
The results of the qualitative phase suggest that enhancements in the reverse logistics system from both firm and task environment factors offer benefits to omnichannel companies. The degree of effectiveness in firm factors and the degree of conformity in task environment factors would influence omnichannel firm performance. By referring to the omnichannel reverse logistics framework, companies could implement proper system to manage products returns. Hence, companies able to save cost and increase customer satisfaction through smart reverse logistics system. Therefore, the omnichannel reverse logistics framework would be effective and important to all companies that adapting omnichannel strategy. In particular, omnichannel business environment has became a new normal of post COVID-19 pandemic (Leu & Masri, 2021)some of them lay off workers or choose to close down. According to the statistics, e-commerce experiences a four-fold growth in sales during the pandemic period. There is an urgency for firms to digitalize
(Continued)
260
their businesses to respond to the change in the landscape of purchasing patterns of consumers. The purpose of this study is to understand the success of a few popular apparel brands in digital businesses. This is a qualitative research, and secondary data is collected for the analysis. The findings reveal that all of them engage in omni-channel methods in digitizing their businesses while utilizing other forms of technologies in their product and operational management. All selected firms agree with the importance of digital business, and omni-channel retailing is their choice. In these unprecedented times, the sustainable success of the apparel firms in digital businesses requires a flexible and innovative approach and a commitment to achieving operational excellence. Continuous renewal and digital transformation are needed so that these companies have the capabilities to adapt to changes and reap the benefits of a satisfactory organizational performance. (Leu & Masri, 2021.
REFERENCES
Abdullah, N. A. H. N., & Yaakub, S. (2015). The pressure for reverse logistics adoption among manufacturers in Malaysia. Asian Journal of Business and Accounting, 8(1), 151–178.
Bai, C., & Sarkis, J. (2013). Flexibility in reverse logistics: A framework and evaluation approach. Journal of Cleaner Production, 47, 306–318. https://doi.org/http://dx.doi.org/10.1016/j.jclepro.2013.01.005
Bernon, M., Cullen, J., & Gorst, J. (2016). Online retail returns management: Integration within an omni-channel distribution context. International Journal of Physical Distribution and Logistics Management, 46(6–7), 584–605. https://doi.org/10.1108/IJPDLM-01-2015-0010
Bevan, M. T. (2014). A method of phenomenological interviewing. Qualitative Health Research, 24(1), 136–144. https://doi.org/10.1177/1049732313519710
Carter, C. R., & Ellram, L. (1998). Reverse Logistics -- a Review of the Literature and Framework for Future Investigation. Journal of Business Logistics.
Choudhary, I., Akhter, S. A., Asif, M., & Choudhry, R. M. (2011). Impact of after sale service characteristics on Customer Satisfaction. Information Management and Business Review, 3(6), 360–365.
Creswell, J. W. (2014). Research Design: Qualitative, Quantitative and Mixed Methods Approaches (Fourth Edi). SAGE Publications.
De Brito, M. P. (2004). Managing Reverse Logistics or Reversing Logistics Management ? (Issue January).
García-Sánchez, E., Guerrero-Villegas, J., & Aguilera-Caracuel, J. (2018). How do technological skills improve reverse logistics? The moderating role of top management support in information technology use and innovativeness. Sustainability (Switzerland), 11(1), 1–17. https://doi.org/10.3390/su11010058
Genchev, S. E., Richey, R. G., & Gabler, C. B. (2011). Evaluating reverse logistics programs: A suggested process formalization. International Journal of Logistics Management, 22(2), 242–263. https://doi.org/10.1108/09574091111156569
Hernández, J. E., Poler, R., Mula, J., & Lario, F. C. (2011). The Reverse Logistic Process of an Automobile Supply Chain Network Supported by a Collaborative Decision-Making Model. Group Decision and Negotiation, 20(1), 79–114. https://doi.org/10.1007/s10726-010-9205-7
Ho, G. T. S., Choy, K. L., Lam, C. H. Y., & Wong, D. W. C. (2012). Factors influencing implementation of reverse logistics: A survey among Hong Kong businesses. Measuring Business Excellence, 16(3), 29–46. https://doi.org/10.1108/13683041211257394
Huang, Y. C., Rahman, S., Wu, Y. C. J., & Huang, C. J. (2015). Salient task environment, reverse logistics and performance. International Journal of Physical Distribution and Logistics Management, 45(9–10), 979–1006. https://doi.org/10.1108/IJPDLM-08-2014-0182
Huang, Y. C., & Yang, M. L. (2014). Reverse logistics innovation, institutional pressures and performance. Management Research Review, 37(7), 615–641. https://doi.org/10.1108/MRR-03-2013-0069
Huang, Y., Yang, M. L., & Wong, Y. J. (2016). Institutional pressures, resources
261
4TH SINTO
K INTERN
ATION
AL CON
FERENCE O
N SO
CIAL SCIENCE AN
D M
ANAG
EMEN
T
commitment, and returns management. Supply Chain Management, 21(3), 398–416. https://doi.org/10.1108/SCM-04-2015-0144
Hübner, A., Holzapfel, A., & Kuhn, H. (2016). Distribution systems in omni-channel retailing. Business Research, 9(2), 255–296. https://doi.org/10.1007/s40685-016-0034-7
Huscroft, J. R. (2010). The Reverse Logistics Process in the Supply Chain and Managing Its Implementation. https://doi.org/10.1017/CBO9781107415324.004
Janakiraman, N., Syrdal, H. A., & Freling, R. (2016). The Effect of Return Policy Leniency on Consumer Purchase and Return Decisions: A Meta-analytic Review. Journal of Retailing, 92(2), 226–235. https://doi.org/10.1016/j.jretai.2015.11.002
Kaur, K., Osman, S., Abu Bakar, E., & Sabri, M. F. bin. (2019). Future of Retailing in Malaysia : Omni-channel retailing. International Research Conference on Multidisciplinary in Social Sciences and Technology (IRCMST 2019), April.
Khor, K. S., & Udin, Z. M. (2012). Impact of Reverse Logistics Product Disposition towards Business Performance in Malaysian E&E Companies. Journal of Supply Chain and Customer Relationship Management, 2012. https://doi.org/10.5171/2012.699469
Lau, K. H., & Wang, Y. (2009). Reverse logistics in the electronic industry of China: A case study. Supply Chain Management, 14(6), 447–465. https://doi.org/10.1108/13598540910995228
Leu, J. F. Y., & Masri, R. (2021). Omni-Channel Retailing and Digital Business: A Case Study in Malaysia. Journal of Asian Finance, Economics and Business, 8(4), 403–412. https://doi.org/10.13106/jafeb.2021.vol8.no4.0403
Mahusni, M. N. A., & Abdul Ghafar, M. (2018). Adaptation of Malaysian Retail Design Towards Omni– Channel and Contextual Retail Concept. Malaysian Journal of Sustainable Environment, 4(1), 95. https://doi.org/10.24191/myse.v4i1.5609
Mai, E. (Shirley), Chen, H., & Anselmi, K. (2012). The role of returns management orientation, internal collaboration, and information support in reverse logistics. Journal of Transportation Management, 23(1), 45–59. https://doi.org/10.22237/jotm/1333238640
Mills, R. (2007). Sustainability, Regulation and Reverse Logistics. Henley Manager Update, 18(4), 21–28. https://doi.org/10.1177/174578660701800403
Morgan, T. R., Richey, R. G., & Autry, C. W. (2016). Developing a reverse logistics competency: The influence of collaboration and information technology. International Journal of Physical Distribution and Logistics Management, 46(3), 293–315. https://doi.org/10.1108/IJPDLM-05-2014-0124
Rai, H. B., Mommens, K., Verlinde, S., & Macharis, C. (2019). How does consumers’ omnichannel shopping behaviour translate into travel and transport impacts? Case-study of a footwear retailer in Belgium. Sustainability (Switzerland), 11(9). https://doi.org/10.3390/su11092534
Roulston, K. (2010). Reflective Interviewing: A Guide to Theory and Practice. Sage.Ryan, G. W., & Bernard, H. R. (2003). Techniques to identify themes. Field Methods,
15(1), 85–109. https://doi.org/10.1177/1525822X02239569Saghiri, S., Wilding, R., Mena, C., & Bourlakis, M. (2017). Toward a three-dimensional
framework for omni-channel. Journal of Business Research, 77, 53–67. https://doi.org/10.1016/j.jbusres.2017.03.025
Tibben-Lembke, R. S., & Rogers, D. S. (2002). Differences between forward and reverse logistics in a retail environment. Supply Chain Management: An International Journal, 7(5), 271–282. https://doi.org/10.1108/13598540210447719
Tombido, L. L., Louw, L., & van Eeden, J. (2018). A systematic review of 3pls’ entry into reverse logistics. South African Journal of Industrial Engineering, 29(3 Special Edition), 235–260. https://doi.org/10.7166/29-3-2062
Vlachos, I. P. (2016). Reverse logistics capabilities and firm performance: the mediating role of business strategy. International Journal of Logistics Research and Applications, 19(5), 424–442. https://doi.org/10.1080/13675567.2015.1115471
Ye, F., Zhao, X., Prahinski, C., & Li, Y. (2013). The impact of institutional pressures, top managers’ posture and reverse logistics on performance - Evidence from China. International Journal of Production Economics, 143(1), 132–143. https://doi.org/10.1016/j.ijpe.2012.12.021
262
SICONSEM 2021:053-023
ENHANCING EMPLOYEE WELL-BEING FROM KNOWLEDGE MANAGEMENT PERSPECTIVES AMONG ACADEMICIANS
1Siti Murni Mat Khairi, 2Norzanah Mat Nor & 3Herwina Rosnan1,2&3Arsyad Ayub Graduate Business School, Universiti Teknologi MARA, Shah Alam,
Malaysia
Corresponding author: [email protected]; [email protected];[email protected]
ABSTRACT
Purpose: Academicians and practitioners have considered knowledge management practices as the keys for organizational competitive advantage which would contribute to the success of a business organization. However, previous studies on knowledge management practices and employee well-being have received little attention. Hence, the purpose of this paper is to empirically investigate the relationship between knowledge management practices, specifically knowledge acquisition, knowledge sharing, knowledge creation, knowledge codification and knowledge retention on employee well-being.
Design/methodology/approach: A questionnaire-based survey was conducted to gather data from academicians in selected private universities in Malaysia. Questionnaires were distributed and gathered with a total of 170 usable responses. The analysis of the findings was conducted using structural equation modeling (SEM-PLS) to produce interesting findings.
Findings: The findings suggested that knowledge acquisition, knowledge creation and knowledge retention are likely to improve employee well-being. The findings also revealed that knowledge sharing and knowledge codification are not significantly related to the enhancement of employee well-being.
Research limitations/implications (if applicable): This paper is limited to academicians in private higher education institutions. Hence, this limits the generalizability of the results. Future research could therefore test the applicability of these findings beyond the higher education sector.
Practical implications (if applicable): These results provide useful information for the management of private higher education institutions. The study also emphasizes the importance of effective knowledge management that can improve employee well-being in organizations.
Originality/value: Studies comprising the relationship between the five main knowledge management practices and employee well-being are still lagging in the academic literature. So, this study provides the theoretical as well as practical information to a relatively unexplored area.
Keywords: Knowledge Management, Employee Well-Being, Academicians, Private University.
INTRODUCTION
Higher education institutions do not only functions as a provider of knowledge but also as a pertinent sector for the nation’s grown and societal well-being (Mabaso & Dlamini, 2018). The universities are known as knowledge-based organizations and serve as knowledge reservoirs. However, in this era of digital environment, this particular institution does not
26
263
4TH SINTO
K INTERN
ATION
AL CON
FERENCE O
N SO
CIAL SCIENCE AN
D M
ANAG
EMEN
T
focus solely on providing knowledge to students. According to Krishnan and Kasinathan (2017), educational institutions are experiencing a paradigm shift in which the employees are dealing with a more and more demanding working environment. Private universities in Malaysia face numerous challenges to compete in the private higher education industry in order to achieve the government’s vision to transform Malaysia as an education hub in the Asian region. Four Malaysian private universities have been listed in the QS World University Rankings of 2020 (QS Asia University Rankings, 2020).
The number of private universities in the country has increased considerably from 11 private universities in 2007 to 53 private universities in 2019 (MOHE, 2019). Since 2010, there were rapid expansion of private university which then contributed to an increase in the number of foreign students, which led to private universities intensely competing to get equipped with potential academicians and at the same time, to retain greater profitability (Manogharan & Thivaharan, 2018; Krishnan & Kasinathan, 2017). Besides that, private universities must ensure that they provide high-quality educational services, and a skilled workforce are produced (Choong et al., 2013). It is therefore not surprising that the rise of the establishment of private universities demonstrates that knowledge management practices are also important in educational institutions as they are in the corporate world. Academicians play a vital role in determining the quality of a private university since it is the core process of the organization. Hence, the efforts to transform organizational practices that can improve the well-being of academicians are therefore highly desirable (Othman, Lamin, & Othman, 2014).
The gravity of declining well-being can be clearly observed from a report that was published by the Malaysian Employers Federation which highlighted the education sector in general has been reported to have a high turnover rate. The turnover rate remained high with 29.8% and decreased to 16.6% for the period of July 2017 to June 2018 and July 2018 to June 2019 respectively (Malaysian Employers Federation, 2019). Although there was a decreasing trend between the year 2018 and 2019, it is noticeable that the turnover rate among the academicians remains high and the improvement is progressing slowly. Previous studies on the well-being of Malaysian academicians in private universities, it was found that most whose well-being was affected consisted of the younger academician (ages 31-40), senior academician and those newly recruited academician (Manogharan & Thivaharan, 2018 & Kasinathan & Arokiasamy, 2019).
Employee well-being is the most researched topic in the field of organizational behaviour and psychology; however it is rarely approached from a KM perspective. Employee well-being can be described as “individual’s life satisfaction and happiness” (Huang et al., 2016). As recommended by Kianto et al. (2016), KM can be “added to the toolbox of managers, consultants and other organizational developers attempting to improve the conditions for well-being at work”. There is a significant gap in literature in offering a comprehensive well-being concept that has been analyzed and proven. Most of the concepts available seemed to focus on the impact of employee engagement, workaholism, supervisory support, workplace social relationships and work-family conflict on employee well-being (Caesens et al., 2014; Kooij et al., 2013; Shimazu et al., 2015). Whereas a relatively small number of empirical research focus on employee well-being from the perspective of knowledge management (Kianto et al., 2016; Chumg et al., 2014; Chumg et al., 2016). Therefore, this study will provide a basis for the conceptualization of knowledge management practices and its aim to examine the effect of knowledge management on “soft” human issues (Kianto et al., 2016) by investigating the relationship between knowledge management and employee well-being among academicians in private higher education sector.
264
LITERATURE REVIEW
Employee Well-Being
Well-being is used interchangeably by scholars with other concepts or terms such as satisfaction, happiness and quality of life (Achour et al., 2017 & Kianto et al., 2016). Employee well-being is at times perceived as workplace well-being or quality of working life (Chan & Wyatt, 2007). The term that specifically defines well-being at organizational level has evolved and broadened over time. Miller (2016) provides a simple definition of well-being as “the balance point between an individual’s resource pool and the challenges faced”. In general, the bottom line is that well-being can be defined as a positive evaluation of one’s life satisfaction and happiness (Mellor et al., 2016 & Hills & Argyle, 2002).
Research has found that various instruments and concept have been studied for an individual’s well-being. According to the study conducted by Caesens et al. (2014), job satisfaction, perceived stress and sleep disorders are indicators of one’s well-being. Their findings have revealed that work engagement is positively linked to the well-being indicator. Work engagement contributes to increased job satisfaction and helps to reduce perceived stress while workaholism leads to a negative result on well-being. Similarly, Shimazu et al., (2015) focused on the effect of work engagement and workaholism on well-being among Japanese workers. Work engagement has been shown to lead to a decline in ill-health and contribute to a better well-being for both life satisfaction and job performance, while workaholism has resulted in a lack of well-being among employees. Shimazu et al. (2015) looked at well-being with various indicators including psychological distress, physical complaints, job satisfaction and family satisfaction.
Further, Kianto et al. (2016) examined the impact of KM practices on job satisfaction among Finnish municipal organizations and pointed out that KM had connection to job satisfaction among employees. KM is a crucial element and should be an organization’s current focus with the aim of improving the condition of employee well-being at work. This is because job satisfaction is closely related to the concept of well-being and it is well known as a well-being indicator by many scholars (Caesens et al., 2014; Chumg et al., 2016; Kianto et al., 2016; Shimazu et al., 2015). In the same vein, Alzyoud (2016) highlighted that there is a positive relationship between job satisfaction and employee well-being. Job satisfaction is commonly characterized as well-being and as an energetic psychological resource for individuals to increase their performance. However, job satisfaction is different from well-being as it is actually only part of employee well-being. Job satisfaction refers to an individual’s attitude about their work (Rafique & Mahmood, 2018). People’s job satisfaction is depending largely on their well-being at workplace. This is due to the fact that job satisfaction is highly inter-related and associated to an individual’s life satisfaction (Chumg et al., 2014). Job satisfaction may therefore influence life satisfaction or vice versa since an individual’s job plays an important role in their life (Chumg et al., 2014).
Most of the studies focused on a wide range of antecedents or determinants that will affect an individual’s well-being which have been conducted in different settings or organization. Nevertheless, it can be concluded that there are limited studies that focus on the perspectives of KM and how this component can improve the employee well-being. As such, it would be a great interest to investigate the subject matter and dwell further on the practice of KM and employee well-being among higher education institutions.
Knowledge Management Practices
KM refers to the process of identifying and influencing collective knowledge that contributes to organizational competitive advantage which would assist organizations to compete in their operating market (Kianto et al., 2016). Scholars discussed that KM practices can be divided into several categories (Nonaka & Takeuchi, 1995; Alavi & Leidner, 2001; Kianto et al., 2016). Following Kianto et al., (2016), this study proposes that
265
4TH SINTO
K INTERN
ATION
AL CON
FERENCE O
N SO
CIAL SCIENCE AN
D M
ANAG
EMEN
T
KM can be divided into five main practices: knowledge acquisition, knowledge sharing, knowledge creation, knowledge codification and knowledge retention. These five main KM practices are important as it is proven that there is an impact of KM on “soft” human issues (i.e, satisfaction, well-being) which are largely unexplored in previous research (Kianto et al., 2016 & Pruzinsky & Mihalcova, 2017).
Knowledge acquisition refers to the collection of external sources information for an organization (Kianto et al., 2016). Knowledge acquisition is devoted to the task of transferring the knowledge from one or more sources to other users (Pruzinsky & Mihalcova, 2017). King (2009) has discovered knowledge acquisition as a focus of knowledge practices as its significance is reflected in its capability to improve organizational behaviors. Knowledge sharing can be defined as one of the fundamental KM practices that involves two or more individuals or groups to mutually exchange or sharing knowledge (Wang & Wang, 2012). Knowledge must be transferred or shared in order for knowledge to have a broad organisational impact (Kianto et al., 2016). Knowledge sharing is a process of know-how to support others and includes the provision of task information various collaboration to overcome arising problems, development of new ideas or introducing more effective and refined policies and procedures for the betterment of the organization (Wang & Wang, 2012).
Knowledge creation can be described as an organization’s ability to encourage the development of proposing new or useful ideas and solutions (Kianto et al., 2016). Any business that exists in the current era of highly competitive economy, needs to have a solid knowledge creation setup in its organization. This helps in creating opportunities in setting up one’s blue ocean strategy (Hashim et al., 2014). Knowledge codification refers to the transformation activity of tacit knowledge into codified or explicit form of knowledge which known as “people-to-document” (Bettiol et al., 2012). Following Nonaka and Takeuchi (1995), the transformation of tacit knowledge into explicit forms of knowledge is through the externalization process. The process of codification is critical where sufficient resources are needed, such as proper tools or systems for communication and information technology (Kianto et al., 2016). According to Kianto et al. (2016), knowledge retention refers to activities related to managing personnel turnover and the associated loss of expert knowledge which is the key strategic resource for an organization. According to Motshegwa (2017), this involves a process of focusing on critical knowledge that poses a risk of losing to an organization.
Conservation of Resources Theory
Conservation of Resources (COR) theory serves as the theoretical foundation for the antecedent of KM practices and the outcome of employee well-being in this study. The theory has been widely used and cited in the field of organizational psychology and organizational behaviour (Avey et al., 2010; Halbesleben et al., 2014; Hobfoll, 2002). COR theory suggests that people “seek to obtain, retain and protect resources or those things that they centrally value” (Avey et al., 2010; Hobfoll et al., 2018). It is a theory of human motivation that explains much of human behaviour based on the evolutionary need to acquire or conserve resources. According to Hobfoll’s definition of resources, anything that holds value to someone could be considered resources (Halbesleben et al., 2014). On the other hand, resources are often loosely perceived as objects resources (e.g., car, tools for work), conditions resources (e.g., seniority, employment, tenure), personal resources (e.g., key skills, self-efficacy), energy resources (e.g., knowledge, credit, money) and other things that people value (Halbesleben et al., 2014; Hobfoll et al., 2018). These included commonly valued resources such as health, well-being, family, self-esteem, and a sense of meaning in life.
This study proposes that the KM practices and employee well-being may be supplemented by the principles of the COR theory to better understand why they contribute to individual’s well-being. Resource investment principle of COR stated that people must invest resources in order to protect against resource loss, recover from losses and gain resources (Hobfoll, 2002; Hobfoll et al., 2018). This study therefore adopts the COR theory,

266
according to which people have an inherent need to grow and develop by acquiring and preserving their knowledge (personal and energy resources) for the protection and acquisition of their individual valued resources, the greater well-being. Employees must invest knowledge resources to protect themselves from the loss of their valued resources, which is their well-being.
Knowledge is considered as one’s personal resources or energy resources, and is embedded at the individual, group or at organizational level. Meanwhile, KM practices exist in both employees and organizations. This is related to the resource caravans of the COR theory where Hobfoll (2002) theorized that resources do not exist individually but travel in packs or caravans, both for individuals and organizations. Organizations with successful KM practices would be perceived as an organizational resource that gives employees empowerment, trust, feeling of happiness, well-being and energy at work (Kim, Lee, & Yun, 2016; Yan et al., 2019). Furthermore, many psychological research has taken the initiative to examine the impact of people’s resources on their resistance to stress and well-being. Well-being is in fact a subjective experience. Avey et al., (2010) stressed that well-being is a primary resource, and it is secured by secondary work-related resources. Guler and Cetin (2019) stressed that personal resources can increase employee well-being positively. In line with the resource investment principle of COR theory, this study proposed that by acquiring, sharing and creating resources through KM practices, it can motivate employees to protect, preserve and improve their valued resources – employee well-being.
HYPOTHESES DEVELOPMENT AND RESEARCH FRAMEWORK
Knowledge Management and Employee Well-Being
Employee well-being from the perspective of positive psychology has been thoroughly studied in the existing literature. The prerequisites for well-being and the validated antecedents including job satisfaction, workaholism, sleeping problems, work pressure and physical symptoms have been widely observed and studied (Caesens et al., 2014 & Shimazu et al., 2015). However, discussions on the relationship between KM and employee well-being are scarce in literature. This shows that KM scholars rarely addressed the effect of KM on “soft” performance issue, such as employee well-being.
There is limited research that explored the relationship between KM and employee well-being. As the term job satisfaction is closely linked to the concept of well-being, past studies have shown that there is a connection between KM and job satisfaction (Arif & Rahman, 2018; Kianto et al., 2016; Pruzinsky & Mihalcova, 2017). Singh & Sharma (2011) have examined the relationship between KM and employee satisfaction in Indian telecommunication sector. The findings of their study showed a positive association between KM and employee job satisfaction. According to the previous research, there is indeed a link between KM and job satisfaction (Arif & Rahman, 2018). Their study on KM and job satisfaction in various industries has proven that KM indeed affects employee’s satisfaction.
The research done by Kianto et al., (2016) that involved Finnish municipal organisations also found that KM practices (knowledge sharing, knowledge codification and knowledge retention) in the working environment are linked to high employee job satisfaction. They also noticed that only knowledge acquisition and knowledge creation that have no relation to job satisfaction. Consistent with this, Pruzinsky & Mihalcova (2017) has concluded that only knowledge acquisition and knowledge creation that have no connection with job satisfaction. Based on their study that was conducted among the public organizations’ employees in south-eastern Slovakia, it was shown that there exists a relationship between KM practices involving knowledge sharing, codification and retention with job satisfaction.
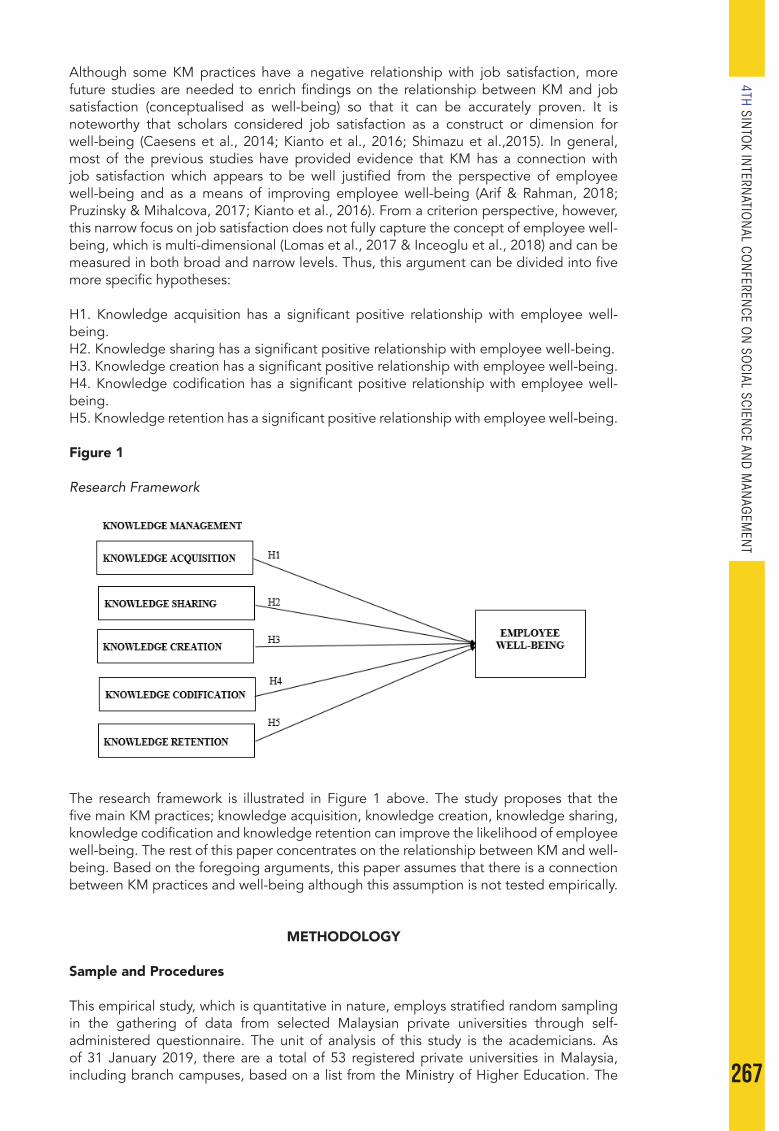
267
4TH SINTO
K INTERN
ATION
AL CON
FERENCE O
N SO
CIAL SCIENCE AN
D M
ANAG
EMEN
T
Although some KM practices have a negative relationship with job satisfaction, more future studies are needed to enrich findings on the relationship between KM and job satisfaction (conceptualised as well-being) so that it can be accurately proven. It is noteworthy that scholars considered job satisfaction as a construct or dimension for well-being (Caesens et al., 2014; Kianto et al., 2016; Shimazu et al.,2015). In general, most of the previous studies have provided evidence that KM has a connection with job satisfaction which appears to be well justified from the perspective of employee well-being and as a means of improving employee well-being (Arif & Rahman, 2018; Pruzinsky & Mihalcova, 2017; Kianto et al., 2016). From a criterion perspective, however, this narrow focus on job satisfaction does not fully capture the concept of employee well-being, which is multi-dimensional (Lomas et al., 2017 & Inceoglu et al., 2018) and can be measured in both broad and narrow levels. Thus, this argument can be divided into five more specific hypotheses:
H1. Knowledge acquisition has a significant positive relationship with employee well-being.H2. Knowledge sharing has a significant positive relationship with employee well-being.H3. Knowledge creation has a significant positive relationship with employee well-being.H4. Knowledge codification has a significant positive relationship with employee well-being.H5. Knowledge retention has a significant positive relationship with employee well-being.
Figure 1
Research Framework
The research framework is illustrated in Figure 1 above. The study proposes that the five main KM practices; knowledge acquisition, knowledge creation, knowledge sharing, knowledge codification and knowledge retention can improve the likelihood of employee well-being. The rest of this paper concentrates on the relationship between KM and well-being. Based on the foregoing arguments, this paper assumes that there is a connection between KM practices and well-being although this assumption is not tested empirically.
METHODOLOGY
Sample and Procedures
This empirical study, which is quantitative in nature, employs stratified random sampling in the gathering of data from selected Malaysian private universities through self-administered questionnaire. The unit of analysis of this study is the academicians. As of 31 January 2019, there are a total of 53 registered private universities in Malaysia, including branch campuses, based on a list from the Ministry of Higher Education. The

268
sampling frame was first divided into geographic sampling areas, regions representing states and territories in Malaysia. From the total of 53 private universities, only 36 private universities would be the target population based on the regions that are located in the Klang Valley zone or Greater Kuala Lumpur. This is due to the fact that most private universities are located in the Klang Valley area which include the central cities of Kuala Lumpur, Cyberjaya, Putrajaya as well as adjacent cities and towns in the State of Selangor.
In this study, 170 data were usable for analysis and this number exceeds the minimum sample size required for the study, which based on G*power statistical of 138 minimum samples From the total respondents, 100 female respondents had participated in the questionnaires compared to only 70 male respondents. Female respondents accounted for 58.8% of all respondents, while male respondents only 41.2%. Most of the respondents were from the group of young and middle-aged academicians since majority of respondents were between 26 to 45 years’ old (83.5%) and mostly hold Lecturer and Senior Lecturer positions (94.7%). The remaining 5.3 % were senior academicians with the academic positions of Associate Professors and Professors.
Measurement Instruments
Multi-item scales were used to measure the five knowledge management practices and employee well-being. A seven-point likert scale (1 = strongly disagree to 7 = strongly disagree) was used to measure the level of respondents’ agreeableness on the statement posted to them. A questionnaire was developed from past studies and modified to suit the context of this study.
Knowledge Management Practices: In order to develop the scale for knowledge management practices, these items have been developed from Kianto et al., (2016). It focused on the five main knowledge management practices that are knowledge acquisition, knowledge sharing, knowledge creation, knowledge codification and knowledge retention. The scale for knowledge acquisition assessed the relevance and fluency of knowledge acquired from extra-organizational sources, while horizontal knowledge that flows within the organization were used as knowledge sharing scale. Knowledge creation items explored the frequency and basis of the emergence of new ideas and information that came from various groups of activities. The documentation process and the extent of knowledge repositories were defined for the items of knowledge codification. The permanency and preservation of knowledge within the organization acted as the scale for knowledge retention.
Employee Well-Being: To measure employee well-being, items are adapted and adopted from the Oxford Happiness Questionnaire (OHQ) developed by Hills and Argyle (2002). This has been widely used and commended for its robust validity by previous scholars. Items were developed with the connection to self-esteem, life satisfaction and also the depression–happiness scale (Chumg et al., 2014, 2016).
DATA ANALYSIS
According to Podsakoff et al. (2003), if the data were collected from single source, common method variance needs to be examined. To further identify the common method variance in PLS-SEM, full collinearity tests are performed as suggested by Kock and Lynn (2012). In this context, Kock and Lynn (2012) proposed the full collinearity test as comprehensive procedure for the simultaneous assessment of both vertical and lateral collinearity. The threshold value for the result of variance inflation factors (VIFs) should be equal to or lower than 3.3 for the model to be considered as free of common method variance (Kock & Lynn, 2012; Kock, 2015). Table 1.0 shows the VIFs generated from a full collinearity test and the result indicates that no collinearity exists in the model of this study. To analyze the study model, the Partial Least Squares (PLS) technique was applied using SmartPLS 3.0 software, a variance-based structural equation modelling. Measurement model (validity and reliability) and structural model (testing the relationship among variables) were tested using this software.
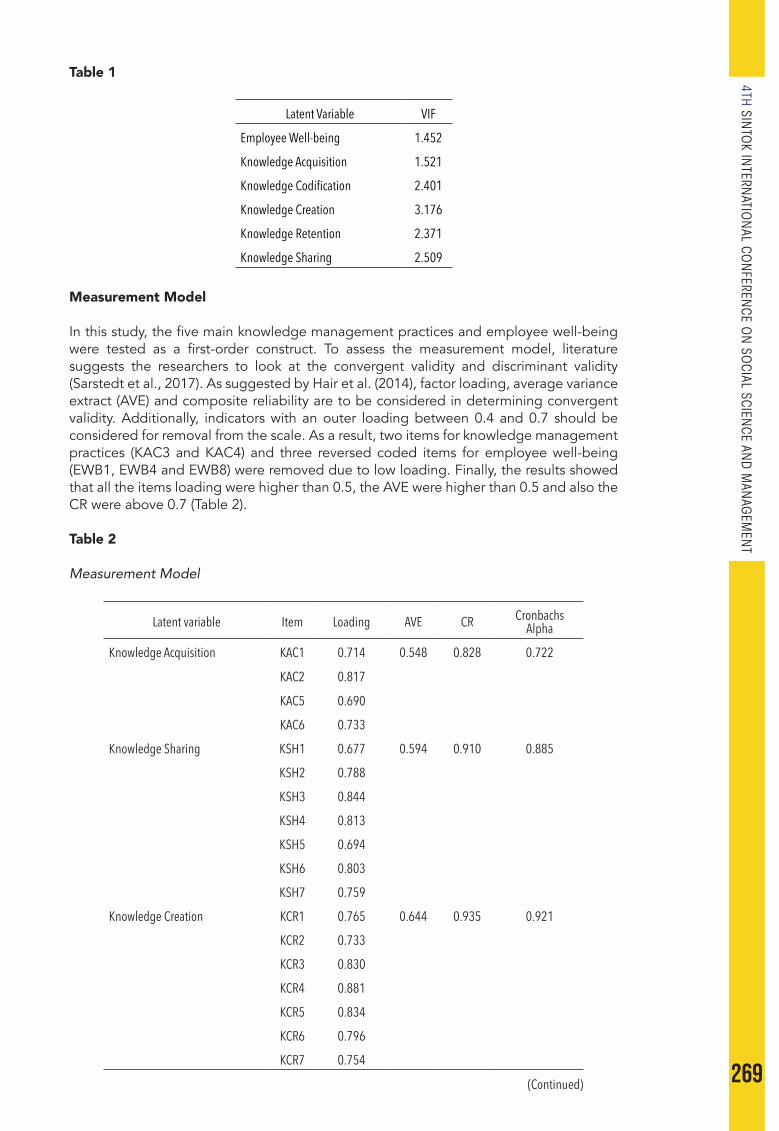
269
4TH SINTO
K INTERN
ATION
AL CON
FERENCE O
N SO
CIAL SCIENCE AN
D M
ANAG
EMEN
T
Table 1
Latent Variable VIF
Employee Well-being 1.452
Knowledge Acquisition 1.521
Knowledge Codification 2.401
Knowledge Creation 3.176
Knowledge Retention 2.371
Knowledge Sharing 2.509
Measurement Model
In this study, the five main knowledge management practices and employee well-being were tested as a first-order construct. To assess the measurement model, literature suggests the researchers to look at the convergent validity and discriminant validity (Sarstedt et al., 2017). As suggested by Hair et al. (2014), factor loading, average variance extract (AVE) and composite reliability are to be considered in determining convergent validity. Additionally, indicators with an outer loading between 0.4 and 0.7 should be considered for removal from the scale. As a result, two items for knowledge management practices (KAC3 and KAC4) and three reversed coded items for employee well-being (EWB1, EWB4 and EWB8) were removed due to low loading. Finally, the results showed that all the items loading were higher than 0.5, the AVE were higher than 0.5 and also the CR were above 0.7 (Table 2).
Table 2
Measurement Model
Latent variable Item Loading AVE CR Cronbachs Alpha
Knowledge Acquisition KAC1 0.714 0.548 0.828 0.722
KAC2 0.817
KAC5 0.690
KAC6 0.733
Knowledge Sharing KSH1 0.677 0.594 0.910 0.885
KSH2 0.788
KSH3 0.844
KSH4 0.813
KSH5 0.694
KSH6 0.803
KSH7 0.759
Knowledge Creation KCR1 0.765 0.644 0.935 0.921
KCR2 0.733
KCR3 0.830
KCR4 0.881
KCR5 0.834
KCR6 0.796
KCR7 0.754
(Continued)
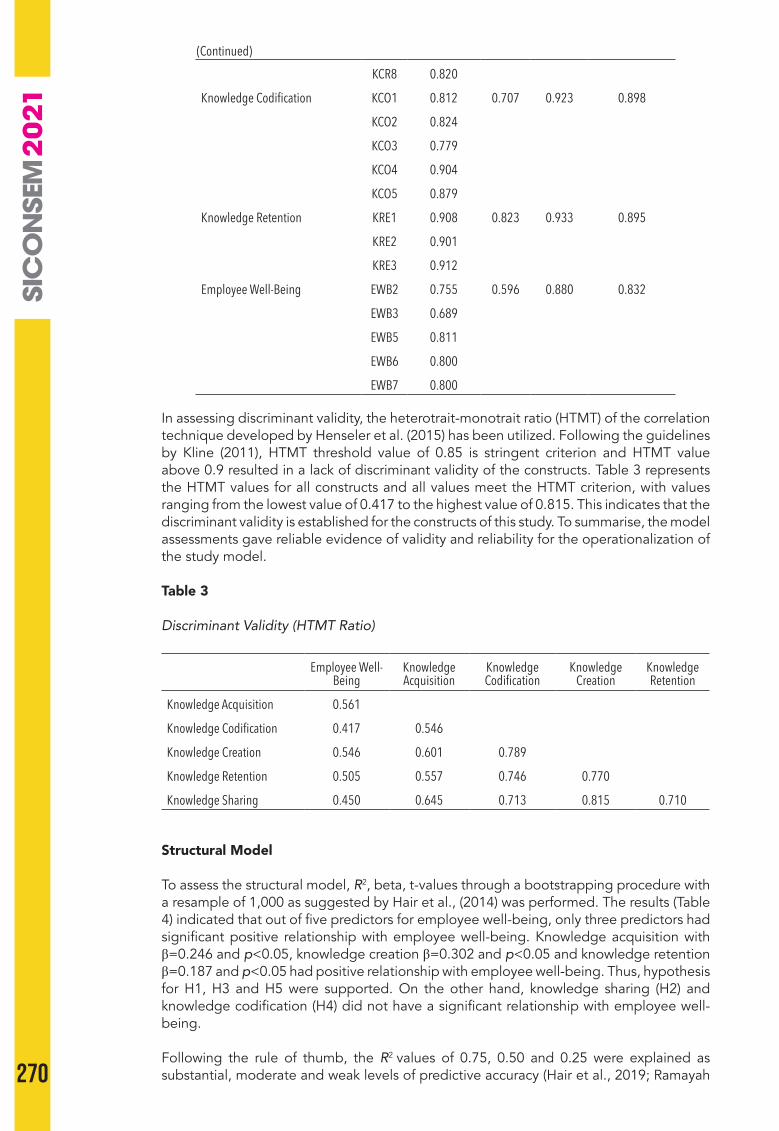
270
KCR8 0.820
Knowledge Codification KCO1 0.812 0.707 0.923 0.898
KCO2 0.824
KCO3 0.779
KCO4 0.904
KCO5 0.879
Knowledge Retention KRE1 0.908 0.823 0.933 0.895
KRE2 0.901
KRE3 0.912
Employee Well-Being EWB2 0.755 0.596 0.880 0.832
EWB3 0.689
EWB5 0.811
EWB6 0.800
EWB7 0.800
In assessing discriminant validity, the heterotrait-monotrait ratio (HTMT) of the correlation technique developed by Henseler et al. (2015) has been utilized. Following the guidelines by Kline (2011), HTMT threshold value of 0.85 is stringent criterion and HTMT value above 0.9 resulted in a lack of discriminant validity of the constructs. Table 3 represents the HTMT values for all constructs and all values meet the HTMT criterion, with values ranging from the lowest value of 0.417 to the highest value of 0.815. This indicates that the discriminant validity is established for the constructs of this study. To summarise, the model assessments gave reliable evidence of validity and reliability for the operationalization of the study model.
Table 3
Discriminant Validity (HTMT Ratio)
Employee Well-Being
Knowledge Acquisition
Knowledge Codification
Knowledge Creation
Knowledge Retention
Knowledge Acquisition 0.561
Knowledge Codification 0.417 0.546
Knowledge Creation 0.546 0.601 0.789
Knowledge Retention 0.505 0.557 0.746 0.770
Knowledge Sharing 0.450 0.645 0.713 0.815 0.710
Structural Model
To assess the structural model, R2, beta, t-values through a bootstrapping procedure with a resample of 1,000 as suggested by Hair et al., (2014) was performed. The results (Table 4) indicated that out of five predictors for employee well-being, only three predictors had significant positive relationship with employee well-being. Knowledge acquisition with β=0.246 and p<0.05, knowledge creation β=0.302 and p<0.05 and knowledge retention β=0.187 and p<0.05 had positive relationship with employee well-being. Thus, hypothesis for H1, H3 and H5 were supported. On the other hand, knowledge sharing (H2) and knowledge codification (H4) did not have a significant relationship with employee well-being.
Following the rule of thumb, the R2 values of 0.75, 0.50 and 0.25 were explained as substantial, moderate and weak levels of predictive accuracy (Hair et al., 2019; Ramayah
(Continued)
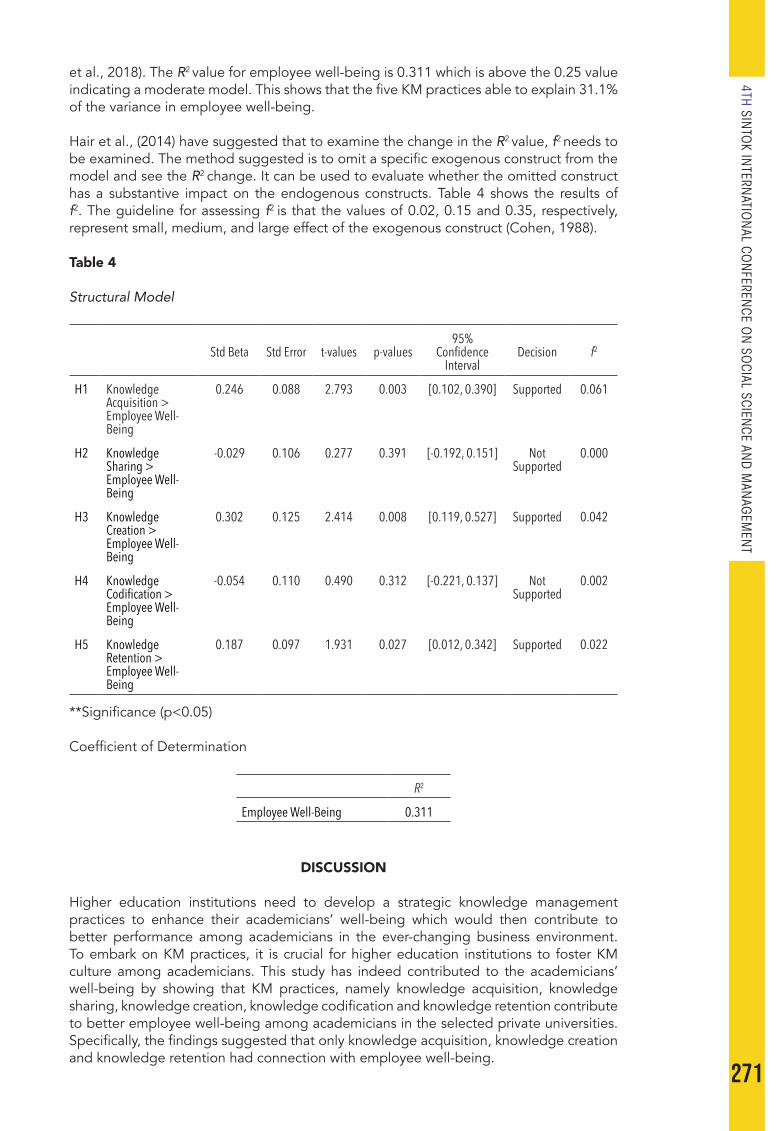
271
4TH SINTO
K INTERN
ATION
AL CON
FERENCE O
N SO
CIAL SCIENCE AN
D M
ANAG
EMEN
T
et al., 2018). The R2 value for employee well-being is 0.311 which is above the 0.25 value indicating a moderate model. This shows that the five KM practices able to explain 31.1% of the variance in employee well-being.
Hair et al., (2014) have suggested that to examine the change in the R2 value, f2 needs to be examined. The method suggested is to omit a specific exogenous construct from the model and see the R2 change. It can be used to evaluate whether the omitted construct has a substantive impact on the endogenous constructs. Table 4 shows the results of f2. The guideline for assessing f2 is that the values of 0.02, 0.15 and 0.35, respectively, represent small, medium, and large effect of the exogenous construct (Cohen, 1988).
Table 4
Structural Model
Std Beta Std Error t-values p-values
95% Confidence
IntervalDecision f2
H1 Knowledge Acquisition > Employee Well-Being
0.246 0.088 2.793 0.003 [0.102, 0.390] Supported 0.061
H2 Knowledge Sharing > Employee Well-Being
-0.029 0.106 0.277 0.391 [-0.192, 0.151] Not Supported
0.000
H3 Knowledge Creation > Employee Well-Being
0.302 0.125 2.414 0.008 [0.119, 0.527] Supported 0.042
H4 Knowledge Codification > Employee Well-Being
-0.054 0.110 0.490 0.312 [-0.221, 0.137] Not Supported
0.002
H5 Knowledge Retention > Employee Well-Being
0.187 0.097 1.931 0.027 [0.012, 0.342] Supported 0.022
**Significance (p<0.05)
Coefficient of Determination
R2
Employee Well-Being 0.311
DISCUSSION
Higher education institutions need to develop a strategic knowledge management practices to enhance their academicians’ well-being which would then contribute to better performance among academicians in the ever-changing business environment. To embark on KM practices, it is crucial for higher education institutions to foster KM culture among academicians. This study has indeed contributed to the academicians’ well-being by showing that KM practices, namely knowledge acquisition, knowledge sharing, knowledge creation, knowledge codification and knowledge retention contribute to better employee well-being among academicians in the selected private universities. Specifically, the findings suggested that only knowledge acquisition, knowledge creation and knowledge retention had connection with employee well-being.

272
In this study, findings have shown that knowledge acquisition is an important facet of KM practices among academician in private universities. This could be due to the nature of the work performed by academicians, carrying the role of educators, who provide lessons to the students and to constantly acquire new knowledge for self-improvement which then contributes to the organizational knowledge that is valuable for the organization. This has to do with the job characteristics of academia which enable them to acquire new knowledge outside the university by attending academic conferences and setting up networking for future partnerships or collaboration on research and educational agenda. It is shown that by actively involved in the process of searching knowledge through external sources and external networks, this has become an important source of knowledge acquisition among academicians in the private universities. This finding was consistent with the previous work of Singh and Sharma (2011) which confirmed the said significant results.
Besides that, knowledge creation is a key KM practice that promotes employee well-being for academicians. This indicates that the knowledge creation process is an important practice in Malaysian private universities that can enhance academicians’ well-being. Academicians experience a greater feeling of well-being and happiness when they are involved in the process of knowledge creation. This has shown that such activities are strongly encouraged by the organization whereby private universities believe that by implementing knowledge creation, it helps the organization to generate new and innovative ideas that would eventually contribute to organizational development (Hashim et al., 2014). Hence, the creation of new knowledge and innovative ideas is critical for private universities to sustain their competitive advantage in the higher education industry.
In the same vein, knowledge retention also had positive significant relationship with employee well-being which was consistent with the previous findings by Kianto et al. (2016) and Pruzinsky and Mihalcova (2017). This showed that the continuous learning and preservation of knowledge among academicians are important for safeguarding the employee well-being. Therefore, knowledge retention practice is critical for private universities to minimize the organizational knowledge loss hence, improving academicians’ well-being.
Contrary to the researcher’s expectations, the remaining two KM practices; knowledge sharing and knowledge codification were shown to have no relationship to employee well-being among academicians at the private universities. Unexpectedly, knowledge sharing has no effect on employee well-being, and this is a rather surprising finding. Several factors are known to be associated with barriers to knowledge sharing in the academic environment. Culture is the main barrier that has been consistently highlighted in literature (Hashim et al., 2014; Jain et al., 2007). There is still a lack of knowledge sharing culture in Malaysia and it remains the biggest challenge for many Malaysian organizations (Hashim et al., 2014). Similarly, findings have shown that knowledge codification have no relationship with employee well-being among academicians. This process requires additional time, energy and commitment from the academicians. Since academicians are well-known for their busy schedule and need to cope with diverse workloads (Winefield et al., 2014), therefore knowledge codification practices are seen as a complicated process and out of their interest. It can be concluded that knowledge sharing and knowledge codification are not effectively practiced in Malaysian private universities.
Implications to Theory and Practice
Even though this study has discussed on the basic conceptual framework of KM practices and employee well-being, there is a huge opportunity for future research to expand the framework and explain on the major constructs role that influences employee well-being. This study contributes to a number of ways to literature and the body of knowledge.
First, given the lack of prior relevant research, this study contributes to providing a better understanding of the importance of KM practices as additional tools for organization to
273
4TH SINTO
K INTERN
ATION
AL CON
FERENCE O
N SO
CIAL SCIENCE AN
D M
ANAG
EMEN
T
improve the current state of employee well-being. This study also provides an extension for the research on KM literature by examining KM practices and their effect on employee well-being at the workplace. Previous research seemed to focus specifically on the effect of KM on organizational performance (Batra & Anand, 2014; Mustapa & Mahmood, 2016). As a result, further observance on the effects of KM towards non-organizational performance such as employee well-being and satisfaction has been hindered. Therefore, the findings of this study provide empirical evidence that KM practices – knowledge acquisition, knowledge creation and knowledge retention– clearly benefit the institutions in enhancing the well-being of academicians. Generally, this illustrates KM as a novel organizational activity that can promote better employee well-being.
Secondly, findings from this study support the COR theory used as a theoretical basis to explain the relationship between KM practices and employee well-being by the so-called human motivational process. The resource investment principle of COR theory suggests that people must invest or acquire resources in order to protect against resource loss and gain valued resources. In relation to selected private universities in Malaysia, KM practices involving knowledge acquisition, knowledge creation and knowledge retention practices are found to be significant to influence the academicians’ well-being. This indicates that by acquiring and gaining new resources (i.e., new knowledge) through the involvement in knowledge acquisition, knowledge creation and knowledge retention practice, academicians can protect and gain their valued resources – their well-being. This study adds to the KM and organizational psychology literature by considering personal or energy resources (i.e. KM practices) in predicting the academicians’ well-being.
In terms of practical implications, the new findings from this study may convince the management of higher education institutions to attach significant importance to KM practices within the institutions with the objective to enhance the academicians’ well-being since the result shows that several KM practices (i.e., knowledge acquisition, knowledge creation and knowledge retention) have a significant positive relationship with employee well-being. On the other hand, analytical results have shown that knowledge sharing and knowledge codification practices have a weak or even insignificant relationship with employee well-being. This may be due to the nature of most private universities wherein the academicians are reluctant to share and transfer knowledge and this contribute to the resistance of knowledge codification process. Therefore, managers should take proactive approach in creating an appropriate atmosphere to foster KM culture among employees. It is important to develop a strong culture of knowledge sharing that will contribute to knowledge creation process and by codifying knowledge, it enables employees to manage and perform their daily tasks effectively and efficiently. This proactive approach is not limited to private university institutions only, but it can be applied to all type of organization.
Other than that, this study may convince the top management of the private universities to attach considerable importance to the outcome of human relations, which is the academicians’ well-being. Managers tend to value the economic and rational outcomes more such as Key Performance Index (KPI) than the outcome of human relations. Thus, managers are commonly more concerned with maximizing profit when implementing new policies or organizational practices than enhancing the employee well-being. Hence, private universities management are encouraged to develop a well-being index to promote greater employee well-being as this study has shown that KM practices can improve academician’s well-being.
CONCLUSIONS, LIMITATIONS AND FUTURE DIRECTIONS
In summary, this study revealed that some facets of KM practices (i.e., knowledge acquisition, knowledge creation and knowledge retention) in selected private universities have a significant relationship with employee well-being. Although another two KM practices, which are knowledge sharing and knowledge codification showed a negative relationship with employee well-being, this signifies that there are rooms for further
274
improvements in KM in higher education institutions. The present study also broadens knowledge in the field of organizational behaviour or psychological studies, which assist organizations to gain better understanding on the importance of employee well-being from KM perspectives. It should be noted that KM practices and employee well-being at work are crucial for any organization and managers should put KM practices as a priority to improve employee well-being at work.
Despite its novel findings, this study has the following limitations and several avenues that may be answered or overcome by future research. Firstly, this study focused on academicians and disregarded non-academicians in the private higher education sector. It is recommended that future research should also include the non-academicians as well. To further validate the findings, future researchers should include a wider population comprising private and public universities or organization beyond the higher education sector. This may contribute to the current debate on differences or similarities between different sectors and industries.
Secondly, this study applied cross-sectional research data that might limit the result since it is dependent on a certain time frame. This study unable to identify the long-term or causal effects between KM practices and well-being. For example, both KM practices and employee well-being can be thought of as latent constructs measured by multiple items. Do KM practices contribute to better employee well-being or does employee with better well-being contribute to the success of KM practices in the organisation? Thus, future studies could consider applying causal effects and longitudinal research method.
In addition, this study focuses solely on the five KM practices as antecedents to the academicians’ well-being in the private higher education institutions. However, there are many other factors that can be considered to enhance employee well-being. Future researchers may consider a different set of factors or antecedents that could improve employee well-being such as to include knowledge types, knowledge hiding and employee commitment which can be used as contingency variables. Besides that, potential fruitful avenues for future research may include adding closely related issues such as digital well-being, examining the connections between knowledge work performance, big data and employee well- being, which would suggest and contribute to more interesting topics for future research.
REFERENCES
Achour, M., Abdul Khalil, S., Ahmad, B., Mohd Nor, M. R., Zulkifli, M. Y., & Yakub, M. (2017). Management and supervisory support as a moderator of work–family demands and women’s well-being: A case study of Muslim female academicians in Malaysia. Humanomics, 33(3), 335–356.
Alavi, M., & Leidner, D. E. (2001). and knowledge management systems: Conceptual foundations and research issues. MIS quarterly, 107-136.
Alzyoud, A. A. Y. (2016). Job Demands and Job Resources on Work Engagement Mediating by Job Satisfaction in Jordan Higher Education Sector. International Journal of Social Science and Economic Research, 1(5), 488–506.
Arif, F. N. T., & Rahman, S. A. (2018). Knowledge Management and Job Satisfaction. International Journal of Academic Research in Business and Social Sciences, 8(9), 266–274.
Avey, J. B., Luthans, F., Smith, R. M., & Palmer, N. F. (2010). Impact of positive psychological capital on employee well-being over time. Journal of Occupational Health Psychology, 15(1), 17–28.
Batra, G. S., & Anand, T. (2014). Review of Studies as To Knowledge Management Trends in China, Malaysia & India. IMED, 7(2).
Caesens, G., Stinglhamber, F., & Luypaert, G. (2014). The Impact of Work Engagement and Workaholism on Well-Being: The Role of Work-Related Social Support. Career Development International, 19(7), 813–835.
275
4TH SINTO
K INTERN
ATION
AL CON
FERENCE O
N SO
CIAL SCIENCE AN
D M
ANAG
EMEN
T
Chan, K. W., & Wyatt, T. a. (2007). Quality of Work Life: A Study of Employees in Shanghai, China. Asia Pacific Business Review, 13(4), 501–517.
Choong, Y. O., Keh, C. G., Tan, Y. T., & Tan, C. E. (2013). Impacts of demographic antecedents toward turnover intention amongst academic staff in Malaysian private universities. Australian Journal of Basic and Applied Sciences, 7(6), 46-54.
Chumg, H. F., Cooke, L., Fry, J., & Hung, I. H. (2014). Factors affecting knowledge sharing in the virtual organisation: Employee well-being as a mediating effect. Computers in Human Behavior, 44, 70–80.
Chumg, H. F., Cooke, L., Seaton, J., & Ding, W. Y. (2016). Factors affecting employees’ knowledge-sharing behaviour in the virtual organisation (ECKM 2015). Proceedings of the European Conference on Knowledge Management, ECKM, 64, 913–919.
Cohen, J. (1988). Statistical power analysis for the behavioral sciences. Abingdon. Guler, M., & Cetin, F. (2019). The relationship between personal resources and well-
being. Management Research Review. 42(2), 199-214. Hair, J. F., Sarstedt, M., & Ringle, C. M. (2014). Partial least squares structural equation
modeling (PLS-SEM). European Business Review (Vol. 26).Hair, J. F., Risher, J. J., Sarstedt, M., & Ringle, C. M. (2019). When to use and how to
report the results of PLS-SEM. European Business Review, 31(1), 2–24. Halbesleben, J. R. B., Neveu, J. P., Paustian-Underdahl, S. C., & Westman, M. (2014).
Getting to the “COR”: Understanding the Role of Resources in Conservation of Resources Theory. Journal of Management, 40(5), 1334–1364.
Hashim, E. M. A. B. A., Talib, N. A., & Alamen, K. M. (2014). Knowledge Management Practice in Malaysian Construction Companies. Middle-East Journal of Scientific Research, 21(11), 1952–1957.
Henseler, J., Ringle, C. M., & Sarstedt, M. (2015). A new criterion for assessing discriminant validity in variance-based structural equation modeling. Journal of The Academy of Marketing Science, 43(1), 115-135.
Hills, P., & Argyle, M. (2002). The Oxford Happiness Questionnaire: a compact scale for the measurement of psychological well-being. Personality and Individual Differences, 33, 1073–1082.
Hobfoll, S. E. (2002). Social and Psychological Resources and Adaptation. Review of General Psychology, 6(4), 307–324.
Hobfoll, S. E., Halbesleben, J., Neveu, J.-P., & Westman, M. (2018). Annual Review of Organizational Psychology and Organizational Behavior Conservation of Resources in the Organizational Context: The Reality of Resources and Their Consequences. Annual Review Organ. Psychol. Organ. Behavior, 5, 103–131.
Huang, L.-C., Ahlstrom, D., Lee, Y.-P., Chen, S.-Y., & Hsieh, M.-J. (2016). High performance work systems, employee well-being, and job involvement: an empirical study. Personnel Review, 45(2), 296–314.
Inceoglu, I., Thomas, G., Chu, C., Plans, D., & Gerbasi, A. (2018). Leadership behavior and employee well-being: An integrated review and a future research agenda. The Leadership Quarterly, 29, 179–202.
Jain, K. K., Sandhu, M. S., & Sidhu, G. K. (2007). Knowledge sharing among academic staff: A case study of business schools in Klang Valley, Malaysia.
Kasinathan, J. P., & Arokiasamy, L. (2019). A Study on Academicians’ Well-Being in Malaysian Universities: A Conceptual Paper. Global Business and Management Research, 11(1), 446-454.
Kianto, A., Vanhala, M., & Heilmann, P. (2016). The impact of knowledge management on job satisfaction. Journal of Knowledge Management, 20(20), 43–5.
Kim, S., & Lee, H. (2010). Factors Affecting Employee Knowledge Acquisition and Application Capabilities. Asia-Pacific Journal of Business Administration, 2(2), 133–152.
King, W. (2009). Knowledge Management and Organizational Learning. Knowledge Management and Organizational Learning, 4(2), 3–13.
Kline, R. B. (2011). Convergence of structural equation modeling and multilevel modeling.
Kock, N. (2015). Common method bias in PLS-SEM: A full collinearity assessment approach. International Journal of e-Collaboration (IJeC), 11(4), 1-10.

276
Kock, N., & Lynn, G. (2012). Lateral collinearity and misleading results in variance-based SEM: An illustration and recommendations. Journal of the Association for Information Systems, 13(7), 546-580.
Kooij, D. T. A. M., Guest, D. E., Clinton, M., Knight, T., Jansen, P. G. W., & Dikkers, J. S. E. (2013). How the impact of HR practices on employee well- being and performance changes with age. Amsterdam Human Resource Management Journal, 23(1), 18–35.
Krishnan, S., & Kasinathan, J. P. (2017). The Effects of Emotional Labour on Private University Lecturers. Human Resource Management Research, 7(1), 28-32.
Lomas, T., Medina, J. C., Ivtzan, I., Rupprecht, S., & Eiroa-Orosa, F. J. (2017). The impact of mindfulness on the wellbeing and performance of educators: A systematic review of the empirical literature. Teaching and Teacher Education, 61, 132–141.
Mabaso, C. M., & Dlamini, B. I. (2018). Total rewards and its effects on organisational commitment in higher education institutions. SA Journal of Human Resource Management, 16(1), 1-8.
Malaysian Employers Federation (2019). MEF Salary Survey for Executives Report 2019/2018
Manogharan, M. W., & Thivaharan, T. (2018). Academic Staff Retention in Private Higher Education Institute - Case Study of Private Colleges in Kuala Lumpur. International Journal of Higher Education, 7(3), 52.
Mellor, N. J., Ingram, L., Huizen, M. Van, Arnold, J., & Harding, A.-H. (2016). Mindfulness training and employee well-being. International Journal of Workplace Health Management, 9(2), 126–145.
Miller, J. (2016). The well-being and productivity link: a significant opportunity for research-into-practice. Journal of Organizational Effectiveness: People and Performance, 3(3), 289–311
MOHE (2019). Directory of Private Universities. Retrieved from http://jpt.mohe.gov.my/index.php/ipt/berkaitan-ipts/ipts
Motshegwa, N. (2017). Knowledge retention strategies employed by Botswana’s tourism and hospitality industry: The case of Gaborone. Tourism Management Perspectives, 24, 107–110.
Mustapa, A. N., & Mahmood, R. (2016). Knowledge Management and Job Performance in the Public Sector: The Moderating Role of Organizational Commitment. International Journal of Research in Business Studies and Management, 3(7), 28–36.
Nonaka, I., & Takeuchi, H. (1995). The Knowledge-Creating: How Japanese companies create the dynamics of innovation. Oxford University Press, 3(4–5), 25–27.
Othman, C. N., Lamin, R. A. C., & Othman, N. (2014). Occupational Stress Index of Malaysian University Workplace. Procedia - Social and Behavioral Sciences, 153, 700–710.
Podsakoff, P. M., Mackenzie, S. B., Lee, J., & Podsakoff, N. P. (2003). Common Method Biases in Behavioral Research : A Critical Review of the Literature and Recommended Remedies. Journal of Applied Psychology, 88(5), 879–903.
Pruzinsky, M., & Mihalcova, B. (2017). Employee Satisfaction and Knowledge Management. In 12th International Workshop on Knowledge Management | School of Management (VŠM) in Trenčín, Slovakia (pp. 12–13).
QS Asia University Rankings (2020), Retrieved from https://www.topuniversities.com/university-rankings/asian-university rankings/2020
Rafique, G. M., & Mahmood, K. (2018). Relationship between knowledge sharing and job satisfaction: a systematic review. Information and Learning Science, 119 (5/6), 295–312.
Ramayah, T., Cheah, J., Chuah, F., Ting, H., & Memon, M. A. (2018). Partial least squares structural equation modeling (PLS-SEM) using SmartPLS 3.0: An updated and practical guide to statistical analysis, 2nd Edition, Pearson.
Sarstedt, M., Ringle, C. M., & Hair, J. F. (2017). Partial least squares structural equation modeling. Handbook of market research, 1-40.

277
4TH SINTO
K INTERN
ATION
AL CON
FERENCE O
N SO
CIAL SCIENCE AN
D M
ANAG
EMEN
T
Shimazu, A., Schaufeli, W. B., Kamiyama, K., & Kawakami, N. (2015). Workaholism vs. Work Engagement: The Two Different Predictors of Future Well-being and Performance. International Journal of Behavioral Medicine, 22(1), 18–23.
Singh, A. K., & Sharma, V. (2011). Knowledge management antecedents and its impact on employee satisfaction. The Learning Organization, 18(2), 115–130.
Wang, Z., & Wang, N. (2012). Knowledge Sharing, Innovation and Firm Performance. Expert Systems with Applications, 39(10), 8899–8908.
Yan, J., Luo, J., Jia, J., & Zhong, J. (2019). High-Commitment Organization and Employees’ Job Performance: The Roles Of The Strength Of The HRM System And Taking Charge. International Journal of Manpower, 40(7), 1305–1318.

278
SICONSEM 2021:123
FISCAL AND MONETARY POLICIES IN MALAYSIA, SINGAPORE, ANDINDONESIA DURING THE COVID-19 CRISIS
1Roziana Baharin & 2Noorhalizam Mohamed Noor 1&2Faculty of Economics and Management
Universiti Kebangsaan Malaysia
Corresponding author: [email protected]
ABSTRACT
Containment measures in response to the unprecedented coronavirus disease (COVID-19) pandemic in 2020 have caused the world economy to contract. Malaysia, Singapore, and Indonesia’s economy was not spared to the impact of weak global demand and domestic containment measures. This study uses the three-equation model of macroeconomic framework and balanced panel data to analyse fiscal and monetary policies in these countries during the COVID-19 crisis from various official agencies. The Fixed Effects Model is an appropriate model chosen to determine the role of the policy. The main findings of the study indicate that government spending is positively significant at the 0.01 level with gross domestic product. Hence, during the COVID-19 crisis, fiscal policy is more effective for the economic growth of Malaysia, Singapore and Indonesia. The model is consistent, stable and robust. This study proposes a coordinated fiscal policy and a sustainable policy-mix framework to mitigate the disruptions of COVID-19.
Keywords: COVID-19, fiscal policy, monetary policy, OLS, economy growth.
INTRODUCTION
Global Growth Contracted by the COVID-19 Pandemic
The world economy contracted sharply by 3.3% and experienced the worst recession since the Great Depression, including developed economies (-4.7%) and emerging markets & developing economies (-2.2%) (IHS Markit, 2021), as shown in Figure 1. The economic downturn stemmed from a major economic disruption caused by containment measures implemented in response to the unprecedented coronavirus disease (COVID-19) pandemic. Measures taken to curb the spread of COVID-19, including travel restrictions, forced closures of businesses and restrictions on social activities, have been weakened in both demand and supply- chain disruptions. Nonetheless, many economies have adopted unprecedented large- scale fiscal and monetary stimulus measures to alleviate the economic impact upon the successful containing the pandemic.
27

279
4TH SINTO
K INTERN
ATION
AL CON
FERENCE O
N SO
CIAL SCIENCE AN
D M
ANAG
EMEN
T
Figure 1
Gross Domestic Product (GDP), 2007-2021
Source: IHS Markit, 2021.
Downside risk of Malaysia, Singapore and Indonesia’s Economy
Malaysia, Singapore, and Indonesia, adopted strict containment measures to break the transmission of COVID-19 pandemic. Measures taken such as total or partial lockdowns, physical distancing rules, bans on public gatherings, and border closures have led to the sudden cessation of personal mobility and non-essential business activities. These are manifested in severe production interruptions and declining demand, especially in consumer and tourism-related industries. As a result, the firm’s profits plummeted, raising unemployment and deteriorating income conditions that affecting the labour market. These unfavourable spill-over effects on domestic demand, especially in the second quarter, led to a full-year GDP contraction in 2020, as shown in Figure 2.
Figure 2
Daily COVID-19 Infection and GDP
Source: DOSM, SingStat, BPS and https://ourworldindata.org
Fiscal and Monetary Policies Introduced to Cushion the Impact from COVID-19
The unfavourable economic shock has triggered Malaysia, Singapore and Indonesia to introduce an unprecedented economic policy response to support households and businesses through government assistance called fiscal policy and central bank mechanisms or monetary policy, as shown in Figure 3.
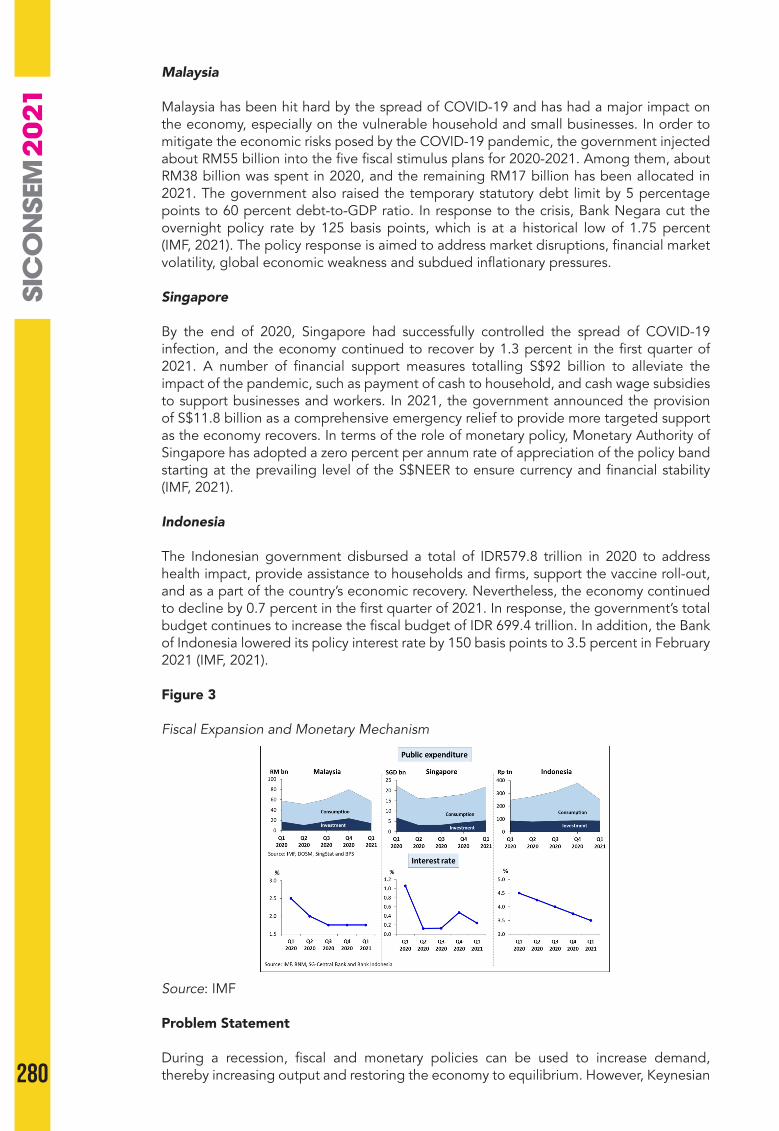
280
Malaysia
Malaysia has been hit hard by the spread of COVID-19 and has had a major impact on the economy, especially on the vulnerable household and small businesses. In order to mitigate the economic risks posed by the COVID-19 pandemic, the government injected about RM55 billion into the five fiscal stimulus plans for 2020-2021. Among them, about RM38 billion was spent in 2020, and the remaining RM17 billion has been allocated in 2021. The government also raised the temporary statutory debt limit by 5 percentage points to 60 percent debt-to-GDP ratio. In response to the crisis, Bank Negara cut the overnight policy rate by 125 basis points, which is at a historical low of 1.75 percent (IMF, 2021). The policy response is aimed to address market disruptions, financial market volatility, global economic weakness and subdued inflationary pressures.
Singapore
By the end of 2020, Singapore had successfully controlled the spread of COVID-19 infection, and the economy continued to recover by 1.3 percent in the first quarter of 2021. A number of financial support measures totalling S$92 billion to alleviate the impact of the pandemic, such as payment of cash to household, and cash wage subsidies to support businesses and workers. In 2021, the government announced the provision of S$11.8 billion as a comprehensive emergency relief to provide more targeted support as the economy recovers. In terms of the role of monetary policy, Monetary Authority of Singapore has adopted a zero percent per annum rate of appreciation of the policy band starting at the prevailing level of the S$NEER to ensure currency and financial stability (IMF, 2021).
Indonesia
The Indonesian government disbursed a total of IDR579.8 trillion in 2020 to address health impact, provide assistance to households and firms, support the vaccine roll-out, and as a part of the country’s economic recovery. Nevertheless, the economy continued to decline by 0.7 percent in the first quarter of 2021. In response, the government’s total budget continues to increase the fiscal budget of IDR 699.4 trillion. In addition, the Bank of Indonesia lowered its policy interest rate by 150 basis points to 3.5 percent in February 2021 (IMF, 2021).
Figure 3
Fiscal Expansion and Monetary Mechanism
Source: IMF
Problem Statement
During a recession, fiscal and monetary policies can be used to increase demand, thereby increasing output and restoring the economy to equilibrium. However, Keynesian
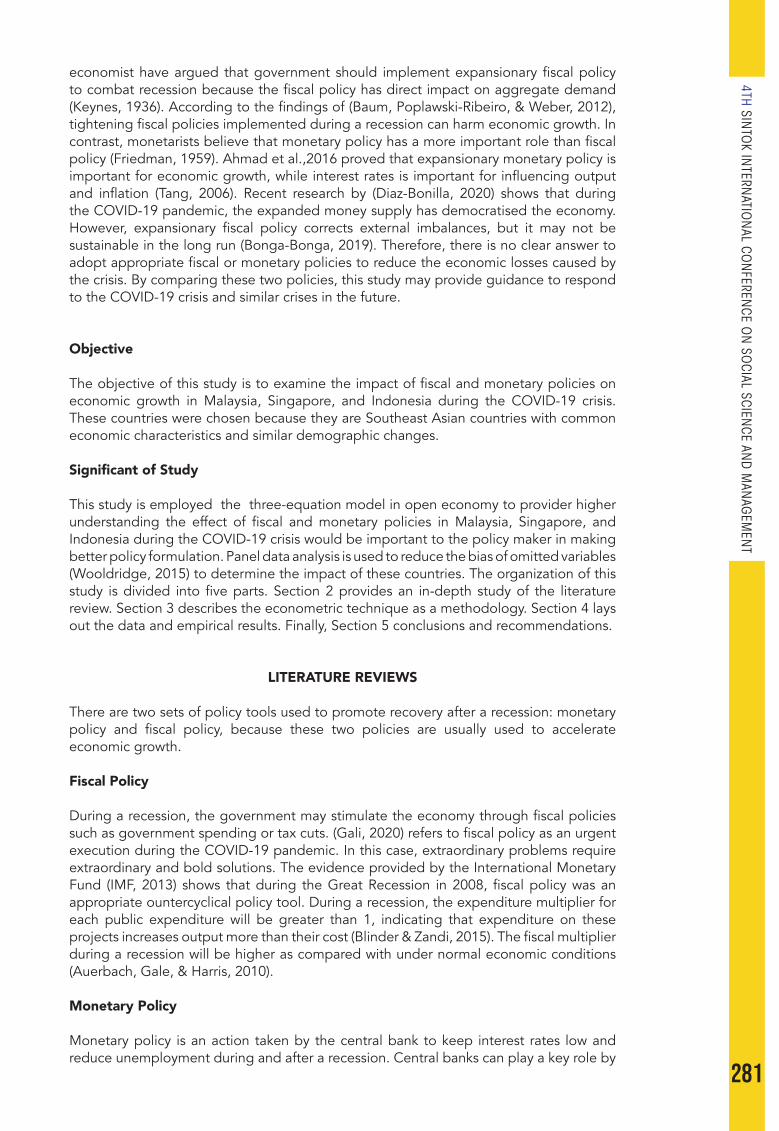
281
4TH SINTO
K INTERN
ATION
AL CON
FERENCE O
N SO
CIAL SCIENCE AN
D M
ANAG
EMEN
T
economist have argued that government should implement expansionary fiscal policy to combat recession because the fiscal policy has direct impact on aggregate demand (Keynes, 1936). According to the findings of (Baum, Poplawski-Ribeiro, & Weber, 2012), tightening fiscal policies implemented during a recession can harm economic growth. In contrast, monetarists believe that monetary policy has a more important role than fiscal policy (Friedman, 1959). Ahmad et al.,2016 proved that expansionary monetary policy is important for economic growth, while interest rates is important for influencing output and inflation (Tang, 2006). Recent research by (Diaz-Bonilla, 2020) shows that during the COVID-19 pandemic, the expanded money supply has democratised the economy. However, expansionary fiscal policy corrects external imbalances, but it may not be sustainable in the long run (Bonga-Bonga, 2019). Therefore, there is no clear answer to adopt appropriate fiscal or monetary policies to reduce the economic losses caused by the crisis. By comparing these two policies, this study may provide guidance to respond to the COVID-19 crisis and similar crises in the future.
Objective
The objective of this study is to examine the impact of fiscal and monetary policies on economic growth in Malaysia, Singapore, and Indonesia during the COVID-19 crisis. These countries were chosen because they are Southeast Asian countries with common economic characteristics and similar demographic changes.
Significant of Study
This study is employed the three-equation model in open economy to provider higher understanding the effect of fiscal and monetary policies in Malaysia, Singapore, and Indonesia during the COVID-19 crisis would be important to the policy maker in making better policy formulation. Panel data analysis is used to reduce the bias of omitted variables (Wooldridge, 2015) to determine the impact of these countries. The organization of this study is divided into five parts. Section 2 provides an in-depth study of the literature review. Section 3 describes the econometric technique as a methodology. Section 4 lays out the data and empirical results. Finally, Section 5 conclusions and recommendations.
LITERATURE REVIEWS
There are two sets of policy tools used to promote recovery after a recession: monetary policy and fiscal policy, because these two policies are usually used to accelerate economic growth.
Fiscal Policy
During a recession, the government may stimulate the economy through fiscal policies such as government spending or tax cuts. (Gali, 2020) refers to fiscal policy as an urgent execution during the COVID-19 pandemic. In this case, extraordinary problems require extraordinary and bold solutions. The evidence provided by the International Monetary Fund (IMF, 2013) shows that during the Great Recession in 2008, fiscal policy was an appropriate ountercyclical policy tool. During a recession, the expenditure multiplier for each public expenditure will be greater than 1, indicating that expenditure on these projects increases output more than their cost (Blinder & Zandi, 2015). The fiscal multiplier during a recession will be higher as compared with under normal economic conditions (Auerbach, Gale, & Harris, 2010).
Monetary Policy
Monetary policy is an action taken by the central bank to keep interest rates low and reduce unemployment during and after a recession. Central banks can play a key role by

282
adopting unconventional monetary policies and establishing various channels to inject liquidity into the economy (Diaz-Bonilla, 2018). Recent finding (Feldkircher, Huber, & Pfarrhofer, 2021) indicate that monetary expansion leads to higher output growth, stock market returns, and dollar depreciation during the COVID-19 recession. (Cecchetti et al.,2006) found that efficient monetary policy can improve the stability of output, reduce the variability of supply shocks, and changes in the economic structure of 24 countries.
METHODOLOGY
This study employs a macroeconomic model, namely the three-equation model (PC-MR, IS- RX and AD-ERU) in the open economy to explain the dynamic adjustment of economic shocks to the return to medium-term equilibrium path. In addition, the empirical framework uses panel data analysis as estimation methods, diagnostic tests, and data descriptions to supplement the interpretation of the methods used in this study. Public expenditure is used as a measure of fiscal expenditure, while interest rates are used to measure monetary policy.
Conceptual Framework
Before the COVID-19 crisis, the country’s economy was stable, which can be described as point A or bliss, that is, the interest rate is stable at r*, the equilibrium output is 𝑦𝑒. At this point, the Phillips Curve PC curve, PC = and Monetary Rules, MR intersect, as shown in Figure 4.
When the COVID-19 pandemic crisis hit to the economy, as an open economy with a flexible exchange rate system experience a positive aggregate demand due to a drastic increase in public expenditure. Therefore, there is fiscal expansion, the IS curve (planned investment and savings decision) represents the demand side shift to the right 𝐼(𝐴′, 𝑞)̅ at point B. At this point, the increase in output (𝑌) and inflation (𝜋0) on the PC is higher than the target inflation () on the PC (𝜋𝐸 = 𝜋0). Realising that 𝜋0 is higher than , then central bank forecasts a new PC that must shift to the left and go through 𝜋0 and ye and move along the PC (𝜋𝐸 = 𝜋0) towards MR, and increase the interest rate from r*to 𝑟0 at desired point C. During this period, the foreign exchange (forex) market predicts r > r*, thus real interest rate appreciated. The central bank knows this and sets 𝑟0 on monetary rule (RX). Economy is at 0, y0, r0 and q0.
At period 1 onwards, when the central bank increases the 𝑟0 , the real exchange rate (𝑞̅0 ) decreases means appreciation in home currency, the country’s export decreases due to the higher prices of goods and services relative to the foreigner. This appreciation moves the IS curve to the left IS(𝐴′, 𝑞0 ) at point C. As a result, the central bank reduces 𝑟0 to r*, 𝑦1 less than 𝑦𝑒. Since 𝑦1 is less than 𝑦𝑒 the central bank has to increase the output by decreasing the interest rate that leads to increase in the real exchange rate means depreciation in home currency, and consequently will increase the country’s exports due to the lower prices of goods and services relative to the foreigner, and consequently the IS curve gradually shift to the right 𝐼(𝐴′, 𝑞̅′) at point Z.
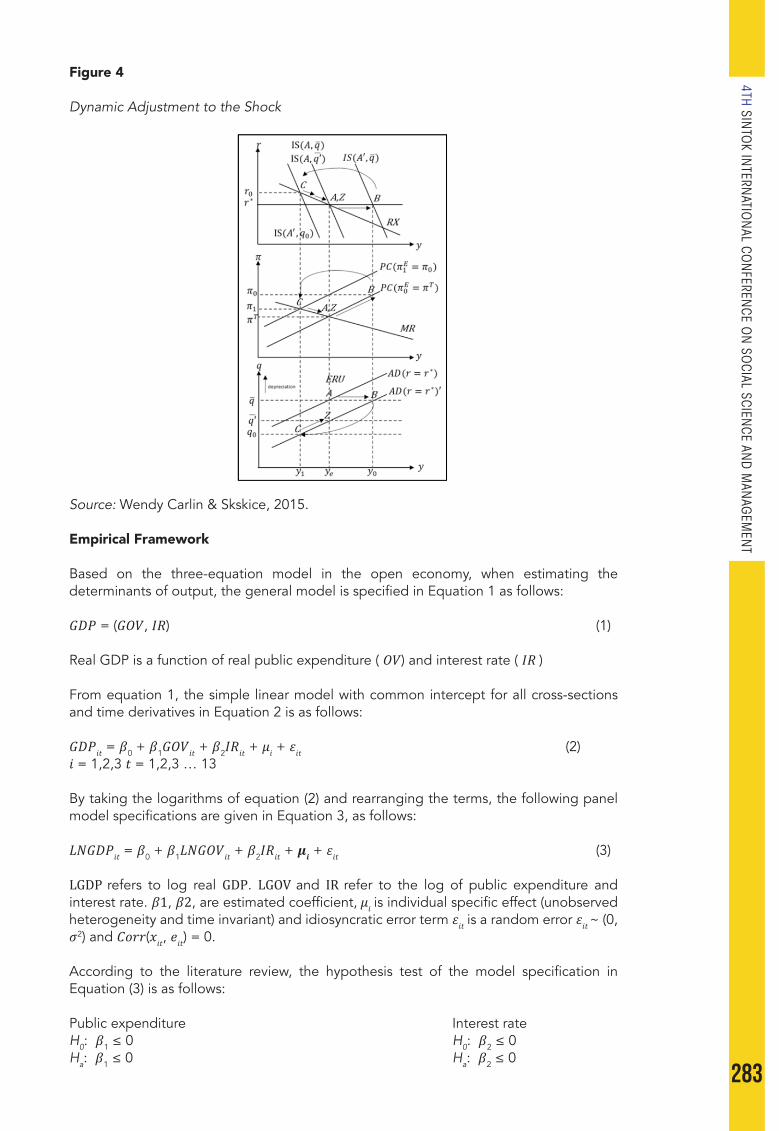
283
4TH SINTO
K INTERN
ATION
AL CON
FERENCE O
N SO
CIAL SCIENCE AN
D M
ANAG
EMEN
T
Figure 4
Dynamic Adjustment to the Shock
Source: Wendy Carlin & Skskice, 2015.
Empirical Framework
Based on the three-equation model in the open economy, when estimating the determinants of output, the general model is specified in Equation 1 as follows:
𝐺𝐷𝑃 = (𝐺𝑂𝑉, 𝐼𝑅) (1)
Real GDP is a function of real public expenditure ( 𝑂𝑉) and interest rate ( 𝐼𝑅 )
From equation 1, the simple linear model with common intercept for all cross-sections and time derivatives in Equation 2 is as follows:
𝐺𝐷𝑃𝑖𝑡 = 𝛽0 + 𝛽1𝐺𝑂𝑉𝑖𝑡 + 𝛽2𝐼𝑅𝑖𝑡 + 𝜇𝑖 + 𝜀𝑖𝑡 (2)𝑖 = 1,2,3 𝑡 = 1,2,3 … 13
By taking the logarithms of equation (2) and rearranging the terms, the following panel model specifications are given in Equation 3, as follows:
𝐿𝑁𝐺𝐷𝑃𝑖𝑡 = 𝛽0 + 𝛽1𝐿𝑁𝐺𝑂𝑉𝑖𝑡 + 𝛽2𝐼𝑅𝑖𝑡 + 𝝁𝒊 + 𝜀𝑖𝑡 (3)
LGDP refers to log real GDP. LGOV and IR refer to the log of public expenditure and interest rate. 𝛽1 , 𝛽2, are estimated coefficient, 𝜇𝑖 is individual specific effect (unobserved heterogeneity and time invariant) and idiosyncratic error term 𝜀𝑖𝑡 is a random error 𝜀𝑖𝑡 ~ (0, 𝜎2) and 𝐶𝑜𝑟𝑟(𝑥𝑖𝑡, 𝑒𝑖𝑡) = 0.
According to the literature review, the hypothesis test of the model specification in Equation (3) is as follows:
Public expenditure Interest rateH0: 𝛽1 ≤ 0 H0: 𝛽2 ≤ 0Ha: 𝛽1 ≤ 0 Ha: 𝛽2 ≤ 0
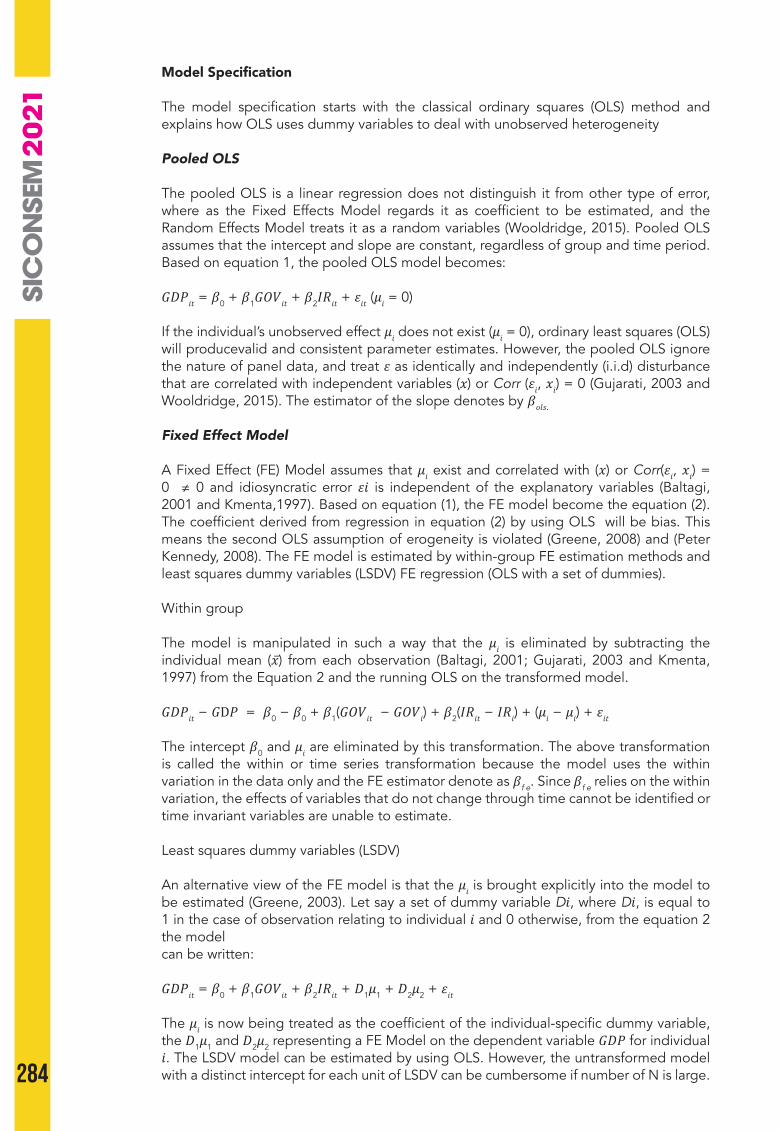
284
Model Specification
The model specification starts with the classical ordinary squares (OLS) method and explains how OLS uses dummy variables to deal with unobserved heterogeneity
Pooled OLS
The pooled OLS is a linear regression does not distinguish it from other type of error, where as the Fixed Effects Model regards it as coefficient to be estimated, and the Random Effects Model treats it as a random variables (Wooldridge, 2015). Pooled OLS assumes that the intercept and slope are constant, regardless of group and time period. Based on equation 1, the pooled OLS model becomes:
𝐺𝐷𝑃𝑖𝑡 = 𝛽0 + 𝛽1𝐺𝑂𝑉𝑖𝑡 + 𝛽2𝐼𝑅𝑖𝑡 + 𝜀𝑖𝑡 (𝜇𝑖 = 0)
If the individual’s unobserved effect 𝜇𝑖 does not exist (𝜇𝑖 = 0), ordinary least squares (OLS) will producevalid and consistent parameter estimates. However, the pooled OLS ignore the nature of panel data, and treat 𝜀 as identically and independently (i.i.d) disturbance that are correlated with independent variables (𝑥) or Corr (𝜀𝑖, 𝑥𝑖) = 0 (Gujarati, 2003 and Wooldridge, 2015). The estimator of the slope denotes by 𝛽𝑜𝑙𝑠.
Fixed Effect Model
A Fixed Effect (FE) Model assumes that 𝜇𝑖 exist and correlated with (𝑥) or Corr(𝜀𝑖, 𝑥𝑖) = 0 ≠ 0 and idiosyncratic error 𝜀𝑖 is independent of the explanatory variables (Baltagi, 2001 and Kmenta,1997). Based on equation (1), the FE model become the equation (2). The coefficient derived from regression in equation (2) by using OLS will be bias. This means the second OLS assumption of erogeneity is violated (Greene, 2008) and (Peter Kennedy, 2008). The FE model is estimated by within-group FE estimation methods and least squares dummy variables (LSDV) FE regression (OLS with a set of dummies).
Within group
The model is manipulated in such a way that the 𝜇𝑖 is eliminated by subtracting the individual mean (𝑥̅) from each observation (Baltagi, 2001; Gujarati, 2003 and Kmenta, 1997) from the Equation 2 and the running OLS on the transformed model.
𝐺𝐷𝑃𝑖𝑡 − 𝐺D𝑃 = 𝛽0 − 𝛽0 + 𝛽1(𝐺𝑂𝑉𝑖𝑡 − 𝐺𝑂𝑉𝑖) + 𝛽2(𝐼𝑅𝑖𝑡 − 𝐼𝑅𝑖) + (𝜇𝑖 − 𝜇𝑖) + 𝜀𝑖𝑡
The intercept 𝛽0 and 𝜇𝑖 are eliminated by this transformation. The above transformation is called the within or time series transformation because the model uses the within variation in the data only and the FE estimator denote as 𝛽f e. Since 𝛽f e relies on the within variation, the effects of variables that do not change through time cannot be identified or time invariant variables are unable to estimate.
Least squares dummy variables (LSDV)
An alternative view of the FE model is that the 𝜇𝑖 is brought explicitly into the model to be estimated (Greene, 2003). Let say a set of dummy variable D𝑖, where D𝑖, is equal to 1 in the case of observation relating to individual 𝑖 and 0 otherwise, from the equation 2 the model can be written:
𝐺𝐷𝑃𝑖𝑡 = 𝛽0 + 𝛽1𝐺𝑂𝑉𝑖𝑡 + 𝛽2𝐼𝑅𝑖𝑡 + 𝐷1𝜇1 + 𝐷2𝜇2 + 𝜀𝑖𝑡
The 𝜇𝑖 is now being treated as the coefficient of the individual-specific dummy variable, the 𝐷1𝜇1 and 𝐷2𝜇2 representing a FE Model on the dependent variable 𝐺𝐷𝑃 for individual 𝑖. The LSDV model can be estimated by using OLS. However, the untransformed model with a distinct intercept for each unit of LSDV can be cumbersome if number of N is large.

285
4TH SINTO
K INTERN
ATION
AL CON
FERENCE O
N SO
CIAL SCIENCE AN
D M
ANAG
EMEN
T
In the same time, include of dummy variable tend to lose degree of freedom.
Random Effect Model
A Random Effect (RE) Model assumes that 𝜇𝑖 exist and uncorrelated with (x) or Corr(𝜀𝑖, 𝑥𝑖) ≠ 0 and as a random variables rather than fixed ones (Baltagi, 2001; Greene, 2003). Based on equation (1), the FE model become the equation (2) because the 𝜇𝑖 is characterised as random and assume part of 𝜀𝑖 that have variance and , respectively. In the RE model, 𝜀𝑖𝑡 is serially correlated within a unit. This is because all observations within a unit have a common component, viz. 𝜆𝑖. Because of this autocorrelation, the third OLS assumption of non-autocorrelation is violated (Greene, 2008) and (Peter Kennedy, 2008). The RE model can beestimated by generalized least square (GLS), involves the following transformed model by OLSand the RE estimator is 𝛽re
(𝐺𝐷𝑃𝑖𝑡 − 𝜃𝐺𝐷𝑃𝑡) = 𝛽0 + 𝛽1(𝐺𝑂𝑉𝑖𝑡 − 𝜃𝑥̅𝑖) + 𝛽2(𝐼𝑅𝑖𝑡 − 𝜃𝑥̅𝑖) + 𝑣𝑖𝑡
Notice that the 𝛽re uses a weighted average of within and between variations in the data. Then if the 𝜃 = 0 the RE estimator become Pooled OLS and the 𝜃 = 1 will back to FE Model. In simplicity, pooled OLS ≤ RE ≤ FE or can be represented as 0 ≤ 𝜃 ≤ 1
Test on model selection
There are three basic test that can help to make the right decision for the model selection. The Lagrange multiplier (LM) test for the existence of the random effects was designed by (Breusch & Pagan, 1980) to distinguish the Pooled OLS model and the RE model. The presence of 𝜇 distinguishes the RE model from the Pooled OLS model. If 𝜇𝑖 = 0, the OLS would be BLUE as there would be no autocorrelation. Otherwise, the RE model is most appropriate (Greene, 2003). The hypothesis test as follows:
𝐻𝑜: 𝑢1 = 𝑢2 = 0 (Pooled OLS model) 𝐻𝐴: 𝑢1 = 𝑢2 ≠ 0 (RE model)
LM test requires the OLS residual 𝜀𝑖𝑡. Under the null hypothesis, the LM distribution is a chi-square with one degree of freedom. Since the variables are defined as Equation 3, it is necessary to test whether the RE model using GLS is necessary or a simple OLS for pooled OLS. The second test is the F-statistics, which is used to identify Pooled OLS and FE models. The data need to run OLS regression by group or by time. As in the first test, there is 𝜇𝑖 to distinguish the FE model from the pooled OLS model. If 𝜇𝑖 = 0, the Pooled OLS model is chosen (Baltagi, 2001). The hypothesis testing as follows:
𝐻𝑜: 𝑢1 = 𝑢2 = 0 (Pooled OLS model) 𝐻𝐴: 𝑢1 = 𝑢2 ≠ 0 (RE model)
If the p-value < 0.05, reject the null hypothesis indicating the FE estimator should be used.
The third test commonly used in applied panel data analysis attempts to determine which is more suitable for the RE model or the FE model by using the Hausman specificationtest. This test compares FE Model and RE Model under the null hypothesis, that is, 𝜇𝑖 is independent of the other explanatory variables in the model (Baltagi, 2001; Greene, 2003). Haus-statistics will have an asymptotic chi-squared distribution with k degrees of freedom under the null hypothesis of regressor-effect independent (RE is appropriate). A large value of Haus is evidence against this (p-value < 0.05) indicating the FE estimator should be used. The hypothesis test translates into:
𝐻𝑜: efficient model (RE model)𝐻𝐴: consistence model (FE model)
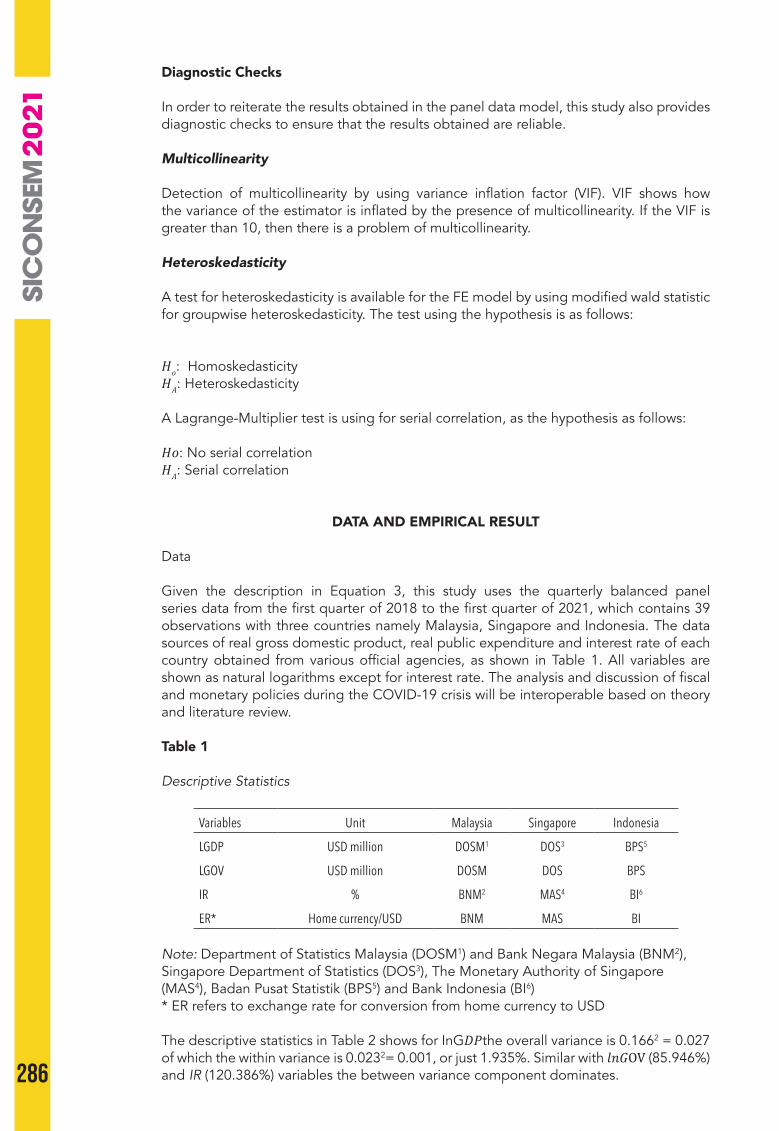
286
Diagnostic Checks
In order to reiterate the results obtained in the panel data model, this study also provides diagnostic checks to ensure that the results obtained are reliable.
Multicollinearity
Detection of multicollinearity by using variance inflation factor (VIF). VIF shows how the variance of the estimator is inflated by the presence of multicollinearity. If the VIF is greater than 10, then there is a problem of multicollinearity.
Heteroskedasticity
A test for heteroskedasticity is available for the FE model by using modified wald statistic for groupwise heteroskedasticity. The test using the hypothesis is as follows:
𝐻𝑜: Homoskedasticity𝐻𝐴: Heteroskedasticity
A Lagrange-Multiplier test is using for serial correlation, as the hypothesis as follows:
𝐻𝑜: No serial correlation𝐻𝐴: Serial correlation
DATA AND EMPIRICAL RESULT
Data
Given the description in Equation 3, this study uses the quarterly balanced panel series data from the first quarter of 2018 to the first quarter of 2021, which contains 39 observations with three countries namely Malaysia, Singapore and Indonesia. The data sources of real gross domestic product, real public expenditure and interest rate of each country obtained from various official agencies, as shown in Table 1. All variables are shown as natural logarithms except for interest rate. The analysis and discussion of fiscal and monetary policies during the COVID-19 crisis will be interoperable based on theory and literature review.
Table 1
Descriptive Statistics
Variables Unit Malaysia Singapore Indonesia
LGDP USD million DOSM1 DOS3 BPS5
LGOV USD million DOSM DOS BPS
IR % BNM2 MAS4 BI6
ER* Home currency/USD BNM MAS BI
Note: Department of Statistics Malaysia (DOSM1) and Bank Negara Malaysia (BNM2), Singapore Department of Statistics (DOS3), The Monetary Authority of Singapore (MAS4), Badan Pusat Statistik (BPS5) and Bank Indonesia (BI6) * ER refers to exchange rate for conversion from home currency to USD
The descriptive statistics in Table 2 shows for InG𝐷𝑃the overall variance is 0.1662 = 0.027 of which the within variance is 0.0232= 0.001, or just 1.935%. Similar with 𝑙𝑛𝐺OV (85.946%) and IR (120.386%) variables the between variance component dominates.

287
4TH SINTO
K INTERN
ATION
AL CON
FERENCE O
N SO
CIAL SCIENCE AN
D M
ANAG
EMEN
T
Table 2
Descriptive Analysis
Variable Mean Std. Dev. Min Max Observations𝒍𝒏𝑮𝑫𝑷 Overall 5.043 0.166 4.826 5.300 N = 39
Between 0.198 4.921 5.272 n = 3
Within 0.023 4.948 5.071 T = 13
𝒍𝒏GOV overall 4.209 0.101 4.055 4.433 N = 39
between 0.094 4.127 4.311 n = 3
Within 0.065 4.093 4.335 T = 13
IR overall 2.883 1.735 0.126 6.000 N = 39
between 1.903 1.097 4.885 n = 3
Within 0.728 1.498 3.998 T = 13
The correlation between the 𝒍𝒏𝑮𝑫𝑷 and all independent variables are highly significant at 0.05 level which IR has more than 80%, as shown in Table 3.
Table 3
Correlation Table
Variables 𝒍𝒏𝑮𝑫𝑷 𝒍𝒏GOV IR
𝒍𝒏𝑮𝑫𝑷 1.000
𝒍𝒏GOV 0.747** 1.000
IR 0.820** 0.718** 1.000
Note: The value of high correlation with more than 0.8 should be in bold** denotes significance level at the 0.05 level
Analysis of Result and Test on Model Specification
Table 4 shows the regression of Pooled OLS, FE model, and RE model. The FE model is found to be an appropriate model through selection tests. Table 5 shows the test results of model selection to determine the appropriate model.
Table 4
Regression Analysis for Pooled OLS, FE Model and RE Model
Dependent variables:𝒍𝒏𝑮𝑫𝑷
Pooled OLS Fixed Effect model Random Effect model
𝒍𝒏𝑮𝑫𝑷 0.534 ** 0.157 *** 0.534 **
(0.206) (0.053) (0.206)
IR 0.056 *** 0.007 0.056 ***
(0.012) (0.005) (0.012)
cons 2.633 *** 4.280 *** 2.633 ***
(0.845) (0.217) (0.845)(Continued)
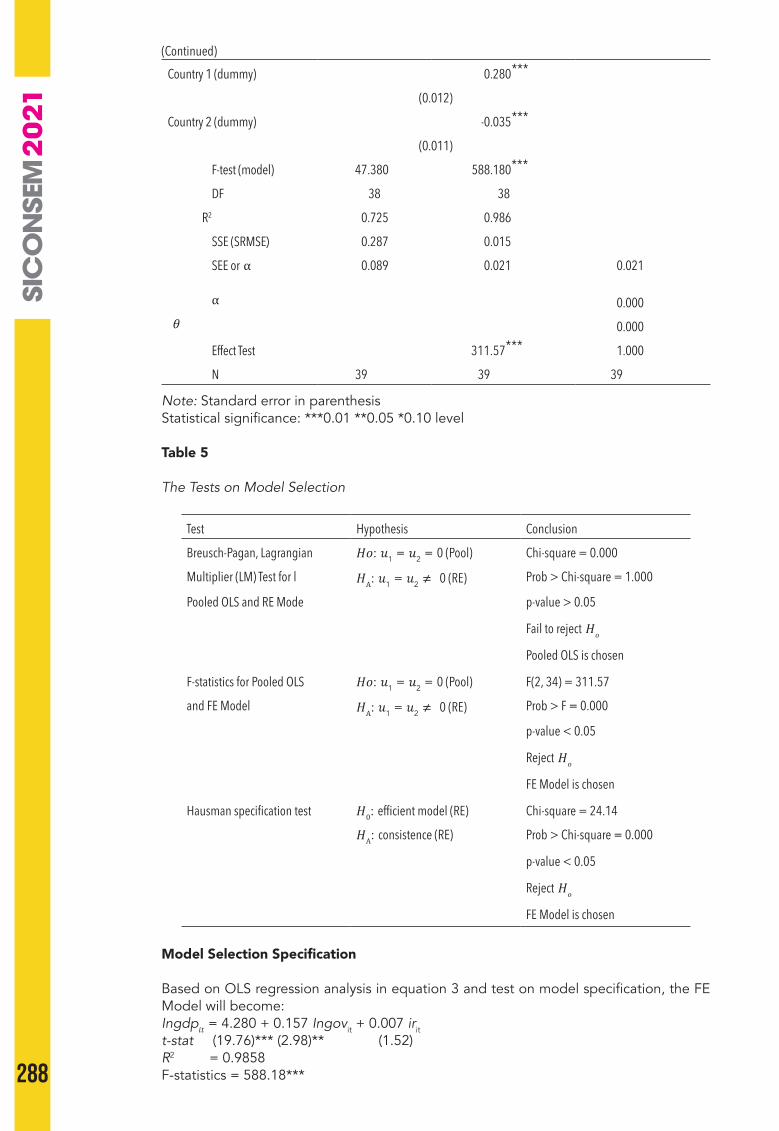
288
Country 1 (dummy) 0.280 ***
(0.012)
Country 2 (dummy) -0.035 ***
(0.011)
F-test (model) 47.380 588.180 ***
DF 38 38
R2 0.725 0.986
SSE (SRMSE) 0.287 0.015
SEE or α 0.089 0.021 0.021
α 0.000𝜃 0.000
Effect Test 311.57*** 1.000
N 39 39 39
Note: Standard error in parenthesisStatistical significance: ***0.01 **0.05 *0.10 level
Table 5
The Tests on Model Selection
Test Hypothesis Conclusion
Breusch-Pagan, Lagrangian 𝐻𝑜: 𝑢1 = 𝑢2 = 0 (Pool) Chi-square = 0.000
Multiplier (LM) Test for l 𝐻A: 𝑢1 = 𝑢2 ≠ 0 (RE) Prob > Chi-square = 1.000
Pooled OLS and RE Mode p-value > 0.05
Fail to reject 𝐻𝑜
Pooled OLS is chosen
F-statistics for Pooled OLS 𝐻𝑜: 𝑢1 = 𝑢2 = 0 (Pool) F(2, 34) = 311.57
and FE Model 𝐻A: 𝑢1 = 𝑢2 ≠ 0 (RE) Prob > F = 0.000
p-value < 0.05
Reject 𝐻𝑜
FE Model is chosen
Hausman specification test 𝐻0: efficient model (RE) Chi-square = 24.14
𝐻A: consistence (RE) Prob > Chi-square = 0.000
p-value < 0.05
Reject 𝐻𝑜
FE Model is chosen
Model Selection Specification
Based on OLS regression analysis in equation 3 and test on model specification, the FE Model will become: Ingdp𝑖𝑡 = 4.280 + 0.157 Ingovit + 0.007 irit
t-stat (19.76)*** (2.98)** (1.52) R2 = 0.9858F-statistics = 588.18***
(Continued)

289
4TH SINTO
K INTERN
ATION
AL CON
FERENCE O
N SO
CIAL SCIENCE AN
D M
ANAG
EMEN
T
The result shows that FE model fits the data well; a high R2 (0.986) means 98.6% of the variance in the explanatory variable can be explained by the variance of Ingdp. Only Ingo variable is significant at the 0.01 level means for USD 1 million increase in public expenditure, the gross domestic product is expected to rise by USD 0.157 million on average, holding other variables constant indicating fiscal policy is more effective for the economic growth of Malaysia, Singapore and Indonesia. This finding consistent with (Gali, 2020) which fiscal policy as an urgent execution during the COVID-19 pandemic and (IMF, 2013) that fiscal policy was an appropriate countercyclical policy tool. This model is also consistent because 𝜇𝑖 has been removed from the model. This model implies that each country has different intercept reflecting every country has initial technology, resource endowments and so that differ across countries.
Diagnostic Checks
The three techniques of diagnostic checks are shown in Table 6. The results of FE model to estimate the fiscal and monetary of these countries during the COVID-19 crisis are stable because there is no multicollinearity, homoskedasticity and no serial correlation problem.
Table 6
Result of Diagnostic Check
Diagnostic checks Result Conclusion
Multicollinearity Variable VIF VIF is <10, indicating no multicollinearity
Detection: variance InGOV 2.07 (consistent with the advantage of using panel data with less collinearity)
inflation factor (VIF) IR 2.07
Mean VIF 2.07
Heteroskedasticity chi (3) = 0.34 A p-value is no significant
Detection: Modified Wald Prob > Chi2 = 0.9529 suggests fail to reject the
statistics for groupwise null hypothesis and
heteroskedasticity 𝐻𝑜: Homoskedasticity conclude there is a homoskedasticity
𝐻A:Heteroskedasticity (variances are constant).
The model is robust to rectify for
heteroskedasticity
Serial correlation F (1,2) = 6.015 A p-value is no significant
(Autocorrelation) Prob > F = 0.1337 suggests fail to reject the
Detection: Wooldrige null hypothesis and
(2002) serial correlation 𝐻𝑜: No serial correlation conclude there is no serial
test 𝐻A: Serial correlation correlation
290
CONCLUSION AND RECOMMENDATION
Conclusion
This study uses balanced panel data to investigate the importance of the fiscal and monetary policies used by Malaysia, Singapore, and Indonesia in response to the economic recession from the first quarter of 2005 to the first quarter of 2021. The empirical results show that the appropriate model is a FE Model. The result revealed that the public spending is positively significant at the 0.01 level with gross domestic product, holding other variables constant. In other words, an increase of USD 1 million in public expenditure is expected to rise the gross domestic by USD 0.157 million on average, cateris paribus. This finding consistent with (Gali, 2020) and (IMF, 2013) that fiscal policy is an appropriate countercyclical policy tool during the crisis. Therefore, during the COVID-19 crisis, fiscal policy is more effective for the economic growth of Malaysia, Singapore and Indonesia. These findings are further confirmed by using VIF, modified Wald statistics and Wooldrige (2002) serial correlation test indicating the model is consistent, stable and robust.
Recommendation
According to the empirical results, this study recommends sound fiscal policies and effective implementation, countries will emerge stronger from this global health crisis. Although fiscal policy has a positive effect on economy, it should be remembered that both policies are interdependent, and it requires a consistent and sustainable policy-mix framework to avoid possible inconsistencies. Hence, it is very important to incorporate both policies into a single model, because their interaction has a significant impact on economic growth. These two policies should be considered at the same time, rather than in isolation.
REFERENCES
Ahmad, D., Afzal, M., & Khan, U. G. (2016). Impact of monetary policy on economic growth empirical evidence of Pakistan. International Journal of Applied Economic Studies, 4(6),1–9.
Auerbach, A. J., Gale, W. G., & Harris, B. H. (2010). Activist fiscal policy. Journal of Economic Perspectives, 24(4), 141–164. https://doi.org/10.1257/jep.24.4.141
Baltagi, B. H. (2001). Econometric analysis of panel data. Springer Nature.Baum, M. A., Poplawski-Ribeiro, M. M., & Weber, A. (2012). Fiscal Multipliers and the
State of the Economy. International Monetary Fund.Blinder, A. S., & Zandi, M. (2015). The financial crisis : Lessons for the next one. Center on
Budget and Policy Priorities, 1–55.Bonga-Bonga, L. (2019). Fiscal policy, monetary policy and external imbalances: Cross-
country evidence from Africa’s three largest economies. Journal of International Trade and Economic Development, 28(2), 123–136. https://doi.org/10.1080/09638199.2018.1507045
Breusch, T. S., & Pagan, A. R. (1980). The Lagrange multiplier test and its applications to model specification in econometrics. The Review of Economic Studies, 47(1), 239–253.
Cecchetti, S. G., Flores-Lagunes, A., & Krause, S. (2006). Has monetary policy become more efficient? A cross-country analysis. Economic Journal, 116(511), 408–433. https://doi.org/10.1111/j.1468-0297.2006.01086.x
Diaz-Bonilla, E. (2018). Financing “a sustainable food future”: Some thoughts for the G20. Economics : The Open-Access, 73, 19. Retrieved from http://www.economics- ejournal.org/economics/discussion papers/2018-73%0AFinancing
Diaz-Bonilla, E. (2020). Fiscal and monetary responses to the COVID-19 pandemic: Some thoughts for developing countries and the international community. COVID-19 and Global Food Security, 98–101. https://ebrary.ifpri.org/digital/collection/p15738coll2/id/133832
291
4TH SINTO
K INTERN
ATION
AL CON
FERENCE O
N SO
CIAL SCIENCE AN
D M
ANAG
EMEN
T
Feldkircher, M., Huber, F., & Pfarrhofer, M. (2021). Measuring the effectiveness of US monetary policy during the COVID-19 recession. Scottish Journal of Political Economy, 68(3), 287–297. https://doi.org/10.1111/sjpe.12275
Friedman, M. (1959). A program for monetary stability. Ravenio Books.Gali, J. (2020). The effects of a money-financed fiscal stimulus. In Journal of Monetary
Economics.Greene, W. H. (2003). Econometric analysis (4th ed.). International edition, New Jersey:
Prentice Hall.Greene, W. H. (2008). Econometric analysis. Prentice Hall. Gujarati, D. N. (2003). Basic Econometrics (4th ed.). McGraw Hill. IHS Markit. (2021). Global economy.IMF. (2013). Reassessing the role and modalities of fiscal Policy in advanced economies.
Policy Papers, 2013(56). https://doi.org/10.5089/9781498341608.007IMF. (2021). Policy responses to COVID-19. Retrieved from International Monetary
Fund website: https://www.imf.org/en/Topics/imf-and-covid19/Policy-Responses-to-COVID-19
Keynes, J. M. (1936). Treatise on money: Pure theory of money Vol. I. Macmillan, London. Kmenta, J. (1997). Element of Econometrics (2nd ed.). University of Michigan Press.Peter Kennedy. (2008). A guide to econometrics (6th ed.). Wiley-Blackwell.Tang, H. C. (2006). The relative importance of monetary policy transmission channels in
Malaysia. In CAMA Working Paper Series. Retrieved from http://cama.anu.edu.auWendy Carlin, & Skskice, D. (2015). Macroeconomics: Institution, Instability and the
Financial System (2nd ed.). Oxford University Press.Wooldridge, J. M. (2015). Introductory econometrics: A modern approach. Cengage
learning.

292
SICONSEM 2021:101-065
INTENDED USE OF IPO PROCEEDS AND SURVIVAL OF PUBLIC LISTED COMPANIES IN MALAYSIA
1Siti Sarah Alyasa-Gan & 2Norliza Che-Yahya1,2Faculty of Business and Management, Universiti Teknologi Mara
Puncak Alam Selangor, Malaysia
Corresponding author: [email protected]
ABSTRACT
This study examines the role of the intended use of IPO proceeds on the survival of 430 Malaysian listed companies from 2000 to 2014. Conforming to the urge of a declining pattern of total listed companies in the Malaysian market, especially among the Main Market participants, this study responds by estimating the predictive role of the intended use of IPO proceeds to the survival of company’s post-IPO. Preliminarily, this study estimates the survival rate using the Kaplan-Meier (K-M) survival model and found 69.30 percent three-year, 59.77 percent five-year and 53.24 percent seven-year of companies’ survival rates post-IPO. By employing the Accelerated Failure Time (AFT) survival model, the findings show a statistically significant and negative effect of growth opportunities and debt repayment on post-IPO survival. Additionally, only initial performance is found to have a significant and positive impact on the survival of companies, whereas the risk of company, quality of company, shareholders retention and market sentiment are significant factors with a negative effect on survival. This study highlights the importance of prospectus information, specifically the intended use of IPO proceeds on the subsequent survival of companies. This study provides new empirical evidence on companies’ motivations during the listing of segregating use of IPO proceeds disclosed as explanations to the survival of companies, specifically in the Malaysian market.
Keywords: Initial public offerings, survival, intended use of IPO proceeds, Malaysian market, accelerated failure time model.
INTRODUCTION
A challenge that companies may face in a systematic change through the process of IPO is the extent of time for them to survive ultimately as public listed companies in the long-run (Serio et al., 2020). Across countries, policymakers, regulators and investors seek to identify when and why IPO companies failed to remain survive post-IPO (Espenlaub et al., 2016). Nevertheless, only few are known to disrupt the survival of companies. Either voluntarily (conversion to a private firm, corporate proposal or merger and acquisition) or involuntarily reasons (unable to fulfil listing requirements or forced liquidation) (Schultz, 1993; Pour & Lasfer, 2013; Helbing, 2019; Shari, 2019), companies that are publicly listed in the stock market primary goal is to remain viable and sustainable post-IPO (Abdul Rahman & Che-yahya, 2019). Going public is also one way for companies to convince shareholders of their survivability in the long-run (Dziczkowski, 2020). The companies’ survival indicates the competitiveness of a company to overcome the brutal market conditions and reflect the companies’ ultimate performance through a longer period of survival post-IPO (Baluja & Singh, 2019).
While there is a substantial empirical literature body examining the short-term and long-term performance of companies post-IPO (Abdul-Rahim & Che-Embi, 2013; Amor & Kooli, 2017; Che-Yahya & Matsuura, 2021; Kumar & Sahoo, 2021; Loughran & Ritter, 2004; Mehmood et al., 2021; Wang & Wang, 2021), the attention on studies of companies’ survival can only be seen to grow recently, especially in the emerging markets (Iwasaki & Kočenda, 2019). Although companies’ survival seems to be consistent with the examination of post-IPO performance, the examination of companies’ survival represents an unambiguous companies’ performance measurement, which is the
28
293
4TH SINTO
K INTERN
ATION
AL CON
FERENCE O
N SO
CIAL SCIENCE AN
D M
ANAG
EMEN
T
inclusion of time element during the estimation (Chancharat et al., 2012). As opposed to the studies on short-term and long-term performance that relies on stock returns for a proxy to companies’ post-IPO performance at a specified point of time, Shumway (2001) states that the advantage of conducting studies using the survival analysis model is that it incorporates time-varying covariates that change with time for higher accuracy of long-run post-IPO prediction.
A growing number of studies on the survival of companies usually leveraging on the role of companies’ characteristics (company size and age) and issuance characteristics (underwriter reputation, venture capitalist and issuance size), have been widely explained (Espenlaub et al., 2012; Kooli & Meknassi, 2007; Lamberto & Rath, 2010; Peristiani & Hong, 2004). Relatively in its scope, this study emphasizes the role of companies’ intended use of IPO proceeds as the predictive factors to companies’ survival. As posited by Ahmad et al. (2021), the financial and non-financial information disclosed prior to the IPO should have a long-term impact on the companies’ survival. In specific, the information disclosure about how the raised IPO proceeds are utilized can transmit information on the future directions of companies (Dziczkowski, 2020). Suppose information on the intended use of IPO proceeds are disclosed with greater transparency. In that case, companies can seize the opportunity to gain investors’ confidence and release credible signals to the public on their IPOs (Kao & Chen, 2020). Companies that are transparent in their information disclosure portray a controllable agency conflict that needs to be borne by the companies, which results in better performance in the long-run (Varghese et al., 2020). Thus, the companies’ disclosure of the intended use of proceeds is arguably one of the compelling pieces of information to estimate companies’ survival post-IPO (Wyatt, 2014).
The intended use of IPO proceeds to different categories reflects the companies’ intention to convert their status from private to public listed companies (SCM, 2021). The information that specifies the companies’ intention to go for public listing can be retrieved from the companies’ prospectus disclosed a few days before the companies’ listing day under the section “utilization of proceeds” or “use of proceeds”. Information disclosed by companies on their IPO proceeds can assist the investors to make informed decisions. In the Malaysian IPO market, the categories of activities are usually for the growth opportunities, debt repayment and working capital (Badru, 2021). Past studies define growth opportunities as activities that can expand the state of the companies through capital expenditure, business expansion, R&D and future assets acquisition (Pagano et al., 1998; Abdul-Rahim & Che-Embi, 2013; Abdul Rahman & Che-Yahya, 2019). On the other hand, debt repayment is defined as activities to destabilize capital structure or to minimize the credit risk of companies and working capital is defined as activities that increase the companies’ cash holdings for daily operations and general corporate purposes (Autore et al., 2009; Andriansyah & Messinis, 2016; Amor & Kooli, 2017; McGuinness, 2019).
Proportion of IPO proceeds allocated for growth opportunities is indicated as companies’ priority (Abdul Rahman & Che-Yahya, 2019). Growth opportunities refer to companies’ abilities to expand bigger in the market which the proceeds are allocated to activities promoting companies’ future growth and wealth (Abdul-Rahim & Che-Embi, 2013; Tajuddin et al., 2016). Consequently, it gives a better chance for companies to have longer survival post-IPO (Amor & Kooli, 2017; Chin-Chi, 2020). Contrarily, past studies have also argued that although growth opportunities usually are activities that expand the business, investors are more concerned about the companies’ value creation from the cash flow volatility (Wyatt, 2014; Ahmad-Zaluki & Badru, 2020). This may lead to higher uncertainty on companies’ sustainability, resulting in a lower chance of companies surviving longer post-IPO. Other categories, which are the intended use of IPO proceeds for debt repayment and working capital, tend to contract the survivability of the companies. Repayment of debt, usually anticipated in rebalancing capital structure, will least attract investors’ attention to buy the marketed shares due to the flat future cash flow stream (McGuinness, 2019). Similarly, the IPO proceeds intended for working capital, which is regarded as unspecified companies’ plans (SCM, 2021), will increase the uncertainty among investors on the companies’ survival (Ljungqvist & Wilhelm, 2003). In cases where marketed shares
294
are undersubscribed, companies cannot raise their desired amount of capital, lowering their ability to succeed post-IPO (Autore et al., 2009). Thus, higher intended use of IPO proceeds for debt repayment and working capital may jeopardize the companies’ ability to survive longer. Regardless of the categories, companies’ early disclosure information found in the prospectus has a great potential to act as a predictive role for early warning signals in examining companies’ survival (Ahmad et al., 2021). To understand the survival of companies, investors need to assess the risk and future directions of companies. It ensures that the investors are in the safest position to optimize their returns. Specifically, this study postulates that it is necessary to examine and be informed of the determinants that explain the survival of public listed companies in the Malaysian market.
There are several motivations to conduct this study in the Malaysian market. Firstly, this study observes a declining trend of total listed companies1 in the Malaysian market since 2006 and only started to incline in 2017, following the establishment of the LEAP market. Figure 1 shows that the number of Main Market participants with active status is steadily reducing over the years. It is a concern as, according to Bursa Malaysia (2021), under the “Selection of FTSE Bursa Malaysia KLCI Constituents”, the benchmark index (i.e., KLCI) of the Malaysian stock market performance relies on the performance of the Main market participants’ performance. A continuous decline in the number of Main market participants may portray the stock market’s underperformance. In return, the underperformance may discourage investors from making potential investments in the market (Luo, 2009). While companies cannot secure their desired capital, it may lead to a potential negative impact on their long-term performance and ability to survive.
Furthermore, this study observes2 that more than 90 percent of inactive companies from Figure 1 are either companies that failed to comply with the listing requirements (e.g. default in payment of loans) or companies with the poor financial condition and operating performance. The remaining are among those who voluntarily delist themselves from the stock market. Rationally, with a high percentage coming from companies who are inactive due to unfavourable reasons, this study acknowledges the implication that continuous decline in Malaysian companies’ survival can be detrimental to the stock market. In fact, on average, the shortest survival for companies3 to be inactive due to unfavourable reasons from 2000 to 2020 in the Malaysian market is by 32 months, which is relatively a short period for companies to be as active listed companies. Therefore, this study from the academic aspect identifies the need to understand the influential factors to companies’ survival post-IPO.
Secondly, according to the 9th Revision Prospectus Guideline, the information on the intended use of IPO proceeds are included as the mandatory information to be disclosed by the companies in prospectus. The objective of the mandatory requirement is to serve as protection for investors’ interest through information transparency and to ensure a stable stock market (SCM, 2020). Mehmood et al. (2021) state that the Malaysian market is among the countries experiencing high uncertainty due to its weak regulatory structure. Understanding that information asymmetry is usually higher in emerging IPO markets such as in Malaysia, investors’ behaviour in the market are likely to be speculative and short-term in nature. If investors are pessimistic about the companies’ prospects, newly issued shares will be undersubscribed (Ahmad & Jelic, 2014). As investors’ participation and subscription of shares are at a minimum, this will threaten the survivability of companies listed in the Malaysian market. Thus, relying to the argument whereby information asymmetry is a continuous challenge in an IPO, this study argues that the intended use of IPO proceeds can provide insights to the investors in predicting companies’ survival in the long-run.
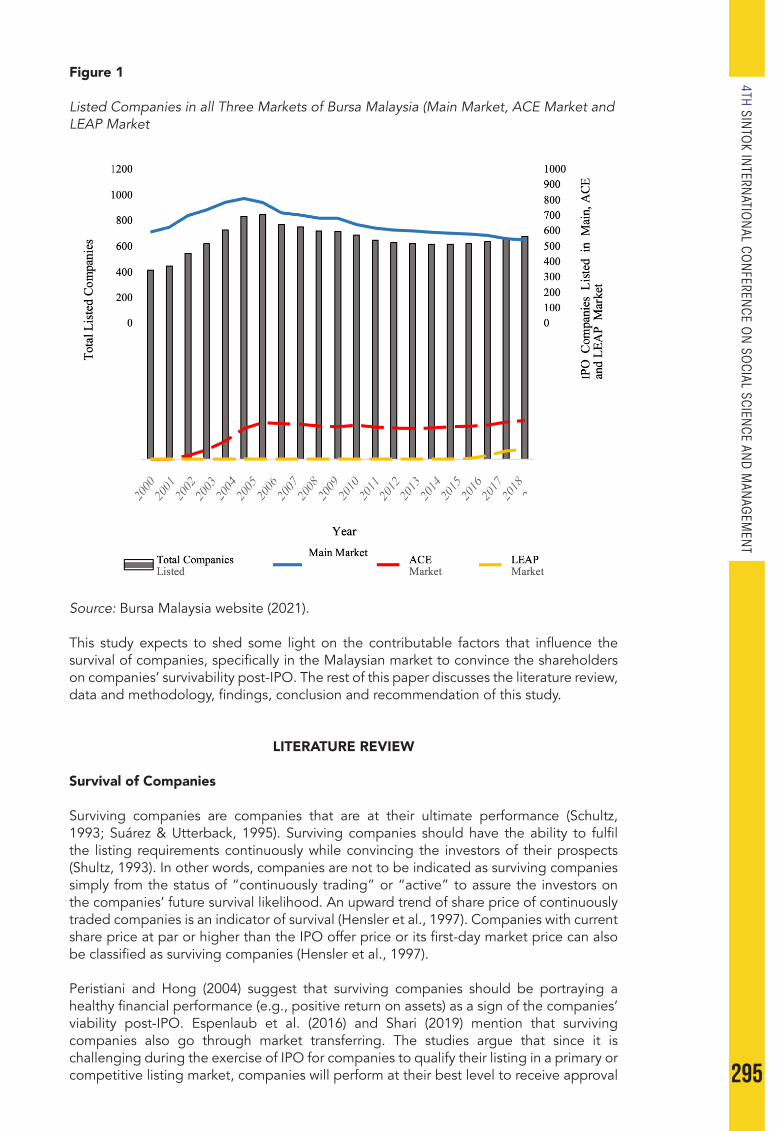
295
4TH SINTO
K INTERN
ATION
AL CON
FERENCE O
N SO
CIAL SCIENCE AN
D M
ANAG
EMEN
T
Figure 1
Listed Companies in all Three Markets of Bursa Malaysia (Main Market, ACE Market and LEAP Market
Source: Bursa Malaysia website (2021).
This study expects to shed some light on the contributable factors that influence the survival of companies, specifically in the Malaysian market to convince the shareholders on companies’ survivability post-IPO. The rest of this paper discusses the literature review, data and methodology, findings, conclusion and recommendation of this study.
LITERATURE REVIEW
Survival of Companies
Surviving companies are companies that are at their ultimate performance (Schultz, 1993; Suárez & Utterback, 1995). Surviving companies should have the ability to fulfil the listing requirements continuously while convincing the investors of their prospects (Shultz, 1993). In other words, companies are not to be indicated as surviving companies simply from the status of “continuously trading” or “active” to assure the investors on the companies’ future survival likelihood. An upward trend of share price of continuously traded companies is an indicator of survival (Hensler et al., 1997). Companies with current share price at par or higher than the IPO offer price or its first-day market price can also be classified as surviving companies (Hensler et al., 1997).
Peristiani and Hong (2004) suggest that surviving companies should be portraying a healthy financial performance (e.g., positive return on assets) as a sign of the companies’ viability post-IPO. Espenlaub et al. (2016) and Shari (2019) mention that surviving companies also go through market transferring. The studies argue that since it is challenging during the exercise of IPO for companies to qualify their listing in a primary or competitive listing market, companies will perform at their best level to receive approval

296
from the policymakers for market transferring (e.g., from ACE Market to Main Market). This indicates that continuously traded companies will have to be at their best state for the market transferring to convince the policymakers of their capabilities. Collectively, surviving companies is defined as active status companies that are ultimately performing post-IPO.
Schultz (1993) is among the earliest to examine the determinants of companies’ survival in the U.S. market. Schultz (1993) found that out of the independent variables included in the study (company size, company age, initial return and underwriter reputation), only initial return is found significant and positively influencing companies’ survival. Another study in the U.S market by Hensler et al. (1997) estimating the survival of companies found companies’ characteristics that are size, age, percentage of insider ownership, initial return and IPO activity level to extend the companies’ survival. Similar to Hensler et al. (1997), Jain and Kini (2000) postulate that the presence of VCs increases the chance of companies surviving longer post- IPO. Since VC aids in offering growth to high-tech companies, the investors receive a positive signal to consider such companies to be in their investment portfolio (Hamza & Kooli, 2010). Ahmad and Jelic (2014) explain 580 companies in the U.K. market survival listed from 1990 to 2006 based on lockup agreement information. As a voluntary lockup reflects founders’ commitment to the companies, founders’ action to proceed with longer lockup periods imply that they are confident with the companies’ prospects (Ahmad & Jelic, 2014). The study clarifies that a longer lockup period results in companies’ longer survival post-IPO due to a low agency problem.
There are only a few studies in the developing market. Zhang et al. (2018) examine 14,065 China high-tech start-up companies listed from 2007 to 2013. The study argues that the offerings of a new product to the market and the acceptance of the new product play significant roles in ensuring the survival of high-tech companies in China market. Zhang et al. (2018) posit that studies should also examine how the high-tech companies perform despite generalizing the sectoral risk to confirm on the actual survivability of high-tech companies. In the Malaysian market, Shari (2019) examines survival of 352 companies from 2002 to 2010, limiting only to descriptive analysis. The study focuses on describing the survival rate of companies without considering any influential factors to survival of companies listed in the Malaysian market. In contrast, a study by Ahmad et al. (2021) examine 943 companies listed in the Malaysian market from 1990 to 2017. The study found share premium and listed capital to lower the failure risk (higher the survival probability) while size and risk of company to higher the failure risk (lower the survival probability). The study infers that over optimism of investors for newly listed companies in the Malaysian market enables the companies to set higher price premium and issue higher listed capital for the companies to have a higher chance of surviving post-IPO. Therefore, due to the scarcity of examining survival in the developing Malaysian market, it isinevitable for this study to be conducted.
Apart from all the significant factors mentioned, this study is interested in another possible determinant, the intended use of IPO proceeds. As per this study’s limited knowledge, Wyatt (2014) is the only study considering the proportion of IPO proceeds to several activities in explaining the survival of companies using the logit method. Wyatt (2014) examines 241 companies listed in the Australian market from 1994 to 2000 and found growth opportunities, debt repayment and working capital to be positively and significantly related to the companies’ survival.
Intended Use of IPO Proceeds and Survival of Companies
Commonly in the Malaysian market, there are three major categories of IPO proceeds’ allocation that the companies usually subdivided in the prospectus4 for their public listing. They are growth opportunities, repayment of debts and financing on working capital (Ahmad-Zaluki & Badru, 2020). In an IPO market, investors will usually favour companies with motives similar to their objectives. Investors’ reactions are more favourable to new offerings with motives catering to investment reasons than offerings with unspecific information and general corporate purposes such as the working capital (Walker &
297
4TH SINTO
K INTERN
ATION
AL CON
FERENCE O
N SO
CIAL SCIENCE AN
D M
ANAG
EMEN
T
Yost, 2008). Varghese et al. (2020) posit that companies should make a wise decision by prioritizing investments to create companies’ value and raise enough capital to meet the listing requirements. Companies must have the capacity to manage their investment projects effectively, or else prioritizing to investments may result to an adverse effect to the companies’ success (Andriansyah and Messinis, 2016). In return, if the investment amount is paid back positively, it will give a positive signal to the investors on the companies’ future value, presenting the companies with higher ability of surviving longer post-IPO. However, a high proportion of IPO proceeds for growth opportunities is also relative to high cash flow volatility due to the time-varying effect (Wyatt, 2014; Ahmad-Zaluki & Badru, 2020). Investors view growth opportunities as a negative signal as they are more concerned on the companies’ ability to create value from their capital expenditure in the long-run. As investors are uncertain about the outcome of the proceeds post-IPO, they will less likely participate in such companies (Carlson et al., 2004). Thus, IPO proceeds to growth can affect companies’ survival post-IPO, negatively.
A significant portion of IPO proceeds can also be for repayment of debt. Although debt repayment is an essential motivation for the companies to help reduce their interest burden, the investors expect the raised proceeds to be directed more on profitable projects for the companies’ future growth (Fan, 2019). The common understanding of debt repayment is to destabilize companies’ capital structure, flattening the future cash inflow. It gives negative signals to investors (Kooli & Meknassi, 2007), leaving an unfavourable impact on companies’ survival. Paleari et al. (2008) also report that the main reason for Italian companies to have survival issues is that most companies declare debt repayment as their primary allocation to the intended use of IPO proceeds. Although the companies’ initial intention is to lower the companies’ cost of credit, the repayment of debt does not endure long-run as the companies tend to access further debt after the IPO, putting the companies at higher risk. Likewise, once the companies finished repaying their debt, the companies do not put weightage on the companies’ survival in the stock market. As a result, it leads to shorter companies’ survival post-IPO.
Similarly, companies can experience unfavourable outcomes post-IPO from allocating a high portion of their IPO proceeds to working capital (Amor & Kooli, 2017). Often, companies that prioritize their intention to working capital have no clear directions on how the raised IPO proceeds will be utilized (Balatbat & Bertinshaw, 2008). Understanding that the intended use of IPO proceeds to working capital is indicated as unspecified activities, the information given may be scarce. Leone et al. (2007) accentuate working capital’s reference being too general for investors to be highly confident in the companies’ future prospects. As such, companies tend to limit the intended use of IPO proceeds for working capital as a protection to investors’ interests and companies’ survivability post-IPO (Wyatt, 2014). Based on the aforementioned evidences, this study hypothesizes:
H1. Intended use of IPO proceeds for growth opportunities is positively related to survival of companies.
H2. Intended use of IPO proceeds for debt repayment is negatively related to survival of companies.
H3. Intended use of IPO proceeds for working capital is negatively related to survival of companies.
Control Variables
Several other determinants found to be significant to the companies’ survival in past studies also worth looking into are initial performance, quality of company, risk of company, shareholders retention and market sentiment (Kooli & Meknassi, 2007; Hamza & Kooli, 2010; Lamberto & Rath, 2010; Chancharat et al., 2012; Espenlaub et al., 2012; Neneh & Smit, 2014; Pour, 2015; Baluja & Singh, 2016; Espenlaub et al., 2016; Ahmad et al., 2021).
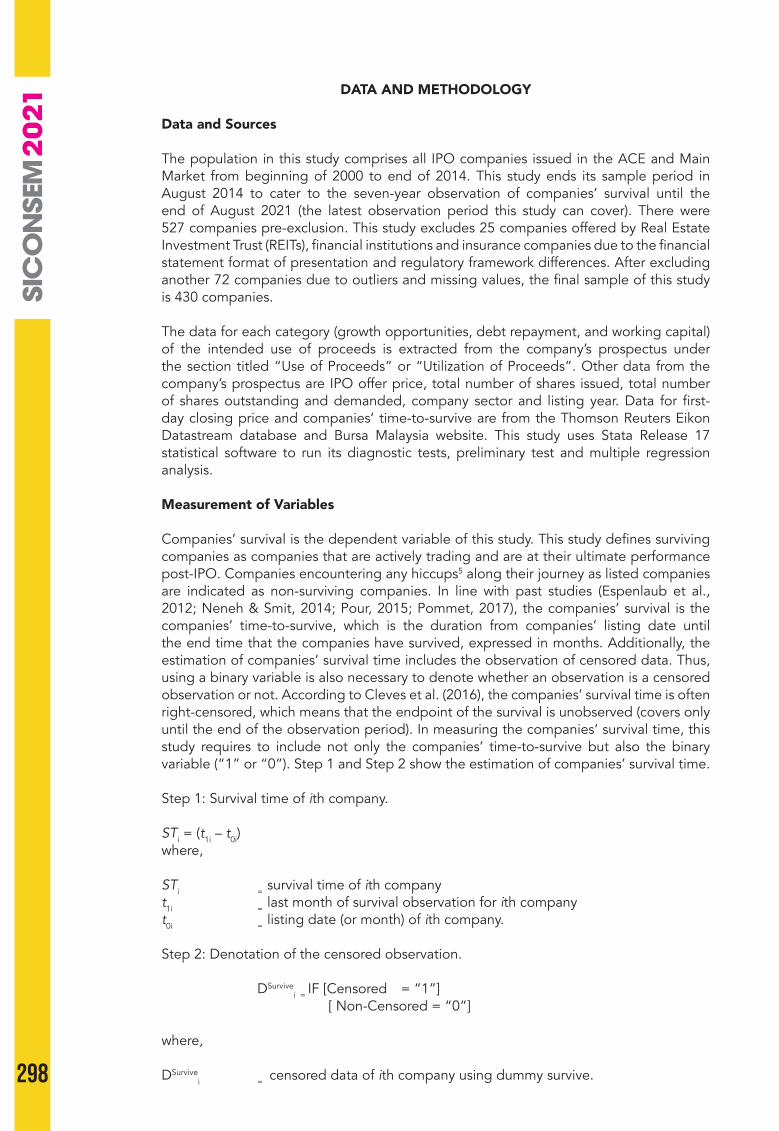
298
DATA AND METHODOLOGY
Data and Sources
The population in this study comprises all IPO companies issued in the ACE and Main Market from beginning of 2000 to end of 2014. This study ends its sample period in August 2014 to cater to the seven-year observation of companies’ survival until the end of August 2021 (the latest observation period this study can cover). There were 527 companies pre-exclusion. This study excludes 25 companies offered by Real Estate Investment Trust (REITs), financial institutions and insurance companies due to the financial statement format of presentation and regulatory framework differences. After excluding another 72 companies due to outliers and missing values, the final sample of this study is 430 companies.
The data for each category (growth opportunities, debt repayment, and working capital) of the intended use of proceeds is extracted from the company’s prospectus under the section titled “Use of Proceeds” or “Utilization of Proceeds”. Other data from the company’s prospectus are IPO offer price, total number of shares issued, total number of shares outstanding and demanded, company sector and listing year. Data for first-day closing price and companies’ time-to-survive are from the Thomson Reuters Eikon Datastream database and Bursa Malaysia website. This study uses Stata Release 17 statistical software to run its diagnostic tests, preliminary test and multiple regression analysis. Measurement of Variables
Companies’ survival is the dependent variable of this study. This study defines surviving companies as companies that are actively trading and are at their ultimate performance post-IPO. Companies encountering any hiccups5 along their journey as listed companies are indicated as non-surviving companies. In line with past studies (Espenlaub et al., 2012; Neneh & Smit, 2014; Pour, 2015; Pommet, 2017), the companies’ survival is the companies’ time-to-survive, which is the duration from companies’ listing date until the end time that the companies have survived, expressed in months. Additionally, the estimation of companies’ survival time includes the observation of censored data. Thus, using a binary variable is also necessary to denote whether an observation is a censored observation or not. According to Cleves et al. (2016), the companies’ survival time is often right-censored, which means that the endpoint of the survival is unobserved (covers only until the end of the observation period). In measuring the companies’ survival time, this study requires to include not only the companies’ time-to-survive but also the binary variable (“1” or “0”). Step 1 and Step 2 show the estimation of companies’ survival time.
Step 1: Survival time of ith company.
STi = (t1i – t0i)where,
STi = survival time of ith companyt1i = last month of survival observation for ith companyt0i = listing date (or month) of ith company.
Step 2: Denotation of the censored observation.
DSurvivei = IF [Censored = “1”]
[ Non-Censored = “0”]
where,
DSurvivei = censored data of ith company using dummy survive.
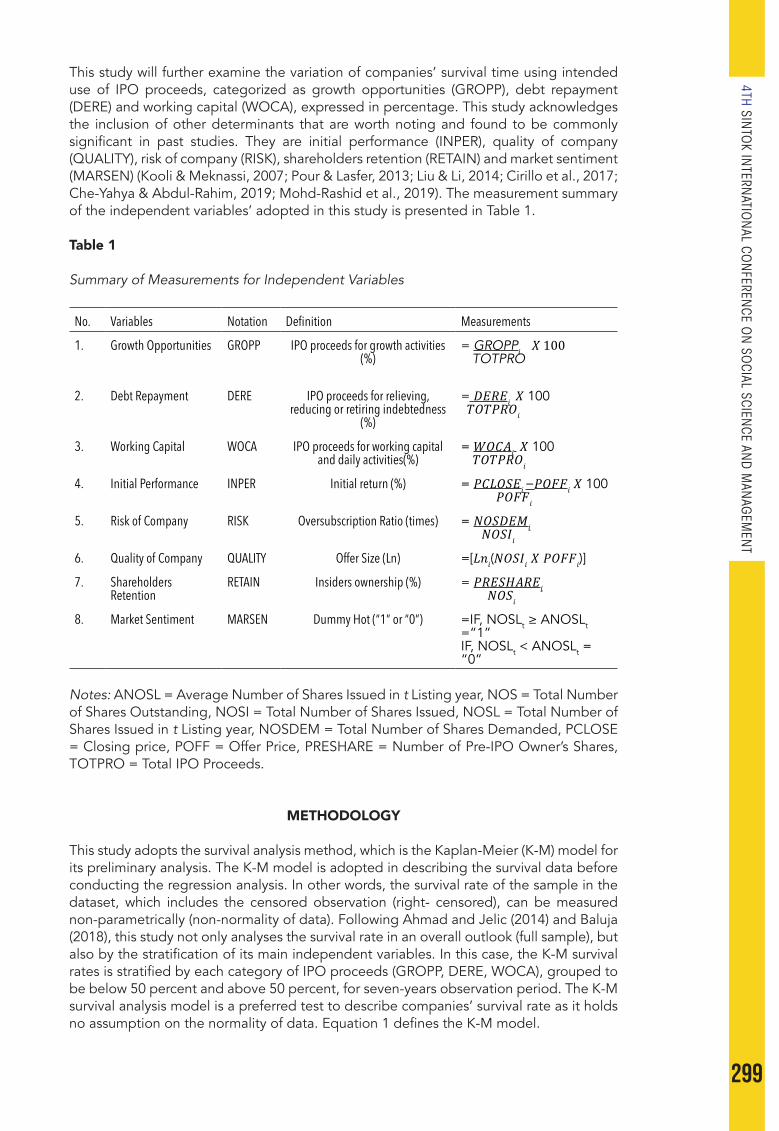
299
4TH SINTO
K INTERN
ATION
AL CON
FERENCE O
N SO
CIAL SCIENCE AN
D M
ANAG
EMEN
T
This study will further examine the variation of companies’ survival time using intended use of IPO proceeds, categorized as growth opportunities (GROPP), debt repayment (DERE) and working capital (WOCA), expressed in percentage. This study acknowledges the inclusion of other determinants that are worth noting and found to be commonly significant in past studies. They are initial performance (INPER), quality of company (QUALITY), risk of company (RISK), shareholders retention (RETAIN) and market sentiment (MARSEN) (Kooli & Meknassi, 2007; Pour & Lasfer, 2013; Liu & Li, 2014; Cirillo et al., 2017; Che-Yahya & Abdul-Rahim, 2019; Mohd-Rashid et al., 2019). The measurement summary of the independent variables’ adopted in this study is presented in Table 1.
Table 1 Summary of Measurements for Independent Variables
No. Variables Notation Definition Measurements
1. Growth Opportunities GROPP IPO proceeds for growth activities (%)
= GROPP𝑖 𝑋 1 0 0 TOTPRO
2. Debt Repayment DERE IPO proceeds for relieving, reducing or retiring indebtedness
(%)
= 𝐷𝐸𝑅𝐸𝑖 𝑋 100 𝑇𝑂𝑇𝑃𝑅𝑂𝑖
3. Working Capital WOCA IPO proceeds for working capital and daily activities(%)
= 𝑊𝑂𝐶𝐴𝑖 𝑋 100 𝑇𝑂𝑇𝑃𝑅𝑂𝑖
4. Initial Performance INPER Initial return (%) = 𝑃𝐶𝐿𝑂𝑆𝐸𝑖 −𝑃𝑂𝐹𝐹𝑖 𝑋 100 𝑃𝑂𝐹𝐹𝑖
5. Risk of Company RISK Oversubscription Ratio (times) = 𝑁𝑂𝑆𝐷𝐸𝑀𝑖 𝑁𝑂𝑆𝐼𝑖
6. Quality of Company QUALITY Offer Size (Ln) =[𝐿𝑛𝑖(𝑁𝑂𝑆𝐼𝑖 𝑋 𝑃𝑂𝐹𝐹𝑖)]
7. Shareholders Retention
RETAIN Insiders ownership (%) = 𝑃𝑅𝐸𝑆𝐻𝐴𝑅𝐸𝑖 𝑁𝑂𝑆𝑖
8. Market Sentiment MARSEN Dummy Hot (“1” or “0”) =IF, NOSLt ≥ ANOSLt =“1” IF, NOSLt < ANOSLt = “0”
Notes: ANOSL = Average Number of Shares Issued in t Listing year, NOS = Total Number of Shares Outstanding, NOSI = Total Number of Shares Issued, NOSL = Total Number of Shares Issued in t Listing year, NOSDEM = Total Number of Shares Demanded, PCLOSE = Closing price, POFF = Offer Price, PRESHARE = Number of Pre-IPO Owner’s Shares, TOTPRO = Total IPO Proceeds.
METHODOLOGY
This study adopts the survival analysis method, which is the Kaplan-Meier (K-M) model for its preliminary analysis. The K-M model is adopted in describing the survival data before conducting the regression analysis. In other words, the survival rate of the sample in the dataset, which includes the censored observation (right- censored), can be measured non-parametrically (non-normality of data). Following Ahmad and Jelic (2014) and Baluja (2018), this study not only analyses the survival rate in an overall outlook (full sample), but also by the stratification of its main independent variables. In this case, the K-M survival rates is stratified by each category of IPO proceeds (GROPP, DERE, WOCA), grouped to be below 50 percent and above 50 percent, for seven-years observation period. The K-M survival analysis model is a preferred test to describe companies’ survival rate as it holds no assumption on the normality of data. Equation 1 defines the K-M model.

300
S(ti) = S(ti-1) ( ) (1)Where,S(ti) = probability of surviving in month ti
S(ti-1) = probability of surviving in month ti-1
i = sample size at the month beginning ti
di = sample size at the month beginning ti
This study tests its developed hypotheses by employing the survival regression analysis method using the Accelerated Failure Time (AFT) model as it focuses more on the time-to-survive rather than the probability of failure by specifying its underlying distribution (i.e., Weibull, Exponential, Log-normal, Log-logistics and Gamma) (Cleves et al., 2016). This study will employ the Akaike Information Criterion (AIC) test in identifying the better-fit model with the lowest AIC value. In ensuring that the estimation of companies’ survival time is consistent, the AFT model captures both the time-to-survive and the censored data. Typically, the AFT model is expressed in terms of a log-linear function in which the survival time will be transformed to the natural logarithm (Bradburn et al., 2003; Hensler et al., 1997). In the AFT model, the exponential estimated coefficient exp(ƩβiXi) acts as an ‘acceleration’ or ‘deceleration’ factor, whereby the effect of the independent variable acts as to extend or shrink the length of the survival time. The AFT regression model for this study is specified as follows:
Ln(STi) = α +β1GROPPi + β2DEREi + β3WOCAi + β4INPERi + β5RISKi + β6QUALITYi + β7 RETAINi + β8MARSENi + ℇi
where,Ln(ST) = natural logarithm of time-to-survive (in months).
I = ith company.α = constant term.β = coefficient of the respective independent variable.GROPP = growth opportunities.DERE = debt repayment.WOCA = working capital.INPER = initial performance.RISK = risk of company.QUALITY = quality of company.RETAIN = shareholders retention.HOT = market sentiment.ℇi = error term.
RESULTS AND DISCUSSION
Variance Inflation Factor
Table 2 presents the variance inflation factors (VIFs) as to address the multicollinearity issue. The value of VIFs ranges are from 1 to 2, reporting a moderate correlation between the independent variables adopted. Following Ahmad et al. (2021), the cut-off point indicating a severe multicollinearity issue is 5. Since Table 2 portrays none of the VIF exceeding the cut-off point, there exist no severe multicollinearity issue between the predictors employed in this study.
Kaplan-Meier Survival Estimates
Using Equation (1), this study estimates the survival rates of companies over the observation period of seven years, from 2000 to 2014, between full sample (Panel A) and categories of IPO proceeds (Panel B). The survival rates across panels vary substantially.

301
4TH SINTO
K INTERN
ATION
AL CON
FERENCE O
N SO
CIAL SCIENCE AN
D M
ANAG
EMEN
T
Referring to Panel A of Table 3, out of 430 companies, 82.09 percent of companies remain survived in the first year of listing. About 17.91 percent of companies have difficulties surviving in the first year post-IPO. In the third-year post-IPO, the survival rate of companies falls to 69.30 percent, which is by 12.79 percent from the first-year of listing. Regularly, the survival rate plunges lower in the fifth year of listing, at 59.77 percent and seventh year of listing, at 53.24 percent. The finding shows that it takes 102 months for half of the companies in this study’s sample (50 percent of companies) to be as non-surviving companies post-IPO. In comparison, this study reports lower survival rates than found, both developed and developing markets in past studies (Schultz, 1993; Kooli & Meknassi, 2007; Chou et al., 2013; Ahmad & Jelic, 2014; Espenlaub et al., 2016). The survival rate of companies reported is also relatively lower than the survival rate of companies found in the recent studies conducted (Shari, 2019 and Ahmad et al., 2021) in the Malaysian market throughout the seven years observation. To justify, the definition of surviving companies in past studies to that of surviving companies applied in this study is dissimilar, i.e., actively traded companies at their ultimate performance. Therefore, it is crucial to understand that the survival rate of companies reported in all studies should vary according to the definition of surviving companies each study exclusively adopts.
Noticeable in Panel B of Table 3, this study breaks down the companies’ survival rates and times by different category of IPO proceeds (i.e. allocation of IPO proceeds below 50 percent and IPO proceeds above 50 percent for each category). The survival rates of companies in GROPP, DERE and WOCA is consistently higher for allocation of IPO proceeds to each category that is lower than 50 percent compared to IPO proceeds higher than 50 percent on the seventh year post-IPO. For instance, the survival rate of companies with allocation of GROPP lesser than 50 percent is continuously higher than allocation that is more than 50 percent throughout the seven-year observation period. In comparison, IPO proceeds intended for DERE shows that the survival rate of companies with more than 50 percent is moderately higher for the first two years post-IPO, subsequently turning lower than allocation of IPO proceeds to DERE below than 50 percent throughout the remaining five years. Similarly, IPO proceeds intended for WOCA shows that the survival rate of companies with lesser than 50 percent of WOCA to have higher survival rates from the second year to the seventh year post-IPO. Companies going public with intended use of proceeds lesser than 50 percent for all categories experience higher 14 months to 23 months survival times. This shows that limiting that distribution of intended use of IPO proceeds to each category is crucial for the companies’ longevity in the long-run. Overall, results from Table 3 visualize the importance of intended use of IPO proceeds for the survival of companies listed in the Malaysian market.
Multiple Regression Analysis using AFT Model
Using Equation (2), Table 4 reports the inferential statistics by employing the AFT model for companies listed in the Malaysian market from 2000 to 2014. This study chooses the Weibull Distribution based on the lowest AIC value among other distributions at 819.92. A p-value above 0.05 indicates a correctly specified model (Asteriou & Hall, 2011). Overall, this model includes reasonable determinants, measured by the Link test p-value of 0.44. Consistently, the p-value of ln(p) exhibits that this model is fit.

302
Table 2
Variance Inflation Factors
Variables VIF
GROPP 2.10
DERE 1.80
WOCA 1.50
INPER 1.20
RISK 1.18
QUALITY 1.16
RETAIN 1.16
MARSEN 1.07
Notes: This table reports the correlation coefficient of the independent variables adopted in this study. It is to observe if the sample is free from multicollinearity issue, or otherwise.
Table 3
Survival Rates of Companies Post-IPO
Categories No. of Companies Cumulative Survival Rates (%)
ST Median (50%)
Year 1 Year 2 Year 3 Year 4 Year 5 Year 6 Year 7
Panel A: Full Sample
Total 430 82.09 74.65 69.30 63.26 59.77 56.28 53.24 102
Panel B: Category of IPO Proceeds
Growth Opportunities
(0% -50%) 252 83.33 74.21 71.83 64.68 60.71 57.94 55.16 104
(51% - 100%) 178 80.34 75.28 65.73 61.24 58.43 53.93 50.54 90
Debt Repayment
(0% -50%) 381 81.63 74.54 68.77 63.25 59.58 56.43 53.79 104
(51% - 100%) 49 85.71 75.51 73.47 63.27 61.22 55.10 48.98 82
Working Capital
(0% -50%) 314 81.53 76.75 70.38 64.97 61.46 57.64 54.77 104
(51% - 100%) 116 83.62 68.97 66.38 58.62 55.17 52.59 49.14 81
Notes: This table shows the cumulative survival rates of companies listed from 2000 to 2014 using the Kaplan-Meier survival analysis model for seven years of observation. Panel A reports the survival rates of full sample of companies included in this study (430 companies) and Panel B across different category of intended use of IPO proceeds (i.e., above 50% and below 50%). This table reports the survival time (ST) median in months. Following Ahmad and Jelic (2014), this study uses 50% for the ST to show how long (in months) the companies fall below 50% post-IPO.
The coefficient on the GROPP is negative and significant with p-value of 0.03. The time ratio of 0.9958 associated with the GROPP means that for a 1 percent increase in GROPP, the survival time decelerates by 0.42 percent (100 percent - 99.58 percent). A higher
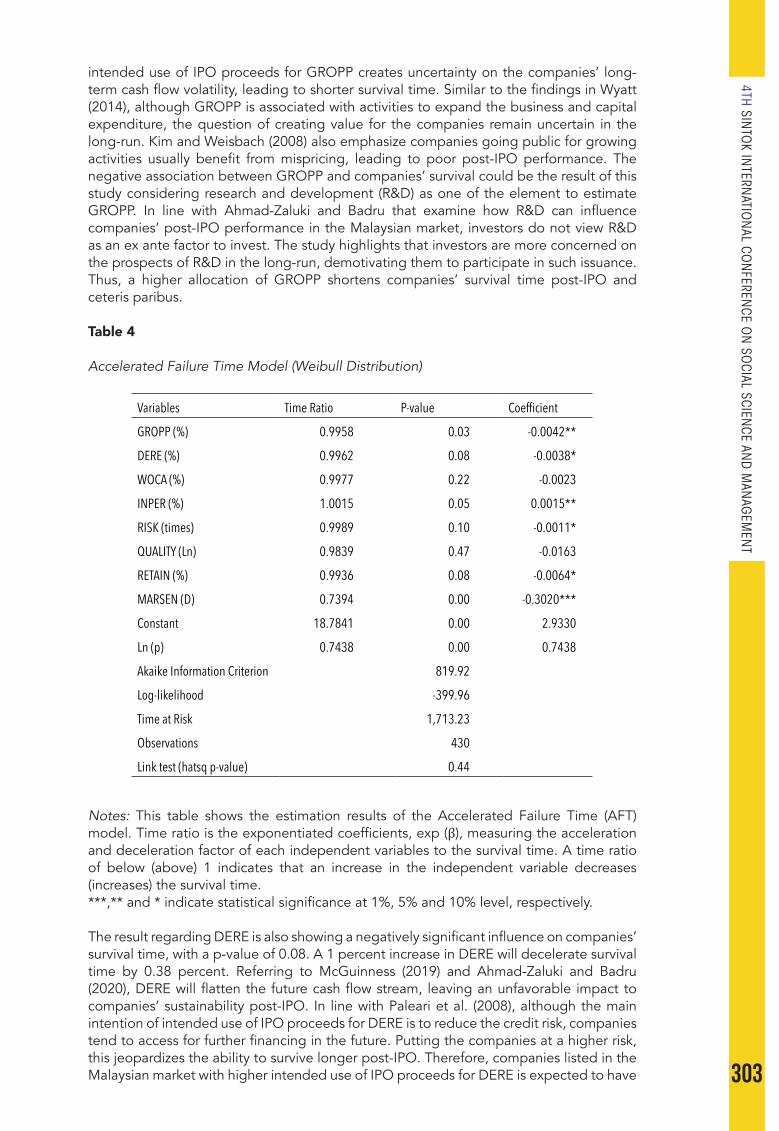
303
4TH SINTO
K INTERN
ATION
AL CON
FERENCE O
N SO
CIAL SCIENCE AN
D M
ANAG
EMEN
T
intended use of IPO proceeds for GROPP creates uncertainty on the companies’ long-term cash flow volatility, leading to shorter survival time. Similar to the findings in Wyatt (2014), although GROPP is associated with activities to expand the business and capital expenditure, the question of creating value for the companies remain uncertain in the long-run. Kim and Weisbach (2008) also emphasize companies going public for growing activities usually benefit from mispricing, leading to poor post-IPO performance. The negative association between GROPP and companies’ survival could be the result of this study considering research and development (R&D) as one of the element to estimate GROPP. In line with Ahmad-Zaluki and Badru that examine how R&D can influence companies’ post-IPO performance in the Malaysian market, investors do not view R&D as an ex ante factor to invest. The study highlights that investors are more concerned on the prospects of R&D in the long-run, demotivating them to participate in such issuance. Thus, a higher allocation of GROPP shortens companies’ survival time post-IPO and ceteris paribus.
Table 4
Accelerated Failure Time Model (Weibull Distribution)
Variables Time Ratio P-value Coefficient
GROPP (%) 0.9958 0.03 -0.0042**
DERE (%) 0.9962 0.08 -0.0038*
WOCA (%) 0.9977 0.22 -0.0023
INPER (%) 1.0015 0.05 0.0015**
RISK (times) 0.9989 0.10 -0.0011*
QUALITY (Ln) 0.9839 0.47 -0.0163
RETAIN (%) 0.9936 0.08 -0.0064*
MARSEN (D) 0.7394 0.00 -0.3020***
Constant 18.7841 0.00 2.9330
Ln (p) 0.7438 0.00 0.7438
Akaike Information Criterion 819.92
Log-likelihood -399.96
Time at Risk 1,713.23
Observations 430
Link test (hatsq p-value) 0.44
Notes: This table shows the estimation results of the Accelerated Failure Time (AFT) model. Time ratio is the exponentiated coefficients, exp (β), measuring the acceleration and deceleration factor of each independent variables to the survival time. A time ratio of below (above) 1 indicates that an increase in the independent variable decreases (increases) the survival time. ***,** and * indicate statistical significance at 1%, 5% and 10% level, respectively.
The result regarding DERE is also showing a negatively significant influence on companies’ survival time, with a p-value of 0.08. A 1 percent increase in DERE will decelerate survival time by 0.38 percent. Referring to McGuinness (2019) and Ahmad-Zaluki and Badru (2020), DERE will flatten the future cash flow stream, leaving an unfavorable impact to companies’ sustainability post-IPO. In line with Paleari et al. (2008), although the main intention of intended use of IPO proceeds for DERE is to reduce the credit risk, companies tend to access for further financing in the future. Putting the companies at a higher risk, this jeopardizes the ability to survive longer post-IPO. Therefore, companies listed in the Malaysian market with higher intended use of IPO proceeds for DERE is expected to have
304
shorter survival time post-IPO. To add, no association is predicted between WOCA and companies’ survival time.
This study also controls for INPER, RISK QUALITY, RETAIN and MARSEN when examining the role of the intended use of IPO proceeds on the survival of companies post-IPO. Higher INPER positively affects the survival time of companies with a p-value of 0.05. A 1 percent increase of initial performance will accelerate companies’ survival time by 0.2 percent (1.0015 -1). Comparable to Schultz (1993) and Hensler et al. (1997), companies with higher first day return exhibits that the market value of the companies’ future undertakings is larger than what has been pre-anticipated. Relatively, companies with higher INPER are better effort companies with additional capital to invest post-IPO, leading to higher chance of surviving in the long-run (Schultz, 1993). Referring to Abdul Rahman and Che-Yahya (2019), it is crucial for companies to perform well at their early stage to sustain in the long-run. Accordingly, this study also finds that it is important for companies to have high INPER for an extended survival time post-IPO.
RISK and RETAIN are both found significant and negatively affecting companies’ survival time post-IPO at p-value of 0.10 and 0.08. A 1 time and 1 percent increase in RISK and RETAIN will decelerate companies’ survival time by 0.11 percent and 0.64 percent. As risk is inevitable and companies are prone to experience it, the findings show that risk is to reduce for a longer survival time post-IPO. Companies with higher oversubscription can lead to a favorable outcome in the immediate aftermarket, but face problems maintaining their performance in the long-run (Kumar & Sahoo, 2021). Similar to McGuinness (2019) and Ahmad et al. (2021), RISK shrinks the survival time of companies in the long-run.
Contrary to Peristiani and Hong, 2004, Chancharat et al., 2012, Ahmad and Jelic, 2014, this study reveals that RETAIN decelerates survival time. Usually, in a situation with high information asymmetry, investors will usually refer to the action and commitment of the insiders in order to make their investment strategies (Mohd-Rashid et al., 2019). However, in the case of companies’ survival time in the Malaysian market, higher RETAIN leads to shorter survival time. This can be supported by an argument made by Fan (2007) that higher RETAIN leads to higher tendency of manipulation on the companies’ value. When insiders are aware of the companies’ true quality (i.e., low-quality), they retain their shareholdings in the early stage to portray otherwise. Although this might help with the immediate aftermarket performance, low-quality companies have little chance of surviving long post-IPO due to the demanding requirements (Baluja & Singh, 2016). Therefore, companies with lower RETAIN shall experience longer survival time.
MARSEN is found to be significant at 1 percent level, negatively influencing companies’ survival time post-IPO. Hensler et al. (1997) and Kooli & Meknassi (2007) argue that opportunistic companies usually will decide on their entrance to the market during good market sentiment. The opportunistic companies practice the bandwagon effect to benefit from investors’ optimism and gain higher returns (Baluja & Singh, 2016). However, similar argument as RETAIN, the rough aftermarket condition and high expectations for public listed companies leave the companies struggling to sustain, resulting to a shorter survival time.
CONCLUSION AND RECOMMENDATIONS
This study examines the determinants of companies’ survival in the Malaysian market by estimating with an AFT model. As hypothesized, GROPP and DERE have negative impact on the survival time of companies post-IPO. WOCA portrays no significant influence on survival time. This study concludes that the prospectus information on the intended use of IPO proceeds is useful in predicting companies’ survival time. In line with the findings of this study, it recommends that the disclosure of companies play a crucial role to ensure that companies are able to survive longer post-IPO, specifically in the Malaysian market. By classifying the intended use of IPO proceeds to three designated categories: GROPP, DERE and WOCA, this study observes that the intended use of IPO proceeds serves as an
305
4TH SINTO
K INTERN
ATION
AL CON
FERENCE O
N SO
CIAL SCIENCE AN
D M
ANAG
EMEN
T
ex ante uncertainty surrounding the future success of companies due to the uncertainty of cash flow volatility in the long-run. Likewise, companies should be able to strategically allocate the raised IPO proceeds to create value and reduce the risk of financing for a longer survival time.
It is also worth highlighting that the findings in this study are relevant to interested parties such as the (long-term) investors and policymakers in the survivability of companies in the Malaysian market. The findings suggest that it is essential for the parties to look closely at the information that is available in the prospectus to be informed of the companies’ future directions. Policymakers such as Bursa Malaysia will find additional insights by monitoring not only the companies’ current endeavours but also the companies’ initial planning of their future undertakings. Finally, it can be suggested that future studies examine other relevant companies’ prospectus information as possible predictors to companies’ survival post-IPO (e.g., risk factors).
ACKNOWLEDGEMENT
This study would like to acknowledge that this article is part of a research project funded by Universiti Teknologi MARA (UiTM). Project ID: 600-RMC/MYRA 5/3/LESTARI (038/2020).
REFERENCES
Abdul-Rahim, R., & Che-Embi, N. A. (2013). Initial returns of shariah versus non-shariah IPOs: Are there any differences? Jurnal Pengurusan, 39, 37-50.
Abdul Rahman, S. S., & Che-Yahya, N. (2019). Initial and long-term performance of IPOs. Does growth opportunity of issuing firm matter? Journal of Business and Eonomic Horizons, 15(2), 276-291. doi:http://dx.doi.org/10.15208/beh.2019.17.
Ahmad-Zaluki, N. A., & Badru, B. O. (2020). Intended use of IPO proceeds and initial returns. Journal of Financial Reporting and Accounting, 36(3). doi:http://dx.doi.org/10.1108/JFRA-12-2019-0172.
Ahmad, I., Ismail, I., & Shaharuddin, S. S. (2021). Predictive role of ex ante strategic firm characteristics for sustainable initial public offering survival. Sustainability, 13(14). doi:https://doi.org/10.3390/su13148063.
Ahmad, W., & Jelic, R. (2014). Lockup agreements and survival of UK IPOs. Journal of Business Finance & Accounting, 41(5-6), 717-742. doi:https://doi.org/10.1111/jbfa.12068.
Amor, S. B., & Kooli, M. (2017). Intended use of proceeds and post-IPO performance. The Quarterly Review of Economics and Finance, 65, 168-181. doi:https://doi.org/10.1016/j.qref.2016.09.001.
Andriansyah, A., & Messinis, G. (2016). Intended use of IPO proceeds and firm performance: A quantile regression approach. Pacific-Basin Finance Journal, 36, 14-30. doi:http://dx.doi.org/10.1016/j.pacfin.2015.12.001.
Asteriou, D., & Hall, S. G. (2011). Applied Econometrics (Second ed.): Palgrave Macmillan. Autore, D. M., Bray, D. E., & Peterson, D. R. (2009). Intended use of proceeds and the
long-run performance of seasoned equity issuers. Journal of Corporate Finance, 15(3), 358-367. doi:https://doi.org/10.1016/j.jcorpfin.2008.12.003.
Badru, B. O. (2021). Decomposition of intended use of initial public offering proceeds: Evidence from Malaysia. Gadjah Mada International Journal of Business, 23(1), 76-90.
Balatbat, M. C., & Bertinshaw, S. (2008). Use of proceeds disclosures in IPO prospectuses: Do issuers come clean? The FINISIA Journal of Applied Finance, 2, 17-21.
Baluja, G. (2018). Does size matter for IPO survival? Empirical evidence from India. Vision: The Journal of Business Perspective, 22(1), 88-104. doi:https://doi.org/10.1177/0972262917750249.
Baluja, G., & Singh, B. (2016). The survival analysis of initial public offerings in India. Journal of Advances in Management Research, 13(1).
306
Baluja, G., & Singh, B. (2019). The impact of market conditions on the aftermarket survival of initial public offerings in India: An accelerated failure time approach. The IUP Journal of Financial Risk Management, 16(2), 7-30.
Bradburn, M. J., Clark, T. G., Love, S. B., & Altman, D. G. (2003). Survival analysis part II: Multivariate data analysis: An introduction to concepts and methods. Br J Cancer, 89(3), 431-436.
Bursa Malaysia. (2021). Selection of FTSE Bursa Malaysia KLCI Constituents. Carlson, M., Fisher, A., & Giammarino, R. (2004). Corporate investment and asset price
dynamics: Implications for the cross-section of returns. The Journal of Finance, 59(6), 2577-2603.
Chancharat, N., Krishnamurti, C., & Tian, G. (2012). Board structure and survival of new economy IPO firms. Corporate Governance: An International Review, 20(2), 144-163.
Che-Yahya, N., & Abdul-Rahim, R. (2019). Moderating effect of information asymmetry on the signalling role of IPO lockup provision. Global Business Review, 20(4), 917-930. doi:https://doi.org/10.1177/ 0972150919844906.
Che-Yahya, N., & Matsuura, Y. (2021). Does individual investors’ sentiment explain Japanese IPO aftermarket performance? Journal of Asian Finance, Economics and Business, 8(4), 1079-1090. doi:10.13106/jafeb.2021.vol8.no4.1079.
Chin-Chi, L. (2020). Intended use of proceeds and long-run performance of reverse mergers: Evidence from Taiwan. Journal of Economics and Management, 16, 33-49.
Chou, T.-K., Cheng, J.-C., & Chien, C.-C. (2013). How useful is venture capital prestige? Evidence from IPO survivability. Small Business Economics, 40(4), 843-863. doi:10.1007/s11187-011-9389-5.
Cirillo, A., Mussolino, D., Romano, M., & Viganò, R. (2017). A complicated relationship: Family involvement in the top management team and post-IPO survival. Journal of Family Business Strategy, 8(1), 42-56. doi:10.1016/j.jfbs.2017.01.004.
Cleves, M., Gould, W. W., & Marchenko, Y. V. (2016). An introduction to survival analysis using stata (Revised 3rd ed.). Stata Press.
Dziczkowski, M. (2020). Strategies for going public. https://www2.deloitte.com/content/dam/Deloitte/us/ Documents/risk/strategies-for-going-public-5th-edition-update.pdf.
Espenlaub, S., Goyal, A., & Mohamed, A. (2016). Impact of legal institutions on IPO survival: A global perspective. Journal of Financial Stability, 25, 98-112.
Espenlaub, S., Khurshed, A., & Mohamed, A. (2012). IPO survival in a reputational market. Journal of Business Finance & Accounting, 39(3-4), 427-463. doi:https://doi.org/10.1111/j.1468-5957.2012.02280.x.
Fan, Q. (2007). Earnings management and ownership retention for initial public offering firms: Theory and evidence. The Accounting Review, 82(1), 27-64. 16
Hamza, O., & Kooli, M. (2010). Does venture capitalists reputation improve the survival profile of IPO firms? Paper presented at the Multinational Finance Society Conference.
Helbing, P. (2019). A review on IPO withdrawal. International Review of Financial Analysis, 62, 200-208. doi:10.1016/j.irfa.2018.09.001.
Hensler, D. A., Rutherford, R. C., & Springer, T. M. (1997). The survival of initial public offerings in the aftermarket. The Journal of Financial Research, 20(1), 93-110.
Iwasaki, I., & Kočenda, E. (2019). Survival of service firms in European emerging economies. Applied Economics Letters, 27(4), 340-348. doi:10.1080/13504851.2019.1616053.
Jain, B. A., & Kini, O. (2000). Does the presence of venture capitalists improve the survival profile of IPO firms? Journal of Business Finance & Accounting, 27(9&10), 1139-1176.
Kao, L., & Chen, A. (2020). How A pre-IPO audit committee improves IPO pricing efficiency in an economy with little value uncertainty and information asymmetry. Journal of Banking & Finance, 110, 1-15. doi:10.1016/j.jbankfin.2019.105688.
Kecskés, A., & Halász, V. (2015). The role of prospectus documentation and prospectus liability. Pravni Vjesnik, 31(3-4), 167-184.
Kim, W., & Weisbach, M. (2008). Motivations for public equity offers: An international perspective☆. Journal of Financial Economics, 87(2), 281-307. doi:10.1016/j.jfineco.2006.09.010.
Kooli, M., & Meknassi, S. (2007). The survival of U.S. IPO issuers 1985-2005. The Journal of Wealth Management, 10(2).
307
4TH SINTO
K INTERN
ATION
AL CON
FERENCE O
N SO
CIAL SCIENCE AN
D M
ANAG
EMEN
T
Kumar, A., & Sahoo, S. (2021). Do anchor investors affect long run performance? Evidence from Indian IPO markets. Pacific Accounting Review, 33(3), 322-346. doi:https://doi.org/10.1108/PAR-09-2020-0149.
Lamberto, A. P., & Rath, S. (2010). The survival of initial public offerings in Australia. The International Journal of Business and Finance Research, 4(1), 133-147.
Leone, A. J., Rock, S., & Willenborg, M. (2007). Disclosure of intended use of proceeds and underpricing in initial public offerings. Journal of Accounting Research, 45(1), 111-153. doi:https://doi.org/10.1111/j.1475-679X.2006.00229.x.
Liu, J., & Li, D. (2014). The life cycle of initial public offering companies in China. Journal of Applied Accounting Research, 15(3), 291-307.
Loughran, T., & Ritter, J. (2004). Why has IPO underpricing changed over time? Financial Management, 33(3), 5-37.
Luo, X. (2009). Quantifying the long-term impact of negative word of mouth on cash flows and stock prices. Marketing Science, 28(1), 148-165. doi:10.1287/mksc.1080.0389.
McGuinness, P. B. (2019). Risk factor and use of proceeds declarations and their effects on IPO subscription, price ‘fixings’, liquidity and after-market returns. The European Journal of Finance, 25(12), 1122-1146. doi:10.1080/1351847X.2019.1572023. 17

308
SICONSEM 2021: 105-069
RISK MANAGEMENT PRACTICES IN MALAYSIAN PUBLIC LISTED COMPANY: A CONCEPT PAPER
1Saifulrizan Norizan, 2Fazlida Mohd Razali, 3Nadiah Abd Hamid & 4Dayangku Ruhayah Awang Bolhan
1&4Faculty of Accountancy, UiTM Cawangan Sarawak, Kota Samarahan, Sarawak, Malaysia
2&3Faculty of Accountancy, UiTM Shah Alam, Selangor, Malaysia
Corresponding author: [email protected]
ABSTRACT
Risk management in publicly listed companies is not an easy task. Several critical processes should be implemented by management in identifying and assessing all types of risks that have a significant impact on the operations and values. Past studies revealed that two (2) factors are vital in managing risks in large companies: commitment and support from top management. Hence, this paper aims to explore the literature findings on the effect of commitment and support from top management that affects enterprise risk management (ERM) practices of Malaysia’s publicly listed companies. This is because this practice will become the best standard for the organisation, primarily for the companies with high-risk exposure. One of the few studies on risk management among companies in emerging economies provides an understanding of the factors of the ERM practices to the organisation, such as commitment and support from top management. The data will be collected using a survey questionnaire and addressed to top management officers of the Malaysian public listed companies. The findings in this study provide an understanding to the Malaysian public listed firms on the importance of ERM effectiveness in managing risk within the companies. Subsequently, it helps to maximise the benefits of ERM to their stakeholders and regulatory improvement in the future.
Keywords: Commitment and support from top management, enterprise risk management, Malaysia public listed companies, risk, stakeholders.
INTRODUCTION
Public-listed companies that operate in Malaysia are critical in developing the national economy since it has a strategic role, especially in offering new business and contributing seriously to boost gross domestic products. Public-listed companies are exposed to a lot of risks every day in their daily activities. Organisations all over the world are exposed to a range of risks every day, varying from market and compliance risk to operational and reputational risk (Bakar, Rasid, and Rizal, 2016). Among emerging risks Malaysian organisations face are business interruption and economic slowdown risk (Tan and Lee, 2021)as well as the business environment. This paper aims to investigate the top risks faced by small and medium-sized enterprises (SMEs. Among factors that raised the awareness of companies about the possible benefits of risk management are uncertainties and intense competition from the effect of globalisation and market liberalisation (Azizan and Lai, 2013) and stakeholder pressure (Schäfer, Hirsch, and Nitzl, 2021). Abdul Rahman, Wang, and Mohamad (2015) stated that risk management can be defined as three (3) processes: identifying, assessing, evaluating, and managing risks. While Gajewska and Ropel (2011) described risk management as a systematic application of management policies, processes, and procedures to identify, analyse, assess, treat, monitor, and communicate the risk that arises within the company. Other researchers such as Liu and Low (2009), Siang and Ali (2012), Mahendra et al. (2013), and Hamzah et al. (2015) defined risk management as a three (3) significance process, namely identifying, assessing, evaluating and managing risks. They also defined risk management as a set
29
309
4TH SINTO
K INTERN
ATION
AL CON
FERENCE O
N SO
CIAL SCIENCE AN
D M
ANAG
EMEN
T
of methods established to control the influences from risks and uncertainties and ensure the effectiveness and efficiency of the process. Risk management aims to identify sources of risk and uncertainty, determine their impact, and develop proper management action. The main obstacle for companies is to ensure successful risk management (Ali et al., 2018).
Empirical evidence on factors that influences the ERM effectiveness by other researchers is still scarce until today. According to Al-Amri and Davydov (2016), Arnold, Benford, Canada and Sutton (2011), Gordon, Loeb, and Tseng (2009), Nair, Rustambekov, McShane, and Fainshmidt (2014), and Paape and Spekle (2012), most of the studies on ERM effectiveness were undertaken in Western countries compared to the other countries in Asian which is limited and scarce. For example, Laisasikorn and Rompho (2014) found that there is a weak positive relationship between the financial performance of the Thai-listed company and the successful ERM system. While Jalal, Al Bayati, and Al Buainain (2011) showed that the majority of Bahrain’s banking sectors have efficiency in terms of ERM framework. While according to Dabari and Saidin (2015), ERM has gained increased attention in recent years and has become a subject of interest to the stakeholders in the business world.
Commitment and support from top management are among the significant determinants that influence ERM effectiveness. This is a scarce and limited topic studied by researchers, whether in Malaysia or overseas. A recent study by Schäfer et al. (2021) found that top management support is crucial for risk management practices. Hartnell, Ou, and Kinicki (2011), Laforet (2016), and Togok (2016) stated that a lot of researchers have already developed several frameworks in this ERM effectiveness. These frameworks are only focused on top management support on ERM effectiveness (Togok, 2016). However, these frameworks are not driven by competency and reward and recognition considerations simultaneously. This study only focuses on the top management of the Malaysian public listed company, as suggested by Dabari and Saidin (2016). Future research is necessary to evaluate the ERM implementation and its effectiveness using the management as respondents. However, previous researchers only focused on the other determining factors such as involvement, structure, enterprise systems, and the strategic role of ERM champions in the same framework in testing the effects on ERM effectiveness. On the other hand, the purpose of this current study is to identify variables that are commitment and support from top management in influencing ERM effectiveness in managing the risk of the companies.
The main purpose of this study is to identify the contributing factors that influence ERM effectiveness to a publicly listed company in Malaysia. For example, commitment and support from top management will be identified in this study. Also, this study aims to test the relationship between the effectiveness of ERM and contributing factors in managing risk within the company. This study investigates these relationships using Malaysian public listed companies as a sample.
LITERATURE REVIEW
Overview of the Enterprise Risk Management (ERM)
Nowadays, enterprise risk management is recognised as a more holistic method as compared to traditional risk management. It provides a greater awareness to the organisations in facing the risk that arises from the business operation and the capability an organisation responds to the risk (Ali, Ab Hamid, and K Ghani, 2019). Risk management can be defined as the process of managing risk within an organisation by reducing return’s unpredictability. Hence, ensuring the sustainability of the organisation (Bogodistov and Wohlgemuth, 2017). In addition, the process of risk management involves three elements. The first element is risk identification, followed by risk assessment and finally managing any possible events that might detriment the organisation. On top of that, it also involves other processes such as underlying internal communication, decision-making, and monitoring (Hassan and Yazid, 2019).
310
Unfortunately, economic and global climate change affect the purpose and scope of risk management. Roslan and Dahan (2013) found that ERM is a new risk management practice because it started to increase attention in the global market when many organisations have begun to implement ERM effectively. Also, risk management can be explained as an approach in managing risk from an organisation-wide view in order to create an effective and sound risk management policy (Ali, Ab Hamid, and K Ghani, 2019). The main purpose of risk management is to maximise shareholders’ value (Lajili and Zeghal, 2005; Santhi and Gurunathan, 2014; Anyanwu et al., 2016; Jones and Mwakipsile, 2017; Mosbah, Serief, and Wahab, 2017; Malarvizhi, Nahar, and Manzoor, 2018, Le et al., 2018). According to Karanja (2017), COSO 2004 and ISO31000:2009 are two (2) main industry-sanctioned ERM models that organisations should focus on implementing ERM programs.
Previous studies about ERM also concentrate on the effects of ERM in terms of organisation performance (Arnaboldi and Lapsley, 2014; Rasid, Isa, and Ismail, 2014), factors of ERM adoption (Khan, Hussain, and Mehmood, 2016; Paape and Spekle, 2012), the effects of ERM practices on firm’s value (McShane, 2018) and internal audit involvement in ERM (Roslan and Dahan, 2013; Zwaan, Stewart, and Subramaniam, 2011).
Upper Echelons’ Theory
Upper Echelons’ Theory, as proposed by Hambrick and Mason (1984), discussed that the action of top management through the importance of their role to the organisation performance. Also, this theory disclosed that the decision making is influenced by managers’ characteristics which they make towards the organisation and realising the key goals organisation can be achieved through the strategic management practices and actions (Henderson, Miller, and Hambrick 2006). According to this theory, top management is comprised of functional background, education, and age. In this study, Upper Echelons’ Theory was used to explain how top management demographics affect the implementation of ERM that has an impact on organisational performance. According to Zenger and Lawrence (1989), the propositions of this theory have brought forth significant literature in research of the role of top management and performance, thus suggesting that top managers’ personal characteristics influence outcomes such as performance.
Definition of Top Management
Top management can be defined as a person who is responsible and accountable for managing, monitoring, and overseeing the entire organisation. Top management consists of senior-level executives of an organisation or those positions that hold the most responsibility. For example, Chief Operating Officer (COO), Chief Executive Officer (CEO), Chief Financial Officer (CFO), President, or Vice President are regularly used by top managers in organisations. According to Obiefuna (2014), top managers are different from other managers that responsible for none other than the owners of the resources used by the organisation. The designation top, middle, first-line categorises managers according to their vertical rank in the organisation (Obiefuna, 2014). According to Malaysia Code Corporate Governance 2017, the main functions of a board within the organisation are setting the appropriate tone at the top-level management, providing leadership, and championing good governance and ethical practices throughout the company.
Commitment and Support from Top Management
Top management is one of the main factors that contribute to the effectiveness of risk management in publicly listed companies. Hassan and Yazid (2019) stated that support from top management is the best determinant that has been debated and discussed broadly by researchers, especially in ERM studies, namely ERM adoption or ERM effectiveness. While according to Tzempelikos (2014), top management has a vital role in shaping organisations. In achieving the organisational goals, commitment and support from top management have been found to be the central aspect of risk management. It becomes among the crucial factors in managing risk effectively and
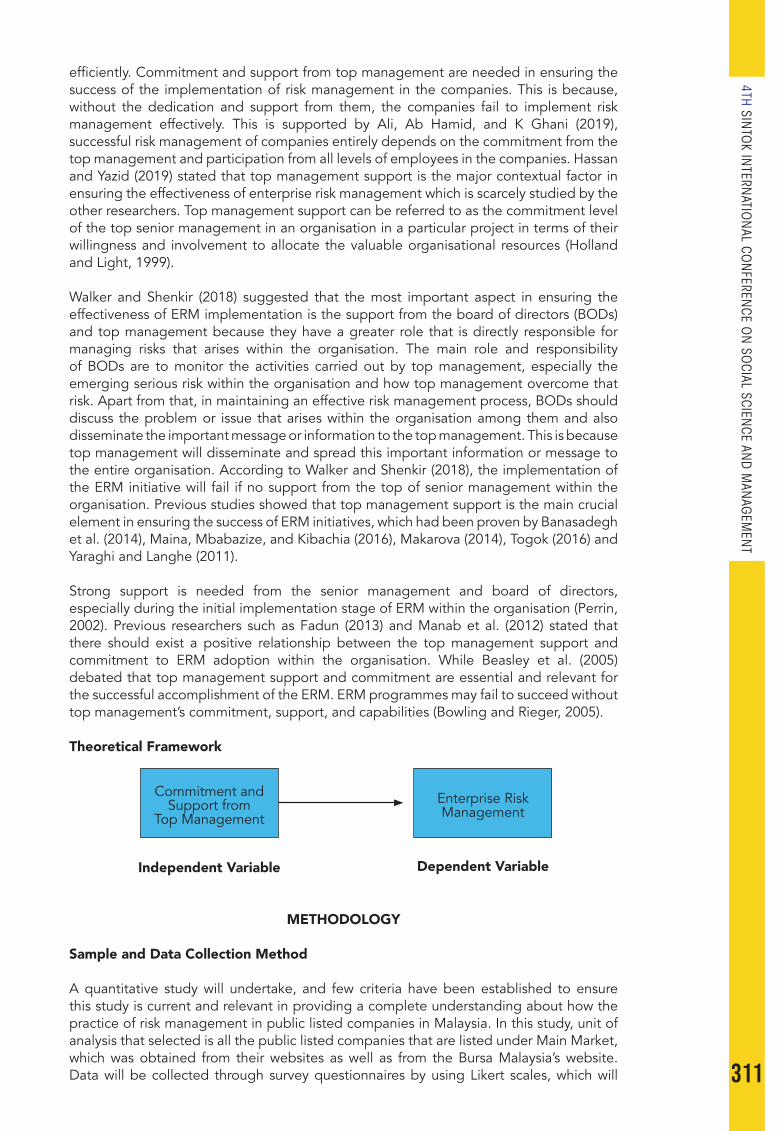
311
4TH SINTO
K INTERN
ATION
AL CON
FERENCE O
N SO
CIAL SCIENCE AN
D M
ANAG
EMEN
T
efficiently. Commitment and support from top management are needed in ensuring the success of the implementation of risk management in the companies. This is because, without the dedication and support from them, the companies fail to implement risk management effectively. This is supported by Ali, Ab Hamid, and K Ghani (2019), successful risk management of companies entirely depends on the commitment from the top management and participation from all levels of employees in the companies. Hassan and Yazid (2019) stated that top management support is the major contextual factor in ensuring the effectiveness of enterprise risk management which is scarcely studied by the other researchers. Top management support can be referred to as the commitment level of the top senior management in an organisation in a particular project in terms of their willingness and involvement to allocate the valuable organisational resources (Holland and Light, 1999).
Walker and Shenkir (2018) suggested that the most important aspect in ensuring the effectiveness of ERM implementation is the support from the board of directors (BODs) and top management because they have a greater role that is directly responsible for managing risks that arises within the organisation. The main role and responsibility of BODs are to monitor the activities carried out by top management, especially the emerging serious risk within the organisation and how top management overcome that risk. Apart from that, in maintaining an effective risk management process, BODs should discuss the problem or issue that arises within the organisation among them and also disseminate the important message or information to the top management. This is because top management will disseminate and spread this important information or message to the entire organisation. According to Walker and Shenkir (2018), the implementation of the ERM initiative will fail if no support from the top of senior management within the organisation. Previous studies showed that top management support is the main crucial element in ensuring the success of ERM initiatives, which had been proven by Banasadegh et al. (2014), Maina, Mbabazize, and Kibachia (2016), Makarova (2014), Togok (2016) and Yaraghi and Langhe (2011).
Strong support is needed from the senior management and board of directors, especially during the initial implementation stage of ERM within the organisation (Perrin, 2002). Previous researchers such as Fadun (2013) and Manab et al. (2012) stated that there should exist a positive relationship between the top management support and commitment to ERM adoption within the organisation. While Beasley et al. (2005) debated that top management support and commitment are essential and relevant for the successful accomplishment of the ERM. ERM programmes may fail to succeed without top management’s commitment, support, and capabilities (Bowling and Rieger, 2005).
Theoretical Framework
METHODOLOGY
Sample and Data Collection Method
A quantitative study will undertake, and few criteria have been established to ensure this study is current and relevant in providing a complete understanding about how the practice of risk management in public listed companies in Malaysia. In this study, unit of analysis that selected is all the public listed companies that are listed under Main Market, which was obtained from their websites as well as from the Bursa Malaysia’s website. Data will be collected through survey questionnaires by using Likert scales, which will
Commitment and Support from
Top Management
Independent Variable
Enterprise Risk Management
Dependent Variable
312
be distributed to the target respondents. For example, Chief Risk Officers (CROs), Chief Internal Auditors (CIAs), and Chief Financial Officers (CFOs) for each of the publicly listed companies will be chosen based on who have applied ERM practices. Under the Main Market of Bursa Malaysia, there are fourteen (14) industries listed as of September 2018, which is classified into closed-end funds, construction, consumer products, finance, hotel, industrial products, IPC, mining, plantations, properties, REITs, SPAC, technology, and trading/ services. All these industries are referred to as population in this study. According to Togok (2016), the Main Market of Bursa Malaysia was selected in this study by excluding ACE Market and LEAP Market because of the regulated environment and the possibility of ERM adoption among publicly listed companies are much higher.
CONCLUSION
This concept paper mainly focused on commitment and support from top management in connection with ERM practice with the aim of gaining new knowledge as well as broaden the knowledge base on this particular subject area, which is important for any future researchers to identify the other factors that affect the ERM practice public listed companies in managing the risk with effectively in Malaysia. This is because ERM practice is a crucial part of corporate strategy in managing the risk effectively. Also, this study has shed some light on the public sector company’s performance on the main market of Bursa Malaysia towards ERM implementation. Besides, this study serves as a platform for academics, researchers, and other interested parties in terms of understanding the approach that publicly listed firms use to manage their activities and financial records effectively.
Accordingly, this study could open up other advantages of implementing ERM practice in Malaysia and not just focus solely on profit maximisation. Overall, the findings of this study could be used as a guide in developing the appropriate framework and best practices that can be used to improve and add value to the companies. Therefore, the conceptual ideas brought from this review paper will set a new direction for future research that will help understand the significance of these conceptual ideas. If it makes sense in future studies, then these concepts will be applied to different practical situations in Malaysia as well as globally. In an effort to make this study more robust, future researchers can use other variables that can potentially improve the effectiveness of the companies that implemented ERM in the business, such as organisational structure, application of software in managing risks, technology, and many more.
REFERENCES
Abdul-Rahman, H., Wang, C., & Mohamad, F. S. (2015). Implementation of risk management in Malaysian Construction Industry: Case Studies. Journal of Construction Engineering, 1-6.
Anyanwu, J. O., Okoroji, L. I., Ezewoko, O. F., & Nwaobilor, C. A. (2016). The impact of training and development on workers performance in Imo State. Global Journal of Social Sciences Studies, 2(2), 51-71.
Arnaboldi, M., & Lapsley, I. (2014). Enterprise-wide risk management and organizational fit: A comparative study. Journal of Organizational Effectiveness: People and Performance, 1(4), 365–377.Http://Doi.Org/10.1108/JOEPP-09-2014-0056
Al-Amri, K., & Davydov, Y. (2016). Testing the effectiveness of ERM: Evidence from operational losses. Journal of Economics and Business, 87, 70–82. http://doi.org/10.1016/j.jeconbus.2016.07.002.
Ali, M. M., Ab Hamid, N. S., & Ghani, E. K. (2019). Examining the relationship between enterprise risk management and firm performance in Malaysia. International Journal of Financial Research, 10(3).
Arnold, V., Benford, T., Canada, J., & Sutton, S. G. (2011). The role of strategic enterprise risk management andorganizational flexibility in easing new regulatory compliance. International Journal of Accounting Information Systems, 12, 171–188. http://doi.

313
4TH SINTO
K INTERN
ATION
AL CON
FERENCE O
N SO
CIAL SCIENCE AN
D M
ANAG
EMEN
T
org/10.1016/j.accinf.2011.02.002.Azizan, N. A., & Lai, F.-W. (2013). Depth penetration of Enterprise Risk Management
Model in Malaysian government sector. Journal for Global Business Advancement, 6(2), 138–151.
Bakar, B. A., Rasid, S. Z. A., & Rizal, A. M. (2016). Risk management practices in the Malaysian public sector. Journal of Global Business & Social Entrepreneurship, 1(2), 88-101.
Banasadegh, Z., Riahi, F., & Davari, A. (2014). A structural framework to assess the influence of CSFS on risk management case study: Oil and gas sector in Iran. Research Journal of Applied Sciences, Engineering and Technology, 7(9), 1787–1793.
Beasley, M.S., Clune, R., Hermanson, D.R. (2005), Enterprise risk management: An empirical analysis of factors associated with the extent of implementation. Journal of Accounting and Public Policy, 24(6), 521-531.
Bowling, D.M., Rieger, L. (2005). Success factors for implementing enterprise risk management: Building on the COSO framework for enterprise risk management to reduce overall risk. Bank Accounting and Finance, 18(3), 21-27.
Bogodistov, Y., & Wohlgemuth, V. (2017). Enterprise risk management: A capability-based perspective. The Journal Of Risk Finance, 18(3), 234–251. Http://Doi.Org/10.1108/ JRF-10-2016-0131
Dabari, I. J., & Saidin, S. Z. (2016). A moderating role of board characteristics on enterprise risk management implementation: Evidence from the Nigerian Banking Sector. International Journal of Economics and Financial Issues, 6(S4), 96-103.
Fadun, O.S. (2013), Promoting ‘Enterprise Risk Management’adoption in business enterprises: Implications and challenges. International Journal of Business and Management Invention, 2(1), 69-78.
Gajewska, E. and Ropel, M. (2011). Risk management practices in a construction project – A case study. Publications Lib Chalmers Se. 1–60. http://publications.lib.chalmers.se/records /fulltext/
144253.pdfGordon, L. A., Loeb, M. P., & Tseng, C. Y. (2009). Enterprise risk management and firm
performance: a contingency perspective. Journal of Accounting and Public Policy, 28(4), 301–327.http://doi.org/10.1016/j.jaccpubpol.2009.06.006
Hassan, M. F., & Yazid A. S (2019). The mediating effect of top management support on the relationship between organizational culture and enterprise risk management effectiveness among Malaysian. Public Listed Companies: A Conceptual Framework.
Hambrick, D.C. & Mason, P.A. (1984). “Upper Echelons”: The organization as a reflection of its top managers. Academy of Management Review.9: 195-206.
Hamzah, A. R., Wang, C. and Farhanim, S. M. (2015). Implementation of risk management in the Malaysian construction industry: Case studies. Journal of Construction Engineering, 2015: 1-6. Available: http://dx.doi.org/10.1155/2015/192742
Hartnell, C. A., Ou, A. Y., & Kinicki, A. (2011). Organizational culture and organizational effectiveness: A metaanalytic investigation of the competing values framework’s theoretical suppositions. Journal of Applied Psychology, 96(4), 677–694. Http://Doi.Org/10.1037/A0021987
Henderson, A. D., Miller, D., & Hambrick, D. C. (2006). How quickly do CEOs become obsolete? Industry dynamism, CEO tenure, and company performance. Strategic Management Journal, 27(5), 447-460.
Holland, C. P., & Light, B. (1999). A critical success factors model for enterprise resource planning implementation. In Proceedings of the Seventh European Conference on Information Systems. http://doi.org/http://dx.doi.org/10.1109/52.765784
Jalal, A., Albayati, F. S., & Albuainain, N. R. (2011). Evaluating enterprise risk management (ERM); Bahrain Financial Sectors As A Case Study. International Business Research, 4(3), 83–93. Http://Doi.Org/10.5539/Ibr.V4n3p83
Jones Osasuyi, O., & Mwakipsile, G. (2017). Working capital management and managerial performance in some selected manufacturing firms in edo state Nigeria. Journal of Accounting, Business and Finance Research, 1(1), 46-55. https://doi.org/10.20448/2002.11.46.55
Karanja, E. (2017). Does the hiring of chief risk officers align with the COSO/ISO Enterprise Risk Management Frameworks? International Journal of Accounting & Information
314
Management, 25(3), 274–295. Http://Doi.Org/10.1108/IJAIM-04-2016-0037Khan, M. J., Hussain, D., & Mehmood, W. (2016). Why do firms adopt enterprise risk
management (ERM)? Empirical Evidence from France. Management Decision, 54(8), 1886–1907. Http://Doi.Org/10.1108/MD-09- 2015-0400
Laforet, S. (2016). Effects of organisational culture on organisational innovation performance in family firms. Journal of Small Business and Enterprise Development, 23(2), 379–407. Http://Doi.Org/10.1108/JSBED-02-2015-0020
Laisasikorn, K., & Rompho, N. (2014). A study of the relationship between a successful enterprise risk management system, a performance measurement system and the financial performance of Thai listed companies. Journal of Applied Business and Economics, 16(2), 81–92.
Lajili, K., & Zeghal, D. (2005). A content analysis of risk management disclosures in Canadian annual reports. Canadian Journal of Administrative Sciences, 22(2), 125-142. https://doi.org/10.1111/j.1936-4490.2005.tb00714.x
Le, H. L., Vu, K. T., Du, N. K., & Tran, M. D. (2018). Impact of working capital management on financial performance: The case of Vietnam. International Journal of Applied Economics, Finance and Accounting, 3(1), 15-20. https://doi.org/10.33094/8.2017.2018.31.15.20
Liu, J. Y. And Low, S. P. (2009). Developing an organizational learning-based model for risk management in chinese construction firms. Disaster Prevention and Management. An International Journal, 18(2), 170–86.
Manab, N.A., Othman, S.N., Kassim, I. (2012), Enterprise-wide risk management best practices: The critical success factors. OIDA International Journal of Sustainable Development, 4(03), 87-96.
Maina, N. P., Mbabazize, M., & Kibachia, J. (2016). Evaluation of factors affecting effectiveness of risk management in public housing construction projects in Rwanda. Case of Batsinda Housing Project. European Journal of Business And Social Sciences, 5(1), 85–101.
Malarvizhi, C. A., Nahar, R., & Manzoor, S. R. (2018). the strategic performance of bangladeshi private commercial banks on post implementation relationship marketing. International Journal of Emerging Trends in Social Sciences, 2(1), 28-33. https://doi.org/10.20448/2001.21.28.33
Mahendra, P. A., Pitroda, J. R. and Bhavsar, J. J. (2013). A study of risk management techniques for construction projects in developing countries. International Journal of Innovative Technology and Exploring Engineering, (5): 139–42.
Mcshane, M. (2018). Enterprise risk management: History and a design science proposal. The Journal of Risk Finance, 19(2), 137–153. Http://Doi.Org/10.1108/JRF-03-2017-0048
Makarova, V. A. (2014). The effectiveness of risk management implementation in Russian companies. World Applied Sciences Journal, 31(5), 833–839. Http://Doi.Org/10.5829/Idosi.Wasj.2014.31.05.1660
Mosbah, A., Serief, S. R., & Wahab, K. A. (2017). Performance of family business in Malaysia. International Journal of Social Sciences Perspectives, 1(1), 20-26. https://doi.org/10.33094/7.2017.11.20.26
Nair, A., Rustambekov, E., Mcshane, M., & Fainshmidt, S. (2014). Enterprise risk management as a dynamic capability: A test of its effectiveness during a crisis. Managerial and Decision Economics, 35, 555–566. Http://Doi.Org/10.1002/Mde.2641
Paape, L., & Spekle, R. F. (2012). The adoption and design of enterprise risk management practices: An empirical study. European Accounting Review, 21(3), 533–564. Http://Doi.Org/10.1080/09638180.2012.661937
Perrin, T.T. (2002). Enterprise risk management in the insurance Industry-2002 benchmarking survey report. world wide web. Available from: http://www. tillinghast. com/tillinghast/publications/reports/ERM_Insur_Ind_2002_benchmark_survey/ERM_2002_all. pdf.
Obiefuna, A. (2014). The role of top management in business organizations. Review of Public Administration and Management, 99.
Rasid, S. Z. A., Isa, C. R., & Ismail, W. K. W. (2014). Management accounting systems, enterprise risk management and organizational performance in financial institutions. Asian Review of Accounting, 22(2), 128–144. Doi:10.1108 /ARA-03-2013-0022
315
4TH SINTO
K INTERN
ATION
AL CON
FERENCE O
N SO
CIAL SCIENCE AN
D M
ANAG
EMEN
T
Roslan, A., & Dahan, H. M. (2013). Mediating effect of enterprise risk management on internal audit and organizational performance: A conceptual framework. International Journal of Commerce, Business And Management, 2(4), 212–215.
Santhi, N. S., & Gurunathan, K. B. (2014). Fama-French three factors model in indian mutual fund market. Asian Journal of Economics and Empirical Research, 1(1), 1-5.
Schäfer, F.-S., Hirsch, B., & Nitzl, C. (2021). Stakeholder pressure as a driver of risk management practices in public administrations. Journal of Accounting & Organizational Change, ahead-of-p(ahead-of-print). https://doi.org/10.1108/jaoc-11-2020-0188
Siang, L. C. and Ali, A. S. (2012). Implementation of risk management in the Malaysian construction industry. Journal of Construction Engineering, 3(1), 1–15.
Tzempelikos, N. (2014). Top management commitment and involvement and their link to key account management effectiveness. Journal of Business & Industrial Marketing.
Tan, C., & Lee, S. Z. (2021). Adoption of enterprise risk management (ERM) in small and medium-sized enterprises: evidence from Malaysia. Journal of Accounting and Organizational Change. https://doi.org/10.1108/JAOC-11-2020-0181
Togok, S. (2016). Factors influencing the effectiveness of enterprise risk management (ERM) in public listed companies. University of Malaya.
Walker, P. L., & Shenkir, W. G. (2018). Enterprise risk management: Frameworks, Elements, and Integration. Institute of Management Accountants. Retrieved from www.imanet.org
Yaraghi, N., & Langhe, R. G. (2011). critical success factors for risk management systems. Journal of Risk Research, 14(5), 551–581. Http://Doi.Org/10.1080/13669877.2010.547253
Zenger, T.D., & Lawrence, B.S. (1989). Organizational demography: The differential effect of age and tenure distributions on technical communication. Academy of Management Journal, 23(2), 355-376.
Zwaan, L. De, Stewart, J., & Subramaniam, N. (2011). Internal audit involvement in enterprise risk management. Managerial Auditing Journal, 26(7), 586–604. Http://Doi.Org/10.1108/02686901111151323

316
SICONSEM 2021:112-073
THE IMPACT OF INCOME AND EDUCATIONAL LEVEL ON HAPPINESS
1Badariah Haji Din, 2,3Muzafar Shah Habibullah & 4 Ratneswary Rasiah 1College of Law Government and International Studies, Universiti Utara Malaysia,
Malaysia2Institute of Agriculture and Food Policy Studies, Universiti Putra Malaysia, Malaysia
3Putra Business School, Malaysia4Taylor’s Business School, Taylor’s University, Malaysia
1Corresponding author email: [email protected]
ABSTRACT
In order to sustain the current and future standard of living, maintaining long-term economic growth has been the ultimate goal of any nations. Many nations relentlessly pursue the path of economic growth to become developed and high income nations, but little do they realize that in their pursuit of material well-being, they seem to have completely missed the human emotions aspect. Recent literature on happiness has shown evidence that in several developed nations that have enjoyed rapid growth and accumulated high levels of material well-being, their citizens have not reported enjoying higher levels of happiness. Does higher income and education related to happiness? Previous studies have found mixed results. In this study we investigate the effects of income and educational attainment on the levels of happiness in a cross-section of 149 countries. Using OLS and quantile regression estimations, our results suggest that there is a nonlinear relation between income and the levels of happiness, in fact, exhibiting an inverted U-shaped Kuznets curve. On the other hand, primary education reduces the levels of happiness; while secondary and tertiary education increases the levels of happiness.
Keywords: happiness, income, education, quantile regression, worldwide evidence .
INTRODUCTION
One of the main aims of nations and policy makers is to achieve sustainable economic growth, as it is believed to bring about material welfare gains and subsequently increase well-being. It is believed that economic growth and development provides a means to an end. The “end” here refers not just to the material gains that human beings receive, but more so for the enhancement of human well-being or happiness. Oswald (1997) encapsulates this by saying that “economic things matter only in so far as they make people happier”. In studying the macro and socioeconomic variables that affect happiness, Emmons (1986) provides a guiding framework in that the variables that affect people’s ability to achieve their goals would invariably affect their subjective well-being. The abundant resources that are available to individuals provide ample opportunities for them to achieve their goals and thereby enhance their happiness.
Prior to the use of happiness, income (proxy by GDP per capita) had always been the key measure of well-being or quality of life in most nations. Income as an indicator of well-being is riddled with many limitations. Income only emphasizes changes in material welfare, but it ignores changes in the quality of life, thus, it is inadequate measure of well-being. This inadequacy in the use of income as an indicator of well-being has led scholars and policy makers to search for alternative measures of quality of life, leading to the numerous studies on happiness or subjective well-being. Nevertheless, searching for important factors affecting happiness has not received much attention from the economists.
30

317
4TH SINTO
K INTERN
ATION
AL CON
FERENCE O
N SO
CIAL SCIENCE AN
D M
ANAG
EMEN
T
Earlier works by Easterlin (1973; 1974) suggests that money can buy happiness up to a certain point in life, thereafter, as expectations exceed aspirations in life, the level of happiness level off or decrease This nonlinear relationship between income and happiness has been proposed by Frey and Stutzer (2000a; 2000b), however, study by Stevenson and Wolfers (2013) do not support this claim. On the other hand, McBride (2010) support the aspirations-based theory of happiness which explain why the level of happiness decrease as the level of income increases.
Another important determinant of happiness that has not received much attention in empirical research is education. Salinas-Jimenez et al. (2016: pp. 116) posit that “many studies analysing the relationship between income (or other economic variables) and happiness include some control variables related to education, but few place their focus on the effects of education on individuals’ well-being. The reason probably lies in that the effects of education on subjective well-being generally manifest in an indirect way through variables as health, income or participation in the labor market.” Nevertheless, some studies have shown that education has strong effects of happiness and their effects is unconditional on household income. Studies by Blanchflower and Oswald (2004), Oreopoulos and Salvanes (2011), Lelkes (2006), Gerdtham and Johannesson (2001), Tsui (2014), Salinas-Jimenez et al. (2016) and Nikolaev (2018) all found that the level of education has a direct effects on the level of happiness. Another important determinant of happiness that has not received much attention in empirical research is education.
The purpose of the present study is twofold: (1) to investigate the nonlinear effects of income level on happiness, and (2) to determine whether education has a direct effects on the level of happiness. We test these two questions on a cross-section of 149 countries. In view of this, the paper is organized as follow. In the next section we discuss the literature that relates happiness to income and education level; and in section 3 is the method used in the analysis. Section 4 presents the results, while the last section contains our conclusion
REVIEW OF RELATED LITERATURE
Income and Happiness
The income-happiness relationship is by far one of the most important and ambiguous relationship in the subjective well-being literature. Easterlin (1974) was one of the first modern economists to carry out a thorough research on happiness using time-series data on several advanced economies, including the USA, Japan, UK, France, Germany, Italy and Netherlands. Easterlin (1974) discovers that economic growth does not buy well-being. He argues that while income was positively related to happiness in some countries, the income-happiness nexus disappeared when considering different countries or using time series data. He concludes that the emphasis on economic growth was misguided as the fact point to that despite consistent increases in income per capita over one or more decades, the scores for subjective well-being generally remained constant, a phenomenon that has come to be known as the Easterlin Paradox. The Easterlin (1973: 4) paradox claims that, “In all societies, more money for the individual typically means more individual happiness. However, raising the incomes of all does not increase the happiness of all.
Easterlin provides a plausible explanation for his findings when he matched his empirical model to that of the interdependent preferences model of Duesenberry (1949) and Pollak (1976) in which the utility or subjective well-being of each person is positively related to his or her own income but negatively related to the average income of others. Relative preference theories (Duesenburry, 1949) posit that the utility derived by an individual from his income is relative to the incomes of other people (reference groups) or relative to that individual’s own previous income stream (adaptive expectations). This social comparison looks at aspects of comparing oneself relative to other individuals or relevant group, emphasizing the importance of relative income rather than absolute income. The
318
concept of relative income is part of the aspiration level theory which provides a plausible explanation as to why higher incomes do not necessarily translate into higher happiness. Thus, Easterlin (1974; 1995) acknowledges the importance of relative income when he argues that getting a higher income did make people happier, on average, but when the incomes of everyone increased, it did not translate to an increase in everyone’s happiness as the relative income effect dominated the absolute income effect causing people to perceive that their incomes had not improved relative to the others.
In fact, several studies have rejected the prosperity-happiness relationship, advocating that growth in incomes will not lead to increases in happiness but rather maintain happiness at a constant level. Di Tella et al. (2003) present evidence that, despite unprecedented growth in real incomes, happiness stagnated over time. Blanchflower and Oswald (2004) examine well-being data over a long period from early 1970s to the late 1990s involving USA and Britain and discovered a decline in reported levels of happiness in the United States while Britain’s reported life satisfaction stagnated, despite a considerable improvement in the standard of living of both countries. Easterlin (2001) explains that while happiness is a positive function of absolute income, any growth in income only brought about increases in people’s aspirations causing subjective well-being to decline as people found it more difficult to achieve their rising aspirations. This was further echoed in the findings of Macdonald and Douthitt (1992) who argue that people who set high aspirations and expectations, for any given level of income, felt a negative impact on their subjective well-being.
Stutzer (2004) reiterates Macdonald and Douthitt’s (1992) argument by providing empirical evidence of the negative impact of higher income aspirations on individual well-being, ceteris paribus. While higher incomes had a positive impact on well-being, it was the higher aspirations that caused a decline in subjective well-being thus giving an almost zero net effect that culminated in happiness stagnating over time. The concepts of adaptation to repeated stimuli and social comparisons with relevant others provide the basis for which individual aspirations are formed. In bringing forth the role of adaptation, Stutzer (2004) found that while an increase in income initially enhanced well-being, given time, people get adapted to their new income which eventually brings their well-being back to its original level. Frey and Stutzer (2002: 12) in their book “Happiness and Economics” discusses how “hedonic adaptation reduces individuals’ responsiveness to repeated or continued stimulus” as people become accustomed to a higher level of income which eventually sees their subjective happiness converging to its original level.
While ample empirical studies have been carried out in developed countries indicating the somewhat negligible impact income growth has on well-being, concurring with Easterlin’s income-happiness paradox, there is a growing body of literature that contradicts these findings. In an attempt to reassess Easterlin’s paradox, Stevenson and Wolfers (2008) analyse a broad spectrum of datasets covering many countries over many decades and found that GDP per capita is positively correlated to average levels of subjective well-being across countries and that happiness did indeed move in tandem with economic growth, contrary to the findings of Easterlin and many others. The authors found no evidence of a threshold income beyond which no further increases in subjective well-being was possible for wealthier countries. The findings re-evaluated the role played by relative income comparisons in explaining happiness to a more limited one, compared to the clearer role played by absolute income. In a nutshell, the study establishes an income-subjective well-being link that was significant and very robust across countries, within countries, and over time.Sacks et al. (2010) reinforce the findings of Stevenson and Wolfers (2008) that absolute income plays a larger role in determining happiness, while downplaying the importance of relative income, adaptation and satiation. Several datasets were analysed to establish evidence that (i) wealthier individuals, within a given country, reported higher life satisfaction; (ii) between countries, on average, higher life satisfaction is reported in wealthier countries and (iii) over time, economic growth does enhance life satisfaction.
319
4TH SINTO
K INTERN
ATION
AL CON
FERENCE O
N SO
CIAL SCIENCE AN
D M
ANAG
EMEN
T
Study by Diener et al. (1993) found that richer countries enjoyed a higher level of happiness compared to their poorer counterparts, at the national level, it was also discovered that a rapid growth in income or a high economic growth led to lower level of happiness. In a later study, Dieneret al. (1995) use a more comprehensive set of national and international data covering a diverse range of nations to discover that despite controlling for basic needs, income was correlated with happiness indicating the impact economic development has on well-being that goes beyond fulfilling humans’ basic biological needs.
Education and Happiness
In recent years, there are many researches linking human capital investment to happiness. Becker (1962) has posited that investment on education; training, medical care in human capital has become as critical as any other capital investments. These expenditures are called human capital investment, as it is impossible to separate people from their knowledge, value, skills, or health. Human capital theory complements the wider benefit to education in helping people’s productivity, earnings and employability, as well as influence in well-being. As a matter of fact, people like to advance in their life through income enhancements and improved working conditions. Leading a satisfying life undoubtedly involves a stable and satisfactory income. Thus, investment in education is a clear pathway most people seek. People also increase their investment in education, as they value freedom that enables them to shape their own destinies. Consequently, more satisfaction comes from sustained growth in GDP allows households to enjoy a better quality of life, consumption, good employment opportunities and better social standing. In life, nobody choose to be unemployed because being unemployed is not a good thing as it only brings misery and unhappiness (Clark & Oswald, 1994).
There are several ways how education can affect happiness. According to Cuñado and de Garcia (2012) happiness can be achieved when there is an increased in self-confidence and self-estimation and pleasure from attaining higher education. Furthermore, with good education an educated person will be able to secure good job with higher salary and as a result can command for better health (see also Hartog & Oosterbeek, 1998). Happiness can also be derived through good education when one is able to engage in social connections and interactions with the family members, community and society at large without the risk of shame or feeling some form of inferiority complex; the feeling that good education can uplift their social status and therefore should raise their social well-being (Checchi, 2006; Chen, 2012).
A meta-analysis conducted by Witter et al. (1984) in relating educational attainment and subjective well-being in the United States; found that the impact is small, but showing a positive impact on happiness. On the other hand, using the samples from the General Social Survey of the United States, Blanchflower and Oswald (2004) posit that the years of education raises the level of happiness among all men and women, blacks and whites in the US for the period 1972-1998. The positive impact of education on happiness were also found by Gerdtham and Johannesson (2001) for Sweden; Cheung and Chan (2011) for 32 countries; and Chen (2012) for four East Asian countries – Japan, Taiwan, Korea and China.
Cuñado and de Garcia (2012) investigate individual-level data for Spain, by using the European Social Survey for the year 2008 and estimate using the Ordinal Logit models. Their study suggests that individuals with higher levels of happiness were those people who attained higher education level, as a result of obtaining higher income levels. Furthermore, they also conclude that the direct impact of education on happiness does not depend on the level of education whether primary, secondary or tertiary.
Theodossiou (1998) analyses the data from the 1992 British Household Panel Study and found that the feelings of unhappiness is 1.27 times greater if the individual has a university degree. Calvo et al. (2017) also found that education is negatively associated with life satisfaction. Their study suggests that for Blacks, immigrants and native-born participants in the US, as education increased, the levels of happiness declined. Peiro (2006), on
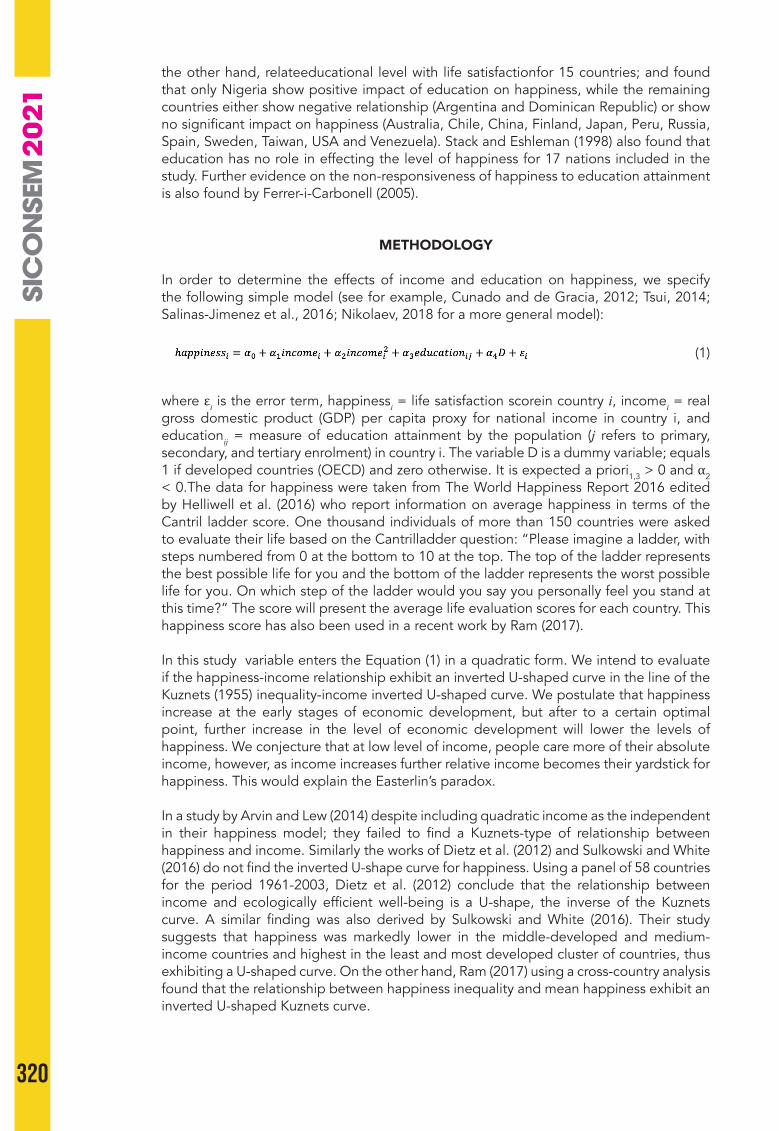
320
the other hand, relateeducational level with life satisfactionfor 15 countries; and found that only Nigeria show positive impact of education on happiness, while the remaining countries either show negative relationship (Argentina and Dominican Republic) or show no significant impact on happiness (Australia, Chile, China, Finland, Japan, Peru, Russia, Spain, Sweden, Taiwan, USA and Venezuela). Stack and Eshleman (1998) also found that education has no role in effecting the level of happiness for 17 nations included in the study. Further evidence on the non-responsiveness of happiness to education attainment is also found by Ferrer-i-Carbonell (2005).
METHODOLOGY
In order to determine the effects of income and education on happiness, we specify the following simple model (see for example, Cunado and de Gracia, 2012; Tsui, 2014; Salinas-Jimenez et al., 2016; Nikolaev, 2018 for a more general model):
(1)
where εi is the error term, happinessi = life satisfaction scorein country i, incomei = real gross domestic product (GDP) per capita proxy for national income in country i, and educationij = measure of education attainment by the population (j refers to primary, secondary, and tertiary enrolment) in country i. The variable D is a dummy variable; equals 1 if developed countries (OECD) and zero otherwise. It is expected a priori1,3 > 0 and α2 < 0.The data for happiness were taken from The World Happiness Report 2016 edited by Helliwell et al. (2016) who report information on average happiness in terms of the Cantril ladder score. One thousand individuals of more than 150 countries were asked to evaluate their life based on the Cantrilladder question: “Please imagine a ladder, with steps numbered from 0 at the bottom to 10 at the top. The top of the ladder represents the best possible life for you and the bottom of the ladder represents the worst possible life for you. On which step of the ladder would you say you personally feel you stand at this time?” The score will present the average life evaluation scores for each country. This happiness score has also been used in a recent work by Ram (2017).
In this study variable enters the Equation (1) in a quadratic form. We intend to evaluate if the happiness-income relationship exhibit an inverted U-shaped curve in the line of the Kuznets (1955) inequality-income inverted U-shaped curve. We postulate that happiness increase at the early stages of economic development, but after to a certain optimal point, further increase in the level of economic development will lower the levels of happiness. We conjecture that at low level of income, people care more of their absolute income, however, as income increases further relative income becomes their yardstick for happiness. This would explain the Easterlin’s paradox.
In a study by Arvin and Lew (2014) despite including quadratic income as the independent in their happiness model; they failed to find a Kuznets-type of relationship between happiness and income. Similarly the works of Dietz et al. (2012) and Sulkowski and White (2016) do not find the inverted U-shape curve for happiness. Using a panel of 58 countries for the period 1961-2003, Dietz et al. (2012) conclude that the relationship between income and ecologically efficient well-being is a U-shape, the inverse of the Kuznets curve. A similar finding was also derived by Sulkowski and White (2016). Their study suggests that happiness was markedly lower in the middle-developed and medium-income countries and highest in the least and most developed cluster of countries, thus exhibiting a U-shaped curve. On the other hand, Ram (2017) using a cross-country analysis found that the relationship between happiness inequality and mean happiness exhibit an inverted U-shaped Kuznets curve.

321
4TH SINTO
K INTERN
ATION
AL CON
FERENCE O
N SO
CIAL SCIENCE AN
D M
ANAG
EMEN
T
Data Sources
In this study data on national income was proxy by using real gross domestic product (GDP) per capita (constant 2010 USD) and education variables were proxy using the number of school enrolment at the primary, secondary and tertiary level. All these data were compiled from the World Bank database at https://data.worldbank.org/indicator. The average happiness score for each country were taken from the World Happiness Report 2016. The year of reference for this study is 2013 and covers 149 countries. The list of countries included in the study is listed in Appendix A.
THE EMPIRICAL RESULTS
We have estimated Equation (1) using OLS and the results are reported in Tables 1 to 3 in Panel A. Table 1 reports model with education proxy using total number of primary enrolment; Table 2 using secondary enrolment; and Table 3 with education proxy using tertiary education enrolment. In all three estimated equations, all variables are significant at least at the 10% level (see Table 2 for education). It seems that income is a very important factor affecting the levels of happiness in these countries. We can observe that the income (incomei, incomei
2) variables are statistically significant at the 1% level in all three tables. Interestingly, the relationship between happiness and income is shown to be nonlinear, and exhibiting an inverted U-shaped Kuznets curve. At lower level of income or economic development, the levels of happiness increases; but as income increases further, the levels of happiness declined, thus exhibiting the inverted U-shaped curve. The intuition behind this relationship is that at low income levels, what really matters in life is to increase their current (absolute) income so that individuals are able to live a comfortable life – care for their families, good education for their children, adequate clothing and housing etc. However, as their income as well as their community and society increases further, their levels of happiness decline as they feel that relative to others their income has not been better-off than their neighbors or member of their communities. Thus, the increasing part of the inverted U-shaped curve support the view contended by Stevenson and Wolfers (2008), Hagerty and Veenhoven (2003) and Inglehart et al. (2008); while the decreasing section of the inverted U-shaped curve is supported by Easterlin (1995), Blanchflower and Oswald (2004) and Macdonald and Douthitt (1992).
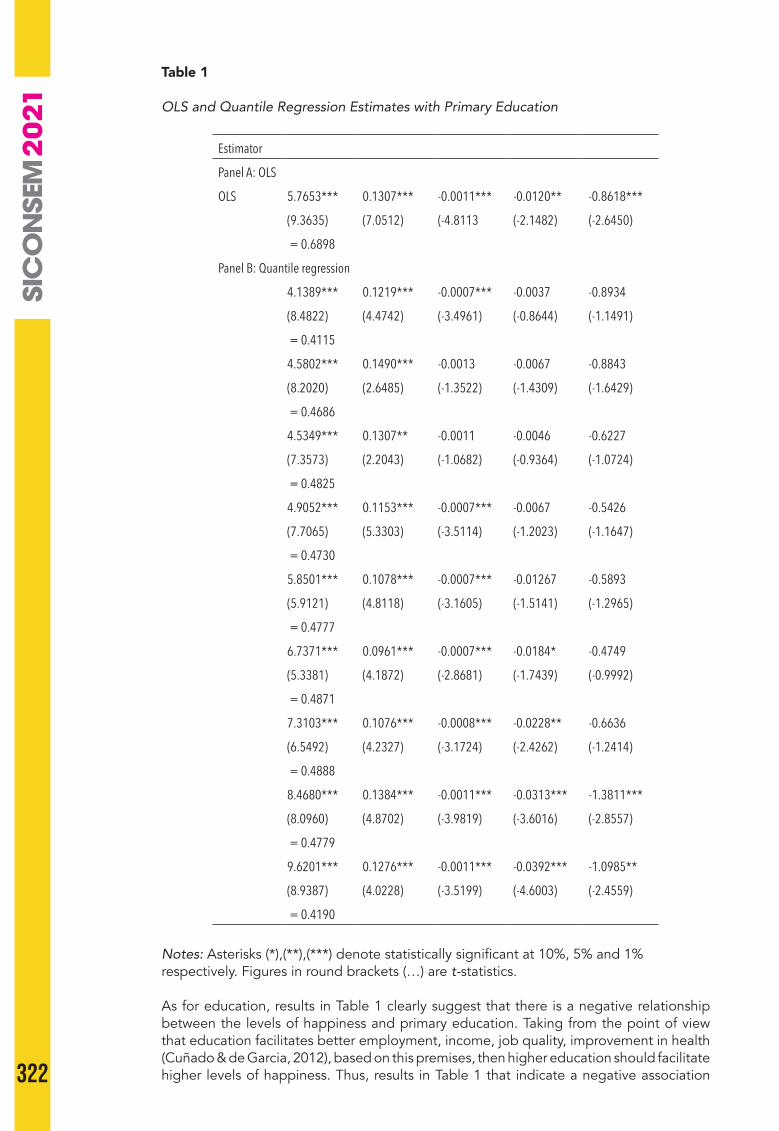
322
Table 1
OLS and Quantile Regression Estimates with Primary Education
Estimator
Panel A: OLS
OLS 5.7653*** 0.1307*** -0.0011*** -0.0120** -0.8618***
(9.3635) (7.0512) (-4.8113 (-2.1482) (-2.6450)
= 0.6898
Panel B: Quantile regression
4.1389*** 0.1219*** -0.0007*** -0.0037 -0.8934
(8.4822) (4.4742) (-3.4961) (-0.8644) (-1.1491)
= 0.4115
4.5802*** 0.1490*** -0.0013 -0.0067 -0.8843
(8.2020) (2.6485) (-1.3522) (-1.4309) (-1.6429)
= 0.4686
4.5349*** 0.1307** -0.0011 -0.0046 -0.6227
(7.3573) (2.2043) (-1.0682) (-0.9364) (-1.0724)
= 0.4825
4.9052*** 0.1153*** -0.0007*** -0.0067 -0.5426
(7.7065) (5.3303) (-3.5114) (-1.2023) (-1.1647)
= 0.4730
5.8501*** 0.1078*** -0.0007*** -0.01267 -0.5893
(5.9121) (4.8118) (-3.1605) (-1.5141) (-1.2965)
= 0.4777
6.7371*** 0.0961*** -0.0007*** -0.0184* -0.4749
(5.3381) (4.1872) (-2.8681) (-1.7439) (-0.9992)
= 0.4871
7.3103*** 0.1076*** -0.0008*** -0.0228** -0.6636
(6.5492) (4.2327) (-3.1724) (-2.4262) (-1.2414)
= 0.4888
8.4680*** 0.1384*** -0.0011*** -0.0313*** -1.3811***
(8.0960) (4.8702) (-3.9819) (-3.6016) (-2.8557)
= 0.4779
9.6201*** 0.1276*** -0.0011*** -0.0392*** -1.0985**
(8.9387) (4.0228) (-3.5199) (-4.6003) (-2.4559)
= 0.4190
Notes: Asterisks (*),(**),(***) denote statistically significant at 10%, 5% and 1% respectively. Figures in round brackets (…) are t-statistics.
As for education, results in Table 1 clearly suggest that there is a negative relationship between the levels of happiness and primary education. Taking from the point of view that education facilitates better employment, income, job quality, improvement in health (Cuñado & de Garcia, 2012), based on this premises, then higher education should facilitate higher levels of happiness. Thus, results in Table 1 that indicate a negative association

323
4TH SINTO
K INTERN
ATION
AL CON
FERENCE O
N SO
CIAL SCIENCE AN
D M
ANAG
EMEN
T
between primary education and the level of happiness would suggest that “individuals overrate their socioeconomic prospects from having primary education relative to real opportunities, thus primary education impacted negatively with happiness (Ferrante, 2009). However, on the other hand, results in Tables 2 and 3 show that an increase in higher levels of education (secondary and tertiary) affects the levels of happiness positively, albeit that in our study, secondary education is statistically significant at the 10% level; while the tertiary education is statistically significant at the 5% level. Thus, higher education can command better living conditions and therefore bring more happiness.
Table 2
OLS and Quantile Regression Estimates with Secondary Education
Estimator
Panel A: OLS
OLS 4.0955*** 0.1072*** -0.0008*** 0.0073* -0.8206**
(15.851) (4.7556) (-3.2523) (1.9143) (-2.4821)
= 0.6822
Panel B: Quantile regression
3.5965*** 0.1059*** -0.0006** 0.0027 -0.8037
(16.403) (3.5995) (-2.4533) (0.7369) (-1.1360)
= 0.4257
3.7756*** 0.1125*** -0.0008*** 0.0033 -0.7294
(16.619) (4.9563) (-3.3620) (0.8757) (-1.5544)
= 0.4767
3.6795*** 0.0971*** -0.0006*** 0.0065 -0.5212
(14.168) (4.1343) (-2.6512) (1.5191) (-1.1317)
= 0.4871
3.9411*** 0.0897*** -0.0006** 0.0059 -0.4971
(14.732) (3.5187) (-2.1677) (1.3228) (-1.0553)
= 0.4829
3.9536*** 0.0841*** -0.0005* 0.0090* -0.5894
(13.366) (3.1324) (-1.9177) (1.8639) (-1.2306)
= 0.4805
4.1640*** 0.0692** -0.0004 0.0092* -0.2011
(12.351) (2.4098) (-1.5683) (1.7658) (-0.3784)
= 0.4727
4.0188*** 0.0876*** -0.0006** 0.0135** -0.7497
(11.542) (2.7665) (-2.0421) (2.4031) (-1.1915)
= 0.4617
4.1382*** 0.1029*** -0.0008** 0.0165** -1.3724***
(9.8949) (3.1958) (-2.6016) (2.5287) (-2.6764)
= 0.4366
4.5973*** 0.0745** -0.0006* 0.0159 -0.7288
(5.3023) (2.0557) (-1.8586) (1.3571) (-1.3671)
= 0.3711
324
Notes: Asterisks (*),(**),(***) denote statistically significant at 10%, 5% and 1% respectively. Figures in round brackets (…) are t-statistics.
Lastly, our dummy variable in all three estimated equations clearly suggest that irrespective of the levels of income as well as the levels of educational attainment, the levels of happiness among the developed countries is lower than the levels of happiness in the developing countries.
FURTHER ANALYSIS USING QUANTILE REGRESSION
It is well known that OLS estimates the effect of the explanatory variables on the mean of the conditional distribution of the dependent variable. To allow the effect of the explanatory variables on the entire conditional distribution of the dependent variable, we also employ the quantile regression (Koenker & Basset, 1978). Quantile regression allows the estimated parameters to differ at different points of the conditional distribution of the dependent variable. Therefore, a number of different quantile regressions give us a more complete description of the underlying conditional distribution.
The quantile regression is defined as follows
(2)
(3)
where xi' equals a vector of explanatory variables as defined above, βτ equals the vector of parameters associated with the τ-th percentile, and μτi equals an unknown error term. The Quantileτ(happinessii|xi)=xi'βτ equals the τ-th conditional quantile of happiness given x with τ ∈ (0,1). By estimating βτ, using different values of τ, quantile regression permits different parameters across different quantiles of the levels of happiness. In other words, repeating the estimation for different values of τ between 0 and 1, we trace the distribution of happiness conditional on x and generate a much more complete picture of how explanatory variables affect the dependent variable. The τ-th quantile regression estimates βτ , by solving the following minimization problem and the median regression occurs when τ = 0.5 and the coefficients of the absolute values both equal one.
In Panel B of Tables 1 to 3we present the estimated results of the quantile regressions for Equation (1). We report the pseudoR2, a quantile measure of goodness of fit. Generally the pseudoR2 increases from the 10th quantile to the 40th quantile or the 70th quartile and then starts to decrease until the 90th quantile. This indicates that the model explains the levels of happiness between 40th and 70th quartile better than the levels of happiness in the lower and higher quantiles. Nevertheless, our results suggest that all variables are significant and show correct sign in the higher quartile for primary and secondary education, and lower quartile for the tertiary education.
In Table 1, the income variable show nonlinear relationship with the levels of happiness in the 10th and 40th to 90th quantiles; while income is linearly related to the levels of happiness only in the 20th and 30th quantiles. Primary education on the other hand, only shows importance in affecting the levels of happiness in the higher quantiles, that is, 60th to 90th quantiles. If education can command good life, thus, primary education can cause regret and therefore show a negative impact on the levels of happiness (Ferrante, 2009). Nevertheless, the levels of primary education do not have any impact on the levels of happiness in the 10th to 50th quantiles.
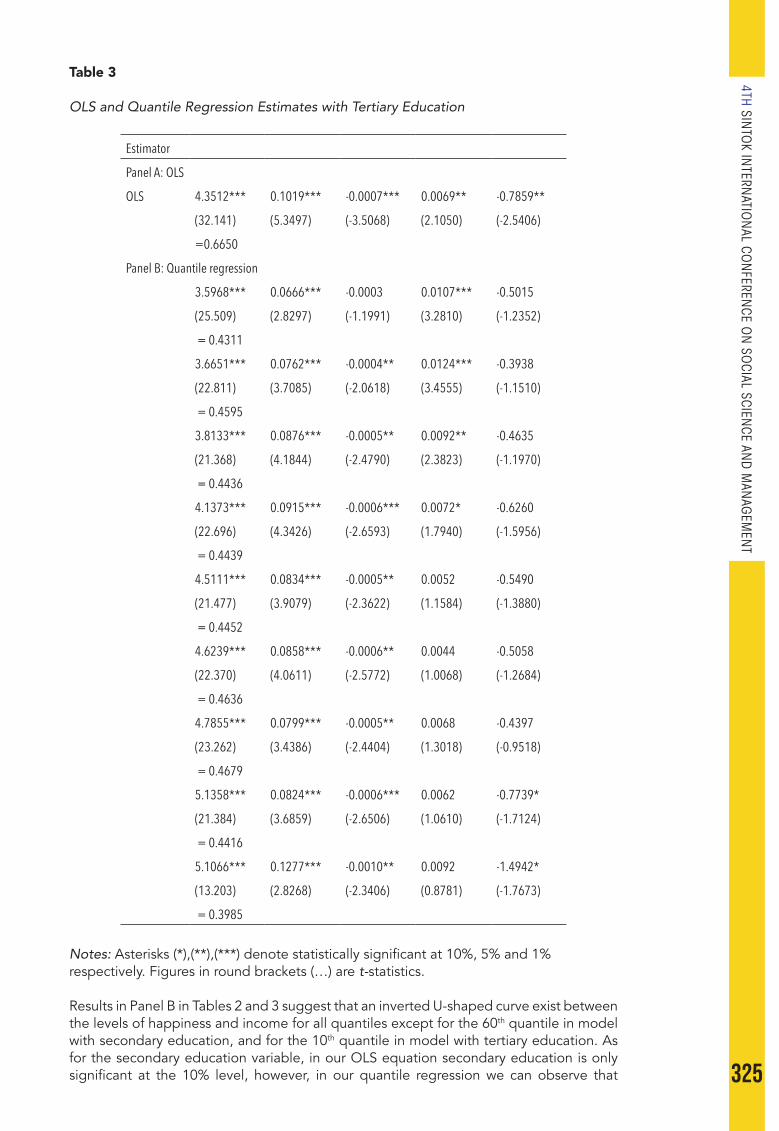
325
4TH SINTO
K INTERN
ATION
AL CON
FERENCE O
N SO
CIAL SCIENCE AN
D M
ANAG
EMEN
T
Table 3
OLS and Quantile Regression Estimates with Tertiary Education
Estimator
Panel A: OLS
OLS 4.3512*** 0.1019*** -0.0007*** 0.0069** -0.7859**
(32.141) (5.3497) (-3.5068) (2.1050) (-2.5406)
=0.6650
Panel B: Quantile regression
3.5968*** 0.0666*** -0.0003 0.0107*** -0.5015
(25.509) (2.8297) (-1.1991) (3.2810) (-1.2352)
= 0.4311
3.6651*** 0.0762*** -0.0004** 0.0124*** -0.3938
(22.811) (3.7085) (-2.0618) (3.4555) (-1.1510)
= 0.4595
3.8133*** 0.0876*** -0.0005** 0.0092** -0.4635
(21.368) (4.1844) (-2.4790) (2.3823) (-1.1970)
= 0.4436
4.1373*** 0.0915*** -0.0006*** 0.0072* -0.6260
(22.696) (4.3426) (-2.6593) (1.7940) (-1.5956)
= 0.4439
4.5111*** 0.0834*** -0.0005** 0.0052 -0.5490
(21.477) (3.9079) (-2.3622) (1.1584) (-1.3880)
= 0.4452
4.6239*** 0.0858*** -0.0006** 0.0044 -0.5058
(22.370) (4.0611) (-2.5772) (1.0068) (-1.2684)
= 0.4636
4.7855*** 0.0799*** -0.0005** 0.0068 -0.4397
(23.262) (3.4386) (-2.4404) (1.3018) (-0.9518)
= 0.4679
5.1358*** 0.0824*** -0.0006*** 0.0062 -0.7739*
(21.384) (3.6859) (-2.6506) (1.0610) (-1.7124)
= 0.4416
5.1066*** 0.1277*** -0.0010** 0.0092 -1.4942*
(13.203) (2.8268) (-2.3406) (0.8781) (-1.7673)
= 0.3985
Notes: Asterisks (*),(**),(***) denote statistically significant at 10%, 5% and 1% respectively. Figures in round brackets (…) are t-statistics.
Results in Panel B in Tables 2 and 3 suggest that an inverted U-shaped curve exist between the levels of happiness and income for all quantiles except for the 60th quantile in model with secondary education, and for the 10th quantile in model with tertiary education. As for the secondary education variable, in our OLS equation secondary education is only significant at the 10% level, however, in our quantile regression we can observe that
326
secondary education variable is statistically significant at the 5% level in the 70th and 80th quantiles, and significant at 10% for the 50th and 60th quantiles. These results clearly suggest that secondary education impacted positively for people with higher levels of happiness but not people with lower levels of happiness. On the other hand, results in Table 3 suggest that tertiary education does matter for people with lower levels of happiness, particularly the levels of happiness at the 10th to 40th quantiles; and it seems that tertiary education is not important for people with higher levels of happiness at the 50th to 90th quantiles.
CONCLUSIONS
Many nations relentlessly pursue the path of economic growth to become developed and high income nations, but little do they realize that in their pursuit of material well-being, they seem to have completely missed the human emotions aspect. Recent literature on happiness has shown evidence that in several developed nations that have enjoyed rapid growth and accumulated high levels of material well-being, their citizens have not reported enjoying higher levels of happiness.
In this study we investigate whether higher income and education can bring more happiness using cross-sectional evidence from 149 countries for the year 2013. This worldwide evidence on the relationship between the levels of happiness and income and education were estimated using OLS and supplemented with quantile regressions. Our OLS regression results overwhelmingly suggest that on average, the relationship between the levels of happiness and income worldwide is nonlinear in nature. The levels of happiness increases at the early stages of economic development, but after to a certain optimal turning point, the levels of happiness declines as economic development progresses further. We put forward this argument to that at lower level of income, current income does matter to the people, but as income increases further, relative income dominates peoples’ behavior and happiness. If their income increases but not in relative to their neighbors, their level of happiness decline. Generally, the OLS results concur with our results from the quantile regressions.
For the education variable, increase in primary education attainment is associated with declining levels of happiness; but primary education only matters for peoples at the higher quantiles not at the lower quantiles. This finding is similar for secondary education attainment where secondary education does matter for people at the higher quantiles. Nevertheless, the impact of secondary education on the levels of happiness is positive, contrary to the effects of primary education. Thus, attaining secondary education facilitates higher levels of happiness. On the other hand, tertiary education also brings more happiness. However, unlike secondary education, tertiary education is important for people at the lower quantile. Thus, people that are less happy in life can uplift their levels of happiness to higher level by engaging in tertiary education. Lastly our results clearly suggest that for all levels of happiness, there is no difference between the developed and the developing countries except for people’s at the most higher levels of happiness.
REFERENCES
Arwin, M., & Lew, B. (2014). Does income matter in the happiness-corruption relationship? Journal of Economic Studies, 41(3), 469-490.
Becker, G. S. (1962). Investment in human capital: A theoretical analysis. Journal of political Economy, 70(5, Part 2), 9-49.
Blanchflower, D.G., & Oswald, A. J. (2004). Well-being over time in Britain and the USA. Journal of Public Economics, 88(7), 1359-1386.
Calvo, R., Carr, D.C., & Matz-Costa, C. (2017). Expanding the happiness paradox: Ethnoracial disparities in life satisfaction among older immigrants in the United States. Journal of Aging and Health, 1-25. DOI: 10.1177/0898264317726608

327
4TH SINTO
K INTERN
ATION
AL CON
FERENCE O
N SO
CIAL SCIENCE AN
D M
ANAG
EMEN
T
Checchi, D. (2006). The economics of education: Human capital, family background and inequality. Cambridge University Press.
Chen, W.C. (2012). How education enhances happiness: Comparison of mediating factors in four East Asian countries. Social Indicators Research, 106, 117-131.
Cheung, H.Y., & Chan, A.W.H. (2011). The relationship of competitiveness motive on people’s happiness through education. International Journal of Intercultural Relations, 35, 179-185.
Clark, A.E., & Oswald, A. J. (1994). Unhappiness and unemployment. The Economic Journal, 104, 648-659.
Cuñado, J., & de Gracia, F. P. (2012). Does education affect happiness? Evidence for Spain. Social Indicators Research, 108(1), 185-196.
Diener, E., Sandvik, E., Seidlitz, L., & Diener, M. (1993). The relationship between income and subjective well-being: Relative or absolute? Social Indicators Research, 28(3), 195–223.
Diener, E., Diener, M., & Diener, C. (1995). Factors predicting the subjective well-being of nations. Journal of Personality and Social Psychology, 69, 851–864.
Dietz, T., Rosa, E.A., & York, R. (2012). Environmentally efficient well-being: Is there a Kuznets curve? Applied Geography, 32, 21-28.
Di Tella, R., MacCulloch, R. J., & Oswald, A. J. (2003). The macroeconomics of happiness. Review of Economics and Statistics, 85, 809-827.
Duesenberry, J. S. (1949). Income, savings, and the theory of consumer behaviour. Harvard University Press.
Easterlin, R. A. (1973). Does money buy happiness? The Public Interest, 30: 3-10.Easterlin, R. A. (1974). Does economic growth improve the human lot? Some empirical
evidence. In P.A. David & M. W. Reder (Eds.), Nations and households in economic growth: Essays in honor of Moses Abramovitz (pp.89-125). The Netherland: Elsevier.
Easterlin, R. (1995). Will raising the incomes of all increase the happiness of all? Journal of Economic Behaviour and Organization, 27, 35-47.
Easterlin, R. A. (2001). Income and happiness: Towards a unified theory. The Economic Journal,111(473), 465-484.
Emmons, R. A. (1986). Personal strivings: An approach to personality and subjective well-being. Journal of Personality and Social Psychology, 51, 1058-1068.
Ferrante, F. (2009). Education, aspirations and life satisfaction. Kyklos, 62(4), 542-562.Ferrer-i-Carbonell, A. (2005). Income and well-being: An empirical analysis of the
comparison income effect. Journal of Public Economics, 89(5), 997-1019.Frey, B. S., & Stutzer, A. (2000a). Happiness, economy and institutions. The Economic
Journal, 110(466), 918-938.Frey, B. S., & Stutzer, A. (2000b). What can economists learn from happiness research?
Journal of Economic Literature, 40, 402-435.Frey, B. S., & Stutzer, A. (2002). Happiness and economics: How the economy and
institutions affect human well-being. Princeton University Press.Gerdtham, U. G., & Johannesson, M. (2001). The relationship between happiness, health,
and socio-economic factors: Results based on Swedish micro data. The Journal of Socio-Economics, 30(6), 553-557.
Hagerty, M. R., & Veenhoven, R. (2003). Wealth and happiness revisited - growing national income does go with greater happiness. Social Indicators Research, 64(1), 1-27.
Hartog, J., & Oosterbeek, H. (1998). Health, wealth and happiness: Why pursue a higher education? Economics of Education Review, 17(3), 245-256.
Helliwell, J. F., Layard, R., & Sachs, J. (Eds.). 2016. World Happiness Report 2016. New York: Sustainable Development Solutions Network.
Inglehart, R., Foa, R., Peterson, C., & Welzel, C. (2008). Development, freedom, and rising happiness: A global perspective (1981-2007). Perspectives on Psychological Science, 3(4), 264-285.
Koenker, R., & Basset, G. (1978). Regression quantiles. Econometrica, 46, 33-50.Kuznets, S. (1955). Economic growth and income inequality. American Economic Review,
45, 1-28.Lelkes, O. (2006). Tasting freedom: Happiness, religion and economic transition. Journal
of Economic Behavior & Organization, 59, 173-194.

328
Macdonald, M., & Douthitt, R. A. (1992). Consumption theories and consumers’ assessments of subjective well- being. The Journal of Consumer Affairs, 26(2), 243-261.
McBride, M. (2010). Money, happiness and aspirations: An experimental study. Journal of Economic Behavior & Organization, 74, 262-276.
Nikolaev, B. (2018). Does higher education increase hedonic and eudaimonic happiness? Journal of Happiness Studies, 19, 483-504.
Oreopoulos, P., & Salvanes, K. G. (2011). Priceless: The nonpecuniary benefits of schooling. Journal of Economic Perspectives, 25(1), 159-184.
Oswald, A. J. (1997). Happiness and economic performance. The Economic Journal, 107(445), 1815-1831.
Peiro, A. (2006). Happiness, satisfaction and socio-economic conditions: Some international evidence. The Journal of Socio-Economics, 35(2), 348-365.
Pollak, R. A. (1976). Interdependent preferences. American Economic Review, 66(3), 309-320.
Ram, R. (2017). Kuznets curve in happiness: A cross-country exploration. Economic Modelling, 66, 272-278.
Sacks, D. W., Stevenson, B., & Wolfers, J. (2010). Subjective well-being, income, economic development and growth. NBER Working Paper No. 16441.
Salinas-Jimenez, M.M., Artes, J., & Salinas-Jimenez, J. (2016). Educational mismatch and job aspirations: A subjective wellbeing analysis using quantile regression. International Journal of Manpower, 37(1), 115-134.
Stack, S., & Eshleman, J. R. (1998). Marital status and happiness: A 17-nation study. Journal of Marriage and Family, 60(2), 527-536.
Stevenson, B., & Wolfers, J. (2008). Economic growth and subjective well-being: Reassessing the Easterlin paradox. Brookings Papers on Economic Activity, Spring: 1-87.
Stevenson, B., & Wolfers, J. (2013). Subjective well-being and income: Is there any evidence of stiation? American Economic Review, 103(3), 598-604.
Stutzer, A. (2004). The role of income aspirations in individual happiness. Journal of Economic Behavior & Organization, 54(1), 89-109.
Sulkowski, A., & White, D. S. (2016). A happiness Kuznets curve? Using model-based cluster analysis to group countries based on happiness, development, income, and carbon emissions. Environment, Development and Sustainability,18(4), 1095-1111.
Theodossiou, I. (1998). The effects of low-pay and unemployment on psychological well-being: A logistic regression approach. Journal of Health Economics, 17, 85-104.
Tsui, H. C. (2014). What affects happiness: Absolute income, relative income or expected income? Journal of Policy Modeling, 36, 994-1007.
Witter, R. A., Okun, M. A., Stock, W. A., & Harring, M. J. (1984). Education and subjective well-being: A meta-analysis. Educational Evaluation and Policy Analysis, 6(2), 165-173.
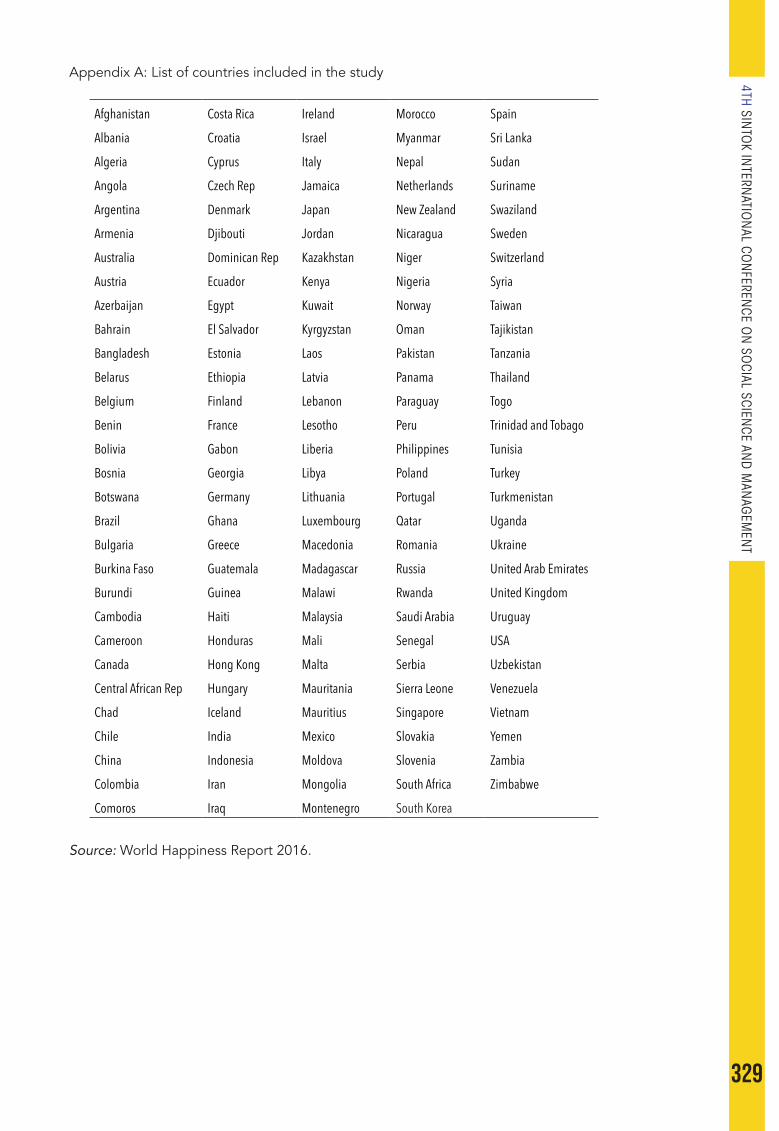
329
4TH SINTO
K INTERN
ATION
AL CON
FERENCE O
N SO
CIAL SCIENCE AN
D M
ANAG
EMEN
T
Appendix A: List of countries included in the study
Afghanistan Costa Rica Ireland Morocco Spain
Albania Croatia Israel Myanmar Sri Lanka
Algeria Cyprus Italy Nepal Sudan
Angola Czech Rep Jamaica Netherlands Suriname
Argentina Denmark Japan New Zealand Swaziland
Armenia Djibouti Jordan Nicaragua Sweden
Australia Dominican Rep Kazakhstan Niger Switzerland
Austria Ecuador Kenya Nigeria Syria
Azerbaijan Egypt Kuwait Norway Taiwan
Bahrain El Salvador Kyrgyzstan Oman Tajikistan
Bangladesh Estonia Laos Pakistan Tanzania
Belarus Ethiopia Latvia Panama Thailand
Belgium Finland Lebanon Paraguay Togo
Benin France Lesotho Peru Trinidad and Tobago
Bolivia Gabon Liberia Philippines Tunisia
Bosnia Georgia Libya Poland Turkey
Botswana Germany Lithuania Portugal Turkmenistan
Brazil Ghana Luxembourg Qatar Uganda
Bulgaria Greece Macedonia Romania Ukraine
Burkina Faso Guatemala Madagascar Russia United Arab Emirates
Burundi Guinea Malawi Rwanda United Kingdom
Cambodia Haiti Malaysia Saudi Arabia Uruguay
Cameroon Honduras Mali Senegal USA
Canada Hong Kong Malta Serbia Uzbekistan
Central African Rep Hungary Mauritania Sierra Leone Venezuela
Chad Iceland Mauritius Singapore Vietnam
Chile India Mexico Slovakia Yemen
China Indonesia Moldova Slovenia Zambia
Colombia Iran Mongolia South Africa Zimbabwe
Comoros Iraq Montenegro South Korea
Source: World Happiness Report 2016.
330
SICONSEM 2021: 077-039
IMPACT OF EMPLOYEE’S CAREER EXPECTATION AND WORK RECOGNITION ON JOB SATISFACTION AMONG WORKING ADULT IN MALAYSIA
1Poon Yih Kiat & 2Lee Huah1,2Faculty of Business and Management, Southern University College
1Corresponding author: [email protected]; [email protected]
ABSTRACT
Understanding how employees’ career expectation and work recognition determine their job satisfaction among working adults from different age groups, backgrounds, and industries will help to improve their working efficiency. Higher career expectation and work recognition will improve employees’ job satisfaction which will in turn improve employees’ effectiveness and efficiency. A five-point Likert scale is applied in the survey questionnaire and the SPSS software is used for statistical analysis. Thirty-five items are listed in the survey questionnaire for the responses of the convenience sampling of 197 respondents. The concluding finding of this study determines that career expectation and work recognition have positive relationship with job satisfaction. Also, employee morale which is considered as moderator of the study is an independent variable of the job satisfaction.
The implication of this study is to develop a new instrument that incorporates the factors of job satisfaction that is recommended. How these factors will boost employees’ job satisfaction would be helpful to management when developing strategies that focus to improve employees’ morale and productivity.
Future studies can be replicated in several different contexts, such as in different countries or different populations. More factors, such as workplace relationships and company values, should also take into consideration its impact on job satisfaction. Moreover, the number of respondent demographic factors should be collected, and equally balanced with other items, such as gender, education level, positions in the company, marital status, to avoid bias in data collection.
Keywords: Career expectation, employee morale, job stress, job satisfaction, work recognition.
INTRODUCTION
The purpose of the study is to examine how career expectation and work recognition impact employee job satisfaction. The finding of the study may give the clearer picture and greater understanding to the management that why employee satisfaction is important to a company and how it impact on employee performance. The study may become the catalyst for the organization to implement strategies to increase employees’ job satisfaction which in turn reduced their turnover intents and improve their efficiency.
The relationship between the two factors, career expectation, and work recognition are moderated by employee morale have not yet been identified, so it is not obvious that stress level and organization culture will amplify or weaken the correlation between the factors of work recognition and career expectation with the employee job satisfaction.
Past research had shown that career expectation and work recognition will improve employee job satisfaction (Reukauf, 2018), and increase the employees’ job performance (Prof. Dr. Dyah Sawitri, 2016). However, some previous studies also indicated that variables
31
331
4TH SINTO
K INTERN
ATION
AL CON
FERENCE O
N SO
CIAL SCIENCE AN
D M
ANAG
EMEN
T
such as age, gender, and working culture also have an impact on job satisfaction. (Munwar Hussain Pahi1*, 2016), (Magee, 2014).
This research is going to find out the relationship between job satisfaction and the factors of career expectation, and work recognition with the moderation of employee morale, and answering the research question as follows: RQ1.) What is the relationship between career expectation and employee job satisfaction?RQ2.) What is the relationship between work recognition and employee job satisfaction?RQ3.) How the career expectation impacted on employee job satisfaction vary by employee
morale? RQ4.) How the work recognition impacted employee job satisfaction vary by employee
morale?
Research Aims and Objectives
This study aims to get a better understanding of how a company can improve its employee job satisfaction to improve its employee’s productivity and efficiency and reduce employee turnover rate.
To achieve the research aim, the objectives of this study are as below:RO1) To analyze how career expectations affect employees’ job satisfaction.RO2) To analyze how work recognition affects employees’ job satisfaction.RO3) To analyze how employee morale moderates career expectation with employee job
satisfaction.RO4) To analyze how employee morale moderates work recognition with employee job
satisfaction.
LITERATURE REVIEW
Job Satisfaction
Employee job satisfaction is the term used to describe the employees’ behavior and attitude towards their job (Robbins et al., 2010). It is interconnected with how the employees feel, think, and perceive their jobs. (Spector, 1997). Also, employee job satisfaction is used as a benchmark for the employees to comparing the difference between the rewards amount received and the expected awards after putting their effort into works (Robbins, 2008).
Employee job satisfaction is also related to how people feel about their jobs and different aspects of their work. (Rainey, 1997). Furthermore, employee satisfaction is the presumption that explains the employees’ behavior, motives, and the needs and requirements for the employees in their workplaces. Several factors affect the employees’ job satisfaction, which includes: achievement, feedback, recognition, working environment, flexibility, and work-life balance. (Vrabie, job satisfaction factors, 2014).
Past studies had shown that demographic factors such as workplace conditions, compensation, and infrastructure are significantly correlated with employees’ job satisfaction. Muthukumaran (2014) has stated that job satisfaction also plays an important role in affecting employee productivity and accomplishing relationship between staff and management. In other words, the success of an organization depends on employees’ satisfaction with their job and feel rewarded for their efforts (Hassan, 2014).
Job satisfaction also often uses in investigating variables of organizational behavior (Rad, 2009). While the low level of job satisfaction often results in tardiness, absenteeism, low morale, and high turnover (Edwards, 2009); a high level of job satisfaction will result in reduced stress, improved empowerment, increased productivity and organizational growth, lowered absenteeism, and increased motivation among employees (Rothausen, 2009).Career Expectation
332
Career expectation is the expectation of an employee hoping for his workplace. Based on Ayinla(2006), the expectations in the workplace are mutually exclusive between employees and employers (Ayinla, 2016).
Based on past research, the expectations of the employer are relatively static and stable across the nature of the organizations (Ayinla, 2016). While the career expectations of employees are more focused on their personality, work experience, family background, culture, situations as well as peer influence (Okwonzor, 2007). An employees’ career expectations are associates with salary, rewards, opportunities, training, recognition, dignity, attractive benefits package, and quality of working life (Ayinla, 2016). The employer should understand the expectations of their employees’ career expectations so that they can motivate their employees and improve their working efficiency and made them available to employees for a better understanding of the work situation (Okwonzor, 2007).
Employers need to understand the basic employees’ expectations before hiring a new employee in their organization (Momud, 2010) which can improve the rate of acceptance to join the organization by the recruits. The understanding of employee’s basic career expectations can help to gain mutual understanding, identify what is the most important to the employees, and receiving positive feedback from the employee to achieve a warm working environment (Akinkunmi, 1999) which will increase improving employees’ job satisfaction and performance (Oginni, 2018).
Work Recognition
In an organization, work recognition plays a key role in motivating employees to increase their performance which in turn reaching corporate goals. Past research shows that the rewards and recognitions no matter financial or non-financial will improve the job satisfaction and motivation of employees (DeCenzo, 2010). Work Recognition can be in the form of praise or a personal note acknowledging achievements (Gostick, 2007) and also can be considered as the appreciation, approval, or acknowledgment of the positive accomplishments or behaviors of an individual or team in their work (Caligiuri, 2010). The forms of recognition can be various, such as: verbal, written phase, public praise, and symbolic gestures by managers (Nelson, 2003).
The employees’ work recognition or reward is also considered as an effort from the company management to shows their gratitude or appreciation to their employees or members for being a role models or complete certain tasks (Ndungu, 2017). The recognition is expected to boost employees’ motivation as the employee knows that they will reward something in return for their hard works, achievements, or contributions to the company or organization.
Recognitions or rewards can be categorized into implicit and explicit rewards. Explicit rewards can be given in the form of salary and bonus; while implicit rewards can be the form of appreciation, recognition, and compliments. It can conclude that work recognition plays a significant role in an organization to retain its talents as it creates more motivation rather than just purely given monetary benefits (salary, money, or other benefits packages) (Tessema, 2013).
Moreover, the employees’ work recognition is found to have a significant impact on job satisfaction regardless of income level or culture (Mussie T. Tessema, 2013). Past research also shows that reward and recognition, work-life balance, and job satisfaction have a significant positive effect on employee retention as well (Tirta & Enrika, 2020).
Employee Morale
Employee morale describes the mental attitude of individuals and groups who show their initiative when doing their work and encouragement to perform better. The morale in work is the behavior of a person that describes the will, excitement, and sincerity which the feeling of arising pleasure when carrying out a job which results in an employee better completing the assigned job and achieving the goals set by the company (Ramadhany,
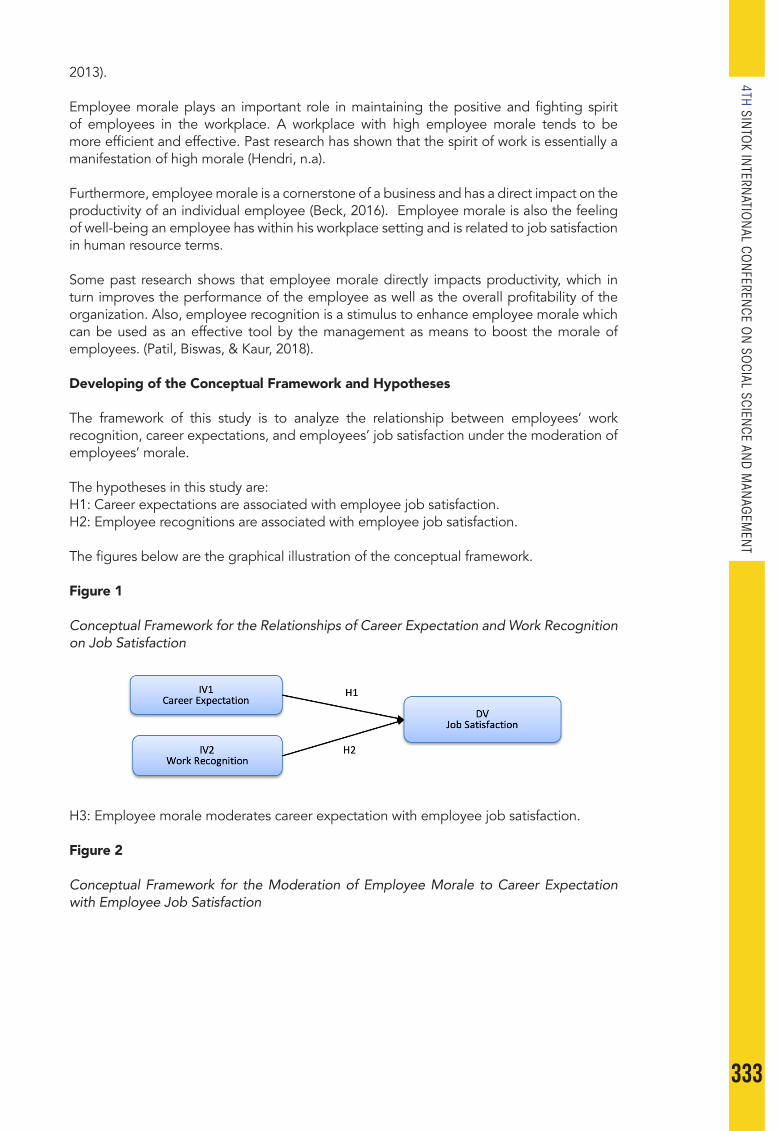
333
4TH SINTO
K INTERN
ATION
AL CON
FERENCE O
N SO
CIAL SCIENCE AN
D M
ANAG
EMEN
T
2013).
Employee morale plays an important role in maintaining the positive and fighting spirit of employees in the workplace. A workplace with high employee morale tends to be more efficient and effective. Past research has shown that the spirit of work is essentially a manifestation of high morale (Hendri, n.a).
Furthermore, employee morale is a cornerstone of a business and has a direct impact on the productivity of an individual employee (Beck, 2016). Employee morale is also the feeling of well-being an employee has within his workplace setting and is related to job satisfaction in human resource terms.
Some past research shows that employee morale directly impacts productivity, which in turn improves the performance of the employee as well as the overall profitability of the organization. Also, employee recognition is a stimulus to enhance employee morale which can be used as an effective tool by the management as means to boost the morale of employees. (Patil, Biswas, & Kaur, 2018).
Developing of the Conceptual Framework and Hypotheses
The framework of this study is to analyze the relationship between employees’ work recognition, career expectations, and employees’ job satisfaction under the moderation of employees’ morale.
The hypotheses in this study are:H1: Career expectations are associated with employee job satisfaction.H2: Employee recognitions are associated with employee job satisfaction.
The figures below are the graphical illustration of the conceptual framework.
Figure 1
Conceptual Framework for the Relationships of Career Expectation and Work Recognition on Job Satisfaction
H3: Employee morale moderates career expectation with employee job satisfaction.
Figure 2
Conceptual Framework for the Moderation of Employee Morale to Career Expectation with Employee Job Satisfaction
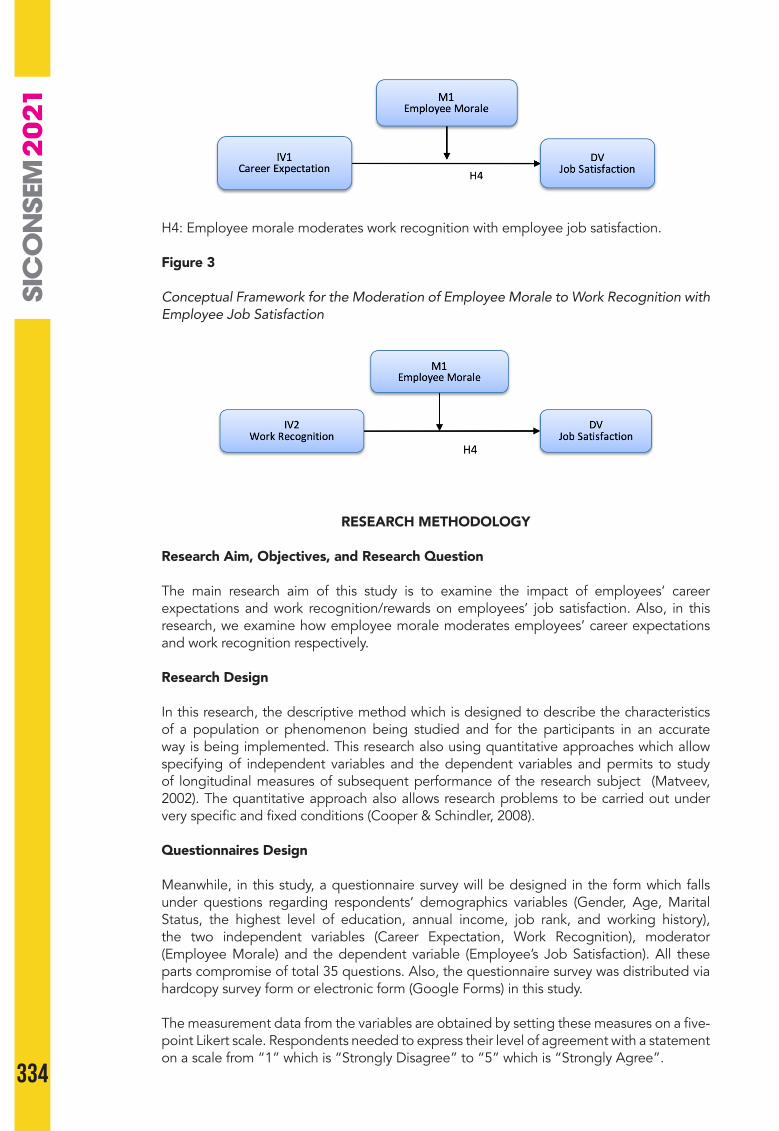
334
H4: Employee morale moderates work recognition with employee job satisfaction.
Figure 3
Conceptual Framework for the Moderation of Employee Morale to Work Recognition with Employee Job Satisfaction
RESEARCH METHODOLOGY
Research Aim, Objectives, and Research Question
The main research aim of this study is to examine the impact of employees’ career expectations and work recognition/rewards on employees’ job satisfaction. Also, in this research, we examine how employee morale moderates employees’ career expectations and work recognition respectively.
Research Design
In this research, the descriptive method which is designed to describe the characteristics of a population or phenomenon being studied and for the participants in an accurate way is being implemented. This research also using quantitative approaches which allow specifying of independent variables and the dependent variables and permits to study of longitudinal measures of subsequent performance of the research subject (Matveev, 2002). The quantitative approach also allows research problems to be carried out under very specific and fixed conditions (Cooper & Schindler, 2008).
Questionnaires Design
Meanwhile, in this study, a questionnaire survey will be designed in the form which falls under questions regarding respondents’ demographics variables (Gender, Age, Marital Status, the highest level of education, annual income, job rank, and working history), the two independent variables (Career Expectation, Work Recognition), moderator (Employee Morale) and the dependent variable (Employee’s Job Satisfaction). All these parts compromise of total 35 questions. Also, the questionnaire survey was distributed via hardcopy survey form or electronic form (Google Forms) in this study.
The measurement data from the variables are obtained by setting these measures on a five-point Likert scale. Respondents needed to express their level of agreement with a statement on a scale from “1” which is “Strongly Disagree” to “5” which is “Strongly Agree”.
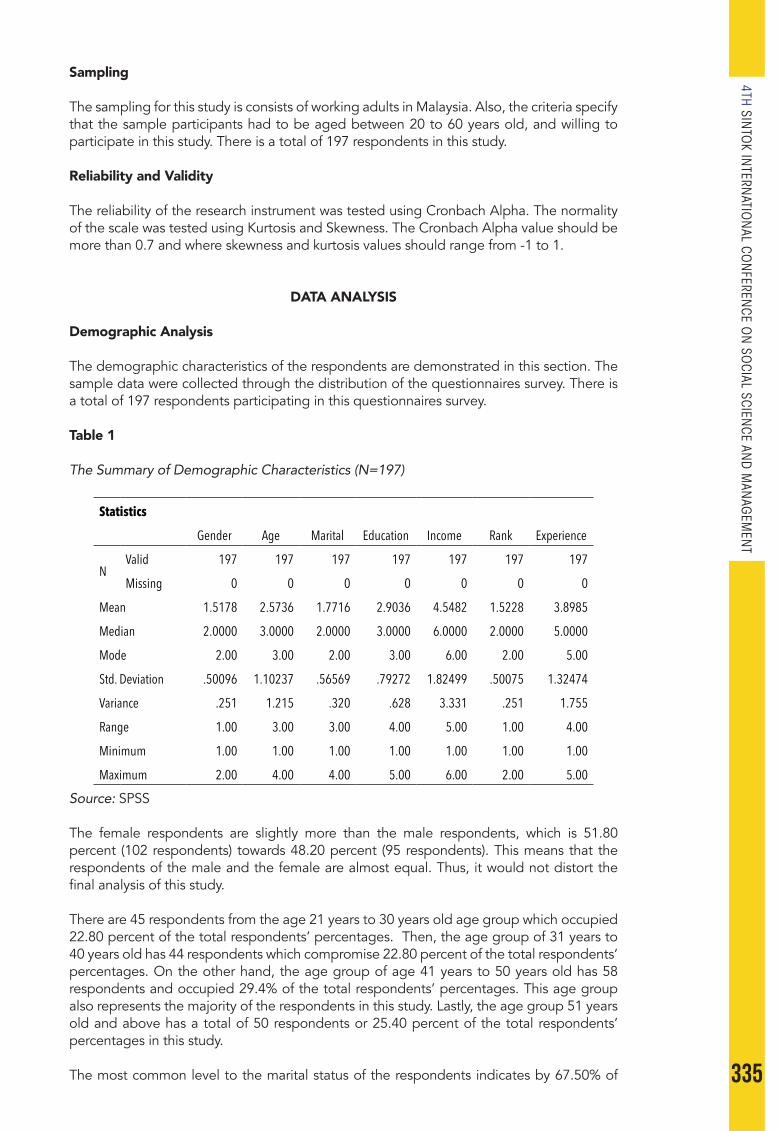
335
4TH SINTO
K INTERN
ATION
AL CON
FERENCE O
N SO
CIAL SCIENCE AN
D M
ANAG
EMEN
T
Sampling
The sampling for this study is consists of working adults in Malaysia. Also, the criteria specify that the sample participants had to be aged between 20 to 60 years old, and willing to participate in this study. There is a total of 197 respondents in this study.
Reliability and Validity
The reliability of the research instrument was tested using Cronbach Alpha. The normality of the scale was tested using Kurtosis and Skewness. The Cronbach Alpha value should be more than 0.7 and where skewness and kurtosis values should range from -1 to 1.
DATA ANALYSIS
Demographic Analysis
The demographic characteristics of the respondents are demonstrated in this section. The sample data were collected through the distribution of the questionnaires survey. There is a total of 197 respondents participating in this questionnaires survey.
Table 1
The Summary of Demographic Characteristics (N=197)
Statistics
Gender Age Marital Education Income Rank Experience
NValid 197 197 197 197 197 197 197
Missing 0 0 0 0 0 0 0
Mean 1.5178 2.5736 1.7716 2.9036 4.5482 1.5228 3.8985
Median 2.0000 3.0000 2.0000 3.0000 6.0000 2.0000 5.0000
Mode 2.00 3.00 2.00 3.00 6.00 2.00 5.00
Std. Deviation .50096 1.10237 .56569 .79272 1.82499 .50075 1.32474
Variance .251 1.215 .320 .628 3.331 .251 1.755
Range 1.00 3.00 3.00 4.00 5.00 1.00 4.00
Minimum 1.00 1.00 1.00 1.00 1.00 1.00 1.00
Maximum 2.00 4.00 4.00 5.00 6.00 2.00 5.00
Source: SPSS
The female respondents are slightly more than the male respondents, which is 51.80 percent (102 respondents) towards 48.20 percent (95 respondents). This means that the respondents of the male and the female are almost equal. Thus, it would not distort the final analysis of this study.
There are 45 respondents from the age 21 years to 30 years old age group which occupied 22.80 percent of the total respondents’ percentages. Then, the age group of 31 years to 40 years old has 44 respondents which compromise 22.80 percent of the total respondents’ percentages. On the other hand, the age group of age 41 years to 50 years old has 58 respondents and occupied 29.4% of the total respondents’ percentages. This age group also represents the majority of the respondents in this study. Lastly, the age group 51 years old and above has a total of 50 respondents or 25.40 percent of the total respondents’ percentages in this study.
The most common level to the marital status of the respondents indicates by 67.50% of
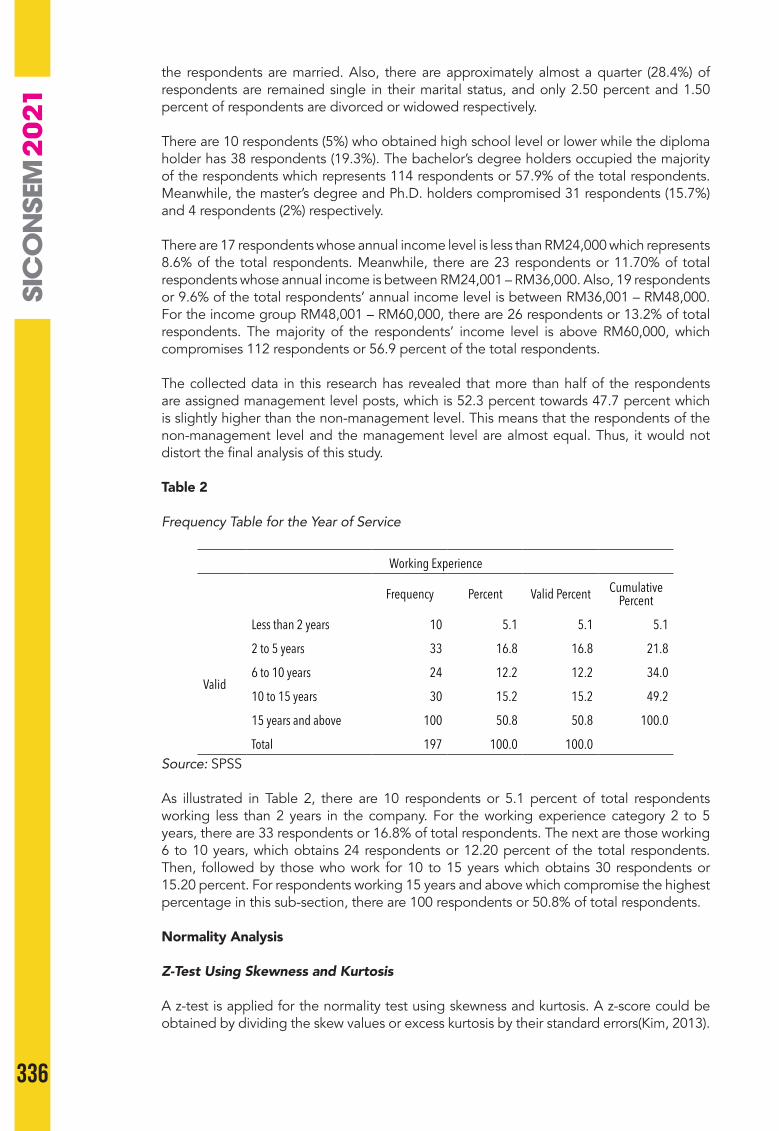
336
the respondents are married. Also, there are approximately almost a quarter (28.4%) of respondents are remained single in their marital status, and only 2.50 percent and 1.50 percent of respondents are divorced or widowed respectively.
There are 10 respondents (5%) who obtained high school level or lower while the diploma holder has 38 respondents (19.3%). The bachelor’s degree holders occupied the majority of the respondents which represents 114 respondents or 57.9% of the total respondents. Meanwhile, the master’s degree and Ph.D. holders compromised 31 respondents (15.7%) and 4 respondents (2%) respectively.
There are 17 respondents whose annual income level is less than RM24,000 which represents 8.6% of the total respondents. Meanwhile, there are 23 respondents or 11.70% of total respondents whose annual income is between RM24,001 – RM36,000. Also, 19 respondents or 9.6% of the total respondents’ annual income level is between RM36,001 – RM48,000. For the income group RM48,001 – RM60,000, there are 26 respondents or 13.2% of total respondents. The majority of the respondents’ income level is above RM60,000, which compromises 112 respondents or 56.9 percent of the total respondents.
The collected data in this research has revealed that more than half of the respondents are assigned management level posts, which is 52.3 percent towards 47.7 percent which is slightly higher than the non-management level. This means that the respondents of the non-management level and the management level are almost equal. Thus, it would not distort the final analysis of this study.
Table 2
Frequency Table for the Year of Service
Working Experience
Frequency Percent Valid Percent Cumulative Percent
Valid
Less than 2 years 10 5.1 5.1 5.1
2 to 5 years 33 16.8 16.8 21.8
6 to 10 years 24 12.2 12.2 34.0
10 to 15 years 30 15.2 15.2 49.2
15 years and above 100 50.8 50.8 100.0
Total 197 100.0 100.0Source: SPSS
As illustrated in Table 2, there are 10 respondents or 5.1 percent of total respondents working less than 2 years in the company. For the working experience category 2 to 5 years, there are 33 respondents or 16.8% of total respondents. The next are those working 6 to 10 years, which obtains 24 respondents or 12.20 percent of the total respondents. Then, followed by those who work for 10 to 15 years which obtains 30 respondents or 15.20 percent. For respondents working 15 years and above which compromise the highest percentage in this sub-section, there are 100 respondents or 50.8% of total respondents.
Normality Analysis
Z-Test Using Skewness and Kurtosis
A z-test is applied for the normality test using skewness and kurtosis. A z-score could be obtained by dividing the skew values or excess kurtosis by their standard errors(Kim, 2013).

337
4TH SINTO
K INTERN
ATION
AL CON
FERENCE O
N SO
CIAL SCIENCE AN
D M
ANAG
EMEN
T
Source: (Kim, 2013).
The null hypothesis at absolute z-value over 3.29 will be rejected for medium-sized samples (50 < n < 300), which corresponds with an alpha level of 0.05, and conclude the distribution of the sample is considered non-normal (Kim, 2013).
Almost all variables’ Skewness and Kurtosis Z-value are among the range of 3.29 < Z < 3.29. Thus, the variables job satisfaction and word recognition are considered normally distributed. Only career expectation Kurtosis z-value is 3.82 and employee morale z-value is 5.9 which the two variables Z-value are higher than absolute Z-value of 3.29, thus these two variables are considered not normal distributed as their Kurtosis Z-values are noticeably deviation from normality.
Shapiro-Wilk Test
Table 3
Test of Normality
Kolmogorov-Smirnova Shapiro-Wilk
Statistic df Sig. Statistic df Sig.
Job Satisfaction .118 197 .000 .958 197 .000
Career Expectation .124 197 .000 .959 197 .000
Work Recognition .120 197 .000 .976 197 .002
Employees’ Morale .111 197 .000 .953 197 .000
a. Lilliefors Significance CorrectionSource: SPSS
As shown in Table 3 the significance value (or p-value) under the Shapiro-Wilk Test, which is used for tests of the normality, is below 0.05 for all variables. Thus, the null hypotheses that the variable follows a normal distribution were rejected for all variables. Also, it can be concluded that the data significantly deviate from a normal distribution for all variables.
Validity Test
Independent VariablesTable 4
KMO and Bartlett’s Test for Independent Variables
KMO and Bartlett’s Test
Kaiser-Meyer-Olkin Measure of Sampling Adequacy.
0.901
Bartlett’s Test of Sphericity
Approx. Chi-Square 1,455.580
df 91.000
Sig. 0.000Source: SPSS
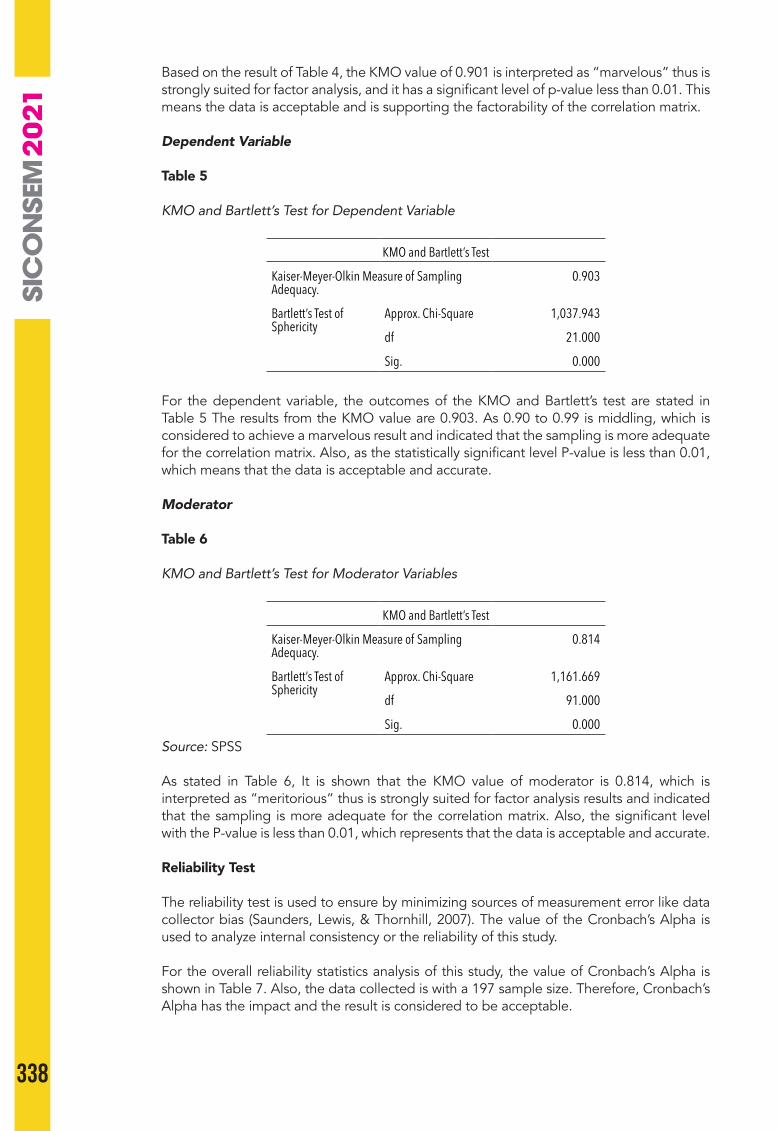
338
Based on the result of Table 4, the KMO value of 0.901 is interpreted as “marvelous” thus is strongly suited for factor analysis, and it has a significant level of p-value less than 0.01. This means the data is acceptable and is supporting the factorability of the correlation matrix.
Dependent Variable
Table 5
KMO and Bartlett’s Test for Dependent Variable
KMO and Bartlett’s Test
Kaiser-Meyer-Olkin Measure of Sampling Adequacy.
0.903
Bartlett’s Test of Sphericity
Approx. Chi-Square 1,037.943
df 21.000
Sig. 0.000
For the dependent variable, the outcomes of the KMO and Bartlett’s test are stated in Table 5 The results from the KMO value are 0.903. As 0.90 to 0.99 is middling, which is considered to achieve a marvelous result and indicated that the sampling is more adequate for the correlation matrix. Also, as the statistically significant level P-value is less than 0.01, which means that the data is acceptable and accurate.
Moderator
Table 6
KMO and Bartlett’s Test for Moderator Variables
KMO and Bartlett’s Test
Kaiser-Meyer-Olkin Measure of Sampling Adequacy.
0.814
Bartlett’s Test of Sphericity
Approx. Chi-Square 1,161.669
df 91.000
Sig. 0.000Source: SPSS
As stated in Table 6, It is shown that the KMO value of moderator is 0.814, which is interpreted as “meritorious” thus is strongly suited for factor analysis results and indicated that the sampling is more adequate for the correlation matrix. Also, the significant level with the P-value is less than 0.01, which represents that the data is acceptable and accurate.
Reliability Test
The reliability test is used to ensure by minimizing sources of measurement error like data collector bias (Saunders, Lewis, & Thornhill, 2007). The value of the Cronbach’s Alpha is used to analyze internal consistency or the reliability of this study.
For the overall reliability statistics analysis of this study, the value of Cronbach’s Alpha is shown in Table 7. Also, the data collected is with a 197 sample size. Therefore, Cronbach’s Alpha has the impact and the result is considered to be acceptable.

339
4TH SINTO
K INTERN
ATION
AL CON
FERENCE O
N SO
CIAL SCIENCE AN
D M
ANAG
EMEN
T
Table 7
Reliability Statistics (Summary)
Scale Cronbach’s Alpha
Cronbach’s Alpha Based on Standardized Items Strength Number of Items
Job Satisfaction 0.930 0.931 Excellent 7
Career Expectation 0.835 0.841 Good 7
Work Recognition 0.868 0.871 Good 7
Employees’ Morale 0.874 0.875 Good 7
Overall 0.918 0.919 Acceptable 4
Source: SPSS & Microsoft Excel.
As demonstrated from the above tables, the highest Cronbach’s Alpha value is found in the Job Satisfaction (Dependent Variable) with 0.930, which is an excellent and acceptable value.
Meanwhile, the average Cronbach’s Alpha of the moderators, independent variables, and the dependent variable is 0.8768. According to Nunnally and Brenstein (1994), the result showed that the Cronbach’s Alpha value of all items is greater than 0.7, which indicates that all items are acceptable (Nunnally & Bernstein, 1994). Consequently, the reliability in this study is considered reliable, and acceptable.
Descriptive Analysis
As demonstrated in Table 8, the majority of the items’ mean values are considered slightly strong which most items’ mean values are slightly higher from the neutral scale. The average mean value scores are 3.904, 3.865, 3.661, and 3.659 which represent Job Satisfaction (Dependent Variable), Career Expectation (Independent Variable 1), Work Recognition (WR2), and Employee Morale (Moderator) respectively. Most of the variables’ mean scores are above the neutral value which is 3.00. Thus, the majority of the variables have an average mean between neutral and agree on the Likert scale.
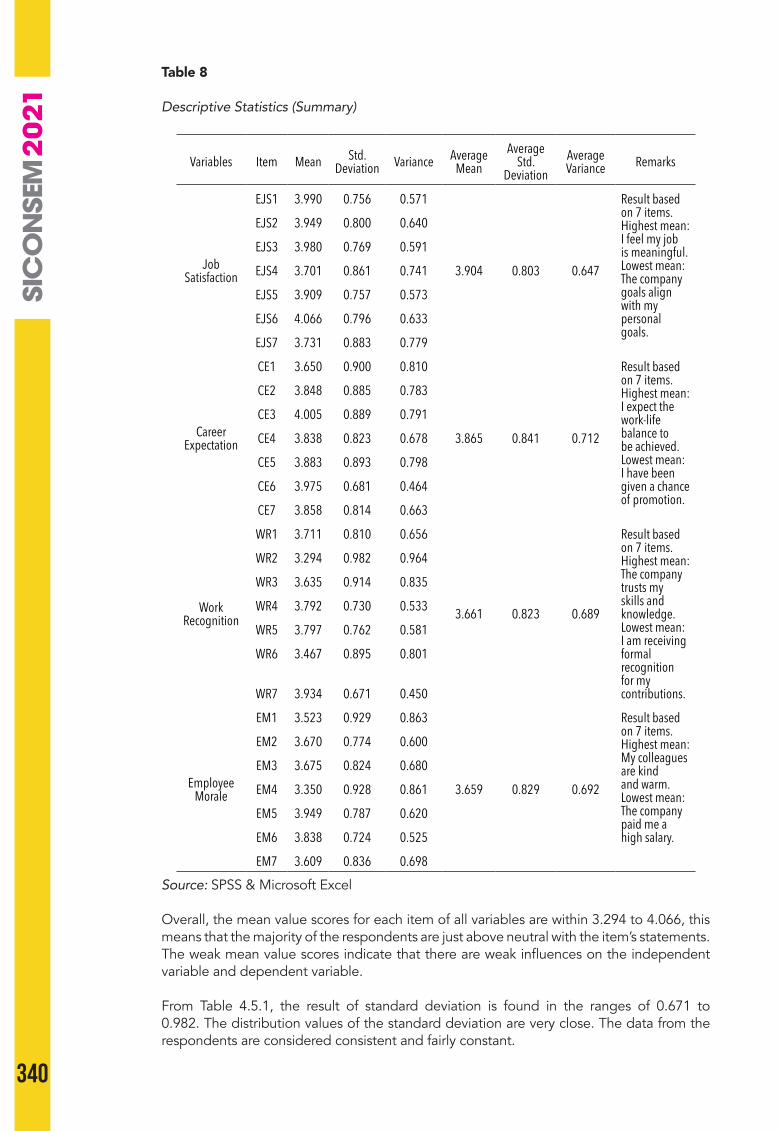
340
Table 8
Descriptive Statistics (Summary)
Variables Item Mean Std. Deviation Variance Average
MeanAverage
Std. Deviation
Average Variance Remarks
Job Satisfaction
EJS1 3.990 0.756 0.571
3.904 0.803 0.647
Result based on 7 items. Highest mean: I feel my job is meaningful. Lowest mean: The company goals align with my personal goals.
EJS2 3.949 0.800 0.640
EJS3 3.980 0.769 0.591
EJS4 3.701 0.861 0.741
EJS5 3.909 0.757 0.573
EJS6 4.066 0.796 0.633
EJS7 3.731 0.883 0.779
Career Expectation
CE1 3.650 0.900 0.810
3.865 0.841 0.712
Result based on 7 items. Highest mean: I expect the work-life balance to be achieved. Lowest mean: I have been given a chance of promotion.
CE2 3.848 0.885 0.783
CE3 4.005 0.889 0.791
CE4 3.838 0.823 0.678
CE5 3.883 0.893 0.798
CE6 3.975 0.681 0.464
CE7 3.858 0.814 0.663
Work Recognition
WR1 3.711 0.810 0.656
3.661 0.823 0.689
Result based on 7 items. Highest mean: The company trusts my skills and knowledge. Lowest mean: I am receiving formal recognition for my contributions.
WR2 3.294 0.982 0.964
WR3 3.635 0.914 0.835
WR4 3.792 0.730 0.533
WR5 3.797 0.762 0.581
WR6 3.467 0.895 0.801
WR7 3.934 0.671 0.450
Employee Morale
EM1 3.523 0.929 0.863
3.659 0.829 0.692
Result based on 7 items. Highest mean: My colleagues are kind and warm. Lowest mean: The company paid me a high salary.
EM2 3.670 0.774 0.600
EM3 3.675 0.824 0.680
EM4 3.350 0.928 0.861
EM5 3.949 0.787 0.620
EM6 3.838 0.724 0.525
EM7 3.609 0.836 0.698
Source: SPSS & Microsoft Excel
Overall, the mean value scores for each item of all variables are within 3.294 to 4.066, this means that the majority of the respondents are just above neutral with the item’s statements. The weak mean value scores indicate that there are weak influences on the independent variable and dependent variable.
From Table 4.5.1, the result of standard deviation is found in the ranges of 0.671 to 0.982. The distribution values of the standard deviation are very close. The data from the respondents are considered consistent and fairly constant.

341
4TH SINTO
K INTERN
ATION
AL CON
FERENCE O
N SO
CIAL SCIENCE AN
D M
ANAG
EMEN
T
Correlation Analysis
In this study, Pearson’s correlation is applied to test the relationships between the two moderators, two independent variables (IVs), and the dependent variables (DV). The Pearson’s correlation coefficients value must range from -1 to +1 for the signification of positive or negative correlation.
Table 9
The Summary of the Correlations between the Moderator, Independent Variables, and the Dependent Variable (N=197)
Job Satisfaction Career
Expectation Work
Recognition Employee Morale
(Moderator)
Job Satisfaction (DV)
Pearson Correlation 1 .793** .666** .700**
Sig. (2-tailed) .000 .000 .000
N 197 197 197
Career Expectation (IV1)
Pearson Correlation 1 .780** .750**
Sig. (2-tailed) .000 .000
N 197 197
Work Recognition (IV2)
Pearson Correlation 1 .755**
Sig. (2-tailed) .000
N 197
**. Correlation is significant at the 0.01 level (2-tailed). (Source: SPSS)
As stated in Table 9, there is a strong, positive relationship between the first independent variable (Career Expectation) and dependent variable (Job Satisfaction) as its’ value of Pearson Correlation is 0.793 which is above 0.70 with the significance value (p-value) is less than 0.01. The finding means that the career expectation of an employee has a strong influence on their job satisfaction. Thus, the first hypothesis: “H1: The career expectations are associated with employee job satisfaction.” is valid.
The second independent variable (Work Recognition) is considered to have a moderate, and positive relationship with the dependent variable as its Pearson Correlation value is 0.666 and p-value less than 0.01 which indicates that the correlation between work recognition and job satisfaction is a moderate (or slightly strong), significant, and positive. This means that the second hypothesis: “H2: The employee recognitions are associated with employee job satisfaction.” is valid as well.
Employee Morale moderator is considered to have a strong, and positive relationship with the dependent variable. It has a p-value less than 0.01 which indicates there is a strong, significant, and positive correlation. Also, it’s Pearson Correlation value is 0.70 (or 70.0%). This result of this correlation analysis means that the higher the employees’ morale, the higher the employees’ job satisfaction.
Multiple Regression Analysis
The Basic Model of The Study
Assuming the dependent variable - job satisfaction is Y, the independent variables – career expectation is X, work recognition as V, the model of this study is as follow:Thus, the basic equation of the study is Y=b1X +b2V.
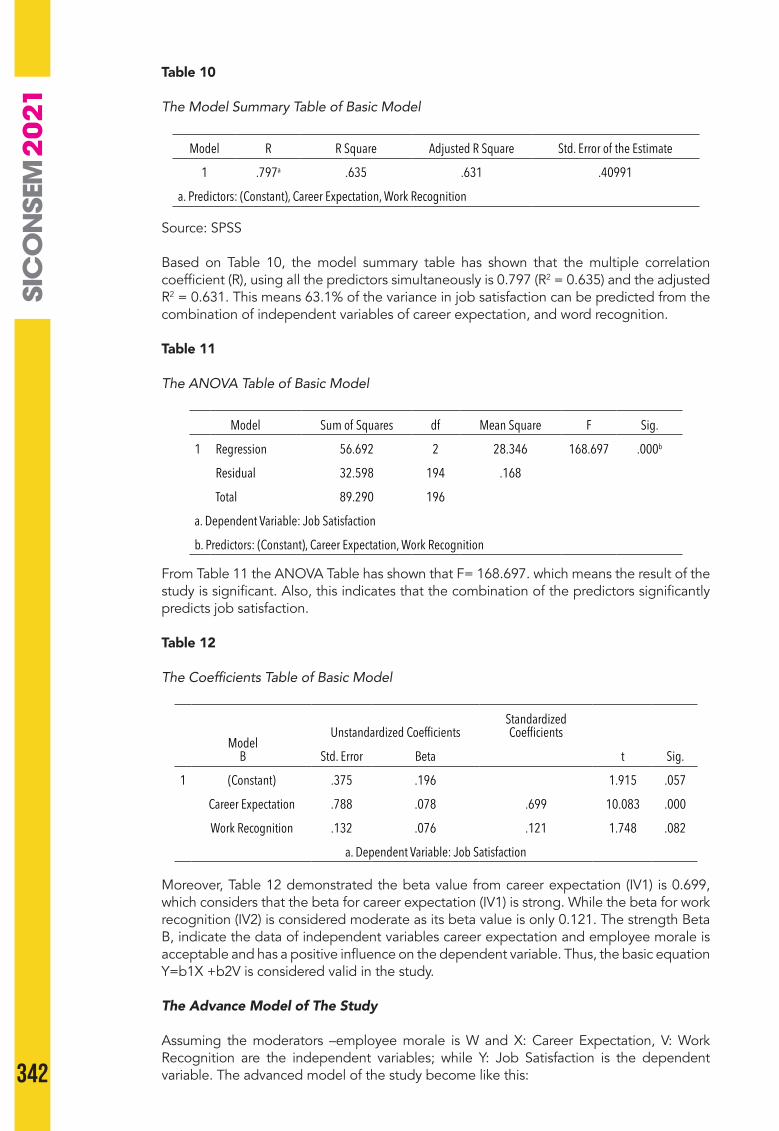
342
Table 10
The Model Summary Table of Basic Model
Model R R Square Adjusted R Square Std. Error of the Estimate
1 .797a .635 .631 .40991
a. Predictors: (Constant), Career Expectation, Work Recognition
Source: SPSS
Based on Table 10, the model summary table has shown that the multiple correlation coefficient (R), using all the predictors simultaneously is 0.797 (R2 = 0.635) and the adjusted R2 = 0.631. This means 63.1% of the variance in job satisfaction can be predicted from the combination of independent variables of career expectation, and word recognition.
Table 11
The ANOVA Table of Basic Model
Model Sum of Squares df Mean Square F Sig.
1 Regression 56.692 2 28.346 168.697 .000b
Residual 32.598 194 .168
Total 89.290 196
a. Dependent Variable: Job Satisfaction
b. Predictors: (Constant), Career Expectation, Work Recognition
From Table 11 the ANOVA Table has shown that F= 168.697. which means the result of the study is significant. Also, this indicates that the combination of the predictors significantly predicts job satisfaction.
Table 12
The Coefficients Table of Basic Model
ModelB
Unstandardized CoefficientsStandardized Coefficients
t Sig.Std. Error Beta
1 (Constant) .375 .196 1.915 .057
Career Expectation .788 .078 .699 10.083 .000
Work Recognition .132 .076 .121 1.748 .082
a. Dependent Variable: Job Satisfaction
Moreover, Table 12 demonstrated the beta value from career expectation (IV1) is 0.699, which considers that the beta for career expectation (IV1) is strong. While the beta for work recognition (IV2) is considered moderate as its beta value is only 0.121. The strength Beta B, indicate the data of independent variables career expectation and employee morale is acceptable and has a positive influence on the dependent variable. Thus, the basic equation Y=b1X +b2V is considered valid in the study.
The Advance Model of The Study
Assuming the moderators –employee morale is W and X: Career Expectation, V: Work Recognition are the independent variables; while Y: Job Satisfaction is the dependent variable. The advanced model of the study become like this:

343
4TH SINTO
K INTERN
ATION
AL CON
FERENCE O
N SO
CIAL SCIENCE AN
D M
ANAG
EMEN
T
Thus, the basic equation of the study is Y=b1X +b2V +b3W
Table 13
The Model Summary Table of Advance Model
Model R R Square Adjusted R Square Std. Error of the Estimate
1 .809a .655 .649 .39965
a. Predictors: (Constant), Career Expectation, Work Recognition, Employee Morale
b. Dependent Variable: Job Satisfaction
Based on Table 13, the model summary table has shown that the multiple correlation coefficient (R), using all the predictors simultaneously is 0.81 (R2 = 0.655) and the adjusted R2 = 0.649. This means 64.9% of the variance in job satisfaction can be predicted from the combination of variables of career expectation, work recognition, and employee morale.
Table 14
The ANOVA Table of Advance Model
ANOVAa
Model Sum of Squares df Mean Square F Sig.
1
Regression 58.464 3 19.488 122.013 .000b
Residual 30.826 193 .160
Total 89.290 196
a. Dependent Variable: Job Satisfaction
b. Predictors: (Constant), Career Expectation, Work Recognition, Employee Morale
From Table 14, the ANOVA Table has shown that F= 122.013 which means the result of the study is significant. Also, this indicates that the combination of the predictors significantly predicts job satisfaction.
Table 15
The Coefficients Table of Advance Model
Coefficientsa
Model Unstandardized Coefficients
Standardized Coefficients t Sig. 95.0% Confidence
Interval for BCollinearity
Statistics
B Std. Error Beta Lower
BoundUpper Bound Tolerance VIF
1
(Constant) .278 .193 1.443 .151 -.102 .659Career Expectation .680 .083 .603 8.209 .000 .517 .843 .332 3.015
Work Recognition .021 .081 .020 .266 .791 -.138 .181 .326 3.071
Employee Morale .251 .075 .233 3.331 .001 .102 .400 .364 2.746
a. Dependent Variable: Job Satisfaction
Table 15 demonstrated the Regression coefficients and the significance value of the independent variables. The beta value from career expectation (IV1) is 0.603, which considers
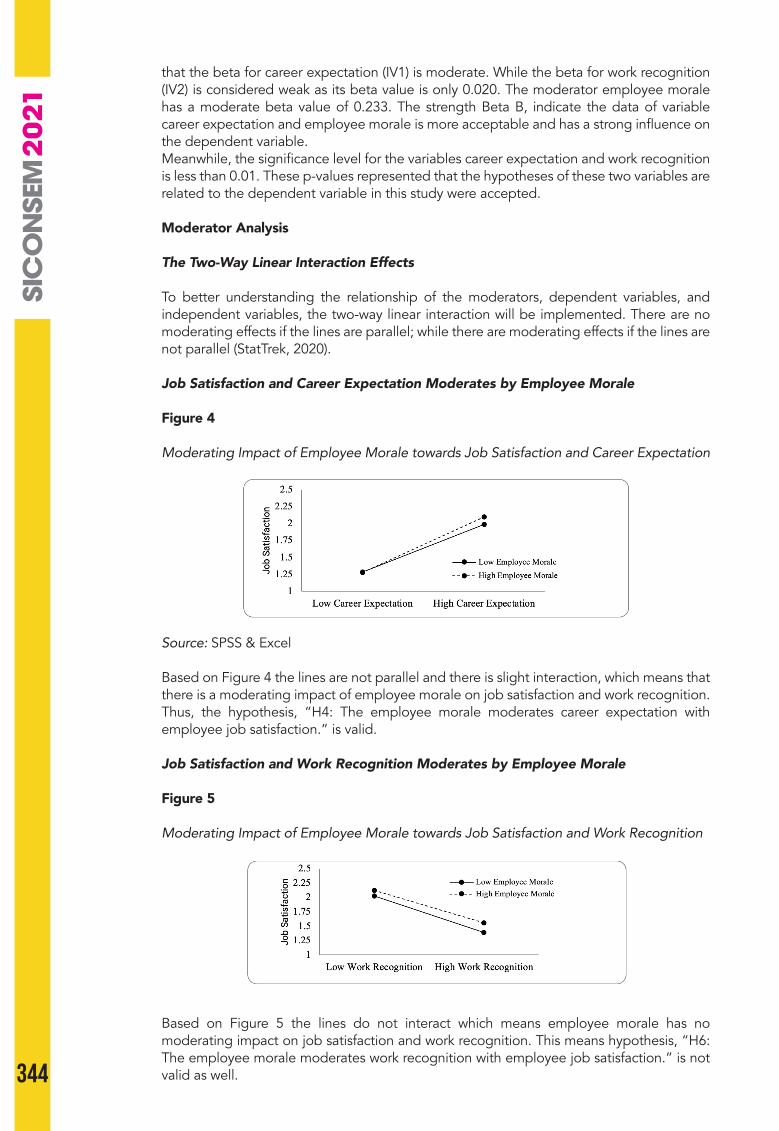
344
that the beta for career expectation (IV1) is moderate. While the beta for work recognition (IV2) is considered weak as its beta value is only 0.020. The moderator employee morale has a moderate beta value of 0.233. The strength Beta B, indicate the data of variable career expectation and employee morale is more acceptable and has a strong influence on the dependent variable.Meanwhile, the significance level for the variables career expectation and work recognition is less than 0.01. These p-values represented that the hypotheses of these two variables are related to the dependent variable in this study were accepted.
Moderator Analysis
The Two-Way Linear Interaction Effects
To better understanding the relationship of the moderators, dependent variables, and independent variables, the two-way linear interaction will be implemented. There are no moderating effects if the lines are parallel; while there are moderating effects if the lines are not parallel (StatTrek, 2020).
Job Satisfaction and Career Expectation Moderates by Employee Morale
Figure 4
Moderating Impact of Employee Morale towards Job Satisfaction and Career Expectation
Source: SPSS & Excel
Based on Figure 4 the lines are not parallel and there is slight interaction, which means that there is a moderating impact of employee morale on job satisfaction and work recognition. Thus, the hypothesis, “H4: The employee morale moderates career expectation with employee job satisfaction.” is valid.
Job Satisfaction and Work Recognition Moderates by Employee Morale
Figure 5
Moderating Impact of Employee Morale towards Job Satisfaction and Work Recognition
Based on Figure 5 the lines do not interact which means employee morale has no moderating impact on job satisfaction and work recognition. This means hypothesis, “H6: The employee morale moderates work recognition with employee job satisfaction.” is not valid as well.
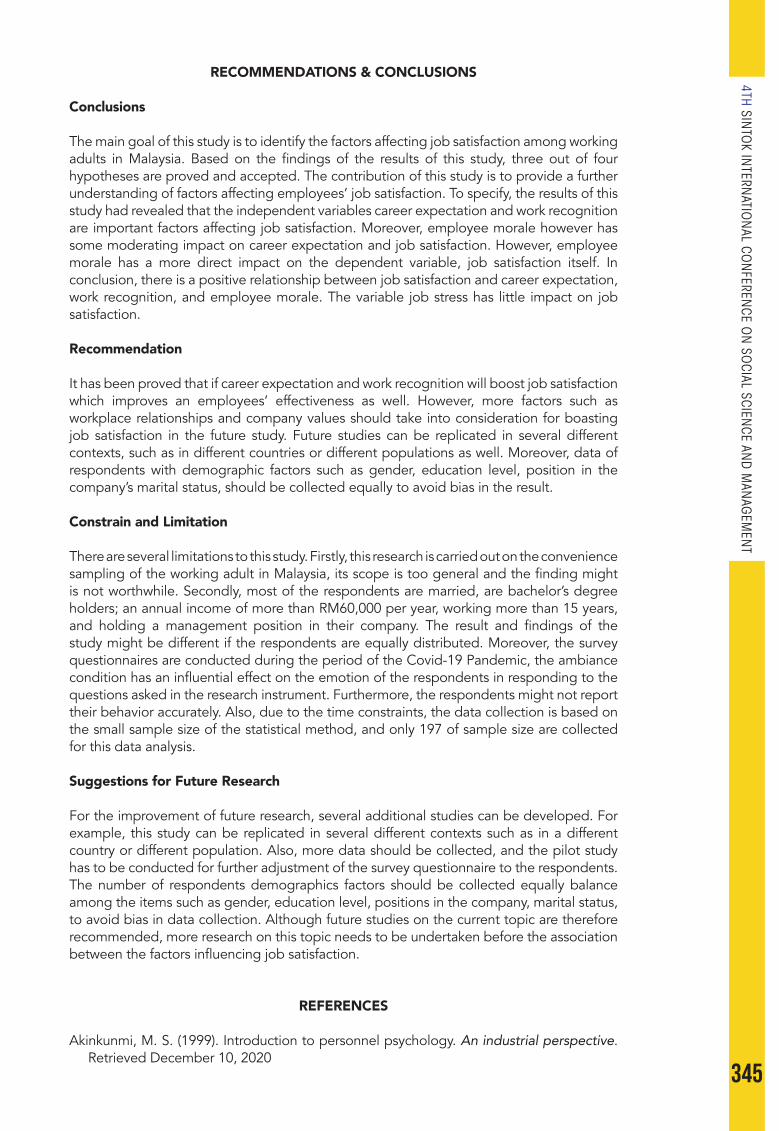
345
4TH SINTO
K INTERN
ATION
AL CON
FERENCE O
N SO
CIAL SCIENCE AN
D M
ANAG
EMEN
T
RECOMMENDATIONS & CONCLUSIONS
Conclusions
The main goal of this study is to identify the factors affecting job satisfaction among working adults in Malaysia. Based on the findings of the results of this study, three out of four hypotheses are proved and accepted. The contribution of this study is to provide a further understanding of factors affecting employees’ job satisfaction. To specify, the results of this study had revealed that the independent variables career expectation and work recognition are important factors affecting job satisfaction. Moreover, employee morale however has some moderating impact on career expectation and job satisfaction. However, employee morale has a more direct impact on the dependent variable, job satisfaction itself. In conclusion, there is a positive relationship between job satisfaction and career expectation, work recognition, and employee morale. The variable job stress has little impact on job satisfaction.
Recommendation
It has been proved that if career expectation and work recognition will boost job satisfaction which improves an employees’ effectiveness as well. However, more factors such as workplace relationships and company values should take into consideration for boasting job satisfaction in the future study. Future studies can be replicated in several different contexts, such as in different countries or different populations as well. Moreover, data of respondents with demographic factors such as gender, education level, position in the company’s marital status, should be collected equally to avoid bias in the result.
Constrain and Limitation
There are several limitations to this study. Firstly, this research is carried out on the convenience sampling of the working adult in Malaysia, its scope is too general and the finding might is not worthwhile. Secondly, most of the respondents are married, are bachelor’s degree holders; an annual income of more than RM60,000 per year, working more than 15 years, and holding a management position in their company. The result and findings of the study might be different if the respondents are equally distributed. Moreover, the survey questionnaires are conducted during the period of the Covid-19 Pandemic, the ambiance condition has an influential effect on the emotion of the respondents in responding to the questions asked in the research instrument. Furthermore, the respondents might not report their behavior accurately. Also, due to the time constraints, the data collection is based on the small sample size of the statistical method, and only 197 of sample size are collected for this data analysis.
Suggestions for Future Research
For the improvement of future research, several additional studies can be developed. For example, this study can be replicated in several different contexts such as in a different country or different population. Also, more data should be collected, and the pilot study has to be conducted for further adjustment of the survey questionnaire to the respondents. The number of respondents demographics factors should be collected equally balance among the items such as gender, education level, positions in the company, marital status, to avoid bias in data collection. Although future studies on the current topic are therefore recommended, more research on this topic needs to be undertaken before the association between the factors influencing job satisfaction.
REFERENCES
Akinkunmi, M. S. (1999). Introduction to personnel psychology. An industrial perspective. Retrieved December 10, 2020
346
Ayinla. (2016). Strategic human resource management, a process approach.Baker, H. G. (1996). The psychological contract between employer and employee. Journal
of Psychology, 33(3), 16-30. Beck, C. W. (2016). Perceptions of thanks in the workplace . Emerald Insight . Brun, J. &. (2008). An analysis of employee recognition: Perspectives on human resources
practices. The International Journal of Human Resource Management, 19(4), 716-730.Caligiuri, P. L. D. (2010). Global dimensions of human resources management: Managing
the global workforce, Hoboken. John Wiley & Sons. Cooper, D. R., & Schindler, P. S. (2008). Business research methods (10th ed.). McGraw-Hill.Cronbach’s alpha. (n.d.). Wikipedia https://en.wikipedia.org/wiki/Cronbach%27s_alpha
#cite_refGeorge,_D._2003_21-0Darrow, L. (1971). Empirical test of the Herzberg two-factor theory of job satisfaction. East
Texas State University, Commerce, TX, n.a.DeCenzo D., a. R. (2010). Fundamentals of human resource management (10th ed.), John
Wiley & Sons.Muthukumaran. (2014, January). Job satisfaction of academic librarians: A correlation
between job satisfactions and demographic condition of the faculty in selected academic libraries. CARE School of Business Management, Trichy,Tamilnadu, India, 4(1), 39-49.
Ekienabor, E. (2016). Impact of job stress on employees’ productivity and commitment. International Journal for Research in Business, Management and Accounting, 2(5).
Edwards, J. (2009). The value of value congruence. Journal of Applied Psychology,(93), 650-671. doi:10.1037/a0014891
Fichter, C. (2010). Role conflict, role ambiguity, job satisfaction and burnout among financial advisors. Journal of American Academy Business,Cambridge(15), 256-261. http://search.proquest.com/docview/222855664?accountid=28180
Gostick, A. E. C. (2007). The daily carrot principle: 365 ways to enhance your career and life. New York: Simon & Schuster.
GriffinM, H. E.-G. (2020). Job involvement,job stress, job satisfaction, and organizational commitment andthe burnout of correctional staff. Crim Justice Behav 37, 239–255.
Hassan, F. (2014). Determinants of job satisfaction and its impact on employee performance and turnover intentions. International Journal of Learning & Development, Vol.4(No.2), 120-140. doi:10.5296/ ijld.v4i2.6094
Hendri, E (n. a) Pengaruh semangat kerja terhadap kinerja pegawai Fakultas Ekonomi Universitas. PGRI Palembang JurnalMedia.
Herzberg, P. F. (1959). Herzberg’s motivation theory. Hedonic or Pleasure Motivational Theories.
Jackson, S. L. (2015). Research methods and statistics: A critical thinking approach (5th ed.). CA: Wadsworth: Cengage Learning.
Kim, H.-Y. (2013, February 26). Statistical notes for clinical researchers: Assessing normal distribution (2) using skewness and kurtosis. Restor Dent Endod, 38(1), 52-54. doi:10.5395/rde.2013.38.1.52
Lambert, E. G., Qureshi, H., Frank, J., Klahm, C., & Smith, B. (2018). Job stress, job involvement, job satisfaction, and organizational commitment and their associations with job burnout among Indian police officers: A research note. Journal of Police and Criminal Psychology; Hauppauge, 33(2), 85-99. doi:10.1007/s11896-017-9236-y
Locke, E. (1976). The nature and causes of job satisfaction. Dunnette, M. (Ed.), Handbook of Industrial and organizational psychology (pp. 297-349). Rand McNally.
Magee, W. (2014). Effects of gender and age on pride in work, and job satisfaction. Journal Happiness Studies, 16, 1091–1115.
Matveev, A. V. (2002). The advantages of employing quantitative and qualitative methods in intercultural research: Practical implications from the study of the perceptions of intercultural communication competence by American and Russian managers. Theory of Communication and Applied Communication, 6(1), 59-67.
Momud, I. K. (2010). Human capital management in the 21st century. A Practical Approach. Munwar Hussain Pahi1, K. A. (2016). Save talent of banking sector of Pakistan: Mediating
job satisfaction between job stress and employee turnover intention. International Review of Management and Marketing, 6(3), 617-624.
Mussie T., & Tessema, K. J. (2013, January). The effects of employee recognition, pay, and
347
4TH SINTO
K INTERN
ATION
AL CON
FERENCE O
N SO
CIAL SCIENCE AN
D M
ANAG
EMEN
T
benefits on job satisfaction: cross country evidence. Journal of Business and Economics, ISSN 2155-7950, USA, 4(1), 1-12. http://www.academicstar.us
Ndungu, D. (2017). The effects of rewards and recognition on employee performance in public educational institutions: A case of Kenyatta University, Kenya. Global Journal of Management and Business Research: An Administration and Management, 17(1), 42-68.
Nelson, B. S. D. (2003). The 1001 rewards & recognition field book: The complete guide. New York: Workman.
Nunnally, J. C., & Bernstein, I. H. (1994). Psychometric theory (3rd ed.). New York: McGraw-Hill.
Oginni, B. O. (2018). The role of employee’s work expectations in job satisfaction.pdf. World Journal of Business and Management, 4(1). doi:10.5296/wjbm.v4 i1 12924
Okwonzor, K. P. (2007). Human resources management in action.Patil, M., Biswas, S., & Kaur, R. (2018). Does gratitude impact employee morale in the
workplace. Journal of Applied Management - Jidnyasa; Pune, 10(2), 21-36. https://search.proquest.com/scholarly-journals/does-gratitude-impact-employee-morale-workplace/docview/2258776512/se-2?accountid=34548
Pines A, K. G. (2005). Stress and burnout: The significant difference. Personal Individ Differ, 39, 625-635.
Dyah Sawitri, S. M. (2016). The impact of job satisfaction, organization commitment, organization citizenship behavior on employees’ performance. The International Journal of Organizational Innovation, 9 , 24-45.
Qaied, D. B. (2015). The impact of job stress resources on job performance of hotels in Amman. International Journal of Business and Social Science, 6(7).
Rad, A. (2009). Factors affecting employees’job satisfaction in public hospitals. Journal of General Management, 34, 51 -66.
Rainey, H. (1997). Understanding and managing public organizations (2nd ed.). Jossey-Bass.
Ramadhany, M. (2013). Pengaruh program kesejahteraan karyawan terhadap semangat kerja karyawan dan prestasi kerja karyawan. Petrokimia Gresik, 2(2), 127-136. http://adminstrasi bisnis studentjournal.ub.ac.id
Reukauf, J. A. (2018). The correlation between job satisfaction and turnover intention in small business.
Robbins, S. (2008). General attitudes of employees: Organizational behaviour (10 ed.). Robson, D., Hague, J., & Newman, G. (1993). Survey of natural materials for use in structural
composites as reinforcement and matrices. Bangor: BioComposites Centre.Rothausen, T. G. (2009). Are all the parts there everywhere? Facet job satisfaction in the
United States and the Philippines. Asia Pacific Journal of Management, 26, 681-700. doi:10.1007/sl0490-008-9116-l
Rumsey, D. J. (2016). What a p-value tells you about statistical data (2nd ed.). For dummies. Saunders, M., Lewis, P., & Thornhill, A. (2007). Research methods for business students (4th
ed.). Harlow: Prentice Hall. https://fcit.usf.edu/assessment/basic/basicc.htmlSpector, P. (1997). Job satisfaction: Application, assessment, causes and consequences.
Designing and testing the model of learners’ satisfaction towards on-the-job training courses case: National Iranian gas company.
StatTrek. (2020). Interaction effects in regression. https://stattrek.com/multiple-regression/interaction.aspx
Tessema, M. T. (2013). The effects of employee recogni-tion, pay, and benefits on job satisfaction: Cross country evidence. Journal of Business and Economics, 14(1), 1-12.
Tirta, A. H., & Enrika, A. (2020, July). Understanding the impact of reward and recognition, work life balance, on employee retention with job satisfaction as mediating variable on millennials in Indonesia. Journal of Business and Retail Management Research; London, 14(3), 88-99. doi:http://dx.doi.org/10.24052/ JBRMR/V14IS03/ART-09
Voelck.J. (1995). Job satisfaction among the support staff in Michigan academic libraries. College & Research Libraires 1995, 56, 157-170.
Vrabie, A. (2014, Mac 12). Job satisfaction factors. https://blog.sandglaz.com/10-psychological-job-satisfaction-factors-that-really-matter

348
SICONSEM 2021: 107-071
MITIGATING CLIMATE CHANGE: EVIDENCE FROM COMPANIESPARTICIPATING IN MYCARBON PROGRAM
1Jamaliah Abdul Majid, 2Noriah Che Adam, 3Nor Atikah Shafai,& 4Saidatul Nurul Hidayah Jannatun Naim
1,2,3&4Tunku Puteri Intan Safinaz School of Accountancy, Universiti Utara Malaysia
1Corresponding author: [email protected]
ABSTRACT
This study explores climate change mitigation strategies adopted by companies that participated in MyCarbon program. The analysis is based on all 14 listed companies from 2017-2019 that participated in the MyCarbon program in 2013. The results show that Tenaga Nasional Berhad (TNB) offered the best disclosure of the climate change followed by Nestle, Telekom, and Petronas with equal scores while Media Prima provided the poorest disclosure. This result suggests that potential leaders in mitigating climate change come not only from the energy sector, being the largest contributor to the GHG emissions, but also from various industries. In addition, the results show that disclosure of the climate change improved from 2017 to 2019. In the climate change mitigation strategies, this study focuses on four main strategic intents, namely, governance (e.g., GHG management and policy development), innovation (e.g., process improvement), compensation (e.g., emission trading scheme), and legitimation (e.g., corporate reporting). The results show that climate change mitigation strategies adopted by the companies tend to focus on corporate activities that related with legitimation followed by governance, innovation, and compensation
Keywords: Climate change, MyCarbon program, mitigation strategy.
32
349
4TH SINTO
K INTERN
ATION
AL CON
FERENCE O
N SO
CIAL SCIENCE AN
D M
ANAG
EMEN
T
SICONSEM2021: 100-064
A PRELIMINARY STUDY ON UNDERSTANDING THE CONSUMPTIONS OF THERAPEUTIC ESSENTIAL OILS DURING COVID-19 PANDEMIC
AMONG ADULTS USING ANN
1Saadi Ahmad Kamaruddin, 2Abdul Malek Yaakob, 3Nor Anis Nadhirah Md Nasir & 4Siti Fatimah Abdul Rahman
1Centre of Testing, Measurement and Appraisal, Universiti Utara Malaysia1&2Institute of Strategic Industrial Decision Modelling
School of Quantitative Sciences, Universiti Utara Malaysia1&2School of Quantitative Sciences, Department of Mathematics and Statistics
Universiti Utara Malaysia3Faculty of Civil Engineering Technology, Universiti Malaysia Perlis, Malaysia.
4Faculty of Mathematical and Computer Sciences, Universiti Teknologi MARA, Perlis, Malaysia
Corresponding author: [email protected]; [email protected]; [email protected]; [email protected]
ABSTRACT
The COVID-19 pandemic has emphasized the significance of utilizing essential oils (EO) as one of the holistic ways of supporting and enhancing health. As a consequence of growing knowledge of connected health concerns, people all over the world are looking for natural ways to avoid different ailments. It has been proven that excellent health and psychological awareness increase the human body’s immune response, therefore boosting disease resistance. Essential oils are derived in a number of ways from valued plants and include active chemicals with medicinal qualities. In Malaysia, many have used EO in their daily lives. In this paper, we are going to identify the hierarchy of importance among factors which contribute towards the usage frequency of essential oil in Malaysia using an artificial neural network. Two-layer neural network (NN) models have been applied, which are multilayer perceptron (MLP) and radial basis function (RBF). Based on the analysis done, RBF-NN performed the best with SSE=4.436 and RE=0.548.It can be concluded that, based on sensitivity analysis, the top five factors toward usage frequency are consumption, age, external use, clinic visit, and occasion with normalized importance of 100%, 90.8%, 89.3%, 68.2%, and 42.2% respectively.
Keywords: Consumptions, therapeutic essential oils, COVID-19, adults, artificial neural network.
INTRODUCTION
The pandemic of COVID-19 has highlighted the importance of using Essential Oils (EO) as one of the holistic approaches in promoting and improving health. Nowadays, peoples all around the world are seeking for natural solutions to prevent various illnesses as a result of increased awareness regarding related health issues. It has been demonstrated that good health and psychological awareness boost the immunological response of the human body, hence increasing disease resistance (Al-Mansour & Adraa, 2020). Essential oils are extracted from valuable plants in a variety of ways and contained active compounds that have therapeutic properties (Fung et al., 2021). Aromatherapy is an alternative medical method that involves the therapeutic use of essential oils and could lead to effective treatment options for this disease (Al-Mansour & Adraa, 2020). The expanding and widespread use of complementary and alternative medicine in the treatment of symptoms of both physical and mental problems in Western countries has been extensively observed (van der Watt, & Janca, 2008). A study by Mazlan & Diah, (2017), shows that despite the lack of clinical evidence for Eo’s usefulness, it’s widely
33
350
used among Malaysians to maintain their emotional well-being. Essential oils has been gaining scientific attention due to high potential as a cough and flu preventive agent, wound healing or skin irritation, stress relief (Fung et al., 2021; Avola et al., 2020).
COVID-19 frequently affects the upper respiratory tract, and the majority of patients are treated at home with a mild-to-moderate form of the virus (Valussi et al., 2021). Antiviral properties of essential oils have been demonstrated against a variety of harmful viruses. Essential oil components may interact with major protein targets of the 2019 severe acute respiratory syndrome coronavirus 2 (SARSCoV2). Current research by Panikar et al. (2021), which test on molecular docking of seven components essential oil (citronellol, alpha-terpineol, eucalyptol, D-limonene, 3-carene, o-cymene, and alpha-pinene) showed that the binding energy, hydrophobic contacts, and hydrogen bond interactions of 6LU7 (Mpro) with Eucalyptus and Corymbia volatile secondary compounds indicated its potential as a Covid-19 treatment.
The application Artificial Neural Network (ANN) in aromatherapy using essential oil has been well established (Acimovic et al., 2021). According to (Niazian et al., 2021), ANN performed better than MLR with an RMSE of 0.262 and an R2 of 0.748. Bahmani et al. (2018), used artificial neural network (ANN) model to predict kinetics of essential oil extraction from tarragon (Artemisia dracunculus L.) using ultrasound pre-treatment with Clevenger.
LITERATURE REVIEW
Essential oils can be used in a variety of ways including diffusion, oral administration, inhalation and massage. According to Seyyed-Rasooli et al. (2016), aromatherapy massage and inhalation aromatherapy had a positive effect in comparison to the control group to reduce both anxiety and pain in burn patients. Takeda et al. (2017), suggested that inhalation aromatherapy has a good influence on sleep disruption symptoms in dementia patients. A study by Donatello et al., (2020), discovered that inhaling LaEO lowers mechanical hyperalgesia in chronic inflammatory and neuropathic pain. The olfactory receptor cells in the nasal epithelium, which number roughly 25 million and are associated to the olfactory bulb, are triggered by essential oils provided through inhalation aromatherapy (Sandez-Vidana et al., 2017).
Several Essential Oil with Their Therapeutic Effect
Based on the existence of various active components, different essential oils will have unique therapeutic effects (Table 1). A study by Gismondi et al., (2021), Lavender essential oil reduced the amount of bacteria in all hospital areas and this trend was even significant in some situations. A study by Sentral et al. (2020), found that citronellol and limonene treatment significantly reduced ACE2 expression in epithelial cells indicated their potential as antiviral properties. Geranium and lemon oils have significant ACE2 inhibitory actions, according to immunoblotting and qPCR analyses. The use of essential oils with increased antibacterial activity in Staphylococcus aureus causes biofilm formation during the early adhesion phase, which has been shown to occur in Patchouli and ylang-ylang essential oils (Bilcu et al., 2014). Furthermore, there are a few essential oils that are linked to human emotional stability. A study by Fung et al. (2021), EO molecules might reach the brain and exert an effect by two separate mechanisms by which the olfactory system and the respiratory system. According to Moeini & Khadibi, (2011), lavender oil aromatherapy reduced sleep disturbances and improved sleep quality in IHD patients in the CCU.

351
4TH SINTO
K INTERN
ATION
AL CON
FERENCE O
N SO
CIAL SCIENCE AN
D M
ANAG
EMEN
T
Table 1
Several Different Essential Oils and Their Therapeutic Effect
Common names
Scientific name
Benefits Authors
Bergamot Citrus bergamia
To improve participants’ positive feelings Han et al., (2017)
Can improve anxiety symptom Cui et al., (2020)
Lavendar Lavandula angustifolia
Anti-inflammatory Donatello et al., (2020)
Anti-bacterial Gismondi et al., (2021)
Citronella Cymbopogon nardus
Can be applied as natural mouthwash, because if its low cytotoxicity and higher antimicrobial activity
Cunha et al., (2020)
Cinnamon Cinnamon zeylanicum
Anti-proliferative, antimicrobial and antioxidant Alizadeh Behbahani et al.,
(2020)
Lemon Citrus lemon Food preservatives , antimicrobial agent Yazgan et al., (2019)
Antiviral Senthil et al., (2020)
Ylang ylang Cananga odorata
Decreased blood pressure Jung et al., (2013)
Reduced stress and effectively prevent suicide Amadéo et al., (2020)
Inhibit bacterial activity Bilcu et al., (2014)
Cedarwood Cedrus atlantica
Antioxidant and antibacterial abilities Huang et al., (2021)
Thyme Thymus vulgaris
Antioxidant substances that help to improve the immune system as well as antiviral properties that
help to relieve respiratory symptoms
Sardari et al., (2021)
Geranium Pelargonium graveolens
Antiviral Senthil et al., (2020)
METHODOLOGY
Random sample of n=50 was chosen among EO users in Malaysia and a questionnaire has been constructed and distributed to the respondents. This EO dataset have been analyzed using artificial neural network methods, specifically (1) multilayer perceptron neural network (MLP-NN) and (2) radial basis function neural network (RBF-NN). The flowchart of this research can be seen in Figure 1.
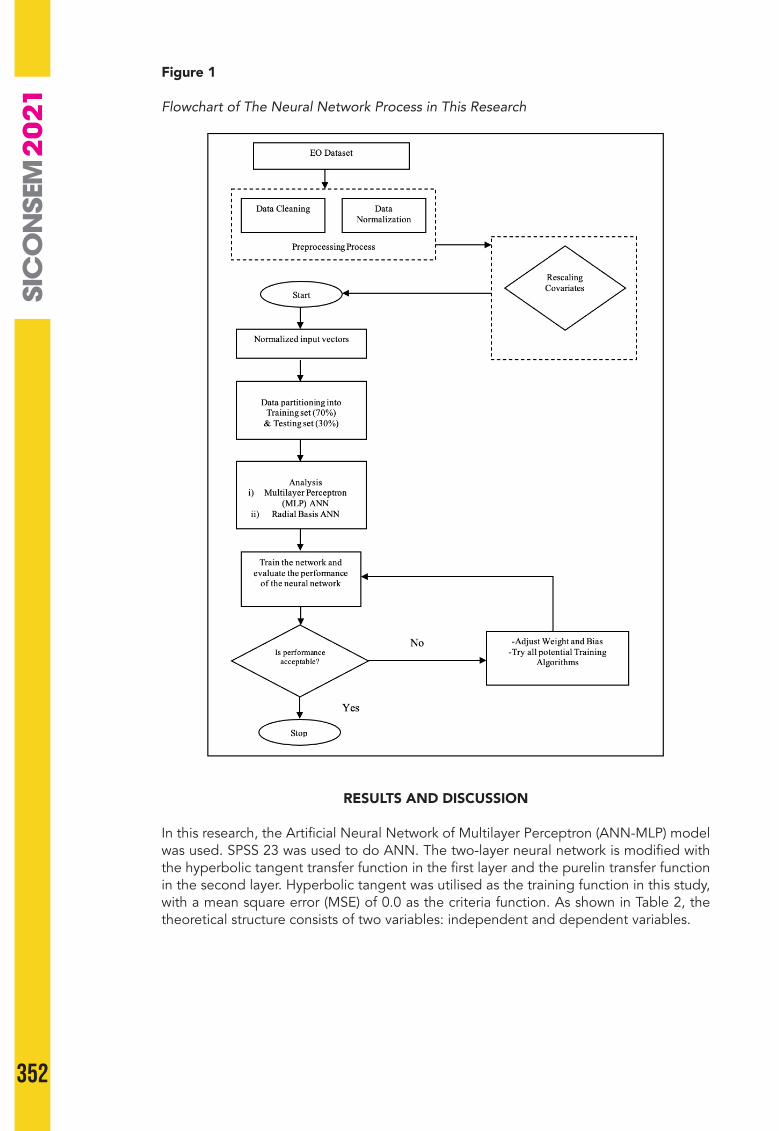
352
Figure 1
Flowchart of The Neural Network Process in This Research
RESULTS AND DISCUSSION
In this research, the Artificial Neural Network of Multilayer Perceptron (ANN-MLP) model was used. SPSS 23 was used to do ANN. The two-layer neural network is modified with the hyperbolic tangent transfer function in the first layer and the purelin transfer function in the second layer. Hyperbolic tangent was utilised as the training function in this study, with a mean square error (MSE) of 0.0 as the criteria function. As shown in Table 2, the theoretical structure consists of two variables: independent and dependent variables.
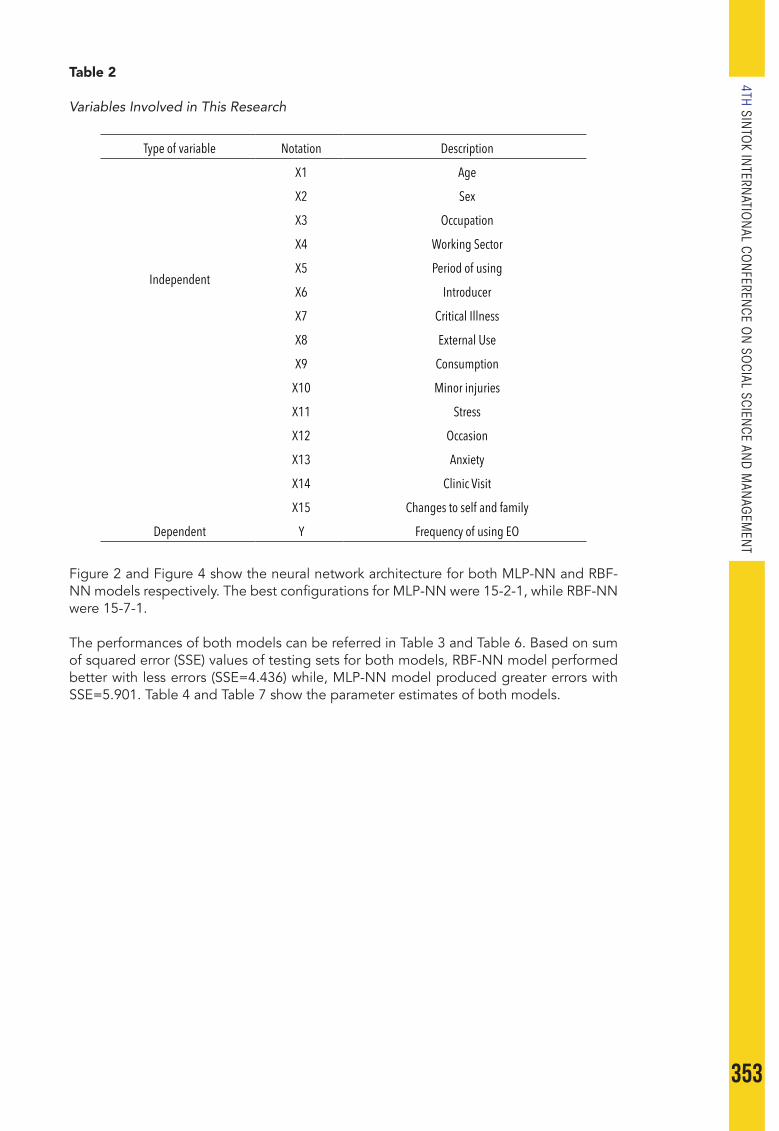
353
4TH SINTO
K INTERN
ATION
AL CON
FERENCE O
N SO
CIAL SCIENCE AN
D M
ANAG
EMEN
T
Table 2
Variables Involved in This Research
Type of variable Notation Description
Independent
X1 Age
X2 Sex
X3 Occupation
X4 Working Sector
X5 Period of using
X6 Introducer
X7 Critical Illness
X8 External Use
X9 Consumption
X10 Minor injuries
X11 Stress
X12 Occasion
X13 Anxiety
X14 Clinic Visit
X15 Changes to self and family
Dependent Y Frequency of using EO
Figure 2 and Figure 4 show the neural network architecture for both MLP-NN and RBF-NN models respectively. The best configurations for MLP-NN were 15-2-1, while RBF-NN were 15-7-1.
The performances of both models can be referred in Table 3 and Table 6. Based on sum of squared error (SSE) values of testing sets for both models, RBF-NN model performed better with less errors (SSE=4.436) while, MLP-NN model produced greater errors with SSE=5.901. Table 4 and Table 7 show the parameter estimates of both models.

354
Figure 2
Neural Network Architecture of MLP-NN Model
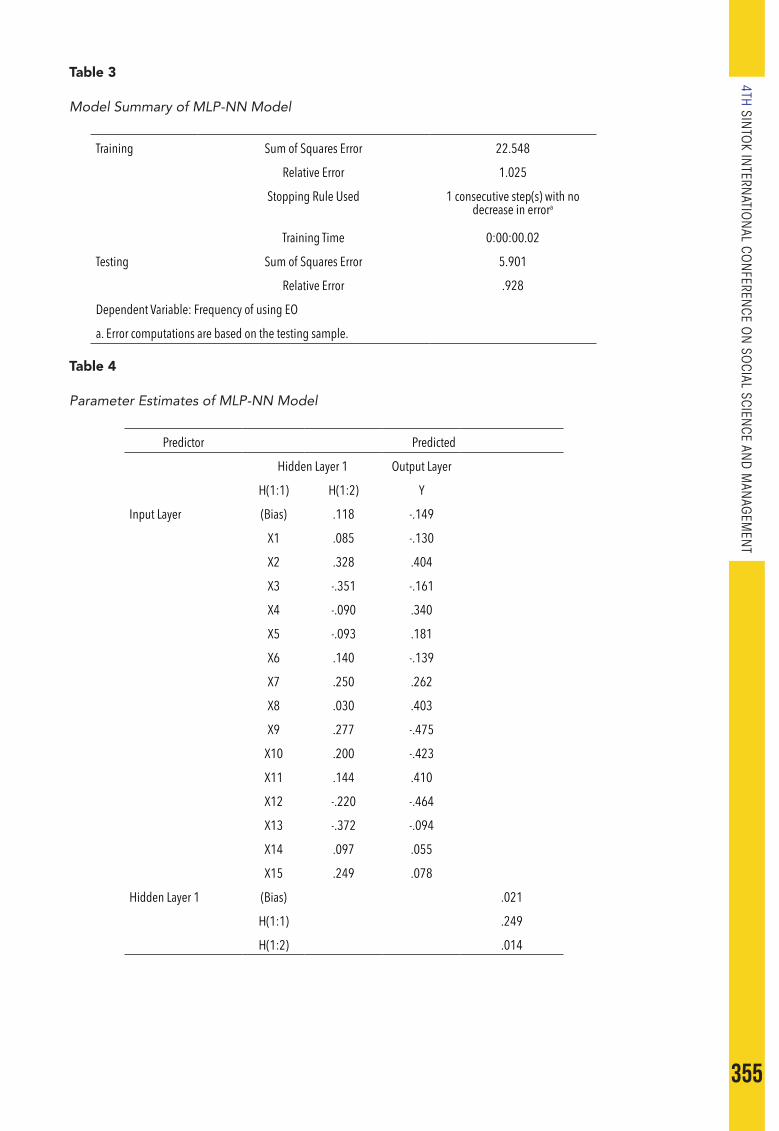
355
4TH SINTO
K INTERN
ATION
AL CON
FERENCE O
N SO
CIAL SCIENCE AN
D M
ANAG
EMEN
T
Table 3
Model Summary of MLP-NN Model
Training Sum of Squares Error 22.548
Relative Error 1.025
Stopping Rule Used 1 consecutive step(s) with no decrease in errora
Training Time 0:00:00.02
Testing Sum of Squares Error 5.901
Relative Error .928
Dependent Variable: Frequency of using EO
a. Error computations are based on the testing sample.
Table 4
Parameter Estimates of MLP-NN Model
Predictor Predicted
Hidden Layer 1 Output Layer
H(1:1) H(1:2) Y
Input Layer (Bias) .118 -.149
X1 .085 -.130
X2 .328 .404
X3 -.351 -.161
X4 -.090 .340
X5 -.093 .181
X6 .140 -.139
X7 .250 .262
X8 .030 .403
X9 .277 -.475
X10 .200 -.423
X11 .144 .410
X12 -.220 -.464
X13 -.372 -.094
X14 .097 .055
X15 .249 .078
Hidden Layer 1 (Bias) .021
H(1:1) .249
H(1:2) .014
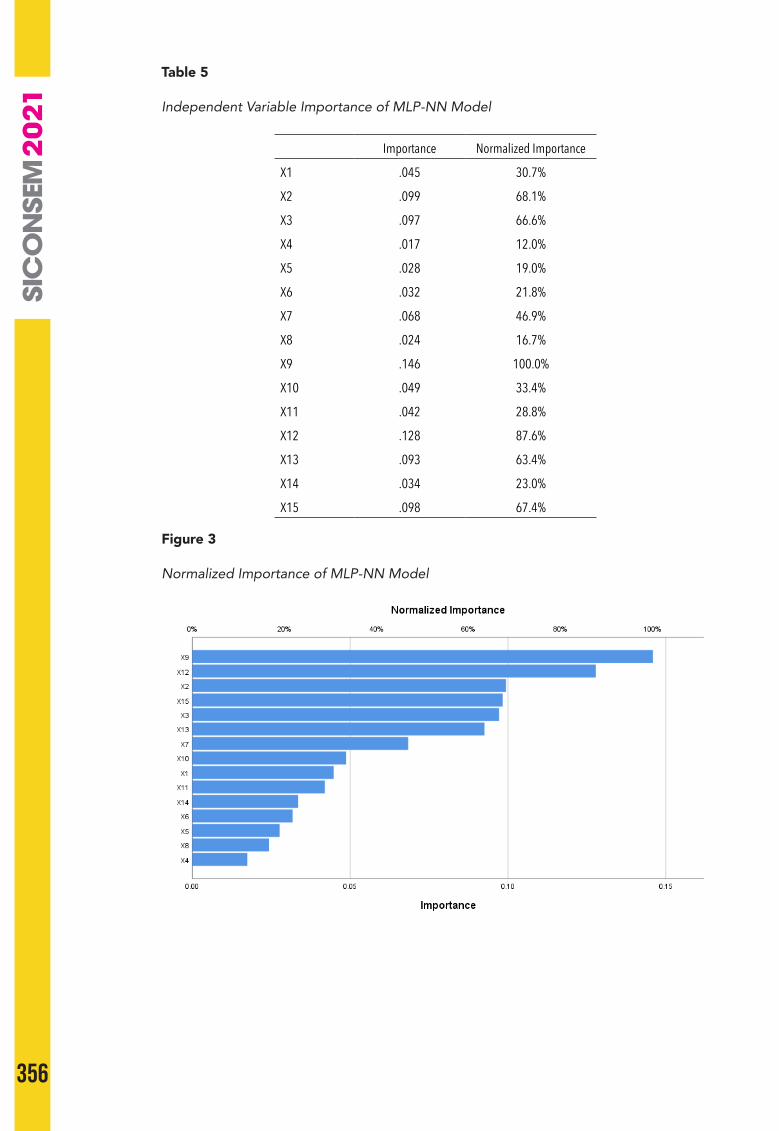
356
Table 5
Independent Variable Importance of MLP-NN Model
Importance Normalized Importance
X1 .045 30.7%
X2 .099 68.1%
X3 .097 66.6%
X4 .017 12.0%
X5 .028 19.0%
X6 .032 21.8%
X7 .068 46.9%
X8 .024 16.7%
X9 .146 100.0%
X10 .049 33.4%
X11 .042 28.8%
X12 .128 87.6%
X13 .093 63.4%
X14 .034 23.0%
X15 .098 67.4%
Figure 3
Normalized Importance of MLP-NN Model
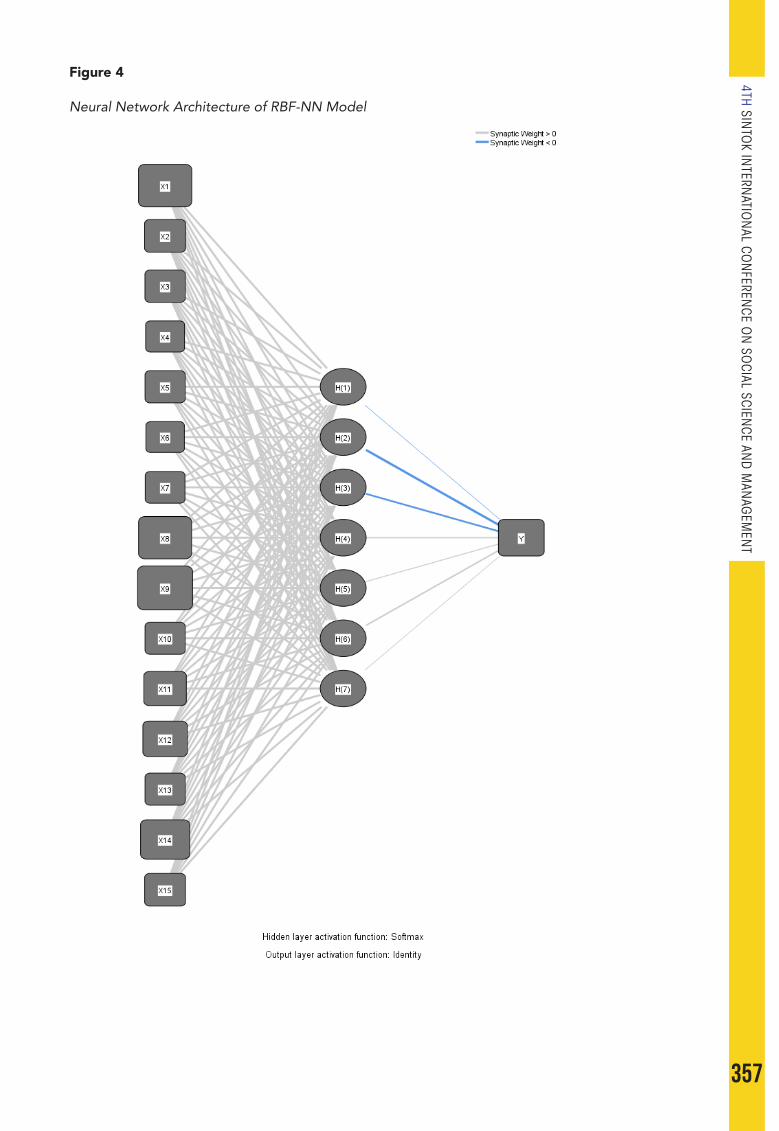
357
4TH SINTO
K INTERN
ATION
AL CON
FERENCE O
N SO
CIAL SCIENCE AN
D M
ANAG
EMEN
T
Figure 4
Neural Network Architecture of RBF-NN Model
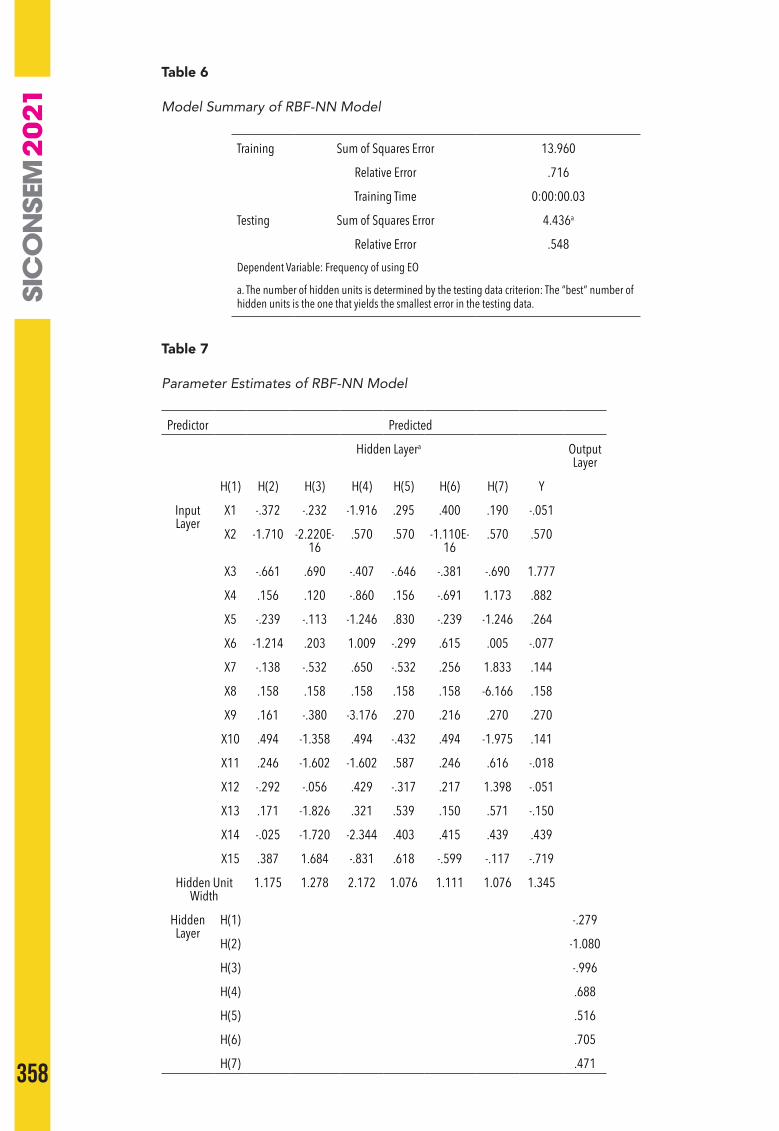
358
Table 6
Model Summary of RBF-NN Model
Training Sum of Squares Error 13.960
Relative Error .716
Training Time 0:00:00.03
Testing Sum of Squares Error 4.436a
Relative Error .548Dependent Variable: Frequency of using EO
a. The number of hidden units is determined by the testing data criterion: The “best” number of hidden units is the one that yields the smallest error in the testing data.
Table 7
Parameter Estimates of RBF-NN Model
Predictor Predicted
Hidden Layera Output Layer
H(1) H(2) H(3) H(4) H(5) H(6) H(7) Y
Input Layer
X1 -.372 -.232 -1.916 .295 .400 .190 -.051
X2 -1.710 -2.220E-16
.570 .570 -1.110E-16
.570 .570
X3 -.661 .690 -.407 -.646 -.381 -.690 1.777
X4 .156 .120 -.860 .156 -.691 1.173 .882
X5 -.239 -.113 -1.246 .830 -.239 -1.246 .264
X6 -1.214 .203 1.009 -.299 .615 .005 -.077
X7 -.138 -.532 .650 -.532 .256 1.833 .144
X8 .158 .158 .158 .158 .158 -6.166 .158
X9 .161 -.380 -3.176 .270 .216 .270 .270
X10 .494 -1.358 .494 -.432 .494 -1.975 .141
X11 .246 -1.602 -1.602 .587 .246 .616 -.018
X12 -.292 -.056 .429 -.317 .217 1.398 -.051
X13 .171 -1.826 .321 .539 .150 .571 -.150
X14 -.025 -1.720 -2.344 .403 .415 .439 .439
X15 .387 1.684 -.831 .618 -.599 -.117 -.719
Hidden Unit Width
1.175 1.278 2.172 1.076 1.111 1.076 1.345
Hidden Layer
H(1) -.279
H(2) -1.080
H(3) -.996
H(4) .688
H(5) .516
H(6) .705
H(7) .471
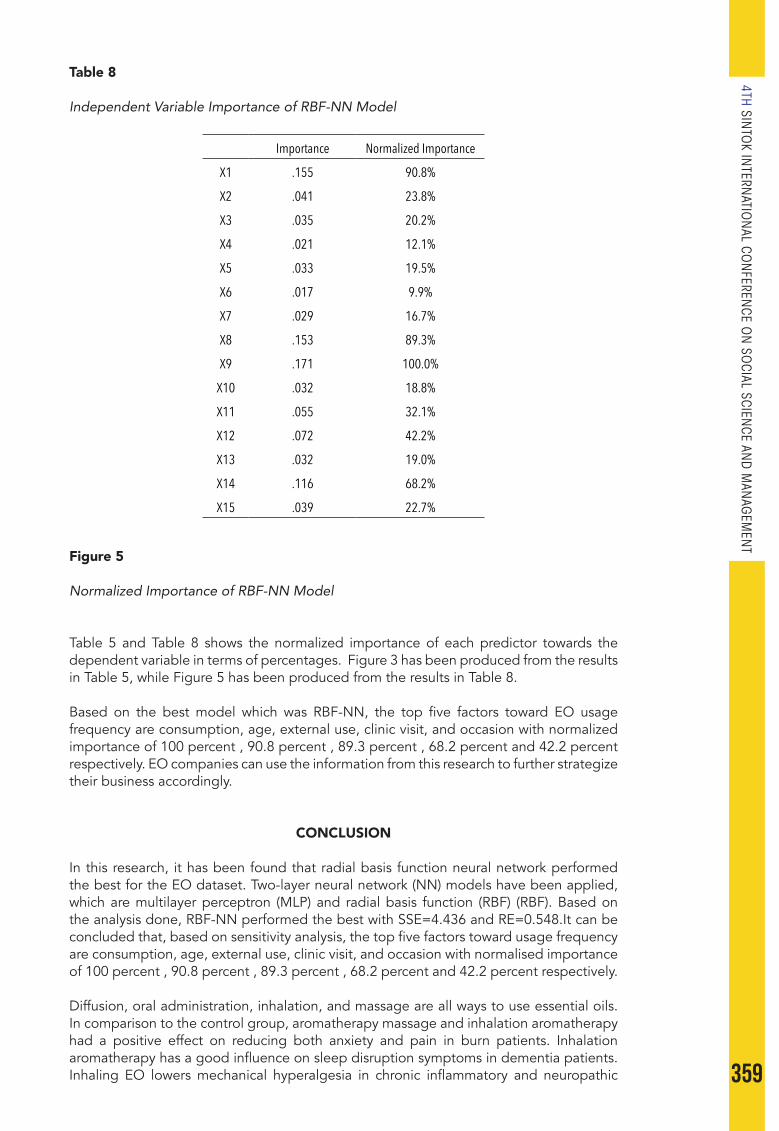
359
4TH SINTO
K INTERN
ATION
AL CON
FERENCE O
N SO
CIAL SCIENCE AN
D M
ANAG
EMEN
T
Table 8
Independent Variable Importance of RBF-NN Model
Importance Normalized Importance
X1 .155 90.8%
X2 .041 23.8%
X3 .035 20.2%
X4 .021 12.1%
X5 .033 19.5%
X6 .017 9.9%
X7 .029 16.7%
X8 .153 89.3%
X9 .171 100.0%
X10 .032 18.8%
X11 .055 32.1%
X12 .072 42.2%
X13 .032 19.0%
X14 .116 68.2%
X15 .039 22.7%
Figure 5
Normalized Importance of RBF-NN Model
Table 5 and Table 8 shows the normalized importance of each predictor towards the dependent variable in terms of percentages. Figure 3 has been produced from the results in Table 5, while Figure 5 has been produced from the results in Table 8.
Based on the best model which was RBF-NN, the top five factors toward EO usage frequency are consumption, age, external use, clinic visit, and occasion with normalized importance of 100 percent , 90.8 percent , 89.3 percent , 68.2 percent and 42.2 percent respectively. EO companies can use the information from this research to further strategize their business accordingly.
CONCLUSION
In this research, it has been found that radial basis function neural network performed the best for the EO dataset. Two-layer neural network (NN) models have been applied, which are multilayer perceptron (MLP) and radial basis function (RBF) (RBF). Based on the analysis done, RBF-NN performed the best with SSE=4.436 and RE=0.548.It can be concluded that, based on sensitivity analysis, the top five factors toward usage frequency are consumption, age, external use, clinic visit, and occasion with normalised importance of 100 percent , 90.8 percent , 89.3 percent , 68.2 percent and 42.2 percent respectively.
Diffusion, oral administration, inhalation, and massage are all ways to use essential oils. In comparison to the control group, aromatherapy massage and inhalation aromatherapy had a positive effect on reducing both anxiety and pain in burn patients. Inhalation aromatherapy has a good influence on sleep disruption symptoms in dementia patients. Inhaling EO lowers mechanical hyperalgesia in chronic inflammatory and neuropathic

360
pain. The olfactory receptor cells in the nasal epithelium, which number roughly 25 million and are associated to the olfactory bulb, are triggered by essential oils provided through inhalation aromatherapy.
ACKNOWLEDGMENTS
Thank you very much to RIMC, UUM upon the research grant UUM/RIMC/P-30/10 Jld.4, ISO: 14919.
REFERENCES
Acimovic, M., Pezo, L., Cvetkovic, M., Stankovic, J., & Cabarkapa, I. (2021). Achillea clypeolata sibth. & sm. essential oil composition and qsrr model for predicting retention indices. Journal of the Serbian Chemical Society, 86(4), 355–366.
Alizadeh Behbahani, B., Falah, F., Lavi Arab, F., Vasiee, M., & Tabatabaee Yazdi, F. (2020). Chemical Composition and Antioxidant, Antimicrobial, and Antiproliferative Activities of Cinnamomum zeylanicum Bark Essential Oil. Evidence-Based Complementary and Alternative Medicine, 1-8
Amadéo, S., Nguyen, N. L., Teai, T., Favro, P., Mulet, A., Colin-Fagotin, N., Rereao, M., Malogne, A., Simone, M. De, Rioche, G., Gassion, V., Pere, P., Prokop, A., Bernis, F., Dufour, P., Tuheiava, A., Vanquin, G., Vilhem, S., Gokalsing, E.,Jehel, L. (2020). Supportive effect of body contact care with ylang ylang aromatherapy and mam for suicide prevention: A pilot study. Journal of International Medical Research, 48(9).
Avola, R., Granata, G., Geraci, C., Napoli, E., Carol, A., Graziano, E. Cardile, V. (2020). Oregano (Origamum vulgare L.,) essential oil provides anti-inflammatory activity and facilities wound healing in human keratinocytes cell model. Food and chemical toxicology, 144,111586.
Bahmani, L., Aboonajmi, M., Arabhosseini, A., & Mirsaeedghazi, H. (2018). ANN modeling of extraction kinetics of essential oil from tarragon using ultrasound pre-treatment. Engineering in Agriculture, Environment and Food, 11(1), 25–29.
Bilcu, M., Grumezescu, A. M., Oprea, A. E., Popescu, R. C., Mogoanu, G. D., Hristu, R., Stanciu, G. A., Mihailescu, D. F., Lazar, V., Bezirtzoglou, E., & Chifiriuc, M. C. (2014). Efficiency of vanilla, patchouli and ylang ylang essential oils stabilized by iron oxide@C14 nanostructures against bacterial adherence and biofilms formed by Staphylococcus aureus and Klebsiella pneumoniae clinical strains. Molecules, 19(11), 17943–17956.
Cui, Y., Che, Y., & Wang, H. (2020). Bergamot essential oil attenuate aluminum induced anxiety-like behavior through antioxidation, anti-inflammatory and GABA regulation in rats. Food and Chemical Toxicology, 145, 111766.
Fung, T. K. H., Lau, B. W. M., Ngai, S. P. C., & Tsang, H. W. H. (2021). Therapeutic effect and mechanisms of essential oils in mood disorders: Interaction between the nervous and respiratory systems. International Journal of Molecular Sciences, 22(9). 4844
Guandalini Cunha, B., Duque, C., Sampaio Caiaffa, K., Massunari, L., Araguê Catanoze, I., dos Santos, D. M., de Oliveira, S. H. P., & Guiotti, A. M. (2020). Cytotoxicity and antimicrobial effects of citronella oil (Cymbopogon nardus) and commercial mouthwashes on S. aureus and C. albicans biofilms in prosthetic materials. Archives of Oral Biology, 109
Han, X., Gibson, J., Eggett, D. L., & Parker, T. L. (2017). Bergamot (Citrus bergamia) essential oil inhalation improves positive feelings in the waiting room of a mental health treatment center: A pilot study. Phytotherapy Research, 31(5), 812–816.
Huang, K., Liu, R., Zhang, Y. & Guan, X. (2021). Characteristics of two cedarwood essential oil emulsions and their antioxidant dan antibacterial activities. Food Chemistry, 128970.
Jung, D-J., Cha, J-Y., Kim, S-E., Ko, I-G., Jee, Y-S. (2013). Effects of Ylang-Ylang aroma on blood pressure and heart rate in healthy men, Journal of Exercise Rehabilitation, 9(2), 250-255
361
4TH SINTO
K INTERN
ATION
AL CON
FERENCE O
N SO
CIAL SCIENCE AN
D M
ANAG
EMEN
T
Mazlan, M & Mohamad Diah, Nurazzura (2017) The awareness and practice of essential oil among Malaysians: Preliminary findings. In: Social Sciences Postgraduate International Seminar (SSPIS 2017), 29th November 2017, Bukit Jambul, Penang.
Panikar, S., Shoba, G., Arun, M., Sahayarayan, J.J., Usha Raja Nanthini, A., Chinnathambi, A., Alharbi, S.A., Nasif, O., Kim, H.-J.(2021). Essential oils as an effective alternative for the treatment of COVID-19: Molecular interaction analysis of protease (Mpro) with pharmacokinetics and toxicological properties. Journal of Infection and Public Health, 15(4), 601-610
Sánchez-Vidaña, D. I., Ngai, S. P. C., He, W., Chow, J. K. W., Lau, B. W. M., & Tsang, H. W. H. (2017). The effectiveness of aromatherapy for depressive symptoms: A systematic review. Evidence-Based Complementary and Alternative Medicine, 1-21.
Sardari, S., Mobaien, A., Ghassemifard, L., Kamali, K., Khavasi, N. (2021). Therapeutic effect of thyme (Thymus vulgaris) essential oil on patients with covid19: A randomized clinical trial. J Adv Med Biomed Res, 29(133), 83-91.
Senthil Kumar, K. J., Vani, M. G., Wang, C. S., Chen, C. C., Chen, Y. C., Lu, L. P., Huang, C. H., Lai, C. S., & Wang, S. Y. (2020). Geranium and lemon essential oils and their active compounds downregulate angiotensin-converting enzyme 2 (ACE2), a SARS-CoV-2 spike receptor-binding domain, in epithelial cells. Plants, 9(6), 1–12.
Seyyed-Rasooli, A., Salehi, F., Mohammadpoorasl, A., Goljaryan, S., Seyyedi, Z., & Thomson, B. (2016). Comparing the effects of aromatherapy massage and inhalation aromatherapy on anxiety and pain in burn patients: A single-blind randomized clinical trial. Burns, 42(8), 1774–1780.
Takeda, A., Watanuki, E., & Koyama, S. (2017). Effects of inhalation aromatherapy on symptoms of sleep disturbance in the elderly with dementia. Evidence-Based Complementary and Alternative Medicine, 2017.
Valussi, M., Antonelli, M., Donelli, D., Firenzuoli, F. (2021). Appropriate use of essential oils and their components in the management of upper respiratory tract symptoms in patients with COVID-19. Journal of Herbal Medicine, 28, 100451.
van der Watt, G., & Janca, A. (2008). Aromatherapy in nursing and mental health care. Contemporary Nurse, 30(1), 69–75.
Yazgan, H., Ozogul, Y., & Kuley, E. (2019). Antimicrobial influence of nanoemulsified lemon essential oil and pure lemon essential oil on food-borne pathogens and fish spoilage bacteria. International Journal of Food Microbiology, 306.
362
SICONSEM2021: 098-063
PANDEMIC: LINKING THE BIG FIVE AND EMPLOYEE PERFORMANCE WITHIN THE SMES CONTEXT IN MALAYSIA
1Nur Lailatul Husna Mohammad Yusof, 2Abdul Halim Abdul Majid &3Siti Norasyikin Abdul Hamid
1,2&3School of Business Management, Universiti Utara Malaysia
Corresponding author: [email protected]
ABSTRACT
Small and medium enterprises (SME) are the driving force behind market economies as well as the development. In Malaysia, SME is known as the backbone of the Malaysian economy and becoming a major employer throughout the region. However, pandemic of Covid-19 outbreak has become a global disruption and affecting the global economy as well as the SME around the globe. As the phenomena are unprecedented, there is a lack of studies on the impact of pandemic on businesses especially among SMEs in Malaysia. Since most of the workforce in Malaysia is contribute by SMEs, increasing the performance of employees is crucial because it will lead to the Malaysian economy sustainability, especially during such crisis. One of the factors that can influence employee performance is personality traits. Personality is one of the major psychological factors affecting the human behaviour and important in the work place. In psychology, the five personality traits are five broad domains or dimensions of personality which consists of extroversion, openness, conscientiousness, agreeableness, and neuroticism. This Big Five Factor have an important role in enhancing the efficiency and effectiveness of employee performance. Therefore, this conceptual paper aims to explore the role of personality traits in determining employee performance within SMEs context in Malaysia due to the pandemic situation.
Keywords: Pandemic, SMEs, big five personality traits, employee performance.
INTRODUCTION
Employees are major contributors to profits and worth of the organization. Therefore, employees are the most valuable assets an organization has. It’s their abilities, knowledge, and experience that can’t be replaced. Therefore, it is clear that sustaining and increasing employee performance is very crucial as it is the backbone of the organization. Thus, an organization with high performing employees will be able to compete locally & globally (Mohamad Hajari, 2020)National Integrity Plan and Clean, Efficient and Trustworthy Campaign have been put in place by the government to improve the performance of its civil servants and public image of its healthcare provision. Nevertheless, poor job performance manifested in delays in receiving treatment, negligence during treatment, poor diagnosis and errors in the delivery of medication remain widespread and as such, the MPS has been subject to much public criticism in recent times. Because the severity of the problem has not been systematically investigated, the current situation warrants a more detailed and evidence-based investigation into job performance in the MPS and the factors related to it. The present research was conducted in order to investigate the issue of poor job performance in Malaysian public hospitals by identifying the factors that enhance or hinder job performance and testing these inter-relationships using an evidenced-based framework of job demands, job/personal resources, subjective well-being and performance. A mixed methods approach with a sequential exploratory design was employed. In Study 1, interview session were carried out with participants at selected hospitals. The data collected from the interviews were used to create additional items for a larger-scale survey used in the Study 2. Study 1 found that job performance in the MPS was at a ‘moderate and acceptable level’ according to participants of the study. Majority
34
363
4TH SINTO
K INTERN
ATION
AL CON
FERENCE O
N SO
CIAL SCIENCE AN
D M
ANAG
EMEN
T
participants were very enthusiastic about their work and workplace and believed that the reporting of incidents of poor job performance by the Malaysian Public Complaints Bureau and newspapers were grossly exaggerated largely based on isolated incidents. Nevertheless, participants did acknowledge that some employees did not perform as well as they could because of problems such as work overload and negative attitudes. Study 1 revealed that six factors affected job performance in the MPS: 1. Besides, according to Johari et al., (2019)employee well-being and job performance in light of the new administrative reform called the Government Transformation Program in Malaysia that stresses on measurable performance outputs. Design/methodology/approach: A total of 208 public sector employees from various public agencies and departments in the northern region of Peninsular Malaysia were surveyed. Some of the agencies that took part in the study include state departments, the fishery department, agriculture-related agencies and the rural development agency. Findings: The authors observed that feedback positively influenced employee well-being, which served as a significant mediator in the relationship between feedback and job performance. The results indicated that 26.4 percent of the variance that explained employee well-being was accounted for by the different characteristics of a job. The authors also demonstrated that employee well-being accounted for 41.8 percent of job performance. Research limitations/implications: The authors recommended that public sector managers consider the element of feedback and enhance employee well-being to improve job performance. Originality/value: This study offers an insight into the effect of perceived changes in the job itself on employee well-being and subsequent job performance in light of government reforms. (Johari et al., 2019, by improving the individual performance will lead to the increasing of the organizational performance. However, the economic crisis brought about by the Covid-19 pandemic is different from the Asian financial crisis in 1997/98 and expected to bring long-lasting effects. The financial crisis had turned a strong expansion of 7.3 per cent in 1997 into a deep contraction of -7.4 per cent in 1998. The outbreak of the pandemic adversely affected the economic growth in Malaysia with -5.6 per cent contraction last year. Hard hit by the COVID-19 pandemic, Malaysia’s gross domestic product fell by 17.1 per cent in the second quarter of 2020. According to the Department of Statistics Malaysia (2021), this was the Malaysian economy’s worst performance since the height of the Asian financial crisis in 1998. The Small and medium-sized enterprises (SMEs) have been particularly affected by this crisis. SMEs contribute to local economies by bringing growth and innovation to the community and help stimulate economic growth by providing employment opportunities to people who may not be employable by larger corporations. There are 95% of enterprises globally (World Bank, 2020)particularly in developing countries. SMEs account for the majority of businesses worldwide and are important contributors to job creation and global economic development. They represent about 90% of businesses and more than 50% of employment worldwide. Formal SMEs contribute up to 40% of national income (GDP, average of 97% in southeast Asia (Asian Development Bank, 2020) and 98.5% in Malaysia (SME Corporation Malaysia, 2019). This proved that SME is the backbone of world’s economy.
PROBLEM STATEMENT
The movement control, lockdown, confinement and social distancing are amongst the governments’ effort to safeguard unprecedented public health and economic responses .The coronavirus may not swing back fully once the outbreak has relented (Craven et al., 2020).However, In Malaysia, Covid-19 expected to become endemic in Malaysia by end of October, says Khairy Jamaluddin as Minister of Health, Malaysia. Khairy said being in an endemic phase would see more sectors reopened with new Covid-19 norms being practised. He added that the ministry would continue to make mask-wearing mandatory for the foreseeable future. So, it is clear, this study is relevant as the country will continue using with current practices in order to decrease effect of pandemic. Although Sarawak for example has already enter into the endemic phase, however, as the end of September, the cases of covid -19 has increasing compare to other states in Malaysia with 2,943 cases (Ministry of Health,Malaysia,2021).Although stringent government policy and response to curb the disease is necessary, but most

364
businesses are expose to negative effects in either short or long-term period (Ahmad et al., 2020). Major hurdles are cash flow problems, closure of operation, laying off workers, retrenchment and diluted firms’ capacity for future expansion (Craven et al., 2020; Smith-Bingham & Hariharan, 2020).
Employees are the important resources to the organization. The issues of employee performance during this pandemic situation such as low labour productivity which declining about -5.4% in 2020 (Department of Statistics Malaysia, 2020),pay reduction, working from home, fear of contracting to viruses at the workplace and many more has impacted the performance among the employees especially within SMEs. This is supported by the study of Massoudi (2018) where it stated that the success or failure of the businesses are depends on the performance of the employee. As we all know, SME is the main contributor to the country’s economic as been stated by Department of Statistics Malaysia, (2020) and SME Corporation Malaysia (2019). There are few factors that contribute to the employee performance. According to study made by Mangkunegara (2013) the employee performance factors consist internal factors, those originating from within an individual, and external factors, those associated with the environment/ situational such as the job and organizational climate and many more. Thus, this is also supported by Paresashvili et al., (2021) where they stated that it is essential that the performance of employees must consists and influenced by both the personality and the situational factors. However, only the personality traits as one of the internal factor that will be discuss further in this conceptual paper.
Personality traits have an important role in enhancing the efficiency and effectiveness of employee’s job performance (Delima, 2019). People are different in terms of personality. This difference cause conflicts such as interpersonal conflict when they interact for example when they are having difference opinion (Ahmed et al., 2010). Personality traits always have negative impact to employee performance (Gridwichai et al., 2020 ; Altangerel, 2015). This is because personality traits affect employee differently in terms of work contexts. In other words, traits appeared in the condition where individuals know that they cannot handle any pressure facing them which later can affect their performance because of the competitive nature of jobs.
Besides that, according to Medeiros & Young, (2021), different individual respond differently to crisis. Everyone is facing similar threats to their health and livelihoods, and how people respond differently to this depending on culture, social groups and individual differences. Each of us have different and unique personality. And understanding someone personality gives us clues on how that person is likely to act and feel in a variety of situation. At the same time, the understanding on the personality will lead to the better performance among the employees.
Personality is thought to be fairly stable across time and context, and difficult to change. As stated by Costa & McCrae, (1985); Soto, (2018) where they claimed that personality traits stable over time. However, according to Sutin et al., (2020), personality traits might change during crisis. This is because traits can and do change in response to distress and treatment for distress respectively. Thus, most study on western context (individualistic society), but limited study on collectivists society. According to Haq (2020) and Hostfede Insight 2019, Malaysia is known as the collectivist society and non individualistics. Therefore, this study is imperative, As such, there is a critical need to investigate the impact of such phenomena when little evidence is curently available for practioners, policy makers and academia references. Ahmad (et.al, 2020). Therefore, this study will include the personality traits and job characteristics that will give impact to the employee performance.
EMPLOYEE PERFORMANCE
Employee performance is one of the most widely researched items in industrial and organisational psychology. Employee performance can be defined as the successful

365
4TH SINTO
K INTERN
ATION
AL CON
FERENCE O
N SO
CIAL SCIENCE AN
D M
ANAG
EMEN
T
completion of tasks by a selected individual or individuals, as set and measured by a supervisor or organization, to pre-defined acceptable standards while efficiently and effectively utilizing available resource within a changing environment (Thao & Hwang, 2010).In other words, employee performance is the ability of the employees to fulfil their roles as well as completed their tasks and be able to behave at their workplace. Besides, employee performance is critical in all businesses because it influences the success or failure of the job and has impacted achieving the goals of the enterprise organisations and meeting the needs of customers. The performance among employees is important in pursuing the company’s goals and ensuring the success or failure of organisations. Most organisations seek to measure employee performance and the factors affecting performance to improve employee performance as much as possible and make it effective and efficient. Employee performance is viewed as a multidimensional construct encompassing more than one type of behaviour. Although researchers present their definitions of work performance, according to Rotundo (2002)citizenship, and counterproductive performance. This study examined the relative importance of each component to ratings of overall performance by using an experimental policy-capturing design. Managers in 5 jobs read hypothetical profiles describing employees’ task, citizenship, and counterproductive performance and provided global ratings of performance. Within-subjects regression analyses indicated that the weights given to the 3 performance components varied across raters. Hierarchical cluster analyses indicated that raters’ policies could be grouped into 3 homogeneous clusters: (a a conventional definition focuses on individual behaviours or activities rather than the effects or outcomes of these actions and behaviours. For example, according to Murphy (1989), employee performance should be measured in terms of actions rather than outcomes. Employees may aim to optimise results at the expense of other things; thus, results-based measurements are not necessarily functional to the organisation. Besides, Nickson (2020) stressed that the accuracy of employee performance includes the direct observation of the behaviour.
However, this study builds upon ideas developed by Borman & Motowidlo, (1997)and a taxonomy of contextual performance containing elements of organizational citizenship behavior and prosocial organizational behavior is offered. Evidence is presented demonstrating that supervisors weight roughly equally subordinate task and contextual performance when making overall judgments of their performance. This, along with data showing that personality successfully predicts contextual performance, provides an alternative explanation for recent meta-analytic findings that personality correlates moderately with overall performance. Personality may be predicting the contextual component of overall performance. Results from studies using the Hogan Personality Inventory confirm that correlations between personality and contextual criteria are higher than correlations between personality and overall performance. We argue that finding such links between predictors and individual criterion elements significantly advances the science of personnel selection. (Borman & Motowidlo, 1997; employee performance is behavioural, episodic, evaluative, and multidimensional. Furthermore, they identified two types of employee behaviour required for organisational effectiveness: task performance and contextual performance. Employee performance has the same meaning as job performance (Massoudi, 2018). It is multifaceted and encompasses a wide range of factors. There are two dimensions of employee behaviour in employee performance: task performance and contextual performance (Kahya, 2009). Borman & Motowidlo (1997)and a taxonomy of contextual performance containing elements of organizational citizenship behavior and prosocial organizational behavior is offered. Evidence is presented demonstrating that supervisors weight roughly equally subordinate task and contextual performance when making overall judgments of their performance. This, along with data showing that personality successfully predicts contextual performance, provides an alternative explanation for recent meta-analytic findings that personality correlates moderately with overall performance. Personality may be predicting the contextual component of overall performance. Results from studies using the Hogan Personality Inventory confirm that correlations between personality and contextual criteria are higher than correlations between personality and overall performance. We argue that finding such links between predictors and individual criterion elements significantly advances
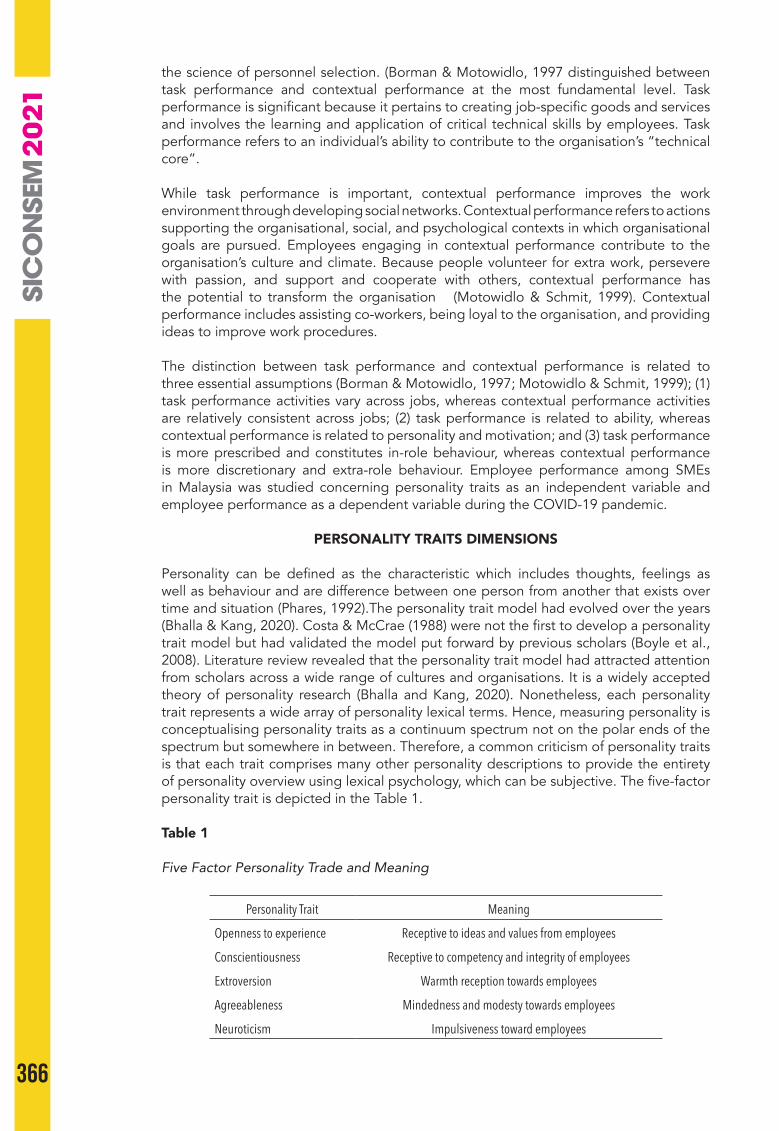
366
the science of personnel selection. (Borman & Motowidlo, 1997 distinguished between task performance and contextual performance at the most fundamental level. Task performance is significant because it pertains to creating job-specific goods and services and involves the learning and application of critical technical skills by employees. Task performance refers to an individual’s ability to contribute to the organisation’s “technical core”.
While task performance is important, contextual performance improves the work environment through developing social networks. Contextual performance refers to actions supporting the organisational, social, and psychological contexts in which organisational goals are pursued. Employees engaging in contextual performance contribute to the organisation’s culture and climate. Because people volunteer for extra work, persevere with passion, and support and cooperate with others, contextual performance has the potential to transform the organisation (Motowidlo & Schmit, 1999). Contextual performance includes assisting co-workers, being loyal to the organisation, and providing ideas to improve work procedures.
The distinction between task performance and contextual performance is related to three essential assumptions (Borman & Motowidlo, 1997; Motowidlo & Schmit, 1999); (1) task performance activities vary across jobs, whereas contextual performance activities are relatively consistent across jobs; (2) task performance is related to ability, whereas contextual performance is related to personality and motivation; and (3) task performance is more prescribed and constitutes in-role behaviour, whereas contextual performance is more discretionary and extra-role behaviour. Employee performance among SMEs in Malaysia was studied concerning personality traits as an independent variable and employee performance as a dependent variable during the COVID-19 pandemic.
PERSONALITY TRAITS DIMENSIONS
Personality can be defined as the characteristic which includes thoughts, feelings as well as behaviour and are difference between one person from another that exists over time and situation (Phares, 1992).The personality trait model had evolved over the years (Bhalla & Kang, 2020). Costa & McCrae (1988) were not the first to develop a personality trait model but had validated the model put forward by previous scholars (Boyle et al., 2008). Literature review revealed that the personality trait model had attracted attention from scholars across a wide range of cultures and organisations. It is a widely accepted theory of personality research (Bhalla and Kang, 2020). Nonetheless, each personality trait represents a wide array of personality lexical terms. Hence, measuring personality is conceptualising personality traits as a continuum spectrum not on the polar ends of the spectrum but somewhere in between. Therefore, a common criticism of personality traits is that each trait comprises many other personality descriptions to provide the entirety of personality overview using lexical psychology, which can be subjective. The five-factor personality trait is depicted in the Table 1.
Table 1
Five Factor Personality Trade and Meaning
Personality Trait Meaning
Openness to experience Receptive to ideas and values from employees
Conscientiousness Receptive to competency and integrity of employees
Extroversion Warmth reception towards employees
Agreeableness Mindedness and modesty towards employees
Neuroticism Impulsiveness toward employees
367
4TH SINTO
K INTERN
ATION
AL CON
FERENCE O
N SO
CIAL SCIENCE AN
D M
ANAG
EMEN
T
THE RELATIONSHIP BETWEEN PERSONALITY TRAITS AND EMPLOYEE PERFORMANCE
One of the most important psychological aspects influencing human behaviour is personality, which is crucial in the workplace. Every organisation values the personality of its employees. The five dimensions of personality provide a clear conceptual and measurement framework for personality research in psychology, and they are used to describe human personality. Even though the Five-Factor Model has amassed a large body of evidence worldwide, it is sometimes criticised for being theoretical, excessively descriptive, and missing concerning personality development across the lifespan. McCrae & Costa (1999) established the Five-Factor Personality Traits Theory in response to these criticisms. Five-Factor Personality Traits Theory is a contemporary version of trait theory based on the assumptions that people are knowable, rational, variable, and proactive (McCrae & Costa, 1999). Every person has different personalities, which all contribute to employee performance in a business. Personality traits have an important effect in improving employee performance to become more efficient and effective. The personality of a person has a significant impact on his/her employment. According to Barrick & Mount (2005), the dimensions of personality traits, such as conscientiousness, extraversion, agreeableness, and openness to experience, have a significant relationship with employee performance and become the core components of a person’s personality. The greatest success of an organisation is determined by not only the skills and abilities of its employees but also by the various personality traits, they possess.
The personality traits theory (McCrae & Costa, 1999) also posits that openness to experience is concerned with a person’s diverse interests and curiosity with novelty. In other words, openness to experience displays the ability to be flexible enough to learn and understand tasks quickly. Openness to experience is a dispositional variable that is likely to be relevant for predicting individual differences in the pattern of performance growth over time (Minbashian et al., 2013). The dimension of openness to experience is likely to influence employee performance by affecting the individual’s intrinsic motivation to learn. It is hypothesised that an individual with high openness to experience is associated with greater continuous learning efforts throughout one’s career. Thus, this may also provide the impetus for continued development and skill acquisition, which may increase employee performance over time.
Another factor of personality traits is conscientiousness. Conscientiousness motivates people to be more engaged in their organisations (Chiaburu et al., 2011). As a result, conscientiousness will be a much more accurate predictor of work performance (Barrick & Mount, 1991). According to the research, conscientiousness is highly associated with job satisfaction (Judge et al., 2002), ongoing commitment (Erdheim et al., 2006), and job performance (Barrick & Mount, 1991). Erdenk & Altuntaş (2017)correlational and cross-sectional design to determine whether personality traits of nurses have an effect on conflict management strategies. Background: It is known that integration, avoidance and compromise conflict management strategies are the most frequent strategies used among nurses and obligation and domination are the least frequent. However, the reasons behind their strategy choice are not known. It is predicted that one of the reasons is the personality characteristics of the nurses. Method: The study was conducted with the participation of 237 nurses working in three different hospitals. Research data were collected by using the ‘Personal Information Form’, ‘Rahim Organisational Conflict Inventory-II’ and ‘Five Factor Personality Inventory’ between December 2013 and February 2014. Ethical approval and the organisations’ approvals were obtained before data collection. The collected data were analysed using frequency and percentage distributions, descriptive statistics, Pearson product-moment correlation analysis, t-test, Cronbach’s alpha coefficient and simple linear regression analysis tests. Results: The majority of nurses had conflict especially with patients’ relatives several times a month. It was found that the personality traits of nurses were mostly ‘conscientiousness’ and ‘openness’ and when they had a conflict, they tended to use ‘integration’ strategy. It was also found that the personality traits of nurses had an effect on some of the conflict management strategies adopted by them. Conclusions: It was found that the personality
368
traits of nurses had an effect on some conflict management strategies adopted by them. Implications for nursing management: Nurse managers should support nurses who adopt appropriate conflict management strategies and there should be conflict management programmes that can teach appropriate skills to other nurses. (Erdenk & Altuntaş, 2017 posited that conscientiousness is an important aspect of employee performance because it involves employees’ ability and not only social aspects at the workplace. Besides, most of the researchers suggested that conscientiousness is the most often correlated with employee performance. According to Barrick and Mount (1991), employees with conscientiousness is able to keep their high performance, even in an environment of a varying organisation. Thus, when taken to an acute, these kinds of employees may also be “workaholics” and perfectionists in their performance at the workplace.
Additionally, extroverts have a bigger social circle both inside and outside of the company (Judge et al., 2002), often have good feelings (McCrae & John, 1992), and feel energised when they are around other people (Cherry, 2019). The extroverted persons in the workplace are more likely to achieve career growth, particularly in occupations requiring attributes such as sociability, assertiveness, and talkativeness (Barrick & Mount, 1991). Fichter et al.,(2020) posited that extroversion is the warmth reception towards others. Meanwhile, Buil et al., (2019)it explores the mediating role of organizational identification and work engagement in the relationship between transformational leadership and job performance and organization-directed citizenship behaviors. Additionally, it examines whether proactive personality moderates the effect of transformational leadership on identification and engagement. Data from 323 frontline hotel employees were analyzed using partial least square regression. Results show that identification and engagement fully mediate the relationship between transformational leadership and organizational citizenship behaviors, whereas engagement partially mediates the link between transformational leadership and job performance. Results indicate a sequential mediation effect of identification and engagement on employee performance. Finally, findings show that proactive personality strengthens the effect of leadership on identification and engagement. The study provides information for hotel managers about why and under what circumstances employees perform the way they do. (Buil et al., 2019 posited that extroversion involves effective communication between employers and employees. Extrovert communication skill involves talking and social activities with people in creating cheerful and optimistic working environment between employers and employees (Anbaz, 2013; Canaan et al., 2016; Khedhaouria & Cucchi, 2019; Kim & Lee, 2016emotional intelligence, internal marketing, service management and customer orientation. Results Factors associated with customer orientation were identified as conscientiousness from personal traits (̅ =.37, p <.001; Kwong & Cheung, 2003; Monteiro et al., 20162016; Rashid et al., 2016the expectations of customer continue to rise. This is very important and challenging task to be done by most banks and financial institutions. Hence, this paper aims to propose a conceptual framework on frontline’s personality traits and its relationship towards their job performance in financial and banking industry. The five-factors in Big-five Model are used as critical dimensions that possibly provide empirical evidence in relation to frontlines’ job performance. Those dimensions or traits are namely as openness to experience, conscientiousness, extraversion, agreeableness and emotional stability. Subsequently, the consequences of personality traits on the multiple types of job performance are further elaborated in this paper too. It is includes task performance and contextual performance. On the other hand, it is expected that the propose framework of this study will assist organizations in delivering high service quality through proper study on their frontline’s personality traits itself. (Rashid et al., 2016; Rubenstein et al., (2019). Employees with high extraversion are continually on the search for better career opportunities. Gridwichai et al. (2020) claimed that high extraversion persons are more aggressive in pursuing higher networking activities. Furthermore, if they can advance in their current organisation, they will be more committed to it and will be able to improve their performance.
Meanwhile, according to Chiaburu et al., (2011), individuals with high agreeableness are stronger team members since people emphasise trust and cooperation. High agreeableness in the workplace translates to modesty and obedience (McCrae &
369
4TH SINTO
K INTERN
ATION
AL CON
FERENCE O
N SO
CIAL SCIENCE AN
D M
ANAG
EMEN
T
John, 1992) and work well with each other (Cherry, 2019). Yao & Li (2021) posited that agreeableness is conducive to developing a cooperative and caring working atmosphere between employers and employees; thus, enhancing employee performance. Woods et al., (2019) agreed with Wu & Minor (1997) that agreeableness is an important variable in determining employee performance. Employees with agreeableness hope that they have been treated equally based on what they have given to the businesses. Suppose the employees have been treated well by having the support and benefits from the organisation. In that case, they will be able to perform well and at the same time be able to achieve the organisational objectives. According to Judge et al., (1999), the nature of agreeable individuals through cooperation may also lead to success in their job and performance. The agreeable employees will increase their performance when the political skill is combined, leveraging relationships to achieve the organisational objectives. It is crucial to highlight that people with low neuroticism do not necessarily have a high level of mental pressure; they are more even-tempered, easy-going, and composed. Besides, individuals with high neuroticism do not cope well with stress, are easily disturbed, and are emotionally vulnerable (Barrick & Mount, 1991; Cherry, 2019). Concerning workplace neuroticism, Judge et al., (2002) stated that studies upon that particular personality trait have continuously been highly associated with job satisfaction. Similarly, Barrick & Mount (1991) discovered that severely neurotic individuals self-select from organisations due to their incapacity to operate efficiently. Nadiah Maisarah et al., (2016)required the organization to have proactive and committed employees in performing higher standard of job performance in order to successfully survive and compete with other competitors. Employees’ job performance is one of the crucial elements that provide both goals and methods to achieve organizational mission. In view of this, effective leadership plays an important role on how the leaders response to employee in the working environment. Leaders who have an understanding of how individuals’ personalities differ can use this understanding to improve their leadership effectiveness and lead to improve employees’ job performance. The findings of this study revealed that leader’s personality traits are closely related with employees’ job performance. (Nadiah Maisarah et al., 2016posited that neuroticism is confrontational, not conducive to a cooperative working environment. Meanwhile, Weng & Chang (2015) posited that neuroticism affects employee performance efficiency and effectiveness. Swelam et al., (2020)loss of money, quality defects and may require lawsuits to resolve them. Negotiation between parties is the first step to resolve disputes and is influenced by many factors among which are the personality traits and the conflict management styles of the negotiators. This paper aims to illustrate Egyptian professional engineers’ behaviors during the negotiation stage; and how this relates to their personality’s traits. Practitioners working in construction projects in Egypt were approached through a web-based questionnaire (7 modules, 162 questions agreed with Nadiah Maisarah et al., (2016)required the organization to have proactive and committed employees in performing higher standard of job performance in order to successfully survive and compete with other competitors. Employees’ job performance is one of the crucial elements that provide both goals and methods to achieve organizational mission. In view of this, effective leadership plays an important role on how the leaders response to employee in the working environment. Leaders who have an understanding of how individuals’ personalities differ can use this understanding to improve their leadership effectiveness and lead to improve employees’ job performance. The findings of this study revealed that leader’s personality traits are closely related with employees’ job performance. (Nadiah Maisarah et al., 2016 and Weng & Chang (2015) on the negative effect of neuroticism trait on employee performance in organisations. Moreover, Soomro et al., (2016) and Selden & Goodie (2018) posited that neuroticism affects team climate, network structures, perceptions, and overall performance of organisations. Samsudin et al., (2020) posited that neuroticism could lead to victimisation and bullying at the workplace.
Overall, personality traits are vital and have the most significant effect in developing employee performance. The personality characterised by traits, which are relatively enduring characteristics, will influence employee behaviour across many situations and work contexts.
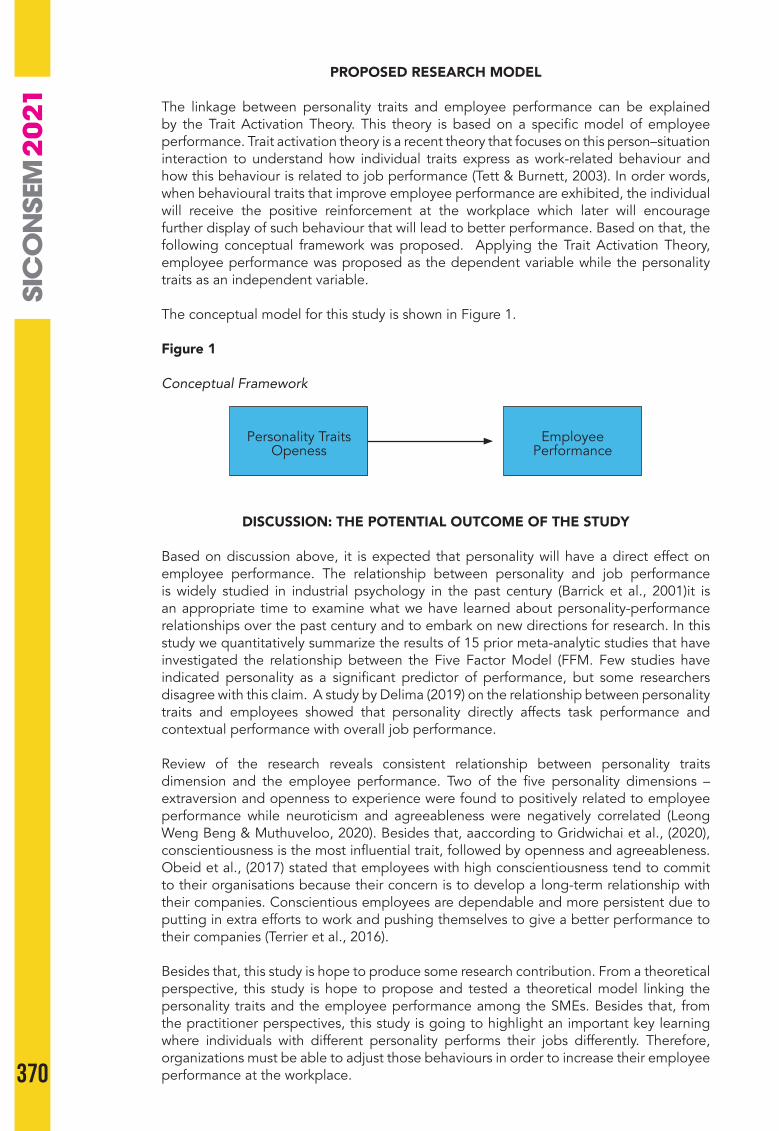
370
PROPOSED RESEARCH MODEL
The linkage between personality traits and employee performance can be explained by the Trait Activation Theory. This theory is based on a specific model of employee performance. Trait activation theory is a recent theory that focuses on this person–situation interaction to understand how individual traits express as work-related behaviour and how this behaviour is related to job performance (Tett & Burnett, 2003). In order words, when behavioural traits that improve employee performance are exhibited, the individual will receive the positive reinforcement at the workplace which later will encourage further display of such behaviour that will lead to better performance. Based on that, the following conceptual framework was proposed. Applying the Trait Activation Theory, employee performance was proposed as the dependent variable while the personality traits as an independent variable.
The conceptual model for this study is shown in Figure 1.
Figure 1
Conceptual Framework
Personality TraitsOpeness
Employee Performance
DISCUSSION: THE POTENTIAL OUTCOME OF THE STUDY
Based on discussion above, it is expected that personality will have a direct effect on employee performance. The relationship between personality and job performance is widely studied in industrial psychology in the past century (Barrick et al., 2001)it is an appropriate time to examine what we have learned about personality-performance relationships over the past century and to embark on new directions for research. In this study we quantitatively summarize the results of 15 prior meta-analytic studies that have investigated the relationship between the Five Factor Model (FFM. Few studies have indicated personality as a significant predictor of performance, but some researchers disagree with this claim. A study by Delima (2019) on the relationship between personality traits and employees showed that personality directly affects task performance and contextual performance with overall job performance.
Review of the research reveals consistent relationship between personality traits dimension and the employee performance. Two of the five personality dimensions – extraversion and openness to experience were found to positively related to employee performance while neuroticism and agreeableness were negatively correlated (Leong Weng Beng & Muthuveloo, 2020). Besides that, aaccording to Gridwichai et al., (2020), conscientiousness is the most influential trait, followed by openness and agreeableness. Obeid et al., (2017) stated that employees with high conscientiousness tend to commit to their organisations because their concern is to develop a long-term relationship with their companies. Conscientious employees are dependable and more persistent due to putting in extra efforts to work and pushing themselves to give a better performance to their companies (Terrier et al., 2016).
Besides that, this study is hope to produce some research contribution. From a theoretical perspective, this study is hope to propose and tested a theoretical model linking the personality traits and the employee performance among the SMEs. Besides that, from the practitioner perspectives, this study is going to highlight an important key learning where individuals with different personality performs their jobs differently. Therefore, organizations must be able to adjust those behaviours in order to increase their employee performance at the workplace.

371
4TH SINTO
K INTERN
ATION
AL CON
FERENCE O
N SO
CIAL SCIENCE AN
D M
ANAG
EMEN
T
CONCLUSION
In conclusion, the personality traits among the employee becoming more critical and essential as it help to boost the performance among the employee.This chapter has discussed the literature in the context of SMEs and the conceptualisation and review on the dependent variable (employee performance), independent variables (personality traits), and subsequently the empirical review about the relationships of variables and underpinning theories of the study. Literature review analysis shows there is a gap in research between the five-factor personality and employee performance. Personality traits, such as openness to experience, conscientiousness, extraversion, agreeableness, and neuroticism, have been discovered to affect employee performance. However, scanty research has been conducted on the relationship between personality traits and employee performance within SMEs in Malaysia during a crisis, such as the COVID-19 pandemic. Personality traits, validated by Costa & McCrae (1988)have chiefly made use of self-reports, and have frequently included only men. In this study, self-reports (N = 983 may have affected employee performance differently with the advent of the COVID-19 pandemic (Fichter et al., 2020). Thus, there is a need for this area to be researched.
REFERENCES
Ahmad Raflis, C. O., Suraiya, I., & Mohd Abdullah, J. (2020). The impact of Covid-19 Movement Control Order on SMEs’ businesses and survival strategies. Malaysian Journal of Society and Space, 16(2). https://doi.org/10.17576/geo-2020-1602-11
Altangerel, O. . R. W. . E. E. . & D. B. (2015). (2015). Investigating the effect of job stress on performance of employees. International Journal of Scientific & Technology Research, 4(2).
Anbaz, K. (2013). The relationship between personality traits and conflict management strategies in physical education managers of Isfahan province. Advances in Environmental Biology, 7(8).
Asian Development Bank. (2020). Asia Small and Medium-Sized Enterprise Monitor 2020 Medium-Sized Enterprise Monitor 2020: Vol. I (Issue October). https://www.adb.org/sites/default/files/publication/646146/asia-sme-monitor-2020-volume-1.pdf
Barrick, M. R., & Mount, M. K. (2005). Yes, personality matters: Moving on to more important matters. In Human Performance (Vol. 18, Issue 4). https://doi.org/10.1207/s15327043hup1804_3
Barrick, M. R., & Mount, M. K. (1991). The big five personality dimensions and job performance: A meta-analysis. Personnel Psychology, 44(1). https://doi.org/10.1111/j.1744-6570.1991.tb00688 .x
Barrick, M. R., Mount, M. K., & Judge, T. A. (2001). Personality and performance at the beginning of the new millennium: What do we know and where do we go next? International Journal of Selection and Assessment, 9(1–2). https://doi.org/10.1111/1468-2389.00160
Bhalla, A., & Kang, L. S. (2020). The role of personality in influencing work–family balance experience: A study of Indian journalists. Global Business Review, 21(4). https://doi.org/10.1177/0972150918779157
Borman, W. C., & Motowidlo, S. J. (1997). Task performance and contextual performance: The meaning for personnel selection research. Human Performance, 10(2). https://doi.org/10.1207/s15327043hup1002_3
Boyle, G. J., Matthews, G., & Saklofske, D. H. (2008). Personality measurement and testing: An overview. In The SAGE Handbook of Personality Theory and Assessment: Volume 2 - Personality Measurement and Testing. https://doi.org/10.4135/9781849200479.n1
Buil, I., Martínez, E., & Matute, J. (2019). Transformational leadership and employee performance: The role of identification, engagement and proactive personality. International Journal of Hospitality Management, 77. https://doi.org/10.1016/j.ijhm.2018.06.014
Chiaburu, D. S., Oh, I. S., Berry, C. M., Li, N., & Gardner, R. G. (2011). The five-factor model of personality traits and organizational citizenship behaviors: A meta-analysis.
372
Journal of Applied Psychology, 96(6). https://doi.org/10.1037/a0024004Costa, P., & McCrae, R. R. (1985). Concurrent validation after 20 Years: The implications of
personality stability for its assessment. Advances in Personality Assessment, January 1985, 43–66. https://doi.org/10.4324/9781315825625-7
Costa, P. T., & McCrae, R. R. (1988). Personality in adulthood: A six-year longitudinal study of self-reports and spouse ratings on the NEO personality inventory. Journal of Personality and Social Psychology, 54(5). https://doi.org/10.1037/0022-3514.54.5.853
Craven, M., Liu, L., Mysore, M., Singhal, S., Smit, S., & Wilson, M. (2020). COVID-19: Implications for business March 2020 Executive Briefing. www.Mckinsey.Com.
Delima, V. J. (2019a). Impact of personality traits on employees’ job performance in Batticaloa teaching hospital. Iconic Research and Engineering Journals, 2(12), 86–97.
Delima, V. J. (2019b). Impact of personality traits on employees’ job performance in Batticaloa teaching hospital. Iconic Research and Engineering Journals, 2(12), 86–97.
Department of Statistics Malaysia. (2020). Labour Market Review, Malaysia Fourth Quarter 2020. 1–38. https://www.dosm.gov.my/v1/uploads/files/1_Articles_By_Themes/Labour Market/Labour Market Review Q3 2020/Labour Market Review%2C Malaysia%2C Q3 2020.pdf
Department of Statistics Malaysia. (2021). Department of Statistic Malaysia Press Release Employment Statistics First Quarter 2021. Jabatan Perangkaan Malaysia, May.
Erdenk, N., & Altuntaş, S. (2017). Do personality traits of nurses have an effect on conflict management strategies? Journal of Nursing Management, 25(5). https://doi.org/10.1111/jonm.12474
Erdheim, J., Wang, M., & Zickar, M. J. (2006). Linking the big five personality constructs to organizational commitment. Personality and Individual Differences, 41(5). https://doi.org/ 10.1016/j.paid.2006.04.005
Fichter, L., von Bernstorff, C., & Rohrmann, S. (2020). The necessity of targeted aptitude diagnostics for company founders: relationships between personality traits, perceived stress, satisfaction, and performance. Heliyon, 6(9). https://doi.org/10.1016/j.heliyon.2020.e04987
Gridwichai, P., Kulwanich, A., Piromkam, B., & Kwanmuangvanich, P. (2020). Role of personality traits on employees job performance in pharmaceutical industry in Thailand. Systematic Reviews in Pharmacy, 11(3), 185–194. https://doi.org/10.5530/srp.2020.3.21
Haq, Y. (2020). Malaysia culture and economy. https://doi.org/10.13140 /RG.2.2.22569.42088
Johari, J., Mohd Shamsudin, F., Fee Yean, T., Yahya, K. K., & Adnan, Z. (2019). Job characteristics, employee well-being, and job performance of public sector employees in Malaysia. International Journal of Public Sector Management, 32(1), 102–119. https://doi.org/10.1108/IJPSM-09-2017-0257
Judge, T. A., Heller, D., & Mount, M. K. (2002). Five-factor model of personality and job satisfaction: A meta-analysis. Journal of Applied Psychology, 87(3). https://doi.org/10.1037/0021-9010. 87.3.530
Judge, T. A., Higgins, C. A., Thoresen, C. J., & Barrick, M. R. (1999). The big five personality traits, general mental ability, and career success across the life span. Personnel Psychology, 52(3). https://doi.org/10.1111/j.1744-6570.1999.tb00174.x
Kahya, E. (2009). The effects of job performance on effectiveness. International Journal of Industrial Ergonomics, 39(1). https://doi.org/10.1016/j.ergon.2008.06.006
Khedhaouria, A., & Cucchi, A. (2019). Technostress creators, personality traits, and job burnout: A fuzzy-set configurational analysis. Journal of Business Research, 101. https://doi.org/10.1016 /j.jbusres.2019.04.029
Kim, B., & Lee, J. (2016). Relationships between personal traits, emotional intelligence, internal marketing, service management, and customer orientation in Korean outpatient department nurses. Asian Nursing Research, 10(1). https://doi.org/10.1016/j.anr.2015.10.005
Kwong, J. Y. Y., & Cheung, F. M. (2003). Prediction of performance facets using specific personality traits in the Chinese context. Journal of Vocational Behavior, 63(1). https://doi.org/10.1016 /S0001-8791(02)00021-0
Leong Weng Beng, T., & Muthuveloo, R. (2020). The influence of personality traits and employee development on the job performance of engineers in Malaysia. Jurnal
373
4TH SINTO
K INTERN
ATION
AL CON
FERENCE O
N SO
CIAL SCIENCE AN
D M
ANAG
EMEN
T
Muara Ilmu Ekonomi Dan Bisnis, 4(2), 366. https://doi.org/10.24912/jmieb.v4i2.8806Massoudi, A. H. (2018). Employees performance dimensions in kurdistan region hotel
industry. October 2016. http://www.recentscientific.comMcCrae, R. R., & Costa, P. T. (1999). A five-factor theory of personality. In L. A. Pervin &
O. P. John (Eds.), Handbook of personality: Theory and research (2nd ed.). 139–153.McCrae, R. R., & John, O. P. (1992). An introduction to the five-factor model and its
applications. Journal of Personality, 60(2). https://doi.org/10.1111/j.1467-6494.1992.tb00970.x
Medeiros, M., & Young, E. (2021). When character forges the crisis: Personality traits of world leaders and differential policy responses to the COVID-19 pandemic. Research Square, 1–22.
Minbashian, A., Earl, J., & Bright, J. E. H. (2013). Openness to experience as a predictor of job performance trajectories. Applied Psychology, 62(1), 1–12. https://doi.org/10.1111/j.1464-0597.2012.00490.x
Mohamad Hajari, F. H. (2020). Job performance in the Malaysian Public Service: The roles of job demands-resources and subjective wellbeing. (Unpublished doctoral dessertation). University of Nottingham.
Monteiro, A. P., Cunha, P., & Lourenço, A. A. (2016). Five personality factors model and conflict management. In The Five-Factor Model: Recent Developments and Clinical Applications.
Motowidlo, S. J., & Schmit, M. J. (1999). Performance assessment in unique jobs. In In Ligen, D. R., & Pulakos, E. D. (Eds), The changing nature of job performance: Implications for staffing, motivation, and development.
Murphy, K. R. (1989). Dimensions of job performance. Testing: Theoretical and applied perspectives, 619.
Nadiah Maisarah, A. G., Nor Sara Nadia, M. Y., & Norliza, S. B. (2016). Leader’s personality traits and employees job performance in public sector, Putrajaya. Procedia Economics and Finance, 37(16), 46–51. https://doi.org/10.1016/s2212-5671(16)30091-0
Nickson, D. (2020). Performance management and appraisal. Human Resource Management for Hospitality, Tourism and Events, 185–206. https://doi.org/10.4324/9780080966496-16
Obeid, M., Salleh, Z., & Mohd Nor, M. N. (2017). The mediating effect of job satisfaction on the relationship between personality traits and premature sign-off. Academy of Accounting and Financial Studies Journal, 21(2).
Paresashvili, N., Maisuradze, T., Gechbaia, B., Weis, L., & Koval, V. (2021). Conflict management impact on the employee productivity. SHS Web of Conferences, 111, 01010. https://doi.org/10.1051/shsconf/202111101010
Phares, E. J. (1992). Clinical psychology: Concepts, methods, & profession, 4th ed. In Clinical psychology: Concepts, methods, & profession (4th ed.).
Rashid, N. M., Sah, N. F. M., Ariffin, N. M., Ghani, W. S. W. A., & Yunus, N. S. N. M. (2016). The influence of bank’s frontlines’ personality traits on job performance. Procedia Economics and Finance, 37. https://doi.org/10.1016/s2212-5671(16)30094-6
Rotundo, M. (2002). The relative importance of task, citizenship, and counterproductive performance to global ratings of job performance: A policy-capturing approach. The Journal of Applied Psychology, 87(1). https://doi.org/10.1037/0021-9010.87.1.66
Rubenstein, A. L., Zhang, Y., Ma, K., Morrison, H. M., & Jorgensen, D. F. (2019). Trait expression through perceived job characteristics: A meta-analytic path model linking personality and job attitudes. Journal of Vocational Behavior, 112. https://doi.org/10.1016/j.jvb.2019.02.002
Samsudin, E. Z., Isahak, M., Rampal, S., Rosnah, I., & Zakaria, M. I. (2020). Individual antecedents of workplace victimisation: The role of negative affect, personality and self-esteem in junior doctors’ exposure to bullying at work. International Journal of Health Planning and Management, 35(5). https://doi.org/10.1002/hpm.2985
Selden, M., & Goodie, A. S. (2018). Review of the effects of five factor model personality traits on network structures and perceptions of structure. Social Networks, 52. https://doi.org/10.1016/ j.socnet.2017.05.007
SME Corporation Malaysia. (2019). About SME Corp. Malaysia. SME Corp. Malaysia.Smith-Bingham, R, & Hariharan, K. (2020). This is the impact of the coronavirus on
business. World Economic Forum. https://www.weforum.org/agenda.

374
Soomro, A. B., Salleh, N., Mendes, E., Grundy, J., Burch, G., & Nordin, A. (2016). The effect of software engineers’ personality traits on team climate and performance: A Systematic Literature Review. Information and Software Technology, 73. https://doi.org/10.1016/j.infsof.2016.01.006
Soto, C. J. (2018). Big five personality traits. The SAGE Encyclopedia of lifespan human development, 2(January). https://doi.org/10.4135/9781506307633.n93
Sutin, A. R., Luchetti, M., Aschwanden, D., Lee, J. H., Sesker, A. A., Strickhouser, J. E., Stephan, Y., & Terracciano, A. (2020). Change in five-factor model personality traits during the acute phase of the coronavirus pandemic. PLoS ONE, 15(8 August), 1–13. https://doi.org/10.1371 /journal.pone.0237056
Swelam, M., El-Said, M., & El-Dokhmaesy, A. (2020). Construction disputes’ negotiation: Do personality and conflict styles matter. Journal of Engineering and Applied Science, 67(5).
Terrier, L., Kim, S., & Fernandez, S. (2016). Who are the good organizational citizens for the environment? An examination of the predictive validity of personality traits. Journal of Environmental Psychology, 48. https://doi.org/10.1016/j.jenvp.2016.10.005
Tett, R. P., & Burnett, D. D. (2003). A personality trait-based interactionist model of job performance. In Journal of Applied Psychology (Vol. 88, Issue 3). https://doi.org/10.1037/0021-9010.88.3.500
Thao, T. L. T., & Hwang, C. J. (2010). Factors affecting employee performance – Evidence from Petrovietnam Engineering. Journal of Management Research, 21(3), 21–33.
Weng, L. C., & Chang, W. C. (2015). Does impression management really help? A multilevel testing of the mediation role of impression management between personality traits and leader-member exchange. Asia Pacific Management Review, 20(1). https://doi.org/10.1016/j.apmrv.2013.03.001
Woods, S. A., Wille, B., Wu, C. huei, Lievens, F., & De Fruyt, F. (2019). The influence of work on personality trait development: The demands-affordances TrAnsactional (DATA) model, an integrative review, and research agenda. In Journal of Vocational Behavior (Vol. 110). https://doi.org/10.1016/j.jvb.2018.11.010
World Bank. (2020). World Bank SME Finance. In World Bank.Wu, W. Y., & Minor, M. S. (1997). Role perceptions, personal traits, lifestyles and leadership:
An empirical study of American, Japanese, and Taiwanese female managers. International Business Review, 6(1). https://doi.org/10.1016/s0969-5931(97)86722-4
Yao, X., & Li, R. (2021). Big five personality traits as predictors of employee creativity in probation and formal employment periods. Personality and Individual Differences, 182. https://doi.org/10.1016/j.paid.2020.109914
375
4TH SINTO
K INTERN
ATION
AL CON
FERENCE O
N SO
CIAL SCIENCE AN
D M
ANAG
EMEN
T
SICONSEM2021: 099-061
REDEFINING SUCCESS THROUGH EMPLOYMENT QUALITY: IMPACT OF PERCEIVED EMPLOYABILITY AND FOCUSED JOB SEARCH DURING UNIVERSITY
TO WORK TRANSITION
RUCHIKA GUPTA & AMIRUL HASAN ANSARICentre for Management Studies, Jamia Millia Islamia
Corresponding authors: [email protected]; [email protected]
ABSTRACT
This study aims to provide insights on how recent management graduates could drive long-term employment success through factors that would foster them to achieve quality jobs. A conceptual framework rooted in social-cognitive theory imparts the present study a twofold purpose of examining the relationship between perceived employability (internal and external), focused job search and employment quality (starting salary and job satisfaction) and investigating the role of focused job search between perceived employability and employment quality. A correlational study performed in two phases (a questionnaire administered during initial contact with students and employment quality attributes measured post 6 months of employment) involved 250 recently employed management graduates. Structural equation modelling (partial least square or PLS) results found that the internal perceived employability was significantly related to starting salary and job satisfaction. However, the external perceived employability was only significantly related to starting salary. Moreover, focused job search found as a competitive mediator negatively influenced the relationship between internal perceived employability and starting salary. Finally, results upheld the idea that employability perceptions and a job search approach are vital aspects to be considered during university-to-work transition. Besides, it is a rare possibility to observe an empirical study investigating job search as a mediating variable to have affected employment success of management graduates. While these insights would assist career counsellors in instilling positive employability perceptions in graduates to enhance their possibility of obtaining better pay and a more satisfying job, industry practitioners could use this opportunity to achieve improved organizational performance.
Keywords Perceived employability, focused job search, employment quality, PLS-SEM.
INTRODUCTION
The 21st century has created a maelstrom of challenges for management graduates to gain admittance in the job market. Despite many efforts, not all of the graduating students succeed in obtaining employment. Such circumstances are even more vulnerable in developing countries like India, where graduates are willing to join informal job markets with unreasonable pay and dissatisfactory work to secure employment (Mehrotra, 2020). As novice job seekers, they lack experiential knowledge for handling university-to-work transition successfully and are prone to experience anxiety and insecurity, making it even more challenging to achieve employment success (Bonaccio et al., 2014).
Early studies have mostly conceptualized employment success as securing employment, while only recently it has been more broadly measured with the quality criterion of a job (Van den Hee et al., 2020)job search motivation, and their interaction with self-regulatory job search behaviors and subsequent outcomes of the job search process. In a three-wave field study among 397 unemployed job seekers, results showed that trait procrastination explained unique variance in job search procrastination and haphazard job search above and beyond future focus and autonomous job search motivation. Trait procrastination was also negatively related to reemployment status via increased job search procrastination
35
376
and haphazard job search, and a reduced number of job interviews. Finally, the negative indirect relation between trait procrastination and reemployment status through job search procrastination, haphazard job search and job interviews, was less negative for job seekers who were more autonomously motivated to engage in job search. Our findings point to the importance of a temporal perspective of job search and suggest that the role of time-related personality attributes and motivation in the job search process should be considered in future research and practice. (Van den Hee et al., 2020. Literature on graduate employment alleges employment quality to have an immense influence on lifelong income, future employability, job sustainability, well-being and long-term career success (Koen et al., 2010; Yang & Gysbers, 2007)learned change, and emotional response. Data on search behaviors were collected from a sample of 186 college and vocational-technical school graduates early in their search, at graduation, and again 3 months following graduation for individuals who remained unemployed. Job searchers decreased the intensity of their search, increased their use of informal sources, and reduced their emphasis on information related to the availability of jobs between early search and graduation. These changes were reversed following graduation. This pattern is most consistent with the sequential model, which suggests that individuals first search broadly to develop a pool of potential jobs, then examine jobs within that pool in detail, reopening the search only if the initial pool does not lead to an acceptable job offer. Copyright © 1994, Wiley Blackwell. All rights reserved. In a study with 191 college students, canonical correlation analysis explored career search self-efficacy and psychological distress (career search set. However, primary research lacked clarity on how the employment quality of graduates can be predicted (Boswell et al., 2012)involving diverse populations of job seekers searching for employment opportunities. In particular, individuals may search for their first jobs following a period of education, may seek reemployment following job loss, or may search for new opportunities while currently employed. Research in each of these contexts has evolved somewhat separately, yet there is value to applying the ideas and findings from one search context to other search contexts. The purpose of this article is to review the prior research in each of the three job search contexts and offer an integrative analysis of the predictors, processes, consequences, and varying objectives of job search behavior across an individual’s potential employment situations (i.e., new entrant, job loser, employed job seeker, indicating a need for further enquiry. Hence, the current study aims to examine the determinants and predictors of employment quality while transitioning from university-to-work.
Higher educational institutions have provided management graduates with ample opportunities for self-development and an industry interface to gather insights into the job market that helped them develop self-perceptions of employability, an instinctive ability to foresee one’s chances of gaining employment (Tomlinson, 2012). Rothwell and Arnold (2007)and for organisations to foster in workforces. The purpose of this paper is to report on the development of a self-report measure of individuals’ perceived employability. It also seeks to examine its construct validity and correlates. Design/methodology/approach - Based on the analysis of relevant literature, this study developed 16 items which were intended collectively to reflect employability within and outside the person’s current organisation, based on his or her personal and occupational attributes. This study administered these items by questionnaire to 200 human resources professionals in the UK, along with established measures of career success and professional commitment, as well as questions reflecting demographic variables. Findings - This article retained 11 of the 16 items for assessing self-perceived employability. Concludes that self-perceived employability can usefully be thought of as either a unitary construct, or one with two related components - internal (to the organisation defined ‘perceived employability’ as an individual’s ability to gain and sustain a desirable job. This definition highlights the role of employability to not only influence the probability of gaining employment but sustainable employment of high quality (Fugate et al., 2004; González-Romá et al., 2018). Besides, perceived employability is argued to be a psycho-social construct that includes internal perceptions of individual abilities and skills and external perceptions of one’s worth in the job market, both of which are equally vital to persist in an uncertain environment (Yizhong et al., 2017). Hence, the first objective of this study is to assess the impact of internal and external perceptions of employability on the employment quality of management graduates.
377
4TH SINTO
K INTERN
ATION
AL CON
FERENCE O
N SO
CIAL SCIENCE AN
D M
ANAG
EMEN
T
Another significant factor impacting the success of university-to-work transition is the job search approach. It comprises a chosen method of one’s commitment to the job-seeking process, which plays a decisive role in determining the success of a transition (Saks & Gruman, 2018)when searching for a new job after the leaving of the French higher education. Cox duration models are used to account for the proportional hypothesis. The main result of this article is that the worker’s recruitment is based more on the choice of the faculty of initial training than the educational level attainment. Some policy implications are derived from our results to give some recommendations for individual job search and policy-makers in education. © 2011 Taylor & Francis. Although work engagement has become an important topic in management, relatively little attention has been given to newcomers’ work engagement in the socialization literature. The purpose of this paper is to explain how newcomers’ work engagement can fluctuate during the first year of organizational entry and the role of organizational socialization in developing and maintaining high levels of newcomers’ work engagement. Design/methodology/approach: A review of the socialization literature indicates that uncertainty reduction theory has been the basis of research on socialization tactics and newcomer information-seeking both of which function by providing newcomers with information to reduce uncertainty. Socialization resources theory is used to develop a new pathway to newcomer socialization which focuses on providing newcomers with resources during the first year of organizational entry and socialization. Findings: The uncertainty reduction pathway to newcomer socialization is narrow and limited because it primarily focuses on minimizing and reducing the negative effects of job demands rather than on providing newcomers with resources that are necessary to facilitate work engagement and socialization. Practical implications: Organizations can use newcomers’ work engagement maintenance curves to map and track fluctuations in newcomers’ work engagement during the first year of organizational entry and they can conduct an audit of socialization resources to determine what resources are required to develop and maintain high levels of newcomers’ work engagement. Originality/value: This paper describes newcomer work engagement maintenance curves and explains how socialization resources can be used to develop and maintain high levels of newcomers’ work engagement. A model of a new pathway to newcomer socialization is developed in which socialization resources, personal resources, and job demands influence newcomers’ work engagement and socialization outcomes. (Barros et al., 2011; Saks & Gruman, 2018. While the current job market characterizes management graduates as more self-driven in regulating their focus, search direction, and effort to achieve employment success (Wanberg et al., 2020), they tend to consider a lower marginal return upon approaching a job market entry. It prompts them to optimize and sustain their efforts on thoroughly screened opportunities and selected employers (Van Hooft & Crossley, 2008). Crossley and Highhouse (2005)the results suggested that people who engaged in a careful and deliberate search and choice process were more satisfied than people who used a more haphazard or intuitive approach. In addition, people who were dispositionally higher in the tendency to consider future outcomes were more likely to use a careful and deliberate approach to finding a job. © 2004 Elsevier B.V. All rights reserved. (Crossley & Highhouse, 2005 termed it as a focused behavioural state. In a focused job search, graduates plan ahead to align employment goals with needs, skills, and experiences and behave proactively to gain better-quality jobs (Van Hooft et al., 2021). As it would be intriguing to know how a job search approach can foster the employment success of management graduates, our second objective investigates the mediating role of focused job search between perceived employability and employment quality.
LITERATURE REVIEW
Employment Quality
In India, collective beliefs and competitiveness drive management graduates towards gaining extrinsic rewards such as starting salary, while individualistic behaviours have eventually persuaded them to achieve intrinsic job satisfaction. Consequently, starting salary and job satisfaction can be considered desirable job attributes to ascertain
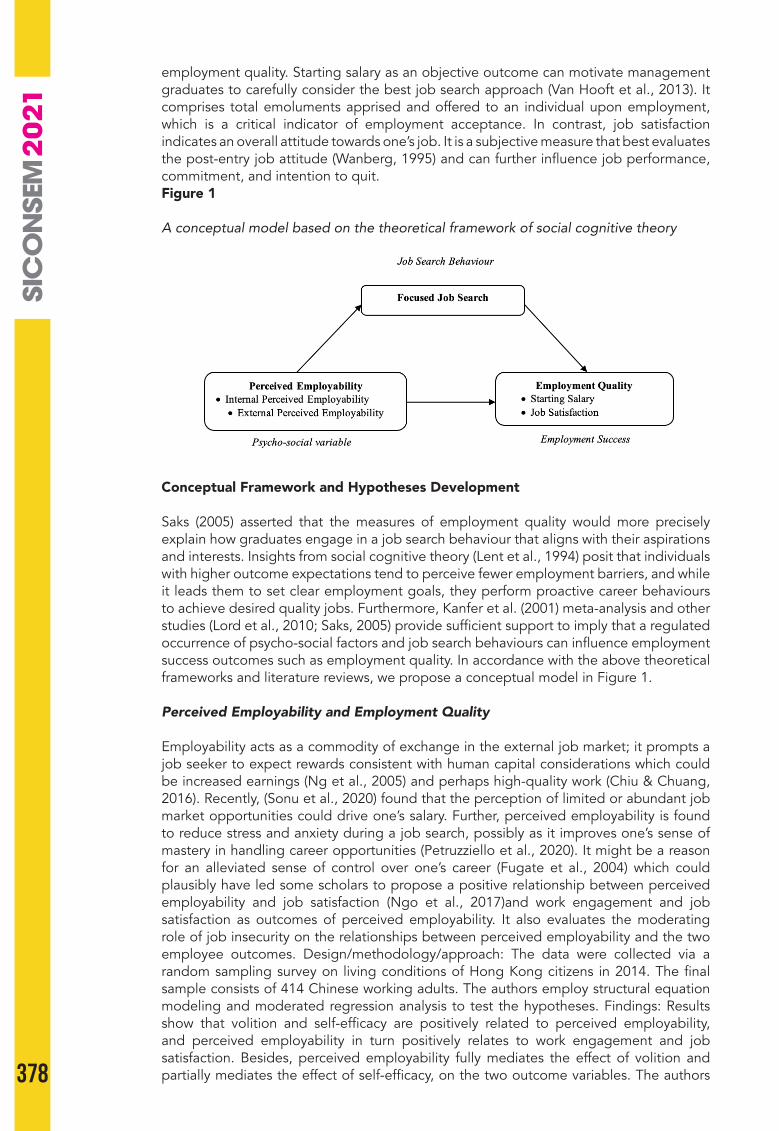
378
employment quality. Starting salary as an objective outcome can motivate management graduates to carefully consider the best job search approach (Van Hooft et al., 2013). It comprises total emoluments apprised and offered to an individual upon employment, which is a critical indicator of employment acceptance. In contrast, job satisfaction indicates an overall attitude towards one’s job. It is a subjective measure that best evaluates the post-entry job attitude (Wanberg, 1995) and can further influence job performance, commitment, and intention to quit. Figure 1
A conceptual model based on the theoretical framework of social cognitive theory
Conceptual Framework and Hypotheses Development
Saks (2005) asserted that the measures of employment quality would more precisely explain how graduates engage in a job search behaviour that aligns with their aspirations and interests. Insights from social cognitive theory (Lent et al., 1994) posit that individuals with higher outcome expectations tend to perceive fewer employment barriers, and while it leads them to set clear employment goals, they perform proactive career behaviours to achieve desired quality jobs. Furthermore, Kanfer et al. (2001) meta-analysis and other studies (Lord et al., 2010; Saks, 2005) provide sufficient support to imply that a regulated occurrence of psycho-social factors and job search behaviours can influence employment success outcomes such as employment quality. In accordance with the above theoretical frameworks and literature reviews, we propose a conceptual model in Figure 1.
Perceived Employability and Employment Quality
Employability acts as a commodity of exchange in the external job market; it prompts a job seeker to expect rewards consistent with human capital considerations which could be increased earnings (Ng et al., 2005) and perhaps high-quality work (Chiu & Chuang, 2016). Recently, (Sonu et al., 2020) found that the perception of limited or abundant job market opportunities could drive one’s salary. Further, perceived employability is found to reduce stress and anxiety during a job search, possibly as it improves one’s sense of mastery in handling career opportunities (Petruzziello et al., 2020). It might be a reason for an alleviated sense of control over one’s career (Fugate et al., 2004) which could plausibly have led some scholars to propose a positive relationship between perceived employability and job satisfaction (Ngo et al., 2017)and work engagement and job satisfaction as outcomes of perceived employability. It also evaluates the moderating role of job insecurity on the relationships between perceived employability and the two employee outcomes. Design/methodology/approach: The data were collected via a random sampling survey on living conditions of Hong Kong citizens in 2014. The final sample consists of 414 Chinese working adults. The authors employ structural equation modeling and moderated regression analysis to test the hypotheses. Findings: Results show that volition and self-efficacy are positively related to perceived employability, and perceived employability in turn positively relates to work engagement and job satisfaction. Besides, perceived employability fully mediates the effect of volition and partially mediates the effect of self-efficacy, on the two outcome variables. The authors
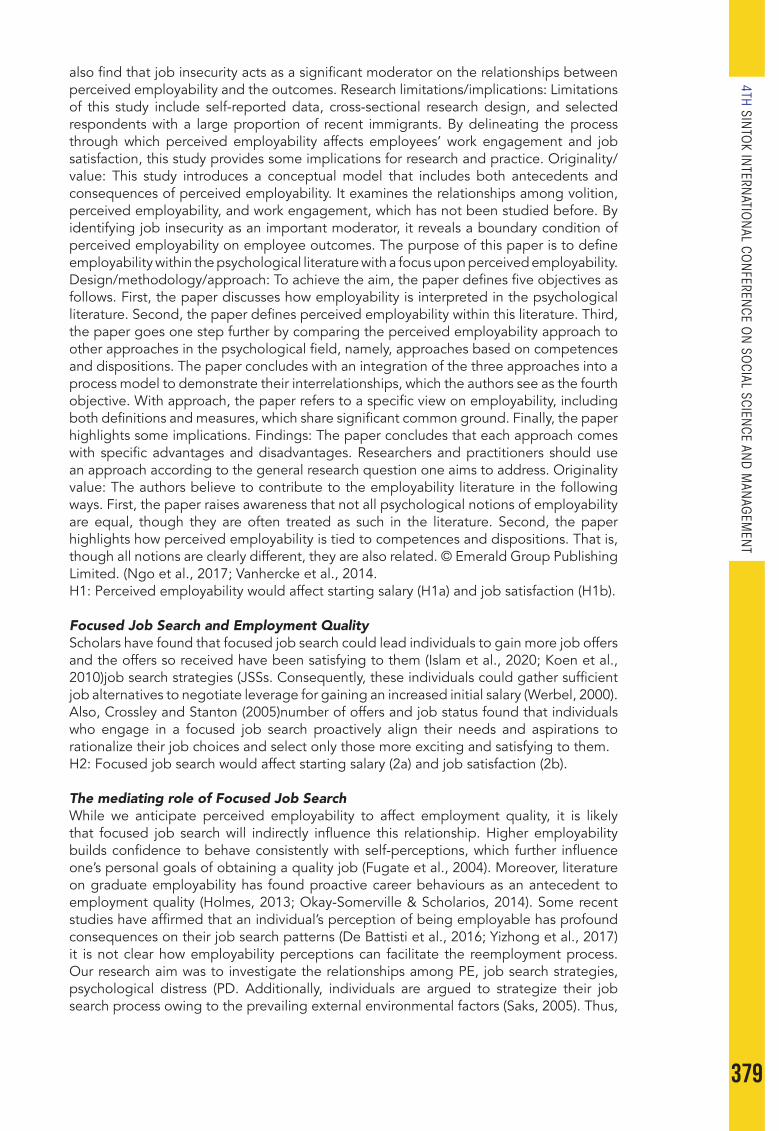
379
4TH SINTO
K INTERN
ATION
AL CON
FERENCE O
N SO
CIAL SCIENCE AN
D M
ANAG
EMEN
T
also find that job insecurity acts as a significant moderator on the relationships between perceived employability and the outcomes. Research limitations/implications: Limitations of this study include self-reported data, cross-sectional research design, and selected respondents with a large proportion of recent immigrants. By delineating the process through which perceived employability affects employees’ work engagement and job satisfaction, this study provides some implications for research and practice. Originality/value: This study introduces a conceptual model that includes both antecedents and consequences of perceived employability. It examines the relationships among volition, perceived employability, and work engagement, which has not been studied before. By identifying job insecurity as an important moderator, it reveals a boundary condition of perceived employability on employee outcomes. The purpose of this paper is to define employability within the psychological literature with a focus upon perceived employability. Design/methodology/approach: To achieve the aim, the paper defines five objectives as follows. First, the paper discusses how employability is interpreted in the psychological literature. Second, the paper defines perceived employability within this literature. Third, the paper goes one step further by comparing the perceived employability approach to other approaches in the psychological field, namely, approaches based on competences and dispositions. The paper concludes with an integration of the three approaches into a process model to demonstrate their interrelationships, which the authors see as the fourth objective. With approach, the paper refers to a specific view on employability, including both definitions and measures, which share significant common ground. Finally, the paper highlights some implications. Findings: The paper concludes that each approach comes with specific advantages and disadvantages. Researchers and practitioners should use an approach according to the general research question one aims to address. Originality value: The authors believe to contribute to the employability literature in the following ways. First, the paper raises awareness that not all psychological notions of employability are equal, though they are often treated as such in the literature. Second, the paper highlights how perceived employability is tied to competences and dispositions. That is, though all notions are clearly different, they are also related. © Emerald Group Publishing Limited. (Ngo et al., 2017; Vanhercke et al., 2014. H1: Perceived employability would affect starting salary (H1a) and job satisfaction (H1b).
Focused Job Search and Employment QualityScholars have found that focused job search could lead individuals to gain more job offers and the offers so received have been satisfying to them (Islam et al., 2020; Koen et al., 2010)job search strategies (JSSs. Consequently, these individuals could gather sufficient job alternatives to negotiate leverage for gaining an increased initial salary (Werbel, 2000). Also, Crossley and Stanton (2005)number of offers and job status found that individuals who engage in a focused job search proactively align their needs and aspirations to rationalize their job choices and select only those more exciting and satisfying to them. H2: Focused job search would affect starting salary (2a) and job satisfaction (2b).
The mediating role of Focused Job Search While we anticipate perceived employability to affect employment quality, it is likely that focused job search will indirectly influence this relationship. Higher employability builds confidence to behave consistently with self-perceptions, which further influence one’s personal goals of obtaining a quality job (Fugate et al., 2004). Moreover, literature on graduate employability has found proactive career behaviours as an antecedent to employment quality (Holmes, 2013; Okay-Somerville & Scholarios, 2014). Some recent studies have affirmed that an individual’s perception of being employable has profound consequences on their job search patterns (De Battisti et al., 2016; Yizhong et al., 2017)it is not clear how employability perceptions can facilitate the reemployment process. Our research aim was to investigate the relationships among PE, job search strategies, psychological distress (PD. Additionally, individuals are argued to strategize their job search process owing to the prevailing external environmental factors (Saks, 2005). Thus,
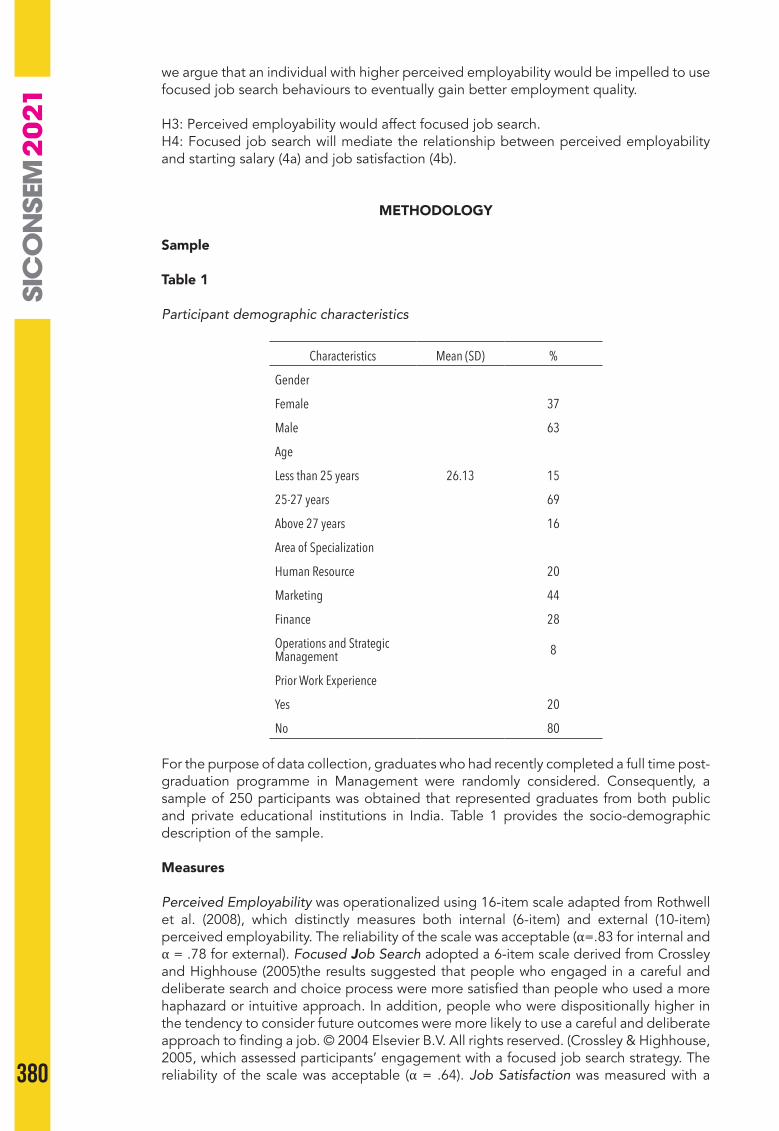
380
we argue that an individual with higher perceived employability would be impelled to use focused job search behaviours to eventually gain better employment quality.
H3: Perceived employability would affect focused job search.H4: Focused job search will mediate the relationship between perceived employability and starting salary (4a) and job satisfaction (4b).
METHODOLOGY
Sample
Table 1
Participant demographic characteristics
Characteristics Mean (SD) %
Gender
Female 37
Male 63
Age
Less than 25 years 26.13 15
25-27 years 69
Above 27 years 16
Area of Specialization
Human Resource 20
Marketing 44
Finance 28
Operations and Strategic Management 8
Prior Work Experience
Yes 20
No 80
For the purpose of data collection, graduates who had recently completed a full time post-graduation programme in Management were randomly considered. Consequently, a sample of 250 participants was obtained that represented graduates from both public and private educational institutions in India. Table 1 provides the socio-demographic description of the sample.
Measures
Perceived Employability was operationalized using 16-item scale adapted from Rothwell et al. (2008), which distinctly measures both internal (6-item) and external (10-item) perceived employability. The reliability of the scale was acceptable (α=.83 for internal and α = .78 for external). Focused Job Search adopted a 6-item scale derived from Crossley and Highhouse (2005)the results suggested that people who engaged in a careful and deliberate search and choice process were more satisfied than people who used a more haphazard or intuitive approach. In addition, people who were dispositionally higher in the tendency to consider future outcomes were more likely to use a careful and deliberate approach to finding a job. © 2004 Elsevier B.V. All rights reserved. (Crossley & Highhouse, 2005, which assessed participants’ engagement with a focused job search strategy. The reliability of the scale was acceptable (α = .64). Job Satisfaction was measured with a
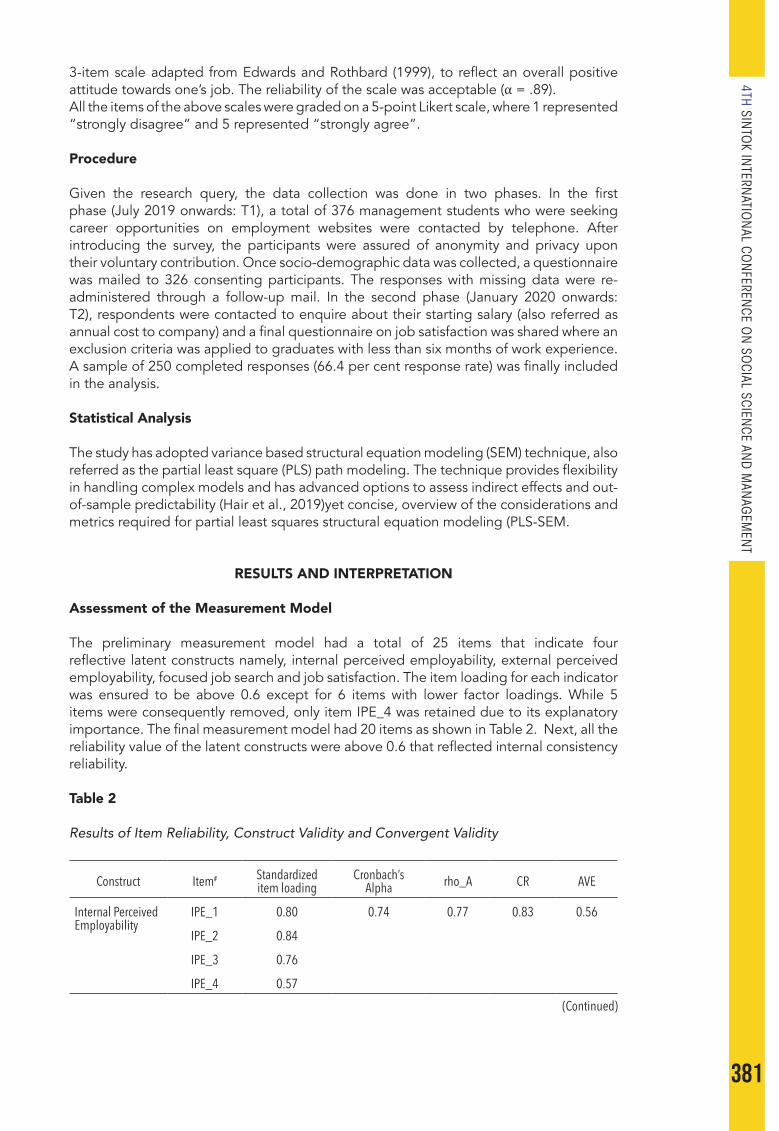
381
4TH SINTO
K INTERN
ATION
AL CON
FERENCE O
N SO
CIAL SCIENCE AN
D M
ANAG
EMEN
T
3-item scale adapted from Edwards and Rothbard (1999), to reflect an overall positive attitude towards one’s job. The reliability of the scale was acceptable (α = .89). All the items of the above scales were graded on a 5-point Likert scale, where 1 represented “strongly disagree” and 5 represented “strongly agree”.
Procedure
Given the research query, the data collection was done in two phases. In the first phase (July 2019 onwards: T1), a total of 376 management students who were seeking career opportunities on employment websites were contacted by telephone. After introducing the survey, the participants were assured of anonymity and privacy upon their voluntary contribution. Once socio-demographic data was collected, a questionnaire was mailed to 326 consenting participants. The responses with missing data were re-administered through a follow-up mail. In the second phase (January 2020 onwards: T2), respondents were contacted to enquire about their starting salary (also referred as annual cost to company) and a final questionnaire on job satisfaction was shared where an exclusion criteria was applied to graduates with less than six months of work experience. A sample of 250 completed responses (66.4 per cent response rate) was finally included in the analysis.
Statistical Analysis
The study has adopted variance based structural equation modeling (SEM) technique, also referred as the partial least square (PLS) path modeling. The technique provides flexibility in handling complex models and has advanced options to assess indirect effects and out-of-sample predictability (Hair et al., 2019)yet concise, overview of the considerations and metrics required for partial least squares structural equation modeling (PLS-SEM.
RESULTS AND INTERPRETATION
Assessment of the Measurement Model
The preliminary measurement model had a total of 25 items that indicate four reflective latent constructs namely, internal perceived employability, external perceived employability, focused job search and job satisfaction. The item loading for each indicator was ensured to be above 0.6 except for 6 items with lower factor loadings. While 5 items were consequently removed, only item IPE_4 was retained due to its explanatory importance. The final measurement model had 20 items as shown in Table 2. Next, all the reliability value of the latent constructs were above 0.6 that reflected internal consistency reliability.
Table 2
Results of Item Reliability, Construct Validity and Convergent Validity
Construct Item# Standardized item loading
Cronbach’s Alpha rho_A CR AVE
Internal Perceived Employability
IPE_1 0.80 0.74 0.77 0.83 0.56
IPE_2 0.84
IPE_3 0.76
IPE_4 0.57(Continued)
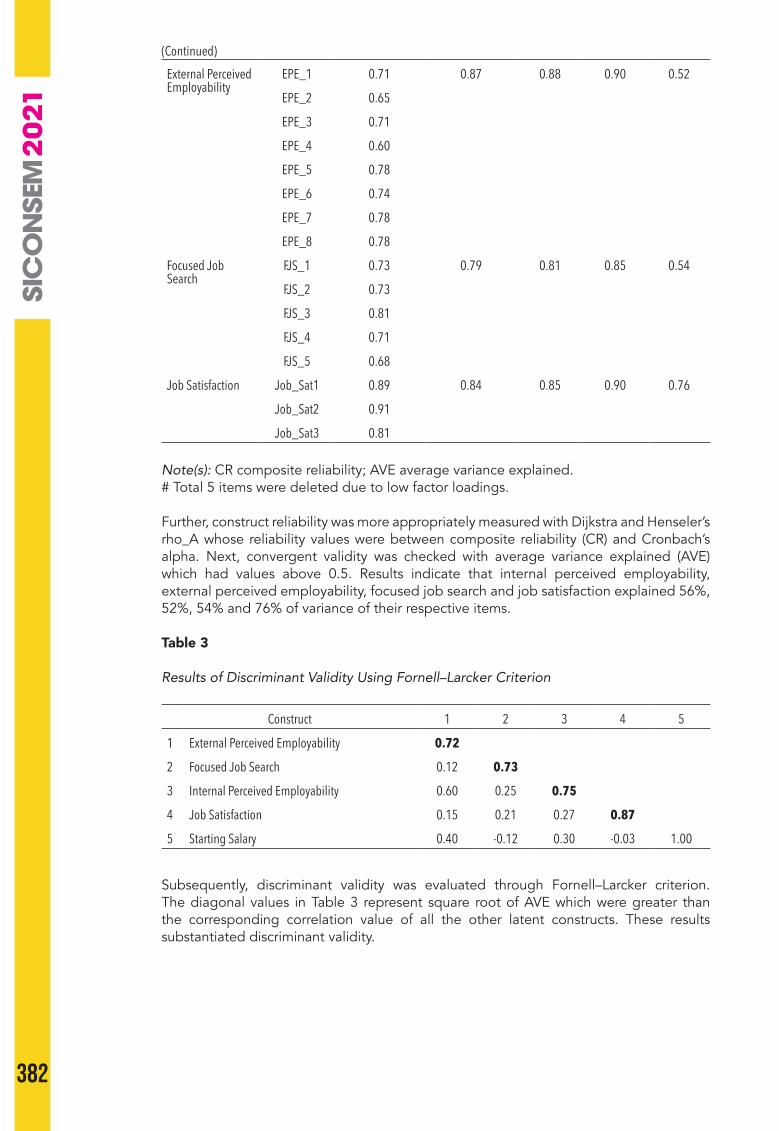
382
External Perceived Employability
EPE_1 0.71 0.87 0.88 0.90 0.52
EPE_2 0.65
EPE_3 0.71
EPE_4 0.60
EPE_5 0.78
EPE_6 0.74
EPE_7 0.78
EPE_8 0.78
Focused Job Search
FJS_1 0.73 0.79 0.81 0.85 0.54
FJS_2 0.73
FJS_3 0.81
FJS_4 0.71
FJS_5 0.68
Job Satisfaction Job_Sat1 0.89 0.84 0.85 0.90 0.76
Job_Sat2 0.91
Job_Sat3 0.81
Note(s): CR composite reliability; AVE average variance explained.# Total 5 items were deleted due to low factor loadings.
Further, construct reliability was more appropriately measured with Dijkstra and Henseler’s rho_A whose reliability values were between composite reliability (CR) and Cronbach’s alpha. Next, convergent validity was checked with average variance explained (AVE) which had values above 0.5. Results indicate that internal perceived employability, external perceived employability, focused job search and job satisfaction explained 56%, 52%, 54% and 76% of variance of their respective items.
Table 3
Results of Discriminant Validity Using Fornell–Larcker Criterion
Construct 1 2 3 4 5
1 External Perceived Employability 0.72
2 Focused Job Search 0.12 0.73
3 Internal Perceived Employability 0.60 0.25 0.75
4 Job Satisfaction 0.15 0.21 0.27 0.87
5 Starting Salary 0.40 -0.12 0.30 -0.03 1.00
Subsequently, discriminant validity was evaluated through Fornell–Larcker criterion. The diagonal values in Table 3 represent square root of AVE which were greater than the corresponding correlation value of all the other latent constructs. These results substantiated discriminant validity.
(Continued)

383
4TH SINTO
K INTERN
ATION
AL CON
FERENCE O
N SO
CIAL SCIENCE AN
D M
ANAG
EMEN
T
Assessment of the Structural Model
Figure 2
Structural Model Path Coefficients
Note: Path coefficients indicate standardized β values; constructs indicate R² values; Internal PE, internal perceived employability; External PE, external perceived employability; Focused JS, focused job search; Salary, starting salary; Job Sat, job satisfaction.
The structural model (Figure 2) is a causal illustration of standardized regression coefficients, also referred to as path coefficients (β) that explains: (1) the direct relationship of internal perceived employability, external perceived employability and focused job search with employment quality measures; starting salary and job satisfaction and (2) the indirect or mediating role of focused job search. The predictability of the PLS model is ascertained with parameters, namely, coefficient of determination (R2), blindfolding-based Stone-Geisser’s Q2 criterion and bootstrapped significant β values using 5,000 re-samples.
The in-sample predictive power of the model is determined by the R² values of starting salary as 0.260 and of job satisfaction as 0.096. These results interpret that the model explains 26% of the variance for starting salary and 9.6% of the variance for job satisfaction that propose satisfactory results given the less number of predictors (Raithel et al., 2012)if investors do not equally value activities targeting different satisfaction drivers, managers focusing on short-term stock returns might over- or under-emphasize certain satisfaction drivers to the detriment of the long-term success of the firm. Therefore, we extend prior research on the value relevance of customer satisfaction by assessing the relationship between the dynamics of key satisfaction drivers and contemporaneous risk-adjusted stock returns. Moreover, we compare three major markets using a dataset covering nearly the entire set of car brands sold between 2004 and 2008. Our results show that investors react to information related to perceived product quality, whereas, surprisingly, the cost of ownership and dealer service quality are unimportant despite the importance attributed to them in consumer research. Furthermore, we observe that information concerning the U.S. market dominates that of the UK and German markets. © 2011 Academy of Marketing Science. (Raithel et al., 2012. Next, the in-sample and out-of-sample predictive ability of the model was assessed through Q² measure (Geisser, 1974; Stone, 1974). The cross validated redundancy findings of the model indicated Q² value for starting salary and job

384
satisfaction as 0.227 and 0.064 respectively which shows small to medium generalizability of the dataset. Moreover, the model results suggested a Standardized Root Mean Square Residual (SRMR) of 0.082, which indicates an overall good fit of the PLS-path model.
Table 4
Results of structural model assessment
Direct Paths Standardized β p value Sample Mean 95% CI Decision
Internal PE -> Salary 0.15 0.03 0.15 (0.02,
0.28) YES
External PE -> Salary 0.34 0.00 0.34 (0.22,
0.46) YES
Focused JS -> Salary -0.19 0.00 -0.20 (-0.31,
-0.07) YES
Internal PE -> Job Sat 0.24 0.01 0.24 (0.06,
0.41) YES
External PE -> Job Sat -0.01 0.91 -0.01 (-0.17,
0.16) NO
Focused JS -> Job Sat 0.15 0.06 0.16 (-0.01,
0.30) NO
Internal PE -> Focused JS 0.28 0.00 0.29 (0.10,
0.44) YES
External PE -> Focused JS -0.05 0.61 -0.05 (-0.23,
0.13) NO
Note(s): Bootstrap test of direct and indirect effects at 0.05 significance level; CI, confidence interval; Internal PE, internal perceived employability; External PE, external perceived employability; Focused JS, focused job search; Salary, starting salary; Job Sat, job satisfaction.
Table 4 shows the PLS path analysis results that evaluate the significance and association for both direct and indirect paths. Both internal perceived employability (β 0.147, p < 0.05) and external perceived employability (β 0.338, p <0.001) were found to have a significant effect on starting salary which supported H1a. While internal perceived employability showed a significant effect on job satisfaction (β 0.242, p < 0.01), the effect of external perceived employability on job satisfaction was insignificant (β -0.009, p > 0.05). Hence, it partially supported H1b hypothesis. Also we found that focused job search was significantly related to starting salary (β -0.193, p < 0.001) but marginally insignificant with job satisfaction (β 0.149, p > 0.05). Hence, the results supported H2a but failed to support H2b. Next, internal perceived employability (β 0.276, p < 0.01) significantly affected focused job search while the effect of external perceived employability (β -0.047, p > 0.05) was insignificant which partially supports H3 hypothesis.
Mediation Analysis
Table 5 shows the indirect effect of internal perceived employability on starting salary mediated by focused job search was negative and significant (β -0.053, p < 0.05). None of the other indirect effects of external perceived employability on starting salary (β 0.009, p > 0.05); internal perceived employability on job satisfaction (β 0.041, p > 0.05); external perceived employability on job satisfaction (β -0.007, p > 0.05) through focused job search were significant. Hence, H4a was partially supported while the results failed to accept H4b.

385
4TH SINTO
K INTERN
ATION
AL CON
FERENCE O
N SO
CIAL SCIENCE AN
D M
ANAG
EMEN
T
Table 5
Results of Mediating Effects
Indirect Paths Standardized β p value Sample Mean 95% CI Decision VAF*
Internal PE -> Focused JS -> Salary -0.05 0.03 -0.06 (-0.11,
-0.01) Yes 0.27
External PE -> Focused JS -> Salary 0.01 0.62 0.01 (-0.03,
0.05) No 0.03
Internal PE -> Focused JS -> Job Sat 0.04 0.12 0.04 (-0.00,
0.10) No 0.15
External PE -> Focused JS -> Job Sat -0.01 0.66 -0.01 (-0.04,
0.02) No 0.44
Note(s): Bootstrap test of direct and indirect effects at 0.05 significance level; CI, confidence interval; Internal PE, internal perceived employability; External PE, external perceived employability; Focused JS, focused job search; Salary, starting salary; Job Sat, job satisfaction; *VAF = (indirect effect/total effect).
Moreover, variance accounted for (VAF) measures the strength of an indirect effect (Nitzl et al., 2016)the methods for testing mediation have become more sophisticated. However, many researchers continue to use outdated methods to test mediating effects in PLS, which can lead to erroneous results. One reason for the use of outdated methods or even the lack of their use altogether is that no systematic tutorials on PLS exist that draw on the newest statistical findings. The paper aims to discuss these issues. Design/methodology/approach - This study illustrates the state-of-the-art use of mediation analysis in the context of PLS-structural equation modeling (SEM. Results assume partial mediation where 26.6 per cent of the effect of internal perceived employability on starting salary was explained via focused job search. However, the direct and indirect effects point in the different directions that indicate competitive partial mediation (Zhao et al., 2010)impeding theoretical development. While the technical literature has disputed some of Baron and Kenny’s tests, this literature has not diffused to practicing researchers. We present a nontechnical summary of the flaws in the Baron and Kenny logic, some of which have not been previously noted. We provide a decision tree and a step-by-step procedure for testing mediation, classifying its type, and interpreting the implications of findings for theory building and future research. © 2010 by JOURNAL OF CONSUMER RESEARCH, Inc. (Zhao et al., 2010. It implied that the intermediate variable that is, focused job search will reduce the magnitude of the relationship between the internal perceived employability and starting salary.
CONCLUSION
This study is based on the rationale that initial steps taken for entering into the world of work can influence long term employment success. The aim was to examine the impact of two crucial yet neglected dimensions of perceived employability (internal and external) on employment quality via the mediation of focused job search among management graduates. While the study supported quite a few hypothesized relationships, it has made multiple contributions. First, it found a strong support for internal as well as external perceived employability to have an effect on the starting salary of management graduates. The graduates who were more confident, self-aware and had a positive perception of university reputation, course credibility and job market benefitted the most to receive higher starting salaries. Second, internal perceived employability was found to have a positive effect on job satisfaction which reflects that one’s belief in the ability to master skills influences intrinsic job outcomes, such as satisfaction with one’s job. Third, contradictory results found a negative effect of focused job search on starting salary. A probable reason could be graduate’s planned behavior to approach only selected
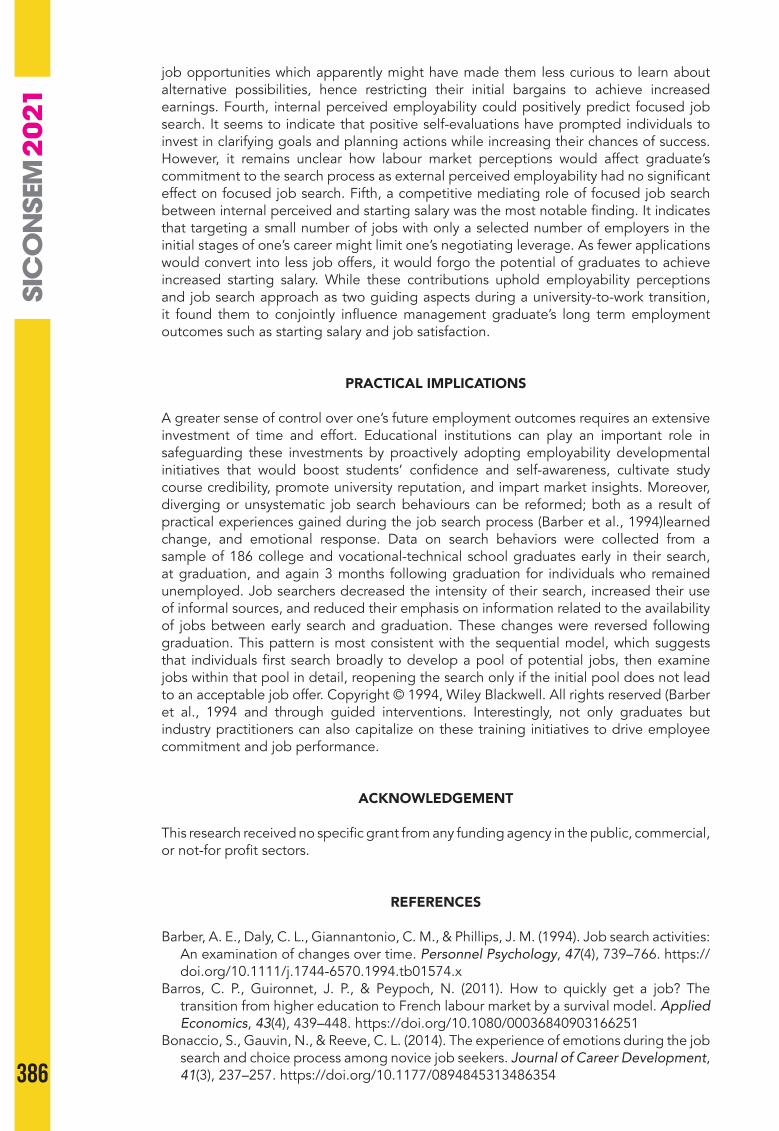
386
job opportunities which apparently might have made them less curious to learn about alternative possibilities, hence restricting their initial bargains to achieve increased earnings. Fourth, internal perceived employability could positively predict focused job search. It seems to indicate that positive self-evaluations have prompted individuals to invest in clarifying goals and planning actions while increasing their chances of success. However, it remains unclear how labour market perceptions would affect graduate’s commitment to the search process as external perceived employability had no significant effect on focused job search. Fifth, a competitive mediating role of focused job search between internal perceived and starting salary was the most notable finding. It indicates that targeting a small number of jobs with only a selected number of employers in the initial stages of one’s career might limit one’s negotiating leverage. As fewer applications would convert into less job offers, it would forgo the potential of graduates to achieve increased starting salary. While these contributions uphold employability perceptions and job search approach as two guiding aspects during a university-to-work transition, it found them to conjointly influence management graduate’s long term employment outcomes such as starting salary and job satisfaction.
PRACTICAL IMPLICATIONS
A greater sense of control over one’s future employment outcomes requires an extensive investment of time and effort. Educational institutions can play an important role in safeguarding these investments by proactively adopting employability developmental initiatives that would boost students’ confidence and self-awareness, cultivate study course credibility, promote university reputation, and impart market insights. Moreover, diverging or unsystematic job search behaviours can be reformed; both as a result of practical experiences gained during the job search process (Barber et al., 1994)learned change, and emotional response. Data on search behaviors were collected from a sample of 186 college and vocational-technical school graduates early in their search, at graduation, and again 3 months following graduation for individuals who remained unemployed. Job searchers decreased the intensity of their search, increased their use of informal sources, and reduced their emphasis on information related to the availability of jobs between early search and graduation. These changes were reversed following graduation. This pattern is most consistent with the sequential model, which suggests that individuals first search broadly to develop a pool of potential jobs, then examine jobs within that pool in detail, reopening the search only if the initial pool does not lead to an acceptable job offer. Copyright © 1994, Wiley Blackwell. All rights reserved (Barber et al., 1994 and through guided interventions. Interestingly, not only graduates but industry practitioners can also capitalize on these training initiatives to drive employee commitment and job performance.
ACKNOWLEDGEMENT
This research received no specific grant from any funding agency in the public, commercial, or not-for profit sectors.
REFERENCES
Barber, A. E., Daly, C. L., Giannantonio, C. M., & Phillips, J. M. (1994). Job search activities: An examination of changes over time. Personnel Psychology, 47(4), 739–766. https://doi.org/10.1111/j.1744-6570.1994.tb01574.x
Barros, C. P., Guironnet, J. P., & Peypoch, N. (2011). How to quickly get a job? The transition from higher education to French labour market by a survival model. Applied Economics, 43(4), 439–448. https://doi.org/10.1080/00036840903166251
Bonaccio, S., Gauvin, N., & Reeve, C. L. (2014). The experience of emotions during the job search and choice process among novice job seekers. Journal of Career Development, 41(3), 237–257. https://doi.org/10.1177/0894845313486354
387
4TH SINTO
K INTERN
ATION
AL CON
FERENCE O
N SO
CIAL SCIENCE AN
D M
ANAG
EMEN
T
Boswell, W. R., Zimmerman, R. D., & Swider, B. W. (2012). Employee job search: Toward an understanding of search context and search objectives. Journal of Management, 38(1), 129–163. https://doi.org/10.1177/0149206311421829
Chiu, S. Y., & Chuang, H. L. (2016). Employability and wage compensation in an Asian economy: Evidence for female college graduates in Taiwan. Emerging Markets Finance and Trade, 52(4), 853–868. https://doi.org/10.1080/1540496X.2015.1117844
Crossley, C. D., & Highhouse, S. (2005). Relation of job search and choice process with subsequent satisfaction. Journal of Economic Psychology, 26(2), 255–268. https://doi.org/10.1016/j.joep.2004.04.001
Crossley, C. D., & Stanton, J. M. (2005). Negative affect and job search: Further examination of the reverse causation hypothesis. Journal of Vocational Behavior, 66(3), 549–560. https://doi.org/10.1016/j.jvb.2004.05.002
De Battisti, F., Gilardi, S., Guglielmetti, C., & Siletti, E. (2016). Perceived employability and reemployment: Do job search strategies and psychological distress matter? Journal of Occupational and Organizational Psychology, 89(4), 813–833. https://doi.org/10.1111/joop.12156
Edwards, J. R., & Rothbard, N. P. (1999). Work and family stress and well-being: An examination of person-environment fit in the work and family domains. Organizational Behavior and Human Decision Processes, 77(2), 85–129. https://doi.org/10.1006/obhd.1998.2813
Fugate, M., Kinicki, A. J., & Ashforth, B. E. (2004). Employability: A psycho-social construct, its dimensions, and applications. Journal of Vocational Behavior, 65(1), 14–38. https://doi.org/10.1016/j.jvb.2003.10.005
Geisser, S. (1974). A predictive approach to the random effect model. Biometrika, 61(1), 101–107. https://academic.oup.com/biomet/article-abstract/61/1/101/264348
González-Romá, V., Gamboa, J. P., & Peiró, J. M. (2018). University graduates’ employability, employment status, and job quality. Journal of Career Development, 45(2), 132–149. https://doi.org/10.1177/0894845316671607
Hair, J. F., Risher, J. J., Sarstedt, M., & Ringle, C. M. (2019). When to use and how to report the results of PLS-SEM. European Business Review, 31(1), 2–24. https://doi.org/10.1108/EBR-11-2018-0203
Holmes, L. (2013). Competing perspectives on graduate employability: Possession, position or process? Studies in Higher Education, 38(4), 538–554. https://doi.org/10.1080/03075079.2011.587140
Islam, Z. U., Weng, Q. (D)., Ali, Z., Ghani, U., Kiani, A., & Naeem, R. M. (2020). Are job seekers predisposed to job search strategies? International Journal of Manpower, 71910107003. https://doi.org/10.1108/IJM-09-2019-0417
Kanfer, R., Kantrowitz, T. M., & Wanberg, C. R. (2001). Job search and employment: A personality-motivational analysis and meta-analytic review. Journal of Applied Psychology, 86(5), 837–855. https://doi.org/10.1037/0021-9010.86.5.837
Koen, J., Klehe, U. C., Van Vianen, A. E. M., Zikic, J., & Nauta, A. (2010). Job-search strategies and reemployment quality. The impact of career adaptability. Journal of Vocational Behavior, 77(1), 126–139. https://doi.org/10.1016/j.jvb.2010.02.004
Lent, R. W., Brown, S. D., & Hackett, G. (1994). Toward a unifying social cognitive theory of career and academic interest, choice, and performance. Journal of Vocational Behavior, 45(1), 79–122. https://doi.org/10.1006/jvbe.1994.1027
Lord, R. G., Diefendorff, J. M., Schmidt, A. M., & Hall, R. J. (2010). Self-regulation at work. In Annual Review of Psychology (Vol. 61, pp. 543–568). https://doi.org/10.1146/annurev.psych.093008.100314
Mehrotra, S. (2020). Informal Employment Trends in the Indian Economy: Persistent informality, but growing positive development. In International Labour Organizationr Organization (EMPLOYMENT Working Paper No. 254; Issue 254). http://www.ilo.org/employment/Whatwedo/Publications/working-papers/WCMS_734503/lang--en/index.htm
Ng, T. W. H., Eby, L. T., Sorensen, K. L., & Feldman, D. C. (2005). Predictors of objective and subjective career success: A meta-analysis. In Personnel Psychology (Vol. 58, Issue 2, pp. 367–408). John Wiley & Sons, Ltd. https://doi.org/10.1111/j.1744-6570.2005.00515.x
388
Ngo, H. Y., Liu, H., & Cheung, F. (2017). Perceived employability of Hong Kong employees: its antecedents, moderator and outcomes. Personnel Review, 46(1), 17–35. https://doi.org/10.1108/PR-01-2015-0015
Nitzl, C., Roldan, J. L., & Cepeda, G. (2016). Mediation analysis in partial least squares path modelling, Helping researchers discuss more sophisticated models. Industrial Management and Data Systems, 116(9), 1849–1864. https://doi.org/10.1108/IMDS-07-2015-0302
Okay-Somerville, B., & Scholarios, D. (2014). Coping with career boundaries and boundary-crossing in the graduate labour market. Career Development International, 19(6), 668–682. https://doi.org/10.1108/CDI-12-2013-0144
Petruzziello, G., Mariani, M. G., Chiesa, R., & Guglielmi, D. (2020). Self-efficacy and job search success for new graduates. Personnel Review, 50(1), 225–243. https://doi.org/10.1108/PR-01-2019-0009
Raithel, S., Sarstedt, M., Scharf, S., & Schwaiger, M. (2012). On the value relevance of customer satisfaction. Multiple drivers and multiple markets. Journal of the Academy of Marketing Science, 40(4), 509–525. https://doi.org/10.1007/s11747-011-0247-4
Rothwell, A., & Arnold, J. (2007). Self-perceived employability: Development and validation of a scale. Personnel Review, 36(1), 23–41. https://doi.org/10.1108/00483480710716704
Rothwell, A., Herbert, I., & Rothwell, F. (2008). Self-perceived employability: Construction and initial validation of a scale for university students. Journal of Vocational Behavior, 73(1), 1–12. https://doi.org/10.1016/j.jvb.2007.12.001
Saks, A. M. (2005). Job Search Success: A Review and Integration of the Predictors, Behaviors, and Outcomes. Career Development and Counseling: Putting Theory and Research to Work., 155–179.
Saks, A. M., & Gruman, J. A. (2018). Socialization resources theory and newcomers’ work engagement: A new pathway to newcomer socialization. In Career Development International (Vol. 23, Issue 1, pp. 12–32). Emerald Group Holdings Ltd. https://doi.org/10.1108/CDI-12-2016-0214
Shen, Y., Demel, B., Unite, J., Briscoe, J. P., Hall, D. T., Chudzikowski, K., Mayrhofer, W., Abdul-Ghani, R., Bogicevic Milikic, B., Colorado, O., Fei, Z., Las Heras, M., Ogliastri, E., Pazy, A., Poon, J. M. L., Shefer, D., Taniguchi, M., & Zikic, J. (2015). Career success across 11 countries: implications for international human resource management. International Journal of Human Resource Management, 26(13), 1753–1778. https://doi.org/10.1080/09585192.2014.962562
Sonu, S. K., Jawahar, I. M., & Saini, G. K. (2020). Influence of return on investment and labor market conditions on job seekers’ preferences of employment attributes in the Indian context. Asian Business and Management. https://doi.org/10.1057/s41291-020-00128-w
Stone, M. (1974). Cross-Validatory Choice and Assessment of Statistical Predictions. Journal of the Royal Statistical Society: Series B (Methodological), 36(2), 111–133. https://doi.org/10.1111/j.2517-6161.1974.tb00994.x
Tomlinson, M. (2012). Graduate employability: A review of conceptual and empirical themes. In Higher Education Policy (Vol. 25, Issue 4, pp. 407–431). https://doi.org/10.1057/hep.2011.26
Van den Hee, S. M., Van Hooft, E. A. J., & Van Vianen, A. E. M. (2020). A temporal perspective of job search: The relation between personality attributes, motivation, job search behavior, and outcomes. Journal of Vocational Behavior, 122(September), 103489. https://doi.org/10.1016/j.jvb.2020.103489
Vanhercke, D., De Cuyper, N., Peeters, E., & De Witte, H. (2014). Defining perceived employability: A psychological approach. Personnel Review, 43(4), 592–605. https://doi.org/10.1108/PR-07-2012-0110
Van Hooft, E. A. J., & Crossley, C. D. (2008). The joint role of locus of control and perceived financial need in job search. International Journal of Selection and Assessment, 16(3), 258–271. https://doi.org/10.1111/j.1468-2389.2008.00432.x
Van Hooft, E. A. J., Kammeyer-Mueller, J. D., Wanberg, C. R., Kanfer, R., & Basbug, G. (2021). Job search and employment success: A quantitative review and future research agenda. Journal of Applied Psychology, 106(5), 674–713. https://doi.org/10.1037/apl0000675

389
4TH SINTO
K INTERN
ATION
AL CON
FERENCE O
N SO
CIAL SCIENCE AN
D M
ANAG
EMEN
T
Van Hooft, E. A. J., Wanberg, C. R., & Van Hoye, G. (2013). Moving beyond job search quantity. Organizational Psychology Review, 3(1), 3–40. https://doi.org/10.1177/2041386612456033
Virick, M., & McKee-Ryan, F. M. (2014). Reemployment quality, underemployment, and career outcomes. In The Oxford Handbook of Job Loss and Job Search (Issue October). Oxford University Press. https://doi.org/10.1093/oxfordhb/9780199764921.013.012
Wanberg, C. R. (1995). A longitudinal study of the effects of unemployment and quality of reemployment. Journal of Vocational Behavior, 46(1), 40–54. https://doi.org/10.1006/jvbe.1995.1003
Wanberg, C. R., Ali, A. A., & Csillag, B. (2020). Job Seeking: The process and experience of looking for a job. Annual Review of Organizational Psychology and Organizational Behavior, 7(1), 315–337. https://doi.org/10.1146/annurev-orgpsych-012119-044939
Werbel, J. D. (2000). Relationships among career exploration, job search intensity, and job search effectiveness in graduating college students. Journal of Vocational Behavior, 57(3), 379–394. https://doi.org/10.1006/jvbe.2000.1746
Yang, E., & Gysbers, N. C. (2007). Career transitions of college seniors. Career Development Quarterly, 56(2), 157–170. https://doi.org/10.1002/j.2161-0045.2007.tb00028.x
Yizhong, X., Lin, Z., Baranchenko, Y., Lau, C. K., Yukhanaev, A., & Lu, H. (2017). Employability and job search behavior: A six-wave longitudinal study of Chinese university graduates. Employee Relations, 39(2), 223–239. https://doi.org/10.1108/ER-02-2016-0042
Zhao, X., Lynch, J. G., & Chen, Q. (2010). Reconsidering Baron and Kenny: Myths and truths about mediation analysis. Journal of Consumer Research, 37(2), 197–206. https://doi.org/10.1086/651257
390
SICONSEM2021:090-050
IMPORTANCE-PERFORMANCE ANALYSIS ON MALAYSIAN SHOPPING MALL FACILITIES
1William Eng Yong Keong1Sunway University
Corresponding author: [email protected]
ABSTRACT
This study attempts to answer a research question: namely “What is the Malaysian perceived on Klang Valley shopping mall facilities?” The objective of this study is to determine Malaysian perceived importance and satisfaction level of shopping mall facilities provided by using Importance-Performance Analysis (IPA). The IPA is a model with a two-dimensional grid (satisfaction rating and importance rating) is divided into four categories: (1) Concentrate Here; (2) Keep Up the Good Work; (3) Low Priority; and (4) Possible Overkill, to enable each of the facility to be plotted into grid. Using a survey method, data were collected from 185 respondents in Malaysia. IPA is a clear and powerful evaluation tool for Klang Valley shopping malls to make decision on what facilities that are essentials and what facilities that need to be improved, which require action immediately. Shopping malls’ facilities should be the most important agenda in each shopping mall to attract and retain customers. Shopping mall also can use the data provided to formulating a business strategy to increase the customer loyalty.
Keywords: Shopping mall, importance-performance analysis, shopper.
INTRODUCTION
The shopping mall industry in Malaysia is still in its growing stage as development works are still undergoing throughout Malaysia to expand the shopping malls to all states of Malaysia (Haque & Rahman, 2009). The ever-increasing demand of Malaysian shopping malls had resulted in anchor tenants to be widely available in all neighboring Malaysian shopping malls and today, the ten largest shopping malls in Malaysia are cumulatively bigger than the shopping malls in the United Kingdom (Chan, 2011). The expansion of the retail industry and the entry of foreign retailers to Malaysia such as Japan’s Uniqlo and Sweden’s H&M has attracted a strong crowd of shoppers to the shopping mall. Soon, Malaysian shopping malls start to grow and the emergence of ‘mega-malls’ begin to dominate the shopping industry in Malaysia. According to Chan (2011), the population in Kuala Lumpur has peaked at 1.7 million and with the current rate of inflow of human capital into the city; it has led to the development of more and more suburban malls.
With the ever increase of demand for more recreational places for the public, development of Malaysian shopping malls has been increasing at a substantial rate and consumers are left with many choices to choose from. Haque & Rahman (2009) states that the dominance of shopping malls in Malaysia has created stiff competitions between the major shopping malls. Every shopping mall are finding ways to attract more customers to their shopping malls by providing more attractive discounts on selected anchor tenants, fun activities for the families and providing customers the freedom to shop to their hearts content (Chan, 2011). Shopping malls who can meet the customers demand will eventually make them more likely to return to the mall as they felt accustomed to the offerings of the particular shopping mall. Major shopping malls in Malaysia becomes essential and vital by providing various facilities to attract customers. Therefore, it is important that shopping mall need to be monitored periodically and improved comprehensively in order to encourage shopper as satisfied shoppers on the facilities provided. In order the shopping malls to satisfy users
36
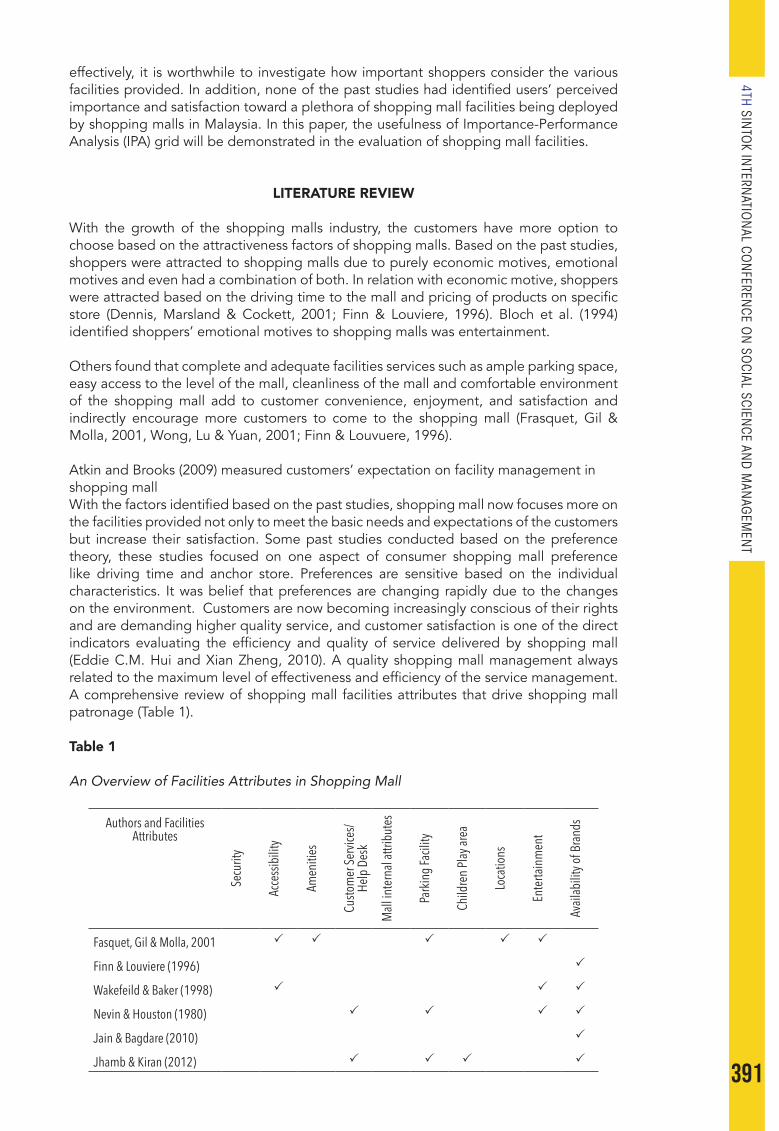
391
4TH SINTO
K INTERN
ATION
AL CON
FERENCE O
N SO
CIAL SCIENCE AN
D M
ANAG
EMEN
T
effectively, it is worthwhile to investigate how important shoppers consider the various facilities provided. In addition, none of the past studies had identified users’ perceived importance and satisfaction toward a plethora of shopping mall facilities being deployed by shopping malls in Malaysia. In this paper, the usefulness of Importance-Performance Analysis (IPA) grid will be demonstrated in the evaluation of shopping mall facilities.
LITERATURE REVIEW
With the growth of the shopping malls industry, the customers have more option to choose based on the attractiveness factors of shopping malls. Based on the past studies, shoppers were attracted to shopping malls due to purely economic motives, emotional motives and even had a combination of both. In relation with economic motive, shoppers were attracted based on the driving time to the mall and pricing of products on specific store (Dennis, Marsland & Cockett, 2001; Finn & Louviere, 1996). Bloch et al. (1994) identified shoppers’ emotional motives to shopping malls was entertainment.
Others found that complete and adequate facilities services such as ample parking space, easy access to the level of the mall, cleanliness of the mall and comfortable environment of the shopping mall add to customer convenience, enjoyment, and satisfaction and indirectly encourage more customers to come to the shopping mall (Frasquet, Gil & Molla, 2001, Wong, Lu & Yuan, 2001; Finn & Louvuere, 1996).
Atkin and Brooks (2009) measured customers’ expectation on facility management in shopping mallWith the factors identified based on the past studies, shopping mall now focuses more on the facilities provided not only to meet the basic needs and expectations of the customers but increase their satisfaction. Some past studies conducted based on the preference theory, these studies focused on one aspect of consumer shopping mall preference like driving time and anchor store. Preferences are sensitive based on the individual characteristics. It was belief that preferences are changing rapidly due to the changes on the environment. Customers are now becoming increasingly conscious of their rights and are demanding higher quality service, and customer satisfaction is one of the direct indicators evaluating the efficiency and quality of service delivered by shopping mall (Eddie C.M. Hui and Xian Zheng, 2010). A quality shopping mall management always related to the maximum level of effectiveness and efficiency of the service management. A comprehensive review of shopping mall facilities attributes that drive shopping mall patronage (Table 1).
Table 1
An Overview of Facilities Attributes in Shopping Mall
Authors and Facilities Attributes
Secu
rity
Acce
ssibil
ity
Amen
ities
Custo
mer
Servi
ces/
Help
Desk
Mall
inter
nal a
ttribu
tes
Parki
ng Fa
cility
Child
ren Pl
ay ar
ea
Loca
tions
Enter
tainm
ent
Avail
abilit
y of B
rands
Fasquet, Gil & Molla, 2001
Finn & Louviere (1996)
Wakefeild & Baker (1998)
Nevin & Houston (1980)
Jain & Bagdare (2010)
Jhamb & Kiran (2012)

392
For measuring whether customers’ satisfied with the shopping malls’ facilities, Importance-Performance Analysis Model (IPA) was proposed to be used. Many analysts in marketing research have taken advantages of IPA since 1976 (Martilla & James, 1977). The underlying assumption of the IPA technique is that the customers’ level of satisfaction with the attributes is mainly derived from their expectations and judgment of the product’s or service’s performance (Martilla & James, 1977). The importance-performance analysis grid serves to identify and classify attributes that affect the success or failure of a strategic plan (Go & Zhang, 1997). IPA has become a popular managerial tool and broadly used to identify the strengths and weaknesses of brands, products, services, and retail establishments (Chapman, 1993). Martilla and James (1977) noted that IPA can yield important insights into aspects of the marketing mix a firm should devote more attention, as well as identify areas that may be consuming too much organizations’ resources.
The importance-performance matrix is divided into four quadrants, distinguish between low and high importance and between low and high performance (i.e. satisfaction). To complete the matrix, the two mean values of each variables related to importance and satisfaction level of Web 2.0 adoption were calculated. Then, a vertical and a horizontal line representing the overall means of importance and satisfaction level of those variables to form a matrix. The matrix was divided into four quadrants (Chu & Choi, 2000): • Quadrant I: Attributes are perceived to be very important to respondents, but
performance levels are fairly low. This sends a direct message that improvement efforts should concentrate here.
• Quadrant II: Attributes are perceived to be very important to respondents, and at the same time, the organization seems to have high levels of performance on these activities. The message here is ‘To Keep up the Good Work’.
• Quadrant III: Attributes are with low importance and low performance. Although performance levels may be low in this cell, organizations should not be overly concerned since the attributes in the cell is not perceived to be very important. Limited resources should be expended on this low priority cell.
• Quadrant IV: This cell contains attributes of low importance, but relatively high performance. Respondents are satisfied with the performance of the organizations, but organizations should consider present efforts on the attributes of this cell as being over-utilized.
Finally, each of attributes was located on the matrix as a form of point (Figure 1).
Figure 1
Importance-Performance Analysis (IPA) Grid
RESEARCH METHODOLOGY
This study used a quantitative survey method to measure the perception of Malaysian toward shopping mall facilities. The questionnaire survey was conducted in 2019. A total of 250 sets of questionnaires will be given out as according to the SPSS software, a minimum amount of 80 sample size is required for the research to be significant.

393
4TH SINTO
K INTERN
ATION
AL CON
FERENCE O
N SO
CIAL SCIENCE AN
D M
ANAG
EMEN
T
Therefore, for formality purposes, 250 was the amount of questionnaires that gave out for this research. Out of 250 sets of questionnaires distributed, 185 were collected and returned to the researcher. This consequently provided an effective overall response rate of 74 percent. The target area for this research will be the respondents around the vicinity of Klang Valley. The data collection method chosen for this method is by using 50% online survey distributed through Google form and the remaining 50% will be physically distributed to respondents around the Klang Valley. This way it can eliminate any biasness or inequality among the respondents responding on the questionnaire. Klang Valley is one of Malaysia’s most modern and vibrant cities and businesses are growing a rapid rate throughout the region. Furthermore, with tourist attraction spots around the Klang Valley are abundant; it has attracted a lot of foreign investments in that region. Furthermore, Malaysian shopping malls are scattered around the Klang Valley therefore it makes it a perfect solution to use it as the target population for this research.
The questionnaires of the study were divided into two sections: (1) Respodents Profile Information, and (2) Shopping Malls’ Facilities Evaluation.
The database comprises demographic questions dealt with gender, age, and shopping behaviors. The second section of the questionnaires listed 22 types of facilities can be found at shopping mall. These facilities attributes were evaluated on the perceived importance and satisfaction level of respondents. In this section, each facility was measured based on the five-point Likert scale, ranging from “Very Importance” to “Not at All Importance” as well as “Very Satisfied” to “Not at All Satisfied”.
RESULTS
The respondents’ profile consists of demographic data including gender, age, and shopping behaviors.Table 2 shows that there were 185 respondents in total and distributed into two categories (female and male). Approximately three-quarter (20.5%) of the respondents were male, and 79.5% were female. Out of the 185 respondents, the highest age group comes from 40-49 years old (43.2%), and followed by 30-39 years old (41.6%).
Majority of the respondents spent in the mall per trip on average at 1-2 hours (51%) and followed by 2-3 hours (30%). Less respondents (7.6%) reported that they spent 3 hours or more at shopping mall. As shown in Table below, almost two-third of the respondents have reported that they visit shopping mall during the weekends (64.9%) and only minority of respondents visit the mall during weekday (35.1%).
Table 2
Respondents Demographics
Demographic Characteristics Percent (%)
GenderMaleFemale
20.5079.50
Age20 – 2930 – 3940 – 4950 and Above
8.6036.1047.108.20
Time spent in the mal per trip on averageLess than one hour1-2 hours2-3 hours3 hours and more
20.2142.1425.3212.33
(Continued)
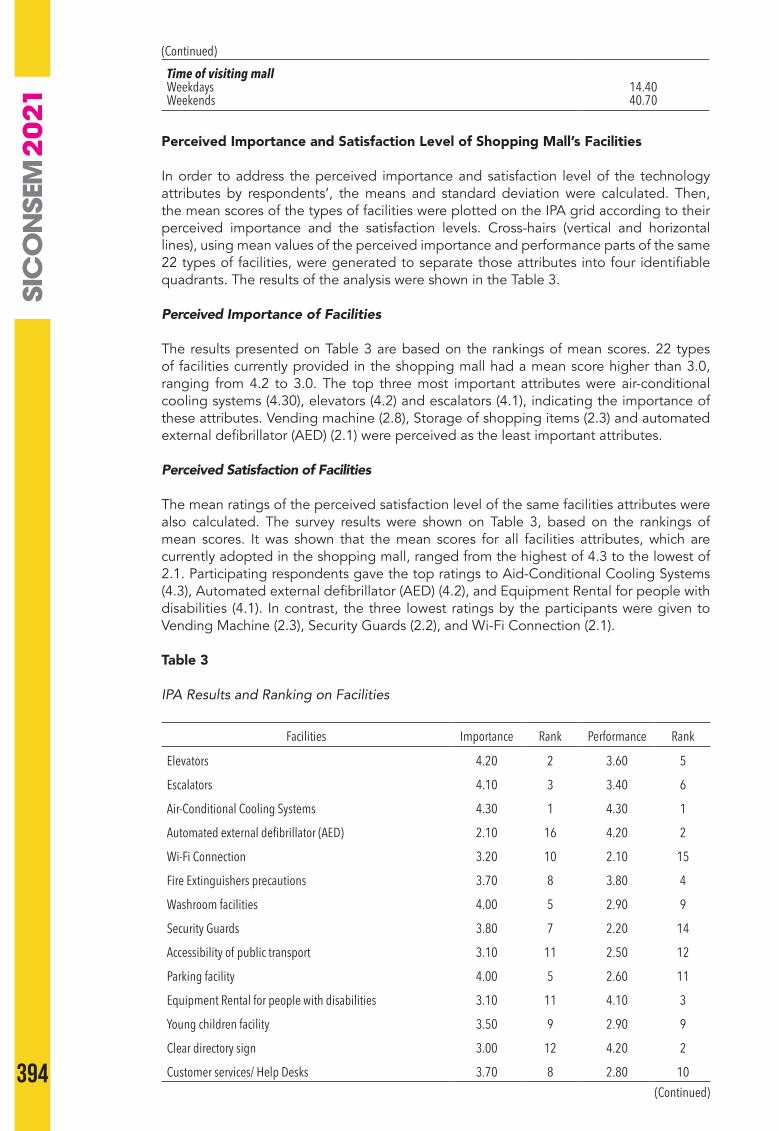
394
Time of visiting mallWeekdaysWeekends
14.4040.70
Perceived Importance and Satisfaction Level of Shopping Mall’s Facilities
In order to address the perceived importance and satisfaction level of the technology attributes by respondents’, the means and standard deviation were calculated. Then, the mean scores of the types of facilities were plotted on the IPA grid according to their perceived importance and the satisfaction levels. Cross-hairs (vertical and horizontal lines), using mean values of the perceived importance and performance parts of the same 22 types of facilities, were generated to separate those attributes into four identifiable quadrants. The results of the analysis were shown in the Table 3.
Perceived Importance of Facilities
The results presented on Table 3 are based on the rankings of mean scores. 22 types of facilities currently provided in the shopping mall had a mean score higher than 3.0, ranging from 4.2 to 3.0. The top three most important attributes were air-conditional cooling systems (4.30), elevators (4.2) and escalators (4.1), indicating the importance of these attributes. Vending machine (2.8), Storage of shopping items (2.3) and automated external defibrillator (AED) (2.1) were perceived as the least important attributes.
Perceived Satisfaction of Facilities
The mean ratings of the perceived satisfaction level of the same facilities attributes were also calculated. The survey results were shown on Table 3, based on the rankings of mean scores. It was shown that the mean scores for all facilities attributes, which are currently adopted in the shopping mall, ranged from the highest of 4.3 to the lowest of 2.1. Participating respondents gave the top ratings to Aid-Conditional Cooling Systems (4.3), Automated external defibrillator (AED) (4.2), and Equipment Rental for people with disabilities (4.1). In contrast, the three lowest ratings by the participants were given to Vending Machine (2.3), Security Guards (2.2), and Wi-Fi Connection (2.1).
Table 3
IPA Results and Ranking on Facilities
Facilities Importance Rank Performance Rank
Elevators 4.20 2 3.60 5
Escalators 4.10 3 3.40 6
Air-Conditional Cooling Systems 4.30 1 4.30 1
Automated external defibrillator (AED) 2.10 16 4.20 2
Wi-Fi Connection 3.20 10 2.10 15
Fire Extinguishers precautions 3.70 8 3.80 4
Washroom facilities 4.00 5 2.90 9
Security Guards 3.80 7 2.20 14
Accessibility of public transport 3.10 11 2.50 12
Parking facility 4.00 5 2.60 11
Equipment Rental for people with disabilities 3.10 11 4.10 3
Young children facility 3.50 9 2.90 9
Clear directory sign 3.00 12 4.20 2
Customer services/ Help Desks 3.70 8 2.80 10
(Continued)
(Continued)

395
4TH SINTO
K INTERN
ATION
AL CON
FERENCE O
N SO
CIAL SCIENCE AN
D M
ANAG
EMEN
T
Seating availability at regular interval in the walkways 4.00 5 2.50 12
Storage of shopping items 2.30 15 2.80 10
Loyalty programme rewarding 3.00 12 3.80 4
ATM Machines 3.90 6 4.10 3
Kiosks Systems 2.90 13 3.30 7
Accessibility Waste Bin 3.90 6 4.30 1
Vending Machines 2.80 14 2.30 13
Drinking water dispenser 4.00 5 3.10 8
Grand Mean 3.48 3.26
DISCUSSION
Table 4
IPA Results Quadrants on Facilities
Facilities Results
Elevators Keep up good work
Escalators Keep up good work
Air-Conditional Cooling Systems Keep up good work
Automated external defibrillator (AED) Possible Overkill
Wi-Fi Connection Low priority
Fire Extinguishers precautions Keep up good work
Washroom facilities Concentrate here
Security Guards Concentrate here
Accessibility of public transport Low priority
Parking facility Concentrate here
Equipment Rental for people with disabilities Possible Overkill
Young children facility Concentrate here
Clear directory sign Possible Overkill
Customer services/ Help Desks Concentrate here
Seating availability at regular interval in the walkways Concentrate here
Storage of shopping items Low priority
Loyalty program rewarding Low priority
ATM Machines Keep up good work
Kiosks Systems Possible Overkill
Accessibility Waste Bin Keep up good work
Vending Machines Low priority
Drinking water dispenser Concentrate here
Concentrate Here Quadrant
The attributes loaded in the concentrate here quadrant was seating availability, customer help desk, children facility, security, washroom, and drinking water dispenser. These
(Continued)
396
facilities were evaluated above average for importance but below average on satisfaction. With the mega mall size, customers may expect more seating area available and great customer help desk to make enquiries. Security is a major attribute for shopper favoring the shopping mall. The consideration on improvement like more the lighting to be installed and more security guards patrol in the parking lots. It is suggested that continuous efforts and special attention should be directed at and concentrated on the enhancement of those facilities to accomplish a high level of satisfaction in utilizing them. If shopping mall operators are not rectify these facilities, it may lead to less frequent visits by the shoppers. With less shoppers may result in the loss of current retail tenants at the shopping mall.
Keep up the Good Work Quadrant
The keep up the good work quadrant captured facilities attributes, including, ATM, elevator, escalator, air conditional systems, fire extinguishers precautions, and accessibility of waste bin. These items were rated above average for both importance and satisfaction level. These results convey the message that in general, shopping malls have performed well in the above respects. Strategic efforts should be made to maintain and improve quality facilities in these areas to attract and retain customers and then, to be competitive against others shopping malls business establishments.
Low Priority Quadrant
Among facilities attributes used for the study, Wi-Fi, accessibility of public transport, storage of shopping items, loyalty program rewarding and vending machines were identified in the low priority quadrant. Facility such as Wi-Fi may not be required by the shoppers because the shoppers may already have subscription on mobile data. Vending machine and storage of shopping items may be replaced with more seating chair and young children play area. These were evaluated below average for both importance and satisfaction. The results indicated that even if the satisfaction level was below average, efforts should not be overly concentrated on these facilities, as attributes identified here were rated as low importance by the respondents, compared with other facilities attributes.
Possible Overkill Quadrant
There were 4 facilities attributes, equipment Rental for people with disabilities, AED, clear directory sign and kiosks in this quadrant. This implied that the attributes were evaluated as lower than the average of the importance level, and that the satisfaction level of the facility was higher than the average. Since these facilities identified in the quadrant were considered the most standardized facilities for in shopping malls. Such facilities commonly can be found in public area, efforts should be towards maintaining a high level of standards without overspending resources in these facilities.
CONCLUSION
This study has provided empirical evidence and knowledge on the perception of facilities in Malaysian shopping mall. The findings from this study had provide information for Malaysian shopping mall operator who plan to invest on the different types of facilities to attract shoppers. Shopping mall also can use the data provided to formulating a business strategy to increase the customer loyalty. In addition, adopting a new facility in the shopping mall requires effort and clear understanding the shopper’s requirement therefore considerations must be carefully planned to maximize the satisfaction of shoppers when it is provided. Whatever matters that related to customers’ dissatisfactions will destruct the credibility and the potential of the shopping mall. Satisfied shoppers will be more likely return to the shopping mall in the near future and refer to other people. By providing such facilities, businesses can generate demand among certain target markets.
397
4TH SINTO
K INTERN
ATION
AL CON
FERENCE O
N SO
CIAL SCIENCE AN
D M
ANAG
EMEN
T
REFERENCES
Atkin, B. and Brooks, A. (2009). Total facilities management (3rd ed.). Blackwell Science Bloch, P. H., Ridgway, N. M., & Dawson, S. A. (1994). The shopping mall as consumer
habitat. Journal of Retailing, 70(1), 23-42. Chan, H. C. (2011). Malaysian shopping centers: The dawn of a new era. Retail Property
Insights, 18(2), 65-71.Chapman, R. G. (1993). Brand performance comparatives. Journal of Product & Brand
Management, 2(1), 42–50.Chu, R. K. S., & Choi, T. (2000). An importance-performance analysis of hotel selection
factors in the Hong Kong hotel industry: A comparison of business and leisure travelers. Tourism Management, 21, 363–377.
Dennis, C. E., Marsland, D., & Cockett, W. (2002). Central place practice: Shopping centre attractiveness measures, hinterland boundaries and the UK retail hierarchy. Journal of Retailing and Consumer Services.
Eddie, C. M., Hui, Zhang, P-H., & Zheng, X. (2013). Facilities management service and customer satisfaction in shopping mall sector. Facilities, 31. 194 – 207
Finn, A., & Louviere, J. J (1992). Determining the appropriate response to evidence of public concern: The case of food safety. Journal of Public Policy & Marketing 11, 12-25
Finn, A., & Louviere, J. (1990). Shopping center patronage models: fashioning a consideration set segmentation solution. Journal of Business Research, 3, 259-75.
Frasquet, M., Gil, I., Molla, A. (2001), Shopping-centre selection modelling: a segmentation approach. The International Review of Retail, Distribution and Consumer Research, 11, 23 – 38.
Go, F., & Zhang, W. (1997). Applying Importance-performance analysis to Beijing as an International Meeting Destination. Journal of Travel Research, 35(4) 42-49.
Haque, A., & Rahman, S. (2009). Exploring customers’ shopping experience through shopping center branding in Malaysia. Journal of Management Research (09725814), 9(3), 167-181.
Jain, R., & Bagdare, S. (2009). Determinants of customer experience in new format retail stores. Journal of Marketing & Communication, 5(2).
Jhamb, D., & Kiran, R. (2012). Emerging trends of organized retailing in India: A shared vision of consumers and retailers perspective. Middle-East Journal of Scientific Research, 11(4), 481-490.
Martilla, J. A., & James, J. C. (1977), Importance-performance analysis. Journal of Marketing, 77-79.
Nevin, J. R., & Houston, M. J. (1980). Image as a component of attraction to intraurban shopping area. Journal of Retailing, 1, 77-93.
Wakefield, K. L., & Baker, J. (1998). Excitement at the mall: determinants and effects on shopping response. Journal of Retailing, 4, 515-39.
Wong, G.K.M., Lu, Y., & Yuan, L. L. (2001), SCATTR: An instrument for measuring shopping centre attractiveness. International Journal of Retail & Distribution Management, 29(2), 76-86.

398
SICONSEM2021: 108-068
PERCEIVED ORGANIZATIONAL SUPPORT AS A MODERATOR IN THE ASSOCIATION BETWEEN WORK-LIFE BALANCE AND EMPLOYEE RETENTION
1Abdul Rahim Zumrah, 2Mohd Azmir Mohd Nizah & 3Nurhamidah Jalil1,2&3Faculty of Leadership and Management, Universiti Sains Islam Malaysia
Corresponding author: [email protected]; [email protected]; [email protected]
ABSTRACT
This study was designed to assess the moderating role of perceived organizational support in the relationship between work-life balance and employee retention. A sample of 201 youth employees, who work in Kuala Lumpur, Malaysia were participated through survey. Moderation analysis was performed using SPSS PROCESS Macro. This study found that work-life balance is a good predictor of employee retention. In addition, perceived organizational support has moderates the relationship between work-life balance and employee retention.
Keywords: Work-life balance, perceived organizational support, employee retention, youth employees, Malaysia.
INTRODUCTION
Work–life balance is defined as an individual’s ability to meet both their work and family commitments, as well as other nonwork responsibilities and activities (Parkes & Langford, 2008). Maxwell (2005) suggests that managers are key to the initiation and implementation of work-life balance practices with some of those practices being the introduction of flexible working hours and arrangements, providing better training, and breaks from work. Wong and Ko (2009) stated that factors relating to having enough time off, allegiance to work, and flexibility were the basis for employee perceptions of work-life balance.
There has been a longstanding academic interest in work-life balance particularly on its consequences (Kelliher, Richardson & Boiarintseva, 2019). Research on work-life balance shows its association with negative employee related outcome, such as job burnout (Sirgy & Lee, 2018), and with positive employee related outcome, such as life satisfaction (Tasdelen-Karckay & Bakalim, 2017). Prior research also attempting to assess the precise nature of the relationship between work-life balance and employee retention, however, has been controversial. Whereas some research has reported a positive relationship (Shockley, Smith & Knudsen, 2017), others found low effect (Amstad et al., 2011; Meyer, Stanley, Herscovitch & Topolnytsky, 2002) or no relationship at all between the two (Parkes & Langford, 2008).
In order to properly identify whether a relationship does indeed exist, researchers such as Wickhamn and Hall (2014) dictates that relevant factors be both identified and considered. Without such consideration, the validity of the findings is suspect. Other researchers argue the inconsistent findings, suggest the likely presence of moderators (Shockley, Smith & Knudsen, 2017). Some of the previous research has acknowledged this necessity and suggested that job factors must be considered in order to garner a more complete understanding of work-life balance relationship with employee retention (Shockley, Smith & Knudsen, 2017).
This paper suggests the job factor that is deserving of consideration is that of perceived organizational support (POS). POS is defined as the employees‘ general belief that their work organization values their contribution and cares about their well-being (Eisenberger
37
399
4TH SINTO
K INTERN
ATION
AL CON
FERENCE O
N SO
CIAL SCIENCE AN
D M
ANAG
EMEN
T
et al., 1986). It associates positively with favourable employee related outcomes such as job performance (Du, Zhang & Tekleab, 2018) and negatively with unfavourable employee related outcomes such as intention to leave (Loi, Hang-Yue & Foley, 2006). In addition, POS has the ability to intensify the positive result of organizational positive treatments-employees‘positive behaviors relationship (Erdogan & Enders, 2007; Zumrah, Boyle & Fein, 2012).
Considering that organizations strive to retain employees, this study believe that understanding work-life balance association with employee retention merits further research. This paper introduces POS as a job factor that able to play the role as a moderator of this relationship. To date, the investigation of organizational support perceptions within work-life balance and employee retention studies has been scant. In fact, the recent study has recommended to identify the moderator that could moderate the relationship (Jaharuddin & Zainol, 2019). Thus, the purpose of the present paper is to address this scarcity, explore the extent of POS as a moderator in the relationship between work-life balance and employee retention.
LITERATURE REVIEW
Work-life Balance and Employee Retention
A framework for improving employee retention rates indicated that the organizational strategies such as work-life balance can cause employee retention (Deery, 2008; Deery & Jago, 2015). Recent researchers also argue that work–life balance practice appear to be important for retention (Shockley, Smith & Knudsen, 2017). Work-life balance has become quite famed as an effective human resource (HR) strategy to retain the skilled employee (Bharadwaj & Yameen, 2021). The previous assumption has been supported by previous empirical studies that were conducted in various level of employees. For instance, an empirical research study with a sample of 149 managers of Small Medium Enterprise (SME) show that work-life balance plays a major role in enhancing retention among managers in SME (Cegarra-Leiva & Sanchez-Vidal, 2012). The similar finding has been determined in a recent study that conducted among 213 executive employees (Jaharuddin & Zainol, 2019). Creating a balance between life and work could result in greater satisfaction in life and at work, which results in greater employee performance and increase retention (Konrad & Mangel, 2000; Pryce et al., 2006). On the other hand, work-life imbalances result in high levels of anxiety, depression, low quality of life and reduced work effectiveness (Kofodimos, 1993), which could result turnover intention (Jaharuddin & Zainol, 2019). Therefore, we posit that: Hypothesis 1: Work-life balance is positively related to employee retention.
Perceived Organizational Support (POS) as a Moderator
Shockley, Smith and Knudsen (2017) have suggested that the relationship between work–life balance and employee retention is not necessarily a straightforward one, but is shaped by moderators (e.g., culture, gender, organizational support and family centrality). According to Shockley, Smith and Knudsen (2017), the value of such research in the retention field lies primarily in the greater empirical understanding of the factors that can reinforce desirable employee outcomes (i.e., high retention). Accordingly, Jaharuddin and Zainol (2019) urged further study to extend the existing literature by investigating the moderator between work-life balance and employee retention.
This study proposed POS as a moderator in the relationship between work-life balance and employee retention. A basic premise of POS theory implies that an employee‘s primary resource-based support is his or her organization (Jawahar & Carr, 2007) and this support has been found to increase the effects of positive work experiences. For example, Erdogan and Enders (2007) found that perceived organizational support moderated the relationship between leader-member exchange and employee job satisfaction. Employees enjoying good relationships with their supervisors showed more satisfaction with their job
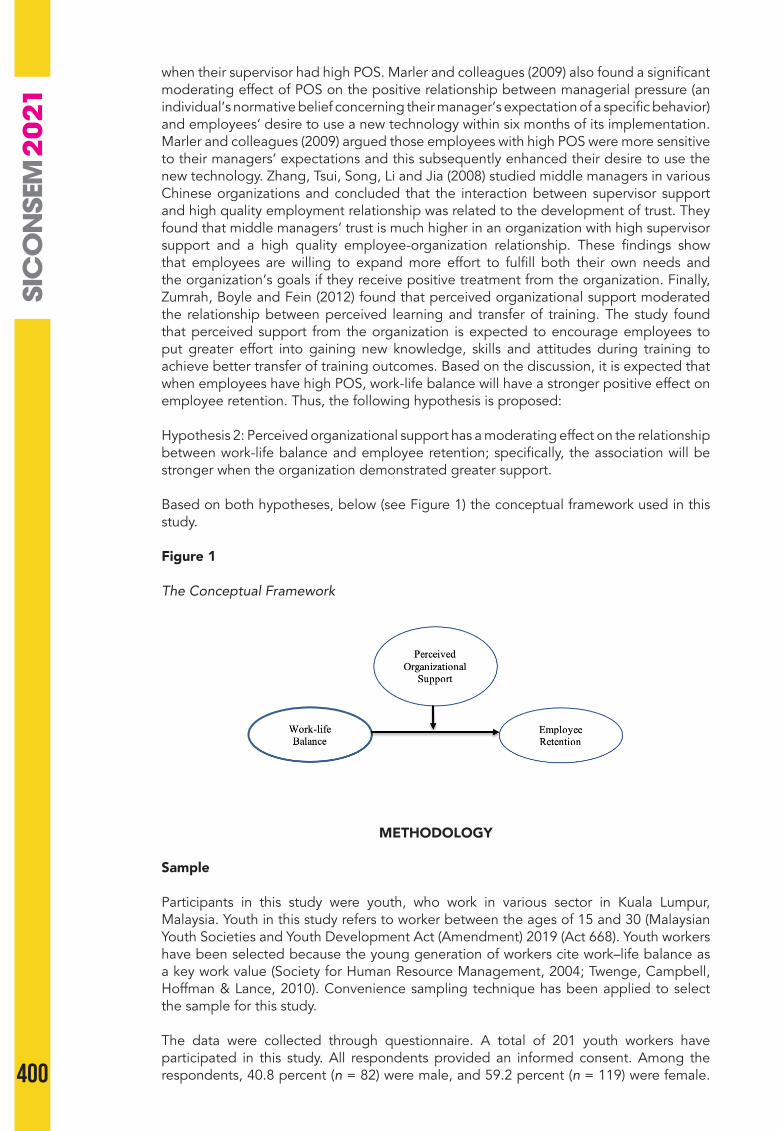
400
when their supervisor had high POS. Marler and colleagues (2009) also found a significant moderating effect of POS on the positive relationship between managerial pressure (an individual‘s normative belief concerning their manager‘s expectation of a specific behavior) and employees‘ desire to use a new technology within six months of its implementation. Marler and colleagues (2009) argued those employees with high POS were more sensitive to their managers‘ expectations and this subsequently enhanced their desire to use the new technology. Zhang, Tsui, Song, Li and Jia (2008) studied middle managers in various Chinese organizations and concluded that the interaction between supervisor support and high quality employment relationship was related to the development of trust. They found that middle managers‘ trust is much higher in an organization with high supervisor support and a high quality employee-organization relationship. These findings show that employees are willing to expand more effort to fulfill both their own needs and the organization‘s goals if they receive positive treatment from the organization. Finally, Zumrah, Boyle and Fein (2012) found that perceived organizational support moderated the relationship between perceived learning and transfer of training. The study found that perceived support from the organization is expected to encourage employees to put greater effort into gaining new knowledge, skills and attitudes during training to achieve better transfer of training outcomes. Based on the discussion, it is expected that when employees have high POS, work-life balance will have a stronger positive effect on employee retention. Thus, the following hypothesis is proposed:
Hypothesis 2: Perceived organizational support has a moderating effect on the relationship between work-life balance and employee retention; specifically, the association will be stronger when the organization demonstrated greater support.
Based on both hypotheses, below (see Figure 1) the conceptual framework used in this study.
Figure 1
The Conceptual Framework
METHODOLOGY
Sample
Participants in this study were youth, who work in various sector in Kuala Lumpur, Malaysia. Youth in this study refers to worker between the ages of 15 and 30 (Malaysian Youth Societies and Youth Development Act (Amendment) 2019 (Act 668). Youth workers have been selected because the young generation of workers cite work–life balance as a key work value (Society for Human Resource Management, 2004; Twenge, Campbell, Hoffman & Lance, 2010). Convenience sampling technique has been applied to select the sample for this study.
The data were collected through questionnaire. A total of 201 youth workers have participated in this study. All respondents provided an informed consent. Among the respondents, 40.8 percent (n = 82) were male, and 59.2 percent (n = 119) were female.
401
4TH SINTO
K INTERN
ATION
AL CON
FERENCE O
N SO
CIAL SCIENCE AN
D M
ANAG
EMEN
T
23.4 percent (n = 47) are still single, while 76.6 percent (n = 154) of them have married. In term of workplace, the majority, 69.7 percent (n = 140) of them working at private sector, 13.4 percent (n = 27) of them working at government sector, and 10 percent (n = 20) of them having their own business.
Measures
This study used previously published measures. All measures were assessed using a five-point Likert-type scale (1 = strongly disagree; 2 = disagree; 3 = neutral; 4 = agree; 5 = strongly agree).
Employee retention was assessed using three items by Langford (2009). An example of the items is ‘I am likely to still be working in this organization in 2 years time’. The measure was validated in a study by Presbitero, Roxas and Chadee (2016). Work-life balance was assessed using three items by Langford (2009). An example of the items is ‘I can have a good balance between work and other activities’. The measure was validated in a study by Presbitero, Roxas and Chadee (2016). Perceived organizational support is measured using Eisenberger, Cummings, Armeli and Lynch’s (1997) short version of the Survey of Perceived Organizational Support (SPOS). This version of the POS contains 8 items. An example of the items is ‘My organization cares about my opinions’. The measure was validated in a study by Zumrah and Boyle (2015).
FINDINGS
To test the hypothesis, this study employ the Statistical Package for the Social Sciences (SPSS) macro named PROCESS (Hayes, 2013), Process Macro regression analysis is an advanced and robust regression-based approach focusing on mediation, moderated models and the conditional indirect effect. PROCESS Macro incorporates the stepwise procedure which facilitates the analysis of the indirect effect, Sobel’s standard theory test and a bootstrap estimation of the confidence intervals. The PROCESS Macro tool was used to estimate the research hypotheses.
Two hypotheses were tested in this study. Hypothesis 1 hypothesised a relationship between work-life balance and employee retention. The regression analysis found a significant relationship between work-life balance and employee retention (β = 0.861, t = 3.879, p < 0.001). The statistical significance of the analysis therefore supports the hypothesised relationship. The second hypothesis (H2) tested the moderating effect of perceived organizational support in the relationship between work-life balance and employee retention. Evidence from the analysis shows that the interaction effect is significant (LLCI = 0.171; ULCI = 0.007). Moderation analysis is significant when zero is not straddled between lower and upper confidence intervals, such as the case in this analysis. In specific, the moderation model with the centered interaction term between work-life balance and perceived organizational support accounted for a significant proportion of the variance in employee retention (ΔR2= .0135, ΔF = 4.597, p = .0332, b = .0892, t(201) = 2.1441, p = .0332). In other word, the higher the organizational support, the greater the influence of work-life balance on employee retention.
DISCUSSION
Work-life balance have been found to be a good predictor of employee retention in previous studies (Cegarra-Leiva & Sanchez-Vidal, 2012; Jaharuddin & Zainol, 2019). In this study, perceived organizational support somewhat strengthen the effects of work-life balance on employee retention. The stronger the organizational support, the greater the relationship between work-life balance and employee retention. This finding is in-line with previous studies that found perceived organizational support able to increase the effects of positive work experiences on employee work attitude and behavior (Erdogan & Enders, 2007; Zhang, Tsui, Song, Li & Jia, 2008; Marler et al., 2009; Zumrah, Boyle & Fein, 2012).

402
Such ability is possible because perceived organizational support enhances employees’ belief and trust to the organization (Chiang et al., 2011). Perceived organizational support can also produce positive attitudes and behaviors that benefit the organization such as commitment to the organization (Tremblay et al., 2010), job satisfaction (Liao, 2011), job involvement (O’Driscoll & Randall, 1999), organizational identification (Edwards, 2009), career satisfaction (Armstrong-Stassen & Ursel, 2009), entrepreneurial behaviour (Zampetakis, Beldekos & Moustakis 2009) and work engagement (Kinnunen et al., 2008). Based on these facts, there is a greater possibility for employees who work in organization that implement work-life balance to remain if they perceived that their organization values their contribution and cares about their well-being.
This study yields important and significant finding to the field of work-life balance, perceived organizational support and employee retention because it supports the hypothesis that perceived organizational support has an ability to intensify the effects of work-life balance on employee retention. The finding of this study highlights that work-life balance and perceived organizational support can be a good strategy for organization to retain the employees. Work-life balance can be implemented through the introduction of flexible working hours and arrangements, providing better training, and breaks from work (Maxwell, 2005), having enough time off, and allegiance to work (Wong & Ko, 2009). Meanwhile, the organizational support can be shown up by considering the employees’ opinions, supporting their career goals, considering their welfare as a person and as an employee and providing support or help to them when they face a problem (Eisenberger et al., 1997).
LIMITATION AND SUGGESTION FOR FUTURE STUDY
A limitation of this study is the focus on perceived organizational support as a moderator. Future study may select other potential moderator in the relationship between work-life balance and employee retention. Testing a potential moderator in such relationship has been continuously suggested by recent researchers (Shockley, Smith & Knudsen, 2017).
The sample in this study are youth workers who work at various sector in Kuala Lumpur. Future research could examine the proposed conceptual framework of this study among senior employees (age above 30 years old) at the specific organization to validate the findings of this study.
This study only includes work-life balance as the only predictor to employee retention. Future study may include other work practices that may influence employee retention. It is due to the work practices that are effective at retaining employees are not necessarily the same (Parkes & Langford, 2008).
REFERENCES
Amstad, F. T., Meier, L. L., Fasel, U., Elfering, A., & Semmer, N. K. (2011). A meta-analysis of work-family conflict and various outcomes with a special emphasis on cross-domain versus matching-domain relations. Journal of Occupational Health Psychology, 16, 151– 169.
Armstrong-Stassen, M., & Ursel, N. D. (2009). Perceived organizational support, career satisfaction, and the retention of older workers. Journal of Occupational and Organizational Psychology, 82, 201-220.
Cegarra-Leiva, D., & Sanchez-Vidal, M. E. (2012). Work life balance and the retention of managers in Spanish SMEs. International Journal of Human Resource Management, 23(1), 91-108.
Chiang, H., Han, T., & Chuang, J. (2011). The relationship between high-commitment HRM and knowledge-sharing behavior and its mediators. International Journal of Manpower, 32(5/6), 604-622.

403
4TH SINTO
K INTERN
ATION
AL CON
FERENCE O
N SO
CIAL SCIENCE AN
D M
ANAG
EMEN
T
Deery, M. (2008). Talent management, work-life balance and retention strategies. International Journal of Contemporary Hospitality Management, 20(7), 792-806.
Deery, M. & Jago, L. (2015). Revisiting talent management, work-life balance and retention strategies. International Journal of Contemporary Hospitality Management, 27(3), 453-472.
Du, Y., Zhang, L. & Tekleab, A. G. (2018). Job strains, job control and POS on employee performance: An interactionist perspective. Journal of Business Research, 82, 213-219.
Edwards, M. R. (2009). HR, perceived organizational support and organizational identification: An analysis after organisational formation. Journal of Human Resource Management, 19(1), 91-115.
Eisenberger, R., Cummings, J., Aemeli, S., & Lynch, P. (1997). Perceived organizational support, discretionary treatment, and job satisfaction. Journal of Applied Psychology, 82(5), 812-820.
Eisenberger, R., Huntington, R., Hutchison, S., & Sowa, D. (1986). Perceived organizational support. Journal of Applied Psychology, 71(3), 500-507.
Erdogan, B., & Enders, J. (2007). Support from the top: Supervisors’ perceived organizational support as a moderator of leader-member exchange to satisfaction and performance relationships. Journal of Applied Psychology, 92(2), 321-330.
Greenhaus, J. H., & Allen, T. D. (2011). Work–family balance: A review and extension of the literature. In L. Tetrick & J. C. Quick (Eds.). Handbook of occupational health psychology (2nd ed., pp. 165-183). American Psychological Association
Jaharuddin, N. S., & Zainol, L. N. (2019). The impact of work-life balance on job engagement and turnover intention. The South East Asian Journal of Management, 13(1), 106-118.
Jawahar, I., & Carr, D. (2007). Conscientiousness and contextual performance: The compensatory effects of perceived organizational support and leader-member exchange. Journal of Managerial Psychology, 22(4), 330-349.
Kelliher, C., Richardson, J. & Boiarintseva, G. (2019). All of work? All of life? Reconceptualising work-life balance for the 21st Century. Human Resource Management Journal, 29(2), 97-112.
Kinnunen, U., Feldt, T., & Makikangas, A. (2008). Testing the effort-reward imbalance model among finnish managers: The role of perceived organizational support. Journal of Occupational Health Psychology, 13(2), 114-127.
Kofodimos, J. R. (1993). Balancing Act. Jossey-Bass, San Francisco.Konrad, A. M., & Mangel, R. (2000). Research notes and commentaries the impact of
work-life programs on firm productivity. Strategic Management Journal, 21(12), 1225–1237.
Langford, P. H. (2009). Measuring organisational climate and employee engagement: Evidence for a 7 Ps model of work practices and outcomes. Australian Journal of Psychology, 61, 185–198
Lazarus, R. S., & Cohen, J. B. (1977). Environmental stress. Human Behavior and Environment, 2, 89– 127.
Liao, P.-Y. (2011). Linking work--family conflict to job attitudes: The mediating role of social exchange relationships. International Journal of Human Resource Management, 22(14), 2965-2980.
Loi, R., Hang-Yue, N., & Foley, S. (2006). Linking employees’ justice perceptions to organizational commitment and intention to leave: The mediating role of perceived organizational support. Journal of Occupational and Organizational Psychology, 79(1), 101-120.
Marler, J. H., Fisher, S. L., & Ke, W. (2009). Employee self-service technology acceptance: A Comparison of pre-implementation relationships. Journal of Personnel Psychology, 62(2), 327-358.
Maxwell, G. (2005), Checks and balances: the role of managers in work-life balance policies and practices. Journal of Retailing and Consumer Services, 12, 179-89.
Meyer, J. P., Stanley, D. J., Herscovitch, L., & Topolnytsky, L. (2002). Affective, continuance, and normative commitment to the organization: A meta-analysis of antecedents, correlates, and consequences. Journal of Vocational Behavior, 61, 20–52.

404
O’Driscoll, M. P., & Randall, D. M. (1999). Perceived organisational support, satisfaction with rewards and employee job involvement and organisational commitment. Journal of Applied Psychology, 48(2), 197-209.
Parkes. L. P., & Langford, P. H. (2008). Work-life balance or work-life alignment? A test of the importance of work–life balance for employee engagement and intention to stay in organisations. Journal of Management & Organization, 14, 267–284.
Presbitero, A., Roxas, B., & Chadee, D. (2016). Looking beyond HRM practices in enhancing employee retention in BPOs: Focus on employee-organisation value fit. International Journal of Human Resource Management, 27(6), 635-652.
Pryce, J., Albertsen, K., & Nielsen, K. (2006). Evaluation of an open-rota system in a Danish psychiatric hospital: a mechanism for improving job satisfaction and work-life balance. Journal of Nursing Management, 14(4), 282–288
Sirgy, M. J., & Lee, D. (2018). Work-life balance: An integrative review. Applied Research Quality Life, 13, 229-254.
Tasdelen-Karckay, A., & Bakalim, O. (2017). The mediating effect of work-life balance on the relationship between work-family conflict and life satisfaction. Australian Journal of Career Development, 26(1), 3-13.
Tremblay, M., Cloutier, J., Simard, G., Chenevert, D., & Vandenberghe, C. (2010). The role of HRM practices, procedural justice, organizational support and trust in organizational commitment and in-role and extra-role performance. International Journal of Human Resource Management, 21(3), 405-433.
Twenge, J. M., Campbell, S. M., Hoffman, B. J., & Lance, C. E. (2010). Generational differences in work values: Leisure and extrinsic values increasing, social and intrinsic values decreasing. Journal of Management, 36, 1117–1142.
Weiss, H. M., & Cropanzano, R. (1996). Affective events theory: A theoretical discussion of the structure, causes and consequences of affective experiences at work. In B. M. Staw & L. L. Cummings (Eds.), Research in organizational behavior (Vol. 18, pp. 1–74). JAI Press.
Wickhamn, W., & Hall, A. T. (2014). Accountability and satisfaction: Organizational support as a moderator. Journal of Managerial Psychology, 29(5), 458-471.
Wong, S., & Ko, A. (2009). Exploratory study of understanding hotel employees’ perception on work-life balance issues. International Journal of Hospitality Management, 28(2), 195-203.
Zampetakis, L. A., Beldekos, P., & Moustakis, V. S. (2009). Day-to-day entrepreneurship within organisations: The role of trait emotional intelligence and perceived organisational support. European Management Journal, 27(3), 165-175.
Zhang, A. Y., Tsui, A. S., Song, L. J., Li, C., & Jia, L. (2008). How do I trust thee? Employee-organization relationship, supervisory support, and middle manager trust in the organization. Journal of Human Resource Management, 47(1), 111-132.
Zumrah, A. R., & Boyle, S. (2015). The effects of perceived organizational support and job satisfaction on transfer of training. Personnel Review, 44, 236–254.
Zumrah, A. R., Boyle, S., & Fein, E.C. (2012). The effect of perceived organizational support on the transfer of training outcomes to the workplace. World Review of Business Research, 2(4), 130-147.

405
4TH SINTO
K INTERN
ATION
AL CON
FERENCE O
N SO
CIAL SCIENCE AN
D M
ANAG
EMEN
T
SICONSEM2021: 071-035
EFFECT OF EXPERIENTIAL AND SYMBOLIC VALUE ON LUXURY COSMETIC BRAND LOYALTY: THE MEDIATING ROLE OF BRAND IDENTIFICATION
1Siti Nor Bayaah Ahmad, 2Azizah Omar & 3Junaidah Zeno 1&3Faculty of Business, Economic and Accountancy, Universiti Malaysia Sabah,
Malaysia 2School of Management, Universiti Sains Malaysia, Malaysia
Corresponding author: [email protected]; [email protected]; [email protected]
ABSTRACT
The cosmetic industry has been expanding rapidly in both developed and developing countries. In Malaysia, the value of cosmetic trade is increasing due to the emerging of homegrown cosmetic brands and competitive market penetration of international brands. With consumer’s tastes and preferences changing, marketers are moving towards relationship marketing strategy to increase customer’s brand loyalty. In this context of luxury cosmetics, the players in the industry have engaged into relationship marketing by conveying a strong message to the community that they are also concerned about the environment and community development. Previous studies have shown that cosmetics users are mostly influenced by self-appearance, brand referral behaviour, and brand popularity when purchasing cosmetics products. However, little is known on the values that the consumers are referring to when making their purchase decision, particularly the luxury cosmetics products. Hence, the study aimed to examine consumers’ experiential and symbolic values towards brand identification and brand loyalty. A total of three hundred and eighty-three respondents participated in this study via online survey. The findings of this research indicated that two dimensions of perceived value which are experiential values and symbolic values have a significant influence on consumer-brand identification. In addition, consumer-brand identification also showed a significant effect on brand loyalty. The study also found that consumer-brand identification mediates the relationship between experiential value and symbolic value towards brand loyalty. The result has a practical contribution to the marketers especially the local cosmetics manufacturer in Malaysia. The marketers should not only focus on a standard marketing mix strategy to enhance positive perception of a brand but to build a strong consumer-brand relationship.
Keywords: Consumer-brand identification, experiential value, luxury cosmetic brand, symbolic value.
INTRODUCTION
Malaysia is experiencing rapid growth in the beauty and wellness industries. According to the Malaysian Department of Statistics (2021), the total expenditure on cosmetics in Malaysia amounts to approximately US$407 million, with imports accounting for the majority of this total expenditure rather than indigenous manufacturers. Apparently, the cosmetic industry has grown tremendously in recent years, owing to increase demand from consumers who are more concerned than ever with their health and appearance. Many studies have been conducted among consumers on the intention to acquire and purchase cosmetics products. Previous studies regarding cosmetic product purchase have investigated the relevance of hedonic and utilitarian factors that influenced consumer behaviour (Leung et al., 2019; Ungarala, 2021), and another study by authors such as (Ninla Elmawati Falabiba, 2019) examined the consumption of halal cosmetics, while (Atkinson & Kang, 2021;Yadav & Pathak, 2016)as it has improved the predictive utility of the proposed model (from 27.1% to 37.7% investigated the issues related to consumption of green cosmetics.
38
406
While wearing cosmetics bring satisfaction to the users, the products have been subject of controversy due to the presence of dangerous components and have been criticised for having a negative impact on the well-being of users as well as the environment (First & Khetriwal, 2010). A large number of other consumers who place a high value on health and the environment are seeking for cosmetics that are not only safe for their skin but are also environmentally friendly. Recently, many people have tended to prefer healthy and sustainable lifestyles, which includes becoming more aware of and concerned about the increasingly detrimental influence of chemical compounds in cosmetics (Minh & Nguyen, 2021). Specifically, Kerdudo et al., (2016) claimed that as a result of consumer health-conscious lifestyles and environmental awareness, cosmetic companies have spent in research and development to offer revolutionary natural cosmetics that fulfil the needs of customers. Individual who are paying greater attention to cosmetics items as part of their daily need to improve their general well-being as the economy grows and their purchasing power risen. On top of consumers’ concern on self-appearance, consumers also placed importance on health and the environment due to the use of cosmetic products (Kessler, 2015), which has become a recent consumer trend in the cosmetic industry. Sociological research suggest that consumers’ concern for the environment has prompted them to act ethically by engaging into more environmentally friendly consumption (Bartels & Onwezen, 2014). Past studies on consumer purchase intention revealed that consumers, in general, were influenced by product benefits and consumer’s perceived value (Kainth & Verma, 2016, 2011; Dall’Olmo Riley, Pina, & Bravo, 2015; Zeithaml, 1988), brand functionality (eg. Zeithaml, 1988; Dall’Olmo Riley et al., 2015). Hence, to have a comprehensive understanding of consumer preferences for cosmetic brands, it is important to investigate the role of experiential and symbolic values of the brand in influencing consumer identification to the brand and eventually to be loyal to the brand of their choice. Additionally, personal values are recognized as key influences in the purchasing decision (De Mooij & Hofstede, 2011; Gabrielova & Buchko, 2021), with several studies endorsing the relationship between personal values and ecologically friendly behaviour (Kim, 2011; Lu, Chang, & Chang, 2013), and between personal values and ethical behaviour. Personal values also influence the choice of product consumption in the context of organic products (Kirmani & Khan, 2016; Yadav & Pathak, 2016; Nikolova & Inman, 2015the success of such programs in promoting healthier choices remains an open question. We examine the effectiveness of a growing health and wellness initiative – a simplified nutrition scoring system. We present a conceptual framework that predicts the effect of such a scoring system on shoppers’ food decisions, their sensitivity to price and promotion, as well as the moderating influence of category-level factors. Using a large-scale quasi-experiment and panel data for over 535,000 frequent shopper program members of a Northeast grocery chain across eight product categories, we demonstrate that the point-of-sale nutrition scoring system helped consumers make healthier food choices, such that they switched to higher-scoring products in the post-rollout period. Our results also reveal that shoppers became less price sensitive and more promotion sensitive following (Nikolova & Inman, 2015 ; Shaari, 2019). Hence, personal values are changing due to an increase of anxiety towards the changing environment. Consequently, businesses need to understand consumer behaviour from the perspective of the implication towards the environment.
Research Question(s)
1. Does consumer’s experiential value has a significant influence on consumer-brand identification of luxury cosmetic?
2. Does consumer’s symbolic value has a significant influence on consumer-brand identification of luxury cosmetic?
3. Does consumer-brand identification has a significant influence on brand loyalty of luxury cosmetic?
4. Does consumer-brand identification mediates the relationship between consumer’s experiential value on brand loyalty of luxury cosmetic?
5. Does consumer-brand identification mediates the relationship between consumer’s symbolic value on brand loyalty of luxury cosmetic?

407
4TH SINTO
K INTERN
ATION
AL CON
FERENCE O
N SO
CIAL SCIENCE AN
D M
ANAG
EMEN
T
Objective
1. To examine the importance of consumer’s experiential value on consumer-brand identification of luxury cosmetic.
2. To investigate the influence of consumer’s symbolic value on consumer-brand identification of luxury cosmetic.
3. To determine the effect of consumer-brand identification on brand loyalty of luxury cosmetic.
4. To determine the mediator role of consumer-brand identification between consumer’s experiential value and symbolic value on brand loyalty of luxury cosmetic.
5. To determine the mediator role of consumer-brand identification between consumer’s experiential value and symbolic value on brand loyalty of luxury cosmetic.
LITERATURE REVIEW
Cosmetics have long been purchased and used for beautifying and enhancing an imperfect appearance. In recent years the cosmetic industry has benefited from the increasing popularity of social networks such as Instagram and Facebook. The beauty and health market in Malaysia are rapidly expanding. The Malaysian Department of Statistics revealed that the aggregate spending is about US$407 million, with imports outnumbering domestically manufactured products (Ali et al., 2019). The cosmetic product is one of many consumer markets where the production can utilise natural or organic ingredients. Due to the high demand for these environmentally sustainable products, the offer has continuously increased in the market that meets the demand of consumers of a healthier lifestyle (Hassali, et al., 2015). The cosmetic industry in Malaysia has contributed billion of Ringgit Malaysia annually and is growing rapidly. This is attributed to rising urbanization and the increased participation of women in the labour force. In addition, the Malaysian market for cosmetics and toiletries products has undergone several changes. For past years, most Malaysian consumers have made purchases mostly on basic personal care items. However, as disposal income of Malaysian consumer’s increase, more new grooming products are made available in specialty stores and shopping malls. Cosmetic has become a common and popular product category among the young generation and adults in which they identify with lifestyle, versatility and comfort (Ahmad et al., 2015; Azuizkulov, 2013; Shaari, 2019)
Perceived Experiential Value and Consumer-Brand Identification
Experiential value refers to the degree to which a product generates suitable experiences, emotions and feelings for customers (Smith and Colgate, 2007), and is mirrored through the hedonic dimension of a brand (Berthon et al. 2009). Understanding different consumption patterns among Asian consumers is not only vital due to the market size and development in Asian economies, but also because progress is fostering the aspiration of an emerging consumers fragment. For ethically-oriented consumers, they wish that their experience in owning and using the product will affect not only their own purchase experience but also their own social group(s), and people around them (Roberts, 2017; Demangeot & Broderick, 2010; Davies et, al., 2012). Ungarala (2021) argues that purchasing a sustainable and eco-friendly products demonstrates the consumer’s core beliefs as they acquire positive experience and prestige through goods produced and traded without causing harm to others. Interaction with brands are sensorial, full of feelings, intellectual, or behavioral in nature which facilitating purchaser’s retrieval or idea and significant data from memory. Wallace, Buil, & de Chernatony (2014), discovered a link between self-expression and the consumer’s inner self. When consumers engage with a brand, they inspire others to like the brand, which to the customers, resonates with their inner selves. Realizing the fact that encountering a brand has an impact on a person; hence it supported the positive impact of brand value on consumer brand identification. This is consistent with the findings of Stokburger-Sauer & Teichmann (2013) and Keng
408
(2013), who also emphasise experiential values in the identification concept. Therefore, the following hypothesis is proposed:
H1: Perceived Experiential Value has a significant influence on consumer brand identification of luxury cosmetics
Perceived Symbolic Value and Consumer-Brand Identification
The symbolic value refers to the perceived message a product communicates regarding a consumer’s self-image to both the consumers and others (Da Aaker & Joachimsthaler, 2000). The symbolic association can lead to a significant, meaningful signal to other customers and the general public about the nature of the individual using the brand (Kapferer, 2010). Different from the view of functional or utilitarian value that shows more physical benefits, the symbolic value on the opposite is intangible, and the benefits are obtained only when the person understands and shares the same meaning with another person in the same group (Tan et al., 2003). Some products such as luxury goods appeal to customers’ self-concept, which induces positive feelings about themselves either in possession or in giving. The product can also provide a means of self-expression which allows consumers to reflect or express their personality, taste and value (Smith & Colgate, 2007). In the context of branding, several researchers have noted that perceived congruity between a brand and a person’s personality will create a sense of affiliation between the consumer and the brand (Da Aaker & Joachimsthaler, 2000). Tan et al. (2003) also confirmed that symbolic values and meanings are desirable and valuable to consumers for the construction of oneself. It was suggested that marketers should make a concerted effort to associate symbolic values with the brand so that customers can easily feel attached to the brand without hesitation to be seen using or wearing the brand. Based on that notion, the following hypothesis is proposed:
H2: Perceived Symbolic Value has a significant relationship with consumer brand identification of luxury cosmetics.
Relationship Between Experiential, Symbolic Values with Consumer-Brand Identification and Brand Loyalty
Consumer-brand identification (CBI) was conceptualized earlier is related to the construct of self-brand connection as proposed by (Escalas & Bettman, 2003)we focus on reference groups as a source of brand associations, which can be linked to one’s mental representation of self to meet self-verification or self-enhancement goals. We conceptualize this linkage at an aggregate level in terms of self-brand connections, that is, the extent to which individuals have incorporated a brand into their self-concept. In 2 studies, we show that brands used by member groups and aspiration groups can become connected to consumers’ mental representation of self as they use these brands to define and create their self-concepts. Results from Experiment 1 show that the degree to which member group and aspiration group usage influences individual self-brand connections is contingent on the degree to which the individual belongs to a member group or wishes to belong to an aspiration group. In Experiment 2, we found that for individuals with self-enhancement goals, aspiration group brand use has a greater impact on self-brand connections; for individuals with self-verification goals, on the other hand, member group use has a greater impact. (Escalas & Bettman, 2003. Consumers symbolically identified themselves by using a brand that holds a similar identity to the user (Tuškej et al., 2013). This indicates that a favourable brand can provide a positive brand value perception and long term brand relationship. Supported by a study done by (Sutikno, 2011), the findings indicated that CBI shows an evidence that consumers shared and communicated their image and personality with the brand of their choice, hence the bond will continue in the future. If the consumers can easily have identified them with the value and image portrayed by the brand, the consumers can easily keep loyal to the brand.
In past studies, brand experience and loyalty seem to be mediated through consumer’s satisfaction (Brakus et al., 2009). However, customer commitment is also an significant
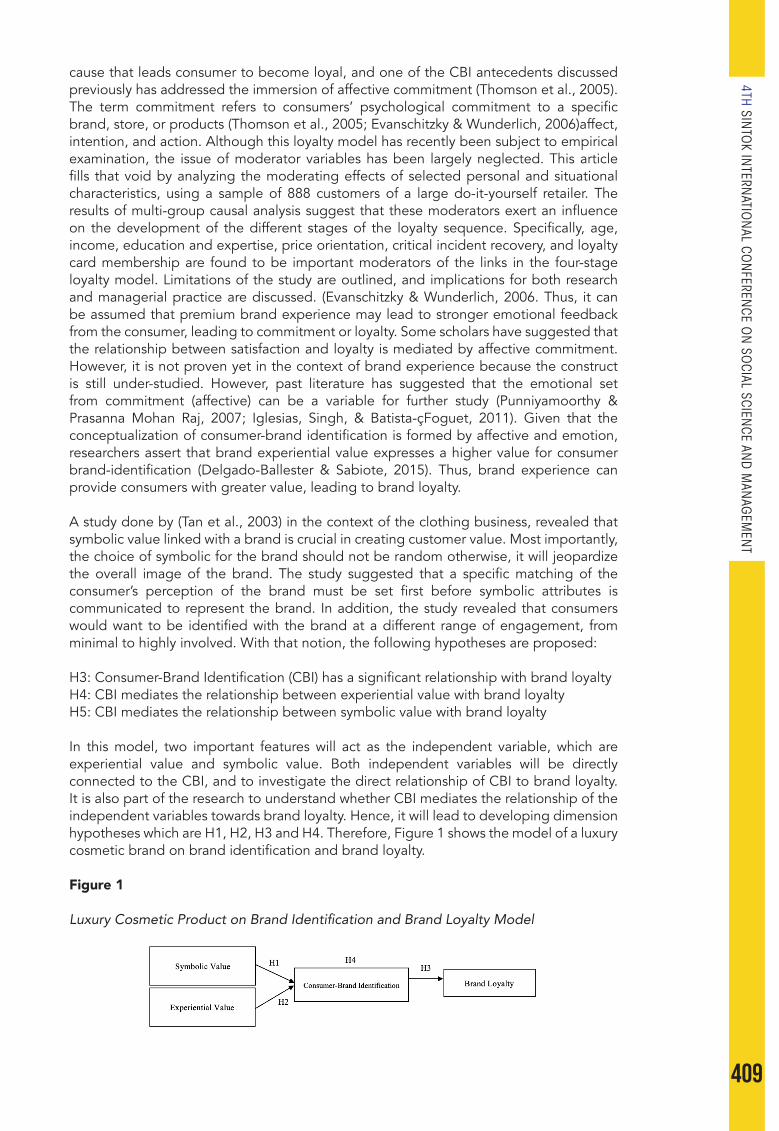
409
4TH SINTO
K INTERN
ATION
AL CON
FERENCE O
N SO
CIAL SCIENCE AN
D M
ANAG
EMEN
T
cause that leads consumer to become loyal, and one of the CBI antecedents discussed previously has addressed the immersion of affective commitment (Thomson et al., 2005). The term commitment refers to consumers’ psychological commitment to a specific brand, store, or products (Thomson et al., 2005; Evanschitzky & Wunderlich, 2006)affect, intention, and action. Although this loyalty model has recently been subject to empirical examination, the issue of moderator variables has been largely neglected. This article fills that void by analyzing the moderating effects of selected personal and situational characteristics, using a sample of 888 customers of a large do-it-yourself retailer. The results of multi-group causal analysis suggest that these moderators exert an influence on the development of the different stages of the loyalty sequence. Specifically, age, income, education and expertise, price orientation, critical incident recovery, and loyalty card membership are found to be important moderators of the links in the four-stage loyalty model. Limitations of the study are outlined, and implications for both research and managerial practice are discussed. (Evanschitzky & Wunderlich, 2006. Thus, it can be assumed that premium brand experience may lead to stronger emotional feedback from the consumer, leading to commitment or loyalty. Some scholars have suggested that the relationship between satisfaction and loyalty is mediated by affective commitment. However, it is not proven yet in the context of brand experience because the construct is still under-studied. However, past literature has suggested that the emotional set from commitment (affective) can be a variable for further study (Punniyamoorthy & Prasanna Mohan Raj, 2007; Iglesias, Singh, & Batista-çFoguet, 2011). Given that the conceptualization of consumer-brand identification is formed by affective and emotion, researchers assert that brand experiential value expresses a higher value for consumer brand-identification (Delgado-Ballester & Sabiote, 2015). Thus, brand experience can provide consumers with greater value, leading to brand loyalty.
A study done by (Tan et al., 2003) in the context of the clothing business, revealed that symbolic value linked with a brand is crucial in creating customer value. Most importantly, the choice of symbolic for the brand should not be random otherwise, it will jeopardize the overall image of the brand. The study suggested that a specific matching of the consumer’s perception of the brand must be set first before symbolic attributes is communicated to represent the brand. In addition, the study revealed that consumers would want to be identified with the brand at a different range of engagement, from minimal to highly involved. With that notion, the following hypotheses are proposed:
H3: Consumer-Brand Identification (CBI) has a significant relationship with brand loyaltyH4: CBI mediates the relationship between experiential value with brand loyaltyH5: CBI mediates the relationship between symbolic value with brand loyalty
In this model, two important features will act as the independent variable, which are experiential value and symbolic value. Both independent variables will be directly connected to the CBI, and to investigate the direct relationship of CBI to brand loyalty. It is also part of the research to understand whether CBI mediates the relationship of the independent variables towards brand loyalty. Hence, it will lead to developing dimension hypotheses which are H1, H2, H3 and H4. Therefore, Figure 1 shows the model of a luxury cosmetic brand on brand identification and brand loyalty.
Figure 1
Luxury Cosmetic Product on Brand Identification and Brand Loyalty Model
410
METHODHOLOGY
This research aims to focus on quantitative analysis to achieve the stated research objectives. The quantitative research approach used in this study relies heavily on structured questionnaires as the primary data collection tool. The current study will collect data using a cross-sectional approach, in which conclusions will be drawn from an examination of a single point in time (Sekaran, 2013). In the current study, the target population is among the individual Malaysian consumers’ ages 18 years and above. The researcher chooses a sample of respondents who have experienced using luxury cosmetic brands, currently or in the past, and purposive sampling fits the purpose of generalizability of the findings. It means that the procedure of using purposive sampling involves identification and selection of individuals or group of individuals that are proficient and well-informed with a phenomenon being studied. In addition to the knowledge and experience the participants have, willingness to participate and ability to communicate their opinion are also required. (Wu Suen et al., 2014; accessible population, simple random sampling, intended sample, actual sample, and statistical power analysis. These terms are then used to explain the difference between \”convenience sampling\” and \”purposive sampling.\” Convenience sampling is a non-probabilistic sampling technique applicable to qualitative or quantitative studies, although it is most frequently used in quantitative studies. In convenience samples, subjects more readily accessible to the researcher are more likely to be included. Thus, in quantitative studies, opportunity to participate is not equal for all qualifed individuals in the target population and study results are not necessarily generalizable to this population. As in all quantitative studies, increasing the sample size increases the statistical power of the convenience sample. In contrast, purposive sampling is typically used in qualitative studies. Researchers who use this technique carefully select subjects based on study purpose with the expectation that each participant will provide unique and rich information of value to the study. As a result, members of the accessible population are not interchangeable and sample size is determined by data saturation not by statistical power analysis. (Wu Suen et al., 2014p.2). The respondents should know about the product and provide a piece of good information (Sekaran & Bougie, 2010). In comparison to other social media platform, Instagram is the only medium selected by the majority of individuals for product sharing and purchase experiences. As such, it would be appropriate to collect data via an online platform that the consumers are familiar with. The online questionnaire distribution method, mainly through Instagram and Facebook, has a potential risk of exposing the survey to those who do not belong to the targeted group.
RESULTS
Profile of Consumer Demographics Characteristics
These statistics gave insight into the demographic profiles of respondents who participated in the mall-intercept. Majority of the respondents are married with children (50.6%), and 30.2% of them are still single. These 354 respondents were represented approximately of a good range, where Malays were 31.4%, Chinese 31.6 % & and Indians were 31.3%.
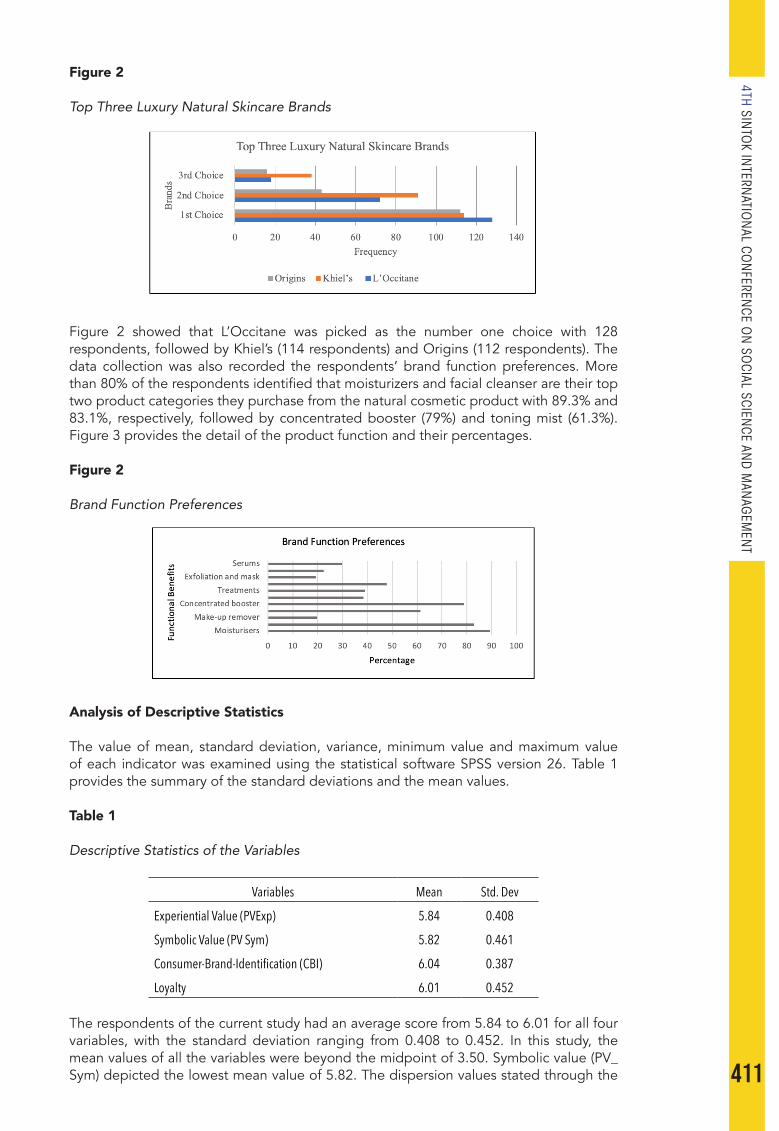
411
4TH SINTO
K INTERN
ATION
AL CON
FERENCE O
N SO
CIAL SCIENCE AN
D M
ANAG
EMEN
T
Figure 2
Top Three Luxury Natural Skincare Brands
Figure 2 showed that L’Occitane was picked as the number one choice with 128 respondents, followed by Khiel’s (114 respondents) and Origins (112 respondents). The data collection was also recorded the respondents’ brand function preferences. More than 80% of the respondents identified that moisturizers and facial cleanser are their top two product categories they purchase from the natural cosmetic product with 89.3% and 83.1%, respectively, followed by concentrated booster (79%) and toning mist (61.3%). Figure 3 provides the detail of the product function and their percentages.
Figure 2
Brand Function Preferences
Analysis of Descriptive Statistics
The value of mean, standard deviation, variance, minimum value and maximum value of each indicator was examined using the statistical software SPSS version 26. Table 1 provides the summary of the standard deviations and the mean values.
Table 1
Descriptive Statistics of the Variables
Variables Mean Std. Dev
Experiential Value (PVExp) 5.84 0.408
Symbolic Value (PV Sym) 5.82 0.461
Consumer-Brand-Identification (CBI) 6.04 0.387
Loyalty 6.01 0.452
The respondents of the current study had an average score from 5.84 to 6.01 for all four variables, with the standard deviation ranging from 0.408 to 0.452. In this study, the mean values of all the variables were beyond the midpoint of 3.50. Symbolic value (PV_Sym) depicted the lowest mean value of 5.82. The dispersion values stated through the

412
standard deviation indicate that the dispersion values were less than 1 for all variables. The Outer Assessment Model (Measurement Models) consists of three criteria namely, Convergent Validity, Discriminant Validity and Composite Reliability (Hair et al., 2014)there has been a heated debate on the benefits and drawbacks of PLS-SEM versus those of its sibling, the covariance-based structural equation modeling (CB-SEM. As shown in Table 2, the square root AVE value for individual construct is more than 0.5 so the divergent validity was all been achieved. In addition, Table 2 also pointed out that all variables have a greater value compared to other constructs of their square root AVE value. In conclusion, the standards for the Partial Test Least Square Models with Outer size (Measurement Model) had all been met in this study.
Table 2
Construct Correlations (Diagonal Elements are Square Roots of the AVE)
CBI Exp_Feel Loyalty Sym_Exp
CBI 0.741
Exp_Feel 0.464 0.781
Loyalty 0.212 0.483 0.756
Sym_Exp 0.417 0.43 0.254 0.865
Note: Brand loyalty, Consumer-Brand Identification (CBI), Experiential Value, Symbolic value
Path Coefficient and Hypothesis Test Result
After running the PLS model, estimations are given for the path coefficients, which signify the hypothesized relationship connecting the constructs. The path coefficient of the structural model were measured, and the bootstrap analysis was carried out to measure the statistical impact of the path coefficients. The path coefficients have standardized values between -1 and +1. The estimated path coefficient closest to +1 signifies a strong positive relationship and vice versa for negative values (Hair et al., 2019)yet concise, overview of the considerations and metrics required for partial least squares structural equation modeling (PLS-SEM. Based on the results in Table 3, it was found that consumer’s experiential value is found to have a positive relationship with CBI (t value = 3.472, p value = 0.001), symbolic value (t value=2.527, p value = 0.012), and between CBI and loyalty (t=4.042, p value=0.000). Hence, H1, H2 and H3 are supported.
Table 3
Direct Relationships of the Variables in the Study
Num Hypothesis Beta Standard Deviation T Values P Values Decision
H1 PV_Exp -> CBI 0.205 0.059 3.472** 0.001 Supported
H2 PV_Sym -> CBI 0.129 0.051 2.275** 0.012 Supported
H3 CBI -> Loylty 0.206 0.051 4.042** 0.000 Supported
*significance at p<0.05 (2.33), ** significance at p<0.01 (1.645) ;(based on one-tailed test), bootstrapping (n=5000). CBI=Consumer-brand Identification, PV_Exp= Experiential value, PV_Sy,= Symbolic value
Next, testing the indirect effect of CBI as a mediator is also one of the key objectives of the present research. Two hypotheses were developed, representing the indirect relationship. Based on Table 4, all indirect relationships were supported (p<0,05 and
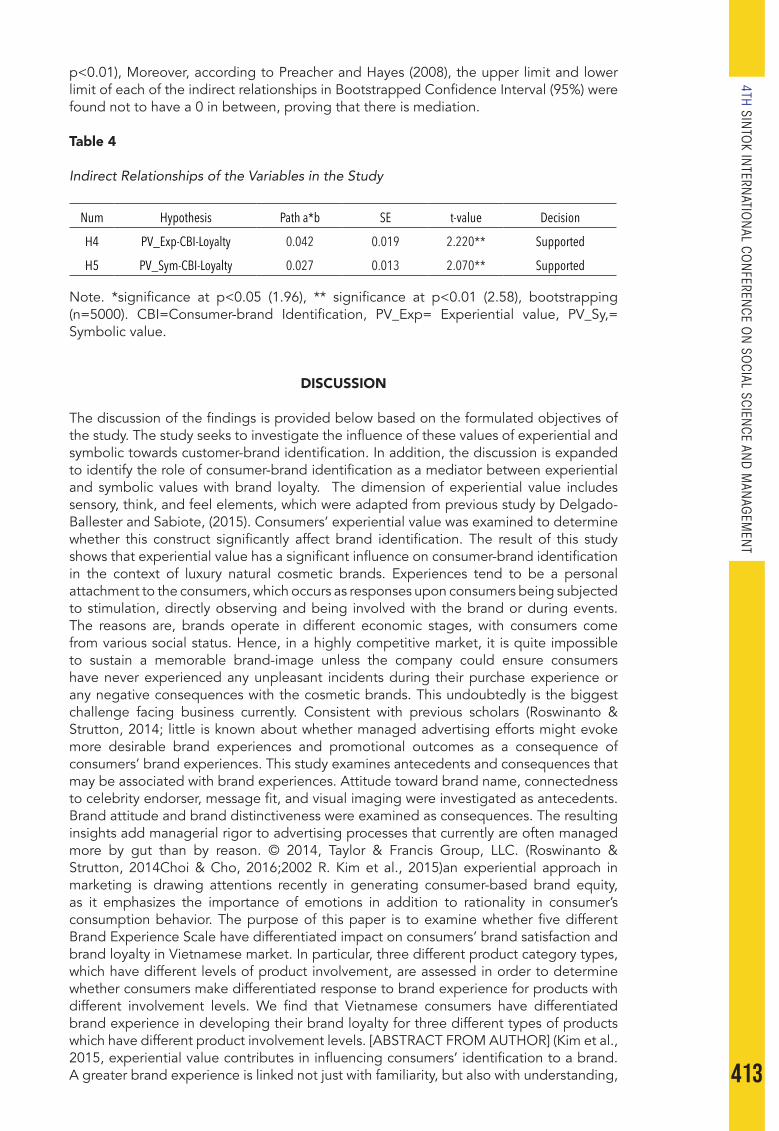
413
4TH SINTO
K INTERN
ATION
AL CON
FERENCE O
N SO
CIAL SCIENCE AN
D M
ANAG
EMEN
T
p<0.01), Moreover, according to Preacher and Hayes (2008), the upper limit and lower limit of each of the indirect relationships in Bootstrapped Confidence Interval (95%) were found not to have a 0 in between, proving that there is mediation.
Table 4
Indirect Relationships of the Variables in the Study
Num Hypothesis Path a*b SE t-value Decision
H4 PV_Exp-CBI-Loyalty 0.042 0.019 2.220** Supported
H5 PV_Sym-CBI-Loyalty 0.027 0.013 2.070** Supported
Note. *significance at p<0.05 (1.96), ** significance at p<0.01 (2.58), bootstrapping (n=5000). CBI=Consumer-brand Identification, PV_Exp= Experiential value, PV_Sy,= Symbolic value.
DISCUSSION
The discussion of the findings is provided below based on the formulated objectives of the study. The study seeks to investigate the influence of these values of experiential and symbolic towards customer-brand identification. In addition, the discussion is expanded to identify the role of consumer-brand identification as a mediator between experiential and symbolic values with brand loyalty. The dimension of experiential value includes sensory, think, and feel elements, which were adapted from previous study by Delgado-Ballester and Sabiote, (2015). Consumers’ experiential value was examined to determine whether this construct significantly affect brand identification. The result of this study shows that experiential value has a significant influence on consumer-brand identification in the context of luxury natural cosmetic brands. Experiences tend to be a personal attachment to the consumers, which occurs as responses upon consumers being subjected to stimulation, directly observing and being involved with the brand or during events. The reasons are, brands operate in different economic stages, with consumers come from various social status. Hence, in a highly competitive market, it is quite impossible to sustain a memorable brand-image unless the company could ensure consumers have never experienced any unpleasant incidents during their purchase experience or any negative consequences with the cosmetic brands. This undoubtedly is the biggest challenge facing business currently. Consistent with previous scholars (Roswinanto & Strutton, 2014; little is known about whether managed advertising efforts might evoke more desirable brand experiences and promotional outcomes as a consequence of consumers’ brand experiences. This study examines antecedents and consequences that may be associated with brand experiences. Attitude toward brand name, connectedness to celebrity endorser, message fit, and visual imaging were investigated as antecedents. Brand attitude and brand distinctiveness were examined as consequences. The resulting insights add managerial rigor to advertising processes that currently are often managed more by gut than by reason. © 2014, Taylor & Francis Group, LLC. (Roswinanto & Strutton, 2014Choi & Cho, 2016;2002 R. Kim et al., 2015)an experiential approach in marketing is drawing attentions recently in generating consumer-based brand equity, as it emphasizes the importance of emotions in addition to rationality in consumer’s consumption behavior. The purpose of this paper is to examine whether five different Brand Experience Scale have differentiated impact on consumers’ brand satisfaction and brand loyalty in Vietnamese market. In particular, three different product category types, which have different levels of product involvement, are assessed in order to determine whether consumers make differentiated response to brand experience for products with different involvement levels. We find that Vietnamese consumers have differentiated brand experience in developing their brand loyalty for three different types of products which have different product involvement levels. [ABSTRACT FROM AUTHOR] (Kim et al., 2015, experiential value contributes in influencing consumers’ identification to a brand. A greater brand experience is linked not just with familiarity, but also with understanding,
414
enjoying, enhancing, and fostering the brand. Previous study confirmed that to strengthen the connection between consumer and brand, how the consumers think of the brand is highly important (Edson Escalas, 2004; Nielsen & Escalas, 2010)the subjective feeling that forming a preference is easy or difficult. Given that the construction of consumer-brand identification is inherently an affective process that is unique, personal and memorable, a heightened brand knowledge perspective results in a greater extent from the mind of the consumers, thus provides a higher order basis for consumer-brand identification. Previous studies such as Solomon (1983), that had suggested symbolic values can drive the relationships between consumers and their brand. Findings of the current study were consistent with past study (Lam, Ahearne, & Schillewaert, 2012;Smith & Colgate, 2007;Shukla, Singh, & Banerjee, 2015) which confirmed that symbolic value has a positive relationship with consumer identification. Many researchers concur that consumer-brand relationship can be mixed exchange that is driven by both utilitarian and symbolic values. The symbolic value of brands is the focus of various streams of marketing research that are based on social identity theory, identity theory, and self-theories. Previous marketing research has mainly focused on either self-brand incongruity or perceived quality in explaining consumer attitude toward the brand and consumer behaviour. It is necessary for consumers to have a strong identification with a brand to view the brand’s success as their own and to ensure the brand they identify with is also viewed positive by others to motivate them to engage in identity-promoting behaviour.
CONCLUSION
It is believed that the findings of the study present the business owners and marketers with a better understanding of the consumers’ attitude and their preferences when it comes to their engagement and commitment with specific brands and finally, the intrinsic notion that turns the customers into brand loyalists. Additionally, this study contributes to the existing research by delving deeper into consumer’s choices and preferences which are not solely based on product functions, but rather on consumer’s inner state pf perceived value, which may have been neglected inadvertently. This study helps business practitioners and marketers to gain better understanding of the primary factors influencing consumer loyalty towards luxury natural cosmetic products. In this study, the natural cosmetic brands play a salient player role that could connect the customers to the company’s vision and future growth. Indeed, the companies are very much dependent on the conspicuous support of the brand users to stay relevant to the market. The portrayal of continuous efforts in providing a good product, with an excellent performance distinction, including assurance of safe usage over long periods should sustain the business in the views of societal marketing philosophy and the embellishments of it. Having the brand that makes one feel proud, superior functionality shown, value of experience given to its users, the safer ingredients used and utilizing non-harmful process-making makes users feel more confident of using the brand. This should give the marketers some solid ideas for formulating creative marketing campaigns and unique strategies to effectively communicate the brand with the customers and enhance brand loyalty.
REFERENCES
Aaker, D., & Joachimsthaler, E. (2000). The brand relationship spectrum: The key to the brand architecture challenge. California Management Review, 42(4), 8–23. https://doi.org/Article
Ali, Q., Salman, A., Yaacob, H., & Parveen, S. (2019). Financial cost and social influence: Factors affecting the adoption of halal cosmetics in Malaysia. Acad Entrep Journal, 25(2), 1-17.
Ahmad, A. N., Rahman, A. A., & Rahman, S. A. (2015). Assessing knowledge and religiosity on consumer behavior towards halal food and cosmetic products. International Journal of Social Science and Humanity, 5(1), 10–14. https://doi.org/10.7763/IJSSH.2015.V5.413
Azuizkulov, D. (2013). Country of origin and brand loyalty on cosmetic products among Universiti Utara Malaysia Students. Atlantic Review of Economics, 2.
415
4TH SINTO
K INTERN
ATION
AL CON
FERENCE O
N SO
CIAL SCIENCE AN
D M
ANAG
EMEN
T
Atkinson, S. D., & Kang, J. (2021). New luxury: Defining and evaluating emerging luxury trends through the lenses of consumption and personal values. Journal of Product & Brand Management, ahead-of-p(ahead-of-print). https://doi.org/10.1108/jpbm-09-2020-3121
Bartels, J., & Onwezen, M. C. (2014). Consumers’ willingness to buy products with environmental and ethical claims: The roles of social representations and social identity. International Journal of Consumer Studies, 38(1), 82–89. https://doi.org/10.1111/ijcs.12067
Brakus, J. J., Schmitt, B. H., & Zarantonello, L. (2009). Brand experience: What is it? How is it measured? Does it affect loyalty? Journal of Marketing, 73(May), 52–68. https://doi.org/10.1509/jmkg.73.3.52
Berthon, P., Pitt, L., Parent, M., & Berthon, J.-P. (2009). Aesthetics and ephemerality: Observing and preserving the luxury brand. California Management Review, 52(1), 45–66. https://doi.org/10.1525/cmr.2009.52.1.45
Choi, Y., & Cho, Y. C. (2016). Exploring factors that affect destination brand in the tourism industry. Journal of Marketing Thought, 3(3), 1–10. http://10.0.60.217/jmt.2016.03.03.1%5 Cnhttp://library. cut.ac.cy/el/vpn
Davies, I. A., Lee, Z., & Ahonkhai, I. (2012). Do consumers care about ethical-luxury? Journal of Business Ethics, 106(1), 37–51. https://doi.org/10.1007/s10551-011-1071-y
Dall’Olmo Riley, F., Pina, J. M., & Bravo, R. (2015). The role of perceived value in vertical brand extensions of luxury and premium brands. Journal of Marketing Management, 31(7–8), 881–913. https://doi.org/10.1080/0267257X.2014.995692
Delgado-Ballester, E., & Sabiote, E. F. (2015). Brand experimental value versus brand functional value. European Journal of Marketing, 49(11/12), 1857–1879. https://doi.org/10.1108/EJM-02-2014-0129
Demangeot, C., & Broderick, A. J. (2010). Consumer perceptions of online shopping environments. Psychology & Marketing, 30(6), 461–469. https://doi.org/10.1002/mar
De Mooij, M., & Hofstede, G. (2011). Cross-cultural consumer behavior: A review of research findings. Journal of International Consumer Marketing, 23(3–4), 181–192. https://doi.org/10.1080/08961530. 2011.578057
Edson E., J. (2004). Narrative processing: Building consumer connections to brands. Journal of Consumer Psychology, 14(1–2), 168–180. https://doi.org/10.1207/s15327663jcp1401&2_19
Escalas, J. E., & Bettman, J. R. (2003). You are what they eat: The influence of reference groups on consumers’ connections to brands. Journal of Consumer Psychology, 13(3), 339–348. https://doi.org/10.1207/S15327663JCP1303_14
Evanschitzky, H., & Wunderlich, M. (2006). An examination of moderator effects in the four-stage loyalty model. Journal of Service Research, 8(4), 330–345. https://doi.org/10.1177/1094670506286325
First, I., & Khetriwal, D. S. (2010). Exploring the relationship between environmental orientation and brand value: Is there fire or only smoke? Business Strategy and the Environment, 19(2), 90–103. https://doi.org/10.1002/bse.619
Gabrielova, K., & Buchko, A. A. (2021). Here comes generation Z: Millennials as managers. Business Horizons, 64(4), 489–499. https://doi.org/10.1016/j.bushor.2021.02.013
Hair, J. F., Risher, J. J., Sarstedt, M., & Ringle, C. M. (2019). When to use and how to report the results of PLS-SEM. European Business Review, 31(1), 2–24. https://doi.org/10.1108/EBR-11-2018-0203
Hair, Sarstedt, M., & Ringle, C. M. (2014). PLS-SEM: Looking back and moving forward. Long Range Planning, 47(3), 132–137. https://doi.org/10.1016/j.lrp.2014.02.008
Hassali, M. A., Al-Tamimi, S. K., Dawood, O. T., Verma, A. V., & Saleem, F. (2015). Malaysian cosmetic market: Current and future prospects. Pharmaceutical Regulatory Affairs, 4(4), 1000155. https://doi.org/10.4172/2167-7689.1000155
Iglesias, O., Singh, J. J., & Batista-Foguet, J. M. (2011). The role of brand experience and affective commitment in determining brand loyalty. Journal of Brand Management, 18(8), 570–582. https://doi.org/10.1057/bm.2010.58
Kapferer. (2010). All that glitters is not green: The challenge of sustainable luxury. The European Business Review, December, 40–45. http://www.theluxurystrategy.com/site/wp-content/uploads/2011/01 /EBR.JNK_.NovDec2010_All-that-Glitters-is-not-Green.SustainableLuxury.pdf
416
Kessler, R. (2015). Cosmetic changes. Environmental Health, 123(5), 120–127. https://doi.org/10.1038/scientificamerican1010-10
Kainth, J. S., & Verma, H. V. (2016). Consumer perceived value: Construct apprehension and its evolution, (January 2011).
Keng, C. (2013). Relationships among brand experience, brand personality, and customer experiential value. 9(3), 247–262. https://doi.org/10.7903/cmr.11086
Kerdudo, A., Burger, P., Merck, F., Dingas, A., Rolland, Y., Michel, T., & Fernandez, X. (2016). Développement d’un ingrédient naturel: Étude de cas d’un conservateur naturel. Comptes Rendus Chimie, 19(9), 1077–1089. https://doi.org/10.1016/j.crci.2016.06.004
Kim, R., Yoon, D. H., Chao, Y., & Dang, N. (2015). Effects of brand experience and product involvement on brand loyalty for vietnamese consumers. DLSU Business and Economics Review, 25(1), 1–15.
Kirmani, M. D., & Khan, M. N. (2016). Environmental concern to attitude towards green products: evidences from India. Serbian Journal of Management, 11(2), 159–179. https://doi.org/10.5937/ sjm11-9241
Kim, Y. (2011). Understanding green purchase: The influence of collectivism, personal values and environmental attitudes, and the moderating effect of perceived consumer effectiveness. Seoul Journal of Business, 17(1), 65–92.
Lu, L. C., Chang, H. H., & Chang, A. (2013). Consumer personality and green buying intention: The mediate role of consumer ethical beliefs. Journal of Business Ethics, 1–15. https://doi.org/10.1007/ s10551-013-2024-4
Lam, S. K., Ahearne, M., & Schillewaert, N. (2012). A multinational examination of the symbolic–instrumental framework of consumer–brand identification. Journal of International Business Studies, 43(3), 306–331. https://doi.org/10.1057/jibs.2011.54
Leung, P. P. L., Wu, C. H., Ip, W. H., & Ho, G. T. S. (2019). Enhancing online-to-offline specific customer loyalty in beauty industry. Enterprise Information Systems, 13(3), 352–375. https://doi.org/10.1080/ 17517575.2018.1527042
Minh, N., & Nguyen, D. (2021). Factors influencing finnish generation Z consumer behaviors towards green purchase of cosmetics. http://www.theseus.fi/handle/10024/493316
Nielsen, J. H., & Escalas, J. E. (2010). Easier is not always better: The moderating role of processing type on preference fluency. Journal of Consumer Psychology, 20(3), 295–305. https://doi.org/10.1016 /j.jcps.2010.06.016
Nikolova, H. D., & Inman, J. J. (2015). Healthy choice: The effect of simplified POS nutritional information on consumer food choice behavior. Journal of Marketing Research, 2437(November), 150313091947009. https://doi.org/10.1509/jmr.13.0270
Ninla Elmawati Falabiba. (2019). The compelling trend of halal cosmetic industry in Malaysia. 3, 1–10.
Preacher, K. J., & Hayes, A. F. (2008). Asymptotic and resampling strategies for assessing and comparing indirect effects in multiple mediator models. Behavior Research Methods, 40(3), 879–891. https://doi.org/10.3758/BRM.40.3.879
Punniyamoorthy, M., & Prasanna Mohan Raj, M. (2007). An empirical model for brand loyalty measurement. Journal of Targeting, Measurement and Analysis for Marketing, 15(4), 222–233. https://doi.org/10.1057/palgrave.jt.5750044
Roberts, J. A. (2017). Green Consumers in the 1990s: Profile and implications for advertising. 2963(July 1996). https://doi.org/10.1016/0148-2963(95)00150-6
Roswinanto, W., & Strutton, D. (2014). Investigating the advertising antecedents to and consequences of brand experience. Journal of Promotion Management, 20(5), 607–627. https://doi.org/10.1080 /10496491.2014.946206
Sekaran, U. (2013). Research methods for business. In Research methods for business (Vol. 65, Issue 3). https://doi.org/10.1017/CBO9781107415324.004
Sekaran, U., & Bougie, R. (2010). Uma Sekaran and Roger Bougie. A skill-building approach, 1–457.
Shaari, H. (2019). Brand referral behaviour among millenials’consumers: The case of cosmetic brands. 1–11.
Shukla, P., Singh, J., & Banerjee, M. (2015). Marketing luxury brands across Asian markets: An investigation of consumer luxury value perceptions in China , India , and Indonesia. 24–26.
Smith, J., & Colgate, M. (2007). Customer value creation: A practical framework. The
417
4TH SINTO
K INTERN
ATION
AL CON
FERENCE O
N SO
CIAL SCIENCE AN
D M
ANAG
EMEN
T
Journal of Marketing Theory and Practice, 15(1), 7–23. https://doi.org/10.2753/MTP1069-6679150101
Solomon, M. R. (1983). The Role of products as social stimuli: A symbolic interactionism perspective. Journal of Consumer Research, 10(3), 319. https://doi.org/10.1086/208971
Stokburger-Sauer, N. E., & Teichmann, K. (2013). Is luxury just a female thing? The role of gender in luxury brand consumption. Journal of Business Research, 66(7), 889–896. https://doi.org/10.1016 /j.jbusres.2011.12.007
Sutikno, B. (2011). Doess consumers’ brand identification matter: The mediating roles of brand loyalty. International Journal of Interdisciplinary Social Sciences, 6(3), 319–331. http://www.scopus.com/ inward/record.url?eid=2-s2.084855768128&partnerID=40&md5=241535337fa4ff1dad19969 d4beca558
Tan, T., Wee, T. S. U., Chua, M., & Ming, H. A. N. (2003). Academic papers leveraging on symbolic values, 10(3), 208–218.
Thomson, M., MacInnis, D. J., & Whan Park, C. (2005). The ties that bind: Measuring the strength of consumers’ emotional attachments to brands. Journal of Consumer Psychology, 15(1), 77–91. https://doi.org/10.1207/s15327663jcp1501_10
Tuškej, U., Golob, U., & Podnar, K. (2013). The role of consumer-brand identification in building brand relationships. Journal of Business Research, 66(1), 53–59. https://doi.org/10.1016/j.jbusres. 2011.07.022
Ungarala, D. P. (2021). Impact of brand experience on the purchase intention and loyalty of luxury cosmetics brands: Mediating role of self concept. Pyschology and Education, 58(2), 10431–10442.
Wallace, E., Buil, I., & de Chernatony, L. (2014). Consumer engagement with self-expressive brands: Brand love and WOM outcomes. Journal of Product & Brand Management, 23(1), 33–42. https://doi.org/10.1108/JPBM-06-2013-0326
Wu Suen, L. J., Huang, H. M., & Lee, H. H. (2014). A comparison of convenience sampling and purposive sampling. Journal of Nursing, 61(3), 105–111. https://doi.org/10.6224/JN.61.3.105
Yadav, R., & Pathak, G. S. (2016a). Intention to purchase organic food among young consumers: Evidences from a developing nation. Appetite, 96, 122–128. https://doi.org/10.1016/j.appet.2015.09.017
Yadav, R., & Pathak, G. S. (2016b). Young consumers’ intention towards buying green products in a developing nation: Extending the theory of planned behavior. Journal of Cleaner Production, 135, 732–739. https://doi.org/10.1016/j.jclepro.2016.06.120
Zeithaml, V. (1988). Consumer perceptions of price, quality, and value: A means-end model and synthesis of evidence. Journal of Marketing, 52(3), 22. https://doi.org/10.2307/1251446

418
Siconsem 2021: 094
NATO EASTWARD EXPANSION AND OFFENSIVE REALISM PERSPECTIVE: AN ANALYSIS
Mohd. Noor Mat YazidFaculty of Social Sciences and Humanities
Universiti Malaysia Sabah, Malaysia
Corresponding author: [email protected]
ABSTRACT
This paper discusses the international politics and security management in the continent of Europe during the early period of the post-Cold War era. The focus of discussion is during the first decade after the end of the Cold War. NATO eastward expansion began after the collapsed of the Soviet Union. Former Warsaw Pact members such as Republic of Czech, Hungary and Poland joined NATO in 1999. In early 2004 Bulgaria, Estonia, Latvia, Lithuania, Romania, Slovakia, and Slovenia joined NATO. The objective of this study are: firstly, to explore why these Eastern European countries joined NATO after the end of the Cold War? secondly what is the impact to the security and regional political stability in continent of Europe? The offensive Realism perspective will be applied in this study. This study concludes that changes of the international political structure (the fall of Soviet Union as a strong power in bipolarity structure) influenced the Eastern European foreign policy and joining NATO as new members. The NATO expansion into Eastern Europe could promote stability and security in the European continent. It also could deter Russia’s intervention in the region. The American influence spread to the whole European continent with the eastward NATO expansion (during the Cold War period, the American only controlled the Western Europe, whereas the Eastern was controlled by the Soviet Union).
Keyword: NATO Eastward, offensive realism, Cold War.
INTRODUCTION
This paper discusses the international politics and security management in the continent of Europe during the early period of the post-Cold War era. The focus of discussion is during the first decade after the end of the Cold War. NATO eastward expansion began after the collapsed of the Soviet Union. Former Warsaw Pact members such as Republic of Czech, Hungary and Poland joined NATO in 1999. In early 2004 Bulgaria, Estonia, Latvia, Lithuania, Romania, Slovakia, and Slovenia joined NATO. The objective of this study are: firstly, to explore why these Eastern European countries joined NATO after the end of the Cold War? secondly what is the impact to the security and regional political stability in continent of Europe? The offensive Realism perspective will be applied in this study. This study concludes that changes of the international political structure (the fall of Soviet Union as a strong power in bipolarity structure) influenced the Eastern European foreign policy and joining NATO as new members. The NATO expansion into Eastern Europe could promote stability and security in the European continent. It also could deter Russia’s intervention in the region. The American influence spread to the whole European continent with the eastward NATO expansion after the end of the Cold War. During the Cold War period, the American only controlled the Western Europe, whereas the Eastern was controlled by the Soviet Union. This paper divided into five sections: firstly, an introduction; secondly, methodology (problem statement, research objectives, research question, scope of study, method of study/data collection, theoretical framework and literature review); thirdly, discussion and finally, a conclusion.
NATO eastward expansion after the end of the Cold War is recognised as one of the important elements in studying and analysing international security and political stability in Europe. American power plays significant role in NATO expansion and the Europe
39

419
4TH SINTO
K INTERN
ATION
AL CON
FERENCE O
N SO
CIAL SCIENCE AN
D M
ANAG
EMEN
T
security management. This study explores the process of NATO expansion and the impact to European stability. To what extent the stable political situation during the period after the end of Cold War was strongly influenced by the NATO expansion? What happened to the European security and political stability without American role and NATO eastward expansion? Is it possible international stability without American role and NATO expansion?
This study has three main objectives, namely (a) to explain the NATO enlargement/expansion into Eastern European countries after the end of the Cold War. (b) to discuss the relationship between the Offensive Realism and the security development in Europe after the end of the Cold War. (c) to analyse the impact to the security and regional political stability in continent of Europe after NATO expansion.
This study has three main research questions, namely what is the changes of NATO after the end of the Cold War? Why the Eastern European countries joined NATO after the end of the Cold War? how the Offensive Realism could be applied in explaining the NATO eastward expansion? And what is the impact to the security and regional political stability in continent of Europe with the NATO expansion?
The scope of the study covers two decades after the end of the end of the Cold War, from 1989 until 2010 emphasising the role of the American and NATO expansion in the new international/regional political institution.
METHODOLOGY
Method of Study/Data Collection
This study deploys a qualitative methodology which mainly uses secondary data such as books, journal academic articles and internet resources. Books written by Mearshiemer, and Waltz used as the precursor in this study. Articles written by distinguished scholars such as Waltz, Mearshiemer, Mattox, Kupchan, and others in the Contemporary Security Policy, Review of International Studies, International Security and Word Politics are widely used in this study.
Theoretical Framework
The Theory of Offensive Realism is applied in this study. This theory is important in understanding the roles played by the American as a unipolar power and the relations with the new structure in the international system after the end of the Cold War. Offensive Realism is different with the Defensive Realism. What causes states to compete for power in Defensive and Offensive realism? Both, offensive realism and defensive compete for power because of the nature of the structure of the international system. In the Defensive Realism, state seeks power for security and for their survival in the system. The power that states required in the defensive realism is not to dominate the other state, but more to survive and maintaining the stability of the system. In the offensive Realism the main and final objective of power is not just for the survivals in the system, but for dominating the other state with the final objective is to be a hegemonic power, the strongest power in the system. The final goal is to dominate the other state in the certain region or in the whole system if possible (Mearshiemer, 2014)
LITERATURE REVIEW
The role of American in Europe and NATO eastward expansion after the end of the Cold War have been widely discussed by scholars of international relations and security studies. Mattox (2000) argued that the enlargement of NATO was a correct decision both for the alliance objective of stability and security in Europe. NATO enlargement to include Poland, Hungary and the Czech Republic was the right decision at the right time (Mattox,
420
2000). Ball (1998) claimed that the NATO eastward expansion into Eastern Europe is important for regional political stability and security. He based his argument that NATO expansion into Eastern Europe could deter Russia from entertaining or engaging in territorial revisionism to recover lost territories or to intimidate Eastern European states. NATO eastward expansion could promote stability and security in the East European region by providing reassurance to its new East European member states (and also for the non-NATO member in that region). Russia would be obliged to take into account the strategic fact that any threat or use of force against East European state would provoke a response from the NATO member. With NATO in the Eastern Europe, Russia would have to stop and consider the consequences of any such threats or military action. McGwire (1998) raised different argument with NATO expansion into Eastern Europe (McGwire, 1998). He argued that NATO eastward expansion is a policy error. It will reduce the good relation and cooperation with the Soviet Union leaders, especially with those who oppose the democratic reform in Russia. With NATO expansion would create line of division between Russia and Eastern Europe.
Mearshiemer (1990) argued that the political stability in Europe after the end of the Cold War would be more suffer to than the past fourty-five years (from the period after World War II until the end of the Cold War ended in 1989). He relates with the structural change from bipolar to multipolar political structure. Europe without the superpower would probably not be as violent as the first 45 years of the twentieth century (1900-1945) but would probably be substantially more prone to violence that the first four decade of the twentieth century. What is the basis for the pessimistic Mearshiemer’s conclusion? He argued that the distribution and nature of military power are the main sources of war and peace in Europe (Mearshiemer, 1990). The ‘Long Peace’ in Europe was a result of three fundamentally important conditions; firstly, the bipolar system of military power in Europe; secondly, the approximate military equality between the United States and the Soviet Union and, the reality that both of the rival superpowers were equipped with an imposing arsenal of nuclear weapons. The withdrawal or collapse of the superpowers from the Europe would give rise to a multipolar system. That multipolar system with many superpowers (Germany, France, Great Britain, Russia and Italy) would prone to instability. According to Mearshiemer’s 1990 article, the Cold War between the United States and the Soviet Union was principally responsible for transforming a historical violent region into a very peaceful place. The demise of the bipolar structure Europe and the emergence of multipolar Europe will produce a highly undesirable return to the bad European instability.1
Kramer (1996) discussed the Soviet Union and sphere of influence in the Waster Europe. He argued that there were closed relationship between the economic factor and the Soviet policy towards Eastern Europe. His study concluded that the transformation of the Soviet policy in Eastern communist state in 1985-1991 strongly influenced by the Soviet weak economic position. Due to weak economic position, Gorbachev cannot control Eastern communist State in the end of the 1980s. Under Gorbachev administration, he avoided military intervention in the Eastern Europe in maintaining the Soviet influence as what practiced by previous Soviet leader.2 Keylor (2003) also relate with economic factor and military in explaining the Soviet influence in Europe beginning from mid-1980as. He concluded that Soviet’s loss of power and sphere of influence in Eastern Europe was prompted by two factors; military low position and the economic weakness. Soviet under Khrushchev and Brezhnev had considered the satellite vital to the Soviet Union’s security interest in Eastern Europe and had therefore intervened in Hungary and Czechoslovakia, respectively to preserve Soviet control. Soviet policy under Gorbachev was different with the Soviet Union under Khrushchev and Brezhnev.
Rauchhaus (2000) argued that by expanding the alliance (NATO), the United States was able to extend its influence further into Eastern Europe while simultenously reducing Russia’s influence in the region (Eastern Europe).Rauchhaus also agreed that a numbers of domestic factors in Eastern Europe also help explain why NATO enlarging into Eastern Europe. All of the above scholars Mattox (2000), Ball (1998), McGwire (1998), Mearshiemer (1990), Kramer (1996), Keylor (2003) and Rauchhhaus (2000) emphasised that security
421
4TH SINTO
K INTERN
ATION
AL CON
FERENCE O
N SO
CIAL SCIENCE AN
D M
ANAG
EMEN
T
and regional stability in the Eastern Europe related with the structure of the regional/international politics. The changes of the regional structure influenced the changes of the security, its institution and great power relations in the Europe.
DISCUSSION
The NATO enlargement/expansion into Eastern European countries after the end of the Cold War.
2. The relationship between the Offensive Realism and the security development in Europe after the end of the Cold War.
3. The impact to the security and regional political stability in continent of Europe after NATO expansion.
CONCLUSION
This study concludes that changes of the international political structure (the fall of Soviet Union as a strong power in bipolarity structure) influenced the Eastern European foreign policy and joining NATO as new members. The NATO expansion into Eastern Europe could promote stability and security in the European continent. It also could deter Russia’s intervention in the region. The American influence spread to the whole European continent with the eastward NATO expansion (during the Cold War period, the American only controlled the Western Europe, whereas the Eastern was controlled by the Soviet Union). After the fall of the Soviet Union, the American became the solely strong power in the Europe. Regional political structure changed from bipolar to unipolarity structure.
ENDNOTES
1 The multipolarity structure do not emerged after the collapsed of the bipolarity Cold War structure Europe in 1991. The United States played active role in dominating the post-Cold War Europe with NATO eastward expansion into former communist Eastern European states. Warsaw Pact was dissolved in July 1991 and the former Warsaw Pact member become NATO membership.
2 The Soviet leader took military action in preventing violent challenges to the local communist regime; for example military action was taken in East Germany in 1953, in Hungary in 1956 and in Czechoslovakia in 1968.
REFERENCES
Aggarwal, V. K. (2000). Analysing NATO Expansion: An institutional bargaining approach, Contemporary Security Policy, 21(2), 63-82.
Ball, C. L. (1998). Nattering NATO negativism? Reason why expansion may be a good thing. Review of International Studies, 24 (Jan), pp. 43-67.
Ball, Christopher. (1998). Nattering NATO Negativism? Reasons why expansion may be a good thing, Review of International Studies, 24 (Jan), 43-68.
Bee, R. J. (2000). Boarding the NATO train: Enlargement and national interest. Contemporary Security Policy, 21(3), 149-169.
Crawford, B. (2000). The Bosnian road to NATO enlargement. Contemporary Security Policy, 21(2), 39-59.
Haas, E. B. (2000). Organization theory: Remedy for Europe’s organizational cacophony, Contemporary Security Policy, 21(2), 83-90.
Heywood, A. (2014). Global Politics (2nd ed.). Palgrave MacmillanJackson, R., & Sorenson, G. (2013). Introduction to international relations: Theories and
422
approaches (6th ed.), Oxford, UK & New York: Oxford University Press.Keylor, W. R. (2003). A world of nations: The international order since 1945. Oxford
University Press.Kramer, M. (1996). The Soviet Union and Eastern Europe: Sphere of Influence. In Woods,
N. Explaining International Relations since 1945 (pp. 98-125). Oxford University Press.Kupchan, C. A. (2000). The origin and future of NATO enlargement. Contemporary
Security Policy, 21(2), 127-148.Mattox, G. A. (2000). NATO enlargement: A step in the process of alliance reform.
Contemporary Security Policy, 21(2), 107-124.McGwire, M. (1998). NATO expansion: A policy error of historic importance. Review o
International Studies, 24(Jan), 23-42.Mearshiemer, J. J. (1990). Back to the future: Instability in Europe after the Cold War.
International Security, (Summer), 15(1), 5-56.Mearshiemer, J. J. (2014). The tragedy of great power politics (updated edition).
Table 1.1, The major realist theories at page 22, explain the differences between ‘Defensive Realism’ and ‘Offensive Realism’ (pp. 19-22). W.W. Norton & Company.
Rauchhaus, R. W. (2000). Marching NATO Eastward: Can international relations theory keep pace? Contemporary Security Policy, 21(2), 3-20.
Reynolds, D. (2001). One world divisible: A global history since 1945. W.W. Norton & Company.
Waltz, K. N. (2000). NATO expansion: A realist’s view. Contemporary Security Policy, 21(2), 23-38.
Weber, S. (2000), A modest proposal for NATO expansion. Contemporary Security Policy, 21(2), 91-106.
Young, J. W., & Kent, J. (2013). International relations since 1945: A global history (2nd ed.). Oxford University Press.

424
ORGANISING COMMITTEEAdvisor Prof. Dr. Haim Hilman Abdullah
Tim. Naib Canselor (Penyelidikan dan Inovasi) Chairman Prof. Dr. Ram Al Jaffri Saad
Deputy Chairman Puan Rosma Ishak
Secretary Puan Nor Arpizah Atan
Abstract & Publication Puan Nor Aziani Jamil Puan Zurina Yahya
Graphic & Layout Puan Rosida Abdul Razak Cik Siti Asmahani Aziz En.ZuraizeeZulkifli En. Muhamad Hasif Muner
ScientificCommittee Prof. Dr. Asmah Laili Hj. Yeon Prof. Dr. Sallahudin Hasan Prof. Dr. Nurwati Ashikin Ahmad Zaluki Prof. Dr. Rosylin Mohd Yusof Prof. Ts. Dr. Norazah Mohd Suki Prof. Dr. Azilah Kassim Assoc.Prof.Dr.TengkuFaekahTengkuAriffin Assoc. Prof. Dr. Ratnaria Wahid Assoc. Prof. Dr. Johanim Johari Assoc. Prof. Dr. Wong Woei Chyuan Assoc. Prof. Dr. Siti Aznor Hj. Ahmad Assoc.Prof.Dr.FuziahShafiie Assoc. Prof. Sr. Dr. Nasrun Mohd Nawi Assoc. Prof. Dr. Aizan Yacob Assoc. Prof. Dr. Siti Jamilah Bidin Assoc. Prof. Dr. Badariah Din Assoc. Prof. Dr. Zaheruddin Othman Dr. Abdul Malek Yaakob Webmaster & Promotion En. Mohamad Amzari Bakri Puan Noor Dalilah Mohd Yunos En. Che Mohamad Khairul Hakiman Ab Rahman Treasurer PuanUmisofianMdYusuf Technical En.MohdAsriHanafi En. Mohd Na’in Mohd Zain En. Zulhilmi Zaini

425
4TH SINTO
K INTERN
ATION
AL CON
FERENCE O
N SO
CIAL SCIENCE AN
D M
ANAG
EMEN
T
ACKNOWLEDGMENTThe organizing committee would like to express gratitude and support given by Universiti Utara Malaysia management. Our deepest appreciation to all secretariat of SICONSEM 2021 and all staff of UUM Press, Editor-in-Chief and editorial board of 21 UUM journals for the cooperation and efforts who have contributed in making 4th Sintok International Conference on Social Science and Management (SICONSEM) 2021 a success.
A sincere thank to our sponsors:• 2K Label Printing Sdn. Bhd.• Fuga Paper Trading• ZICOM Enterprise• Percetakan Mofad

426