short run underpricing of initial public offerings (ipos) in the
TRANSCRIPT

* Associate Professor, Department of Commerce, Delhi School of Economics, University of Delhi, Email:
** Research Scholar, Department of Commerce, Delhi School of Economics, University of Delhi, Email:
[email protected] (Corresponding Author)
RIJBR ISSN : 2455-5959
Short Run Underpricing of Initial Public Offerings (IPOs) in
the National Stock Exchange (NSE)
Amit Kumar Singh*
Shivani Kalra**
ABSTRACT
In order to gauge the phenomenon of underpricing and behaviour of returns
generated by Indian IPOs with respect to underlying factors, a complete
analysis of the short run performance of IPOs listed on National Stock
Exchange (NSE) has been done by taking 210 sample stocks from 2009-
2017 for which Market Adjusted Average Returns have been calculated for
first, fifth, tenth, fifteenth and twentieth trading days respectively. After an
analysis of the Short Run Performance of the stocks using Market Adjusted
Average Returns (MAAR) technique, t-statistics, Wealth Relative statistics,
etc, it is analysed whether size of the offering as measured by the price at
which it is offered has any correlation or effect on the short run
performance of the IPO. Further the relationship between the short run
performance of an IPO and its volume (measured by market capitalisation
value) has been studied by dividing the entire data into categories above
and below median volume. The results show maximum returns on the 10th
trading day and a positive correlation between underpricing and size of the
IPOs. Overall, the high volume stocks give a consistent return of 11% and
maximum returns when the stock is held till the fifteenth day of trading. The
study provides useful insights to both investors for their investment and
divestment planning as well as to issuer companies with respect to timing of
IPO issue.
Keywords: IPOs, Underpricing, Short-Run Performance, Market
Capitalization, MAAR
JEL Classification: G0, G12, C12, C13
223
1. INTRODUCTION
An efficient market is defined as the one in which an investor cannot
possibly earn abnormal returns with the publicly available information. But
the evidence on deviations of the returns and volatility of stock prices of
new issues reflect clear inconsistency with the fundamentals of efficient
market hypothesis and makes it questionable. And hence studying the
underpricing anomaly becomes an interesting investigation for researchers.
The term 'underpricing' itself suggests that the IPO has been priced below
its intrinsic worth and this can be calculated by taking the difference
between the price at which the issue was offered and the price on the first
trading day. If the price of first trade comes out to be more than the price
offered, the IPO is said to be underpriced. This analysis can be further
extended to determine the short run performance of the IPO by taking the
difference between offer price and the price on different trading days such st th th th
as 1 day, 5 day10 day 15 day, etc. or even over a few months.
This study examines the performance of IPO stocks in the short run
considering the market adjustments and helps evaluate underpricing of such
stocks over a few initial trading days. This is done to prevent the
conclusions about initial underpricing of the stocks (calculated on the basis
of listing day returns) from getting hampered due to variation caused by
external factors. Thus, the analysis provides a strengthened basis for the
cause and behaviour of underpricing in the IPO stocks by taking returns
over a few trading days and not just initial trading day. Also, the study tests
the impact of important issue characteristics on the short run performance
of stocks, providing useful insights to investors.
1.1 Theoretical framework
The financial economists have identified three prevalent anomalies in the
IPO market which are as follows:
A) UNDERPRICING
As illustrated above, it is a universal phenomenon observed across the globe
wherein due to first trade price being higher than the offer price; positive
excess returns are achieved, thus contravening the basic rudiments of
efficient market hypothesis. Various degrees of underpricing have been
RIJBR ISSN : 2455-5959224
observed across different countries (Loughran, Ritter and Rydqvist (1994).
B) HOT ISSUE PHENOMENON
According to Ibbotson and Jaffe (1975), the New Issues Market can be
categorized as Hot Markets and Cold Markets and thus even IPOs pass
through these cycles. 'Hot issue market' is a phenomenon in which there is
severe underpricing along with enormous issue activity i.e. large number of
offerings. On the other hand, 'cold issue market' phenomenon is
characterized by less number of offerings as well as low underpricing level.
C) LONG RUN UNDERPERFORMANCE
As per Ritter (1991), the long run underperformance of IPOs has been a
prevalent anomaly arising out of market timing hypothesis wherein
managers try to take advantage of favourable market conditions and select
such timing for issue in which their stock is overvalued by the market in the
early stage. This may also be the result of overreaction effect in which
investors overvalue the stock in the early stage and when the stock reaches
its equilibrium value in the long run, it reflects long run underperformance
and hence its negative relationship with initial after market returns.
1.2 Possible reasons behind underpricing
An efficient primary market can be extremely beneficial to both growing
firms as well as large corporations for it helps in stimulating growth
potential as well as ensures low cost capital for expansion purposes.
However, the phenomenon of short run underpricing of IPO market does
not go hand in hand with the fundamentals of an efficient market. Hence, it
is interesting to investigate further this widely researched area of
underpricing of IPOs and discuss the possible reasons behind.
Ÿ Rock (1986) developed the to provide for a
strong evidence for short run underpricing of IPOs, wherein he
categorized the investors as informed and uninformed. Out of these two
categories, the uninformed investors do not have much idea about
desirable or undesirable issues and hence they are unbiased towards
them while applying for the IPO. However, if they receive complete
allotment of the issue they applied for, it reflects that it is not a desirable
issue or is the least demanded for, especially by informed investors.
Winners' curse hypothesis
RIJBR ISSN : 2455-5959225
Hence they suffer winners' curse due to their 'lack of information'
handicap. In order to prevent them from exiting the market, the IPOs are
priced lower so that the uninformed investors, especially the individual
investors (who are in majority while investing in India) are compensated
and they do not leave.
Ÿ Another reason behind short run underpricing could be the tactic of
issuers to persuade the first few investors to invest in the issue so that
others get motivated to follow them who otherwise would have been
reluctant at the start. This process is also termed as informational
cascading (Welch, 1992). The evidence of using this tactic by Indian
issuers is clear in the advertisements which they come up with,
highlighting the agreement of institutional investors to subscribe to the
issue.
Ÿ Sometimes, the regulatory conditions require the firms coming up with
an initial public offer to set the price as per past performance, past
earnings, book value or value of ratios. Thus firms with lower past
performance or those without any past performance such as those who
are new (green field corporations) have to set the price of their stock low
according to regulatory requirements and hence are found to be more
underpriced. This regulatory factor serves as another reason behind
large scale underpricing.
Ÿ In India, there is absence of a proper mechanism to gather information
regarding demand of a particular IPO. Investment bankers, while setting
the price, do not consult investors or regular institutional clients, rather
only discuss with finance managers and since they do not wish to take
the risk of being undersubscribed, they usually set the price lower.
Ÿ Another factor influencing the issuers to set the price of issue lower
could be the motive of achieving political connections. This can be
achieved through biased allocation and allotment of shares to politicians
and their deliberate underpricing. At times, government owned
companies earn a lot of votes by coming out with substantially
underpriced IPOs.
Ÿ Whenever a firm which came out with an IPO decides to come up with a
further issue after a few years, it is referred to as seasoned offering. Since
RIJBR ISSN : 2455-5959226
the first issue was well underpriced giving positive abnormal returns to
investors, coming out with an FPO facilitates better prices because as
per Allen and Faulhaber (1989), underpriced new issues “leave a good
taste in investors' mouths”.
The above list of probable reasons behind underpricing is not exhaustive as
many other factors can contribute towards it. Underpricing can also result
from the influence of multiple factors at the same time which may include
macro economic factors as well (political and economic).
In our study we wish to analyse the short run performance of new issues
which came out in the post crisis or Recovery period i.e. from 2009-17. The
study comprises of 210 IPOs, analyses their market adjusted returns and
decomposes it into different criteria such as size of issue (based on IPO
pricing) and volume of issue (market capitalisation). The rest of the chapter
is bifurcated into different sections. The second section gives a
comprehensive literature review based on both domestic as well as
international evidence of underpricing in the first few trading days of an
IPO. The third section provides the objectives of the study based on
research gaps identified through the in-depth literature review. The data
sources, hypothesis and methodology have been highlighted in the fourth
section. The fifth section presents the results of empirical analysis
conducted on the sample IPOs. The last section concludes along with
highlighting the scope for future research.
2. LITERATURE REVIEW
Based on cross sectional regression analysis of 668 IPOs of Shanghai and
Shenzhen Stock Exchange of China during 1996 to 2000, Chi and Padgett
(2002) concluded Chinese IPOs to be extraordinarily underpriced. Also, the
Wealth Relative (WR) figures were indicative of outperformance by
Chinese IPOs. A severely high proportion of individual investors with
inadequate information along with Chinese quota system (an annual quota
system decided by Chinese Securities Regulatory Committee (CSRC) for
issue of new shares as per development goals of various regions) causing
high demand were the major two factors that were identified leading to
underpricing. In China, the demand of investment in stock market is much
higher because of lack of attractive investment opportunities elsewhere as
RIJBR ISSN : 2455-5959227
well as reduction in interest rates. And due to this high demand, the
underpricing in Chinese stock market is also very high. Hence, quota
system is found to be a major factor leading to underpricing because of lack
of supply with respect to number of issues allowed by CSRC (less supply-
high demand misbalance).
The study also tests whether there is any relationship between size of the
IPO issue and underpricing. As per Rock's model, if the size of IPO is small,
it is easy to manipulate price and hence the stocks are risky leading to higher
underpricing. As per the study, the Chinese stock market shows a negative
relationship between initial returns and size of IPOs.
The study also tries to find if any relationship exists between underpricing
and government ownership of shares in the Chinese market. The results are
indicative of negative relationship between the two as private ownership of
shares is expected to lead to improved corporate governance, more
confident investors and high management efficiency, thus resulting in high
market adjusted initial returns.
The conclusion is that in Chinese stock market, investors welcome
privatization more than government ownership. This study supports Rock's
Model and Information Asymmetry Hypothesis but not Signaling
Hypothesis.
Perera and Kulendran (2012) also tested the Rock Model and Uncertainty
Hypothesis in the Australian IPO Market using a sample of 254 IPOs listed
during 2006-2011. Underpricing was found to be a prevalent phenomenon
in case of primary and total market although secondary market was found to
be overpriced by 1.55% according to the results obtained by the technique
of MAAR (Market Adjusted Average Abnormal Returns). The study is
bifurcated into First day Returns Analysis and Post Day Returns Analysis.
In the first day returns analysis based on sectors, it was observed that the
industrial sector IPOs showed highest underpricing in the Australian
market whereas in post listing analysis, the highest marginal probability
was reflected by Consumer Discretionary/ Staples Industry. For post listing
analysis, Cumulative Average Returns (CAR) were calculated w.r.t. nine
trading days which led to the conclusion that underpricing decreased from th th
7 to 10 trading day due to fall in the post listing prices.
RIJBR ISSN : 2455-5959228
Using the binary regression model of Logit and Probit, the major
determinants of short run performance of Australian IPOs were identified
some of which included time to listing, listing delay, IPO period, market
volatility, etc. Out of the five major determinants identified, four of them
namely, listing delay, IPO period, Total listing period and Total Net
Proceeds Ratio were found to be inversely related to underpricing whereas
market volatility was identified to be positively related.
In order to identify the most influential factor affecting short run
performance of IPOs, marginal probability analysis was also done which
concluded with identification of Market Volatility and Total Net Proceeds
ratio to be the explanatory variables contributing to major changes in the
performance of IPOs in the short run. Out of the two variables identified,
Market Volatility has a positive relationship with uncertainty and thus
underpricing whereas TNRP holds a negative association.
In order to empirically test the indirect implications of the Rock Model,
Khursheed and Mudambi (2001) analysed the short run performance of
575 IPOs on UK Main Market out of which 190 were investment trusts and
the remaining were conventional issuing companies. The former is different
from the latter in the sense that the scope of creating an information
advantage is much less for investment trusts due to characteristics such as
lack of business history, fixed capital stock and assets containing frequently
traded securities with publicly quoted price. On computation of Wealth
Relative (WR), Market Adjusted Abnormal Return (MAAR) and t-statistic
of the sample pertaining to 1989-96, the results showed strong evidence in
support of Rock Model, that suggested less underpricing in case of
investment trusts due to lack of information advantage. However the results
do not support the finding of Risk Aversion Hypothesis which suggests no
difference between conventional issuing companies and investment trusts.
Also the results are in contrast to Baron's Hypothesis of Vertical Asymmetry
and Monopsony Hypothesis which favour the direct relationship between
underpricing and involvement of intermediaries such as investment banks
as no significant underpricing was found in case of investment trusts which
involve financial intermediaries. Overall the findings which favour Rock's
Model suggest that Investment Trust are not a good choice for investors
looking for extremely short run profits from investment in an IPO.
RIJBR ISSN : 2455-5959229
With a sample of 34 IPOs listed on Tunis Stock Exchange (TSE), Zouri et
al (2011) examined their short run performance from 1992-2008 using the
methodology of Market Adjusted Average Abnormal Returns (MAAR).
The initial returns were calculated for the first three trading days which
resulted in underpricing to the extent of 17.8 per cent. Further on applying
Linear Regression Model, the authors tried to analyse the factors leading to
IPO underpricing along with introducing control variables. The study tried
to find out whether underpricing was negatively or positively affected by
factors such as retained capital, oversubscription rate, size of issue, offer
price, size of issuing firm, age of issuing firm, listing time, and underwriter
price support. Three control variables were also introduced in the study
namely level of price discount set by issuer which was based on mean of
firm value, liquidity contract in IPO and part of IPO reserved for
institutional investors. It was found that firm age, size of issue and firm size
did not affect the level of underpricing while oversubscription rate was
positively related. Retained capital, listing delay and offer price were found
to be major determinants of IPO underpricing in Tunisian Stock Market as
per the study. Lastly, based on sectoral analysis, IPO underpricing was
found to be more pronounced in Non-Manufacturing sector than in
manufacturing sector (which includes General Manufacturing, Metal,
Steel, Chemical, Pharmaceutical, etc)
Applying Event Study methodology, Kaya (2012) tried to analyse short run
performance of 32 IPOs listed on Istanbul Stock Exchange (ISE) between
January 2010 and June 2011. Firstly, the Market Adjusted Stock Returns
were calculated taking ISE as the base index, followed by expected/
predicted returns using Capital Asset Pricing Model (CAPM). In the third
step, the difference between actual and predicted returns of CAPM was
calculated to arrive at abnormal returns. And finally, One way ANNOVA
test analysed the significance of the results.
st nd rd thThe returns were analysed for 1 , 2 , 3 , 4 trading days, first week, one
month and finally three months and six months time basis. It was observed
that out of 32 IPO firms, 15 showed negative returns after first day and 19 of
them gave negative performance after first month. The abnormal returns
were observed to be positive only at the end of third trading day.
The second part of the study analysed the short run performance of sample
RIJBR ISSN : 2455-5959230
IPOs based on abnormal returns by grouping the IPOs into different criteria
such as firm size, sector of IPO firms, age and shares sold to foreign
investors. The results reflected no significant association of short run
performance with the above factors taken in consideration.
Using a sample of 225 Greek IPOs listed on Athens Stock Exchange (ASE),
Gounopoulos (2003) analysed the Initial Returns (IR) and Market
Adjusted Initial Returns (MAIR) in order to oversee the initial performance
of the IPOs. The study revealed an underpricing of 63.92% on an average. A
sectoral bifurcation was done with three broad classification categories
namely industrial, financial and others. The highest initial underpricing was
observed in the 'industrial' category i.e. to the extent of 67.14%, followed by
the 'financial' category and 'others' category respectively.
In the second part of the study, multiple regression method was applied in
order to identify more pronounced determinants of initial
underperformance of Greek IPOs. Under this, Market Adjusted Initial
Returns was the dependent variable and all the possible factors influencing
returns of IPOs (based on past literature) formed the independent variables
such as market condition, demand multiple, age of the company, industrial
classification, cold and hot period IPOs , underwriters' reputation, etc. Out
of all these variables, the analysis concluded that significant determinants
of underpricing were limited to four variables namely market condition,
demand multiple, cold-hot issue periods and offer price independence.
3. OBJECTIVES OF THE STUDY
Based on an extensive literature review of both Indian as well as
International researches on IPO underpricing or short run performance of
IPOs, we could identify a few research gaps and wanted to extend the
empirical evidence on initial performance of IPOs with respect to the
following objectives:
1) To measure the short run performance of IPOs listed on
National Stock Exchange (NSE) on the basis of Market Adjusted
Average Returns (MAAR).
2) To analyze the relationship between size of offering and initial
returns of IPOs calculated on the basis of Market Adjusted Short
Run Performance (MASRP).
RIJBR ISSN : 2455-5959231
3) To examine whether short run performance of IPOs is correlated
with or is dependent of volume of IPO issue.
4. DATA SOURCES AND METHODOLOGY
4.1 Data
The study comprises of 210 sample IPOs which were listed on National
Stock Exchange (NSE) during 2009-17. The data has been collected from
various sources such as the websites of chittorgarh (www.chittorgarh.com),
moneycontrol (www.monycontrol.com), NSE (www.nse.com), SEBI
(www.sebi.com), etc. The website Chittorgarh provided data of IPO returns st th th th th
on 1 , 5 , 10 , 15 and 20 trading days and the market index value on these
days were taken from the NSE website.
A short run analysis is performed on the data of IPOs in which Mean Market
Adjusted returns are calculated along with t-statistic and Wealth Relative
(WR). In our study, it is also analysed if size and volume of IPO issue, have
any effect on the short run performance of IPOs.
Microsoft Excel has been used to calculate the figures of Market Adjusted
Average Returns (MAAR), t-statistic as well as Wealth Relative (WR).
Following previous literature, Market Adjusted Average Returns (MAAR)
is used as an indicator of short run performance, and Wealth Relative (WR)
is used to indicate whether the IPO is outperforming the market or not
(where, if WR > 1, it indicates that IPO outperforms the market).
4.2 Methodology
The conventional method of measuring the performance of IPOs in the
short run has been Mean Market Adjusted Initial Returns (MAIR) and
Wealth Relative (WR) Method. These techniques have been widely used in
previous literature by economists and researchers such as Aggarwal et al.
(1993), Khursheed and Mudambi (2001), Chi and Padgett (2002), Sadaqat
et al. (2011), Heerden and Alagidede (2012), etc.
The raw initial return is calculated by using the following formula:
RIJBR ISSN : 2455-5959232
Raw Initial Return= (Price on a particular trading day- Offer Price)/ Offer
Price
RIRx, d =
Where,
th RIR = Raw Initial Return of stock 'x' on d trading dayx,d
thP = Price of stock 'x' on d trading dayx,d
P = Offer price of stock 'x’x,0
Now, we calculate the average of Raw Initial Return calculated above:
RIRx, d = RIRx, d
The average Raw Initial Return represents the sum of individual Raw Initial
Returns of different stocks divided by the number of stocks in the sample.
This return calculated above is ideal only when the markets are perfect. In
other words, there is neither any transaction cost nor any opportunity cost.
Also, when there is no time gap between the offer closing day and the day of
trading/listing. However, in order to incorporate market changes occurring
from the offer date till the date of trading, this Raw Initial Return has been
adjusted with the market return in the following way:
Using the National Stock Exchange as the benchmark index for calculating
market returns, the market return on the stock market of the country has
been calculated as follows:
Return of the stock market on dth trading day= (Market Index Value at the
end of dth trading day- Market Index Value on the offer day)/ Market Index
Value on the offer day)
Rm, d =
Where,
R = Market Return on dth trading daym,d
MI = Market Index value on dth trading daym,d
MI = Market Index value on the offer day of stock 'x'm,0
Now, we incorporate the market return in the Average Raw Initial Return
calculated above in order to arrive at the market-adjusted performance of
RIJBR ISSN : 2455-5959233
Px, d - Px, 0Px, 0
1N
n
i=1S
MIm, d - MIm, 0MIm, 0
the stock in the short run.
The Market Adjusted Short Run Performance is calculated as follows:
MASRPx, d = 100
In order to arrive at the average Market Adjusted Short Run Performance,
we divide the above results by the sample number of IPOs in the following
way:
MASRPx, d = MASRPx, d
Having calculated the average market adjusted short run performance, we
test the hypothesis to see whether Average Market Short Run Performance
is equal to zero or different from it.
For this, t statistic is calculated using the following formula:
t =
Where,
MASRP = Average Market Adjusted Short Run Performance of stock x,d
'x' on dth trading day
s= Standard Deviation
n= Number of firms
Lastly, in order to gauge whether IPOs have outperformed the market or not,
Wealth Relative Method has been applied for dth trading day and 'n' number
of sample IPOs.
According to Ritter (1991), if the wealth relative formulated above gives a
result greater than 1, it means that market has been outperformed by the
IPOs in that period. However, if the WR comes out to be less than one, then
it indicates the underperformance of IPOs as compared to the market
performance.
RIJBR ISSN : 2455-5959234
*(1 + RIRx, d)(1 + Rm, d)
- 1{ }
1N
n
i=1S
MASRPx, d
s / Ön
1n
nx=1S
1n
nm=1S1 + ( ) RIRm, d
WRd = 1 + ( ) RIRx, d
5. Data and Results
5.1 Short Run Analysis
The returns on the initial day of trading are influenced by a lot of external
factors due to which irregularities are inevitable. Thus it is wise to analyse
the short run performance of the IPOs according to their returns in the initial
few days of getting listed. After a review of literature taking both domestic
as well as international aspect, it was decided to take the returns of the IPOs
taken in our study for the first, fifth, tenth, fifteenth and twentieth trading
days.
In our study, the short run performance of IPOs listed from 2009-17 has
been analysed by taking their Market Adjusted Average Returns (MAAR) st th th th thas on 1 , 5 , 10 , 15 and 20 trading days. The examination of returns as on
these days has been done in consistency with the existing literature.
However, as per the existing literature, the highest returns are achieved on
the first trading day whereas our study indicates that the highest returns are th st th th thachieved on the 10 trading day followed by 1 , 5 , 15 and 20 trading
days.
This is consistent with the analysis of a few economists who argue in favour
of irregularities on the first trading day which ultimately lead to
insignificant initial returns on that day. Our study highlights that an investor
would have preferred to hold on to his IPO investment for at least 10 days,
post which the returns are expected to be the highest.
In order to test the hypothesis, p-value is calculated and compared with the
level of significance.
If p-value is greater than the significance level, then the null hypothesis is
not rejected.
If p-value is less than the significance level, then null hypothesis is rejected.
RIJBR ISSN : 2455-5959235
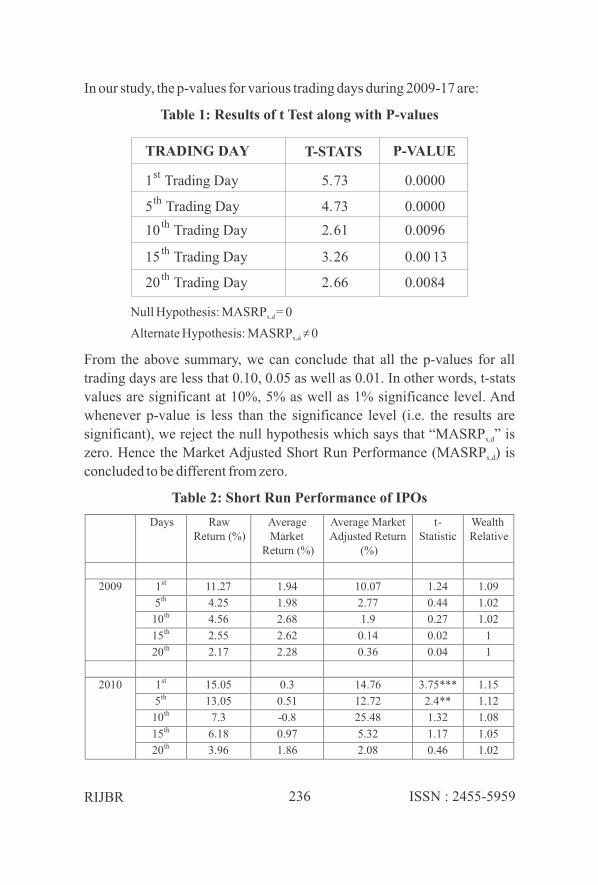
In our study, the p-values for various trading days during 2009-17 are:
Table 1: Results of t Test along with P-values
Null Hypothesis: MASRP = 0x,d
Alternate Hypothesis: MASRP ≠ 0x,d
From the above summary, we can conclude that all the p-values for all
trading days are less that 0.10, 0.05 as well as 0.01. In other words, t-stats
values are significant at 10%, 5% as well as 1% significance level. And
whenever p-value is less than the significance level (i.e. the results are
significant), we reject the null hypothesis which says that “MASRP ” is x,d
zero. Hence the Market Adjusted Short Run Performance (MASRP ) is x,d
concluded to be different from zero.
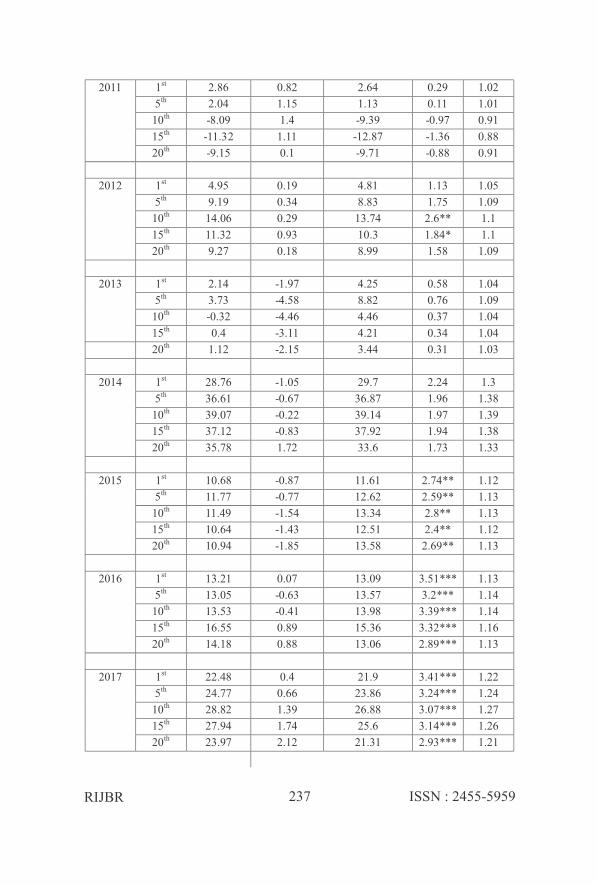
Table 2: Short Run Performance of IPOs
RIJBR ISSN : 2455-5959236
TRADING DAY T-STATS P-VALUE
1st
Trading Day
5th
Trading Day
10th
Trading Day
15th
Trading Day
20th
Trading Day
5.73
4.73
2.61
3.26
2.66
0.0000
0.0000
0.0096
0.00 13
0.0084
Days Raw Return (%)
Average Market
Return (%)
Average Market Adjusted Return
(%)
t-Statistic
Wealth Relative
2009 1st 11.27 1.94 10.07 1.24 1.09
5th 4.25 1.98 2.77 0.44 1.02
10th 4.56 2.68 1.9 0.27 1.02
15th 2.55 2.62 0.14 0.02 1
20th 2.17 2.28 0.36 0.04 1
2010 1st 15.05 0.3 14.76 3.75*** 1.15
5th 13.05 0.51 12.72 2.4** 1.12
10th 7.3 -0.8 25.48 1.32 1.08
15th 6.18 0.97 5.32 1.17 1.05
20th 3.96 1.86 2.08 0.46 1.02
RIJBR ISSN : 2455-5959237
20th 1.12 -2.15 3.44 0.31 1.03
2014 1st 28.76
-1.05
29.7
2.24
1.3
5th 36.61
-0.67
36.87
1.96
1.38
10th 39.07
-0.22
39.14
1.97
1.39
15th 37.12
-0.83
37.92
1.94
1.38
20th 35.78
1.72
33.6
1.73
1.33
2015 1st 10.68
-0.87
11.61
2.74** 1.12
5th 11.77
-0.77
12.62
2.59** 1.13
10th 11.49
-1.54
13.34
2.8** 1.13
15th 10.64
-1.43
12.51
2.4** 1.12
20th 10.94
-1.85
13.58
2.69** 1.13
2016 1st 13.21
0.07
13.09
3.51*** 1.13
5th 13.05
-0.63
13.57
3.2*** 1.14
10th 13.53
-0.41
13.98
3.39*** 1.14
15th 16.55
0.89
15.36
3.32*** 1.16
20th 14.18
0.88
13.06
2.89*** 1.13
2017 1st 22.48 0.4 21.9 3.41*** 1.22
5th 24.77 0.66 23.86 3.24*** 1.24
10th 28.82 1.39 26.88 3.07*** 1.27
15th 27.94 1.74 25.6 3.14*** 1.26
20th 23.97 2.12 21.31 2.93*** 1.21
2011 1st 2.86 0.82 2.64 0.29 1.02
5th 2.04 1.15 1.13 0.11 1.01
10th -8.09 1.4 -9.39 -0.97 0.91
15th -11.32 1.11 -12.87 -1.36 0.88
20th -9.15 0.1 -9.71 -0.88 0.91
2012 1st 4.95
0.19
4.81
1.13
1.05
5th 9.19
0.34
8.83
1.75
1.09
10th 14.06
0.29
13.74
2.6** 1.1
15th 11.32
0.93
10.3
1.84* 1.1
20th 9.27
0.18
8.99
1.58
1.09
2013 1st 2.14
-1.97
4.25
0.58
1.04
5th 3.73
-4.58
8.82
0.76
1.09
10th -0.32 -4.46 4.46 0.37 1.04
15th 0.4 -3.11 4.21 0.34 1.04
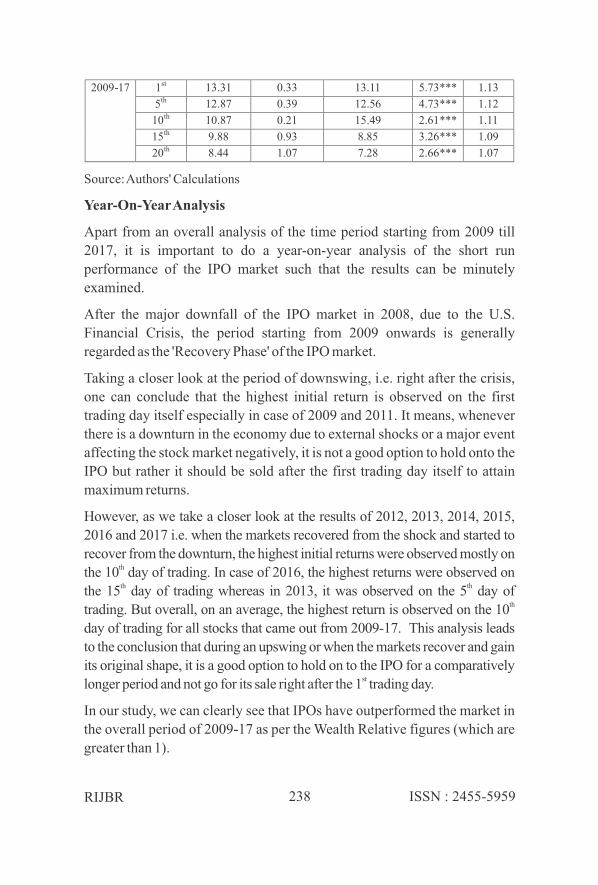
Source: Authors' Calculations
Year-On-Year Analysis
Apart from an overall analysis of the time period starting from 2009 till
2017, it is important to do a year-on-year analysis of the short run
performance of the IPO market such that the results can be minutely
examined.
After the major downfall of the IPO market in 2008, due to the U.S.
Financial Crisis, the period starting from 2009 onwards is generally
regarded as the 'Recovery Phase' of the IPO market.
Taking a closer look at the period of downswing, i.e. right after the crisis,
one can conclude that the highest initial return is observed on the first
trading day itself especially in case of 2009 and 2011. It means, whenever
there is a downturn in the economy due to external shocks or a major event
affecting the stock market negatively, it is not a good option to hold onto the
IPO but rather it should be sold after the first trading day itself to attain
maximum returns.
However, as we take a closer look at the results of 2012, 2013, 2014, 2015,
2016 and 2017 i.e. when the markets recovered from the shock and started to
recover from the downturn, the highest initial returns were observed mostly on th
the 10 day of trading. In case of 2016, the highest returns were observed on th ththe 15 day of trading whereas in 2013, it was observed on the 5 day of
thtrading. But overall, on an average, the highest return is observed on the 10
day of trading for all stocks that came out from 2009-17. This analysis leads
to the conclusion that during an upswing or when the markets recover and gain
its original shape, it is a good option to hold on to the IPO for a comparatively stlonger period and not go for its sale right after the 1 trading day.
In our study, we can clearly see that IPOs have outperformed the market in
the overall period of 2009-17 as per the Wealth Relative figures (which are
greater than 1).
RIJBR ISSN : 2455-5959238
2009-17 1st 13.31 0.33 13.11 5.73*** 1.13
5th 12.87 0.39 12.56 4.73*** 1.12
10th 10.87 0.21 15.49 2.61*** 1.11
15th 9.88 0.93 8.85 3.26*** 1.09
20th 8.44 1.07 7.28 2.66*** 1.07
Year-on-Year analysis also reflects that IPOs have outperformed the market th thin all the years except in 2011 where the Wealth Relative value for 10 , 15
thand 20 trading days is less than 1. This result is in tandem with the negative
values of Market Adjusted Returns of the stocks.
5.2 Size
According to Ibbotson et. al. (1994), on an average, small offerings (low
priced IPOs) in the US have been found to be more underpriced as
compared to large offerings. One probable reason could be the risk factor
involved in low priced offerings. Since small offering are considered as
comparatively riskier than large offerings, higher returns are expected out
of them. Hence, in order to compensate the risk, high returns may be
expected out of small offerings. However, the past literature highlights that
during the period of downturn or any unforeseen event that affects the
market negatively, a preference for valuable or large offerings by the
investors has been observed. Hence, on an average, low priced stocks are
found to be less underpriced as compared to large offerings. In other words,
they give fewer returns as compared to large offerings.
In our study, the benchmark IPO size has been taken as INR 185 as it is in
close proximity to the median IPO price during the nine year study period.
The IPOs which were priced above INR 185 during 2009-17 have generated
more returns in the short run as compared to those priced below INR 185. In
other words, underpricing has been observed in high priced shares on an
average.
However, if we take a more specific Year-on-Year look at the size-based
results, the MASRP values are higher in case of IPOs priced less than INR
185 especially in 2014 and 2017, when markets started to recover and got
back into their original shape. In these two years, more underpricing has
been observed in low priced IPOs. In 2014, high priced IPOs gave negative
returns whereas low priced IPOs were found to be severely underpriced.
RIJBR ISSN : 2455-5959239
RIJBR ISSN : 2455-5959
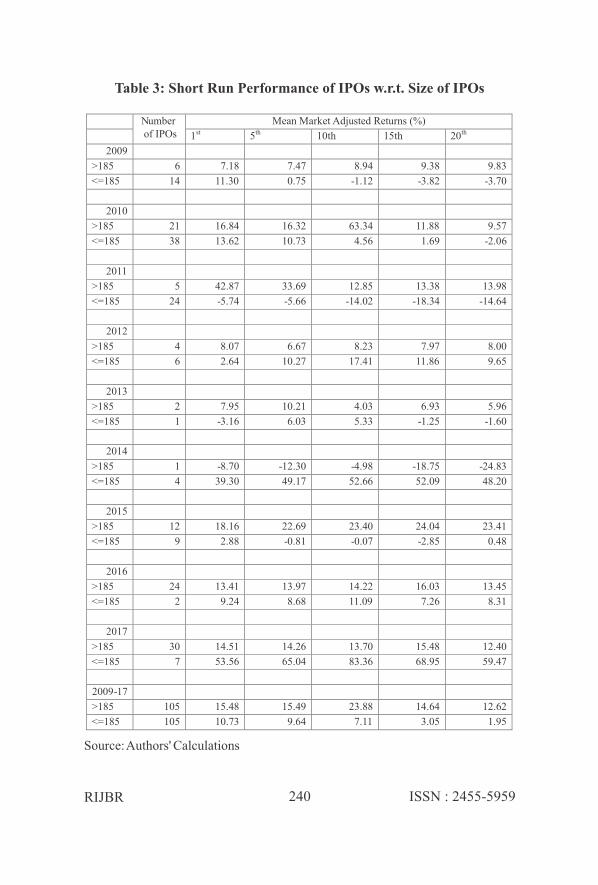
Table 3: Short Run Performance of IPOs w.r.t. Size of IPOs
Source: Authors' Calculations
240
2014
>185 1 -8.70 -12.30 -4.98 -18.75 -24.83
<=185 4 39.30 49.17 52.66 52.09 48.20
2015
>185 12 18.16 22.69 23.40 24.04 23.41
<=185 9 2.88 -0.81 -0.07 -2.85 0.48
2016
>185 24 13.41 13.97 14.22 16.03 13.45
<=185 2 9.24 8.68 11.09 7.26 8.31
2017
>185 30 14.51 14.26 13.70 15.48 12.40
<=185 7 53.56 65.04 83.36 68.95 59.47
2009-17
>185 105 15.48 15.49 23.88 14.64 12.62
<=185 105 10.73 9.64 7.11 3.05 1.95
Number of IPOs
Mean Market Adjusted Returns (%)
1st 5th 10th 15th 20th
2009
>185 6 7.18 7.47 8.94 9.38 9.83
<=185 14 11.30 0.75 -1.12 -3.82 -3.70
2010
>185 21 16.84 16.32 63.34 11.88 9.57
<=185 38 13.62 10.73 4.56 1.69 -2.06
2011
>185 5 42.87 33.69 12.85 13.38 13.98
<=185 24 -5.74 -5.66 -14.02 -18.34 -14.64
2012
>185 4 8.07 6.67 8.23 7.97 8.00
<=185 6 2.64 10.27 17.41 11.86 9.65
2013
>185 2 7.95 10.21 4.03 6.93 5.96
<=185 1 -3.16 6.03 5.33 -1.25 -1.60
Right after the major crisis of 2008 which affected the stock markets on a
global level, preference for high priced IPOs has been observed, especially
in the year 2008, 2010 and 2011. In these three years, high priced or
valuable investments have shown better returns or we could say that
investors have preferred valuable investments at the time of crisis and in the
immediate post crisis period.
In 2012, low priced IPOs gave higher returns to compensate for the risk that
is associated to them except on the initial day of trading.
After 2011, when market recovered from the downturn, less underpricing
has been observed in high priced IPOs except in those years where the
proportion of low and high priced IPOs is biased towards one side. For
example, in 2016, only two IPOs were priced below INR 185 whereas 24
IPOs were priced above it. As a result, the average market returns in 2016
are higher for IPO priced above INR 185 and which are more in number.
Overall, our study shows a fluctuating and mixed trend of price based
results of MASRP of IPOs during 2009-17. The average analysis, however,
show high priced IPOs to be more underpriced during the recovery period.
After the 2008 crisis, the average IPO price has increased from INR 190.65
in 2009 to INR 514 in 2017 which clearly indicates preference of investors
for quality IPOs of established companies (as per the results of the study).
5.3 Market Capitalisation
Following the previous literature, the median volume/ market capitalisation
has been taken to segregate the data into high volume IPOs and low volume
IPOs. Therefore, the IPOs with market capitalization of more than INR 351
CR (median market capitalisation value) form the first category and those
with a market capitalization of less than INR 351 CR form the second.
The 2008 U.S. Financial crisis had severely affected the markets globally
including the Indian market. Due to its impact, the investors' trust was
shaken and hence they preferred quality companies both during crisis and
post crisis period. In other words, their preference shifted to well known and
established firms and not to those with high volume issues, at least in the
initial years right after crisis period.
RIJBR ISSN : 2455-5959241
RIJBR ISSN : 2455-5959242
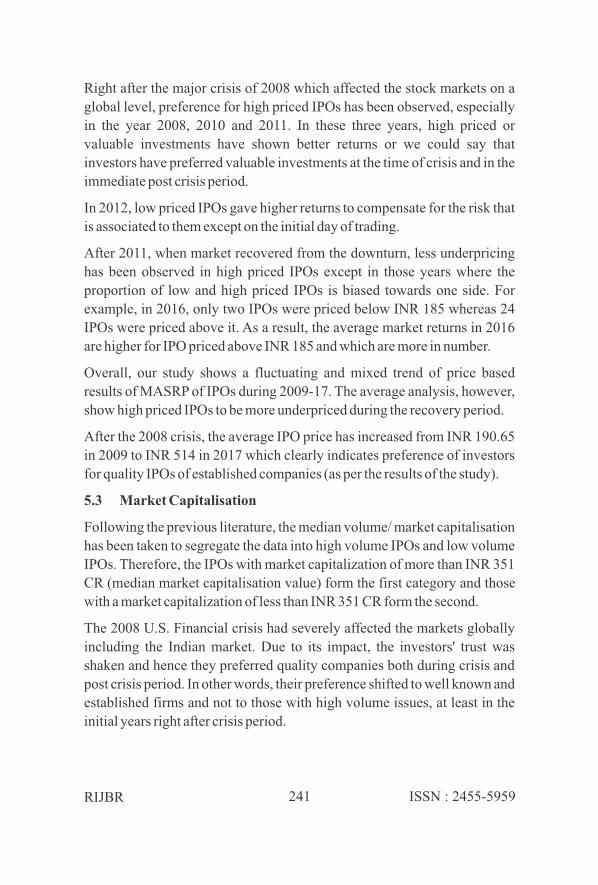
According to the capitalisation based results, one can observe that in the
post crisis period, starting from 2009 to 2011, the IPOs with market
capitalization of less than INR 351 CR gave higher returns as compared to
those of high capitalisation companies. This can be attributed to the risk
attached to the companies with small market capitalisation. They tend to
underprice their stocks more in order to attract the investors. Hence in 2009,
a return of 16.78% can be observed for the initial day of trading for firms
with a market capitalisation value of less than INR 351 CR. Similarly a
return of 21.53% has been generated in 2010 by firms of lower market
capitalisation as compared to negative returns by higher capitalized
companies.
However, when the market started to move towards normalcy, it started
reflecting the regular trend of high volume companies (capitalisation more
than INR 351 CR) generating better returns as compared to low volume
companies. In other words, better returns are generated by companies with
high market capitalisation.
In 2017, IPOs with a market capitalization of less than INR 351 CR showed
more underpricing as compared to those with a volume of more than INR
351 CR, even though low volume companies were 6 in number.
A mixed trend has been observed with respect to market capitalisation for
the sample period taken in our study. The overall results show that
companies with market capitalisation of less than INR 351 CR tend to
underprice more in order to attract investors. However, companies with
market capitalisation of more than INR 351 CR show consistent results and thmaximum returns when the investment is held till 15 day of trading.
Table 4: Short Run Performance of IPOs w.r.t. Market
Capitalisation
Number of IPOs
Mean Market Adjusted Returns (%)
1st 5th 10th 15th 20th
2009
>351 10 3.35 1.55 1.91 2.35 2.08
<=351 10 16.78 3.99 1.88 -2.07 -1.36
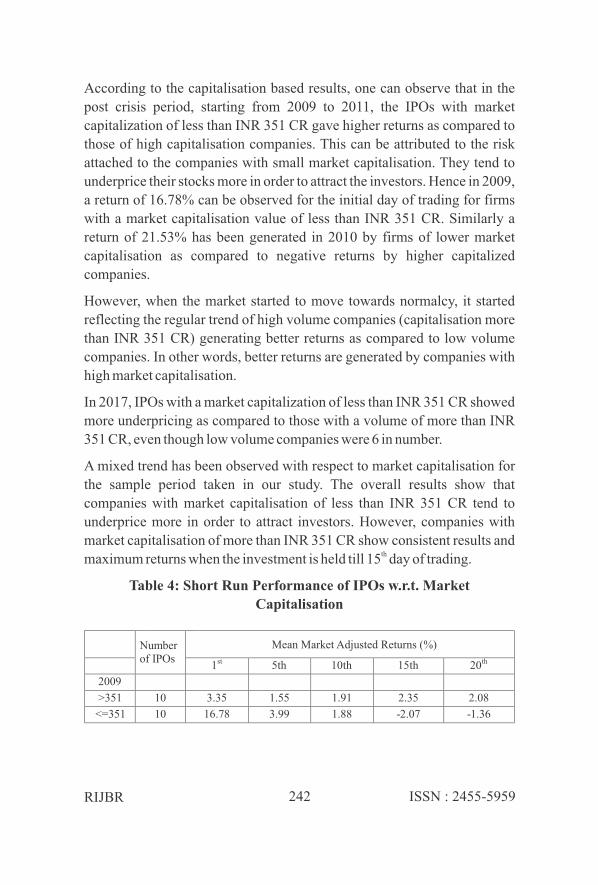
2010
>351 18 -0.64 -3.70 -4.57 -4.05 -6.53
<=351 41 21.53 19.93 38.67 9.43 5.86
2011
>351 3 -2.29 -7.46 -9.17 -7.28 -4.70
<=351 26 3.21 2.12 -9.41 -13.52 -10.28
2012
>351 4 12.08 15.99 16.84 14.42 13.80
<=351 6 -0.03 4.05 11.67 7.56 5.79
2013
>351 1 18.87 30.12 24.69 27.56 24.96
<=351 2 3.06 1.84 5.65 7.47 7.32
2014
>351 1 50.55 68.10 74.86 62.67 64.99
<=351 4 24.49 29.07 30.20 31.74 25.75
2015
>351 14 15.99 18.99 19.59 19.76 19.59
<=351 7 2.85 0.12 0.86 1.98 1.57- -
2016
>351 23 13.64 14.53 13.46 15.65 13.43
<=351 3 8.88 6.18 17.98 13.12 10.20
2017
>351 31 16.04 15.46 16.71 16.43 13.17
<=351 6 52.18 67.28 79.40 72.94 63.34
2009-17
>351 105 11.12 11.12 11.22 11.64 9.77
<=351 105 15.10 14.00 19.77 6.05 4.80
RIJBR ISSN : 2455-5959243
Source: Authors' Calculations
thOverall, from 2009-17, the data show that till the 10 day of trading, low
volume IPOs are underpriced more however, if the investor holds onto the th thinvestment till 15 or 20 day of trading, high volume IPOs i.e. those with
market capitalization of more than INR351 CR tend to be more underpriced
and hence generate returns.
6. CONCLUSION
Market Adjusted Average Returns have been taken (with NIFTY as the
benchmark index) as the proxy to measure the short run performance of 210
IPOs taken in our study. These returns have been calculated for first, fifth,
tenth, fifteenth and twentieth trading days keeping in mind the irregularities
affecting the listing day return hence making it an inappropriate variable to
test the short run performance of IPOs. An analysis of the short run
performance of the IPOs which came out during 2009-17 reflect that
maximum returns are achieved only when the IPO is held till the tenth day
of trading. However, during a downturn in the economy resulting from any
economic slowdown or a global shock, it is better to sell off the investment
on the first day of trading as it generates the maximum return for investors.
The second part of the analysis finds out the association between 'Size of the
IPO' measured by the Issue price with the short run performance of the IPO
measured by Market Adjusted Average Returns for initial trading days. The
results are indicative of investors' preference for quality IPOs (high priced
IPOs) during the period of economic downturn (immediate post crisis
period from 2009 to 2012) as they give better returns as compared to low
priced IPOs. However, in the normal scenario or when markets tend to take
the original shape, low priced IPOs tend to give higher returns (more
underpriced) in order to attract investors and to compensate for the risk
attached to them. In our study, post 2012, high priced IPOs give lesser
returns if seen on an individual basis but due to mixed price based results,
the overall figures show more underpricing in case of high priced IPOs.
For assessing the relationship between Market Capitalisation of IPO stocks
and the short run performance of such stocks, median value of capitalisation
was taken to bifurcate the 210 sample IPOs into the categories of low and
high market capitalized IPOs. The overall results reflect that companies
with market capitalisation of less than INR 351 CR (median value) tend to
underprice more in order to attract the investors and to compensate for the
risk associated to them whereas high market capitalisation IPOs (more than
INR 351 CR) give consistent returns of 11% during 2009-17 and maximum
RIJBR ISSN : 2455-5959244
returns if the IPO is held till the fifteenth day of trading. However, an year
on year analysis shows a mixed trend.
The study not only gives an overall picture of how IPOs have performed
over the years with respect to short run analysis but also indicates the impact
of important issue characteristics such as size of the issue, market
capitalisation, etc on short run underpricing of the stocks. The conclusion of
the research reflects the timing of the issue as well as behaviour of stocks
and their returns in the short run as per market conditions, thus adding to the
knowledge bank of investors. The study clearly indicates the performance
of stocks with high market capitalisation during economic recovery period
as well as downturn. Also, it shows the impact of size of offering on the
stock performance during normal conditions as well as post crisis period,
thus enhancing the base of IPO literature.
6.1 Implications of the Study
The study contributes to the knowledge enhancement of investors with
respect to taking investment decisions in such a way that helps maximize
returns from the stocks in the short run. Fly-by investors who sell their stock
on the first day of trading can attain optimum returns during crisis period or
a period of abnormal conditions in the market. However, investors who look
forward to a short run gain, can achieve maximum returns if they hold their
stock till the tenth trading day. This shows that investors can plan to redeem
their investment in the IPOs as per the condition in the market if they have a
short run outlook.
Also, as per the findings of our study, during a slowdown in the economy,
investors should invest in those IPOs which are high priced and prefer to
invest in low priced IPOs during normal scenario as the low priced IPOs are
more underpriced.
As far as volume of the stock is concerned, consistent returns have been
achieved by high volume stock that is, those IPOs with high market
capitalisation.
6.2 Limitations
The short run analysis conducted in our research has the following
shortcomings:
RIJBR ISSN : 2455-5959245
a) The study focuses on majorly two factors, namely Size and Market
Capitalisation, to gauge the impact on short run performance of
IPOs over the study period. Various other factors also play a crucial
role in the determination of underpricing of IPOs.
b) Also, the analysis conducted to identify underpricing in the IPOs is
limited to initial twenty days of trading only.
c) The data has been categorized into two parts based on the median
size of the offering and median market capitalisation; however three
subcategories would have given a clearer picture with respect to
performance of the stocks over the years.
6.3 Scope for Future Research
Based on the above shortcomings of the study, further investigation can be
conducted in future in the following way:
a) Factors such as listing delay, underwriters' reputation,
oversubscription, etc can also be taken into consideration in order to
gauge the performance of IPOs in the short run.
b) The study can be further extended to one month, three months, six
months or one year time period for analysis of the short run
underpricing of IPOs.
c) Various other techniques such as multiple regression, event study,
etc can also be applied to validate the returns achived by Market
Adjusted Average Returns methodology.
REFERENCES
Gounopoulos, D. (2003). The Initial Performance of IPOs: Evidence from
Athens Stock Exchange. EFMA 2003 Helsinki Meetings. DOI:
http://dx.doi.org/10.2139/ssrn.406702
Heerden, G. & Alagidede, P. (2012). Short Run Underpricing of Initial
Public Offerings (IPOs) inthe Johannesburg Stock Exchange (JSE). Review
of Development Finance, 2(3-4), 130-138.DOI: 10.1016/j.rdf.2012.10.001
Ibbotson, R. G. & Jaffe, J. F. (1975). 'Hot Issue' Markets. The Journal of
Finance, 30(4). DOI:10.1111/j.1540-6261.1975.tb01019.x
RIJBR ISSN : 2455-5959246
Kaya, T. (2012). The Short Term Performance of Initial Public Offerings in
Istanbul Stock Exchange: 2010-2011 Application. Journal of Business,
Economics and Finance, 1(1). Available
at:https://www.researchgate.net/publication/292538740_THE_SHORT_T
ERM_PERFORMANCE_OF_INITIAL_PUBLIC_OFFERINGS_IN_IS
TANBUL_STOCK_EXCHANGE_2010_-2011_APPLICATION
Loughran, T Ritter, J R and Rydqvist, K (1994). "Initial Public 30 Offerings:
International Insights," Journal of Pacific- Basin Finance, Vol. 2, pp 165-
199. DOI: 10.1016/0927-538X(94)90016-7
Mudambi, R. & Khursheed, A. (2001). The Short Run Price Performance of
Investment Trust IPOs on the UK Main Market. DOI: 10.2139/ssrn.280788
Padgett, C. & Chi, J. (2002). Short-Run Underpricing and its
Characteristics in Chinese IPO Markets. ISMA Centre Finance Discussion
Paper No. 2001-12. DOI: 10.2139/ssrn.309921
Perera, W. & Kulendran, N. (2012). New Evidence of Short Run
Underpricing in Australian IPOs.SSRN Electronic Journal, 13(2).
Available at: https://www.ssrn.com/abstract=1979050
Ritter, J.R. (1991). The Long Run Performance of Initial Public Offerings.
The Journal of Finance, 46(1). DOI: 10.1111/j.1540-6261.1991.tb03743.x
Welch, I. (1992). Sequential Sales, Learning, and Cascades. Journal of
Finance, 47, 695-732. DOI: 10.1111/j.1540-6261.1992.tb04406.x
Zouari, S. B. S. et al. (2011). Determinants of IPO Underpricing: Evidence
from Tunisia. The International Journal of Business and Finance Research,
5(1), 13-32. Available at:
https://papers.ssrn.com/sol3/papers.cfm?abstract_id=1876043
RIJBR ISSN : 2455-5959247
