shogren, k.a., thompson, j.r., wehmeyer, m.l., chapman, t., tasse, m.j., & mclaughlin, c.a....
TRANSCRIPT
Protection and Advocacy Scale
1
Reliability and Validity of the Supplemental Protection and Advocacy Scale of the Supports
Intensity Scale
Karrie A. Shogren
University of Kansas
James R. Thompson
Illinois State University
Michael L. Wehmeyer & Tec Chapman
University of Kansas
Marc J. Tassé
The Ohio State University
Colleen A. McLaughlin
University of Medicine and Dentistry of New Jersey, Robert Wood Johnson Medical School
Final Submitted Version
Shogren, K.A., Thompson, J.R., Wehmeyer, M.L., Chapman, T., Tasse, M.J., & McLaughlin,
C.A. (in press). Reliability and validity of the supplemental protection and advocacy scale of the
Supports Intensity Scale. Inclusion.
Protection and Advocacy Scale
2
Abstract
Three separate studies were undertaken to examine the reliability and validity of the
Supplemental Protection and Advocacy Scale (P&A Scale) of the Supports Intensity Scale (SIS).
In Study 1, the interrater reliability of the P&A Scale was investigated when interviewers were
trained in SIS administration and scoring. Pearson’s product moment coefficients were
considerably higher than coefficients reported in a previous study conducted with untrained
interviewers. In Study 2, the reliability (internal consistency, standard error of measurement, and
interrater reliability) and validity (content and construct validity) of the P&A Scale when
administered by trained interviewers with a sample of individuals with intellectual disability
receiving services from a state ID/DD agency was examined. Results suggest strong reliability
and validity of the P&A Scale, comparable to other domains of the SIS. In Study 3, additional
psychometric properties of the P&A Scales were examined in a large sample of trained
interviewers from across the United States and Canada using the SIS Online, again suggesting
strong psychometric properties. Collectively, findings from these three investigations suggest
that the Supplemental Protection and Advocacy Scale is a reliable and valid of a measure of
support needs. In future revisions of the SIS, it should be considered as part of the section of the
SIS that yields standard scores reflecting an individual’s relative intensity of support need.
Protection and Advocacy Scale
3
Psychometric Properties of the Supplemental Protection and Advocacy Scale of the
Supports Intensity Scale
The Supports Intensity Scale (SIS) (Thompson et al., 2004a) was developed to provide an
objective and standardized method to assess the support needs of people with intellectual
disability and related developmental disabilities. Since its publication in 2004, the SIS been
translated into 13 languages and it is currently being used by researchers and practitioners in 17
countries (American Association on Intellectual and Developmental Disabilities (AAIDD),
2014). The current version of the SIS includes three sections: Section 1, the Supports Needs
Index Scale, Section 2, the Supplemental Protection and Advocacy Scale, and Section 3,
Exceptional Medical and Behavioral Support Needs. Section 1 consists of six subscales (Home
Living, Community Living, Lifelong Learning, Employment, Health and Safety, and Social
Activities). Each item in Section 1 corresponds to a daily life activity for which people with
intellectual and developmental disabilities might need extraordinary support; that is, types,
intensity, and duration of supports people from the general population would not need to
successfully function in the given domain. These six subscales each include eight or nine items
that are scored using three five-point scales that measure the intensity of support a person needs
with regard to three dimensions: Frequency (how often support needs to be provided), Daily
Support Time (how much time is involved in providing support on a day when support is
needed), and Type of Support (what is nature of support provided by other people). Scores from
the three dimensions are summed for each item. Total raw scores are calculated for each
subscale, which are converted into standard scores. The sum of these subscale standards are then
converted into a composite score, the overall SIS Support Needs Index.
Protection and Advocacy Scale
4
The items in Section 2 of the SIS, the Supplemental Protection and Advocacy Scale (P&A
Scale), are structured and scored the same way as items in Section 1 (i.e., using 5-point scales
measuring the three dimensions of support). Items in this section address life activities associated
with self-advocacy and self-determination. Instead of generating standard scores, however, the
raw scores for each item in Section 2 are ordinally ranked. The ordinal ranking indicates the
relative intensity of supports a person needs in relation to the other items that comprise the P&A
Scale. For example, a person may have more intense support needs in the life activity of
“protecting self from exploitation” than in the life activity of “advocating for self.” However, the
ordinal ranking does not provide norm-referenced information. That is, scores on the P&A Scale
do not provide any information on an individual’s intensity of support needs in relation to others.
Section 3 of the SIS provides an assessment of a person’s exceptional support needs
related to health issues and problem behaviors. The format and structure of items in Section 3 are
quite different than the prior sections. Section 3 items are scored using a 3-point Likert-type
scale based on the extent of extra support needed due to the presence of challenging behaviors
and medical conditions. Like Section 2, scores on Section 3 items provide descriptive
information about a person, but these scores do not produce a standard score that enables
meaningful comparisons between people.
Section 3 was conceptualized to be qualitatively different that the other sections of the
SIS because the items are not focused on the pattern and intensity of support needed by a person
to participate in life activities in culturally valued settings. Rather, Section 3 items are focused on
extra support needed due to health problems and/or problem behaviors. Because of the relatively
low incidence of specific health conditions and/or specific problem behaviors, there was no
reason to include Section 3 scores in the standardized portion of the SIS. However, this was not
Protection and Advocacy Scale
5
the case with the items in Section 2, the P&A scale. Section 2 was originally intended to be a
subscale in the standardized portion of the SIS (Section 1, Support Needs Index scale). Data
collected during the field test of the SIS (Clay-Adkins, 2004), however, introduced concerns with
regard to the reliability of the P&A Scale (Clay-Adkins, 2004). Specifically, Clay-Adkins
(2004) found that the interrater reliability data for the P&A Scale were poor, reporting a
correlation coefficient of .29 for a mixed interrater study (i.e., different interviewers who
interviewed different respondents about the same person on separate occasions). Due to its poor
interrater reliability, the SIS authors made the decision to remove the P&A scale from the
standardized portion of the SIS (Thompson et al., 2004b). Based, however, on the face validity
of the eight items comprising this section (i.e., data from field test interviewers and findings from
a Q-Sort conducted by experts in the field of intellectual and developmental disabilities), the
authors elected to include it as a supplemental scale (Section 2) that was not factored into
standardized scores. The authors considered the items to be important for interviewers and
respondents to reflect upon, and requiring planning teams who used the SIS to rank order the
P&A scale items would encourage to thoughtful consideration of supports needed by a person for
self-determination and self-advocacy activities.
The interrater reliability for the other six subscales and the SNI Index score, while
significant stronger than the reliability of the P&A Scale, still had non-corrected reliability
coefficients for three subscales in the “poor range”, two other subscales had coefficients in in
the “fair” range, only subscale had a coefficient that was in the “excellent” range (Cicchetti &
Sparrow, 1981). The composite (i.e., SNI score) r was .58 (fair range). These findings were
puzzling because other psychometric indicators of the SIS were quite strong (e.g., internal
consistency). Subsequent research has suggested that the interrater reliability findings reported
Protection and Advocacy Scale
6
by Clay-Adkins’ (2004) may have resulted from a lack of interviewer training during the initial
norming process (Thompson, Tassé, & McLaughlin, 2008). Participants in the initial norming
process did not receive specific training regarding how to administer the SIS, but rather were
given informal verbal instructions and provided with concise written directions. At the time of
data collection there were not any training sessions available nor were there any background
materials (e.g., SIS User’s Manual) to which the interviewers could refer. Further, Clay-Adkins
noted that a significant number of interviewers and respondents in her study were staff employed
at a relatively large residential center serving individuals with multiple disabilities. She
speculated that certain items on the P&A Scale in particular (e.g., Exercising legal
responsibilities; Belonging to and participating in self-advocacy organizations; Advocating for
others) may have been difficult for these staff to score because the people with intellectual and
developmental disabilities with whom they worked had no (or very limited) experience with such
activities.
Thompson et al. (2008) re-examined interrater reliability for Section 1 with trained
observers and parceled out variance due to using different interviewers and using different
respondents. They established three conditions: an interinterviewer reliability condition where
the same respondents were interviewed by different interviewers in separate interviews; and
interrespondent reliability condition where the same interviewer interviewed two sets of
different respondents in separate interviews, and a mixed interrater condition where different
interviewers interviewed different respondents in separate interviews. The results were striking.
Of the 36 correlation coefficients produced (i.e., both non-corrected and corrected rs for 6
subscales for the 3 interrater conditions), 22 (61%) were in the excellent range, 10 (28%) were in
the good range, 4 (11%) were in the fair range, and none were in the poor range based on
Protection and Advocacy Scale
7
Cicchetti and Sparrow’s (1981) criteria. Moreover, in regard to the SNI score, non-corrected and
corrected rs for all three reliability conditions were in the excellent range. The authors concluded
that their findings made a strong case for training interviewers. Because reliability results were
similar in all three conditions, it is appears that any variation introduced from having different
interviewers or different respondents can be mediated as long as interviewers are trained on how
to properly administer the scale.
Thompson et al. (2008) only examined reliability for Section 1 of the SIS. Given their
findings, however, it is possible that Clay-Adkins’ (2004) findings for the P&A Scale were also
influenced by the lack of interviewer training as well as the characteristics of the sample
employed to evaluate interrater reliability. Further examination of the psychometric properties
of the P&A Scale seem warranted to determine the degree to which, in future revisions of the
SIS, the P&A Scale could be considered as part of Section 1 and used to generate standard scores
and the overall SNI score. The purpose of this paper is to describe three separate studies
examining the reliability and validity of the P&A Scale when administered by trained
interviewers.
Study 1
As mentioned previously, Thompson et al. (2008) found that interrater reliability for
Section 1 (i.e., 6 included subscales and the SNI score) of the SIS improved significantly when
interviewers were trained, but only examined the effect of training for Section 1 of the scale.
Therefore, the purpose of Study 1 was to examine the interrater reliability of P&A Scale (Section
2) when interviewers that have been trained on how to administer and score the SIS. Further,
because completing the SIS requires the involvement of interviewers (who score the scale) as
well as respondents (who provide the information), this study separated out error variance
Protection and Advocacy Scale
8
attributable to different interviewers and different respondents. This investigation was completed
through a secondary analysis of data collected by Thompson et al. (2008). Thompson et al.’s
participants completed the full SIS, however, the authors only examined interrater reliability for
Section 1. For this study, the P&A Scale data were analyzed.
Method
Participants. Participants included interviewers, respondents, and people with
intellectual disability. Detailed information on the demographic characteristics of each group of
participants can be found in Thompson et al. (2008). The interviewers were participants in a SIS
training workshop conducted by one of the authors of this study. They were invited to
participate in a study of the reliability of the SIS by trained interviewers. Their participation was
totally voluntary and did not impact their access to the training. If interested in participating, they
were asked to collect data on at least one case, but they were given the option of completing
work on more than one case if they desired. In total, 51 different interviewers from four
different states within the United States, Australia, and Canada participated. Eighty (80)
respondents participated, all of whom reported that they knew the person being evaluated well,
with 85% reporting that they had known this individual for at least one year. And finally, the
support needs of 40 individuals with an intellectual disability were assessed using the SIS. This
was a diverse sample of individuals with intellectual disability in terms of gender, age, ethnicity,
IQ and adaptive behavior levels, living arrangements, and employment status.
Procedures. Pairs of interviewers were provided with materials containing detailed
instructions on the procedures to collect interrater reliability data for this study (see Thompson et
al., 2008). Multiple safeguards were put into place to document and assure that (a) interviewer
dyads collected data on the same person, and (b) data corresponded to a specific interrater
Protection and Advocacy Scale
9
reliability condition (i.e., interinterviewer, interrespondent, mixed interrater). Scores from each
item on the P&A Scale were generated by summing the three support ratings (frequency, support
time, type of support). Next, raw scores for all 8 items were summed to produce the unit of
analysis for this study. The SIS User’s Manual (Thompson et al., 2004b) does not provide a
standard score conversion for the Supplemental Protection and Advocacy Scale. Therefore,
Pearson’s rs were computed using total raw scores, which was the same procedure used by Clay-
Adkins (2004). The SIS User’s Manual does not provide information regarding variance on
Section 2, so attenuation effects could not be determined and corrected rs could not be produced.
Data were analyzed using the Statistical Package for the Social Sciences (SPSS 11 for Mac
OSX).
Results
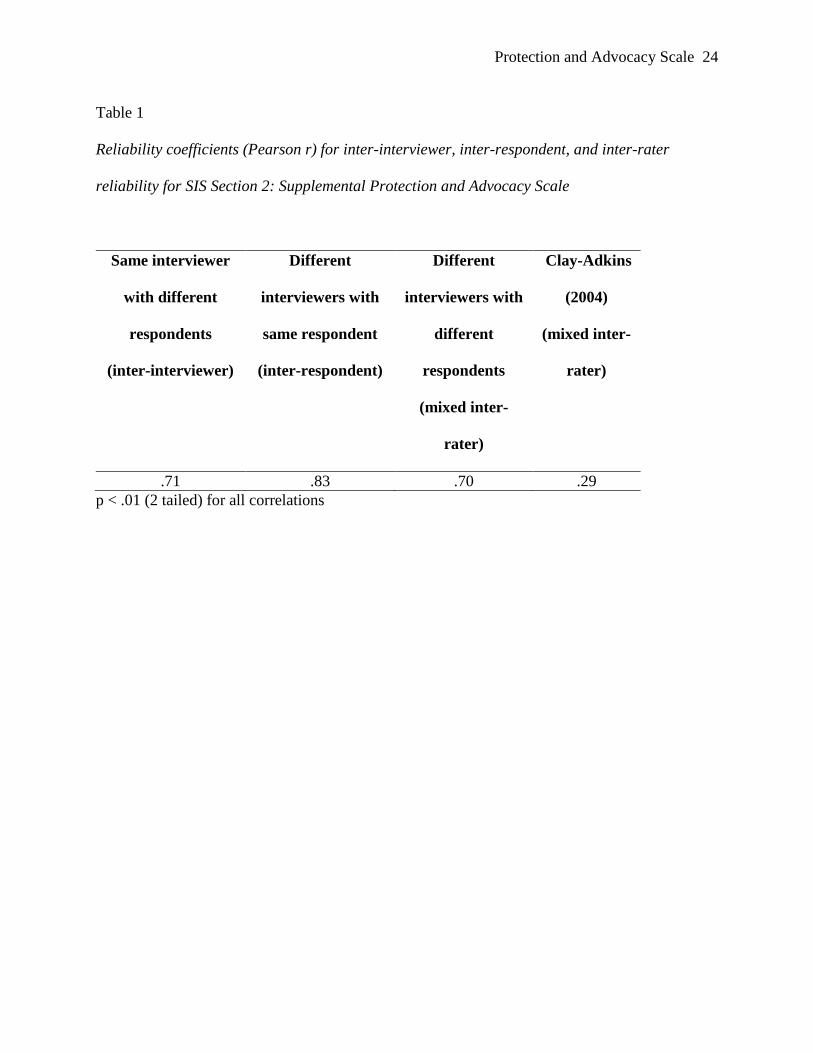
Table 1 provides the Pearson’s Product Moment Coefficients (r) that were generated to
assess inter-interviewer reliability (pairs of SIS scores generated from different interviewers who
interviewed the same respondent) inter-respondent reliability (pairs of SIS scores generated from
the same interviewer who interviewed different respondents on two different occasions), and
mixed inter-rater reliability (pairs of SIS scores generated from the different interviewers who
interviewed different respondents), along with mixed inter-rater reliability correlations provided
by Clay-Adkins (2004). Data yielded much higher coefficients than were obtained by Clay-
Adkins (2004). In two of the three conditions (inter-respondent and mixed inter-rater) the
coefficients were in the “good” range and in the inter-interviewer condition the coefficient was in
the “excellent” range according to guidelines provided by Cicchetti and Sparrow (1981) for
evaluating reliability coefficients for adaptive behavior (AB) scales.
Study 1 Discussion
Protection and Advocacy Scale
10
The findings from this secondary analysis of data collected on the P&A Scale by trained
interviewers suggest the importance of using trained interviewers not just for Section 1, but also
for the P&A Scale. The reliability coefficients from the current study are much higher than those
reported by Clay-Adkins (2004), suggesting that, like Section 1, the initial data collected during
the norming of the SIS may have been impacted by a lack of training for interviewers. This also
suggests that in terms of interrater reliability, the P&A Scale may be as psychometrically robust
as the six subscales included in Section 1 and future work is needed on other reliability and
validity properties to inform consideration of the inclusion of the P&A Scale in Section 1 in
future revisions of the SIS. Items on the Supplemental Protection and Advocacy Scale do not
appear to be redundant with other items in Section 1. Moreover, because these items are focused
on choice-making, decision-making, self-advocacy, and excising legal responsibilities, they are
integrally related to providing types of support that may lead to greater self-determination.
Limitations. The findings from this investigation should be considered in light of at least
two limitations. First, interviewers only interviewed 1 respondent when completing the SIS. This
was done to isolate error variance due to having different respondents. The SIS User’s Manual
clearly calls for interviewers to interview at least two respondents when completing the SIS and
incorporate the responses of those interviewed into a single assessment form. It is possible that
if interviewers in this study had interviewed multiple respondents instead of a single respondent
the reliability coefficients would have been different.
A second limitation is that the interviewers were volunteers, instead of a random sample
of interviewers. It is reasonable to assume that the volunteer interviewers were individuals who,
because of their high level of commitment, might be more conscientious in the completion the
SIS than a random sample of interviewers. Future studies involving a random selection of
Protection and Advocacy Scale
11
interviewers would enable judgments to be made regarding whether selection bias was a
confounding factor in this study.
Study 2
Because the P&A Scale was dropped from Section 1 of the SIS, its reliability and validity
properties was not reported in the SIS User’s Manual. The purpose of Study 2 was to examine
multiple aspects of the reliability (internal consistency, standard error of measurement, and
interrater reliability) and validity (content and construct validity) of the P&A Scale when
administered by trained interviewers with a sample of individuals with intellectual disability
receiving services from a state DD agency. These analyses parallel analyses undertaken by the
SIS author team, reported in the User’s Manual (Thompson et al., 2004b) for Section 1. They
also provide additional information on interrater reliability as multiple respondents were
included, per recommendations in the SIS User’s Manual.
Method
Participants. Study participants were interviewers, respondents and people with
intellectual disability. Interviewers included a doctoral student and three graduate research
assistants (GRA) trained by the doctoral student, all of whom were trained to mastery on the
administration of the SIS, as described in the SIS User’s Manual (Thompson et al., 2004b).
Respondent teams, ranging from two to four persons, were configured with the following
parameters pertaining to who should participate in the interview: (a) The person served, to the
maximum extent possible and based upon the person’s preferences; (b) A direct support
professional who had experience working with the person on a daily basis and knew the person
served; (c) A representative from the person’s community support provider; and (d) The person’s
case manager, guardian, and/or a family member. In all interviews, at least one direct support
Protection and Advocacy Scale
12
person served as a respondent. In 16% of interviews (n = 44), a parent or guardian also served as
a respondent.
The support needs of 274 adults with intellectual disability receiving funding from a state
DD agency were assessed. Participant mean age at time of testing was 41.6 years (range = 19 to
83 years, SD=14.3). Approximately 61% (n=167) of participants were male, and 39% (n=107)
were female. The mean age for males was 41.5 (range = 19 to 79 years, SD=14.4). The mean age
for females was 41.8 (range = 19 to 83 years, SD=14.2). Seven percent of participants were
African American (n=19), one percent were Native American (n=3), and approximately 90%
(n=246) were White, with all other ethnicities represented at less than one percent of the sample.
One hundred and thirty participants (47%) had at least one psychiatric diagnosis identified, 32
(12%) had two psychiatric diagnoses, 11 (4%) had three, and 144 (53%) had no psychiatric
diagnoses. Across the sample, 24% of participants had mild levels of intellectual impairment,
23% had moderate, 14% had severe, and 37.2% had profound levels. Eight-two percent of the
sample had hearing within normal ranges, 8% had a mild hearing loss, 5% a moderate loss, 1.5%
a severe loss, and 3% a profound hearing loss. Sixty-five percent of the sample had normal
vision, 19% had a moderate vision loss, 7% had a severe vision loss, 6% could only perceive
light, and visual ability of 3% of the sample was undetermined. Twelve percent of the sample
lived alone, 24% were living with two or fewer persons with developmental disabilities, 47%
were living with three to seven other persons with developmental disabilities, 2% were living
with eight or more people with developmental disabilities, 14% were living with relatives, and
living arrangement was classified as “other” for the remaining 3%. With regard to current day
activities for people in the sample, 5% were receiving special education services in school
settings, 2% were competitively employed (either greater or less than 20 hours per week), 7%

Protection and Advocacy Scale
13
were working in congregate settings fewer than 20 hours per week, 23% were working in
congregate setting more than 20 hours a week, 7% were involved in agency-based, non-work
activities, and the rest were involved in “generic community activities.”
People with intellectual disability were randomly selected from the population of all
people receiving services from the state agency for participation. Participants were restricted to
persons 18 years and over because the SIS was normed for use with adults. Informed consent
was obtained from all participants and/or their parents or guardians. Using procedures described
subsequently, SIS interview data were completed for all participants and demographic data were
obtained for all participants with a completed SIS.
Procedures
All data collection was conducted a doctoral student who had used the SIS in his
professional role and three graduate research assistant (GRA) interviewers, all of whom were
trained to mastery on administering the SIS. Research staff collaborated with state agency
personnel to schedule interview dates, times, and locations. All interviews were conducted at a
location convenient to the person with the disability and informants and were arranged in
conjunction with the cooperating direct support providing agency. A primary contact at each
local direct support agency was designated who was responsible for coordinating the location for
all SIS interviews. All data were entered and analyzed using SPSS for Windows, version 13.0.
Results
Reliability of the P&A Scale. To examine the reliability of the P&A Scale, we
determined internal consistency reliability using Cronbach’s alpha and split-half reliability
analyses, calculated Standard Error of Measurement, and examined interrater reliability on the
scale for Frequency, Daily Support Time, and Type of Support. Cronbach’s Alpha for the P&A

Protection and Advocacy Scale
14
Scale was .87. A high value of alpha, typically accepted to be above .70 and below .90 is
interpreted evidence that the items measure an underlying (or latent) construct. Split-half
reliability analyses yielded a .814 correlation between forms, with forms yielding Cronbach
Alpha scores of .791 and .723 for Part 1 and 2, respectively. Standard Error of Measurment was
.905, again well in the range of acceptable performance.
With regard to interrater reliability, for 34 participants (12.4% of all participants), two
interviewers completed SIS protocols while interviewing the same respondent. In all 34
reliability analyses, the doctoral student served as the primary rater and one of the GRAs served
as the second interviewer. Across interviewers, there was 100% agreement on Frequency, Daily
Support Time (DST), and Type of Support for P&A items 1, 2, 3, 4, and 5. For item 6,
interviewers had 100% agreement for Frequency and Type of Support scores, and 91% accuracy
on DST scores. For item 7, interviewers had 100% agreement for DST and Type of Support
scores, and 97% accuracy on Frequency scores. For item 8, interviewers had 100% agreement
for Types of Support scores, 97% agreement for Frequency, and 97% agreement on DST scores.
All disagreements were within one point.
Validity of the P&A Scale. To examine validity, we conducted correlational analyses of
the P&A scale total and item scores, other scales within the SIS, and conceptually related
measures. We would expect the P&A scores to correlate strongly with other SIS domain scores,
and, in fact, there were high intercorrelations between P&A total raw scores and total raw scores
for other SIS sections (Home Living r = .79; Community Living r = .80; Lifelong Learning r =
.88; Employment r = ..815; Health and Safety r = .895; Social Activities r = .844). To examine
age differences, we divided the sample by age in decades (in their 20s, 30s, 40s, 50s, 60s, or over
70). Multiple Analysis of Variance for both total P&A score or item score yielded only one
Protection and Advocacy Scale
15
significant overall difference for item 1 (advocating for self), but post-hoc analysis for
differences between each age group and every other age group did not yield any significant
differences. As such, it is fair to say that there were no age-related differences in total or item
scores for the P&A scale. Since we hypothesize that the P&A scale should perform consistently
across ages, we interpret this in support of the scale’s validity.
For a conceptually-related measure, we used findings from the Developmental
Disabilities Profile. The Developmental Disabilities Profile (DDP) (Brown et al., 1986) was
developed by the New York State Office of Mental Retardation and Developmental Disabilities
and yields scores for three domains, Adaptive, Maladaptive, and Medical/Health. In the original
version of the DDP, an individual’s score in each domain is divided by the highest score
obtained by any individual in the sample for that domain, and then these domain factors are
totaled to yield a final score from 50 to 300 (Brown et al., 1986). The state DD system from
which the sample was derived in this study used the DDP with a modified scoring system. The
DDP has been used as part of the funding determination process in several state systems and for
research purposes (Holburn, Jacobson, Schwartz, Flory, & Vietze, 2004; Janicki & Dalton, 1988)
and, as Holburn and colleagues observed, the validity and reliability of the DDP are “comparable
to those for adaptive behavior scales generally” (p. 66). We hypothesized that the P&A total raw
scores would correlate most highly with the Adaptive subscale, which contains a number of
support-like items, and least highly with the maladaptive subscale. In fact, the correlation
between the P&A scale and the Health DDP score was r=.37, the Maladaptive DDP score was
r=.18, and the Adaptive DDP was r=.74 (all significant at the .05 alpha level).
Study 2 Discussion
Protection and Advocacy Scale
16
The findings from this analysis of the reliability and validity of the P&A Scale suggest
that it is a valid and reliable measure of supports needed by people with developmental
disabilities in the domain of self-determination and self-advocacy. Like Study 1, it further
confirms the importance of using trained interviewers for Section 2, and also suggests that higher
levels of interrater reliability can be obtained even with multiple respondents, when training is
provided to interviewers. Further, the findings suggest that other forms of reliability for the
P&A Scale are consistent with reliability data for Section 1 reported in the SIS User’s Manual
(Thompson et al., 2004). The P&A Scale also appears to have strong content and construct
validity, specifically, the P&A Scale has strong correlations with other SIS subscale scores, but
that there are still clear distinctions in the aspects of support needs captured by the P&A Scale
compared to other SIS domains. And, like other SIS domains, there were no age-related
differences. Finally, the P&A Scale appears to be measuring a difference construct than the
DDP, as would be predicted for the other SIS subscales and SNI score. Overall these findings
suggest that the P&A Scale is as reliable and valid as other domains included in SIS Support
Needs Index (Section 1) and contribute unique information.
Limitations. The findings from this study should be considered in light of the
characteristics of the interviewers and participants with intellectual disability. The interviewers
included a doctoral student and trained graduate students, not a sample of interviewers trained by
AAIDD to administer the SIS. Further the individuals with intellectual disability were selected
from one state. Further research is needed with interviewers who are actually administering the
SIS within states and provider organizations with a range of people with intellectual disability.
Study 3
Protection and Advocacy Scale
17
Since the publication of the SIS in 2004, AAIDD developed the SIS Online, an online
portal used by states, provinces, and large service providers for the completion of SIS protocols.
The SIS Online mirrors the paper version of the SIS, except that responses are entered
electronically and users have immediate access to a SIS Online Report. Further, the data that is
entered into the SIS Online is available to AAIDD for evaluation purposes. All interviewers
using the SIS Online are required to participate in AAIDD recognized SIS Training to ensure
they are qualified to complete the SIS with individuals with disabilities. The purpose of Study 3
was to use data from the SIS Online to further examine the reliability (internal consistency) and
validity (intercorrelation of SIS Scores) of the P&A Scale with a large sample of trained
interviewers from across the United States and Canada.
Method
Data and Sample. For the purposes of the present analyses, we conducted secondary
data analysis using raw data from 139,129 completed SIS Online protocols. Given that this was
secondary data analysis, we did not have access to identifiable information about target
individuals, interviewers, or location. As mentioned previously, however, all interviewers using
the SIS Online are required to participate in AAIDD recognized SIS Training to ensure they are
qualified to complete the SIS with individuals with disabilities. Currently, 17 states and 2
Canadian provinces are using the SIS Online. All of the states and provinces are using the SIS
for resource allocation and/or supports planning within their developmental disability service
system.
Limited demographic information was available on the target individuals (people with
intellectual disability) for whom the SIS was completed. It can be assumed that all had an
intellectual and developmental disability because the SIS Online was being used for resource
Protection and Advocacy Scale
18
allocation and/or supports planning within developmental disability service systems. The only
demographic information available was age and gender information. Males comprised 59% of
the sample, and females 41%. The average age of the target participants was 39.8 years (SD =
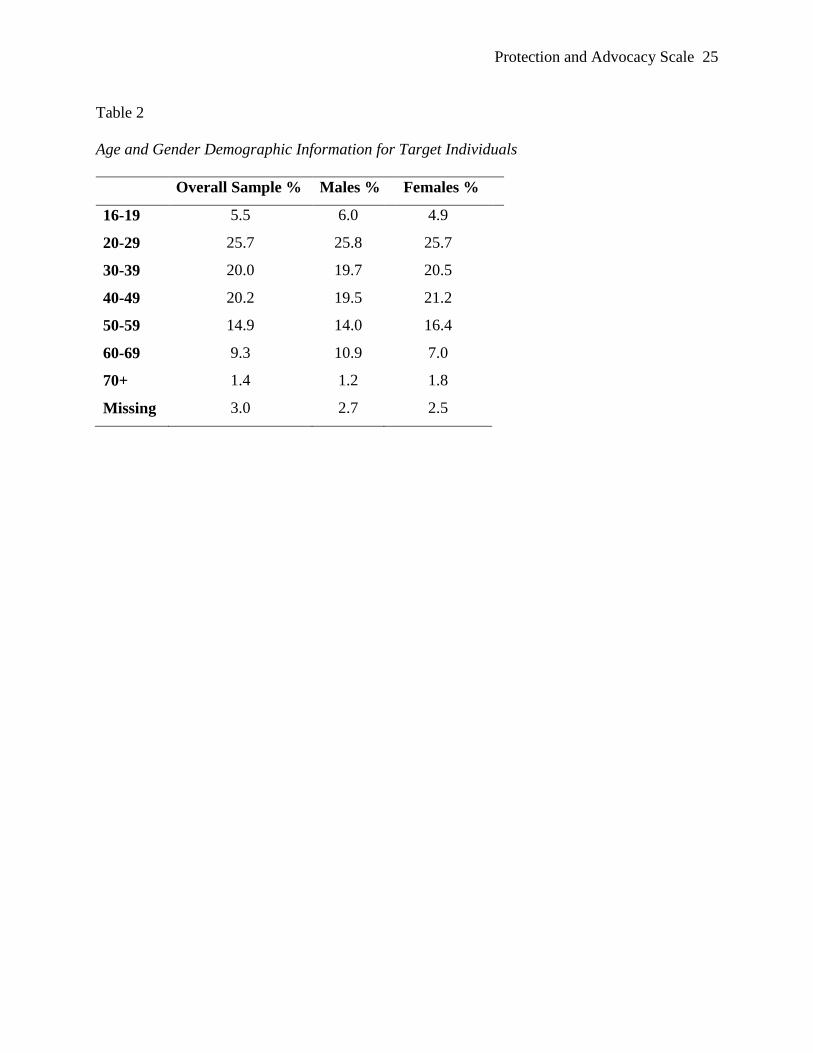
14.34, Range = 16.0 – 79.9). Table 2 provides a breakdown of age percentages by decade and by
gender.
Analyses. To examine the internal consistency reliability of the Supplemental Protection
and Advocacy Scale and the six scales that comprise the SIS Support Needs Index, alpha
coefficients were calculated using IBM SPSS Statistics 20. Alpha coefficients were calculated
for each of the scales, including Protection and Advocacy as well as for the SIS overall (all items
included) with and without the Supplemental Protection and Advocacy scale items included.
To examine the validity of the P&A Scale (intercorrelation of SIS Scores) correlations
were computed using IBM SPSS Statistics 20. Correlations between the six scales included in
the SIS Support Needs Index and the Supplemental Protection and Advocacy scale were
calculated. In addition, correlations between gender, age, and the seven scales were explored.
Results
Reliability. Table 3 presents the internal consistency reliability values for the seven
scales as well as for two SIS Totals, one that includes and one that does not include the
Protection and Advocacy Scale items. All alpha values exceeded .90, which several experts have
set as the acceptable level for reliability for assessments (Anastasi & Urbaina, 1997; Salvia &
Ysseldyke, 2001). Also presented in Table 3 are the average alpha values presented in SIS
manual (Thompson et al., 2004b) for comparison. Although the alpha values are slightly lower,
on average, for the present sample. The differences are minimal and, as mentioned previously,
all scales exceeded .90.
Protection and Advocacy Scale
19
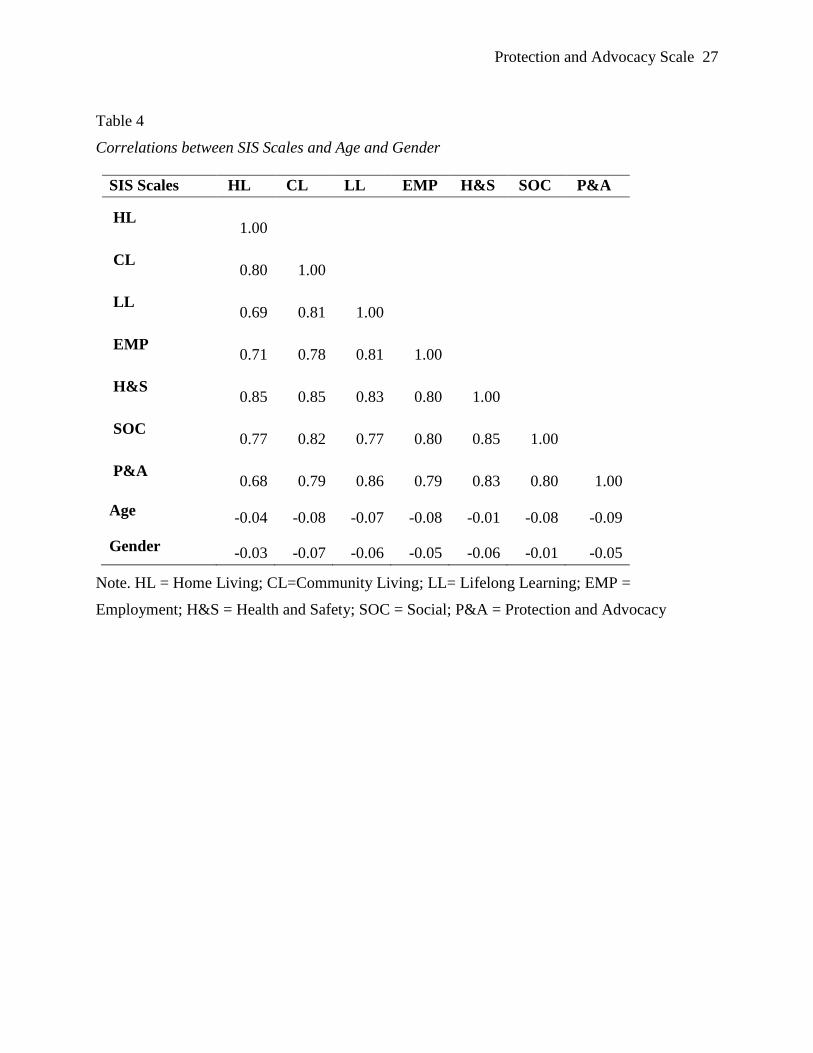
Validity. Table 4 provides the correlations between the six scales included in the SIS
Support Needs Index and the P&A Scale. Correlations with gender and age are also included in
Table 4. The Supplemental Protection and Advocacy scale has correlations ranging between
0.68 and 0.86 with all of the other scales, similar in magnitude to the pattern of intercorrelations
between the six scales that comprise the SIS Support Needs Index. Further, the correlation of all
of the scales, including Protection and Advocacy, with age and gender were below 0.1,
demonstrating negligible relationships of any of the scales, including Protection and Advocacy,
with age and gender. This is consistent with the original SIS norming sample (Thompson et al.,
2004b). Age and gender, therefore, were not included in the internal consistency reliability
analyses.
Study 3 Discussion
The results of Study 3 suggest that the internal consistency reliability value for the P&A
Scale is high, meets accepted standards, and is consistent with the internal consistency reliability
values for six scales that comprise the SIS Support Needs Index (Section 1). And, when
introducing the Protection and Advocacy Scale to the SIS Total, it has no appreciable effect on
the internal consistency reliability of the scale as a whole. Further, P&A Scale has a similar
pattern of intercorrelations with six scales included in the SIS Support Needs Index as well as
with key demographic variables, specifically age and gender. Overall, data from almost 140,000
individuals suggests that the Protection and Advocacy Scale demonstrates strong relations with
the other six scales included in the SIS Support Needs Index, and has similar internal consistency
reliability. This data – along with the results of Studies 1 and 2 – suggests that when revising the
SIS, the authors should consider including the Protection and Advocacy Scale in Section 1 and in
the SIS Support Needs Index.

Protection and Advocacy Scale
20
Limitations. This was a secondary analysis of data collected through the SIS Online.
Secondary data analysis introduces limitations because of the restricted information that is often
available to researchers. In our case, limited demographic information was available and
detailed descriptions of the interviewers and the target individuals with disabilities cannot be
provided for the sample. However, the size of the sample and its geographic diversity provide
strong justification for using the data. Further, the consistency between the results of the
analyses and the analysis on the original SIS norming sample, comprised of 1,306 individuals,
suggests that the SIS, when used with a larger and more diverse sample of interviewers and
target participants demonstrates similar technical properties.
Conclusions
The results of the three separate studies reported in this paper clearly suggest that the
Supplemental Protection and Advocacy Scale (Section 2) of the SIS has strong reliability and
validity, comparable to that reported for the other SIS subscales (Section 1) in Thompson et al.
(2004b). As has been suggested by other research, it appears that the role of trained interviewers
significantly impacts interrater reliability, and that this may particularly true for the P&A Scale,
where some respondents may have less experience in evaluating support needs in domains
associated with self-determination and self-advocacy. Unlike assessing adaptive behavior,
where respondents are reporting whether a person performs specific skills, assessing support
needs requires a different set of skills related to probing and clarifying the frequency, time, and
types of support a person needs to participate in complex activities (Thompson et al., 2008).
Study 3 included interviewers trained by AAIDD through their SIS Training program, developed
to ensure consistency of standards and training in administering the SIS. Data was not available
from SIS Online on interrater reliability, and further research is needed to examine interrater
Protection and Advocacy Scale
21
reliability of interviewers trained through the SIS Training program. Such research would
supplement the findings of Study 1 and 2, which examined the interrater reliability of trained
interviewers, but not through the formal SIS Training program.
In addition to interrater reliability and implications for training of interviewers, these
studies also suggest that the P&A Scale has adequate internal consistency and validity. It shows
strong relationships with other SIS domains, but the results suggest that it measures a unique
domain of support needs. Further, the P&A Scale, as with other SIS domains does not appear to
vary based on age or gender, and measures a different construct from other conceptually-related
measures. Because these items are focused on choice-making, decision-making, self-advocacy,
and excising legal responsibilities, they are integrally related to providing types of support that
may lead to greater self-determination, a valued outcomes that should be measured and included
in the generation of standard scores of support needs. For these reasons, and because of the
critical importance of self-determination and self-advocacy to achieving valued life outcomes for
people with intellectual and developmental disabilities, it appears warranted to consider, in future
revisions of the SIS, moving the P&A Scale from a supplemental section that does not yield
standard scores or contribute to the overall Support Needs Index Score to a part of the
standardized portion of the SIS. Doing so ensures that critical support needs related to full
inclusion and participation in the community, are not left out of the standardized portion of the
SIS.
Protection and Advocacy Scale
22
References
American Association on Intellectual and Developmental Disabilities (AAIDD). (2014).
International SIS Use. Retrieved February 3, 2014, from
http://aaidd.org/sis/international#.UsWhcPaSKW4
Anastasi, A., & Urbaina, S. (1997). Psychological testing (7th ed.). Upper Saddle River, NJ:
Prentice-Hall.
Brown, M. C., Hanley, A. T., Nemeth, C., Epple, W., Bird, W., & Bontempo, A. (1986). The
Developmental Disabilities Profile: Final report the design, development & testing of the
core instrument. Albany, NY: New York State Office of Mental Retardation and
Developmental Disabilities.
Cicchetti, D. V., & Sparrow, S. A. (1981). Developing criteria for establishing interrater
reliability of specific items: Applications to assessments of adaptive beahvior. American
Journal of Mental Deficiency, 86, 127-137.
Clay-Adkins, S. (2004). Reliability and validity of the Supports Intensity Scale. Unpublished
doctoral dissertation. Illinois State University, Department of Special Education. Normal,
Il.
Holburn, S., Jacobson, J. W., Schwartz, A. A., Flory, M. J., & Vietze, P. M. (2004). The
Willowbrook Futures Project: A Longitudinal Analysis of Person-Centered Planning.
American Journal on Mental Retardation, 109(1), 63-76.
Janicki, M., & Dalton, A. (Eds.). (1988). Dementia, aging, and intellectual disabilities: A
handbook. Castleton, NY: Hamilton Printing.
Salvia, J., & Ysseldyke, J. E. (2001). Assessment (8th ed.). Boston: Houghton-Mifflin.
Protection and Advocacy Scale
23
Thompson, J. R., Bryant, B. R., Campbell, E. M., Craig, E. P. M., Hughes, C. M., Rotholz, D.
A., . . . Wehmeyer, M. L. (2004a). Supports Intensity Scale. Washington, DC: American
Association on Intellectual and Developmental Disabilities.
Thompson, J. R., Bryant, B. R., Campbell, E. M., Craig, E. P. M., Hughes, C. M., Rotholz, D.
A., . . . Wehmeyer, M. L. (2004b). Supports Intensity Scale: Users Manual. Washington,
DC: American Association on Intellectual and Developmental Disabilities.
Thompson, J. R., Tassé, M. J., & McLaughlin, C. A. (2008). Interrater reliability of the Supports
Intensity Scale (SIS). American Journal on Mental Retardation, 113, 231-237.
Protection and Advocacy Scale
24
Table 1
Reliability coefficients (Pearson r) for inter-interviewer, inter-respondent, and inter-rater
reliability for SIS Section 2: Supplemental Protection and Advocacy Scale
Same interviewer
with different
respondents
(inter-interviewer)
Different
interviewers with
same respondent
(inter-respondent)
Different
interviewers with
different
respondents
(mixed inter-
rater)
Clay-Adkins
(2004)
(mixed inter-
rater)
.71 .83 .70 .29
p < .01 (2 tailed) for all correlations
Protection and Advocacy Scale
25
Table 2
Age and Gender Demographic Information for Target Individuals
Overall Sample % Males % Females %
16-19 5.5 6.0 4.9
20-29 25.7 25.8 25.7
30-39 20.0 19.7 20.5
40-49 20.2 19.5 21.2
50-59 14.9 14.0 16.4
60-69 9.3 10.9 7.0
70+ 1.4 1.2 1.8
Missing 3.0 2.7 2.5

Protection and Advocacy Scale
26
Table 3
Internal Consistency Reliability Coefficients
SIS Scales Alpha Original SIS
Sample
(Thompson et
al., 2004b)
HL .93 .95
CL .92 .95
LL .94 .97
EMP .95 .97
H&S .90 .94
SOC .94 .96
P&A .97 --
Total (with P&A) .99 --
Total (without
P&A)
.98 .99
Note. HL = Home Living; CL=Community Living; LL= Lifelong Learning; EMP =
Employment; H&S = Health and Safety; SOC = Social; P&A = Protection and Advocacy
Protection and Advocacy Scale
27
Table 4
Correlations between SIS Scales and Age and Gender
SIS Scales HL CL LL EMP H&S SOC P&A
HL
1.00
CL
0.80
1.00
LL
0.69
0.81
1.00
EMP
0.71
0.78
0.81
1.00
H&S
0.85
0.85
0.83
0.80
1.00
SOC
0.77
0.82
0.77
0.80
0.85
1.00
P&A
0.68
0.79
0.86
0.79
0.83
0.80 1.00
Age -0.04 -0.08 -0.07 -0.08 -0.01 -0.08 -0.09
Gender -0.03 -0.07 -0.06 -0.05 -0.06 -0.01 -0.05
Note. HL = Home Living; CL=Community Living; LL= Lifelong Learning; EMP =
Employment; H&S = Health and Safety; SOC = Social; P&A = Protection and Advocacy