serving our stakeholders for over 50years
TRANSCRIPT
SERVING OUR STAKEHOLDERS FOR OVER 50 YEARS
th54 ANNUAL REPORT
2016 - 2017


Annual Report 2016 - 2017 13
NOTICE
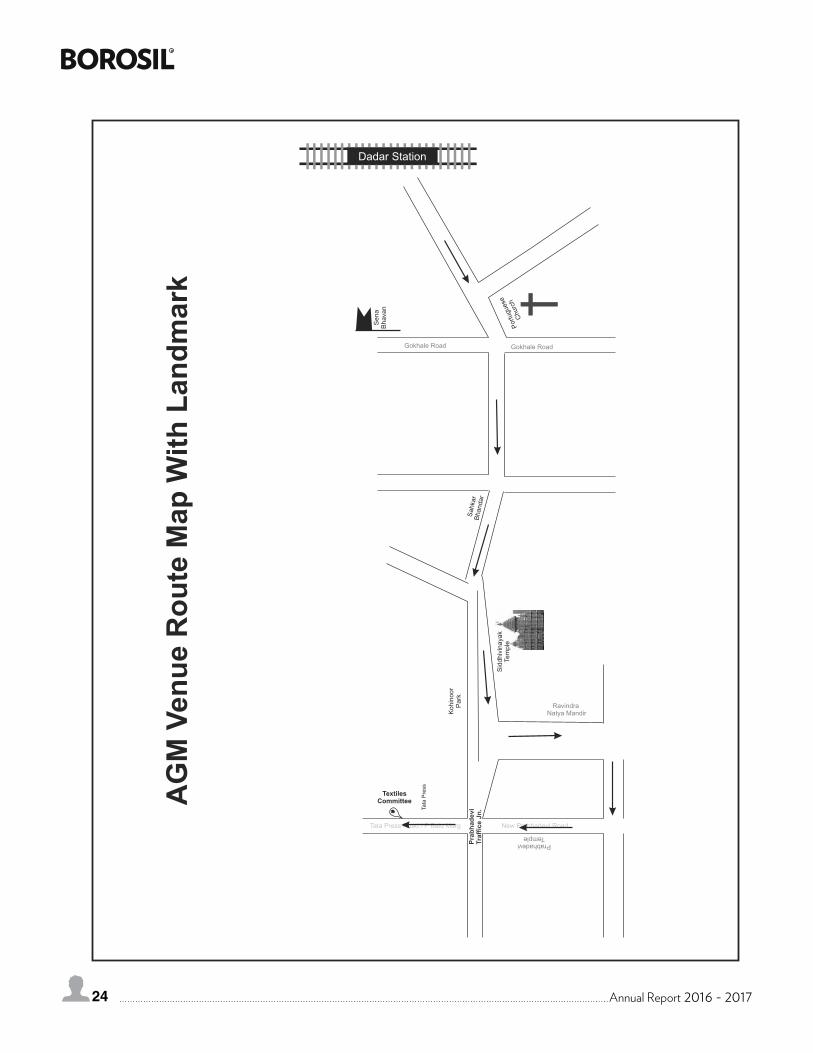
NOTICE is hereby given that the Fifty Fourth Annual General Meeting of the Members of Borosil Glass Works Limited will be held at Textiles Committee Auditorium, Textiles Committee Building, P. Balu Road, near Tata Press, Prabhadevi Chowk, Mumbai – 400 025 on Thursday, 10th day of August, 2017 at 2:30 p.m. to transact the following business:
ORDINARY BUSINESS
1. To consider and adopt:
(a) theauditedfinancialstatementoftheCompanyforthefinancialyearendedMarch31,2017,thereportsoftheBoardofDirectors and Auditors thereon; and
(b) theauditedconsolidatedfinancialstatementoftheCompanyforthefinancialyearendedMarch31,2017andAuditorsReport thereon.
2. To declare dividend on Equity Shares for the year ended March 31, 2017.
3. To appoint a Director in place of Mr. B. L. Kheruka, (DIN 00016861) who retires by rotation and, being eligible, offers himself for re-appointment.
4. Toconsiderandifthoughtfit,topass,withorwithoutmodification(s),thefollowingresolutionasanOrdinaryResolution:
“RESOLVED THAT pursuant to the provisions of Section 139 and other applicable provisions, if any, of the Companies Act, 2013andRules framed thereunder, asamended from time to time, theCompanyhereby ratifies theappointment of M/s. Pathak H. D. & Associates, Chartered Accountants (Firm Registration No. 107783W) as Statutory Auditors of the Company toholdofficefromtheconclusionofthisMeetingtilltheconclusionofthenextAnnualGeneralMeeting.
RESOLVED FURTHER THAT theBoardofDirectorsbeandisherebyauthorisedtofixtheremunerationpayableandthereimbursementofout-of-pocket-expenses,ifany,forthefinancialyearendingMarch31,2018tothesaidStatutoryAuditors.”
SPECIAL BUSINESS
5. Re-appointment of Mr. Shreevar Kheruka (DIN 01802416) as Managing Director & Chief Executive Officer of the Company.
Toconsiderandifthoughtfit,topass,withorwithoutmodification(s),thefollowingresolutionasSpecialResolution:
“RESOLVED THAT pursuant to the provisions of Sections 196,197, 198 and 203 read with Schedule V and all other applicableprovisions,ifany,oftheCompaniesAct,2013(includinganystatutorymodificationtheretofromtimetotimeorany re-enactment thereof for the time being in force), consent of the Company be and is hereby accorded to the appointment of Mr. Shreevar Kheruka (DIN 01802416) (relative of Mr. B. L. Kheruka, Executive Chairman and Mr. P. K. Kheruka, Vice-ChairmanoftheCompany)asManagingDirector&ChiefExecutiveOfficer(CEO)oftheCompany,notliabletoretirebyrotation,foraperiodoffiveyearswitheffectfromAugust16,2017,onthetermsandconditionsincludingremunerationas set out in Item No. 5 of the Statement pursuant to Section 102(1) of the Companies Act, 2013, with a liberty to the Board ofDirectors(hereinafterreferredtoas“theBoard”whichtermshallbedeemedtoincludethe‘NominationandRemunerationCommittee’ constituted by the Board) to alter and vary the terms and conditions of the said appointment and/or remuneration subjecttothesamenotexceedingthelimitsspecifiedinScheduleVtotheAct.
RESOLVED FURTHER THAT incaseof lossor inadequacyofprofits inanyfinancialyearduringhistenureasManagingDirector&CEO,Mr.ShreevarKherukashallbepaidtheremunerationassetoutintheStatementpursuanttoSection102(1)ofthe Companies Act, 2013 as the minimum remuneration subject to limits laid down in Schedule V of the Companies Act, 2013, or as may be approved by the Central Government.
RESOLVED FURTHER THAT the Board be and is hereby authorised to take all steps as may be necessary, proper and expedienttogiveeffecttothisResolution.”
6. Sub-division of Equity Shares.
Toconsiderandifthoughtfit,topass,withorwithoutmodification(s),thefollowingresolutionasSpecialResolution:
“RESOLVED THAT pursuant to the provisions of Section 61 (1) (d) and all other applicable provisions, if any, of the Companies Act,2013(includinganystatutorymodification(s)orre-enactmentthereof,forthetimebeinginforce)andtheprovisionsoftheMemorandum and Articles of Association of the Company and subject to such approvals, consents, permissions and sanctions as may be necessary from the concerned authorities or bodies, the consent of the shareholder be and is hereby accorded to sub-divide the equity shares of the Company, including the authorised, issued, subscribed and paid-up shares, such that each Equity Share of the Company having face value of `10/-(RupeesTenOnly)into10(Ten)EquitySharesoffacevalueof` 1/- (RupeeOneOnly)eachfullypaid-upandconsequentlytheauthorisedsharecapitaloftheCompanyof̀ 12,00,00,000 (Rupees Twelve crores) would comprise of 12,00,00,000 Equity Shares having a face value of ` 1/- each.
14 Annual Report 2016 - 2017
RESOLVED FURTHER THAT on sub-division, the 10 (Ten) Equity Shares of face value of `1/-(RupeeOneOnly)eachbeissued in lieu of 1(one) Equity Share of `10/-(RupeesTenOnly)each,subjecttothetermsofMemorandumandArticlesofAssociation of the Company and shall rank pari passu in all respect with and carry the same rights as the existing fully paid Equity Shares of `10/-(RupeesTenOnly)eachoftheCompanyandshallbeentitledtodividend(s)tobedeclaredafterthesub-division of equity shares.
RESOLVED FURTHER THAT uponthesub-divisionof theEquitySharesasaforesaid, theexistingShareCertificate(s) inrelation to the existing Equity Shares of the face value of ` 10/- each held in physical form shall be deemed to have been automatically cancelled and be of no effect on and from the Record Date and the Company may without requiring the surrender oftheexistingShareCertificate(s)directly issueanddispatchthenewShareCertificate(s)oftheCompany, in lieuofsuchexistingissuedShareCertificate(s)andinthecaseoftheEquitySharesheldinthedematerializedform,thenumberofsub-dividedEquitySharesbecreditedtotherespectivebeneficiaryaccountsoftheShareholderswiththeDepositoryParticipantsin lieu of the existing credits representing the Equity Shares of the Company before sub-division.
RESOLVED FURTHER THAT Mr.B.L.Kheruka,ExecutiveChairman,Mr.ShreevarKheruka,ManagingDirector&CEOandMs.GitaYadav,CompanySecretaryoftheCompanybeandareherebyseverallyauthorizedtodoallsuchacts,deeds,mattersand steps as may be necessary for obtaining such approvals in relation to the above and to execute all such documents, instruments and writings as may be required in this connection and to delegate such authority as may be deemed necessary or expedient in this matter or connected therewith or incidental thereto. AND the Common Seal of the Company, if required, beaffixedtotherelevantdocumentsinthepresenceoftwoDirectorsoranyoneoftheDirectoroftheCompanyandMr.ArunKumar, Vice President - Legal & Secretarial or Ms. Gita Yadav, Company Secretary of the Company, who shall sign the same intokenoftheirpresence.”
7. Alteration of the Capital clause in the Memorandum of Association of the Company in view of Sub-division of Equity Shares.
Toconsiderandifthoughtfit,topass,withorwithoutmodification(s),thefollowingresolutionasSpecialResolution:
“RESOLVED THAT pursuant to the provisions of Section 13 and all other applicable provisions, if any, of the Companies Act,2013, (includinganystatutorymodification(s)or re-enactment thereof, for the timebeing in force), theconsentof theShareholders be and is hereby accorded for alteration of the Memorandum of Association of the Company as follows:
The existing Clause V of the Memorandum of Association of the Company be and is hereby deleted and the following new Clause V be and is hereby substituted in lieu of the deleted clause:
V. The Authorised Share Capital of the Company is ` 12,00,00,000 (Rupees Twelve Crores) divided into 12,00,00,000 (Twelve Crore) Equity Shares of `1/-(RupeeOne)each.TheCompanyhavethepowertoincreaseorreduceormodifythecapitalandto divide all or any of the shares in the capital of the Company for the time being in force and to classify and reclassify such shares from the shares of one class into shares of other class or classes and to attach thereto respectively such preferential, deferred,qualifiedorotherspecialrights,privileges,conditionsorrestrictionsasmaybedeterminedinaccordancewiththeArticles of Association of the Company and to vary, modify or abrogate any such rights, privileges, conditions or restrictions in such manner and by such person as may for the time being be permitted under the provisions of the Articles of Association of the Company or legislative provisions for the time being in force in that behalf.
RESOLVED FURTHER THAT Mr.B.L.Kheruka,ExecutiveChairmanandMr.ShreevarKheruka,ManagingDirector&CEOandMs.GitaYadav,CompanySecretaryoftheCompanybeandareherebyseverallyauthorizedtodoallsuchacts,deeds,matters and steps as may be necessary for obtaining such approvals in relation to the above and to execute all such documents, instruments and writings as may be required in this connection and to delegate such authority as may be deemed necessary orexpedientinthismatterorconnectedtherewithorincidentalthereto.”
8. Approval of Borosil Employee Stock Option Scheme, 2017.
Toconsiderandifdeemedfit,topasswithorwithoutmodification(s),thefollowingresolutionasaSpecialResolution:
“RESOLVED THAT pursuant to the provisions of Section 62(1)(b) and other applicable provisions, if any, of the Companies Act, 2013 and the Rules made thereunder and in accordance with the Memorandum and Articles of Association of the Company, the Listing Agreements entered into by the Company with the Stock Exchanges, Regulation 6 of the Securities and Exchange BoardofIndia(ShareBasedEmployeeBenefits)Regulations,2014(hereinafterreferredas“SEBISBEBRegulations”)andother SEBI Regulations, and further subject to such other approvals, permissions and sanctions as may be necessary and uponsuchconditionsandmodificationsasmaybeprescribedor imposedwhilegrantingsuchapprovals,permissionsandsanctions, the approval of the Company be and is hereby accorded to the introduction and implementation of Borosil Employee StockOptionScheme2017(hereinafterreferredtoasthe“ESOS2017”)authorisingtheBoardofDirectorsoftheCompany(hereinafter referred to as the “Board” which term shall be deemed to include any Committee, including the Nomination and
Annual Report 2016 - 2017 15
Remuneration Committee which the Board has constituted to exercise its powers, including the powers, conferred by this resolution) to create, and grant from time to time, in one or more tranches, not exceeding 1,15,500 (One lac fifteen thousand and five hundred) (equity shares of ` 10/- each) or 11,55,000 (Eleven lacs fifty five thousand) (post sub-division of equity shares of `1/-each)EmployeeStockOptionstoorforthebenefitofsuchperson(s)whoareinpermanentemploymentoftheCompany, its subsidiary company or holding company, including any Director, whether whole time or otherwise, (other than Promoters of the Company, Independent Directors and Directors holding directly or indirectly more than 10% of the outstanding EquitySharesof theCompany),asmaybedecidedunderESOS2017,exercisable intonotmorethan1,15,500 (One lac fifteen thousand and five hundred) equity shares of face value of ` 10/- (Rupees Ten) each fully paid-up or 11,55,000 (Eleven lacs fifty five thousand) equity shares of face value of `1/-(RupeeOne)eachfullypaid-up(postsub-divisionofequity shares), on such terms and in such manner as the Board may decide in accordance with the provisions of the applicable lawsandtheprovisionsofESOS2017.
RESOLVED FURTHER THAT the equity shares so issued and allotted as mentioned hereinbefore shall rank pari passu with the then existing equity shares of the Company.
RESOLVED FURTHER THAT in case of any corporate action(s) such as rights issues, bonus issues, merger and sale of divisionandothers,ifanyadditionalequitysharesaretobeissuedbytheCompanytotheOptiongranteesforthepurposeofmakingafairandreasonableadjustmenttotheOptionsgrantedearlier,theceilingonthenumberofOptionsmentionedintheresolution above, shall be deemed to be increased to the extent of such additional equity shares issued.
RESOLVED FURTHER THAT in case the equity shares of the Company are consolidated, then the number of equity shares to beallottedandtheexercisepricepayablebytheoptiongranteesundertheESOS2017shallautomaticallystandaugmentedin the same proportion as the present face value of ` 10/- (Rupees Ten) per equity share or `1/-(RupeeOne)perequityshare (post sub-division of equity shares) bears to the revised face value of the equity shares of the Company after such consolidation, without affecting any other rights or obligations of the said grantees.
RESOLVED FURTHER THAT the Board including designated committee of the Board, if any be and is hereby authorised to takerequisitestepsforlistingoftheEquitySharesallottedunderESOS2017ontheStockExchangeswheretheEquitySharesof the Company are listed.
RESOLVED FURTHER THAT the Company shall conform to the accounting policies prescribed from time to time under the SEBISBEBRegulationsandanyotherapplicablelawsandregulationstotheextentrelevantandapplicabletotheESOS2017.
RESOLVED FURTHER THAT theBoard includingdesignatedcommitteeof theBoard, ifanybeand isherebyauthorizedatanytimetomodify,change,vary,alter,amend,suspendorterminatetheESOS2017subjecttothecompliancewiththeapplicable laws and regulations and to do all such acts, deeds, matters and things as may at its absolute discretion deems fit,forsuchpurposeandalsotosettleanyissues,questions,difficultiesordoubtsthatmayariseinthisregardwithoutbeingrequired to seek any further consent or approval of the members and further to execute all such documents, writings and to givesuchdirectionsandorinstructionsasmaybenecessaryorexpedienttogiveeffecttosuchmodification,change,variation,alteration,amendment,suspensionorterminationoftheESOS2017anddoallotherthingsincidentalandancillarythereof.
RESOLVED FURTHER THATtheBoard,beandisherebyauthorizedtodoallsuchacts,deeds,andthings,asmay,atitsabsolute discretion, deems necessary including authorizing or directing to appointMerchant Bankers, Brokers, Solicitors,Registrars, Advertisement Agency, Compliance Officer, Investors Service Centre and other Advisors, Consultants orRepresentatives,beingincidentaltotheeffectiveimplementationandadministrationofESOS2017asalsotomakeapplicationsto the appropriate Authorities, Parties and the Institutions for their requisite approvals as also to initiate all necessary actions for thepreparationand issueofpublicannouncementandfilingofpublicannouncement, if required,with theSEBI/StockExchange(s),andallotherdocumentsrequiredtobefiledintheaboveconnectionandtosettleallsuchquestions,difficultiesordoubtswhatsoeverwhichmayariseandtakeallsuchstepsanddecisionsinthisregard.”
9. To approve grant of Employee Stock Options to the Employees of Subsidiary Companies of the Company under Borosil Employee Stock Option Scheme 2017.
Toconsiderandifdeemedfit,topasswithorwithoutmodification(s),thefollowingresolutionasaSpecialResolution:
“RESOLVED THAT pursuant to the provisions of Section 62(1)(b) and other applicable provisions, if any, of the Companies Act, 2013 and the Rules made there under and in accordance with the Memorandum and Articles of Association of the Company, the Listing Agreements entered into by the Company with the Stock Exchanges, Regulation 6 of Securities and Exchange Boardof India (ShareBasedEmployeeBenefits)Regulations,2014 (“SEBISBEBRegulations”),andsuchconditionsandmodificationsasmaybeprescribedorimposedwhilegrantingsuchapprovals,permissionsandsanctions,theapprovaloftheCompanybeandisherebyaccordedtotheBoardofDirectorsoftheCompany(hereinafterreferredtoasthe“Board”whichterm shall be deemed to include any Committee, including the Nomination and Remuneration Committee which the Board has constituted to exercise its powers, including the powers, conferred by this resolution) to create and grant from time to
16 Annual Report 2016 - 2017
time,inoneofmoretranchessuchnumberofEmployeeStockOptionsunderBorosilEmployeeStockOptionScheme2017(“ESOS2017”)(hereinafterreferredtoasthe“ESOS2017”)within the limitprescribedtherein toor for thebenefitofsuchperson(s) who are in permanent employment of any existing or in future Subsidiary Company of the Company, including any Director thereof, whether whole time or otherwise (other than Promoters of the Company, Independent Directors and Directors holding directly or indirectly more than 10% of the outstanding Equity Shares of the Company), of any existing and future SubsidiaryCompany(ies)oftheCompanywhetherinoroutsideIndiaasmaybedecidedunderESOS2017,exercisableintocorresponding number of Equity Shares of face value of ` 10/- (Rupees Ten) each fully paid up or `1/-(RupeeOne)eachfullypaid-up (post sub-division of equity shares), on such terms and in such manner as the Board may decide in accordance with theprovisionsoftheapplicablelawsandtheprovisionsofESOS2017.”
ByOrderoftheBoard For Borosil Glass Works Limited
Place : Mumbai Gita YadavDate : May 13, 2017 Company Secretary
Registered Office:Khanna Construction House,44, Dr. R.G. Thadani Marg,Worli, Mumbai – 400 018CIN: L99999MH1962PLC012538e-mail: [email protected]
NOTES
(1) The Statement pursuant to Section 102(1) of the Companies Act, 2013 with respect to the Special Business set out in the Notice is annexed.
(2) AMEMBERENTITLEDTOATTENDANDVOTEATTHEMEETINGISENTITLEDTOAPPOINTAPROXYTOATTENDANDVOTEONAPOLLINSTEADOFHIMSELF/HERSELFANDSUCHPROXYNEEDNOTBEAMEMBEROFTHECOMPANY.THEPROXYINORDERTOBEEFFECTIVEMUSTBEDEPOSITEDATTHEREGISTEREDOFFICEOFTHECOMPANYNOTLESSTHAN48HOURSBEFORETHECOMMENCEMENTOFTHEMEETING.Apersoncanactasproxyonbehalfofmembersnotexceedingfifty(50)andholdinginaggregatenotmorethantenpercentofthetotalsharecapitaloftheCompany.
(3) Members/ProxiesshouldbringthedulyfilledAttendanceSlipattheAnnualGeneralMeeting(AGM).CorporateMembersarerequestedtosendadulycertifiedcopyoftheBoardResolutionauthorizingtheirrepresentative(s)toattendandvoteontheirbehalf at the Meeting.
(4) PursuanttotheprovisionsofSection91oftheCompaniesAct,2013andSEBI(ListingObligationsandDisclosureRequirements)Regulations, 2015, the Register of Members and Share Transfer Books of the Company will remain closed from Friday, August 04, 2017 to Thursday, August 10, 2017 (both days inclusive).
(5) Members are requested to note that the Company’s shares are under compulsory electronic trading for all investors. Members are,therefore,requestedtodematerializetheirshareholdingtoavoidinconvenience.Memberswhosesharesareinelectronicmode are requested to inform change of address and updates of bank account(s) to their respective Depository Participants.
(6) As per the provisions of Section 72 of the Act and Rule 19(1) of the Companies (Share Capital and Debentures) Rules, 2014, MembersholdingsharesinphysicalformmayfilenominationintheprescribedformSH-13withtheCompany’sRegistrarandShareTransferAgent.Inrespectofsharesheldindematform,thenominationformmaybefiledwiththerespectiveDP.
(7) Memberswishingtoclaimdividends,whichremainunclaimedarerequestedtocorrespondwithUniversalCapitalSecuritiesPrivate Limited, Registrar & Share Transfer Agent. Members are requested to note that dividends not claimed within seven yearsfromthedateofthetransfertotheCompany’sUnpaidDividendAccount,willasperSection124oftheCompaniesAct,2013 (Section 205A of the erstwhile Companies Act, 1956) be transferred to the Investor Education and Protection Fund.
Thelastdateforclaimingtheunpaiddividendamountforthefinancialyear2010-11(interimdividend)isonorbeforeOctober26, 2017.
(8) Members who have not registered their e-mail address so far are requested to register their e-mail address, by sending an email stating clearly their name, folio no. if shares are held in physical form / DP Id & Client Id and if shares are held in dematerializedformto:[email protected]
(9) The Annual Report for the year 2016-17 of the Company circulated to the members of the Company will be made available on the Company’s website at www.borosil.com and also on the website of the stock exchange at www.bseindia.com
Annual Report 2016 - 2017 17
(10)AlldocumentsreferredtointheNoticewillbeavailableforinspectionattheCompany’sregisteredofficeduringnormalbusinesshours on working days up to date of the AGM.
(11) The details of Director seeking re-appointment at the forthcoming Annual General Meeting (pursuant to Regulation 36 of the SEBI (Listing Obligations and Disclosure Requirements) Regulations, 2015 and Secretarial Standard - 2 issued by The Institute of Company Secretaries of India, are furnished below:-
Name of Director Mr. B. L. Kheruka Mr. Shreevar KherukaDIN 00016861 01802416
Date of birth 07.11.1930 04.01.1982
Date of appointment 24.11.1988 24.08.2009
Expertise in specific Professionalareas
Industrialist having 64 years of experience in various functional areas of business/industry.
More than 12 years Corporate experience including position of Vice-President in our Company. He was also briefly associated with a USbased multinational group.
Qualification B. Com B.Sc in Economics and B.A. in InternationalRelationsfromUniversityofPennsylvania,U.S.A.
List of other Indian Public Limited Companies (listed company) in which Directorship held
Gujarat Borosil LimitedWindow Glass Limited
-
Chairman/Member of the Committee of Board other Public Limited (listed company) Companies
Gujarat Borosil Limited
Corporate Social Responsibility Committee
Chairman -
Gujarat Borosil Limited
Share Transfer Committee
Chairman
Gujarat Borosil Limited
Nomination and Remuneration Committee
Member
Gujarat Borosil Limited
Stakeholders Relationship Committee
Member
Window Glass Limited
Audit Committee Member
Number of Shares held in the Company
2,84,092 25,050
Relationship between Directors inter-se
Mr. B. L. Kheruka is father of Mr. P. K. Kheruka and grandfather of Mr. Shreevar Kheruka. In this way, they are related to each other.
Mr. Shreevar Kheruka is son of Mr. P. K. Kheruka and grandson of Mr. B. L. Kheruka. In this way, they are related to each other.
(12) Voting through electronic means
Pursuant to the provisions of Section 108 of the Companies Act, 2013, Rule 20 and Rule 21 of Companies (Management andAdministration)Rules,2014andRegulation44ofSEBI(LODR)Regulations,2015,theCompanyispleasedtoprovidemembers facility to exercise their right to vote at the (AGM) by electronic means and the business may be transacted through e-voting services provided by Central Depository Services Limited (CDSL). The facility for voting through ballot/ polling will also be made available at the venue of the AGM. Members who have voted electronically through remote e-voting may attend the AGM but shall not be allowed to vote at the AGM.
Procedure / Instructions for e-voting are as under:
The instructions for shareholders voting electronically are as under:
(i) The remote e-voting period begins on Monday, August 07, 2017 (9:00 a.m. IST) and ends on Wednesday, August 09, 2017 (5:00 p.m. IST). During this period shareholders’ of the Company, holding shares either in physical form or in dematerializedform,asonthecut-offdate(recorddate)ofFriday,August04,2017maycasttheirvoteelectronically.Theremote e-voting module shall be disabled by CDSL for voting thereafter.
18 Annual Report 2016 - 2017
(ii) Shareholders who have already voted prior to the meeting date would not be entitled to vote at the meeting venue.
(iii) The shareholders should log on to the e-voting website www.evotingindia.com.
(iv) Click on Shareholders.
(v) NowEnteryourUserID
a. ForCDSL:16digitsbeneficiaryID,
b. For NSDL: 8 Character DP ID followed by 8 Digits Client ID,
c. Members holding shares in Physical Form should enter Folio Number registered with the Company.
(vi) NextentertheImageVerificationasdisplayedandClickonLogin.
(vii) If you are holding shares in demat form and had logged on to www.evotingindia.com and voted on an earlier voting of any company, then your existing password is to be used.
(viii) Ifyouareafirsttimeuserfollowthestepsgivenbelow:
For Members holding shares in Demat Form and Physical FormPAN Enter your 10 digit alpha-numeric PAN issued by Income Tax Department (Applicable for both
demat shareholders as well as physical shareholders)l Members who have not updated their PAN with the Company/Depository Participant are
requested to use the first two letters of their name and the 8 digits of the sequencenumberwhichismentionedinaddresslabelassr.no.affixedonAnnualReport,inthePANfield.
l In case the sequence number is less than 8 digits enter the applicable number of 0’s beforethenumberafterthefirsttwocharactersofthenameinCAPITALletters.E.g.Ifyour name is Ramesh Kumar with sequence number 1 then enter RA00000001 in the PANfield.
Dividend Bank DetailsORDateofBirth(DOB)
Enter the Dividend Bank Details or Date of Birth (in dd/mm/yyyy format) as recorded in your demat account or in the company records in order to login.l If both the details are not recorded with the depository or company please enter the
memberid/folionumberintheDividendBankdetailsfieldasmentionedininstruction(v).
(ix) Afterenteringthesedetailsappropriately,clickon“SUBMIT”tab.
(x) Members holding shares in physical form will then directly reach the Company selection screen. However, members holdingsharesindematformwillnowreach‘PasswordCreation’menuwhereintheyarerequiredtomandatorilyentertheirloginpasswordinthenewpasswordfield.Kindlynotethatthispasswordistobealsousedbythedematholdersforvoting for resolutions of any other company on which they are eligible to vote, provided that Company opts for e-voting through CDSL platform. It is strongly recommended not to share your password with any other person and take utmost caretokeepyourpasswordconfidential.
(xi) For Members holding shares in physical form, the details can be used only for e-voting on the resolutions contained in this Notice.
(xii) Click on the EVSN for Borosil Glass Works Limited on which you choose to vote.
(xiii)Onthevotingpage,youwillsee“RESOLUTIONDESCRIPTION”andagainstthesametheoption“YES/NO”forvoting.SelecttheoptionYESorNOasdesired.TheoptionYESimpliesthatyouassenttotheResolutionandoptionNOimpliesthat you dissent to the Resolution.
(xiv)Clickonthe“RESOLUTIONSFILELINK”ifyouwishtoviewtheentireResolutiondetails.
(xv) Afterselectingtheresolutionyouhavedecidedtovoteon,clickon“SUBMIT”.Aconfirmationboxwillbedisplayed.Ifyouwishtoconfirmyourvote,clickon“OK”,elsetochangeyourvote,clickon“CANCEL”andaccordinglymodifyyourvote.
(xvi)Onceyou“CONFIRM”yourvoteontheresolution,youwillnotbeallowedtomodifyyourvote.
(xvii)Youcanalsotakeaprintofthevotescastbyclickingon“Clickheretoprint”optionontheVotingpage.
(xviii)IfademataccountholderhasforgottentheloginpasswordthenEntertheUserIDandtheimageverificationcodeandclick on Forgot Password & enter the details as prompted by the system.

Annual Report 2016 - 2017 19
(xxi) Shareholders can also cast their vote using CDSL’s mobile app m-Voting available for android based mobiles. The m-Voting app can be downloaded from Google Play Store. iPhone and Windows phone users can download the app from the App Store and the Windows Phone Store respectively. Please follow the instructions as prompted by the mobile app while voting on your mobile.
(xx) Note for Non–Individual Shareholders and Custodians
l Non-Individual shareholders (i.e.other than Individuals,HUF,NRIetc.)andCustodianare required to logon to www.evotingindia.com and register themselves as Corporates.
l A scanned copy of the Registration Form bearing the stamp and sign of the entity should be emailed to [email protected].
l After receiving the logindetailsaComplianceUsershouldbecreatedusing theadmin loginandpassword.TheComplianceUserwouldbeabletolinktheaccount(s)forwhichtheywishtovoteon.
l The list of accounts linked in the login should be emailed to [email protected] and on approval of the accounts they would be able to cast their vote.
l Ascannedcopyof theBoardResolutionandPowerofAttorney (POA)which theyhave issued in favourof theCustodian,ifany,shouldbeuploadedinPDFformatinthesystemforthescrutinizertoverifythesame.
(xxi)Incaseyouhaveanyqueriesorissuesregardinge-voting,youmayrefertheFrequentlyAskedQuestions(“FAQs”)ande-voting manual available at www.evotingindia.com, under help section or write an email to [email protected].
(xxii) In case of any grievances in connection with voting by electronic means the shareholders can contact Ms. Gita Yadav, Company Secretary at her email [email protected] or contact her at 022-6740 6318.
(xxiii)Institutionalshareholders(i.e.otherthanIndividuals,HUF,NRIetc.)arerequiredtologontohttps://www.evotingindia.co.in and register themselves, link their account(s) which they wish to vote on and then cast their vote. They should upload a scannedcopyoftheBoardResolution/AuthorityletterinPDFformatinthesystemforthescrutinizertoverifythesame.Further,theyarerequestedtosendthescannedcopyoftheBoardResolution/AuthoritylettertotheemailidofScrutinizer([email protected]), RTA ([email protected]) and Company ([email protected]).
Mr.VirendraGBhatt,PracticingCompanySecretary(C.P.No.124)hasbeenappointedastheScrutinizertoscrutinizethe e-voting process in a fair and transparent manner.
The Results shall be declared within 48 hours after the AGM of the Company and the resolutions will be deemed to be passed on the AGM date, subject to receipt of the requisite number of votes in favor of the resolutions. The results declaredalong-withtheScrutinizer’sReportshallbeplacedonthewebsiteoftheCompanywww.borosil.com and on the website of CDSL www.evotingindia.com and the same shall also be communicated to BSE Limited.
20 Annual Report 2016 - 2017
ANNEXURE TO THE NOTICE
STATEMENT PURSUANT TO SECTION 102(1) OF THE COMPANIES ACT, 2013
Item No. 5
Mr.ShreevarKheruka,aged35years,wasappointedasManagingDirectorandChiefExecutiveOfficeroftheCompanyatthe49th Annual General Meeting held on August 09, 2012 for a period of 5 years, his current term is ending on August 15, 2017. Mr.ShreevarKherukahasarichcorporateexperienceandtheCompanyhasgrownmanyfoldsduringlastfiveyears.TheBoardof Director of the Company decided, subject to necessary approvals, to re-appoint Mr. Shreevar Kheruka as Managing Director and ChiefExecutiveOfficer,foraperiodoffiveyearswitheffectfromAugust16,2017.
The appointment of Mr. Shreevar Kheruka is subject to the provisions of Sections 196,197, 198 and 203 read with Schedule V and allotherapplicableprovisions,ifany,oftheCompaniesAct,2013(includinganystatutorymodificationtheretofromtimetotimeoranyre-enactmentthereofforthetimebeinginforce)(hereinafterreferredtoas“Act”).
The terms and conditions of Mr. Shreevar Kheruka’s appointment and remuneration payable to him, as approved by the Nomination and Remuneration Committee are as follows:
I. Remuneration
a) Salary : ` 4,00,000/- p.m.b) Commission : SuchpercentageofthenetprofitsoftheCompanyorsuchamountasmaybedecidedby
theBoardofDirectors(whichincludesanyCommitteethereof)foreachfinancialyearorpartthereofwithinoverallceilingof5%ofthenetprofitsoftheCompany,asalsowithinthelimitof10%ofthenetprofitsoftheCompanyforallmanagerialpersonnel.
c) Perquisites : i) Medical Expenses Domiciliary Treatment - At actuals subject to a ceiling of ` 15,000/- p.a. for Mr. Shreevar
Kheruka and his family. Hospitalisation - Mr. Shreevar Kheruka and his dependents will be covered by the
Company’s medical insurance scheme.ii) Club Fees Reimbursement of membership fee for upto 3 clubs in India including admission and life
membership fee.iii) Personal Accident Insurance Personal Accident Insurance Policy of such amount, the premium of which shall not
exceed ` 10,000 /- p.a.iv) Mr. Shreevar Kheruka will be provided with a Company maintained car with Driver.v) Phone rental and call charges will be paid by the Company at actuals for telephone at
the residence/mobile phone. vi) Company’s contribution to Provident Fund, Gratuity and encashment of leave, payable
as per rules of the Company. These shall not be included in the computation of limits for the remuneration or perquisites aforesaid.
vii) Leave Leave with full pay or encashment thereof as per the Rules of the Company.viii) Mr. Shreevar Kheruka will further be entitled to reimbursement of actual entertainment
and traveling expenses incurred by him for business purposes.
II. IncaseofinadequacyorabsenceofprofitsinanyfinancialyearduringthetenureofMr.ShreevarKherukaasaManagingDirector&CEO, theremunerationpayable tohim in thatfinancialyearshallbecalculated inamannerso that itdoesnotexceed double the limits laid down in Section II of Part II of Schedule V of the Companies Act, 2013 (as a special resolution is being passed) or as may be approved by the Central Government.
III. Other terms and conditions
This arrangement may be terminated by either party by giving three months' notice in writing.
The Board recommends the special resolution set out at Item No. 5 of the Notice for approval by the shareholders.
Except Mr. B. L. Kheruka, who is grandfather, Mr. P.K. Kheruka, who is father of Mr. Shreevar Kheruka and Mr. Shreevar Kheruka himself, none of the Directors/ Key Managerial Personnel of the Company or their relatives are, in any way, concerned or interested in the special resolution as set out in the aforesaid resolution.
Annual Report 2016 - 2017 21
Item No. 6
The equity shares of the Company are listed on the BSE Limited, with a view to broad the investor base by encouraging the participation of the small investors and in order to improve the liquidity of equity shares of the Company, the Board of Directors in its meeting held on May 13, 2017 considered and approved sub-division of the nominal value of the equity share capital of the Company from ` 10/- per share to ` 1/- per share, subject to the approval of the shareholders and such other authorities as may be necessary.
At present, the Authorised Share Capital of the Company is `12,00,00,000(RupeesTwelveCroresOnly)dividedinto1,20,00,000(One Crore Twenty Lakhs) Equity Shares of ` 10/- (Rupees Ten) each. The issued subscribed and paid up capital of the Company is divided into 23,10,000 (Twenty Three Lakh Ten Thousand) Equity Shares of ` 10/- (Rupees Ten) each amounting to ` 2,31,00,000(RupeesTwoCroreThirtyOneLakhOnly).
According, Authorised Share Capital and each paid up equity share of nominal value of ` 10/- (RupeesTenOnly)eachof theCompany,existingontheRecordDateasmaybefixedbytheBoardofDirectorsshallbesub-dividedinto10(Ten)EquitySharesof Nominal Value of `1/-(RupeeOneOnly).
Consequently, Clause V of the Memorandum of Association is proposed to be altered in the manner set out in resolution Item No. 7.
TheRecorddatefortheaforesaidsub-divisionoftheequityshareswillbefixedaftertheapprovaloftheshareholdersandnecessaryauthorities is obtained.
A copy of the Memorandum of Association of the Company along with the proposed amendments is available for inspection by the membersattheRegisteredOfficeoftheCompanyonallworkingdaysduringtheofficehoursoftheCompanytilltheconclusionofthe Annual General Meeting.
None of the Directors / Key Managerial Personnel of the Company or their relatives are, in any way, concerned or interested in the resolution except to the extent of their shareholding.
Item No. 7
The proposed sub-division of the face value of the Equity Shares of the Company of ` 10/- each into denomination of ` 1/- each requires amendment to the Memorandum of Association of the Company.
Accordingly, Clause V of the Memorandum of Association is proposed to be amended as set out in Item No. 7 in the accompanying notice for reflecting the corresponding changes in theAuthorizedShareCapital of theCompany, consequent to theproposed sub-division i.e. ` 12,00,00,000 (Rupees Twelve Crores) divided into 12,00,00,000 (Twelve Crore) Equity Shares of ` 1/- each.
The Board recommends the resolutions as set out in Item No. 7 of the accompanying notice for the approval of the members of the Company as Special Resolution.
A copy of the Memorandum of Association of the Company along with the proposed amendments is available for inspection by the membersattheRegisteredOfficeoftheCompanyonallworkingdaysduringtheofficehoursoftheCompanytilltheconclusionofthe Annual General Meeting.
None of the Directors / Key Managerial Personnel of the Company or their relatives are, in any way, concerned or interested in the resolution except to the extent of their shareholding.
Item No. 8 & 9
Equity based compensation is considered to be an integral part of employee compensation across sectors which enables alignment ofpersonalgoalsoftheemployeeswithorganizationalobjectives.YourCompanybelievesinrewardingitsemployeesincludingDirectors of the Company along with employees of the subsidiaries for their continuous hard work, dedication and support, which hasledtheCompanyonthegrowthpath.TheCompanyintendstoimplementEmployeeStockOptionSchemewithaviewtoattractand retain key talents working with the Company by way of rewarding their performance and motivate them to contribute to the overallcorporategrowthandprofitability.
Withthisobjectiveinmind,yourCompanyintendstoimplementBorosilEmployeeStockOptionScheme2017(“ESOS2017”)forthe permanent employees including Directors of the Company.
TheCompanyseeksmembers’approval in respectofESOS2017andgrantofStockOptions to theeligibleemployeesof theCompany as decided in this behalf from time to time in due compliance of the Regulation 6 of the Securities and Exchange Board ofIndia(ShareBasedEmployeeBenefits)Regulations,2014(“SEBISBEBRegulations”).
22 Annual Report 2016 - 2017
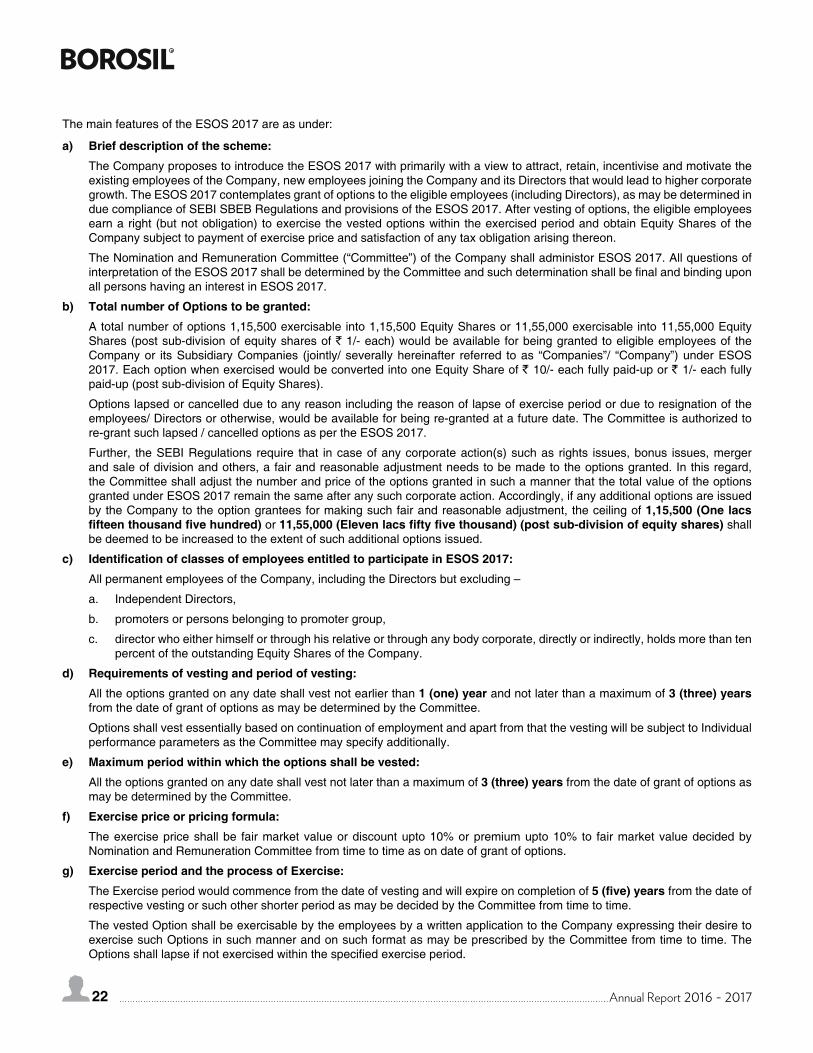
ThemainfeaturesoftheESOS2017areasunder:
a) Brief description of the scheme:
TheCompanyproposestointroducetheESOS2017withprimarilywithaviewtoattract,retain,incentiviseandmotivatetheexisting employees of the Company, new employees joining the Company and its Directors that would lead to higher corporate growth.TheESOS2017contemplatesgrantofoptionstotheeligibleemployees(includingDirectors),asmaybedeterminedinduecomplianceofSEBISBEBRegulationsandprovisionsoftheESOS2017.Aftervestingofoptions,theeligibleemployeesearn a right (but not obligation) to exercise the vested options within the exercised period and obtain Equity Shares of the Company subject to payment of exercise price and satisfaction of any tax obligation arising thereon.
TheNominationandRemunerationCommittee(“Committee”)oftheCompanyshalladministorESOS2017.AllquestionsofinterpretationoftheESOS2017shallbedeterminedbytheCommitteeandsuchdeterminationshallbefinalandbindinguponallpersonshavinganinterestinESOS2017.
b) Total number of Options to be granted:
A total number of options 1,15,500 exercisable into 1,15,500 Equity Shares or 11,55,000 exercisable into 11,55,000 Equity Shares (post sub-division of equity shares of ` 1/- each) would be available for being granted to eligible employees of the Companyor itsSubsidiaryCompanies (jointly/ severallyhereinafter referred toas “Companies”/ “Company”)underESOS2017. Each option when exercised would be converted into one Equity Share of ` 10/- each fully paid-up or ` 1/- each fully paid-up (post sub-division of Equity Shares).
Optionslapsedorcancelledduetoanyreasonincludingthereasonoflapseofexerciseperiodorduetoresignationoftheemployees/Directorsorotherwise,wouldbeavailableforbeingre-grantedatafuturedate.TheCommitteeisauthorizedtore-grantsuchlapsed/cancelledoptionsaspertheESOS2017.
Further, the SEBI Regulations require that in case of any corporate action(s) such as rights issues, bonus issues, merger and sale of division and others, a fair and reasonable adjustment needs to be made to the options granted. In this regard, the Committee shall adjust the number and price of the options granted in such a manner that the total value of the options grantedunderESOS2017remainthesameafteranysuchcorporateaction.Accordingly,ifanyadditionaloptionsareissuedby the Company to the option grantees for making such fair and reasonable adjustment, the ceiling of 1,15,500 (One lacs fifteen thousand five hundred) or 11,55,000 (Eleven lacs fifty five thousand) (post sub-division of equity shares) shall be deemed to be increased to the extent of such additional options issued.
c) Identification of classes of employees entitled to participate in ESOS 2017:
All permanent employees of the Company, including the Directors but excluding –
a. Independent Directors,
b. promoters or persons belonging to promoter group,
c. director who either himself or through his relative or through any body corporate, directly or indirectly, holds more than ten percent of the outstanding Equity Shares of the Company.
d) Requirements of vesting and period of vesting:
All the options granted on any date shall vest not earlier than 1 (one) year and not later than a maximum of 3 (three) years from the date of grant of options as may be determined by the Committee.
OptionsshallvestessentiallybasedoncontinuationofemploymentandapartfromthatthevestingwillbesubjecttoIndividualperformance parameters as the Committee may specify additionally.
e) Maximum period within which the options shall be vested:
All the options granted on any date shall vest not later than a maximum of 3 (three) years from the date of grant of options as may be determined by the Committee.
f) Exercise price or pricing formula:
The exercise price shall be fair market value or discount upto 10% or premium upto 10% to fair market value decided by Nomination and Remuneration Committee from time to time as on date of grant of options.
g) Exercise period and the process of Exercise:
The Exercise period would commence from the date of vesting and will expire on completion of 5 (five) years from the date of respective vesting or such other shorter period as may be decided by the Committee from time to time.
ThevestedOptionshallbeexercisablebytheemployeesbyawrittenapplicationtotheCompanyexpressingtheirdesiretoexercisesuchOptionsinsuchmannerandonsuchformatasmaybeprescribedbytheCommitteefromtimetotime.TheOptionsshalllapseifnotexercisedwithinthespecifiedexerciseperiod.
Annual Report 2016 - 2017 23
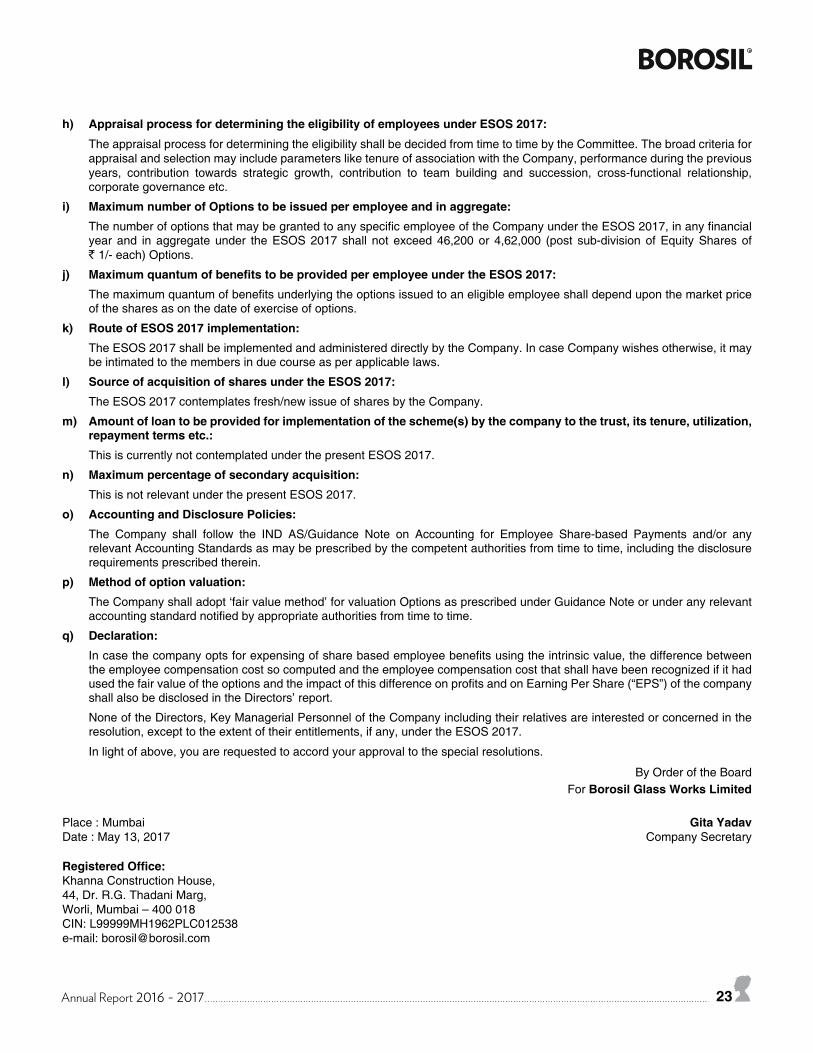
h) Appraisal process for determining the eligibility of employees under ESOS 2017:
The appraisal process for determining the eligibility shall be decided from time to time by the Committee. The broad criteria for appraisal and selection may include parameters like tenure of association with the Company, performance during the previous years, contribution towards strategic growth, contribution to team building and succession, cross-functional relationship, corporate governance etc.
i) Maximum number of Options to be issued per employee and in aggregate:
ThenumberofoptionsthatmaybegrantedtoanyspecificemployeeoftheCompanyundertheESOS2017,inanyfinancialyear and in aggregateunder theESOS2017 shall not exceed46,200or 4,62,000 (post sub-divisionofEquitySharesof ` 1/-each)Options.
j) Maximum quantum of benefits to be provided per employee under the ESOS 2017:
Themaximumquantumofbenefitsunderlyingtheoptionsissuedtoaneligibleemployeeshalldependuponthemarketpriceof the shares as on the date of exercise of options.
k) Route of ESOS 2017 implementation:
TheESOS2017shallbeimplementedandadministereddirectlybytheCompany.IncaseCompanywishesotherwise,itmaybe intimated to the members in due course as per applicable laws.
l) Source of acquisition of shares under the ESOS 2017:
TheESOS2017contemplatesfresh/newissueofsharesbytheCompany.
m) Amount of loan to be provided for implementation of the scheme(s) by the company to the trust, its tenure, utilization, repayment terms etc.:
ThisiscurrentlynotcontemplatedunderthepresentESOS2017.
n) Maximum percentage of secondary acquisition:
ThisisnotrelevantunderthepresentESOS2017.
o) Accounting and Disclosure Policies:
The Company shall follow the IND AS/Guidance Note on Accounting for Employee Share-based Payments and/or any relevant Accounting Standards as may be prescribed by the competent authorities from time to time, including the disclosure requirements prescribed therein.
p) Method of option valuation:
TheCompanyshalladopt‘fairvaluemethod’forvaluationOptionsasprescribedunderGuidanceNoteorunderanyrelevantaccountingstandardnotifiedbyappropriateauthoritiesfromtimetotime.
q) Declaration:
Incasethecompanyoptsforexpensingofsharebasedemployeebenefitsusingtheintrinsicvalue,thedifferencebetweentheemployeecompensationcostsocomputedandtheemployeecompensationcostthatshallhavebeenrecognizedifithadusedthefairvalueoftheoptionsandtheimpactofthisdifferenceonprofitsandonEarningPerShare(“EPS”)ofthecompanyshall also be disclosed in the Directors’ report.
None of the Directors, Key Managerial Personnel of the Company including their relatives are interested or concerned in the resolution,excepttotheextentoftheirentitlements,ifany,undertheESOS2017.
In light of above, you are requested to accord your approval to the special resolutions.
ByOrderoftheBoard For Borosil Glass Works Limited
Place : Mumbai Gita YadavDate : May 13, 2017 Company Secretary
Registered Office:Khanna Construction House,44, Dr. R.G. Thadani Marg,Worli, Mumbai – 400 018CIN: L99999MH1962PLC012538e-mail: [email protected]
24 Annual Report 2016 - 2017
AG
M V
en
ue
Ro
ute
Ma
p W
ith
La
nd
ma
rk
Annual Report 2016 - 2017 25
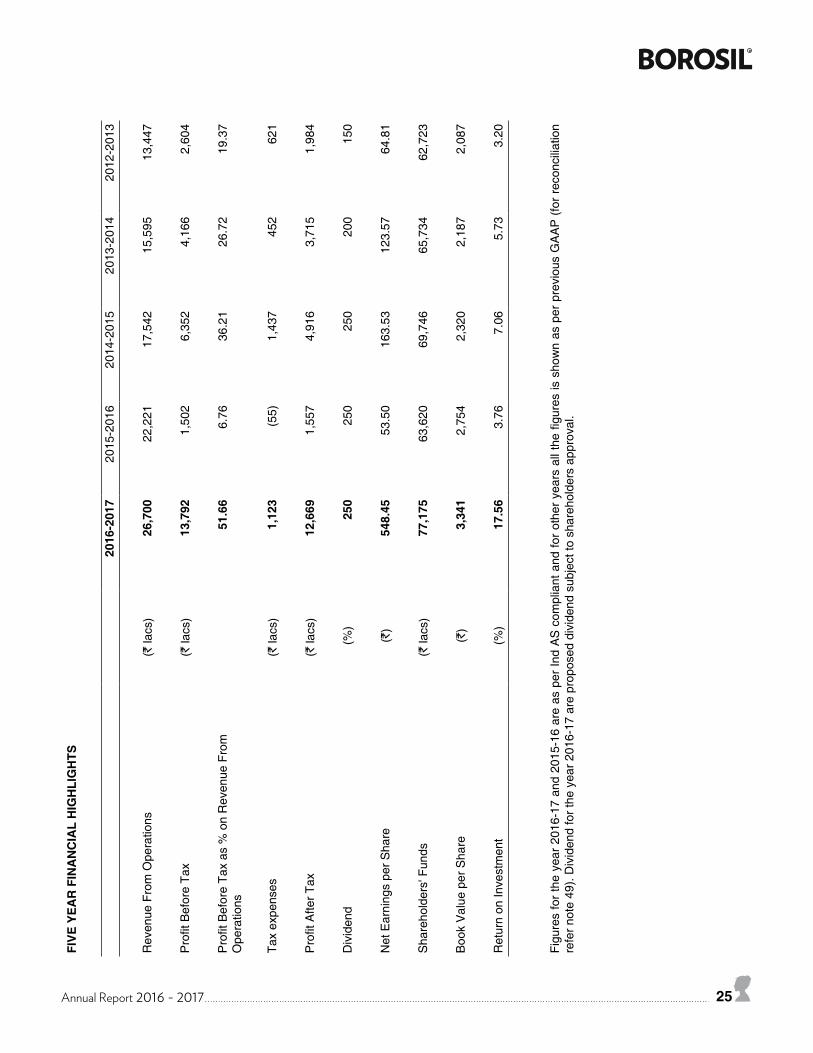
FIV
E Y
EA
R F
INA
NC
IAL
HIG
HLI
GH
TS
2016
-201
720
15-2
016
2014
-201
520
13-2
014
2012
-201
3
RevenueFromOperations
(` la
cs)
26,
700
22,
221
17,
542
15,
595
13,
447
ProfitBeforeTax
(` la
cs)
13,
792
1,5
02 6
,352
4,1
66 2
,604
ProfitBeforeTaxas%onRevenueFrom
Operations
51.
66 6
.76
36.
21 2
6.72
19.
37
Tax
expe
nses
(` la
cs)
1,1
23 (5
5) 1
,437
452
621
ProfitAfterT
ax(`
lacs
) 1
2,66
9 1
,557
4,9
16 3
,715
1,9
84
Div
iden
d (%
) 2
50 2
50 2
50 2
00 1
50
Net
Ear
ning
s pe
r Sha
re (`
) 5
48.4
5 5
3.50
163
.53
123
.57
64.
81
Sha
reho
lder
s' F
unds
(` la
cs)
77,
175
63,
620
69,
746
65,
734
62,
723
Boo
k V
alue
per
Sha
re (`
) 3
,341
2,7
54 2
,320
2,1
87 2
,087
Ret
urn
on In
vest
men
t (%
) 1
7.56
3.7
6 7
.06
5.7
3 3
.20
Figuresfortheyear2016-17and2015-16areasperIndAScom
pliantandforotheryearsallthefiguresisshownasperpreviousGAAP(forreconciliation
refe
r not
e 49
). D
ivid
end
for t
he y
ear 2
016-
17 a
re p
ropo
sed
divi
dend
sub
ject
to s
hare
hold
ers
appr
oval
.
26 Annual Report 2016 - 2017
DIRECTORS’ REPORT
To
The Members ofBOROSIL GLASS WORKS LIMITED
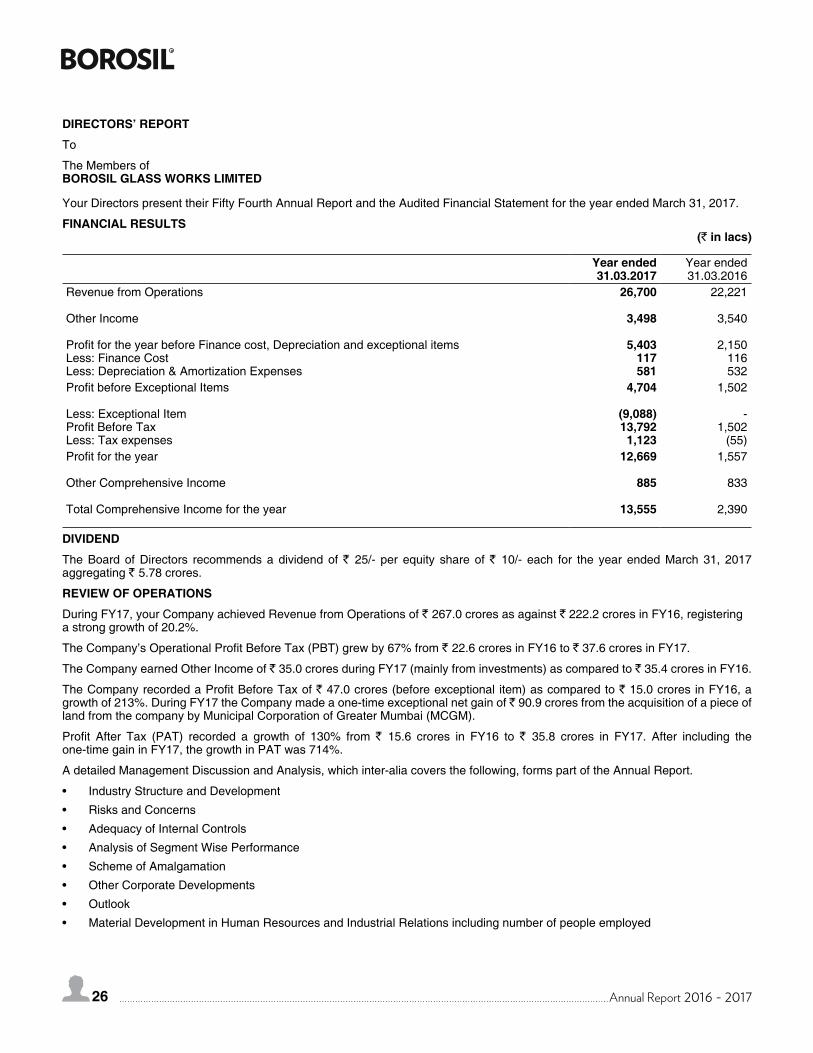
Your Directors present their Fifty Fourth Annual Report and the Audited Financial Statement for the year ended March 31, 2017.
FINANCIAL RESULTS (` in lacs)
Year ended31.03.2017
Year ended 31.03.2016
RevenuefromOperations 26,700 22,221
OtherIncome 3,498 3,540
ProfitfortheyearbeforeFinancecost,DepreciationandexceptionalitemsLess: Finance CostLess:Depreciation&AmortizationExpenses
5,403117581
2,150116
532ProfitbeforeExceptionalItems 4,704 1,502
Less: Exceptional ItemProfitBeforeTaxLess: Tax expenses
(9,088)13,7921,123
-1,502
(55)Profitfortheyear 12,669 1,557
OtherComprehensiveIncome 885 833
Total Comprehensive Income for the year 13,555 2,390
DIVIDEND
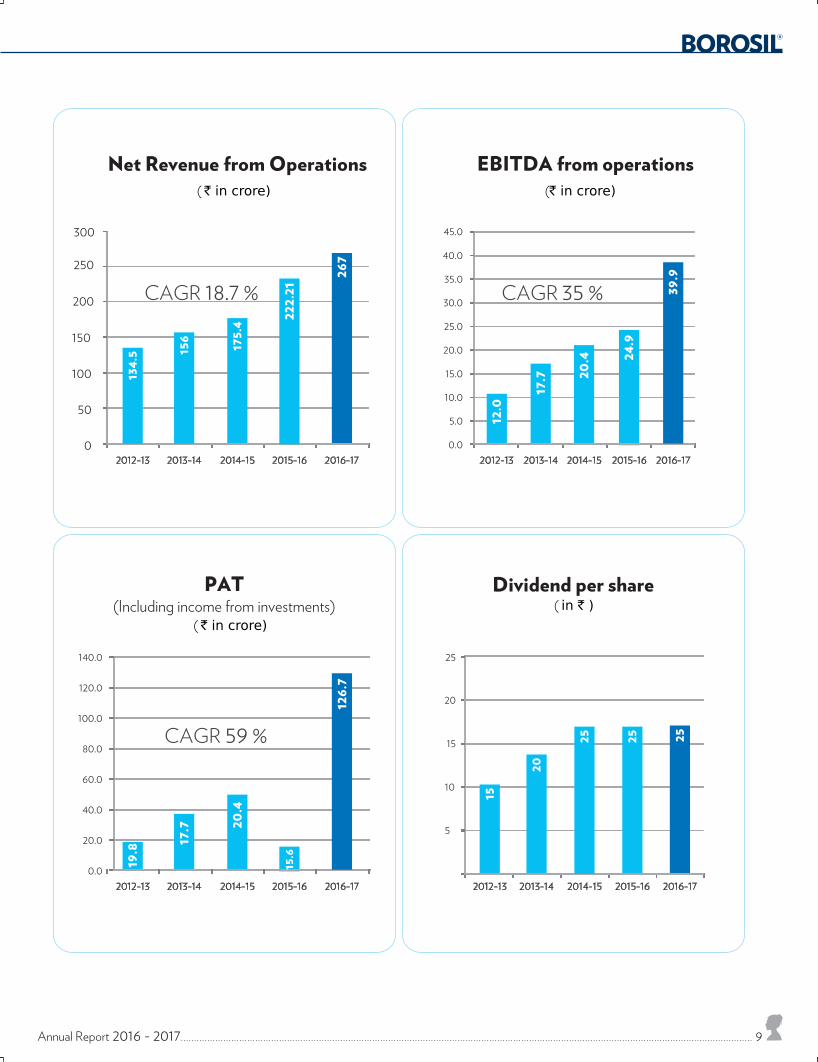
The Board of Directors recommends a dividend of ` 25/- per equity share of ` 10/- each for the year ended March 31, 2017 aggregating ` 5.78 crores.
REVIEW OF OPERATIONS
DuringFY17,yourCompanyachievedRevenuefromOperationsof` 267.0 crores as against ` 222.2 crores in FY16, registering a strong growth of 20.2%.
TheCompany’sOperationalProfitBeforeTax(PBT)grewby67%from` 22.6 crores in FY16 to ` 37.6 crores in FY17.
TheCompanyearnedOtherIncomeof` 35.0 crores during FY17 (mainly from investments) as compared to ` 35.4 crores in FY16.
TheCompanyrecordedaProfitBeforeTaxof` 47.0 crores (before exceptional item) as compared to ` 15.0 crores in FY16, a growth of 213%. During FY17 the Company made a one-time exceptional net gain of ` 90.9 crores from the acquisition of a piece of land from the company by Municipal Corporation of Greater Mumbai (MCGM).
Profit After Tax (PAT) recorded a growth of 130% from ` 15.6 crores in FY16 to ` 35.8 crores in FY17. After including the one-time gain in FY17, the growth in PAT was 714%.
A detailed Management Discussion and Analysis, which inter-alia covers the following, forms part of the Annual Report.
• IndustryStructureandDevelopment
• RisksandConcerns
• AdequacyofInternalControls
• AnalysisofSegmentWisePerformance
• SchemeofAmalgamation
• OtherCorporateDevelopments
• Outlook
• MaterialDevelopmentinHumanResourcesandIndustrialRelationsincludingnumberofpeopleemployed
Annual Report 2016 - 2017 27
MANAGEMENT DISCUSSION AND ANALYSIS
ThisdiscussioncoversthefinancialresultsandotherdevelopmentsduringApril,2016-March,2017inrespectoftheConsolidatedResultsofBorosilcomprisingitsScientific&IndustrialProductsDivision(SIP)anditsConsumerProductsDivision(CPD).TheseincludethefinancialsofBorosilGlassWorksLimited,HopewellTablewarePrivateLimited(100%subsidiary),KlasspackPrivateLimited (60.3% subsidiary), Borosil Afrasia FZE (100% subsidiary) and Fennel Investment and Finance Private Limited (an associate company).Theconsolidatedentityhasbeenreferredtohereinafteras“Company”or“Borosil”.AbriefoverviewofthebusinessofGujarat Borosil Limited is provided separately.
ThefinancialsofthecompanyhavebeenpreparedinaccordancewithIndianAccountingStandards(INDASs).ThefinancialsofFY16 have been restated accordingly wherever necessary.
Some statements in this discussion pertaining to projections, estimates, expectations or outlook may be forward looking. Actual results may however differ materially from those stated on account of various factors such as changes in government regulations, tax regimes, economic developments, exchange rate and interest rate movements, impact of competing products and their pricing, product demand and supply constraints within India and other countries where the Company conducts business. Estimates made withregardtomarketsizeofvarioussegmentsandtheirrespectiveratesofgrowthareinternalestimatesmadebythemanagement.
INDUSTRY STRUCTURE AND DEVELOPMENT
Notwithstanding sluggish global growth in recent years, the Indian economy has shown robust growth. It continues to be one of the fastest growing large economies. A large domestic market and sector diversity helps to insulate the country from external shocks. Both the World Bank and the International Monetary Fund have projected growth rates of over 7.0% in India’s GDP over each of the nextthreeyears.Indiacouldthusbeconsideredoneoftheenginesforglobalgrowth.OnaUS$2.3trillionbase,IndiawouldaddUS$600-900billionoverthenext5yearsevenwithamodest5%-7%growthrate.
Prime Minister Narendra Modi’s, Bharatiya Janata Party (BJP) won a sweeping mandate in the last general elections in 2014 resultinginasinglepartyruleatthecentralgovernmentasopposedtocoalitionruleforthefirsttimein30years.Thishasgiventhis administration the opportunity to govern without the drag of coalition politics. It is seen as pro-business and pro-reform. A stable and forward lookinggovernment isexpected todriveseveralpositiveeconomicchanges.Currentandfiscaldeficitshavebeenloweredandinflationhasbeenmoderatethisyearaidedbybetteragriculturaloutputaswellaslowerinternationalcrudeoilprices.PrevalenceofhighinflationhadpreventedIndiafromsofteninginterestrates.Interestrateshadreachedahighof14.5%duringCY13. These have since declined to about 11% and are expected to come down further to about 10% giving a boost to investment demand.
PublicandprivateinvestmentdrivenGDPgrowthisexpectedtoseeariseinthepercapitalincome.OnaPurchasingPowerParity(PPP)basisitspercapitalincomeisabout$6000peryear.Risingincomeisleadingtoanupwardmobilitywithabout150millionexpected to be added to the middle class by 2025 creating a large consumer market in India (Source: Boston Consulting Group). India has the largest youth population with about 356 million between 10-24 years of age. It is expected that 64% of the population will be working age by 2021 giving India the advantage of a demographic dividend. The reduced expenditure on dependents will increase the ability to save as well as enable individuals to spend more on discretionary consumption, education, entertainment withawidervarietyandhighervalueofpurchases.Indiaisseeingarapidtrendinurbanization.Itsurbanpopulationisexpectedtoincrease by about 300 million over the next 30 years. India has the second largest base of internet users and an explosion in mobile phonepenetrationhasbroughtinlargenumbersofmobilefirstinternetusers.Thisisleadingtoarapidlygrowingtrendofonlineconsumption.
Fromthefinancialyear2017-18, India isexpectedtowitnessthebenefitof twoverysignificanteconomicpolicydevelopments.A constitutional amendment has paved the way for the long awaited and transformational Goods and Services Tax (GST). It is expectedtobeimplementedbyJuly,2017.ItwillcreateacommonIndianmarketleadingtoasimplificationoftaxation,eliminatethecascadingeffectofmultiplicityof taxationandwidenthetaxbasethroughimprovedcompliance.OnNovember8,2016thegovernment “demonetized” the two largest denomination currencynotes.This86%of the currency in circulation ceased tobelegal tender. These were to be deposited in banks by December 30, 2016. The aim was to curb corruption, counterfeiting and accumulationof“blackmoney”generatedfromincomethathadnotbeendeclaredtotaxauthorities.Whilethisledtoshortterminconvenienceandhardship,demonetizationhasthelongtermpotentialofreducingcorruption,greaterdigitizationoftheeconomyandgreaterformalizationoftheeconomy.
BorosilGlassWorksLimitedconductsitsoperationsintwobusinesssegments,namelyitsScientific&IndustrialProductsDivision(SIP) and its Consumer Products Division (CPD).
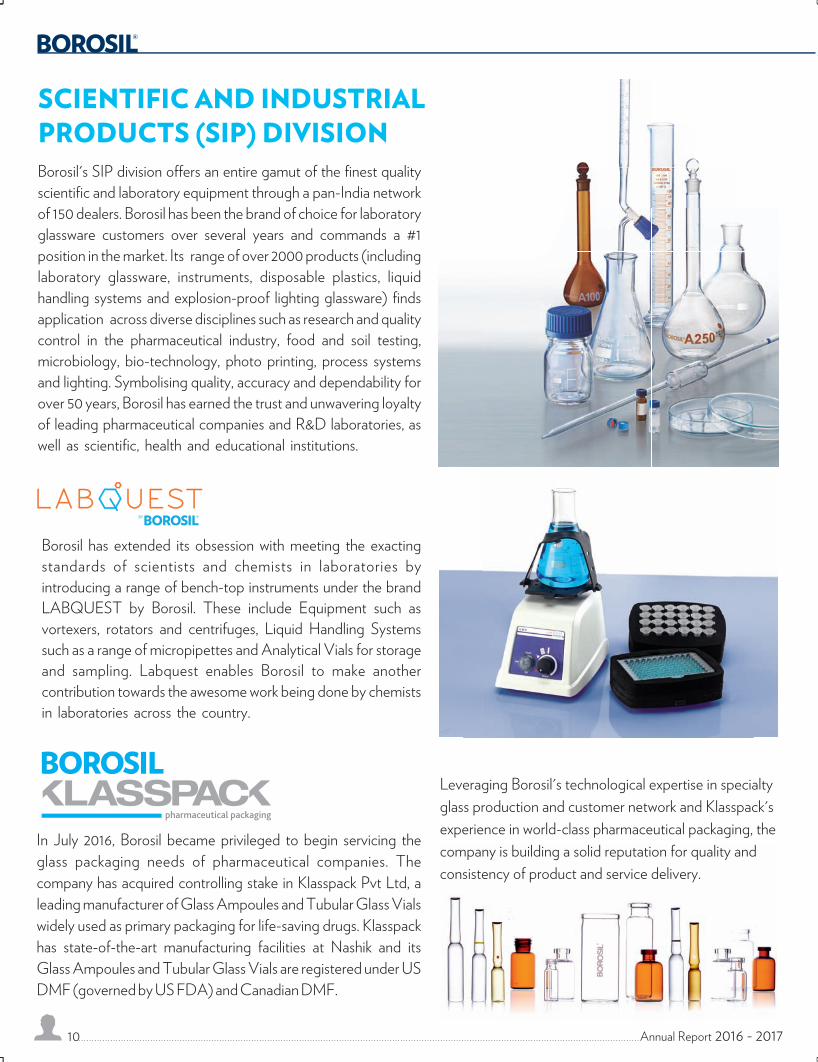
SIP caters to the needs of the Pharmaceutical, Research and Development, Education and Healthcare segments of the market. These industries are seeing a rapid move towards automation. This shift is improving productivity multifold and exponentially increasing the volumes of tests and analyses being conducted. New methodologies are being developed for sample preparation enabling multiple analyses. Consequently, there is a large market emerging for new equipment and other products. Traditionally theCompanyusedtomarketglasswareincludingawidevarietyofscientific, industrialandpharmaceuticalglassitemssourcedboth from international and domestic markets. Changing with market needs, it has now begun to see itself evolve from a glassware manufacturer to a solutions provider to its customers for their laboratory and product needs. A beginning has been made through the marketing of HPLC vials, Liquid Handling Systems as well as Bench Top Equipment under the brand Labquest by Borosil.
28 Annual Report 2016 - 2017
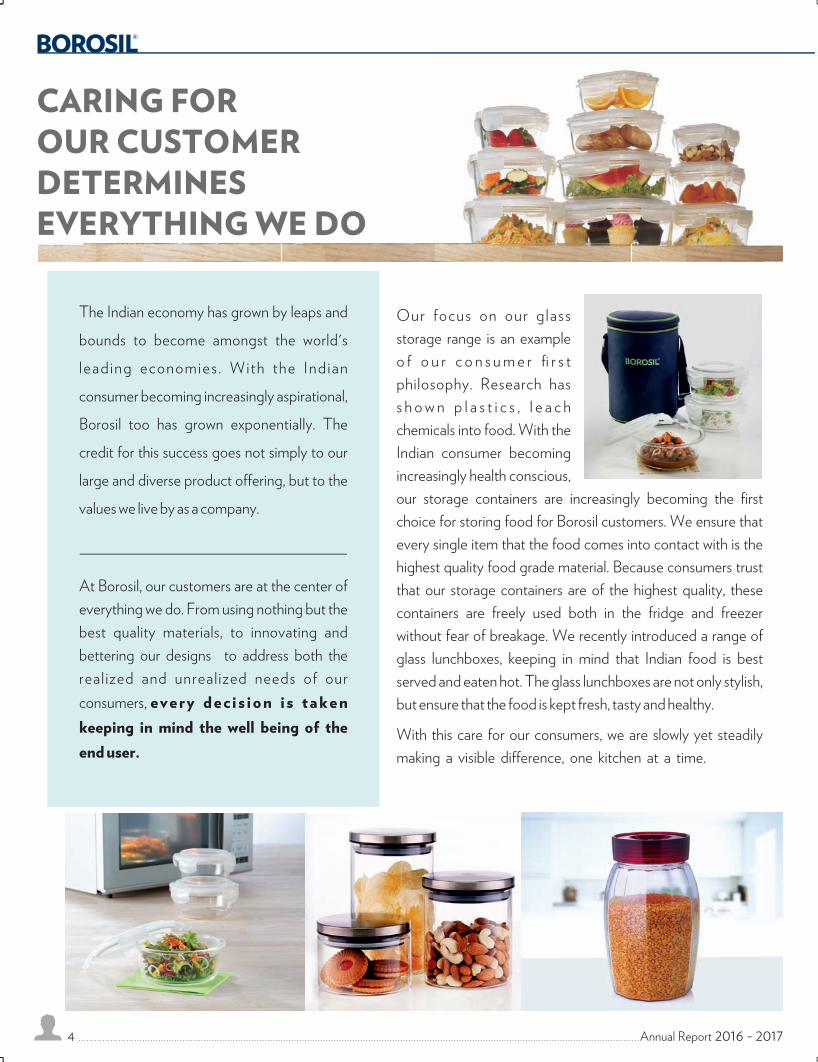
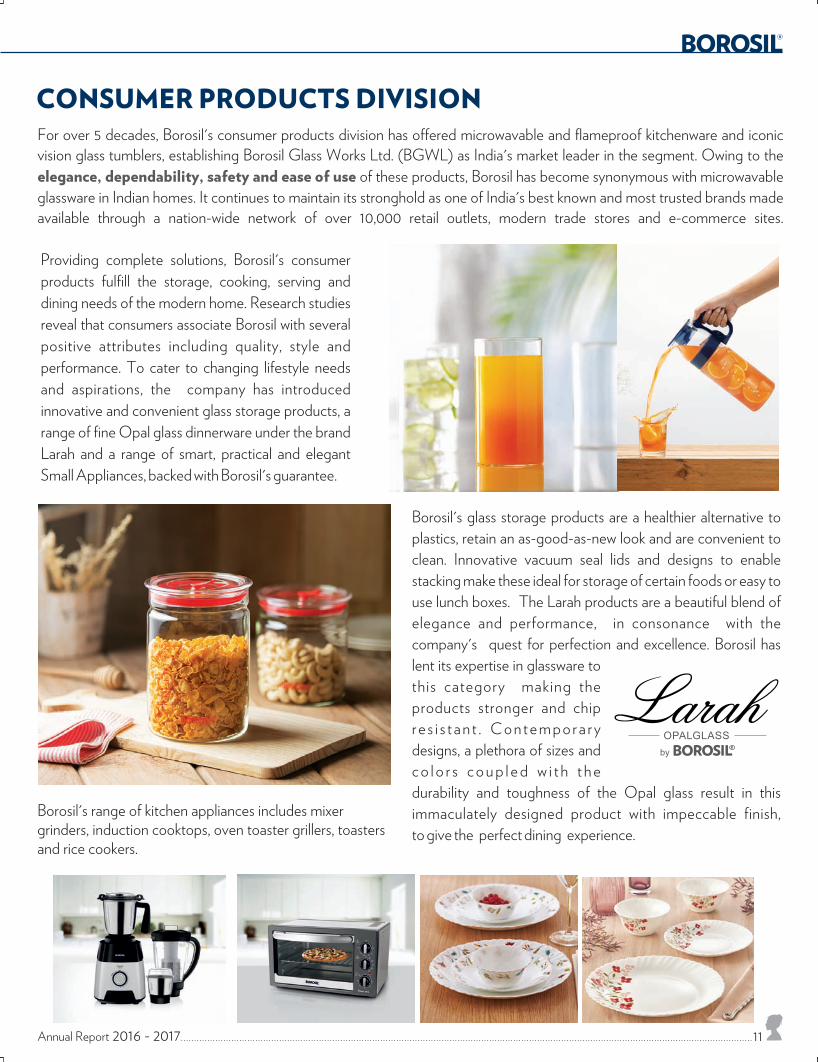
CPDhasbeenmarketingmicrowaveableglasswareproductstoconsumers.Thereisadefinitetrendintermsofincreaseddisposableincome of households, more nuclear families and changes in consumer lifestyle. Kitchen designs are improving (even as they might get smaller) and consumers are entertaining at home more often. This gives rise to the need for kitchen and serving products that performmoreefficientlyandareatthesametimemoreelegant.Borosilproductsseektoempowertheirconsumerswithjustthat,inaccordancewithourtag-line“performsbeautifully”.Withariseinhealthconsciousnessinthecountry,thereisagradualshiftfromstorage of food items in plastic to glass containers. The Company now markets Larah by Borosil, a range of opal tableware products, a glass storage range and has introduced a range of kitchen appliances to exploit these opportunities.
RISKS AND CONCERNS
(a) Macro Economic Factors: In situations of economic constraints, items which are in the nature of discretionary spending are the firsttobecurtailed.FactorssuchaslowGDPgrowthandhighfoodinflationcanresultinpostponementofpurchaseordown-trading from premium to mass market products.
(b) Changing Customer Preferences: Demand can be adversely impacted by a shift in customer and consumer preferences. The Companykeepsaclosewatchonchangingtrendsandidentifiesnewproductlinesthatitcanofferitsexistingcustomers.
(c) Competition: With low entry barriers, there could be an increase in the number of competing brands. Counter campaigning and aggressive pricing by competitors (including e-commerce players buying sales through heavy discounting) have the potential of creating a disruption. China could be a source of low cost products in addition to grey market imports. The Company brand “BOROSIL”enjoysafirstmoveradvantageandsignificantbrandequity.Marketinginvestmentstofurtherstrengthenthebrandmay mitigate the impact of aggressive competition.
(d) GrowthofOnlineasanewchannel:Newbrandsarebeing launchedonline.With increasedonlinepenetrationdistributorrelationships may no longer remain a critical success factor. The Company has listed its products on major e-tailor marketplaces and has also launched its own e-commerce portal www.myborosil.com.
(e) NewProductLaunches:Newproductsmaynotfindvery favorableacceptancebyconsumersormay fail toachievesalestargets. The Company has a systematic outside-in insighting and new product development process which helps in increasing the chances of new product success.
(f) Acquisitions: Acquisitions entail deployment of capital and may increase the challenge of improving returns on investment, particularlyintheshortrun.Integrationofoperationsmaytaketimetherebydeferringbenefitsofsynergiesofunification.TheCompanycontemplatesacquisitionswithahighstrategicfitwhereitenvisagesaclearpotentialtoderivesynergisticbenefits.
(g) Input Costs: Unexpected changes in commodity prices resulting from global demand and supply fluctuations as well asvariations in the value of the Indian Rupee versus foreign currencies could lead to an increased cost base with a consequent impact on margins.
(h) Counterfeits: Counterfeits, pass-offs and lookalikes are a constant source of unfair competition for leadership brands.
(i) Volatility inFinancialMarkets: Investments inequity,debtandrealestatemarketsarealwayssubjecttomarketfluctuationrisks.TheCompanyhasreducedthesizeofitsinvestmentportfolioandisexpectedtoparksurplusfundsprimarilyinsafe,liquid assets.
Adequacy of Internal Financial Controls
TheCompanyhasadequate InternalControlSystems commensuratewith its size andnature of business. InternalAudits areperiodicallyconductedbyanexternalfirmofCharteredAccountantswhomonitorandevaluate theefficiencyandadequacyofinternal control systems in the Company, its compliance with operating systems, accounting procedures and policies at all locations of the Company. Based on the report of internal audit function, suitable corrective actions are taken and thereby controls are strengthened. These Internal Audit reports are reviewed by the Audit Committee.
Review of Operations – Consolidated for SIP and CPD
DuringFY17BorosilachievedRevenuefromOperationsof` 388.8 crores as against ` 234.7 crores, a strong growth of 66%. FY17 includes inorganic revenue of ` 121.8 crores. The organic growth during FY17 was a robust 20.2%.
During FY17 Borosil achieved an EBITDA of ` 43.2 crores, a growth of 60% over the previous year, in line with revenue growth. CPDmadesignificantinvestmentsinbrandbuildinginFY17.EBITDAmarginduringtheyearwas11.5%.TheCompanyexpectstoimprove its EBITDA margin as it scales its operations in the coming years.
OtherIncomeduringFY17wasat` 35.7 crore (mainly from investments) as compared to ` 35.1 crore in FY16.
Borosil’sProfitBeforeTax(PBT)excludingprofitfrominvestmentsandexceptionalitemsalsogrewby3%from̀ 24.0 crore in FY16 to ` 24.9 crore in FY17. During FY17, Borosil made a one-time exceptional gain of ` 90.9 crores from the acquisition of a piece of land from the company by Municipal Corporation of Greater Mumbai (MCGM).
ProfitAfterTax(PAT)recordedagrowthof37%from` 23.5 crore in FY16 to ` 32.2 crore in FY17. After including the one-time gain (shown as exceptional item), the growth in PAT was 424%.
Annual Report 2016 - 2017 29
The Effective Tax Rate during FY17 was 6.5%. This was lower primarily on account of non-taxable earnings from the sale of long-terminvestmentsandProfitonSaleofProperty,PlantandEquipments(shownasexceptionalitem).
ANALYSIS OF SEGMENT WISE PERFORMANCE
Scientific & Industrial Products Division (SIP)
Overtheyears,Borosil’sSIPdivisionhasestablishedleadershipinthe` 220 crore lab glassware segment (internal estimates) with nearly 60% market share. The Company’s client list includes most well-known pharmaceutical players in the country, apart from governmentlaboratories,microbiology,biotechnologyandfood&soiltestingorganizationsandinstitutionsofhighereducation.Itslarge network of customers ensures that the company has virtually no client concentration risk. The nature of business requires servicingclientswithavery largerangeofSKUs(thecompanyhasa rangeofover2000SKUs).Given lowunitpriceofeachitem and being a rather small proportion of the consumables budget of pharmaceutical labs, clients are reluctant to have multiple supplierbrands.Borosilenjoysanincumbent’sadvantagewiththesecustomers.Moreover,thewiderangeofSKUsisnoteasyforanewcomer to offer as customers often demand immediate delivery with little or no demand forecasts. The Company has developed a strong sales team that keeps in touch with its customers, the scientists and technicians in the laboratories, to promote its products, take orders, assist with usage procedures and understand new needs. This reinforces Borosil’s branding and increases stickiness for this low-value but critical range of items in laboratories across the country.
As part of its strategy to market more products to existing customers, the Company introduced LabQuest, its brand of lab instrumentation,duringthepreviousyear.Asignificantportionoftheapproximately` 150 crore market (growing at ~8% to 10%) is currently serviced by expensive imports. Borosil’s SIP has a strong team of over 50 sales persons who are trained to talk to customers about product and secure periodic contracts for Borosil lab glass as well as to discuss and introduce new products. The team has been able to generate trials and interest in LabQuest products such as Micro Centrifuges, Shakers and Magnetic Stirrers. Many new products will be introduced over the next few years as we understand our customers’ instrumentation needs better. While the assembly of these instrumentation products is outsourced, Borosil uses its technical expertise in assisting with product design.
The Company has begun to build an additional avenue for growth through exports of its lab glassware products. It intends to market the Borosil range in The Middle East, Africa and South East Asia. These markets do not have dominant local brands as yet and BorosilbenefitsfromafavourableIndia-basedcoststructure.WithIndianpharmaceuticalcompaniesexpandingoperationsinthesegeographies, lab personnel from India are expected to prefer using the brand that they are familiar with. As a result of this focus, export revenues for the SIP division have grown from ` 1.4 crores in FY13 to ` 9.2 crores in FY17.
Acquisition of 60.3% stake in Klasspack
OnJuly29,2016, theCompanyacquired60.3%EquitySharesofKlasspackPrivateLimitedaNashikbasedmanufacturerandmarketer of Glass Ampoules and Tubular Glass Vials. Hitherto Borosil was marketing lab glassware to pharmaceutical companies for their research lab and quality control lab needs. With the addition of the Klasspack range to its portfolio, the Company can now service the product manufacturing glass packaging needs of their customers. With Borosil’s technological expertise in specialty glass production and Klasspack’s experience in world-class ampoule and tubular glass production, the Company’s pharmaceutical company customers get a high quality choice for sourcing their glass packaging needs.
During FY16 Klasspack had achieved a turnover of about ` 28 crore. The industry is quite fragmented and Klasspack is one of the leading players. It is the #2 player in the estimated ` 500 crore market for Glass Ampoules and Tubular Glass Vials. Klasspack provides Borosil’s pharmaceutical customers a credible alternative supplier. Its existing relationship with several pharmaceutical manufacturers helps the Company gain access to these customers and the equity of Borosil facilitates an evaluation opportunity. Borosil plans to invest to upgrade Klasspack’s production facility to world class standards with clean rooms, automatic manufacturing and camera inspection systems.Given the long lead times required to pass the stringent quality specifications to become anapprovedsupplierthereisasignificantbarriertoentryforfutureplayers.TheCompanyhascommencedtheregisteringprocesswitha number of potential customers. The approval cycles could take between 6 months to 18 months.
During FY17, the SIP division achieved Net Revenue of ` 136.6 crore, a growth of 14.7% over the previous year. Revenue from the international business was about ` 9.2 crore. The net revenue from Klasspack, an acquisition made in July 2016, during FY17 was about ` 22.6 crore.
Consumer Products Division (CPD)
Borosil, India’s most well-known and trusted brand in microwaveable kitchenware, has evolved in its products offering over the past few years. In the traditional microwaveable kitchenware segment, Borosil maintains a stronghold on the estimated ` 100 crore segment. It commands a 60% national market share (internal estimate). An established network of over 10,000 retail outlets as well as presence through key Modern Retail stores gives this homemakers’ favourite brand a nationwide reach.
The modern homemaker is looking for convenience in the kitchen and is also more conscious about how she presents / serves meals at home. This is leading to a strong tail wind in the categories of storage, tableware and kitchen appliances. These products
30 Annual Report 2016 - 2017
also have everyday use as opposed to the occasional use of microwaveable glass kitchenware. The company has introduced a rangeofproductsthatcovertheentireprocessofcookingandservingthatempoweritsconsumerstoperformmoreefficientlyandpresent more beautifully.
The kitchen storage market is estimated to be ` 700 crore (organised only) and growing between 15% and 20% annually. This is currently dominated by steel and plastics. Steel suffers from being aesthetically inferior and being opaque is less convenient to use. Plasticsarelightanddurable,butthereisagrowingawarenessaboutthehazardsofusingplasticsforstorageoffoodsandworseto microwave in it. Glass inert property makes it safe. It can be aesthetically designed and containers can be used for storage, be microwaved, easily cleaned and look as good as new over long periods of time as it does not stain with Indian spices. Glass storage products can be designed without being unduly heavy. The company has introduced a range of storage products and has received agoodresponse.Theseincludelunchboxesthathavemadeitveryconvenientforofficegoerstomicrowaveandeattheirmealsatoffice.Glassjarswithavacuumsealingfunctionarehelpingtokeepfoodsfreshonthekitchenshelvesinconsumers’homes.Borosil’s strategy is to create a shift towards adopting glass for storage through building awareness about the advantages of glass.
Acquisition of Hopewell Tableware Pvt Ltd (“Larah”)
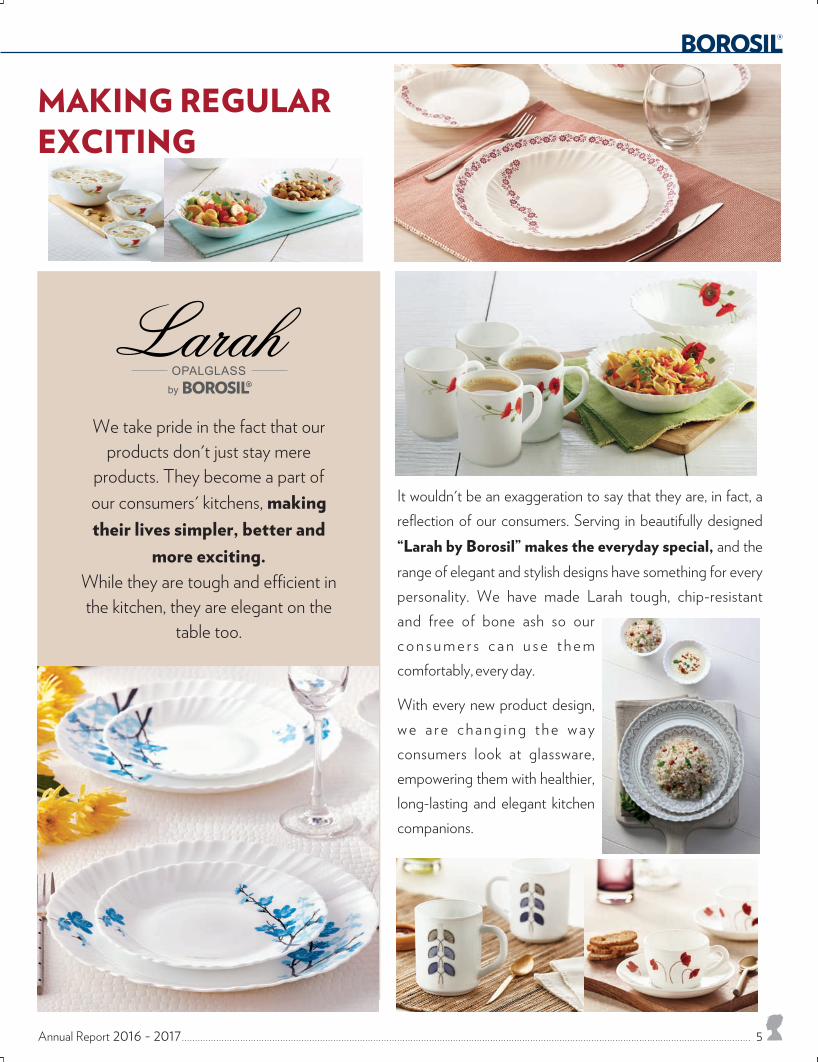
In January 2016, the Company acquired 100% share in Hopewell Tableware Pvt Ltd, owners of the brand Larah. With Larah the Company has gained participation in the fast growth ` 300 crore opal glass market. The modern homemaker is looking for elegantly designed and fashionable products that can be used frequently (daily use) without fear of damage. Larah offers a light, strong and chip resistant product range that caters to this consumer need. Additionally, the products are bone-ash free, making them vegetarian friendly.
Hithertothecategoryhasbeendominatedbyasingleplayer,LaOpala.BorosilseesanopportunitytoinvestinandgrowLarahintoa strong brand of choice for the consumer. It has launched an advertising campaign which highlights the beauty and utility of Larah dinnerware.Thetaglineofthiscampaignis“Khaanekobanaayekhaas”.
During FY16, Larah had achieved a turnover of about ` 55 crore. The advertising campaign together with leveraging the company’s distribution reachof~10,000 retailersand relationshipswith large formatstoreshasgaveLarahafillipduringFY17withsalesreaching ` 99.4 crore.
The market for kitchen appliances is estimated at ` 9,000 crore and growing at about 10% each year. Competitive intensity in the category is also high. The company would thus be selective in introducing unique and differentiated products. It expects to leverage its kitchenware equity to help it to participate in the growth of the category, without having to play out an aggressive share gain strategy. In order to de-risk its strategy the company will use third party manufacturers in the short term to produce the products under Borosil’s brand.
Sales Channels
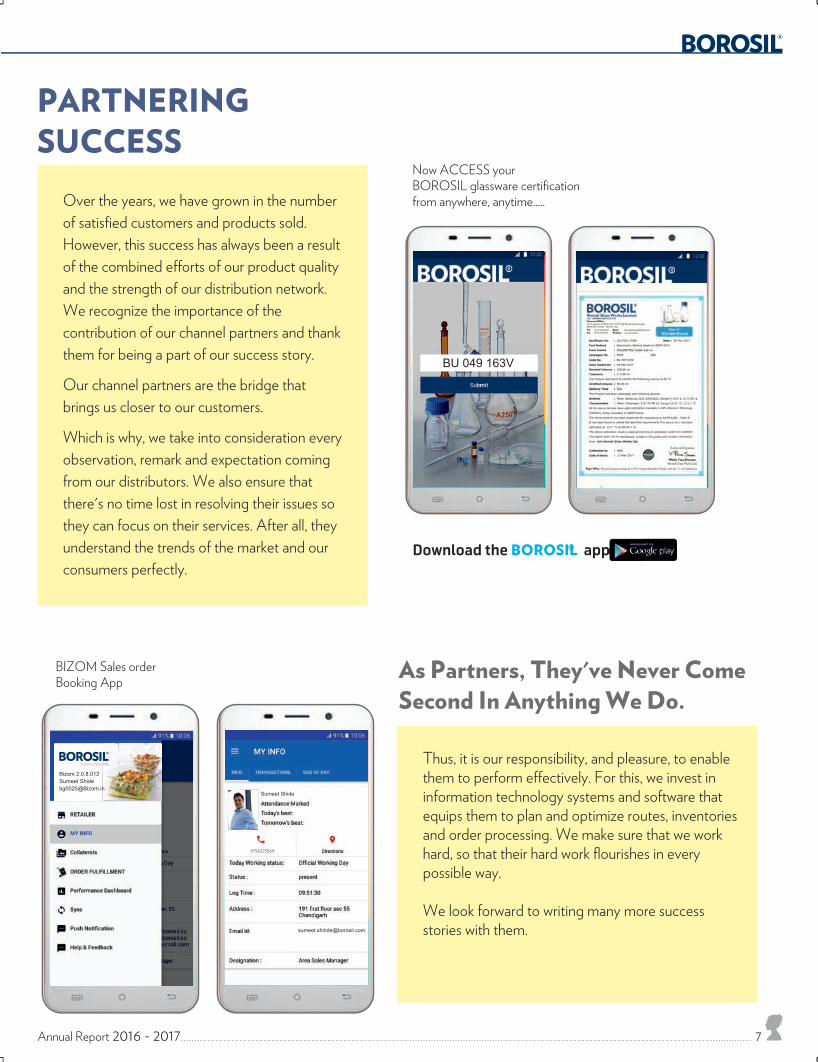
Borosil has established a strong national distribution network for both its SIP and CPD divisions. The Company sells products to about 200 distributors who in turn service about 10,000 retailers. The Company’s products are available in all major Modern Trade store chains. Sales through Modern Trade comprise about 20% of the consumer products sales. The Canteen Stores Department (CSD) which is a channel for households of the armed forces is a customer. With e-commerce as a channel gaining momentum, theCompanymarketsitsproductsthroughmarketplacessuchasAmazonaswellasitsowne-commercesite,www.myborosil.com
Supply Chain
In the SIP division, the Company sources its lab glassware products from Vyline Glass Works Ltd. (a promoter held company), internationalcompaniesandotherdomesticthirdparties.TheSIPdivisionisrunasaprofitcenteranditsmanagementisfreetoprocure products from Vyline or anywhere else in the world. The instrumentation range under the brand LabQuest is manufactured through third parties. The pharma packaging range, under the brand Klasspack is produced at Klasspack’s own factory at Nashik.
In the CPD division, the microwaveable glass products are sourced through third parties, including through imports. Some of the products (comprising glass tumblers, decorative glass products etc.) are procured from Vyline. Similar to the SIP division, this is done at arm’s length pricing and Vyline competes with other third party suppliers. The Larah range of opal-ware products are manufactured at the facilities of Hopewell at Jaipur.
TheCompanyhasproposedaschemeofamalgamation.UndertheschemeitisenvisagedthatFennelInvestmentandFinancePvt.Ltd., Vyline Glass Works Ltd and Hopewell Tableware Pvt Ltd will be merged into Borosil Glass Works Ltd.
Klasspack has adequate manufacturing capacity to handle growth in the near to medium term. It currently operates on a single shift. Moreover, a part of the consideration paid by the company to acquire 60.3% stake has been by way of a primary infusion to carry out balancing of manufacturing lines and fund working capital.
The Hopewell facility can currently service approximately ` 100 crore of sales. The Company is making investments to expand capacity and modernise the plant to improve productivity. An investment of about ` 60 crore is planned which would enable the plant
Annual Report 2016 - 2017 31
to increase its output to about `150crore.Simultaneously,thisinvestmentwillimprovethequalityoffinalproductandenhancedyields are expected to help in improving margins.
The company plans to invest in a new warehouse (approximately `30crores).ThisisexpectedtoimprovefreightefficienciesfortheCPD division by combining dispatches of the Borosil range and the Larah by Borosil range and thus creating full truck-loads. These efficienciesinLarahmanufacturingandinfreightarelikelytogetimplementedbythefourthquarterofFY18.
Operating Margins (EBITDA)
The EBITDA margin during FY17 was 11.5%. This was achieved after absorbing stepped up its advertising and sales promotion expensesduringtheyear.TheASPtoSalesstoodat6.4%.OverthenexttwoyearsthecompanyexpectstodeliveranexpansionintheEBITDAmargin.Thisislikelytobeachievedwithincreasingscalewhereinfixedoverheadsandmarketingexpensesdonotincrease at the same pace as revenue. In addition, the Company is upgrading its manufacturing facility for Larah which will lead to efficiencyandyieldimprovements.Investmentisanewwarehousewillalsoresultinoptimizationoffreights.Aproposedschemeof amalgamation (discussed in a later section) will also lead to EBITDA from the Vyline business getting added to the Company’s margins.Overthenexttwotothreeyears,theCompanyexpectstoimproveitsEBITDAtoabout15%to20%.
(These operating margins are stated after excluding expenses which are directly resulting from the treasury related activities of the Company.AdirectcomparisonwiththeprofitandlossstatementoftheCompanyisthusnotpossible).
Capital Employed
As on March 31, 2017, the Company had operating capital employed of ̀ 300 crore (as compared to ̀ 230 crore on March 31, 2016). This excludes capital employed in non-core assets and treasury related investments made by the Company and its investment in PreferenceSharesofGujaratBorosilLimited.Basedontheabove,theCompanyturneditscapitalemployed1.3XtimesduringFY17.
In the SIP business the Company strategically holds a higher level of inventory. This is to ensure that its regional warehouses maintain stocks that enable Borosil to service its customers’ requirements within 24 hours. This service level differentiates Borosil from its competitors. Moreover, the cost of holding inventory is lower than the cost of losing sale.
As of March 31, 2017, the Company had Net Fixed Assets of ` 219 crores. As mentioned in the section on Supply Chain, the company plans to invest ` 90 crores in enhancing capacity of opal-ware and building a new warehouse. This investment is likely to takecareoftheCompany’sneartomiddletermfixedassetsrequirements.
The Company has decided to release capital from non-core assets. This is in line with the Company’s evolving new thinking on capital allocation. During the year FY17, the Municipal Corporation of Greater Mumbai (MCGM) acquired a piece of land from the Company for which it received a compensation of `90.9crore.AsofMarch31,2017,theCompanyhasnon-corefixedassetsof ` 62.2 crore. The Company intends to dispose these assets (primarily real estate) as soon as it can receive appropriately priced valid offers.
Investments / Surplus / Other Income
During FY17, the Company recorded other income of ` 35.7 crore as compared to ` 35.1croreduringFY16.TheCompanyutilizedpart of its cash surplus to make a buyback of its shares and acquire Hopewell in Q4FY16. In addition it acquired 60.3% in Klasspack inJuly,2016.InDecember,2016,theCompanyrealized` 90.9 crore from the acquisition of a real estate property from it by MCGM. As of March 31, 2017 the Company had surplus funds of ` 210crore.Theseareinvestedinfinancialassetssuchasfixedincomemutual funds, equity mutual funds and real estate funds.
In the past the Company believed that it would not require its surplus funds in the near to medium term and had hence invested these monies in a mix of debt and equity funds with the objective of maintaining the purchasing power of the funds (earn a return at leastequaltoinflation).GiventheCompany’sgrowthplans,includingthroughtheinorganicroute,theCompanyintendstoretainits war-chest of ` 210 crore. It will actively look for opportunities to unwind its positions in equity funds and real estate funds and maintainallsurplusfundsprimarilyinfixedincomemutualfunds.
SHARE CAPITAL
The Paid-up Capital of the Company is ` 2,31,00,000/- and Authorised Capital of the Company is ` 12,00,00,000/-.
Discussion on Financial Performance with respect to operational performance
SincetheCompanyisdebtfree,theoverallfinancialperformancewasinlinewiththeoperationalperformance,exceptthat,theCompany has income from its investible funds.
32 Annual Report 2016 - 2017
Scheme of Amalgamation
In Q3FY17 the board of the company approved a scheme of amalgamation to transfer all the assets and liabilities of Hopewell Tableware Pvt Ltd (HTPL), Fennel Investment and Finance Pvt Ltd (FIFPL) and Vyline Glass Works Ltd (VGWL) into Borosil Glass Works Ltd (BGWL). HTPL engaged in the business of manufacturing and marketing opal tableware items, is a wholly owned subsidiary of BGWL so no shares will be issued to the shareholders of HTPL under the scheme.
FIFPL is an associate company of BGWL and registered as a Non-Banking Financial Institution. It is held by BGWL and the promoters of BGWL. Shareholders of FIFPL will be issued 10 equity shares of BGWL for every 207 equity shares of FIFPL held.
VGWL, held by the promoters of BGWL, is in the business of manufacturing glass and glass products which it supplies primarily to BGWL. Shareholders of VGWL will be issued 4 equity shares of BGWL for every 65 equity shares of VGWL held.
The share exchange ratio was arrived at as per a valuation report and an addendum thereto by SSPA & Co, Chartered Accountant. A fairness opinion including an addendum was provided by M/s Keynote Corporate Services Ltd.
The amalgamation will eliminate cross holdings among group companies and simplify the group structure. A key rationale is the reduction in related party transactions in the current operations. The merger of HTPL, FIFPL and VGWL would lead to consolidation of the entities and business operations of HTPL and VGWL with BGWL which will result in reduction in costs for administration, legal andcomplianceandleadtogreatergeneraladministrativeefficiencyandoptimalutilizationofvariousresources.
The scheme of amalgamation is subject to various requisite approvals including that of shareholders, creditors, Securities and Exchange Board of India, BSE Limited and the jurisdictional High Court. The scheme would become effective thereafter and the Company expects this to be accomplished during H2FY18. Consequent to the scheme becoming effective, BGWL’s issued and paid up equity shares will increase from 2.31 million to 2.51 million leading to a dilution of about 9%. The promoter shareholding in BGWL will increase from 74.28% to 76.28%.
Aftertheschemeofamalgamationbecomeseffective,theprofitsandlossesofVylinewillgetconsolidatedinBGWL.Moreover,Gujarat Borosil Ltd., a manufacturer and marketer of solar glass which is held 25.25% by BGWL will become a 58.38% subsidiary of BGWL.GujaratBorosilLtd.islistedonBSEandhadamarketcapitalizationof` 553 crore at the close of trading on March 31, 2017.
Gujarat Borosil Ltd
Gujarat Borosil is the only manufacturer of solar glass in India. During the year FY17, the company recorded a turnover of ` 188 crore. There was no growth over the previous year as the Company was running at full capacity. The EBITDA margin of the company duringFY17was25.3%,upfrom19.1%inFY16.ProfitAfterTaxduringFY17was` 14.1 crore.
The company has a strong R&D team and a state of the art manufacturing facility located at Bharuch. The company has achieved a high degree of innovation to drive down total cost of ownership for its end customers. Its glass ensures high light transmission, with anti-reflectivecoatingtoincreaseefficiency.Ithaslowironcontentandthecompanyhasalsodevelopedtheworld’sfirstantimonyfree solar glass. Gujarat Borosil faces competition from Chinese suppliers. Given the government subsidies that Chinese companies receive theyenjoy theadvantageofanunevenplayingfield.GujaratBorosilhasa lowcostofproductionandnotwithstandingsubsidies for Chinese suppliers is able to sell its product at a modest premium to the competition. The company believes that its customers would always maintain an alternative source of supply from an Indian company.
India’s currently has about 12 GW of solar energy installations. The Government of India is providing a big impetus to solar energy and has set an objective of 100 GW from solar by 2022. Gujarat Borosil has a capacity to service about 1 GW per year. The company has thus drawn up a plan to increase its capacity to service 2.3 GW per year. The company is examining a mix of various options tofinancethisexpansion.
Other Corporate Developments
At its meeting held on May 13, 2017, the Board of Directors approved a proposal to sub-divide (split) the shares of the Company from a face value of ` 10/- per shares to 10 shares of a face value of ` 1/- per share. The approval is subject to the approval of the shareholders of the company. A lower face value per share is expected to bring down the quoted price per share on the stock exchange and facilitate increased access to the company’s shares to a larger number of retail investors. This may also provide additional liquidity to the company’s shares on the stock exchange.
People are the Company’s critical resource. In order to attract and retain the best talent relevant to the company’s plans and keep them highly motivated, it practices and continues to evolve best Human Resources strategies. The company has an incentive plan that rewards superior performance. In order to align senior management incentives with long term shareholder value objectives, the BoardofDirectors,atitsmeetingheldonMay13,2017gaveitsgoaheadtothecompanytodevelopanEmployeeStockOptionPlan(ESOP).TheplanwouldbeimplementedafteranapprovalfromtheshareholdersoftheCompany.
Outlook
In the SIP business, the company expects to maintain its dominant market leadership in the lab glassware segment in India. The market is expected to grow at 8% to 10%. The company has also begun to grow an international franchise and will focus on The Middle East, Africa and South East Asia. Two new avenues of growth are being built through the introduction of LabQuest for lab instrumentationandanentryintothepharmapackagingsegmentwiththeacquisitionof60.3%equitystakeinKlasspack.Overallthe SIP division is expected to grow 12% to 15% in the medium term.
Annual Report 2016 - 2017 33
In the CPD business the company expects to maintain its share in the kitchen microwaveable glass segment. The company expects a significant portion of its growth to come from the glass storage segment by tapping into conversions from steel and plasticstorage containers to glass and from opalware dining products. In opalware the company will build the equity of its brand Larah and participate in market growth as well as improve market share. In the medium to long term, the company will experiment with making introductions of innovative products in the kitchen appliances segment.
The company has a strong balance sheet and surplus cash on hand. It will leverage this to look for inorganic opportunities with a strategicfit.
In the solar glass business, the company expects to ride the strong tail wind in the solar power industry. The company’s current capacity and planned expansion will service a very small portion of the Government of India’s targeted installations. As the only domestic supplier of solar glass, the company expects to continue to see robust growth.
Material Development in Human Resources, Industrial Relations and number of people employed
The Company believes that talent and culture can be nurtured into a source of competitive advantage. The Company has initiated several steps to build a strong culture and institution.
The Company has prepared and published its Vision Statement & Corporate Values. The Company has developed & published an overallorganizationalstrategytoachievegrowthaspirationsoftheorganizationforthenextthreeyears,throughdeliberationbyaSteering Committee comprising the Managing Director and Functional heads.
Based on its vision and strategic goals, the Company has evolved the desired set of deliverables & competencies for all employees. Employeedevelopmentplansarebeingalignedtothedefinedcompetenciesinordertoachievedesiredbusinessgoals.Similarly,all new recruitments will also be made on the basis of this set of competencies.
The Company is building a performance oriented culture with merit based rewards and recognition.
The Company, as a part of its program for upgrading skills of its employees, arranges various training programs for executives at various levels including functional and soft skills training. During the year, the Company has arranged a number of development initiatives which include:
1. “LeadershipDevelopmentProgram”forConsumerProductsDivision.
2. Workshopon“MSExcelwithanaccountingperspective”forSupportDivision.
TheCompanyhasalsodevisedvariousemployeebenefitpolicieswhicharerevisedfromtimetotime.Inordertomaintainaworklifebalanceand toencourage team interactionbeyondwork, theCompanyorganizesvariousevents includinganeventknownas ‘Unwind’onabi-monthlybasisandvariousotheremployeeengagement initiativesdrivenby teamknownas “Umang”.TheCompany has also put in place a Code of Business Ethics.
The Company had 217 officestaff/managerialpersonnelemployedasonMarch31,2017invariousoffices/locations.Inaddition,there were 10retainersindifferentfields.
SUBSIDIARY & ASSOCIATES
The Company has two wholly owned subsidiaries namely:
BorosilAfrasiaFZE(FreeZoneEstablishment)inJebelAliFreeZonesituatedinDubaiinUnitedArabEmirates(UAE).ThesaidFZEis engaged in the business of marketing the Company’s products in the Middle East and African markets; and Hopewell Tableware Private Limited engaged in the business of manufacture and marketing of opal glassware with a factory in Jaipur, Rajasthan.
Further, Borosil Afrasia FZE has incorporated a Limited Liability Company namely Borosil Afrasia Middle East Trading LLC. As per UAElaw,foreignentitiesareentitledtoholdamaximumof49%sharesinanLLC,accordingly,BorosilAfrasiaFZEholds49%shares in the said LLC.
During the year, the Company acquired 60.3% shares in Klass Pack Private Limited (Klasspack) and with effect from July 29, 2016 it became a subsidiary of the Company. Klasspack is engaged in the manufacture and supply of pharmaceutical vials and ampoules to the Pharmaceutical industry for over 15 years and has its manufacturing facilities at Nashik, Maharashtra.
The Company has formulated a Policy on material subsidiaries of the Company. The said policy is available on the website of the Companyathttp://www.borosil.com/doc_files/Policy%20for%20Determining%20Material%20Subsidiaries.pdf
The Company has two associate companies namely Gujarat Borosil Limited and Fennel Investment and Finance Private Limited by virtue of its holding of more than 20% of the respective equity share capital of those companies.
CONSOLIDATED FINANCIAL STATEMENTS
AsperSection129(3)ofCompaniesAct,2013,theCompanyhaspreparedaconsolidatedfinancialstatementoftheCompany,alongwith Borosil Afrasia FZE (Subsidiary), Hopewell Tableware Private Limited (Subsidiary), Klasspack Private Limited (Subsidiary), Gujarat Borosil Limited (in which the Company exercises control more than 50% of the voting rights as per Indian Accounting
34 Annual Report 2016 - 2017
Standard (Ind- AS) 110) and Fennel Investment and Finance Private Limited (associate company). Apart from standalone annual accounts,consolidatedaccounts,StatementcontainingsalientfeaturesonfinancialstatementsofsubsidiaryinFormAOC1,theindividualstandalonefinancialstatementofallsubsidiary/associateasmentionedabovewillbeuploadedon thewebsiteof theCompany as per Section 136 of the Companies Act, 2013.
TheCompanywillprovideacopyofseparateauditedfinancialstatementsinrespectofitssubsidiariestoanyshareholderoftheCompanywhoasksforitandthesaidannualaccountswillalsobekeptopenforinspectionattheRegisteredOfficeoftheCompanyand that of the subsidiary company.
The Consolidated Financial Statements of the Company are prepared in accordance with relevant Indian Accounting Standards (Ind-AS)viz.Ind-AS110,117,112and28issuedbytheInstituteofCharteredAccountantsofIndia,formspartofthisAnnualReport.
BOARD OF DIRECTORS, ITS MEETINGS, EVALUATION ETC.
Board Meetings
TheBoardofDirectorsoftheCompanymetfivetimesduringtheyearonMay30,2016,August11,2016,November25,2016,February 09, 2017 and March 07, 2017.
Independent Directors
TheCompanyhasfourIndependentDirectorsnamelyMr.U.K.Mukhopadhyay,Mr.NaveenKumarKshatriya,Mr.S.Bagaiand Mrs. Anupa R. Sahney, all of them having tenure upto March 31, 2019.
Declaration by Independent Directors
The Company has received declaration of independence in terms of Section 149(7) of Companies Act, 2013 from the above mentioned Independent Directors.
Company’s Policy on Directors’ Appointment and Remuneration etc.
UnderSection178oftheCompaniesAct,2013,theCompanyhaspreparedapolicyonDirector’sappointmentandRemuneration.TheCompanyhasalso laiddowncriteria fordeterminingqualifications,positiveattributesand independenceofaDirector.TheRemunerationpolicyisattachedherewithasan‘AnnexureA’tothisreport.
Familiarization Programme for Independent Directors
AFamiliarizationprogrammewaspreparedby theCompanyabout roles, rightsandresponsibilitiesof IndependentDirectors inthe Company, nature of industry in which the Company operates business model of the Company, etc., which was presented to Independent Directors on February 09, 2017.
The details of the above programme are available on website of the Company at http://www.borosil.com/doc_files/Familiarization%20Programme%20for%20Independent%20Director-2017.pdf
Formal Annual Evaluation
The Formal Annual Evaluation has been made as follows:
1. The Company has laid down evaluation criteria separately for the Board, Independent Directors, Directors other than Independent Directors and various committees of the Board. The criteria for evaluation of Directors (including the Chairman) includedparameterssuchaswillingnessandcommitmenttofulfillduties,highlevelofprofessionalethics,contributionduringmeetings and timely disclosure of all the notice/details required under various provisions of laws. Based on such criteria, the evaluation was done in a structured manner through peer consultation & discussion.
2. Evaluationof theBoardwasmadeataSeparateMeetingof IndependentDirectorsheldunderChairmanshipofMr.U.K.Mukhopadhyay, Lead Independent Director (without attendance of Non–Independent Director and members of the management) on March 07, 2017.
3. The performance evaluation of following committees namely:
1. Audit Committee
2. Nomination and Remuneration Committee
3. Corporate Social Responsibility Committee
4. Share Transfer Committee
was done by the Board of Directors at its meeting held on March 07, 2017. However, evaluation of Stakeholders Relationship Committee was done by the Board of Directors at its meeting held on May 13, 2017.
4. Performance evaluation of Non-Independent Directors namely Mr. B. L. Kheruka, Mr. P.K. Kheruka, Mr. Shreevar Kheruka and Mr. V. Ramaswami was done at a Separate Meeting of Independent Directors.
Annual Report 2016 - 2017 35
5. Evaluation of Independent Directors namely Mr. U. K. Mukhopadhyay, Mr. Naveen Kumar Kshatriya, Mr. S. Bagai and Mrs. Anupa R. Sahney was done (excluding the Director who was evaluated) by the Board of Directors’ of the Company at its meeting held on March 07, 2017.
6. In addition, the Nomination and Remuneration Committee has carried out evaluation of every Director’s performance at its meeting held on March 07, 2017 as required under Section 178 (2) of Companies Act, 2013.
7. The Directors expressed their satisfaction with the evaluation process. Performance evaluation of the Board, its various committees and directors including Independent Directors was found satisfactory.
RE-APPOINTMENT OF DIRECTOR
As per the provisions of the Companies Act, 2013 and Articles of Association of the Company, Mr. B. L. Kheruka (DIN 00016861) retires by rotation and, being eligible, offers himself for re-appointment.
Brief details of the Director being re-appointed have been incorporated in the Notice of Annual General Meeting.
There is no change in the composition of the Board of Directors during the year under review.
KEY MANAGERIAL PERSONNEL
There is no change in the Key Managerial Personnel of the Company.
Mr.ShreevarKherukaistheManagingDirectorandChiefExecutiveOfficer,Mr.SwadhinPadiaistheChiefFinancialOfficerandMs.GitaYadavistheCompanySecretary&ComplianceOfficeroftheCompany.
CORPORATE GOVERNANCE REPORT
AReportonCorporateGovernancealongwiththeComplianceCertificatefromtheAuditorsisannexedheretoandformspartofthis Report.
The Board of Directors of the Company has evolved and adopted a Code of Conduct and posted the same on the Company’s website, ‘www.borosil.com’.TheDirectorsandseniormanagementpersonnelhaveaffirmedtheircompliancewiththeCodefortheyear ended March 31, 2017.
FIXED DEPOSITS
TheCompanyhasstoppedacceptingfreshfixeddepositssinceJuly,2006.
There are no unclaimed deposits.
DEVELOPMENT AND IMPLENTATION OF RISK MANAGEMENT POLICY
TheCompanyfacesvariousrisks in the formoffinancial risk,operational risksetc.TheCompanyunderstands that itneedstosurvive these risks in the market and hence, has made a comprehensive policy on Risk Management.
RELATED PARTY TRANSACTIONS
TheCompany entered into variousRelatedParty Transactions during the financial yearwhichwere in the ordinary course ofbusiness. The Company places before the Audit Committee all transactions which are foreseen and repetitive in nature on a quarterly basis. The Company had also obtained approval of shareholders in the previous year for such Related Party Transactions which exceeded the threshold limits as mentioned under the Companies (Meetings of the Board and its Powers) Rules, 2013 or which were material in nature with Vyline Glass Works Limited and Gujarat Borosil Limited.
The Company has formulated a policy on dealing with Related Party Transactions. This is available on the website of the Company at http://www.borosil.com/doc_files/Related%20Parties%20Transaction%20Policy.pdf
Particulars of Contracts or Arrangements entered into with Related Parties referred to in Section 188(1) of the Companies Act, 2013, inprescribedFormAOC-2isattachedasan‘AnnexureB’tothisReport.
ThedetailsofallthetransactionswithRelatedPartiesareprovidedintheaccompanyingfinancialstatements.
CORPORATE SOCIAL RESPONSIBILITY (CSR)
As part of its initiatives under “Corporate Social Responsibility” (CSR), theCompany has undertaken projects in the areas ofEducation, Health and protection of sites of historical importance, which were in accordance with Schedule VII of the Companies Act, 2013. The Company contributed:
1. ` 10,00,000/- to aproject ofFriendsofTribalSociety for promotingeducation through ‘OneTeacherSchool’ called ‘EkalVidyalaya’ for tribal children in rural areas.
2. ` 3,00,000/- to Samarth for its Lead India 2020 programme which imparts life skills, thinking skills, global skills, positive attitude with vision, mission & inculcating values among persons in the age group of 10 to 30 years, also known as “Aap Badho Desho KoBadhao”.
36 Annual Report 2016 - 2017
3. `1,00,000/-toShriRamKrishnaCancerHospital,Deoband,UttarPradeshforbuildingconstructionandinfrastructureofthehospital, purchasing equipment and accessories.
4. `2,00,000/-toRamakrishnaMission,Khetri,RajasthanforrenovationofthehistoricashramabuildingsanctifiedbySwamiVivekananda and to protect it from destruction.
5. ` 50,00,000/- to JSW Foundation to bear a part of running annual cost of Indian Institute of Sport, a brainchild of JSW group which is a training centre for supporting Indian athletes in Vijayanagar, Karnataka.
In terms of Section 135 of the Companies Act, 2013 and Rules made thereunder, the Company has constituted CSR committee comprising the following members:
1. Mr. B.L. Kheruka
2. Mr. Shreevar Kheruka
3. Mr.U.K.Mukhopadhyay
4. Mr. Naveen Kumar Kshatriya
outofwhichMr.U.K.MukhopadhyayandMr.NaveenKumarKshatriyaareIndependentDirectors.
a. The CSR Committee of the Board of Directors indicates the activities to be undertaken by the Company (within the framework ofactivitiesasspecifiedinScheduleVIIoftheAct)duringtheparticularyear.
b. recommends to the Board the amount of expenditure to be incurred during the year under some of the activities covered in the Company’s CSR Policy.
c. monitors the said Policy.
d. ensures that the activities as included in CSR Policy of the Company are undertaken by it in a phased manner depending on the available opportunities.
COMPANY’S CSR POLICYThe Board of Directors of the Company has approved the CSR Policy as recommended by the CSR Committee. This has been uploadedontheCompany’swebsiteathttp://www.borosil.com/doc_files/Corporate%20Social%20Responsibility.pdf
INITIATIVES TAKEN BY THE COMPANY DURING THE YEAR
The2%of thenetprofitsof theCompanyduring the immediate threeprecedingfinancialyearsamounts to` 73,12,000/-. The Company has contributed a sum of ` 66,00,000/- during the year. As such the Company could not contribute a sum of ` 7,12,000/-, as the Company was looking for genuine and socially useful opportunities, where the money could be fruitfully used. The Company will make every endeavour to utilise its CSR expenditure budget during the current year.
The Company has jointly with Hopewell Tableware Private Limited (HTPL), wholly owned subsidiary and Gujarat Borosil Limited (GBL), a subsidiary of theCompany constitutedaTrust namely - ‘Borosil Foundation’with themainobjectiveofmakingCSRcontributions by the Company, HTPL and GBL, from time to time. Further, the Company will contribute its future CSR contribution through the Borosil Foundation as and when said trust is fully operative.
An Annual Report on CSR activities in terms of Section 134 (3) (o) of the Companies Act, 2013 read with the Companies (Corporate SocialResponsibility)Rules,2014isattachedherewithasan‘AnnexureC’tothisReport.
EXTRACT OF ANNUAL RETURN
ExtractofAnnualReturninFormMGT9isattachedasan‘AnnexureD’tothisReport.
VIGIL MECHANISM
The Company has Whistle Blower Policy to deal with instances of fraud and mismanagement.
SIGNIFICANT AND MATERIAL ORDERS PASSED BY THE REGULATORS OR COURTS
Thereareno significantmaterial orderspassedby theRegulators/Courtswhichwould impact thegoing concern statusof theCompany and its future operations.
AUDITORS’ REPORT
TheAuditors’ReportfortheyearendedMarch31,2017doesnotcontainanyqualification.
AUDITORS
M/s.PathakH.D.&Associates,CharteredAccountants,wereappointedasStatutoryAuditorsofyourCompanyforatermoffiveyears from the conclusion of the 53rd Annual General Meeting held on August 11, 2016 till the conclusion of the 58th Annual General Meeting,subjecttotheratificationofMembersateachAnnualGeneralMeeting.
Annual Report 2016 - 2017 37
Awrittenconsentfromthemhasbeenreceivedalongwithacertificatethattheirappointmentifmade,shallbeinaccordancewiththe prescribed conditions and the said Auditors satisfy the criteria provided in Section 141 of the Companies Act, 2013.
TheresolutionseekingratificationoftheirappointmenthasbeenincludedintheNoticeofAnnualGeneralMeeting.
COST RECORDS AND AUDIT
UndertheSection148oftheCompaniesAct,2013,theCentralGovernmenthasprescribedmaintenanceandauditofcostrecordsvide the Companies (Cost Records and Audit) Rules, 2014 to such class of companies as mentioned in the Table appended to Rule 3 of the said Rules. CETA headings under which Company’s products are covered are not included. Hence, maintenance of cost records and cost audit provisions are not applicable to the Company as of now.
SECRETARIAL AUDIT
Secretarial Audit Report dated May 13, 2017 by Mr. Virendra Bhatt, Practising Company Secretary (CP no.124) is attached herewith asan‘AnnexureE’tothisReport.SecretarialAuditReportdosenotcontainanyqualification.
TRANSFER TO INVESTOR EDUCATION AND PROTECTION FUND
There was no amount transferrable to the Investor Education and Protection Fund (IEPF) established by the Central Government in compliancewithSection124ofCompaniesAct,2013duringthefinancialyear2016-17.
However,thereisanunpaiddividendforthefinancialyear2010-11whichisduetobetransferredtoIEPFonNovember26,2017,thelastdateforclaimingtheunpaiddividendisonorbeforeOctober26,2017.TheCompanywilltransfertheamountontheduedate.
DIRECTORS’ RESPONSIBILITY STATEMENT
Subject to disclosures in the Annual Accounts and also on the basis of the discussion with the Statutory Auditors of the Company from time to time, the Board of Directors state as under:
(a) that in the preparation of the annual accounts, the applicable accounting standards had been followed along with proper explanation relating to material departures;
(b) that we had selected such accounting policies and applied them consistently and made judgments and estimates that are reasonableandprudentsoastogiveatrueandfairviewofthestateofaffairsoftheCompanyattheendofthefinancialyearandoftheprofitandlossoftheCompanyforthatperiod;
(c) thatwehad takenproperandsufficient care for themaintenanceofadequateaccounting records inaccordancewith theprovisions of this Act for safeguarding the assets of the Company and for preventing and detecting fraud and other irregularities;
(d) that we had prepared the annual accounts on a going concern basis;
(e) and that we, had laid down Internal Financial Controls to be followed by the Company and that such Internal Financial Controls are adequate and were operating effectively.
(f) that we had devised proper systems to ensure compliance with the provisions of all applicable laws and that such systems were adequate and operating effectively.
PARTICULARS OF LOANS, GUARANTEES AND INVESTMENTS
AstatementonParticularsofLoans,GuaranteesandInvestmentsisattachedasan‘AnnexureF’tothisReportreadwithnote8and13tothefinancialstatements.
EMPLOYEES’ SAFETY
The Company is continuously endeavoring to ensure safe working conditions for all its employees.
DISCLOSURE UNDER THE SEXUAL HARASSMENT OF WOMEN AT WORKPLACE (PREVENTION, PROHIBITION AND REDRESSAL) ACT, 2013
The Company has in place a Policy for Prevention Prohibition and Redressal of Sexual Harassment at work place which is in line with the requirements of the Sexual Harassment of women at the Workplace (Prevention, Prohibition & Redressal) Act, 2013 and Rules made thereunder. All employees (permanent, contractual, temporary and trainees) are covered under this Policy. The Companyhasconstitutedan InternalComplaintCommittee for itsHeadOfficeandbranch/salesofficesunderSection4of thecaptionedAct.Nocomplainthasbeenfiledbeforethesaidcommitteetilldate.TheCompanyhasfiledanAnnualReportwiththeconcerned Authority in the matter.
DISCLOSURE UNDER RULE 5(1) OF THE COMPANIES (APPOINTMENT AND REMUNERATION OF MANAGERIAL PERSONEEL), RULES, 2014
The information required pursuant to Section 197 read with Rule 5(1) of the Companies (Appointment and Remuneration of ManagerialPersonnel),Rules,2014inrespectofemployeesoftheCompanyandDirectorsisattachedasan‘AnnexureG’.
38 Annual Report 2016 - 2017
PARTICULARS OF EMPLOYEES
Particulars of Employees as required under Rule 5(2) of the Companies (Appointment and Remuneration of Managerial Personnel) Rules,2014isattachedasan‘AnnexureH’.
CONSERVATION OF ENERGY, TECHNOLOGY ABSORPTION AND FOREIGN EXCHANGE EARNINGS AND OUTGO
The Company is engaged in trading activity and it did not carry out any Research & Development activities nor introduced any new technology during the year. Hence, Rule 8 (3) of the Companies (Accounts) Rules, 2014 are not applicable with respect to those details.
Particulars with regard to foreign exchange earnings and outgo during the year are as under:
(` in lacs)
Foreign exchange earnings 1,153.73
Foreign exchange outgo 3,270.99
ACKNOWLEDGEMENT
Your Directors record their appreciation for the co-operation received from the Employees, Customers and last but not least the shareholders for their unstinted support, during the year under review.
For and on behalf of the Board of Directors
B. L. KherukaPlace : Mumbai Chairman Date : May 13, 2017 DIN 00016861
Annual Report 2016 - 2017 39
Annexure A
Policy relating to remuneration for the Directors, Key Managerial Personnel and other employees
OBJECTIVE
The remuneration policy for members of the Board of Directors, Key Managerial Personals and Other Employees has beenformulated pursuant to Section 178 of the Companies Act, 2013, which strive to ensure:
i) thelevelandcompositionofremunerationisreasonableandsufficienttoattract,retainandmotivatedirectorsofthequalityrequired to run the Company successfully;
ii) relationship of remuneration to performance is clear and meets appropriate performance benchmarks; and
iii) remunerationtodirectors,keymanagerialpersonnelandseniormanagementinvolvesabalancebetweenfixedandincentivepayreflectingshortandlong-termperformanceobjectivesappropriatetotheworkingoftheCompanyanditsgoals.
REMUNERATION OF THE BOARD OF DIRECTORS
The Board of Directors of the Company comprises of Executive and Non-Executive Directors, for which separate policies have been framed:
1. Executive Directors comprising of Promoter Directors and Professional Directors;
2. Non-Executive Directors comprises of Promoter (Non Independent) Director and Independent Directors
Remuneration of Executive Directors
Fixed remuneration:
AllExecutiveDirectorsvizExecutiveChairman,ManagingDirectorandWhole-timeDirectorwillhaveacomponentofFixedSalary,whichmaybefixedforthewholetenureorinagradedpayscalebasis.Inaddition,theywillbeentitledtousualperkswhicharenormallyofferedtotoplevelexecutives,suchasFurnished/Unfurnishedhouse/HouseRentAllowance,Medical/Hospitalizationreimbursement,Personalaccidentinsurance,clubfees,carwithdriverandretrialbenefitsincludingleaveencashmentattheendof the tenure.
Variable Components:
Commission:
Subject to the approval of the shareholders and within the overall limits prescribed in Section 197 of the Companies Act, 2013, the Executive Directors shall be paid commission based on nature of duties and responsibilities, as may be determined by the Board of Directors on year to year basis.
Reimbursement of Expenses:
Directors will be entitled for actual entertainment and travelling expenses incurred for business purposes.
The above payments shall be subject to such approvals as may be necessary under the Companies Act, 2013 and the Listing Agreement.
Remuneration of Non-Executive Directors:
Fees:
Shall be entitled to payment of fees for attending each Board and Committee Meetings as may be decided by the Executive Directors (members) of the Board, within the limit prescribed under the Rules made under the Companies Act, 2013. The fees may beonuniformbasis,asthecommitteeviewsthatalldirectorsaffectivelycontributetothebenefit/growthoftheCompany.
Separate fees may be decided in respect of Board Meetings and Committee Meetings.
Variable Components:
Commission:
Subject to the approval of the shareholders and within the overall limit of 1% as prescribed by the Companies Act, 2013, the Non-Executive Directors may be paid commission on a pro rata basis.
Reimbursement of Expenses:
For Non-Executive Directors actual expenses in connection with Board and Committee Meetings are to be reimbursed. In addition, if a Non-Executive Director is travelling on Company’s business, as permitted by the Board, he/she shall be entitled for his/her travelling and lodging expenses on actual basis.
40 Annual Report 2016 - 2017
Key Managerial Personnel:
KeyManagerialPersonnelshallbepaidsalaryandperquisites,likeotheremployeesoftheCompanybasedontheirqualification,job experience, as may be applicable and as may be applicable to the grade, to which they belong.
Other Employees:
TheCompanyhasaperformancemanagementsysteminplaceinformofsoftwarethatisknownas‘Vconnect’,forassessingtheperformanceandcompetenceinordertofixtheremunerationanddeterminationofincrementsoftheemployees.
The Company has various grades starting fromOfficers Level to Senior Vice President. There are different departments likeMarketing-Consumer Ware & Lab Ware, Finance, HR & Administration, Legal & Secretarial and IT, with departmental heads of each departments of the level of Vice President / General Manager with their respective teams/subordinates of different grades.
Initialremunerationsaredecidedbasedonanemployee’squalification,pastexperience,suitabilityforthejobandthelevelforwhichthe position is intended.
At the start of every financial year, organizational strategy is converted into department goalswhich further get converted asindividualKRAs&Competencies.Attheendofeveryfinancialyear,individualperformanceismeasuredagainstthesesetKRAs&Competencies.Theincrementsthenaredecidedonthebasisof4parameters,viz.
1) Individual Performance
2) OrganizationalPerformance
3) Newyear’sbudgetedOrganizationalPerformance
4) Industry benchmark
ThePromotionsaredecidedbroadlyonthebasisofthreeparametersviz.availabilityofpromotableposition,consistentperformance,potential of the incumbent to grow to the next level.
Loans / advances to employees:
The Company have policy for granting loan/advances to its employees containing such terms & conditions including regarding interest,asitmaydeemfit.TheCompanymayinspecialcasesgrantloan/advancesbeyondthelimitprescribedinthesaidpolicy.The Company may vary said policy from time to time.
CRITERIA FOR DETERMINING QUALIFICATION, POSITIVE ATTRIBUTES AND INDEPENDENCE OF A DIRECTOR
I QUALIFICATIONS
He/sheshallpossessappropriateskills,experienceandknowledgeinoneormorefieldsoffinance,law,management,sales,marketing, administration, research, corporate governance, technical operations, or other disciplines related to Company’s business.
The Company will have a blend of Directors comprising of entrepreneurs, professionals and those having administrative experiencelikeex-IASofficers.
II POSITIVE ATTRIBUTES
• Clarityofvision
• Originality
• Objectivelyopentootherpeople’sideas/pointsofview.
• Isanalytical, can get to the core issue quickly
• Challenges the status quo
• Agood communicator, both in one-to-one and group situations.
• Hasthecourage of their convictions - particularly in troubled times.
• Isclear on their direction - knows where they are heading and why, and how to get there
• Minimises the casualties from their decisions
• Maintainsfocus on the strategic direction
• Hashighstandardsofintegrity - and insists on the same from others
• Intellect - has a high level of intelligence
Annual Report 2016 - 2017 41
• Exercisessoundjudgement - particularly under pressure
• Knowsthequestions to ask
• Isagoodlistener, emotionally as well
• Isnumerate -canreadandunderstandfinancialstatements
• Hasahealthyself-esteem - but does not believe they are infallible
• Isstrategic in thinking and outlook - but is also aware that successful implementation is what counts
• Understands the ‘value proposition’ of the business
• Isvisionary - can see the big picture and read future trends
• Funtoworkwithi.e.shouldhavegoodworkingrelationshipwithotherBoardMembers.
• CanmakesubstantialcontributionsbytakingpartindeliberationsduringMeetings.
III CRITERIA FOR INDEPENDENCE
An independent director is one:
(a) who, in the opinion of the Board, is a person of integrity and possesses relevant expertise and experience;
(b) (i) who is/ or was not a promoter of the company or its holding, subsidiary or associate company;
(ii) who is not related to promoters or directors in the company, its holding, subsidiary or associate company;
(c) who has or had no pecuniary relationship with the company, its holding, subsidiary or associate company, or their promoters,ordirectors,duringthetwoimmediatelyprecedingfinancialyearsorduringthecurrentfinancialyear;
(d) none of whose relatives has or had pecuniary relationship or transaction with the company, its holding, subsidiary or associate company, or their promoters, or directors, amounting to two percent or more of its gross turnover or total income orfiftylakhrupeesorsuchhigheramountasmaybeprescribed,whicheverislower,duringthetwoimmediatelyprecedingfinancialyearsorduringthecurrentfinancialyear;
(e) who, neither himself nor any of his relatives-
(i) holds or has held the position of a key managerial personnel or is or has been employee of the company or its holding,subsidiaryorassociatecompanyinanyofthethreefinancialyearsimmediatelyprecedingthefinancialyearin which he is proposed to be appointed;
(ii) isorhasbeenanemployeeorproprietororapartner,inanyofthethreefinancialyearsimmediatelyprecedingthefinancialyearinwhichheisproposedtobeappointed,of-
(A) afirmofauditorsorcompanysecretariesinpracticeorcostauditorsofthecompanyoritsholding,subsidiaryorassociate company; or
(B) any legal or a consulting firm that has or had any transactionwith the company, its holding, subsidiary orassociatecompanyamountingtotenpercentormoreofthegrossturnoverofsuchfirm;
(iii) holds together with his relatives two percent or more of the total voting power of the company; or
(iv) isaChiefExecutiveordirector,bywhatevernamecalled,ofanynon-profitorganisationthatreceivestwenty-fivepercent or more of its receipts from the company, any of its promoters, directors or its holding, subsidiary or associate company or that holds two per cent or more of the total voting power of the company.
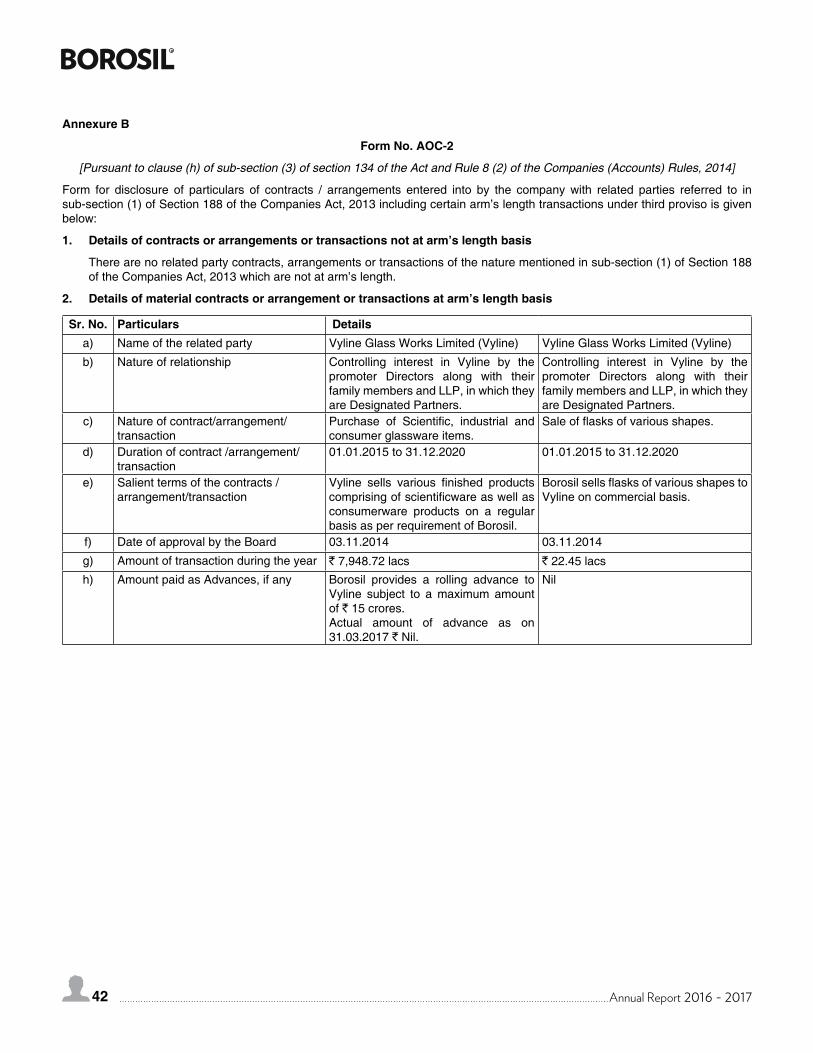
42 Annual Report 2016 - 2017
Annexure B
Form No. AOC-2
[Pursuant to clause (h) of sub-section (3) of section 134 of the Act and Rule 8 (2) of the Companies (Accounts) Rules, 2014]
Form for disclosure of particulars of contracts / arrangements entered into by the company with related parties referred to in sub-section (1) of Section 188 of the Companies Act, 2013 including certain arm’s length transactions under third proviso is given below:
1. Details of contracts or arrangements or transactions not at arm’s length basis
There are no related party contracts, arrangements or transactions of the nature mentioned in sub-section (1) of Section 188 of the Companies Act, 2013 which are not at arm’s length.
2. Details of material contracts or arrangement or transactions at arm’s length basis
Sr. No. Particulars Detailsa) Name of the related party Vyline Glass Works Limited (Vyline) Vyline Glass Works Limited (Vyline)
b) Nature of relationship Controlling interest in Vyline by the promoter Directors along with their family members and LLP, in which they are Designated Partners.
Controlling interest in Vyline by the promoter Directors along with their family members and LLP, in which they are Designated Partners.
c) Nature of contract/arrangement/transaction
Purchase of Scientific, industrial andconsumer glassware items.
Saleofflasksofvariousshapes.
d) Duration of contract /arrangement/transaction
01.01.2015 to 31.12.2020 01.01.2015 to 31.12.2020
e) Salient terms of the contracts /arrangement/transaction
Vyline sells various finished productscomprisingofscientificwareaswellasconsumerware products on a regular basis as per requirement of Borosil.
BorosilsellsflasksofvariousshapestoVyline on commercial basis.
f) Date of approval by the Board 03.11.2014 03.11.2014
g) Amount of transaction during the year ` 7,948.72 lacs ` 22.45 lacs
h) Amount paid as Advances, if any Borosil provides a rolling advance to Vyline subject to a maximum amount of ` 15 crores.Actual amount of advance as on 31.03.2017 ` Nil.
Nil
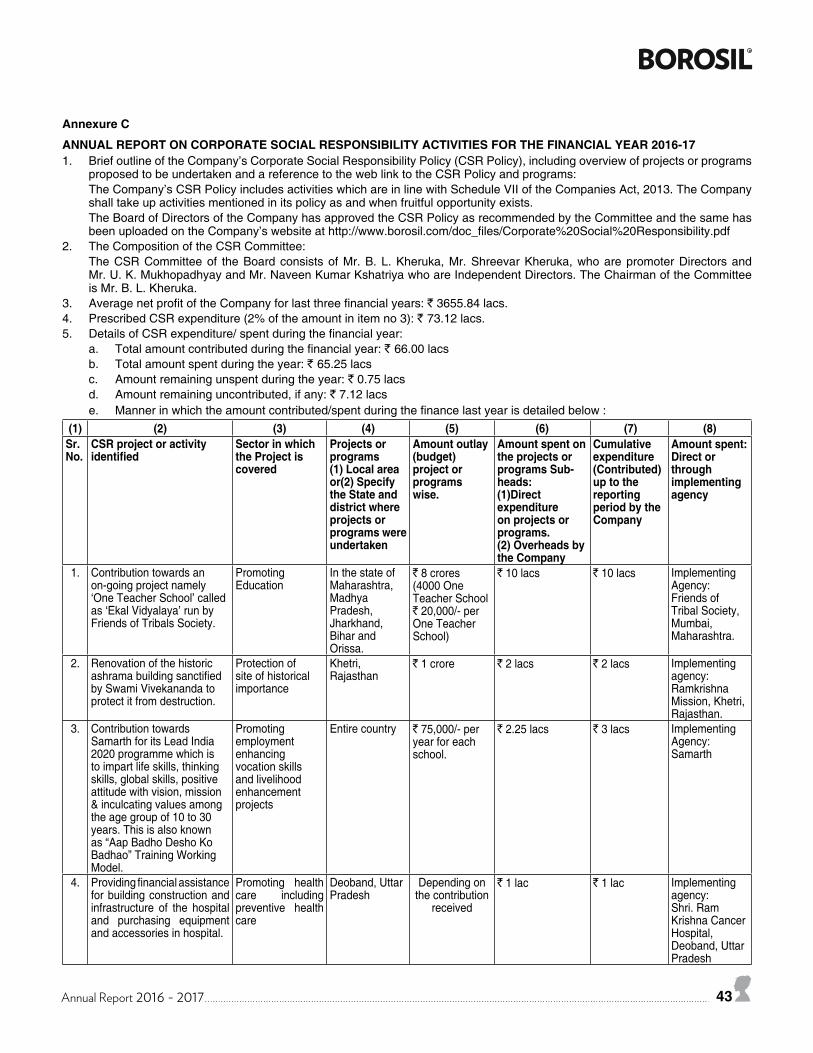
Annual Report 2016 - 2017 43
Annexure C
ANNUAL REPORT ON CORPORATE SOCIAL RESPONSIBILITY ACTIVITIES FOR THE FINANCIAL YEAR 2016-171. Brief outline of the Company’s Corporate Social Responsibility Policy (CSR Policy), including overview of projects or programs
proposed to be undertaken and a reference to the web link to the CSR Policy and programs: The Company’s CSR Policy includes activities which are in line with Schedule VII of the Companies Act, 2013. The Company
shall take up activities mentioned in its policy as and when fruitful opportunity exists. The Board of Directors of the Company has approved the CSR Policy as recommended by the Committee and the same has
been uploaded on the Company’s website at http://www.borosil.com/doc_files/Corporate%20Social%20Responsibility.pdf2. The Composition of the CSR Committee: The CSR Committee of the Board consists of Mr. B. L. Kheruka, Mr. Shreevar Kheruka, who are promoter Directors and
Mr.U.K.MukhopadhyayandMr.NaveenKumarKshatriyawhoareIndependentDirectors.TheChairmanoftheCommitteeis Mr. B. L. Kheruka.
3. AveragenetprofitoftheCompanyforlastthreefinancialyears:` 3655.84 lacs.4. Prescribed CSR expenditure (2% of the amount in item no 3): ` 73.12 lacs.5. DetailsofCSRexpenditure/spentduringthefinancialyear:
a. Totalamountcontributedduringthefinancialyear:` 66.00 lacsb. Total amount spent during the year: ` 65.25 lacsc. Amount remaining unspent during the year: ` 0.75 lacsd. Amount remaining uncontributed, if any: ` 7.12 lacse. Mannerinwhichtheamountcontributed/spentduringthefinancelastyearisdetailedbelow:
(1) (2) (3) (4) (5) (6) (7) (8)Sr.No.
CSR project or activity identified
Sector in which the Project is covered
Projects or programs(1) Local area or(2) Specify the State and district where projects or programs were undertaken
Amount outlay (budget) project or programs wise.
Amount spent on the projects or programs Sub-heads:(1)Direct expenditure on projects or programs.(2) Overheads by the Company
Cumulative expenditure (Contributed) up to the reporting period by the Company
Amount spent:Direct or through implementing agency
1. Contribution towards an on-going project namely ‘OneTeacherSchool’calledas‘EkalVidyalaya’runbyFriends of Tribals Society.
Promoting Education
In the state of Maharashtra, Madhya Pradesh, Jharkhand, Bihar and Orissa.
` 8 crores (4000OneTeacher School ` 20,000/- per OneTeacherSchool)
` 10 lacs ` 10 lacs Implementing Agency: Friends of Tribal Society, Mumbai, Maharashtra.
2. Renovation of the historic ashramabuildingsanctifiedby Swami Vivekananda to protect it from destruction.
Protection of site of historical importance
Khetri, Rajasthan
` 1 crore ` 2 lacs ` 2 lacs Implementing agency:Ramkrishna Mission, Khetri, Rajasthan.
3. Contribution towards Samarth for its Lead India 2020 programme which is to impart life skills, thinking skills, global skills, positive attitude with vision, mission & inculcating values among the age group of 10 to 30 years. This is also known as “Aap Badho Desho Ko Badhao”TrainingWorkingModel.
Promoting employment enhancing vocation skills and livelihood enhancement projects
Entire country ` 75,000/- per year for each school.
` 2.25 lacs ` 3 lacs Implementing Agency: Samarth
4. Providingfinancialassistancefor building construction and infrastructure of the hospital and purchasing equipment and accessories in hospital.
Promoting health care including preventive health care
Deoband,UttarPradesh
Depending on the contribution
received
` 1 lac ` 1 lac Implementing agency:Shri. Ram Krishna Cancer Hospital, Deoband,UttarPradesh
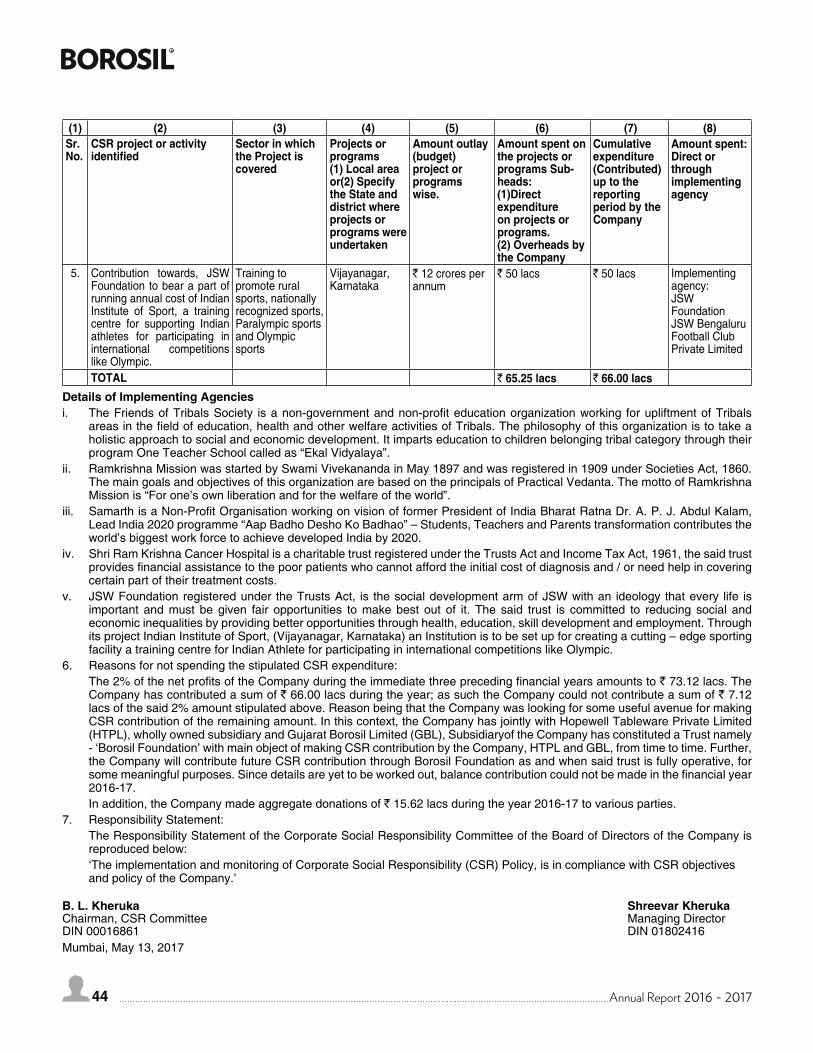
44 Annual Report 2016 - 2017
(1) (2) (3) (4) (5) (6) (7) (8)Sr.No.
CSR project or activity identified
Sector in which the Project is covered
Projects or programs(1) Local area or(2) Specify the State and district where projects or programs were undertaken
Amount outlay (budget) project or programs wise.
Amount spent on the projects or programs Sub-heads:(1)Direct expenditure on projects or programs.(2) Overheads by the Company
Cumulative expenditure (Contributed) up to the reporting period by the Company
Amount spent:Direct or through implementing agency
5. Contribution towards, JSW Foundation to bear a part of running annual cost of Indian Institute of Sport, a training centre for supporting Indian athletes for participating in international competitions likeOlympic.
Training to promote rural sports, nationally recognizedsports,Paralympic sports andOlympicsports
Vijayanagar, Karnataka
` 12 crores per annum
` 50 lacs ` 50 lacs Implementing agency:JSW Foundation JSW Bengaluru Football Club Private Limited
TOTAL ` 65.25 lacs ` 66.00 lacsDetails of Implementing Agenciesi. TheFriendsofTribalsSociety isanon-governmentandnon-profiteducationorganizationworking forupliftmentofTribals
areasinthefieldofeducation,healthandotherwelfareactivitiesofTribals.Thephilosophyofthisorganizationistotakeaholistic approach to social and economic development. It imparts education to children belonging tribal category through their programOneTeacherSchoolcalledas“EkalVidyalaya”.
ii. Ramkrishna Mission was started by Swami Vivekananda in May 1897 and was registered in 1909 under Societies Act, 1860. ThemaingoalsandobjectivesofthisorganizationarebasedontheprincipalsofPracticalVedanta.ThemottoofRamkrishnaMissionis“Forone’sownliberationandforthewelfareoftheworld”.
iii. SamarthisaNon-ProfitOrganisationworkingonvisionofformerPresidentofIndiaBharatRatnaDr.A.P.J.AbdulKalam,LeadIndia2020programme“AapBadhoDeshoKoBadhao”–Students,TeachersandParentstransformationcontributestheworld’s biggest work force to achieve developed India by 2020.
iv. Shri Ram Krishna Cancer Hospital is a charitable trust registered under the Trusts Act and Income Tax Act, 1961, the said trust providesfinancialassistancetothepoorpatientswhocannotaffordtheinitialcostofdiagnosisand/orneedhelpincoveringcertain part of their treatment costs.
v. JSW Foundation registered under the Trusts Act, is the social development arm of JSW with an ideology that every life is important and must be given fair opportunities to make best out of it. The said trust is committed to reducing social and economic inequalities by providing better opportunities through health, education, skill development and employment. Through its project Indian Institute of Sport, (Vijayanagar, Karnataka) an Institution is to be set up for creating a cutting – edge sporting facilityatrainingcentreforIndianAthleteforparticipatingininternationalcompetitionslikeOlympic.
6. Reasons for not spending the stipulated CSR expenditure: The2%ofthenetprofitsoftheCompanyduringtheimmediatethreeprecedingfinancialyearsamountsto` 73.12 lacs. The
Company has contributed a sum of ` 66.00 lacs during the year; as such the Company could not contribute a sum of ` 7.12 lacs of the said 2% amount stipulated above. Reason being that the Company was looking for some useful avenue for making CSR contribution of the remaining amount. In this context, the Company has jointly with Hopewell Tableware Private Limited (HTPL), wholly owned subsidiary and Gujarat Borosil Limited (GBL), Subsidiaryof the Company has constituted a Trust namely -‘BorosilFoundation’withmainobjectofmakingCSRcontributionbytheCompany,HTPLandGBL,fromtimetotime.Further,the Company will contribute future CSR contribution through Borosil Foundation as and when said trust is fully operative, for somemeaningfulpurposes.Sincedetailsareyettobeworkedout,balancecontributioncouldnotbemadeinthefinancialyear2016-17.
In addition, the Company made aggregate donations of ` 15.62 lacs during the year 2016-17 to various parties.7. Responsibility Statement: The Responsibility Statement of the Corporate Social Responsibility Committee of the Board of Directors of the Company is
reproduced below: ‘TheimplementationandmonitoringofCorporateSocialResponsibility(CSR)Policy,isincompliancewithCSRobjectives
and policy of the Company.’
B. L. Kheruka Shreevar KherukaChairman, CSR Committee Managing Director DIN 00016861 DIN 01802416Mumbai, May 13, 2017

Annual Report 2016 - 2017 45
Annexure D
EXTRACT OF ANNUAL RETURN
As on financial year ended on 31.03.2017
Pursuant to Section 92 (3) of the Companies Act, 2013 and Rule 12(1) of the Company (Management & Administration) Rules, 2014
I. REGISTRATION & OTHER DETAILS1. CIN L99999MH1962PLC012538
2. Registration Date 14.12.1962
3. Name of the Company Borosil Glass Works Limited
4. Category/Sub-category of the Company Public Company Limited by shares
5. AddressoftheRegisteredoffice&contactdetails Khanna Construction House, 44, Dr. R.G. Thadani Marg, Worli, Mumbai - 400 018. Ph : +91-022-2493 0362
6. Whether listed company Yes
7. Name, Address & contact details of the Registrar & Transfer Agent, if any.
UniversalCapitalSecuritiesPvt.Ltd.21, Shakil Niwas, Mahakali Caves Road,Andheri (East), Mumbai - 400 093Contact Person : Mr. Rajesh KarlekarPh : +91-022-28207203 / 28207204 / 28207205
II. PRINCIPAL BUSINESS ACTIVITIES OF THE COMPANY (All the business activities contributing 10% or more of the total turnover of the company shall be stated)
Sr. No. Name and Description of main products / services NIC Code of the Product/service
% to total turnover of the company
1. Scientificwareitems 7017 51.15%
2. Consumerware items 7013 48.57%
III. PARTICULARS OF HOLDING, SUBSIDIARY AND ASSOCIATE COMPANIESSr.No.
Name of theCompany
Address of Company CIN/GLN Holding/Subsidiary/ Associate
% of shares held
ApplicableSection
1. Borosil Afrasia FZE
POBox-263287,B34BS33WS309, 3rdFloor,PVAXXOfficeBuilding, Jebel Ali Free Zone,Dubai-UAE
140740 Wholly OwnedSubsidiary
100% 2(87)(ii)
2. Hopewell Tableware Private Limited
1101,11th Floor, Crescenzo,G-Block,PlotNoC-38,Opp.MCA Club, Bandra Kurla Complex, Bandra (East), Mumbai - 400051, Maharashtra, India
U26913MH2010PTC292722 Wholly OwnedSubsidiary
100% through itself and its nominee
2(87)(ii)
3. Klass Pack Private Limited
H-27, MIDC Area, Ambad, Nasik, Maharashtra - 422010, India
U74999MH1991PTC061851 Subsidiary 60.3% 2(87)(ii)
4. Borosil Afrasia Middle East Trading LLC
POBoxNo.413900,OfficeNo.7,31st Floor, KKR Business Center, Aspin Commercial Tower, Sheikh Zayed Road,Dubai-UAE
Subsidiary Borosil Afrasia FZE held 49% Shares
2(87)(ii)
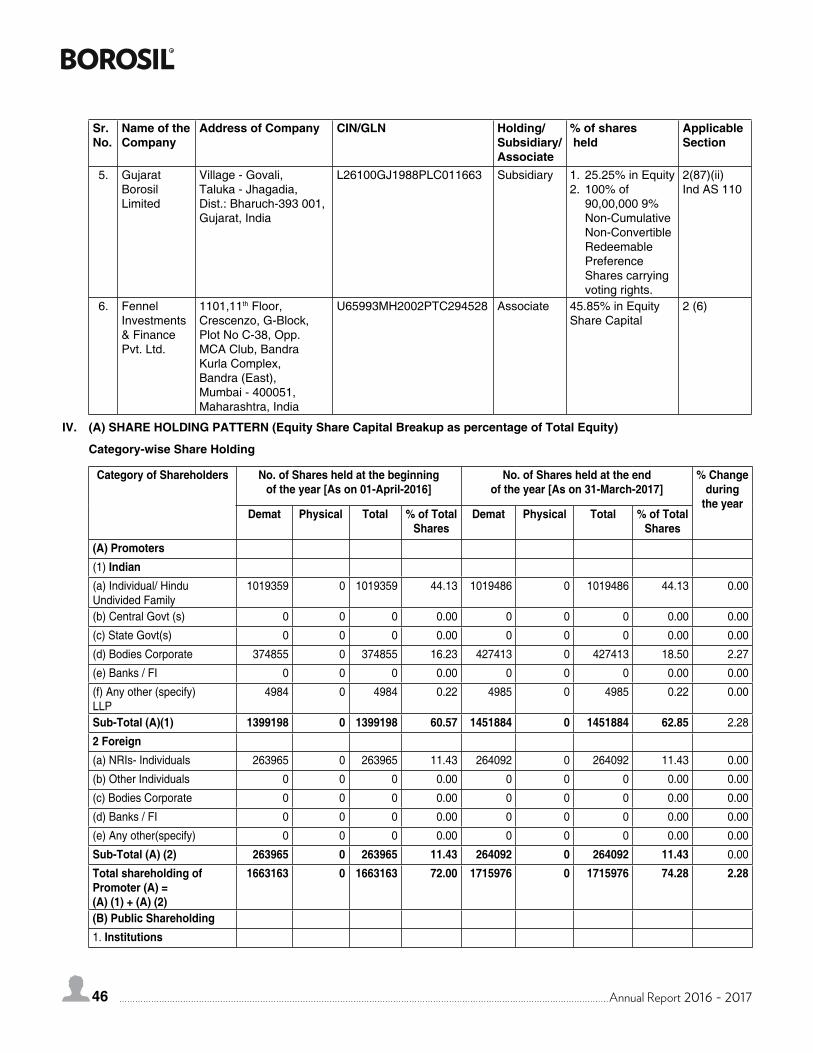
46 Annual Report 2016 - 2017
Sr.No.
Name of theCompany
Address of Company CIN/GLN Holding/Subsidiary/ Associate
% of shares held
ApplicableSection
5. Gujarat Borosil Limited
Village - Govali,Taluka - Jhagadia,Dist.: Bharuch-393 001,Gujarat, India
L26100GJ1988PLC011663 Subsidiary 1. 25.25% in Equity2. 100% of
90,00,000 9% Non-Cumulative Non-Convertible Redeemable Preference Shares carrying voting rights.
2(87)(ii)Ind AS 110
6. Fennel Investments & Finance Pvt. Ltd.
1101,11th Floor, Crescenzo,G-Block,PlotNoC-38,Opp.MCA Club, Bandra Kurla Complex, Bandra (East), Mumbai - 400051, Maharashtra, India
U65993MH2002PTC294528 Associate 45.85% in Equity Share Capital
2 (6)
IV. (A) SHARE HOLDING PATTERN (Equity Share Capital Breakup as percentage of Total Equity)
Category-wise Share Holding
Category of Shareholders No. of Shares held at the beginning of the year [As on 01-April-2016]
No. of Shares held at the end of the year [As on 31-March-2017]
% Change during
the yearDemat Physical Total % of Total
SharesDemat Physical Total % of Total
Shares(A) Promoters(1) Indian(a) Individual/ Hindu UndividedFamily
1019359 0 1019359 44.13 1019486 0 1019486 44.13 0.00
(b) Central Govt (s) 0 0 0 0.00 0 0 0 0.00 0.00
(c) State Govt(s) 0 0 0 0.00 0 0 0 0.00 0.00
(d) Bodies Corporate 374855 0 374855 16.23 427413 0 427413 18.50 2.27
(e) Banks / FI 0 0 0 0.00 0 0 0 0.00 0.00
(f) Any other (specify)LLP
4984 0 4984 0.22 4985 0 4985 0.22 0.00
Sub-Total (A)(1) 1399198 0 1399198 60.57 1451884 0 1451884 62.85 2.28
2 Foreign(a) NRIs- Individuals 263965 0 263965 11.43 264092 0 264092 11.43 0.00
(b)OtherIndividuals 0 0 0 0.00 0 0 0 0.00 0.00
(c) Bodies Corporate 0 0 0 0.00 0 0 0 0.00 0.00
(d) Banks / FI 0 0 0 0.00 0 0 0 0.00 0.00
(e) Any other(specify) 0 0 0 0.00 0 0 0 0.00 0.00
Sub-Total (A) (2) 263965 0 263965 11.43 264092 0 264092 11.43 0.00
Total shareholding of Promoter (A) =(A) (1) + (A) (2)
1663163 0 1663163 72.00 1715976 0 1715976 74.28 2.28
(B) Public Shareholding1. Institutions
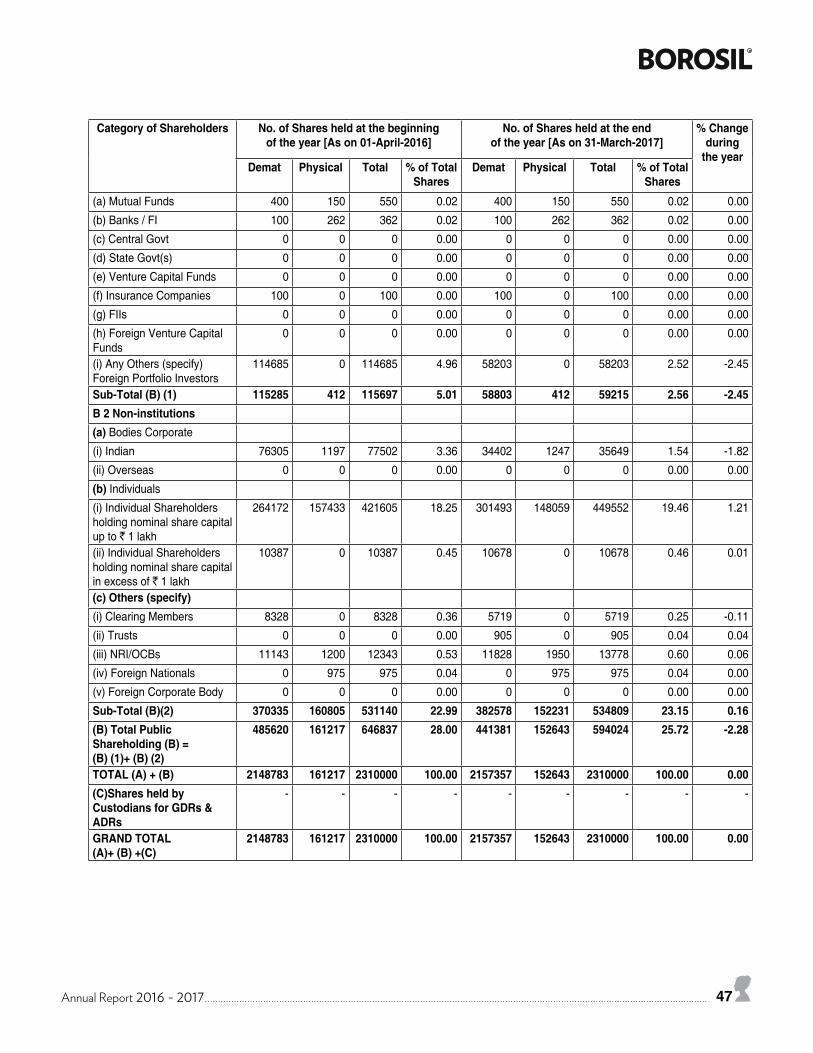
Annual Report 2016 - 2017 47
Category of Shareholders No. of Shares held at the beginning of the year [As on 01-April-2016]
No. of Shares held at the end of the year [As on 31-March-2017]
% Change during
the yearDemat Physical Total % of Total
SharesDemat Physical Total % of Total
Shares(a) Mutual Funds 400 150 550 0.02 400 150 550 0.02 0.00
(b) Banks / FI 100 262 362 0.02 100 262 362 0.02 0.00
(c) Central Govt 0 0 0 0.00 0 0 0 0.00 0.00
(d) State Govt(s) 0 0 0 0.00 0 0 0 0.00 0.00
(e) Venture Capital Funds 0 0 0 0.00 0 0 0 0.00 0.00
(f) Insurance Companies 100 0 100 0.00 100 0 100 0.00 0.00
(g) FIIs 0 0 0 0.00 0 0 0 0.00 0.00
(h) Foreign Venture Capital Funds
0 0 0 0.00 0 0 0 0.00 0.00
(i)AnyOthers(specify)Foreign Portfolio Investors
114685 0 114685 4.96 58203 0 58203 2.52 -2.45
Sub-Total (B) (1) 115285 412 115697 5.01 58803 412 59215 2.56 -2.45B 2 Non-institutions(a) Bodies Corporate
(i) Indian 76305 1197 77502 3.36 34402 1247 35649 1.54 -1.82
(ii)Overseas 0 0 0 0.00 0 0 0 0.00 0.00
(b) Individuals
(i) Individual Shareholders holding nominal share capital up to ` 1 lakh
264172 157433 421605 18.25 301493 148059 449552 19.46 1.21
(ii) Individual Shareholders holding nominal share capital in excess of ` 1 lakh
10387 0 10387 0.45 10678 0 10678 0.46 0.01
(c) Others (specify)(i) Clearing Members 8328 0 8328 0.36 5719 0 5719 0.25 -0.11
(ii) Trusts 0 0 0 0.00 905 0 905 0.04 0.04
(iii)NRI/OCBs 11143 1200 12343 0.53 11828 1950 13778 0.60 0.06
(iv) Foreign Nationals 0 975 975 0.04 0 975 975 0.04 0.00
(v) Foreign Corporate Body 0 0 0 0.00 0 0 0 0.00 0.00
Sub-Total (B)(2) 370335 160805 531140 22.99 382578 152231 534809 23.15 0.16(B) Total Public Shareholding (B) =(B) (1)+ (B) (2)
485620 161217 646837 28.00 441381 152643 594024 25.72 -2.28
TOTAL (A) + (B) 2148783 161217 2310000 100.00 2157357 152643 2310000 100.00 0.00(C)Shares held by Custodians for GDRs & ADRs
- - - - - - - - -
GRAND TOTAL(A)+ (B) +(C)
2148783 161217 2310000 100.00 2157357 152643 2310000 100.00 0.00
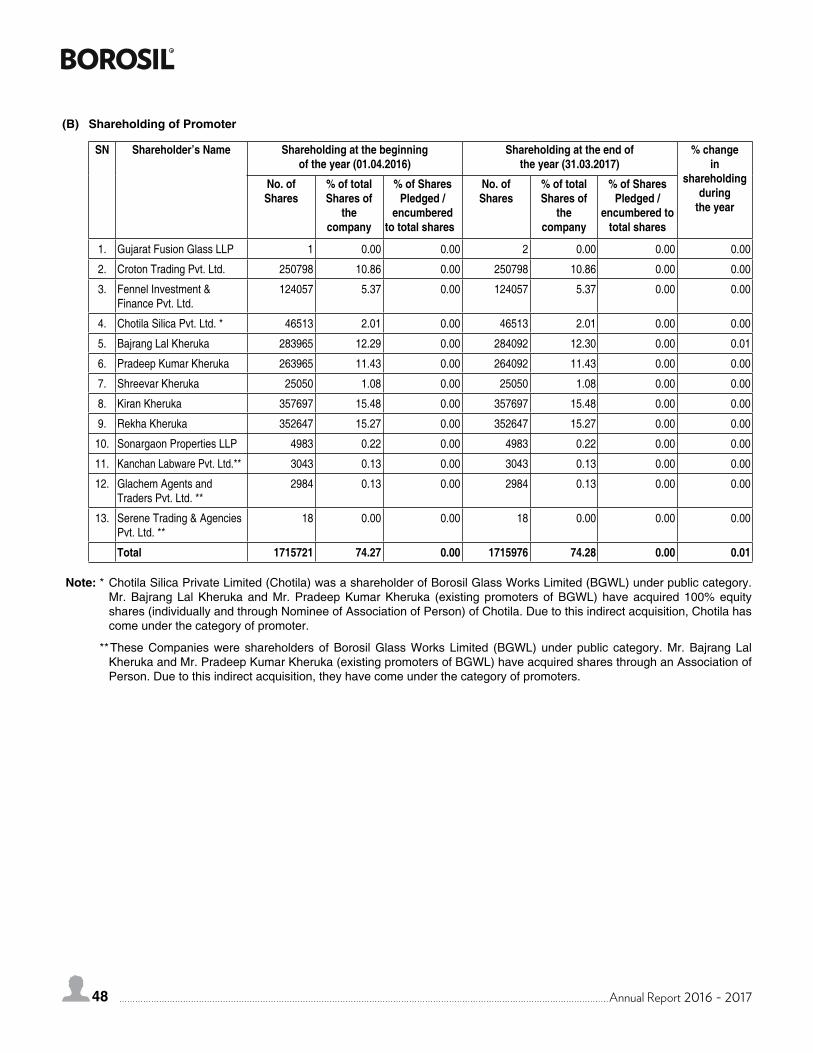
48 Annual Report 2016 - 2017
(B) Shareholding of Promoter
SN Shareholder’s Name Shareholding at the beginning of the year (01.04.2016)
Shareholding at the end of the year (31.03.2017)
% change in
shareholding during
the year
No. of Shares
% of total Shares of
the company
% of Shares Pledged /
encumberedto total shares
No. of Shares
% of total Shares of
the company
% of Shares Pledged /
encumbered to total shares
1. Gujarat Fusion Glass LLP 1 0.00 0.00 2 0.00 0.00 0.00
2. Croton Trading Pvt. Ltd. 250798 10.86 0.00 250798 10.86 0.00 0.00
3. Fennel Investment & Finance Pvt. Ltd.
124057 5.37 0.00 124057 5.37 0.00 0.00
4. Chotila Silica Pvt. Ltd. * 46513 2.01 0.00 46513 2.01 0.00 0.00
5. Bajrang Lal Kheruka 283965 12.29 0.00 284092 12.30 0.00 0.01
6. Pradeep Kumar Kheruka 263965 11.43 0.00 264092 11.43 0.00 0.00
7. Shreevar Kheruka 25050 1.08 0.00 25050 1.08 0.00 0.00
8. Kiran Kheruka 357697 15.48 0.00 357697 15.48 0.00 0.00
9. Rekha Kheruka 352647 15.27 0.00 352647 15.27 0.00 0.00
10. Sonargaon Properties LLP 4983 0.22 0.00 4983 0.22 0.00 0.00
11. Kanchan Labware Pvt. Ltd.** 3043 0.13 0.00 3043 0.13 0.00 0.00
12. Glachem Agents and Traders Pvt. Ltd. **
2984 0.13 0.00 2984 0.13 0.00 0.00
13. Serene Trading & Agencies Pvt. Ltd. **
18 0.00 0.00 18 0.00 0.00 0.00
Total 1715721 74.27 0.00 1715976 74.28 0.00 0.01
Note: * Chotila Silica Private Limited (Chotila) was a shareholder of Borosil Glass Works Limited (BGWL) under public category. Mr. Bajrang Lal Kheruka and Mr. Pradeep Kumar Kheruka (existing promoters of BGWL) have acquired 100% equity shares (individually and through Nominee of Association of Person) of Chotila. Due to this indirect acquisition, Chotila has come under the category of promoter.
** These Companies were shareholders of Borosil Glass Works Limited (BGWL) under public category. Mr. Bajrang Lal Kheruka and Mr. Pradeep Kumar Kheruka (existing promoters of BGWL) have acquired shares through an Association of Person. Due to this indirect acquisition, they have come under the category of promoters.
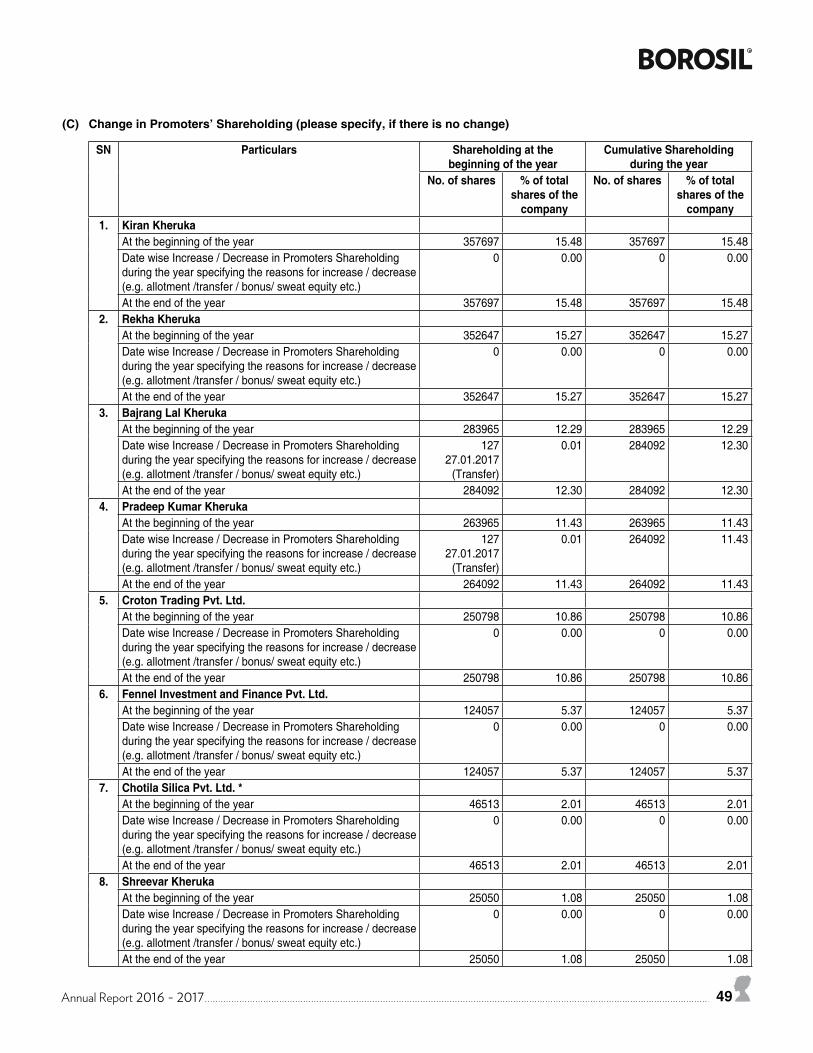
Annual Report 2016 - 2017 49
(C) Change in Promoters’ Shareholding (please specify, if there is no change)
SN Particulars Shareholding at the beginning of the year
Cumulative Shareholding during the year
No. of shares % of totalshares of the
company
No. of shares % of totalshares of the
company1. Kiran Kheruka
At the beginning of the year 357697 15.48 357697 15.48Date wise Increase / Decrease in Promoters Shareholding during the year specifying the reasons for increase / decrease (e.g. allotment /transfer / bonus/ sweat equity etc.)
0 0.00 0 0.00
At the end of the year 357697 15.48 357697 15.482. Rekha Kheruka
At the beginning of the year 352647 15.27 352647 15.27Date wise Increase / Decrease in Promoters Shareholding during the year specifying the reasons for increase / decrease (e.g. allotment /transfer / bonus/ sweat equity etc.)
0 0.00 0 0.00
At the end of the year 352647 15.27 352647 15.273. Bajrang Lal Kheruka
At the beginning of the year 283965 12.29 283965 12.29Date wise Increase / Decrease in Promoters Shareholding during the year specifying the reasons for increase / decrease (e.g. allotment /transfer / bonus/ sweat equity etc.)
12727.01.2017
(Transfer)
0.01 284092 12.30
At the end of the year 284092 12.30 284092 12.304. Pradeep Kumar Kheruka
At the beginning of the year 263965 11.43 263965 11.43Date wise Increase / Decrease in Promoters Shareholding during the year specifying the reasons for increase / decrease (e.g. allotment /transfer / bonus/ sweat equity etc.)
12727.01.2017
(Transfer)
0.01 264092 11.43
At the end of the year 264092 11.43 264092 11.435. Croton Trading Pvt. Ltd.
At the beginning of the year 250798 10.86 250798 10.86Date wise Increase / Decrease in Promoters Shareholding during the year specifying the reasons for increase / decrease (e.g. allotment /transfer / bonus/ sweat equity etc.)
0 0.00 0 0.00
At the end of the year 250798 10.86 250798 10.866. Fennel Investment and Finance Pvt. Ltd.
At the beginning of the year 124057 5.37 124057 5.37Date wise Increase / Decrease in Promoters Shareholding during the year specifying the reasons for increase / decrease (e.g. allotment /transfer / bonus/ sweat equity etc.)
0 0.00 0 0.00
At the end of the year 124057 5.37 124057 5.377. Chotila Silica Pvt. Ltd. *
At the beginning of the year 46513 2.01 46513 2.01Date wise Increase / Decrease in Promoters Shareholding during the year specifying the reasons for increase / decrease (e.g. allotment /transfer / bonus/ sweat equity etc.)
0 0.00 0 0.00
At the end of the year 46513 2.01 46513 2.018. Shreevar Kheruka
At the beginning of the year 25050 1.08 25050 1.08Date wise Increase / Decrease in Promoters Shareholding during the year specifying the reasons for increase / decrease (e.g. allotment /transfer / bonus/ sweat equity etc.)
0 0.00 0 0.00
At the end of the year 25050 1.08 25050 1.08
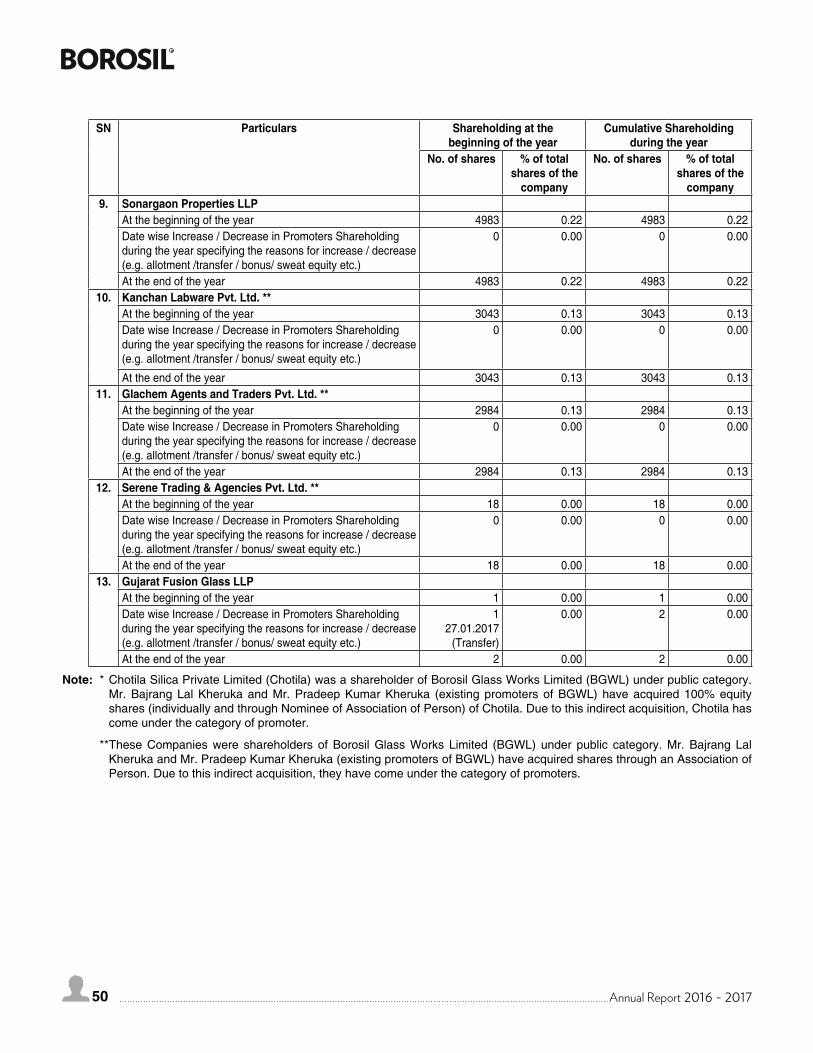
50 Annual Report 2016 - 2017
SN Particulars Shareholding at the beginning of the year
Cumulative Shareholding during the year
No. of shares % of totalshares of the
company
No. of shares % of totalshares of the
company9. Sonargaon Properties LLP
At the beginning of the year 4983 0.22 4983 0.22Date wise Increase / Decrease in Promoters Shareholding during the year specifying the reasons for increase / decrease (e.g. allotment /transfer / bonus/ sweat equity etc.)
0 0.00 0 0.00
At the end of the year 4983 0.22 4983 0.2210. Kanchan Labware Pvt. Ltd. **
At the beginning of the year 3043 0.13 3043 0.13Date wise Increase / Decrease in Promoters Shareholding during the year specifying the reasons for increase / decrease (e.g. allotment /transfer / bonus/ sweat equity etc.)
0 0.00 0 0.00
At the end of the year 3043 0.13 3043 0.1311. Glachem Agents and Traders Pvt. Ltd. **
At the beginning of the year 2984 0.13 2984 0.13Date wise Increase / Decrease in Promoters Shareholding during the year specifying the reasons for increase / decrease (e.g. allotment /transfer / bonus/ sweat equity etc.)
0 0.00 0 0.00
At the end of the year 2984 0.13 2984 0.1312. Serene Trading & Agencies Pvt. Ltd. **
At the beginning of the year 18 0.00 18 0.00Date wise Increase / Decrease in Promoters Shareholding during the year specifying the reasons for increase / decrease (e.g. allotment /transfer / bonus/ sweat equity etc.)
0 0.00 0 0.00
At the end of the year 18 0.00 18 0.0013. Gujarat Fusion Glass LLP
At the beginning of the year 1 0.00 1 0.00Date wise Increase / Decrease in Promoters Shareholding during the year specifying the reasons for increase / decrease (e.g. allotment /transfer / bonus/ sweat equity etc.)
1 27.01.2017
(Transfer)
0.00 2 0.00
At the end of the year 2 0.00 2 0.00
Note: * Chotila Silica Private Limited (Chotila) was a shareholder of Borosil Glass Works Limited (BGWL) under public category. Mr. Bajrang Lal Kheruka and Mr. Pradeep Kumar Kheruka (existing promoters of BGWL) have acquired 100% equity shares (individually and through Nominee of Association of Person) of Chotila. Due to this indirect acquisition, Chotila has come under the category of promoter.
**These Companies were shareholders of Borosil Glass Works Limited (BGWL) under public category. Mr. Bajrang Lal Kheruka and Mr. Pradeep Kumar Kheruka (existing promoters of BGWL) have acquired shares through an Association of Person. Due to this indirect acquisition, they have come under the category of promoters.
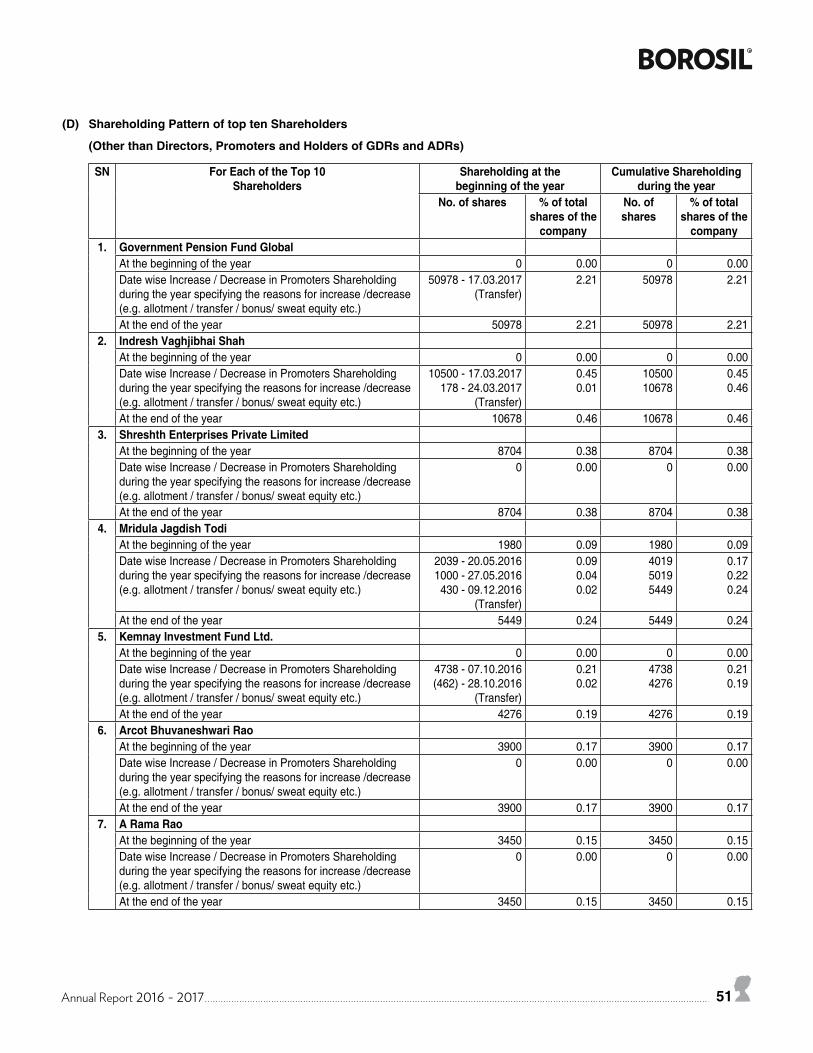
Annual Report 2016 - 2017 51
(D) Shareholding Pattern of top ten Shareholders
(Other than Directors, Promoters and Holders of GDRs and ADRs)
SN For Each of the Top 10Shareholders
Shareholding at the beginning of the year
Cumulative Shareholding during the year
No. of shares % of totalshares of the
company
No. of shares
% of totalshares of the
company1. Government Pension Fund Global
At the beginning of the year 0 0.00 0 0.00Date wise Increase / Decrease in Promoters Shareholding during the year specifying the reasons for increase /decrease (e.g. allotment / transfer / bonus/ sweat equity etc.)
50978 - 17.03.2017(Transfer)
2.21 50978 2.21
At the end of the year 50978 2.21 50978 2.212. Indresh Vaghjibhai Shah
At the beginning of the year 0 0.00 0 0.00Date wise Increase / Decrease in Promoters Shareholding during the year specifying the reasons for increase /decrease (e.g. allotment / transfer / bonus/ sweat equity etc.)
10500 - 17.03.2017178 - 24.03.2017
(Transfer)
0.450.01
1050010678
0.450.46
At the end of the year 10678 0.46 10678 0.463. Shreshth Enterprises Private Limited
At the beginning of the year 8704 0.38 8704 0.38Date wise Increase / Decrease in Promoters Shareholding during the year specifying the reasons for increase /decrease (e.g. allotment / transfer / bonus/ sweat equity etc.)
0 0.00 0 0.00
At the end of the year 8704 0.38 8704 0.384. Mridula Jagdish Todi
At the beginning of the year 1980 0.09 1980 0.09Date wise Increase / Decrease in Promoters Shareholding during the year specifying the reasons for increase /decrease (e.g. allotment / transfer / bonus/ sweat equity etc.)
2039 - 20.05.20161000 - 27.05.2016430 - 09.12.2016
(Transfer)
0.090.040.02
401950195449
0.170.220.24
At the end of the year 5449 0.24 5449 0.245. Kemnay Investment Fund Ltd.
At the beginning of the year 0 0.00 0 0.00Date wise Increase / Decrease in Promoters Shareholding during the year specifying the reasons for increase /decrease (e.g. allotment / transfer / bonus/ sweat equity etc.)
4738 - 07.10.2016(462) - 28.10.2016
(Transfer)
0.210.02
47384276
0.210.19
At the end of the year 4276 0.19 4276 0.196. Arcot Bhuvaneshwari Rao
At the beginning of the year 3900 0.17 3900 0.17Date wise Increase / Decrease in Promoters Shareholding during the year specifying the reasons for increase /decrease (e.g. allotment / transfer / bonus/ sweat equity etc.)
0 0.00 0 0.00
At the end of the year 3900 0.17 3900 0.177. A Rama Rao
At the beginning of the year 3450 0.15 3450 0.15Date wise Increase / Decrease in Promoters Shareholding during the year specifying the reasons for increase /decrease (e.g. allotment / transfer / bonus/ sweat equity etc.)
0 0.00 0 0.00
At the end of the year 3450 0.15 3450 0.15
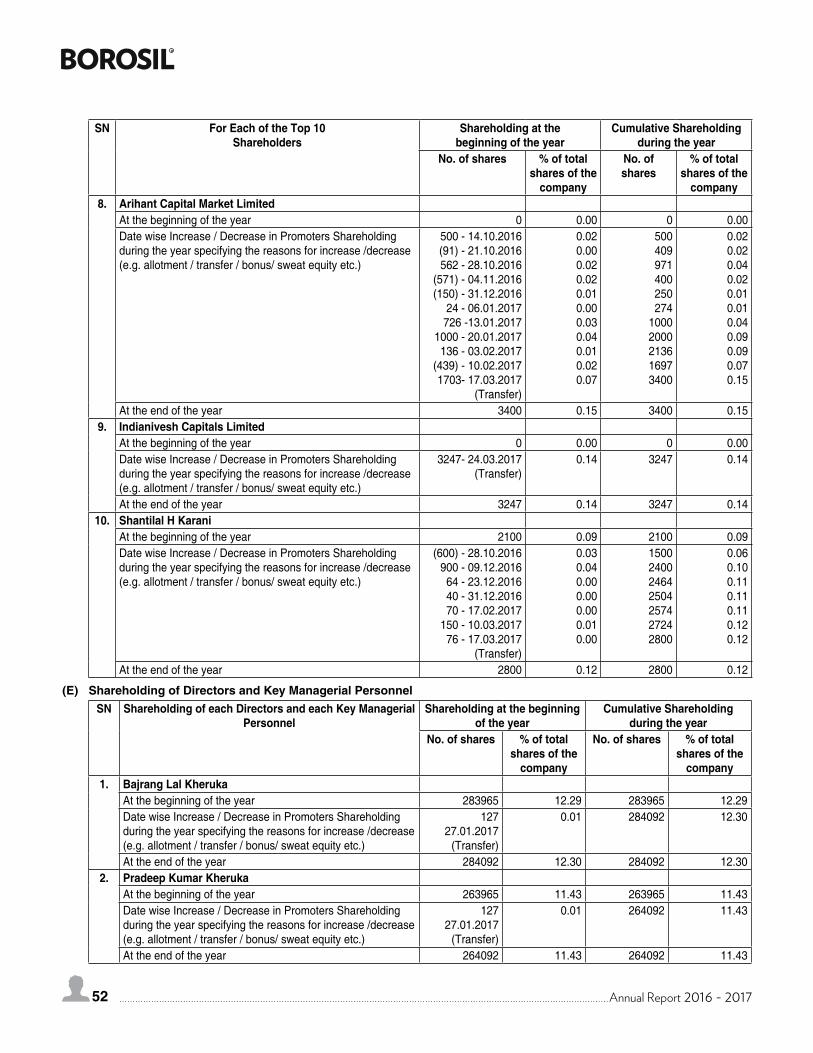
52 Annual Report 2016 - 2017
SN For Each of the Top 10Shareholders
Shareholding at the beginning of the year
Cumulative Shareholding during the year
No. of shares % of totalshares of the
company
No. of shares
% of totalshares of the
company8. Arihant Capital Market Limited
At the beginning of the year 0 0.00 0 0.00Date wise Increase / Decrease in Promoters Shareholding during the year specifying the reasons for increase /decrease (e.g. allotment / transfer / bonus/ sweat equity etc.)
500 - 14.10.2016(91) - 21.10.2016562 - 28.10.2016
(571) - 04.11.2016(150) - 31.12.2016
24 - 06.01.2017726 -13.01.2017
1000 - 20.01.2017136 - 03.02.2017
(439) - 10.02.20171703- 17.03.2017
(Transfer)
0.020.000.020.020.010.000.030.040.010.020.07
500409971400250274
10002000213616973400
0.020.020.040.020.010.010.040.090.090.070.15
At the end of the year 3400 0.15 3400 0.159. Indianivesh Capitals Limited
At the beginning of the year 0 0.00 0 0.00Date wise Increase / Decrease in Promoters Shareholding during the year specifying the reasons for increase /decrease (e.g. allotment / transfer / bonus/ sweat equity etc.)
3247- 24.03.2017(Transfer)
0.14 3247 0.14
At the end of the year 3247 0.14 3247 0.1410. Shantilal H Karani
At the beginning of the year 2100 0.09 2100 0.09Date wise Increase / Decrease in Promoters Shareholding during the year specifying the reasons for increase /decrease (e.g. allotment / transfer / bonus/ sweat equity etc.)
(600) - 28.10.2016900 - 09.12.201664 - 23.12.201640 - 31.12.201670 - 17.02.2017
150 - 10.03.201776 - 17.03.2017
(Transfer)
0.030.040.000.000.000.010.00
1500240024642504257427242800
0.060.100.110.110.110.120.12
At the end of the year 2800 0.12 2800 0.12
(E) Shareholding of Directors and Key Managerial PersonnelSN Shareholding of each Directors and each Key Managerial
PersonnelShareholding at the beginning
of the yearCumulative Shareholding
during the yearNo. of shares % of total
shares of thecompany
No. of shares % of totalshares of the
company1. Bajrang Lal Kheruka
At the beginning of the year 283965 12.29 283965 12.29Date wise Increase / Decrease in Promoters Shareholding during the year specifying the reasons for increase /decrease (e.g. allotment / transfer / bonus/ sweat equity etc.)
12727.01.2017
(Transfer)
0.01 284092 12.30
At the end of the year 284092 12.30 284092 12.302. Pradeep Kumar Kheruka
At the beginning of the year 263965 11.43 263965 11.43Date wise Increase / Decrease in Promoters Shareholding during the year specifying the reasons for increase /decrease (e.g. allotment / transfer / bonus/ sweat equity etc.)
12727.01.2017
(Transfer)
0.01 264092 11.43
At the end of the year 264092 11.43 264092 11.43
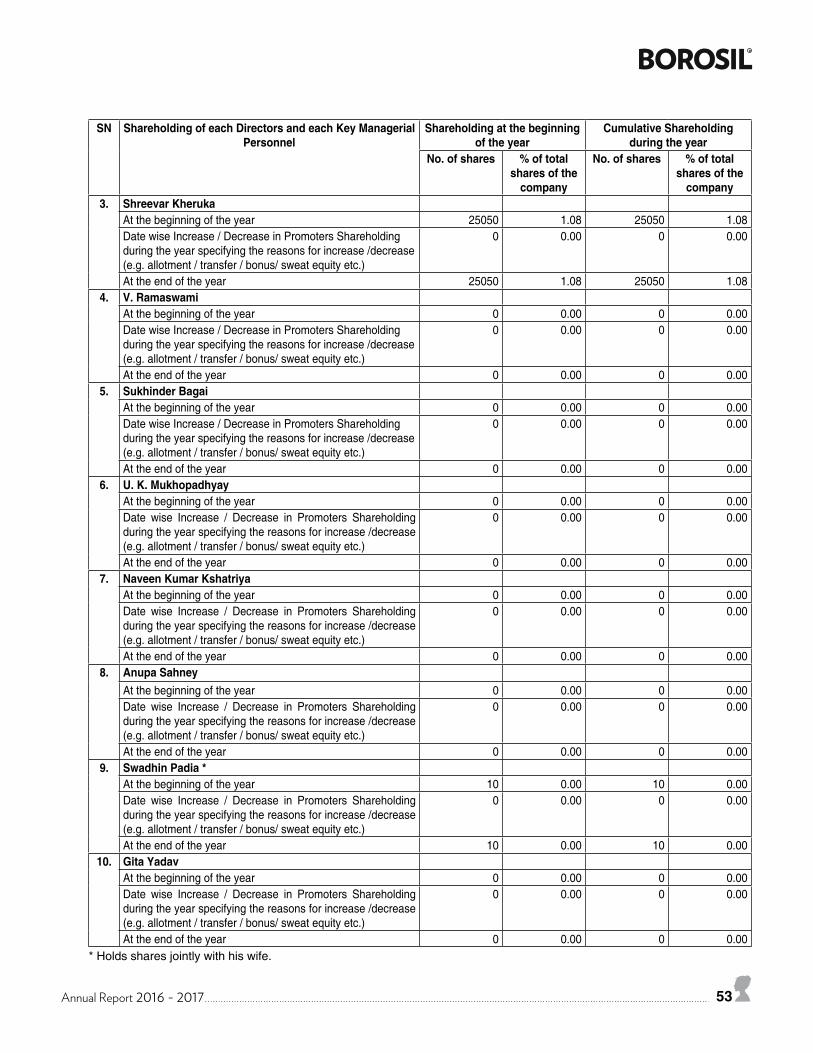
Annual Report 2016 - 2017 53
SN Shareholding of each Directors and each Key Managerial Personnel
Shareholding at the beginningof the year
Cumulative Shareholding during the year
No. of shares % of totalshares of the
company
No. of shares % of totalshares of the
company3. Shreevar Kheruka
At the beginning of the year 25050 1.08 25050 1.08Date wise Increase / Decrease in Promoters Shareholding during the year specifying the reasons for increase /decrease (e.g. allotment / transfer / bonus/ sweat equity etc.)
0 0.00 0 0.00
At the end of the year 25050 1.08 25050 1.084. V. Ramaswami
At the beginning of the year 0 0.00 0 0.00Date wise Increase / Decrease in Promoters Shareholding during the year specifying the reasons for increase /decrease (e.g. allotment / transfer / bonus/ sweat equity etc.)
0 0.00 0 0.00
At the end of the year 0 0.00 0 0.005. Sukhinder Bagai
At the beginning of the year 0 0.00 0 0.00Date wise Increase / Decrease in Promoters Shareholding during the year specifying the reasons for increase /decrease (e.g. allotment / transfer / bonus/ sweat equity etc.)
0 0.00 0 0.00
At the end of the year 0 0.00 0 0.006. U. K. Mukhopadhyay
At the beginning of the year 0 0.00 0 0.00Date wise Increase / Decrease in Promoters Shareholding during the year specifying the reasons for increase /decrease (e.g. allotment / transfer / bonus/ sweat equity etc.)
0 0.00 0 0.00
At the end of the year 0 0.00 0 0.007. Naveen Kumar Kshatriya
At the beginning of the year 0 0.00 0 0.00Date wise Increase / Decrease in Promoters Shareholding during the year specifying the reasons for increase /decrease (e.g. allotment / transfer / bonus/ sweat equity etc.)
0 0.00 0 0.00
At the end of the year 0 0.00 0 0.008. Anupa Sahney
At the beginning of the year 0 0.00 0 0.00Date wise Increase / Decrease in Promoters Shareholding during the year specifying the reasons for increase /decrease (e.g. allotment / transfer / bonus/ sweat equity etc.)
0 0.00 0 0.00
At the end of the year 0 0.00 0 0.009. Swadhin Padia *
At the beginning of the year 10 0.00 10 0.00Date wise Increase / Decrease in Promoters Shareholding during the year specifying the reasons for increase /decrease (e.g. allotment / transfer / bonus/ sweat equity etc.)
0 0.00 0 0.00
At the end of the year 10 0.00 10 0.0010. Gita Yadav
At the beginning of the year 0 0.00 0 0.00Date wise Increase / Decrease in Promoters Shareholding during the year specifying the reasons for increase /decrease (e.g. allotment / transfer / bonus/ sweat equity etc.)
0 0.00 0 0.00
At the end of the year 0 0.00 0 0.00 * Holds shares jointly with his wife.
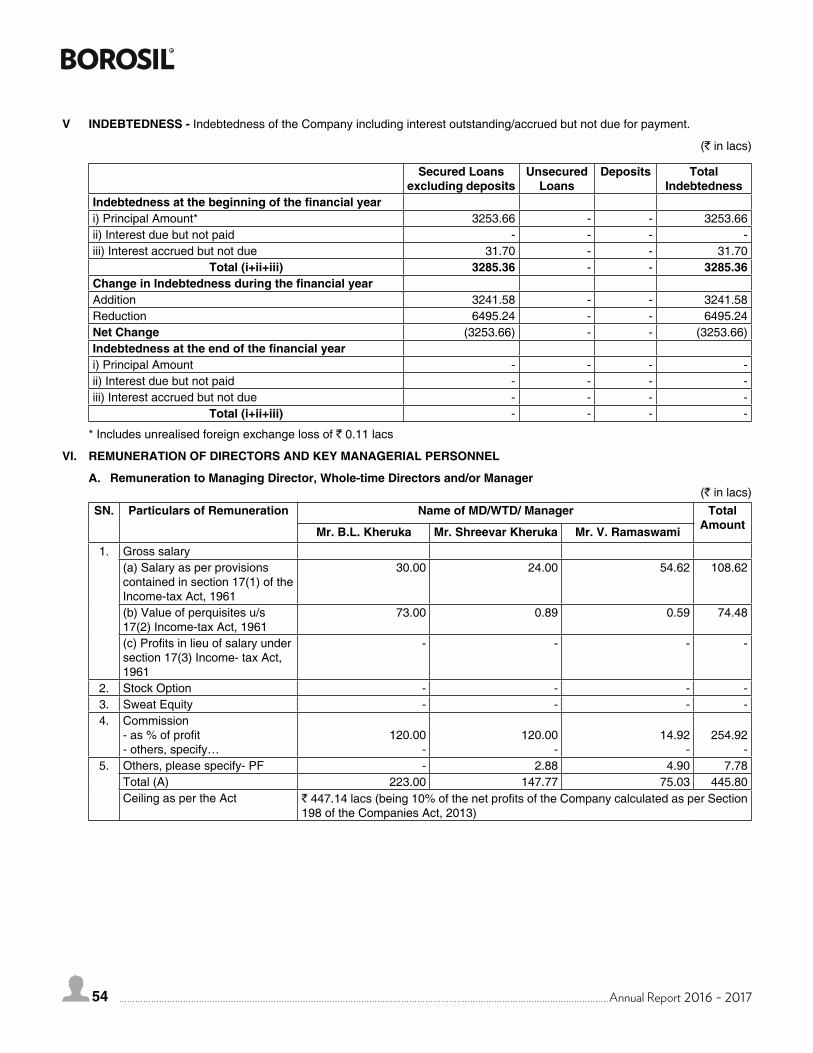
54 Annual Report 2016 - 2017
V INDEBTEDNESS - Indebtedness of the Company including interest outstanding/accrued but not due for payment.
(` in lacs)
Secured Loans excluding deposits
Unsecured Loans
Deposits Total Indebtedness
Indebtedness at the beginning of the financial yeari) Principal Amount* 3253.66 - - 3253.66ii) Interest due but not paid - - - -iii) Interest accrued but not due 31.70 - - 31.70
Total (i+ii+iii) 3285.36 - - 3285.36Change in Indebtedness during the financial yearAddition 3241.58 - - 3241.58Reduction 6495.24 - - 6495.24Net Change (3253.66) - - (3253.66)Indebtedness at the end of the financial yeari) Principal Amount - - - -ii) Interest due but not paid - - - -iii) Interest accrued but not due - - - -
Total (i+ii+iii) - - - -
* Includes unrealised foreign exchange loss of ` 0.11 lacs
VI. REMUNERATION OF DIRECTORS AND KEY MANAGERIAL PERSONNEL
A. Remuneration to Managing Director, Whole-time Directors and/or Manager (` in lacs)
SN. Particulars of Remuneration Name of MD/WTD/ Manager Total AmountMr. B.L. Kheruka Mr. Shreevar Kheruka Mr. V. Ramaswami
1. Gross salary(a) Salary as per provisions contained in section 17(1) of the Income-tax Act, 1961
30.00 24.00 54.62 108.62
(b) Value of perquisites u/s 17(2) Income-tax Act, 1961
73.00 0.89 0.59 74.48
(c)Profitsinlieuofsalaryundersection 17(3) Income- tax Act, 1961
- - - -
2. StockOption - - - -3. Sweat Equity - - - -4. Commission
-as%ofprofit - others, specify…
120.00-
120.00-
14.92-
254.92-
5. Others,pleasespecify-PF - 2.88 4.90 7.78Total (A) 223.00 147.77 75.03 445.80Ceiling as per the Act `447.14lacs(being10%ofthenetprofitsoftheCompanycalculatedasperSection
198 of the Companies Act, 2013)
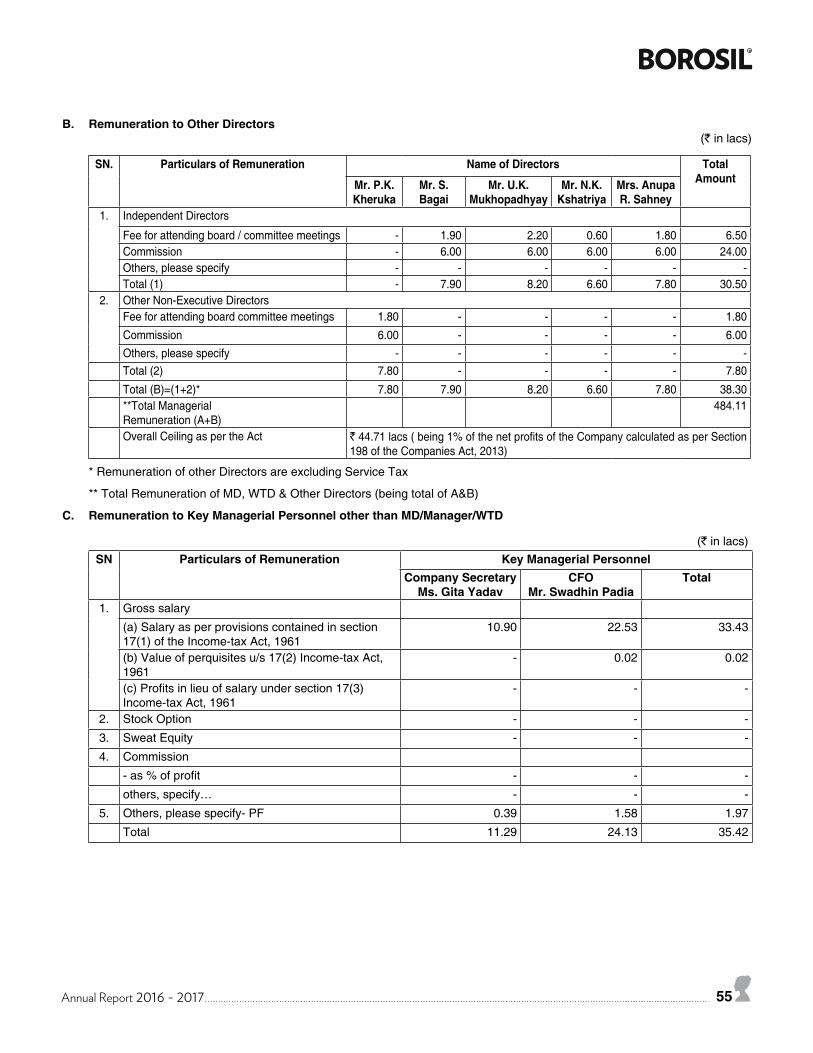
Annual Report 2016 - 2017 55
B. Remuneration to Other Directors (` in lacs)
SN. Particulars of Remuneration Name of Directors Total AmountMr. P.K.
KherukaMr. S. Bagai
Mr. U.K. Mukhopadhyay
Mr. N.K. Kshatriya
Mrs. Anupa R. Sahney
1. Independent Directors
Fee for attending board / committee meetings - 1.90 2.20 0.60 1.80 6.50Commission - 6.00 6.00 6.00 6.00 24.00Others,pleasespecify - - - - - -Total (1) - 7.90 8.20 6.60 7.80 30.50
2. OtherNon-ExecutiveDirectorsFee for attending board committee meetings 1.80 - - - - 1.80
Commission 6.00 - - - - 6.00Others,pleasespecify - - - - - -Total (2) 7.80 - - - - 7.80
Total (B)=(1+2)* 7.80 7.90 8.20 6.60 7.80 38.30**Total Managerial Remuneration (A+B)
484.11
OverallCeilingaspertheAct `44.71lacs(being1%ofthenetprofitsoftheCompanycalculatedasperSection198 of the Companies Act, 2013)
* Remuneration of other Directors are excluding Service Tax
**TotalRemunerationofMD,WTD&OtherDirectors(beingtotalofA&B)
C. Remuneration to Key Managerial Personnel other than MD/Manager/WTD
(` in lacs)SN Particulars of Remuneration Key Managerial Personnel
Company SecretaryMs. Gita Yadav
CFOMr. Swadhin Padia
Total
1. Gross salary
(a) Salary as per provisions contained in section 17(1) of the Income-tax Act, 1961
10.90 22.53 33.43
(b) Value of perquisites u/s 17(2) Income-tax Act, 1961
- 0.02 0.02
(c)Profitsinlieuofsalaryundersection17(3)Income-tax Act, 1961
- - -
2. StockOption - - -
3. Sweat Equity - - -
4. Commission
-as%ofprofit - - -
others, specify… - - -
5. Others,pleasespecify-PF 0.39 1.58 1.97
Total 11.29 24.13 35.42
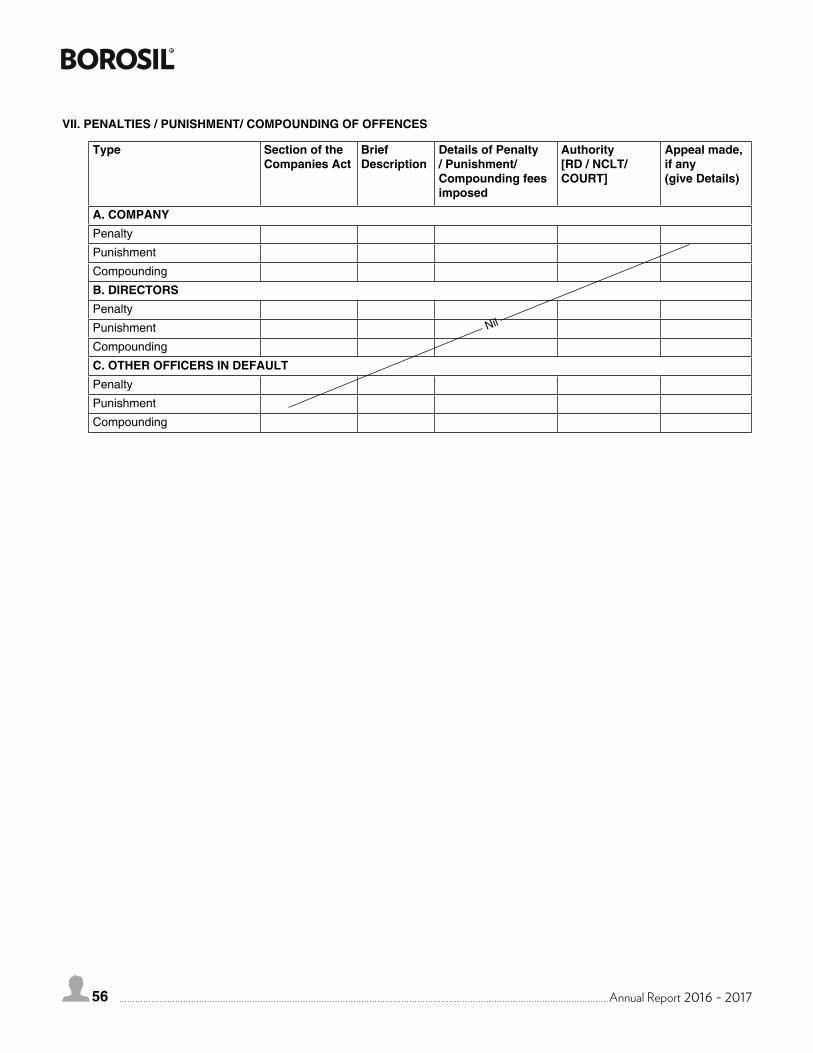
56 Annual Report 2016 - 2017
VII. PENALTIES / PUNISHMENT/ COMPOUNDING OF OFFENCES
Type Section of the Companies Act
Brief Description
Details of Penalty / Punishment/ Compounding fees imposed
Authority [RD / NCLT/ COURT]
Appeal made, if any (give Details)
A. COMPANYPenalty
Punishment
Compounding
B. DIRECTORSPenalty
Punishment
Compounding
C. OTHER OFFICERS IN DEFAULTPenalty
Punishment
Compounding
Nil
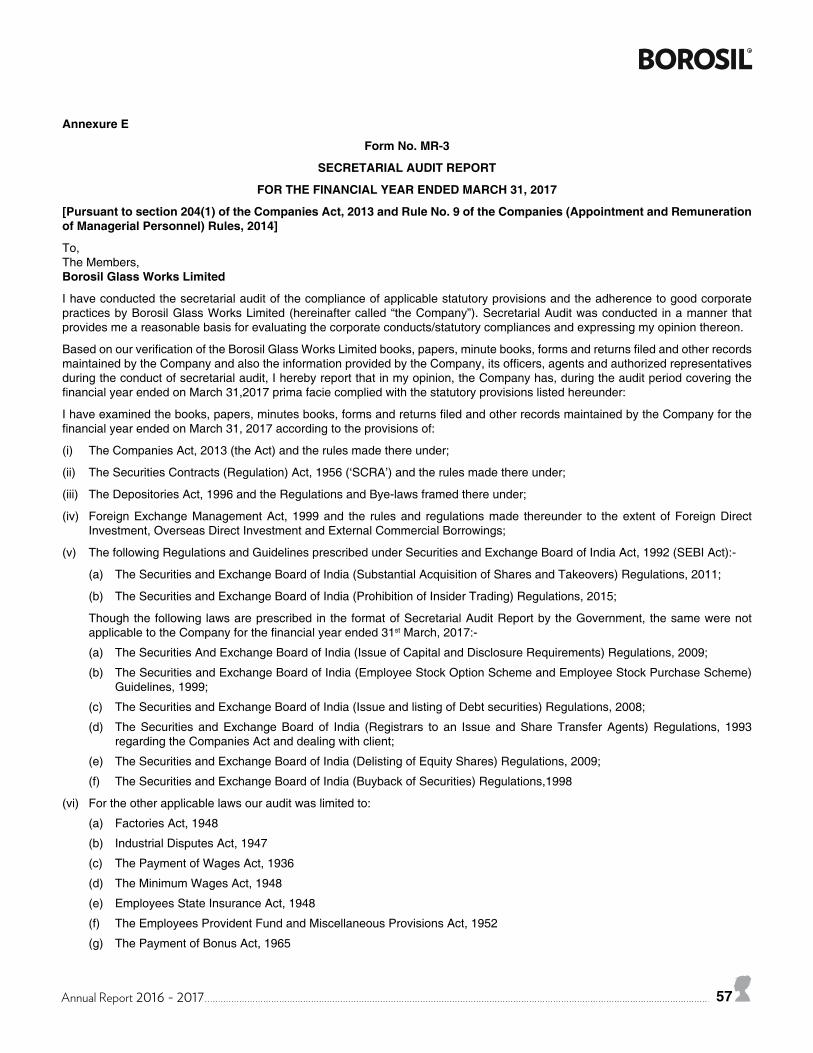
Annual Report 2016 - 2017 57
Annexure E
Form No. MR-3
SECRETARIAL AUDIT REPORT
FOR THE FINANCIAL YEAR ENDED MARCH 31, 2017
[Pursuant to section 204(1) of the Companies Act, 2013 and Rule No. 9 of the Companies (Appointment and Remuneration of Managerial Personnel) Rules, 2014]
To, The Members,Borosil Glass Works Limited
I have conducted the secretarial audit of the compliance of applicable statutory provisions and the adherence to good corporate practicesbyBorosilGlassWorksLimited(hereinaftercalled“theCompany”).SecretarialAuditwasconducted inamannerthatprovides me a reasonable basis for evaluating the corporate conducts/statutory compliances and expressing my opinion thereon.
BasedonourverificationoftheBorosilGlassWorksLimitedbooks,papers,minutebooks,formsandreturnsfiledandotherrecordsmaintainedbytheCompanyandalsotheinformationprovidedbytheCompany,itsofficers,agentsandauthorizedrepresentativesduring the conduct of secretarial audit, I hereby report that in my opinion, the Company has, during the audit period covering the financialyearendedonMarch31,2017primafaciecompliedwiththestatutoryprovisionslistedhereunder:
Ihaveexaminedthebooks,papers,minutesbooks,formsandreturnsfiledandotherrecordsmaintainedbytheCompanyforthefinancialyearendedonMarch31,2017accordingtotheprovisionsof:
(i) The Companies Act, 2013 (the Act) and the rules made there under;
(ii) TheSecuritiesContracts(Regulation)Act,1956(‘SCRA’)andtherulesmadethereunder;
(iii) The Depositories Act, 1996 and the Regulations and Bye-laws framed there under;
(iv) Foreign Exchange Management Act, 1999 and the rules and regulations made thereunder to the extent of Foreign Direct Investment,OverseasDirectInvestmentandExternalCommercialBorrowings;
(v) The following Regulations and Guidelines prescribed under Securities and Exchange Board of India Act, 1992 (SEBI Act):-
(a) The Securities and Exchange Board of India (Substantial Acquisition of Shares and Takeovers) Regulations, 2011;
(b) The Securities and Exchange Board of India (Prohibition of Insider Trading) Regulations, 2015;
Though the following laws are prescribed in the format of Secretarial Audit Report by the Government, the same were not applicabletotheCompanyforthefinancialyearended31st March, 2017:-
(a) The Securities And Exchange Board of India (Issue of Capital and Disclosure Requirements) Regulations, 2009;
(b) TheSecuritiesandExchangeBoardofIndia(EmployeeStockOptionSchemeandEmployeeStockPurchaseScheme)Guidelines, 1999;
(c) The Securities and Exchange Board of India (Issue and listing of Debt securities) Regulations, 2008;
(d) The Securities and Exchange Board of India (Registrars to an Issue and Share Transfer Agents) Regulations, 1993 regarding the Companies Act and dealing with client;
(e) The Securities and Exchange Board of India (Delisting of Equity Shares) Regulations, 2009;
(f) The Securities and Exchange Board of India (Buyback of Securities) Regulations,1998
(vi) For the other applicable laws our audit was limited to:
(a) Factories Act, 1948
(b) Industrial Disputes Act, 1947
(c) The Payment of Wages Act, 1936
(d) The Minimum Wages Act, 1948
(e) Employees State Insurance Act, 1948
(f) The Employees Provident Fund and Miscellaneous Provisions Act, 1952
(g) The Payment of Bonus Act, 1965
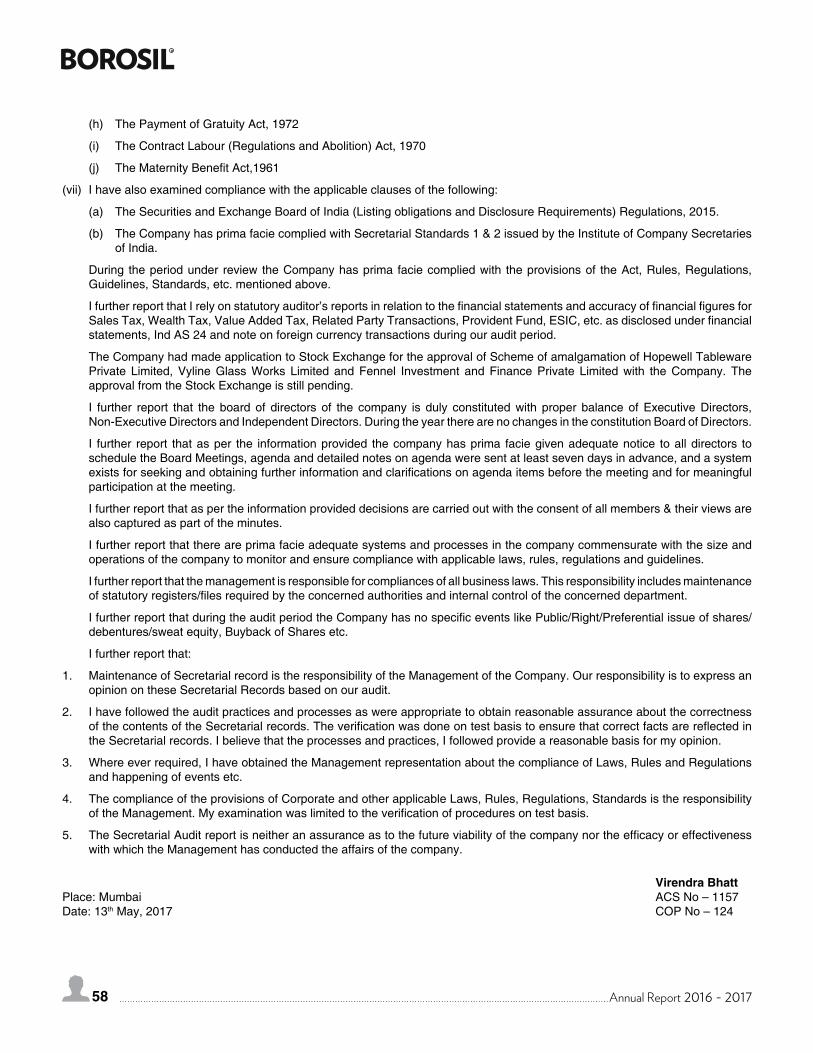
58 Annual Report 2016 - 2017
(h) The Payment of Gratuity Act, 1972
(i) The Contract Labour (Regulations and Abolition) Act, 1970
(j) TheMaternityBenefitAct,1961
(vii) I have also examined compliance with the applicable clauses of the following:
(a) The Securities and Exchange Board of India (Listing obligations and Disclosure Requirements) Regulations, 2015.
(b) The Company has prima facie complied with Secretarial Standards 1 & 2 issued by the Institute of Company Secretaries of India.
During the period under review the Company has prima facie complied with the provisions of the Act, Rules, Regulations, Guidelines, Standards, etc. mentioned above.
IfurtherreportthatIrelyonstatutoryauditor’sreportsinrelationtothefinancialstatementsandaccuracyoffinancialfiguresforSalesTax,WealthTax,ValueAddedTax,RelatedPartyTransactions,ProvidentFund,ESIC,etc.asdisclosedunderfinancialstatements, Ind AS 24 and note on foreign currency transactions during our audit period.
The Company had made application to Stock Exchange for the approval of Scheme of amalgamation of Hopewell Tableware Private Limited, Vyline Glass Works Limited and Fennel Investment and Finance Private Limited with the Company. The approval from the Stock Exchange is still pending.
I further report that the board of directors of the company is duly constituted with proper balance of Executive Directors, Non-Executive Directors and Independent Directors. During the year there are no changes in the constitution Board of Directors.
I further report that as per the information provided the company has prima facie given adequate notice to all directors to schedule the Board Meetings, agenda and detailed notes on agenda were sent at least seven days in advance, and a system existsforseekingandobtainingfurtherinformationandclarificationsonagendaitemsbeforethemeetingandformeaningfulparticipation at the meeting.
I further report that as per the information provided decisions are carried out with the consent of all members & their views are also captured as part of the minutes.
Ifurtherreportthatthereareprimafacieadequatesystemsandprocessesinthecompanycommensuratewiththesizeandoperations of the company to monitor and ensure compliance with applicable laws, rules, regulations and guidelines.
I further report that the management is responsible for compliances of all business laws. This responsibility includes maintenance ofstatutoryregisters/filesrequiredbytheconcernedauthoritiesandinternalcontroloftheconcerneddepartment.
IfurtherreportthatduringtheauditperiodtheCompanyhasnospecificeventslikePublic/Right/Preferentialissueofshares/debentures/sweat equity, Buyback of Shares etc.
I further report that:
1. MaintenanceofSecretarialrecordistheresponsibilityoftheManagementoftheCompany.Ourresponsibilityistoexpressanopinion on these Secretarial Records based on our audit.
2. I have followed the audit practices and processes as were appropriate to obtain reasonable assurance about the correctness ofthecontentsoftheSecretarialrecords.Theverificationwasdoneontestbasistoensurethatcorrectfactsarereflectedinthe Secretarial records. I believe that the processes and practices, I followed provide a reasonable basis for my opinion.
3. Where ever required, I have obtained the Management representation about the compliance of Laws, Rules and Regulations and happening of events etc.
4. The compliance of the provisions of Corporate and other applicable Laws, Rules, Regulations, Standards is the responsibility oftheManagement.Myexaminationwaslimitedtotheverificationofproceduresontestbasis.
5. TheSecretarialAuditreportisneitheranassuranceastothefutureviabilityofthecompanynortheefficacyoreffectivenesswith which the Management has conducted the affairs of the company.
Virendra BhattPlace: Mumbai ACS No – 1157Date: 13thMay,2017 COPNo–124
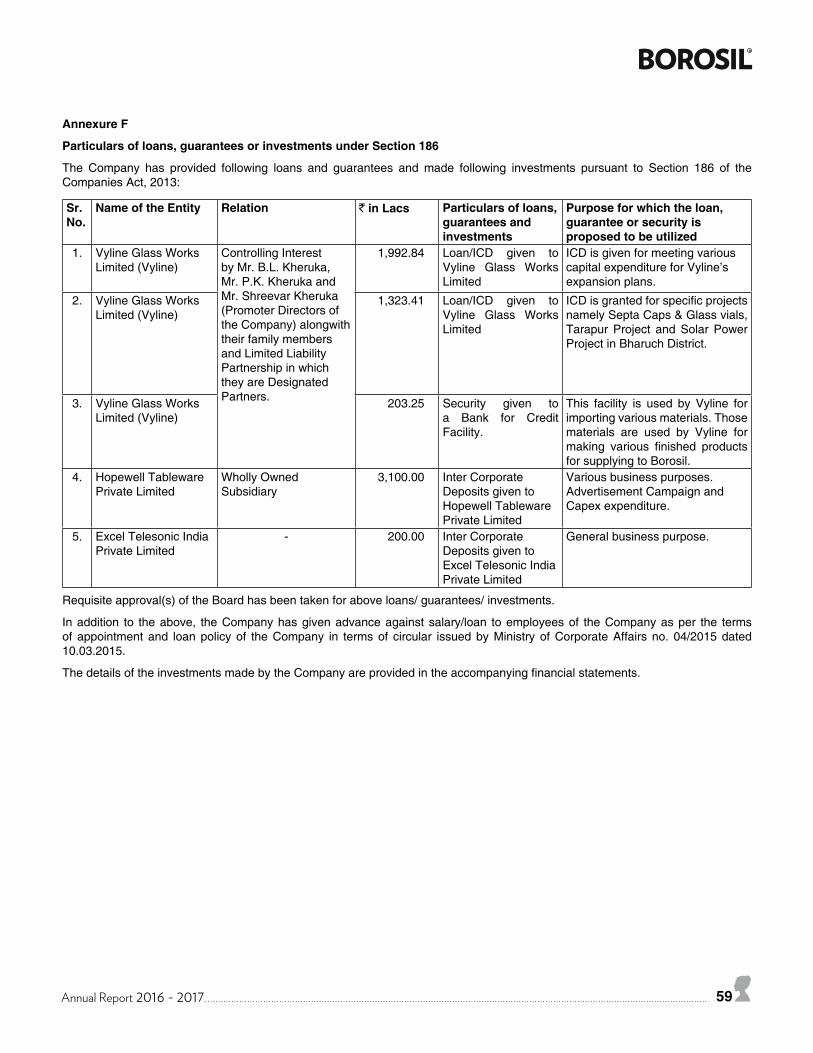
Annual Report 2016 - 2017 59
Annexure F
Particulars of loans, guarantees or investments under Section 186
The Company has provided following loans and guarantees and made following investments pursuant to Section 186 of the Companies Act, 2013:
Sr.No.
Name of the Entity Relation ` in Lacs Particulars of loans, guarantees and investments
Purpose for which the loan, guarantee or security is proposed to be utilized
1. Vyline Glass Works Limited (Vyline)
Controlling Interest by Mr. B.L. Kheruka, Mr. P.K. Kheruka and Mr. Shreevar Kheruka (Promoter Directors of the Company) alongwith their family members and Limited Liability Partnership in which they are Designated Partners.
1,992.84 Loan/ICD given to Vyline Glass Works Limited
ICD is given for meeting various capital expenditure for Vyline’s expansion plans.
2. Vyline Glass Works Limited (Vyline)
1,323.41 Loan/ICD given to Vyline Glass Works Limited
ICDisgrantedforspecificprojectsnamely Septa Caps & Glass vials, Tarapur Project and Solar Power Project in Bharuch District.
3. Vyline Glass Works Limited (Vyline)
203.25 Security given to a Bank for Credit Facility.
This facility is used by Vyline for importing various materials. Those materials are used by Vyline for making various finished productsfor supplying to Borosil.
4. Hopewell Tableware Private Limited
WhollyOwnedSubsidiary
3,100.00 Inter Corporate Deposits given to Hopewell Tableware Private Limited
Various business purposes.Advertisement Campaign and Capex expenditure.
5. Excel Telesonic India Private Limited
- 200.00 Inter Corporate Deposits given to Excel Telesonic India Private Limited
General business purpose.
Requisite approval(s) of the Board has been taken for above loans/ guarantees/ investments.
In addition to the above, the Company has given advance against salary/loan to employees of the Company as per the terms of appointment and loan policy of the Company in terms of circular issued by Ministry of Corporate Affairs no. 04/2015 dated 10.03.2015.
ThedetailsoftheinvestmentsmadebytheCompanyareprovidedintheaccompanyingfinancialstatements.
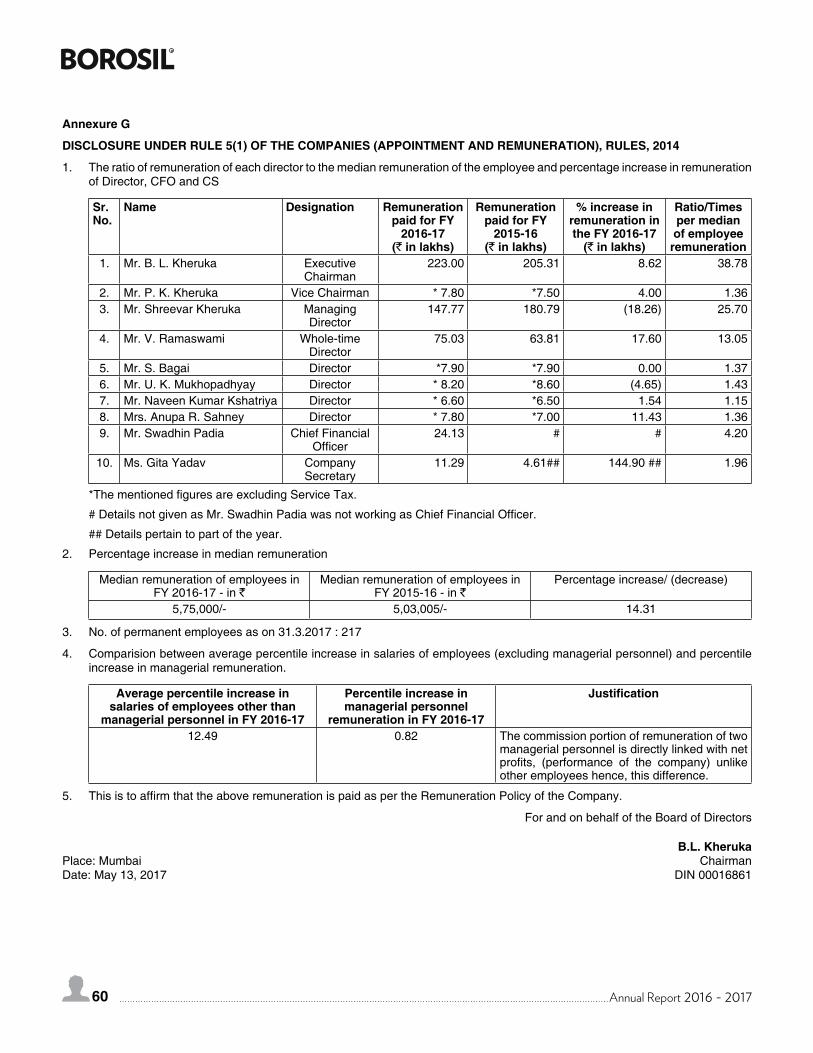
60 Annual Report 2016 - 2017
Annexure G
DISCLOSURE UNDER RULE 5(1) OF THE COMPANIES (APPOINTMENT AND REMUNERATION), RULES, 2014
1. The ratio of remuneration of each director to the median remuneration of the employee and percentage increase in remuneration ofDirector,CFOandCS
Sr. No.
Name Designation Remuneration paid for FY
2016-17(` in lakhs)
Remuneration paid for FY
2015-16(` in lakhs)
% increase in remuneration in the FY 2016-17
(` in lakhs)
Ratio/Times per median of employee
remuneration1. Mr. B. L. Kheruka Executive
Chairman223.00 205.31 8.62 38.78
2. Mr. P. K. Kheruka Vice Chairman * 7.80 *7.50 4.00 1.363. Mr. Shreevar Kheruka Managing
Director147.77 180.79 (18.26) 25.70
4. Mr. V. Ramaswami Whole-time Director
75.03 63.81 17.60 13.05
5. Mr. S. Bagai Director *7.90 *7.90 0.00 1.376. Mr.U.K.Mukhopadhyay Director * 8.20 *8.60 (4.65) 1.437. Mr. Naveen Kumar Kshatriya Director * 6.60 *6.50 1.54 1.158. Mrs. Anupa R. Sahney Director * 7.80 *7.00 11.43 1.369. Mr. Swadhin Padia Chief Financial
Officer24.13 # # 4.20
10. Ms. Gita Yadav Company Secretary
11.29 4.61## 144.90 ## 1.96
*ThementionedfiguresareexcludingServiceTax.
#DetailsnotgivenasMr.SwadhinPadiawasnotworkingasChiefFinancialOfficer.
## Details pertain to part of the year.
2. Percentage increase in median remuneration
Median remuneration of employees in FY 2016-17 - in `
Median remuneration of employees in FY 2015-16 - in `
Percentage increase/ (decrease)
5,75,000/- 5,03,005/- 14.31
3. No. of permanent employees as on 31.3.2017 : 217
4. Comparision between average percentile increase in salaries of employees (excluding managerial personnel) and percentile increase in managerial remuneration.
Average percentile increase in salaries of employees other than
managerial personnel in FY 2016-17
Percentile increase in managerial personnel
remuneration in FY 2016-17
Justification
12.49 0.82 The commission portion of remuneration of two managerial personnel is directly linked with net profits, (performance of the company) unlikeother employees hence, this difference.
5. ThisistoaffirmthattheaboveremunerationispaidaspertheRemunerationPolicyoftheCompany.
For and on behalf of the Board of Directors
B.L. KherukaPlace: Mumbai ChairmanDate: May 13, 2017 DIN 00016861
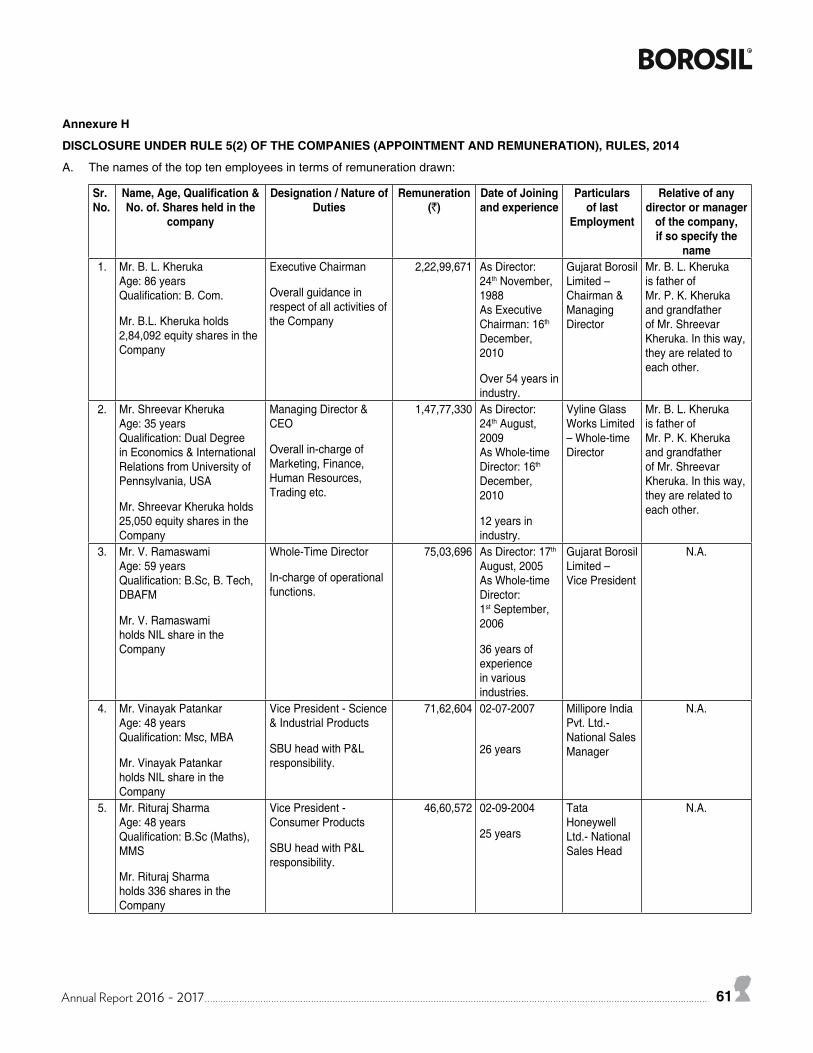
Annual Report 2016 - 2017 61
Annexure H
DISCLOSURE UNDER RULE 5(2) OF THE COMPANIES (APPOINTMENT AND REMUNERATION), RULES, 2014
A. The names of the top ten employees in terms of remuneration drawn:
Sr. No.
Name, Age, Qualification & No. of. Shares held in the
company
Designation / Nature of Duties
Remuneration (`)
Date of Joining and experience
Particulars of last
Employment
Relative of any director or manager
of the company, if so specify the
name1. Mr. B. L. Kheruka
Age: 86 yearsQualification:B.Com.
Mr. B.L. Kheruka holds 2,84,092 equity shares in the Company
Executive Chairman
Overallguidanceinrespect of all activities of the Company
2,22,99,671 As Director:24th November, 1988As Executive Chairman: 16th December, 2010
Over54yearsinindustry.
Gujarat Borosil Limited – Chairman & Managing Director
Mr. B. L. Kheruka is father of Mr. P. K. Kheruka and grandfather of Mr. Shreevar Kheruka. In this way, they are related to each other.
2. Mr. Shreevar KherukaAge: 35 yearsQualification:DualDegreein Economics & International RelationsfromUniversityofPennsylvania,USA
Mr. Shreevar Kheruka holds 25,050 equity shares in the Company
Managing Director & CEO
Overallin-chargeofMarketing, Finance, Human Resources, Trading etc.
1,47,77,330 As Director:24th August, 2009As Whole-time Director: 16th December, 2010
12 years in industry.
Vyline Glass Works Limited – Whole-time Director
Mr. B. L. Kheruka is father of Mr. P. K. Kheruka and grandfather of Mr. Shreevar Kheruka. In this way, they are related to each other.
3. Mr. V. RamaswamiAge: 59 yearsQualification:B.Sc,B.Tech,DBAFM
Mr. V. Ramaswamiholds NIL share in the Company
Whole-Time Director
In-charge of operational functions.
75,03,696 As Director: 17th August, 2005As Whole-time Director:1st September, 2006
36 years of experience in various industries.
Gujarat Borosil Limited – Vice President
N.A.
4. Mr. Vinayak Patankar Age: 48 yearsQualification:Msc,MBA
Mr. Vinayak Patankar holds NIL share in the Company
Vice President - Science & Industrial Products
SBUheadwithP&Lresponsibility.
71,62,604 02-07-2007
26 years
Millipore India Pvt. Ltd.- National Sales Manager
N.A.
5. Mr. Rituraj SharmaAge: 48 yearsQualification:B.Sc(Maths),MMS
Mr. Rituraj Sharma holds 336 shares in the Company
Vice President - Consumer Products
SBUheadwithP&Lresponsibility.
46,60,572 02-09-2004
25 years
Tata Honeywell Ltd.- National Sales Head
N.A.
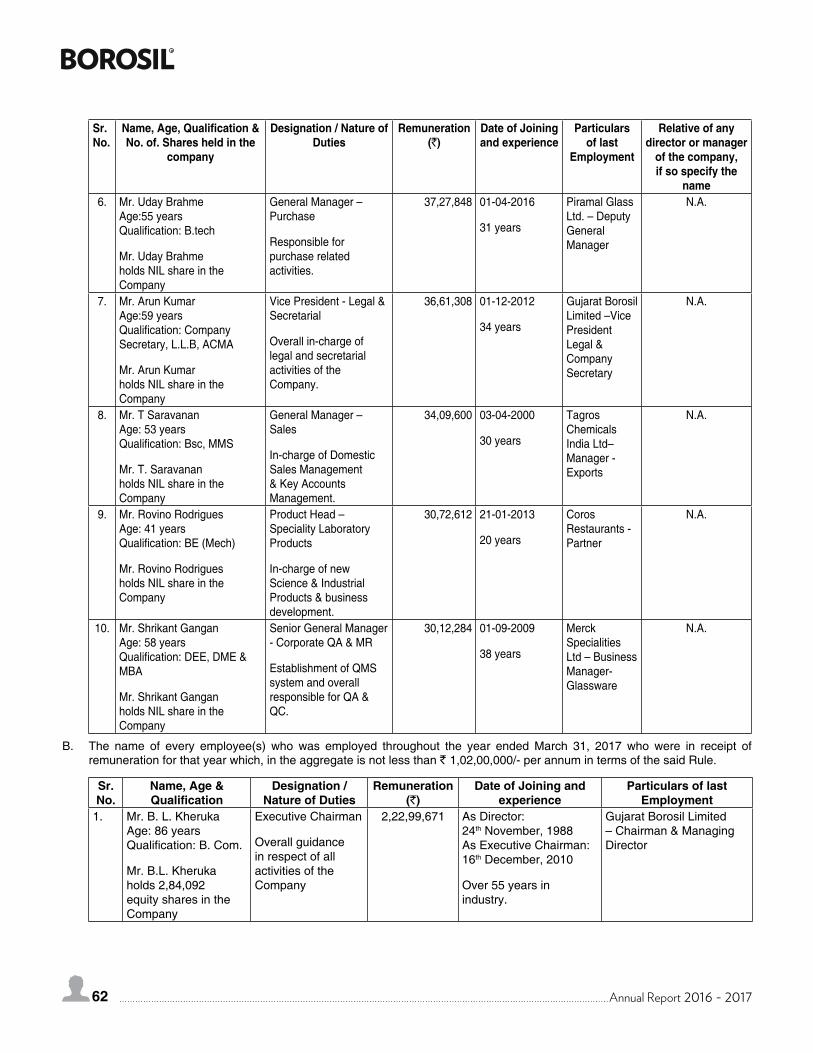
62 Annual Report 2016 - 2017
Sr. No.
Name, Age, Qualification & No. of. Shares held in the
company
Designation / Nature of Duties
Remuneration (`)
Date of Joining and experience
Particulars of last
Employment
Relative of any director or manager
of the company, if so specify the
name6. Mr.UdayBrahme
Age:55 yearsQualification:B.tech
Mr.UdayBrahme holds NIL share in the Company
General Manager – Purchase
Responsible for purchase related activities.
37,27,848 01-04-2016
31 years
Piramal Glass Ltd. – Deputy General Manager
N.A.
7. Mr. Arun KumarAge:59 yearsQualification:CompanySecretary, L.L.B, ACMA
Mr. Arun Kumar holds NIL share in the Company
Vice President - Legal & Secretarial
Overallin-chargeoflegal and secretarial activities of the Company.
36,61,308 01-12-2012
34 years
Gujarat Borosil Limited –Vice President Legal & Company Secretary
N.A.
8. Mr. T SaravananAge: 53 yearsQualification:Bsc,MMS
Mr. T. Saravananholds NIL share in the Company
General Manager – Sales
In-charge of Domestic Sales Management & Key Accounts Management.
34,09,600 03-04-2000
30 years
Tagros Chemicals India Ltd–Manager - Exports
N.A.
9. Mr. Rovino RodriguesAge: 41 yearsQualification:BE(Mech)
Mr. Rovino Rodrigues holds NIL share in the Company
Product Head – Speciality Laboratory Products
In-charge of new Science & Industrial Products & business development.
30,72,612 21-01-2013
20 years
Coros Restaurants - Partner
N.A.
10. Mr. Shrikant GanganAge: 58 yearsQualification:DEE,DME&MBA
Mr. Shrikant Gangan holds NIL share in the Company
Senior General Manager - Corporate QA & MR
Establishment of QMS system and overall responsible for QA & QC.
30,12,284 01-09-2009
38 years
Merck Specialities Ltd – Business Manager- Glassware
N.A.
B. The name of every employee(s) who was employed throughout the year ended March 31, 2017 who were in receipt of remuneration for that year which, in the aggregate is not less than ` 1,02,00,000/- per annum in terms of the said Rule.
Sr. No.
Name, Age & Qualification
Designation / Nature of Duties
Remuneration (`)
Date of Joining and experience
Particulars of last Employment
1. Mr. B. L. KherukaAge: 86 yearsQualification:B.Com.
Mr. B.L. Kheruka holds 2,84,092 equity shares in the Company
Executive Chairman
Overallguidancein respect of all activities of the Company
2,22,99,671 As Director:24th November, 1988As Executive Chairman:16th December, 2010
Over55yearsinindustry.
Gujarat Borosil Limited – Chairman & Managing Director
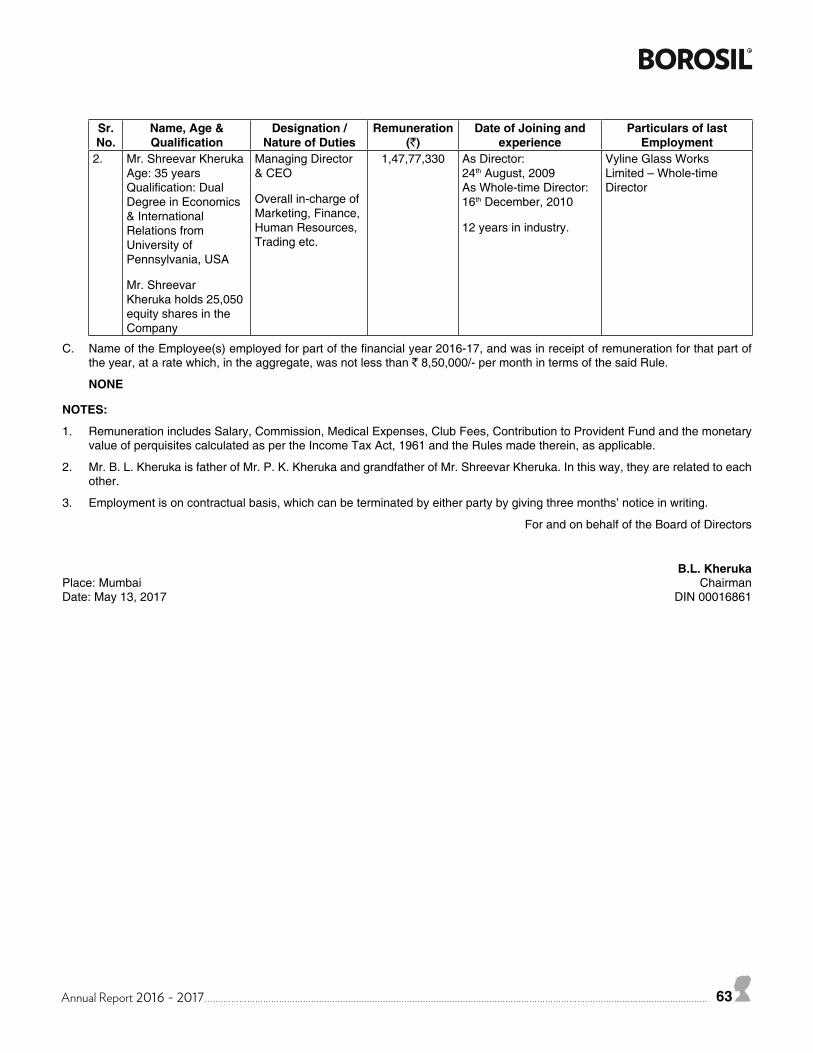
Annual Report 2016 - 2017 63
Sr. No.
Name, Age & Qualification
Designation / Nature of Duties
Remuneration (`)
Date of Joining and experience
Particulars of last Employment
2. Mr. Shreevar KherukaAge: 35 yearsQualification:DualDegree in Economics & International Relations from UniversityofPennsylvania,USA
Mr. Shreevar Kheruka holds 25,050 equity shares in the Company
Managing Director &CEO
Overallin-chargeofMarketing, Finance, Human Resources, Trading etc.
1,47,77,330 As Director:24th August, 2009As Whole-time Director: 16th December, 2010
12 years in industry.
Vyline Glass Works Limited – Whole-time Director
C. NameoftheEmployee(s)employedforpartofthefinancialyear2016-17,andwasinreceiptofremunerationforthatpartofthe year, at a rate which, in the aggregate, was not less than ` 8,50,000/- per month in terms of the said Rule.
NONE
NOTES:
1. Remuneration includes Salary, Commission, Medical Expenses, Club Fees, Contribution to Provident Fund and the monetary value of perquisites calculated as per the Income Tax Act, 1961 and the Rules made therein, as applicable.
2. Mr. B. L. Kheruka is father of Mr. P. K. Kheruka and grandfather of Mr. Shreevar Kheruka. In this way, they are related to each other.
3. Employment is on contractual basis, which can be terminated by either party by giving three months’ notice in writing.
For and on behalf of the Board of Directors
B.L. KherukaPlace: Mumbai ChairmanDate: May 13, 2017 DIN 00016861
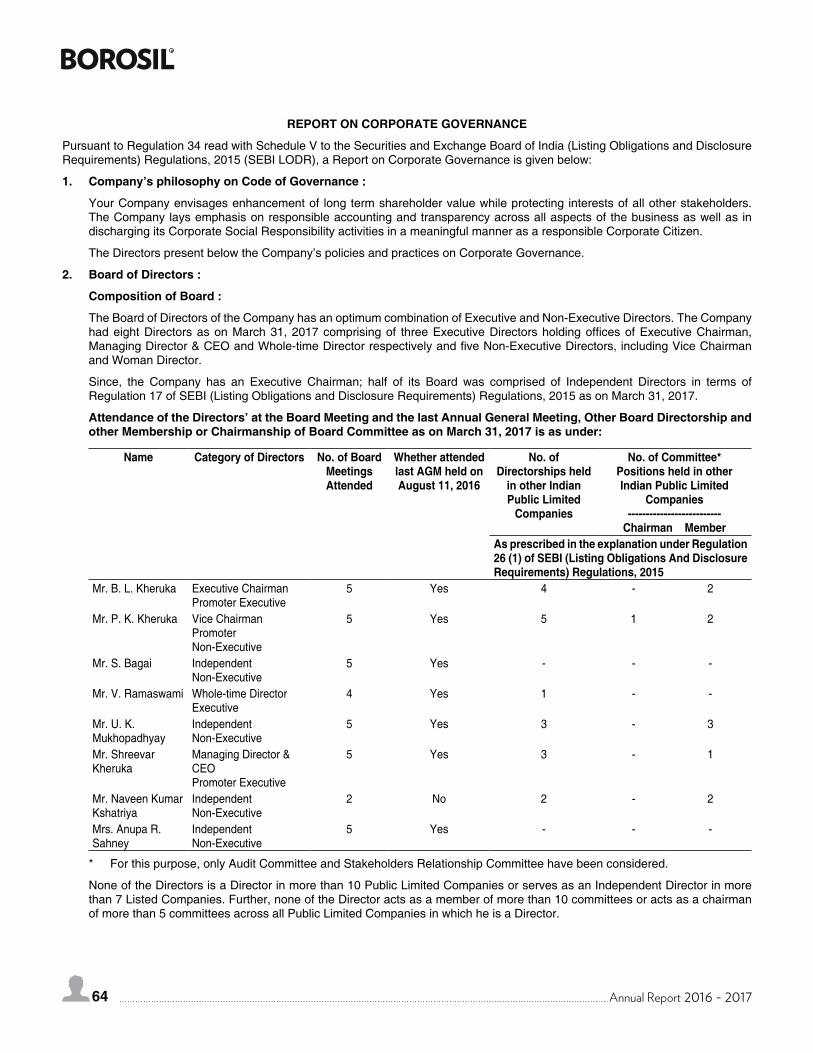
64 Annual Report 2016 - 2017
REPORT ON CORPORATE GOVERNANCE
PursuanttoRegulation34readwithScheduleVtotheSecuritiesandExchangeBoardofIndia(ListingObligationsandDisclosureRequirements)Regulations,2015(SEBILODR),aReportonCorporateGovernanceisgivenbelow:
1. Company’s philosophy on Code of Governance :
Your Company envisages enhancement of long term shareholder value while protecting interests of all other stakeholders. The Company lays emphasis on responsible accounting and transparency across all aspects of the business as well as in dischargingitsCorporateSocialResponsibilityactivitiesinameaningfulmannerasaresponsibleCorporateCitizen.
The Directors present below the Company’s policies and practices on Corporate Governance.
2. Board of Directors :
Composition of Board :
The Board of Directors of the Company has an optimum combination of Executive and Non-Executive Directors. The Company hadeightDirectorsasonMarch31,2017comprisingof threeExecutiveDirectorsholdingofficesofExecutiveChairman,ManagingDirector&CEOandWhole-timeDirectorrespectivelyandfiveNon-ExecutiveDirectors,includingViceChairmanand Woman Director.
Since, the Company has an Executive Chairman; half of its Board was comprised of Independent Directors in terms of Regulation17ofSEBI(ListingObligationsandDisclosureRequirements)Regulations,2015asonMarch31,2017.
Attendance of the Directors’ at the Board Meeting and the last Annual General Meeting, Other Board Directorship and other Membership or Chairmanship of Board Committee as on March 31, 2017 is as under:
Name Category of Directors No. of Board Meetings Attended
Whether attended last AGM held on
August 11, 2016
No. of Directorships held
in other Indian Public Limited
Companies
No. of Committee* Positions held in other Indian Public Limited
Companies--------------------------
Chairman MemberAs prescribed in the explanation under Regulation 26 (1) of SEBI (Listing Obligations And Disclosure Requirements) Regulations, 2015
Mr. B. L. Kheruka Executive ChairmanPromoter Executive
5 Yes 4 - 2
Mr. P. K. Kheruka Vice ChairmanPromoterNon-Executive
5 Yes 5 1 2
Mr. S. Bagai IndependentNon-Executive
5 Yes - - -
Mr. V. Ramaswami Whole-time DirectorExecutive
4 Yes 1 - -
Mr.U.K.Mukhopadhyay
IndependentNon-Executive
5 Yes 3 - 3
Mr. Shreevar Kheruka
Managing Director & CEOPromoter Executive
5 Yes 3 - 1
Mr. Naveen Kumar Kshatriya
IndependentNon-Executive
2 No 2 - 2
Mrs. Anupa R. Sahney
IndependentNon-Executive
5 Yes - - -
* For this purpose, only Audit Committee and Stakeholders Relationship Committee have been considered.
None of the Directors is a Director in more than 10 Public Limited Companies or serves as an Independent Director in more than 7 Listed Companies. Further, none of the Director acts as a member of more than 10 committees or acts as a chairman of more than 5 committees across all Public Limited Companies in which he is a Director.
Annual Report 2016 - 2017 65
Board Meetings:
TheBoardmetfivetimesduringthefinancialyear2016-17onMay30,2016;August11,2016;November25,2016;February09, 2017 and March 07, 2017.
The gap between two board meetings did not exceed 120 days.
TheminimuminformationasspecifiedinPartAofScheduleIIofRegulation17(7)ofSEBI(ListingObligationsandDisclosureRequirements) Regulations, 2015 is regularly made available to the Board, whenever applicable, for discussion and consideration.
The Company also provide video conferencing facility to its Directors to enable participation so that they can contribute in the discussion at the Meeting.
Disclosure of relationship between Directors inter-se:
Mr. B. L. Kheruka is father of Mr. P. K. Kheruka and grandfather of Mr. Shreevar Kheruka. In this way, they are related to each other.
Number of shares held by Non-Executive Directors:
Mr. P. K. Kheruka, Non-Executive Vice Chairman holds 2,64,092 Equity Shares. None of the other Non-Executive Directors hold any Shares or convertible instruments of the Company as on March 31, 2017.
Familiarisation programme for Independent Directors:
A Familiarization Program was conducted for Independent Directors on February 09, 2017, to familiarize the Independent Directors with the Company, their roles, rights, responsibilities in the Company, nature of the industry in which the Company operates, business model of the Company so that they can contribute in a meaningful way to the Company. Familiarization Program for Independent Directors has been uploaded on the Company website at http://www.borosil.com/doc_files/Familiarization%20Programme%20for%20Independent%20Director-2017.pdf
3. Audit Committee :
The powers, role and terms of reference of the Audit Committee covers the areas as contemplated under Regulation 18 of SEBI(ListingObligationsandDisclosureRequirements)Regulations,2015andSection177oftheCompaniesAct,2013,asapplicable, besides other terms as referred by the Board of Directors.
Powers of Audit Committee:
The Audit Committee has the following powers:
1. To investigate any activity within its terms of reference.
2. To seek information from any employee.
3. To obtain outside legal or other professional advice.
4. To secure attendance of outsiders with relevant expertise, if it considers necessary.
Role of Audit Committee:
The role of Audit Committee includes the following:
1. OversightoftheCompany’sfinancialreportingprocessandthedisclosureofitsfinancialinformationtoensurethatthefinancialstatementiscorrect,sufficientandcredible.
2. To recommend to the Board, the appointment, remuneration and terms of appointment of auditors of the Company.
3. To approve payment to statutory auditors for any other services rendered by the statutory auditors.
4. Toreviewwiththemanagement,theannualfinancialstatementsauditor’sreportthereonbeforesubmissiontotheboardfor approval, with particular reference to:
a. Matters required to be included in the Director’s Responsibility Statement to be included in the Board’s report in terms of clause (c) of sub-section 3 of Section 134 of the Companies Act, 2013.
b. Changes, if any, in accounting policies and practices and reasons for the same.
c. Major accounting entries involving estimates based on the exercise of judgment by management.
d. Significantadjustmentsmadeinthefinancialstatementsarisingoutofauditfindings.
e. Compliancewithlistingandotherlegalrequirementsrelatingtofinancialstatements.
f. Disclosure of any related party transactions.
g. ModifiedOpinionsinthe draft audit report.
66 Annual Report 2016 - 2017
5. Toreviewwiththemanagement,thequarterlyfinancialstatementsbeforesubmissiontotheboardforapproval.
6. To review with the management, the statement of uses / application of funds raised through an issue (public issue, rights issue,preferentialissue,etc.),thestatementoffundsutilizedforpurposesotherthanthosestatedintheofferdocument/prospectus/notice and the report submitted by the monitoring agency monitoring the utilisation of proceeds of a public or rights issue, and making appropriate recommendations to the Board to take up steps in this matter.
7. To review and monitor the auditor’s independence and performance, and effectiveness of audit process.
8. Toapproveoranysubsequentmodificationoftransactionsofthecompanywithrelatedparties.
9. Scrutiny of inter-corporate loans and investments.
10. Valuation of undertakings or assets of the company, wherever it is necessary.
11. Evaluationofinternalfinancialcontrolsandriskmanagementsystems.
12. To review, with the management, performance of statutory and internal auditors, adequacy of the internal control systems.
13. Toreviewtheadequacyofinternalauditfunction,ifany,includingthestructureoftheinternalauditdepartment,staffingandseniorityoftheofficialheadingthedepartment,reportingstructurecoverageandfrequencyofinternalaudit.
14. Todiscusswithinternalauditorsanysignificantfindingsandfollowupthereon.
15. Toreviewthefindingsofanyinternalinvestigationsbytheinternalauditorsintomatterswherethereissuspectedfraudorirregularity or a failure of internal control systems of a material nature and reporting the matter to the board.
16. To discuss with statutory auditors before the audit commences, about the nature and scope of audit as well as post audit discussion to ascertain any area of concern.
17. To look into the reasons for substantial defaults in the payment to the depositors, debenture holders, shareholders (in case of non-payment of declared dividends) and creditors.
18. To review the functioning of the Whistle Blower Mechanism.
19. ApprovalofappointmentofChiefFinancialOfficerafterassessingthequalifications,experienceandbackgroundetc.ofthe candidate.
20. Carrying out any other function as is mentioned in the terms of reference of the audit committee.
Review of information by Audit Committee:
The Audit Committee mandatorily reviews the following information:
1. Managementdiscussionandanalysisoffinancialconditionandresultsofoperations;
2. Statementofsignificantrelatedpartytransactions(asdefinedbytheauditcommittee),submittedbymanagement;
3. Management letters/letters of internal control weaknesses issued by the statutory auditors;
4. Internal audit reports relating to internal control weaknesses; and
5. The appointment, removal and terms of remuneration of the Chief internal auditor shall be subject to review by the Audit Committee.
6. Statement of deviations:
(a) quarterly statement of deviation(s) including report of monitoring agency, if applicable, submitted to stock exchange(s) in terms of Regulation 32(1).
(b) annualstatementoffundsutilizedforpurposesotherthanthosestatedintheofferdocument/prospectus/noticeinterms of Regulation 32(7).
Itmaybeclarifiedthatthepower,roleandreviewoftheAuditCommitteeincludesmattersspecifiedunderPartCofScheduleIIofSEBI(ListingObligationsandDisclosureRequirements)Regulations,2015asamendedfromtimetotimeenteredintobetween the Company and BSE Ltd. on which the shares of the Company are listed.
Composition & Members of the Committee:
Your Company has an Audit Committee at the Board level, which acts as a link between the Management, the Statutory and InternalAuditorsandtheBoardofDirectorsanditoverseesthefinancialreportingprocess.
Annual Report 2016 - 2017 67
The Audit Committee of the Company comprised of four members as on March 31, 2017, the composition of which is furnished hereunder:
Sr. No. Name of the Director/Member Category1. Mr. S. Bagai (Chairman of the Committee) Independent Director
2. Mr. P.K. Kheruka Non-Executive Director
3. Mr.U.K.Mukhopadhyay Independent Director
4. Mrs. Anupa R. Sahney Independent Director
AllmembersoftheAuditCommitteearecapableofunderstandingfinancialstatementsandtwo memberpossessesfinancialmanagement expertise in accordance with Regulation 18 of SEBI (Listing Obligations and Disclosure Requirements)Regulations, 2015.
The Chairman of the Audit Committee, Mr. S. Bagai, an Independent Director was present at the Annual General Meeting of the Company held on August 11, 2016.
ApartfromthemembersofAuditCommittee,generally,meetingsarealsoattendedbyChiefFinancialOfficerandCompanySecretary. Representatives of Internal Auditors and Statutory Auditors are invited to the meetings.
The Company Secretary acts as the Secretary to the Committee.
Meetings and attendance during the year:
TheCommitteemetfourtimesduringthefinancialyear2016-17onMay30,2016;August11,2016,November25,2016andFebruary 09, 2017.
Attendance of Members:
Sr. No. Name of the Directors No. of. Meetings Held No. of Meetings Attended
1. Mr. S. Bagai (Chairman of the Committee) 4 4
2. Mr. P.K. Kheruka 4 3
3. Mr.U.K.Mukhopadhyay 4 4
4. Mrs. Anupa R. Sahney 4 4
4. Nomination and Remuneration Committee : The powers, role and terms of reference of the Nomination and Remuneration Committee covers the areas as contemplated
underRegulation19oftheSEBI(ListingObligationsandDisclosureRequirements)Regulations,2015andSection178oftheCompanies Act, 2013, besides other terms as referred by the Board of Directors.
Terms of Reference of the Nomination and Remuneration Committee:(i) Laying down criteria, to identify persons who are qualified to become directors & who can be appointed in senior
management;(ii) Recommending to the Board, appointment & removal of directors & senior management;(iii) Carrying out evaluation of every director’s performance;(iv) Formulatingcriteriafordeterminingqualifications,positiveattributes&independenceofdirectors;(v) Recommending to Board, a policy relating to remuneration of directors, KMP & other employees;(vi) Devising a policy on Board diversity.
Composition, Members & Meetings: The Nomination and Remuneration Committee of the Company comprised of three members as on March 31, 2017, the
composition of which is furnished hereunder:
Sr. No. Name of the Director/Member Category1. Mr.U.K.Mukhopadhyay(ChairmanoftheCommittee) Independent Director
2. Mr. P. K. Kheruka Non-Executive Director
3. Mr. Naveen Kumar Kshatriya Independent Director
TheCommitteemettwiceduringthefinancialyear2016-17onFebruary09,2017andMarch07,2017.
68 Annual Report 2016 - 2017
Meeting held on February 09, 2017 was cancelled due to lack of quorum.
All the Committee members, were present at the meeting held on March 07, 2017.
Performance Evaluation of Independent Directors :
Pursuant to the provisions of the Companies Act, 2013 and Regulation 17 and 19 read with part D of Schedule II of the SEBI (ListingObligations andDisclosureRequirements)Regulations, 2015, theBoard has carried out the annual performanceevaluation of its own performance, the Directors individually as well as the evaluation of the working of its Committees.
The Performance Evaluation of the Independent Directors of the Company based on the evaluation criteria laid down by the Nomination and Remuneration Committee was completed in the Board meeting held on March 07, 2017.
5. Remuneration of Directors:
Remuneration Policy: Remuneration Policy of the Company forms part of Directors’ Report.
(I) Details of sitting fees/commission to Non-Executive Directors
(Amt. in `)Name of the Directors Sitting fee for Board /
Committee MeetingsCommission Total *
Mr. S. BagaiMr.U.K.MukhopadhyayMr. P.K. KherukaMr. Naveen Kumar KshatriyaMrs. Anupa R. Sahney
1,90,0002,20,0001,80,000
60,0001,80,000
6,00,0006,00,0006,00,0006,00,0006,00,000
7,90,0008,20,0007,80,0006,60,0007,80,000
(I) Total 8,30,000 30,00,000 38,30,000
* Excluding Service Tax
(II) Details of remuneration/commission to Executive Directors (Amt. in `)
Name of the Directors RemunerationA) Mr. B. L. Kheruka, Executive Chairman
SalaryPerquisitesCommission
30,00,000 72,99,671
1,20,00,000(A) 2,22,99,671
B) Mr. Shreevar Kheruka, Managing Director
SalaryPerquisitesContribution to P.F.Commission
24,00,00089,330
2,88,0001,20,00,000
(B) 1,47,77,330
C) Mr. V. Ramaswami, Whole-time DirectorSalary (including HRA)PerquisitesContribution to P.F.Commission
54,62,819 58,977
4,89,60014,92,300
(C) 75,03,696(II) Total (A + B + C) 4,45,80,697GRAND TOTAL (I) + (II) 4,84,10,697
Notes:
(a) The Non-Executive Directors are paid sitting fees of ` 20,000/- per meeting for attending the Board and Audit Committee meetings and ` 10,000/- per meeting for attending other Committee meetings. There is no sitting fee for attending Share Transfer Committee meetings.
Annual Report 2016 - 2017 69
(b) The Board has decided to pay Commission to all Non-Executive Directors who were on the Board during the year 2016-17, in equal proportion.
Commission is payable to the Executive Chairman, Managing Director & Whole-time Director as decided by the Board within the limits set out in their respective terms of appointment.
(c) The Company has not granted any stock option to the Executive Directors. However, Mr. B. L. Kheruka, Executive Chairman holds 2,84,092 Equity Shares and Mr. Shreevar Kheruka, Managing Director holds 25,050 Equity Shares of the Company.
(d) ThetermofofficeoftheExecutiveChairman&ManagingDirectorisfor5yearsandWhole-timeDirectorisfor3yearsand Notice period is 3 months from either side.
(e) The criteria for making payments to Non-Executive Directors of the Company is uploaded on the website of the Company.
6. Stakeholders’ Relationship Committee :
TheStakeholder’sRelationshipCommittee is headed byMr. U. K.Mukhopadhyay, IndependentDirector and consists ofmembers as stated below:
Sr. No. Name of the Director/Member Category1. Mr.U.K.Mukhopadhyay(ChairmanoftheCommittee) Independent Director
2. Mr. B. L. Kheruka Executive Chairman
3. Mr. P. K. Kheruka Non-Executive Director
4. Mr. S. Bagai Independent Director
Name & Designation of Compliance Officer:
Ms. Gita Yadav, Company Secretary.
Number of Shareholders’ complaints handled as on March 31, 2017:
Sr. No. Nature of Complaint Opening Received during the year
Resolved Pending Complaints
1. Non-receipt of Annual Report Nil 5 5 Nil
2. Non-receipt of declared dividends Nil 5 5 Nil
3. Claming of shares without proof of ownership
1 Nil 1 Nil
TheCommitteemetonceduringthefinancialyear2016-17onApril23,2016.
All the Committee members were present at the meeting.
Inorder to look into the ‘complaintsredressalstatus’ inrespectof theyearendedMarch31,2017, theCommitteemeton May 13, 2017.
Terms of Reference of the Committee :
To resolve the grievances of security holders including complaints related to transfer of shares, non-receipt of balance sheet, non-receipt of declared dividends.
7. Share Transfer Committee :
A Share Transfer Committee of Board of Directors was constituted on May 29, 2014.
The members of the Committee are as stated below:
Sr. No. Name of the Director/Member Category1. Mr. B. L. Kheruka (Chairman of the Committee) Executive Chairman
2. Mr. S. Bagai Independent Director
3. Mr. Shreevar Kheruka ManagingDirector&CEO
The Company Secretary acts as the Secretary to the Committee.
70 Annual Report 2016 - 2017
Duringtheyear2016-2017,theCommitteemetfifteentimesi.e.onApril20,2016;May05,2016;June03,2016;June23,2016;August11,2016;August24,2016;September06,2016;September16,2016;October13,2016;October27,2016;November 22, 2016; December 13, 2016; January 02, 2017; January 25, 2017 and February 23, 2017.
Attendance of Members :
Sr. No. Name of the Director/ Member No. of Meetings Held No. of Meetings Attended1. Mr. B. L. Kheruka (Chairman of the Committee) 15 142. Mr. S. Bagai 15 153. Mr. Shreevar Kheruka 15 12
The Committee has power to approve the transfer/transmission of shares or any other securities as provided in Rule 5 of the Companies(ManagementandAdministration)Rules,2014andasspecifiedinScheduleVIIofSEBI(ListingObligationsandDisclosureRequirements)Regulations,2015andtoissuerenewedorduplicatesharecertificates&relatedmattersasprovidedin Rule 6(2) (a) of Companies (Share Capital and Debentures) Rules, 2014.
8. Corporate Social Responsibility Committee :
The Company has constituted a Corporate Social Responsibility Committee (CSR Committee) as required under Section 135 of the Companies Act, 2013, the composition of which is furnished hereunder:
Sr. No. Name of the Director/Member Category
1. Mr. B. L. Kheruka (Chairman of the Committee) Executive Chairman2. Mr. Shreevar Kheruka ManagingDirector&CEO3. Mr.U.K.Mukhopadhyay Independent Director4. Mr. Naveen Kumar Kshatriya Independent Director
TheCommitteemettwiceduringthefinancialyear2016-17i.e.onMay30,2016andNovember25,2016.
Attendance of Members :
Sr. No. Name of the Director/Member No. of. Meetings Held
No. of Meetings Attended
1. Mr. B. L. Kheruka (Chairman of the Committee) 2 22. Mr. Shreevar Kheruka 2 23. Mr.U.K.Mukhopadhyay 2 24. Mr. Naveen Kumar Kshatriya 2 1
Terms of Reference of the Committee :
i. To formulate and recommend to the Board, a CSR Policy which shall indicate the activities to be undertaken by the CompanyasspecifiedinScheduleVIIoftheCompaniesAct,2013;
ii. To recommend the amount of expenditure to be incurred on the activities as prescribed in Schedule VII of the said Act;
iii. To monitor the CSR Policy of the Company from time to time by preparing a transparent mechanism.
9. Investment Committee :
The Investment Committee of the Company comprised of three members as on March 31, 2017, the composition of which is furnished hereunder:
Sr. No. Name of the Director/Member Category1. Mr. B. L. Kheruka (Chairman of the Committee) Executive Chairman
2. Mr. P.K. Kheruka Non-Executive Director
3. Mr. Shreevar Kheruka ManagingDirector&CEO
The Committee lays down policy guidelines and procedures for investing the Company’s funds, and reviews this activity at regular intervals.
TheCommitteemetonceduringthefinancialyear2016-17i.e.onMarch23,2017.
All the Committee members, were present at the meeting except Mr. P.K. Kheruka.
Annual Report 2016 - 2017 71
10. Separate Meeting of the Independent Directors :
As per the Code of Independent Directors under Schedule IV of the Companies Act, 2013 and the Regulation 25(3) of SEBI (ListingObligationsandDisclosureRequirements)Regulations,2015,aseparatemeetingoftheIndependentDirectorswasheld onMarch 07, 2017 under theChairmanship ofMr. U. K.Mukhopadhyay, Lead Independent Director, to review theperformance of the non-independent director, the Board as a whole and Chairman of the Company. The Independent Directors alsoassessed thequality, quantityand timelinessof flowof informationbetween theManagementand theBoardand itsCommittees which is necessary to effectively and reasonably perform their duties.
All Independent Directors were present at the meeting held on March 07, 2017.
11. General Body Meetings :
(a) & (b) Location, Date and Time of the General Meetings held during the last 3 years:
Year Location AGM/EGM Day & Date Time No. of Special Resolutions
passed2015-16 Textiles Committee Auditorium,
Textiles Committee Building, P. Balu Road, Near Tata Press, Prabhadevi Chowk, Mumbai - 400 025
AGM Thursday, August 11, 2016
3:30 p.m. Nil
2014-15 Textiles Committee Auditorium, Textiles Committee Building, P. Balu Road, Near Tata Press, Prabhadevi Chowk, Mumbai - 400 025
AGM Friday,August 28, 2015
2:30 p.m. 2
2013-14 Textiles Committee Auditorium, Textiles Committee Building, P. Balu Road, Near Tata Press, Prabhadevi Chowk, Mumbai - 400 025
AGM Wednesday,August 13, 2014
3:00 p.m. 2
(c) Resolutions passed through postal ballots
During the year, no resolution was passed through Postal Ballot.
12. Means of Communication :
The quarterly and half yearly unaudited and annual audited financial results were published in ‘The Economic Times’ in English and ‘Maharashtra Times’ in Marathi (regional language). The quarterly financial results, shareholding pattern, reports on compliance with corporate governance, annual reports, etc. are regularly uploaded on the Company’s website – ‘www.borosil.com’, in compliancewithRegulation46and47ofSEBI (ListingObligationsandDisclosureRequirements)Regulations, 2015. Presentation made to the Analyast and the Institutional Investors after the declaration of the quarterly, half yearly and annual results are also displayed on the Company’s website.
The Annual Report is circulated to all members and is also available on the Company’s website.
13. General Shareholder Information :
Annual General Meeting:Day & Date : Thursday, August 10, 2017
Time : 2.30 p.m.
Venue : Textiles Committee Auditorium, Textiles Committee Building, P. Balu Road, Near Tata Press, Prabhadevi Chowk, Mumbai - 400 025.
Financial year : 1st April to 31st March
Financial Calendar : First Quarter – 2nd week of AugustSecond Quarter – 2nd week of NovemberThird Quarter – 2nd week of FebruaryFourth Quarter – 4th week of May
Date of Book Closure : August 04, 2017 to August 10, 2017
Listing on Stock Exchange : BSE Ltd.1st Floor, New Trading Ring, Rotunda Building, P. J. Towers, Dalal Street, Mumbai - 400 001
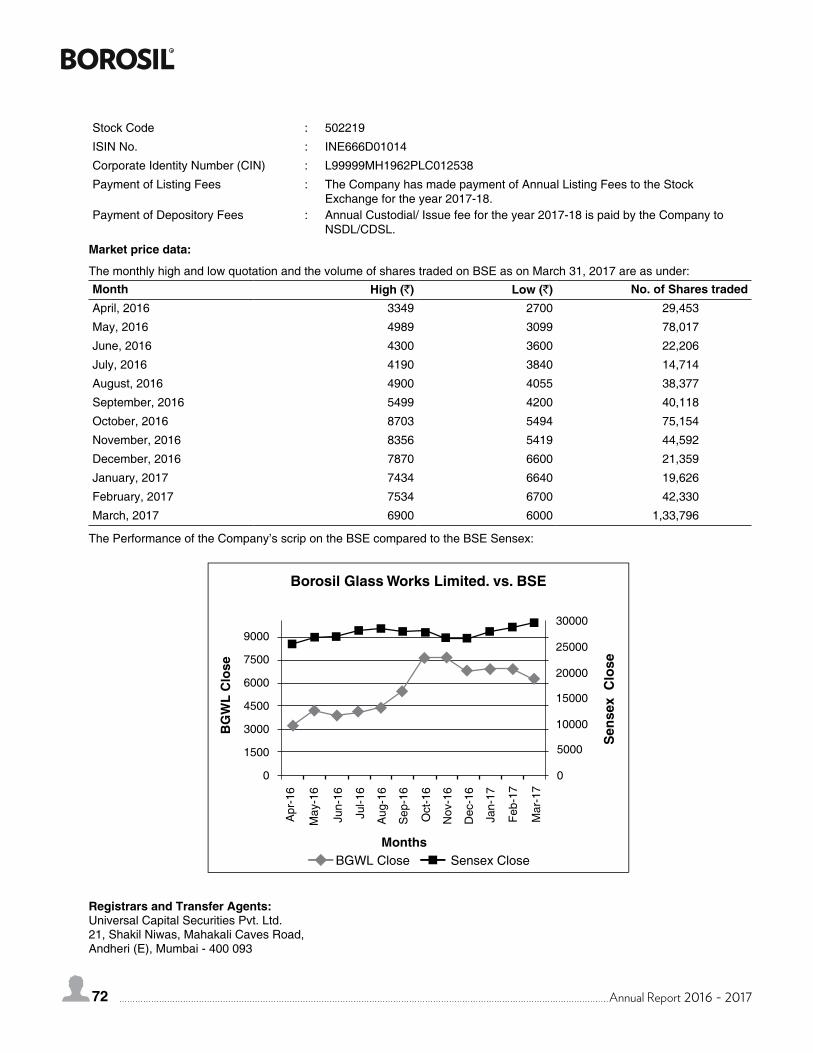
72 Annual Report 2016 - 2017
Stock Code : 502219
ISIN No. : INE666D01014
Corporate Identity Number (CIN) : L99999MH1962PLC012538
Payment of Listing Fees : The Company has made payment of Annual Listing Fees to the Stock Exchange for the year 2017-18.
Payment of Depository Fees : Annual Custodial/ Issue fee for the year 2017-18 is paid by the Company to NSDL/CDSL.
Market price data:
The monthly high and low quotation and the volume of shares traded on BSE as on March 31, 2017 are as under:Month High (`) Low (`) No. of Shares tradedApril, 2016 3349 2700 29,453
May, 2016 4989 3099 78,017
June, 2016 4300 3600 22,206
July, 2016 4190 3840 14,714
August, 2016 4900 4055 38,377
September, 2016 5499 4200 40,118
October,2016 8703 5494 75,154
November, 2016 8356 5419 44,592
December, 2016 7870 6600 21,359
January, 2017 7434 6640 19,626
February, 2017 7534 6700 42,330
March, 2017 6900 6000 1,33,796
The Performance of the Company’s scrip on the BSE compared to the BSE Sensex:
Registrars and Transfer Agents: UniversalCapitalSecuritiesPvt.Ltd. 21, Shakil Niwas, Mahakali Caves Road, Andheri (E), Mumbai - 400 093
Annual Report 2016 - 2017 73
Share Transfer System:
The Registrars and Transfer Agents process, inter-alia, the share transfer requests received in physical and electronic mode andconfirmdematerialisationrequestsandextinguishmentofsharesandothershareregistrywork.
The transfers are normally processed within 10-12 days from the date of receipt if the documents are complete in all respects.
Distribution of shareholding as at March 31, 2017No. of equity shares held Shareholders Shares
Nos. Percentage Nos. PercentageUpto500 8697 98.32 375163 16.24
501 to 1000 91 1.03 64851 2.81
1001 to 2000 31 0.35 42781 1.85
2001 to 3000 8 0.09 20151 0.87
3001 to 4000 5 0.06 17040 0.74
4001 to 5000 2 0.02 9259 0.40
5001 to 10000 2 0.02 14153 0.61
10001 & above 10 0.11 1766602 76.48
Total 8846 100.00 2310000 100.00
Categories of shareholders as on March 31, 2017Particulars No. of folios No. of shares PercentageIndividuals 8145 460230 19.93
Mutual Funds 03 550 0.02
Promoters 13 1715976 74.28
Banks, Financial Institutions, Insurance Companies, Central / State Govt. Institutions / Non-Govt. Institutions
06 462 0.02
Private Corporate Bodies 147 35649 1.54
Non Resident Individuals 156 13778 0.60
Foreign Portfolio Investors 05 58203 2.52
HUF 261 17150 0.74
NBFC 1 6 0.00
Trusts 1 905 0.04
Any other - Clearing Members 103 5719 0.25
L L P 2 397 0.02
Foreign Nationals 3 975 0.04
Total 8846 2310000 100.00
Dematerialisation of shares and liquidity:
As on March 31, 2017, 21,57,357 shares of the Company representing 93.39% of the Company’s total paid up share capital had been dematerialised and 1,52,643 shares representing 6.61% were in physical form.
The Company’s shares are regularly traded on BSE Ltd. as is indicated in the table containing market information.
Outstanding ADRs/ GDRs/ Warrants or any convertible instruments, conversion date and likely impact on equity: Not applicable.
Commodity price risk or foreign exchange risk and hedging activities:
The Board of Directors of the Company had formulated Risk Management Plan. The Company has laid down procedures to informBoardmembersabouttheriskassessmentandminimizationprocedures,whichissubjecttoreviewbytheManagementand is required to be placed before the Board on an annual basis. In line with the requirements of Regulation 17(9) of the SEBI (LODR)Regulations,2015,theAuditCommitteeandtheBoardofDirectorsreviewedtheManagementperceptionoftherisksfacedbytheCompanyandmeasurestakentominimizethesame.TheCompanyhasnotenteredintoanyhedgingactivities,thedetailsofUnhedgedForeignCurrencyexposureasonMarch31,2017aredisclosedinFinancialStatements.
74 Annual Report 2016 - 2017
Plant Locations: Zonal Sales Offices
i. KanakiaZillion,Bwing,Unitno.306,L.B.S.Marg,Kurla(West),Mumbai-400070.
ii. Dabriwala House, 10-C, Middleton Row, Kolkata – 700 071.
iii. 1stFloor,Newno.20,OldNo.9,BrahadammalRoad,Nungambakkam,Chennai-600034.
iv. 19/90, Connaught Circus, Madras Hotel Block, New Delhi – 110 001.
Address for Correspondence:
Any communication by the Shareholders may be addressed to either of the following:
Borosil Glass Works Limited Universal Capital Securities Pvt. Ltd. 11thfloor,1101Crescenzo,GBlock, Unit:BorosilGlassWorksLimited OppositeMCAClub, ShakilNiwas,MahakaliCavesRoad, Bandra Kurla Complex, Bandra (East), Andheri (East), Mumbai – 400 051 Mumbai - 400 093 Tel No: 022-6740 6300 Tel No: 022-28207203/04/05, 28262920
Complaints/grievances may also be addressed to ‘[email protected]’.
14. Other Disclosures :
Related Party Transactions:
ThedetailsofalltransactionswithrelatedpartiesareplacedbeforetheAuditCommitteeperiodically,withjustificationwhereverrequired.
Nomaterial transactionhasbeenentered intoby theCompanywith relatedparties thatmayhaveapotentialconflictwithinterest of the Company. The details of related party transactions have been given in Financial Statements.
The Company has formulated a policy on dealing with related party transactions and has been uploaded on the website of the Company at http://www.borosil.com/doc_files/Related%20Parties%20Transaction%20Policy.pdf
Non-compliance/strictures/penalties imposed:
No strictures/penalties have been imposed on the Company by Stock Exchange(s) or the SEBI or any statutory authority on any matters related to capital markets during the last three years.
Whistle Blower Policy:
The Company has laid down a Whistle Blower Policy providing a platform to all the Directors/Employees to report about unethical behavior, actual or suspected fraud or violation of the Company’s code of conduct or ethics policy.
Themechanismprovides foradequatesafeguardsagainstvictimizationofemployees toavailof themechanismandalsoprovide for direct access to the Chairman of the Audit Committee in exceptional cases.
The said Policy is posted on the website (www.borosil.com) of the Company.
Subsidiary Companies:
WhollyOwnedSubsidiaryvizBorosilAfrasiaFZEwasformedonJanuary09,2014intheJabelAliFreeZoneinDubai,UAE.The said subsidiary has formed a Limited Liability Company (LLC).
As already reported in last year, the Company along with its nominee has acquired 100% equity shares of Hopewell Tableware Private Limited (HTPL) and subsequently HTPL has become anUnlistedWhollyOwned Indian Subsidiary (WOS) of theCompany with effect from January 28, 2016.
During the year, the Company has acquired 60.28% equity shares of Klass Pack Private Limited (Klasspack) and subsequently Klasspack has become an unlisted subsidiary of the Company with effect from July 29, 2016.
TheCompanyhasformulatedapolicyfordetermining‘material’subsidiariesandhasbeenuploadedonthewebsiteoftheCompany at http://www.borosil.com/doc_files/Policy%20for%20Determining%20Material%20Subsidiaries.pdf
TheCompanycomplieswiththerequirementsof‘Subsidiary’aspertheSEBI(ListingObligationsandDisclosureRequirements)Regulations, 2015.
Annual Report 2016 - 2017 75
Code of Conduct for Prevention of Insider Trading :
As required by the provisions of the Securities and Exchange Board of India (Prohibition of Insider Trading) Regulations, 2015, the Company has adopted a Code of Conduct for Prevention of Insider Trading. Ms. Gita Yadav, Company Secretary is the ComplianceOfficer.TheCodeofConductisapplicabletoallDirectors,Whole-timeDirectors,CFO,VicePresident(s),GeneralManager(s),StatutoryAuditors,SecretarialAuditorsandInternalAuditorswhoareexpectedtohaveaccesstoUnpublishedprice sensitive information relating to the Company.
CEO/CFO Certification :
TheManagingDirector&CEOandtheChiefFinancialOfficeroftheCompanyhasissuedacertificatepursuanttotheprovisionsofRegulation17(8)intermsofScheduleIIPartBofSEBI(ListingObligationsandDisclosureRequirements)Regulations,2015and the same was taken on record by the Board at its meeting held on May 13, 2017.
Code of Conduct :
As required under, Regulation 17 of the SEBI (ListingObligations and Disclosure Requirements) Regulations, 2015, theCompany has laid down Code of Conduct for Directors and Senior Management Personnel of the Company. The Company hasreceivedaffirmationofcompliancefromDirectorsandSeniorManagementPersonneloftheCompanyforthefinancialyear ended March 31, 2017. The said Code is posted on the Company’s website http://www.borosil.com/doc_files/Revised%20Code%20of%20Conduct.pdf
15. Non-compliance of any requirement of corporate governance :
TheCompanyhascompliedwithallthemandatoryrequirementsascontainedintheSEBI(ListingObligationsandDisclosureRequirements) Regulations, 2015.
16. Discretionary requirements - Part E of Schedule II :
i. The Board:
TheCompanyhasanExecutiveChairmanwhoseofficeismaintainedbytheCompanyatitsexpenses.ThetravellingandotherexpensesoftheChairmanforofficepurposesarepaid/reimbursedbytheCompany.
ii. Shareholder Rights:
Thequarterlyandhalfyearlyfinancialperformancearepublishedinthenewspapersandarealsopostedonthewebsiteof the Company and hence, it is not being sent to the shareholders.
iii. Audit qualifications:
TheCompany’sfinancialstatementfortheyear2016-17doesnotcontainanyauditqualification.
iv. Separate posts of Chairman and Chief Executive Officer:
TheCompanyhasanExecutiveChairmanwhosepositionisseparatefromthatoftheManagingDirector&CEOoftheCompany.
v. Reporting of Internal Auditor:
The Internal Auditor presents his report to the Audit Committee on quarterly basis.
17. Compliance Certificate :
ACertificatefromtheAuditorsoftheCompanyregardingcomplianceofconditionofcorporategovernancefortheyearendedonMarch31,2017,asstipulatedinchapterIVoftheSecuritiesandExchangeBoardofIndia(ListingObligationsandDisclosureRequirements) Regulations, 2015 is annexed hereto.
76 Annual Report 2016 - 2017
DECLARATION ON COMPLIANCE WITH THE COMPANY’S CODE OF CONDUCT
The Members ofBorosil Glass Works Limited
IconfirmthatallDirectorsandmembersofSeniorManagementPersonneloftheCompanyhaveaffirmedcompliancewiththeCodeof Conduct of the Company for the year ended March 31, 2017.
For Borosil Glass Works Limited
Shreevar KherukaPlace :Mumbai ManagingDirector&CEODate : May 13, 2017 DIN 01802416
Annual Report 2016 - 2017 77
AUDITOR’S CERTIFICATE OF CORPORATE GOVERNANCE
To,The Members,Borosil Glass Works Limited
We have examined the compliance of conditions of Corporate Governance by Borosil Glass Works Limited (‘theCompany’),forthe year ended 31st March, 2017, as stipulated in regulations 17 to 27 and clauses (b) to (i) of regulation 46(2) and para C and D of ScheduleVoftheSEBI(ListingObligationsandDisclosureRequirements)Regulations,2015(‘ListingRegulations’).
MANAGEMENTS’ RESPONSIBILITY
The compliance of conditions of Corporate Governance is the responsibility of the Management. This responsibility includes the design, implementation and maintenance of internal control and procedures to ensure the compliance with the conditions of the Corporate Governance stipulated in Listing Regulations.
AUDITOR’S RESPONSIBILITY
Our responsibility is limited to examining the procedures and implementation thereof, adopted by the Company for ensuringcompliance with the conditions of Corporate Governance. It is neither an audit nor an expression of opinion on the financialstatements of the Company.
We have examined the books of account and other relevant records and documents maintained by the Company for the purposes of providing reasonable assurance on the compliance with Corporate Governance requirements by the Company.
We havecarriedoutanexaminationoftherelevantrecordsoftheCompanyinaccordancewiththeGuidanceNoteonCertificationof Corporate Governance issued by the Institute of the Chartered Accountants of India (the ICAI), the Standards on Auditing specifiedunderSection143(10)oftheCompaniesAct,2013,insofarasapplicableforthepurposeofthiscertificateandaspertheGuidanceNoteonReportsorCertificatesforSpecialPurposesissuedbytheICAIwhichrequiresthatwecomplywiththeethicalrequirements of the Code of Ethics issued by the ICAI.
We have complied with the relevant applicable requirements of the Standard on Quality Control (SQC) 1, Quality Control for Firms thatPerformAuditsandReviewsofHistoricalFinancialInformation,andOtherAssuranceandRelatedServicesEngagements.
OPININON
Based on our examination of the relevant records and according to the information and explanations provided to us and the representations provided by the Management, we certify that the Company has complied with the conditions of Corporate Governance as stipulated in regulations 17 to 27 and clauses (b) to (i) of regulation 46(2) and para C and D of Schedule V of the Listing Regulations during the year ended 31st March, 2017.
WestatethatsuchcomplianceisneitheranassuranceastothefutureviabilityoftheCompanynortheefficiencyoreffectivenesswith which the Management has conducted the affairs of the Company.
For Pathak H.D. & AssociatesChartered AccountantsFirm Registration No: 107783W
Gyandeo ChaturvediPartnerMembership No. 046806
Place: MumbaiDate: 13th May, 2017
78 Annual Report 2016 - 201778
Independent Auditor’s Report
To the Members ofBorosil Glass Works Limited
Report on the Standalone Ind AS Financial Statements
We have audited the accompanying Standalone Ind AS financial statements of BOROSIL GLASS WORKS LIMITED (“the Company”), which comprise the Balance Sheet as at 31st March, 2017, and the Statement of Profit and Loss (including Other Comprehensive Income), the Cash Flow Statement and the Statement of Changes in Equity for the year then ended, and a summary of the significant accounting policies and other explanatory information.
Management’s Responsibility for the Standalone Ind AS Financial Statements
The Company’s Board of Directors is responsible for the matters stated in Section 134(5) of the Companies Act, 2013 (“the Act”) with respect to the preparation of these Standalone Ind AS financial statements that give a true and fair view of state of affairs (financial position), profit (financial performance including other comprehensive income), cash flows and changes in equity of the Company in accordance with the accounting principles generally accepted in India, including the Indian Accounting Standards (Ind AS) prescribed under section 133 of the Act read with relevant rules issued there under.
This responsibility also includes maintenance of adequate accounting records in accordance with the provisions of the Act for safeguarding the assets of the Company and for preventing and detecting frauds and other irregularities; selection and application of appropriate accounting policies; making judgments and estimates that are reasonable and prudent; and design, implementation and maintenance of adequate internal financial controls, that were operating effectively for ensuring the accuracy and completeness of the accounting records, relevant to the preparation and presentation of the Standalone Ind AS financial statements that give a true and fair view and are free from material misstatement, whether due to fraud or error.
Auditors’ Responsibility
Our responsibility is to express an opinion on these Standalone Ind AS financial statements based on our audit.
We have taken into account the provisions of the Act, the accounting and auditing standards and matters which are required to be included in the audit report under the provisions of the Act and the rules made there under.
We conducted our audit of the Standalone Ind AS financial statements in accordance with the Standards on Auditing specified under Section 143(10) of the Act. Those Standards require that we comply with ethical requirements and plan and perform the audit to obtain reasonable assurance about whether the Standalone Ind AS financial statements are free from material misstatement.
An audit involves performing procedures to obtain audit evidence about the amounts and the disclosures in the Standalone Ind AS financial statements. The procedures selected depend on the auditor’s judgment, including the assessment of the risks of material misstatement of the Standalone Ind AS financial statements, whether due to fraud or error. In making those risk assessments, the auditor considers internal financial control relevant to the Company’s preparation of the Standalone Ind AS financial statements that give a true and fair view in order to design audit procedures that are appropriate in the circumstances. An audit also includes evaluating the appropriateness of the accounting policies used and the reasonableness of the accounting estimates made by the Company’s Directors, as well as evaluating the overall presentation of the Standalone Ind AS financial statements.
We believe that the audit evidence we have obtained is sufficient and appropriate to provide a basis for our audit opinion on the Standalone Ind AS financial statements.
Opinion
In our opinion and to the best of our information and according to the explanations given to us, the aforesaid Standalone Ind AS financial statements give the information required by the Act in the manner so required and give a true and fair view in conformity with the accounting principles generally accepted in India, of the state of affairs of the Company as at 31st March, 2017, and its profit including total comprehensive income, its cash flows and the Statement of changes in equity for the year ended on that date.
Other Matters
The comparative financial information of the Company for the year ended 31st March, 2016 and the transition date opening balance sheet as at 1st April, 2015 included in these Standalone Ind AS financial statements, are based on the previously issued statutory financial statements prepared in accordance with the Companies (Accounting Standards) Rules, 2006, audited by the predecessor auditor, whose report for the year ended 31st March, 2016 and 31st March, 2015 dated 30th May, 2016 and 25th May, 2015 respectively expressed an unmodified opinion on those financial statements, as adjusted for the differences in the accounting principles adopted by the Company on transition to the Ind AS, which have been audited by us.
Annual Report 2016 - 2017 79
Our opinion is not modified in respect of above said matter.
Report on Other Legal and Regulatory Requirements
1. As required by Section 143 (3) of the Act, we report that:
a) We have sought and obtained all the information and explanations which to the best of our knowledge and belief were necessary for the purposes of our audit;
b) In our opinion, proper books of account as required by law have been kept by the Company so far as it appears from our examination of those books;
c) The Balance Sheet, the Statement of Profit and Loss (including other comprehensive income), the Cash Flow Statement and Statement of Changes in Equity dealt with by this Report are in agreement with the books of account;
d) In our opinion, the aforesaid Standalone Ind AS financial statements comply with the Indian Accounting Standards prescribed under section 133 of the Act read with relevant rules there under.
e) On the basis of the written representations received from the directors as on 31st March, 2017 taken on record by the Board of Directors, none of the directors is disqualified as on 31st March, 2017 from being appointed as a director in terms of Section 164(2) of the Act;
f) With respect to the adequacy of the internal financial controls over financial reporting of the Company and the operating effectiveness of such controls, refer to our separate Report in “Annexure A”;
g) With respect to the other matters to be included in the Auditor’s Report in accordance with Rule 11 of the Companies (Audit and Auditors) Rules, 2014, in our opinion and to the best of our information and according to the explanations given to us:
(a) The Company has disclosed the impact of pending litigations on its financial position in its Standalone Ind AS financial statements as referred to in Note no. 37 to the financial statements.
(b) The Company does not have long term contracts including derivative contracts for which there were any material foreseeable losses
(c) There has been no amounts during the year, which required to be transferred, to the Investor Education and Protection Fund by the Company;
(d) The Company has provided requisite disclosures in the Standalone Ind AS financial statements as regards to its holdings and dealings in Specified Bank Notes as defined in the Notification S.O. 3407 (E) dated 8th November, 2016 of the Ministry of Finance, during the period from 8th November, 2016 to 30th December, 2016. Based on audit procedure performed and representations provided to us by the management, we report that the disclosures are in accordance with the books of account maintained by the Company and as produced to us by the management.
2. As required by the Companies (Auditor’s Report) Order, 2016 (“the Order”) issued by the Central Government of India, in terms of sub-section (11) of Section 143 of the Act, we give in “Annexure B” hereto, a statement on the matters specified in paragraphs 3 and 4 of the Order, to the extent applicable.
For Pathak H.D. & AssociatesChartered AccountantsFirm Registration No: 107783W
Gyandeo ChaturvediPartnerMembership No. 046806
Place: MumbaiDate: 13th May, 2017
80 Annual Report 2016 - 201780
“ANNEXURE A” TO INDEPENDENT AUDITORS’ REPORT
(Referred to in paragraph 1 (f) under ‘Report on Other Legal and Regulatory Requirements’ of our report of even date to the members of Borosil Glass Works Limited on the Standalone Ind AS financial statements for the year ended 31st March, 2017)
Report on the Internal Financial Controls Over Financial Reporting under Clause (i) of Sub-section 3 of Section 143 of the Companies Act, 2013 (“the Act”)
We have audited the internal financial controls over financial reporting of Borosil Glass Works Limited (“the Company”) as of 31st March, 2017 in conjunction with our audit of the Standalone Ind AS financial statements of the Company for the year ended on that date.
Management’s Responsibility for Internal Financial Controls
The Company’s management is responsible for establishing and maintaining internal financial controls based on the internal control over financial reporting criteria established by the Company considering the essential components of internal control stated in the Guidance Note on Audit of Internal Financial Controls over Financial Reporting (the “Guidance Note”) issued by the Institute of Chartered Accountants of India. These responsibilities include the design, implementation and maintenance of adequate internal financial controls that were operating effectively for ensuring the orderly and efficient conduct of its business, including adherence to Company’s policies, the safeguarding of its assets, the prevention and detection of frauds and errors, the accuracy and completeness of the accounting records, and the timely preparation of reliable financial information, as required under the Act.
Auditors’ Responsibility
Our responsibility is to express an opinion on the Company's internal financial controls over financial reporting based on our audit. We conducted our audit in accordance with the Guidance Note and the Standards on Auditing prescribed under Section 143(10) of the Act, to the extent applicable to an audit of internal financial controls. Those Standards and the Guidance Note require that we comply with ethical requirements and plan and perform the audit to obtain reasonable assurance about whether adequate internal financial controls over financial reporting was established and maintained and if such controls operated effectively in all material respects.
Our audit involves performing procedures to obtain audit evidence about the adequacy of the internal financial controls system over financial reporting and their operating effectiveness.
Our audit of internal financial controls over financial reporting included obtaining an understanding of internal financial controls over financial reporting, assessing the risk that a material weakness exists, and testing and evaluating the design and operating effectiveness of internal control based on the assessed risk. The procedures selected depend on the auditor’s judgment, including the assessment of the risks of material misstatement of the financial statements, whether due to fraud or error.
We believe that the audit evidence we have obtained is sufficient and appropriate to provide a basis for our audit opinion on the Company’s internal financial controls system over financial reporting.
Meaning of Internal Financial Controls over Financial Reporting
A Company's internal financial control over financial reporting is a process designed to provide reasonable assurance regarding the reliability of financial reporting and the preparation of financial statements for external purposes in accordance with generally accepted accounting principles. A Company's internal financial control over financial reporting includes those policies and procedures that (1) pertain to the maintenance of records that, in reasonable detail, accurately and fairly reflect the transactions and dispositions of the assets of the Company; (2) provide reasonable assurance that transactions are recorded as necessary to permit preparation of financial statements in accordance with generally accepted accounting principles, and that receipts and expenditures of the Company are being made only in accordance with authorisations of management and directors of the Company; and (3) provide reasonable assurance regarding prevention or timely detection of unauthorised acquisition, use, or disposition of the Company's assets that could have a material effect on the financial statements.
Annual Report 2016 - 2017 81
Inherent Limitations of Internal Financial Controls over Financial Reporting
Because of the inherent limitations of internal financial controls over financial reporting, including the possibility of collusion or improper management override of controls, material misstatements due to error or fraud may occur and not be detected. Also, projections of any evaluation of the internal financial controls over financial reporting to future periods are subject to the risk that the internal financial control over financial reporting may become inadequate because of changes in conditions, or that the degree of compliance with the policies or procedures may deteriorate.
Opinion
In our opinion, to the best of our information and according to the explanations given to us, the Company has, in all material respects, an adequate internal financial controls over financial reporting and such internal financial controls over financial reporting were operating effectively as at 31st March, 2017 based on the internal control over financial reporting criteria established by the Company considering the essential components of internal control stated in the Guidance Note.
For Pathak H.D. & AssociatesChartered AccountantsFirm Registration No: 107783W
Gyandeo ChaturvediPartnerMembership No. 046806
Place: MumbaiDate: 13th May, 2017
82 Annual Report 2016 - 201782
“ANNEXURE B” TO INDEPENDENT AUDITORS’ REPORT
(Referred to in paragraph 2 under the heading “Report on Other Legal and Regulatory Requirements” of our report of even date to the members of Borosil Glass Works Limited on the Standalone Ind AS financial statements for the year ended 31st March, 2017)
i. In respect of its fixed assets:
a. The Company has maintained proper records showing full particulars, including quantitative details and situation of fixed assets on the basis of available information.
b. As explained to us, the Company has physically verified all assets. No material discrepancies were noticed on such physical verification as compared with the available records.
c. According to the information and explanation provided to us and the records examined by us and based on the examination of the registered sale deed/conveyance deed, we report that, the title deeds, comprising all the immovable properties of land and buildings which are freehold, are held in the name of the Company as at the balance sheet date, except the following:-
Particulars Gross Block
as at 31st
March, 2017 (` in lacs)
Net Block as at 31st
March, 2017(` in lacs)
Remarks
Freehold land at Mumbai (one case)
0.12 0.12 The title deeds are in the names of erstwhile Company that merged with the Company under Section 391 to 394 of the Companies Act, 1956 pursuant to Schemes of Amalgamation and Arrangement as approved by the Honorable High Court.
Building (Office Gala)at Mumbai (one case)
8.85 4.67 Share certificates are in the name of the Company.
In respect of immovable properties of land that have been taken on lease, the lease agreements are in the name of the Company, where the Company is the lessee in the agreement.
ii. In respect of its inventories:
As explained to us, inventories except goods in transit have been physically verified during the year by the management. In our opinion the frequency of verification is reasonable. Discrepancies noticed on physical verification of the inventories between the physical inventories and book records were not material, having regard to the size of the operations of the Company, and the same have been properly dealt with.
iii. In respect of loans, secured or unsecured, granted by the Company to Companies, firms, Limited liability partnerships or other parties covered in the register maintained under section 189 of the Act.
a. In our opinion and according to the information given to us, the terms and conditions of the loans given by the Company are prima facie, not prejudicial to the interest of the Company.
b. The schedule of repayment of principal and payment of interest has been stipulated and repayments of principal amounts and/ or receipts of interest have been regular as per stipulations.
c. There are no overdue amounts as at the year- end in respect of both principal and interest.
iv. In our opinion and according to the information and explanations given to us, the Company has complied with the provisions of sections 185 & 186 of the Act as applicable, in respect of grant of loans, making investments and providing guarantees & securities.
v. According to the information and explanations given to us, the Company has not accepted any deposit from the public. Therefore, the provisions of clause (v) of paragraph 3 of the Order are not applicable to the Company.
vi. According to the information and explanations given to us, Central Government has not prescribed maintenance of cost records under sub-Section (1) of Section 148 of the Act in respect of activities carried on by the Company. Therefore, the provisions of clause (vi) of paragraph 3 of the Order are not applicable to the Company.
Annual Report 2016 - 2017 83
vii. According to the information and explanations given to us, in respect of statutory dues:
a. The Company has been generally regular in depositing undisputed statutory dues, including provident fund, employees' state insurance, income tax, sales-tax, service tax, duty of customs, duty of excise, value added tax, cess and any other statutory dues to the appropriate authorities as applicable during the year. According to the information and explanations given to us, no undisputed amounts payable in respect of such statutory dues were outstanding as at 31st March, 2017 for a period of more than six months from the date they became payable
b. Details of dues of Income tax and sales tax / Value added tax aggregating to ` 32.18 Lacs that have not been deposited on account of disputed matters pending before appropriate authorities are as under:
Name of the Statute Nature of the Dues Amount(` in lacs)
Period to which the amount relates
Forum where dispute is pending
Sales Tax Act Sales Tax 6.52 1997-98 Tribunal
25.13* 2002-03 to 2005-06 Joint Commissioner -Taxes Appeal
0.53 2001-01 & 2002-03 Asst. Commissioner Sales Tax
Total 32.18
(*) Net of amount deposited under protest viii. Based on our audit procedures and according to the information and explanations given by the management, we are of the
opinion that as on 31st March, 2017 the Company has not defaulted in repayment of dues to banks. The Company does not have any borrowings from financial institutions, government and debenture holders.
ix. According to the information and explanations given to us, the Company did not raise any money by way of initial public offer or further public offer (including debt instruments) and no term loan was raised during the year. Therefore, the provisions of clause (ix) of paragraph 3 of the Order are not applicable to the Company.
x. Based on our audit procedures performed for the purpose of reporting the true and fair view of the financial statements and on the basis of information and explanations given by the management, no fraud by the Company or on the Company by its officers or employees has been noticed or reported during the year.
xi. In our opinion and according to the information and explanations given to us, the Company has paid or provided managerial remuneration in accordance with the requisite approvals mandated by the provision of section 197 read with Schedule V to the Act
xii. In our opinion, the Company is not a Nidhi Company. Therefore, the provisions of clause (xii) of paragraph 3 of the Order are not applicable to the Company.
xiii. According to the information and explanations given to us, Company’s transactions with the related parties are in compliance with section 177 and 188 of the Act as applicable and details of such transactions have been disclosed in the financial statements as required by the applicable Indian accounting standards.
xiv. According to the information and explanations give to us and based on our examination of the records of the Company, the Company has not made any preferential allotment or private placement of shares or fully or partly convertible debentures during the year. Therefore, the provisions of clause (xiv) of paragraph 3 of the Order are not applicable to the Company.
xv. According to the information and explanations given to us and based on our examination of records of the Company, the Company has not entered into non-cash transactions with directors or persons connected with him, Therefore, the provisions of clause (xv) of paragraph 3 of the Order are not applicable to the Company.
xvi. In our opinion and according to information and explanations provided to us, the Company is not required to be registered under section 45-IA of the Reserve Bank of India Act, 1934.
For Pathak H.D. & AssociatesChartered AccountantsFirm Registration No: 107783W
Gyandeo ChaturvediPartnerMembership No. 046806
Place: MumbaiDate: 13th May, 2017
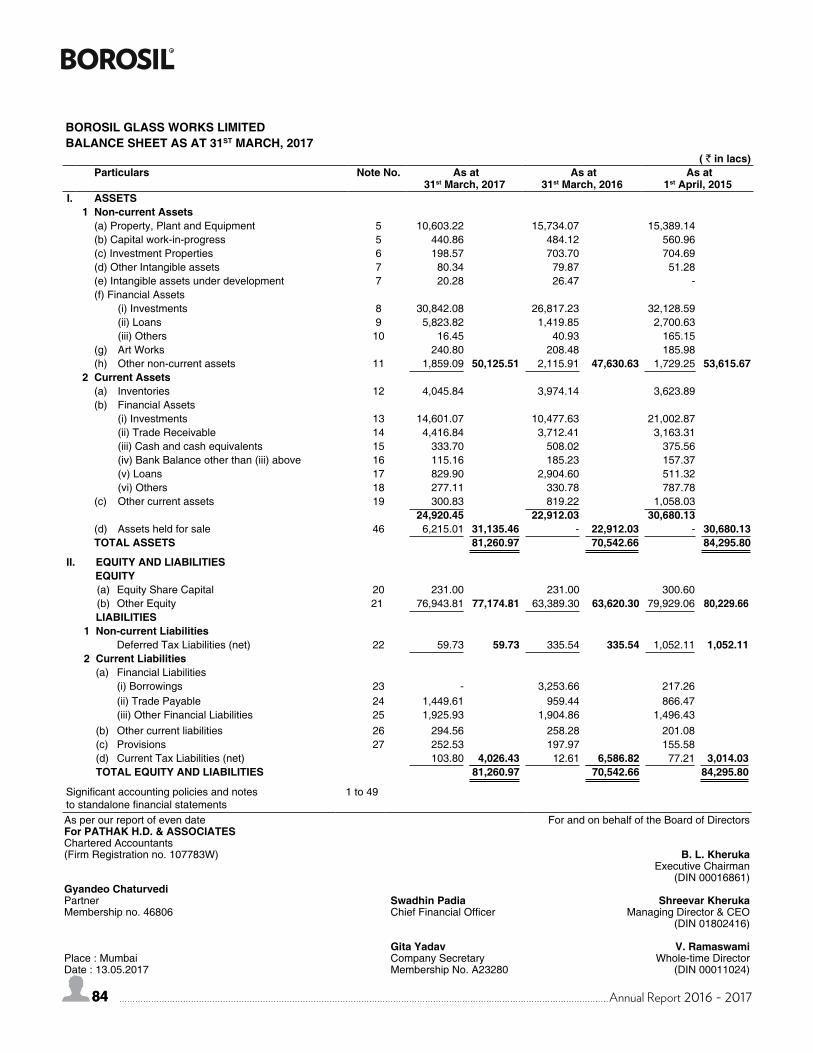
84 Annual Report 2016 - 201784
BOROSIL GLASS WORKS LIMITEDBALANCE SHEET AS AT 31ST MARCH, 2017
( ` in lacs)Particulars Note No. As at
31st March, 2017 As at
31st March, 2016 As at
1st April, 2015I. ASSETS
1 Non-current Assets(a) Property, Plant and Equipment 5 10,603.22 15,734.07 15,389.14(b) Capital work-in-progress 5 440.86 484.12 560.96(c) Investment Properties 6 198.57 703.70 704.69(d) Other Intangible assets 7 80.34 79.87 51.28(e) Intangible assets under development 7 20.28 26.47 -(f) Financial Assets
(i) Investments 8 30,842.08 26,817.23 32,128.59(ii) Loans 9 5,823.82 1,419.85 2,700.63(iii) Others 10 16.45 40.93 165.15
(g) Art Works 240.80 208.48 185.98(h) Other non-current assets 11 1,859.09 50,125.51 2,115.91 47,630.63 1,729.25 53,615.67
2 Current Assets(a) Inventories 12 4,045.84 3,974.14 3,623.89(b) Financial Assets
(i) Investments 13 14,601.07 10,477.63 21,002.87(ii) Trade Receivable 14 4,416.84 3,712.41 3,163.31(iii) Cash and cash equivalents 15 333.70 508.02 375.56(iv) Bank Balance other than (iii) above 16 115.16 185.23 157.37(v) Loans 17 829.90 2,904.60 511.32(vi) Others 18 277.11 330.78 787.78
(c) Other current assets 19 300.83 819.22 1,058.03 24,920.45 22,912.03 30,680.13
(d) Assets held for sale 46 6,215.01 31,135.46 - 22,912.03 - 30,680.13TOTAL ASSETS 81,260.97 70,542.66 84,295.80
II. EQUITY AND LIABILITIESEQUITY(a) Equity Share Capital 20 231.00 231.00 300.60(b) Other Equity 21 76,943.81 77,174.81 63,389.30 63,620.30 79,929.06 80,229.66LIABILITIES
1 Non-current LiabilitiesDeferred Tax Liabilities (net) 22 59.73 59.73 335.54 335.54 1,052.11 1,052.11
2 Current Liabilities(a) Financial Liabilities
(i) Borrowings 23 - 3,253.66 217.26(ii) Trade Payable 24 1,449.61 959.44 866.47(iii) Other Financial Liabilities 25 1,925.93 1,904.86 1,496.43
(b) Other current liabilities 26 294.56 258.28 201.08(c) Provisions 27 252.53 197.97 155.58(d) Current Tax Liabilities (net) 103.80 4,026.43 12.61 6,586.82 77.21 3,014.03TOTAL EQUITY AND LIABILITIES 81,260.97 70,542.66 84,295.80
Significant accounting policies and notesto standalone financial statements
1 to 49
As per our report of even date For and on behalf of the Board of DirectorsFor PATHAK H.D. & ASSOCIATESChartered Accountants(Firm Registration no. 107783W) B. L. Kheruka
Executive Chairman(DIN 00016861)
Gyandeo ChaturvediPartner Swadhin Padia Shreevar KherukaMembership no. 46806 Chief Financial Officer Managing Director & CEO
(DIN 01802416)
Gita Yadav V. RamaswamiPlace : Mumbai Company Secretary Whole-time DirectorDate : 13.05.2017 Membership No. A23280 (DIN 00011024)
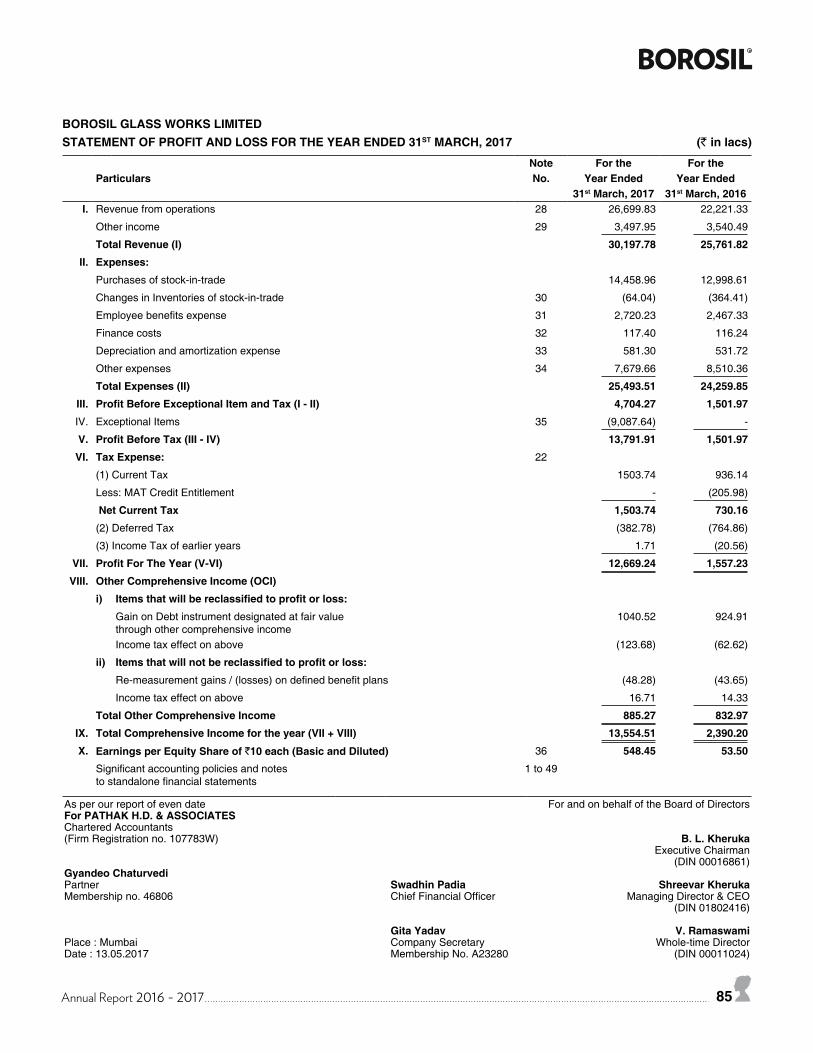
Annual Report 2016 - 2017 85
Note For the For theParticulars No. Year Ended Year Ended
31st March, 2017 31st March, 2016I. Revenue from operations 28 26,699.83 22,221.33
Other income 29 3,497.95 3,540.49
Total Revenue (I) 30,197.78 25,761.82
II. Expenses:
Purchases of stock-in-trade 14,458.96 12,998.61
Changes in Inventories of stock-in-trade 30 (64.04) (364.41)
Employee benefits expense 31 2,720.23 2,467.33
Finance costs 32 117.40 116.24
Depreciation and amortization expense 33 581.30 531.72
Other expenses 34 7,679.66 8,510.36
Total Expenses (II) 25,493.51 24,259.85
III. Profit Before Exceptional Item and Tax (I - II) 4,704.27 1,501.97
IV. Exceptional Items 35 (9,087.64) -
V. Profit Before Tax (III - IV) 13,791.91 1,501.97
VI. Tax Expense: 22
(1) Current Tax 1503.74 936.14
Less: MAT Credit Entitlement - (205.98)
Net Current Tax 1,503.74 730.16
(2) Deferred Tax (382.78) (764.86)
(3) Income Tax of earlier years 1.71 (20.56)
VII. Profit For The Year (V-VI) 12,669.24 1,557.23
VIII. Other Comprehensive Income (OCI)
i) Items that will be reclassified to profit or loss:
Gain on Debt instrument designated at fair value through other comprehensive income
1040.52 924.91
Income tax effect on above (123.68) (62.62)
ii) Items that will not be reclassified to profit or loss:
Re-measurement gains / (losses) on defined benefit plans (48.28) (43.65)
Income tax effect on above 16.71 14.33
Total Other Comprehensive Income 885.27 832.97
IX. Total Comprehensive Income for the year (VII + VIII) 13,554.51 2,390.20
X. Earnings per Equity Share of `10 each (Basic and Diluted) 36 548.45 53.50
Significant accounting policies and notesto standalone financial statements
1 to 49
BOROSIL GLASS WORKS LIMITEDSTATEMENT OF PROFIT AND LOSS FOR THE YEAR ENDED 31ST MARCH, 2017 (` in lacs)
As per our report of even date For and on behalf of the Board of DirectorsFor PATHAK H.D. & ASSOCIATESChartered Accountants(Firm Registration no. 107783W) B. L. Kheruka
Executive Chairman(DIN 00016861)
Gyandeo ChaturvediPartner Swadhin Padia Shreevar KherukaMembership no. 46806 Chief Financial Officer Managing Director & CEO
(DIN 01802416)
Gita Yadav V. RamaswamiPlace : Mumbai Company Secretary Whole-time DirectorDate : 13.05.2017 Membership No. A23280 (DIN 00011024)
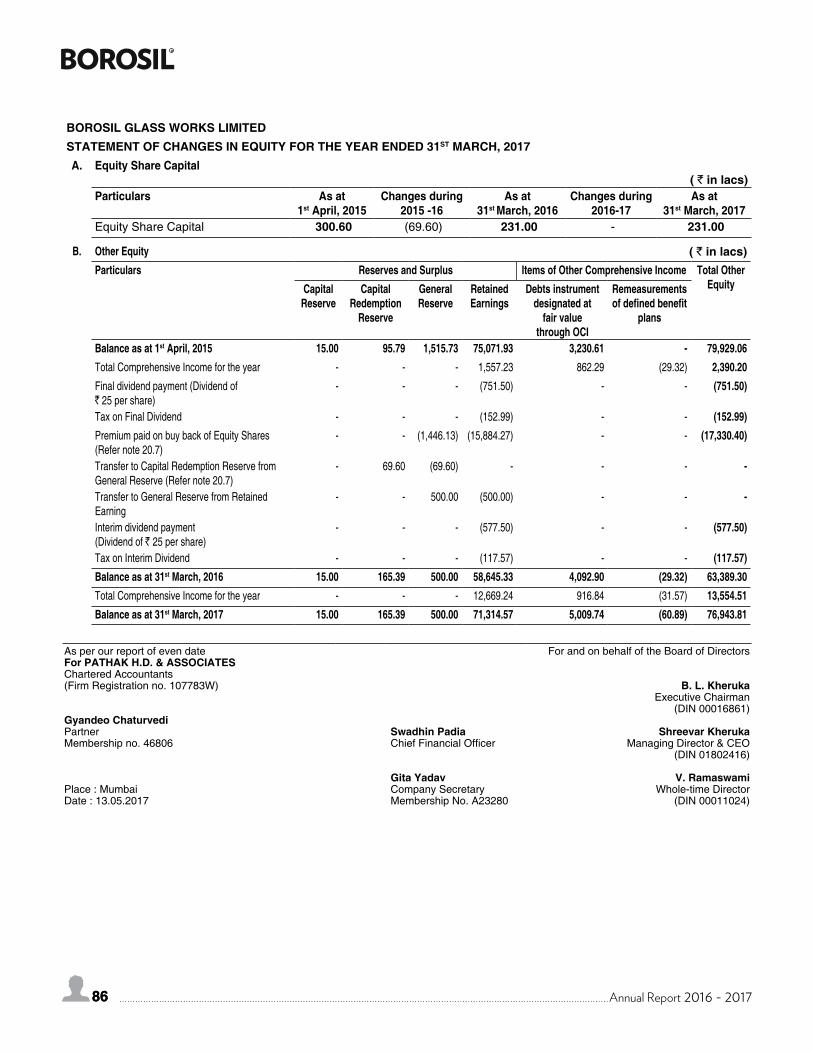
86 Annual Report 2016 - 201786
BOROSIL GLASS WORKS LIMITEDSTATEMENT OF CHANGES IN EQUITY FOR THE YEAR ENDED 31ST MARCH, 2017A. Equity Share Capital
( ` in lacs)Particulars As at
1st April, 2015Changes during
2015 -16As at
31st March, 2016Changes during
2016-17As at
31st March, 2017Equity Share Capital 300.60 (69.60) 231.00 - 231.00
B. Other Equity ( ` in lacs)Particulars Reserves and Surplus Items of Other Comprehensive Income Total Other
EquityCapital Reserve
Capital Redemption
Reserve
General Reserve
Retained Earnings
Debts instrument designated at
fair value through OCI
Remeasurements of defined benefit
plans
Balance as at 1st April, 2015 15.00 95.79 1,515.73 75,071.93 3,230.61 - 79,929.06Total Comprehensive Income for the year - - - 1,557.23 862.29 (29.32) 2,390.20Final dividend payment (Dividend of ` 25 per share)
- - - (751.50) - - (751.50)
Tax on Final Dividend - - - (152.99) - - (152.99)Premium paid on buy back of Equity Shares (Refer note 20.7)
- - (1,446.13) (15,884.27) - - (17,330.40)
Transfer to Capital Redemption Reserve from General Reserve (Refer note 20.7)
- 69.60 (69.60) - - - -
Transfer to General Reserve from Retained Earning
- - 500.00 (500.00) - - -
Interim dividend payment (Dividend of ` 25 per share)
- - - (577.50) - - (577.50)
Tax on Interim Dividend - - - (117.57) - - (117.57)Balance as at 31st March, 2016 15.00 165.39 500.00 58,645.33 4,092.90 (29.32) 63,389.30Total Comprehensive Income for the year - - - 12,669.24 916.84 (31.57) 13,554.51Balance as at 31st March, 2017 15.00 165.39 500.00 71,314.57 5,009.74 (60.89) 76,943.81
As per our report of even date For and on behalf of the Board of DirectorsFor PATHAK H.D. & ASSOCIATESChartered Accountants(Firm Registration no. 107783W) B. L. Kheruka
Executive Chairman(DIN 00016861)
Gyandeo ChaturvediPartner Swadhin Padia Shreevar KherukaMembership no. 46806 Chief Financial Officer Managing Director & CEO
(DIN 01802416)
Gita Yadav V. RamaswamiPlace : Mumbai Company Secretary Whole-time DirectorDate : 13.05.2017 Membership No. A23280 (DIN 00011024)
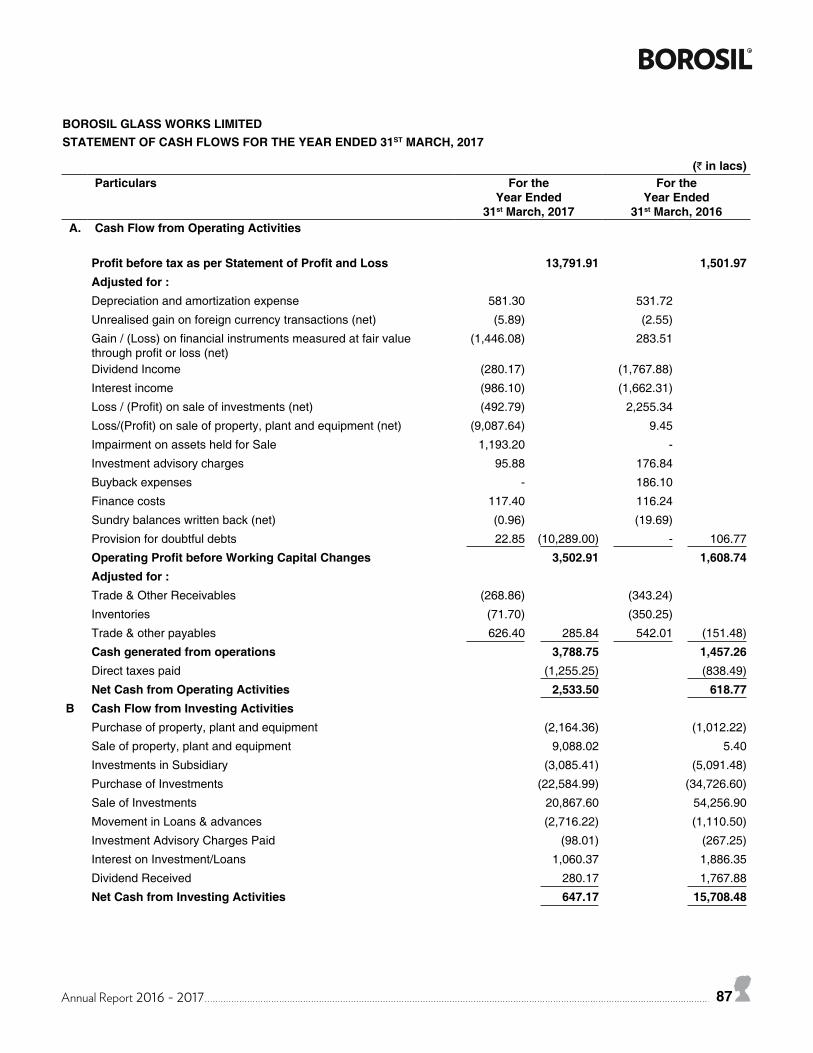
Annual Report 2016 - 2017 87
(` in lacs) Particulars For the
Year Ended31st March, 2017
For theYear Ended
31st March, 2016 A. Cash Flow from Operating Activities
Profit before tax as per Statement of Profit and Loss 13,791.91 1,501.97Adjusted for :Depreciation and amortization expense 581.30 531.72
Unrealised gain on foreign currency transactions (net) (5.89) (2.55)
Gain / (Loss) on financial instruments measured at fair value through profit or loss (net)
(1,446.08) 283.51
Dividend Income (280.17) (1,767.88)
Interest income (986.10) (1,662.31)
Loss / (Profit) on sale of investments (net) (492.79) 2,255.34
Loss/(Profit) on sale of property, plant and equipment (net) (9,087.64) 9.45
Impairment on assets held for Sale 1,193.20 -
Investment advisory charges 95.88 176.84
Buyback expenses - 186.10
Finance costs 117.40 116.24
Sundry balances written back (net) (0.96) (19.69)
Provision for doubtful debts 22.85 (10,289.00) - 106.77
Operating Profit before Working Capital Changes 3,502.91 1,608.74Adjusted for :Trade & Other Receivables (268.86) (343.24)
Inventories (71.70) (350.25)
Trade & other payables 626.40 285.84 542.01 (151.48)
Cash generated from operations 3,788.75 1,457.26Direct taxes paid (1,255.25) (838.49)
Net Cash from Operating Activities 2,533.50 618.77B Cash Flow from Investing Activities
Purchase of property, plant and equipment (2,164.36) (1,012.22)
Sale of property, plant and equipment 9,088.02 5.40
Investments in Subsidiary (3,085.41) (5,091.48)
Purchase of Investments (22,584.99) (34,726.60)
Sale of Investments 20,867.60 54,256.90
Movement in Loans & advances (2,716.22) (1,110.50)
Investment Advisory Charges Paid (98.01) (267.25)
Interest on Investment/Loans 1,060.37 1,886.35
Dividend Received 280.17 1,767.88
Net Cash from Investing Activities 647.17 15,708.48
BOROSIL GLASS WORKS LIMITED STATEMENT OF CASH FLOWS FOR THE YEAR ENDED 31ST MARCH, 2017
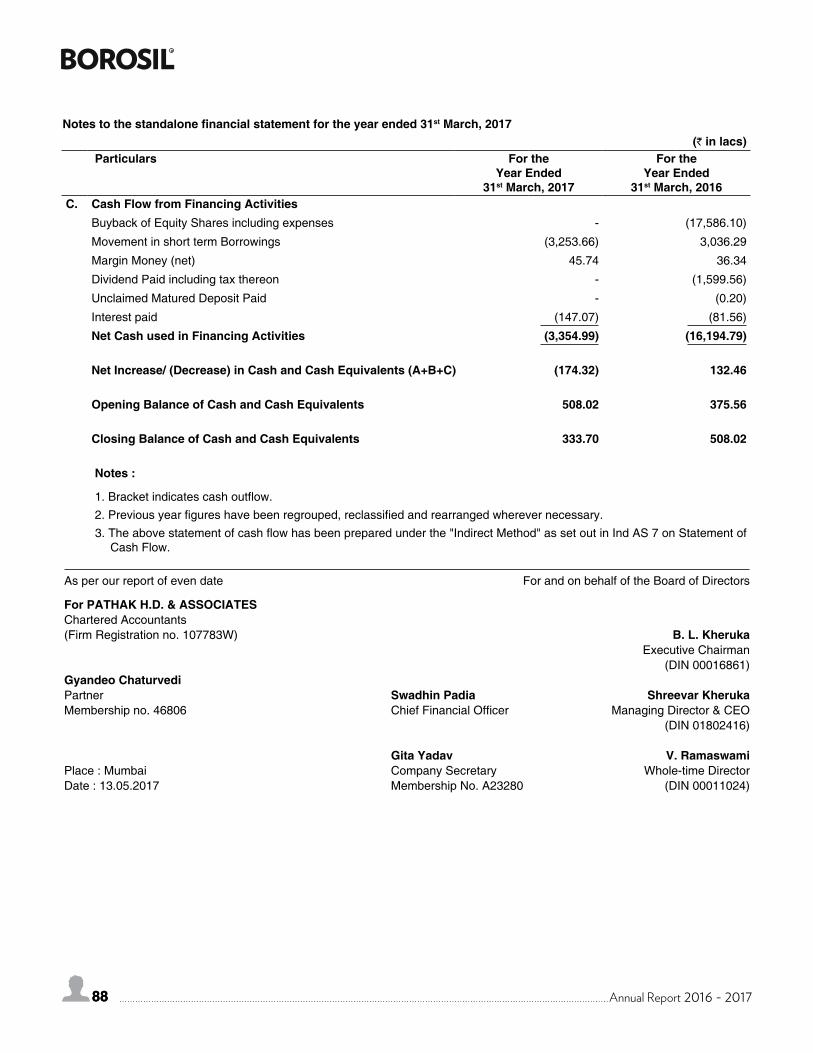
88 Annual Report 2016 - 201788
(` in lacs) Particulars For the
Year Ended31st March, 2017
For theYear Ended
31st March, 2016C. Cash Flow from Financing Activities
Buyback of Equity Shares including expenses - (17,586.10)
Movement in short term Borrowings (3,253.66) 3,036.29
Margin Money (net) 45.74 36.34
Dividend Paid including tax thereon - (1,599.56)
Unclaimed Matured Deposit Paid - (0.20)
Interest paid (147.07) (81.56)
Net Cash used in Financing Activities (3,354.99) (16,194.79)
Net Increase/ (Decrease) in Cash and Cash Equivalents (A+B+C) (174.32) 132.46
Opening Balance of Cash and Cash Equivalents 508.02 375.56
Closing Balance of Cash and Cash Equivalents 333.70 508.02
Notes :
1. Bracket indicates cash outflow. 2. Previous year figures have been regrouped, reclassified and rearranged wherever necessary. 3. The above statement of cash flow has been prepared under the "Indirect Method" as set out in Ind AS 7 on Statement of
Cash Flow.
As per our report of even date For and on behalf of the Board of Directors
For PATHAK H.D. & ASSOCIATESChartered Accountants(Firm Registration no. 107783W) B. L. Kheruka
Executive Chairman(DIN 00016861)
Gyandeo ChaturvediPartner Swadhin Padia Shreevar KherukaMembership no. 46806 Chief Financial Officer Managing Director & CEO
(DIN 01802416)
Gita Yadav V. RamaswamiPlace : Mumbai Company Secretary Whole-time DirectorDate : 13.05.2017 Membership No. A23280 (DIN 00011024)
Notes to the standalone financial statement for the year ended 31st March, 2017
Annual Report 2016 - 2017 89
Notes to the standalone financial statement for the year ended 31st March, 2017Note 1 - CORPORATE INFORMATION: Borosil Glass Works Limited ("the Company") is a limited Company domiciled and incorporated in India and its shares are
publicly traded on the Bombay Stock Exchange (BSE), in India. The registered office of the Company is situated at Khanna Construction House, 44, Dr. R.G. Thadani Marg, Worli, Mumbai 400 018.
Company is engaged in the business of Scientific and Industrial Products (SIP) and Consumer Products (CP). SIP consist of laboratory glassware, instruments, disposable plastics, liquid handling systems and explosion proof lighting glassware. CP consist of microwavable and flameproof kitchenware, glass tumblers, Appliances and Storage products.
The financial statements of the Company for the year ended 31st March, 2017 were approved and adopted by board of directors in their meeting held on 13th May, 2017.
Note 2 - BASIS OF PREPARATION: The financial statements of the Company have been prepared in accordance with Indian Accounting Standards notified
under the Companies (Indian Accounting Standards) Rules, 2015 (Ind AS). For all periods up to year ended 31st March, 2016, the Company prepared its financial statements in accordance with
accounting standards notified under the Section 133 of the Companies Act 2013, read together with paragraph 7 of the Companies (Accounts) Rules, 2014 (Indian GAAP). These financial statements for the year ended 31st March, 2017 are the first financial statement, the Company has prepared in accordance with Ind AS.
The financial statements have been prepared on a historical cost basis, except for certain financial assets and liabilities, which are measured at fair value/amortised cost.
The financial statements are presented in Indian Rupees (`), which is the Company’s functional and presentation currency and all values are rounded to the nearest lacs, except when otherwise indicated.
Note 3 - SIGNIFICANT ACCOUNTING POLICIES:3.1 Property, Plant and Equipment: Property, plant and equipment are carried at cost less accumulated depreciation and accumulated impairment losses, if
any. Cost includes purchase price, borrowing cost and any cost directly attributable to the bringing the assets to its working condition for its intended use.
Depreciation on the property, plant and equipment is provided using straight line method over the useful life of assets as specified in schedule II to the Companies Act, 2013. Depreciation on property, plant and equipment which are added / disposed off during the year, is provided on pro-rata basis with reference to the date of addition / deletion. Freehold land is not depreciated.
The assets’ residual values, useful lives and method of depreciation are reviewed at each financial year end and are adjusted prospectively, if appropriate.
Capital work-in-progress includes cost of property, plant and equipment under installation / under development as at the balance sheet date.
Property, plant and equipment are eliminated from financial statement, either on disposal or when retired from active use. Profits / losses arising in the case of retirement / disposal of property, plant and equipment are recognised in the statement of profit and loss in the year of occurrence.
Leasehold lands are amortised over the period of lease. Buildings constructed on leasehold land are depreciated based on the useful life specified in schedule II to the Companies Act, 2013, where the lease period of land is beyond the life of the building. In other cases, buildings constructed on leasehold lands are amortised over the primary lease period of the lands.
3.2 Investment Properties: Investment properties are measured initially at cost, including transaction costs. Subsequent to initial recognition, investment
properties are stated at cost less accumulated depreciation and accumulated impairment loss, if any. Depreciation on investment properties are provided using straight line method over the estimated useful lives as specified in
Schedule II to the Companies Act, 2013. Residual values, useful lives and method of depreciation of investment properties are reviewed at each financial year end and are adjusted prospectively, if appropriate. The effects of any revision are included in the statement of profit and loss when the changes arises.
Though the Company measures investment properties using cost based measurement, the fair value of investment property is disclosed in the notes.
Investment properties are derecognised either when they have been disposed off or when they are permanently withdrawn from use and no future economic benefit is expected from their disposal. The difference between the net disposal proceeds and the carrying amount of the asset is recognised in statement of profit and loss in the period of derecognition.
90 Annual Report 2016 - 201790
3.3 Intangible Assets: Intangible assets are carried at cost less accumulated amortisation and accumulated impairment losses, if any. Cost
includes expenditure that is directly attributable to the acquisition of the intangible assets. Identifiable intangible assets are recognised when it is probable that future economic benefits attributed to the asset will flow
to the Company and the cost of the asset can be reliably measured. Computer softwares are capitalised at the amounts paid to acquire the respective license for use and are amortised over
the period of useful lives or period of three years, whichever is less. The assets’ useful lives are reviewed at each financial year end.
Gains or losses arising from derecognition of an intangible asset are measured as the difference between the net disposal proceeds and the carrying amount of the asset and are recognised in the statement of profit and loss when the asset is derecognised.
3.4 Art Works: Art Works are carried at cost less accumulated impairment losses, if any. Cost includes expenditure that is directly
attributable to the acquisition of the items. Profit / loss arising from retirement / disposal of Art Works are recognised in the statement of profit and loss in the year of occurrence.
3.5 Leases: A lease is classified at the inception date as a finance lease or an operating lease. A lease that transfers substantially all
the risks and rewards incidental to ownership to the Company is classified as a finance lease. Finance leases are capitalised at the commencement of the lease at the inception date at fair value of the leased property
or, if lower, at the present value of the minimum lease payments. The corresponding liability is included in the balance sheet as a finance lease liability. Lease payments are apportioned between finance charges and reduction of the lease liability so as to achieve a constant rate of interest on the remaining balance of the liability. Finance charges are recognised as finance costs in the statement of profit and loss.
A leased asset is depreciated over the useful life of the asset. However, if there is no reasonable certainty that the Company will obtain ownership by the end of the lease term, the asset is depreciated over the shorter of the estimated useful life of the asset and the lease term.
Assets acquired on leases where a significant portion of the risks and rewards of ownership are retained by lessor are classified as operating leases. Operating lease payments are recognised as an expense in the statement of profit and loss on a straight-line basis over the lease term except where another systematic basis is more representative of time pattern in which economic benefits from the leased assets are consumed.
3.6 Inventories: Inventories are valued at the lower of cost and net realizable value except scrap (cullet), which is valued at net realizable
value. Net realisable value is the estimated selling price in the ordinary course of business, less estimated costs of completion and the estimated costs necessary to make the sale. The cost of inventories comprises of cost of purchase, cost of conversion and other costs incurred in bringing the inventories to their respective present location and condition. Cost is computed on the weighted average basis. Cost of work in progress and finished goods is determined on absorption costing method.
3.7 Cash and cash equivalents: Cash and cash equivalent in the balance sheet comprise cash at banks, cash on hand and short-term deposits with an
original maturity of three months or less, which are subject to an insignificant risk of changes in value. For the purpose of the statement of cash flows, cash and cash equivalents consist of cash and short-term deposits,
as defined above, net of outstanding bank overdrafts as they are considered an integral part of the Company's cash management.
3.8 Impairment of assets: An asset is considered as impaired when at the date of Balance Sheet, there are indications of impairment and the carrying
amount of the asset, or where applicable, the cash generating unit to which the asset belongs, exceeds its recoverable amount (i.e. the higher of the net asset selling price and value in use).The carrying amount is reduced to the recoverable amount and the reduction is recognized as an impairment loss in the statement of profit and loss. The impairment loss recognized in the prior accounting period is reversed if there has been a change in the estimate of recoverable amount. Post impairment, depreciation is provided on the revised carrying value of the impaired asset over its remaining useful life.
Notes to the standalone financial statement for the year ended 31st March, 2017
Annual Report 2016 - 2017 91
3.9 Discontinued operation and non-current assets (or disposal groups) held for sale: Discontinued operation: A discontinued operation is a component of the Company that has been disposed off or is classified as held for sale and
that represents a separate major line of business or geographical area of operations, is part of a single co-ordinated plan to dispose off such a line of business or area of operations, or is a subsidiary acquired exclusively with a view to resale. The results of discontinued operations are presented separately in the statement of profit or loss.
Held for Sale: Non-current assets are classified as held for sale if their carrying amount will be recovered principally through a sale
transaction rather than through continuing use. This condition is regarded as met only when a sale is highly probable from the date of classification, management are committed to the sale and the asset is available for immediate sale in its present condition. Non-current assets are classified as held for sale from the date these conditions are met and are measured at the lower of carrying amount and fair value less cost to sell. Any resulting impairment loss is recognised in the statement of profit and loss as a separate line item. On classification as held for sale, the assets are no longer depreciated. Assets and liabilities classified as held for sale are presented separately as current items in the Balance Sheet.
3.10 Financial instruments – initial recognition, subsequent measurement and impairment: A financial instrument is any contract that gives rise to a financial asset of one entity and a financial liability or equity
instrument of another entity. I) Financial assets - Initial recognition and measurement: All financial assets are initially recognized at fair value. Transaction costs that are directly attributable to the acquisition
or issue of financial assets, which are not at fair value through profit or loss, are adjusted to the fair value on initial recognition. Financial assets are classified, at initial recognition, as financial assets measured at fair value or as financial assets measured at amortised cost.
Financial assets - Subsequent measurement: For the purpose of subsequent measurement, financial assets are classified in two broad categories:- a) Financial assets at fair value b) Financial assets at amortised cost Where assets are measured at fair value, gains and losses are either recognised entirely in the statement of profit and
loss (i.e fair value through profit or loss), or recognised in other comprehensive income (i.e. fair value through other comprehensive income)
A financial asset that meets the following two conditions is measured at amortised cost (net of any write down for impairment) unless the asset is designated at fair value through profit or loss under the fair value option.
a) Business model test: The objective of the Company's business model is to hold the financial asset to collect the contractual cash flow.
b) Cash flow characteristics test: The contractual terms of the financial asset give rise on specified dates to cash flow that are solely payments of principal and interest on the principal amount outstanding.
A financial asset that meets the following two conditions is measured at fair value through other comprehensive income unless the asset is designated at fair value through profit or loss under the fair value option.
a) Business model test: The financial asset is held within a business model whose objective is achieved by both collecting contractual cash flow and selling financial assets.
b) Cash flow characteristics test: The contractual terms of the financial asset give rise on specified dates to cash flow that are solely payments of principal and interest on the principal amount outstanding.
All other financial asset is measured at fair value through profit or loss. Financial assets - Equity Investment in subsidiaries, associates and joint venture: The Company has accounted for its equity investment in subsidiaries, associates and joint venture at cost. Financial assets - Derecognition A financial assets (or, where applicable, a part of a financial asset or part of a group of similar financial assets) is
primarily derecognised (i.e. removed form the Company's statement of financial position) when: a) The rights to receive cash flows from the asset have expired, or b) The Company has transferred its rights to receive cash flow from the asset.
Notes to the standalone financial statement for the year ended 31st March, 2017
92 Annual Report 2016 - 201792
II) Financial liabilities - Initial recognition and measurement: The financial liabilities are recognised initially at fair value and, in the case of loans and borrowings and payables, net of
directly attributable transaction costs. Financial liabilities - Subsequent measurement: Financial liabilities are subsequently carried at amortized cost using the effective interest method. For trade and other
payables maturing within one year from the balance sheet date, the carrying amounts are approximate at their fair value due to the short maturity of these instruments.
Financial Liabilities - Financial guarantee contracts: Financial guarantee contracts issued by the Company are those contracts that require a payment to be made to reimburse
the holder for a loss it incurs because the specified debtor fails to make a payment when due in accordance with the terms of a debt instrument. Financial guarantee contracts are recognised initially as a liability at fair value, adjusted for transaction costs that are directly attributable to the issuance of the guarantee. Subsequently, the liability is measured at the higher of the amount of loss allowance determined and the amount recognised less cumulative amortisation.
Financial Liabilities - Derecognition: A financial liability is derecognised when the obligation under the liability is discharged or cancelled or expires. When
an existing financial liability is replaced by another, from the same lender on substantially different terms, or the terms of an existing liability are substantially modified, such an exchange or modification is treated as the derecognition of the original liability and the recognition of a new liability. The difference in the respective carrying amounts is recognised in the statement of profit and loss.
3.11 Provisions, Contingent Liabilities, Contingent Assets and Commitments: Provisions are recognised when the Company has a present obligation (legal or constructive) as a result of a past event. It
is probable that an outflow of resources embodying economic benefits will be required to settle the obligation and a reliable estimate can be made of the amount of the obligation. If the effect of the time value of money is material, provisions are discounted using equivalent period government securities interest rate. Unwinding of the discount is recognised in the statement of profit and loss as a finance cost. Provisions are reviewed at each balance sheet date and are adjusted to reflect the current best estimate.
Contingent liabilities are disclosed when there is a possible obligation arising from past events, the existence of which will be confirmed only by the occurrence or non-occurrence of one or more uncertain future events not wholly within the control of the Company or a present obligation that arises from past events where it is either not probable that an outflow of resources will be required to settle or a reliable estimate of the amount cannot be made. Information on contingent liability is disclosed in the Notes to the Financial Statements. Contingent assets are not recognised. However, when the realisation of income is virtually certain, then the related asset is no longer a contingent asset, but it is recognised as an asset.
3.12 Dividend Distribution: Annual dividend distribution to the shareholders is recognised as a liability in the period in which the dividends are approved
by the shareholders Any interim dividend paid is recognised on approval by Board of Directors. Dividend payable and corresponding tax on dividend distribution is recognised directly in other equity.
3.13 Revenue recognition and other income: Sale of goods: Revenue from the sale of goods is recognised when the significant risks and rewards of ownership of the goods have
passed to the buyer as per the terms of the contracts, usually on delivery of the goods, and no significant uncertainty exists regarding the amount of the consideration that will be derived from the sale of goods. It also includes excise duty, if applicable, and excludes value added tax / sales tax. Revenue from the sale of goods is measured at the fair value of the consideration received or receivable, net of returns and allowances, trade discounts and volume rebates.
Sale of Services: Revenue from sale of services is recognised as per the terms of the contract with customer based on stage of completion
when the outcome of the transactions involving rendering of services can be estimated reliably. Percentage of completion method requires the Company to estimate the services performed to date as a proportion of the total services to be performed.
Other Operating Income: Incentives on exports and other Government incentives related to operations are recognised in the statement of profit or
loss after due consideration of certainty of utilization/receipt of such incentives.
Notes to the standalone financial statement for the year ended 31st March, 2017

Annual Report 2016 - 2017 93
Interest Income: Interest income from a financial asset is recognised when it is probable that the economic benefits will flow to the Company
and the amount of income can be measured reliably. Interest income is accrued on a time basis, by reference to the principal outstanding and at the effective interest rate applicable, which is the rate that exactly discounts estimated future cash receipts through the expected life of the financial asset to that asset’s net carrying amount on initial recognition.
Dividend Income: Dividend Income is recognised when the right to receive the payment is established. Rental income: Rental income arising from operating leases is accounted for on a straight-line basis over the lease terms and is included
as other income in the statement of profit or loss.3.14 Foreign currency reinstatement and translation: Transactions in foreign currencies are initially recorded by the Company at rates prevailing at the date of the transaction.
Subsequently monetary items are translated at closing exchange rates as on balance sheet date and the resulting exchange difference recognised in statement of profit and loss. Differences arising on settlement of monetary items are also recognised in statement of profit and loss.
Non-monetary items that are measured in terms of historical cost in a foreign currency are translated using the exchange rates at the dates of the transaction. Non-monetary items carried at fair value that are denominated in foreign currencies are translated at the exchange rates prevailing at the date when the fair value was determined. The gain or loss arising on translation of non-monetary items measured at fair value is treated in line with the recognition of the gain or loss on the change in fair value of the item (i.e., translation differences on items whose fair value gain or loss is recognised in OCI or profit or loss are also recognised in OCI or profit or loss, respectively).
Foreign exchange differences regarded as an adjustment to borrowing costs are presented in the statement of profit and loss, within finance costs. All other finance gains / losses are presented in the statement of profit and loss on a net basis.
3.15 Employee Benefits: Short term employee benefits are recognized as an expense in the statement of profit and loss of the year in which the
related services are rendered. Leave encashment being a defined benefit plan is accounted for using the projected unit credit method, on the basis of
actuarial valuations carried out by third party actuaries at each Balance Sheet date. Actuarial gains and losses arising from experience adjustments and changes in actuarial assumptions are charged or credited to other comprehensive income in the year in which they arise. Other costs are accounted in statement of profit and loss.
Contribution to Provident Fund, a defined contribution plan, is made in accordance with the statute, and is recognised as an expense in the year in which employees have rendered services.
Contribution to Superannuation fund, a defined contribution plan, is made in accordance with the Company policy, and is recognised as an expense in the year in which employees have rendered services.
The cost of providing gratuity, a defined benefit plans, is determined using the Projected Unit Credit Method, on the basis of actuarial valuations carried out by third party actuaries at each Balance Sheet date. Actuarial gains and losses arising from experience adjustments and changes in actuarial assumptions are charged or credited to other comprehensive income in the period in which they arise. Other costs are accounted in statement of profit and loss.
Remeasurements of defined benefit plan in respect of post employment and other long term benefits are charged to the other comprehensive income in the year in which they occur. Remeasurements are not reclassified to statement of profit and loss in subsequent periods.
3.16 Taxes on Income: Income tax expense represents the sum of current tax (including MAT and income tax for earlier years) and deferred tax.
Tax is recognised in the statement of profit and loss, except to the extent that it relates to items recognised directly in equity or other comprehensive income, in such cases the tax is also recognised directly in equity or in other comprehensive income. Any subsequent change in direct tax on items initially recognised in equity or other comprehensive income is also recognised in equity or other comprehensive income.
Current tax provision is computed for income calculated after considering allowances and exemptions under the provisions of the applicable Income Tax Laws. Current tax assets and current tax liabilities are off set, and presented as net.
Deferred tax is recognised on differences between the carrying amounts of assets and liabilities in the Balance sheet and the corresponding tax bases used in the computation of taxable profit. Deferred tax liabilities are generally recognised for
Notes to the standalone financial statement for the year ended 31st March, 2017
94 Annual Report 2016 - 201794
all taxable temporary differences, and deferred tax assets are generally recognised for all deductible temporary differences, carry forward tax losses and allowances to the extent that it is probable that future taxable profits will be available against which those deductible temporary differences, carry forward tax losses and allowances can be utilised. Deferred tax assets and liabilities are measured at the applicable tax rates. The carrying amount of deferred tax assets is reviewed at each balance sheet date and reduced to the extent that it is no longer probable that sufficient taxable profits will be available against which the temporary differences can be utilised.
Minimum Alternative Tax (MAT) is applicable to the Company. Credit of MAT is recognised as an asset only when and to the extent there is convincing evidence that the Company will pay normal income tax during the specified period, i.e., the period for which MAT credit is allowed to be carried forward. In the year in which the MAT credit becomes eligible to be recognised as an asset, the said asset is created by way of a credit to the statement of profit and loss and shown as MAT credit entitlement. The Company reviews the same at each balance sheet date and writes down the carrying amount of MAT credit entitlement to the extent there is no longer convincing evidence to the effect that the Company will pay normal income tax during the specified period.
3.17 Borrowing Costs: Borrowing costs specifically relating to the acquisition or construction of qualifying assets that necessarily takes a substantial
period of time to get ready for its intended use are capitalized (net of income on temporarily deployment of funds) as part of the cost of such assets. Borrowing costs consist of interest and other costs that the Company incurs in connection with the borrowing of funds. For general borrowing used for the purpose of obtaining a qualifying asset, the amount of borrowing costs eligible for capitalization is determined by applying a capitalization rate to the expenditures on that asset. The capitalization rate is the weighted average of the borrowing costs applicable to the borrowings of the Company that are outstanding during the period, other than borrowings made specifically for the purpose of obtaining a qualifying asset. The amount of borrowing costs capitalized during a period does not exceed the amount of borrowing cost incurred during that period. All other borrowing costs are expensed in the period in which they occur.
3.18 Earnings per share: Basic earnings per share is computed using the net profit for the year attributable to the shareholders’ and weighted
average number of equity shares outstanding during the year. Diluted earnings per share is computed using the net profit for the year attributable to the shareholders’ and weighted average
number of equity and potential equity shares outstanding during the year including share options, convertible preference shares and debentures, except where the result would be anti-dilutive. Potential equity shares that are converted during the year are included in the calculation of diluted earnings per share, from the beginning of the year or date of issuance of such potential equity shares, to the date of conversion.
3.19 Current and non-current classification: The Company presents assets and liabilities in statement of financial position based on current/non-current classification. The Company has presented non-current assets and current assets before equity, non-current liabilities and current
liabilities in accordance with Schedule III, Division II of Companies Act, 2013 notified by MCA. An asset is classified as current when it is: a) Expected to be realised or intended to be sold or consumed in normal operating cycle, b) Held primarily for the purpose of trading, c) Expected to be realised within twelve months after the reporting period, or d) Cash or cash equivalent unless restricted from being exchanged or used to settle a liability for at least twelve months
after the reporting period. All other assets are classified as non-current. A liability is classified as current when it is: a) Expected to be settled in normal operating cycle, b) Held primarily for the purpose of trading, c) Due to be settled within twelve months after the reporting period, or d) There is no unconditional right to defer the settlement of the liability for at least twelve months after the reporting period. All other liabilities are classified as non-current. The operating cycle is the time between the acquisition of assets for processing and their realisation in cash or cash
equivalents. Deferred tax assets and liabilities are classified as non-current assets and liabilities. The Company has identified twelve months as its normal operating cycle.
Notes to the standalone financial statement for the year ended 31st March, 2017
Annual Report 2016 - 2017 95
3.20 Fair value measurement: The Company measures financial instruments at fair value at each balance sheet date. Fair value is the price that would be received to sell an asset or paid to transfer a liability in an orderly transaction between
market participants at the measurement date. The fair value measurement is based on the presumption that the transaction to sell the asset or transfer the liability takes place either:
a) In the principal market for the asset or liability, or b) In the absence of a principal market, in the most advantageous market for the asset or liability. A fair value measurement of a non-financial asset takes into account a market participant’s ability to generate economic
benefits by using the asset in its highest and best use or by selling it to another market participant that would use the asset in its highest and best use.
The Company uses valuation techniques that are appropriate in the circumstances and for which sufficient data are available to measure fair value, maximising the use of relevant observable inputs and minimising the use of unobservable inputs.
All assets and liabilities for which fair value is measured or disclosed in the financial statements are categorised within the fair value hierarchy.
3.21 Off-setting financial Instrument: Financial assets and liabilities are offset and the net amount is reported in the balance sheet where there is a legally
enforceable rights to offset the recognised amounts and there is an intention to settle on a net basis or realise the asset and settle the liability simultaneously. The legally enforceable rights must not be contingent on future events and must be enforceable in the normal course of business and in the event of default, insolvency or bankruptcy of the Company or counterparty.
Note 4 - SIGNIFICANT ACCOUNTING JUDGEMENTS, ESTIMATES AND ASSUMPTIONS: The preparation of the financial statements requires management to make judgements, estimates and assumptions that
affect the reported amounts of revenues, expenses, assets and liabilities, and the accompanying disclosures, and the disclosure of contingent liabilities. Uncertainty about these assumptions and estimates could result in outcomes that require a material adjustment to the carrying amount of assets or liabilities affected in future periods. The key assumptions concerning the future and other key sources of estimation uncertainty at the reporting date, that have a significant risk of causing a material adjustment to the carrying amounts of assets and liabilities within the next financial year, are described below. The Company based on its assumptions and estimates on parameters available when the financial statements were prepared. However, existing circumstances and assumptions about future developments may change due to market changes or circumstances arising that are beyond the control of the Company. Such changes are reflected in the assumptions when they occur.
4.1 Property, plant and equipment, Investment Properties and Intangible Assets: Management reviews the estimated useful lives and residual values of the assets annually in order to determine the amount
of depreciation to be recorded during any reporting period. The useful lives and residual values as per schedule II of the Companies Act, 2013 or are based on the Company’s historical experience with similar assets and taking into account anticipated technological changes, whichever is more appropriate.
4.2 Income Tax: The Company reviews at each balance sheet date the carrying amount of deferred tax assets. The factors used in estimates
may differ from actual outcome which could lead to an adjustment to the amounts reported in the standalone financial statements.
4.3 Contingencies: Management has estimated the possible outflow of resources at the end of each annual reporting financial year, if any,
in respect of contingencies/claim/litigations against the Company as it is not possible to predict the outcome of pending matters with accuracy.
4.4 Impairment of financial assets: The impairment provisions for financial assets are based on assumptions about risk of default and expected cash loss. The
Company uses judgement in making these assumptions and selecting the inputs to the impairment calculation, based on Company’s past history, existing market conditions as well as forward looking estimates at the end of each reporting period.
4.5 Impairment of non-financial assets: The Company assesses at each reporting date whether there is an indication that an asset may be impaired. If any indication
exists, or when annual impairment testing for an asset is required, the Company estimates the asset’s recoverable amount.
Notes to the standalone financial statement for the year ended 31st March, 2017
96 Annual Report 2016 - 201796
An asset’s recoverable amount is the higher of an asset’s or Cash Generating Units (CGU) fair value less costs of disposal and its value in use. It is determined for an individual asset, unless the asset does not generate cash inflows that are largely independent to those from other assets or groups of assets. Where the carrying amount of an asset or CGU exceeds its recoverable amount, the asset is considered impaired and is written down to its recoverable amount.
In assessing value in use, the estimated future cash flows are discounted to their present value using a pre-tax discount rate that reflects current market assessments of the time value of money and the risks specific to the asset. In determining fair value less cost of disposal, recent market transactions are taken into account. If no such transactions can be identified, an appropriate valuation model is used. These calculations are corroborated by valuation multiples or other available fair value indicators
4.6 Defined benefits plans: The Cost of the defined benefit plan and other post-employment benefits and the present value of such obligation are
determined using actuarial valuations. An actuarial valuation involves making various assumptions that may differ from actual developments in the future. These include the determination of the discount rate, future salary increases, mortality rates and attrition rate. Due to the complexities involved in the valuation and its long-term nature, a defined benefit obligation is highly sensitive to changes in these assumptions. All assumptions are reviewed at each reporting date.
4.7 Recoverability of trade receivable: Judgements are required in assessing the recoverability of overdue trade receivables and determining whether a provision
against those receivables is required. Factors considered include the credit rating of the counterparty, the amount and timing of anticipated future payments and any possible actions that can be taken to mitigate the risk of non-payment.
4.8 Provisions: Provisions and liabilities are recognized in the period when it becomes probable that there will be a future outflow of funds
resulting from past operations or events and the amount of cash outflow can be reliably estimated. The timing of recognition and quantification of the liability require the application of judgement to existing facts and circumstances, which can be subject to change. Since the cash outflows can take place many years in the future, the carrying amounts of provisions and liabilities are reviewed regularly and adjusted to take account of changing facts and circumstances.
4.9 Fair value measurement of financial instruments : When the fair value of financial assets and financial liabilities recorded in the balance sheet cannot be measured based on
quoted prices in active markets, their fair value is measured using valuation techniques including the Discounted Cash Flow (DCF) model. The inputs to these models are taken from observable markets where possible, but where this is not feasible, a degree of judgement is required in establishing fair values. Judgements include considerations of inputs such as liquidity risk, credit risk and volatility. Changes in assumptions about these factors could affect the reported fair value of financial instruments.
Notes to the standalone financial statement for the year ended 31st March, 2017
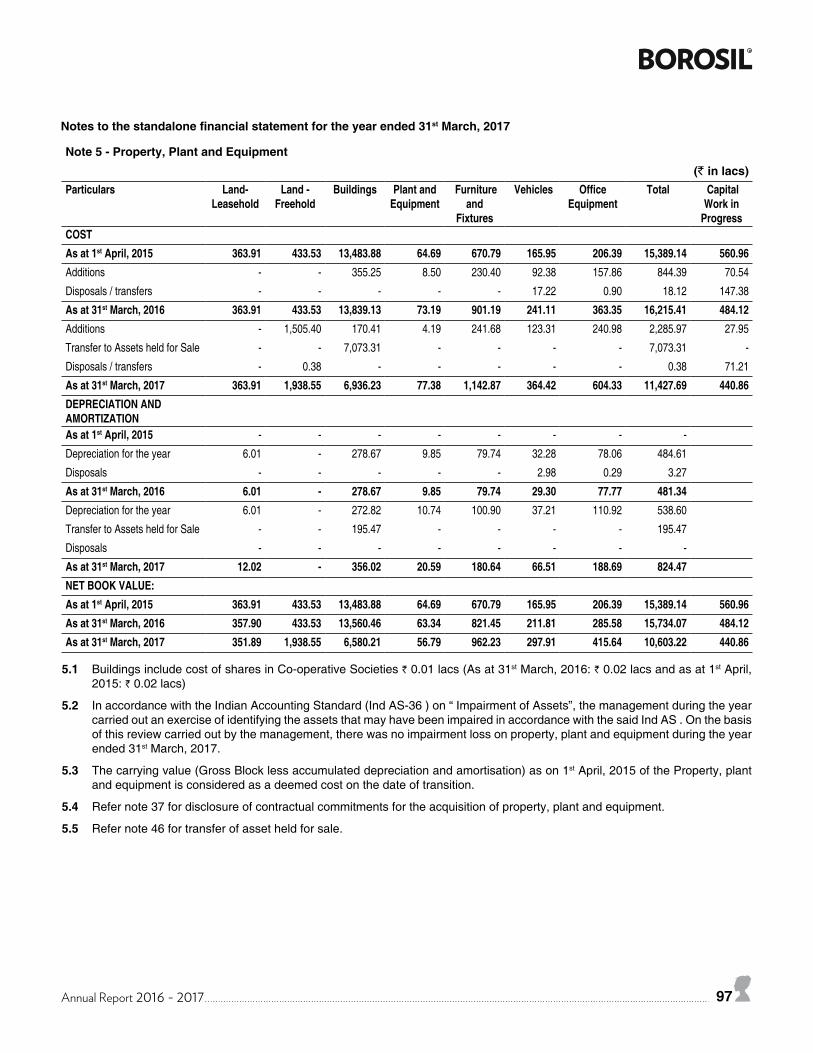
Annual Report 2016 - 2017 97
Note 5 - Property, Plant and Equipment(` in lacs)
Particulars Land- Leasehold
Land - Freehold
Buildings Plant and Equipment
Furniture and
Fixtures
Vehicles Office Equipment
Total Capital Work in
ProgressCOSTAs at 1st April, 2015 363.91 433.53 13,483.88 64.69 670.79 165.95 206.39 15,389.14 560.96Additions - - 355.25 8.50 230.40 92.38 157.86 844.39 70.54
Disposals / transfers - - - - - 17.22 0.90 18.12 147.38
As at 31st March, 2016 363.91 433.53 13,839.13 73.19 901.19 241.11 363.35 16,215.41 484.12Additions - 1,505.40 170.41 4.19 241.68 123.31 240.98 2,285.97 27.95
Transfer to Assets held for Sale - - 7,073.31 - - - - 7,073.31 -
Disposals / transfers - 0.38 - - - - - 0.38 71.21
As at 31st March, 2017 363.91 1,938.55 6,936.23 77.38 1,142.87 364.42 604.33 11,427.69 440.86DEPRECIATION AND AMORTIZATIONAs at 1st April, 2015 - - - - - - - -
Depreciation for the year 6.01 - 278.67 9.85 79.74 32.28 78.06 484.61
Disposals - - - - - 2.98 0.29 3.27
As at 31st March, 2016 6.01 - 278.67 9.85 79.74 29.30 77.77 481.34Depreciation for the year 6.01 - 272.82 10.74 100.90 37.21 110.92 538.60
Transfer to Assets held for Sale - - 195.47 - - - - 195.47
Disposals - - - - - - - -
As at 31st March, 2017 12.02 - 356.02 20.59 180.64 66.51 188.69 824.47NET BOOK VALUE:As at 1st April, 2015 363.91 433.53 13,483.88 64.69 670.79 165.95 206.39 15,389.14 560.96As at 31st March, 2016 357.90 433.53 13,560.46 63.34 821.45 211.81 285.58 15,734.07 484.12As at 31st March, 2017 351.89 1,938.55 6,580.21 56.79 962.23 297.91 415.64 10,603.22 440.86
5.1 Buildings include cost of shares in Co-operative Societies ` 0.01 lacs (As at 31st March, 2016: ` 0.02 lacs and as at 1st April, 2015: ` 0.02 lacs)
5.2 In accordance with the Indian Accounting Standard (Ind AS-36 ) on “ Impairment of Assets”, the management during the year carried out an exercise of identifying the assets that may have been impaired in accordance with the said Ind AS . On the basis of this review carried out by the management, there was no impairment loss on property, plant and equipment during the year ended 31st March, 2017.
5.3 The carrying value (Gross Block less accumulated depreciation and amortisation) as on 1st April, 2015 of the Property, plant and equipment is considered as a deemed cost on the date of transition.
5.4 Refer note 37 for disclosure of contractual commitments for the acquisition of property, plant and equipment.
5.5 Refer note 46 for transfer of asset held for sale.
Notes to the standalone financial statement for the year ended 31st March, 2017
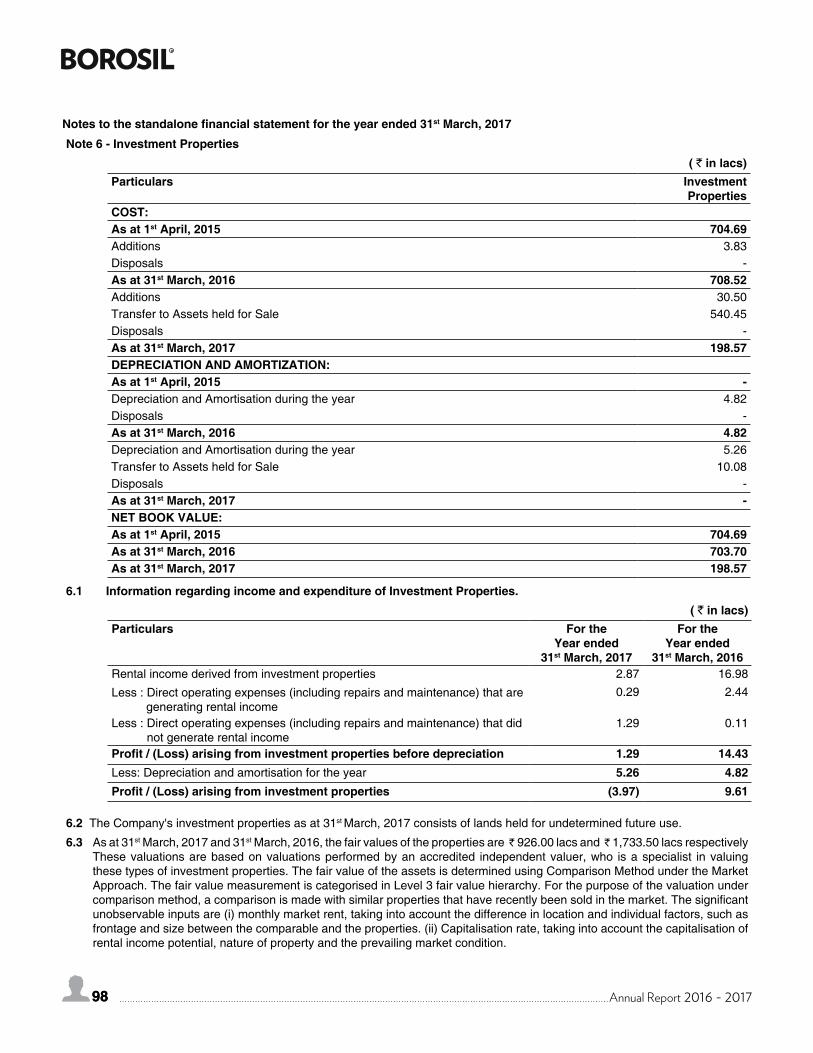
98 Annual Report 2016 - 201798
Note 6 - Investment Properties( ` in lacs)
Particulars Investment Properties
COST:As at 1st April, 2015 704.69Additions 3.83Disposals -As at 31st March, 2016 708.52Additions 30.50Transfer to Assets held for Sale 540.45Disposals -As at 31st March, 2017 198.57DEPRECIATION AND AMORTIZATION:As at 1st April, 2015 -Depreciation and Amortisation during the year 4.82Disposals -As at 31st March, 2016 4.82Depreciation and Amortisation during the year 5.26Transfer to Assets held for Sale 10.08Disposals -As at 31st March, 2017 -NET BOOK VALUE:As at 1st April, 2015 704.69As at 31st March, 2016 703.70As at 31st March, 2017 198.57
6.1 Information regarding income and expenditure of Investment Properties.( ` in lacs)
Particulars For the Year ended
31st March, 2017
For the Year ended
31st March, 2016Rental income derived from investment properties 2.87 16.98
Less : Direct operating expenses (including repairs and maintenance) that are generating rental income
0.29 2.44
Less : Direct operating expenses (including repairs and maintenance) that did not generate rental income
1.29 0.11
Profit / (Loss) arising from investment properties before depreciation 1.29 14.43Less: Depreciation and amortisation for the year 5.26 4.82Profit / (Loss) arising from investment properties (3.97) 9.61
6.2 The Company's investment properties as at 31st March, 2017 consists of lands held for undetermined future use.
6.3 As at 31st March, 2017 and 31st March, 2016, the fair values of the properties are ̀ 926.00 lacs and ̀ 1,733.50 lacs respectively These valuations are based on valuations performed by an accredited independent valuer, who is a specialist in valuing these types of investment properties. The fair value of the assets is determined using Comparison Method under the Market Approach. The fair value measurement is categorised in Level 3 fair value hierarchy. For the purpose of the valuation under comparison method, a comparison is made with similar properties that have recently been sold in the market. The significant unobservable inputs are (i) monthly market rent, taking into account the difference in location and individual factors, such as frontage and size between the comparable and the properties. (ii) Capitalisation rate, taking into account the capitalisation of rental income potential, nature of property and the prevailing market condition.
Notes to the standalone financial statement for the year ended 31st March, 2017
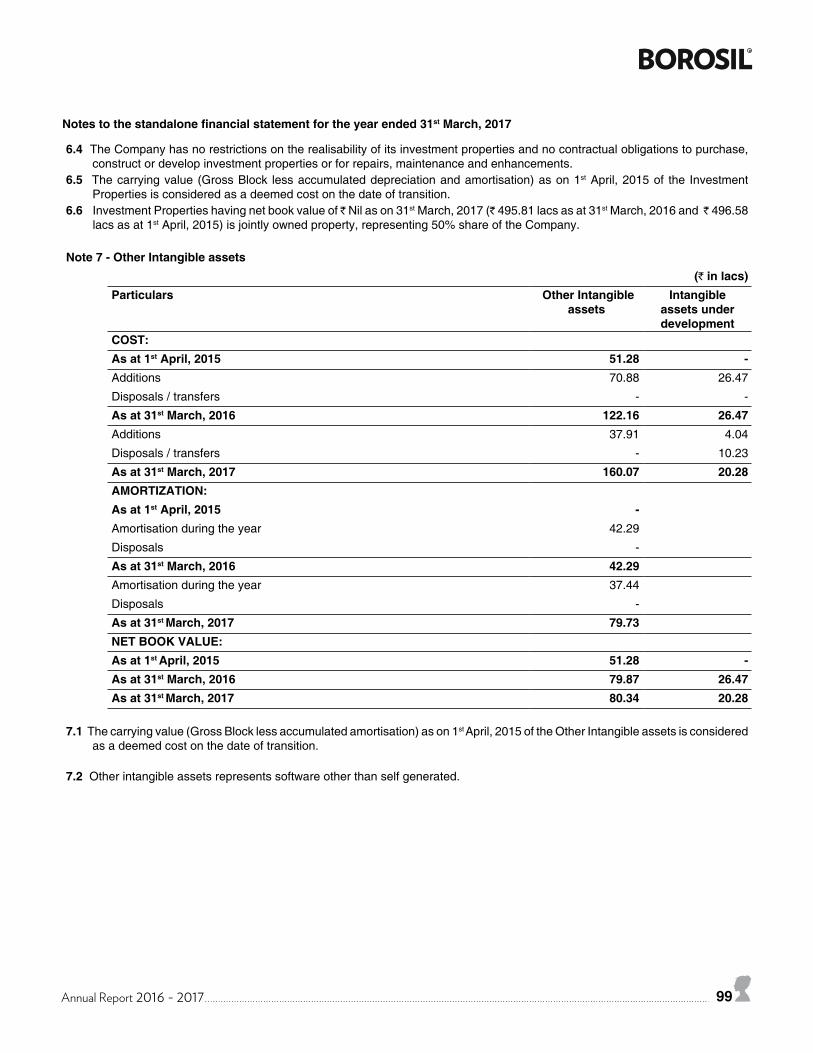
Annual Report 2016 - 2017 99
6.4 The Company has no restrictions on the realisability of its investment properties and no contractual obligations to purchase, construct or develop investment properties or for repairs, maintenance and enhancements.
6.5 The carrying value (Gross Block less accumulated depreciation and amortisation) as on 1st April, 2015 of the Investment Properties is considered as a deemed cost on the date of transition.
6.6 Investment Properties having net book value of ̀ Nil as on 31st March, 2017 (` 495.81 lacs as at 31st March, 2016 and ̀ 496.58 lacs as at 1st April, 2015) is jointly owned property, representing 50% share of the Company.
Note 7 - Other Intangible assets(` in lacs)
Particulars Other Intangible assets
Intangible assets under development
COST:As at 1st April, 2015 51.28 -Additions 70.88 26.47
Disposals / transfers - -
As at 31st March, 2016 122.16 26.47Additions 37.91 4.04
Disposals / transfers - 10.23
As at 31st March, 2017 160.07 20.28AMORTIZATION:As at 1st April, 2015 -Amortisation during the year 42.29
Disposals -
As at 31st March, 2016 42.29Amortisation during the year 37.44
Disposals -
As at 31st March, 2017 79.73NET BOOK VALUE:As at 1st April, 2015 51.28 -As at 31st March, 2016 79.87 26.47As at 31st March, 2017 80.34 20.28
7.1 The carrying value (Gross Block less accumulated amortisation) as on 1st April, 2015 of the Other Intangible assets is considered as a deemed cost on the date of transition.
7.2 Other intangible assets represents software other than self generated.
Notes to the standalone financial statement for the year ended 31st March, 2017
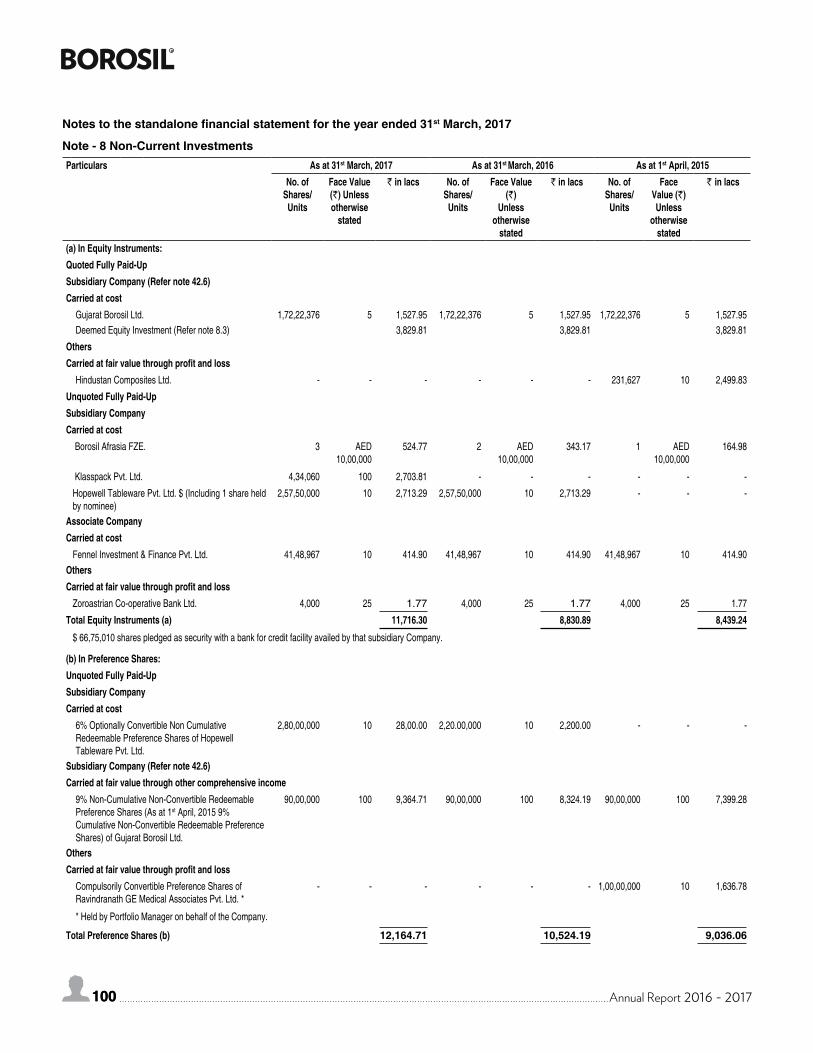
100 Annual Report 2016 - 2017100
Particulars As at 31st March, 2017 As at 31st March, 2016 As at 1st April, 2015No. of
Shares/Units
Face Value (`) Unless otherwise
stated
` in lacs No. of Shares/
Units
Face Value (`)
Unless otherwise
stated
` in lacs No. of Shares/
Units
Face Value (`)Unless
otherwise stated
` in lacs
(a) In Equity Instruments:Quoted Fully Paid-UpSubsidiary Company (Refer note 42.6)Carried at cost
Gujarat Borosil Ltd. 1,72,22,376 5 1,527.95 1,72,22,376 5 1,527.95 1,72,22,376 5 1,527.95Deemed Equity Investment (Refer note 8.3) 3,829.81 3,829.81 3,829.81
OthersCarried at fair value through profit and loss
Hindustan Composites Ltd. - - - - - - 231,627 10 2,499.83
Unquoted Fully Paid-UpSubsidiary CompanyCarried at cost Borosil Afrasia FZE. 3 AED
10,00,000 524.77 2 AED
10,00,000 343.17 1 AED
10,00,000 164.98
Klasspack Pvt. Ltd. 4,34,060 100 2,703.81 - - - - - -
Hopewell Tableware Pvt. Ltd. $ (Including 1 share held by nominee)
2,57,50,000 10 2,713.29 2,57,50,000 10 2,713.29 - - -
Associate CompanyCarried at cost Fennel Investment & Finance Pvt. Ltd. 41,48,967 10 414.90 41,48,967 10 414.90 41,48,967 10 414.90OthersCarried at fair value through profit and loss Zoroastrian Co-operative Bank Ltd. 4,000 25 1.77 4,000 25 1.77 4,000 25 1.77
Total Equity Instruments (a) 11,716.30 8,830.89 8,439.24
$ 66,75,010 shares pledged as security with a bank for credit facility availed by that subsidiary Company.
(b) In Preference Shares:Unquoted Fully Paid-UpSubsidiary CompanyCarried at cost
6% Optionally Convertible Non Cumulative Redeemable Preference Shares of Hopewell Tableware Pvt. Ltd.
2,80,00,000 10 28,00.00 2,20.00,000 10 2,200.00 - - -
Subsidiary Company (Refer note 42.6)Carried at fair value through other comprehensive income
9% Non-Cumulative Non-Convertible Redeemable Preference Shares (As at 1st April, 2015 9% Cumulative Non-Convertible Redeemable Preference Shares) of Gujarat Borosil Ltd.
90,00,000 100 9,364.71 90,00,000 100 8,324.19 90,00,000 100 7,399.28
OthersCarried at fair value through profit and loss
Compulsorily Convertible Preference Shares of Ravindranath GE Medical Associates Pvt. Ltd. *
- - - - - - 1,00,00,000 10 1,636.78
* Held by Portfolio Manager on behalf of the Company.
Total Preference Shares (b) 12,164.71 10,524.19 9,036.06
Notes to the standalone financial statement for the year ended 31st March, 2017
Note - 8 Non-Current Investments
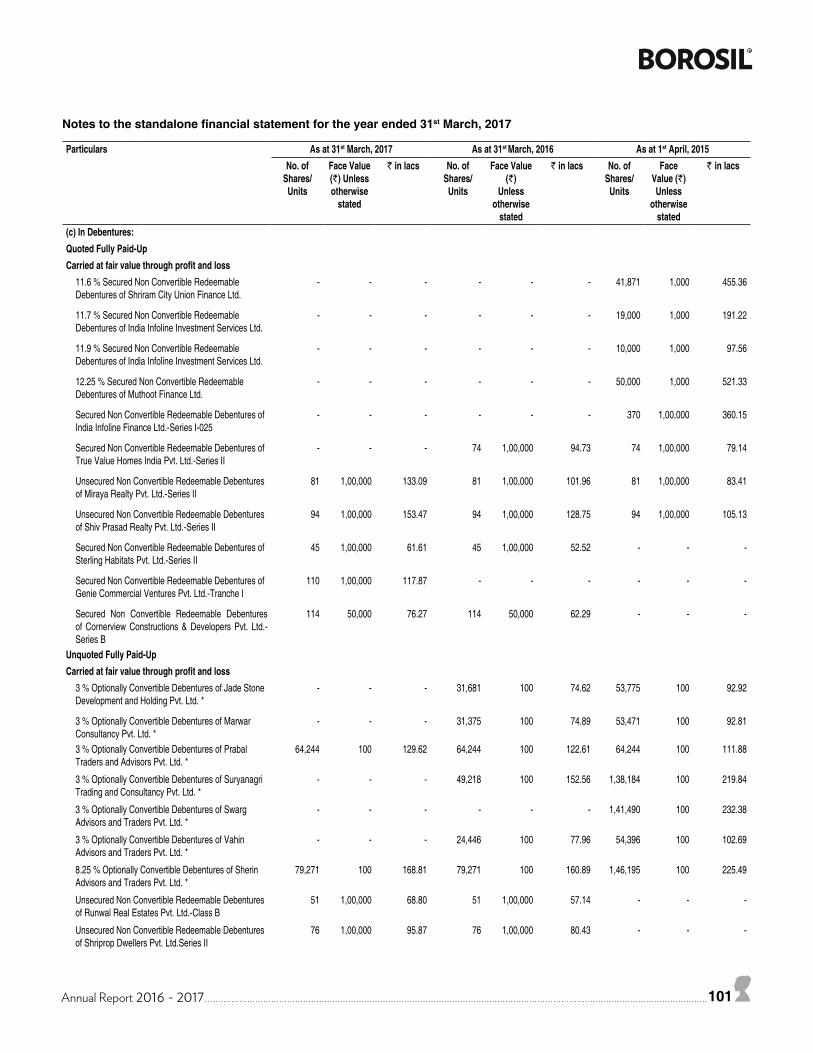
Annual Report 2016 - 2017 101
Particulars As at 31st March, 2017 As at 31st March, 2016 As at 1st April, 2015No. of
Shares/Units
Face Value (`) Unless otherwise
stated
` in lacs No. of Shares/
Units
Face Value (`)
Unless otherwise
stated
` in lacs No. of Shares/
Units
Face Value (`)Unless
otherwise stated
` in lacs
(c) In Debentures:Quoted Fully Paid-UpCarried at fair value through profit and loss
11.6 % Secured Non Convertible Redeemable Debentures of Shriram City Union Finance Ltd.
- - - - - - 41,871 1,000 455.36
11.7 % Secured Non Convertible Redeemable Debentures of India Infoline Investment Services Ltd.
- - - - - - 19,000 1,000 191.22
11.9 % Secured Non Convertible Redeemable Debentures of India Infoline Investment Services Ltd.
- - - - - - 10,000 1,000 97.56
12.25 % Secured Non Convertible Redeemable Debentures of Muthoot Finance Ltd.
- - - - - - 50,000 1,000 521.33
Secured Non Convertible Redeemable Debentures of India Infoline Finance Ltd.-Series I-025
- - - - - - 370 1,00,000 360.15
Secured Non Convertible Redeemable Debentures of True Value Homes India Pvt. Ltd.-Series II
- - - 74 1,00,000 94.73 74 1,00,000 79.14
Unsecured Non Convertible Redeemable Debentures of Miraya Realty Pvt. Ltd.-Series II
81 1,00,000 133.09 81 1,00,000 101.96 81 1,00,000 83.41
Unsecured Non Convertible Redeemable Debentures of Shiv Prasad Realty Pvt. Ltd.-Series II
94 1,00,000 153.47 94 1,00,000 128.75 94 1,00,000 105.13
Secured Non Convertible Redeemable Debentures of Sterling Habitats Pvt. Ltd.-Series II
45 1,00,000 61.61 45 1,00,000 52.52 - - -
Secured Non Convertible Redeemable Debentures of Genie Commercial Ventures Pvt. Ltd.-Tranche I
110 1,00,000 117.87 - - - - - -
Secured Non Convertible Redeemable Debentures of Cornerview Constructions & Developers Pvt. Ltd.-Series B
114 50,000 76.27 114 50,000 62.29 - - -
Unquoted Fully Paid-UpCarried at fair value through profit and loss
3 % Optionally Convertible Debentures of Jade Stone Development and Holding Pvt. Ltd. *
- - - 31,681 100 74.62 53,775 100 92.92
3 % Optionally Convertible Debentures of Marwar Consultancy Pvt. Ltd. *
- - - 31,375 100 74.89 53,471 100 92.81
3 % Optionally Convertible Debentures of Prabal Traders and Advisors Pvt. Ltd. *
64,244 100 129.62 64,244 100 122.61 64,244 100 111.88
3 % Optionally Convertible Debentures of Suryanagri Trading and Consultancy Pvt. Ltd. *
- - - 49,218 100 152.56 1,38,184 100 219.84
3 % Optionally Convertible Debentures of Swarg Advisors and Traders Pvt. Ltd. *
- - - - - - 1,41,490 100 232.38
3 % Optionally Convertible Debentures of Vahin Advisors and Traders Pvt. Ltd. *
- - - 24,446 100 77.96 54,396 100 102.69
8.25 % Optionally Convertible Debentures of Sherin Advisors and Traders Pvt. Ltd. *
79,271 100 168.81 79,271 100 160.89 1,46,195 100 225.49
Unsecured Non Convertible Redeemable Debentures of Runwal Real Estates Pvt. Ltd.-Class B
51 1,00,000 68.80 51 1,00,000 57.14 - - -
Unsecured Non Convertible Redeemable Debentures of Shriprop Dwellers Pvt. Ltd.Series II
76 1,00,000 95.87 76 1,00,000 80.43 - - -
Notes to the standalone financial statement for the year ended 31st March, 2017
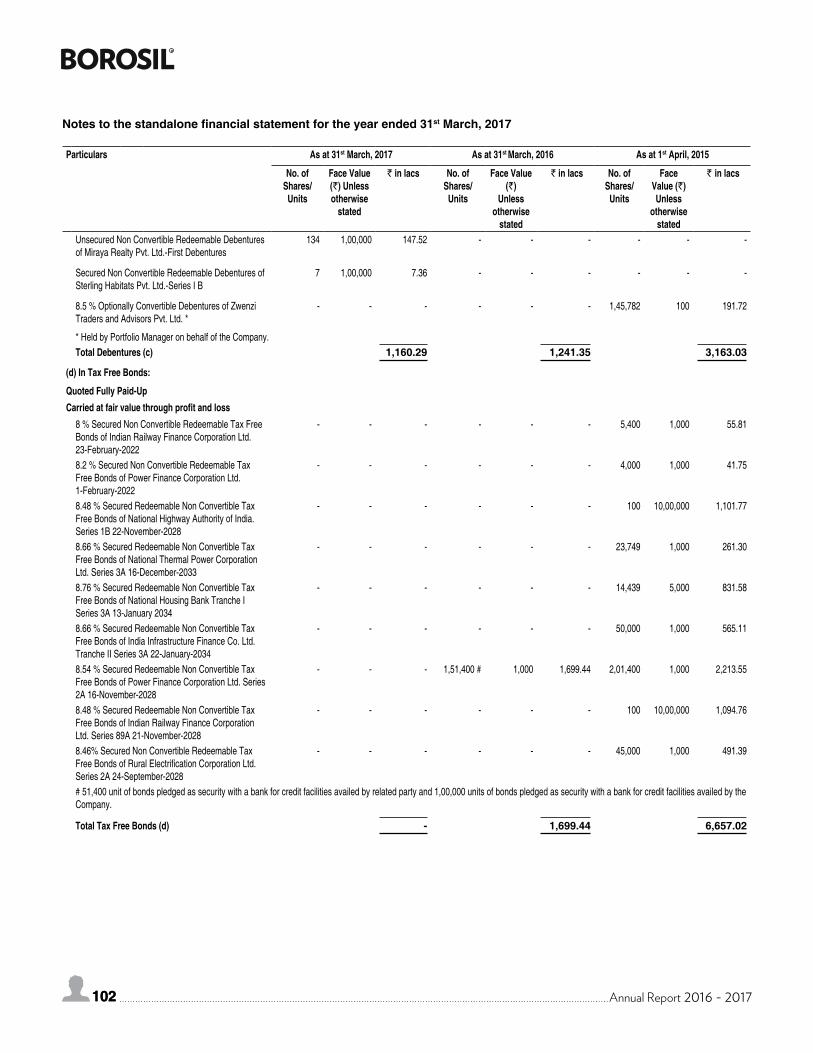
102 Annual Report 2016 - 2017102
Particulars As at 31st March, 2017 As at 31st March, 2016 As at 1st April, 2015
No. of Shares/
Units
Face Value (`) Unless otherwise
stated
` in lacs No. of Shares/
Units
Face Value (`)
Unless otherwise
stated
` in lacs No. of Shares/
Units
Face Value (`)Unless
otherwise stated
` in lacs
Unsecured Non Convertible Redeemable Debentures of Miraya Realty Pvt. Ltd.-First Debentures
134 1,00,000 147.52 - - - - - -
Secured Non Convertible Redeemable Debentures of Sterling Habitats Pvt. Ltd.-Series I B
7 1,00,000 7.36 - - - - - -
8.5 % Optionally Convertible Debentures of Zwenzi Traders and Advisors Pvt. Ltd. *
- - - - - - 1,45,782 100 191.72
* Held by Portfolio Manager on behalf of the Company.Total Debentures (c) 1,160.29 1,241.35 3,163.03
(d) In Tax Free Bonds:
Quoted Fully Paid-UpCarried at fair value through profit and loss
8 % Secured Non Convertible Redeemable Tax Free Bonds of Indian Railway Finance Corporation Ltd. 23-February-2022
- - - - - - 5,400 1,000 55.81
8.2 % Secured Non Convertible Redeemable Tax Free Bonds of Power Finance Corporation Ltd. 1-February-2022
- - - - - - 4,000 1,000 41.75
8.48 % Secured Redeemable Non Convertible Tax Free Bonds of National Highway Authority of India. Series 1B 22-November-2028
- - - - - - 100 10,00,000 1,101.77
8.66 % Secured Redeemable Non Convertible Tax Free Bonds of National Thermal Power Corporation Ltd. Series 3A 16-December-2033
- - - - - - 23,749 1,000 261.30
8.76 % Secured Redeemable Non Convertible Tax Free Bonds of National Housing Bank Tranche I Series 3A 13-January 2034
- - - - - - 14,439 5,000 831.58
8.66 % Secured Redeemable Non Convertible Tax Free Bonds of India Infrastructure Finance Co. Ltd. Tranche II Series 3A 22-January-2034
- - - - - - 50,000 1,000 565.11
8.54 % Secured Redeemable Non Convertible Tax Free Bonds of Power Finance Corporation Ltd. Series 2A 16-November-2028
- - - 1,51,400 # 1,000 1,699.44 2,01,400 1,000 2,213.55
8.48 % Secured Redeemable Non Convertible Tax Free Bonds of Indian Railway Finance Corporation Ltd. Series 89A 21-November-2028
- - - - - - 100 10,00,000 1,094.76
8.46% Secured Non Convertible Redeemable Tax Free Bonds of Rural Electrification Corporation Ltd. Series 2A 24-September-2028
- - - - - - 45,000 1,000 491.39
# 51,400 unit of bonds pledged as security with a bank for credit facilities availed by related party and 1,00,000 units of bonds pledged as security with a bank for credit facilities availed by the Company.
Total Tax Free Bonds (d) - 1,699.44 6,657.02
Notes to the standalone financial statement for the year ended 31st March, 2017
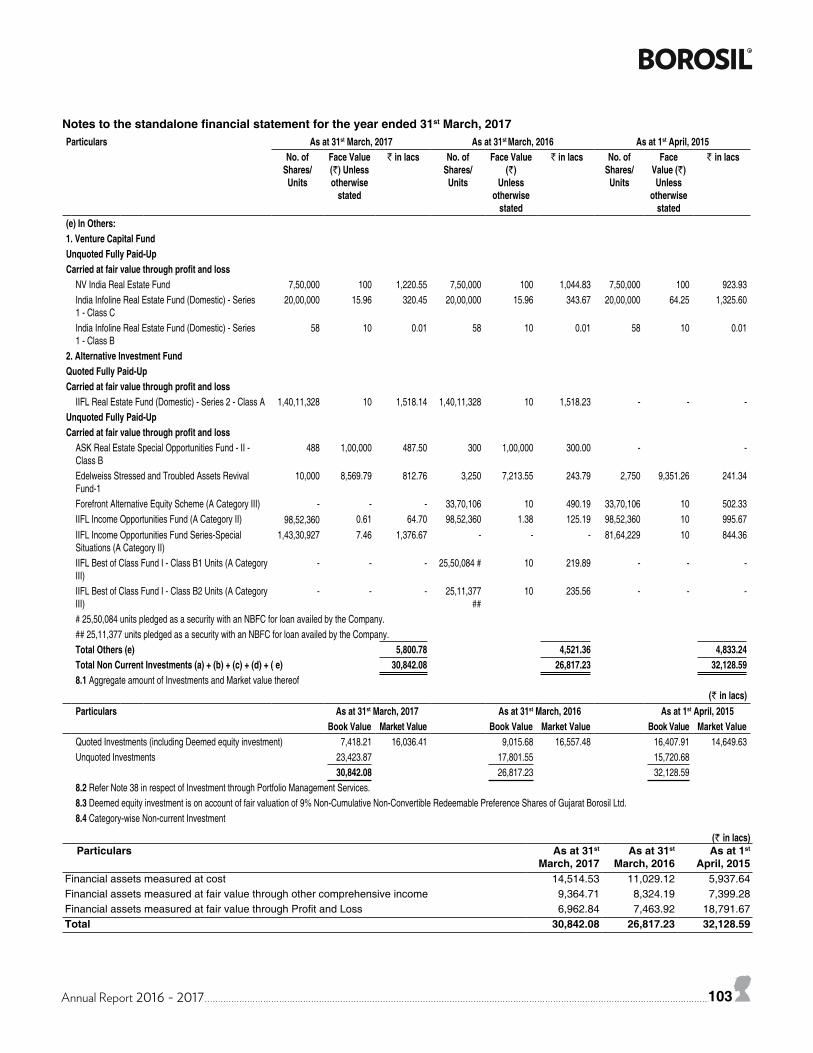
Annual Report 2016 - 2017 103
Particulars As at 31st March, 2017 As at 31st March, 2016 As at 1st April, 2015No. of
Shares/Units
Face Value (`) Unless otherwise
stated
` in lacs No. of Shares/
Units
Face Value (`)
Unless otherwise
stated
` in lacs No. of Shares/
Units
Face Value (`)Unless
otherwise stated
` in lacs
(e) In Others:1. Venture Capital FundUnquoted Fully Paid-UpCarried at fair value through profit and loss
NV India Real Estate Fund 7,50,000 100 1,220.55 7,50,000 100 1,044.83 7,50,000 100 923.93India Infoline Real Estate Fund (Domestic) - Series 1 - Class C
20,00,000 15.96 320.45 20,00,000 15.96 343.67 20,00,000 64.25 1,325.60
India Infoline Real Estate Fund (Domestic) - Series 1 - Class B
58 10 0.01 58 10 0.01 58 10 0.01
2. Alternative Investment FundQuoted Fully Paid-UpCarried at fair value through profit and loss
IIFL Real Estate Fund (Domestic) - Series 2 - Class A 1,40,11,328 10 1,518.14 1,40,11,328 10 1,518.23 - - -Unquoted Fully Paid-UpCarried at fair value through profit and loss
ASK Real Estate Special Opportunities Fund - II - Class B
488 1,00,000 487.50 300 1,00,000 300.00 - -
Edelweiss Stressed and Troubled Assets Revival Fund-1
10,000 8,569.79 812.76 3,250 7,213.55 243.79 2,750 9,351.26 241.34
Forefront Alternative Equity Scheme (A Category III) - - - 33,70,106 10 490.19 33,70,106 10 502.33IIFL Income Opportunities Fund (A Category II) 98,52,360 0.61 64.70 98,52,360 1.38 125.19 98,52,360 10 995.67IIFL Income Opportunities Fund Series-Special Situations (A Category II)
1,43,30,927 7.46 1,376.67 - - - 81,64,229 10 844.36
IIFL Best of Class Fund I - Class B1 Units (A Category III)
- - - 25,50,084 # 10 219.89 - - -
IIFL Best of Class Fund I - Class B2 Units (A Category III)
- - - 25,11,377 ##
10 235.56 - - -
# 25,50,084 units pledged as a security with an NBFC for loan availed by the Company.## 25,11,377 units pledged as a security with an NBFC for loan availed by the Company. Total Others (e) 5,800.78 4,521.36 4,833.24Total Non Current Investments (a) + (b) + (c) + (d) + ( e) 30,842.08 26,817.23 32,128.598.1 Aggregate amount of Investments and Market value thereof
(` in lacs)Particulars As at 31st March, 2017 As at 31st March, 2016 As at 1st April, 2015
Book Value Market Value Book Value Market Value Book Value Market ValueQuoted Investments (including Deemed equity investment) 7,418.21 16,036.41 9,015.68 16,557.48 16,407.91 14,649.63Unquoted Investments 23,423.87 17,801.55 15,720.68
30,842.08 26,817.23 32,128.598.2 Refer Note 38 in respect of Investment through Portfolio Management Services. 8.3 Deemed equity investment is on account of fair valuation of 9% Non-Cumulative Non-Convertible Redeemable Preference Shares of Gujarat Borosil Ltd.8.4 Category-wise Non-current Investment
(` in lacs) Particulars As at 31st
March, 2017As at 31st
March, 2016As at 1st
April, 2015Financial assets measured at cost 14,514.53 11,029.12 5,937.64Financial assets measured at fair value through other comprehensive income 9,364.71 8,324.19 7,399.28Financial assets measured at fair value through Profit and Loss 6,962.84 7,463.92 18,791.67Total 30,842.08 26,817.23 32,128.59
Notes to the standalone financial statement for the year ended 31st March, 2017
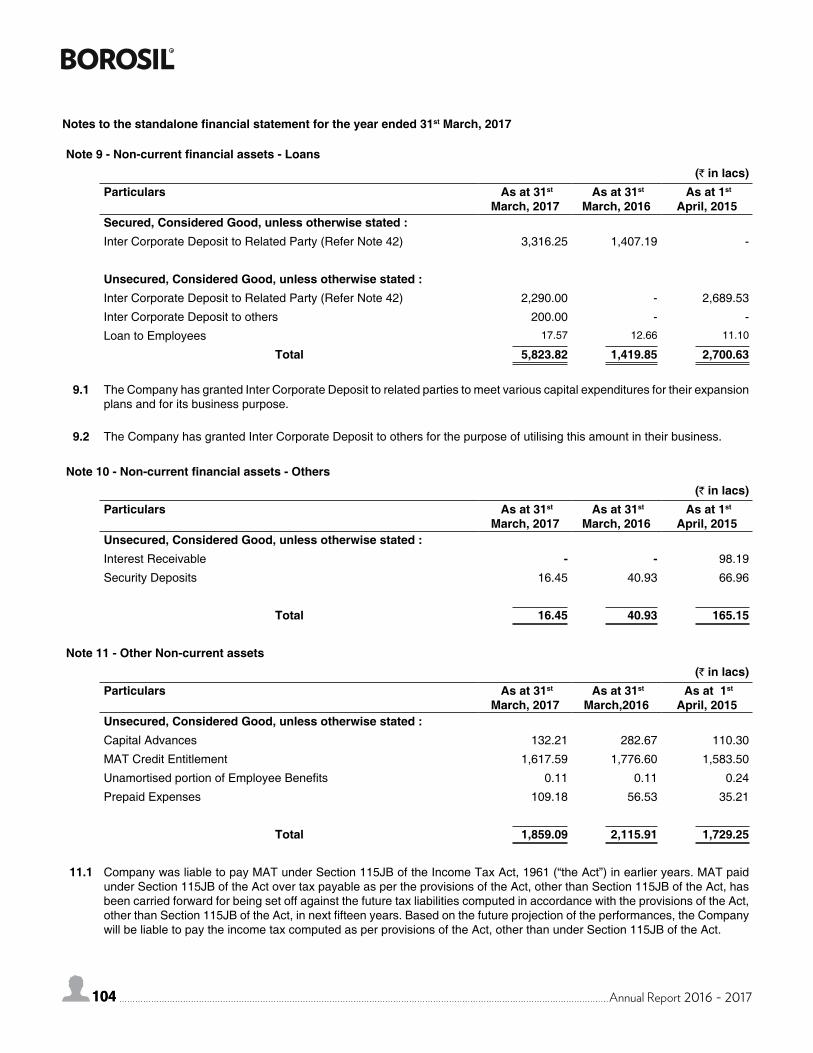
104 Annual Report 2016 - 2017104
Note 9 - Non-current financial assets - Loans (` in lacs)
Particulars As at 31st March, 2017
As at 31st March, 2016
As at 1st April, 2015
Secured, Considered Good, unless otherwise stated :Inter Corporate Deposit to Related Party (Refer Note 42) 3,316.25 1,407.19 -
Unsecured, Considered Good, unless otherwise stated :Inter Corporate Deposit to Related Party (Refer Note 42) 2,290.00 - 2,689.53
Inter Corporate Deposit to others 200.00 - -
Loan to Employees 17.57 12.66 11.10
Total 5,823.82 1,419.85 2,700.63
9.1 The Company has granted Inter Corporate Deposit to related parties to meet various capital expenditures for their expansion plans and for its business purpose.
9.2 The Company has granted Inter Corporate Deposit to others for the purpose of utilising this amount in their business.
Note 10 - Non-current financial assets - Others(` in lacs)
Particulars As at 31st March, 2017
As at 31st March, 2016
As at 1st April, 2015
Unsecured, Considered Good, unless otherwise stated :Interest Receivable - - 98.19
Security Deposits 16.45 40.93 66.96
Total 16.45 40.93 165.15
Note 11 - Other Non-current assets(` in lacs)
Particulars As at 31st March, 2017
As at 31st March,2016
As at 1st April, 2015
Unsecured, Considered Good, unless otherwise stated :Capital Advances 132.21 282.67 110.30
MAT Credit Entitlement 1,617.59 1,776.60 1,583.50
Unamortised portion of Employee Benefits 0.11 0.11 0.24
Prepaid Expenses 109.18 56.53 35.21
Total 1,859.09 2,115.91 1,729.25
11.1 Company was liable to pay MAT under Section 115JB of the Income Tax Act, 1961 (“the Act”) in earlier years. MAT paid under Section 115JB of the Act over tax payable as per the provisions of the Act, other than Section 115JB of the Act, has been carried forward for being set off against the future tax liabilities computed in accordance with the provisions of the Act, other than Section 115JB of the Act, in next fifteen years. Based on the future projection of the performances, the Company will be liable to pay the income tax computed as per provisions of the Act, other than under Section 115JB of the Act.
Notes to the standalone financial statement for the year ended 31st March, 2017
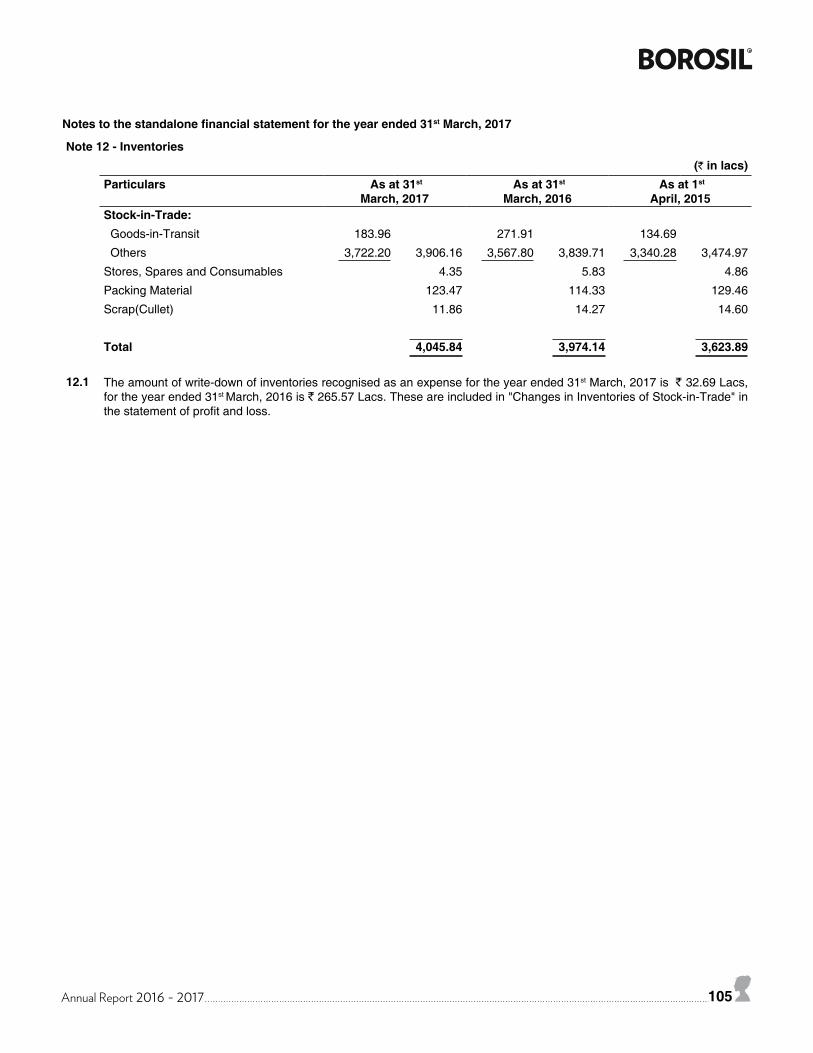
Annual Report 2016 - 2017 105
Notes to the standalone financial statement for the year ended 31st March, 2017
Note 12 - Inventories(` in lacs)
Particulars As at 31st
March, 2017 As at 31st
March, 2016 As at 1st
April, 2015Stock-in-Trade: Goods-in-Transit 183.96 271.91 134.69
Others 3,722.20 3,906.16 3,567.80 3,839.71 3,340.28 3,474.97
Stores, Spares and Consumables 4.35 5.83 4.86
Packing Material 123.47 114.33 129.46
Scrap(Cullet) 11.86 14.27 14.60
Total 4,045.84 3,974.14 3,623.89
12.1 The amount of write-down of inventories recognised as an expense for the year ended 31st March, 2017 is ` 32.69 Lacs, for the year ended 31st March, 2016 is ` 265.57 Lacs. These are included in "Changes in Inventories of Stock-in-Trade" in the statement of profit and loss.
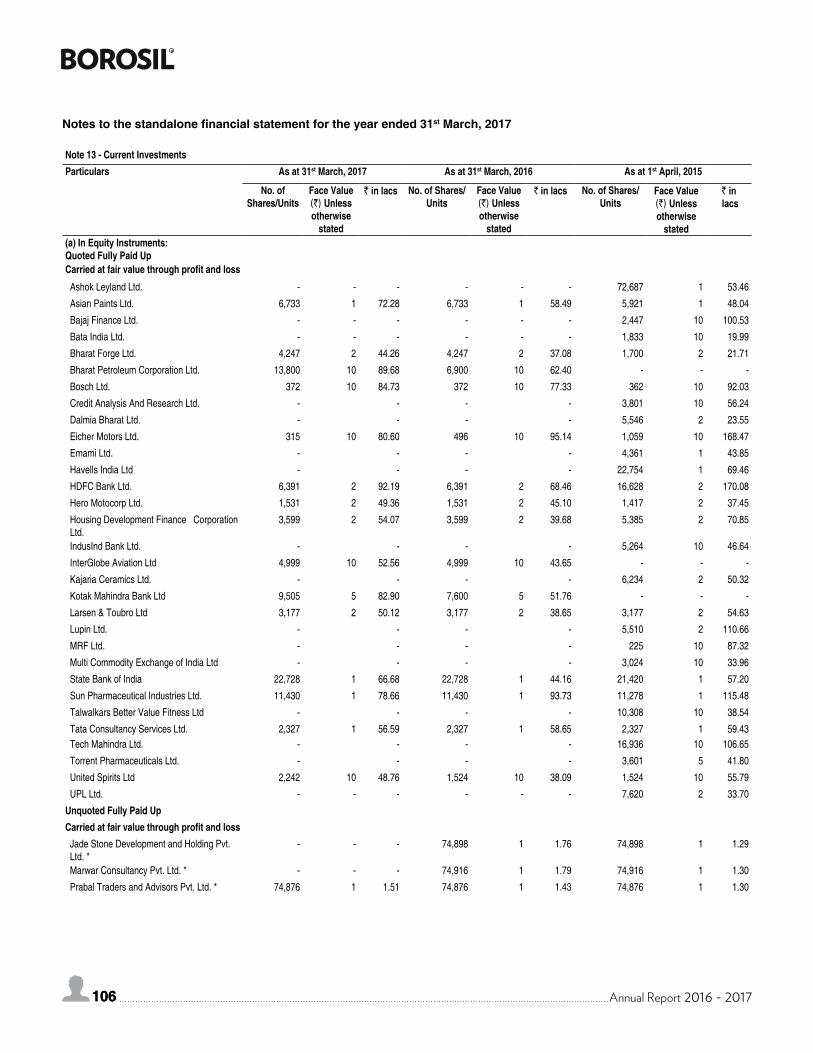
106 Annual Report 2016 - 2017106
Note 13 - Current Investments Particulars As at 31st March, 2017 As at 31st March, 2016 As at 1st April, 2015
No. of Shares/Units
Face Value (`) Unless otherwise
stated
` in lacs No. of Shares/Units
Face Value (`) Unless otherwise
stated
` in lacs No. of Shares/Units
Face Value (`) Unlessotherwise
stated
` in lacs
(a) In Equity Instruments:Quoted Fully Paid UpCarried at fair value through profit and loss Ashok Leyland Ltd. - - - - - - 72,687 1 53.46
Asian Paints Ltd. 6,733 1 72.28 6,733 1 58.49 5,921 1 48.04
Bajaj Finance Ltd. - - - - - - 2,447 10 100.53
Bata India Ltd. - - - - - - 1,833 10 19.99
Bharat Forge Ltd. 4,247 2 44.26 4,247 2 37.08 1,700 2 21.71
Bharat Petroleum Corporation Ltd. 13,800 10 89.68 6,900 10 62.40 - - -
Bosch Ltd. 372 10 84.73 372 10 77.33 362 10 92.03
Credit Analysis And Research Ltd. - - - - 3,801 10 56.24
Dalmia Bharat Ltd. - - - - 5,546 2 23.55
Eicher Motors Ltd. 315 10 80.60 496 10 95.14 1,059 10 168.47
Emami Ltd. - - - - 4,361 1 43.85
Havells India Ltd - - - - 22,754 1 69.46
HDFC Bank Ltd. 6,391 2 92.19 6,391 2 68.46 16,628 2 170.08
Hero Motocorp Ltd. 1,531 2 49.36 1,531 2 45.10 1,417 2 37.45
Housing Development Finance Corporation Ltd.
3,599 2 54.07 3,599 2 39.68 5,385 2 70.85
IndusInd Bank Ltd. - - - - 5,264 10 46.64
InterGlobe Aviation Ltd 4,999 10 52.56 4,999 10 43.65 - - -
Kajaria Ceramics Ltd. - - - - 6,234 2 50.32
Kotak Mahindra Bank Ltd 9,505 5 82.90 7,600 5 51.76 - - -
Larsen & Toubro Ltd 3,177 2 50.12 3,177 2 38.65 3,177 2 54.63
Lupin Ltd. - - - - 5,510 2 110.66
MRF Ltd. - - - - 225 10 87.32
Multi Commodity Exchange of India Ltd - - - - 3,024 10 33.96
State Bank of India 22,728 1 66.68 22,728 1 44.16 21,420 1 57.20
Sun Pharmaceutical Industries Ltd. 11,430 1 78.66 11,430 1 93.73 11,278 1 115.48
Talwalkars Better Value Fitness Ltd - - - - 10,308 10 38.54
Tata Consultancy Services Ltd. 2,327 1 56.59 2,327 1 58.65 2,327 1 59.43 Tech Mahindra Ltd. - - - - 16,936 10 106.65
Torrent Pharmaceuticals Ltd. - - - - 3,601 5 41.80
United Spirits Ltd 2,242 10 48.76 1,524 10 38.09 1,524 10 55.79
UPL Ltd. - - - - - - 7,620 2 33.70
Unquoted Fully Paid UpCarried at fair value through profit and loss Jade Stone Development and Holding Pvt.
Ltd. * - - - 74,898 1 1.76 74,898 1 1.29
Marwar Consultancy Pvt. Ltd. * - - - 74,916 1 1.79 74,916 1 1.30
Prabal Traders and Advisors Pvt. Ltd. * 74,876 1 1.51 74,876 1 1.43 74,876 1 1.30
Notes to the standalone financial statement for the year ended 31st March, 2017
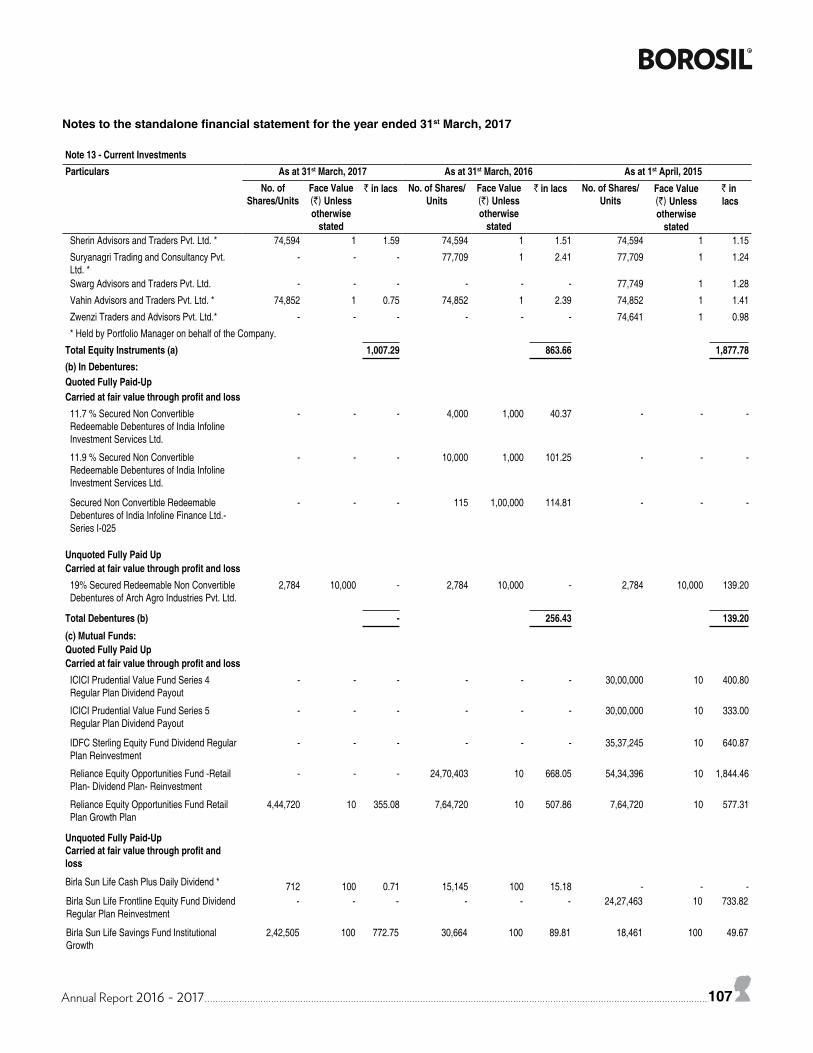
Annual Report 2016 - 2017 107
Note 13 - Current Investments Particulars As at 31st March, 2017 As at 31st March, 2016 As at 1st April, 2015
No. of Shares/Units
Face Value (`) Unless otherwise
stated
` in lacs No. of Shares/Units
Face Value (`) Unless otherwise
stated
` in lacs No. of Shares/Units
Face Value (`) Unlessotherwise
stated
` in lacs
Sherin Advisors and Traders Pvt. Ltd. * 74,594 1 1.59 74,594 1 1.51 74,594 1 1.15
Suryanagri Trading and Consultancy Pvt. Ltd. *
- - - 77,709 1 2.41 77,709 1 1.24
Swarg Advisors and Traders Pvt. Ltd. - - - - - - 77,749 1 1.28
Vahin Advisors and Traders Pvt. Ltd. * 74,852 1 0.75 74,852 1 2.39 74,852 1 1.41
Zwenzi Traders and Advisors Pvt. Ltd.* - - - - - - 74,641 1 0.98
* Held by Portfolio Manager on behalf of the Company.
Total Equity Instruments (a) 1,007.29 863.66 1,877.78(b) In Debentures:Quoted Fully Paid-UpCarried at fair value through profit and loss 11.7 % Secured Non Convertible
Redeemable Debentures of India Infoline Investment Services Ltd.
- - - 4,000 1,000 40.37 - - -
11.9 % Secured Non Convertible Redeemable Debentures of India Infoline Investment Services Ltd.
- - - 10,000 1,000 101.25 - - -
Secured Non Convertible Redeemable Debentures of India Infoline Finance Ltd.-Series I-025
- - - 115 1,00,000 114.81 - - -
Unquoted Fully Paid UpCarried at fair value through profit and loss 19% Secured Redeemable Non Convertible
Debentures of Arch Agro Industries Pvt. Ltd. 2,784 10,000 - 2,784 10,000 - 2,784 10,000 139.20
Total Debentures (b) - 256.43 139.20
(c) Mutual Funds:Quoted Fully Paid UpCarried at fair value through profit and loss ICICI Prudential Value Fund Series 4
Regular Plan Dividend Payout - - - - - - 30,00,000 10 400.80
ICICI Prudential Value Fund Series 5 Regular Plan Dividend Payout
- - - - - - 30,00,000 10 333.00
IDFC Sterling Equity Fund Dividend Regular Plan Reinvestment
- - - - - - 35,37,245 10 640.87
Reliance Equity Opportunities Fund -Retail Plan- Dividend Plan- Reinvestment
- - - 24,70,403 10 668.05 54,34,396 10 1,844.46
Reliance Equity Opportunities Fund Retail Plan Growth Plan
4,44,720 10 355.08 7,64,720 10 507.86 7,64,720 10 577.31
Unquoted Fully Paid-UpCarried at fair value through profit and loss
Birla Sun Life Cash Plus Daily Dividend * 712 100 0.71 15,145 100 15.18 - - -Birla Sun Life Frontline Equity Fund Dividend Regular Plan Reinvestment
- - - - - - 24,27,463 10 733.82
Birla Sun Life Savings Fund Institutional Growth
2,42,505 100 772.75 30,664 100 89.81 18,461 100 49.67
Notes to the standalone financial statement for the year ended 31st March, 2017
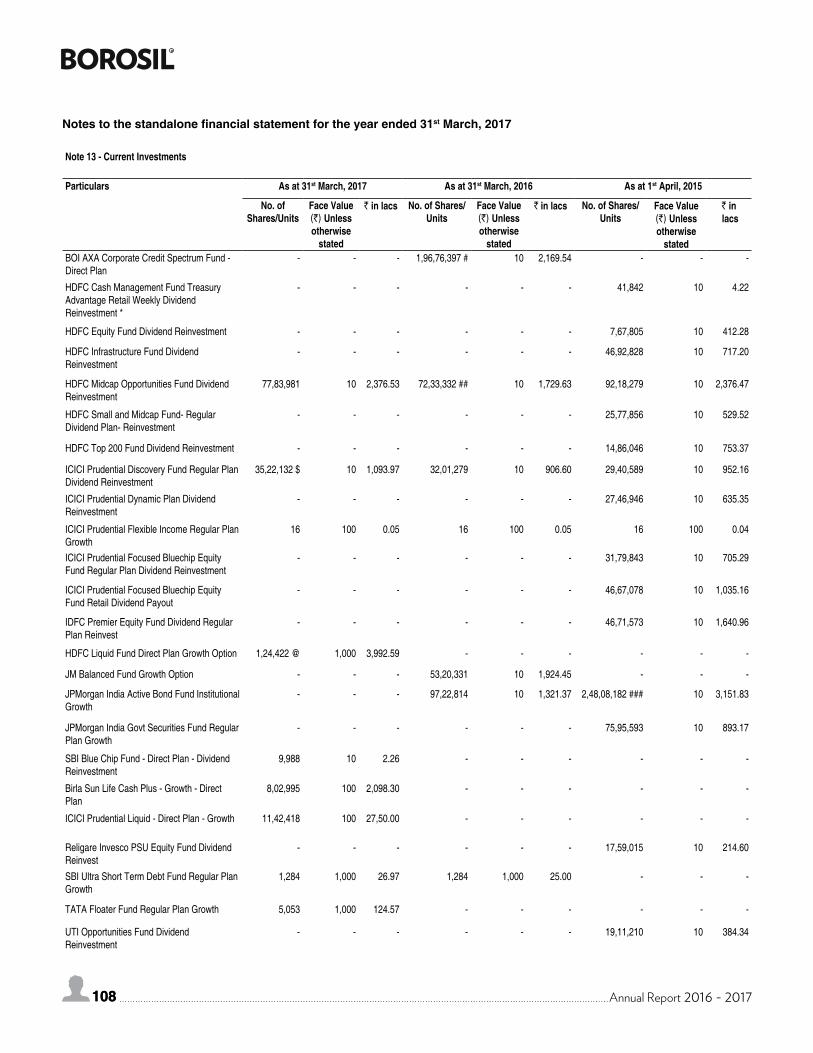
108 Annual Report 2016 - 2017108
Note 13 - Current Investments
Particulars As at 31st March, 2017 As at 31st March, 2016 As at 1st April, 2015
No. of Shares/Units
Face Value (`) Unless otherwise
stated
` in lacs No. of Shares/Units
Face Value (`) Unless otherwise
stated
` in lacs No. of Shares/Units
Face Value (`) Unlessotherwise
stated
` in lacs
BOI AXA Corporate Credit Spectrum Fund - Direct Plan
- - - 1,96,76,397 # 10 2,169.54 - - -
HDFC Cash Management Fund Treasury Advantage Retail Weekly Dividend Reinvestment *
- - - - - - 41,842 10 4.22
HDFC Equity Fund Dividend Reinvestment - - - - - - 7,67,805 10 412.28
HDFC Infrastructure Fund Dividend Reinvestment
- - - - - - 46,92,828 10 717.20
HDFC Midcap Opportunities Fund Dividend Reinvestment
77,83,981 10 2,376.53 72,33,332 ## 10 1,729.63 92,18,279 10 2,376.47
HDFC Small and Midcap Fund- Regular Dividend Plan- Reinvestment
- - - - - - 25,77,856 10 529.52
HDFC Top 200 Fund Dividend Reinvestment - - - - - - 14,86,046 10 753.37
ICICI Prudential Discovery Fund Regular Plan Dividend Reinvestment
35,22,132 $ 10 1,093.97 32,01,279 10 906.60 29,40,589 10 952.16
ICICI Prudential Dynamic Plan Dividend Reinvestment
- - - - - - 27,46,946 10 635.35
ICICI Prudential Flexible Income Regular Plan Growth
16 100 0.05 16 100 0.05 16 100 0.04
ICICI Prudential Focused Bluechip Equity Fund Regular Plan Dividend Reinvestment
- - - - - - 31,79,843 10 705.29
ICICI Prudential Focused Bluechip Equity Fund Retail Dividend Payout
- - - - - - 46,67,078 10 1,035.16
IDFC Premier Equity Fund Dividend Regular Plan Reinvest
- - - - - - 46,71,573 10 1,640.96
HDFC Liquid Fund Direct Plan Growth Option 1,24,422 @ 1,000 3,992.59 - - - - - -
JM Balanced Fund Growth Option - - - 53,20,331 10 1,924.45 - - -
JPMorgan India Active Bond Fund Institutional Growth
- - - 97,22,814 10 1,321.37 2,48,08,182 ### 10 3,151.83
JPMorgan India Govt Securities Fund Regular Plan Growth
- - - - - - 75,95,593 10 893.17
SBI Blue Chip Fund - Direct Plan - Dividend Reinvestment
9,988 10 2.26 - - - - - -
Birla Sun Life Cash Plus - Growth - Direct Plan
8,02,995 100 2,098.30 - - - - - -
ICICI Prudential Liquid - Direct Plan - Growth 11,42,418 100 27,50.00 - - - - - -
Religare Invesco PSU Equity Fund Dividend Reinvest
- - - - - - 17,59,015 10 214.60
SBI Ultra Short Term Debt Fund Regular Plan Growth
1,284 1,000 26.97 1,284 1,000 25.00 - - -
TATA Floater Fund Regular Plan Growth 5,053 1,000 124.57 - - - - - -
UTI Opportunities Fund Dividend Reinvestment
- - - - - - 19,11,210 10 384.34
Notes to the standalone financial statement for the year ended 31st March, 2017
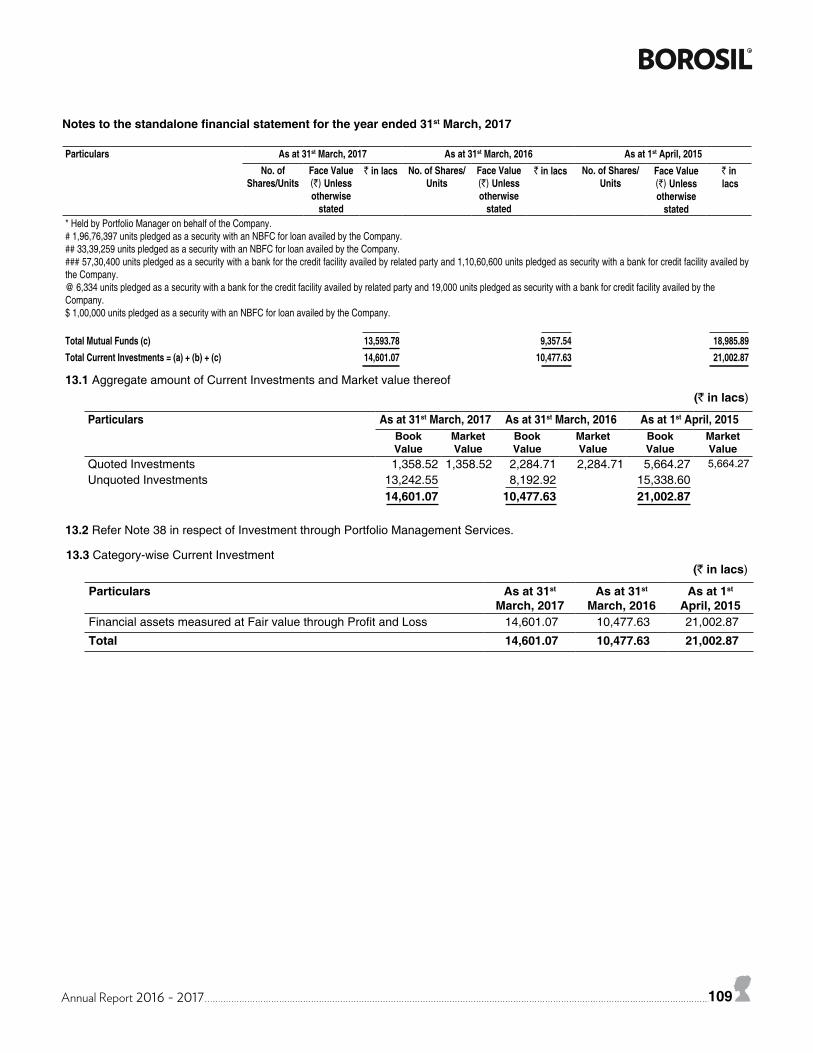
Annual Report 2016 - 2017 109
Notes to the standalone financial statement for the year ended 31st March, 2017
Particulars As at 31st March, 2017 As at 31st March, 2016 As at 1st April, 2015No. of
Shares/UnitsFace Value (`) Unless otherwise
stated
` in lacs No. of Shares/Units
Face Value (`) Unless otherwise
stated
` in lacs No. of Shares/Units
Face Value (`) Unlessotherwise
stated
` in lacs
* Held by Portfolio Manager on behalf of the Company.# 1,96,76,397 units pledged as a security with an NBFC for loan availed by the Company.## 33,39,259 units pledged as a security with an NBFC for loan availed by the Company.### 57,30,400 units pledged as a security with a bank for the credit facility availed by related party and 1,10,60,600 units pledged as security with a bank for credit facility availed by the Company.@ 6,334 units pledged as a security with a bank for the credit facility availed by related party and 19,000 units pledged as security with a bank for credit facility availed by the Company.$ 1,00,000 units pledged as a security with an NBFC for loan availed by the Company.
Total Mutual Funds (c) 13,593.78 9,357.54 18,985.89Total Current Investments = (a) + (b) + (c) 14,601.07 10,477.63 21,002.87
13.1 Aggregate amount of Current Investments and Market value thereof (` in lacs)
Particulars As at 31st March, 2017 As at 31st March, 2016 As at 1st April, 2015Book Value
Market Value
Book Value
Market Value
Book Value
Market Value
Quoted Investments 1,358.52 1,358.52 2,284.71 2,284.71 5,664.27 5,664.27
Unquoted Investments 13,242.55 8,192.92 15,338.60 14,601.07 10,477.63 21,002.87
13.2 Refer Note 38 in respect of Investment through Portfolio Management Services.
13.3 Category-wise Current Investment (` in lacs)
Particulars As at 31st March, 2017
As at 31st March, 2016
As at 1st April, 2015
Financial assets measured at Fair value through Profit and Loss 14,601.07 10,477.63 21,002.87
Total 14,601.07 10,477.63 21,002.87
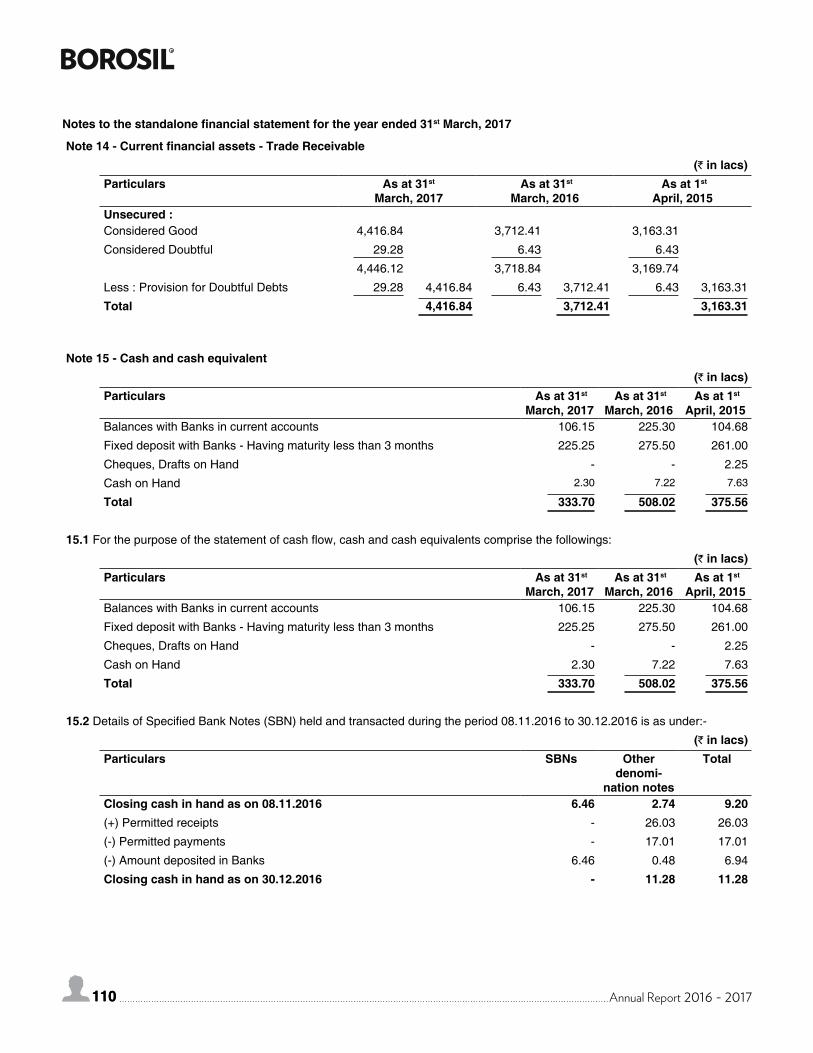
110 Annual Report 2016 - 2017110
Note 14 - Current financial assets - Trade Receivable (` in lacs)
Particulars As at 31st
March, 2017 As at 31st
March, 2016 As at 1st
April, 2015Unsecured :Considered Good 4,416.84 3,712.41 3,163.31
Considered Doubtful 29.28 6.43 6.43
4,446.12 3,718.84 3,169.74
Less : Provision for Doubtful Debts 29.28 4,416.84 6.43 3,712.41 6.43 3,163.31
Total 4,416.84 3,712.41 3,163.31
Note 15 - Cash and cash equivalent (` in lacs)
Particulars As at 31st March, 2017
As at 31st March, 2016
As at 1st April, 2015
Balances with Banks in current accounts 106.15 225.30 104.68
Fixed deposit with Banks - Having maturity less than 3 months 225.25 275.50 261.00
Cheques, Drafts on Hand - - 2.25
Cash on Hand 2.30 7.22 7.63
Total 333.70 508.02 375.56
15.1 For the purpose of the statement of cash flow, cash and cash equivalents comprise the followings:
(` in lacs)Particulars As at 31st
March, 2017 As at 31st
March, 2016 As at 1st
April, 2015Balances with Banks in current accounts 106.15 225.30 104.68
Fixed deposit with Banks - Having maturity less than 3 months 225.25 275.50 261.00
Cheques, Drafts on Hand - - 2.25
Cash on Hand 2.30 7.22 7.63
Total 333.70 508.02 375.56
15.2 Details of Specified Bank Notes (SBN) held and transacted during the period 08.11.2016 to 30.12.2016 is as under:-
(` in lacs)Particulars SBNs Other
denomi-nation notes
Total
Closing cash in hand as on 08.11.2016 6.46 2.74 9.20(+) Permitted receipts - 26.03 26.03
(-) Permitted payments - 17.01 17.01
(-) Amount deposited in Banks 6.46 0.48 6.94
Closing cash in hand as on 30.12.2016 - 11.28 11.28
Notes to the standalone financial statement for the year ended 31st March, 2017
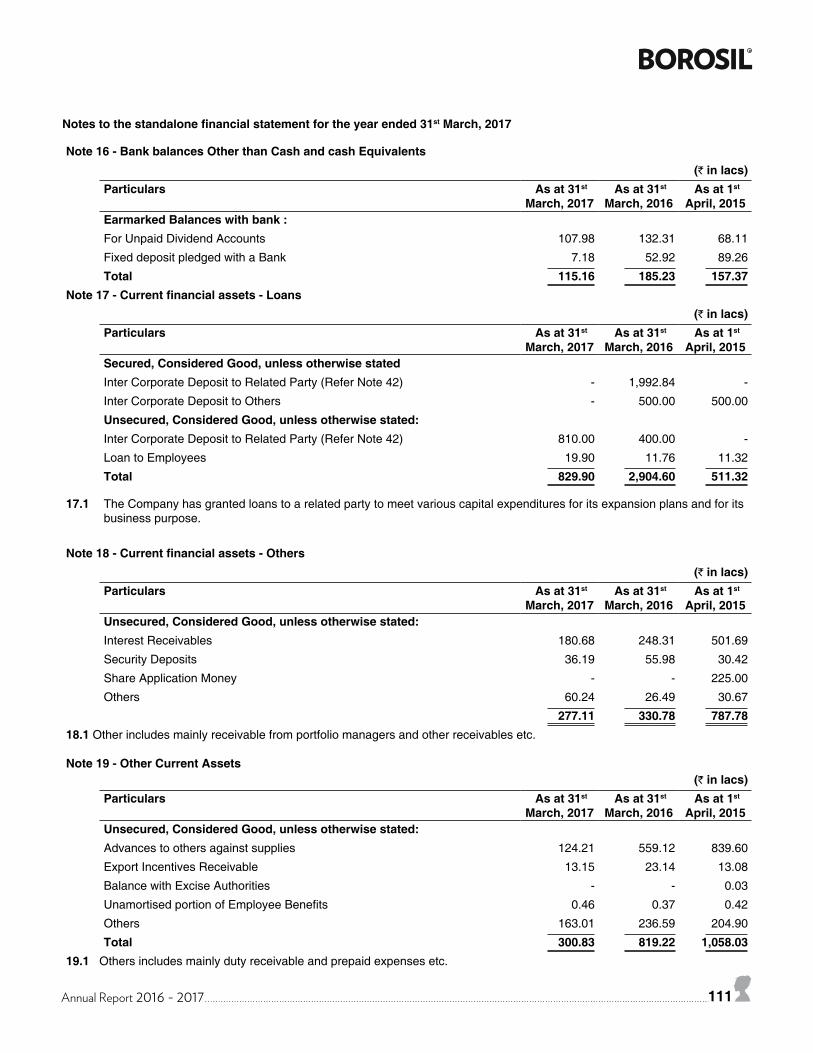
Annual Report 2016 - 2017 111
Note 16 - Bank balances Other than Cash and cash Equivalents (` in lacs)
Particulars As at 31st March, 2017
As at 31st March, 2016
As at 1st April, 2015
Earmarked Balances with bank :For Unpaid Dividend Accounts 107.98 132.31 68.11
Fixed deposit pledged with a Bank 7.18 52.92 89.26
Total 115.16 185.23 157.37Note 17 - Current financial assets - Loans
(` in lacs)Particulars As at 31st
March, 2017 As at 31st
March, 2016 As at 1st
April, 2015Secured, Considered Good, unless otherwise statedInter Corporate Deposit to Related Party (Refer Note 42) - 1,992.84 -
Inter Corporate Deposit to Others - 500.00 500.00
Unsecured, Considered Good, unless otherwise stated:Inter Corporate Deposit to Related Party (Refer Note 42) 810.00 400.00 -
Loan to Employees 19.90 11.76 11.32
Total 829.90 2,904.60 511.32
17.1 The Company has granted loans to a related party to meet various capital expenditures for its expansion plans and for its business purpose.
Note 18 - Current financial assets - Others (` in lacs)
Particulars As at 31st March, 2017
As at 31st March, 2016
As at 1st April, 2015
Unsecured, Considered Good, unless otherwise stated:Interest Receivables 180.68 248.31 501.69
Security Deposits 36.19 55.98 30.42
Share Application Money - - 225.00
Others 60.24 26.49 30.67
277.11 330.78 787.7818.1 Other includes mainly receivable from portfolio managers and other receivables etc.
Note 19 - Other Current Assets (` in lacs)
Particulars As at 31st March, 2017
As at 31st March, 2016
As at 1st April, 2015
Unsecured, Considered Good, unless otherwise stated:Advances to others against supplies 124.21 559.12 839.60
Export Incentives Receivable 13.15 23.14 13.08
Balance with Excise Authorities - - 0.03
Unamortised portion of Employee Benefits 0.46 0.37 0.42
Others 163.01 236.59 204.90
Total 300.83 819.22 1,058.0319.1 Others includes mainly duty receivable and prepaid expenses etc.
Notes to the standalone financial statement for the year ended 31st March, 2017
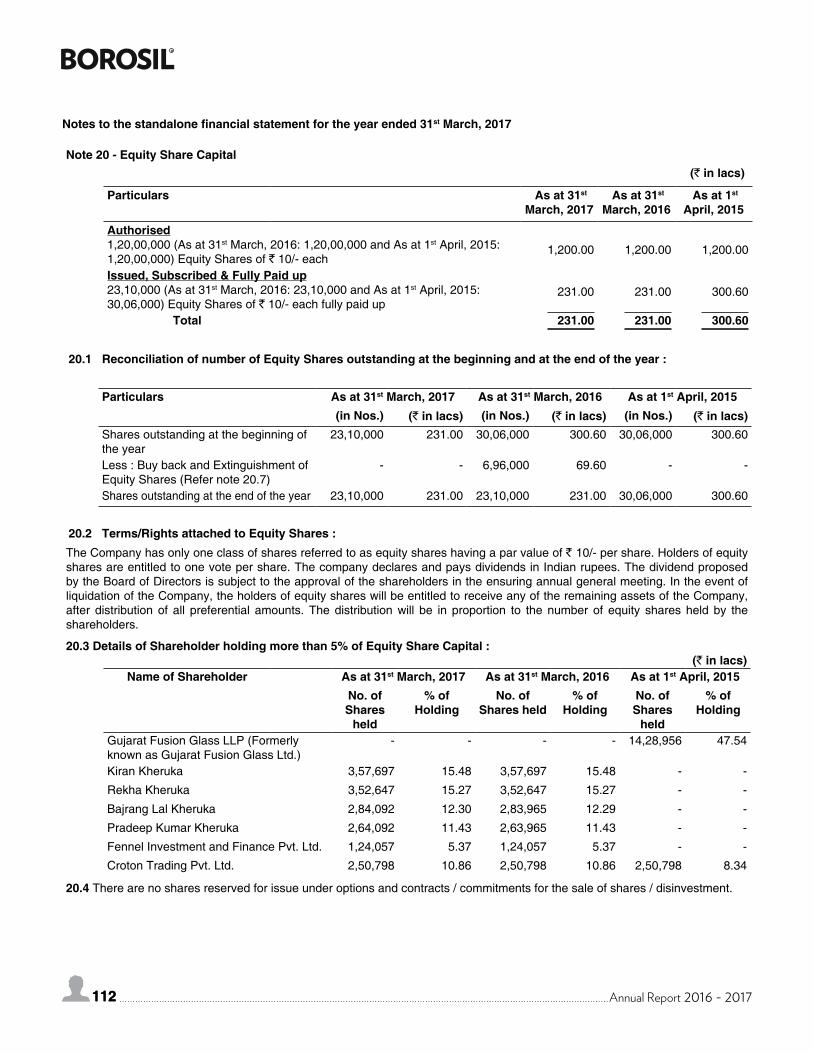
112 Annual Report 2016 - 2017112
Note 20 - Equity Share Capital (` in lacs)
Particulars As at 31st March, 2017
As at 31st March, 2016
As at 1st April, 2015
Authorised1,20,00,000 (As at 31st March, 2016: 1,20,00,000 and As at 1st April, 2015: 1,20,00,000) Equity Shares of ` 10/- each
1,200.00 1,200.00 1,200.00
Issued, Subscribed & Fully Paid up23,10,000 (As at 31st March, 2016: 23,10,000 and As at 1st April, 2015: 30,06,000) Equity Shares of ` 10/- each fully paid up
231.00 231.00 300.60
Total 231.00 231.00 300.60
20.1 Reconciliation of number of Equity Shares outstanding at the beginning and at the end of the year :
Particulars As at 31st March, 2017 As at 31st March, 2016 As at 1st April, 2015(in Nos.) (` in lacs) (in Nos.) (` in lacs) (in Nos.) (` in lacs)
Shares outstanding at the beginning of the year
23,10,000 231.00 30,06,000 300.60 30,06,000 300.60
Less : Buy back and Extinguishment of Equity Shares (Refer note 20.7)
- - 6,96,000 69.60 - -
Shares outstanding at the end of the year 23,10,000 231.00 23,10,000 231.00 30,06,000 300.60
20.2 Terms/Rights attached to Equity Shares :The Company has only one class of shares referred to as equity shares having a par value of ` 10/- per share. Holders of equity shares are entitled to one vote per share. The company declares and pays dividends in Indian rupees. The dividend proposed by the Board of Directors is subject to the approval of the shareholders in the ensuring annual general meeting. In the event of liquidation of the Company, the holders of equity shares will be entitled to receive any of the remaining assets of the Company, after distribution of all preferential amounts. The distribution will be in proportion to the number of equity shares held by the shareholders.
20.3 Details of Shareholder holding more than 5% of Equity Share Capital :(` in lacs)
Name of Shareholder As at 31st March, 2017 As at 31st March, 2016 As at 1st April, 2015No. of Shares
held
% of Holding
No. of Shares held
% of Holding
No. of Shares
held
% of Holding
Gujarat Fusion Glass LLP (Formerly known as Gujarat Fusion Glass Ltd.)
- - - - 14,28,956 47.54
Kiran Kheruka 3,57,697 15.48 3,57,697 15.48 - -
Rekha Kheruka 3,52,647 15.27 3,52,647 15.27 - -
Bajrang Lal Kheruka 2,84,092 12.30 2,83,965 12.29 - -
Pradeep Kumar Kheruka 2,64,092 11.43 2,63,965 11.43 - -
Fennel Investment and Finance Pvt. Ltd. 1,24,057 5.37 1,24,057 5.37 - -
Croton Trading Pvt. Ltd. 2,50,798 10.86 2,50,798 10.86 2,50,798 8.34
20.4 There are no shares reserved for issue under options and contracts / commitments for the sale of shares / disinvestment.
Notes to the standalone financial statement for the year ended 31st March, 2017
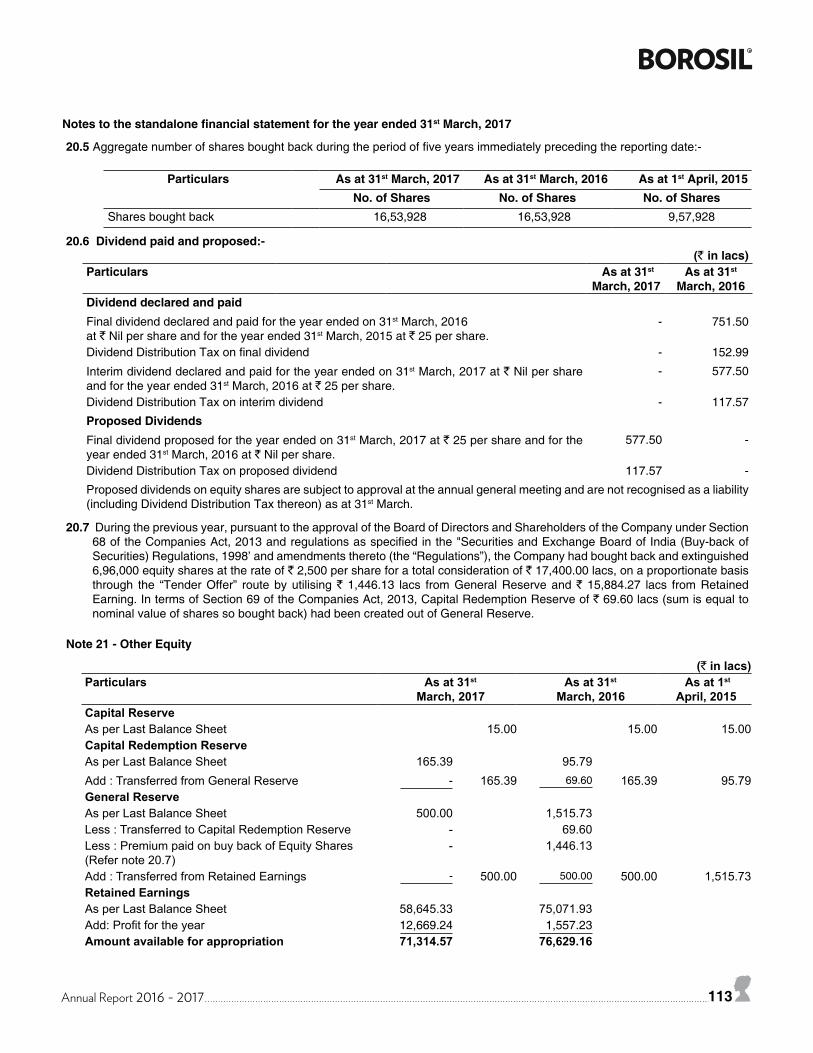
Annual Report 2016 - 2017 113
20.5 Aggregate number of shares bought back during the period of five years immediately preceding the reporting date:-
Particulars As at 31st March, 2017 As at 31st March, 2016 As at 1st April, 2015 No. of Shares No. of Shares No. of Shares
Shares bought back 16,53,928 16,53,928 9,57,928
20.6 Dividend paid and proposed:-(` in lacs)
Particulars As at 31st March, 2017
As at 31st
March, 2016Dividend declared and paidFinal dividend declared and paid for the year ended on 31st March, 2016 at ` Nil per share and for the year ended 31st March, 2015 at ` 25 per share.
- 751.50
Dividend Distribution Tax on final dividend - 152.99
Interim dividend declared and paid for the year ended on 31st March, 2017 at ` Nil per share and for the year ended 31st March, 2016 at ` 25 per share.
- 577.50
Dividend Distribution Tax on interim dividend - 117.57
Proposed DividendsFinal dividend proposed for the year ended on 31st March, 2017 at ` 25 per share and for the year ended 31st March, 2016 at ` Nil per share.
577.50 -
Dividend Distribution Tax on proposed dividend 117.57 -
Proposed dividends on equity shares are subject to approval at the annual general meeting and are not recognised as a liability (including Dividend Distribution Tax thereon) as at 31st March.
20.7 During the previous year, pursuant to the approval of the Board of Directors and Shareholders of the Company under Section 68 of the Companies Act, 2013 and regulations as specified in the "Securities and Exchange Board of India (Buy-back of Securities) Regulations, 1998’ and amendments thereto (the “Regulations”), the Company had bought back and extinguished 6,96,000 equity shares at the rate of ` 2,500 per share for a total consideration of ` 17,400.00 lacs, on a proportionate basis through the “Tender Offer” route by utilising ` 1,446.13 lacs from General Reserve and ` 15,884.27 lacs from Retained Earning. In terms of Section 69 of the Companies Act, 2013, Capital Redemption Reserve of ` 69.60 lacs (sum is equal to nominal value of shares so bought back) had been created out of General Reserve.
Note 21 - Other Equity
(` in lacs) Particulars As at 31st
March, 2017 As at 31st
March, 2016 As at 1st
April, 2015 Capital ReserveAs per Last Balance Sheet 15.00 15.00 15.00 Capital Redemption ReserveAs per Last Balance Sheet 165.39 95.79 Add : Transferred from General Reserve - 165.39 69.60 165.39 95.79 General ReserveAs per Last Balance Sheet 500.00 1,515.73 Less : Transferred to Capital Redemption Reserve - 69.60 Less : Premium paid on buy back of Equity Shares (Refer note 20.7)
- 1,446.13
Add : Transferred from Retained Earnings - 500.00 500.00 500.00 1,515.73 Retained EarningsAs per Last Balance Sheet 58,645.33 75,071.93 Add: Profit for the year 12,669.24 1,557.23 Amount available for appropriation 71,314.57 76,629.16
Notes to the standalone financial statement for the year ended 31st March, 2017
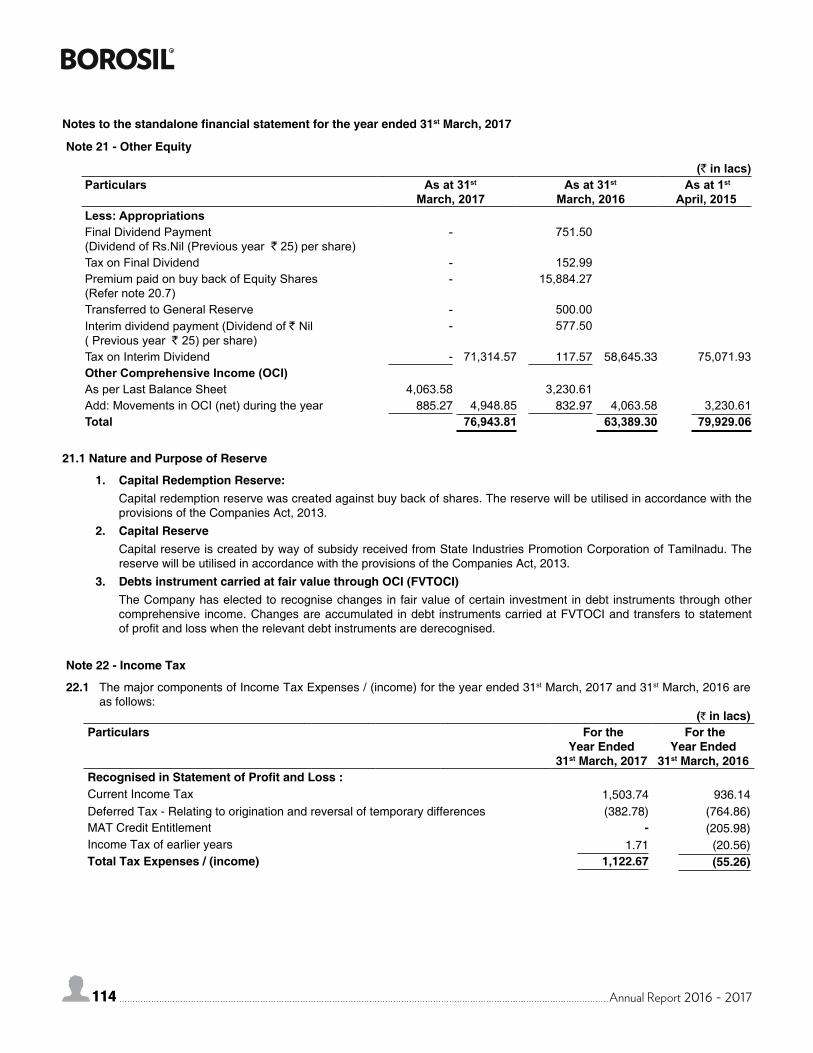
114 Annual Report 2016 - 2017114
Note 21 - Other Equity
(` in lacs) Particulars As at 31st
March, 2017 As at 31st
March, 2016 As at 1st
April, 2015 Less: AppropriationsFinal Dividend Payment (Dividend of Rs.Nil (Previous year ` 25) per share)
- 751.50
Tax on Final Dividend - 152.99 Premium paid on buy back of Equity Shares (Refer note 20.7)
- 15,884.27
Transferred to General Reserve - 500.00 Interim dividend payment (Dividend of ` Nil ( Previous year ` 25) per share)
- 577.50
Tax on Interim Dividend - 71,314.57 117.57 58,645.33 75,071.93 Other Comprehensive Income (OCI)As per Last Balance Sheet 4,063.58 3,230.61 Add: Movements in OCI (net) during the year 885.27 4,948.85 832.97 4,063.58 3,230.61 Total 76,943.81 63,389.30 79,929.06
21.1 Nature and Purpose of Reserve
1. Capital Redemption Reserve: Capital redemption reserve was created against buy back of shares. The reserve will be utilised in accordance with the
provisions of the Companies Act, 2013. 2. Capital Reserve
Capital reserve is created by way of subsidy received from State Industries Promotion Corporation of Tamilnadu. The reserve will be utilised in accordance with the provisions of the Companies Act, 2013.
3. Debts instrument carried at fair value through OCI (FVTOCI) The Company has elected to recognise changes in fair value of certain investment in debt instruments through other
comprehensive income. Changes are accumulated in debt instruments carried at FVTOCI and transfers to statement of profit and loss when the relevant debt instruments are derecognised.
Note 22 - Income Tax
22.1 The major components of Income Tax Expenses / (income) for the year ended 31st March, 2017 and 31st March, 2016 are as follows:
(` in lacs)Particulars For the
Year Ended31st March, 2017
For the Year Ended
31st March, 2016Recognised in Statement of Profit and Loss :Current Income Tax 1,503.74 936.14Deferred Tax - Relating to origination and reversal of temporary differences (382.78) (764.86)MAT Credit Entitlement - (205.98)Income Tax of earlier years 1.71 (20.56)Total Tax Expenses / (income) 1,122.67 (55.26)
Notes to the standalone financial statement for the year ended 31st March, 2017
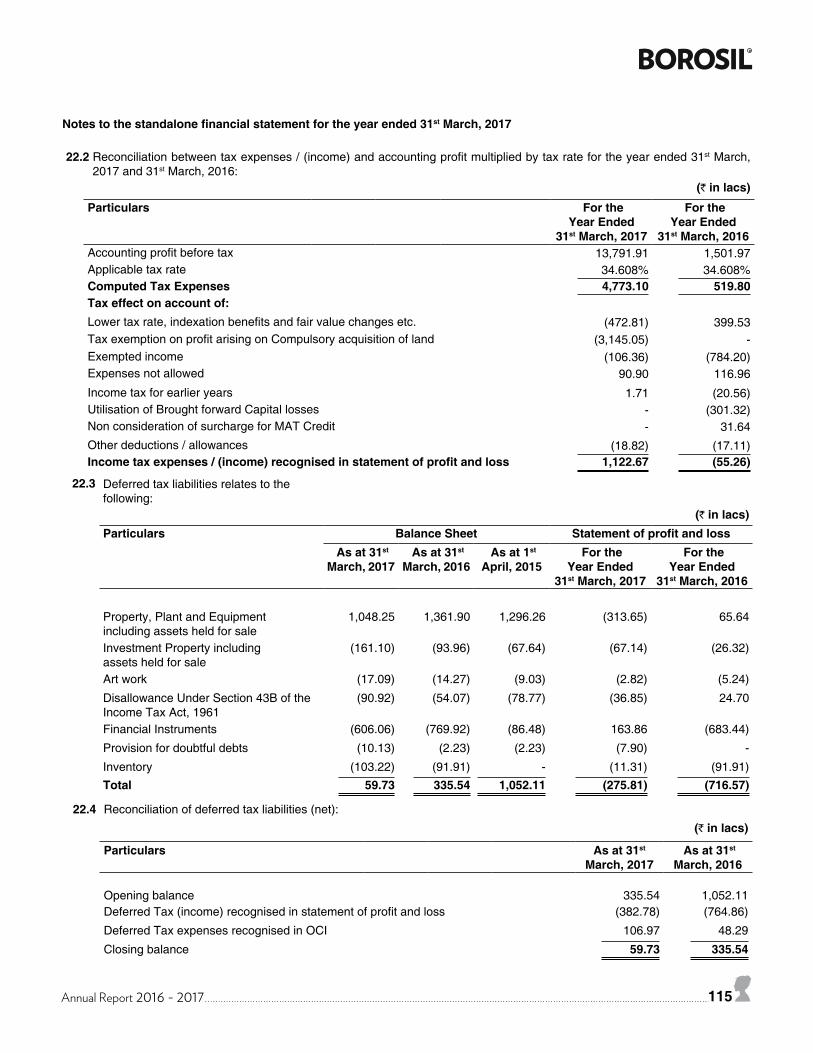
Annual Report 2016 - 2017 115
22.2 Reconciliation between tax expenses / (income) and accounting profit multiplied by tax rate for the year ended 31st March, 2017 and 31st March, 2016:
(` in lacs)
Particulars For the Year Ended
31st March, 2017
For the Year Ended
31st March, 2016Accounting profit before tax 13,791.91 1,501.97Applicable tax rate 34.608% 34.608%Computed Tax Expenses 4,773.10 519.80Tax effect on account of:Lower tax rate, indexation benefits and fair value changes etc. (472.81) 399.53Tax exemption on profit arising on Compulsory acquisition of land (3,145.05) -Exempted income (106.36) (784.20)Expenses not allowed 90.90 116.96
Income tax for earlier years 1.71 (20.56)Utilisation of Brought forward Capital losses - (301.32)Non consideration of surcharge for MAT Credit - 31.64Other deductions / allowances (18.82) (17.11)Income tax expenses / (income) recognised in statement of profit and loss 1,122.67 (55.26)
22.3 Deferred tax liabilities relates to the following:
(` in lacs)Particulars Balance Sheet Statement of profit and loss
As at 31st
March, 2017 As at 31st
March, 2016 As at 1st
April, 2015 For the
Year Ended31st March, 2017
For the Year Ended
31st March, 2016
Property, Plant and Equipmentincluding assets held for sale
1,048.25 1,361.90 1,296.26 (313.65) 65.64
Investment Property including assets held for sale
(161.10) (93.96) (67.64) (67.14) (26.32)
Art work (17.09) (14.27) (9.03) (2.82) (5.24)
Disallowance Under Section 43B of the Income Tax Act, 1961
(90.92) (54.07) (78.77) (36.85) 24.70
Financial Instruments (606.06) (769.92) (86.48) 163.86 (683.44)
Provision for doubtful debts (10.13) (2.23) (2.23) (7.90) -
Inventory (103.22) (91.91) - (11.31) (91.91)Total 59.73 335.54 1,052.11 (275.81) (716.57)
22.4 Reconciliation of deferred tax liabilities (net):
(` in lacs)
Particulars As at 31st March, 2017
As at 31st March, 2016
Opening balance
335.54
1,052.11Deferred Tax (income) recognised in statement of profit and loss (382.78) (764.86)
Deferred Tax expenses recognised in OCI 106.97 48.29
Closing balance 59.73 335.54
Notes to the standalone financial statement for the year ended 31st March, 2017
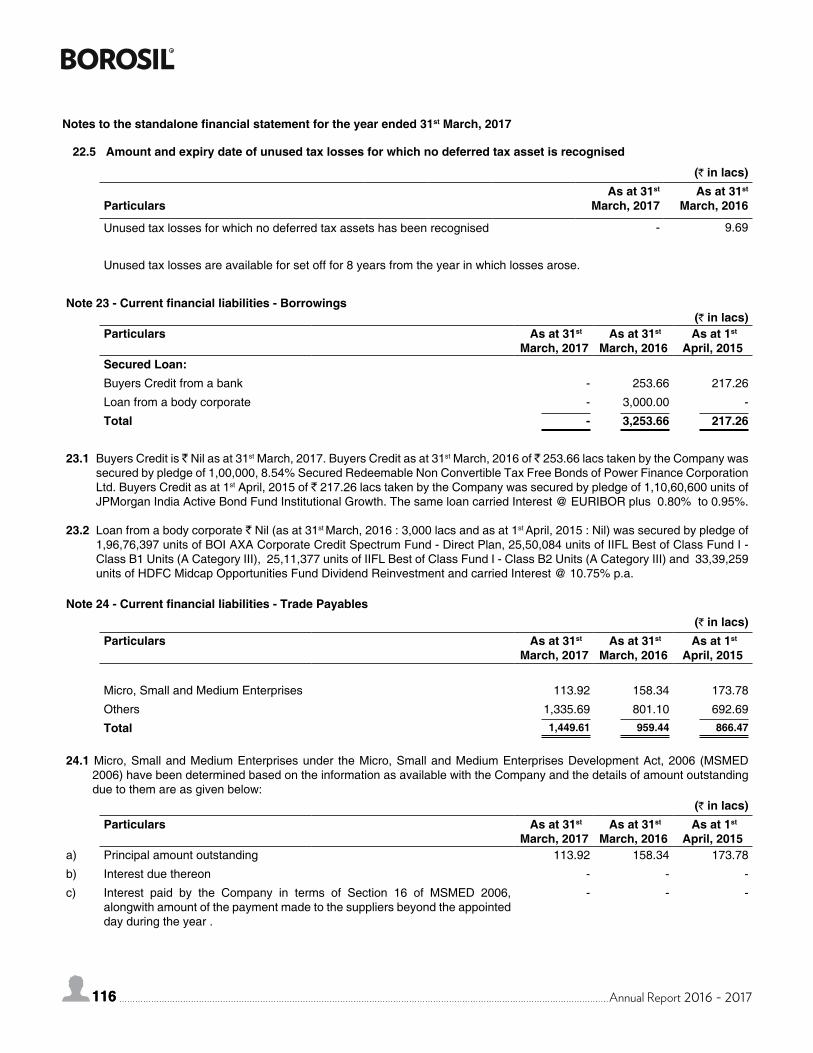
116 Annual Report 2016 - 2017116
22.5 Amount and expiry date of unused tax losses for which no deferred tax asset is recognised
(` in lacs)
ParticularsAs at 31st
March, 2017 As at 31st
March, 2016
Unused tax losses for which no deferred tax assets has been recognised - 9.69
Unused tax losses are available for set off for 8 years from the year in which losses arose.
Note 23 - Current financial liabilities - Borrowings (` in lacs)
Particulars As at 31st March, 2017
As at 31st March, 2016
As at 1st April, 2015
Secured Loan:Buyers Credit from a bank - 253.66 217.26
Loan from a body corporate - 3,000.00 -
Total - 3,253.66 217.26
23.1 Buyers Credit is ̀ Nil as at 31st March, 2017. Buyers Credit as at 31st March, 2016 of ̀ 253.66 lacs taken by the Company was secured by pledge of 1,00,000, 8.54% Secured Redeemable Non Convertible Tax Free Bonds of Power Finance Corporation Ltd. Buyers Credit as at 1st April, 2015 of ` 217.26 lacs taken by the Company was secured by pledge of 1,10,60,600 units of JPMorgan India Active Bond Fund Institutional Growth. The same loan carried Interest @ EURIBOR plus 0.80% to 0.95%.
23.2 Loan from a body corporate ` Nil (as at 31st March, 2016 : 3,000 lacs and as at 1st April, 2015 : Nil) was secured by pledge of
1,96,76,397 units of BOI AXA Corporate Credit Spectrum Fund - Direct Plan, 25,50,084 units of IIFL Best of Class Fund I - Class B1 Units (A Category III), 25,11,377 units of IIFL Best of Class Fund I - Class B2 Units (A Category III) and 33,39,259 units of HDFC Midcap Opportunities Fund Dividend Reinvestment and carried Interest @ 10.75% p.a.
Note 24 - Current financial liabilities - Trade Payables(` in lacs)
Particulars As at 31st March, 2017
As at 31st March, 2016
As at 1st April, 2015
Micro, Small and Medium Enterprises 113.92 158.34 173.78
Others 1,335.69 801.10 692.69
Total 1,449.61 959.44 866.47
24.1 Micro, Small and Medium Enterprises under the Micro, Small and Medium Enterprises Development Act, 2006 (MSMED 2006) have been determined based on the information as available with the Company and the details of amount outstanding due to them are as given below:
(` in lacs)Particulars As at 31st
March, 2017 As at 31st
March, 2016 As at 1st
April, 2015a) Principal amount outstanding 113.92 158.34 173.78
b) Interest due thereon - - -
c) Interest paid by the Company in terms of Section 16 of MSMED 2006, alongwith amount of the payment made to the suppliers beyond the appointed day during the year .
- - -
Notes to the standalone financial statement for the year ended 31st March, 2017
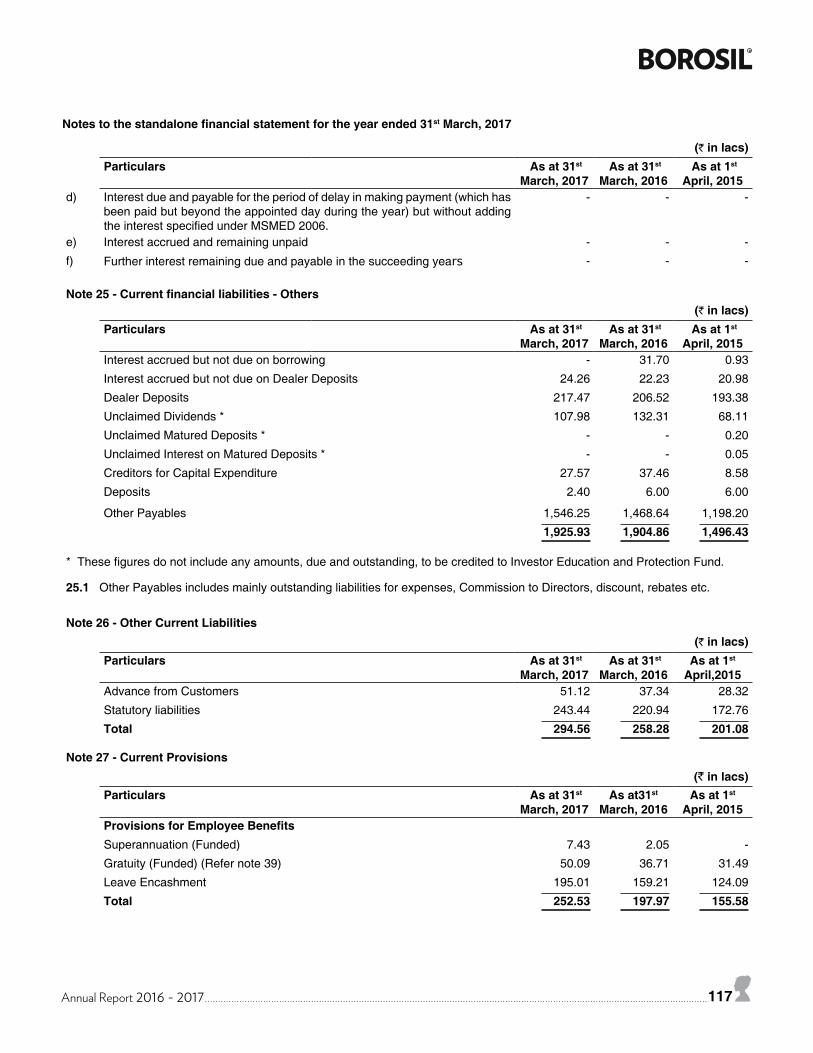
Annual Report 2016 - 2017 117
Notes to the standalone financial statement for the year ended 31st March, 2017
(` in lacs)Particulars As at 31st
March, 2017 As at 31st
March, 2016 As at 1st
April, 2015d) Interest due and payable for the period of delay in making payment (which has
been paid but beyond the appointed day during the year) but without adding the interest specified under MSMED 2006.
- - -
e) Interest accrued and remaining unpaid - - -
f) Further interest remaining due and payable in the succeeding years - - -
Note 25 - Current financial liabilities - Others(` in lacs)
Particulars As at 31st March, 2017
As at 31st March, 2016
As at 1st April, 2015
Interest accrued but not due on borrowing - 31.70 0.93
Interest accrued but not due on Dealer Deposits 24.26 22.23 20.98
Dealer Deposits 217.47 206.52 193.38
Unclaimed Dividends * 107.98 132.31 68.11
Unclaimed Matured Deposits * - - 0.20
Unclaimed Interest on Matured Deposits * - - 0.05
Creditors for Capital Expenditure 27.57 37.46 8.58
Deposits 2.40 6.00 6.00
Other Payables 1,546.25 1,468.64 1,198.20
1,925.93 1,904.86 1,496.43
* These figures do not include any amounts, due and outstanding, to be credited to Investor Education and Protection Fund.
25.1 Other Payables includes mainly outstanding liabilities for expenses, Commission to Directors, discount, rebates etc.
Note 26 - Other Current Liabilities (` in lacs)
Particulars As at 31st March, 2017
As at 31st March, 2016
As at 1st April,2015
Advance from Customers 51.12 37.34 28.32
Statutory liabilities 243.44 220.94 172.76
Total 294.56 258.28 201.08
Note 27 - Current Provisions(` in lacs)
Particulars As at 31st March, 2017
As at31st March, 2016
As at 1st April, 2015
Provisions for Employee BenefitsSuperannuation (Funded) 7.43 2.05 -
Gratuity (Funded) (Refer note 39) 50.09 36.71 31.49
Leave Encashment 195.01 159.21 124.09
Total 252.53 197.97 155.58
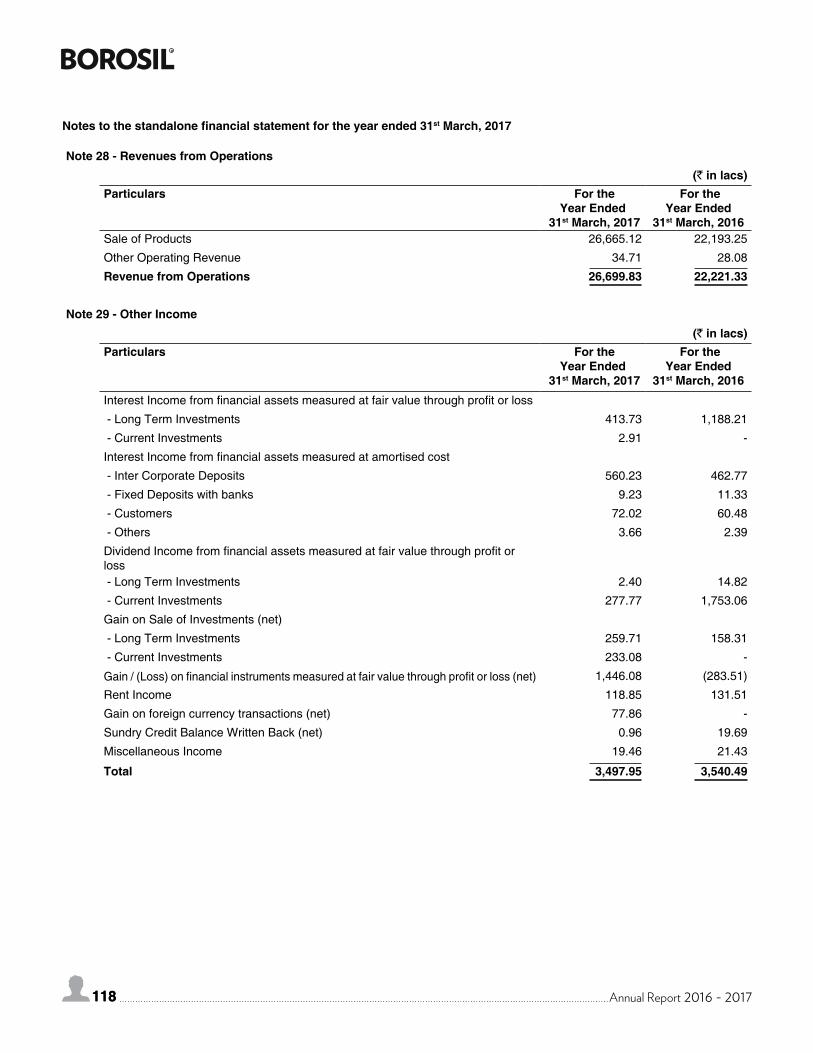
118 Annual Report 2016 - 2017118
Notes to the standalone financial statement for the year ended 31st March, 2017
Note 28 - Revenues from Operations (` in lacs)
Particulars For the Year Ended
31st March, 2017
For the Year Ended
31st March, 2016Sale of Products 26,665.12 22,193.25
Other Operating Revenue 34.71 28.08
Revenue from Operations 26,699.83 22,221.33
Note 29 - Other Income (` in lacs)
Particulars For the Year Ended
31st March, 2017
For the Year Ended
31st March, 2016Interest Income from financial assets measured at fair value through profit or loss
- Long Term Investments 413.73 1,188.21
- Current Investments 2.91 -
Interest Income from financial assets measured at amortised cost
- Inter Corporate Deposits 560.23 462.77
- Fixed Deposits with banks 9.23 11.33
- Customers 72.02 60.48
- Others 3.66 2.39
Dividend Income from financial assets measured at fair value through profit or loss - Long Term Investments 2.40 14.82
- Current Investments 277.77 1,753.06
Gain on Sale of Investments (net)
- Long Term Investments 259.71 158.31
- Current Investments 233.08 -
Gain / (Loss) on financial instruments measured at fair value through profit or loss (net) 1,446.08 (283.51)
Rent Income 118.85 131.51
Gain on foreign currency transactions (net) 77.86 -
Sundry Credit Balance Written Back (net) 0.96 19.69
Miscellaneous Income 19.46 21.43
Total 3,497.95 3,540.49
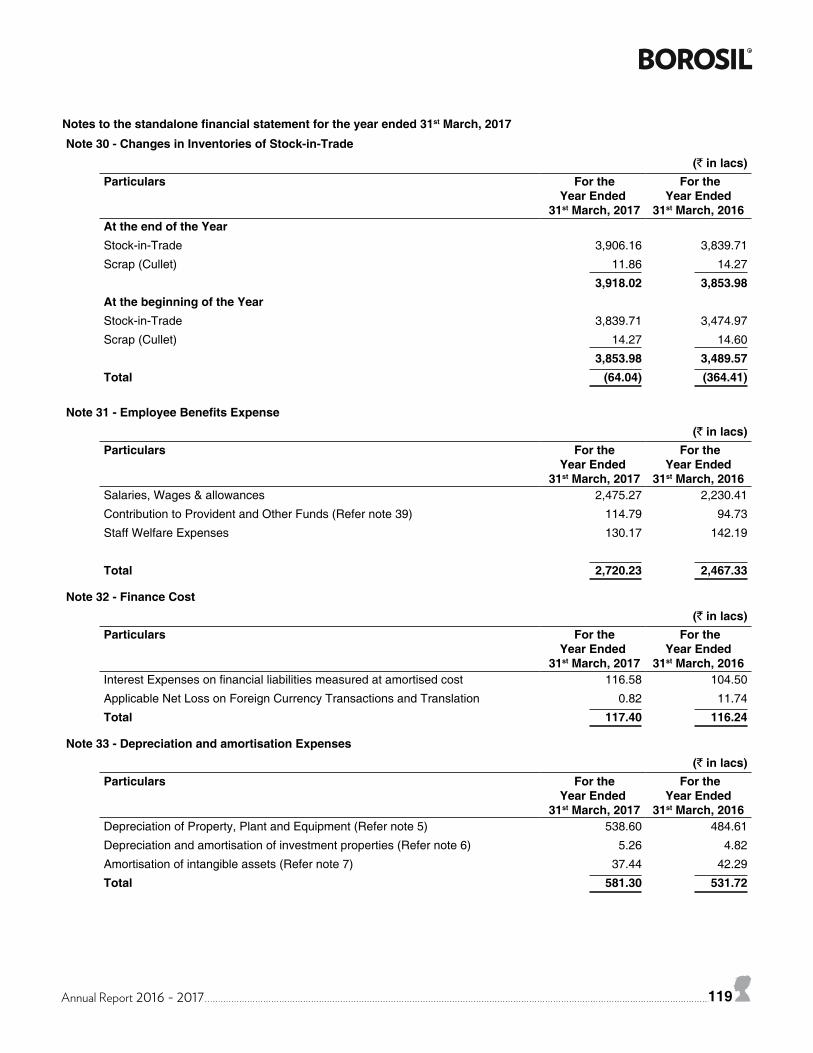
Annual Report 2016 - 2017 119
Notes to the standalone financial statement for the year ended 31st March, 2017
Note 30 - Changes in Inventories of Stock-in-Trade (` in lacs)
Particulars For the Year Ended
31st March, 2017
For the Year Ended
31st March, 2016At the end of the YearStock-in-Trade 3,906.16 3,839.71
Scrap (Cullet) 11.86 14.27
3,918.02 3,853.98At the beginning of the YearStock-in-Trade 3,839.71 3,474.97
Scrap (Cullet) 14.27 14.60
3,853.98 3,489.57Total (64.04) (364.41)
Note 31 - Employee Benefits Expense (` in lacs)
Particulars For the Year Ended
31st March, 2017
For the Year Ended
31st March, 2016Salaries, Wages & allowances 2,475.27 2,230.41
Contribution to Provident and Other Funds (Refer note 39) 114.79 94.73
Staff Welfare Expenses 130.17 142.19
Total 2,720.23 2,467.33
Note 32 - Finance Cost (` in lacs)
Particulars For the Year Ended
31st March, 2017
For the Year Ended
31st March, 2016Interest Expenses on financial liabilities measured at amortised cost 116.58 104.50
Applicable Net Loss on Foreign Currency Transactions and Translation 0.82 11.74
Total 117.40 116.24
Note 33 - Depreciation and amortisation Expenses (` in lacs)
Particulars For the Year Ended
31st March, 2017
For the Year Ended
31st March, 2016Depreciation of Property, Plant and Equipment (Refer note 5) 538.60 484.61
Depreciation and amortisation of investment properties (Refer note 6) 5.26 4.82
Amortisation of intangible assets (Refer note 7) 37.44 42.29
Total 581.30 531.72
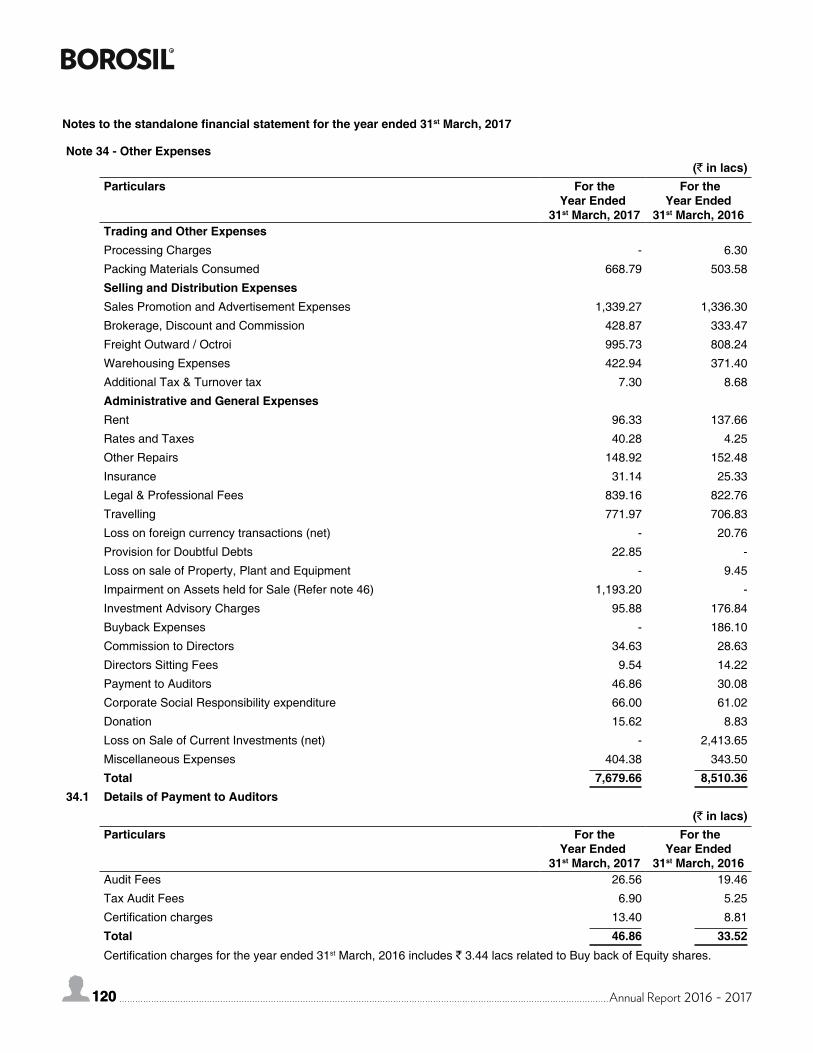
120 Annual Report 2016 - 2017120
Notes to the standalone financial statement for the year ended 31st March, 2017
Note 34 - Other Expenses (` in lacs)
Particulars For the Year Ended
31st March, 2017
For the Year Ended
31st March, 2016Trading and Other ExpensesProcessing Charges - 6.30
Packing Materials Consumed 668.79 503.58
Selling and Distribution ExpensesSales Promotion and Advertisement Expenses 1,339.27 1,336.30
Brokerage, Discount and Commission 428.87 333.47
Freight Outward / Octroi 995.73 808.24
Warehousing Expenses 422.94 371.40
Additional Tax & Turnover tax 7.30 8.68
Administrative and General ExpensesRent 96.33 137.66
Rates and Taxes 40.28 4.25
Other Repairs 148.92 152.48
Insurance 31.14 25.33
Legal & Professional Fees 839.16 822.76
Travelling 771.97 706.83
Loss on foreign currency transactions (net) - 20.76
Provision for Doubtful Debts 22.85 -
Loss on sale of Property, Plant and Equipment - 9.45
Impairment on Assets held for Sale (Refer note 46) 1,193.20 -
Investment Advisory Charges 95.88 176.84
Buyback Expenses - 186.10
Commission to Directors 34.63 28.63
Directors Sitting Fees 9.54 14.22
Payment to Auditors 46.86 30.08
Corporate Social Responsibility expenditure 66.00 61.02
Donation 15.62 8.83
Loss on Sale of Current Investments (net) - 2,413.65
Miscellaneous Expenses 404.38 343.50
Total 7,679.66 8,510.3634.1 Details of Payment to Auditors
(` in lacs)Particulars For the
Year Ended 31st March, 2017
For the Year Ended
31st March, 2016Audit Fees 26.56 19.46
Tax Audit Fees 6.90 5.25
Certification charges 13.40 8.81
Total 46.86 33.52Certification charges for the year ended 31st March, 2016 includes ` 3.44 lacs related to Buy back of Equity shares.
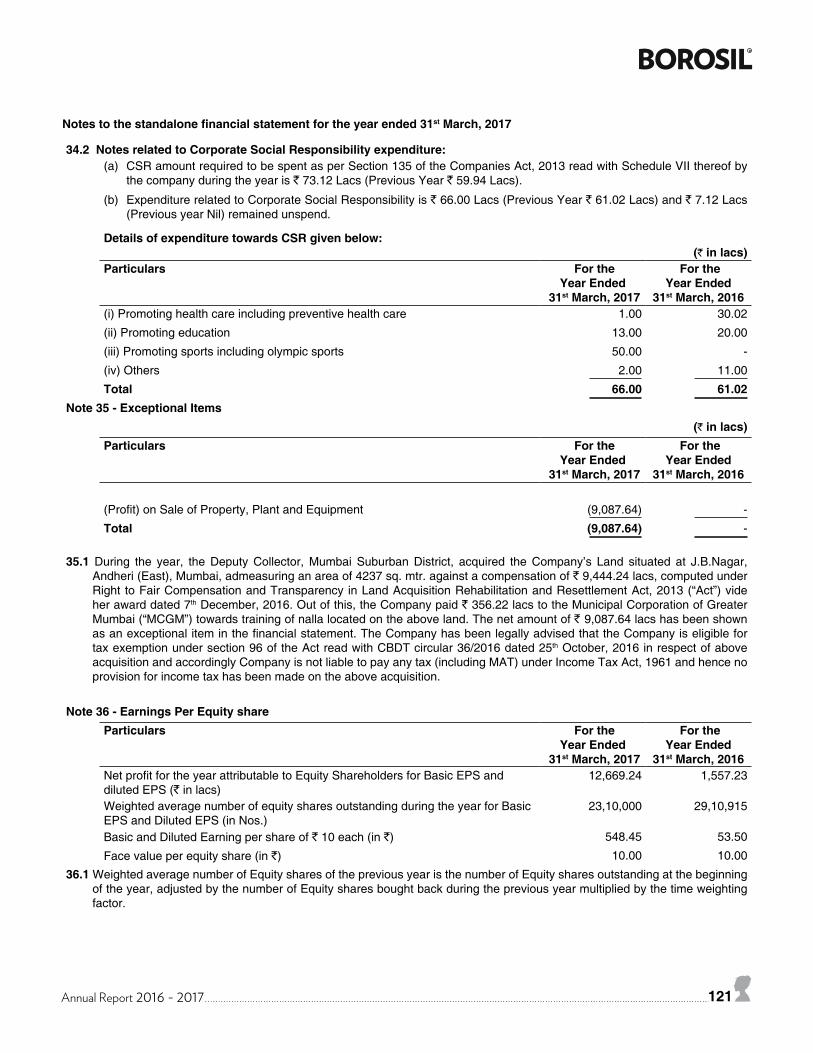
Annual Report 2016 - 2017 121
Notes to the standalone financial statement for the year ended 31st March, 2017
34.2 Notes related to Corporate Social Responsibility expenditure:(a) CSR amount required to be spent as per Section 135 of the Companies Act, 2013 read with Schedule VII thereof by
the company during the year is ` 73.12 Lacs (Previous Year ` 59.94 Lacs).
(b) Expenditure related to Corporate Social Responsibility is ` 66.00 Lacs (Previous Year ` 61.02 Lacs) and ` 7.12 Lacs (Previous year Nil) remained unspend.
Details of expenditure towards CSR given below:(` in lacs)
Particulars For the Year Ended
31st March, 2017
For the Year Ended
31st March, 2016(i) Promoting health care including preventive health care 1.00 30.02
(ii) Promoting education 13.00 20.00
(iii) Promoting sports including olympic sports 50.00 -
(iv) Others 2.00 11.00
Total 66.00 61.02Note 35 - Exceptional Items
(` in lacs)Particulars For the
Year Ended 31st March, 2017
For the Year Ended
31st March, 2016
(Profit) on Sale of Property, Plant and Equipment (9,087.64) -
Total (9,087.64) -
35.1 During the year, the Deputy Collector, Mumbai Suburban District, acquired the Company’s Land situated at J.B.Nagar, Andheri (East), Mumbai, admeasuring an area of 4237 sq. mtr. against a compensation of ` 9,444.24 lacs, computed under Right to Fair Compensation and Transparency in Land Acquisition Rehabilitation and Resettlement Act, 2013 (“Act”) vide her award dated 7th December, 2016. Out of this, the Company paid ` 356.22 lacs to the Municipal Corporation of Greater Mumbai (“MCGM”) towards training of nalla located on the above land. The net amount of ` 9,087.64 lacs has been shown as an exceptional item in the financial statement. The Company has been legally advised that the Company is eligible for tax exemption under section 96 of the Act read with CBDT circular 36/2016 dated 25th October, 2016 in respect of above acquisition and accordingly Company is not liable to pay any tax (including MAT) under Income Tax Act, 1961 and hence no provision for income tax has been made on the above acquisition.
Note 36 - Earnings Per Equity shareParticulars For the
Year Ended 31st March, 2017
For the Year Ended
31st March, 2016Net profit for the year attributable to Equity Shareholders for Basic EPS and diluted EPS (` in lacs)
12,669.24 1,557.23
Weighted average number of equity shares outstanding during the year for Basic EPS and Diluted EPS (in Nos.)
23,10,000 29,10,915
Basic and Diluted Earning per share of ` 10 each (in `) 548.45 53.50
Face value per equity share (in `) 10.00 10.00
36.1 Weighted average number of Equity shares of the previous year is the number of Equity shares outstanding at the beginning of the year, adjusted by the number of Equity shares bought back during the previous year multiplied by the time weighting factor.
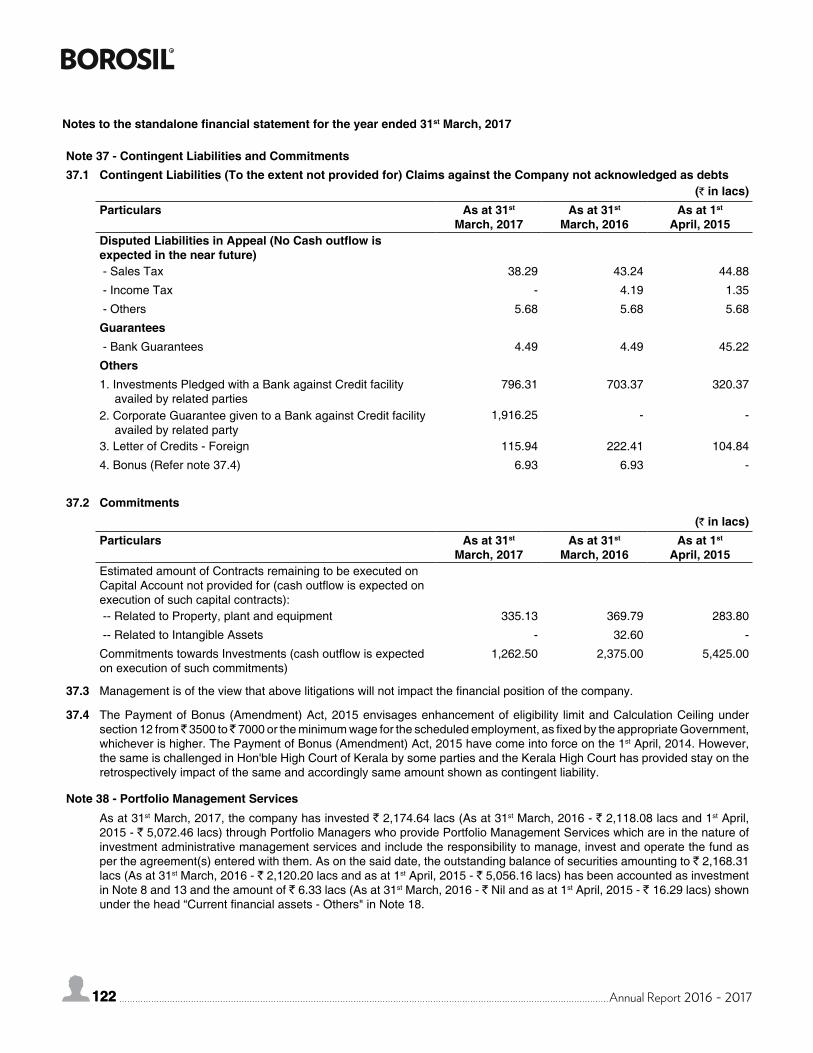
122 Annual Report 2016 - 2017122
Note 37 - Contingent Liabilities and Commitments37.1 Contingent Liabilities (To the extent not provided for) Claims against the Company not acknowledged as debts
(` in lacs)Particulars As at 31st
March, 2017As at 31st
March, 2016As at 1st
April, 2015Disputed Liabilities in Appeal (No Cash outflow is expected in the near future) - Sales Tax 38.29 43.24 44.88
- Income Tax - 4.19 1.35
- Others 5.68 5.68 5.68
Guarantees - Bank Guarantees 4.49 4.49 45.22
Others1. Investments Pledged with a Bank against Credit facility
availed by related parties 796.31 703.37 320.37
2. Corporate Guarantee given to a Bank against Credit facility availed by related party
1,916.25 - -
3. Letter of Credits - Foreign 115.94 222.41 104.84
4. Bonus (Refer note 37.4) 6.93 6.93 -
37.2 Commitments (` in lacs)
Particulars As at 31st March, 2017
As at 31st March, 2016
As at 1st April, 2015
Estimated amount of Contracts remaining to be executed on Capital Account not provided for (cash outflow is expected on execution of such capital contracts): -- Related to Property, plant and equipment 335.13 369.79 283.80
-- Related to Intangible Assets - 32.60 -
Commitments towards Investments (cash outflow is expected on execution of such commitments)
1,262.50 2,375.00 5,425.00
37.3 Management is of the view that above litigations will not impact the financial position of the company.
37.4 The Payment of Bonus (Amendment) Act, 2015 envisages enhancement of eligibility limit and Calculation Ceiling under section 12 from ̀ 3500 to ̀ 7000 or the minimum wage for the scheduled employment, as fixed by the appropriate Government, whichever is higher. The Payment of Bonus (Amendment) Act, 2015 have come into force on the 1st April, 2014. However, the same is challenged in Hon'ble High Court of Kerala by some parties and the Kerala High Court has provided stay on the retrospectively impact of the same and accordingly same amount shown as contingent liability.
Note 38 - Portfolio Management ServicesAs at 31st March, 2017, the company has invested ` 2,174.64 lacs (As at 31st March, 2016 - ` 2,118.08 lacs and 1st April, 2015 - ` 5,072.46 lacs) through Portfolio Managers who provide Portfolio Management Services which are in the nature of investment administrative management services and include the responsibility to manage, invest and operate the fund as per the agreement(s) entered with them. As on the said date, the outstanding balance of securities amounting to ` 2,168.31 lacs (As at 31st March, 2016 - ` 2,120.20 lacs and as at 1st April, 2015 - ` 5,056.16 lacs) has been accounted as investment in Note 8 and 13 and the amount of ` 6.33 lacs (As at 31st March, 2016 - ` Nil and as at 1st April, 2015 - ` 16.29 lacs) shown under the head “Current financial assets - Others" in Note 18.
Notes to the standalone financial statement for the year ended 31st March, 2017
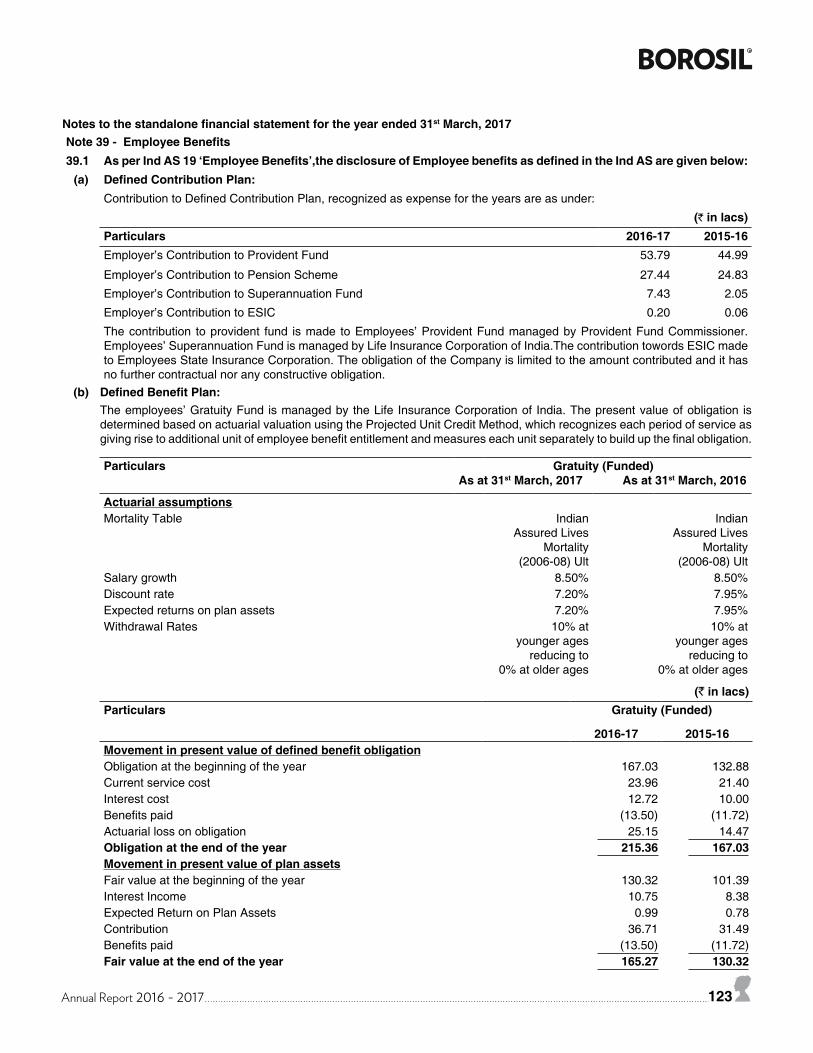
Annual Report 2016 - 2017 123
Note 39 - Employee Benefits39.1 As per Ind AS 19 ‘Employee Benefits’,the disclosure of Employee benefits as defined in the Ind AS are given below:
(a) Defined Contribution Plan:Contribution to Defined Contribution Plan, recognized as expense for the years are as under:
(` in lacs)Particulars 2016-17 2015-16Employer’s Contribution to Provident Fund 53.79 44.99
Employer’s Contribution to Pension Scheme 27.44 24.83
Employer’s Contribution to Superannuation Fund 7.43 2.05
Employer’s Contribution to ESIC 0.20 0.06
The contribution to provident fund is made to Employees’ Provident Fund managed by Provident Fund Commissioner. Employees’ Superannuation Fund is managed by Life Insurance Corporation of India.The contribution towords ESIC made to Employees State Insurance Corporation. The obligation of the Company is limited to the amount contributed and it has no further contractual nor any constructive obligation.
(b) Defined Benefit Plan:The employees’ Gratuity Fund is managed by the Life Insurance Corporation of India. The present value of obligation is determined based on actuarial valuation using the Projected Unit Credit Method, which recognizes each period of service as giving rise to additional unit of employee benefit entitlement and measures each unit separately to build up the final obligation.
Particulars Gratuity (Funded)As at 31st March, 2017 As at 31st March, 2016
Actuarial assumptionsMortality Table Indian
Assured Lives Mortality
(2006-08) Ult
Indian Assured Lives
Mortality (2006-08) Ult
Salary growth 8.50% 8.50%Discount rate 7.20% 7.95%Expected returns on plan assets 7.20% 7.95%Withdrawal Rates 10% at
younger ages reducing to
0% at older ages
10% at younger ages
reducing to 0% at older ages
(` in lacs)Particulars Gratuity (Funded)
2016-17 2015-16Movement in present value of defined benefit obligationObligation at the beginning of the year 167.03 132.88Current service cost 23.96 21.40Interest cost 12.72 10.00Benefits paid (13.50) (11.72)Actuarial loss on obligation 25.15 14.47Obligation at the end of the year 215.36 167.03Movement in present value of plan assetsFair value at the beginning of the year 130.32 101.39Interest Income 10.75 8.38Expected Return on Plan Assets 0.99 0.78Contribution 36.71 31.49Benefits paid (13.50) (11.72)Fair value at the end of the year 165.27 130.32
Notes to the standalone financial statement for the year ended 31st March, 2017
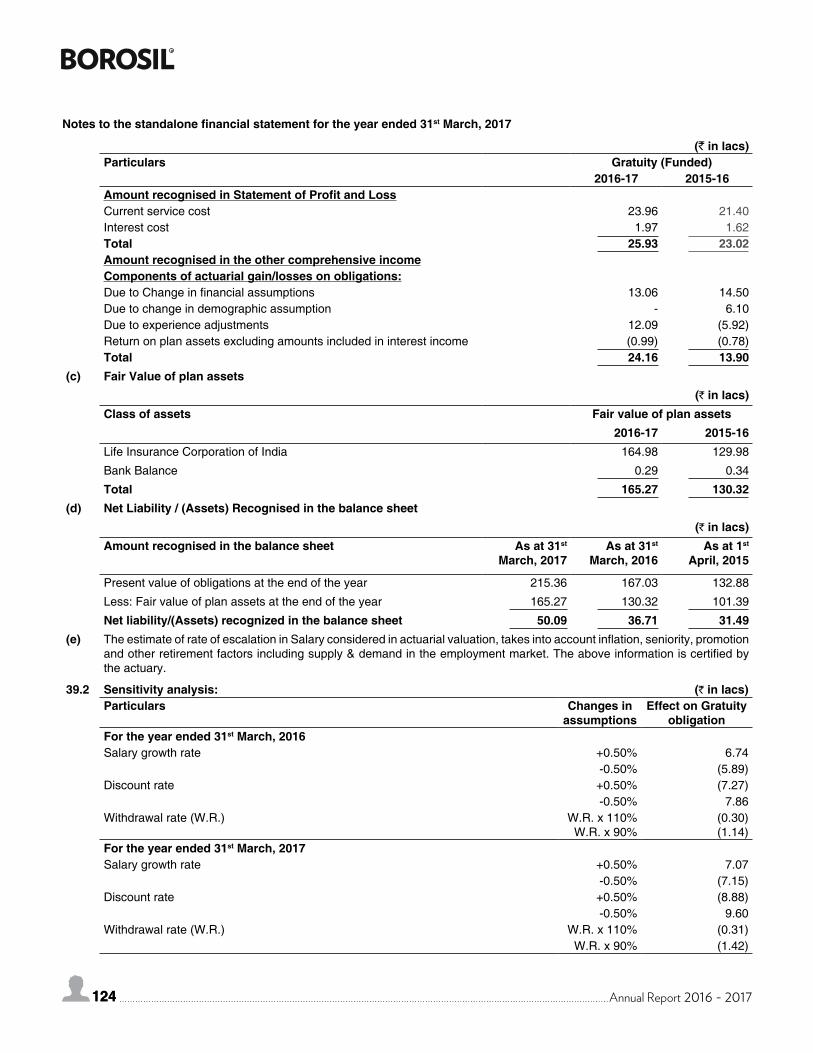
124 Annual Report 2016 - 2017124
(` in lacs)Particulars Gratuity (Funded)
2016-17 2015-16Amount recognised in Statement of Profit and LossCurrent service cost 23.96 21.40Interest cost 1.97 1.62Total 25.93 23.02Amount recognised in the other comprehensive incomeComponents of actuarial gain/losses on obligations:Due to Change in financial assumptions 13.06 14.50Due to change in demographic assumption - 6.10Due to experience adjustments 12.09 (5.92)Return on plan assets excluding amounts included in interest income (0.99) (0.78)Total 24.16 13.90
(c) Fair Value of plan assets(` in lacs)
Class of assets Fair value of plan assets2016-17 2015-16
Life Insurance Corporation of India 164.98 129.98
Bank Balance 0.29 0.34
Total 165.27 130.32(d) Net Liability / (Assets) Recognised in the balance sheet
(` in lacs)Amount recognised in the balance sheet As at 31st
March, 2017As at 31st
March, 2016 As at 1st April, 2015
Present value of obligations at the end of the year 215.36 167.03 132.88
Less: Fair value of plan assets at the end of the year 165.27 130.32 101.39
Net liability/(Assets) recognized in the balance sheet 50.09 36.71 31.49(e) The estimate of rate of escalation in Salary considered in actuarial valuation, takes into account inflation, seniority, promotion
and other retirement factors including supply & demand in the employment market. The above information is certified by the actuary.
39.2 Sensitivity analysis: (` in lacs)Particulars Changes in
assumptionsEffect on Gratuity
obligationFor the year ended 31st March, 2016Salary growth rate +0.50% 6.74
-0.50% (5.89)Discount rate +0.50% (7.27)
-0.50% 7.86Withdrawal rate (W.R.) W.R. x 110%
W.R. x 90% (0.30) (1.14)
For the year ended 31st March, 2017Salary growth rate +0.50% 7.07
-0.50% (7.15)Discount rate +0.50% (8.88) -0.50% 9.60Withdrawal rate (W.R.) W.R. x 110% (0.31)
W.R. x 90% (1.42)
Notes to the standalone financial statement for the year ended 31st March, 2017
Annual Report 2016 - 2017 125
39.3
The above sensitivity analysis is based on a change in an assumption while holding all other assumptions constant. In practice, this is unlikely to occur, and changes in some of the assumptions may be correlated. In presenting the above sensitivity analysis, the present value of defined benefit obligation has been calculated using the projected unit credit method at the end of reporting period, which is the same as that applied in calculating the defined obligation liability recognized in the balance sheet. Risk exposuresA. Actuarial Risk:It is the risk that benefits will cost more than expected. This can arise due to one of the following reasons:
Adverse Salary Growth Experience: Salary hikes that are higher than the assumed salary escalation will result into an increase in obligation at a rate that is higher than expected.
Variability in mortality rates: If actual mortality rates are higher than assumed mortality rate than the Gratuity benefits will be paid earlier than expected. Since there is no condition of vesting on the death benefit, the acceleration of cashflow will lead to an actuarial loss or gain depending on the relative values of the assumed salary growth and discount rate.
Variability in withdrawal rates: If actual withdrawal rates are higher than assumed withdrawal rate than the Gratuity benefits will be paid earlier than expected. The impact of this will depend on whether the benefits are vested as at the resignation date.
B. Investment Risk:For funded plans that rely on insurers for managing the assets, the value of assets certified by the insurer may not be the fair value of instruments backing the liability. In such cases, the present value of the assets is independent of the future discount rate. This can result in wide fluctuations in the net liability or the funded status if there are significant changes in the discount rate during the inter-valuation period.
C. Liquidity Risk:Employees with high salaries and long durations or those higher in hierarchy, accumulate significant level of benefits. If some of such employees resign/retire from the company there can be strain on the cashflows.
D. Market Risk:Market risk is a collective term for risks that are related to the changes and fluctuations of the financial markets. One actuarial assumption that has a material effect is the discount rate. The discount rate reflects the time value of money. An increase in discount rate leads to decrease in Defined Benefit Obligation of the plan benefits & vice versa. This assumption depends on the yields on the corporate/government bonds and hence the valuation of liability is exposed to fluctuations in the yields as at the valuation date.
E. Legislative Risk:Legislative risk is the risk of increase in the plan liabilities or reduction in the plan assets due to change in the legislation/regulation. The government may amend the Payment of Gratuity Act thus requiring the companies to pay higher benefits to the employees. This will directly affect the present value of the Defined Benefit Obligation and the same will have to be recognized immediately in the year when any such amendment is effective.
39.4 Details of Asset-Liability Matching StrategyGratuity benefits liabilities of the company are Funded. There are no minimum funding requirements for a Gratuity benefits plan in India and there is no compulsion on the part of the Company to fully or partially pre-fund the liabilities under the Plan. The trustees of the plan have outsourced the investment management of the fund to an insurance company which are regulated by IRDA. Due to the restrictions in the type of investments that can be held by the fund, it may not be possible to explicitly follow an asset-liability matching strategy to manage risk actively in a conventional fund.
39.5 The expected payments towards contributions to the defined benefit plan is within one year.
Notes to the standalone financial statement for the year ended 31st March, 2017
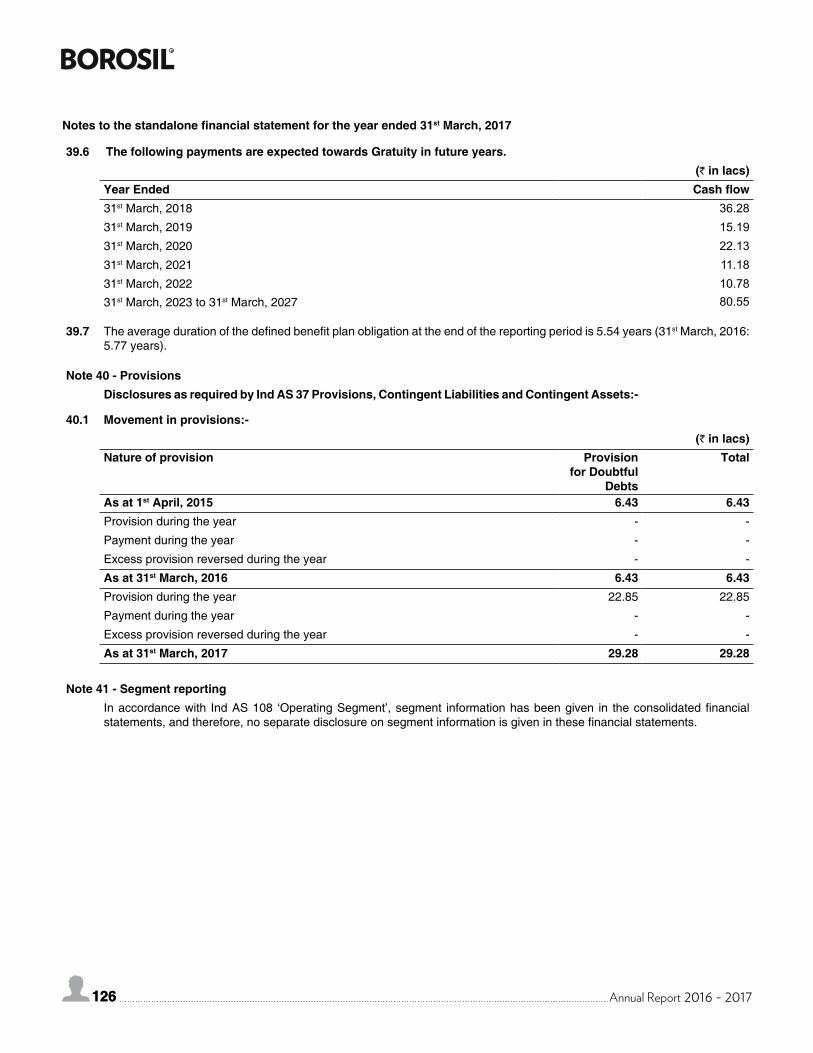
126 Annual Report 2016 - 2017126
Notes to the standalone financial statement for the year ended 31st March, 2017
39.6 The following payments are expected towards Gratuity in future years.
(` in lacs)Year Ended Cash flow31st March, 2018 36.28 31st March, 2019 15.19 31st March, 2020 22.13 31st March, 2021 11.18 31st March, 2022 10.78 31st March, 2023 to 31st March, 2027 80.55
39.7 The average duration of the defined benefit plan obligation at the end of the reporting period is 5.54 years (31st March, 2016: 5.77 years).
Note 40 - ProvisionsDisclosures as required by Ind AS 37 Provisions, Contingent Liabilities and Contingent Assets:-
40.1 Movement in provisions:-(` in lacs)
Nature of provision Provision for Doubtful
Debts
Total
As at 1st April, 2015 6.43 6.43Provision during the year - -
Payment during the year - -
Excess provision reversed during the year - -
As at 31st March, 2016 6.43 6.43Provision during the year 22.85 22.85
Payment during the year - -
Excess provision reversed during the year - -
As at 31st March, 2017 29.28 29.28
Note 41 - Segment reportingIn accordance with Ind AS 108 ‘Operating Segment’, segment information has been given in the consolidated financial statements, and therefore, no separate disclosure on segment information is given in these financial statements.
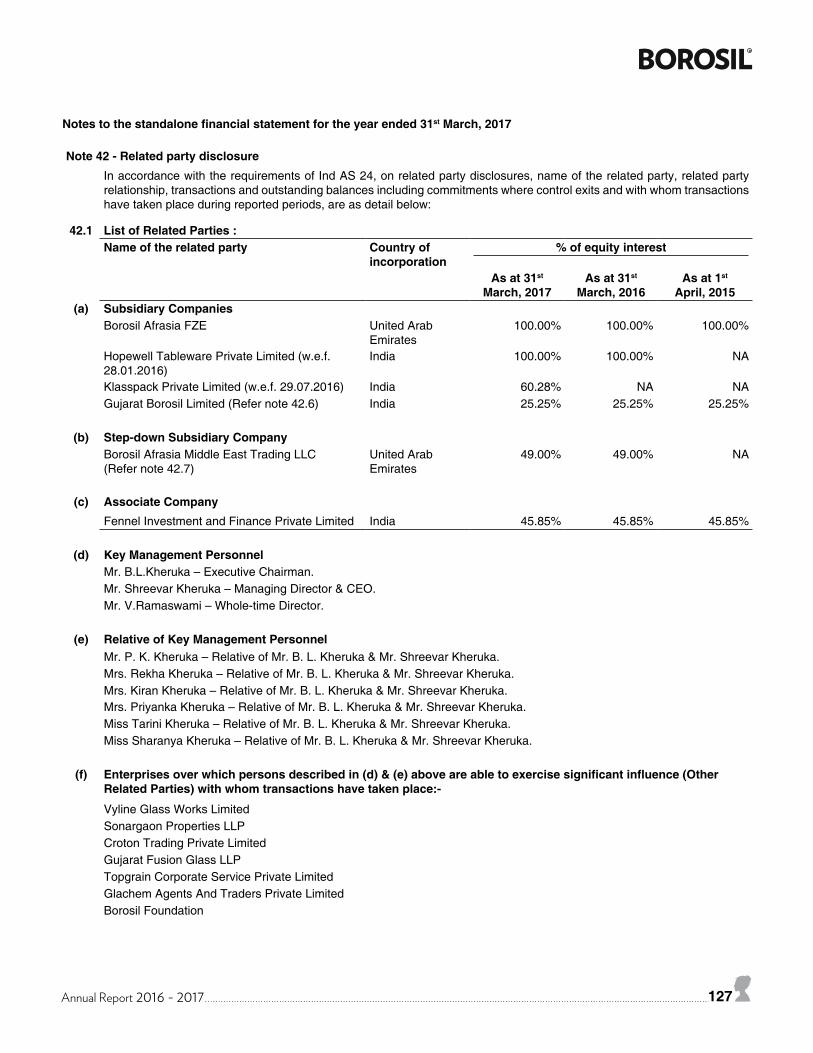
Annual Report 2016 - 2017 127
Note 42 - Related party disclosureIn accordance with the requirements of Ind AS 24, on related party disclosures, name of the related party, related party relationship, transactions and outstanding balances including commitments where control exits and with whom transactions have taken place during reported periods, are as detail below:
42.1 List of Related Parties :Name of the related party Country of
incorporation% of equity interest
As at 31st March, 2017
As at 31st March, 2016
As at 1st April, 2015
(a) Subsidiary CompaniesBorosil Afrasia FZE United Arab
Emirates100.00% 100.00% 100.00%
Hopewell Tableware Private Limited (w.e.f. 28.01.2016)
India 100.00% 100.00% NA
Klasspack Private Limited (w.e.f. 29.07.2016) India 60.28% NA NAGujarat Borosil Limited (Refer note 42.6) India 25.25% 25.25% 25.25%
(b) Step-down Subsidiary CompanyBorosil Afrasia Middle East Trading LLC (Refer note 42.7)
United Arab Emirates
49.00% 49.00% NA
(c) Associate CompanyFennel Investment and Finance Private Limited India 45.85% 45.85% 45.85%
(d) Key Management PersonnelMr. B.L.Kheruka – Executive Chairman.Mr. Shreevar Kheruka – Managing Director & CEO.Mr. V.Ramaswami – Whole-time Director.
(e) Relative of Key Management PersonnelMr. P. K. Kheruka – Relative of Mr. B. L. Kheruka & Mr. Shreevar Kheruka.Mrs. Rekha Kheruka – Relative of Mr. B. L. Kheruka & Mr. Shreevar Kheruka.Mrs. Kiran Kheruka – Relative of Mr. B. L. Kheruka & Mr. Shreevar Kheruka.Mrs. Priyanka Kheruka – Relative of Mr. B. L. Kheruka & Mr. Shreevar Kheruka.Miss Tarini Kheruka – Relative of Mr. B. L. Kheruka & Mr. Shreevar Kheruka.Miss Sharanya Kheruka – Relative of Mr. B. L. Kheruka & Mr. Shreevar Kheruka.
(f) Enterprises over which persons described in (d) & (e) above are able to exercise significant influence (Other Related Parties) with whom transactions have taken place:-
Vyline Glass Works LimitedSonargaon Properties LLPCroton Trading Private LimitedGujarat Fusion Glass LLPTopgrain Corporate Service Private LimitedGlachem Agents And Traders Private LimitedBorosil Foundation
Notes to the standalone financial statement for the year ended 31st March, 2017
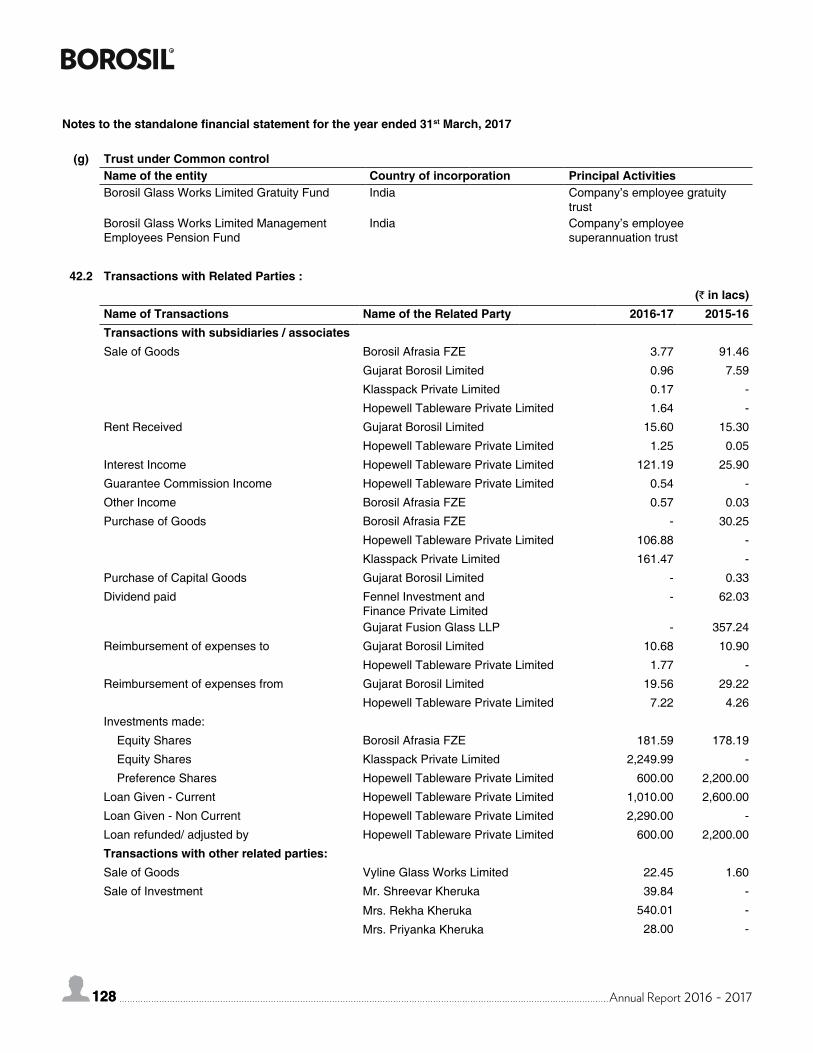
128 Annual Report 2016 - 2017128
(g) Trust under Common controlName of the entity Country of incorporation Principal ActivitiesBorosil Glass Works Limited Gratuity Fund India Company’s employee gratuity
trustBorosil Glass Works Limited Management Employees Pension Fund
India Company’s employee superannuation trust
42.2 Transactions with Related Parties :(` in lacs)
Name of Transactions Name of the Related Party 2016-17 2015-16Transactions with subsidiaries / associatesSale of Goods Borosil Afrasia FZE 3.77 91.46
Gujarat Borosil Limited 0.96 7.59
Klasspack Private Limited 0.17 -
Hopewell Tableware Private Limited 1.64 -
Rent Received Gujarat Borosil Limited 15.60 15.30
Hopewell Tableware Private Limited 1.25 0.05
Interest Income Hopewell Tableware Private Limited 121.19 25.90
Guarantee Commission Income Hopewell Tableware Private Limited 0.54 -
Other Income Borosil Afrasia FZE 0.57 0.03
Purchase of Goods Borosil Afrasia FZE - 30.25
Hopewell Tableware Private Limited 106.88 -
Klasspack Private Limited 161.47 -
Purchase of Capital Goods Gujarat Borosil Limited - 0.33
Dividend paid Fennel Investment and Finance Private Limited
- 62.03
Gujarat Fusion Glass LLP - 357.24
Reimbursement of expenses to Gujarat Borosil Limited 10.68 10.90
Hopewell Tableware Private Limited 1.77 -
Reimbursement of expenses from Gujarat Borosil Limited 19.56 29.22
Hopewell Tableware Private Limited 7.22 4.26
Investments made:
Equity Shares Borosil Afrasia FZE 181.59 178.19
Equity Shares Klasspack Private Limited 2,249.99 -
Preference Shares Hopewell Tableware Private Limited 600.00 2,200.00
Loan Given - Current Hopewell Tableware Private Limited 1,010.00 2,600.00
Loan Given - Non Current Hopewell Tableware Private Limited 2,290.00 -
Loan refunded/ adjusted by Hopewell Tableware Private Limited 600.00 2,200.00
Transactions with other related parties:Sale of Goods Vyline Glass Works Limited 22.45 1.60
Sale of Investment Mr. Shreevar Kheruka 39.84 -
Mrs. Rekha Kheruka 540.01 -
Mrs. Priyanka Kheruka 28.00 -
Notes to the standalone financial statement for the year ended 31st March, 2017
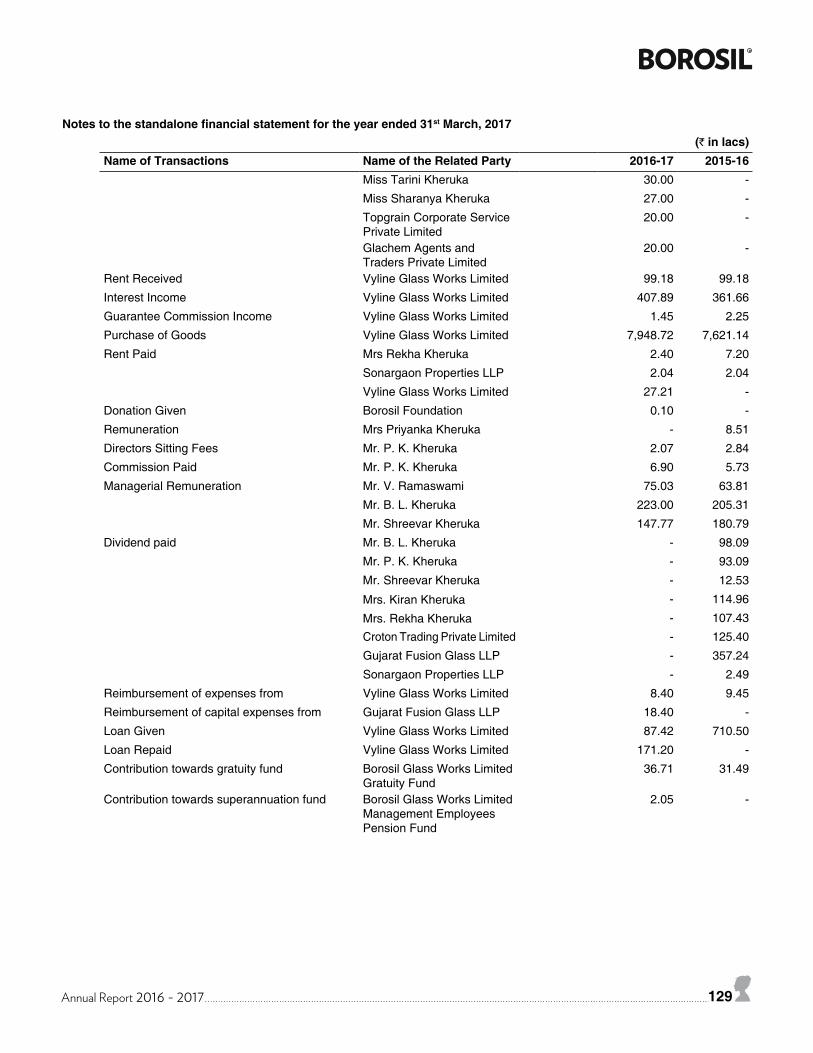
Annual Report 2016 - 2017 129
(` in lacs)Name of Transactions Name of the Related Party 2016-17 2015-16
Miss Tarini Kheruka 30.00 -
Miss Sharanya Kheruka 27.00 -
Topgrain Corporate Service Private Limited
20.00 -
Glachem Agents and Traders Private Limited
20.00 -
Rent Received Vyline Glass Works Limited 99.18 99.18
Interest Income Vyline Glass Works Limited 407.89 361.66
Guarantee Commission Income Vyline Glass Works Limited 1.45 2.25
Purchase of Goods Vyline Glass Works Limited 7,948.72 7,621.14
Rent Paid Mrs Rekha Kheruka 2.40 7.20
Sonargaon Properties LLP 2.04 2.04
Vyline Glass Works Limited 27.21 -
Donation Given Borosil Foundation 0.10 -
Remuneration Mrs Priyanka Kheruka - 8.51
Directors Sitting Fees Mr. P. K. Kheruka 2.07 2.84
Commission Paid Mr. P. K. Kheruka 6.90 5.73
Managerial Remuneration Mr. V. Ramaswami 75.03 63.81
Mr. B. L. Kheruka 223.00 205.31
Mr. Shreevar Kheruka 147.77 180.79
Dividend paid Mr. B. L. Kheruka - 98.09
Mr. P. K. Kheruka - 93.09
Mr. Shreevar Kheruka - 12.53
Mrs. Kiran Kheruka - 114.96
Mrs. Rekha Kheruka - 107.43
Croton Trading Private Limited - 125.40
Gujarat Fusion Glass LLP - 357.24
Sonargaon Properties LLP - 2.49
Reimbursement of expenses from Vyline Glass Works Limited 8.40 9.45
Reimbursement of capital expenses from Gujarat Fusion Glass LLP 18.40 -
Loan Given Vyline Glass Works Limited 87.42 710.50
Loan Repaid Vyline Glass Works Limited 171.20 -
Contribution towards gratuity fund Borosil Glass Works Limited Gratuity Fund
36.71 31.49
Contribution towards superannuation fund Borosil Glass Works Limited Management Employees Pension Fund
2.05 -
Notes to the standalone financial statement for the year ended 31st March, 2017
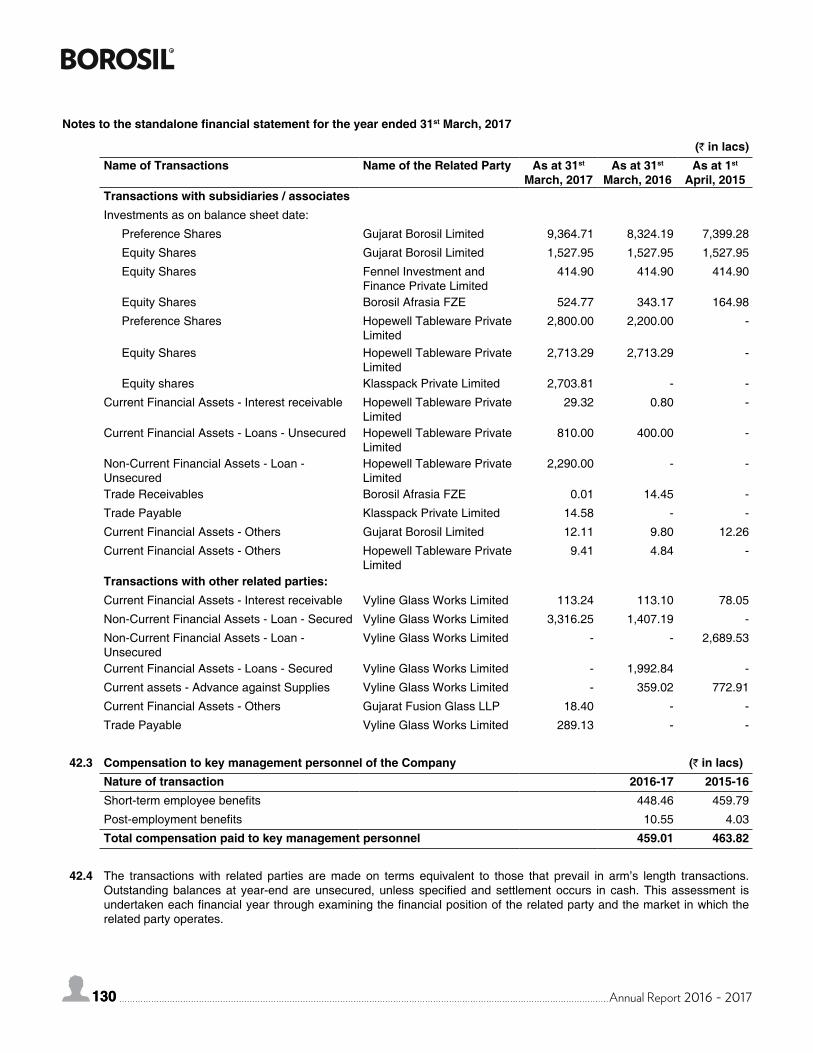
130 Annual Report 2016 - 2017130
Notes to the standalone financial statement for the year ended 31st March, 2017
(` in lacs)Name of Transactions Name of the Related Party As at 31st
March, 2017As at 31st
March, 2016As at 1st
April, 2015Transactions with subsidiaries / associatesInvestments as on balance sheet date:
Preference Shares Gujarat Borosil Limited 9,364.71 8,324.19 7,399.28
Equity Shares Gujarat Borosil Limited 1,527.95 1,527.95 1,527.95
Equity Shares Fennel Investment and Finance Private Limited
414.90 414.90 414.90
Equity Shares Borosil Afrasia FZE 524.77 343.17 164.98
Preference Shares Hopewell Tableware Private Limited
2,800.00 2,200.00 -
Equity Shares Hopewell Tableware Private Limited
2,713.29 2,713.29 -
Equity shares Klasspack Private Limited 2,703.81 - -
Current Financial Assets - Interest receivable Hopewell Tableware Private Limited
29.32 0.80 -
Current Financial Assets - Loans - Unsecured Hopewell Tableware Private Limited
810.00 400.00 -
Non-Current Financial Assets - Loan - Unsecured
Hopewell Tableware Private Limited
2,290.00 - -
Trade Receivables Borosil Afrasia FZE 0.01 14.45 -
Trade Payable Klasspack Private Limited 14.58 - -
Current Financial Assets - Others Gujarat Borosil Limited 12.11 9.80 12.26
Current Financial Assets - Others Hopewell Tableware Private Limited
9.41 4.84 -
Transactions with other related parties:Current Financial Assets - Interest receivable Vyline Glass Works Limited 113.24 113.10 78.05
Non-Current Financial Assets - Loan - Secured Vyline Glass Works Limited 3,316.25 1,407.19 -
Non-Current Financial Assets - Loan - Unsecured
Vyline Glass Works Limited - - 2,689.53
Current Financial Assets - Loans - Secured Vyline Glass Works Limited - 1,992.84 -
Current assets - Advance against Supplies Vyline Glass Works Limited - 359.02 772.91
Current Financial Assets - Others Gujarat Fusion Glass LLP 18.40 - -
Trade Payable Vyline Glass Works Limited 289.13 - -
42.3 Compensation to key management personnel of the Company (` in lacs)Nature of transaction 2016-17 2015-16Short-term employee benefits 448.46 459.79
Post-employment benefits 10.55 4.03
Total compensation paid to key management personnel 459.01 463.82
42.4 The transactions with related parties are made on terms equivalent to those that prevail in arm’s length transactions. Outstanding balances at year-end are unsecured, unless specified and settlement occurs in cash. This assessment is undertaken each financial year through examining the financial position of the related party and the market in which the related party operates.
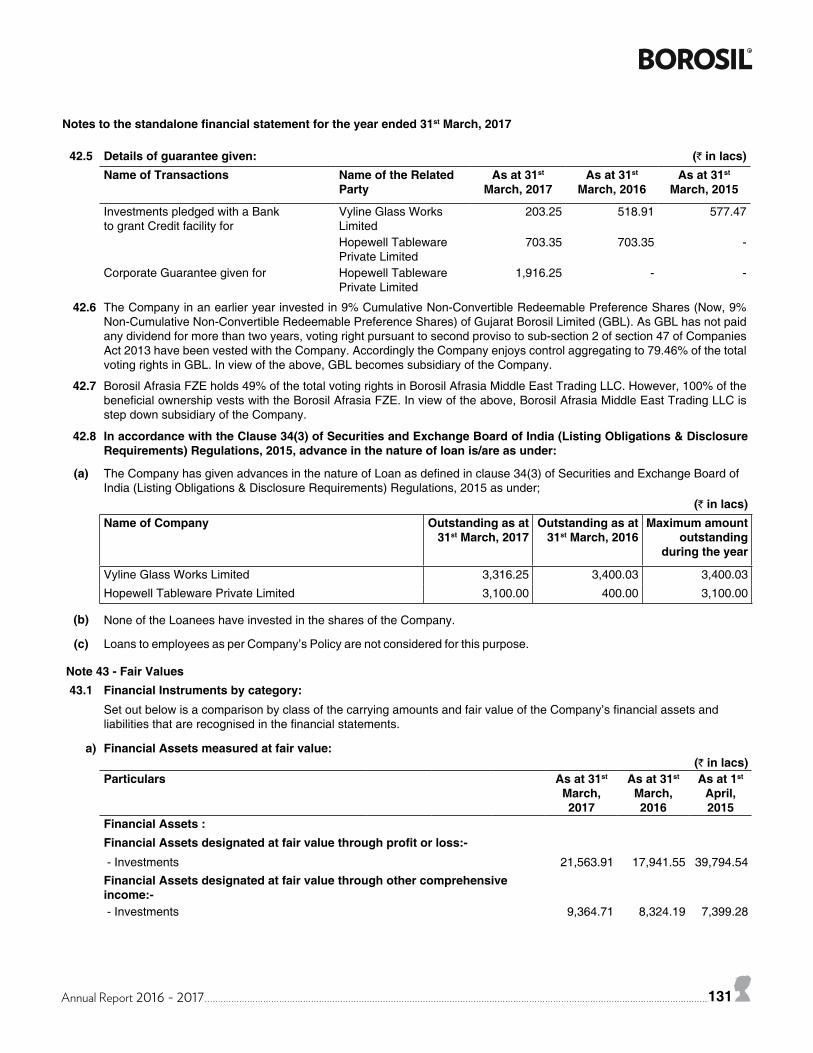
Annual Report 2016 - 2017 131
Notes to the standalone financial statement for the year ended 31st March, 2017
42.5 Details of guarantee given: (` in lacs)Name of Transactions Name of the Related
PartyAs at 31st
March, 2017As at 31st
March, 2016As at 31st
March, 2015
Investments pledged with a Bank to grant Credit facility for
Vyline Glass Works Limited
203.25 518.91 577.47
Hopewell Tableware Private Limited
703.35 703.35 -
Corporate Guarantee given for Hopewell Tableware Private Limited
1,916.25 - -
42.6 The Company in an earlier year invested in 9% Cumulative Non-Convertible Redeemable Preference Shares (Now, 9% Non-Cumulative Non-Convertible Redeemable Preference Shares) of Gujarat Borosil Limited (GBL). As GBL has not paid any dividend for more than two years, voting right pursuant to second proviso to sub-section 2 of section 47 of Companies Act 2013 have been vested with the Company. Accordingly the Company enjoys control aggregating to 79.46% of the total voting rights in GBL. In view of the above, GBL becomes subsidiary of the Company.
42.7 Borosil Afrasia FZE holds 49% of the total voting rights in Borosil Afrasia Middle East Trading LLC. However, 100% of the beneficial ownership vests with the Borosil Afrasia FZE. In view of the above, Borosil Afrasia Middle East Trading LLC is step down subsidiary of the Company.
42.8 In accordance with the Clause 34(3) of Securities and Exchange Board of India (Listing Obligations & Disclosure Requirements) Regulations, 2015, advance in the nature of loan is/are as under:
(a) The Company has given advances in the nature of Loan as defined in clause 34(3) of Securities and Exchange Board of India (Listing Obligations & Disclosure Requirements) Regulations, 2015 as under;
(` in lacs)Name of Company Outstanding as at
31st March, 2017Outstanding as at
31st March, 2016Maximum amount
outstanding during the year
Vyline Glass Works Limited 3,316.25 3,400.03 3,400.03
Hopewell Tableware Private Limited 3,100.00 400.00 3,100.00
(b) None of the Loanees have invested in the shares of the Company.
(c) Loans to employees as per Company’s Policy are not considered for this purpose.
Note 43 - Fair Values43.1 Financial Instruments by category:
Set out below is a comparison by class of the carrying amounts and fair value of the Company’s financial assets and liabilities that are recognised in the financial statements.
a) Financial Assets measured at fair value:(` in lacs)
Particulars As at 31st March, 2017
As at 31st March, 2016
As at 1st April, 2015
Financial Assets :Financial Assets designated at fair value through profit or loss:- - Investments 21,563.91 17,941.55 39,794.54Financial Assets designated at fair value through other comprehensive income:- - Investments 9,364.71 8,324.19 7,399.28
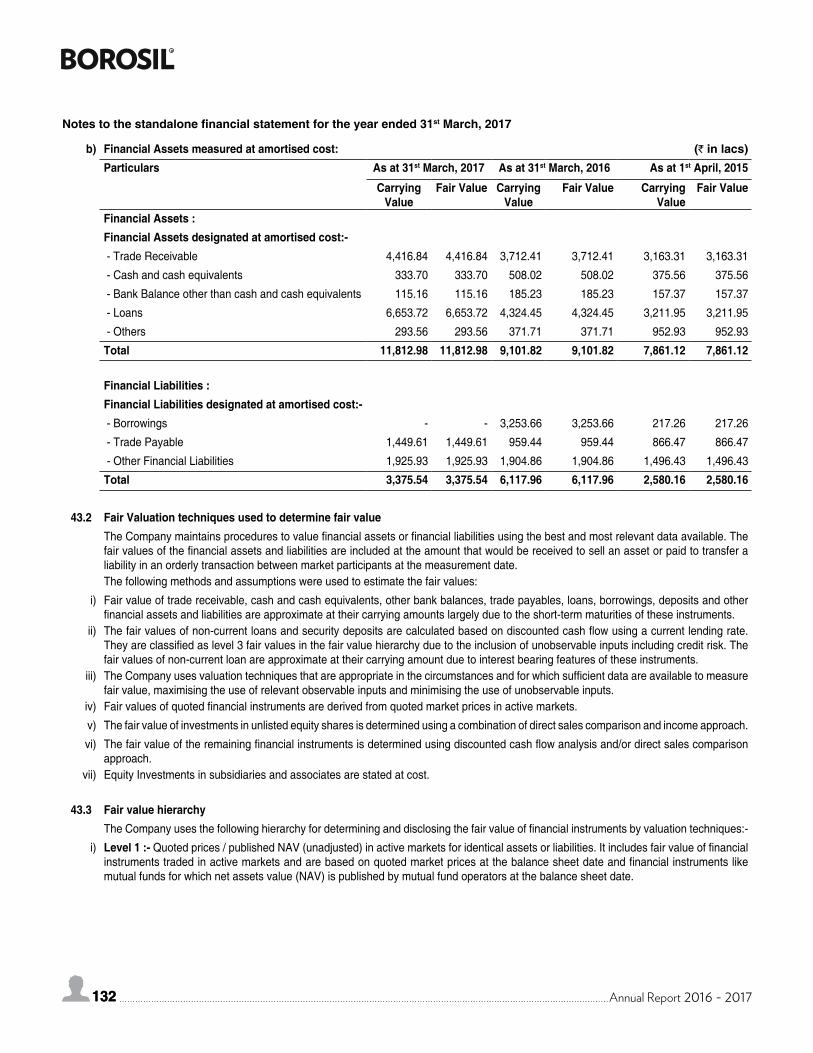
132 Annual Report 2016 - 2017132
b) Financial Assets measured at amortised cost: (` in lacs)Particulars As at 31st March, 2017 As at 31st March, 2016 As at 1st April, 2015
Carrying Value
Fair Value Carrying Value
Fair Value Carrying Value
Fair Value
Financial Assets :Financial Assets designated at amortised cost:- - Trade Receivable 4,416.84 4,416.84 3,712.41 3,712.41 3,163.31 3,163.31
- Cash and cash equivalents 333.70 333.70 508.02 508.02 375.56 375.56
- Bank Balance other than cash and cash equivalents 115.16 115.16 185.23 185.23 157.37 157.37
- Loans 6,653.72 6,653.72 4,324.45 4,324.45 3,211.95 3,211.95
- Others 293.56 293.56 371.71 371.71 952.93 952.93
Total 11,812.98 11,812.98 9,101.82 9,101.82 7,861.12 7,861.12
Financial Liabilities :Financial Liabilities designated at amortised cost:- - Borrowings - - 3,253.66 3,253.66 217.26 217.26
- Trade Payable 1,449.61 1,449.61 959.44 959.44 866.47 866.47
- Other Financial Liabilities 1,925.93 1,925.93 1,904.86 1,904.86 1,496.43 1,496.43
Total 3,375.54 3,375.54 6,117.96 6,117.96 2,580.16 2,580.16
43.2 Fair Valuation techniques used to determine fair valueThe Company maintains procedures to value financial assets or financial liabilities using the best and most relevant data available. The fair values of the financial assets and liabilities are included at the amount that would be received to sell an asset or paid to transfer a liability in an orderly transaction between market participants at the measurement date.The following methods and assumptions were used to estimate the fair values:
i) Fair value of trade receivable, cash and cash equivalents, other bank balances, trade payables, loans, borrowings, deposits and other financial assets and liabilities are approximate at their carrying amounts largely due to the short-term maturities of these instruments.
ii) The fair values of non-current loans and security deposits are calculated based on discounted cash flow using a current lending rate. They are classified as level 3 fair values in the fair value hierarchy due to the inclusion of unobservable inputs including credit risk. The fair values of non-current loan are approximate at their carrying amount due to interest bearing features of these instruments.
iii) The Company uses valuation techniques that are appropriate in the circumstances and for which sufficient data are available to measure fair value, maximising the use of relevant observable inputs and minimising the use of unobservable inputs.
iv) Fair values of quoted financial instruments are derived from quoted market prices in active markets.
v) The fair value of investments in unlisted equity shares is determined using a combination of direct sales comparison and income approach.
vi) The fair value of the remaining financial instruments is determined using discounted cash flow analysis and/or direct sales comparison approach.
vii) Equity Investments in subsidiaries and associates are stated at cost.
43.3 Fair value hierarchyThe Company uses the following hierarchy for determining and disclosing the fair value of financial instruments by valuation techniques:-
i) Level 1 :- Quoted prices / published NAV (unadjusted) in active markets for identical assets or liabilities. It includes fair value of financial instruments traded in active markets and are based on quoted market prices at the balance sheet date and financial instruments like mutual funds for which net assets value (NAV) is published by mutual fund operators at the balance sheet date.
Notes to the standalone financial statement for the year ended 31st March, 2017
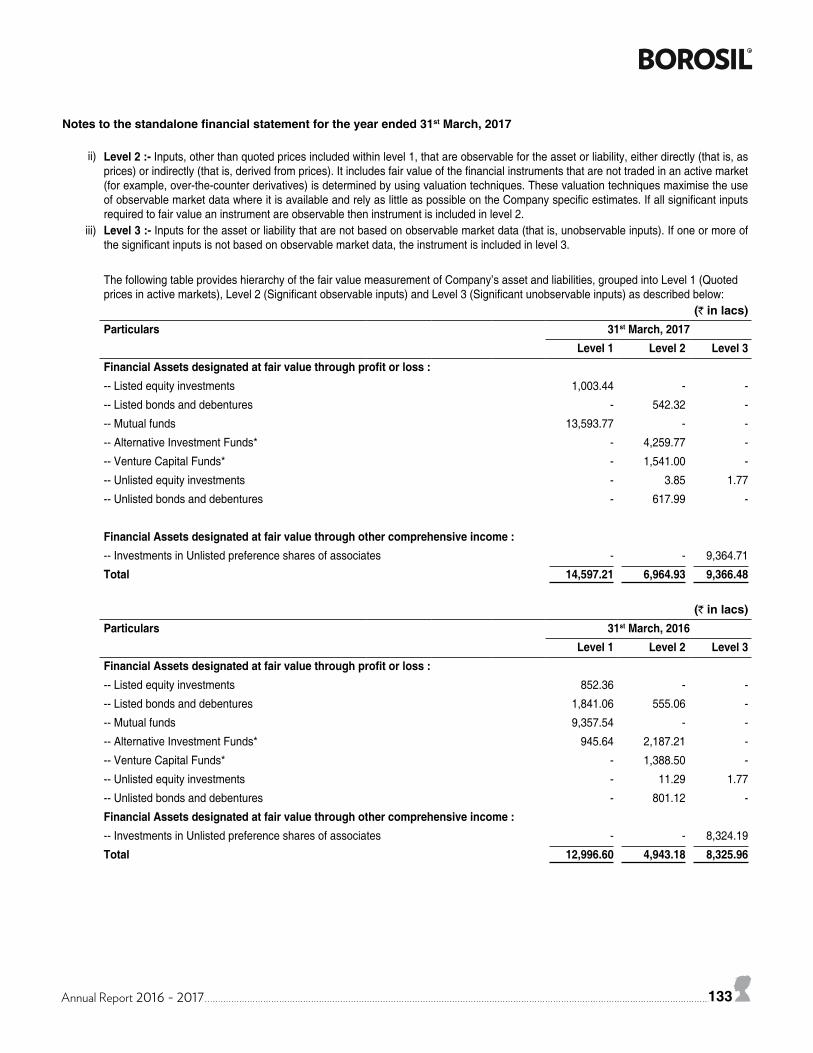
Annual Report 2016 - 2017 133
ii) Level 2 :- Inputs, other than quoted prices included within level 1, that are observable for the asset or liability, either directly (that is, as prices) or indirectly (that is, derived from prices). It includes fair value of the financial instruments that are not traded in an active market (for example, over-the-counter derivatives) is determined by using valuation techniques. These valuation techniques maximise the use of observable market data where it is available and rely as little as possible on the Company specific estimates. If all significant inputs required to fair value an instrument are observable then instrument is included in level 2.
iii) Level 3 :- Inputs for the asset or liability that are not based on observable market data (that is, unobservable inputs). If one or more of the significant inputs is not based on observable market data, the instrument is included in level 3.
The following table provides hierarchy of the fair value measurement of Company’s asset and liabilities, grouped into Level 1 (Quoted prices in active markets), Level 2 (Significant observable inputs) and Level 3 (Significant unobservable inputs) as described below:
(` in lacs)Particulars 31st March, 2017
Level 1 Level 2 Level 3Financial Assets designated at fair value through profit or loss :-- Listed equity investments 1,003.44 - -
-- Listed bonds and debentures - 542.32 -
-- Mutual funds 13,593.77 - -
-- Alternative Investment Funds* - 4,259.77 -
-- Venture Capital Funds* - 1,541.00 -
-- Unlisted equity investments - 3.85 1.77
-- Unlisted bonds and debentures - 617.99 -
Financial Assets designated at fair value through other comprehensive income :-- Investments in Unlisted preference shares of associates - - 9,364.71
Total 14,597.21 6,964.93 9,366.48
(` in lacs)Particulars 31st March, 2016
Level 1 Level 2 Level 3Financial Assets designated at fair value through profit or loss :-- Listed equity investments 852.36 - -
-- Listed bonds and debentures 1,841.06 555.06 -
-- Mutual funds 9,357.54 - -
-- Alternative Investment Funds* 945.64 2,187.21 -
-- Venture Capital Funds* - 1,388.50 -
-- Unlisted equity investments - 11.29 1.77
-- Unlisted bonds and debentures - 801.12 -
Financial Assets designated at fair value through other comprehensive income :-- Investments in Unlisted preference shares of associates - - 8,324.19
Total 12,996.60 4,943.18 8,325.96
Notes to the standalone financial statement for the year ended 31st March, 2017
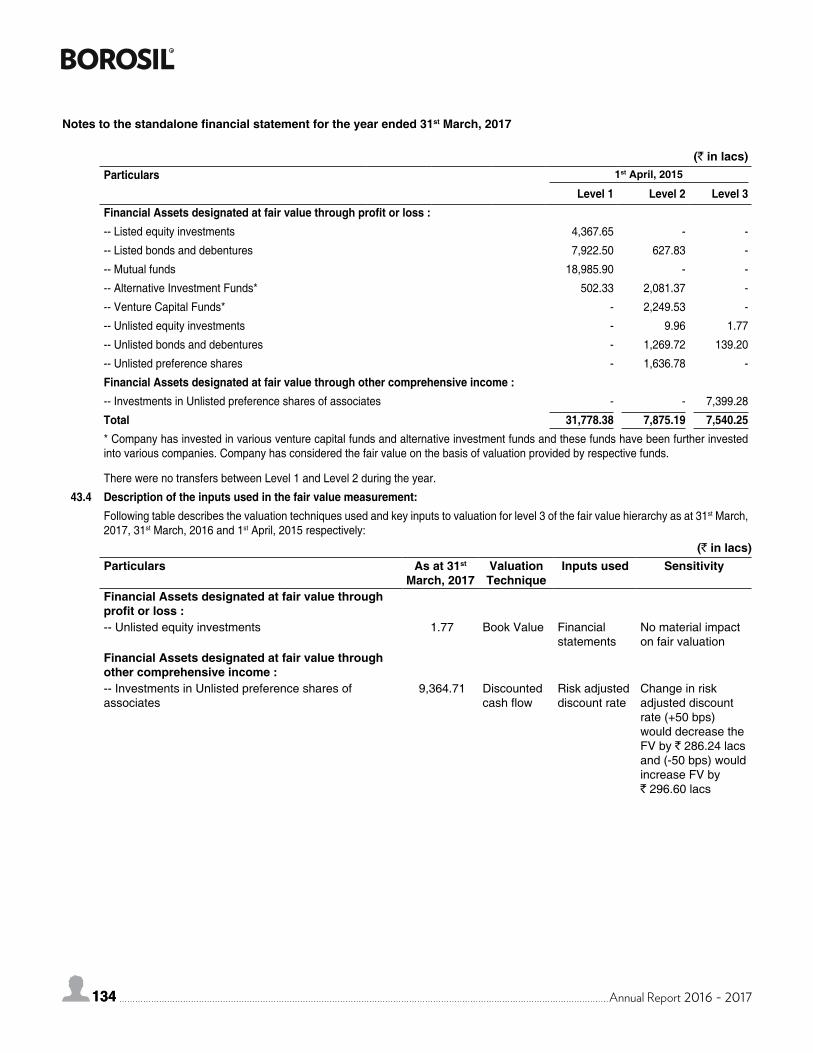
134 Annual Report 2016 - 2017134
(` in lacs)Particulars 1st April, 2015
Level 1 Level 2 Level 3Financial Assets designated at fair value through profit or loss :-- Listed equity investments 4,367.65 - -
-- Listed bonds and debentures 7,922.50 627.83 -
-- Mutual funds 18,985.90 - -
-- Alternative Investment Funds* 502.33 2,081.37 -
-- Venture Capital Funds* - 2,249.53 -
-- Unlisted equity investments - 9.96 1.77
-- Unlisted bonds and debentures - 1,269.72 139.20
-- Unlisted preference shares - 1,636.78 -
Financial Assets designated at fair value through other comprehensive income :-- Investments in Unlisted preference shares of associates - - 7,399.28
Total 31,778.38 7,875.19 7,540.25* Company has invested in various venture capital funds and alternative investment funds and these funds have been further invested into various companies. Company has considered the fair value on the basis of valuation provided by respective funds.
There were no transfers between Level 1 and Level 2 during the year.
43.4 Description of the inputs used in the fair value measurement:Following table describes the valuation techniques used and key inputs to valuation for level 3 of the fair value hierarchy as at 31st March, 2017, 31st March, 2016 and 1st April, 2015 respectively:
(` in lacs)Particulars As at 31st
March, 2017Valuation Technique
Inputs used Sensitivity
Financial Assets designated at fair value through profit or loss :-- Unlisted equity investments 1.77 Book Value Financial
statementsNo material impact on fair valuation
Financial Assets designated at fair value through other comprehensive income :-- Investments in Unlisted preference shares of associates
9,364.71 Discounted cash flow
Risk adjusted discount rate
Change in risk adjusted discount rate (+50 bps) would decrease the FV by ` 286.24 lacs and (-50 bps) would increase FV by ` 296.60 lacs
Notes to the standalone financial statement for the year ended 31st March, 2017
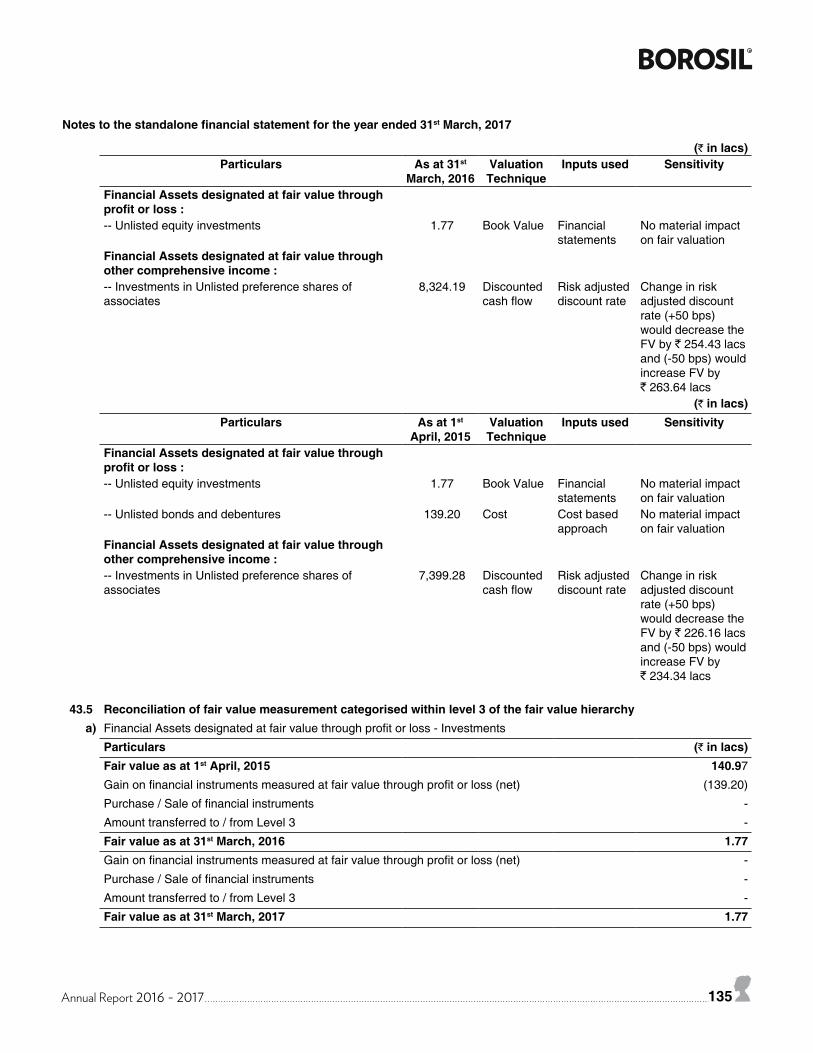
Annual Report 2016 - 2017 135
(` in lacs)Particulars As at 31st
March, 2016Valuation Technique
Inputs used Sensitivity
Financial Assets designated at fair value through profit or loss :-- Unlisted equity investments 1.77 Book Value Financial
statementsNo material impact on fair valuation
Financial Assets designated at fair value through other comprehensive income :-- Investments in Unlisted preference shares of associates
8,324.19 Discounted cash flow
Risk adjusted discount rate
Change in risk adjusted discount rate (+50 bps) would decrease the FV by ` 254.43 lacs and (-50 bps) would increase FV by ` 263.64 lacs
(` in lacs)Particulars As at 1st
April, 2015Valuation Technique
Inputs used Sensitivity
Financial Assets designated at fair value through profit or loss :-- Unlisted equity investments 1.77 Book Value Financial
statementsNo material impact on fair valuation
-- Unlisted bonds and debentures 139.20 Cost Cost based approach
No material impact on fair valuation
Financial Assets designated at fair value through other comprehensive income :-- Investments in Unlisted preference shares of associates
7,399.28 Discounted cash flow
Risk adjusted discount rate
Change in risk adjusted discount rate (+50 bps) would decrease the FV by ` 226.16 lacs and (-50 bps) would increase FV by ` 234.34 lacs
43.5 Reconciliation of fair value measurement categorised within level 3 of the fair value hierarchya) Financial Assets designated at fair value through profit or loss - Investments
Particulars (` in lacs)Fair value as at 1st April, 2015 140.97
Gain on financial instruments measured at fair value through profit or loss (net) (139.20)
Purchase / Sale of financial instruments -
Amount transferred to / from Level 3 -
Fair value as at 31st March, 2016 1.77Gain on financial instruments measured at fair value through profit or loss (net) -
Purchase / Sale of financial instruments -
Amount transferred to / from Level 3 -
Fair value as at 31st March, 2017 1.77
Notes to the standalone financial statement for the year ended 31st March, 2017
136 Annual Report 2016 - 2017136
b) Financial Assets designated at fair value through other comprehensive income - Investments
Particulars (` in lacs)Fair value as at 1st April, 2015 7,399.28Gain on Debt instrument designated at fair value through other comprehensive income 924.91
Purchase / Sale of financial instruments -
Amount transferred to / from Level 3 -
Fair value as at 31st March, 2016 8,324.19Gain on Debt instrument designated at fair value through other comprehensive income 1,040.52
Purchase / Sale of financial instruments -
Amount transferred to / from Level 3 -
Fair value as at 31st March, 2017 9,364.71
43.6 Description of the valuation processes used by the Company for fair value measurement categorised within level 3
At each reporting date, the Company analysis the movements in the values of financial assets and liabilities which are required to be remeasured or re-assessed as per the accounting policies. For this analysis, the Company verifies the major inputs applied in the latest valuation by agreeing the information in the valuation computation to contracts and other relevant documents.The Company also compares the change in the fair value of each financial asset and liability with relevant external sources to determine whether the change is reasonable. The Company also discusses of the major assumptions used in the valuations.For the purpose of fair value disclosures, the Company has determined classes of financial assets and liabilities on the basis of the nature, characteristics and risks of the asset or liability and the level of the fair value hierarchy as explained above.
Note 44 :- Financial Risk Management - Objectives and PoliciesThe Company is exposed to market risk, credit risk and liquidity risk. Risk management is carried out by the company under policies approved by the board of directors. This Risk management plan defines how risks associated with the Company will be identified, analysed, and managed. It outlines how risk management activities will be performed, recorded, and monitored by the Company. The basic objective of risk management plan is to implement an integrated risk management approach to ensure all significant areas of risks are identified, understood and effectively managed, to promote a shared vision of risk management and encourage discussion on risks at all levels of the organization to provide a clear understanding of risk/benefit trade-offs, to deploy appropriate risk management methodologies and tools for use in identifying, assessing, managing and reporting on risks, and to determine the appropriate balance between cost and control of risk and deploy appropriate resources to manage/optimize key risks. Activities are developed to provide feedback to management and other interested parties (e.g. Audit committee, Board etc.). The results of these activities ensure that risk management plan is effective in the long term.
44.1 Market riskMarket risk is the risk that the fair value or future cash flows of a financial instrument will fluctuate because of changes in market prices. Market prices comprise of three types of risk: foreign currency rate risk, interest rate risk and other price risks, such as equity price risk and commodity risk. Financial instruments affected by market risk include loans and borrowings, deposits and investments.The sensitivity analysis is given relate to the position as at 31st March, 2017 and 31st March, 2016.
The sensitivity analysis excludes the impact of movements in market variables on the carrying value of post-employment benefit obligations, provisions and on the non-financial assets and liabilities. The sensitivity of the relevant statement of profit and loss item is the effect of the assumed changes in the respective market risks. The Company’s activities expose it to a variety of financial risks, including the effects of changes in foreign currency exchange rates and interest rates. This is based on the financial assets and financial liabilities held as at 31st March, 2017 and 31st March, 2016.
Notes to the standalone financial statement for the year ended 31st March, 2017
Annual Report 2016 - 2017 137
(a) Foreign exchange risk and sensitivityForeign currency risk is the risk that the fair value or future cash flows of a financial instrument will fluctuate because of changes in foreign exchange rates. The Company's exposure to the risk of changes in foreign exchange rates relates primarily to the Company's operating activities. The Company transacts business primarily in USD and Euro. The Company has obtained foreign currency loans and has foreign currency trade payables and receivables and is therefore, exposed to foreign exchange risk. The Company is regularly reviews and evaluates exchange rate exposure arising from foreign currency transactions.The following table demonstrates the sensitivity in the USD and Euro to the Indian Rupee with all other variables held constant. The impact on the Company’s profit before tax due to changes in the fair values of monetary assets and liabilities is given below:
Unhedged Foreign currency exposure as at 31st March, 2016 Currency Amount in FC (` in lacs)
Trade Receivables USD 1,07,117 70.53
Trade Payable USD 1,12,533 75.17
Trade Payable EURO 2,62,305 198.70
Borrowings and interest thereon EURO 3,35,770 254.35
Investment in foreign subsidiary AED 20,00,000 343.17
Unhedged Foreign currency exposure as at 31st March, 2017 Currency Amount in FC (` in lacs)Trade Receivables USD 90,201 58.13
Trade Payable USD 1,49,305 96.72
Trade Payable EURO 2,88,193 2,01.53
Investment in foreign subsidiary AED 30,00,000 524.77
Foreign currency sensitivity1% increase or decrease in foreign exchange rates will have the following impact on profit before tax (PBT) :-
(` in lacs)Particulars 2016-17 2015-16
1% Increase - Increase/(Decrease)
in PBT
1% Increase - Increase/
(Decrease) in PBT
1% Increase - Increase/
(Decrease) in PBT
1% Increase - Increase/
(Decrease) in PBT
USD (0.39) 0.39 (0.05) 0.05
EURO (2.02) 2.02 (4.53) 4.53
AED 5.25 (5.25) 3.43 (3.43)
Increase / (Decrease) in profit before tax 2.85 (2.85) (1.15) 1.15b) Interest rate risk and sensitivity :-Interest rate risk is the risk that the fair value or future cash flows of a financial instrument will fluctuate because of changes in market interest rates. During the previous year, the company was having short term borrowings in the form of buyers credit. There was a fixed rate of interest and was payable at the time of repayment of buyers credit and hence, there was no interest rate risk associated with buyers credit borrowings.c) Commodity price risk:-The Company is exposed to the movement in price of key traded materials in domestic and international markets. The Company entered into contracts for procurement of material, most of the transactions are short term fixed price contract and hence Company is not exposed to significant risk.
Notes to the standalone financial statement for the year ended 31st March, 2017
138 Annual Report 2016 - 2017138
d) Equity price risk:-The Company exposure to equity securities price risk arises from investments held by the company and classified in the balance sheet as fair value through profit or loss. To manage its price risk arising from investments in equity securities, the company diversifies its portfolio. Diversification of the portfolio is done in accordance with the limits set by the management. Reports on the equity portfolio are submitted to the Company’s senior management on a regular basis. The Company’s Board of Directors reviews and approves all equity investment decisions.The table below summarises the impact of increases/decreases of the index on the company equity and profit for the year. The analysis is based on the assumption that the index has been increased by 5% or decreased by 5% with all other variable held constant, and that all the company's equity instruments moved in line with the index. Impact on profit before tax is given below:
(` in lacs)Particulars 2016-17 2015-16NSE NIFTY 50 Index increased by 5% 241.56 376.73NSE NIFTY 50 Index decreased by 5% (241.56) (376.73)
44.2 Credit riskCredit risk is the risk that a counter party will not meet its obligations under a financial instrument or customer contract, leading to a financial loss. The Company is exposed to credit risk from its operating activities (primarily trade receivables) and from its financing activities, including deposits with banks, foreign exchange transactions and other financial instruments.a) Trade Receivables:-The Company extends credit to customers in normal course of business. The Company considers factors such as credit track record in the market and past dealings with the Company for extension of credit to customers. The Company monitors the payment track record of the customers. Outstanding customer receivables are regularly monitored. The Company evaluates the concentration of risk with respect to trade receivables as low, as its customers are located in several jurisdictions and industries and operate in largely independent markets. The Company has also taken security deposits in certain cases from its customers, which mitigate the credit risk to some extent. No single customer accounted for 10% or more of revenue in any of the years presented. The history of trade receivables shows a negligible provision for bad and doubtful debts. Therefore, the Company does not expect any material risk on account of non-performance by Company’s counterparties.b) Financial instruments and cash deposits:-The Company considers factors such as track record, size of the institution, market reputation and service standards to select the banks with which balances are maintained. Credit risk from balances with bank is managed by the Company's finance department. Investment of surplus funds are also managed by finance department. The Company does not maintain significant cash in hand. Excess balance of cash other than those required for its day to day operations is deposited into the bank.For other financial instruments, the finance department assesses and manage credit risk based on internal assessment. Internal assessment is performed for each class of financial instrument with different characteristics.
44.3 Liquidity riskLiquidity risk is the risk that the Company may not be able to meet its present and future cash and collateral obligations without incurring unacceptable losses. The Company’s objective is to, at all times, maintain optimum levels of liquidity to meet its cash and collateral requirements. The Company relies operating cash flows and short term borrowings in the form of buyers credit to meet its needs for funds. Company does not breach any covenants (where applicable) on any of its borrowing facilities. The Company has access to a sufficient variety of sources of funding as per requirement.The table below provides undiscounted cash flows towards financial liabilities into relevant maturity based on the remaining period at the balance sheet to the contractual maturity date.
(` in lacs)Particulars On Demand Maturity Total
0 - 3 Months 3 - 6 Months
6 - 12 months
More than 1 year
As at 31st March, 2016Short term borrowings 3,000.00 127.68 125.98 - - 3,253.66Trade Payable - 959.44 - - - 959.44Other Financial Liabilities - 1,553.50 351.36 - - 1,904.86Total 3,000.00 2,640.62 477.34 - - 6,117.96
Notes to the standalone financial statement for the year ended 31st March, 2017
Annual Report 2016 - 2017 139
(` in lacs)Particulars On Demand Maturity Total
0 - 3 Months 3 - 6 Months
6 - 12 months
More than 1 year
As at 31st March, 2017Short term borrowings - - - - - -
Trade Payable - 1,449.61 - - - 1,449.61
Other Financial Liabilities - 1,639.51 286.42 - - 1,925.93
Total - 3,089.12 286.42 - - 3,375.54
44.4 Competition and price riskThe Company faces competition from local and foreign competitors. Nevertheless, it believes that it has competitive advantage in terms of high quality products and by continuously upgrading its expertise and range of products to meet the needs of its customers
Note 45 - Capital ManagementFor the purpose of Company's capital management, capital includes issued capital, all other equity reserves and debts. The primary objective of the Company’s capital management is to maximise shareholders value. The Company manages its capital structure and makes adjustments in the light of changes in economic environment and the requirements of the financial covenants.The Company monitors capital using gearing ratio, which is net debt divided by total capital (equity plus net debt). Net debt are non-current and current debts as reduced by cash and cash equivalents, other bank balances and current investments. Equity comprises all components including other comprehensive income.
(` in lacs)Particulars As at 31st
March, 2017As at 31st
March, 2016Total Debt - 3,253.66
Less:- Cash and cash equivalent 333.70 508.02
Less :- Current Investment 14,601.07 10,477.63Net Debt - -Total Equity (Equity Share Capital plus Other Equity) 77,174.81 63,620.30
Total Capital (Total Equity plus net debt) 77,174.81 63,620.30Gearing ratio 0.00% 0.00%
Note 46 - Assets held for sale:(` in lacs)
Description of the assets held for sale As at 31st March,2017
As at 31st March,2016
As at 1st April, 2015
Building 5,850.90 - -
Investment Property 364.11 - -
Total 6,215.01 - -
46.1 On 23rd March, 2017, the Investment Committee of the Company has decided to sell above mentioned assets and accordingly , these assets are classified as assets held for sale. The expected sale is within 12 months.
46.2 The assets held for sale are measured at the lower of its carrying amount and fair value less cost to sell, resulting into recognition of a write down of ` 1,193.20 lacs as an impairment loss on assets held for sale in the statement of profit and loss.
Notes to the standalone financial statement for the year ended 31st March, 2017
140 Annual Report 2016 - 2017140
46.3 Fair valuations are based on valuations performed by an accredited independent valuer, who is a specialist in valuing these types of assets. The fair value of the assets is determined using Comparison Method under the Market Approach. This is level 3 measurement as per the fair value hierarchy. For the purpose of the valuation under comparison method, a comparision is made with similar properties that have recently been sold in the market. The comparable properties are selected for their similarity to the subject property, considering attributes such as age, size, shape, quality of construction, building features, condition, design, gentry, etc. Their sale prices are then adjusted for their difference from the subject property.
Note 47The Board of Directors of the Company at its meeting held on 25th November, 2016 approved a Scheme of Amalgamation for merger of Hopewell Tableware Private Limited (Wholly owned subsidiary company), Fennel Investment and Finance Private Limited (associate company) and Vyline Glass Works Limited with the Company. The Scheme is, inter alia, subject to necessary regulatory approvals from concerned authorities, which is under process and will be given effect to upon receipt of such approvals.
Note 48 First time adoption of Ind AS48.1 Basis of preparation
For all period up to the year ended 31st March, 2016, the Company has prepared its financial statements in accordance with generally accepted accounting principles in India (Indian GAAP). These financial statements for the year ended 31st March, 2017 are the Company’s first annual Ind AS financial statements and have been prepared in accordance with Ind AS.Accordingly, the Company has prepared financial statements, which comply with Ind AS, applicable for periods beginning on or after 1st April, 2015 as described in the accounting policies. In preparing these financial statements, the Company’s opening Balance Sheet was prepared as at 1st April, 2015, the Company’s date of transition to Ind AS. This note explains the principal adjustments made by the Company in restating its Indian GAAP Balance Sheet as at 1st April, 2015 and its previously published Indian GAAP financial statements for the year ended 31st March, 2016.
48.2 Exemptions AppliedInd AS 101 “First-time Adoption of Indian Accounting Standards” allows first-time adopters certain exemptions from the retrospective application of certain requirements under Ind AS. The Company has applied the following exemptions:1) Property, plant and equipment, intangible assets and investment properties:- The Company has elected to apply Indian GAAP carrying amount as deemed cost on the date of transition to Ind AS for its property, plant and equipment, intangible assets and investment properties.2) Equity Investments in subsidiaries and associates :- The Company has elected to apply Indian GAAP carrying amount as deemed cost on the date of transition to Ind AS for its equity investments in subsidiaries and associates.3) Designation of previously recognised financial instruments:- Ind AS 101 allows to designate investments in equity instruments at fair value through OCI on the basis of facts and circumstances at the date of transition to Ind AS. The Company has elected to apply this exemption for its investment in 9% Non-Cumulative Non-Convertible Redeemable Preference Shares of Gujarat Borosil Ltd.
48.3 Mandatory exceptions appliedThe following mandatory exceptions have been applied in accordance with Ind AS 101 in preparing the financial statements.
1) Estimates:- The Company's estimates in accordance with Ind AS at the date of transition to Ind AS shall be consistent with estimates made for the same date in accordance with Indian GAAP (after adjustments to reflect any difference in accounting policies), unless there is objective evidence that those estimates were in error. Ind AS estimates as at 1st April, 2015 are consistent with the estimates as at the same date made in conformity with Indian GAAP except where Ind AS required a different basis for estimates as compared to the Indian GAAP.2) Classification and measurement of financial assets:- The Company has classified the financial assets in accordance with Ind AS 109 “Financial Instruments” on the basis of facts and circumstances that exist at the date of transition to Ind AS.
Notes to the standalone financial statement for the year ended 31st March, 2017
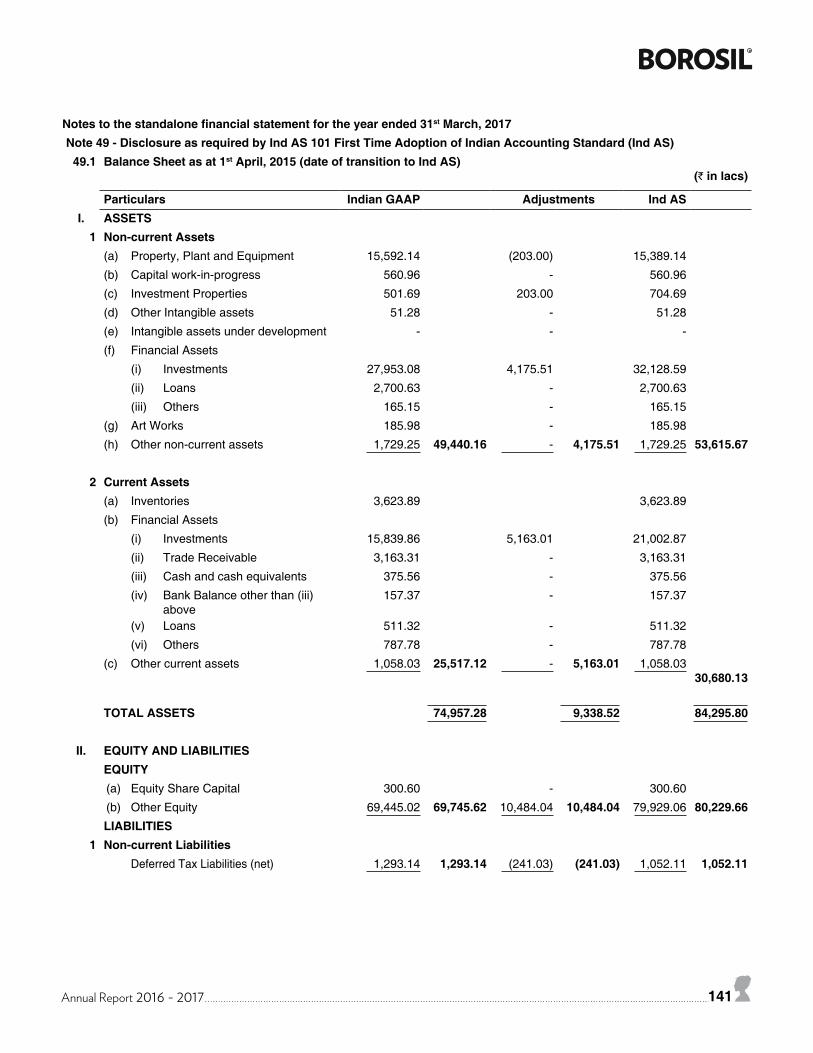
Annual Report 2016 - 2017 141
Notes to the standalone financial statement for the year ended 31st March, 2017Note 49 - Disclosure as required by Ind AS 101 First Time Adoption of Indian Accounting Standard (Ind AS)
49.1 Balance Sheet as at 1st April, 2015 (date of transition to Ind AS) (` in lacs)
Particulars Indian GAAP Adjustments Ind ASI. ASSETS
1 Non-current Assets(a) Property, Plant and Equipment 15,592.14 (203.00) 15,389.14
(b) Capital work-in-progress 560.96 - 560.96
(c) Investment Properties 501.69 203.00 704.69
(d) Other Intangible assets 51.28 - 51.28
(e) Intangible assets under development - - -
(f) Financial Assets
(i) Investments 27,953.08 4,175.51 32,128.59
(ii) Loans 2,700.63 - 2,700.63
(iii) Others 165.15 - 165.15
(g) Art Works 185.98 - 185.98
(h) Other non-current assets 1,729.25 49,440.16 - 4,175.51 1,729.25 53,615.67
2 Current Assets(a) Inventories 3,623.89 3,623.89
(b) Financial Assets
(i) Investments 15,839.86 5,163.01 21,002.87
(ii) Trade Receivable 3,163.31 - 3,163.31
(iii) Cash and cash equivalents 375.56 - 375.56
(iv) Bank Balance other than (iii) above
157.37 - 157.37
(v) Loans 511.32 - 511.32
(vi) Others 787.78 - 787.78
(c) Other current assets 1,058.03 25,517.12 - 5,163.01 1,058.03 30,680.13
TOTAL ASSETS 74,957.28 9,338.52 84,295.80
II. EQUITY AND LIABILITIESEQUITY(a) Equity Share Capital 300.60 - 300.60
(b) Other Equity 69,445.02 69,745.62 10,484.04 10,484.04 79,929.06 80,229.66LIABILITIES
1 Non-current LiabilitiesDeferred Tax Liabilities (net) 1,293.14 1,293.14 (241.03) (241.03) 1,052.11 1,052.11
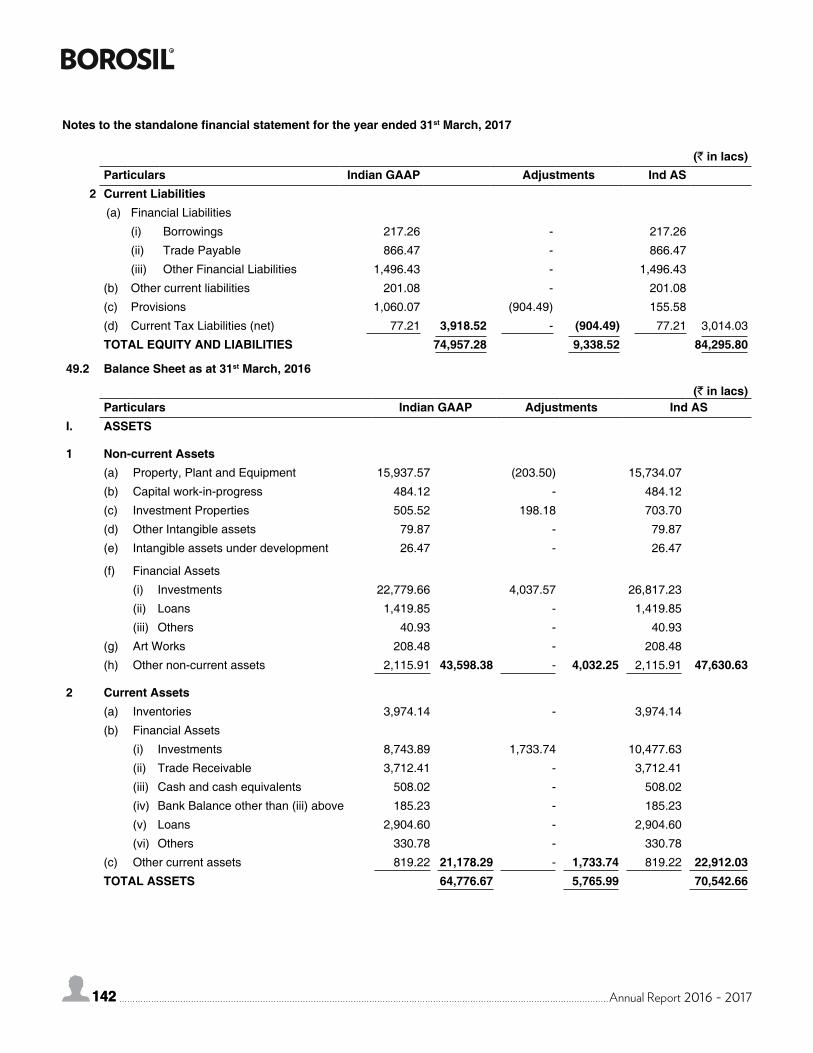
142 Annual Report 2016 - 2017142
Notes to the standalone financial statement for the year ended 31st March, 2017
(` in lacs)Particulars Indian GAAP Adjustments Ind AS
2 Current Liabilities(a) Financial Liabilities
(i) Borrowings 217.26 - 217.26
(ii) Trade Payable 866.47 - 866.47
(iii) Other Financial Liabilities 1,496.43 - 1,496.43
(b) Other current liabilities 201.08 - 201.08
(c) Provisions 1,060.07 (904.49) 155.58
(d) Current Tax Liabilities (net) 77.21 3,918.52 - (904.49) 77.21 3,014.03
TOTAL EQUITY AND LIABILITIES 74,957.28 9,338.52 84,295.80
49.2 Balance Sheet as at 31st March, 2016
(` in lacs)Particulars Indian GAAP Adjustments Ind AS
I. ASSETS
1 Non-current Assets(a) Property, Plant and Equipment 15,937.57 (203.50) 15,734.07
(b) Capital work-in-progress 484.12 - 484.12
(c) Investment Properties 505.52 198.18 703.70
(d) Other Intangible assets 79.87 - 79.87
(e) Intangible assets under development 26.47 - 26.47
(f) Financial Assets
(i) Investments 22,779.66 4,037.57 26,817.23
(ii) Loans 1,419.85 - 1,419.85
(iii) Others 40.93 - 40.93
(g) Art Works 208.48 - 208.48
(h) Other non-current assets 2,115.91 43,598.38 - 4,032.25 2,115.91 47,630.63
2 Current Assets(a) Inventories 3,974.14 - 3,974.14
(b) Financial Assets
(i) Investments 8,743.89 1,733.74 10,477.63
(ii) Trade Receivable 3,712.41 - 3,712.41
(iii) Cash and cash equivalents 508.02 - 508.02
(iv) Bank Balance other than (iii) above 185.23 - 185.23
(v) Loans 2,904.60 - 2,904.60
(vi) Others 330.78 - 330.78
(c) Other current assets 819.22 21,178.29 - 1,733.74 819.22 22,912.03TOTAL ASSETS 64,776.67 5,765.99 70,542.66
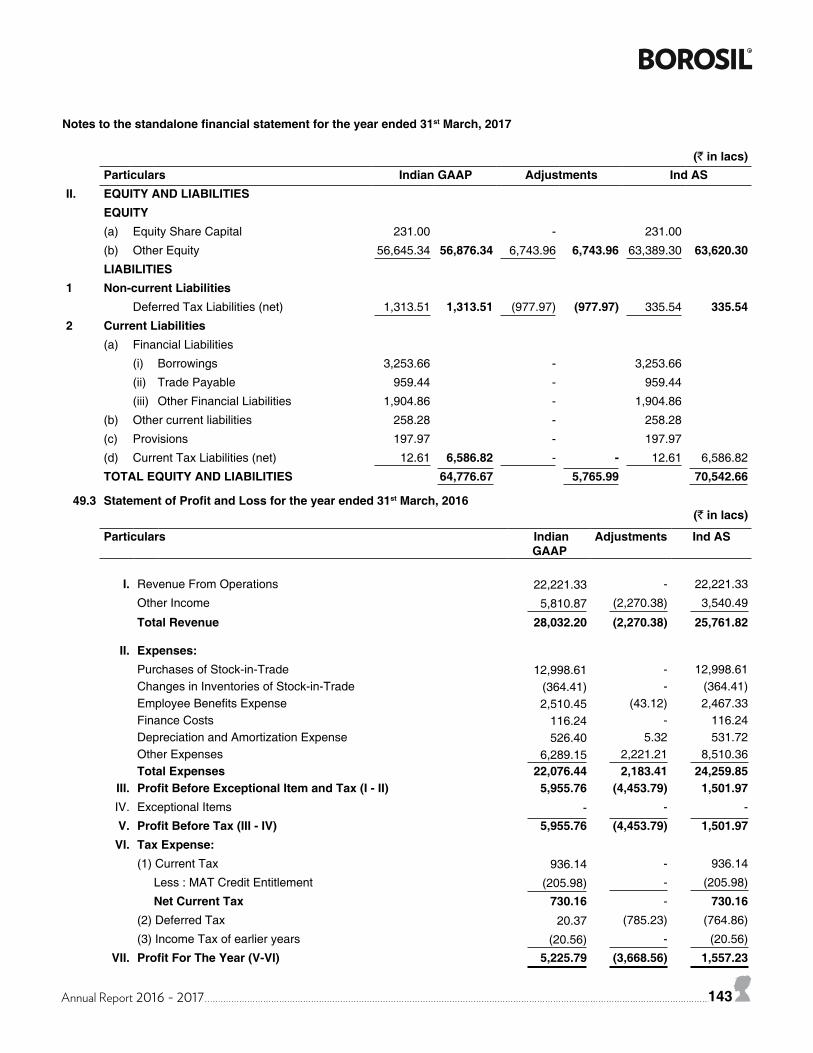
Annual Report 2016 - 2017 143
Notes to the standalone financial statement for the year ended 31st March, 2017
(` in lacs)Particulars Indian GAAP Adjustments Ind AS
II. EQUITY AND LIABILITIESEQUITY(a) Equity Share Capital 231.00 - 231.00
(b) Other Equity 56,645.34 56,876.34 6,743.96 6,743.96 63,389.30 63,620.30LIABILITIES
1 Non-current LiabilitiesDeferred Tax Liabilities (net) 1,313.51 1,313.51 (977.97) (977.97) 335.54 335.54
2 Current Liabilities(a) Financial Liabilities
(i) Borrowings 3,253.66 - 3,253.66
(ii) Trade Payable 959.44 - 959.44
(iii) Other Financial Liabilities 1,904.86 - 1,904.86
(b) Other current liabilities 258.28 - 258.28
(c) Provisions 197.97 - 197.97
(d) Current Tax Liabilities (net) 12.61 6,586.82 - - 12.61 6,586.82
TOTAL EQUITY AND LIABILITIES 64,776.67 5,765.99 70,542.66
49.3 Statement of Profit and Loss for the year ended 31st March, 2016 (` in lacs)
Particulars Indian GAAP
Adjustments Ind AS
I. Revenue From Operations 22,221.33 - 22,221.33
Other Income 5,810.87 (2,270.38) 3,540.49
Total Revenue 28,032.20 (2,270.38) 25,761.82
II. Expenses:Purchases of Stock-in-Trade 12,998.61 - 12,998.61Changes in Inventories of Stock-in-Trade (364.41) - (364.41)Employee Benefits Expense 2,510.45 (43.12) 2,467.33Finance Costs 116.24 - 116.24Depreciation and Amortization Expense 526.40 5.32 531.72Other Expenses 6,289.15 2,221.21 8,510.36Total Expenses 22,076.44 2,183.41 24,259.85
III. Profit Before Exceptional Item and Tax (I - II) 5,955.76 (4,453.79) 1,501.97IV. Exceptional Items - - -
V. Profit Before Tax (III - IV) 5,955.76 (4,453.79) 1,501.97VI. Tax Expense:
(1) Current Tax 936.14 - 936.14
Less : MAT Credit Entitlement (205.98) - (205.98)
Net Current Tax 730.16 - 730.16(2) Deferred Tax 20.37 (785.23) (764.86)
(3) Income Tax of earlier years (20.56) - (20.56)
VII. Profit For The Year (V-VI) 5,225.79 (3,668.56) 1,557.23
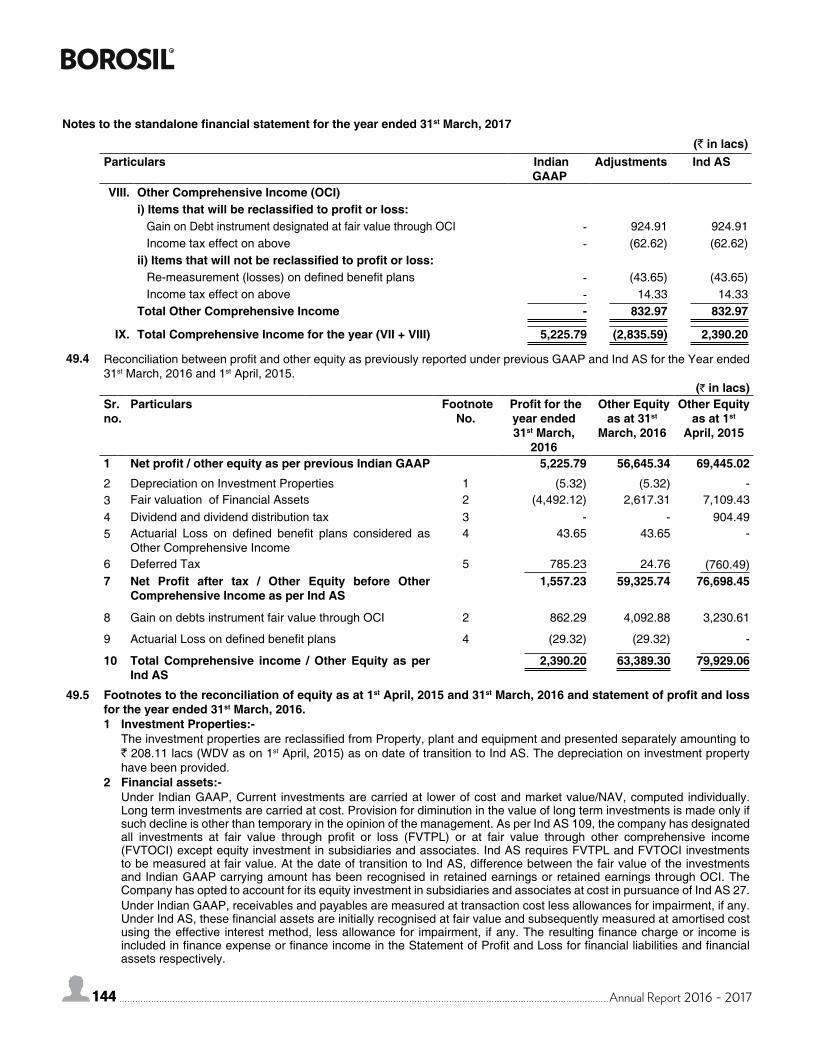
144 Annual Report 2016 - 2017144
Notes to the standalone financial statement for the year ended 31st March, 2017
(` in lacs)Particulars Indian
GAAPAdjustments Ind AS
VIII. Other Comprehensive Income (OCI)i) Items that will be reclassified to profit or loss:
Gain on Debt instrument designated at fair value through OCI - 924.91 924.91Income tax effect on above - (62.62) (62.62)
ii) Items that will not be reclassified to profit or loss:Re-measurement (losses) on defined benefit plans - (43.65) (43.65)Income tax effect on above - 14.33 14.33
Total Other Comprehensive Income - 832.97 832.97
IX. Total Comprehensive Income for the year (VII + VIII) 5,225.79 (2,835.59) 2,390.20
49.4 Reconciliation between profit and other equity as previously reported under previous GAAP and Ind AS for the Year ended 31st March, 2016 and 1st April, 2015.
(` in lacs)Sr. no.
Particulars Footnote No.
Profit for the year ended 31st March,
2016
Other Equity as at 31st
March, 2016
Other Equity as at 1st
April, 2015
1 Net profit / other equity as per previous Indian GAAP 5,225.79 56,645.34 69,445.02
2 Depreciation on Investment Properties 1 (5.32) (5.32) -3 Fair valuation of Financial Assets 2 (4,492.12) 2,617.31 7,109.434 Dividend and dividend distribution tax 3 - - 904.495 Actuarial Loss on defined benefit plans considered as
Other Comprehensive Income4 43.65 43.65 -
6 Deferred Tax 5 785.23 24.76 (760.49)7 Net Profit after tax / Other Equity before Other
Comprehensive Income as per Ind AS 1,557.23 59,325.74 76,698.45
8 Gain on debts instrument fair value through OCI 2 862.29 4,092.88 3,230.61
9 Actuarial Loss on defined benefit plans 4 (29.32) (29.32) -
10 Total Comprehensive income / Other Equity as per Ind AS
2,390.20 63,389.30 79,929.06
49.5 Footnotes to the reconciliation of equity as at 1st April, 2015 and 31st March, 2016 and statement of profit and loss for the year ended 31st March, 2016.1 Investment Properties:-
The investment properties are reclassified from Property, plant and equipment and presented separately amounting to ` 208.11 lacs (WDV as on 1st April, 2015) as on date of transition to Ind AS. The depreciation on investment property have been provided.
2 Financial assets:-Under Indian GAAP, Current investments are carried at lower of cost and market value/NAV, computed individually. Long term investments are carried at cost. Provision for diminution in the value of long term investments is made only if such decline is other than temporary in the opinion of the management. As per Ind AS 109, the company has designated all investments at fair value through profit or loss (FVTPL) or at fair value through other comprehensive income (FVTOCI) except equity investment in subsidiaries and associates. Ind AS requires FVTPL and FVTOCI investments to be measured at fair value. At the date of transition to Ind AS, difference between the fair value of the investments and Indian GAAP carrying amount has been recognised in retained earnings or retained earnings through OCI. The Company has opted to account for its equity investment in subsidiaries and associates at cost in pursuance of Ind AS 27.Under Indian GAAP, receivables and payables are measured at transaction cost less allowances for impairment, if any. Under Ind AS, these financial assets are initially recognised at fair value and subsequently measured at amortised cost using the effective interest method, less allowance for impairment, if any. The resulting finance charge or income is included in finance expense or finance income in the Statement of Profit and Loss for financial liabilities and financial assets respectively.

Annual Report 2016 - 2017 145
Notes to the standalone financial statement for the year ended 31st March, 2017
3 Dividend and dividend distribution tax:-Under Indian GAAP, proposed dividends were recognised as an adjusting event occurring after the balance sheet date however under the Ind AS proposed dividend are non adjusting events after the balance sheet date and hence recognised as and when approved by the ShareholdersIn the case of the Company, the declaration of dividend occurs after period end. Therefore, the liability for dividend of ` 904.49 lacs (including dividend distribution tax) for the year ended on 31st March, 2015 has been derecognised with corresponding impact in the retained earnings on 1st April, 2015.
4 Defined benefit liabilitiesBoth under Indian GAAP and Ind AS, the company recognised costs related to its post-employment defined benefit plan on an actuarial basis. Under Indian GAAP, the entire cost, including actuarial gains and losses, are charged to statement of profit or loss. Under Ind AS, remeasurements comprising of actuarial gains and losses are recognised immediately in the balance sheet with a corresponding debit or credit to retained earnings through OCI.
5 Deferred TaxIndian GAAP requires deferred tax accounting using the income statement approach, which focuses on differences between taxable profits and accounting profits for the year. Ind AS 12 “Income Taxes” requires entities to account for deferred taxes using the balance sheet approach, which focuses on temporary differences between the carrying amount of an asset or liability in the balance sheet and its tax base. The application of Ind AS 12 approach has resulted in recognition of deferred tax on new temporary differences which was not required under Indian GAAP. The impact of transitional adjustments for computation of deferred taxes has resulted in charge to Retained earning, on the date of transition, with consequential impact to the statement of Profit and Loss and OCI for the subsequent periods.
6 Other comprehensive incomeUnder Indian GAAP, the Company has not presented other comprehensive income (OCI) separately. Hence, Indian GAAP statement of profit or loss is reconciled with statement of profit or loss as per Ind AS.
7 The Ind AS adjustments are either non cash adjustments or are regrouping among the cash flow from operating, investing and financing activities. Consequently, Ind AS adoption has no impact on the net cash flow for the year ended 31st March, 2016 as compared with the previous GAAP.
As per our report of even date For and on behalf of the Board of DirectorsFor PATHAK H.D. & ASSOCIATESChartered Accountants(Firm Registration no. 107783W) B. L. Kheruka
Executive Chairman(DIN 00016861)
Gyandeo ChaturvediPartnerMembership no. 46806
Swadhin PadiaChief Financial Officer
Shreevar KherukaManaging Director & CEO
(DIN 01802416)
Gita YadavCompany Secretary
Membership No. A23280
V. RamaswamiWhole-time Director
(DIN 00011024))Place : MumbaiDate : 13.05.2017
146 Annual Report 2016 - 2017146
INDEPENDENT AUDITOR’S REPORTTo The Members ofBorosil Glass Works LimitedReport on the Consolidated Ind AS Financial Statements We have audited the accompanying consolidated Ind AS financial statements of Borosil Glass Works Limited (hereinafter referred to as “the Holding Company”) and its subsidiaries (the Holding Company and its subsidiaries together referred to as “the Group”) and its associate comprising of the Consolidated Balance Sheet as at 31st March, 2017, the Consolidated statement of Profit and Loss (including other comprehensive income) , the Consolidated Cash Flow Statement and the Statement of Changes in Equity for the year then ended, and a summary of the significant accounting policies and other explanatory information (hereinafter referred to as “the consolidated Ind AS financial statements”).Management’s Responsibility for the Consolidated Ind AS Financial StatementsThe Holding Company’s Board of Directors is responsible for the matters stated in Section 134(5) of the Companies Act, 2013 (“the Act”) with respect to preparation of these consolidated Ind AS financial statements that give a true and fair view of the consolidated financial position, consolidated financial performance including other comprehensive income, consolidated cash flows and change in equity of the Group including its associate in accordance with the accounting principles generally accepted in India, including the Indian Accounting Standards (Ind AS) prescribed under Section 133 of the Act with relevant rules issued thereunder.The respective Board of Directors of the companies included in the Group and its associate are responsible for maintenance of adequate accounting records in accordance with the provisions of the Act for safeguarding the assets of the Group and of its associate and for preventing and detecting frauds and other irregularities; selection and application of appropriate accounting policies; making judgments and estimates that are reasonable and prudent; and the design, implementation and maintenance of adequate internal financial controls, that were operating effectively for ensuring the accuracy and completeness of the accounting records, relevant to the preparation and presentation of the financial statements that give a true and fair view and are free from material misstatement, whether due to fraud or error, which have been used for the purpose of preparation of the consolidated Ind As financial statements by the Directors of the Holding Company, as aforesaid.Auditor’s ResponsibilityOur responsibility is to express an opinion on these consolidated Ind AS financial statements based on our audit. While conducting the audit, we have taken into account the provisions of the Act, the accounting and auditing standards and matters which are required to be included in the audit report under the provisions of the Act and the rules made thereunder.We conducted our audit of consolidated financial statements in accordance with the Standards on Auditing specified under Section 143 (10) of the Act. Those Standards require that we comply with ethical requirements and plan and perform the audit to obtain reasonable assurance about whether the consolidated Ind AS financial statements are free from material misstatement.An audit involves performing procedures to obtain audit evidence about the amounts and the disclosures in the consolidated Ind AS financial statements. The procedures selected depend on the auditor’s judgment, including the assessment of the risks of material misstatement of the consolidated Ind AS financial statements, whether due to fraud or error. In making those risk assessments, the auditor considers internal financial control relevant to the Holding Company’s preparation of the consolidated Ind AS financial statements that give a true and fair view in order to design audit procedures that are appropriate in the circumstances. An audit also includes evaluating the appropriateness of the accounting policies used and the reasonableness of the accounting estimates made by the Holding Company’s Board of Directors, as well as evaluating the overall presentation of the consolidated Ind AS financial statements.We believe that the audit evidence obtained by us and by the other auditors in terms of their reports referred to in the Other Matters paragraph below, is sufficient and appropriate to provide a basis for our audit opinion on the consolidated Ind AS financial statements.OpinionIn our opinion and to the best of our information and according to the explanations given to us, and based on the consideration of the reports of other auditors on separate financial statements and on the other financial information of the subsidiaries and associate, referred to in Other Matters paragraph below, the aforesaid consolidated Ind AS financial statements give the information required by the Act in the manner so required and give a true and fair view in conformity with the accounting principles generally accepted in India, of the consolidated state of affairs of the Group and its associate as at 31st March 2017, and their consolidated profit including total comprehensive income, their consolidated cash flows and the consolidated statement of changes in equity for the year ended on that date.Other Matters a) We did not audit the financial statements/consolidated financial statements of 2 subsidiaries whose financial statements
reflect total assets of ` 22,369.34 lacs as at 31st March, 2017, total revenues of ` 18,917.86 lacs and net cash inflows of ` 108.32 lacs for the year ended on that date, as considered in the consolidated Ind AS financial statements. These financial statements / consolidated financial statements have been audited by the other auditors whose reports have been furnished to us by management and our opinion is based solely on the reports of the other auditors.
b) The consolidated Ind AS financial statements also include the Group’s share of total comprehensive income (net profit plus other comprehensive income) of ` 2291.48 lacs for the year ended 31st March, 2017, as considered in the consolidated Ind AS financial statements, in respect of an associate, whose consolidated financial statements have not been audited by us. The consolidated financial statements of that associate have been audited by the other auditors whose report has been furnished to us by the management and our opinion on the consolidated Ind AS financial statements, in so far as it relates
Annual Report 2016 - 2017 147
to the amounts and disclosures included in respect of that associates is based solely on the reports of the other auditors. Our opinion on the consolidated Ind AS financial statements and our report on Other Legal and Regulatory Requirements
below, is not modified in respect of the above matter with respect to our reliance on the work done and reports of the other auditors.
c ) The comparative financial information of the Group including its associates for the year ended 31st March, 2016 and transition date opening balance sheet as at 1st April, 2015, included in these consolidated Ind AS financial statements, are based on previously issued annual statutory financial statements, prepared in accordance with the Companies (Accounting Standards) Rules, 2006, audited by predecessor auditor, whose report for the year ended 31st March, 2016 and 31st March, 2015 dated 30th May, 2016 and 25th May, 2015 respectively expressed an unmodified opinion on those financial statements, as adjusted for the differences in the accounting principles adopted by the Group including its associate on transition to the Ind AS, which have been audited by us.
Report on Other Legal and Regulatory Requirements1. As required by Section 143(3) of the Act, based on our audit and on consideration of reports of other auditors on separate
financial statements and other financial information of subsidiaries and associate incorporated in India, as noted in the Other Matters paragraph above, we report, to the extent applicable, that:a) We have sought and obtained all the information and explanations which to the best of our knowledge and belief were
necessary for the purposes of our audit of the aforesaid consolidated Ind AS financial statements.b) In our opinion, proper books of account as required by law relating to preparation of the aforesaid consolidated Ind AS
financial statements have been kept so far as it appears from our examination of those books and the reports of the other auditors.
c) The Consolidated Balance Sheet, the Consolidated statement of Profit and Loss (including other comprehensive income), and the Consolidated Cash Flow Statement and Consolidated Statement of changes in Equity dealt with by this Report are in agreement with the relevant books of account maintained for the purpose of preparation of the consolidated Ind AS financial statements.
d) In our opinion, the aforesaid consolidated Ind AS financial statements comply with the Indian Accounting Standards prescribed under Section 133 of the Companies Act, 2013, as applicable.
e) On the basis of the written representations received from the directors of the Holding Company as on 31st March, 2017 taken on record by the Board of Directors of the Holding Company and the reports of the statutory auditors of its subsidiary Companies and associate, incorporated in India, none of the directors of these entities is disqualified as on 31st March, 2017 from being appointed as a director in terms of Section 164 (2) of the Act.
f) With respect to the adequacy of the internal financial controls over financial reporting and the operating effectiveness of such controls; refer to our Report in “Annexure A”, which is based on the auditors’ reports of the subsidiary companies and associate company incorporated in India.
g) With respect to the other matters to be included in the Auditor’s Report in accordance with Rule 11 of the Companies (Audit and Auditor’s) Rules, 2014, in our opinion and to the best of our information and according to the explanations given to us: i. The consolidated Ind AS financial statements disclose the impact of pending litigations on the consolidated
financial position of the Group, as referred to in note 40, 49.2 and 51 to the consolidated Ind AS financial statements.
ii. The Group and its associate do not have any long-term contracts including derivative contracts for which there were any material foreseeable losses.
iii. There has been no delay in transferring amounts, if any, required to be transferred, to the Investor Education and Protection Fund by the Holding Company its subsidiary companies and associate company, incorporated in India.
iv. The Holding Company has provided requisite disclosures in its consolidated Ind AS financial statements as to holdings as well as dealings in Specified Bank Notes as defined in the Notification S.O. 3407(E) dated the 8th November, 2016 of the Ministry of Finance, during the period from 8th November, 2016 to 30th December, 2016. Based on audit procedures performed and the representations provided to us by the management we report that the disclosures are in accordance with the books of accounts maintained by the Holding Company and the respective group entities, as produced to us and based on the consideration of report of other auditors, referred to in the Other Matters paragraph above.
For Pathak H.D. & AssociatesChartered AccountantsFirm Registration No: 107783W
Gyandeo ChaturvediPartnerMembership No. 046806
Place: MumbaiDate: 13th May, 2017
148 Annual Report 2016 - 2017148
ANNEXURE “A” TO THE INDEPENDENT AUDITOR’S REPORT
(Referred to in paragraph 1 (f) under ‘Report on Other Legal and Regulatory Requirements’ of our report of even date on consolidated Ind AS financial statements of Borosil Glass Works Limited for the year ended 31st March, 2017)
Report on the Internal Financial Controls over financial reporting under Clause (i) of Sub-section 3 of Section 143 of the Companies Act, 2013 (“the Act”)
In conjunction with our audit of the consolidated Ind AS financial statements of the Group and its associate as of and for the year ended 31st March, 2017, we have audited the internal financial controls over financial reporting of Borosil Glass Works Limited (hereinafter referred to as “the Holding Company”) and its subsidiaries (the Holding Company and its subsidiaries referred to as “the Group”) and its associate as of that date.
Management’s Responsibility for Internal Financial Controls
The respective Board of Directors of the Holding Company, its subsidiaries and its associate, all incorporated in India, are responsible for establishing and maintaining internal financial controls based on the internal control over financial reporting criteria established by the Holding Company, its subsidiaries and its associate, considering the essential components of internal control stated in the Guidance Note on Audit of Internal Financial Controls Over Financial Reporting (‘the Guidance Note’) issued by the Institute of Chartered Accountants of India. These responsibilities include the design, implementation and maintenance of adequate internal financial controls that were operating effectively for ensuring the orderly and efficient conduct of its business, including adherence to Company’s policies, the safeguarding of its assets, the prevention and detection of frauds and errors, the accuracy and completeness of the accounting records, and the timely preparation of reliable financial information, as required under the Companies Act, 2013.
Auditor’s Responsibility
Our responsibility is to express an opinion on the Company’s internal financial controls over financial reporting based on our audit. We conducted our audit in accordance with the Guidance Note on Audit of Internal Financial Controls Over Financial reporting issued by the Institute of Chartered Accountants of India and the Standards on Auditing prescribed under section 143(10) of the Companies Act, 2013, to the extent applicable to an audit of internal financial controls. Those Standards and the Guidance Note require that we comply with ethical requirements and plan and perform the audit to obtain reasonable assurance about whether adequate internal financial controls over financial reporting was established and maintained and if such controls operated effectively in all material respects.
Our audit involves performing procedures to obtain audit evidence about the adequacy of the internal financial controls system over financial reporting and their operating effectiveness. Our audit of internal financial controls over financial reporting included obtaining an understanding of internal financial controls over financial reporting, assessing the risk that a material weakness exists, and testing and evaluating the design and operating effectiveness of internal control based on the assessed risk. The procedures selected depend on the auditor’s judgement, including the assessment of the risks of material misstatement of the financial statements, whether due to fraud or error.
We believe that the audit evidence obtained by us and the audit evidence obtained by other auditors in terms of their reports referred to in the Other Matters paragraph below, is sufficient and appropriate to provide a basis for our audit opinion on the Company’s internal financial controls system over financial reporting.
Meaning of Internal Financial Controls Over Financial Reporting
A Company’s internal financial control over financial reporting is a process designed to provide reasonable assurance regarding the reliability of financial reporting and the preparation of financial statements for external purposes in accordance with generally accepted accounting principles. A Company’s internal financial control over financial reporting includes those policies and procedures that (1) pertain to the maintenance of records that, in reasonable detail, accurately and fairly reflect the transactions and dispositions of the assets of the Company; (2) provide reasonable assurance that transactions are recorded as necessary to permit preparation of financial statements in accordance with generally accepted accounting principles, and that receipts and expenditures of the Company are being made only in accordance with authorisations of management and directors of the Company; and (3) provide reasonable assurance regarding prevention or timely detection of unauthorised acquisition, use, or disposition of the Company’s assets that could have a material effect on the financial statements.
Inherent Limitations of Internal Financial Controls Over Financial Reporting
Because of the inherent limitations of internal financial controls over financial reporting, including the possibility of collusion or improper management override of controls, material misstatements due to error or fraud may occur and not be detected. Also, projections of any evaluation of the internal financial controls over financial reporting to future periods are subject to the risk that the internal financial control over financial reporting may become inadequate because of changes in conditions, or that the degree of compliance with the policies or procedures may deteriorate.
Opinion
In our opinion, to the best of our information and according to the explanations given to us, the Holding Company, its subsidiaries
Annual Report 2016 - 2017 149
and its associate, have, in all material respects, an adequate internal financial controls system over financial reporting and such internal financial controls over financial reporting were operating effectively as at 31st March, 2017, based on the internal control over financial reporting criteria established by the Company considering the essential components of internal control stated in the Guidance Note.
Other Matters
Our aforesaid reports under Section 143(3)(i) of the Act on the adequacy and operating effectiveness of the internal financial controls over financial reporting in so far as it relates to subsidiary companies and an associate, which are companies incorporated in India, is based on the corresponding reports of the auditors of such companies
For Pathak H.D. & AssociatesChartered AccountantsFirm Registration No: 107783W
Gyandeo ChaturvediPartnerMembership No. 046806
Place: MumbaiDate: 13th May, 2017
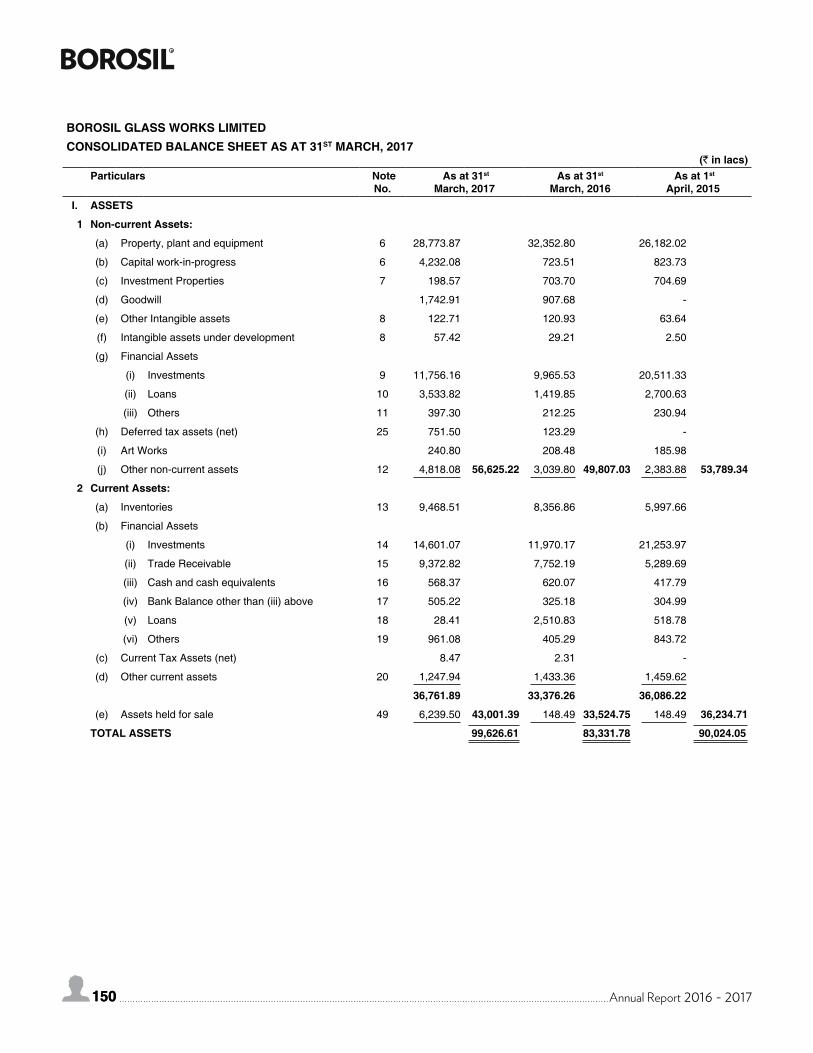
150 Annual Report 2016 - 2017150
BOROSIL GLASS WORKS LIMITEDCONSOLIDATED BALANCE SHEET AS AT 31ST MARCH, 2017
(` in lacs)Particulars Note
No. As at 31st
March, 2017 As at 31st
March, 2016 As at 1st
April, 2015I. ASSETS
1 Non-current Assets:
(a) Property, plant and equipment 6 28,773.87 32,352.80 26,182.02
(b) Capital work-in-progress 6 4,232.08 723.51 823.73
(c) Investment Properties 7 198.57 703.70 704.69
(d) Goodwill 1,742.91 907.68 -
(e) Other Intangible assets 8 122.71 120.93 63.64
(f) Intangible assets under development 8 57.42 29.21 2.50
(g) Financial Assets
(i) Investments 9 11,756.16 9,965.53 20,511.33
(ii) Loans 10 3,533.82 1,419.85 2,700.63
(iii) Others 11 397.30 212.25 230.94
(h) Deferred tax assets (net) 25 751.50 123.29 -
(i) Art Works 240.80 208.48 185.98
(j) Other non-current assets 12 4,818.08 56,625.22 3,039.80 49,807.03 2,383.88 53,789.34
2 Current Assets:
(a) Inventories 13 9,468.51 8,356.86 5,997.66
(b) Financial Assets
(i) Investments 14 14,601.07 11,970.17 21,253.97
(ii) Trade Receivable 15 9,372.82 7,752.19 5,289.69
(iii) Cash and cash equivalents 16 568.37 620.07 417.79
(iv) Bank Balance other than (iii) above 17 505.22 325.18 304.99
(v) Loans 18 28.41 2,510.83 518.78
(vi) Others 19 961.08 405.29 843.72
(c) Current Tax Assets (net) 8.47 2.31 -
(d) Other current assets 20 1,247.94 1,433.36 1,459.62
36,761.89 33,376.26 36,086.22
(e) Assets held for sale 49 6,239.50 43,001.39 148.49 33,524.75 148.49 36,234.71
TOTAL ASSETS 99,626.61 83,331.78 90,024.05
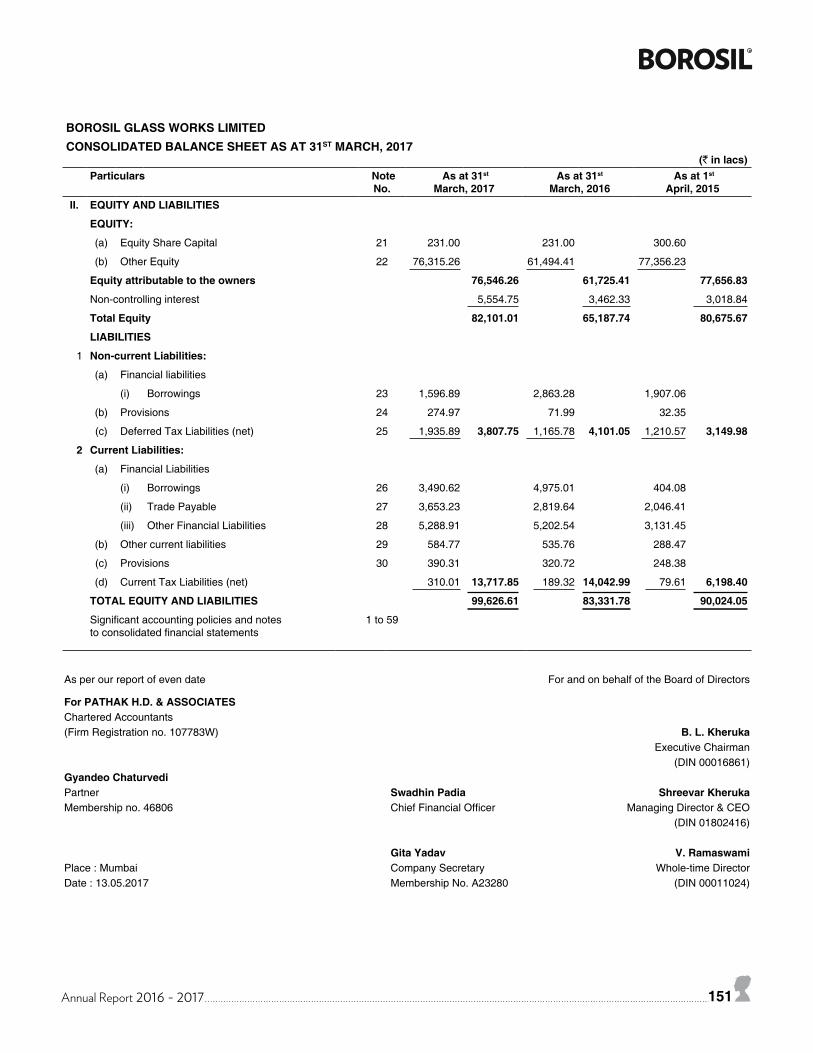
Annual Report 2016 - 2017 151
As per our report of even date For and on behalf of the Board of Directors
For PATHAK H.D. & ASSOCIATESChartered Accountants(Firm Registration no. 107783W) B. L. Kheruka
Executive Chairman(DIN 00016861)
Gyandeo ChaturvediPartner Swadhin Padia Shreevar KherukaMembership no. 46806 Chief Financial Officer Managing Director & CEO
(DIN 01802416)
Gita Yadav V. RamaswamiPlace : Mumbai Company Secretary Whole-time DirectorDate : 13.05.2017 Membership No. A23280 (DIN 00011024)
BOROSIL GLASS WORKS LIMITEDCONSOLIDATED BALANCE SHEET AS AT 31ST MARCH, 2017
(` in lacs)Particulars Note
No. As at 31st
March, 2017 As at 31st
March, 2016 As at 1st
April, 2015II. EQUITY AND LIABILITIES
EQUITY:
(a) Equity Share Capital 21 231.00 231.00 300.60
(b) Other Equity 22 76,315.26 61,494.41 77,356.23
Equity attributable to the owners 76,546.26 61,725.41 77,656.83
Non-controlling interest 5,554.75 3,462.33 3,018.84
Total Equity 82,101.01 65,187.74 80,675.67
LIABILITIES
1 Non-current Liabilities:
(a) Financial liabilities
(i) Borrowings 23 1,596.89 2,863.28 1,907.06
(b) Provisions 24 274.97 71.99 32.35
(c) Deferred Tax Liabilities (net) 25 1,935.89 3,807.75 1,165.78 4,101.05 1,210.57 3,149.98
2 Current Liabilities:
(a) Financial Liabilities
(i) Borrowings 26 3,490.62 4,975.01 404.08
(ii) Trade Payable 27 3,653.23 2,819.64 2,046.41
(iii) Other Financial Liabilities 28 5,288.91 5,202.54 3,131.45
(b) Other current liabilities 29 584.77 535.76 288.47
(c) Provisions 30 390.31 320.72 248.38
(d) Current Tax Liabilities (net) 310.01 13,717.85 189.32 14,042.99 79.61 6,198.40
TOTAL EQUITY AND LIABILITIES 99,626.61 83,331.78 90,024.05
Significant accounting policies and notes to consolidated financial statements
1 to 59
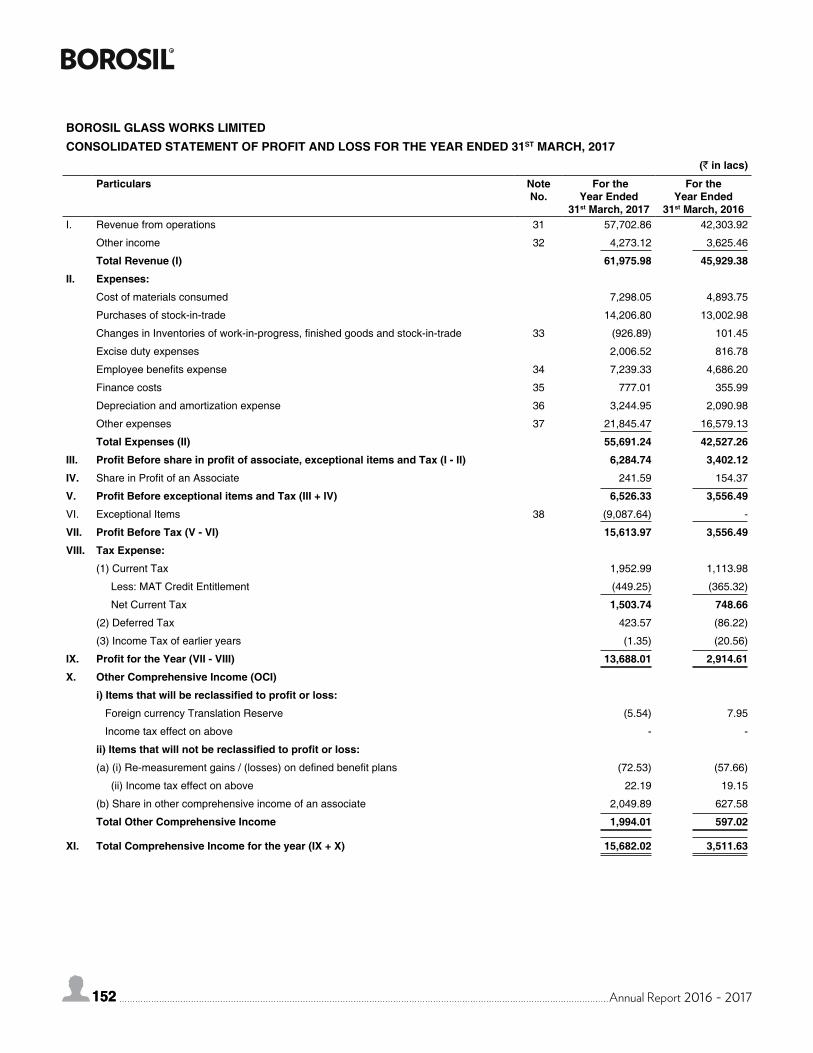
152 Annual Report 2016 - 2017152
BOROSIL GLASS WORKS LIMITEDCONSOLIDATED STATEMENT OF PROFIT AND LOSS FOR THE YEAR ENDED 31ST MARCH, 2017
(` in lacs)
Particulars Note No.
For the Year Ended
31st March, 2017
For the Year Ended
31st March, 2016I. Revenue from operations 31 57,702.86 42,303.92
Other income 32 4,273.12 3,625.46
Total Revenue (I) 61,975.98 45,929.38
II. Expenses:
Cost of materials consumed 7,298.05 4,893.75
Purchases of stock-in-trade 14,206.80 13,002.98
Changes in Inventories of work-in-progress, finished goods and stock-in-trade 33 (926.89) 101.45
Excise duty expenses 2,006.52 816.78
Employee benefits expense 34 7,239.33 4,686.20
Finance costs 35 777.01 355.99
Depreciation and amortization expense 36 3,244.95 2,090.98
Other expenses 37 21,845.47 16,579.13
Total Expenses (II) 55,691.24 42,527.26
III. Profit Before share in profit of associate, exceptional items and Tax (I - II) 6,284.74 3,402.12
IV. Share in Profit of an Associate 241.59 154.37
V. Profit Before exceptional items and Tax (III + IV) 6,526.33 3,556.49
VI. Exceptional Items 38 (9,087.64) -
VII. Profit Before Tax (V - VI) 15,613.97 3,556.49
VIII. Tax Expense:
(1) Current Tax 1,952.99 1,113.98
Less: MAT Credit Entitlement (449.25) (365.32)
Net Current Tax 1,503.74 748.66
(2) Deferred Tax 423.57 (86.22)
(3) Income Tax of earlier years (1.35) (20.56)
IX. Profit for the Year (VII - VIII) 13,688.01 2,914.61
X. Other Comprehensive Income (OCI)
i) Items that will be reclassified to profit or loss:
Foreign currency Translation Reserve (5.54) 7.95
Income tax effect on above - -
ii) Items that will not be reclassified to profit or loss:
(a) (i) Re-measurement gains / (losses) on defined benefit plans (72.53) (57.66)
(ii) Income tax effect on above 22.19 19.15
(b) Share in other comprehensive income of an associate 2,049.89 627.58
Total Other Comprehensive Income 1,994.01 597.02
XI. Total Comprehensive Income for the year (IX + X) 15,682.02 3,511.63
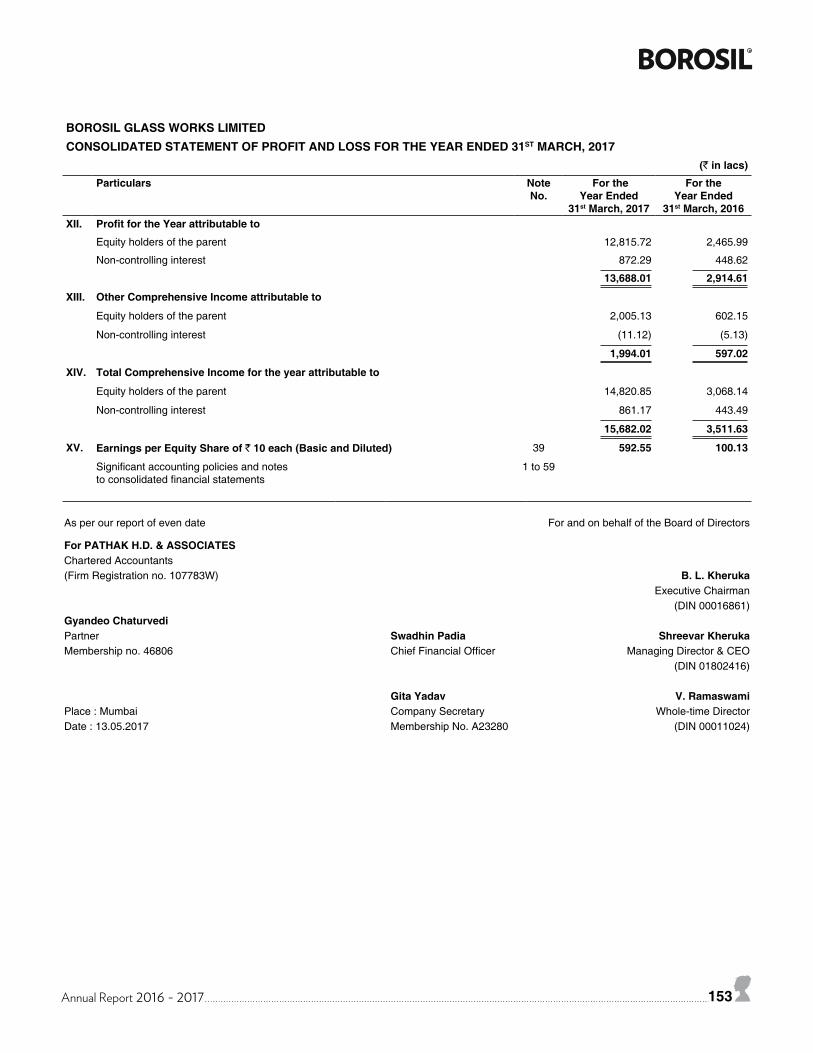
Annual Report 2016 - 2017 153
BOROSIL GLASS WORKS LIMITEDCONSOLIDATED STATEMENT OF PROFIT AND LOSS FOR THE YEAR ENDED 31ST MARCH, 2017
(` in lacs)
Particulars Note No.
For theYear Ended
31st March, 2017
For theYear Ended
31st March, 2016XII. Profit for the Year attributable to
Equity holders of the parent 12,815.72 2,465.99
Non-controlling interest 872.29 448.62
13,688.01 2,914.61
XIII. Other Comprehensive Income attributable to
Equity holders of the parent 2,005.13 602.15
Non-controlling interest (11.12) (5.13)
1,994.01 597.02
XIV. Total Comprehensive Income for the year attributable to
Equity holders of the parent 14,820.85 3,068.14
Non-controlling interest 861.17 443.49
15,682.02 3,511.63
XV. Earnings per Equity Share of ` 10 each (Basic and Diluted) 39 592.55 100.13
Significant accounting policies and notesto consolidated financial statements
1 to 59
As per our report of even date For and on behalf of the Board of Directors
For PATHAK H.D. & ASSOCIATESChartered Accountants(Firm Registration no. 107783W) B. L. Kheruka
Executive Chairman(DIN 00016861)
Gyandeo ChaturvediPartner Swadhin Padia Shreevar KherukaMembership no. 46806 Chief Financial Officer Managing Director & CEO
(DIN 01802416)
Gita Yadav V. RamaswamiPlace : Mumbai Company Secretary Whole-time DirectorDate : 13.05.2017 Membership No. A23280 (DIN 00011024)
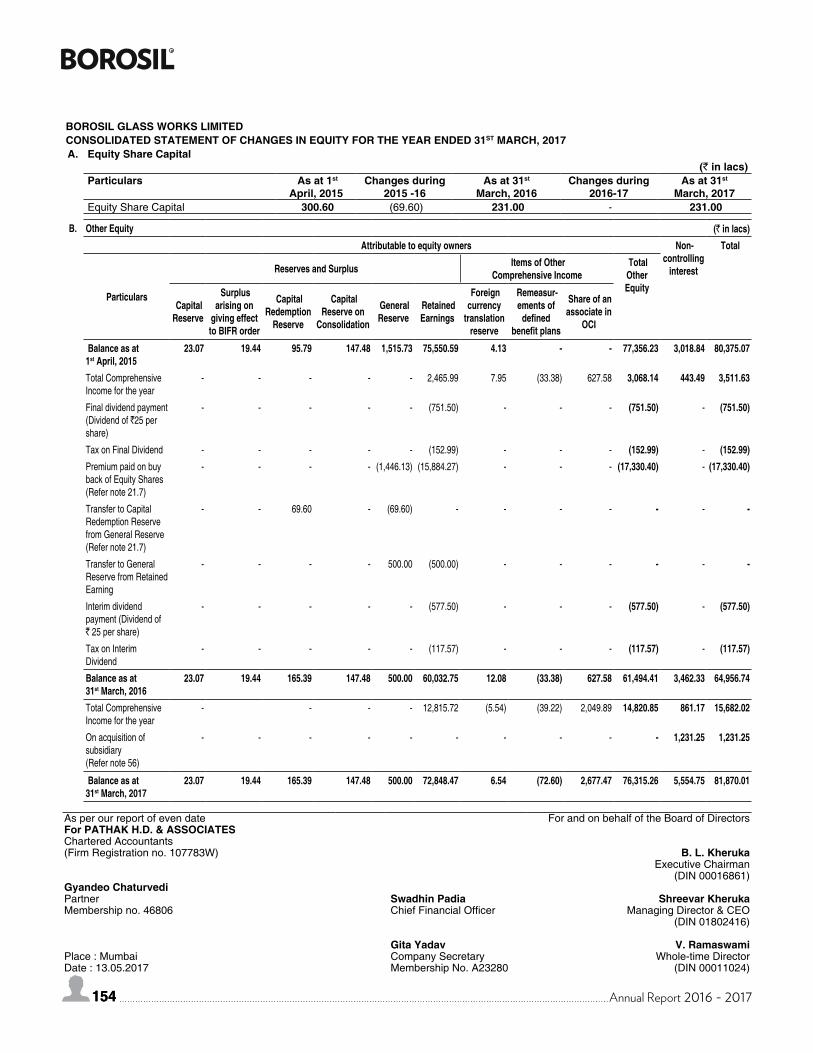
154 Annual Report 2016 - 2017154
BOROSIL GLASS WORKS LIMITEDCONSOLIDATED STATEMENT OF CHANGES IN EQUITY FOR THE YEAR ENDED 31ST MARCH, 2017A. Equity Share Capital
(` in lacs)Particulars As at 1st
April, 2015Changes during
2015 -16As at 31st
March, 2016Changes during
2016-17As at 31st
March, 2017Equity Share Capital 300.60 (69.60) 231.00 - 231.00
B. Other Equity (` in lacs) Attributable to equity owners Non-
controlling interest
Total
Particulars
Reserves and Surplus Items of Other Comprehensive Income
Total Other Equity
Capital Reserve
Surplus arising on
giving effect to BIFR order
Capital Redemption
Reserve
Capital Reserve on
Consolidation
General Reserve
Retained Earnings
Foreign currency
translation reserve
Remeasur-ements of
defined benefit plans
Share of an associate in
OCI
Balance as at 1st April, 2015
23.07 19.44 95.79 147.48 1,515.73 75,550.59 4.13 - - 77,356.23 3,018.84 80,375.07
Total Comprehensive Income for the year
- - - - - 2,465.99 7.95 (33.38) 627.58 3,068.14 443.49 3,511.63
Final dividend payment (Dividend of `25 per share)
- - - - - (751.50) - - - (751.50) - (751.50)
Tax on Final Dividend - - - - - (152.99) - - - (152.99) - (152.99)Premium paid on buy back of Equity Shares (Refer note 21.7)
- - - - (1,446.13) (15,884.27) - - - (17,330.40) - (17,330.40)
Transfer to Capital Redemption Reserve from General Reserve (Refer note 21.7)
- - 69.60 - (69.60) - - - - - - -
Transfer to General Reserve from Retained Earning
- - - - 500.00 (500.00) - - - - - -
Interim dividend payment (Dividend of ` 25 per share)
- - - - - (577.50) - - - (577.50) - (577.50)
Tax on Interim Dividend
- - - - - (117.57) - - - (117.57) - (117.57)
Balance as at 31st March, 2016
23.07 19.44 165.39 147.48 500.00 60,032.75 12.08 (33.38) 627.58 61,494.41 3,462.33 64,956.74
Total Comprehensive Income for the year
- - - - 12,815.72 (5.54) (39.22) 2,049.89 14,820.85 861.17 15,682.02
On acquisition of subsidiary (Refer note 56)
- - - - - - - - - - 1,231.25 1,231.25
Balance as at 31st March, 2017
23.07 19.44 165.39 147.48 500.00 72,848.47 6.54 (72.60) 2,677.47 76,315.26 5,554.75 81,870.01
As per our report of even date For and on behalf of the Board of DirectorsFor PATHAK H.D. & ASSOCIATESChartered Accountants(Firm Registration no. 107783W) B. L. Kheruka
Executive Chairman(DIN 00016861)
Gyandeo ChaturvediPartner Swadhin Padia Shreevar KherukaMembership no. 46806 Chief Financial Officer Managing Director & CEO
(DIN 01802416)
Gita Yadav V. RamaswamiPlace : Mumbai Company Secretary Whole-time DirectorDate : 13.05.2017 Membership No. A23280 (DIN 00011024)
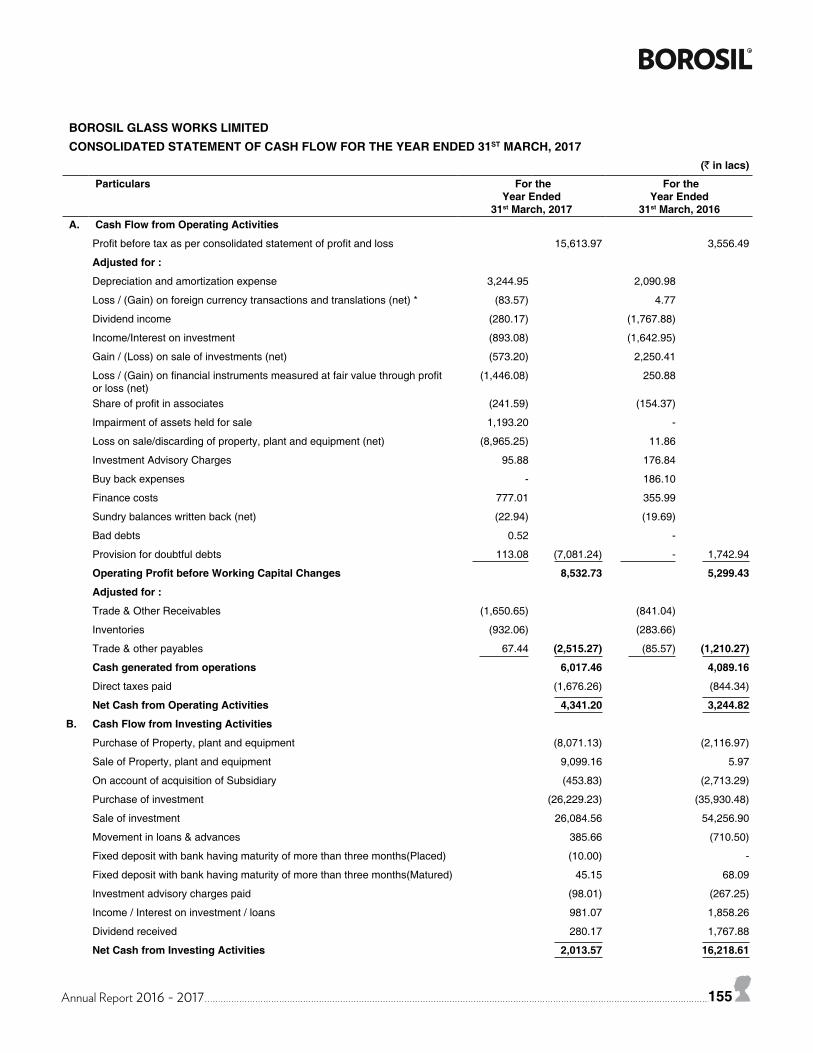
Annual Report 2016 - 2017 155
BOROSIL GLASS WORKS LIMITED CONSOLIDATED STATEMENT OF CASH FLOW FOR THE YEAR ENDED 31ST MARCH, 2017
(` in lacs)
Particulars For the Year Ended
31st March, 2017
For the Year Ended
31st March, 2016 A. Cash Flow from Operating Activities
Profit before tax as per consolidated statement of profit and loss 15,613.97 3,556.49
Adjusted for :
Depreciation and amortization expense 3,244.95 2,090.98
Loss / (Gain) on foreign currency transactions and translations (net) * (83.57) 4.77
Dividend income (280.17) (1,767.88)
Income/Interest on investment (893.08) (1,642.95)
Gain / (Loss) on sale of investments (net) (573.20) 2,250.41
Loss / (Gain) on financial instruments measured at fair value through profit or loss (net)
(1,446.08) 250.88
Share of profit in associates (241.59) (154.37)
Impairment of assets held for sale 1,193.20 -
Loss on sale/discarding of property, plant and equipment (net) (8,965.25) 11.86
Investment Advisory Charges 95.88 176.84
Buy back expenses - 186.10
Finance costs 777.01 355.99
Sundry balances written back (net) (22.94) (19.69)
Bad debts 0.52 -
Provision for doubtful debts 113.08 (7,081.24) - 1,742.94
Operating Profit before Working Capital Changes 8,532.73 5,299.43
Adjusted for :
Trade & Other Receivables (1,650.65) (841.04)
Inventories (932.06) (283.66)
Trade & other payables 67.44 (2,515.27) (85.57) (1,210.27)
Cash generated from operations 6,017.46 4,089.16
Direct taxes paid (1,676.26) (844.34)
Net Cash from Operating Activities 4,341.20 3,244.82
B. Cash Flow from Investing Activities
Purchase of Property, plant and equipment (8,071.13) (2,116.97)
Sale of Property, plant and equipment 9,099.16 5.97
On account of acquisition of Subsidiary (453.83) (2,713.29)
Purchase of investment (26,229.23) (35,930.48)
Sale of investment 26,084.56 54,256.90
Movement in loans & advances 385.66 (710.50)
Fixed deposit with bank having maturity of more than three months(Placed) (10.00) -
Fixed deposit with bank having maturity of more than three months(Matured) 45.15 68.09
Investment advisory charges paid (98.01) (267.25)
Income / Interest on investment / loans 981.07 1,858.26
Dividend received 280.17 1,767.88
Net Cash from Investing Activities 2,013.57 16,218.61
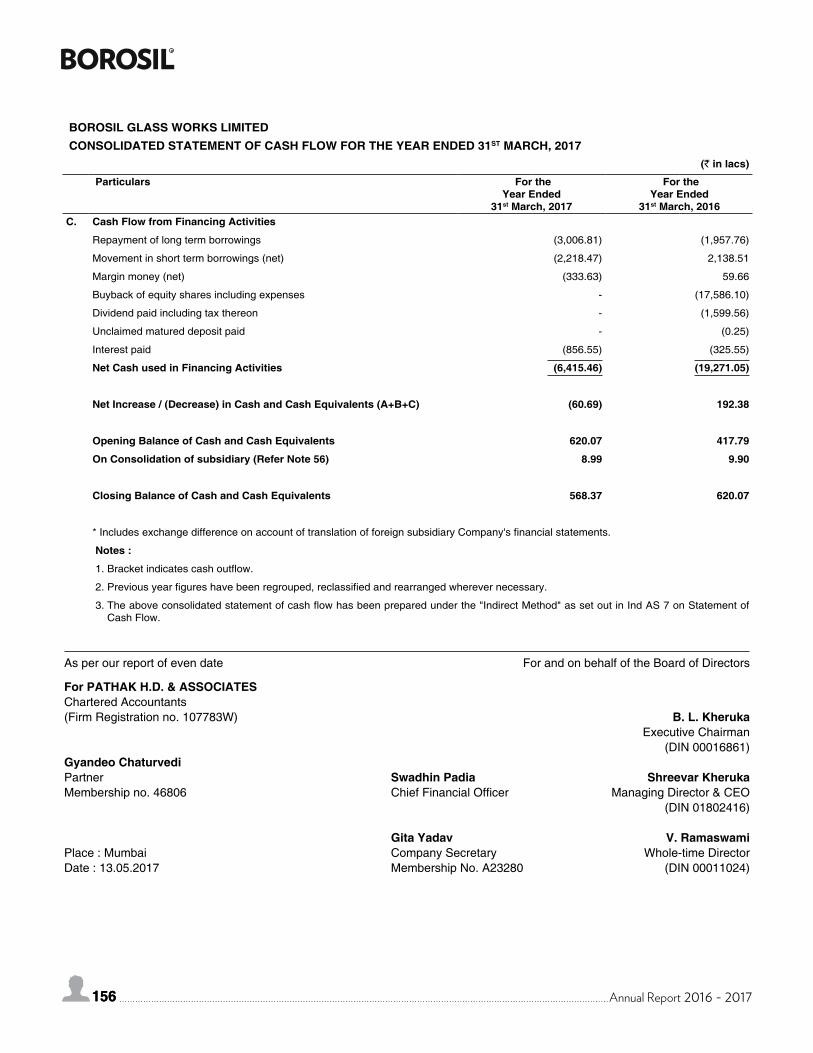
156 Annual Report 2016 - 2017156
BOROSIL GLASS WORKS LIMITED CONSOLIDATED STATEMENT OF CASH FLOW FOR THE YEAR ENDED 31ST MARCH, 2017
(` in lacs)
Particulars For the Year Ended
31st March, 2017
For the Year Ended
31st March, 2016C. Cash Flow from Financing Activities
Repayment of long term borrowings (3,006.81) (1,957.76)
Movement in short term borrowings (net) (2,218.47) 2,138.51
Margin money (net) (333.63) 59.66
Buyback of equity shares including expenses - (17,586.10)
Dividend paid including tax thereon - (1,599.56)
Unclaimed matured deposit paid - (0.25)
Interest paid (856.55) (325.55)
Net Cash used in Financing Activities (6,415.46) (19,271.05)
Net Increase / (Decrease) in Cash and Cash Equivalents (A+B+C) (60.69) 192.38
Opening Balance of Cash and Cash Equivalents 620.07 417.79
On Consolidation of subsidiary (Refer Note 56) 8.99 9.90
Closing Balance of Cash and Cash Equivalents 568.37 620.07
* Includes exchange difference on account of translation of foreign subsidiary Company's financial statements.
Notes :
1. Bracket indicates cash outflow.
2. Previous year figures have been regrouped, reclassified and rearranged wherever necessary.
3. The above consolidated statement of cash flow has been prepared under the "Indirect Method" as set out in Ind AS 7 on Statement of Cash Flow.
As per our report of even date For and on behalf of the Board of Directors
For PATHAK H.D. & ASSOCIATESChartered Accountants(Firm Registration no. 107783W) B. L. Kheruka
Executive Chairman(DIN 00016861)
Gyandeo ChaturvediPartner Swadhin Padia Shreevar KherukaMembership no. 46806 Chief Financial Officer Managing Director & CEO
(DIN 01802416)
Gita Yadav V. RamaswamiPlace : Mumbai Company Secretary Whole-time DirectorDate : 13.05.2017 Membership No. A23280 (DIN 00011024)
Annual Report 2016 - 2017 157
BOROSIL GLASS WORKS LIMITED
Notes to the consolidated financial statement for the year ended 31st March, 2017
Note 1 - CORPORATE INFORMATION:
The consolidated financial statements comprise financial statements of Borosil Glass Works Limited ("the company") and its subsidiaries namely, Gujarat Borosil Limited ("GBL"), Hopewell Tableware Private Limited ("HTPL"), Klasspack Private Limited ("KPL"), Borosil Afrasia FZE ("BAF") and Borosil Afrasia Middle East Trading LLC ("BAMET") (collectively, "the Group") and an associate namely, Fennel Investment and Finance Private Limited ("FIFPL") for the year ended 31st March, 2017. The Company is a limited Company domiciled and incorporated in India and its shares are publicly traded on the Bombay Stock Exchange (BSE), in India. The registered office of the Company is situated at Khanna Construction House, 44, Dr. R.G. Thadani Marg, Worli, Mumbai - 400 018.
Group is engaged in the trading and manufacturing business of Scientific & Industrial Products (SIP), Consumer Products (CP) and Flat Glass. SIP consist of laboratory glassware, instruments, disposable plastics, liquid handling systems, explosion proof lighting glassware, glass ampoules and tabular glass vials. CP consist of microwavable and flameproof kitchenware, glass tumblers, Appliances and Storage products and tableware and dinnerware items made from opal glassware. Flat Glass consists of low iron solar glass for application in photovoltaic panels, flat plate collectors and green houses.
The consolidated financial statements for the year ended 31st March, 2017 were approved and adopted by board of directors in their meeting held on 13th May, 2017.
Note 2 - BASIS OF PREPARATION:
The consolidated financial statements have been prepared in accordance with Indian Accounting Standards notified under the Companies (Indian Accounting Standards) Rules, 2015 (Ind AS).
For all periods up to year ended 31st March, 2016, the Group prepared its consolidated financial statements in accordance with accounting standards notified under the Section 133 of the Companies Act 2013, read together with paragraph 7 of the Companies (Accounts) Rules, 2014 (Indian GAAP). These consolidated financial statements for the year ended 31st March, 2017 are the first consolidated financial statements, the Group has prepared in accordance with Ind AS.
The consolidated financial statements have been prepared on a historical cost basis, except for certain financial assets and liabilities, which are measured at fair value / amortised cost.
The consolidated financial statements are presented in Indian Rupees (`) which is the Group’s functional and presentation currency and all values are rounded to the nearest lacs, except when otherwise indicated.
Note 3 - BASIS OF CONSOLIDATION:
The consolidated financial statements comprise the financial statements of the Company and its subsidiaries as at 31st March, 2017. Control is achieved when the Group is exposed, or has rights, to variable returns from its involvement with the investee and has the ability to affect those returns through its power over the investee.
Generally, there is a presumption that a majority of voting rights result in control. To support this presumption and when the Group has less than a majority of the voting or similar rights of an investee, the Group considers all relevant facts and circumstances in assessing whether it has power over an investee, including the contractual arrangement with the other vote holders of the investee, rights arising from other contractual arrangements, the Group’s voting rights and potential voting rights and the size of the Group’s holding of voting rights relative to the size and dispersion of the holdings of the other voting rights holders.
The Group re-assesses whether or not it controls an investee if facts and circumstances indicate that there are changes to one or more of the three elements of control. Consolidation of a subsidiary begins when the Group obtains control over the subsidiary and ceases when the Group loses control of the subsidiary. Assets, liabilities, income and expenses of a subsidiary acquired during the year are included in the consolidated financial statements from the date the Group obtains control and assets, liabilities, income and expenses of a subsidiary disposed off during the year are included in the consolidated financial statement till the date the Group ceases to control the subsidiary.
An associate is an entity over which the Group has significant influence. Significant influence is the power to participate in the financial and operating policy decisions of the investee, but has no control or joint control over those policies.
Consolidation procedure:
a) Combine like items of assets, liabilities, equity, income, expenses and cash flows of the parent with those of its subsidiaries. For this purpose, income and expenses of the subsidiary are based on the amounts of the assets and liabilities recognised in the consolidated financial statements at the acquisition date.
158 Annual Report 2016 - 2017158
b) Offset (eliminate) the carrying amount of the parent’s investment in each subsidiary and the parent’s portion of equity of each subsidiary. The difference between the cost of investment in the subsidiaries and the Parent's share of net assets at the time of acquisition of control in the subsidiaries is recognised in the consolidated financial statement as goodwill. However, resultant gain (bargain purchase) is recognized in other comprehensive income on the acquisition date and accumulated to capital reserve in equity.
c) Intra-Group balances and transactions, and any unrealized income and expenses arising from intra Group transactions, are eliminated in preparing the consolidated financial statements.
d) In the case of foreign subsidiaries, being non-integral foreign operations, revenue items are consolidated at the average exchange rates prevailing during the year. All assets and liabilities are converted at rates prevailing at the end of the year. Components of equity are translated at closing rate. Any gain / (Loss) on exchange difference arising on consolidation is recognized in the Foreign Currency Translation Reserve (FCTR) through OCI.
e) Consolidated statement of profit or loss and each component of OCI are attributed to the equity holders of the parent of the Group and to the non-controlling interests, even if this results in the non-controlling interests having a deficit balance.
f) For the acquisitions of additional interests in subsidiaries, where there is no change in the control, the Group recognises a reduction to the non-controlling interest of the respective subsidiary with the difference between this figure and the cash paid, inclusive of transaction fees, being recognised in equity. In addition, upon dilution of controlling interests, the difference between the cash received from sale or listing of the subsidiary shares and the increase to non-controlling interest is also recognised in equity. If the Group loses control over a subsidiary, it derecognises the related assets (including goodwill), liabilities, non-controlling interest and other components of equity, while any resultant gain or loss is recognised in consolidated statement of profit and loss. Any investment retained is recognised at fair value. The results of subsidiaries acquired or disposed off during the year are included in the consolidated statement of Profit and Loss from the effective date of acquisition or up to the effective date of disposal, as appropriate.
g) Interest in associates are consolidated using equity method as per Ind AS 28 – ‘Investment in Associates and Joint Ventures’. The investment in associates is initially recognised at cost. Subsequently, under the equity method, post-acquisition attributable profit/losses and other comprehensive income are adjusted in the carrying value of investment to the extent of the Group's investment in the associates. Goodwill relating to the associate is included in the carrying amount of the investment and is not tested for impairment individually.
h) Consolidated financial statements are prepared using uniform accounting policies for like transactions and other events in similar circumstances. If an entity of the group uses accounting policies other than those adopted in the consolidated financial statements for like transactions and events in similar circumstances, appropriate adjustments are made to that Group member’s financial statements in preparing the consolidated financial statements to ensure conformity with the Group’s accounting policies.
i) Consolidated financial statements of all entities used for the purpose of consolidation are drawn up to same reporting date as that of the parent company, i.e., year ended on 31st March. When the end of the reporting period of the parent is different from that of a subsidiary, if any, the subsidiary prepares, for consolidation purposes, additional financial information as of the same date as the consolidated financial statements of the parent to enable the parent to consolidate the financial information of the subsidiary, unless it is impracticable to do so.
Note 4 - SIGNIFICANT ACCOUNTING POLICIES
4.1 Business Combinations and goodwill:
Business combinations are accounted for using the acquisition method. The cost of an acquisition is measured as the aggregate of the consideration transferred measured at acquisition date fair value and the amount of any non-controlling interests in the acquiree. For each business combination, the Group elects whether to measure the non-controlling interests in the acquiree at fair value or at the proportionate share of the acquiree’s identifiable net assets. Acquisition-related costs are expensed as incurred.
At the acquisition date, the identifiable assets acquired and the liabilities assumed are recognised at their acquisition date fair values, except certain assets and liabilities required to be measured as per the applicable standard. For this purpose, the liabilities assumed include contingent liabilities representing present obligation and they are measured at their acquisition fair values irrespective of the fact that outflow of resources embodying economic benefits is not probable.
Notes to the consolidated financial statement for the year ended 31st March, 2017
Annual Report 2016 - 2017 159
Goodwill is initially measured at cost, being the excess of the aggregate of the consideration transferred and the amount recognised for non-controlling interests, and any previous interest held, over the net identifiable assets acquired and liabilities assumed. If the fair value of the net assets acquired is in excess of the aggregate consideration transferred, the Group re-assesses whether it has correctly identified all of the assets acquired and all of the liabilities assumed and reviews the procedures used to measure the amounts to be recognised at the acquisition date. If the reassessment still results in an excess of the fair value of net assets acquired over the aggregate consideration transferred, then the gain is recognised in other comprehensive income and accumulated in equity as capital reserve. However, if there is no clear evidence of bargain purchase, the entity recognises the gain directly in equity as capital reserve, without routing the same through other comprehensive income.
After initial recognition, goodwill is measured at cost less any accumulated impairment losses. For the purpose of impairment testing, goodwill acquired in a business combination is, from the acquisition date, allocated to each of the Group’s cash-generating units that are expected to benefit from the combination, irrespective of whether other assets or liabilities of the acquiree are assigned to those units. A cash generating unit to which goodwill has been allocated is tested for impairment annually, or more frequently when there is an indication that the unit may be impaired. If the recoverable amount of the cash generating unit is less than its carrying amount, the impairment loss is allocated first to reduce the carrying amount of any goodwill allocated to the unit and then to the other assets of the unit pro rata based on the carrying amount of each asset in the unit. Any impairment loss for goodwill is recognised in consolidated statement of profit or loss. An impairment loss recognised for goodwill is not reversed in subsequent periods.
4.2 Property, Plant and Equipment:
Property, plant and equipment are carried at cost less accumulated depreciation and accumulated impairment losses, if any. Cost includes purchase price, borrowing cost and any cost directly attributable to bringing the assets to its working condition for its intended use.
Depreciation on the property, plant and equipment is provided using straight line method over the useful life of assets as specified in schedule II to the Companies Act, 2013 except in respect of depreciation on rollers charged over a period of three years and following assets where the useful life is different as per technical evaluation than those prescribed in Schedule II.
Particulars Useful life considered for depreciation
Captive Power Plant :- 15 Years
Depreciation on property, plant and equipment which are added / disposed off during the year is provided on pro-rata basis with reference to the date of addition / deletion. Freehold land is not depreciated.
The assets' residual values, useful lives and method of depreciation are reviewed at each financial year end and are adjusted prospectively, if appropriate.
Capital work-in-progress includes cost of property, plant and equipment under installation / under development as at the balance sheet date.
Property, plant and equipment are eliminated from consolidated financial statement, either on disposal or when retired from active use. Profits / losses arising in the case of retirement / disposal of property, plant and equipment are recognised in the statement of profit and loss in the year of occurrence.
Leasehold lands are amortised over the period of lease. Buildings constructed on leasehold land are depreciated based on the useful life specified in schedule II to the Companies Act, 2013, where the lease period of land is beyond the life of the building. In other cases, buildings constructed on leasehold lands are amortised over the primary lease period of the lands.
4.3 Investment Properties:
Investment properties are measured initially at cost, including transaction costs. Subsequent to initial recognition, investment properties are stated at cost less accumulated depreciation and accumulated impairment loss, if any.
Depreciation on investment properties is provided using straight line method over the estimated useful lives as specified in Schedule II to the Companies Act, 2013. Residual values, useful lives and method of depreciation of investment properties are reviewed at each financial year end and are adjusted prospectively, if appropriate. The effects of any revision are included in the consolidated statement of profit and loss when the changes arises.
Notes to the consolidated financial statement for the year ended 31st March, 2017
160 Annual Report 2016 - 2017160
Though the Group measures investment properties using cost based measurement, the fair value of investment property is disclosed in the notes.
Investment properties are derecognised either when they have been disposed off or when they are permanently withdrawn from use and no future economic benefit is expected from their disposal. The difference between the net disposal proceeds and the carrying amount of the asset is recognised in consolidated statement of profit and loss in the period of derecognition.
4.4 Intangible Assets :
Intangible assets are carried at cost less accumulated amortisation and accumulated impairment losses, if any. Cost includes expenditure that is directly attributable to the acquisition of the intangible assets.
Identifiable intangible assets are recognised when it is probable that future economic benefits attributed to the asset will flow to the Group and the cost of the asset can be reliably measured.
Computer softwares are capitalised at the amounts paid to acquire the respective license for use and are amortised over the period of useful lives or period of three years, whichever is less. The assets’ useful lives are reviewed at each financial year end.
Gains or losses arising from derecognition of an intangible asset are measured as the difference between the net disposal proceeds and the carrying amount of the asset and are recognised in the consolidated statement of profit and loss when the asset is derecognised.
4.5 Art Works:
Art Works are carried at cost less accumulated impairment losses, if any. Cost includes expenditure that is directly attributable to the acquisition of the items. Profit / loss arising from retirement / disposal of Art Works are recognised in the consolidated statement of profit and loss in the year of occurrence.
4.6 Leases:
A lease is classified at the inception date as a finance lease or an operating lease. A lease that transfers substantially all the risks and rewards incidental to ownership to the Group is classified as a finance lease.
Finance leases are capitalised at the commencement of the lease at the inception date at fair value of the leased property or, if lower, at the present value of the minimum lease payments. The corresponding liability is included in the balance sheet as a finance lease liability. Lease payments are apportioned between finance charges and reduction of the lease liability so as to achieve a constant rate of interest on the remaining balance of the liability. Finance charges are recognised in finance costs in the consolidated statement of profit and loss.
A leased asset is depreciated over the useful life of the asset. However, if there is no reasonable certainty that the Group will obtain ownership by the end of the lease term, the asset is depreciated over the shorter of the estimated useful life of the asset and the lease term.
Assets acquired on leases where a significant portion of the risks and rewards of ownership are retained by lessor are classified as operating leases. Operating lease payments are recognised as an expense in the consolidated statement of profit and loss on a straight-line basis over the lease term except where another systematic basis is more representative of time pattern in which economic benefits from leased assets are consumed.
4.7 Inventories:
Inventories are valued at the lower of cost and net realizable value except scrap (cullet), which is valued at net realizable value or at raw material cost, as appropriate. Net realisable value is the estimated selling price in the ordinary course of business, less estimated costs of completion and the estimated costs necessary to make the sale. The cost of inventories comprises of cost of purchase, cost of conversion and other costs incurred in bringing the inventories to their respective present location and condition. Cost is computed on the weighted average basis. Cost of work in progress and finished goods is determined on absorption costing method.
4.8 Cash and cash equivalents:
Cash and cash equivalent in the balance sheet comprise cash at banks, cash on hand and short-term deposits with an original maturity of three months or less, which are subject to an insignificant risk of changes in value.
Notes to the consolidated financial statement for the year ended 31st March, 2017
Annual Report 2016 - 2017 161
For the purpose of the statement of cash flows, cash and cash equivalents consist of cash and short-term deposits, as defined above, net of outstanding bank overdrafts as they are considered an integral part of the Group's cash management.
4.9 Impairment of assets:
An asset is considered as impaired when at the date of Balance Sheet there are indications of impairment and the carrying amount of the asset, or where applicable the cash generating unit, to which the asset belongs exceeds its recoverable amount (i.e. the higher of the net asset selling price and value in use).The carrying amount is reduced to the recoverable amount and the reduction is recognized as an impairment loss in the consolidated statement of profit and loss. The impairment loss recognized in the prior accounting period is reversed if there has been a change in the estimate of recoverable amount. Post impairment, depreciation is provided on the revised carrying value of the impaired asset over its remaining useful life.
4.10 Discontinued operation and non-current assets (or disposal groups) held for sale:
Discontinued operation:
A discontinued operation is a component of the Group that has been disposed off or is classified as held for sale and that represents a separate major line of business or geographical area of operations, is part of a single co-ordinated plan to dispose off such a line of business or area of operations, or is a subsidiary acquired exclusively with a view to resale. The results of discontinued operations are presented separately in the consolidated statement of profit or loss.
Held for Sale:
Non-current assets are classified as held for sale if their carrying amount will be recovered principally through a sale transaction rather than through continuing use. This condition is regarded as met only when a sale is highly probable from the date of classification, management are committed to the sale and the asset is available for immediate sale in its present condition. Non-current assets are classified as held for sale from the date these conditions are met and are measured at the lower of carrying amount and fair value less cost to sell. Any resulting impairment loss is recognised in the consolidated statement of profit and loss as a separate line item. On classification as held for sale, the assets are no longer depreciated. Assets and liabilities classified as held for sale are presented separately as current items in the balance sheet.
4.11 Financial instruments – initial recognition, subsequent measurement and impairment:
A financial instrument is any contract that gives rise to a financial asset of one entity and a financial liability or equity instrument of another entity.
I) Financial assets - Initial recognition and measurement:
All financial assets are initially recognized at fair value. Transaction costs that are directly attributable to the acquisition or issue of financial assets, which are not at fair value through profit or loss, are adjusted to the fair value on initial recognition. Financial assets are classified, at initial recognition, as financial assets measured at fair value or as financial assets measured at amortised cost.
Financial assets - Subsequent measurement:
For the purpose of subsequent measurement, financial assets are classified in two broad categories:-
a) Financial assets at fair value
b) Financial assets at amortised cost
Where assets are measured at fair value, gains and losses are either recognised entirely in the consolidated statement of profit and loss (i.e. fair value through profit or loss), or recognised in other comprehensive income (i.e. fair value through other comprehensive income).
A financial asset that meets the following two conditions is measured at amortised cost (net of any write down for impairment) unless the asset is designated at fair value through profit or loss under the fair value option.
a) Business model test: The objective of the Group's business model is to hold the financial asset to collect the contractual cash flow.
b) Cash flow characteristics test: The contractual terms of the financial asset give rise on specified dates to cash flow that are solely payments of principal and interest on the principal amount outstanding.
A financial asset that meets the following two conditions is measured at fair value through other comprehensive income unless the asset is designated at fair value through profit or loss under the fair value option.
Notes to the consolidated financial statement for the year ended 31st March, 2017
162 Annual Report 2016 - 2017162
a) Business model test: The financial asset is held within a business model whose objective is achieved by both collecting contractual cash flow and selling financial assets.
b) Cash flow characteristics test: The contractual terms of the financial asset give rise on specified dates to cash flow that are solely payments of principal and interest on the principal amount outstanding.
All other financial asset is measured at fair value through profit or loss.
Financial assets - Derecognition:
A financial assets (or, where applicable, a part of a financial asset or part of a group of similar financial assets) is primarily derecognised (i.e. removed form the Group's consolidated statement of financial position) when:
a) The rights to receive cash flows from the asset have expired, or
b) The Group has transferred its rights to receive cash flow from the asset.
II) Financial liabilities - Initial recognition and measurement:
The financial liabilities are recognised initially at fair value and, in the case of loans and borrowings and payables, net of directly attributable transaction costs.
Financial liabilities - Subsequent measurement:
Financial liabilities are subsequently carried at amortized cost using the effective interest method. For trade and other payables maturing within one year from the balance sheet date, the carrying amounts approximate at their fair value due to the short maturity of these instruments.
Financial Liabilities - Financial guarantee contracts:
Financial guarantee contracts issued by the Group are those contracts that require a payment to be made to reimburse the holder for a loss it incurs because the specified debtor fails to make a payment when due in accordance with the terms of a debt instrument. Financial guarantee contracts are recognised initially as a liability at fair value, adjusted for transaction costs that are directly attributable to the issuance of the guarantee. Subsequently, the liability is measured at the higher of the amount of loss allowance determined and the amount recognised less cumulative amortisation.
Financial Liabilities - Derecognition:
A financial liability is derecognised when the obligation under the liability is discharged or cancelled or expires. When an existing financial liability is replaced by another, from the same lender on substantially different terms, or the terms of an existing liability are substantially modified, such an exchange or modification is treated as the derecognition of the original liability and the recognition of a new liability. The difference in the respective carrying amounts is recognised in the consolidated statement of profit and loss.
4.12 Provisions, Contingent Liabilities, Contingent assets and Commitments:
Provisions are recognised when the Group has a present obligation (legal or constructive) as a result of a past event, it is probable that an outflow of resources embodying economic benefits will be required to settle the obligation and a reliable estimate can be made of the amount of the obligation. If the effect of the time value of money is material, provisions are discounted using equivalent period government securities interest rate. Unwinding of the discount is recognised in the consolidated statement of profit and Loss as a finance cost. Provisions are reviewed at each balance sheet date and are adjusted to reflect the current best estimate.
Contingent liabilities are disclosed when there is a possible obligation arising from past events, the existence of which will be confirmed only by the occurrence or non-occurrence of one or more uncertain future events not wholly within the control of the Group or a present obligation that arises from past events where it is either not probable that an outflow of resources will be required to settle or a reliable estimate of the amount cannot be made. Information on contingent liability is disclosed in the Notes to the consolidated financial statements. Contingent assets are not recognised. However, when the realisation of income is virtually certain, then the related asset is no longer a contingent asset, but it is recognised as an asset.
4.13 Dividend Distribution:
Annual dividend distribution to the shareholders is recognised as a liability in the period in which the dividends are approved by the shareholders. Any interim dividend paid is recognised on approval by Board of Directors. Dividend payable and corresponding tax on dividend distribution is recognised directly in other equity.
Notes to the consolidated financial statement for the year ended 31st March, 2017
Annual Report 2016 - 2017 163
4.14 Revenue recognition and other income:
Sale of goods:
Revenue from the sale of goods is recognised when the significant risks and rewards of ownership of the goods have passed to the buyer as per the terms of the contracts, usually on delivery of the goods, and no significant uncertainty exists regarding the amount of the consideration that will be derived from the sale of goods. It also includes excise duty, if applicable, and excludes value added tax / sales tax. Revenue from the sale of goods is measured at the fair value of the consideration received or receivable, net of returns and allowances, trade discounts and volume rebates.
Sale of Services :
Revenue from sale of services is recognised as per the terms of the contract with customer based on stage of completion when the outcome of the transactions involving rendering of services can be estimated reliably. Percentage of completion method requires the Group to estimate the services performed to date as a proportion of the total services to be performed.
Other Operating Income:
Incentives on exports and other Government incentives related to operations are recognised in the consolidated statement of profit and loss after due consideration of certainty of utilization/receipt of such incentives.
Interest Income:
Interest income from a financial asset is recognised when it is probable that the economic benefits will flow to the Group and the amount of income can be measured reliably. Interest income is accrued on a time basis, by reference to the principal outstanding and at the effective interest rate applicable, which is the rate that exactly discounts estimated future cash receipts through the expected life of the financial asset to that asset’s net carrying amount on initial recognition.
Dividend Income:
Dividend Income is recognised when the right to receive the payment is established.
Rental income:
Rental income arising from operating leases is accounted for on a straight-line basis over the lease terms and is included in other income in the consolidated statement of profit and loss.
4.15 Foreign currency reinstatement and translation:
Transactions in foreign currencies are initially recorded by the Group at rates prevailing at the date of the transaction. Subsequently monetary items are translated at closing exchange rates as on balance sheet date and the resulting exchange difference recognised in consolidated statement of profit and loss. Differences arising on settlement of monetary items are also recognised in consolidated statement of profit and loss.
Non-monetary items that are measured in terms of historical cost in a foreign currency are translated using the exchange rates at the dates of the transaction. Non-monetary items carried at fair value that are denominated in foreign currencies are translated at the exchange rates prevailing at the date when the fair value was determined. The gain or loss arising on translation of non-monetary items measured at fair value is treated in line with the recognition of the gain or loss on the change in fair value of the item (i.e., translation differences on items whose fair value gain or loss is recognised in OCI or profit or loss are also recognised in OCI or profit or loss, respectively).
Foreign exchange differences regarded as an adjustment to borrowing costs are presented in the consolidated statement of profit and loss, within finance costs. All other finance gains / losses are presented in the consolidated statement of profit and loss on a net basis.
4.16 Employee Benefits:
Short term employee benefits are recognized as an expense in the consolidated statement of profit and loss of the year in which the related services are rendered.
Leave encashment being a defined benefit plan is accounted for using the projected unit credit method, on the basis of actuarial valuations carried out by third party actuaries at each Balance Sheet date. Actuarial gains and losses arising from experience adjustments and changes in actuarial assumptions are charged or credited to other comprehensive income in the year in which they arise. Other costs are accounted in consolidated statement of profit and loss.
Contribution to Provident Fund, a defined contribution plan, is made in accordance with the statute, and is recognised as an expense in the year in which employees have rendered services.
Notes to the consolidated financial statement for the year ended 31st March, 2017
164 Annual Report 2016 - 2017164
Contribution to Superannuation fund, a defined contribution plan, is made in accordance with the respective Company's policy, and is recognised as an expense in the year in which employees have rendered services.
The cost of providing gratuity, a defined benefit plans, is determined using the Projected Unit Credit Method, on the basis of actuarial valuations carried out by third party actuaries at each Balance Sheet date. Actuarial gains and losses arising from experience adjustments and changes in actuarial assumptions are charged or credited to other comprehensive income in the period in which they arise. Other costs are accounted in consolidated statement of profit and loss.
Remeasurements of defined benefit plan in respect of post employment and other long term benefits are charged to the other comprehensive income in the year in which they occur. Remeasurements are not reclassified to consolidated statement of profit and loss in subsequent periods.
4.17 Taxes on Income: Income tax expense represents the sum of current tax (including MAT and income tax for earlier years) and deferred tax.
Tax is recognised in the consolidated statement of profit and loss, except to the extent that it relates to items recognised directly in equity or other comprehensive income, in such cases the tax is also recognised directly in equity or in other comprehensive income. Any subsequent change in direct tax on items initially recognised in equity or other comprehensive income is also recognised in equity or other comprehensive income.
Current tax provision is computed for Income calculated after considering allowances and exemptions under the provisions of the applicable Income Tax Laws. Current tax assets and current tax liabilities are off set, and presented as net.
Deferred tax is recognised on differences between the carrying amounts of assets and liabilities in the Balance sheet and the corresponding tax bases used in the computation of taxable profit. Deferred tax liabilities are generally recognised for all taxable temporary differences, and deferred tax assets are generally recognised for all deductible temporary differences, carry forward tax losses and allowances to the extent that it is probable that future taxable profits will be available against which those deductible temporary differences, carry forward tax losses and allowances can be utilised. Deferred tax assets and liabilities are measured at the applicable tax rates. The carrying amount of deferred tax assets is reviewed at each balance sheet date and reduced to the extent that it is no longer probable that sufficient taxable profits will be available against which the temporary differences can be utilised.
Credit of MAT is recognised as an asset only when and to the extent there is convincing evidence that the respective Company, as applicable, will pay normal income tax during the specified period, i.e., the period for which MAT credit is allowed to be carried forward. In the year in which the MAT credit becomes eligible to be recognised as an asset, the said asset is created by way of a credit to the consolidated statement of profit and loss and shown as MAT credit entitlement. The applicable Company reviews the same at each balance sheet date and writes down the carrying amount of MAT credit entitlement to the extent there is no longer convincing evidence to the effect that the applicable Company will pay normal income tax during the specified period.
4.18 Borrowing Costs: Borrowing costs specifically relating to the acquisition or construction of qualifying assets that necessarily takes a
substantial period of time to get ready for its intended use are capitalized (net of income on temporarily deployment of funds) as part of the cost of such assets. Borrowing costs consist of interest and other costs that the Group incurs in connection with the borrowing of funds. For general borrowing used for the purpose of obtaining a qualifying asset, the amount of borrowing costs eligible for capitalization is determined by applying a capitalization rate to the expenditures on that asset. The capitalization rate is the weighted average of the borrowing costs applicable to the borrowings of the Group that are outstanding during the period, other than borrowings made specifically for the purpose of obtaining a qualifying asset. The amount of borrowing costs capitalized during a period does not exceed the amount of borrowing cost incurred during that period. All other borrowing costs are expensed in the period in which they occur.
4.19 Earnings per share: Basic earnings per share is computed using the net profit for the year attributable to the shareholders’ and weighted
average number of equity shares outstanding during the year. Diluted earnings per share is computed using the net profit for the year attributable to the shareholder’ and weighted
average number of equity and potential equity shares outstanding during the year including share options, convertible preference shares and debentures, except where the result would be anti-dilutive. Potential equity shares that are converted during the year are included in the calculation of diluted earnings per share, from the beginning of the year or date of issuance of such potential equity shares, to the date of conversion.
4.20 Current and non-current classification: The Group presents assets and liabilities in statement of financial position based on current/non-current classification. The Group has presented non-current assets and current assets before equity, non-current liabilities and current liabilities
in accordance with Schedule III, Division II of Companies Act, 2013 notified by MCA.
Notes to the consolidated financial statement for the year ended 31st March, 2017
Annual Report 2016 - 2017 165
An asset is classified as current when it is: a) Expected to be realised or intended to be sold or consumed in normal operating cycle, b) Held primarily for the purpose of trading, c) Expected to be realised within twelve months after the reporting period, or d) Cash or cash equivalent unless restricted from being exchanged or used to settle a liability for at least twelve months
after the reporting period. All other assets are classified as non-current. A liability is classified as current when it is: a) Expected to be settled in normal operating cycle, b) Held primarily for the purpose of trading, c) Due to be settled within twelve months after the reporting period, or d) There is no unconditional right to defer the settlement of the liability for at least twelve months after the reporting
period. All other liabilities are classified as non-current. The operating cycle is the time between the acquisition of assets for processing and their realisation in cash or cash
equivalents. Deferred tax assets and liabilities are classified as non-current assets and liabilities. The Group has identified twelve months as its normal operating cycle.
4.21 Fair value measurement: The Group measures financial instruments at fair value at each balance sheet date. Fair value is the price that would be received to sell an asset or paid to transfer a liability in an orderly transaction
between market participants at the measurement date. The fair value measurement is based on the presumption that the transaction to sell the asset or transfer the liability takes place either:
a) In the principal market for the asset or liability, or b) In the absence of a principal market, in the most advantageous market for the asset or liability A fair value measurement of a non-financial asset takes into account a market participant’s ability to generate economic
benefits by using the asset in its highest and best use or by selling it to another market participant that would use the asset in its highest and best use.
The Group uses valuation techniques that are appropriate in the circumstances and for which sufficient data are available to measure fair value, maximising the use of relevant observable inputs and minimising the use of unobservable inputs.
All assets and liabilities for which fair value is measured or disclosed in the consolidated financial statements are categorised within the fair value hierarchy.
4.22 Government Grant Government grants are recognized only if there is reasonable assurance as to its receipt and that the conditions attached
there to shall be complied with and are recognised and shown under the head "Other Income".4.23 Off-setting financial Instrument: Financial assets and liabilities are offset and the net amount is reported in the balance sheet where there is a legally
enforceable rights to offset the recognised amounts and there is an intention to settle on a net basis or realise the asset and settle the liability simultaneously. The legally enforceable rights must not be contingent on future events and must be enforceable in the normal course of business and in the event of default, insolvency or bankruptcy of the Company or counterparty.
Note 5 SIGNIFICANT ACCOUNTING JUDGEMENTS, ESTIMATES AND ASSUMPTIONS: The preparation of the consolidated financial statements requires management to make judgements, estimates and
assumptions that affect the reported amounts of revenues, expenses, assets and liabilities, and the accompanying disclosures, and the disclosure of contingent liabilities. Uncertainty about these assumptions and estimates could result in outcomes that require a material adjustment to the carrying amount of assets or liabilities affected in future periods. The key assumptions concerning the future and other key sources of estimation uncertainty at the reporting date, that have a significant risk of causing a material adjustment to the carrying amounts of assets and liabilities within the next financial year, are described below. The Group based its assumptions and estimates on parameters available when the consolidated financial statements were prepared. However, existing circumstances and assumptions about future developments may change due to market changes or circumstances arising that are beyond the control of the Group. Such changes are reflected in the assumptions when they occur.
Notes to the consolidated financial statement for the year ended 31st March, 2017
166 Annual Report 2016 - 2017166
5.1 Property, plant and equipment, Investment Properties and Intangible Assets: Management reviews the estimated useful lives and residual values of the assets annually in order to determine the
amount of depreciation to be recorded during any reporting period. The useful lives and residual values as per schedule II of the Companies Act, 2013 or are based on the Company’s historical experience with similar assets and taking into account anticipated technological changes, whichever is more appropriate.
5.2 Income Tax: The Group reviews at each balance sheet date the carrying amount of deferred tax assets. The factors used in estimates
may differ from actual outcome which could lead to an adjustment to the amounts reported in the consolidated financial statements.
5.3 Contingencies: Management has estimated the possible outflow of resources at the end of each annual reporting financial year, if any, in
respect of contingencies/claim/litigations against the Group as it is not possible to predict the outcome of pending matters with accuracy.
5.4 Impairment of financial assets: The impairment provisions for financial assets are based on assumptions about risk of default and expected cash loss.
The Group uses judgement in making these assumptions and selecting the inputs to the impairment calculation, based on Group’s past history, existing market conditions as well as forward looking estimates at the end of each reporting period.
5.5 Impairment of non-financial assets: The Group assesses at each reporting date whether there is an indication that an asset may be impaired. If any indication
exists, or when annual impairment testing for an asset is required, the Group estimates the asset’s recoverable amount. An asset’s recoverable amount is the higher of an asset’s or Cash Generating Units (CGU) fair value less costs of disposal and its value in use. It is determined for an individual asset, unless the asset does not generate cash inflows that are largely independent to those from other assets or groups of assets. Where the carrying amount of an asset or CGU exceeds its recoverable amount, the asset is considered impaired and is written down to its recoverable amount.
In assessing value in use, the estimated future cash flows are discounted to their present value using a pre-tax discount rate that reflects current market assessments of the time value of money and the risks specific to the asset. In determining fair value less cost of disposal, recent market transactions are taken into account. If no such transactions can be identified, an appropriate valuation model is used. These calculations are corroborated by valuation multiples or other available fair value indicators.
5.6 Defined benefits plans: The Cost of the defined benefit plan and other post-employment benefits and the present value of such obligation are
determined using actuarial valuations. An actuarial valuation involves making various assumptions that may differ from actual developments in the future. These include the determination of the discount rate, future salary increases, mortality rates and attrition rate. Due to the complexities involved in the valuation and its long-term nature, a defined benefit obligation is highly sensitive to changes in these assumptions. All assumptions are reviewed at each reporting date.
5.7 Recoverability of trade receivable: Judgements are required in assessing the recoverability of overdue trade receivables and determining whether a provision
against those receivables is required. Factors considered include the credit rating of the counterparty, the amount and timing of anticipated future payments and any possible actions that can be taken to mitigate the risk of non-payment.
5.8 Provisions: Provisions and liabilities are recognized in the period when it becomes probable that there will be a future outflow of
funds resulting from past operations or events and the amount of cash outflow can be reliably estimated. The timing of recognition and quantification of the liability require the application of judgement to existing facts and circumstances, which can be subject to change. Since the cash outflows can take place many years in the future, the carrying amounts of provisions and liabilities are reviewed regularly and adjusted to take account of changing facts and circumstances.
5.9 Fair value measurement of financial instruments : When the fair value of financial assets and financial liabilities recorded in the balance sheet cannot be measured based
on quoted prices in active markets, their fair value is measured using valuation techniques including the Discounted Cash Flow (DCF) model. The inputs to these models are taken from observable markets where possible, but where this is not feasible, a degree of judgement is required in establishing fair values. Judgements include considerations of inputs such as liquidity risk, credit risk and volatility. Changes in assumptions about these factors could affect the reported fair value of financial instruments.
Notes to the consolidated financial statement for the year ended 31st March, 2017
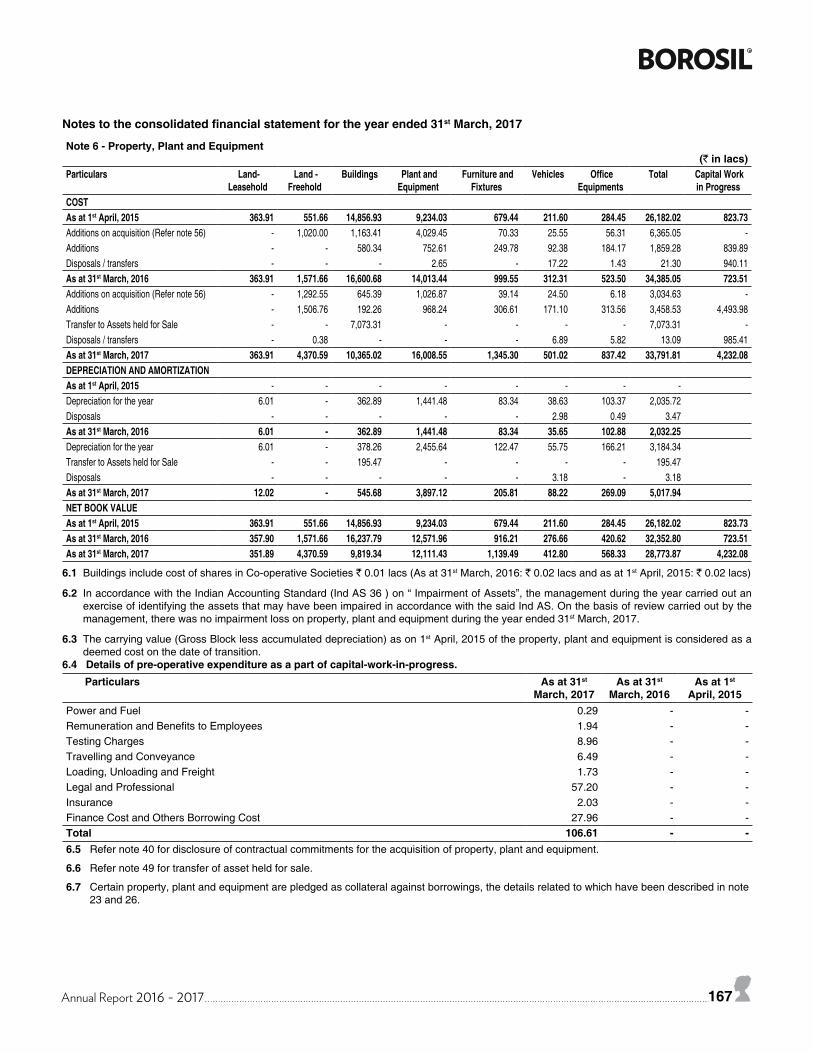
Annual Report 2016 - 2017 167
Note 6 - Property, Plant and Equipment (` in lacs)
Particulars Land- Leasehold
Land - Freehold
Buildings Plant and Equipment
Furniture and Fixtures
Vehicles Office Equipments
Total Capital Work in Progress
COSTAs at 1st April, 2015 363.91 551.66 14,856.93 9,234.03 679.44 211.60 284.45 26,182.02 823.73Additions on acquisition (Refer note 56) - 1,020.00 1,163.41 4,029.45 70.33 25.55 56.31 6,365.05 -Additions - - 580.34 752.61 249.78 92.38 184.17 1,859.28 839.89Disposals / transfers - - - 2.65 - 17.22 1.43 21.30 940.11As at 31st March, 2016 363.91 1,571.66 16,600.68 14,013.44 999.55 312.31 523.50 34,385.05 723.51Additions on acquisition (Refer note 56) - 1,292.55 645.39 1,026.87 39.14 24.50 6.18 3,034.63 -Additions - 1,506.76 192.26 968.24 306.61 171.10 313.56 3,458.53 4,493.98Transfer to Assets held for Sale - - 7,073.31 - - - - 7,073.31 -Disposals / transfers - 0.38 - - - 6.89 5.82 13.09 985.41As at 31st March, 2017 363.91 4,370.59 10,365.02 16,008.55 1,345.30 501.02 837.42 33,791.81 4,232.08DEPRECIATION AND AMORTIZATIONAs at 1st April, 2015 - - - - - - - -Depreciation for the year 6.01 - 362.89 1,441.48 83.34 38.63 103.37 2,035.72Disposals - - - - - 2.98 0.49 3.47As at 31st March, 2016 6.01 - 362.89 1,441.48 83.34 35.65 102.88 2,032.25Depreciation for the year 6.01 - 378.26 2,455.64 122.47 55.75 166.21 3,184.34Transfer to Assets held for Sale - - 195.47 - - - - 195.47Disposals - - - - - 3.18 - 3.18As at 31st March, 2017 12.02 - 545.68 3,897.12 205.81 88.22 269.09 5,017.94NET BOOK VALUEAs at 1st April, 2015 363.91 551.66 14,856.93 9,234.03 679.44 211.60 284.45 26,182.02 823.73As at 31st March, 2016 357.90 1,571.66 16,237.79 12,571.96 916.21 276.66 420.62 32,352.80 723.51As at 31st March, 2017 351.89 4,370.59 9,819.34 12,111.43 1,139.49 412.80 568.33 28,773.87 4,232.08
6.1 Buildings include cost of shares in Co-operative Societies ` 0.01 lacs (As at 31st March, 2016: ` 0.02 lacs and as at 1st April, 2015: ` 0.02 lacs)
6.2 In accordance with the Indian Accounting Standard (Ind AS 36 ) on “ Impairment of Assets”, the management during the year carried out an exercise of identifying the assets that may have been impaired in accordance with the said Ind AS. On the basis of review carried out by the management, there was no impairment loss on property, plant and equipment during the year ended 31st March, 2017.
6.3 The carrying value (Gross Block less accumulated depreciation) as on 1st April, 2015 of the property, plant and equipment is considered as a deemed cost on the date of transition.
6.4 Details of pre-operative expenditure as a part of capital-work-in-progress.Particulars As at 31st
March, 2017As at 31st
March, 2016As at 1st
April, 2015Power and Fuel 0.29 - -Remuneration and Benefits to Employees 1.94 - -Testing Charges 8.96 - -Travelling and Conveyance 6.49 - -Loading, Unloading and Freight 1.73 - -Legal and Professional 57.20 - -Insurance 2.03 - -Finance Cost and Others Borrowing Cost 27.96 - -Total 106.61 - -6.5 Refer note 40 for disclosure of contractual commitments for the acquisition of property, plant and equipment.
6.6 Refer note 49 for transfer of asset held for sale.
6.7 Certain property, plant and equipment are pledged as collateral against borrowings, the details related to which have been described in note 23 and 26.
Notes to the consolidated financial statement for the year ended 31st March, 2017
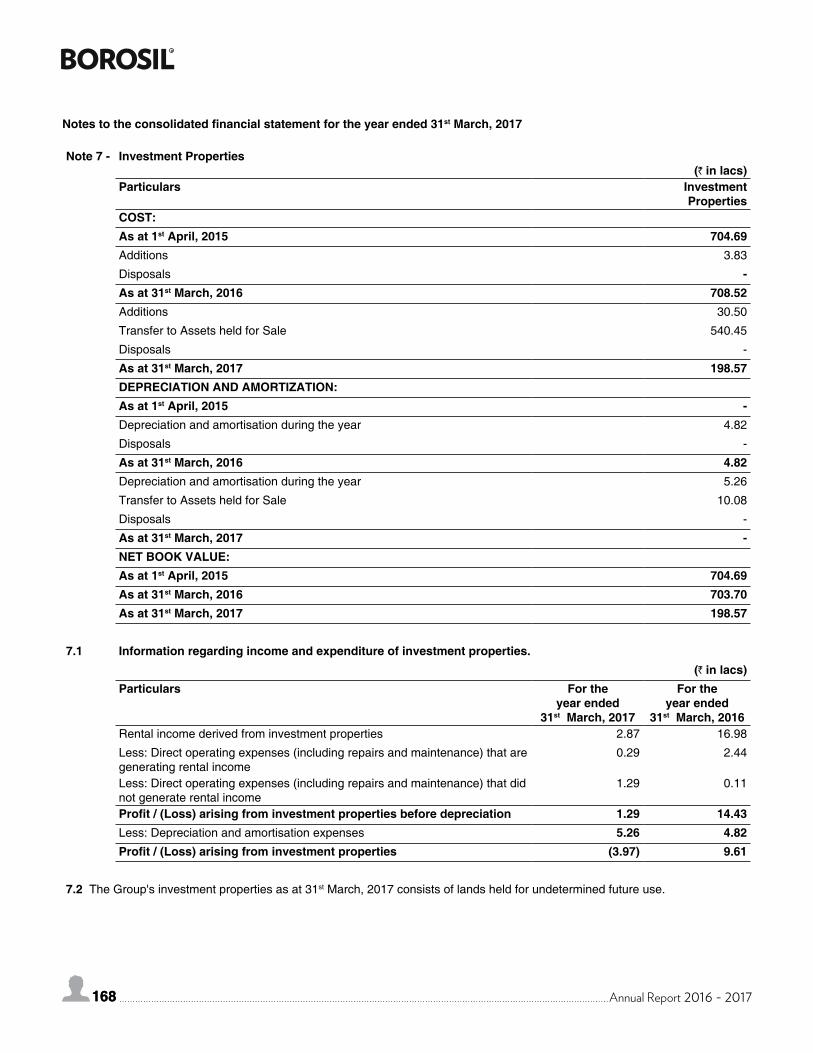
168 Annual Report 2016 - 2017168
Note 7 - Investment Properties(` in lacs)
Particulars Investment Properties
COST:As at 1st April, 2015 704.69Additions 3.83
Disposals -As at 31st March, 2016 708.52Additions 30.50
Transfer to Assets held for Sale 540.45
Disposals -
As at 31st March, 2017 198.57DEPRECIATION AND AMORTIZATION:As at 1st April, 2015 -Depreciation and amortisation during the year 4.82
Disposals -
As at 31st March, 2016 4.82Depreciation and amortisation during the year 5.26
Transfer to Assets held for Sale 10.08
Disposals -
As at 31st March, 2017 -NET BOOK VALUE:As at 1st April, 2015 704.69As at 31st March, 2016 703.70As at 31st March, 2017 198.57
7.1 Information regarding income and expenditure of investment properties.(` in lacs)
Particulars For the year ended
31st March, 2017
For the year ended
31st March, 2016Rental income derived from investment properties 2.87 16.98
Less: Direct operating expenses (including repairs and maintenance) that are generating rental income
0.29 2.44
Less: Direct operating expenses (including repairs and maintenance) that did not generate rental income
1.29 0.11
Profit / (Loss) arising from investment properties before depreciation 1.29 14.43Less: Depreciation and amortisation expenses 5.26 4.82Profit / (Loss) arising from investment properties (3.97) 9.61
7.2 The Group's investment properties as at 31st March, 2017 consists of lands held for undetermined future use.
Notes to the consolidated financial statement for the year ended 31st March, 2017
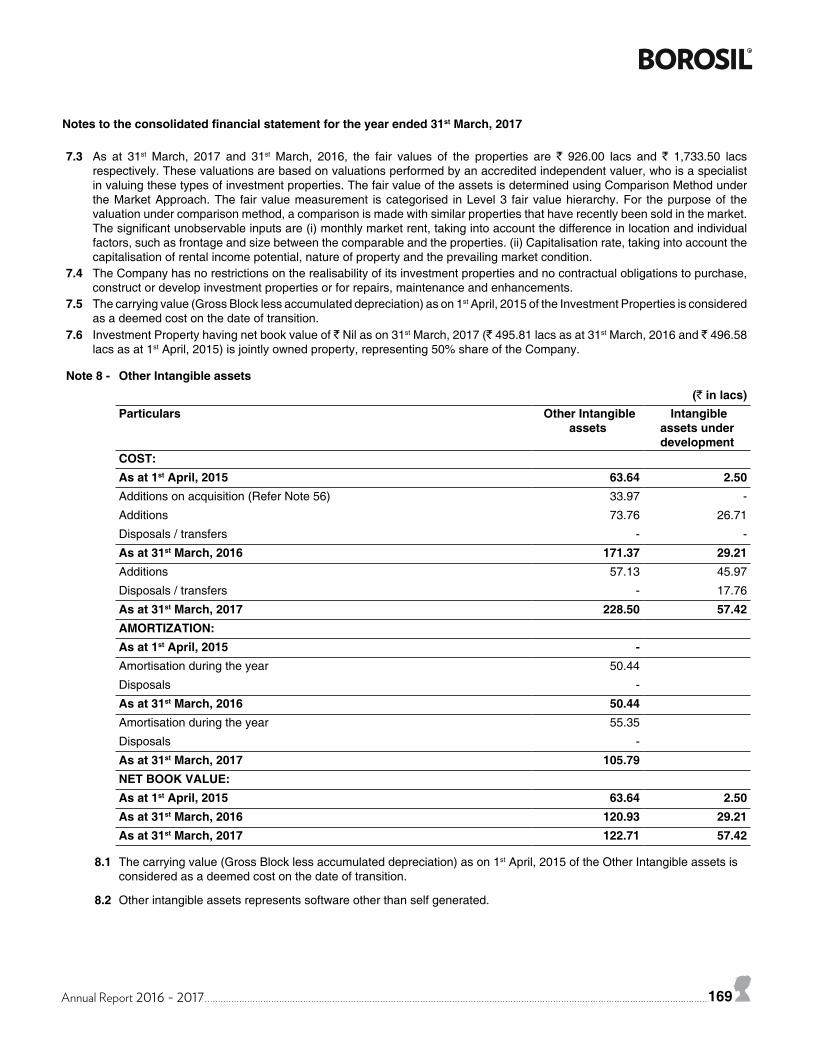
Annual Report 2016 - 2017 169
7.3 As at 31st March, 2017 and 31st March, 2016, the fair values of the properties are ` 926.00 lacs and ` 1,733.50 lacs respectively. These valuations are based on valuations performed by an accredited independent valuer, who is a specialist in valuing these types of investment properties. The fair value of the assets is determined using Comparison Method under the Market Approach. The fair value measurement is categorised in Level 3 fair value hierarchy. For the purpose of the valuation under comparison method, a comparison is made with similar properties that have recently been sold in the market. The significant unobservable inputs are (i) monthly market rent, taking into account the difference in location and individual factors, such as frontage and size between the comparable and the properties. (ii) Capitalisation rate, taking into account the capitalisation of rental income potential, nature of property and the prevailing market condition.
7.4 The Company has no restrictions on the realisability of its investment properties and no contractual obligations to purchase, construct or develop investment properties or for repairs, maintenance and enhancements.
7.5 The carrying value (Gross Block less accumulated depreciation) as on 1st April, 2015 of the Investment Properties is considered as a deemed cost on the date of transition.
7.6 Investment Property having net book value of ` Nil as on 31st March, 2017 (` 495.81 lacs as at 31st March, 2016 and ` 496.58 lacs as at 1st April, 2015) is jointly owned property, representing 50% share of the Company.
Note 8 - Other Intangible assets(` in lacs)
Particulars Other Intangible assets
Intangible assets under development
COST:As at 1st April, 2015 63.64 2.50Additions on acquisition (Refer Note 56) 33.97 -
Additions 73.76 26.71
Disposals / transfers - -
As at 31st March, 2016 171.37 29.21Additions 57.13 45.97
Disposals / transfers - 17.76
As at 31st March, 2017 228.50 57.42AMORTIZATION:As at 1st April, 2015 -Amortisation during the year 50.44
Disposals -
As at 31st March, 2016 50.44Amortisation during the year 55.35
Disposals -
As at 31st March, 2017 105.79NET BOOK VALUE:As at 1st April, 2015 63.64 2.50As at 31st March, 2016 120.93 29.21As at 31st March, 2017 122.71 57.42
8.1 The carrying value (Gross Block less accumulated depreciation) as on 1st April, 2015 of the Other Intangible assets is considered as a deemed cost on the date of transition.
8.2 Other intangible assets represents software other than self generated.
Notes to the consolidated financial statement for the year ended 31st March, 2017
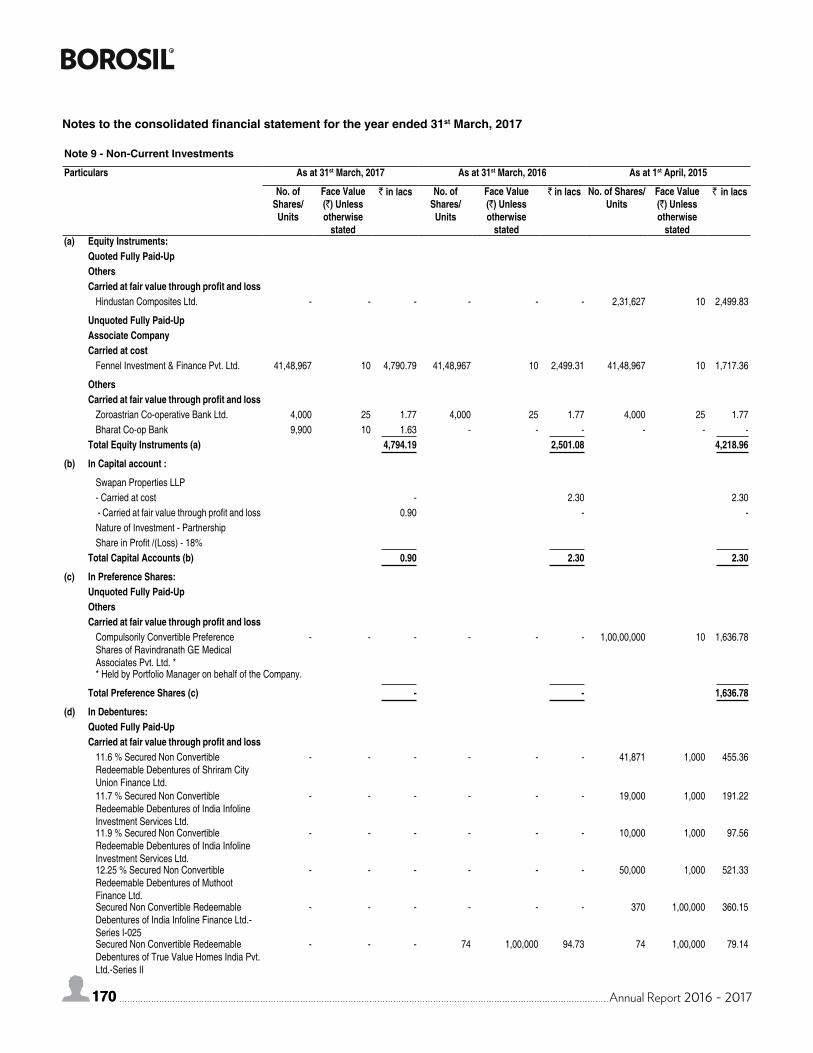
170 Annual Report 2016 - 2017170
Note 9 - Non-Current Investments
Particulars As at 31st March, 2017 As at 31st March, 2016 As at 1st April, 2015
No. of Shares/
Units
Face Value (`) Unless otherwise
stated
` in lacs No. of Shares/
Units
Face Value (`) Unless otherwise
stated
` in lacs No. of Shares/Units
Face Value (`) Unless otherwise
stated
` in lacs
(a) Equity Instruments:Quoted Fully Paid-UpOthersCarried at fair value through profit and loss
Hindustan Composites Ltd. - - - - - - 2,31,627 10 2,499.83
Unquoted Fully Paid-UpAssociate CompanyCarried at cost
Fennel Investment & Finance Pvt. Ltd. 41,48,967 10 4,790.79 41,48,967 10 2,499.31 41,48,967 10 1,717.36
OthersCarried at fair value through profit and loss
Zoroastrian Co-operative Bank Ltd. 4,000 25 1.77 4,000 25 1.77 4,000 25 1.77Bharat Co-op Bank 9,900 10 1.63 - - - - - -
Total Equity Instruments (a) 4,794.19 2,501.08 4,218.96
(b) In Capital account :
Swapan Properties LLP - Carried at cost - 2.30 2.30 - Carried at fair value through profit and loss 0.90 - -Nature of Investment - PartnershipShare in Profit /(Loss) - 18%
Total Capital Accounts (b) 0.90 2.30 2.30
(c) In Preference Shares:Unquoted Fully Paid-UpOthersCarried at fair value through profit and loss
Compulsorily Convertible Preference Shares of Ravindranath GE Medical Associates Pvt. Ltd. *
- - - - - - 1,00,00,000 10 1,636.78
* Held by Portfolio Manager on behalf of the Company.
Total Preference Shares (c) - - 1,636.78
(d) In Debentures:Quoted Fully Paid-UpCarried at fair value through profit and loss
11.6 % Secured Non Convertible Redeemable Debentures of Shriram City Union Finance Ltd.
- - - - - - 41,871 1,000 455.36
11.7 % Secured Non Convertible Redeemable Debentures of India Infoline Investment Services Ltd.
- - - - - - 19,000 1,000 191.22
11.9 % Secured Non Convertible Redeemable Debentures of India Infoline Investment Services Ltd.
- - - - - - 10,000 1,000 97.56
12.25 % Secured Non Convertible Redeemable Debentures of Muthoot Finance Ltd.
- - - - - - 50,000 1,000 521.33
Secured Non Convertible Redeemable Debentures of India Infoline Finance Ltd.-Series I-025
- - - - - - 370 1,00,000 360.15
Secured Non Convertible Redeemable Debentures of True Value Homes India Pvt. Ltd.-Series II
- - - 74 1,00,000 94.73 74 1,00,000 79.14
Notes to the consolidated financial statement for the year ended 31st March, 2017
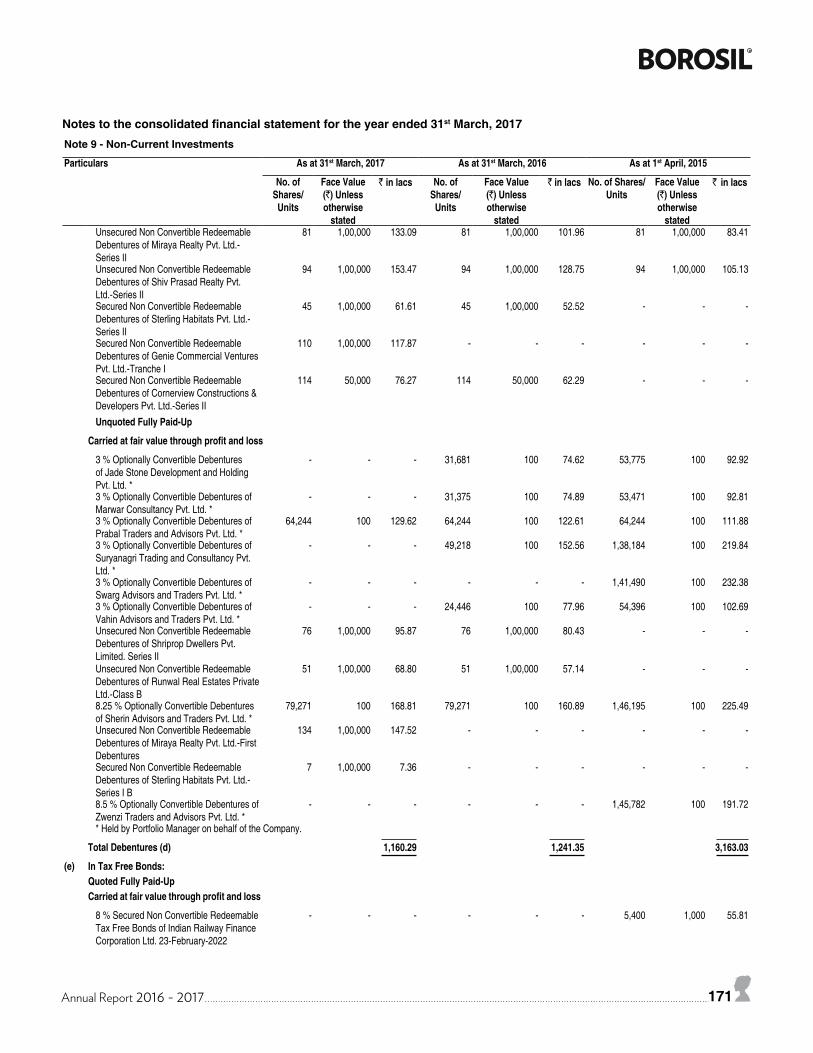
Annual Report 2016 - 2017 171
Note 9 - Non-Current Investments
Particulars As at 31st March, 2017 As at 31st March, 2016 As at 1st April, 2015
No. of Shares/
Units
Face Value (`) Unless otherwise
stated
` in lacs No. of Shares/
Units
Face Value (`) Unless otherwise
stated
` in lacs No. of Shares/Units
Face Value (`) Unless otherwise
stated
` in lacs
Unsecured Non Convertible Redeemable Debentures of Miraya Realty Pvt. Ltd.-Series II
81 1,00,000 133.09 81 1,00,000 101.96 81 1,00,000 83.41
Unsecured Non Convertible Redeemable Debentures of Shiv Prasad Realty Pvt. Ltd.-Series II
94 1,00,000 153.47 94 1,00,000 128.75 94 1,00,000 105.13
Secured Non Convertible Redeemable Debentures of Sterling Habitats Pvt. Ltd.-Series II
45 1,00,000 61.61 45 1,00,000 52.52 - - -
Secured Non Convertible Redeemable Debentures of Genie Commercial Ventures Pvt. Ltd.-Tranche I
110 1,00,000 117.87 - - - - - -
Secured Non Convertible Redeemable Debentures of Cornerview Constructions & Developers Pvt. Ltd.-Series II
114 50,000 76.27 114 50,000 62.29 - - -
Unquoted Fully Paid-Up
Carried at fair value through profit and loss
3 % Optionally Convertible Debentures of Jade Stone Development and Holding Pvt. Ltd. *
- - - 31,681 100 74.62 53,775 100 92.92
3 % Optionally Convertible Debentures of Marwar Consultancy Pvt. Ltd. *
- - - 31,375 100 74.89 53,471 100 92.81
3 % Optionally Convertible Debentures of Prabal Traders and Advisors Pvt. Ltd. *
64,244 100 129.62 64,244 100 122.61 64,244 100 111.88
3 % Optionally Convertible Debentures of Suryanagri Trading and Consultancy Pvt. Ltd. *
- - - 49,218 100 152.56 1,38,184 100 219.84
3 % Optionally Convertible Debentures of Swarg Advisors and Traders Pvt. Ltd. *
- - - - - - 1,41,490 100 232.38
3 % Optionally Convertible Debentures of Vahin Advisors and Traders Pvt. Ltd. *
- - - 24,446 100 77.96 54,396 100 102.69
Unsecured Non Convertible Redeemable Debentures of Shriprop Dwellers Pvt. Limited. Series II
76 1,00,000 95.87 76 1,00,000 80.43 - - -
Unsecured Non Convertible Redeemable Debentures of Runwal Real Estates Private Ltd.-Class B
51 1,00,000 68.80 51 1,00,000 57.14 - - -
8.25 % Optionally Convertible Debentures of Sherin Advisors and Traders Pvt. Ltd. *
79,271 100 168.81 79,271 100 160.89 1,46,195 100 225.49
Unsecured Non Convertible Redeemable Debentures of Miraya Realty Pvt. Ltd.-First Debentures
134 1,00,000 147.52 - - - - - -
Secured Non Convertible Redeemable Debentures of Sterling Habitats Pvt. Ltd.-Series I B
7 1,00,000 7.36 - - - - - -
8.5 % Optionally Convertible Debentures of Zwenzi Traders and Advisors Pvt. Ltd. *
- - - - - - 1,45,782 100 191.72
* Held by Portfolio Manager on behalf of the Company.
Total Debentures (d) 1,160.29 1,241.35 3,163.03
(e) In Tax Free Bonds:Quoted Fully Paid-UpCarried at fair value through profit and loss
8 % Secured Non Convertible Redeemable Tax Free Bonds of Indian Railway Finance Corporation Ltd. 23-February-2022
- - - - - - 5,400 1,000 55.81
Notes to the consolidated financial statement for the year ended 31st March, 2017
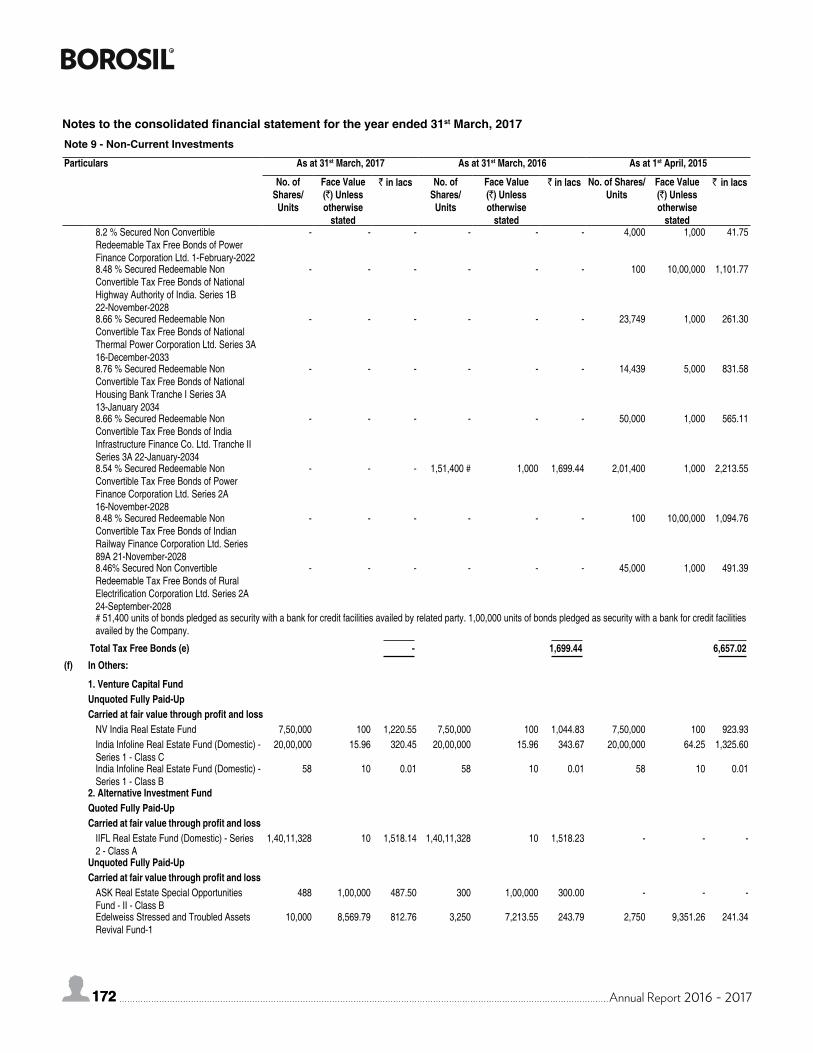
172 Annual Report 2016 - 2017172
Note 9 - Non-Current Investments
Particulars As at 31st March, 2017 As at 31st March, 2016 As at 1st April, 2015
No. of Shares/
Units
Face Value (`) Unless otherwise
stated
` in lacs No. of Shares/
Units
Face Value (`) Unless otherwise
stated
` in lacs No. of Shares/Units
Face Value (`) Unless otherwise
stated
` in lacs
8.2 % Secured Non Convertible Redeemable Tax Free Bonds of Power Finance Corporation Ltd. 1-February-2022
- - - - - - 4,000 1,000 41.75
8.48 % Secured Redeemable Non Convertible Tax Free Bonds of National Highway Authority of India. Series 1B 22-November-2028
- - - - - - 100 10,00,000 1,101.77
8.66 % Secured Redeemable Non Convertible Tax Free Bonds of National Thermal Power Corporation Ltd. Series 3A 16-December-2033
- - - - - - 23,749 1,000 261.30
8.76 % Secured Redeemable Non Convertible Tax Free Bonds of National Housing Bank Tranche I Series 3A 13-January 2034
- - - - - - 14,439 5,000 831.58
8.66 % Secured Redeemable Non Convertible Tax Free Bonds of India Infrastructure Finance Co. Ltd. Tranche II Series 3A 22-January-2034
- - - - - - 50,000 1,000 565.11
8.54 % Secured Redeemable Non Convertible Tax Free Bonds of Power Finance Corporation Ltd. Series 2A 16-November-2028
- - - 1,51,400 # 1,000 1,699.44 2,01,400 1,000 2,213.55
8.48 % Secured Redeemable Non Convertible Tax Free Bonds of Indian Railway Finance Corporation Ltd. Series 89A 21-November-2028
- - - - - - 100 10,00,000 1,094.76
8.46% Secured Non Convertible Redeemable Tax Free Bonds of Rural Electrification Corporation Ltd. Series 2A 24-September-2028
- - - - - - 45,000 1,000 491.39
# 51,400 units of bonds pledged as security with a bank for credit facilities availed by related party. 1,00,000 units of bonds pledged as security with a bank for credit facilities availed by the Company.
Total Tax Free Bonds (e) - 1,699.44 6,657.02(f) In Others:
1. Venture Capital FundUnquoted Fully Paid-UpCarried at fair value through profit and loss
NV India Real Estate Fund 7,50,000 100 1,220.55 7,50,000 100 1,044.83 7,50,000 100 923.93India Infoline Real Estate Fund (Domestic) - Series 1 - Class C
20,00,000 15.96 320.45 20,00,000 15.96 343.67 20,00,000 64.25 1,325.60
India Infoline Real Estate Fund (Domestic) - Series 1 - Class B
58 10 0.01 58 10 0.01 58 10 0.01
2. Alternative Investment FundQuoted Fully Paid-UpCarried at fair value through profit and loss
IIFL Real Estate Fund (Domestic) - Series 2 - Class A
1,40,11,328 10 1,518.14 1,40,11,328 10 1,518.23 - - -
Unquoted Fully Paid-UpCarried at fair value through profit and loss
ASK Real Estate Special Opportunities Fund - II - Class B
488 1,00,000 487.50 300 1,00,000 300.00 - - -
Edelweiss Stressed and Troubled Assets Revival Fund-1
10,000 8,569.79 812.76 3,250 7,213.55 243.79 2,750 9,351.26 241.34
Notes to the consolidated financial statement for the year ended 31st March, 2017
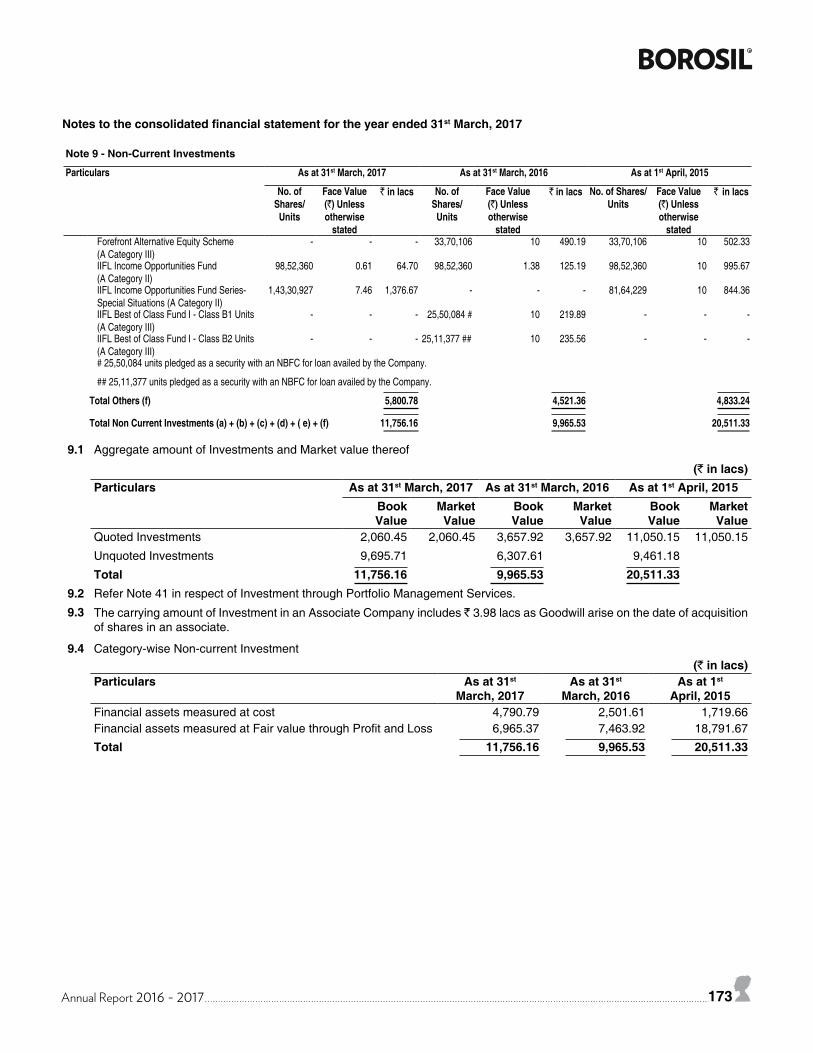
Annual Report 2016 - 2017 173
Note 9 - Non-Current Investments
Particulars As at 31st March, 2017 As at 31st March, 2016 As at 1st April, 2015
No. of Shares/
Units
Face Value (`) Unless otherwise
stated
` in lacs No. of Shares/
Units
Face Value (`) Unless otherwise
stated
` in lacs No. of Shares/Units
Face Value (`) Unless otherwise
stated
` in lacs
Forefront Alternative Equity Scheme (A Category III)
- - - 33,70,106 10 490.19 33,70,106 10 502.33
IIFL Income Opportunities Fund (A Category II)
98,52,360 0.61 64.70 98,52,360 1.38 125.19 98,52,360 10 995.67
IIFL Income Opportunities Fund Series-Special Situations (A Category II)
1,43,30,927 7.46 1,376.67 - - - 81,64,229 10 844.36
IIFL Best of Class Fund I - Class B1 Units (A Category III)
- - - 25,50,084 # 10 219.89 - - -
IIFL Best of Class Fund I - Class B2 Units (A Category III)
- - - 25,11,377 ## 10 235.56 - - -
# 25,50,084 units pledged as a security with an NBFC for loan availed by the Company.
## 25,11,377 units pledged as a security with an NBFC for loan availed by the Company.
Total Others (f) 5,800.78 4,521.36 4,833.24
Total Non Current Investments (a) + (b) + (c) + (d) + ( e) + (f) 11,756.16 9,965.53 20,511.33
9.1 Aggregate amount of Investments and Market value thereof
(` in lacs)Particulars As at 31st March, 2017 As at 31st March, 2016 As at 1st April, 2015
Book Value
Market Value
Book Value
Market Value
Book Value
Market Value
Quoted Investments 2,060.45 2,060.45 3,657.92 3,657.92 11,050.15 11,050.15
Unquoted Investments 9,695.71 6,307.61 9,461.18
Total 11,756.16 9,965.53 20,511.339.2 Refer Note 41 in respect of Investment through Portfolio Management Services.
9.3 The carrying amount of Investment in an Associate Company includes ` 3.98 lacs as Goodwill arise on the date of acquisition of shares in an associate.
9.4 Category-wise Non-current Investment (` in lacs)
Particulars As at 31st March, 2017
As at 31st March, 2016
As at 1st April, 2015
Financial assets measured at cost 4,790.79 2,501.61 1,719.66 Financial assets measured at Fair value through Profit and Loss 6,965.37 7,463.92 18,791.67
Total 11,756.16 9,965.53 20,511.33
Notes to the consolidated financial statement for the year ended 31st March, 2017
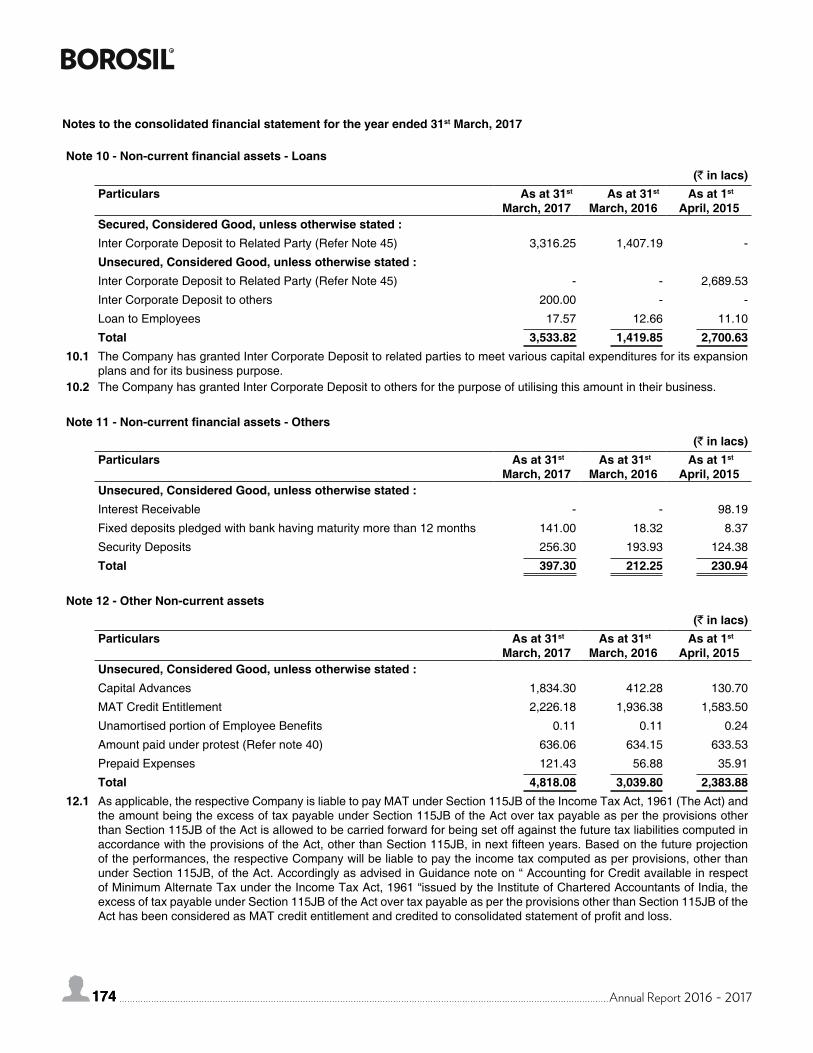
174 Annual Report 2016 - 2017174
Note 10 - Non-current financial assets - Loans (` in lacs)
Particulars As at 31st March, 2017
As at 31st March, 2016
As at 1st April, 2015
Secured, Considered Good, unless otherwise stated :Inter Corporate Deposit to Related Party (Refer Note 45) 3,316.25 1,407.19 -
Unsecured, Considered Good, unless otherwise stated :Inter Corporate Deposit to Related Party (Refer Note 45) - - 2,689.53
Inter Corporate Deposit to others 200.00 - -
Loan to Employees 17.57 12.66 11.10
Total 3,533.82 1,419.85 2,700.6310.1 The Company has granted Inter Corporate Deposit to related parties to meet various capital expenditures for its expansion
plans and for its business purpose.10.2 The Company has granted Inter Corporate Deposit to others for the purpose of utilising this amount in their business.
Note 11 - Non-current financial assets - Others (` in lacs)
Particulars As at 31st March, 2017
As at 31st March, 2016
As at 1st April, 2015
Unsecured, Considered Good, unless otherwise stated :Interest Receivable - - 98.19
Fixed deposits pledged with bank having maturity more than 12 months 141.00 18.32 8.37
Security Deposits 256.30 193.93 124.38
Total 397.30 212.25 230.94
Note 12 - Other Non-current assets (` in lacs)
Particulars As at 31st March, 2017
As at 31st March, 2016
As at 1st April, 2015
Unsecured, Considered Good, unless otherwise stated :Capital Advances 1,834.30 412.28 130.70
MAT Credit Entitlement 2,226.18 1,936.38 1,583.50
Unamortised portion of Employee Benefits 0.11 0.11 0.24
Amount paid under protest (Refer note 40) 636.06 634.15 633.53
Prepaid Expenses 121.43 56.88 35.91
Total 4,818.08 3,039.80 2,383.8812.1 As applicable, the respective Company is liable to pay MAT under Section 115JB of the Income Tax Act, 1961 (The Act) and
the amount being the excess of tax payable under Section 115JB of the Act over tax payable as per the provisions other than Section 115JB of the Act is allowed to be carried forward for being set off against the future tax liabilities computed in accordance with the provisions of the Act, other than Section 115JB, in next fifteen years. Based on the future projection of the performances, the respective Company will be liable to pay the income tax computed as per provisions, other than under Section 115JB, of the Act. Accordingly as advised in Guidance note on “ Accounting for Credit available in respect of Minimum Alternate Tax under the Income Tax Act, 1961 “issued by the Institute of Chartered Accountants of India, the excess of tax payable under Section 115JB of the Act over tax payable as per the provisions other than Section 115JB of the Act has been considered as MAT credit entitlement and credited to consolidated statement of profit and loss.
Notes to the consolidated financial statement for the year ended 31st March, 2017
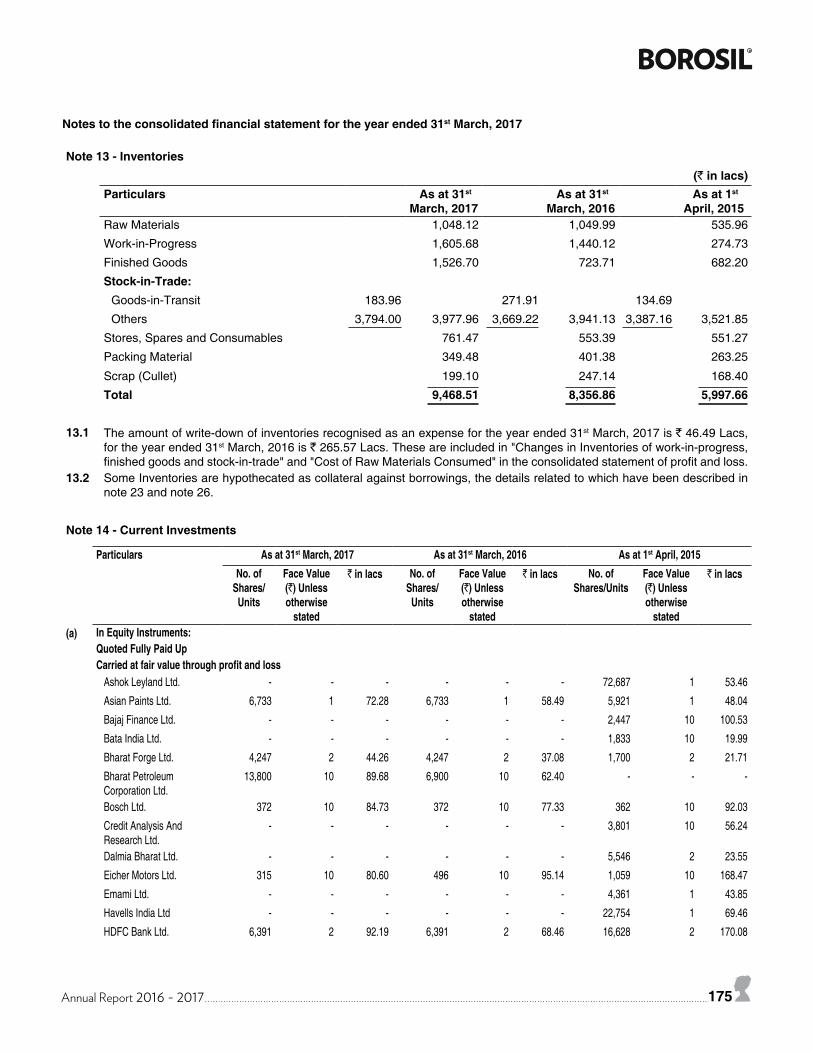
Annual Report 2016 - 2017 175
Note 13 - Inventories (` in lacs)
Particulars As at 31st March, 2017
As at 31st March, 2016
As at 1st April, 2015
Raw Materials 1,048.12 1,049.99 535.96
Work-in-Progress 1,605.68 1,440.12 274.73
Finished Goods 1,526.70 723.71 682.20
Stock-in-Trade:Goods-in-Transit 183.96 271.91 134.69
Others 3,794.00 3,977.96 3,669.22 3,941.13 3,387.16 3,521.85
Stores, Spares and Consumables 761.47 553.39 551.27
Packing Material 349.48 401.38 263.25
Scrap (Cullet) 199.10 247.14 168.40
Total 9,468.51 8,356.86 5,997.66
13.1 The amount of write-down of inventories recognised as an expense for the year ended 31st March, 2017 is ` 46.49 Lacs, for the year ended 31st March, 2016 is ` 265.57 Lacs. These are included in "Changes in Inventories of work-in-progress, finished goods and stock-in-trade" and "Cost of Raw Materials Consumed" in the consolidated statement of profit and loss.
13.2 Some Inventories are hypothecated as collateral against borrowings, the details related to which have been described in note 23 and note 26.
Note 14 - Current Investments
Particulars As at 31st March, 2017 As at 31st March, 2016 As at 1st April, 2015No. of
Shares/Units
Face Value (`) Unless otherwise
stated
` in lacs No. of Shares/
Units
Face Value (`) Unless otherwise
stated
` in lacs No. of Shares/Units
Face Value (`) Unless otherwise
stated
` in lacs
(a) In Equity Instruments:Quoted Fully Paid UpCarried at fair value through profit and loss
Ashok Leyland Ltd. - - - - - - 72,687 1 53.46
Asian Paints Ltd. 6,733 1 72.28 6,733 1 58.49 5,921 1 48.04
Bajaj Finance Ltd. - - - - - - 2,447 10 100.53
Bata India Ltd. - - - - - - 1,833 10 19.99
Bharat Forge Ltd. 4,247 2 44.26 4,247 2 37.08 1,700 2 21.71
Bharat Petroleum Corporation Ltd.
13,800 10 89.68 6,900 10 62.40 - - -
Bosch Ltd. 372 10 84.73 372 10 77.33 362 10 92.03
Credit Analysis And Research Ltd.
- - - - - - 3,801 10 56.24
Dalmia Bharat Ltd. - - - - - - 5,546 2 23.55
Eicher Motors Ltd. 315 10 80.60 496 10 95.14 1,059 10 168.47
Emami Ltd. - - - - - - 4,361 1 43.85
Havells India Ltd - - - - - - 22,754 1 69.46
HDFC Bank Ltd. 6,391 2 92.19 6,391 2 68.46 16,628 2 170.08
Notes to the consolidated financial statement for the year ended 31st March, 2017
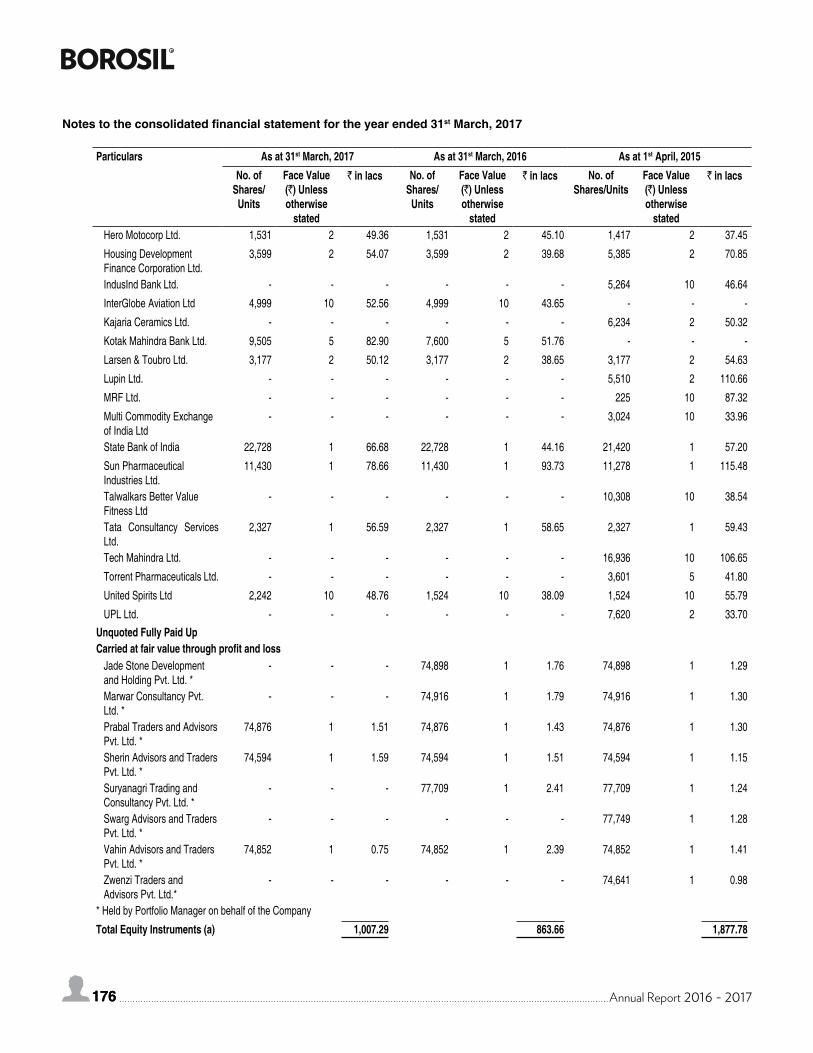
176 Annual Report 2016 - 2017176
Particulars As at 31st March, 2017 As at 31st March, 2016 As at 1st April, 2015No. of
Shares/Units
Face Value (`) Unless otherwise
stated
` in lacs No. of Shares/
Units
Face Value (`) Unless otherwise
stated
` in lacs No. of Shares/Units
Face Value (`) Unless otherwise
stated
` in lacs
Hero Motocorp Ltd. 1,531 2 49.36 1,531 2 45.10 1,417 2 37.45
Housing Development Finance Corporation Ltd.
3,599 2 54.07 3,599 2 39.68 5,385 2 70.85
IndusInd Bank Ltd. - - - - - - 5,264 10 46.64
InterGlobe Aviation Ltd 4,999 10 52.56 4,999 10 43.65 - - -
Kajaria Ceramics Ltd. - - - - - - 6,234 2 50.32
Kotak Mahindra Bank Ltd. 9,505 5 82.90 7,600 5 51.76 - - -
Larsen & Toubro Ltd. 3,177 2 50.12 3,177 2 38.65 3,177 2 54.63
Lupin Ltd. - - - - - - 5,510 2 110.66
MRF Ltd. - - - - - - 225 10 87.32
Multi Commodity Exchange of India Ltd
- - - - - - 3,024 10 33.96
State Bank of India 22,728 1 66.68 22,728 1 44.16 21,420 1 57.20
Sun Pharmaceutical Industries Ltd.
11,430 1 78.66 11,430 1 93.73 11,278 1 115.48
Talwalkars Better Value Fitness Ltd
- - - - - - 10,308 10 38.54
Tata Consultancy Services Ltd.
2,327 1 56.59 2,327 1 58.65 2,327 1 59.43
Tech Mahindra Ltd. - - - - - - 16,936 10 106.65
Torrent Pharmaceuticals Ltd. - - - - - - 3,601 5 41.80
United Spirits Ltd 2,242 10 48.76 1,524 10 38.09 1,524 10 55.79
UPL Ltd. - - - - - - 7,620 2 33.70Unquoted Fully Paid UpCarried at fair value through profit and loss
Jade Stone Development and Holding Pvt. Ltd. *
- - - 74,898 1 1.76 74,898 1 1.29
Marwar Consultancy Pvt. Ltd. *
- - - 74,916 1 1.79 74,916 1 1.30
Prabal Traders and Advisors Pvt. Ltd. *
74,876 1 1.51 74,876 1 1.43 74,876 1 1.30
Sherin Advisors and Traders Pvt. Ltd. *
74,594 1 1.59 74,594 1 1.51 74,594 1 1.15
Suryanagri Trading and Consultancy Pvt. Ltd. *
- - - 77,709 1 2.41 77,709 1 1.24
Swarg Advisors and Traders Pvt. Ltd. *
- - - - - - 77,749 1 1.28
Vahin Advisors and Traders Pvt. Ltd. *
74,852 1 0.75 74,852 1 2.39 74,852 1 1.41
Zwenzi Traders and Advisors Pvt. Ltd.*
- - - - - - 74,641 1 0.98
* Held by Portfolio Manager on behalf of the Company
Total Equity Instruments (a) 1,007.29 863.66 1,877.78
Notes to the consolidated financial statement for the year ended 31st March, 2017

Annual Report 2016 - 2017 177
Particulars As at 31st March, 2017 As at 31st March, 2016 As at 1st April, 2015No. of
Shares/Units
Face Value (`) Unless otherwise
stated
` in lacs No. of Shares/
Units
Face Value (`) Unless otherwise
stated
` in lacs No. of Shares/Units
Face Value (`) Unless otherwise
stated
` in lacs
(b) In Debentures:Quoted Fully Paid-UpCarried at fair value through profit and loss
11.7 % Secured Non Convertible Redeemable Debentures of India Infoline Investment Services Ltd.
- - - 4,000 1,000 40.37 - - -
11.9 % Secured Non Convertible Redeemable Debentures of India Infoline Investment Services Ltd.
- - - 10,000 1,000 101.25 - - -
Secured Non Convertible Redeemable Debentures of India Infoline Finance Ltd.-Series I-025
- - - 115 1,00,000 114.81 - - -
Unquoted Fully Paid UpCarried at fair value through profit and loss
19% Secured Redeemable Non Convertible Debentures of Arch Agro Industries Pvt. Ltd.
2,784 10,000 - 2,784 10,000 - 2,784 10,000 139.20
Total Debentures (b) - 256.43 139.20(c) Mutual Funds:
Quoted Fully Paid UpCarried at fair value through profit and loss
ICICI Prudential Value Fund Series 4 Regular Plan Dividend Payout
- - - - - - 30,00,000 10 400.80
ICICI Prudential Value Fund Series 5 Regular Plan Dividend Payout
- - - - - - 30,00,000 10 333.00
IDFC Sterling Equity Fund Dividend Regular Plan Reinvestment
- - - - - - 35,37,245 10 640.87
Reliance Equity Opportunities Fund -Retail Plan- Dividend Plan- Reinvestment
- - - 24,70,403 10 668.05 54,34,396 10 1,844.46
Reliance Equity Opportunities Fund Retail Plan Growth Plan
4,44,720 10 355.08 7,64,720 10 507.86 7,64,720 10 577.31
Notes to the consolidated financial statement for the year ended 31st March, 2017
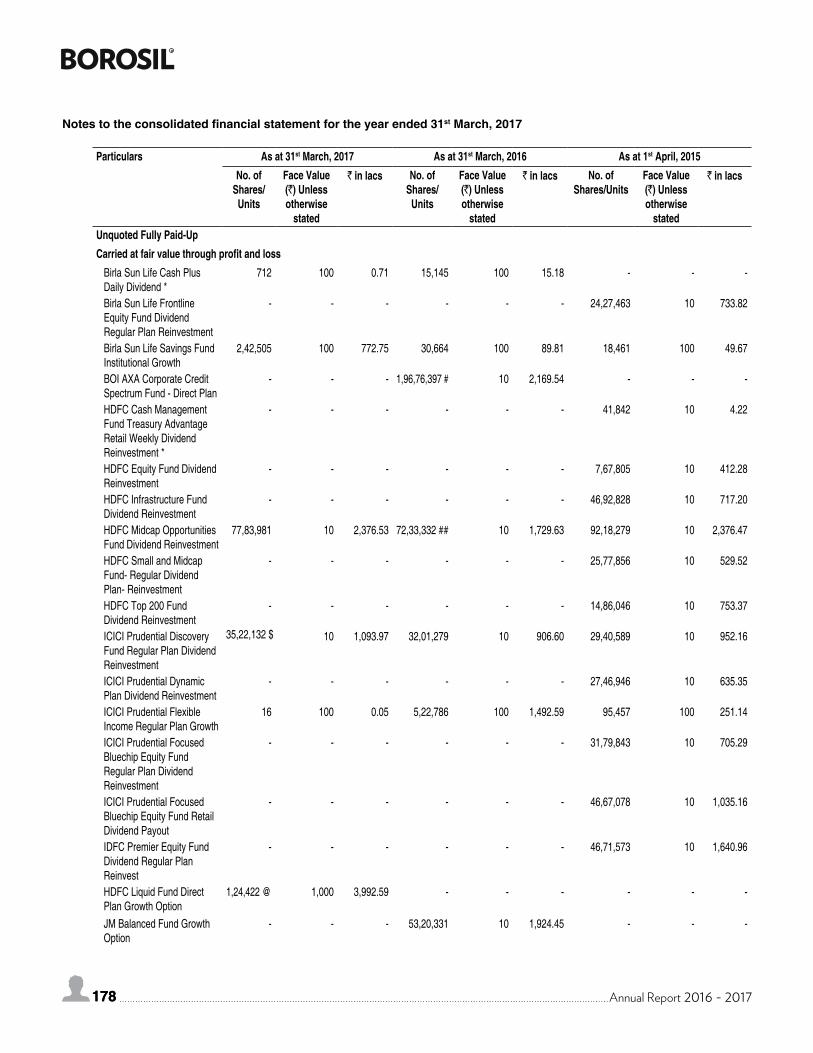
178 Annual Report 2016 - 2017178
Particulars As at 31st March, 2017 As at 31st March, 2016 As at 1st April, 2015No. of
Shares/Units
Face Value (`) Unless otherwise
stated
` in lacs No. of Shares/
Units
Face Value (`) Unless otherwise
stated
` in lacs No. of Shares/Units
Face Value (`) Unless otherwise
stated
` in lacs
Unquoted Fully Paid-UpCarried at fair value through profit and loss
Birla Sun Life Cash Plus Daily Dividend *
712 100 0.71 15,145 100 15.18 - - -
Birla Sun Life Frontline Equity Fund Dividend Regular Plan Reinvestment
- - - - - - 24,27,463 10 733.82
Birla Sun Life Savings Fund Institutional Growth
2,42,505 100 772.75 30,664 100 89.81 18,461 100 49.67
BOI AXA Corporate Credit Spectrum Fund - Direct Plan
- - - 1,96,76,397 # 10 2,169.54 - - -
HDFC Cash Management Fund Treasury Advantage Retail Weekly Dividend Reinvestment *
- - - - - - 41,842 10 4.22
HDFC Equity Fund Dividend Reinvestment
- - - - - - 7,67,805 10 412.28
HDFC Infrastructure Fund Dividend Reinvestment
- - - - - - 46,92,828 10 717.20
HDFC Midcap Opportunities Fund Dividend Reinvestment
77,83,981 10 2,376.53 72,33,332 ## 10 1,729.63 92,18,279 10 2,376.47
HDFC Small and Midcap Fund- Regular Dividend Plan- Reinvestment
- - - - - - 25,77,856 10 529.52
HDFC Top 200 Fund Dividend Reinvestment
- - - - - - 14,86,046 10 753.37
ICICI Prudential Discovery Fund Regular Plan Dividend Reinvestment
35,22,132 $ 10 1,093.97 32,01,279 10 906.60 29,40,589 10 952.16
ICICI Prudential Dynamic Plan Dividend Reinvestment
- - - - - - 27,46,946 10 635.35
ICICI Prudential Flexible Income Regular Plan Growth
16 100 0.05 5,22,786 100 1,492.59 95,457 100 251.14
ICICI Prudential Focused Bluechip Equity Fund Regular Plan Dividend Reinvestment
- - - - - - 31,79,843 10 705.29
ICICI Prudential Focused Bluechip Equity Fund Retail Dividend Payout
- - - - - - 46,67,078 10 1,035.16
IDFC Premier Equity Fund Dividend Regular Plan Reinvest
- - - - - - 46,71,573 10 1,640.96
HDFC Liquid Fund Direct Plan Growth Option
1,24,422 @ 1,000 3,992.59 - - - - - -
JM Balanced Fund Growth Option
- - - 53,20,331 10 1,924.45 - - -
Notes to the consolidated financial statement for the year ended 31st March, 2017
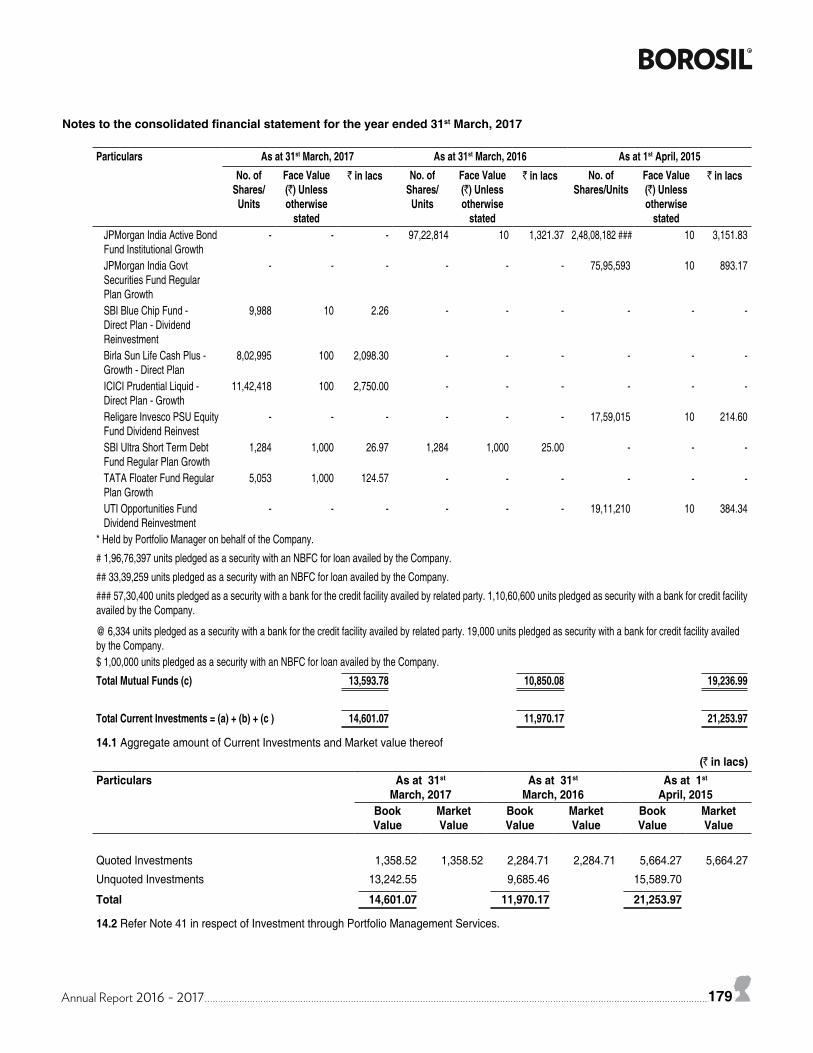
Annual Report 2016 - 2017 179
Particulars As at 31st March, 2017 As at 31st March, 2016 As at 1st April, 2015No. of
Shares/Units
Face Value (`) Unless otherwise
stated
` in lacs No. of Shares/
Units
Face Value (`) Unless otherwise
stated
` in lacs No. of Shares/Units
Face Value (`) Unless otherwise
stated
` in lacs
JPMorgan India Active Bond Fund Institutional Growth
- - - 97,22,814 10 1,321.37 2,48,08,182 ### 10 3,151.83
JPMorgan India Govt Securities Fund Regular Plan Growth
- - - - - - 75,95,593 10 893.17
SBI Blue Chip Fund - Direct Plan - Dividend Reinvestment
9,988 10 2.26 - - - - - -
Birla Sun Life Cash Plus - Growth - Direct Plan
8,02,995 100 2,098.30 - - - - - -
ICICI Prudential Liquid - Direct Plan - Growth
11,42,418 100 2,750.00 - - - - - -
Religare Invesco PSU Equity Fund Dividend Reinvest
- - - - - - 17,59,015 10 214.60
SBI Ultra Short Term Debt Fund Regular Plan Growth
1,284 1,000 26.97 1,284 1,000 25.00 - - -
TATA Floater Fund Regular Plan Growth
5,053 1,000 124.57 - - - - - -
UTI Opportunities Fund Dividend Reinvestment
- - - - - - 19,11,210 10 384.34
* Held by Portfolio Manager on behalf of the Company.
# 1,96,76,397 units pledged as a security with an NBFC for loan availed by the Company.
## 33,39,259 units pledged as a security with an NBFC for loan availed by the Company.
### 57,30,400 units pledged as a security with a bank for the credit facility availed by related party. 1,10,60,600 units pledged as security with a bank for credit facility availed by the Company.
@ 6,334 units pledged as a security with a bank for the credit facility availed by related party. 19,000 units pledged as security with a bank for credit facility availed by the Company.$ 1,00,000 units pledged as a security with an NBFC for loan availed by the Company.
Total Mutual Funds (c) 13,593.78 10,850.08 19,236.99
Total Current Investments = (a) + (b) + (c ) 14,601.07 11,970.17 21,253.97
14.1 Aggregate amount of Current Investments and Market value thereof
(` in lacs)Particulars As at 31st
March, 2017As at 31st
March, 2016As at 1st
April, 2015Book Value
Market Value
Book Value
Market Value
Book Value
Market Value
Quoted Investments 1,358.52 1,358.52 2,284.71 2,284.71 5,664.27 5,664.27
Unquoted Investments 13,242.55 9,685.46 15,589.70
Total 14,601.07 11,970.17 21,253.97
14.2 Refer Note 41 in respect of Investment through Portfolio Management Services.
Notes to the consolidated financial statement for the year ended 31st March, 2017

180 Annual Report 2016 - 2017180
14.3 Category-wise Current Investment (` in lacs)
Particulars As at 31st
March, 2017As at 31st
March, 2016As at 1st
April, 2015Financial assets measured at Fair value through Profit and Loss 14,601.07 11,970.17 21,253.97Total 14,601.07 11,970.17 21,253.97
Note 15 - Current financial assets - Trade Receivable (` in lacs)
Particulars As at 31st March, 2017
As at 31st March, 2016
As at 1st April, 2015
Unsecured : Considered Good 9,372.82 7,752.19 5,289.69
Considered Doubtful 230.57 10.91 580.17
9,603.39 7,763.10 5,869.86
Less : Provision for Doubtful Debts 230.57 9,372.82 10.91 7,752.19 580.17 5,289.69
Total 9,372.82 7,752.19 5,289.69
Note 16 - Cash and cash equivalent (` in lacs)
Particulars As at 31st March, 2017
As at 31st March, 2016
As at 1st April, 2015
Balances with Banks in current accounts 319.27 319.15 133.63Fixed deposit with Banks - Having maturity less than 3 months 225.25 275.50 261.00Cheques, Drafts on Hand - - 2.25Cash on Hand 23.85 25.42 20.91Total 568.37 620.07 417.79
16.1 For the purpose of the statement of cash flow, cash and cash equivalents comprise the followings: (` in lacs)
Particulars As at 31st March, 2017
As at 31st March, 2016
As at 1st April, 2015
Balances with Banks in current accounts 319.27 319.15 133.63Fixed deposit with Banks - Having maturity less than 3 months 225.25 275.50 261.00Cheques, Drafts on Hand - - 2.25Cash on Hand 23.85 25.42 20.91Total 568.37 620.07 417.79
16.2 Details of Specified Bank Notes (SBN) held and transacted during the period 08.11.2016 to 30.12.2016 is as under:-
(` in lacs)Particulars SBNs Other
denomination notes
Total
Closing cash in hand as on 08.11.2016 16.40 17.11 33.51(+) Permitted receipts - 55.37 55.37
(-) Permitted payments - 38.18 38.18
(-) Amount deposited in Banks 16.40 1.98 18.38
Closing cash in hand as on 30.12.2016 - 32.32 32.32
Notes to the consolidated financial statement for the year ended 31st March, 2017
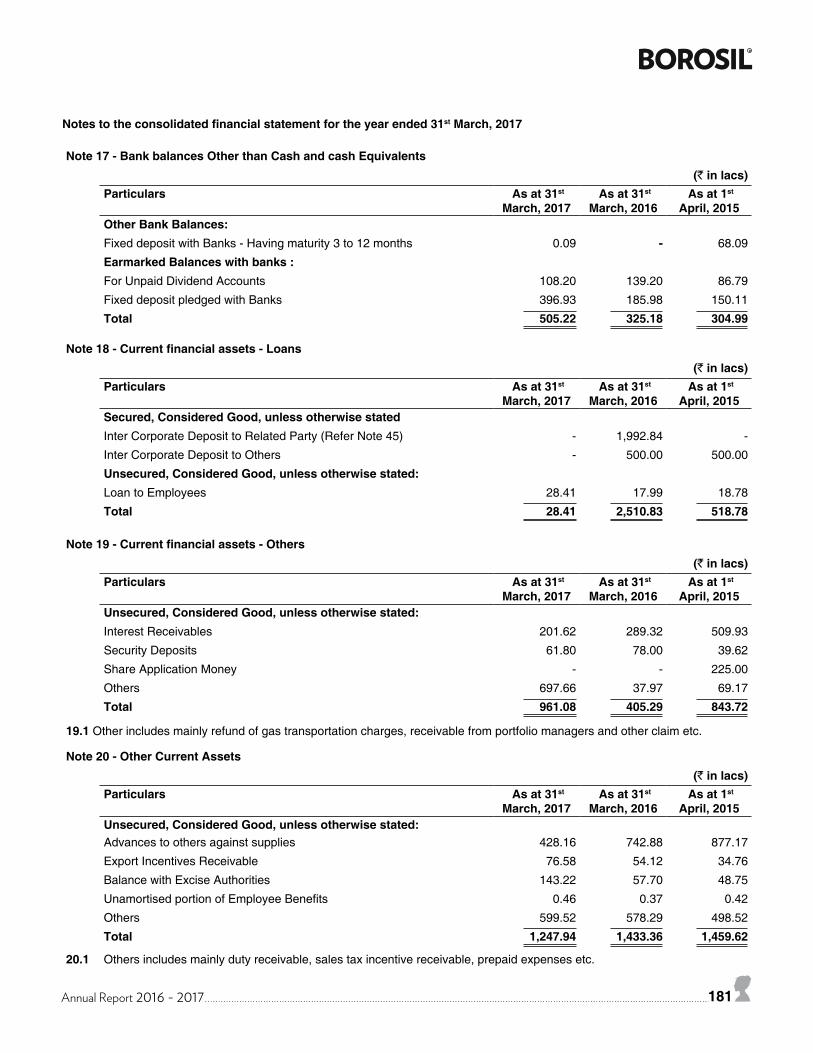
Annual Report 2016 - 2017 181
Note 17 - Bank balances Other than Cash and cash Equivalents (` in lacs)
Particulars As at 31st March, 2017
As at 31st March, 2016
As at 1st April, 2015
Other Bank Balances:Fixed deposit with Banks - Having maturity 3 to 12 months 0.09 - 68.09
Earmarked Balances with banks :For Unpaid Dividend Accounts 108.20 139.20 86.79
Fixed deposit pledged with Banks 396.93 185.98 150.11
Total 505.22 325.18 304.99
Note 18 - Current financial assets - Loans (` in lacs)
Particulars As at 31st March, 2017
As at 31st March, 2016
As at 1st April, 2015
Secured, Considered Good, unless otherwise statedInter Corporate Deposit to Related Party (Refer Note 45) - 1,992.84 -
Inter Corporate Deposit to Others - 500.00 500.00
Unsecured, Considered Good, unless otherwise stated:Loan to Employees 28.41 17.99 18.78
Total 28.41 2,510.83 518.78
Note 19 - Current financial assets - Others (` in lacs)
Particulars As at 31st March, 2017
As at 31st March, 2016
As at 1st April, 2015
Unsecured, Considered Good, unless otherwise stated:Interest Receivables 201.62 289.32 509.93
Security Deposits 61.80 78.00 39.62
Share Application Money - - 225.00
Others 697.66 37.97 69.17
Total 961.08 405.29 843.72
19.1 Other includes mainly refund of gas transportation charges, receivable from portfolio managers and other claim etc.
Note 20 - Other Current Assets (` in lacs)
Particulars As at 31st March, 2017
As at 31st March, 2016
As at 1st April, 2015
Unsecured, Considered Good, unless otherwise stated:Advances to others against supplies 428.16 742.88 877.17
Export Incentives Receivable 76.58 54.12 34.76
Balance with Excise Authorities 143.22 57.70 48.75
Unamortised portion of Employee Benefits 0.46 0.37 0.42
Others 599.52 578.29 498.52
Total 1,247.94 1,433.36 1,459.62
20.1 Others includes mainly duty receivable, sales tax incentive receivable, prepaid expenses etc.
Notes to the consolidated financial statement for the year ended 31st March, 2017
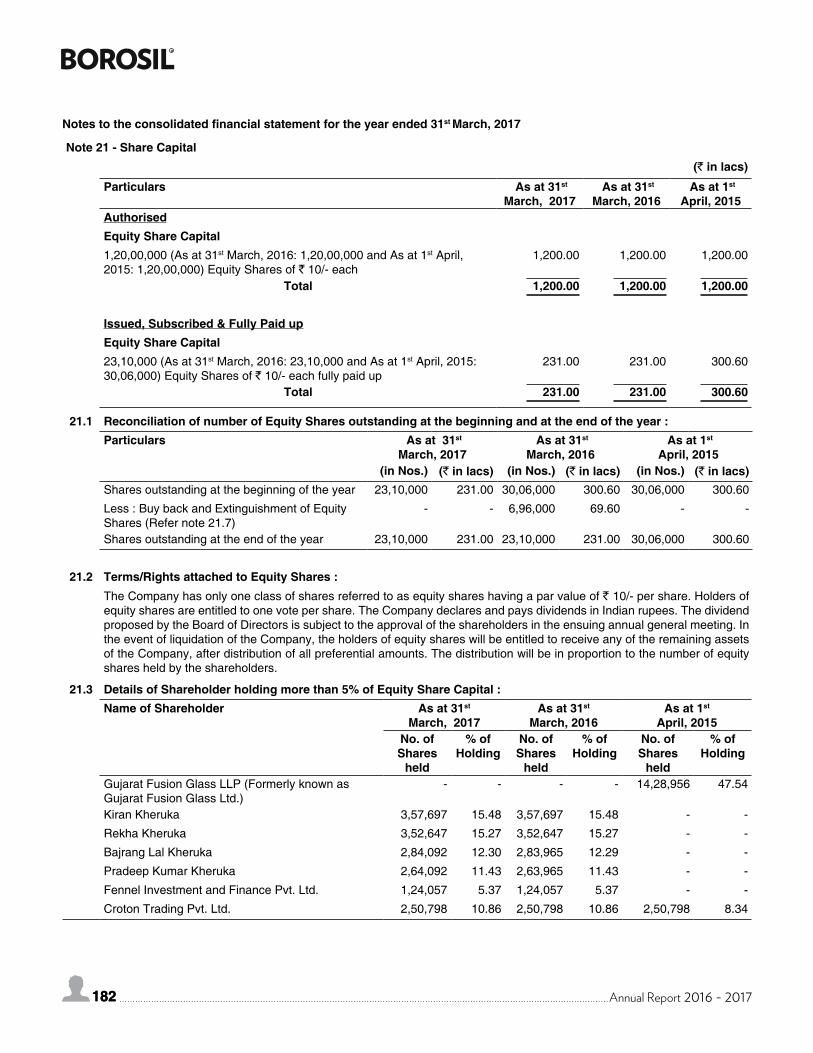
182 Annual Report 2016 - 2017182
Note 21 - Share Capital(` in lacs)
Particulars As at 31st March, 2017
As at 31st March, 2016
As at 1st April, 2015
AuthorisedEquity Share Capital1,20,00,000 (As at 31st March, 2016: 1,20,00,000 and As at 1st April, 2015: 1,20,00,000) Equity Shares of ` 10/- each
1,200.00 1,200.00 1,200.00
Total 1,200.00 1,200.00 1,200.00
Issued, Subscribed & Fully Paid upEquity Share Capital23,10,000 (As at 31st March, 2016: 23,10,000 and As at 1st April, 2015: 30,06,000) Equity Shares of ` 10/- each fully paid up
231.00 231.00 300.60
Total 231.00 231.00 300.60
21.1 Reconciliation of number of Equity Shares outstanding at the beginning and at the end of the year :Particulars As at 31st
March, 2017 As at 31st
March, 2016 As at 1st
April, 2015(in Nos.) (` in lacs) (in Nos.) (` in lacs) (in Nos.) (` in lacs)
Shares outstanding at the beginning of the year 23,10,000 231.00 30,06,000 300.60 30,06,000 300.60
Less : Buy back and Extinguishment of Equity Shares (Refer note 21.7)
- - 6,96,000 69.60 - -
Shares outstanding at the end of the year 23,10,000 231.00 23,10,000 231.00 30,06,000 300.60
21.2 Terms/Rights attached to Equity Shares :The Company has only one class of shares referred to as equity shares having a par value of ` 10/- per share. Holders of equity shares are entitled to one vote per share. The Company declares and pays dividends in Indian rupees. The dividend proposed by the Board of Directors is subject to the approval of the shareholders in the ensuing annual general meeting. In the event of liquidation of the Company, the holders of equity shares will be entitled to receive any of the remaining assets of the Company, after distribution of all preferential amounts. The distribution will be in proportion to the number of equity shares held by the shareholders.
21.3 Details of Shareholder holding more than 5% of Equity Share Capital :Name of Shareholder As at 31st
March, 2017As at 31st
March, 2016As at 1st
April, 2015No. of Shares
held
% of Holding
No. of Shares
held
% of Holding
No. of Shares
held
% of Holding
Gujarat Fusion Glass LLP (Formerly known as Gujarat Fusion Glass Ltd.)
- - - - 14,28,956 47.54
Kiran Kheruka 3,57,697 15.48 3,57,697 15.48 - -
Rekha Kheruka 3,52,647 15.27 3,52,647 15.27 - -
Bajrang Lal Kheruka 2,84,092 12.30 2,83,965 12.29 - -
Pradeep Kumar Kheruka 2,64,092 11.43 2,63,965 11.43 - -
Fennel Investment and Finance Pvt. Ltd. 1,24,057 5.37 1,24,057 5.37 - -
Croton Trading Pvt. Ltd. 2,50,798 10.86 2,50,798 10.86 2,50,798 8.34
Notes to the consolidated financial statement for the year ended 31st March, 2017
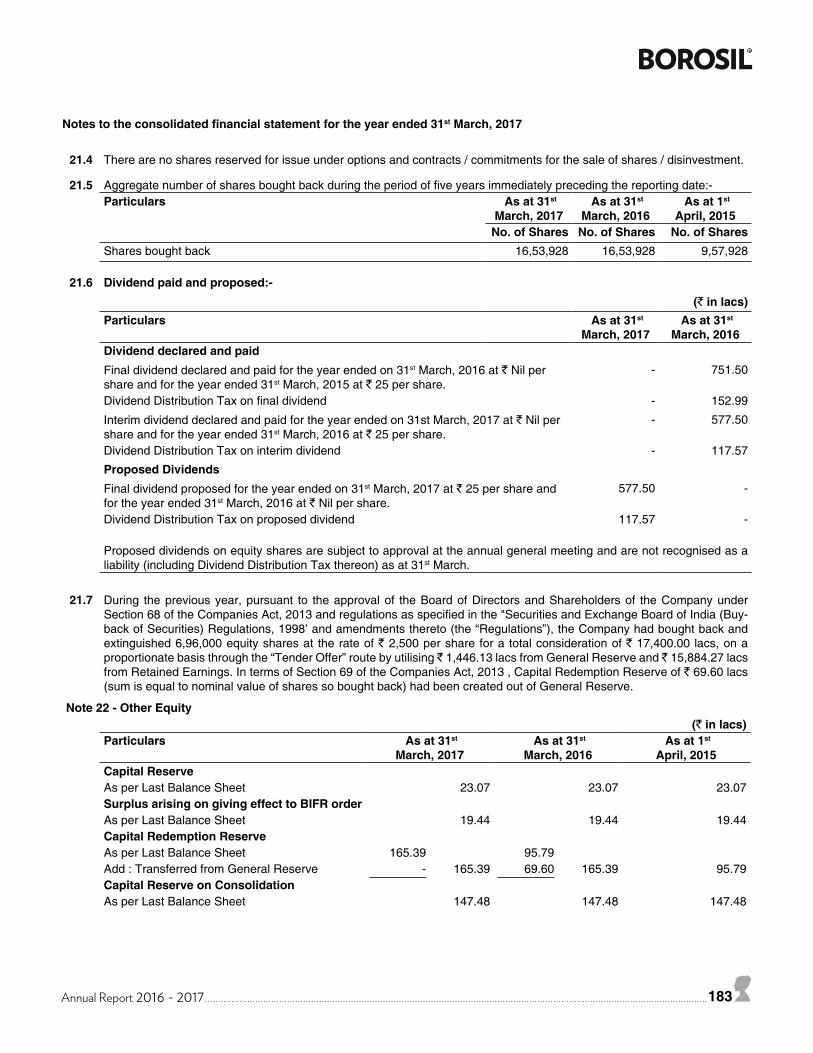
Annual Report 2016 - 2017 183
21.4 There are no shares reserved for issue under options and contracts / commitments for the sale of shares / disinvestment.
21.5 Aggregate number of shares bought back during the period of five years immediately preceding the reporting date:-Particulars As at 31st
March, 2017 As at 31st
March, 2016 As at 1st
April, 2015No. of Shares No. of Shares No. of Shares
Shares bought back 16,53,928 16,53,928 9,57,928
21.6 Dividend paid and proposed:-(` in lacs)
Particulars As at 31st March, 2017
As at 31st March, 2016
Dividend declared and paidFinal dividend declared and paid for the year ended on 31st March, 2016 at ` Nil per share and for the year ended 31st March, 2015 at ` 25 per share.
- 751.50
Dividend Distribution Tax on final dividend - 152.99
Interim dividend declared and paid for the year ended on 31st March, 2017 at ` Nil per share and for the year ended 31st March, 2016 at ` 25 per share.
- 577.50
Dividend Distribution Tax on interim dividend - 117.57
Proposed DividendsFinal dividend proposed for the year ended on 31st March, 2017 at ` 25 per share and for the year ended 31st March, 2016 at ` Nil per share.
577.50 -
Dividend Distribution Tax on proposed dividend 117.57 -
Proposed dividends on equity shares are subject to approval at the annual general meeting and are not recognised as a liability (including Dividend Distribution Tax thereon) as at 31st March.
21.7 During the previous year, pursuant to the approval of the Board of Directors and Shareholders of the Company under Section 68 of the Companies Act, 2013 and regulations as specified in the "Securities and Exchange Board of India (Buy-back of Securities) Regulations, 1998’ and amendments thereto (the “Regulations”), the Company had bought back and extinguished 6,96,000 equity shares at the rate of ` 2,500 per share for a total consideration of ` 17,400.00 lacs, on a proportionate basis through the “Tender Offer” route by utilising ` 1,446.13 lacs from General Reserve and ̀ 15,884.27 lacs from Retained Earnings. In terms of Section 69 of the Companies Act, 2013 , Capital Redemption Reserve of ` 69.60 lacs (sum is equal to nominal value of shares so bought back) had been created out of General Reserve.
Note 22 - Other Equity (` in lacs)
Particulars As at 31st March, 2017
As at 31st March, 2016
As at 1st April, 2015
Capital ReserveAs per Last Balance Sheet 23.07 23.07 23.07Surplus arising on giving effect to BIFR orderAs per Last Balance Sheet 19.44 19.44 19.44Capital Redemption ReserveAs per Last Balance Sheet 165.39 95.79Add : Transferred from General Reserve - 165.39 69.60 165.39 95.79Capital Reserve on ConsolidationAs per Last Balance Sheet 147.48 147.48 147.48
Notes to the consolidated financial statement for the year ended 31st March, 2017
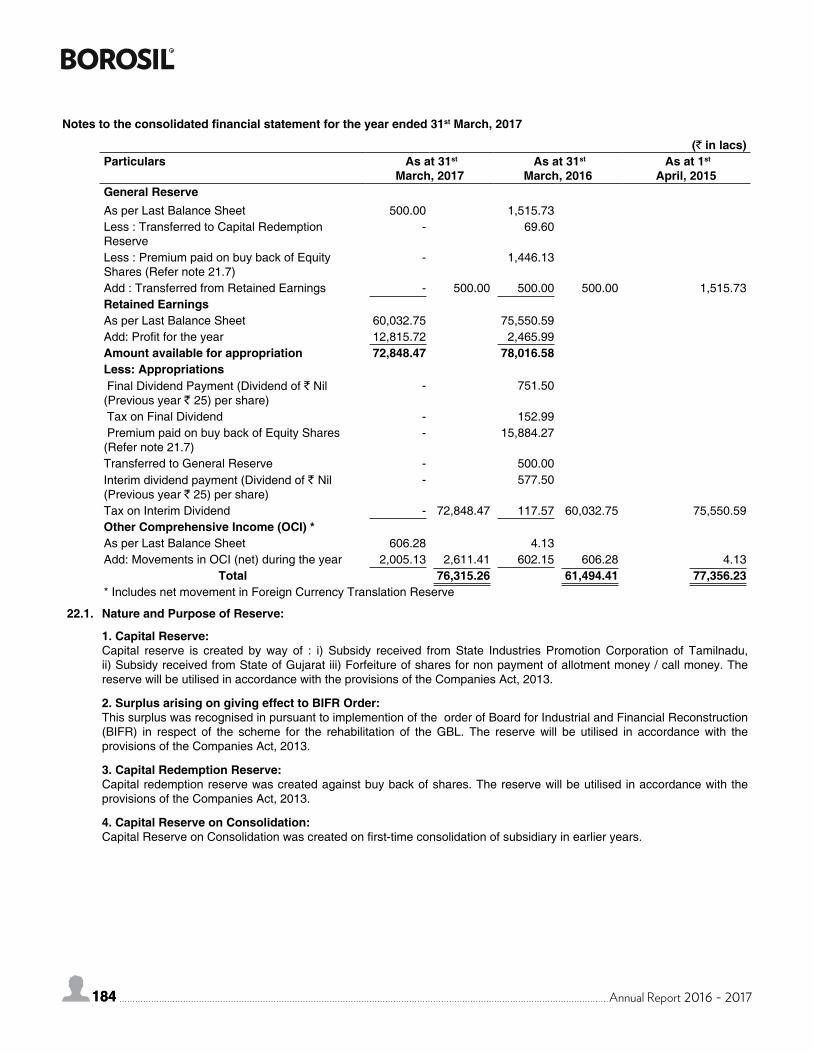
184 Annual Report 2016 - 2017184
(` in lacs)Particulars As at 31st
March, 2017 As at 31st
March, 2016 As at 1st
April, 2015General ReserveAs per Last Balance Sheet 500.00 1,515.73Less : Transferred to Capital Redemption Reserve
- 69.60
Less : Premium paid on buy back of Equity Shares (Refer note 21.7)
- 1,446.13
Add : Transferred from Retained Earnings - 500.00 500.00 500.00 1,515.73Retained EarningsAs per Last Balance Sheet 60,032.75 75,550.59Add: Profit for the year 12,815.72 2,465.99Amount available for appropriation 72,848.47 78,016.58Less: Appropriations Final Dividend Payment (Dividend of ` Nil (Previous year ` 25) per share)
- 751.50
Tax on Final Dividend - 152.99 Premium paid on buy back of Equity Shares (Refer note 21.7)
- 15,884.27
Transferred to General Reserve - 500.00Interim dividend payment (Dividend of ` Nil (Previous year ` 25) per share)
- 577.50
Tax on Interim Dividend - 72,848.47 117.57 60,032.75 75,550.59Other Comprehensive Income (OCI) *As per Last Balance Sheet 606.28 4.13Add: Movements in OCI (net) during the year 2,005.13 2,611.41 602.15 606.28 4.13
Total 76,315.26 61,494.41 77,356.23* Includes net movement in Foreign Currency Translation Reserve
22.1. Nature and Purpose of Reserve:
1. Capital Reserve:Capital reserve is created by way of : i) Subsidy received from State Industries Promotion Corporation of Tamilnadu, ii) Subsidy received from State of Gujarat iii) Forfeiture of shares for non payment of allotment money / call money. The reserve will be utilised in accordance with the provisions of the Companies Act, 2013.
2. Surplus arising on giving effect to BIFR Order:This surplus was recognised in pursuant to implemention of the order of Board for Industrial and Financial Reconstruction (BIFR) in respect of the scheme for the rehabilitation of the GBL. The reserve will be utilised in accordance with the provisions of the Companies Act, 2013.
3. Capital Redemption Reserve:Capital redemption reserve was created against buy back of shares. The reserve will be utilised in accordance with the provisions of the Companies Act, 2013.
4. Capital Reserve on Consolidation:Capital Reserve on Consolidation was created on first-time consolidation of subsidiary in earlier years.
Notes to the consolidated financial statement for the year ended 31st March, 2017
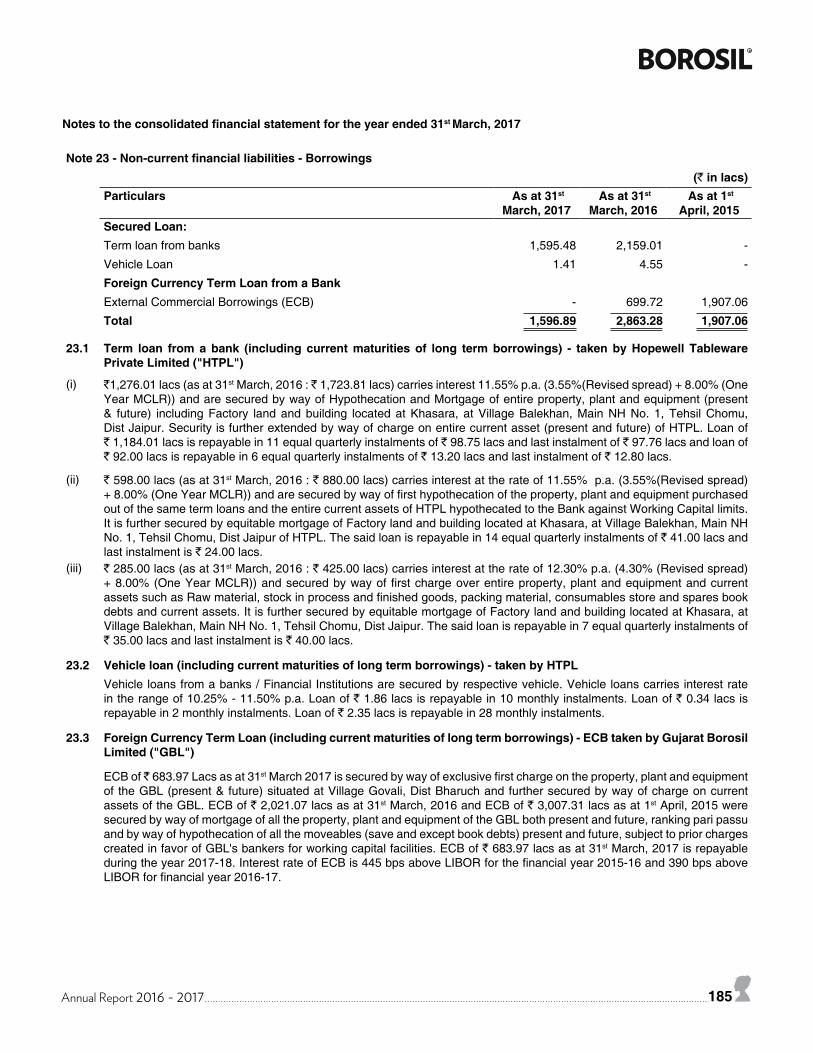
Annual Report 2016 - 2017 185
Note 23 - Non-current financial liabilities - Borrowings (` in lacs)
Particulars As at 31st March, 2017
As at 31st March, 2016
As at 1st April, 2015
Secured Loan:Term loan from banks 1,595.48 2,159.01 -
Vehicle Loan 1.41 4.55 -
Foreign Currency Term Loan from a BankExternal Commercial Borrowings (ECB) - 699.72 1,907.06
Total 1,596.89 2,863.28 1,907.06
23.1 Term loan from a bank (including current maturities of long term borrowings) - taken by Hopewell Tableware Private Limited ("HTPL")
(i) `1,276.01 lacs (as at 31st March, 2016 : ̀ 1,723.81 lacs) carries interest 11.55% p.a. (3.55%(Revised spread) + 8.00% (One Year MCLR)) and are secured by way of Hypothecation and Mortgage of entire property, plant and equipment (present & future) including Factory land and building located at Khasara, at Village Balekhan, Main NH No. 1, Tehsil Chomu, Dist Jaipur. Security is further extended by way of charge on entire current asset (present and future) of HTPL. Loan of ` 1,184.01 lacs is repayable in 11 equal quarterly instalments of ` 98.75 lacs and last instalment of ` 97.76 lacs and loan of ` 92.00 lacs is repayable in 6 equal quarterly instalments of ` 13.20 lacs and last instalment of ` 12.80 lacs.
(ii) ` 598.00 lacs (as at 31st March, 2016 : ` 880.00 lacs) carries interest at the rate of 11.55% p.a. (3.55%(Revised spread) + 8.00% (One Year MCLR)) and are secured by way of first hypothecation of the property, plant and equipment purchased out of the same term loans and the entire current assets of HTPL hypothecated to the Bank against Working Capital limits. It is further secured by equitable mortgage of Factory land and building located at Khasara, at Village Balekhan, Main NH No. 1, Tehsil Chomu, Dist Jaipur of HTPL. The said loan is repayable in 14 equal quarterly instalments of ` 41.00 lacs and last instalment is ` 24.00 lacs.
(iii) ` 285.00 lacs (as at 31st March, 2016 : ` 425.00 lacs) carries interest at the rate of 12.30% p.a. (4.30% (Revised spread) + 8.00% (One Year MCLR)) and secured by way of first charge over entire property, plant and equipment and current assets such as Raw material, stock in process and finished goods, packing material, consumables store and spares book debts and current assets. It is further secured by equitable mortgage of Factory land and building located at Khasara, at Village Balekhan, Main NH No. 1, Tehsil Chomu, Dist Jaipur. The said loan is repayable in 7 equal quarterly instalments of ` 35.00 lacs and last instalment is ` 40.00 lacs.
23.2 Vehicle loan (including current maturities of long term borrowings) - taken by HTPLVehicle loans from a banks / Financial Institutions are secured by respective vehicle. Vehicle loans carries interest rate in the range of 10.25% - 11.50% p.a. Loan of ` 1.86 lacs is repayable in 10 monthly instalments. Loan of ` 0.34 lacs is repayable in 2 monthly instalments. Loan of ` 2.35 lacs is repayable in 28 monthly instalments.
23.3 Foreign Currency Term Loan (including current maturities of long term borrowings) - ECB taken by Gujarat Borosil Limited ("GBL")
ECB of ̀ 683.97 Lacs as at 31st March 2017 is secured by way of exclusive first charge on the property, plant and equipment of the GBL (present & future) situated at Village Govali, Dist Bharuch and further secured by way of charge on current assets of the GBL. ECB of ` 2,021.07 lacs as at 31st March, 2016 and ECB of ` 3,007.31 lacs as at 1st April, 2015 were secured by way of mortgage of all the property, plant and equipment of the GBL both present and future, ranking pari passu and by way of hypothecation of all the moveables (save and except book debts) present and future, subject to prior charges created in favor of GBL's bankers for working capital facilities. ECB of ` 683.97 lacs as at 31st March, 2017 is repayable during the year 2017-18. Interest rate of ECB is 445 bps above LIBOR for the financial year 2015-16 and 390 bps above LIBOR for financial year 2016-17.
Notes to the consolidated financial statement for the year ended 31st March, 2017
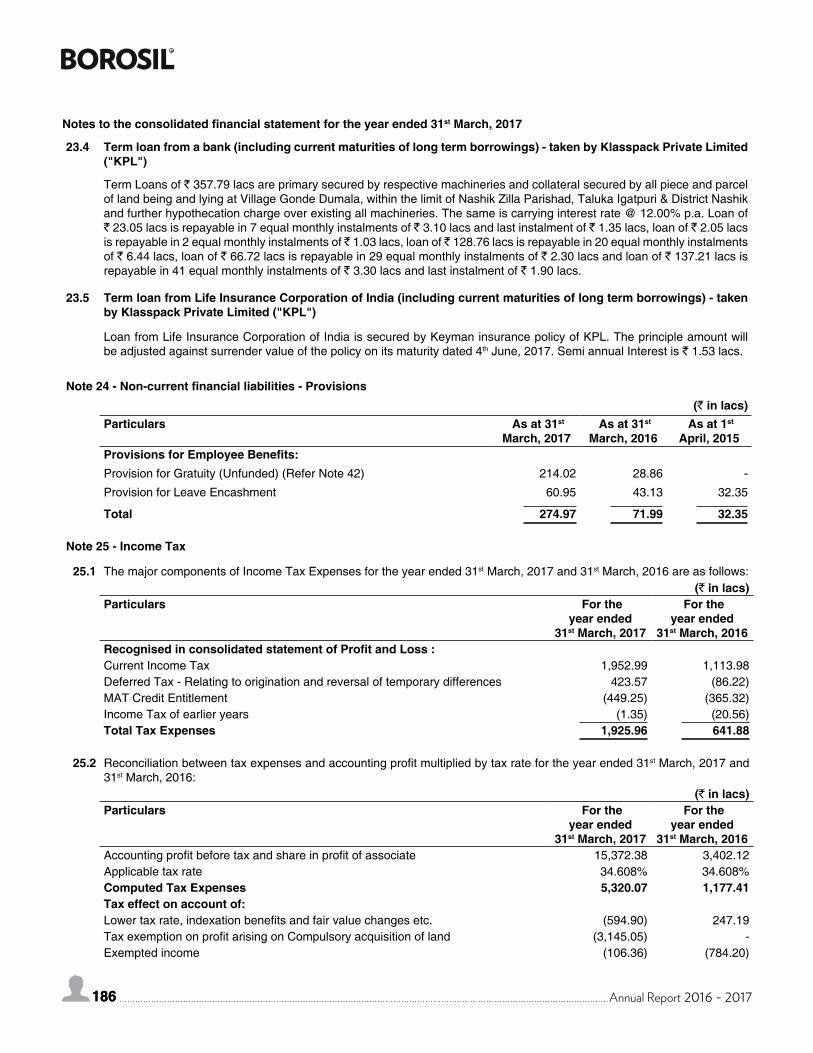
186 Annual Report 2016 - 2017186
23.4 Term loan from a bank (including current maturities of long term borrowings) - taken by Klasspack Private Limited ("KPL")
Term Loans of ` 357.79 lacs are primary secured by respective machineries and collateral secured by all piece and parcel of land being and lying at Village Gonde Dumala, within the limit of Nashik Zilla Parishad, Taluka Igatpuri & District Nashik and further hypothecation charge over existing all machineries. The same is carrying interest rate @ 12.00% p.a. Loan of ` 23.05 lacs is repayable in 7 equal monthly instalments of ` 3.10 lacs and last instalment of ` 1.35 lacs, loan of ` 2.05 lacs is repayable in 2 equal monthly instalments of ̀ 1.03 lacs, loan of ̀ 128.76 lacs is repayable in 20 equal monthly instalments of ` 6.44 lacs, loan of ` 66.72 lacs is repayable in 29 equal monthly instalments of ` 2.30 lacs and loan of ` 137.21 lacs is repayable in 41 equal monthly instalments of ` 3.30 lacs and last instalment of ` 1.90 lacs.
23.5 Term loan from Life Insurance Corporation of India (including current maturities of long term borrowings) - taken by Klasspack Private Limited ("KPL")
Loan from Life Insurance Corporation of India is secured by Keyman insurance policy of KPL. The principle amount will be adjusted against surrender value of the policy on its maturity dated 4th June, 2017. Semi annual Interest is ` 1.53 lacs.
Note 24 - Non-current financial liabilities - Provisions (` in lacs)
Particulars As at 31st March, 2017
As at 31st March, 2016
As at 1st April, 2015
Provisions for Employee Benefits:Provision for Gratuity (Unfunded) (Refer Note 42) 214.02 28.86 -
Provision for Leave Encashment 60.95 43.13 32.35
Total 274.97 71.99 32.35
Note 25 - Income Tax
25.1 The major components of Income Tax Expenses for the year ended 31st March, 2017 and 31st March, 2016 are as follows: (` in lacs)
Particulars For the year ended
31st March, 2017
For the year ended
31st March, 2016Recognised in consolidated statement of Profit and Loss :Current Income Tax 1,952.99 1,113.98Deferred Tax - Relating to origination and reversal of temporary differences 423.57 (86.22)MAT Credit Entitlement (449.25) (365.32)Income Tax of earlier years (1.35) (20.56)Total Tax Expenses 1,925.96 641.88
25.2 Reconciliation between tax expenses and accounting profit multiplied by tax rate for the year ended 31st March, 2017 and 31st March, 2016:
(` in lacs)Particulars For the
year ended 31st March, 2017
For the year ended
31st March, 2016Accounting profit before tax and share in profit of associate 15,372.38 3,402.12Applicable tax rate 34.608% 34.608%Computed Tax Expenses 5,320.07 1,177.41Tax effect on account of:Lower tax rate, indexation benefits and fair value changes etc. (594.90) 247.19Tax exemption on profit arising on Compulsory acquisition of land (3,145.05) -Exempted income (106.36) (784.20)
Notes to the consolidated financial statement for the year ended 31st March, 2017
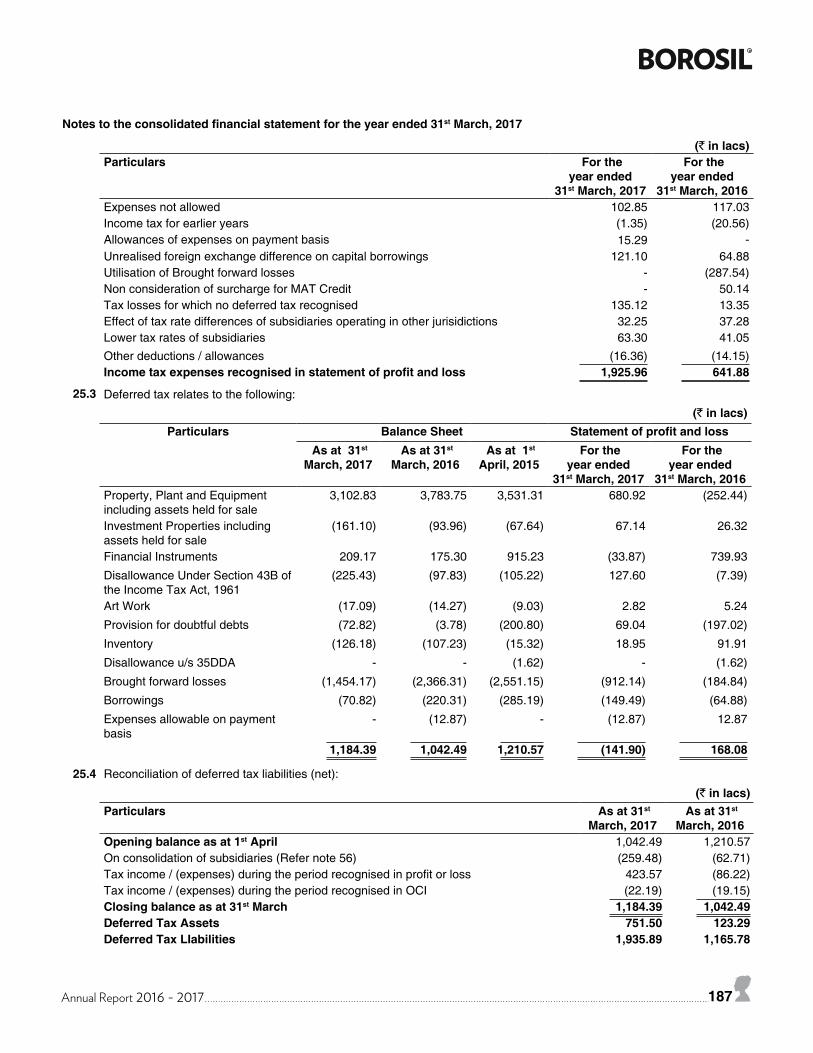
Annual Report 2016 - 2017 187
Notes to the consolidated financial statement for the year ended 31st March, 2017
(` in lacs)Particulars For the
year ended 31st March, 2017
For the year ended
31st March, 2016Expenses not allowed 102.85 117.03Income tax for earlier years (1.35) (20.56)Allowances of expenses on payment basis 15.29 -Unrealised foreign exchange difference on capital borrowings 121.10 64.88Utilisation of Brought forward losses - (287.54)Non consideration of surcharge for MAT Credit - 50.14Tax losses for which no deferred tax recognised 135.12 13.35Effect of tax rate differences of subsidiaries operating in other jurisidictions 32.25 37.28Lower tax rates of subsidiaries 63.30 41.05Other deductions / allowances (16.36) (14.15)Income tax expenses recognised in statement of profit and loss 1,925.96 641.88
25.3 Deferred tax relates to the following:
(` in lacs)Particulars Balance Sheet Statement of profit and loss
As at 31st
March, 2017 As at 31st
March, 2016 As at 1st
April, 2015 For the
year ended 31st March, 2017
For the year ended
31st March, 2016Property, Plant and Equipment including assets held for sale
3,102.83 3,783.75 3,531.31 680.92 (252.44)
Investment Properties including assets held for sale
(161.10) (93.96) (67.64) 67.14 26.32
Financial Instruments 209.17 175.30 915.23 (33.87) 739.93
Disallowance Under Section 43B of the Income Tax Act, 1961
(225.43) (97.83) (105.22) 127.60 (7.39)
Art Work (17.09) (14.27) (9.03) 2.82 5.24
Provision for doubtful debts (72.82) (3.78) (200.80) 69.04 (197.02)
Inventory (126.18) (107.23) (15.32) 18.95 91.91
Disallowance u/s 35DDA - - (1.62) - (1.62)
Brought forward losses (1,454.17) (2,366.31) (2,551.15) (912.14) (184.84)
Borrowings (70.82) (220.31) (285.19) (149.49) (64.88)
Expenses allowable on payment basis
- (12.87) - (12.87) 12.87
1,184.39 1,042.49 1,210.57 (141.90) 168.08
25.4 Reconciliation of deferred tax liabilities (net):
(` in lacs)Particulars As at 31st
March, 2017 As at 31st
March, 2016Opening balance as at 1st April 1,042.49 1,210.57On consolidation of subsidiaries (Refer note 56) (259.48) (62.71)Tax income / (expenses) during the period recognised in profit or loss 423.57 (86.22)Tax income / (expenses) during the period recognised in OCI (22.19) (19.15)Closing balance as at 31st March 1,184.39 1,042.49Deferred Tax Assets 751.50 123.29Deferred Tax LIabilities 1,935.89 1,165.78
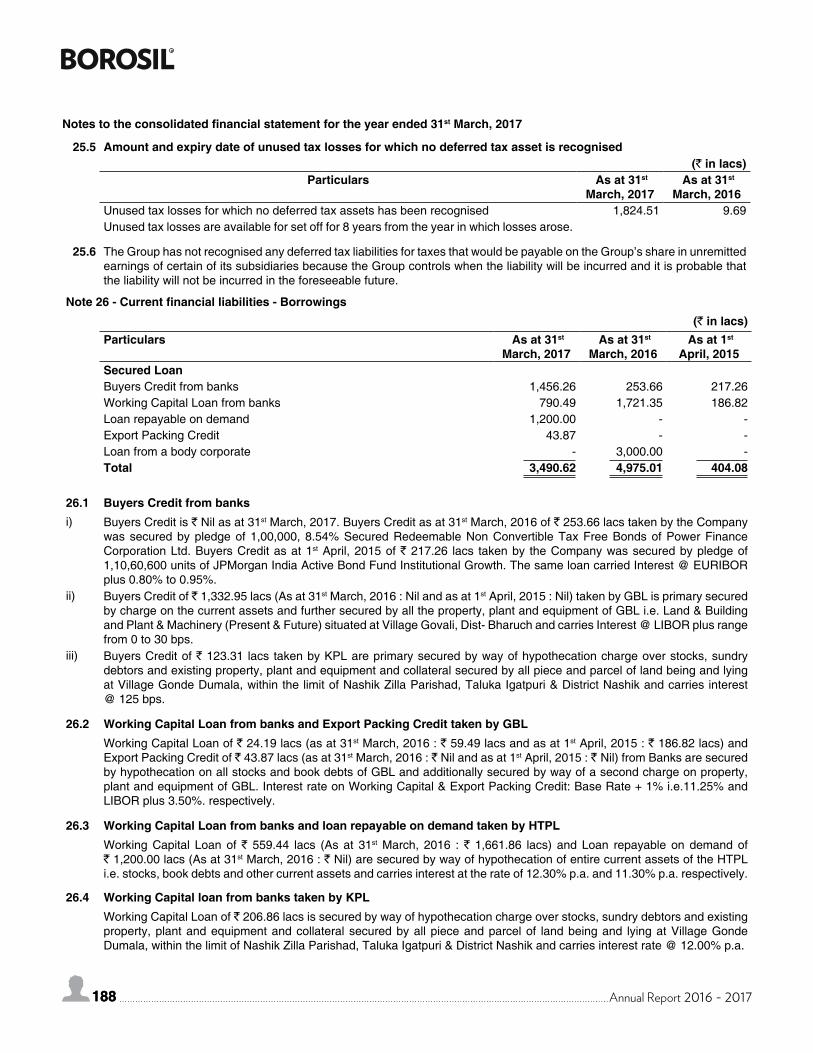
188 Annual Report 2016 - 2017188
Notes to the consolidated financial statement for the year ended 31st March, 2017
25.5 Amount and expiry date of unused tax losses for which no deferred tax asset is recognised (` in lacs)
Particulars As at 31st March, 2017
As at 31st March, 2016
Unused tax losses for which no deferred tax assets has been recognised 1,824.51 9.69Unused tax losses are available for set off for 8 years from the year in which losses arose.
25.6 The Group has not recognised any deferred tax liabilities for taxes that would be payable on the Group’s share in unremitted earnings of certain of its subsidiaries because the Group controls when the liability will be incurred and it is probable that the liability will not be incurred in the foreseeable future.
Note 26 - Current financial liabilities - Borrowings (` in lacs)
Particulars As at 31st March, 2017
As at 31st March, 2016
As at 1st April, 2015
Secured LoanBuyers Credit from banks 1,456.26 253.66 217.26Working Capital Loan from banks 790.49 1,721.35 186.82Loan repayable on demand 1,200.00 - -Export Packing Credit 43.87 - -Loan from a body corporate - 3,000.00 -Total 3,490.62 4,975.01 404.08
26.1 Buyers Credit from banksi) Buyers Credit is ` Nil as at 31st March, 2017. Buyers Credit as at 31st March, 2016 of ` 253.66 lacs taken by the Company
was secured by pledge of 1,00,000, 8.54% Secured Redeemable Non Convertible Tax Free Bonds of Power Finance Corporation Ltd. Buyers Credit as at 1st April, 2015 of ` 217.26 lacs taken by the Company was secured by pledge of 1,10,60,600 units of JPMorgan India Active Bond Fund Institutional Growth. The same loan carried Interest @ EURIBOR plus 0.80% to 0.95%.
ii) Buyers Credit of ` 1,332.95 lacs (As at 31st March, 2016 : Nil and as at 1st April, 2015 : Nil) taken by GBL is primary secured by charge on the current assets and further secured by all the property, plant and equipment of GBL i.e. Land & Building and Plant & Machinery (Present & Future) situated at Village Govali, Dist- Bharuch and carries Interest @ LIBOR plus range from 0 to 30 bps.
iii) Buyers Credit of ` 123.31 lacs taken by KPL are primary secured by way of hypothecation charge over stocks, sundry debtors and existing property, plant and equipment and collateral secured by all piece and parcel of land being and lying at Village Gonde Dumala, within the limit of Nashik Zilla Parishad, Taluka Igatpuri & District Nashik and carries interest @ 125 bps.
26.2 Working Capital Loan from banks and Export Packing Credit taken by GBLWorking Capital Loan of ` 24.19 lacs (as at 31st March, 2016 : ` 59.49 lacs and as at 1st April, 2015 : ` 186.82 lacs) and Export Packing Credit of ` 43.87 lacs (as at 31st March, 2016 : ` Nil and as at 1st April, 2015 : ` Nil) from Banks are secured by hypothecation on all stocks and book debts of GBL and additionally secured by way of a second charge on property, plant and equipment of GBL. Interest rate on Working Capital & Export Packing Credit: Base Rate + 1% i.e.11.25% and LIBOR plus 3.50%. respectively.
26.3 Working Capital Loan from banks and loan repayable on demand taken by HTPLWorking Capital Loan of ` 559.44 lacs (As at 31st March, 2016 : ` 1,661.86 lacs) and Loan repayable on demand of ` 1,200.00 lacs (As at 31st March, 2016 : ` Nil) are secured by way of hypothecation of entire current assets of the HTPL i.e. stocks, book debts and other current assets and carries interest at the rate of 12.30% p.a. and 11.30% p.a. respectively.
26.4 Working Capital loan from banks taken by KPLWorking Capital Loan of ` 206.86 lacs is secured by way of hypothecation charge over stocks, sundry debtors and existing property, plant and equipment and collateral secured by all piece and parcel of land being and lying at Village Gonde Dumala, within the limit of Nashik Zilla Parishad, Taluka Igatpuri & District Nashik and carries interest rate @ 12.00% p.a.
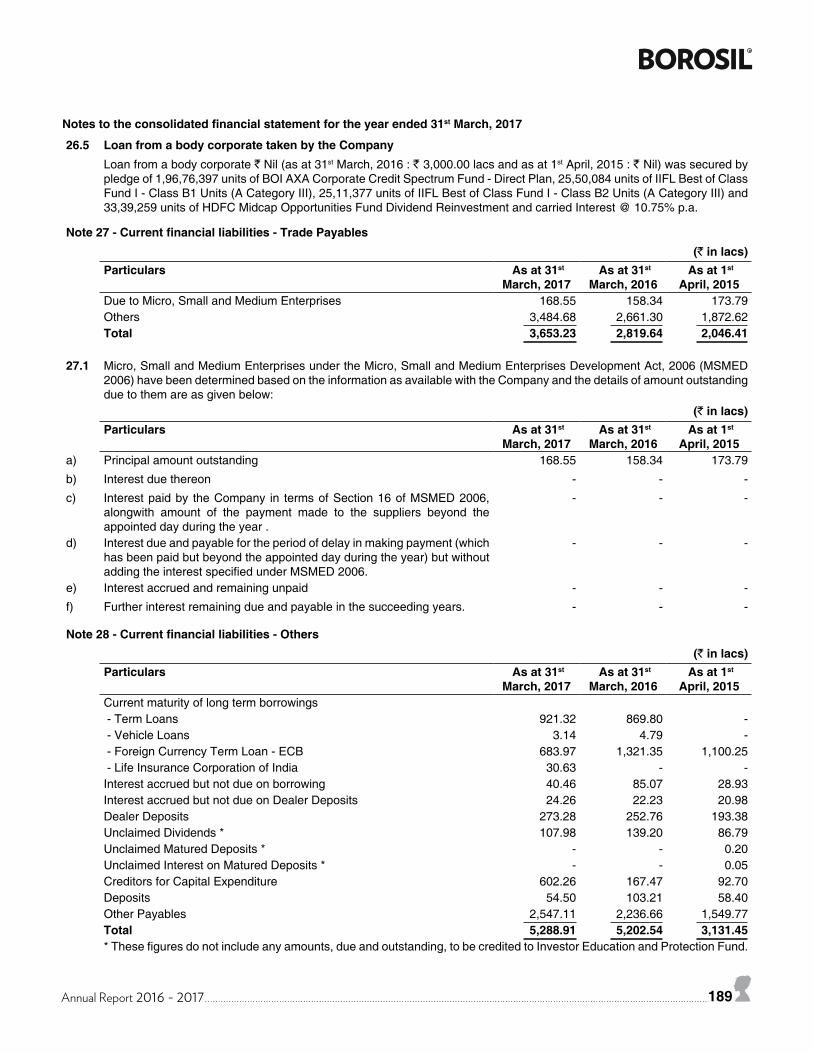
Annual Report 2016 - 2017 189
Notes to the consolidated financial statement for the year ended 31st March, 2017
26.5 Loan from a body corporate taken by the CompanyLoan from a body corporate ` Nil (as at 31st March, 2016 : ` 3,000.00 lacs and as at 1st April, 2015 : ` Nil) was secured by pledge of 1,96,76,397 units of BOI AXA Corporate Credit Spectrum Fund - Direct Plan, 25,50,084 units of IIFL Best of Class Fund I - Class B1 Units (A Category III), 25,11,377 units of IIFL Best of Class Fund I - Class B2 Units (A Category III) and 33,39,259 units of HDFC Midcap Opportunities Fund Dividend Reinvestment and carried Interest @ 10.75% p.a.
Note 27 - Current financial liabilities - Trade Payables (` in lacs)
Particulars As at 31st March, 2017
As at 31st March, 2016
As at 1st April, 2015
Due to Micro, Small and Medium Enterprises 168.55 158.34 173.79Others 3,484.68 2,661.30 1,872.62Total 3,653.23 2,819.64 2,046.41
27.1 Micro, Small and Medium Enterprises under the Micro, Small and Medium Enterprises Development Act, 2006 (MSMED 2006) have been determined based on the information as available with the Company and the details of amount outstanding due to them are as given below:
(` in lacs)Particulars As at 31st
March, 2017 As at 31st
March, 2016 As at 1st
April, 2015a) Principal amount outstanding 168.55 158.34 173.79
b) Interest due thereon - - -
c) Interest paid by the Company in terms of Section 16 of MSMED 2006, alongwith amount of the payment made to the suppliers beyond the appointed day during the year .
- - -
d) Interest due and payable for the period of delay in making payment (which has been paid but beyond the appointed day during the year) but without adding the interest specified under MSMED 2006.
- - -
e) Interest accrued and remaining unpaid - - -
f) Further interest remaining due and payable in the succeeding years. - - -
Note 28 - Current financial liabilities - Others (` in lacs)
Particulars As at 31st March, 2017
As at 31st March, 2016
As at 1st April, 2015
Current maturity of long term borrowings - Term Loans 921.32 869.80 - - Vehicle Loans 3.14 4.79 - - Foreign Currency Term Loan - ECB 683.97 1,321.35 1,100.25 - Life Insurance Corporation of India 30.63 - -Interest accrued but not due on borrowing 40.46 85.07 28.93Interest accrued but not due on Dealer Deposits 24.26 22.23 20.98Dealer Deposits 273.28 252.76 193.38Unclaimed Dividends * 107.98 139.20 86.79Unclaimed Matured Deposits * - - 0.20Unclaimed Interest on Matured Deposits * - - 0.05Creditors for Capital Expenditure 602.26 167.47 92.70Deposits 54.50 103.21 58.40Other Payables 2,547.11 2,236.66 1,549.77Total 5,288.91 5,202.54 3,131.45* These figures do not include any amounts, due and outstanding, to be credited to Investor Education and Protection Fund.

190 Annual Report 2016 - 2017190
Notes to the consolidated financial statement for the year ended 31st March, 2017
28.1 Other Payables includes mainly outstanding salaries, wages & bonus payable, liabilities for expenses, Commission to Directors, discount, rebates etc.
Note 29 - Other Current Liabilities (` in lacs)
Particulars As at 31st March, 2017
As at 31st March, 2016
As at 1st April, 2015
Advance from Customers 167.48 143.61 74.67
Statutory liabilities 370.95 343.96 201.43
Others 46.34 48.19 12.37
Total 584.77 535.76 288.4729.1 Others includes export obligation liability etc.
Note 30 - Current Provisions (` in lacs)
Particulars As at 31st March, 2017
As at 31st March, 2016
As at 1st April, 2015
Provisions for Employee BenefitsSuperannuation 7.43 2.05 -
Gratuity (Funded) (Refer Note 42) 67.09 61.12 57.48
Gratuity (Unfunded) (Refer Note 42) 5.96 0.15 -
Leave Encashment 239.53 176.23 133.43
OthersProvision for Excise duty 70.30 81.17 57.47
Total 390.31 320.72 248.38
Note 31 - Revenues from Operations (` in lacs)
Particulars For the Year Ended
31st March, 2017
For the Year Ended
31st March, 2016Sale of Products (Including Excise Duty) 57,510.07 42,156.68
Sale of Services 40.91 -
Other Operating Revenue 151.88 147.24
Revenue from Operations 57,702.86 42,303.92
Note 32 - Other Income (` in lacs)
Particulars For the Year Ended
31st March, 2017
For the Year Ended
31st March, 2016Interest Income from financial assets measured at fair value through profit or loss
- Long Term Investments 413.73 1,188.21
- Current Investments 2.91 -
Interest Income from financial assets measured at amortised cost
- Inter Corporate Deposits 439.04 436.87
- Fixed Deposits with banks 37.40 17.87
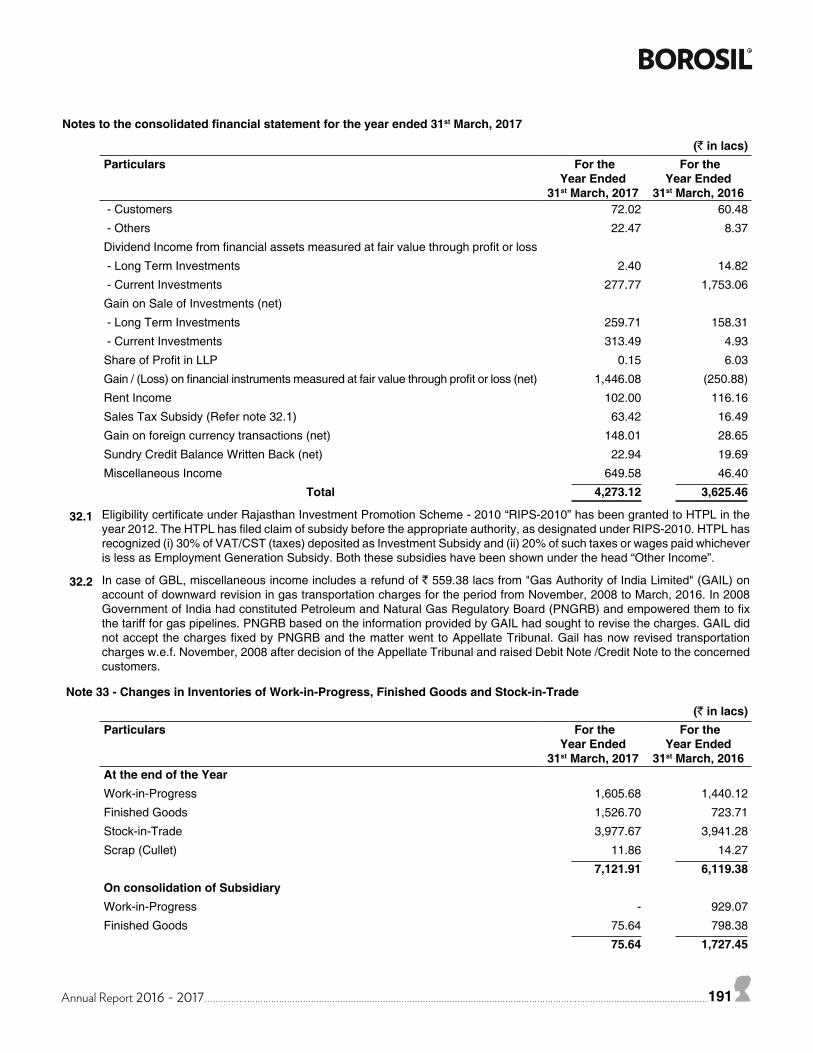
Annual Report 2016 - 2017 191
Notes to the consolidated financial statement for the year ended 31st March, 2017
(` in lacs)Particulars For the
Year Ended 31st March, 2017
For the Year Ended
31st March, 2016 - Customers 72.02 60.48
- Others 22.47 8.37
Dividend Income from financial assets measured at fair value through profit or loss
- Long Term Investments 2.40 14.82
- Current Investments 277.77 1,753.06
Gain on Sale of Investments (net)
- Long Term Investments 259.71 158.31
- Current Investments 313.49 4.93
Share of Profit in LLP 0.15 6.03
Gain / (Loss) on financial instruments measured at fair value through profit or loss (net) 1,446.08 (250.88)
Rent Income 102.00 116.16
Sales Tax Subsidy (Refer note 32.1) 63.42 16.49
Gain on foreign currency transactions (net) 148.01 28.65
Sundry Credit Balance Written Back (net) 22.94 19.69
Miscellaneous Income 649.58 46.40
Total 4,273.12 3,625.46
32.1 Eligibility certificate under Rajasthan Investment Promotion Scheme - 2010 “RIPS-2010” has been granted to HTPL in the year 2012. The HTPL has filed claim of subsidy before the appropriate authority, as designated under RIPS-2010. HTPL has recognized (i) 30% of VAT/CST (taxes) deposited as Investment Subsidy and (ii) 20% of such taxes or wages paid whichever is less as Employment Generation Subsidy. Both these subsidies have been shown under the head “Other Income”.
32.2 In case of GBL, miscellaneous income includes a refund of ` 559.38 lacs from "Gas Authority of India Limited" (GAIL) on account of downward revision in gas transportation charges for the period from November, 2008 to March, 2016. In 2008 Government of India had constituted Petroleum and Natural Gas Regulatory Board (PNGRB) and empowered them to fix the tariff for gas pipelines. PNGRB based on the information provided by GAIL had sought to revise the charges. GAIL did not accept the charges fixed by PNGRB and the matter went to Appellate Tribunal. Gail has now revised transportation charges w.e.f. November, 2008 after decision of the Appellate Tribunal and raised Debit Note /Credit Note to the concerned customers.
Note 33 - Changes in Inventories of Work-in-Progress, Finished Goods and Stock-in-Trade (` in lacs)
Particulars For the Year Ended
31st March, 2017
For the Year Ended
31st March, 2016At the end of the YearWork-in-Progress 1,605.68 1,440.12
Finished Goods 1,526.70 723.71
Stock-in-Trade 3,977.67 3,941.28
Scrap (Cullet) 11.86 14.27
7,121.91 6,119.38On consolidation of SubsidiaryWork-in-Progress - 929.07
Finished Goods 75.64 798.38
75.64 1,727.45
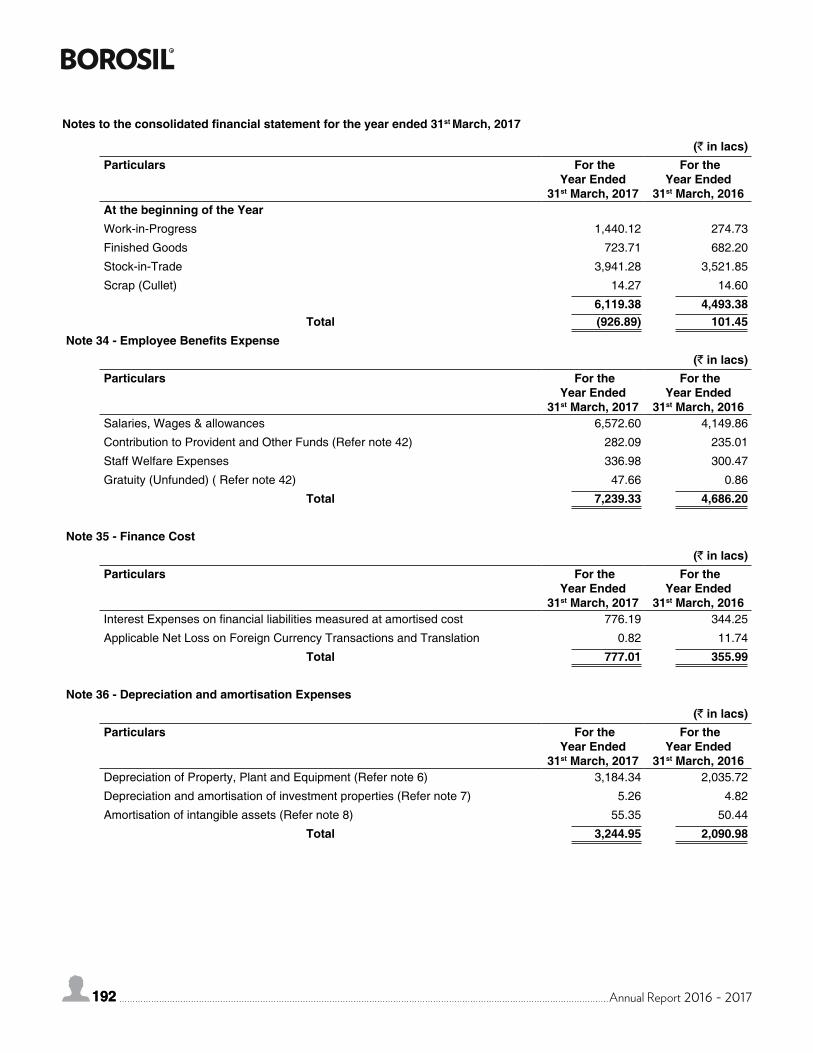
192 Annual Report 2016 - 2017192
Notes to the consolidated financial statement for the year ended 31st March, 2017
(` in lacs)Particulars For the
Year Ended 31st March, 2017
For the Year Ended
31st March, 2016At the beginning of the YearWork-in-Progress 1,440.12 274.73
Finished Goods 723.71 682.20
Stock-in-Trade 3,941.28 3,521.85
Scrap (Cullet) 14.27 14.60
6,119.38 4,493.38Total (926.89) 101.45
Note 34 - Employee Benefits Expense (` in lacs)
Particulars For the Year Ended
31st March, 2017
For the Year Ended
31st March, 2016Salaries, Wages & allowances 6,572.60 4,149.86
Contribution to Provident and Other Funds (Refer note 42) 282.09 235.01
Staff Welfare Expenses 336.98 300.47
Gratuity (Unfunded) ( Refer note 42) 47.66 0.86
Total 7,239.33 4,686.20
Note 35 - Finance Cost (` in lacs)
Particulars For the Year Ended
31st March, 2017
For the Year Ended
31st March, 2016Interest Expenses on financial liabilities measured at amortised cost 776.19 344.25
Applicable Net Loss on Foreign Currency Transactions and Translation 0.82 11.74
Total 777.01 355.99
Note 36 - Depreciation and amortisation Expenses (` in lacs)
Particulars For the Year Ended
31st March, 2017
For the Year Ended
31st March, 2016Depreciation of Property, Plant and Equipment (Refer note 6) 3,184.34 2,035.72
Depreciation and amortisation of investment properties (Refer note 7) 5.26 4.82
Amortisation of intangible assets (Refer note 8) 55.35 50.44
Total 3,244.95 2,090.98
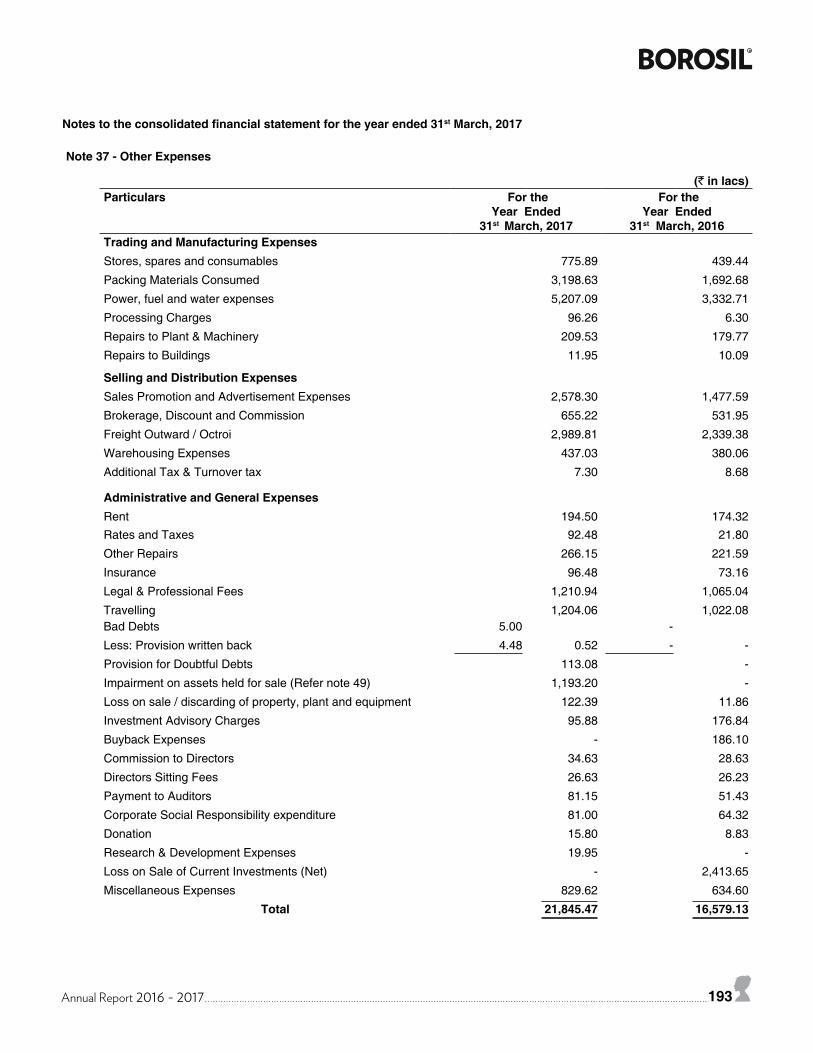
Annual Report 2016 - 2017 193
Notes to the consolidated financial statement for the year ended 31st March, 2017
Note 37 - Other Expenses
(` in lacs)Particulars For the
Year Ended 31st March, 2017
For the Year Ended
31st March, 2016Trading and Manufacturing ExpensesStores, spares and consumables 775.89 439.44
Packing Materials Consumed 3,198.63 1,692.68
Power, fuel and water expenses 5,207.09 3,332.71
Processing Charges 96.26 6.30
Repairs to Plant & Machinery 209.53 179.77
Repairs to Buildings 11.95 10.09
Selling and Distribution ExpensesSales Promotion and Advertisement Expenses 2,578.30 1,477.59
Brokerage, Discount and Commission 655.22 531.95
Freight Outward / Octroi 2,989.81 2,339.38
Warehousing Expenses 437.03 380.06
Additional Tax & Turnover tax 7.30 8.68
Administrative and General ExpensesRent 194.50 174.32Rates and Taxes 92.48 21.80
Other Repairs 266.15 221.59
Insurance 96.48 73.16
Legal & Professional Fees 1,210.94 1,065.04
Travelling 1,204.06 1,022.08Bad Debts 5.00 -
Less: Provision written back 4.48 0.52 - -
Provision for Doubtful Debts 113.08 -
Impairment on assets held for sale (Refer note 49) 1,193.20 -
Loss on sale / discarding of property, plant and equipment 122.39 11.86
Investment Advisory Charges 95.88 176.84
Buyback Expenses - 186.10
Commission to Directors 34.63 28.63
Directors Sitting Fees 26.63 26.23
Payment to Auditors 81.15 51.43
Corporate Social Responsibility expenditure 81.00 64.32
Donation 15.80 8.83
Research & Development Expenses 19.95 -
Loss on Sale of Current Investments (Net) - 2,413.65
Miscellaneous Expenses 829.62 634.60
Total 21,845.47 16,579.13
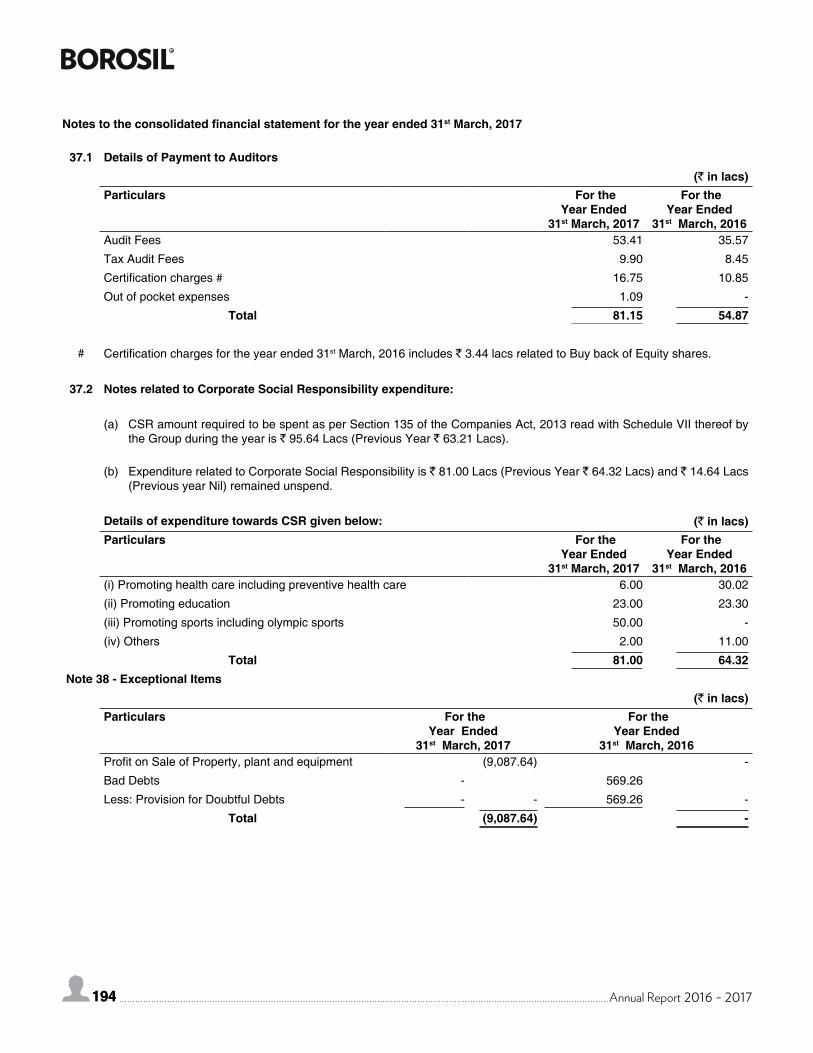
194 Annual Report 2016 - 2017194
Notes to the consolidated financial statement for the year ended 31st March, 2017
37.1 Details of Payment to Auditors (` in lacs)
Particulars For the Year Ended
31st March, 2017
For the Year Ended
31st March, 2016Audit Fees 53.41 35.57
Tax Audit Fees 9.90 8.45
Certification charges # 16.75 10.85
Out of pocket expenses 1.09 -
Total 81.15 54.87
# Certification charges for the year ended 31st March, 2016 includes ` 3.44 lacs related to Buy back of Equity shares.
37.2 Notes related to Corporate Social Responsibility expenditure:
(a) CSR amount required to be spent as per Section 135 of the Companies Act, 2013 read with Schedule VII thereof by the Group during the year is ` 95.64 Lacs (Previous Year ` 63.21 Lacs).
(b) Expenditure related to Corporate Social Responsibility is ` 81.00 Lacs (Previous Year ` 64.32 Lacs) and ` 14.64 Lacs (Previous year Nil) remained unspend.
Details of expenditure towards CSR given below: (` in lacs)Particulars For the
Year Ended 31st March, 2017
For the Year Ended
31st March, 2016(i) Promoting health care including preventive health care 6.00 30.02
(ii) Promoting education 23.00 23.30
(iii) Promoting sports including olympic sports 50.00 -
(iv) Others 2.00 11.00
Total 81.00 64.32Note 38 - Exceptional Items
(` in lacs)Particulars For the
Year Ended 31st March, 2017
For theYear Ended
31st March, 2016Profit on Sale of Property, plant and equipment (9,087.64) -
Bad Debts - 569.26
Less: Provision for Doubtful Debts - - 569.26 -
Total (9,087.64) -
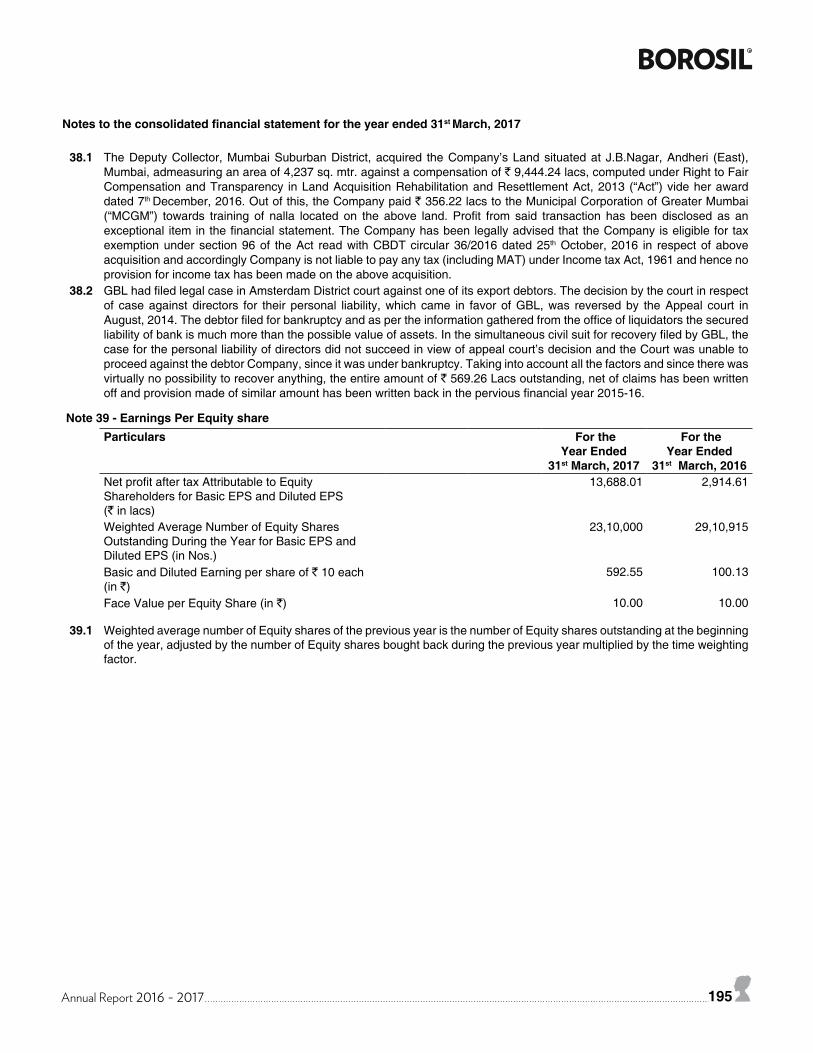
Annual Report 2016 - 2017 195
Notes to the consolidated financial statement for the year ended 31st March, 2017
38.1 The Deputy Collector, Mumbai Suburban District, acquired the Company’s Land situated at J.B.Nagar, Andheri (East), Mumbai, admeasuring an area of 4,237 sq. mtr. against a compensation of ` 9,444.24 lacs, computed under Right to Fair Compensation and Transparency in Land Acquisition Rehabilitation and Resettlement Act, 2013 (“Act”) vide her award dated 7th December, 2016. Out of this, the Company paid ` 356.22 lacs to the Municipal Corporation of Greater Mumbai (“MCGM”) towards training of nalla located on the above land. Profit from said transaction has been disclosed as an exceptional item in the financial statement. The Company has been legally advised that the Company is eligible for tax exemption under section 96 of the Act read with CBDT circular 36/2016 dated 25th October, 2016 in respect of above acquisition and accordingly Company is not liable to pay any tax (including MAT) under Income tax Act, 1961 and hence no provision for income tax has been made on the above acquisition.
38.2 GBL had filed legal case in Amsterdam District court against one of its export debtors. The decision by the court in respect of case against directors for their personal liability, which came in favor of GBL, was reversed by the Appeal court in August, 2014. The debtor filed for bankruptcy and as per the information gathered from the office of liquidators the secured liability of bank is much more than the possible value of assets. In the simultaneous civil suit for recovery filed by GBL, the case for the personal liability of directors did not succeed in view of appeal court’s decision and the Court was unable to proceed against the debtor Company, since it was under bankruptcy. Taking into account all the factors and since there was virtually no possibility to recover anything, the entire amount of ` 569.26 Lacs outstanding, net of claims has been written off and provision made of similar amount has been written back in the pervious financial year 2015-16.
Note 39 - Earnings Per Equity shareParticulars For the
Year Ended 31st March, 2017
For the Year Ended
31st March, 2016Net profit after tax Attributable to Equity Shareholders for Basic EPS and Diluted EPS(` in lacs)
13,688.01 2,914.61
Weighted Average Number of Equity Shares Outstanding During the Year for Basic EPS and Diluted EPS (in Nos.)
23,10,000 29,10,915
Basic and Diluted Earning per share of ` 10 each (in `)
592.55 100.13
Face Value per Equity Share (in `) 10.00 10.00
39.1 Weighted average number of Equity shares of the previous year is the number of Equity shares outstanding at the beginning of the year, adjusted by the number of Equity shares bought back during the previous year multiplied by the time weighting factor.

196 Annual Report 2016 - 2017196
Note 40 - Contingent Liabilities and Commitments40.1 Contingent Liabilities (To the extent not provided for)
Claims against the Group not acknowledged as debts (` in lacs)
Particulars As at 31st March, 2017
As at 31st March, 2016
As at 1st April, 2015
Disputed Liabilities in Appeal (No Cash outflow is expected in the near future)Sales Tax (amount paid under protest is ` 23.53 lacs) 640.91 594.08 595.72
Income Tax 332.20 302.84 645.35
Excise (amount paid under protest of ` 590.08 Lacs, ` 589.64 Lacs and ` 589.40 Lacs as at 31st March, 2017, 31st March, 2016 and 1st April, 2015 respectively)
1,252.13 1,252.13 1,252.13
Cenvat Credit/Service Tax (amount paid under protest of ` 1.85 lacs and ` 0.38 lacs as at 31st March, 2017 and 31st March, 2016 respectively)
52.99 66.43 9.73
Others 49.81 49.81 49.81
Guarantees Bank Guarantees 547.22 262.55 209.27
Others1. Investments Pledged with a Bank against Credit facility availed by related parties
92.96 0.02 320.37
2. Letter of Credits 2,177.10 382.41 479.37
3. Bill discounting with Bank - - 113.23
4. Bonus (Refer note 40.4) 35.24 35.24 -
5. Claims against the Group not acknowledged as debts 28.38 32.67 32.67
40.2 Commitments (` in lacs)
Particulars As at 31st March, 2017
As at 31st March, 2016
As at 1st April, 2015
Estimated amount of Contracts remaining to be executed on Capital Account not provided for (cash outflow is expected on execution of such capital contracts) -- Related to Property, plant and equipment 4,220.03 614.64 409.77
-- Related to Intangible Assets 11.82 37.57 -
Commitments towards Investments (cash outflow is expected on execution of such commitments)
1,262.50 2,375.00 5,425.00
Commitments towards EPCG License 707.84 649.17 -
40.3 Management is of the view that above litigations will not materially impact the financial position of the Group.
40.4 The Payment of Bonus (Amendment) Act, 2015 envisages enhancement of eligibility limit and Calculation Ceiling under section 12 from ̀ 3500 to ̀ 7000 or the minimum wage for the scheduled employment, as fixed by the appropriate Government, whichever is higher. The Payment of Bonus (Amendment) Act, 2015 have come into force on the 1st April, 2014. However the same is challenged in Hon'ble High Court of Kerala by some parties and the Kerala High Court has provided stay on the retrospectively impact of the same and accordingly same amount shown as contingent liability.
Notes to the consolidated financial statement for the year ended 31st March, 2017
Annual Report 2016 - 2017 197
Notes to the consolidated financial statement for the year ended 31st March, 2017
Note 41 - Portfolio Management ServicesAs at 31st March 2017, the Company has invested ` 2,174.64 lacs (31st March, 2016 ` 2,118.08 lacs and 1st April, 2015 : ` 5,072.46 lacs) through Portfolio Managers who provide Portfolio Management Services which are in the nature of investment administrative management services and include the responsibility to manage, invest and operate the fund as per the agreement(s) entered with them. As on the said date, the outstanding balance of securities amounting to ` 2,168.31 lacs (As at 31st March, 2016 - ` 2,120.20 lacs and as at 1st April, 2015 - ` 5,056.16 lacs ) has been accounted as investment in Note 9 and 14 and the amount of ` 6.33 lacs (As at 31st March, 2016 - ` Nil and as at 1st April, 2015 - ` 16.29 lacs) shown under the head “Current financial assets - Others" in Note 19.
Note 42 - Employee Benefits 42.1 As per Ind AS 19 ‘Employee Benefits’, the disclosure of Employee benefits as defined in the Ind AS are given below:
(a) Defined Contribution Plan:Contribution to Defined Contribution Plan, recognized as expense for the years are as under:
( ` in lacs)Particulars 2016-17 2015-16Employer’s Contribution to Provident Fund 164.39 117.39
Employer’s Contribution to Pension Scheme 57.60 28.82Employer’s Contribution to Superannuation Fund 7.43 2.05
Employer’s Contribution to ESIC 6.72 0.06
Employer’s Contribution to MLWF 0.06 -
The contribution to provident fund is made to Employees’ Provident Fund managed by Provident Fund Commissioner. Employees’ Superannuation Fund is managed by Life Insurance Corporation of India. The contribution towards ESIC made to Employees' State Insurance Corporation. The contribution towards MLWF is made to Maharashtra Labour Welfare Fund. The obligation of the Group is limited to the amount contributed and it has no further contractual nor any constructive obligation.
(b) Defined Benefit Plan:The employees’ Gratuity Fund of the Company is managed by the Life Insurance Corporation of India. The employees’ Gratuity Fund of the GBL is managed by the Birla Sun Life Insurance Corporation Limited. The present value of obligation is determined based on actuarial valuation using the Projected Unit Credit Method, which recognizes each period of service as giving rise to additional unit of employee benefit entitlement and measures each unit separately to build up the final obligation.Particulars Gratuity
As at 31st March, 2017
As at 31st March, 2016
Actuarial assumptionsMortality Table Indian Assured
Lives Mortality (2006-08) Ult
Indian Assured Lives Mortality (2006-08) Ult
Salary growth 5% to 10% 5% to 10%
Discount rate 7% to 7.25% 7.8% to 7.85%
Expected returns on plan assets 7.20% to 9.00% 7.95% to 9.00%
Withdrawal Rates 1% to 10% 1% to 10%
198 Annual Report 2016 - 2017198
( ` in lacs)Particulars Gratuity
2016-17 2015-16Movement in present value of defined benefit obligationObligation at the beginning of the year 413.64 331.44On account of consolidation of subsidiary (Refer note 56) 130.00 -Current service cost 78.58 58.64Interest cost 42.69 25.69Benefits paid (37.16) (66.37)Actuarial loss on obligation 35.00 64.24Past Service Cost 15.23 -Obligation at the end of the year 677.99 413.64Movement in present value of plan assetsFair value at the beginning of the year 323.50 273.96Adjustment to opening Fair value of plan Assets - 0.51Interest Income 28.24 8.38Expected Return on Plan Assets 12.51 1.16Contribution 61.71 105.87Benefits paid (35.04) (66.37)Fair value at the end of the year 390.92 323.51Current Provisions (Funded) 67.09 61.12Non-current Provisions (Unfunded) 214.02 28.86Current Provisions (Unfunded) 5.96 0.15Amount recognised in the statement of profit and lossCurrent service cost 77.04 44.98Interest cost 10.77 17.31Adjustment to opening Fair value of plan Assets - (0.51)Past service cost 10.26 -
Total 98.07 61.78Amount recognised in the statement of profit and loss - Funded 50.41 60.92Amount recognised in the statement of profit and loss - Unfunded 47.66 0.86
Amount recognised in the other comprehensive incomeComponents of actuarial gain or losses on obligations:Due to Change in financial assumptions 40.36 21.30Due to change in demographic assumption - 6.10Due to experience adjustments (7.51) 23.20Return on plan assets excluding amounts included in interest income (12.51) (1.16)
Total 20.34 49.44Amount recognised in the other comprehensive Income - Funded 22.80 48.59Amount recognised in the other comprehensive Income - Unfunded (2.46) 0.85
(c) Fair Value of plan assets( ` in lacs)
Class of assets Fair value of plan asset2016-17 2015-16
Life Insurance Corporation of India 164.98 129.98Bank Balance 0.29 0.34Birla Sun Life Insurance Corporation of India 225.65 193.19
Total 390.92 323.51
Notes to the consolidated financial statement for the year ended 31st March, 2017
Annual Report 2016 - 2017 199
Notes to the consolidated financial statement for the year ended 31st March, 2017
(d) Net Liability / (Assets) Recognised in the balance sheet( ` in lacs)
Amount recognised in the balance sheet As at 31st March, 2017
As at 31st
March, 2016Present value of obligations at the end of the year 677.99 413.64
Less: Fair value of plan assets at the end of the year 390.91 323.51
Net liability/(Assets) recognized in the balance sheet 287.08 90.13
(e) The estimate of rate of escalation in Salary considered in actuarial valuation, takes into account inflation, seniority, promotion and other retirement factors including supply & demand in the employment market. The above information is certified by the actuary.
42.2 Sensitivity analysis: (` in lacs)Particulars Changes in assumptions Effect on Gratuity obligationFor the year ended 31st March, 2016Salary growth rate +0.50% to 1% 19.51
-0.5% to -1% (17.08)
Discount rate +0.50% to 1% (19.24)
-0.5% to -1% 20.89
Withdrawal rate (W.R.) W.R. X 110% (0.08)
W.R. X 90% (1.32)
For the year ended 31st March, 2017Salary growth rate +0.50% 27.06
-0.50% (27.27)
Discount rate +0.50% (31.79)
-0.50% 34.29
Withdrawal rate (W.R.) W.R. X 110% 0.14
W.R. X 90% (2.01)
The above sensitivity analysis is based on a change in an assumption while holding all other assumptions constant. In practice, this is unlikely to occur, and changes in some of the assumptions may be correlated. In presenting the above sensitivity analysis, the present value of defined benefit obligation has been calculated using the projected unit credit method at the end of reporting period, which is the same as that applied in calculating the defined obligation liability recognized in the consolidated balance sheet.
42.3 Risk exposures
A. Actuarial Risk: It is the risk that benefits will cost more than expected. This can arise due to one of the following reasons: Adverse Salary Growth Experience: Salary hikes that are higher than the assumed salary escalation will result into an
increase in Obligation at a rate that is higher than expected. Variability in mortality rates: If actual mortality rates are higher than assumed mortality rate than Gratuity benefits will
be paid earlier than expected. Since there is no condition of vesting on the death benefit, the acceleration of cash flow will lead to an actuarial loss or gain depending on the relative values of the assumed salary growth and discount rate.
Variability in withdrawal rates: If actual withdrawal rates are higher than assumed withdrawal rate than the Gratuity benefits will be paid earlier than expected. The impact of this will depend on whether the benefits are vested as at the resignation date.
200 Annual Report 2016 - 2017200
B. Investment Risk: For funded plans that rely on insurers for managing the assets, the value of assets certified by the insurer may not be the
fair value of instruments backing the liability. In such cases, the present value of the assets is independent of the future discount rate. This can result in wide fluctuations in the net liability or the funded status if there are significant changes in the discount rate during the inter-valuation period.
C. Liquidity Risk: Employees with high salaries and long durations or those higher in hierarchy, accumulate significant level of benefits.
If some of such employees resign/retire from the Group, there can be strain on the cash flows. D. Market Risk: Market risk is a collective term for risks that are related to the changes and fluctuations of the financial markets.
One actuarial assumption that has a material effect is the discount rate. The discount rate reflects the time value of money. An increase in discount rate leads to decrease in Defined Benefit Obligation of the plan benefits & vice versa. This assumption depends on the yields on the corporate/government bonds and hence the valuation of liability is exposed to fluctuations in the yields as at the valuation date.
E. Legislative Risk: Legislative risk is the risk of increase in the plan liabilities or reduction in the plan assets due to change in the legislation/
regulation. The government may amend the Payment of Gratuity Act thus requiring the companies to pay higher benefits to the employees. This will directly affect the present value of the Defined Benefit Obligation and the same will have to be recognized immediately in the year when any such amendment is effective.
42.4 Details of Asset-Liability Matching Strategy
Gratuity benefits liabilities are Funded in case of the Company and GBL and unfunded in case of other companies of the Group.
In case where gratuity is funded, there are no minimum funding requirements for a Gratuity benefits plan in India and there is no compulsion on the part of the Company and GBL to fully or partially pre-fund the liabilities under the Plan. The trustees of the plan have outsourced the investment management of the fund to an insurance company which are regulated by IRDA. Due to the restrictions in the type of investments that can be held by the fund, it may not be possible to explicitly follow an asset-liability matching strategy to manage risk actively in a conventional fund.
In case where gratuity is unfunded, there is no Asset-Liability Matching strategy deviced for the plan.42.5 The expected payments towards contributions to the defined benefit plan, in case of funded gratuity, is within one year.
42.6 The following payments are expected towards Gratuity in future years:(` in lacs)
Year ended Cash flow31st March, 2018 60.69
31st March, 2019 34.63
31st March, 2020 48.83
31st March, 2021 38.42
31st March, 2022 35.91
31st March, 2023 to 31st March, 2027 279.29
42.7 The average duration range of the defined benefit plan obligation at the end of the reporting period is 2.56 years to 13.79 years (Previous year 2.19 to 13.40 years).
Notes to the consolidated financial statement for the year ended 31st March, 2017
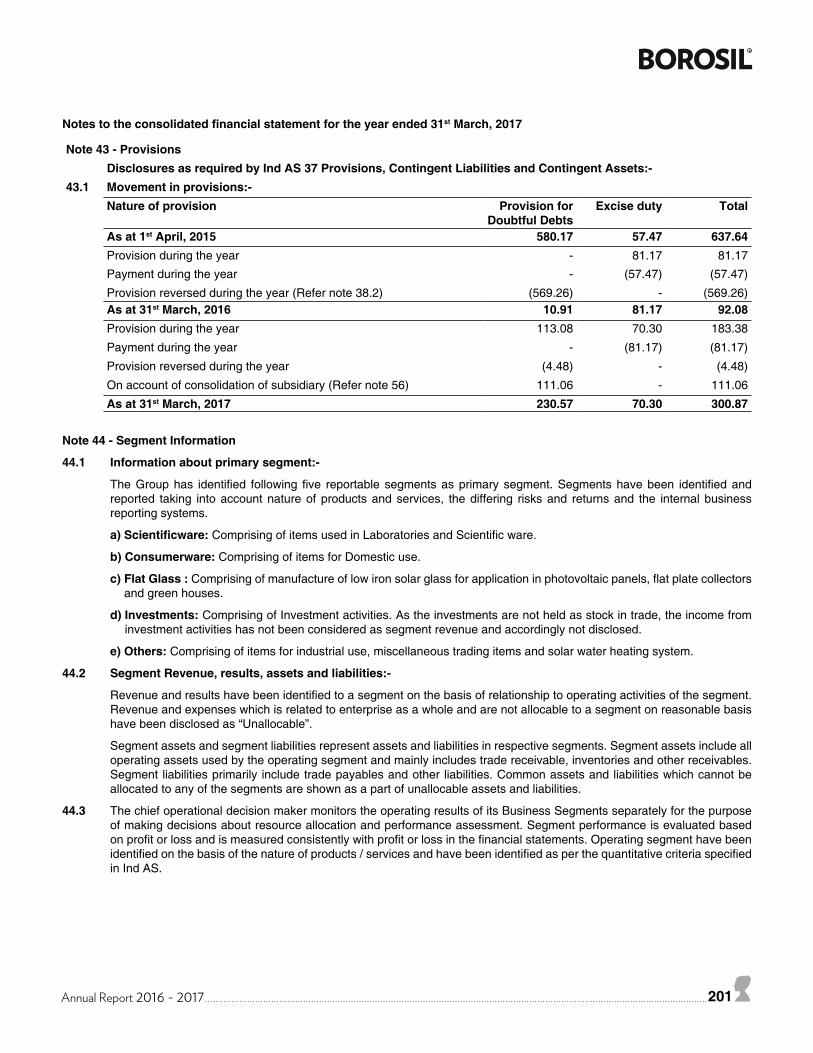
Annual Report 2016 - 2017 201
Notes to the consolidated financial statement for the year ended 31st March, 2017
Note 43 - ProvisionsDisclosures as required by Ind AS 37 Provisions, Contingent Liabilities and Contingent Assets:-
43.1 Movement in provisions:-Nature of provision Provision for
Doubtful DebtsExcise duty Total
As at 1st April, 2015 580.17 57.47 637.64Provision during the year - 81.17 81.17
Payment during the year - (57.47) (57.47)
Provision reversed during the year (Refer note 38.2) (569.26) - (569.26)As at 31st March, 2016 10.91 81.17 92.08Provision during the year 113.08 70.30 183.38
Payment during the year - (81.17) (81.17)
Provision reversed during the year (4.48) - (4.48)
On account of consolidation of subsidiary (Refer note 56) 111.06 - 111.06
As at 31st March, 2017 230.57 70.30 300.87
Note 44 - Segment Information
44.1 Information about primary segment:-
The Group has identified following five reportable segments as primary segment. Segments have been identified and reported taking into account nature of products and services, the differing risks and returns and the internal business reporting systems.
a) Scientificware: Comprising of items used in Laboratories and Scientific ware.
b) Consumerware: Comprising of items for Domestic use.
c) Flat Glass : Comprising of manufacture of low iron solar glass for application in photovoltaic panels, flat plate collectors and green houses.
d) Investments: Comprising of Investment activities. As the investments are not held as stock in trade, the income from investment activities has not been considered as segment revenue and accordingly not disclosed.
e) Others: Comprising of items for industrial use, miscellaneous trading items and solar water heating system.
44.2 Segment Revenue, results, assets and liabilities:-
Revenue and results have been identified to a segment on the basis of relationship to operating activities of the segment. Revenue and expenses which is related to enterprise as a whole and are not allocable to a segment on reasonable basis have been disclosed as “Unallocable”.
Segment assets and segment liabilities represent assets and liabilities in respective segments. Segment assets include all operating assets used by the operating segment and mainly includes trade receivable, inventories and other receivables. Segment liabilities primarily include trade payables and other liabilities. Common assets and liabilities which cannot be allocated to any of the segments are shown as a part of unallocable assets and liabilities.
44.3 The chief operational decision maker monitors the operating results of its Business Segments separately for the purpose of making decisions about resource allocation and performance assessment. Segment performance is evaluated based on profit or loss and is measured consistently with profit or loss in the financial statements. Operating segment have been identified on the basis of the nature of products / services and have been identified as per the quantitative criteria specified in Ind AS.
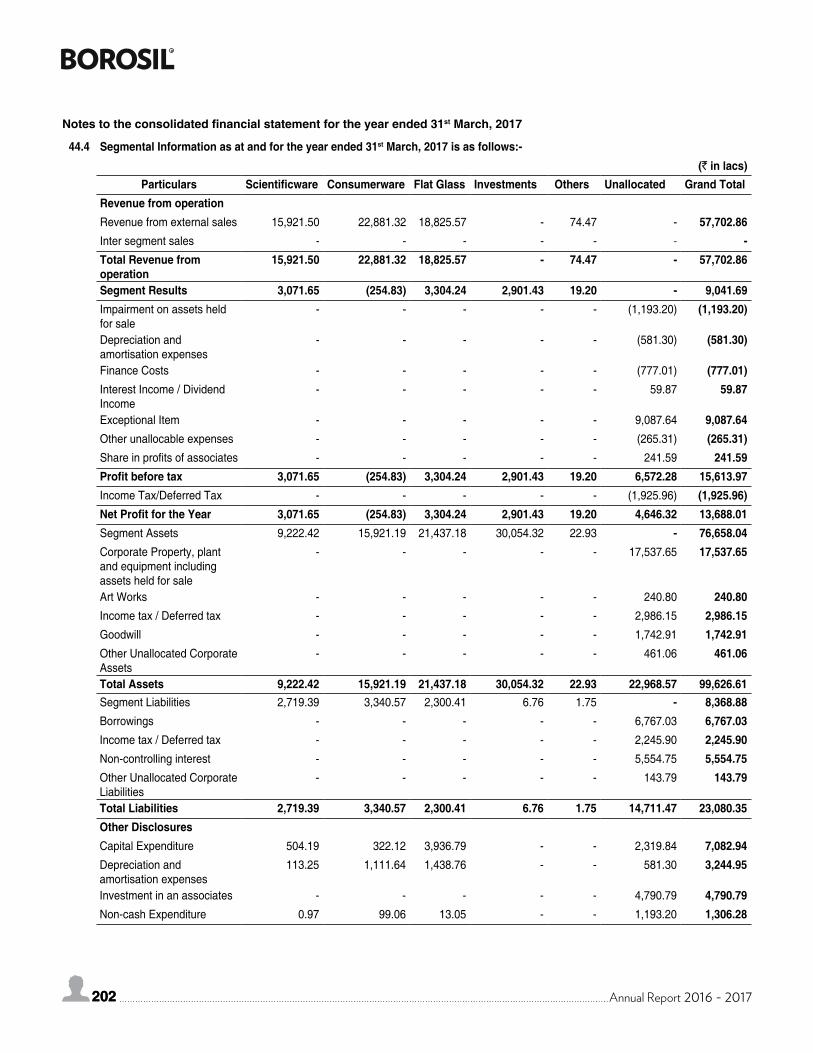
202 Annual Report 2016 - 2017202
44.4 Segmental Information as at and for the year ended 31st March, 2017 is as follows:-(` in lacs)
Particulars Scientificware Consumerware Flat Glass Investments Others Unallocated Grand TotalRevenue from operationRevenue from external sales 15,921.50 22,881.32 18,825.57 - 74.47 - 57,702.86Inter segment sales - - - - - - -Total Revenue from operation
15,921.50 22,881.32 18,825.57 - 74.47 - 57,702.86
Segment Results 3,071.65 (254.83) 3,304.24 2,901.43 19.20 - 9,041.69Impairment on assets held for sale
- - - - - (1,193.20) (1,193.20)
Depreciation and amortisation expenses
- - - - - (581.30) (581.30)
Finance Costs - - - - - (777.01) (777.01)Interest Income / Dividend Income
- - - - - 59.87 59.87
Exceptional Item - - - - - 9,087.64 9,087.64Other unallocable expenses - - - - - (265.31) (265.31)Share in profits of associates - - - - - 241.59 241.59Profit before tax 3,071.65 (254.83) 3,304.24 2,901.43 19.20 6,572.28 15,613.97Income Tax/Deferred Tax - - - - - (1,925.96) (1,925.96)Net Profit for the Year 3,071.65 (254.83) 3,304.24 2,901.43 19.20 4,646.32 13,688.01Segment Assets 9,222.42 15,921.19 21,437.18 30,054.32 22.93 - 76,658.04Corporate Property, plant and equipment including assets held for sale
- - - - - 17,537.65 17,537.65
Art Works - - - - - 240.80 240.80Income tax / Deferred tax - - - - - 2,986.15 2,986.15Goodwill - - - - - 1,742.91 1,742.91Other Unallocated Corporate Assets
- - - - - 461.06 461.06
Total Assets 9,222.42 15,921.19 21,437.18 30,054.32 22.93 22,968.57 99,626.61Segment Liabilities 2,719.39 3,340.57 2,300.41 6.76 1.75 - 8,368.88Borrowings - - - - - 6,767.03 6,767.03Income tax / Deferred tax - - - - - 2,245.90 2,245.90Non-controlling interest - - - - - 5,554.75 5,554.75Other Unallocated Corporate Liabilities
- - - - - 143.79 143.79
Total Liabilities 2,719.39 3,340.57 2,300.41 6.76 1.75 14,711.47 23,080.35Other DisclosuresCapital Expenditure 504.19 322.12 3,936.79 - - 2,319.84 7,082.94Depreciation and amortisation expenses
113.25 1,111.64 1,438.76 - - 581.30 3,244.95
Investment in an associates - - - - - 4,790.79 4,790.79Non-cash Expenditure 0.97 99.06 13.05 - - 1,193.20 1,306.28
Notes to the consolidated financial statement for the year ended 31st March, 2017
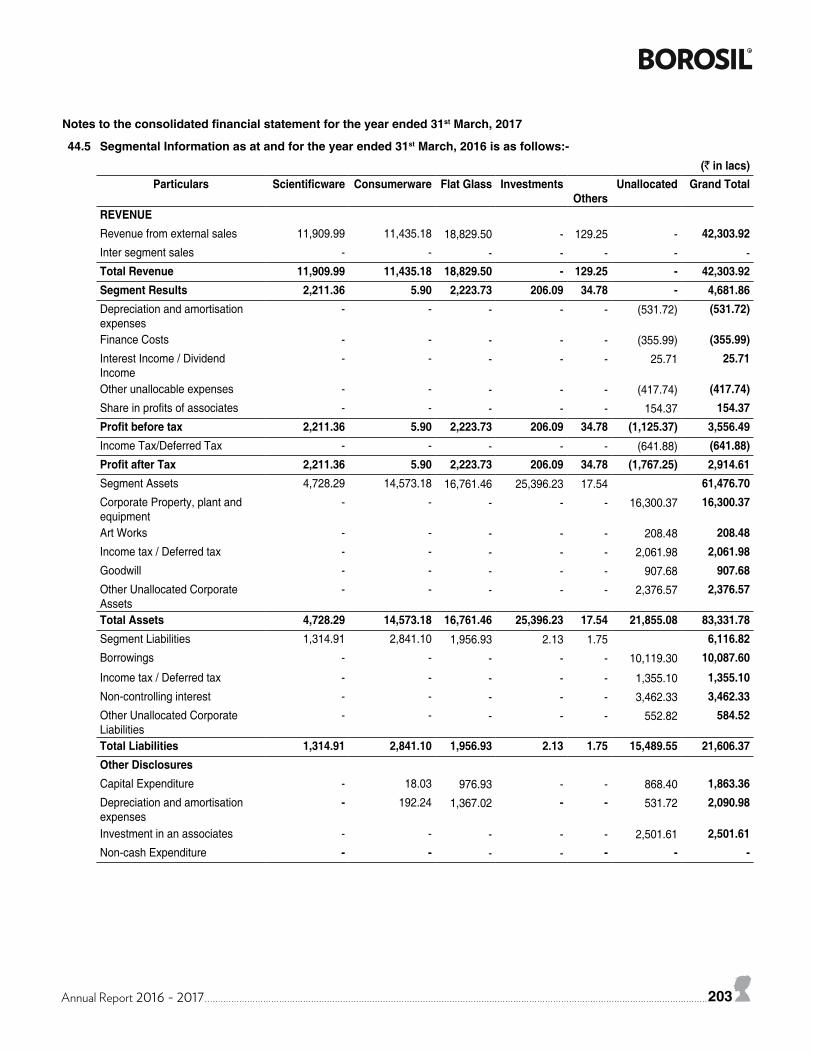
Annual Report 2016 - 2017 203
44.5 Segmental Information as at and for the year ended 31st March, 2016 is as follows:-(` in lacs)
Particulars Scientificware Consumerware Flat Glass Investments Others
Unallocated Grand Total
REVENUERevenue from external sales 11,909.99 11,435.18 18,829.50 - 129.25 - 42,303.92Inter segment sales - - - - - - -Total Revenue 11,909.99 11,435.18 18,829.50 - 129.25 - 42,303.92Segment Results 2,211.36 5.90 2,223.73 206.09 34.78 - 4,681.86Depreciation and amortisation expenses
- - - - - (531.72) (531.72)
Finance Costs - - - - - (355.99) (355.99)Interest Income / Dividend Income
- - - - - 25.71 25.71
Other unallocable expenses - - - - - (417.74) (417.74)Share in profits of associates - - - - - 154.37 154.37Profit before tax 2,211.36 5.90 2,223.73 206.09 34.78 (1,125.37) 3,556.49Income Tax/Deferred Tax - - - - - (641.88) (641.88)Profit after Tax 2,211.36 5.90 2,223.73 206.09 34.78 (1,767.25) 2,914.61Segment Assets 4,728.29 14,573.18 16,761.46 25,396.23 17.54 61,476.70Corporate Property, plant and equipment
- - - - - 16,300.37 16,300.37
Art Works - - - - - 208.48 208.48Income tax / Deferred tax - - - - - 2,061.98 2,061.98Goodwill - - - - - 907.68 907.68Other Unallocated Corporate Assets
- - - - - 2,376.57 2,376.57
Total Assets 4,728.29 14,573.18 16,761.46 25,396.23 17.54 21,855.08 83,331.78Segment Liabilities 1,314.91 2,841.10 1,956.93 2.13 1.75 6,116.82Borrowings - - - - - 10,119.30 10,087.60
Income tax / Deferred tax - - - - - 1,355.10 1,355.10Non-controlling interest - - - - - 3,462.33 3,462.33Other Unallocated Corporate Liabilities
- - - - - 552.82 584.52
Total Liabilities 1,314.91 2,841.10 1,956.93 2.13 1.75 15,489.55 21,606.37Other DisclosuresCapital Expenditure - 18.03 976.93 - - 868.40 1,863.36Depreciation and amortisation expenses
- 192.24 1,367.02 - - 531.72 2,090.98
Investment in an associates - - - - - 2,501.61 2,501.61Non-cash Expenditure - - - - - - -
Notes to the consolidated financial statement for the year ended 31st March, 2017
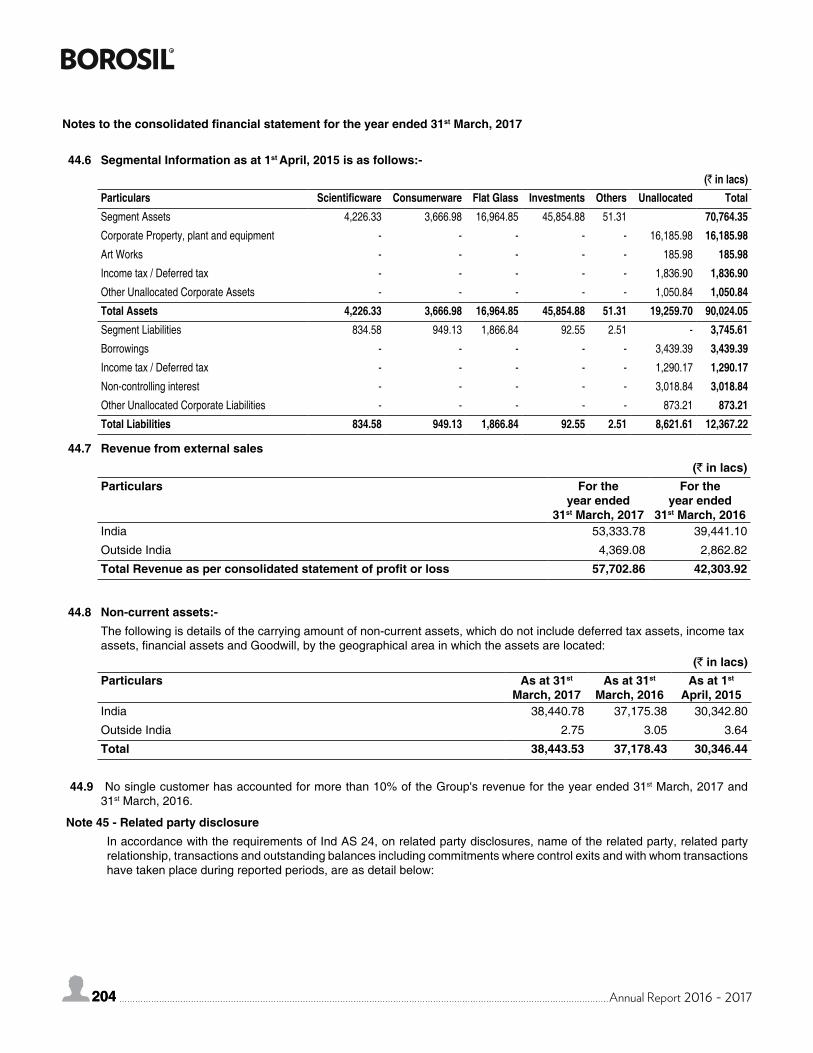
204 Annual Report 2016 - 2017204
44.6 Segmental Information as at 1st April, 2015 is as follows:-(` in lacs)
Particulars Scientificware Consumerware Flat Glass Investments Others Unallocated TotalSegment Assets 4,226.33 3,666.98 16,964.85 45,854.88 51.31 70,764.35Corporate Property, plant and equipment - - - - - 16,185.98 16,185.98Art Works - - - - - 185.98 185.98Income tax / Deferred tax - - - - - 1,836.90 1,836.90Other Unallocated Corporate Assets - - - - - 1,050.84 1,050.84Total Assets 4,226.33 3,666.98 16,964.85 45,854.88 51.31 19,259.70 90,024.05Segment Liabilities 834.58 949.13 1,866.84 92.55 2.51 - 3,745.61Borrowings - - - - - 3,439.39 3,439.39Income tax / Deferred tax - - - - - 1,290.17 1,290.17Non-controlling interest - - - - - 3,018.84 3,018.84Other Unallocated Corporate Liabilities - - - - - 873.21 873.21Total Liabilities 834.58 949.13 1,866.84 92.55 2.51 8,621.61 12,367.22
44.7 Revenue from external sales(` in lacs)
Particulars For the year ended
31st March, 2017
For the year ended
31st March, 2016India 53,333.78 39,441.10
Outside India 4,369.08 2,862.82
Total Revenue as per consolidated statement of profit or loss 57,702.86 42,303.92
44.8 Non-current assets:-The following is details of the carrying amount of non-current assets, which do not include deferred tax assets, income tax assets, financial assets and Goodwill, by the geographical area in which the assets are located:
(` in lacs)Particulars As at 31st
March, 2017As at 31st
March, 2016As at 1st
April, 2015India 38,440.78 37,175.38 30,342.80
Outside India 2.75 3.05 3.64
Total 38,443.53 37,178.43 30,346.44
44.9 No single customer has accounted for more than 10% of the Group's revenue for the year ended 31st March, 2017 and 31st March, 2016.
Note 45 - Related party disclosureIn accordance with the requirements of Ind AS 24, on related party disclosures, name of the related party, related party relationship, transactions and outstanding balances including commitments where control exits and with whom transactions have taken place during reported periods, are as detail below:
Notes to the consolidated financial statement for the year ended 31st March, 2017
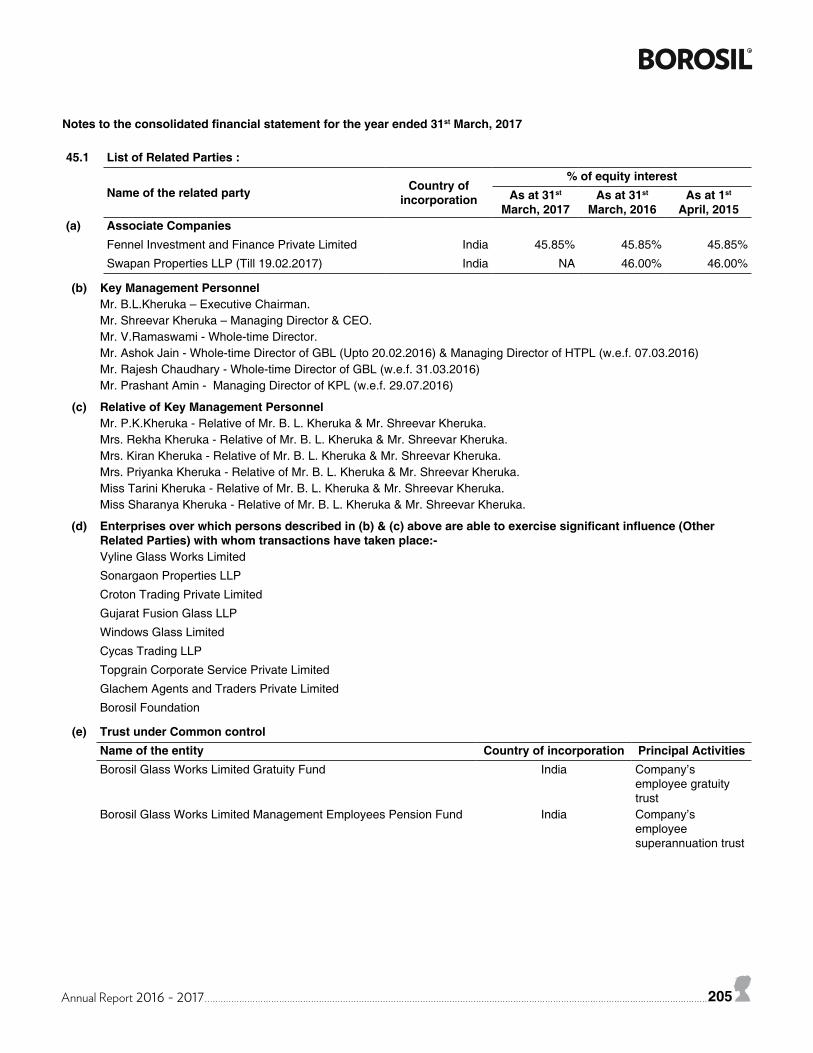
Annual Report 2016 - 2017 205
Notes to the consolidated financial statement for the year ended 31st March, 2017
45.1 List of Related Parties :
Name of the related party Country of incorporation
% of equity interestAs at 31st
March, 2017As at 31st
March, 2016As at 1st
April, 2015(a) Associate Companies
Fennel Investment and Finance Private Limited India 45.85% 45.85% 45.85%
Swapan Properties LLP (Till 19.02.2017) India NA 46.00% 46.00%
(b) Key Management PersonnelMr. B.L.Kheruka – Executive Chairman.Mr. Shreevar Kheruka – Managing Director & CEO.Mr. V.Ramaswami - Whole-time Director.Mr. Ashok Jain - Whole-time Director of GBL (Upto 20.02.2016) & Managing Director of HTPL (w.e.f. 07.03.2016)Mr. Rajesh Chaudhary - Whole-time Director of GBL (w.e.f. 31.03.2016)Mr. Prashant Amin - Managing Director of KPL (w.e.f. 29.07.2016)
(c) Relative of Key Management PersonnelMr. P.K.Kheruka - Relative of Mr. B. L. Kheruka & Mr. Shreevar Kheruka.Mrs. Rekha Kheruka - Relative of Mr. B. L. Kheruka & Mr. Shreevar Kheruka.Mrs. Kiran Kheruka - Relative of Mr. B. L. Kheruka & Mr. Shreevar Kheruka.Mrs. Priyanka Kheruka - Relative of Mr. B. L. Kheruka & Mr. Shreevar Kheruka.Miss Tarini Kheruka - Relative of Mr. B. L. Kheruka & Mr. Shreevar Kheruka.Miss Sharanya Kheruka - Relative of Mr. B. L. Kheruka & Mr. Shreevar Kheruka.
(d) Enterprises over which persons described in (b) & (c) above are able to exercise significant influence (Other Related Parties) with whom transactions have taken place:-Vyline Glass Works Limited
Sonargaon Properties LLP
Croton Trading Private Limited
Gujarat Fusion Glass LLP
Windows Glass Limited
Cycas Trading LLP
Topgrain Corporate Service Private Limited
Glachem Agents and Traders Private Limited
Borosil Foundation
(e) Trust under Common controlName of the entity Country of incorporation Principal ActivitiesBorosil Glass Works Limited Gratuity Fund India Company’s
employee gratuity trust
Borosil Glass Works Limited Management Employees Pension Fund India Company’s employee superannuation trust
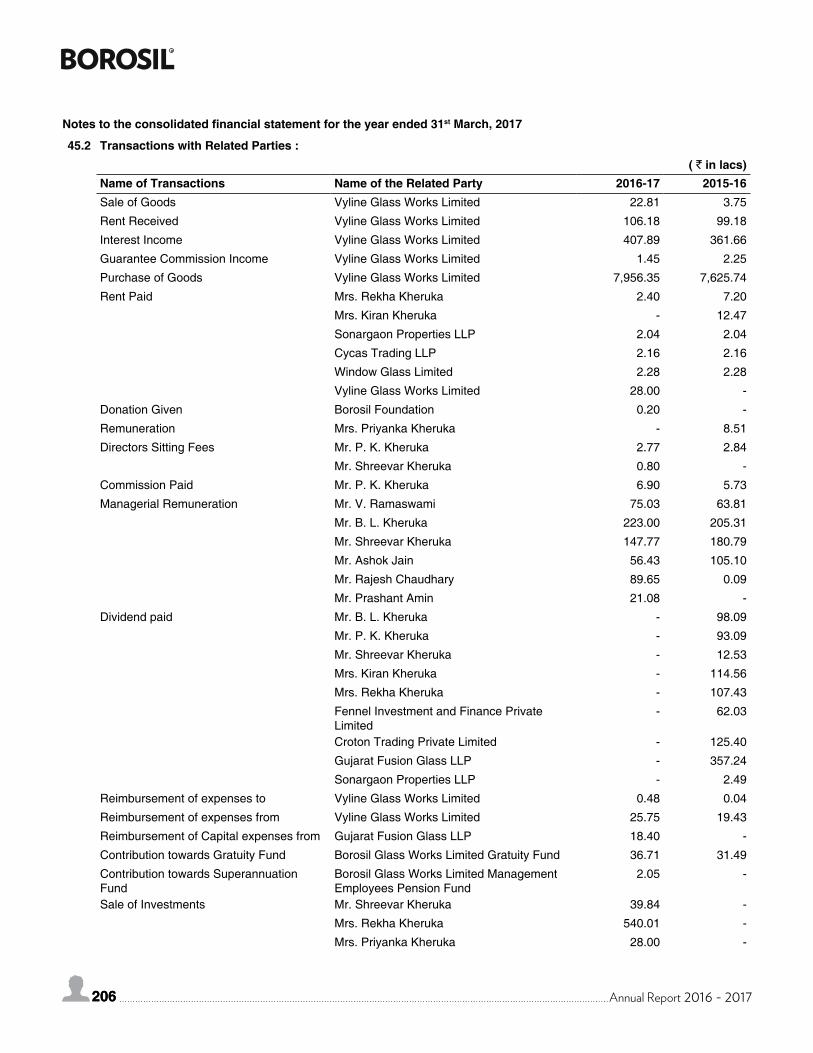
206 Annual Report 2016 - 2017206
45.2 Transactions with Related Parties :( ` in lacs)
Name of Transactions Name of the Related Party 2016-17 2015-16Sale of Goods Vyline Glass Works Limited 22.81 3.75
Rent Received Vyline Glass Works Limited 106.18 99.18
Interest Income Vyline Glass Works Limited 407.89 361.66
Guarantee Commission Income Vyline Glass Works Limited 1.45 2.25
Purchase of Goods Vyline Glass Works Limited 7,956.35 7,625.74
Rent Paid Mrs. Rekha Kheruka 2.40 7.20
Mrs. Kiran Kheruka - 12.47
Sonargaon Properties LLP 2.04 2.04
Cycas Trading LLP 2.16 2.16
Window Glass Limited 2.28 2.28
Vyline Glass Works Limited 28.00 -
Donation Given Borosil Foundation 0.20 -
Remuneration Mrs. Priyanka Kheruka - 8.51
Directors Sitting Fees Mr. P. K. Kheruka 2.77 2.84
Mr. Shreevar Kheruka 0.80 -
Commission Paid Mr. P. K. Kheruka 6.90 5.73
Managerial Remuneration Mr. V. Ramaswami 75.03 63.81
Mr. B. L. Kheruka 223.00 205.31
Mr. Shreevar Kheruka 147.77 180.79
Mr. Ashok Jain 56.43 105.10
Mr. Rajesh Chaudhary 89.65 0.09
Mr. Prashant Amin 21.08 -
Dividend paid Mr. B. L. Kheruka - 98.09
Mr. P. K. Kheruka - 93.09
Mr. Shreevar Kheruka - 12.53
Mrs. Kiran Kheruka - 114.56
Mrs. Rekha Kheruka - 107.43
Fennel Investment and Finance Private Limited
- 62.03
Croton Trading Private Limited - 125.40
Gujarat Fusion Glass LLP - 357.24
Sonargaon Properties LLP - 2.49
Reimbursement of expenses to Vyline Glass Works Limited 0.48 0.04
Reimbursement of expenses from Vyline Glass Works Limited 25.75 19.43
Reimbursement of Capital expenses from Gujarat Fusion Glass LLP 18.40 -
Contribution towards Gratuity Fund Borosil Glass Works Limited Gratuity Fund 36.71 31.49
Contribution towards Superannuation Fund
Borosil Glass Works Limited Management Employees Pension Fund
2.05 -
Sale of Investments Mr. Shreevar Kheruka 39.84 -
Mrs. Rekha Kheruka 540.01 -
Mrs. Priyanka Kheruka 28.00 -
Notes to the consolidated financial statement for the year ended 31st March, 2017
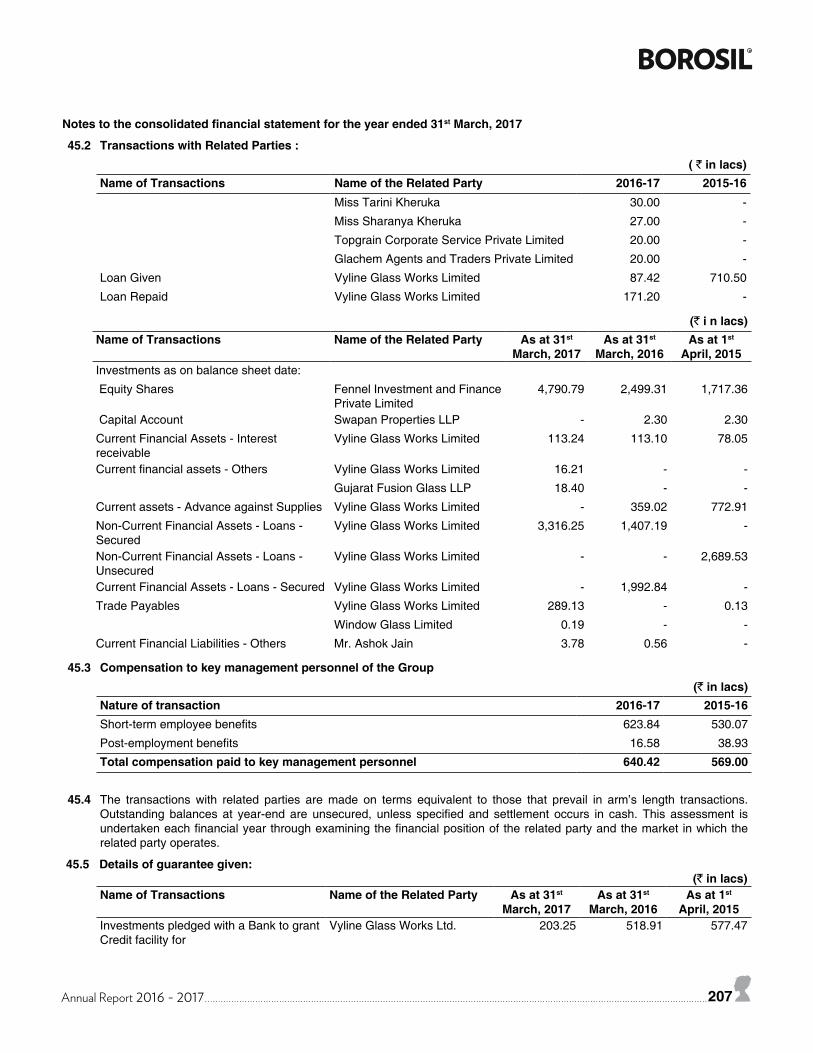
Annual Report 2016 - 2017 207
Notes to the consolidated financial statement for the year ended 31st March, 2017
45.2 Transactions with Related Parties :( ` in lacs)
Name of Transactions Name of the Related Party 2016-17 2015-16Miss Tarini Kheruka 30.00 -
Miss Sharanya Kheruka 27.00 -
Topgrain Corporate Service Private Limited 20.00 -
Glachem Agents and Traders Private Limited 20.00 -
Loan Given Vyline Glass Works Limited 87.42 710.50
Loan Repaid Vyline Glass Works Limited 171.20 -
(` i n lacs)Name of Transactions Name of the Related Party As at 31st
March, 2017As at 31st
March, 2016As at 1st
April, 2015Investments as on balance sheet date:
Equity Shares Fennel Investment and Finance Private Limited
4,790.79 2,499.31 1,717.36
Capital Account Swapan Properties LLP - 2.30 2.30
Current Financial Assets - Interest receivable
Vyline Glass Works Limited 113.24 113.10 78.05
Current financial assets - Others Vyline Glass Works Limited 16.21 - -
Gujarat Fusion Glass LLP 18.40 - -
Current assets - Advance against Supplies Vyline Glass Works Limited - 359.02 772.91
Non-Current Financial Assets - Loans - Secured
Vyline Glass Works Limited 3,316.25 1,407.19 -
Non-Current Financial Assets - Loans - Unsecured
Vyline Glass Works Limited - - 2,689.53
Current Financial Assets - Loans - Secured Vyline Glass Works Limited - 1,992.84 -
Trade Payables Vyline Glass Works Limited 289.13 - 0.13
Window Glass Limited 0.19 - -
Current Financial Liabilities - Others Mr. Ashok Jain 3.78 0.56 -
45.3 Compensation to key management personnel of the Group(` in lacs)
Nature of transaction 2016-17 2015-16Short-term employee benefits 623.84 530.07
Post-employment benefits 16.58 38.93
Total compensation paid to key management personnel 640.42 569.00
45.4 The transactions with related parties are made on terms equivalent to those that prevail in arm’s length transactions. Outstanding balances at year-end are unsecured, unless specified and settlement occurs in cash. This assessment is undertaken each financial year through examining the financial position of the related party and the market in which the related party operates.
45.5 Details of guarantee given:(` in lacs)
Name of Transactions Name of the Related Party As at 31st March, 2017
As at 31st March, 2016
As at 1st April, 2015
Investments pledged with a Bank to grant Credit facility for
Vyline Glass Works Ltd. 203.25 518.91 577.47
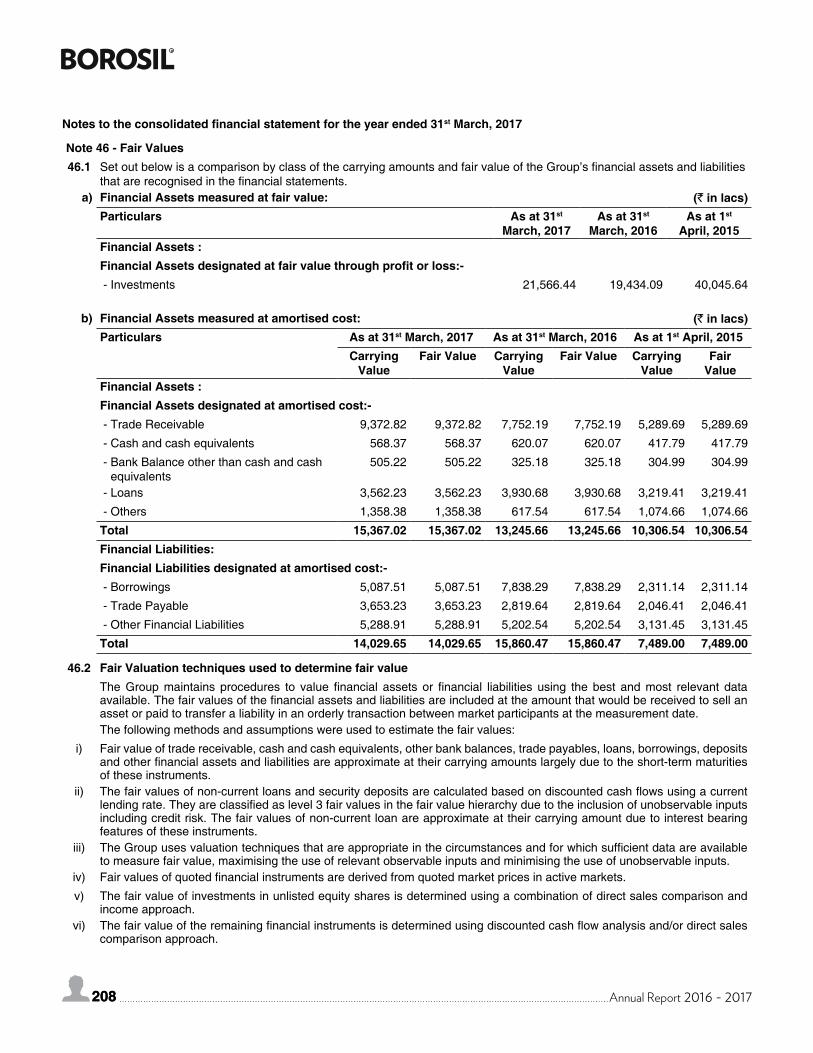
208 Annual Report 2016 - 2017208
Note 46 - Fair Values46.1 Set out below is a comparison by class of the carrying amounts and fair value of the Group’s financial assets and liabilities
that are recognised in the financial statements.a) Financial Assets measured at fair value: (` in lacs)
Particulars As at 31st March, 2017
As at 31st March, 2016
As at 1st April, 2015
Financial Assets :Financial Assets designated at fair value through profit or loss:- - Investments 21,566.44 19,434.09 40,045.64
b) Financial Assets measured at amortised cost: (` in lacs)Particulars As at 31st March, 2017 As at 31st March, 2016 As at 1st April, 2015
Carrying Value
Fair Value Carrying Value
Fair Value Carrying Value
Fair Value
Financial Assets :Financial Assets designated at amortised cost:- - Trade Receivable 9,372.82 9,372.82 7,752.19 7,752.19 5,289.69 5,289.69
- Cash and cash equivalents 568.37 568.37 620.07 620.07 417.79 417.79
- Bank Balance other than cash and cash equivalents
505.22 505.22 325.18 325.18 304.99 304.99
- Loans 3,562.23 3,562.23 3,930.68 3,930.68 3,219.41 3,219.41
- Others 1,358.38 1,358.38 617.54 617.54 1,074.66 1,074.66
Total 15,367.02 15,367.02 13,245.66 13,245.66 10,306.54 10,306.54Financial Liabilities:Financial Liabilities designated at amortised cost:- - Borrowings 5,087.51 5,087.51 7,838.29 7,838.29 2,311.14 2,311.14
- Trade Payable 3,653.23 3,653.23 2,819.64 2,819.64 2,046.41 2,046.41
- Other Financial Liabilities 5,288.91 5,288.91 5,202.54 5,202.54 3,131.45 3,131.45
Total 14,029.65 14,029.65 15,860.47 15,860.47 7,489.00 7,489.00
46.2 Fair Valuation techniques used to determine fair valueThe Group maintains procedures to value financial assets or financial liabilities using the best and most relevant data available. The fair values of the financial assets and liabilities are included at the amount that would be received to sell an asset or paid to transfer a liability in an orderly transaction between market participants at the measurement date.The following methods and assumptions were used to estimate the fair values:
i) Fair value of trade receivable, cash and cash equivalents, other bank balances, trade payables, loans, borrowings, deposits and other financial assets and liabilities are approximate at their carrying amounts largely due to the short-term maturities of these instruments.
ii) The fair values of non-current loans and security deposits are calculated based on discounted cash flows using a current lending rate. They are classified as level 3 fair values in the fair value hierarchy due to the inclusion of unobservable inputs including credit risk. The fair values of non-current loan are approximate at their carrying amount due to interest bearing features of these instruments.
iii) The Group uses valuation techniques that are appropriate in the circumstances and for which sufficient data are available to measure fair value, maximising the use of relevant observable inputs and minimising the use of unobservable inputs.
iv) Fair values of quoted financial instruments are derived from quoted market prices in active markets.
v) The fair value of investments in unlisted equity shares is determined using a combination of direct sales comparison and income approach.
vi) The fair value of the remaining financial instruments is determined using discounted cash flow analysis and/or direct sales comparison approach.
Notes to the consolidated financial statement for the year ended 31st March, 2017
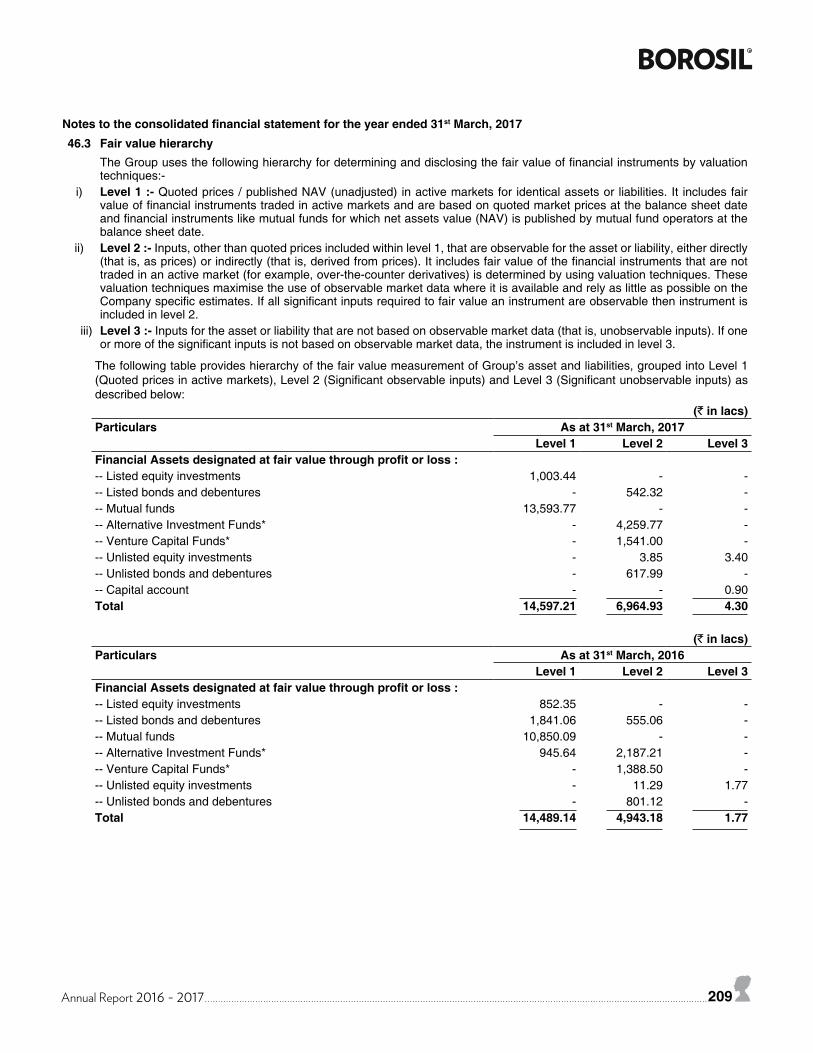
Annual Report 2016 - 2017 209
Notes to the consolidated financial statement for the year ended 31st March, 201746.3 Fair value hierarchy
The Group uses the following hierarchy for determining and disclosing the fair value of financial instruments by valuation techniques:-
i) Level 1 :- Quoted prices / published NAV (unadjusted) in active markets for identical assets or liabilities. It includes fair value of financial instruments traded in active markets and are based on quoted market prices at the balance sheet date and financial instruments like mutual funds for which net assets value (NAV) is published by mutual fund operators at the balance sheet date.
ii) Level 2 :- Inputs, other than quoted prices included within level 1, that are observable for the asset or liability, either directly (that is, as prices) or indirectly (that is, derived from prices). It includes fair value of the financial instruments that are not traded in an active market (for example, over-the-counter derivatives) is determined by using valuation techniques. These valuation techniques maximise the use of observable market data where it is available and rely as little as possible on the Company specific estimates. If all significant inputs required to fair value an instrument are observable then instrument is included in level 2.
iii) Level 3 :- Inputs for the asset or liability that are not based on observable market data (that is, unobservable inputs). If one or more of the significant inputs is not based on observable market data, the instrument is included in level 3.
The following table provides hierarchy of the fair value measurement of Group’s asset and liabilities, grouped into Level 1 (Quoted prices in active markets), Level 2 (Significant observable inputs) and Level 3 (Significant unobservable inputs) as described below:
(` in lacs)Particulars As at 31st March, 2017
Level 1 Level 2 Level 3Financial Assets designated at fair value through profit or loss :-- Listed equity investments 1,003.44 - --- Listed bonds and debentures - 542.32 --- Mutual funds 13,593.77 - --- Alternative Investment Funds* - 4,259.77 --- Venture Capital Funds* - 1,541.00 --- Unlisted equity investments - 3.85 3.40-- Unlisted bonds and debentures - 617.99 --- Capital account - - 0.90Total 14,597.21 6,964.93 4.30
(` in lacs)Particulars As at 31st March, 2016
Level 1 Level 2 Level 3Financial Assets designated at fair value through profit or loss :-- Listed equity investments 852.35 - --- Listed bonds and debentures 1,841.06 555.06 --- Mutual funds 10,850.09 - --- Alternative Investment Funds* 945.64 2,187.21 --- Venture Capital Funds* - 1,388.50 --- Unlisted equity investments - 11.29 1.77-- Unlisted bonds and debentures - 801.12 -Total 14,489.14 4,943.18 1.77
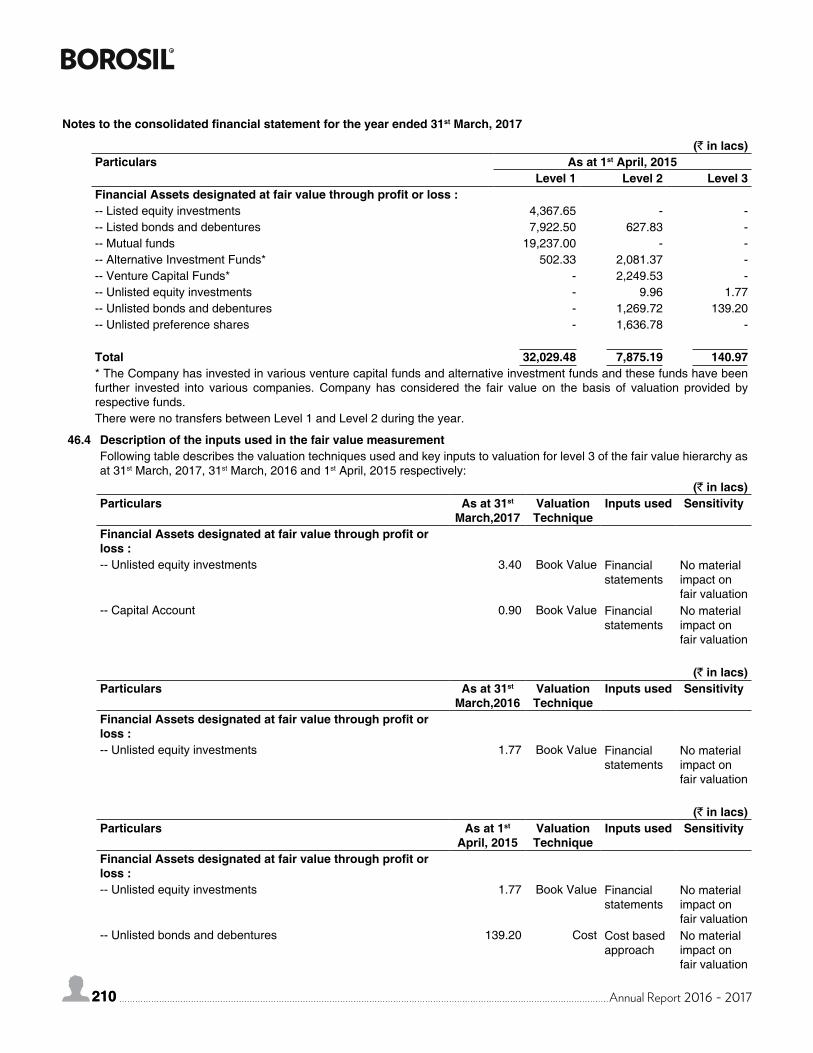
210 Annual Report 2016 - 2017210
Notes to the consolidated financial statement for the year ended 31st March, 2017
(` in lacs)Particulars As at 1st April, 2015
Level 1 Level 2 Level 3Financial Assets designated at fair value through profit or loss :-- Listed equity investments 4,367.65 - --- Listed bonds and debentures 7,922.50 627.83 --- Mutual funds 19,237.00 - --- Alternative Investment Funds* 502.33 2,081.37 --- Venture Capital Funds* - 2,249.53 --- Unlisted equity investments - 9.96 1.77-- Unlisted bonds and debentures - 1,269.72 139.20-- Unlisted preference shares - 1,636.78 -
Total 32,029.48 7,875.19 140.97* The Company has invested in various venture capital funds and alternative investment funds and these funds have been further invested into various companies. Company has considered the fair value on the basis of valuation provided by respective funds.There were no transfers between Level 1 and Level 2 during the year.
46.4 Description of the inputs used in the fair value measurementFollowing table describes the valuation techniques used and key inputs to valuation for level 3 of the fair value hierarchy as at 31st March, 2017, 31st March, 2016 and 1st April, 2015 respectively:
(` in lacs)Particulars As at 31st
March,2017Valuation Technique
Inputs used Sensitivity
Financial Assets designated at fair value through profit or loss :-- Unlisted equity investments 3.40 Book Value Financial
statementsNo material impact on fair valuation
-- Capital Account 0.90 Book Value Financial statements
No material impact on fair valuation
(` in lacs)Particulars As at 31st
March,2016Valuation Technique
Inputs used Sensitivity
Financial Assets designated at fair value through profit or loss :-- Unlisted equity investments 1.77 Book Value Financial
statementsNo material impact on fair valuation
(` in lacs)Particulars As at 1st
April, 2015Valuation Technique
Inputs used Sensitivity
Financial Assets designated at fair value through profit or loss :-- Unlisted equity investments 1.77 Book Value Financial
statementsNo material impact on fair valuation
-- Unlisted bonds and debentures 139.20 Cost Cost based approach
No material impact on fair valuation
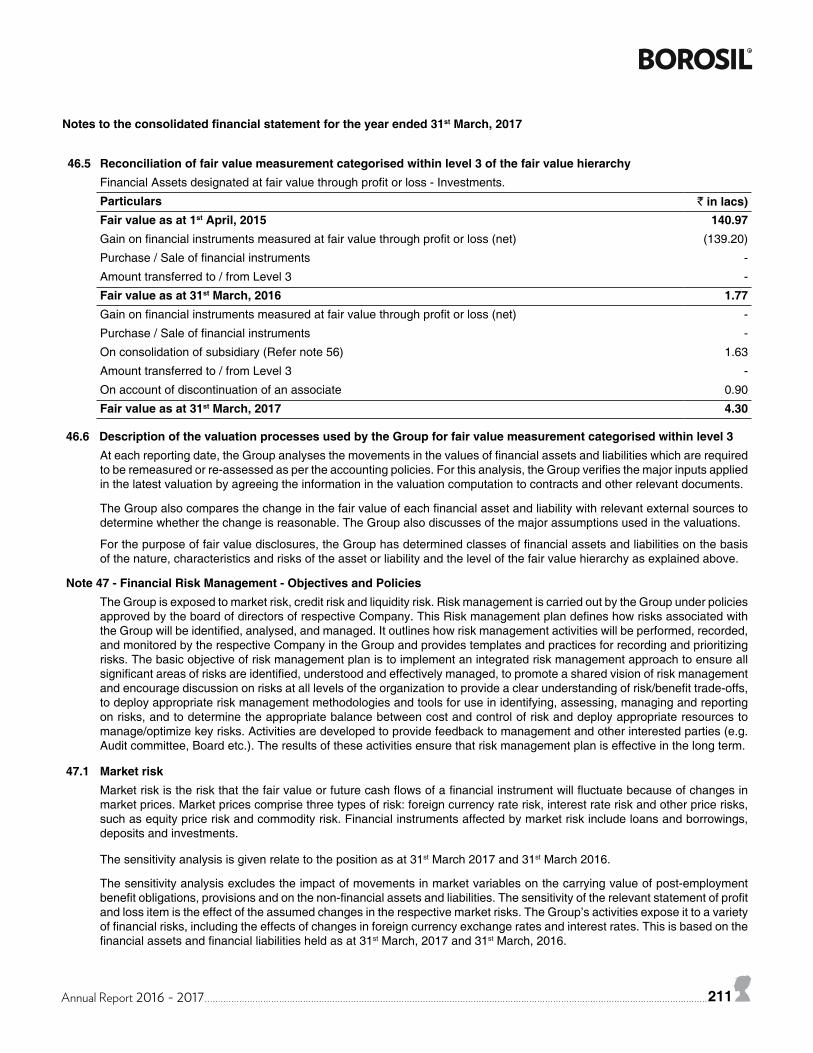
Annual Report 2016 - 2017 211
Notes to the consolidated financial statement for the year ended 31st March, 2017
46.5 Reconciliation of fair value measurement categorised within level 3 of the fair value hierarchyFinancial Assets designated at fair value through profit or loss - Investments.
Particulars ` in lacs)Fair value as at 1st April, 2015 140.97Gain on financial instruments measured at fair value through profit or loss (net) (139.20)
Purchase / Sale of financial instruments -
Amount transferred to / from Level 3 -
Fair value as at 31st March, 2016 1.77Gain on financial instruments measured at fair value through profit or loss (net) -
Purchase / Sale of financial instruments -
On consolidation of subsidiary (Refer note 56) 1.63
Amount transferred to / from Level 3 -
On account of discontinuation of an associate 0.90
Fair value as at 31st March, 2017 4.30
46.6 Description of the valuation processes used by the Group for fair value measurement categorised within level 3At each reporting date, the Group analyses the movements in the values of financial assets and liabilities which are required to be remeasured or re-assessed as per the accounting policies. For this analysis, the Group verifies the major inputs applied in the latest valuation by agreeing the information in the valuation computation to contracts and other relevant documents.
The Group also compares the change in the fair value of each financial asset and liability with relevant external sources to determine whether the change is reasonable. The Group also discusses of the major assumptions used in the valuations.
For the purpose of fair value disclosures, the Group has determined classes of financial assets and liabilities on the basis of the nature, characteristics and risks of the asset or liability and the level of the fair value hierarchy as explained above.
Note 47 - Financial Risk Management - Objectives and Policies The Group is exposed to market risk, credit risk and liquidity risk. Risk management is carried out by the Group under policies approved by the board of directors of respective Company. This Risk management plan defines how risks associated with the Group will be identified, analysed, and managed. It outlines how risk management activities will be performed, recorded, and monitored by the respective Company in the Group and provides templates and practices for recording and prioritizing risks. The basic objective of risk management plan is to implement an integrated risk management approach to ensure all significant areas of risks are identified, understood and effectively managed, to promote a shared vision of risk management and encourage discussion on risks at all levels of the organization to provide a clear understanding of risk/benefit trade-offs, to deploy appropriate risk management methodologies and tools for use in identifying, assessing, managing and reporting on risks, and to determine the appropriate balance between cost and control of risk and deploy appropriate resources to manage/optimize key risks. Activities are developed to provide feedback to management and other interested parties (e.g. Audit committee, Board etc.). The results of these activities ensure that risk management plan is effective in the long term.
47.1 Market riskMarket risk is the risk that the fair value or future cash flows of a financial instrument will fluctuate because of changes in market prices. Market prices comprise three types of risk: foreign currency rate risk, interest rate risk and other price risks, such as equity price risk and commodity risk. Financial instruments affected by market risk include loans and borrowings, deposits and investments.
The sensitivity analysis is given relate to the position as at 31st March 2017 and 31st March 2016.
The sensitivity analysis excludes the impact of movements in market variables on the carrying value of post-employment benefit obligations, provisions and on the non-financial assets and liabilities. The sensitivity of the relevant statement of profit and loss item is the effect of the assumed changes in the respective market risks. The Group’s activities expose it to a variety of financial risks, including the effects of changes in foreign currency exchange rates and interest rates. This is based on the financial assets and financial liabilities held as at 31st March, 2017 and 31st March, 2016.
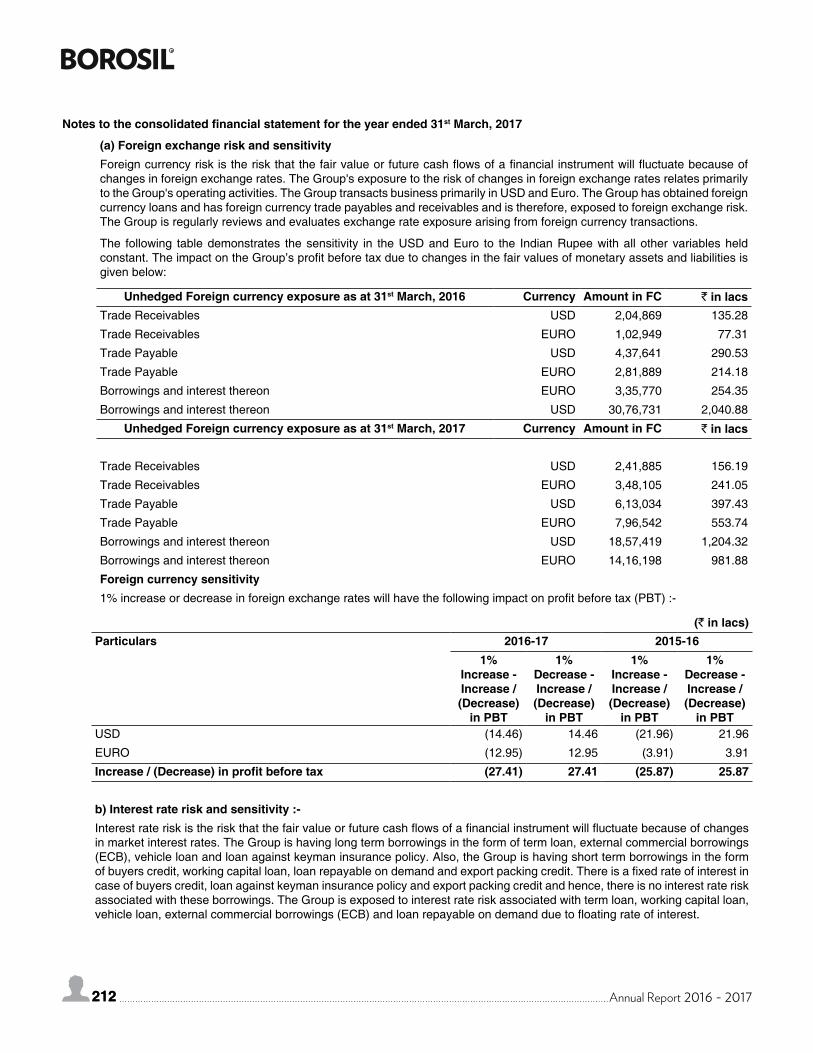
212 Annual Report 2016 - 2017212
Notes to the consolidated financial statement for the year ended 31st March, 2017
(a) Foreign exchange risk and sensitivityForeign currency risk is the risk that the fair value or future cash flows of a financial instrument will fluctuate because of changes in foreign exchange rates. The Group's exposure to the risk of changes in foreign exchange rates relates primarily to the Group's operating activities. The Group transacts business primarily in USD and Euro. The Group has obtained foreign currency loans and has foreign currency trade payables and receivables and is therefore, exposed to foreign exchange risk. The Group is regularly reviews and evaluates exchange rate exposure arising from foreign currency transactions.
The following table demonstrates the sensitivity in the USD and Euro to the Indian Rupee with all other variables held constant. The impact on the Group’s profit before tax due to changes in the fair values of monetary assets and liabilities is given below:
Unhedged Foreign currency exposure as at 31st March, 2016 Currency Amount in FC ` in lacsTrade Receivables USD 2,04,869 135.28
Trade Receivables EURO 1,02,949 77.31
Trade Payable USD 4,37,641 290.53
Trade Payable EURO 2,81,889 214.18
Borrowings and interest thereon EURO 3,35,770 254.35
Borrowings and interest thereon USD 30,76,731 2,040.88
Unhedged Foreign currency exposure as at 31st March, 2017 Currency Amount in FC ` in lacs
Trade Receivables USD 2,41,885 156.19
Trade Receivables EURO 3,48,105 241.05
Trade Payable USD 6,13,034 397.43
Trade Payable EURO 7,96,542 553.74
Borrowings and interest thereon USD 18,57,419 1,204.32
Borrowings and interest thereon EURO 14,16,198 981.88
Foreign currency sensitivity1% increase or decrease in foreign exchange rates will have the following impact on profit before tax (PBT) :-
(` in lacs)Particulars 2016-17 2015-16
1% Increase - Increase / (Decrease)
in PBT
1% Decrease - Increase / (Decrease)
in PBT
1% Increase - Increase / (Decrease)
in PBT
1% Decrease - Increase / (Decrease)
in PBTUSD (14.46) 14.46 (21.96) 21.96
EURO (12.95) 12.95 (3.91) 3.91
Increase / (Decrease) in profit before tax (27.41) 27.41 (25.87) 25.87
b) Interest rate risk and sensitivity :-Interest rate risk is the risk that the fair value or future cash flows of a financial instrument will fluctuate because of changes in market interest rates. The Group is having long term borrowings in the form of term loan, external commercial borrowings (ECB), vehicle loan and loan against keyman insurance policy. Also, the Group is having short term borrowings in the form of buyers credit, working capital loan, loan repayable on demand and export packing credit. There is a fixed rate of interest in case of buyers credit, loan against keyman insurance policy and export packing credit and hence, there is no interest rate risk associated with these borrowings. The Group is exposed to interest rate risk associated with term loan, working capital loan, vehicle loan, external commercial borrowings (ECB) and loan repayable on demand due to floating rate of interest.
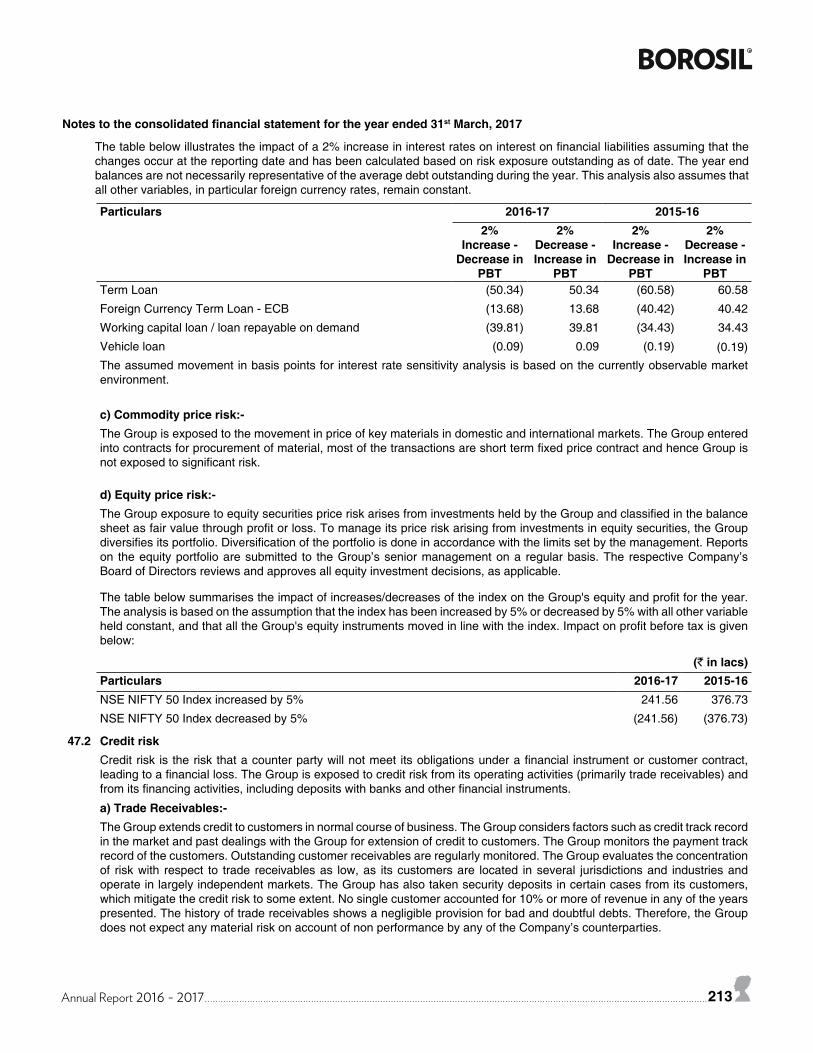
Annual Report 2016 - 2017 213
The table below illustrates the impact of a 2% increase in interest rates on interest on financial liabilities assuming that the changes occur at the reporting date and has been calculated based on risk exposure outstanding as of date. The year end balances are not necessarily representative of the average debt outstanding during the year. This analysis also assumes that all other variables, in particular foreign currency rates, remain constant.
Particulars 2016-17 2015-162%
Increase - Decrease in
PBT
2% Decrease - Increase in
PBT
2% Increase -
Decrease in PBT
2% Decrease - Increase in
PBTTerm Loan (50.34) 50.34 (60.58) 60.58
Foreign Currency Term Loan - ECB (13.68) 13.68 (40.42) 40.42
Working capital loan / loan repayable on demand (39.81) 39.81 (34.43) 34.43
Vehicle loan (0.09) 0.09 (0.19) (0.19)The assumed movement in basis points for interest rate sensitivity analysis is based on the currently observable market environment.
c) Commodity price risk:-The Group is exposed to the movement in price of key materials in domestic and international markets. The Group entered into contracts for procurement of material, most of the transactions are short term fixed price contract and hence Group is not exposed to significant risk.
d) Equity price risk:-The Group exposure to equity securities price risk arises from investments held by the Group and classified in the balance sheet as fair value through profit or loss. To manage its price risk arising from investments in equity securities, the Group diversifies its portfolio. Diversification of the portfolio is done in accordance with the limits set by the management. Reports on the equity portfolio are submitted to the Group’s senior management on a regular basis. The respective Company’s Board of Directors reviews and approves all equity investment decisions, as applicable.
The table below summarises the impact of increases/decreases of the index on the Group's equity and profit for the year. The analysis is based on the assumption that the index has been increased by 5% or decreased by 5% with all other variable held constant, and that all the Group's equity instruments moved in line with the index. Impact on profit before tax is given below:
(` in lacs)Particulars 2016-17 2015-16NSE NIFTY 50 Index increased by 5% 241.56 376.73
NSE NIFTY 50 Index decreased by 5% (241.56) (376.73)
47.2 Credit riskCredit risk is the risk that a counter party will not meet its obligations under a financial instrument or customer contract, leading to a financial loss. The Group is exposed to credit risk from its operating activities (primarily trade receivables) and from its financing activities, including deposits with banks and other financial instruments.
a) Trade Receivables:-The Group extends credit to customers in normal course of business. The Group considers factors such as credit track record in the market and past dealings with the Group for extension of credit to customers. The Group monitors the payment track record of the customers. Outstanding customer receivables are regularly monitored. The Group evaluates the concentration of risk with respect to trade receivables as low, as its customers are located in several jurisdictions and industries and operate in largely independent markets. The Group has also taken security deposits in certain cases from its customers, which mitigate the credit risk to some extent. No single customer accounted for 10% or more of revenue in any of the years presented. The history of trade receivables shows a negligible provision for bad and doubtful debts. Therefore, the Group does not expect any material risk on account of non performance by any of the Company’s counterparties.
Notes to the consolidated financial statement for the year ended 31st March, 2017
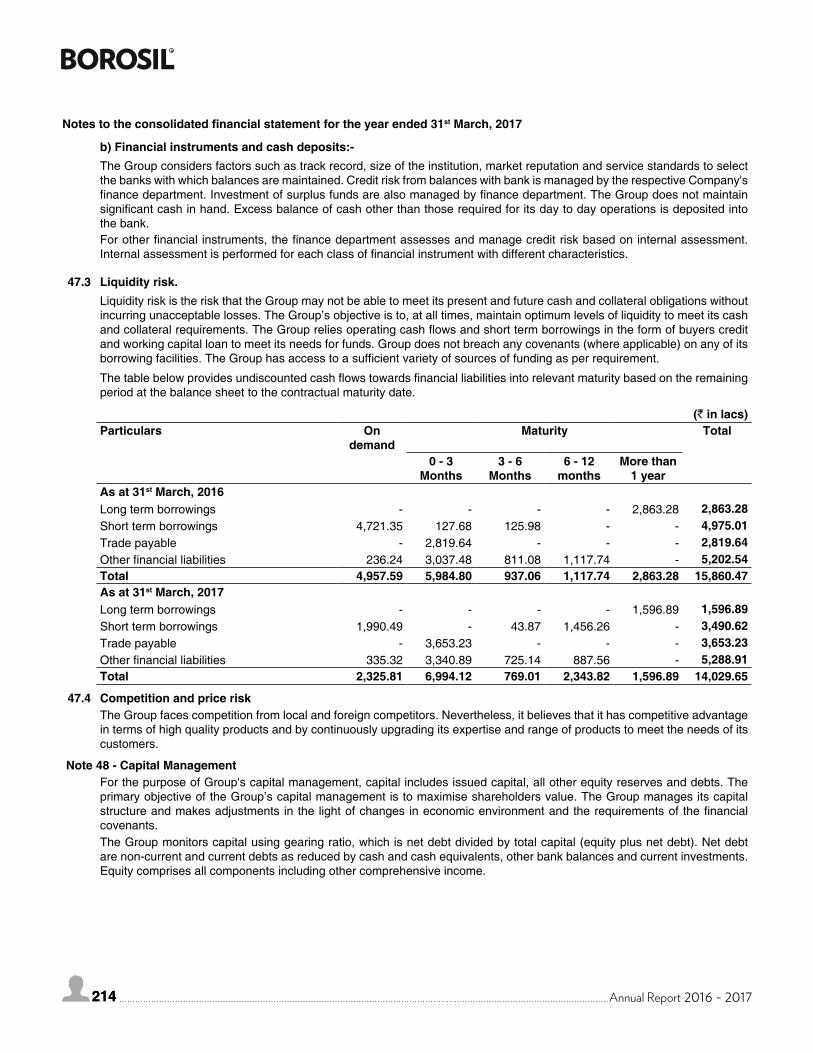
214 Annual Report 2016 - 2017214
b) Financial instruments and cash deposits:-The Group considers factors such as track record, size of the institution, market reputation and service standards to select the banks with which balances are maintained. Credit risk from balances with bank is managed by the respective Company's finance department. Investment of surplus funds are also managed by finance department. The Group does not maintain significant cash in hand. Excess balance of cash other than those required for its day to day operations is deposited into the bank.For other financial instruments, the finance department assesses and manage credit risk based on internal assessment. Internal assessment is performed for each class of financial instrument with different characteristics.
47.3 Liquidity risk.Liquidity risk is the risk that the Group may not be able to meet its present and future cash and collateral obligations without incurring unacceptable losses. The Group’s objective is to, at all times, maintain optimum levels of liquidity to meet its cash and collateral requirements. The Group relies operating cash flows and short term borrowings in the form of buyers credit and working capital loan to meet its needs for funds. Group does not breach any covenants (where applicable) on any of its borrowing facilities. The Group has access to a sufficient variety of sources of funding as per requirement.
The table below provides undiscounted cash flows towards financial liabilities into relevant maturity based on the remaining period at the balance sheet to the contractual maturity date.
(` in lacs)Particulars On
demandMaturity Total
0 - 3 Months
3 - 6 Months
6 - 12 months
More than 1 year
As at 31st March, 2016Long term borrowings - - - - 2,863.28 2,863.28Short term borrowings 4,721.35 127.68 125.98 - - 4,975.01Trade payable - 2,819.64 - - - 2,819.64Other financial liabilities 236.24 3,037.48 811.08 1,117.74 - 5,202.54Total 4,957.59 5,984.80 937.06 1,117.74 2,863.28 15,860.47As at 31st March, 2017Long term borrowings - - - - 1,596.89 1,596.89Short term borrowings 1,990.49 - 43.87 1,456.26 - 3,490.62Trade payable - 3,653.23 - - - 3,653.23Other financial liabilities 335.32 3,340.89 725.14 887.56 - 5,288.91Total 2,325.81 6,994.12 769.01 2,343.82 1,596.89 14,029.65
47.4 Competition and price riskThe Group faces competition from local and foreign competitors. Nevertheless, it believes that it has competitive advantage in terms of high quality products and by continuously upgrading its expertise and range of products to meet the needs of its customers.
Note 48 - Capital ManagementFor the purpose of Group's capital management, capital includes issued capital, all other equity reserves and debts. The primary objective of the Group’s capital management is to maximise shareholders value. The Group manages its capital structure and makes adjustments in the light of changes in economic environment and the requirements of the financial covenants.The Group monitors capital using gearing ratio, which is net debt divided by total capital (equity plus net debt). Net debt are non-current and current debts as reduced by cash and cash equivalents, other bank balances and current investments. Equity comprises all components including other comprehensive income.
Notes to the consolidated financial statement for the year ended 31st March, 2017
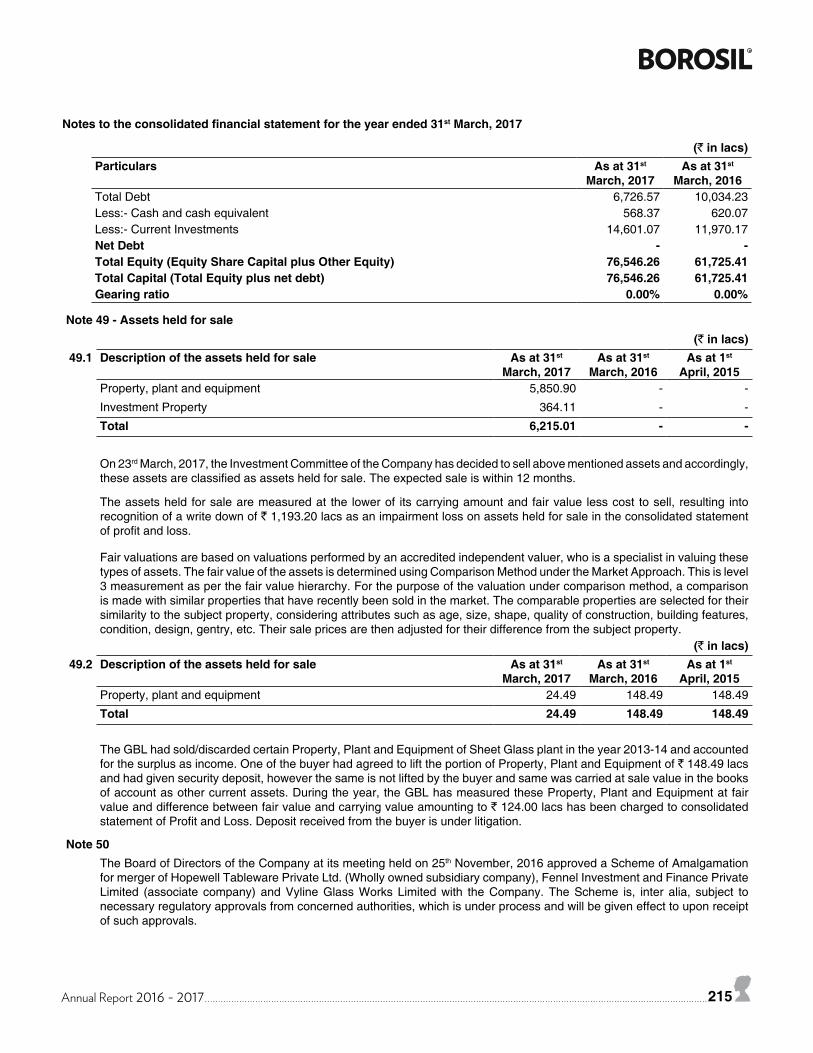
Annual Report 2016 - 2017 215
Notes to the consolidated financial statement for the year ended 31st March, 2017
(` in lacs)Particulars As at 31st
March, 2017As at 31st
March, 2016Total Debt 6,726.57 10,034.23Less:- Cash and cash equivalent 568.37 620.07Less:- Current Investments 14,601.07 11,970.17Net Debt - -Total Equity (Equity Share Capital plus Other Equity) 76,546.26 61,725.41Total Capital (Total Equity plus net debt) 76,546.26 61,725.41Gearing ratio 0.00% 0.00%
Note 49 - Assets held for sale(` in lacs)
49.1 Description of the assets held for sale As at 31st March, 2017
As at 31st March, 2016
As at 1st April, 2015
Property, plant and equipment 5,850.90 - -
Investment Property 364.11 - -
Total 6,215.01 - -
On 23rd March, 2017, the Investment Committee of the Company has decided to sell above mentioned assets and accordingly, these assets are classified as assets held for sale. The expected sale is within 12 months.
The assets held for sale are measured at the lower of its carrying amount and fair value less cost to sell, resulting into recognition of a write down of ` 1,193.20 lacs as an impairment loss on assets held for sale in the consolidated statement of profit and loss.
Fair valuations are based on valuations performed by an accredited independent valuer, who is a specialist in valuing these types of assets. The fair value of the assets is determined using Comparison Method under the Market Approach. This is level 3 measurement as per the fair value hierarchy. For the purpose of the valuation under comparison method, a comparison is made with similar properties that have recently been sold in the market. The comparable properties are selected for their similarity to the subject property, considering attributes such as age, size, shape, quality of construction, building features, condition, design, gentry, etc. Their sale prices are then adjusted for their difference from the subject property.
(` in lacs)49.2 Description of the assets held for sale As at 31st
March, 2017As at 31st
March, 2016As at 1st
April, 2015Property, plant and equipment 24.49 148.49 148.49
Total 24.49 148.49 148.49
The GBL had sold/discarded certain Property, Plant and Equipment of Sheet Glass plant in the year 2013-14 and accounted for the surplus as income. One of the buyer had agreed to lift the portion of Property, Plant and Equipment of ` 148.49 lacs and had given security deposit, however the same is not lifted by the buyer and same was carried at sale value in the books of account as other current assets. During the year, the GBL has measured these Property, Plant and Equipment at fair value and difference between fair value and carrying value amounting to ` 124.00 lacs has been charged to consolidated statement of Profit and Loss. Deposit received from the buyer is under litigation.
Note 50The Board of Directors of the Company at its meeting held on 25th November, 2016 approved a Scheme of Amalgamation for merger of Hopewell Tableware Private Ltd. (Wholly owned subsidiary company), Fennel Investment and Finance Private Limited (associate company) and Vyline Glass Works Limited with the Company. The Scheme is, inter alia, subject to necessary regulatory approvals from concerned authorities, which is under process and will be given effect to upon receipt of such approvals.
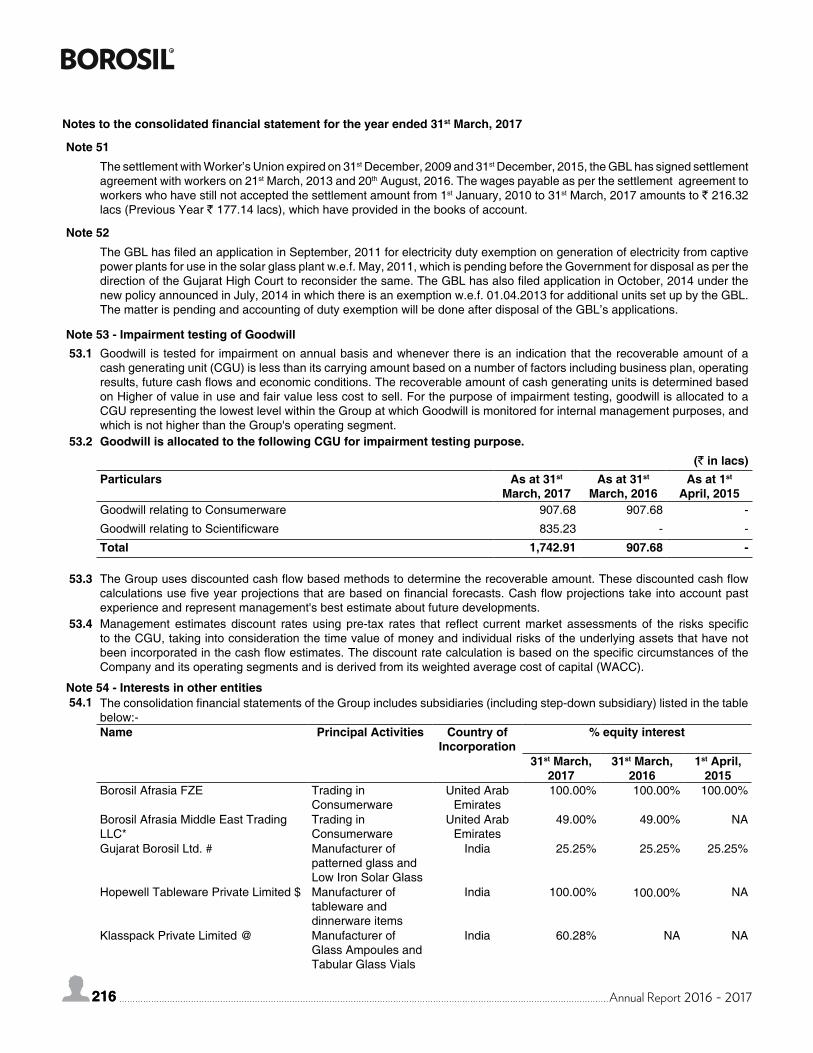
216 Annual Report 2016 - 2017216
Note 51The settlement with Worker’s Union expired on 31st December, 2009 and 31st December, 2015, the GBL has signed settlement agreement with workers on 21st March, 2013 and 20th August, 2016. The wages payable as per the settlement agreement to workers who have still not accepted the settlement amount from 1st January, 2010 to 31st March, 2017 amounts to ` 216.32 lacs (Previous Year ` 177.14 lacs), which have provided in the books of account.
Note 52The GBL has filed an application in September, 2011 for electricity duty exemption on generation of electricity from captive power plants for use in the solar glass plant w.e.f. May, 2011, which is pending before the Government for disposal as per the direction of the Gujarat High Court to reconsider the same. The GBL has also filed application in October, 2014 under the new policy announced in July, 2014 in which there is an exemption w.e.f. 01.04.2013 for additional units set up by the GBL. The matter is pending and accounting of duty exemption will be done after disposal of the GBL’s applications.
Note 53 - Impairment testing of Goodwill53.1 Goodwill is tested for impairment on annual basis and whenever there is an indication that the recoverable amount of a
cash generating unit (CGU) is less than its carrying amount based on a number of factors including business plan, operating results, future cash flows and economic conditions. The recoverable amount of cash generating units is determined based on Higher of value in use and fair value less cost to sell. For the purpose of impairment testing, goodwill is allocated to a CGU representing the lowest level within the Group at which Goodwill is monitored for internal management purposes, and which is not higher than the Group's operating segment.
53.2 Goodwill is allocated to the following CGU for impairment testing purpose.(` in lacs)
Particulars As at 31st March, 2017
As at 31st March, 2016
As at 1st April, 2015
Goodwill relating to Consumerware 907.68 907.68 -
Goodwill relating to Scientificware 835.23 - -
Total 1,742.91 907.68 -
53.3 The Group uses discounted cash flow based methods to determine the recoverable amount. These discounted cash flow calculations use five year projections that are based on financial forecasts. Cash flow projections take into account past experience and represent management's best estimate about future developments.
53.4 Management estimates discount rates using pre-tax rates that reflect current market assessments of the risks specific to the CGU, taking into consideration the time value of money and individual risks of the underlying assets that have not been incorporated in the cash flow estimates. The discount rate calculation is based on the specific circumstances of the Company and its operating segments and is derived from its weighted average cost of capital (WACC).
Note 54 - Interests in other entities54.1 The consolidation financial statements of the Group includes subsidiaries (including step-down subsidiary) listed in the table
below:-Name Principal Activities Country of
Incorporation% equity interest
31st March, 2017
31st March, 2016
1st April, 2015
Borosil Afrasia FZE Trading in Consumerware
United Arab Emirates
100.00% 100.00% 100.00%
Borosil Afrasia Middle East Trading LLC*
Trading in Consumerware
United Arab Emirates
49.00% 49.00% NA
Gujarat Borosil Ltd. # Manufacturer of patterned glass and Low Iron Solar Glass
India 25.25% 25.25% 25.25%
Hopewell Tableware Private Limited $ Manufacturer of tableware and dinnerware items
India 100.00% 100.00% NA
Klasspack Private Limited @ Manufacturer of Glass Ampoules and Tabular Glass Vials
India 60.28% NA NA
Notes to the consolidated financial statement for the year ended 31st March, 2017
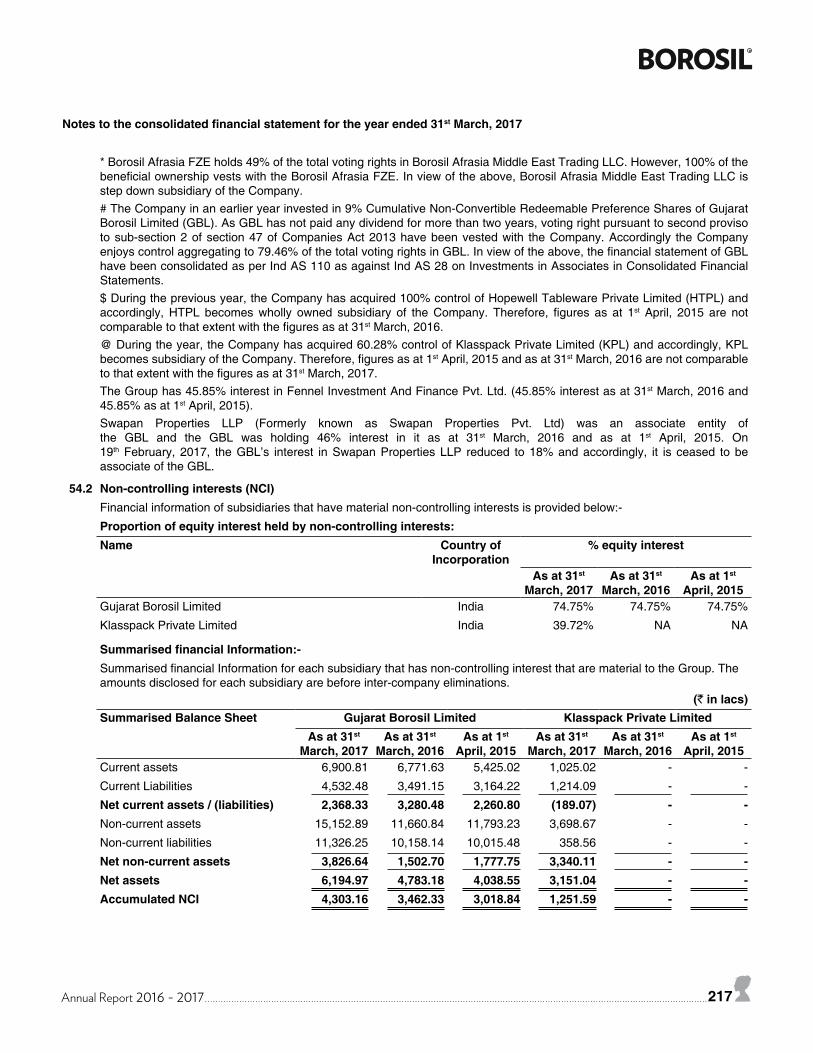
Annual Report 2016 - 2017 217
* Borosil Afrasia FZE holds 49% of the total voting rights in Borosil Afrasia Middle East Trading LLC. However, 100% of the beneficial ownership vests with the Borosil Afrasia FZE. In view of the above, Borosil Afrasia Middle East Trading LLC is step down subsidiary of the Company.# The Company in an earlier year invested in 9% Cumulative Non-Convertible Redeemable Preference Shares of Gujarat Borosil Limited (GBL). As GBL has not paid any dividend for more than two years, voting right pursuant to second proviso to sub-section 2 of section 47 of Companies Act 2013 have been vested with the Company. Accordingly the Company enjoys control aggregating to 79.46% of the total voting rights in GBL. In view of the above, the financial statement of GBL have been consolidated as per Ind AS 110 as against Ind AS 28 on Investments in Associates in Consolidated Financial Statements.$ During the previous year, the Company has acquired 100% control of Hopewell Tableware Private Limited (HTPL) and accordingly, HTPL becomes wholly owned subsidiary of the Company. Therefore, figures as at 1st April, 2015 are not comparable to that extent with the figures as at 31st March, 2016.@ During the year, the Company has acquired 60.28% control of Klasspack Private Limited (KPL) and accordingly, KPL becomes subsidiary of the Company. Therefore, figures as at 1st April, 2015 and as at 31st March, 2016 are not comparable to that extent with the figures as at 31st March, 2017.The Group has 45.85% interest in Fennel Investment And Finance Pvt. Ltd. (45.85% interest as at 31st March, 2016 and 45.85% as at 1st April, 2015).Swapan Properties LLP (Formerly known as Swapan Properties Pvt. Ltd) was an associate entity of the GBL and the GBL was holding 46% interest in it as at 31st March, 2016 and as at 1st April, 2015. On 19th February, 2017, the GBL’s interest in Swapan Properties LLP reduced to 18% and accordingly, it is ceased to be associate of the GBL.
54.2 Non-controlling interests (NCI)Financial information of subsidiaries that have material non-controlling interests is provided below:-
Proportion of equity interest held by non-controlling interests:Name Country of
Incorporation% equity interest
As at 31st March, 2017
As at 31st March, 2016
As at 1st April, 2015
Gujarat Borosil Limited India 74.75% 74.75% 74.75%
Klasspack Private Limited India 39.72% NA NA
Summarised financial Information:-Summarised financial Information for each subsidiary that has non-controlling interest that are material to the Group. The amounts disclosed for each subsidiary are before inter-company eliminations.
(` in lacs)Summarised Balance Sheet Gujarat Borosil Limited Klasspack Private Limited
As at 31st March, 2017
As at 31st March, 2016
As at 1st April, 2015
As at 31st March, 2017
As at 31st March, 2016
As at 1st April, 2015
Current assets 6,900.81 6,771.63 5,425.02 1,025.02 - -
Current Liabilities 4,532.48 3,491.15 3,164.22 1,214.09 - -
Net current assets / (liabilities) 2,368.33 3,280.48 2,260.80 (189.07) - -Non-current assets 15,152.89 11,660.84 11,793.23 3,698.67 - -
Non-current liabilities 11,326.25 10,158.14 10,015.48 358.56 - -
Net non-current assets 3,826.64 1,502.70 1,777.75 3,340.11 - -Net assets 6,194.97 4,783.18 4,038.55 3,151.04 - -Accumulated NCI 4,303.16 3,462.33 3,018.84 1,251.59 - -
Notes to the consolidated financial statement for the year ended 31st March, 2017
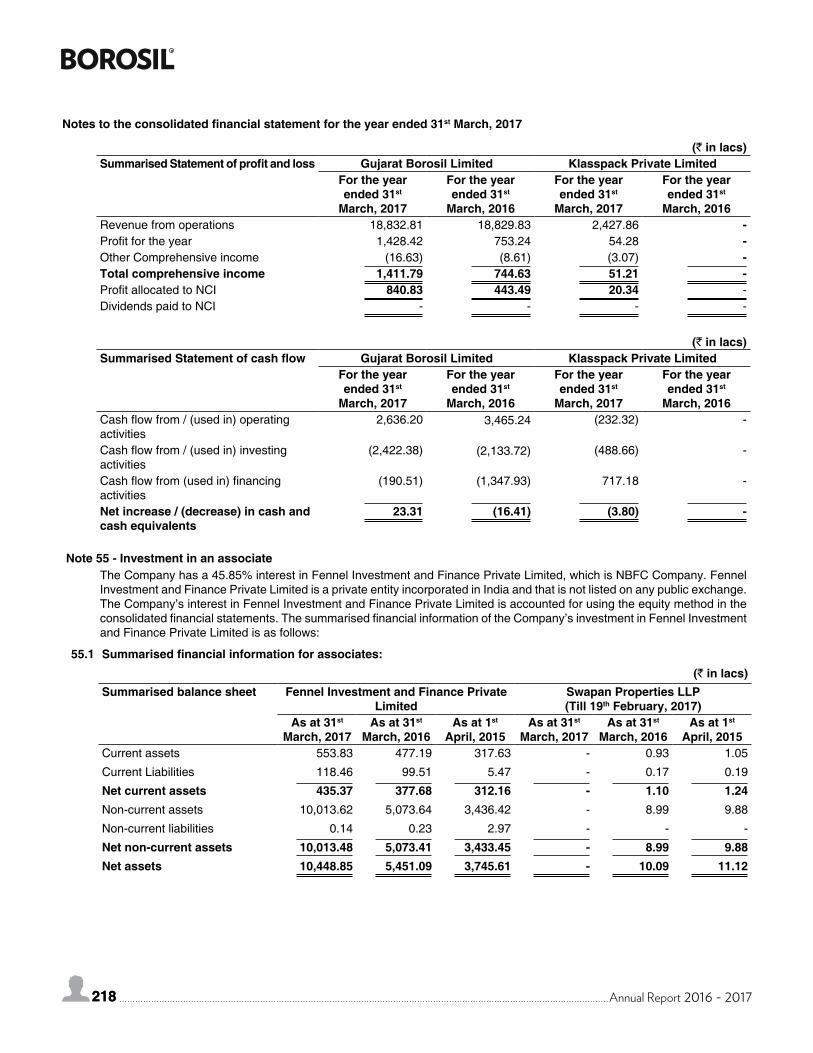
218 Annual Report 2016 - 2017218
(` in lacs)Summarised Statement of profit and loss Gujarat Borosil Limited Klasspack Private Limited
For the year ended 31st
March, 2017
For the year ended 31st
March, 2016
For the year ended 31st
March, 2017
For the year ended 31st
March, 2016Revenue from operations 18,832.81 18,829.83 2,427.86 -Profit for the year 1,428.42 753.24 54.28 -Other Comprehensive income (16.63) (8.61) (3.07) -Total comprehensive income 1,411.79 744.63 51.21 -Profit allocated to NCI 840.83 443.49 20.34 -Dividends paid to NCI - - - -
(` in lacs)Summarised Statement of cash flow Gujarat Borosil Limited Klasspack Private Limited
For the year ended 31st
March, 2017
For the year ended 31st
March, 2016
For the year ended 31st
March, 2017
For the year ended 31st
March, 2016Cash flow from / (used in) operating activities
2,636.20 3,465.24 (232.32) -
Cash flow from / (used in) investing activities
(2,422.38) (2,133.72) (488.66) -
Cash flow from (used in) financing activities
(190.51) (1,347.93) 717.18 -
Net increase / (decrease) in cash and cash equivalents
23.31 (16.41) (3.80) -
Note 55 - Investment in an associateThe Company has a 45.85% interest in Fennel Investment and Finance Private Limited, which is NBFC Company. Fennel Investment and Finance Private Limited is a private entity incorporated in India and that is not listed on any public exchange. The Company’s interest in Fennel Investment and Finance Private Limited is accounted for using the equity method in the consolidated financial statements. The summarised financial information of the Company’s investment in Fennel Investment and Finance Private Limited is as follows:
55.1 Summarised financial information for associates:(` in lacs)
Summarised balance sheet Fennel Investment and Finance Private Limited
Swapan Properties LLP (Till 19th February, 2017)
As at 31st March, 2017
As at 31st March, 2016
As at 1st April, 2015
As at 31st March, 2017
As at 31st March, 2016
As at 1st April, 2015
Current assets 553.83 477.19 317.63 - 0.93 1.05
Current Liabilities 118.46 99.51 5.47 - 0.17 0.19
Net current assets 435.37 377.68 312.16 - 1.10 1.24Non-current assets 10,013.62 5,073.64 3,436.42 - 8.99 9.88
Non-current liabilities 0.14 0.23 2.97 - - -
Net non-current assets 10,013.48 5,073.41 3,433.45 - 8.99 9.88Net assets 10,448.85 5,451.09 3,745.61 - 10.09 11.12
Notes to the consolidated financial statement for the year ended 31st March, 2017
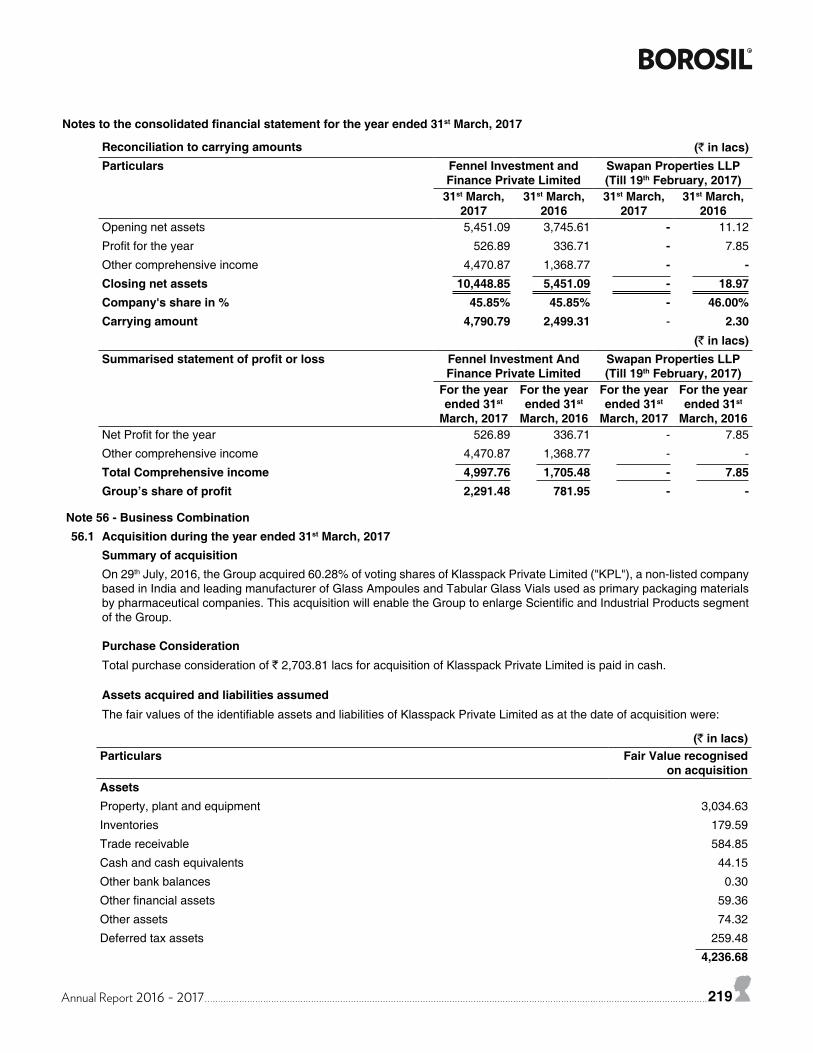
Annual Report 2016 - 2017 219
Reconciliation to carrying amounts (` in lacs)Particulars Fennel Investment and
Finance Private LimitedSwapan Properties LLP (Till 19th February, 2017)
31st March, 2017
31st March, 2016
31st March, 2017
31st March, 2016
Opening net assets 5,451.09 3,745.61 - 11.12
Profit for the year 526.89 336.71 - 7.85
Other comprehensive income 4,470.87 1,368.77 - -Closing net assets 10,448.85 5,451.09 - 18.97Company's share in % 45.85% 45.85% - 46.00%Carrying amount 4,790.79 2,499.31 - 2.30
(` in lacs)Summarised statement of profit or loss Fennel Investment And
Finance Private LimitedSwapan Properties LLP (Till 19th February, 2017)
For the year ended 31st
March, 2017
For the year ended 31st
March, 2016
For the year ended 31st
March, 2017
For the year ended 31st
March, 2016Net Profit for the year 526.89 336.71 - 7.85
Other comprehensive income 4,470.87 1,368.77 - -
Total Comprehensive income 4,997.76 1,705.48 - 7.85Group’s share of profit 2,291.48 781.95 - -
Note 56 - Business Combination56.1 Acquisition during the year ended 31st March, 2017
Summary of acquisitionOn 29th July, 2016, the Group acquired 60.28% of voting shares of Klasspack Private Limited ("KPL"), a non-listed company based in India and leading manufacturer of Glass Ampoules and Tabular Glass Vials used as primary packaging materials by pharmaceutical companies. This acquisition will enable the Group to enlarge Scientific and Industrial Products segment of the Group.
Purchase ConsiderationTotal purchase consideration of ` 2,703.81 lacs for acquisition of Klasspack Private Limited is paid in cash.
Assets acquired and liabilities assumedThe fair values of the identifiable assets and liabilities of Klasspack Private Limited as at the date of acquisition were:
(` in lacs)Particulars Fair Value recognised
on acquisitionAssetsProperty, plant and equipment 3,034.63
Inventories 179.59
Trade receivable 584.85
Cash and cash equivalents 44.15
Other bank balances 0.30
Other financial assets 59.36
Other assets 74.32
Deferred tax assets 259.48
4,236.68
Notes to the consolidated financial statement for the year ended 31st March, 2017
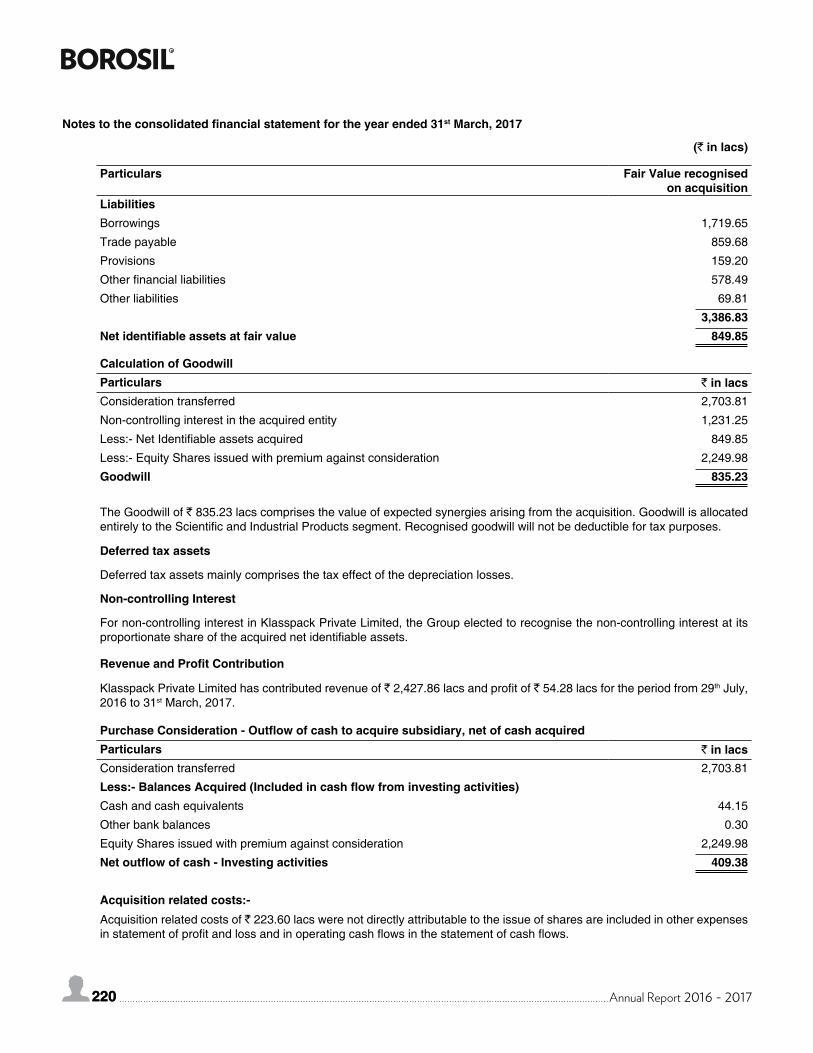
220 Annual Report 2016 - 2017220
(` in lacs)
Particulars Fair Value recognised on acquisition
LiabilitiesBorrowings 1,719.65
Trade payable 859.68
Provisions 159.20
Other financial liabilities 578.49
Other liabilities 69.81
3,386.83Net identifiable assets at fair value 849.85
Calculation of GoodwillParticulars ` in lacsConsideration transferred 2,703.81
Non-controlling interest in the acquired entity 1,231.25
Less:- Net Identifiable assets acquired 849.85
Less:- Equity Shares issued with premium against consideration 2,249.98
Goodwill 835.23
The Goodwill of ` 835.23 lacs comprises the value of expected synergies arising from the acquisition. Goodwill is allocated entirely to the Scientific and Industrial Products segment. Recognised goodwill will not be deductible for tax purposes.
Deferred tax assets
Deferred tax assets mainly comprises the tax effect of the depreciation losses.
Non-controlling Interest
For non-controlling interest in Klasspack Private Limited, the Group elected to recognise the non-controlling interest at its proportionate share of the acquired net identifiable assets.
Revenue and Profit Contribution
Klasspack Private Limited has contributed revenue of ` 2,427.86 lacs and profit of ` 54.28 lacs for the period from 29th July, 2016 to 31st March, 2017.
Purchase Consideration - Outflow of cash to acquire subsidiary, net of cash acquiredParticulars ` in lacsConsideration transferred 2,703.81
Less:- Balances Acquired (Included in cash flow from investing activities)Cash and cash equivalents 44.15
Other bank balances 0.30
Equity Shares issued with premium against consideration 2,249.98
Net outflow of cash - Investing activities 409.38
Acquisition related costs:-Acquisition related costs of ` 223.60 lacs were not directly attributable to the issue of shares are included in other expenses in statement of profit and loss and in operating cash flows in the statement of cash flows.
Notes to the consolidated financial statement for the year ended 31st March, 2017
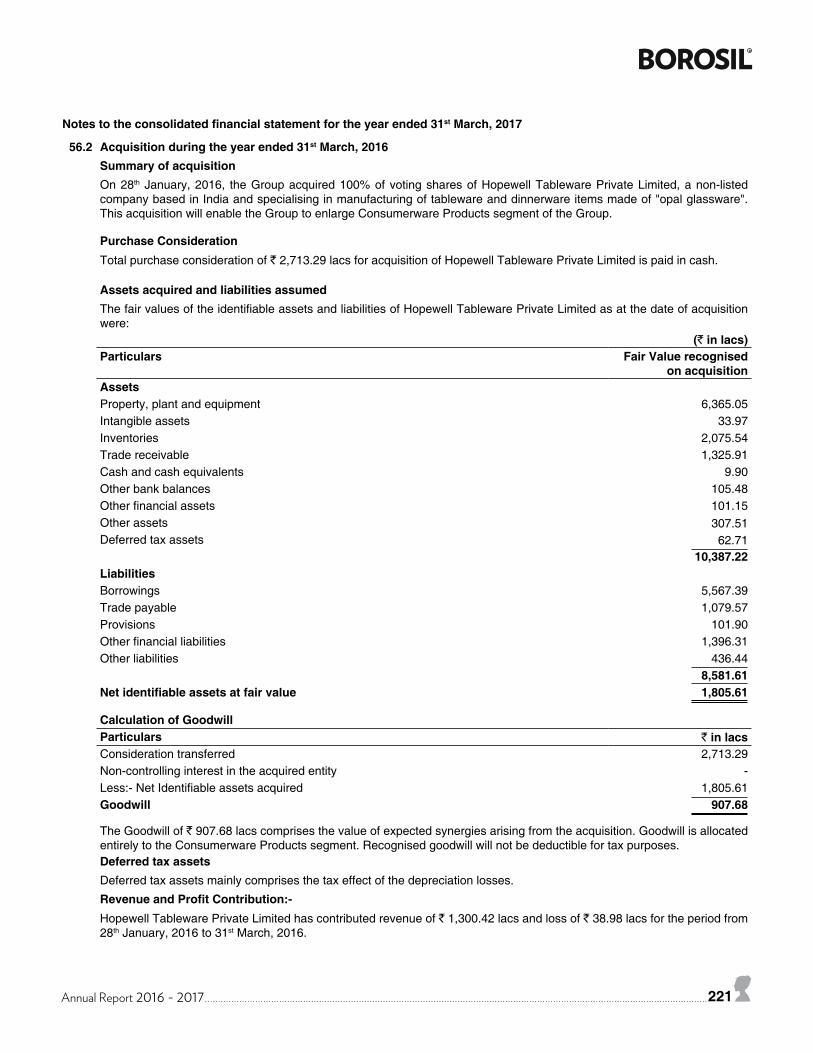
Annual Report 2016 - 2017 221
56.2 Acquisition during the year ended 31st March, 2016Summary of acquisitionOn 28th January, 2016, the Group acquired 100% of voting shares of Hopewell Tableware Private Limited, a non-listed company based in India and specialising in manufacturing of tableware and dinnerware items made of "opal glassware". This acquisition will enable the Group to enlarge Consumerware Products segment of the Group.
Purchase ConsiderationTotal purchase consideration of ` 2,713.29 lacs for acquisition of Hopewell Tableware Private Limited is paid in cash.
Assets acquired and liabilities assumedThe fair values of the identifiable assets and liabilities of Hopewell Tableware Private Limited as at the date of acquisition were:
(` in lacs)Particulars Fair Value recognised
on acquisitionAssetsProperty, plant and equipment 6,365.05Intangible assets 33.97Inventories 2,075.54Trade receivable 1,325.91Cash and cash equivalents 9.90Other bank balances 105.48Other financial assets 101.15Other assets 307.51Deferred tax assets 62.71
10,387.22LiabilitiesBorrowings 5,567.39Trade payable 1,079.57Provisions 101.90Other financial liabilities 1,396.31Other liabilities 436.44
8,581.61Net identifiable assets at fair value 1,805.61
Calculation of GoodwillParticulars ` in lacsConsideration transferred 2,713.29Non-controlling interest in the acquired entity -Less:- Net Identifiable assets acquired 1,805.61Goodwill 907.68
The Goodwill of ` 907.68 lacs comprises the value of expected synergies arising from the acquisition. Goodwill is allocated entirely to the Consumerware Products segment. Recognised goodwill will not be deductible for tax purposes.Deferred tax assetsDeferred tax assets mainly comprises the tax effect of the depreciation losses.
Revenue and Profit Contribution:-Hopewell Tableware Private Limited has contributed revenue of ` 1,300.42 lacs and loss of ` 38.98 lacs for the period from 28th January, 2016 to 31st March, 2016.
Notes to the consolidated financial statement for the year ended 31st March, 2017
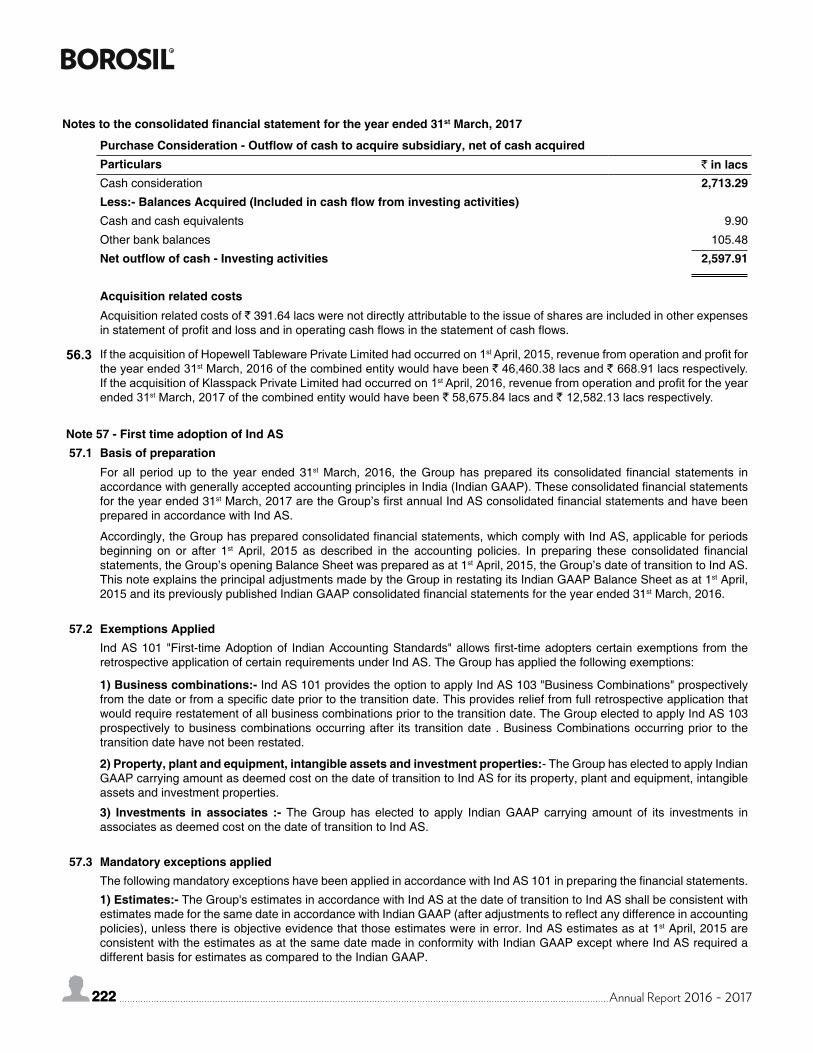
222 Annual Report 2016 - 2017222
Purchase Consideration - Outflow of cash to acquire subsidiary, net of cash acquiredParticulars ` in lacsCash consideration 2,713.29Less:- Balances Acquired (Included in cash flow from investing activities)Cash and cash equivalents 9.90
Other bank balances 105.48
Net outflow of cash - Investing activities 2,597.91
Acquisition related costsAcquisition related costs of ` 391.64 lacs were not directly attributable to the issue of shares are included in other expenses in statement of profit and loss and in operating cash flows in the statement of cash flows.
56.3 If the acquisition of Hopewell Tableware Private Limited had occurred on 1st April, 2015, revenue from operation and profit for the year ended 31st March, 2016 of the combined entity would have been ` 46,460.38 lacs and ` 668.91 lacs respectively. If the acquisition of Klasspack Private Limited had occurred on 1st April, 2016, revenue from operation and profit for the year ended 31st March, 2017 of the combined entity would have been ` 58,675.84 lacs and ` 12,582.13 lacs respectively.
Note 57 - First time adoption of Ind AS57.1 Basis of preparation
For all period up to the year ended 31st March, 2016, the Group has prepared its consolidated financial statements in accordance with generally accepted accounting principles in India (Indian GAAP). These consolidated financial statements for the year ended 31st March, 2017 are the Group’s first annual Ind AS consolidated financial statements and have been prepared in accordance with Ind AS.
Accordingly, the Group has prepared consolidated financial statements, which comply with Ind AS, applicable for periods beginning on or after 1st April, 2015 as described in the accounting policies. In preparing these consolidated financial statements, the Group’s opening Balance Sheet was prepared as at 1st April, 2015, the Group’s date of transition to Ind AS. This note explains the principal adjustments made by the Group in restating its Indian GAAP Balance Sheet as at 1st April, 2015 and its previously published Indian GAAP consolidated financial statements for the year ended 31st March, 2016.
57.2 Exemptions AppliedInd AS 101 "First-time Adoption of Indian Accounting Standards" allows first-time adopters certain exemptions from the retrospective application of certain requirements under Ind AS. The Group has applied the following exemptions:
1) Business combinations:- Ind AS 101 provides the option to apply Ind AS 103 "Business Combinations" prospectively from the date or from a specific date prior to the transition date. This provides relief from full retrospective application that would require restatement of all business combinations prior to the transition date. The Group elected to apply Ind AS 103 prospectively to business combinations occurring after its transition date . Business Combinations occurring prior to the transition date have not been restated.
2) Property, plant and equipment, intangible assets and investment properties:- The Group has elected to apply Indian GAAP carrying amount as deemed cost on the date of transition to Ind AS for its property, plant and equipment, intangible assets and investment properties.
3) Investments in associates :- The Group has elected to apply Indian GAAP carrying amount of its investments in associates as deemed cost on the date of transition to Ind AS.
57.3 Mandatory exceptions appliedThe following mandatory exceptions have been applied in accordance with Ind AS 101 in preparing the financial statements.
1) Estimates:- The Group's estimates in accordance with Ind AS at the date of transition to Ind AS shall be consistent with estimates made for the same date in accordance with Indian GAAP (after adjustments to reflect any difference in accounting policies), unless there is objective evidence that those estimates were in error. Ind AS estimates as at 1st April, 2015 are consistent with the estimates as at the same date made in conformity with Indian GAAP except where Ind AS required a different basis for estimates as compared to the Indian GAAP.
Notes to the consolidated financial statement for the year ended 31st March, 2017
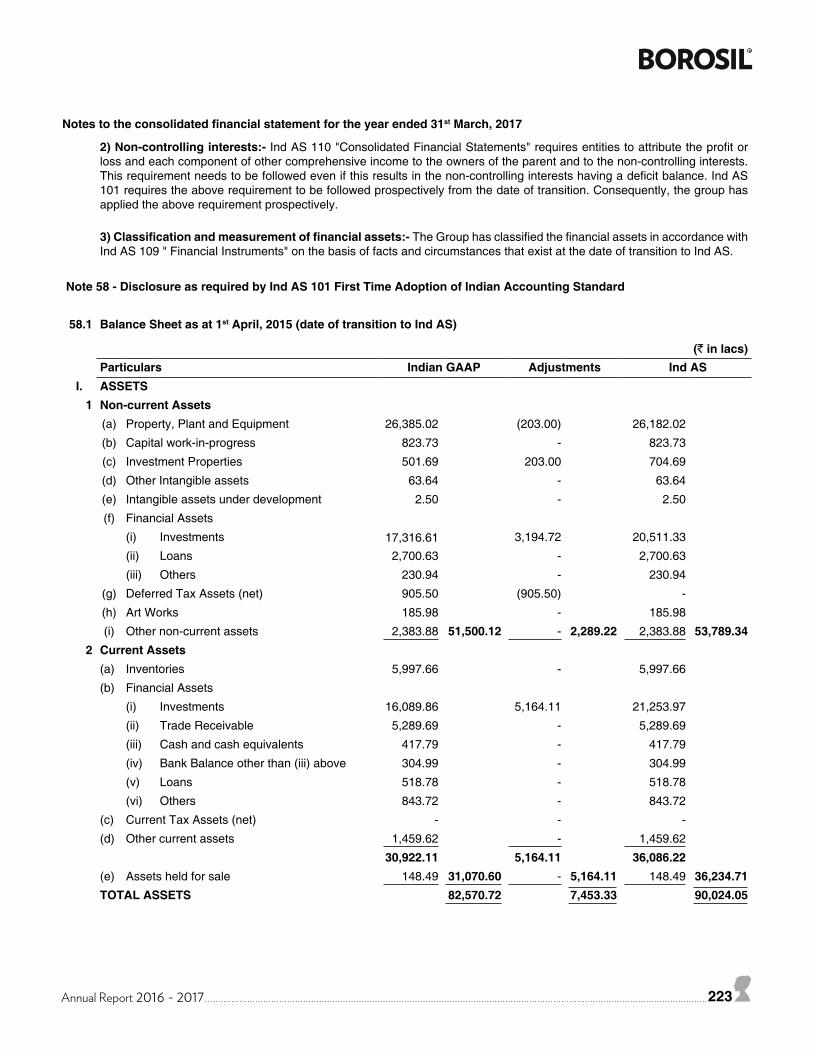
Annual Report 2016 - 2017 223
2) Non-controlling interests:- Ind AS 110 "Consolidated Financial Statements" requires entities to attribute the profit or loss and each component of other comprehensive income to the owners of the parent and to the non-controlling interests. This requirement needs to be followed even if this results in the non-controlling interests having a deficit balance. Ind AS 101 requires the above requirement to be followed prospectively from the date of transition. Consequently, the group has applied the above requirement prospectively.
3) Classification and measurement of financial assets:- The Group has classified the financial assets in accordance with Ind AS 109 " Financial Instruments" on the basis of facts and circumstances that exist at the date of transition to Ind AS.
Note 58 - Disclosure as required by Ind AS 101 First Time Adoption of Indian Accounting Standard
58.1 Balance Sheet as at 1st April, 2015 (date of transition to Ind AS)
(` in lacs)Particulars Indian GAAP Adjustments Ind AS
I. ASSETS1 Non-current Assets
(a) Property, Plant and Equipment 26,385.02 (203.00) 26,182.02
(b) Capital work-in-progress 823.73 - 823.73
(c) Investment Properties 501.69 203.00 704.69
(d) Other Intangible assets 63.64 - 63.64
(e) Intangible assets under development 2.50 - 2.50
(f) Financial Assets
(i) Investments 17,316.61 3,194.72 20,511.33
(ii) Loans 2,700.63 - 2,700.63
(iii) Others 230.94 - 230.94
(g) Deferred Tax Assets (net) 905.50 (905.50) -
(h) Art Works 185.98 - 185.98
(i) Other non-current assets 2,383.88 51,500.12 - 2,289.22 2,383.88 53,789.342 Current Assets
(a) Inventories 5,997.66 - 5,997.66
(b) Financial Assets
(i) Investments 16,089.86 5,164.11 21,253.97
(ii) Trade Receivable 5,289.69 - 5,289.69
(iii) Cash and cash equivalents 417.79 - 417.79
(iv) Bank Balance other than (iii) above 304.99 - 304.99
(v) Loans 518.78 - 518.78
(vi) Others 843.72 - 843.72
(c) Current Tax Assets (net) - - -
(d) Other current assets 1,459.62 - 1,459.62
30,922.11 5,164.11 36,086.22(e) Assets held for sale 148.49 31,070.60 - 5,164.11 148.49 36,234.71TOTAL ASSETS 82,570.72 7,453.33 90,024.05
Notes to the consolidated financial statement for the year ended 31st March, 2017
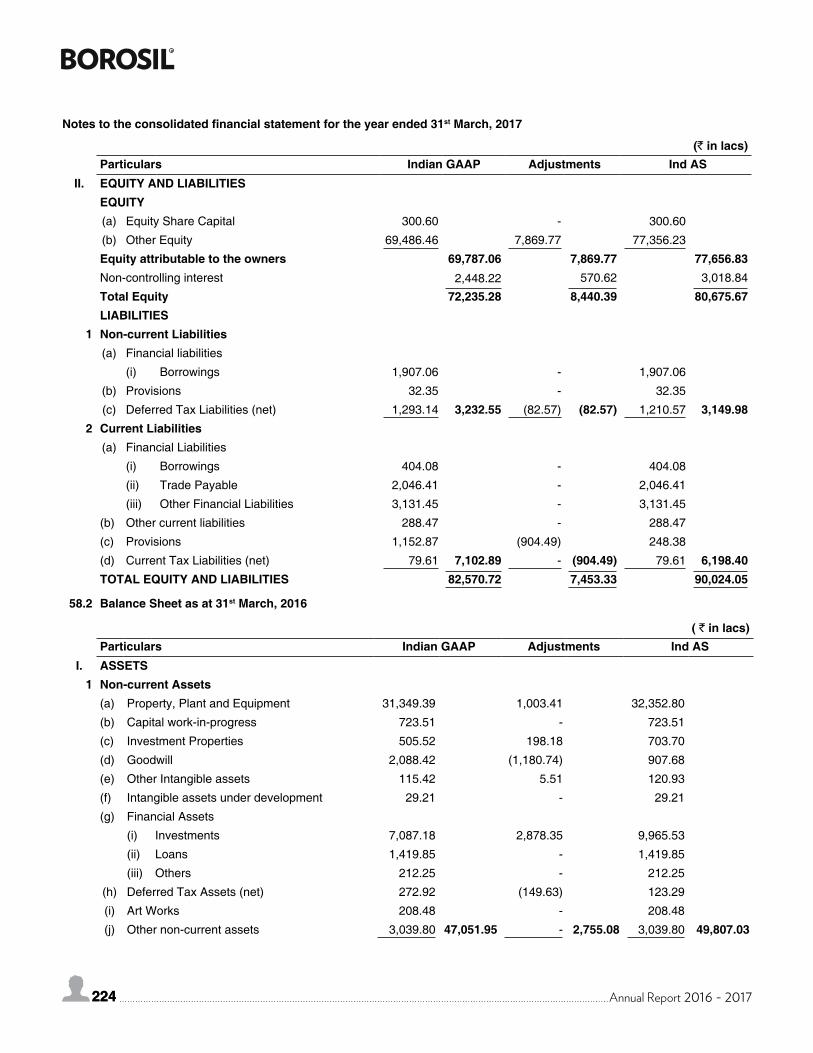
224 Annual Report 2016 - 2017224
(` in lacs)Particulars Indian GAAP Adjustments Ind AS
II. EQUITY AND LIABILITIESEQUITY(a) Equity Share Capital 300.60 - 300.60
(b) Other Equity 69,486.46 7,869.77 77,356.23
Equity attributable to the owners 69,787.06 7,869.77 77,656.83Non-controlling interest 2,448.22 570.62 3,018.84
Total Equity 72,235.28 8,440.39 80,675.67LIABILITIES
1 Non-current Liabilities(a) Financial liabilities
(i) Borrowings 1,907.06 - 1,907.06
(b) Provisions 32.35 - 32.35
(c) Deferred Tax Liabilities (net) 1,293.14 3,232.55 (82.57) (82.57) 1,210.57 3,149.982 Current Liabilities
(a) Financial Liabilities
(i) Borrowings 404.08 - 404.08
(ii) Trade Payable 2,046.41 - 2,046.41
(iii) Other Financial Liabilities 3,131.45 - 3,131.45
(b) Other current liabilities 288.47 - 288.47
(c) Provisions 1,152.87 (904.49) 248.38
(d) Current Tax Liabilities (net) 79.61 7,102.89 - (904.49) 79.61 6,198.40TOTAL EQUITY AND LIABILITIES 82,570.72 7,453.33 90,024.05
58.2 Balance Sheet as at 31st March, 2016
( ` in lacs)Particulars Indian GAAP Adjustments Ind AS
I. ASSETS1 Non-current Assets
(a) Property, Plant and Equipment 31,349.39 1,003.41 32,352.80
(b) Capital work-in-progress 723.51 - 723.51
(c) Investment Properties 505.52 198.18 703.70
(d) Goodwill 2,088.42 (1,180.74) 907.68
(e) Other Intangible assets 115.42 5.51 120.93
(f) Intangible assets under development 29.21 - 29.21
(g) Financial Assets
(i) Investments 7,087.18 2,878.35 9,965.53
(ii) Loans 1,419.85 - 1,419.85
(iii) Others 212.25 - 212.25
(h) Deferred Tax Assets (net) 272.92 (149.63) 123.29
(i) Art Works 208.48 - 208.48
(j) Other non-current assets 3,039.80 47,051.95 - 2,755.08 3,039.80 49,807.03
Notes to the consolidated financial statement for the year ended 31st March, 2017
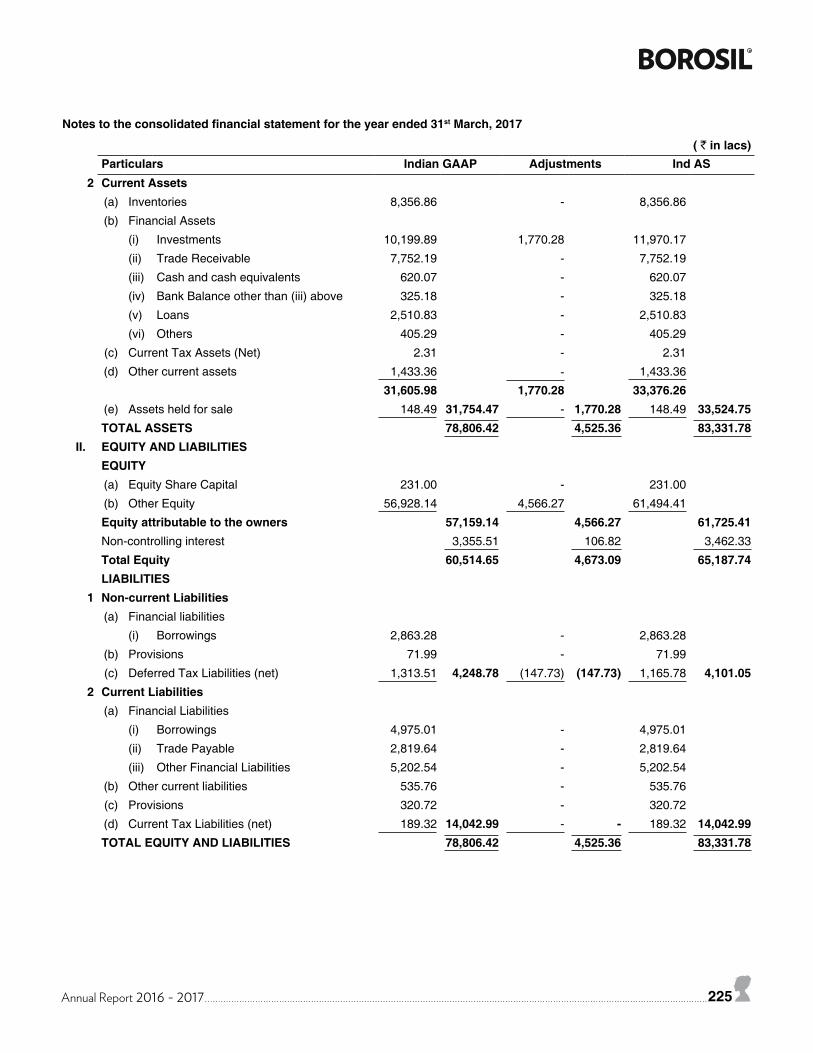
Annual Report 2016 - 2017 225
( ` in lacs)Particulars Indian GAAP Adjustments Ind AS
2 Current Assets(a) Inventories 8,356.86 - 8,356.86
(b) Financial Assets
(i) Investments 10,199.89 1,770.28 11,970.17
(ii) Trade Receivable 7,752.19 - 7,752.19
(iii) Cash and cash equivalents 620.07 - 620.07
(iv) Bank Balance other than (iii) above 325.18 - 325.18
(v) Loans 2,510.83 - 2,510.83
(vi) Others 405.29 - 405.29
(c) Current Tax Assets (Net) 2.31 - 2.31
(d) Other current assets 1,433.36 - 1,433.36
31,605.98 1,770.28 33,376.26(e) Assets held for sale 148.49 31,754.47 - 1,770.28 148.49 33,524.75TOTAL ASSETS 78,806.42 4,525.36 83,331.78
II. EQUITY AND LIABILITIESEQUITY(a) Equity Share Capital 231.00 - 231.00
(b) Other Equity 56,928.14 4,566.27 61,494.41
Equity attributable to the owners 57,159.14 4,566.27 61,725.41Non-controlling interest 3,355.51 106.82 3,462.33
Total Equity 60,514.65 4,673.09 65,187.74LIABILITIES
1 Non-current Liabilities(a) Financial liabilities
(i) Borrowings 2,863.28 - 2,863.28
(b) Provisions 71.99 - 71.99
(c) Deferred Tax Liabilities (net) 1,313.51 4,248.78 (147.73) (147.73) 1,165.78 4,101.052 Current Liabilities
(a) Financial Liabilities
(i) Borrowings 4,975.01 - 4,975.01
(ii) Trade Payable 2,819.64 - 2,819.64
(iii) Other Financial Liabilities 5,202.54 - 5,202.54
(b) Other current liabilities 535.76 - 535.76
(c) Provisions 320.72 - 320.72
(d) Current Tax Liabilities (net) 189.32 14,042.99 - - 189.32 14,042.99TOTAL EQUITY AND LIABILITIES 78,806.42 4,525.36 83,331.78
Notes to the consolidated financial statement for the year ended 31st March, 2017
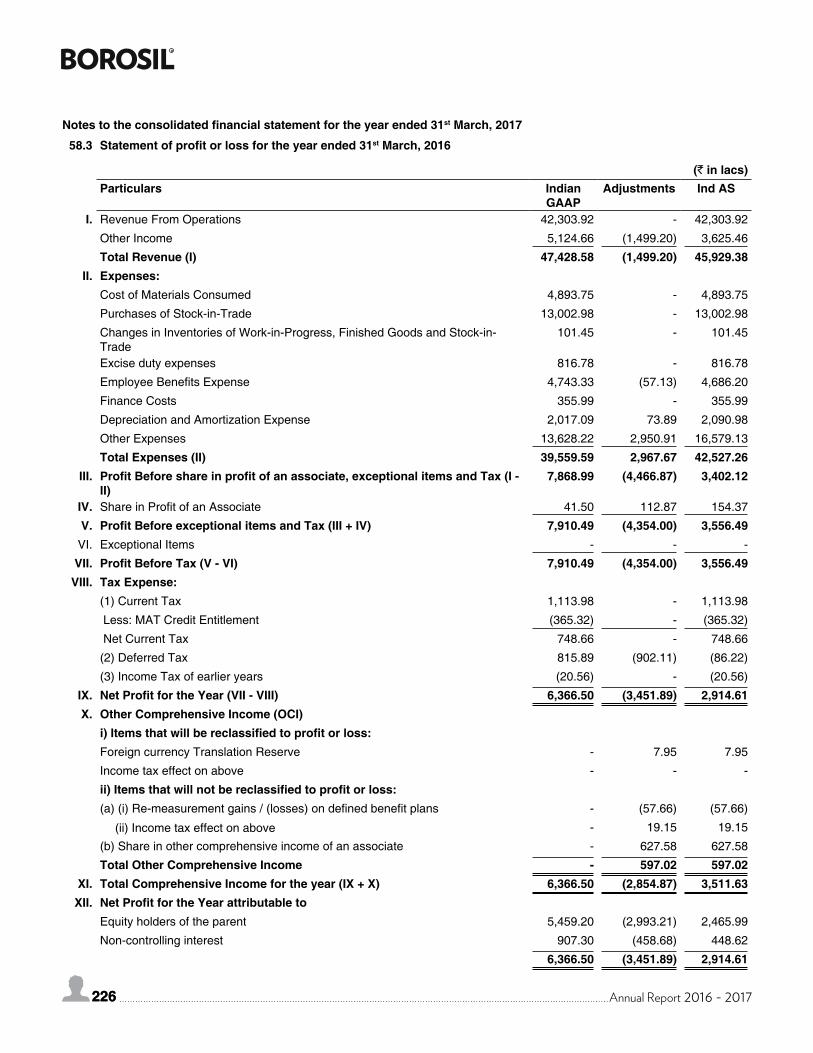
226 Annual Report 2016 - 2017226
58.3 Statement of profit or loss for the year ended 31st March, 2016
(` in lacs)Particulars Indian
GAAPAdjustments Ind AS
I. Revenue From Operations 42,303.92 - 42,303.92
Other Income 5,124.66 (1,499.20) 3,625.46
Total Revenue (I) 47,428.58 (1,499.20) 45,929.38II. Expenses:
Cost of Materials Consumed 4,893.75 - 4,893.75
Purchases of Stock-in-Trade 13,002.98 - 13,002.98
Changes in Inventories of Work-in-Progress, Finished Goods and Stock-in-Trade
101.45 - 101.45
Excise duty expenses 816.78 - 816.78
Employee Benefits Expense 4,743.33 (57.13) 4,686.20
Finance Costs 355.99 - 355.99
Depreciation and Amortization Expense 2,017.09 73.89 2,090.98
Other Expenses 13,628.22 2,950.91 16,579.13
Total Expenses (II) 39,559.59 2,967.67 42,527.26III. Profit Before share in profit of an associate, exceptional items and Tax (I -
II) 7,868.99 (4,466.87) 3,402.12
IV. Share in Profit of an Associate 41.50 112.87 154.37
V. Profit Before exceptional items and Tax (III + IV) 7,910.49 (4,354.00) 3,556.49VI. Exceptional Items - - -
VII. Profit Before Tax (V - VI) 7,910.49 (4,354.00) 3,556.49VIII. Tax Expense:
(1) Current Tax 1,113.98 - 1,113.98
Less: MAT Credit Entitlement (365.32) - (365.32)
Net Current Tax 748.66 - 748.66
(2) Deferred Tax 815.89 (902.11) (86.22)
(3) Income Tax of earlier years (20.56) - (20.56)
IX. Net Profit for the Year (VII - VIII) 6,366.50 (3,451.89) 2,914.61X. Other Comprehensive Income (OCI)
i) Items that will be reclassified to profit or loss:Foreign currency Translation Reserve - 7.95 7.95
Income tax effect on above - - -
ii) Items that will not be reclassified to profit or loss:(a) (i) Re-measurement gains / (losses) on defined benefit plans - (57.66) (57.66)
(ii) Income tax effect on above - 19.15 19.15
(b) Share in other comprehensive income of an associate - 627.58 627.58
Total Other Comprehensive Income - 597.02 597.02XI. Total Comprehensive Income for the year (IX + X) 6,366.50 (2,854.87) 3,511.63XII. Net Profit for the Year attributable to
Equity holders of the parent 5,459.20 (2,993.21) 2,465.99
Non-controlling interest 907.30 (458.68) 448.62
6,366.50 (3,451.89) 2,914.61
Notes to the consolidated financial statement for the year ended 31st March, 2017
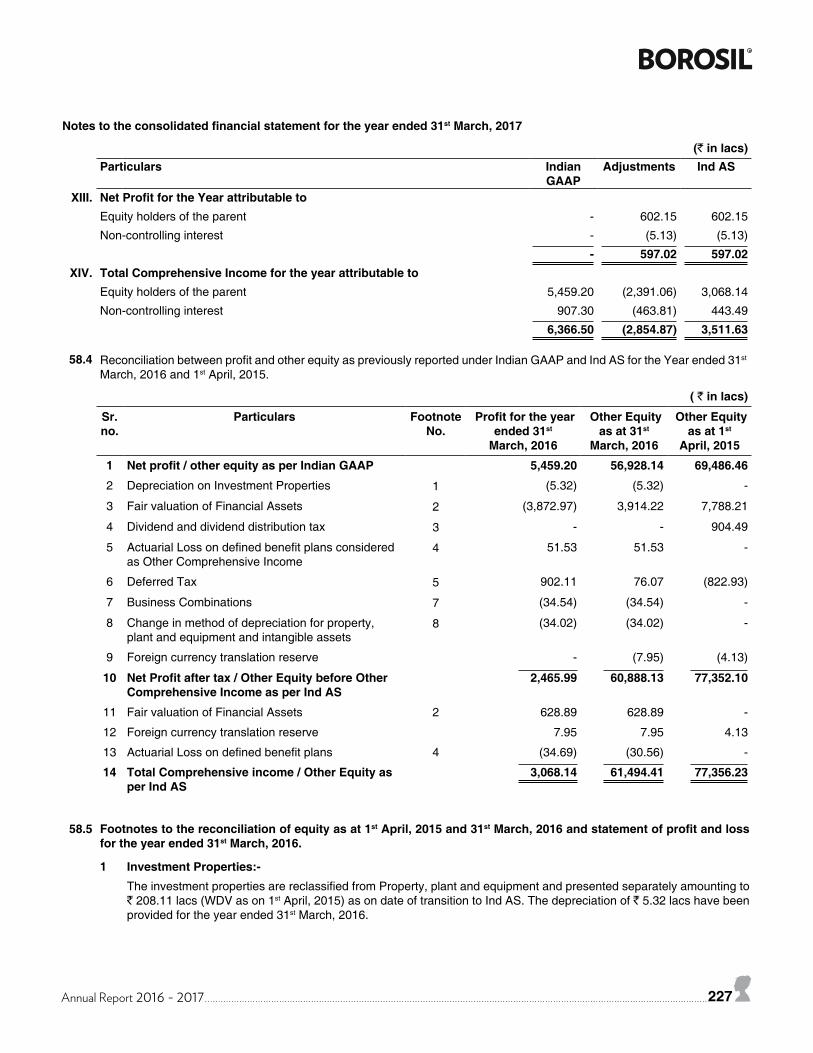
Annual Report 2016 - 2017 227
(` in lacs)Particulars Indian
GAAPAdjustments Ind AS
XIII. Net Profit for the Year attributable toEquity holders of the parent - 602.15 602.15
Non-controlling interest - (5.13) (5.13)
- 597.02 597.02XIV. Total Comprehensive Income for the year attributable to
Equity holders of the parent 5,459.20 (2,391.06) 3,068.14
Non-controlling interest 907.30 (463.81) 443.49
6,366.50 (2,854.87) 3,511.63
58.4 Reconciliation between profit and other equity as previously reported under Indian GAAP and Ind AS for the Year ended 31st March, 2016 and 1st April, 2015.
( ` in lacs)
Sr. no.
Particulars Footnote No.
Profit for the year ended 31st
March, 2016
Other Equity as at 31st
March, 2016
Other Equity as at 1st
April, 2015
1 Net profit / other equity as per Indian GAAP 5,459.20 56,928.14 69,486.46
2 Depreciation on Investment Properties 1 (5.32) (5.32) -
3 Fair valuation of Financial Assets 2 (3,872.97) 3,914.22 7,788.21
4 Dividend and dividend distribution tax 3 - - 904.49
5 Actuarial Loss on defined benefit plans considered as Other Comprehensive Income
4 51.53 51.53 -
6 Deferred Tax 5 902.11 76.07 (822.93)
7 Business Combinations 7 (34.54) (34.54) -
8 Change in method of depreciation for property, plant and equipment and intangible assets
8 (34.02) (34.02) -
9 Foreign currency translation reserve - (7.95) (4.13)
10 Net Profit after tax / Other Equity before Other Comprehensive Income as per Ind AS
2,465.99 60,888.13 77,352.10
11 Fair valuation of Financial Assets 2 628.89 628.89 -
12 Foreign currency translation reserve 7.95 7.95 4.13
13 Actuarial Loss on defined benefit plans 4 (34.69) (30.56) -
14 Total Comprehensive income / Other Equity as per Ind AS
3,068.14 61,494.41 77,356.23
58.5 Footnotes to the reconciliation of equity as at 1st April, 2015 and 31st March, 2016 and statement of profit and loss for the year ended 31st March, 2016.
1 Investment Properties:-The investment properties are reclassified from Property, plant and equipment and presented separately amounting to ` 208.11 lacs (WDV as on 1st April, 2015) as on date of transition to Ind AS. The depreciation of ` 5.32 lacs have been provided for the year ended 31st March, 2016.
Notes to the consolidated financial statement for the year ended 31st March, 2017
228 Annual Report 2016 - 2017228
2 Financial assets and Liabilities:-Under Indian GAAP, Current investments are carried at lower of cost and market value/NAV, computed individually. Long term investments are carried at cost. Provision for diminution in the value of long term investments is made only if such decline is other than temporary in the opinion of the management. As per Ind AS 109, the company has designated all investments at fair value through profit or loss (FVTPL) except equity investment in associates. Ind AS requires FVTPL investments to be measured at fair value. At the date of transition to Ind AS, difference between the fair value of the investments and Indian GAAP carrying amount has been recognised in retained earnings. The Company has opted to account for its equity investment in associates at cost in pursuance of Ind AS 27.Under Indian GAAP, receivables and payables were measured at transaction cost less allowances for impairment, if any. Under Ind AS, these financial assets and liabilities are initially recognised at fair value and subsequently measured at amortised cost using the effective interest method, less allowance for impairment, if any. The resulting finance charge or income is included in finance expense or finance income in the Statement of Profit and Loss for financial liabilities and financial assets respectively.
3 Dividend and dividend distribution tax:-Under Indian GAAP, proposed dividends were recognised as an adjusting event occurring after the balance sheet date however under the Ind AS proposed dividend are non adjusting events after the balance sheet date and hence recognised as and when approved by the Shareholders.In the case of the Company, the declaration of dividend occurs after period end. Therefore, the liability for dividend of ` 904.49 lacs (including dividend distribution tax) for the year ended on 31st March, 2015 has been derecognised with corresponding impact in the retained earnings on 1st April, 2015.
4 Defined benefit liabilities:-Both under Indian GAAP and Ind AS, the Group recognised costs related to its post-employment defined benefit plan on an actuarial basis. Under Indian GAAP, the entire cost, including actuarial gains and losses, are charged to statement of profit or loss. Under Ind AS, remeasurements comprising of actuarial gains and losses are recognised immediately in the balance sheet with a corresponding debit or credit to retained earnings through OCI.
5 Deferred Tax:-Indian GAAP requires deferred tax accounting using the income statement approach, which focuses on differences between taxable profits and accounting profits for the period / year. Ind AS 12 “Income Taxes” requires entities to account for deferred taxes using the balance sheet approach, which focuses on temporary differences between the carrying amount of an asset or liability in the balance sheet and its tax base. The application of Ind AS 12 approach has resulted in recognition of deferred tax on new temporary differences which was not required under Indian GAAP. The impact of transitional adjustments for computation of deferred taxes has resulted in charge to Retained Earning, on the date of transition, with consequential impact to the statement of Profit and Loss and OCI for the subsequent periods.
6 Sale of goods:-Under Indian GAAP, sale of goods was presented as net of excise duty. However, under Ind AS, sale of goods includes excise duty. Excise duty on sale of goods is separately presented on the face of statement of profit and loss. Thus sale of goods under Ind AS has increased with a corresponding increase in other expense.
7 Fair valuation of acquired assets and liabilities as at acquisition date:-Under Indian GAAP, excess consideration paid over carrying amount the assets and liabilities on acquisition date of the subsidiary company is recognised as an Goodwill. Under Ind AS, excess consideration paid over fair value of acquired assets and liabilities is recognised as a Goodwill. Accordingly, due to fair valuation of acquired assets and liabilities, there is change in the values of property, plant and equipment, intangible assets and depreciation in the consolidated financial statements.
8 Depreciation on property, plant and equipment and intangible assets:-Under Indian GAAP, when there is a change in method of depreciation, depreciation is recalculated in accordance with the new method from the date of the asset put to use and the deficiency or surplus arising from retrospective recomputation of depreciation in accordance with new method is adjusted in the accounts in the year in which the method of depreciation is changed. The change in method of depreciation is treated as change in estimate as per Ind AS 8 “Accounting Policies, Changes in Accounting Estimates and Errors” as against changes in accounting policies and accordingly, it is applied prospectively from the year in which new method of depreciation is adopted. Accordingly, there is change in values of depreciation on account of prospective application of change in method of depreciation. Accordingly, the value of property, plant and equipment and intangible assets are also changed.
Notes to the consolidated financial statement for the year ended 31st March, 2017
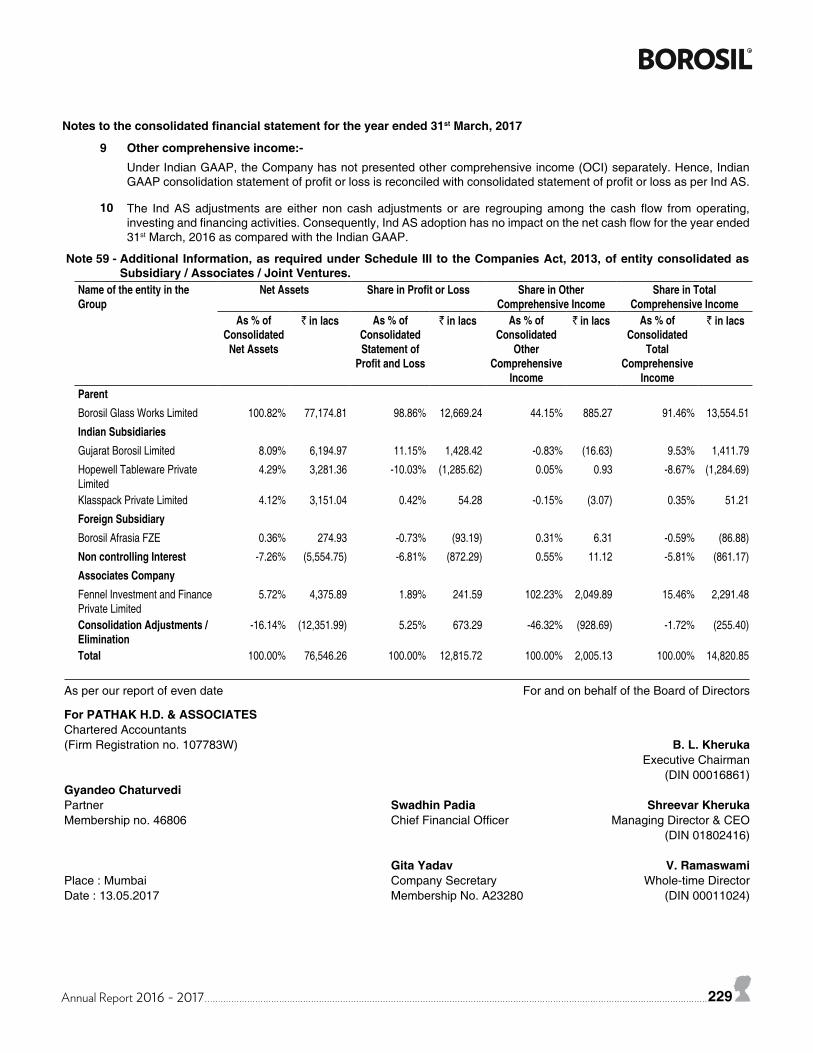
Annual Report 2016 - 2017 229
Notes to the consolidated financial statement for the year ended 31st March, 2017
9 Other comprehensive income:-Under Indian GAAP, the Company has not presented other comprehensive income (OCI) separately. Hence, Indian GAAP consolidation statement of profit or loss is reconciled with consolidated statement of profit or loss as per Ind AS.
10 The Ind AS adjustments are either non cash adjustments or are regrouping among the cash flow from operating, investing and financing activities. Consequently, Ind AS adoption has no impact on the net cash flow for the year ended 31st March, 2016 as compared with the Indian GAAP.
Note 59 - Additional Information, as required under Schedule III to the Companies Act, 2013, of entity consolidated as Subsidiary / Associates / Joint Ventures.
Name of the entity in the Group
Net Assets Share in Profit or Loss Share in Other Comprehensive Income
Share in Total Comprehensive Income
As % of Consolidated
Net Assets
` in lacs As % of Consolidated Statement of
Profit and Loss
` in lacs As % of Consolidated
Other Comprehensive
Income
` in lacs As % of Consolidated
Total Comprehensive
Income
` in lacs
ParentBorosil Glass Works Limited 100.82% 77,174.81 98.86% 12,669.24 44.15% 885.27 91.46% 13,554.51
Indian SubsidiariesGujarat Borosil Limited 8.09% 6,194.97 11.15% 1,428.42 -0.83% (16.63) 9.53% 1,411.79
Hopewell Tableware Private Limited
4.29% 3,281.36 -10.03% (1,285.62) 0.05% 0.93 -8.67% (1,284.69)
Klasspack Private Limited 4.12% 3,151.04 0.42% 54.28 -0.15% (3.07) 0.35% 51.21
Foreign SubsidiaryBorosil Afrasia FZE 0.36% 274.93 -0.73% (93.19) 0.31% 6.31 -0.59% (86.88)
Non controlling Interest -7.26% (5,554.75) -6.81% (872.29) 0.55% 11.12 -5.81% (861.17)
Associates CompanyFennel Investment and Finance Private Limited
5.72% 4,375.89 1.89% 241.59 102.23% 2,049.89 15.46% 2,291.48
Consolidation Adjustments / Elimination
-16.14% (12,351.99) 5.25% 673.29 -46.32% (928.69) -1.72% (255.40)
Total 100.00% 76,546.26 100.00% 12,815.72 100.00% 2,005.13 100.00% 14,820.85
As per our report of even date For and on behalf of the Board of Directors
For PATHAK H.D. & ASSOCIATESChartered Accountants(Firm Registration no. 107783W) B. L. Kheruka
Executive Chairman(DIN 00016861)
Gyandeo ChaturvediPartner Swadhin Padia Shreevar KherukaMembership no. 46806 Chief Financial Officer Managing Director & CEO
(DIN 01802416)
Gita Yadav V. RamaswamiPlace : Mumbai Company Secretary Whole-time DirectorDate : 13.05.2017 Membership No. A23280 (DIN 00011024)
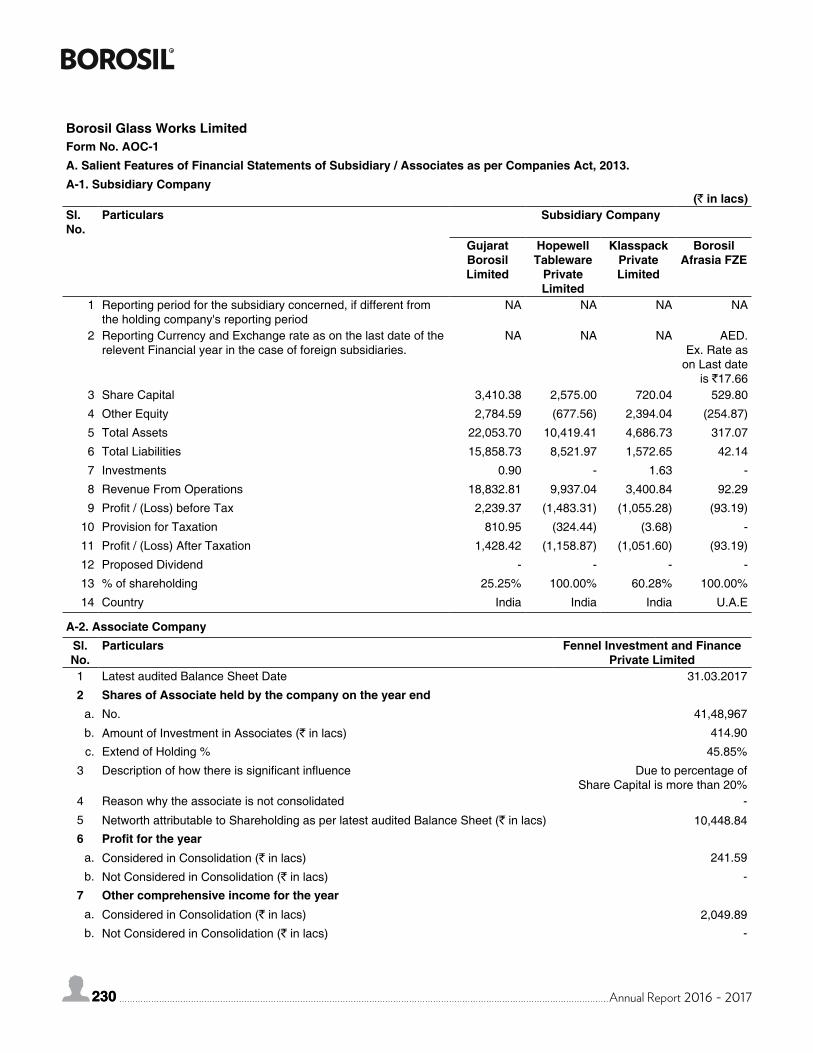
230 Annual Report 2016 - 2017230
Borosil Glass Works LimitedForm No. AOC-1A. Salient Features of Financial Statements of Subsidiary / Associates as per Companies Act, 2013.A-1. Subsidiary Company
(` in lacs)Sl. No.
Particulars Subsidiary Company
Gujarat Borosil Limited
Hopewell Tableware
Private Limited
Klasspack Private Limited
Borosil Afrasia FZE
1 Reporting period for the subsidiary concerned, if different from the holding company's reporting period
NA NA NA NA
2 Reporting Currency and Exchange rate as on the last date of the relevent Financial year in the case of foreign subsidiaries.
NA NA NA AED.Ex. Rate as
on Last date is `17.66
3 Share Capital 3,410.38 2,575.00 720.04 529.80
4 Other Equity 2,784.59 (677.56) 2,394.04 (254.87)
5 Total Assets 22,053.70 10,419.41 4,686.73 317.07
6 Total Liabilities 15,858.73 8,521.97 1,572.65 42.14
7 Investments 0.90 - 1.63 -
8 Revenue From Operations 18,832.81 9,937.04 3,400.84 92.29
9 Profit / (Loss) before Tax 2,239.37 (1,483.31) (1,055.28) (93.19)
10 Provision for Taxation 810.95 (324.44) (3.68) -
11 Profit / (Loss) After Taxation 1,428.42 (1,158.87) (1,051.60) (93.19)
12 Proposed Dividend - - - -
13 % of shareholding 25.25% 100.00% 60.28% 100.00%
14 Country India India India U.A.E
A-2. Associate CompanySl. No.
Particulars Fennel Investment and Finance Private Limited
1 Latest audited Balance Sheet Date 31.03.2017
2 Shares of Associate held by the company on the year enda. No. 41,48,967
b. Amount of Investment in Associates (` in lacs) 414.90
c. Extend of Holding % 45.85%
3 Description of how there is significant influence Due to percentage of Share Capital is more than 20%
4 Reason why the associate is not consolidated -
5 Networth attributable to Shareholding as per latest audited Balance Sheet (` in lacs) 10,448.846 Profit for the year
a. Considered in Consolidation (` in lacs) 241.59
b. Not Considered in Consolidation (` in lacs) -
7 Other comprehensive income for the yeara. Considered in Consolidation (` in lacs) 2,049.89b. Not Considered in Consolidation (` in lacs) -
Annual Report 2016 - 2017 231
B. There are no Subsidiaries / Associates which are yet to commence operations.
C. There are no Subsidiaries / Associates which have been liquidated or sold during the year.
For and on behalf of the Board of Directors
B. L. KherukaExecutive Chairman
(DIN 00016861)
Swadhin Padia Shreevar Kheruka Chief Financial Officer Managing Director & CEO
(DIN 01802416)
Gita Yadav V. RamaswamiPlace : Mumbai Company Secretary Whole-time DirectorDate : 13.05.2017 Membership No. A23280 (DIN 00011024)
Form No. AOC-1
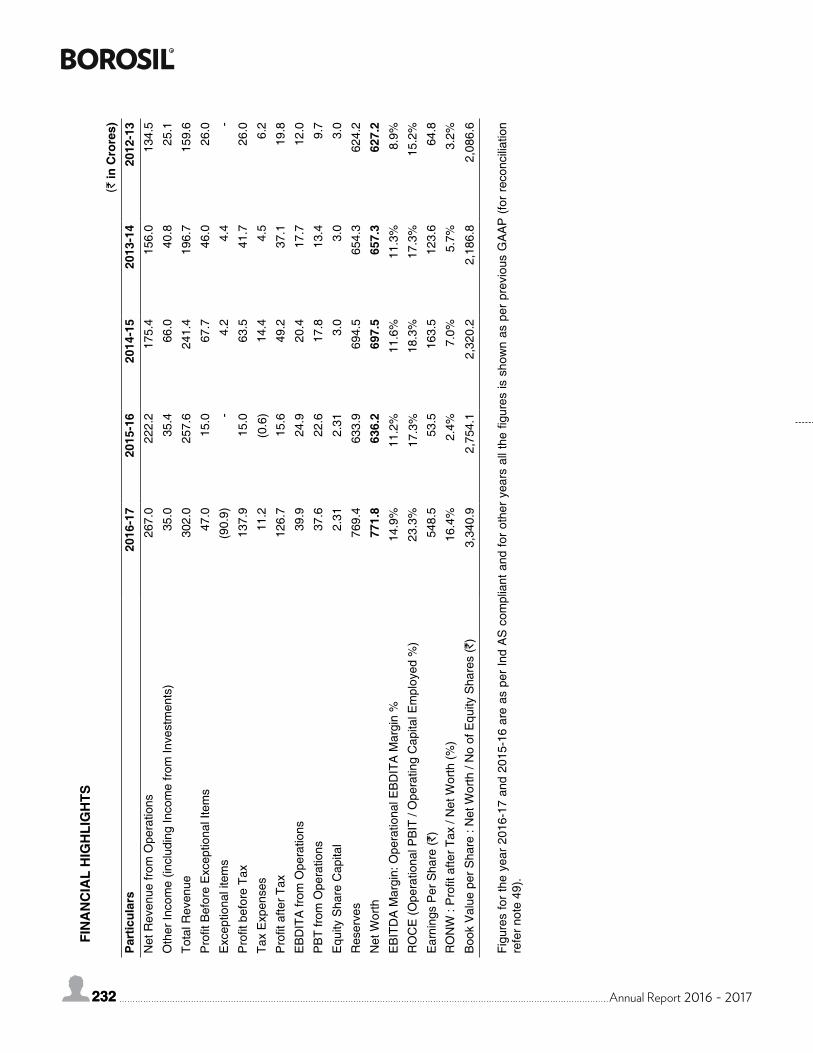
232 Annual Report 2016 - 2017232
(` in
Cro
res)
Par
ticul
ars
2016
-17
2015
-16
2014
-15
2013
-14
2012
-13
Net
Rev
enue
from
Ope
ratio
ns26
7.0
222.
217
5.4
156.
013
4.5
Oth
er In
com
e (in
clud
ing
Inco
me
from
Inve
stm
ents
)35
.035
.466
.040
.825
.1
Tota
l Rev
enue
302.
025
7.6
241.
419
6.7
159.
6
Pro
fit B
efor
e E
xcep
tiona
l Ite
ms
47.0
15.0
67.7
46.0
26.0
Exc
eptio
nal i
tem
s (9
0.9)
-4.
24.
4 -
Pro
fit b
efor
e Ta
x13
7.9
15.0
63.5
41.7
26.0
Tax
Exp
ense
s11
.2(0
.6)
14.4
4.5
6.2
Pro
fit a
fter T
ax12
6.7
15.6
49.2
37.1
19.8
EB
DIT
A fr
om O
pera
tions
39.9
24.9
20.4
17.7
12.0
PB
T fro
m O
pera
tions
37.6
22.6
17.8
13.4
9.7
Equ
ity S
hare
Cap
ital
2.31
2.31
3.0
3.0
3.0
Res
erve
s76
9.4
633.
969
4.5
654.
362
4.2
Net
Wor
th77
1.8
636.
269
7.5
657.
362
7.2
EB
ITD
A M
argi
n: O
pera
tiona
l EB
DIT
A M
argi
n %
14.9
%11
.2%
11.6
%11
.3%
8.9%
RO
CE
(Ope
ratio
nal P
BIT
/ O
pera
ting
Cap
ital E
mpl
oyed
%)
23.3
%17
.3%
18.3
%17
.3%
15.2
%
Ear
ning
s P
er S
hare
(`)
548.
553
.5 1
63.5
123
.6 6
4.8
RO
NW
: P
rofit
afte
r Tax
/ N
et W
orth
(%)
16.4
%2.
4%7.
0%5.
7%3.
2%
Boo
k V
alue
per
Sha
re :
Net
Wor
th /
No
of E
quity
Sha
res
(`)
3,34
0.9
2,75
4.1
2,32
0.2
2,18
6.8
2,08
6.6
Figu
res
for
the
year
201
6-17
and
201
5-16
are
as
per
Ind
AS
com
plia
nt a
nd fo
r ot
her
year
s al
l the
figu
res
is s
how
n as
per
pre
viou
s G
AA
P (
for
reco
ncili
atio
n re
fer n
ote
49).
FIN
AN
CIA
L H
IGH
LIG
HTS
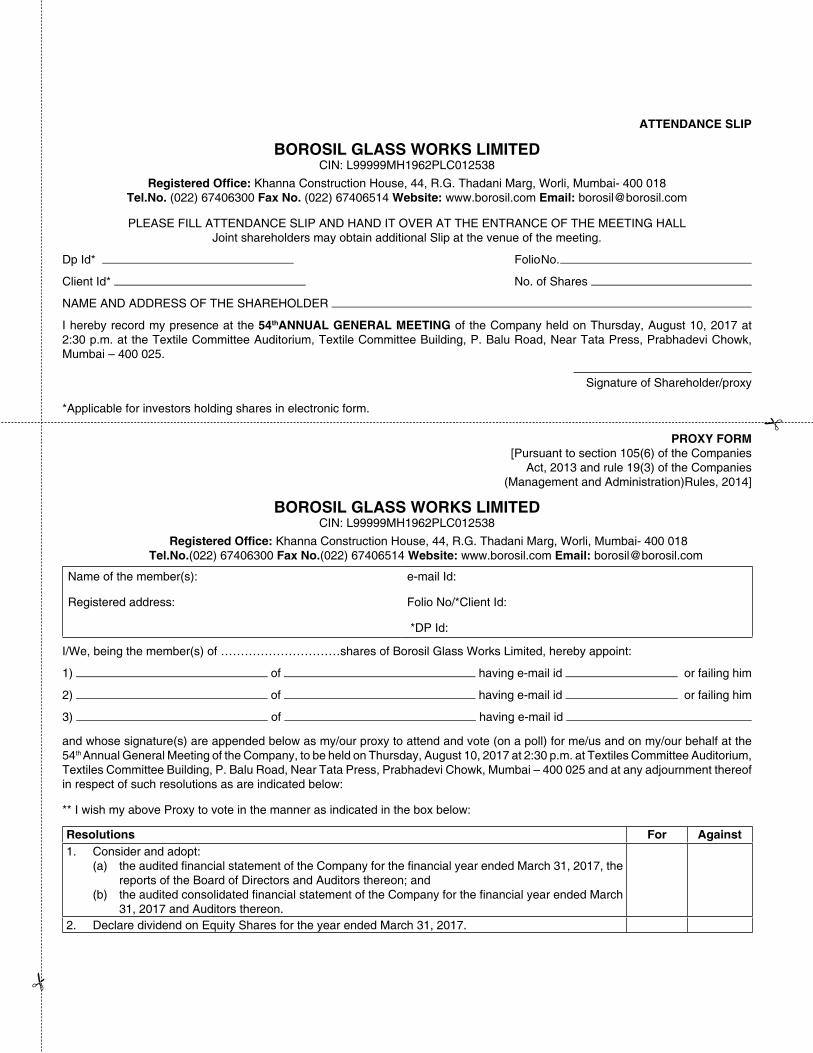
ATTENDANCE SLIP
BOROSIL GLASS WORKS LIMITEDCIN: L99999MH1962PLC012538
Registered Office: Khanna Construction House, 44, R.G. Thadani Marg, Worli, Mumbai- 400 018Tel.No. (022) 67406300 Fax No. (022) 67406514 Website: www.borosil.com Email: [email protected]
PLEASE FILL ATTENDANCE SLIP AND HAND IT OVER AT THE ENTRANCE OF THE MEETING HALLJoint shareholders may obtain additional Slip at the venue of the meeting.
Dp Id* Folio No.
Client Id* No. of Shares
NAME AND ADDRESS OF THE SHAREHOLDER
I hereby record my presence at the 54thANNUAL GENERAL MEETING of the Company held on Thursday, August 10, 2017 at 2:30 p.m. at the Textile Committee Auditorium, Textile Committee Building, P. Balu Road, Near Tata Press, Prabhadevi Chowk, Mumbai – 400 025.
Signature of Shareholder/proxy
*Applicable for investors holding shares in electronic form.
PROXY FORM [Pursuant to section 105(6) of the Companies
Act, 2013 and rule 19(3) of the Companies(Management and Administration)Rules, 2014]
BOROSIL GLASS WORKS LIMITEDCIN: L99999MH1962PLC012538
Registered Office: Khanna Construction House, 44, R.G. Thadani Marg, Worli, Mumbai- 400 018 Tel.No.(022) 67406300 Fax No.(022) 67406514 Website: www.borosil.com Email: [email protected]
Name of the member(s):
Registered address:
e-mail Id:
Folio No/*Client Id:
*DP Id:
I/We, being the member(s) of …………………………shares of Borosil Glass Works Limited, hereby appoint:
1) of having e-mail id or failing him
2) of having e-mail id or failing him
3) of having e-mail id
and whose signature(s) are appended below as my/our proxy to attend and vote (on a poll) for me/us and on my/our behalf at the 54th Annual General Meeting of the Company, to be held on Thursday, August 10, 2017 at 2:30 p.m. at Textiles Committee Auditorium, Textiles Committee Building, P. Balu Road, Near Tata Press, Prabhadevi Chowk, Mumbai – 400 025 and at any adjournment thereof in respect of such resolutions as are indicated below:
** I wish my above Proxy to vote in the manner as indicated in the box below:
Resolutions For Against1. Consider and adopt:
(a) the audited financial statement of the Company for the financial year ended March 31, 2017, the reports of the Board of Directors and Auditors thereon; and
(b) the audited consolidated financial statement of the Company for the financial year ended March 31, 2017 and Auditors thereon.
2. Declare dividend on Equity Shares for the year ended March 31, 2017.
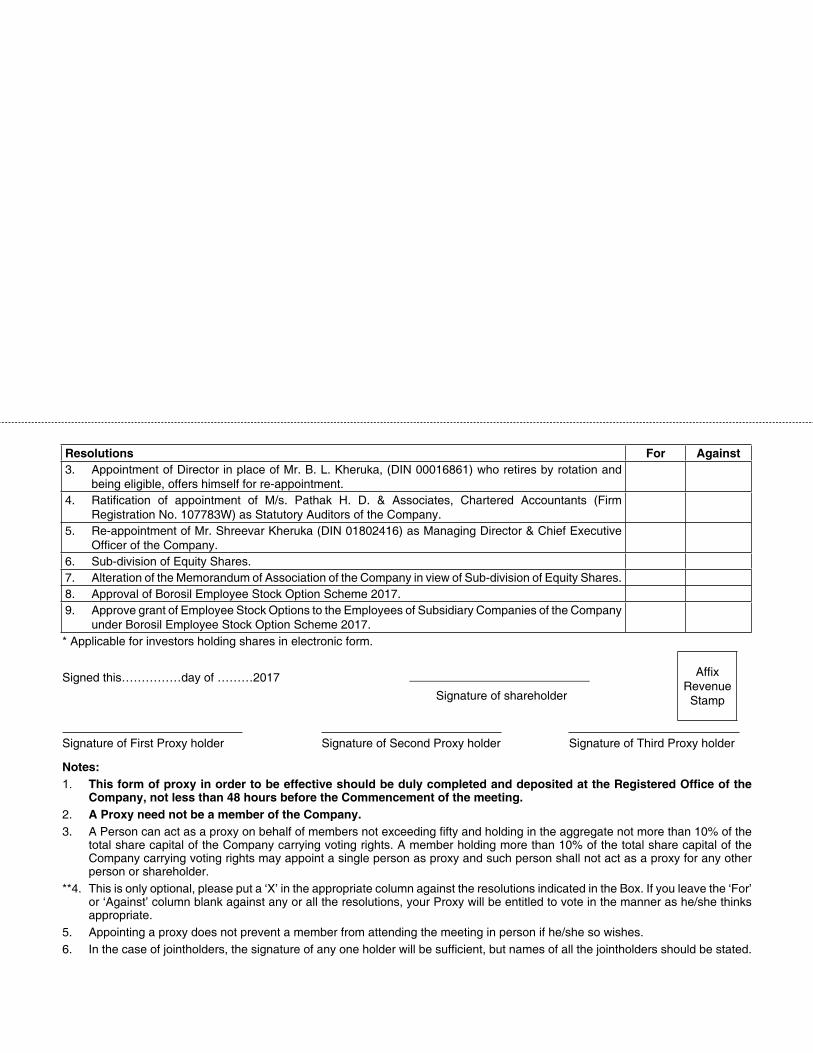
Notes:1. This form of proxy in order to be effective should be duly completed and deposited at the Registered Office of the
Company, not less than 48 hours before the Commencement of the meeting.2. A Proxy need not be a member of the Company.3. A Person can act as a proxy on behalf of members not exceeding fifty and holding in the aggregate not more than 10% of the
total share capital of the Company carrying voting rights. A member holding more than 10% of the total share capital of the Company carrying voting rights may appoint a single person as proxy and such person shall not act as a proxy for any other person or shareholder.
**4. This is only optional, please put a ‘X’ in the appropriate column against the resolutions indicated in the Box. If you leave the ‘For’ or ‘Against’ column blank against any or all the resolutions, your Proxy will be entitled to vote in the manner as he/she thinks appropriate.
5. Appointing a proxy does not prevent a member from attending the meeting in person if he/she so wishes.6. In the case of jointholders, the signature of any one holder will be sufficient, but names of all the jointholders should be stated.
Resolutions For Against3. Appointment of Director in place of Mr. B. L. Kheruka, (DIN 00016861) who retires by rotation and
being eligible, offers himself for re-appointment.4. Ratification of appointment of M/s. Pathak H. D. & Associates, Chartered Accountants (Firm
Registration No. 107783W) as Statutory Auditors of the Company.5. Re-appointment of Mr. Shreevar Kheruka (DIN 01802416) as Managing Director & Chief Executive
Officer of the Company.6. Sub-division of Equity Shares.7. Alteration of the Memorandum of Association of the Company in view of Sub-division of Equity Shares.8. Approval of Borosil Employee Stock Option Scheme 2017.9. Approve grant of Employee Stock Options to the Employees of Subsidiary Companies of the Company
under Borosil Employee Stock Option Scheme 2017.* Applicable for investors holding shares in electronic form.
Signed this……………day of ………2017 Signature of shareholder
Signature of First Proxy holder Signature of Second Proxy holder Signature of Third Proxy holder
AffixRevenue
Stamp
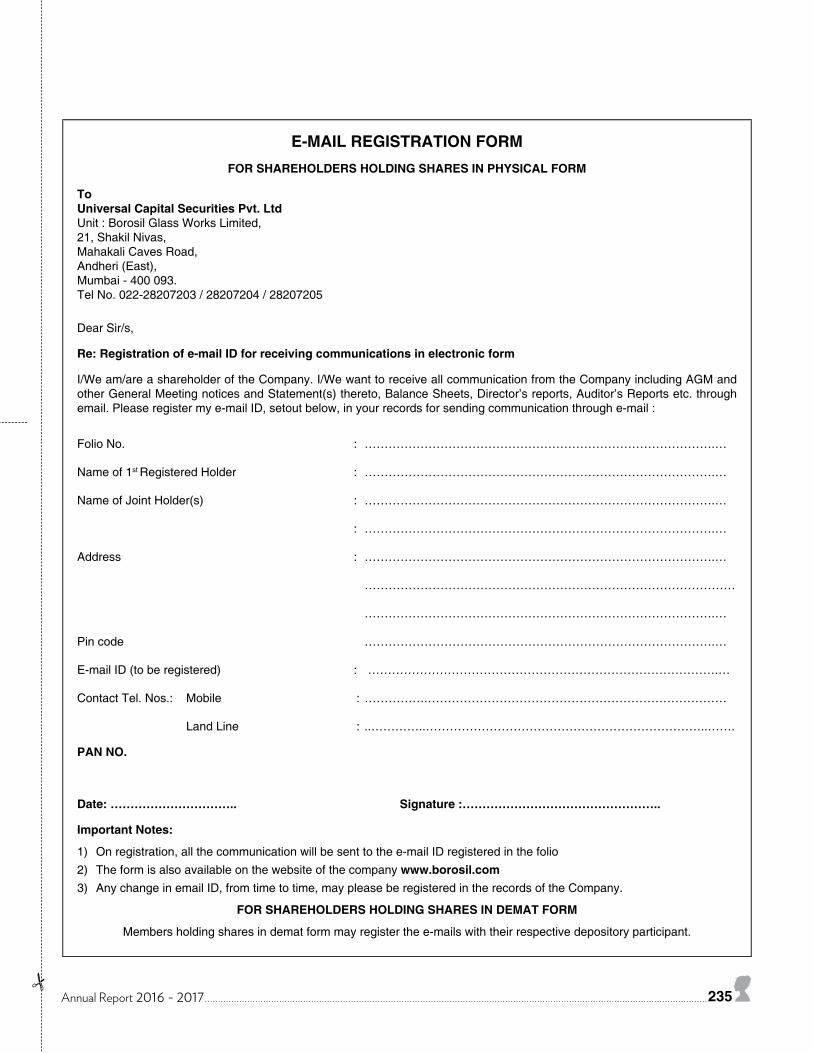
Annual Report 2016 - 2017 235
E-MAIL REGISTRATION FORMFOR SHAREHOLDERS HOLDING SHARES IN PHYSICAL FORM
ToUniversal Capital Securities Pvt. LtdUnit : Borosil Glass Works Limited,21, Shakil Nivas,Mahakali Caves Road,Andheri (East),Mumbai - 400 093.Tel No. 022-28207203 / 28207204 / 28207205
Dear Sir/s,
Re: Registration of e-mail ID for receiving communications in electronic form
I/We am/are a shareholder of the Company. I/We want to receive all communication from the Company including AGM and other General Meeting notices and Statement(s) thereto, Balance Sheets, Director’s reports, Auditor’s Reports etc. through email. Please register my e-mail ID, setout below, in your records for sending communication through e-mail :
Folio No. : …………………………………………………………………………….…
Name of 1st Registered Holder : …………………………………………………………………………….…
Name of Joint Holder(s) : …………………………………………………………………………….…
: …………………………………………………………………………….…
Address : …………………………………………………………………………….…
…………………………………………………………………………………
…………………………………………………………………………….…
Pin code …………………………………………………………………………….…
E-mail ID (to be registered) : …………………………………………………………………………….…
Contact Tel. Nos.: Mobile : …………….…………………………………………………………………
Land Line : ..…………..……………………………………………………………..…….
PAN NO.
Date: ………………………….. Signature :…………………………………………..
Important Notes:
1) On registration, all the communication will be sent to the e-mail ID registered in the folio2) The form is also available on the website of the company www.borosil.com3) Any change in email ID, from time to time, may please be registered in the records of the Company.
FOR SHAREHOLDERS HOLDING SHARES IN DEMAT FORM
Members holding shares in demat form may register the e-mails with their respective depository participant.

Annual Report 2016 - 2017
OR
IEN
T