service systems
TRANSCRIPT
International Journal of Energy, Information and Communications
Vol.4, Issue 5 (2013), pp.45-60
http://dx.doi.org/10.14257/ijeic.2013.4.5.05
ISSN: 2093-9655 IJEIC
Copyright ⓒ 2013 SERSC
An Agent-based Model to Study the Evolution of Service Systems
through the Service Life Cycle
Chathura Rajapakse and Takao Terano
Department of Computational Intelligence and Systems Science,
Tokyo Institute of Technology, Japan
Abstract
We introduce a unified concept of service life cycle (SLC) for the study of service system
evolution. The need for this research arises from the fact that studying service ecosystems has
become a critical need in the modern service economy. Adopting the view that a service
ecosystem is a complex adaptive system of interacting service systems, we propose Agent-
based Modeling methodology as a potential candidate for service research. Our agent-based
model simulates an artificial market, in which one hypothetical service is being offered and
customer agents interact with service provider agents to co-create value. The design of the
model takes inputs from the service dominant logic, Kauffman’s NKCS model and the ISPAR
model of service system interactions. The simulation results reveal that the evolution of
service providers follows a life cycle pattern, which we call the Service Life Cycle. We
propose the SLC to be used as a reference to evaluate the performance of service providers in
a service ecosystem, initiating a novel S-D logic based discussion on sustainability of
business firms.
Keywords: Service Ecosystems, Service Science, Life cycle, Service Life cycle, ISPAR
Model, NKCS Model
1. Introduction
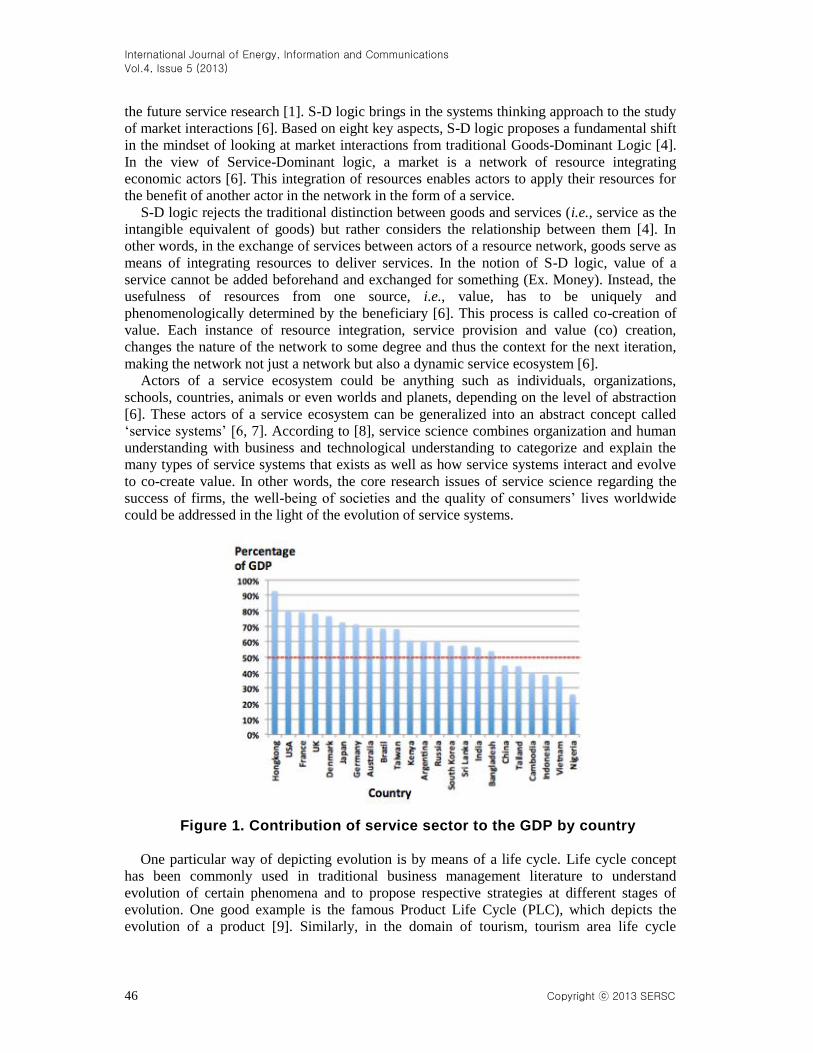
The world is becoming characterized by services and we can observe a rapid growth in the
percentage contribution of the services sector to the GDP of many countries in the world [1,
2]. According to Figure 1, this percentage is more than 70% in many of the world’s most
advanced economies and even many developing countries have a figure more than 50% [3].
However, the business logic of the market is still largely focusing on manufacturing and
selling goods and based on this traditional Goods-Dominant logic, a service is the intangible
equivalent of goods [4]. Unarguably, acting with yesterday’s logic is not going to help
businesses become competitive in today’s (and future) market. This has given rise to an ever-
growing array of questions that have significant implications for the success of firms, the
well-being of societies and the quality of consumers’ lives worldwide [1]. Consequently,
understanding service systems to foster service innovation has become a critical need in this
modern service economy [5]. In response, there emerges a new interdisciplinary research
discipline called ‘Service Science’, which focuses it’s inquiry on fundamental science,
models, theories, and applications to drive service innovation, competition, and well-being
through co-creation of value [1].
Contemporary service research has been largely influenced and benefited by the Service-
Dominant Logic (S-D Logic). In fact, it has been most commonly cited as a catalyst theory in
International Journal of Energy, Information and Communications
Vol.4, Issue 5 (2013)
46 Copyright ⓒ 2013 SERSC
the future service research [1]. S-D logic brings in the systems thinking approach to the study
of market interactions [6]. Based on eight key aspects, S-D logic proposes a fundamental shift
in the mindset of looking at market interactions from traditional Goods-Dominant Logic [4].
In the view of Service-Dominant logic, a market is a network of resource integrating
economic actors [6]. This integration of resources enables actors to apply their resources for
the benefit of another actor in the network in the form of a service.
S-D logic rejects the traditional distinction between goods and services (i.e., service as the
intangible equivalent of goods) but rather considers the relationship between them [4]. In
other words, in the exchange of services between actors of a resource network, goods serve as
means of integrating resources to deliver services. In the notion of S-D logic, value of a
service cannot be added beforehand and exchanged for something (Ex. Money). Instead, the
usefulness of resources from one source, i.e., value, has to be uniquely and
phenomenologically determined by the beneficiary [6]. This process is called co-creation of
value. Each instance of resource integration, service provision and value (co) creation,
changes the nature of the network to some degree and thus the context for the next iteration,
making the network not just a network but also a dynamic service ecosystem [6].
Actors of a service ecosystem could be anything such as individuals, organizations,
schools, countries, animals or even worlds and planets, depending on the level of abstraction
[6]. These actors of a service ecosystem can be generalized into an abstract concept called
‘service systems’ [6, 7]. According to [8], service science combines organization and human
understanding with business and technological understanding to categorize and explain the
many types of service systems that exists as well as how service systems interact and evolve
to co-create value. In other words, the core research issues of service science regarding the
success of firms, the well-being of societies and the quality of consumers’ lives worldwide
could be addressed in the light of the evolution of service systems.
Figure 1. Contribution of service sector to the GDP by country
One particular way of depicting evolution is by means of a life cycle. Life cycle concept
has been commonly used in traditional business management literature to understand
evolution of certain phenomena and to propose respective strategies at different stages of
evolution. One good example is the famous Product Life Cycle (PLC), which depicts the
evolution of a product [9]. Similarly, in the domain of tourism, tourism area life cycle
International Journal of Energy, Information and Communications
Vol.4, Issue 5 (2013)
Copyright ⓒ 2013 SERSC 47
(TALC) has been proposed to understand the evolution of a tourist destination [10]. Both of
these life cycles measure the frequency of consumption over time and enable to identify
different phases of evolution such as introduction, growth, stagnation, decline, etc. to
determine probable strategies for each phase for business performance. This same concept
could be used in the domain of service ecosystems to study the evolution of service systems.
However, this study of the evolution of service systems is a challenging task. According to
S-D logic, a service ecosystem comprising multiplicities of interacting service systems is a
complex adaptive system [6]. As we could observe, current research in the service research
frontiers is very often depending on the data collected through questionnaires and interviews.
One particular challenge with the study of complex adaptive systems is the inability to
analyze by decomposition due to the property of ‘emergence’ associated with complex
adaptive systems [11]. The evolutionary pattern of service systems in a service ecosystem
could be identified as an emerging pattern due to their interactions with other service systems.
Therefore, research based on data collected through interviews and questionnaires is not
adequate to get a holistic picture about the evolution of service systems. Moreover, an
interdisciplinary research approach has been recommended for the service science research to
develop necessary knowledge and tools [5].
In this research, we intend to study the evolution of service systems using the Agent-based
Modeling (ABM) approach [12]. Due to its widespread use in the domain of complex
adaptive systems, ABM has a potential as a research methodology in the domain of service
science. Agent-based modeling consist of a number of interacting autonomous agents
who are represented as computerized independent entities capable of acting locally in
response to stimuli or to communication from other agents [12, 13, 14]. These local
actions of each individual of a population of agents emerge various global complex
patterns. In other words, these agents act as parts of a complex system, of which the
macro-level properties can only be studied by letting the parts to interact with each
other. Due to this reason, agent-based modeling has become a prominent technology in
studying complex adaptive systems [12, 13]. On the other hand, G-D logic is well
established in the world and it makes real experiments to test an alternative dominant
logic risky and difficult. Therefore, simulation approach could be recommended and
agent-based modeling becomes an obvious solution.
This paper elaborates the details of an agent-based model of a service ecosystem
developed with the objective of studying the evolution of service systems by means of
analyzing a life cycle. The service ecosystem model is an artificial market model, which
contains two types of service systems – Service Providers and Customers. The artificial
market contains multiplicities of service systems (agents) of both types. All service
providers offer one particular hypothetical service that satisfies a need of customers.
We develop the model based on the fundamentals of S-D logic using two existing
theoretical models as major building blocks. One is Kauffman’s NKCS model [15] used
to formalize the service ecosystem as a computational model of service systems. The
other is the ISPAR model of service system interactions used to model the interactions
between service systems [7].
In the analysis based on the initial results of the model, we basically focus on the
evolution of service providers measuring the number of service interactions take place
with each service provider at each time step over a longer period of time. Through this,
we observe a life cycle pattern of evolution, which is similar to the known life cycle
patterns such as the product life cycle and tourism area life cycle. We propose this new
life cycle to be called Service Life Cycle (SLC) and argue that other existing life cycles
could be brought under this common umbrella to initiate a novel S-D logic based
International Journal of Energy, Information and Communications
Vol.4, Issue 5 (2013)
48 Copyright ⓒ 2013 SERSC
discussion on the sustainability of business entities [16]. The rest of the paper is
organized as below. Chapter two revisits the important literature in both service science and
agent-based modeling. Chapter three explains our agent-based model in detail and chapter
four presents the initial results. Chapter five contains a discussion based on results and
chapter six provides concluding remarks.
2. Literature Review
According to [17], as a common standard, articles on agent-based modeling should include
references to the theoretical background of the social or economic phenomenon that is
investigated. Therefore, we include a substantial review on service science and service
dominant logic in this section.
2.1. Service Research Vocabulary
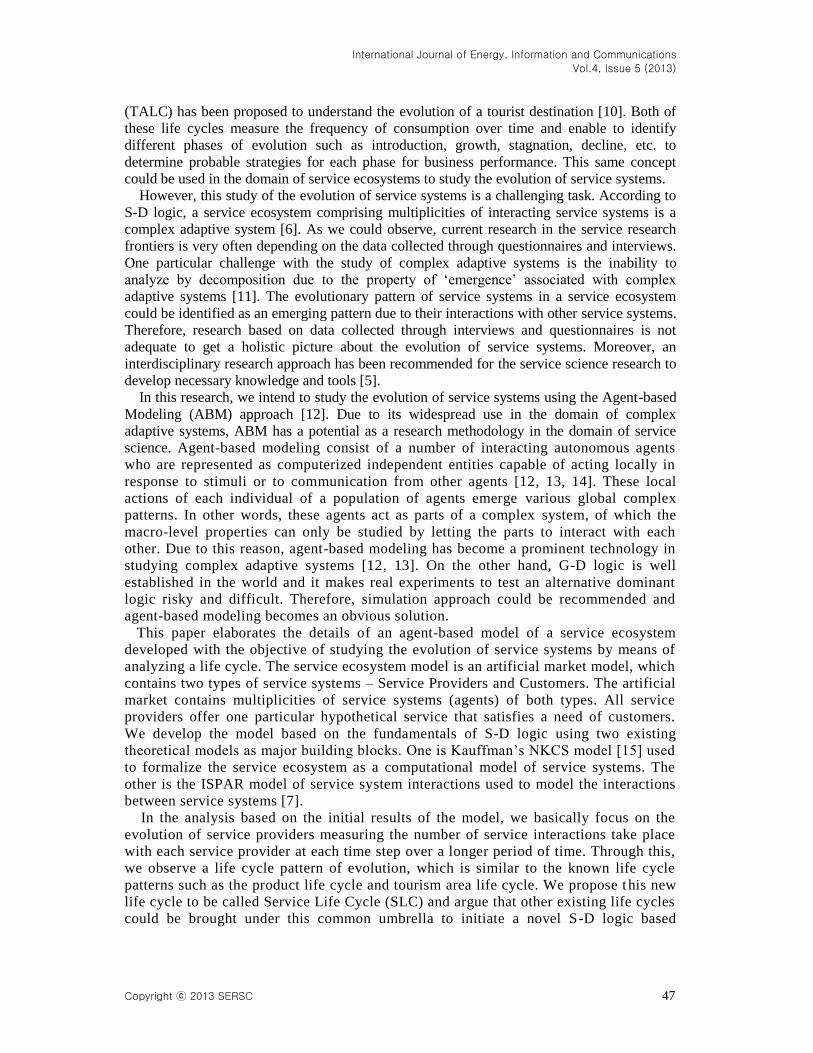
Generally, the core vocabulary in modern service research is provided by Service-
Dominant logic [4]. As shown in Figure 2, in its guidance to shift from a goods-centered view
to a service-centered view, S-D logic proposes eight commensurate shifts in thinking: (1) a
shift to a focus on the process of serving rather than the creation of goods, (2) a shift to the
primacy of intangibles rather than tangibles, (3) a shift to a focus on the creation and use of
dynamic operant resources as opposed to the consumption and depletion of static operand
resources, (4) a recognition of the strategic advantage of symmetric rather than asymmetric
information, (5) a shift to conversation and dialog as opposed to propaganda, (6) an
understanding that the firm can only make and follow through on value propositions rather
than create and add value, (7) a shift in focus to relational rather than transactional exchange,
and (8) a shift to an emphasis on financial performance for information feedback rather than a
goal of profit maximization.
Figure 2. The prosed eight fundamental shifts in S-D logic
When a firm sees itself as a manufacturer with an implied purpose of selling what it makes,
it sees the key to making more money as selling more and more goods. In contrast, the S-D
logic suggests that since these manufactured goods are actually mechanisms for service
provision, the customer is always buying a service flow rather than a tangible thing, and thus
the firm should perhaps reconsider the nature of its offering [4]. S-D logic emphasizes
importance of dynamic operant resources over static operand resources. The operand
resources, such as natural resources, require something be done to it to be useful, where as
International Journal of Energy, Information and Communications
Vol.4, Issue 5 (2013)
Copyright ⓒ 2013 SERSC 49
dynamic operant resources are largely intangible and can produce an effect. The main operant
resource it recognizes is knowledge, which is the only sustainable source of national wealth
and competitive advantage. S-D logic also emphasizes the importance of exchanging
symmetric information between the two parties and also the importance of having a
conversation between the two parties than one party leading propaganda through advertising.
The traditional G-D logic views value as a property of a good, which was added during the
manufacturing process. Thus, the cost of adding value reflects the price the customer has to
pay to acquire the good. However, S-D logic recognizes that value is not created and added at
the factory but rather co-created by the customers’ assessment of value-in-use. This
involvement of customer implies that the firms can only make an offer of value creation
through the application of its resources to some need of the customer- that is through a
service. In other words, firms can only make a value proposition and if customers accept it,
value will be co-created. Traditional G-D logic encourages maximizing profits by completing
as much transactions as possible. In contrast, S-D logic advises to maintain longer
relationships with customers using financial feedbacks as sources of information for learning
to continuously generate and test new hypothesis that serve customers better.
According to [6], a society is a complex system of servicing actors. It could also be viewed
as a value constellation that comprise of multiple service systems [18]. Service system has
been defined as a dynamic value co-creation configuration of resources, including people,
organizations, shared information (language, laws, measures, methods), and technology, all
connected internally and externally to other service systems by value propositions [7]. In this
definition, anything such as people, businesses, government agencies, etc., could be a service
system. A similar view on servicing actors of a society could be found in [19], where it
defines business and social organizations as viable systems. A dynamic and complex system
of interacting service systems such as a society is called a service ecosystem [6].
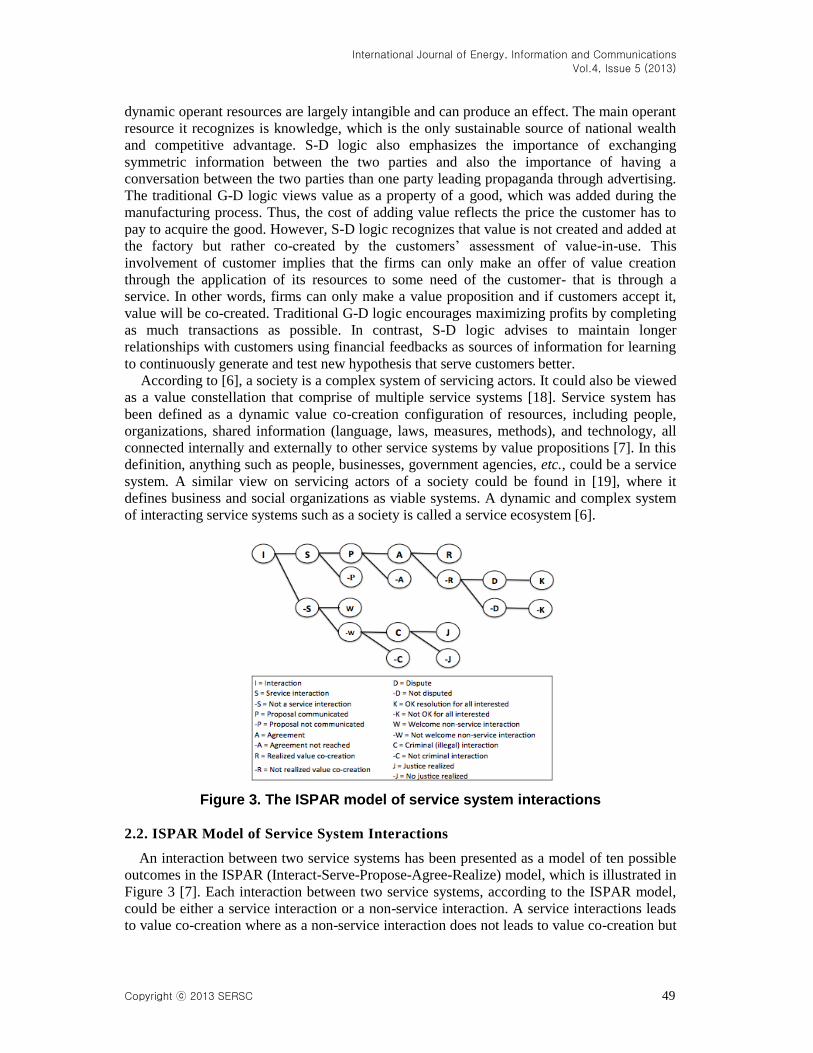
Figure 3. The ISPAR model of service system interactions
2.2. ISPAR Model of Service System Interactions
An interaction between two service systems has been presented as a model of ten possible
outcomes in the ISPAR (Interact-Serve-Propose-Agree-Realize) model, which is illustrated in
Figure 3 [7]. Each interaction between two service systems, according to the ISPAR model,
could be either a service interaction or a non-service interaction. A service interactions leads
to value co-creation where as a non-service interaction does not leads to value co-creation but
International Journal of Energy, Information and Communications
Vol.4, Issue 5 (2013)
50 Copyright ⓒ 2013 SERSC
rather has the potential for influencing value co-creation in future service interactions. For
example, exchanging pleasantries with a future customer may affect the potential of value co-
creation in the future service interactions.
According to the ISPAR model, a service interaction starts by communicating a proposal
(P) by a customer to a service provider. Unless a proposal is communicated properly and
understood by the other service system, a service interaction may not proceed. After the
proposal communication the two service systems should come to an agreement for the
service. Success of an agreement depends on some properties of the value propositions of the
service systems or the fulfillment of certain requirements. For example, to get some services,
the customer would need to possess proper identification documents. Similarly, to offer some
services, the service providers have to possess a certain education level or a valid license.
After coming to an agreement, the proposal will be realized and the service will be consumed.
However, depending on the characteristics of the value propositions of the two service
systems, value may (R) or may not (-R) be co-created. Being unable to co-create value
sometimes may lead to a dispute (D), to which a satisfactory resolution may (K) or may not (-
K) be found.
A non-service interaction (-S) could be either welcome interaction (W) or a non-welcome
interaction (-W). A welcome interaction would make a positive impact on future service
interactions where as a non-welcome interaction would make a negative impact. A non-
welcome interaction could perhaps be a crime (C), to which justice may (J) or may not (-J) be
realized.
2.3. Kauffman’s NKCS Model
According to [6], even the tangible resources in the ecosystem we live in can be viewed in
terms of service provision. For example, natural pollination of crops by insects and trees that
help prevent erosion and protect the watershed are examples of service provision. Notably,
with these service provisions entities of such ecosystems coevolve by adapting to each other’s
changes. For example, human consumption of timber affects the growth of trees, which in
turn makes an impact on the watershed, affecting humans. Therefore, in [20] we proposed
Kauffman’s NKCS model, which was originally proposed to study the coevolution of
biological species [15], as a modeling framework for service ecosystems.
The NKCS model defines a system of S entities, each having N attributes. Each entity is
connected with X other interacting entities in the system (X <= S). Each attribute can be at D
number of states and a state value combination of all N attributes determines a state of the
entity. Hence, each entity has DN possible states. In other words, a state could be considered
as a point in an N-dimensional hypercube, which has a total of DN points. Each point d = {d1,
d2… dN} is associated with a utility value f denoted by equation 1.
(1)
Here, fi
is the utility contribution of the ith dimension (attribute) and the total utility of a given point
(state) is the average of the utility contributions of all N dimensions. A notable feature in the
NKCS model is that the utility contribution of an individual dimension depends on: (1) its
state, (2) K other dimensions of the same entity, (3) and C other dimensions of each of the X
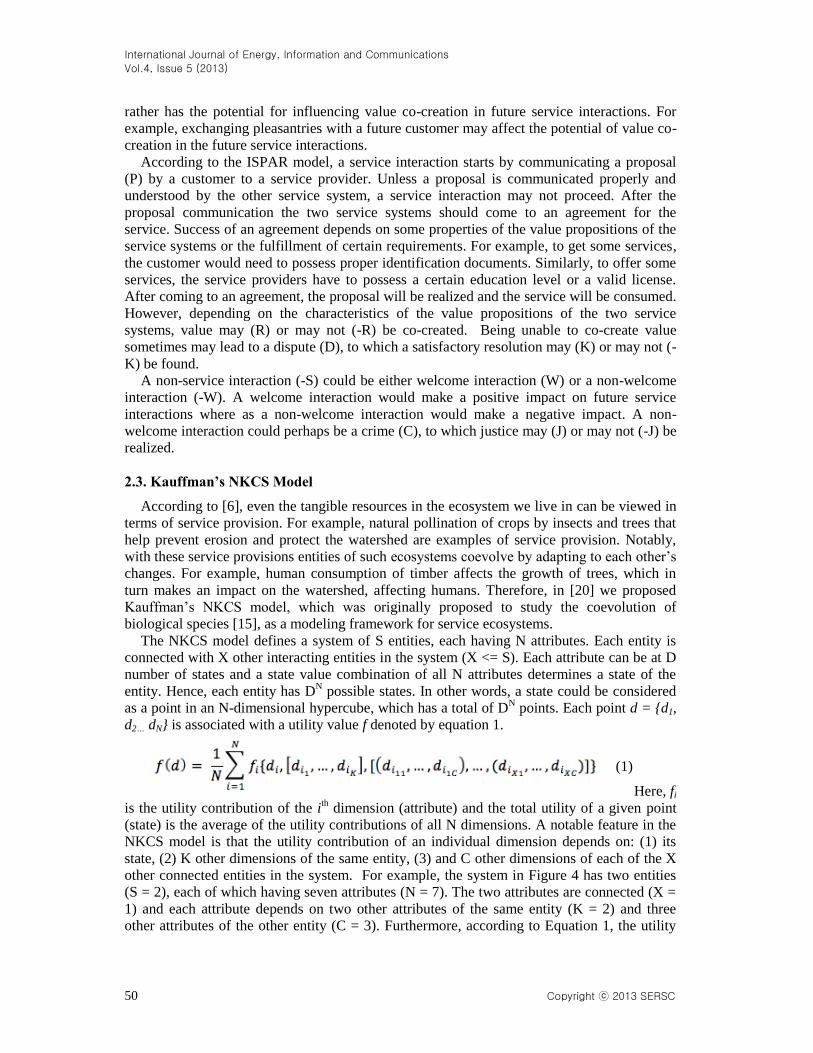
other connected entities in the system. For example, the system in Figure 4 has two entities
(S = 2), each of which having seven attributes (N = 7). The two attributes are connected (X =
1) and each attribute depends on two other attributes of the same entity (K = 2) and three
other attributes of the other entity (C = 3). Furthermore, according to Equation 1, the utility
International Journal of Energy, Information and Communications
Vol.4, Issue 5 (2013)
Copyright ⓒ 2013 SERSC 51
contribution of 2nd
attribute of Entity 1 depends on attribute 4 and 6 of the same entity and
attributes 1, 4 and 6 of the opposite entity. These positions are picked randomly. This system
is scalable due to the parameter S since more and more entities could be added to the system
and the complexity could be controlled using parameters N, K, C and X.
Figure 4. Dependency structure of two service system entities according to the
NKCS architecture
The utility contribution of each dimension fi is determined by a function, which is defined
by Equation 2. Here, R is drawn from a uniform distribution in the range (0, 1) to each of the
D(K + CX + 1)
inputs.
(2)
These DN states and their respective utility values result in a rugged utility landscape of
each entity in the system. In the original NKCS model, each entity has a representative agent,
whose task is to continuously seek in the respective landscape for higher utilities. Each agent
gets its turn to move from the current state to a new state in its one-mutant neighboring states
[15], which give them a higher utility. However, due to the interdependency imposed by
parameters K and C, a move of an agent representing one entity to a new state alters the
current utilities of other interacting entities. This induces those interacting species to look for
better states in their respective landscapes at their respective turns to move. These moves by
all entities result in coevolution in terms of utility. The model stops execution when all
entities are better off at their current states. Further details on the NKCS model can be found
in [15].
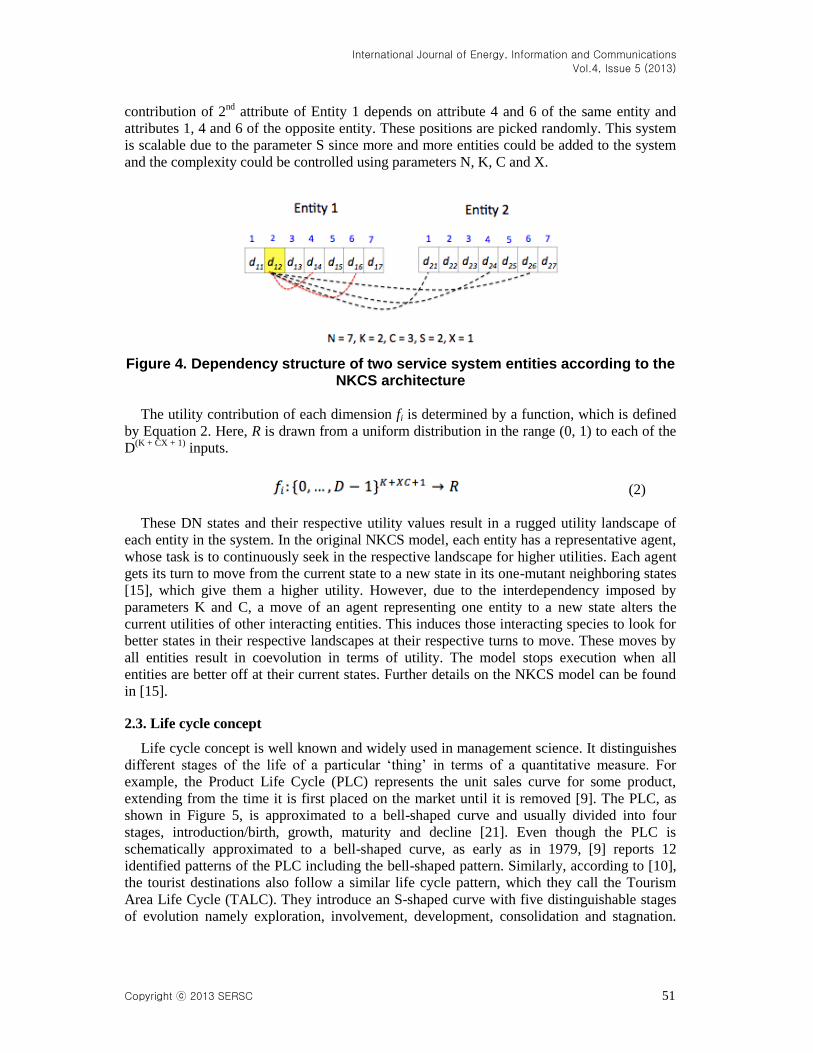
2.3. Life cycle concept
Life cycle concept is well known and widely used in management science. It distinguishes
different stages of the life of a particular ‘thing’ in terms of a quantitative measure. For
example, the Product Life Cycle (PLC) represents the unit sales curve for some product,
extending from the time it is first placed on the market until it is removed [9]. The PLC, as
shown in Figure 5, is approximated to a bell-shaped curve and usually divided into four
stages, introduction/birth, growth, maturity and decline [21]. Even though the PLC is
schematically approximated to a bell-shaped curve, as early as in 1979, [9] reports 12
identified patterns of the PLC including the bell-shaped pattern. Similarly, according to [10],
the tourist destinations also follow a similar life cycle pattern, which they call the Tourism
Area Life Cycle (TALC). They introduce an S-shaped curve with five distinguishable stages
of evolution namely exploration, involvement, development, consolidation and stagnation.
International Journal of Energy, Information and Communications
Vol.4, Issue 5 (2013)
52 Copyright ⓒ 2013 SERSC
After stagnation stage, they propose that the curve would take one of five possible paths
between rejuvenation and decline. Despite many criticisms as well as praises, the TALC
concept is still being researched and cited even after three decades since it was first
introduced [22].
Figure 5. The basic product life cycle
3. The agent-based model description
The recent developments of agent-based modeling suggest using a common protocol
for communicating agent-based models [16]. Therefore we describe our model adhering
to the ODD protocol proposed by Grimm et al., [23]
3.1. Overview
3.1.1. Purpose: The purpose is to study the evolution of service systems with respect to a life
cycle. In our hypothetical system comprising two types of service systems - customers and
service providers - we specifically focus on the evolution of service providers.
3.1.2. State variables and scales: Our hypothetical service ecosystem has only two types of
service system entities, i.e. service providers and consumers. A service system is represented
as an ‘agent’ in the system and the number of agents of each type set at the initialization of
the model. All service providers offer one particular service; for example, they all are beach
hotels at a tropical island. Or else, they could be considered as fast food outlets near a
university. According to [7], service systems connect to other service systems by value
propositions. In other words, both customers and service providers should have a value
proposition. Hence in our model, we define a distinct value proposition for the service
provider entity and another distinct value proposition for the customer entity. According to
[24], a value proposition can be defined by a set of value creating attributes. For example, in
the value proposition of a hotel, connectivity (to the Internet), comfort, relaxation, etc. could
be value-creating attributes. The hotel can mobilize its resources to these attributes to make
an offer for value co-creation. For example, some hotels may provide Internet Hotspots or
Wi-Fi zones for the residents to connect to the Internet while some hotels provide in-room Wi-
Fi access.
We define a value proposition of N attributes for each service system entity. Value
proposition of service provider entity defines its service while the value proposition of
customer entity helps defining customers. Furthermore, each attribute can be at two states, 0
International Journal of Energy, Information and Communications
Vol.4, Issue 5 (2013)
Copyright ⓒ 2013 SERSC 53
and 1. A state reflects a particular level reached by using resources, particularly knowledge.
For example, some hotels may not offer its residents and Internet connection (state = 0) and
some will offer a Wi-Fi connection (state = 1). Different agents of both service system
entities could be at different states in their value propositions reflecting the reality. We define
a state variable called current state (currentState) as an integer array for this purpose. For
example, if X and Y are two agents of same type and N = 8, X could be at state 00001111 and
Y could be at state 10101010. Current state of a service provider reflects its service level or
service standard while the current state of a customer reflects his or her customer profile.
However, in reality, these value-creating attributes are not standalone. Their outcome
depends on the states of many other known and unknown attributes. For example, the appeal
of the hotel room will depend on the its design as well as other internal factors such as safety
and maintenance and external factors such as the preferences of the customer that stay in.
Therefore, we define each attribute of a given entity’s value proposition to depend on K other
attributes of the same entity and C other attributes of the other entity. This connectivity
structure is similar to the system illustrated by Figure 4, even though K and C are two input
parameters that could be initialized at the runtime. Using this structure, we manage to mimic
an important, if not the most important, feature in service system interactions; the value co-
creation. When a customer agent consumes the service from a particular service provider, the
current state of the service provider is used to determine the value for that customer in that
service. In other words, the final value realized by the customer (utility) is the average of the
utility contributed by each attribute of the service provider’s value proposition. However, due
to the dependency structure imposed through parameters K and C, the utility contribution by a
given attribute of a service provider depends on its own state, states of K other attributes of
the same entity and C attributes of the customer. In other words, for a customer to realize the
full utility of a given attribute on service provider’s value proposition, it is important to have
the relevant attributes of his own value proposition at right states. For example, even if a hotel
offers in-room Wi-Fi access, unless the customer possesses a laptop and knows how to
connect to the Internet, he cannot realize the value of that offering. Similarly, the value of the
service provider realized by a particular service interaction is determined by the average of
the utility contributions of the attributes of customer’s value proposition.
Initially, we set the current states of both customers and service providers randomly. It
resulted in a pool of customers with diverse characteristics in their profiles as well as a
diverse set of service providers at different service levels. In the current implementation, we
set the current state of service providers to be constant, meaning that the service level of the
service providers remains constant. However, the customers’ current states change as they
learn by experience and seek for better opportunities for value co-creation with different
service providers.
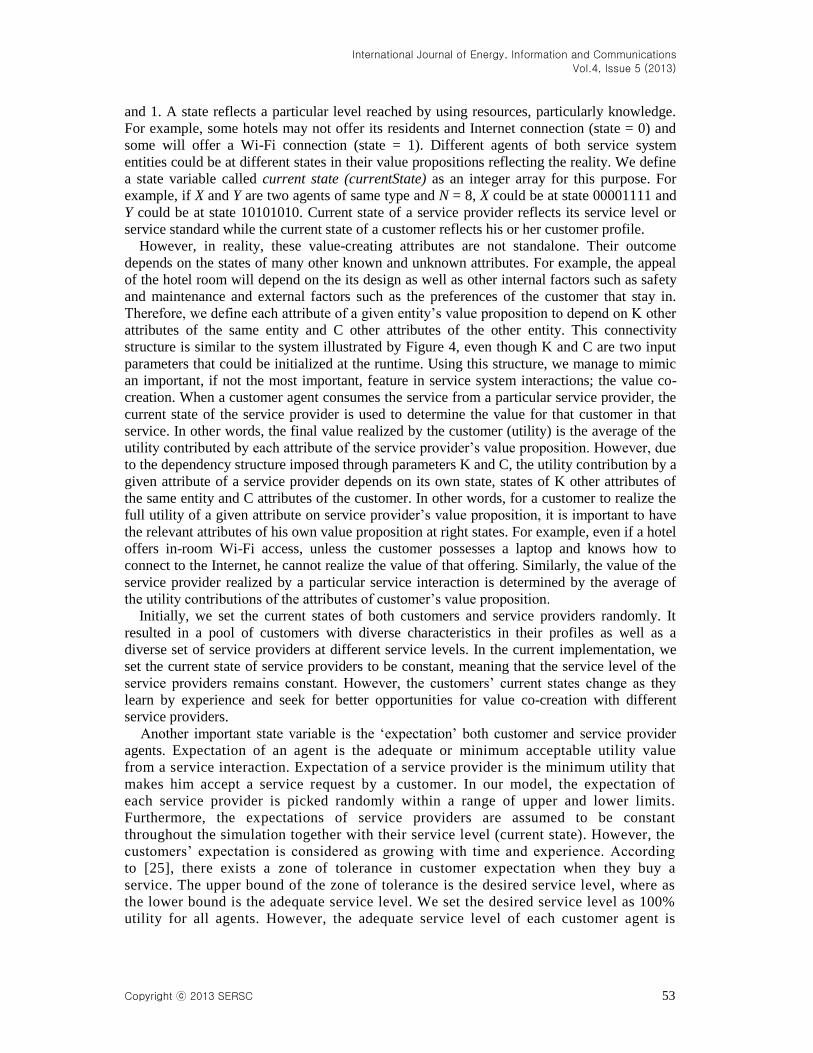
Another important state variable is the ‘expectation’ both customer and service provider
agents. Expectation of an agent is the adequate or minimum acceptable utility value
from a service interaction. Expectation of a service provider is the minimum utility that
makes him accept a service request by a customer. In our model, the expectation of
each service provider is picked randomly within a range of upper and lower limits.
Furthermore, the expectations of service providers are assumed to be constant
throughout the simulation together with their service level (current state). However, the
customers’ expectation is considered as growing with time and experience. According
to [25], there exists a zone of tolerance in customer expectation when they buy a
service. The upper bound of the zone of tolerance is the desired service level, where as
the lower bound is the adequate service level. We set the desired service level as 100%
utility for all agents. However, the adequate service level of each customer agent is
International Journal of Energy, Information and Communications
Vol.4, Issue 5 (2013)
54 Copyright ⓒ 2013 SERSC
picked randomly within a specified range. According to [25], the adequate service level
of a given customer grows with time when the customer gets experience. It means a
once delightful service would become less attractive when experiencing the service
over and over. Therefore as shown by Figure 6, we increase the adequate service level
of a particular customer by a certain percentage determined by a variable called ‘growth
coefficient’ after each successful value co-creation interaction.
Figure 6. The change of customer expectation with time
Customers also have a variable that holds a memory about each service provider
(memoryOfProviders) that he has previously interacted with. The memory contains the
current states of the previously interacted providers. This memory is used when agents
seek for a suitable service provider once he got the need. The frequency that the
customer agents get the service need is controlled by a probability value
(needProbability). If this probability is high, the customers get the service need very
often. For example, fast food outlets serve for such a high frequent service need. Hotels
basically serve for a low frequent need as people usually travel few times a year.
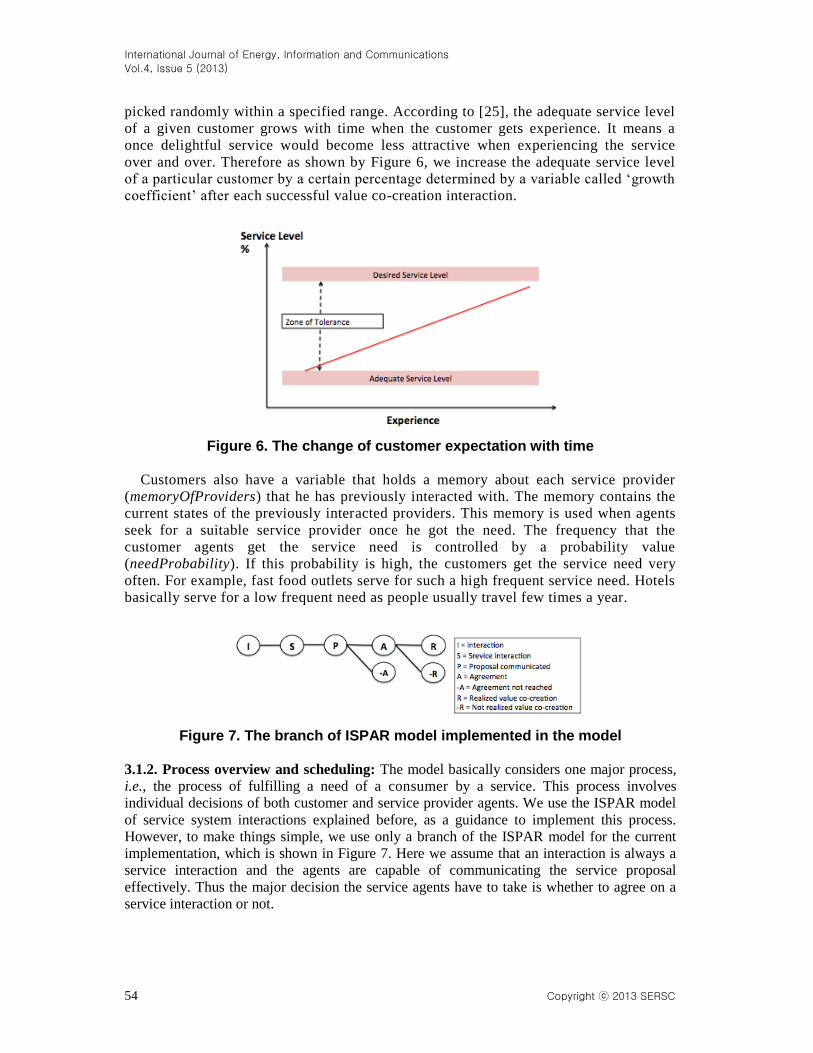
Figure 7. The branch of ISPAR model implemented in the model
3.1.2. Process overview and scheduling: The model basically considers one major process,
i.e., the process of fulfilling a need of a consumer by a service. This process involves
individual decisions of both customer and service provider agents. We use the ISPAR model
of service system interactions explained before, as a guidance to implement this process.
However, to make things simple, we use only a branch of the ISPAR model for the current
implementation, which is shown in Figure 7. Here we assume that an interaction is always a
service interaction and the agents are capable of communicating the service proposal
effectively. Thus the major decision the service agents have to take is whether to agree on a
service interaction or not.
International Journal of Energy, Information and Communications
Vol.4, Issue 5 (2013)
Copyright ⓒ 2013 SERSC 55
The process starts with a customer agent getting a service need. Once a customer agent gets
a service need, the first task of the agent is finding a suitable provider. The agent first looks
for a provider in the memory of providers and if it is empty (customer is a first-timer), a
service provider will be picked randomly. If the memory is not empty, the customer agent
evaluates the potential co-created value with each service provider and selects the one that is
likely to give the highest value within his zone of tolerance. If a suitable provider could not be
found yet, the customer agent seeks for previously unvisited providers and selects one
randomly. Here we assume that the customer agents have a prior knowledge about all
available service providers. If no provider could be found yet, the customer agent tries to
change its current state to find a suitable provider. Following a greedy strategy [15], it
evaluates all its one-mutant neighboring states for all service providers and selects the best
provider and the corresponding new state. Moving to a new state by a customer agent reflects
a change in the customer profile of that agent done by learning and adapting to the
environment. Failing to find a suitable provider after all these attempts will lead the customer
agent to give up the need and abort the service interaction.
Once a suitable provider is found, the consumer agent initiates an interaction by
contacting the selected provider through a service request. This is similar to making a
proposal in the ISPAR model. Here we assume that the proposal gets communicated without
any misunderstanding. When a consumer agent makes a proposal, he transfers his current
state to the service provider. The service provider checks the current state of the consumer to
determine the potential value to him in the service interaction. For example, making a
hotel room reservation will require a credit card number as a guarantee and if a
customer fails to provide a valid credit card number, the hotel may reject the
reservation request since the potential value is less than the expectation . If the potential
value is higher than his expectation, the provider agent agrees to provide the service or
reject otherwise. With the response of the service provider agent, the customer agent
gets to know the current state of the service provider. Once the consent of the service
provider is received (Agreement) for a service proposal, the service interaction comes
to the value co-creation phase (Realize).
At the value co-creation phase, the consumer will determine the value of the service
by evaluating the utility in the landscape. Since the total utility perceived by the
customer from the service provider’s value proposition depends on the current states of
both the service provider and customer, value can be considered as co-created. If the
perceived value is within the zone of tolerance of the customer agent, it becomes a
realization of value co-creation (R) as both parties get benefited from the interaction.
Otherwise, it is not a realization of value co-creation (-R). Further details on the
process overview and the ISPAR model can be found in [26].
3.2. Design Concepts
3.2.1. Emergence: We focus on the emerging pattern based on the number of service
interactions that occur with each service provider at each time step. All service interactions
that passed through the agreement phase (A) of the ISPAR model are counted for this
purpose.
3.2.2. Adaptation: Only customer agents display an adaptive behavior. When they are unable
to find a service provider who can meet their expectation, they search for a better state in their
one-mutant neighboring states, where it is more likely that they can co-create value with one
of the providers. Moving to the one-mutant neighboring states can be likened to the process of
International Journal of Energy, Information and Communications
Vol.4, Issue 5 (2013)
56 Copyright ⓒ 2013 SERSC
changing one’s own customer profile along a given attribute. For example, a customer who
didn’t possess a credit card before and found it difficult to reserve a hotel room will try to buy
a credit card before trying to reserve a hotel next time. This could be considered as a change
in state.
3.2.3. Fitness/Objectives: In this implementation, only the customer agents have an
objective. They try to meet their increasing expectations through successfully realized value
co-creation interactions with available providers.
3.2.4. Prediction: If a customer agent interacted with a service provider before, his memory
contains the current state (service level) of the provider, which helps to predict the potential
for realized value co-creation in future interactions.
3.2.5. Stochasticity: If a customer agent consumes the service for the first time or if the
customer agent finds that the service providers in his memory have no potential for further
value co-creation, he selects a new provider randomly from the previously unvisited list.
4. Results
This section contains the results of the simulation based on the above model. For all our
simulation runs, we set N = 8, K = 2 and C = 2. The reason for selecting those values was
none other than preserving computational resources to ensure faster execution of the
simulation. We further set the number of consumer agents to 1000 and the number of provider
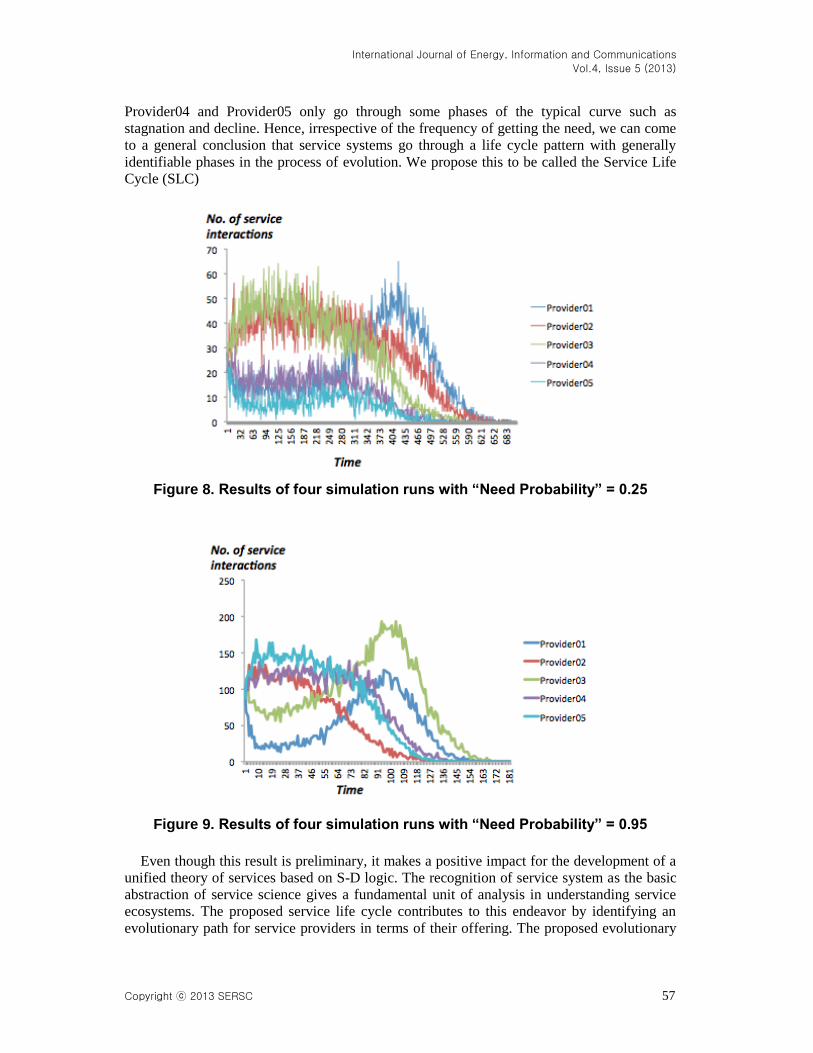
agents to 5. In our first experiment, we set the need probability to 0.25 to ensure a lower
frequency of getting the service need. The result of the simulation is shown in Figure 8. The
five lines on the graph correspond to five random service providers offering the same value
proposition but with different service levels. In other words, the initial states of the value
propositions of those providers are different from each other. Moreover, those initial states
are set to be constant throughout the simulation to reflect a fixed service level. In other words,
the service provider agents in this simulation do not change their service level due to learning.
The Y-axis corresponds to the number of service interactions done by each provider at a
given time step.
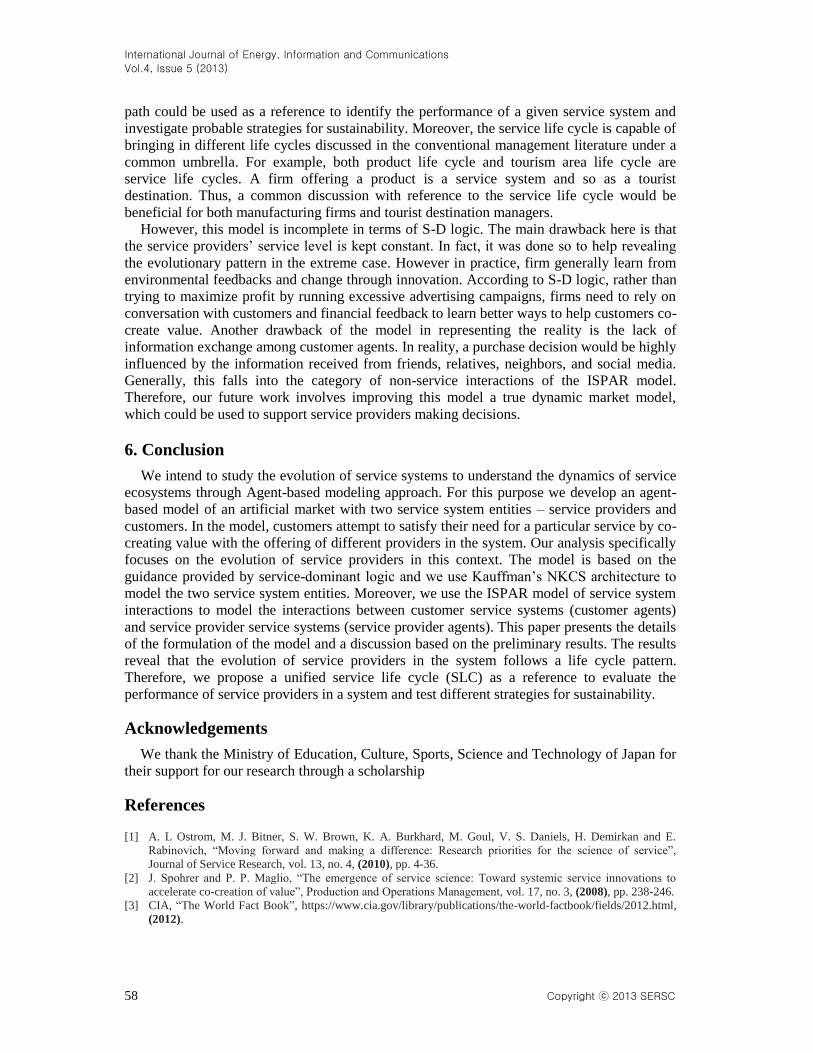
In the second experiment, we setup the need probability to 0.95 to secure a high frequency
in getting the service need. For example, the fast food industry serves for a high frequent
need. The corresponding result is shown in Figure 9. Similar to the previous case, the five
lines on the graph correspond to five service providers offering the same value proposition
but at different levels of service. Notably, the value proposition in this case is not necessarily
to be the same as in the previous case. In other words, the two simulation runs are mutually
independent. Similar to the previous case, the Y-axis corresponds to the number of service
interactions occurred between each service provider agent and customer agents.
5. Discussion
At this point, what we are interested in is the basic shapes of the curves on each graph.
Looking at the two graphs, it is apparent that all the curves more or less display the properties
of the known life cycle patterns. For example, in the graph in Figure 8, Provider01 goes
through the typical bell-shaped life cycle pattern where as Provider02 and Provider03 follows
almost a similar pattern. The other two providers follow patterns of unsuccessful businesses
with less growth and subsequent decline. Similarly, the Provider01 and Provider03 on the
graph in Figure 9 follow the typical bell-shaped life cycle pattern where as Provider02,
International Journal of Energy, Information and Communications
Vol.4, Issue 5 (2013)
Copyright ⓒ 2013 SERSC 57
Provider04 and Provider05 only go through some phases of the typical curve such as
stagnation and decline. Hence, irrespective of the frequency of getting the need, we can come
to a general conclusion that service systems go through a life cycle pattern with generally
identifiable phases in the process of evolution. We propose this to be called the Service Life
Cycle (SLC)
Figure 8. Results of four simulation runs with “Need Probability” = 0.25
Figure 9. Results of four simulation runs with “Need Probability” = 0.95
Even though this result is preliminary, it makes a positive impact for the development of a
unified theory of services based on S-D logic. The recognition of service system as the basic
abstraction of service science gives a fundamental unit of analysis in understanding service
ecosystems. The proposed service life cycle contributes to this endeavor by identifying an
evolutionary path for service providers in terms of their offering. The proposed evolutionary
International Journal of Energy, Information and Communications
Vol.4, Issue 5 (2013)
58 Copyright ⓒ 2013 SERSC
path could be used as a reference to identify the performance of a given service system and
investigate probable strategies for sustainability. Moreover, the service life cycle is capable of
bringing in different life cycles discussed in the conventional management literature under a
common umbrella. For example, both product life cycle and tourism area life cycle are
service life cycles. A firm offering a product is a service system and so as a tourist
destination. Thus, a common discussion with reference to the service life cycle would be
beneficial for both manufacturing firms and tourist destination managers.
However, this model is incomplete in terms of S-D logic. The main drawback here is that
the service providers’ service level is kept constant. In fact, it was done so to help revealing
the evolutionary pattern in the extreme case. However in practice, firm generally learn from
environmental feedbacks and change through innovation. According to S-D logic, rather than
trying to maximize profit by running excessive advertising campaigns, firms need to rely on
conversation with customers and financial feedback to learn better ways to help customers co-
create value. Another drawback of the model in representing the reality is the lack of
information exchange among customer agents. In reality, a purchase decision would be highly
influenced by the information received from friends, relatives, neighbors, and social media.
Generally, this falls into the category of non-service interactions of the ISPAR model.
Therefore, our future work involves improving this model a true dynamic market model,
which could be used to support service providers making decisions.
6. Conclusion
We intend to study the evolution of service systems to understand the dynamics of service
ecosystems through Agent-based modeling approach. For this purpose we develop an agent-
based model of an artificial market with two service system entities – service providers and
customers. In the model, customers attempt to satisfy their need for a particular service by co-
creating value with the offering of different providers in the system. Our analysis specifically
focuses on the evolution of service providers in this context. The model is based on the
guidance provided by service-dominant logic and we use Kauffman’s NKCS architecture to
model the two service system entities. Moreover, we use the ISPAR model of service system
interactions to model the interactions between customer service systems (customer agents)
and service provider service systems (service provider agents). This paper presents the details
of the formulation of the model and a discussion based on the preliminary results. The results
reveal that the evolution of service providers in the system follows a life cycle pattern.
Therefore, we propose a unified service life cycle (SLC) as a reference to evaluate the
performance of service providers in a system and test different strategies for sustainability.
Acknowledgements
We thank the Ministry of Education, Culture, Sports, Science and Technology of Japan for
their support for our research through a scholarship
References [1] A. L Ostrom, M. J. Bitner, S. W. Brown, K. A. Burkhard, M. Goul, V. S. Daniels, H. Demirkan and E.
Rabinovich, “Moving forward and making a difference: Research priorities for the science of service”,
Journal of Service Research, vol. 13, no. 4, (2010), pp. 4-36.
[2] J. Spohrer and P. P. Maglio, “The emergence of service science: Toward systemic service innovations to
accelerate co-creation of value”, Production and Operations Management, vol. 17, no. 3, (2008), pp. 238-246.
[3] CIA, “The World Fact Book”, https://www.cia.gov/library/publications/the-world-factbook/fields/2012.html,
(2012).
International Journal of Energy, Information and Communications
Vol.4, Issue 5 (2013)
Copyright ⓒ 2013 SERSC 59
[4] R. F. Lusch, S. L. Vargo and A. J. Malter, “Taking a leadership role in global marketing management”,
Organizational Dynamics, vol. 35, no. 3, (2006), pp. 264-278.
[5] IfM and IBM, “Succeeding through service innovation: A service perspective for education, research,
business and government”, Cambridge, United Kingdom: University of Cambridge Institute for
Manufacturing, (2008).
[6] S. L. Vargo and R. F. Lusch, “It’s all B2B….and beyond: Toward a systems perspective of market”,
Industrial Marketing Management, vol. 40, no. 2, (2011), pp. 181-187.
[7] P. P. Maglio, S. L. Vargo, N. Caswell and J. Spohrer, “Service system is the basic abstraction of service
science”, Information Systems and e-Business Management, vol. 7, no. 4, (2009), pp. 395-406.
[8] P. P. Maglio and J. Spohrer, “Fundamentals of service science”, Journal of the Academy of Marketing
Science, vol. 36, no. 1, (2008), pp. 18-20.
[9] D. R. Rink and J. E. Swan, “Product life cycle research: A literature review”, Journal of business
Research, vol. 7, no. 3, (1979), pp. 219-242.
[10] R. W. Butler, “The concept of a tourist area cycle of evolution: implications for management of resources”,
The Canadian Geographer/Le Géographe canadien, vol. 24, no. 1, (1980), pp. 5-12.
[11] I. Ng, R. Maull and L. Smith, “Embedding the new discipline of service science”, The Science of Service
Systems, Springer US, (2011), pp. 13-35.
[12] T. Terano, “Beyond the KISS principal of agent-based social simulation”, Journal of Socio-informatics, vol. 1,
no. 1, (2008), pp. 175-187.
[13] J. M. Epstein, “Agent-based computational models and generative social science, Generative Social Science:
Studies in Agent-based Computational Modeling”, Joshua M. Epstein (Eds.), Princeton University Press,
Princeton, New Jersey, (2006).
[14] M. A. Janssen, “Complexity and eco-systems management: The theory and practice of multi-agent systems”,
Edward Elgar Publishing, Inc., Cheltenham, UK, (2000).
[15] J. Padget, R. Vidgen, J. Mitchell, A. Marshall and R. Mellor, “Sendero: an extended, agent-based
implementation of Kauffman’s NKCS model”, Journal of Artificial Societies and Social Simulation, vol. 12,
no. 4, (2009), pp. 824-844.
[16] C. Rajapakse and T. Terano, “Analyzing the Evolution of Service Ecosystems with respect to Life Cycle
Concept through Agent-based Modeling Approach”, Proceedings of the 2nd International Workshop on Smart
Technologies for Energy, Information and Communication, Republic of Korea, (2013).
[17] R. Matteo, R. Leombruni, N. Saam and M. Sonnessa, “A common protocol for agent-based social
simulation”, Journal of artificial societies and social simulation, vol. 9, (2006).
[18] C. A. KielisZewski, P. P. Maglio and M. Cefkin, “On modeling value constellations to understand complex
service system interactions”, European Management Journal, vol. 30, no. 5, (2012), pp. 438-450.
[19] R. Badinelli, S. Barile, I. Ng, F. Polese, M. Saviano and P. D. Nauta, “Viable service systems and decision
making in service management”, Journal of Service Management, vol. 23, no. 4, (2012), pp. 498-526.
[20] C. Rajapakse and T. Terano, “Modeling value co-creation process in complex service systems using
Kauffman’s NKCS architecture”, Advanced Methods and Technologies for Agent and Multi-Agent Systems,
D. Barbucha, M. T. Le, R. J. Howlett, L. C. Jain (Eds.) Frontiers in Artificial Intelligence and Applications
series, vol. 252, ios Press, (2013), pp. 71-80.
[21] G. S. Day, “The product life cycle: analysis and applications issues”, The Journal of Marketing, (1981), pp.
60-67.
[22] R. W. Butler, “Tourism Area Life Cycle”, Contemporary Tourism Reviews, Chris Cooper (Eds.), Goodfellow
Publishers Ltd., (2011).
[23] G. J. Polhill, D. Parker, D. Brown and V. Grimm, “Using the ODD protocol for describing three agent-based
social simulation models of land-use change”, Journal of Artificial Societies and Social Simulation, vol. 11,
no. 2, (2008).
[24] I. Ng, G. Parry, L. Smith, R. Maull and G. Briscoe, “Transitioning from a Goods-Dominant to a Service-
Dominant Logic: Visualizing the Value Propositions of Rolls-Royce”, Journal of Service Management, vol.
23, no. 3, (2012), pp. 416-439.
[25] V. A. Zeithamal and L. B. Leonard, “The nature and determinants of customer expectations of service”,
Journal of the Academy of Marketing Science, vol. 21, no. 1, (1993), pp. 1-12.
[26] C. Rajapakse and T. Terano, “An agent-based implementation of service system interactions based on the
ISPAR model”, In proceedings of the 8th International Workshop on Agent-based Approaches in Economic
and Social Complex Systems, Tokyo, Japan, (2013).
International Journal of Energy, Information and Communications
Vol.4, Issue 5 (2013)
60 Copyright ⓒ 2013 SERSC
Authors
Chathura Rajapakse
Chathura Rajapakse is a second year doctoral degree candidate at the
Terano laboratory of the Department of Computational Intelligence and
Systems Science, Tokyo Institute of Technology, Japan. He possesses a
B.Sc. degree in Industrial Management from the Department of Industrial
Management, Faculty of Science, University of Kelaniya, Sri Lanka and
a Master of Engineering degree from the Department of Computational
Intelligence and Systems Science, Tokyo Institute of Technology, Japan.
He is a recipient of the Japanese Government Scholarship and his current
research interests include Service Science, Agent-based Modeling and
Knowledge Management. He is also attached to the Department of
Industrial Management, Faculty of Science, University of Kelaniya, Sri
Lanka as a lecturer since 2007.
Takao Terano
Takao Terano is a professor at Department of Computational
Intelligence and System Science, Interdisciplinary Graduate School of
Science and Engineering, Tokyo Institute of Technology. He received
BA degree in Mathematical Engineering in 1976 from University of
Tokyo, M. A. degree in Information Engineering in 1978 from University
of Tokyo, and Doctor of Engineering Degree in 1991 from Tokyo
Institute of Technology. His research interests include Agent-based
Modeling, Knowledge Systems, Evolutionary Computation, and Service
Science. He is a member of the editorial board of major Artificial
Intelligence and System science- related academic societies in Japan and
a member of IEEE, AAAI, and ACM. He is also the president of PAAA.